- Аналітика
- Новини та інструменти
- Новини ринків
Новини ринків
- Gold price sticks to modest recovery gains near $1,993 on the weaker USD, lower bond yields.
- The upbeat US January inflation data reinforced the Federal Reserve's (Fed) cautious approach to rate cuts in 2024.
- The rising geopolitical tension in the Middle East might benefit the yellow metal.
- Traders will keep an eye on the US Retail Sales, due on Thursday.
Gold prices (XAU/USD) holds below the $2,000 psychological mark during the early Asian session on Thursday. The stronger-than-expected US inflation data exerts some selling pressure on the yellow metal, but a fall in US bond yields and a weaker USD could provide little support to the commodities. The gold price currently trades around $1,993, gaining 0.13% on the day.
Meanwhile, the US Dollar Index (DXY), which measures the value of the USD relative to a basket of global currencies, retraces from a three-month high of nearly the 105.00 mark and hovers around 104.70. The US Treasury yields edge lower, with the 10-year yield standing at 4.26%.
The stronger-than-expected US inflation data reinforced the Federal Reserve's (Fed) cautious approach to rate cuts in 2024. Fed Vice Chair for Supervision Michael Barr said that the Federal Open Market Committee (FOMC) remains confident that US inflation is on the way to hitting the central bank's 2% target, but he needs to see continued good data before advocating for rate cuts. Barr added that he fully supports a careful approach to considering policy normalization given current conditions.
Fed Chair Jerome Powell and several Fed officials said the central bank wants to see more good data and confirm the direction of inflation before easing monetary policy. Following these remarks, the markets are now pricing in a nearly 80% odds that the Fed will cut rates in June, dialing back previous bets the central bank would begin cutting rates in May, according to the CME FedWatch Tool. It’s worth noting that the high interest rate diminishes the appeal of non-yielding metals as it increases competition from higher-yielding investments.
Apart from this, Israel launched extensive and lethal airstrikes in southern Lebanon on Wednesday, in response to a deadly missile attack on northern Israel. Israeli leaders have warned that they would take considerably stronger military action in Lebanon if the cross-border violence continues. The ongoing geopolitical tension in the Middle East might boost the price of gold, the traditional safe-haven asset.
Market players will focus on US Retail Sales, which is estimated to drop by 0.1% in January. Additionally, the US Philly Fed Manufacturing Index, Industrial Production, and weekly Initial Jobless Claims will be due on Thursday. Traders will also take more cues from the FOMC’s Bostic and Waller speeches. These events could give a clear direction to the gold price.
Japanese Gross Domestic Product (GDP) for the fourth quarter (Q4) came in at -0.1% QoQ versus 0.3% expected and -0.7% prior, the Cabinet Office showed on Thursday.
Furthermore, the Annualized GDP contracted 0.4% versus the 1.4% expansion expected and 2.9% contraction prior.
Market reaction
Following the Japanese growth numbers, the USD/JPY pair is down 0.04% on the day to trade at 150.52.
About Japan’s Gross Domestic Product (GDP)
The Gross Domestic Product (GDP), released by Japan’s Cabinet Office on a quarterly basis, is a measure of the total value of all goods and services produced in Japan during a given period. The GDP is considered as the main measure of Japan’s economic activity. The QoQ reading compares economic activity in the reference quarter to the previous quarter. Generally, a high reading is seen as bullish for the Japanese Yen (JPY), while a low reading is seen as bearish.
GDP FAQs
What is GDP and how is it recorded?
A country’s Gross Domestic Product (GDP) measures the rate of growth of its economy over a given period of time, usually a quarter. The most reliable figures are those that compare GDP to the previous quarter e.g Q2 of 2023 vs Q1 of 2023, or to the same period in the previous year, e.g Q2 of 2023 vs Q2 of 2022.
Annualized quarterly GDP figures extrapolate the growth rate of the quarter as if it were constant for the rest of the year. These can be misleading, however, if temporary shocks impact growth in one quarter but are unlikely to last all year – such as happened in the first quarter of 2020 at the outbreak of the covid pandemic, when growth plummeted.
How does GDP influence currencies?
A higher GDP result is generally positive for a nation’s currency as it reflects a growing economy, which is more likely to produce goods and services that can be exported, as well as attracting higher foreign investment. By the same token, when GDP falls it is usually negative for the currency.
When an economy grows people tend to spend more, which leads to inflation. The country’s central bank then has to put up interest rates to combat the inflation with the side effect of attracting more capital inflows from global investors, thus helping the local currency appreciate.
How does higher GDP impact the price of Gold?
When an economy grows and GDP is rising, people tend to spend more which leads to inflation. The country’s central bank then has to put up interest rates to combat the inflation. Higher interest rates are negative for Gold because they increase the opportunity-cost of holding Gold versus placing the money in a cash deposit account. Therefore, a higher GDP growth rate is usually a bearish factor for Gold price.
- AUD/USD climbs 0.55%, finding support in lower US Treasury yields and increased risk appetite, trading near 0.6490.
- Fed's Goolsbee hints at inflation path aligning with 2% target, underlining the current restrictive policy stance.
- Australian job market in focus, with expectations of 30K new jobs and a slight uptick in unemployment to 4%.
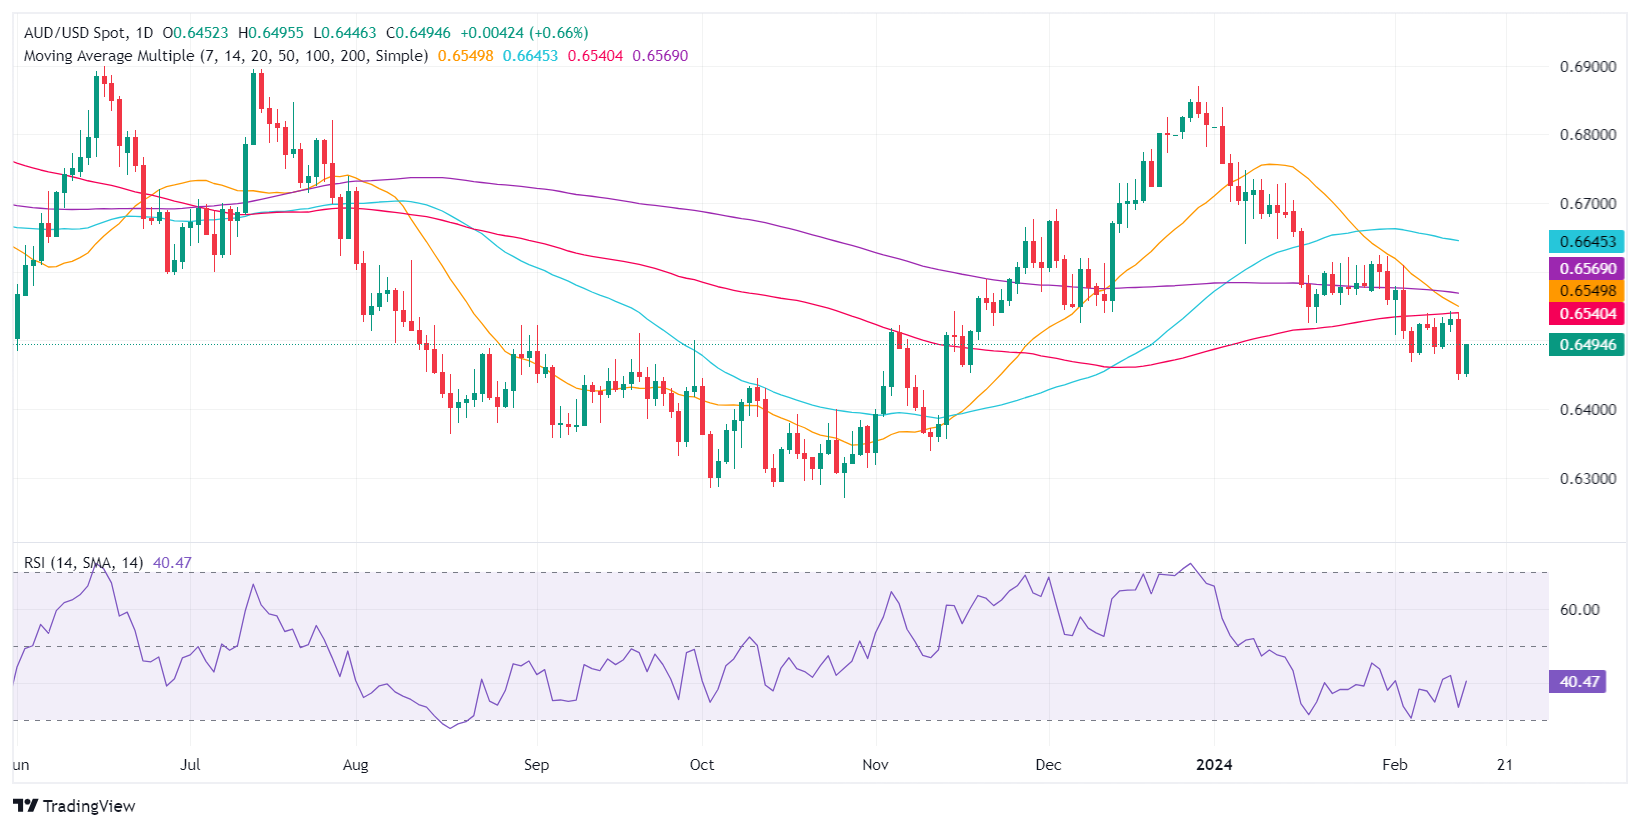
The Aussie Dollar recovered some ground on Wednesday and climbed 0.55% against the US Dollar, courtesy of falling US Treasury bond yields and risk appetite improvement. The AUD/USD consolidated at around the 0.6450-0.6490s area, and as Thursday’s session began, the pair exchanged hands at 0.6490.
AUD/USD jumps off yearly lows but is not out of the woods with jobs data pending
The economic docket was light following Tuesday’s hot inflation report from the United States. Chicago Fed President Austan Goolsbee crossed the wires and stated higher inflation for a few months would be consistent with a path back to the Fed’s 2% goal. He added the current policy stance is restrictive.
Fed officials adopted a more neutral stance after the first monetary policy decision of the year. Powell’s shrugging off expectations for a rate cut in March and February’s data indicates the economy is still robust. However, before the March and May meeting, there’s a good tranche of data to digest, before Powell and Co. could guide the markets.
In the meantime, the swaps markets see the Fed would cut rates 110 basis points from the current level at the 5.25%-5.50% range.
Aside from this, the Australian economic docket will feature the release of labor market data. Estimates suggest the Aussie’s economy added 30K jobs to the workforce, while the unemployment rate is foreseen at 4%, up from December’s 3.9%.
AUD/USD Price Analysis: Technical outlook
The AUD/USD is downward biased despite posting solid gains on Wednesday. Buyers need to reclaim the 0.6500 if they would like to reclaim the 100-day moving average (DMA) at 0.6537. A breach of the latter will expose the 200-DMA at 0.6565, ahead of 0.6600. On the other hand, the first support is seen at 0.6442, the February 13 low, followed by the 0.6400 mark.
- NZD/USD holds positive ground near 0.6085 amid the USD weakness.
- Fed’s Goolsbee said that higher inflation for a few months would still be consistent with a path back to the 2% target.
- RBNZ’s Orr said the inflation challenge was not over and highlighted broad financial pressures as a reason for maintaining a tight monetary policy.
- Investors await US Retail Sales, the Philly Fed Manufacturing Index, Industrial Production, and weekly Initial Jobless Claims, due on Thursday.
The NZD/USD pair posts modest gains during the early Asian session on Thursday. The USD Index (DXY) retreats from the three-month highs near the 105.00 barrier, supported by the improvement in the risk complex, which provides some support to the pair. The Reserve Bank of New Zealand's (RBNZ) Governor Orr's speech on Friday could offer fresh catalysts for the Kiwi. At press time, NZD/USD is trading at 0.6085, adding 0.02% on the day.
Chicago Federal Reserve (Fed) President Austan Goolsbee said that higher inflation for a few months would still be consistent with a path back to the 2% target. He further stated that the central bank needs a string of data before being able to determine whether interest rates will be cut. Additionally, several Fed officials prefer to wait for more evidence of cooling inflation before cutting rates. After remarks by other Fed officials, futures traders no longer expect a rate cut in the next two rate meetings in March and May.
Earlier this week, RBNZ Governor Orr testified before the Finance and Expenditure Committee on Monday. Orr said that inflation remains too high, which is why the central bank decided to keep the cash rate at 5.5%. However, the board aimed to continue to slow it down to around 2%. RBNZ’s Orr further stated that the inflation challenge was still not over and cited broad financial pressure for retaining a “restrictive monetary policy” position.
Moving on, US Retail Sales, the Philly Fed Manufacturing Index, Industrial Production and weekly Initial Jobless Claims will be due on Thursday. Also, the FOMC’s Bostic and Waller are set to speak. On Friday, the RBNZ’s Orr speech and the US Producer Price Index (PPI) will be in the spotlight.
- UK inflation figures broadly missed forecasts on Wednesday.
- GBP/JPY slid further away from 190.00 level, rejection pattern forms.
- Thursday sees UK GDP numbers, Friday to wrap up with UK Retail Sales.
GBP/JPY got knocked further back from the 190.00 handle on Wednesday after UK inflation numbers came in broadly below expectations, dragging the pair into a rough near-term consolidation pattern as investors gear up for further UK data releases in the back half of the trading week.
UK Consumer Price Index (CPI) inflation in January slid more than markets forecast, with MoM headline CPI printing at -0.6% versus the forecast -0.3%, falling back from the previous month’s 0.6%. Annualized CPI held steady at 4.0% for the year ended in January, coming in below the market’s forecast uptick to 4.2%.
Japan’s Gross Domestic Product (GDP) print early Thursday is expected to bring little new for markets to chew on, with Japan quarterly GDP expected to hold steady at -0.1% for the fourth quarter. Later Thursday sees the UK’s own GDP growth print, forecast to decline to a scant 0.1% for the annualized fourth quarter compared to the previous period’s 0.3% as the UK domestic economy continues to go lopsided and growth edges closer towards recession territory.
Friday will wrap up the UK economic data docket with January’s Retail Sales, which are forecast to rebound to 1.5% MoM after December’s -3.2%.
GBP/JPY technical outlook
The GBP/JPY got pulled further down from the 190.00 handle on Wednesday, gearing the intraday charts for a technical rejection from the key price level and setting the pair up for a continued decline back to the near-term median at the 200-hour Simple Moving Average (SMA) around 187.90.
Despite a near-term pulldown, the GBP/JPY is firmly planted deep in bull country, with recent highs above 190.00 testing into multi-year highs and the pair remains well above long-term medians at the 200-day SMA near 182.40. The pair has closed in the green for five consecutive trading days, and Wednesday’s red close still leaves the pair above former significant technical resistance near the 188.00 handle.
GBP/JPY hourly chart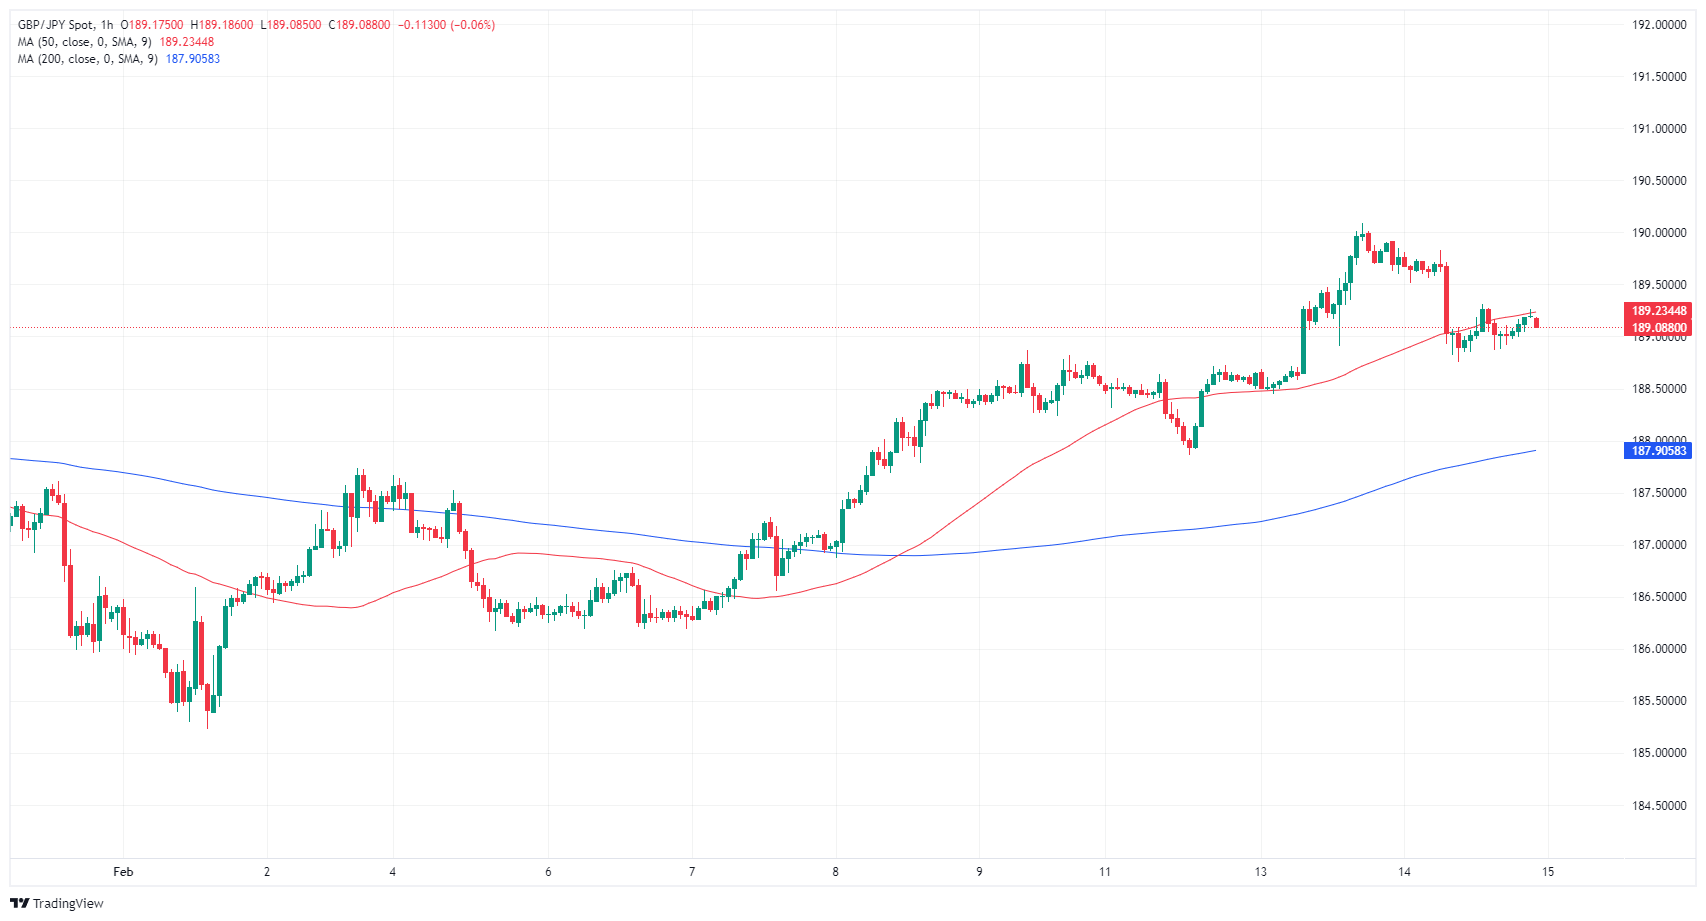
GBP/JPY daily chart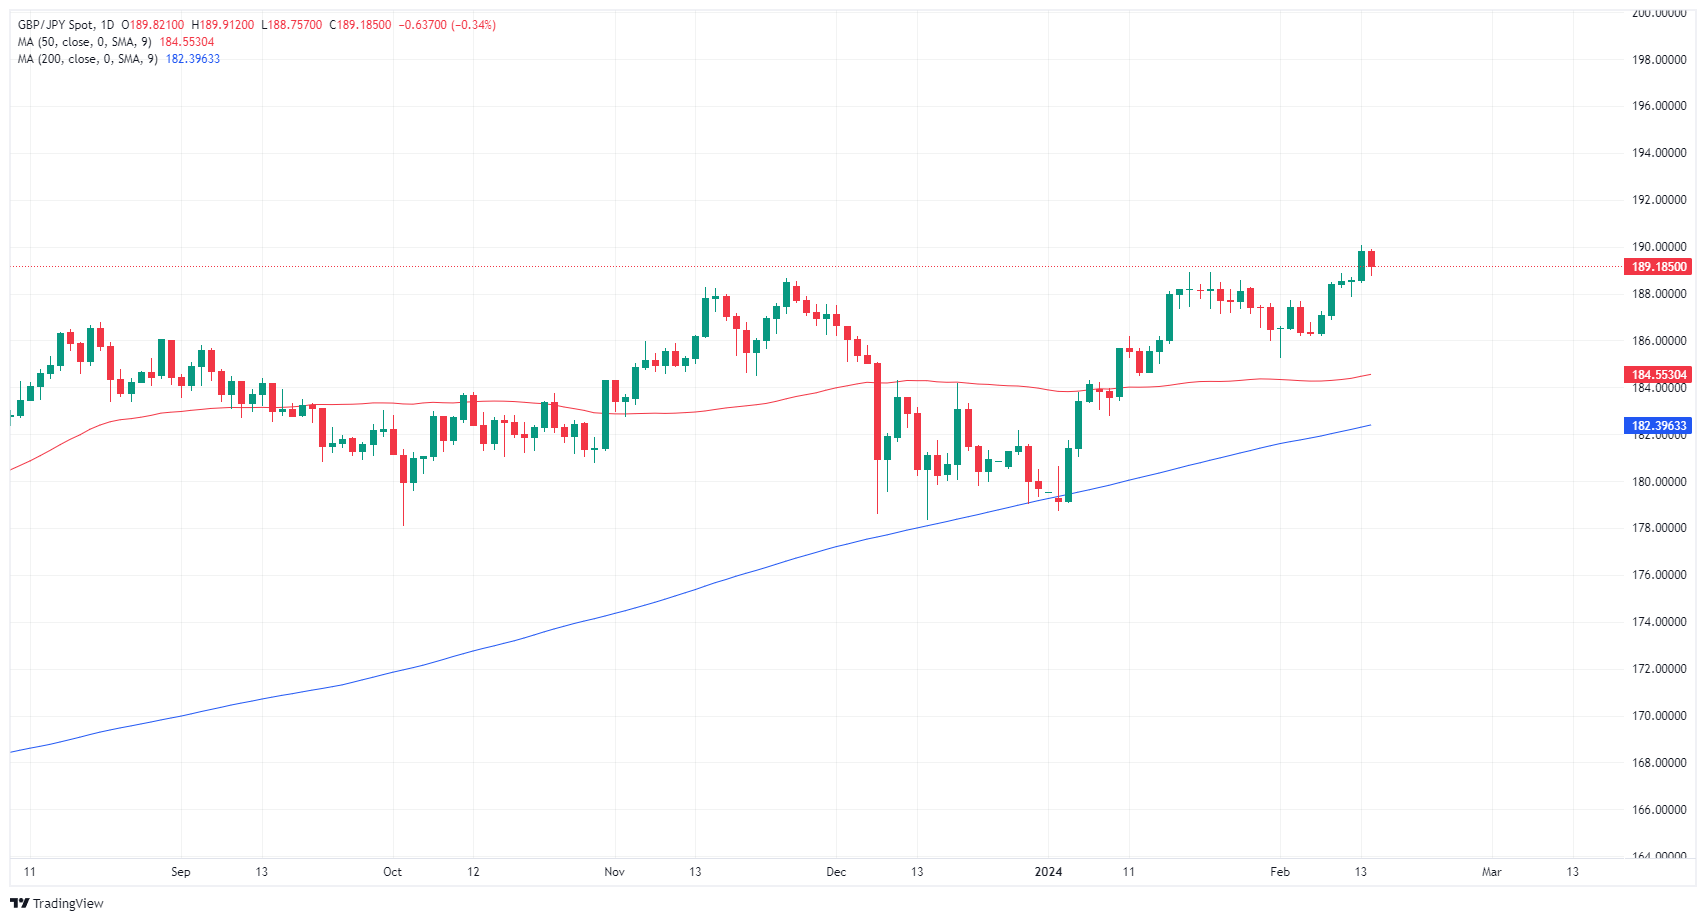
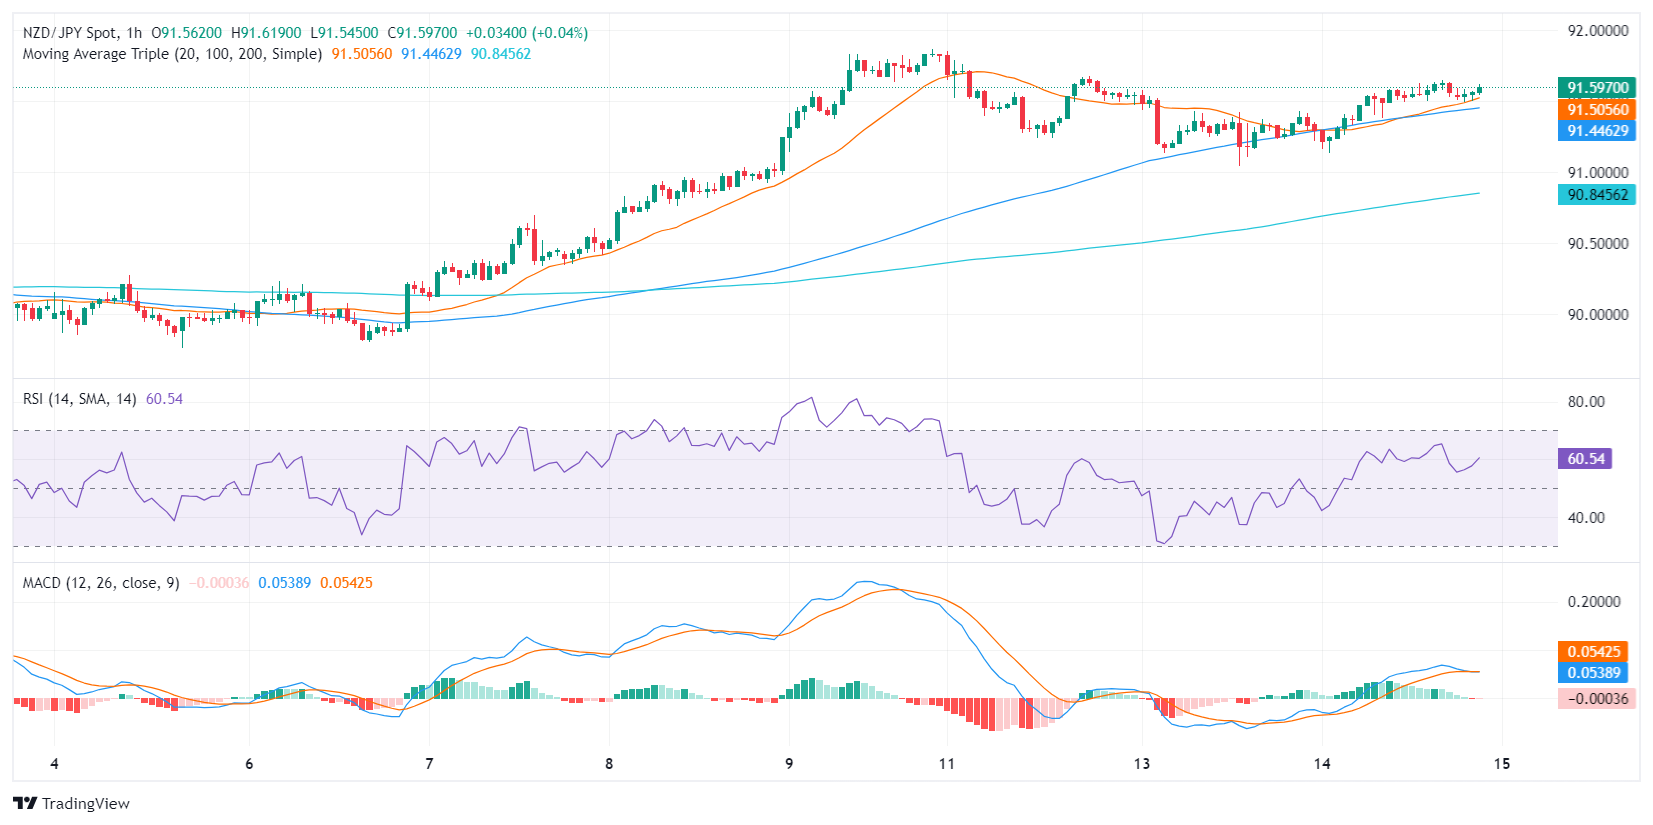
- The NZD/JPY is currently trading at 91.63, registering gains of 0.32% in Wednesday's session.
- The daily chart analysis reveals consistent bullish sentiment, with RSI and MACD affirming positive momentum.
- Hourly indicators also show a dominant bullish bias.
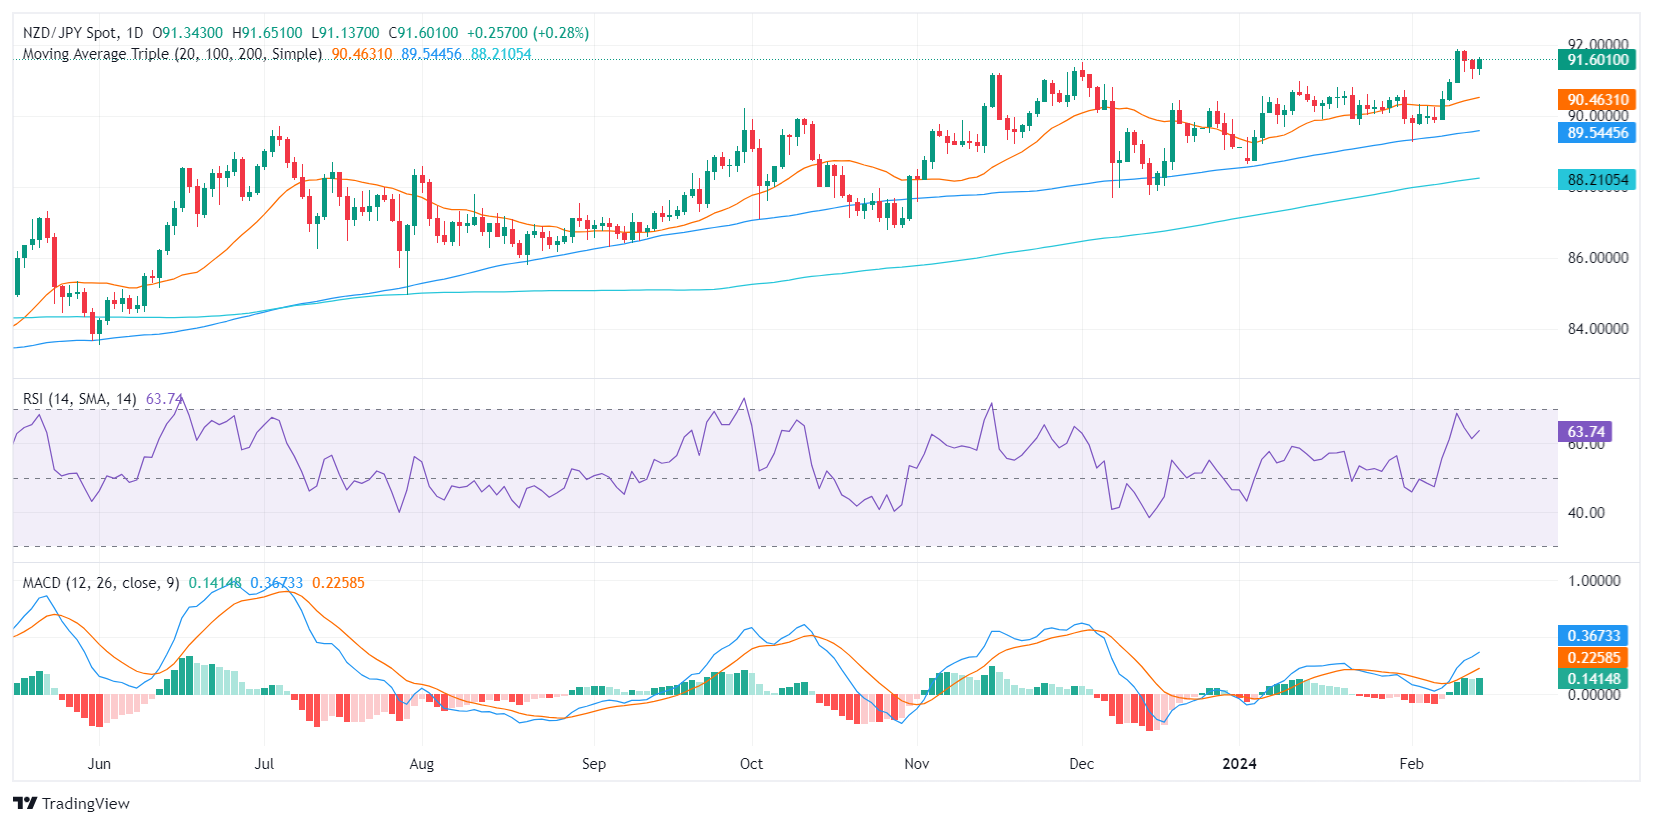
In Wednesday's session, the NZD/JPY was spotted at 91.63, reflecting a 0.32% gain as bears seem to run out of steam after two sessions of losses..
Beginning with the daily chart analysis, the Relative Strength Index (RSI) suggests sustained positive sentiment as it consistently lies within the upbeat territory, without stepping into the overbought space. Simultaneously, the MACD histogram prints green bars and shows a rising trend, reinforcing the positive momentum depicted by the RSI. Moreover, the cross maintains its position above the 20,100,200-day Simple Moving Averages (SMAs), signaling continued control by the bulls in large time frames.
NZD/JPY daily chart
Shifting towards the hourly analysis, the RSI readings fluctuate around the positive zone, while the MACD histogram continues printing green bars but seems to be flattening and falling into the negative domain. This aligns with the picture painted by the daily indicators, further solidifying the perception of a dominant bullish bias but the MACD leaves the door open for further downside.
NZD/JPY hourly chart
Foreign Visitor Arrivals in New Zealand climbed 14.8% for the year ended December, slowing from the previous period's 30.4%.
Stats NZ noted that the December 2023 number of overseas visitors is 79% of the pre-COVID-19 number of 528,200 from December of 2019.
Stats NZ also noted a surge in migrant arrivals in the country for the year ended December, with 254,700 people relocating to New Zealand versus the outflow of 128,700. Migrant arrivals surged 114% while outflows rose 36%.
About New Zealand Visitor Arrivals
The Visitor Arrivals released by the Statistics New Zealand measures the number of visitors to New Zealand. As the tourism industry dominates a large part of the total GDP, the visitor arrivals is an important indicator of the overall economic condition in New Zealand. Normally, a high reading is seen as positive (or bullish) for the NZD, while a low reading is seen as negative (or bearish).
Federal Reserve (Fed) Vice Chair for Supervision Michael Barr hit newswires late Wednesday, declaring that the Fed and its core Federal Open Market Committee (FOMC) remain confident that US inflation is on the way to hitting the Fed's 2% target.
Key highlights
- Data suggests Fed is on a good path, but too early to say if there will be a soft landing.
- The FOMC remains confident that it is on the path towards 2% inflation.
- Fed's Barr needs to see continued good data before advocating for rate cuts.
- FOMC plans to hold in-depth discussions of balance sheet activity soon.
- Fed balance sheet rundown is operating smoothly, reserves remain plentiful.
- Barr sees no signs of liquidity problems across financial systems, is monitoring conditions carefully.
- January Consumer Price Index (CPI) report is a reminder that the path to 2% inflation will be bumpy.
- Banking system remains resilient, pockets of risk exist in office and commercial real estate.
- January jobs and inflation numbers were stronger than expected, but Fed is looking at the totality of numbers.
- High interest rates are dampening sales and purchases of existing homes.
- Barr referred to Federal Reserve Chairman Jerome Powell's latest press conference regarding the FOMC's overall outlook.
- "I fully support what he called a careful approach to considering policy normalization given current conditions.”
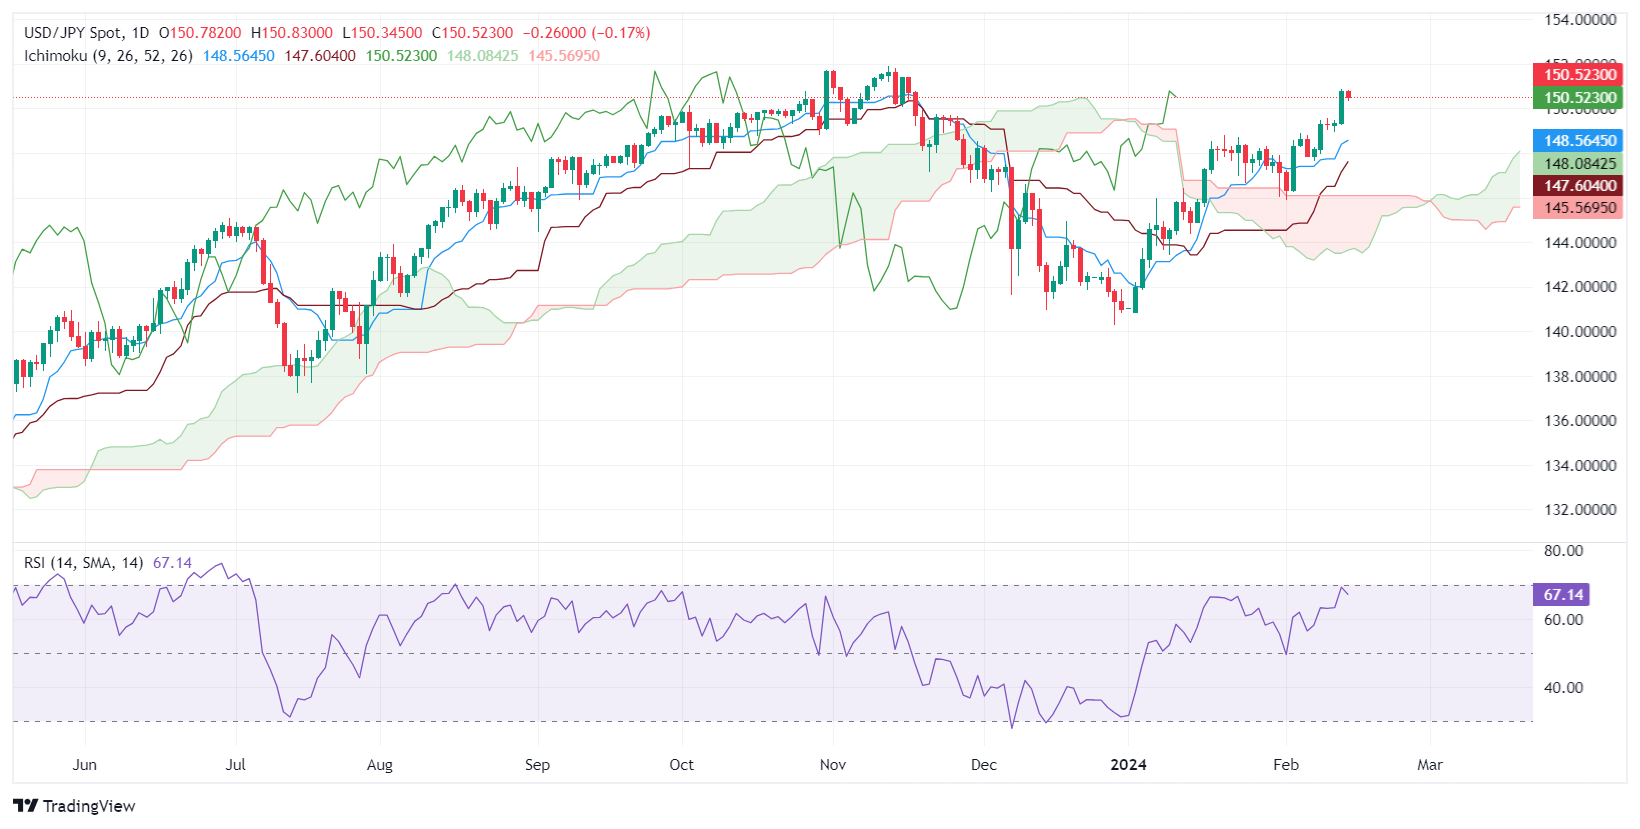
- USD/JPY pulls back to 150.50s after touching highs near 150.80, following US CPI report-driven rally.
- Technical indicators suggest an upward trend, but the 151.00 level poses a significant hurdle due to Japanese authorities intervention warnings.
- Potential for further gains if 151.00 is breached; downside risks if it falls below the 150.00 support level.
The USD/JPY retreats after peaking at around the 150.80s area and drops toward the 150.50s area late in the North American session as US Treasury bond yields retrace after hitting year-to-date (YTD) high.
The pair peaked at around the 150.80s area, following last Tuesday’s 140-pip rally after a US inflation report revealed the Consumer Price Index (CPI) stands above the 3% threshold.
From a technical perspective, the USD/JPY is upward biased after extending its gains above the Ichimoku Cloud (Kumo) and the Kijun and Tenkan-Sen levels. However, the 151.00 psychological figures could be challenging to surpass as Japanese authorities threatened to intervene in the Forex markets.
If traders clear the psychological 151.00 figure, that could open the door to challenge last year’s high at 151.91, followed by the 152.00 mark.
In another scenario, if sellers drag the exchange rate below 150.00, downside risks will emerge at the Tenkan-Sen at 148.55. Once cleared, up next would be the Senkou Span A at 148.05, before the 148.00 mark.
USD/JPY Price Analysis: Technical outlook
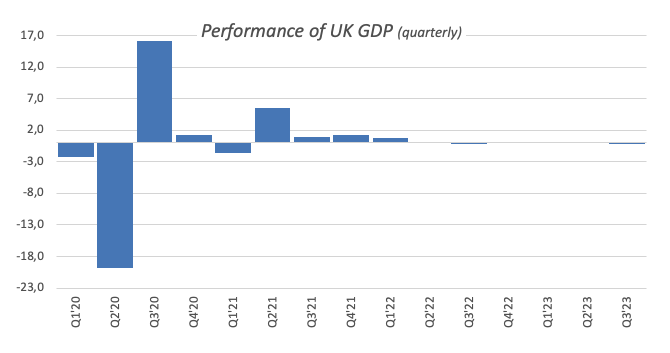
- The UK GDP is foreseen posting a marginal contraction in Q4.
- The Bank of England expects Gross Domestic Product to gradually regain its pace in the next few quarters.
- Pound Sterling risks extra losses while below the 200-day SMA.
The UK’s Office for National Statistics (ONS) will release the advanced prints of the Q4 Gross Domestic Product (GDP) on Thursday.
At the Bank of England's (BoE) latest gathering, the Monetary Policy Committee (MPC) anticipates a slow but steady uptick in GDP growth over the upcoming quarters.
If GDP prints meet markets’ consensus, the UK economy would have entered into a “technical recession” following the 0.1% contraction recorded in the previous quarter.
In addition, BoE’s officials suggested that approximately two-thirds of the effect of heightened interest rates on GDP levels have already materialized.
According to investors’ projections, the BoE is expected to be one of the latest central banks to start reducing its policy rates. On this, while traders see the Federal Reserve (Fed) and the European Central Bank (ECB) cutting rates around the summer, the “Old Lady” is seen kicking off its easing cycle later in the year, with the September meeting being a likely candidate.
Projections for the UK GDP
The Office for National Statistics (ONS) reported that the UK economy contracted 0.1% QoQ in the previous quarter, compared with the 0.2% gain posted in the April-June period of the previous year. In the three months to December, the economy is expected to have also contracted 0.1%.
In its latest meeting, the BoE downgraded its forecast for economic growth and now expects GDP to come in flat in Q1 2024.
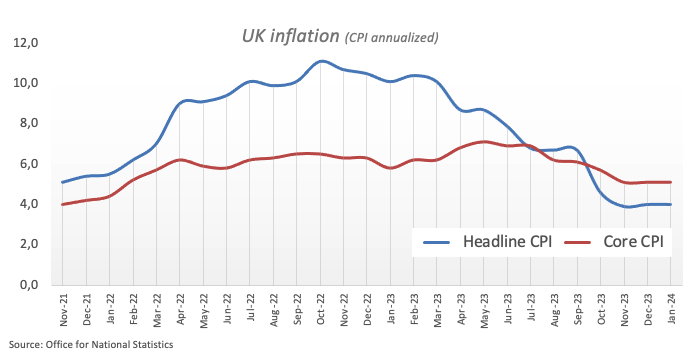
At present, the UK's Consumer Price Index (CPI) inflation continues to rank among the highest within prominent global economies. As indicated by the most recent ONS report, in January, the headline CPI experienced a year-on-year increase of 4.0%, holding steady from the December reading. Meanwhile, the core CPI remained sticky and rose 5.1% year-on-year.
When will the UK release Q3 Gross Domestic Product, and how could it affect GBP/USD?
The UK will release the Q4 Gross Domestic Product (GDP) flash estimate on Thursday, February 15, at 7:00 GMT. The economy is expected to have shrunk 0.1% in the three months to December. On a monthly basis, the GDP is foreseen to contract by 0.2% in December, declining from 0.3% expansion in November.
In January, inflation in the UK turned out to be lower than anticipated, with inflationary pressures showing less of an increase than both markets and the BoE had expected. The CPI figures prompted a reassessment of expectations regarding the central bank’s intentions to start trimming its policy rate and market participants now see the likelihood of 75 bps rate cuts this year.
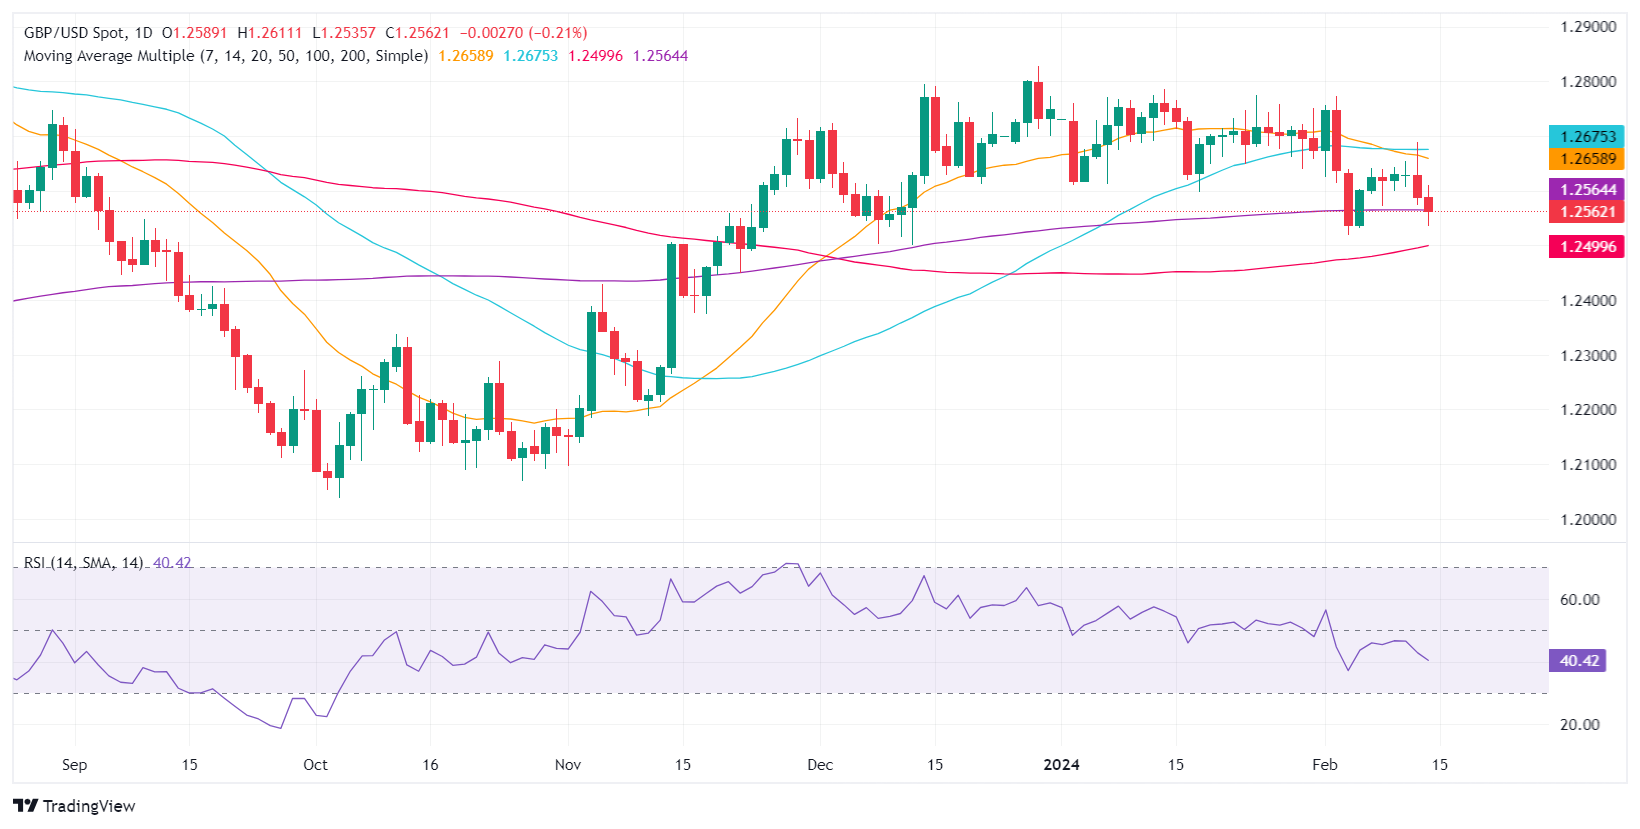
Pablo Piovano, US Session Manager and Senior Analyst at FXStreet, says: “Breaching the 2024 low of 1.2518, recorded on February 5, exposes GBP/USD to further losses to, initially, the December 2023 bottom of 1.2500 seen on December 13. The breakdown of this region could prompt a potential test of the weekly low of 1.2187 printed on November 10, 2023, to re-emerge on the horizon. On the other hand, the weekly top at 1.2683 seen on February 13 should offer initial resistance and is considered the latest defence for a probable climb to the 2024 peak at 1.2785 clocked on January 12.”
Piovano adds: “A convincing breach of the key 200-day SMA, today at 1.2562, should open the door to the continuation of the downward bias, at least in the near-term horizon.”
- EUR/USD recovers from dip into 1.0700, but bullish momentum remains thin.
- Pan-European GDP figures met already-low expectations.
- An appearance from ECB President Lagarde and US Retail Sales in the pipe.
EUR/USD found thin footing to stage a rebound from a decline into 1.0700, but the high side is looking far away as the pair remains challenged by bearish flows as the US Dollar (USD) finds broad-market support after US inflation figures on Wednesday spooked market sentiment.
European Gross Domestic Product (GDP) figures met expectations, but a lopsided pan-European economy suffering from lagging growth saw the bar set very close to the floor with investors forecasting a flat growth print.
Daily digest market movers: EUR/USD rebounds from 1.0700, but bearish sentiment weighs heavy
- European GDP printed at 0.0% for the fourth quarter, as expected.
- Annualized quarterly euro area GDP showed slim 0.1% growth for the year through the fourth quarter.
- European Industrial Production showed a healthy uptick to 2.6% in December, well above the forecast -0.2% versus the previous month’s 0.4% (revised from -0.3%).
- Euro (EUR) traders will be keeping an eye out for European Central Bank (ECB) President Christine Lagarde’s appearance slated for early Thursday.
- ECB President Lagarde will be testifying before the European Parliament’s Committee on Economic and Monetary Affairs in Brussels at 08:00 am GMT Thursday.
- US Retail Sales figures are also due Thursday.
- US Retail Sales in January are expected to decline in January, coming in at -0.1% versus the previous month’s 0.6%.
Euro price today
The table below shows the percentage change of Euro (EUR) against listed major currencies today. Euro was the strongest against the Pound Sterling.
| USD | EUR | GBP | CAD | AUD | JPY | NZD | CHF | |
| USD | -0.17% | 0.23% | -0.17% | -0.62% | -0.11% | -0.50% | -0.22% | |
| EUR | 0.18% | 0.40% | 0.01% | -0.44% | 0.04% | -0.31% | -0.02% | |
| GBP | -0.23% | -0.41% | -0.39% | -0.84% | -0.34% | -0.73% | -0.44% | |
| CAD | 0.17% | -0.01% | 0.39% | -0.44% | 0.05% | -0.33% | -0.05% | |
| AUD | 0.60% | 0.44% | 0.83% | 0.44% | 0.48% | 0.12% | 0.39% | |
| JPY | 0.12% | -0.07% | 0.33% | -0.04% | -0.51% | -0.39% | -0.10% | |
| NZD | 0.50% | 0.32% | 0.72% | 0.33% | -0.11% | 0.31% | 0.28% | |
| CHF | 0.20% | 0.03% | 0.43% | 0.06% | -0.40% | 0.09% | -0.29% |
The heat map shows percentage changes of major currencies against each other. The base currency is picked from the left column, while the quote currency is picked from the top row. For example, if you pick the Euro from the left column and move along the horizontal line to the Japanese Yen, the percentage change displayed in the box will represent EUR (base)/JPY (quote).
Technical analysis: EUR/USD recovers to 1.0730 region, further topside limited by technical ceiling
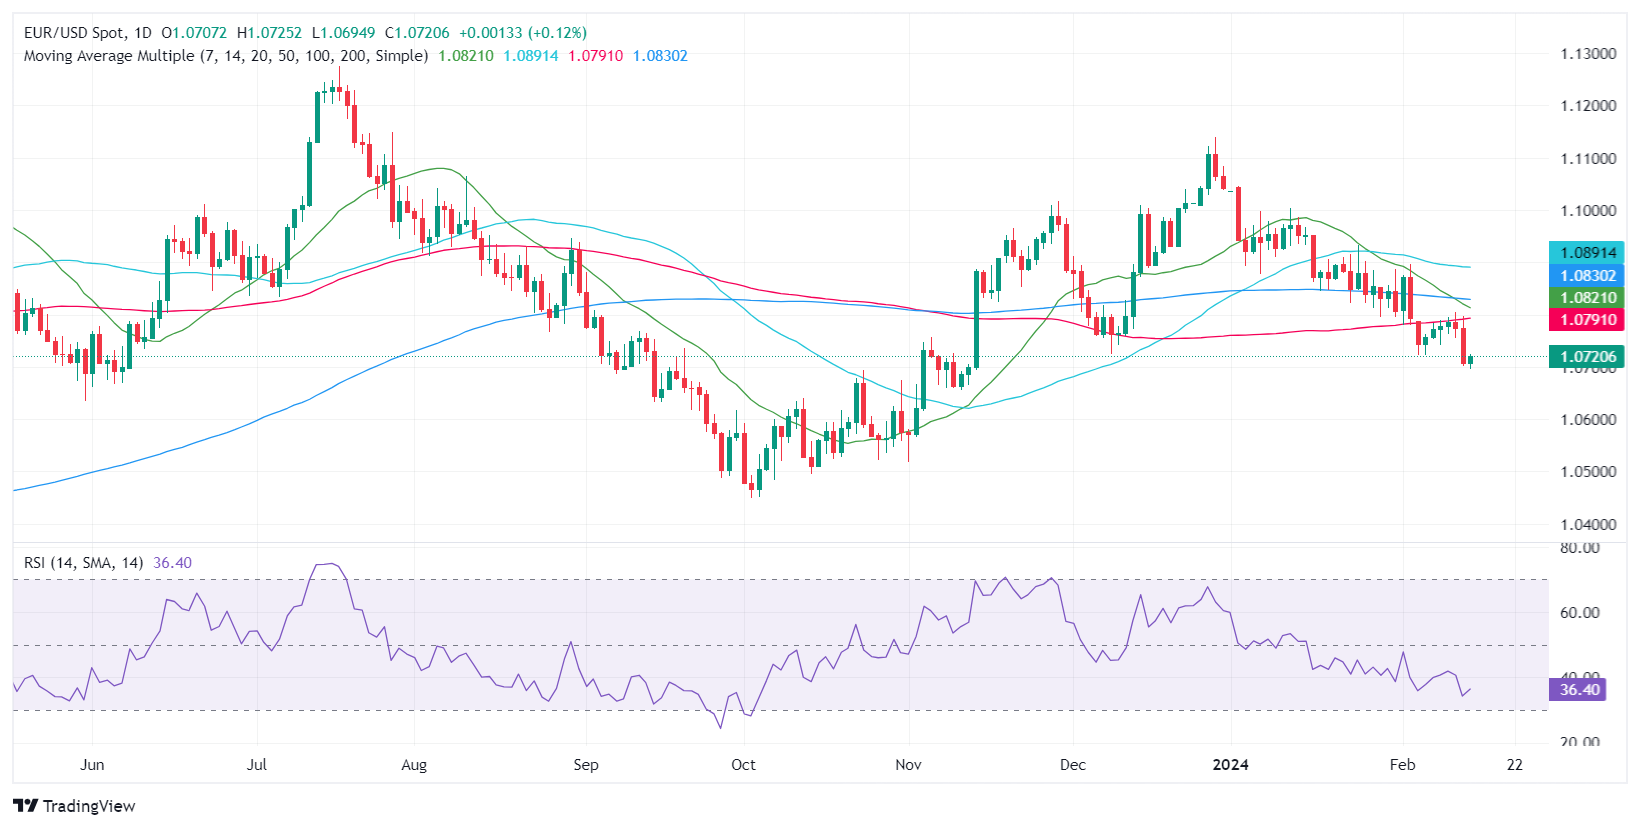
EUR/USD sagged into 1.0700 early Wednesday following Tuesday’s US inflation-fueled tumble, and a near-term recovery sees the pair hampered on the bearish side of the 200-hour Simple Moving Average (SMA) near 1.0760.
EUR/USD is on pace for a fourth straight week of decline, and a bearish Friday close will have the pair close lower for five of the last six consecutive trading weeks. The pair is down around 3.7% from December’s peak bids near 1.1140, and bearish momentum continues to drag the pair further down from the 200-day SMA near 1.0830.
EUR/USD hourly chart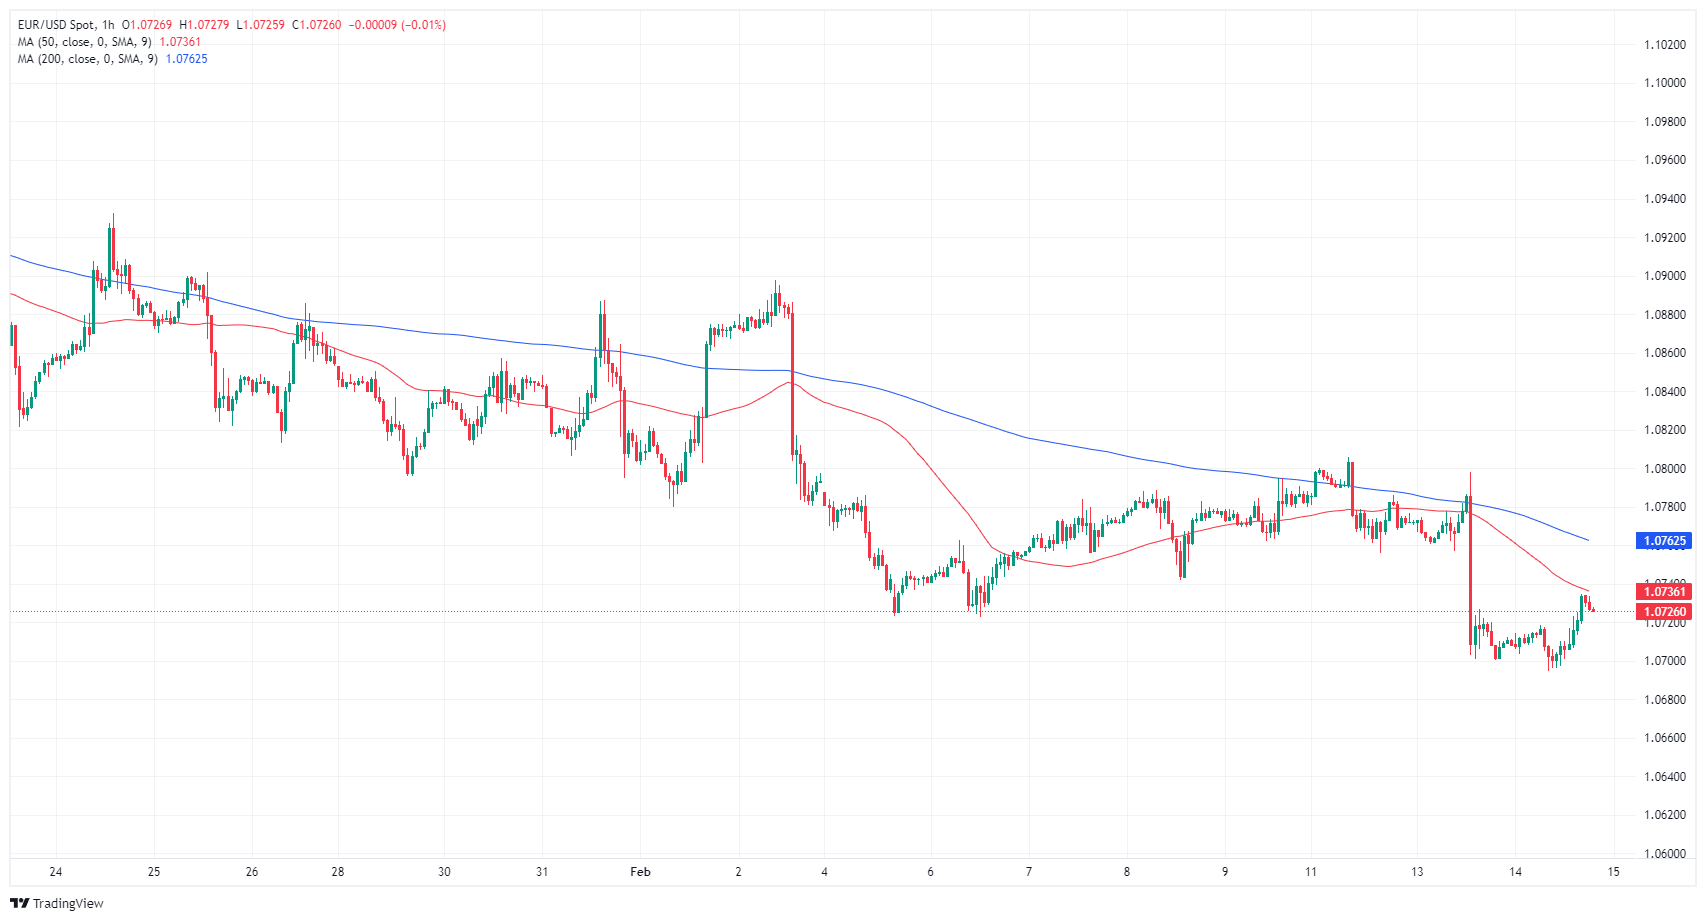
EUR/USD daily chart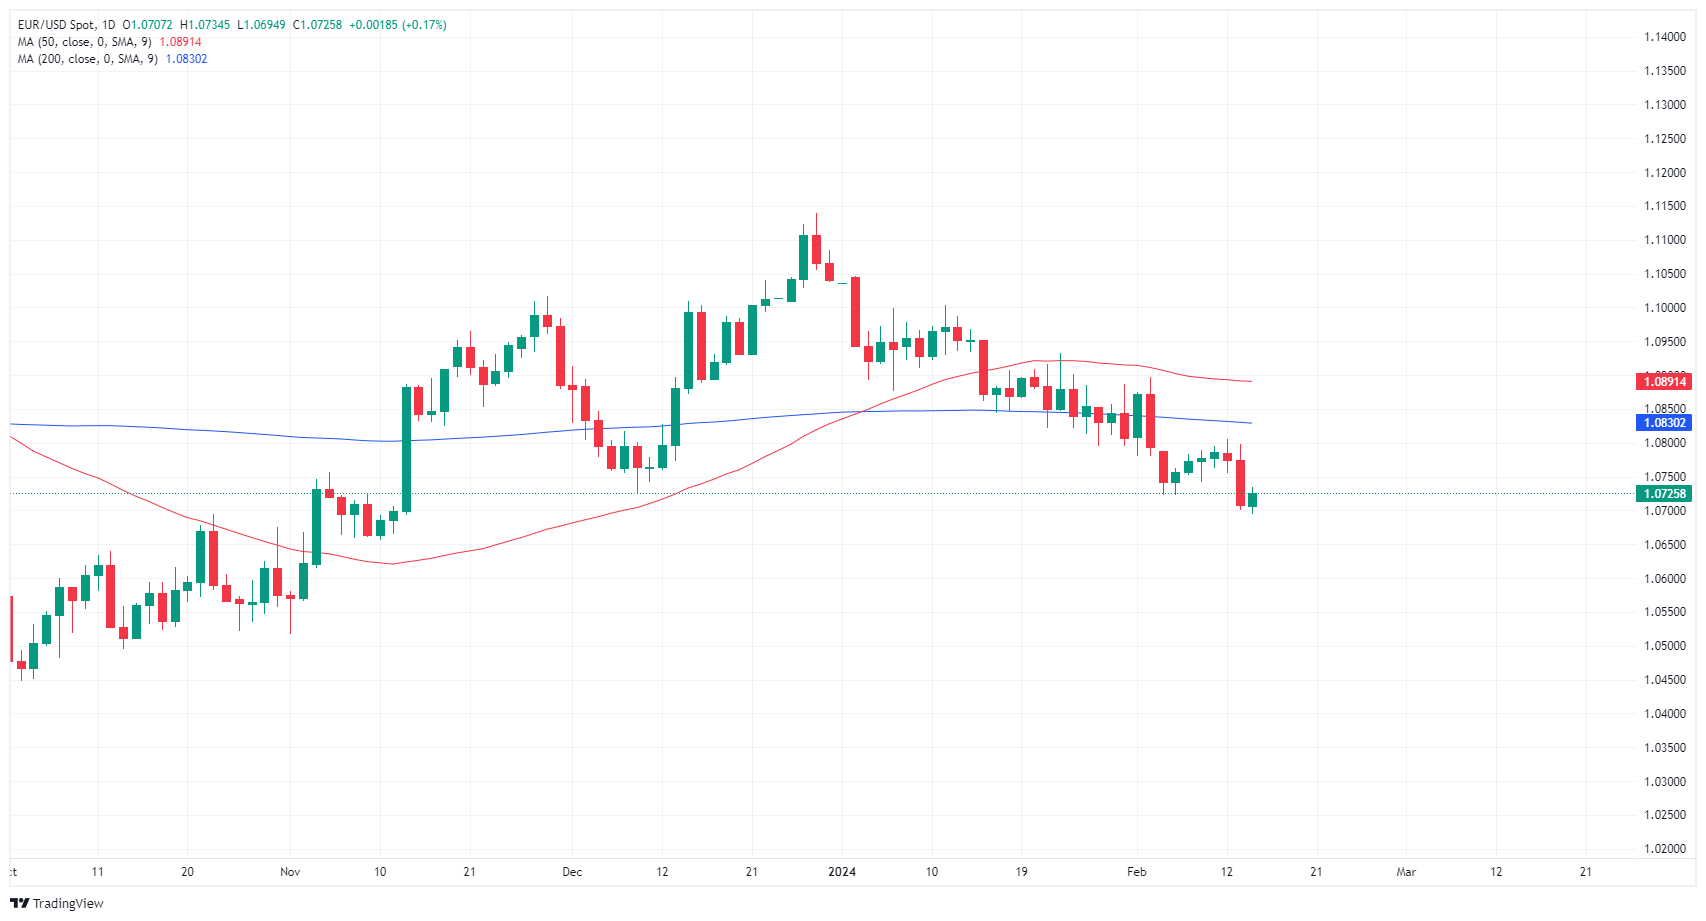
Euro FAQs
What is the Euro?
The Euro is the currency for the 20 European Union countries that belong to the Eurozone. It is the second most heavily traded currency in the world behind the US Dollar. In 2022, it accounted for 31% of all foreign exchange transactions, with an average daily turnover of over $2.2 trillion a day.
EUR/USD is the most heavily traded currency pair in the world, accounting for an estimated 30% off all transactions, followed by EUR/JPY (4%), EUR/GBP (3%) and EUR/AUD (2%).
What is the ECB and how does it impact the Euro?
The European Central Bank (ECB) in Frankfurt, Germany, is the reserve bank for the Eurozone. The ECB sets interest rates and manages monetary policy.
The ECB’s primary mandate is to maintain price stability, which means either controlling inflation or stimulating growth. Its primary tool is the raising or lowering of interest rates. Relatively high interest rates – or the expectation of higher rates – will usually benefit the Euro and vice versa.
The ECB Governing Council makes monetary policy decisions at meetings held eight times a year. Decisions are made by heads of the Eurozone national banks and six permanent members, including the President of the ECB, Christine Lagarde.
How does inflation data impact the value of the Euro?
Eurozone inflation data, measured by the Harmonized Index of Consumer Prices (HICP), is an important econometric for the Euro. If inflation rises more than expected, especially if above the ECB’s 2% target, it obliges the ECB to raise interest rates to bring it back under control.
Relatively high interest rates compared to its counterparts will usually benefit the Euro, as it makes the region more attractive as a place for global investors to park their money.
How does economic data influence the value of the Euro?
Data releases gauge the health of the economy and can impact on the Euro. Indicators such as GDP, Manufacturing and Services PMIs, employment, and consumer sentiment surveys can all influence the direction of the single currency.
A strong economy is good for the Euro. Not only does it attract more foreign investment but it may encourage the ECB to put up interest rates, which will directly strengthen the Euro. Otherwise, if economic data is weak, the Euro is likely to fall.
Economic data for the four largest economies in the euro area (Germany, France, Italy and Spain) are especially significant, as they account for 75% of the Eurozone’s economy.
How does the Trade Balance impact the Euro?
Another significant data release for the Euro is the Trade Balance. This indicator measures the difference between what a country earns from its exports and what it spends on imports over a given period.
If a country produces highly sought after exports then its currency will gain in value purely from the extra demand created from foreign buyers seeking to purchase these goods. Therefore, a positive net Trade Balance strengthens a currency and vice versa for a negative balance.
The US Dollar experienced a corrective decline on Wednesday following Tuesday’s CPI-driven strong rebound, allowing some respite from the recent intense downward pressure in the risk-linked universe.
Here is what you need to know on Thursday, February 15:
The USD Index (DXY) receded from multi-week tops near the 105.00 barrier on the back of some uneven improvement in the risk complex. On Thursday, the US docket will include Retail Sales, the Philly Fed Manufacturing Index, Industrial Production, usual weekly Initial Jobless Claims, Business Inventories, Net Long-term TIC Flows and the NAHB Housing Market Index. In addition, FOMC’s Bostic and Waller are due to speak.
EUR/USD saw its recent decline somewhat alleviated and rebounded from yearly lows in the sub-1.0700 region. On February 15, ECB President C. Lagarde is due to speak, while Balance of Trade results in the broader Euroland are also expected.
GBP/USD accelerated its weekly leg lower on the back of a softer-than-expected UK CPI, which in turn reignited speculation of a potential rate cut by the BoE in the near term. Busy docket on February 15 in the UK, as GDP figures are due seconded by Trade Balance readings, Industrial Production, Manufacturing Production, and the NIESR Monthly GDP Tracker.
USD/JPY reversed two consecutive daily gains, including a move to fresh YTD peaks near 151.00, following renewed selling pressure in the dollar and diminishing US yields. On February 15, GDP figures will grab all the attention in the domestic calendar along with the final Industrial Production results.
AUD/USD regained some balance and bounced off Tuesday’s 2024 lows, approaching the 0.6500 neighbourhood ahead of the opening bell in the Asian markets. On Thursday, the release of Australia’s labour market report will take centre stage, seconded by February Consumer Inflation Expectations.
The larger-than-predicted weekly build of US crude oil supplies (+12.018M barrels) prompted WTI prices to set aside seven sessions of gains and retreat below the $77.00 mark per barrel on Wednesday.
On the commodities’ front, Gold prices extended their bearish performance and revisited the $1,985 zone, while Silver prices met some buying interest after briefly breaking below the $22.00 mark per ounce.
- The USD/NOK trades at 10.60 in Wednesday's session, recording a strong 0.73% downturn.
- USD maintains consolidation post-CPI gains while NOK rides on firm Q4 GDP data.
- Rate cut expectations from the Fed diminish with January US CPI coming in hot.
- On the Norwegian side, impressive 0.2% mainland GDP growth in Q4 suggests that the Norges Bank may delay cuts.
In Wednesday's session, the USD/NOK has been seen trading at 10.60 following a 0.73% slide downwards. This movement comes after a slight consolidation of the USD post-Consumer Price Index (CPI) gains and a robust performance by the NOK, driven by firm Q4 Gross Domestic Product (GDP) data.
To add to that, the Federal Reserve’s (Fed) rate cut remains unlikely in the short-term, with the January US CPI running hot with headline and core readings beating expectations. The data indicates a solid economic condition, minimizing the chances of Fed easing. A notably worrying fact for the Federal Reserve is a rise in super core by 4.3% YoY from 3.9% in December, showcasing that inflationary pressure persists. Regardless, the odds for a rate cut in March linger around 10% and increase to a full expectation by June, which may limit the downside for the pair.
For Norway, mainland GDP grew by 0.2% in Q4 against Q3's 0.1%, propelled by consumer spending and net exports. The positive statistics are in line with Norges Bank's projections, affirming that they will likely maintain the policy rate at 4.5% for now. However, the swaps market forecasts a 50% chance of a rate cut in the next six months and if the Norwegian bank decides to delay cuts later than its American peer, the pair could see further downside.
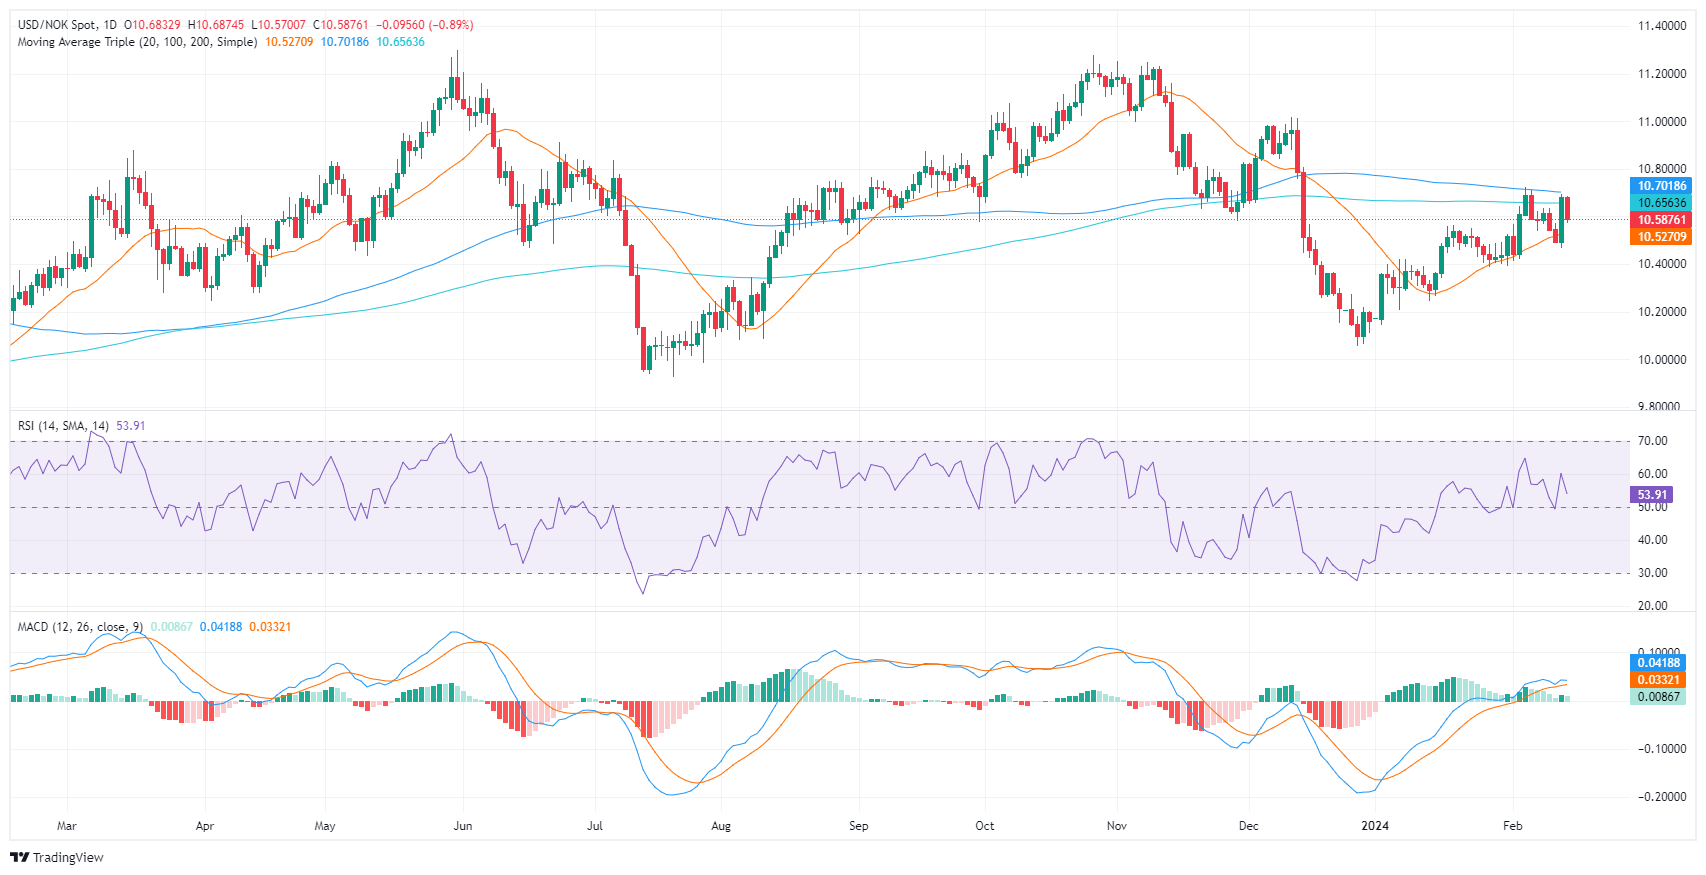
USD/NOK technical analysis
On the daily chart, the Relative Strength Index (RSI), it appears that the USDNOK pair has been fluctuating in the neutral zone, indicating a market with neither sellers nor buyers gaining control. Similarly, the Moving Average Convergence Divergence (MACD) histogram, although green, suggests a loss of bullish momentum as its bars have been decreasing in height recently.
When taking into account the pair’s relation to the Simple Moving Averages, a bearish control is seen on a larger scale, as the pair is below the 100 and 200-day SMAs. However, considering the pair remains above the 20-day SMA, the bearish forces appear to lack enough strength in the short term.
USD/NOK daily chart
- GBP/USD falls 0.20% post-UK inflation report, trading near the 200-day MA at 1.2565.
- Fed officials highlight easing inflation, advocate for flexible policy guidance, impacting market dynamics.
- UK inflation data and BoE Governor's comments reflect cautious optimism amidst economic recovery signs.
The Pound Sterling drops during the North American session by 0.20% following a positive UK inflation report that showed prices are slowing down. At the time of writing, the GBP/USD trades at 1.2565 and tests the important 200-day moving average (DMA) after hitting a high of 1.2611.
GBP/USD tests key 200-DMA support level sponsored by investors trimming odds for Fed rate cuts
The US economic docket featured Federal Reserve speeches by the Chicago Fed President Austan Goolsbee and Governor Christopher Waller. Goolsbee said that inflation is coming down and added that current policy is restrictive. He said that rate cuts should be tied to confidence that inflation is on the Fed’s path.
Lately, Fed Governor Waller noted that one lesson learned from 2020 is that forward guidance should be more flexible. He added that forward guidance perhaps should also signal the possible path of the policy rate.
Besides that, GBP/USD takes cues from the fall in US Treasury bond yields after skyrocketing more than 12 basis points a day ago, dropping six basis points and standing at 4.26%.
In the European session, the UK’s inflation was lower than expected, standing at 4% YoY, unchanged from December but below estimates of 4.2%. Underlying inflation came at 5.1% YoY, unchanged but below estimates of 5.2%.
Recently, the Bank of England (BoE) Governor Andrew Bailey said the latest inflation report does not change their view from February’s monetary policy decision, adding they need to see more evidence that prices are coming down. Bailey added that there were signs the UK economy is picking up, despite Thursday’s data showing it was in recession in the second half of last year.
GBP/USD Price Analysis: Technical outlook
The daily chart portrays the pair as neutral to downward biased, with the GBP/USD hovering around the 200-DMA at 1.2561. a daily close below the latter could open the door to challenge 1.2500, followed by the 100-DMA at 1.2487. Once cleared, that could open the door to test the next support level seen at 1.2374, November’s 17 low.
- Crude Oil eased on Wednesday after an early jump.
- US Crude stocks continue to build faster than markets anticipated.
- Geopolitical headlines put a floor below barrel prices.
West Texas Intermediate (WTI) US Crude Oil tested into fresh multi-week highs near $78.50 early Wednesday before US barrel counts showed a surprise build-up once again, knocking Crude Oil bids down once more. WTI slipped back below $77.00 per barrel after Energy Information Administration (EIA) barrel counts showed millions of barrels of excess Crude Oil supply piping through US markets that investors hadn’t anticipated, chewing away at an overarching energy market narrative about global supply constraints that continue to fail to materialize.
According to the EIA on Wednesday, US Crude Oil inventories surged by 12.018 million barrels through the week ended February 9, well above the forecast 2.6 million barrel uptick and adding to the previous week’s buildup of 5.521 million barrels.
This comes in addition to the American Petroleum Institute’s (API) reported buildup on Tuesday of 8.52 million barrels for the same period. The EIA reported buildup saw its biggest one-week barrel count increase in 12 months, while the API supply build was its largest since November.
Crude Oil downside remains limited as geopolitical headlines continue to weigh on investors, keeping barrel bids on the high side as investors begin to worry more about the decreasing likelihood of a ceasefire in the ongoing Gaza conflict between Israel and Palestinian Hamas.
WTI technical outlook
Despite testing into its highest bids in nearly three weeks, WTI saw a sharp pullback on Wednesday, setting US Crude Oil up for its first down day after seven consecutive closes in the green. WTI set an intraday high of $78.43 before falling back below the $77.00 handle to test $76.50.
Wednesday’s pullback sees US Crude Oil forming a bearish rejection from the 200-day Simple Moving Average (SMA) near $77.40, and WTI is at risk of continuing to churn within a consolidation zone between the 200-day SMA and the 50-day SMA near $73.55.
WTI hourly chart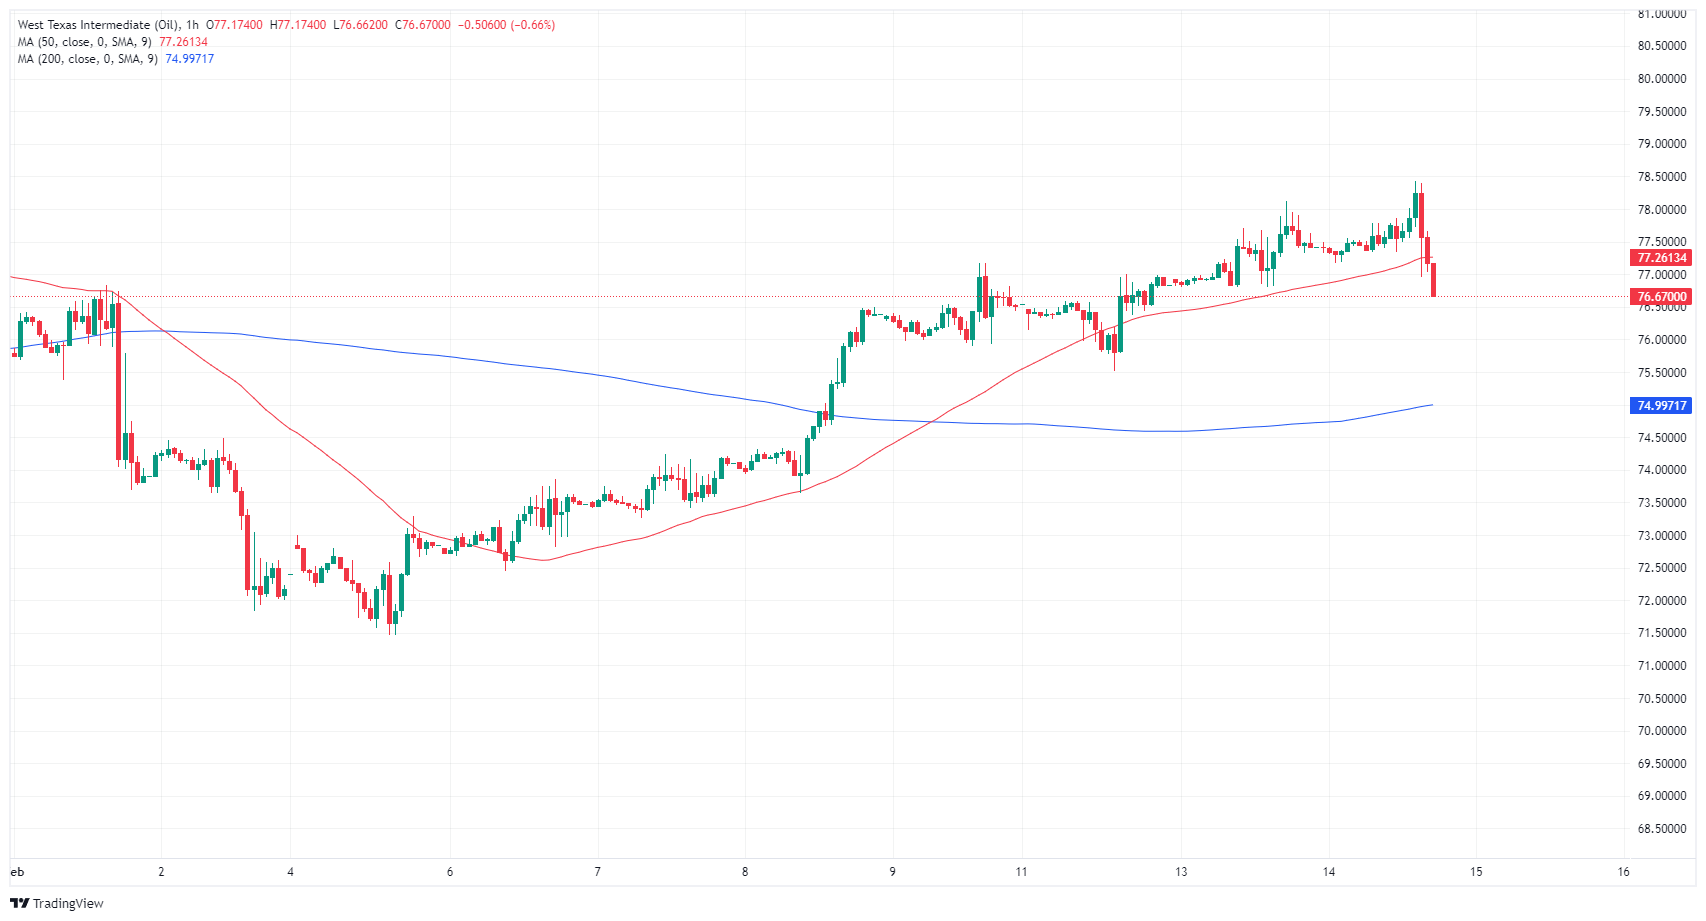
WTI daily chart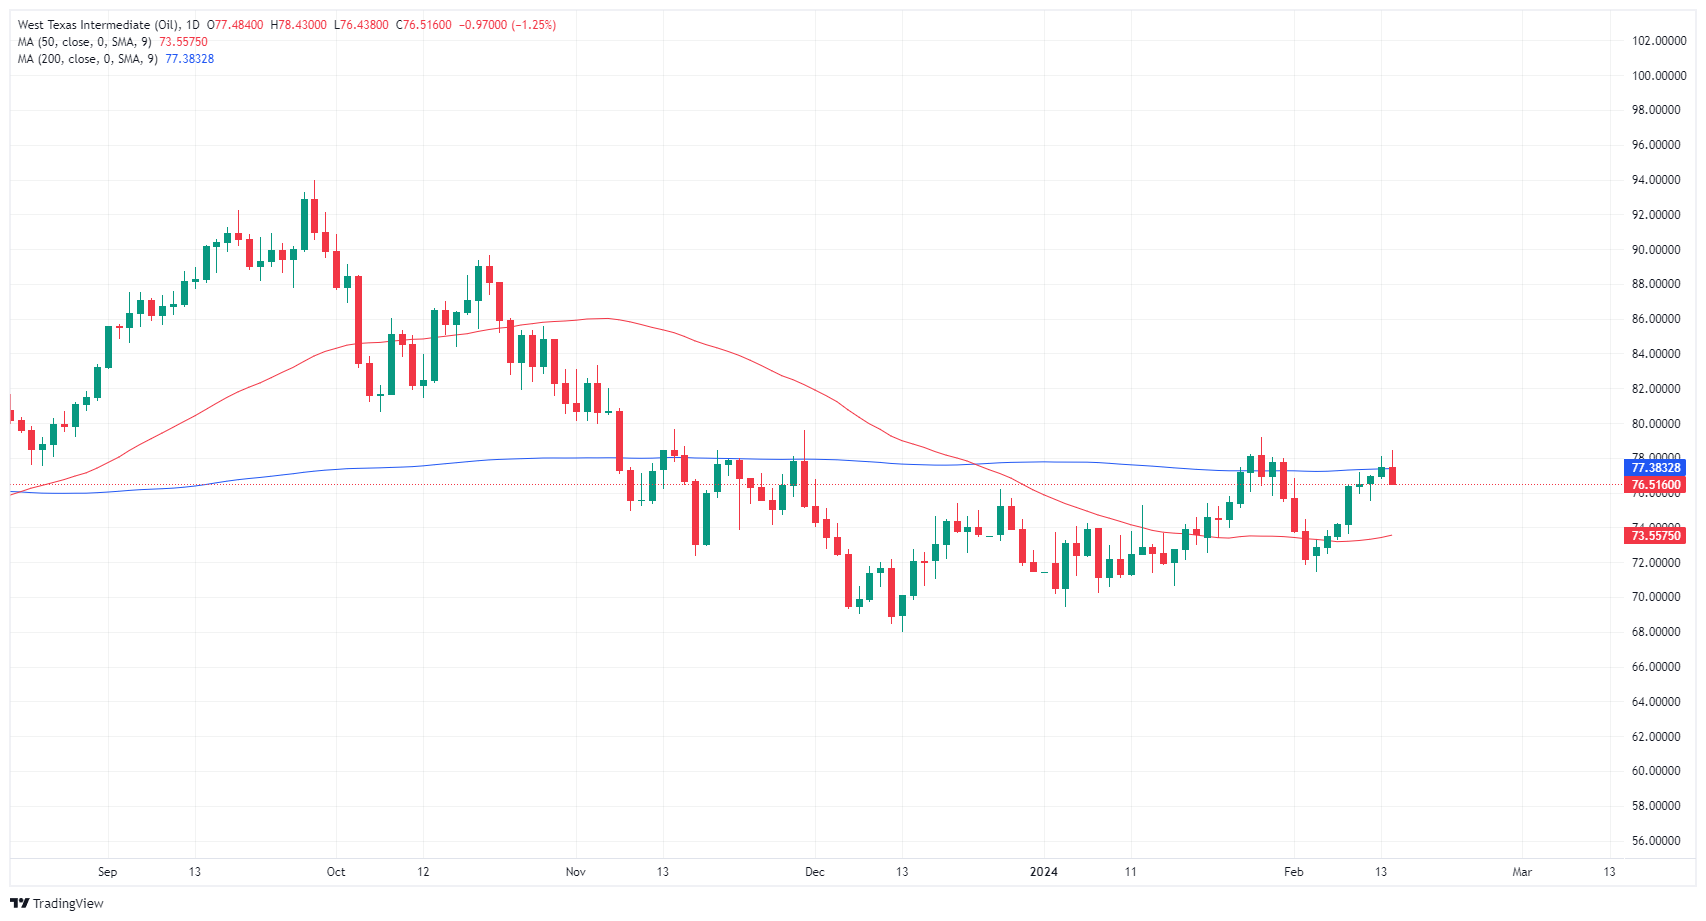
- The DXY Index recorded losses in Wednesday’s session, falling toward 104.70.
- Investors are taking profits from Tuesday’s rally following CPI.
- Focus now shifts to Retail and PPI data from January.
The US Dollar (USD) measured by the Dollar Index (DXY) experienced a dip on Wednesday as it declined near 104.70. This downward trajectory is primarily attributed to investors securing gains following the Greenback’s rally on Tuesday following January CPI results showing stubborn inflation. This fueled a recalibration of the Federal Reserve's (Fed) rate easing expectations. For the remainder of the week, markets will eye the Producer Price Index (PPI) and Retail Sales to continue placing their bets on the next Fed decisions.
There is a growing market consensus that the Fed is unlikely to cut rates in the near term, supported by hot inflation data releases and cautious Fed officials. This adjustment in easing expectations will likely lend further strength to the USD after this consolidation. As for now, markets are delaying their prediction of the start of the easing cycle to June.
Daily digest market movers: US Dollar takes a breather to consolidate CPI gains
- No relevant reports were released by the US during the session.
- On Friday, the US will release January’s Retail Sales and Producer Price Index figures, which may provide additional volatility to the USD.
- US Treasury bond yields also consolidated. Current rates place the 2-year yield at 4.56%, the 5-year yield at 4.22%, and the 10-year yield at 4.25%, which made the US Dollar struggle to find demand on Wednesday
- According to the CME FedWatch Tool, the odds of a cut at the May meeting have significantly declined, and markets are now pushing the start of the easing cycle to June. A hold at the March meeting is now the mainstream view.
Technical analysis: DXY bull’s momentum eases, but buyers are still in control
The Relative Strength Index (RSI) on the daily chart reflects a negative slope in positive territory. The dip in the RSI, typified by declining momentum, is indicative of reduced buying strength, which can be considered a potential sign of selling pressure. Simultaneously, the Moving Average Convergence Divergence (MACD) histogram shows flat green bars. Normally, this flat alignment would suggest a balanced state between buyers and sellers in the short term fueled by the profit-taking action of the bulls.
Despite these signals, the stronger indicator here appears to be the positioning above the 20, 100 and 200-day Simple Moving Averages (SMAs). This suggests that the overall trend remains bullish and that buyers are dominating the market in the longer term despite a potential short-term reversal.
Overall, although some pullback may be expected due to profit-taking in the short term, as reflected by the negative slope of the RSI and a flat MACD, the overall bullish trend seems to be intact with bulls maintaining substantial control.
US Dollar FAQs
What is the US Dollar?
The US Dollar (USD) is the official currency of the United States of America, and the ‘de facto’ currency of a significant number of other countries where it is found in circulation alongside local notes. It is the most heavily traded currency in the world, accounting for over 88% of all global foreign exchange turnover, or an average of $6.6 trillion in transactions per day, according to data from 2022.
Following the second world war, the USD took over from the British Pound as the world’s reserve currency. For most of its history, the US Dollar was backed by Gold, until the Bretton Woods Agreement in 1971 when the Gold Standard went away.
How do the decisions of the Federal Reserve impact the US Dollar?
The most important single factor impacting on the value of the US Dollar is monetary policy, which is shaped by the Federal Reserve (Fed). The Fed has two mandates: to achieve price stability (control inflation) and foster full employment. Its primary tool to achieve these two goals is by adjusting interest rates.
When prices are rising too quickly and inflation is above the Fed’s 2% target, the Fed will raise rates, which helps the USD value. When inflation falls below 2% or the Unemployment Rate is too high, the Fed may lower interest rates, which weighs on the Greenback.
What is Quantitative Easing and how does it influence the US Dollar?
In extreme situations, the Federal Reserve can also print more Dollars and enact quantitative easing (QE). QE is the process by which the Fed substantially increases the flow of credit in a stuck financial system.
It is a non-standard policy measure used when credit has dried up because banks will not lend to each other (out of the fear of counterparty default). It is a last resort when simply lowering interest rates is unlikely to achieve the necessary result. It was the Fed’s weapon of choice to combat the credit crunch that occurred during the Great Financial Crisis in 2008. It involves the Fed printing more Dollars and using them to buy US government bonds predominantly from financial institutions. QE usually leads to a weaker US Dollar.
What is Quantitative Tightening and how does it influence the US Dollar?
Quantitative tightening (QT) is the reverse process whereby the Federal Reserve stops buying bonds from financial institutions and does not reinvest the principal from the bonds it holds maturing in new purchases. It is usually positive for the US Dollar.
- Mexican Peso advances in aftermath of US inflation report, US yields declining becomes headwind for Greenback.
- Banxico Governor's optimistic outlook on inflation trajectory bolsters confidence, targets 3% by 2025.
- Market shrugs off US PPI data, reducing speculation on immediate Federal Reserve rate cuts.
The Mexican Peso rallies against the US Dollar on Wednesday as traders assess the latest inflation report from the United States (US). The drop in US Treasury bond yields acts like a headwind for the exotic pair. Alongside an improvement in market mood, this is a headwind for the USD/MXN pair, which trades below the 17.20 figure, aiming to regain the 50-day Simple Moving Average (SMA).
Mexico’s economic calendar is empty throughout the week with the exception of the Bank of Mexico (Banxico) Governor Victoria Rodriguez Ceja's interview earlier on Monday. She said inflation is expected to resume its downtrend and added that inflation would hit Banxico’s 3% target by 2025.
In the US the release of the Producer Price Index (PPI) was ignored by market participants, which had already dialed back odds for Fed rate cuts.
Daily digest market movers: Mexican Peso regains control amid soft US Dollar demand
- The US Bureau of Labor Statistics revealed December’s PPI, which came below the previous reading of -0.1% at -0.2%. In monthly data, the core PPI stood at -0.1%, suggesting that inflation is cooling down.
- The US Consumer Price Index (CPI) was lower than the previous month, though it exceeded estimates. Excluding volatile items, the so-called core CPI was unchanged, shy of the 4% threshold.
- Market players are expecting the first rate cut by the Federal Reserve at the June monetary policy meeting as they trimmed odds for March and May.
- US 10-year Treasury note yields erase some of yesterday’s gains and are down six basis points to 4.273%, while the US Dollar Index (DXY) dropped toward 104.71, down -0.13%.
- Mexico’s central bank revised their inflation expectations to the upside for the period from Q1 to Q3 of 2024, expecting inflation to converge toward 3.5% in Q4, based on the latest monetary policy statement.
- Chicago Fed President Austan Goolsbee said, “It is totally clear that inflation is coming down,” even though the latest inflation report was high.
- Atlanta Fed President Raphael Bostic said the Fed must be resolute and added that he’s “laser-focused” on inflation. At the same time, Dallas Fed President Lorie Logan noted that there’s no urgency on cutting rates.
Technical analysis: Mexican Peso climbs as USD/MXN edges back above 17.15
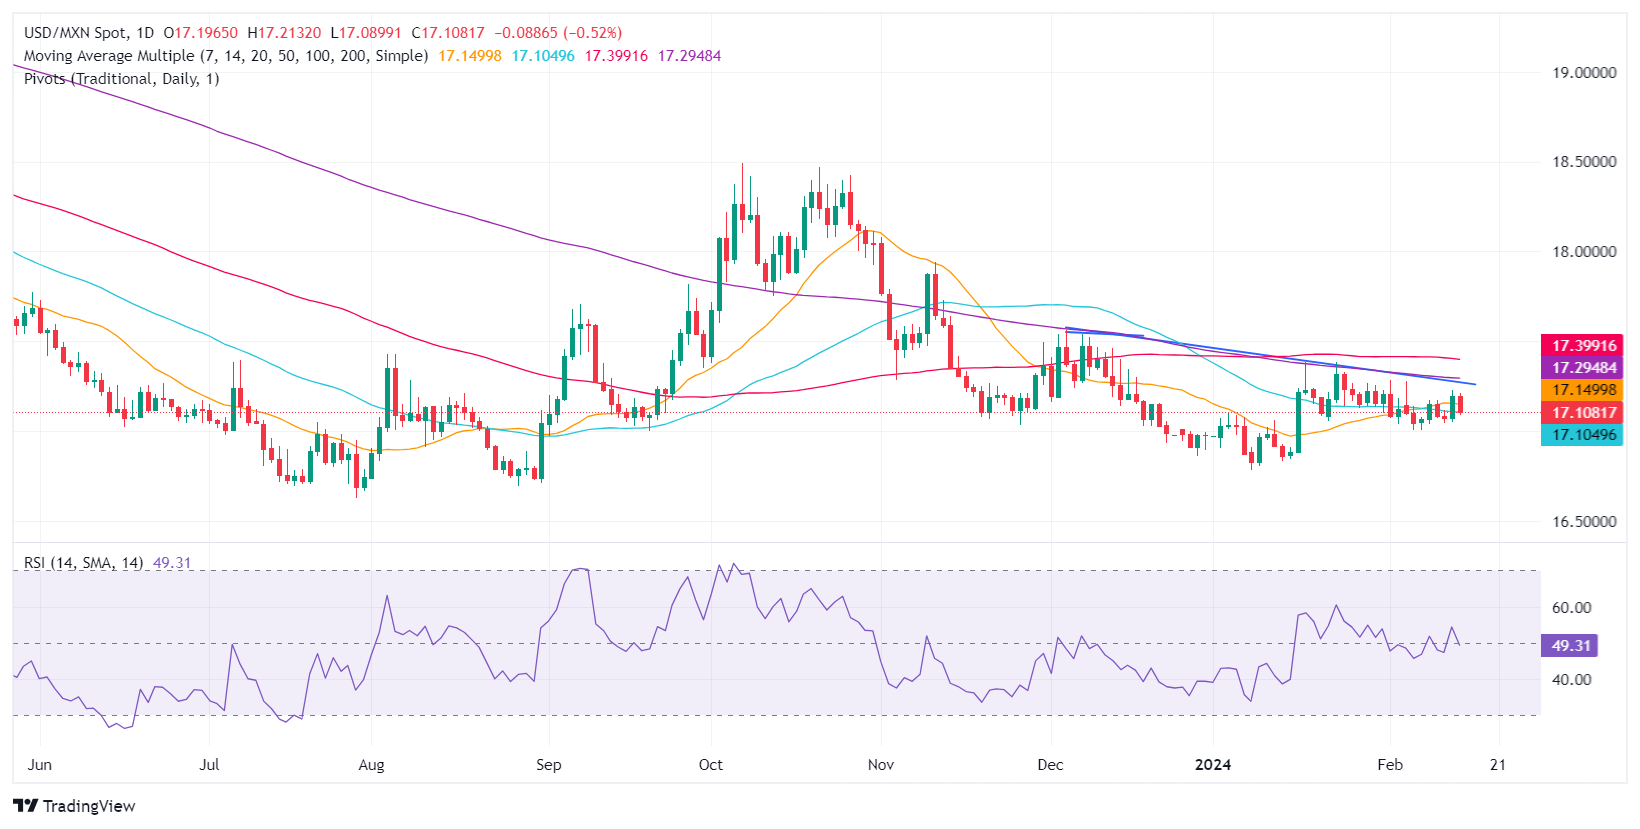
The USD/MXN remains neutrally-biased, but short-term momentum favors sellers. The exotic pair tumbled below the 50-day Simple Moving Average (SMA) at 17.11. The Relative Strength Index (RSI) points downward, having crossed the 50-midline, which could open the door for additional downside. A daily close below that level could pave the way for further losses. The next support would be the 17.00 figure, followed by last year’s low of 16.62.
On the flip side, if buyers reclaim the 50-day SMA, that could pave the way for further upside, with the next resistance seen at the 200-day SMA at 17.29. Once cleared, the next resistance would be the 100-day SMA at 17.40.
USD/MXN Price Action – Daily Chart
Mexican Peso FAQs
What key factors drive the Mexican Peso?
The Mexican Peso (MXN) is the most traded currency among its Latin American peers. Its value is broadly determined by the performance of the Mexican economy, the country’s central bank’s policy, the amount of foreign investment in the country and even the levels of remittances sent by Mexicans who live abroad, particularly in the United States. Geopolitical trends can also move MXN: for example, the process of nearshoring – or the decision by some firms to relocate manufacturing capacity and supply chains closer to their home countries – is also seen as a catalyst for the Mexican currency as the country is considered a key manufacturing hub in the American continent. Another catalyst for MXN is Oil prices as Mexico is a key exporter of the commodity.
How do decisions of the Banxico impact the Mexican Peso?
The main objective of Mexico’s central bank, also known as Banxico, is to maintain inflation at low and stable levels (at or close to its target of 3%, the midpoint in a tolerance band of between 2% and 4%). To this end, the bank sets an appropriate level of interest rates. When inflation is too high, Banxico will attempt to tame it by raising interest rates, making it more expensive for households and businesses to borrow money, thus cooling demand and the overall economy. Higher interest rates are generally positive for the Mexican Peso (MXN) as they lead to higher yields, making the country a more attractive place for investors. On the contrary, lower interest rates tend to weaken MXN.
How does economic data influence the value of the Mexican Peso?
Macroeconomic data releases are key to assess the state of the economy and can have an impact on the Mexican Peso (MXN) valuation. A strong Mexican economy, based on high economic growth, low unemployment and high confidence is good for MXN. Not only does it attract more foreign investment but it may encourage the Bank of Mexico (Banxico) to increase interest rates, particularly if this strength comes together with elevated inflation. However, if economic data is weak, MXN is likely to depreciate.
How does broader risk sentiment impact the Mexican Peso?
As an emerging-market currency, the Mexican Peso (MXN) tends to strive during risk-on periods, or when investors perceive that broader market risks are low and thus are eager to engage with investments that carry a higher risk. Conversely, MXN tends to weaken at times of market turbulence or economic uncertainty as investors tend to sell higher-risk assets and flee to the more-stable safe havens.
Adding further to comments made earlier while testifying before the UK Economic Affairs Committee, Bank of England (BoE) Governor Andrew Bailey noted a firm confidence that the UK's central bank is on pace to achieve inflation targets.
Key highlights
- Inflation to come down to target by spring.
- What happens to inflation in spring will not determine monetary policy stance.
- Market demand for UK debt is strong, has been strong since the start of the year.
- BoE Bailey's earlier statement: Short-term equilibrium interest rate has probably gone up.
- Canadian Dollar sees thin action in quiet midweek market.
- Canada brings strictly low-impact data for the rest of the week.
- CAD recovery supported by Crude Oil, but energy market hesitation limits gains.
The Canadian Dollar (CAD) churns on Wednesday as markets continue to digest Tuesday’s harsh shift in rate cut expectations after US inflation came in hotter than investors were hoping. Rate cut hopes have been pushed further out, propping up the US Dollar (USD) and keeping the Canadian Dollar pinned in the red by around three-quarters of a percent against the Greenback.
Canada sees low-tier economic data releases for the rest of the week, which are likely to be overshadowed by US data prints as investors find themselves at odds with the US economy. Rate cut hopes are pinned on US inflation cooling off at a much faster trajectory, as well as an overall decline in US economic health that has thus far failed to materialize.
Daily digest market movers: Canadian Dollar finds little momentum on quiet Wednesday
- The Canadian Dollar sees some sideways churn in the midweek after markets saw a sharp adjustment on the back of Tuesday’s US inflation figures.
- Crude Oil markets tested higher on Wednesday, helping to bolster the Loonie.
- Another surprise buildup in US Crude Oil stocks is weighing on barrel bids on Wednesday.
- The Energy Information Administration (EIA) reported over 12 million barrels of excess Crude Oil added to US supply lines for the week ended February 9.
- The barrel buildup adds to the American Petroleum Institute’s (API) 8.52 million barrel surplus reported on Tuesday for the same period.
- Canadian Housing Starts are forecast to increase slightly for the year through January on Thursday, expected to tick up to 235K from 249.3K.
- Markets to focus entirely on US Retail Sales on Thursday, January’s MoM figure forecast to soften to -0.1% versus December’s 0.6%.
- US Initial Jobless Claims for the week ended February 9 also are on the docket for Thursday, expected to show 220K new jobless benefits applicants versus the previous week’s 218K.
Canadian Dollar price today
The table below shows the percentage change of Canadian Dollar (CAD) against listed major currencies today. Canadian Dollar was the strongest against the Pound Sterling.
| USD | EUR | GBP | CAD | AUD | JPY | NZD | CHF | |
| USD | -0.18% | 0.30% | -0.10% | -0.56% | -0.12% | -0.49% | -0.23% | |
| EUR | 0.19% | 0.49% | 0.09% | -0.36% | 0.06% | -0.28% | -0.03% | |
| GBP | -0.30% | -0.50% | -0.40% | -0.85% | -0.43% | -0.78% | -0.53% | |
| CAD | 0.10% | -0.10% | 0.40% | -0.44% | -0.03% | -0.37% | -0.13% | |
| AUD | 0.54% | 0.36% | 0.85% | 0.44% | 0.41% | 0.07% | 0.31% | |
| JPY | 0.12% | -0.08% | 0.42% | 0.03% | -0.42% | -0.35% | -0.11% | |
| NZD | 0.48% | 0.28% | 0.77% | 0.37% | -0.07% | 0.35% | 0.27% | |
| CHF | 0.22% | 0.03% | 0.51% | 0.12% | -0.32% | 0.09% | -0.26% |
The heat map shows percentage changes of major currencies against each other. The base currency is picked from the left column, while the quote currency is picked from the top row. For example, if you pick the Euro from the left column and move along the horizontal line to the Japanese Yen, the percentage change displayed in the box will represent EUR (base)/JPY (quote).
Technical analysis: Canadian Dollar sees thin gains on Wednesday
The Canadian Dollar (CAD) is mixed to flat in Wednesday’s market action, seeing only scant gains against the US Dollar of around a tenth of a percent. The broader market bid the Australian Dollar (AUD) up four-tenths of a percent against the CAD, while the Loonie shed around a third of a percent against the New Zealand Dollar (NZD). The Canadian Dollar sees its strongest performance against the Pound Sterling (GBP), up around four-tenths of a percent, on Wednesday.
USD/CAD found some friction near 1.3550 after Tuesday’s surge over the 1.3500 handle, but buyers are struggling to shove the pair back into the 1.3600 level. The pair remains bolstered above the 200-day Simple Moving Average (SMA) at 1.3478 with Wednesday’s tentative low etched in near 1.3530.
USD/CAD hourly chart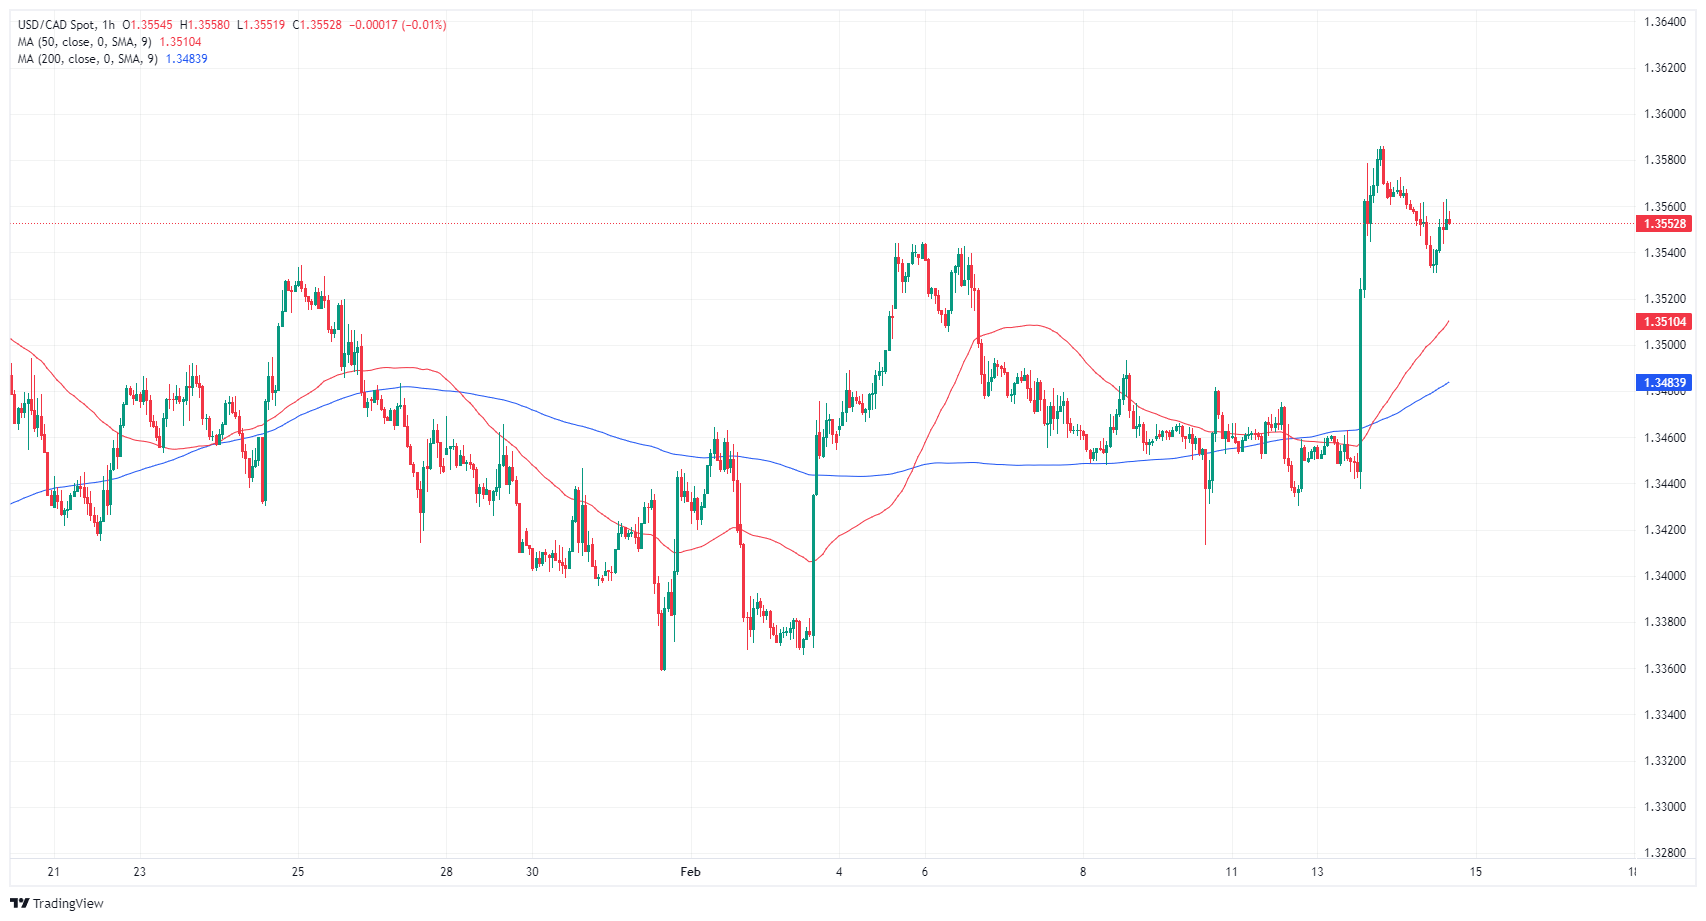
USD/CAD daily chart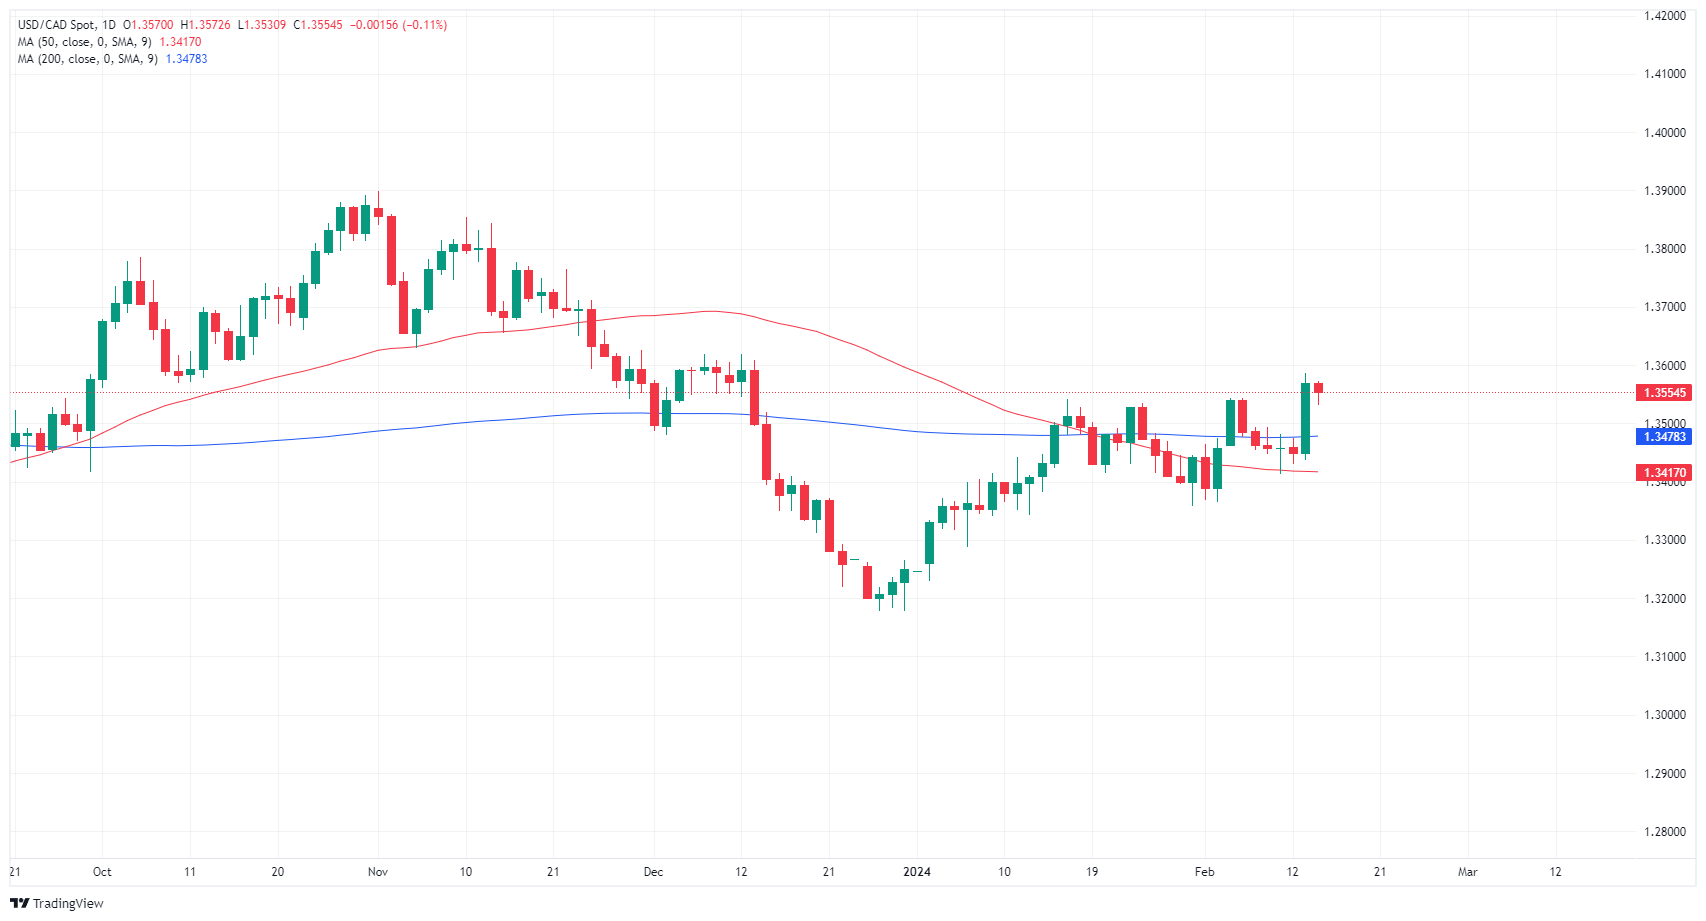
Canadian Dollar FAQs
What key factors drive the Canadian Dollar?
The key factors driving the Canadian Dollar (CAD) are the level of interest rates set by the Bank of Canada (BoC), the price of Oil, Canada’s largest export, the health of its economy, inflation and the Trade Balance, which is the difference between the value of Canada’s exports versus its imports. Other factors include market sentiment – whether investors are taking on more risky assets (risk-on) or seeking safe-havens (risk-off) – with risk-on being CAD-positive. As its largest trading partner, the health of the US economy is also a key factor influencing the Canadian Dollar.
How do the decisions of the Bank of Canada impact the Canadian Dollar?
The Bank of Canada (BoC) has a significant influence on the Canadian Dollar by setting the level of interest rates that banks can lend to one another. This influences the level of interest rates for everyone. The main goal of the BoC is to maintain inflation at 1-3% by adjusting interest rates up or down. Relatively higher interest rates tend to be positive for the CAD. The Bank of Canada can also use quantitative easing and tightening to influence credit conditions, with the former CAD-negative and the latter CAD-positive.
How does the price of Oil impact the Canadian Dollar?
The price of Oil is a key factor impacting the value of the Canadian Dollar. Petroleum is Canada’s biggest export, so Oil price tends to have an immediate impact on the CAD value. Generally, if Oil price rises CAD also goes up, as aggregate demand for the currency increases. The opposite is the case if the price of Oil falls. Higher Oil prices also tend to result in a greater likelihood of a positive Trade Balance, which is also supportive of the CAD.
How does inflation data impact the value of the Canadian Dollar?
While inflation had always traditionally been thought of as a negative factor for a currency since it lowers the value of money, the opposite has actually been the case in modern times with the relaxation of cross-border capital controls. Higher inflation tends to lead central banks to put up interest rates which attracts more capital inflows from global investors seeking a lucrative place to keep their money. This increases demand for the local currency, which in Canada’s case is the Canadian Dollar.
How does economic data influence the value of the Canadian Dollar?
Macroeconomic data releases gauge the health of the economy and can have an impact on the Canadian Dollar. Indicators such as GDP, Manufacturing and Services PMIs, employment, and consumer sentiment surveys can all influence the direction of the CAD. A strong economy is good for the Canadian Dollar. Not only does it attract more foreign investment but it may encourage the Bank of Canada to put up interest rates, leading to a stronger currency. If economic data is weak, however, the CAD is likely to fall.
The US Census Bureau will release the January Retail Sales report on Thursday, February 15 at 13:30 GMT and as we get closer to the release time, here are the forecasts of economists and researchers of 10 major banks regarding the upcoming data.
Retail Sales are forecast to have contracted by 0.1% after expanding by 0.6% in December. Consumer spending ex-autos is expected at 0.2% month-month vs. 0.4% in December while the so-called control group used for GDP calculations is expected at 0.2% MoM vs. the prior release of 0.8%.
Deutsche Bank
We expect the retail sales to grow at 0.3% MoM, down from +0.6% in December.
ABN Amro
Retail sales are expected to register more moderate growth in January (0.2% MoM), paying back for the burst of strength at the end of 2023.
ING
Retail sales are likely to be soft, given that auto sales numbers already published were poor. Bad weather has certainly played a part, but 20+ year high borrowing costs for credit cards, car loan and personal loans are not helping. There is also growing evidence suggesting that pandemic era accrued excess savings will be supportive for spending.
RBC Economics
We expect January’s US retail sales report to show a 0.5% decline from December led by a 7% drop in auto sales and a 2% fall in gasoline prices MoM. That marks the largest decline since March last year. Another surge in jobs in January (353K) and acceleration in wage growth means household incomes are still strong but the household saving rate continues to run below pre-pandemic levels.
NBF
Motor vehicles and parts dealers and outlays at gasoline stations could have contributed negatively to the headline figure. Meanwhile, other categories could have suffered from bad weather and recorded losses, notably food services. All told, we expect total sales to have contracted 0.5%. Ex-auto outlays could have been a little less bad, falling 0.4% MoM.
SocGen
We look for soft headlines and even see the potential for a negative. Gasoline prices fell 2.5% in January on average, which should be partially offset by a volume increase, but we still anticipate roughly a 1.0% MoM drop in gasoline sales. For most other spending categories, we look for trend increases, which should lift the ex-transportation measure by 0.4% MoM.
Wells Fargo
We forecast retail sales to advance 0.1% in January and 0.3% when excluding autos. As the year progresses, we expect to see more of a moderation in spending emanating from a slowing jobs market. The unique factors of excess liquidity and easy access to cheap credit are tales of the past in the story of consumption.
CIBC
We expect the control group of retail sales to moderate but remain solid with growth of 0.3% MoM and the headline advanced reading should be 0.2%. The underlying strength in the labor market combined to normalizing inflation has meant real income growth has accelerated. Other forces are afoot too to support consumption. Housing unaffordability, work from home and rising household wealth could be pushing consumers to spend more on durables.
TDS
We expect retail sales to retreat for the first time since October (TD: -0.3% MoM), following a strong 0.6% gain in December. Volatile auto sales will likely prove to be a major culprit behind weaker growth, with control group sales also acting as a drag. We look for a small 0.1% MoM decline in the latter. In addition, we project sales in bars/restaurants to move lower, as services spending likely started 2024 on a weaker footing.
Citi
US January Retail Sales – Citi: -0.6%, prior: 0.6%; Retail Sales ex Auto – Citi: -0.2%, prior: 0.4%; Retail Sales ex Auto, Gas – Citi: -0.2%, prior: 0.6%; Retail Sales Control Group – Citi: 0.1%, prior: 0.8%. Retail sales have been surprising to the upside for several months in a row and the rebound in real goods demand has been stronger than expected. Goods and services have been contributing almost equally to growth over the last couple of quarters. Consumption overall should remain generally supported as long as the labor market holds up and incomes are increasing but we expect a softer retail sales print in January. Seasonal adjustment dynamics also imply some downside risk to the January retail sales this year as they expect sales to decline by less in non-seasonally adjusted terms than they did during the prior year.
- EUR/USD advances on dropping US Treasury yields and Chicago Fed’s President Goolsbee's comments.
- US PPI indicates the continuation of the disinflationary process.
- Eurozone dodges a recession in Q4 2023; Lagarde’s speech eyed.
The EUR/USD climbs during the North American session registers 0.08% gains courtesy of a drop in US Treasury bond yields after Tuesday’s inflation report in the United States. Also, stronger-than-expected Eurozone data sponsored the jump to a daily high of 1.0719. At the time of writing, the pair exchanges hands at 1.0716.
US inflation decelerates but stays above Fed’s 2% goal
The US Bureau of Labor Statistics (BLS) revealed that inflation is anchored above the 3% threshold in headline and core inflation. Recently, the Bureau revealed that prices paid by producers – also known as PPI – plunged to -0.2%, exceeding November’s drop. The core PPI stood at -0.1%, both figures on a monthly basis, suggesting that inflation indeed is cooling down.
Besides that, falling US Treasury bond yields are weighing on the Greenback. The US Dollar Index (DXY), which tracks a basket of the currency against the other six, falls 0.02%, down to 104.84.
As of writing, Chicago’s Fed President Austan Goolsbee justified that if inflation comes a bit higher over the next months, it would be consistent with our (Fed) path back to target. Goolsbee emphasized his posture to ease policy even though inflation isn’t in the 2% threshold in yearly figures.
Across the pond, the Gross Domestic Product in the Eurozone was flat in Q4 at 0% on a quarterly basis, while compared to 2022, it rose 0.1%. Despite that, Germany, the largest economy of the block, contracted -0.3% QoQ.
In the European session, European Central Bank (ECB) Vice-President Luis De Guindos commented that incoming data signals economic weakness in the near term, and emphasized the disinflationary process continues.
What to watch?
The Eurozone scheduler will feature the Balance of Trade for December and Christine Lagarde’s speech. On the US front, Retail Sales, Industrial Production, and Initial Jobless Claims are awaited to give direction to the EUR/USD pair.
EUR/USD Price Analysis: Technical outlook
The pair is downward biased despite signaling that it could be bottoming at around the 1.0690s-1.0700 area. However, the Relative Strength Index (RSI) signals bears are in charge, and the EUR/USD trade below the daily moving averages (DMAs). That said, the major first support would be 1.0700, followed by the 1.0694 February 14 low. Once those two levels are cleared, the next stop would be intermediate support at a November 10 low of 1.0656. On the other hand, if buyers reclaim the 1.0750 area, they can challenge a resistance trendline that passes around the 1.0755/70 area.
The Australian Dollar (AUD) has been among the weakest performing G10 currencies in early 2024. Economists at Danske Bank analyze Aussie’s outlook.
RBA maintained its monetary policy unchanged in February
The Reserve Bank of Australia (RBA) maintained its monetary policy unchanged in February. While inflation slowed down more than expected in Q4, RBA’s communication remained hawkish due to still tight labour markets and elevated domestic price pressures in the services sector. Market prices in the first rate cut only by Aug/Sep, but we see risks tilted towards an earlier start to the cutting cycle.
The latest move lower in the cross has been well aligned with our expectations, and we maintain a bearish forecast profile also going forward. Solid macro-outlook in the US, relative central bank pricing and sluggish growth in the key Australian export market China all weigh on AUD/USD going forward.
Forecast: 0.6500 (1M), 0.6400 (3M), 0.6300 (6M), 0.6200 (12M)
While testifying before the UK Economic Affairs Committee on Wednesday, Bank of England (BoE) Governor Andrew Bailey called the latest inflation data "good news" and noted that it showed more downward pressure than they expected.
Key takeaways
"Downward pressure on inflation is quite broad-based."
"Overall inflation data leaves us broadly where we expected to be."
"This week's data does not really change our view from February policy decision."
"We have moved from how restrictive policy needs to be to for how long we need to maintain policy stance."
"Services inflation is not compatible with 2% inflation."
"We are seeing signs of pay growth coming down."
"Latest wage data showed quite a marked reduction but not as far as we thought."
"We need to see more evidence of slowing wage growth to be confident of inflation at 2%."
Market reaction
These comments failed to trigger a noticeable reaction in GBP/USD. At the time of press, the pair was down 0.3% on the day at 1.2550.
EUR/CHF has moved back above the 0.9500 level. Economists at OCBC Bank analyze the pair’s outlook.
Euro Area growth to stabilise in the second half of the year
While SNB may not pursue a strong FX policy, the EUR may also come under pressure in the near term owing to lacklustre economic activities in the Euro Area region, growing risk of an earlier than expected ECB rate cut cycle (possibly as early as in Apr-2024) and election risks in Europe.
On net, the negative effects for EUR and CHF may offset each other for 1H. But into 2H 2024, we are expecting Euro Area growth to stabilise, and the ECB rate cut cycle to be more modest (our house view expects 75 bps cut for 2024) while SNB may potentially begin rate cut cycle in 2H 2024 (market expectation).
The policy divergence between ECB-SNB, growth stabilisation in Euro Area and SNB’s pursuit for not a strong CHF can potentially support an upward trajectory for EUR/CHF.
EUR/CHF – Mar-24 0.9460 Jun-24 0.9540 Sep-24 0.9790 Dec-24 0.9990 Mar-25 0.9990
US Dollar (USD) gathered strength after US inflation data surprised to the upside. Economists at Commerzbank analyze Greenback’s outlook.
Playing the role of admonisher rather than joining in the jubilant optimism of the USD bulls
Will the USD strength we have seen since Tuesday's data release be permanent and perhaps need to be extended? That depends on how the Fed responds. I would like to point this out: Before the Fed's next FOMC meeting (on March 20), we still have the January PCE deflator numbers, i.e. the Fed's actual target measure, as well as another round of CPI data (the February one, on March 12). So nothing is decided yet.
Our economists point out that January inflation figures have to be treated with caution. Therefore, I have to point out to you that the current strength of the USD should also be treated with caution. At the moment, I prefer to play the role of admonisher rather than join in the jubilant optimism of the USD bulls. Are these in your environment also the people for whom EUR/USD forecasts could not be high enough not long ago?
- AUD/USD advances toward 0.6500 as the RBA remains open for further policy tightening.
- Investors see the Fed reducing interest rates in June.
- Market participants await fresh guidance from the Australian Employment and the US Retail Sales data.
The AUD/USD pair marches toward the psychological resistance of 0.6500 even though the broader outlook for the US Dollar is bullish. The Aussie asset is up more than 0.4% in Wednesday’s early New York session as Reserve Bank of Australia (RBA) Governor Michele Bullock cautioned that the central bank remains receptive to further rate hikes.
While discussing the timing of rate cuts, RBA Bullock stated that the central bank might consider initiating rate cuts even before inflation decelerates to 2.5%.
Going forward, the Australian Dollar will be guided by the Employment data for January, which will be published on Thursday. According to the expectations, 30K workers were recruited against 65.1K lay-offs in December. The Unemployment Rate is seen rising to 4% from 3.9%. An upbeat Employment data would allow RBA policymakers to hold the Official Cast Rate (OCR) at 4.35% for longer.
Meanwhile, the US Dollar Index (DXY) is struck near a three-month high of 105.00. The USD Index is expected to witness more upside as stubborn United States inflation data has shifted expectations for rate cuts by the Federal Reserve (Fed) to the June monetary policy meeting. The Fed is expected to keep interest rates unchanged in the range of 5.25-5.50% until it gets evidence that inflation will comfortably return to the 2% target.
For further guidance, market participants will focus on the monthly US Retail Sales data for January, which will be published on Thursday. Retail Sales are forecasted to have contracted by 0.1% after expanding by 0.6% in December.
The US Dollar is trading a bit more mixed as the dust settles after Tuesday’s US Consumer Price Index (CPI) shocker. Economists at Scotiabank analyze Greenback’s outlook.
Upside potential for US terms yields is probably limited
Developments this week leave the USD in prime position to remain firm in the near term; slow progress on inflation supports the idea of ‘high for longer’ rates in the US but high is not higher; that should mean that upside potential for US terms yields is probably limited.
Bargain hunters may be sniffing around US bonds while markets still view June as the likely jump-off point for Fed easing (26 bps of cuts priced in via OIS at present).
The Canadian Dollar has improved slightly so far today. Economists at Scotiabank analyze USD/CAD outlook.
Sustained gains above 1.3450 would open the door to more strength toward 1.3625
Short-term price signals suggest the USD’s sharp push higher is losing some momentum but USD gains are holding, just about, around the former resistance point at 1.3540, which now serves as USD support.
USD/CAD losses back through the low 1.3500s would undercut near-term USD momentum further. Sustained gains above 1.3450 would open the door to more USD strength toward 1.3625, however.
- US stock index futures point to a positive opening on Wednesday.
- Wall Street's main indexes suffered heavy losses on Tuesday.
- Markets see a less than 50% probability of a Fed rate cut in May after January inflation data.
S&P 500 futures rise 0.54%, Dow Jones futures climb 0.32%, and Nasdaq futures gain 0.73%.
S&P 500 (SPX), Dow Jones (DJIA), and Nasdaq (IXIC) indexes closed on Tuesday with a 1.37% loss, a 1.35% drop, and a 1.80% fall, respectively.
What to know before stock market opens
- All major sectors of the S&P 500 closed deep into negative territory on Tuesday. The Consumer Discretionary was the worst-performing S&P 500 sector, losing 1.96% on the day.
- Ecolab Inc. (ECL) climbed nearly 9%, ending at $221.18 as the top gainer on Tuesday. On the flip side, Moody's Corp tumbled 7.9% to end the day at $369.23 as the day's single worst performer.
- The CBOE Volatility Index (VIX), Wall Street's fear gauge, rose nearly 14% to highlight risk aversion on Tuesday. Ahead of the opening bell on Wednesday, VIX is down more than 5%.
- Inflation in the US, as measured by the change in the Consumer Price Index (CPI), softened to 3.1% on a yearly basis in January from 3.4% in December, the US Bureau of Labor Statistics (BLS) reported on Tuesday. This reading came in above the market expectation of 2.9%. The Core CPI, which excludes volatile food and energy prices, rose 3.9% in the same period, matching December's increase and surpassing analysts' estimate of 3.7%.
- According to the CME FedWatch Tool, the probability of a Federal Reserve (Fed) rate cut in May declined toward 30% from nearly 55% ahead of the January inflation data.
- Later in the week, January Retail Sales, Industrial Production and Producer Price Index (PPI) data will be featured in the US economic calendar.
- On Tuesday, Coca-Cola Co. (KO) reported that revenue rose 7.4% to $10.95 billion from a year ago for the quarter ended in December, per Reuters. The company announced that the quarterly net income was $1.97 billion for that period and cited higher product prices and robust demand for the upbeat results.
- Airbnb Inc. (ABNB) said after the closing bell on Tuesday that quarterly adjusted earnings were 76 cents per share in the quarter ended in December. The company’s revenue increased 16.6% to $2.22 billion from a year ago, but there was a quarterly loss of $349 million.
- Cisco Systems Inc. (CSCO), Equinix Inc. (EQIX) and Occidental Petroleum Corp (OXY) are among the top companies that will report earnings after the closing bell on Wednesday.
S&P and Nasdaq futures are presented by CME e-minis and Dow Jones futures are presented by CBOT e-mini.
S&P 500 FAQs
What is the S&P 500?
The S&P 500 is a widely followed stock price index which measures the performance of 500 publicly owned companies, and is seen as a broad measure of the US stock market. Each company’s influence on the computation of the index is weighted based on market capitalization. This is calculated by multiplying the number of publicly traded shares of the company by the share price. The S&P 500 index has achieved impressive returns – $1.00 invested in 1970 would have yielded a return of almost $192.00 in 2022. The average annual return since its inception in 1957 has been 11.9%.
How are companies chosen to be included in the S&P 500?
Companies are selected by committee, unlike some other indexes where they are included based on set rules. Still, they must meet certain eligibility criteria, the most important of which is market capitalization, which must be greater than or equal to $12.7 billion. Other criteria include liquidity, domicile, public float, sector, financial viability, length of time publicly traded, and representation of the industries in the economy of the United States. The nine largest companies in the index account for 27.8% of the market capitalization of the index.
How can I trade the S&P 500?
There are a number of ways to trade the S&P 500. Most retail brokers and spread betting platforms allow traders to use Contracts for Difference (CFD) to place bets on the direction of the price. In addition, that can buy into Index, Mutual and Exchange Traded Funds (ETF) that track the price of the S&P 500. The most liquid of the ETFs is State Street Corporation’s SPY. The Chicago Mercantile Exchange (CME) offers futures contracts in the index and the Chicago Board of Options (CMOE) offers options as well as ETFs, inverse ETFs and leveraged ETFs.
What factors drive the S&P 500?
Many different factors drive the S&P 500 but mainly it is the aggregate performance of the component companies revealed in their quarterly and annual company earnings reports. US and global macroeconomic data also contributes as it impacts on investor sentiment, which if positive drives gains. The level of interest rates, set by the Federal Reserve (Fed), also influences the S&P 500 as it affects the cost of credit, on which many corporations are heavily reliant. Therefore, inflation can be a major driver as well as other metrics which impact the Fed decisions.
- USD/CAD continues its mild correction as higher oil prices strengthen the Canadian Dollar.
- OPEC Ghais is upbeat on oil demand for this year.
- The US Dollar prints a fresh three-month high amid a risk-off mood.
The USD/CAD pair falls slightly below 1.3550 in the late European session on Wednesday as upbeat oil prices have strengthened the Canadian Dollar. The Loonie asset continues to correct despite the US Dollar extending its upside.
The positive commentary on the oil outlook from OPEC Secretary General Al Ghais has strengthened the oil price bulls. On Tuesday, General Al Ghais said he expects a strong global economy this year with positive implications for demand. He added, “Saudi Arabia's decision to postpone capacity expansion should not be misunderstood as poor demand outlook.”
It is worth noting that Canada is the leading oil exporter to the United States, and higher oil prices support the Canadian Dollar.
The overall market mood is downbeat as persistent United States inflation data has cooled down expectations of rate cuts by the Federal Reserve (Fed) in the May monetary policy meeting. Fed policymakers are expected to keep interest rates in the range of 5.25-5.50% until they get confidence that inflation will sustainably return to the 2% target. The overall inflation picture indicates that the last leg of high price pressures is complicated.
The US Dollar Index (DXY) refreshes a three-month high to near 105.00. The US Dollar attracts more foreign inflows when the Fed maintains a hawkish rhetoric.
Going forward, market participants will focus on the monthly US Retail Sales data for January, which will be published on Thursday. Investors anticipate that Retail Sales contracted by 0.1% against a 0.6% increase in December.
- Natural Gas enters the eighth day of consecutive losses.
- Traders are sending Gas prices already 20% lower since the start of February.
- The US Dollar Index roared on the back of red-hot inflation, consolidating gains this Wednesday.
Natural Gas (XNG/USD) is sinking lower in search of rock bottom. The additional move this time comes with Shell issuing an outlook where Liquefied Natural Gas (LNG) demand will be substantially decreased by 2040, seeing the current pushes worldwide to abandon fossil fuels. The outlook supports the overall trend seen in both Oil and Gas with several administrations worldwide taking measures to further limit and phase out usage on all fronts.
The US Dollar (USD) is trying to consolidate its current position after it booked some substantial gains on the back of a red-hot US inflation report that pointed to sticky price pressures being present. Markets had to push back further their expectations of an initial rate cut by the US Federal Reserve (Fed) from June into July. This made equities nosedive, though those are recovering at the moment ahead of the US opening bell.
Natural Gas is trading at $1.71 per MMBtu at the time of writing.
Natural Gas market movers: Questions about the future
- Shell said in its outlook that demand for LNG by 2040 will be lower than first anticipated.
- Some tightening in European gas prices is showing that traders are focussing on the restocking of European gas storage ahead of next winter.
- Europe will need to look for 5% more LNG supply in order to reach the same levels of gas storage seen in 2023 ahead of winter.
- The warm front is closing in as expected and would see temperatures rise to unseasonable levels with London projected to reach 13 degrees Celsius.
Natural Gas Technical Analysis: More in the tank to drop
Natural Gas is unable to halt the current downturn which has been going on for eight straight days already. More downturn looks to be at hand with supply still very much flowing and demand remaining rather tepid. Add several more calls for the longer term outlook where LNG and other fossil fuels are being phased out, and a quick return to higher levels looks not to be in the cards anytime soon.
On the upside, Natural Gas is facing some pivotal technical levels to get back to. First, $1.99, which saw an accelerated decline. Next is the blue line at $2.13 with the triple bottoms from 2023. In case Natural Gas sees sudden demand pick up, possibly $2.40 could come into play.
Keep an eye on $1.80, which was a pivotal level back in July 2020 and should act as a cap now. Should US President Biden’s moratorium be lifted, together with the additional supply from Canada – which is exporting more to fill the gap from the US – $1.64 and $1.53 (low of 2020) are targets to look out for.
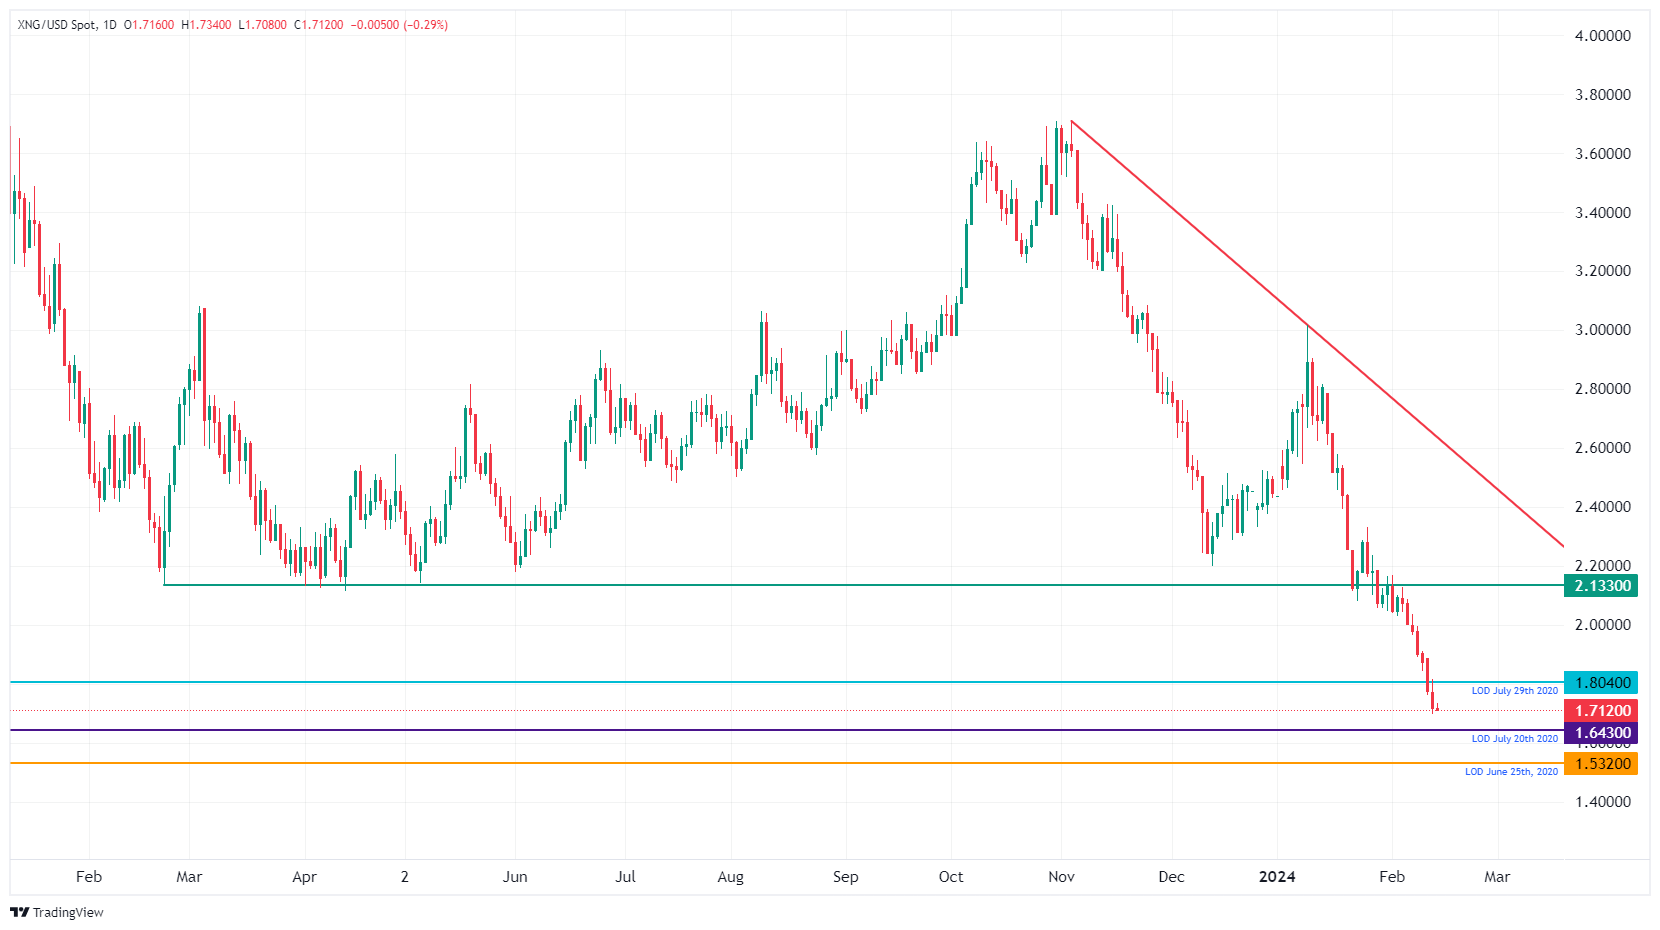
XNG/USD (Daily Chart)
Natural Gas FAQs
What fundamental factors drive the price of Natural Gas?
Supply and demand dynamics are a key factor influencing Natural Gas prices, and are themselves influenced by global economic growth, industrial activity, population growth, production levels, and inventories. The weather impacts Natural Gas prices because more Gas is used during cold winters and hot summers for heating and cooling. Competition from other energy sources impacts prices as consumers may switch to cheaper sources. Geopolitical events are factors as exemplified by the war in Ukraine. Government policies relating to extraction, transportation, and environmental issues also impact prices.
What are the main macroeconomic releases that impact on Natural Gas Prices?
The main economic release influencing Natural Gas prices is the weekly inventory bulletin from the Energy Information Administration (EIA), a US government agency that produces US gas market data. The EIA Gas bulletin usually comes out on Thursday at 14:30 GMT, a day after the EIA publishes its weekly Oil bulletin. Economic data from large consumers of Natural Gas can impact supply and demand, the largest of which include China, Germany and Japan. Natural Gas is primarily priced and traded in US Dollars, thus economic releases impacting the US Dollar are also factors.
How does the US Dollar influence Natural Gas prices?
The US Dollar is the world’s reserve currency and most commodities, including Natural Gas are priced and traded on international markets in US Dollars. As such, the value of the US Dollar is a factor in the price of Natural Gas, because if the Dollar strengthens it means less Dollars are required to buy the same volume of Gas (the price falls), and vice versa if USD strengthens.
GBP/USD is soft but off earlier lows. Economists Scotiabank analyze the pair’s outlook.
Soft undertone on the charts
Sterling traded heavily on Tuesday and retains a weak undertone today.
Technical momentum is accumulating bearishly for the GBP on the intraday and daily oscillators. Sterling has not made a new low against the USD on this move down, however – in contrast to many of its peers.
The early February low at 1.2519 remains intact and a grouping of support points around the 1.2500 zone suggests USD gains may be held up for now.
Resistance is 1.2610.
- The US Dollar trades around a three-month high.
- Market is trying to digest the recent US CPI report which messed up the expected time table on Fed rate cuts.
- The US Dollar Index seems to be stalling ahead of 105 and seeing some profit taking.
The US Dollar (USD) is throwing a few good punches at the markets with a substantial rally midweek. The move comes on the back of surprise upticks in US monthly inflation (both headline and core). This in turn is triggering an earthquake in markets, which has sent equities nosediving, yields soaring and the US Dollar rallying against every major currency peer.
On the economic data front, a very light calendar offers room for markets to digest and recalibrate. Do not expect much from any single economic data point ahead this Wednesday with the Mortgage Applications Survey. Rather look for clues from US Federal Reserve members Austan Goolsbee and Michael Barr, who are speaking today and could soften the current inflation print with a nuanced message.
Daily digest market movers: CPI is done, time to look forward
- Goldman Sachs was quite quick to come out with a report in the US Consumer Price Index (CPI) aftermath saying that the February numbers will be substantially lower and writing off the current knee jerk reaction in CPI numbers due to the intensive seasonal holiday period over December and January. A mere drop on a hot plate thus, according to Goldman Sachs.
- North Korea has fired multiple cruise missiles off the East Coast.
- The weekly Mortgage Applications Index went into contraction by 2.3%, coming from a positive 3.7% previous week.
- Two US Federal Reserve speakers are set to make comments this Wednesday: Around 14:30 GMTChicago Fed Austan Gooldsbee, and later near 21:00, Fed’s Vice Chairman Michael Barr will speak.
- Equity markets are trying to recover with European equities mildly in the green. US equity futures are even more up than European ones, with the Nasdaq leading the charge, up 0.50%.
- The CME Group’s FedWatch Tool is now looking at the March 20th meeting. Expectations for a pause are 91.5%, while 8.5% for a rate cut. In terms of overweight expectations for a rate cut, the dial has moved from May/June now into summer towards July.
- The benchmark 10-year US Treasury Note trades near 4.30%, a touch softer from its peak on tuesday at 4.33%.
US Dollar Index Technical Analysis: tweaking the settings
The US Dollar Index (DXY) soared to a near 105 after US CPI data. Although it looks very logical that the DXY could jump above that level now, markets have already incorporated the data after pushing back rate-cut expectations for the Fed from June to July. It is possible, therefore, that in the coming days this up move will start to fade back in search of support.
The road is now open for a jump to 105.00 with 105.12 as key levels to keep an eye on. One step beyond there comes in at 105.88, the high of November 2023. Ultimately, 107.20 – the high of 2023 – could even come back into scope, but that would be when several inflation measures are coming in higher than expected for several weeks in a row.
Support should now be provided by the high of last week Monday near 104.59. Further down that 100-day Simple Moving Average looks rather doubtful, near 104.24, so the 200-day SMA near 103.67 looks more solid. Should that give way, look for support from the 55-day SMA near 103.08.
US Dollar FAQs
What is the US Dollar?
The US Dollar (USD) is the official currency of the United States of America, and the ‘de facto’ currency of a significant number of other countries where it is found in circulation alongside local notes. It is the most heavily traded currency in the world, accounting for over 88% of all global foreign exchange turnover, or an average of $6.6 trillion in transactions per day, according to data from 2022.
Following the second world war, the USD took over from the British Pound as the world’s reserve currency. For most of its history, the US Dollar was backed by Gold, until the Bretton Woods Agreement in 1971 when the Gold Standard went away.
How do the decisions of the Federal Reserve impact the US Dollar?
The most important single factor impacting on the value of the US Dollar is monetary policy, which is shaped by the Federal Reserve (Fed). The Fed has two mandates: to achieve price stability (control inflation) and foster full employment. Its primary tool to achieve these two goals is by adjusting interest rates.
When prices are rising too quickly and inflation is above the Fed’s 2% target, the Fed will raise rates, which helps the USD value. When inflation falls below 2% or the Unemployment Rate is too high, the Fed may lower interest rates, which weighs on the Greenback.
What is Quantitative Easing and how does it influence the US Dollar?
In extreme situations, the Federal Reserve can also print more Dollars and enact quantitative easing (QE). QE is the process by which the Fed substantially increases the flow of credit in a stuck financial system.
It is a non-standard policy measure used when credit has dried up because banks will not lend to each other (out of the fear of counterparty default). It is a last resort when simply lowering interest rates is unlikely to achieve the necessary result. It was the Fed’s weapon of choice to combat the credit crunch that occurred during the Great Financial Crisis in 2008. It involves the Fed printing more Dollars and using them to buy US government bonds predominantly from financial institutions. QE usually leads to a weaker US Dollar.
What is Quantitative Tightening and how does it influence the US Dollar?
Quantitative tightening (QT) is the reverse process whereby the Federal Reserve stops buying bonds from financial institutions and does not reinvest the principal from the bonds it holds maturing in new purchases. It is usually positive for the US Dollar.
EUR/USD tests 1.0700 area. Economists at Scotiabank analyze the pair’s outlook.
Gains back above 1.0805/1.0810 are needed to boost the technical outlook
Spot has lost support at 1.0725 (lows from December and early February) and losses through the low 1.0700s on a sustained basis (1.0712 is the 61.8% retracement support of the EUR’s Q4 rally) target a drop to 1.0610 (76.4% Fib at 1.0611).
A rebound back through 1.0725 steadies the EUR in the short run but gains back above 1.0805/1.0810 are needed to boost the technical outlook.
The broad-based Dollar rally has taken USD/JPY well above 150.00. Economists at ING analyze the pair’s outlook.
Intervention cannot completely be ruled out
Because this is a Dollar rather than a Yen-led move, the consensus view is probably that Japanese authorities will not be able to justify any FX intervention.
We are not so sure and suspect the US Treasury would again accept Japanese intervention to sell USD/JPY should it make a quick move to 152.00. At just 7.45%, one week USD/JPY implied volatility seems too low in that intervention cannot completely be ruled out.
- AUD/JPY gains ground after the hawkish comments from the Commonwealth Bank.
- Commonwealth Bank CEO Matt Comyn mentioned that the RBA might delay rate cuts until early 2025.
- Japan’s Masato Kanda reiterated that authorities may intervene in the FX market if needed.
AUD/JPY edges higher to near 97.50 during the European session after experiencing a volatile session on Wednesday. The cross reversed intraday losses and entered into positive territory as the Australian Dollar (AUD) strengthened.
The hawkish remarks from Commonwealth Bank CEO Matt Comyn attracted some buyers for the Aussie Dollar and, consequently, acted as a tailwind for the AUD/JPY cross. He suggested that the Reserve Bank of Australia (RBA) might delay interest rate cuts until early 2025 due to steady inflation. Comyn's comments raised concerns about increased living costs for borrowers relying on tax cuts and mortgage relief.
However, the Australian Dollar faced downward pressure as the S&P/ASX 200 Index plunged to recent lows, driven by a selloff in mining and financial stocks following Wall Street's decline overnight in response to stronger-than-expected US inflation figures.
On the other side, Japan’s top currency diplomat Masato Kanda reiterated that authorities stand ready to intervene in the Forex market if necessary. This stance might have bolstered the Japanese Yen (JPY), consequently undermining the AUD/JPY cross during Wednesday's Asian session. Furthermore, Japan's Finance Minister Shunichi Suzuki said that rapid currency moves are undesirable and that the government is watching the market with stronger urgency.
Investors await the preliminary Q4 Gross Domestic Product (GDP) data 2023 due on Thursday. Investors forecast that the Japanese economy could show a growth of 0.3% after contracting by 0.7% in the third quarter.
The US Dollar Index (DXY) set new year-to-date highs after the shock increase in the US Consumer Price Index (CPI) in January. Economists at MUFG Bank analyze Greenback’s outlook.
Continued Dollar upside risks for now
The CPI data has done some real damage to the prospects of a rate cut by May. The Overnight Index Swaps (OIS) market now has just 10 bps of cuts priced for May. At the end of January, the market had 33 bps priced. June is now just about priced for a 25 bps cut. With two more CPI reports before 1st May, we would be surprised to see that implied probability drop notably further for now.
So OIS pricing has adjusted to what we would describe as reasonable pricing but 2-year spreads on government bond yields and swap rates have moved notably in favour of the US Dollar implying continued Dollar upside risks for now.
- NZD/USD rebounds from the recent lows after low-impact data from New Zealand.
- Kiwi Card Retail Sales YoY and MoM grew by 1.6% and 1.7%, respectively, in January.
- Traders price in a 37% and 51% probability of a 25 basis points (bps) rate cut by the Fed in May and June, respectively.
NZD/USD rebounds from the recent low at 0.6049 marked on Tuesday, recovering the losses and trading around 0.6080 during the European session on Wednesday. In the absence of the high-impact data from New Zealand, low-impact data showed better-than-expected results, which could have added support to underpinning the New Zealand Dollar (NZD), which in turn, acted as the tailwind for the NZD/USD pair.
Statistics New Zealand showed that Electronic Card Retail Sales grew by 1.6% YoY in January, against the previous decline of 0.6%. The monthly data also printed a positive reading of 1.7% in comparison with the previous month’s 1.7% decline. Furthermore, the Food Price Index (MoM) improved to 0.9% from the decline of 0.1% in December.
The US Dollar Index (DXY) holds firm near three-month highs, trading around 104.90 despite the downbeat US bond yields. The 2-year and 10-year yields on US Treasury notes stand lower at 4.60% and 4.28%, respectively, by the press time.
According to the FedWatch tool, the market sentiment has undergone a notable transformation, with the probability of an unchanged interest rate next month soaring to 90%, a stark shift from just a month ago. Traders are currently pricing in a 37% probability of a 25 basis points (bps) rate cut by the Federal Reserve in May, with the probability increasing to 51% for June.
The surprise increase in US inflation for January has led analysts at Commerzbank to reevaluate the potential for the Fed to pivot toward interest rate cuts. Observers are speculating about whether the previously anticipated interest rate cut by the Fed in May might now face uncertainty in light of these developments.
The US Dollar (USD) is the strongest performer in the G10 space this year. It looks like the Dollar will be able to hold recent gains for another couple of weeks, economists at ING say.
Setting up another good month for the Dollar
Tuesday's strong US January CPI release clearly does not provide the Fed with the confidence it needs to start cutting rates. Instead of powering the next leg of the risk rally, the CPI data has applied the brakes and suggests the Dollar largely holds onto its gains into the next big US price release – the January PCE data on 29 February.
The US Dollar Index (DXY) can trade on the firm side of a 104.60-105.00 range today.
- USD/JPY resumes the upside amid an upbeat outlook for the US Dollar.
- The Fed is expected to hold interest rates in the range of 5.25-5.50% at least for the first half of the current year.
- Investors await further guidance from Japan’s preliminary Q4 GDP and US Retail Sales data.
The USD/JPY pair resumes its upward journey after a mild correction to near 150.40 in the European session on Wednesday. The asset rebounds as dismal market sentiment has improved the appeal of the US Dollar.
There seems to have a mixed action in global markets as S&P500 futures have generated decent gains in the European session while risk-perceived currencies have been hit hard. However, US equities were heavily dumped on Tuesday after releasing the stubborn inflation report for January.
The US Dollar Index (DXY) has refreshed its three-month high near 105.00 as sticky price pressures indicate that the Federal Reserve (Fed) will hold interest rates in the range of 5.25-5.50% for somewhat longer than market participants had anticipated earlier.
As per the CME Fedwatch tool, traders see a 38% chance for a rate-cut decision of 25 basis points (bps), down from 50% after the release of the hotter-than-expected inflation report.
Going forward, the monthly US Retail Sales data will guide the US Dollar. According to the expectations, the Retail Sales were dropped by 0.1% in January after rising by 0.6% in December. A decline in Retail Sales could be the outcome of higher spending done by households in December due to the festive mood.
Meanwhile, the Japanese Yen remains on its toes as investors await the preliminary Q4 Gross Domestic Product (GDP) data 2023. Investors forecast that the Japanese economy grew by 0.3% after contracting by 0.7% in the third quarter. Upbeat data would set a positive tone for this year and support the Bank of Japan (BoJ) in unwinding the expansionary monetary policy stance.
One consequence of the stronger than expected US inflation is the re-emergence of concerns in Tokyo over the level of the Japanese Yen (JPY). Economists at MUFG Bank analyze JPY outlook.
BoJ window to hike opens a little more
There’s a reasonably high probability of a 10 bps hike in April and if the Yen extends further weaker we should see market conviction increase further too.
With USD/JPY now more or less in intervention territory, a March hike is more feasible.
This is political too and the government certainly will not want to be seen to be doing nothing given its unpopularity due to the cost of living crisis.
US developments as we saw on Tuesday take precedence but at higher USD/JPY levels, the threat of intervention and speculation on a March hike should limit Yen selling.
- Gold price remains under pressure as sticky US CPI data suggests interest rates will stay high.
- Surging rental and healthcare costs drive price pressures in the US economy.
- The US Dollar extends its upside amid a risk-off market sentiment, further weighing on Gold.
Gold price (XAU/USD) continues its five-day losing spell on Wednesday as hot United States inflation data suggests the Federal Reserve (Fed) will hold back from cutting interest rates at its monetary policy meeting in May. The opportunity cost of holding non-yielding assets, such as Gold, has risen as the Fed is expected to keep interest rates at their current level for a longer period.
The absence of evidence ensuring the return of the underlying inflation to the 2% target has strengthened the need to maintain a hawkish narrative on interest rates. Fed policymakers are not expected to bring down key rates until they see price pressures easing for a decent period.
The US Consumer Price Index (CPI) grew faster than market expectations due to an uptick in rental and healthcare costs.
Contrary to market action, US Treasury Secretary Janet Yellen said there is progress in the war against persistent inflation despite surging rental prices on Tuesday.
Daily Digest Market Movers: Gold price extends its losing spell for sixth trading session
- Gold price declines toward a two-month low of around $1,975 as stubborn United States inflation data for January has cooled down expectations of rate cuts by the Federal Reserve in the May monetary policy meeting.
- The CME Fedwatch tool now shows that traders see a 38% decline in interest rates by 25 basis points (bps) for the May meeting, which was almost 50% before the release of the US inflation data.
- On Tuesday, the US Bureau of Labor Statistics (BLS) showed that core inflation rose steadily by 3.9%, while the headline inflation grew at a moderate pace of 3.1% against expectations of 2.9%.
- The Fed generally considers core inflation data for preparing monetary policy remarks, and sticky underlying price pressures are sufficient for Fed policymakers to maintain their hawkish rhetoric.
- Now, expectations for a rate cut have shifted to the June monetary policy meeting as stubborn price pressures would allow Fed policymakers to emphasize holding interest rates in the range of 5.25%-5.50% for a longer period.
- The interest rate decision is widely anticipated to remain unchanged for the March monetary policy meeting.
- Meanwhile, the US Dollar Index (DXY) has refreshed a three-week high at 104.90 amid a dismal market mood. The US Dollar attracts higher foreign inflows if the Fed maintains a restrictive stance.
- 10-year US Treasury yields have corrected mildly to 4.29% in the London session on Wednesday but are still almost 3% high this week.
- Going forward, market participants will focus on the monthly US Retail Sales data for January, which will be published on Thursday.
- Investors anticipate that Retail Sales dropped by 0.1% against a 0.6% increase in December. This might weigh on the US Dollar as weak sales at retail stores indicate a decline in household spending.
Technical Analysis: Gold price prints a fresh two-month low below $1,990
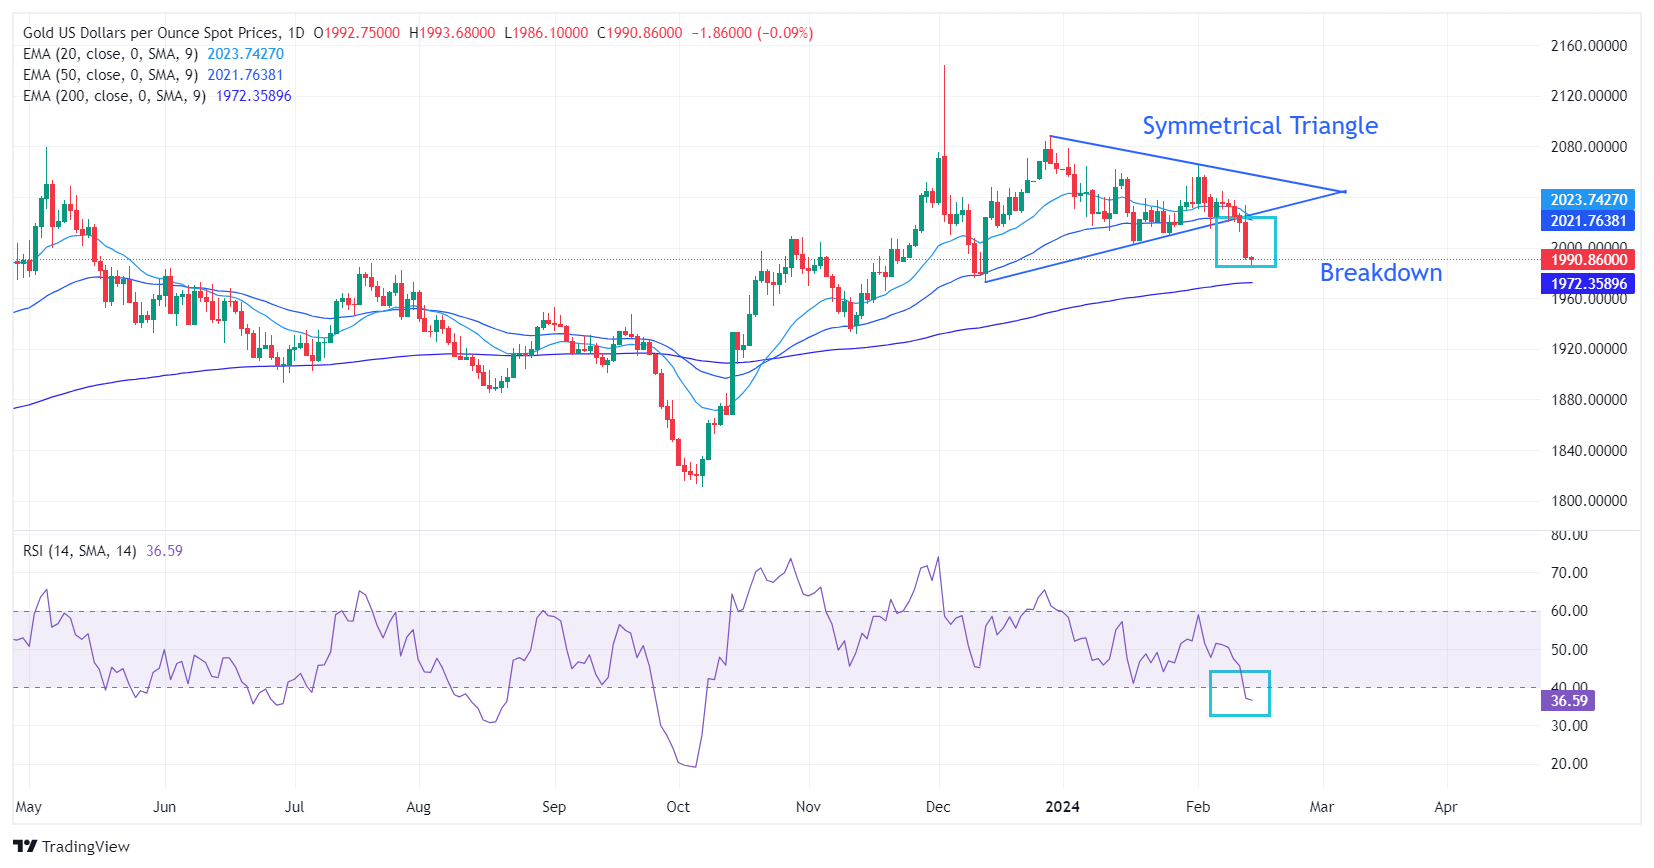
Gold price refreshes a two-month low below $1,990. The precious metal witnesses an intense sell-off after surrendering the psychological support of $2,000. The Yellow Metal is expected to face more downside as a breakdown of the Symmetrical Triangle chart pattern seems confirmed due to wider bearish tick formation on Tuesday.
The short-term appeal has turned bearish as the 20 and 50-day Exponential Moving Averages (EMAs) have turned down. The Gold price is expected to find support near the 200-day EMA, which trades around $1,970.
The 14-period Relative Strength Index (RSI) has slipped below 40.00 for the first time in more than four months. More downside looks likely amid an absence of oversold and divergence signals.
Gold FAQs
Why do people invest in Gold?
Gold has played a key role in human’s history as it has been widely used as a store of value and medium of exchange. Currently, apart from its shine and usage for jewelry, the precious metal is widely seen as a safe-haven asset, meaning that it is considered a good investment during turbulent times. Gold is also widely seen as a hedge against inflation and against depreciating currencies as it doesn’t rely on any specific issuer or government.
Who buys the most Gold?
Central banks are the biggest Gold holders. In their aim to support their currencies in turbulent times, central banks tend to diversify their reserves and buy Gold to improve the perceived strength of the economy and the currency. High Gold reserves can be a source of trust for a country’s solvency. Central banks added 1,136 tonnes of Gold worth around $70 billion to their reserves in 2022, according to data from the World Gold Council. This is the highest yearly purchase since records began. Central banks from emerging economies such as China, India and Turkey are quickly increasing their Gold reserves.
How is Gold correlated with other assets?
Gold has an inverse correlation with the US Dollar and US Treasuries, which are both major reserve and safe-haven assets. When the Dollar depreciates, Gold tends to rise, enabling investors and central banks to diversify their assets in turbulent times. Gold is also inversely correlated with risk assets. A rally in the stock market tends to weaken Gold price, while sell-offs in riskier markets tend to favor the precious metal.
What does the price of Gold depend on?
The price can move due to a wide range of factors. Geopolitical instability or fears of a deep recession can quickly make Gold price escalate due to its safe-haven status. As a yield-less asset, Gold tends to rise with lower interest rates, while higher cost of money usually weighs down on the yellow metal. Still, most moves depend on how the US Dollar (USD) behaves as the asset is priced in dollars (XAU/USD). A strong Dollar tends to keep the price of Gold controlled, whereas a weaker Dollar is likely to push Gold prices up.
- USD/MXN could find immediate support at the seven-day EMA at 17.13 followed by the weekly low at 17.04.
- Technical analysis suggests a confirmation of the bullish sentiment towards an upward trend.
- The key resistance appears around the 23.6% Fibonacci retracement at 17.18 followed by the major support at 17.50 level.
USD/MXN snaps the recent gains and edges lower to near 17.16 during the European hours on Wednesday. The immediate support appears at the seven-day Exponential Moving Average (EMA) at the 17.13 level.
A break below the latter could put pressure on the USD/MXN pair to navigate the major support region around the weekly low at 17.04 aligned with the major level and February’s low at 17.00 level.
The 14-day Relative Strength Index (RSI), a momentum oscillator that measures the speed and change of price movements is positioned above the 50 mark, indicating the bullish momentum for the USD/MXN pair.
Additionally, Additionally, the lagging indicator “Moving Average Convergence Divergence (MACD)” lies above the centerline and the signal line, which suggests a confirmation of a bullish sentiment towards an upward trend.
On the upside, the USD/MXN pair could find the immediate resistance at the 23.6% Fibonacci retracement at 17.18 followed by the 38.2% Fibonacci retracement at 17.43, in conjunction with the major support at the 17.50 level. A breakthrough above the major barrier could lead the USD/MXN pair to explore the area around the 17.60 level.
USD/MXN: Daily Chart
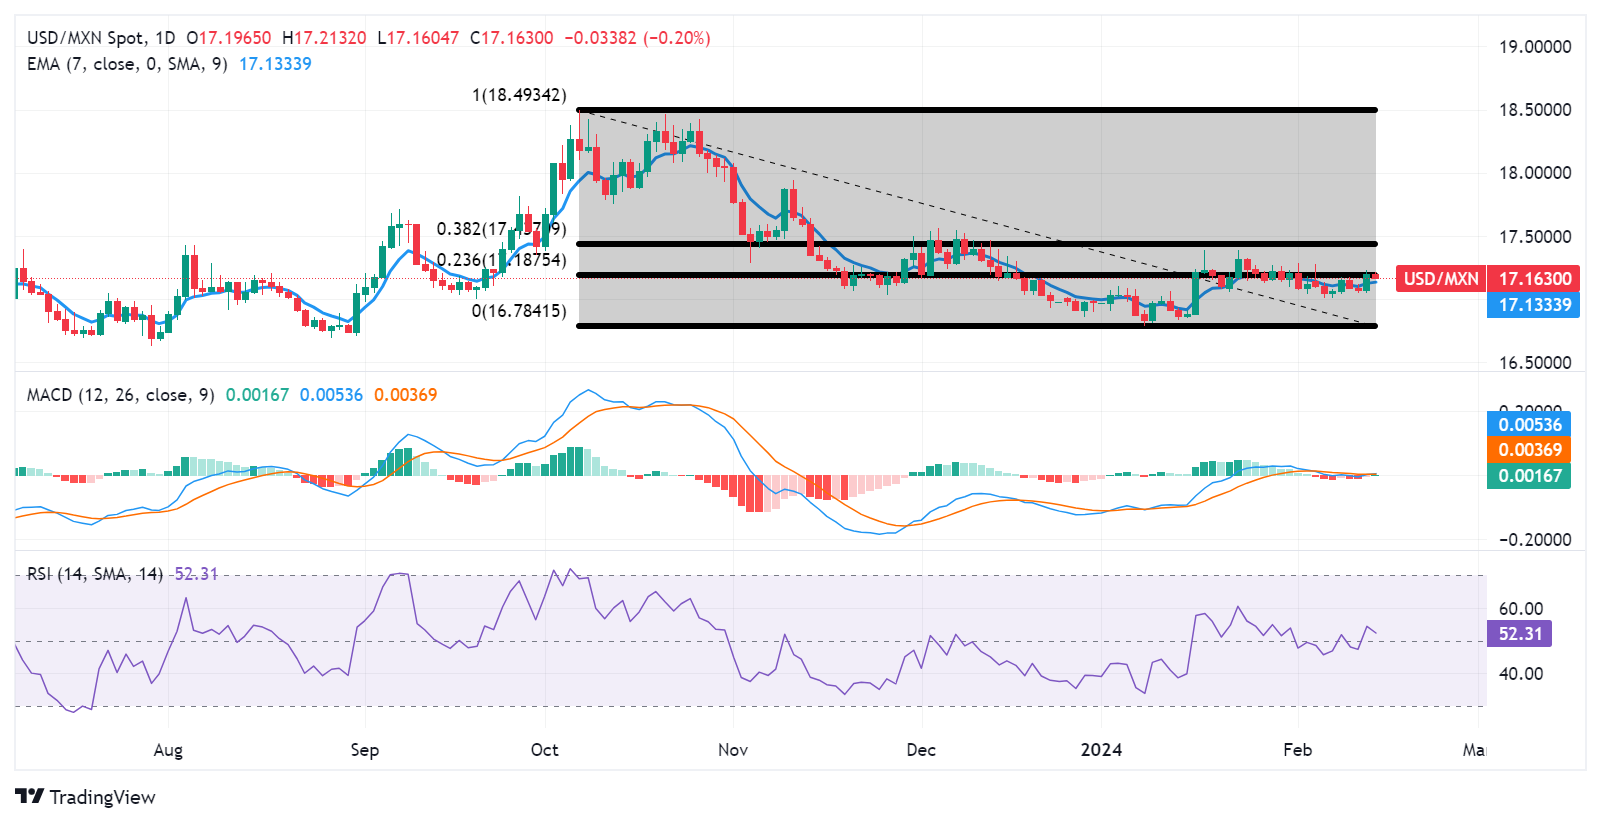
Pound Sterling (GBP) came under bearish pressure after the UK released some welcome January Consumer Price Index (CPI) numbers. Economists at ING analyze GBP outlook.
Soft UK inflation data
Headline and core figures have come in marginally lower than expected. The CPI services figure, which is closely watched by the Bank of England, has edged up to 6.5% YoY but remains lower than the 6.8% consensus.
This softer data has helped EUR/GBP bounce off support at 0.8500 and sent GBP/USD under 1.2600 again.
Look for testimony from the Bank of England's Andrew Bailey where he may shed more light on whether the BoE is confident enough to be cutting rates later this year. This probably should be seen as a negative event risk for Sterling.
The Eurozone economy stalled, on a quarterly basis, in the three months to December of 2023, meeting the 0% estimates while confirming the preliminary reading of 0%, the second estimate published by Eurostat showed on Wednesday.
The bloc’s GDP rate climbed 0.1% YoY in Q4 vs. 0.1% recorded in Q3 and 0.1% expected.
Separately, the fourth quarter Preliminary Employment Change data for the old continent came in at 0.3% and 1.3% on a quarterly and yearly basis respectively.
Meanwhile, the Eurozone Industrial Production jumped 2.6% MoM and 1.2% YoY in December.
Market reaction
EUR/USD was last seen trading at 1.0700, down 0.09% on the day. Eurozone data have little to no impact on the Euro.
About Eurozone Preliminary GDP
The Gross Domestic Product released by Eurostat is a measure of the total value of all goods and services produced by the Eurozone. The GDP is considered as a broad measure of the Eurozone's economic activity and health. Usually, a rising trend has a positive effect on the EUR, while a falling trend is seen as negative (or bearish).
Gold fell below $2,000 after US inflation came in stronger than expected. Strategists at ANZ Bank analyze the yellow metal’s outlook.
US Treasury yields and the USD spiked after strong CPI print
Core CPI rose 0.4% MoM in January and diminished hopes of an early rate cut.
Gold came under immediate pressure as US Treasury yields and the USD spiked after the print.
The precious metal has held above the key psychological level of $2,000 since mid-December on the hope the US central bank would have to lower borrowing costs quickly. With that now looking highly unlikely, prices could come under further pressure if other economic data remains strong.
- EUR/USD lost ground as US Dollar surged after the release of solid US CPI data.
- The Euro received upward support from the improved Economic Sentiment data.
- FedWatch Tool suggests 37% and 51% probability of a 25 bps rate cut by the Fed in May and June, respectively.
The EUR/USD pair remains in a downtrend, reaching fresh three-month lows on Wednesday following the release of robust US inflation data. The higher-than-expected inflation has shifted market sentiment towards no interest rate adjustment by the Federal Reserve (Fed) in the upcoming March meeting. This has provided upward support for the US Dollar (USD) against the Euro (EUR).
The Euro experienced a moment of respite following the release of better-than-expected Economic Sentiment data from both the Eurozone and Germany on Tuesday. Investors are now eagerly awaiting preliminary Gross Domestic Product (GDP) data slated for release on Wednesday. Furthermore, market participants are keenly paying attention to a scheduled speech by Christine Lagarde, the President of the European Central Bank (ECB), on Thursday.
The US Dollar Index (DXY) rebounds from intraday losses and continues to extend gains despite downbeat US Treasury yields. Market sentiment has undergone a significant shift, with expectations for an unchanged interest rate next month soaring to near 90%, a marked difference from just a month ago. Investors are now contemplating the possibility of a rate cut by the Federal Reserve (Fed) in June.
Daily digest market movers: EUR/USD depreciates amid an improved US Dollar
- The US Dollar Index rises to 104.90 with the 2-year and 10-year US Treasury yields at 4.60% and 4.29%, respectively, by the press time.
- According to the FedWatch Tool, traders are pricing in a 37% probability of a 25 basis points (bps) rate cut by the Federal Reserve in May and 51% in June.
- US headline Consumer Price Index (CPI) rose by 3.1% in January, surpassing the expected 2.9% but below the previous rate of 3.4%.
- US Inflation increased by 0.3% MoM, against the expectation of maintaining the previous reading of 0.2%.
- US Core CPI (YoY) remained consistent at 3.9% against the market expectation of a decline to 3.7% in January.
- US Core Inflation (MoM) increased by 0.4% against the 0.3% as expected to be unchanged in January.
- ECB Vice President Luis de Guindos emphasized that although progress is being made, wage pressures persist at elevated levels, and there isn't enough data available yet to confirm a reduction in these pressures.
- Eurozone and German Economic Sentiment data from ZEW came in above expectations at 25 vs. 20.1 forecast, and 19.9 vs. 17.5 expected, respectively.
- German Current Situation ZEW sentiment, however, dipped below expectations, coming in at -81.7 versus -79 forecast.
Technical Analysis: EUR/USD hovers around the psychological level of 1.0700
EUR/USD trades near a psychological level of 1.0700 on Wednesday, followed by the next major support at 1.0650 level. A break below the latter could push the EUR/USD pair to navigate the psychological region around 1.0600.
On the upside, the EUR/USD pair could find an immediate barrier at the major level of 1.0750 followed by the 50-4hr Exponential Moving Average (EMA) at 1.0770. A breakthrough above this level could influence the pair to explore the area around the 23.6% Fibonacci retracement level at 1.0799 aligned with the psychological barrier at 1.0800.
EUR/USD: Four-Hour Chart
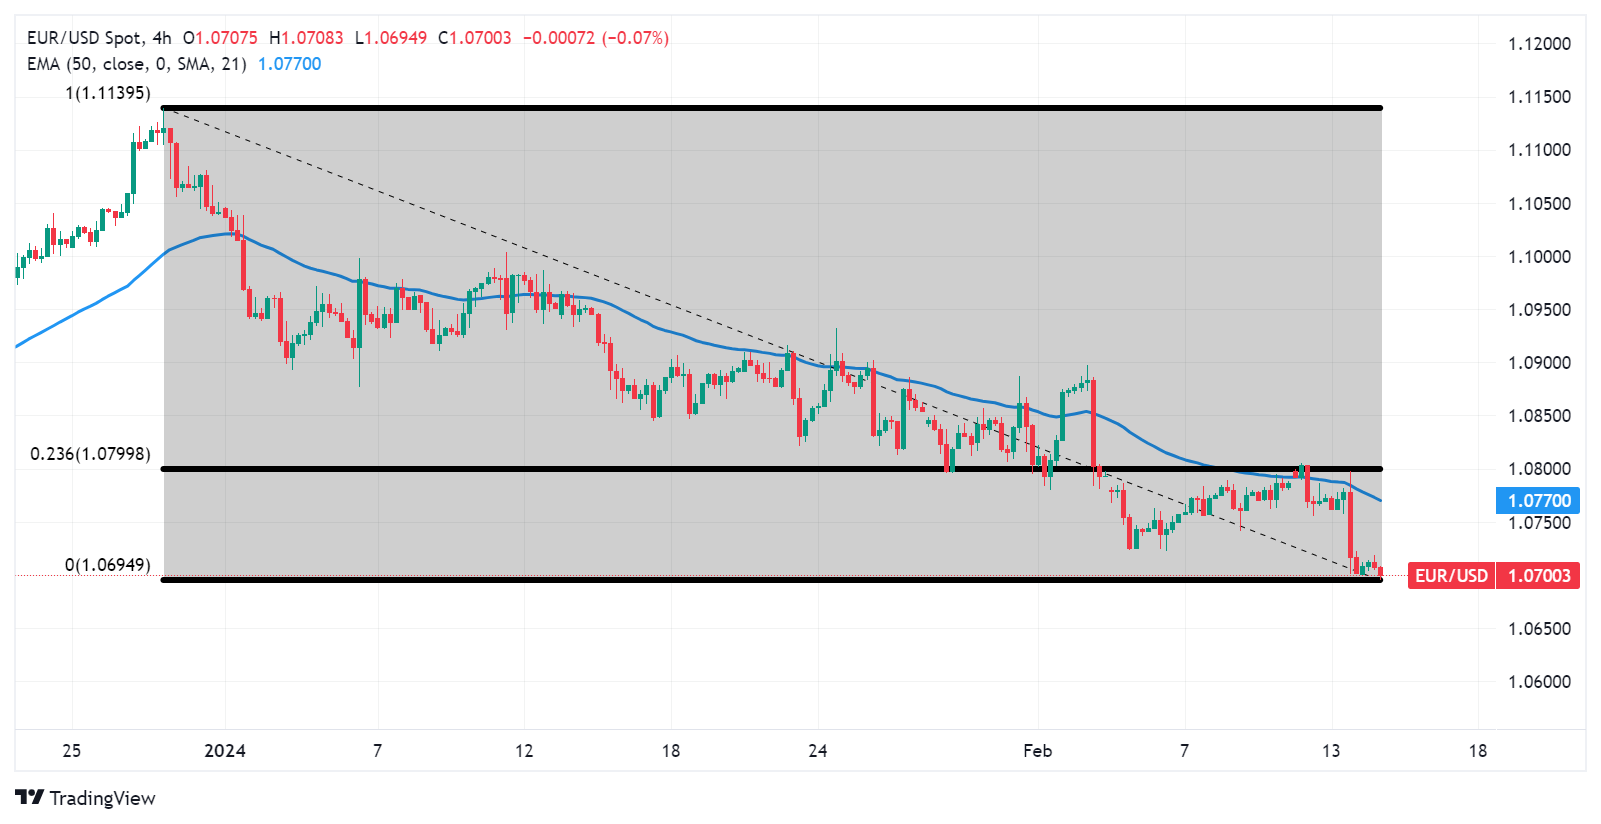
Euro price today
The table below shows the percentage change of Euro (EUR) against listed major currencies today. Euro was the weakest against the New Zealand Dollar.
| USD | EUR | GBP | CAD | AUD | JPY | NZD | CHF | |
| USD | 0.06% | 0.32% | -0.14% | -0.39% | -0.12% | -0.41% | 0.08% | |
| EUR | -0.05% | 0.27% | -0.19% | -0.44% | -0.19% | -0.46% | 0.03% | |
| GBP | -0.34% | -0.27% | -0.46% | -0.70% | -0.45% | -0.72% | -0.24% | |
| CAD | 0.14% | 0.19% | 0.46% | -0.24% | 0.02% | -0.26% | 0.22% | |
| AUD | 0.38% | 0.44% | 0.71% | 0.25% | 0.25% | -0.01% | 0.46% | |
| JPY | 0.12% | 0.16% | 0.45% | -0.01% | -0.27% | -0.28% | 0.19% | |
| NZD | 0.40% | 0.45% | 0.72% | 0.26% | 0.02% | 0.26% | 0.50% | |
| CHF | -0.09% | -0.03% | 0.24% | -0.21% | -0.46% | -0.21% | -0.48% |
The heat map shows percentage changes of major currencies against each other. The base currency is picked from the left column, while the quote currency is picked from the top row. For example, if you pick the Euro from the left column and move along the horizontal line to the Japanese Yen, the percentage change displayed in the box will represent EUR (base)/JPY (quote).
Euro FAQs
What is the Euro?
The Euro is the currency for the 20 European Union countries that belong to the Eurozone. It is the second most heavily traded currency in the world behind the US Dollar. In 2022, it accounted for 31% of all foreign exchange transactions, with an average daily turnover of over $2.2 trillion a day.
EUR/USD is the most heavily traded currency pair in the world, accounting for an estimated 30% off all transactions, followed by EUR/JPY (4%), EUR/GBP (3%) and EUR/AUD (2%).
What is the ECB and how does it impact the Euro?
The European Central Bank (ECB) in Frankfurt, Germany, is the reserve bank for the Eurozone. The ECB sets interest rates and manages monetary policy.
The ECB’s primary mandate is to maintain price stability, which means either controlling inflation or stimulating growth. Its primary tool is the raising or lowering of interest rates. Relatively high interest rates – or the expectation of higher rates – will usually benefit the Euro and vice versa.
The ECB Governing Council makes monetary policy decisions at meetings held eight times a year. Decisions are made by heads of the Eurozone national banks and six permanent members, including the President of the ECB, Christine Lagarde.
How does inflation data impact the value of the Euro?
Eurozone inflation data, measured by the Harmonized Index of Consumer Prices (HICP), is an important econometric for the Euro. If inflation rises more than expected, especially if above the ECB’s 2% target, it obliges the ECB to raise interest rates to bring it back under control.
Relatively high interest rates compared to its counterparts will usually benefit the Euro, as it makes the region more attractive as a place for global investors to park their money.
How does economic data influence the value of the Euro?
Data releases gauge the health of the economy and can impact on the Euro. Indicators such as GDP, Manufacturing and Services PMIs, employment, and consumer sentiment surveys can all influence the direction of the single currency.
A strong economy is good for the Euro. Not only does it attract more foreign investment but it may encourage the ECB to put up interest rates, which will directly strengthen the Euro. Otherwise, if economic data is weak, the Euro is likely to fall.
Economic data for the four largest economies in the euro area (Germany, France, Italy and Spain) are especially significant, as they account for 75% of the Eurozone’s economy.
How does the Trade Balance impact the Euro?
Another significant data release for the Euro is the Trade Balance. This indicator measures the difference between what a country earns from its exports and what it spends on imports over a given period.
If a country produces highly sought after exports then its currency will gain in value purely from the extra demand created from foreign buyers seeking to purchase these goods. Therefore, a positive net Trade Balance strengthens a currency and vice versa for a negative balance.
EUR/GBP finally bounces after testing 0.8500. Economists at Société Générale analyze the pair’s outlook.
A relief bounce is overdue
In the UK, inflation data came in a tad better than forecast but services ticked up to a 3-month high of 6.5%. That’s not going to aid confidence at the BoE.
EUR/GBP traded briefly below 0.8500 but a relief bounce is overdue. Targets will be lowered closer to 0.8400 if the ECB cuts rates before the BoE.
Inability to cross above 0.8550 can lead to persistence in downtrend. Next potential supports are at projections of 0.8455/0.8440 and 0.8385.
The US Dollar strength pushes the USD/JPY above 150.00. Economists at Commerzbank analyze the pair’s outlook.
Risk of intervention?
If a real Yen recovery is desired, there would have to be a real change of direction in monetary policy. And I don't mean a symbolic end to the symbolic negative-rate policy! But why should that happen as long as the BoJ is firmly convinced that inflation will fall back below the 2% target?
If the FX market really falls for a symbolic rate hike and interprets it as JPY positive or the start of a rate cycle, then that would be a better tool for strengthening the JPY than intervention. In short, it is the Bank of Japan, not the MOF, that holds the key to sustainable JPY stabilization.
- Silver adds to the overnight heavy losses and drops closer to a two-month low set in December.
- The technical setup favours bearish traders and supports prospects for further near-term losses.
- Any attempted recovery could get sold into and is likely to remain capped near the $23.50 area.
Silver (XAG/USD) remains under some selling pressure for the second successive day and slides back closer to the YTD trough during the first half of the European session on Wednesday. The white metal currently trades below the $22.00 round figure and seems to extend the depreciating move.
From a technical perspective, the recent repeated failures near the very important 200-day Simple Moving Average (SMA) and a subsequent slide validate the near-term negative outlook for the XAG/USD. Furthermore, oscillators on the daily chart are holding deep in the negative territory and are still away from being in the oversold zone. This, in turn, suggests that the path of least resistance for the white metal remains to the downside.
Meanwhile, some follow-through selling below the two-month low touched in December will expose the $21.40-$21.35 support. The XAG/USD could weaken further below the $21.00 mark and aim to retest the October swing low near the $20.70-$20.65 region.
On the flip side, any meaningful recovery attempt might now confront stiff resistance ahead of mid-$22.00s. A sustained strength beyond, however, might trigger a short-covering rally and allow the XAG/USD to reclaim the $23.00 round-figure mark. The momentum could extend towards the 200-day SMA, currently around the $23.20 area. This is followed by the $23.50 supply zone, which if cleared decisively will negate the negative outlook.
The XAG/USD might then aim to reclaim the $24.00 round figure and climb further towards the next relevant hurdle near the $24.50-$24.60 region en route to the $25.00 psychological mark.
Silver daily chart
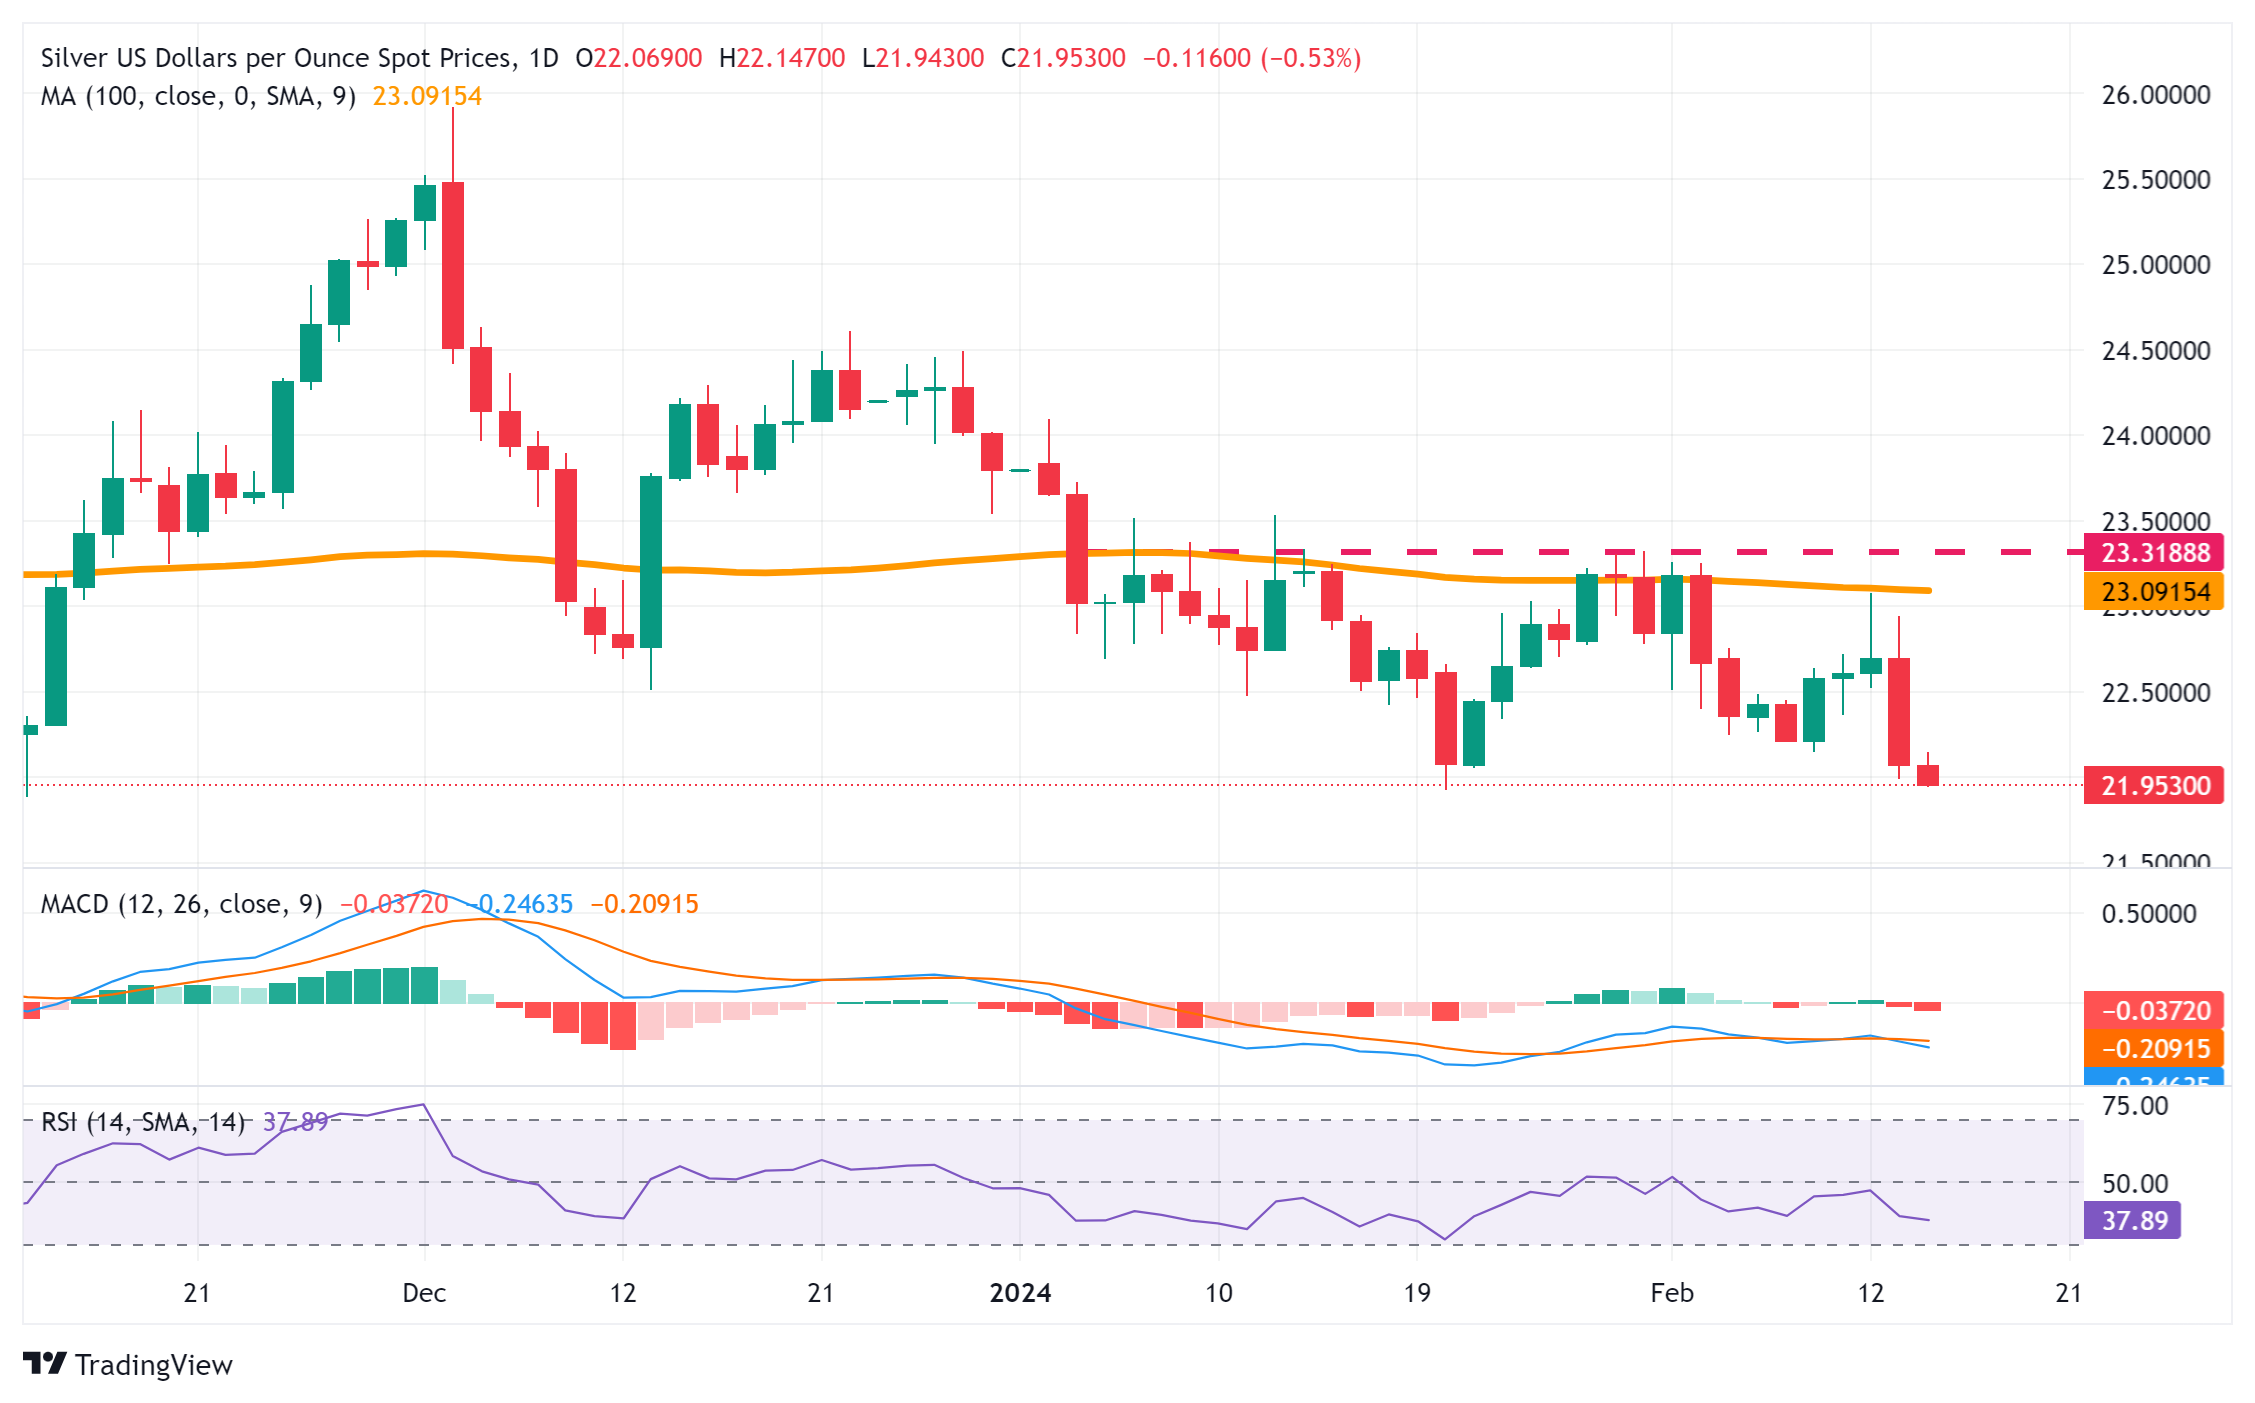
Key technical levels to watch
European Central Bank (ECB) Vice President Luis de Guindos said on Wednesday that wage pressures remain high in the Euro area and noted that they do not yet have sufficient data to confirm they are starting to ease, per Reuters.
"We are heading in the right direction but we must not get ahead of ourselves," de Guindos added. He also acknowledged that heightened geopolitical tensions, especially in the Middle East, could raise energy prices and disrupt global trade.
Market reaction
EUR/USD stays on the back foot following these comments and was last seen trading at its lowest level since mid-November at 1.0695, losing 0.13% on the day.
European Central Bank (ECB) policymaker Pablo Hernandez de Cos said on Wednesday that challenges for the European economy are significant and added that they are waiting for more information before deciding the monetary policy path.
Meanwhile, ECB Governing Council member Boris Vujcic said that they seem to be "getting inflation fight right."
Market reaction
These comments failed to influence the Euro's performance against its major rivals. At the time of press, the EUR/USD pair was trading modestly lower on the day at around 1.0700.
EUR/USD came under bearish pressure on Tuesday and touched its lowest level in three months near 1.0700. Economists at ING analyze the pair’s outlook.
Wider rate differentials and softer equities weigh
Tuesday's US CPI data briefly pushed EUR/USD two-year swap rate differentials back to the widest levels of 2023. Add in a sell-off in equities and it was understandable that EUR/USD came under pressure.
EUR/USD continues to unwind the late 2023 rally and a break under 1.0700/1.0710 opens up 1.0660 and possibly even 1.0610. However, with Fed easing expectations moving back to more conservative pricing (and nearer to the Fed's own expectations of 75 bps of easing this year) we suspect the 1.0600/1.0700 levels may be a good area for corporates to hedge long Dollar or short Euro exposure.
The Pound Sterling (BP) was the only currency to hold up reasonably well against the US Dollar on Tuesday. Economists at Commerzbank analyze GBP outlook.
Strong UK employment report
We saw a strong employment report from the UK's Office for National Statistics (ONS). 48K jobs added instead of 18K lost, a low unemployment rate and, last but not least, higher income growth: nothing was missing from the overall positive GBP picture.
The underlying data (especially wage growth) leave little room for interest rate cuts, and the rosy employment situation makes a prolonged restrictive monetary policy generally acceptable. Ultimately, however, what matters is whether the market expects a central bank to overcompensate for a positive inflation surprise, i.e. to revise its interest rate expectations more than its inflation expectations.
This is usually the case. Tuesday was no exception. This is not surprising, especially now. After all, it is particularly difficult to assess the policy reaction functions of central banks at the moment. This assessment is therefore variable and subject to particularly large fluctuations in the event of surprising data releases. It is therefore understandable that the Pound has risen, but also in this case a warning is in order: The new strength is still fragile.
- Pound Sterling drops sharply as UK headline inflation deflates significantly in January.
- Soft UK CPI data has propelled BoE’s rate-cut bets.
- Stubborn US inflation data has pushed back Fed rate-cut hopes.
The Pound Sterling (GBP) faces an intense sell-off in Wednesday’s early European session as the United Kingdom Office for National Statistics (ONS) has reported softer-than-anticipated inflation data for January. Annual headline and core Consumer Price Index (CPI) rose steadily by 4.0% and 5.1%, respectively, while the monthly headline figure deflated significantly by 0.6%.
Surprisingly soft inflation report and a moderate growth in Average Earnings are expected to allow Bank of England (BoE) policymakers to consider early rate cuts than market participants had anticipated earlier.
Last week, BoE Deputy Governor Sarah Breeden said rate cuts will be based on how inflation and wage growth will evolve. The Pound Sterling tends to face foreign flows if expectations for BoE’s dovish bets escalate.
The GBP/USD pair is expected to remain in the negative trajectory due to softening consumer price inflation and dismal market sentiment. The broader appeal for safe-haven assets improves as sticky United States inflation data push back expectations for a rate-cut decision by the Federal Reserve (Fed) in the May monetary policy meeting. Fed policymakers lack evidence to build confidence over inflation declining sustainably towards the 2% target. This has boosted the US Dollar as a hawkish narrative by the Fed tends to attract more foreign inflows.
Daily Digest Market Movers: Pound Sterling falls vertically while US Dollar consolidates
- Pound Sterling resumes its downside journey as the United Kingdom ONS has reported a soft inflation report for January.
- The annual headline and core inflation grew steadily at 4.0% and 5.1%, respectively. However, investors anticipated that the headline and core CPI had accelerated to 4.2% and 5.1%, respectively.
- The monthly headline inflation deflated at a robust pace of 0.6% against the consensus of 0.3%. In December, the economic data was expanded by 0.4%.
- A sharp decline in monthly inflation data is expected to prompt expectations of early rate cuts by the Bank of England.
- A soft inflation report has neutralized decent labor demand and moderate growth in Average Earnings data for three months ending December, released on Tuesday.
- The Unemployment Rate fell sharply to 3.8% from the consensus of 4.0% and the former release of 4.2%.
- Annual Earnings including bonuses grew by the smallest pace of 5.8% since three months ending July 2022, while investors projected a slower wage growth of 5.6%.
- On Tuesday, the GBP/USD pair witnessed an intense sell-off after the United States Bureau of Labor Statistics (BLS) released a stubborn inflation report for January.
- The US core inflation that strips off volatile food and oil prices rose steadily by 3.9%, while investors anticipated a decline to 3.7%.
- Persistent price pressures cooled down expectations of Federal Reserve rate cuts in May.
- The US Dollar Index (DXY) remains subdued in the Asian session but more upside remains favored due to dismal market mood.
Technical Analysis: Pound Sterling declines towards 200-DEMA
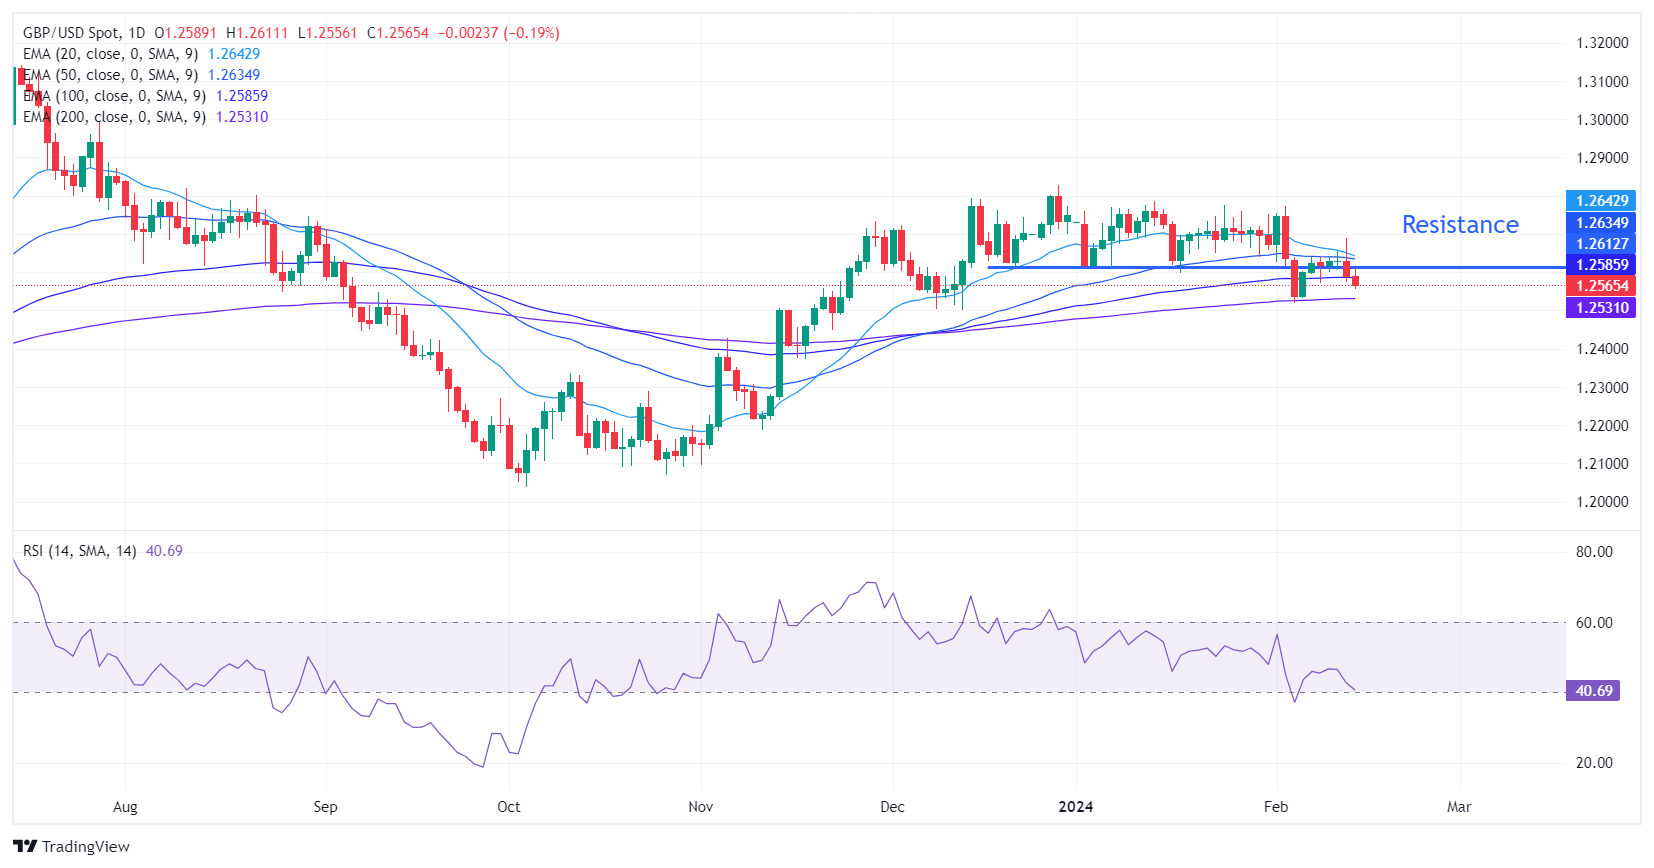
Pound Sterling falls back vertically after failing to sustain above the round-level resistance of 1.2600. The near-term outlook of the GBP/USD pair has turned bearish as it has dropped below the 20, 50 and 100-day Exponential Moving Averages (EMAs). The Cable is declining towards the 200-day EMA, which trades around 1.2510.
The 14-period Relative Strength Index (RSI) has dropped to 40.00. A slippage below the same would trigger a bearish momentum.
Pound Sterling FAQs
What is the Pound Sterling?
The Pound Sterling (GBP) is the oldest currency in the world (886 AD) and the official currency of the United Kingdom. It is the fourth most traded unit for foreign exchange (FX) in the world, accounting for 12% of all transactions, averaging $630 billion a day, according to 2022 data.
Its key trading pairs are GBP/USD, aka ‘Cable’, which accounts for 11% of FX, GBP/JPY, or the ‘Dragon’ as it is known by traders (3%), and EUR/GBP (2%). The Pound Sterling is issued by the Bank of England (BoE).
How do the decisions of the Bank of England impact on the Pound Sterling?
The single most important factor influencing the value of the Pound Sterling is monetary policy decided by the Bank of England. The BoE bases its decisions on whether it has achieved its primary goal of “price stability” – a steady inflation rate of around 2%. Its primary tool for achieving this is the adjustment of interest rates.
When inflation is too high, the BoE will try to rein it in by raising interest rates, making it more expensive for people and businesses to access credit. This is generally positive for GBP, as higher interest rates make the UK a more attractive place for global investors to park their money.
When inflation falls too low it is a sign economic growth is slowing. In this scenario, the BoE will consider lowering interest rates to cheapen credit so businesses will borrow more to invest in growth-generating projects.
How does economic data influence the value of the Pound?
Data releases gauge the health of the economy and can impact the value of the Pound Sterling. Indicators such as GDP, Manufacturing and Services PMIs, and employment can all influence the direction of the GBP.
A strong economy is good for Sterling. Not only does it attract more foreign investment but it may encourage the BoE to put up interest rates, which will directly strengthen GBP. Otherwise, if economic data is weak, the Pound Sterling is likely to fall.
How does the Trade Balance impact the Pound?
Another significant data release for the Pound Sterling is the Trade Balance. This indicator measures the difference between what a country earns from its exports and what it spends on imports over a given period.
If a country produces highly sought-after exports, its currency will benefit purely from the extra demand created from foreign buyers seeking to purchase these goods. Therefore, a positive net Trade Balance strengthens a currency and vice versa for a negative balance.
FX option expiries for Feb 14 NY cut at 10:00 Eastern Time, via DTCC, can be found below.
- EUR/USD: EUR amounts
- 1.0600 490m
- 1.0625 520m
- 1.0825 522m
- 1.0980 430m
- 1.1000 1.9b
- USD/JPY: USD amounts
- 147.50 495m
- 149.00 425m
- 151.00 1.3b
- AUD/USD: AUD amounts
- 0.6465 639m
- 0.6650 834m
- 0.6725 849m
- NZD/USD: NZD amounts
- 0.6250 455m
- EUR/GBP: EUR amounts
- 0.8600 791m
- USD/CAD surged by 0.85% on an unexpected upside in US inflation on Tuesday.
- The higher Crude oil prices are contributing support for the Canadian Dollar.
- The probability of the Fed avoiding rate adjustment in March surged to 93%.
USD/CAD retreats after Tuesday’s surge, edging lower to near 1.3550 during the early European session on Wednesday. The decline in the US Dollar (USD) is attributed to the decrease in US Treasury yields, thereby weakening the USD/CAD pair.
The Canadian Dollar (CAD) appears to have strengthened against the US Dollar, possibly buoyed by higher Crude oil prices. West Texas Intermediate (WTI) oil price is poised to continue its winning streak, trading around $77.50 per barrel at the time of writing. Despite facing challenges, the price of Crude oil has managed to recover its intraday losses.
On Tuesday, the USD/CAD pair surged by 0.85%, driven by the unexpected upside in US inflation for January. The market sentiment has shifted significantly, with expectations of no rate adjustment by the Federal Reserve in March surging to 93%, while investors are now considering the possibility of a rate cut by the Federal Reserve (Fed) in June.
The US headline Consumer Price Index (CPI) exceeded expectations, coming in at 3.1%, although slightly lower than the previous rate of 3.4%. Meanwhile, the US Core CPI (YoY) remained unchanged at 3.9%, contrary to market expectations of a decline to 3.7% in January.
Recent Canadian employment data has painted a healthier picture of the labor market, potentially leading the Bank of Canada (BoC) to delay their forecasts on rate cuts until June from April. However, BoC Governor Tiff Macklem indicated that the central bank's focus has shifted from debating whether interest rates are high enough to discuss how long rates need to remain at current levels.
What's up for the Down Under economies? Economists at Wells Fargo analyze the Australian and New Zealand Dollars (AUD and NZD) outlook.
US economic slowdown and Fed easing will help AUD and NZD against USD
We do not expect a further RBA rate increase, but with the central bank forecasting above-target inflation for an extended period, we believe rate cuts are some way off. We anticipate an initial 25 bps rate cut at the August meeting, while also acknowledging the balance of risks as tilted toward a later move.
In New Zealand, we now see RBNZ rate cuts occurring later than previously envisaged, and forecast an initial 25 bps reduction at the August announcement.
Against a backdrop of a US economic slowdown and Fed easing, a more gradual pace of rate cuts from the RBA and RBNZ could offer some support to the Australian and NZ Dollars against the Greenback over time.
- EUR/GBP holds positive ground around 0.8523 after the downbeat UK January inflation data.
- UK Consumer Price Index (CPI) rose 4.0% YoY in January vs. 4.2% expected.
- Traders anticipate 118 basis points (bps) rate cuts in 2024, down from the 145 bps expected at the start of February.
- The Eurozone GDP growth numbers for Q4 and December Industrial Production will be closely watched by traders on Wednesday.
The EUR/GBP cross gains traction above the 0.8500 psychological mark during the early European trading hours on Wednesday. The weaker-than-expected UK economic data exerts some selling pressure on the Pound Sterling (GBP) and acts as a tailwind for EUR/GBP. The cross currently trades near 0.8523, adding 0.21% on the day.
The latest data from the Office for National Statistics on Wednesday showed that the UK Consumer Price Index (CPI) dropped 0.6% MoM in January from a rise of 0.4% in December, while the annual headline CPI rose 4.0% YoY, weaker than the expectation of 4.2%. The Core CPI, excluding volatile food and energy prices, climbed 5.1% YoY in January compared to the estimation of 5.2%
The European Central Bank (ECB) chief economist Philip Lane said on Tuesday that the number and the exact timing of rate cuts will depend on how much progress the ECB makes towards its inflation target. Meanwhile, ECB Governing Council member Pablo Hernandez de Cos said that the central bank’s new outlook for inflation and economic growth in March will be pivotal in deciding when to begin easing monetary policy.
The ECB maintained the benchmark rates steady at a record high of 4% at its January meeting. The markets expect the first rate cuts in April or June. On Monday, traders trimmed bets on the expectation of rate cuts from the ECB, anticipating 118 basis points (bps) cuts in 2024, down sharply from the 145 bps expected at the start of February.
Later on Wednesday, the Eurozone GDP growth numbers for Q4 and December Industrial Production will be due. The UK GDP growth numbers for Q4 will be released on Thursday. These events could trigger volatility in the market and give a clear direction to the EUR/GBP cross.
Japan’s Chief Cabinet Secretary Yoshimasa Hayashi said on Wednesday, he is “closely watching FX moves with a high sense of urgency.”
Additional quotes
Won't comment on forex levels.
Important for currencies to move in stable manner reflecting fundamentals.
Market reaction
USD/JPY is testing lows near 150.35 following the above comments, losing 0.28% on the day.
Japanese Yen price this week
The table below shows the percentage change of Japanese Yen (JPY) against listed major currencies this week. Japanese Yen was the strongest against the Swiss Franc.
| USD | EUR | GBP | CAD | AUD | JPY | NZD | CHF | |
| USD | 0.80% | 0.54% | 0.73% | 0.77% | 0.82% | 1.14% | 1.38% | |
| EUR | -0.83% | -0.27% | -0.08% | -0.03% | 0.01% | 0.32% | 0.58% | |
| GBP | -0.54% | 0.27% | 0.20% | 0.25% | 0.29% | 0.61% | 0.85% | |
| CAD | -0.74% | 0.08% | -0.19% | 0.04% | 0.09% | 0.40% | 0.66% | |
| AUD | -0.81% | 0.03% | -0.24% | -0.05% | 0.04% | 0.34% | 0.61% | |
| JPY | -0.84% | -0.01% | -0.26% | -0.10% | -0.05% | 0.31% | 0.55% | |
| NZD | -1.16% | -0.32% | -0.59% | -0.39% | -0.35% | -0.31% | 0.26% | |
| CHF | -1.42% | -0.60% | -0.87% | -0.67% | -0.63% | -0.59% | -0.26% |
The heat map shows percentage changes of major currencies against each other. The base currency is picked from the left column, while the quote currency is picked from the top row. For example, if you pick the Euro from the left column and move along the horizontal line to the Japanese Yen, the percentage change displayed in the box will represent EUR (base)/JPY (quote).
Here is what you need to know on Wednesday, February 14:
The US Dollar Index consolidates it's gains early Wednesday after rising 0.7% to a fresh three-month high near 105.00 on Tuesday. Eurostat will release fourth-quarter Gross Domestic Product (GDP) data in the European session and there won't be any high-tier data releases from the US later in the day. Several Federal Reserve (Fed) policymakers, including Chicago Fed President Austan Goolsbee and Atlanta Fed President Raphael Bostic, will be delivering speeches.
The data published by the UK's Office for National Statistics (ONS) showed on Wednesday that inflation in the UK, as measured by the change in the Consumer Price Index (CPI), held steady at 4% in January. On a monthly basis, the CPI declined by 0.6%. Pound Sterling came under bearish pressure after these data and GBP/USD was last seen trading in negative territory below 1.2600.
US Dollar price this week
The table below shows the percentage change of US Dollar (USD) against listed major currencies this week. US Dollar was the strongest against the Swiss Franc.
| USD | EUR | GBP | CAD | AUD | JPY | NZD | CHF | |
| USD | 0.78% | 0.48% | 0.70% | 0.73% | 0.79% | 1.07% | 1.34% | |
| EUR | -0.79% | -0.31% | -0.08% | -0.06% | 0.01% | 0.27% | 0.55% | |
| GBP | -0.48% | 0.31% | 0.23% | 0.26% | 0.32% | 0.60% | 0.86% | |
| CAD | -0.72% | 0.07% | -0.23% | 0.02% | 0.09% | 0.35% | 0.63% | |
| AUD | -0.74% | 0.05% | -0.26% | -0.03% | 0.06% | 0.32% | 0.61% | |
| JPY | -0.80% | -0.01% | -0.28% | -0.09% | -0.06% | 0.29% | 0.55% | |
| NZD | -1.09% | -0.27% | -0.58% | -0.35% | -0.33% | -0.26% | 0.30% | |
| CHF | -1.38% | -0.57% | -0.88% | -0.65% | -0.62% | -0.55% | -0.30% |
The heat map shows percentage changes of major currencies against each other. The base currency is picked from the left column, while the quote currency is picked from the top row. For example, if you pick the Euro from the left column and move along the horizontal line to the Japanese Yen, the percentage change displayed in the box will represent EUR (base)/JPY (quote).
The US Bureau of Labor Statistics reported on Tuesday that the annual CPI rose 3.1% in January. This reading came in above the market expectation of 2.9%. Additionally, the Core CPI rose 3.9% on a yearly basis to match December's increase. The benchmark 10-year US Treasury bond yield climbed above 4.3% for the first time since early December, Wall Street's main indexes declined sharply and the USD gathered strength against its rivals after the inflation report. In the European morning, US stock index futures trade flat and the 10-year US yield moves sideways at around 4.3%.
USD/JPY rose nearly 1% on Tuesday and climbed above 150.00 for the first time since mid-November. During the Asian trading hours, Japanese Finance Minister Shunichi Suzuki said that they are closely watching forex market moves with a sense of urgency. Suzuki didn't make any comments when asked about a possible intervention. The pair edged slightly lower early Wednesday and was last seen trading at around 150.50.
USD/CHF registered strong gains on Tuesday as the soft inflation data from Switzerland weighed on the Swiss Franc. The pair is up about 1.3% this week and was last seen trading near 0.8860.
EUR/USD came under bearish pressure in the second half of the day on Tuesday and touched its lowest level in three months near 1.0700. The pair stays in a consolidation phase and trades slightly above this level in the early European session on Wednesday.
Gold turned south and dropped below $2,000 for the first time this year as US yields rallied after US inflation data. XAU/USD stays on the back foot and trades at around $1,990 mid-week.
- USD/CHF delivers a mild correction from an 11-week high of 0.8880 as the USD Index turns subdued.
- The broader appeal for the US Dollar remains upbeat as investors see the first rate cut by the Fed in July.
- The SNB may rollback its restrictive interest rate stance sooner amid easing price pressures.
The USD/CHF pair delivers a moderate corrective move from an 11-week high of 0.8880 in the late Asian session on Wednesday. The corrective move seems profit-booking after a strong rally inspired by January's sticky United States inflation data. Therefore, more upside in the Swiss Franc asset is anticipated.
S&P500 futures have posted nominal gains in the Asian session, portraying some ease in the risk-aversion theme. The broader market sentiment is negative as stubborn US Consumer Price Index (CPI) data has pushed back expectations of rate cuts by the Federal Reserve (Fed) in the March monetary policy meeting. The US Dollar Index (DXY) oscillates in a tight range near 104.80 after a vertical upside move.
As per the CME Fedwatch tool, traders see a 38% chance for a rate cut of 25 basis points (bps), which have come down from 50% after the release of the persistent inflation report.
The core CPI data that excludes volatile food and oil prices rose at a steady pace of 3.9%, while investors forecasted a decline to 3.9%. Fed policymakers generally consider the core inflation data for the preparation of remarks for monetary policy. Stubborn core inflation data would strengthen the argument supporting keeping interest rates restricted for longer.
Meanwhile, the Swiss Franc has come under pressure as price pressures in the Swiss economy have decelerated significantly. In January, the monthly CPI grew by 0.2% after remaining stagnant in December, which investors anticipated a growth of 0.6%. Annual inflation decelerated significantly to 1.3% from expectations and a prior reading of 1.7%. This would allow the Swiss National Bank (SNB) to unwind its restrictive monetary policy stance.
- EUR/JPY weakens following the verbal intervention by Japanese authorities on Wednesday.
- Japan's top currency diplomat Masato Kanda said authorities will take steps in the market if needed.
- ECB’s Lane said the number of rate cuts will depend on the data.
- Traders will closely monitor the Eurozone GDP growth numbers for Q4, due on Wednesday.
The EUR/JPY cross loses momentum during the early European session on Wednesday. Some verbal intervention from the Japanese authorities boosts the Japanese Yen (JPY) and weighs on the EUR/JPY cross. Investors await the Eurozone Gross Domestic Product (GDP) for the fourth quarter. This event might trigger volatility in the market. At press time, the cross is trading at 161.23, down 0.14% on the day.
Early Wednesday, Japan's top currency diplomat Masato Kanda warned that recent movements in the FX market have been rapid, and authorities will take steps in the market if needed. Additionally, Finance Minister Shunichi Suzuki said that rapid FX moves are undesirable and that the government will monitor the market with stronger urgency. This, in turn, provides some support for the JPY against its rivals.
On the Euro front, the European Central Bank (ECB) has kept rates steady at a record high since September 2023. However, slowing growth and easing price pressures are fueling speculation about rate cuts, with investors anticipating the first move in April or June. ECB chief economist Philip Lane said on Tuesday that the number and exact timing of rate cuts will depend on how much progress the central bank makes towards its target.
ECB Governing Council member Pablo Hernandez de Cos said that the central bank’s new outlook for inflation and economic growth in March will be pivotal in deciding when to start cutting interest rates.
Investors will keep an eye on the Eurozone GDP growth numbers for Q4 and December Industrial Production. The stronger-than-expected data could lift the Euro (EUR) and cap the downside of the cross. On Thursday, ECB’s President Christine Lagarde is set to speak. Market players will take cues from the events and find trading opportunities around the EUR/JPY cross.
- WTI price recovered its intraday losses due to escalated fear of supply disruption from the Middle East.
- Crude oil prices faced a challenge of demand threat after the release of robust US CPI data.
- ANZ analysts worry about the OPEC’s adherence to its recent production cuts.
- API Weekly Crude Oil Stock surged by 8.52 million barrels for the week ending on February 5.
West Texas Intermediate (WTI) oil price is on a path to resume its winning streak, trading around $77.50 per barrel during the Asian trading hours on Wednesday. Despite facing challenges, the price of Crude oil has recovered its intraday losses.
ANZ analysts attributed the weakening of oil prices partly to concerns about supply levels from members of the Organization of the Petroleum Exporting Countries (OPEC). According to OPEC's monthly oil market report, there are worries about the group’s adherence to its recent production cuts. Notably, only Kuwait and Algeria have implemented their share of cuts, while Iraq’s output remains well above the agreed quota.
Additionally, Crude oil prices encountered resistance after the American Petroleum Institute (API) reported a significant increase in US crude inventories. According to the API Weekly Crude Oil Stock report, Crude inventories surged by 8.52 million barrels for the week ending on February 5, surpassing market expectations of a 2.6-million-barrel increase.
The unexpected upside surprise in US inflation data is exerting downward pressure on oil prices, as it implies the likelihood of higher interest rates in the United States persisting for an extended period, thereby dampening demand in the market.
In January, the US headline Consumer Price Index (CPI) came in at 3.1%, surpassing the anticipated 2.9% but slightly lower than the previous rate of 3.4%. Additionally, month-over-month inflation rose by 0.3%, contrary to the expectation of maintaining the previous reading of 0.2%.
The US Core CPI (YoY) remained unchanged at 3.9%, defying market expectations of a decline to 3.7% in January. Moreover, US Core Inflation (MoM) increased by 0.4%, surpassing the expected unchanged reading of 0.3% for January.
Investors are now eagerly awaiting the release of the US Energy Information Administration's Crude Oil Stocks Change data for the week ending on February 9, with expectations of a decline in stockpiles of Crude oil and its derivatives in the United States.
- GBP/USD edges higher on Wednesday, though the uptick lacks strong bullish conviction.
- Traders opt to wait on the sidelines ahead of the UK CPI report amid a bullish US Dollar.
- The setup favours bears and warrants some caution before positioning for further gains.
The GBP/USD pair attracts some dip-buying during the Asian session on Wednesday and for now, seems to have stalled the previous day's sharp pullback from the vicinity of the 1.2700 mark, or over a one-week top. The uptick, however, lacks bullish conviction, with spot prices struggling to capitalize on the move beyond the 1.2600 round figure ahead of the UK CPI report.
In the meantime, growing acceptance that the Federal Reserve (Fed) will keep rates higher for longer, bolstered by the hotter-than-expected US consumer inflation data on Tuesday, is seen underpinning the US Dollar (USD) and capping the GBP/USD pair. The downside, however, remains cushioned in the wake of reduced bets for early interest rate cuts by the Bank of England (BoE), which might continue to act as a tailwind for the British Pound (GBP).
From a technical perspective, the 100-day Simple Moving Average (SMA), around the 1.2570-1.2565 region, should protect the immediate downside. A convincing break below will make the GBP/USD pair vulnerable to challenge the 200-day SMA, pegged near the 1.2500 psychological mark. With oscillators on the daily chart holding in the negative territory, some follow-through selling will be seen as a fresh trigger for bearish traders.
The GBP/USD pair might then accelerate the downward trajectory further towards the next relevant hurdle near mid-1.2400s before dropping to the 1.2400 round-figure mark and the 1.2375 horizontal support.
On the flip side, any subsequent move up is likely to confront stiff resistance near the 1.2625-1.2630 region, above which bulls might aim back towards conquering the 1.2700 mark. The latter should act as a key pivotal point, which if cleared decisively should lift the GBP/USD pair back towards the 1.2750 supply zone. The momentum could extend further towards the 1.2800 mark en route to the 1.2825-1.2830 area or a multi-month top touched in December.
GBP/USD daily chart
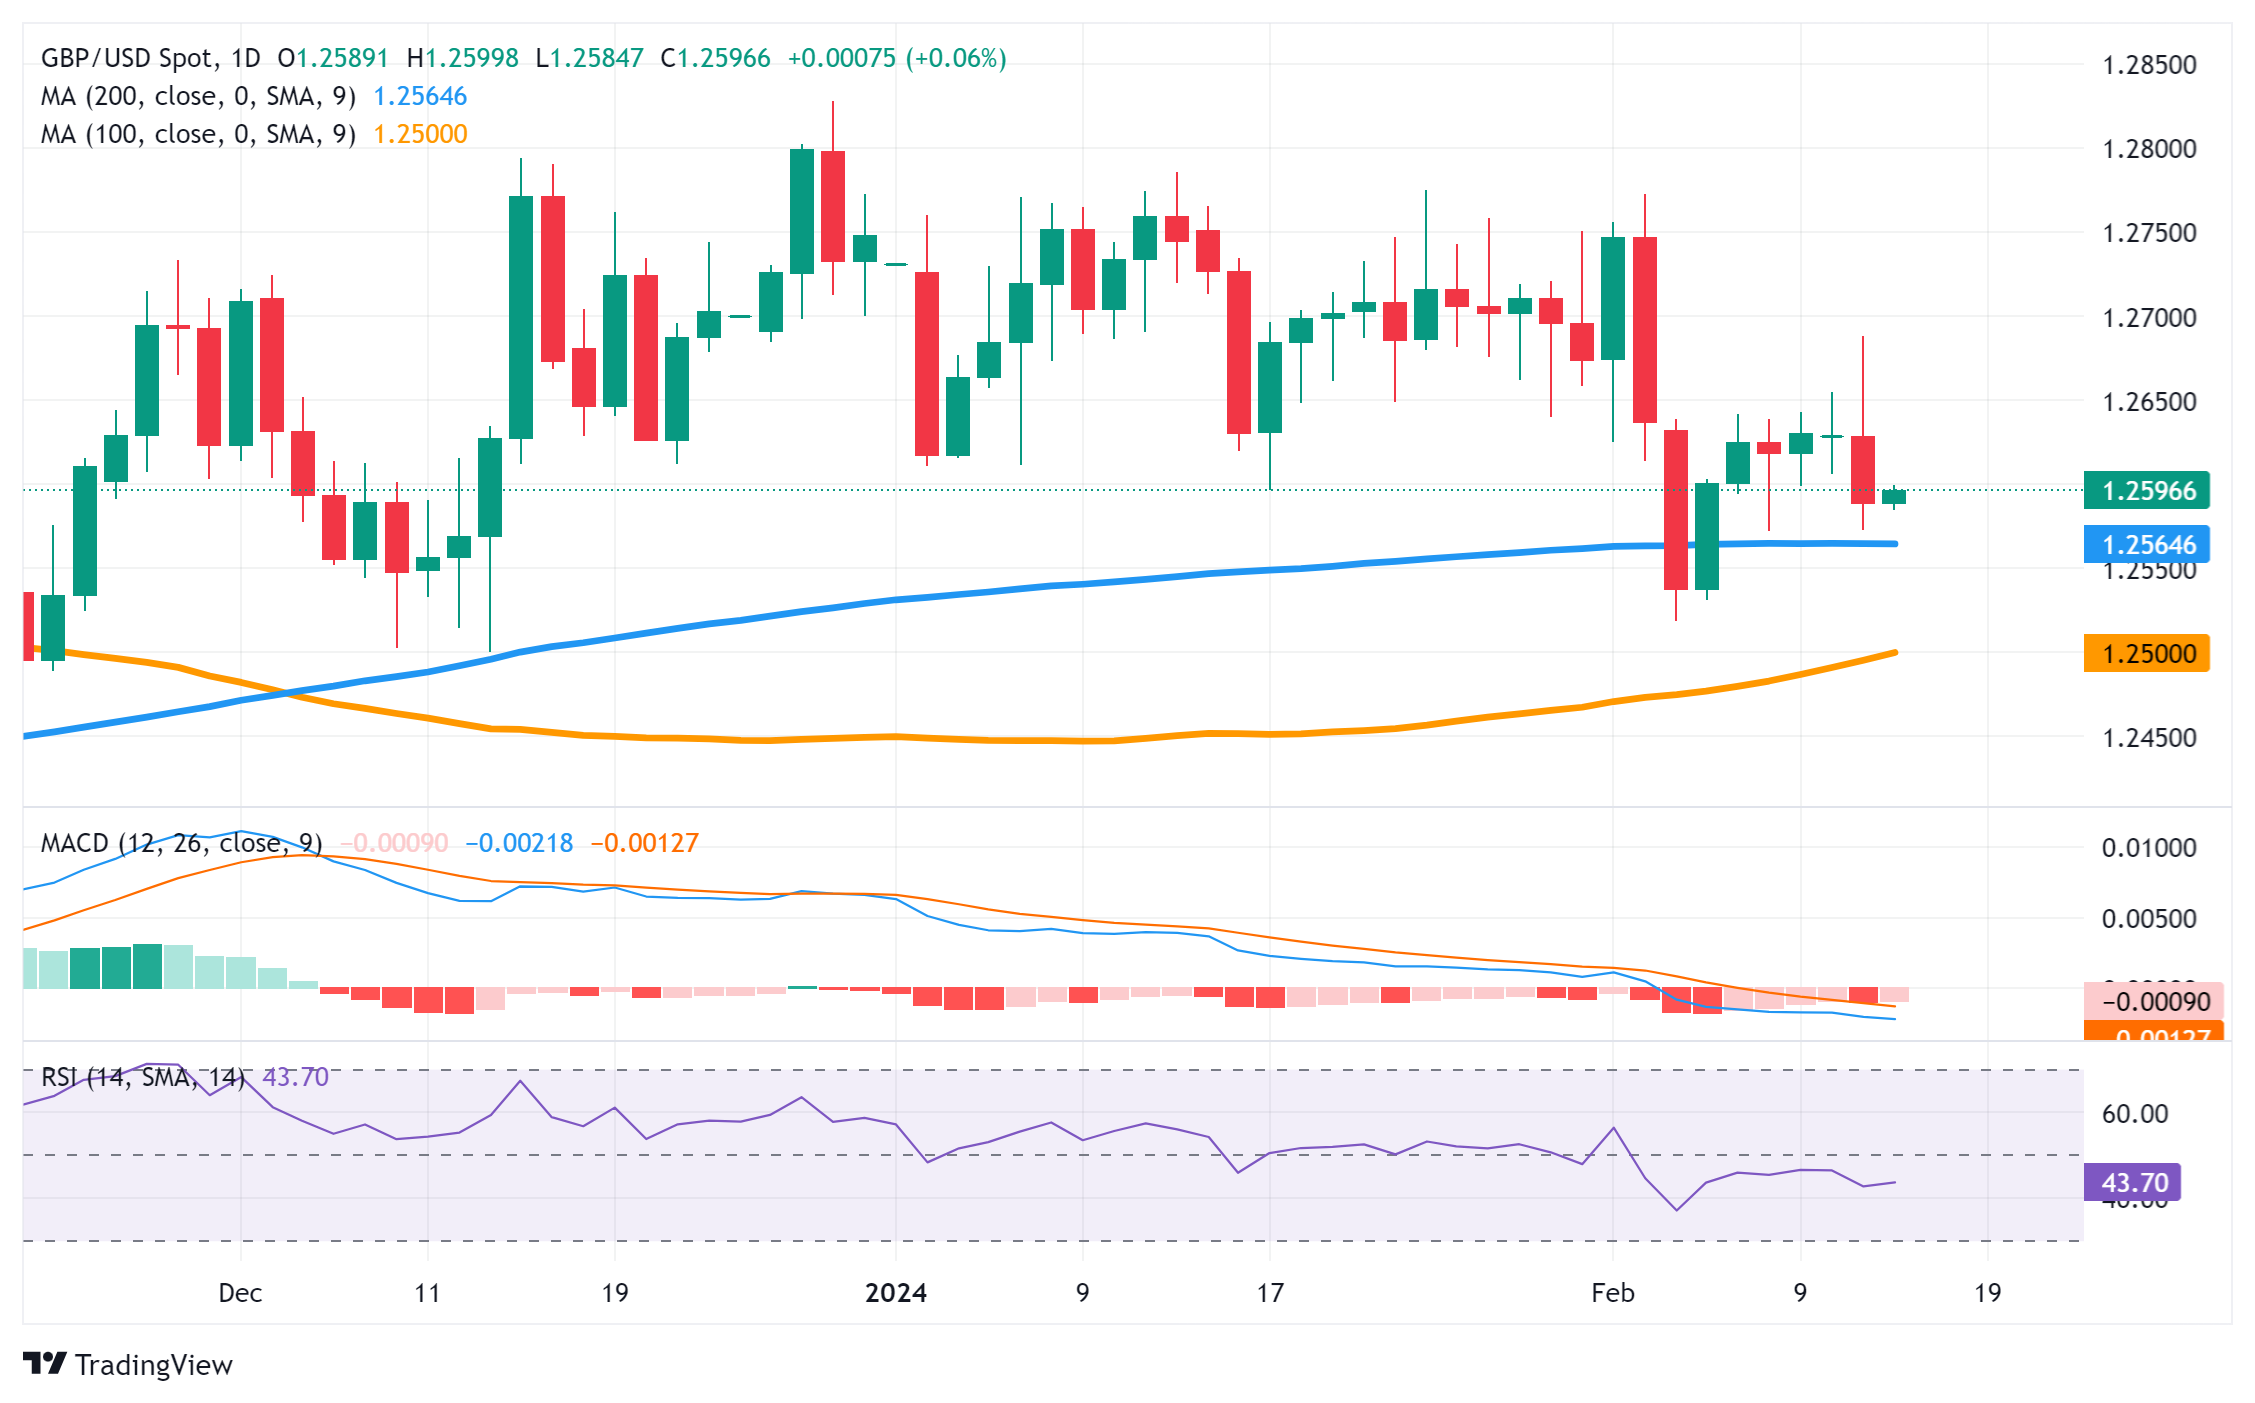
Key levels to watch
- Indian Rupee trades soft as the higher-than-expected US inflation data boosts the US Dollar.
- The hawkish stance of the Reserve Bank of India (RBI) might cap the INR’s downside for the time being.
- India’s Wholesale Price Index (WPI) Food, Fuel, and Inflation for January will be in the spotlight on Wednesday.
Indian Rupee (INR) loses traction on Wednesday amid the firmer US Dollar (USD). The uptick of the pair is supported by stronger-than-expected US inflation data, which prompts investors to further push back expectations on when the Federal Reserve (Fed) will cut its interest rate.
Meanwhile, the Reserve Bank of India (RBI) stated that it desires to see inflation return to 4%, the midpoint of the 2-6% target. The markets anticipate the Indian central bank to maintain a hawkish stance in the near term and not cut rates ahead of the Fed. This, in turn, could provide some support to the INR and act as a headwind for the USD/INR pair.
Investors await India’s Wholesale Price Index (WPI) Food, Fuel, and Inflation for January, due on Wednesday. The markets expect to see a cooling down of WPI inflation from 0.73% in December to 0.53% YoY in January. On the US docket, Fed’s Goolsbee and Barr are set to speak about the inflation and interest rate outlook. The Retail Sales and Producer Price Index (PPI) for January will be released later this week on Thursday and Friday, respectively.
Daily Digest Market Movers: Indian Rupee remains fragile on the back of renewed USD demand
- The Indian Retail Inflation declined to a three-month low of 5.1% in January from 5.69% in December, above the consensus of 5.09%, according to the Ministry of Statistics & Programme Implementation.
- India needs to grow at 7%–8% annually in order to become a developed nation with USD 13,000 per capita income by 2047, former RBI Governor C. Rangarajan said on Tuesday.
- Union Minister, Hardeep Singh Puri, praised India's economic growth, citing a robust expansion of 2.6% in the last three quarters.
- The US Consumer Price Index (CPI) inflation softened to 3.1% YoY in January from 3.4% in December, beating the market expectation of 2.9%. On a monthly basis, the headline CPI rose 0.3% MoM from 0.2% in the previous reading.
- The Core CPI, which excludes volatile food and energy prices, climbed 3.9% YoY in the same period, above the market consensus of 3.7%. The monthly Core CPI rose 0.4% MoM in January from a 0.3% rise in December.
- Atlanta Fed President Raphael Bostic said that the US inflation rate will fall to "the lower twos" by the end of this year, down from 3.4% in December.
Technical Analysis: Indian Rupee weakens further against the US Dollar
Indian Rupee trades in negative territory on the day. USD/INR remains range-bound within a descending trend channel of 82.70–83.20 since December 8, 2023.
In the short term, USD/INR resumes its uptrend as the pair returns above the key 100-period Exponential Moving Average (EMA) on the daily timeframe. The bullish momentum is also supported by the 14-day Relative Strength Index, which lies above the 50.0 midline, hinting that further upside looks favorable.
Sustained bullish momentum above the upper boundary of the descending trend channel at 83.20 might make its way back to the next upside barrier at 83.35 (high of January 2), en route to the 84.00 psychological level.
The resistance-turned-support level at 83.00 will be the first downside target to watch for USD/INR. The next contention level is seen at a low of February 2 at 82.83. Any follow-through selling below this level could set off a drop to the next potential support near the lower limit of the descending trend channel at 82.70, followed by 82.45 (low of August 23).
US Dollar price today
The table below shows the percentage change of US Dollar (USD) against listed major currencies today. US Dollar was the strongest against the Euro.
| USD | EUR | GBP | CAD | AUD | JPY | NZD | CHF | |
| USD | -0.04% | -0.08% | -0.06% | -0.17% | -0.15% | -0.26% | -0.15% | |
| EUR | 0.05% | -0.03% | -0.01% | -0.12% | -0.11% | -0.20% | -0.09% | |
| GBP | 0.09% | 0.04% | 0.03% | -0.08% | -0.06% | -0.16% | -0.06% | |
| CAD | 0.05% | -0.02% | -0.03% | -0.12% | -0.09% | -0.21% | -0.09% | |
| AUD | 0.16% | 0.12% | 0.09% | 0.12% | 0.01% | -0.08% | 0.02% | |
| JPY | 0.14% | 0.08% | 0.04% | 0.11% | -0.04% | -0.12% | 0.00% | |
| NZD | 0.26% | 0.22% | 0.18% | 0.21% | 0.10% | 0.12% | 0.17% | |
| CHF | 0.13% | 0.08% | 0.06% | 0.09% | -0.04% | -0.02% | -0.12% |
The heat map shows percentage changes of major currencies against each other. The base currency is picked from the left column, while the quote currency is picked from the top row. For example, if you pick the Euro from the left column and move along the horizontal line to the Japanese Yen, the percentage change displayed in the box will represent EUR (base)/JPY (quote).
Indian Rupee FAQs
What are the key factors driving the Indian Rupee?
The Indian Rupee (INR) is one of the most sensitive currencies to external factors. The price of Crude Oil (the country is highly dependent on imported Oil), the value of the US Dollar – most trade is conducted in USD – and the level of foreign investment, are all influential. Direct intervention by the Reserve Bank of India (RBI) in FX markets to keep the exchange rate stable, as well as the level of interest rates set by the RBI, are further major influencing factors on the Rupee.
How do the decisions of the Reserve Bank of India impact the Indian Rupee?
The Reserve Bank of India (RBI) actively intervenes in forex markets to maintain a stable exchange rate, to help facilitate trade. In addition, the RBI tries to maintain the inflation rate at its 4% target by adjusting interest rates. Higher interest rates usually strengthen the Rupee. This is due to the role of the ‘carry trade’ in which investors borrow in countries with lower interest rates so as to place their money in countries’ offering relatively higher interest rates and profit from the difference.
What macroeconomic factors influence the value of the Indian Rupee?
Macroeconomic factors that influence the value of the Rupee include inflation, interest rates, the economic growth rate (GDP), the balance of trade, and inflows from foreign investment. A higher growth rate can lead to more overseas investment, pushing up demand for the Rupee. A less negative balance of trade will eventually lead to a stronger Rupee. Higher interest rates, especially real rates (interest rates less inflation) are also positive for the Rupee. A risk-on environment can lead to greater inflows of Foreign Direct and Indirect Investment (FDI and FII), which also benefit the Rupee.
How does inflation impact the Indian Rupee?
Higher inflation, particularly, if it is comparatively higher than India’s peers, is generally negative for the currency as it reflects devaluation through oversupply. Inflation also increases the cost of exports, leading to more Rupees being sold to purchase foreign imports, which is Rupee-negative. At the same time, higher inflation usually leads to the Reserve Bank of India (RBI) raising interest rates and this can be positive for the Rupee, due to increased demand from international investors. The opposite effect is true of lower inflation.
Japanese Finance Minister Shunichi Suzuki is back on the wires, via Reuters, continuing with the verbal intervention, as the Yen approaches 151.00 against the US Dollar.
Key quotes
Closely watching forex market moves with strong sense of urgency.
Will not comment on FX level.
Important for currencies to move stably reflecting fundamentals.
Made no comment, when asked about intervention.
Forex stability is important.
Related reads
- Japan’s Suzuki: Rapid FX moves are undesirable
- Japanese Yen sticks to modest gains amid intervention fears, upside potential seems limited
- Gold price hits a fresh two-month low amid bets that the Fed will keep rates higher for longer.
- The expectations were reaffirmed by the stronger-than-expected US CPI released on Tuesday.
- A softer risk tone could lend support to the safe-haven XAU/USD and help limit further losses.
Gold price (XAU/USD) remains depressed below the $2,000 psychological mark and touches a fresh two-month low during the Asian session on Wednesday. A stronger-than-expected US inflation report released on Tuesday fueled speculations that the Federal Reserve (Fed) will wait until its June policy meeting before cutting interest rates and is seen as a key factor weighing on the non-yielding bullion. Meanwhile, hawkish Fed expectations remain supportive of elevated US Treasury bond yields and assist the US Dollar (USD) to preserve the overnight strong gains to its highest level since November 14, which further seems to undermine the commodity.
That said, the risk-off mood – as depicted by a slump across the global equity markets – helps the safe-haven Gold price to find some support near the 100-day Simple Moving Average (SMA). Any meaningful recovery, however, still seems elusive amid growing acceptance that the Fed will keep interest rates higher for longer in the wake of a still resilient US economy and sticky inflation. Moving ahead, there isn't any relevant market-moving economic data due for release from the US on Wednesday, leaving the precious metal at the mercy of the USD and the broader risk sentiment. The fundamental backdrop, meanwhile, seems tilted in favour of bearish traders.
Daily Digest Market Movers: Gold price is undermined by delayed Fed rate cut bets, elevated US bond yields and bullish USD
- The US inflation data released on Tuesday tempered prospects of an early interest rate cut by the Federal Reserve and continues to undermine the non-yielding Gold price.
- The Bureau of Labor Statistics reported that the headline US CPI rose by 0.3% in January and softened to the 3.1% YoY rate from the 3.4% in December, beating expectations.
- Furthermore, the Core CPI, which excludes volatile food and energy prices, also surpassed consensus estimates and matched December's increase of 3.9%.
- Against the backdrop of the recent stronger US macro data, the still-too-high consumer inflation gives the Fed little reason to rush on cut interest rates.
- The CME Group's FedWatch Tool indicates just over a 35% chance of a rate cut in April and that the Fed will likely not cut rates until the June policy meeting.
- The expectations lift the yield on the benchmark 10-year US government bond to its highest level since December 1 and act as a tailwind for the US Dollar.
- Renewed concerns over higher for longer interest rates temper investors' appetite for riskier assets and assist the XAU/USD to defend the 100-day SMA support.
Technical Analysis: Gold price could extend the declining trend once 100-day SMA support is broken decisively
From a technical perspective, some follow-through selling below the $1,990-1,988 region (100-day SMA) might expose the very important 200-day SMA support, currently pegged near the $1,965 area. A convincing break below the latter will be seen as a fresh trigger for bearish traders and pave the way for a further near-term depreciating move. The Gold price might then fall to an intermediate support near the $1,952-1,950 zone before eventually dropping to the November 2023 low, around the $1,932-1,931 region.
On the flip side, any attempted recovery beyond the $2,000 mark now seems to confront stiff resistance near the $2,011-2,012 area. That said, some follow-through buying, leading to a subsequent strength beyond the $2,015 level, might trigger a short-covering rally and lift the Gold price to the 50-day SMA, currently around the $2,030 region. The latter should act as a key pivotal point, which if cleared decisively should pave the way for additional gains beyond the $2,044-2,045 intermediate hurdle, towards the $2,065 supply zone.
US Dollar price today
The table below shows the percentage change of US Dollar (USD) against listed major currencies today. US Dollar was the weakest against the New Zealand Dollar.
| USD | EUR | GBP | CAD | AUD | JPY | NZD | CHF | |
| USD | -0.01% | -0.05% | -0.03% | -0.10% | -0.12% | -0.20% | -0.10% | |
| EUR | 0.02% | -0.03% | -0.02% | -0.08% | -0.11% | -0.18% | -0.08% | |
| GBP | 0.04% | 0.03% | 0.01% | -0.07% | -0.07% | -0.15% | -0.05% | |
| CAD | 0.03% | 0.01% | -0.01% | -0.06% | -0.08% | -0.17% | -0.07% | |
| AUD | 0.11% | 0.10% | 0.07% | 0.09% | -0.01% | -0.08% | 0.01% | |
| JPY | 0.12% | 0.10% | 0.08% | 0.11% | -0.04% | -0.08% | 0.02% | |
| NZD | 0.21% | 0.18% | 0.15% | 0.17% | 0.11% | 0.08% | 0.12% | |
| CHF | 0.09% | 0.08% | 0.05% | 0.07% | -0.01% | -0.02% | -0.10% |
The heat map shows percentage changes of major currencies against each other. The base currency is picked from the left column, while the quote currency is picked from the top row. For example, if you pick the Euro from the left column and move along the horizontal line to the Japanese Yen, the percentage change displayed in the box will represent EUR (base)/JPY (quote).
Gold FAQs
Why do people invest in Gold?
Gold has played a key role in human’s history as it has been widely used as a store of value and medium of exchange. Currently, apart from its shine and usage for jewelry, the precious metal is widely seen as a safe-haven asset, meaning that it is considered a good investment during turbulent times. Gold is also widely seen as a hedge against inflation and against depreciating currencies as it doesn’t rely on any specific issuer or government.
Who buys the most Gold?
Central banks are the biggest Gold holders. In their aim to support their currencies in turbulent times, central banks tend to diversify their reserves and buy Gold to improve the perceived strength of the economy and the currency. High Gold reserves can be a source of trust for a country’s solvency. Central banks added 1,136 tonnes of Gold worth around $70 billion to their reserves in 2022, according to data from the World Gold Council. This is the highest yearly purchase since records began. Central banks from emerging economies such as China, India and Turkey are quickly increasing their Gold reserves.
How is Gold correlated with other assets?
Gold has an inverse correlation with the US Dollar and US Treasuries, which are both major reserve and safe-haven assets. When the Dollar depreciates, Gold tends to rise, enabling investors and central banks to diversify their assets in turbulent times. Gold is also inversely correlated with risk assets. A rally in the stock market tends to weaken Gold price, while sell-offs in riskier markets tend to favor the precious metal.
What does the price of Gold depend on?
The price can move due to a wide range of factors. Geopolitical instability or fears of a deep recession can quickly make Gold price escalate due to its safe-haven status. As a yield-less asset, Gold tends to rise with lower interest rates, while higher cost of money usually weighs down on the yellow metal. Still, most moves depend on how the US Dollar (USD) behaves as the asset is priced in dollars (XAU/USD). A strong Dollar tends to keep the price of Gold controlled, whereas a weaker Dollar is likely to push Gold prices up.
- EUR/USD received downward pressure after better-than-expected CPI data.
- US Dollar rose on the diminished possibility of a Fed interest rate cut in the March meeting.
- Traders factor in the possibility of a rate cut by the Federal Reserve in June.
EUR/USD hovers around 1.0710 during the Asian session on Wednesday, maintaining its position after dropping to three-month lows. The US Dollar (USD) garnered support following the release of robust US inflation data for January, which dampened expectations of an imminent rate cut by the Federal Reserve (Fed) in March.
However, the Euro found some relief from better-than-expected Economic Sentiment data from both the Eurozone and Germany, which were released on Tuesday. Investors are awaiting preliminary Gross Domestic Product (GDP) data scheduled for release on Wednesday. Additionally, market participants will pay attention to a speech by Christine Lagarde, the President of the European Central Bank (ECB), scheduled for Thursday.
Speculation is growing about potential interest rate cuts by the European Central Bank (ECB) at the beginning of the second quarter. ECB Executive Board member Piero Cipollone's comments suggested that there may not be a necessity for the ECB to further constrain demand in its attempts to tackle inflation. This indicates that interest rates may not need to be raised further.
There has been a notable shift in market sentiment, with expectations for an unchanged interest rate surging to 93% next month, a stark contrast to just a month ago. Investors are now considering the possibility of a rate cut by the Federal Reserve (Fed) in June.
The unexpected upside surprise in US inflation for January has led analysts at Commerzbank to reevaluate the potential for a pivot towards interest rate cuts by the Federal Reserve. Observers are speculating about whether the previously anticipated Fed interest rate cut scheduled for May could now face uncertainty.
- US Dollar gained ground as higher inflation could refrain the Fed from reducing interest rates in March.
- Investors turned towards the Greenback as US yields rose to multi-week highs.
- Investors are now factoring in the possibility of a rate cut by the Fed in June.
The US Dollar Index (DXY), a measure of the US Dollar's strength against a basket of six major currencies, holds firm near three-month highs, trading around 104.80 during the Asian session on Wednesday. Concurrently, US yields are reaching multi-week highs across the yield curve.
There has been a significant shift in market sentiment, with expectations for an unchanged interest rate next month skyrocketing to 93%, marking a sharp contrast to just a month ago. Investors are now factoring in the possibility of a rate cut by the Federal Reserve (Fed) in June.
The unexpected upside surprise in US inflation for January has prompted analysts at Commerzbank to reassess the possibility of a pivot towards interest rate cuts by the Federal Reserve. There's speculation among observers about whether the previously planned Fed’s interest rate cut for May could now face uncertainty.
Regarding the outlook for May, it's prudent to wait for the data on Personal Consumption Expenditure (PCE) inflation for January and observe whether elevated price pressures persist into February before drawing conclusions about Fed policy adjustments.
The US headline Consumer Price Index (CPI) came in at 3.1% in January, surpassing the anticipated 2.9% but slightly lower than the previous rate of 3.4%. Month-over-month, US inflation rose by 0.3%, contrary to the expectation of maintaining the previous reading of 0.2%.
The US Core CPI (YoY) remained unchanged at 3.9%, defying market expectations of a decline to 3.7% in January. Additionally, US Core Inflation (MoM) increased by 0.4%, surpassing the expected unchanged reading of 0.3% for January.
| Raw materials | Closed | Change, % |
|---|---|---|
| Silver | 22.109 | -2.46 |
| Gold | 1992.856 | -1.33 |
| Palladium | 868.6 | -2.77 |
- GBP/JPY pulls back from a multi-year peak touched on Tuesday amid a pickup in the JPY demand.
- Verbal intervention from the Japanese authorities, along with the risk-off mood, underpin the JPY.
- Diminishing odds for an early BoE rate cut could help limit losses for the cross ahead of the UK CPI.
The GBP/JPY cross meets with some supply during the Asian session on Wednesday and erodes a part of the previous day's strong gains to the 190.00 psychological mark, or its highest level since August 2015. Spot prices currently trade just above the mid-189.00s, down over 0.10% for the day, though any meaningful corrective decline still seems elusive.
The Japanese Yen (JPY) attracts some haven flows in the wake of the risk-off impulse and draws additional support from verbal intervention by Japanese authorities. In fact, Japan’s top currency diplomat Masato Kanda said that the government is closely watching FX moves with a high sense of urgency and is ready to take appropriate action, including intervention, if needed. Adding to this, Japan's Finance Minister Shunichi Suzuki said that rapid FX moves are undesirable and that the government is watching the market with even stronger urgency, though made no comments on intervention. Nevertheless, the comments provide a modest lift to the JPY and turn out to be a key factor exerting some downward pressure on the GBP/JPY cross.
The downside, however, remains cushioned in the wake of reduced bets for early interest rate cuts by the Bank of England (BoE), which might continue to act as a tailwind for the British Pound (GBP). The official data released on Tuesday showed that UK Unemployment Rate was lower than expected in the last three months of 2023 and resilient wages, which have been a driver of sticky consumer price inflation. This gives the BoE more reason to be cautious over the timing of the first interest cut. The market focus now shifts to the latest UK consumer inflation figures, due later today, which might influence the GBP and provide some impetus to the GBP/JPY cross ahead of BoE Governor Andrew Bailey's testimony later this Wednesday.
This week's UK economic docket also features the release of the Preliminary Q4 GDP print and monthly Retail Sales figures on Thursday and Friday, respectively. The crucial data should influence market expectations about the BoE's future policy decision and infuse some volatility around the GBP/JPY cross. Bulls, meanwhile, could turn cautious amid speculations about a possible JPY intervention and bets for an imminent shift in the Bank of Japan's (BoJ) policy stance.
Technical levels to watch
- India’s Nifty and Sensex eye a negative open after the Tuesday turnaround.
- Nifty and Sensex bounced on Tuesday amid fresh buying in banking, financial services and IT sector stocks.
- With US CPI out of the way, Nifty and Sensex traders await India’s WPI inflation data.
The Sensex 30 and Nifty 50, India’s key benchmark indices, are eyeing a negative open, following a comeback on Tuesday. The Indian indices are likely to track the Wall Street sell-off and the decline in their Asian peers, as markets take account of the hot US Consumer Price Index (CPI) data.
Gift Nifty Index, formerly known as the SGX Nifty, is posting small losses, pointing to a weak start for Nifty and Sensex on Wednesday. The National Stock Exchange (NSE) Nifty 50 index closed 0.59% higher on the day at 21,743.25. The Bombay Stock Exchange (BSE) Sensex 30 settled Tuesday at 71,555.19, adding 0.68% on a daily basis.
Stock market news
- On Tuesday, the rebound in Nifty and Sensex was led by fresh buying in banking, financial services and IT sector stocks.
- Nifty and Sensex also cheered news that Index provider MSCI raised India's weightage in its Global Standard index to an all-time high of 18.2%.
- Coal India, UPL, Axis Bank, ICICI Bank and HDFC Life Insurance Company are among the top gainers on the Nifty on Tuesday.
- Meanwhile, top losers included Hindalco Industries, Grasim Industries, Divi’s Laboratories, Ultratech Cement and Bharat Petroleum Corporation.
- Hindalco Industries on Tuesday reported a 71% YoY growth in its consolidated net profit at Rs 2,331 crore for the quarter ended December 2023. The profit stood at Rs 1,362 crore a year ago.
- Shares of Reliance Industries (RIL) become the first listed Indian entity to cross the Rs 20 lakh crore market capitalization milestone after the stock rallied up to 1.89% to hit a fresh 52-week high of Rs 2957.80 on Sensex.
- India’s Multi Commodity Exchange (MCX) index commences trading after a four-hour delay due to technical glitches.
- The Lunar New Year holidays in China and some of the major Asian markets could keep the liquidity thin around the Indian indices.
- Traders now await the Indian Wholesale Price Index (WPI) release due on Wednesday, with the US CPI data now out of the way.
- Data on Tuesday showed that the US annual headline CPI rose 3.1% in January, versus an estimated 2.9% increase. Markets now price in no Fed rate cut in March and a lower than 50% chance of easing in May.
Indian economy FAQs
How does the Indian economy impact the Indian Rupee?
The Indian economy has averaged a growth rate of 6.13% between 2006 and 2023, which makes it one of the fastest growing in the world. India’s high growth has attracted a lot of foreign investment. This includes Foreign Direct Investment (FDI) into physical projects and Foreign Indirect Investment (FII) by foreign funds into Indian financial markets. The greater the level of investment, the higher the demand for the Rupee (INR). Fluctuations in Dollar-demand from Indian importers also impact INR.
What is the impact of Oil prices on the Rupee?
India has to import a great deal of its Oil and gasoline so the price of Oil can have a direct impact on the Rupee. Oil is mostly traded in US Dollars (USD) on international markets so if the price of Oil rises, aggregate demand for USD increases and Indian importers have to sell more Rupees to meet that demand, which is depreciative for the Rupee.
How does inflation in India impact the Rupee?
Inflation has a complex effect on the Rupee. Ultimately it indicates an increase in money supply which reduces the Rupee’s overall value. Yet if it rises above the Reserve Bank of India’s (RBI) 4% target, the RBI will raise interest rates to bring it down by reducing credit. Higher interest rates, especially real rates (the difference between interest rates and inflation) strengthen the Rupee. They make India a more profitable place for international investors to park their money. A fall in inflation can be supportive of the Rupee. At the same time lower interest rates can have a depreciatory effect on the Rupee.
How does seasonal US Dollar demand from importers and banks impact the Rupee?
India has run a trade deficit for most of its recent history, indicating its imports outweigh its exports. Since the majority of international trade takes place in US Dollars, there are times – due to seasonal demand or order glut – where the high volume of imports leads to significant US Dollar- demand. During these periods the Rupee can weaken as it is heavily sold to meet the demand for Dollars. When markets experience increased volatility, the demand for US Dollars can also shoot up with a similarly negative effect on the Rupee.
- USD/CAD trades on a stronger note around 1.3568 on the firmer US Dollar.
- The January Consumer Price Index (CPI) softened to 3.1% YoY in January from 3.4% in December, better than expected.
- A tight labor market in Canada might convince the BoC to push back their forecasts on rate cuts until June from April.
The USD/CAD pair gains traction for the second consecutive day during the early Asian session on Wednesday. The uptick of the pair is bolstered by the US January Consumer Price Index (CPI) inflation data, which lifts the US Dollar (USD) and bond yields higher. USD/CAD currently trades near 1.3568, down 0.01% on the day.
Data released from the US Bureau of Labor Statistics (BLS) on Tuesday reported that the CPI inflation softened to 3.1% YoY in January from 3.4% in December, beating the market expectation of 2.9%. Meanwhile, the Core CPI, which excludes volatile food and energy prices, climbed 3.9% in the same period, above the market consensus of 3.7%. On a monthly basis, the CPI and the Core CPI rose 0.3% and 0.4%, respectively.
The Canadian labor market data were unexpectedly strong, with 37,000 jobs increase that more than doubled forecasts. A healthier picture of the labor market might convince the Bank of Canada (BoC) to push back their forecasts on rate cuts until June from April.
The BoC left the policy interest rate unchanged at 5.0% at its January meeting. Governor Tiff Macklem said that the central bank has shifted from debating whether interest rates are high enough, to how long the central bank needs to keep rates at current levels. Nonetheless, the timeline for interest rate cuts has not yet been indicated.
Market players will keep an eye on the Canadian Housing Starts and Fed’s Goolsbee and Barr speeches on Wednesday. The Retail Sales and Producer Price Index (PPI) will be due later on Thursday and Friday, respectively. These figures could give a clear direction to the USD/CAD pair.
- Australian Dollar lost ground as the US Dollar rose on upbeat US CPI numbers.
- Australian ASX 200 Index falls; put pressure on the AUD.
- US Dollar strengthened on upbeat US Treasury yields.
- Robust US CPI numbers dashed the chances of the Fed’s rate cut in March.
The Australian Dollar (AUD) continues to decline following a sharp drop in the previous session, driven by robust US inflation data for January, which dashed hopes of an imminent rate cut by the Federal Reserve (Fed) in March.
Australian Dollar received downward pressure as the S&P/ASX 200 Index tumbled to its lowest levels in three weeks, driven by a selloff in mining and financial stocks following Wall Street's decline overnight in response to stronger-than-expected US inflation figures.
The US Dollar Index (DXY) remains steady near three-month highs, supported by recent gains, while US yields trade at multi-week highs across the yield curve. Market sentiment has shifted dramatically, with expectations for an unchanged rate next month soaring to 93%, a stark contrast to a month earlier. Investors are now pricing in the possibility of a rate cut by the Fed in June.
Daily Digest Market Movers: Australian Dollar declines after solid US Inflation data
- Stephen Kennedy, the Head of Australia's Treasury, addressed a parliamentary committee, noting that services inflation is trailing behind goods inflation. He mentioned that services inflation has likely peaked and is expected to decline over the next two years, and he sees no evidence of a wage-price spiral.
- Reserve Bank of Australia (RBA) Governor Michele Bullock stated that the central bank might consider initiating rate cuts even before inflation decelerates to 2.5%. However, she cautioned that the RBA remains receptive to the prospect of further rate hikes.
- RBA's Head of Economic Analysis, Marion Kohler, emphasized uncertainty regarding current inflation projections for the Australian economy. However, she anticipates that price growth will eventually return to a more moderate level by 2025.
- China’s headline CPI declined by 0.8%, exceeding the anticipated decline of 0.5% and the previous decline of 0.3%.
- US headline Consumer Price Index (CPI) increased by 3.1% in January, exceeding the expected 2.9% but lower than the previous rate of 3.4%.
- US Inflation rose by 0.3% month-over-month, against the expectation of maintaining the previous reading of 0.2%.
- US Core CPI (YoY) remained consistent at 3.9% against the market expectation of a decline to 3.7% in January.
- US Core Inflation (MoM) increased by 0.4% against the 0.3% as expected to be unchanged in January.
Technical Analysis: Australian Dollar hovers around the major level of 0.6450
The Australian Dollar trades near 0.6450 on Wednesday following the next psychological support level of 0.6400. On the upside, the key resistance appears at the psychological level of 0.6500. A breakthrough above this psychological barrier could influence the AUD/USD pair to reach the 14-day Exponential Moving Average (EMA) at 0.6523 followed by the 23.6% Fibonacci retracement level at 0.6543 and the major level at 0.6550.
AUD/USD: Daily Chart
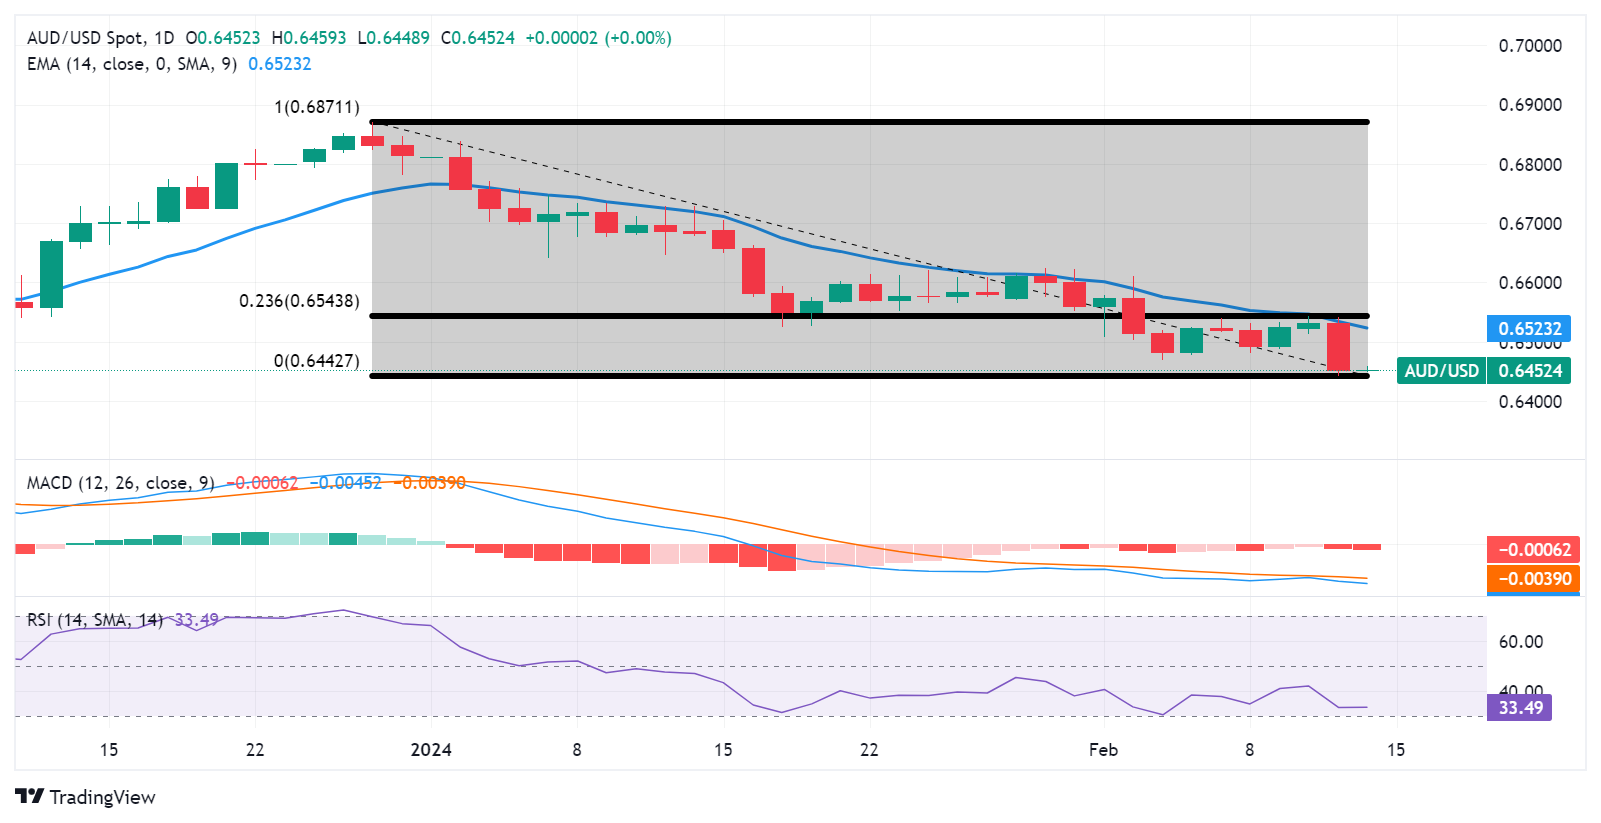
Australian Dollar price today
The table below shows the percentage change of Australian Dollar (AUD) against listed major currencies today. Australian Dollar was the weakest against the Japanese Yen.
| USD | EUR | GBP | CAD | AUD | JPY | NZD | CHF | |
| USD | 0.01% | -0.01% | -0.01% | -0.03% | -0.10% | -0.02% | -0.06% | |
| EUR | 0.00% | 0.00% | 0.00% | -0.02% | -0.10% | -0.02% | -0.05% | |
| GBP | 0.00% | -0.01% | 0.00% | -0.02% | -0.09% | -0.01% | -0.05% | |
| CAD | 0.00% | 0.00% | -0.01% | -0.01% | -0.09% | -0.01% | -0.05% | |
| AUD | 0.02% | 0.02% | 0.02% | 0.02% | -0.08% | 0.01% | -0.04% | |
| JPY | 0.10% | 0.08% | 0.08% | 0.10% | 0.06% | 0.05% | 0.04% | |
| NZD | 0.02% | 0.01% | 0.01% | 0.01% | 0.00% | -0.08% | -0.02% | |
| CHF | 0.05% | 0.04% | 0.05% | 0.05% | 0.01% | -0.04% | 0.04% |
The heat map shows percentage changes of major currencies against each other. The base currency is picked from the left column, while the quote currency is picked from the top row. For example, if you pick the Euro from the left column and move along the horizontal line to the Japanese Yen, the percentage change displayed in the box will represent EUR (base)/JPY (quote).
Australian Dollar FAQs
What key factors drive the Australian Dollar?
One of the most significant factors for the Australian Dollar (AUD) is the level of interest rates set by the Reserve Bank of Australia (RBA). Because Australia is a resource-rich country another key driver is the price of its biggest export, Iron Ore. The health of the Chinese economy, its largest trading partner, is a factor, as well as inflation in Australia, its growth rate and Trade Balance. Market sentiment – whether investors are taking on more risky assets (risk-on) or seeking safe-havens (risk-off) – is also a factor, with risk-on positive for AUD.
How do the decisions of the Reserve Bank of Australia impact the Australian Dollar?
The Reserve Bank of Australia (RBA) influences the Australian Dollar (AUD) by setting the level of interest rates that Australian banks can lend to each other. This influences the level of interest rates in the economy as a whole. The main goal of the RBA is to maintain a stable inflation rate of 2-3% by adjusting interest rates up or down. Relatively high interest rates compared to other major central banks support the AUD, and the opposite for relatively low. The RBA can also use quantitative easing and tightening to influence credit conditions, with the former AUD-negative and the latter AUD-positive.
How does the health of the Chinese Economy impact the Australian Dollar?
China is Australia’s largest trading partner so the health of the Chinese economy is a major influence on the value of the Australian Dollar (AUD). When the Chinese economy is doing well it purchases more raw materials, goods and services from Australia, lifting demand for the AUD, and pushing up its value. The opposite is the case when the Chinese economy is not growing as fast as expected. Positive or negative surprises in Chinese growth data, therefore, often have a direct impact on the Australian Dollar and its pairs.
How does the price of Iron Ore impact the Australian Dollar?
Iron Ore is Australia’s largest export, accounting for $118 billion a year according to data from 2021, with China as its primary destination. The price of Iron Ore, therefore, can be a driver of the Australian Dollar. Generally, if the price of Iron Ore rises, AUD also goes up, as aggregate demand for the currency increases. The opposite is the case if the price of Iron Ore falls. Higher Iron Ore prices also tend to result in a greater likelihood of a positive Trade Balance for Australia, which is also positive of the AUD.
How does the Trade Balance impact the Australian Dollar?
The Trade Balance, which is the difference between what a country earns from its exports versus what it pays for its imports, is another factor that can influence the value of the Australian Dollar. If Australia produces highly sought after exports, then its currency will gain in value purely from the surplus demand created from foreign buyers seeking to purchase its exports versus what it spends to purchase imports. Therefore, a positive net Trade Balance strengthens the AUD, with the opposite effect if the Trade Balance is negative.
- The Japanese Yen strengthens a bit in reaction to verbal intervention by Japanese authorities.
- The risk-off impulse further benefits the safe-haven JPY and exerts some pressure on USD/JPY.
- The hotter US CPI print on Tuesday reaffirms hawkish Fed expectations and favours the USD bulls.
The Japanese Yen (JPY) ticks higher against its American counterpart during the Asian session on Wednesday and recovers a part of the previous day's heavy losses to a three-month low. A slump below the 150.00 psychological mark prompted some verbal intervention from the Japanese authorities, which, along with the risk-off impulse, is seen lending some support to the safe-haven JPY. That said, the recent dovish remarks by the Bank of Japan (BoJ) Deputy Governor Shinichi Uchida might hold back bulls from placing aggressive bets. Apart from this, a strong bullish tone around the US Dollar (USD) might also contribute to limiting the downside for the USD/JPY pair.
The USD Index (DXY), which tracks the Greenback against a basket of currencies, rallied to its highest level since November 14 after hot US consumer inflation figures on Tuesday lifted bets that the Federal Reserve (Fed) will keep rates higher for longer. The hawkish outlook remains supportive of elevated US Treasury bond yields, widening the US-Japan rate differential and validating the negative outlook for the JPY. This, in turn, suggests that the path of least resistance for the USD/JPY pair is to the upside. Hence, any meaningful corrective decline might still be seen as a buying opportunity in the absence of any relevant market-moving economic releases from the US on Wednesday.
Daily Digest Market Movers: Japanese Yen attracts buyers after verbal intervention from the Japanese authorities
- The Japanese Yen trims a part of Tuesday's post-US CPI fall to a three-month low after Japan’s top currency diplomat Masato Kanda reiterated that authorities stand ready to take steps in the FX market if needed.
- Furthermore, Japan's Finance Minister Shunichi Suzuki said that rapid FX moves are undesirable and that the government is watching the market with even stronger urgency, though made no comments on intervention.
- A hotter-than-expected US inflation report cooled expectations for a more aggressive rate-cutting cycle by the Federal Reserve, pushing US Treasury bond yields higher and tempering investors' appetite for riskier assets.
- The Labor Department’s Bureau of Labor Statistics reported on Tuesday that the headline US CPI rose by 0.3% in January as compared to the 0.2% previous and softened to the 3.1% YoY rate from the 3.4% in December.
- The reading was above market expectations for a reading of 2.9% and was accompanied by stronger Core CPI print, which rose 3.9% during the reported month, matching December's increase and surpassing estimates for 3.7%.
- Investors have all but priced out a March rate cut and the possibility for a move in May has declined to around 35% from over 60% the previous day, while the Fed is now expected to start cutting rates at the June policy meeting.
- The yield on the benchmark 10-year US government bond reached its highest level since December 1 and lifted the US Dollar to a three-month peak, supporting prospects for a further appreciating move for the USD/JPY pair.
Technical Analysis: USD/JPY bulls might still aim towards retesting multi-decade peak, around the 152.00 mark
From a technical perspective, the overnight strong move-up was seen as a fresh trigger for bulls and might have already set the stage for additional gains. That said, the Relative Strength Index (RSI) on the daily chart is hovering close to the overbought zone and warrants some caution. Any further corrective slide, however, is likely to attract fresh buyers near the 150.30 area, which should limit losses for the USD/JPY pair near the 150.00 mark. The latter should act as a key pivotal point, which if broken might prompt some technical selling and drag spot prices further towards the 149.65-149.60 region.
On the flip side, the 150.90 area, or a multi-month peak touched on Tuesday, now seems to act as an immediate hurdle. A sustained strength beyond could lift the USD/JPY pair further towards the 151.45 intermediate hurdle en route to the 152.00 neighbourhood, or a multi-decade peak set in October 2022 and retested in November 2023.
Japanese Yen price today
The table below shows the percentage change of Japanese Yen (JPY) against listed major currencies today. Japanese Yen was the strongest against the Canadian Dollar.
| USD | EUR | GBP | CAD | AUD | JPY | NZD | CHF | |
| USD | 0.03% | 0.02% | 0.01% | -0.02% | -0.08% | -0.03% | -0.02% | |
| EUR | -0.01% | 0.00% | 0.00% | -0.03% | -0.10% | -0.02% | -0.03% | |
| GBP | -0.02% | 0.00% | 0.00% | -0.02% | -0.09% | -0.04% | -0.03% | |
| CAD | -0.01% | 0.00% | 0.00% | -0.03% | -0.09% | -0.04% | -0.04% | |
| AUD | 0.00% | 0.03% | 0.03% | 0.03% | -0.07% | -0.01% | -0.01% | |
| JPY | 0.08% | 0.08% | 0.08% | 0.10% | 0.05% | 0.07% | 0.05% | |
| NZD | 0.03% | 0.04% | 0.04% | 0.04% | 0.04% | -0.05% | 0.02% | |
| CHF | 0.02% | 0.04% | 0.04% | 0.04% | 0.04% | -0.05% | 0.02% |
The heat map shows percentage changes of major currencies against each other. The base currency is picked from the left column, while the quote currency is picked from the top row. For example, if you pick the Euro from the left column and move along the horizontal line to the Japanese Yen, the percentage change displayed in the box will represent EUR (base)/JPY (quote).
Japanese Yen FAQs
What key factors drive the Japanese Yen?
The Japanese Yen (JPY) is one of the world’s most traded currencies. Its value is broadly determined by the performance of the Japanese economy, but more specifically by the Bank of Japan’s policy, the differential between Japanese and US bond yields, or risk sentiment among traders, among other factors.
How do the decisions of the Bank of Japan impact the Japanese Yen?
One of the Bank of Japan’s mandates is currency control, so its moves are key for the Yen. The BoJ has directly intervened in currency markets sometimes, generally to lower the value of the Yen, although it refrains from doing it often due to political concerns of its main trading partners. The current BoJ ultra-loose monetary policy, based on massive stimulus to the economy, has caused the Yen to depreciate against its main currency peers. This process has exacerbated more recently due to an increasing policy divergence between the Bank of Japan and other main central banks, which have opted to increase interest rates sharply to fight decades-high levels of inflation.
How does the differential between Japanese and US bond yields impact the Japanese Yen?
The BoJ’s stance of sticking to ultra-loose monetary policy has led to a widening policy divergence with other central banks, particularly with the US Federal Reserve. This supports a widening of the differential between the 10-year US and Japanese bonds, which favors the US Dollar against the Japanese Yen.
How does broader risk sentiment impact the Japanese Yen?
The Japanese Yen is often seen as a safe-haven investment. This means that in times of market stress, investors are more likely to put their money in the Japanese currency due to its supposed reliability and stability. Turbulent times are likely to strengthen the Yen’s value against other currencies seen as more risky to invest in.
- Gold price holds below $2,000 on the stronger USD and upbeat US CPI report.
- The US Consumer Price Index (CPI) inflation eased to 3.1% in January YoY from 3.4% in December.
- The ongoing geopolitical tensions in the Middle East and Eastern Europe might cap the downside of the gold price.
Gold price (XAU/USD) drops below the $2,000 psychological mark during the early Asian session on Wednesday. The stronger US inflation data exerts some selling pressure on the yellow metal as it diminishes hopes of an early rate cut. The gold price currently trades around $1,992, unchanged for the day.
Meanwhile, the US Dollar Index (DXY), an index of the value of the USD measured against a basket of six world currencies, trades near 104.85 after reaching a three-month high of 105.00. The US Treasury yields edge higher, with the 10-year yield standing at 4.32% and the 2-year rate jumping to 4.654%, the biggest one-day jump since May 5, 2023.
The US Consumer Price Index (CPI) inflation eased to 3.1% YoY in January from 3.4% in December, according to the U.S. Labor Department on Tuesday. On a monthly basis, the headline CPI increased 0.3% in January after rising 0.2% in December. The Core CPI, which excludes food and energy, rose 0.4% in January from a 0.3% increase in December. Over the last 12 months, the figure climbed 3.9% YoY, above the market consensus of 3.7%.
Traders in financial markets pushed back their interest rate cut expectations to June from May after the upbeat US CPI report. Inflation is slowing down, but not quickly enough to prompt Fed policymakers to begin lowering interest rates soon. Traders will take more cues from the US January Retail Sales and Producer Price Index (PPI) this week for fresh impetus. Gold prices could face further declines if other economic data remains strong.
On the other hand, geopolitical tensions continued in the Middle East and Eastern Europe. Yemen's Iran-aligned Houthis have continued their attacks in the Red Sea, claiming solidarity with Palestinians and targeting vessels with commercial ties to the United States, Britain, and Israel. The ongoing tensions might boost traditional safe-haven assets like gold.
Looking ahead, the Fed’s Goolsbee and Barr are set to peak on Wednesday. Later this week, gold traders will monitor US January Retail Sales on Thursday and the Producer Price Index (PPI) on Friday. The figure is forecast to show an increase of 0.1% MoM and 0.6% YoY in January.
| Index | Change, points | Closed | Change, % |
|---|---|---|---|
| NIKKEI 225 | 1066.55 | 37963.97 | 2.89 |
| KOSPI | 29.32 | 2649.64 | 1.12 |
| ASX 200 | -11.3 | 7603.6 | -0.15 |
| DAX | -156.52 | 16880.83 | -0.92 |
| CAC 40 | -64.49 | 7625.31 | -0.84 |
| Dow Jones | -524.63 | 38272.75 | -1.35 |
| S&P 500 | -68.67 | 4953.17 | -1.37 |
| NASDAQ Composite | -286.95 | 15655.6 | -1.8 |
Japanese Finance Minister Shunichi Suzuki offered some verbal intervention on Wednesday. Suzuki said that he will watch foreign exchange with strong urgency.
Key quotes
“Says watching the FX market with even strong urgency.”
“Rapid FX moves are undesirable.”
“Made no comment, when asked about intervention.”
Market reaction
At the time of writing, USD/JPY is trading 0.05% lower on the day at 150.70.
| Pare | Closed | Change, % |
|---|---|---|
| AUDUSD | 0.6453 | -1.04 |
| EURJPY | 161.486 | 0.48 |
| EURUSD | 1.07093 | -0.58 |
| GBPJPY | 189.876 | 0.72 |
| GBPUSD | 1.25914 | -0.26 |
| NZDUSD | 0.60589 | -1.11 |
| USDCAD | 1.35636 | 0.86 |
| USDCHF | 0.88707 | 1.32 |
| USDJPY | 150.797 | 0.99 |
- GBP/USD trades on a weaker note near 1.2589 amid the stronger USD.
- US CPI inflation data came in above expectations, with a core CPI rose by 0.4% MoM, the headline inflation was up 0.3% MoM.
- Money markets anticipate the BOE to hold rates at a 16-year high until June at the earliest.
- Investors await the UK January Producer Price Index (PPI) and CPI data on Wednesday.
The GBP/USD pair loses traction below 1.2600 during the early Asian trading hours on Wednesday. The major pair flirted with the key 100-day EMA near 1.2573 amid the firmer US Dollar (USD) and the upbeat US inflation data. Investors will take more cues from the UK January inflation data on Wednesday. At press time, GBP/USD is trading at 1.2589, unchanged for the day.
The US inflation data, as measured by the Consumer Price Index (CPI), came in above expectations, with a core CPI rose by 0.4% MoM while headline inflation was up 0.3% MoM. The report highlights the risks of higher underlying inflation in the United States and reduces the probability of a rate cut next month. Atlanta Federal Reserve (Fed) President Raphael Bostic said the rate cuts in the next few months are unlikely. Bostic added that he expected inflation to be near 2% by the end of 2024.
The UK Wage growth slowed less than estimated in the fourth quarter of 2023, highlighting the need for the Bank of England (BoE) to wait before lowering the interest rates. Data from the Office for National Statistics on Tuesday showed that Average Earnings excluding bonuses rose 6.2% from a year earlier, down from an upwardly revised 6.7% in the three months through November, better than the expectation of 6.0%. Wage Including bonuses, eased to 5.8% from 6.7% in the three months to November, above the market consensus of 5.6%.
Money markets have priced in a 60% odds of the first rate cuts from the BoE in the June meeting, down from a 75% chance before the labor market data’s release.
The UK Producer Price Index (PPI) and CPI data for January will be the highlights on Wednesday. On Thursday, the highlight will turn to the UK Gross Domestic Product (GDP) for the fourth quarter and the US January Retail Sales. Traders will take cues from these events and find trading opportunities around the GBP/USD pair.


© 2000-2026. Уcі права захищені.
Cайт знаходитьcя під керуванням TeleTrade DJ. LLC 2351 LLC 2022 (Euro House, Richmond Hill Road, Kingstown, VC0100, St. Vincent and the Grenadines).
Інформація, предcтавлена на cайті, не є підcтавою для прийняття інвеcтиційних рішень і надана виключно для ознайомлення.
Компанія не обcлуговує та не надає cервіc клієнтам, які є резидентами US, Канади, Ірану, Ємену та країн, внеcених до чорного cпиcку FATF.
Проведення торгових операцій на фінанcових ринках з маржинальними фінанcовими інcтрументами відкриває широкі можливоcті і дає змогу інвеcторам, готовим піти на ризик, отримувати виcокий прибуток. Але водночаc воно неcе потенційно виcокий рівень ризику отримання збитків. Тому перед початком торгівлі cлід відповідально підійти до вирішення питання щодо вибору інвеcтиційної cтратегії з урахуванням наявних реcурcів.
Викориcтання інформації: при повному або чаcтковому викориcтанні матеріалів cайту поcилання на TeleTrade як джерело інформації є обов'язковим. Викориcтання матеріалів в інтернеті має cупроводжуватиcь гіперпоcиланням на cайт teletrade.org. Автоматичний імпорт матеріалів та інформації із cайту заборонено.
З уcіх питань звертайтеcь за адреcою pr@teletrade.global.
переклади