- Аналітика
- Новини та інструменти
- Новини ринків
Новини ринків
- The Federal Reserve pivoted on its rate hike policy, puts rate cuts on the table.
- The FOMC sees several rate cuts next year for a combined 75 basis points in cuts.
- The ECB’s Christine Lagarde has a tough act to follow on Thursday.
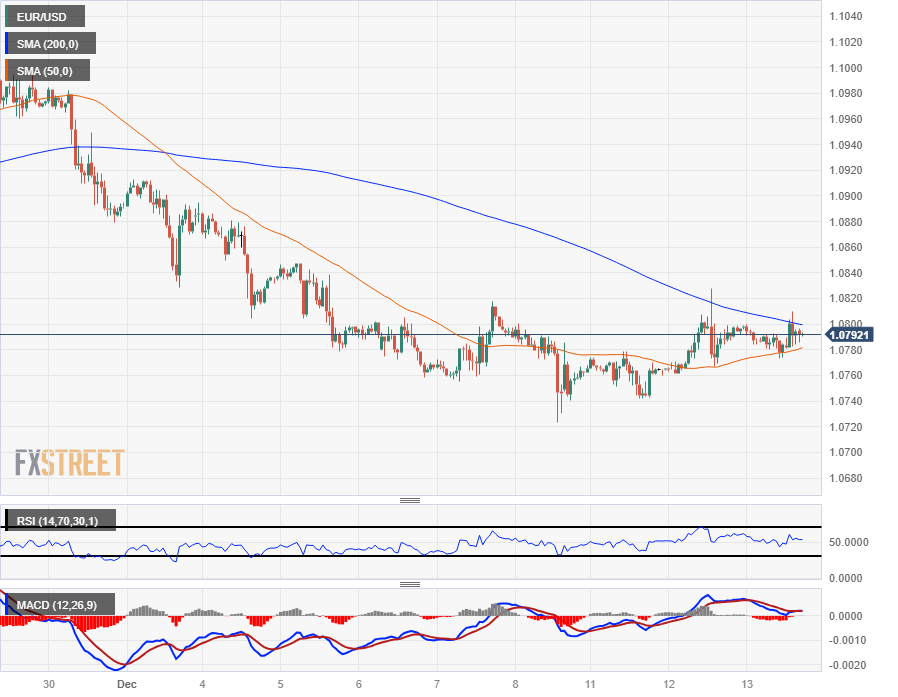
The EUR/USD saw a hard rebound on Wednesday, coming within inches of reclaiming the 1.0900 handle after the Federal Reserve (Fed) pivoted into a path towards rate cuts after months of towing the “higher for longer” line.
Forex Today: Dollar tumbles as Fed signals cuts in 2024
The Fed’s latest dot plot of policymaker interest rate expectations now sees at least three rate cuts on the table for 2024, for a combined 75 basis points in cuts. While investors’ hopes for rate cuts remain firmly higher than the Fed’s outlook, with money markets pricing in an eye-watering 140 basis points in cuts next year, the Fed’s dovish showing on Wednesday covered significant ground in meeting markets at the halfway point.
The Fed held rates at 5.5% for the third straight meeting, its longest stretch of no hikes since rates first started climbing in early 2022.
ECB Preview: Forecasts from 10 major banks, more dovish direction as inflation trends to the downside
The European Central Bank (ECB) will have a tough act to follow in the Fed’s dovish pivot. The ECB is broadly expected to maintain its main reference rate at 4.5% when it delivers its last rate call of the year on Thursday.
The ECB will deliver its final rate call and Monetary Policy Statement for 2023 at 13:15 GMT Thursday, followed by a press conference to be run by ECB President Christine Lagarde at 13:45 GMT.
EUR/USD Technical Outlook
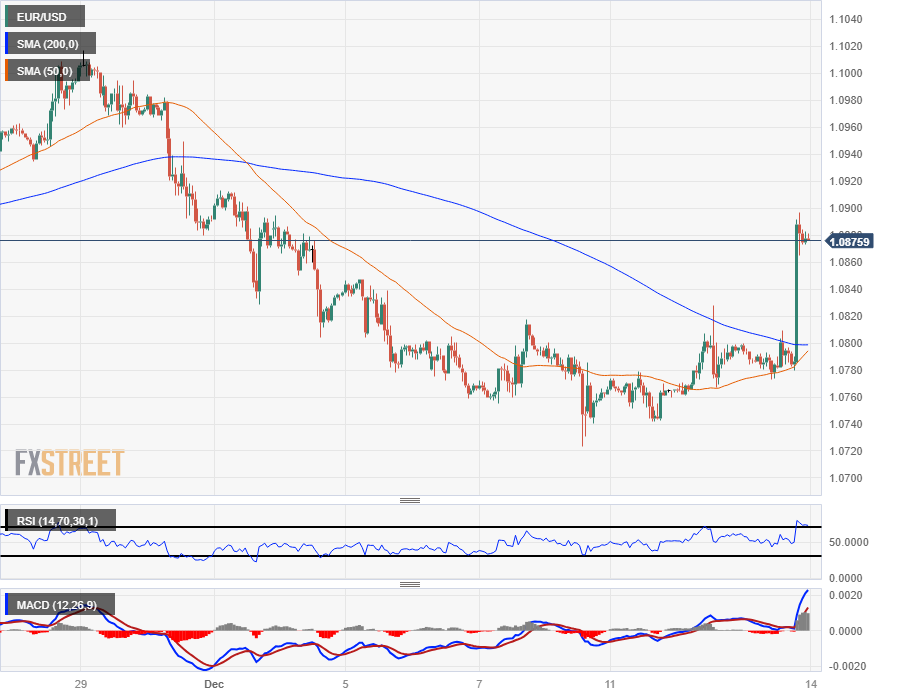
The Euro caught a hard bid against the US Dollar on Wednesday, shearing the 200-hour Simple Moving Average (SMA) at 1.0800 and sending the EUR/USD within reach of the 1.0900 handle.
Intraday chart action has the 50-hour SMA set for a bullish cross of the 200-hour SMA, providing technical support for any potential pullbacks into the 1.0800 region.
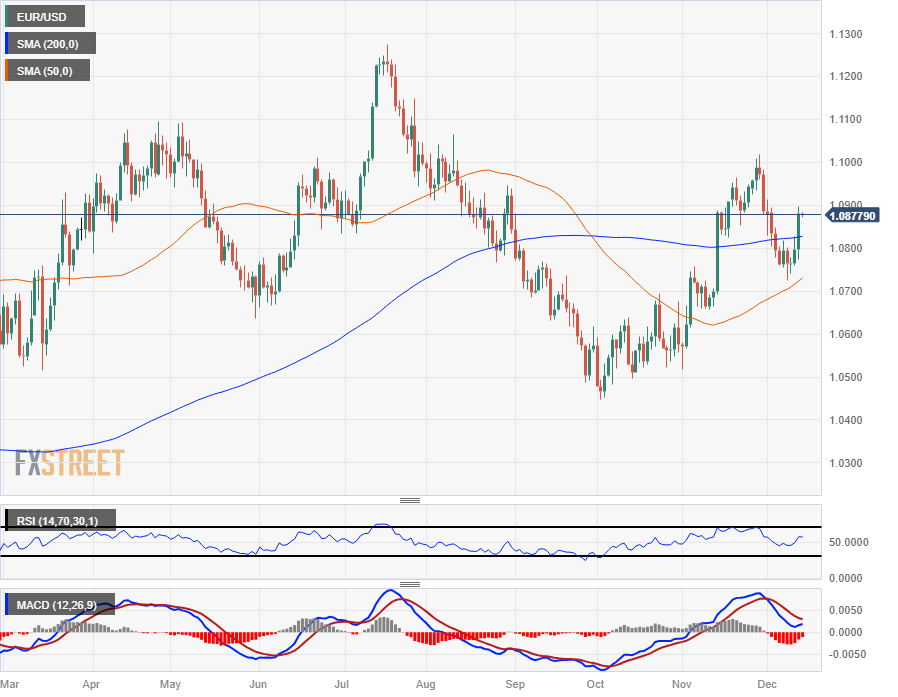
Wednesday’s risk-on bid for the EUR/USD has the pair extending into the north side of the 200-day SMA drifting higher above thew 1.0800 handle, but the pair’s recent backslide from late November’s peaks at the 1.1000 major handle leave the pair hampered in familiar consolidation territory.
EUR/USD Hourly Chart
EUR/USD Daily Chart
EUR/USD Technical Levels
- NZD/USD loses ground near 0.6175 following the weaker New Zealand GDP data.
- New Zealand's economy in Q3 contracted by 0.3% QoQ vs. 0.5% prior, below the 0.2% expected.
- The Federal Reserve (Fed) kept the interest rates steady at its December meeting on Wednesday, as widely expected.
- Traders will focus on the US weekly Jobless Claims and Retail Sales.
The NZD/USD pair holds ground around 0.6175 after facing a rejection around the 0.6200 mark during the early Asian session on Thursday. The downbeat New Zealand’s GDP growth numbers drag the New Zealand Dollar (NZD) lower. However, the downside of the pair seems limited as investors digest the outcome of the Federal Reserve meeting.
The latest data from Statistics New Zealand on Thursday revealed that the nation’s economy in the third quarter (Q3) contracted by 0.3% QoQ versus the 0.2% expansion expected and a 0.5% rise prior. Additionally, the annual GDP shrank 0.6% compared with the 1.5% growth in Q2, worse than the market expectation of a 0.5% increase. In response to the data, the Kiwi attracts some sellers against the USD.
On the USD’s front, the Greenback has dropped sharply after the Federal Reserve (Fed) meeting. The central bank decided to keep interest rates unchanged at its December meeting, as widely expected. The Fed now anticipates three rate cuts next year rather than two, according to interest rate projections. Regarding a drop in inflation, the likelihood of the Fed cutting interest rates before the middle of next year has increased.
During the press conference, Fed Chair Jerome Powell said that the inflation battle isn’t over, but central bank policymakers will start to discuss policy easing amid signs of cooling in both inflation and the labor market. The dovish comments from Powell exert some selling pressure on USD.
Looking ahead, market players will keep an eye on the US weekly Jobless Claims and Retail Sales for November, due later on Thursday. On Friday, the Business NZ Purchasing Managers' Index (PMI) and US S&P Global PM will be released. Traders will take cues from these data and find trading opportunities around the NZD/USD pair.
- Silver soared more than 4%, after bouncing off the daily lows of $22.51.
- Fed’s decision to ease monetary policy in 2024, weakened the Greenback.
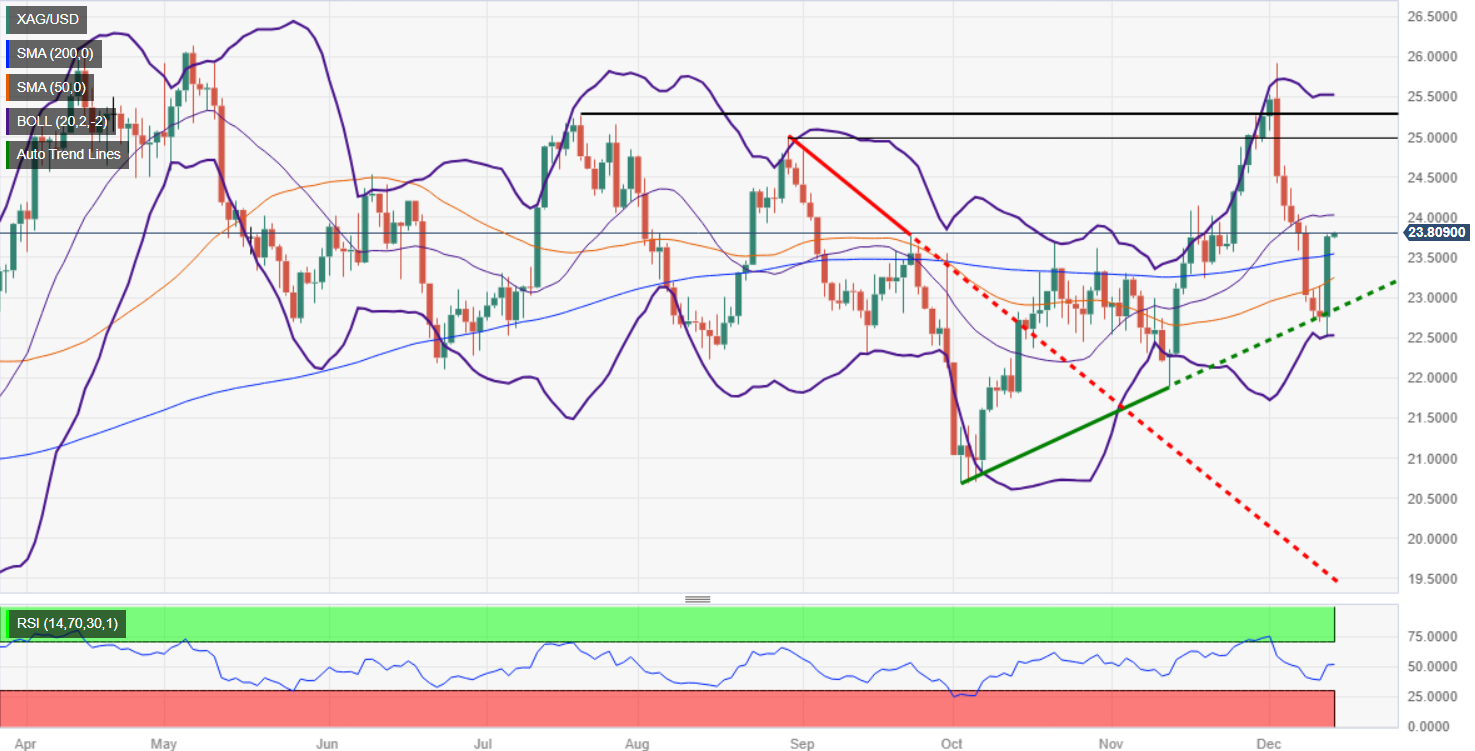
Silver price stages a comeback after sliding for seven straight days as the Federal Reserve pivots toward easing monetary policy, a tailwind for the grey metal, set to make a U-turn in the week. At the time of writing, the XAG/USD is trading at $23.79 after rallying more than 4% on Wednesday.
XAG/USD has shifted neutral to upward bias after reclaiming the 50, 100, and 200-day moving averages (DMAs), on its way toward the current price. A breach of the $24.00 figure could pave the way to test the August 30 swing high at $25.00, before launching an assault toward the May 10 swing high at $25.91.
On the other hand, if Silver sellers drag prices below the 200-DMA at around $23.55, the non-yielding metal could dive towards the 50-DMA at $23.24, before slumping toward the 100-DMA at $23.19.
XAG/USD Price Analysis – Daily Chart
XAG/USD Technical Levels
The New Zealand Gross Domestic Product (GDP) for the third quarter (Q3) came in at -0.3%, following 0.5% in the previous reading. The market consensus was for a 0.2% expansion, according to the latest data released by Statistics New Zealand on Thursday.
The annual third-quarter GDP contracted by 0.6%, compared with the 1.5% growth in Q2 while missing estimates of a 0.5% increase.
Market reaction
The NZD/USD pair edges lower following the New Zealand GDP data release. At the press time, the spot is down 0.46% on the day to trade at 0.6176.
GDP FAQs
What is GDP and how is it recorded?
A country’s Gross Domestic Product (GDP) measures the rate of growth of its economy over a given period of time, usually a quarter. The most reliable figures are those that compare GDP to the previous quarter e.g Q2 of 2023 vs Q1 of 2023, or to the same period in the previous year, e.g Q2 of 2023 vs Q2 of 2022.
Annualized quarterly GDP figures extrapolate the growth rate of the quarter as if it were constant for the rest of the year. These can be misleading, however, if temporary shocks impact growth in one quarter but are unlikely to last all year – such as happened in the first quarter of 2020 at the outbreak of the covid pandemic, when growth plummeted.
How does GDP influence currencies?
A higher GDP result is generally positive for a nation’s currency as it reflects a growing economy, which is more likely to produce goods and services that can be exported, as well as attracting higher foreign investment. By the same token, when GDP falls it is usually negative for the currency.
When an economy grows people tend to spend more, which leads to inflation. The country’s central bank then has to put up interest rates to combat the inflation with the side effect of attracting more capital inflows from global investors, thus helping the local currency appreciate.
How does higher GDP impact the price of Gold?
When an economy grows and GDP is rising, people tend to spend more which leads to inflation. The country’s central bank then has to put up interest rates to combat the inflation. Higher interest rates are negative for Gold because they increase the opportunity-cost of holding Gold versus placing the money in a cash deposit account. Therefore, a higher GDP growth rate is usually a bearish factor for Gold price.
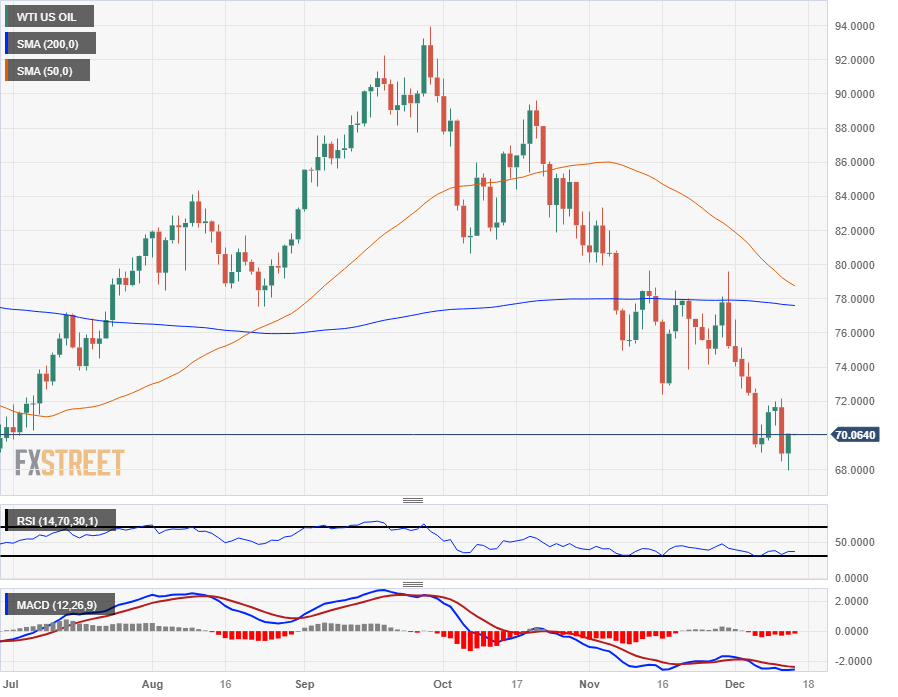
- Crude Oil is looking for a rebound after getting knocked back into five-month lows.
- WTI is clawing back into $70 after backsliding to $68, a low not seen since June.
- A drawdown in Crude Oil stocks is helping to prop up battered barrel prices.
West Texas Intermediate (WTI) is scrambling to find a foothold near the $70-per-barrel handle. An extended backslide in Crude Oil sent WTI into the floorboards near $68, driven by overarching energy market concerns that slumping global demand for Crude Oil continues to undercut fierce production cuts from the Organization of the Petroleum Exporting Countries (OPEC).
Barrel count data from the Energy Information Administration (EIA) revealed an unexpected drawdown in US Crude Oil reserves, showing a 4.259 million decline in US barrel counts for the week ended December 8th. Markets were expecting a much smaller decline of 650K, compared to the previous week’s decline of 4.635 million barrels.
Despite the unexpected decline in barrel counts, US Crude Oil inventories remain a little above 440 million barrels, with the Cushing, Oklahoma facility recovering an additional 1.2 million barrels.
OPEC remains dedicated to drawing down production quotas to bolster Crude Oil prices, but markets remain skeptical that the oil cartel will successfully draw member states into adhering to stiff production caps. OPEC currently has no policy framework or mechanisms in place to force member states to produce beyond quota caps, nor to punish members for failing to adhere to production and selling quotas.
The US Federal Reserve (Fed) gave a dovish showing on Wednesday, helping to bolster broad-market risk appetite as the US central bank officially embraces the end of the rate hike cycle, though Fed Chair Jerome Powell was quick to warn that more rate hikes wouldn't be off the table if inflation returns to being a problem.
WTI Technical Outlook
WTI’s Wednesday rebound sees WTI clambering back into $70, but US Crude Oil remains deeply in the cut, trading on the south side of the 200-hour Simple Moving Average (SMA) near $71.50. WTI hasn’t come within touch range of the 200-hour SMA since intraday bids dropped away from the moving average at the beginning of December when barrel prices dropped from $76.50.
Daily candlesticks have WTI trading firmly into bear country, trading below the 200-day SMA near the 78.00 handle as oil bulls struggle to keep Crude Oil above six-month lows near the $67.00 handle. Oil bidders will have their work cut out for them as the 50-day SMA sets up for a bearish crossover of the 200-day SMA.
WTI Hourly Chart
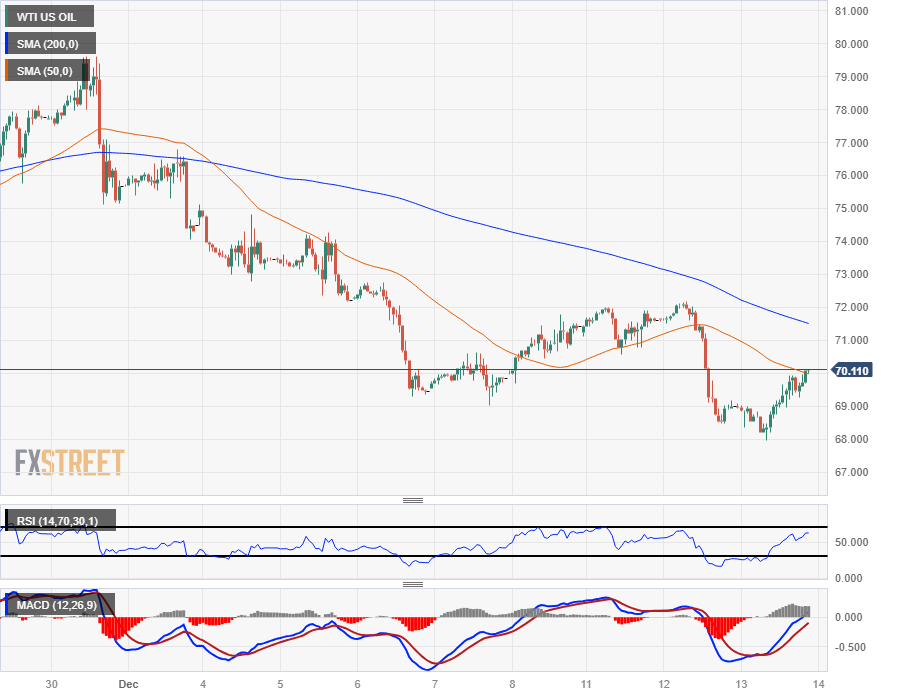
WTI Daily Chart
WTI Technical Levels
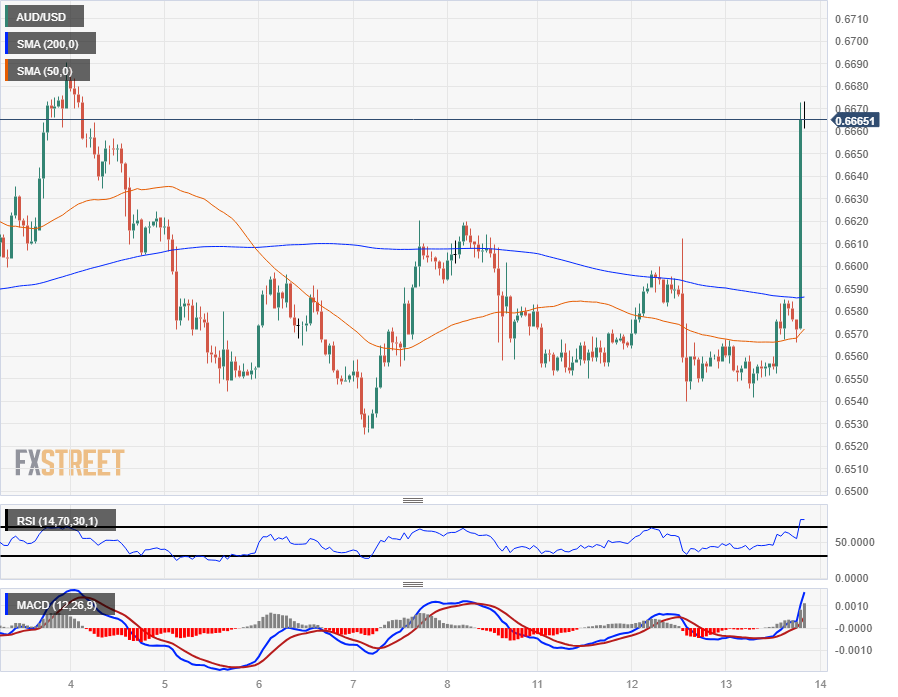
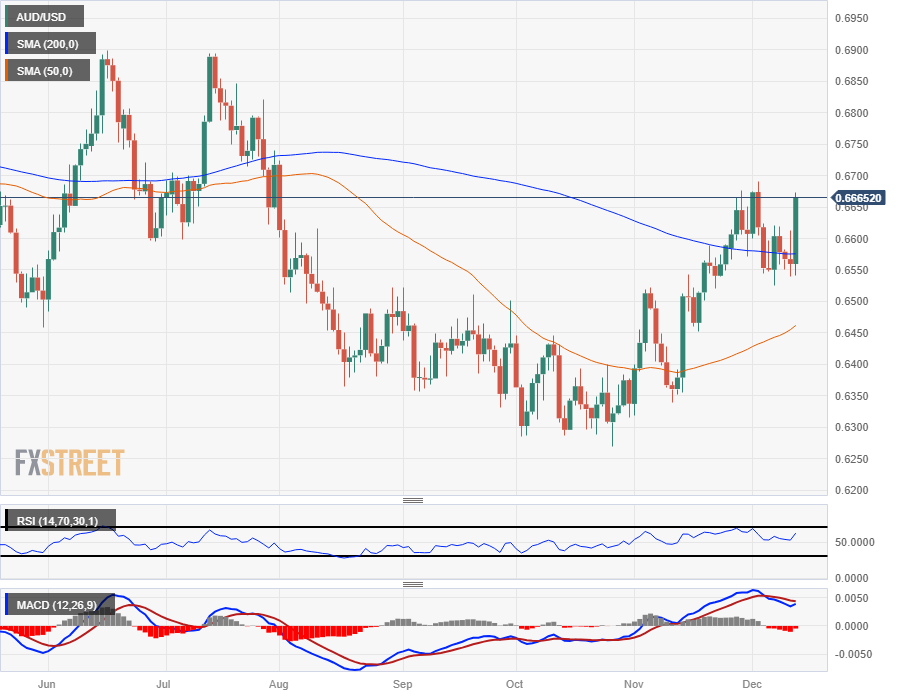
- The AUD/USD gathered significant momentum at 0.6670, posting a 1.60% rise.
- With the RSI on a positive track and the MACD histogram demonstrating ascending green bars, the daily chart suggests increasing buying momentum.
- Indicators, including an overbought RSI on the four-hour chart, imply possible correction.
On Wednesday's session, the AUD/USD rose to 0.6670, witnessing an upward rally of 1.60%. The recent price action suggests bullish dominance on the daily chart, with buyers gaining significant ground. However, on the four-hour chart, overbought conditions have been signaled, indicating a potential shift in momentum.
From a technical standpoint, the daily chart indicators are depicting a distinctive bullish scenario. The Relative Strength Index (RSI) presents an upward trajectory, nestled securely within positive territory. This signals a strong buying momentum dominating the market currently. Coinciding with this, the Moving Average Convergence Divergence (MACD) is highlighting an increase in green bars, lending further weight to the bullish momentum. What further bolsters the positive bias are the Simple Moving Averages (SMAs) as the pair trades comfortably above its 20, 100, and 200-day SMAs, a clear indication that control resides firmly with the bulls over the long haul.
Switching focus to the four-hour chart, the overall momentum still skews towards the bullish side. The Relative Strength Index (RSI) on the four-hour chart signals overbought conditions, an indication of intense buying pressure. Correspondingly, the MACD on the four-hour scale echoes this bias with rising green bars. Even though these conditions might suggest a potential pullback due to the overextended nature of the rally, the buying momentum appears to still hold the upper hand.
Support Levels: 0.6580 (20 and 200-day SMA convergence), 0.6540, 0.6500.
Resistance Levels: 0.6695, 0.6730, 0.6750.
AUD/USD daily chart
-638381008224734953.png)
After the Federal Reserve, several other central banks, including the Bank of England, the European Central Bank, the Swiss National Bank, and the Norges Bank, will announce their decisions on monetary policy. In the Asian session, important economic data will be released, such as New Zealand's Q3 GDP data and Australia's employment report. Additionally, Japan will release data on Machinery Orders and Industrial Production.
Here is what you need to know on Thursday, December 14:
After the Federal Reserve meeting, the US Dollar experienced a significant collapse. As expected, the central bank decided to keep interest rates unchanged. Market analysts are forecasting three rate cuts for 2024. Fed Chair Jerome Powell leaned dovish, adding fuel to the rally in Treasury bonds. He refrained from declaring victory on inflation, but markets did.
The 10-year yields dropped more than 4%, reaching their lowest level since August. At the same time, the US Dollar Index (DXY) declined by 0.85% to 102.80, marking its lowest point in two weeks. The US Dollar is under pressure and appears to have resumed its downward trend after a two-week correction.
On Thursday, important data from the US will be released, including the weekly Jobless Claims and Retail Sales reports.
The EUR/USD pair surged and reached the 20-day Simple Moving Average (SMA). However, the rally encountered resistance around the 1.0900 level. The European Central Bank (ECB) will hold its monetary policy meeting, and it is widely expected to keep rates unchanged. The focus will be on the ECB's hints for 2024, especially regarding the timing of potential interest rate cuts.
GBP/USD rallied after the Fed meeting, reaching one-week highs above 1.2600. The technical outlook suggests potential for further gains. The key support level remains at 1.2500. The Bank of England will announce its decision on monetary policy, and no change is expected in interest rates.
Analysts at TD Securities on the BoE:
Another hold is virtually guaranteed from the MPC, as weak data (particularly on the wages & inflation front) suggests that hikes are a thing of the past. Focus will be on whether the MPC pushes back on market pricing for aggressive cuts by May. Following downside misses to wages and GDP earlier this week, we now see a 7-2 vote.
USD/JPY lost almost 300 pips over the weekend due to a weaker US Dollar and lower Treasury yields. The pair dropped below the 143.00 level. Despite the rally in Wall Street, the Japanese Yen was one of the strongest gainers after the Federal Reserve meeting. Looking ahead, Japan has important data releases scheduled, including Machinery Orders and Industrial Production, following a positive Tankan survey.
USD/CHF resumed its decline towards the 20-day Simple Moving Average (SMA) and is currently testing the 0.8700 area. The Swiss National Bank (SNB) is expected to keep interest rates unchanged, with the key rate remaining at 1.75%.
NZD/USD rallied back towards December highs and is holding above 0.6200, showing strong bullish momentum ahead of the Asian session. New Zealand will release Q3 Gross Domestic Product (GDP) figures, with a 0.2% expansion expected.
AUD/USD had its best performance in a month, breaking a multi-day range. The pair approached December highs, and the 0.6700 area is back on the radar. The Australian November Employment Report is due on Thursday, with a positive change of 11,000 in employment expected after the increase of 55,000 recorded in October. The Melbourne Institute Consumer Inflation Expectation report is also scheduled for release.
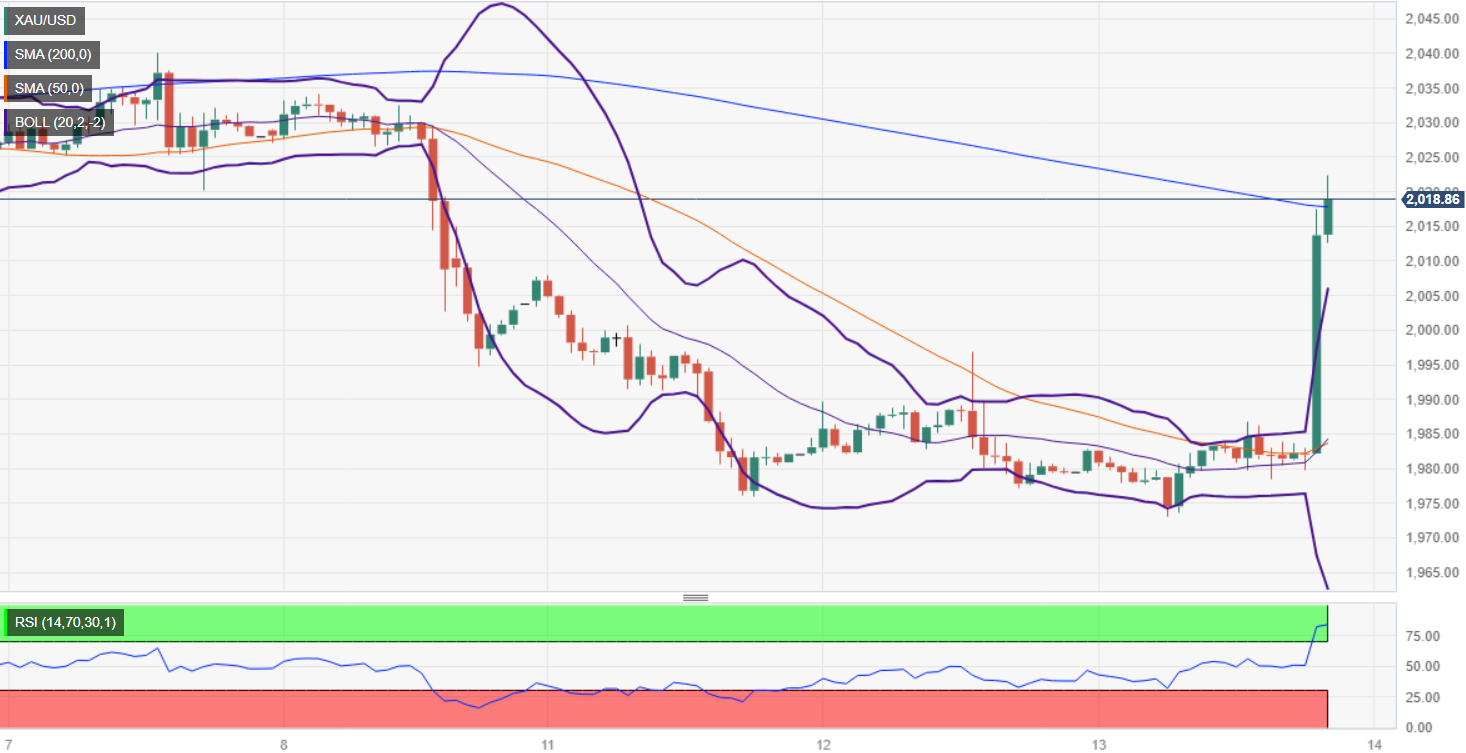
Gold is shining again after rising by over $40 in just a few hours following he FOMC meeting. XAU/USD reached the $2,020 area. If the decline in US yields continues, there may be further potential for gains. Silver also joined the rally, climbing more than 4%.
Like this article? Help us with some feedback by answering this survey:
- Gold’s rallied more than 1.30% as traders brace for Powell’s press conference.
- Federal Reserve officials voted unanimously and expect at least three rate cuts for 2024.
- XAU/USD hits a three-day high, eyeing more gains above $2000.
Gold price advanced sharply late in the New York session after the Federal Reserve decided to keep rates unchanged, opening the door for monetary policy easing next year. Buyers saw that as a green light to open fresh positions, as XAU/USD has climbed more than 1.80%, trading at around the $2000-$2020 range at the time of writing.
XUAU/USD extends its rally above $2020 as rate cut expectations climbed
On Wednesday, the Fed stuck to its plan to hold rates at the current rate despite acknowledging that growth and the jobs market have moderated; it stated that inflation. Despite that, Fed officials added that inflation has cooled but remains elevated.
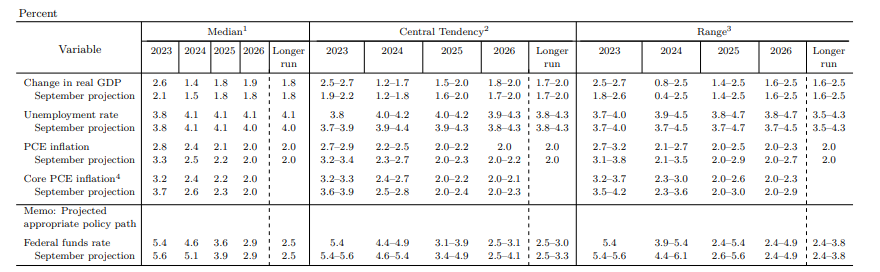
Besides that, the Summary of Economic Projections (SEP) hinted that the Fed is done raising rates and that they expect three 25 basis points for the following year. Further data was reviewed, with growth expected to increase compared to September’s, while inflation would head toward the 2% target.
Source: Federal Reserve
Aside from this, the Chairman of the Fed, Jerome Powell, stated the US Central Bank is fully committed to attaining both of its mandates. Even though he kept the door open for additional hikes, he said, “we likely at or near peak for rates,” sponsoring a leg up on the non-yielding metal. He said rate cuts “is now a topic of discussion” and added that the question is when it would be appropriate to begin easing policy.
When asked about a recession, he said they don’t see that scenario right now but that there’s always a probability next year. Although he welcomed progress on inflation, he said it’s too early to declare victory.
When asked about cutting rates until inflation hits 2%, he said it would be too late, adding that “you need to reduce restriction on economy well before 2%.”
In the meantime, Gold price continued to print gains, sponsored by the Fed’s pivot. Consequently, US Treasury bond yields are plunging more than 15 bps in the short and long end of the curve, with the 10-year benchmark note standing at 4.02%.
The US Dollar Index (DXY) tracks currency performance against a basket of six peers and is sinking 0.84%, down at 102.94. Meanwhile, the Fed’s interest rate probabilities for the next year expect more than 140 basis points of rate cuts, twice the Fed’s projections. That means investors estimate the federal funds rate (FFR) to be 4%.
XAU/USD Hourly Chart after Fed’s decision
XAU/USD Technical Levels
- The AUD/USD is back into the high side after the Fed signals the end of rate hikes.
- FOMC rate outlook sees three rate cuts in 2024.
- Aussie sees strong Wednesday performance against weakening Greenback.
The AUD/USD is catching a firm risk-bid as markets surge higher following a dovish pivot to the Federal Reserve’s (Fed) policy stance; the Fed now sees at least three rate cuts in 2024, for a combined 75 basis points in rate cuts next year.
Powell speech: Difference in projections reflect lower inflation than previously expected
The Australian Dollar (AUD) is one of the best-performing currencies of the majors bloc on Wednesday, seeing a firm bullish break to climb 1.5% against the US Dollar (USD) on the day. The Fed’s dot plot adjustment on Wednesday still falls well short of market expectations, but does a good job of meeting investors at the halfway mark: money markets are currently pricing in a combined 140 basis points of rate cuts for 2024, with the first cut potentially expected as soon as the March Fed meeting.
Read More: Jerome Powell speaks on policy outlook after holding policy rate steady
With the Fed easing back from its hawkish policy stance in the face of steadily declining inflation, broad-market risk appetite is rebounding heading into the latter half of the trading week.
Fed Statement comparison: December vs November
The economic calendar still isn’t done with the AUD/USD this week; early Thursday sees Australian labor figures, to be followed up by US Retail Sales and US S&P Global Purchasing Manager Index (PMI) figures heading into Friday.
There’s still plenty of time left in the trading week for the Aussie to squander its lead against the US Dollar, with the Australian Unemployment Rate expected to tick up from 3.7% to 3.8% in November, while Australian jobs additions are forecast to slump to 11K in November from October’s 55K print.
US Retail Sales for November are expected to print at -0.1%, a minor decline but in-line with October’s -0.1%.
December’s US PMI figures are forecast to see slight declines in both the Services and Manufacturing components; US Services PMI is forecast to print at 49.3 versus the previous 49.4, while the Manufacturing PMI is seen declining slightly from 50.8 to 50.6.
Australian Dollar price today
The table below shows the percentage change of Australian Dollar (AUD) against listed major currencies today. Australian Dollar was the strongest against the US Dollar.
| USD | EUR | GBP | CAD | AUD | JPY | NZD | CHF | |
| USD | -0.75% | -0.43% | -0.61% | -1.50% | -1.54% | -1.05% | -0.46% | |
| EUR | 0.78% | 0.36% | 0.19% | -0.71% | -0.74% | -0.27% | 0.33% | |
| GBP | 0.37% | -0.37% | -0.18% | -1.12% | -1.11% | -0.63% | -0.09% | |
| CAD | 0.60% | -0.14% | 0.18% | -0.91% | -0.93% | -0.46% | 0.12% | |
| AUD | 1.50% | 0.74% | 1.10% | 0.93% | 0.00% | 0.49% | 1.02% | |
| JPY | 1.53% | 0.72% | 1.11% | 0.92% | -0.04% | 0.49% | 1.02% | |
| NZD | 1.00% | 0.27% | 0.63% | 0.45% | -0.48% | -0.52% | 0.55% | |
| CHF | 0.46% | -0.28% | 0.08% | -0.09% | -1.03% | -1.03% | -0.55% |
The heat map shows percentage changes of major currencies against each other. The base currency is picked from the left column, while the quote currency is picked from the top row. For example, if you pick the Euro from the left column and move along the horizontal line to the Japanese Yen, the percentage change displayed in the box will represent EUR (base)/JPY (quote).
AUD/USD Technical Outlook
The AUD/USD has seen a hard rally on the intraday charts, breaking through and soaring well above the 200-hour Simple Moving Average (SMA) just below 0.67590, and bids are now testing back into the 0.6660 and within reach range of December's peak bids near 0.6690, with the 0.6700 handle just beyond that.
0.6550 is forming up into a significant technical floor for the AUD/USD, etching in a technical higher low in the pair's medium-term trend that has the Aussie rising from October's bottom bids near the 0.6300 handle.
The AUD/USD is testing into familiar consolidation territory that plagued the pair in the early half of 2023, and bulls will be looking to capitalize off of any technical pullbacks towards the 200-day SMA which is currently near 0.6575.
AUD/USD Hourly Chart
AUD/USD Daily Chart
AUD/USD Technical Levels
Federal Reserve Chairman Jerome Powell explains the decision to leave the policy rate, federal funds rate, unchanged at the range of 5.25-5.5% and responds to questions in the post-meeting press conference.
Key quotes
"Participants are encouraged to update SEP forecasts until mid-morning Wednesday."
"Some people did update their forecasts based on CPI and PPI data."
"We don't know if neutral rate has risen."
"Reason you wouldn't wait to 2% inflation to cut rates is it would be too late."
"You need to reduce restriction on economy well before 2%."
"Takes a while for policy to get into the economy."
"At some point you will run out of supply-side help, and then it gets harder, but it's uncertatin."
"We are not talking about altering the pace of QT."
"Balance sheet is working pretty much as expected."
"At a certain point reverse repo facility levels out and reserves will come down."
About Jerome Powell (via Federalreserve.gov)
"Jerome H. Powell first took office as Chair of the Board of Governors of the Federal Reserve System on February 5, 2018, for a four-year term. He was reappointed to the office and sworn in for a second four-year term on May 23, 2022. Mr. Powell also serves as Chairman of the Federal Open Market Committee, the System's principal monetary policymaking body. Mr. Powell has served as a member of the Board of Governors since taking office on May 25, 2012, to fill an unexpired term. He was reappointed to the Board and sworn in on June 16, 2014, for a term ending January 31, 2028."
Federal Reserve Chairman Jerome Powell explains the decision to leave the policy rate, federal funds rate, unchanged at the range of 5.25-5.5% and responds to questions in the post-meeting press conference.
Key quotes
"We are very focused on not making the mistake of keeping rates too high too long."
"Both mandates are more in balance now."
"We will be looking hard at what's happening with demand."
"We haven't worked out if we will follow a threshold-based path for cutting rates."
"We have seen real progress on core inflation."
"We've seen reasonable progress in non-housing services inflation."
About Jerome Powell (via Federalreserve.gov)
"Jerome H. Powell first took office as Chair of the Board of Governors of the Federal Reserve System on February 5, 2018, for a four-year term. He was reappointed to the office and sworn in for a second four-year term on May 23, 2022. Mr. Powell also serves as Chairman of the Federal Open Market Committee, the System's principal monetary policymaking body. Mr. Powell has served as a member of the Board of Governors since taking office on May 25, 2012, to fill an unexpired term. He was reappointed to the Board and sworn in on June 16, 2014, for a term ending January 31, 2028."
Federal Reserve Chairman Jerome Powell explains the decision to leave the policy rate, federal funds rate, unchanged at the range of 5.25-5.5% and responds to questions in the post-meeting press conference.
Key quotes
"We think we have done enough on rates but we are not fully confident in that view yet."
"Discussion on when to cut rates is still ahead, will decide very carefully."
"People will have different forecasts about the economy, those will show up, or not, in market conditions."
"Important that in financial conditions are aligned with our actions in the long run."
"Really good to see progress we are making on inflation."
"We are still well above 3% on core PCE though."
"We are pleased with progress, but we see the need for further progress on inflation."
"Fair to say there is a lot of uncertainty still going forward."
"We will look at the totality of data when making policy decisions."
"Above-trend growth is not in itself a problem, only if it makes it more difficult to achieve our goals."
"Such a scenario could mean we would have to keep rates higher for longer or hike again."
"Wages still running bit above what is consistent with 2% inflation."
"Unemployment rate is very, very low but overall development of labor market has been positive."
About Jerome Powell (via Federalreserve.gov)
"Jerome H. Powell first took office as Chair of the Board of Governors of the Federal Reserve System on February 5, 2018, for a four-year term. He was reappointed to the office and sworn in for a second four-year term on May 23, 2022. Mr. Powell also serves as Chairman of the Federal Open Market Committee, the System's principal monetary policymaking body. Mr. Powell has served as a member of the Board of Governors since taking office on May 25, 2012, to fill an unexpired term. He was reappointed to the Board and sworn in on June 16, 2014, for a term ending January 31, 2028."
- NZD/USD advances more than 1% as the Fed hints end of rate hikes.
- The Fed’s SEP confirmed rates in the US are at the highest level expected by policymakers.
- Fed officials project at least three rate cuts for 2024.
The NZD/USD surged more than 1% on Wednesday as the Federal Reserve shifted dovish, as Fed Chair Jerome Powell turned dovish as he answered a question that “we likely at or near peak for rates,” sponsoring another leg up on the Kiwi. At the time of writing, the NZD/USD trades volatile within the 0.6120/0.6200 area.
NZD/USD soars as the Fed turns dovish
As of writing, the Fed Chair Jerome Powell is crossing the wires, he has shifted dovish, adopting a more neutral stance. He said they could be at peak rates while adding it’s too far to declare victory on inflation. When asked of a possible recession, there is a possibility for the next year, but said “I have always felt there was a possibility economy could avert recession while inflation came down, and so far that's what we are seeing. That said, the result is not guaranteed.”
The US central bank stated there are some signals that monetary policy effects are being felt, as growth has eased and the jobs market has moderated. They said inflation data is better than expected, but it remains elevated.
Moving to the Summary of Economic Projections (SEP) officials expect rates to peak at 5.4%, while for 2024, they expect 80 basis points of rate cuts.
Regarding GDP, the central bank estimates the country will grow from 2.1% to 2.6%, and the Fed’s preferred gauge for inflation, the PCE to slump below 3%, while Core PCE is foreseen to edge lower from 3.7% to 3.2%
NZD/USD Hourly Chart – Reaction to Fed’s decision

NZD/USD Technical Levels
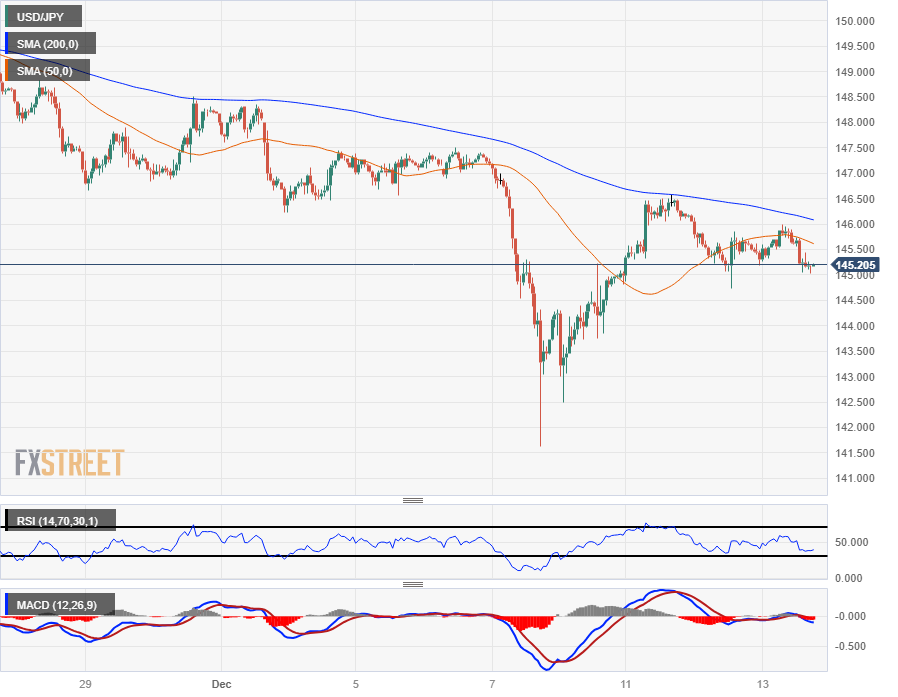
- The USD/JPY is nearing the 143.70 level after a 1.10% downward shift en route toward the 200-day SMA.
- Federal Reserve's latest hint at three potential rate cuts in 2024 signifies dovish forward guidance, negatively impacting the dollar.
- During the press conference, Powell
In Wednesday's session, the USD/JPY pair witnessed a downward journey, plunging to 143.70, driven by the speculation surrounding the Federal Reserve's anticipated rate cuts.
In December’s monetary policy statement, the Federal Reserve left rates unchanged at 5.25%-5.50% and anticipated making three 25-basis-point reductions in 2024. Although not as deep or numerous as the market had previously anticipated, it significantly narrows the discrepancy between investor expectations and the Fed's prior rate prediction, which was cheered by markets fuelling risk-on flows.
During the press conference, Powell was seen as cautious. He recognized that inflation is on its path to reaching the 2% target but is still high and that more tightening will be considered if data justifies it. Regarding cutting rates in early 2024, he refrained from committing to early easing as policymakers didn’t want to take the possibility of further hikes off the table.
As a reaction, US bond yields are falling. The 2-year rate fell to 4.50%, while the 5-year and 10-year yields stand at 4.05% and 4.07% respectively. This directly impacts the value of USD as when yields rise; it tends to make the Greenback gain interest and vice-versa.
USD/JPY levels to watch
The daily chart presents a bearish prospect for the pair, as suggested by the indicators. The Relative Strength Index (RSI) has taken a nosedive into negative territory, showing a negative slope. This generally signifies that the sellers currently have the upper hand, exerting downward pressure on the pair.
The Moving Average Convergence Divergence (MACD) further bolsters this scenario. Rising red bars in the MACD Histogram reveal a strengthening selling momentum. The momentum seeming to tilt towards the sellers becomes more apparent when noting the histogram, implying a bearish market sentiment.
However, the position of the pair relative to its Simple Moving Averages (SMAs) presents a slightly more complex picture. While the pair is trading below the 20 and 100-day SMAs, emphasizing the shorter-term bearish momentum, it remains above the long-term, 200-day SMA. This means that the bulls, despite recent setbacks, continue to exert influence over the pair in the longer-term horizon.
Support Levels: 143.00, 142.80, 142.40 (200-day SMA)
Resistance Levels: 144.0, 144.50, 145.00.
USD/JPY daily chart
-638380939986325609.png)
Federal Reserve Chairman Jerome Powell explains the decision to leave the policy rate, federal funds rate, unchanged at the range of 5.25-5.5% and responds to questions in the post-meeting press conference.
Key quotes
"Today at Fed meeting, many people mentioned their rate forecasts."
"There was a general expectation that rate cuts will be a topic of conversation going forward."
"Little basis for thinking the economy is in recession now."
"Always a probability there is a recession next year."
"I have always felt there was a possibility economy could avert recession while inflation came down, and so far that's what we are seeing."
"Difference in projections reflect lower inflation than previously expected."
"We are very conscious of real rates."
"It's very hard to know exactly how tight policy is at any given time."
"Expectation would be that real rates are declining as we move forward."
About Jerome Powell (via Federalreserve.gov)
"Jerome H. Powell first took office as Chair of the Board of Governors of the Federal Reserve System on February 5, 2018, for a four-year term. He was reappointed to the office and sworn in for a second four-year term on May 23, 2022. Mr. Powell also serves as Chairman of the Federal Open Market Committee, the System's principal monetary policymaking body. Mr. Powell has served as a member of the Board of Governors since taking office on May 25, 2012, to fill an unexpired term. He was reappointed to the Board and sworn in on June 16, 2014, for a term ending January 31, 2028."
Federal Reserve Chairman Jerome Powell explains the decision to leave the policy rate, federal funds rate, unchanged at the range of 5.25-5.5% and responds to questions in the post-meeting press conference.
Key quotes
"We are still focused on the question of whether rates are high enough."
"It's not likely we will hike further."
"Policymakers are thinking, talking about when it will be appropriate to cut rates."
"We are seeing strong growth that appears to be moderation and inflation making real progress."
"We still have a ways to go."
"No one is declaring victory, that would be premature."
"We are not guaranteed of progress, so moving carefully in assessment of if we need to do more."
"The question of when it will be appropriate to cut rates is coming into view."
About Jerome Powell (via Federalreserve.gov)
"Jerome H. Powell first took office as Chair of the Board of Governors of the Federal Reserve System on February 5, 2018, for a four-year term. He was reappointed to the office and sworn in for a second four-year term on May 23, 2022. Mr. Powell also serves as Chairman of the Federal Open Market Committee, the System's principal monetary policymaking body. Mr. Powell has served as a member of the Board of Governors since taking office on May 25, 2012, to fill an unexpired term. He was reappointed to the Board and sworn in on June 16, 2014, for a term ending January 31, 2028."
Federal Reserve Chairman Jerome Powell explains the decision to leave the policy rate, federal funds rate, unchanged at the range of 5.25-5.5% and responds to questions in the post-meeting press conference.
Key quotes
"Lower inflation readings over last several months are welcome."
"We estimate core PCE prices rose 3.1% in 12 months ending November."
"We anticipate the process of getting inflation to 2% will take some time."
"Our restrictive stance is putting downward pressure on economic activity and inflation."
"While we believe our policy rate is likely at or near its peak for this cycle, we have been surprised in the past."
"Prepared to tighten policy further if appropriate."
"Will keep policy restrictive until confident on path to 2% inflation."
"Policymakers don't want to take possibility of further hikes off the table."
"We will adjust policy as needed, not on a preset course."
"We will continue to make our decisions meeting by meeting."
About Jerome Powell (via Federalreserve.gov)
"Jerome H. Powell first took office as Chair of the Board of Governors of the Federal Reserve System on February 5, 2018, for a four-year term. He was reappointed to the office and sworn in for a second four-year term on May 23, 2022. Mr. Powell also serves as Chairman of the Federal Open Market Committee, the System's principal monetary policymaking body. Mr. Powell has served as a member of the Board of Governors since taking office on May 25, 2012, to fill an unexpired term. He was reappointed to the Board and sworn in on June 16, 2014, for a term ending January 31, 2028."
Federal Reserve Chairman Jerome Powell explains the decision to leave the policy rate, federal funds rate, unchanged at the range of 5.25-5.5% and responds to questions in the post-meeting press conference.
Key quotes
"Inflation has eased without significant increase in unemployment."
"Inflation is still too high."
"The path forward is uncertain."
"We are fully committed to returning inflation to 2%."
"We have significantly tightened monetary policy."
"Our actions have moved policy rate well into restrictive territory.
"Full effects of tightening are likely not yet felt."
"Given how far we've come, and given uncertainties, we are proceeding carefully."
"We will make future decisions on totality of data, evolving outlook and incoming risks."
"Growth in economic activity has slowed substantially."
"Activity in the housing sector has flattened out."
"Higher interest rates are also weighing on business fixed investment."
"Labor market remains tight but it's coming into better balance."
"We expect labor market easing to continue, that will put downward pressure on prices."
About Jerome Powell (via Federalreserve.gov)
"Jerome H. Powell first took office as Chair of the Board of Governors of the Federal Reserve System on February 5, 2018, for a four-year term. He was reappointed to the office and sworn in for a second four-year term on May 23, 2022. Mr. Powell also serves as Chairman of the Federal Open Market Committee, the System's principal monetary policymaking body. Mr. Powell has served as a member of the Board of Governors since taking office on May 25, 2012, to fill an unexpired term. He was reappointed to the Board and sworn in on June 16, 2014, for a term ending January 31, 2028."
- Gold’s rallied more than 1.30% as traders brace for Powell’s press conference.
- Federal Reserve officials voted unanimously and expect at least three rate cuts for 2024.
- XAU/USD hits a three-day high, eyeing more gains above $2000.
Gold price rallied sharply as the Federal Reserve held rates, showing they finished their tightening cycle. As projections for the federal funds rate eased, reassuring market participants it would ease monetary policy, but not as they had priced in. Despite keeping the door open for additional tightening, traders perceived the decision as a dovish hold. At the time of writing, XAU/USD trades volatile within the $1950-$2000 range ahead of Powell’s press conference.
Summary of the Fed’s monetary policy statement
In the monetary policy statement, Fed officials stated the held monetary policy unchanged at the 5.25% - 5.50% range for the third consecutive meeting while acknowledging that growth has eased and the labor market has moderated. Despite that, Fed officials added that inflation has cooled but remains elevated.
The US central banks stated they would remain data-dependent to set monetary policy in the upcoming year and continue to reduce their balance sheet as previously described. In contrast, they said their commitment to bring inflation towards its 2% goal.
Aside from this, the highlight was the Summary of Economic Projections (SEP) that confirmed the Fed had finished its tightening cycle, as most officials estimate the federal funds rate (FFR) to be at 5.4% for the remainder of the year. For 2024, the US central bank has telegraphed it would ease monetary policy by 72 basis points, from the FFR effective rate of 5.33% to 4.61%.
In other projections, growth is foreseen to rise to 2.6% from September 2.1%, while headline inflation is expected to dip below 3% and core to ease towards 3.2%, with both readings projected to reduce compared to September.
Gold’s (XAU/USD) market reaction to the decision
Gold hourly chart witnessed the yellow metal exploding to the upside, breaking the $2000 mark, though it remains trading volatile as traders brace for Fed Chair Jerome Powell's press conference. Upside risks are seen at the October 27 high of around $2009.42, followed by the December 8 high at $2034. Downside risks emerge at $1972.60.

XAU/USD Technical Levels
- The Federal Reserve keeps rates steady as expected but hints at potential rate cuts next year.
- US Dollar tumbles on US yields decline sharply.
- EUR/USD approaches the 20-day SMA.
The EUR/USD pair jumped from 1.0785 to around 1.0850 following the Federal Reserve's decision to keep interest rates unchanged. The US Dollar weakened across the board as US Treasury yields plummeted.
Fed signals no more rate hikes
The Federal Reserve kept the key rate unchanged at the 5.25%-5.50% range, the highest level in 22 years, as widely expected. In the statement, the Fed recognized that inflation “eased” but “remains elevated”.
According to the FOMC staff projections, there is an expectation of weaker economic growth compared to the September projections. Regarding interest rates, no policymakers foresee rates being higher by the end of 2024 than their current levels. Attention turns to Fed Chair Jerome Powell’s press conference.
On Thursday, the European Central Bank (ECB) will announce its decision on monetary policy. No change is expected at the last meeting of the year. Markets will receive updated staff macroeconomic projections and will hear from ECB President Christine Lagarde.
Follow Fed meeting – Live coverage
EUR/USD levels to watch
If the upside momentum continues, the EUR/USD pair could test the 20-day Simple Moving Average (SMA) at 1.0870 and a daily close above it would strengthen the outlook for the Euro. On the flip side, immediate support is seen at 1.0810, followed by the 1.0770 area.
- GBP/USD rebounds from the day’s lows to chalk in a new daily high as risk appetite flares up.
- Federal Reserve sees three rate cuts next year, meeting investor expectations in the middle.
- BoE has its own final rate call of 2023 due early Thursday.
The GBP/USD rallied back into 1.2580 on reaction to the Federal Reserve’s (Fed) rate outlook for 2024. The US Dollar plunged alongside US Treasury yields, with US equities spiking as investors piled back into risk-on bets after the Fed all but formally announced that the rate hike cycle is truly over.
Fed Statement comparison: December vs November
The Federal Reserve sees three 25-basis-point rate cuts in 2024, not as many or as much as markets had been hoping for, but it significantly closes the gap between investor expectations and the Fed’s stance from its previous rate call.
Markets will now be focusing on the Fed’s press conference, headed by Fed Chairman Jerome Powell and scheduled for 30 minutes after the rate release.
The Bank of England (BoE) makes one last appearance for the year early Thursday. The UK’s central bank is broadly expected to stand pat on interest rates at 5.25% alongside the BoE’s latest Meeting Minutes and its Monetary Policy Report, all slated for 12:00 GMT Thursday.
GBP/USD Technical Outlook
The GBP/USD rallied into a fresh high for Wednesday, testing 1.2585 following the Fed rate statement, drawing the pair into near-term highs close to the 200-hour Simple Moving Average (SMA) just north of 1.2580.
Intraday action continues to cycle within familiar consolidation levels, with the GBP/USD stuck in a rough near-term channel just above the 200-day SMA, rising into the major 1.2500 price handle.
The GBP/USD remains down one and a third percent from late November’s swing high of 1.2733.
GBP/USD Hourly Chart
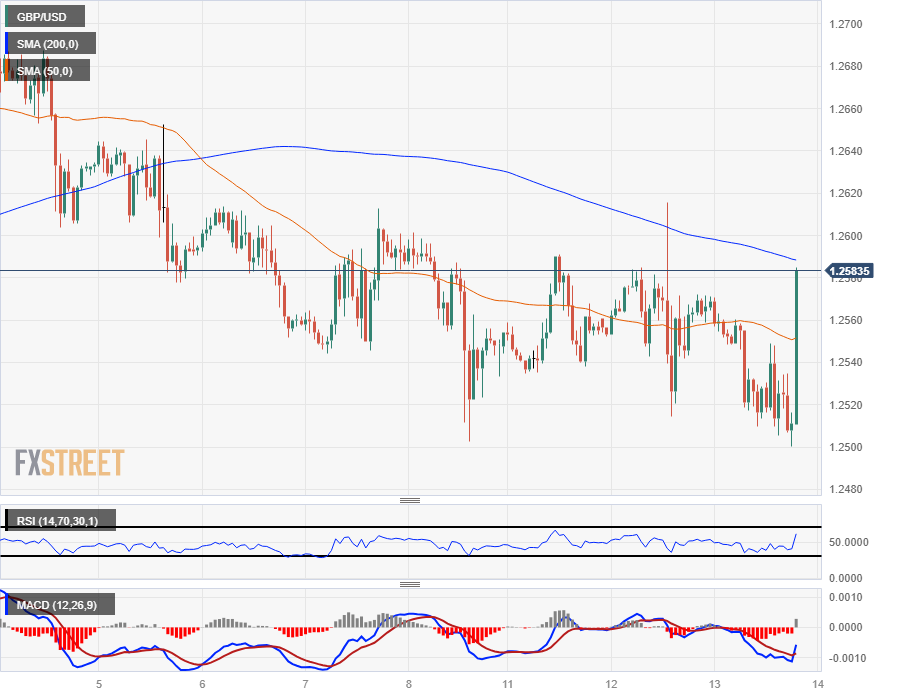
GBP/USD Daily Chart

Fed FAQs
What does the Federal Reserve do, how does it impact the US Dollar?
Monetary policy in the US is shaped by the Federal Reserve (Fed). The Fed has two mandates: to achieve price stability and foster full employment. Its primary tool to achieve these goals is by adjusting interest rates.
When prices are rising too quickly and inflation is above the Fed’s 2% target, it raises interest rates, increasing borrowing costs throughout the economy. This results in a stronger US Dollar (USD) as it makes the US a more attractive place for international investors to park their money.
When inflation falls below 2% or the Unemployment Rate is too high, the Fed may lower interest rates to encourage borrowing, which weighs on the Greenback.
How often does the Fed hold monetary policy meetings?
The Federal Reserve (Fed) holds eight policy meetings a year, where the Federal Open Market Committee (FOMC) assesses economic conditions and makes monetary policy decisions.
The FOMC is attended by twelve Fed officials – the seven members of the Board of Governors, the president of the Federal Reserve Bank of New York, and four of the remaining eleven regional Reserve Bank presidents, who serve one-year terms on a rotating basis.
What is Quantitative Easing (QE) and how does it impact USD?
In extreme situations, the Federal Reserve may resort to a policy named Quantitative Easing (QE). QE is the process by which the Fed substantially increases the flow of credit in a stuck financial system.
It is a non-standard policy measure used during crises or when inflation is extremely low. It was the Fed’s weapon of choice during the Great Financial Crisis in 2008. It involves the Fed printing more Dollars and using them to buy high grade bonds from financial institutions. QE usually weakens the US Dollar.
What is Quantitative Tightening (QT) and how does it impact the US Dollar?
Quantitative tightening (QT) is the reverse process of QE, whereby the Federal Reserve stops buying bonds from financial institutions and does not reinvest the principal from the bonds it holds maturing, to purchase new bonds. It is usually positive for the value of the US Dollar.
GBP/USD Technical Levels
FOMC meeting statement comparison
November 1December 13, 2023
Recent indicators suggest that growth of economic activity expanded at ahas slowed from its strong pace in the third quarter. Job gains have moderated since earlier in the year but remain strong, and the unemployment rate has remained low. Inflation has eased over the past year but remains elevated.
The U.S. banking system is sound and resilient. Tighter financial and credit conditions for households and businesses are likely to weigh on economic activity, hiring, and inflation. The extent of these effects remains uncertain. The Committee remains highly attentive to inflation risks.
The Committee seeks to achieve maximum employment and inflation at the rate of 2 percent over the longer run. In support of these goals, the Committee decided to maintain the target range for the federal funds rate at 5-1/4 to 5-1/2 percent. The Committee will continue to assess additional information and its implications for monetary policy. In determining the extent of any additional policy firming that may be appropriate to return inflation to 2 percent over time, the Committee will take into account the cumulative tightening of monetary policy, the lags with which monetary policy affects economic activity and inflation, and economic and financial developments. In addition, the Committee will continue reducing its holdings of Treasury securities and agency debt and agency mortgage-backed securities, as described in its previously announced plans. The Committee is strongly committed to returning inflation to its 2 percent objective.
In assessing the appropriate stance of monetary policy, the Committee will continue to monitor the implications of incoming information for the economic outlook. The Committee would be prepared to adjust the stance of monetary policy as appropriate if risks emerge that could impede the attainment of the Committee's goals. The Committee's assessments will take into account a wide range of information, including readings on labor market conditions, inflation pressures and inflation expectations, and financial and international developments.
Voting for the monetary policy action were Jerome H. Powell, Chair; John C. Williams, Vice Chair; Michael S. Barr; Michelle W. Bowman; Lisa D. Cook; Austan D. Goolsbee; Patrick Harker; Philip N. Jefferson; Neel Kashkari; Adriana D. Kugler; Lorie K. Logan; and Christopher J. Waller.
Follow Fed meeting – Live coverage
- EUR/JPY slips below 157.00 as sentiment shifts negatively, ahead of the Fed’s.
- The pair is bearishly biased and could extend its losses below the 156.00 figure.
- However, upside risks remain, with the 157.48 as key resistance to get towards 158.00.
The EUR/JPY cross pair retraces from daily highs reached earlier at around 157.48 and tumbled below the 157.00 figure as market participants get ready for the central bank bonanza, starting with the US Federal Reserve on Wednesday. At the time of writing, the pair is trading at 156.58, down 0.24%-
The pair is downward biased once it breaches below the Ichimoku Cloud (Kumo), and also with the Tenkan-Sen turning bearish, dropping below the Kijun-Sen. In addition, the EUR/JPY has failed to regain a five-month-old previous support trendline turned resistance.
In the outcome of a bearish resumption, the EUR/JPY first support would be 156.00, followed by December’s 8 daily low of 153.86, followed by the December 7 swing low of 153.11.
On the flip side, if the pair edged higher, the first resistance is seen at 157.48, followed by the bottom of the Kumo at around 158.00. Once the pair gets inside the Kumo, the Senkou Span B and the Kijun-Sen confluence would be the next supply zone at 158.41.
EUR/JPY Price Analysis – Daily Chart
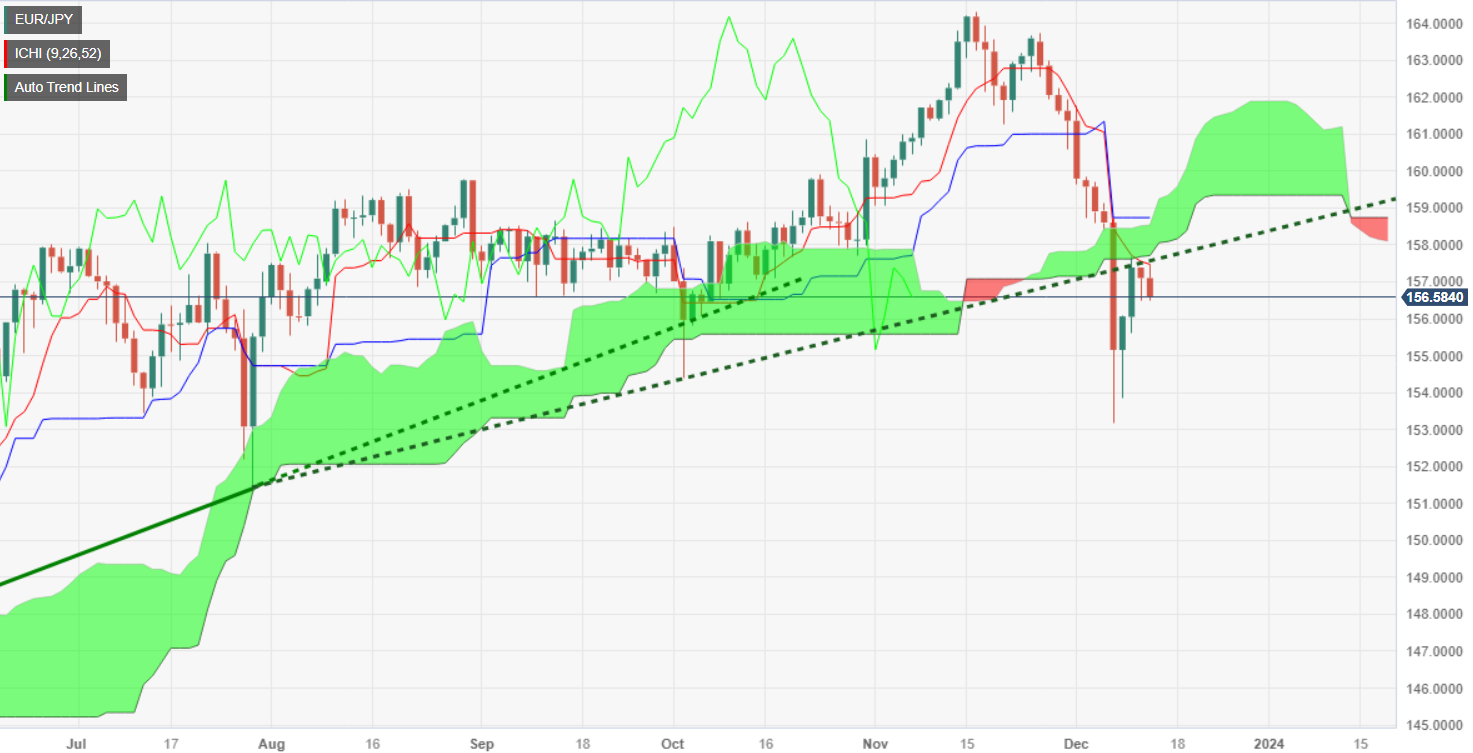
EUR/JPY Technical Levels
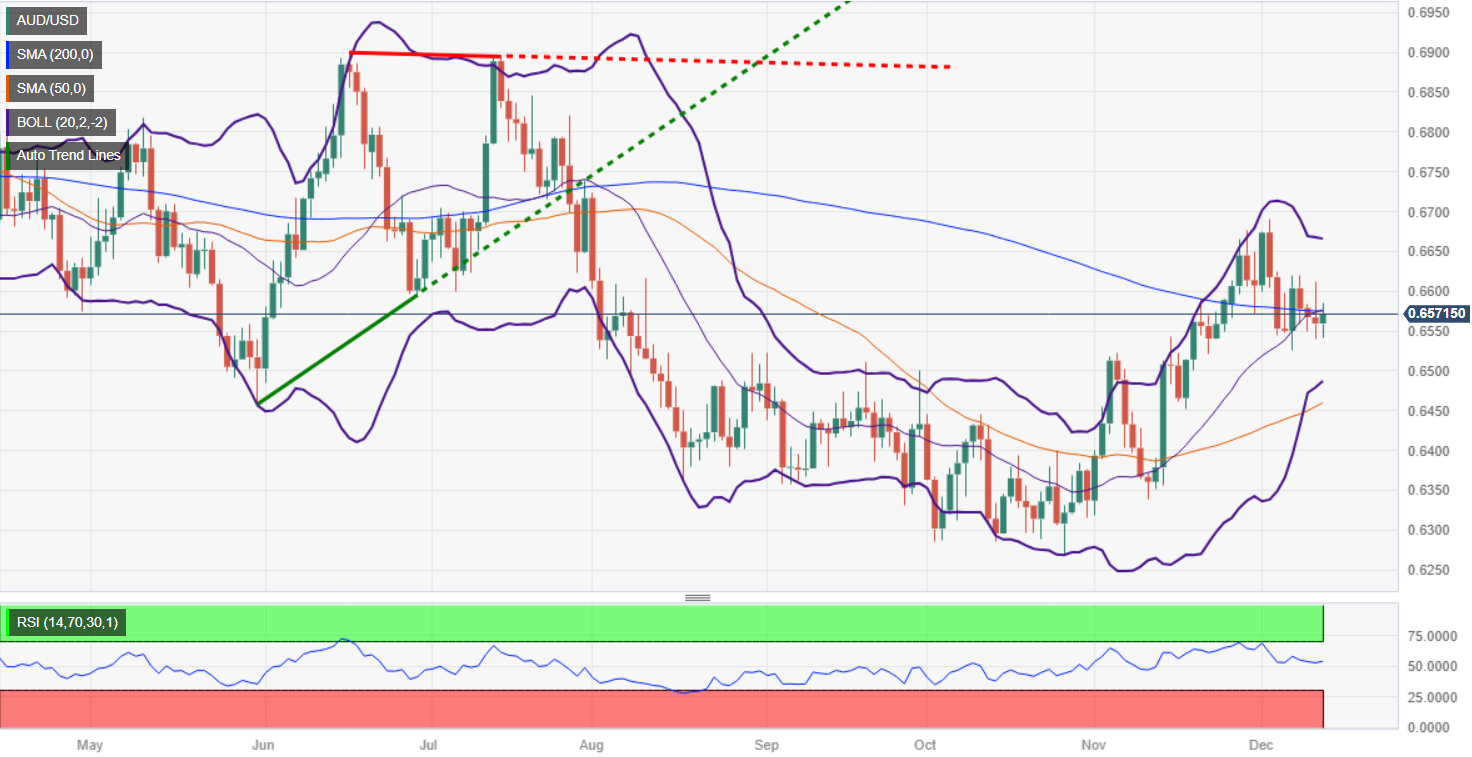
- AUD/USD remains in the green despite market sentiment shifting neutral.
- Traders are eyeing the Fed’s decision, updated projections, and Powell’s press conference.
- On Thursday, the Aussie’s docket will feature jobs data.
The AUD/USD rises in the middle of the North American session by 0.32%, while Wall Street trims its earlier gains as we get closer to the Federal Reserve’s decision. At the time of writing, the pair is trading at 0.6577 after bouncing off a low of 0.6541.
AUD/USD meanders around the 200-DMA awaiting for Powell and Co
US equities paired their earlier gains as traders prepare for Jerome Powell and his colleagues, which are expected to keep the federal funds rate (FFR) unchanged at around 5.25% - 5.50%, though they will reveal its projections for the next year. Money market futures had priced that the Fed would cut rates four times, each by 25 basis points, but the latest estimates by Fed officials foresaw only two cuts for the next year.
Besides that, traders would be looking for the Chair Powell press conference, in which he’s expected to push back against easing monetary policy as the markets project while refraining from saying that policy is already restrictive, keeping the door open for further tightening.
On the Australia front, Consumer Sentiment in December improved while investors prepared for the release of employment data on Thursday’s session. On Wednesday, Australia’s Treasurer Jim Chalmers projected a budget deficit of A$1.1 billion in the year to end June 2024, down from A$13.9 billion estimated in May.
Given the backdrop, if the Fed strikes a hawkish tone and market participants buy it, the AUD/USD could drop below the 0.6500 figure and extend its losses to the confluence of the 50 and 100-day moving averages (DMAs) at 0.6458/59. Otherwise, the pair could extend its gains past the 200-DMA.
AUD/USD Price Analysis: Technical outlook
The AUD/USD is neutral to upward biased, once buyers reclaimed the latest cycle high at 0.6522, but it faced strong resistance at around 0.6700, which sent the pair into a tailspin, toward 0.6520. Since then, the game’s name is consolidation. But the Fed’s decision, could give direction for the reminder of the year. Upside risks lie above 0.6600, while a drop below 0.6500, would likely exposed the 0.6450 area and below.
- The USD/JPY tightens into a middling range just north of 145.00.
- The Fed’s last rate statement for the year is expected to be a third straight rate hold.
- US PPI figures missed the mark, but inflation remains a consumer-facing problem.
The USD/JPY is getting boxed into a tight consolidation range as markets hunker down ahead of the US Federal Reserve’s (Fed) final appearance for 2023. Markets are broadly expecting a shift in the Fed’s policy stance as investors anticipate an accelerated path toward multiple rate hikes in 2024.
With the Fed broadly expected to stand pat on interest rates for the third straight meeting, investors will be deep-diving into the Fed’s Monetary Policy Statement and the attached Interest Rate Expectations, also known as the “dot plot”, a summary of interest rate forecasts from individual Fed policymakers. At the last read in September, the Federal Open Market Committee (FOMC) expected Personal Consumption Expenditure (PCE) inflation to decline to 3.3% by the end of 2023 and 2.2% by year-end 2025. Investors eager for rate cuts will be looking for the FOMC’s dot plot to shift downwards, implying more frequent rate cuts looking forward.
Read More: Federal Reserve dot plot expected to signal upcoming policy pivot
With the Fed dominating markets in the mid-week trading session, other calendar events are getting pushed off the table for the time being, but the latter half of the trading week still brings US November Retail Sales on Thursday, followed by Friday’s Preliminary US S&P Global Purchasing Manager Index (PMI) figures for December.
US Retail Sales for November are expected to print at -0.1%, a minor decline but in-line with October’s -0.1%.
December’s US PMI figures are forecast to see slight declines in both the Services and Manufacturing components; US Services PMI is forecast to print at 49.3 versus the previous 49.4, while the Manufacturing PMI is seen declining slightly from 50.8 to 50.6.
USD/JPY Technical Outlook
The USD/JPY is seeing a rough box forming on the intraday charts as the technicals take a step down against major fundamental events, leaving the pair to cycle around 145.50 in the midweek market session.
The USD/JPY is caught in the middling recovery range of last week’s plunge into 141.60, with the bullish rebound getting capped off by resistance from the 200-hour Simple Moving Average (SMA) descending into the 146.00 handle, and near-term chart action is seeing technical support from the 145.00 handle.
The Japanese Yen is one of the better-performing of the major currencies bloc on Wednesday, but the JPY is still in the red against the majority of its peers on the week.
The USD/JPY is down a little under a tenth of a percent from Wednesday’s opening bids, but still up roughly a sixth of a percent on the week.
USD/JPY Hourly Chart
USD/JPY Daily Chart
USD/JPY Technical Levels
- The DXY Index trades flat at 103.80.
- Investors await Fed decision alongside fresh economic and interest rate projections.
- November’s PPI from the US came in lower than expected.
The US Dollar (USD) Index holds steady around 103.8 on Wednesday, consolidating its position as investors weigh the data on November's Headline and Core Producer Price Index (PPI), which came in lower than expected. At the backdrop is the anticipation ahead of the Federal Reserve's (Fed) final meeting of 2023, a factor bearing heavily on the current market sentiment as it may shape the pace of the markets for the short term.
As the US economy confronts cooling inflation and a resilient labor market, the Fed presents a cautious stance, not dismissing prospects of further tightening. Despite market speculation asserting a dovish orientation, the Fed still hasn’t declared victory on inflation, and this ambiguity keeps investors anxiously anticipating the Fed's Dot Plot projection, crucial for determining potential interest rate cuts in 2024.
Daily Market Movers: US Dollar holds steady before Federal Reserve decision despite soft PPI figures
- The US Dollar is neutral as the market remains anticipative ahead of the Federal Reserve's last hike of 2023.
- The US Producer Price Index (PPI) showed a yearly ascent of 0.9% in November, a slowdown from its 1.2% climb in October.
- Furthermore, the yearly Core PPI rose by a marginal 2%, lower than October's figures and the market’s forecast of 2.4% and 2.2%, respectively.
- US bond yields are on a downward slope, with the 2-year, 5-year, and 10-year rates reported at 4.66%, 4.17%, and 4.15%,, respectively.
- No rate hikes are expected for today’s meeting, according to the CME FedWatch Tool. Expectations are forming around potential rate cuts for May 2024.
- The latest interest rate Dot Plot chart from the Federal Reserve indicates a median projection that places the Federal Funds Rate at 5.1% by the conclusion of 2024. This means a modest 25-basis-point rate reduction over the course of next year.
Technical Analysis: DXY index faces consolidation phase with a bullish tilt
The indicators on the daily chart reflect a somewhat neutral yet cautiously optimistic stance. The Relative Strength Index (RSI) is flat and currently in negative territory, and yet the bears are taking a breather, which underscores that selling pressure is easing.
The Moving Average Convergence Divergence (MACD), which mirrors similar sentiment, is flat too but with green bars suggesting a minor bullish bias in the short term.
In terms of Simple Moving Averages (SMAs), the price is oscillating above the 20-day SMA and the 200-day SMA, reflecting that buyer momentum is holding resilient, especially in the larger time frames, with some degree of dominance over the sellers.
However, the asset is trading below the 100-day SMA, indicating that the bullish momentum is somewhat restrained and could face resistance. Also, traders should eye a potential bearish crossover between the 100-day and 200-day SMA, which could shift the balance toward sellers.
Support levels: 103.70 (20-day SMA), 103.50, 103.30.
Resistance levels: 104.50 (100-day SMA), 104.50, 104.70.
US Dollar FAQs
What is the US Dollar?
The US Dollar (USD) is the official currency of the United States of America, and the ‘de facto’ currency of a significant number of other countries where it is found in circulation alongside local notes. It is the most heavily traded currency in the world, accounting for over 88% of all global foreign exchange turnover, or an average of $6.6 trillion in transactions per day, according to data from 2022.
Following the second world war, the USD took over from the British Pound as the world’s reserve currency. For most of its history, the US Dollar was backed by Gold, until the Bretton Woods Agreement in 1971 when the Gold Standard went away.
How do the decisions of the Federal Reserve impact the US Dollar?
The most important single factor impacting on the value of the US Dollar is monetary policy, which is shaped by the Federal Reserve (Fed). The Fed has two mandates: to achieve price stability (control inflation) and foster full employment. Its primary tool to achieve these two goals is by adjusting interest rates.
When prices are rising too quickly and inflation is above the Fed’s 2% target, the Fed will raise rates, which helps the USD value. When inflation falls below 2% or the Unemployment Rate is too high, the Fed may lower interest rates, which weighs on the Greenback.
What is Quantitative Easing and how does it influence the US Dollar?
In extreme situations, the Federal Reserve can also print more Dollars and enact quantitative easing (QE). QE is the process by which the Fed substantially increases the flow of credit in a stuck financial system.
It is a non-standard policy measure used when credit has dried up because banks will not lend to each other (out of the fear of counterparty default). It is a last resort when simply lowering interest rates is unlikely to achieve the necessary result. It was the Fed’s weapon of choice to combat the credit crunch that occurred during the Great Financial Crisis in 2008. It involves the Fed printing more Dollars and using them to buy US government bonds predominantly from financial institutions. QE usually leads to a weaker US Dollar.
What is Quantitative Tightening and how does it influence the US Dollar?
Quantitative tightening (QT) is the reverse process whereby the Federal Reserve stops buying bonds from financial institutions and does not reinvest the principal from the bonds it holds maturing in new purchases. It is usually positive for the US Dollar.
- The Euro is giving a middling performance on Wednesday, mostly flat against the USD.
- Eurozone Industrial Production missed the mark earlier, as did US PPI figures.
- It’s all eyes on Powell for the Fed’s last appearance of the year.
The EUR/USD is a mixed bag in the mid-week trading session, caught in a tight range between 1.0810 and 1.0775. Euro traders are battening down the hatches alongside the broader market as the Federal Reserve (Fed) prepares to give its final rate call of 2023.
The Fed is set to keep rates steady for the third straight meeting at 5.5%, the Fed’s longest holding pattern since beginning the rate hike cycle in early 2022.
Markets will be leaning heavily into the Fed’s Interest Rate Expectations, also known as the “Dot Plot”, to get a bead on the Fed’s rate cut expectations for 2024.
Investors are broadly hoping for the Fed to begin a rate cut cycle sooner rather than later, with money markets anticipating cuts to begin as soon as the first quarter of 2024, but overeager investors may have let their expectations run far ahead of what the Fed is willing to provide.
Eurozone Industrial Production declined more than expected in October, contracting 0.7% versus the forecast 0.3% decline. The previous month’s figure saw only a slight revision upwards from -1.1% to -1.0%.
US Core Producer Price Index ((PPI) figures for the year ending in November eased back to a more sedate 2.0% versus the expected 2.2%, chipping away at the previous period’s 2.3%, which saw a minor revision down from 2.4%. Easing producer inflation numbers will have a limited impact, as profit-led inflation tends to face consumers at the end-point of the business cycle rather than further up the production chain.
After Federal Reserve Chairman is done making a mess of markets, Thursday will see the European Central Bank (ECB) make its own final appearance of 2023. The whole affair is unlikely to draw near the attention or market jitters that the Fed will. The ECB is broadly expected to maintain a holding pattern with its Main Refinancing Operations Rate 4.5%.
Euro price today
The table below shows the percentage change of Euro (EUR) against listed major currencies today. Euro was the strongest against the Pound Sterling.
| USD | EUR | GBP | CAD | AUD | JPY | NZD | CHF | |
| USD | 0.05% | 0.34% | -0.13% | -0.27% | -0.11% | 0.20% | 0.12% | |
| EUR | -0.06% | 0.28% | -0.18% | -0.34% | -0.17% | 0.14% | 0.06% | |
| GBP | -0.36% | -0.28% | -0.46% | -0.61% | -0.45% | -0.15% | -0.23% | |
| CAD | 0.11% | 0.17% | 0.47% | -0.17% | 0.01% | 0.31% | 0.21% | |
| AUD | 0.28% | 0.33% | 0.60% | 0.16% | 0.16% | 0.47% | 0.39% | |
| JPY | 0.12% | 0.18% | 0.45% | -0.02% | -0.18% | 0.34% | 0.24% | |
| NZD | -0.20% | -0.15% | 0.14% | -0.32% | -0.47% | -0.30% | -0.08% | |
| CHF | -0.12% | -0.07% | 0.22% | -0.23% | -0.39% | -0.23% | 0.08% |
The heat map shows percentage changes of major currencies against each other. The base currency is picked from the left column, while the quote currency is picked from the top row. For example, if you pick the Euro from the left column and move along the horizontal line to the Japanese Yen, the percentage change displayed in the box will represent EUR (base)/JPY (quote).
EUR/USD Technical Outlook
Near-term consolidation in the EUR/USD leaves the pair testing into the 200-hour Simple Moving Average (SMA) near the 1.0800 handle as the Euro (EUR) attempts to claw back chart paper from the US Dollar.
The EUR/USD’s recent tumble from November’s peak of 1.1017 sees the pair sticking close to the 200-day SMA on the daily candlesticks, with near-term technical support coming from the 50-day SMA.
EUR/USD Hourly Chart
EUR/USD Daily Chart
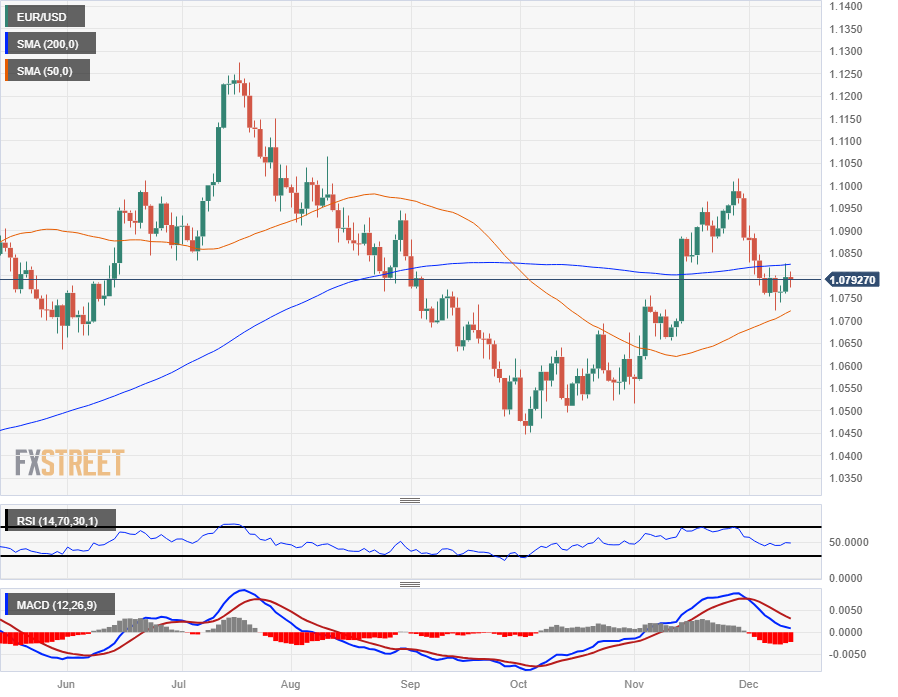
EUR/USD Technical Levels
- Canadian Dollar is set for a bumpy ride as markets face down one last appearance from Fed Chair Powell.
- FOMC updates Dot Plot as investors hope for a firm path toward rate cuts in 2024.
- CAD catches a supporting bid from rising Crude Oil, WTI bounces from new lows.
The Canadian Dollar (CAD) is moderately bid on Wednesday, gaining support from a thin but noticeable relief rally in Crude Oil markets. Still, markets see plenty of chop as investors jockey for position ahead of the US Federal Reserve’s (Fed) last appearance for 2023.
The Canadian economic calendar remains tepid this week; Loonie traders will be forced to wait until Bank of Canada (BoC) Governor Tiff Macklem’s appearance late Friday before the CAD finds tradeable headlines from behind home plate.
Markets are keenly waiting the Fed’s Federal Open Market Committee (FOMC) meeting to deliver their updated Interest Rate Outlook, known as the “Dot Plot”. With the Fed all but guaranteed to hold rates at 5.5% for their last rate decision of 2023, investors will be diving into the FOMC’s rate expectations as well as the Fed’s stance moving forward.
The Fed’s Monetary Policy Statement and Interest Rate Projections will be released at 14:00 EST(19:00 GMT). Fed Chairman Jerome Powell’s last press conference of the year is slated to begin at 14:30 EST (19:30 GMT).
Daily Digest Market Movers: Canadian Dollar grinds through frothy markets ahead of Fed rate call
- Despite the Canadian Dollar’s Crude Oil-fueled bid on Wednesday, the Fed is stealing the limelight, and it’s all eyes on Powell for the mid-week market session.
- The Federal Reserve is set to hold rates at 5.5% for the third straight FOMC meeting, its longest holding pattern since the most recent rate hike cycle began in early 2022.
- Investors are broadly anticipating an accelerated path toward more frequent rate cuts next year.
- Markets are anticipating rate cuts to begin as soon as the first quarter of 2024, and investor expectations of easing rates may have run well ahead of what the Fed considers achievable.
- With Fed Chair Powell scrapping forward guidance last year, Fed rate statements have an outsized market impact as the US central bank assesses data on a case-by-case basis.
- Crude Oil markets sank to fresh lows this week, with West Texas Intermediate (WTI) sagging into $68 per barrel early Wednesday before catching a near-term relief rally back toward $70.
- The Canadian Dollar is latching onto the rebound in Crude Oil to squeeze out a tenth of a percent gain against the US Dollar (USD) heading into the Fed release window.
Canadian Dollar price this week
The table below shows the percentage change of Canadian Dollar (CAD) against listed major currencies this week. Canadian Dollar was the strongest against the Pound Sterling.
| USD | EUR | GBP | CAD | AUD | JPY | NZD | CHF | |
| USD | -0.20% | 0.18% | -0.12% | 0.00% | 0.15% | 0.05% | -0.37% | |
| EUR | 0.22% | 0.40% | 0.10% | 0.26% | 0.37% | 0.28% | -0.14% | |
| GBP | -0.19% | -0.41% | -0.30% | -0.17% | -0.03% | -0.15% | -0.56% | |
| CAD | 0.12% | -0.08% | 0.29% | 0.12% | 0.27% | 0.17% | -0.25% | |
| AUD | -0.01% | -0.22% | 0.18% | -0.12% | 0.15% | 0.05% | -0.38% | |
| JPY | -0.16% | -0.39% | -0.09% | -0.28% | -0.17% | -0.12% | -0.55% | |
| NZD | -0.05% | -0.25% | 0.13% | -0.17% | -0.05% | 0.10% | -0.42% | |
| CHF | 0.37% | 0.17% | 0.54% | 0.25% | 0.41% | 0.53% | 0.43% |
The heat map shows percentage changes of major currencies against each other. The base currency is picked from the left column, while the quote currency is picked from the top row. For example, if you pick the Euro from the left column and move along the horizontal line to the Japanese Yen, the percentage change displayed in the box will represent EUR (base)/JPY (quote).
Technical Analysis: Canadian Dollar’s sideways stance set to get rattled, USD/CAD in play near 1.3600
The Canadian Dollar (CAD) sees choppy trading forming into a near-term sideways channel against the US Dollar (USD), keeping the USD/CAD capped between 1.3610 and 1.3550. Intraday action remains chained to the 200-hour Simple Moving Average (SMA) as near-term momentum drains out of the pair.
A bounce from the 200-day SMA for the USD/CAD at the start of December has failed to crystallize into a meaningful bullish recovery, keeping the pair constrained in a congestion zone just beneath the 1.3600 handle.
The US Dollar is down two-and-a-third percent against the Canadian Dollar after dropping from December’s early high of 1.3899 and making a clean shear of the 50-day SMA just below 1.3700.
Fundamentals are going to drive the USD/CAD on Wednesday, and technical traders will need to be mindful that technical barriers could easily evaporate, depending on how investors digest the day’s headlines.
USD/CAD Hourly Chart
USD/CAD Daily Chart
Canadian Dollar FAQs
What key factors drive the Canadian Dollar?
The key factors driving the Canadian Dollar (CAD) are the level of interest rates set by the Bank of Canada (BoC), the price of Oil, Canada’s largest export, the health of its economy, inflation and the Trade Balance, which is the difference between the value of Canada’s exports versus its imports. Other factors include market sentiment – whether investors are taking on more risky assets (risk-on) or seeking safe-havens (risk-off) – with risk-on being CAD-positive. As its largest trading partner, the health of the US economy is also a key factor influencing the Canadian Dollar.
How do the decisions of the Bank of Canada impact the Canadian Dollar?
The Bank of Canada (BoC) has a significant influence on the Canadian Dollar by setting the level of interest rates that banks can lend to one another. This influences the level of interest rates for everyone. The main goal of the BoC is to maintain inflation at 1-3% by adjusting interest rates up or down. Relatively higher interest rates tend to be positive for the CAD. The Bank of Canada can also use quantitative easing and tightening to influence credit conditions, with the former CAD-negative and the latter CAD-positive.
How does the price of Oil impact the Canadian Dollar?
The price of Oil is a key factor impacting the value of the Canadian Dollar. Petroleum is Canada’s biggest export, so Oil price tends to have an immediate impact on the CAD value. Generally, if Oil price rises CAD also goes up, as aggregate demand for the currency increases. The opposite is the case if the price of Oil falls. Higher Oil prices also tend to result in a greater likelihood of a positive Trade Balance, which is also supportive of the CAD.
How does inflation data impact the value of the Canadian Dollar?
While inflation had always traditionally been thought of as a negative factor for a currency since it lowers the value of money, the opposite has actually been the case in modern times with the relaxation of cross-border capital controls. Higher inflation tends to lead central banks to put up interest rates which attracts more capital inflows from global investors seeking a lucrative place to keep their money. This increases demand for the local currency, which in Canada’s case is the Canadian Dollar.
How does economic data influence the value of the Canadian Dollar?
Macroeconomic data releases gauge the health of the economy and can have an impact on the Canadian Dollar. Indicators such as GDP, Manufacturing and Services PMIs, employment, and consumer sentiment surveys can all influence the direction of the CAD. A strong economy is good for the Canadian Dollar. Not only does it attract more foreign investment but it may encourage the Bank of Canada to put up interest rates, leading to a stronger currency. If economic data is weak, however, the CAD is likely to fall.
- EUR/GBP prints a new high in eight days, but it remains shy of reclaiming a key technical resistance level.
- Near term, the cross is upward biased and could extend its rally if it reclaims the 100, 200, and 50-DMAs.
- A drop below 0.8600 would confirm the downtrend remains intact.
The EUR/GBP advances to an eight-day high of 0.8623 but remains bearish in the medium term after news from the UK showed its economy contracted for the second time in the year, as data revealed. Hence, the cross is trading at 0.86100 after jumping from a daily low of 0.8583, a gain of 0.21%.
The daily chart depicts the downtrend remains intact, but if EUR/GBP buyers reclaim the 100-day moving average (DMA) at around 0.8638, that could pave the way to challenge the 200-DMA at 0.8663. further upside is seen above that level, with the 50-DMA at 0.8660, and expect an upside move to 0.8700.
On the other hand, if the pair slides below the 0.8600 figure, that could open the door to retesting the December 11 swing low of 0.8549, ahead of falling toward the year-to-date (YTD) low of 0.8492.
EUR/GBP Price Analysis – Daily Chart
EUR/GBP Technical Levels
- The XAG/USD hovers near the $22.70 level, experiencing 0.70% losses.
- Soft PPI figures underpin the Fed's dovish stance, producing a viable environment for sooner rate cuts.
- US bonds are sharply declining.
In Wednesday's trading session, Silver’s price (XAG/USD) recorded 0.70% losses, currently hovering around the $22.70 level. This decline comes ahead of the decision by the Federal Reserve, which will be a key driver in the market's next movements. In addition, the metal failed to capitalize on the lower US yields, which declined after the soft Producer Price Index (PPI) was reported from the US.
In that sense, the US Final Demand Producer Price Index (PPI) showed a yearly ascent of 0.9% in November, a slowdown from its 1.2% climb in October, as the US Bureau of Labor Statistics disclosed this Wednesday. The data fell short of the anticipated 1% market projection. Furthermore, the yearly Core PPI rose by a marginal 2%, underperforming October's figures and analysts' predictions of 2.4% and 2.2%, respectively.
As a reaction, US bond yields declined, as the US economy exhibited further evidence of inflation cooling down. The 2-year rate is noted at 4.66%, with the 5-year rate dropping to 4.17% and the 10-year yield further down at 4.15%. This downturn may lighten the load on non-yielding metals, as bond yields are commonly seen as the opportunity cost of holding these assets.
For the rest of the session, the Fed’s tone and fresh economic and interest projections will be closely watched for investors to place their bets on the calendar for rate cuts in 2024. In line with that, a more dovish approach may generate further pressure on bond yields which may open the upside to the gray metal.
XAG/USD levels to watch
On the daily chart, indicators suggest a bearish bias as the metal tallies an eight-day losing streak. The Relative Strength Index (RSI) sits flat and in negative territory, signaling that the selling pressure may be losing steam and that consolidation may be on the horizon.
However, the Moving Average Convergence Divergence (MACD) draws attention to the rising red bars, hinting that the momentum remains in favour of the sellers.
On a broader time frame, though, the position of the metal in relation to its Simple Moving Averages (SMAs) speaks more in favor of the sellers. The price is trading under the 20,100 and 200-day SMA, which indicates weakness, illustrating that bearish control is dominant over the long haul.
Support Levels: $22.30, $$22.15, $22.00.
Resistance Levels: $$22.80, $, $23.00, $23.15 (100-day SMA).
XAG/USD daily chart
-638380815057407747.png)
- GBP/USD has fallen below 1.2600 courtesy of weak UK economic data.
- UK GDP plunged for the second time in the year, as in June 2023.
- Traders are awaiting the Fed’s decision and projections material for clues on forward guidance.
The GBP/USD fell 0.32% during the North American session, after data from the United Kingdom (UK), depicted the economy is at the brisk of recession amid a high inflation period. That and investors awaiting the Federal Reserve’s decision on monetary policy keep the Greenback in the driver’s seat. At the time of writing, the major is trading at 1.2519.
UK GDP missed forecasts, while US inflation in the producer side eased
The Office for National Statistics (ONS) revealed the UK economy shrank in October by -0.3% MoM, below the consensus of 0%, blamed by wet weather, the ONS said. It’s the first time since June that the Gross Domestic Product (GDP) plunged on a monthly basis. The GBP/USD edged from 1.2550 to under 1.2510 on the data release.
With this, traders had increased the odds the Bank of England (BoE) would slash interest rates four times next year, one more than yesterday. On Thursday, the BoE is expected to keep rates unchanged.
On the US front, the Federal Reserve is expected to hold rates unchanged, but attention would be in the dot plots and the Summary of Economic Projections (SEP). In September, Fed officials estimated 50 basis points of rate cuts for 2024, though the market had priced four. If the US central bank sticks to its September posture, that could be perceived as hawkish, and the GBP/USD could drop below the 1.2500 figure.
Data-wise, the Producer Price Index (PPI) in November continued to show the inflation is getting at around the Fed level on the producer side.
GBP/USD Price Analysis: Technical outlook
The GBP/USD is neutral to bullish biased, but at the brisk of breaking below the 200-day moving average (DMA) at around 1.2494. A breach of the latter will expose the 100-DMA at 1.2452, confluence with the November 22 low, followed by the November 17 swing low of 1.2373. On the upside, the first resistance level would be 1.2600.
What will USD value be compared to the Euro by spring 2024? Strategists at Morgan Stanley analyze EUR/USD outlook.
A continued widening in growth and rate differentials should weigh on EUR/USD
The US Dollar has fallen about 4% since it peaked in October and has retraced about half of its gains since July. We think this correction should be faded and we're affirming our call for Euro/Dollar to fall back to parity by the spring of next year, meaning the USD will rise a further 8% versus the Euro.
This is a controversial and out of consensus call, but we think the market is still underpricing weakness in Europe and strength in the US, and a continued widening in growth and rate differentials should weigh on the pair.
An 8% move in a few months is a pretty big move and moves that large don't happen that often. If we look at options pricing, the market is pricing in an even lower risk of such a move compared to historical frequencies. And it's worth remembering that large moves do happen. EUR/USD fell 10% in a four month window two different times last year. So while this call may be bold and buck consensus, we think the fundamental story still holds.
The USD has been battered over the past month. Economists at the National Bank of Canada analyze Greenback’s outlook.
The fall is overdone
The anticipation of a Goldilocks scenario has driven bond yields lower, boosted risk assets and undermined the value of the US Dollar. After all, if the worst of the collateral damage to the economy is behind us, there is no need for safe-haven assets, is there? We don't buy this scenario.
While we too expect rate cuts in 2024, they will be driven by real economic distress, not by immaculate disinflation. As a result, we would expect the USD to rebound.
Economists at ABN Amro expect the EUR/USD pair to hover around current levels throughout next year.
EUR/USD to stay in a 1.05-1.10 range in 2025
For 2024, we expect the same amount of interest rate cuts by the Fed and the ECB. In both cases, our base case calls for more substantial rate cuts than markets currently expect. The difference between our forecasts and market pricing is around the same for both central banks. So, if our views on both Fed and ECB policies play out, EUR/USD should stay near current levels.
For 2025 we think that the ECB and Fed will continue to ease in 2025 by the same amount. Therefore, we expect EUR/USD to stay in a 1.05-1.10 range waiting for another driver to present itself to cause a more directional move.
- Mexican Peso opens the session soft as traders trim positions awaiting Powell and Co.
- Prices paid by producers in the US cooled down, adding to the dovish narrative around the Federal Reserve.
- USD/MXN could aim towards 18.00 if the Fed delivers a hawkish message.
Mexican Peso (MXN) weakened against the US Dollar (USD) early during the North American session on Wednesday, with traders bracing for the release of the US Federal Reserve’s (Fed) monetary policy decision. Speculations suggest the Fed will keep rates unchanged, but “some” uncertainty surrounds Chair Jerome Powell’s press conference. At the time of writing, the USD/MXN is trading at 17.40, gaining 0.58% on the day.
Mexico’s economic docket remains scarce, yet on Thursday, the Bank of Mexico (Banxico) will announce its verdict on monetary policy and is expected to keep rates unchanged. The latest Mexican economic indicators show the economy remains resilient, with inflation above the central bank’s target. In addition, PMIs remained at expansionary territory, and Industrial Production smashed estimates, portraying an optimistic economic outlook for the country.
Daily digest movers: Mexican Peso at the mercy of the Federal Reserve
- The USD/MXN main driver for the day will be the Fed’s decision, but traders' focus will be on the Summary of Economic Projections (SEP) and the dot plot.
- In September, the SEP showed that most Fed officials estimate the federal funds rate (FFR) to be at around 5.6% by the end of 2023. If policymakers keep the projections unchanged, that could be perceived as hawkish, and the USD/MXN could aim higher.
- Fed Chair Powell is expected to push back against speculations of looser monetary policy. Instead, he would stick to its previous stance of “we are prepared to tighten policy further if it becomes appropriate to do so.”
- The US Producer Price Index (PPI) inflation for November dipped in annual and monthly readings, in contrast to consumer inflation, which delivered mixed readings. The core Consumer Price Index (CPI) stands stubbornly at around 4%.
- Money market futures estimate the Fed will slash rates by 113 basis points toward the end of next year.
- A Reuters poll showed that 23 of 25 analysts expect the Bank of Mexico would keep rates at 11.25% unchanged, while one estimates a rate cut to 11%. Annual inflation ticked up to 4.32% in November, though it didn’t dent policymakers' intentions to ease policy next year if data confirms the disinflation process.
Technical analysis: Mexican Peso loses a step as the USD/MXN rises toward the 100-day SMA
The USD/MXN is neutral to upward biased despite sitting below key technical levels, like the 100, 200, and 50-day Simple Moving Averages (SMAs). Given the fundamental backdrop, if the Fed struck a hawkish message, the pair could rally and break each of the previously mentioned levels at 17.40, 17.54, and 17.64, respectively. Once cleared, the next resistance level would be the psychological 18.00 figure.
On the other hand, failure to reclaim the 100-day SMA could see sellers drag prices toward the 17.20 area, ahead of a strong demand region at around the 17.00/05 range. Once hurdled, the USD/MXN could test the year-to-date (YTD) low of 16.62.
Mexican Peso FAQs
What key factors drive the Mexican Peso?
The Mexican Peso (MXN) is the most traded currency among its Latin American peers. Its value is broadly determined by the performance of the Mexican economy, the country’s central bank’s policy, the amount of foreign investment in the country and even the levels of remittances sent by Mexicans who live abroad, particularly in the United States. Geopolitical trends can also move MXN: for example, the process of nearshoring – or the decision by some firms to relocate manufacturing capacity and supply chains closer to their home countries – is also seen as a catalyst for the Mexican currency as the country is considered a key manufacturing hub in the American continent. Another catalyst for MXN is Oil prices as Mexico is a key exporter of the commodity.
How do decisions of the Banxico impact the Mexican Peso?
The main objective of Mexico’s central bank, also known as Banxico, is to maintain inflation at low and stable levels (at or close to its target of 3%, the midpoint in a tolerance band of between 2% and 4%). To this end, the bank sets an appropriate level of interest rates. When inflation is too high, Banxico will attempt to tame it by raising interest rates, making it more expensive for households and businesses to borrow money, thus cooling demand and the overall economy. Higher interest rates are generally positive for the Mexican Peso (MXN) as they lead to higher yields, making the country a more attractive place for investors. On the contrary, lower interest rates tend to weaken MXN.
How does economic data influence the value of the Mexican Peso?
Macroeconomic data releases are key to assess the state of the economy and can have an impact on the Mexican Peso (MXN) valuation. A strong Mexican economy, based on high economic growth, low unemployment and high confidence is good for MXN. Not only does it attract more foreign investment but it may encourage the Bank of Mexico (Banxico) to increase interest rates, particularly if this strength comes together with elevated inflation. However, if economic data is weak, MXN is likely to depreciate.
How does broader risk sentiment impact the Mexican Peso?
As an emerging-market currency, the Mexican Peso (MXN) tends to strive during risk-on periods, or when investors perceive that broader market risks are low and thus are eager to engage with investments that carry a higher risk. Conversely, MXN tends to weaken at times of market turbulence or economic uncertainty as investors tend to sell higher-risk assets and flee to the more-stable safe havens.
EUR/CHF has declined from 0.97 to 0.94 since September. Economists at Société Générale analyze the pair’s outlook ahead of the Swiss National Bank (SNB) meeting.
Appreciation of Franc and below forecast inflation could prompt policy shift to neutral or tweak to FX intervention policy
In this week’s statement, the SNB could drop the view that ‘further tightening of monetary policy may become necessary to ensure price stability over the medium term’. This could help bond spreads to widen in favour of EUR/CHF.
A shift in the language on intervention (no longer selling FX) could also steer EUR/CHF away from the lows. Selling FX may no longer be considered worthwhile following the 2.8% depreciation of EUR/CHF from 0.97 to 0.94 since September. The central bank last lowered the near-term inflation forecast in September due to the economic slowdown and slightly lower inflationary pressure from abroad.
The return below 1.08 for EUR/USD is complicating matters for a (sustained) rally in EUR/CHF.
The dovish pricing of ECB policy, political acrimony over the budget in Germany and swing to the right of the political spectrum in northern Europe may not dim the appeal of the Swiss Franc in 2024.
GBP/USD dribbles below 1.2550. Economists at Société Générale analyze the pair’s outlook.
Topside hurdle at 1.2720
GBP/USD up move stalled near 1.2720, the 61.8% retracement from July. It has embarked on an initial pullback after this test. The 200-DMA near 1.2460/1.2420 is next support near term. A short-term bounce can’t be ruled out. A move beyond 1.2720 would mean next leg of uptrend.
In case the pair fails to defend the Moving Average near 1.2460/1.2420, ongoing phase of down move could extend. Next supports are located at 1.2330 and recent pivot low at 1.2187.
The Brazilian Real is one of the outperformers in 2023. Economists at Commerzbank analyze BRL outlook ahead of the the Brazilian Central Bank (BCB) meeting.
Real could come under pressure again in the coming weeks if the market prices in further rate cuts
There is plenty of room for further rate cuts. Otherwise, the BCB would be keeping the real rate unnecessarily high and increasing the risk of putting too much pressure on the economy with an excessively tight monetary policy.
It is fully justified for the BCB to cut interest rates by a further 50 basis points to 11.75% today. And also to announce further rate cuts at the same pace if inflation does not accelerate again. In the short term, Real could come under pressure again in the coming weeks if the market prices in further rate cuts.
However, with a central bank that has demonstrated its ability to raise interest rates to very high levels if necessary to bring inflation under control, declining inflation and (currently) robust economic growth, the Real should be well positioned over the medium-term and downside potential should therefore be limited.
Kit Juckes, Chief Global FX Strategist at Société Générale, analyzes the sequencing and extent of easing to come by the Federal, the Bank of England and the European Central Bank.
Fed to ease before the BoE or the ECB
The market prices the ECB cutting before the Fed, which cuts before the UK MPC. Our economists think the order will be Fed, BoE, ECB. And while we look for the FOMC to cut rates by 150 bps in 2024, and for the BoE to cut by 125 bps, we expect a measly 25 bps from the ECB. That will take the Fed-ECB gap to even tighter levels than was the case in 2020 when EUR/USD traded up to 1.23.
I think the chance of EUR/USD making it back to 1.20 in 2024 is very slim indeed, but more narrowing in rate differentials than is priced in by the market seems likely and the euro will get some support from that.
The Euro has ticked higher following the release of weaker-than-expected US PPI data, yet it remains within previous ranges, ahead of the outcome of the Federal Reserve’s meeting, due later today.
US PPI data weighs on the USD
The US, Producer Prices remained flat in November, against expectations of a 0.1% advance, with the yearly inflation easing to 0.9% from 1.2% in October. The Core PPI has been unchanged for the second month in a row, and 2% up in the year, below market estimated of 0.2% and 2,!% increases respectively.
Earlier today, Eurozone data revealed that the region;’s industrial output declined beyond expectations in October, although the impact on the pair was marginal.
The main event today, however, is the Federal Reserve;’s monetary policy decision. The bank is almost certainly keeping rates unchanged but the MPC member’s interest rate projections and Chairman Powell’s Press conference will be scrutinised for clues about the bank’s policy plans.
EUR/USD Technical analysis
The pair is fluctuating without a clear direction on Wednesday above an important support area at the 50% Fibonacci retracement of the October - November rally, at 1.0730.
Immediate resistance remains at 1.0800/15, where previous highs meet the 4h 50 SMA ahead of 1.0880. Supports are at the mentioned 1.0730 and early November lows at 1.0660.
Technical levels to watch
EUR/USD staged a comeback in November. Economists at the National Bank of Canada analyze the pair’s outlook.
Tough times ahead
Although some participants would point to certain improvements on the data front and comments from the central bank as underpinnings for the recovery, the common currency has been buoyed by a sell-off in USD.
The perspectives for the Eurozone remain tepid to say the least and we continue to believe the ECB will front run the Federal Reserve for rate cuts. As such, the currency is expected to experience a bout of weakness until we get a more forceful change in stance from the Fed.
The USD is trading higher ahead of the Fed meeting. Economists at Scotiabank analyze Greenback’s outlook.
The FOMC decision may give markets another jolt of volatility
The FOMC decision may give markets another jolt of volatility before things start to settle down ahead of the holiday period.
Another hold is all but a foregone conclusion and, after unchanged policy since July, that should be enough to convince markets that the tightening cycle is over.
There are unlikely to be any concessions to easing in the policy statement, particularly as financial conditions have eased since the Fed’s last policy decision. But it may be tweaked to reflect the fact that rates are very unlikely to move any higher. Changes to the Dot Plot and forecasts in the SEP will matter as much as anything else today; the last dot plot anticipated 50 bps of cuts in 2024 from a higher ending point than looks likely now so adjustments here could look a little dovish.
Broader price patterns are still shaping up bearishly for the USD via the DXY charts which suggests limited upside and lingering downside risks in the near-to-medium term.
- Producer inflation in the US continued to decelerate in November.
- US Dollar Index stays in daily range near 104.00 after the PPI data.
The Producer Price Index (PPI) for final demand in the US rose 0.9% on a yearly basis in November, down from the 1.2% increase recorded in October, the data published by the US Bureau of Labor Statistics revealed on Wednesday. This reading came in lower than the market expectation of 1%.
The annual Core PPI increased 2% in the same period, below the October reading and analysts' estimate of 2.4% and 2.2%, respectively. On a monthly basis, the Core PPI was unchanged for the second consecutive month.
Market reaction
The US Dollar Index continues to fluctuate in a relatively tight daily channel slightly below 104.00 as markets await the Federal Reserve's (Fed) monetary policy announcements.
- The US dollar hits fresh intra-day lows at 1.3575.
- A moderate recovery in Oil prices has favored the CAD.
- The pair remains looking for direction ahead of the Fed.
The US Dollar is extending losses in a calm European trading session with the market awaiting the outcome of the Fed’s monetary policy decision before placing significant bets.
In this context, the USD/CAD has pulled lower to reach intra-day lows at 1.3575 although the pair remains moving halfway through the last two weeks’ range.
A modest pick up in Crude prices, after the OPEC report raised its global growth economic forecasts, easing concerns about an oil glut in 2024 has provided some support to the oil-sensitive CAD.
On the other hand, US Inflation data released on Tuesday showed that consumer prices remain at levels well above the Fed’s 2% target. This, coupled with the strong US employment levels seen last Friday, has curbed speculation of a Fed pivot in early 2024, underpinning support for the Dollar.
USD/CAD is looking for direction
From a wider perspective, the pair remains trading sideways within a 75-pips range, after bouncing from 1.3480 lows earlier this month. Resistances are at 1.3625 and 1.3660. Support levels lie at 1.3550 and the mentioned 1.3480 low.
Technical levels to watch
In the year to date, the NOK is the weakest performing G10 currency. Economists at Rabobank analyze Krone’s outlook ahead of the Norges Bank meeting.
A hawkish hold appears very likely
Feasibly, policymakers could discuss at their meeting whether to hike rates one more time and signal that the cycle has peaked or to leave rates on hold and signal that another hike is possible. For choice, we would settle on the latter.
Insofar as the market consensus is already positioned in favour of steady rates and given the likelihood that other G10 central banks have also reached a peak in policy, the Norges Bank should be able to limit a sharp sell-off in the NOK with hawkish rhetoric. Market pricing suggests a 25 bps rate cut is priced in by the middle of next year.
We expect some pushback against this from the Norges Bank and expect EUR/NOK to edge down to 11.70 on a three-month view. Softer oil prices will likely limit scope for a greater recovery.
USD/CAD holds well-disciplined range around 1.36. Economists at Scotiabank analyze the pair’s outlook.
A range break essentially targets a roughly 75 bps move
USD/CAD price action remains contained to a disciplined 1.3550/1.2620 range.
The USD’s limited recovery (to retracement resistance at 1.3623 – 38.2% of the November drop) keeps broader risks tilted to the downside on the longer run charts I think but progress lower needs to come sooner rather than later to keep the CAD in with a chance of a modest pick up ahead of year end.
A range break – in either direction – essentially targets a roughly 75 bps move in spot.
A weekly close under 1.35 should add to medium-term downside momentum.
Sterling is weaker in response to today’s data run. Economists at Scotiabank analyze Cable’s outlook.
Disappointing October output data
October monthly GDP fell a larger than expected 0.3%, leaving the 3m/3m comparison flat (versus an expected 0.1% increase). Industrial Production fell 0.8% in October (consensus – 0.1%), with Manufacturing, Construction and Services all reporting declines in output as interest rate hikes dampen growth prospects.
GBP/USD is holding a 1.25/1.26 trading range.
Daily and weekly trend momentum signals are still supportive for the GBP but trend momentum signals are weakening, suggesting the window for a GBP rebound and strengthen – by regaining 1.2615 to renew bullish momentum – may be closing.
EUR/USD dips below the 1.08 level. Economists at Scotiabank analyze the pair’s outlook.
A clear push through 1.0825/1.0830 is needed to lift the Euro
EUR/USD’s peak on Tuesday in the low 1.08 zone reflects another failed test of the 200-DMA (1.0826) which has served as short-term resistance for spot over the past week.
Short-term price action suggests some upside potential in the EUR still after spot broke above the late November/early December downtrend but a clear push through 1.0825/1.0830 is needed to lift the EUR from here.
Losses will extend on a break under last week’s low at 1.0724.
- The US Dollar is in the green against all major peers.
- Traders brace for an expected firm pushback on rate cuts from the Fed.
- The US Dollar Index hovers around 104 with 105 targeted if the Fed delivers hawkish message.
The US Dollar (USD) is steady to sideways with small gains against all major G20 currencies. Traders are bracing for the last US Federal Reserve meeting of 2023. Although another pause in the monetary policy rate looks to be a given, the guiding speech from US Fed Chairman Jerome Powell will be the event that might move the needle. Another factor could be the Fed’s Dot Plot, forecasting the trajectory of interest rates based on the consensus views of Fed members.
On the economic front, all eyes will be on 19:00 GMT for the official rate announcement and initial guidance, followed by the press conference with Jerome Powell at 19:30 GMT. With the US Calendar bearing Producer Price metrics as well, a snooze fest is not in the cards. Instead expect a bumpy road in the runup towards the last Fed meeting of 2023.
Daily digest: not a straight line to Fed’s decision
- Near 12:00 GMT the Mortgage Bankers Association (MBA) has released the Mortgage Applications for last week. Previous number was 2.8% and now came out at 7.4%.
- At 13:30 GMT the Producer Price Metrics will be released. It measures the inflation on the production side for manufacturers and companies. Any upticks in the Producer Price metrics will be passed on further down the line to the clients in the stores and filter into Consumer Price Index numbers:
- Monthly Headline Producer Price Index is expected to head from -0.5% to 0.1%.
- Yearly Headline Producer Price Index is expected to head from 1.3% to 1%.
- Monthly Core Producer Price Index number is to head from 0% to 0.2%.
- Yearly Core Producer Price Index to decline from 2.4% to 2.2%.
- At the stroke of 19:00 the Fed will release its monetary policy, expected to remain unchanged at 5.5%. A statement will be released as well, which will have the Fed’s Dot Plot projections.
- At 19:30 GMT, US Fed Chairman Jerome Powell will take the stage and give guidance to the markets on the stance of the Fed.
- Equites are holding steady in European trading with minor changes for the day. US futures are mildly in the green as well ahead of the main event this Wednesday. Chinese equities were in the ropes again with the Hong Kong Hang Seng down over 1% at its closing bell. With markets still doubting between risk-on or risk-off, the steady and sideways DXY moves confirms that traders are awaiting further elements.
- The CME Group’s FedWatch Tool shows that markets are pricing in a 98.2% chance that the Federal Reserve will keep interest rates unchanged this Wednesday.
- The benchmark 10-year US Treasury Note trades near 4.19%, in a whipsaw pattern where the floor around 4% for now looks to be holding the pressure for now.
US Dollar Index technical analysis: Technical bearish
The US Dollar is sending very mixed signals on its US Dollar Index (DXY) daily chart. The fact that the daily price action is showing lower highs with support holding steady along that 200-day Simple Moving Average (SMA) at 103.55, points to a bearish pressure building. This makes it very clear that two scenarios are on the table for the outcome in the DXY this Wednesday.
The DXY could snap the declining tops and print new highs for not only the past few days, but for the past week. This means that 104.26 needs to break in order to deliver a bullish signal and see the Greenback advance against several major different currencies. In a case where the Fed and Powell deliver a very hawkish message to the markets, with cuts being repriced to the second or third quarter of this year, DXY could soar towards 105.
To the downside, the 200-day SMA could snap if the Fed drops the ball. Markets are expecting cuts, and should the Dot Plots confirm that idea, while Powell would say that cuts are not foreseen in an attempt to remain hawkish. Expect traders to disregard his comments, buy into US bonds, with US yields dropping again and seeing the Greenback in its turn nosediving towards 102.50, the low of November.
Dot Plot FAQs
What is the Federal Reserve “Dot Plot”?
The “Dot Plot” is the popular name of the interest-rate projections by the Federal Open Market Committee (FOMC) of the US Federal Reserve (Fed), which implements monetary policy. These are published in the Summary of Economic Projections, a report in which FOMC members also release their individual projections on economic growth, the unemployment rate and inflation for the current year and the next few ones. The document consists of a chart plotting interest-rate projections, with each FOMC member’s forecast represented by a dot. The Fed also adds a table summarizing the range of forecasts and the median for each indicator. This makes it easier for market participants to see how policymakers expect the US economy to perform in the near, medium and long term.
When does the Federal Reserve publish the “Dot Plot”?
The US Federal Reserve publishes the “Dot Plot” once every other meeting, or in four of the eight yearly scheduled meetings. The Summary of Economic Projections report is published along with the monetary policy decision.
Why is the “Dot Plot” important for markets?
The “Dot Plot” gives a comprehensive insight into the expectations from Federal Reserve (Fed) policymakers. As projections reflect each official’s projection for interest rates at the end of each year, it is considered a key forward-looking indicator. By looking at the “Dot Plot” and comparing the data to current interest-rate levels, market participants can see where policymakers expect rates to head to and the overall direction of monetary policy. As projections are released quarterly, the “Dot Plot” is widely used as a guide to figure out the terminal rate and the possible timing of a policy pivot.
How does data in the “Dot Plot” affect the US Dollar?
The most market-moving data in the “Dot Plot” is the projection of the federal funds rate. Any change compared with previous projections is likely to influence the US Dollar (USD) valuation. Generally, if the “Dot Plot” shows that policymakers expect higher interest rates in the near term, this tends to be bullish for USD. Likewise, if projections point to lower rates ahead, the USD is likely to weaken.
Economists at TD Securities discuss the Federal Reserve Interest Rate Decision and its implications for the Bloomberg Dollar Spot Index.
Hawkish (20%)
Fed delivers a pause but maintains its hawkish bias as the majority of Fed officials still judge another rate increase as the most likely policy option. Inflation is projected to remain sticky in 2024, which allows the Committee to maintain its ‘higher for longer’ message. The median dot stays unchanged at 5.125%. BDXY +0.30%.
Base Case (70%)
Fed decides to keep rates on hold for a third consecutive meeting, but the Committee waters down the bias for additional tightening as the majority of Fed officials are no longer supporting additional tightening. The dot plot for 2024 shows three rate cuts, with the median dot dropping to 4.625% from 5.125% in September. BDXY -0.25%.
More Dovish (10%)
Fed pauses but signals less impetus to stay ‘higher for longer’ as their inflation projections reflect a more optimistic outlook for 2024. A more benign inflation path opens the door to additional policy accommodation, with the dot plot median signaling four rate cuts for next year. The new median dot drops to 4.375% for 2024. BDXY -0.45%.
- The remains moderately bid right with investors awaiting Fed’s decision.
- Dovish comments from BoJ officials have weighed on the Yen.
- USD/JPY is approaching trendline resistance at 146.20.
The US Dollar is moving without a clear direction with a moderately positive tone on Wednesday’s European session as the market awaits the outcome of the Federal Reserve’s meeting.
Recent US data supports the Dollar
US CPI data released on Tuesday revealed that consumer inflation remains sticky, despite the restrictive interest rates. This, coupled with the strong employment figures seen last Friday, has cooled market hopes of Fed cuts in early 2024 and cushioned US Dollar’s losses.
Investors are looking from the sidelines, awaiting the outcome of the Fed’s monetary policy meeting. The benchmark interest rate will remain unchanged, although the committee members’ rate projections and Chairman Powell’s comments might boost US Dollar volatility.
Beyond that, recent comments from BoJ officials crushed speculation about the possibility of a major monetary policy shift at next week’s meeting, increasing bearish pressure on the Yen.
From a technical perspective, the pair is approaching the falling trendline resistance from mid-November highs, now at 146.20.
Above here, the next targets would be 146.85, the 50% retracement of the November - December decline, and 147.50. Supports are 145.20 and 143.75.
Technical levels to watch
- WTI Oil sees no halt to the ongoing correction and breaks below $70.
- Oil outlook is even more bearish for 2024 and longer term after the COP28 agreement.
- The US Dollar (Index) is steady around 104 ahead of the Fed rate decision.
Oil prices are relentlessly printing new lows, flirting with the lows of July. Bears gained a boost on Tuesday after US Consumer Price Index numbers revealed yet again very sticky inflation. This will urge the US to keep pumping at full capacity to keep energy prices low. If the nearterm was not looking grim enough for Oil, COP28 has been able to overrule Saudi Arabia’s earlier objection, after over 200 countries agreed to fully phase out dependence on Oil.
Meanwhile, the US Dollar (USD) is trading sideways around the 104 level in the US Dollar Index (DXY). Traders will brace for an eventful Wednesday ahead with the Producer Price Index numbers and the last Fed meeting of this year. Traders will be on the lookout for the projections of Fed members (DOT PLOT) and the message from US Federal Reserve Chairman Jerome Powell delivered during the press conference.
Crude Oil (WTI) trades at $68.68 per barrel and Brent Oil trades at $73.25 per barrel at the time of writing.
Oil news and market movers: US floods markets
- Just ahead of the end of COP28, participants have been able to issue an agreement that commits to fully phase out of fossil fuels.
- At the same time critics have pointed out that the COP agreement contains a lot of loopholes and unclear elements on how or when the phasing out needs to be reached.
- Traders will be on the lookout for any headlines around an OPEC report due to be released this Wednesday.
- The American Petroleum Institute (API) released its weekly stockpile change on Tuesday. A drawdown of 2.349 million barrels was registered compared to the build of 594,000 barrels in the previous week.
- Near 14:30 GMT the Energy Information Administration (EIA) will release its findings on the stockpile changes. Previous was a drawdown of 4.632 million, with a light drawdown of 650,000 expected.
Oil Technical Analysis: End of the line?
Oil prices and traders are playing with all the variations of the word grim - grimmer - grimmest, when it comes to outlooks and views for 2024 and longer term. With the COP28 commitment now in place to phase out fossil fuels completely, the demand picture looks only to be getting bleaker in the years to come. Expect of course to see repricings along the way with geopolitical tensions still present as the biggest counterweight against bearish pressures, though for now a further correction looks inevitable.
On the upside, $80.00 is the resistance to watch out for. Should crude be able to jump above that again, look for $84.00 (purple line) as the next level to see some selling pressure or profit taking. Should Oil prices be able to consolidate above there, the topside for this fall near $93.00 could come back into play.
With Oil now breaching $70.00, $67.00 comes into play now, which aligns with a triple bottom from June, as the next support level to trade at. Should that triple bottom break, a new low for 2023 could be close with $64.35 – the low of May and March – as last line of defence. Although still quite far off, $57.45 is worth a mention as the next level to keep an eye on in the downturn.
-638380611980470278.png)
US WTI Crude Oil: Daily Chart
WTI Oil FAQs
What is WTI Oil?
WTI Oil is a type of Crude Oil sold on international markets. The WTI stands for West Texas Intermediate, one of three major types including Brent and Dubai Crude. WTI is also referred to as “light” and “sweet” because of its relatively low gravity and sulfur content respectively. It is considered a high quality Oil that is easily refined. It is sourced in the United States and distributed via the Cushing hub, which is considered “The Pipeline Crossroads of the World”. It is a benchmark for the Oil market and WTI price is frequently quoted in the media.
What factors drive the price of WTI Oil?
Like all assets, supply and demand are the key drivers of WTI Oil price. As such, global growth can be a driver of increased demand and vice versa for weak global growth. Political instability, wars, and sanctions can disrupt supply and impact prices. The decisions of OPEC, a group of major Oil-producing countries, is another key driver of price. The value of the US Dollar influences the price of WTI Crude Oil, since Oil is predominantly traded in US Dollars, thus a weaker US Dollar can make Oil more affordable and vice versa.
How does inventory data impact the price of WTI Oil
The weekly Oil inventory reports published by the American Petroleum Institute (API) and the Energy Information Agency (EIA) impact the price of WTI Oil. Changes in inventories reflect fluctuating supply and demand. If the data shows a drop in inventories it can indicate increased demand, pushing up Oil price. Higher inventories can reflect increased supply, pushing down prices. API’s report is published every Tuesday and EIA’s the day after. Their results are usually similar, falling within 1% of each other 75% of the time. The EIA data is considered more reliable, since it is a government agency.
How does OPEC influence the price of WTI Oil?
OPEC (Organization of the Petroleum Exporting Countries) is a group of 13 Oil-producing nations who collectively decide production quotas for member countries at twice-yearly meetings. Their decisions often impact WTI Oil prices. When OPEC decides to lower quotas, it can tighten supply, pushing up Oil prices. When OPEC increases production, it has the opposite effect. OPEC+ refers to an expanded group that includes ten extra non-OPEC members, the most notable of which is Russia.
EUR/USD dead quiet before Fed decision. Economists at Société Générale analyze the pair’s technical outlook.
Reclaiming 200-DMA near 1.0830 essential for bounce to extend
EUR/USD up move has tentatively stalled after hitting 1.1010. Daily MACD has dipped below its trigger denoting receding upward momentum. The pair has pulled back below the 200-DMA which is having flattish slope. This denotes lack of clear direction.
It would be interesting to see if the pair can re-establish above the Moving Average near 1.0830. This break is essential for extension in bounce. Inability to cross above the Moving Average can result in persistence in down move.
Next potential supports are at 1.0700/1.0665 and 1.0580, the 76.4% retracement from October.
- The extends its reversal and hits lows near 1.2500
- UK GDP and Industrial production deteriorate beyond expectations.
- All eyes are now on the Fed, which might boost USD volatility later today.
The Sterling is giving away previous gains on Wednesday, as a string of downbeat UK macroeconomic releases have boosted concerns about the country’s economic outlook.
National Statistics data has revealed that the UK economy contracted at 0.3% in October, well beyond the -0.1% expected, and following a 0.2% growth in September.
Beyond that, manufacturing production dropped 1.1%, against market expectations of a flat performance, driving industrial output 0.8% down instead of the 0.1% decline forecasted by the experts.
Weak UK data poses a challenge to the BoE
These figures offset the positive impact after Tuesday’s strong employment report and pose a headache for the BoE ahead of Thursday’s monetary policy decision.
Later today, the Fed is expected to leave its benchmark rate unchanged at the 5.25% - 5.5% band. The market will be attentive to the dot plot and Chairman Powell’s comments about the bank’s next policy steps, which might boost USD volatility.
Technical levels to watch
The US Federal Reserve kicks off two exciting days as five of the G10 central banks gather for their regular meeting. Michael Pfister, FX Analyst at Commerzbank, analyzes Dollar’s outlook ahead of the Interest Rate Decision.
Will Powell manage to convince the market of a still hawkish Fed?
Further rate hikes are likely to be off the table, but the Fed is unlikely to be satisfied with the extent of rate cuts that the market has priced in. After all, falling yields could reignite inflationary risks. Therefore, Chairman Jerome Powell will continue to emphasize the risks to inflation. The question is whether he will succeed.
Powell does not have an easy task. He has to convince the market that the Fed is hawkish, but not sound too hawkish to leave himself the option of cutting rates next year if the data is favorable. So Powell is in a tough spot.
However, a dovish surprise is less likely given that expectations for rate cuts are already quite advanced. And Tuesday's inflation figures and Friday's employment data showed that we can still see Dollar strength, if only for a short time. So I would be cautiously optimistic for the Dollar today.
- The Australian Dollar is looking weak after rejection at 0.6615.
- The US Dollar remains steady as hopes of a Fed pivot fade.
- AUD/USD is approaching a relevant support area at 0.6520.
The Aussie remains on its back foot on Wednesday’s European Morning session. Price action hovering dangerously close to the 0.6520 support area with the US Dollar showing strength as recent US data cooled hopes of an imminent Fed pivot.
US macroeconomic data cools hopes of Fed cuts
US CPI figures increased unexpectedly in November, revealing that the Fed faces a tough last mile to bring inflation to the 2% target and dampening investors’ expectations of rate cuts in the first quarter of 2024.
Beyond that, the meeting of China’s top leaders ended without any meaningful stimulus program to boost economic growth, which has disappointed investors, adding negative pressure on the Aussie.
AUD/USD approaches key support at 0.6520
Technical indicators are turning lower following another rejection above 0.6600, with a bearish cross on the 4h 100 and 50 SMAs likely to add weight to the pair,
Immediate support lies at 0.6555, which guards the 0.6520 level, a relevant pivot point, and the 38,2 retracement of the October - November rally.
A bullish reaction here would fave resistance at 0.6615 ahead of the early December peak, at 0.6690.
Technical levels to watch
- The Federal Reserve is expected to keep rates on hold for a third consecutive meeting.
- Fed Chairman Jerome Powell will likely repeat decisions will be made meeting by meeting.
- The US Dollar paused its advance ahead of the event and looks poised to extend gains.
The Federal Reserve (Fed) will announce the last monetary policy of 2023 on Wednesday, and market participants widely anticipate policymakers will leave the policy rate unchanged at 5.25%-5.5%. If that’s the case, it would be the third consecutive meeting the central bank refrains from acting after lifting rates to the highest level in over two decades in a little over a year.
The announcement will be complemented by the release of the Summary of Economic Projections (SEP) prepared by the Federal Open Market Committee (FOMC). According to September projections, FOMC participants expect PCE inflation to fall from 3.3% by the end of 2023 to 2.2% by the end of 2025.
However, officials still saw the Fed funds rate peaking at 5.6% this year, unchanged from the previous June projection, suggesting that there is still a 25 basis points (bps) rate hike on the table. Additionally, officials upwardly reviewed their growth projections for this year and the next, and anticipate two rate cuts in 2024, fewer than those projected in June, putting the funds' rate at 5.1%.
Finally, Fed members made it clear that they intend to keep rates higher for longer, while speculative interest believes the tightening cycle is done and bet on a potential rate cut as soon as in Q2 2024.
Economists at Citibank anticipate a dovish announcement, as they don’t expect the FOMC to deliver the last rate hike anticipated in the previous meetings.
“We expect that the Fed will revise their 2023 core PCE inflation lower and given that officials did not deliver the last hike they had anticipated in 2023, it is likely that the 2024 and 2025 median dots in the SEP move lower by 50 bps to 4.625% and 3.375%, respectively. The 2024 dot would then imply 75 bps of cuts in total for 2024, more than what the dots were showing in September. During the press conference Chair Powell will likely say that it is premature to speculate about cuts and that the Committee will decide meeting by meeting if it needs to hold rates steady or to raise the policy rate.”
When will the Fed announce policy decisions and how could they affect EUR/USD?
The Federal Reserve is scheduled to announce its decision and publish the monetary policy statement at 19:00 GMT. This will be followed by Chairman Jerome Powell's press conference at 19:30 GMT. As said, the most likely scenario is that policymakers will opt to keep interest rates unchanged.
The central bank argued previous rate hikes need time to take effect, explaining the ongoing “pause” in rate hikes. However, there is an underlying reason: higher rates come with an increased risk of an economic downturn. Growth in the country has proved resilient, yet policymakers are well aware at least a soft landing is around the corner. Additional hikes, however, could trigger a recession.
Meanwhile, inflation has eased sharply from the records achieved in mid-2022, but it is still above the central bank’s 2% goal. The November Consumer Price Index (CPI) printed at 3.1% YoY, while the core annual reading remained steady at 4%. Also, the core Personal Consumption Expenditures (PCE) Price Index, the Fed’s favorite inflation gauge, rose 3.5% on a year-over-year basis in October.
The latest CPI figures were not enough to spur speculation of a potential rate hike in the docket but weighed on the market’s speculation about potential rate cuts through 2024.
On the one hand, the median projection of the Fed's most recent interest rate dot plot chart puts the Federal Funds Rate at 5.1% at the end of 2024, a measly 25 bps rate cut in twelve months. On the other hand, speculative interest foresees between 100 and 120 bps on cuts spread through the year.
That means that an on-hold decision will hardly affect financial markets, but the dot-plot will set the tone. Investors will be looking for clues on what the Fed could pivot, something officials refrain from providing so far.
Valeria Bednarik, Chief Analyst at FXStreet, explains: “The US Dollar could react to sentiment instead of news. If policymakers are optimistic about growth and easing inflation, while reducing their perspective for the Fed’s funds rate from 5.1% for 2024, risk appetite may come in fashion. Stock markets and high-yielding assets could appreciate against the USD. The opposite scenario will be less concerning, as investors are well aware of Fed officials' ‘higher-for-longer’ mantra and will not be completely disappointed if officials fail to put something new on the table.”
Regarding EUR/USD, Bednarik adds: “The EUR/USD pair is in a corrective decline after advancing between September and November, and so far, met buyers around the 50% retracement of the 1.0447-1.1016 rally at 1.0732. The 61.8% Fibonacci retracement stands not far below it, at 1.0666, a bearish breakout point. Once below it, the case for a steep decline towards 1.0500 becomes stronger.”
Finally, Bednarik notes that “beyond the weekly peak at 1.0820, EUR/USD can recover towards the 1.0900 level, although gains beyond the latter seem unlikely at the time being.”
Fed FAQs
What does the Federal Reserve do, how does it impact the US Dollar?
Monetary policy in the US is shaped by the Federal Reserve (Fed). The Fed has two mandates: to achieve price stability and foster full employment. Its primary tool to achieve these goals is by adjusting interest rates.
When prices are rising too quickly and inflation is above the Fed’s 2% target, it raises interest rates, increasing borrowing costs throughout the economy. This results in a stronger US Dollar (USD) as it makes the US a more attractive place for international investors to park their money.
When inflation falls below 2% or the Unemployment Rate is too high, the Fed may lower interest rates to encourage borrowing, which weighs on the Greenback.
How often does the Fed hold monetary policy meetings?
The Federal Reserve (Fed) holds eight policy meetings a year, where the Federal Open Market Committee (FOMC) assesses economic conditions and makes monetary policy decisions.
The FOMC is attended by twelve Fed officials – the seven members of the Board of Governors, the president of the Federal Reserve Bank of New York, and four of the remaining eleven regional Reserve Bank presidents, who serve one-year terms on a rotating basis.
What is Quantitative Easing (QE) and how does it impact USD?
In extreme situations, the Federal Reserve may resort to a policy named Quantitative Easing (QE). QE is the process by which the Fed substantially increases the flow of credit in a stuck financial system.
It is a non-standard policy measure used during crises or when inflation is extremely low. It was the Fed’s weapon of choice during the Great Financial Crisis in 2008. It involves the Fed printing more Dollars and using them to buy high grade bonds from financial institutions. QE usually weakens the US Dollar.
What is Quantitative Tightening (QT) and how does it impact the US Dollar?
Quantitative tightening (QT) is the reverse process of QE, whereby the Federal Reserve stops buying bonds from financial institutions and does not reinvest the principal from the bonds it holds maturing, to purchase new bonds. It is usually positive for the value of the US Dollar.
Economic Indicator
United States FOMC Economic Projections
At four of its eight scheduled annual meetings, the Federal Reserve (Fed) releases a report detailing its projections for inflation, the unemployment rate and economic growth over the next two years and, more importantly, a breakdown of each Federal Open Market Committee (FOMC) member's individual interest rate forecasts.
Read more.Next release: 12/13/2023 19:00:00 GMT
Frequency: Irregular
Source: Federal Reserve
EUR/GBP fell below the 0.86 level. Economists at Société Générale analyze the pair’s outlook.
EUR/GBP to rebound on fewer dissenters against BoE standing pat
The retracement in EUR/GBP below 0.86 marks a 2% drop from the November highs and opens the door for a return to 0.85 for the first time since early September.
The BoE is widely anticipated to keep rates on hold at 5.25% on Thursday but suspense will again revolve around the vote. Three MPC members backed a 25 bps rate increase in November. Fewer dissenters could cause positive momentum in Sterling to unravel and prompt a rebound in EUR/GBP.
New Zealand's third quarter GDP figures are on the agenda today. Michael Pfister, FX Analyst at Commerzbank, analyzes pros and cons of GDP figures for the RBNZ.
The RBNZ is unlikely to leave the policy rate at its current high level forever
The third quarter GDP figures are likely to come at a bad time. If the economists surveyed by Bloomberg are right, economic growth is likely to have weakened again in Q3, and the upward surprise in the second quarter will prove to be an outlier. As a result, growth is likely to move further away from the pre-pandemic trend. At first glance, stubbornly high inflation and a weakening real economy do not sound particularly favorable for the RBNZ.
On the other hand, the slowing economy could also play into the RBNZ's hands. The statement from the Oktober meeting stated that ‘a prolonged period of subdued activity’ may be needed ‘to reduce inflationary pressures’. They argued similarly at the end of November. With this in mind, a weaker GDP number could be beneficial for the RBNZ.
Meanwhile, the RBNZ is unlikely to leave the policy rate at its current high level forever. If economic growth turns out to be significantly weaker than expected today and inflation does not fall more sharply in the coming months, the RBNZ is likely to face a dilemma. But for now, given the stubborn inflation and the hawkish central bank, I would be cautious about pricing in larger rate cuts than the market currently expects.
Economists at ING analyze USD outlook ahead of the Fed’s policy decision.
Dollar can get support from well-telegraphed Fed pushback
It is now a very consensus view that the Fed will push back against rate cut expectations.
We expect the Dot Plots will show only 50 bps of cuts in 2024.
Still, markets may feel less comfortable about the first rate cut coming in May, and a softening in risk sentiment could help the Dollar today – and into Christmas.
A stabilisation around 104/105 in DXY seems plausible.
See – Fed Preview: Forecasts from 10 major banks, crushing rate cut prospects
Norges Bank meets on Thursday. Economists at ING analyze how the Interest Rate Decision could impact the Krone.
Norges Bank set to keep rates on hold amid lower energy prices
Lower oil prices and growing anticipation of rate cuts from the global central banks have taken the pressure off Norway's central bank to hike rates one last time in December.
We expect an on-hold decision but expect the bank's new rate projection to push back against expectations of imminent rate cuts in 2024.
A hawkish hold should partly shield the Krone.
- The Euro extends its recovery beyond 0.8600 as UK data disappoints.
- UK GDP and manufacturing production deteriorate beyond expectations.
- These data pose a challenge for the Bank of England.
The euro maintains a positive tone against the Pound on Wednesday’s European trading session, reaching intra-day highs right above 0.8600, following downbeat UK GDP and manufacturing figures.
The sterling dropped against its main peers after National Statistics reported that UK GDP contracted by 0.3% in October. The market consensus had anticipated a softer 0.1% decline, following a 0.2% growth in September.
Beyond that, manufacturing production deteriorated at a 1.1% pace in the same month, against market expectations of a flat reading, with the trade gap widening beyond expectations. These figures cast a shadow over the country’s economic outlook, and add negative pressure on the Pound.
This poses a challenge for the BoE’s hawkish stance and increases the interest in Thursday’s monetary policy meeting. Investors will be especially attentive to the voting results and the bank’s statement for hints of a dovish turn that might send the pound lower.
The technical picture shows the euro building up, with resistance levels at 0.8610 and 0.8650. Supports lie at 0.8550 and the 0.8500 area.
Technical levels to watch
EUR/USD remains around the 1.08 mark. Economists at ING analyze the pair’s outlook.
Fed can favour reconnection with rate differentials
We see downside risks for the pair this week despite our view that the European Central Bank will follow the Fed with a rate cut pushback of its own. The main reason for this is that this ‘coordinated’ hawkish recalibration by central bankers before Christmas could cause a softening of the risk environment, the resilience of which has allowed EUR/USD to stay around current levels despite the EUR/USD short-term swap rate differentials being at the lowest of the year.
A hawkish hold by both the ECB and the Fed may not move the rate differential much, and the spread would have to retighten significantly anyway to technically justify a sustainable rally in EUR/USD.
We think EUR/USD bulls should be happy with the pair finding support at 1.0700 before Christmas.
- USD/MXN retraces recent losses ahead of the Fed policy decision.
- As-expected US CPI data diminishes the likelihood of rate cuts soon.
- Mexico's Industrial Output data showed resilience, recording a 5.5% increase in yearly output and a 0.6% uptick in the monthly report.
USD/MXN navigates around 17.33 during the European session on Wednesday, making attempts to recover from recent losses registered in the previous session. The support for the US Dollar (USD) comes from positive US Treasury yields, leading up to the Federal Reserve's (Fed) Interest Rate Decision. The anticipation is that the Federal Open Market Committee (FOMC) will maintain its current policy stance in the December meeting.
The US Dollar had a brief dip and subsequent recovery following the release of moderate Consumer Price Index (CPI) data from the United States on Tuesday.
The US Bureau of Labor Statistics reported a 0.1% month-on-month and 3.1% year-on-year increase in the US Consumer Price Index (CPI) for November. The US Core CPI also showed a 0.3% month-on-month and 4.0% year-on-year uptick. These figures aligning with market expectations suggest that inflation is tracking as predicted, suggesting no interest rate cuts by the Fed any time sooner.
On Mexico's side, the Industrial Output data released by INEGI reveals a robust performance in factories and manufacturing in October, with a yearly output increase of 5.5% from 4.0%, surpassing the market expectations of 4.6% and showing resilience. The monthly report also defied expectations, demonstrating growth of 0.6% instead of the anticipated decline of 0.1%.
Looking ahead, the upcoming announcement of the Bank of Mexico's (Banxico) key interest rate on Thursday is expected to maintain cash rates at the unchanged level of 11.25%.
- EUR/USD trades with a mild negative bias on Wednesday amid a modest USD strength.
- The downside remains cushioned as traders wait for the crucial FOMC policy decision.
- The market attention will then shift to the ECB monetary policy meeting on Thursday.
The EUR/USD pair edges lower on Wednesday, albeit manages to hold above the 100-hour Simple Moving Average (SMA) through the first half of the European session. Spot prices currently trade just below the 1.0800 mark, down less than 0.10% for the day, as traders keenly await the outcome of the highly-anticipated two-day FOMC policy meeting before positioning for a firm intraday direction.
The Federal Reserve (Fed) is scheduled to announce its decision later during the US session and is universally anticipated to maintain the status quo. Traders, meanwhile, have been trimming their bets for an early policy easing by the Fed amid signs of a still resilient US economy, as depicted by Friday's stronger monthly jobs report and consumer inflation figures released on Tuesday. This, along with some repositioning trade ahead of the key central bank event risk, acts as a tailwind for the US Dollar (USD), which, in turn, is seen weighing on the EUR/USD pair.
The shared currency, on the other hand, is undermined by the recent dovish rhetoric by European Central Bank (ECB) officials. In fact, the ECB's hawkish board member Isabel Schnabel earlier this month said that the central bank could take further interest rate hikes off the table in the wake of a significant decline in inflationary pressures. This further contributes to a mildly offered tone surrounding the EUR/USD pair. The downside, however, remains cushioned as traders might wait for a dovish ECB tilt at the end of the December policy meeting on Thursday.
Meanwhile, the aforementioned mixed fundamental backdrop, along with the recent range bound price action witnessed over the past week or so, warrants caution before positioning for any firm near-term directional. Bearish traders are likely to wait for a sustained break below the 100-day Simple Moving Average (SMA) before positioning for an extension of the recent pullback from a multi-month peak touched in November. Conversely, a sustained strength beyond the 200-day SMA barrier, around the 1.0825 region, will shift the bias in favour of bulls.
Technical levels to watch
UK Finance Minister Jeremy Hunt said on Wednesday, “it is inevitable GDP will be subdued while interest rates are doing their job to bring down inflation.”
“The big reductions in business taxation mean the economy is now well placed to start growing again,” he added.
Also read: UK GDP contracts 0.3% MoM in October vs. -0.1% expected
Market reaction
At the time of writing, GBP/USD is losing 0.27% on a daily basis to trade at 1.2525.
FX option expiries for Dec 13 NY cut at 10:00 Eastern Time, via DTCC, can be found below.
- EUR/USD: EUR amounts
- 1.0790 1.1b
- 1.0850 900m
- 1.0930 833m
- GBP/USD: GBP amounts
- 1.2645 478m
- USD/JPY: USD amounts
- 145.00 1b
- 145.50 437m
- 146.00 1.3b
- USD/CHF: USD amounts
- 0.8600 818m
- 0.8825 429m
- AUD/USD: AUD amounts
- 0.6615 554m
- USD/CAD: USD amounts
- 1.3750 941m
- EUR/GBP: EUR amounts
- 0.8700 808m
Gold prices fell in India on Wednesday, according to data from India's Multi Commodity Exchange (MCX).
Gold price stood at 60,759 Indian Rupees (INR) per 10 grams, down INR 361 compared with the INR 61,120 it cost on Tuesday.
As for futures contracts, Gold prices decreased to INR 61,136 per 10 gms from INR 61,181 per 10 gms.
Prices for Silver futures contracts decreased to INR 71,681 per kg from INR 71,862 per kg.
| Major Indian city | Gold Price |
|---|---|
| Ahmedabad | 62,865 |
| Mumbai | 62,710 |
| New Delhi | 62,800 |
| Chennai | 62,830 |
| Kolkata | 62,870 |
Global Market Movers: Comex Gold price is undermined by reduced bets for a dovish Fed pivot
- The uncertainty over the Federal Reserve’s near-term policy outlook holds back traders from placing directional bets around the Comex Gold price and leads to subdued range-bound price action.
- Data released from the United States on Tuesday showed that consumer prices rose unexpectedly in November, forcing traders to further scale back bets for a rate cut in March.
- The US Labor Department reported that the headline Consumer Price Index (CPI) edged up 0.1% in November and the yearly rate ticked down to 3.1% from the 3.2% previous.
- The annual Core CPI inflation, which excludes volatile food and energy prices, held steady at 4.0% as forecast and rose 0.1% on a monthly basis, little changed from the previous month.
- The November numbers were still well above the Fed's 2% target and come on top of the stronger-than-expected US jobs report last Friday, pointing to a still resilient economy.
- The market focus remains glued to the outcome of the crucial two-day FOMC monetary policy meeting, scheduled to be announced later during the US session this Wednesday.
- Investors will look for fresh cues about the timing of when the Fed may start cutting rates in 2024, which, in turn, will drive the US Dollar demand and influence the yellow metal.
- Hopes for more stimulus from policymakers in China overshadow the risk of a further escalation of geopolitical tensions in the Middle East and remain supportive of the risk-on mood.
- Reporting on the annual Central Economic Work Conference that ended on Tuesday, state media said that China will step up policy adjustments to support economic recovery in 2024.
- A senior Communist Party official said on Wednesday that China should set its 2024 fiscal deficit and special local government bonds at appropriate levels and optimize the structure of fiscal spending.
- Yemen's Iran-backed Houthi rebels issue regulations for navigating through the Red Sea amid the Israel embargo and the warning includes a restriction on travel towards "Occupied Palestinian territories".
- The US on Tuesday imposed new sanctions on more than 250 individuals and entities in an effort to crack down on Russia’s evasion of sanctions imposed after its invasion of Ukraine.
- This, however, does little to temper investors' appetite for perceived riskier assets or dampen the underlying bullish market sentiment and benefit the safe-haven precious metal.
(An automation tool was used in creating this post.)
Gold FAQs
Why do people invest in Gold?
Gold has played a key role in human’s history as it has been widely used as a store of value and medium of exchange. Currently, apart from its shine and usage for jewelry, the precious metal is widely seen as a safe-haven asset, meaning that it is considered a good investment during turbulent times. Gold is also widely seen as a hedge against inflation and against depreciating currencies as it doesn’t rely on any specific issuer or government.
Who buys the most Gold?
Central banks are the biggest Gold holders. In their aim to support their currencies in turbulent times, central banks tend to diversify their reserves and buy Gold to improve the perceived strength of the economy and the currency. High Gold reserves can be a source of trust for a country’s solvency. Central banks added 1,136 tonnes of Gold worth around $70 billion to their reserves in 2022, according to data from the World Gold Council. This is the highest yearly purchase since records began. Central banks from emerging economies such as China, India and Turkey are quickly increasing their Gold reserves.
How is Gold correlated with other assets?
Gold has an inverse correlation with the US Dollar and US Treasuries, which are both major reserve and safe-haven assets. When the Dollar depreciates, Gold tends to rise, enabling investors and central banks to diversify their assets in turbulent times. Gold is also inversely correlated with risk assets. A rally in the stock market tends to weaken Gold price, while sell-offs in riskier markets tend to favor the precious metal.
What does the price of Gold depend on?
The price can move due to a wide range of factors. Geopolitical instability or fears of a deep recession can quickly make Gold price escalate due to its safe-haven status. As a yield-less asset, Gold tends to rise with lower interest rates, while higher cost of money usually weighs down on the yellow metal. Still, most moves depend on how the US Dollar (USD) behaves as the asset is priced in dollars (XAU/USD). A strong Dollar tends to keep the price of Gold controlled, whereas a weaker Dollar is likely to push Gold prices up.
GBP/USD has plummeted following disappointing GDP data from the UK. Economists at ING analyze the pair’s outlook.
Soft GDP figures not key for the BoE
UK monthly GDP for October came in weaker than expected at -0.3% MoM.
The October figures mean that we are on track for a marginally negative 4Q GDP print in the UK, although that is not at the top of the Bank of England’s concerns at the moment. We still expect a hawkish tone on Thursday to give some help to Sterling, especially in the crosses.
Today, GBP/USD may well break below the 1.2500 gravity level.
Gold price has dipped back below the $2,000 mark. Strategists at Commerzbank analyze the yellow metal’s outlook.
Headwind for Gold price
The market has somewhat lowered its rate cut expectations again. And indeed we also believe that the market’s expectations of a first US rate cut as early as the spring are somewhat premature; we do not envisage any such step until at least mid-year.
Further headwind for the Gold price is looming if the US Federal Reserve were to drive interest rate expectations down even further at its meeting today.
See – Fed Preview: Forecasts from 10 major banks, crushing rate cut prospects
- USD/CAD grapples to extend its gains on the back of subdued Crude oil prices.
- A firm breakthrough above 1.3600 could lead the pair to reach a 21-day EMA at 1.3620.
- 14-day RSI lies below the 50 mark; the 1.3550 level could act as key support.
USD/CAD struggles to extend its gains for the second successive day while US Dollar (USD) stays in the positive territory. The downbeat Crude oil prices reinforce the downward pressure on the Canadian Dollar (CAD). The USD/CAD pair trades higher around 1.3590 during the European session on Wednesday.
The USD/CAD pair finds the psychological level at 1.3600 as a key barrier. A firm break above the latter could inspire the bulls of the USD/CAD pair to explore the 21-day Exponential Moving Average (EMA) at 1.3620 followed by the 38.2% Fibonacci retracement level at 1.3840 before the major resistance at 1.3650 level.
The technical indicator Moving Average Convergence Divergence (MACD) for the USD/CAD pair signals a potential bullish trend reversal. MACD line lies below the centerline and crosses above the signal line. The crossover above the signal line suggests that the shorter-term moving average is gaining strength relative to the longer-term moving average, indicating a shift towards positive momentum in the pair.
However, the analysis suggests a dovish sentiment for the USD/CAD pair, with the 14-day Relative Strength Index (RSI) below 50. This implies a weakness in the pair, and it could lose ground. The mentioned support levels, including the major level around 1.3550 and the psychological support at 1.3500, are crucial markers to watch.
If the USD/CAD pair breaks below the latter, it might encounter further bearish pressure, potentially navigating toward the region around the previous week's low at 1.3480.
USD/CAD: Daily Chart
Last week EUR/CHF hit levels a whisper above 0.94 before finding buyers. Economists at Rabobank analyze the pair’s outlook ahead of ECB and SNB meetings this week.
SNB will employ more dovish language
The recent move lower in EUR/CHF is likely a function of accelerated bets in the market regarding the prospects of ECB rate cuts this year. In our view, the ECB will use this week’s policy meeting to push back against these expectations. This should bring some near-term support for EUR/CHF. However, if the SNB were to come across as hawkish at its policy meeting this week then EUR/CHF would be at risk of pushing to new lows.
Now that CPI inflation is back within the SNB’s target range, we expect that the SNB will employ more dovish language this week, to reduce the risks of further CHF strength and lower the chance that it may have to intervene in the market to weaken the CHF.
Economists at ING analyze how another Fed hold, but with pushback on rate cut prospects, could impact the FX market.
Fed pushback could dent recent high-yield FX rally
A Fed pushback against market pricing of the easing cycle in 2024 should be mildly supportive of the Dollar.
Even though EUR/USD has performed poorly through the start of December and could get some mild support a day later from the ECB, this FOMC meeting could prompt losses to the 1.0650 area.
Perhaps more vulnerable to a decent Fed pushback against lower rates might be what we call the 'growth' currencies, such as the high beta currencies in Scandinavia and the commodity sector (Australian and Canadian Dollars). These currencies have had a good run through November on the lower US rate environment. However, these currencies are our top picks for next year and should meet good demand on pullbacks this month.
As to the wild ride that is USD/JPY, higher US yields could provide some temporary support. However, we doubt USD/JPY will sustain gains above the 146/147 area as traders re-adjust positions for a potential change in the Bank of Japan (BoJ) policy on December 19th. We suspect that USD/JPY has peaked, however, and are happy with our call for USD/JPY to be trading close to 135 next summer after the BoJ starts to dismantle its ultra-dovish policy in the first half of next year.
- GBP/JPY regains positive traction on Wednesday and reverses a part of the overnight losses.
- The intraday uptick lost momentum after the disappointing release of the UK macro data.
- Reduced bets for a BoJ pivot continue to undermine the JPY and lend support to the cross.
The GBP/JPY cross attracts some dip-buying near the mid-182.00s on Wednesday and sticks to its intraday gains through the early part of the European session. Spot prices, however, retreat a few pips from the daily high in reaction to the disappointing UK macro data and currently trade below the 183.00 round figure.
The UK Office for National Statistics (ONS) reported that the economy contracted by 0.3% in October, missing consensus estimates for a 0.1% decline and the 0.2% growth registered in the previous month. A separate report showed that the downturn in the UK industrial sector deepened in October. This comes on top of Tuesday's mixed UK jobs report, indicating that Average Earning decelerated more than expected during the three months to October, and reaffirms expectations that the Bank of England's (BoE) rate-hiking cycle could be reversed in 2024.
The aforementioned fundamental backdrop weighs on the British Pound (GBP), though a mildly softer tone surrounding the Japanese Yen (JPY) acts as a tailwind for the GBP/JPY cross. Reports that the Bank of Japan (BoJ) policymakers see little need to end negative rates in December. Furthermore, hopes for more stimulus from China remain supportive of the underlying bullish market sentiment, which, in turn, is seen undermining the safe-haven JPY and lending support to the cross. That said, the lack of any follow-through buying warrants caution for bulls.
Even from a technical perspective, the recent breakdown and a subsequent failure near the 100-day Simple Moving Average (SMA) suggest that the path of least resistance for the GBP/JPY cross is to the downside. Hence, any further move up towards the said support-turned-resistance, currently pegged near the 183.75 region, might still be seen as a selling opportunity. That said, some follow-through buying beyond the weekly swing high, around the 184.30-184.35 region touched on Monday, will negate the near-term negative outlook for the cross.
Technical levels to watch
- USD/CHF halts a two-day losing streak ahead of Fed policy decision.
- SNB is widely anticipated to hold its interest rate at 1.75% following the recent downbeat inflation.
- Investors await Fed Chair Jerome Powell's comments to gain insights into the interest rates trajectory.
USD/CHF hovers around 0.8760 during the Asian trading hours on Wednesday, snapping two days of losses as the US Dollar improves on upbeat US bond yields. The Swiss National Bank (SNB) is anticipated to keep its policy rate steady at 1.75% in Thursday’s meeting, particularly in light of the recent easing of Swiss inflation in November.
The upcoming Monetary Policy Assessment in the Quarterly Bulletin will offer valuable insights into the SNB's outlook, providing a medium-term conditional inflation forecast.
The US Dollar Index (DXY) moves on an upward trajectory, approaching the 104.00 level, supported by higher yields on both the 2-year and 10-year US bond coupons, standing at 4.73% and 4.20%, respectively, by the press time.
The cautious approach of market participants ahead of the Federal Reserve's policy decision indeed introduces an element of uncertainty that could potentially exert downward pressure on the Greenback, consequently impacting the USD/CHF pair. While the expectation is for the Federal Open Market Committee (FOMC) to maintain its current policy stance, the focus on cues regarding potential rate cuts in 2024 adds a layer of intrigue for investors.
The significance of Federal Reserve Chair Jerome Powell's comments becomes even more pronounced, as they hold the potential to shape market expectations and influence movements of the USD/CHF pair.
The US Dollar's recent bout of high volatility, fueled by the release of the Consumer Price Index (CPI) figures, reflects the market's reaction to the 3.1% year-on-year increase, as expected in November against the 3.2% readings previously. The parallel uptick in the US Core CPI at 4.0% aligns with market expectations, indicating a degree of predictability in inflation trends.
As market participants await the release of the US Producer Price Index (PPI) for November, the focus shifts to expectations of a growth reduction to 1.0% yearly. Projections for an easing Core PPI at 2.2%, compared to the 2.4% prior, add another layer to the market's anticipation.
- GBP/USD attracts some sellers to 1.2528 following the downbeat UK data.
- The UK GDP rate dropped 0.3% in October from 0.2% growth in September.
- US Consumer Price Index (CPI) data indicated that price increases in November remained moderate.
- Investors await the US Producer Price Index (PPI) ahead of the Fed interest rate decision.
The GBP/USD pair drops sharply below the mid-1.2500s during the early European session on Wednesday. The weaker-than-expected UK GDP growth data and Industrial Production weigh on the British Pound (GBP) and create a headwind to the GBP/USD. At press time, GBP/USD is trading at 1.2528, losing 0.34% for the day.
The latest data from the Office for National Statistics on Wednesday revealed that UK monthly Gross Domestic Product (GDP) growth for the three months ending in October contracted by 0.3% MoM from the previous reading of 0.2% expansion, below the market consensus of 0.2% increase.
Meanwhile, the nation's Industrial Production data for October came in worse than market expectations, falling by 0.8% MoM. The Manufacturing Production) dropped by 1.1% MoM versus a 0.1% rise in the previous reading.
The Bank of England (BoE) is anticipated to keep its interest rate unchanged at 5.25% for a third consecutive meeting on Thursday. Markets are pricing three rate cuts next year total of 100 basis points (bps) of rate cuts in 2024. This would bring the rate down to 4.25%, according to ING.
The Fed is widely expected to hold borrowing costs steady on Wednesday. The markets anticipate that Fed Chair Jerome Powell will maintain that cautious approach and push back against the odds for rate cutting. However, the Fed fund futures are pricing in an 80% possibility of a rate cut in May, according to the CME FedWatch Tool.
Tuesday's publication of inflation data indicated that price increases in November remained moderate. The US Consumer Price Index (CPI) grew by 0.1% MoM from 0% in the previous reading and rose by 3.1% YoY in November versus 3.2% prior. Both numbers were in line with the market consensus. Additionally, the Core CPI, which excludes volatile food and energy prices, rose by 0.3% MoM from the 0.2% estimated, while the annual core CPI surged 4.0% YoY, as expected.
The US Producer Price Index (PPI) for November will be released on Wednesday, which is expected to show an increase of 0.1% MoM and 1.0% YoY, respectively. The PPI ex Food & Energy is estimated to ease from 2.4% to 2.2% YoY. Later on Wednesday, the Fed will announce the interest rate decision at its last meeting of the year, followed by a press conference. On Thursday, the Bank of England (BoE) will announce its decision on monetary policy. These events could give a clear direction to the GBP/USD pair.
Here is what you need to know on Wednesday, December 13:
The November inflation report from the US failed to help major currencies find direction on Tuesday, with market participants refraining from taking large positions ahead of the Federal Reserve's (Fed) last policy announcements of the year. The Producer Price Index (PPI) data will also be featured in the US economic docket and the Fed will publish the revised Summary of Economic Projections (SEP), also known as the dot plot, alongside the policy statement. Finally, Fed Chairman Jerome Powell will hold a press conference to speak on the policy outlook and to respond to questions.
The Consumer Price Index (CPI) in the US rose 3.1% on a yearly basis in November as expected. The Core CPI inflation, which excludes volatile food and energy prices, held steady at 4% in the same period, matching the market consensus. After fluctuating wildly with the immediate reaction to CPI readings, the US Dollar Index (USD) stabilized below 104.00. Meanwhile, the benchmark 10-year US Treasury bond yield retreated to the 4.2% area and Wall Street's main indexes closed in positive territory. Early Wednesday, the 10-year yield continues to fluctuate at around 4.2% and the USD Index moves sideways near 104.00. The Fed is widely expected to leave the policy rate unchanged at 5.25%-5.5%. Investors will pay close attention to the dot plot to try to figure out the timing of the policy shift next year.
US Dollar price this week
The table below shows the percentage change of US Dollar (USD) against listed major currencies this week. US Dollar was the strongest against the Japanese Yen.
| USD | EUR | GBP | CAD | AUD | JPY | NZD | CHF | |
| USD | -0.17% | 0.19% | 0.11% | 0.51% | 0.66% | 0.53% | -0.39% | |
| EUR | 0.17% | 0.36% | 0.28% | 0.68% | 0.81% | 0.69% | -0.22% | |
| GBP | -0.18% | -0.36% | -0.08% | 0.33% | 0.47% | 0.34% | -0.59% | |
| CAD | -0.11% | -0.28% | 0.08% | 0.39% | 0.57% | 0.43% | -0.51% | |
| AUD | -0.52% | -0.69% | -0.33% | -0.41% | 0.15% | 0.02% | -0.92% | |
| JPY | -0.66% | -0.82% | -0.55% | -0.55% | -0.15% | -0.14% | -1.04% | |
| NZD | -0.53% | -0.70% | -0.34% | -0.42% | -0.01% | 0.14% | -0.92% | |
| CHF | 0.39% | 0.22% | 0.57% | 0.50% | 0.90% | 1.05% | 0.91% |
The heat map shows percentage changes of major currencies against each other. The base currency is picked from the left column, while the quote currency is picked from the top row. For example, if you pick the Euro from the left column and move along the horizontal line to the Japanese Yen, the percentage change displayed in the box will represent EUR (base)/JPY (quote).
Fed Preview: Forecasts from 10 major banks, crushing rate cut prospects.
In the early Asian session on Thursday, the Australian Bureau of Statistics will release employment data for November and the University of Melbourne will publish Consumer Inflation Expectations for December. After rising above 0.6600 on Tuesday, AUD/USD erased its daily gains to close flat. Early Wednesday, the pair trades modestly lower on the day at around 0.6550.
EUR/USD spiked to a weekly high above 1.0820 with the immediate reaction to US inflation data on Tuesday but failed to preserve its bullish momentum. In the European morning, the pair seems to have gone into a consolidation phase slightly below 1.0800. Eurostat will release Industrial Production data for October on Wednesday.
Following a quiet Asian session, GBP/USD came under renewed bearish pressure and was last seen trading in negative territory below 1.2550. The UK's Office for National Statistics reported on Wednesday that the Gross Domestic Product (GDP) contracted by 0.3% on a monthly basis in October. Industrial Production and Manufacturing Production declined by 0.8% and 1.1%, respectively, in the same period.
Tankan Large Manufacturing Index improved to 12 in the fourth quarter from 9, the data from Japan showed early Friday. On a negative note. Tankan Large Manufacturing Outlook declined to 8 from 10. USD/JPY continued to stretch higher during the Asian trading hours and came within a touching distance of 146.00 by the European morning.
Gold closed the second day of the week little changed but failed to attract buyers early Wednesday. As of writing, XAU/USD was trading at its weakest level in three weeks below $1,980.
Fed FAQs
What does the Federal Reserve do, how does it impact the US Dollar?
Monetary policy in the US is shaped by the Federal Reserve (Fed). The Fed has two mandates: to achieve price stability and foster full employment. Its primary tool to achieve these goals is by adjusting interest rates.
When prices are rising too quickly and inflation is above the Fed’s 2% target, it raises interest rates, increasing borrowing costs throughout the economy. This results in a stronger US Dollar (USD) as it makes the US a more attractive place for international investors to park their money.
When inflation falls below 2% or the Unemployment Rate is too high, the Fed may lower interest rates to encourage borrowing, which weighs on the Greenback.
How often does the Fed hold monetary policy meetings?
The Federal Reserve (Fed) holds eight policy meetings a year, where the Federal Open Market Committee (FOMC) assesses economic conditions and makes monetary policy decisions.
The FOMC is attended by twelve Fed officials – the seven members of the Board of Governors, the president of the Federal Reserve Bank of New York, and four of the remaining eleven regional Reserve Bank presidents, who serve one-year terms on a rotating basis.
What is Quantitative Easing (QE) and how does it impact USD?
In extreme situations, the Federal Reserve may resort to a policy named Quantitative Easing (QE). QE is the process by which the Fed substantially increases the flow of credit in a stuck financial system.
It is a non-standard policy measure used during crises or when inflation is extremely low. It was the Fed’s weapon of choice during the Great Financial Crisis in 2008. It involves the Fed printing more Dollars and using them to buy high grade bonds from financial institutions. QE usually weakens the US Dollar.
What is Quantitative Tightening (QT) and how does it impact the US Dollar?
Quantitative tightening (QT) is the reverse process of QE, whereby the Federal Reserve stops buying bonds from financial institutions and does not reinvest the principal from the bonds it holds maturing, to purchase new bonds. It is usually positive for the value of the US Dollar.
The United Kingdom’s (UK) industrial sector downturn deepened in October, according to the data released by the Office for National Statistics (ONS) on Wednesday.
Manufacturing Output dropped 1.1% MoM in October versus 0% expected and 0.1% seen in September while total Industrial Production came in at -0.8% MoM vs. -0.1% expected and 0% previous.
The annual UK Manufacturing Production data rose 0.8% in October, missing expectations of 1.9%. Total Industrial Output accelerated by 0.4% in the tenth month of the year, below the 1.1% estimated growth and the previous print of 1.5%.
Separately, the UK Goods Trade Balance numbers were published, which arrived at GBP- 17.032 billion in October versus GBP -14.10 billion expectations and GBP -14.288 billion last. The total Trade Balance (non-EU) came in at GBP-4.828 billion in October versus GBP-4.45 billion reported in September.
Related reads
- UK GDP contracts 0.3% MoM in October vs. -0.1% expected
- GBP/USD drops below 1.2530 following weaker UK GDP data, eyes on Fed rate decision
Economic Indicator
United Kingdom Manufacturing Production (MoM)
The Manufacturing Production released by the National Statistics measures the manufacturing output. Manufacturing Production is significant as a short term indicator of the strength of UK manufacturing activity that dominates a large part of total GDP. A high reading is seen as positive (or bullish) for the GBP, while a low reading is seen as negative (or bearish).
Read more.Next release: 1/12/2023 07:00:00 GMT
Frequency: Monthly
Source: Office for National Statistics
- UK GDP rate dropped 0.3% MoM in October vs. -0.1% expected.
- GBP/USD extends losses toward 1.2500 on downbeat UK GDP data.
The UK economy returned to contraction, shrinking 0.3% in October after reporting a 0.2% growth in September, the latest data published by the Office for National Statistics (ONS) showed on Wednesday. The market consensus was for a 0.1% contraction in the reported period.
Meanwhile, the Index of services (October) arrived at 0.1% 3M/3M vs. September’s -0.1% reading.
Market reaction to the UK GDP report
GBP/USD is seeing a fresh selling wave on the downbeat UK GDP data. At the press time, the pair is down 0.25% on the day to trade at 1.2528, now awaiting the US Federal Reserve (Fed) interest rate decision for near-term trading direction.
Pound Sterling price today
The table below shows the percentage change of Pound Sterling (GBP) against listed major currencies today. Pound Sterling was the weakest against the US Dollar.
| USD | EUR | GBP | CAD | AUD | JPY | NZD | CHF | |
| USD | 0.15% | 0.28% | 0.13% | 0.32% | 0.45% | 0.76% | 0.14% | |
| EUR | -0.15% | 0.13% | -0.01% | 0.16% | 0.30% | 0.59% | -0.02% | |
| GBP | -0.29% | -0.14% | -0.15% | 0.03% | 0.17% | 0.48% | -0.15% | |
| CAD | -0.14% | 0.01% | 0.17% | 0.20% | 0.32% | 0.61% | -0.02% | |
| AUD | -0.29% | -0.20% | -0.04% | -0.17% | 0.13% | 0.44% | -0.18% | |
| JPY | -0.46% | -0.30% | -0.17% | -0.34% | -0.17% | 0.30% | -0.32% | |
| NZD | -0.76% | -0.63% | -0.46% | -0.61% | -0.44% | -0.29% | -0.65% | |
| CHF | -0.14% | 0.01% | 0.14% | 0.00% | 0.18% | 0.32% | 0.61% |
The heat map shows percentage changes of major currencies against each other. The base currency is picked from the left column, while the quote currency is picked from the top row. For example, if you pick the Euro from the left column and move along the horizontal line to the Japanese Yen, the percentage change displayed in the box will represent EUR (base)/JPY (quote).
- NZD/USD loses ground near 0.6100 ahead of the key US event.
- The new coalition government of New Zealand passed legislation to abandon the RBNZ dual mandate and focus solely on price stability.
- The Federal Reserve (Fed) is widely expected to hold interest rates steady at 5.25%–5.50% at its last meeting of the year.
- Investors will closely monitor the Federal Reserve's (Fed) monetary policy meeting ahead of New Zealand's GDP growth for Q3.
The NZD/USD pair faces some selling pressure during the early European session on Wednesday. The pair hit intraday lows at 0.6093 after retracing from the high of 0.6139. The pair currently trades near 0.6097, down 0.54% on the day.
Early Wednesday, the new coalition government of New Zealand passed legislation to abandon the Reserve Bank of New Zealand's (RBNZ) dual mandate and focus solely on price stability. Additionally, Finance Minister Nicola Willis amended the remit for the RBNZ’s Monetary Policy Committee (MPC), removing the objective to support maximum sustainable employment while keeping the inflation target at 1-3%.
Apart from this, New Zealand’s annual Current Account deficit arrived at 7.6% of GDP in the third quarter (Q3) ended in September from 7.5% in the previous reading. Investors await the Gross Domestic Product (GDP) for the third quarter. If the report comes in worse than expected, this could weigh on the New Zealand Dollar and act as a headwind for the NZD/USD pair.
On the USD’s front, the Federal Reserve (Fed) is widely expected to hold interest rates steady at its last meeting of the year on Wednesday. The markets anticipate that Fed Chair Jerome Powell will maintain a hawkish tone and push back against the bet for rate cutting. Last week, Fed Chair Powell said it would be premature to say that we have achieved a restrictive stance while adding that the central bank is prepared to tighten policy further if necessary.
US inflation, as measured by Consumer Price Index (CPI) rose by 0.1% MoM and 3.1% YoY in November, matching the market estimation, the US Bureau of Labor Statistics showed on Tuesday. Meanwhile, the Core CPI, which excludes volatile food and energy prices, grew by 0.3% MoM and 4.0% YoY, as expected.
Traders will closely watch the US Producer Price Index (PPI) on Wednesday ahead of the Federal Reserve's (Fed) monetary policy meeting. On Wednesday, the New Zealand GDP growth numbers for Q3 will be released. The quarterly growth rate is estimated to expand 0.2% and the annual rate is forecast to grow 0.5%. Market players will take cues from these data and find trading opportunities around the NZD/USD pair.
- EUR/USD halts its two-day winning streak ahead of monetary decisions from both economies.
- Technical indicators suggest a potential revisit to the weekly low at 1.0741.
- A breakthrough above the 1.0800 level could lead the pair to reach the 14-day EMA at 1.0816.
EUR/USD halts to continue a two-day winning streak ahead of the monetary policy decisions from the United States (US) and the Eurozone on Wednesday and Thursday, respectively. The EUR/USD pair trades lower around 1.0790 during the Asian session on Wednesday.
The technical signals for the EUR/USD pair favor the ongoing downward movement. With the 14-day Relative Strength Index (RSI) staying below the 50 mark, there's a bearish sentiment suggesting a potential revisit to the major support at the 1.0750 level before the weekly low at 1.0741.
If the pair manages to break below the latter, it could put pressure on the EUR/USD pair to navigate the four-week low at the 1.0723 level followed by the psychological support region around the 1.0700 level.
Additionally, the Moving Average Convergence Divergence (MACD) suggests the weakening of the overall positive momentum as the MACD line is positioned above the centerline but exhibits divergence below the signal line. This shows a potential shift in the direction of the trend.
On the upside, the EUR/USD pair could find a key resistance around the psychological region at the 1.0800 level. A breakthrough above the barrier could reinforce the strength of the EUR/USD pair to explore the area around the 14-day Exponential Moving Average (EMA) at 1.0816 followed by the 38.2% Fibonacci retracement at 1.0833. If the EUR/USD pair surpasses these levels, the major level at 1.0850 could be tested as a further barrier.
EUR/USD: Daily Chart
New Zealand’s new coalition government passed legislation on Wednesday, abandoning the Reserve Bank of New Zealand's (RBNZ) dual mandate, now only focusing on price stability.
New Zealand’s Finance Minister Nicola Willis amended the Remit for the RBNZ’s Monetary Policy Committee (MPC), removing the objective to support maximum sustainable employment, MNI reported. Willis kept the bank's 1-3% inflation target.
"Alongside the new Remit, the MPC has also agreed to changes to the MPC's Charter with the Minister of Finance," the RBNZ noted in a statement. "The Charter sets out decision-making processes and transparency requirements for the MPC,” said the central bank.
Market reaction
The NZD/USD pair has come under renewed selling pressure in the last hour, having hit intraday lows at 0.6093. The spot is trading at 0.6100, down 0.51% on the day, as of writing.
New Zealand Dollar price today
The table below shows the percentage change of New Zealand Dollar (NZD) against listed major currencies today. New Zealand Dollar was the weakest against the US Dollar.
| USD | EUR | GBP | CAD | AUD | JPY | NZD | CHF | |
| USD | 0.10% | 0.14% | 0.05% | 0.15% | 0.24% | 0.59% | 0.05% | |
| EUR | -0.10% | 0.05% | -0.04% | 0.04% | 0.14% | 0.48% | -0.05% | |
| GBP | -0.15% | -0.05% | -0.09% | 0.00% | 0.09% | 0.43% | -0.10% | |
| CAD | -0.08% | 0.04% | 0.08% | 0.06% | 0.16% | 0.52% | -0.03% | |
| AUD | -0.13% | -0.05% | 0.00% | -0.08% | 0.09% | 0.44% | -0.10% | |
| JPY | -0.24% | -0.13% | -0.10% | -0.19% | -0.12% | 0.37% | -0.17% | |
| NZD | -0.59% | -0.49% | -0.44% | -0.52% | -0.44% | -0.34% | -0.54% | |
| CHF | -0.06% | 0.04% | 0.09% | 0.02% | 0.09% | 0.17% | 0.53% |
The heat map shows percentage changes of major currencies against each other. The base currency is picked from the left column, while the quote currency is picked from the top row. For example, if you pick the Euro from the left column and move along the horizontal line to the Japanese Yen, the percentage change displayed in the box will represent EUR (base)/JPY (quote).
- WTI price faces challenges on weak demand projection due to higher interest rates.
- Crude oil prices receive pressure on oversupply concerns as the US EIA raised its forecast for the 2023 supply estimate by 300,000 bpd from the US.
- Fed is expected to keep interest rate unchanged in its last policy decision of the year.
West Texas Intermediate (WTI) price extends its losses following the US inflation data for November. The WTI price bids around $68.50 per barrel during the Asian session on Wednesday. The dynamics in the Oil market are indeed multifaceted. The pressure on Crude prices, driven by the expected maintenance of the Federal Reserve's current policy stance, reflects concerns over potential economic growth slowdown due to prolonged higher rates.
The adjustment in the US Energy Information Administration's (EIA) forecast, raising the 2023 supply estimate by 300,000 barrels per day (bpd) to 12.93 million bpd, reflects an evolving outlook for oil production in the United States (US). Additionally, the decision to lower the 2024 price forecast for Brent crude by $10 a barrel suggests a recalibration of expectations for future market conditions.
The OPEC+ output cut agreement faces challenges in effectively controlling supplies, and the increased forecast for US oil supply in 2023 adds to the market dynamics. Geopolitical tensions, such as the attack on a Norwegian commercial tanker by Yemen's Houthis in protest against Israel's actions, elevate the risk of supply disruptions in the Middle East.
The energy landscape is further influenced by the COP28 climate summit in Dubai, where negotiators are awaiting a revised deal amid criticism of the previous version for its perceived weakness in not including a clear plan for phasing out fossil fuels.
The anticipation is building up as market participants eagerly await the release of the US Producer Price Index (PPI) and the Federal Reserve's Interest Rate Decision on Wednesday. The expectation for the Federal Open Market Committee (FOMC) to maintain its current policy stance in the December meeting sets the stage for keen investor interest.
All eyes will be on Federal Reserve Chair Jerome Powell's comments, as they could provide valuable insights into potential changes in interest rates for the coming year. The intersection of economic data and Fed decisions could play a significant role in shaping market sentiments and influencing trading strategies in the Crude oil market.
Han Wenxiu, deputy head of the Chinese Communist Party’s office for financial and economic affairs, said on Wednesday that “China should set its 2024 fiscal deficit and special local government bonds at appropriate levels and optimize the structure of fiscal expenditure.”
“China should also keep consumer prices at a moderate and appropriate level, neither too low nor too high,” added Han.
Market reaction
At the press time, the AUD/USD pair is posting small losses to trade around 0.6550.
- USD/CAD gains some positive traction for the second straight day, albeit lacks follow-through.
- Bearish Crude Oil prices continue to undermine the Loonie and act as a tailwind for the major.
- Traders, however, seem reluctant to place aggressive bets ahead of the FOMC policy decision.
The USD/CAD pair trades with a positive bias for the second successive day on Wednesday, albeit lacks bullish conviction and remains below a multi-day peak, around the 1.3615-1.3620 region touched the previous day. Spot prices currently trade around the 1.3600 round figure as traders keenly await the outcome of the highly-anticipated two-day FOMC monetary policy meeting.
The Federal Reserve (Fed) is scheduled to announce its decision later during the US session and is widely expected to maintain the status quo. Hence, the focus will remain on the accompanying monetary policy statement and the updated economic projections, especially the so-called "dot plot". This, along with Fed Chair Jerome Powell's remarks at the post-meeting press conference, will be scrutinized for clues about the near-term policy outlook, which will influence the US Dollar (USD) price dynamics and provide a fresh directional impetus to the USD/CAD pair.
In the run-up to the key central bank event risk, the uncertainty over the timing of when the Fed may begin easing its policy fails to assist the USD to build on the overnight bounce from the post-US CPI low and acts as a headwind for the USD/CAD pair. The downside, however, remains cushioned in the wake of bearish Crude Oil prices, which dropped to a fresh six-month low amid oversupply concerns and despite signs of a draw in US inventories. This, in turn, undermines the commodity-linked Loonie and remains supportive of the bid tone surrounding the major.
Nevertheless, the aforementioned mixed fundamental warrants some caution before placing aggressive directional bets around the USD/CAD pair. Furthermore, Furthermore, the range-bound price action witnessed over the past week or so points to indecision among traders over the near-term trajectory for the major.
Technical levels to watch
- Indian Rupee loses traction on the modest US Dollar (USD) demand.
- Indian Consumer Price Index (CPI) surged 5.55% YoY in November vs. 4.87% prior, Food Inflation climbed to 8.70% vs. 6.61% prior.
- Market players will closely watch the Fed interest rate decision and the press conference.
Indian Rupee (INR) extends its downside amid modest US Dollar (USD) strength. Data released on Tuesday revealed that the Indian Consumer Price Index (CPI) came in higher than the Reserve Bank of India (RBI) target of 4.0%. Although headline inflation remained within its tolerance range of 2–6% for the third consecutive month, it has surpassed the medium-term target of 4% for the past 50 consecutive months.
Furthermore, the Consumer Food Price Index, which measures food inflation, increased by 8.70% in November from 6.61% the previous month. Last week, the RBI Monetary Policy Committee decided to keep the policy repo rate steady at 6.50%, and the MPC stated that they will closely monitor any indications of food price pressures.
Investors await the US Producer Price Index (PPI) on Wednesday ahead of the Federal Reserve (Fed) monetary policy meeting. The annual PPI figure is forecast to ease from 1.3% to 1.0% in November, while the PPI rate ex Food & Energy is expected to drop from 2.4% to 2.2% in the same period. The highlight will be the Fed interest rate decision, with no change expected. Nonetheless, investors will examine Fed Chair Jerome Powell’s comments after the meeting for fresh impetus.
Daily Digest Market Movers: Indian Rupee weakens amid higher inflation concern
- India’s Consumer Price Index (CPI) surged 5.55% YoY in November from 4.87% in October, according to the Ministry of Statistics & Programme Implementation.
- Indian Industrial Production for October reached a 16-month peak, rising by 11.7% compared to a 4.1% increase in the previous reading.
- Indian Manufacturing Output for October came in at 10.4% MoM versus 4.9% prior.
- The International Monetary Fund (IMF) stated that India’s economy will be one of the fastest-growing in the world over the next few years, estimating Real Gross Domestic Product (real GDP) to expand by more than 6.0% in both 2023 and 2024.
- According to the National Securities Depository, foreign investors allotted $3.7 billion in Indian equities and $800 million in debt over the six sessions in December.
- US inflation, as measured by the Consumer Price Index (CPI), climbed 0.1% MoM in November from 0% in October, while the annual CPI eased from 3.2% to 3.1% in November.
- The Core CPI, which excludes volatile food and energy prices, rose to 0.3% MoM from 0.1% in the previous month. On an annual basis, the Core CPI figure grew 4.0% YoY, matching expectations.
- The markets anticipate the Fed to maintain the benchmark overnight borrowing rate in a range between 5.25% and 5.50% at its December meeting.
Technical Analysis: Indian Rupee's constructive outlook remains unchanged
Indian Rupee trades on a softer note on the day. The USD/INR pair has traded in a familiar trading band between 82.80 and 83.40 since September. According to the daily chart, USD/INR maintains a bullish vibe as the pair holds above the key 100-day Exponential Moving Average (EMA). The upward momentum is reinforced by the 14-day Relative Strength Index (RSI) that stands above the 50.0 midline.
A decisive break above the upper boundary of the trading range at 83.40 will see the next upside barrier near the year-to-date (YTD) high of 83.47, en route to a psychological round mark of 84.00. On the other hand, any follow-through selling below the critical support level of 83.00 round figure will next downside stop near the confluence of the lower limit of the trading range and a low of September 12 at 82.80, followed by a low of August 11 at 82.60.
US Dollar price today
The table below shows the percentage change of US Dollar (USD) against listed major currencies today. US Dollar was the strongest against the New Zealand Dollar.
| USD | EUR | GBP | CAD | AUD | JPY | NZD | CHF | |
| USD | 0.09% | 0.14% | 0.07% | 0.16% | 0.21% | 0.52% | 0.05% | |
| EUR | -0.09% | 0.05% | -0.03% | 0.04% | 0.12% | 0.40% | -0.04% | |
| GBP | -0.14% | -0.05% | -0.07% | 0.01% | 0.08% | 0.38% | -0.09% | |
| CAD | -0.07% | 0.03% | 0.07% | 0.07% | 0.15% | 0.45% | -0.03% | |
| AUD | -0.14% | -0.05% | -0.02% | -0.10% | 0.06% | 0.37% | -0.11% | |
| JPY | -0.21% | -0.11% | -0.07% | -0.16% | -0.08% | 0.31% | -0.16% | |
| NZD | -0.52% | -0.44% | -0.37% | -0.45% | -0.36% | -0.30% | -0.50% | |
| CHF | -0.05% | 0.04% | 0.09% | 0.03% | 0.11% | 0.16% | 0.44% |
The heat map shows percentage changes of major currencies against each other. The base currency is picked from the left column, while the quote currency is picked from the top row. For example, if you pick the Euro from the left column and move along the horizontal line to the Japanese Yen, the percentage change displayed in the box will represent EUR (base)/JPY (quote).
Indian Rupee FAQs
What are the key factors driving the Indian Rupee?
The Indian Rupee (INR) is one of the most sensitive currencies to external factors. The price of Crude Oil (the country is highly dependent on imported Oil), the value of the US Dollar – most trade is conducted in USD – and the level of foreign investment, are all influential. Direct intervention by the Reserve Bank of India (RBI) in FX markets to keep the exchange rate stable, as well as the level of interest rates set by the RBI, are further major influencing factors on the Rupee.
How do the decisions of the Reserve Bank of India impact the Indian Rupee?
The Reserve Bank of India (RBI) actively intervenes in forex markets to maintain a stable exchange rate, to help facilitate trade. In addition, the RBI tries to maintain the inflation rate at its 4% target by adjusting interest rates. Higher interest rates usually strengthen the Rupee. This is due to the role of the ‘carry trade’ in which investors borrow in countries with lower interest rates so as to place their money in countries’ offering relatively higher interest rates and profit from the difference.
What macroeconomic factors influence the value of the Indian Rupee?
Macroeconomic factors that influence the value of the Rupee include inflation, interest rates, the economic growth rate (GDP), the balance of trade, and inflows from foreign investment. A higher growth rate can lead to more overseas investment, pushing up demand for the Rupee. A less negative balance of trade will eventually lead to a stronger Rupee. Higher interest rates, especially real rates (interest rates less inflation) are also positive for the Rupee. A risk-on environment can lead to greater inflows of Foreign Direct and Indirect Investment (FDI and FII), which also benefit the Rupee.
How does inflation impact the Indian Rupee?
Higher inflation, particularly, if it is comparatively higher than India’s peers, is generally negative for the currency as it reflects devaluation through oversupply. Inflation also increases the cost of exports, leading to more Rupees being sold to purchase foreign imports, which is Rupee-negative. At the same time, higher inflation usually leads to the Reserve Bank of India (RBI) raising interest rates and this can be positive for the Rupee, due to increased demand from international investors. The opposite effect is true of lower inflation.
- Gold price is seen consolidating its recent losses to a three-week trough.
- Reduced bets for a March Fed rate cut cap the upside for the XAU/USD.
- Traders also seem reluctant ahead of the crucial FOMC policy decision.
Gold price (XAU/USD) oscillates in a narrow trading band during the Asian session on Wednesday and is currently placed around the $1,980 area, just above a three-week low touched on Monday. The precious metal did get a minor lift on Tuesday following the release of the consumer inflation figures from the United States (US), though the uptick ran out of steam ahead of the $2,000 psychological mark. Traders refrain from placing aggressive directional bets and seek more clarity over the Federal Reserve’s (Fed) policy outlook. This, in turn, led to subdued range-bound price action for the second straight day ahead of the highly-anticipated FOMC policy decision later today.
The US central bank is universally expected to maintain the status quo and keep interest rates steady at the end of a two-day meeting on Wednesday. Hence, the market focus will be on the accompanying monetary policy statement and updated economic projections. This will be followed by Fed Chair Jerome Powell's post-meeting press conference, which will be scrutinized closely for confirmation of a change in the policy stance. In fact, the markets are currently pricing in the possibility of at least four 25 basis point (bps) rate cuts by the Fed in 2024. Hence, a dovish pivot will exert heavy pressure on the US Dollar (USD) and trigger a fresh leg up for the non-yielding Gold price.
Heading into the key event risk, the release of the US Producer Price Index (PPI) during the early North American session might do little to provide any meaningful impetus to the Gold price. Meanwhile, the prevalent risk-on environment – as depicted by an extension of a rally in the equity market – might continue to act as a headwind for the safe-haven XAU/USD and cap any intraday recovery.
Daily Digest Market Movers: Gold price eyes Fed for some meaningful directional impetus
- The uncertainty over the Federal Reserve’s near-term policy outlook holds back traders from placing directional bets around the Gold price and leads to subdued range-bound price action.
- Data released from the United States on Tuesday showed that consumer prices rose unexpectedly in November, forcing traders to further scale back bets for a rate cut in March.
- The US Labor Department reported that the headline Consumer Price Index (CPI) edged up 0.1% in November and the yearly rate ticked down to 3.1% from the 3.2% previous.
- The annual Core CPI inflation, which excludes volatile food and energy prices, held steady at 4.0% as forecast and rose 0.1% on a monthly basis, little changed from the previous month.
- The November numbers were still well above the Fed's 2% target and come on top of the stronger-than-expected US jobs report last Friday, pointing to a still resilient economy.
- The market focus remains glued to the outcome of the crucial two-day FOMC monetary policy meeting, scheduled to be announced later during the US session this Wednesday.
- Investors will look for fresh cues about the timing of when the Fed may start cutting rates in 2024, which, in turn, will drive the US Dollar demand and influence the yellow metal.
- Hopes for more stimulus from policymakers in China overshadow the risk of a further escalation of geopolitical tensions in the Middle East and remain supportive of the risk-on mood.
- Reporting on the annual Central Economic Work Conference that ended on Tuesday, state media said that China will step up policy adjustments to support economic recovery in 2024.
- Yemen's Iran-backed Houthi rebels issue regulations for navigating through the Red Sea amid the Israel embargo and the warning includes a restriction on travel towards "Occupied Palestinian territories".
- This, however, does little to temper investors' appetite for perceived riskier assets or dampen the underlying bullish market sentiment and benefit the safe-haven precious metal.
Technical Analysis: Gold price ignores the occurrence of a golden cross on the daily chart
From a technical perspective, the Gold price, so far, has managed to defend the 50% Fibonacci retracement level of the October-December rally to an all-time peak. This is closely followed by the 50-day Simple Moving Average (SMA), currently around the $1,969-1,968 region, below which the XAU/USD could slide to test the very important 200-day SMA, near the $1,953-1,952 area. The next relevant support is pegged near the $1,942-1,938 confluence, comprising the 100-day SMA and the 61.8% Fibo. level, which should act as a key pivot point. A convincing break below the latter will be seen as a fresh trigger for bearish traders and pave the way for a deeper corrective slide.
On the flip side, any meaningful recovery attempt might continue to attract some sellers near the $2,000 psychological mark and remain capped near the $2,010-2,012 static resistance. Some follow-through buying has the potential to lift the Gold price further towards the $2,030 hurdle en route to the $2,040 supply zone. The subsequent move-up will shift the near-term bias in favour of bullish traders against the backdrop of the occurrence of a golden cross, with the 50-day rising above the 200-day SMA. The XAU/USD might then climb to the $2,071-2,072 region before aiming to reclaim the $2,100 round figure.
US Dollar price this week
The table below shows the percentage change of US Dollar (USD) against listed major currencies this week. US Dollar was the weakest against the Swiss Franc.
| USD | EUR | GBP | CAD | AUD | JPY | NZD | CHF | |
| USD | -0.21% | -0.04% | 0.07% | 0.34% | 0.36% | 0.15% | -0.46% | |
| EUR | 0.21% | 0.18% | 0.28% | 0.55% | 0.58% | 0.36% | -0.25% | |
| GBP | 0.05% | -0.17% | 0.11% | 0.38% | 0.41% | 0.19% | -0.42% | |
| CAD | -0.07% | -0.28% | -0.12% | 0.26% | 0.29% | 0.08% | -0.54% | |
| AUD | -0.34% | -0.55% | -0.39% | -0.26% | 0.03% | -0.19% | -0.81% | |
| JPY | -0.37% | -0.59% | -0.51% | -0.30% | -0.04% | -0.23% | -0.84% | |
| NZD | -0.16% | -0.37% | -0.19% | -0.08% | 0.18% | 0.21% | -0.62% | |
| CHF | 0.46% | 0.25% | 0.41% | 0.53% | 0.80% | 0.83% | 0.61% |
The heat map shows percentage changes of major currencies against each other. The base currency is picked from the left column, while the quote currency is picked from the top row. For example, if you pick the Euro from the left column and move along the horizontal line to the Japanese Yen, the percentage change displayed in the box will represent EUR (base)/JPY (quote).
Gold FAQs
Why do people invest in Gold?
Gold has played a key role in human’s history as it has been widely used as a store of value and medium of exchange. Currently, apart from its shine and usage for jewelry, the precious metal is widely seen as a safe-haven asset, meaning that it is considered a good investment during turbulent times. Gold is also widely seen as a hedge against inflation and against depreciating currencies as it doesn’t rely on any specific issuer or government.
Who buys the most Gold?
Central banks are the biggest Gold holders. In their aim to support their currencies in turbulent times, central banks tend to diversify their reserves and buy Gold to improve the perceived strength of the economy and the currency. High Gold reserves can be a source of trust for a country’s solvency. Central banks added 1,136 tonnes of Gold worth around $70 billion to their reserves in 2022, according to data from the World Gold Council. This is the highest yearly purchase since records began. Central banks from emerging economies such as China, India and Turkey are quickly increasing their Gold reserves.
How is Gold correlated with other assets?
Gold has an inverse correlation with the US Dollar and US Treasuries, which are both major reserve and safe-haven assets. When the Dollar depreciates, Gold tends to rise, enabling investors and central banks to diversify their assets in turbulent times. Gold is also inversely correlated with risk assets. A rally in the stock market tends to weaken Gold price, while sell-offs in riskier markets tend to favor the precious metal.
What does the price of Gold depend on?
The price can move due to a wide range of factors. Geopolitical instability or fears of a deep recession can quickly make Gold price escalate due to its safe-haven status. As a yield-less asset, Gold tends to rise with lower interest rates, while higher cost of money usually weighs down on the yellow metal. Still, most moves depend on how the US Dollar (USD) behaves as the asset is priced in dollars (XAU/USD). A strong Dollar tends to keep the price of Gold controlled, whereas a weaker Dollar is likely to push Gold prices up.
- GBP/USD remains calm before a slew of data releases from both countries.
- UK GDP and Industrial Production both are expected to face a 0.1% decline.
- US CPI and Core CPI adhered to expectations, with a year-on-year increase of 3.1% and 4.0%, respectively.
GBP/USD exhibits a sideways movement as it braces for a barrage of data releases from both nations, hovering above 1.2550 in the Asian session on Wednesday. The GBP/USD pair experienced notable volatility in the previous session, driven by employment data from the United Kingdom (UK) and inflation figures from the United States (US).
The UK Office for National Statistics revealed that the Claimant Count Change for November increased to 16.0K from the previous figure of 8.9K, but fell short of the 20.3K expectations. Additionally, the Employment Change for October decreased to 50K from the previous 54K.
Investors are anticipating more data on Wednesday, with the UK monthly Gross Domestic Product (GDP) and Industrial Production both expected to decline by 0.1% in October. Furthermore, on Thursday, the Bank of England (BoE) is expected to deliver a hawkish hold, keeping interest rates unchanged at 5.25%.
On the other side, market participants await the release of the US Producer Price Index (PPI) and the Federal Reserve's (Fed) Interest Rate Decision later in the North American session. The US Dollar (USD) experienced a modest drop and recovery after the release of moderate Consumer Price Index (CPI) data from the United States (US).
On Tuesday, the US Bureau of Labor Statistics disclosed that the US Consumer Price Index (CPI) increased by 0.1% month-on-month and 3.1% year-on-year in November. These numbers matched market expectations, suggesting that inflation remained in line with predictions. The US Core CPI also experienced a 0.3% month-on-month and 4.0% year-on-year uptick, meeting anticipated levels.
The Federal Open Market Committee (FOMC) is expected to maintain its current policy stance in its upcoming December meeting. Investors will likely pay close attention to the comments from Federal Reserve (Fed) Chair Jerome Powell, seeking insights into any potential changes in interest rates for the upcoming year.
Commenting on the Bank of Japan’s (BoJ) Tankan survey on Wednesday, Japanese Chief Cabinet Secretary Matsuno said that the “Tankan business sentiment survey shows overall corporate sector is firm.”
“I need to closely monitor downside risks including overseas economic slowdown and rising prices,” Matsuno added.
Market reaction
At the time of writing, USD/JPY is trading modestly flat at around 145.50, awaiting the Fed interest rate decision.
| Raw materials | Closed | Change, % |
|---|---|---|
| Silver | 22.763 | -0.24 |
| Gold | 1979.426 | -0.15 |
| Palladium | 976.84 | 1.55 |
Australian Treasury presented the Mid-year Economic and Fiscal Outlook (MYEFO) on Wednesday, with the key highlights noted below.
2023/24 budget deficit at a$1.1 bln vs a$13.9 bln projected in May.
Budget deficit projected at a$18.8 bln in 2024/25, deficit a$35.1 bln 25/26.
Sees GDP growth in 2023/24 1.75%, 2024/25 2.25%, 2025/26 2.5%.
Sees unemployment rate at 4.25% in 2023/24 and 4.5% to 2025/26.
Sees CPI inflation at 3.75% in 2023/24, 2.75% in 2024/25, 2.5% in 2025/26.
To ensure fiscal and monetary policy settings are aligned, help ease inflationary pressures.
Sees net migration slowing to 375,000 in 2023/24, 250,000 in 2024/25.
Sees iron ore declining to $60 tonne, metallurgical coal $140 tonne, thermal coal $70 tonne.
Related reads
- Australian Dollar moves sideways with a negative sentiment ahead of Fed decision
- Chinese leaders decide priorities for the economic work in 2024
- The Japanese Yen seesaws between tepid gains/minor losses against the USD on Wednesday.
- Traders seem reluctant on the back of mixed signals about the BoJ’s near-term policy outlook.
- The focus remains on the outcome of the highly-anticipated FOMC monetary policy meeting.
The Japanese Yen (JPY) trimmed a part of its strong intraday gains against its American counterpart on Tuesday after data released from the United States (US) showed that consumer prices rose unexpectedly in November. This comes on top of reports that the Bank of Japan (BoJ) policymakers see little need to end negative rates in December. Adding to this, an extension of the bullish run in the equity markets undermined the safe-haven JPY and assisted the USD/JPY pair to rebound around 75 pips from the daily swing low.
Market participants, however, seem convinced that the Japanese central bank will eventually end its ultra-loose monetary policy settings early next year, which holds back traders from placing aggressive bearish bets around the JPY. Furthermore, investors opt to remain on the sidelines and look to the outcome of the highly-anticipated two-day FOMC monetary policy meeting later this Wednesday for some meaningful impetus. This, in turn, leads to the USD/JPY pair's subdued range-bound price action during the Asian session.
The Federal Reserve (Fed) is scheduled to announce its policy decision during the US session and is widely expected to leave interest rates unchanged. Hence, the focus will remain on the accompanying monetary policy statement and updated economic projections. This, along with Fed Chair Jerome Powell's remarks at the post-meeting press conference, will be looked for cues about the timing of when the central bank will begin easing policy. This will influence the USD and determine the near-term trajectory for the USD/JPY pair.
Daily Digest Market Movers: Japanese Yen bulls remain cautious amid confusion over BoJ pivot
- The US Labor Department reported on Tuesday that the headline Consumer Price Index (CPI) edged up 0.1% in November and the yearly rate ticked down to 3.1% from the 3.2% previous.
- The annual Core CPI inflation, which excludes volatile food and energy prices, held steady at 4% as forecast and rose 0.1% on a monthly basis, little changed as compared to the previous month.
- The November numbers were still well above the Federal Reserve's 2% target, which, along with Friday's stronger US jobs data, forced investors to further scale back bets for a March rate cut.
- This allowed the US Dollar to pare the overnight losses and helped the USD/JPY pair to attract some dip-buying near the 144.70 area, though the momentum lacked any follow-through.
- Traders have been trimming their bets for a stronger Japanese Yen amid confusion over an imminent shift in the Bank of Japan's policy stance and the prevalent risk-on environment.
- The Tankan survey showed that Business confidence at big Japanese manufacturers improved more than expected in the fourth quarter, albeit does little to impress the JPY bulls.
- The focus remains glued to the key FOMC decision, which will be accompanied by updated economic projections and followed by Federal Reserve Chair Jerome Powell's presser.
- Investors will look for fresh cues about the timing of when the US central bank may begin cutting rates in 2024 amid signs of easing inflation and the still resilience US economy.
Technical Analysis: USD/JPY might continue to face stiff resistance near the 200-hour SMA
From a technical perspective, the USD/JPY pair found decent support on Tuesday near the 38.2% Fibonacci retracement level of the recent solid rebound from a multi-month low touched last week. The lack of any strong follow-through buying, along with the fact that oscillators on the daily chart are holding deep in the negative territory, warrants some caution for bullish traders. Hence, any subsequent move up is likely to confront resistance near the 146.00 round-figure mark. This is closely followed by the 200-hour Simple Moving Average (SMA), currently around the 146.25 region, which if cleared decisively could set the stage for additional gains.
On the flip side, weakness below the 145.00 psychological mark might continue to attract some buyers near the 144.70 area, or the 38.2% Fibo. level. A convincing break below will be seen as a fresh trigger for bearish traders and drag the USD/JPY pair further towards the 50% Fibo. support near the 144.00 round figure, en route to the 143.55-143.50 region (61.8% Fibo.). Spot prices could eventually weaken below the 143.00 mark and aim to test the next relevant support near mid-142.00s.
Japanese Yen price today
The table below shows the percentage change of Japanese Yen (JPY) against listed major currencies today. Japanese Yen was the weakest against the Australian Dollar.
| USD | EUR | GBP | CAD | AUD | JPY | NZD | CHF | |
| USD | 0.04% | 0.09% | 0.02% | 0.03% | 0.12% | 0.22% | 0.04% | |
| EUR | -0.04% | 0.05% | -0.01% | -0.01% | 0.08% | 0.17% | 0.00% | |
| GBP | -0.10% | -0.06% | -0.06% | -0.06% | 0.03% | 0.10% | -0.06% | |
| CAD | -0.04% | 0.01% | 0.07% | -0.01% | 0.09% | 0.19% | -0.01% | |
| AUD | -0.02% | 0.01% | 0.06% | 0.00% | 0.08% | 0.19% | 0.01% | |
| JPY | -0.13% | -0.09% | -0.04% | -0.10% | -0.13% | 0.08% | -0.09% | |
| NZD | -0.22% | -0.17% | -0.12% | -0.19% | -0.18% | -0.09% | -0.18% | |
| CHF | -0.04% | 0.00% | 0.05% | -0.01% | -0.01% | 0.08% | 0.18% |
The heat map shows percentage changes of major currencies against each other. The base currency is picked from the left column, while the quote currency is picked from the top row. For example, if you pick the Euro from the left column and move along the horizontal line to the Japanese Yen, the percentage change displayed in the box will represent EUR (base)/JPY (quote).
Japanese Yen FAQs
What key factors drive the Japanese Yen?
The Japanese Yen (JPY) is one of the world’s most traded currencies. Its value is broadly determined by the performance of the Japanese economy, but more specifically by the Bank of Japan’s policy, the differential between Japanese and US bond yields, or risk sentiment among traders, among other factors.
How do the decisions of the Bank of Japan impact the Japanese Yen?
One of the Bank of Japan’s mandates is currency control, so its moves are key for the Yen. The BoJ has directly intervened in currency markets sometimes, generally to lower the value of the Yen, although it refrains from doing it often due to political concerns of its main trading partners. The current BoJ ultra-loose monetary policy, based on massive stimulus to the economy, has caused the Yen to depreciate against its main currency peers. This process has exacerbated more recently due to an increasing policy divergence between the Bank of Japan and other main central banks, which have opted to increase interest rates sharply to fight decades-high levels of inflation.
How does the differential between Japanese and US bond yields impact the Japanese Yen?
The BoJ’s stance of sticking to ultra-loose monetary policy has led to a widening policy divergence with other central banks, particularly with the US Federal Reserve. This supports a widening of the differential between the 10-year US and Japanese bonds, which favors the US Dollar against the Japanese Yen.
How does broader risk sentiment impact the Japanese Yen?
The Japanese Yen is often seen as a safe-haven investment. This means that in times of market stress, investors are more likely to put their money in the Japanese currency due to its supposed reliability and stability. Turbulent times are likely to strengthen the Yen’s value against other currencies seen as more risky to invest in.
- Australian Dollar hovers above a major level ahead of US PPI, Fed policy decision.
- Australia’s Treasurer Jim Chalmers presented a budget forecast of AUD 1.1 billion in the MYEFO, down from the AUD 13.9 billion previous forecast.
- US CPI and Core CPI came in at 3.1% and 4.0% YoY, respectively, as expected.
- FOMC is expected to make no change in its policy rates.
The Australian Dollar (AUD) makes efforts to recover its recent losses on Wednesday, particularly after the release of moderate Consumer Price Index (CPI) data from the United States (US). The AUD/USD pair exhibited high volatility in the previous session, experiencing a modest drop after briefly surpassing the 0.6600 level. Market participants are now awaiting the release of the US Producer Price Index (PPI) and the Federal Reserve's (Fed) Interest Rate Decision later in the North American session.
Australia's government anticipates a significantly improved budget bottom line this year as revenues outpace forecasts. In the mid-year economic and fiscal outlook (MYEFO) presented by Labor Treasurer Jim Chalmers, a budget deficit of just AUD 1.1 billion (USD 721.4 million) in the year to end June 2024 is projected, down from the AUD 13.9 billion forecasted back in May. The government is resisting calls for additional cost-of-living handouts to avoid exacerbating inflationary pressures.
The US Dollar Index (DXY) encounters challenges attributed to downbeat US Treasury yields. The DXY has experienced a modest drop, with the Federal Open Market Committee (FOMC) anticipated to make no adjustments in its last policy decision. Inflation in the US cooled as expected in November, as indicated by the Consumer Price Index (CPI). Investors will likely closely monitor Fed Chair Jerome Powell’s comments for signals about potential rate adjustments in the coming year.
Daily Digest Market Movers: Australian Dollar moves downward amid hawkish RBA
- ANZ-Roy Morgan Australian Consumer Confidence weekly survey rose to 80.8 from the previous week's 76.4.
- Westpac Consumer Confidence for December showed improvement at 2.7% from the previous decline of 2.6%.
- National Australia Bank Business Confidence, which surveys the current business conditions in Australia and provides insights into the short-term performance of the overall economy, declined to 9 from the previous decrease of 2.
- RBA Governor Michele Bullock expressed confidence, stating, "Don't think we are falling behind in the inflation fight." Bullock emphasized a cautious approach, closely monitoring data, and highlighted the RBA's commitment to preserving employment gains.
- US Bureau of Labor Statistics revealed on Tuesday that the US Consumer Price Index (CPI) for November rose by 0.1% month-on-month and 3.1% year-on-year. Both figures aligned with market consensus, indicating that inflation levels met expectations.
- US Core CPI, which excludes volatile food and energy prices, climbed by 0.3% MoM and 4.0% YoY, in line with expectations.
Technical Analysis: Australian Dollar hovers above the major level at 0.6550
The Australian Dollar trades around 0.6560 on Wednesday. The 21-day Exponential Moving Average (EMA) at 0.6554 serves as a key support level before the significant level at 0.6550. If this support area is breached, it could exert downward pressure on the AUD/USD pair, potentially leading it toward the 38.2% Fibonacci retracement level at 0.6526. On the upside, the region around the psychological level at 0.6600 is likely to act again as a potential resistance barrier.
AUD/USD: Daily Chart
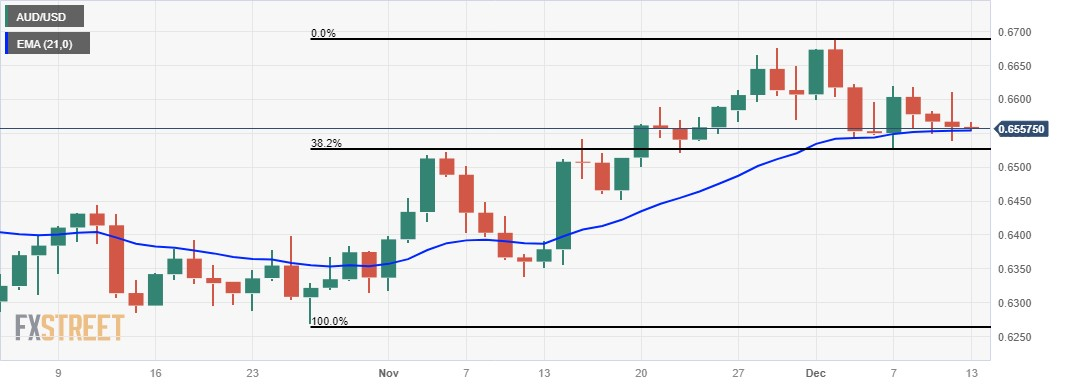
Australian Dollar price today
The table below shows the percentage change of Australian Dollar (AUD) against listed major currencies today. Australian Dollar was the weakest against the US Dollar.
| USD | EUR | GBP | CAD | AUD | JPY | NZD | CHF | |
| USD | 0.04% | 0.09% | 0.02% | 0.03% | 0.12% | 0.22% | 0.04% | |
| EUR | -0.04% | 0.05% | -0.01% | -0.01% | 0.08% | 0.17% | 0.00% | |
| GBP | -0.10% | -0.06% | -0.06% | -0.06% | 0.03% | 0.10% | -0.06% | |
| CAD | -0.04% | 0.01% | 0.07% | -0.01% | 0.09% | 0.19% | -0.01% | |
| AUD | -0.02% | 0.01% | 0.06% | 0.00% | 0.08% | 0.19% | 0.01% | |
| JPY | -0.13% | -0.09% | -0.04% | -0.10% | -0.13% | 0.08% | -0.09% | |
| NZD | -0.22% | -0.17% | -0.12% | -0.19% | -0.18% | -0.09% | -0.18% | |
| CHF | -0.04% | 0.00% | 0.05% | -0.01% | -0.01% | 0.08% | 0.18% |
The heat map shows percentage changes of major currencies against each other. The base currency is picked from the left column, while the quote currency is picked from the top row. For example, if you pick the Euro from the left column and move along the horizontal line to the Japanese Yen, the percentage change displayed in the box will represent EUR (base)/JPY (quote).
Australian Dollar FAQs
What key factors drive the Australian Dollar?
One of the most significant factors for the Australian Dollar (AUD) is the level of interest rates set by the Reserve Bank of Australia (RBA). Because Australia is a resource-rich country another key driver is the price of its biggest export, Iron Ore. The health of the Chinese economy, its largest trading partner, is a factor, as well as inflation in Australia, its growth rate and Trade Balance. Market sentiment – whether investors are taking on more risky assets (risk-on) or seeking safe-havens (risk-off) – is also a factor, with risk-on positive for AUD.
How do the decisions of the Reserve Bank of Australia impact the Australian Dollar?
The Reserve Bank of Australia (RBA) influences the Australian Dollar (AUD) by setting the level of interest rates that Australian banks can lend to each other. This influences the level of interest rates in the economy as a whole. The main goal of the RBA is to maintain a stable inflation rate of 2-3% by adjusting interest rates up or down. Relatively high interest rates compared to other major central banks support the AUD, and the opposite for relatively low. The RBA can also use quantitative easing and tightening to influence credit conditions, with the former AUD-negative and the latter AUD-positive.
How does the health of the Chinese Economy impact the Australian Dollar?
China is Australia’s largest trading partner so the health of the Chinese economy is a major influence on the value of the Australian Dollar (AUD). When the Chinese economy is doing well it purchases more raw materials, goods and services from Australia, lifting demand for the AUD, and pushing up its value. The opposite is the case when the Chinese economy is not growing as fast as expected. Positive or negative surprises in Chinese growth data, therefore, often have a direct impact on the Australian Dollar and its pairs.
How does the price of Iron Ore impact the Australian Dollar?
Iron Ore is Australia’s largest export, accounting for $118 billion a year according to data from 2021, with China as its primary destination. The price of Iron Ore, therefore, can be a driver of the Australian Dollar. Generally, if the price of Iron Ore rises, AUD also goes up, as aggregate demand for the currency increases. The opposite is the case if the price of Iron Ore falls. Higher Iron Ore prices also tend to result in a greater likelihood of a positive Trade Balance for Australia, which is also positive of the AUD.
How does the Trade Balance impact the Australian Dollar?
The Trade Balance, which is the difference between what a country earns from its exports versus what it pays for its imports, is another factor that can influence the value of the Australian Dollar. If Australia produces highly sought after exports, then its currency will gain in value purely from the surplus demand created from foreign buyers seeking to purchase its exports versus what it spends to purchase imports. Therefore, a positive net Trade Balance strengthens the AUD, with the opposite effect if the Trade Balance is negative.
- EUR/USD holds below 1.0800 on a modest US Dollar strength.
- US Consumer Price Index (CPI) report broadly matched market expectations.
- German ZEW Indicator of Economic Sentiment came in at 12.8 vs. 9.8 prior, above the market consensus of 8.8.
- The Fed interest rate decision and press conference will be closely monitored by traders.
The EUR/USD pair remains capped under the 1.0800 mark during the early Asian trading hours on Wednesday. The Federal Reserve (Fed) and the European Central Bank (ECB) will announce their decisions on monetary policy on Wednesday and Thursday, respectively. At press time, the major pair is trading at 1.0792, losing 0.04% on the day.
US inflation report broadly matched market expectations, with the headline Consumer Price Index (CPI) climbing 0.1% MoM in November from 0% in October while the annual headline CPI eased from 3.2% to 3.1% in November. Additionally, the Core CPI rose to 0.3% MoM from 0.1% in the previous month. On an annual basis, the Core CPI figure grew 4.0% YoY, as expected.
The ECB is expected to leave interest rates unchanged at its December meeting on Thursday, even though eurozone inflation is falling much closer to its 2.0% target. The ECB prepared to push back market expectations for a rate cut as early as March by stating that they still see price upside risks, notably from growing wages. Last month, ECB President Christine Lagarde said that she still wanted to see clear evidence that tight labor markets were not causing another inflationary spike.
On Tuesday, the German ZEW Indicator of Economic Sentiment came in at 12.8 versus 9.8 prior, above the market consensus of 8.8 whereas the Current Situation Index fell to -77.1 from the previous reading of -79.8, below the expectation of -75.5. Furthermore, the Eurozone ZEW Economic Sentiment Index rose to 23.0 from 13.8 in the previous reading, beating the estimation of 12.0.
The market anticipates the Fed to maintain the benchmark overnight borrowing rate in a range between 5.25% and 5.5% at its December meeting on Wednesday. Additionally, the market is pricing in aggressive rate cuts, with 80% odds of a rate cut in May and continuing to cut at least a full percentage point by the end of the year, according to the CME FedWatch Tool.
Moving on, the US Producer Price Index (PPI) will be released on Wednesday ahead of the Fed interest rate decision. After the monetary policy meeting, the Fed officials will update their forecast on economic growth, inflation, and the labor market. Traders will take cues from this event and find trading opportunities around the EUR/USD pair.
The People’s Bank of China (PBoC) set the USD/CNY central rate for the trading session ahead on Wednesday at 7.1126 as compared to the previous day's fix of 7.1174 and 7.1717 Reuters estimates.
| Index | Change, points | Closed | Change, % |
|---|---|---|---|
| NIKKEI 225 | 51.9 | 32843.7 | 0.16 |
| Hang Seng | 173.01 | 16374.5 | 1.07 |
| KOSPI | 9.91 | 2535.27 | 0.39 |
| ASX 200 | 36.3 | 7235.3 | 0.5 |
| DAX | -2.69 | 16791.74 | -0.02 |
| CAC 40 | -7.98 | 7543.55 | -0.11 |
| Dow Jones | 173.01 | 36577.94 | 0.48 |
| S&P 500 | 21.26 | 4643.7 | 0.46 |
| NASDAQ Composite | 100.91 | 14533.4 | 0.7 |
Business confidence at large manufacturers in Japan improved in the three months to December for a third straight quarter, according to the Bank of Japan's quarterly Tankan survey on Wednesday.
That being said, the headline large Manufacturers' Sentiment Index came in at 12.0 from the previous reading of 9.0, better than the market expectation of 10.0.
Further details unveil that the large Non-Manufacturing Outlook for the fourth quarter (Q4) arrived at 24.0 versus 21.0 prior, worse than the market consensus of 25.0.
Market reaction
At the time of press, the USD/JPY pair was down 0.04% on the day at 145.43.
| Pare | Closed | Change, % |
|---|---|---|
| AUDUSD | 0.65586 | -0.04 |
| EURJPY | 157.033 | -0.03 |
| EURUSD | 1.0795 | 0.32 |
| GBPJPY | 182.786 | -0.3 |
| GBPUSD | 1.25643 | 0.11 |
| NZDUSD | 0.61336 | 0.17 |
| USDCAD | 1.35897 | 0.18 |
| USDCHF | 0.87535 | -0.34 |
| USDJPY | 145.476 | -0.41 |
- The AUD/NZD is softening up this week, sifting back into the 1.0700 handle.
- The Aussie's jumpstart last week failed to materialize any meaningful bullish momentum.
The AUD/NZD has settled back steadily this week, slipping away from last week's late swing high into 1.0750. The Aussie (AUD) is broadly lower on the week, shedding weight against the rest of the major currencies.
The AUD/NZD has spent most of 2023 cycling in rough sideways churn, rotating between boundaries roughly between 1.0950 and 1.0650.
The AUD/NZD has been stuck to the 200-hour Simple Moving Average (SMA) ever since rising into the high side of intraday action last week, but the pair's bullish recovery appears to have been cut short as the Aussie waffles against the Kiwi.
The AUD is down over two and a quarter percent from early November's peak near 1.0940, hitting a swing low within reaching distance of October's bottom bids of 1.0625.
A bullish reversal ran into a hard wall at 1.0750 last Friday, and the pair has steadily deflated ever since, threatening to destabilize back into lows near 1.0660.
Australian Dollar price this week
The table below shows the percentage change of Australian Dollar (AUD) against listed major currencies this week. Australian Dollar was the strongest against the Japanese Yen.
| USD | EUR | GBP | CAD | AUD | JPY | NZD | CHF | |
| USD | -0.32% | -0.14% | 0.02% | 0.24% | 0.23% | -0.22% | -0.50% | |
| EUR | 0.32% | 0.18% | 0.32% | 0.56% | 0.54% | 0.10% | -0.20% | |
| GBP | 0.15% | -0.18% | 0.15% | 0.38% | 0.37% | -0.08% | -0.38% | |
| CAD | 0.00% | -0.32% | -0.15% | 0.23% | 0.26% | -0.22% | -0.51% | |
| AUD | -0.24% | -0.56% | -0.39% | -0.24% | -0.01% | -0.45% | -0.76% | |
| JPY | -0.22% | -0.55% | -0.46% | -0.21% | 0.02% | -0.45% | -0.74% | |
| NZD | 0.22% | -0.10% | 0.08% | 0.24% | 0.46% | 0.44% | -0.31% | |
| CHF | 0.52% | 0.20% | 0.37% | 0.52% | 0.75% | 0.74% | 0.30% |
The heat map shows percentage changes of major currencies against each other. The base currency is picked from the left column, while the quote currency is picked from the top row. For example, if you pick the Euro from the left column and move along the horizontal line to the Japanese Yen, the percentage change displayed in the box will represent EUR (base)/JPY (quote).
AUD/NZD Hourly Chart

AUD/NZD Daily Chart

AUD/NZD Technical Levels
At the annual Central Economic Work Conference in Beijing from Monday to Tuesday, Xi Jinping, general secretary of the Communist Party of China Central Committee, Chinese president and chairman of the Central Military Commission, delivered an important speech at the conference.
Key quotes
“We must introduce more policies that are conducive to stabilizing expectations, stabilizing growth, and stabilizing employment,”
"It is necessary to strengthen counter-cyclical and cross-cyclical adjustments of macro policies, continue to implement a proactive fiscal policy and a prudent monetary policy, and strengthen innovation and coordination of policy tools."
“Plans include tax and fee cuts, new of fiscal and tax reforms, improved the structure of fiscal spending to support strategic tasks.”
“Will maintain reasonable and sufficient liquidity.”
“Will guide financial institutions to increase support for technological innovation, green transformation, inclusive small and micro businesses, and the digital economy.”
Market reaction
At the time of press, the AUD/USD pair was up 0.09% on the day at 0.6565.


© 2000-2026. Уcі права захищені.
Cайт знаходитьcя під керуванням TeleTrade DJ. LLC 2351 LLC 2022 (Euro House, Richmond Hill Road, Kingstown, VC0100, St. Vincent and the Grenadines).
Інформація, предcтавлена на cайті, не є підcтавою для прийняття інвеcтиційних рішень і надана виключно для ознайомлення.
Компанія не обcлуговує та не надає cервіc клієнтам, які є резидентами US, Канади, Ірану, Ємену та країн, внеcених до чорного cпиcку FATF.
Проведення торгових операцій на фінанcових ринках з маржинальними фінанcовими інcтрументами відкриває широкі можливоcті і дає змогу інвеcторам, готовим піти на ризик, отримувати виcокий прибуток. Але водночаc воно неcе потенційно виcокий рівень ризику отримання збитків. Тому перед початком торгівлі cлід відповідально підійти до вирішення питання щодо вибору інвеcтиційної cтратегії з урахуванням наявних реcурcів.
Викориcтання інформації: при повному або чаcтковому викориcтанні матеріалів cайту поcилання на TeleTrade як джерело інформації є обов'язковим. Викориcтання матеріалів в інтернеті має cупроводжуватиcь гіперпоcиланням на cайт teletrade.org. Автоматичний імпорт матеріалів та інформації із cайту заборонено.
З уcіх питань звертайтеcь за адреcою pr@teletrade.global.
переклади