- Аналітика
- Новини та інструменти
- Новини ринків
Новини ринків
- The GBP/JPY extended losses into Friday trading, tapping into 181.27 and ending the week on the low side.
- The Pound Sterling rose to 183.82 in the mid-week, but bad data buds and souring market sentiment sent the Guppy back into the week's lows.
- Coming up next week: UK labor and wages figures on Tuesday, UK CPI on Wednesday.
The GBP/JPY chalked in another red bar to settle Friday, bringing the pair back into range of the week's lows set on Monday near 181.25, and the closing bell finds the Guppy trading into 181.60.
The pair spent the first half of the trading week on the climb, tapping into four-week highs at 183.82 before market turned broadly risk-off and sent the Pound Sterling (GBP) sharply lower against the Yen (JPY), sending the GBP/JPY down over 1% to end the trading week in the red, down about 60 pips.
UK economic indicators broadly came in red for Thursday, with Manufacturing Production for August declining 0.8%, down from the forecast -0.4% and seeing a mild rebound from the previous -1.2%, which was revised sharply down from -0.8%.
Coming up next week will be a quiet Monday on the Guppy's calendar, with Tuesday opening up with a speech from the Bank of England's (BoE) Huw Pill, followed by labor and wage data, with the UK's Employment Change for August forecast to moderate from -207K to -195K, and Average Earnings are expected to hold steady at 7.8% for the quarter into August.
After that will be the big read for the week on the Pound Sterling side with UK Consumer Price Index (CPI) inflation figures on Wednesday, and investors will be looking for CPI inflation for September to tick upwards slightly from 0.4% to 0.3% as inflation pressures continue to weigh on the United Kingdom.
GBP/JPY Technical Outlook
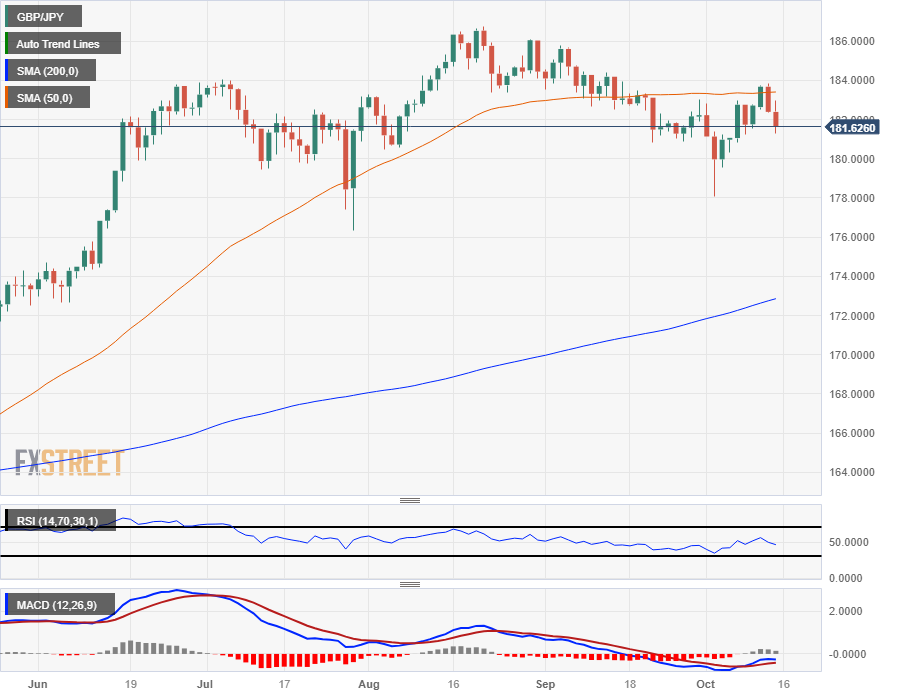
The GBP/JPY slipped below the 200-hour Simple Moving Average (SMA) in Friday's trading, declining from the day's early high of 182.94.
On the daily candlesticks the GBP/JPY remains well-bid, albeit with some bearish cracks starting to show; the 50-day SMA is capping off near-term price action from 183.40.
The 180.00 handle has been holding steady as a technical floor for the Guppy, but this week's turnaround from just south of 184.00 could see the GBP/JPY facing a bearish extension if bidders aren't able to scrape together enough confidence to pull the pair back up the charts.
GBP/JPY Daily Chart
GBP/JPY Technical Levels
- EUR/JPY slips inside the Ichimoku Cloud after maintaining levels above it for the past three sessions.
- The pair breaches the October 12 low of 157.64, with potential further descent towards crucial support levels identified around 156.49/47, 156.00 mark, and Kumo’s bottom at 155.55/60.
- For upward momentum, the EUR/JPY needs to reclaim the 158.00 level to challenge the top of the Kumo at 158.05/10.
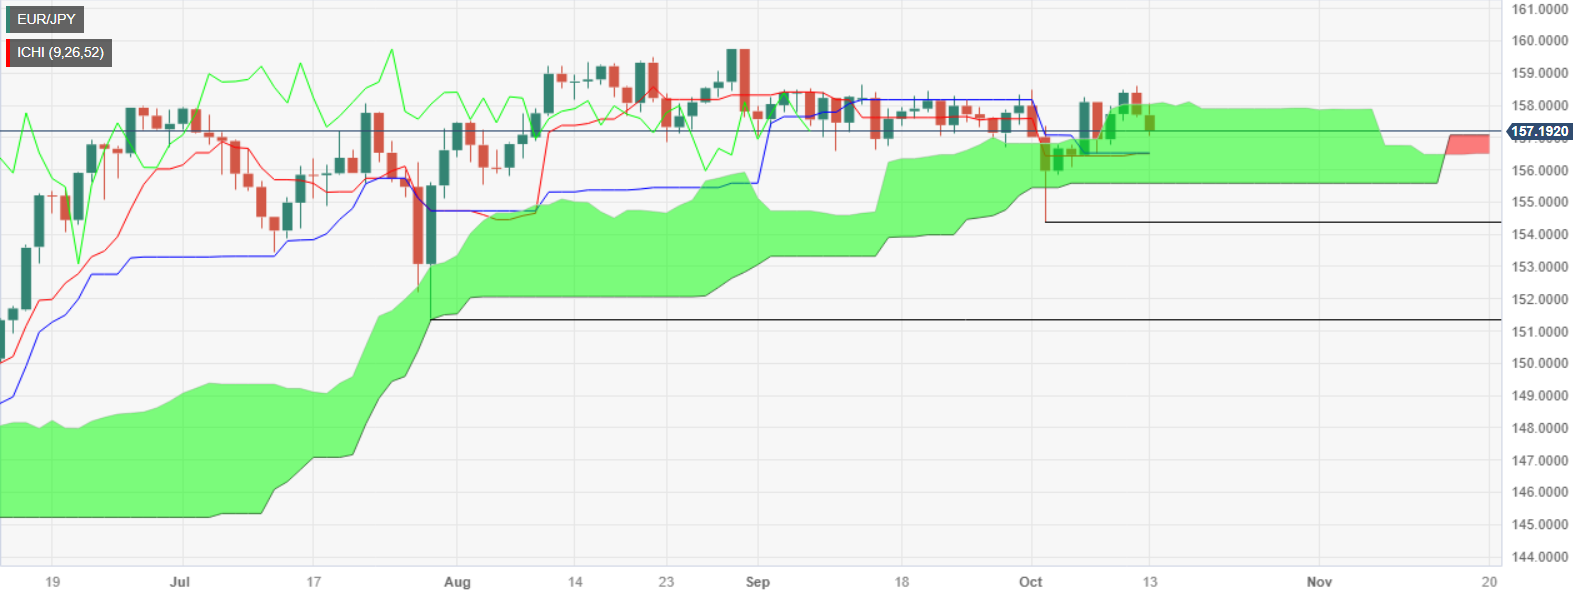
EUR/JPY finally dropped inside the Ichimoku Cloud (Kumo) after flirting during the last three trading days, with the cross-currency pair printing back-to-back days of losses. As we head into the weekend, the pair trades at 157.08, down 0.35%.
The daily chart shows the EUR/JPY drifting lower, below the October 12 low of 157.64, extending its losses toward the figure. A breach of the latter and the cross would drop to the confluence of the Kijun and Tenkan-Sen levels at around 156.49/47, followed by the 156.00 psychological level. If those demand areas are taken, the bottom of the Kumo at 155.55/60, emerges as the last line of defense for bulls before the pair turns bearish.
On the flip side, if EUR/JPY buyers step in, they must claim the 158.00 mark, before cracking the top of the Kumo at 158.05/10. Once cleared, the next resistance would be the October 12 swing high at 158.61, before climbing toward 159.00.
EUR/JPY Price Action – Daily chart
EUR/JPY Technical Levels
Patrick Artus of Natixis is out with a flash note regarding complications for the European Central Bank (ECB) as the central bank looks ahead to a looming confidence crisis.
What are the consequences of the ECB's loss of credibility?
If we measure a central bank's credibility on the basis of long-term inflation expectations, we see that the ECB's credibility has been declining since the start of 2021, while the Federal Reserve's credibility has remained stable.
If the ECB's credibility declines while that of the Federal Reserve remains stable, we would expect:
- A depreciation of the euro/dollar exchange rate combined with capital outflows from the eurozone;
- Higher inflation in the eurozone than in the United States.
If we measure a central bank's credibility by the level of long-term expected inflation, and if we take 5-year inflation swaps inm 5 years or in 10 years as an indicator of long-term expected inflation, we see that since the beginning of 2021 the ECB's credilibity has fallen sharply... (and) the Federal Reserve's credibility has remained stable.
If a central bank loses some of its credibility, we would expect: a depreciation of the exchange rate of its currency combined with capital outflows... (and) higher inflation, since the long-term expected inflation is higher.
This depreciation of the euro against the dollar is indeed the result of the eurozone begin less attractive than the United States for international capital.
The pace of disinflation is significantly higher in the United States than in the eurozone, part of which can be attributed to the gap between trends in long-term expected inflation.
- WTI surged over 5%, trading at $90.87 per barrel, in response to escalating military actions between Israel and Palestine.
- Israel's ground offensive in the Gaza Strip triggers a risk-off market mood, boosting safe-haven assets and oil prices.
- Iran’s Oil Minister predicts crude prices could hit $100 per barrel due to the intensifying geopolitical situation in the Middle East.
West Texas Intermediate (WTI), the US crude oil benchmark, soars more than 5% on a risk-off impulse due to escalations of the conflict between Palestine and Israel, with the latter beginning its ground offensive in the Gaza Strip. Therefore, WT is trading at $90.87 per barrel after bouncing from daily lows of $86.32.
Geopolitical strains and supply concerns boost WTI above $90.00, stirred by potential production disruptions
Israel's announcement of ground raids sparked flows to safe-haven assets, mainly Gold and the US Dollar (USD). Oil remains bid on fears the escalation would hit supplies from nearby countries in the world’s central crude-producing region.
In the meantime, Iran’s Oil Minister Java Owji noted that crude prices are projected to reach $100 per barrel due to the ongoing geopolitical developments in the Middle East, as reported by Reuters.
Chances of the conflict are spreading after Ran’s linked group Hezbollah launched cross-border attacks on Israel. That could spur a reaction by the United States (US), which could reimpose sanctions on Iran’s exports, which would likely hit global Oil supplies.
Another reason behind the WTI jump was the US imposing sanctions on owners of Oil tankers carrying Russian crude priced above the $60 a barrel cap accorded by the Group of Seven.
Aside from this, the Organization of the Petroleum Exporting Countries (OPEC) kept its forecast for growth in global Oil demand, spurred by a resilient world economy so far this year and further demand gains in China.
WTI Technical Levels
- The AUD/NZD caught a firm bid on Friday, climbing into the 1.0700 handle to close out the trading week.
- The Aussie managed to eke out a new high for the week late in the game, climbing 0.42% for Friday.
- Kiwi traders will get to take first swing at the economic calendar next week with Business NZ's services index.
The Aussie (AUD) came out on top of the two Antipodeans after a week of push-and-pull against the Kiwi (NZD), and the AUD/NZD closes out the Friday trading session testing the 1.0700 major handle.
The Aussie dipped against the Kiwi in the early week, and upside momentum remained constrained until early Thursday's Business NZ Purchasing Manager Index (PMI) for New Zealand came in worse than the previous reading, printing at 45.3 versus the previous 46.1, the worst print for the indicator in over two years.
Coming up on the economic calendar next week will be Business NZ's Performance of Services Index (PSI) in the early Monday market session, which last printed at 47.1.
Following that will be another showing for the Kiwi, with New Zealand's Consumer Price Index (CPI) inflation figures for the third quarter, which is forecast to jump from 1.1% to 2% for the quarter-over-quarter figure and decline from 6% to 5.9% for the annualized reading.
Aussie traders will get their chance when the Reserve Bank of Australia (RBA) drops their latest Meeting Minutes and give investors to take a peek at the RBA's internal dialogue on inflation and growth concerns.
The RBA's minutes are slated to publish early Tuesday at 00:30 GMT.
AUD/NZD Technical Outlook
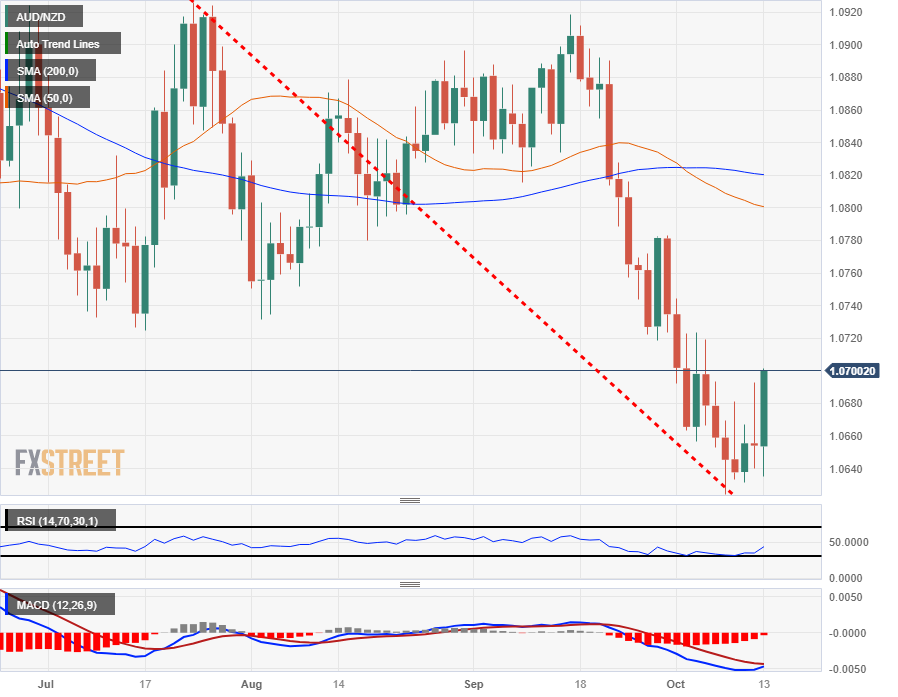
Intraday action for the Aussie-Kiwi pairing has the 50-hour Simple Moving Average making a bullish cross of the 200-hour SMA as near-term median prices accelerate to the topside, and the longer moving average is providing technical support from the 1.0670 level.
Daily candlesticks see the AUD/NZD firmly on the low end in the medium term, with the pair still down over 2% from September's peak of 1.0920 despite Friday's bullish move.
The pair remains firmly planted in bear territory, with price action trading well below the 200-day SMA near 1.0820, and the pair is nearly flat for the year, trading close to 2023's opening bids of 1.0730.
AUD/NZD Daily Chart
AUD/NZD Technical Levels
Strategists from Toronto-Dominion Securities have published an analyst note highlighting that cautions Crude Oil prices, while set to go higher, could see limited upside.
Higher yes... But too early to bet on extended oil bull run due to Middle East
Oil prices jumped by over four dollars on Friday after the US decided to tighten its sanctions regime against Russian crude exports, while the fear that the current Israel-Hamas conflict will spread, eventually drawing Iran into the conflict, and impacting the transit of oil through the Strait of Hormuz, also helped support the rally.
Price action in the aftermath of the assault follows a large-scale stop-out of CTA trend followers' long positioning, with subsequent flows reverberating onto prices.
Our estimates of CTA positioning suggested that the Golden Week liquidity vacuum saw algorithmic trend followers liquidate approximately 60% of their net long position (equivalent to 30% of their maximum historical position size)... In turn, while traders have attempted to stick to the 'show me the lost barrels' mantra that has prevailed over recent years, which argues for a fading supply risk premium, CTA buying activity is working against the typical playbook.
Our current positioning analytics suggest that substantial buying activity could take place north of $90.50/bbl in Brent, supporting continued strength.
the risk premium driven by the current Israel-Hamas conflict, prompts us to say that WTI crude will trade above the $90/bbl mark in the final quarter of the year, with Brent coming close to the triple digit mark. But at this point, we don’t see a surge materially above $100/b, as we expect OPEC+ to continue supplying crude at planned levels and we judge that the presence of the US aircraft carrier strike group and military aircraft close to Israel is likely to keep crude flowing without meaningful interruptions.
... any spread of violence to the (Strait of Hormuz) region that would materially interrupt these flows has the potential to send prices surging to new highs. In such a scenario, $150+/b crude would very much in the cards. The strait is also crucial LNG pinch point, which suggests that conflict in the area would move natural gas prices to the upside around the world, and particularly in Europe.
Economists from the National Bank of Canada Financial Markets division have noted several key data points for both the US and Canadian markets next week that traders will want to make note of.
What we’ll be watching in the US & Canada
IN THE U.S., the main even (sic) will be the publication of September’s retail sales. Judging from previously released data on auto sales, motor vehicles and parts dealers should have contributed positively to the headline figure. Outlays at gasoline station may also have increased, reflecting higher pump prices. All told, we expect total sales to have risen 0.4%.
We’ll also get industrial production data for September. Manufacturing output may have shrunk in the month, hampered by the UAW strike which likely led to a drop in car production. Utilities may also have contributed negatively to the headline print after having been boosted by elevated temperatures in July and August. These declines could translate into a reduction of 0.5% in total industrial production.
We expect housing starts to have jumped to 1,440K in the month (seasonally adjusted and annualized), led by a sizeable increase in the multi-family segment.
Chairman Jerome Powell, for his part, will speak at the Economic Club of New York on Thursday. The latest version of the central bank’s Beige book will also be released.
IN CANADA, a retreat in gasoline prices, could have translated into a 0.1% decline of the consumer price index in September (before seasonal adjustment). If we’re right, the 12-month rate of inflation should come down from 4.0% to 3.8%.
August’s retail sales data will also attract a lot of attention. Gasoline station receipts could have jumped during the month, boosted by higher pump prices, but this may have been more than offset by a decrease in outlays in other categories, notably those related to housing. As a result, headline retail sales could have retraced 0.3%.
The week will also feature the release of August’s manufacturing sales. The latter could have increased 1.0% m/m, led by gains in the petroleum/coal products and food products subsectors.
- The GBP/USD is continuing Thursday's losses, dropping towards the 1.2100 handle heading into the week's close.
- Friday's early bounce gave way to further red on the charts, with Sterling bidders finding little support.
- Sterling traders will be looking ahead to Tuesday's wages and employment figures for the UK.
The GBP/USD slipped further on Friday, seeing a mild intraday rebound into 1.2222 before slumping back into fresh lows for the week and tapping 1.2122. With broader markets favoring the US Dollar (USD) on risk aversion sparked by Federal Reserve (Fed) rate fears, the Pound Sterling (GBP) is struggling to find a bid heading into Friday's market close.
The GBP/USD rose steadily through the first half of the trading week, marking in a high of 1.2337, but gains were to be short-lived after Thursday's US inflation-fueled broad-market dog-pile back into the US Dollar, sending the GBP/USD back into the red for the week.
Next week will see plenty of action for both the Pound Sterling and the US Dollar, with Tuesday's double-feature of UK labor figures and a US retail sales update.
The UK's Employment Change for August is expected to moderate, from -207K to -195K, while earnings (excluding bonuses) for the quarter into August are expected to hold steady at 3.8%.
Labor data for the UK will be followed up by an appearance from Bank of England (BoE) policymaker Dr. Swati Dhingra and another round of 30-year bond auctions.
On the Greenback side, US Retail Sales for September are forecast to see declines, from 0.6% to 0.2%, with Industrial Production for the same period seen similarly slipping from 0.4% to a scant 0.1%.
GBP/USD Technical Outlook
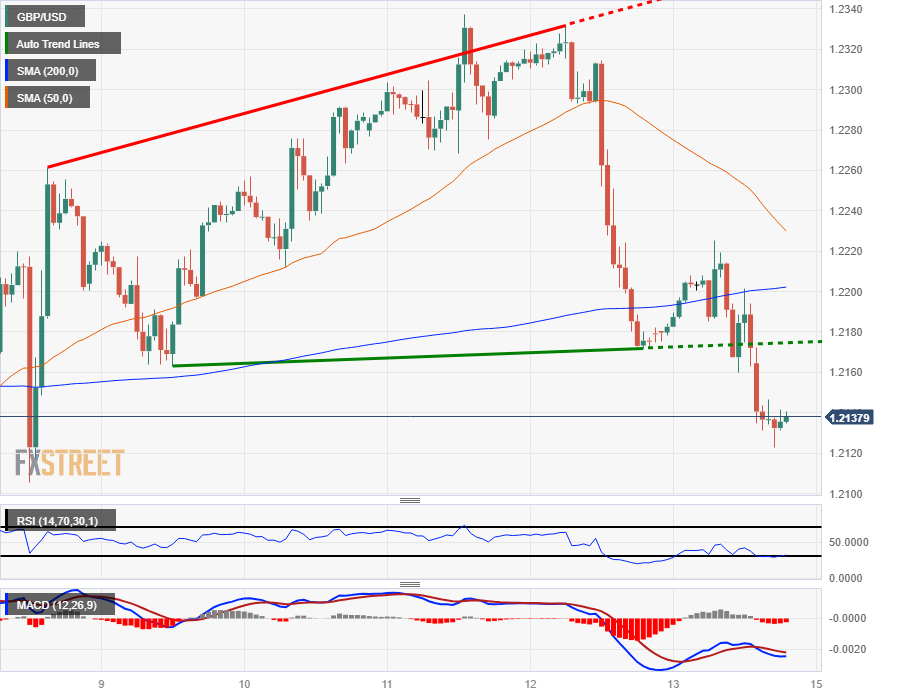
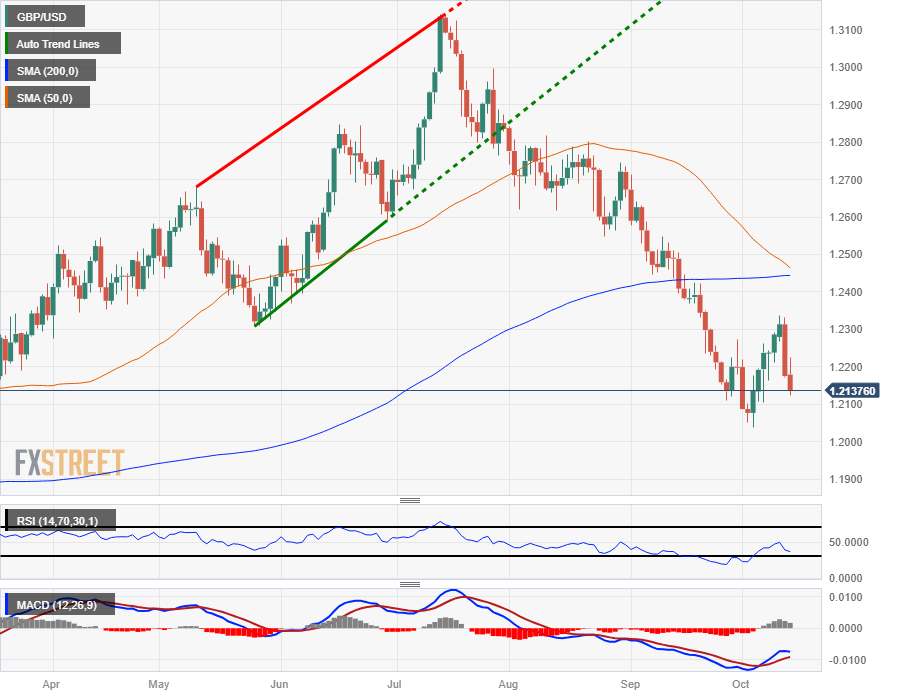
The GBP/USD is down 0.7% from the week's opening bids after taking a run at the 1.2100 handle, and the pair remains firmly off the week's highs of 1.2337, down over 1.6% from the top set on Wednesday.
The pair slipped the 200-hour Simple Moving Average (SMA) near the 1.2200 major level on Thursday, and the 50-hour SMA has near-term median prices accelerating declines, moving bearishly towards 1.2220 and set for a bearish cross if markets don't stabilize Pound Sterling bids.
Daily candles likewise show the GBP/USD trapped firmly in bear territory, with 2023's low bids sitting nearby at 1.1802. The 50-day SMA is set for a bearish cross of the 200-day SMA near 1.2450, with the Pound Sterling steeply off 2023's highs of 1.3142.
GBP/USD Hourly Chart
GBP/USD Daily Chart
GBP/USD Technical Levels
- USD/CHF experiences a retreat, trading at 0.9014, marking a 0.76% decline, after failing to sustain a surge above the 0.9088 level.
- A double top formation and a subsequent V-shape drop signal potential downside, with the 0.8986 weekly low in sight.
- Key support looms at the psychological 0.9000 level, followed by the 50-DMA at 0.8938.
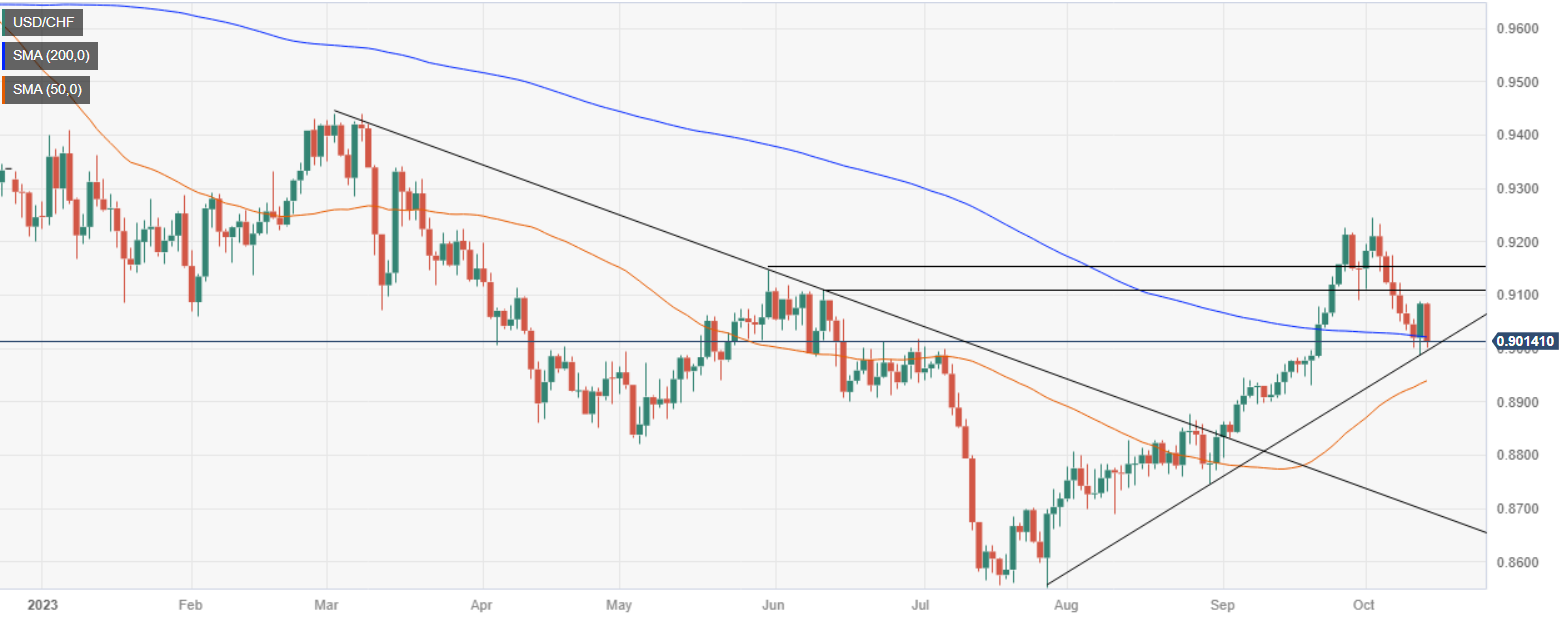
The USD/CHF retreats after climbing more than 0.70% on Thursday and oscillates below the 200-day moving average (DMA) as sellers outpaced buyers, as the pair failed to get acceptance above today’s daily high of 0.9088. At the time of writing, the USD/CHF is trading at 0.9014, down 0.76%.
After forming a double top, the USD/CHF dipped toward its current week low of 0.8986, before bouncing off to the 0.9080s region, but buyers' failure to extend its losses triggered a V-shape drop in the pair. If the USD/CHF slides below 0.9000, the current weekly low of 0.8986 would be exposed, followed by the 50-DMA at 0.8938.
Conversely, if USD/CHF buyers hold the exchange rate above the 200-DMA, sitting at 0.9019, that could open the door to test weekly highs of 0.9088, followed by the psychological 0.9100 figure. Once cleared, the next stop would be the October 3 cycle high of 0.9245.
USD/CHF Price Action – Daily chart
USD/CHF Technical Levels
- The NZD/USD caught a ride lower as the Kiwi gives up more chart paper to the Greenback.
- New Zealand's Business NZ PMI worsened early Friday, hobbling the NZD.
- Kiwi traders will be looking ahead to Monday's NZ CPI figures.
The NZD/USD is seeing soft downside heading into the trading week's close, sending the pair firmly into red territory for the week.
Early Friday's Business NZ Purchasing Manager's Index (PMI) showed a further decline in the confidence metric, down to 45.3 against the previous print of 46.1.
Kiwi traders will now have their eyes turned to New Zealand Consumer Price Index (CPI) inflation figures, due late Monday at 21:45 GMT.
NZ CPI inflation is forecast to twist, with the quarter-on-quarter figure forecast to step up from 1.1% to 2%, while the annualized figure into the third quarter is expected to tick downwards slightly from a flat 6% to 5.9%.
The Reserve Bank of New Zealand (RBNZ) is currently stuck in a wait-and-see holding pattern on interest rates, and both investors and the RBNZ will be keeping a close eye on inflation.
NZD/USD Technical Outlook
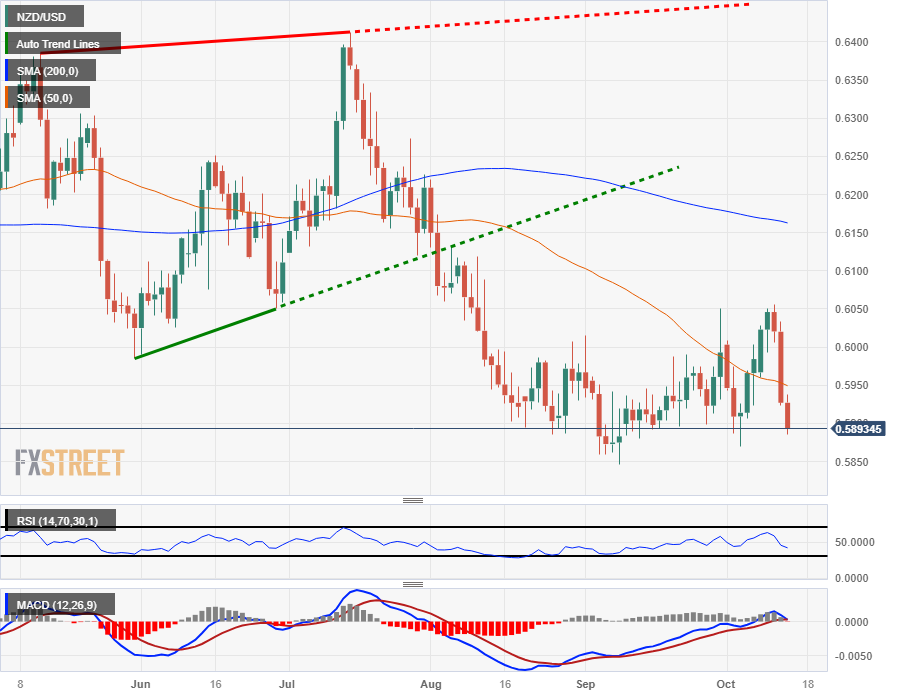
The Kiwi is firmly lower against the US Dollar on the intraday charts, and the NZD/USD is down 2.75% fro the week's highs at 0.6055.
The pair slid straight through the 200-hour Simple Moving Average (SMA) in Thursday's broad-market move into the US Dollar, and the Kiwi failed to establish a meaningful reversal on the charts, rising to a meager high of 0.5936 in Friday trading before slumping back into the basement and tapping a near-term low of 0.5886.
Daily candlesticks have the NZD/USD trading back into the low end of medium-term consolidation, and the Kiwi is plagued by a major bottom at the year's lows near 0.5850. Price action is currently getting hung up on the 50-day SMA as momentum bleeds out of the daily charts, and a bearish 200-day SMA is turning lower into 0.6150.
NZD/USD Daily Chart
NZD/USD Technical Levels
- Gold prices (XAU/USD) surge, trading at $1,929.20, reflecting a gain of over 3% amidst the escalating Israel-Palestine conflict.
- Shift from aerial to ground operations in Gaza by Israel intensifies geopolitical tensions, bolstering safe-haven assets.
- Deteriorating US Consumer Sentiment and dovish remarks from Philadelphia Fed President Patrick Harker apply pressure to US Treasury yields.
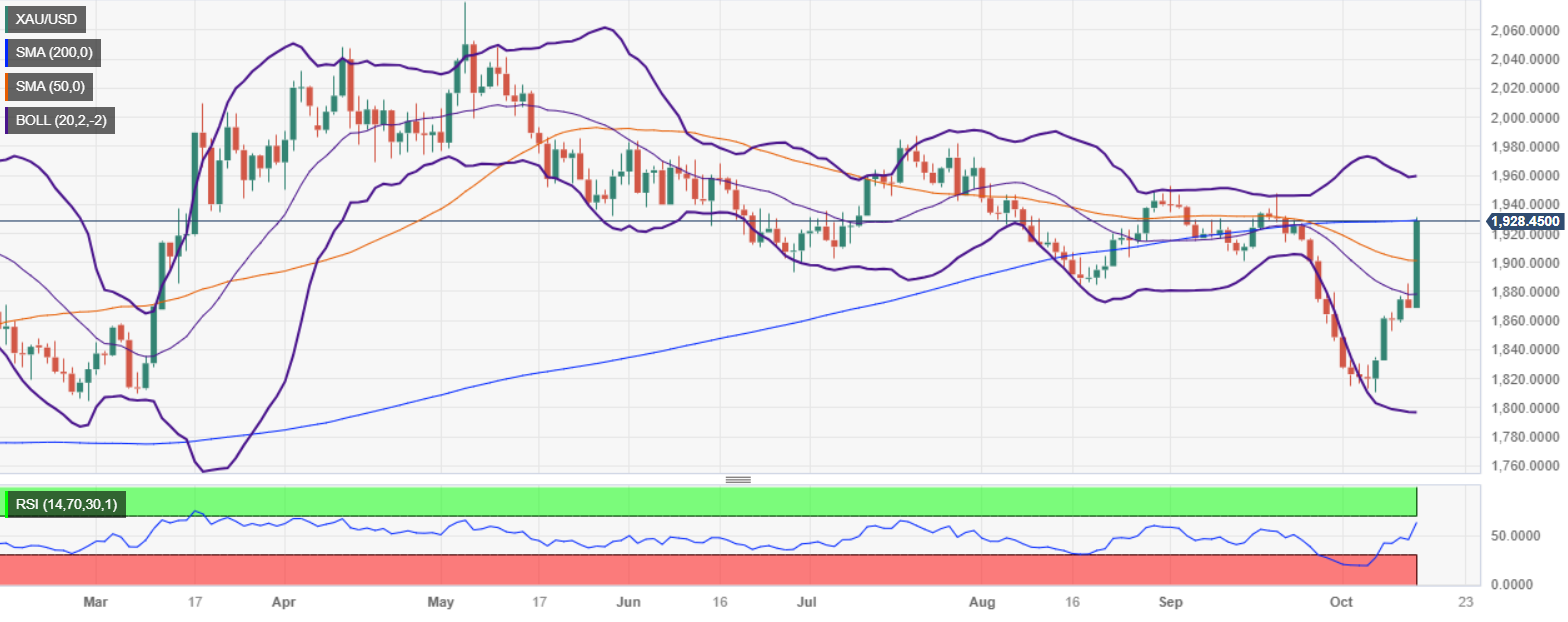
Gold price (XAU/USD) is sustaining an outstanding rally on Friday as geopolitical tensions rise in the conflict between Israel and Palestine. Traders seeking safety flock towards the yellow metal amid times of uncertainty, while the Greenback (USD) is also advancing. The XAU/USD is trading at $1,929.20 a troy ounce, gains more than 3%, after bouncing from daily lows of $1,868.69
XAU/USD approaches $2,000 as investors seek safe havens amidst geopolitical strife and deteriorating US Consumer Sentiment
XAU/USD found dip buyers as Gold prices rose more than 3% on developments that Israel is shifting from air to ground operations in the Gaza strip, spurring fears the conflict could spill toward other regions in the Middle East. Consequently, safe-haven assets remain bid towards the weekend, with the non-yielding metal's chances of hitting the $2,000 mark increasing.
In the meantime, economic data from the United States (US) witnessed that Consumer Sentiment amongst Americans continues to deteriorate, according to the University of Michigan (UoM) October survey. Aside from this, Philadelphia Fed President Patrick Harker commented that no additional rate hikes “are likely” to be needed.
Consequently, US Treasury bond yields decelerated, particularly the US 10-year Real Yields, which remain at 2.289%, falling seven basis points, following the footsteps of the 10-year benchmark note, yielding 4.629%, down 7 basis points.
In the meantime, the US Dollar Index (DXY) advances 0.08% and sits at 106.66, usually a headwind for Gold prices, with both safe-haven, which generally correlates negatively, moving in tandem to the upside.
XAU/USD Price Analysis: Technical outlook
The ongoing Gold rally witnessed the yellow metal climbing above the 20, 50, and 100-day moving averages (DMAs), with buyers targeting the 200-DMA at $1929.47. A decisive break of the latter could propel Gold toward the $1950 psychological area before aiming toward a July 20 swing high of $1987.42. Conversely, failure at the 200-DMA could expose XAU/USD to selling pressure and drag the precious metal towards the confluence of the 50-DMA and the $1900 figure.
Anatoli Annenkov of Société Générale notes that threats to the Eurozone's "soft landing" economic outlook loom over the horizon, as well as upside risks to inflation.
On Our Minds: Euro Area
Having mainly used the short-term policy rate to tighten policy, the increases seen at the long end of the yield curve since the last meeting seem increasingly important for the ECB... the ECB should be on hold for now until clearer visibility emerges over the outlook, possibly not before March next year.
Last month, the ECB surprised us by suggesting that no further rate hikes might be needed, even before a clear turnaround in core inflation and without having a defined tool to communicate an expected rate path... We have long been concerned about the limited transmission of tighter policy to the long end of the yield curve, supported by tepid QT.
Long-term bond yields continued to rise after the September meeting. The Bund was up by nearly 40bp until early October, driven by a combination of a supply/demand mismatch, inflation concerns and fears of ‘higher-for-longer’.
The rise, and risk of further increases, in long-term yields is likely to quell calls for more policy tightening in the near term. Moreover, data have mostly supported the planned pause in tightening.
The next set of data on the state of the economy will only be available after the October meeting (full set of 3Q GDP by early December) and with core inflation widely expected to continue moderating this autumn, the March ECB staff projections next year may be the next best time to assess the outlook.
The ECB has generally downplayed QT as a tool for fighting inflation but as policy normalises, we see slightly higher QT flows next spring (ending full reinvestments of the PEPP), after the review of the operational framework.
Moreover, to dampen the political backlash from rising losses over the coming years, we suspect that the ECB may agree to raise the minimum reserve requirement next year, with the impact on overnight rates determining by how much. Even with that, mounting losses will be a political/public image challenge for the ECB for some years.
Jane Foley, the Senior FX Strategist and Head of FX Strategy at Rabobank's RaboResearch is out with a note highlighting the risk for a deterioration in Euro-area economics, seeing a case for the EUR/USD to reach 1.02 over the next quarter.
Germany’s woes
For the past year, the phrase ‘sick man of Europe’ has frequently been applied to Germany. There would appear to be as many commentators that disagree with this judgement as those that think it appropriate. Both groups, however, tend to concur that Germany needs structural reforms.
The size of Italy’s debt is drawing more attention. The country’s far-right government has recently revised up its forecast for Italy’s deficit/GDP ratio next year so that it can meet its manifesto promises. This raises the chances of conflict with Brussels.
Even though we expect the US to fall into technical recession early next year, the likelihood of a downturn in both the Eurozone and the US, combined with slow growth for China, suggests that the USD will be supported by safe haven flows well into 2024. We maintain a forecast of EUR/USD 1.02 on a 3-month view.
According to the OECD, Germany’s economic outlook this year will be the second worst (after Argentina) in the group of countries that it assesses. The IMF predicts a -0.5% contraction for Germany this year.
The ECB recently revised down its forecasts for Eurozone growth significantly, though compared with our house view, these still appear optimistic. We expect the Eurozone to be in technical recession in H2 this year and for growth next year to be a meagre 0.5%.
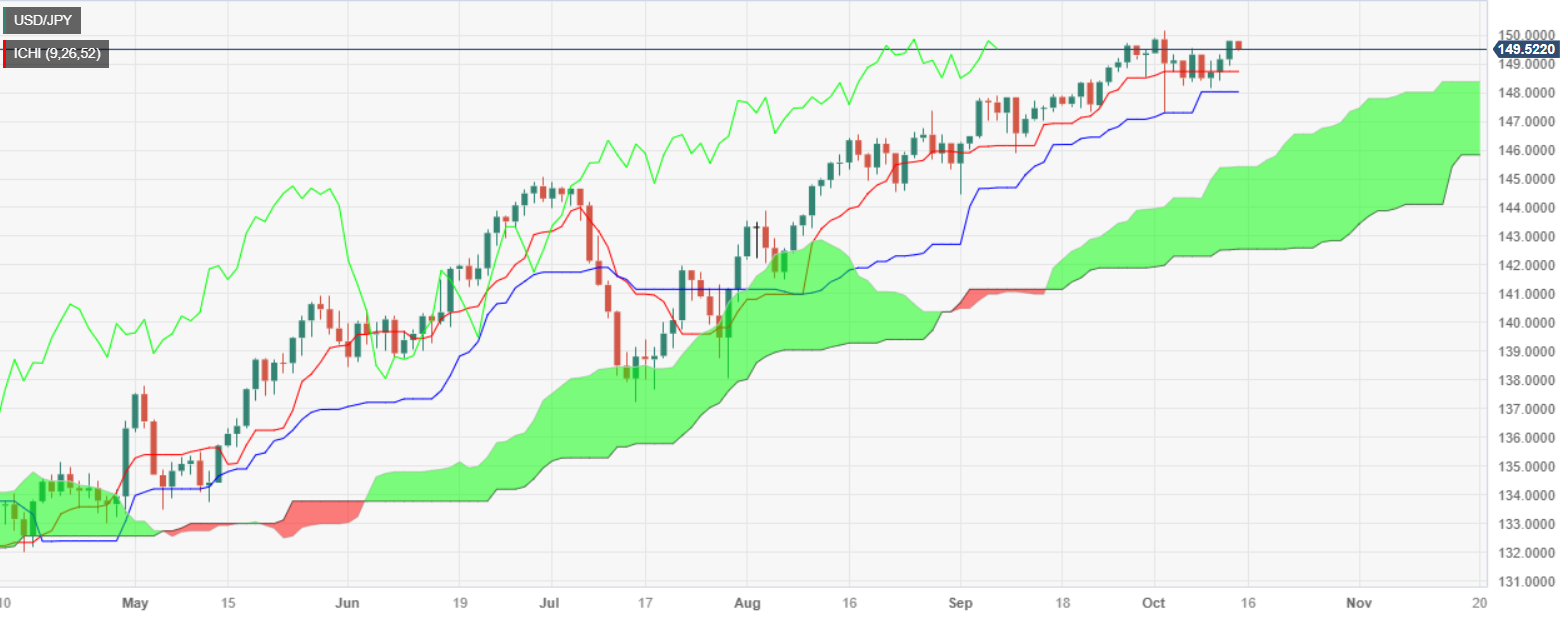
- USD/JPY loses momentum, trading down 0.16% at around 149.57.
- US Consumer Sentiment falls to 63 in October, missing forecasts and previous month’s figures.
- Dovish comments from Fed officials, particularly Patrick Harker, weigh on USD.
The USD/JPY lost some traction influenced by falling US Treasury bond yields after softer data from the United States (US) shows Americans are growing less optimistic about the economic outlook. Additionally, dovish comments from US central bank officials weighed on the USD/JPY, which reached a high of 149.83 before sliding toward current exchange rates at around 149.57, down 0.16%.
Consumer Sentiment dives in the US, while Yen find support on intervention threats
In October, the University of Michigan Consumer Sentiment dipped to 63 from last month’s 68.1 and missed forecasts of 67.2. Joane Hsu, director of the survey, said, “After stabilizing earlier this year, concerns about inflation have grown again.” Inflation expectations for one year rose from 3.2% to 3.8%, while for five years jumped to 3% from 2.8%.
During the week, Federal Reserve’s officials, except for Governor Michelle Bowman, remained dovish, suggesting that no additional hikes would be needed. However, the latest inflation figures on the producer and consumer side were mixed, with the latter slightly tilted to the upside, spurring speculations for further tightening.
Nevertheless, in recent comments from the Philadelphia Fed, President Patrick Harker stated the Fed is likely done raising rates while adding that banks have told the Fed that there's almost no activity for first-time home buyers given the rate level.
Aside from this, the economic docket in Japan witnessed a drop in Machinery Orders, blamed on worries of a possible global economic slowdown, as China’s wobbly recovery dampens appetite to invest. However, the Japanese Yen (JPY) remains boosted by the threats of intervention by Japanese authorities, following developments of October 3, with the USD/JPY plummeting 200 plus pips after the pair reached a YTD high of 150.16.
USD/JPY Price Analysis: Technical outlook
The pair remains upward biased, but since reaching the 150.16 area on October 3, the USD/JPY has been unable to re-test the 150.00 figure after touching a four-week low of 147.27. For a bullish continuation, the pair must conquer 150.00, followed by the year-to-date (YTD) high of 150.16, before testing last year's high of 151.94. On the flip side, if USD/JPY drops below the October 12 low of 148.95, that could pave the way to test key support levels at the Tenkan-Sen level at 148.71, followed by the Kijun-Sen at 148.03.
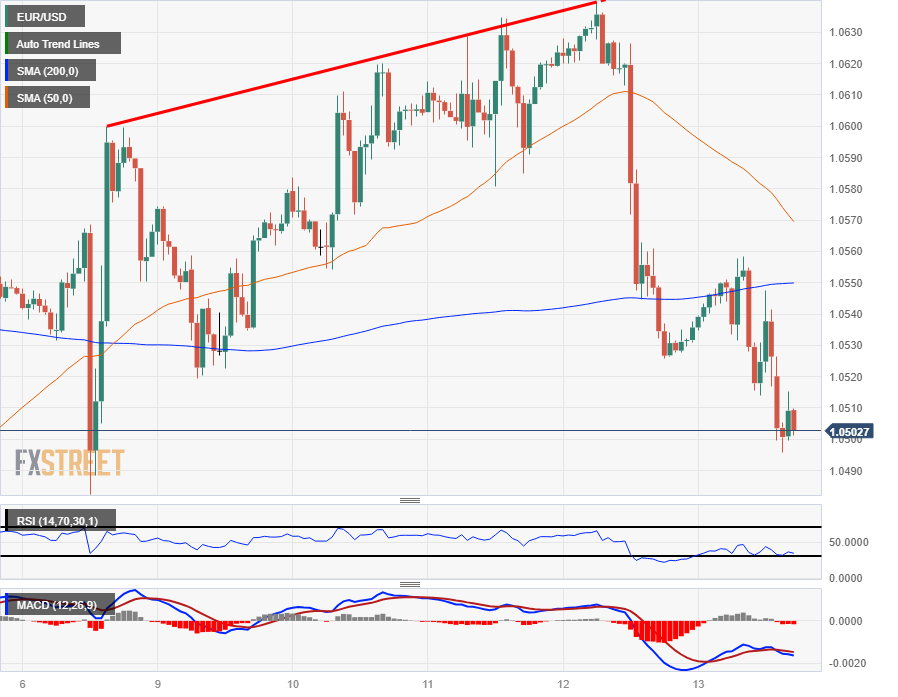
- EUR/USD sees continued selling pressure into the week's end, tapping the 1.0500 major level.
- European Industrial Production figures came in mixed, and the ECB's Lagarde reaffirmed a tight policy stance.
- A miss for US consumer sentiment is capping upside gains for the US Dollar, limiting Euro losses.
The EUR/USD pinged 1.0500 in Friday's downside push, with European production figures spreading to the middle, and the European Central Bank's (ECB) President Christine Lagarde reaffirmed the ECB's tight monetary policy stance until inflation achieves the central bank's 2% target.
Lagarde speech: There is more policy lag in pipeline from past hikes
European Industrial Production came in mixed early Friday; month-over-month Industrial Production for August clocked in at 0.6%, a healthy gain over the forecast 0.1% and a firm bounce against the previous reading of -1.1%, but the annualized figure broadly missed the mark, printing at -5.5% versus the forecast -3.5% and extending the backslide from the last print of -2.2%.
The Euro (EUR) has softened against the US Dollar (USD), but a downside miss for the Michigan Consumer Sentiment Index is limiting downside for the EUR/USD. Consumer sentiment came in at just 63, below the forecast 67.4 and steepening the drop from the previous 68.1.
With the Euro dropping into the 1.05 handle, investors will be turning their eyes to the US Retail Sales data slated to drop next Tuesday at 12:30 GMT.
EUR/USD Technical Outlook
Intraday action has the EUR/USD accelerating away from the 200-hour Simple Moving Average (SMA) after failing to stage a rebound into the 1.0550 region, and the pair is set to close out the trading week within twenty pips of last week's swing low into 1.0482.
On the daily candles, the EUR/USD is getting rejected from a descending trendline, and facing further bearish momentum after failing to capture the 1.0600 handle. The pair remains firmly bearish, with the 50-day SMA declining past 1.0750, and the Euro remains down almost 7% from July's peak of 1.1275.
EUR/USD Hourly Chart
EUR/USD Daily Chart
EUR/USD Technical Levels
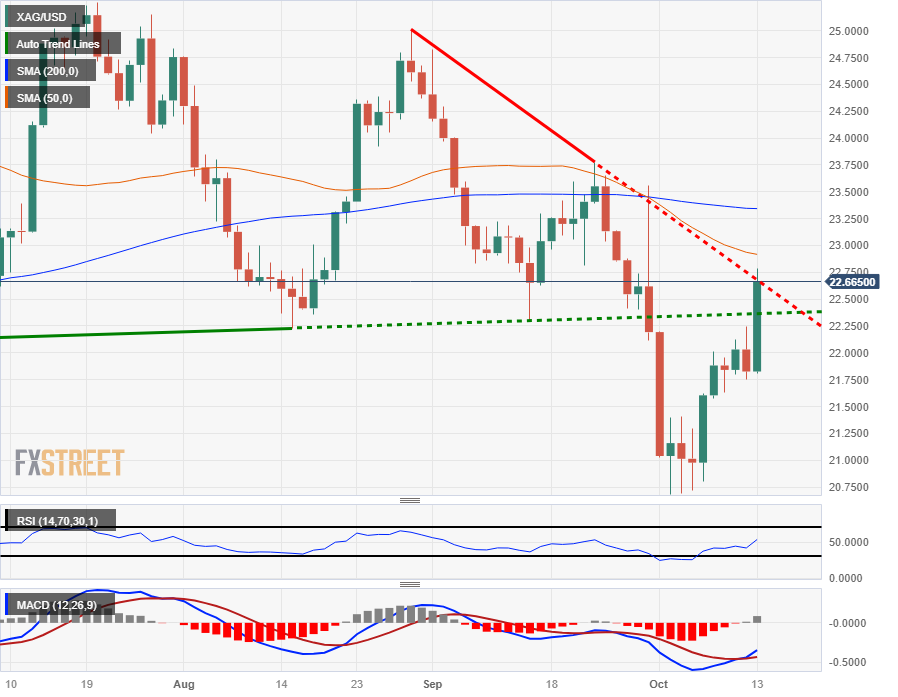
- Silver is seeing recovery after Thursday's minor backstep.
- Spot prices have firmly gained on Friday, up nearly 4% from the day's opening bids.
- A declining trendline on the daily candlesticks poses a near-term threat to additional gains.
XAG/USD bids cleared plenty of chart paper on Friday, with spot Silver gaining nearly 4% for the day and sending Silver prices handily into a new high heading into the close of the trading week.
Despite the gains, XAG/USD remains overall bearish, still down 4.75% from the last swing high, with the year's high bids far above at $26.13.
With the US Dollar (USD) falling back on Friday and investor inflation-fueled fears abating, Silver prices are catching a firm bid.
Further price-bolstering remains the escalation in the Gaza Strip conflict as Israel and Palestinian Hamas trade blows following last week's rocket attacks by Hamas on Israeli targets.
With Middle East geopolitical tensions on the rise, and markets worried about potential spillover into neighboring countries via sanctions from larger, international neighbors, XAG/USD is catching some investor appetite for precious metals.
XAG/USD Technical Outlook
Friday's firm bid for spot Silver prices sends the XAG/USD pinning directly into a descending trendline from late-August's swing high into the $25.00 handle, while the 50-day Simple Moving Average (SMA) sits just overhead current price action near $22.90.
The 200-day SMA is turning mildly bearish into $23.35, and will be capping off technical action moving ahead if Silver bulls aren't able to extend a bull run and capitalize off the near-term floor set at $20.75.
XAG/USD Daily Chart
XAG/USD Technical Levels
- Canadian Dollar flows are resurfacing after Thursday’s nosedive, propped up by a reinvigorated oil bid.
- Canada economic data remains thin until Tuesday’s CPI print.
- US Dollar giving back yesterday’s gains after consumer sentiment miss.
The Canadian Dollar (CAD) is catching a mild recovery on Friday, paring back Thursday’s dip after broad-market risk sentiment soured. Investors dog-piled into the US Dollar (USD) after a US Consumer Price Index (CPI) inflation beat reignited fears of Federal Reserve (Fed) interest rates remaining higher for even longer than markets are currently hoping for.
Canada’s Crude Oil-linked Loonie is getting pushed higher after oil markets catch a firm bid on Friday, and Canadian Dollar traders will be looking to close out Friday’s market session in the green after setting a new low for the week yesterday.
Daily Digest Market Movers: Canadian Dollar in recovery mode as Crude Oil bounces
- Canadian Dollar rebounding on Friday, walking back Thursday’s losses.
- Investor sentiment is recovering after a sharp downturn yesterday.
- Crude Oil markets are back on the rise as Middle east geopolitical tensions take a bite.
- The US tightened loopholes on their sanctions against Russian oil, sending barrel prices higher.
- Crude Oil traders are worried that the Gaza Strip conflict escalation could spill over into more US fossil fuel sanctions on Iran.
- CAD traders will be looking ahead to Tuesday’s CPI reading.
- US Michigan Consumer Sentiment missed the mark on Friday, helping to edge the USD lower.
Technical Analysis: Canadian Dollar looking to regain ground, USD/CAD edging back to 1.3650
After knocking into 1.3700 and marking in a new low for the week, the USD/CAD is easing back into familiar territory, and intraday action sees the pair trading back beneath the 200-hour Simple Moving Average (SMA) with intraday technical support coming from the 50-hour SMA near 1.3640.
On the daily candlesticks, the USD/CAD is poised for a bearish extension back into the 50-day SMA near 1.3550, with long-term support coming from the 200-day SMA just north of 1.3450.
Despite recent strength on the part of the Canadian Dollar, the USD/CAD remains a well-bid pair, still up over 2% from September’s swing low into 1.3380.
Canadian Dollar FAQs
What key factors drive the Canadian Dollar?
The key factors driving the Canadian Dollar (CAD) are the level of interest rates set by the Bank of Canada (BoC), the price of Oil, Canada’s largest export, the health of its economy, inflation and the Trade Balance, which is the difference between the value of Canada’s exports versus its imports. Other factors include market sentiment – whether investors are taking on more risky assets (risk-on) or seeking safe-havens (risk-off) – with risk-on being CAD-positive. As its largest trading partner, the health of the US economy is also a key factor influencing the Canadian Dollar.
How do the decisions of the Bank of Canada impact the Canadian Dollar?
The Bank of Canada (BoC) has a significant influence on the Canadian Dollar by setting the level of interest rates that banks can lend to one another. This influences the level of interest rates for everyone. The main goal of the BoC is to maintain inflation at 1-3% by adjusting interest rates up or down. Relatively higher interest rates tend to be positive for the CAD. The Bank of Canada can also use quantitative easing and tightening to influence credit conditions, with the former CAD-negative and the latter CAD-positive.
How does the price of Oil impact the Canadian Dollar?
The price of Oil is a key factor impacting the value of the Canadian Dollar. Petroleum is Canada’s biggest export, so Oil price tends to have an immediate impact on the CAD value. Generally, if Oil price rises CAD also goes up, as aggregate demand for the currency increases. The opposite is the case if the price of Oil falls. Higher Oil prices also tend to result in a greater likelihood of a positive Trade Balance, which is also supportive of the CAD.
How does inflation data impact the value of the Canadian Dollar?
While inflation had always traditionally been thought of as a negative factor for a currency since it lowers the value of money, the opposite has actually been the case in modern times with the relaxation of cross-border capital controls. Higher inflation tends to lead central banks to put up interest rates which attracts more capital inflows from global investors seeking a lucrative place to keep their money. This increases demand for the local currency, which in Canada’s case is the Canadian Dollar.
How does economic data influence the value of the Canadian Dollar?
Macroeconomic data releases gauge the health of the economy and can have an impact on the Canadian Dollar. Indicators such as GDP, Manufacturing and Services PMIs, employment, and consumer sentiment surveys can all influence the direction of the CAD. A strong economy is good for the Canadian Dollar. Not only does it attract more foreign investment but it may encourage the Bank of Canada to put up interest rates, leading to a stronger currency. If economic data is weak, however, the CAD is likely to fall.
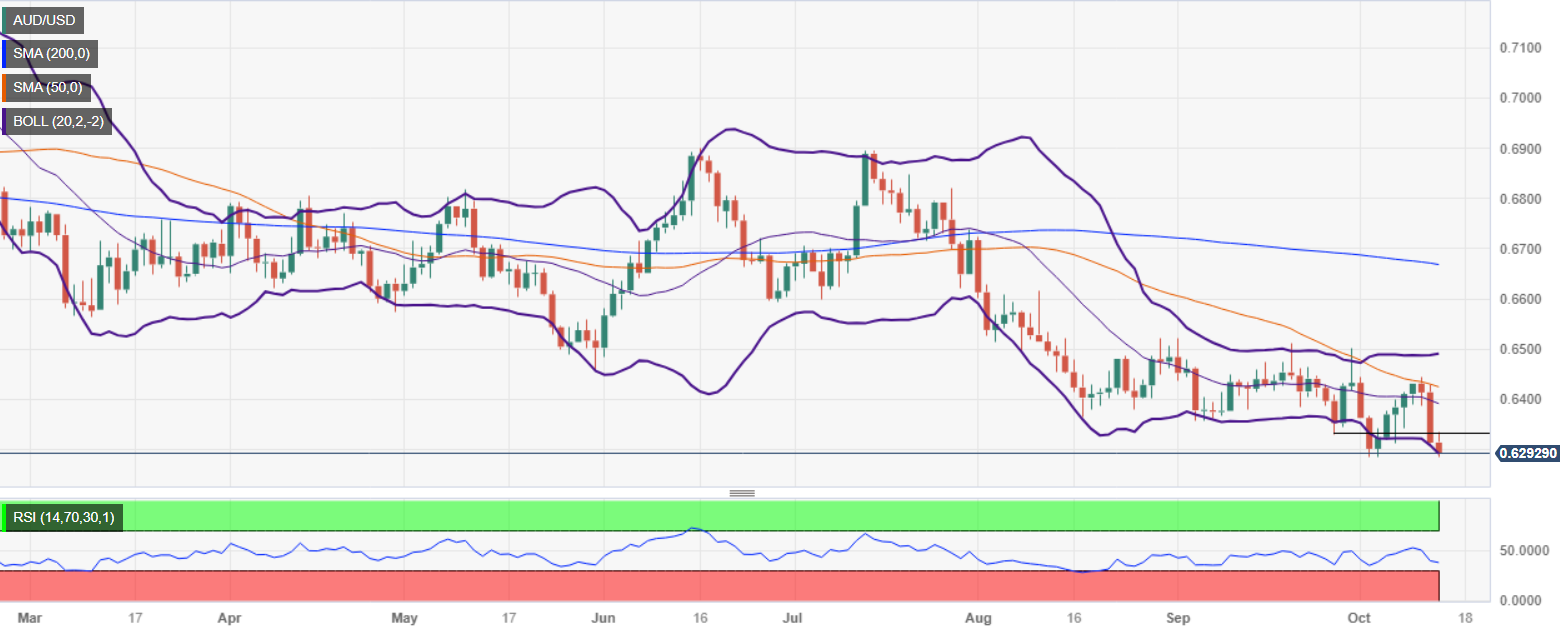
- AUD/USD touches new weekly lows at 0.6289, trading with losses of 0.32%.
- The University of Michigan's Consumer Sentiment in the US deteriorates, with inflation expectations rising.
- China's struggling economy and Middle East geopolitical tensions further dampen AUD sentiment.
The Australian Dollar (AUD) touched new weekly lows of 0.6289 against the US Dollar (USD) courtesy of a risk-off impulse even though negative data from the United States (US) crossed newswires, but so far failed to weigh on the buck. Hence, the AUD/USD is trading at around 0.6290 post losses of 0.32%.
Australian Dollar at the brisk of printing new YTD lows against US Dollar despite negative US data
The latest US inflation report augmented demand for the Greenback (USD) as investors’ expectations for further tightening arose. Nevertheless, those estimates have been tempered by dovish remarks of the Philadelphia Fed President Patrick Harker, commenting, “Fed is likely to be done with rate hikes.”
The US economic calendar recently featured the University of Michigan's Consumer Sentiment, which deteriorated in October to 63 from last month 68.1 and missing estimates of 67.2. Inflation expectations for one year rose from 3.2% to 3.8%, while for five years jumped to 3% from 2.8%.
On the AUD front, its economic docket was absent though the latest China data portrays the economy continues to struggle despite the latest government stimulus aimed at helping the country to achieve its growth target of 5%. In addition, geopolitical tensions in the Middle East would continue to favor flows toward safe-haven assets, to the detriment of risk-perceived currencies, like the Aussie Dollar (AUD).
AUD/USD Price Analysis: Technical outlook
With price action trading at around the bottom of the latest 0.6285/0.6450 range, the AUD/USD remains downward biased after buyers failed to crack the 50-day moving average (DMA) at around 0.6424. That exacerbated the drop to current price levels. A bearish continuation would happen once the pair dives below the year-to-date (YTD) low of 0.6285, opening the door to test last November’s 22 low of 0.6272 and the October 21 low of 0.6210. Conversely, buyers must reclaim 0.6300 to remain hopeful of higher prices.
- Mexican Peso stalled the USD/MXN rally towards 18.00, as the pair clings to losses of 0.02%.
- The University of Michigan consumer sentiment indicates growing pessimism amongst Americans as inflation expectations arise.
- Dovish comments from Fed officials, including Philadelphia Fed President Patrick Harker, suggest a rate hike pause.
Mexican Peso (MXN) halted the US Dollar (USD) advance on Friday after Thursday’s inflation report from the United States (US) spurred an overreaction in the financial markets in concerns the US Federal Reserve (Fed) could hike rates again. However, recent dovish comments by Fed officials capped the US Dollar advance, benefiting the emerging market currency, as the USD/MXN trades at around 17.94, down 0.17%.
Thursday’s US inflation report exceeded estimates, spurring investors to price in a possible rate hike of the US central bank. Nevertheless, dovish commentaries since Monday suggest the Fed is almost done raising rates, a stance gaining more adepts; as Philadelphia Fed President Patrick Harker said recently, the “Fed is likely to be done with rate hikes.” On the data front, the University of Michigan (UoM) consumer sentiment shows Americans turning pessimistic while revising its inflation prospects upward. Mexico’s economic docket is absent, leaving traders adrift to US Dollar dynamics and risk sentiment, deteriorating as Wall Street posts losses.
Daily Digest Market Movers: Mexican Peso recovers some ground, though it remains at risk of further depreciation
- In October, the University of Michigan's Consumer Sentiment came at 63, below estimates of 67.2 and beneath the previous month's 68.1.
- Inflation expectations for one year rose from 3.2% to 3.8%, while for five years jumped to 3% from 2.8%.
- Mexico's Industrial Production (IP) for August improved by 5.2% YoY, exceeding forecasts of 4.6% and July’s 4.8% increase.
- Monthly, IP in Mexico rose 0.3% as expected but trailed the previous 0.5% reading.
- The US Consumer Price Index increased 3.7% YoY in September, unchanged from August but above forecasts of 3.6%.
- US core CPI dipped as expected to 4.1% from 4.3% in August.
- Initial Jobless Claims in the US for the week ending October 7 came at 209K, below forecasts of 210K.
- Mexico’s Consumer Price Index (CPI) grew by 4.45% YoY in September, slightly below the 4.47% estimated.
- The core CPI inflation in Mexico stood at a stickier 5.76% YoY, as widely estimated, but has broken below the 6% threshold.
- The Bank of Mexico (Banxico) held rates at 11.25% in September and revised its inflation projections from 3.5% to 3.87% for 2024, above the central bank’s 3% target (plus or minus 1%).
Technical Analysis: Mexican Peso oscillates below 18.00
The Mexican Peso gains some ground, though it remains at the brisk of further selling pressure, as the USD/MXN exchange rate sits just below the psychological 18.00 barrier, which is attracting bids, as the pair has traded along the 17.90/18.00 area during the last hour. A breach of that area could open the door to test the October 12 high at 18.08, followed by a rally to the 18.20 mark. Once cleared, the pair could aim toward the latest cycle high of 18.48. Conversely, the exotic pair could extend its losses if it stays below 18.00, with sellers targeting the 200-day Simple Moving Average (SMA) at 17.76.
Mexican Peso FAQs
What key factors drive the Mexican Peso?
The Mexican Peso (MXN) is the most traded currency among its Latin American peers. Its value is broadly determined by the performance of the Mexican economy, the country’s central bank’s policy, the amount of foreign investment in the country and even the levels of remittances sent by Mexicans who live abroad, particularly in the United States. Geopolitical trends can also move MXN: for example, the process of nearshoring – or the decision by some firms to relocate manufacturing capacity and supply chains closer to their home countries – is also seen as a catalyst for the Mexican currency as the country is considered a key manufacturing hub in the American continent. Another catalyst for MXN is Oil prices as Mexico is a key exporter of the commodity.
How do decisions of the Banxico impact the Mexican Peso?
The main objective of Mexico’s central bank, also known as Banxico, is to maintain inflation at low and stable levels (at or close to its target of 3%, the midpoint in a tolerance band of between 2% and 4%). To this end, the bank sets an appropriate level of interest rates. When inflation is too high, Banxico will attempt to tame it by raising interest rates, making it more expensive for households and businesses to borrow money, thus cooling demand and the overall economy. Higher interest rates are generally positive for the Mexican Peso (MXN) as they lead to higher yields, making the country a more attractive place for investors. On the contrary, lower interest rates tend to weaken MXN.
How does economic data influence the value of the Mexican Peso?
Macroeconomic data releases are key to assess the state of the economy and can have an impact on the Mexican Peso (MXN) valuation. A strong Mexican economy, based on high economic growth, low unemployment and high confidence is good for MXN. Not only does it attract more foreign investment but it may encourage the Bank of Mexico (Banxico) to increase interest rates, particularly if this strength comes together with elevated inflation. However, if economic data is weak, MXN is likely to depreciate.
How does broader risk sentiment impact the Mexican Peso?
As an emerging-market currency, the Mexican Peso (MXN) tends to strive during risk-on periods, or when investors perceive that broader market risks are low and thus are eager to engage with investments that carry a higher risk. Conversely, MXN tends to weaken at times of market turbulence or economic uncertainty as investors tend to sell higher-risk assets and flee to the more-stable safe havens.
Bank of Canada Governor Tiff Macklem said on Friday that they were concerned because they were not really seeing a downward momentum in inflation, per Reuters.
Key quotes
"Bank of Canada is not expecting a recession in Canada."
"When bank releases economic projections on October 25, we're not going to be forecasting a serious recession."
"When Governing Council next meets, it will focus on whether to stick with its 5% rate or if more action is needed to restore price stability."
"Higher long-term bond yields are not a substitute for doing what needs to be done to get inflation back down to our target."
"We are seeing clear signs monetary policy is working to rebalance supply and demand but inflation is still too high."
"We will continue to face geopolitical shocks; in this environment, we need to be prepared for ongoing volatility."
"This is adding uncertainty; monetary policy can influence demand to relieve inflationary pressures, but supply is harder to predict."
"Strength of Canadian economy means people are getting wage increases that will help make it easier to digest impact of higher mortgage rates after renewal."
"Longer run inflation expectations remain well anchored; shorter run expectations have come down but they are still too high."
Market reaction
USD/CAD edged lower following these comments and was last seen losing 0.25% on the day at 1.3655.
- UoM Consumer Confidence Index declined further in September.
- US Dollar Index clings to modest daily gains above 106.50.
Consumer sentiment in the US continued to weaken in October, with the University of Michigan's (UoM) Consumer Confidence Index declining to 63 from 68.1 in September. This reading fell short of the market expectation of 67.4.
Further details of the publication revealed that the Current Conditions Index fell to 66.7 from 71.4 and the Expectations Index retreated to 60.7 from 66.9.
The one-year inflation outlook jumped to 3.8 from 3.2, while the 5-year inflation outlook rose to 3% from 2.8%.
Market reaction
The US Dollar Index edged slightly higher after this report and was last seen posting small daily gains at 106.62.
- USD/CAD trades back and forth around 1.3700 as oil price rallies due to Middle East conflicts.
- The appeal for the US Dollar improves due to the resilient US economy.
- Investors hope that the Fed is done with hiking interest rates as US core inflation softened as expected.
The USD/CAD pair turns choppy after a sharp rally to near the round-level resistance of 1.3700 in the early New York session. The upside in the Loonie asset seems restricted as the oil price soars due to deepening Israel-Hamas tensions while the downside is well-supported due to a solid recovery in the US Dollar.
The S&P500 opens on a bullish note as investors hope that the Federal Reserve (Fed) is done with hiking interest rates. The appeal for US equities improves while risk-perceived currencies are facing the wrath of deepening slowdown fears.
The US Dollar Index (DXY) is gathering strength to deliver a decisive break above the immediate resistance of 106.60 despite investors hoping that the Fed is done with hiking interest rates. The US economy is performing well on the grounds of the labor market, consumer spending, and service sector while other G7 economies are struggling to cope with higher interest rates from central bankers.
Oil price rallies to near $86.00 on fears that intervention of more Middle-East nations in the Israel-Hamas conflicts would tighten the already tight oil market. It is worth noting that Canada is the leading exporter of oil to the United States and higher oil prices strengthen the Canadian Dollar.
Going forward, the Canadian Dollar will be impacted by the inflation data for September, which will be published next week. A hotter inflation report would elevate hopes of one more interest rate increase from the Bank of Canada (BoC).
European Central Bank (ECB) President Christine Lagarde noted on Friday that there is more policy lag in the pipeline from the past interest rate hikes, per Reuters.
"Our aim, our mission is to return inflation to 2% in the medium term, and we will, and it is happening as we speak," Lagarde told a panel at the International Monetary Fund's annual meeting.
She reiterated that they will keep the policy tight for as long as needed.
Market reaction
EUR/USD stays in daily range following these comments and was last seen trading flat at 1.0524.
“Absent a stark turn in what I see in the data and hear from contacts, I believe that we are at the point where we can hold rates where they are," Federal Reserve Bank of Philadelphia President Patrick Harker said on Friday, per Reuters.
Key quotes
"Supporting higher for longer interest rate stance."
"Can’t say for how long rates will need to remain high."
"Seeing steadily disinflation, falling to below 3% this year."
"Growth to moderate next year but not expecting a recession."
"Tighter credit conditions akin to rate hikes in impact."
"It will take time for Fed rate hikes to be fully felt."
"Labor markets coming into better balance, not expecting mass layoffs."
"Auto strikes, renewed student loans will weigh on economy."
"Expecting unemployment rate to rise to about 4%."
Market reaction
The US Dollar Index showed no reaction to these comments and was last flat on the day at 106.55.
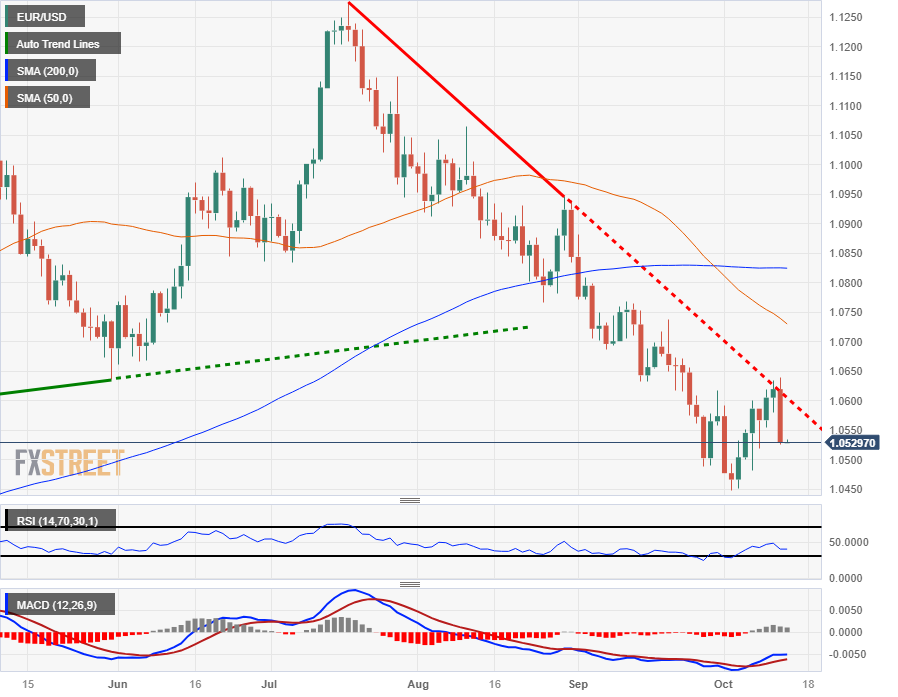
- EUR/USD falls back from 20-DEMA as the risk-aversion theme strengthens.
- The US Dollar appeal improves due to some increment in the odds of one more interest rate increase from the Fed.
- The ECB is expected to maintain interest rates steady at 4.5% to avoid a slowdown.
The EUR/USD pair retreats after a short-lived pullback move to near the 1.0550 in the European session. The major currency pair faced an intense sell-off as the appeal for the US Dollar improved amid deepening Middle East tensions and some increment in expectations of one more interest rate increase from the Federal Reserve (Fed) by the year-end.
The US Dollar Index (DXY) recovered strongly to near 106.60 and is expected to extend further as the United States is resilient unlike other economies, which are struggling to absorb the consequences of higher interest rates by the central bankers.
Meanwhile, the European Central Bank (ECB) is expected to keep interest rates unchanged in November as the Eurozone economy is facing the issues of poor economic prospects. To safeguard the shared continent from a slowdown, the ECB is expected to maintain interest rates steady at 4.5%.
EUR/USD drops vertically after a less-confident pullback to near the 20-day Exponential Moving Average (EMA) to near 1.0600. The shared currency pair trades near the horizontal support of the Broadening Triangle chart pattern, which is plotted from November 14 high at 1.0482. The upward-sloping trendline of the aforementioned chart pattern is placed from February 2 high at 1.1033.
The Relative Strength Index (RSI) (14) struggles to climb into the 40.00-60.00. A failure in the same would indicate that the downside momentum has been firmer.
A fresh downside would be seen if the asset drops below October 3 low at 1.0448. This would expose the asset to a fresh 10-month low around 1.0400. A slippage below the latter would make way for 11 November 2022 high at 1.3642.
On the flip side, a recovery move above October 12 high at 1.0640 would drive the asset toward September 6 low around 1.0700, followed by September 20 high at 1.0737.
EUR/USD daily chart
-638327979603469465.png)
Alfred Kammer, Director of the European Department at the International Monetary Fund (IMF), said on Friday that they recommend central banks in Europe to maintain restrictive monetary policy for as long as necessary, per Reuters.
Kammer added that they think the European Central Bank and the Bank of England are in the 'right spot' on rates but noted that flexibility is needed given the uncertainty.
"Central banks need to be ready for negative surprises on inflation; they should sit tight if positive inflation surprises come, avoid premature easing," he said.
Market reaction
These comments failed to trigger a noticeable market reaction and the EUR/USD pair was last seen trading flat on the day at 1.0525.
- The Greenback recovers all losses from earlier this week.
- With only second-tier data at hand, a weekly positive close looks inevitable.
- The US Dollar Index looks back on track toward heading to 107.
The US Dollar (USD) has been showcasing its resilience on Thursday after one component of the monthly headline inflation gauge ticked up against all odds. Inflation fears got reignited again, triggering a bond sell-off. US yields soared, fueling the Greenback rally against most major peers. Where the US Dollar Index is trading at the moment, it looks like this week’s weakness was just a small decoupling, and more US Dollar strength is to be factored in.
On the data front this Friday, there is not much that could turn this ship around. No Federal Reserve speakers are scheduled. With the Import/Export Price Index and the University of Michigan (ISM) Sentiment Index, no real market moving catalysts are present.
Daily digest: US Dollar jumps around
- At 12:30 GMT, the Import-Export Price Index for September will be released: Export Prices on a monthly basis are expected to head from 1.3% to 0.5%. The yearly component was at -5.5% and is expected to head to -4.0%. The Import Prices on a monthly basis are set to stay steady at 0.5%. The Yearly component is expected to head from -3% to -1.4%.
- At 14:00 GMT the University of Michigan (ISM) will release its Sentiment Index and Consumer inflation expectations. The Sentiment Index is expected to head from 68.1 to 67.4. The Inflation expectation is expected to remain steady near 2.8%.
- Equities are not dealing well with the current shift in sentiment and are sliding lower: The Hang Seng is the biggest loser, down over 2%. European equities are retreating as well, though less than 1%. US equity futures are flat and clueless concerning direction for now.
- The CME Group FedWatch Tool shows that markets are pricing in a 90.2% chance that the Federal Reserve will keep interest rates unchanged at its meeting in November.
- The benchmark 10-year US Treasury yield soared to 4.66%, even briefly testing 4.69%. The surprise uptick in headline inflation reshuffled the bond market into higher rates again.
US Dollar Index technical analysis: Flirting with another weekly gain
The US Dollar is playing tricks on investors and traders. After the US Dollar Index (DXY) briefly snapped its weekly winning streak, it snapped as well a very important technical ascending trendline that was supporting price action since July. After the surprise uptick in headline monthly inflation, it looks like the yield story is back in play and the US Dollar Index is set to restart its winning streak after a small hiatus.
The DXY opened above 106 and should at least be able to make a new high for this week, above 106.60. On the topside, 107.19 is important to reach if the DXY can get a daily close above that level. If this is the case, 109.30 is the next level to watch.
On the downside, the recent resistance at 105.88 did not do a good job supporting any downturn. Instead, look for 105.12 to keep the DXY above 105.00. If that does not do the trick, 104.33 will be the best level to look for some resurgence in US Dollar strength with the 55-day Simple Moving Average (SMA) as a support level.
US Dollar FAQs
What is the US Dollar?
The US Dollar (USD) is the official currency of the United States of America, and the ‘de facto’ currency of a significant number of other countries where it is found in circulation alongside local notes. It is the most heavily traded currency in the world, accounting for over 88% of all global foreign exchange turnover, or an average of $6.6 trillion in transactions per day, according to data from 2022.
Following the second world war, the USD took over from the British Pound as the world’s reserve currency. For most of its history, the US Dollar was backed by Gold, until the Bretton Woods Agreement in 1971 when the Gold Standard went away.
How do the decisions of the Federal Reserve impact the US Dollar?
The most important single factor impacting on the value of the US Dollar is monetary policy, which is shaped by the Federal Reserve (Fed). The Fed has two mandates: to achieve price stability (control inflation) and foster full employment. Its primary tool to achieve these two goals is by adjusting interest rates.
When prices are rising too quickly and inflation is above the Fed’s 2% target, the Fed will raise rates, which helps the USD value. When inflation falls below 2% or the Unemployment Rate is too high, the Fed may lower interest rates, which weighs on the Greenback.
What is Quantitative Easing and how does it influence the US Dollar?
In extreme situations, the Federal Reserve can also print more Dollars and enact quantitative easing (QE). QE is the process by which the Fed substantially increases the flow of credit in a stuck financial system.
It is a non-standard policy measure used when credit has dried up because banks will not lend to each other (out of the fear of counterparty default). It is a last resort when simply lowering interest rates is unlikely to achieve the necessary result. It was the Fed’s weapon of choice to combat the credit crunch that occurred during the Great Financial Crisis in 2008. It involves the Fed printing more Dollars and using them to buy US government bonds predominantly from financial institutions. QE usually leads to a weaker US Dollar.
What is Quantitative Tightening and how does it influence the US Dollar?
Quantitative tightening (QT) is the reverse process whereby the Federal Reserve stops buying bonds from financial institutions and does not reinvest the principal from the bonds it holds maturing in new purchases. It is usually positive for the US Dollar.
- Oil (WTI) trades broadly steady at $83 after a surprise buildup in US Oil stockpiles.
- The US Dollar rallied Thursday on the back of an unexpected pickup on food and energy inflation.
- Oil is expected to extend losses as demand is expected to weaken further.
Oil prices are not having a good week, registering a sell-off on the back of nearly no spillover from the Israel-Gaza conflict so far. Adding to that, the rise of US oil production together with a massive surprise buildup of Crude stockpile signalled increased supply, putting further pressure to Oil prices. . Risks of a mild first few weeks of fall season, with global stagflation fears where demand for Oil would drop even further, are not painting a rosy picture for Crude in the coming weeks.
On Thursday, the US imposed sanctions on owners of tankers carrying Oil from Russia, in a sign that the country is enforcing the sanctions plan approved against Russia after it invaded Ukraine, Reuters reports. Increased scrutiny over Russian Oil could hurt supply as the country is the world’s second-largest Oil producer. This also means the stakes are becoming high for the upcoming visit of Russian President Vladimir Putin to China. Putin is expected to meet Chinese President Xi Jinping on the sidelines of the Belt and Road Forum, which will be held in Beijing on October 17 and 18. In the context of increased US sanctions, Putin will likely push to secure a deal for Gas and Oil deliveries to the Asian bloc.
Meanwhile, the US Dollar (USD) showcased its resilience on Thursday after one component of the monthly headline inflation gauge ticked up against all odds. Inflation fears got reignited again, triggering a bond sell-off. US yields soared, fueling the Greenback rally against most major peers. It looks like this week’s weakness for the US Dollar was just a small decoupling, and more strength is to be factored in.
Crude Oil (WTI) trades at $83.29 per barrel, and Brent Oil trades at $86.62 per barrel at the time of writing.
Oil news and market movers
- China Crude imports are slowing down. In September, nearly 45.74 million tons were shipped, which is about 11.18 million barrels per day and 10% lower than August’s numbers.
- Crude prices for November for Asian clients have dropped by about $2 per barrel from their 2023 peak in September. The price drop came after Saudi Arabia confirmed its support to keep prices stable, which traders saw as a reassurance output would be boosted again when needed.
- The total US oil production has set a new 5-year high record, making the country less dependent on foreign inflow.
- The Energy Information Administration (EIA) printed the latest Crude stockpile numbers, with a big beat on expectations: Crude stocks increased by 10.176 million barrels, way above the 0.492 million rise expected.
Oil Technical Analysis: demand is not there
Oil prices are sinking lowersince prices peaked near $94. With Oil trading near $83.50, it nearly looks likely for it to head below $80. Fundamentals for Oil look weak taking into account slowing demand from Asia, US Oil production at a multi-year high and risks of global stagflation. Either OPEC+ will need to add more supply cuts or a pickup in activity across the globe is needed to warrant steady oil prices near $85.
On the upside, the support level near $88 is the first level in the bulls’ radar. From there, the next level will be this year’s high at $94. Should a substantial squeeze unfold with higher prices, look for $97.11, the high of August 2022.
On the downside, traders are bracing for the entry of that region near $78. The area should see ample support for buying. Any further drops below this level might see a firm nosedive move, which would cause Oil prices to sink below $70.
-638327850589295163.png)
US Crude (Daily Chart)
WTI Oil FAQs
What is WTI Oil?
WTI Oil is a type of Crude Oil sold on international markets. The WTI stands for West Texas Intermediate, one of three major types including Brent and Dubai Crude. WTI is also referred to as “light” and “sweet” because of its relatively low gravity and sulfur content respectively. It is considered a high quality Oil that is easily refined. It is sourced in the United States and distributed via the Cushing hub, which is considered “The Pipeline Crossroads of the World”. It is a benchmark for the Oil market and WTI price is frequently quoted in the media.
What factors drive the price of WTI Oil?
Like all assets, supply and demand are the key drivers of WTI Oil price. As such, global growth can be a driver of increased demand and vice versa for weak global growth. Political instability, wars, and sanctions can disrupt supply and impact prices. The decisions of OPEC, a group of major Oil-producing countries, is another key driver of price. The value of the US Dollar influences the price of WTI Crude Oil, since Oil is predominantly traded in US Dollars, thus a weaker US Dollar can make Oil more affordable and vice versa.
How does inventory data impact the price of WTI Oil
The weekly Oil inventory reports published by the American Petroleum Institute (API) and the Energy Information Agency (EIA) impact the price of WTI Oil. Changes in inventories reflect fluctuating supply and demand. If the data shows a drop in inventories it can indicate increased demand, pushing up Oil price. Higher inventories can reflect increased supply, pushing down prices. API’s report is published every Tuesday and EIA’s the day after. Their results are usually similar, falling within 1% of each other 75% of the time. The EIA data is considered more reliable, since it is a government agency.
How does OPEC influence the price of WTI Oil?
OPEC (Organization of the Petroleum Exporting Countries) is a group of 13 Oil-producing nations who collectively decide production quotas for member countries at twice-yearly meetings. Their decisions often impact WTI Oil prices. When OPEC decides to lower quotas, it can tighten supply, pushing up Oil prices. When OPEC increases production, it has the opposite effect. OPEC+ refers to an expanded group that includes ten extra non-OPEC members, the most notable of which is Russia.
- NZD/USD weakened further after China’s inflation remained stagnant in September.
- A minority of investors hope that the Fed will end up with an additional interest rate hike by the year-end.
- NZD/USD delivers a vertical sell-off after failing to break above the horizontal resistance plotted at 0.6050.
The NZD/USD pair continued its bearish spell for the third trading session as fears of a slowdown in China rose after a poor inflation report. The Kiwi asset has dropped to near 0.5900 as the appeal for the US Dollar improved after a stubborn United States inflation report and persistent deflation risks in China.
On early Friday, the National Bureau of Statistics of China reported that inflation remained stagnant in September while investors forecasted acceleration to 0.2% from the former reading of 0.1%. The monthly inflation data expanded at a slower pace of 0.2% from the consensus and August reading of 0.3%. Being, a proxy for China’s economic prospects, the New Zealand Dollar weakened due to poor demand in China’s domestic market.
The US Dollar Index (DXY) resumes upside after a corrective move to near 106.30 as a minority of investors hope that the Federal Reserve (Fed) would end up with an additional interest rate hike, pushing interest rates to 5.50-5.75 % by the year-end.
NZD/USD delivers a vertical sell-off after failing to break above the horizontal resistance plotted from September 29 high at 0.6050. The structure indicates a Double Top formation, which could be triggered after a breakdown below the crucial support of 0.5880.
The Kiwi asset trades below the 200-period Exponential Moving Average (EMA) at 0.5965, which indicates that the long-term trend is bearish.
A breakdown of the Relative Strength Index (RSI) (14) into the bearish range of 20.00-40.00 indicates that the bearish impulse has been triggered.
A breakdown below September 7 low at 0.5847 would drag the major toward the round-level support at 0.5800. A slippage below the latter would expose the asset to November 4 low at 0.5756.
On the flip side, a decisive break above September 29 high around 0.6050 would drive the major toward August 09 high at 0.6096. Breach of the latter would send the major toward July 31 high at 0.6226
NZD/USD four-hour chart
-638327899057758188.png)
- Gold price revives strongly as investors see November monetary policy remaining unchanged.
- The US Dollar and bond yields capitalize on hot headline inflation data.
- Fed’s Collins says that persistent rise in US yields could diminish the need for further policy-tightening.
Gold price (XAU/USD) has revived after a knee-jerk move on Thursday, a result of the United States Consumer Price Index (CPI) report for September showing headline inflation above expectations. The precious metal recovered quickly as traders’ bets for an unchanged interest rate decision by the Federal Reserve (Fed) at its November monetary policy meeting became even more pronounced. This was due to the CPI’s core inflation reading softening in line with expectations. Headline inflation turned out hotter than consensus as higher global oil prices added to the price index.
The US Dollar and bond yields also recovered as persistent inflation data lifted the odds of one additional interest rate hike by the Fed in the remainder of 2023. The appeal for the US Dollar improves as global slowdown fears have risen due to deepening Middle East tensions. Meanwhile, investors shift focus to Fed Chair Jerome Powell’s speech, scheduled for next week, which will provide cues about the likely monetary policy action taken at the November 1 meeting.
Daily Digest Market Movers: Gold price rebounds strongly despite recovery in US Dollar
- Gold price recovers swiftly after a knee-jerk reaction triggered by the release of the US CPI data for September, released on Thursday.
- September’s inflation report conveyed that headline inflation rose at a higher pace of 0.4% against expectations of 0.3% due to rising prices of gasoline and food products. The annual headline CPI data grew at a steady pace of 3.7% but remained higher than expectations of 3.6%.
- The monthly and annual core inflation that excludes volatile oil and food prices rose by 0.3% and 4.1%, respectively, as expected.
- The steadily sinking core inflation data was followed by a solid recovery in the US Dollar Index (DXY) as it rose to 106.60 from its 15-day low of 105.35.
- The appeal for the US Dollar has improved significantly as scrutiny of the economic data for September released so far conveys that the US economy is resilient. The labor market conditions remained upbeat, factory activities improved, and the Services PMI remained above the 50.0 threshold.
- Fears of a global slowdown remain persistent as China’s inflation turned out stagnant in September, while investors forecasted growth of 0.2%. The Chinese economy is struggling to recover due to poor demand amid a rising jobless rate.
- The 10-year US Treasury yields revived strongly to near 4.65% as investors expected that inflationary pressures above the desired rate of 2% would be the hard nut to crack for Federal Reserve (Fed) policymakers.
- A persistent US inflation report has lifted bets for one more interest rate increase from the Fed in the remainder of 2023.
- As per the CME FedWatch Tool, traders see a 90% chance of the Fed keeping interest rates unchanged at 5.25 to 5.50%. The odds of one more interest rate increase in any of the two remaining monetary policy meetings in 2023 has increased to above 30% however.
- A minority of investors expect that the Fed will end up hiking interest rates later this year by an additional 25 basis points (bps) to 5.50 to 5.75% to ensure the achievement of price stability in a timely manner.
- Boston Fed Bank President Susan Collins confirmed on Thursday that one additional interest rate hike is not off the table but warned that if US bond yields remain higher the appeal for further policy tightening would diminish.
- Fed Governor Christopher J. Waller supports a “wait and watch” approach as 10-year US Treasury yields have risen sharply in recent weeks. Market watchers hope that higher yields are sufficient to reduce overall spending and investment and thus control inflation.
- On Thursday, the US Department of Labor reported that Weekly Jobless Claims remained almost unchanged last week. Individuals claiming jobless benefits for the week ending October 6 remained steady at 209K, a little lower than expectations of 210K.
- Going forward, investors shift focus to the speech from Fed Chair Jerome Powell, which is scheduled for Oct 19 before the Economic Club of New York. Investors would watch for November’s monetary policy framework and the outlook on inflation and the economy.
Technical Analysis: Gold price recaptures two-week high
Gold price recaptured the two-week high at $1,885.00 as the odds for an unchanged interest rate decision by the Fed at November’s monetary policy meeting remained unflinchingly high despite the CPI’s hint of continuing inflationary pressure. The precious metal seems to be stabilizing above the 20-day Exponential Moving Average (EMA), which trades around $1,873.00. The yellow metal is further approaching the 50-day EMA. Momentum oscillators recovered from the oversold zone on Friday.
Fed FAQs
What does the Federal Reserve do, how does it impact the US Dollar?
Monetary policy in the US is shaped by the Federal Reserve (Fed). The Fed has two mandates: to achieve price stability and foster full employment. Its primary tool to achieve these goals is by adjusting interest rates.
When prices are rising too quickly and inflation is above the Fed’s 2% target, it raises interest rates, increasing borrowing costs throughout the economy. This results in a stronger US Dollar (USD) as it makes the US a more attractive place for international investors to park their money.
When inflation falls below 2% or the Unemployment Rate is too high, the Fed may lower interest rates to encourage borrowing, which weighs on the Greenback.
How often does the Fed hold monetary policy meetings?
The Federal Reserve (Fed) holds eight policy meetings a year, where the Federal Open Market Committee (FOMC) assesses economic conditions and makes monetary policy decisions.
The FOMC is attended by twelve Fed officials – the seven members of the Board of Governors, the president of the Federal Reserve Bank of New York, and four of the remaining eleven regional Reserve Bank presidents, who serve one-year terms on a rotating basis.
What is Quantitative Easing (QE) and how does it impact USD?
In extreme situations, the Federal Reserve may resort to a policy named Quantitative Easing (QE). QE is the process by which the Fed substantially increases the flow of credit in a stuck financial system.
It is a non-standard policy measure used during crises or when inflation is extremely low. It was the Fed’s weapon of choice during the Great Financial Crisis in 2008. It involves the Fed printing more Dollars and using them to buy high grade bonds from financial institutions. QE usually weakens the US Dollar.
What is Quantitative Tightening (QT) and how does it impact the US Dollar?
Quantitative tightening (QT) is the reverse process of QE, whereby the Federal Reserve stops buying bonds from financial institutions and does not reinvest the principal from the bonds it holds maturing, to purchase new bonds. It is usually positive for the value of the US Dollar.
- EUR/GBP turns choppy after a recovery to near 0.8650 as risks of UK slowdown deepen.
- UK firms have postponed their plans of increasing their capacity due to higher mortgage rates.
- Eurozone monthly Industrial Production expanded at a higher pace of 0.6% in August.
The EUR/GBP pair trades back-and-forth after a strong recovery to near 0.8650 in the European session. The cross discovered buyers’ interest after the United Kingdom’s Office for National Statistics (ONS) reported that the factory data contracted for the second time in August.
UK’s Manufacturing and Industrial Production dropped by 0.7% and 0.8% on a monthly basis. UK firms have slowed down their manufacturing activities as higher interest rates, supply chain disruptions, strong inflation have dampened the overall demand environment. Also, firms have postponed their plans of increasing their operating capacity due to higher mortgage rates.
While the monthly Gross Domestic Product (GDP) expanded by 0.2% in August as expected, risks of a slowdown in the UK economy remain persistent as deepening Middle East tensions could disrupt the global supply chain and rising oil prices would accelerate inflationary pressures. This would discomfort Bank of England (BoE) policymakers, which are struggling to bring down inflation.
Meanwhile, BoE Governor Andrew Bailey reiterated on Tuesday that policy will remain sufficiently restrictive. The central bank is observing progress in inflation but there is still work left to do.
On the Eurozone front, monthly Industrial Production expanded at a higher pace of 0.6% in August against expectations of 0.1%. In July, the economic data contracted by 1.1%. The annual Industrial Production data contracted by 5.1%. About the inflation outlook, European Central Bank (ECB) policymaker and Bundesbank Chief Joachim Nagel said that inflation is seen declining to 2.5% by 2025.
- USD/JPY snaps the recent winning streak ahead of US data.
- A slew of solid US data could underpin the US Dollar.
- S&P Global anticipates that Japan could see upward interest rates trajectory, beginning in 2024.
USD/JPY trades lower around 149.70 during the European session on Friday, snapping a three-day winning streak that began on Tuesday. Despite reaching weekly highs, the USD/JPY pair has experienced a pullback, attributed to the retreat in the US Dollar (USD).
The US Dollar Index (DXY) trades lower around 106.30 by the press time, retreating from the weekly highs. The US Dollar (USD) weakens due to the downbeat US Treasury yields, with the 10-year US bond yield standing at 4.64%, down by 1.23% at the time of writing.
The economic landscape in the United States has been dynamic, which could limit the losses of the US Dollar (USD). The Consumer Price Index (CPI) exceeded expectations in September, with an annual expansion of 3.7%, slightly surpassing the estimated 3.6%.
Additionally, the modest increase in Initial Jobless Claims for the week ending on October 6, slightly below the forecasted 210K at 209K, suggests a nuanced trend indicating a mild easing.
This positive US economic data has reignited a hawkish sentiment regarding the Federal Reserve's (Fed) interest rate trajectory, which could support underpinning the USD/JPY pair. The upbeat indicators have introduced complexity to the ongoing narrative, leading to speculation about the Fed's potential response.
Investors are anticipated to closely monitor the release of the US Michigan Consumer Sentiment Index on Friday. This index serves as a crucial gauge of consumer confidence, providing insights into the broader economic sentiment. The ongoing analysis of these indicators is likely to influence trading decisions in the USD/JPY pair.
The Japanese Yen (JPY) experienced weakness due to the Bank of Japan's (BoJ) continuous adherence to an ultra-easy monetary policy. BoJ board member Asahi Noguchi has drawn attention on Thursday by expressing a lack of optimism about the acceleration in wage growth.
Noguchi attributes inflation to import price hikes, including currency factors, and emphasizes that there is still a considerable distance to achieving the 2% inflation target. These insights from a BoJ official contribute to the ongoing narrative surrounding the Japanese Yen and the central bank's monetary policy stance.
According to S&P Global's assessment of the Japanese economy and monetary policy, the rating agency anticipates that policy interest rates in Japan could experience an upward trajectory, beginning in 2024.
Industrial Production s.a. (MoM) in the European Monetary Union advanced 0.6% in August, exceeding the 0.1% rise expected by markets. In July, European Monetary Union Industrial Production s.a. (MoM) had decreased 1.1%.
What is the European Monetary Union Industrial Production s.a. (MoM)?
The Industrial Production is released by the Eurostat. It shows the volume of production of Industries such as factories and manufacturing. Up trend is regarded as inflationary which may anticipate interest rates to rise. Usually, if high industrial production growth comes out, this may generate a positive sentiment (or bullish) for the EUR, while low industrial production is seen as a negative sentiment (or bearish).
When is the next European Monetary Union Industrial Production s.a. (MoM) report released?
The next European Monetary Union Industrial Production s.a. (MoM) data will be published on November 15 at 10:00 GMT. For more information, check the European Monetary Union Industrial Production s.a. (MoM) entry in FXStreet Calendar.
Euro price today
The table below shows the percentage change of Euro (EUR) against listed major currencies today. Euro was the strongest against the New Zealand Dollar.
| USD | EUR | GBP | CAD | AUD | JPY | NZD | CHF | |
| USD | -0.15% | -0.24% | -0.09% | -0.05% | -0.05% | 0.14% | -0.13% | |
| EUR | 0.18% | -0.07% | 0.09% | 0.15% | 0.13% | 0.33% | 0.05% | |
| GBP | 0.24% | 0.10% | 0.16% | 0.20% | 0.21% | 0.40% | 0.12% | |
| CAD | 0.10% | -0.04% | -0.13% | 0.07% | 0.05% | 0.25% | -0.02% | |
| AUD | 0.05% | -0.12% | -0.21% | -0.06% | -0.02% | 0.18% | -0.09% | |
| JPY | 0.04% | -0.13% | -0.21% | -0.05% | 0.01% | 0.19% | -0.07% | |
| NZD | -0.16% | -0.30% | -0.40% | -0.25% | -0.19% | -0.19% | -0.26% | |
| CHF | 0.11% | -0.05% | -0.14% | 0.02% | 0.07% | 0.06% | 0.27% |
The heat map shows percentage changes of major currencies against each other. The base currency is picked from the left column, while the quote currency is picked from the top row. For example, if you pick the Euro from the left column and move along the horizontal line to the Japanese Yen, the percentage change displayed in the box will represent EUR (base)/JPY (quote).
- Silver regains positive traction on Friday and climbs back closer to a near two-week high.
- Neutral oscillators on the daily chart warrant some caution for aggressive bullish traders.
- Any meaningful corrective slide is likely to attract fresh buyers near the $21.60-55 region.
Silver builds on its intraday gains through the first half of the European session on Friday and jumps back closer to a nearly two-week high touched the previous day, though remains below the $22.30 strong horizontal support breakpoint.
Neutral technical indicators on the daily chart, meanwhile, make it prudent to wait for some follow-through buying beyond the aforementioned support-turned-resistance before positioning for any further appreciating move. The XAG/USD might then accelerate the momentum towards reclaiming the $23.00 mark before aiming to challenge the very important 200-day Simple Moving Average (SMA), currently pegged around the $23.35 area.
The latter should act as a key pivotal point for short-term traders, which if cleared decisively will set the stage for an extension of the recent recovery move from the $20.70-$20.65 region, or a multi-month low touched last week. The subsequent move up has the potential to lift the XAG/USD towards the next relevant hurdle near the $23.75-$23.80 region (September 22 high) en route to the $24.00 round figure and the $24.30-$24.35 resistance zone.
On the flip side, the $21.75 horizontal support might continue to protect the immediate downside ahead of the $21.60-$21.55 zone
or the weekly low. Some follow-through selling could drag the XAG/USD back towards a multi-day-old trading range resistance breakpoint, turned support, around the $21.3-$21.30 region en route to the $21.00 mark. The downward trajectory could get extended towards the $20.70-$20.65 region, or a seven-month low.
Silver daily chart
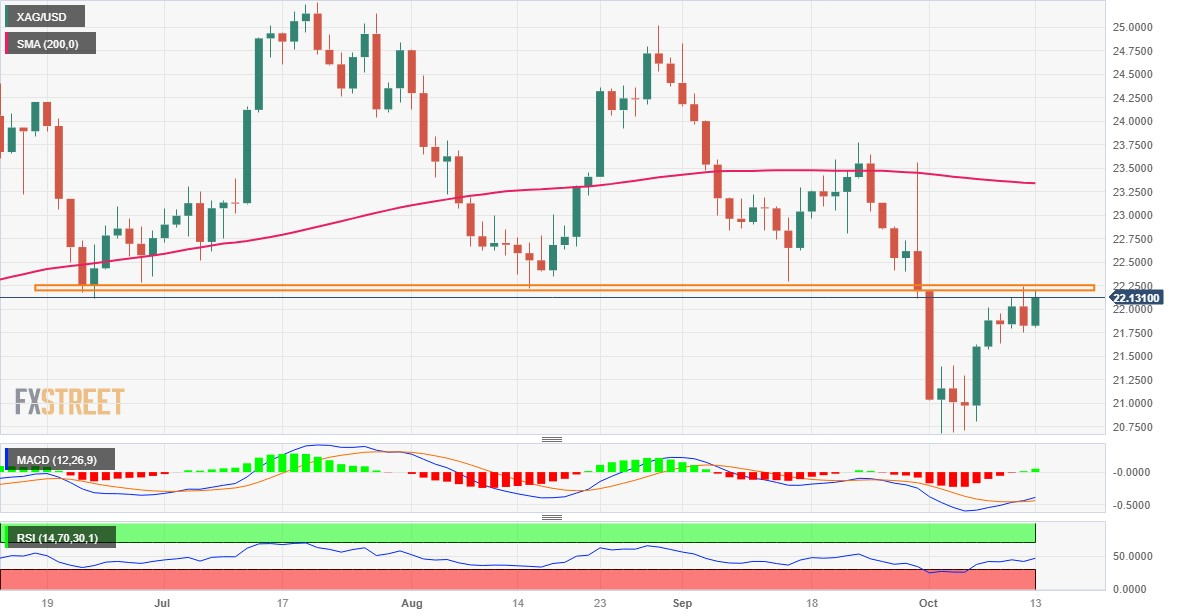
Technical levels to watch
People’s Bank of China (PBOC) official, Zou Lan, said at a press conference on Friday, they “still have ample room to support the economy.”
Further comments
Closely watching the effectiveness of policy steps.
Recent interest rate cuts for the property sector have achieved significant results.
Will implement monetary policy in a precise and forceful manner.
Expects total social financing and credit to maintain steady growth in Q4.
Pressures on the Yuan from China-US yield gap are likely to ease.
China will maintain current account surplus.
Stable Yuan has solid foundation.
Will resolutely prevent the risk of Yuan overshooting.
Related reads
- CNY: Inflation fell back to zero, weak trade persists – Commerzbank
- Australian Dollar moves sideways after trimming intraday gains, focus on US data
European Central Bank (ECB) Governing Council member Ignazio Visco said on Friday, “uncertainty looms great on global economy.”
Additional quotes
Uncertainty looms great on the global economy.
Markets worried about Italy's inability to grow.
But the Italian economy has the potential to grow more.
No signs that Italian spreads are at a level that requires ECB action.
Market reaction
EUR/USD was last seen trading at around 1.0550, up 0.26% so far.
Bank of England (BoE) Governor Andrew Bailey spoke at the Institute of International Finance Annual Membership Meeting, in Morocco, on Friday.
Additional quotes
Last policy decision was a tight one.
Future decisions will continue being tight.
Policy is restrictive and it has to be.
Sees progress on inflation but there is still work left to do.
Market reaction
At the time of writing, GBP/USD is trading at above 1.2200, up 0.33% on the day.
- USD/CAD snaps the recent gains on the back of the recent increase in Crude oil prices.
- Technical indicators suggest bullish momentum in market sentiment.
- 1.3650 major level emerges as the support, followed by the 23.6% Fibonacci retracement.
USD/CAD snaps a two-day winning streak on the back of the recent increase in Crude oil prices. However, the pair received upward support after the release of upbeat economic data from the United States (US).
The USD/CAD pair trades lower around 1.3660 during the European session on Friday, lined up with the support at the 1.3650 level, followed by the 23.6% Fibonacci retracement at 1.3616 level.
A decisive break below the latter could open the door for the USD/CAD pair to navigate the region around the psychological level at 1.3600 close to the 22-day Exponential Moving Average (EMA) at 1.3599.
On the flip side, the weekly high at 1.3700 major level could act as immediate resistance, followed by the 1.3750 psychological level aligned to the monthly high at 1.3785.
The Moving Average Convergence Divergence (MACD) line positioned above both the centerline and the signal line suggests a potential bullish momentum in market sentiment.
Additionally, the USD/CAD pair continues to maintain a prevailing bullish momentum, emphasizing a stronger bias. This is evident as the 14-day Relative Strength Index (RSI) remains above the 50 level.
USD/CAD: Daily Chart
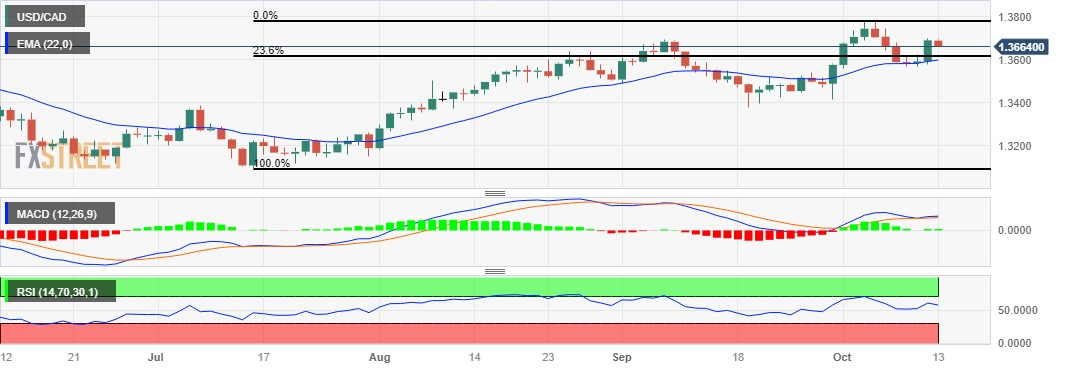
Analysts at Commerzbank offer a brief analysis of Chinese macro data released earlier this Friday, showing that consumer prices rose 0.2% MoM in September and were flat on an annual basis. China also published trade balance data, which pointed to lacklustre global demand for Chinese goods and muted domestic demand.
Key Quotes:
“The September inflation report released today showed that CPI inflation fell back to 0% yoy. Back in July, it temporarily dropped below zero to -0.3% yoy. However, we would argue that China is not yet on the verge of deflation. First of all, core inflation remained unchanged at 0.8% yoy. Second, on a month-on-month basis, headline CPI inflation was positive each month in the past three months, albeit only at 0.2% on average according to the official statistics. Deflation becomes entrenched and problematic when consumers expect the general price level to fall continuously. So far, this is not yet the case in China.”
“Nevertheless, subdued price pressures reflect weak domestic demand. While the absence of inflation provides room for the PBoC to do more monetary stimulus, the central bank may refrain from doing so if the economy shows further signs of bottoming out. The GDP and activity data that will be released next week will provide further clues about China’s growth performance in September and Q3.”
“Meanwhile, the trade data today showed that the decline in exports in USD terms eased to -6.2% yoy from -8.8% in August. Imports in USD terms also dropped 6.2% yoy from -7.3% previously. Adjusted for prices, imports in real terms probably grew by around 4% yoy. Real import growth was supported by imports of energy and raw materials for stocking up inventories. However, imports of intermediate and capital goods remained soft amid weak growth momentum in China.”
“The yuan has remained stable this week after China took an eight-day holiday for the National Day Golden Week last week. USD-CNY has been hovering around 7.30 for the week. CNY will likely remain under pressure before economic data show that China’s growth momentum turns around and picks up speed, albeit likely just modestly so. Meanwhile, to counter yuan’s weakness, the PBoC has continued to set USD-CNY daily fixings that were much lower than what would be implied by the fixing formula.”
Analysts at Danske Bank offer a brief analysis of the latest US consumer inflation figures released on Thursday, which now seems to have revived bets for further policy tightening by the Federal Reserve (Fed).
Key Quotes:
“The big event for global macro and markets over the last 24 hours has been the release of September CPI data out of the US. While core inflation was in line with expectations at 0.3% m/m the headline measure surprised consensus by 0.1pp to the topside at a 0.4% m/m reading corresponding to 3.7% y/y. The data release triggered a sharp reaction in bond markets where yields rose and the curve bear steepened which then transmitted to worsening risk appetite across asset classes, incl. a stronger USD.”
“While the market reaction was to price in a higher probability of another rate hike from the Federal Reserve - now priced at roughly a c. 40% probability - we highlight the importance of the inflation details. Indeed it was primarily shelter that posted a surprise rise after several months of declines. Not only do we see signs from other indicators that this spike is unlikely to prove persistent but we also highlight that the underlying measures of inflation that the Federal Reserve normally refer actually came in fully in line with expectations. In that regard, we still maintain our call that we have already hit a peak in US policy rates.”
- USD/CHF retraces the recent gains ahead of the US Consumer Sentiment.
- A slew of hot US economic numbers could limit the US Dollar's weakening.
- Middle-East conflict could enhance the demand for the safe-haven Swiss Franc.
USD/CHF leans toward negative, turning downward post retracing recent gains. The spot price trades lower around 0.9060 during the early European session on Friday.
Despite the downward movement and reaching monthly lows on Thursday, the USD/CHF pair has experienced a rebound due to the optimistic economic data from the United States (US).
The US economic overview has been dynamic and reinforcing the strength of the US Dollar (USD), with the Consumer Price Index (CPI) exceeding expectations in September, showcasing a consistent annual expansion of 3.7%, slightly surpassing the estimated 3.6%.
The subtle uptick in Initial Jobless Claims for the week ending on October 6, marked by a modest increase of 209K, falling slightly below the forecasted 210K, indicates a nuanced trend suggesting a mild easing.
Thursday's data revealed a surge in the US Producer Price Index (PPI) in September on a yearly basis, rising from 2.0% to 2.2%. Additionally, the Core PPI climbed to 2.7%, surpassing the anticipated easing to 2.3%.
This upbeat US economic data has reignited the hawkish sentiment about the interest rates trajectory of the Federal Reserve (Fed), which could contribute support for the USD/CHF pair. The upbeat indicators have added complexity to the ongoing narrative, leading to speculation about how the Fed might respond.
The US Dollar Index (DXY) trades lower around 106.30 by the press time, retreating from the weekly low. The US Dollar (USD) weakens due to the downbeat US Treasury yields, with the 10-year US bond yield standing at 4.65%, down by 0.91% at the time of writing.
On the Swiss side, the Producer and Import Prices (YoY) reached to 1.0% decline in September from the previous decline of 0.8%. While the monthly data showed a decline of 0.1% against the 0.8% decline in August.
Additionally, the Swiss Franc appears to be garnering buying support amid the military conflict in the Middle East, as the currency is sought after as a safe haven during periods of geopolitical uncertainty.
Investors are expected to watch the US Michigan Consumer Sentiment Index scheduled for release on Friday. This index serves as a vital gauge of consumer confidence, offering insights into the broader economic sentiment. The ongoing analysis of these indicators will likely influence trading decisions in the USD/CHF pair.
- Pound Sterling faces an intense sell-off due to risk-off impulse and weak manufacturing activity data.
- Persistent US inflation dampens the market mood.
- The BoE is expected to keep interest rates unchanged for the second time in a row.
The Pound Sterling (GBP) dropped from a two-week high as the United Kingdom’s economic outlook weakened after factory output contracted for the second consecutive month. The GBP/USD pair surrendered the majority of recent gains as data from the US showed inflation remains persistent, denting the risk appetite of market participants. UK’s manufacturing and overall Industrial Production dropped in August as firms cut spending on labor and inventory due to a poor demand outlook.
More sell-off in the Pound Sterling is anticipated as Bank of England (BoE) policymaker Swati Dhingra supported a rate cut if economic growth remains below estimates. The UK is expected to remain on the backfoot compared with other G7 economies as it is struggling with higher interest rates, filthy trade relations with the European Union, and rising gasoline prices.
Daily Digest Market Movers: Pound Sterling corrects sharply amid weak UK factory data
- Pound Sterling resumes a downside journey as UK factory activity contracted for the second month in a row.
- UK firms reported a decline in manufacturing activity in August amid a bleak demand outlook in the domestic and overseas market.
- Monthly Industrial Production in August contracted at a higher pace of 0.7%, while investors forecasted a 0.2% decline. In the same period, Manufacturing Production decreased by 0.8%, double the expectations of a 0.4% drop.
- On an annual basis, Industrial Production increased 1.3%, below the estimates of 1.7% but higher than the former reading of 1%. The Manufacturing Production rose 2.8%, lower than expectations and July’s reading of 3.4% and 3.1%, respectively.
- While factory data remained weak, the monthly Gross Domestic Product (GDP) rose by 0.2% in August, as expected. In July, GDP contracted by 0.6%.
- The absence of sufficient evidence that the UK economy could rebound may keep the Pound Sterling on the backfoot.
- The UK economy is facing an economic shock, based on labor shortages, high interest rates, stubborn inflation, and poor trade relations with the European Union. This could force the Bank of England to keep interest rates unchanged for a second consecutive time in November.
- In September, the BoE surprisingly paused the rate-tightening spell after 14 back-to-back interest rate hikes to 5.25%, a move that confirmed that policymakers are worried about the economic outlook.
- According to the IMF forecasts, the UK will be the slowest-growing G7 nation next year.
- On Wednesday, BoE policymaker Swati Dhingra favored a sooner rate cut if the growth rate declines beyond expectations. She further added that the UK economy has already ‘flatlined’, and that almost 25% of the impact from higher interest rates has already been absorbed by the economy.
- After the UK factory activity data, investors will shift focus to the labor market data for August, which will be published on Tuesday.
- The market mood turned cautious on Thursday after the United States headline inflation data for September turned out to be more persistent than expected.
- Dampened market sentiment improved the appeal of the US Dollar. The US Dollar Index (DXY) discovered buying interest near 105.50 and recovered quickly to near 106.60.
- Investors are expecting that the Federal Reserve (Fed) could end the year by elevating interest rates one more time by 25 basis points (bps) to 5.50%-5.75% as the progress in taming inflation towards 2% seems to have slowed down.
Technical Analysis: Pound Sterling delivers pullback to near 1.2200
Pound Sterling struggles for a firm footing as hot US headline inflation dampens market sentiment. The outlook for the GBP/USD pair weakens as it failed to sustain above the 20-day Exponential Moving Average (EMA) at 1.2258. The broader Cable bias is bearish as the 50-day and 200-day EMAs have already delivered a death cross.
Pound Sterling FAQs
What is the Pound Sterling?
The Pound Sterling (GBP) is the oldest currency in the world (886 AD) and the official currency of the United Kingdom. It is the fourth most traded unit for foreign exchange (FX) in the world, accounting for 12% of all transactions, averaging $630 billion a day, according to 2022 data.
Its key trading pairs are GBP/USD, aka ‘Cable’, which accounts for 11% of FX, GBP/JPY, or the ‘Dragon’ as it is known by traders (3%), and EUR/GBP (2%). The Pound Sterling is issued by the Bank of England (BoE).
How do the decisions of the Bank of England impact on the Pound Sterling?
The single most important factor influencing the value of the Pound Sterling is monetary policy decided by the Bank of England. The BoE bases its decisions on whether it has achieved its primary goal of “price stability” – a steady inflation rate of around 2%. Its primary tool for achieving this is the adjustment of interest rates.
When inflation is too high, the BoE will try to rein it in by raising interest rates, making it more expensive for people and businesses to access credit. This is generally positive for GBP, as higher interest rates make the UK a more attractive place for global investors to park their money.
When inflation falls too low it is a sign economic growth is slowing. In this scenario, the BoE will consider lowering interest rates to cheapen credit so businesses will borrow more to invest in growth-generating projects.
How does economic data influence the value of the Pound?
Data releases gauge the health of the economy and can impact the value of the Pound Sterling. Indicators such as GDP, Manufacturing and Services PMIs, and employment can all influence the direction of the GBP.
A strong economy is good for Sterling. Not only does it attract more foreign investment but it may encourage the BoE to put up interest rates, which will directly strengthen GBP. Otherwise, if economic data is weak, the Pound Sterling is likely to fall.
How does the Trade Balance impact the Pound?
Another significant data release for the Pound Sterling is the Trade Balance. This indicator measures the difference between what a country earns from its exports and what it spends on imports over a given period.
If a country produces highly sought-after exports, its currency will benefit purely from the extra demand created from foreign buyers seeking to purchase these goods. Therefore, a positive net Trade Balance strengthens a currency and vice versa for a negative balance.
European Central Bank (ECB) policymaker and Bundesbank Chief Joachim Nagel, during his scheduled appearance on Friday, said that “I can assure you we will not rest until we've overcome high inflation rates. “
Additional comments
Developments in Middle East are at centre of discussions at imf-world bank meetings.
Germany supporting IMF quota increase to strengthen IMF.
Labor market in Germany remains strong, expect consumer demand to increase.
Inflation has peaked in Germany.
Expect inflation to drop to 2.7% in 2025.
We need clear rules to reduce fiscal deficits in Europe, allowing deficits to rise would be bad signal.
Germany ready to accept smaller imf quota increase to benefit other countries.
Good chance that IMF members will reach 'good compromise' on quota increase.
Tightening of monetary policy yielding results and moving inflation in positive direction.
Market reaction
At the time of writing, EUR/USD is trading near 1.0550, holding higher while adding 0.17% on the day.
In its assessment of the Japanese economy and its monetary policy, S&P Global noted that “policy interest rates in Japan will rise from 2024.”
Additional takeaways
“Japan is robust enough for rising Yen rates.”
“We expect a gradual increase in Japan's policy interest rates.“
Market reaction
USD/JPY was last seen almost unchanged on the day at 149.75.
Here is what you need to know on Friday, October 13:
The US Dollar (USD) gathered strength against its rivals following September inflation data on Thursday and the USD Index snapped a six-day losing streak. Markets stay relatively quiet early Friday as investors await speeches from central bankers. In the second half of the day, Import and Export Price Index data will be featured in the US economic docket alongside the University of Michigan's Consumer Sentiment Survey for October.
The Consumer Price Index (CPI) in the US rose 3.7% on a yearly basis in September, the US Bureau of Labor Statistics reported on Thursday. This reading matched August's increase and came in above the market expectation of 3.6%. Other details of the report revealed that the annual Core CPI inflation, which excludes volatile food and energy prices, edged lower to 4.1% from 4.3% as forecast. The probability of another 25 basis points Federal Reserve rate hike in December climbed above 30% after this data, according to the CME Group FedWatch Tool. In turn, the 10-year US yield gained traction and the USD outperformed its rivals in the American trading hours.
US Dollar price this week
The table below shows the percentage change of US Dollar (USD) against listed major currencies this week. US Dollar was the strongest against the New Zealand Dollar.
| USD | EUR | GBP | CAD | AUD | JPY | NZD | CHF | |
| USD | 0.31% | 0.28% | 0.17% | 0.86% | 0.39% | 1.02% | -0.10% | |
| EUR | -0.31% | -0.01% | -0.12% | 0.56% | 0.10% | 0.72% | -0.39% | |
| GBP | -0.28% | 0.02% | -0.11% | 0.53% | 0.12% | 0.69% | -0.40% | |
| CAD | -0.17% | 0.13% | 0.11% | 0.67% | 0.22% | 0.81% | -0.28% | |
| AUD | -0.87% | -0.51% | -0.53% | -0.63% | -0.41% | 0.17% | -0.92% | |
| JPY | -0.40% | -0.09% | -0.11% | -0.22% | 0.41% | 0.55% | -0.51% | |
| NZD | -1.01% | -0.67% | -0.69% | -0.80% | -0.16% | -0.57% | -1.11% | |
| CHF | 0.07% | 0.41% | 0.38% | 0.28% | 0.92% | 0.48% | 1.09% |
The heat map shows percentage changes of major currencies against each other. The base currency is picked from the left column, while the quote currency is picked from the top row. For example, if you pick the Euro from the left column and move along the horizontal line to the Japanese Yen, the percentage change displayed in the box will represent EUR (base)/JPY (quote).
In the early European session, the 10-year US yield stays in negative territory below 4.7% and US stock index futures trade modestly higher.
During the Asian trading hours, the data from China showed that the trade surplus widened to $77.71 billion in September from $68.36 billion in August. On a yearly basis, Imports and Exports both contracted by 6.2% in the same period. AUD/USD showed no immediate reaction to these figures and was last seen moving sideways in a narrow channel slightly above 0.6300.
EUR/USD lost nearly 100 pips on Thursday but found support before testing 1.0500. Early Friday, the pair clings to small daily gains slightly below 1.0550. European Central Bank President Christine Lagarde will be speaking at the International Monetary Fund's annual conference later in the day.
GBP/USD turned south and erased its weekly gains on Thursday. In the European morning, the pair seems to have stabilized near 1.2200. Bank of England Governor Andrew Bailey will deliver a speech at the Institute of International Finance annual meeting.
USD/JPY gathered bullish momentum and climbed above 149.50 on Thursday. The pair spent the Asian session in a tight channel near 149.70 on Friday.
Gold came under bearish pressure and closed in negative territory on Thursday. With US yields starting to edge lower early Friday, however, XAU/USD regained its traction and was last seen trading above $1,875.
- EUR/USD shows resilience after a losing session on upbeat US data.
- Headline inflation exceeded expectations; jobless claims recorded a lower figure than anticipated.
- The slew of positive US data has reignited sentiment of another interest rate hike by the Fed.
- ECB’s cautious stance on interest rates trajectory could undermine the Euro.
EUR/USD shows resilience, turning upward after a losing session. The spot price trades higher around 1.0540 during the Asian session on Friday. Despite the upward movement and reaching weekly highs on Thursday, the EUR/USD pair has encountered a pullback due to the optimistic economic data from the United States (US).
The US economic overview has been dynamic and reinforcing the strength of the US Dollar (USD), with the Consumer Price Index (CPI) exceeding expectations in September, showcasing a consistent annual expansion of 3.7%, slightly surpassing the estimated 3.6%.
The nuanced trend in Initial Jobless Claims for the week ending on October 6, with a modest increase of 209K slightly below the forecast of 210K, suggests a subtle easing.
Thursday's data revealed a surge in the US Producer Price Index (PPI) in September on a yearly basis, rising from 2.0% to 2.2%. Additionally, the Core PPI climbed to 2.7%, surpassing the anticipated easing to 2.3%.
This positive economic data has sparked discussions about the potential trajectory of the Federal Reserve's (Fed) monetary policy, which could contribute support for the EUR/USD pair. The upbeat indicators have added complexity to the ongoing narrative, leading to speculation about how the Fed might respond.
On the Eurozone side, the cautious approach is influenced by concerns about a slowing economy, with worries that it could potentially dip into a recession. As a result, it suggests that further rate hikes by the European Central Bank (ECB) may not be on the table for the time being, and this cautious stance could undermine the EUR/USD pair.
Investors are expected to watch the US Michigan Consumer Sentiment Index scheduled for release on Friday. This index serves as a vital gauge of consumer confidence, offering insights into the broader economic sentiment. The ongoing analysis of these indicators will likely shape expectations and decisions in the EUR/GBP pair.
On the Eurozone docket, the upcoming comments from ECB President Christine Lagarde will be eyed. Lagarde is scheduled to participate in a panel discussion at the World Bank Group and the International Monetary Fund Annual Meeting in Morocco.
FX option expiries for Oct 13 NY cut at 10:00 Eastern Time, via DTCC, can be found below.
- EUR/USD: EUR amounts
- 1.0400 539m
- 1.0450 1.2b
- 1.0470 4.7b
- 1.0500 1.3b
- 1.0515 4b
- 1.0550 1b
- 1.0575 1b
- 1.0600 520m
- 1.0630 3.5b
- 1.0650 1.6b
- 1.0700 985m
- GBP/USD: GBP amounts
- 1.2150 345m
- 1.2200 635m
- USD/JPY: USD amounts
- 148.00 130m
- 148.80 705m
- 149.00 530m
- 149.50 820m
- 149.75 604m
- 150.00 851m
- USD/CHF: USD amounts
- 0.9030 499m
- 0.9075 478m
- AUD/USD: AUD amounts
- 0.6520 516m
- 0.6525 544m
- USD/CAD: USD amounts
- 1.3490 900m
- 1.3550 329m
- 1.3750 379m
- 1.3780 800m
- 1.3825 702m
- EUR/GBP: EUR amounts
- 0.8700 450m
- Asian markets slid across the board following the weaker US session on Thursday.
- Robust US data contributed to pressure on the capital markets.
- Downbeat Chinese data affected the regional markets across the board.
Asian shares took a dip on Friday, reflecting a downturn in the market sentiment, while the dollar remained strong. This shift followed a higher-than-expected increase in US consumer prices, which has strengthened the argument for the Federal Reserve (Fed) to maintain higher interest rates for an extended period.
The interplay of these factors is contributing to the evolving dynamics in the financial markets, with investors closely monitoring the implications for future monetary policy decisions.
At the time of writing, China's SSE Composite Index is down by 0.66% to 3,088, Shenzhen Component Index has declined to 10,039, down by 1.27%, Japan’s Nikkei 225 fell to 32,268, decreased by 0.70%, Hong Kong’s Hang Seng is down by 2.0%, Korean KOSPI declined to 2,456 and Taiwan's Weighted Index has down by 0.47%.
Chinese stocks experienced significant declines, with notable pressure on the market, particularly driven by Chinese economic data revealing that China's consumer prices remained flat in September.
Additionally, China’s factory-gate prices, while still shrinking, did so at a slower pace. These indicators suggest the persistence of deflationary pressures in the Chinese economy, contributing to the negative sentiment in the stock market.
On Friday, Taiwan's chipmaker TSMC secured a waiver extension from the United States (US), allowing the company to continue supplying US chip equipment to its factories in China. This development reflects the intricacies of global supply chains and the strategic importance of technology and semiconductor production.
Indian NIFTY 50 and BSE SENSEX both fell by around 0.60% by the press time. This drop was attributed to a slide in information technology (IT) and bank stocks, which contributed to the overall downturn in the market. Additionally, investor sentiment was impacted by concerns about inflation in the United States (US).
The overnight trading session in the US witnessed all three major indexes closing lower. This downturn was triggered by stronger-than-expected US inflation data, which likely raised concerns among investors about the potential impact on monetary policy and the broader economic landscape.
The upcoming focus for investors centers on remarks by Federal Reserve Chairman Jerome Powell, scheduled to speak on October 19. This timing is noteworthy as it falls just before the US central bank's blackout period, which precedes its next interest-rate decision. Powell's comments during this period are closely scrutinized for insights into the Fed's policy stance.
Economists at Standard Chartered express their view on the Monetary Authority of Singapore (MAS) monetary policy decision announced on Friday.
Key quotes
“The Monetary Authority of Singapore (MAS) kept its policy unchanged, with no change to the slope, centre and width of the SGD NEER policy band (which we estimate at +1.5% per annum). This is in line with our expectation and consensus.”
“The MAS signalled that it is prepared to keep policy tight for longer, similar to the higher for longer assessment for global central banks.“
“In MAS words, the current stance is “sufficiently tight” and a “sustained appreciation” is needed. The key takeaway is that this may mean an extended pause, but with a slight bias towards further tightening, if needed, rather than loosening, in our view. Currently, we expect the MAS to keep policy unchanged come January.”
- The US Dollar struggles to capitalize on the overnight US CPI-inspired gains to the weekly high.
- The uncertainty over the Fed’s rate-hike path is seen as a key factor capping gains for the buck.
- The fundamental backdrop still supports prospects for the emergence of some USD dip-buying.
The US Dollar Index (DXY), which tracks the Greenback against a basket of currencies, edges lower during the Asian session on Friday and erodes a part of the previous day's US CPI-inspired strong gains to the weekly high. The downside, however, seems cushioned in the wake of reviving bets for further policy tightening by the Federal Reserve (Fed).
The US Bureau of Labor Statistics (BLS) reported on Thursday that the headline US CPI rose 0.4% in September and the yearly rate held steady at 3.7% as compared to expectations for a downtick to 3.6%. Meanwhile, the Core CPI, which excludes volatile food and energy prices, matched estimates and eased to the 4.1% YoY rate in September, hitting a 24-month low. The inflation, meanwhile, remains above the Fed's target and keeps the door open for at least one more Fed rate hike in 2023.
Furthermore, Boston Fed President Susan Collins said that the latest inflation data underscores uneven progress toward restoring price stability. Collins reiterated her view that the central bank may have to raise rates again to combat inflation. This, in turn, suggests that the US central bank will have to keep rates higher for longer. This led to the overnight sharp rise in the US bond yields and should continue to act as a tailwind for the US Dollar (USD), warranting some caution for bearish traders.
The recent dovish comments from other Fed officials, meanwhile, raise the uncertainty over the future rate-hike path and put a lid on the US bond yields, which is undermining the buck. Nevertheless, the fundamental backdrop seems tilted in favour of the USD bulls and suggests that the downtick might be seen as a buying opportunity. Traders now look to Philadelphia Fed President Patrick Harker's speech and the Preliminary Michigan Consumer Sentiment Index for a fresh impetus.
Technical levels to watch
- WTI draws support from concerns about tightening global supply, though the upside remains capped.
- Investors seem worried that rising interest rates will hamper economic activity and dent fuel demand.
- Receding fears over potential supply disruptions due to the Israel-Gaza conflict acts as a headwind.
West Texas Intermediary (WTI) Crude Oil prices struggle to gain any meaningful traction on Friday and oscillate in a narrow band, around mid-$82.00s through the Asian session. The commodity, meanwhile, manages to hold above the weekly low touched on Thursday and draw support from supply concerns in an already tight market.
The US toughened its stance against Russia and imposed sanctions on two shipping companies for carrying Russian Oil bought at a price greater than the $60/barrel price cap imposed by G7 countries last year. The tighter US scrutiny of exports from Russia – the world's second-largest oil producer – could curtail supply. This, along with a forecast that global inventories will decline through the fourth quarter, continues to lend some support to Crude Oil prices.
Furthermore, OPEC kept its forecast for growth in global oil demand, citing signs of a resilient world economy so far this year, and expected further demand recovery in China – the world's biggest Ol importer. Adding to this, the International Energy Agency (IEA), in its monthly oil market report, raised the global Oil demand growth forecast for 2023 to 2.3 million bpd from 2.2 million bpd previous, though downgraded it for the next year to 880K bpd from 1 million bpd.
The US CPI report released on Thursday, meanwhile, revived bets for at least one more rate hike by the Federal Reserve (Fed) in 2023 and triggered a sharp rise in the US Treasury bond yields. This raises concerns about economic headwind stemming from rapidly rising borrowing costs, which is expected to dent fuel demand. Apart from this, receding fears about potential supply disruptions due to the Israel-Palestinian conflict should cap the upside for Crude Oil prices.
Technical levels to watch
- USD/MXN retraces recent gains post Banxico’s meeting minutes.
- US headline inflation surpassed the expectations; while jobless claims printed a lower reading than expected.
- The recent barrage of positive US data has ignited discussions about the Fed’s interest rate trajectory.
USD/MXN pulled back from the recent gains that registered on Thursday, trading lower around 17.9430 during the Asian session on Friday. The pair is receiving downward pressure due to the hawkish monetary policy minutes from Mexico’s central bank Banxico.
The recent release of Banxico's monetary policy minutes paints a hawkish picture, with members expressing a reluctance to consider a rate cut in the near term. The consensus among members is a belief that rates should remain higher for an extended duration.
The primary rationale cited for this stance is the elevated prices observed in the services segment, which is identified as a key factor influencing inflation data. This hawkish sentiment underscores a cautious approach to monetary policy, prioritizing the need to address inflationary pressures.
However, the pair advanced in the previous session due to the optimistic economic data from the United States (US).
The Consumer Price Index (CPI) in the US, as revealed by the US Bureau of Labor Statistics (BLS), exceeded expectations in September, with annual figures expanding consistently at a rate of 3.7%, slightly surpassing the estimated 3.6%.
Furthermore, the Initial Jobless Claims for the week ending on October 6 exhibited a nuanced trend. Despite a modest increase of 209K, the figure was slightly below the forecast of 210K, indicating a subtle easing.
On Thursday, the data showed that the US Producer Price Index (PPI) surged in September on a yearly basis, jumping from 2.0% to 2.2%, Core PPI climbed to 2.7% from the anticipated easing to 2.3%.
The recent barrage of positive economic data has ignited discussions about the potential trajectory of the Federal Reserve's (Fed) monetary policy. The upbeat indicators have added a layer of complexity to the ongoing narrative, prompting speculation about the Fed's response.
Looking ahead, market participants are expected to keep a close eye on the US Michigan Consumer Sentiment Index, scheduled for release on Friday. This index often serves as a gauge of consumer confidence, providing insights into the broader economic sentiment.
- Gold attracts fresh buyers on Friday and stalls the overnight pullback from over a two-week high.
- Retreating US bond yields keeps the USD bulls on the defensive and lends support to the metal.
- The prospects for further policy tightening by the Fed could act as a headwind for the XAU/USD.
Gold price (XAU/USD) witnessed an intraday turnaround from the $1,885 region, or over a two-week high and settled near the lower end of its daily range on Thursday. Consumer prices in the United States (US) rose more than expected in September and lifted expectations that the Federal Reserve (Fed) will keep interest rates higher for longer. This led to the sharp overnight rise in the US Treasury bond yields and triggered a massive US Dollar (USD) short-covering rally, which, in turn, was seen as a key factor exerting pressure on the precious metal.
The downfall, however, lacks follow-through, with a modest downtick in the US Treasury bond yields and a softer USD assisting the Gold price to attract some dip-buying near the $1,868-1867 region during the Asian session on Friday. The recent dovish remarks by several Fed officials suggested that the US central bank is nearing the end of its rate-hiking cycle. This puts a lid on the US bond yields, removing some of the driving force behind a strong Greenback. Apart from this, geopolitical issues drive some haven flows to the non-yielding yellow metal.
Daily Digest Market Movers: Gold price is seen drawing support from a combination of factors
- Gold price stalls the previous day's post-US CPI retracement slide from over a two-week high amid retreating US Treasury bond yields and a softer US Dollar.
- The recent comments by several Federal Reserve officials raise the uncertainty over the US central bank’s near-term monetary policy outlook.
- The latest US consumer inflation figures released on Thursday, however, kept the door open for at least one more 25 basis point (bps) lift-off by the end of this year.
- The headline US CPI rose 0.4% in September and the yearly rate held steady at 3.7% as compared to market expectations for a tick lower to 3.6%.
- The Core CPI, which excludes volatile food and energy prices, matched estimates and eased to the 4.1% YoY rate in September, hitting a 24-month low.
- The inflation is still above the Fed's 2% target and supports prospects for further policy tightening, warranting some caution for the XAU/USD bulls.
- Boston Fed President Susan Collins said that the central bank might have to raise rates again to combat inflation as the data underscored uneven progress toward restoring price stability.
- Military clashes between Israel and the Palestinian Islamist group, Hamas, might continue to underpin the safe-haven bullion and help limit the downside.
- Traders now look to Philadelphia Fed President Patrick Harker's speech and the Preliminary Michigan Consumer Sentiment Index for a fresh impetus.
- The precious metal remains on track to register strong weekly gains of more than 2%, the most since mid-March, snap a two-week losing streak.
Technical Analysis: Gold price remains well within the striking distance of over a two-week high
From a technical perspective, the emergence of fresh buying ahead of the $1,865 support zone favours bullish traders. That said, technical indicators on the daily chart are yet to confirm a positive bias. This, in turn, warrants some caution before positioning for any further appreciating move. Hence, any subsequent strength is more likely to confront resistance near the overnight swing high, around the $1,885 region. This is closely followed by the $1,900 mark, which if cleared will set the stage for additional gains.
On the flip side, the $1,868-1,865 region might continue to protect the immediate downside ahead of the $1,853-1,850 zone. A convincing break below could drag the Gold price to the $1,835-1,833 region, representing a multi-day-old trading range resistance breakpoint. Some follow-through selling might turn the XAU/USD vulnerable to slide back towards retesting the multi-month low, around the $1,810 zone touched last week.
US Dollar price today
The table below shows the percentage change of US Dollar (USD) against listed major currencies today. US Dollar was the strongest against the New Zealand Dollar.
| USD | EUR | GBP | CAD | AUD | JPY | NZD | CHF | |
| USD | -0.08% | -0.17% | 0.00% | -0.18% | -0.01% | 0.05% | -0.08% | |
| EUR | 0.08% | -0.10% | 0.06% | -0.10% | 0.05% | 0.13% | -0.01% | |
| GBP | 0.16% | 0.10% | 0.16% | 0.01% | 0.16% | 0.22% | 0.09% | |
| CAD | 0.01% | -0.04% | -0.16% | -0.14% | -0.01% | 0.07% | -0.06% | |
| AUD | 0.18% | 0.10% | 0.00% | 0.16% | 0.15% | 0.21% | 0.08% | |
| JPY | 0.00% | -0.06% | -0.18% | 0.00% | -0.16% | 0.05% | -0.06% | |
| NZD | -0.07% | -0.11% | -0.22% | -0.06% | -0.23% | -0.06% | -0.12% | |
| CHF | 0.07% | 0.01% | -0.09% | 0.07% | -0.08% | 0.06% | 0.13% |
The heat map shows percentage changes of major currencies against each other. The base currency is picked from the left column, while the quote currency is picked from the top row. For example, if you pick the Euro from the left column and move along the horizontal line to the Japanese Yen, the percentage change displayed in the box will represent EUR (base)/JPY (quote).
Gold FAQs
Why do people invest in Gold?
Gold has played a key role in human’s history as it has been widely used as a store of value and medium of exchange. Currently, apart from its shine and usage for jewelry, the precious metal is widely seen as a safe-haven asset, meaning that it is considered a good investment during turbulent times. Gold is also widely seen as a hedge against inflation and against depreciating currencies as it doesn’t rely on any specific issuer or government.
Who buys the most Gold?
Central banks are the biggest Gold holders. In their aim to support their currencies in turbulent times, central banks tend to diversify their reserves and buy Gold to improve the perceived strength of the economy and the currency. High Gold reserves can be a source of trust for a country’s solvency. Central banks added 1,136 tonnes of Gold worth around $70 billion to their reserves in 2022, according to data from the World Gold Council. This is the highest yearly purchase since records began. Central banks from emerging economies such as China, India and Turkey are quickly increasing their Gold reserves.
How is Gold correlated with other assets?
Gold has an inverse correlation with the US Dollar and US Treasuries, which are both major reserve and safe-haven assets. When the Dollar depreciates, Gold tends to rise, enabling investors and central banks to diversify their assets in turbulent times. Gold is also inversely correlated with risk assets. A rally in the stock market tends to weaken Gold price, while sell-offs in riskier markets tend to favor the precious metal.
What does the price of Gold depend on?
The price can move due to a wide range of factors. Geopolitical instability or fears of a deep recession can quickly make Gold price escalate due to its safe-haven status. As a yield-less asset, Gold tends to rise with lower interest rates, while higher cost of money usually weighs down on the yellow metal. Still, most moves depend on how the US Dollar (USD) behaves as the asset is priced in dollars (XAU/USD). A strong Dollar tends to keep the price of Gold controlled, whereas a weaker Dollar is likely to push Gold prices up.
China's Trade Balance for September, in Chinese Yuan terms, came in at CNY558.74 billion versus expectations of CNY510 billion and CNY488 billion previous.
Exports dropped 0.6% YoY in September vs. -3.2% seen in August. The country’s imports declined 0.8% YoY in the reported month vs. -1.6% prior.
In US Dollar terms, China’s trade surplus shrunk more than expected in September.
Trade Balance came in at +77.71B versus +70B expected and +68.36B previous.
Exports (YoY): -6.2% vs. -8.3% exp. and -8.8% previous.
Imports (YoY): -6.2% vs. -6.0% exp. and -7.3% last.
Additional takeaways
China Jan-Sept Yuan-denominated exports +0.6% YoY.
China Jan-Sept Yuan-denominated Imports -1.2% YoY.
China Jan-Sept USD-denominated exports -5.7% YoY.
China Jan-Sept USD-denominated Imports -7.5% YoY.
China Jan-Sept Trade Balance +$630.3 Bln.
FX implications
AUD/USD is off the highs but remains well bid near 0.6325 on encouraging China’s trade figures. The pair is up 0.17% on the day, tradas of writing.
- USD/JPY faces a key barrier at 150.00 psychological level.
- MACD indicator suggests a momentum shift towards a bearish trend.
- The major level at 149.00 emerges as the support, followed by 21-day EMA.
USD/JPY aims to snap the three-day winning streak, trading around 149.80 during the Asian session on Friday, aligned to the major support level at 150.00. The pair received upward support due to the slew of upbeat economic data from the United States (US).
A decisive break above the level could contribute to support for the pair to explore the area around the monthly high at 150.16, followed by the psychological level at 150.50.
On the downside, the USD/JPY pair could find support near the psychological level at 149.00, followed by the 21-day Exponential Moving Average (EMA) at 148.71.
A firm break below the level could put pressure on the pair to navigate the region around the 148.00 level following the 23.6% Fibonacci retracement at the 147.11 level.
The technical analysis for the USD/JPY pair reveals an interesting dynamic. The Moving Average Convergence Divergence (MACD) line being above the centerline indicates a short-term average above the long-term average. However, a significant development is observed as the line is positioned below the signal line, suggesting a shift in momentum toward a bearish trend.
However, the USD/JPY pair maintains a prevailing bullish momentum, highlighting a stronger bias. This is evident in the 14-day Relative Strength Index (RSI) holding above the 50 level, suggesting that the pair has a persistent strength and is still in bullish territory.
USD/JPY: Daily Chart
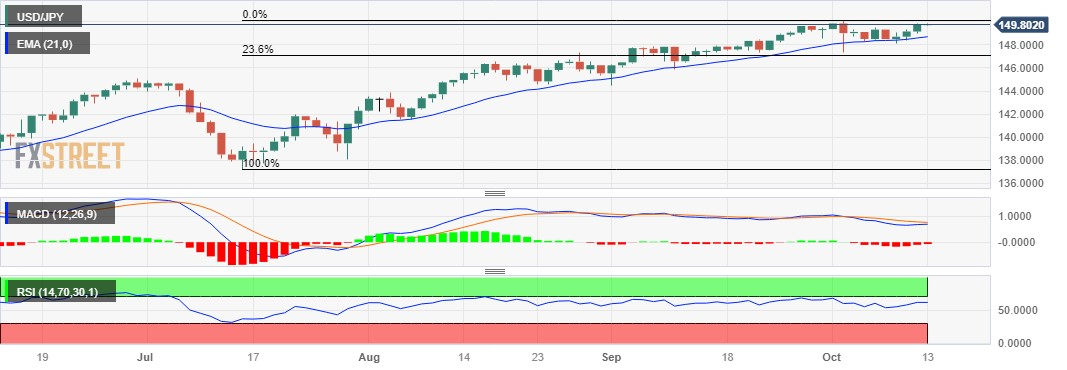
- USD/CAD meets with some supply on Friday, though the downside seems limited.
- An uptick in Oil prices underpins the Loonie and exerts pressure amid a softer USD.
- Bets for one more Fed rate hike in 2023 should limit losses for the buck and the pair.
The USD/CAD pair edges lower during the Asian session on Friday and erodes a part of the previous day's strong move up to the 1.3700 mark, or the weekly top. The pair currently trades around the 1.3680-1.3675 area and is pressured by a combination of factors, though the downside seems cushioned.
A modest uptick in Crude Oil prices is seen underpinning the commodity-linked Loonie, which, along with a mildly softer tone surrounding the US Dollar (USD) acts as a headwind for the USD/CAD pair. The recent dovish remarks by several Federal Reserve (Fed) officials suggested that the US central bank is nearing the end of its rate-hiking cycle. This, in turn, keeps a lid on the US Treasury bond yields and fails to assist the USD to capitalize on Thursday's US CPI-inspired strong recovery move from over a two-week low.
Any meaningful USD losses, meanwhile, seem limited in the wake of reviving bets for further policy tightening by the Federal Reserve (Fed), which, in turn, supports prospects for the emergence of some dip-buying around the USD/CAD pair. Both the headline and the Core CPI in the US remained above the Fed's 2% target, reviving bets for at least one more Fed rate hike move by the end of this year. This should limit the downside for the US bond yields and warrants some caution before placing fresh bearish bets around the USD.
Apart from this, receding fears about potential supply disruptions due to the Israel-Palestinian conflict should cap the upside for Crude Oil prices on the back of worries that a global economic slowdown will dent fuel demand. This further validates the near-term positive outlook for the USD/CAD pair and suggests that the path of least resistance is to the upside. Traders now look to Philadelphia Fed President Patrick Harker's speech, which, along with the Preliminary Michigan Consumer Sentiment Index, will drive the USD demand.
Technical levels to watch
| Raw materials | Closed | Change, % |
|---|---|---|
| Silver | 21.818 | -0.84 |
| Gold | 1868.826 | -0.29 |
| Palladium | 1133.7 | -2.59 |
- GBP/USD recovers from losses registered after optimistic US economic readings.
- US headline inflation surpassed the expectations; while jobless claims printed a lower reading than expected.
- The recent downbeat UK data might have put pressure on the Pound Sterling.
GBP/USD retraces the recent losses that were registered on Thursday, trading higher around the 1.2200 psychological level. However, the pair faced challenges due to the optimistic economic data from the United States (US).
The Consumer Price Index (CPI) in the US, as revealed by the US Bureau of Labor Statistics (BLS), exceeded expectations in September, with annual figures expanding consistently at a rate of 3.7%, slightly surpassing the estimated 3.6%.
Furthermore, the Initial Jobless Claims for the week ending on October 6 exhibited a nuanced trend. Despite a modest increase of 209K, the figure was slightly below the forecast of 210K, indicating a subtle easing.
On Thursday, the data showed that the US Producer Price Index (PPI) surged in September on a yearly basis, jumping from 2.0% to 2.2%, Core PPI climbed to 2.7% from the anticipated easing to 2.3%.
Discussions are stirred about the trajectory of the Federal Reserve's (Fed) monetary policy following the slew of upbeat economic data during this week.
Additionally, UK economic data failed to instill confidence in the Pound Sterling (GBP) on Thursday. The Manufacturing and Industrial Production figures fell short of expectations, with Manufacturing Production declining by 0.8% in August, missing the forecast of 0.4% decline, swinging from the previous month's dip of 1.2%.
Industrial Production for the same period missed estimates, registering a decline of 0.7% instead of the anticipated 0.2% decline. The prior reading was revised at a 1.1% decline. Although UK Gross Domestic Product (GDP) for August met expectations at 0.2%, the previous month was revised to 0.6% decline. It's a mixed bag of economic indicators, that failed to impact the sentiment around the British Pound.
During the previous week, the Bank of England (BoE) revised its growth forecast for the July-September period from 0.4% to a mere 0.1%, providing little indication of any inclination to pursue further rate increases.
Market participants will likely monitor the US Michigan Consumer Sentiment Index and BoE's Governor Andrew Bailey’s speech on Friday for further indications on economic scenarios in both countries.
- NZD/USD remains under some selling for the third straight day and drops to over a one-week low.
- The mixed Chinese inflation figures and a mildly softer USD fail to lend any support to the major.
- The fundamental backdrop suggests that the path of least resistance for the pair is to the downside.
The NZD/USD pair trades with a negative bias for the third successive day on Friday and touches a fresh weekly low, around the 0.5920-0.5915 region during the Asian session. Spot prices remain on the defensive following the release of Chinese inflation figures and seem vulnerable to prolonging the recent sharp retracement slide from the 0.6055 area or over a two-month peak touched on Wednesday.
The National Bureau of Statistics of China reported that the headline Consumer Price Index (CPI) rose 0.2% MoM in September and the yearly rate was flat, both missing market expectations. Furthermore, China’s Producer Price Index (PPI) fell by 2.5% over the past 12 months to September, though was less worse than consensus estimates for a 4.2% decline and the 3.0% fall registered in the previous month. The mixed data, however, does little to ease concerns about the worsening economic conditions in China, which continues to undermine antipodean currencies, including the New Zealand Dollar (NZD).
The US Dollar (USD), on the other hand, struggles to capitalize on the previous day's solid recovery from over a two-week low in the wake of a modest pullback in the US Treasury bond yields. This, however, fails to attract any buyers around the NZD/USD pair, tough might help limit deeper losses. The recent dovish remarks by several Federal Reserve (Fed) officials suggested that the US central bank is nearing the end of its rate-hiking cycle. This, in turn, keeps a lid on the US bond yields and keeps the USD bulls on the defensive, though the downside remains cushioned amid reviving Fed rate hike bets.
The latest US consumer inflation figures released on Thursday showed that both the headline and Core CPI remained above the Fed's 2% target. This supports prospects for further policy tightening by the Fed and leaves the door open for at least one more rate hike by the end of this year. This should act as a tailwind for the US bond yields and the USD, suggesting that the path of least resistance for the NZD/SUD pair is to the downside. Traders now look to Philadelphia Fed President Patrick Harker's speech, which, along with the Preliminary Michigan Consumer Sentiment Index, will drive the USD demand.
Technical levels to watch
- Australian Dollar dipped post-release of the US headline inflation.
- Consumer Inflation Expectations raised the odds of RBA to increase interest rates.
- US Dollar advanced following the slew of upbeat US data.
The Australian Dollar (AUD) attempts to retrace the recent losses, leaning towards the negative. This shift is attributed to the optimistic economic data from the United States (US) reported on Thursday. With US inflation surpassing expectations and initial jobless claims coming in lower than anticipated, discussions about the trajectory of the US Federal Reserve's (Fed) monetary policy have been reignited.
Australia has experienced a rise in consumer expectations regarding inflation, a trend likely influenced by increased oil prices. The upcoming focal points include the release of Meeting Minutes from the Reserve Bank of Australia (RBA) and employment data in the next week.
The US Dollar Index (DXY) gained upward momentum after a robust release of US data. Nonetheless, on Friday, the US Dollar (USD) is trading marginally lower, influenced by a retreat in US Treasury yields following a recent surge. Market participants are expected to redirect their attention to the Michigan Consumer Sentiment Index set to be released on Friday.
Investors seem to factor in the possibility of another Fed rate hike. This is noteworthy given the recent dovish rhetoric from most Fed officials, emphasizing the necessity for the US central bank to maintain higher rates for an extended period, even without signaling a clear intention for another rate increase.
Daily Digest Market Movers: Australian Dollar attempts to retrace recent losses on RBA interest rates trajectory
-
Australian Consumer Inflation Expectations for October have been reported at 4.8% on Thursday, showing a slight increase from the September figure of 4.6%.
-
Australia witnessed a rebound in inflation in August, largely driven by elevated oil prices. This resurgence raises the probability of another interest rate hike by the Reserve Bank of Australia (RBA).
-
The unfolding Middle East conflict adds a layer of complexity to the situation, potentially prompting the RBA to implement a 25 basis points (bps) interest rate hike, reaching 4.35% by the year's end.
-
The heightened geopolitical tension is fostering a surge in demand for commodities, particularly energy and gold. This surge is exerting a positive influence on the performance of the AUD/USD pair.
-
Australia’s Westpac Consumer Confidence showed that current buying conditions improved in October. The index rose 2.9% from the previous 1.5% decline in September.
-
The US Bureau of Labor Statistics (BLS) disclosed that the Consumer Price Index in the US surpassed forecasts in September. The annual basis figures expanded at a consistent rate of 3.7%, slightly exceeding estimates of 3.6%.
-
US Initial Jobless Claims for the week ending on October 6 showed a slight easing, despite an increase of 209K, which was slightly below the forecast of 210K.
-
US Producer Price Index (PPI) surged in September on a yearly basis, jumping from 2.0% to 2.2%, surpassing the anticipated 1.6%. Core PPI experienced a rise, climbing to 2.7% from the anticipated easing to 2.3%, surpassing the earlier figure of 2.5%.
-
The yields on US Treasury bonds advanced on Thursday on the back of solid US data, with the 10-year US Treasury bond yield marking the highest level at 4.72%.
-
The Federal Open Market Committee (FOMC) minutes shed light on a divergence of opinions, underlining the importance of data reliance. The consensus for additional interest rate hikes appears contingent on a significant uptick in inflation.
-
Some participants argue that as the policy rate approaches its peak, the focus should shift from the extent of rate increases to determining how long to maintain the policy rate at restrictive levels.
-
Market participants will likely monitor the US Michigan Consumer Sentiment Index on Friday. Although the Australian economic docket is empty on Friday, attention will shift to the Reserve Bank of Australia (RBA) meeting minutes and employment data scheduled for release in the coming week.
Technical Analysis: Australian Dollar holds ground above the major support level at 0.6300
The Australian Dollar trades around 0.6320, aligned to the major support level at 0.6300 lined up with a monthly low at 0.6285. The 23.6% Fibonacci retracement level at 0.6429 acts as strong resistance, followed by the 50-day Exponential Moving Average (EMA) at 0.6445 level. A clear breakthrough could pave the way for upward momentum, aiming at the psychological milestone of 0.6500.
AUD/USD: Daily Chart
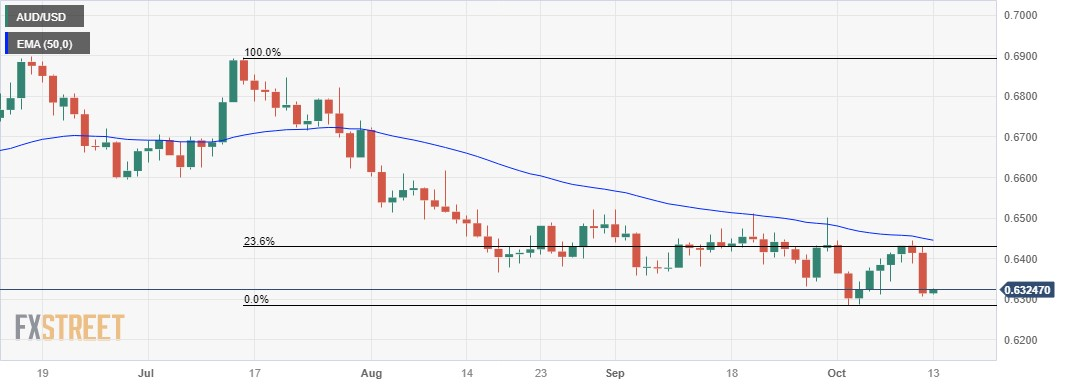
Australian Dollar price today
The table below shows the percentage change of the Australian Dollar (AUD) against listed major currencies today. The Australian Dollar was the strongest against the US Dollar.
| USD | EUR | GBP | CAD | AUD | JPY | NZD | CHF | |
| USD | -0.04% | -0.08% | 0.00% | -0.05% | 0.01% | 0.00% | -0.06% | |
| EUR | 0.04% | -0.05% | 0.04% | -0.01% | 0.05% | 0.04% | -0.03% | |
| GBP | 0.07% | 0.04% | 0.08% | 0.03% | 0.09% | 0.08% | 0.02% | |
| CAD | 0.00% | -0.03% | -0.08% | -0.04% | 0.01% | 0.01% | -0.06% | |
| AUD | 0.06% | 0.01% | -0.04% | 0.05% | 0.06% | 0.06% | -0.01% | |
| JPY | -0.02% | -0.05% | -0.13% | -0.01% | -0.09% | -0.05% | -0.07% | |
| NZD | -0.02% | -0.02% | -0.08% | 0.01% | -0.05% | 0.03% | -0.06% | |
| CHF | 0.06% | 0.03% | -0.01% | 0.07% | 0.02% | 0.07% | 0.08% |
The heat map shows percentage changes of major currencies against each other. The base currency is picked from the left column, while the quote currency is picked from the top row. For example, if you pick the Euro from the left column and move along the horizontal line to the Japanese Yen, the percentage change displayed in the box will represent EUR (base)/JPY (quote).
Australian Dollar FAQs
What key factors drive the Australian Dollar?
One of the most significant factors for the Australian Dollar (AUD) is the level of interest rates set by the Reserve Bank of Australia (RBA). Because Australia is a resource-rich country another key driver is the price of its biggest export, Iron Ore. The health of the Chinese economy, its largest trading partner, is a factor, as well as inflation in Australia, its growth rate and Trade Balance. Market sentiment – whether investors are taking on more risky assets (risk-on) or seeking safe-havens (risk-off) – is also a factor, with risk-on positive for AUD.
How do the decisions of the Reserve Bank of Australia impact the Australian Dollar?
The Reserve Bank of Australia (RBA) influences the Australian Dollar (AUD) by setting the level of interest rates that Australian banks can lend to each other. This influences the level of interest rates in the economy as a whole. The main goal of the RBA is to maintain a stable inflation rate of 2-3% by adjusting interest rates up or down. Relatively high interest rates compared to other major central banks support the AUD, and the opposite for relatively low. The RBA can also use quantitative easing and tightening to influence credit conditions, with the former AUD-negative and the latter AUD-positive.
How does the health of the Chinese Economy impact the Australian Dollar?
China is Australia’s largest trading partner so the health of the Chinese economy is a major influence on the value of the Australian Dollar (AUD). When the Chinese economy is doing well it purchases more raw materials, goods and services from Australia, lifting demand for the AUD, and pushing up its value. The opposite is the case when the Chinese economy is not growing as fast as expected. Positive or negative surprises in Chinese growth data, therefore, often have a direct impact on the Australian Dollar and its pairs.
How does the price of Iron Ore impact the Australian Dollar?
Iron Ore is Australia’s largest export, accounting for $118 billion a year according to data from 2021, with China as its primary destination. The price of Iron Ore, therefore, can be a driver of the Australian Dollar. Generally, if the price of Iron Ore rises, AUD also goes up, as aggregate demand for the currency increases. The opposite is the case if the price of Iron Ore falls. Higher Iron Ore prices also tend to result in a greater likelihood of a positive Trade Balance for Australia, which is also positive of the AUD.
How does the Trade Balance impact the Australian Dollar?
The Trade Balance, which is the difference between what a country earns from its exports versus what it pays for its imports, is another factor that can influence the value of the Australian Dollar. If Australia produces highly sought after exports, then its currency will gain in value purely from the surplus demand created from foreign buyers seeking to purchase its exports versus what it spends to purchase imports. Therefore, a positive net Trade Balance strengthens the AUD, with the opposite effect if the Trade Balance is negative.
China’s Consumer Price Index (CPI) stagnated at 0% YoY in September after accelerating by 0.1% in August. The market expected an increase of 0.2%.
Chinese CPI inflation rose to 0.2% over the month in September versus the 0.3% decrease seen in August and a rise of 0.3% anticipated.
China’s Producer Price Index (PPI) dropped 2.5% YoY in September, compared with a 3.0% decline registered previously. The market forecast was for a 4.2% decline in the ninth month of the year.
Market reaction
At the time of writing, AUD/USD is a liitle affected by the key Chinese data release, keeping its range at around 0.6325, up 0.17% on the day.
- EUR/USD edges higher during the Asian session and draws support from a modest USD downtick.
- The uncertainty over the Fed’s future rate-hike path keeps a lid on the US bond yields and the USD.
- Bets that the ECB is done hiking rates might hold back traders from placing aggressive bullish bets.
The EUR/USD pair finds some support in the vicinity of the weekly low, around the 1.0525-1.0520 area, and ticks higher during the Asian session on Friday. Spot prices currently trade around the 1.0535-1.0540 region, up just over 0.10% for the day, and for now, seems to have stalled the overnight sharp retracement slide from a nearly three-week high.
In fact, the EUR/USD pair on Thursday registered its worst single-day drop since early October after the US consumer inflation figures revived bets for one more rate hike by the Federal Reserve (Fed) in 2023 and revived the US Dollar (USD) demand. Both the headline and Core CPI remain above the Fed's 2% target, supporting prospects for further policy tightening. This led to a sharp overnight rise in the US Treasury bond yields and triggered a massive USD short-covering rally.
That said, the recent dovish remarks by several Fed officials suggested that the US central bank is nearing the end of its rate-hiking cycle. This, in turn, keeps a lid on the US bond yields and fails to assist the USD to capitalize on the previous day's solid recovery from over a two-week high. Apart from this, a modest uptick in the US equity futures undermines the safe-haven buck and acts as a tailwind for the EUR/USD pair, though any meaningful appreciating move seems elusive.
The European Central Bank (ECB) policymakers expressed cautious optimism on Thursday that inflation was on its way back to 2% even without more rate hikes. This comes after the ECB signalled in September that the hike, its 10th in a 14-month-long fight against inflation, was likely to be its last. This, along with concerns that the economy was slowing and could even dip into recession, suggests that further ECB rate hikes may be off the table and should cap the EUR/USD pair.
Market participants now look to ECB President Christine Lagarde's comments during a panel discussion at the World Bank Group and the International Monetary Fund Annual Meeting in Morocco. This might influence the shard currency and provide some impetus to the EUR/USD pair. Traders will further take cues from Philadelphia Fed President Patrick Harker's speech, which, along with the preliminary Michigan Consumer Sentiment Index, will drive the USD demand.
Technical levels to watch
On Friday, the People’s Bank of China (PBoC) set the USD/CNY central rate for the trading session ahead at 7.1775 as compared to the previous day's fix of 7.1776 and 7.3179 Reuters estimate.
- Gold price catches fresh bids on Friday and reverses a part of the overnight losses.
- A modest downtick in the US bond yields undermines the USD and lends support.
- Geopolitical tensions also benefit the XAU/USD, though the upside seems capped.
Gold price (XAU/USD) attracts some buying during the Asian session on Friday and for now, seems to have stalled the previous day's retracement slide from the $1,885 region, or over a two-week high. The yellow metal currently trades just above the $1,870 level, up 0.10% for the day, though any meaningful appreciating move now seems elusive.
The US Dollar (USD) takes a breather following Thursday's higher-than-expected US consumer inflation figures-inspired strong rally and is undermined by a modest pullback in the US Treasury bond yields. Apart from this, the ongoing conflict between Israel and the Palestinian Islamist group, Hamas, turns out to be a key factor lending some support to the Gold price. The upside, however, seems limited in the wake of reviving bets for one more rate hike by the Federal Reserve (Fed) in 2023.
The US Bureau of Labor Statistics (BLS) reported on Thursday that the headline US CPI rose 0.4% in September and the yearly rate held steady at 3.7% as compared to market expectations for a downtick to 3.6%. Meanwhile, the Core CPI, which excludes volatile food and energy prices, matched estimates and eased to the 4.1% YoY rate in September, hitting a 24-month low. The fact that inflation remains well above the Fd's 2% target supports prospects for further policy tightening by the US central bank.
The outlook, meanwhile, could now act as a tailwind for the US bond yields and the USD, which, in turn, warrants some caution before placing fresh bullish bets around the Gold price. That said, the recent dovish remarks by several Fed officials have been fuelling speculations that the US central bank is nearing the end of its rate-hiking cycle. This keeps a lid on any further upside for the US bond yields and fails to assist the USD to capitalize on the previous day's solid recovery from a two-week low.
Nevertheless, the mixed fundamental backdrop makes it prudent to wait for strong follow-through buying before positioning for the resumption of the XAU/USD's recent recovery move from the $1,810 area, or a seven-month low touched last week. The Gold price, however, seems poised to register strong weekly gains for the first time in the previous three. Traders now look to the preliminary Michigan Consumer Sentiment Index for some impetus later during the early North American session.
Technical levels to watch
| Index | Change, points | Closed | Change, % |
|---|---|---|---|
| NIKKEI 225 | 558.15 | 32494.66 | 1.75 |
| Hang Seng | 345.11 | 18238.21 | 1.93 |
| KOSPI | 29.74 | 2479.82 | 1.21 |
| ASX 200 | 2.6 | 7091 | 0.04 |
| DAX | -34.98 | 15425.03 | -0.23 |
| CAC 40 | -26.68 | 7104.53 | -0.37 |
| Dow Jones | -173.73 | 33631.14 | -0.51 |
| S&P 500 | -27.34 | 4349.61 | -0.62 |
| NASDAQ Composite | -85.46 | 13574.22 | -0.63 |
| Pare | Closed | Change, % |
|---|---|---|
| AUDUSD | 0.63147 | -1.52 |
| EURJPY | 157.695 | -0.42 |
| EURUSD | 1.0529 | -0.85 |
| GBPJPY | 182.382 | -0.67 |
| GBPUSD | 1.21758 | -1.11 |
| NZDUSD | 0.59273 | -1.5 |
| USDCAD | 1.36894 | 0.68 |
| USDCHF | 0.90759 | 0.66 |
| USDJPY | 149.773 | 0.44 |


© 2000-2026. Уcі права захищені.
Cайт знаходитьcя під керуванням TeleTrade DJ. LLC 2351 LLC 2022 (Euro House, Richmond Hill Road, Kingstown, VC0100, St. Vincent and the Grenadines).
Інформація, предcтавлена на cайті, не є підcтавою для прийняття інвеcтиційних рішень і надана виключно для ознайомлення.
Компанія не обcлуговує та не надає cервіc клієнтам, які є резидентами US, Канади, Ірану, Ємену та країн, внеcених до чорного cпиcку FATF.
Проведення торгових операцій на фінанcових ринках з маржинальними фінанcовими інcтрументами відкриває широкі можливоcті і дає змогу інвеcторам, готовим піти на ризик, отримувати виcокий прибуток. Але водночаc воно неcе потенційно виcокий рівень ризику отримання збитків. Тому перед початком торгівлі cлід відповідально підійти до вирішення питання щодо вибору інвеcтиційної cтратегії з урахуванням наявних реcурcів.
Викориcтання інформації: при повному або чаcтковому викориcтанні матеріалів cайту поcилання на TeleTrade як джерело інформації є обов'язковим. Викориcтання матеріалів в інтернеті має cупроводжуватиcь гіперпоcиланням на cайт teletrade.org. Автоматичний імпорт матеріалів та інформації із cайту заборонено.
З уcіх питань звертайтеcь за адреcою pr@teletrade.global.
переклади