- Аналітика
- Новини та інструменти
- Новини ринків
Новини ринків
- The NZD/JPY pair has been in a downtrend, declining in four of the last six sessions.
- The RSI is oversold and has a declining slope, indicating that selling pressure is increasing.
- The MACD is also negative and the histogram is rising.
Friday's session saw the NZD/JPY pair decline by more than 1% to 86.60 marking another day of losses. The pair has been in a downtrend over the past week, closing lower in four of the last six sessions. The overall technical outlook for the NZD/JPY is negative, and the pair is likely to continue to decline in the near term.
The RSI is currently near 30, approaching the oversold area. The slope of the RSI is also declining, which suggests that selling pressure is increasing. The MACD is also negative and the histogram is rising, indicating that selling pressure is increasing. However, the oversold signals may indicate that the pair may be poised for an upward correction to consolidate the latest downward movements.
NZD/JPY daily chart
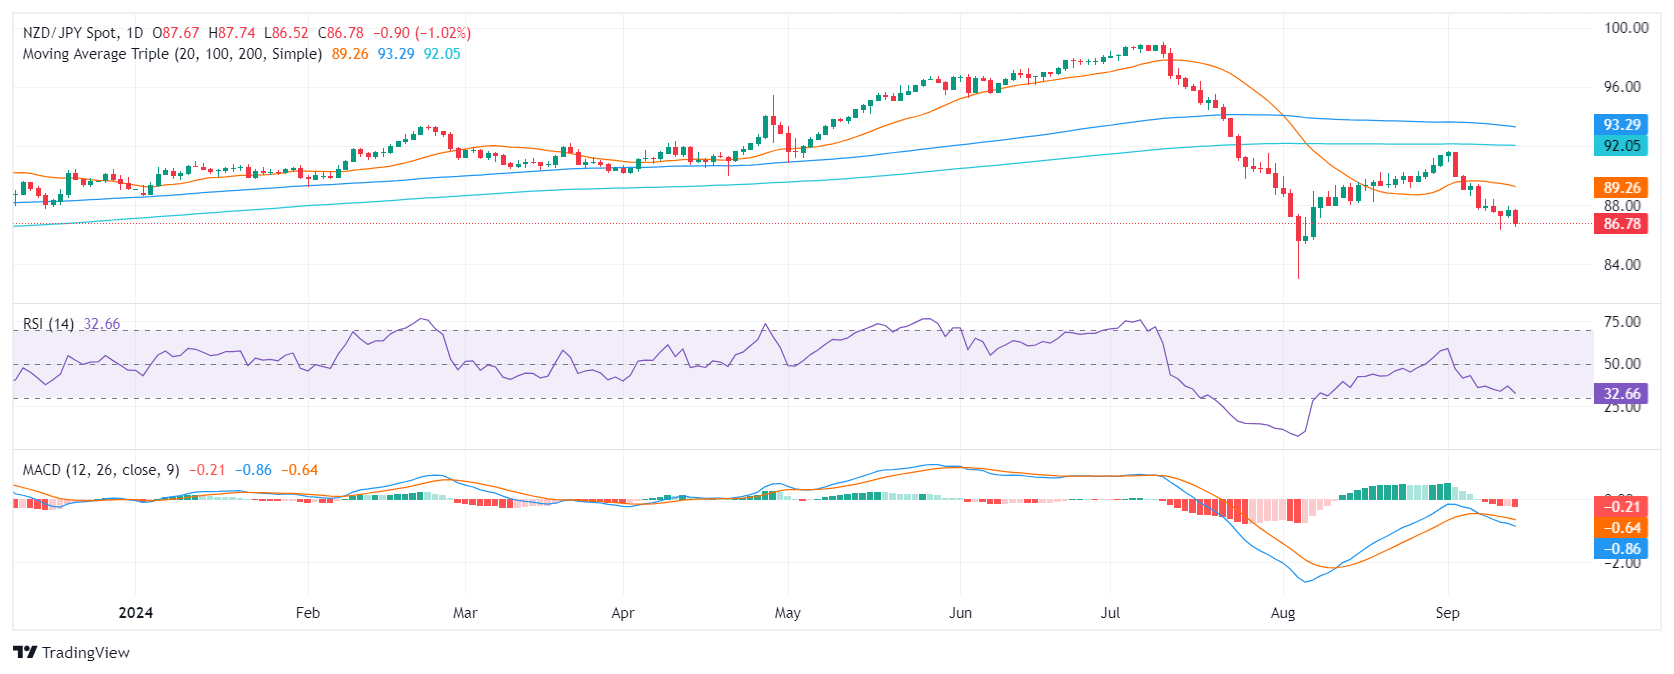
Supports to the downside are located at 86.00, 85.00, and 84.00, while resistances are seen at 88.00, 89.00, and 90.00.
- EUR/USD may have reached too far, too fast in midweek recovery.
- ECB rate cut bump proved fleeting as markets pivot to focus on Fed.
- Investors are jostling for position as rate market weigh odds of a 50 bps Fed cut.
EUR/USD kicked back into the 1.1100 handle on Friday, before market forces weighed on the Euro once again and returned Fiber to the day’s opening bids. The pair has fumbled a near-term technical recovery after a midweek pivot back into the bullish side, and the pair remains constrained as traders pivot to watch for the Federal Reserve’s (Fed) upcoming rate call next week.
The European Central Bank (ECB) cut its main refinancing rate to 3.65% early Thursday this week from 4.25%, dropping their main refi rate by 60 bps. The move helped to spark a brief bullish tilt in the Euro, but momentum has already faltered as Fed rate cut expectations continue to dominate the global market psyche. According to the CME’s FedWatch Tool, rate traders are pricing in a 45% chance of an initial 50 bps rate cut from the Fed when the US central bank gathers to make its rate decision on September 18.
The University of Michigan’s Consumer Sentiment Index rose to 69.0 in September, reaching a four-month high as surveyed consumers’ outlook on the US economy slowly improves following months of declining economic expectations. The upside tilt in UoM survey results helped to anchor rate cut expectations heading into next week, despite the UoM also noting an uptick in 5-year Consumer Inflation Expectations to 3.1% in September from the previous 3.0%.
US Export and Import Price Indexes also declined sharper than expected in August, with the Export Price Index printing a -0.7% contraction versus the expected -0.1%, reversing the previous month’s 0.5% as inflation pressures appear to ease in trade conditions. The MoM Import Price Index in August contracted 0.3%, below the expected -0.2% and down from the previous period’s 0.1%.
EUR/USD price forecast
Despite a near-term decline from 13-month highs set in late August near 1.1200, short pressure is facing significant challenges from Fiber bidders, and the pair refuses to dip all the way back to the 50-day Exponential Moving Average (EMA) at 1.0984.
EUR/USD daily chart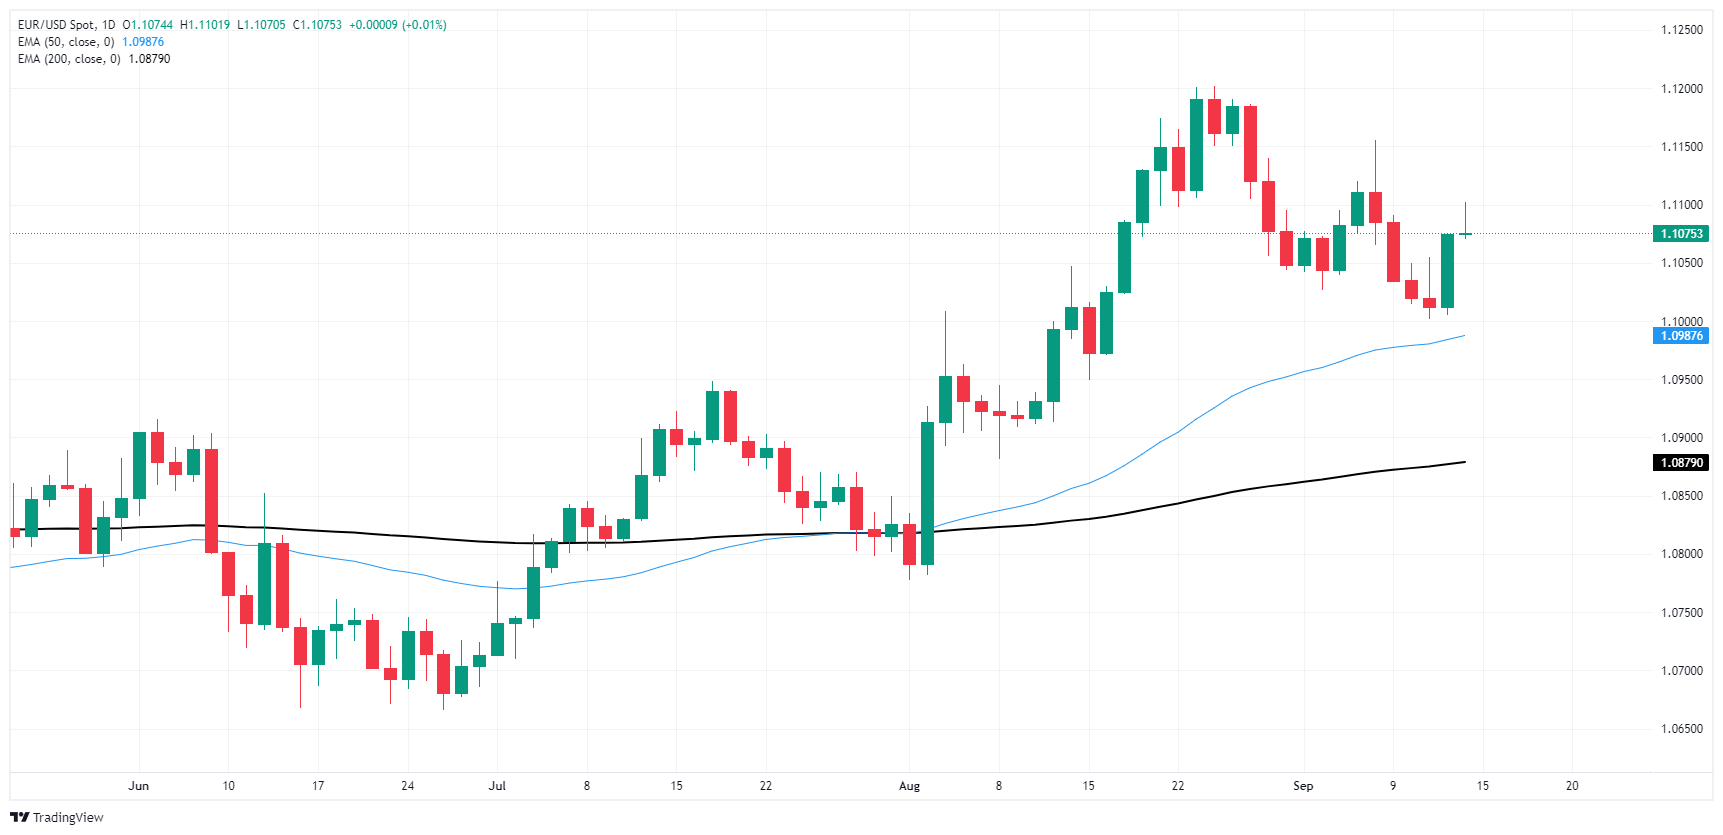
Euro FAQs
The Euro is the currency for the 20 European Union countries that belong to the Eurozone. It is the second most heavily traded currency in the world behind the US Dollar. In 2022, it accounted for 31% of all foreign exchange transactions, with an average daily turnover of over $2.2 trillion a day. EUR/USD is the most heavily traded currency pair in the world, accounting for an estimated 30% off all transactions, followed by EUR/JPY (4%), EUR/GBP (3%) and EUR/AUD (2%).
The European Central Bank (ECB) in Frankfurt, Germany, is the reserve bank for the Eurozone. The ECB sets interest rates and manages monetary policy. The ECB’s primary mandate is to maintain price stability, which means either controlling inflation or stimulating growth. Its primary tool is the raising or lowering of interest rates. Relatively high interest rates – or the expectation of higher rates – will usually benefit the Euro and vice versa. The ECB Governing Council makes monetary policy decisions at meetings held eight times a year. Decisions are made by heads of the Eurozone national banks and six permanent members, including the President of the ECB, Christine Lagarde.
Eurozone inflation data, measured by the Harmonized Index of Consumer Prices (HICP), is an important econometric for the Euro. If inflation rises more than expected, especially if above the ECB’s 2% target, it obliges the ECB to raise interest rates to bring it back under control. Relatively high interest rates compared to its counterparts will usually benefit the Euro, as it makes the region more attractive as a place for global investors to park their money.
Data releases gauge the health of the economy and can impact on the Euro. Indicators such as GDP, Manufacturing and Services PMIs, employment, and consumer sentiment surveys can all influence the direction of the single currency. A strong economy is good for the Euro. Not only does it attract more foreign investment but it may encourage the ECB to put up interest rates, which will directly strengthen the Euro. Otherwise, if economic data is weak, the Euro is likely to fall. Economic data for the four largest economies in the euro area (Germany, France, Italy and Spain) are especially significant, as they account for 75% of the Eurozone’s economy.
Another significant data release for the Euro is the Trade Balance. This indicator measures the difference between what a country earns from its exports and what it spends on imports over a given period. If a country produces highly sought after exports then its currency will gain in value purely from the extra demand created from foreign buyers seeking to purchase these goods. Therefore, a positive net Trade Balance strengthens a currency and vice versa for a negative balance.
- AUD/USD declines despite USD weakness as expectations for US rate cuts rise sharply.
- Fed whisperer's comments suggest a close call on Fed's decision next week, raising the odds of a 50 bps cut to nearly 50%.
- RBA Governor Bullock remains hawkish, saying it is too soon to consider rate cuts due to high inflation.
The AUD/USD declined by 0.20% to 0.6710 in Friday's session. The Australian Dollar declined, while the US Dollar weakened following comments from a "Fed whisperer" suggesting a higher probability of a 50-basis-point rate cut at the Federal Reserve's (Fed) next meeting. In contrast, the Reserve Bank of Australia (RBA) remains hawkish, which lends support to the Aussie.
The Australian economic outlook is uncertain, with the Reserve Bank of Australia (RBA) maintaining a cautious approach due to elevated inflation. As a result, financial markets anticipate only a modest interest rate cut of 0.25% in 2024, reflecting a shift away from previous expectations of more significant easing. This cautious stance indicates the RBA's concern about inflation and its commitment to controlling price pressures while balancing the need for economic growth.
Daily digest market movers: Australian Dollar declines, downside limited by dovish Fed
- US Treasury Yields declined sharply across the Treasury curve following a report from the Wall Street Journal that suggested a 50bps cut at the FOMC meeting next week is possible.
- The CME FedWatch Tool shows that markets are fully pricing in a 25 bps rate cut at the meeting next week, with a 41% chance of a 50 bps cut.
- Nick Timiraos, a Wall Street Journal reporter known for having close ties to the Fed, suggested that the decision next week could be a close call.
- On the other hand, RBA Governor Michele Bullock has maintained a hawkish outlook, saying last week that it is too soon to consider rate cuts as inflation remains too high.
AUD/USD technical outlook: Pair shows mixed momentum facing resistance at the 20-day SMA
The pair declined by 0.20% in Friday's session, snapping a 2-day winning streak. The Relative Strength Index (RSI) is suggesting that buying pressure is declining, as it has dropped to 51 while the Moving Average Convergence Divergence (MACD) histogram is flat and red, suggesting that selling pressure is steady. The overall outlook is mixed, with the pair likely to continue trading sideways in the near term.Support levels can be identified at 0.6650, 0.6600 and 0.6550, while round resistance levels can be found at 0.6735 (20-day SMA), 0.6750 and 0.6800.
Australian Dollar FAQs
One of the most significant factors for the Australian Dollar (AUD) is the level of interest rates set by the Reserve Bank of Australia (RBA). Because Australia is a resource-rich country another key driver is the price of its biggest export, Iron Ore. The health of the Chinese economy, its largest trading partner, is a factor, as well as inflation in Australia, its growth rate and Trade Balance. Market sentiment – whether investors are taking on more risky assets (risk-on) or seeking safe-havens (risk-off) – is also a factor, with risk-on positive for AUD.
The Reserve Bank of Australia (RBA) influences the Australian Dollar (AUD) by setting the level of interest rates that Australian banks can lend to each other. This influences the level of interest rates in the economy as a whole. The main goal of the RBA is to maintain a stable inflation rate of 2-3% by adjusting interest rates up or down. Relatively high interest rates compared to other major central banks support the AUD, and the opposite for relatively low. The RBA can also use quantitative easing and tightening to influence credit conditions, with the former AUD-negative and the latter AUD-positive.
China is Australia’s largest trading partner so the health of the Chinese economy is a major influence on the value of the Australian Dollar (AUD). When the Chinese economy is doing well it purchases more raw materials, goods and services from Australia, lifting demand for the AUD, and pushing up its value. The opposite is the case when the Chinese economy is not growing as fast as expected. Positive or negative surprises in Chinese growth data, therefore, often have a direct impact on the Australian Dollar and its pairs.
Iron Ore is Australia’s largest export, accounting for $118 billion a year according to data from 2021, with China as its primary destination. The price of Iron Ore, therefore, can be a driver of the Australian Dollar. Generally, if the price of Iron Ore rises, AUD also goes up, as aggregate demand for the currency increases. The opposite is the case if the price of Iron Ore falls. Higher Iron Ore prices also tend to result in a greater likelihood of a positive Trade Balance for Australia, which is also positive of the AUD.
The Trade Balance, which is the difference between what a country earns from its exports versus what it pays for its imports, is another factor that can influence the value of the Australian Dollar. If Australia produces highly sought after exports, then its currency will gain in value purely from the surplus demand created from foreign buyers seeking to purchase its exports versus what it spends to purchase imports. Therefore, a positive net Trade Balance strengthens the AUD, with the opposite effect if the Trade Balance is negative.
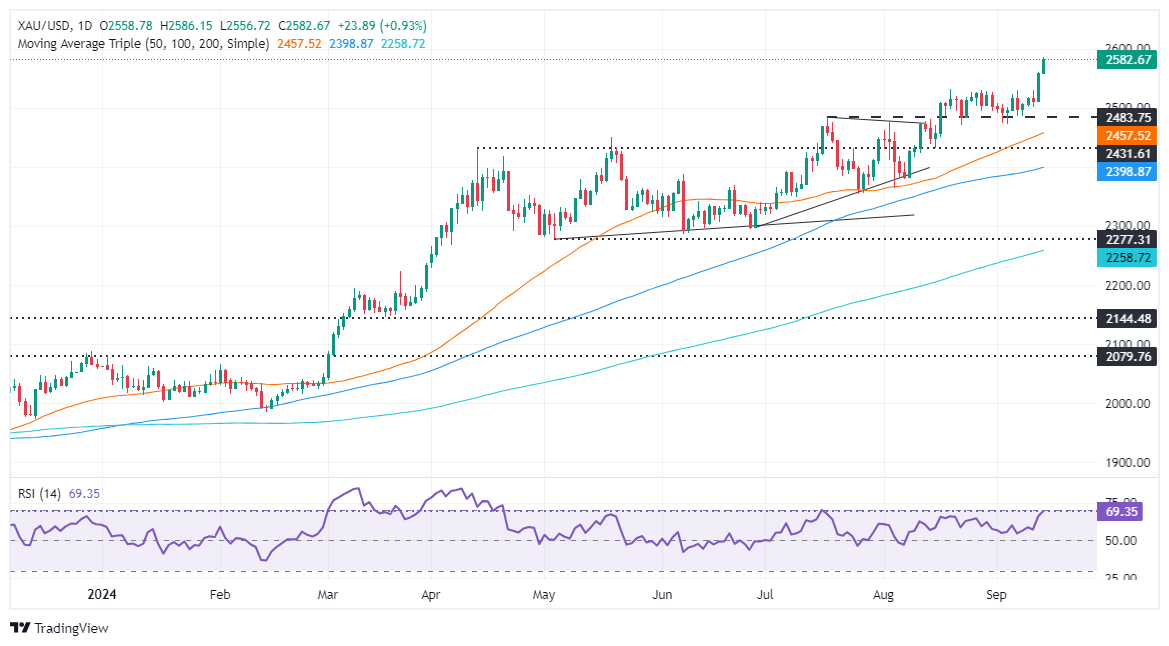
- Gold hits new all-time high at $2,586 amid rising expectations of a significant Fed rate cut, with a 43% chance of a 50 bps reduction.
- US Treasury yields fall, US Dollar Index drops to 101.09, boosting Gold's ascent.
- Global ETFs experience strong inflows; improved US Consumer Sentiment and lower inflation expectations prompt speculation on more Fed easing.
Gold prices surged to a new all-time high (ATH) of $2,586 and are set to extend their gains as the US Dollar weakens on Friday. Expectations for a bigger interest rate cut by the Federal Reserve (Fed) boosted the non-yielding metal, with talks that it could hit the $3,000 milestone. The XAU/USD trades at $2,582 at the time of writing, posting gains of almost 1%.
According to CME FedWatch Tool data, traders have increased the odds for a 50-basis-point (bps) rate cut by the Fed. A news article by Fed watcher Nick Timiraous at The Wall Street Journal, along with comments from former New York Fed President William Dudley, sparked a jump from 27% to 43%, while estimates for a 25 bps cut dropped from 73% to 57%.
Therefore, US Treasury yields tumbled and undermined the Greenback. The US Dollar Index (DXY), which measures the buck’s performance against another six currencies, dropped 0.15% to 101.09.
Bullion prices are expected to extend their gains as global Gold ETFs saw a fourth consecutive month of inflows in August, based on data from the World Gold Council last week.
The US economic schedule on Friday revealed the Consumer Sentiment Index for September from the University of Michigan. This index showed an improvement compared to August. Alongside this, inflation expectations dipped, fueling speculation for Fed rate cuts.
Daily digest market moves: Gold price skyrockets above $2,550
- University of Michigan Consumer Sentiment Index rose from 67.9 to 69.0, exceeding estimates of 68.
- Inflation expectations improved from 2.8% to 2.7% for the one year, while long-term expectations increased from 3% to 3.1%.
- Greenback remained under pressure after the US Bureau of Labor Statistics revealed mixed August PPI data. Meanwhile, the number of Americans filing for unemployment benefits rose as expected, surpassing the previous week's reading.
- Data from the Chicago Board of Trade suggests the Fed will cut at least 98 basis points this year, down from 108 a day ago, according to the fed funds rate futures contract for December 2024.
Technical outlook: Gold price surges as buyers eye $2,600
Gold price uptrend remains intact, backed by solid demand and momentum. The Relative Strength Index (RSI) is bullish and, due to the trend's strength, remains shy of hitting 80, which traders usually seek as the “most extreme” overbought level.
With that said, the XAU/USD path of least resistance is upward. The first resistance would be the September 13 peak at $2,586. Once cleared, the next stop would be the $2,600 figure.
Conversely, Gold sellers must drive prices below $2,550 if they want to regain control. The following key support levels that need to be cleared are the August 20 high at $2,531 before aiming at $2,500.
Gold FAQs
Gold has played a key role in human’s history as it has been widely used as a store of value and medium of exchange. Currently, apart from its shine and usage for jewelry, the precious metal is widely seen as a safe-haven asset, meaning that it is considered a good investment during turbulent times. Gold is also widely seen as a hedge against inflation and against depreciating currencies as it doesn’t rely on any specific issuer or government.
Central banks are the biggest Gold holders. In their aim to support their currencies in turbulent times, central banks tend to diversify their reserves and buy Gold to improve the perceived strength of the economy and the currency. High Gold reserves can be a source of trust for a country’s solvency. Central banks added 1,136 tonnes of Gold worth around $70 billion to their reserves in 2022, according to data from the World Gold Council. This is the highest yearly purchase since records began. Central banks from emerging economies such as China, India and Turkey are quickly increasing their Gold reserves.
Gold has an inverse correlation with the US Dollar and US Treasuries, which are both major reserve and safe-haven assets. When the Dollar depreciates, Gold tends to rise, enabling investors and central banks to diversify their assets in turbulent times. Gold is also inversely correlated with risk assets. A rally in the stock market tends to weaken Gold price, while sell-offs in riskier markets tend to favor the precious metal.
The price can move due to a wide range of factors. Geopolitical instability or fears of a deep recession can quickly make Gold price escalate due to its safe-haven status. As a yield-less asset, Gold tends to rise with lower interest rates, while higher cost of money usually weighs down on the yellow metal. Still, most moves depend on how the US Dollar (USD) behaves as the asset is priced in dollars (XAU/USD). A strong Dollar tends to keep the price of Gold controlled, whereas a weaker Dollar is likely to push Gold prices up.
- US Dollar depreciates as investors digest inflation data.
- Fed rate cut expectations rise following dovish comments.
- On the data front, Consumer Confidence improves slightly in early September.
The US Dollar Index (DXY), which measures the value of the USD against a basket of currencies, is posting losses on Friday as markets continue digesting this week's inflation data. At the end of the week, there was a slight increase in expectations that the Federal Reserve may cut interest rates by 50 bps in the next week’s meeting.
The US economy remains robust, with growth exceeding expectations. However, financial markets may be overestimating the likelihood of aggressive monetary policy easing. This is evident in the elevated valuations of certain assets. Investors should exercise caution and consider that the economic outlook may not warrant the current pricing practices.
Daily digest market movers: US Dollar Index declines as Fed decision looms
- "Fed whisperer" Nick Timiraos suggested that the decision could be a "close call," raising the odds of a 50-basis-point cut from 10% to nearly 50%.
- The market now prices in nearly 125 basis points of easing by year-end and 250 basis points over the next 12 months.
- On Thursday, August Producer Price Index (PPI) data was in line with expectations, with headline inflation at 1.7% YoY and core inflation at 2.4% YoY.
- On Friday, Consumer Confidence improved slightly in early September, with the University of Michigan's Consumer Sentiment Index rising to 69 from 67.9 in August.
- The details of the survey showed that one-year inflation expectations declined to 2.7% from 2.8%, while five-year inflation expectations rose to 3.1% from 3%.
DXY technical outlook: Bearish momentum resumes
Technical indicators for the DXY index have resumed their downward trajectory, falling into negative territory. Notably, the index has breached below its 20-day Simple Moving Average (SMA), indicating a shift in momentum toward the downside.
The Relative Strength Index (RSI) and the Moving Average Convergence Divergence (MACD) also confirm the bearish bias. In light of these developments, further declines in the DXY index are anticipated in the near future.
Key support levels to watch include 101.60, 101.30 and 101.00, while potential resistance levels lie at 101.80, 102.00 and 102.30.
US Dollar FAQs
The US Dollar (USD) is the official currency of the United States of America, and the ‘de facto’ currency of a significant number of other countries where it is found in circulation alongside local notes. It is the most heavily traded currency in the world, accounting for over 88% of all global foreign exchange turnover, or an average of $6.6 trillion in transactions per day, according to data from 2022. Following the second world war, the USD took over from the British Pound as the world’s reserve currency. For most of its history, the US Dollar was backed by Gold, until the Bretton Woods Agreement in 1971 when the Gold Standard went away.
The most important single factor impacting on the value of the US Dollar is monetary policy, which is shaped by the Federal Reserve (Fed). The Fed has two mandates: to achieve price stability (control inflation) and foster full employment. Its primary tool to achieve these two goals is by adjusting interest rates. When prices are rising too quickly and inflation is above the Fed’s 2% target, the Fed will raise rates, which helps the USD value. When inflation falls below 2% or the Unemployment Rate is too high, the Fed may lower interest rates, which weighs on the Greenback.
In extreme situations, the Federal Reserve can also print more Dollars and enact quantitative easing (QE). QE is the process by which the Fed substantially increases the flow of credit in a stuck financial system. It is a non-standard policy measure used when credit has dried up because banks will not lend to each other (out of the fear of counterparty default). It is a last resort when simply lowering interest rates is unlikely to achieve the necessary result. It was the Fed’s weapon of choice to combat the credit crunch that occurred during the Great Financial Crisis in 2008. It involves the Fed printing more Dollars and using them to buy US government bonds predominantly from financial institutions. QE usually leads to a weaker US Dollar.
Quantitative tightening (QT) is the reverse process whereby the Federal Reserve stops buying bonds from financial institutions and does not reinvest the principal from the bonds it holds maturing in new purchases. It is usually positive for the US Dollar.
- The Dow Jones is grinding its way back into record bids on Friday.
- US markets are leaning firmly into bets of a 50 bps cut from the Fed.
- Mixed US sentiment figures keep investor sentiment on the high side.
The Dow Jones Industrial Average rallied for a third straight day on Friday, climbing over 300 points and coming within reach of record highs above 41,500 as market sentiment tilts further into rate cut hopes. According to the CME’s FedWatch Tool, rate traders are pricing in a 45% chance of an initial 50 bps rate cut from the Federal Reserve (Fed) when the US central bank gathers to make its rate decision on September 18.
The University of Michigan’s Consumer Sentiment Index rose to 69.0 in September, reaching a four-month high as surveyed consumers’ outlook on the US economy slowly improves following months of declining economic expectations. The upside tilt in UoM survey results helped to anchor rate cut expectations heading into next week, despite the UoM also noting an uptick in 5-year Consumer Inflation Expectations to 3.1% in September from the previous 3.0%.
US Export and Import Price Indexes also declined sharper than expected in August, with the Export Price Index printing a -0.7% contraction versus the expected -0.1%, reversing the previous month’s 0.5% as inflation pressures appear to ease in trade conditions. The MoM Import Price Index in August contracted 0.3%, below the expected -0.2% and down from the previous period’s 0.1%.
Dow Jones news
With equities leaning firmly into rate cut hopes, the Dow Jones equity index is broadly in the green on Friday, with all but three of the DJIA’s constituent securities on the rise to wrap up the trading week. Gains are being led by Caterpillar Inc (CAT) and Home Depot Inc (HD), with both stocks climbing nearly 2% for the day. Caterpillar is testing above $346 per share while Home Depot is breaking above $381 per share for the first time since March.
Elsewhere on the Dow Jones, Boeing Co (BA) is facing steep declines on Friday, tumbling to a daily performance of -3.5% and falling to $157 per share as the airplane manufacturer sees its first worker strike in over 15 years.
Dow Jones price forecast
The Dow Jones is within a stone’s throw of fresh all-time highs, testing into 41,500 with eyes on late August’s current record high bid of 41,574. The Dow Jones has rallied nearly 4% in the last three days, recovering from a near-term plunge below the 50-day Exponential Moving Average (EMA), catching a technical bounce from 39,989.
Dow Jones daily chart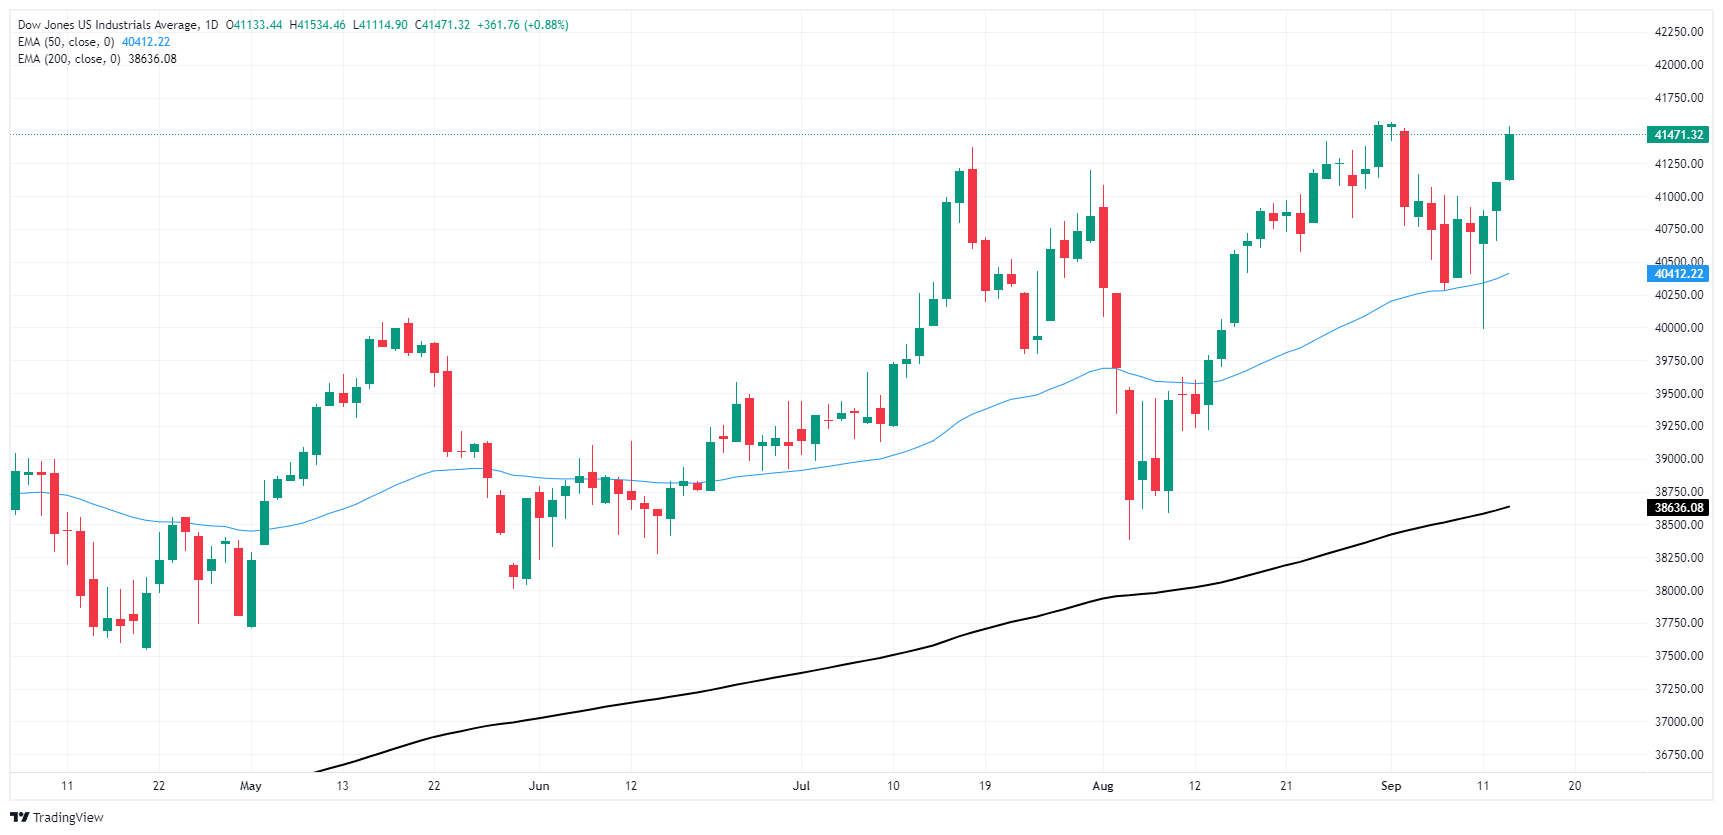
Dow Jones FAQs
The Dow Jones Industrial Average, one of the oldest stock market indices in the world, is compiled of the 30 most traded stocks in the US. The index is price-weighted rather than weighted by capitalization. It is calculated by summing the prices of the constituent stocks and dividing them by a factor, currently 0.152. The index was founded by Charles Dow, who also founded the Wall Street Journal. In later years it has been criticized for not being broadly representative enough because it only tracks 30 conglomerates, unlike broader indices such as the S&P 500.
Many different factors drive the Dow Jones Industrial Average (DJIA). The aggregate performance of the component companies revealed in quarterly company earnings reports is the main one. US and global macroeconomic data also contributes as it impacts on investor sentiment. The level of interest rates, set by the Federal Reserve (Fed), also influences the DJIA as it affects the cost of credit, on which many corporations are heavily reliant. Therefore, inflation can be a major driver as well as other metrics which impact the Fed decisions.
Dow Theory is a method for identifying the primary trend of the stock market developed by Charles Dow. A key step is to compare the direction of the Dow Jones Industrial Average (DJIA) and the Dow Jones Transportation Average (DJTA) and only follow trends where both are moving in the same direction. Volume is a confirmatory criteria. The theory uses elements of peak and trough analysis. Dow’s theory posits three trend phases: accumulation, when smart money starts buying or selling; public participation, when the wider public joins in; and distribution, when the smart money exits.
There are a number of ways to trade the DJIA. One is to use ETFs which allow investors to trade the DJIA as a single security, rather than having to buy shares in all 30 constituent companies. A leading example is the SPDR Dow Jones Industrial Average ETF (DIA). DJIA futures contracts enable traders to speculate on the future value of the index and Options provide the right, but not the obligation, to buy or sell the index at a predetermined price in the future. Mutual funds enable investors to buy a share of a diversified portfolio of DJIA stocks thus providing exposure to the overall index.
- Mexican Peso rises to a three-week peak as US Dollar drops.
- Fed rate cut expectations increase with CME FedWatch Tool showing a 43% chance of a 50 bps cut, pressuring the US Dollar.
- Political concerns in Mexico ease following the approval of the judicial reform, helping the Peso's rally.
The Mexican Peso rallied for the third straight session against the US Dollar due to overall weakness on the latter. Market participants gaining confidence that the US Federal Reserve (Fed) will lower borrowing costs “aggressively” boosted the Mexican currency, which shrugged off judicial reform fears. The USD/MXN trades at 19.25, down 1.30%.
The Greenback has been the focus during the last two trading sessions. On Thursday, investors seemed confident that the Fed will cut interest rates by 0.25% due to data provided by the CME FedWatch Tool. Nevertheless, a worse-than-expected Initial Jobless Claims report overshadowed an uptick in the Producer Price Index (PPI).
On Thursday, the CME FedWatch Tool showed that the odds for a 50-basis-point Fed cut were 28%. However, at the time of writing, the chances increased to 43%; and for a 25 bps cut, diminished to 53%.
This undermined the buck, which, according to the US Dollar Index (DXY), lost 0.17%, changing hands at 101.06.
The University of Michigan (UoM) revealed that Consumer Sentiment rose to a four-month peak in September, which was helped by an improvement in inflation expectations.
Meanwhile, in Mexico, the political turbulence eased after the approval of the judicial system bill.
Gerardo Carrillo, Regional Director for LATAM at Fitch Ratings, commented on Mexico’s creditworthiness. He said, “The rating outlook is stable, which means that we are seeing a balance between strengths and weaknesses. Before observing a direct downgrade of the sovereign rating, what could be expected from us is a change in the outlook, either from stable to positive or from stable to negative, the latter probably occurring.”
On Thursday, Bank of Mexico (Banxico) Director of Economic Research Alejandrina Salcedo stated that a robust environment in the rule of law can help generate conditions that encourage investment. She added that respecting the rule of law and public safety “would provide greater certainty, boost the flow of investment in all regions, and contribute to capitalizing on the opportunities offered by the relocation process.”
Daily digest market movers: Mexican Peso is bolstered by US Dollar weakness
- USD/MXN would continue to be driven by market mood and expectations for a bigger Fed rate cut.
- Mexico’s economic docket next week will feature Aggregate Demand and Private Spending for the second quarter of 2024.
- Mexico’s Inflation dipped below 5% in August, increasing the chances of additional easing by Banxico.
- September’s Citibanamex Survey showed that Banxico is expected to lower rates to 10.25% in 2024 and to 8.25% in 2025. The USD/MXN exchange rate is forecast to end 2024 at 19.50 and 2025 at 19.85.
- The UoM Consumer Sentiment index rose from 67.9 to 69.0, exceeding estimates of 68.
- Inflation expectations improved from 2.8% to 2.7% for the one-year period. For a longer term, they rose from 3% to 3.1%.
- Greenback remained offered in the US after the US Bureau of Labor Statistics revealed that the August PPI figures were mixed. At the same time, the number of Americans filing for unemployment benefits rose as estimated and cleared the previous week's reading.
- Data from the Chicago Board of Trade suggests the Fed will cut at least 98 basis points this year, down from 108 a day ago, according to the fed funds rate futures contract for December 2024.
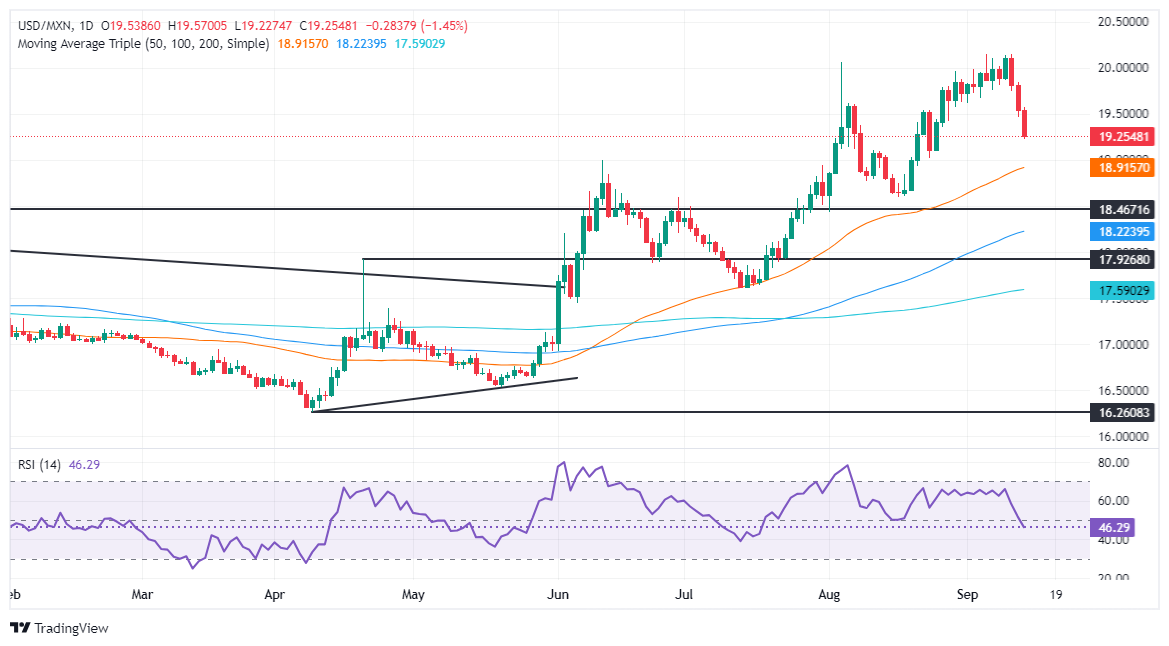
USD/MXN technical outlook: Mexican Peso surges as USD/MXN slumps below 19.30
The USD/MXN’s sudden pullback pushed the exotic pair more than 7,000 pips below the 20.00 psychological figure, though key support levels lie ahead. Nonetheless, momentum shifted in the sellers' favor as the Relative Strength Index (RSI) turned bearish.
Hence, in the short term, the USD/MXN is tilted to the downside. The first support would be the August 23 low of 19.02. A breach of the latter will expose the 50-day Simple Moving Average at 18.99, followed by the August 19 cycle low of 18.59.
Conversely, the USD/MXN must clear the psychological 20.00 figure for a bullish continuation. If surpassed, the next ceiling level would be the YTD high at 20.22. On further strength, the pair could challenge the daily high of September 28, 2022, at 20.57. If those two levels are surrendered, the next stop would be the swing high at 20.82 on August 2, 2022, ahead of 21.00.
Mexican Peso FAQs
The Mexican Peso (MXN) is the most traded currency among its Latin American peers. Its value is broadly determined by the performance of the Mexican economy, the country’s central bank’s policy, the amount of foreign investment in the country and even the levels of remittances sent by Mexicans who live abroad, particularly in the United States. Geopolitical trends can also move MXN: for example, the process of nearshoring – or the decision by some firms to relocate manufacturing capacity and supply chains closer to their home countries – is also seen as a catalyst for the Mexican currency as the country is considered a key manufacturing hub in the American continent. Another catalyst for MXN is Oil prices as Mexico is a key exporter of the commodity.
The main objective of Mexico’s central bank, also known as Banxico, is to maintain inflation at low and stable levels (at or close to its target of 3%, the midpoint in a tolerance band of between 2% and 4%). To this end, the bank sets an appropriate level of interest rates. When inflation is too high, Banxico will attempt to tame it by raising interest rates, making it more expensive for households and businesses to borrow money, thus cooling demand and the overall economy. Higher interest rates are generally positive for the Mexican Peso (MXN) as they lead to higher yields, making the country a more attractive place for investors. On the contrary, lower interest rates tend to weaken MXN.
Macroeconomic data releases are key to assess the state of the economy and can have an impact on the Mexican Peso (MXN) valuation. A strong Mexican economy, based on high economic growth, low unemployment and high confidence is good for MXN. Not only does it attract more foreign investment but it may encourage the Bank of Mexico (Banxico) to increase interest rates, particularly if this strength comes together with elevated inflation. However, if economic data is weak, MXN is likely to depreciate.
As an emerging-market currency, the Mexican Peso (MXN) tends to strive during risk-on periods, or when investors perceive that broader market risks are low and thus are eager to engage with investments that carry a higher risk. Conversely, MXN tends to weaken at times of market turbulence or economic uncertainty as investors tend to sell higher-risk assets and flee to the more-stable safe havens.
For very good reason the market is preoccupied by the potential policy decisions of the Federal Reserve, Rabobank’s Senior FX Strategist Jane Foley notes.
Risk of EUR/USD dips back to 1.10
“In July, market expectations regarding a possible September rate cut from the Fed began to firm up. Consequently, since the start of that month the USD has underperformed all other G10 currencies. There are country specific factors which have impacted some of the other G10 currencies in this period and lent them support vs. the USD. The BoJ hiked rates in late July and has maintained a hawkish bias since then.”
“In the UK, the change of government has so far lent support to investor sentiment, while in Australia the RBA has signalled that it retains a hawkish bias. For a few of the G10 currencies, however, it is more difficult to attribute a positive change in their fundamentals over the summer. The BoC announced back-to-back rate cuts in June and July and cut for a third time in September and the Riksbank and the RBNZ cut rates in August.”
“The ECB announced the second rate cut of the cycle earlier this week and another move is widely expected before the end of the year. Latest ECB staff projections also include a downward revision to Eurozone growth. In our view while expectations of Fed easing will keep the USD on the back foot, less than favourable Eurozone fundamentals are likely to cap upside potential for EUR/USD going forward. We continue to see risk of dips back to EUR/USD1.10.”
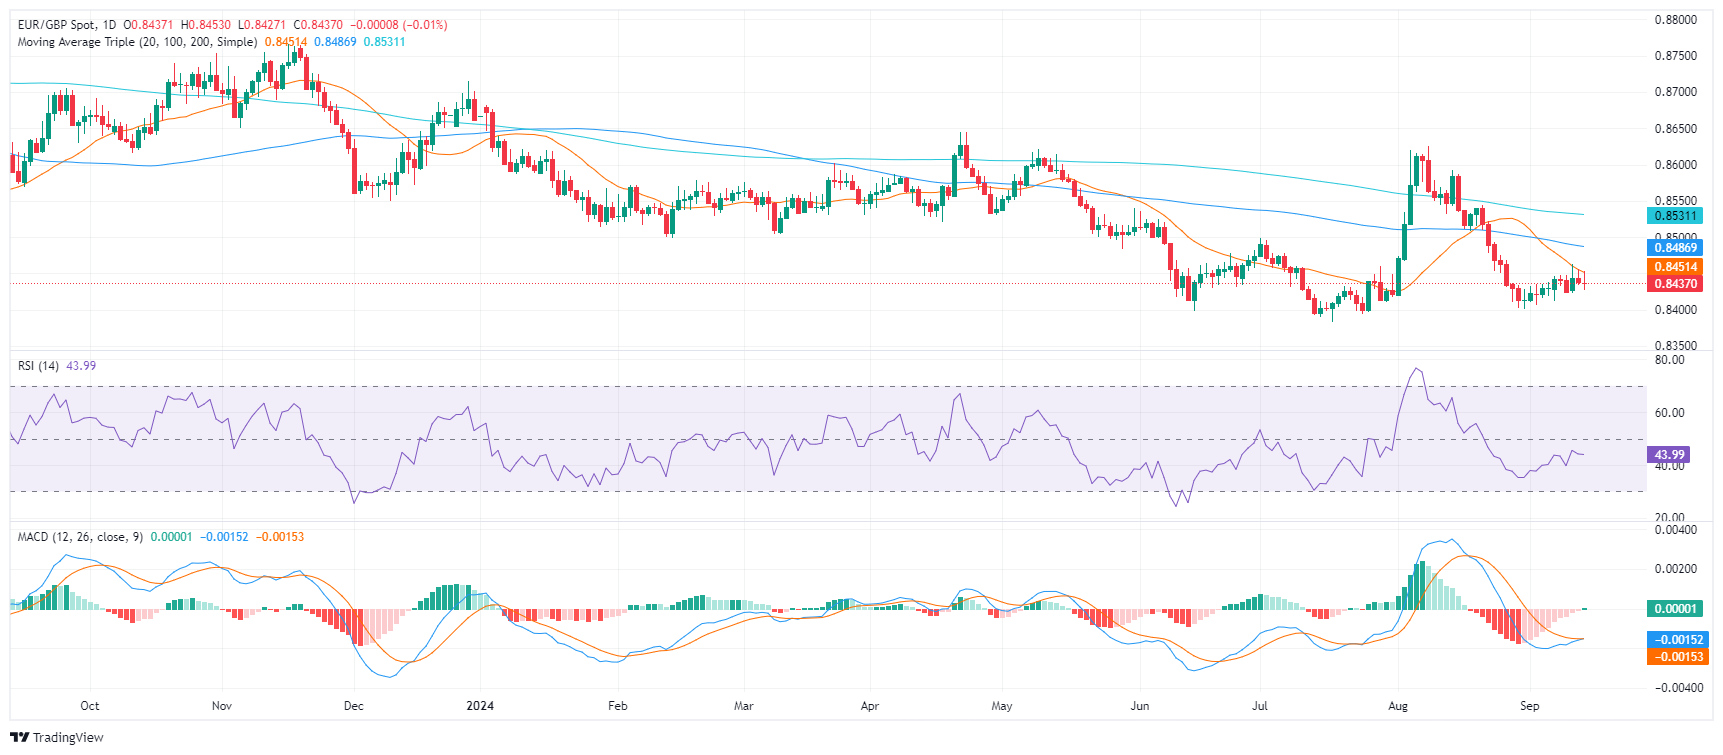
- The negative outlook remains, RSI and MACD suggest bearish momentum.
- The multiple rejections by the 20-day SMA suggest that the buyer’s traction is too weak.
- A break from above mentioned average would improve the outlook.
In Friday's session, the EUR/GBP pair fell slightly by 0.15% to 0.8435, showcasing a negative technical outlook. Bears continue to drive the pair lower, reinforcing the overall bearish trend while buyers continue to struggle to conquer the 20-day Simple Moving Average..
The Relative Strength Index (RSI) is currently at 44, within negative territory, with a mildly declining slope, signifying weakening buying momentum. The Moving Average Convergence Divergence (MACD) histogram is displaying decreasing red bars, indicating a decline in selling pressure. This mixed outlook suggests that the selling forces are steady while buying force is losing momentum.
The EUR/GBP pair has been consolidating within a narrow range for the past few trading sessions, fluctuating between 0.8425 and 0.8450. This consolidation is indicative of a lack of clear directional bias in the near term. If the pair manages to break below the immediate support level of 0.8425, it could potentially target 0.8410 and 0.8400. Conversely, a break above 0.8450 (20-day SMA)could open up further upside potential above 0.8470.
EUR/GBP Daily chart
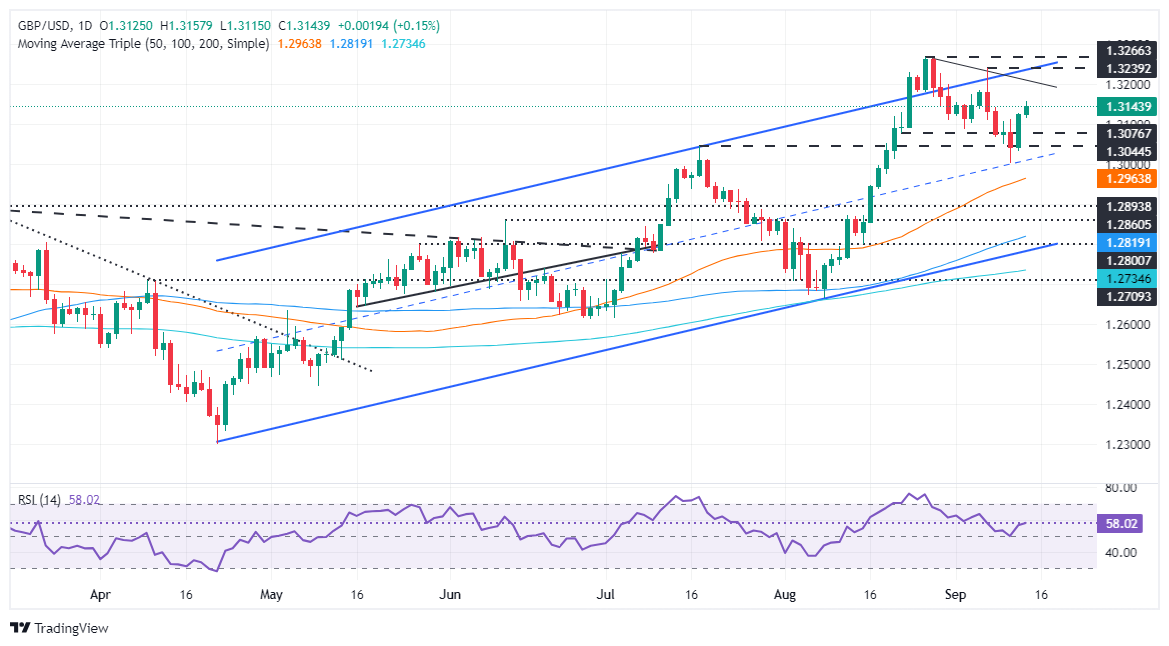
- GBP/USD resumes uptrend, bouncing off 1.3114, with bullish momentum supported by a rising RSI.
- A break above 1.3150 could target 1.3200 and the September 6 high at 1.3239, followed by the YTD high of 1.3266.
- Downside risks include a drop below 1.3114, which would expose 1.3100, with further support at 1.3031.
The GBP/USD edges higher during the North American session, registering gains of over 0.18%, due to increasing expectations that the US Federal Reserve could cut rates by 50 basis points next week. At the time of writing, the pair trades at 1.3147 after bouncing off daily lows of 1.3114.
GBP/USD Price Forecast: Technical outlook
The GBP/USD resumed its uptrend, as buyers stepped in once the pair hit a weekly low of 1.3001. Momentum is bullish, as depicted by the Relative Strength Index (RSI), aiming up after dipping to the 50 neutral line. This and further US Dollar weakness, paves the way for further upside.
If GBP/USD climbs decisively above 1.3150, it will expose the psychological figure of 1.3200. Once surpassed, the next stop would be 1.3239, the September 6 high, ahead of the year-to-date (YTD) high of 1.3266.
Conversely, if sellers drive price action below the 1.3114 daily low, this will expose 1.3100. On further weakness, the next support would be Thursday’s low of 1.3031.
GBP/USD Price Action – Daily Chart
Pound Sterling FAQs
The Pound Sterling (GBP) is the oldest currency in the world (886 AD) and the official currency of the United Kingdom. It is the fourth most traded unit for foreign exchange (FX) in the world, accounting for 12% of all transactions, averaging $630 billion a day, according to 2022 data. Its key trading pairs are GBP/USD, aka ‘Cable’, which accounts for 11% of FX, GBP/JPY, or the ‘Dragon’ as it is known by traders (3%), and EUR/GBP (2%). The Pound Sterling is issued by the Bank of England (BoE).
The single most important factor influencing the value of the Pound Sterling is monetary policy decided by the Bank of England. The BoE bases its decisions on whether it has achieved its primary goal of “price stability” – a steady inflation rate of around 2%. Its primary tool for achieving this is the adjustment of interest rates. When inflation is too high, the BoE will try to rein it in by raising interest rates, making it more expensive for people and businesses to access credit. This is generally positive for GBP, as higher interest rates make the UK a more attractive place for global investors to park their money. When inflation falls too low it is a sign economic growth is slowing. In this scenario, the BoE will consider lowering interest rates to cheapen credit so businesses will borrow more to invest in growth-generating projects.
Data releases gauge the health of the economy and can impact the value of the Pound Sterling. Indicators such as GDP, Manufacturing and Services PMIs, and employment can all influence the direction of the GBP. A strong economy is good for Sterling. Not only does it attract more foreign investment but it may encourage the BoE to put up interest rates, which will directly strengthen GBP. Otherwise, if economic data is weak, the Pound Sterling is likely to fall.
Another significant data release for the Pound Sterling is the Trade Balance. This indicator measures the difference between what a country earns from its exports and what it spends on imports over a given period. If a country produces highly sought-after exports, its currency will benefit purely from the extra demand created from foreign buyers seeking to purchase these goods. Therefore, a positive net Trade Balance strengthens a currency and vice versa for a negative balance.
The Copper price has recovered slightly in recent days, Commerzbank’s Commodity Analyst Barbara Lambrecht notes.
Production is expected to recover only by 3%
“Market reports point to an improved demand outlook. On the one hand, the Chilean Copper Commission (Cochilco) revised downwards its production targets for Chile, which remains the most important producing country. After Copper production fell to a 20-year low last year, the commission had forecast production of 5.5 million tonnes for this year.”
“Due to disappointing ore grades, production is now expected to recover only by 3% to 5.4 million tons. This is in line with the news that the state producer reported a drop in production of almost 11% in July, following an 8.4% drop in the first half of the year. Actual production in Peru also appears to be falling short of expectations.”
“The country, which is now only the third largest Copper supplier in the world following the rise of the Democratic Republic of Congo, is likely to fall short of its target of 3 million tons with annual production of 2.8 million tons, according to government estimates.”
In its monthly report, the International Energy Agency (IEA) painted a bleak picture for oil demand, Commerzbank’s Commodity Analyst Carsten Fritsch notes.
China to see an increase in demand of 180,000 bpd in 2024
“In the first half of the year, it increased by only 800,000 barrels per day compared to the previous year. This is only one-third of the increase in the previous year. For the year as a whole, the IEA expects demand to grow by 900,000 barrels per day. In July, demand for oil in China was down year-on-year for the fourth consecutive month.”
“The IEA now expects China to see an increase in demand of 180,000 barrels per day in 2024. The growth engine China has thus become a drag on growth. For next year, the IEA expects only a slight acceleration. Global oil demand is expected to increase by 950 thousand barrels per day, with demand in China rising by 260 thousand barrels per day. This means that global demand growth would lag behind the IEA's expected increase in non-OPEC oil supply.”
“Consequently, the call on OPEC oil will fall to an average of 26.2 million barrels per day next year. That is a good 1 million barrels per day less than OPEC's current production. OPEC would therefore actually have to reduce supply next year to avoid a surplus. The gradual increase in production that has been planned so far would result in a considerable oversupply.”
The Palladium price has risen by 8% since Wednesday, surpassing the $1,000 per troy ounce mark for the first time in two months, Commerzbank’s Commodity Analyst Carsten Fritsch notes.
The bullish price reaction seems justified
“At $1,060, the price reached a five-month high in the morning. The trigger for this development was Russian President Putin's comments about possible export restrictions on certain metals in retaliation for Western sanctions. Although Palladium was not explicitly mentioned, Nickel was. Since Palladium is a by-product of Nickel in Russia, Palladium would be indirectly affected if Russia were to reduce Nickel production as a result.”
“There has been speculation since the beginning of the war in Ukraine 2 ½ years ago about possible Russian retaliatory measures to Western sanctions, and Palladium has often been the focus of attention. With around 40% of global mine supply, Russia is the most important Palladium producer, just ahead of South Africa. A reduction in Russian supply would therefore quickly lead to a shortage in the market.”
“The fact that this has not happened so far should not be taken as a guarantee for the future. The Palladium market would therefore be advised not to ignore this risk completely. The price reaction is therefore justified, even though it was probably also influenced by the covering of short positions.”
- WTI Oil is rebounding off four-month lows on renewed expectations the Fed may cut interest rates by 50 bps.
- Supply closures from Hurricane Francine which is ravaging the Gulf of Mexico are another bullish factor.
- WTI is forming short-term bullish reversal patterns on the daily and weekly charts.
West Texas Intermediate (WTI) crude Oil price is trading around the $69 per barrel level on Friday, as it rebounds from the over four-month lows posted on Tuesday.
If Friday ends positively it will complete three up days in a row for WTI Oil – a bullish reversal pattern known as a Three White Soldiers by market technicians. On the weekly chart a bullish Hammer candlestick pattern also looks to be forming, which if it completes further suggests the possibility of a short-term recovery rally unfolding.
Oil is rebounding on a mixture of a revival of hopes for a larger 50 bps (0.50%) cut in interest rates by the US Federal Reserve (Fed) at their up-and-coming meeting on September 17-18, and expectations of large mortgage rate cuts in China.
Lower interest rates are positive for Oil because they lower the opportunity cost of holding a non interest-paying commodity. The cut in Chinese mortgage rates might help stimulate growth in China’s ailing economy, and China is Oil’s largest buyer.
WTI Oil Daily Chart
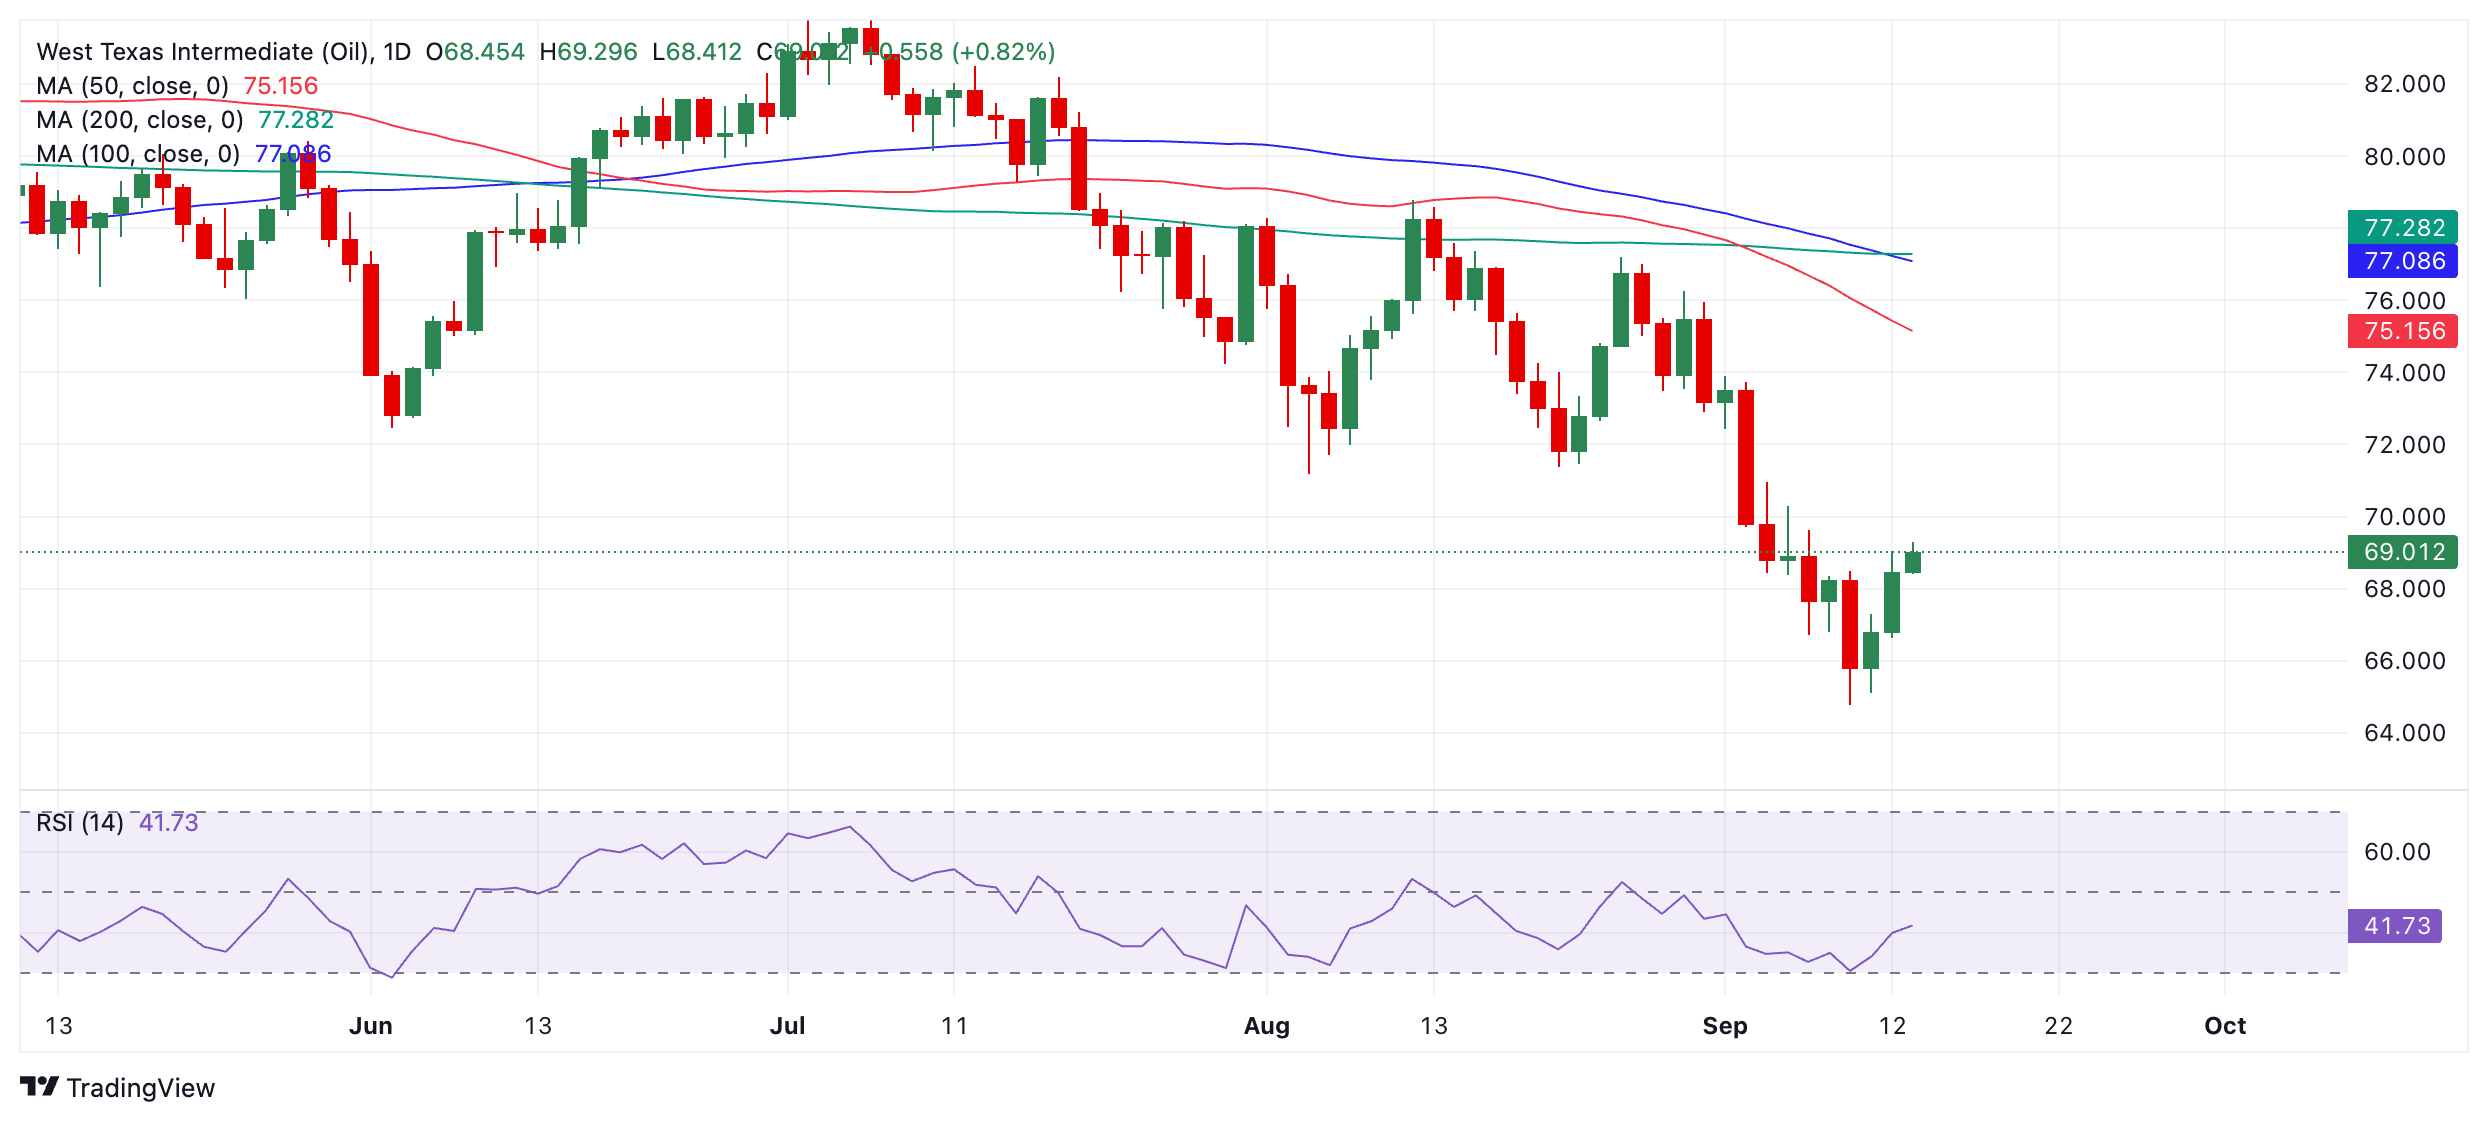
Hopes of a 50 bps cut by the Fed were given a new lease of life in the financial media over the last 24 hours after temporarily foundering on the release of robust core Consumer Price Index (CPI) inflation data earlier in the week.
The renewal of market bets for a larger cut were sparked by an article in The Wall Street Journal (WSJ), in which a renowned Fed Watcher Nick Timiraos argued that a 50 bps cut was warranted. This was followed by a similar story in the Financial Times (FT), and a speech from former New York Fed President William Dudley who also advocated for a half-a-percent cut. The Two-year US Treasury yield dropped five points on the news and the USD saw further losses.
WTI Oil is also supported by news of Hurricane Francine which is ravaging the US Gulf of Mexico. An estimated 730,000 barrels of Oil per day, or 42% of the region’s production was outed on Thursday as a result of shutdowns caused by the hurricane.
Despite these factors, upside for black gold may be limited by a broadly negative demand outlook. Both the Organization of Petroleum Exporting Countries (OPEC) and the International Energy Agency (IEA) lowered their demand growth forecasts earlier this week. This, to a larger extent, overshadows worries about output disruptions caused by Hurricane Francine and limits the upside for Crude Oil prices.
The main reason for the negative outlook is China’s weakening economy. Recent data revealed that China's crude Oil imports were 3.1% lower from January to August 2024 compared to the same period in the previous year. Even if OPEC+ limits supply, a surplus of crude Oil is expected in 2024. In addition, US demand also remains tepid according to recent inventory figures.
- USD/CAD stays sideways below 1.3600 with the Fed policy taking center stage.
- Traders remain divided over Fed potential rate cut size.
- Firm speculation for BoC aggressive policy-easing cycle weighs on the Canadian Dollar.
The USD/CAD pair trades in a tight range below the round-level resistance of 1.3600 in Friday’s North American session. The Loonie asset struggles for direction with investors focusing on the Federal Reserve’s (Fed) monetary policy meeting, which is scheduled for Wednesday.
The Fed is almost certain to start reducing interest rates in Wednesday’s meeting as officials are worried about deteriorating labor market conditions, with growing confidence that inflationary pressures will sustainably return to the bank’s target of 2%.
Meanwhile, traders remain split over the Fed's likely interest rate cut size. The CME FedWatch tool shows that the probability of the Fed reducing interest rates by 50 basis points (bps) to 4.75%-5.00% in September has increased sharply to 45% from 28% a day ago.
On the data front, the University of Michigan (UoM) has reported higher-than-expected preliminary Consumer Sentiment Index (CSI) data for September. The sentiment data rose to 69.0 from expectations of remaining almost steady at 68.0.
In the Canadian region, a decent recovery in the Oil price fails to uplift the Canadian Dollar (CAD). The currency remains weak as the Bank of Canada’s (BoC) policy-easing cycle is expected to be more aggressive than other central bankers from G7 nations. The BoC has already slashed its key borrowing rates by 75 bps and is expected to cut them further in the remainder of the year.
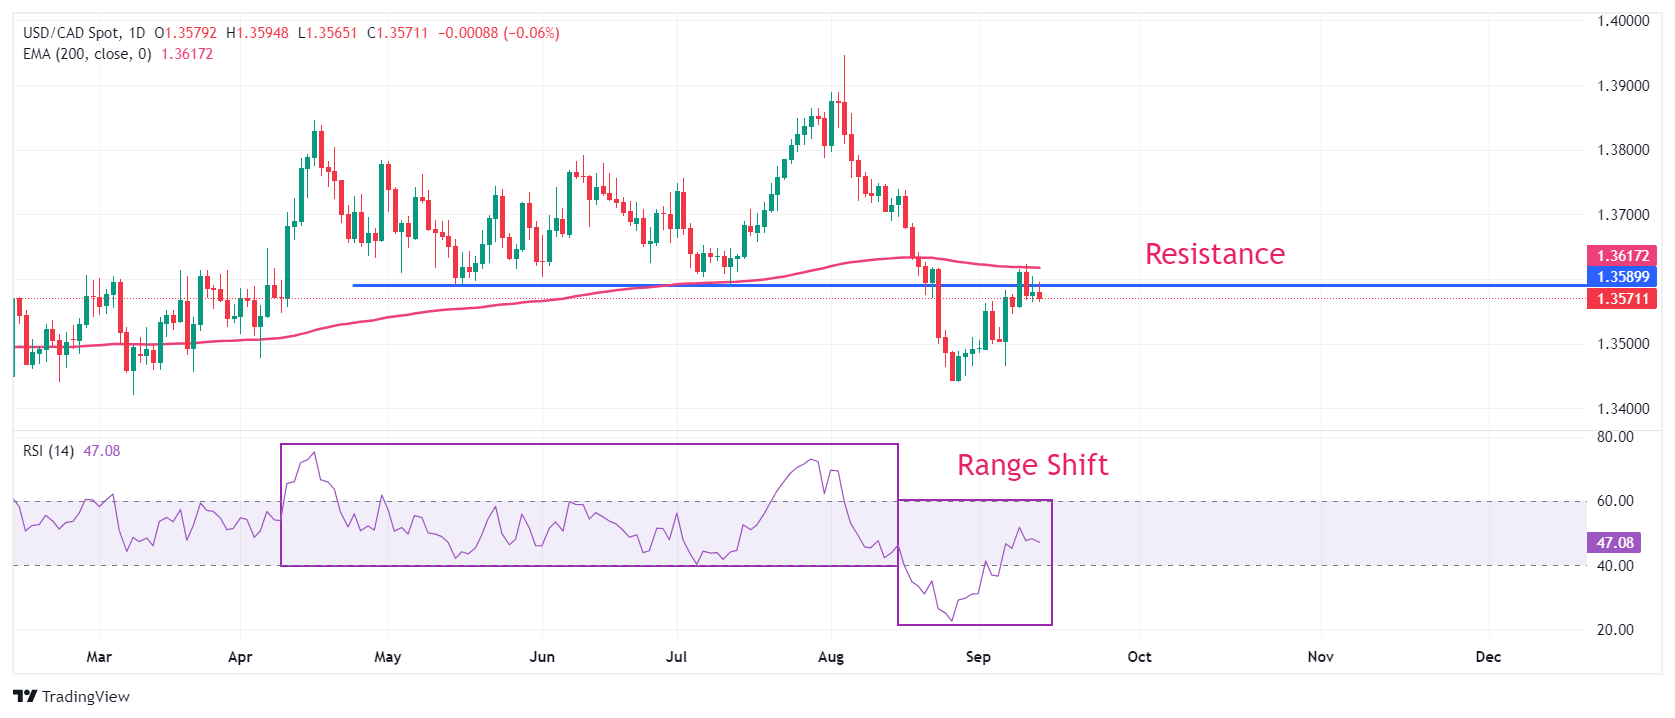
USD/CAD delivers a mean reversion to near the 200-day Exponential Moving Average (EMA), which trades around 1.3620. The near-term outlook of the pair appears to be bearish as the 14-day Relative Strength Index (RSI) has shifted into the bearish range of 20.00-60.00 from 40.00-80.00.
The horizontal resistance plotted from May 15 low of 1.3590 continues to act as a major barricade for the US Dollar bulls.
An upside recovery above August 21 high of 1.3626 would drive the asset towards 19 August high of 1.3687 and August 15 high of 1.3738.
On the flip side, further correction below April 5 low of 1.3540 will drag the asset towards the psychological support of 1.3500, followed by September 6 low of 1.3466.
USD/CAD daily chart
Economic Indicator
Fed Interest Rate Decision
The Federal Reserve (Fed) deliberates on monetary policy and makes a decision on interest rates at eight pre-scheduled meetings per year. It has two mandates: to keep inflation at 2%, and to maintain full employment. Its main tool for achieving this is by setting interest rates – both at which it lends to banks and banks lend to each other. If it decides to hike rates, the US Dollar (USD) tends to strengthen as it attracts more foreign capital inflows. If it cuts rates, it tends to weaken the USD as capital drains out to countries offering higher returns. If rates are left unchanged, attention turns to the tone of the Federal Open Market Committee (FOMC) statement, and whether it is hawkish (expectant of higher future interest rates), or dovish (expectant of lower future rates).
Read more.Next release: Wed Sep 18, 2024 18:00
Frequency: Irregular
Consensus: 5.25%
Previous: 5.5%
Source: Federal Reserve
- Consumer confidence in the US improved slightly in early September.
- UoM survey showed one-year inflation expectation edged lower to 2.7%.
Consumer confidence in the US improved slightly in early September, with the preliminary University of Michigan's Consumer Sentiment Index edging higher to 69 from 67.9 in August. This reading came in above the market expectation of 68.
The Current Conditions Index rose to 62.9 from 61.3 and the Consumer Expectations Index improved to 73 from 72.1.
The details of the survey showed that the one-year inflation expectation edged lower to 2.7% from 2.8%, while the five-year inflation outlook increased to 3.1% from 3%.
Market reaction
These data failed to trigger a noticeable market reaction. At the time of press, the US Dollar Index was down 0.3% on the day at 100.94.
The Pound Sterling (GBP) is little changed on the day after rallying in late trade Thursday, Scotiabank’s Chief FX Strategist Shaun Osborne notes.
Short term chart suggests a top
“The August BoE/Ipsos inflation outlook survey anticipates inflation dipping to 2.7% in the next 12 months, down from 2.8% in July. This is the lowest reading in three years. Longer run inflation expectations crept a tenth higher to 3.2%, so the Bank still has some work to anchor longer run price expectations.”
“Positive late week price action in the GBP is being overshadowed by signs that the pound’s rebound has stalled around 1.3150/55 (now key intraday resistance) through the overnight session. The intraday chart shows the development of a bearish “evening star” candle which may push spot back towards 1.31.”
At the beginning of next week, there will be all kinds of economic data from China to ‘work through’, Commerzbank’s commodity analyst Barbara Lambrecht notes.
Data is unlikely to provide a significant boost to oil prices
“Industrial production, retail sales, fixed asset investment, and new home sales will all provide insight into the current state of the Chinese economy. Its weakness is likely to have continued until recently. In the oil market, the focus is likely to be on crude oil processing. The significant increase in Chinese crude oil imports in August would suggest a recovery in processing.”
“In its monthly report, the International Energy Agency (IEA) pointed out that crack spreads in the product markets were lower than at this time of the year in recent years. Secondly, the IEA has once again revised its forecast for Chinese demand growth downwards: It now expects an increase of just under 200,000 barrels per day, down from 700,000 barrels per day at the beginning of the year, which was actually slightly higher than the average increase over the past decade.”
“Both of these factors argue against a significant increase in crude processing, which was less than 14 million barrels per day in July, the lowest level since October 2022. As such, the data is unlikely to provide a significant boost to oil prices.”
- NZD/USD drops sharply to near 0.6160 despite diminishing Fed small rate cut bets weighing on the US Dollar.
- Slower-than-expected US annual PPI boosted Fed 50 bps rate cut prospects.
- The RBNZ is expected to cut interest rates in both policy meetings in October and November this year.
The NZD/USD pair falls to near 0.6160 in Friday’s North American session. The Kiwi asset declines despite the US Dollar (USD) weakens as traders raise bets for the Federal Reserve (Fed) reducing interest rates by 50 basis points (bps) on Thursday.
The debate over the Fed’s likely interest rate cut size returns after Thursday’s United States (US) Producer Price Index (PPI) report for August showed that the annual producer inflation decelerated further.
According to the CME FedWatch tool, the probability of the Fed reducing interest rates by 50 bps to 4.75%-5.00% in September has increased sharply to 45% from 28% a day ago.
The PPI report showed that annual headline producer inflation grew by 1.7%, slower than the estimates of 1.8% and the prior release of 2.1% due to falling energy prices. The core PPI – which excludes volatile food and energy prices – rose steadily by 2.4%.
A slowdown in the pace of the price rise by producers at factory gates has also prompted the risk appetite of investors. S&P 500 futures have posted decent gains in the early New York session. The US Dollar Index (DXY), which tracks the Greenback’s value against six major currencies, slides below the crucial support of 101.00.
Meanwhile, the New Zealand Dollar (NZD) weakens amid growing speculation that the Reserve Bank of New Zealand (RBNZ) will cut interest rates aggressively. The RBNZ started the policy-easing cycle unexpectedly in August and is expected to reduce its Official Cash Rate (OCR) in each of its remaining policy meetings this year.
New Zealand Dollar FAQs
The New Zealand Dollar (NZD), also known as the Kiwi, is a well-known traded currency among investors. Its value is broadly determined by the health of the New Zealand economy and the country’s central bank policy. Still, there are some unique particularities that also can make NZD move. The performance of the Chinese economy tends to move the Kiwi because China is New Zealand’s biggest trading partner. Bad news for the Chinese economy likely means less New Zealand exports to the country, hitting the economy and thus its currency. Another factor moving NZD is dairy prices as the dairy industry is New Zealand’s main export. High dairy prices boost export income, contributing positively to the economy and thus to the NZD.
The Reserve Bank of New Zealand (RBNZ) aims to achieve and maintain an inflation rate between 1% and 3% over the medium term, with a focus to keep it near the 2% mid-point. To this end, the bank sets an appropriate level of interest rates. When inflation is too high, the RBNZ will increase interest rates to cool the economy, but the move will also make bond yields higher, increasing investors’ appeal to invest in the country and thus boosting NZD. On the contrary, lower interest rates tend to weaken NZD. The so-called rate differential, or how rates in New Zealand are or are expected to be compared to the ones set by the US Federal Reserve, can also play a key role in moving the NZD/USD pair.
Macroeconomic data releases in New Zealand are key to assess the state of the economy and can impact the New Zealand Dollar’s (NZD) valuation. A strong economy, based on high economic growth, low unemployment and high confidence is good for NZD. High economic growth attracts foreign investment and may encourage the Reserve Bank of New Zealand to increase interest rates, if this economic strength comes together with elevated inflation. Conversely, if economic data is weak, NZD is likely to depreciate.
The New Zealand Dollar (NZD) tends to strengthen during risk-on periods, or when investors perceive that broader market risks are low and are optimistic about growth. This tends to lead to a more favorable outlook for commodities and so-called ‘commodity currencies’ such as the Kiwi. Conversely, NZD tends to weaken at times of market turbulence or economic uncertainty as investors tend to sell higher-risk assets and flee to the more-stable safe havens.
Thursday’s ECB policy decision yielded no surprises, Scotiabank’s Chief FX Strategist Shaun Osborne notes.
Narrower EZ/US yield differentials push EUR higher
“Rates were trimmed 25bps, as expected, and President Lagarde’s ‘data dependent, meeting by meeting’ approach to future policy adjustment suggests no rush to cut again. With only limited data available ahead of the next rate meeting in October, a December cut looks the most likely way forward from here.”
“The EUR caught a modest bid off the outlook and EZ yields firmed a little. That, plus the dip in US short rates around the Fed outlook today has driven 2Y bond spreads to –138bps, the narrowest since May 2023, helping the EUR retest the 1.11 area.”
“Solid gains yesterday for the EUR and a high close on the week are complemented by some reinvigorated, bullish DMI signals on the intraday and daily charts. A push above 1.1125 consolidation resistance would signal scope for additional EUR gains in the short term at least. Support is 1.1055 now.”
Listening to ECB President Christine Lagarde, one gets the impression that a further ECB interest rate hike as early as October is highly unlikely. Of course, Lagarde is not ruling anything out. And why should she? She has nothing to gain from limiting her options. Observers who still lament the lack of forward guidance have not understood what is different today from the days when interest rates were stuck at the lower bound, Commerzbank’s FX Head of FX and Commodity Research Ulrich Leuchtmann notes.
Considerable gap between the current EUR/USD level and 1.14
“Yesterday's communication did sound very much like a pause in October. The ECB's projection for HICP inflation was not changed; the market panic of falling inflation expectations is not shared by Europe's monetary authorities. On the contrary, the forecast for core inflation in 2024 and 2025, which is particularly relevant for the inflation outlook, was even revised slightly upwards. The ECB could not have done more to refute the recent changes in market expectations.”
“Those who believe in moderate deflation rather than in the inflation collapse that the market is currently assuming will have to conclude that the ECB interest rate cuts will not be as rapid or pronounced as the market currently assumes. From this perspective, the fact that the ECB expectations did not change significantly yesterday merely shows that there is still a need for adjustment. This applies to inflation and ECB expectations as well as to EUR exchange rates.”
“Whether the market majority or those who do not believe in dramatic disinflation will be proven right will become clear in the next few months, when further inflation data is released. As our economists tend to agree with the ECB's view on inflation, I feel vindicated in our bullish EUR/USD view from a EUR perspective and am rather pleased that the market is not immediately following our view. Despite the USD weakness, there is still a considerable gap between the current EUR/USD level and our target of 1.14.”
- EUR/GBP has rebounded after touching the lower channel line of its rising channel.
- The chart suggests a mild bullish bias as price slowly makes steps higher.
EUR/GBP bounces off the lower channel line of its shallow rising channel and pushes higher.
Price continues to respect the confines of the recovery channel which began at the August 30 lows. Little by little it climbs higher suggesting a new short-term uptrend is taking root.
EUR/GBP 4-hour Chart
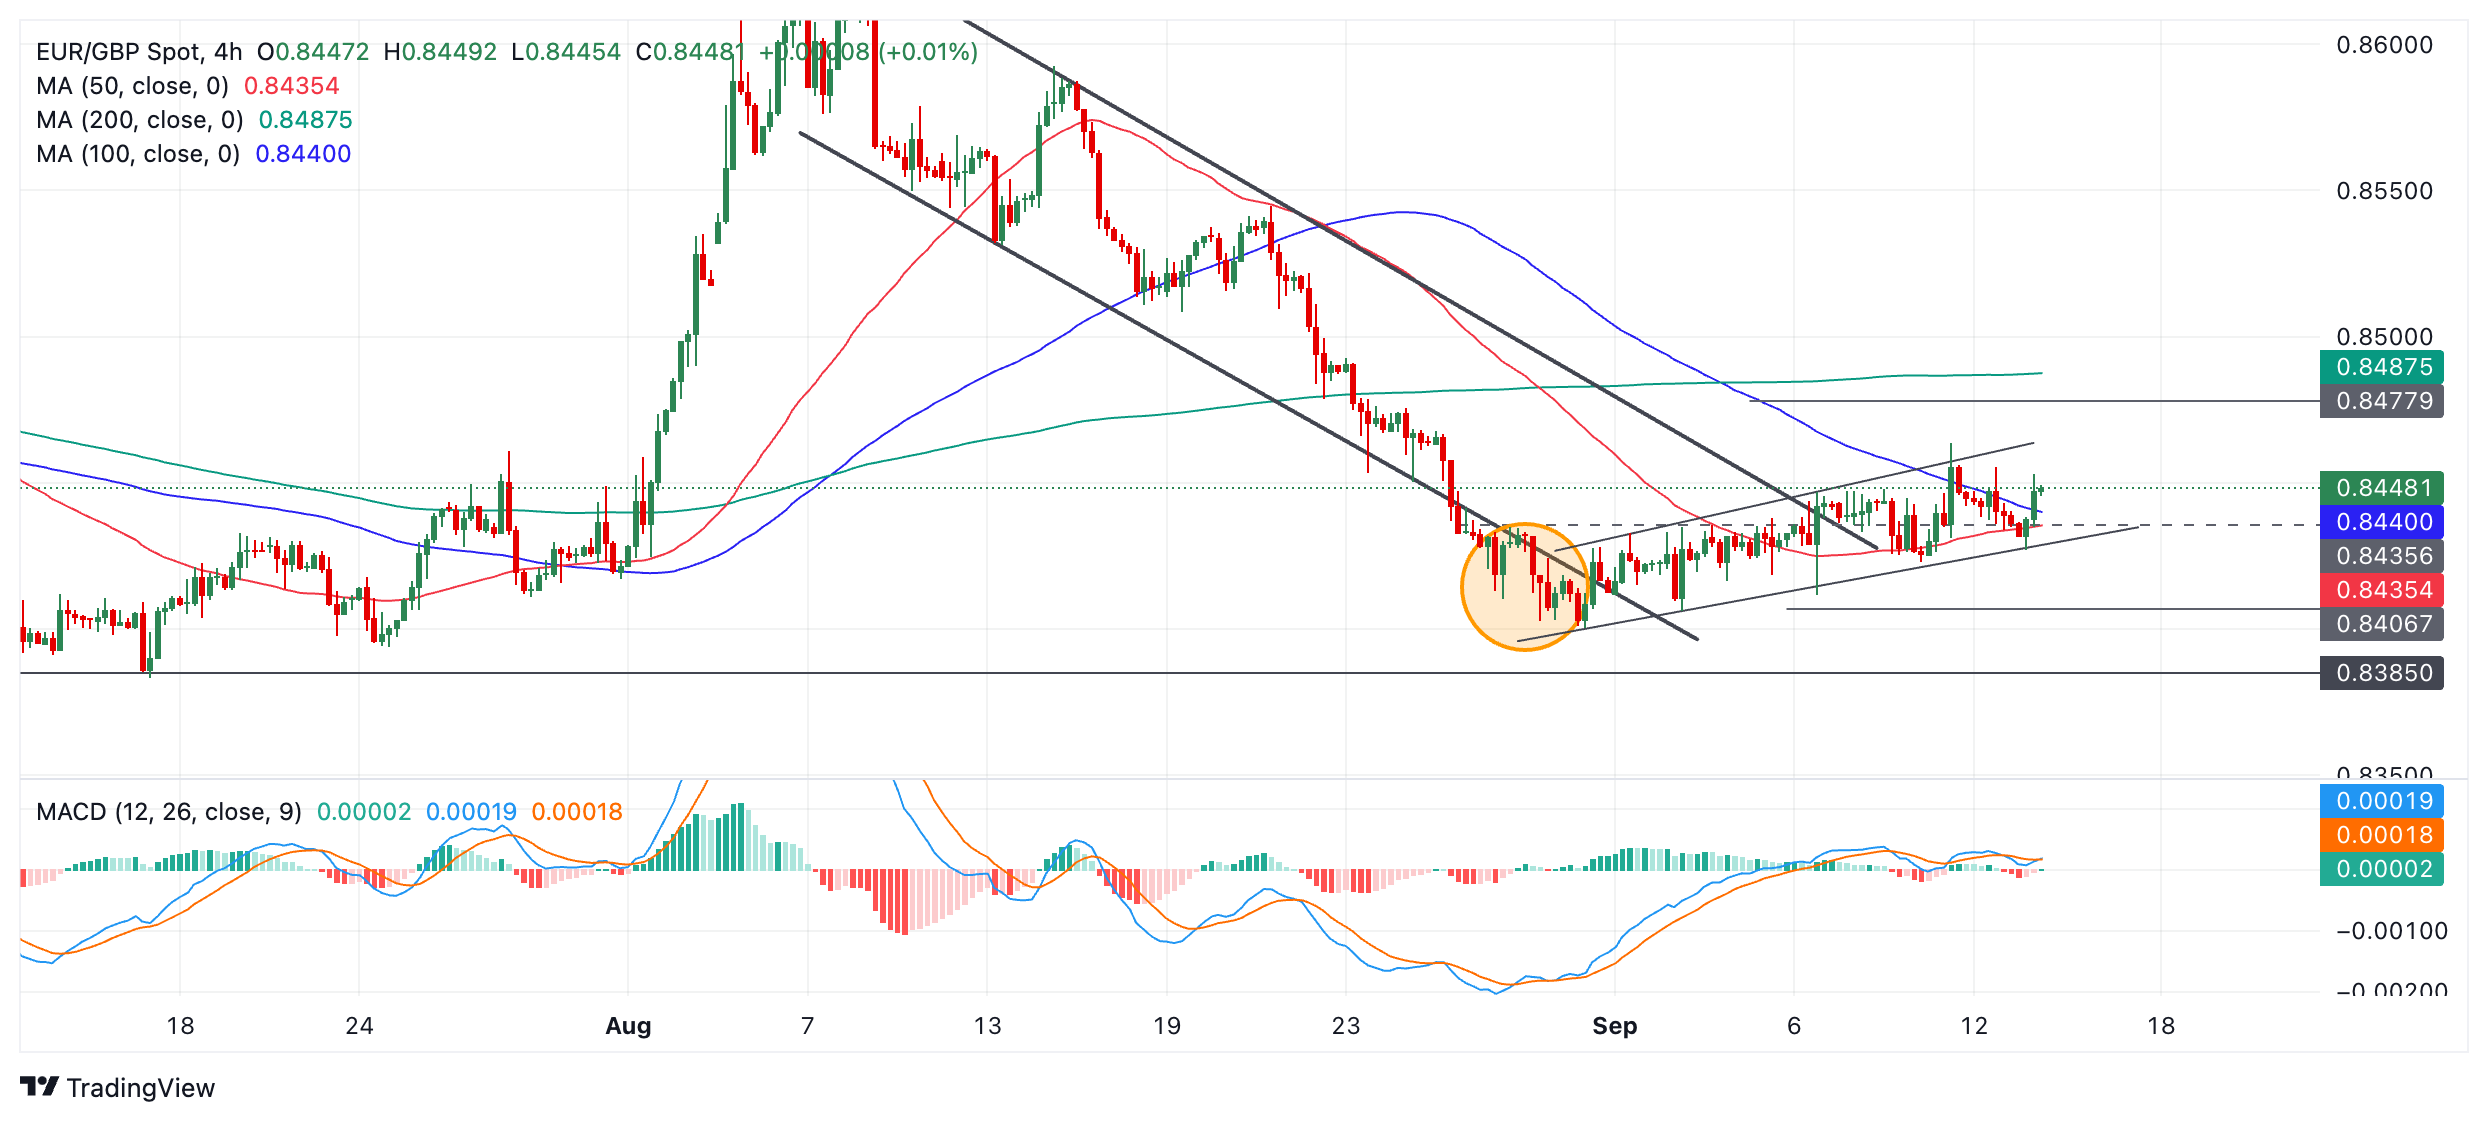
The Moving Average Convergence Divergence (MACD) momentum indicator stays above the zero line indicating a mild bullishness to price dynamics.
A close above the 0.8464 high (September 11 high) would be required to confirm an upside breakout from the channel. Such a move would likely reach about 0.8477, the 0.618 Fibonacci (Fib) extension if the height of the channel extrapolated higher.
Bullish signs now marginally outweigh bearish. For starters EUR/GBP keeps rising within a bullish channel, secondly it has now worked its way through the previous falling channel, and finally the exhaustion break during August (orange shaded circle) – when it accelerated to the downside – is a bullish reversal sign.
The main bearish sign is the relative shallowness of the rising channel in comparison to the much steeper previous bear move.
A close below 0.8423 (September 10 low) would pave the way for further weakness to a downside target at 0.8406, the 0.618 Fib extension lower.
Lower US yields and narrower US/Canada spreads are weighing on USD/CAD, Scotiabank’s Chief FX Strategist Shaun Osborne notes.
CAD is supported by narrower US/Canada spreads
“Spot is pressuring the upper 1.35 area where the USD has found support on a number of occasions over the past couple of sessions. Firmer risk appetite and higher crude are adding to CAD support at the margin. USD/CAD fair value has edged lower to 1.3592 this morning, reflecting the sweep of factors shifting back into the CAD’s favour.”
“Wholesale Sales for July are expected to fall 1.1% in the month, in line with the Statcan flash estimate released with the soft (-0.6%) June data. Spot trends look soft on the short-term chart and the USD’s move back under the 200-day MA continues to give the daily chart a softer look.”
“But the USD is generating support around 1.3565 on the short-term chart and trend indicators remain bullishly aligned on the intraday and daily DMI oscillators. The CAD will have to put in a bit more effort—i.e., crack support at 1.3565—to improve and have a run at the low 1.35s. Resistance is 1.3605/25.”
Gold price surpassed its previous all-time high and reached a new record level of $2,570 per troy ounce on Friday, supported by expectations that the US Federal Reserve will cut interest rates aggressively, Commerzbank’s Commodity Analyst Carsten Fritsch notes.
Expectations of large Fed rate cuts support Gold
“The driving factor is the marked increase in rate cut expectations since yesterday. It should be noted that the core index of US consumer prices rose slightly more than expected in August, which should make a 50 basis point rate cut by the Fed less likely in the coming week. The Fed Funds Futures are currently pricing in a probability of around 45% for this.”
“However, the market is still expecting the Fed to cut interest rates by around 100 basis points by the end of the year, i.e. rates would have to be cut by 50 basis points at one of the two remaining meetings after September. According to Fed funds futures, a further 100 basis points are then expected to follow by mid-2025. It is therefore likely due to these aggressive interest rate cut expectations for the coming months that the Gold price is rising.”
“In Euro terms, too, Gold jumped to a new record high of more than 2,300 EUR per troy ounce yesterday. Yesterday's interest rate cut by the ECB probably provided a tailwind here, especially as the market also expects the ECB to cut interest rates further in the coming months.”
- USD/JPY has fallen to fresh lows at a key support level.
- The long-term uptrend has probably reversed as the pair continues to make lower lows.
USD/JPY continues sliding and makes a lower low at 140.36 on Friday, bottoming out at about the same level as the key December 2023 low – where it is expected to encounter firm support.
USD/JPY 4-hour Chart
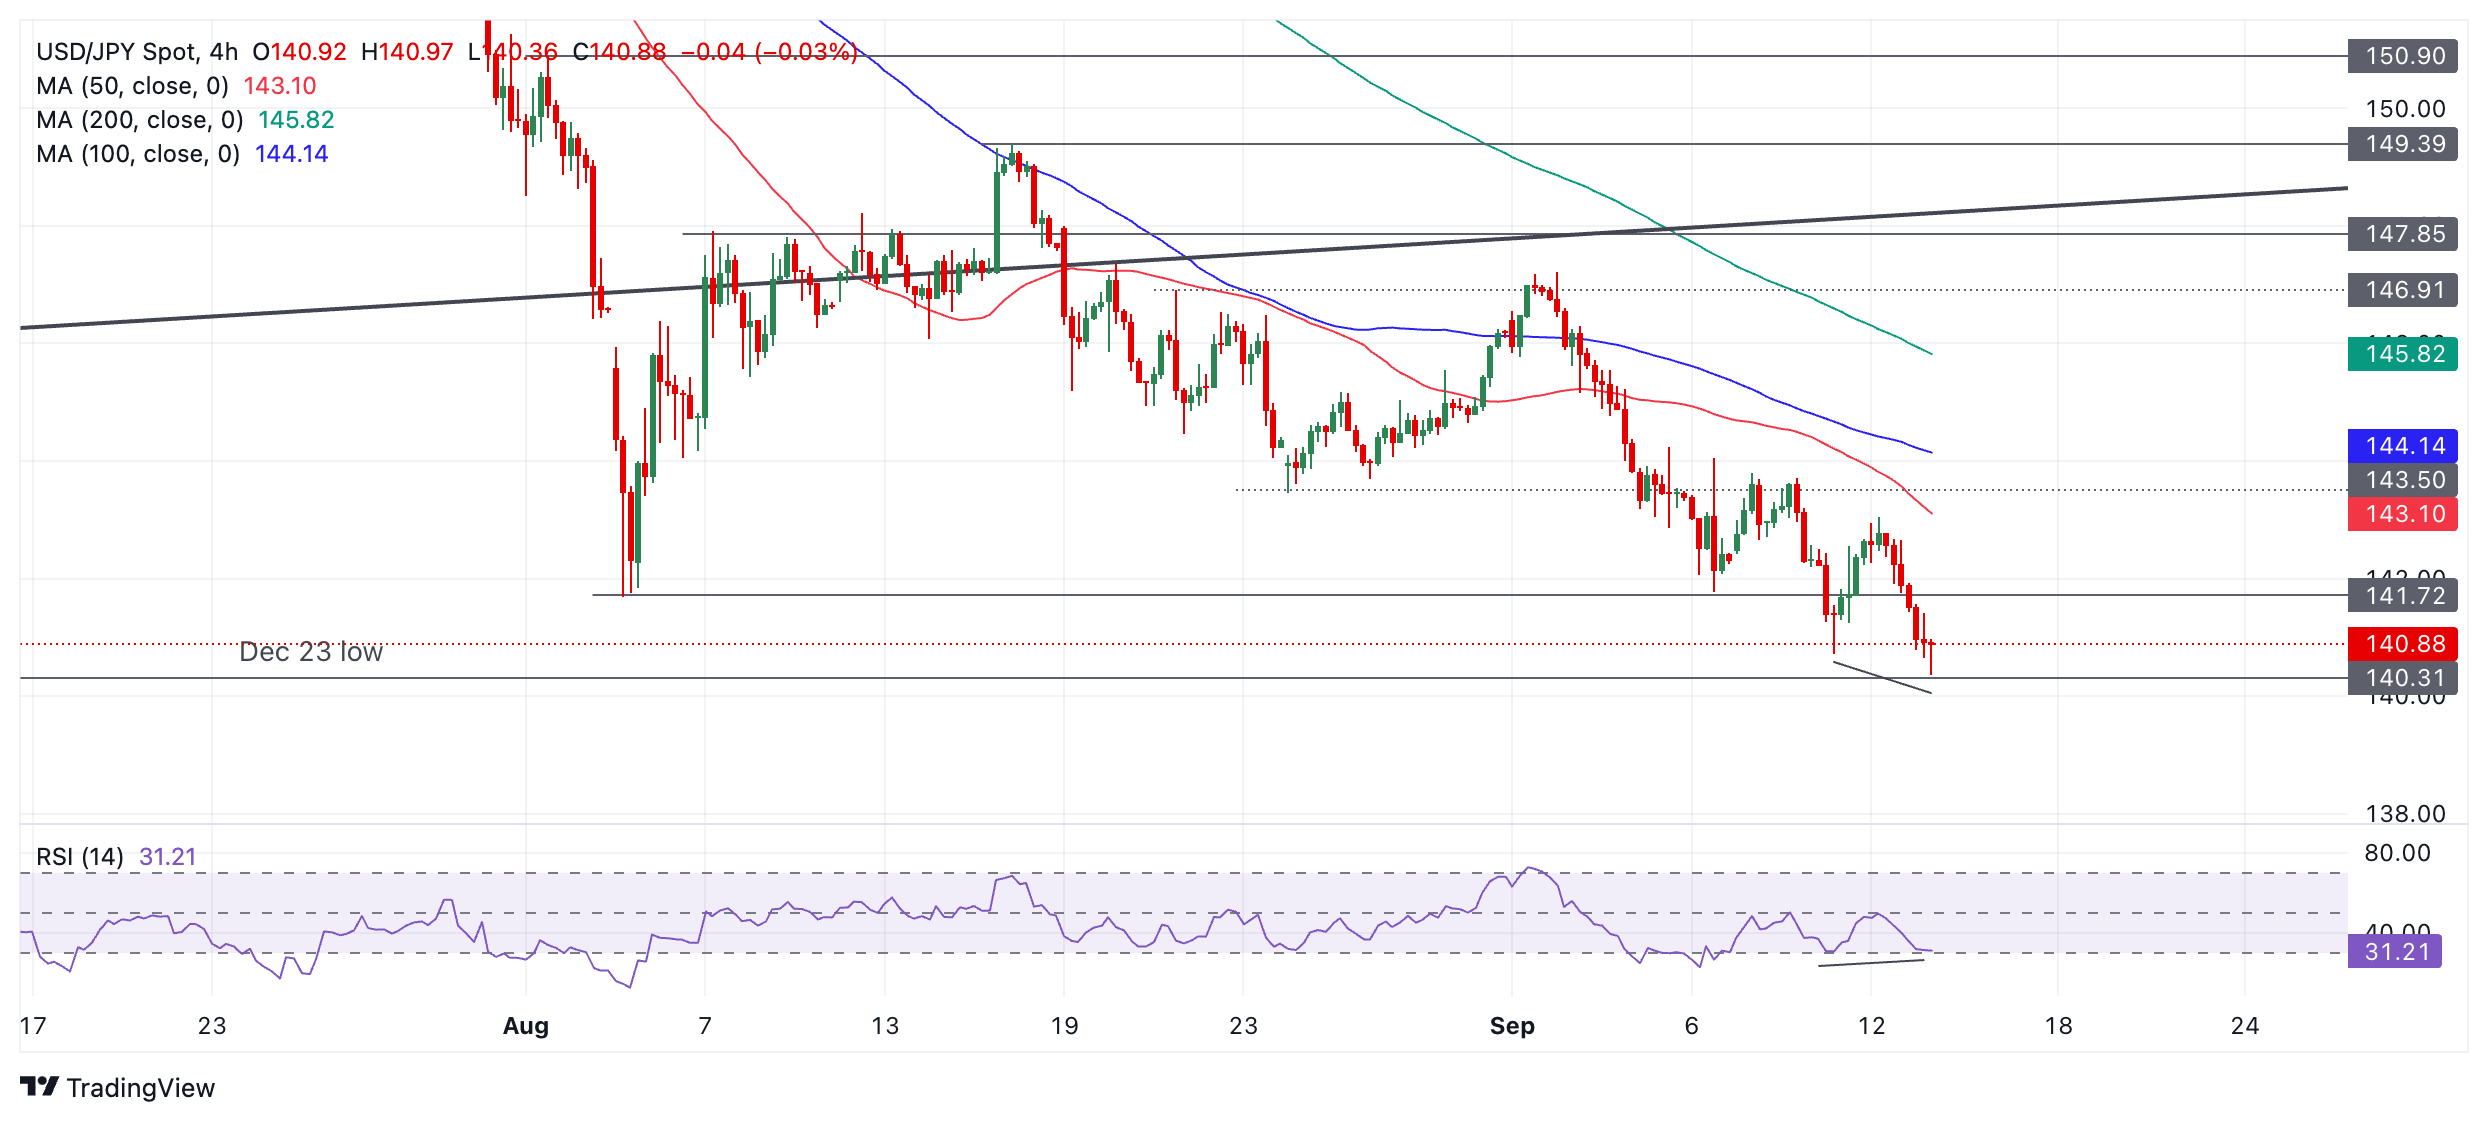
The break below the August 5 low on September 11 crossed an important threshold for the pair. Taken together with the break below the major multi-year trendline at the beginning of August, it suggests a possibility the long-term uptrend has reversed. Given it is a principle of technical analysis that “the trend is your friend” such a reversal suggests the broad bias has shifted from being “bullish” to “bearish”.
If USD/JPY can make a daily close below the 140.25 December 2023 low, it would provide even more confirmatory evidence of a long-term trend reversal. Such a break might then see price fall to the next target at 137.24 (July 2023 low). It should be noted that the short and medium-term trends are already bearish.
USD/JPY is showing mild bullish convergence between the price and the Relative Strength Index (RSI). At the September 11 low the RSI was in the oversold zone, now even though price has sunk even lower, the RSI has not.
This could be a sign that the move down lacks some bearish conviction and suggests a risk of a pull-back evolving. Given the other bearish signs on the chart, however, such a rebound if it materializes is likely to be temporary before the bear trend resumes and takes the pair to new lows.
The first Federal Reserve interest-rate cut in four and a half years will be the main focus for Gold traders next week, Commerzbank’s Commodity Analyst Barbara Lambrecht notes. Still, the fact that the rate cut has been mostly priced in could keep the price reaction muted, she said.
Fed rate cut on the horizon after another record high for Gold
“We expect a small rate cut. Since the market has already widely anticipated a reduction in interest rates, we do not expect significant price movements in the Gold market after the price rose to a record high.”
“Swiss Gold exports, to be published on Thursday, are likely to be very high again. This is because exports to India are expected to remain high as a result of the significant import tax cut at the end of July, while inflows into Gold ETFs suggest that Gold exports to the UK and US will also be high.”
Many of the readers pay particular attention to the EUR/USD exchange rate. The fact that it rose so sharply yesterday and this morning could easily be interpreted as an effect of yesterday's ECB decision. But that would be a mistake, Commerzbank’s FX Head of FX and Commodity Research Ulrich Leuchtmann notes.
USD short positions are likely to appear more attractive
“The EUR/USD movement since the evening before yesterday was exclusively USD weakness. EUR didn't move at all. I think the reason for the Greenback weakness is obvious: it is clear to everyone that a 50-basis-point move by the Fed next Wednesday is a serious possibility. Some market participants may have long perceived a 50 basis point move as an unlikely possibility.”
“Because the labor market is still not in as dramatic a situation as it usually is when the Fed makes major interest rate moves, because interest rate hikes are tricky during a presidential election campaign anyway, and a big one even more so, because the Fed is unlikely to share the market's extremely low inflation expectations, which are probably driven more by fears of recession than by cool economic analysis.”
“For the currency market, there is another argument: those who are bullish on the USD because they expect the Fed to cut interest rates slowly in the medium term would be instantly refuted by a 50 basis point move on Wednesday. But those who are USD-bearish because they expect a rapid pace of interest rate cuts in the medium term would not have to capitulate if there are only 25 basis points on Wednesday. The risks of USD positions next week are likely to be asymmetrical. For risk-averse investors who are undecided between 25 and 50 basis points, USD short positions are likely to appear more attractive than USD long positions. This is already weakening the USD.”
The USD is posting broad, if mostly limited losses against the major currencies on the day (after falling in late trade yesterday). The AUD is the exception at one end of the scale, trading little changed as iron ore prices fall again, while the JPY is leading gains and rising nearly 1% on the session. USD/JPY losses are close to putting key support just under 140 under a little more duress, Scotiabank’s Chief FX Strategist Shaun Osborne notes.
USD eases as reports highlight Fed policy dilemma over scale of cut
“Stocks are broadly higher while bonds are firmer, with Treasurys outperforming. The root issue here is renewed speculation that the Fed could start off its easing cycle with a 50bps rate cut. WSJ Fed watcher Nick Timiraos’ article yesterday afternoon suggested the issue of a small or big move is still something of a dilemma for policymakers and the framing of the article seemed to make the case that a bolder move might be appropriate, citing a recent advisor to Powell.”
“Additionally, an FT report suggests today the Fed is ‘wrestling’ with how aggressively to cut rates while former NY Fed President Dudley commented that there was a case for cutting 50bps. I’m not that surprised. As I noted yesterday, the Fed’s focus is clearly on the labour market and labour market conditions have weakened further since July when, FOMC minutes suggested, the Fed was much closer to cutting than we perhaps appreciated. Swaps have added some 8bps of additional easing risk back in for next week since yesterday afternoon and are pricing in 37bps of cuts for next week—effectively halfway to pricing in an additional quarter point.”
“Market anxiety is likely to persist into the FOMC decison, keeping the USD tone defensive. USD/JPY support at 140.25 (major low from December) is at risk. A stronger JPY will likely pull the Asian FX complex higher with it and spill over into the other majors to some extent at least. US Import Prices are forecast down 0.2% in August. The preliminary U. Michigan Sentiment data for September is expected to show a small improvement (68.5) over August (67.9).”
As expected, the ECB cut the deposit facility rate by 25bp to 3.50%. This was an uncontentious and unanimous decision by the Governing Council. Also as expected, the ECB is coy about what happens next. The ECB continues to avoid explicit guidance and retains optionality on the sequence and scale of this easing cycle, Deutsche Bank’s macro analysts note.
ECB to cut the deposit rate 25bp in December
“There is uncertainty and the ECB does not want to commit itself to any particular path for policy. The market is growing more sceptical about growth and inflation and is pricing a more aggressive easing cycle, with faster cuts to a terminal rate slightly below neutral. The ECB is not convinced. Domestic inflation remains elevated and the case for domestic recovery can still be made. More significant downgrades would be necessary in December to justify market pricing.”
“The ECB is neither ruling in nor ruling out a rate cut at the next Governing Council meeting in October, but the impression is it is not very likely. The ECB will have a lot more information available at the December meeting. It will also know the outcome of the US election in December – and hence whether Europe is facing Trump’s proposed tariffs or not. A trade war would significantly weaken the outlook for 2025. This is one of many sources of significant uncertainty.”
“Our baseline remains unchanged. We expect the ECB to cut the deposit rate 25bp in December and continue at the pace of 25bp per quarter until it reaches a terminal rate landing zone of 2.00-2.50%, broadly in line with neutral, around the end of 2025. The risks are clearly skewed towards the ECB normalising monetary policy more rapidly than this. However, it’s still not obvious to us that policy rates need to go below neutral and certainly not far below neutral. Much will depend on fiscal policy.”
- Fed rate futures for September are flip-flopping and price back in a chance for a 50 basis points interest-rate cut by the Federal Reserve.
- Former Fed member Dudley surprised markets by advocating for a bigger rate cut, while a couple of news articles suggest that a big rate cut is still in play.
- The US Dollar Index is crossing back to the lower band at 100.62 after another rejection.
The US Dollar (USD) trades very soft again on Friday, set to close out the week with another loss. The decline comes on comments from former Federal Reserve Bank of New York President William Dudley, who mentioned there is still a possibility for a 50-basis-point interest-rate cut next week from the Fed. These comments came after two news articles published in The Wall Street Journal and the Financial Times suggested that a 50bps move is still on the cards after markets had largely ruled out such a big move.
Dudley pointed to a slowing US labor market, with risks to jobs greater than those from lingering inflation, supported by the comments from Fed Chairman Jerome Powell in his Jackson Hole speech that he did not want to see more weakness in the labor market, Reuters reports.
On the economic data front, the US Import/Export prices are due, together with the University of Michigan Consumer Sentiment data. However, not much movement is expected unless the Michigan Consumer Sentiment number comes in well below estimates, a scenario that could support further the case for a 50-basis-point rate cut.
Daily digest market movers: Dudley pushes back
- At 12:30 GMT, both the Import and Export Price indexes for August will be released:
- Monthly Import Prices are expected to decline by -0.2% after increasing by 0.1% in July. On the year, import prices grew by 1.6% in July, with no forecast pencilled in for August.
- The monthly Export Prices are expected to shrink by 0.1% after the 0.7% advance seen a month earlier. The yearly index was at 1.4%, with no consensus issued.
- The University of Michigan preliminary findings for September are expected at 14:00 GMT:
- The headline Michigan Consumer Sentiment is expected to increase slightly to 68.0 from 67.9.
- The 5-Year inflation expectation, a closely-followed indicator by the Fed, stood at 3% at the end of July. There is no forecast available for August.
- Asian equities have closed off this Friday in the red, while European equities are jumping higher on expectations that the European Central Bank will cut more than previously foreseen. US futures are rather flat.
- The CME Fedwatch Tool shows only a 57.0% chance aof a 25 basis points (bps) interest rate cut by the Fed on September 18, sharply down from the 87% seen a day ago. Meanwhile, markets have increased the chances of a 50 bps cut to 43.0% on the back of Fed’s Dudley comments and the news articles. For the meeting on November 7, another 25 bps cut (if September is a 25 bps cut) is expected by 24.9%, while there is a 51.4% chance that rates will be 75 bps (25 bps + 50 bps) and a 23.7% probability of rates being 100 (25 bps + 75 bps) basis points lower.
- The US 10-year benchmark rate trades at 3.63%, very close to the 15-month low at 3.60%.
US Dollar Index Technical Analysis: Breakout for another day
The US Dollar Index (DXY) came close to snapping the upper band at 101.90 for a breakout on Thursday. That was until Fed Dudley came along and placed the possibility for a 50-basis-point rate cut back in the mind of traders. The DXY is now back down, at a loss for this week, and could be seen testing that lower band at 100.62 for possibly a break lower.
The first resistance at 101.90 is getting ready for a third test after its rejection last week and earlier this week. Further up, a steep 1.2% uprising would be needed to get the index to 103.18. The next tranche up is a very misty one, with the 55-day Simple Moving Average (SMA) at 103.40, followed by the 200-day SMA at 103.89, just ahead of the big 104.00 round level.
On the downside, 100.62 (the low from December 28) holds strong and has already made the DXY rebound four times in recent weeks. Should it break, the low from July 14, 2023, at 99.58, will be the ultimate level to look out for. Once that level gives way, early levels from 2023 are coming in near 97.73.
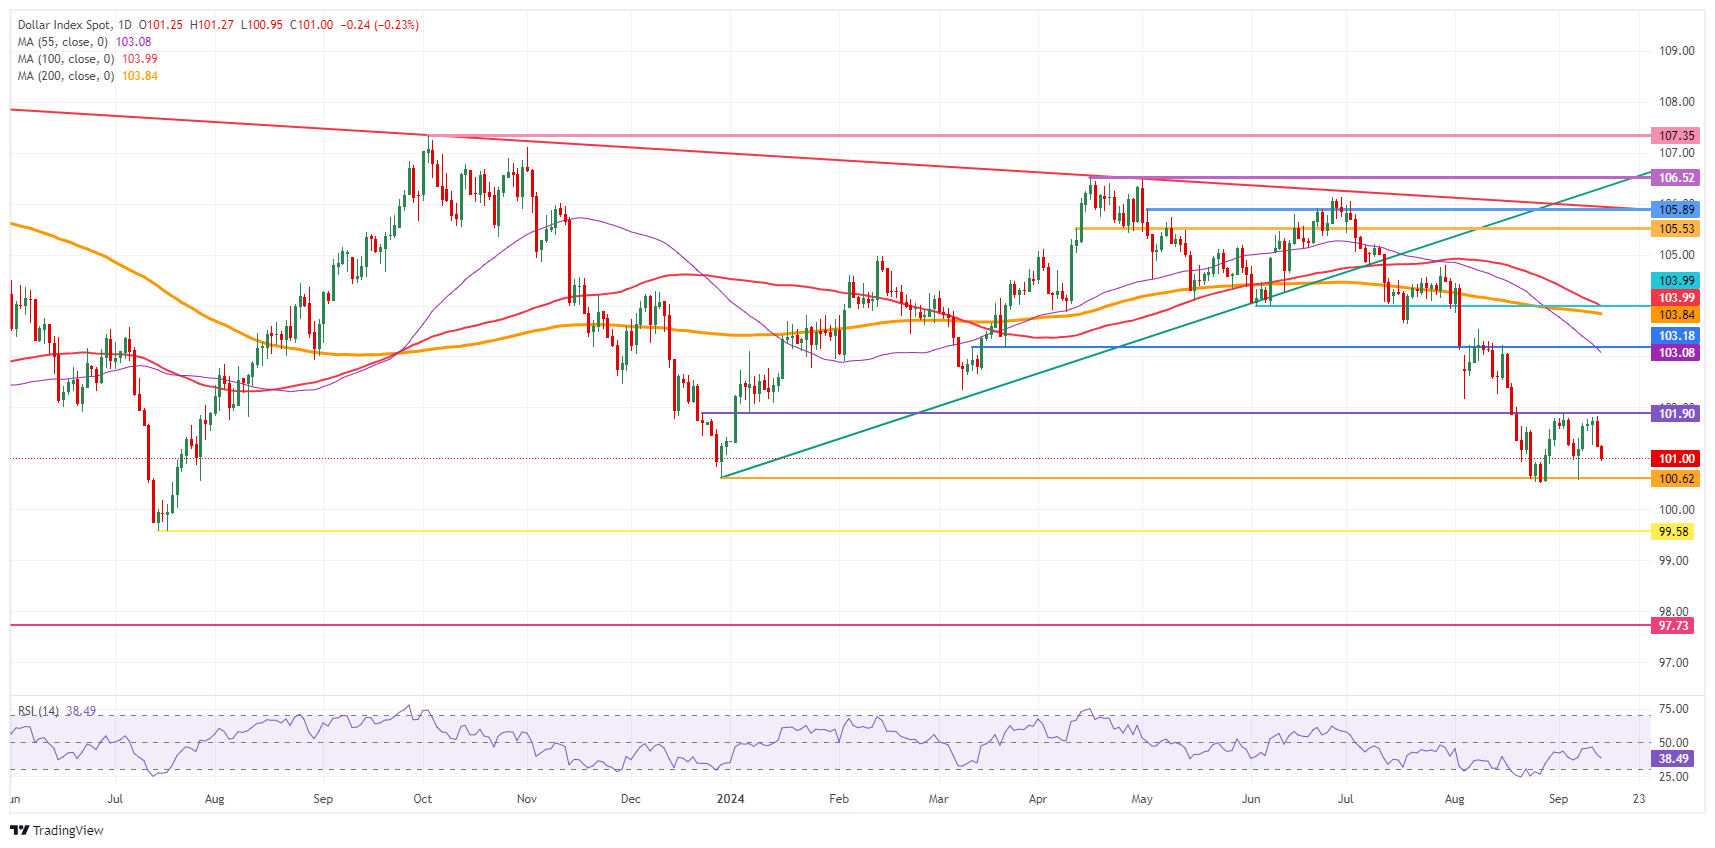
US Dollar Index: Daily Chart
US Dollar FAQs
The US Dollar (USD) is the official currency of the United States of America, and the ‘de facto’ currency of a significant number of other countries where it is found in circulation alongside local notes. It is the most heavily traded currency in the world, accounting for over 88% of all global foreign exchange turnover, or an average of $6.6 trillion in transactions per day, according to data from 2022. Following the second world war, the USD took over from the British Pound as the world’s reserve currency. For most of its history, the US Dollar was backed by Gold, until the Bretton Woods Agreement in 1971 when the Gold Standard went away.
The most important single factor impacting on the value of the US Dollar is monetary policy, which is shaped by the Federal Reserve (Fed). The Fed has two mandates: to achieve price stability (control inflation) and foster full employment. Its primary tool to achieve these two goals is by adjusting interest rates. When prices are rising too quickly and inflation is above the Fed’s 2% target, the Fed will raise rates, which helps the USD value. When inflation falls below 2% or the Unemployment Rate is too high, the Fed may lower interest rates, which weighs on the Greenback.
In extreme situations, the Federal Reserve can also print more Dollars and enact quantitative easing (QE). QE is the process by which the Fed substantially increases the flow of credit in a stuck financial system. It is a non-standard policy measure used when credit has dried up because banks will not lend to each other (out of the fear of counterparty default). It is a last resort when simply lowering interest rates is unlikely to achieve the necessary result. It was the Fed’s weapon of choice to combat the credit crunch that occurred during the Great Financial Crisis in 2008. It involves the Fed printing more Dollars and using them to buy US government bonds predominantly from financial institutions. QE usually leads to a weaker US Dollar.
Quantitative tightening (QT) is the reverse process whereby the Federal Reserve stops buying bonds from financial institutions and does not reinvest the principal from the bonds it holds maturing in new purchases. It is usually positive for the US Dollar.
European Central Bank (ECB) policymaker Robert Holzmann told The Financial Times on Friday that the monetary policy is on a good trajectory, per Reuters.
Holzmann further noted that October might not be the right time for another rate cut but added that there could be room for a reduction in rates in December. "The uncertainty is now significantly smaller," he said and explained that the economic activity is increasingly in line with the ECB's forecasts.
Market reaction
These comments failed to trigger a noticeable market reaction. At the time of press, EUR/USD was trading at 1.1090, where it was up 0.12% on a daily basis.
USD/SGD resumed its move lower, taking cues from softer UST yields, USD overnight, OCBC’s FX analysts Frances Cheung and Christopher Wong note.
Mild bullish momentum on daily chart fades
“Mild bullish momentum on daily chart faded while RSI fell. Consolidation likely at lower levels. Support at 1.2953 (recent low). Resistance at 1.3065 (21-DMA), 1.3160 levels (23.6% fibo retracement of 2024 high to low).”
“S$NEER was last estimated at ~1.89% above our model-implied mid, with model implied spot lower bound at 1.2979. With S$NEER close to its strong end of its band, the room for further downside in USDSGD will continue to be restrained intra-day unless broader USD takes another leg lower, then the implied lower bound of USD/SGD can shift lower.”
- AUD/USD falls to near 0.6700 as Aussie growth worries weigh on the Australian Dollar.
- Soft US PPI has renewed debate for potential Fed interest rate cut size.
- AUD/USD recovers from 38.2% Fibo retracement.
The AUD/USD pair corrects to near the round-level support of 0.6700 in Friday’s European session. The Aussie asset declines as the Australian Dollar (AUD) weakens amid growing worries over Australia’s economic growth due to the maintenance of high interest rates by the Reserve Bank of Australia (RBA).
Market experts worry that a long RBA hawkish interest rate stance could deteriorate labor market conditions. However, RBA officials continue to support maintaining their Official Cash Rate (OCR) higher as the battle against inflationary pressures is far from over.
Meanwhile, the US Dollar (USD) is also underperforming against its major peers as softer-than-expected United States (US) annual Producer Price Index (PPI) data for August has brought the debate over the likely interest rate cut to size by the Federal Reserve (Fed) back on the table. Market speculation for the Fed to start reducing interest rates aggressively from Thursday has strengthened. The CME FedWatch tool shows that the probability of the Fed reducing interest rates by 50 basis points (bps) to 4.75%-5.00% in September has increased sharply to 43%.
AUD/USD bounces back sharply after retracing 38.2% of the last swing high (plotted from August 5 low near 0.6350 to August 29 high of 0.6824) at 0.6643 on a daily timeframe. The asset has mildly corrected but is holding the key 20-day Exponential Moving Average (EMA), which trades around 0.6700.
The 14-day Relative Strength Index (RSI) oscillates in the 40.00-60.00 range, suggesting a sideways trend ahead.
The Aussie asset would witness a fresh upside move if it breaks above the September 6 high of 0.6767, which will drive the asset toward the round-level resistance of 0.6800 and the Year-To-Date (YTD) high of 0.6840.
On the flip side, a downside move below the weekly low of 0.6622 will drag the asset towards a 50% Fibonacci retracement at 0.6587, followed by an August 6 high of 0.6542.
AUD/USD daily chart
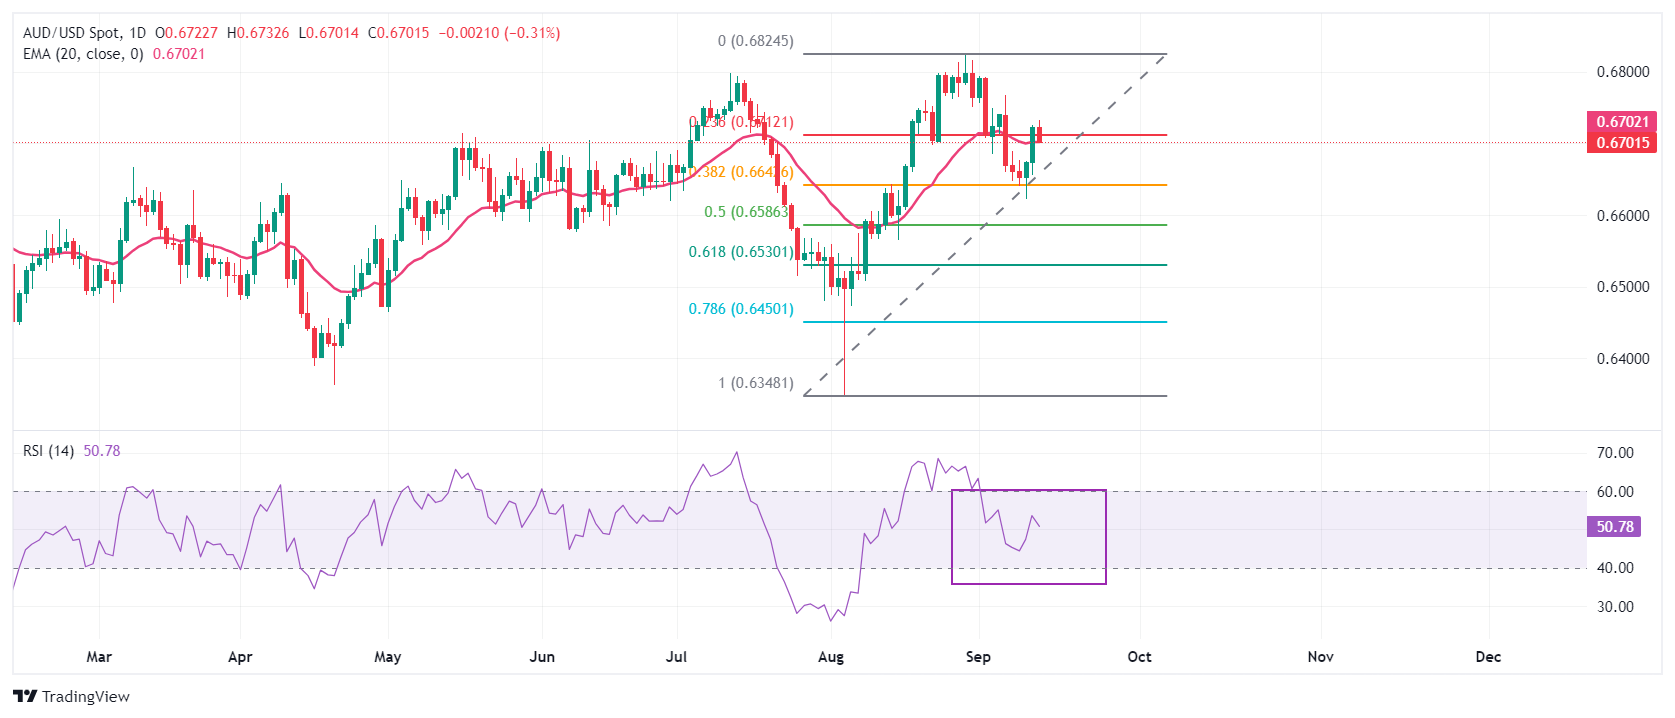
Australian Dollar FAQs
One of the most significant factors for the Australian Dollar (AUD) is the level of interest rates set by the Reserve Bank of Australia (RBA). Because Australia is a resource-rich country another key driver is the price of its biggest export, Iron Ore. The health of the Chinese economy, its largest trading partner, is a factor, as well as inflation in Australia, its growth rate and Trade Balance. Market sentiment – whether investors are taking on more risky assets (risk-on) or seeking safe-havens (risk-off) – is also a factor, with risk-on positive for AUD.
The Reserve Bank of Australia (RBA) influences the Australian Dollar (AUD) by setting the level of interest rates that Australian banks can lend to each other. This influences the level of interest rates in the economy as a whole. The main goal of the RBA is to maintain a stable inflation rate of 2-3% by adjusting interest rates up or down. Relatively high interest rates compared to other major central banks support the AUD, and the opposite for relatively low. The RBA can also use quantitative easing and tightening to influence credit conditions, with the former AUD-negative and the latter AUD-positive.
China is Australia’s largest trading partner so the health of the Chinese economy is a major influence on the value of the Australian Dollar (AUD). When the Chinese economy is doing well it purchases more raw materials, goods and services from Australia, lifting demand for the AUD, and pushing up its value. The opposite is the case when the Chinese economy is not growing as fast as expected. Positive or negative surprises in Chinese growth data, therefore, often have a direct impact on the Australian Dollar and its pairs.
Iron Ore is Australia’s largest export, accounting for $118 billion a year according to data from 2021, with China as its primary destination. The price of Iron Ore, therefore, can be a driver of the Australian Dollar. Generally, if the price of Iron Ore rises, AUD also goes up, as aggregate demand for the currency increases. The opposite is the case if the price of Iron Ore falls. Higher Iron Ore prices also tend to result in a greater likelihood of a positive Trade Balance for Australia, which is also positive of the AUD.
The Trade Balance, which is the difference between what a country earns from its exports versus what it pays for its imports, is another factor that can influence the value of the Australian Dollar. If Australia produces highly sought after exports, then its currency will gain in value purely from the surplus demand created from foreign buyers seeking to purchase its exports versus what it spends to purchase imports. Therefore, a positive net Trade Balance strengthens the AUD, with the opposite effect if the Trade Balance is negative.
USD/JPY fell, driven by decline in the USD leg as expectations for larger Fed cut returned to the table, and was last seen at 140.70, OCBC’s FX analysts Frances Cheung and Christopher Wong note.
Bias to the downside
“Daily momentum is not showing a clear bias for now but RSI fell. Death cross earlier formed is getting more ‘entrenched’. Bias to the downside. Support at 140.70, 140.30 levels. Resistance at 143.50, 144.40 (21 DMA). Markets will be eyeing 140 level.”
“A decisive break on that level may trigger other USD/AXJs to break their recent support. Recent BoJspeaks reinforced normalisation bias. BoJ’s Tamura said that BoJ needs to lift rate to 1% by outlook period end (2026) while BoJ’s Nakagawa said that real rates are at very low level and that BoJ will continue to adjust the degree of easing if the economy and prices perform in line with expectations.”
“Fed-BoJ policy shifts and growing pace of normalisation can bring about faster narrowing of UST-JGB yield differentials and this should continue to underpin the broader direction of travel for USD/JPY to the downside.”
Earlier this week, we pointed out how EUR/NOK was substantially expensive close to the 12.0 mark, and that the risks of a correction lower were very high. That correction has materialised, and it is clear that the key engine for a NOK recovery at this stage is more dovish bets on the Fed, ING’s FX strategist Francesco Pesole notes.
A further EUR/NOK depreciation to 11.60-11.70
“At 11.85, EUR/NOK remains expensive, but we still have to stress how the risks of speculative dynamics (favoured by slimmer NOK liquidity) will keep volatility on both sides quite elevated. We believe Norges Bank will remain focused on helping the krone and refrain from sounding dovish at next week’s meeting.”
“Ultimately, that can favour a further EUR/NOK depreciation to 11.60-11.70, and potentially to even lower levels if the Fed cuts by 50bp.”
The Pound Sterling (GBP) remains in a strong position, ING’s FX strategist Francesco Pesole notes.
BoE is deemed unlikely to cut rates next week
“The Bank of England is deemed unlikely to cut rates next week, and while the Sonia curve pricing can be affected by the Fed's dovish rerating, the data has so far prevented the sterling market from making the kind of dovish pivot we saw in USD swaps. The 1.3250 August highs in GBP/USD appear well within reach at this stage.”
“Looking at EUR/GBP, a tentative bounce earlier this week proved to be quite short-lived. The ECB-BoE and eurozone-UK growth outlook divergence continues to weigh on the pair, and while the pound is starting to look expensive in relative terms, a sustainable recovery to the 0.85+ levels likely requires some strong dovish hints by the BoE.”
“The next big event for GBP is the CPI figures released on Wednesday, one day before the BoE announcement. Until then, global FX dynamics will dominate, and the pound should remain broadly supported.”
The DXY Index should continue to retreat from the top of its three-week range between 100.5 and 101.9, DBS’ Senior FX Strategist Philip Wee notes.
USD’s turn to fall lower ahead of next week’s FOMC meeting
“The futures market will likely be wrong in anticipating a larger 50 bps cut, reading too much into Fed Chair Jerome Powell’s remark at Jackson Hole that the Fed do everything it could to support a strong labour market as it made progress towards price stability. The S&P 500 Index has recovered to 5596, near its lifetime high of 5670, after its near-10% plunge over July 16-August 5 on fears that higher US joblessness heralded a US recession.”
“The Fed has never described the labour market as weak; Powell reckoned it was time to lower rates to avert a further cooling in the labour market. The US unemployment rate eased to 4.2% in August from 4.3%, while CPI inflation excluding food and energy rose to 0.3% MoM from 0.2% over the same period. Yesterday, PPI core inflation also rose to 0.3% MoM from -0.2%.” “Today, the University of Michigan consumer survey will likely show 1Y inflation expectations staying unchanged at 2.8% in September after three months of declines. Hence, we expect the Fed to deliver a 25 bps cut to 5.25-5.50% next week. However, through its Summary of Economic Projections, the Fed should be more explicit than its counterparts regarding its multiple rate cut trajectory over 2025-2026 amid a soft landing, keeping the pressure on the greenback.”
EUR/USD is eyeing 1.11 again after the combined support of a not-dovish-enough European Central Bank and rising dovish bets on the Fed, ING’s FX strategist Francesco Pesole notes.
There is no strong technical resistance before 1.120
“It is abundantly clear that President Christine Lagarde is fine with keeping communication quiet and predictable at this stage, offering little to no guidance. At the press conference, she merely admitted the direction for policy rates is ‘pretty obvious’ (i.e., more cuts), but what truly resonated with markets is the firm reiteration of data dependency.”
“The EUR OIS curve is now pricing in some 5-6bp higher year-end deposit rate compared to yesterday: 3.10% from the current 3.50%. A 50bp move by the Fed can surely convince markets to price in 50bp of easing in the eurozone too this year, but the net impact on the EUR:USD swap rate gap would be neutral, so that support for EUR/USD from a rates perspective should remain intact.”
“We have two ECB speakers to keep an eye on today amid an otherwise light eurozone calendar. Lagarde speaks again at an event in Budapest, and before her Finnish central bank chief Olli Rehn (a neutral member) will participate at an event. Comments from Germany’s Joachim Nagel overnight were quite cautious and merely justified the rate cut with recent data. We can see EUR/USD breaking above 1.110 in the next few days on the back of USD weakness. There is no strong technical resistance before the 1.120 August highs.”
- Natural Gas extends its rally for a fourth straight trading day.
- European Gas reserves are nearly 93% full.
- The US Dollar index eases after a former Federal Reserve member calls for a 50-basis-points interest-rate cut.
Natural Gas is trading near $2.58 on Friday, up for a fourth straight day in a row. The prices rally comes amid increasing concerns around the impact of tropical storm Francine as the US Gas supply might face disruptions due to the closure of several offshore platforms in the Gulf Coast. Also on the supply side, the deteriorating situation between Russia and Ukraine is not helping, with the risk of Russia fully cutting off Europe from its supply.
Meanwhile, the US Dollar Index (DXY), which tracks the Greenback's value against six major currencies, is on the back foot after rallying earlier this week. At one point the US Dollar was rising with markets pricing in only a 25-basis-point interest-rate cut by the US Federal Reserve next week. That was until former Federal Reserve Bank of New York President William Dudley and several articles in top media sites mentioned there is still a possibility for a 50 basis point rate cut next week from the Fed. These led to a seismic shift overnight, with markets now undecided between odds on how big the upcoming rate cut will be.
Natural Gas is trading at $2.58 per MMBtu at the time of writing.
Natural Gas news and market movers: Europe is ready for next winter
- European underground Gas storage level is at 93%, with still some volumes underway and Norwegian Gas flows picking up after a lengthy period of maintenance and outages, Bloomberg reports.
- Egypt has bought another 20 cargoes of Liquified Natural gas (LNG) with an additional premium of $1.2 to $1.5 per mmBtu to European benchmark prices, revealing that Egypt still needs more LNG to get enough electricity, Bloomberg reports.
- US natural gas futures rallied after the weekly storage report showed stockpiles increased by less than what traders initially expected, with the south-central region showing storage still drawing down despite surplus everywhere else. The weekly Energy Information Administration (EIA) on Thursday reported that stockpiles jumped from 13 billion to 40 billion, lower than the 49 billion expected.
Natural Gas Technical Analysis: Concerns back to the forefront
Natural Gas prices are rallying, but there are increasing concerns about demand as Europe reserves look robust ahead of the upcoming heating season. This happens as traders were hoping that Thursday’s number from the EIA would have shown an addition of 49 billion cubic meters of Gas to US reserves. Instead, the number came up 9 billion cubic meters short, fueling concerns that this could mean issues ahead for the upcoming winter in the US at a moment when tropical storm Francine has disrupted Gas production in the Gulf.
On the upside, that blue ascending trend line could act as a keep short-term, near $2.62. Should the Gas price make its way above it, a longer term uptrend could play out here. Further up, $2.80 and $2.86 (red descending trend line) are coming into play.
On the downside, three clear levels can be identified to provide near-term and longer- term support in case prices correct to the downside. First up is the 100-day Simple Moving Average (SMA) at $2.46. A leg lower, both the 200-day SMA and the 55-day SMA are around $2.28, just ahead of $2.13.
Natural Gas: Daily Chart
Natural Gas FAQs
Supply and demand dynamics are a key factor influencing Natural Gas prices, and are themselves influenced by global economic growth, industrial activity, population growth, production levels, and inventories. The weather impacts Natural Gas prices because more Gas is used during cold winters and hot summers for heating and cooling. Competition from other energy sources impacts prices as consumers may switch to cheaper sources. Geopolitical events are factors as exemplified by the war in Ukraine. Government policies relating to extraction, transportation, and environmental issues also impact prices.
The main economic release influencing Natural Gas prices is the weekly inventory bulletin from the Energy Information Administration (EIA), a US government agency that produces US gas market data. The EIA Gas bulletin usually comes out on Thursday at 14:30 GMT, a day after the EIA publishes its weekly Oil bulletin. Economic data from large consumers of Natural Gas can impact supply and demand, the largest of which include China, Germany and Japan. Natural Gas is primarily priced and traded in US Dollars, thus economic releases impacting the US Dollar are also factors.
The US Dollar is the world’s reserve currency and most commodities, including Natural Gas are priced and traded on international markets in US Dollars. As such, the value of the US Dollar is a factor in the price of Natural Gas, because if the Dollar strengthens it means less Dollars are required to buy the same volume of Gas (the price falls), and vice versa if USD strengthens.
USD fell overnight. Higher jobless claims and the WSJ article on Fed's rate cut dilemma revived markets' confidence to price in a jumbo cut at Sep FOMC, OCBC’s FX analysts Frances Cheung and Christopher Wong note.
Risks are now skewed to the downside
“Probability of 50bp cut for Sep FOMC is at 46% vs. 37% probability a day ago. In particular, the article carried an interview with Jon Faust. He said that the amount of cuts over the next few months ‘is going to be a lot more important than whether the first move is 25 or 50, which I think is a close call’. He also said that the economy is in a spot that calls for a pre-emptive 50 but his ‘preference would be slightly starting with 50’. He added that Fed could manage concerns about spooking investors with a larger cut by providing ‘a lot of language around it that make it not scary’ and then ‘it wouldn’t be a sign of worry’.”
“UST yields fell, alongside USD. Elsewhere on US data, initial jobless claims inched up slightly to +230k (vs. +227k prior) while 4w moving average shows signs of turning after declining in Aug. DXY gapped lower in the open. Last at 101. Daily momentum is bullish while RSI fell. Risks now skewed to the downside. Support at 100.50 levels. Resistance at 101.40 (21 DMA), 101.90 and 102.20 (23.6% fibo retracement of 2023 high to 2024 low). Day ahead brings Uni of Michigan sentiment, export/import price index data.”
EUR/USD rebounded from its critical support level of 1.10 by 0.6% to 1.1074 after the European Central Bank meeting. As expected, the ECB lowered the deposit facility rate by 25 bps to 3.50%, DBS’ Senior FX Strategist Philip Wee notes.
First Fed cut expected at next week’s FOMC meeting
“In maintaining its stance on deciding rates meeting by meeting based on data, the ECB did not signal another cut at the October 17 meeting. Although the ECB lowered its forecasts for the Eurozone economy to 0.8% from 0.9% for 2024 and to 1.3% from 1.4% for 2025, it expected inflation to rise again in 4Q24 after another low reading In September, in anticipation of negotiated wage growth staying high for the rest of 2024.”
“In line with past guidance, the ECB lowered the main refi and marginal lending facility rates by a larger 60 bps to 3.65% and 3.90%, respectively. This technical adjustment to narrow the gaps between the three policy rates should help rekindle lending between banks and support the economy amid higher inflation in the final quarter.”
“Hence, the ECB will likely defer any decision to lower rates again to the year’s final meeting on December 12. Meanwhile, EUR/USD should keep recovering within its three-week range from markets turning its attention to the first Fed cut expected at next week’s FOMC meeting on September 18.”
The currency market has cemented its view that the Federal Reserve's focus has shifted away from inflation this week. The dollar is trading on the soft side after two above-consensus inflation prints (CPI and PPI), with the impact of the former proving to be rather short-lived. The swap market is currently pricing in 37bp of easing for next week’s FOMC meeting, implying equally split chances of a 25bp or 50bp cut, ING’s FX strategist Francesco Pesole notes.
DXY cam retest the 100.5 recent lows into the FOMC
“Helping the dovish case overnight were some remarks by former FOMC member Bill Dudley, who explicitly said he would push for a 50bp cut were he still in the committee. He said in particular: ‘It’s very unusual to go into the meeting with this level of uncertainty – usually the Fed doesn’t like to surprise markets’. It may mean that markets themselves can tilt the balance towards a half-point move should their dovish bets be pent up into Wednesday’s meeting. There were also some media reports suggesting it would be a close call between 25bp and 50bp, which contributed to the dovish repricing.”
“We recently called for subdued USD performance into the US election. Unless the Fed surprises with a hawkish cut, we think even a dovish 25bp move can prevent a sustainable dollar recovery. Investors will also monitor the direction of US election polls in the coming days. Kamala Harris is openly calling for another debate, but Donald Trump has ruled it out. Remember that Harris is seen as a more dollar-negative candidate, and if her good momentum extends from the debate into the polls, we would really need some data/a Fed surprise to take the dollar higher.”
“Today, the only event in the US calendar is the University of Michigan survey, where inflation expectations are expected to have flatlined in September. If actual inflation data didn’t help the dollar much, we doubt some tier-two indicators will. With Fed members in the pre-meeting ‘blackout’ period, there is no real way to tone down the market’s dovish bets after Dudley’s comments, so the chances of more dovish repricing into Wednesday – and further dollar underperformance – have increased substantially. DXY could retest the 100.5 recent lows into the FOMC.”
The Euro (EUR) rebounded and was last seen at 1.1099 levels, OCBC FX analysts Frances Cheung and Christopher Wong note.
Bearish momentum on daily chart shows signs of fading
"ECB meeting was perceived as lack of dovishness. 25bp rate cut was delivered, well within market expectations. At the press conference, Lagarde said that it was “pretty obvious” interest rates were on a declining path but that the speed and scale of rate cuts had yet to be determined. She reiterated that policy decision will remain data-dependent in view of the uncertainty and that policymakers shall decide on rates meeting by meeting."
"Elsewhere the broad pullback in USD also contributed to the EUR rebound. Bearish momentum on daily chart shows signs of fading while RSI rose. Risks are skewed to the upside for now. Resistance at 1.1140 and 1.12 levels. Support at 1.1010, 1.0970 (50-DMA, 38.2% fibo retracement of 2024 low to high)."
- EUR/USD rises as increasing bets of a large cut by the Federal Reserve weigh on the US Dollar.
- The ECB said it remains data-dependent for further monetary policy action after Thursday’s cut.
- ECB's President Lagarde refrained from providing a specific interest-rate cut path.
EUR/USD jumps to near 1.1100 in Friday’s European session. The major currency pair rises as the Euro (EUR) strengthens following the European Central Bank’s (ECB) monetary policy announcement on Thursday, and the US Dollar (USD) weakens after soft United States (US) Producer Price Index (PPI) data for August. The ECB cuts its Rate On Deposit Facility by 25 basis points (bps) to 3.50%, as widely anticipated.
The central bank was already expected to cut its key borrowing rates as the Eurozone economic outlook appears to have faltered due to a weak demand environment and price pressures in the old continent continue to decelerate.
The outlook of the Euro has improved due to the absence of a pre-defined interest rate cut path in the monetary policy statement and ECB President Christine Lagarde’s press conference. Comments from Lagarde indicated that the central bank will follow a data-centric approach, saying, "the interest rate decisions will be based on its assessment of inflation outlook in light of incoming economic and financial data, dynamics of underlying inflation and strength of monetary policy transmission," at the press conference.
For the remainder of the year, market participants see the ECB reducing interest rates one more time as price pressures are expected to soften further. In the late Asian session, ECB policymaker Joachin Nagel told German radio Deutschlandfunk, "We assume that core inflation will improve, especially with the declining wage trend in the Eurozone.”
In the economic data front, Eurozone Industrial Production decreased by 2.2% year-over-year (YoY) in July, Eurostat reported on Friday. The number was better than the -2.7% expected and the -4.1% (revised from -3.9%) seen in June. On a monthly basis, Industrial Production decreased by 0.3%, as expected.
Daily digest market movers: EUR/USD gains as US Dollar slides further
- EUR/USD strengthens at the expense of a weak US Dollar. The US Dollar Index (DXY), which tracks the Greenback’s value against six major currencies, extends its downside to near 101.00. The Greenback faces sharp selling pressure as market speculation for the Federal Reserve (Fed) to reduce interest rates by 50 basis points (bps) on Wednesday soars.
- According to the CME FedWatch tool, the probability of the Fed reducing interest rates by 50 basis points (bps) to 4.75%-5.00% in September has increased sharply to 43% from 14% after the US PPI data release.
- Thursday’s PPI data showed that the producer inflation grew at a slower-than-expected pace year-over-year in August. The headline inflation rose by 1.7%, slower than the estimates of 1.8% and from 2.1% in July, downwardly revised from 2.2%. In the same period, the core producer inflation – which excludes volatile food and energy prices – rose steadily by 2.4%, slower than expectations of 2.5%.
- A slower pace in the price increase of goods and services at factory gates suggests a sluggish consumer spending trend, which historically prompts Federal Reserve (Fed) interest rate cut bets.
- Going forward, investors will focus on the preliminary Michigan Consumer Sentiment Index data for September, which will be published at 14:00 GMT. The sentiment data is estimated to have remained almost steady at 68.0 from the prior release of 67.9.
Technical Analysis: EUR/USD bounces back strongly from 1.1000
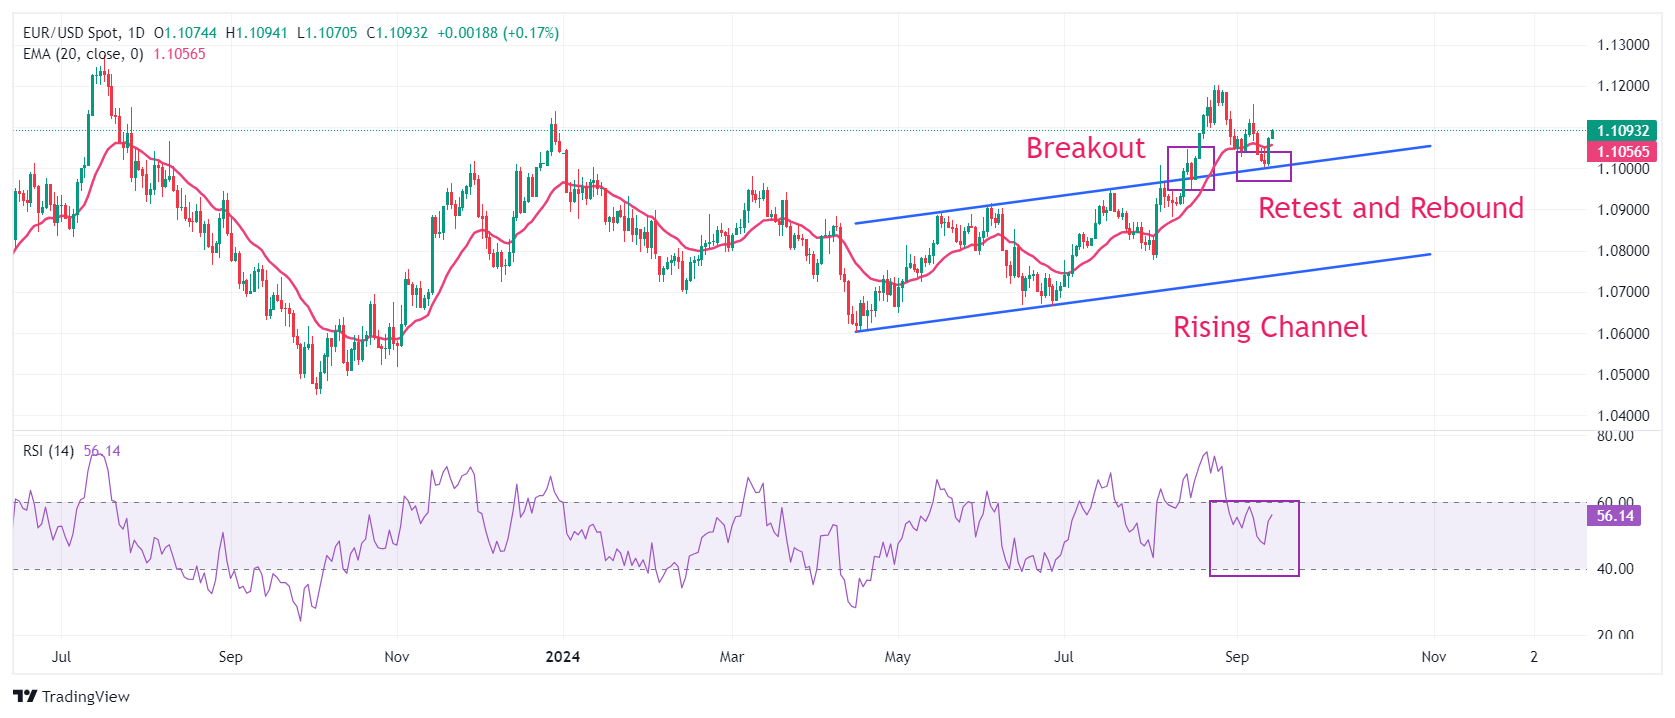
EUR/USD soars after retesting the breakout of the Rising Channel chart pattern formed on a daily timeframe near the psychological support of 1.1000. The near-term outlook of the major currency pair has strengthened as it has climbed above the 20-day Exponential Moving Average (EMA), which trades around 1.1055.
The 14-day Relative Strength Index (RSI) oscillates inside the 40.00-60.00 range. A bullish momentum would trigger after breaking above 60.00.
Looking up, last week’s high of 1.1155 and the round-level resistance of 1.1200 will act as major barricades for the Euro bulls. On the downside, the psychological level of 1.1000 and the July 17 high near 1.0950 will be major support zones.
Euro FAQs
The Euro is the currency for the 20 European Union countries that belong to the Eurozone. It is the second most heavily traded currency in the world behind the US Dollar. In 2022, it accounted for 31% of all foreign exchange transactions, with an average daily turnover of over $2.2 trillion a day. EUR/USD is the most heavily traded currency pair in the world, accounting for an estimated 30% off all transactions, followed by EUR/JPY (4%), EUR/GBP (3%) and EUR/AUD (2%).
The European Central Bank (ECB) in Frankfurt, Germany, is the reserve bank for the Eurozone. The ECB sets interest rates and manages monetary policy. The ECB’s primary mandate is to maintain price stability, which means either controlling inflation or stimulating growth. Its primary tool is the raising or lowering of interest rates. Relatively high interest rates – or the expectation of higher rates – will usually benefit the Euro and vice versa. The ECB Governing Council makes monetary policy decisions at meetings held eight times a year. Decisions are made by heads of the Eurozone national banks and six permanent members, including the President of the ECB, Christine Lagarde.
Eurozone inflation data, measured by the Harmonized Index of Consumer Prices (HICP), is an important econometric for the Euro. If inflation rises more than expected, especially if above the ECB’s 2% target, it obliges the ECB to raise interest rates to bring it back under control. Relatively high interest rates compared to its counterparts will usually benefit the Euro, as it makes the region more attractive as a place for global investors to park their money.
Data releases gauge the health of the economy and can impact on the Euro. Indicators such as GDP, Manufacturing and Services PMIs, employment, and consumer sentiment surveys can all influence the direction of the single currency. A strong economy is good for the Euro. Not only does it attract more foreign investment but it may encourage the ECB to put up interest rates, which will directly strengthen the Euro. Otherwise, if economic data is weak, the Euro is likely to fall. Economic data for the four largest economies in the euro area (Germany, France, Italy and Spain) are especially significant, as they account for 75% of the Eurozone’s economy.
Another significant data release for the Euro is the Trade Balance. This indicator measures the difference between what a country earns from its exports and what it spends on imports over a given period. If a country produces highly sought after exports then its currency will gain in value purely from the extra demand created from foreign buyers seeking to purchase these goods. Therefore, a positive net Trade Balance strengthens a currency and vice versa for a negative balance.
- Gold is hitting record highs on Friday as markets debate anew whether the Fed will cut by 50 or 25 basis points in September.
- The revival of the possibility of a “jumbo” 0.50% cut fuels another rally in Gold.
- Gold’s broad uptrend resumes although momentum is flashing “overbought”.
Gold (XAU/USD) is exchanging hands in the high $2,560s on Friday, trading about 0.40% higher on the day after posting new record highs on Thursday when it broke decisively out of a range it had been oscillating in since it peaked on August 20.
The initial catalyst for the breakout was the release of mixed “factory gate” price inflation data, or Producer Price Index (PPI) data out of the US for August. The figures showed a deeper-than-expected slowdown in headline PPI, and although core PPI remained sticky, the market reacted as if the data was disinflationary.
Gold extends rally after media reignites debate over 0.50% vs 0.25% Fed cut
Gold continued to rally during Friday’s Asian session due to the revival of the debate over whether the Federal Reserve (Fed) will cut interest rates by 0.50% or 0.25% at its meeting next Wednesday.
The release of still-high core consumer price inflation data, in the form of the Consumer Price Index (CPI) on Wednesday, had seemingly put to bed hopes of a “jumbo” 0.50% (50 pbs) cut. However, an article by a respected The Wall Street Journal (WSJ) Fed Watcher Nick Timiraos, as well as comments from former President of the New York Fed William Dudley, suggested a 0.50% should still be considered. This, in turn, led to a fall in US Treasury yields, a sell-off in the US Dollar (USD), and a rally in Gold’s price.
Lower interest rates are positive for Gold because it reduces the opportunity cost of holding the non-interest-bearing asset, making it more attractive to investors.
Technical Analysis: Gold pushes to record highs as broad uptrend resumes
Gold (XAU/USD) breaks out of its multi-week sideways range and surpasses the previous record highs of $2,531.
The longer-term trend for Gold is bullish, and according to technical analysis theory, since “the trend is your friend,” this favors a continuation of the uptrend.
XAU/USD 4-hour Chart
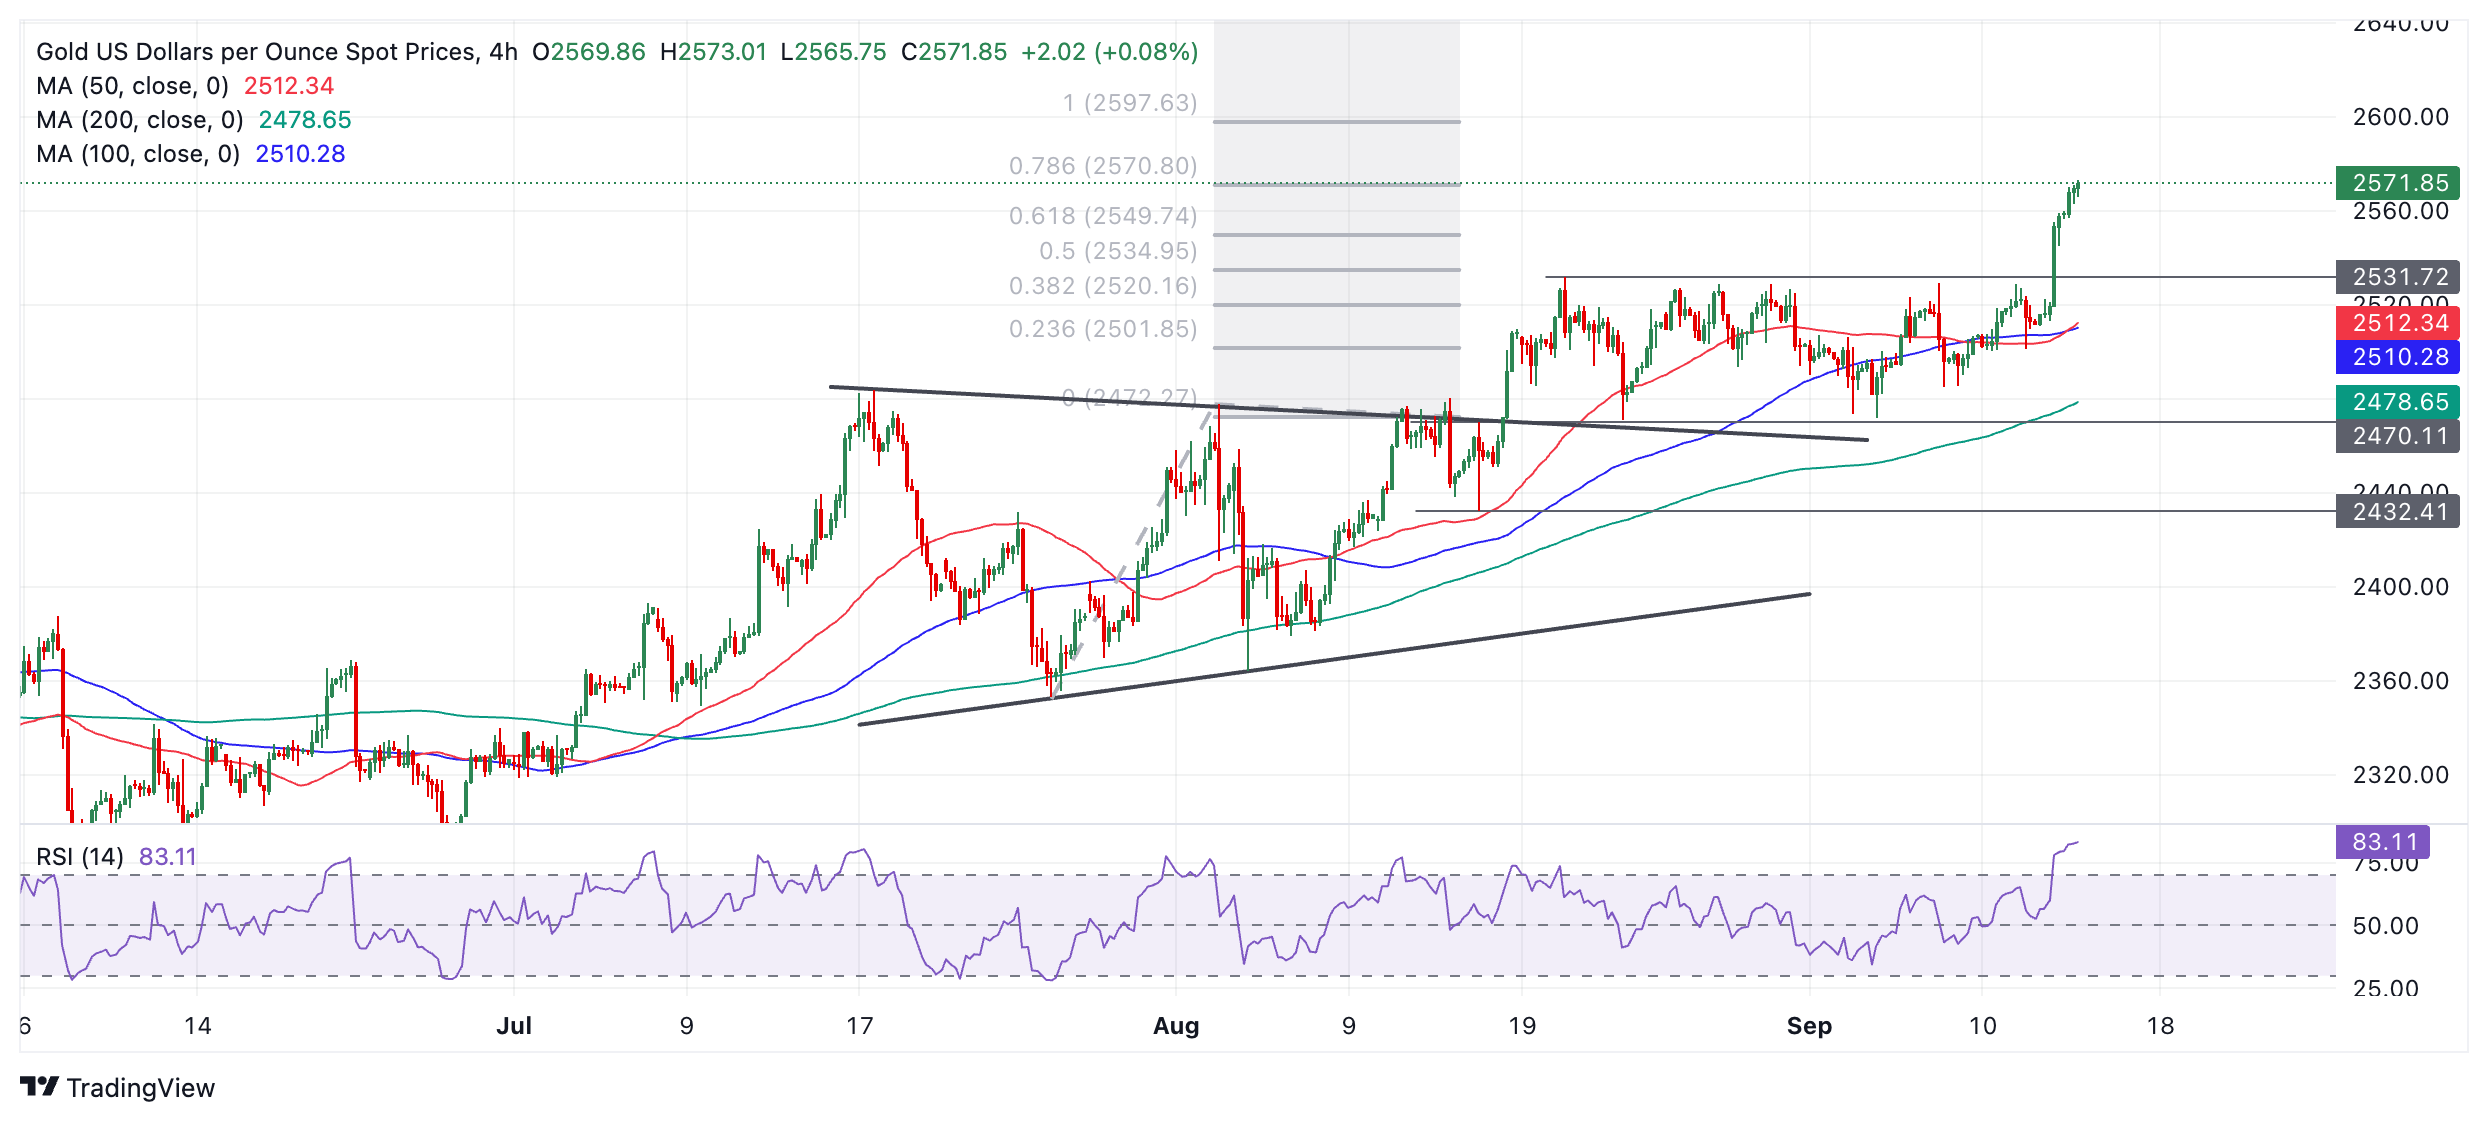
The precious metal has met its previous target at $2,550, generated after the original breakout from the July-August range on August 14, and now sets its sights on the next target at around $2,590.
Gold is overbought, however, according to the Relative Strength Index (RSI). This advises long holders not to add to their positions because of an increased risk of a pullback materializing.
If the RSI exits overbought, it will signal a correction is unfolding. If such a correction unfolds, it will likely find support either at the $2,550 prior target or firmer support lower at the $2,531 former high.
The trend on all timeframes remains bullish, however, suggesting any correction will eventually run out of steam and the broader uptrend will resume, pushing the yellow metal to new highs.
Economic Indicator
Producer Price Index (YoY)
The Producer Price Index released by the Bureau of Labor statistics, Department of Labor measures the average changes in prices in primary markets of the US by producers of commodities in all states of processing. Changes in the PPI are widely followed as an indicator of commodity inflation. Generally speaking, a high reading is seen as positive (or bullish) for the USD, whereas a low reading is seen as negative (or bearish).
Read more.Last release: Thu Sep 12, 2024 12:30
Frequency: Monthly
Actual: 1.7%
Consensus: 1.8%
Previous: 2.2%
Source: US Bureau of Labor Statistics
Silver prices (XAG/USD) rose on Friday, according to FXStreet data. Silver trades at $30.17 per troy ounce, up 0.97% from the $29.88 it cost on Thursday.
Silver prices have increased by 26.77% since the beginning of the year.
| Unit measure | Silver Price Today in USD |
|---|---|
| Troy Ounce | 30.17 |
| 1 Gram | 0.97 |
The Gold/Silver ratio, which shows the number of ounces of Silver needed to equal the value of one ounce of Gold, stood at 85.27 on Friday, down from 85.64 on Thursday.
Silver FAQs
Silver is a precious metal highly traded among investors. It has been historically used as a store of value and a medium of exchange. Although less popular than Gold, traders may turn to Silver to diversify their investment portfolio, for its intrinsic value or as a potential hedge during high-inflation periods. Investors can buy physical Silver, in coins or in bars, or trade it through vehicles such as Exchange Traded Funds, which track its price on international markets.
Silver prices can move due to a wide range of factors. Geopolitical instability or fears of a deep recession can make Silver price escalate due to its safe-haven status, although to a lesser extent than Gold's. As a yieldless asset, Silver tends to rise with lower interest rates. Its moves also depend on how the US Dollar (USD) behaves as the asset is priced in dollars (XAG/USD). A strong Dollar tends to keep the price of Silver at bay, whereas a weaker Dollar is likely to propel prices up. Other factors such as investment demand, mining supply – Silver is much more abundant than Gold – and recycling rates can also affect prices.
Silver is widely used in industry, particularly in sectors such as electronics or solar energy, as it has one of the highest electric conductivity of all metals – more than Copper and Gold. A surge in demand can increase prices, while a decline tends to lower them. Dynamics in the US, Chinese and Indian economies can also contribute to price swings: for the US and particularly China, their big industrial sectors use Silver in various processes; in India, consumers’ demand for the precious metal for jewellery also plays a key role in setting prices.
Silver prices tend to follow Gold's moves. When Gold prices rise, Silver typically follows suit, as their status as safe-haven assets is similar. The Gold/Silver ratio, which shows the number of ounces of Silver needed to equal the value of one ounce of Gold, may help to determine the relative valuation between both metals. Some investors may consider a high ratio as an indicator that Silver is undervalued, or Gold is overvalued. On the contrary, a low ratio might suggest that Gold is undervalued relative to Silver.
(An automation tool was used in creating this post.)
- USD/CAD trades in a tight range even though the US Dollar slides further.
- Rising Fed large rate cut prospects improve the appeal of risk-sensitive assets.
- The BoC may extend the policy-easing cycle next month.
The USD/CAD pair consolidates inside Thursday’s range slightly below the round-level resistance of 1.3600 in Friday’s European session. The Loonie asset remains sideways despite sheer weakness in the US Dollar (USD), suggesting that the Canadian Dollar (CAD) is also performing weakly.
S&P 500 futures have posted decent gains in the European session, exhibiting a strong risk appetite of investors. The US Dollar Index (DXY), which tracks the Greenback’s value against six major currencies, slumps to near 101.00. The appeal of risk-perceived assets has improved as market speculation for the Federal Reserve (Fed) to start the policy-easing process aggressively has strengthened.
The CME FedWatch tool shows that the probability of the Fed reducing interest rates by 50 basis points (bps) to 4.75%-5.00% in September has increased sharply to 43% from 14% on Thursday. Fed large rate cut bets were prompted after the release of the United States (US) Producer Price Index (PPI) data for August, which showed that the producer inflation rose at a slower-than-estimated pace year-on-year.
US core PPI – which excludes volatile food and energy prices – rose steadily by 2.4%, while economists expected the underlying producer inflation to have grown by 2.5%. The headline PPI decelerated to 1.7% from the estimates of 1.8% and the former release of 2.1%. Soft PPI data has diminished fears for price pressures remaining persistent.
Meanwhile, a sharp weakness in the Canadian Dollar appears to be the outcome of firm expectations that the Bank of Canada (BoC) will extend the policy-easing cycle in the October policy meeting. The BoC has already slashed its interest rates by 75 basis points (bps) this year and more rate cuts seem warranted due to lingering growth worries. The Canadian labor market has been hit hard due to the maintenance of a restrictive interest rate stance by the BoC for a longer period.
Canadian Dollar FAQs
The key factors driving the Canadian Dollar (CAD) are the level of interest rates set by the Bank of Canada (BoC), the price of Oil, Canada’s largest export, the health of its economy, inflation and the Trade Balance, which is the difference between the value of Canada’s exports versus its imports. Other factors include market sentiment – whether investors are taking on more risky assets (risk-on) or seeking safe-havens (risk-off) – with risk-on being CAD-positive. As its largest trading partner, the health of the US economy is also a key factor influencing the Canadian Dollar.
The Bank of Canada (BoC) has a significant influence on the Canadian Dollar by setting the level of interest rates that banks can lend to one another. This influences the level of interest rates for everyone. The main goal of the BoC is to maintain inflation at 1-3% by adjusting interest rates up or down. Relatively higher interest rates tend to be positive for the CAD. The Bank of Canada can also use quantitative easing and tightening to influence credit conditions, with the former CAD-negative and the latter CAD-positive.
The price of Oil is a key factor impacting the value of the Canadian Dollar. Petroleum is Canada’s biggest export, so Oil price tends to have an immediate impact on the CAD value. Generally, if Oil price rises CAD also goes up, as aggregate demand for the currency increases. The opposite is the case if the price of Oil falls. Higher Oil prices also tend to result in a greater likelihood of a positive Trade Balance, which is also supportive of the CAD.
While inflation had always traditionally been thought of as a negative factor for a currency since it lowers the value of money, the opposite has actually been the case in modern times with the relaxation of cross-border capital controls. Higher inflation tends to lead central banks to put up interest rates which attracts more capital inflows from global investors seeking a lucrative place to keep their money. This increases demand for the local currency, which in Canada’s case is the Canadian Dollar.
Macroeconomic data releases gauge the health of the economy and can have an impact on the Canadian Dollar. Indicators such as GDP, Manufacturing and Services PMIs, employment, and consumer sentiment surveys can all influence the direction of the CAD. A strong economy is good for the Canadian Dollar. Not only does it attract more foreign investment but it may encourage the Bank of Canada to put up interest rates, leading to a stronger currency. If economic data is weak, however, the CAD is likely to fall.
- Silver is rallying towards the ceiling of a broad range.
- The RSI is overbought, however, suggesting the risk of a pull back evolving.
Silver (XAG/USD) is trading in an up leg towards the top of a broad range that stretches from the $26s to the $30s.
Silver is bullish over the short-term and given it is a principle of technical analysis that “the trend is your friend” more upside is favored.
Silver 4-hour Chart
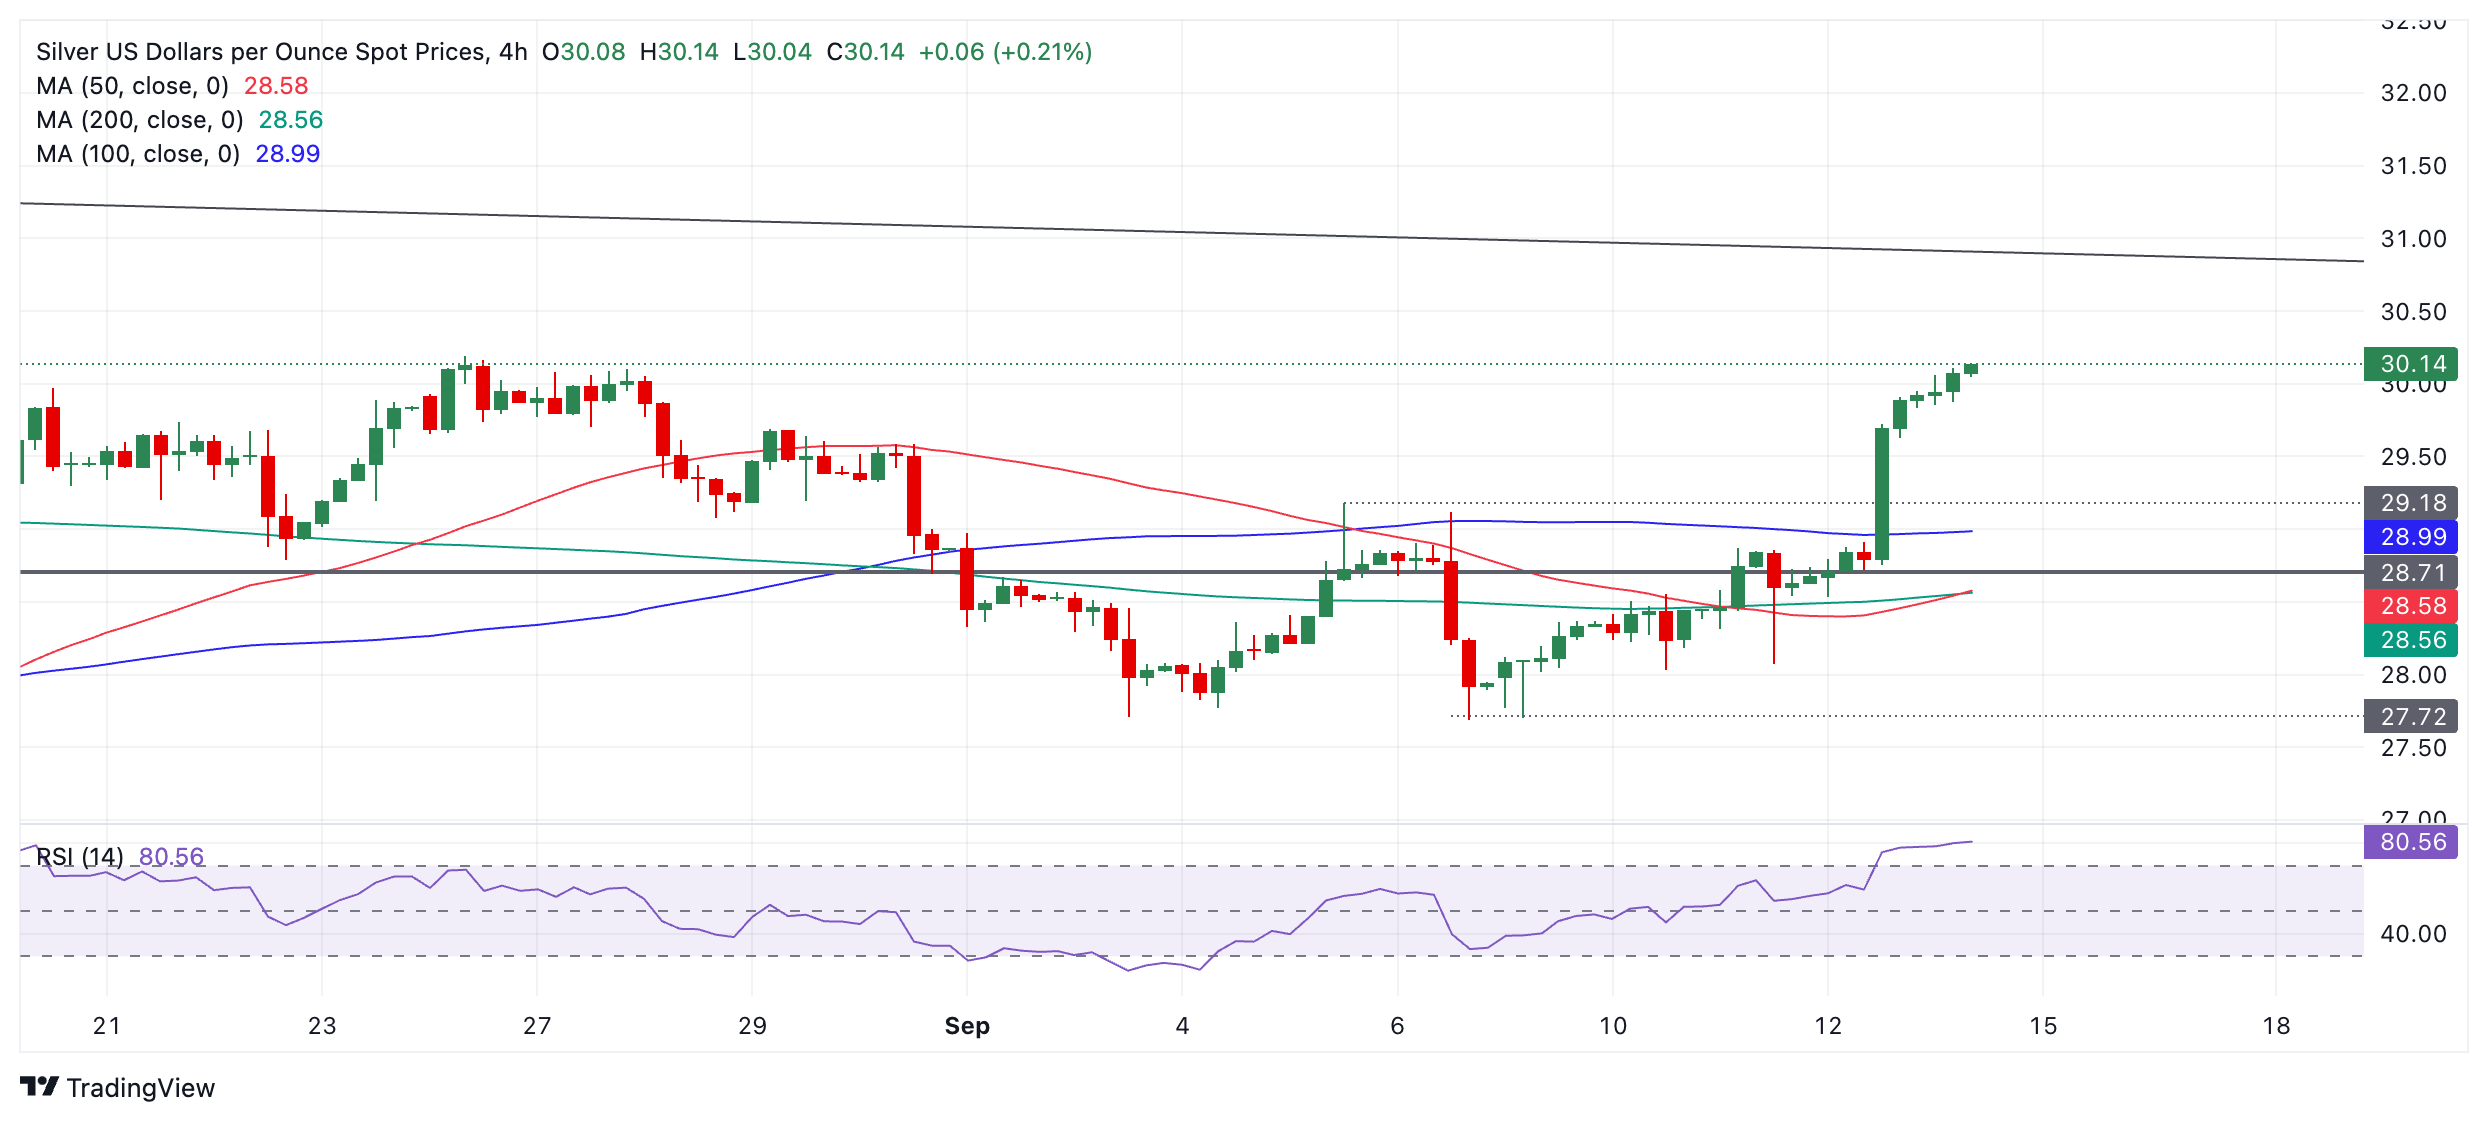
Silver will probably continue higher towards the range high at roughly $30.90 before encountering resistance from the ceiling.
Silver is overbought, however, according to the Relative Strength Index (RSI) momentum indicator. This advises traders not to add to their long positions. If RSI moves back out of the overbought zone it will provide a sell signal and indicate a probable correction is evolving.
Such a correction might find support either in the $29.60s (August 28 high) or, if deeper, at the $29.18 former mini-range high.
Given the short-term trend is bullish, the correction is likely to eventually run out of steam, however, and the uptrend to resume, pushing Silver to new heights.
Eurozone’s industrial sector activity accelerated its pace of decline in July, the latest data published by Eurostat showed on Friday.
Industrial output in the old continent decreased by 0.3% MoM, aligning with the expected decline of 0.3% while down from a 0% reading in June.
Eurozone Industrial Production fell at an annual rate of 2.2% in July versus June’s -4.1%. The market forecast was for -2.7%.
EUR/USD reaction to the Eurozone Industrial Production data
Mixed Eurozone industrial figures have little to no impact on the Euro, as EUR/USD continues to hold higher ground near 1.1100. The pair is up 0.16% on the day, at the press time.
UK public inflation expectations for the next 12 months are seen at 2.7% in August, a tad lower from a 2.8% forecast in May, the quarterly survey conducted by the Bank of England (BoE) and Ipsos showed on Friday.
Additional findings
UK public inflation expectations for 12 months after that 2.6% (previous: 2.6%).
UK public inflation expectations for 5 years' time 3.2% (previous: 3.1%).
Public confidence in boe +4 (previous: -4).
Market reaction
At the time of writing, GBP/USD is adding 0.16% on the day to trade near 1.3145, little affected by the survey findings.
- USD/JPY remains under some selling pressure on Friday and hits a fresh YTD low.
- The divergent Fed-BoJ policy expectations continue to weigh heavily on the pair.
- Investors look to Fed and BoJ meetings next week for a fresh directional impetus.
The USD/JPY pair drops to a fresh YTD trough during the first half of the European session on Friday, albeit manages to recover a few pips in the last hour. Spot prices currently trade around the 140.75 region, still down over 0.75% for the day and seem vulnerable to slide further.
The divergent Federal Reserve (Fed)-Bank of Japan (BoJ) policy expectations led to the recent narrowing of the US-Japan rate differential and continued to prompt the unwinding of the Japanese Yen (JPY) carry trades. In fact, the markets started pricing in the possibility of a larger interest rate cut by the US central bank following the release of the softer-than-expected US Producer Price Index (PPI), which indicated that inflation is subsiding.
Dovish Fed expectations, meanwhile, drag the yield on the benchmark 10-year US government bond to its lowest level since May 2023. Meanwhile, Japan’s 10-year government bond yield also fell to a four-week low, though hawkish signals from BoJ policymakers should limit the fall. BoJ board member Junko Nakagawa said this week that the central bank will raise interest rates further if the economy and inflation move in line with its forecasts.
Adding to this, BoJ board member Naoki Tamura said on Thursday that the central bank must push up short-term rates to at least around 1% through fiscal 2026 to stably achieve the 2% inflation target. This, in turn, reaffirms bets that the Japanese central bank will announce another interest rate hike by the end of this year, which might continue to drive flows towards the JPY and support prospects for a further depreciating move for the USD/JPY pair.
That said, the upbeat market mood might keep a lid on any further JPY gains as traders look forward to next week's key central bank event risks before placing fresh directional bets. The Fed is scheduled to announce its decision at the end of a two-day policy meeting on Wednesday. This will be followed by the BoJ policy update on Friday, which will play a key role in influencing the USD/JPY pair in the near term. Nevertheless, spot prices remain on track to register losses for the second straight week – also marking the third in the previous four.
Economic Indicator
BoJ Interest Rate Decision
The Bank of Japan (BoJ) announces its interest rate decision after each of the Bank’s eight scheduled annual meetings. Generally, if the BoJ is hawkish about the inflationary outlook of the economy and raises interest rates it is bullish for the Japanese Yen (JPY). Likewise, if the BoJ has a dovish view on the Japanese economy and keeps interest rates unchanged, or cuts them, it is usually bearish for JPY.
Read more.Next release: Fri Sep 20, 2024 03:00
Frequency: Irregular
Consensus: -
Previous: 0.15%
Source: Bank of Japan
- The Mexican Peso rises in key pairs as expectations of lower interest rates in the US and Europe weigh on counterparts.
- The USD is hit by a revival of the debate over a 50 or 25 bps cut, and the Euro by lower economic growth forecasts.
- USD/MXN reaches the downside target after a key breakout from a rising channel.
The Mexican Peso (MXN) extends its gains on Friday, capping off a week in which the currency has appreciated on average 2.3% against its most heavily-traded counterparts so far.
The expectation that interest rates will fall more rapidly in Europe and the US as growth slows and labor markets weaken is weighing on the Peso’s key counterparts – the US Dollar (USD), the Euro (EUR) and the Pound Sterling (GBP). Meanwhile, still-elevated interest rates in Mexico, at 10.75%, continue to attract foreign capital inflows, supporting MXN.
Mexican Peso rises against USD after WSJ article, Dudley speech
The Mexican Peso rises against the USD on the back of a revival of the possibility of the Federal Reserve (Fed) making a larger 0.50% (50 basis points) interest-rate cut at its September meeting next week. Such a cut would be negative for the US Dollar (USD) as lower interest rates attract less capital inflows.
Speculation of a larger 0.50% cut was revived by a respected The Wall Street Journal (WSJ) reporter, Nick Timiraos, who wrote an article in support of the case. This was followed by a story in the Financial Times (FT) along similar lines.
During Friday’s Asian session, William Dudley, the former President of the Federal Reserve (Fed) Bank of New York, said “there’s a strong case” for the Fed making a half a percentage point rate cut at the September FOMC meeting, in a speech in Singapore, according to Reuters.
The articles and Dudley’s comments appear to have caused a sudden drop in two-year US Treasury yields, which tumbled five basis points during Friday’s Asisan session. The USD weakened too as traders priced in the possibility of lower interest rates amid a less inflationary outlook.
“US yields fell in Asia trade on Friday while rates futures rallied in reaction to media reports that next week's decision on whether to cut by 25 bps or 50 bps was a close call,” according to Reuters.
ECB cuts rates and flags waning economic growth
Against the Euro, the Peso is rising after the European Central Bank (ECB) decided to slash interest rates at its September meeting on Thursday.
The ECB cut its deposit rate by 0.25% but lowered its main overnight refinancing rate and marginal lending facility by a deeper 0.60%. Although the cuts were widely telegraphed, the accompanying statement showed a downward-revision to ECB economic growth forecasts for the region, which some analysts see as a red flag warning of future cuts. This, in turn, weakened the Euro.
ECB President Christine Lagarde refused to speculate as to whether the ECB would cut rates again in October during her press conference. However, according to Bloomberg News, if the Fed goes ahead with a larger 0.50% cut next Wednesday, it would encourage the ECB to cut by another 0.25% in October.
The Pound Sterling, meanwhile, is trading on the back foot after data out of the UK showed Gross Domestic Product (GDP) growth stalled in July when economists had forecast a 0.2% rise. This, combined with declines in both Manufacturing and Industrial output, suggests a greater likelihood of the Bank of England (BoE) deciding to cut interest rates when it meets next Thursday, weighing on GBP.
Peso holds ground
The Mexican Peso remains relatively strong despite the passing of controversial judicial reforms in the country’s Senate on Wednesday. Although the reforms have been widely criticized by investors – including rating agencies such as Moody’s – for undermining the independence of the judiciary and potentially leading to a fall in foreign investment, the Peso appears to have already priced in the risk.
The lower probability of former President Donald Trump winning the presidential election in November after his poor performance in a debate with Vice President Kamala Harris on Tuesday has alleviated some of the political risk that would be associated with the “America First” orientation expected from a Trump presidency.
Despite investor concerns relating to the policies of the current left-leaning government, Mexico continues to benefit from a nearshoring boom as global manufacturing companies relocate to Mexico to produce goods for the US and Latin American market.
This was highlighted by Volvo’s announcement in August, when the automaker said it was planning to build a $700 million heavy-duty truck manufacturing plant in the northern Mexican city of Monterrey.
At the time of writing, one US Dollar (USD) buys 19.50 Mexican Pesos, EUR/MXN trades at 21.60, and GBP/MXN at 25.64.
Technical Analysis: USD/MXN reaches downside target for channel breakout
USD/MXN recently broke out of a channel and has now fallen to the target for the breakout at 19.62, calculated by taking the 0.618 Fibonacci (Fib) ratio of the height of the channel and extrapolating it lower.
USD/MXN 4-hour Chart
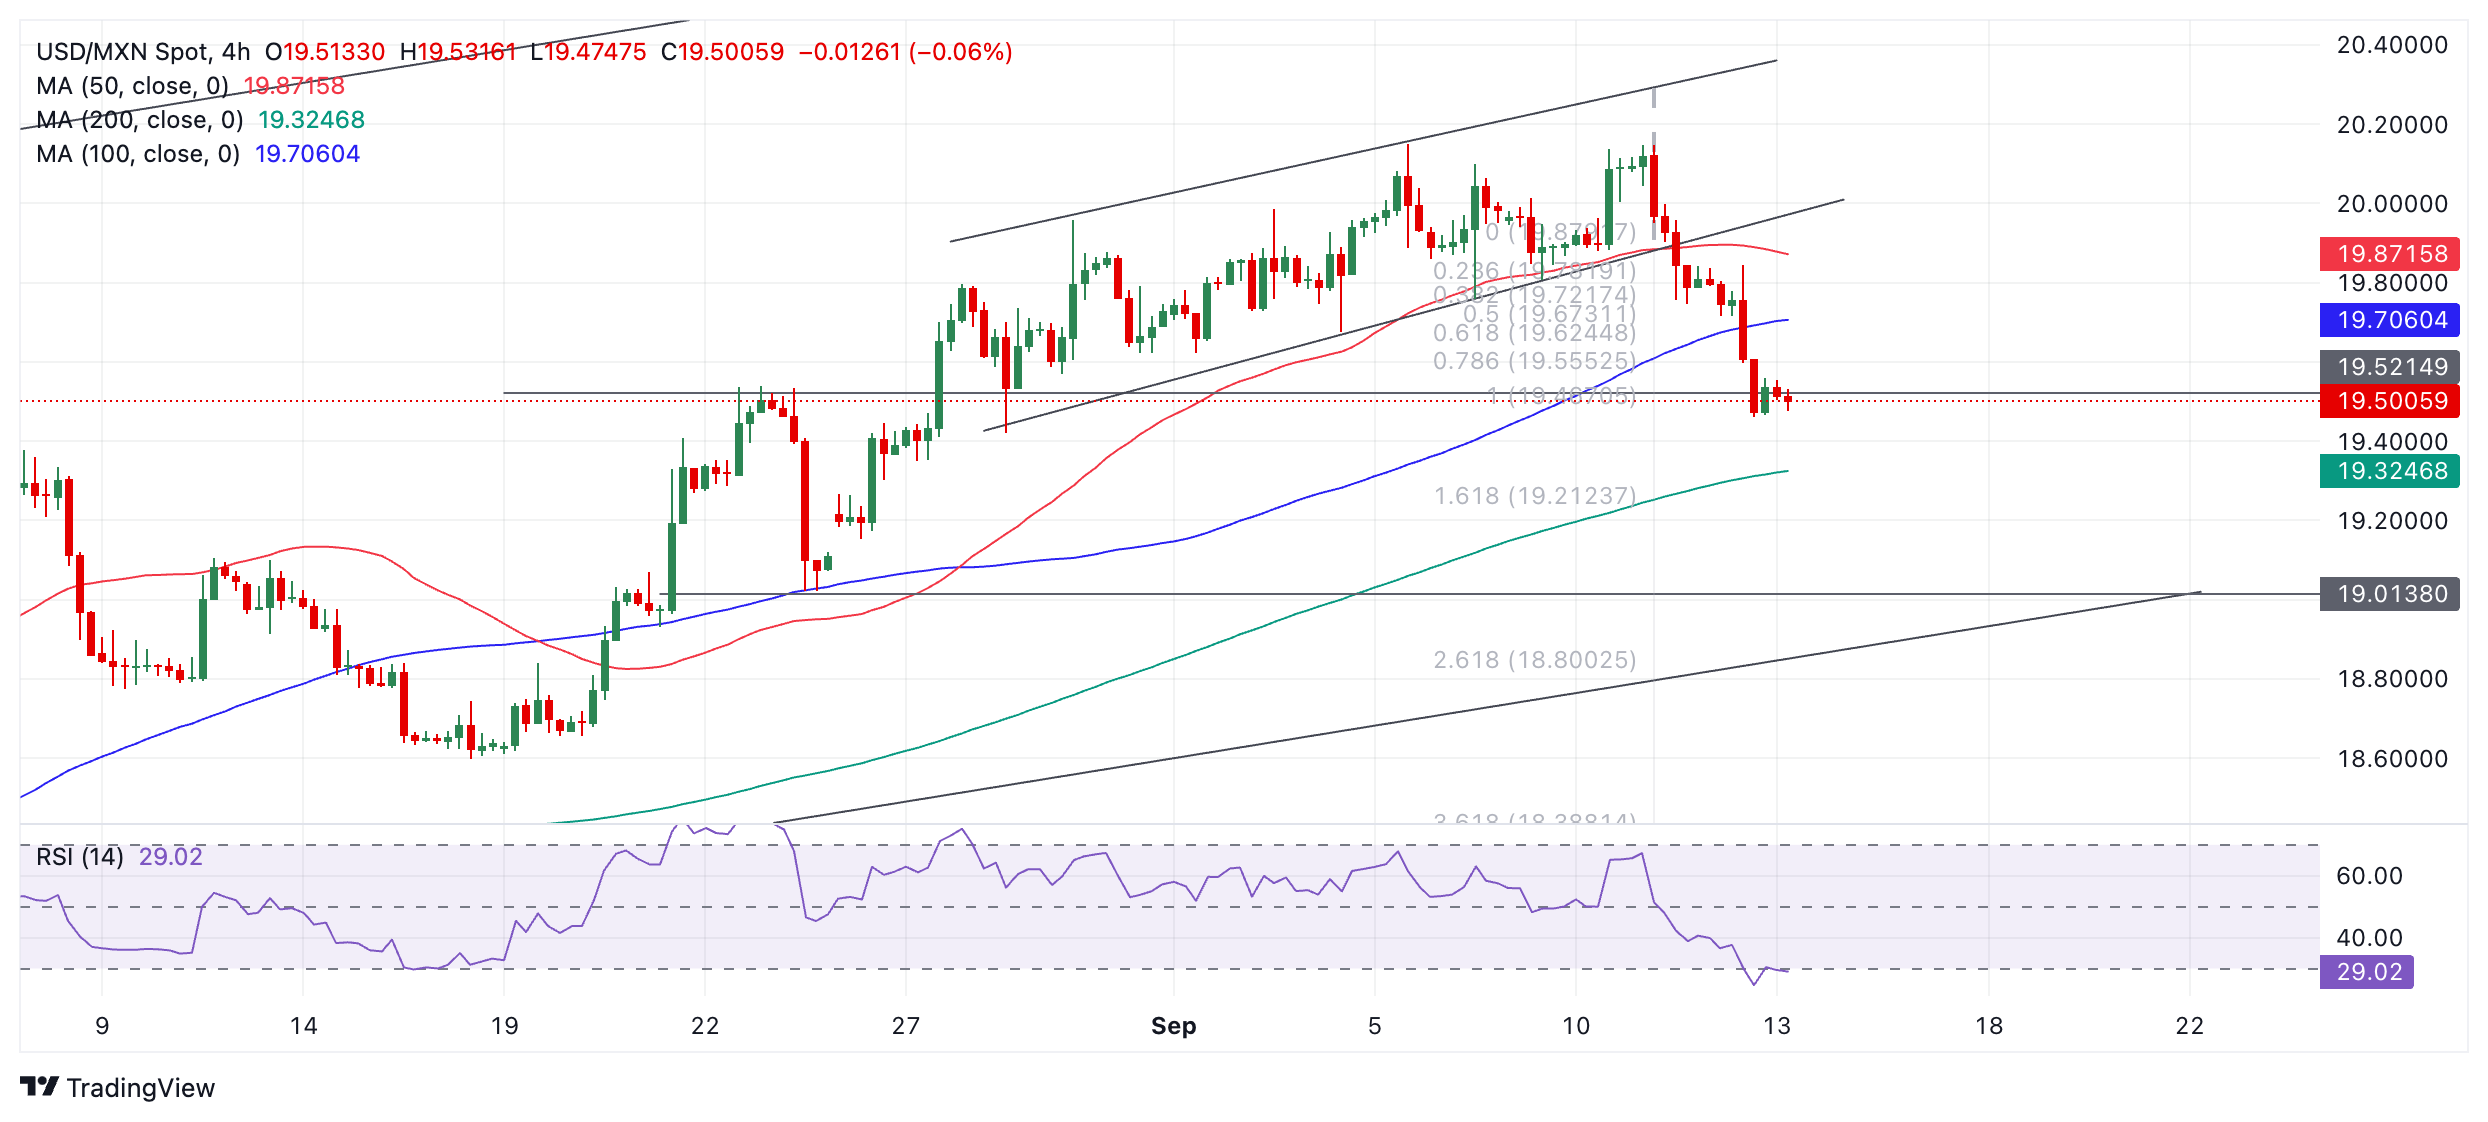
It has also now reached the next target at 19.50 mark, the 1.000 ratio Fib extension, which also coincides with the key support level from the August 22 swing high.
The pair is now oversold, according to the Relative Strength Index (RSI), advising traders not to add to short positions as the risk of a pullback has increased. If RSI exists oversold it will give a signal that a correction is underway and prices will recover. However, given the bear trend in the short term, such a correction might be relatively short-lived before prices resume their downtrend.
A close below the 19.46 September 12 low would confirm an extension of the downtrend towards the next target at 19.01 (August 23 low).
The trend on the medium and long-term charts, however, remains bullish, suggesting the risk of a recovery and resumption of the broader trend higher.
A break above 19.84 would be the first sign of such a bullish resumption, although a break above the year-to-date high at 20.15 would provide more concrete confirmation of a continuation of the bull trend, with the next target at the upper channel line in the 20.60s.
Economic Indicator
Producer Price Index (YoY)
The Producer Price Index released by the Bureau of Labor statistics, Department of Labor measures the average changes in prices in primary markets of the US by producers of commodities in all states of processing. Changes in the PPI are widely followed as an indicator of commodity inflation. Generally speaking, a high reading is seen as positive (or bullish) for the USD, whereas a low reading is seen as negative (or bearish).
Read more.Last release: Thu Sep 12, 2024 12:30
Frequency: Monthly
Actual: 1.7%
Consensus: 1.8%
Previous: 2.2%
Source: US Bureau of Labor Statistics
- WTI consolidates its recovery gains registered over the past two days amid mixed cues.
- Concerns about slowing demand in China and the US cap the upside for Crude Oil prices.
- Dovish Fed-inspired broad-based USD weakness offers support and helps limit losses.
West Texas Intermediate (WTI) US crude Oil prices struggle to capitalize on a two-day-old recovery move from the lowest level since May 2023 and oscillate in a range around mid-$68.00s through the first half of the European session on Friday.
Despite worries about output disruptions caused by Hurricane Francine in the US Gulf of Mexico, a dismal demand outlook is seen as a key factor acting as a headwind for the black liquid. In fact, both the Organization of Petroleum Exporting Countries (OPEC) and the International Energy Agency (IEA) lowered their demand growth forecasts earlier this week. This, to a larger extent, overshadows worries about output disruptions caused by Hurricane Francine in the US Gulf of Mexico and caps the upside for Crude Oil prices.
Meanwhile, the softer-than-expected US Producer Price Index (PPI) report released on Thursday lifted bets for a larger interest rate cut by the Federal Reserve (Fed) at its upcoming policy meeting on September 17-18. This, in turn, drags the yield on the benchmark 10-year US government bond to its lowest level since May 2023. Apart from this, the prevalent risk-on mood across the global equity markets weighs on the safe-haven US Dollar (USD) and lends support to the USD-denominated commodities, including Crude Oil prices.
Nevertheless, the black liquid remains on track to register modest weekly gains for the first time in the previous five, though the aforementioned fundamental backdrop warrants some caution before positioning for any further appreciating move. Traders might also prefer to wait on the sidelines ahead of next week's central bank event risk – the outcome of the highly-anticipated FOMC monetary policy meeting on Wednesday.
WTI Oil FAQs
WTI Oil is a type of Crude Oil sold on international markets. The WTI stands for West Texas Intermediate, one of three major types including Brent and Dubai Crude. WTI is also referred to as “light” and “sweet” because of its relatively low gravity and sulfur content respectively. It is considered a high quality Oil that is easily refined. It is sourced in the United States and distributed via the Cushing hub, which is considered “The Pipeline Crossroads of the World”. It is a benchmark for the Oil market and WTI price is frequently quoted in the media.
Like all assets, supply and demand are the key drivers of WTI Oil price. As such, global growth can be a driver of increased demand and vice versa for weak global growth. Political instability, wars, and sanctions can disrupt supply and impact prices. The decisions of OPEC, a group of major Oil-producing countries, is another key driver of price. The value of the US Dollar influences the price of WTI Crude Oil, since Oil is predominantly traded in US Dollars, thus a weaker US Dollar can make Oil more affordable and vice versa.
The weekly Oil inventory reports published by the American Petroleum Institute (API) and the Energy Information Agency (EIA) impact the price of WTI Oil. Changes in inventories reflect fluctuating supply and demand. If the data shows a drop in inventories it can indicate increased demand, pushing up Oil price. Higher inventories can reflect increased supply, pushing down prices. API’s report is published every Tuesday and EIA’s the day after. Their results are usually similar, falling within 1% of each other 75% of the time. The EIA data is considered more reliable, since it is a government agency.
OPEC (Organization of the Petroleum Exporting Countries) is a group of 13 Oil-producing nations who collectively decide production quotas for member countries at twice-yearly meetings. Their decisions often impact WTI Oil prices. When OPEC decides to lower quotas, it can tighten supply, pushing up Oil prices. When OPEC increases production, it has the opposite effect. OPEC+ refers to an expanded group that includes ten extra non-OPEC members, the most notable of which is Russia.
European Central Bank (ECB) policymaker Madis Muller said on Friday that “confidence is growing that inflation is on the right track..”
Additional quotes
Temporary acceleration in inflation is likely.
Services inflation is still a concern.
The Eurozone economy is awaiting moderate recovery.
- The Pound Sterling climbs to near 1.3150 against the US Dollar as traders raise bets for a Fed 50 bps interest rate cut for next week's meeting.
- Slowed US annual PPI for August prompted the Fed’s sizable rate cut prospects.
- Investors expect that the BoE is unlikely to cut interest rates next week.
The Pound Sterling (GBP) extends its recovery to nearly 1.3150 against the US Dollar (USD) in Friday’s London session. The GBP/USD pair gains as the US Dollar (USD) falls sharply after the United States (US) Producer Price Index (PPI) data for August prompted market expectations for the Federal Reserve (Fed) to begin reducing interest rates next week aggressively.
The US Dollar Index (DXY), which tracks the Greenback’s value against six major currencies, slides further to near 101.00.
The PPI report showed that the annual headline producer inflation rose by 1.7%, slower than the estimates of 1.8% and July’s print of 2.1%. In the same period, the core PPI – which excludes volatile food and energy prices – grew steadily by 2.4%. Investors expected the core PPI to have accelerated to 2.5%. Meanwhile, the monthly headline and core PPI rose at a faster pace of 0.2% and 0.3%, respectively.
According to the CME FedWatch tool, the probability of the Fed reducing interest rates by 50 basis points (bps) to 4.75%-5.00% in September has increased sharply to 43% from the 14% before the US PPI data release.
In Friday’s session, investors will focus on the preliminary Michigan Consumer Sentiment Index data for September. The sentiment data is estimated to have remained almost steady at 68.0 from the prior release of 67.9.
Daily digest market movers: Pound Sterling outperforms US Dollar
- The Pound Sterling exhibits a strong performance against its major peers on Friday. The British currency strengthens on multiple tailwinds. Growing speculation for the Fed to reduce interest rates aggressively has improved market sentiment. In addition, firm expectations for the Bank of England (BoE) to follow a shallow policy-easing cycle have also strengthened the Pound Sterling.
- Historically, the scenario of the Fed pivoting to policy-normalization aggressively improves the appeal of risky assets. S&P 500 futures have posted nominal gains in the Asian session after a bullish Thursday, suggesting an improvement in investors’ risk appetite.
- According to a Reuters poll, the BoE is unlikely to cut interest rates in its next policy meeting, scheduled for next week. All 65 economists in a Reuters poll said the BoE would likely hold rates at 5.0% on Thursday after cutting from a 16-year high of 5.25% in August.
- Meanwhile, the next major trigger for the Pound Sterling will be the United Kingdom (UK) Consumer Price Index (CPI) data for August, which will be published on Wednesday. The latest BoE forecast showed that the UK annual headline inflation will remain above 2% by the year-end.
Technical Analysis: Pound Sterling bounces back from 1.3000
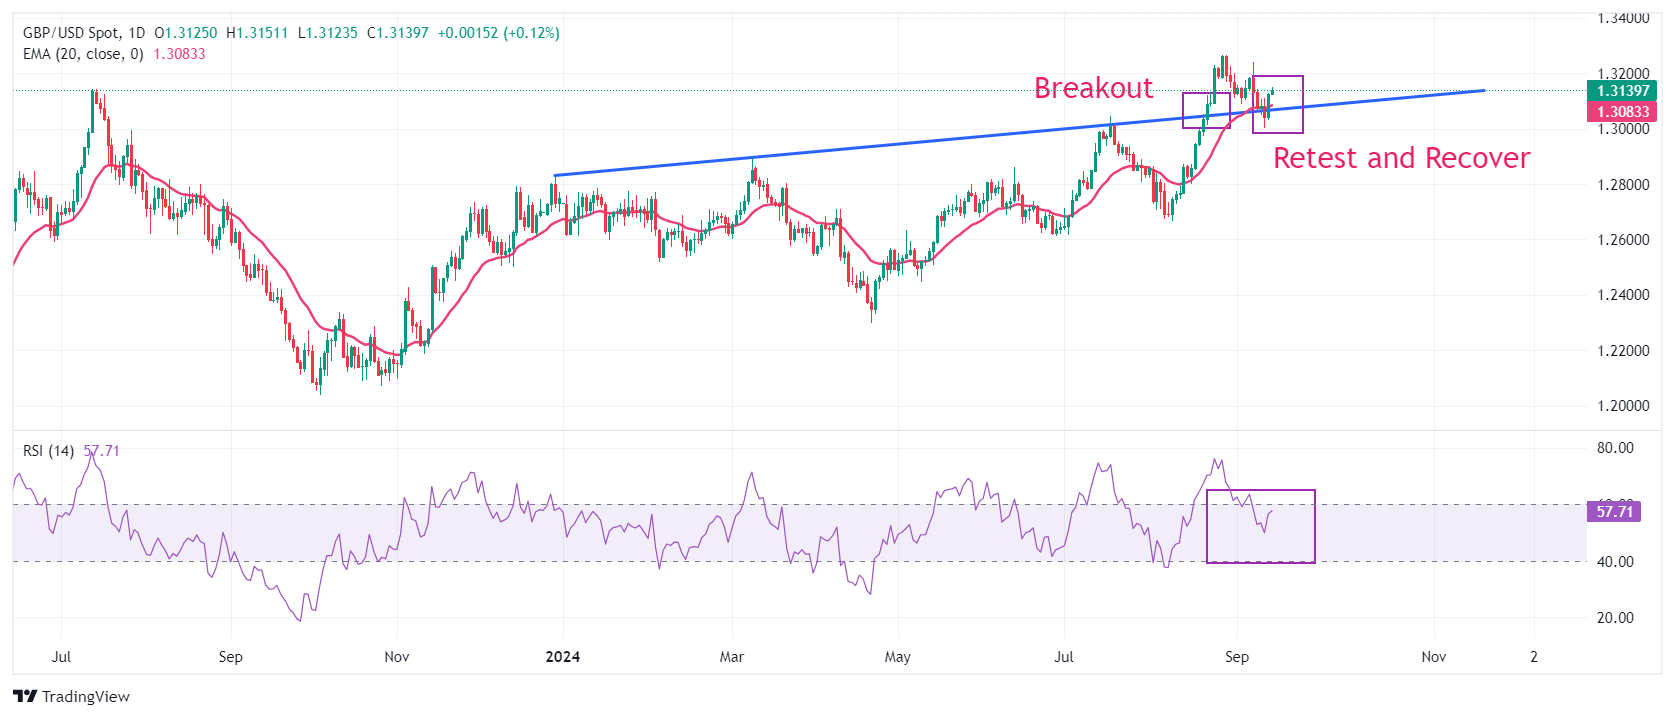
The Pound Sterling recovers sharply to near 1.3150 against the US Dollar. The GBP/USD pair bounced back strongly after discovering strong buying interest near the trendline plotted from the December 28, 2023, high of 1.2828, from where it delivered a sharp upside move after a breakout on August 21. Also, the 20-day Exponential Moving Average (EMA) near 1.3080 has acted as major support for the Pound Sterling’s appeal.
The 14-day Relative Strength Index (RSI) remains inside the 40.00-60.00 range. A fresh bullish impulse would occur if the momentum oscillator breaks above 60.00.
Looking up, the Cable will face resistance near the round-level resistance of 1.3200 and the psychological level of 1.3500. On the downside, the psychological level of 1.3000 emerges as crucial support for the Pound Sterling bulls.
Pound Sterling FAQs
The Pound Sterling (GBP) is the oldest currency in the world (886 AD) and the official currency of the United Kingdom. It is the fourth most traded unit for foreign exchange (FX) in the world, accounting for 12% of all transactions, averaging $630 billion a day, according to 2022 data. Its key trading pairs are GBP/USD, aka ‘Cable’, which accounts for 11% of FX, GBP/JPY, or the ‘Dragon’ as it is known by traders (3%), and EUR/GBP (2%). The Pound Sterling is issued by the Bank of England (BoE).
The single most important factor influencing the value of the Pound Sterling is monetary policy decided by the Bank of England. The BoE bases its decisions on whether it has achieved its primary goal of “price stability” – a steady inflation rate of around 2%. Its primary tool for achieving this is the adjustment of interest rates. When inflation is too high, the BoE will try to rein it in by raising interest rates, making it more expensive for people and businesses to access credit. This is generally positive for GBP, as higher interest rates make the UK a more attractive place for global investors to park their money. When inflation falls too low it is a sign economic growth is slowing. In this scenario, the BoE will consider lowering interest rates to cheapen credit so businesses will borrow more to invest in growth-generating projects.
Data releases gauge the health of the economy and can impact the value of the Pound Sterling. Indicators such as GDP, Manufacturing and Services PMIs, and employment can all influence the direction of the GBP. A strong economy is good for Sterling. Not only does it attract more foreign investment but it may encourage the BoE to put up interest rates, which will directly strengthen GBP. Otherwise, if economic data is weak, the Pound Sterling is likely to fall.
Another significant data release for the Pound Sterling is the Trade Balance. This indicator measures the difference between what a country earns from its exports and what it spends on imports over a given period. If a country produces highly sought-after exports, its currency will benefit purely from the extra demand created from foreign buyers seeking to purchase these goods. Therefore, a positive net Trade Balance strengthens a currency and vice versa for a negative balance.
- EUR/GBP recovers its daily losses following the remarks from ECB Policymakers.
- ECB Governing Council member Bostjan Vasle stated that the central bank is not committed to any predetermined rate path.
- BoE is expected to deliver additional rate cuts following a slowdown in UK wage growth and flat GDP data.
EUR/GBP recovers intraday losses, trading around 0.8430 during the early European hours on Friday. However, the EUR/GBP cross faced challenges following the European Central Bank’s (ECB) interest rate decision on Thursday.
The ECB reduced the Main Refinancing Operations Rate to 3.65% with a 60 basis points (bps) rate cut, exceeding the market expectations of a 25 bps cut. Additionally, in an interview with Deutschlandfunk early Friday, ECB policymaker and Bundesbank President Joachim Nagel mentioned that "core inflation is also moving in the right direction." Nagel expects the inflation goal to be achieved at the end of next year.
ECB Governing Council member Bostjan Vasle stated on Friday that "we are not committed to any predetermined rate path." Vasle also mentioned that inflation will largely be driven by core inflation and services. Meanwhile, ECB policymaker Olli Rehn emphasized that future policy decisions will continue to be based on an assessment of the inflation outlook, with current uncertainties highlighting the importance of relying on fresh economic data.
Traders are anticipating additional interest rate cuts by the Bank of England (BoE), particularly after this week's data indicated a slowdown in UK wage growth and a flat GDP print for the second consecutive month in July. These economic signals have reinforced expectations of more easing measures by the BoE.
Friday’s Eurozone Industrial Production is anticipated to decrease by 0.3% MoM in July, following a previous 0.1% decline. Meanwhile, the annual data is expected to show a 2.7% decline, an improvement from the previous 3.9% drop. On the UK front, Consumer Inflation Expectations will be eyed.
Interest rates FAQs
Interest rates are charged by financial institutions on loans to borrowers and are paid as interest to savers and depositors. They are influenced by base lending rates, which are set by central banks in response to changes in the economy. Central banks normally have a mandate to ensure price stability, which in most cases means targeting a core inflation rate of around 2%. If inflation falls below target the central bank may cut base lending rates, with a view to stimulating lending and boosting the economy. If inflation rises substantially above 2% it normally results in the central bank raising base lending rates in an attempt to lower inflation.
Higher interest rates generally help strengthen a country’s currency as they make it a more attractive place for global investors to park their money.
Higher interest rates overall weigh on the price of Gold because they increase the opportunity cost of holding Gold instead of investing in an interest-bearing asset or placing cash in the bank. If interest rates are high that usually pushes up the price of the US Dollar (USD), and since Gold is priced in Dollars, this has the effect of lowering the price of Gold.
The Fed funds rate is the overnight rate at which US banks lend to each other. It is the oft-quoted headline rate set by the Federal Reserve at its FOMC meetings. It is set as a range, for example 4.75%-5.00%, though the upper limit (in that case 5.00%) is the quoted figure. Market expectations for future Fed funds rate are tracked by the CME FedWatch tool, which shapes how many financial markets behave in anticipation of future Federal Reserve monetary policy decisions.
European Central Bank (ECB) Governing Council member and Bank of France President, Francois Villeroy de Galhau, commented on the interest rate outlook on Friday.
Key quotes
On activity, the latest data have been somewhat disappointing.
Sees very gradual recovery in France beyond one-off olympics stimulus.
We should continue to reduce gradually and as appropriate degree of monetary restriction.
Pace has to be highly pragmatic, we keep our full optionality for our next meetings.
Market reaction
EUR/USD shrugs off the ECB-speak to trade modestly flat at 1.1075, as of writing.
Here is what you need to know on Friday, September 13:
Following the bullish action seen in the first half of the week, the US Dollar (USD) Index turned south on Thursday and erased all of its weekly gains. The index struggles to gain traction early Friday and edges lower toward 101.00. Eurostat will release Industrial Production data for July and the US economic docket will feature August Export Price Index and Import Price Index data, alongside the University of Michigan's Consumer Sentiment Survey for September.
US Dollar PRICE This week
The table below shows the percentage change of US Dollar (USD) against listed major currencies this week. US Dollar was the weakest against the Japanese Yen.
| USD | EUR | GBP | JPY | CAD | AUD | NZD | CHF | |
|---|---|---|---|---|---|---|---|---|
| USD | 0.08% | 0.02% | -0.82% | 0.12% | -0.66% | -0.06% | 0.55% | |
| EUR | -0.08% | -0.12% | -0.88% | 0.04% | -0.78% | -0.12% | 0.44% | |
| GBP | -0.02% | 0.12% | -0.87% | 0.16% | -0.67% | -0.03% | 0.56% | |
| JPY | 0.82% | 0.88% | 0.87% | 0.96% | 0.19% | 0.77% | 1.57% | |
| CAD | -0.12% | -0.04% | -0.16% | -0.96% | -0.74% | -0.19% | 0.59% | |
| AUD | 0.66% | 0.78% | 0.67% | -0.19% | 0.74% | 0.64% | 1.21% | |
| NZD | 0.06% | 0.12% | 0.03% | -0.77% | 0.19% | -0.64% | 0.59% | |
| CHF | -0.55% | -0.44% | -0.56% | -1.57% | -0.59% | -1.21% | -0.59% |
The heat map shows percentage changes of major currencies against each other. The base currency is picked from the left column, while the quote currency is picked from the top row. For example, if you pick the US Dollar from the left column and move along the horizontal line to the Japanese Yen, the percentage change displayed in the box will represent USD (base)/JPY (quote).
Soft producer inflation data from the US revived expectations for a large Federal Reserve (Fed) rate cut at the policy meeting next week, causing the USD to weaken against its major rivals. On a yearly basis, the Producer Price Index (PPI) rose 1.7% in August, down from 2.1% in July and below the market expectation of 1.8%. Additionally, the improving risk mood put additional weight on the USD's shoulders. Early Friday, US stock index futures trade flat and the 10-year US Treasury bond yield stays in negative territory at around 3.65%.
The European Central Bank (ECB) announced on Thursday that it lowered the deposit facility rate, also known as the benchmark interest rate, by 25 basis points (bps) to 3.5% as expected. In the post-meeting press conference, ECB President Christine Lagarde refrained from hinting on whether they are planning to ease policy further in the near term. EUR/USD gathered bullish momentum in the second half of the day on Thursday and rose more than 0.5%, snapping a four-day losing streak.
GBP/USD benefited from improving risk mood and the renewed USD weakness on Thursday and gained over 0.6%. The pair stays relatively quiet and trades in a tight channel above 1.3100 in the European morning.
Fitch Ratings said in its latest report that they expect the Bank of Japan’s (BoJ) to hike rates to 0.5% by the end of 2024, 0.75% in 2025 and 1% by end-2026. After closing the day marginally lower on Thursday, USD/JPY continues to stretch lower in the European morning and was last seen losing 0.5% on the day at 141.10.
Gold surged higher in the second half of the day on Thursday and reached a new record-high of $2,570 during the Asian trading hours on Friday. Although XAU/USD retreated slightly, it holds above $2,560 and remains on track to post strong weekly gains.
Interest rates FAQs
Interest rates are charged by financial institutions on loans to borrowers and are paid as interest to savers and depositors. They are influenced by base lending rates, which are set by central banks in response to changes in the economy. Central banks normally have a mandate to ensure price stability, which in most cases means targeting a core inflation rate of around 2%. If inflation falls below target the central bank may cut base lending rates, with a view to stimulating lending and boosting the economy. If inflation rises substantially above 2% it normally results in the central bank raising base lending rates in an attempt to lower inflation.
Higher interest rates generally help strengthen a country’s currency as they make it a more attractive place for global investors to park their money.
Higher interest rates overall weigh on the price of Gold because they increase the opportunity cost of holding Gold instead of investing in an interest-bearing asset or placing cash in the bank. If interest rates are high that usually pushes up the price of the US Dollar (USD), and since Gold is priced in Dollars, this has the effect of lowering the price of Gold.
The Fed funds rate is the overnight rate at which US banks lend to each other. It is the oft-quoted headline rate set by the Federal Reserve at its FOMC meetings. It is set as a range, for example 4.75%-5.00%, though the upper limit (in that case 5.00%) is the quoted figure. Market expectations for future Fed funds rate are tracked by the CME FedWatch tool, which shapes how many financial markets behave in anticipation of future Federal Reserve monetary policy decisions.
European Central Bank (ECB) Governing Council member Bostjan Vasle said on Friday that “we are not committed to any predetermined rate path.”
“Inflation to be largely steered by core and services,” he added.
Market reaction
EUR/USD was last seen trading at 1.1077, unmmoved by these above comments. The pair is up 0.03% on the day.
Euro PRICE Today
The table below shows the percentage change of Euro (EUR) against listed major currencies today. Euro was the strongest against the Australian Dollar.
| USD | EUR | GBP | JPY | CAD | AUD | NZD | CHF | |
|---|---|---|---|---|---|---|---|---|
| USD | -0.01% | -0.04% | -0.47% | 0.00% | 0.10% | 0.00% | -0.17% | |
| EUR | 0.00% | -0.04% | -0.47% | -0.01% | 0.11% | 0.08% | -0.16% | |
| GBP | 0.04% | 0.04% | -0.41% | 0.01% | 0.14% | 0.13% | -0.13% | |
| JPY | 0.47% | 0.47% | 0.41% | 0.48% | 0.57% | 0.54% | 0.32% | |
| CAD | -0.00% | 0.00% | -0.01% | -0.48% | 0.08% | 0.10% | -0.17% | |
| AUD | -0.10% | -0.11% | -0.14% | -0.57% | -0.08% | -0.01% | -0.28% | |
| NZD | -0.00% | -0.08% | -0.13% | -0.54% | -0.10% | 0.00% | -0.26% | |
| CHF | 0.17% | 0.16% | 0.13% | -0.32% | 0.17% | 0.28% | 0.26% |
The heat map shows percentage changes of major currencies against each other. The base currency is picked from the left column, while the quote currency is picked from the top row. For example, if you pick the Euro from the left column and move along the horizontal line to the US Dollar, the percentage change displayed in the box will represent EUR (base)/USD (quote).
- USD/CHF depreciates as Friday’s US data reinforce the likelihood of an aggressive Fed rate cut in September.
- Former New York Fed President Bill Dudley suggested a strong case for a 50 basis points rate cut next week.
- Traders expect the SNB to deliver a 25 basis points rate cut at its September meeting.
USD/CHF extends its losses for the second successive session, trading around 0.8490 during the Asian hours on Friday. The decline of the USD/CHF pair could be attributed to the subdued US Dollar (USD) following Friday’s economic data from the United States (US) reinforced the odds of a bumper rate cut by the Federal Reserve (Fed) next week.
According to the CME FedWatch Tool, markets are fully pricing at least a 25 basis point (bps) rate cut by the Federal Reserve at its September meeting. The likelihood of a 50 bps rate cut has sharply increased to 41.0%, up from 14.0% a day ago.
The decline in the US Treasury yields also contributes to the downward pressure for the Greenback. The US Dollar Index (DXY), which measures the value of the US Dollar against its six major peers, trades around 101.10 with 2-year and 10-year yields on US Treasury bonds standing at 3.58% and 3.64%, respectively, at the time of writing.
Former New York Fed President Bill Dudley suggested there is a strong case for a 50 basis points interest rate cut in the United States. Speaking at the Bretton Woods Committee's annual Future of Finance Forum in Singapore, Dudley remarked, "I think there's a strong case for 50, whether they're going to do it or not," per Reuters.
Last week, the Swiss Consumer Price Index fell to 1.1% year-on-year in August. Meanwhile, the monthly index showed no change against a 0.1% rise. This inflation report has further intensified speculation about an imminent rate cut by the Swiss National Bank (SNB) in September.
The market is anticipating a 25 basis points reduction at its September meeting. Traders will likely observe next week’s Trade Balance data to gauge the scale of interest rate cuts by the end of the year.
Swiss Franc FAQs
The Swiss Franc (CHF) is Switzerland’s official currency. It is among the top ten most traded currencies globally, reaching volumes that well exceed the size of the Swiss economy. Its value is determined by the broad market sentiment, the country’s economic health or action taken by the Swiss National Bank (SNB), among other factors. Between 2011 and 2015, the Swiss Franc was pegged to the Euro (EUR). The peg was abruptly removed, resulting in a more than 20% increase in the Franc’s value, causing a turmoil in markets. Even though the peg isn’t in force anymore, CHF fortunes tend to be highly correlated with the Euro ones due to the high dependency of the Swiss economy on the neighboring Eurozone.
The Swiss Franc (CHF) is considered a safe-haven asset, or a currency that investors tend to buy in times of market stress. This is due to the perceived status of Switzerland in the world: a stable economy, a strong export sector, big central bank reserves or a longstanding political stance towards neutrality in global conflicts make the country’s currency a good choice for investors fleeing from risks. Turbulent times are likely to strengthen CHF value against other currencies that are seen as more risky to invest in.
The Swiss National Bank (SNB) meets four times a year – once every quarter, less than other major central banks – to decide on monetary policy. The bank aims for an annual inflation rate of less than 2%. When inflation is above target or forecasted to be above target in the foreseeable future, the bank will attempt to tame price growth by raising its policy rate. Higher interest rates are generally positive for the Swiss Franc (CHF) as they lead to higher yields, making the country a more attractive place for investors. On the contrary, lower interest rates tend to weaken CHF.
Macroeconomic data releases in Switzerland are key to assessing the state of the economy and can impact the Swiss Franc’s (CHF) valuation. The Swiss economy is broadly stable, but any sudden change in economic growth, inflation, current account or the central bank’s currency reserves have the potential to trigger moves in CHF. Generally, high economic growth, low unemployment and high confidence are good for CHF. Conversely, if economic data points to weakening momentum, CHF is likely to depreciate.
As a small and open economy, Switzerland is heavily dependent on the health of the neighboring Eurozone economies. The broader European Union is Switzerland’s main economic partner and a key political ally, so macroeconomic and monetary policy stability in the Eurozone is essential for Switzerland and, thus, for the Swiss Franc (CHF). With such dependency, some models suggest that the correlation between the fortunes of the Euro (EUR) and the CHF is more than 90%, or close to perfect.
European Central Bank (ECB) policymaker Olli Rehn said on Friday that “ECB rate cuts are supportive of growth.”
Additional quotes
Current uncertainties emphasize the dependence on fresh data on the economy.
Will base decisions on the assessment of the inflation outlook, dynamics of core inflation, and also the strength of monetary policy transmission.
FX option expiries for Sept 13 NY cut at 10:00 Eastern Time, via DTCC, can be found below.
EUR/USD: EUR amounts
- 1.0950 721m
- 1.0975 1.4b
- 1.1000 878m
- 1.1030 1b
- 1.1120 982m
- 1.1125 826m
USD/JPY: USD amounts
- 142.00 1.3b
- 143.00 696m
- 145.49 1.1b
USD/CHF: USD amounts
- 0.8455 815m
- 0.8600 556m
AUD/USD: AUD amounts
- 0.6740 1.4b
- 0.6800 532m
USD/CAD: USD amounts
- 1.3690 1.3b
- 1.3695 975m
- 1.3750 690m
EUR/GBP: EUR amounts
- 0.8500 476m
- EUR/JPY loses ground as the BoJ indicates further rate hikes if the economic outlook meets expectations.
- Fitch Ratings report suggests that the BoJ may raise rates to 0.5% by the end of 2024.
- ECB policymaker Joachim Nagel mentioned that core inflation is moving in the right direction.
EUR/JPY edges lower to near 156.20 during Friday’s Asian session, continuing to receive support from the Bank of Japan's (BoJ) hawkish signals. The BoJ has indicated that it may raise interest rates further if the economic outlook meets expectations.
Fitch Ratings' latest report on the Bank of Japan's policy outlook suggests that the BoJ might raise rates to 0.5% by the end of 2024, 0.75% in 2025, and 1.0% by the end of 2026. The BoJ is diverging from the global trend of policy easing, having raised rates more aggressively than anticipated in July. This move underscores its increasing confidence that reflation is now firmly established.
Read more: Fitch expects BoJ interest rate at 0.75% by 2025
On Thursday, hawkish BoJ policymaker Naoki Tamura stated that the central bank should raise interest rates to at least 1% as early as the second half of the next fiscal year. This comment reinforces the BoJ's commitment to ongoing monetary tightening. Tamura noted that the likelihood of Japan’s economy sustainably reaching the BoJ's 2% inflation target was improving, indicating that conditions for further rate hikes are becoming more favorable, according to Reuters.
The European Central Bank (ECB) reduced the Main Refinancing Operations Rate to 4.0% with a 25 basis-point cut on Thursday. Additionally, in an interview with Deutschlandfunk early Friday, ECB policymaker and Bundesbank President Joachim Nagel mentioned that "core inflation is also moving in the right direction." Nagel expects the inflation goal to be achieved at the end of next year.
Traders await the Eurozone's Industrial Production data scheduled for later today. The monthly figure is anticipated to decrease by 0.3% in July, following a previous 0.1% decline. Meanwhile, the annual data is expected to show a 2.7% decline, an improvement from the previous 3.9% drop.
Interest rates FAQs
Interest rates are charged by financial institutions on loans to borrowers and are paid as interest to savers and depositors. They are influenced by base lending rates, which are set by central banks in response to changes in the economy. Central banks normally have a mandate to ensure price stability, which in most cases means targeting a core inflation rate of around 2%. If inflation falls below target the central bank may cut base lending rates, with a view to stimulating lending and boosting the economy. If inflation rises substantially above 2% it normally results in the central bank raising base lending rates in an attempt to lower inflation.
Higher interest rates generally help strengthen a country’s currency as they make it a more attractive place for global investors to park their money.
Higher interest rates overall weigh on the price of Gold because they increase the opportunity cost of holding Gold instead of investing in an interest-bearing asset or placing cash in the bank. If interest rates are high that usually pushes up the price of the US Dollar (USD), and since Gold is priced in Dollars, this has the effect of lowering the price of Gold.
The Fed funds rate is the overnight rate at which US banks lend to each other. It is the oft-quoted headline rate set by the Federal Reserve at its FOMC meetings. It is set as a range, for example 4.75%-5.00%, though the upper limit (in that case 5.00%) is the quoted figure. Market expectations for future Fed funds rate are tracked by the CME FedWatch tool, which shapes how many financial markets behave in anticipation of future Federal Reserve monetary policy decisions.
- EUR/USD builds on this week’s bounce from a multi-week low amid a bearish USD.
- Bets for a larger rate cut by the Fed and a positive risk tone weigh on the Greenback.
- Bulls need to wait for a break through a descending channel before placing fresh bets.
The EUR/USD pair builds on the previous day's goodish recovery move from the 1.1000 psychological mark, or a nearly four-week low and attracts some follow-through buyers for the second straight day on Friday. The momentum lifts spot prices to the top end of the weekly range, around the 1.1090 area during the Asian session and is sponsored by broad-based US Dollar (USD) weakness.
The softer-than-expected US Producer Price Index (PPI) report released on Thursday lifted bets for a larger interest rate cut by the Federal Reserve (Fed) next week. This, along with a positive risk tone, drags the USD to over a one-week low and turns out to be a key factor acting as a tailwind for the EUR/USD pair. Meanwhile, the European Central Bank (ECB) refrained from providing a specific interest rate guidance, which underpins the shared currency and contributes to the bid tone surrounding the currency pair.
From a technical perspective, spot prices currently trade near the top end of over a three-week-old descending trend channel. A sustained strength beyond will suggest that the recent corrective decline from the highest level since July 2023 touched last month, has run its course and pave the way for a further near-term appreciating move. The EUR/USD pair might then accelerate the positive move towards the next relevant hurdle near the 1.1155 area before making a fresh attempt to conquer the 1.1200 round-figure mark.
On the flip side, the 1.1065-1.1060 horizontal zone now seems to protect the immediate downside ahead of the 1.1000 pivotal support. The latter is closely followed by the descending trend-channel support, currently near the 1.0975 area, which if broken decisively will be seen as a fresh trigger for bearish traders and prompt aggressive technical selling. The subsequent downfall has the potential to drag the EUR/USD pair towards testing sub-1.0900 levels, with some intermediate support near the 1.0950 region.
EUR/USD 4-hour chart
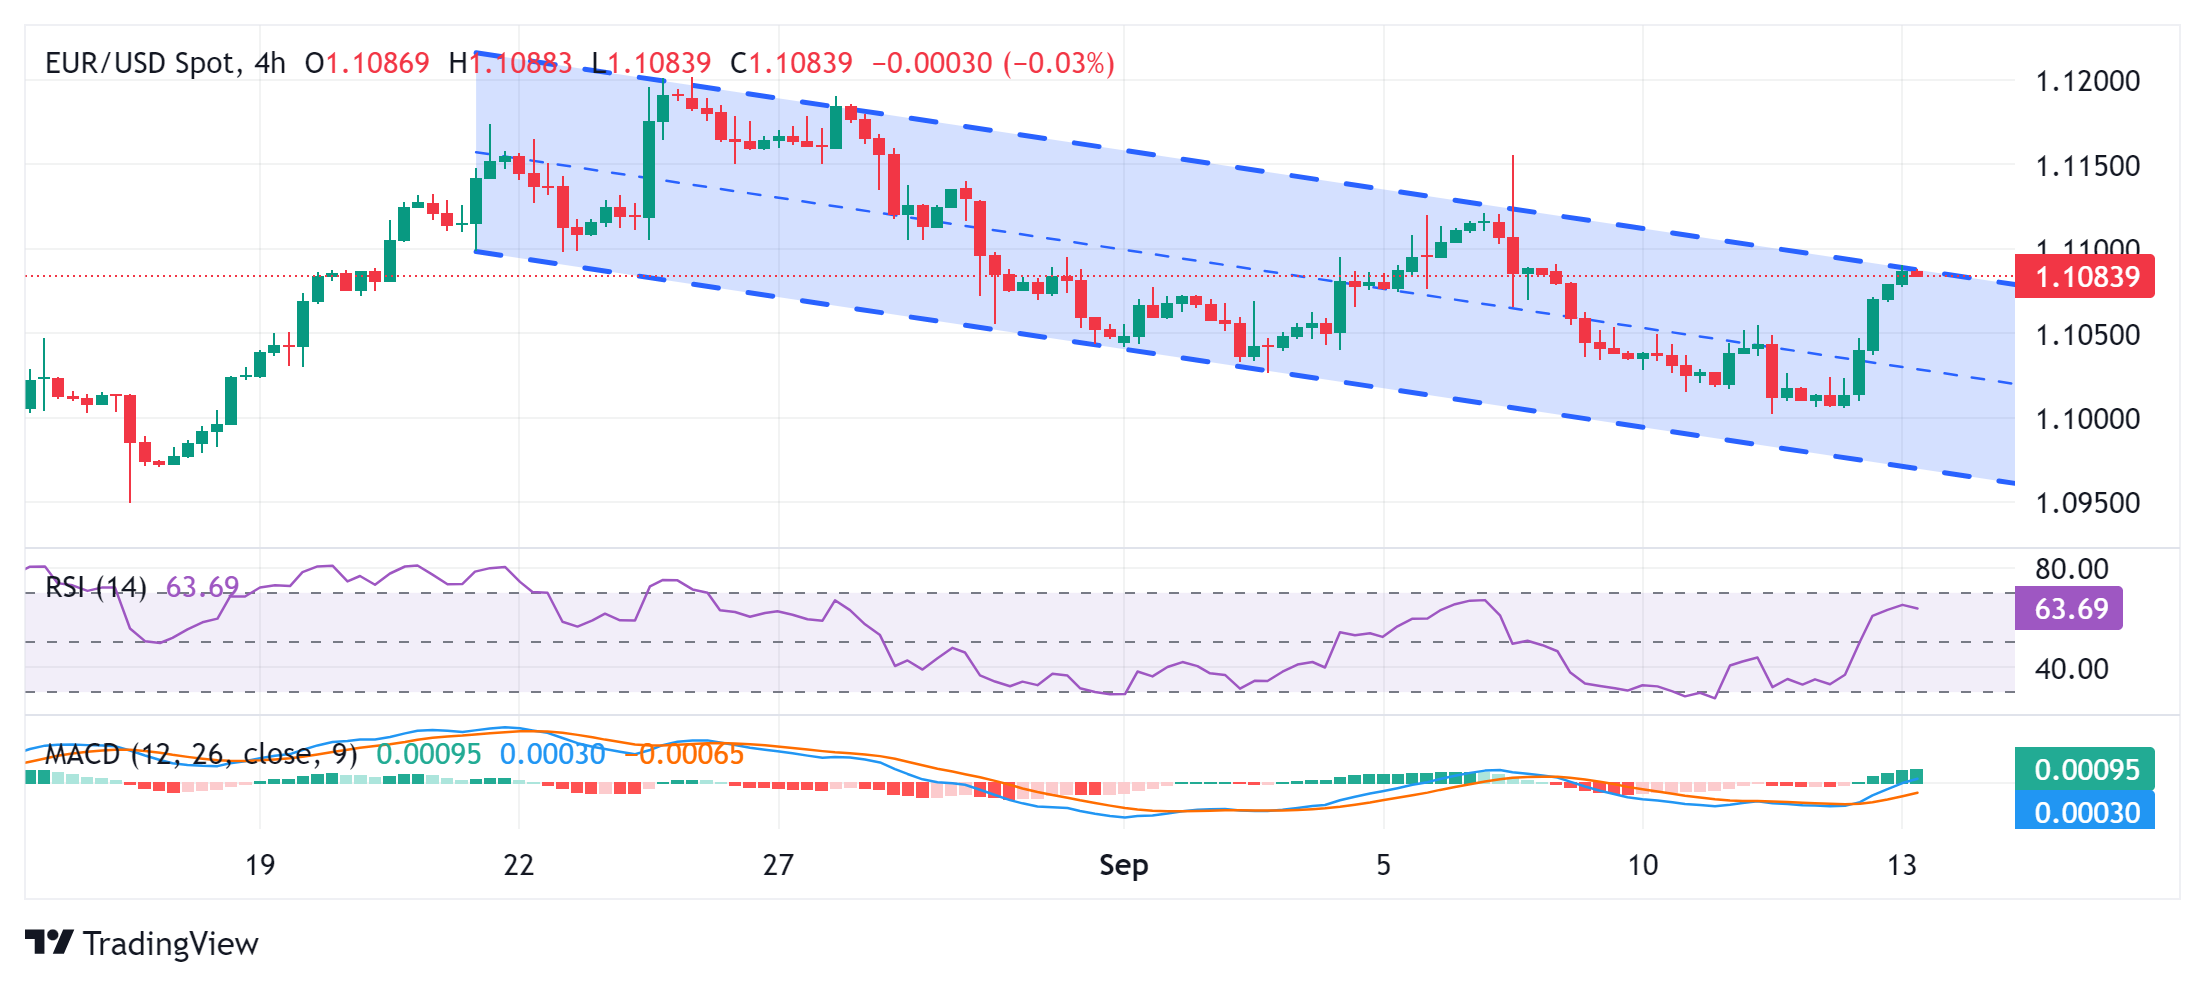
In an interview with Deutschlandfunk early Friday, European Central Bank (ECB) policymaker and Bundesbank President Joachim Nagel said that the “core inflation is also going in the right direction.”
Additional quotes
Expect to reach our inflation goal at the end of next year.
On EU competition proposals: Mario Draghi is correct on a lot of points.
We must come together as Eeuropeans to overcome weak investment.
Market reaction
These comments fail to move the needle around the Euro, as the EUR/USD pair keeps its range at around 1.1080, up 0.08% on the day, at the press time.
ECB FAQs
The European Central Bank (ECB) in Frankfurt, Germany, is the reserve bank for the Eurozone. The ECB sets interest rates and manages monetary policy for the region. The ECB primary mandate is to maintain price stability, which means keeping inflation at around 2%. Its primary tool for achieving this is by raising or lowering interest rates. Relatively high interest rates will usually result in a stronger Euro and vice versa. The ECB Governing Council makes monetary policy decisions at meetings held eight times a year. Decisions are made by heads of the Eurozone national banks and six permanent members, including the President of the ECB, Christine Lagarde.
In extreme situations, the European Central Bank can enact a policy tool called Quantitative Easing. QE is the process by which the ECB prints Euros and uses them to buy assets – usually government or corporate bonds – from banks and other financial institutions. QE usually results in a weaker Euro. QE is a last resort when simply lowering interest rates is unlikely to achieve the objective of price stability. The ECB used it during the Great Financial Crisis in 2009-11, in 2015 when inflation remained stubbornly low, as well as during the covid pandemic.
Quantitative tightening (QT) is the reverse of QE. It is undertaken after QE when an economic recovery is underway and inflation starts rising. Whilst in QE the European Central Bank (ECB) purchases government and corporate bonds from financial institutions to provide them with liquidity, in QT the ECB stops buying more bonds, and stops reinvesting the principal maturing on the bonds it already holds. It is usually positive (or bullish) for the Euro.
- Silver price advances as recent US data reinforced the likelihood of a 50 basis points rate cut by the Fed.
- CME FedWatch Tool indicates the likelihood of a 50 basis points rate cut increasing to 41.0%, from 14.0% a day ago.
- Markets assess demand prospects in China while factoring the renewable energy growth, which is crucial for Silver demand.
Silver price (XAG/USD) continues its winning streak that began on September 9, trading around $29.90 per troy ounce during the Asian hours on Friday. The non-yielding assets like Silver received support after economic data from the United States (US) reinforced the possibility that the Federal Reserve (Fed) could lower interest rates by 50 basis points next week. Lower interest rates make non-yielding assets more attractive for investment returns.
According to the CME FedWatch Tool, markets are fully anticipating at least a 25 basis point (bps) rate cut by the Federal Reserve at its September meeting. The likelihood of a 50 bps rate cut has sharply increased to 41.0%, up from 14.0% a day ago.
The US Producer Price Index (PPI) rose to 0.2% month-on-month in August, exceeding the forecasted 0.1% increase and the previous 0.0%. Meanwhile, core PPI accelerated to 0.3% MoM, against the expected 0.2% rise and July’s 0.2% contraction. However, US Initial Jobless Claims rose slightly higher for the week ended September 6, increasing to the expected 230K from the prior 228K reading.
On Thursday, the European Central Bank (ECB) lowered the Main Refinancing Operations Rate to 4.0% by implementing a 25 basis-point rate cut. Additionally, the UK GDP showed no growth in July, following a stagnation in June, which reinforces expectations of a possible quarter-point rate cut by the Bank of England (BoE) in November. Some traders are also pricing in the possibility of an additional rate cut in December.
Markets are assessing demand prospects in China, the world's largest consumer, following mixed economic signals, while also considering the growth of the renewable energy sector, where Silver plays a key role in solar panel production.
Silver FAQs
Silver is a precious metal highly traded among investors. It has been historically used as a store of value and a medium of exchange. Although less popular than Gold, traders may turn to Silver to diversify their investment portfolio, for its intrinsic value or as a potential hedge during high-inflation periods. Investors can buy physical Silver, in coins or in bars, or trade it through vehicles such as Exchange Traded Funds, which track its price on international markets.
Silver prices can move due to a wide range of factors. Geopolitical instability or fears of a deep recession can make Silver price escalate due to its safe-haven status, although to a lesser extent than Gold's. As a yieldless asset, Silver tends to rise with lower interest rates. Its moves also depend on how the US Dollar (USD) behaves as the asset is priced in dollars (XAG/USD). A strong Dollar tends to keep the price of Silver at bay, whereas a weaker Dollar is likely to propel prices up. Other factors such as investment demand, mining supply – Silver is much more abundant than Gold – and recycling rates can also affect prices.
Silver is widely used in industry, particularly in sectors such as electronics or solar energy, as it has one of the highest electric conductivity of all metals – more than Copper and Gold. A surge in demand can increase prices, while a decline tends to lower them. Dynamics in the US, Chinese and Indian economies can also contribute to price swings: for the US and particularly China, their big industrial sectors use Silver in various processes; in India, consumers’ demand for the precious metal for jewellery also plays a key role in setting prices.
Silver prices tend to follow Gold's moves. When Gold prices rise, Silver typically follows suit, as their status as safe-haven assets is similar. The Gold/Silver ratio, which shows the number of ounces of Silver needed to equal the value of one ounce of Gold, may help to determine the relative valuation between both metals. Some investors may consider a high ratio as an indicator that Silver is undervalued, or Gold is overvalued. On the contrary, a low ratio might suggest that Gold is undervalued relative to Silver.
Gold prices rose in India on Friday, according to data compiled by FXStreet.
The price for Gold stood at 6,933.35 Indian Rupees (INR) per gram, up compared with the INR 6,905.34 it cost on Thursday.
The price for Gold increased to INR 80,880.93 per tola from INR 80,545.38 per tola a day earlier.
| Unit measure | Gold Price in INR |
|---|---|
| 1 Gram | 6,933.35 |
| 10 Grams | 69,343.53 |
| Tola | 80,880.93 |
| Troy Ounce | 215,658.20 |
FXStreet calculates Gold prices in India by adapting international prices (USD/INR) to the local currency and measurement units. Prices are updated daily based on the market rates taken at the time of publication. Prices are just for reference and local rates could diverge slightly.
Gold FAQs
Gold has played a key role in human’s history as it has been widely used as a store of value and medium of exchange. Currently, apart from its shine and usage for jewelry, the precious metal is widely seen as a safe-haven asset, meaning that it is considered a good investment during turbulent times. Gold is also widely seen as a hedge against inflation and against depreciating currencies as it doesn’t rely on any specific issuer or government.
Central banks are the biggest Gold holders. In their aim to support their currencies in turbulent times, central banks tend to diversify their reserves and buy Gold to improve the perceived strength of the economy and the currency. High Gold reserves can be a source of trust for a country’s solvency. Central banks added 1,136 tonnes of Gold worth around $70 billion to their reserves in 2022, according to data from the World Gold Council. This is the highest yearly purchase since records began. Central banks from emerging economies such as China, India and Turkey are quickly increasing their Gold reserves.
Gold has an inverse correlation with the US Dollar and US Treasuries, which are both major reserve and safe-haven assets. When the Dollar depreciates, Gold tends to rise, enabling investors and central banks to diversify their assets in turbulent times. Gold is also inversely correlated with risk assets. A rally in the stock market tends to weaken Gold price, while sell-offs in riskier markets tend to favor the precious metal.
The price can move due to a wide range of factors. Geopolitical instability or fears of a deep recession can quickly make Gold price escalate due to its safe-haven status. As a yield-less asset, Gold tends to rise with lower interest rates, while higher cost of money usually weighs down on the yellow metal. Still, most moves depend on how the US Dollar (USD) behaves as the asset is priced in dollars (XAU/USD). A strong Dollar tends to keep the price of Gold controlled, whereas a weaker Dollar is likely to push Gold prices up.
(An automation tool was used in creating this post.)
- The Indian Rupee may appreciate as US data reinforce the likelihood of an aggressive Fed rate cut.
- CME FedWatch Tool suggests the likelihood of a 50 bps rate cut has sharply increased to 41.0%.
- India Consumer Price Index increased 3.65% in August, against the expected 3.55% and July’s 3.54% readings.
The USD/INR pair holds its position on Friday following the losses registered in the previous as recent US economic data reinforced the odds of an aggressive rate cut by the Federal Reserve (Fed) next week.
According to the CME FedWatch Tool, markets are fully pricing at least a 25 basis point (bps) rate cut by the Federal Reserve at its September meeting. The likelihood of a 50 bps rate cut has sharply increased to 41.0%, up from 14.0% a day ago.
India's August retail inflation was slightly higher than economists' expectations on the back of a sharp rise in vegetable prices, Reuters cited government data released on Thursday. Consumer Price Index (CPI) rose 3.65% in August, compared with expected 3.55% and July’s 3.54% readings.
On Thursday, Reuters cited five traders stating that the Reserve Bank of India (RBI) might have intervened in the open markets to prevent the Indian Rupee (INR) from weakening beyond the 84.00 level. Traders await Trade Deficit Government and FX Reserves, USD scheduled to be released on Friday.
Daily Digest Market Movers: Indian Rupee may hold position due to improved risk sentiment
- The Reserve Bank of India Governor Shaktikanta Das said at the Bretton Woods Committee's annual Future of Finance Forum on Friday that India's growth potential is 7.5% or more, which is a little above the central bank's full-year forecast for 2024 of 7.2%, per Reuters.
- The US Producer Price Index (PPI) rose to 0.2% month-on-month in August, exceeding the forecasted 0.1% increase and the previous 0.0%. Meanwhile, core PPI accelerated to 0.3% MoM, against the expected 0.2% rise and July’s 0.2% contraction.
- US Initial Jobless Claims rose slightly higher for the week ended September 6, increasing to the expected 230K from the prior 228K reading.
- India’s Industrial Output rose by 4.8% in July, slightly above market expectations of 4.7%, following a 4.2% growth in the previous month.
- India is considering relaxing investment rules for Chinese firms to stimulate its manufacturing sector. Additionally, the country has eased visa issuance for Chinese nationals to support local manufacturing. India's trade deficit with China has nearly doubled since 2020, according to a Reuters report.
- The US Consumer Price Index dipped to 2.5% year-on-year in August, from the previous reading of 2.9%. The index has fallen short of the expected 2.6% reading. Meanwhile, headline CPI stood at 0.2% MoM. Core CPI ex Food & Energy, remained unchanged at 3.2% YoY. On a monthly basis, core CPI rose to 0.3% from the previous 0.2% reading.
- The first US presidential debate between former President Donald Trump and Democratic nominee Kamala Harris in Pennsylvania was won by Harris, according to a CNN poll. The debate began with a critical focus on the economy, inflation, and economic policies.
Technical Analysis: USD/INR breaks below symmetrical triangle, hovering below 84.00
The USD/INR pair trades around 83.90 on Friday. Analysis of the daily chart shows that the USD/INR pair has broken below the symmetrical triangle pattern, indicating the emergence of a bearish bias. However, the 14-day Relative Strength Index (RSI) remains slightly above the 50 level, suggesting a retest of the triangle pullback cannot be ruled out.
On the downside, the USD/INR pair may retest its six-week low around 83.72, followed by the psychological level of 83.50.
In terms of resistance, the nine-day Exponential Moving Average (EMA) at 83.91 could serve as an immediate barrier, aligning with the lower boundary of the symmetrical triangle near 83.95.
Further resistance appears at the upper boundary of the symmetrical triangle near the 84.00 level. A breakout above this point could propel the pair toward the all-time high of 84.14, recorded on August 5.
USD/INR: Daily Chart
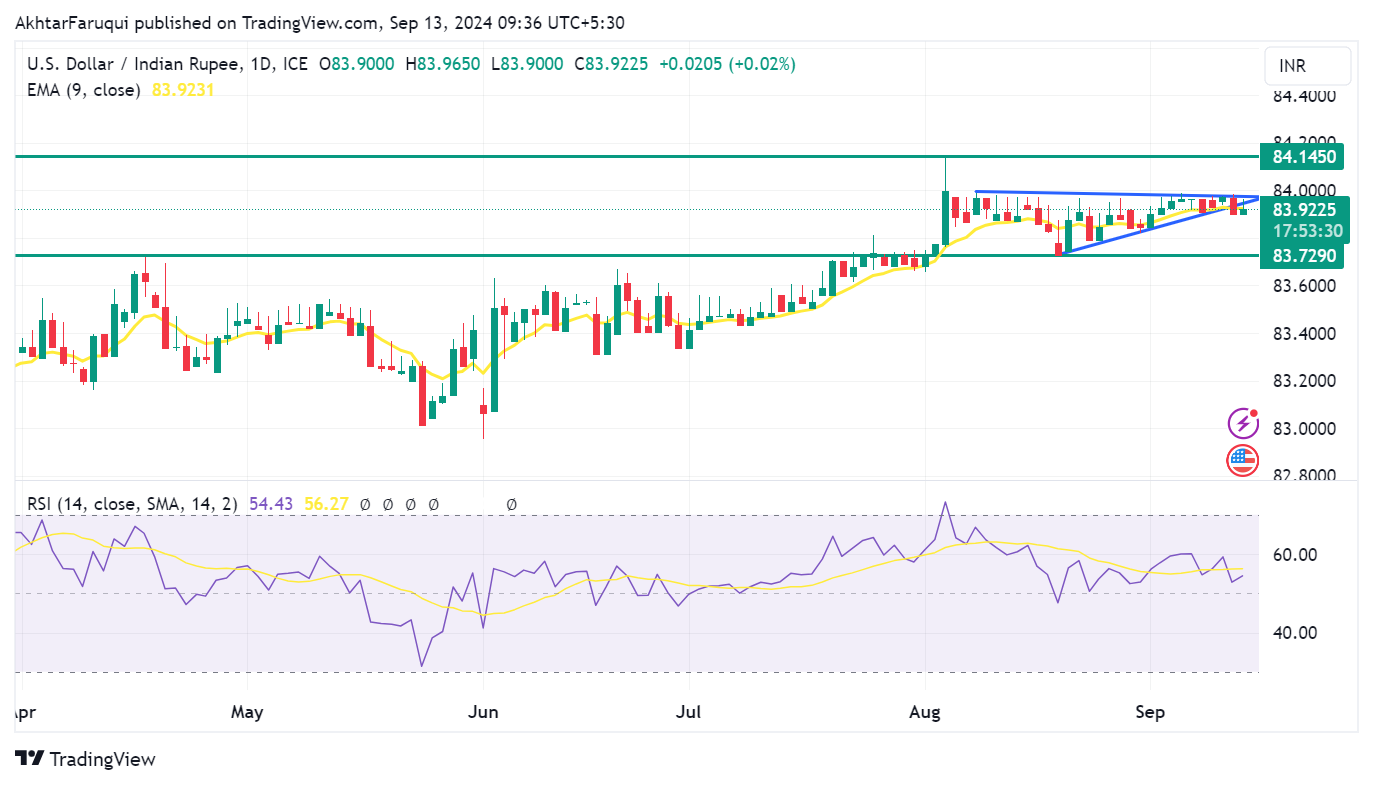
Indian Rupee FAQs
The Indian Rupee (INR) is one of the most sensitive currencies to external factors. The price of Crude Oil (the country is highly dependent on imported Oil), the value of the US Dollar – most trade is conducted in USD – and the level of foreign investment, are all influential. Direct intervention by the Reserve Bank of India (RBI) in FX markets to keep the exchange rate stable, as well as the level of interest rates set by the RBI, are further major influencing factors on the Rupee.
The Reserve Bank of India (RBI) actively intervenes in forex markets to maintain a stable exchange rate, to help facilitate trade. In addition, the RBI tries to maintain the inflation rate at its 4% target by adjusting interest rates. Higher interest rates usually strengthen the Rupee. This is due to the role of the ‘carry trade’ in which investors borrow in countries with lower interest rates so as to place their money in countries’ offering relatively higher interest rates and profit from the difference.
Macroeconomic factors that influence the value of the Rupee include inflation, interest rates, the economic growth rate (GDP), the balance of trade, and inflows from foreign investment. A higher growth rate can lead to more overseas investment, pushing up demand for the Rupee. A less negative balance of trade will eventually lead to a stronger Rupee. Higher interest rates, especially real rates (interest rates less inflation) are also positive for the Rupee. A risk-on environment can lead to greater inflows of Foreign Direct and Indirect Investment (FDI and FII), which also benefit the Rupee.
Higher inflation, particularly, if it is comparatively higher than India’s peers, is generally negative for the currency as it reflects devaluation through oversupply. Inflation also increases the cost of exports, leading to more Rupees being sold to purchase foreign imports, which is Rupee-negative. At the same time, higher inflation usually leads to the Reserve Bank of India (RBI) raising interest rates and this can be positive for the Rupee, due to increased demand from international investors. The opposite effect is true of lower inflation.
- GBP/USD attracts buyers for the second straight day amid dovish Fed-inspired USD weakness.
- Expectations that the BoE will cut rates less than the Fed also contribute to the positive move.
- Bulls might now opt to move to the sidelines ahead of the Fed and the BoE meetings next week.
The GBP/USD pair gains positive traction for the second straight day and recovers further from over a three-week low, around the 1.3000 psychological mark touched on Wednesday. The momentum lifts spot prices to mid-1.3100s, or a fresh weekly top during the Asian session, and it is sponsored by the heavily offered tone surrounding the US Dollar (USD).
The USD Index (DXY), which tracks the Greenback against a basket of currencies, sinks to over a one-week low amid rising bets for a larger interest rate cut by the Federal Reserve (Fed), bolstered the softer US Producer Price Index (PPI) report on Thursday. Dovish Fed expectations keep the US Treasury bond yields depressed near the 2024 low, which, along with the upbeat market mood, undermines the safe-haven buck and acts as a tailwind for the GBP/USD pair.
Bulls, meanwhile, seem unaffected by bets for more interest rate cuts by the Bank of England (BoE), especially after data released this week pointed to a slowdown in the UK wage growth and a flat GDP print for the second straight month in July. The markets, however, think that the BoE will loosen policy by less than the Fed over the next year. This, in turn, benefits the British Pound (GBP) and turns out to be another factor lending additional support to the GBP/USD pair.
It, however, remains to be seen if bulls can capitalize on the move or refrain from placing aggressive bets ahead of next week's key central bank event risks. The Fed is scheduled to announce its policy decision at the end of a two-day policy meeting next Wednesday. This will be followed by the crucial BoE meeting on Thursday, which will play a key role in providing some meaningful impetus to the GBP/USD pair and determining the next leg of a directional move.
BoE FAQs
The Bank of England (BoE) decides monetary policy for the United Kingdom. Its primary goal is to achieve ‘price stability’, or a steady inflation rate of 2%. Its tool for achieving this is via the adjustment of base lending rates. The BoE sets the rate at which it lends to commercial banks and banks lend to each other, determining the level of interest rates in the economy overall. This also impacts the value of the Pound Sterling (GBP).
When inflation is above the Bank of England’s target it responds by raising interest rates, making it more expensive for people and businesses to access credit. This is positive for the Pound Sterling because higher interest rates make the UK a more attractive place for global investors to park their money. When inflation falls below target, it is a sign economic growth is slowing, and the BoE will consider lowering interest rates to cheapen credit in the hope businesses will borrow to invest in growth-generating projects – a negative for the Pound Sterling.
In extreme situations, the Bank of England can enact a policy called Quantitative Easing (QE). QE is the process by which the BoE substantially increases the flow of credit in a stuck financial system. QE is a last resort policy when lowering interest rates will not achieve the necessary result. The process of QE involves the BoE printing money to buy assets – usually government or AAA-rated corporate bonds – from banks and other financial institutions. QE usually results in a weaker Pound Sterling.
Quantitative tightening (QT) is the reverse of QE, enacted when the economy is strengthening and inflation starts rising. Whilst in QE the Bank of England (BoE) purchases government and corporate bonds from financial institutions to encourage them to lend; in QT, the BoE stops buying more bonds, and stops reinvesting the principal maturing on the bonds it already holds. It is usually positive for the Pound Sterling.
- USD/CAD struggles to attract any meaningful buyers amid broad-based USD weakness.
- Bets for a larger Fed rate cut, along with a positive risk tone, weigh heavily on the buck.
- This week’s stronger recovery in Oil prices underpins the Loonie and acts as a headwind.
The USD/CAD pair reverses a modest Asian session dip and currently trades around the 1.3575 region, nearly unchanged for the day, though any meaningful appreciating move still seems elusive.
The US Dollar (USD) sinks to over a one-week low amid growing expectations for an oversized interest rate cut by the Federal Reserve (Fed) next week, bolstered by signs of easing inflationary pressures in the US. In fact, data published on Thursday showed that the annual headline Producer Price Index (PPI) decelerated to 1.7% from the previous month's downwardly revised reading of 2.1%. Adding to this, the core PPI, which excludes volatile food and energy prices, missed consensus estimates and came in 2.4% YoY during the reported month.
The markets were quick to react and are now pricing in over 40% chance that the US central bank will lower borrowing costs by 50 basis points at its policy meeting on September 17-18. This keeps the US Treasury bond yields depressed near the 2024 low, which, along with a positive risk tone, weighs on the USD and acts as a headwind for the USD/CAD pair. Furthermore, this week's goodish recovery in Crude Oil prices, from the lowest level since June 2023, should underpin the commodity-linked Loonie and contribute to capping spot prices.
Market participants now look forward to Friday's economic docket – featuring the release of the Preliminary Michigan US Consumer Sentiment Index and second-tier data from Canada. Apart from this, the US bond yields and the broader risk sentiment might influence the USD demand, which, along with Oil price dynamics, could allow traders to grab short-term opportunities around the USD/CAD pair. Nevertheless, spot prices seem poised to register modest weekly gains, though bulls need to wait for acceptance above the 1.3600 mark before placing fresh bets.
US Dollar PRICE Today
The table below shows the percentage change of US Dollar (USD) against listed major currencies today. US Dollar was the strongest against the Australian Dollar.
| USD | EUR | GBP | JPY | CAD | AUD | NZD | CHF | |
|---|---|---|---|---|---|---|---|---|
| USD | -0.11% | -0.17% | -0.61% | -0.04% | -0.03% | -0.04% | -0.20% | |
| EUR | 0.11% | -0.08% | -0.50% | 0.05% | 0.07% | 0.13% | -0.09% | |
| GBP | 0.17% | 0.08% | -0.43% | 0.11% | 0.14% | 0.22% | -0.03% | |
| JPY | 0.61% | 0.50% | 0.43% | 0.57% | 0.57% | 0.63% | 0.42% | |
| CAD | 0.04% | -0.05% | -0.11% | -0.57% | -0.01% | 0.10% | -0.16% | |
| AUD | 0.03% | -0.07% | -0.14% | -0.57% | 0.01% | 0.09% | -0.16% | |
| NZD | 0.04% | -0.13% | -0.22% | -0.63% | -0.10% | -0.09% | -0.25% | |
| CHF | 0.20% | 0.09% | 0.03% | -0.42% | 0.16% | 0.16% | 0.25% |
The heat map shows percentage changes of major currencies against each other. The base currency is picked from the left column, while the quote currency is picked from the top row. For example, if you pick the US Dollar from the left column and move along the horizontal line to the Japanese Yen, the percentage change displayed in the box will represent USD (base)/JPY (quote).
- WTI price appreciated as Hurricane Francine caused output disruptions in the US Gulf of Mexico.
- Official data showed that nearly 42% of US Gulf of Mexico’s Oil production had been shut in as of Thursday.
- Both OPEC and IEA have lowered their forecasts for Oil demand growth, citing economic challenges in China.
West Texas Intermediate (WTI) Oil price holds gains for the third consecutive day, trading around $68.50 during the Asian session on Friday. The rise in crude Oil prices is driven by Hurricane Francine, which forced producers to evacuate platforms ahead of its impact on the Louisiana coast on Wednesday, causing output disruptions in the US Gulf of Mexico.
On Thursday, Oil producers conducted damage assessments and safety checks in preparation to resume operations in the US Gulf of Mexico. According to Reuters, UBS analysts projected that Oil output in the region for September would decrease by 50,000 barrels per day (bpd) compared to the previous month. Meanwhile, FGE analysts estimated a larger drop of 60,000 bpd, bringing total output to 1.69 million bpd. Official reports indicated that nearly 42% of the region's Oil production had been shut in as of Thursday.
This week, both the Organization of Petroleum Exporting Countries (OPEC) and the International Energy Agency (IEA) lowered their forecasts for Oil demand growth, attributing the revision to economic challenges in China, the world's largest Oil importer. Additionally, speakers at the APPEC conference highlighted that China's transition toward lower-carbon fuels is also dampening its Oil demand.
China's crude Oil imports averaged 3.1% lower from January through August this year compared to the same period last year, according to customs data released on Tuesday. In addition to concerns about China, demand worries have also intensified in the United States. US gasoline and distillate futures hit multi-year lows this week, with analysts pointing to weaker-than-expected demand in the world's top petroleum-consuming country.
WTI Oil FAQs
WTI Oil is a type of Crude Oil sold on international markets. The WTI stands for West Texas Intermediate, one of three major types including Brent and Dubai Crude. WTI is also referred to as “light” and “sweet” because of its relatively low gravity and sulfur content respectively. It is considered a high quality Oil that is easily refined. It is sourced in the United States and distributed via the Cushing hub, which is considered “The Pipeline Crossroads of the World”. It is a benchmark for the Oil market and WTI price is frequently quoted in the media.
Like all assets, supply and demand are the key drivers of WTI Oil price. As such, global growth can be a driver of increased demand and vice versa for weak global growth. Political instability, wars, and sanctions can disrupt supply and impact prices. The decisions of OPEC, a group of major Oil-producing countries, is another key driver of price. The value of the US Dollar influences the price of WTI Crude Oil, since Oil is predominantly traded in US Dollars, thus a weaker US Dollar can make Oil more affordable and vice versa.
The weekly Oil inventory reports published by the American Petroleum Institute (API) and the Energy Information Agency (EIA) impact the price of WTI Oil. Changes in inventories reflect fluctuating supply and demand. If the data shows a drop in inventories it can indicate increased demand, pushing up Oil price. Higher inventories can reflect increased supply, pushing down prices. API’s report is published every Tuesday and EIA’s the day after. Their results are usually similar, falling within 1% of each other 75% of the time. The EIA data is considered more reliable, since it is a government agency.
OPEC (Organization of the Petroleum Exporting Countries) is a group of 13 Oil-producing nations who collectively decide production quotas for member countries at twice-yearly meetings. Their decisions often impact WTI Oil prices. When OPEC decides to lower quotas, it can tighten supply, pushing up Oil prices. When OPEC increases production, it has the opposite effect. OPEC+ refers to an expanded group that includes ten extra non-OPEC members, the most notable of which is Russia.
| Raw materials | Closed | Change, % |
|---|---|---|
| Silver | 29.873 | 4.05 |
| Gold | 255.867 | 1.85 |
| Palladium | 1044.16 | 3 |
- Gold price gains some follow-through traction on Friday and hits a fresh record high.
- Rising bets for a larger Fed rate cut weigh on the USD and boost the precious metal.
- Geopolitical risks further contribute to drive flows towards the safe-haven XAU/USD.
Gold price (XAU/USD) touched a fresh all-time peak, around the $2,563-2,564 region during the Asian session on Friday amid expectations for a more aggressive policy easing by the Federal Reserve (Fed). The softer-than-expected US Producer Price Index (PPI) report released on Thursday provided further evidence that inflation was subsiding and lifted bets for a larger, 50-basis points (bps) Fed rate cut move at the next policy meeting on September 17-18. This keeps the US Treasury bond yields depressed near the 2024 low and drags the US Dollar (USD) to a fresh weekly trough, which, in turn, is seen as a key factor driving flows towards the non-yielding yellow metal.
Apart from this, geopolitical risks stemming from the ongoing conflicts in the Middle East and the protracted Russia-Ukraine war further underpin demand for the traditional safe-haven Gold price. With the latest leg up, the XAU/USD confirms a breakout through a multi-week-old trading range and seems poised to prolong the recent well-established uptrend. Investors, however, might refrain from placing fresh bullish bets and prefer to move to the sidelines ahead of next week's key central bank event risks – the highly-anticipated Fed decision on Wednesday and the Bank of Japan (BoJ) meeting on Friday. Nevertheless, the metal remains on track to register strong weekly gains.
Daily Digest Market Movers: Gold price is underpinned by 50-bps Fed rate cut bets and geopolitical tensions
- Rising bets for a larger interest rate cut by the Federal Reserve, along with geopolitical risks, lift the Gold price to a fresh all-time high on Friday and confirm a bullish breakout through a multi-week-old trading range.
- The US Bureau of Labor Statistics reported on Thursday that the annual headline Producer Price Index (PPI) rose 1.7% against estimates of 1.8% and the previous month's reading was revised down to 2.1% from 2.2%.
- Adding to this, the core PPI, which excludes volatile food and energy prices, came in at 2.4% YoY, also missing expectations for a reading of 2.5% and further pointing to signs of easing inflationary pressures in the US.
- Separately, data published by the US Department of Labor (DoL) showed that the number of individuals who applied for unemployment insurance benefits for the first time rose to 230K in the week ending September 7.
- According to the CME Group's FedWatch Tool, market players are now pricing in over a 40% chance that the US central bank will lower borrowing costs by 50-basis points at the end of a two-day meeting next Wednesday.
- Israel intensified airstrikes on Iranian-linked targets in Syria, while Hamas and Hezbollah pounded northern Israel on September 11 in one of the largest aerial attacks, fueling concerns over a wider conflict in the Middle East.
- Russian President Vladimir Putin warned on Friday that he would regard an agreement to allow Ukraine to strike targets inside Russia with Western-supplied missiles as tantamount to NATO directly entering the war.
- Investors now look forward to the release of the Preliminary Michigan US Consumer Sentiment Index to grab short-term opportunities around the XAU/USD, which remains on track to register strong weekly gains.
Technical Outlook: Gold price could extend uptrend to an upper ascending channel boundary
From a technical perspective, the recent move up from the June swing low constitutes the formation of an ascending channel and points to a well-established uptrend. Moreover, Thursday's close above the $2,525-2,526 supply zone and a subsequent move beyond the previous all-time peak, near the $2,531-2,532 area was seen as a fresh trigger for bullish traders. With oscillators on the daily chart holding in positive territory and still away from being in the overbought zone, the Gold price seems poised to climb further towards challenging the trend-channel resistance, currently pegged just ahead of the $2,600 mark. The latter should act as a strong barrier ahead of the FOMC meeting next week.
On the flip side, any meaningful corrective fall is likely to attract fresh buyers near the $2,530-2,525 resistance breakpoint. This should help limit the downside near the $2,500 psychological mark, which should now act as a strong base for the Gold price and a key pivotal point for short-term traders. That said, some follow-through selling, leading to a further decline below the weekly low, around the $2,485 region, could drag the XAU/USD to the $2,470 horizontal support en route to the $2,457-2,456 confluence. The latter comprises the lower boundary of the aforementioned channel and the 50-day Simple Moving Average (SMA), which if broken decisively might shift the near-term bias in favor of bearish traders.
Gold FAQs
Gold has played a key role in human’s history as it has been widely used as a store of value and medium of exchange. Currently, apart from its shine and usage for jewelry, the precious metal is widely seen as a safe-haven asset, meaning that it is considered a good investment during turbulent times. Gold is also widely seen as a hedge against inflation and against depreciating currencies as it doesn’t rely on any specific issuer or government.
Central banks are the biggest Gold holders. In their aim to support their currencies in turbulent times, central banks tend to diversify their reserves and buy Gold to improve the perceived strength of the economy and the currency. High Gold reserves can be a source of trust for a country’s solvency. Central banks added 1,136 tonnes of Gold worth around $70 billion to their reserves in 2022, according to data from the World Gold Council. This is the highest yearly purchase since records began. Central banks from emerging economies such as China, India and Turkey are quickly increasing their Gold reserves.
Gold has an inverse correlation with the US Dollar and US Treasuries, which are both major reserve and safe-haven assets. When the Dollar depreciates, Gold tends to rise, enabling investors and central banks to diversify their assets in turbulent times. Gold is also inversely correlated with risk assets. A rally in the stock market tends to weaken Gold price, while sell-offs in riskier markets tend to favor the precious metal.
The price can move due to a wide range of factors. Geopolitical instability or fears of a deep recession can quickly make Gold price escalate due to its safe-haven status. As a yield-less asset, Gold tends to rise with lower interest rates, while higher cost of money usually weighs down on the yellow metal. Still, most moves depend on how the US Dollar (USD) behaves as the asset is priced in dollars (XAU/USD). A strong Dollar tends to keep the price of Gold controlled, whereas a weaker Dollar is likely to push Gold prices up.
- The AUD/USD pair appreciates as US data reinforce the likelihood that the Fed will lower interest rates next week.
- The US Producer Price Index rose above expectations, driven by higher service costs.
- Fed is expected to deliver a 25-basis points interest rate cut at its September meeting.
The AUD/USD extends its upside for the third successive session on Friday as economic data from the United States (US) reinforced the possibility that the Federal Reserve (Fed) would lower interest rates next week.
The US Labor Department reported that Initial Jobless Claims for the previous week increased as anticipated, surpassing the previous week’s figures. Additionally, US factory inflation rose above expectations, driven by higher service costs.
August’s US Consumer Price Index (CPI) data showed that headline inflation dropped to a three-year low, although core inflation exceeded expectations. This development has heightened the likelihood that the Federal Reserve (Fed) will begin its easing cycle with a 25-basis points interest rate cut in September. Investors shift their focus to the Michigan Consumer Sentiment Index, which is scheduled for Friday.
Daily Digest Market Movers: Australian Dollar extends upside due to improved risk sentiment
- The US Producer Price Index (PPI) rose to 0.2% month-on-month in August, exceeding the forecasted 0.1% increase and the previous 0.0%. Meanwhile, core PPI accelerated to 0.3% MoM, against the expected 0.2% rise and July’s 0.2% contraction.
- US Initial Jobless Claims rose slightly higher for the week ended September 6, increasing to the expected 230K from the prior 228K reading.
- The former Reserve Bank of Australia (RBA) Governor Bernie Fraser criticized the current RBA Board for being overly focused on inflation at the expense of the job market. Fraser suggested that the Board should lower the cash rate, warning of "recessionary risks" that could have severe consequences for employment.
- Australia’s Consumer Inflation Expectations eased to 4.4% in September, down slightly from August's four-month high of 4.5%. This decline highlights the central bank's efforts to balance bringing inflation down within a reasonable timeframe and maintaining gains in the labor market.
- The US Consumer Price Index dipped to 2.5% year-on-year in August, from the previous reading of 2.9%. The index has fallen short of the expected 2.6% reading. Meanwhile, headline CPI stood at 0.2% MoM.
- US core CPI ex Food & Energy, remained unchanged at 3.2% YoY. On a monthly basis, core CPI rose to 0.3% from the previous 0.2% reading.
- The first US presidential debate between former President Donald Trump and Democratic nominee Kamala Harris in Pennsylvania was won by Harris, according to a CNN poll. The debate began with a critical focus on the economy, inflation, and economic policies.
- On Wednesday, Sarah Hunter, the Reserve Bank of Australia's (RBA) Assistant Governor for Economics, remarked that high interest rates are suppressing demand, which is expected to lead to a mild economic downturn. Hunter also pointed out that the labor market remains tight relative to full employment levels, with employment growth projected to continue, though slower than population growth, according to Reuters.
Technical Analysis: Australian Dollar moves above 0.6700, nine-day EMA
The AUD/USD pair trades near 0.6730 on Friday. Technical analysis of the daily chart indicates that the pair has broken above the descending channel, signaling a weakening bearish bias. Additionally, the 14-day Relative Strength Index (RSI) has moved above the 50 level, suggesting a shift in momentum from a bearish to a bullish trend.
On the upside, the AUD/USD pair may explore the region around its seven-month high of 0.6798, aligned with a psychological level of 0.6800.
On the downside, the AUD/USD pair could find immediate support around the upper boundary of the descending channel near 0.6720, followed by the nine-day Exponential Moving Average (EMA) at 0.6707 level.
A return to the descending channel would reinforce the bearish bias and lead the pair to navigate the region around the lower boundary of the descending channel around 0.6600, followed by the throwback support zone near 0.6575.
AUD/USD: Daily Chart
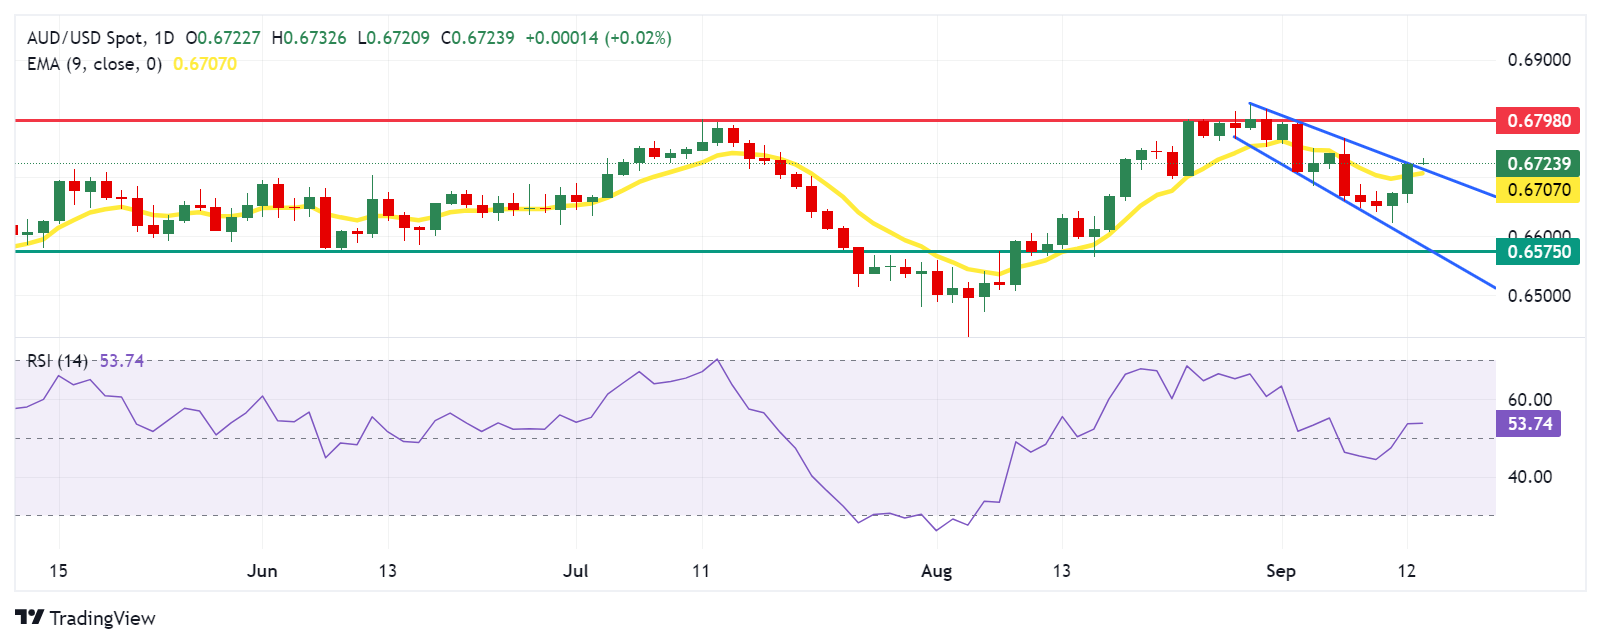
Australian Dollar PRICE Today
The table below shows the percentage change of Australian Dollar (AUD) against listed major currencies today. Australian Dollar was the strongest against the New Zealand Dollar.
| USD | EUR | GBP | JPY | CAD | AUD | NZD | CHF | |
|---|---|---|---|---|---|---|---|---|
| USD | -0.12% | -0.16% | -0.48% | -0.07% | -0.05% | -0.09% | -0.21% | |
| EUR | 0.12% | -0.06% | -0.38% | 0.03% | 0.07% | 0.10% | -0.09% | |
| GBP | 0.16% | 0.06% | -0.30% | 0.06% | 0.12% | 0.17% | -0.05% | |
| JPY | 0.48% | 0.38% | 0.30% | 0.41% | 0.43% | 0.46% | 0.28% | |
| CAD | 0.07% | -0.03% | -0.06% | -0.41% | 0.00% | 0.09% | -0.14% | |
| AUD | 0.05% | -0.07% | -0.12% | -0.43% | -0.01% | 0.05% | -0.16% | |
| NZD | 0.09% | -0.10% | -0.17% | -0.46% | -0.09% | -0.05% | -0.21% | |
| CHF | 0.21% | 0.09% | 0.05% | -0.28% | 0.14% | 0.16% | 0.21% |
The heat map shows percentage changes of major currencies against each other. The base currency is picked from the left column, while the quote currency is picked from the top row. For example, if you pick the Australian Dollar from the left column and move along the horizontal line to the US Dollar, the percentage change displayed in the box will represent AUD (base)/USD (quote).
Australian Dollar FAQs
One of the most significant factors for the Australian Dollar (AUD) is the level of interest rates set by the Reserve Bank of Australia (RBA). Because Australia is a resource-rich country another key driver is the price of its biggest export, Iron Ore. The health of the Chinese economy, its largest trading partner, is a factor, as well as inflation in Australia, its growth rate and Trade Balance. Market sentiment – whether investors are taking on more risky assets (risk-on) or seeking safe-havens (risk-off) – is also a factor, with risk-on positive for AUD.
The Reserve Bank of Australia (RBA) influences the Australian Dollar (AUD) by setting the level of interest rates that Australian banks can lend to each other. This influences the level of interest rates in the economy as a whole. The main goal of the RBA is to maintain a stable inflation rate of 2-3% by adjusting interest rates up or down. Relatively high interest rates compared to other major central banks support the AUD, and the opposite for relatively low. The RBA can also use quantitative easing and tightening to influence credit conditions, with the former AUD-negative and the latter AUD-positive.
China is Australia’s largest trading partner so the health of the Chinese economy is a major influence on the value of the Australian Dollar (AUD). When the Chinese economy is doing well it purchases more raw materials, goods and services from Australia, lifting demand for the AUD, and pushing up its value. The opposite is the case when the Chinese economy is not growing as fast as expected. Positive or negative surprises in Chinese growth data, therefore, often have a direct impact on the Australian Dollar and its pairs.
Iron Ore is Australia’s largest export, accounting for $118 billion a year according to data from 2021, with China as its primary destination. The price of Iron Ore, therefore, can be a driver of the Australian Dollar. Generally, if the price of Iron Ore rises, AUD also goes up, as aggregate demand for the currency increases. The opposite is the case if the price of Iron Ore falls. Higher Iron Ore prices also tend to result in a greater likelihood of a positive Trade Balance for Australia, which is also positive of the AUD.
The Trade Balance, which is the difference between what a country earns from its exports versus what it pays for its imports, is another factor that can influence the value of the Australian Dollar. If Australia produces highly sought after exports, then its currency will gain in value purely from the surplus demand created from foreign buyers seeking to purchase its exports versus what it spends to purchase imports. Therefore, a positive net Trade Balance strengthens the AUD, with the opposite effect if the Trade Balance is negative.
Fitch Ratings said in its latest report on the Bank of Japan’s (BoJ) policy outlook that the “BoJ could hike rates to 0.5% by the end of 2024, 0.75% in 2025 and 1% by end-2026.”
Additional takeaways
BoJ is bucking the global trend of policy easing and hiked rates more aggressively than we had anticipated in July. This reflects its growing conviction that reflation is now firmly entrenched.
Core inflation above the BoJ’s target for 23 straight months.
Firms prepared to grant “ongoing” and “sizable” wage rises.
Situation quite different from the 1990s “lost decade” when wages failed to grow amid persistent deflation.
BoJ’s goal of a virtuous wage-price cycle.
BoJ’s confidence that it can continue to raise rates towards neutral settings.
A more hawkish BoJ could continue to have global ramifications.
On Friday, the People’s Bank of China (PBOC) set the USD/CNY central rate for the trading session ahead at 7.1030, as against the previous day's fix of 7.1214 and 7.1048 Reuters estimates.
- USD/JPY trades with negative bias for the fourth straight day and hangs near the YTD low.
- The divergent Fed-BoJ policy expectations turn out to be a key factor weighing on the pair.
- Investors now look forward to next week’s key central bank event risks for a fresh impetus.
The USD/JPY pair weakens further below mid-141.00s during the Asian session on Friday and has now moved back closer to the YTD low touched earlier this week. Moreover, the fundamental backdrop seems tilted firmly in favor of bearish traders and supports prospects for an extension of a well-established downtrend witnessed over the past two months or so.
The US Dollar (USD) dives to a fresh weekly low in the wake of rising bets for a more aggressive policy easing by the Federal Reserve (Fed) next week, bolstered by Wednesday's release of softer-than-expected US Producer Price Index (PPI) print. In fact, the markets are now pricing in over a 40% chance that the US central bank will lower borrowing costs by 50 basis points at the end of the September meeting. This keeps the US Treasury bond yields depressed near the 2024 low, which is seen weighing on the buck and dragging the USD/JPY pair lower.
The Japanese Yen (JPY), on the other hand, continues to draw support from the Bank of Japan's (BoJ) hawkish signals, indicating that it will raise interest rates further if the economic outlook aligns with the forecasts. In fact, BoJ board member Naoki Tamura said on Thursday that the path towards ending the easy policy is still very long. This marks a big divergence in comparison to dovish Fed expectations, which, in turn, prompts further unwinding of the Japanese Yen (JPY) carry trades and contributes to the offered tone surrounding the USD/JPY pair.
The aforementioned fundamental backdrop suggests that the path of least resistance for spot prices remains to the downside, though traders might prefer to move to the sidelines ahead of the key central bank event risks next week. The Fed is scheduled to announce its decision at the end of a two-day meeting next Wednesday. This will be followed by the BoJ policy update on Friday, which will determine the next leg of a directional move for the USD/JPY pair. Nevertheless, the pair remains on track to end deep in the red for the second successive week.
Japanese Yen FAQs
The Japanese Yen (JPY) is one of the world’s most traded currencies. Its value is broadly determined by the performance of the Japanese economy, but more specifically by the Bank of Japan’s policy, the differential between Japanese and US bond yields, or risk sentiment among traders, among other factors.
One of the Bank of Japan’s mandates is currency control, so its moves are key for the Yen. The BoJ has directly intervened in currency markets sometimes, generally to lower the value of the Yen, although it refrains from doing it often due to political concerns of its main trading partners. The current BoJ ultra-loose monetary policy, based on massive stimulus to the economy, has caused the Yen to depreciate against its main currency peers. This process has exacerbated more recently due to an increasing policy divergence between the Bank of Japan and other main central banks, which have opted to increase interest rates sharply to fight decades-high levels of inflation.
The BoJ’s stance of sticking to ultra-loose monetary policy has led to a widening policy divergence with other central banks, particularly with the US Federal Reserve. This supports a widening of the differential between the 10-year US and Japanese bonds, which favors the US Dollar against the Japanese Yen.
The Japanese Yen is often seen as a safe-haven investment. This means that in times of market stress, investors are more likely to put their money in the Japanese currency due to its supposed reliability and stability. Turbulent times are likely to strengthen the Yen’s value against other currencies seen as more risky to invest in.
| Index | Change, points | Closed | Change, % |
|---|---|---|---|
| NIKKEI 225 | 1213.5 | 36833.27 | 3.41 |
| Hang Seng | 131.68 | 17240.39 | 0.77 |
| KOSPI | 58.72 | 2572.09 | 2.34 |
| ASX 200 | 87.8 | 8075.7 | 1.1 |
| DAX | 188.12 | 18518.39 | 1.03 |
| CAC 40 | 38.24 | 7435.07 | 0.52 |
| Dow Jones | 235.06 | 41096.77 | 0.58 |
| S&P 500 | 41.63 | 5595.76 | 0.75 |
| NASDAQ Composite | 174.15 | 17569.68 | 1 |
| Pare | Closed | Change, % |
|---|---|---|
| AUDUSD | 0.67214 | 0.69 |
| EURJPY | 157.057 | 0.26 |
| EURUSD | 1.1073 | 0.55 |
| GBPJPY | 186.158 | 0.34 |
| GBPUSD | 1.31231 | 0.61 |
| NZDUSD | 0.61822 | 0.75 |
| USDCAD | 1.35797 | 0.04 |
| USDCHF | 0.85111 | -0.07 |
| USDJPY | 141.834 | -0.28 |


© 2000-2025. Уcі права захищені.
Cайт знаходитьcя під керуванням TeleTrade DJ. LLC 2351 LLC 2022 (Euro House, Richmond Hill Road, Kingstown, VC0100, St. Vincent and the Grenadines).
Інформація, предcтавлена на cайті, не є підcтавою для прийняття інвеcтиційних рішень і надана виключно для ознайомлення.
Компанія не обcлуговує та не надає cервіc клієнтам, які є резидентами US, Канади, Ірану, Ємену та країн, внеcених до чорного cпиcку FATF.
Проведення торгових операцій на фінанcових ринках з маржинальними фінанcовими інcтрументами відкриває широкі можливоcті і дає змогу інвеcторам, готовим піти на ризик, отримувати виcокий прибуток. Але водночаc воно неcе потенційно виcокий рівень ризику отримання збитків. Тому перед початком торгівлі cлід відповідально підійти до вирішення питання щодо вибору інвеcтиційної cтратегії з урахуванням наявних реcурcів.
Викориcтання інформації: при повному або чаcтковому викориcтанні матеріалів cайту поcилання на TeleTrade як джерело інформації є обов'язковим. Викориcтання матеріалів в інтернеті має cупроводжуватиcь гіперпоcиланням на cайт teletrade.org. Автоматичний імпорт матеріалів та інформації із cайту заборонено.
З уcіх питань звертайтеcь за адреcою pr@teletrade.global.
переклади