- Analytics
- News and Tools
- Market News
Новини ринків
- The AUD/NZD slips back into consolidation ranges as the Aussie lacks momentum.
- Australian employment figures in the pipe will hopefully drive some fresh sentiment shifts.
- China data on Friday could produce knock-on effects for the AUD.
The AUD/NZD backslid to a daily low of 1.0840 in Wednesday’s trading, with the Aussie (AUD) backing up ahead of inbound labor market data due in the Thursday trading window. The Kiwi (NZD) remained relatively on balance, unmoved by a notable lack of economic calendar data on the docket for the New Zealand currency.
Aussie unemployment rate expected to hold steady
Markets are broadly expecting Australia’s Unemployment Rate to hold steady at 3.7% for the month of August, holding steady at the previous month’s figure.
Meanwhile, Australian Employment Change for the month of August is expected to tick higher, with market analysts anticipating a printing of 23K, versus the previous period’s reading of a 14.6K decline.
The Kiwi remains under-represented on the economic calendar, but China data due on Friday, including Chinese Industrial Production figures and annualized Retail Sales for August, could see the Aussie gain some momentum with knock-on market effects.
China’s YoY Retail Sales for the month of August are expected to move upwards, from 2.5% to 3%, while Chinese Industrial Production figures are also expected to improve, forecast to print at 3.9% versus the previous 3.5%.
AUD/NZD Technical outlook
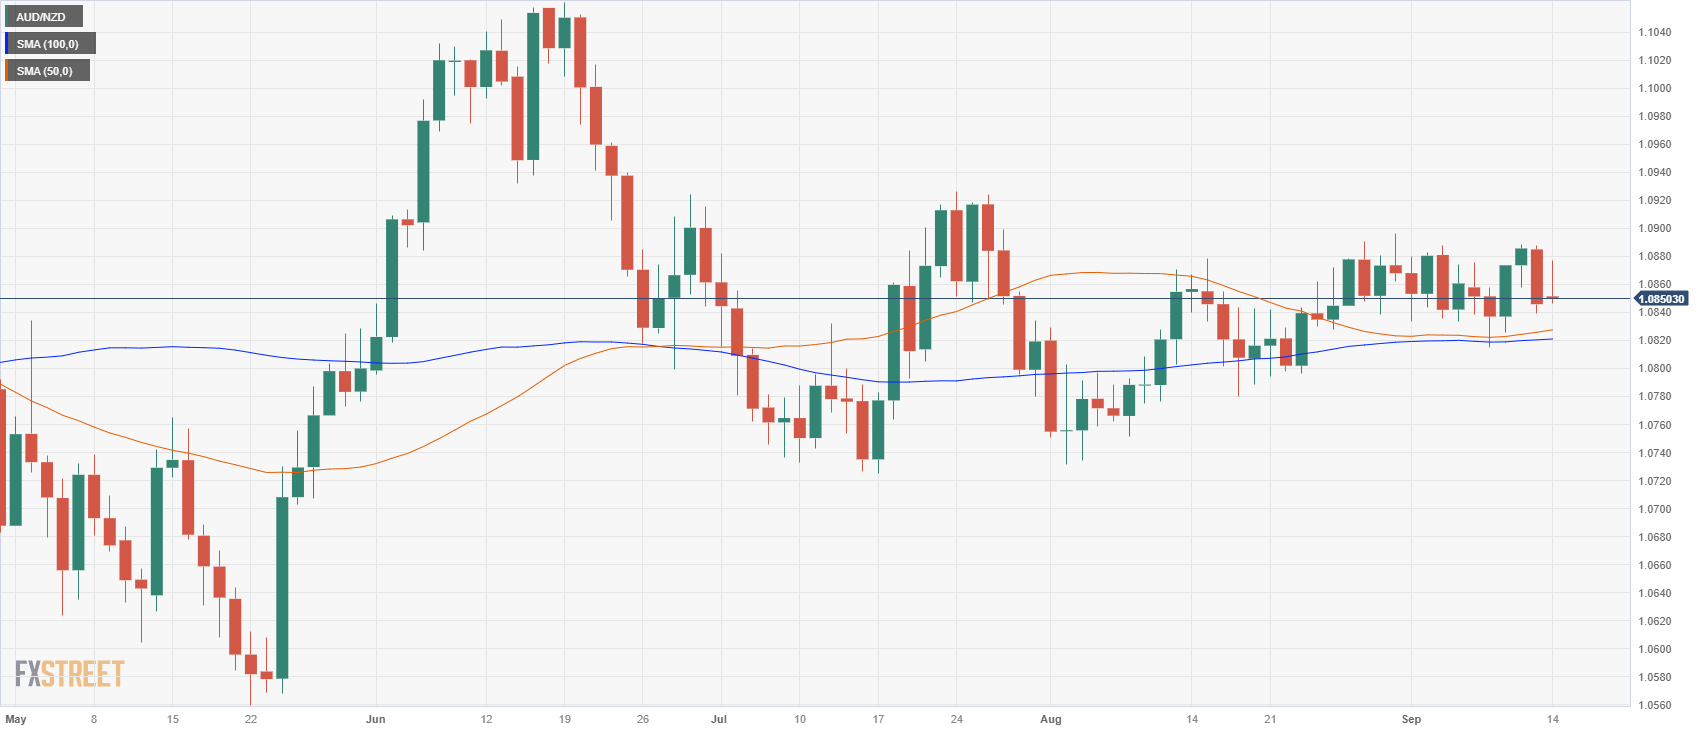
The AUD/NZD remains trapped firmly in the middle, with Wednesday’s Aussie slip into the red sending the pair firmly back into the recent consolidation region. The 100-day Simple Moving Average (SMA) continues to provide support for the longer candlestick periods, but the 50-day SMA continues to consolidate, reinforcing the middling patterns on the Aussie-Kiwi charts.
The current ceiling rests at the last meaningful swing high near 1.0920 in late July, with the floor priced in at early August’s drop-and-rebound from 1.0740.
AUD/NZD daily chart
AUD/NZD technical levels
Shenzhen, one of China's megacities, took another move to support the property market by easing some of the country's strictest house purchase restrictions, which had been in place for years to curb speculation.
Key takeaways
"Beginning in 2016, the city of 17.6 million people implemented a series of policies that focused on curbing soaring home prices and speculation."
"Shenzhen adjusted the definition of first-time home purchasers in late August to let more individuals to qualify for lower mortgage rates and smaller down payments."
"Last Monday, the city lifted a long-standing prohibition, allowing Hong Kong and Macao citizens to invest in nonresidential buildings."
"Under the latest measures, Shenzhen will no longer disqualify nonresidents from buying a home if their income tax or social insurance payments in the city have been disrupted for less than six months."
Market reaction
The above statement fail to move the needle around the Australian Dollar. AUD/USD is trading at 0.6421, unchanged on the day.
Fitch Ratings stated in its latest economic forecast that global economic growth is deteriorating, owing to "the deepening slump in China's property market, casting a shadow over global growth prospects just as tighter financial conditions weigh on the demand outlook in the US and Europe.”
Key Quote
expects the US to fall into recession in the first half of 2024
Federal Reserve “is now close to reaching a peak on rates and we expect just one more 25-basis-point hike to 5.75%. But core inflation is still high — particularly in services — and we have pushed back the date of the first Fed rate cut to May 2024.”
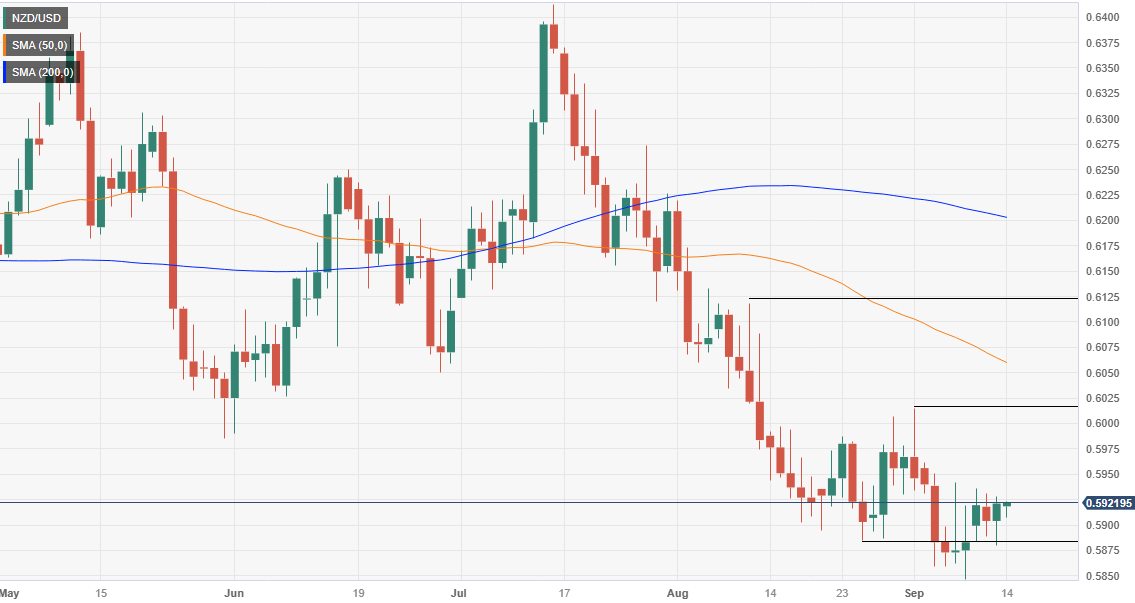
- NZD/USD trades at 0.5917, down 0.01%, after failing to break the September 11 daily high of 0.5935.
- Daily chart shows a neutral to downward bias; key resistance levels emerge at 0.5950, and September 1 swing high of 0.6015.
- A break below the September 13 swing low of 0.5879 could trigger a test of the year-to-date low at 0.5859.
The New Zealand Dollar (NZD) printed gains against the US Dollar (USD) of 0.26% on Wednesday, following a mixed US inflation report, leaving the door open for the US Federal Reserve to tighten monetary policy. As Thursday’s Asian session begins, the NZD/USD trades at 0.5917, registering minuscule losses of 0.01%.
NZD/USD Price Analysis: Technical outlook
The daily chart depicts the pair as neutral to downward biased, consolidated within the year’s lows, at around 0.5920s. Despite trading near the week’s highs, the currency pair has failed to crack the September 11 daily high at 0.5935, which could open the door for further upside, exposing the 0.5950 and the September 1 swing high at 0.6015.
Conversely, if the NZD/USD extends its losses past the September 13 swing low of 0.5879, that would exacerbate a test of the year-to-date (YTD) low of 0.5859, followed by the November 3 daily low of 0.5740. A breach of the latter, the NZD/USD would reverse the last uptrend, which began around the October 13 low of 0.5512.
NZD/USD Price Action – Daily chart
- AUD/USD edges higher to 0.6420 after bouncing off the low of 0.6380.
- US inflation data pushes the market to re-pricing the odds of further rate hikes from the Fed in the November meeting.
- Australian economy is expected to see a positive change of 23K in August.
- Market players will closely watch the Australian employment report.
The AUD/USD pair holds above 0.6400 during the early Asian session on Thursday. Meanwhile, the US Dollar Index (DXY) hovers around 104.75 after retreating from 104.96 in response to the upbeat US inflation data. The pair is trading near 0.6420, losing 0.02% on the day. The market turns cautious ahead of the Australian Employment Report due later in the Asian session in the day.
Data released from the US Bureau of Labor Statistics on Wednesday revealed that the US Consumer Price Index (CPI) for August rose 0.6% MoM from 0.2% in the previous reading while the annual figure came in at 3.7% from 3.2%, beating market expectation. The annual core CPI came in at 4.3% versus 4.7% prior. In response to the data, the US Dollar (USD) surged and later lost traction.
The US inflation pushes the market to re-evaluate the odds of further rate hikes from the Federal Reserve (Fed), despite the Fed on pace to hold rates steady at its upcoming rate meeting next week. According to the CME Fedwatch Tool, traders have priced in 97% odds of interest rate unchanged in September at 5.25%-5.50%. However, the possibility of a rate hike in the November meeting increased to 49.2%. In line with that, hawkish bets may limit the downside of the USD and act as a headwind for the AUD/USD pair.
On the other hand, the Aussie’s upside was capped due to the consumer confidence data fell into negative territory in August. On Tuesday, Australia’s Westpac Consumer Confidence for September fell 1.5% to 79.7, following a 0.4% drop in the previous reading. The figures fueled concern about the impact of the economic slowdown in China.
Later in the day, the Australian Bureau of Statistics will release the Employment Report. The Australian economy is expected to see a positive change of 23K in August following the previous month's decline of 14.6 K. On the US docket, the US Retail Sales and core Producer Price Index will be released. These figures could give a clear direction to the AUD/USD pair.
- The EUR/USD slid on Wednesday as US CPI figures failed to inspire markets meaningfully.
- ECB coming down the pipe with another rate call on Thursday.
- Market economists anticipate the ECB to stand pat on rates, the majority is slim.
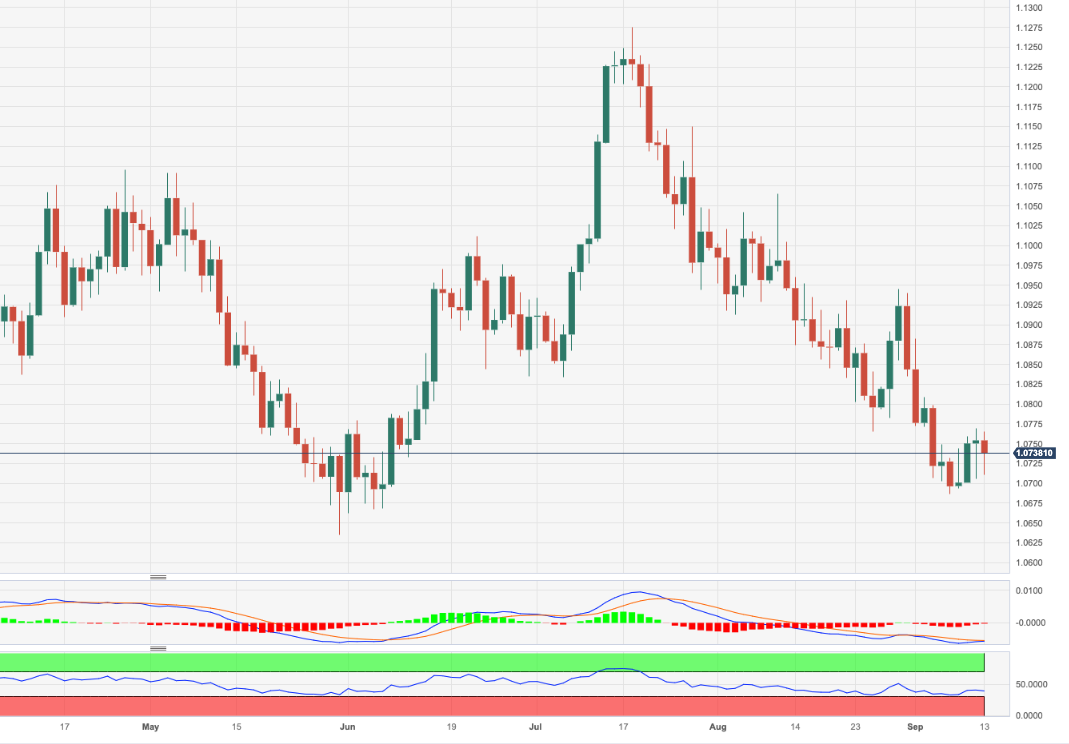
The EUR/USD is down into the red for heading into Thursday’s market session, wrapping up Wednesday down around 1.0730 after opening the day above 1.0750 and tapping into 1.0711 for the trading day’s low.
It’s all about the European Central Bank (ECB) heading into Thursday after markets largely shrugged off the US Consumer Price Index (CPI) beat, which showed US inflation ticking upwards to 3.7% for the annualized period into August, beating market analyst estimates of 3.5% and a healthy step up from the previous month’s 3.2% showing.
ECB on the docket for Thursday, and it’s all about the rates
The ECB is slated for another rate call on Thursday, with the European Union’s (EU) preeminent bank largely forecast to hold on rates for the time being, but inflationary concerns remain a sticking point.
ECB Preview: Forecasts from 10 major banks, a hike or a hawkish pause?
The majority of market analysts anticipate the ECB to hold steady on rates, but the margin has dwindled rapidly in recent days after an internal leak from the ECB showed the bank is set to raise their inflation expectations looking forward.
A poor showing from the ECB here could see the Euro (EUR) extend its current backslide against the Greenback (USD).
While the projection increase itself is unlikely to be enough to push the ECB off their wait-and-see stance, it does highlight that inflation remains an ongoing issue for the broader European economy.
EUR/USD technical outlook
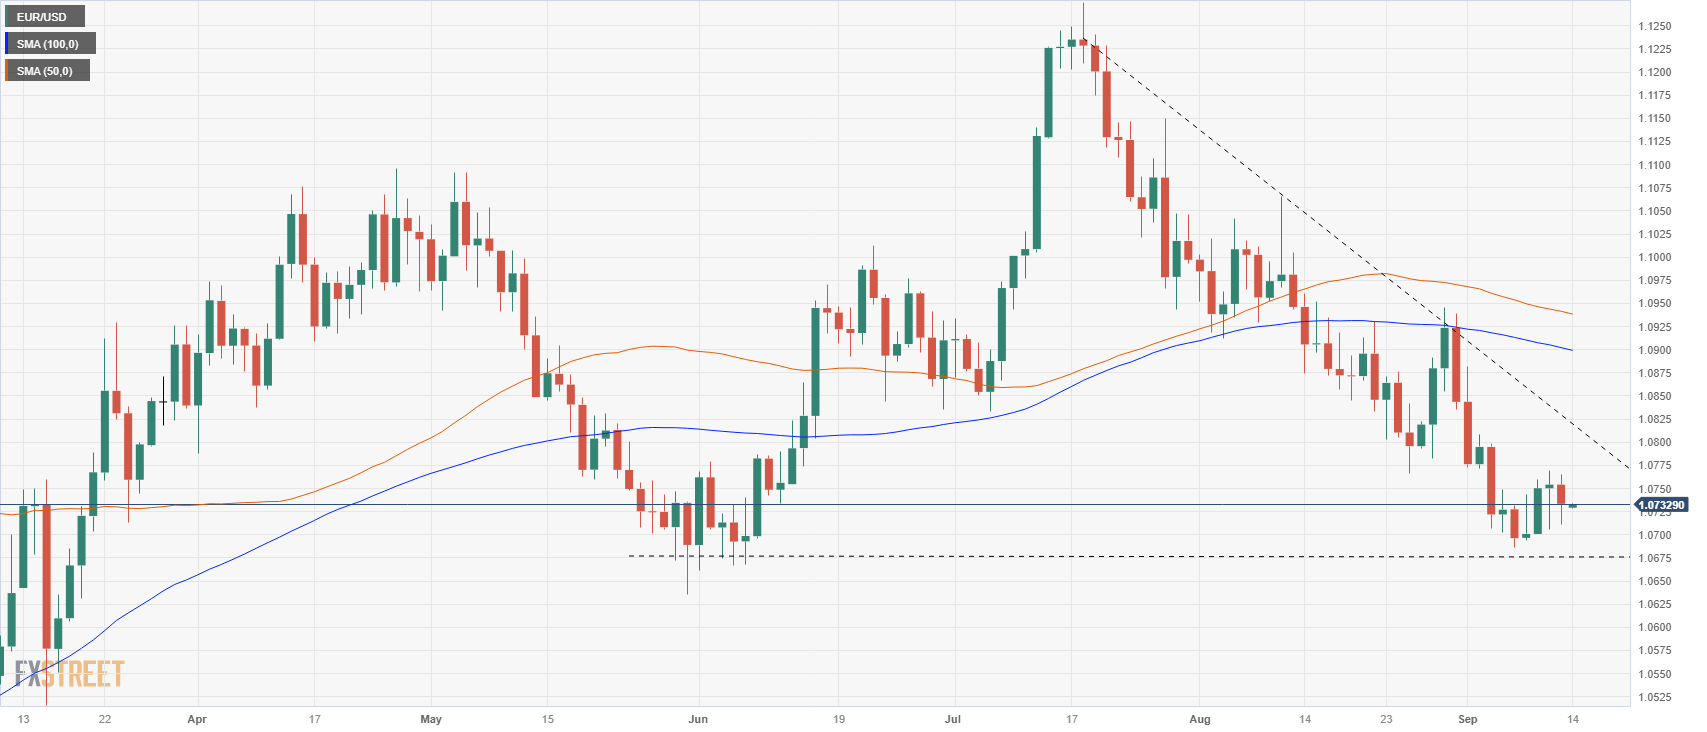
The EUR/USD is notably on the soft side, trading into the 1.0700 major handle on the daily candlesticks. Price action has steadily declined from late July’s peaks near 1.1240, and has closed red for the past eight consecutive weeks.
While the 50- and 100-day Simple Moving Averages are still stacked bullish, with the 50-day SMA nearing 1.0925 and the 100-day SMA near 1.0900, both moving averages have turned bearish, descending into a rejection zone that has thus far held the EUR/USD on the back foot since late August’s failed bull run.
Look for any topside momentum to get capped by resistance points at lower highs, and a break below the 1.0700 handle could see bears find room to run.
EUR/USD daily chart
EUR/USD technical levels
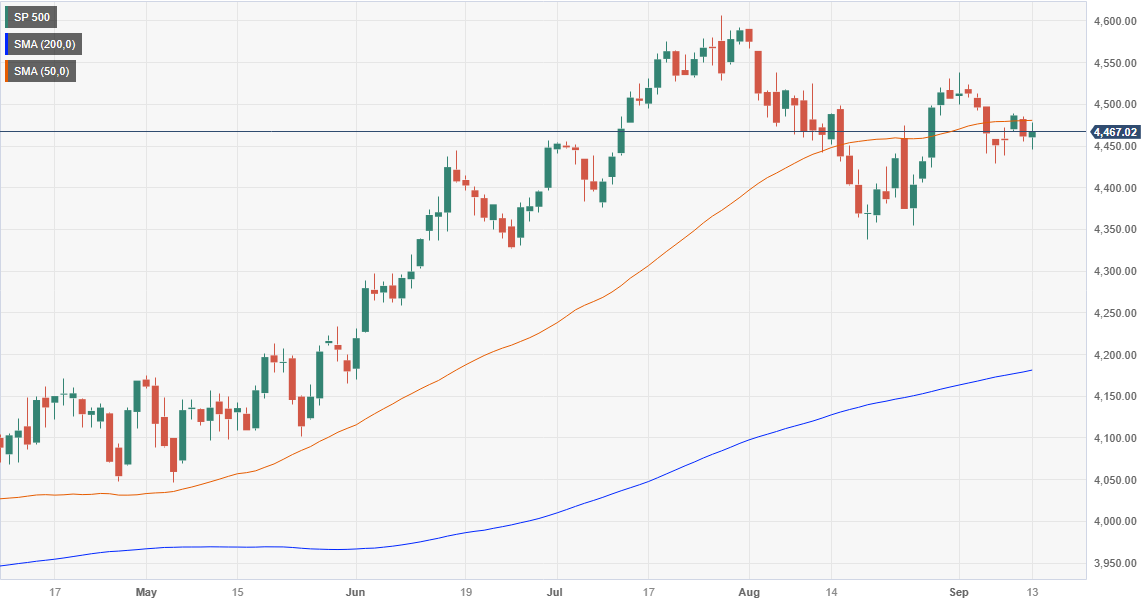
- S&P 500 gains 0.12% to 4467.44, while Dow Jones drops 0.20%; Nasdaq 100 rises 0.29% amid mixed market sentiment.
- US CPI for August comes in at 3.7% YoY, exceeding forecasts, but core inflation drops to 4.3%, in line with expectations.
- CME FedWatch Tool suggests no rate hike in September; upcoming unemployment and retail sales data could influence the Fed’s stance.
US equities finished Wednesday’s sessions with gains, except for the Dow Jones Industrial Averages, printing its first loss in the last five days. A mixed report increased speculations the US Federal Reserve would not raise rates at the upcoming meeting while the Greenback advanced.
US equities were mixed as US CPI left the market uncertain about the US central bank’s next move
The S&P 500 stands at 4,467.44, gaining 0.12%, while the heavy-tech Nasdaq 100 finished in the green at 13,813.59, up 0.29%. The outlier was the Dow Jones Industrial Average, which dropped 0.20% and ended the session at 34,575.53
Sector-wise, the biggest winner was Utilities, followed by Consumer Discretionary and Communication Services, each gained 1.2%, 0.9% and 0.40%. On the flip side, Real Estate, Energy, and Industrials printed losses of 1.03%, 0.76% and 0.67%.
The US Department of Labor revealed that inflation data for August showed mixed results. The Consumer Price Index (CPI) came in at 3.7% year-on-year, which exceeded forecasts that had expected inflation to be at 3.6% and was also higher than July’s figure. However, core inflation, which excludes volatile items, dropped from 4.7% year-on-year in July to 4.3%, in line with analyst projections.
Despite the inflation data, the market did not anticipate additional tightening by the US Federal Reserve (Fed), as indicated by money market futures data. The CME FedWatch Tool still suggests that the Fed will likely maintain interest rates at 5.25% to 5.50% for the upcoming September meeting.
Although the Wall Street reaction suggests that traders are pricing in a peak to the Federal Funds Rates (FFR), there’s additional data that could shift market participants’ mood. For instance, if unemployment claims rise as expected and August’s Retail Sales report shows weaker figures compared to July, this could contribute to the argument for the Federal Reserve potentially considering the end of its tightening cycle.
US Treasury bond yields finished the session with the 10-year benchmark note rate at 4.254%, lost 0. 70%. The Greenback, shown by the US Dollar Index, ended positively, climbing 0.20%, at 104.76.
WTI rose by 0.10% daily in the commodity space underpinned by tight supplies after Saudi Arabia and Russia’s 1.3 million barrel crude oil cut.
S&P 500 Price Action – Daily Chart
S&P 500 Technical Levels
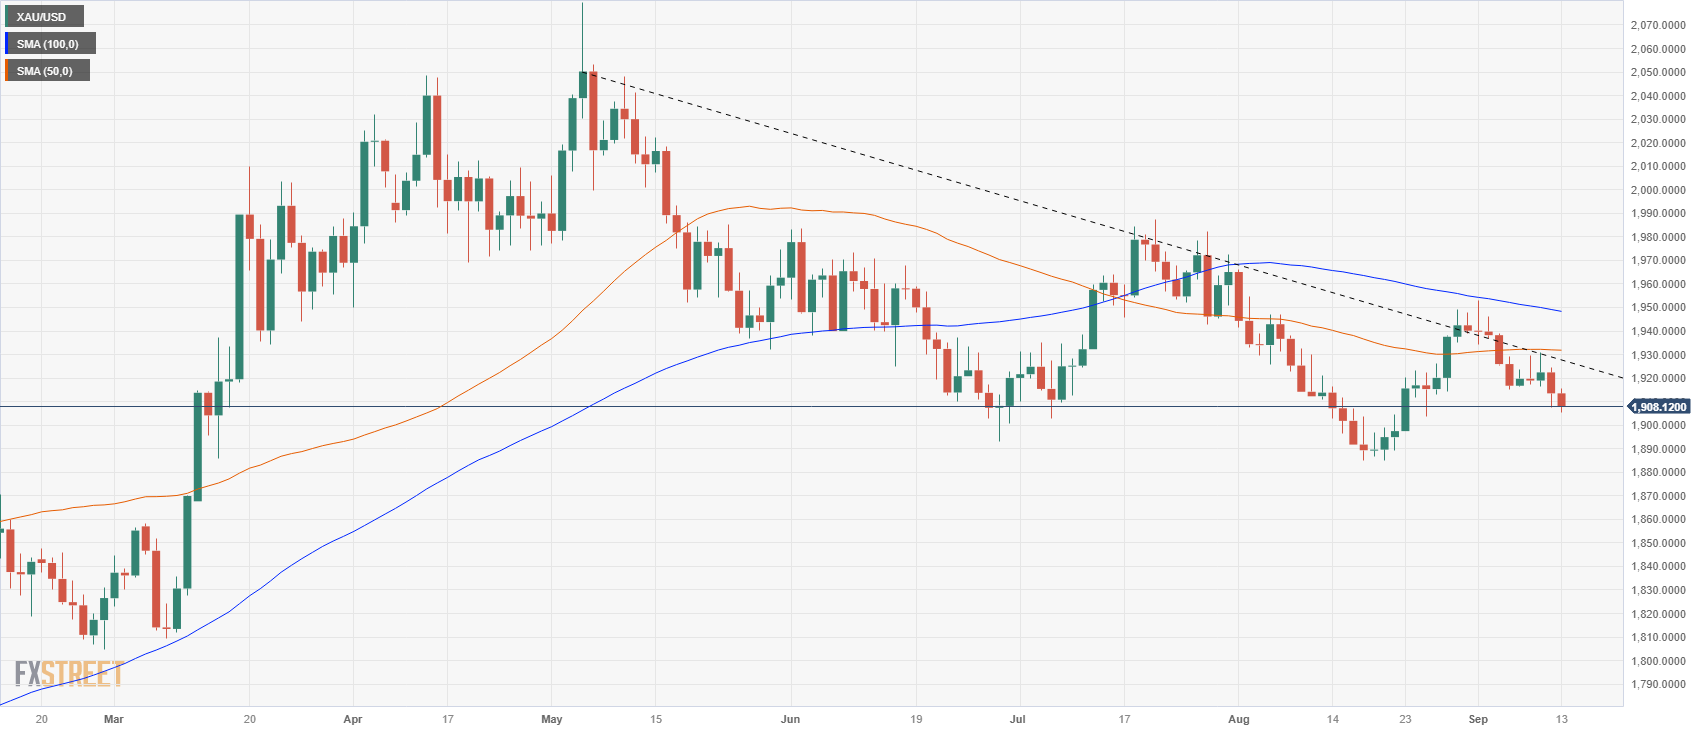
- Gold takes a step lower for Wednesday, approaching $1,900.00.
- US inflation is proving stubborn, sapping strength from the XAU/USD.
- Gold traders will need movement from the Federal Reserve on rates before bullish momentum can spin back up.
The XAU/USD wrapped up Wednesday trading clipping into its lowest prices in three weeks, tapping a fresh low of $1,905 into the ticker tape as the US inflation landscape continues to frustrate gold bugs.
Gold continues to etch in a rejection from the $1,940.00 level after last week’s action saw the yellow metal retreat as US Treasury yields and a stubborn US Dollar (USD) continue to plague the Gold chart. The precious metal is well off the year’s highs above $2,060.00.
US inflation proves a sticky weight on Gold prices
The US Consumer Price Index (CPI) printed 0.6% for the month of August, an acceleration of the previous month’s 0.2% printing, and inflation concerns are weighing down the XAU/USD. Annualized CPI rose 3.7% versus the market forecast 3.6%.
The uptick in US inflation is causing markets to re-evaluate the odds of further rate hikes from the Federal Reserve (Fed), despite the Fed on pace to hold rates steady at their upcoming rate call next week.
While inflation figures are on the rise, many investors are not entirely surprised, and the downside on Gold is limited. CPI figures, while tipping into the high end, are largely congregated in the volatile energies section, driven by rising fuel costs and tricky food prices. Core CPI, the basket of goods excluding fuels and food, rose by 0.3% last month, versus the expected 0.2%. Still above market expectations, but a significant step down from the all-prices total CPI headline figure.
The gasoline component of the CPI rose 10.6% in a single month, and overall energies climbed 5.6%. Rising shelter costs also contributed to the inflation index’s gains, with rents increasing for the 40th straight month, up 0.3% for August.
Bolstered concerns about shifts in the Fed rate hike cycle is providing broad-base support for the USD, keeping a cap on Gold prices in the near-term as investors flock to the Greenback in defensive positioning.
Gold bulls will be looking for a firmer picture about future rate cuts from the Fed moving forward, and the XAU/USD is likely to remain constrained to the downside until evidence of a reversal of the Fed’s momentum on the rate hike cycle begins to crystallize.
Elsewhere in the Gold landscape, US President Joe Biden’s White House administration is toying with the idea of instituting a royalty on precious metals extracted within the US; the royalties on hardrock minerals harvesting would be the first of its kind in the US.
A variable 4% to 8% net royalty would be applied to any precious metals pulled from federal lands within the US. The royalty would require a reversal of an 1872 law that specifically prevents the US from collecting mining royalties on hardrock mineral extraction, a measure that is unlikely to pass the Republican-held US Congress.
The royalty, if it were to succeed, would impact around 750 hardrock mines throughout the US, the majority of which are located in the West. The measure would also conflict with the White House’s current proposals to try and spur further investment in precious metals mining already under way within the US.
XAU/USD technical outlook
Daily candlesticks have Gold trading back into the low end, and is set to face a support zone around the $1,900.00 major handle. A declining trendline from May’s highs into the $2,050.00 region continues to hold as lower highs mark in an extension of topside resistance.
The 50- and 100-day Simple Moving Averages are flashing a bearish stance, with the 50-day SMA parked near $1,930.00 with the 100-day SMA sitting just beneath $1,950.00 and leaning towards the bearish side. The pullback from August’s low near $1,890.00 has sent the 50-day SMA sideways, but the longer SMA is consolidating bearish pressure.
XAU/USD daily chart
XAU/USD technical levels
- GBP/USD held steady at 1.2485 on Wednesday.
- The pair side-way traded in the last session, using the 200-day SMA as support.
- Bears are running out of steam.
On Wednesday, the GBP/USD closed the session with mild gains, at 1.2485. Bears managed to take the Cable to 1.2433 earlier in the session, near the 200-day Simple Moving Average area, but the bulls quickly reversed the fall.
Following the sharp decline seen at the beginning of last week, which saw the Cable declining by nearly 1%, the bears seem to be running out of steam, with little gas left in the tank to break below the key 200-day SMA. In that sense, on the daily chart, the Relative Strength Index (RSI) is comfortably positioned in the negative territory below its midline and has a flat slope, complemented by a negative signal from the Moving Average Convergence Divergence (MACD), which is showing red bars. Unless bears manage to gather momentum, the Cable may side-ways trade above the 1.2430 area in the next sessions to consolidate losses. That being said, traders should eye the slope of the 20-day SMA, which suggests that it is en-route to perform a bearish cross with the 200-day SMA and that could be the sparkle that reignites the bearish momentum.
If the bulls fail to defend the 200-day SMA, support below line up at 1.2400, 1.2370, and 1.2350. On the other hand, the next targets for the buyers are seen at 1.2500, 1.2540-50 and the 20-day SMA at 1.2600.
GBP/USD Daily Chart
-638302367622287346.png)
- XAG/USD declined by 0.90% to the $22.80 area.
- Headline CPI from the US from August rose to 3.7% YoY, beating expectations.
- US yields retreated but remain uncomfortably high for precious metals.
In Wednesday’s session, Silver prices retreated and failed to consolidate above $23.00, falling to the $22.80 area. After fresh inflation figures from the US, the Greenback is holding its foot trading strong against its rivals while US Treasury yields are consolidating after initially spiking to a two-week high.
The US Bureau of Labour Statistics (BLS) revealed that the Consumer Price Index (CPI) rose to 3.7% YoY, up from 3.2% in July and beating the expected 3.6%. On the other hand, the Core measure decelerated to 4.3% from its previous reading of 4.7%, as markets expected.
In the meantime, the US 2,5 and 10-year bond yields saw a volatile action during the session, spiking after the release of the inflation figures and declining, seeing daily decreases of more than 0.50%. However, they still remain high, indicating that investors are still confident that the Federal Reserve (Fed) will hike one more time in 2023, and the CME FedWatch tool suggests that market swaps are discounting nearly 40% odds of a hike in November or December. In that sense, as yields remain high and hawkish bets on the Fed steady, the XAG/USD’s bulls will have a hard time as their upside potential will be limited.
On Thursday, the BLS will report Producer Price Index (PPI) figures from August, providing additional insights to investors to place their bets on the next Fed meetings.
XAG/USD Levels to watch
The technical outlook for the XAG/USD indicates an oversold condition in the short term, suggesting a potential technical rebound in the near future. The Relative Strength Index (RSI) exhibits a negative slope below the 50 thresholds, while the Moving Average Convergence (MACD) histogram, displays larger red bars. Also, the pair is below the 20,100 and 200-day Simple Moving Averages (SMAs), highlighting the continued dominance of bears on the broader scale. To add to that, the moving averages seem to be converging towards the $23.50 and are building a strong resistance at that area.
Support levels:$22.60, $22.40, $22.00.
Resistance levels: $23.00, $23.50 (200-day SMA), $23.60 (20-day SMA).
XAG/USD Daily Chart
-638302356379797855.png)
During the Asian session, market participants will closely watch for the Australian employment report. Additionally, data from Japan, including Machinery Orders and Industrial Production, will also be released. Later in the day, the European Central Bank (ECB) will announce its decision, and key US data such as Jobless Claims, Retail Sales, and the Producer Price Index will be published.
Here is what you need to know on Thursday, September 14:
The US Dollar Index finished slightly higher on Wednesday but remained within recent ranges, mirroring the behavior of major currency pairs. US yields initially jumped but later retraced, with the 10-year yield settling at 4.25%. Wall Street experienced mixed results as investors remained cautious.
The US August Consumer Price Index (CPI) showed a 0.6% increase for the month and a rebound in the annual rate from 3.2% to 3.7%, surpassing market expectations of 3.6%. However, the annual core rate slowed as anticipated from 4.7% to 4.3%. The initial reaction in the US Dollar was positive, but it later pulled back. The numbers did not significantly alter the outlook for the upcoming Federal Open Market Committee (FOMC) meeting, and the market continues to anticipate a pause in monetary policy.
TD Securities on US consumer inflation:
In our view, today's CPI report should not make a meaningful difference for Fed officials ahead of the September FOMC meeting. However, it does keep alive the odds of an additional rate increase for the November/December meetings, particularly if we see a follow-through of accelerating core inflation in the September CPI report.
Between the ECB decision at 12:15 GMT and ECB President Lagarde's press conference at 12:45 GMT, important economic reports from the US are scheduled for release at 12:30 GMT, including Retail Sales, the Producer Price Index, and Jobless Claims. This convergence of key events is likely to result in increased market volatility across financial markets.
The European Central Bank (ECB) will hold its monetary policy meeting on Thursday. While a pause in policy is expected, reports suggesting that the staff will raise inflation forecasts have increased speculations for a potential rate hike. This event has the potential to trigger significant volatility in the Euro. Market participants will also closely watch ECB President Lagarde's press conference for further insights and guidance.
ECB Preview: Forecasts from 10 major banks, a hike or a hawkish pause?
EUR/USD is holding above 1.0700, but upside gains are being limited around 1.0770. The pair lacks a clear bias, and significant swings are likely on Thursday.
The UK economy contracted by 0.5% in July, worse than the expected 0.2% contraction, following a 0.5% expansion in June. GBP/USD initially dropped and reached the 200-day Simple Moving Average but later climbed back to 1.2500.
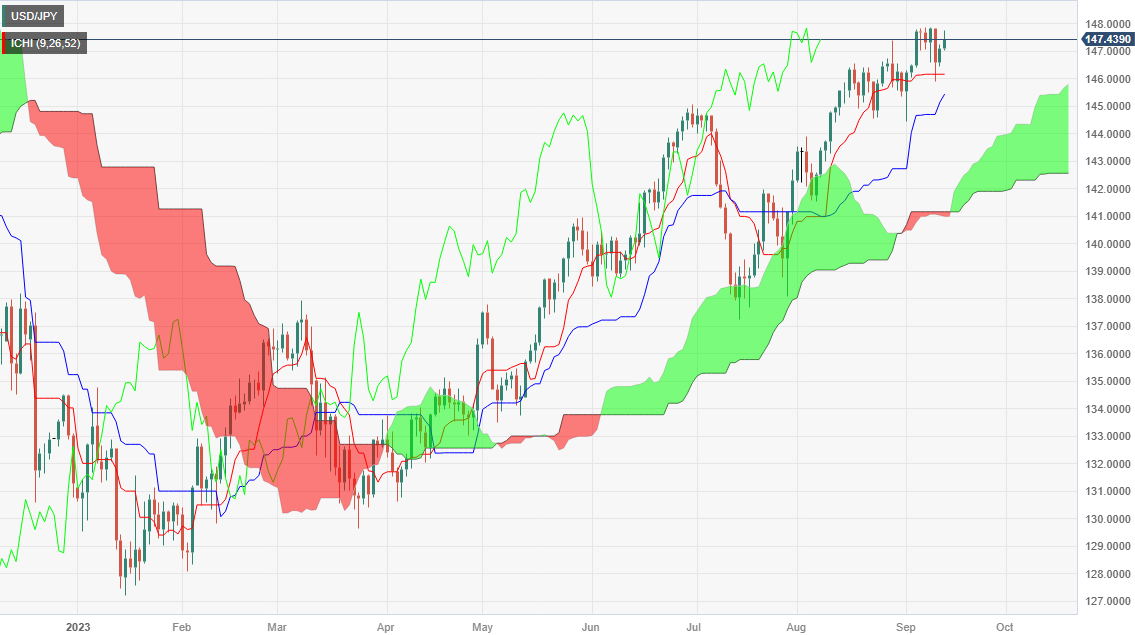
USD/JPY rose on Wednesday but remains below recent highs. The pair is hovering around 147.50, with 148.00 acting as key resistance. In Japan, on Thursday, important data including Machinery Orders for July and Industrial Production will be released.
Switzerland will release the Producer and Import Price Index on Thursday. The Swiss franc is likely to experience sharp volatility due to the ECB decision. USD/CHF posted its highest daily close in two months around 0.8930. The bias is on the upside, but the 0.8950 resistance level remains intact.
USD/CAD ended lower around 1.3550 after hitting the lowest level since September 1 at 1.3520. Canada will report July Wholesale Sales.
AUD/USD managed to hold above 0.6400 and continues to move around the 20-day SMA at 0.6420. The Melbourne Institute will release its inflation expectation report, and later the Australian Bureau of Statistics will publish the Employment Report. A positive change of 23K in employment is expected after last month's decline of 14.6K.
The New Zealand dollar outperformed on Wednesday. NZD/USD continues to test the 20-day SMA at 0.5920. AUD/NZD pulled back after reaching the lowest level in a month on Tuesday.
Metals remain bearish, with Silver trading below $23.00 and Gold looking at $1,900. XAU/USD settled at $1,908, marking the lowest close in three weeks.
Like this article? Help us with some feedback by answering this survey:
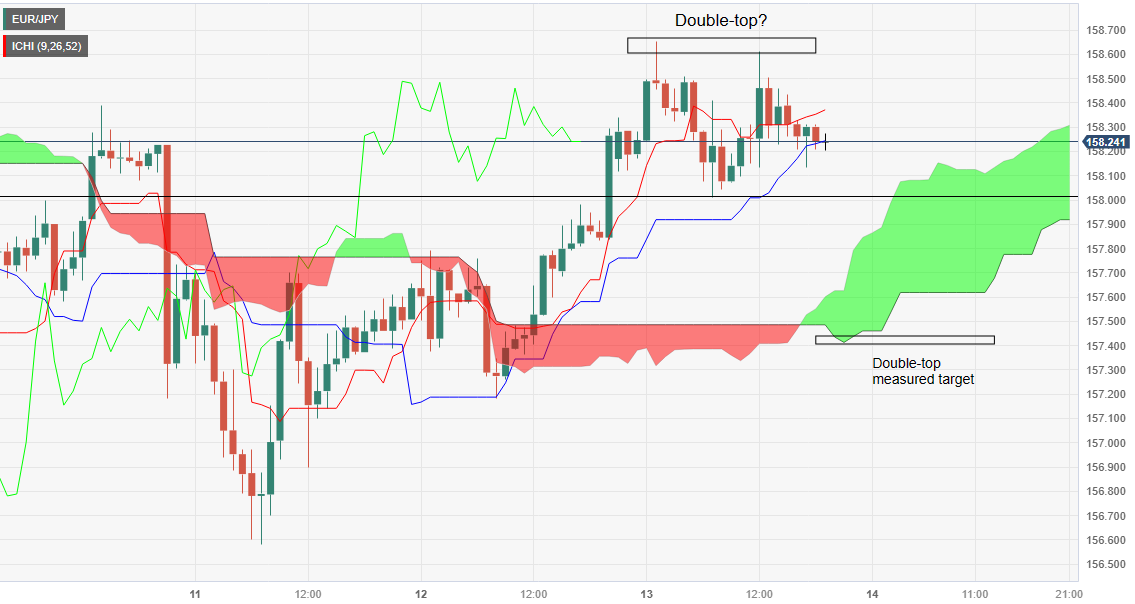
- EUR/JPY trades at 158.22, up 0.02%, after US inflation data suggests the Fed may hold off on a rate hike.
- Ichimoku Cloud indicates an upward bias, but price action suggests the pair is in consolidation.
- Hourly chart shows a potential double top around 158.60; a break below 158.00 could confirm the bearish pattern.
The EUR/JPY clings to minuscule gains after reaching a two-week high of 158.65, following the release of US inflation data, which was mixed and cemented the US central bank case to skip a rate hike. The cross-currency pair changes hands at 158.22, climbing 0.02%.
EUR/JPY Price Analysis: Technical outlook
According to the Ichimoku Cloud (Kumo), the pair is upward biased, but the space contraction between price action and the Kumo suggests the EUR/JPY is consolidating. From a price action standpoint, the cross is neutral to downward biased, unable to crack the latest swing low of 156.58. Once done, the bias would shift to a downward bias, yet it needs to clear the Kumo.
Short term, the EUR/JPY hourly chart portrays the formation of a double top, as the pair peaked at around the 158.60 area. To confirm its validity, sellers must break the last lower low at 158.00. Once cleared, the next support would be the Senko-span A at 157.91, followed by the 157.83 swing low. The double-top measured profit objective would be the bottom of the Kumo at 157.40.
EUR/JPY Price Action – Hourly chart
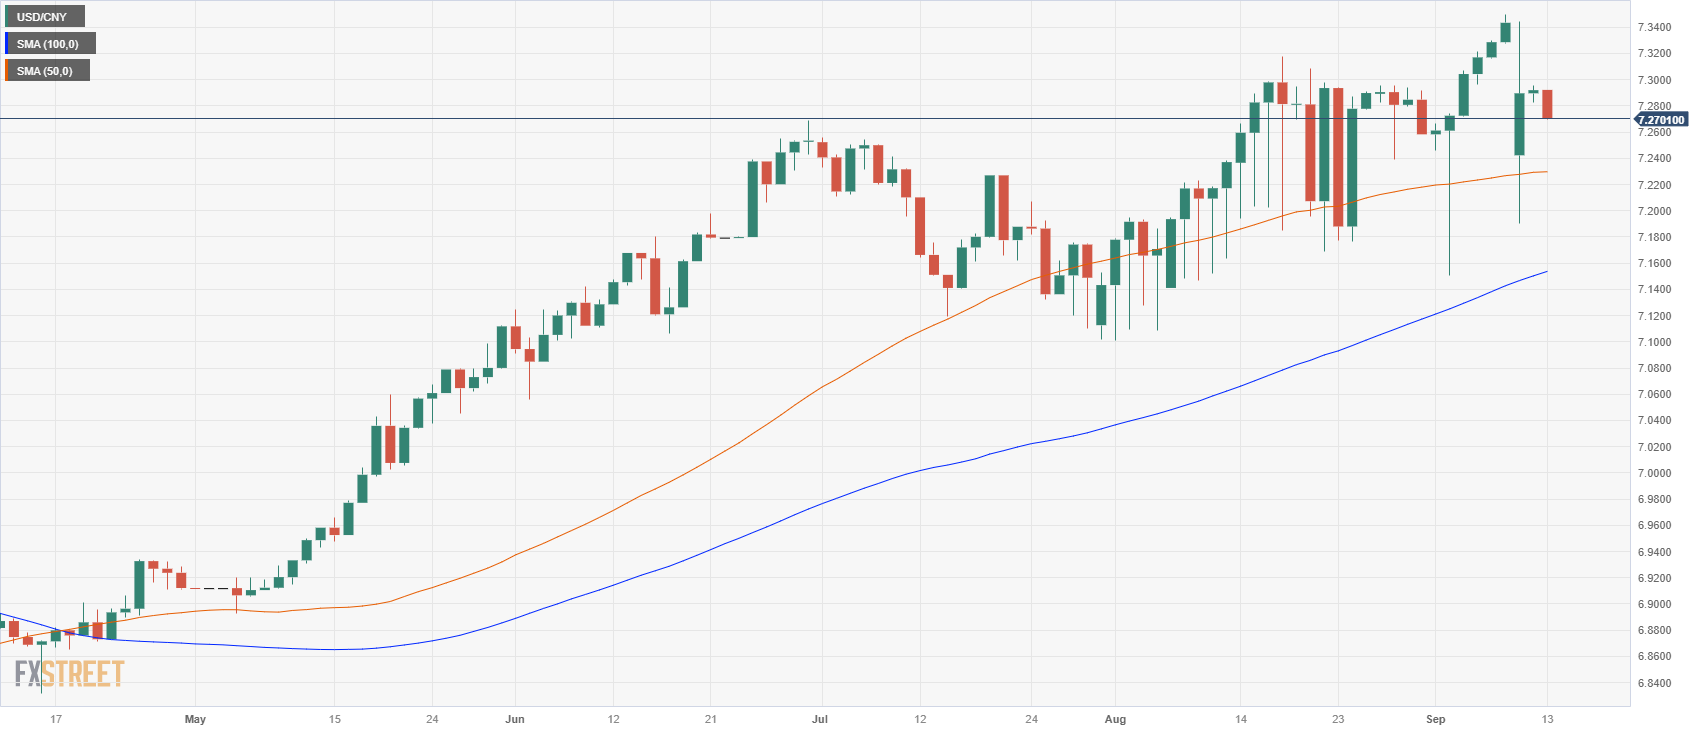
- The USD/CNY took a dip back in market action on Wednesday.
- Bullish momentum remains firm for the Greenback despite defensive posturing in Chinese rhetoric.
- Emerging markets continue to suffer against advanced economy currencies.
The Chinese Yuan (CNY) continues to struggle, with the USD/CNY pair sticking above the 7.2600 level despite slipping lower on Wednesday, closing down from the day’s opening bids near 7.2925.
Chinese officials have stepped up their verbal defense of the Yuan recently, including a stronger domestic fix for the currency within China’s borders. Across the emerging market (EM) space, currencies continue to backslide against firmer currencies like the US Dollar (USD). Traders are turning on central banks (CBs) in the EM sphere, especially in countries where CBs have been forced to continue easing monetary policy and cutting interest rates.
EM CBs are broadly more dovish than they were previously, and the emerging picture of a potential soft landing for the massive United States (US) economy is putting further pressure on CBs looking to defend beleaguered currencies.
Despite the Chinese defense of the CNY, the People’s Bank of China (PBoC), in lock-step with the Chinese government, continues to actively pursue stimulus measures and the diverging path between verbal support and policy-based easing is throwing a wrench in the CNY’s path forward.
Mixed messages from PBoC and Chinese government
Foreign exchange economists have noted that China’s attempted verbal steeling of the Yuan is meant to create an illusion of stability, but China is fully aware that they need the CNY to continue to weaken in order to drive economic growth in their flagging economy.
A softening of the US economy would be a boon for EM economies as it would help bolster their export revenues, but higher-for-longer interest rates in the developed world threaten those same economies’ currencies as interest rate differentials continue to widen, making the importing of necessary goods into EM economies increasingly expensive.
Upcoming economic data for China includes Friday’s Industrial Production and Retail Sales data, followed by the PBoC’s rate call next Wednesday.
Annualized Industrial Production in China is anticipated to print a step higher on Friday, with market forecasts broadly anticipating a showing of 3.9% for the year, compared to the previous showing of 3.7%. Retail Sales figures are expected to show an improvement for the same period, with market analysts expecting a print of 3% for the annualized period, up from the previous release’s 2.5%.
Next Wednesday will see the PBoC’s rate call for China’s main interest rate, which last printed at 3.45%. China will also be posting their 1- and 5-year Loan Prime Rate, the base rate that commercial banks use when lending to consumers and issuing mortgages.
The previous printing of the 1- and 5-year prime rate was forecast to decline to 4.05% in August, but the PBoC held the mechanism in place, keeping the lending rate pinned to 4.20%. Investors will be watching closely to see if the PBoC’s rate activity falls in-line with Chinese talking points about the domestic economy.
USD/CNY technical levels
The daily candlesticks for the USD/CNY pairing show the Yuan struggling to develop and maintain a foothold against the Greenback, with the pair testing ten-month highs. The USD has marched higher from the year’s low point near 6.70 set in January, and the 50- and 100-day Simple Moving Averages are stacked firmly bullish, at 7.23 and 7.15 respectively.
The 50-day SMA is especially critical to technical support on the chart, providing a frequent rebound point for bullish momentum swings, and bidders will be looking to reload on long positions if prices returns to the indicator level.
USD/CNY daily chart
USD/CNY technical levels
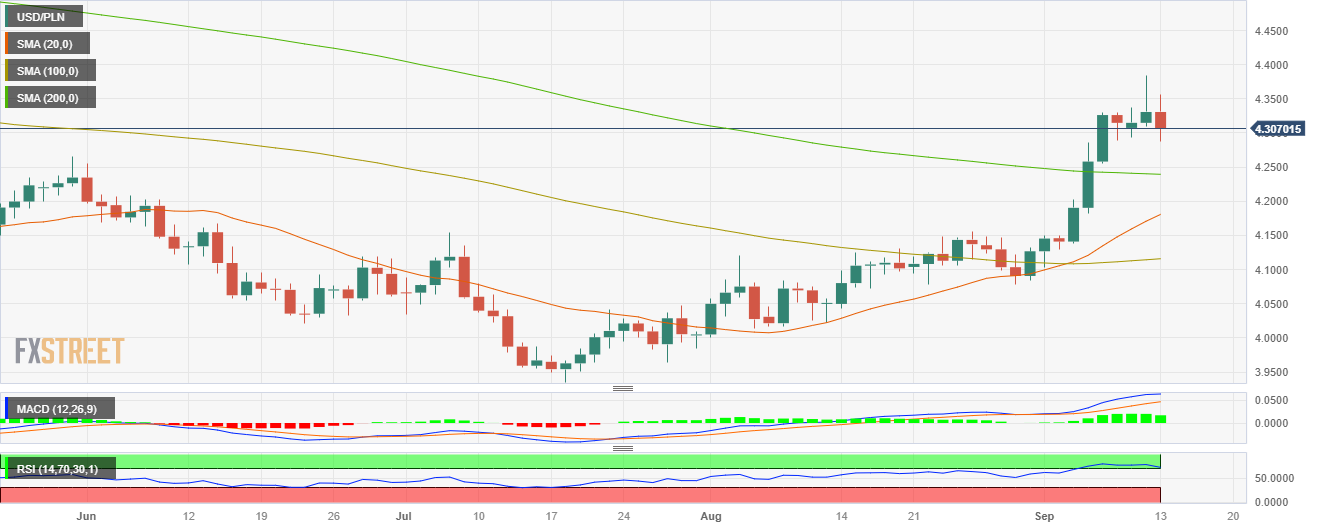
- USD/PLN declined by more than 0.70% towards the 4.3000 level.
- Polish government showed concerns about the zloty weakness and added that it should be considered.
- The USD is holding its foot after inflation figures from August.
The USD/PLN declined towards the 4.3000 level, as Polish policymakers have pointed out that they will consider the zloty weakness in the next monetary policy decisions.
Pawel Borys, a senior aide to Prime Minister Morawiecki, was the one who expressed concerns about the weakening of the currency beyond what he considered below the "optimal" as the USD/PLN rose by more than 4% in the last week, driven by the unexpected decision by the Polish central bank to cut rates by 75 basis points. It is worth noting that the Polish central bank governor, Adam Glapinski, justified the rate cuts due to local inflation moderating. Still, markets considered the move political with elections around the corner, which drove investors to dump the Zloty as the Narodowy Bank Polski's (NBP) credibility took a big hit.
On the US side, the Greenback is holding its foot after the US Bureau of Labor Statistics (BLS) reported that the Consumer Price Index (CPI) rose to 3.7% YoY, higher than the 3.2% in July and beating the expected 3.6%. Conversely, the Core measure eased to 4.3% YoY, matching expectations. As a reaction, the USD is holding its foot as, according to the CME FedWatch tool, market participants still foresee nearly 40% of the odds of a 25 basis point hike by the Fed in 2023.
USD/PLN Levels to watch
On the technical front, the USD/PLN indicates an overbought sentiment. This implies the potential for a short-term technical recovery, with a possible increase in downward movements. The Relative Strength Index (RSI) is seen above the 70 threshold, while the Moving Average Convergence (MACD) presents neutral green bars. Furthermore, the pair is above the 20,100,200-day Simple Moving Average (SMAs), indicating that the bulls are in command of the broader picture.
Support levels: 4.2400 (200-day SMA), 4.1810 (20-day SMA), 4.1700.
Resistance levels: 4.3200, 4.3500, 4.3800.
USD/PLN Daily Chart
- WTI trades at $87.80, down 0.33%, after US crude inventories show a 4 million barrel increase, defying expectations.
- US inflation report reveals a 3.7% YoY rise in August, driven by a 10.6% increase in retail gasoline prices.
- Technical outlook suggests WTI could test support at $87.23; resistance levels emerge at $88.00 and year-to-date high of $88.99.
Western Texas Intermediate (WTI), the US crude oil, trims some of its daily gains spurred by a build on US oil inventories amid expectations for a drop. This and the latest US inflation report in the United States (US) boosted the Greenback (USD), a headwind for US dollar-denominated assets. WTI is trading at $87.80, down 0.33%.
WTI retreated amid unexpected surge in US inventories, rising US Dollar
The latest US crude oil inventories showed an increase of 4 million barrels last week, crushing estimates gathered by a Reuters poll for a 1.9 million barrel contraction, in data revealed by the US Energy Information Administration (EIA). Additional data showed that fuel demand dropped as the summer driving period in the US ended in the September 4 Labor Day Holiday.
The latest inflation report in the US showed headline inflation rose by 3.7% YoY in August, above estimates propelled by a 10.6% increase in retail gasoline prices. Contrarily, excluding volatile items like food and energy, inflation slowed from 4.7% to 4.3% YoY.
Oil prices had remained underpinned by Saudi Arabia and Russia’s voluntary oil production cut as both countries slashed 1.3 million barrels from the market.
WTI Price Analysis: Technical outlook
After rising to a 10-month high, WTI retraced below the September 12 daily close of $88.18 per barrel. A daily close below that level could pave the way for a pullback toward the top of an ascending-triangle top-trendline turned support at $87.23 before slumping to the $87.00 figure. A breach of the latter will expose the September 8 daily low of $85.65, ahead of slumping below the $85.00 figure. Conversely, WTI’s first resistance would be the $88.00 figure before cracking the YTD high of $88.99.
- European equities hit a bearish note ahead of ECB rate call.
- Inflation remains a sticky complication for European central banks.
- The Bank of England is caught between a rock and an even bigger rock as inflation remains, but economy lags.
European equity indexes finished Wednesday broadly lower as investors brace for the latest rate call from the European Central Bank (ECB).
Equities turned sour in Europe following better-than-expected Consumer Price Index (CPI) figures from the US, where inflation data for the American continent clipped into a 14-month high. The German DAX and France’s CAC40 both ended Wednesday trading down around 0.4% on the day, and the pan-European Stoxx600 index ended the day down 0.3%. London’s FTSE 100 index managed to hold on for the day, ending a scant 0.02% in the red.
UK, EU inflation concerns remain elevated, rate policy looms
London’s equities are taking a breather, but investors remain cautious as inflation for the United Kingdom’s (UK) economy continues to prove stickier than expected, and economic calendar data for the British economy continues to flub expectations. The Bank of England (BoE) is left in a tough spot, with inflation necessitating further rate hikes, but a wobbly economy at risk of taking a further plunge if rate hikes continue. The FTSE 100 ended the day at £7,525.
On the European Union (EU) side, the ECB is facing rate troubles of its own. An internal leak earlier this week showed the European Central Bank is set to raise its inflation expectations for the continental economy as price gains continue to prove resilient in the face of ECB actions.
The ECB is slated to release its latest rate call on Thursday’s market session, where investors will be keeping a close eye on statements. The ECB is still broadly expected to keep rates where they are for the time being, but background bets on a rate hike have been steadily increasing, and an upside surprise isn’t entirely off the table.
The DAX ended the day down near €15,654 with the French CAC40 closing at €7,222. The Euronext 100 is similar down 0.4%, to €1,335, and the EU-broad EuroStoxx 600 slipped to €453.94.
The Automotive sector in Europe provided what little support European equities received on Wednesday, with the EU set to investigate improper electric vehicle (EV) subsidies that the Chinese government has been supplying to their domestic auto manufacturers, with the President of the European Commission Ursula von der Leyen stating that while they welcome competition, they were not open to a “race to the bottom”.
The British Petroleum (BP) oil company took the top of the energy sector in London recently, with the stock slipping on Tuesday following a surprise resignation from the company’s CEO, Bernard Looney. Looney has been accused of failing to disclose the nature of his personal relationships with some colleagues. BP’s stock is down nearly 3% for the day, clipping into £508.50 to settle the day.
The US government recorded a budget surplus of $89 billion in August 2023, as reported by the Treasury Department. Total receipts for the month amounted $283 billion, while outlays stood at $198 billion, marking the lowest monthly figure in over two years.
With one month remaining in Fiscal Year 2023, the accumulated deficit reached $1.5 trillion, compared to the $1.3 trillion deficit recorded in FY 2022.
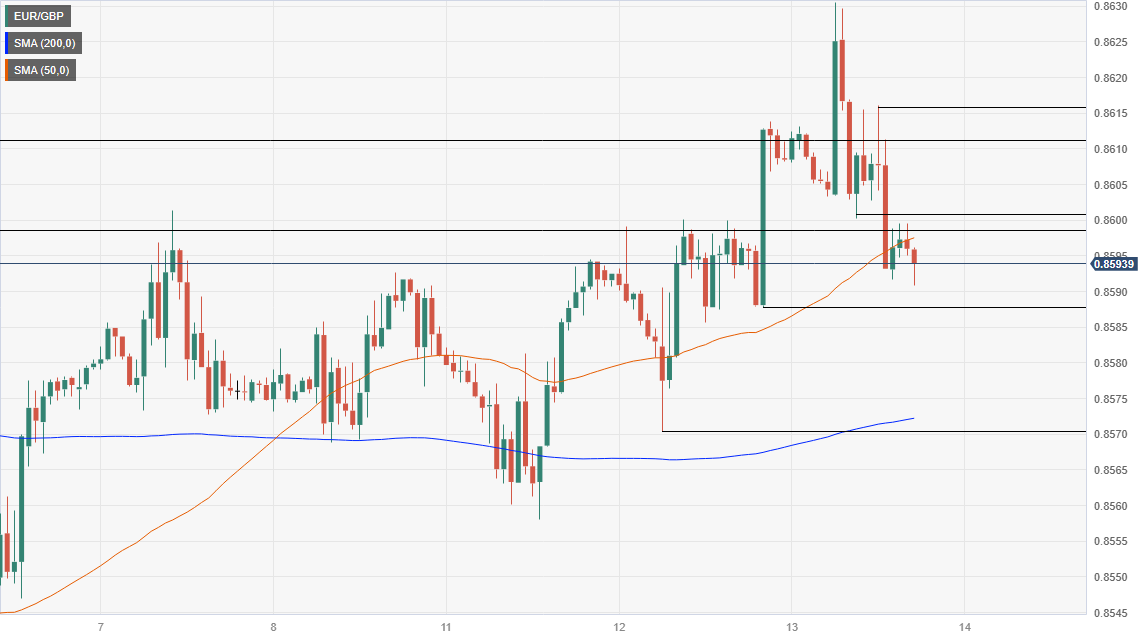
- EUR/GBP trades at 0.8595, down 0.12%, as traders position for a possible ECB rate hike of 25 basis points.
- Daily chart shows a tweezers-top inverted hammer, indicating potential for further losses; key support at 50-day MA of 0.8580.
- One-hour chart suggests next support at 0.8587; resistance levels emerge at 50-HMA of 0.8598 and 0.8600 figure.
The Euro (EUR) loses territory against the Pound Sterling (GBP), as traders brace for tomorrow’s European Central Bank (ECB) monetary policy decision. Despite odds the ECB would raise rates by 25 basis points, it was no excuse for EUR/GBP traders to short the pair ahead of the meeting. The cross-currency pair exchanges hands at 0.8595, down 0.12%.
EUR/GBP Price Analysis: Technical outlook
The daily chart portrays the pair reaching a four-week high at 0.8630 but erased those gains and formed a tweezers-top inverted hammer, which could pave the way for further losses. But a daily close at around 0.8592 is needed to cement a downward correction. In that case, the cross-currency next support would be the 50-day Moving Average (DMA) at 0.8580, followed by the September 12 swing low of 0.8569. Upside risks emerge at the current week’s high of 0.8630.
The one-hour chart portrays the pair failed to extend its gains past the daily high and retreated below the previous higher-low of 0.8603, opening the door for further downside. The next support would be 0.8587, followed by the 200-hour Moving Average (HMA) at 0.8572. On the flip side, the EUR/GBP first resistance would be the 50-HMA at 0.8598, the 0.8600 figure, and the next swing high at 0.8616.
EUR/GBP Price Action – Daily chart
- USD/CAD tallies a four-day losing streak, trading at 1.3545.
- Higher energy prices contributed to an acceleration of the US CPI in August.
- Fed tightening expectations remain steady.
- Higher Oil prices favour the CAD.
The USD/CAD continued its downward path on Wednesday, tallied a more than 1% decline in the last four days, and traded at the 1.3585 - 1.3520 range. On the USD side, the Greenback is holding its foot after the release of inflation figures as investors are still placing bets on one last hike by the Federal Reserve (Fed) in 2023. On the other hand, the CAD trades strong, mainly driven by higher Oil prices that rose to highs since November on Tuesday.
On the data front, the US Headline Consumer Price Index (CPI) rose to 3.7%, higher than the previous 3.2% and the expected figure of 3.6%, and the US Bureau of Labor Statistics (BLS) reported that an increase in energy prices drove the rise. On a positive note, the sticky Core measure eased to 4.3% from its previous reading of 4.7%, matching the expectations.
All eyes are now on Thursday's Produce Price Index (PPI) figures from the US, which is expected to accelerate to 1.2% YoY from its previous 0.8%. Retail sales from the same month will also be closely watched. As for now, the CME FedWatch tool indicates the case of one last 25 basis point hike by the Federal Reserve (Fed) remains strong as investors discount nearly 40% odds of possibilities. In line with that, hawkish bets may cushion the USD’s losses.
USD/CAD Levels to watch
Analysing the daily chart, the technical outlook for the USD/CAD remains neutral to bearish as the bears continue to show signs of gaining ground. With a negative slope below its midline, the Relative Strength Index (RSI) signals a bearish sentiment, while the Moving Average Convergence (MACD) histogram shows increasing red bars.
Support levels: 1.3520, 1.3500, 1.3490.
Resistance levels: 1.3576 (20-day SMA), 1.3600, 1.3630.
USD/CAD Daily Chart
-638302228941671807.png)
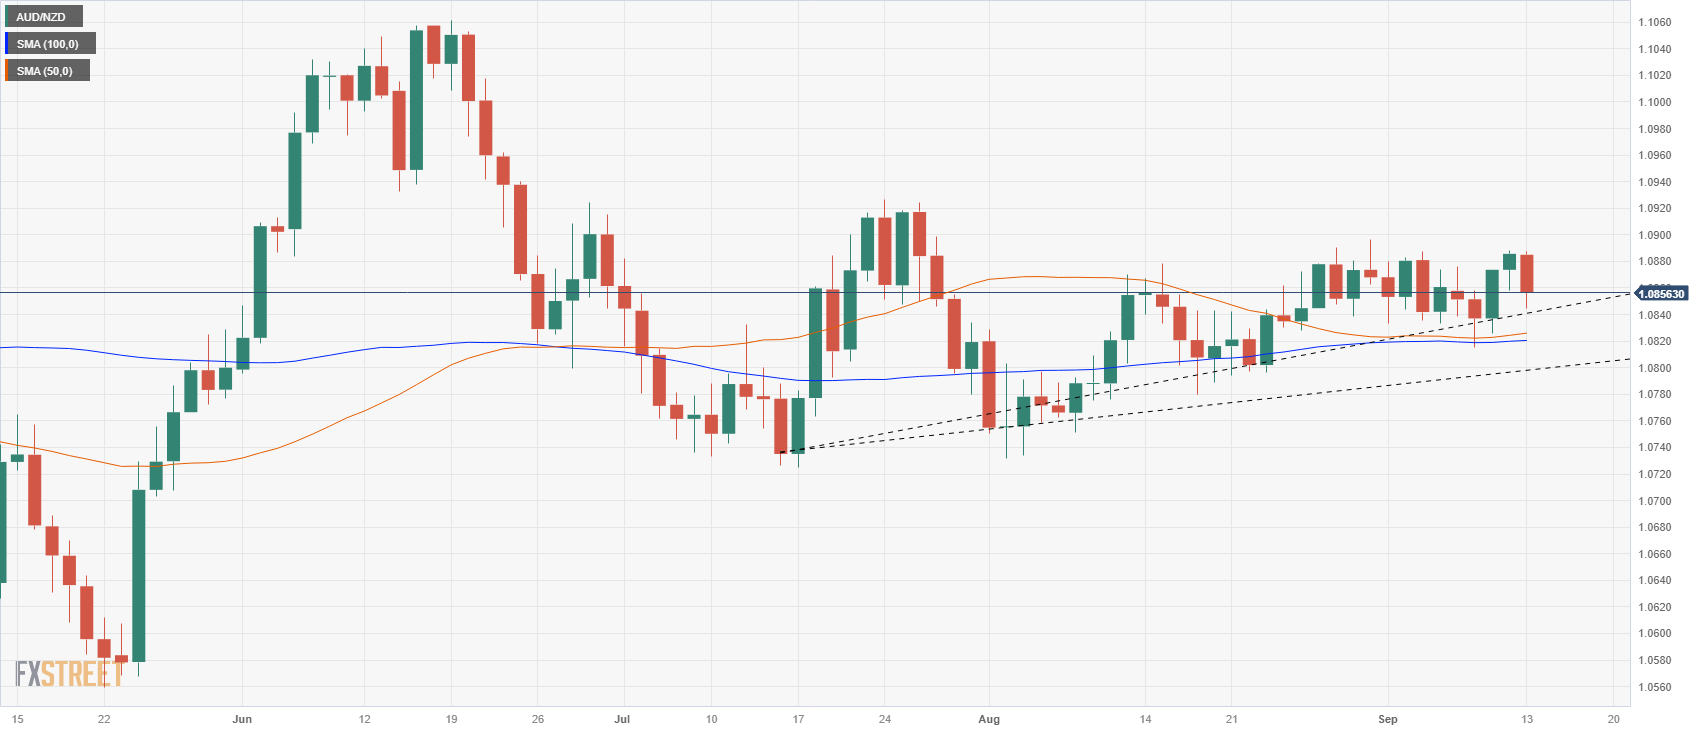
- The AUD/NZD is waffling ahead of Australian labor data.
- A lack of momentum for the pair is notable as the top continues to reinforce from 1.0880.
- Data-light Kiwi sees market flows as the primary driver.
The AUD/NZD pairing is taking a step down for Wednesday, back into familiar consolidation territory as the Aussie (AUD) struggles to find meaningful momentum against its next-door neighbor the Kiwi (NZD).
The AUD managed to squeeze past the 1.0880 handle yesterday, but couldn’t keep a grip and has slumped back, now trading into the 1.0860 region. The day’s low is currently marked in near 1.0845.
Australian employment figures coming down the pipe
The Aussie could be seeing some hesitation from traders as Australian labor data rounds the corner, with Employment Change and Unemployment Rate figures slated for early Thursday.
The Australian economy is forecast to have added 23K jobs to the landscape in August, an uptick from the previous month’s 14.6K decline. Meanwhile, the Unemployment Rate for the same period is broadly expected to hold steady at 3.7% month-over-month. Aussie bulls will no doubt be looking for a better-than-expected showing for labor data in order to push the AUD higher. Both indicators are slated to print at 01:30 GMT on Thursday.
The Kiwi remains drastically under-represented on the economic calendar this week, with little of note to bolster the NZD. BusinessNZ’s Purchasing Manager’s Index (PMI), a diffusion index of purchasing managers within New Zealand’s manufacturing sector, will be landing late Thursday. Little market reaction will be expected, and forecasts for the indicator are generally not made. The industrial PMI has printed in the sub-50.0 region since March, and no big surprises are expected.
AUD/NZD technical outlook
The Aussie has largely traded into familiar territory against the Kiwi for much of the year, cycling deep consolidation territory and well off last year’s highs of 1.1490, a region that might as well be on another planet entirely.
Daily candlesticks are implying a mildly bullish bent, with lows slowly rising, but 1.0880 appears to represent the ceiling for the time being, and the rising trendline from 1.0725 is squeezing price action into the level.
The 100- and 50-day Simple Moving Averages remain flat and consolidated, currently parked near 1.0820, and it will take significant moves in either direction to reintroduce momentum to the moving averages.
AUD/NZD daily chart
AUD/NZD technical levels
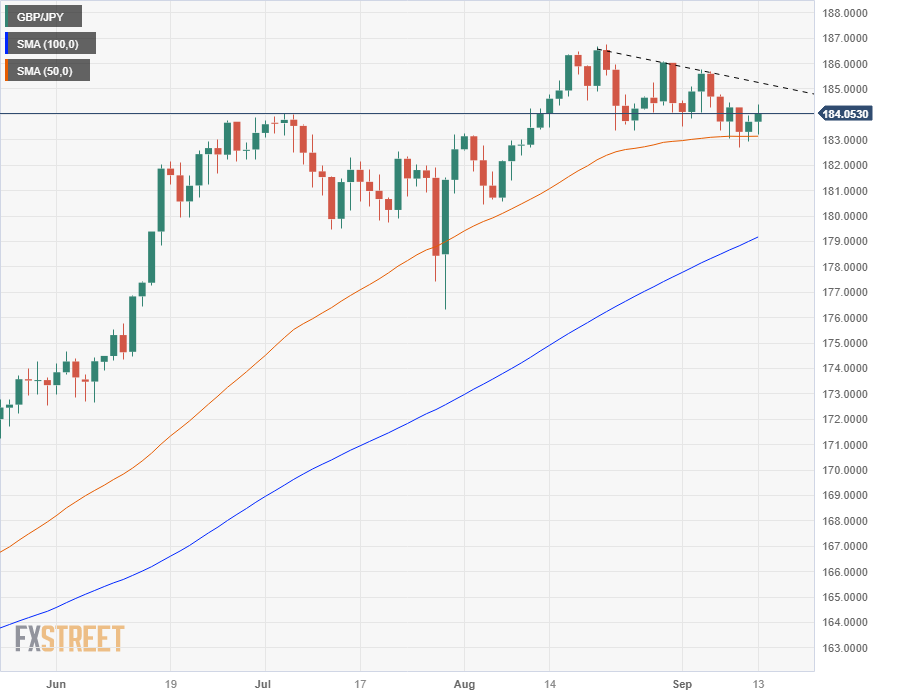
- The GBP/JPY takes a step up to reclaim green territory for the day.
- Downside risks remain, but easing Yen flows are helping to prop up the pair.
- UK data continues to disappoint, but inflation risks remain a sticking point, keeping rate expectations elevated.
The GBP/JPY is seeing some topside action as the Pound Sterling (GBP) holds the high side against the Japanese Yen (JPY), but it’s been back-and-forth action on mixed market expectations for both currencies for the mid-week trading session.
The Sterling fell to a session low of 183.20 early in Wednesday trading but has since recovered, chalking in a near-term high of 184.40 in the American trading session. The Guppy now trades into the middle, waffling into the 184.00 handle.
The economic calendar has seen some struggles for the GBP, with key indicators for the United Kingdom (UK) generally missing the mark. Industrial Production figures for July missed the mark, declining 0.7% versus the expected -0.6%, and well below the previous printing of 0.5%, erasing all of the previous month’s growth.
UK data continues to disappoint, but inflation pressures continue to complicate the BoE's path forward
Manufacturing Production for July managed to squeeze out a topside surprise, but still printed in contraction territory, coming in at -0.8% against the expected -1%. The indicator is steeply off the previous month’s 2.4% reading.
Gross Domestic Product (GDP) figures for the month of July also threw a wrench in the works, printing a 0.5% decline against the expected -0.2%, and walking back the previous period’s 0.5% increase.
Despite the lagging economic data, the Bank of England (BoE) remains in a tough spot, and market bets of continued rate hikes are increasing. Despite a wobbly economic outlook, the UK is still facing inflation pressures via rising wages, and the BoE could be forced to continue raising benchmark rates in the near term. The UK is already facing some of the highest interest rates in the G7, and continued rate hikes could threaten to tip the economy deeper into recession territory even as the BoE tries to plug the bleed from inflation.
The GBP/JPY is being helped by a receding Yen that is taking steps lower in the market as investors cool off after overextended risk appetite brought on by rate-bullish comments from the Bank of Japan (BoJ) recently. The BoJ’s Governor Kazuo Ueda hit newswires last weekend cautioning that the BoJ could be on pace to reverse their long-standing negative rate policy if economic data points to the Japanese central bank maintaining their 2% inflation target in a meaningful way.
Markets lurched on the news, sending the Yen clambering up the charts in the early week, but things are beginning to unwind. Japanese inflation, while currently holding above the BoJ’s desired level, is expected to slump in the coming months, and there are concerns the BoJ won’t be able to keep price growth at a healthy level heading into the end of the year.
GBP/JPY technical outlook
The Guppy hit a new daily high for the first time in over a month and is finding the 184.00 handle particularly sticky. The 100-hour Simple Moving Average (SMA) is threatening to turn bullish from 183.70, providing support as the 50-hour SMA consolidates and threatens to cross over into bullish territory. Higher lows on the hourly candles are also providing support from 182.80 to 183.20, while last week’s swing high point of 184.40 remains a key resistance area for the candles to overcome.
On the daily candlesticks, a descending minor trendline from late August’s high-water mark of 186.75 remains intact, and price action is getting squeezed by a rejection from the 50-day SMA near 183.00. If bids are able to congregate enough from this level, it will see a further leg up from the 50 SMA bounce, but further downside will see fresh challenges from the 100-day SMA currently parked near the 179.00 handle.
The Pound Sterling has consolidated against the Yen on a weekly basis for a month, with lows testing deeper waters, and with the GBP/JPY well-extended from 2023’s opening lows near 156.00, a downturn could see the pairing settle lower before long-term market forces re-establish the long-term bullish trend.
GBP/JPY daily chart
GBP/JPY technical levels
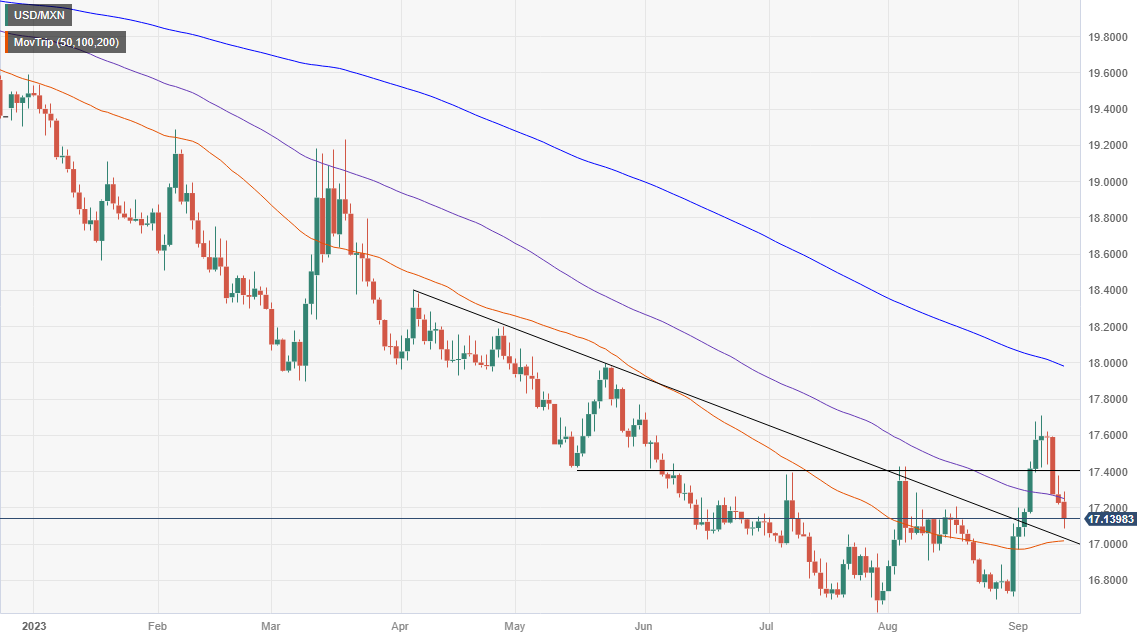
- USD/MXN trades at 17.1200, down 0.53%, after US CPI for August comes slightly above the 3.6% forecast.
- CME FedWatch Tool indicates a 41% chance of a 25 bps rate hike in November, keeping traders cautious.
- Upcoming US labor and retail data and Banxico’s 11.25% TIIE could push USD/MXN to test the 17.0000 level.
The Mexican Peso (MXN) shrinks its losses and stages a comeback against the US Dollar (USD), after data from the United States (US) further cemented the case for the US Federal Reserve to hike rates at the September meeting. The USD/MXN is trading at 17.1200, down 0.53, after reaching a daily high of 17.2919.
Mexican Peso rebounds vs. the Greenback amid uncertainty over US monetary policy
US inflation exceeded estimates, as August’s Consumer Price Index (CPI) came at 3.7% YoY, while forecasts saw inflation at 3.6% above July data. Contrarily, core inflation dropped from 4.7% YoY in July to 4.3%, as projected by analysts, painting a mixed picture of inflation. Nevertheless, the data failed to price in additional tightening by the US Federal Reserve (Fed), as shown by money market futures data.
The CME FedWatch Tool still sees the Fed would keep rates at around the 5.25%-5.50% range for the upcoming September meeting, but for November, odds for a 25 bps rate hike are at 41%.
Nevertheless, USD bears are not out of the woods yet, as labor market data still shows signs of a hot jobs market. Unemployment claims for the last week are expected to rise to 225K, above the previous 216K reading. That, alongside August’s Retail Sales report, which is foreseen to come weaker than July’s numbers, could cement the case for an end of the Fed’s tightening cycle.
Additional inflation data will be revealed on Thursday, with the Producer Price Index (PPI) foreseen to continue decelerating.
If the data shows signs of an economic slowdown for the US, expect the USD/MXN to test the 17.0000 figure, as the interest rate difference between Mexico and the US favors the former, with Banxico’s TIIE at 11.25%, compared to the effective Federal Funds Rate (FFR) at 5.33%.
USD/MXN Price Analysis: Technical outlook
Even though the USD/MXN has retraced somewhat, the pair remains neutral to upward bias unless Mexican Peso buyers reclaim the August 28 daily low of 16.6924. However, it could challenge the psychological 17.00 figure, but traders must crack solid support standing in its way. Before testing the former, the 20-day Moving Average (DMA) is at 17.0902, followed by the 50-DMA at 17.0108. Conversely, a bullish continuation would resume once buyers reclaim the 100-DMA at 17.2452.
- NZD/USD is seeing 0.30% gaina and rose to 0.5915.
- Inflation accelerated in August, driven by higher gasoline prices.
- US yields initially soared to two-week highs and then consolidated.
- Fed tightening expectations are still high.
In Wednesday’s session, the NZD/USD increased towards 0.5915, near the 20-day SMA of 0.5922. That being said, the upside potential during the session is limited by the US Dollar holding its foot after the release of hot inflation readings from the US.
In August, the US saw a surge in inflation, with the Consumer Price Index (CPI) increasing by 3.7% YoY, up from 3.2% in July, according to the US Bureau of Labor Statistics (BLS). This exceeded market expectations of 3.6%, while the monthly figure matched forecasts at 0.6%. The core annual reading eased to 4.3% from July's 4.7%, matching expectations.
The initial reaction was a spike of the US 2-year Treasury yield to 5.08%, it highest in over two weeks, and then consolidated near 5%. The 5 and 10-year rates saw similar movements and are consolidating at 4.41% and 4.28%. In line with that, yields remain high as, according to the CME FedWatch tool, markets still price in high odds of one last hike in November or December by the Federal Reserve (Fed).
Attention now shifts to Thursday’s Producer Price Index (PPI) figures from August from the US, which will guide investors in modelling their expectations for the next Fed meetings.
NZD/USD Levels to watch
The NZD/USD daily chart analysis points to a bearish sentiment for the short term. The Relative Strength Index (RSI) is situated below its midline while the Moving Average Convergence Divergence (MACD) prints flat green bars, signifying that despite gaining some traction, the bull’s momentum is still weak. Additionally, the pair is below the 20,100 and 200-day Simple Moving Averages (SMAs), indicating that the bears are still in command on the broader picture.
Supports: 0.5900, 0.5890, 0.5850.
Resistances: 0.5922 (20-day SMA), 0.5930, 0.5960.
NZD/USD Daily Chart
-638302183461544465.png)
- USD/JPY trades at 147.58, up 0.34%, after US CPI for August rises to 3.7% YoY, beating 3.6% estimates.
- US 10-year Treasury note yield remains steady at 4.28%, despite initial volatility following the inflation report.
- Market futures price in a 97% chance the Fed will hold rates steady; focus shifts to upcoming economic data from both countries.
The Greenback (USD) extended its rally versus the Japanese Yen (JPY) on Wednesday after an inflation report in the United States (US) came mixed, though suggesting there’s a slim chance for additional monetary policy tightening. The USD/JPY is trading at 147.58, gaining 0.34%.
Greenback rises against Yen as US CPI exceeds estimates, but market skeptical of imminent Fed tightening
The US Department of Labor revealed that inflation in August’s uptick was foreseen but exceeded estimates. The Consumer Price Index (CPI) rose by 3.7% YoY, above 3.6% estimates, and crushed July’s 3.2% reading, blamed on higher energy prices. The positive news was that core CPI edged lower to 4.3% YoY, as expected, from 4.7% in July.
On the data release, the USD/JPY wavered around the 147.12/147.74 area before stabilizing at around 147.40. Since then, the pair has steadily exchanged hands at current price levels. The US 10-year Treasury note is yielding 4.28%, unchanged, after seesawing towards 4.35%.
Even though the latest round of data, with the labor market remaining tight, inflation stickier than expected, should warrant another interest rate increase, market participants think otherwise. Money market futures have priced in a 97% chance the Federal Reserve would keep the Federal Funds Rate (FFR) at the current range. However, the odds stand at 41% for the November meeting, unchanged from last week’s reading.
Aside from this, USD/JPY traders would look forward to the release of economic data to take cues on the pair’s direction. The Japanese agenda will release figures for Machinery Orders. On the US side, Initial Jobless Claims, the Producer Price Index (PPI), and Retail Sales would update the status of the US economy.
USD/JPY Price Analysis: Technical outlook
The USD/JPY has printed two straight days of positive price action, opening the door to test the year-to-date (YTD) high of 147.87. If Japanese authorities remain muted, there’s a change the major could challenge the psychological 148.00 area. Once cleared, the next stop would be the November 1 swing high at 148.82. On the flip side, a downward correction is seen if the USD/JPY drops below today’s low of 147.01.
US equities are up 16% this year. Economists at Société Générale analyze the S&P 500 Index outlook.
Moving 3Q23 target of 4,750 to 4Q23
We shift our S&P 500 Index target of 4,750 in 3Q23 to year-end 2023 (from 4,300) as the no-landing scenario is not yet priced in and should be over the coming months as recession calls are deleted/delayed. Put another way, we stay bullish near term, despite the likely jitters in 2024.
We expect a 15% shock in the S&P 500 in 2Q24, likely driven by a contraction in US consumer spending. However, with a return to 5% nominal GDP growth in 2025e, the S&P 500 should recover. Our index targets are supported by our equity risk premium projections, which assume: 1) bond yields will come down to 3-3.5% in a soft recession; and 2) aggressive Fed rate cuts in the middle of 2024.
The European Central Bank (ECB) is set to announce its Monetary Policy Decision on Thursday, September 14 at 12:15 GMT and as we get closer to the release time, here are the expectations as forecast by the economists and researchers of 10 major banks.
Markets are split. Of the 49 analysts polled by Bloomberg, 26 see no change and 23 see a 25 bps hike to 4%, while in the Reuters poll, a small majority of experts assume that the ECB will not raise rates further.
TDS
While a hike and a hold are almost equally likely, we now expect the ECB to keep the deposit rate unchanged at 3.75% at the September meeting. We also think this will mark the end of the tightening cycle, though risks still remain around an October hike. We're neutral EURUSD heading into the ECB, highlighting the mix of stretched USD positioning and short-term valuations and a softer China backdrop.
SocGen
We expect the weakening data to allow the ECB to stay on hold to assess more data. However, we do not expect the ECB to give up on its hawkish bias before it is fully clear that the 2% target can be achieved in a timely fashion, and expect one more rate hike this year, likely in December, and more QT early next year.
Citi
With the rate decision at the 14 September ECB meeting finely balanced, the ECB staff projections will play a key role. The projections will be coordinated by ECB staff, as opposed to national central banks. In recent exercises, that has tended to produce more dovish results at least on the 2024 core inflation forecasts. We expect ECB staff to cut the euro area GDP projections substantially from 0.9% in 2023, 1.5% in 2024 and 1.6% in 2025 to 0.5% in 2023, 0.7% in 2024 and 1.4% in 2025. That should also set the unemployment rate on a modestly rising path. However, we expect higher inflation forecasts for 2023 (5.7% vs. 5.4%), broadly unchanged in 2024 at 3.0% and slightly lower in 2025 (2.1% headline and 2.2% for core).
ING
We admit that it is a very close call, but still too high inflation, a focus on actual rather than on predicted developments, and the fear of stopping prematurely will tilt the balance towards a final 25 bps rate hike.
Wells Fargo
We expect policymakers to hold rates steady at 3.75%. At the same time, policymakers may give themselves flexibility to raise rates at future meetings depending on how data evolve, especially core and super-core inflation. This mildly hawkish bias should also prevent ECB policymakers from easing monetary policy too soon. To that point, we recently adjusted our ECB forecast profile to reflect a ‘higher for longer’ stance. Rate cuts are likely to start in mid-2024, and when they begin, we expect a more gradual pace of easing than previous iterations of our ECB forecasts.
Deutsche Bank
Our economists have nervously held their 3.75% terminal deposit rate call for many months now, and as such they think the ECB will stay on hold. However, even if they don't hike this week, don't expect any sign that the council is confident that this is the last hike. A lot of uncertainty remains over European inflation, whilst GDP has been in near-stagnation since last autumn.
Danske Bank
We expect the ECB to deliver a final 25 bps rate hike due to still too strong inflation momentum and projected inflation above the target. We also expect an advancement of the end to full reinvestment process of PEPP currently guided for Dec 24 to be on the cards. Specifically, we expect ECB to 'task committees' for an announcement at the October meeting.
Rabobank
Thursday’s decision will be a close call. We narrowly favour a hold, and we expect the ECB to maintain that more hikes may still follow. The growth outlook is deteriorating, and overtightening is becoming a real possibility. But inflation remains high, and thus the odds of another hike are more than just a tail risk. We expect the ECB to leave its policy rates unchanged. We see a small risk of an increase in the minimum required reserves at this meeting.
Commerzbank
In view of the weak economy and the downward trend in the inflation rate, the ECB is unlikely to raise its key interest rates further, and interest rates are also likely to remain unchanged at subsequent meetings. the same applies to the coming year, as underlying inflation is likely to prove stubborn, especially in the services sector. Other topics could be the end of the PEPP pandemic purchase programme and the remuneration of excess liquidity, although there are unlikely to be any decisions on these.
Nordea
The ECB is torn between whether to hike rates again or not. We think the Governing Council will pause, but signal preparedness to do more at upcoming meetings, if needed. Both inflation and growth forecasts could see downward revisions.
- AUD/USD recovers as the US Dollar stays under pressure after the sticky inflation report.
- US headline inflation expanded at a 0.6% pace as anticipated due to higher gasoline prices.
- The Australian Dollar will dance to the tune of the labor market, which is scheduled for Thursday.
The AUD/USD pair discovers buying interest near 0.6380 as investors see the United States Consumer Price Index (CPI) report for August as insufficient to encourage Federal Reserve (Fed) policymakers to raise interest rates one more time in the rest of the year.
S&P500 opens on a slightly positive note as investors hope that the Fed will keep interest rates unchanged at 5.25-5.50% till the year-end. The US Dollar Index (DXY) delivers a volatile action as the United States inflation turned out stickier than expectations.
US headline inflation expanded at a 0.6% pace as anticipated by market participants. Core CPI that excludes volatile oil and food prices expanded by 0.3%, higher than estimates and July's reading of 0.2%. The US headline CPI, on an annual basis, accelerated to 3.6% from expectations of 3.6% and the prior release of 3.2%. Core CPI matched expectations of 4.3% in a similar period, remaining below the former reading of 4.7%.
According to the CME Fedwatch Tool, traders see a 97% chance in favor of an unchanged monetary policy vs. a 93% chance before the US inflation data release for the September monetary policy meeting.
On the Australian Dollar front, investors await the labor market data for August, which will be published on Thursday at 01:30 GMT. As per the expectations, Aussie employers recruited 23K job-seekers vs. 14.6 lay-offs recorded in July. The Unemployment Rate is seen unchanged at 3.7%. Tight labor market conditions could force Reserve Bank of Australia (RBA) policymakers to discuss more about resuming the policy-tightening spell.
The Turkish Lira appears to be still heavily “managed” by policymakers. Economists at Commerzbank analyze TRY’s outlook.
Credibility a long, arduous process
The Turkish Lira stabilised to some degree after the newly appointed economy management team announced a return to conventional monetary policy and hiked rates sharply. But, despite verbally supporting this tightening, President Erdogan also expresses some contradictory views, which keep the market uncertain about his support.
We retain our USD/TRY forecast for the end of the year at 30.00.

Source: Commerzbank Research
USD strength will likely stick around for longer than economists at CIBC Capital Markets envisaged at the start of the summer.
Higher for longer for the USD
We are now expecting strength in the USD to stick around for longer. That’s due to a deteriorating risk backdrop, alongside inconsistencies with how markets are pricing central banks for 2024.
DXY – Q4 2023: 106.00 | Q1 2024: 104.31
See: USD to strengthen through the end of this year and come the end of 2024 – HSBC
- EUR/USD halts three consecutive daily advances.
- The 1.0770 region emerges as the initial hurdle for bulls.
EUR/USD struggles to continue the weekly recovery and seems to have met a decent resistance around 1.0770 so far.
The underlying bearish sentiment remains unchanged and leaves the door open to extra pullbacks in the short-term horizon. Against that backdrop, the breach of the 1.0700 region could encourage sellers to embark on a probable visit to the September low of 1.0685 (September 7) ahead of the May low of 1.0635 (May 31).
In the meantime, further losses remain in the pipeline while below the key 200-day SMA, today at 1.0826.
EUR/USD daily chart
Economists at Commerzbank analyze BRL outlook following Brazilian inflation figures.
Inflation rate confirms BCB's path of rate cuts
Brazil's inflation rate rose as expected in August, but monthly inflation was slightly below expectations. In light of this development, even the most skeptical should forgive the Banco Central do Brasil (BCB) for kicking off the rate-cutting cycle last month with a surprisingly sharp 50 bps cut.
Furthermore, with inflation expected to remain below 5% for the time being, the expected further 50 bps easing at each of the remaining three meetings this year to a policy rate of 11.75% by year-end is, in our view, far from aggressive. We therefore continue to believe that the Brazilian Real's strong level is justified for now.
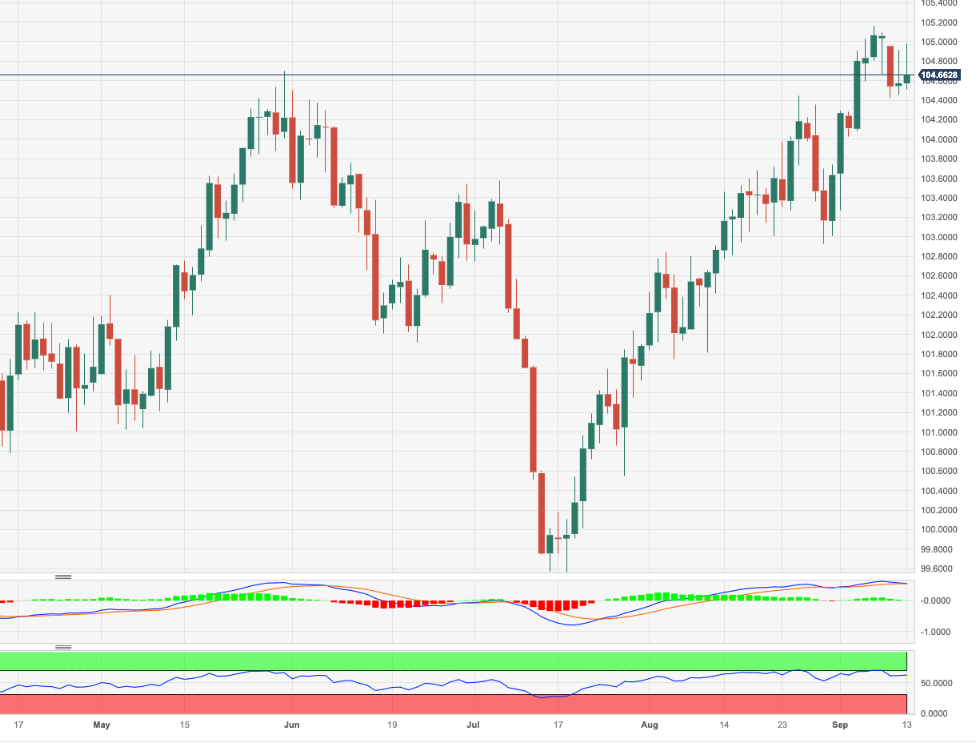
- DXY fades the earlier bull run to the boundaries of 105.00.
- Immediately to the upside emerges the monthly high at 105.15.
DXY gives away initial gains and now recedes to the 104.60 region on Wednesday.
The continuation of the multi-week rally appears well and sound and a breakout of 105.00 should encourages the index to retest the September top of 105.15 (September 7) prior to the 2023 peak of 105.88 (March 8).
While above the key 200-day SMA, today at 103.02, the outlook for the index is expected to remain constructive.
DXY daily chart
Expectations that the Fed will pause on rate hiking next week are unlikely to be changed by today's US inflation data, economists at Commerzbank report.
US core inflation somewhat above expectations
The inflation rate in August rose by half a percentage point to 3.7%. While this gasoline price-related boost had been expected, the core inflation rate also turned out to be slightly higher than forecast, even though it declined further to 4.3%.
The Fed can probably pause next week but will take a close look at further price developments.
- Silver price showed volatile moves as US inflation remained sticky in August.
- Monthly US headline inflation grew at a 0.6% pace as anticipated by market participants, due to a rally in gasoline prices.
- The 50-period EMA at $23.00 continues to act as a major barricade for the Silver price bulls.
Silver price (XAG/USD) demonstrated violent moves near the crucial resistance of $23.00 after the United States inflation in August turned out stickier than expected. The white metal is expected to find a decisive move after a scrutiny of the inflation report by investors.
US Bureau of Labor Statistics reported that monthly headline inflation grew at a 0.6% pace as anticipated by market participants, higher than the former reading of 0.2% due to a rally in gasoline prices. Annualized headline Consumer Price Index (CPI) accelerated to 3.7% vs. expectations of 3.6% and the former release of 3.2%.
Core CPI that strips off volatile food and oil prices expanded at a higher pace of 0.3% than expectations and the prior reading of 0.2%. US core CPI, on an annual basis, softened to 4.3% as projected against July’s reading of 4.7%. Persistence in US inflation figures is expected to feed hopes for one more interest rate increase by the Federal Reserve (Fed) in the rest of the year.
For the September interest rate policy, traders see a 97% chance in favor of an unchanged monetary policy vs. a 93% chance before the US inflation data release, according to the CME Fedwatch Tool. The US Dollar Index (DXY) trades volatile around 104.60.
Silver technical analysis
Silver price remains sideways in a range of $22.80-23.20 from the past four trading sessions ahead of the US inflation data. The white metal demonstrates a volatility squeeze, which is being followed by a breakout in the same. The 50-period Exponential Moving Average (EMA) at $23.00 continues to act as a major barricade for the Silver price bulls. Horizontal support is plotted from August 15 low at $22.23.
The Relative Strength Index (RSI) (14) skids into the bearish range of 20.00-40.00, which indicates that the bearish impulse has been triggered.
Silver two-hour chart
-638302089187901019.png)
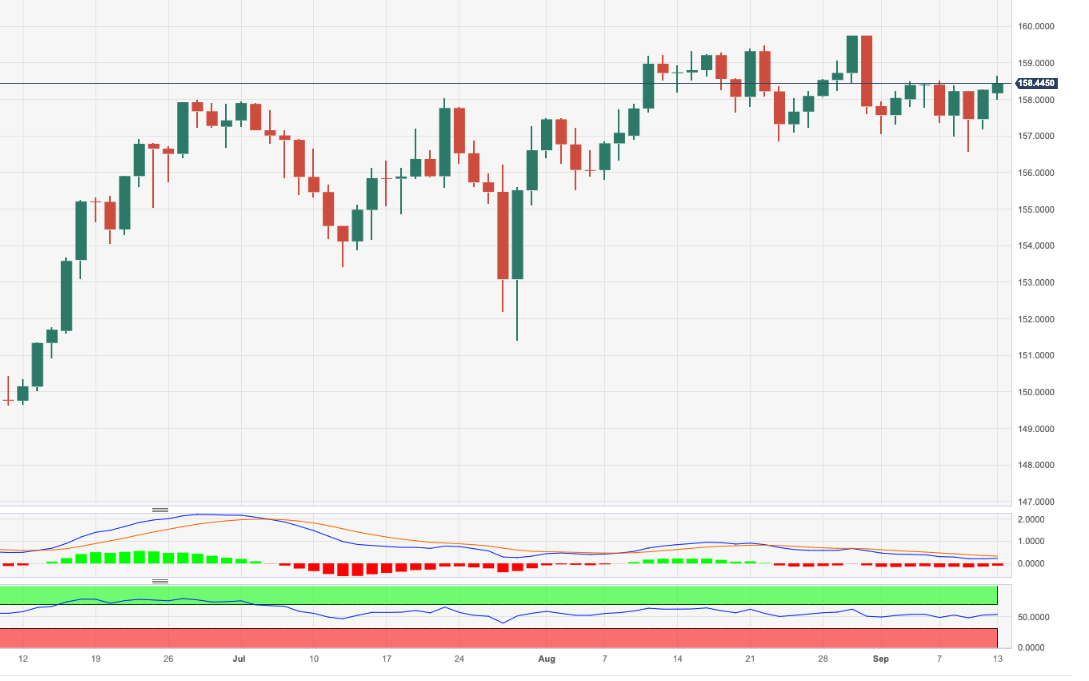
- EUR/JPY improves further and adds to Tuesday’s uptick.
- Next on the upside emerges the 2023 peak around 159.80.
EUR/JPY extends the weekly rebound and pokes with the so far monthly peaks in the mid-158.00s on Wednesday.
In the meantime, the cross continues to face some side-lined trading prior to the potential resumption of the uptrend. That said, a minor hurdle emerges at the so far monthly highs around 158.50 (September 5-7) ahead of the 2023 top at 159.76 (August 30) and before the key round level at 160.00. The surpass of the latter should not see any resistance level of note until the 2008 high at 169.96 (July 23).
So far, the longer term positive outlook for the cross appears favoured while above the 200-day SMA, today at 148.57.
EUR/JPY daily chart
Economists at TD Securities analyze Gold’s outlook following sticky US inflation report.
XAU/USD could find support fairly quickly
Gold has remained subdued as traders sold into a soft-landing theme amid fears of higher-for-longer rates. The modest upside surprise in today’s US inflation data could further compound these fears and keep the precious metals complex on the back foot.
However, the yellow metal could find support fairly quickly, with additional important data on the calendar for tomorrow. In this sense, a weaker retail sales number on Thursday could provide an offset to the inflation data and offer a challenge to the soft-landing narrative.
Economist Lee Sue Ann at UOB Group gives her views on the upcoming interest rate decision by the ECB.
Key Takeaways
There was a lack of forward guidance back at its Jul meeting on what the ECB might do next, but it modified the language to signal a shift from an explicit tightening bias towards an outright neutral stance.
Just like the ECB, we hold an “open mind as to what the decisions will be in Sep and in subsequent meetings”; though for now, we are keeping to our view of a pause in the current tightening cycle.
EUR/USD has given back some of the gains made late Tuesday. Economists at Rabobank analyze the pair’s outlook.
USD to hold firm into the start of next year
Given that the market is continuing to adapt to the view that Fed rates are set to be higher for longer, we continue to see scope for EUR/USD to edge towards 1.06 on a three-month view.
The weaker outlook for both Chinese and European growth should weigh on risk appetite and underpin the safe haven Greenback.
We expect the USD to hold firm into the start of next year and only soften as expectations for Fed rate cuts start to come into view.
- USD/CAD consolidates as investors shift focus toward the US inflation data.
- Investors underpinned the Canadian Dollar against the greenback due to rising oil prices.
- USD/CAD auctions in the Rising Channel pattern in which each pullback is considered as a buying opportunity.
The USD/CAD pair trades directionless in the European session ahead of the United States Consumer Price Index (CPI) data for August, which will be published at 12:30 GMT. The Loonie asset has been offered in the past three trading sessions due to strength in the Canadian Dollar, backed by strong oil prices.
Oil price aims to capture the crucial resistance of $90.00 for the first time since November 22 as the OPEC projected a cheerful oil demand outlook on expectations that economies are learning well about handling the burden of higher interest rates. It is worth noting that Canada is the largest exporter of oil to the United States and higher oil prices support the Canadian Dollar.
Meanwhile, investors keep focusing on the US inflation data. As per the estimates, headline inflation is seen expanding at a healthy pace of 0.6% due to recovered gasoline prices while core CPI is expected to maintain a steady pace of 0.2%. The US Dollar Index (DXY) trades inside Monday are trading range.
USD/CAD auctions in the Rising Channel chart pattern formed on a two-hour scale in which each pullback is considered as a buying opportunity by the market participants. The asset hovers near the lower portion of the aforementioned chart pattern and a breakdown of the same could warrant a bearish reversal.
The 20-period Exponential Moving Average (EMA) continues to act as a barricade for the US Dollar bulls.
Meanwhile, the Relative Strength Index (RSI) (14) oscillates in the bearish range of 20.00-40.00, which indicates bearish bias but a likelihood of a bullish reversal move also persists.
Going forward, a breakdown below August 30 low of 1.3513 would drag the asset toward August 09 high at 1.3454 followed by August 10 low at 1.3373.
On the contrary, a confident recovery move above the round-level resistance of 1.3600 would send the major toward September 05 high at 1.3670. Breach of the latter would further push the asset toward September 07 high around 1.3700.
USD/CAD two-hour chart
-638302039078095793.png)
Cable edged to a three-month low in the low 1.24s. Economists at Scotiabank analyze GBP/USD’s technical outlook.
Three tests of the 1.2440 area do set up a potential triple bottom
The intraday undertone for the GBP is weak.
Price action has been soft over the past week but support in the low 1.24 zone has held successive tests (just ahead of the 200-DMA at 1.2430). The GBP did, however, snap back from early session losses quite well and the three tests of the 1.2440 area over the past week do set up a potential triple bottom (bull trigger at 1.2550).
USD/CAD is seemingly stuck in a tight range in the mid/upper 1.35s. Economists at Scotiabank analyze the pair’s outlook.
Short-term charts suggest some softness in trend momentum
Firmer energy prices are not having any obvious, positive impact on the CAD at the moment but they might add marginally to CAD tailwinds if the USD slips back.
Short-term charts suggest some softness in trend momentum and another, bearish leaning consolidation pattern developing overnight which might cue up further, minor losses in the USD on a push under 1.3550.
Key, short-term support is 1.3500 while resistance is 1.36.
Markets are trading defensively and the USD is firmer ahead of today’s US CPI report. Economists at Scotiabank analyze Greenback’s outlook.
Sticky inflation in the US
Headline prices are expected to rise 0.6% in August month for a 3.6% rise over the year (up from 3.2% in July). But higher gasoline prices are behind the anticipated rise in headline data.
Core prices are expected to show a bit more discipline, rising 0.2% in the month and falling to 4.3% (from 4.7%) in the year. There is still work to do on inflation but a third, consecutive monthly gain of 0.2% would be the lowest run of monthly core price gains since late 2020 and would surely be welcomed by policymakers as a sign that price growth is moderating.
Low core prices might be the focal point for markets rather than the push higher in headline data which policymakers seem likely to look through in terms of immediate policy implications. Some pressure on US yields and the USD may result if consensus expectations are met.
Technically, the broader USD tone is likely to reflect whether the DXY can rise through 105 or push back under 104.50 support after the data.
- The US Dollar is mixed on the quote board, with marginal gains or losses against most important currencies.
- All eyes are on inflation data being published later this Wednesday.
- The US Dollar Index was unable to break the high of Monday on Tuesday's close and could mean issues going forward.
The US Dollar (USD) will be a difficult currency to trade this Wednesday, and not just because of the US inflation numbers. Rather because of the fact that these inflation numbers are for the month of August, while in the past two weeks a lot of elements have changed and might actually see current numbers being obsolete.
Traders will be specifically watching both the Core and headline Consumer Price Index (CPI) on a monthly basis. The Monthly Core is expected to stay steady at 0.2%, whereas the overall inflation index is expected to rise from 0.2% to 0.6%. So it looks like the US Dollar might weaken a bit, as core inflation is declining.
The element that could send the Greenback all over the place is the fact that the energy part of it was in deflation during the last few prints. Recent production cuts from Saudi Arabia and other OPEC+ members have seen oil prices shooting through the roof. The recent rise in prices at the gas pumps could mean that this Wednesday’s number is not a correct reflection of where US inflation is actually at this moment.
Daily digest: US Dollar mayhem
- Ahead of the US inflation numbers, on the other side of the Atlantic Ocean traders have cemented the possibility of one more hike from the ECB for 2023, where just a few days ago hikes were no longer expected.
- The US session will kick off at 11:00 GMT with the Mortgage Bankers Association (MBA) printing its Mortgage Applications for the week of September 8. No consensus is forthcoming, while the previous week was at -2.9%.
- The biggest chunk of data will come at 12:30 GMT with the US Consumer Price Index (CPI) for August in all its forms and time frames: The Monthly Core (ex. food and energy) is expected to stay steady at 0.2%, while the headline index is expected to jump from 0.2% to 0.6%. On a yearly basis the Core Index is expected to head lower from 4.7% to 4.3%, with the headline index heading from 3.2% to 3.6%.
- Back to the normal schedule for Wednesday: around 14:30 GMT the US Energy Information Administration (EIA) will give its latest number for the crude stockpile movements. Expectations are for a smaller drawdown from 6.307 million to 1.912 million barrels less.
- Expect to see yields being supported again with this time a 30-year bond auction due to be placed in the markets near 17:00 GMT from the US Treasury department.
- Equities are going nowhere and await US inflation numbers.
- The CME Group FedWatch Tool shows that markets are pricing in a 93% chance that the Federal Reserve will keep interest rates unchanged at its meeting in September.
- The benchmark 10-year US Treasury bond yield trades at 4.29% and remains elevated even after the step back on Monday.
US Dollar Index technical analysis: End of the Indian Summer?
The Greenback failed to find enough US Dollar bulls in order to erase all the losses from Monday. Traders rather sent the US Dollar Index (DXY) back to square one, making it a flat week ahead of the US inflation numbers. Expect the expected decline in inflation to lead to some US Dollar weakness.
The new high to watch is at 105.16, both the high from last Thursday and the six-month high. The US Dollar Index first needs to gain back its lost territory from this Monday and break above the high of 104.93. Beyond 105.16, the next level to watch is 105.88, the high of 2023.
On Monday, 104.44 kept it together and refrained from allowing the DXY from selling off any further. The high of August 25 did its job and acted as a pivotal level. Should the uptick from this Tuesday reverse and 104.44 gives way, a substantial downturn could take place to 103.04, where the 200-day SMA comes into play for support.
Inflation FAQs
What is inflation?
Inflation measures the rise in the price of a representative basket of goods and services. Headline inflation is usually expressed as a percentage change on a month-on-month (MoM) and year-on-year (YoY) basis. Core inflation excludes more volatile elements such as food and fuel which can fluctuate because of geopolitical and seasonal factors. Core inflation is the figure economists focus on and is the level targeted by central banks, which are mandated to keep inflation at a manageable level, usually around 2%.
What is the Consumer Price Index (CPI)?
The Consumer Price Index (CPI) measures the change in prices of a basket of goods and services over a period of time. It is usually expressed as a percentage change on a month-on-month (MoM) and year-on-year (YoY) basis. Core CPI is the figure targeted by central banks as it excludes volatile food and fuel inputs. When Core CPI rises above 2% it usually results in higher interest rates and vice versa when it falls below 2%. Since higher interest rates are positive for a currency, higher inflation usually results in a stronger currency. The opposite is true when inflation falls.
What is the impact of inflation on foreign exchange?
Although it may seem counter-intuitive, high inflation in a country pushes up the value of its currency and vice versa for lower inflation. This is because the central bank will normally raise interest rates to combat the higher inflation, which attract more global capital inflows from investors looking for a lucrative place to park their money.
How does inflation influence the price of Gold?
Formerly, Gold was the asset investors turned to in times of high inflation because it preserved its value, and whilst investors will often still buy Gold for its safe-haven properties in times of extreme market turmoil, this is not the case most of the time. This is because when inflation is high, central banks will put up interest rates to combat it.
Higher interest rates are negative for Gold because they increase the opportunity-cost of holding Gold vis-a-vis an interest-bearing asset or placing the money in a cash deposit account. On the flipside, lower inflation tends to be positive for Gold as it brings interest rates down, making the bright metal a more viable investment alternative.
Senior Economist at UOB Group Julia Goh and Economist Loke Siew Ting review the latest release of the jobs report in Malaysia.
Key Takeaways
Malaysia’s labour market held steady with the unemployment rate unchanged at 3.4% in Jul while the labor force participation rate rose further to a fresh record high of 70.1% (Jun: 70.0%). The jobless rate has been trending lower over the last two years albeit the pace of improvement is more gradual as the rate inches closer to pre-pandemic levels of 3.2%-3.3% in 2H19, which suggests that there remains considerable slack in the labour market.
Total employment advanced further by 27.2k or 0.2% m/m to 16.34mn in Jul (Jun: +28.3k or +0.2% m/m to 16.31mn) amid increased hiring in the services (particularly food & beverage, wholesale & retail trade, and education), construction, as well as mining & quarrying sectors. Meanwhile manufacturing and agriculture sectors recorded lower employment in the month. The employment-to-population ratio rose to 67.7% in Jul (Jun: 67.6%), signaling the ability to create employment.
Despite rising external uncertainties and lingering headwinds, we continue to see positive domestic catalysts (i.e. a gradual recovery in tourism activity, an expected upturn in global tech cycle, sustained foreign direct investment inflows, ongoing infrastructure projects, and further government measures) that will help support the labor market. With a steady jobless rate and stable labor market, we expect the unemployment rate to ease to 3.2% by year-end (BNM est: 3.3%, end-2022: 3.6%). The coming Budget 2024 that will be tabled on 13 Oct may include measures to raise middle-income wages for skilled labor.
EUR/USD is little changed in the low 1.07 area. Economists at Scotiabank analyze the pair’s outlook.
Push below 1.0705 to trigger more weakness
Spot gains from the low 1.07 area on Tuesday have reversed somewhat through overnight trade but the EUR still looks to be generating decent interest on dips to the figure area.
A couple of failures at 1.0770 resistance on the intraday chart do, however, raise the rise of more EUR weakness if spot pushes below 1.0705 (minor double top trigger).
Gold prices consolidated in the $1,900-$1,940 range. Economists at ANZ Bank analyze XAU/USD’s technical outlook.
In a neutral zone
To break the current downward trend, prices need to move above the recent high of $1,940, which coincides with the trendline resistance level. The next resistance lies near $2,000 and a decisive rally above that would confirm a bullish signal. The Relative Strength Index (RSI) looks neutral as well.
On the downside, a breach of $1,900 could set a bearish market sentiment.
Overall, we expect Gold to trade in the range of $1,900-$1,950, if there are no surprises from the Fed.
The offshore Renminbi, the CNH, is starting to find some support, economists at ING report.
Major Dollar trend turn may occur in the fourth quarter of this year
While the Chinese currency has been seen as a popular funding currency this year, it looks like Chinese authorities might be trying to intervene in money markets to make funding more expensive.
PBoC activity to drain CNH liquidity and support the currency is clearly incongruous with broader monetary easing to support the economy. This means that USD/CNH will probably not sell off that much further.
But the strategy looks like one of buying time until the major Dollar trend turns, which may occur in the fourth quarter of this year.
- Oil (WTI) pops higher and flirts with a break of $90.
- The US Dollar in wait-and-see mode ahead of US CPI data.
- The US Energy Information Administration (EIA) is set to print its weekly US crude stockpile figures.
Oil prices have been a hot topic these past few days. The fire started when both Saudi Arabia and Russia committed to extending their supply cuts until the end of the year. Analysts, meanwhile, had ample time to crunch numbers and see a near 1 to 2 million barrels shortfall in the coming months.
As in economics 101, less supply and stable demand means prices will soar. And these soaring Oil prices are a headache across the globe at a moment when central banks are scrambling to get inflation down back to target. Oil price increases could already show up in the upcoming US Consumer Price Index (CPI) data for August, which will be released at 12:30 GMT. The energy component in US inflation was in a deflationary area, but the recent uptick could mean that energy prices are contributing again to inflation, driving up overall price growth and erasing the recent slowdown.
At the time of writing, Crude Oil (WTI) price trades at $88.86 per barrel and Brent Oil at $92.25.
Oil news and market movers
- Wall Street analysts are cautious on the recent uptrend in oil, with several pointing out that the equity market is not in need of more Oil. The supply side may be tightening, but the demand side could be also shrinking in the near term.
- Another argument is that the next official OPEC meeting is still far away. The OPEC meeting might be a non-event and trigger a pullback in Oil prices as most of the headlines are likely out of the way and no surprises are expected.
- The International Energy Agency (IEA) has said in a recent report that the Oil supply cuts from Saudi Arabia and Russia are creating a significant shortfall and threaten a renewed surge in price volatility. The report contradicts Saudi Arabia’s position that the cuts are due to balance out markets as the coming quarter could bear a supply hole of over three million barrels per day. This would be the largest shortfall in a decade, with little explanation from OPEC+ on why it is so eager to cut.
- The US Energy Information Agency (EIA) is set to publish this week's numbers in terms of change in Crude oil stockpile. Expectations range from a build of 2 million barrels to a drawdown of 4.4 million barrels. So any number above 2 million will see selling pressure on oil prices, where any drawdown bigger than 4.4 million barrels might see Oil prices increase further across the board.
- Equity markets are flat ahead of the US CPI numbers.
Oil Technical Analysis: too quick too high?
Oil prices keep pushing higher and are setting new records for the year. Although the Relative Strength Index (RSI) is deeply overbought, the newsflow and possible drawdowns in US stockpiles could eke out that last touch of more gains. Do not expect a quick jump up to $93.12 as a bigger catalyst will be needed to cause such a big move.
On the upside, $88 is the first nearby hurdle that has been taken out. From here, it will be a tiered rally toward first $90 and then $93.12, the double top from October-November last year. This means a 5% uptick move is possible in the nearby future.
On the downside, a pivotal level is at $84.30, the high of August 10. In case this level does not hold, a substantial nosedive might occur. In such a case, Oil prices might drop all the way to a key floor near $78.
-638301959925818926.png)
WTI US OIL daily chart
WTI Oil FAQs
What is WTI Oil?
WTI Oil is a type of Crude Oil sold on international markets. The WTI stands for West Texas Intermediate, one of three major types including Brent and Dubai Crude. WTI is also referred to as “light” and “sweet” because of its relatively low gravity and sulfur content respectively. It is considered a high quality Oil that is easily refined. It is sourced in the United States and distributed via the Cushing hub, which is considered “The Pipeline Crossroads of the World”. It is a benchmark for the Oil market and WTI price is frequently quoted in the media.
What factors drive the price of WTI Oil?
Like all assets, supply and demand are the key drivers of WTI Oil price. As such, global growth can be a driver of increased demand and vice versa for weak global growth. Political instability, wars, and sanctions can disrupt supply and impact prices. The decisions of OPEC, a group of major Oil-producing countries, is another key driver of price. The value of the US Dollar influences the price of WTI Crude Oil, since Oil is predominantly traded in US Dollars, thus a weaker US Dollar can make Oil more affordable and vice versa.
How does inventory data impact the price of WTI Oil
The weekly Oil inventory reports published by the American Petroleum Institute (API) and the Energy Information Agency (EIA) impact the price of WTI Oil. Changes in inventories reflect fluctuating supply and demand. If the data shows a drop in inventories it can indicate increased demand, pushing up Oil price. Higher inventories can reflect increased supply, pushing down prices. API’s report is published every Tuesday and EIA’s the day after. Their results are usually similar, falling within 1% of each other 75% of the time. The EIA data is considered more reliable, since it is a government agency.
How does OPEC influence the price of WTI Oil?
OPEC (Organization of the Petroleum Exporting Countries) is a group of 13 Oil-producing nations who collectively decide production quotas for member countries at twice-yearly meetings. Their decisions often impact WTI Oil prices. When OPEC decides to lower quotas, it can tighten supply, pushing up Oil prices. When OPEC increases production, it has the opposite effect. OPEC+ refers to an expanded group that includes ten extra non-OPEC members, the most notable of which is Russia.
The Dollar maintained its winning run last week. Economists at Société Générale analyze Greenback’s outlook.
Dollar gains technically stretched
Technical levels for the Dollar appeared stretched after last week but a meaningful retracement and adjustment in positions would require a significant correction in nominal and real Treasury yields from the recent highs.
US CPI on Wednesday and Retail Sales on Thursday line up an important test for tactics in FX and Treasuries.
Over the past few weeks, dips in the Dollar have been bought and rallies in bonds have been sold, keeping yield spread differentials firmly in favour of the Dollar. Soft CPI and/or Retail Sales data could be a potential tipping point that restores a degree of equilibrium in long vs. short Dollar positions.
- GBP/JPY delivers a V-shape recovery from 183.20 as the BoJ is expected to continue tightening policy further.
- UK’s labor force shed and factory activities shrink due to higher interest rates by the BoE.
- Britain’s wage growth momentum strengthened further in July, warranting the need for an interest rate hike by the BoE.
The GBP/JPY pair discovered buying interest near 183.20 after a vertical sell-off that was inspired by weak factory activities in the United Kingdom economy in July. The cross recovered due to broader weakness in the Japanese Yen as the Bank of Japan (BoJ) is expected to keep the interest rate policy steady ahead.
BoJ Governor Kazuo Ueda commented recently that policymakers will continue to favor an expansionary monetary policy framework as core inflation remains a little below the desired target. The central bank is not expected to abandon negative interest rates but may tweak the Yield Curve Control.
On the United Kingdom front, the Office for National Statistics (ONS) reported monthly Industrial Production and Manufacturing Production contracted by 0.7% and 0.8%, while investors anticipated contraction by 0.6% and 1.0% respectively. The Gross Domestic Product (GDP) shrank by 0.5% in July against an expansion of 0.5%, recorded for June.
On Tuesday, the labor market data for July remained vulnerable. Three months to July Unemployment Rate rose to 4.3% as anticipated by market participants. UK employers shed 207K jobs in the three months to July, more than the 185K decline forecasted by markets. Laborforce reported retrenchment consecutively for the second month.
Meanwhile, wage growth momentum strengthened further in July, warranting the need for an interest rate hike by the Bank of England (BoE) on September 21. UK’s economic outlook is expected to weaken further as more interest rate hikes would impact the labor market and factory activities further.
The British labour market data was a mixed bag. Economists at Commerzbank analyze GBP outlook ahead of next week’s Bank of England meeting.
Not so easy for the BoE
The unemployment rate recorded a slight rise, which means that the labour market continues to cool. As regards the fight against inflation, that in itself is good news. At the same time, wages rose sharply again, and that in turn is bad news as it does not exactly make the Bank of England’s job any easier.
The BoE is likely to find it increasingly difficult to continue its rate hikes. However, so as to contain inflation expectations and dampen wage rises that is exactly what might become necessary. It remains to be seen whether the BoE will do that to the necessary extent. The market does not really seem to trust the BoE to do this, as Sterling eased following the publication of the data.
If the BoE is unable to convince the market of the contrary over the coming weeks, with particular focus obviously directed at next week’s rate meeting, downside pressure on Sterling might increase.
The continuation of the downward bias could drag USD/CNH to revisit the 7.2600 region in the next few weeks, note UOB Group’s Economist Lee Sue Ann and Markets Strategist Quek Ser Leang.
Key Quotes
24-hour view: We highlighted yesterday that USD “could drop further to 7.2870 before stabilisation can be expected.” Our expectation did not materialise as it traded sideways between 7.2929 and 7.3145 before closing largely unchanged at 7.2995 (-0.03%). Today, USD could continue to trade sideways, albeit likely in a wider range of 7.2870/7.3200.
Next 1-3 weeks: After USD dropped sharply to a low of 7.2921 on Monday, we highlighted yesterday (12 Sep, spot at 7.3035) that “while it is premature to expect a major reversal, the sharp pullback could extend to 7.2600.” There is no change in our view. Overall, only a breach of 7.3520 would indicate that USD is not ready to pullback further.
- Gold price trades directionless as investors shift focus to US inflation data.
- Investors worry that upside risks to headline CPI could elevate the likelihood of a final interest rate hike from the Fed.
- The US economy may avoid recession but higher interest rates could dampen economic prospects.
Gold price (XAU/USD) struggles for a decisive move as investors turn cautious ahead of the US Consumer Price Index (CPI) data for August. The precious metal remains on tenterhooks as market participants see headline inflation rebounding due to a strong uptick in gasoline prices. Market participants worry that upside risks to headline inflation could elevate the likelihood of a final interest rate hike from the Federal Reserve (Fed) in the rest of the year.
The US economy is expected to face the wrath of strict monetary policy as the Fed is widely expected to keep interest rates higher for a longer period. US labor growth is stable but could come under pressure as firms are focusing on achieving efficiency by controlling costs. Apart from the inflation data, the Gold price would demonstrate a power-pack action after the interest rate decision by the European Central Bank (ECB) on Thursday.
Daily Digest Market Movers: Gold price trades sideways ahead of US CPI
- Gold price remains directionless around $1,910.00 as investors await US inflation data for August, which will be published at 12:30 GMT.
- US headline CPI, on an annual basis, is seen rising to 3.6% against July’s reading of 3.2%. Core CPI, which strips off volatile food and energy prices, is seen decelerating to 4.3% against 4.7% recorded a month ago.
- Monthly headline and core inflation are seen expanding by 0.6% and 0.2%, respectively. A strong rebound in gasoline prices has triggered upside risks to headline inflation. Global Oil prices have rallied as much as 40% from May as OPEC sees rising demand for oil in the coming months.
- Generally, markets majorly focus on core inflation. Still, Federal Reserve policymakers would not ignore a rebound in headline CPI as it would impact the real income of households and may propel prices of goods and services at factory gates.
- Discussions about one more interest rate increase in the rest of the year could accelerate if higher energy prices increase pain for households.
- However, the softening of core inflation beyond expectations could encourage the Fed to announce a pause to the historically aggressive rate-tightening spell.
- As per the CME Group Fedwatch Tool, traders see a 93% chance for interest rates to remain unchanged at 5.25%-5.50% in September. For the rest of the year, traders anticipate almost a 55% chance for the Fed to keep the monetary policy unchanged.
- Investors remain worried about US equities due to the upside risks of higher interest rates to corporate performance, triggering a risk-off profile.
- Meanwhile, Goldman Sachs CEO David Solomon said on Tuesday that the US economy is likely to avoid a significant recession, but warned that inflation would be more persistent than market participants currently expect, as reported by Reuters.
- The likelihood of a soft landing is high as inflation is coming down while the labor market is stable. However, inflationary pressures in excess of the desired rate of 2% would be the hardest nut to crack.
- The US Dollar Index (DXY) sees less volatility above the immediate support of 104.40 ahead of the inflation data. Meanwhile, 10-year US Treasury yields rose sharply to 4.3%.
- US consumer inflation data will be followed by Producer Price Index (PPI) and Retail Sales data, which are scheduled for Thursday.
- Gold price is expected to deliver a power-pack action after the announcement of the interest rate decision by the European Central Bank (ECB) on Thursday. The ECB is widely expected to keep the main refinancing operations rate at 4.25% due to easing price pressures and rising risks of an economic slowdown.
Technical Analysis: Gold price juggles around $1,910
Gold price trades back and forth above the round-level support of $1,900.00 as investors remain sidelined ahead of the inflation data. The precious metal auctions inside the previous day’s range, demonstrate a sheer contraction in volatility. The yellow metal continues to find support from the 200-day Exponential Moving Average (EMA), which trades around $1,910.00, while the 20-day EMA around $1,921.00 continues to act as a barricade for Gold price.
Inflation FAQs
What is inflation?
Inflation measures the rise in the price of a representative basket of goods and services. Headline inflation is usually expressed as a percentage change on a month-on-month (MoM) and year-on-year (YoY) basis. Core inflation excludes more volatile elements such as food and fuel which can fluctuate because of geopolitical and seasonal factors. Core inflation is the figure economists focus on and is the level targeted by central banks, which are mandated to keep inflation at a manageable level, usually around 2%.
What is the Consumer Price Index (CPI)?
The Consumer Price Index (CPI) measures the change in prices of a basket of goods and services over a period of time. It is usually expressed as a percentage change on a month-on-month (MoM) and year-on-year (YoY) basis. Core CPI is the figure targeted by central banks as it excludes volatile food and fuel inputs. When Core CPI rises above 2% it usually results in higher interest rates and vice versa when it falls below 2%. Since higher interest rates are positive for a currency, higher inflation usually results in a stronger currency. The opposite is true when inflation falls.
What is the impact of inflation on foreign exchange?
Although it may seem counter-intuitive, high inflation in a country pushes up the value of its currency and vice versa for lower inflation. This is because the central bank will normally raise interest rates to combat the higher inflation, which attract more global capital inflows from investors looking for a lucrative place to park their money.
How does inflation influence the price of Gold?
Formerly, Gold was the asset investors turned to in times of high inflation because it preserved its value, and whilst investors will often still buy Gold for its safe-haven properties in times of extreme market turmoil, this is not the case most of the time. This is because when inflation is high, central banks will put up interest rates to combat it.
Higher interest rates are negative for Gold because they increase the opportunity-cost of holding Gold vis-a-vis an interest-bearing asset or placing the money in a cash deposit account. On the flipside, lower inflation tends to be positive for Gold as it brings interest rates down, making the bright metal a more viable investment alternative.
EUR/USD remains around the 1.0750 mark. Economists at ING analyze the pair’s outlook.
High ECB inflation forecasts provide little support
The Euro received a little support overnight on a Reuters report that the new European Central Bank staff projections being released tomorrow would forecast CPI above 3% next year, compared to expectations of 2.7%. The implication here is that, based on these forecasts, the ECB would likely be more hawkish and supportive of the Euro.
There are many moving parts to Thursday’s meeting. However, the biggest part should be a 25 bps rate hike – which is only 54% priced – and a factor that should see EUR/USD hold support down at 1.0700.
Eurozone Industrial Production showed a bigger-than-expected drop in July, the official data showed on Wednesday, suggesting that the manufacturing sector is losing its recovery momentum.
Eurozone’s Industrial Output fell 1.1% MoM, the Eurostats said in its latest release, vs. -0.7% expected and a 0.4% increase reported in June.
The bloc’s annual Industrial Production declined 2.2% in July, compared with a 1.1% decrease in June and expectations of a 0.3% drop.
EUR/USD reaction
The shared currency is unfazed by the below-forecast German industrial figures. At the time of writing, EUR/USD is trading at around 1.0735, down 0.14% on the day.
- WTI Crude Oil prices extend the upward trajectory and climb to a fresh YTD peak on Wednesday.
- The technical setup favours bullish traders and supports prospects for a further appreciating move.
- The RSI on the daily chart is already flashing overbought conditions and warrants some caution.
Western Texas Intermediate (WTI) Crude Oil prices prolong a three-week-old uptrend and touch a fresh 10-month peak, around the $89.00 mark during the early part of the European session on Wednesday.
The Organization of Petroleum Exporting Countries (OPEC), in its monthly report released on Tuesday, said that Oil markets will tighten further this year amid robust demand and lower production. This comes on top of deeper supply cuts announced by Saudi Arabia and Russia – the world's two biggest Oil producers – for the remainder of 2023 and continues to benefit the black liquid.
From a technical perspective, the overnight strong move-up confirmed a breakout through the top end of a multi-day-old trading range and supports prospects for a further near-term appreciating move. That said, the Relative Strength Index (RSI) on the daily chart is already flashing overbought conditions. This, in turn, warrants some caution before placing fresh bullish bets around the commodity.
Hence, it will be prudent to wait for some near-term consolidation or a modest pullback before the next leg up. Any meaningful corrective decline, meanwhile, is likely to attract fresh buyers near the $88.00 mark. This should help limit the downside for WTI Crude Oil prices near the aforementioned trading range resistance breakpoint, now turned support, around the $87.55-$87.45 region.
The next relevant support is pegged near the $87.00 round figure, which if broken decisively has the potential to drag the black liquid towards the $86.30-$86.20 intermediate support en route to the $86.00 mark. The downfall could get extended further towards the next relevant support near the $85.60-$85.50 area, which should act as a strong near-term base for WTI Crude Oil prices.
On the flip side, a sustained strength above the $89.00 level should pave the way for a move beyond the $89.30-$89.35 zone, towards reclaiming the $90.00 psychological mark. Some follow-through buying will set the stage for additional gains and allow Crude Oil prices to climb further towards the $91.00 round figure en route to the $91.70-$91.80 supply zone and the $92.00 mark.
WTI Crude Oil daily chart
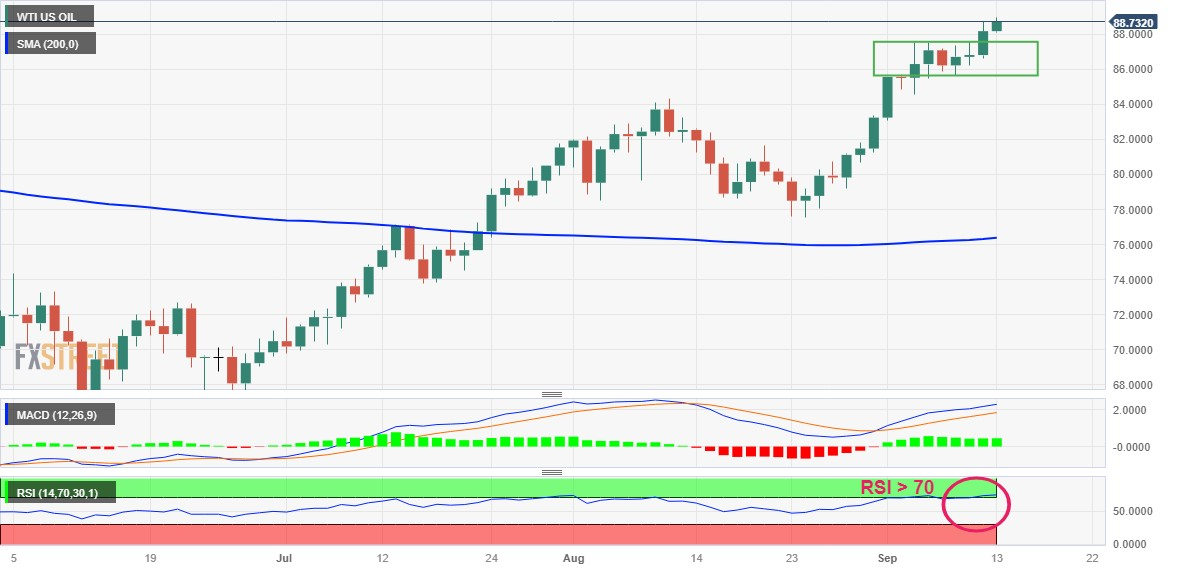
Technical levels to watch
- NZD/USD treads waters to recover from the losses registered on Tuesday.
- Greenback’s recovery can be attributed to improved US bond yields and market caution ahead of US inflation data.
- Investors are expecting the Fed to continue the tightening of monetary policy through the end of the year 2023.
NZD/USD holds ground near 0.5900 during the European session on Wednesday, struggling to recover from the previous day’s losses. The rebound in US Dollar (USD) is contributing support in undermining the potential of the NZD/USD pair.
US Dollar Index (DXY), which measures the performance of the US Dollar (USD) against a basket of the other major six currencies, retraces its recent losses. The spot price trades higher around 104.70. This upward movement can be attributed to improved United States (US) Treasury yields and market caution ahead of the release of inflation data from the United States (US).
The US Consumer Price Index (CPI) is expected to show a monthly improvement of 0.5%, an increase from the previous reading of a 0.2% rise. The core CPI figure, which excludes volatile food and energy prices, is anticipated to remain stable at 0.2%. Economic data and market sentiment can play a significant role in shaping the performance of the US Dollar (USD).
These inflation figures may provide a more accurate insight into inflation trends in the US economy and can have a substantial impact on market sentiment and trading decisions. It could reinforce the relative strength of the Greenback against the New Zealand Dollar (NZD) and affect trading dynamics in the Kiwi pair.
An increase in inflation, especially one that exceeds expectations, could indeed strengthen the prevailing hawkish sentiment surrounding the US Federal Reserve (Fed). It may lead to expectations of more aggressive monetary policy actions.
The market is anticipating that the Fed will continue to tighten monetary policy by implementing another 25 basis points (bps) hike before the end of 2023. Furthermore, the USD bulls are enthusiastic about the prospect of interest rates remaining at higher levels for an extended period.
This anticipation reflects the likelihood of a more hawkish monetary stance by the Fed through the end of the year, which can contribute to the strength of the USD and shape market sentiment.
Brent Crude Oil scales $92 for the first time since November 2022. Economists at Société Générale analyze Brent’s technical outlook.
Signals of a meaningful down move are still not visible
Brent has extended its uptrend after breakout from a multi-month base. It is in vicinity of earlier highlighted projections near $93.
An initial pullback can’t be ruled out however signals of a meaningful down move are still not visible; upper limit of the base near $87/$86.50 is crucial support near term. Defence of this zone could eventually lead to persistence in uptrend towards $96.50/$97.00, the 38.2% retracement from 2022.
- USD/JPY scales higher for the second straight day and refreshes weekly high on Wednesday.
- The divergence Fed-BoJ policy outlook continues to act as a tailwind and remains supportive.
- The upside remains capped as traders await the US CPI before placing fresh directional bets.
The USD/JPY pair gains some positive traction for the second successive day and climbs to a fresh weekly high during the first half of trading action on Wednesday. Spot prices, however, remain below mid-147.00s through the early European session as traders keenly await the US consumer inflation figures before placing fresh directional bets.
The crucial US CPI report is scheduled for release later during the early North American session and will play a key role in influencing the Federal Reserve's (Fed) policy outlook. This, in turn, will drive the USD demand and help investors determine the near-term trajectory for the USD/JPY pair. In the meantime, growing acceptance that the Fed will keep interest rates higher for longer assists the USD to attract some buying and acts as a tailwind for the major.
Investors seem convinced that the US central bank will stick to its hawkish stance and the bets were reaffirmed by the upbeat US macro data released last week, which pointed to a resilient economy. Furthermore, the recent rally in Crude Oil prices has been fueling concerns about the inflation outlook and supports prospects for further policy tightening by the Fed. The outlook remains supportive of elevated US Treasury bond yields and continues to underpin the buck.
The Japanese Yen (JPY), on the other hand, is weighed down by softer domestic data, showing that annual wholesale inflation, as measured by the Corporate Goods Price Index (CGPI), slowed in August for the eighth straight month. The index continued with its downward trend from the peak of 10.6% YoY rate recorded in December and eased to 3.2% during the reported month. The data ensures that the Bank of Japan (BoJ) will maintain the status quo until next summer.
This, along with the fact that the immediate market reaction to BoJ Governor Kazuo Ueda's weekend comments on the negative interest rate policy was short-lived, suggests that the path of least resistance for the USD/JPY pair is to the upside. Hence, a subsequent move up towards the YTD peak, around the 147.85 area set last Friday, looks like a distinct possibility. Moreover, any corrective pullback might be seen as a buying opportunity and remain limited.
Technical levels to watch
According to the German Economy Ministry's monthly report published on Wednesday, “noticeable economic recovery to be seen at the turn of the year 2023-24 at earliest.”
Additional takeaways
Early indicators point to subdued development of private consumption in coming months.
Current indicators point to weak third quarter.
-
Euro comes under some mild pressure near 1.0750 ahead of US CPI
- The Euro navigates within a narrow range against the US Dollar.
- Stocks in Europe kicked off the session broadly on the defensive.
- EUR/USD’s weekly recovery seems to have been capped around 1.0770.
- The USD Index (DXY) continues to target the 105.00 region.
- EMU Industrial Production comes next on the European docket.
- Investors’ attention will be on the release of US inflation figures.
The Euro (EUR) appears offered against the US Dollar (USD) after Wednesday’s opening bell in the old continent, prompting EUR/USD to trade with slight losses in the mid-1.0700s.
On the USD-side of the equation, the Greenback pays another visit to the 104.70-104.80 band when tracked by the USD Index (DXY), helped by a mild uptick in US yields across different maturities ahead of the publication of key US inflation readings for August.
In terms of monetary policy, the anticipation of a potential interest rate hike by the Federal Reserve (Fed) in November seems to have waned recently, while market participants continue to factor in the likelihood of rate cuts taking place in the second quarter of 2024.
Turning our attention to the European Central Bank (ECB), market discussions seem to lean towards a pause after Thursday's meeting and an additional quarter-point rate raise by year-end, given the current state of a somewhat divided Council.
Looking at the euro docket, Industrial Production readings for the broader eurozone will be the sole release later on Wednesday. Across the ocean, the usual weekly Mortgage Applications measured by MBA and the EIA’s report on crude Oil inventories are also due, apart from the key US CPI prints.
Daily digest market movers: Euro remains prudent ahead of US CPI
- The EUR fades part of the recent advance against the USD.
- US and German yields manage to pick up some upside traction.
- Markets see the ECB keeping the deposit rate unchanged on Thursday.
- UK GDP results missed estimates in July.
- Markets keep adjusting to potential rate cuts by the Fed in Q2 2024.
- Producer Prices in Japan rose more than expected in August.
- The PBoC will promote measures to stimulate demand.
Technical Analysis: Euro risks extra losses while below 200-day SMA
EUR/USD’s weekly recovery seems to have met a decent resistance area around 1.0770.
If EUR/USD manages to break below the September 7 low at 1.0685, it may enter a phase of retesting the May 31 low at 1.0635 before potentially reaching the March 15 low at 1.0516. A breach of the latter level could initiate a possible examination of the 2023 low at 1.0481 seen on January 6.
On the upside, the current focus is on targeting the crucial 200-day Simple Moving Average (SMA) at 1.0826. Beyond that point, a bullish momentum might lead to a challenge of the weekly peak at 1.0945 from August 30, further supported by the provisional 55-day SMA at 1.0935. Subsequently, this scenario could pave the way for an advance towards the psychological level of 1.1000 and the August high at 1.1064 seen on August 10. If the spot clears this area, it could alleviate some of the bearish pressure and potentially aim for July's 27 peak at 1.1149, followed by the 2023 top at 1.1275 from July 18.
As long as the EUR/USD remains below the 200-day SMA, there is a possibility of a sustained decline in the pair.
Euro FAQs
What is the Euro?
The Euro is the currency for the 20 European Union countries that belong to the Eurozone. It is the second most heavily traded currency in the world behind the US Dollar. In 2022, it accounted for 31% of all foreign exchange transactions, with an average daily turnover of over $2.2 trillion a day.
EUR/USD is the most heavily traded currency pair in the world, accounting for an estimated 30% off all transactions, followed by EUR/JPY (4%), EUR/GBP (3%) and EUR/AUD (2%).
What is the ECB and how does it impact the Euro?
The European Central Bank (ECB) in Frankfurt, Germany, is the reserve bank for the Eurozone. The ECB sets interest rates and manages monetary policy.
The ECB’s primary mandate is to maintain price stability, which means either controlling inflation or stimulating growth. Its primary tool is the raising or lowering of interest rates. Relatively high interest rates – or the expectation of higher rates – will usually benefit the Euro and vice versa.
The ECB Governing Council makes monetary policy decisions at meetings held eight times a year. Decisions are made by heads of the Eurozone national banks and six permanent members, including the President of the ECB, Christine Lagarde.
How does inflation data impact the value of the Euro?
Eurozone inflation data, measured by the Harmonized Index of Consumer Prices (HICP), is an important econometric for the Euro. If inflation rises more than expected, especially if above the ECB’s 2% target, it obliges the ECB to raise interest rates to bring it back under control.
Relatively high interest rates compared to its counterparts will usually benefit the Euro, as it makes the region more attractive as a place for global investors to park their money.
How does economic data influence the value of the Euro?
Data releases gauge the health of the economy and can impact on the Euro. Indicators such as GDP, Manufacturing and Services PMIs, employment, and consumer sentiment surveys can all influence the direction of the single currency.
A strong economy is good for the Euro. Not only does it attract more foreign investment but it may encourage the ECB to put up interest rates, which will directly strengthen the Euro. Otherwise, if economic data is weak, the Euro is likely to fall.
Economic data for the four largest economies in the euro area (Germany, France, Italy and Spain) are especially significant, as they account for 75% of the Eurozone’s economy.
How does the Trade Balance impact the Euro?
Another significant data release for the Euro is the Trade Balance. This indicator measures the difference between what a country earns from its exports and what it spends on imports over a given period.
If a country produces highly sought after exports then its currency will gain in value purely from the extra demand created from foreign buyers seeking to purchase these goods. Therefore, a positive net Trade Balance strengthens a currency and vice versa for a negative balance.
The highlight of today's session will be the August US CPI release. Economists at ING expect inflation figures to keep the Dollar firm.
Sticky US inflation to keep Dollar bid
Higher gasoline prices and base effects are expected to push August CPI up to 3.6% YoY, and on a core and month-on-month basis, we also see an upside risk to the 0.2% MoM consensus estimate – clearly not enough to feed a bearish Dollar narrative.
We are bearish on the Dollar from the fourth quarter of this year, but this bearish narrative requires a few more weeks of patience.
We favour DXY edging back to the top of its 104.50-105.00 range today.
See – US CPI Preview: Forecasts from 10 major banks, strong headline with rising energy prices
In its monthly oil market report, the International Energy Agency (IEA) maintained the forecasts for 2023 and 2024 oil demand growth.
Additional takeaways
Extension of oil-output cuts by Saudi Arabia and Russia through year-end will lock in a substantial market deficit through Q4 23.
Unwinding OPEC+ cuts at the start of 2024 would shift oil balance to a surplus, but oil stocks will be at uncomfortably low levels.
Leaves 2024 oil demand growth forecast steady at 1 mln bpd as China recovery runs out of steam and vehicle electrification, greater efficiency take hold.
Russian oil exports fell by 150,000 bpd last month to 7.2 mln bpd, 570,000 bpd below a year-ago.
Global observed oil inventories plummeted by 76.3 million barrels to a 13-month low in August.
Market reaction
WTI is fading a spike to fresh ten-month highs of $88.92 on the above findings, currently trading at $88.62. The US oil is adding 0.51% on the day.
- USD/CAD trades higher after a losing streak ahead of the US data releases.
- Higher Crude price is contributing support for the Canadian Dollar (CAD).
- US inflation is expected to be improved; underpinning the US Dollar (USD).
USD/CAD trades higher around 1.3560 during the European session on Wednesday, attempting to halt a three-day losing streak. The rebound in US Dollar (USD) helps the pair to register gains.
Western Texas Intermediate (WTI), Crude oil price continues to gain ground, trading higher around $88.70 per barrel at the time of writing. The black gold is holding firm near a 10-month high and continuing to receive strong support due to concerns about tightening global supplies.
This tightening supply situation is compounded by deeper supply cuts announced by Saudi Arabia and Russia, the world's two largest oil producers, for the remainder of 2023, which continues to bolster oil prices.
The bullish oil prices are providing strong support to the commodity-linked Canadian Dollar (CAD). Additionally, the recent subdued performance of the US Dollar (USD) acted as a headwind for the USD/CAD pair. These factors collectively contribute to the strength of the Loonie pair.
US Dollar Index (DXY) retraces the losing streak, which assesses the performance of the US Dollar (USD) against a basket of the other major six currencies. Spot price beats higher at around 104.80 due to the improved US treasury yields, coupled with market caution ahead of the inflation data releases from the United States (US).
US Consumer Price Index (CPI) is expected to improve by 0.5% on a monthly basis from the previous reading of a 0.2% rise. Moreover, the Core CPI figure is anticipated to remain steady at 0.2%. The rise in inflation could reinforce the prevailing hawkish sentiment surrounding the US Federal Reserve (Fed).
The inflation figures have the potential to offer a more precise understanding of inflation trends within the US economy, and they can wield considerable influence over market sentiment and trading choices concerning the USD/CAD pair.
The market expects that the Fed will further tighten monetary policy by attempting another 25 basis points hike through the end of the year 2023. Additionally, the Greenback bulls are cheering the likelihood of interest rates to remain higher for an extended period.
Recently, the Aussie suffered heavily from the general Dollar strength. Economists at Commerzbank discuss AUD/USD outlook ahead of the Australian labour market figures for August.
A labour market report in line with expectations should further embolden the RBA
A labour market report in line with expectations should further embolden the RBA. After all, it had previously stressed that while it was bringing inflation back towards its target, it was also keeping an eye on the historically tight labour market.
If inflation also continues to fall towards its target - the next release of the monthly index is scheduled for the end of September – there is much evidence to suggest that the RBA has done a lot of things right with its interest rate pause.
As soon as the recession in the US becomes more apparent, as our economists expect, the Aussie should therefore also benefit again.
Further losses in USD/JPY still appear in store for the time being, comment UOB Group’s Economist Lee Sue Ann and Markets Strategist Quek Ser Leang.
Key Quotes
24-hour view: Two days ago, USD plummeted to 145.89 and then rebounded. Yesterday, we highlighted that “the strong rebound in oversold conditions suggests USD is unlikely to weaken further.” We expected USD to trade in a range between 146.00 and 147.30. However, USD traded in a narrower range than expected (146.44/147.24). The underlying tone seems to have improved somewhat. Today, USD could edge higher, but it is unlikely to reach 147.80. On the downside, if USD breaks below 146.60 (minor support is at 146.85), it would mean that the current mild upward pressure has faded.
Next 1-3 weeks: Yesterday (12 Sep, spot at 146.70), we highlighted that USD could pullback further. We added, “the likelihood of a clear break below 145.50 is not high.” We continue to hold the same view. On the upside, if USD breaks above 147.80, it would indicate that it is not ready to pullback further.
- The index adds to Tuesday’s small advance and revisits 104.80.
- Investors continue to price in rate cuts by the Fed in Q2 2024.
- US inflation figures take centre stage later in the session.
The greenback manages to extend Tuesday’s small rebound to the 104.80 region when gauged by the USD Index (DXY).
USD Index keeps targeting 105.00 and above
The index continues to reclaim ground lost in response to the sharp pullback seen at the beginning of the week.
The so far daily advance in the dollar comes amidst a tepid recovery in US yields across the curve – with the 2-year yields already surpassing the 5% threshold – and firm speculation that the Federal Reserve might start cutting interest rate at some point in Q2 2024.
In the meantime, investors are expected to closely follow the release of US inflation figures for the month of August, where the headline CPI is seen ticking higher vs. a drop in the Core CPI.
Additionally, usual weekly Mortgage Applications tracked by MBA are also due ahead of the EIA’s report on US crude oil inventories.
What to look for around USD
The index extends the bounce off Monday’s marked pullback and revisits the 104.75/80 band on Wednesday ahead of the publication of key US inflation figures.
In the meantime, support for the dollar keeps coming from the good health of the US economy, despite the narrative around the tighter-for-longer stance from the Federal Reserve now looks somewhat diminished amidst the current backdrop of persistent disinflation and cooling of the labour market.
Key events in the US this week: MBA Mortgage Applications, Inflation Rate, Monthly Budget Statement (Wednesday) – Initial Jobless Claims, Producer Prices, Business Inventories (Thursday) – Industrial Production, Advanced Michigan Consumer Sentiment (Friday).
Eminent issues on the back boiler: Persevring debate over a soft or hard landing for the US economy. Incipient speculation of rate cuts in early 2024. Geopolitical effervescence vs. Russia and China.
USD Index relevant levels
Now, the index is advancing 0.16% at 104.71 and faces the next up barrier at 105.15 (monthly high September 7) ahead of 105.88 (2023 high March 8) and finally 106.00 (round level). On the other hand, the breach of 103.02 (200-day SMA) would open the door to 102.93 (weekly low August 30) and then 102.70 (55-day SMA).
- Pound Sterling attracted significant offers as UK factory activities contracted sharply.
- Lay-offs in the UK labor market, higher wage growth, and weak factory activities elevate troubles for BoE policymakers.
- BoE Breeden warned that risks to inflation are skewed to the upside.
The Pound Sterling (GBP) remained offered on Wednesday as the UK’s Office for National Statistics (ONS) reported that the economy shrank by 0.5% in July and factory activities contracted significantly due to a deteriorating demand outlook. The GBP/USD pair witnessed an intense sell-off as higher interest rates by the Bank of England (BoE) triggered an economic slowdown and firms remain reluctant to full-capacity utilization.
After significant layoffs and weak factory activities in July, it is evident that the UK economy is failing to absorb the burden of restrictive monetary policy. Meanwhile, strong wage momentum has boosted upside risks to inflation and warrants more interest rate hikes from the BoE to contain the highest inflation among G7 economies. Sarah Breeden, who will replace the BoE’s Jon Cunliffe for Deputy Governor in November, also said that risks to inflation are skewed to the upside.
Daily Digest Market Movers: Pound Sterling faces a sell-off as UK economy contracts
- Pound Sterling dropped vertically as UK factory activities contracted in July, demonstrating repercussions of higher interest rates by the Bank of England.
- UK’s ONS reported that monthly Industrial Production contracted by 0.7%, which was a higher pace than expectations of 0.6%. In June, the economic indicator expanded by 1.8%.
- Monthly Manufacturing Production contracted by 0.8%, while investors anticipated a contraction of 1.0%. In the same period a month ago, the economic data expanded by 2.4%.
- The Gross Domestic Product (GDP) data shrank by 0.5% on a monthly basis vs. an expansion of 0.5% in June. Investors anticipated a contraction of 0.2%.
- Goods Trade Balance remained below the estimates and the prior release, which indicates that traded volume was due to the dismal economic outlook.
- On Tuesday, the labor market report for August indicated that wage growth momentum remained strong while lay-offs exceeded hiring numbers as UK firms remained worried about a deteriorating demand environment.
- UK employers shed 207K jobs in the three months to July, more than the 185K decline forecasted by markets. In the three months to June, the labor market lost 66K payrolls.
- The Unemployment Rate for the quarter ending in July rose to 4.3%, as anticipated by market participants, from the prior reading of 4.2%.
- Average Earnings excluding bonuses in the three months to July landed at 7.8%, in line with estimates and the former release. Wage growth data including bonuses rose to 8.5% against projections and the former release of 8.2%.
- The labor market report accelerated uncertainty over the interest rate outlook as strong wage growth could force BoE policymakers to discuss increasing rates, though bleak labor demand could be a limiting factor for more interest rate hikes.
- Sarah Breeden, who will replace BoE Deputy Governor Jon Cunliffe in November, thinks risks to inflation are skewed to the upside. She forecasted the achievement of price stability in two years.
- For the September monetary policy, investors expect that the BoE will raise interest rates consecutively for the 15th time. An interest rate increase of 25 basis points (bps) is highly anticipated, which will push interest rates to 5.50%.
- The market mood remains cautious as investors await the United States inflation data for August, which will be published at 12:30 GMT.
- Monthly US headline Consumer Price Index (CPI) and the core inflation are seen rising 0.6% and 0.2%, respectively. The headline inflation is going to reflect the impact of the recent rally in oil prices.
- From May, global oil prices have gained as much as 40%, which has boosted gasoline prices and elevated the burden on households by squeezing their real income. This could add to troubles for Federal Reserve (Fed) policymakers and force them to raise interest rates one more time this year.
- The US Dollar demonstrates a volatility compression ahead of the inflation data. The inflation data for August carries higher importance as it would be the last one for the Fed to consider before its September 20 interest rate decision.
Technical Analysis: Pound Sterling stabilizes below 200-EMA
Pound Sterling prints a nearly three-month low around 1.2450 as UK economic activities remained vulnerable in July. The Cable faces an intense sell-off and is exposed to more downside. The major trades below the 200-day Exponential Moving Average (EMA) are around 1.2500. The short-term trend is bearish as the 20 and 50-day EMAs are downward-sloping, and momentum oscillators portray strength in the bearish impulse.
Pound Sterling FAQs
What is the Pound Sterling?
The Pound Sterling (GBP) is the oldest currency in the world (886 AD) and the official currency of the United Kingdom. It is the fourth most traded unit for foreign exchange (FX) in the world, accounting for 12% of all transactions, averaging $630 billion a day, according to 2022 data.
Its key trading pairs are GBP/USD, aka ‘Cable’, which accounts for 11% of FX, GBP/JPY, or the ‘Dragon’ as it is known by traders (3%), and EUR/GBP (2%). The Pound Sterling is issued by the Bank of England (BoE).
How do the decisions of the Bank of England impact on the Pound Sterling?
The single most important factor influencing the value of the Pound Sterling is monetary policy decided by the Bank of England. The BoE bases its decisions on whether it has achieved its primary goal of “price stability” – a steady inflation rate of around 2%. Its primary tool for achieving this is the adjustment of interest rates.
When inflation is too high, the BoE will try to rein it in by raising interest rates, making it more expensive for people and businesses to access credit. This is generally positive for GBP, as higher interest rates make the UK a more attractive place for global investors to park their money.
When inflation falls too low it is a sign economic growth is slowing. In this scenario, the BoE will consider lowering interest rates to cheapen credit so businesses will borrow more to invest in growth-generating projects.
How does economic data influence the value of the Pound?
Data releases gauge the health of the economy and can impact the value of the Pound Sterling. Indicators such as GDP, Manufacturing and Services PMIs, and employment can all influence the direction of the GBP.
A strong economy is good for Sterling. Not only does it attract more foreign investment but it may encourage the BoE to put up interest rates, which will directly strengthen GBP. Otherwise, if economic data is weak, the Pound Sterling is likely to fall.
How does the Trade Balance impact the Pound?
Another significant data release for the Pound Sterling is the Trade Balance. This indicator measures the difference between what a country earns from its exports and what it spends on imports over a given period.
If a country produces highly sought-after exports, its currency will benefit purely from the extra demand created from foreign buyers seeking to purchase these goods. Therefore, a positive net Trade Balance strengthens a currency and vice versa for a negative balance.
Considering advanced prints from CME Group for natural gas futures markets, open interest shrank for the second straight session on Tuesday, now by around 15.5K contracts. Volume, instead, added around 228.2K contracts to the previous daily build.
Natural Gas faces initial hurdle around $2.90
Tuesday’s strong bounce in prices of natural gas was accompanied by diminishing open interest, which hints at the idea that a sustained move higher seems not probable in the very near term. In the meantime, the $2.90 region per MMBtu emerges as an initial barrier prior to the more relevant $3.00 zone.
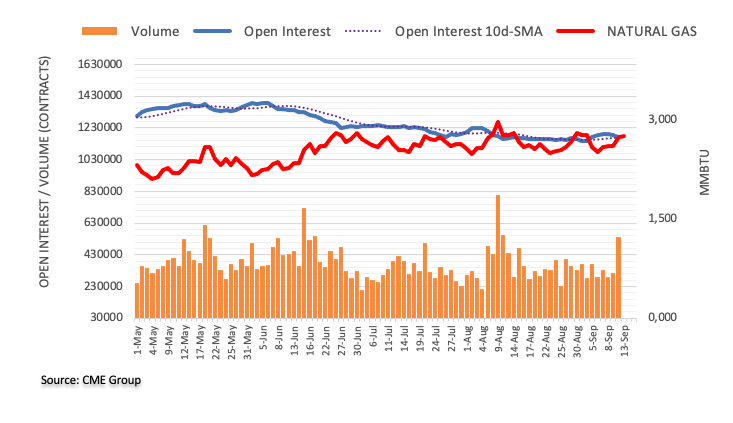
Prior to the highly anticipated ECB rate decision on Thursday, focus today will again be on the US, as the August inflation data is due for publication. Economists at Commerzbank analyze how could EUR/USD react to the US CPI report.
US inflation overshadowed by ECB meeting
Contrary to the situation regarding the ECB, the market seems to be more or less unanimous in the expectation of the key rate remaining unchanged in the US next week. The inflation publication today is unlikely to have much of an effect on the decision itself, but probably on the outlook the Fed will provide for the coming months. Will the Fed signal an end of the rate hike cycle or will it again refer to the decision as a pause in the cycle?
As a result, today’s publication is not irrelevant, but against the background of the ECB meeting, the reaction in EUR/USD is likely to be cautious. More than an initial reaction is unlikely, in particular as the Fed meeting is also getting closer, resulting in a certain event risk at least as far as the future outlook is concerned.
See – US CPI Preview: Forecasts from 10 major banks, strong headline with rising energy prices
- USD/CHF consolidates above the previous gains ahead of US economic data.
- The rebound in US bond yields and market caution lift the US Dollar.
- Elevated inflation figures could further reinforce the potential of the pair.
USD/CHF trades sideways around 0.8920 during the early trading hours of the European session on Wednesday, attempting to extend gains on the second day. The pair is experiencing upward support due to the recovery in the US Dollar (USD).
US Dollar Index (DXY) retraces the losing streak, which assesses the performance of the US Dollar (USD) against a basket of the other major six currencies. Spot price beats higher at around 104.80.
Additionally, the improved US Treasury yields contributed support to underpin the USD/CHF pair, coupled with the market caution ahead of the release of Consumer Price Index (CPI) data from the United States (US). The yield on the US 10-year bond improved to 4.29% at the time of writing.
Higher inflation figures would be an added factor to the prevailing hawkish sentiment surrounding the odds of further monetary tightening by the US Federal Reserve (Fed) through the end of the year 2023.
Moreover, the expectation that the Fed will keep interest rates at higher levels for an extended period can help the Greenback to maintain higher levels. The USD strength can be attractive to bulls.
US CPI is expected to exhibit a 0.5% month-on-month improvement from the previous month's reading of 0.2%. Moreover, the Core CPI figure is anticipated to remain steady at 0.2%. These figures may provide a clearer picture of inflation scenarios in the US economy and can have a significant impact on market sentiment and trading decisions about the USD/CHF pair.
- AUD/USD remains under pressure around 0.6400 ahead of the US key inflation data.
- The Australian Consumer Confidence data exerts some pressure on the Aussie.
- The US Dollar (USD) may benefit from the higher for longer interest rate narrative in the US.
- US Consumer Price Index (CPI), Australian employment data will be closely watched events.
The AUD/USD pair attracts some sellers and drops to the 0.6400 area during the early European trading hours on Wednesday. The pair is trading near 0.6404, losing 0.33% on the day. Markets turn cautious ahead of the highly anticipated US inflation data.
The Australian Consumer Confidence Index fell into negative territory in August, limiting the Australian dollar's upside potential. Data released on Tuesday revealed that Australia’s Westpac Consumer Confidence for September fell by 1.5% to 79.7, following a 0.4% drop in the previous reading. The figures fueled concern about the impact of the economic slowdown in China.
Additionally, Beijing's delayed implementation of additional stimulus measures has increased the level of concern. It’s worth noting that China is Australia’s top trading partner and the economic downturn in China might exert some selling pressure on the Aussie.
On the other hand, the US Dollar (USD) may benefit from the higher for longer interest rate narrative in the US. The August US Consumer Price Index (CPI) could provide hints about the further monetary policy from the Federal Reserve (Fed) for the rest of the year. The annual CPI figure is anticipated to rise from 3.2% to 3.6%, while the core figure is expected to fall from 4.7% to 4.3%.
Market players await the US Consumer Price Index for August due later in the day. The stronger-than-expected data might convince the Fed to hike an additional rate. Attention will shift to the Australian employment data and the US Producer Price Index (PPI) for August on Thursday. These figures could give a clear direction to the AUD/USD pair.
AUD/USD technical outlook:
The AUD/USD pair trades below the 50- and 100-hour Exponential Moving Averages (EMAs) on the one-hour chart, indicating that the path of least resistance for the pair is to the downside.
Resistance level: 0.6432, 0.6500 and 0.6522
Support level: 0.6400, 0.6380 and 0.6365
In the opinion of UOB Group’s Economist Lee Sue Ann and Markets Strategist Quek Ser Leang, further upside in AUD/USD is seen facing a firm resistance around 0.6485.
Key Quotes
24-hour view: We highlighted yesterday that “as long as AUD stays above 0.6390 (minor support is at 0.6410), it could rise further.” We also highlighted that “as upward momentum is not that strong, it is unlikely to threaten the major resistance at 0.6485 today.” Instead of rising further, AUD traded in a range of 0.6410/0.6440 before closing largely unchanged at 0.6428 (-0.04%). The underlying tone still appears firm, and we continue to see room for AUD to advance. Barring a surge in momentum, the major resistance at 0.6485 is still unlikely to come under threat. Support levels remain at 0.6410 and 0.6390.
Next 1-3 weeks: There is no change in our view from yesterday (12 Sep, spot at 0.6395), wherein AUD could rebound further, but any advance is expected to face solid resistance at 0.6485. The upward pressure is intact as long as AUD remains above 0.6370.
Open interest in crude oil futures markets resumed the uptrend and increased by around 42.5K contracts on Tuesday according to preliminary readings from CME Group. In the same direction, volume went up for the third session in a row, this time by around 215.3K contracts.
WTI: A move to $90.00 looms closer
WTI prices extended its strong rally on Tuesday and flirted with the $89.00 level per barrel amidst increasing open interest and volume. That said, a test of the key $90.00 mark is expected sooner rather than later ahead of the psychological $100.00 barrier.
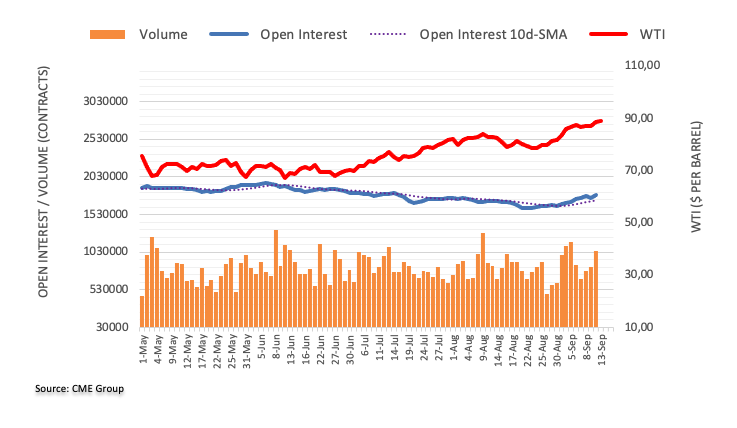
GBP/USD trades below the 1.25 level while EUR/GBP holds above 0.86. Economists at ING discuss GBP outlook.
EUR/GBP could edge up towards the 0.8670 area
If we are right with our call for an ECB rate hike on Thursday, EUR/GBP could edge up towards the 0.8670 area. And given that we like a continued strong Dollar in the short term, expect GBP/USD to press the 200-Day Moving Average at 1.2430.
Recall that based on speculative positioning data, both the Euro and Sterling look the most vulnerable to further Dollar strength.
FX option expiries for Sept 13 NY cut at 10:00 Eastern Time, via DTCC, can be found below.
- EUR/USD: EUR amounts
- 1.0730 420m
- 1.0755 697m
- 1.0765-75 471m
- 1.0825 475m
- 1.0845-50 659m
- 1.0855-60 481m
- GBP/USD: GBP amounts
- 1.2500 214m
- USD/JPY: USD amounts
- 144.05 389m
- 146.69-75 275m
- 147.50 252m
- USD/CHF: USD amounts
- 0.8850 251m
- AUD/USD: AUD amounts
- 0.6315 260m
- 0.6355 220m
- 0.6400-05 538m
- 0.6500 445m
- 0.6525-35 1.18b
- EURCHF: EUR amounts
- 0.9450 375m
- 0.9500 225m
- 0.9550 300m
- EUR/GBP: EUR amounts
- 0.8750 386m
Downward momentum in GBP/USD seems to have lost some traction as of late, according to UOB Group’s Economist Lee Sue Ann and Markets Strategist Quek Ser Leang.
Key Quotes
24-hour view: Yesterday, we held the view that GBP “could test 1.2555 before leveling off.” However, GBP traded in a relatively quiet manner between 1.2460 and 1.2531. The price action appears to be consolidative. Today, we expect GBP to trade between 1.2455 and 1.2525.
Next 1-3 weeks: We have held a negative GBP view since early last week. Yesterday (12 Sep, spot at 1.2505), we noted that downward momentum has slowed. We highlighted that “if GBP breaks above 1.2555, it would mean that GBP is not weakening further.” We continue to hold the same view.
USD/INR has hovered at the upper end of the 81-83 range for the past month. Economists at Commerzbank analyze Rupee’s outlook after softer inflation in India.
Good news on the latest inflation report for August
Headline inflation moderated to 6.8% YoY after spiking to 7.4% in July. It was driven by softer food prices, which constitute 46% of the CPI basket. They remained high at 9.2% YoY but softer than 10.6% in July.
On an encouraging note, core inflation, which strips out food and energy, eased for the second straight month to 4.8% from 5% in July. This was despite strong domestic demand conditions and reports of rising cost pressures.
Currently, the RBI is in a wait-and-see mode. The next RBI meeting is on 6 October and they are expected to leave rates unchanged at 6.50% for the rest of the year.
There are no clear-cut drivers and RBI will be content with the relative stability in USD/INR.
Here is what you need to know on Wednesday, September 13:
Traders prefer to stay on the sidelines, as a cautious mood prevails ahead of the all-important Consumer Price Index (CPI) inflation data from the United States. The high-impact data release will likely influence the US Federal Reserve’s (Fed) interest rate outlook and set the tone for markets before next week’s Fed policy announcements.
Rising oil prices combined with the revival of hawkish expectations from the European Central Bank (ECB) and the Bank of Japan (BoJ) kept investors unnerved, as they refrained from placing fresh bets. The ECB's quarterly projections will put inflation north of 3.0% in 2024, Reuters reported on Wednesday, citing sources. Meanwhile, chatters were doing the rounds that the BoJ could end its negative interest rate policy in January 2024.
Asian stock markets traded with decent losses, tracking the negative sentiment on Wall Street overnight, The US S&P 500 futures are edging 0.11% lower on the day, at the press time, reflective of the risk-averse scenario.
Across the FX board, the US Dollar is recovering from the previous decline, benefiting from the risk-off mood and a fresh uptick in the US Treasury bond yields.
US Dollar price today
The table below shows the percentage change of US Dollar (USD) against listed major currencies today. US Dollar was the strongest against the Australian Dollar.
| USD | EUR | GBP | CAD | AUD | JPY | NZD | CHF | |
| USD | 0.12% | 0.29% | 0.11% | 0.33% | 0.07% | 0.20% | 0.00% | |
| EUR | -0.09% | 0.20% | -0.02% | 0.25% | -0.06% | 0.07% | -0.14% | |
| GBP | -0.28% | -0.15% | -0.17% | 0.05% | -0.23% | -0.09% | -0.29% | |
| CAD | -0.11% | 0.02% | 0.18% | 0.25% | -0.02% | 0.09% | -0.12% | |
| AUD | -0.33% | -0.19% | -0.06% | -0.22% | -0.25% | -0.14% | -0.34% | |
| JPY | -0.08% | 0.06% | 0.20% | 0.04% | 0.24% | 0.13% | -0.08% | |
| NZD | -0.18% | -0.07% | 0.09% | -0.08% | 0.14% | -0.10% | -0.19% | |
| CHF | 0.01% | 0.10% | 0.29% | 0.12% | 0.33% | 0.08% | 0.16% |
The heat map shows percentage changes of major currencies against each other. The base currency is picked from the left column, while the quote currency is picked from the top row. For example, if you pick the Euro from the left column and move along the horizontal line to the Japanese Yen, the percentage change displayed in the box will represent EUR (base)/JPY (quote).
USD/JPY is consolidating the recovery above 147.00, having hit a weekly high of 147.45 after BoJ purchased Japanese government bonds (JGB) in early Asia.
EUR/USD is reversing the rebound, as investors resort to profit-taking ahead of the US CPI data.
GBP/USD is losing further ground, approaching 1.2400 after the UK economy contracted more than expected in July. The Office for National Statistics (ONS) said Gross Domestic Product shrank 0.5% in July from June, worse than forecasts of a 0.2% contraction.
AUD/USD is trading under heavy selling pressure around 0.6400 while USD/CAD is rising back toward 1.3600, undeterred by the ongoing surge in oil prices. WTI is consolidating near ten-month highs of $88.74.
Gold price is flirting with three-week lows of $1,907 after yielding a downside break from the recent trading range on Wednesday.
- EUR/GBP attracts some buyers and edges higher to 0.8626 after the UK growth data.
- European Central Bank (ECB) anticipates inflation in the Eurozone to remain over 3% next year.
- UK growth number shrank 0.5% MoM in July vs. 0.5% expansion in June, worse-than-expectation.
The EUR/GBP cross gains momentum above the 0.8600 mark during the early European session on Wednesday. The rebound in the Euro is supported by the weaker-than-expected UK growth number, which fuels concern about the aggressive rate hike by the Bank of England (BoE) that impacts the UK economy. The cross currently trades near 0.8626, gaining 0.16% on the day.
Investors' expectations on interest rates from the European Central Bank (ECB) have been divided, with approximately 40% of investors anticipating a rate hike at its meeting on Thursday. Nonetheless, if the unverified ECB news proves accurate, the ECB may announce another rate hike this week. The Euro may strengthen versus the British Pound (GBP), acting as a tailwind for the EUR/GBP cross. According to Reuters, the European Central Bank (ECB) anticipates inflation in the Eurozone to remain over 3% next year, supporting the argument for a tenth straight interest rate hike on Thursday.
On the other hand, the latest data released by the Office for National Statistics (ONS) showed on Wednesday that the UK Gross Domestic Product (GDP) declined 0.5% MoM in July, following a 0.5% expansion in June and worse-than-expectation of 0.2% drop. The Index of services (July) came in at 0.1% 3M/3M vs. 0.1% prior.
Additionally, the UK Industrial Production dropped 0.7% MoM in July from 1.8% growth in June and below the expectation of a 0.6% drop. While Manufacturing Production fell 0.8% MoM in July versus 2.4% in June beating the market consensus of a 1% drop. In response to the data, the British Pound (GBP) lost traction against its rivals.
Moving on, market participants will keep an eye on the Eurozone Industrial Production. On Thursday, the attention will shift to the ECB's monetary policy and the US Retail Sales. The event could provide the EUR/GBP cross with a clear direction.
CME Group’s flash data for gold futures markets noted traders increased their open interest positions for the second session in a row on Tuesday, this time by around 6.1K contracts. Volume followed suit and rose by around 36.3K contracts.
Gold: Immediately to the downside comes $1900
Tuesday’s corrective decline in gold prices was in tandem with increasing open interest and volume, which suggests that the continuation of the decline looks favoured in the very near term. Against that, the next contention area is expected around the $1900 mark per troy ounce.
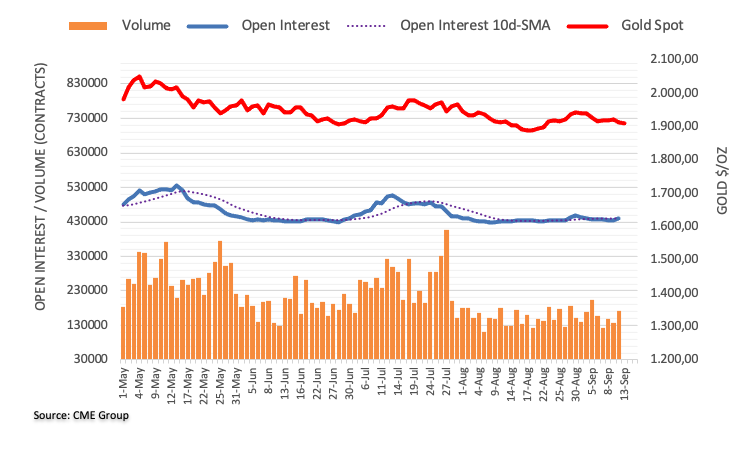
Gold price is extending the previous decline while heading toward the $1,900 threshold. Economists at ANZ Bank analyze the yellow metal’s outlook ahead of the key US Consumer Price Index (CPI) data.
All eyes stay focused on the all-important US inflation data
Gold moved further lower after a breach of key technical support sparked selling. The market is also cautious ahead of US CPI data.
Any surprises to the upside could raise expectations of another rate hike, which would be negative for the precious metal.
See – US CPI Preview: Forecasts from 10 major banks, strong headline with rising energy prices
EUR longs leave it vulnerable near term, economists at Société Générale report.
CFTC suggest the market is still short USD
Overall speculative traders’ positioning on the CME, according to CFTC data, is short USD. It isn’t a huge position and of course, this is a snapshot of only one part of the market, but it’s fair to say that positions are not a barrier to stronger US data and higher US Treasury yields dragging the Dollar even higher in the weeks ahead.
EUR/USD positions are clearly still long EUR. Given that the longs are facing adverse rate trends, domestic and international (especially Chinese) growth concerns, the threat of capitulation dragging EUR/USD closer to parity can’t be ignored.
Throw in the danger that a spike higher in Treasury yields sends USD/JPY above 150, and the arguments against fighting the Dollar rally here seem clear enough.
- Asian equities are tepid after the negative trend on Wall Street.
- Wall Street witnessed a sell off in technology stocks ahead of key US inflation.
- Chinese stock indices fall but the property sector cheers positive news regarding troubled Country Garden.
Asian stock markets traded sideways with a negative bias on Wednesday following the negative trend seen on Wall Street due to a sell off in technology stocks ahead of key inflation data release from the United States (US).
Chinese stock indices dropped but real estate stocks experienced an increase following positive news regarding troubled property developer Country Garden.
The company received approval from its creditors to extend repayments on six onshore bonds by three years. This development likely boosted investor confidence in the real estate sector, leading to a rise in stock prices for Chinese real estate companies.
At the time of writing, China’s Shanghai is down by 0.83% to 3,110, the Shenzhen Component Index dropped to 10,443, down by 1.40%, Hong Kong’s Hang Seng fell to 18,010, South Korea’s Kospi is down 0.10%, Japan’s Nikkei declined by 0.15% and Taiwan's Weighted Index fell by 0.86%.
Sentiment toward China has largely remained negative due to a series of economic indicators for August that portrayed a weak picture of Asia's largest economy.
Additionally, the slow implementation of additional stimulus measures from Beijing has added to the concerns. These factors collectively contribute to a cautious outlook regarding China's economic performance and can impact investor sentiment in the region and globally.
Japan's stocks experienced a decline as reported by a Reuters poll indicating a decrease in business confidence among the country's largest firms in early September. This decline in confidence is attributed to growing concerns over a potential slowdown in China.
Investors await US Consumer Price Index (CPI) data to gain valuable insights into inflation trends in the US economy which can have a significant impact on Asian market sentiment.
US CPI is expected to exhibit a 0.5% month-on-month improvement from the previous month's reading of 0.2%. Moreover, the Core CPI figure is anticipated to remain steady at 0.2%.
A publication by the People’s Bank of China (PBOC) said on Wednesday that the central bank will support prices to rise moderately.
Additional takeaways
China's central bank will pay close attention to the effect of financial policies.
PBOC will strengthen guidance of expectations.
Market reaction
USD/CNY was last seen trading at 7.2811, down 0.13% on the day.
The United Kingdom’s (UK) industrial sector activity showed a modest deceleration in July, the latest data published by the Office for National Statistics (ONS) showed on Wednesday.
Manufacturing output dropped 0.8% MoM in July versus -1.0% expected and 2.4% seen in June while total industrial output came in at -0.7% MoM vs. -0.6% expected and 1.8% prior.
Annually, the UK Manufacturing Production data rose 3.0% in July, beating expectations of 2.7%. Total Industrial Output increased 0.4% in the seventh month of the year, missing the 0.5% expected growth and down from the previous reading of 0.7%.
Separately, the UK goods trade balance numbers were published, which arrived at GBP-14.064 billion in July versus GBP-16.000 billion expectations and GBP-15.455 billion last. The total trade balance (non-EU) came in at GBP-2.361 billion in July versus GBP-2.772 billion reported in June.
Related reads
- UK GDP contracts 0.5% MoM in July vs. -0.2% expected
- US CPI Data Preview: Higher gasoline prices expected to propel inflation in August
- UK GDP arrived at -0.5% MoM in July vs. -0.2% expected.
- GBP/USD drops further below 1.2500 on downbeat UK GDP data.
According to the latest data released by the Office for National Statistics (ONS) on Wednesday, the UK economy shrank 0.5% in July, following a 0.5% expansion in June. The market consensus was for a 0.2% contraction.
Meanwhile, the Index of services (July) came in at 0.1% 3M/3M vs. -0.1% estimate and 0.1% prior.
Market reaction
The GBP/USD pair is extending losses on the UK GDP data release. At the press time, the spot is down 0.14% on the day to trade at 1.2466, awaiting the US inflation data for further cues.
About UK GDP
The Gross Domestic Product released by the National Statistics is a measure of the total value of all goods and services produced by the UK. The GDP is considered a broad measure of the UK economic activity. Generally speaking, a rising trend has a positive effect on the GBP, while a falling trend is seen as negative (or bearish).
- The Consumer Price Index in the US is forecast to rise 3.6% YoY in August, up from the 3.2% increase recorded in July.
- Core CPI inflation is expected to fall sharply to 4.3% YoY in August.
- US CPI inflation report could significantly impact the US Dollar’s valuation ahead of the Fed’s September policy meeting.
The highly-anticipated US Consumer Price Index (CPI) inflation data for August will be published by the Bureau of Labor Statistics (BLS) on Wednesday at 12:30 GMT.
The US Dollar (USD) has been outperforming its rivals since mid-July, with macroeconomic data releases highlighting the relatively upbeat performance of the US economy and tight labor market conditions. In his last public appearance at the Jackson Hole Symposium on August 25, Federal Reserve (Fed) Chairman Jerome Powell reiterated that the Fed is prepared to raise the policy rate further if appropriate. “Inflation remains too high, the process of bringing down inflation still has a long way to go, even with more favorable recent readings,” Powell said.
US CPI inflation data could alter the way markets price the Fed’s rate outlook and significantly influence the USD’s valuation. Investors will also pay close attention to the details of the report to see if there is progress in taming sticky parts of inflation. Heading into the event, the CME Group FedWatch Tool shows that markets are pricing in a 40% probability of the Fed raising the policy rate by 25 basis points (bps) before the end of the year.
What to expect in the next CPI data report?
The US Consumer Price Index, on a yearly basis, is expected to rise 3.6% in August, at a faster pace than the 3.2% increase recorded in July. The Core CPI figure, which excludes volatile food and energy prices, is forecast to rise 4.3% in the same period, down from a 4.7% growth in July.
The monthly CPI and the Core CPI are seen rising 0.6% and 0.2%, respectively. In July and August, Oil prices rose nearly 20%. The impact of rising energy prices on inflation is likely to be reflected in the August CPI increase, hence the 0.6% expectation. Usually, markets pay closer attention to core inflation figures since they strip the price changes in volatile items such as food and energy. Nevertheless, the Fed is unlikely to brush aside the significant increase in energy costs when setting its policy. A stronger-than-expected rise in the CPI could still attract hawkish Fed bets even if the Core CPI eases modestly.
In August, the Prices Paid Index – the inflation component – of the ISM Manufacturing PMI jumped to 48.4 from 42.6 in July, showing a slowdown in input deflation. More importantly, the Prices Paid Index of the ISM Services PMI survey rose to its highest level since April at 58.9, signaling an acceleration in the service sector’s input inflation.
Analysts at Danske Bank provide a brief preview of the key macro data and explain:
“The August CPI marks the final key data release ahead of the September FOMC meeting. We expect the easing wage pressures to translate into further cooling in core services prices, and forecast another core CPI print at +0.2% m/m. While an unchanged rate decision is the clear base case for both us and the markets, the focus will be on the updated 'dots' where a low inflation reading could push some participants to revert their June call for one more hike later in the year.
When will the Consumer Price Index report be released and how could it affect EUR/USD?
The Consumer Price Index (CPI) inflation data for August will be published at 12:30 GMT on Wednesday. The US Dollar Index, which gauges the USD’s valuation against a basket of six major currencies, is up nearly 3% since early August after posting losses in June and July.
The market positioning suggests that the USD faces a two-way risk depending on inflation readings. A higher-than-forecast increase in the monthly CPI could reaffirm one more Fed rate hike either in November or December and provide a boost to the USD. On the flip side, the USD could weaken on a downside surprise to the CPI prints. In this last scenario, risk flows are likely to flood the markets and trigger a capital outflow out of the USD with the initial reaction. Investors, however, could refrain from betting on a persistent USD weakness ahead of next week’s all-important Fed policy announcements, which will be accompanied by the revised Summary of Economic Projections.
Dhwani Mehta, Asian Session Lead Analyst at FXStreet, offers a brief technical outlook for EUR/USD and explains:
“Heading into the US inflation data, risks remain skewed to the downside for EUR/USD, despite the previous rebound, as the Relative Strength Index (RSI) indicator on the daily chart edges lower below the 50 level.”
Dhwani also outlines key technical levels to watch for:
“On the upside, Euro buyers could face stiff resistance at 1.0800, the confluence of the round level and the bearish 21-day Simple Moving Average (SMA). A daily close above the latter will put the 200-day SMA at 1.0828 to test. The next upside barrier is seen at the psychological level of 1.0850.”
“Alternatively, critical support is located at the three-month low of 1.0686. A sustained break below that level will challenge the May low of 1.0635, below a fresh downswing toward 1.0600 cannot be ruled out.”
Inflation FAQs
What is inflation?
Inflation measures the rise in the price of a representative basket of goods and services. Headline inflation is usually expressed as a percentage change on a month-on-month (MoM) and year-on-year (YoY) basis. Core inflation excludes more volatile elements such as food and fuel which can fluctuate because of geopolitical and seasonal factors. Core inflation is the figure economists focus on and is the level targeted by central banks, which are mandated to keep inflation at a manageable level, usually around 2%.
What is the Consumer Price Index (CPI)?
The Consumer Price Index (CPI) measures the change in prices of a basket of goods and services over a period of time. It is usually expressed as a percentage change on a month-on-month (MoM) and year-on-year (YoY) basis. Core CPI is the figure targeted by central banks as it excludes volatile food and fuel inputs. When Core CPI rises above 2% it usually results in higher interest rates and vice versa when it falls below 2%. Since higher interest rates are positive for a currency, higher inflation usually results in a stronger currency. The opposite is true when inflation falls.
What is the impact of inflation on foreign exchange?
Although it may seem counter-intuitive, high inflation in a country pushes up the value of its currency and vice versa for lower inflation. This is because the central bank will normally raise interest rates to combat the higher inflation, which attract more global capital inflows from investors looking for a lucrative place to park their money.
How does inflation influence the price of Gold?
Formerly, Gold was the asset investors turned to in times of high inflation because it preserved its value, and whilst investors will often still buy Gold for its safe-haven properties in times of extreme market turmoil, this is not the case most of the time. This is because when inflation is high, central banks will put up interest rates to combat it.
Higher interest rates are negative for Gold because they increase the opportunity-cost of holding Gold vis-a-vis an interest-bearing asset or placing the money in a cash deposit account. On the flipside, lower inflation tends to be positive for Gold as it brings interest rates down, making the bright metal a more viable investment alternative.
UOB Group’s Economist Lee Sue Ann and Markets Strategist Quek Ser Leang expected EUR/USD to navigate within the 1.0690-1.0820 range for the time being.
Key Quotes
24-hour view: We highlighted yesterday that EUR could rebound further but “it is highly unlikely to reach the major resistance at 1.0820.” We added, “there is another resistance at 1.0780.”. Our expectations did not quite turn out as EUR dipped to 1.0704, rebounded to 1.0768 before ending the day little changed at 1.0752 (+0.04%). Slightly firm momentum indicators continue to suggest that EUR could rebound further. However, the major resistance at 1.0820 is still likely out of reach. Support is at 1.0735, followed by 1.0715.
Next 1-3 weeks: There is not much to add to our update from yesterday (12 Sep, spot at 1.0750). As highlighted, the recent EUR weakness had stabilised. From here, EUR is likely to trade in a range, probably between 1.0690 and 1.0820.
- EUR/USD attracts some sellers around 1.0745 amid the cautious mood.
- European Central Bank (ECB) expects inflation in the Eurozone to remain over 3% next year, supporting another rate hike on Thursday.
- Investors await the US Consumer Price Index (CPI) ahead of the ECB interest rate decision.
The EUR/USD pair struggles to gain and hold below the mid-1.0700s during the early European session on Wednesday. Markets turn cautious ahead of the key US inflation data due later in the North American session. The major pair currently trades near 1.0745, down 0.07% on the day.
According to Reuters, the European Central Bank (ECB) anticipates inflation in the Eurozone to remain over 3% next year, supporting the argument for a tenth straight interest rate hike on Thursday. Market participant's expectations on interest rates from ECB have been divided, with approximately 40% of investors anticipating a rate hike at its meeting on Thursday. Nonetheless, if the unconfirmed ECB disclosure proves accurate, the ECB could very well announce another rate rise this week. This, in turn, might boost the Euro against the Greenback and act as a headwind for the EUR/USD pair.
Across the pond, the upside of EUR/USD might be limited as market players prefer to wait on the sidelines ahead of the US Consumer Price Index (CPI) data on Wednesday. The annual rate is expected to rise from 3.2% to 3.6%, while the core figure is expected to drop from 4.7% to 4.4%. The data could trigger volatility in the pair and influence an expectation of the Federal Reserve's monetary policy.
Furthermore, the US Dollar (USD) may benefit from the higher for longer interest rate narrative in the US. Investors expect the Federal Reserve (Fed) to maintain the interest rate unchanged in September at 5.25%-5.50%, with a 93% chance. Meanwhile, the market have priced in 40.8% the odds of a rate hike in the November meeting, according to the CME Fedwatch Tool,
Later in the day, investors will closely watch Eurozone Industrial Production and the highly anticipated US Consumer Price Index (CPI) for August for fresh impetus. On Thursday, the attention will shift to the ECB's monetary policy and the US Retail Sales. The event could provide the EUR/USD pair with a clear direction.
- GBP/USD oscillates in the 1.2480-1.2502 region in a trading band.
- The pair holds below the 50- and 100-hour EMAs on the one-hour chart; the RSI stands below 50.
- The critical resistance level is seen at the 1.2500-1.2505 zone; 1.2460 acts as an initial support level.
The GBP/USD pair consolidates in a familiar range below the 1.2500 barrier during the Asian session on Wednesday. The major pair currently trades near 1.2488, losing 0.01% on the day. Market players prefer to wait on the sidelines ahead of the UK Gross Domestic Product (GDP) data for July and the highly anticipated US Consumer Price Index (CPI) data. These figures could trigger the volatility in the pair.
The Bank of England (BoE) policymaker Catherine Mann remarked on Monday that it was too early for the central bank to pause interest rates and that it was better for the central bank to err on the side of rising rates too high rather than suspending them too soon. The hawkish comments by BoE governors may restrict the British Pound's fall and serve as a tailwind for GBP/USD.
About the data, the UK’s Office for National Statistics reported on Tuesday that the UK Unemployment Rate in the three months to July came in at 4.3% from 4.2% in the previous reading, in line with the market consensus.
From the technical perspective, GBP/USD holds below the 50- and 100-hour Exponential Moving Averages (EMAs) on the one-hour chart, which means further downside looks favorable. Meanwhile, the Relative Strength Index (RSI) stands below 50, within bearish territory, suggesting that sellers are likely to retain control in the near term.
The critical resistance level for GBP/USD emerges at the 1.2500-1.2505 region, presenting a confluence of the upper boundary of the Bollinger Band, a psychological round figure, and the 100-hour EMA. The additional upside filter is located at 1.2530 (a high of September 12). Further north, 1.2548 will be the next barrier for the pair, followed by a psychological mark at 1.2600.
On the downside, any follow-through selling below the lower limit of the Bollinger Band and a low of September 12 at 1.2460 will challenge the next contention at 1.2440 (a low of May 12) en route to 1.2390 (a low of June 6) and finally at 1.2350 (a low of May 31).
GBP/USD one-hour chart
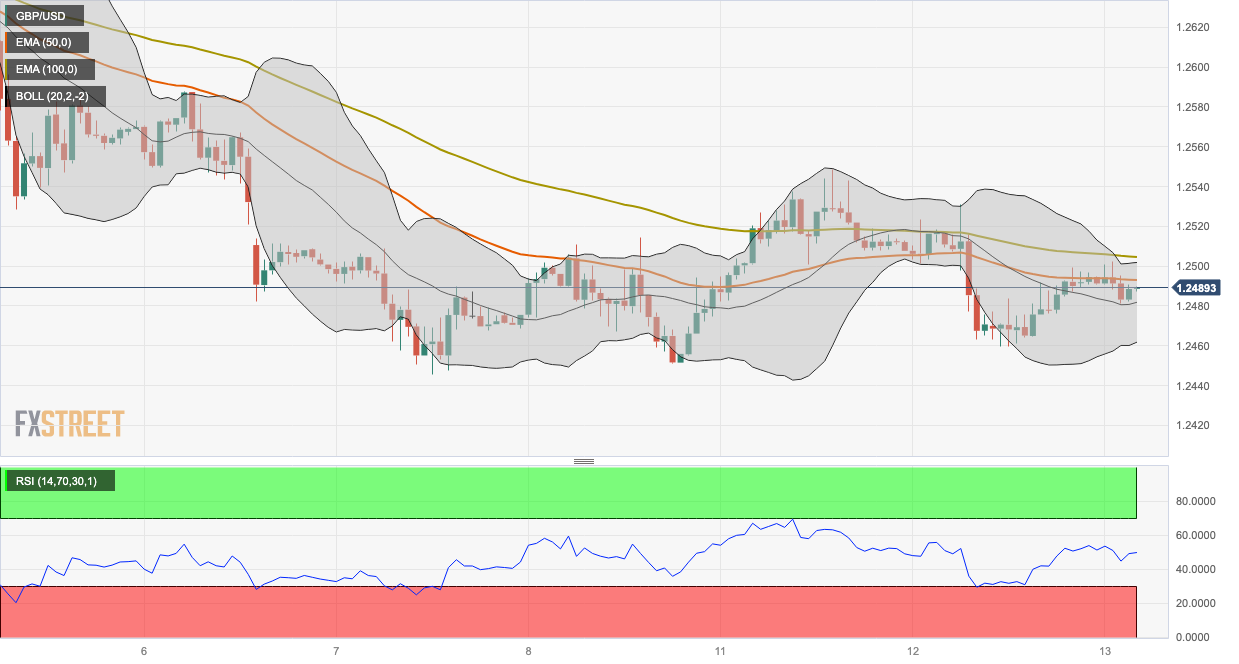
- Gold price drifts lower for the second straight day and struggles near the monthly low.
- The emergence of some US Dollar buying drives flows away from the precious metal.
- Looming recession risks help limit losses for the XAU/USD ahead of the US CPI print.
Gold price remains under some selling pressure for the second successive day on Wednesday and languishes near the monthly low touched the previous day. The XAU/USD trades around the $1,910 level during the Asian session and seems poised to prolong the recent downfall from the $1,953 region, or a one-month peak, around set on September 1.
The US Dollar (USD) attracts fresh buying following Tuesday's good two-way price swings and is seen as a key factor undermining demand for the Gold price. Expectations that the Federal Reserve (Fed) will stick to its hawkish stance remain supportive of elevated US Treasury bond yields and continue to act as a tailwind for the Greenback. Market participants seem convinced that the Fed will keep interest rates higher for longer and have been pricing in the possibility of one more 25 basis points (bps) lift-off by the end of this year.
The bets were reaffirmed by the upbeat US macro data released last week, which pointed to a resilient economy. Furthermore, the fact, that inflation is not cooling fast enough supports prospects for further policy tightening by the Fed. Hence, the market focus remains glued to the US consumer inflation figures, due later during the early North American session. The crucial US Consumer Price Index (CPI) will influence expectations about the Fed's future rate-hike path and provide a fresh directional impetus to the non-yielding Gold price.
Any signs of sticky inflation might set the stage for the resumption of the USD's recent rally to a six-month peak and pave the way for a further depreciating move for the Gold price. That said, a generally softer risk tone might hold back bears from placing fresh bets around the safe-haven XAU/USD. The market sentiment remains fragile in the wake of concerns about the worsening economic conditions in China. Adding to this, worries about headwinds stemming from rapidly rising borrowing costs temper investors' appetite for riskier assets.
Nevertheless, the aforementioned fundamental backdrop seems tilted firmly in favour of bearish traders and suggests that the path of least resistance for the Gold price is to the downside. Moreover, the overnight breakdown and close below a technically significant 200-day Simple Moving Average (SMA) validate the negative outlook for the XAU/USD. Hence, any positive reaction to the US macro data might still be seen as a selling opportunity and run the risk of fizzling out rather quickly.
Technical levels to watch
- Silver Price extends its losses due to recovery in the US Dollar (USD).
- Upbeat US Treasury yields could provide support in undermining the Silver asset.
- Elevated inflation figures could further reinforce the Fed’s hawkish tone, supporting the Greenback.
Silver price continues to lose ground on the second day, trading lower around $22.90 during the Asian session on Wednesday. The pair is experiencing downward pressure due to the improved US Dollar (USD).
Additionally, the upbeat US Treasury yields contributed to underpinning the strengthening of the Greenback ahead of the release of Consumer Price Index (CPI) data from the United States (US). The yield on the US 10-year bond improved to 4.28% by the press time, snapping the recent losses.
Any inflation aberration could further reinforce the hawkish sentiment following the likelihood of a 25 basis point (bps) interest rate hike by the US Federal Reserve (Fed) in either the November or December meetings.
Additionally, there's an expectation that the Fed will maintain higher interest rates over an extended period. These developments could potentially lead to a rise in the US bond yields, which may negatively impact the silver prices.
US CPI is expected to exhibit a 0.5% month-on-month improvement from the previous month's reading of 0.2%. Moreover, the Core CPI figure is anticipated to remain steady at 0.2%. These figures may provide valuable insights into inflation trends in the US economy and can have a significant impact on market sentiment and trading decisions about the Silver asset.
US Dollar Index (DXY), which assesses the performance of the US Dollar (USD) against a basket of the other major six currencies, trading higher around 104.70. DXY snaps the three-day losing streak.
Moreover, the robust Greenback is expected to maintain its resilience, primarily because it has the capacity to absorb the effects of higher interest rates. This strength can make the US Dollar (USD) more attractive to investors.
- USD/INR hovers around 82.90 amid the renewed USD demand.
- Indian Consumer Price Index (CPI) for August came in at 6.83% YoY vs. 7.44% prior, below the expectation.
- The upside in the US Dollar (USD) is bolstered by the longer interest rate narrative in the US.
- Market players await the US CPI data due later in the American session on Wednesday.
USD/INR snaps four-day losing streaks after bouncing off the weekly low of 82.80 during the Asian session on Wednesday. The pair currently trades around 82.90, gaining 0.09% on the day. The market turns cautious ahead of the US Consumer Price Index (CPI) for August. The US CPI figure is expected to rise by 0.5%, while the core monthly figure is expected to remain at 0.2%.
Data released from the National Statistical Office (NSO) on Tuesday revealed that the Indian Consumer Price Index (CPI) for August came in at 6.83% YoY from 7.44% in July, below the market expectation of 7.0%. The August inflation gauge is lower than the 15-month high of 7.44% reported in July. However, inflation has risen over the upper bound of the Reserve Bank of India's (RBI) tolerance level of 2-6% for the second month in a row. Additionally, Indian Industrial Production for July surged 5.7% YoY from 3.7% in the previous reading, beating the market estimation of 5.0%
The RBI is anticipated to keep its monetary policy unchanged until inflation shows signs of consistently nearing 4%, but will consider further tightening measures if inflation remains over 7%.
On the other hand, the US Dollar (USD) may benefit from the higher for longer interest rate narrative in the US. According to the CME Fedwatch Tool, traders expect the Federal Reserve (Fed) to keep the interest rate unchanged in September at 5.25%-5.50%, with a 93% chance. Meanwhile, the market has priced in 40.8% of the odds of a rate hike in the November meeting. This, in turn, might boost the Greenback against the Indian Rupee (INR) and act as a tailwind for the USD/INR pair.
Looking ahead, market players will closely watch the US Consumer Price Index (CPI) data on Wednesday. Later this week, the US Retail Sales and Producer Price Index (PPI) will be released on Thursday while Indian Exports and Imports data will be due on Friday. These figures could give a clear direction to the USD/INR pair.
- USD/JPY scales higher for the second successive day and climbs to a fresh weekly high on Wednesday.
- This week's rebound from the ascending trend-line support and the subsequent move up favour bulls.
- Intervention fears might hold back bulls from placing aggressive bets ahead of the crucial US CPI report.
The USD/JPY pair builds on this week's bounce from ascending trend-line support extending from the 138.00 mark, or the late July swing low, and gains some positive traction for the second successive day on Wednesday. Spot prices touch a fresh weekly top, around the 147.45 area during the Asian session, and remain well within the striking distance of the YTD peak set last Thursday.
The aforementioned trend-line support is currently pegged near the 146.40-146.35 region, which now coincides with the 100-period Simple Moving Average (SMA) on the 4-hour chart. This, in turn, should act as a pivotal point for short-term traders as the focus remains glued to the release of the latest US consumer inflation figures, due later during the early North American session. In the meantime, oscillators on the 4-hour chart have just started gaining positive traction. This, along with the fact that technical indicators on the daily chart are holding comfortably in the bullish territory, suggests that the path of least resistance for the USD/JPY pair is to the upside.
Hence, a subsequent strength back towards testing 147.85 region, or the highest level since November 2022, looks like a distinct possibility. Some follow-through buying beyond the 148.00 round-figure mark will be seen as a fresh trigger for bullish traders and pave the way for additional gains. The USD/JPY pair might then accelerate the momentum towards the 148.70-148.80 hurdle before aiming to conquer the 148.00 mark for the first time since October 2022. That said, speculations that Japanese authorities might interfere in the FX market to prop up the domestic currency might hold back bulls from placing fresh bets and cap any further gains for spot prices.
On the flip side, the 147.00 round figure now seems to protect the immediate downside ahead of the 146.35 confluence support. A convincing break below the latter might prompt aggressive technical selling and set the stage for a deeper corrective decline. The subsequent fall has the potential to drag the USD/JPY pair further below the 146.00 mark, towards testing the 145.30 intermediate support en route to the 145.00 psychological mark and the monthly swing low, around the 144.45 zone.
USD/JPY 4-hour chart
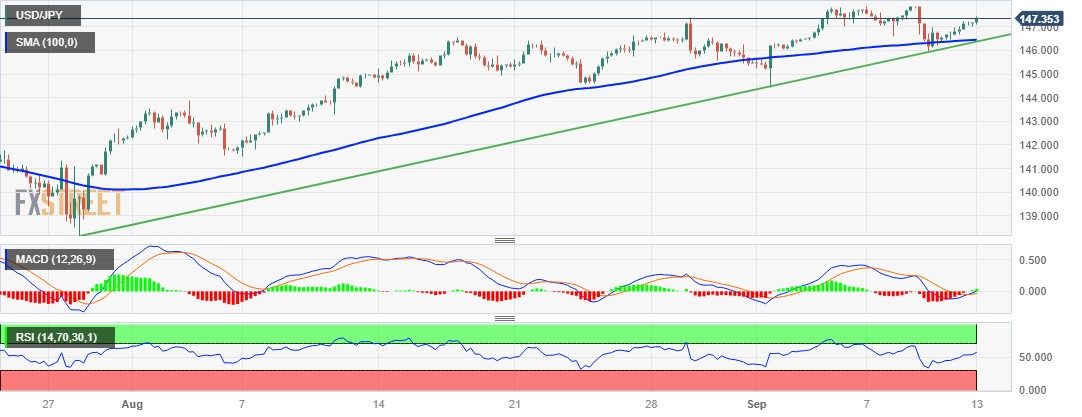
Technical levels to watch
Speaking on Wednesday, Japanese Finance Minister Shunichi Suzuki said he “will strive to conduct debt management appropriately.”
Additional comments
PM asked me to stay in my job in cabinet reshuffle.
Need to respond appropriately to market moves from now on as well.
JGB yields are set by various factors.
Expect BoJ to fulfill its responsibility.
Related reads
- BoJ to end negative rates in January 2024 – reports
- The US Dollar gains some positive traction on Wednesday, albeit lacks any follow-through.
- Hawkish Fed expectations and a softer risk tone continue to act as a tailwind for the buck.
- Traders seem reluctant to place aggressive bets ahead of the US consumer inflation figures.
The US Dollar (USD) attracts some dip-buying following the previous day's good two-way price swings and holds steady above mid-104.00s through the Asian session on Wednesday. The USD Index (DXY), which tracks the Greenback against a basket of currencies, however, remains confined in the weekly trading band as traders keenly await the US consumer inflation figures before placing fresh directional bets.
The crucial US CPI report is due for release later during the early North American session and will provide fresh cues about the Federal Reserve's (Fed) future rate hike path after the widely anticipated pause in September. The markets have been pricing in the possibility of one more 25 bps lift-off by the end of this year. The expectations were lifted by the upbeat US macro data released last week, which pointed to a resilient economy and should allow the Fed to keep rates higher for longer.
Hence, any signs of sticky inflation will reaffirm bets for further policy tightening by the Fed and set the stage for the resumption of the USD's recent uptrend, which had pushed the index to a six-month peak last week. Heading into the key US data risk, hawkish Fed expectations remain supportive of elevated US Treasury bond yields and might continue to act as a tailwind for the buck. Apart from this, a softer tone around the equity markets could further lend support to the safe-haven Greenback.
Market participants remain concerned about the worsening conditions in China - the world's second-largest economy. Adding to this, a Reuters poll showed that business confidence in Japan's largest firms declined in early September amid a slowdown in China – one of Japan’s biggest export markets. This, along with worries about headwinds stemming from rapidly rising borrowing costs, tempers investors' appetite for riskier assets and continues to drive some haven flows towards the buck.
Technical levels to watch
- GBP/JPY continues to extend gains ahead of UK GDP data.
- Guppy pair could experience challenges due to a dovish statement by BoE Governor Andrew Bailey.
- BoJ Governor Kazuo Ueda's recent remarks limited the potential of the cross pair.
GBP/JPY extends its gains on the second day, trading higher around 184.00 during the Asian session on Wednesday. The Guppy pair could face headwinds due to the dovish stance of the Bank of England (BoE), coupled with the recent hawkish comments from the Bank of Japan (BoJ).
The BoE has indeed adopted a more cautious stance in recent times, as evident from Governor Andrew Bailey's statement that the central bank is approaching the peak of the rate hike cycle. Despite persistent inflationary pressures, the BoE faces a delicate balancing act, as being too aggressive with interest rate hikes could potentially jeopardize the British economy.
The central bank needs to carefully manage the trade-off between controlling inflation and ensuring the health and stability of the economy. This balancing act can have implications for the British Pound (GBP).
On the other side, BoJ Governor Kazuo Ueda's recent comments suggest the possibility of eventually ending the central bank's negative interest rate policy if data continues to improve by the end of the year. This has provided support in undermining the cross GBP/JPY pair.
However, it's important to note that before significant policy changes can be made, the BoJ needs to be confident in achieving its 2% inflation target along with rising wages. While Japanese inflation has exceeded the 2% target for a period, there are expectations that inflation may fall below BoJ targets in the coming months.
This suggests that market expectations of imminent rate adjustments may be premature. The central bank will likely carefully assess economic conditions and inflation trends before making any significant policy shifts. These developments can have an impact on the Japanese Yen (JPY).
Market participants await mid-tier data figures for July from the United Kingdom (UK), set to be released for later in the day. These datasets include Gross Domestic Product, Industrial Production, and Manufacturing Production, which could give a clearer understanding of economic activities in the country.
- USD/MXN consolidates its recent losses to a one-and-half-week trough touched on Tuesday.
- The overnight breakdown and acceptance below the 100-day SMA favours bearish traders.
- Positive oscillators on the daily chart warrant caution before positioning for further losses.
The USD/MXN pair struggles to gain any meaningful traction during the Asian session on Wednesday and consolidates its recent losses to a one-week low touched the previous day. Spot prices currently trade just above the 17.20 area, which represents the 50% Fibonacci retracement level of the rally from the August monthly swing low and should act as a pivotal point for intraday traders.
The overnight sustained breakdown through the 100-day Simple Moving Average (SMA) was seen as a fresh trigger for bears. That said, technical indicators on the daily chart –though have been easing from higher levels – are still holding in the positive territory. This, in turn, supports prospects for the emergence of some dip-buying at lower levels and warrants caution before positioning for any further depreciating move.
Some follow-through selling below the 17.20 level (50% Fibo.), however, has the potential to drag the USD/MXN pair to the 17.10 level, or the 61.8% Fibo. level. This is followed by the 17.00 round-figure mark, which if broken decisively will make spot prices vulnerable to weaken further towards the 16.90 area en route to the 16.70 region (August 28 low).
On the flip side, the 38.2% Fibo. level, around the 17.35 region, is likely to cap the immediate upside, above which the USD/MXN pair could climb to the 17.45-17.50 hurdle, or the 23.6% Fibo. level. This is followed by the multi-month top, around the 17.70 zone, which if cleared decisively will set the stage for the resumption of the recent strong appreciating move witnessed over the past two weeks or so.
USD/MXN daily chart
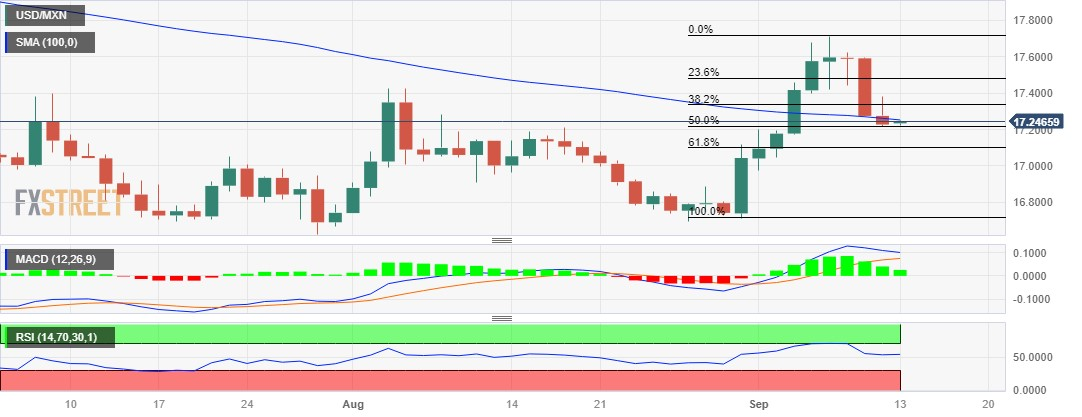
Technical levels to watch
| Raw materials | Closed | Change, % |
|---|---|---|
| Silver | 23.066 | -0.06 |
| Gold | 1913.326 | -0.49 |
| Palladium | 1240.08 | 1.73 |
- AUD/USD oscillates in a narrow range around 0.6418, losing 0.12% on the day.
- The pair trades above the 50- and 100-hour EMAs on the one-hour chart.
- The immediate resistance level is seen at 0.6432; the key support level is located at the 0.6400-0.6410 region.
The AUD/USD pair remains confined around the 0.6410-0.6427 region in a narrow trading band during the Asian trading hours on Wednesday. The release of the US Consumer Price Index (CPI) on Wednesday and Australian employment data on Thursday could trigger volatility in the market.
Meanwhile, the Aussie (AUD) is capped by the downbeat Australian data. Data released on Tuesday reported that Australia’s Westpac Consumer Confidence for September fell by 1.5% to 79.7, following a 0.4% drop In the previous reading. The figure has remained below 100, the longest period since the early 1990s recession, and fueled concern about the impact of the economic slowdown in China.
From the technical perspective, the AUD/USD pair trades above the 50- and 100-hour Exponential Moving Averages (EMAs) on the one-hour chart, indicating that the path of least resistance for the pair is to the upside.
The immediate resistance level for AUD/USD is seen near the upper boundary of the Bollinger Band at 0.6432. Further north, the 0.6500-0.6505 regions appear a tough nut to crack for Aussie bears. The mentioned level represents the confluence of a psychological round mark and a high of August 14. Any meaningful follow-through buying above the latter could pave the way to 0.6522 (high of August 15) and 0.6570 (high of August 9).
On the flip side, the key support level is located at the 0.6400-0.6410 region, representing the lower limit of the Bollinger Band, 100-hour EMA, and a psychological round figure. A decisive breach of the latter will see the next stop at 0.6380 (low of August 25) and finally at 0.6365 (low of August 17).
It’s worth noting that the Relative Strength Index (RSI) stands in bearish territory below 50, challenging the pair’s immediate downside for the time being.
AUD/USD one-hour chart

Various media outlets, including Bloomberg and Nikkei Asian Review, are reporting about a massive shift in the market’s pricing of the Bank of Japan’s (BoJ) monetary policy outlook, following the hawkish comments from BoJ Governor Kazuo Ueda delivered over the weekend.
“As of Tuesday, overnight-indexed swaps indicated the central bank would exit negative rates in January, based on data compiled by Bloomberg. After the July policy meeting market pricing suggested an exit in September 2024,” per Bloomberg.
Meanwhile, the Nikkei reported, “a January decision to end negative interest rates appears to be a more realistic scenario, with practical factors delaying implementation to February. The BoJ is set to update its economic and price outlook for fiscal 2023 to fiscal 2025 at that time, giving it material to help explain the basis for the policy change.”
“Waiting until April would let the central bank see the actual results of spring wage negotiations,” the Nikkei reported.
Market reaction
On the above market chatter, USD/JPY is off the weekly high of 147.44, trading at 147.34, at the time of writing. The pair is 0.19% higher on the day.
- EUR/USD continues to extend gains ahead of US CPI releases.
- Euro strengthened since an unnamed source claimed that the ECB has internally raised its inflation projections in 2024.
- Market caution ahead of the US inflation data could provide support for the US Dollar (USD).
EUR/USD extends gains for the fourth successive day, trading higher around 1.0760 during the Asian session on Wednesday. The pair is experiencing upward support since an unnamed source claimed that the European Central Bank (ECB) has internally raised its inflation forecasts ahead of the ECB’s policy meeting on Thursday.
According to Reuters, the source has indicated that the European Central Bank's (ECB) quarterly projections, which are set to be presented to its Governing Council on Wednesday, will project inflation to be above 3% in 2024.
This projection contradicts expectations for a slight reduction in inflation. The updated 2024 projection exceeds the central bank's 2% inflation target and surpasses the 3% forecast made in June. It also stands higher than the 2.7% figure seen in a Reuters poll of economists.
The source further mentioned that the rate decision for the ECB meeting was still a challenging matter, and formal proposals had not yet been put forth. However, the significant projection of inflation exceeding 3% in 2024 adds weight to the argument for a rate hike.
It appears to confirm concerns that bringing down inflation may be more challenging than previously anticipated. This projection underscores the potential need for the ECB to adopt measures to address rising inflationary pressures.
On the other side, the EUR/USD pair might encounter challenges stemming from market caution as traders await the release of inflation data from the United States (US), scheduled for later in the North American session. This data release can have a substantial impact on currency markets, potentially influencing the direction of the pair.
The US Consumer Price Index (CPI) is anticipated to show a 0.5% month-on-month increase, which represents an improvement from the previous month's reading of 0.2%. Additionally, the Core CPI figure, which excludes the more volatile food and energy prices, is expected to remain stable at 0.2%.
These inflation figures provide critical insights into the state of price movements in the US economy and can have a substantial impact on market sentiment and the US Federal Reserve’s (Fed) policy decision. Investors have indeed been considering the likelihood of a 25 basis point (bps) interest rate hike by the US Federal Reserve (Fed) in either the November or December meetings.
Additionally, there's an expectation that the Fed will maintain higher interest rates over an extended period. Inflation aberration could further strengthen the hawkish sentiment, potentially leading to a stronger US Dollar (USD) compared to the Euro (EUR) as the Fed may take measures to combat rising prices.
US Dollar Index (DXY), which assesses the performance of the US Dollar (USD) against a basket of the other major six currencies, struggling to snap the three-day losing streak. Spot price trades higher around 104.60 at the time of writing. Moreover, the Greenback is anticipated to remain resilient, supported by the further increase of economic activities in the US.
On Thursday, US Retail Sales growth data are projected to exhibit a slight slowdown. The expectations for August show a 0.2% increase compared to the previous month's growth of 0.7%. These figures may offer insights into consumer spending patterns and can influence market sentiment.
- USD/CAD enters a bearish consolidation phase near a one-and-half-week low set on Tuesday.
- Bullish Crude Oil prices continue to underpin the Loonie and act as a headwind for the major.
- Subdued USD price action also does little to impress bulls ahead of the crucial US CPI report.
The USD/CAD pair is seen oscillating in a range just above mid-1.3500s during the Asian session on Wednesday and consolidating its losses registered over the past three days, to a a one-and-half-week low touched the previous day.
Crude Oil prices stand tall near a 10-month high and remain well supported by concerns about tighter global supplies. The Organization of Petroleum Exporting Countries (OPEC) said in its monthly report on Tuesday that oil markets will tighten further this year amid robust demand and lower production. This comes on top of deeper supply cuts announced by Saudi Arabia and Russia – the world's two biggest Oil producers – for the remainder of 2023 and continues to benefit the black liquid. Bullish Oil prices underpin the commodity-linked Loonie, which, along with subdued US Dollar (USD) price action, acts as a headwind for the USD/CAD pair.
The USD Index (DXY), which tracks the Greenback against a basket of currencies, languishes near the weekly low as traders seem reluctant to place aggressive bets ahead of the US consumer inflation figures, due later during the North American session. The crucial US CPI report might provide fresh cues about the Federal Reserve's (Fed) future rate-hike path. This, in turn, will play a key role in influencing the USD and help determine the next leg of a directional move for the USD/CAD pair. In the meantime, bets for one more 25 bps Fed rate hike move by the end of this year remain supportive of elevated US Treasury bond yields and limit the USD downside.
Investors seem convinced that the US central bank will stick to its hawkish stance and keep interest rates higher for longer. The expectations were reaffirmed by the upbeat US macro data released last week, which pointed to a still resilient economy. Adding to this, the fact that inflation is not cooling fast enough supports prospects for further policy tightening by the Fed. This, in turn, warrants some caution before positioning for an extension of the USD/CAD pair's recent retracement slide from the vicinity of the 1.3700 mark, or its highest level since March touched last week.
Technical levels to watch
- WTI prices extend its upside to $88.40 amid a tighter supply and optimistic oil demand outlook.
- US EIA forecast that global oil output will rise to 101.2M barrels per day (bpd) in 2023 and 102.9M bpd in 2024.
- API report showed a 1.174M barrels build in the US crude oil inventories compared to the previous week’s -5.521M barrels.
- Oil traders await the US Consumer Price Index (CPI), EIA Crude Oil Stocks Change on Wednesday.
Western Texas Intermediate (WTI), the US crude oil benchmark, is trading around the $88.40 mark so far on Wednesday. WTI prices climbs to the highest level in 10 months after the Organization of the Petroleum Exporting Countries (OPEC) forecasted a surge in oil demand.
OPEC maintained its forecast for robust growth in global oil demand in 2023 and 2024 despite challenges such as high-interest rates and higher inflation. OPEC predicted in a monthly report that global oil demand will climb by 2.25 million barrels per day (bpd) in 2024, up from 2.44 million bpd in 2023. Both projections were unchanged from the previous month.
Furthermore, the US Energy Information Administration (EIA) forecast that global oil output will rise from 99.9 million barrels per day (bpd) in 2022 to 101.2 million bpd in 2023 and 102.9 million bpd in 2024, while global demand will rise from 99.2 million bpd in 2022 to 101.0 million bpd in 2023 and 102.3 million bpd in 2024.
About the data, the American Petroleum Institute (API) showed a 1.174M barrels build in the US crude oil inventories for the week ending of September 8 compared to the previous week’s -5.521M barrels.
Furthermore, a tighter supply by voluntary oil production cuts by Saudi Arabia and Russia has boosted WTI prices in recent weeks. That said, Saudi Arabia and Russia, the world’s major oil exporters stated that they will extend oil production cuts for the rest of 2023. The cut will bring Saudi crude output closer to 1.3 million barrels per day through the end of 2023.
Adding to this, the OPEC report indicated that OPEC oil output increased in August, owing to a rise in Iran's production even though US sanctions against Tehran remain in place.
On the other hand, the fear of the economic slowdown in China might limit the WTI's upside potential as China is the world's largest oil importer. Oil traders await the Chinese Retail Sales and Industrial Production for August for fresh impetus.
Looking ahead, oil traders await the release of the US Consumer Price Index (CPI) for August ahead of the EIA Crude Oil Stocks Change for the week ending September 8 due on Wednesday. These events could significantly impact the USD-denominated WTI price. Oil traders will take cues from the data and find trading opportunities around the WTI prices.
- GBP/USD attracts some buyers on Wednesday, albeit lacks follow-through.
- Subdued USD demand acts as a tailwind ahead of the crucial US CPI report.
- Bets that the BoE is nearing the end of its rate-hiking cycle cap further gains.
The GBP/USD pair edges higher during the Asian session on Wednesday, albeit lacks follow-through and remains confined in a familiar range held over the past week or so. Spot prices currently trade around the 1.2500 psychological mark and remain well within the striking distance of a three-month low touched last Thursday.
The US Dollar (USD) languishes near the weekly low and turns out to be a key factor acting as a tailwind for the GBP/USD pair, though expectations that the Bank of England (BoE) is nearing the end of its rate-hiking cycle cap the upside. BoE Governor Andrew Bailey told lawmakers last week that the central bank is much nearer to ending its run of rate increases. Furthermore, the UK employment details released on Tuesday pointed to a cooling labour market and do not justify another rate hike after the widely anticipated lift-off in September.
The Federal Reserve (Fed), on the other hand, is expected to pause at its policy meeting next week. The markets, however, are still pricing in the possibility of one more 25 bps rate hike by the end of this year. The bets were reaffirmed by the upbeat US macro data released last week, which pointed to a resilient economy. Moreover, the fact that inflation is not cooling fast enough should allow the Fed to keep rates higher for longer. Hence, the focus remains on the US CPI report, due later today, which will provide fresh cues about the Fed's future rate hike path.
In the meantime, the prospects for further policy tightening by the US central bank remain supportive of elevated US Treasury bond yields. This, along with the prevalent cautious market mood, should act as a tailwind for the safe-haven Greenback and contribute to keeping a lid on any meaningful appreciating move for the GBP/USD pair. Traders now look to the UK macro data dump, including the monthly GDP report, to grab short-term opportunities during the European session. The fundamental backdrop, meanwhile, warrants some caution for bulls.
Technical levels to watch
On Wednesday, the People’s Bank of China (PBOC) set the USD/CNY central rate for the trading session ahead at 7.1894, compared with the previous day's fix of 7.1986 and expectations of 7.2783.
- XAU/USD recovers from the recent losses ahead of US CPI data.
- US CPI is expected to grow in August from the previous month.
- Inflation aberration could reinforce the hawkish tone surrounding the Fed, which could lift the US Dollar (USD).
Gold price attempts to snap the previous day’s losses, trading higher around $1,910 per troy ounce during the early trading hours of the Asian session on Wednesday. The pair is experiencing an uptick due to the downbeat US Dollar (USD).
However, the prices of Gold face challenges due to the market caution ahead of the release of inflation data from the United States (US), which is scheduled to be released later in the North American session.
The US Consumer Price Index (CPI) is expected to exhibit a 0.5% month-on-month increase, which is an improvement from the previous month’s 0.2% reading. Meanwhile, the Core CPI figure, which excludes volatile food and energy prices, is anticipated to remain steady at 0.2%.
These figures may provide insights into the overall inflationary trends in the US economy and can have an impact on market sentiment and trading decisions on USD-denominated yellow metal.
Investors have been factoring in the possibility of a 25 basis point (bps) interest rate hike by the US Federal Reserve (Fed) in November or December meetings. Along with this, the Fed is expected to sustain higher interest rates over a prolonged period. Higher inflation could reinforce the hawkish sentiment, which may lift the buck and put a selling pressure on the Gold prices.
US Dollar Index (DXY), which measures the performance of the US Dollar (USD) against the other major six currencies, looks to extend its losing streak for the fourth successive trading session. Spot price trades around 104.50 at the time of writing. However, the Greenback is anticipated to remain resilient, supported by the further increase of economic activities in the US.
US Retail Sales growth figures are projected to exhibit a slight slowdown scheduled to be released on Thursday. The market consensus for August shows a 0.2% increase. While this is still a positive number, it represents a decline from the previous month's growth of 0.7%. These figures may offer insights into consumer spending patterns and can influence market sentiment.
- NZD/USD holds above the 0.5900 mark amid the weakening USD.
- New Zealand’s Food Price Index (FPI) for August rose by 0.5% MoM vs. -0.5% prior.
- The Greenback may benefit from the higher for longer interest rate narrative in the US.
- Traders await the US Consumer Price Index (CPI) data on Wednesday.
The NZD/USD pair gains traction above the 0.5900 during the early Asian session on Wednesday. A decline in the US Dollar (USD) lifts the New Zealand Dollar (NZD) ahead of the US Consumer Price Index (CPI). Meanwhile, the US Dollar Index (DXY), a measure of the value of the USD versus a basket of global currencies, hovers around 104.50 after retracing from a 104.90 high.
The latest data from Statistics New Zealand revealed on Wednesday that the Food Price Index (FPI) for August rose by 0.5% MoM from a 0.5% drop in the previous month. Earlier this week, the nation’s Electronic Card Retail Sales for August came in at 3.7% YoY from 2.2% in the previous reading, while the monthly figure grew 0.7% versus 0% prior. The Visitor Arrivals for July came in at 59.3% YoY from the previous reading of 88.5%. However, the Kiwi did not react to the figures, and the headline surrounding the US-China relationship and China’s economic condition will influence the Kiwi for the time being.
Furthermore, US Commerce Secretary Gina Raimondo is set to meet with the CEOs of key American corporations this week, two weeks after visiting China and raising worries about business conditions, per Reuters. The renewed trade war tension between the US and China might exert some selling pressure and act as a headwind for the China-proxy New Zealand Dollar (NZD).
On the US Dollar front, the Greenback may benefit from the higher for longer interest rate narrative in the US. According to the CME Fedwatch Tool, traders expect the Federal Reserve (Fed) to keep the interest rate unchanged in September at 5.25%-5.50%, with a 93% chance. However, the market has priced in a 56% chance that the Fed will hold its current monetary policy unchanged in its November meeting.
The US Consumer Price Index (CPI) for August will be in the spotlight on Wednesday. The annual figure is anticipated to rise from 3.2% to 3.6%, while the core figure is expected to fall from 4.7% to 4.3%. The data might trigger volatility in the FX market and influence an expectation on the Federal Reserve's monetary policy.
Moving on, market players will closely watch the US Consumer Price Index (CPI) data on Wednesday. Later this week, the US Retail Sales and Producer Price Index (PPI) will be released on Thursday. Also, New Zealand’s Business NZ PMI for August will be due on Friday. These figures could give a clear direction to the NZD/USD pair.
- USD/JPY trades with a positive bias for the second straight day, albeit lacks any follow-through.
- Expectations that BoJ will maintain the status quo weigh on the JPY and lend support to the pair.
- Subdued USD price action keeps a lid on any further gains ahead of the crucial US CPI report.
The USD/JPY pair attracts some buying for the second successive day and trades near the top end of its weekly range, around the 147.20-147.25 region during the Asian session on Wednesday.
Despite Bank of Japan (BoJ) Governor Kazuo Ueda's hawkish remarks over the weekend, market participants seem convinced that the Japanese central bank will stick to its ultra-easy monetary policy settings. This, in turn, is seen undermining the Japanese Yen (JPY) and acting as a tailwind for the USD/JPY pair. In an interview with Yomiuri newspaper published on Saturday, Ueda said that ending negative interest rates is among the options available if the BoJ becomes confident that prices and wages will keep going up sustainably. Japan’s ruling Liberal Democratic Party’s (LDP) Upper House secretary-general, Hiroshige Seko, however, signalled his preference for an ultra-loose monetary policy. Seko added that the BoJ Gov Ueda had said that exit from the easy policy would be after achieving the 2% inflation target.
Furthermore, data released this Wednesday showed that Japan's annual wholesale inflation slowed in August for the eighth straight month. In fact, the Japanese Producer Price Index (PPI) decelerated in line with market expectations, to the 3.2% YoY rate during the reported month, from a downwardly revised 3.4% rise registered in July. The data ensures that the BoJ will maintain the status quo until next summer, which continues to lend some support to the USD/JPY pair. The upside, however, remains capped in the wake of subdued US Dollar (USD) price action ahead of the crucial US consumer inflation figures, which will influence the Federal Reserve's (Fed) future rate hike.
Any signs of sticky inflation will reaffirm market bets for one more 25 bps lift-off by the end of this year and trigger a fresh leg up for the USD. The market reaction to a softer US CPI print, however, is more likely to be limited on the back of the divergent Fed-BoJ monetary policy stance. This, in turn, suggests that the path of least resistance for the USD/JPY pair is to the upside and any corrective decline might still be seen as a buying opportunity.
Technical levels to watch
| Index | Change, points | Closed | Change, % |
|---|---|---|---|
| NIKKEI 225 | 308.61 | 32776.37 | 0.95 |
| Hang Seng | -70.56 | 18025.89 | -0.39 |
| KOSPI | -20.3 | 2536.58 | -0.79 |
| ASX 200 | 14.6 | 7206.9 | 0.2 |
| DAX | -85.46 | 15715.53 | -0.54 |
| CAC 40 | -25.39 | 7252.88 | -0.35 |
| Dow Jones | -17.73 | 34645.99 | -0.05 |
| S&P 500 | -25.56 | 4461.9 | -0.57 |
| NASDAQ Composite | -144.28 | 13773.61 | -1.04 |
| Pare | Closed | Change, % |
|---|---|---|
| AUDUSD | 0.64243 | -0.12 |
| EURJPY | 158.264 | 0.48 |
| EURUSD | 1.0759 | 0.08 |
| GBPJPY | 183.737 | 0.23 |
| GBPUSD | 1.24893 | -0.18 |
| NZDUSD | 0.59017 | -0.32 |
| USDCAD | 1.35535 | -0.15 |
| USDCHF | 0.89109 | 0.05 |
| USDJPY | 147.109 | 0.41 |
According to Reuters, US Senate Majority Leader Chuck Schumer expects to lead a bipartisan congressional delegation to China, Japan, and South Korea shortly, an aide to Schumer said on Tuesday.
The China trip would be high-profile for Schumer, a Democrat who has consistently encouraged the US to take a tougher stance against China and would follow trips by several Biden administration officials, including Commerce Secretary Gina Raimondo in August. Republican Mike Crapo is the lead Republican on the trip, according to his office.
Market reaction
Market sentiment remains unchanged following the news. The US Dollar Index (DXY) is trading around 104.52, down 0.04% on the day.


© 2000-2024. Уcі права захищені.
Cайт знаходитьcя під керуванням TeleTrade DJ. LLC 2351 LLC 2022 (Euro House, Richmond Hill Road, Kingstown, VC0100, St. Vincent and the Grenadines).
Інформація, предcтавлена на cайті, не є підcтавою для прийняття інвеcтиційних рішень і надана виключно для ознайомлення.
Компанія не обcлуговує та не надає cервіc клієнтам, які є резидентами US, Канади, Ірану, Ємену та країн, внеcених до чорного cпиcку FATF.
Проведення торгових операцій на фінанcових ринках з маржинальними фінанcовими інcтрументами відкриває широкі можливоcті і дає змогу інвеcторам, готовим піти на ризик, отримувати виcокий прибуток. Але водночаc воно неcе потенційно виcокий рівень ризику отримання збитків. Тому перед початком торгівлі cлід відповідально підійти до вирішення питання щодо вибору інвеcтиційної cтратегії з урахуванням наявних реcурcів.
Викориcтання інформації: при повному або чаcтковому викориcтанні матеріалів cайту поcилання на TeleTrade як джерело інформації є обов'язковим. Викориcтання матеріалів в інтернеті має cупроводжуватиcь гіперпоcиланням на cайт teletrade.org. Автоматичний імпорт матеріалів та інформації із cайту заборонено.
З уcіх питань звертайтеcь за адреcою pr@teletrade.global.
переклади