- Аналітика
- Новини та інструменти
- Новини ринків
Новини ринків
“Bullock is the right person to lead the RBA into the future and ensure we have the world’s best and most effective central bank,” said the Australian government officials during an emergency press conference held early Friday.
That said, Australian Prime Minister Anthony Albanese and Treasurer Jim Chalmers called an emergency press conference after media reports circulated that Philip Lowe won’t have a chance for reappointment after his term expires in September 2023.
The government update also mentioned that Bullock will be the first woman to lead the RBA while also citing the empty space for RBA Deputy Governor’s place, which will be filled in the next few months. The news also mentioned that the appointment will take place from September 18, 2023.
USD/MXN licks its wounds at the lowest levels since December 2015, making rounds to 16.85 during early Asian session on Friday.
That said, the Mexican Peso (MXN) pair dropped in the last five consecutive days amid broad based US Dollar weakness, mainly driven by the concerns that the downbeat US inflation lcues will prod the US Federal Reserve (Fed) from lifting interest rates past July. Adding strength to the USD/MXN bearish bias are the downbeat options market signals.
That said, the one-month Risk Reversal (RR) of the USD/MXN pair, a measure of the spread between call and put prices, dropped the most in six days to -0.240 by the end of Thursday’s North American trading session.
In doing so, the options market figures defy the hopes of witnessing a corrective bounce in the USD/MXN price. It should be noted that the options market gauge prints the biggest weekly RR slump since early June with -0.327 mark at the latest.
Elsewhere, the US Dollar Index (DXY) remains on the back foot at lowest levels since since April 2022 ahead of the preliminary readings of July’s Michigan Consumer Sentiment Index, as well as the five-year Consumer Inflation Expectations.
Also read: Forex Today: Dollar's downward spiral continues
Fed’s Waler: Jobs, economic strength give Fed space to hike further
- AUD/JPY gains 1% and breaches the Tenkan-Sen line, exposing the Kijun-Sen.
- A morning star candlestick pattern signals potential AUD/JPY upside.
- The AUD/JPY could turn bearish if demand prices dive below 95.00.
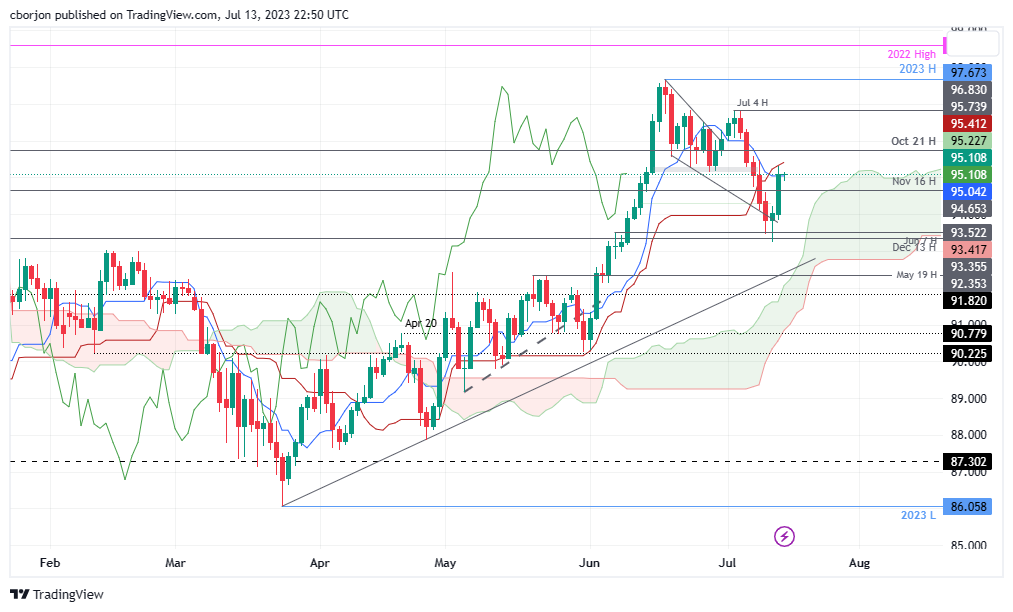
AUD/JPY reversed its downtrend, and rallied sharply on Thursday, gaining more than 1%, or 106 pips, courtesy of a risk-on impulse due to cooling US inflation and a break of a technical resistance level that has turned support. As the Asian session begins, the AUD/JPY is trading at 95.08, almost flat.
AUD/JPY Price Analysis: Technical outlook
The daily chart portrays the AUD/JPY as upward biased but hovering above/below the Tenkan-Sen line at 95.04. Price action witnessed the pair bouncing slightly below the June 7 high of 93.52, a guarded area for Aussie (AUD) bulls, forming a hammer candlestick on Wednesday. That, alongside Thursday’s long bullish and Tuesday’s bearish candles, formed a three-candlestick pattern, ‘morning star,’ indicating that further upside is expected.
AUD/JPY’s next resistance emerges at the Kijun-Sen line at 95.08, followed by the October 21 daily high at 95.74. The 96.00 figure would be up next, followed by the July 4 high at 96.84, before the pair attacks the 97.00 mark.
For a bearish resumption, AUD/JPY sellers need prices to dive below 95.00 as they eye the current week’s low of 93.25.
AUD/JPY Price Action – Daily chart
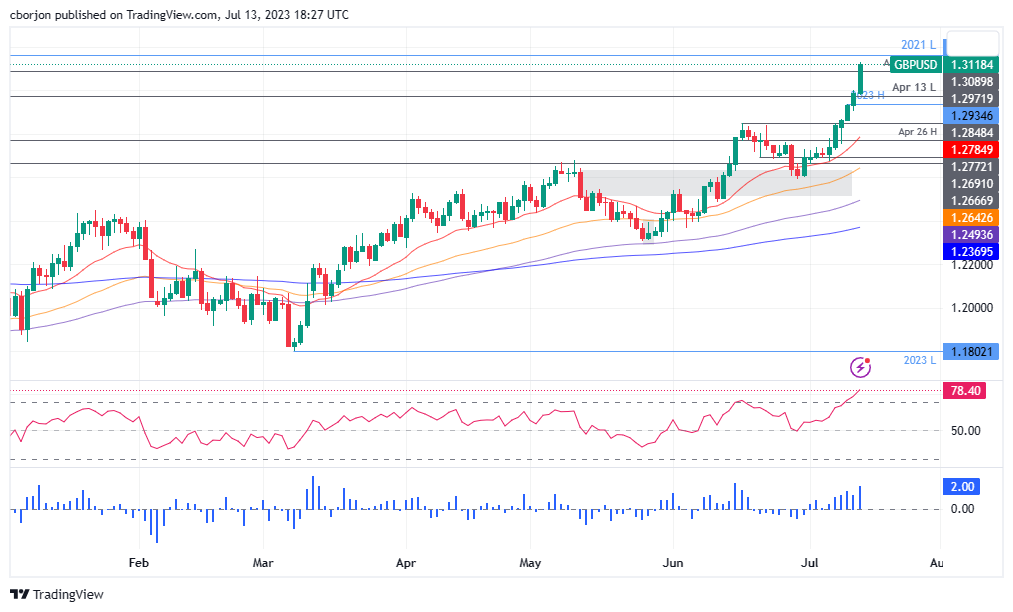
- GBP/USD seesaws at the highest level since April 2022, pauses six-day uptrend.
- Overbought RSI conditions, late 2021 low challenge Cable buyers.
- Pound Sterling’s upside remains favored unless staying beyond two-month-old previous resistance line.
- Bulls can aim for 1.3300 on breaking immediate upside hurdle.
GBP/USD makes rounds to 1.3130-40 after refreshing a 15-month high as it awaits fresh clues during the early hours of Friday’s Asian session. In doing so, the Cable pair takes clues from the overbought RSI conditions while portraying the trader’s cautious mood at the key upside hurdle.
Also read: GBP/USD rally breaks 1.3100 barrier amid soft US PPI data
That said, December 2021 bottom surrounding 1.3160 restricts the immediate upside of the Pound Sterling pair at the multi-month high, amid the overbought RSI (14) line, suggesting a pullback toward the 78.6% Fibonacci retracement of the January-September 2022 downturn, near 1.3030.
However, the Pound Sterling buyers remain hopeful unless the quote stays beyond the previous resistance line stretched from early May 2023, around 1.2970 by the press time.
Following that, the previous monthly high of around 1.2850 and May’s peak of 1.2680 could lure the GBP/USD sellers.
Meanwhile, the Cable buyer’s ability to cross the 1.3160 hurdle could quickly propel the price toward the March 2022 high surrounding 1.3300.
Though, January 2022 low near 1.3360-55 and multiple tops marked in early 2022 around 1.3650 may prod the GBP/USD bulls before directing them to the previous yearly top of near 1.3750.
GBP/USD: Daily chart
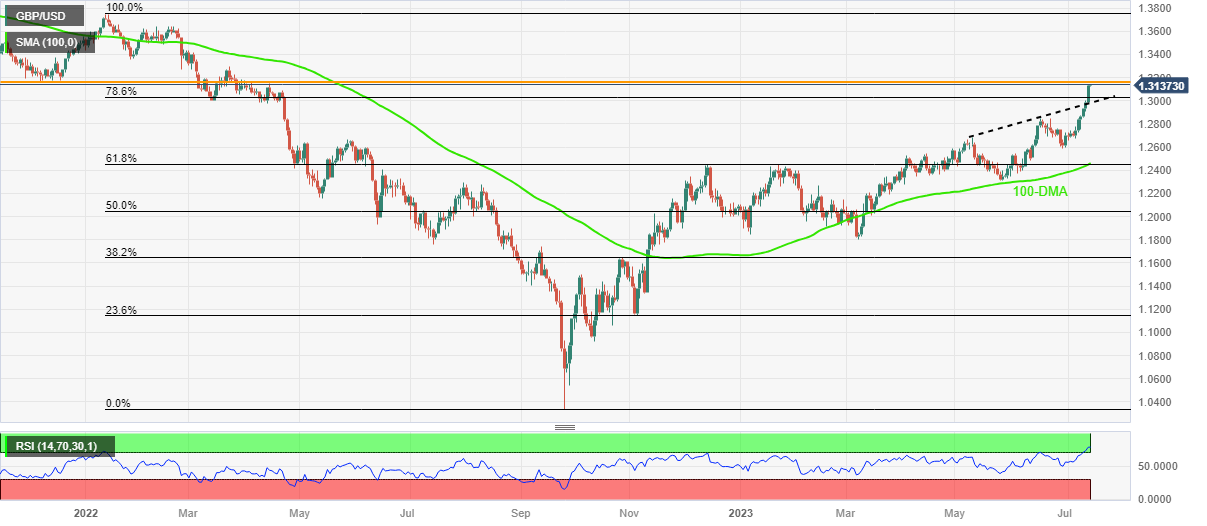
Trend: Limited upside expected
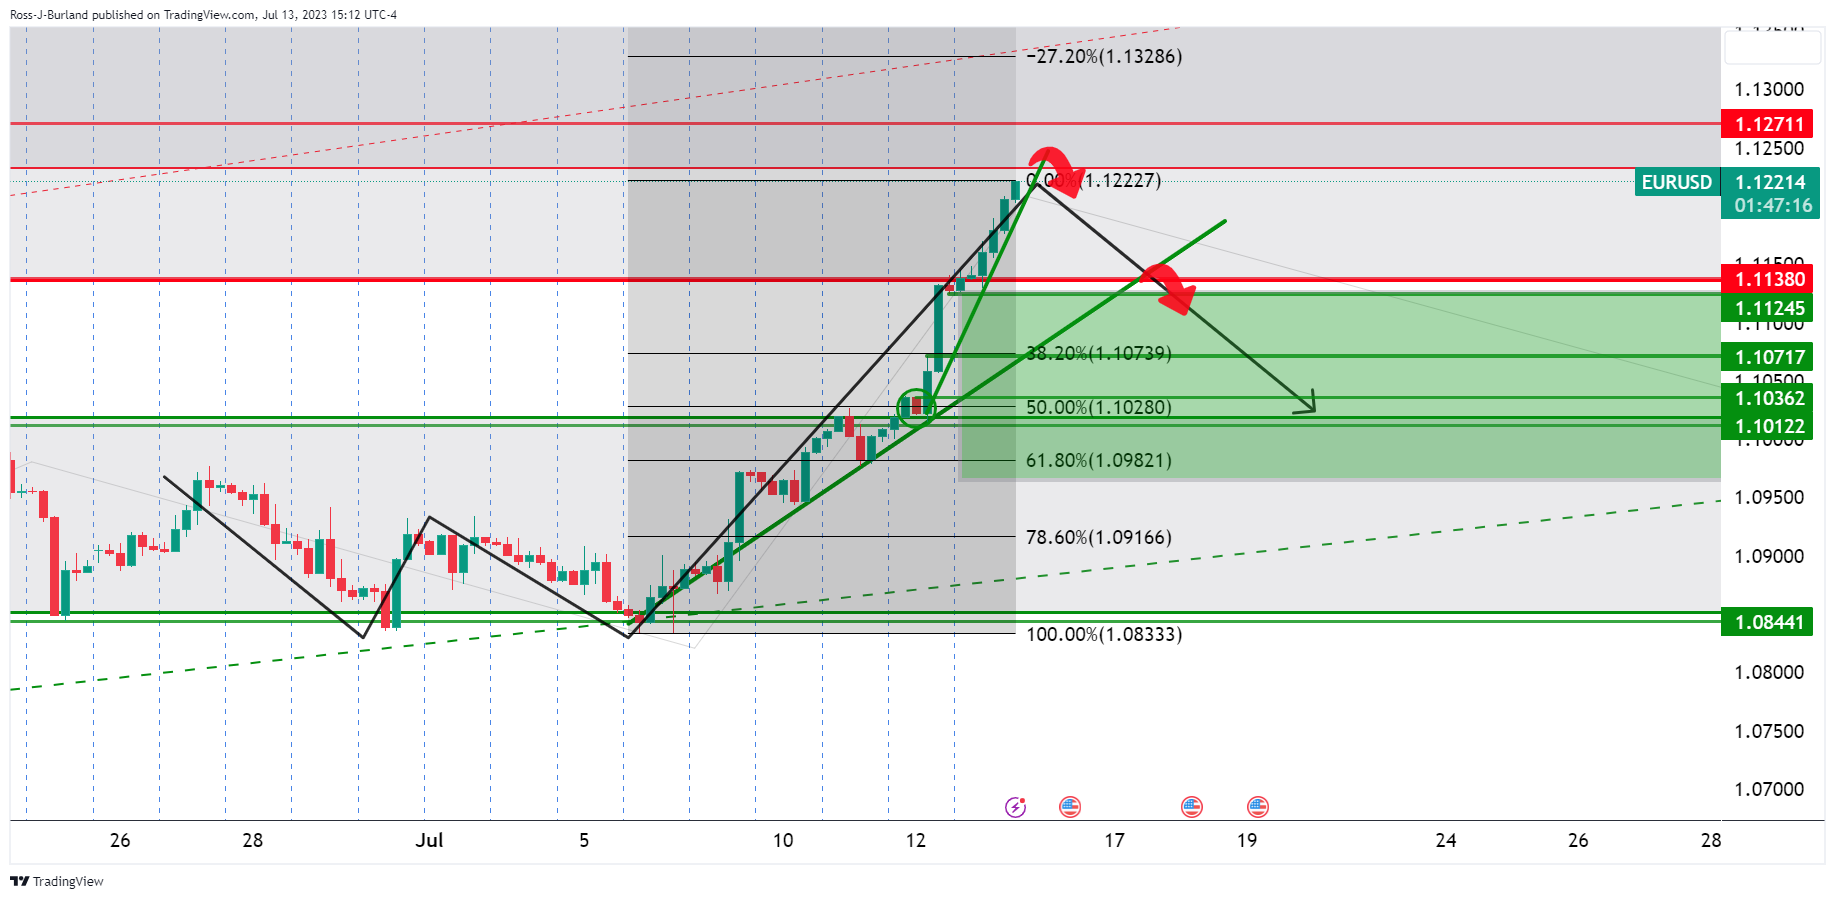
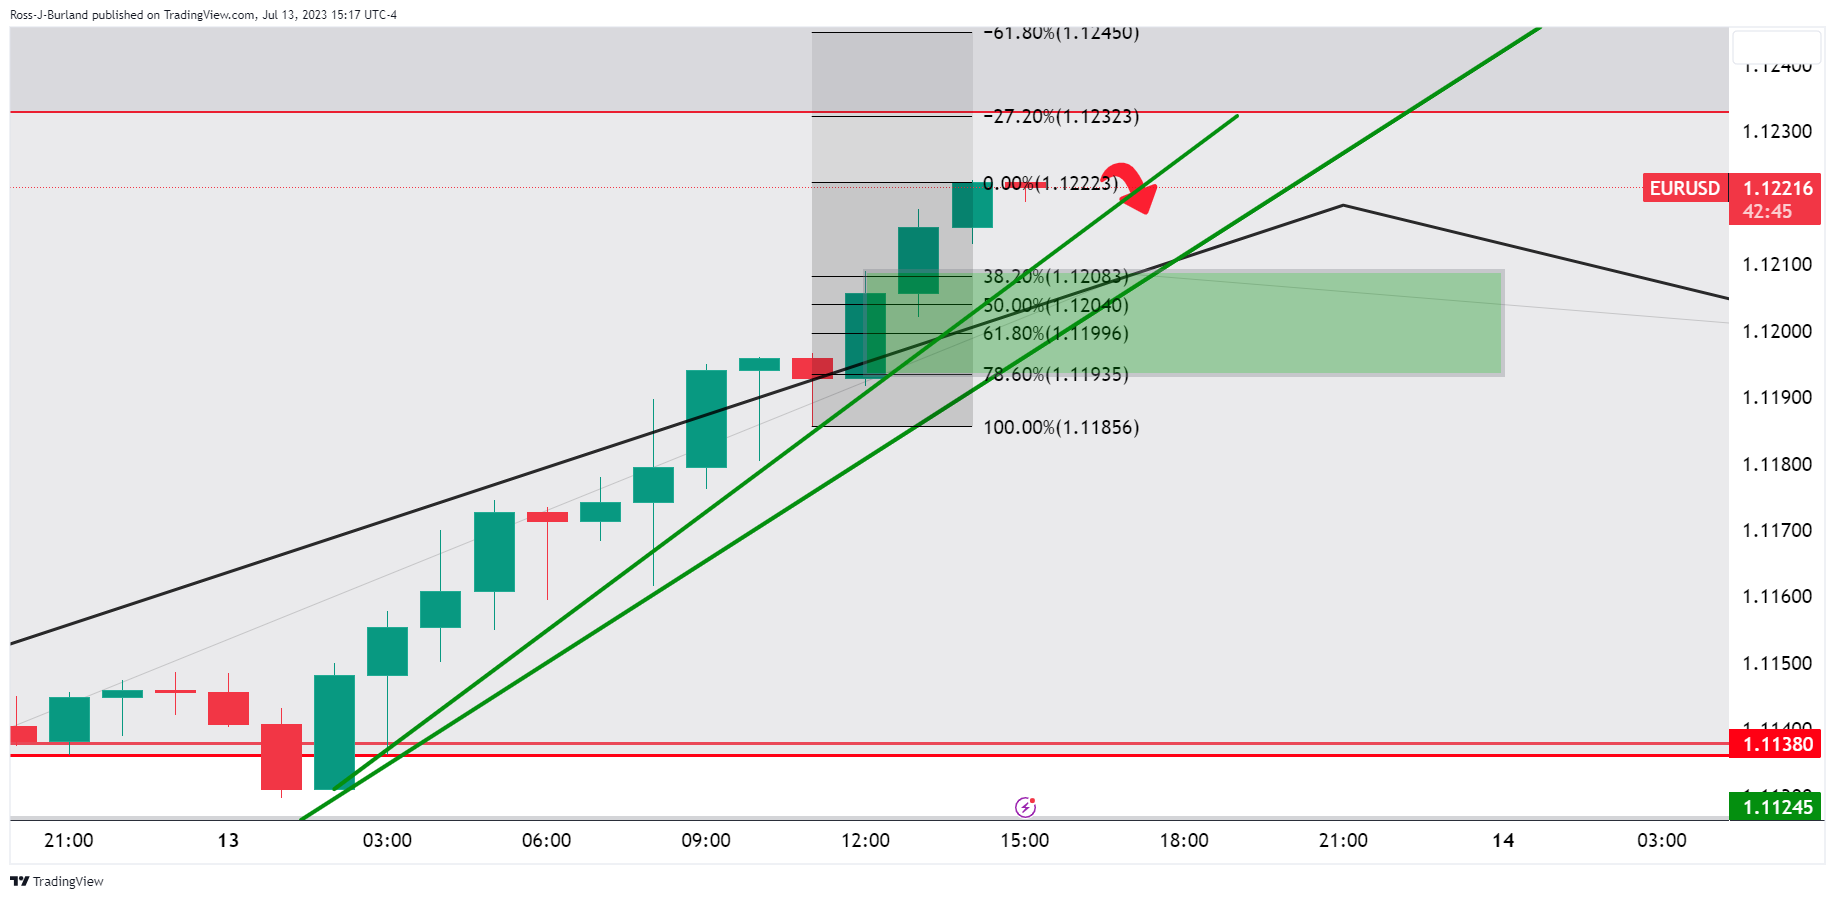
- EUR/USD seesaws at the highest level since March 2022, stabilizing after six-day uptrend.
- US Dollar slumps as US inflation clues suggest limited room for the Fed to lift interest rates past July.
- Mixed EU data at home, unimpressive ECB talks fail to probe Euro buyers.
- EC economic forecasts, US Michigan Consumer Sentiment Index, inflation expectations in focus for clear directions.
EUR/USD bulls take a breather at the highest levels in 16 months, bracing for the biggest weekly gain since November 2022, as it makes rounds to 1.1225-30 amid early Friday morning in Asia. In doing so, the Euro pair cheers the broad-based US Dollar weakness amid concerns that the Federal Reserve has limited scope to increase the interest rates past July. Additionally, downbeat US Treasury bond yields and hawkish clues from the European Central Bank (ECB) officials also propel the major currency pair.
US Dollar Index (DXY) dropped to the lowest level since April 2022 the previous day, down 2.45% on a week so far, as downbeat inflation clues from the US push back the Federal Reserve (Fed) hawks.
On Thursday, US Producer Price Index (PPI) came in as 0.1% YoY for June, versus 0.4% expected and 0.9% prior while the PPI ex Food & Energy, also known as the Core PPI, eased to 2.4% YoY from 2.8% previous reading and 2.6% market forecasts.
Earlier in the week, the US Consumer Price Index (CPI) registered a 3.0% YoY figure for June versus 3.1% market forecasts and 4.0% reported for May. Further details suggest that the CPI ex Food & Energy, also known as the Core CPI, softened to 4.8% yearly for the said month compared to analysts’ estimations of 5.0% and 5.3% previous readings.
That said, the US Weekly Initial Jobless Claims declined to 237K for the week ended on July 07, from 250K expected and 249K prior (revised).
Following the disappointing inflation data, the market’s expectations of the Fed rate hike past July have sharply deteriorated.
On the other hand, Eurozone Industrial Production eased to 0.2% MoM for May on a seasonally adjusted basis versus 0.3% market forecasts and 1.0% previous readings.
It should be noted, however, that the European Central Bank’s (ECB) June policy meeting revealed on Thursday that minimum of two successive rate hikes needed for inflation projections to materialize.
Alternatively, ECB Governing Council member Ignazio Visco said during an interview with Italy's Sky TG24 news channel, “We are not very far' from peak in interest rates.”
Against this backdrop, Wall Street cheers risk-on mood while the US 10-year and two-year Treasury bond yields plummet.
While the dovish Fed concerns propel the EUR/USD pair, today’s European Commission (EC) Economic Forecasts and trade numbers may direct the traders ahead of the preliminary readings of July’s Michigan Consumer Sentiment Index, as well as the five-day Consumer Inflation Expectations. Should the final clues of the US inflation appear downbeat, the Euro may easily aim for the previous yearly high of around 1.1500.
Technical analysis
A daily closing beyond an ascending resistance line stretched from May 2022, around 1.1190 by the press time, keeps EUR/USD bulls hopeful of visiting the 1.1300 round figure.
- Western Texas Intermediate (WTI), the US crude oil benchmark, rallied more than 1.70% on Thursday, hitting a new three-month high amid easing US inflation data.
- Recent Consumer and Producer Price Indices (CPI and PPI) figures in the United States showed modest climbs, sparking speculation that the US interest rate could be peaking soon.
- Higher US interest rates, which often boost the US Dollar and slow economic growth, typically dampen demand for crude oil.
Western Texas Intermediate (WTI), the US crude oil benchmark, rallied sharply on Thursday, more than 1.70%, and hit a new three-month high, following two inflation reports that could warrant the Fed of overtightening monetary conditions. At the time of writing, WTI exchanges hands at $77.10, slightly down as the Asian session begins.
Rising oil demand forecasts and the soft US Dollar boosted WTI prices
Inflation data in the United States (US) continued its downward trajectory, with Consumer and Producer Price Indices (CPI and PPI) figures climbing modestly, spurring speculations that the US central bank might refrain from lifting rates past the July FOMC’s meeting.
Higher interest rates in the US usually boost the US Dollar (USD) and tend to slow economic growth, denting demand for crude oil. In the meantime, the US Dollar Index (DXY) dropped to its lowest level since April 2022, helping to boost WTI prices, as the DXY sits at 99.778, down 0.80%.
In the meantime, the International Energy Agency (IEA) revealed that oil demand would increase and reach a record high, despite global tightened monetary conditions and economic headwinds.
Despite the current economic weakness, the Organization of Petroleum Exporting Countries (OPEC) updated its oil demand, which remained upbeat. The cartel raised the growth forecast for the rest of 2023 and a slight economic slowdown in the next year.
WTI Price Analysis: Technical outlook
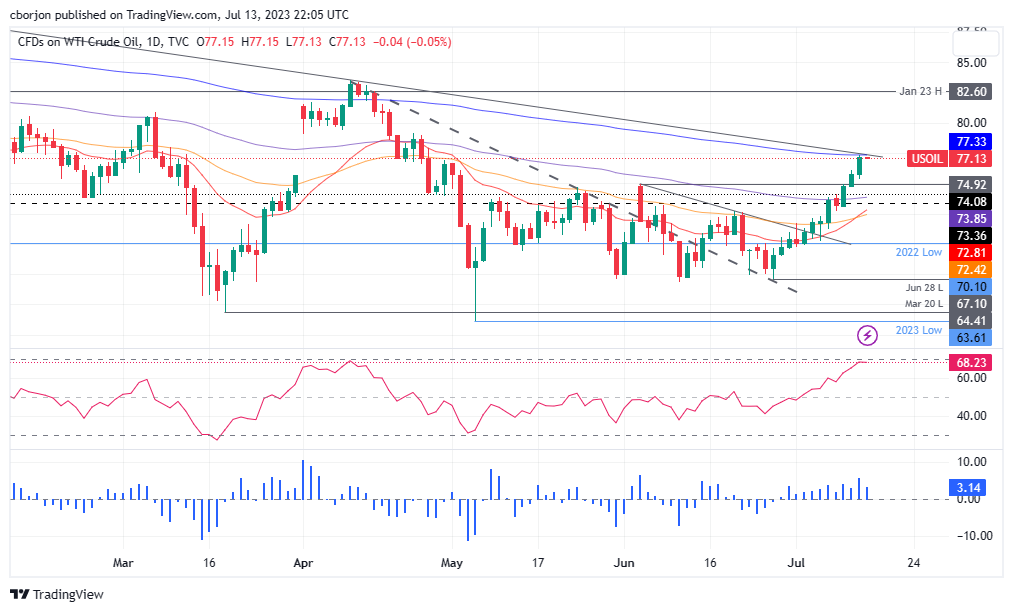
Given the fundamental backdrop, WTI’s price action left oil’s price close to testing the 200-day Exponential Moving Average (EMA) at $77.34, which, once cleared, could open WTI’s path to challenge $80.00 per barrel. Also, a downslope trendline drawn from November highs passes nearby the 200-day EMA, making its break an essential achievement for oil bulls. Once cleared, the next resistance would be the psychological $80.00, followed by the January 23 swing high at $82.60. Failure to conquer the 200-day EMA will leave WTI’s exposed to selling pressure. Key support levels lie at $77.00, the $76.00 figure and the June 5 daily high turned support at $74.92.
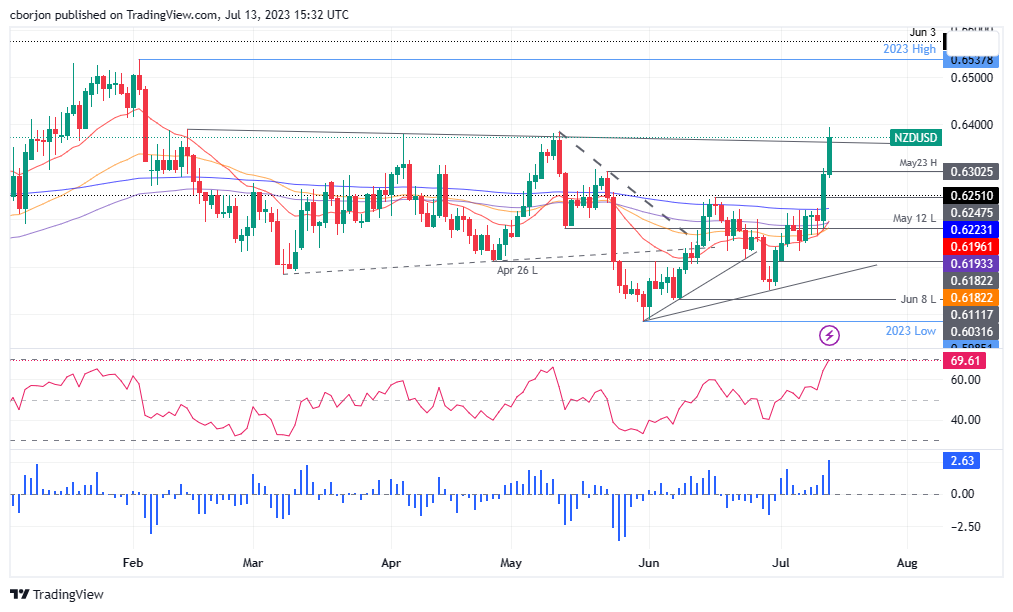
- NZD/USD bulls are in the market but a fading opportunity could be on the cards.
- Friday is the end of the three-day cycle that could prove fruitful for the bears.
The New Zealand dollar strengthened for the second straight session as the US dollar continues to slide. An eight-week high was made on fresh selling of the Greenback as further data pointed to disinflation in the US economy signaling the Federal Reserve will need to adopt a less hawkish stance this year. meanwhile, although New Zealand's inflation rate slowed to 6.7% in the first quarter, it is still above the Reserve Bank of New Zealand's target range of 1-3% over the medium term.
On the technical front, we have a topping pattern in play as follows:
NZD/USD H1 chart
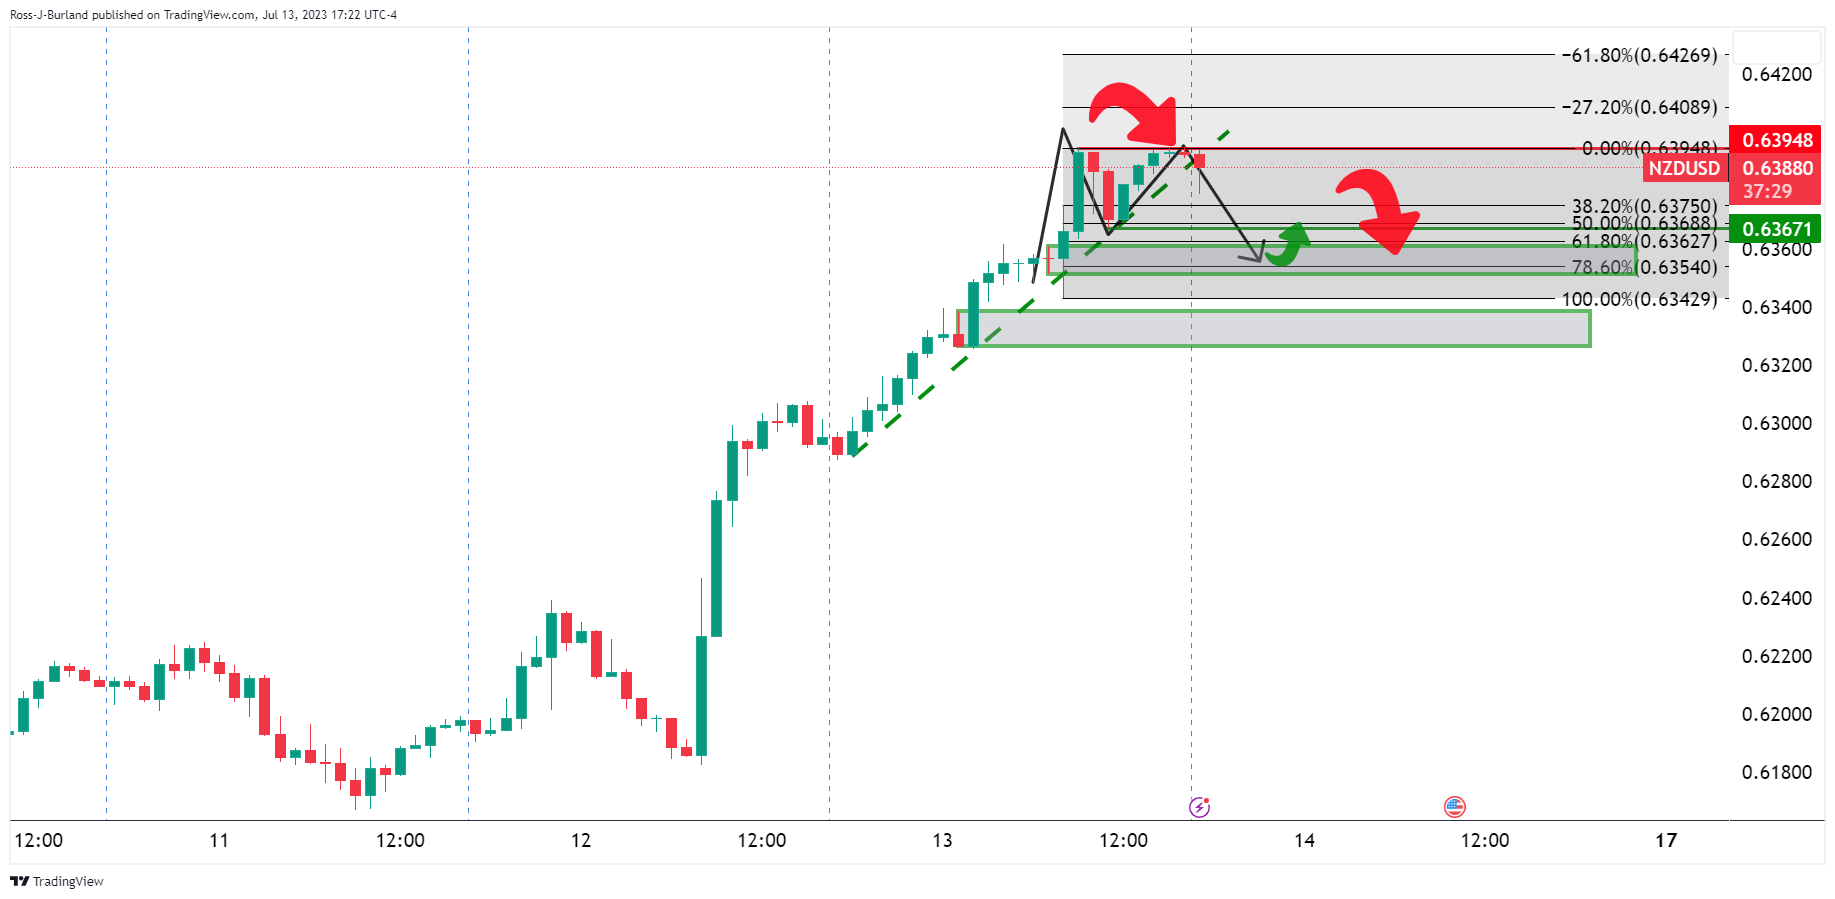
It's the end of the week and a three-day cycle that could see the price deteriorate into longs that have been built up since Wednesday's rally. The M-formation is a topping pattern that could offer an opportunity before the week is out as traders take profits into the weekend.
NZD/USD M15 charts
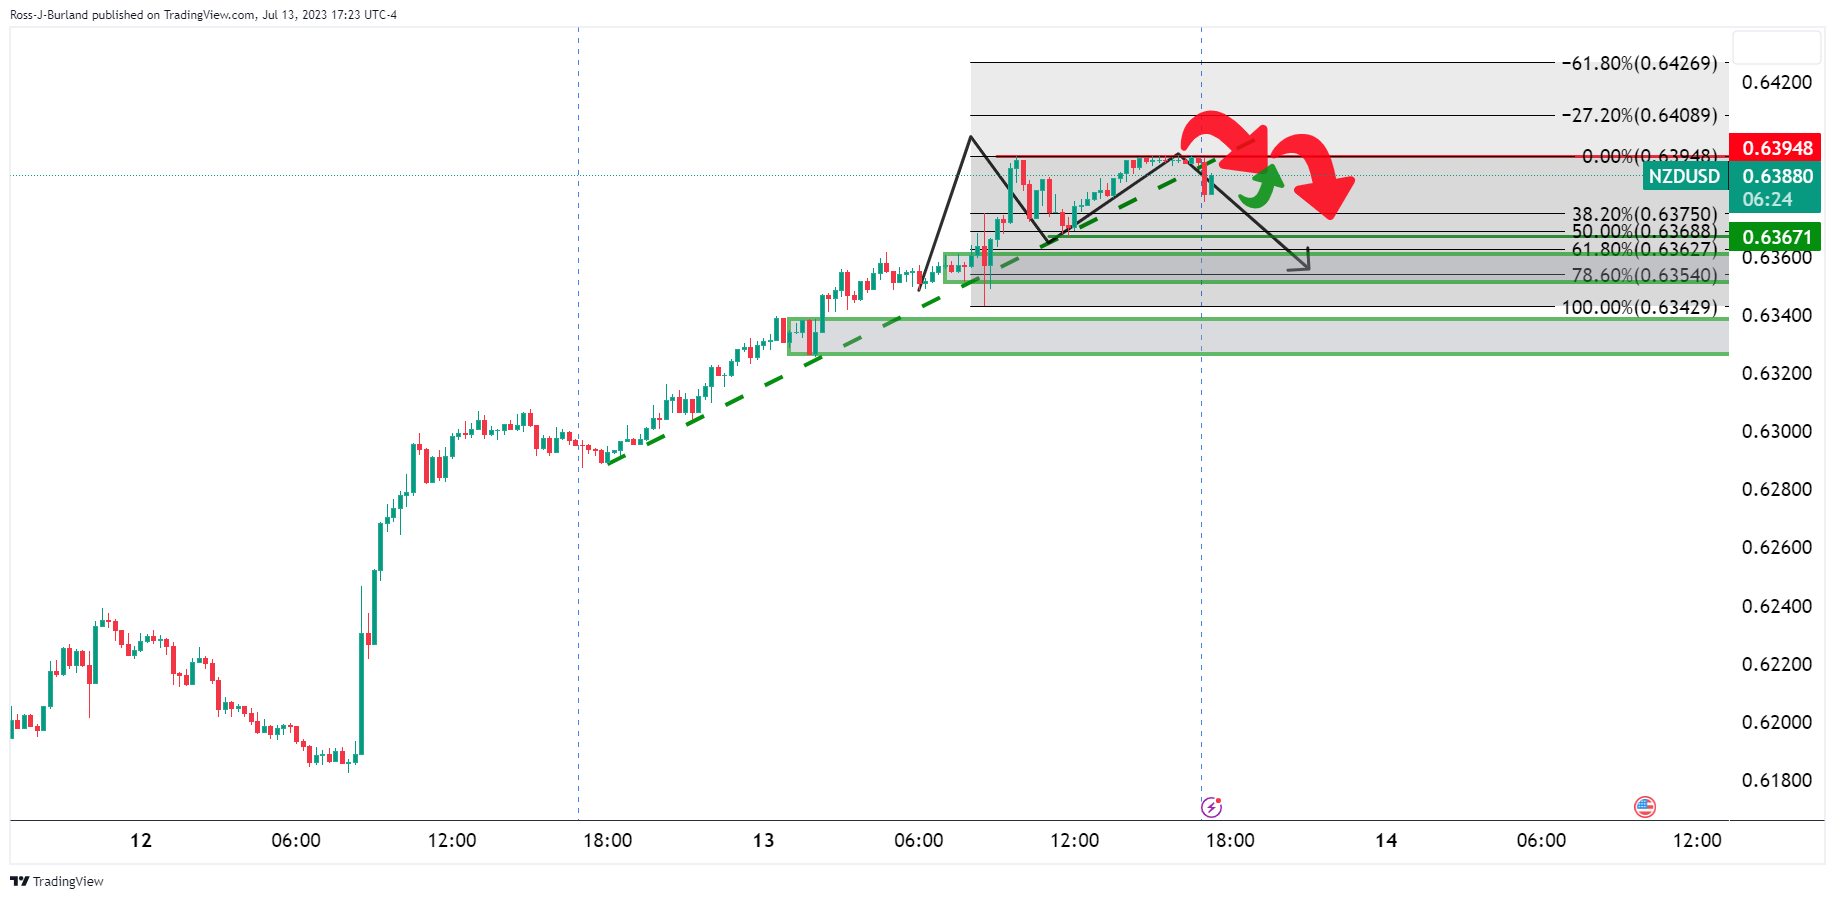
We are seeing signs of deceleration, but there will need to be a break of the 0.6370s to confirm that bearish bias. even still, there are prospects of a move higher to test 0.6400/20:
NZD/USD daily chart
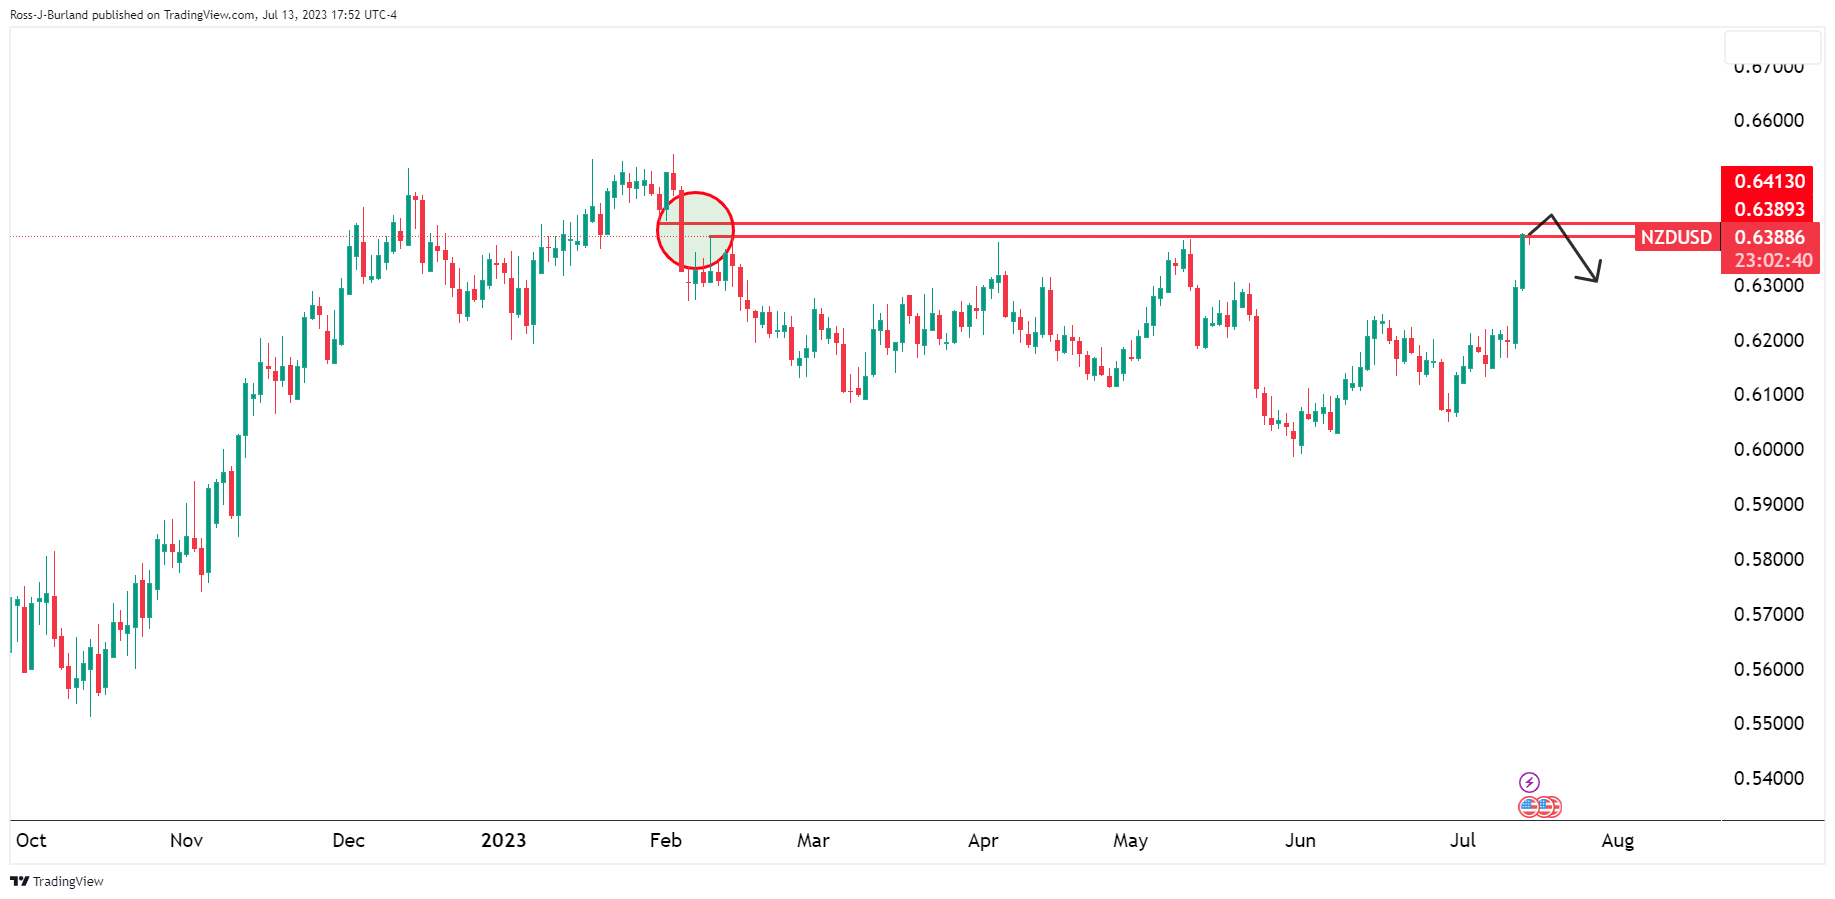
The daily chart is offering prospects of a continuation...traders can look for a fade if the market offers the set up to end the week.
- AUD/USD closed Thursday near 0.6890, recording a 1.47% gain.
- The Aussie held gains despite weak Import and Exports Chinese data reported during the Asian session.
- USD faced severe selling pressure following soft PPI figures.
On Thursday, the AUD/USD tallied a fifth consecutive day of gains and closed near the 0.6890 zone. The broad USD weakness amid dovish bets on the Federal Reserve (Fed) following soft inflation figures allowed the Aussie to gain ground despite weak Trade Balance figures reported from China early in the Asian session.
The Producer Price Index (PPI) from the US from June came in at 0.1% lower than expected at 0.2%, and the Core Figure was 2.4% lower than expected at 2.6%. As a reaction, US Treasury bond yields saw sharp declines across the board, with the 2, 5 and 10-year yields retreating to 4.63%, 3.94% and 3.76%, respectively.
Even though a 25 basis point rate hike is expected at the next FOMC (Federal Open Market Committee) meeting on July 25-26, what is driving the Dollar lower is the belief that it will be the last hike. It's worth noting that several officials deemed “additional” increases necessary but the recent inflation from the US figures released on Wednesday and Thursday made markets refrain from betting on an additional hike past July.
AUD/USD Levels to watch
The daily chart suggests that the pair’s outlook for the short term is bullish. Indicators hold strong in positive territory, with the Relative Strength Index (RSI) nearing overbought conditions and the Moving Average Convergence Divergence (MACD) printing rising green bars, indicating that the bulls have the upper hand.
Resistance Levels: 0.6900 (June's high), 0.6950,0.6980.
Support Levels: 0.6785, 0.6750, 0.6715 (20-day Simple Moving Average).
-638248804518007813.png)
During the Asian session, Japan will release Industrial Production data. Later in Europe, Germany will release wholesale June inflation, the European Commission's economic growth forecast, and trade balance data. Later in the day, US Consumer Confidence and Canadian Manufacturing Sales are due. The US Dollar's decline remains in the spotlight.
Here is what you need to know on Friday, July 14:
The US Dollar dropped sharply again after the release of more inflation data from the US. The figures offer signals that inflation continues to cool, triggering more gains in Wall Street and Treasury bonds.
The US Producer Price Index (PPI), which peaked at 11.2% in June 2022, rose 0.1% in June from a year ago, the lowest reading since August 2020. Labor market data showed Initial Jobless Claims totaled 237K in the week ended July 8, below the 249K of the previous week. Despite inflation cooling, the Federal Reserve (Fed) is on its way to raise interest rates by 25 basis points on July 26. However, market participants are increasing bets that it will be the last hike of the tightening cycle. Those expectations are driving the US Dollar lower. On Friday, the University of Michigan will release its Consumer Confidence report.
The US Dollar Index (DXY) dropped below 100.00, reaching its lowest level since April 2022. The DXY has fallen for six consecutive days and is not showing signs of stabilization. The bearish Dollar's momentum remains strong and could lead to further losses.
Wall Street cheered inflation figures again. The Dow Jones rose 0.14%, the S&P 500 gained 0.85% (highest close since April 2022), and the Nasdaq rose by 1.58%. Commodities also rose further, with Silver extending weekly gains with a 3% gain to $24.85, while Gold remained steady hovering around $1,960.
The upbeat tone across equity markets remained despite weak June trade data reported by China early on Thursday. Exports fell 12.4% YoY (the largest contraction since February 2020) and imports rose 6.8%, both worse than expected. The numbers increase the pressure on Chinese officials to introduce more stimulus.
EUR/USD soared to 1.1225, remains at the highs, as the bullish momentum remains intact. The European Central Bank (ECB) minutes pointed to another rate hike in July. On Friday, the European Commission will release economic growth forecasts and trade balance data.
GBP/USD posted another daily gain, as it has been the case since the beginning of the month. The pair broke above 1.3000 and also 1.3100, to the highest level in 15 months. UK GDP data showed a contraction in May of 0.1%, better than the expected -0.3%. Industrial Production indicators also showed a decline in May, but less than forecasted. The Pound remains strong even as tightening expectations from the Bank of England soften.
USD/JPY fell for the sixth consecutive day, reflecting the weakness of the Dollar and lower government bond yields, falling towards 138.00. The Japanese currency gained ground versus other currencies amid risk appetite.
Antipodean countries continue to benefit from the weaker Dollar and higher equity prices. AUD/USD jumped towards 0.6900, testing June highs and posting the highest daily close since February. NZD/USD climbed to the highest level since early February, just below 0.6400.
USD/CAD closed at 1.3100, the lowest level since August 2022. On Friday, Canada will report May Manufacturing Sales. The Loonie lagged behind AUD and NZD despite the 2% gain in crude oil prices.
Like this article? Help us with some feedback by answering this survey:
- After five days of losses, the GBP/JPY managed to jump above 181.00 on Thursday.
- GDP in the UK contracted in May but was lower than expected.
- BoJ’s policy tweak expectations to limit the JPY’s losses.
The GBP/JPY gains ground despite weak economic figures from the UK. Investors continue to bet on an aggressive Bank of England (BoE), which limits the Pound’s losses, while the expectations of a pivot of the Bank of Japan (BoJ) support the Yen.
The Office for National Statistics (ONS) revealed that the UK's Gross Domestic Product (GDP) declined slower than expected in May at 0.1% MoM vs the expectations of 0.3%. The Manufacturing production saw similar results as they also contracted by 0.2% MoM in the same period but lower than the expectations of 0.5%. Finally, Industrial Production declined, but at a higher pace than expected at 0.6% vs 0.4% MoM in the same period.
The U.K. is undoubtedly moving towards a recession as the Bank of England tightens its monetary policy, and the economy weakens. In addition, the GDP has experienced a monthly contraction for the first time since March 2021.
Despite weak economic data, according to the World Interest Rate Probabilities (WIRP), the markets have already priced in a 50 basis points (bps) interest rate hike for August 3rd. However, the expectations have shifted for the subsequent hikes as a 25 bps increase is currently priced in for September 21st, as opposed to the initial projection of a 50 bps hike earlier in the week.
On the Japanese side, the JPY may limit its losses on the back of a Yield Control Curve (YCC) policy pivot by the Bank of Japan (BoJ). Masato Kanda, a currency diplomat from Japan, acknowledged that the prevailing deflationary trends "might be changing". Its worth noticing that rising wages may contribute to an increase in inflationary pressures, but the Bank shouldn’t disregard China’s economic situation, which is showing signs of weakness, as it could further weaken the local economy.
GBP/JPY Levels to watch
Despite indicators gaining ground, the short-term outlook favours the Yen over the GBP. The Relative Strength Index (RSI) shows strong downward momentum despite standing in positive territory. At the same time, the Moving Average Convergence Divergence (MACD) prints higher red bars indicating that the bears are in command.
Support Levels: 181.00, 180.50, 179.00.
Resistance Levels: 182.25 (20-day SMA), 182.50, 183.00.
GBP/JPY Daily chart
-638248777249918137.png)
- Gold price could be on the verge of a correction as per resistance, but the bulks are still in control.
- A move through the current resistance of the $1,970s opens risk for a test of the $1,983 highs.
- Gold price bears eye the 61.8% ratio to the downside in line with $1,932 support.
Gold prices edged higher on Thursday while the Greenback continued lower as data continue to dictate the market's sentiment. US Treasury yields were the driver on yet another report that showed slowing US price pressures, pushing investors to add risk.
This benefitted the Gold price that was already glowing on the United States reported inflation report that showed that the Consumer Price Index rose by just 3% annualized in June, which was down from a 4% rate in May. On Thursday, the price pressures were shown to have eased in June, with the Producer Price index rising 0.1% annualized from 1.1% in May.
The DXY is already down for the sixth straight day and traded at its lowest since April 2021 near 99.97. A close below 100.00 will open risk for a test of the late March 2022 low near 97.685. Looking to US Treasury yields, the 2-year traded as low as 4.622% today and has fallen nearly half a percentage point from last week’s peak near 5.12%.
Gold technical analysis
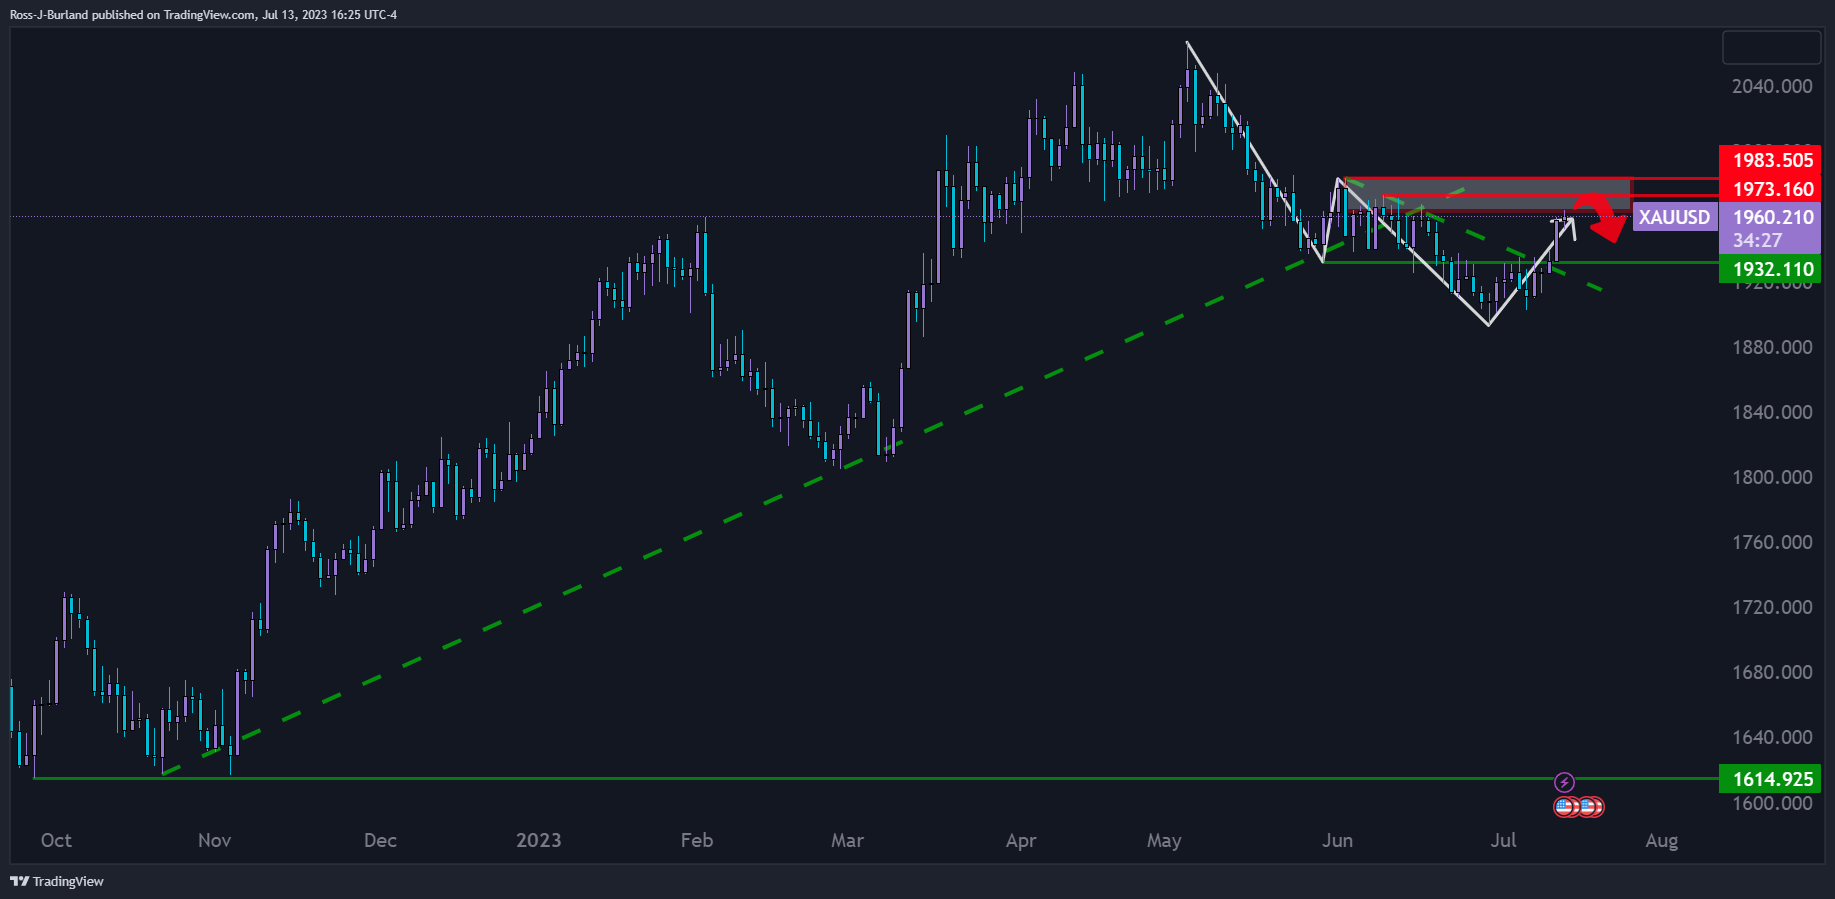
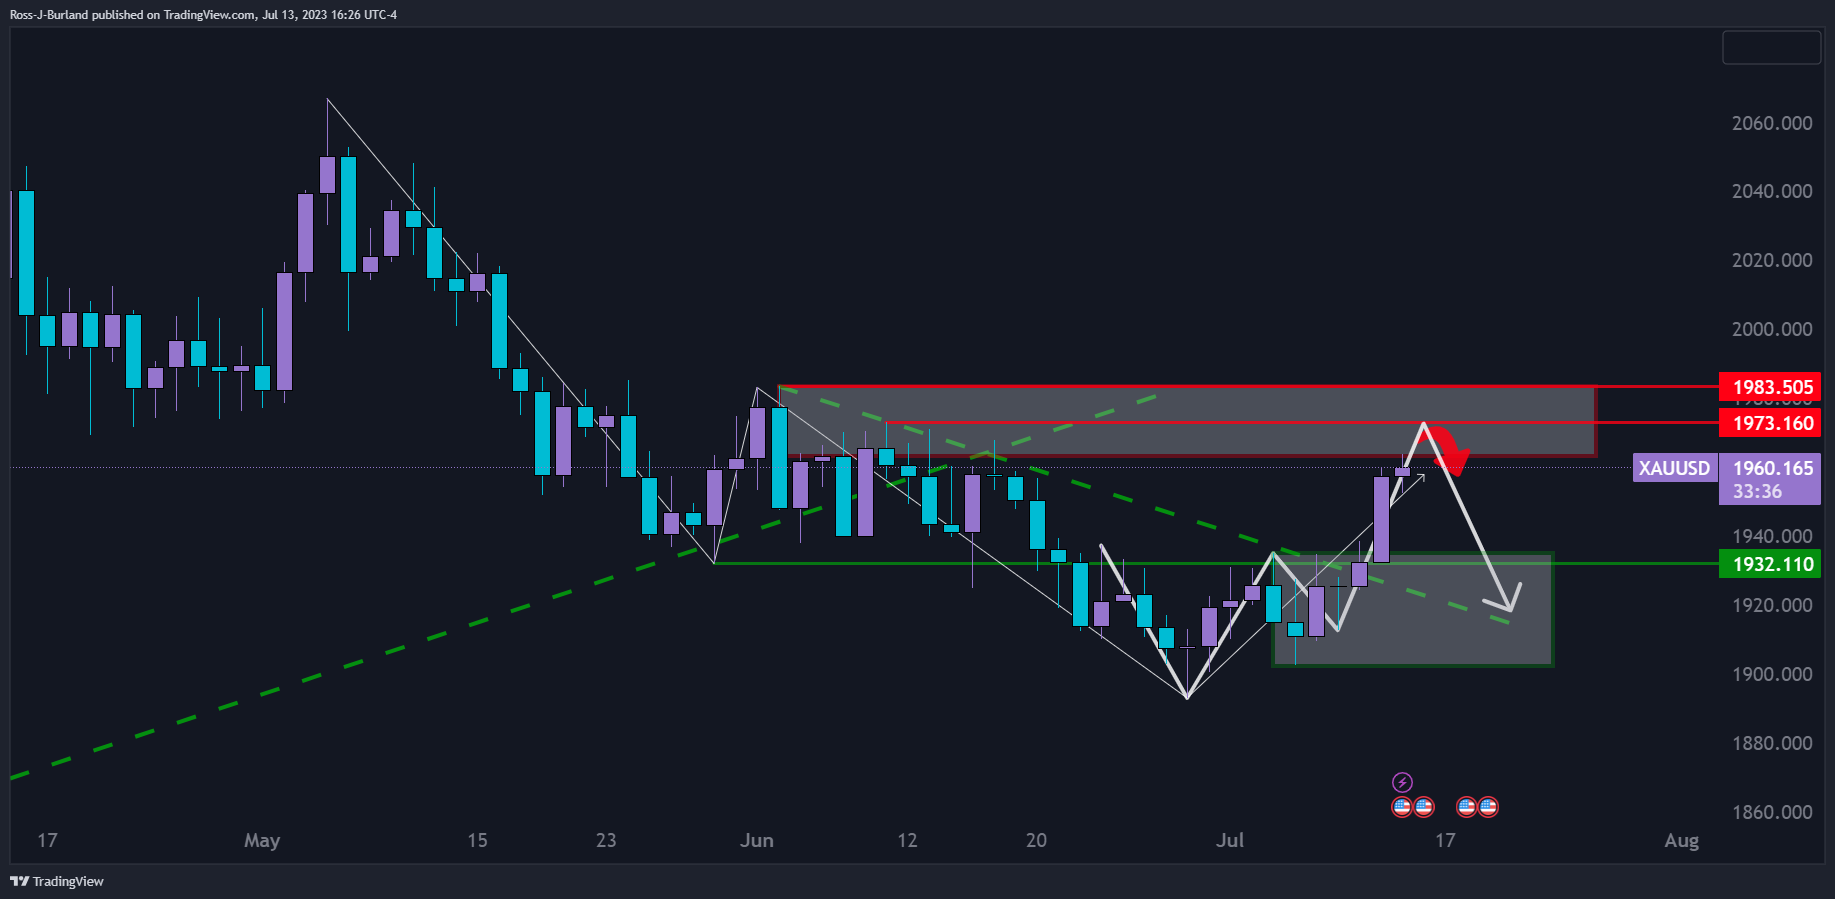
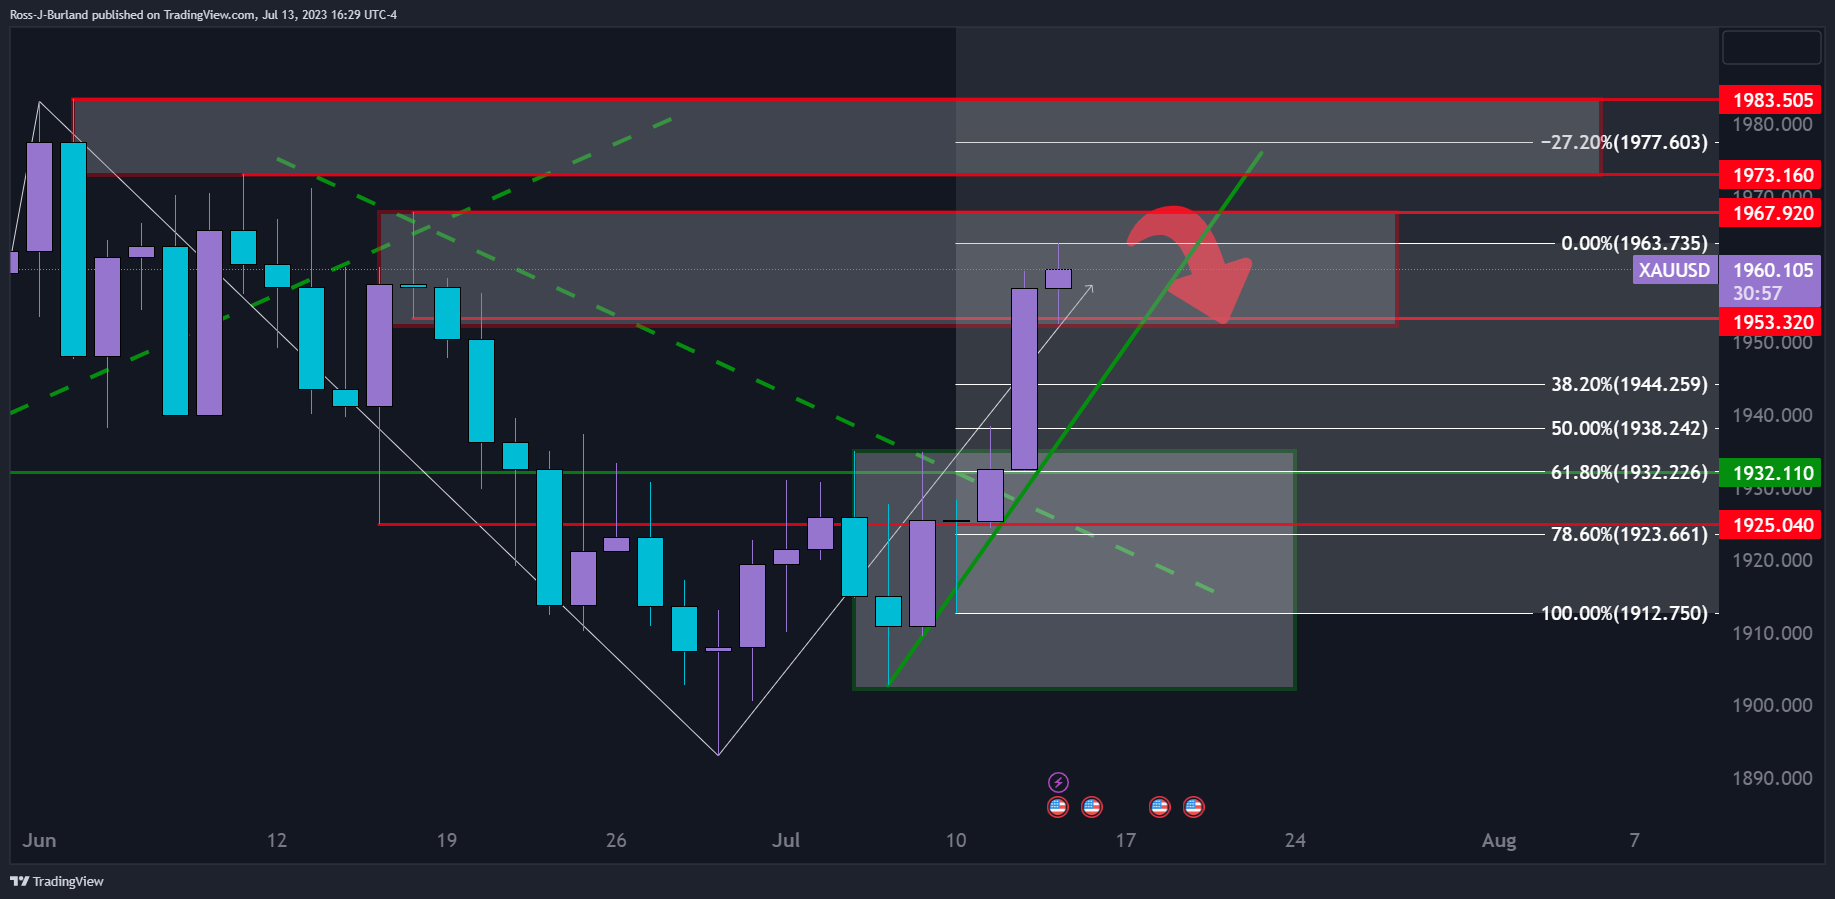
The daily charts show that the price is now in a resistance area and could be on the verge of a correction. The 61.8% Fibonacci retracement area is eyed as support to $1,932.
- US inflation seems to be easing, with June’s Producer Price Index (PPI) missing estimates and the previous month’s data. The Core PPI, excluding volatile items, also showed signs of weakening.
- The Federal Funds Rate (FFR) is expected to peak at 5.25%-5.50% for the remainder of the year, according to money market futures, despite softening inflation data.
- Japanese households expect higher inflation levels, averaging 10.5% for next year, well above the BoJ’s 2% target.
The USD/JPY extended its losses for the sixth consecutive trading session and broke to a new two-month low of 137.92 on speculations the US Federal Reserve would hike in July to reach its peak rates as inflation continued to ease. Hence, the USD/JPY is trading at 137.98, below the psychological 138.00 figure, after hitting a daily high of 138.95.
Yen strengthens as the USD softens, following disappointing US PPI data and low bond yields
Inflation in the United States (US) is edging lower after data revealed that the June Producer Price Index (PPI) missed estimates of the downside following Wednesday’s consumer inflation report. PPI expanded at a 0.1% YoY pace, beneath forecasts of 0.4%, and lower than May 1.1%, while Core PPI, which strips volatile items, showed signs of losing steam and expanded at a 2.4% YoY pace, below estimates of 2.6% and the previous month’s 2.8%.
Although the data would justify a pause on the Fed’s tightening cycle, money market futures think otherwise. According to the CME FedWatcth Tool, odds for a quarter of a percentage increase lie above 90%. Even though Fed Chair Jerome Powell and some of his colleagues expressed that “a couple” of increases are pending, investors pared those bets. That said, the Federal Funds Rate (FFR) is expected to peak at 5.25%-5.50% for the remainder of the year.
That would likely keep the greenback pressured, as shown by the US Dollar Index (DXY). The DXY, which tracks the buck’s performance against other currencies, tumbled to a new 15-month low of 99.741, losing 0.80%. Another factor weighed by lower inflation levels in the US is bond yields, with the US 10-year note rate sitting at 3.767%, down nine basis points.
Therefore, the USD/JPY has dropped 4% since July 6, mainly attributed to a soft US Dollar and lowes US bond yields.
On the Japanese front, households’ expectations for higher inflation levels put pressure on the Bank of Japan (BoJ). According to Reuters, “Households expect inflation to average 10.5% a year from now, the June survey showed, down from 11.1% in the previous survey but well above the BOJ’s 2% target.” That comes at the expense of BoJ Governor Kazuo Ueda’s stance to keep monetary policy loose until the BoJ sees clear evidence that inflation will persist at around 2%.
USD/JPY Price Analysis: Technical outlook
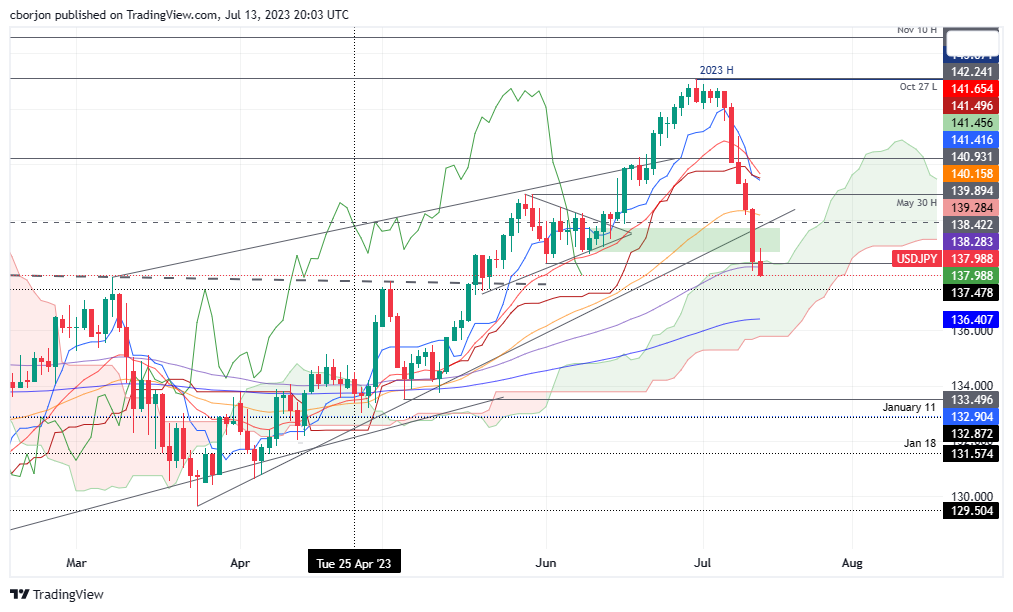
The USD/JPY has tumbled below the 100-day Exponential Moving Average (EMA) of 138.79, extending its downward path past the top of the Ichimoku Cloud. With USD/JPY prices dropping inside the Cloud suggests the trend is still strong. The Tenkan-Sen crossing below the Kijun-Sen, while the Chikou Span standing below the price action, means the USD/JPY shifted bearish and could threaten to edge lower. First support emerges at the 137.00 mark, followed by the 200-day EMA at 136.40. Conversely, if USD/JPY buyers reclaim 138.00, that could pave the way to regain the 100-day EMA, followed by the 139.00 figure.
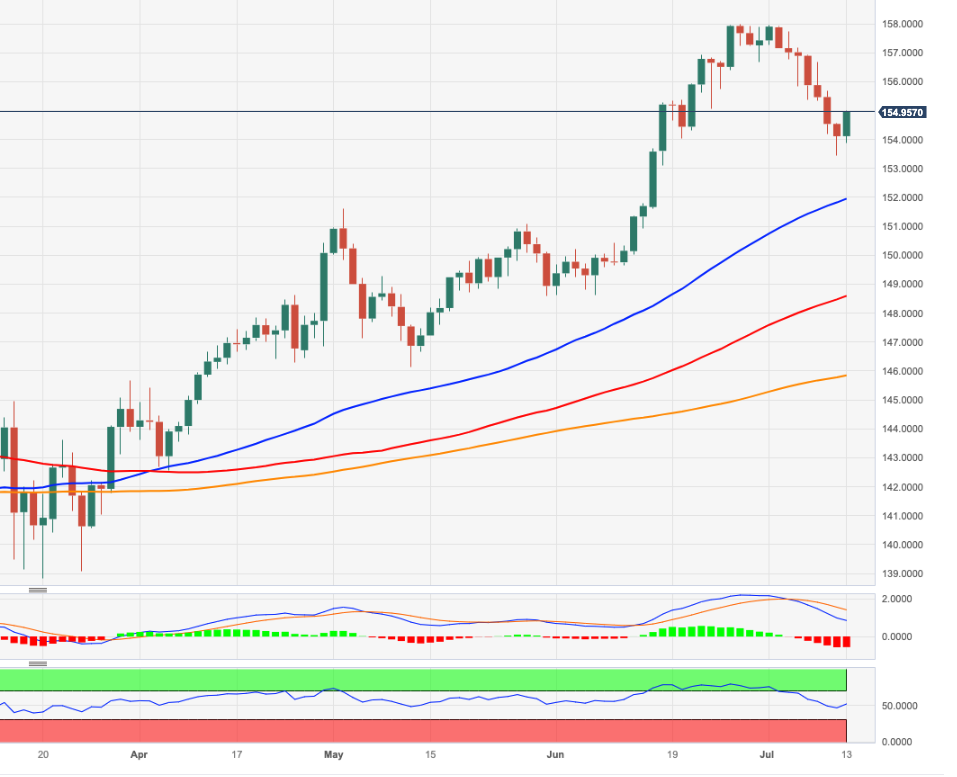
- EUR/JPY’s bulls gained ground following seven consecutive days of losses and jumped to 154.90.
- ECB’s accounts confirmed two additional hikes in 2023.
- China’s weak data weights on the JPY.
On Thursday, the EUR/JPY managed to stop the bleeding following a seven-day losing streak and jumped towards the 154.90 area. The Euro gained traction following the release of the European’s Central Bank (ECB) accounts from the June meeting, and the Yen lost ground against most of its rivals amid weak Chinese Trade Balance data.
ECB’s monetary policy accounts showed that most of the Governing Council supported a 25 basis points (bps) hike in June and confirmed that a minimum of two additional increases were needed. In addition, the members “could consider” hiking beyond July if necessary. That being said, the ECB’s tightening expectations remain steady. World Interest Rate Probabilities (WIRP) suggests that a 25 basis points (bps) hike is already priced in for the July meeting, and additional hikes of a quarter of a percentage points rise to 60% and 80% in September and October, respectively. The markets foresee no more hikes following December.
During the early Asian trading hours, China released that its trade surplus rose to $70.62 billion from $65.81 billion in June. In addition, Imports and Exports declined by 6.8% and 12.4% YoY respectively in the same period. In that sense, the Bank of Japan (BoJ) should monitor its biggest trading partner situation as it could aggravate the local economic downturn.
In addition, Japan's currency diplomat Masato Kanda cited that deflationary norms “may be changing” and that the BoJ is closely monitoring the FX markets. It's worth noticing that the JPY had gained ground in the previous session thanks to expectations on a Yield Control Curve (YCC) policy tweak by the BoJ, so any hints of a pivot may contribute to limiting the Yen’s losses.
EUR/JPY Levels to watch
According to the daily chart, the EUR/JPY still holds a negative outlook for the short term. Indicators display weakness, with the Relative Strength Index (RSI) and Moving Average Convergence Divergence (MACD) standing in negative territory. However, on the bigger picture the outlook favour the Euro as it holds above the 100 and 200-day Simple Moving Averages (SMAs)
Support Levels: 153.40, 153.00, 152.50.
Resistance Levels: 155.40, 156.17 (20-day SMA), 157.00.
EUR/JPY Daily chart
-638248742970352418.png)
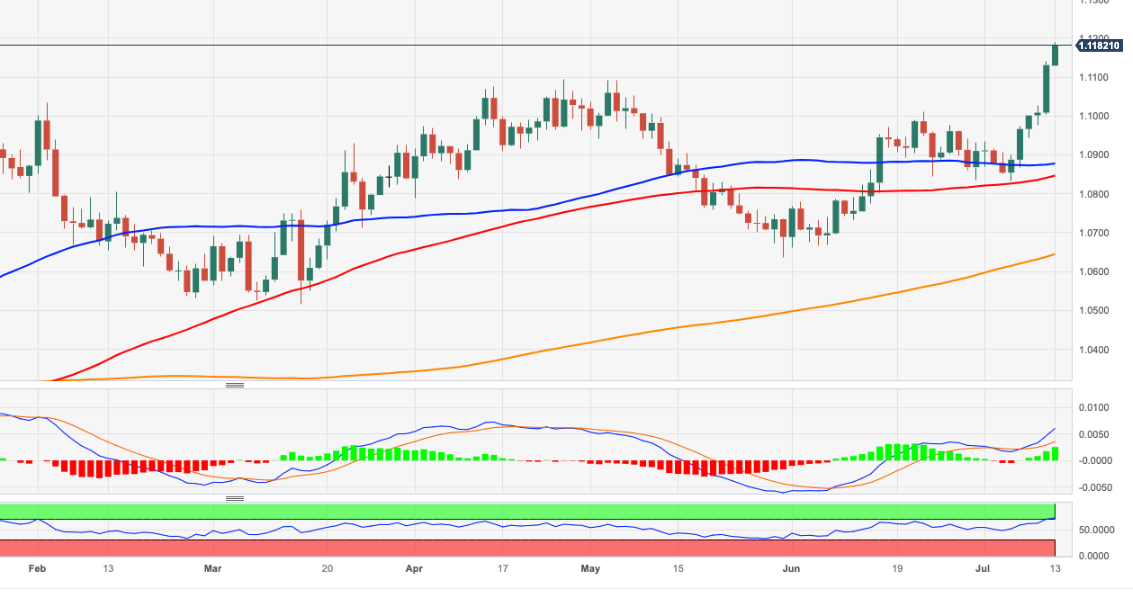
- EUR/USD bulls are in the market, but the trend could be ripening for a correction.
- Longs could face a squeeze into the end of the week and the charts below show the prospect of a correction.
EUR/USD has climbed by over 0.8%, to trade at its highest since April 2022 as markets foresee European Central Bank hiking another 50bp before cutting rates by about 65bp in H2 2024. Sentiment around the Federal Reserve has shifted more dovish further out which is seeing a waterfall slide in the Greenback this week after inflation data came in lower than expected.
EUR/USD weekly chart
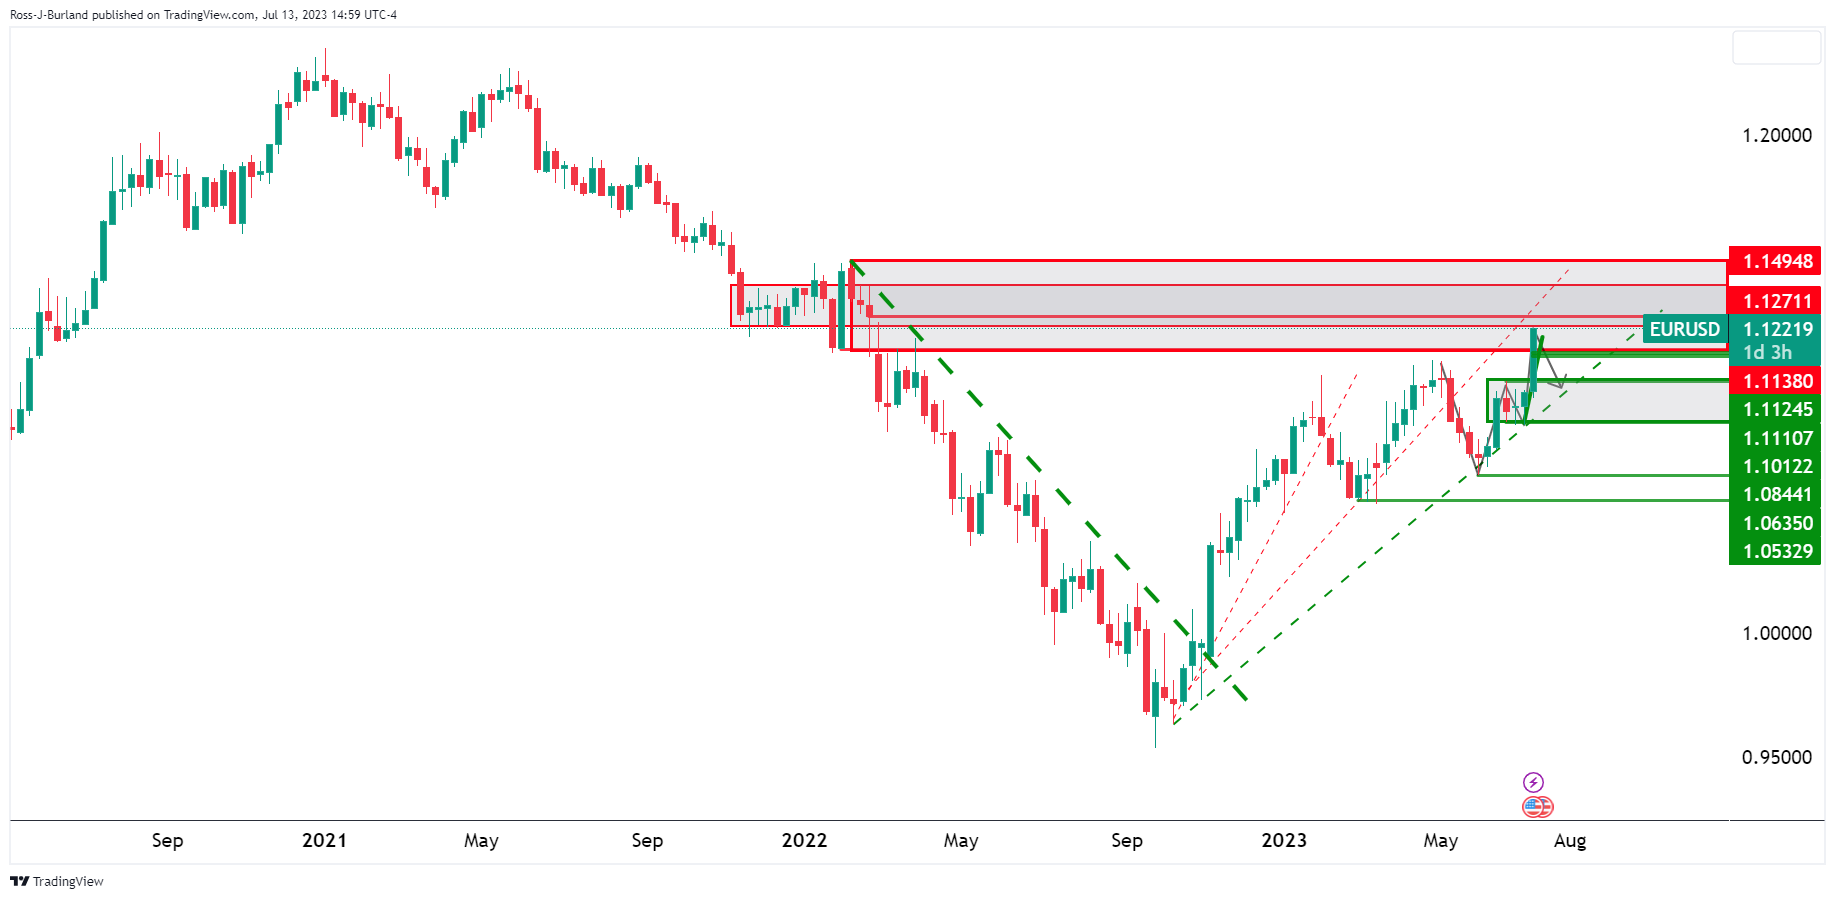
The weekly chart's W-formation is still in progress with the right-hand arm heading higher into supply territory.
EUR/USD daily chart
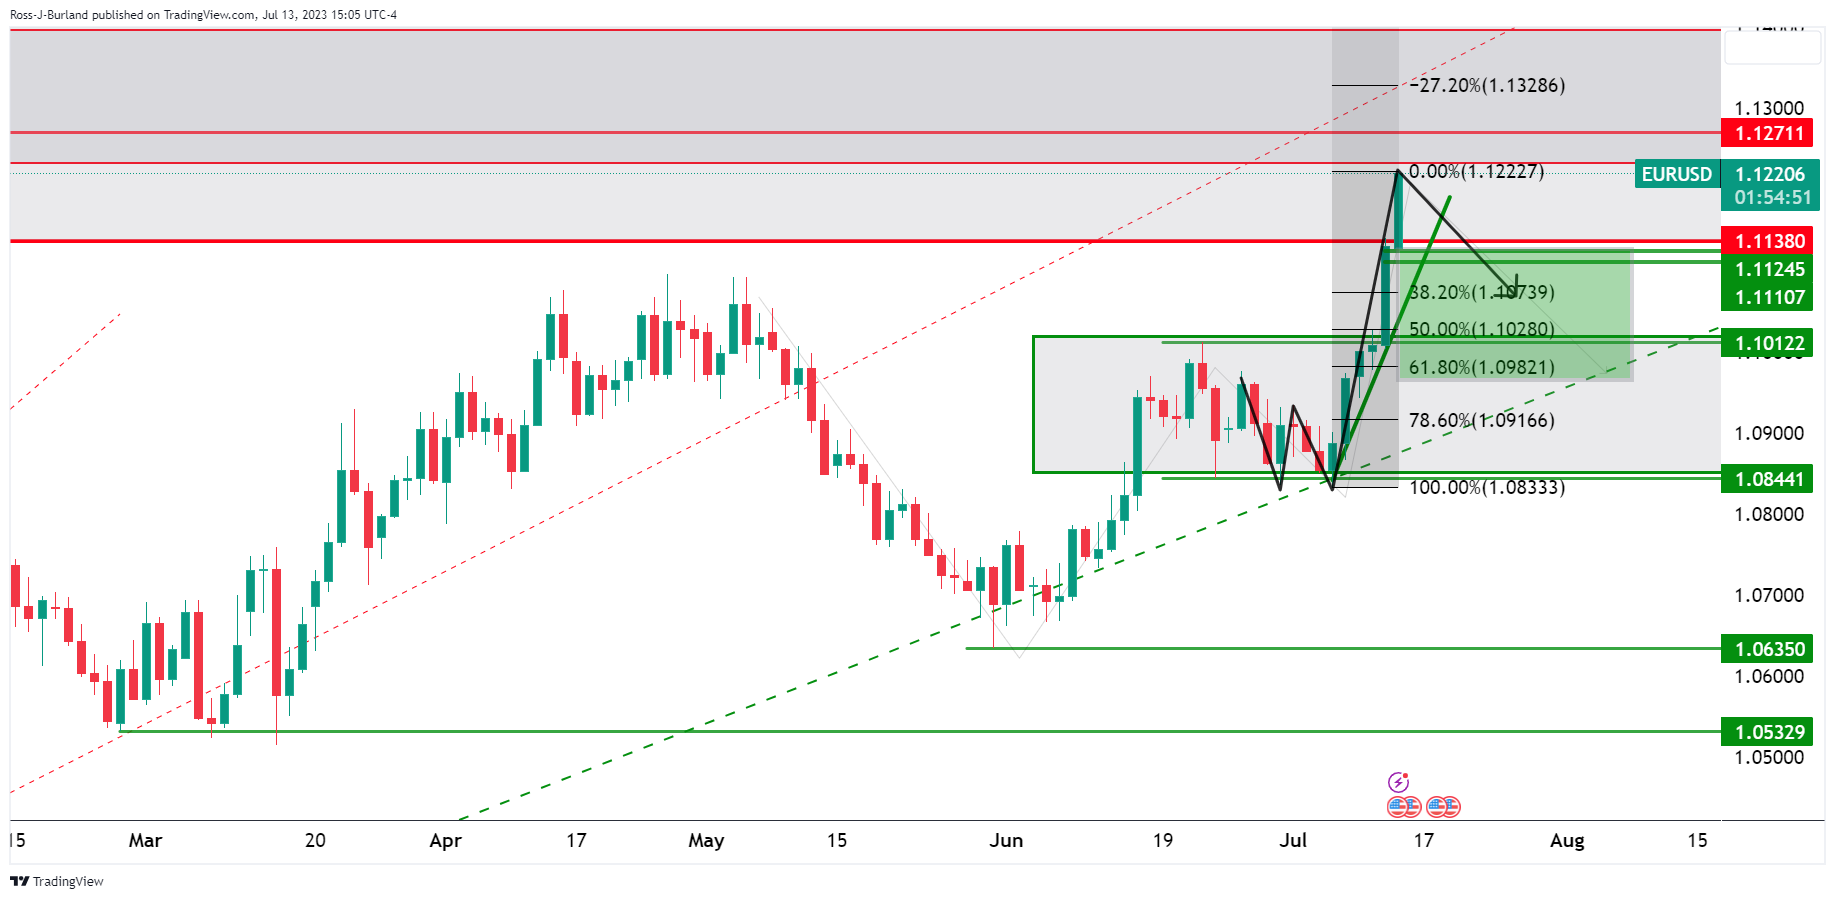
The daily chart's W-formation is over-extended, so there are fewer prospects of a move into the neckline. However, a 50% mean reversion is feasible.
EUR/USD H4 chart
EUR/USD is showing no signs of deceleration on the 4-hour chart at this juncture.
EUR/USD H1 chart
EUR/USD is petering out, perhaps, as per the hourly chart. The 38.2% ratio is in sight and breaking the 50% mean reversion area will likely set the scene for a deeper correction into London and New York.
- The US Producer Price Index (PPI) for June rose below estimates, suggesting a steady deceleration of inflation in the US.
- Initial Jobless Claims in the US were lower than estimated, although the focus remains on the Fed’s inflation targets.
- The UK missed a recession, though fears reignited as the Bank of England is expected to tighten monetary conditions.
GBP/USD rallies past the 1.3100 mark and is gaining close to 1% on Thursday, as overall US Dollar (USD) weakness extended amid speculations the Federal Reserve (Fed) is closing to finishing its tightening cycle after June’s PPI and CPI data was softer than expected. The GBP/USD is exchanging hands at 1.3111 after hitting a daily low of 1.2979.
Rising speculations of Fed’s tightening cycle ending spurs Sterling gains
GBP/USD accelerated its gains after the US Bureau of Labor Statistics (BLS) revealed that prices paid by producers, also known as the Producer Price Index (PPI) in June, rose below estimates, suggesting the deflation process in the US is gathering pace. PPI rose by 0.1% YoY, below forecasts of 0.4%, down ticked from May 1.1%. Core PPI, which strips volatile items, showed signs of losing steam and expanded at a 2.4% YoY pace, below estimates of 2.6% and the previous month’s 2.8%.
At the same time, the BLS informed that Initial Jobless Claims for the week ending July 5 climbed less than estimates of 250K, standing at 237K. Even though the data portrays a tight labor market, investors ignored it, as the Fed’s primary focus remained on inflation.
Despite the inflation downtrend continuing, the Federal Reserve is estimated to raise rates by 25 bps at the upcoming July meeting. However, bets for the rest of the year, paired as shown by November’s odds standing at 21%, according to CME FedWatch Tool.
On the UK front, the UK economy dodged a recession, as UK’s GDP growth for the last 3-months came at 0%, while month-over-month (MoM) figures in May dropped -0.1%, trailing April’s 0.2% expansion. Although the economy didn’t grow, concerns of a recession loom, as the Bank of England (BoE) is set to tighten monetary policy to curb high inflation at 8.6 percent levels.
GBP/USD Price Analysis: Technical outlook
the GBP/USD is set to test the 2021 yearly low of 1.3160 after storming through the 1.3000 figure, which didn’t last long enough, to refrain buyers from committing to open fresh long bets, that Sterling (GBP) would continue to edge higher. A decisive break above the former could put the 1.3200 figure on the table; otherwise, a healthy correction could send the pair dipping towards the 1.3100 psychological level before diving to July 12 daily high at 1.3000. Of note, the Relative Strength Index (RSI) is at overbought conditions, still shy of reaching the 80 levels, usually used as the extreme overbought area, after an asset witnessed a strong uptrend.
The US Treasury Department has announced that the government recorded a $227.8 billion deficit in June, which was larger than the expected deficit of $175 billion. Total receipts in June amounted $418 billion, while outlays were $646 billion.
In the same month last year, the deficit was $88 billion. So far, during the fiscal year 2023 (FY 2023), the fiscal deficit has reached $1,392 billion, which is $17 billion higher than the total deficit of FY 2022. July, August, and September are typically deficit-heavy months, so the final deficit for FY 2023 will likely be larger.
- USD/CHF recorded more than 0.85% losses on the day, falling below the 0.8600 mark.
- Following soft CPI and PPI figures from the US from June, investors take of the table an additional hike by the Fed past July.
- Jobless Claims decelerated in the week ending on July 7.
- Declining US Treasury yields made the DXY dive to lows since April 2022.
On Thursday, the USD/CHF tallied a six-day losing streak, falling below the 0.8600 mark for the first time since January 2015. In that sense, soft Consumer Price Index (CPI) and Produce Price Index (PPI) data from the US fueled a widespread USD weakness as its DXY index fell below the 100.00 level for the first time since April 2022.
The Producer Price Index (PPI) from the US from June came in at 0.1% MoM, less than the 0.2% anticipated, and the Core Figure came in at 2.4%, falling short of the 2.6% forecast. Furthermore, US Jobless Claims for the week ending July 7 slowed down. It was reported that 237K people filed their first state unemployment insurance claims, less than the consensus estimate of 250K and the previous figure of 249K.
The yields on US Treasury bonds are falling in response to the US data. The 2-year yield decreased to 4.62%, the 5-year rate to 3.85%, and the 10-year yield decreased to 3.77% all displaying more than 2% slides.
Despite this, the CME FedWatch tool indicates that investors continue to wager on a 25 basis point increase by the Federal Reserve (Fed) in July. The declining yields reflect a drop in the likelihood of a subsequent hike after July, which is now just about 15%, down from 40% at the beginning of the week.
On the CHF’s side, investors will eye the release of the Producer Price Index from Switzerland from June on Friday, expected to decline 0.2% MoM from the previous 0.3% reading.
USD/CHF Levels to watch
According to the daily chart, the daily chart suggests a bearish outlook for the USD/CHF. However, the Relative Strength Index (RSI) pierced through the oversold threshold of 70.00, suggesting that an upwards correction may be on the horizon to consolidate the latest downward movements.
If there is an upwards correction, short-term resistance levels line up at 0.8665, 0.8700 and 0.8750. In case bears continue to gain momentum, supports are seen at 0.8500, 0.8360 and 0.8300 (January 15, 2015 low).
USD/CHF Daily chart
-638248651410489613.png)
- USD/MXN recovers slightly after touching multi-year lows of 16.8083 but stays below the 17.0000 figure.
- Initial Jobless Claims in the US rose less than expected, while US Producer Price Index (PPI) for June grew by 0.1% MoM, less than estimates.
- With no Mexican economic data, USD/MXN traders are focused on US dynamics.
USD/MXN resumes its downtrend after touching muti-year lows of 16.8083, remains below the 17.0000 figure on Thursday after data from the United States (US) shows the Federal Reserve’s (Fed) job is about to be achieved, as inflation continues to edge lower. At the time of writing, the USD/MXN is trading at 16.8682 after hitting a daily high of 16.9619.
Mexican peso gains ground as US Dollar weakens amid lower-than-expected jobless claims, PPI
The USD/MXN drops due to improved risk appetite, to the detriment of safe-haven peers, like the US Dollar (USD). Data from the US Department of Labor (DoL) revealed that Initial Jobless Claims for the last week climbed less than estimates of 250K, standing at 237K. The Fed’s Beige Book showed that demand for labor “remained healthy” in June, though it noted that hiring “was getting more targeted and selective.”
At the same time, the US Producer Price Index (PPI) for June expanded by 0.1% MoM, exceeding May’s 0.4% plunge but was beneath estimates of 0.2%. On year-over-year (YoY) figures, PPI grew 0.1%, below forecasts of 0.4%, while the Core PPI, which excludes volatile items, increased 0.1% MoM, unchanged from May, accelerating below estimates of 0.2%. Yearly Core PPI cooled down compared to expectations of 2.6% and came at 2.4%. Hence PPI data followed suit with a soft US CPI report that could refrain Fed officials from lifting rates twice, as they previously commented after the FOMC’s June meeting.
An absent Mexican economic docket leaves USD/MXN traders focused on the US dynamics. As long as the interest rate differential between the US and Mexico favors the latter, further downside is expected. However, traders must know that political risks are beginning to boil in Mexico as general elections loom for June 2024.
USD/MXN Price Analysis: Technical outlook
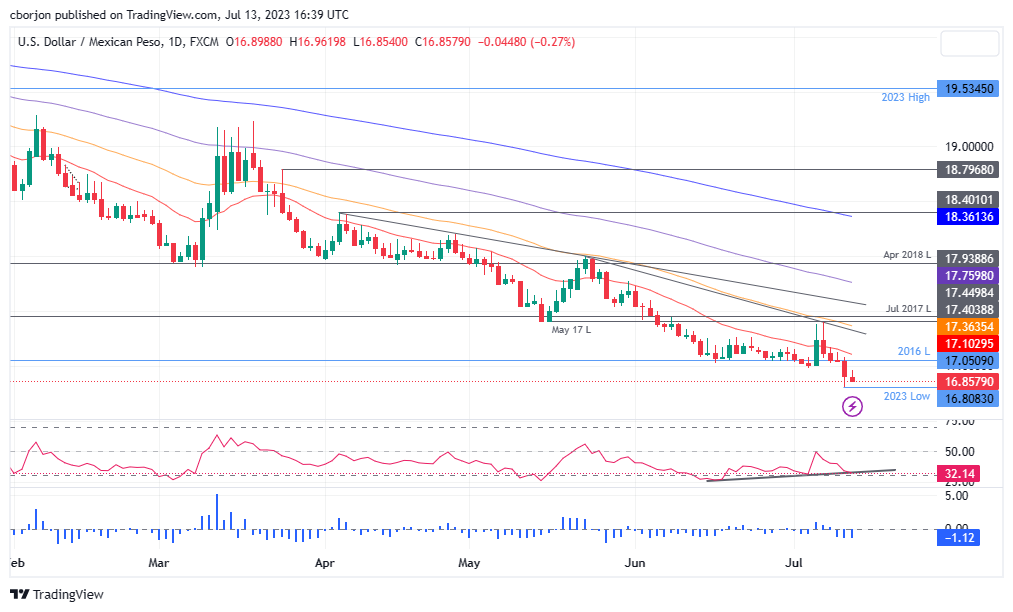
The USD/MXN downtrend would likely continue as the pair remains below the 17.00 mark. Sellers eyeing the October 2015 swing low of 16.3267 keeps the USD/MXN pressured, with the next support eyed at 16.5000 before sellers reclaim the latter. The following support would emerge at 16.00. Conversely, if USD/MXN buyers regain the 17.0000 figure, it could exacerbate a recovery toward the 20-day Exponential Moving Average (EMA) at 17.1073 short term. The USD/MXN must surpass the 17.4038 area to switch the bias to neutral.
- The XAG/USD records more than 2% gains on the day, jumping to the $24.70 area.
- Following soft CPI figures on Wednesday, weak PPI on Thursday applied further pressure on the US Dollar.
- Falling US Treasury yields and dovish bets on the Fed allowed precious metals to advance.
The XAG/USD recorded a fifth consecutive day of gains and jumped to its highest level since mid-May towards the $24.70 area. In that sense, following soft Consumer Price Index (CPI) and Produce Price Index (PPI) data from the US, investors refrained from betting on an additional hike from the Federal Reserve (Fed) past July which made the US yields decline across the board.
The Producer Price Index (PPI) came in at 0.1% MoM, which waslower than the 0.2% expected, while the Core Figure came in at 2.4% YoY, failing to match the expectations of 2.6%. In addition, US Jobless Claims for the week ending on July 7 decelerated. The number of people filing first-time claims for state unemployment insurance came in at 237K, lower than the consensus of 250K and its previous figure of 249K.
The US Treasury yields, which could be seen as the opportunity cost of holding non-yielding metals, continue to decrease following Wednesday’s soft CPI figures. The 2-year yield fell to 4.86%, the 5-year rate to 4%, and the 10-year yield to 3.80%. The 2-year and 5-year rates are displaying a 6% decline on the week, and the 10-year nearly a 3% fall, allowing the XAG/USD to advance.
According to the CME FedWatch tool, investors continue to bet on a 25 basis point hike by the Federal Reserve (Fed) in July. The falling yields reflect the decline in the odds of an additional hike following July which stand near 15% vs 40% at the start of the week.
XAG/USD Levels to watch
The daily chart suggests a (very) bullish outlook for the grey metal for the short term. The price trades above its main Simple Moving Averages (SMAs) of 20, 100 and 200 days while technical indicators hint at a strong bullish momentum. In that sense, the Relative Strength Index (RSI) points north near overbought conditions while the Moving Average Convergence Divergence (MACD) prints rising green bars.
Resistance Levels: $25.00, $25.30, $25.60.
Support Levels: $24.05, $23.50 (100-day SMA), $23.10 (20-day SMA),.
-638248594415611915.png)
In an interview with CNBC on Thursday, San Francisco Federal Reserve President Mary Daly said it was too early to declare victory on inflation, as reported by Reuters.
Additional takeaways
"Hard to say wage growth is going to lead inflation down."
"We still have an economy with a lot of momentum."
"We need to move rates up to restrictive territory."
"Policy effects need to go through the system."
"As inflation starts coming down, we can start lowering the nominal rate to bring real rates down to neutral level."
"We want to start heading towards the neutral rate as we approach 2% on inflation."
"Right now, all of my attention is on decidedly if we need to hike more and how much more we need hike in order to really get inflation heading down to 2%."
Market reaction
These comments failed to help the US Dollar find demand. As of writing, the US Dollar Index was down 0.55% on the day at 100.00.
- NZD/USD trading at 0.6378 extends gains vs. the USD, bolstered by recent US inflation data.
- US Producer Price Index (PPI) for June rose by 0.1% MoM, slightly below estimates of 0.2%, indicating slowing factory inflation in the US.
- Initial Jobless Claims in the US for the week ended July 6 were less than expected, suggesting a tight labor market.
The New Zealand Dollar (NZD) extends its gains vs. the US Dollar (USD), spurred by recent inflation data in the United States (US) on the consumer side, registered a solid deceleration. Also, today’s economic docket prompted speculations the Federal Reserve (Fed) is about to end its tightening cycle. At the time of writing, the NZD/USD is trading at 0.6378.
US inflation data spurs speculation about Fed’s tightening cycle, boosting Kiwi
A risk-on impulse favors risk-perceived Forex currencies like the Kiwi (NZD), contrarily to the safe-haven greenback. On Thursday, the US Bureau of Labor Statistics (BLS) delivered inflation and labor market data, crucial for the Fed, which Is expected to lift rates 25 bps at the July meeting. The US Producer Price Index (PPI) for
US Producer Price Index (PPI) for June rose by 0.1% MoM, exceeding May’s 0.4% plunge but was beneath estimates of 0.2%. Annually based, PPI expanded by 0.1%, below forecasts of 0.%. The so-called Core PPI, which strips out volatile items, rose by 0.1% MoM, unchanged from May, and accelerated below estimates of 0.2%. Yearly Core PPI cooled down compared to expectations of 2.6% and came at 2.4%. The data showed the also called factory inflation is slowing down, in tune with Wednesday’s CPI report, which witnessed a 1% drop in CPI towards the 3% threshold.
In other data, the BLS revealed Initial Jobless Claims for the week ended July 6, jumping 237K, below the estimates of 250K, portraying a tight labor market. The Fed’s Beige Book showed that demand for labor “remained healthy” in June, though it noted that hiring “was getting more targeted and selective.”
The NZD/USD reacted upwards to the data, hitting a daily high of 0.6394, before retracing some pips, to current spot prices.
Data on the New Zealand (NZ) front, even though it was weaker, with the manufacturing sector contracting in June to its lowest level since November 2022, it was ignored by investors. Even the latest monetary policy decision of the Reserve Bank of New Zealand (RBNZ) of keeping rates unchanged does little to cramp NZD/USD uptrend.
NZd/USD Price Analysis: Technical outlook
The NZD/USD daily chart portrays the pair as neutral-upwards, threatening to extend its gains past the February 14 swing high at 0.6389, which could put into play 0.6400 if cleared. Once the figure is reclaimed, the NZD/USD yearly high of 0.6538 would be at the brisk of being challenged. Nonetheless, traders must achieve a daily close above 0.6389 to cement the case for higher prices. Conversely, the NZD/USD first support would be the 0.6300 mark. Sellers would keep a close eye, as they would like to test the 200-day EMA at 0.6223, but firstly they must reclaim June 16 daily high turned support at 0.6248, as they eye the 0.6200 barrier.
A spokesperson for the International Monetary Fund (IMF) said on Thursday that slowing exports and weaker private investment cause China's growth momentum to slow, per Reuters.
"The overall picture of growth in China is one of slowing economy, consistent with the IMF forecasts in April," the spokesperson added. "Subdued inflation in China is due to weaker demand, slack in the economy after strong reopening in the first quarter."
Market reaction
These comments don't seem to be having a noticeable impact on risk mood. As of writing, the S&P 500 Index was up 0.6% on the day.
The Riksbank delivered in June but was unable to convince the market. Economists at Commerzbank analyze the Swedish Krona outlook.
No upside potential for the time being
Although the Riksbank raised the key interest rate in June, it is not acting decisively enough against inflation risks compared to the European Central Bank. Therefore, the SEK will probably not have much upside potential this year.
Only next year, when the tide turns in favour of the Riksbank, should the Krona appreciate again.

Source: Commerzbank Research
Gold price has recovered and is back to $1,950. Economists at Commerzbank analyze the yellow metal’s outlook.
Further upside potential towards the end of the year
The recent weakening of the Gold price is likely to have come to an end, now that the market has significantly scaled back its expectations of further US interest rate hikes.
We even see some further upside potential towards the end of the year. Because by then at the latest it should be clear that the US rate hike cycle is over.

Source: Commerzbank Research
Slowing inflation adds to headwinds for the US Dollar, economists at UBS report.
Inflation continued to soften
US consumer price inflation slowed markedly in June, rekindling hopes that the Fed could soon be able to call an end to its fastest rate-hiking cycle since the 1980s. Annual headline inflation for the month was 3%, down from 4% the prior month and the smallest increase since March 2021.
Core inflation, which excludes volatile food and energy prices, rose 4.8%, decelerating from 5.3% in May and coming in below the consensus forecast of economists. There were even promising signs that services sector inflation, which has been a major concern for policymakers, is cooling. Services excluding housing and energy decelerated to a 4% annual advance, also the smallest increase since late 2021.
Despite the good news on inflation, our view is that the Fed will be reluctant to declare victory just yet. But the data do support our base case that an end to hikes is now in sight, which will add to pressure on the US Dollar.
USD/CAD could now break below 1.3000 quite soon, economists at ING report.
Loonie has the best volatility-adjusted carry in the G10 space
The extra hike by the BoC and no pushback against further moves in the future mean that CAD can keep benefitting from an attractive carry.
It’s worth remembering that the Loonie has the best volatility-adjusted carry in the G10 space. We don’t necessarily see this as the inception of a broader USD downtrend, but the close USD/CAD correlation also means that CAD is more shielded in the event of a USD rebound than other pro-cyclical currencies.
A move below 1.3000 is surely possible in the coming weeks, although we may need to wait the fourth quarter of this year to see USD/CAD sustainably trade around 1.27/1.28.
Economists at Nordea continue to think that the 25 bps hike very likely seen at the July meeting will be the last one in this cycle.
Another 25 bps rate hike in July is close to a done deal
The European Central Bank continues to see more tightening warranted, and another hike in July appears a done deal.
Upside inflation risks need to ease further and the impact of tighter policy to strengthen for the ECB to stop after July, which remains our baseline.
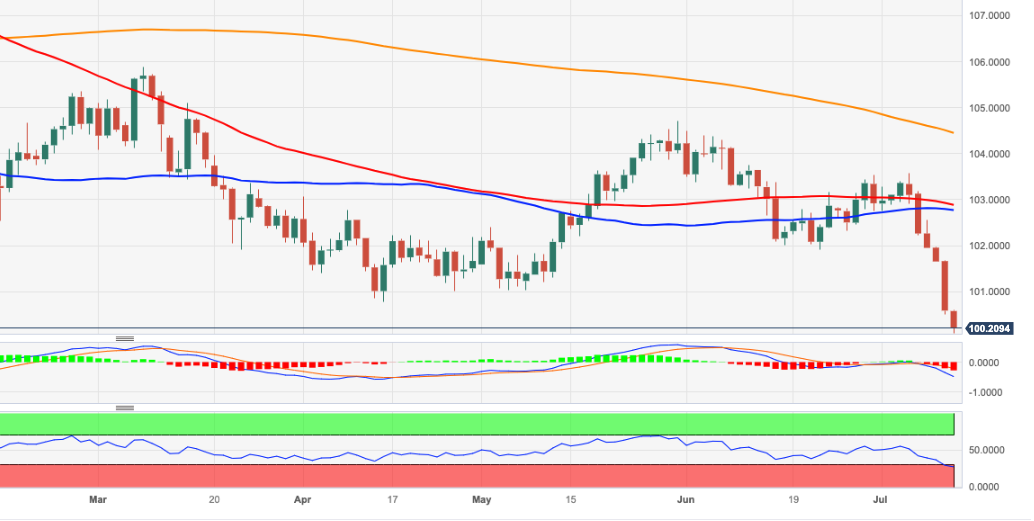
- USD/JPY has found an intermediate cushion near 138.50. More downside is expected as US PPI has softened significantly.
- The monthly headline and core PPI expanded by 0.1% but at a slower pace than the consensus of 0.2%.
- A significant decline in US factory gate prices indicates that household demand has dropped sharply.
The USD/JPY pair has gauged intermediate support near 138.50 in the early European session. The asset has attempted a recovery move after building a base around 138.50, however, more downside seems favored as the United States Producer Price Index (PPI) has softened more than expected.
The monthly headline and core PPI expanded by 0.1% but at a slower pace than expected by the market participants at 0.2%. On an annualized basis, headline prices at factory gates have decelerated dramatically to 0.1% vs. the consensus of 0.4% and the former release of 0.9%. Additionally, core PPI has softened to 2.4% against the estimates of 2.65 and the prior release of 2.8%.
After the soft inflation report, a significant decline in factory gate prices indicates that price pressures are declining broadly. Also, households’ demand has dropped sharply which has forced producers to grip retail prices.
The pace of softening in inflation and the PPI report is going to encourage the Federal Reserve (Fed) to skip the policy-tightening spell for the second time.
Apart from the PPI report, weekly Initial Jobless Claims have also been released for the week ending July 07. The US Department of Labor has reported that first-time claimers were 237K vs. expectations of 250K and the former release of 249K.
S&P500 is expected to open on a bullish note, considering positive gains made in the overnight session. US equities have remained firm as soft inflation has trimmed fears of a recession significantly. The US Dollar Index (DXY) has continued its decline to near 100.15.
On the Japanese Yen front, Japan's top currency diplomat Masato Kanda cited that deflationary norms may be changing. Kanda added the government is closely watching FX market moves.
- EUR/USD prints new 2023 peaks around 1.1190.
- Immediately to the upside emerges the 1.1200 barrier.
EUR/USD extends the monthly bullish performance and approaches the 1.1200 hurdle for the first time since February 2022.
The continuation of the upside momentum is expected to revisit the round level at 1.1200 in the very near term. Once this level is cleared, a probable visit to the 2022 high at 1.1495 (February 10) could start emerging on the horizon.
Looking at the longer run, the positive view remains unchanged while above the 200-day SMA, today at 1.0643.
EUR/USD daily chart
-
Canadian Dollar continues rallying against the US Dollar on Thursday after the BoC’s decision to raise rates at its meeting on the previous day.
-
The Bank of Canada cited Canada’s robust economic growth as the main reason for raising rates as it fears inflationary forces building.
-
USD/CAD falls close to the June lows in 1.31s, threatening a break, but tough support below likely to prevent deeper sell-off.
Canadian Dollar (CAD) continues rising versus the US Dollar (USD), on Thursday, in the aftermath of the Bank of Canada’s (BoC) decision to raise interest rates by 0.25% and its open-ended, data-driven approach to forward guidance.
USD/CAD is trading in the upper 1.31s as the US session gets underway.
Canadian Dollar news and market movers
-
The Canadian Dollar trades higher after the BoC raises interest rates by 0.25%, bringing the overnight rate to 5.00% at its meeting on Wednesday.
-
Higher rates are positive for CAD (negative for USD/CAD) as they attract more foreign capital inflows increasing demand for the currency.
-
Governor Tiff Macklem stressed future policy decisions would be dependent on incoming data, leaving markets unclear on whether this would be the BoC’s last hike in the tightening cycle.
-
The decision to raise rates at the July meeting had only been reached after a discussion by board members on the relative merits of leaving rates unchanged or raising them.
-
“On balance, our assessment was the cost of delaying action was larger,” Macklem concluded.
-
Regarding inflation, the BoC Governor said that whilst it was welcome inflation in Canada had fallen to 3.4% in May – substantially below the 8.1% of last summer – a large number of items in the basket of goods used to calculate the Consumer Price Index (CPI) were still rising strongly.
-
“A little over half the components of the CPI basket,” had seen their prices rising more than 5%, said Macklem in the press conference after the announcement. “If you look across the basket, meat is up 6%, bread is up 13%, coffee is up 8%, baby food is up 9% … rent is up 6%,” he added.
-
Demand and consumption in the Canadian economy were still growing, said Macklem, indicating the possibility of inflation pressures ahead.
-
The sensitive housing market had also defied expectations of a slow-down and was instead showing signs of picking up despite higher interest rates increasing mortgage repayments.
-
Recent labor market stats showed 60K new jobs were filled in Canada in June, more than three times the estimated 20K. Average Hourly wages rose 3.9%, which though lower than the previous month’s 5.1%, was nevertheless buoyant. Despite the strong jobs number, the report also showed the Unemployment Rate unexpectedly rising to 5.4% from 5.2% in the previous month, and higher than the 5.3% forecast.
-
All in all, the overall positive macroeconomic data from the Canadian economy leant the BoC governing council to make their decision to raise rates to stave off incoming inflationary effects rather than wait and see.
-
The BoC does not now see inflation returning to its 2% target until the middle of 2025, about 6 months later than its previous forecast.
-
Although the Canadian Dollar rose on the BoC announcement, a growing number of analysts foresee a harsher climate for the currency in the second half of 2023.
-
Analysts at National Bank of Canada, Macquarie and Nomura Bank all foresee the CAD weakening in H2 of 2023.
-
“Our bearish view for the second half 2023 remains predicated on the prospect that Canada will suffer a more severe slowdown than the U.S.,” said Thierry Wizman, global currencies and interest rate strategist at Macquarie Futures USA.
-
Wizman cites the negative impact higher interest rates will have on the Montreal Housing market as a major driver of a weaker CAD later in the year.
-
“The rise in rates has already happened and households will begin to feel the squeeze as fixed-rate mortgages are rolled over at higher rates,” Wizman said, in a note quoted by the Financial Post.
-
Nomura sees rate differentials and greater growth in the US as driving USD/CAD higher.
-
The negative effect of a global economic slowdown on commodity prices negatively impacting Canada's terms of trade is the main factor dragging CAD down, according to National Bank of Canada in a note cited on Poundsterlinglive.com.
-
The US Federal Reserve is almost certain to raise rates at its July 26 meeting, given the 5.3% Core CPI still prevalent in the US, which will probably boost the US Dollar.
-
Despite Wednesday’s lower-than-expected US inflation data, market gauges of the probability of a further rate hike from the Fed at their July 26 meeting put the chances at above 90%, although any further hikes in 2023 are now less probable than the Fed standing pat.
Canadian Dollar Technical Analysis: June lows threatened
Despite recent weakness, USD/CAD is in a long-term uptrend on the weekly chart, which began at the 2021 lows. Since October 2022, the exchange rate has been in a sideways consolidation within that uptrend. Given the old saying that ‘the trend is your friend’, however, the probabilities of an eventual continuation higher marginally favor longs over shorts.
USD/CAD appears to have completed a large measured move price pattern that began forming at the March 2023 highs. This pattern resembles a 3-wave ABC correction, in which the first and third waves are of a similar length (labeled waves A and C on the chart below).
USD/CAD’s measured move looks like it has completed, given waves A and C are of a similar length. This suggests price probably bottomed at the June 27 lows and is now at the start of a new cycle higher.
-638248499864483916.png)
US Dollar vs Canadian Dollar: Weekly Chart
A confluence of support situated under the June lows in the upper 1.3000s, which is made up of several longer moving averages and a major trendline, provides a backstop to further losses. Only a decisive break below 1.3050 would indicate this thick band of weighty support has been definitively broken, bringing the uptrend into doubt.
-638248499434094636.png)
US Dollar vs Canadian Dollar: Daily Chart
The daily chart shows USD/CAD recovered to just shy of the 1.3400 crossroads where the 50-day Simple Moving Average (SMA) is located, last Thursday, before reversing lower.
It has since declined all through this week and is now threatening the June 27 lows at 1.3117. It is possible that price may break below those lows – however, it is unlikely to go much lower immediately below them is the confluence of support situated between 1.3080-1.3100. Only a clean break below 1.3050 would reverse the trend and suggest a much more bearish picture for USD/CAD.
More likely, the pair will retest the level of the June 27 lows and then recover again as it forms a complex basing pattern before eventually going higher.
It will take a decisive break above the 50-day SMA, however, to reinvigorate the USD/CAD uptrend again. Bulls marginally have the upper hand, with the odds slightly favoring a recovery and a continuation higher.
Bank of Canada FAQs
What is the Bank of Canada and how does it influence the Canadian Dollar?
The Bank of Canada (BoC), based in Ottawa, is the institution that sets interest rates and manages monetary policy for Canada. It does so at eight scheduled meetings a year and ad hoc emergency meetings that are held as required. The BoC primary mandate is to maintain price stability, which means keeping inflation at between 1-3%. Its main tool for achieving this is by raising or lowering interest rates. Relatively high interest rates will usually result in a stronger Canadian Dollar (CAD) and vice versa. Other tools used include quantitative easing and tightening.
What is Quantitative Easing (QE) and how does it affect the Canadian Dollar?
In extreme situations, the Bank of Canada can enact a policy tool called Quantitative Easing. QE is the process by which the BoC prints Canadian Dollars for the purpose of buying assets – usually government or corporate bonds – from financial institutions. QE usually results in a weaker CAD. QE is a last resort when simply lowering interest rates is unlikely to achieve the objective of price stability. The Bank of Canada used the measure during the Great Financial Crisis of 2009-11 when credit froze after banks lost faith in each other’s ability to repay debts.
What is Quantitative tightening (QT) and how does it affect the Canadian Dollar?
Quantitative tightening (QT) is the reverse of QE. It is undertaken after QE when an economic recovery is underway and inflation starts rising. Whilst in QE the Bank of Canada purchases government and corporate bonds from financial institutions to provide them with liquidity, in QT the BoC stops buying more assets, and stops reinvesting the principal maturing on the bonds it already holds. It is usually positive (or bullish) for the Canadian Dollar.
The disinflation trend continued in June. While this will not derail a July Fed hike, it increases ABN Amro’s conviction that this will be the final rate rise.
June disinflation will not derail a July Fed hike
While the Fed will welcome further disinflationary progress, the June CPI report is unlikely to prevent the FOMC from hiking by another 25bp when it meets on 24-25 July, given the stickiness in labour-intensive services inflation and the broader resilience in other macro indicators in the US.
However, the report gives us greater conviction that July will be the last hike of the current cycle, with a September hike looking unlikely assuming current data trends persist. Our base case continues to be for the Fed to start cutting rates next March. Still, we continue to see a risk that stickier services inflation keeps broader price growth above the Fed’s target in the medium term, with the risk therefore tilted towards rates staying restrictive for longer.
- DXY extends the sell-off to the 100.15/10 band, new YTD lows.
- A test of the key 100.00 support looms closer.
Further downside bias drags DXY to new 2023 lows in the 100.15/10 band on Thursday.
The continuation of the decline of the dollar looks the most likely scenario for the time being. Against that, the index now targets the psychological 100.00 yardstick ahead of the weekly low of 99.81 (April 21 2022).
Looking at the broader picture, while below the 200-day SMA at 104.44, the outlook for the index is expected to remain negative.
DXY daily chart
Markets Strategist at UOB Group Quek Ser Leang comments on the recent price action and prospects for EUR/USD.
Key Quotes
While EUR/USD rose above the cloud resistance and reached 1.1010, it then fell back lower. However, EUR/USD did not break below 1.0800 (low of 1.0832 last week). EUR/USD turned around strongly from 1.0832, and yesterday (12 July 2023), it jumped to a fresh year-to-date high of 1.1140.
Weekly MACD appears poised to crossover into positive territory. This bodes well for further EUR/USD strength. On the weekly chart, there are hardly any significant resistance levels until the 2022 high of 1.1495. The top of the weekly exponential moving average envelope is also near 1.1495. However, it remains to be seen if EUR/USD has enough momentum to reach this solid resistance level in the next couple of months. Note that on the daily chart, EUR/USD has already moved above the top of the exponential moving average envelope.
This time around, in order to keep the momentum going, EUR/USD must stay above the trendline support, currently near 1.0880. This level is also near the 55-day exponential moving average. On a short-term note, 1.1010 is already a rather strong support level.
- Producer inflation in the US increased only 0.1% on a yearly basis in June.
- US Dollar Index stays in negative territory below 100.50.
The Producer Price Index (PPI) for final demand in the US rose 0.1% on a yearly basis in June, down from the 0.9% increase recorded in May, the data published by the US Bureau of Labor Statistics revealed on Thursday. This reading came in lower than the market expectation of 0.4%.
The annual Core PPI increased 2.4% in the same period, compared to the market expectation of 2.6%. On a monthly basis, the PPI and the Core PPI both rose 0.1%.
Market reaction
The US Dollar stays under modest bearish pressure after this data and the US Dollar Index was last seen losing 0.25% on the day at 100.30.
- EUR/JPY manages to gather some upside traction on Thursday.
- Initial contention seems to have turned up near around 153.30.
EUR/JPY partially reverses the recent 7-session negative streak on Thursday.
The cross regains some balance and manages to bounce off Wednesday’s 4-week lows near 153.30. In case sellers return to the market, the cross risks a probable decline to the intermediary 55-day SMA, today at 151.91.
So far, the longer term positive outlook for the cross appears favoured while above the 200-day SMA, today at 145.81.
EUR/JPY daily chart
- Initial Jobless Claims decreased by 12,000 in the week ending July 8.
- Continuing Jobless Claims rise by 11,000 in the week ending July 1.
- US Dollar Index hits fresh lows, and then rebounds above 100.30.
Initial Jobless claims totaled 237,000 in the week ending July 8, the weekly data published by the US Department of Labor (DOL) showed on Thursday. The print follows the previous week's 249,000 (revised from 248,000) and came in below market expectations of 250,000.
Further details showed that “the 4-week moving average was 246,750, a decrease of 6,750 from the previous week's revised average.”
Continuing Claims rose by 11,000 in the week ended July 1 to 1.729 million, a reading worse than market estimates of 1.723 million. The four-week moving average was “1,735,250, a decrease of 10,750 from the previous week's revised average.”
Market reaction:
Alongside Jobless Claims, the June Produce Price Index (PPI) was released, showing more evidence of inflation slowing down. The US Dollar Index (DXY) hit fresh monthly lows after the reports at 100.12 and then rebounded, trimming a small fraction of recent losses, rising above 100.30.
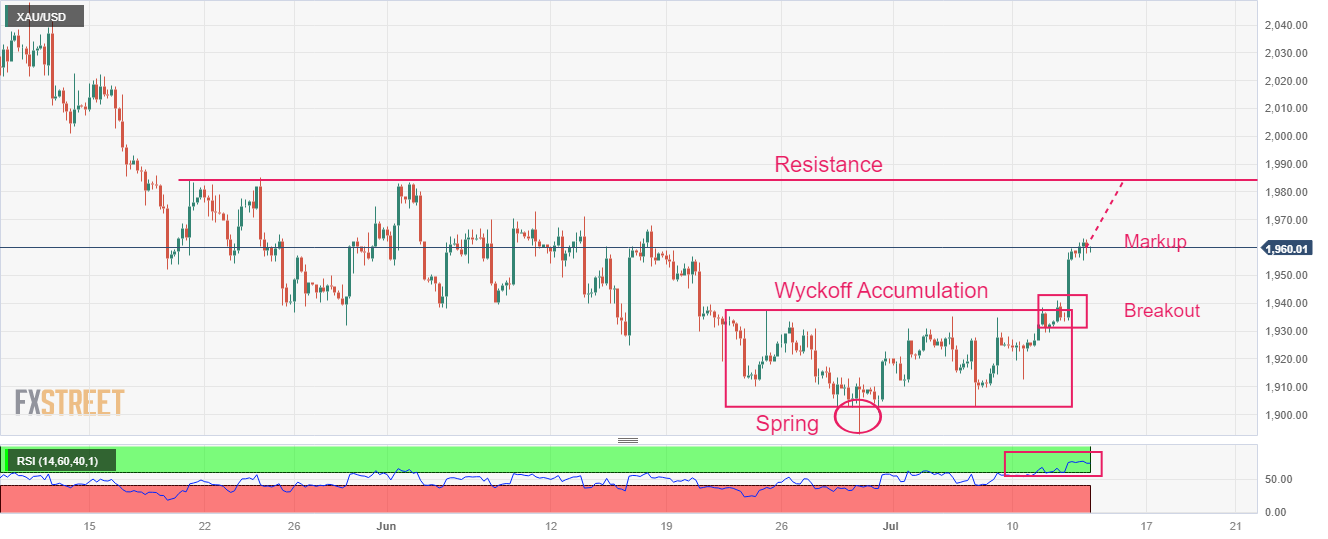
- Gold price is trading back-and-forth around $1,960.00 as investors await further triggers.
- As the second-quarter result season is on its way, sheer volatility in US equities cannot be ruled out.
- Gold price has delivered a breakout of the Wyckoff ‘Accumulation’ chart pattern.
Gold price (XAU/USD) is demonstrating a non-directional performance around $1,960.00 as investors are awaiting United States Producer Price Index (PPI) data for further guidance. The US Dollar Index (DXY) is struggling to find any intermediate support as investors are hoping that the Federal Reserve (Fed) could tweak its old commentary of ‘two more rate hikes are appropriate’ after June’s soft inflation report.
S&P500 futures have generated significant gains in the European session, portraying the strong risk appetite of the market participants. As the second-quarter result season is on its way, sheer volatility in US equities cannot be ruled out. The yields offered on 10-year US Treasury bonds have rebounded to near 3.83%.
After soft inflation report, investors have shifted their focus towards the US PPI data, which will release at 12:30 GMT. As per the consensus, monthly headline and core PPI are expected to show a pace of 0.2%. Annual headline PPI is likely to decelerate to 0.4% vs. the former release of 1.1%. Sheer softening of prices of goods and services at factory gates would cool down inflationary pressures. Also, a decline in PPI would convey that the overall demand is in a declining stage.
Minneapolis Fed Bank President Neel Kashkari cited that policy rates needed to raise further and supervisors must ensure that banks are prepared to run new high-inflation stress tests to identify at-risk banks and size individual capital shortfalls.", as reported by Reuters.
Gold technical analysis
Gold price has delivered a breakout of the Wyckoff ‘Accumulation’ formed on a four-hour scale in which inventory is transferred from retail participants to institutional investors. The precious metal is in a ‘mark up’ phase and is expected to find stoppage near the horizontal resistance plotted from May 19 high at $1,984.25.
The Relative Strength Index (RSI) (14) has shifted into the bullish range of 60.00-80.00, indicating strength in the upside momentum.
Gold four-hour chart
USD losses extend. Shaun Osborne, Chief FX Strategist at Scotiabank, analyzes the Greenback’s outlook.
USD to be more susceptible to weak economic data reports moving forward
Economic data this week have cut the odds of the Fed delivering two more hikes this year and history shows markets are quick to discount the prospect of lower Fed rates once the rate cycle peak is in; history also shows that this typically pressures the USD and that feels about where we are in this process, with the USD trading at its lowest since last April. The USD is likely to be more susceptible to weak economic data reports moving forward.
The DXY is down nearly 2% on the week and is trading below the January and April lows at 100.8. This implies (to me) that risks are tilted towards another 2-3% drop at least in the coming weeks and months (which could stretch to a loss of around 5%, based on the charts).
The accounts of the European Central Bank's (ECB) June policy meeting revealed on Thursday that policymakers agreed that it was seen as essential to communicate that monetary policy had still more ground to cover.
Key takeaways as summarized by Reuters
"It was argued that market participants would be surprised by the upward revision of inflation."
"A very broad consensus supported the 25 basis point rate increase."
"Emphasis was put on the merit of sticking to a data-dependent, meeting-by-meeting approach."
"A very broad consensus also prevailed in favour of confirming the end of reinvestments under the APP as of July."
"The level of the peak deposit facility interest rate, as well as its duration, as embodied in the forward curve and reflected in the staff projections, could be judged as insufficient to bring inflation back to the 2% medium-term target."
"Governing Council should stress that fiscal policy needed to be tightened."
"Inflation was still projected to remain too high for too long, calling into question whether it was returning to target in a timely manner."
"Upside risks to the inflation outlook were judged to still prevail."
"For the inflation projections to materialise, the Governing Council had still, as a minimum, to deliver two successive interest rate increases in June and July."
"Bringing inflation down from very high numbers to more moderate levels was easier than achieving a full return to 2%."
"Longer-term market-based measures remained stubbornly high."
"The view was held that the Governing Council could consider increasing interest rates beyond July, if necessary."
Market reaction
EUR/USD trades at fresh 15-month highs on Thursday, clings to strong daily gains at around 1.1170 after the ECB's publication.
USD/CAD is soft but holding within Wednesday’s range. Economists at Scotiabank analyze the pair outlook.
The underlying trend is USD-negative, but…
The underlying trend is USD-negative but trend dynamics are not quite as strong here as in some of the other USD pairs. Trend oscillators are, however, aligned bearishly for the USD across short, medium, and longer-term studies which continues to point to limited scope for USD rebounds and ongoing pressure on the downside towards the 1.31 area in the near term.
Resistance is 1.3200 and 1.3250.
- GBP/JPY has sustained comfortably above 180.00 as BoE is preparing for a consecutive fat rate hike.
- Weak UK factory activity data failed to impact the rally in the Pound Sterling.
- Japan's top currency diplomat Masato Kanda cited that deflationary norms may be changing.
The GBP/JPY pair is holding its auction above the psychological resistance of 180.00 in the London session. The cross picked strength after a five-day losing streak around 179.50 as investors expect that the Bank of England (BoE) is preparing for a consecutive fat rate hike in August.
Headline Consumer Price Index (CPI) in the United Kingdom seems sticky at 8.7% while core inflation that excludes volatile oil and food prices has printed a fresh high of 7.1%. Tight labor market conditions have started releasing heat due to higher interest rates but the journey towards achieving 2% inflation is far from over.
BoE Governor Andrew Bailey has already pushed interest rates to 5% and more interest rate hikes are in the pipeline. Money markets are anticipating that the interest rate peak by the BoE will be around 6.5%.
Meanwhile, weak UK factory activity data failed to impact the rally in the Pound Sterling. Manufacturing Production reported a light pace in contraction at 0.2% vs. the consensus of -0.5%. Meanwhile, the economic indicator remained between the consensus of -1.7% and the prior release of -0.6% at -1.2%. Monthly Gross Domestic Product (GDP) has posted a contraction by 0.1% while investors were anticipating a contraction by 0.3%.
UK Finance Minister Jeremy Hunt said that “while an extra Bank Holiday had an impact on growth in May, high inflation remains a drag anchor on economic growth.”
On the Japanese Yen front, Japan's top currency diplomat Masato Kanda cited that deflationary norms may be changing. This must be the outcome of the rising contribution of demand-driven aspects in inflationary pressures. Kanda added the government is closely watching FX market moves.
EUR/USD makes quick progress through the upper 1.11s. Shaun Osborne, Chief FX Strategist at Scotiabank, analyzes the pair’s outlook.
The 200-Week Moving Average of 1.1183 is a nearby bellwether to monitor
Solid gains and solid trend momentum are bringing my 1.12/1.13 target zone into range a bit more quickly than expected.
The 200-Week Moving Average (1.1183) is a nearby bellwether to monitor. The EUR has not traded above this mark since late 2021 and it has been a pretty good pointer for the EUR tone in recent years. A solid move (a weekly close, perhaps two) above here would suggest the EUR rebound has medium/longer term legs and might put 1.16/1.17 on the radar for the months ahead.
Sterling is strengthening further on Thursday. Economists at Scotiabank analyze GBP/USD outlook.
Spreads support firm gains
Cable is strengthening, with the help of solid yield spreads over the USD.
Sterling is trading higher for a sixth, consecutive daily gain and a 2.8% gain over the period.
GBP/USD is trading well through its 200-Week Moving Average which is support now at 1.2887 and has little ahead of it in terms of resistance until 1.3328 (76.4% retracement of the 2021/22 decline).
See – GBP/USD: Many investors will now be targeting a move to 1.33 assuming a weekly close above 1.30 – ING
Ahead of the summer, G10 volatility has just hit its lowest level since early 2022. Fed tightening cycles kill Dollar volatility until data suggest that the economy will need rate cuts, economists at Société Générale report.
Since 2003, August is clearly the worst month to hold a short vol position
EUR/USD volatility has just hit its lowest level since early 2022. But global monetary tightening comes at the cost of future growth, and investors could feel the pain when the data strike back.
US inflation is decelerating quickly, while historically, Fed tightening cycles suppress Dollar volatility until data suggest that the economy will need rate cuts.
Last but not least, August is generally a month where being short vol is a painful trade. Since 2003, EUR/USD volatility has increased this month in 75% of the years. Even if history is not bound to repeat, investors should not neglect this seasonal effect, especially in an environment where volatility remains under selling pressure and with the imminent threat of thinner summer liquidity.
US inflation came slightly lower than had been expected. Economists at Commerzbank analyze USD outlook after the US CPI report.
A small surprise in US CPI, a giant jump in EUR/USD
The majority of analysts had expected that the core rate would stand at 0.3% (MoM, seasonally adjusted), but it turned out to be just under 0.2%. ‘So what?’ one might wonder. That does not mean that the inflation issue in the US has now been solved. We might see setbacks over the coming months.
Greenback weakened significantly after the data release. One might ask if an inflation surprise of relatively small absolute magnitude can justify such market reaction. But we've seen similar patterns before. At recent levels, USD exchange rates obviously had priced in quite an unrealistic level of Fed tightening. That part of the USD exchange rates had to be corrected quite quickly.
The prospect of a reduced USD carry is putting pressure on a currency. That bit is the simple part of the story. However, there is one complication. As it is not just the terminal rate that matters (i.e. the rate peak) but also a matter of how long interest rates remain at this high level. That means: there is still some scope toward further Dollar weakness. Wednesday’s market move does not have to constitute the end of the USD weakness.
Economists at Scotiabank analyze USD/CAD outlook.
USD/CAD rebounds to remain limited to the 1.33, perhaps 1.34 – at most – area for now
The hot take bottom line from here is that USD/CAD rebounds are likely to remain limited to the 1.33, perhaps 1.34 (at most) area for now.
We have a 1.30 forecast for year-end but the risk of a downside overshoot to 1.28 through Q3 looks to be a growing risk.
See: USD/CAD set to move to 1.30 in the near future – TDS
Lee Sue Ann, Economist at UOB Group, reviews the latest interest rate decision by the RBNZ.
Key Takeaways
As expected, the Reserve Bank of New Zealand (RBNZ) decided to leave its official cash rate (OCR) unchanged at 5.50% at its Jul meeting. Since today’s decision was an interim review rather than a quarterly Monetary Policy Statement, there were no updated forecasts nor press conference with RBNZ Governor Adrian Orr.
New Zealand entered a technical recession in 1Q23, with the economy contracting by 0.1% q/q. Meanwhile, inflation undershot the RBNZ’s projection for two consecutive quarters. Headline CPI growth eased to 6.7% y/y in 1Q23. All eyes will now turn to 2Q23 CPI data due on 19 Jul, which is expected to see a further drop to 6.0% or lower.
We are keeping our OCR forecast at 5.50% for the rest of this year, though bearing in mind that the RBNZ has paused in previous tightening cycles before hiking again. The next monetary policy decision is on 16 Aug.
- US Dollar is near several multi-month lows against major currencies.
- The economic calendar puts the spotlight on the US Producer Price Index release.
- The US Dollar Index said goodbye to 101.00 and is now pulled toward 100.00.
The US Dollar (USD) was in a sea of red on Wednesday when compared to several other major currencies. It was very hard to look for any green print as the Greenback lost substantial ground against all G10 currencies with notable losses against the Japanese Yen extending over 1%. On Thursday, the US Dollar was down nearly 1% against the Australian Dollar (AUD/USD) and the New Zealand Dollar (NZD/USD). The US Dollar Index (DXY) has been unable to catch a breath and is again on the back foot nearing the all important 100.00 line in the sand.
Thursday’s economic calendar has more inflation data coming in, this time from the producer side, as expectations will ramp up after the substantial lower US Consumer Price Index (CPI) in both its core and overall measure. The overall Producer Price Index (PPI) is expected to decelerate for the tenth month in a row. Moreover, an uptick in jobless claims could ignite another round of US Dollar weakness as recession fears might take over.
Daily digest: US Dollar at risk for another round of selling
- The International Energy Agency (IEA) cuts its global oil demand outlook for 2023 as it sees the global economy slowing substantially in the last quarter of this year.
- Chinese trade exports shrunk from -7.5% to even -12.4% for June as the nation is losing its title as biggest exporter of the world.
- Some mild data to start at 11:00 GMT with the Mortgage Bankers Association issuing the Mortgage Applications for the first week of July.
- Just one moment to look for on the economic calendar at 12:30 GMT: US Producer Price Index (PPI) to be released for both overall and core gauges, both on a monthly and yearly time frame. The Overall PPI on a yearly basis is expected to decelerate from 1.1% to 0.4%. The core PPI rise also expected to slow down from 2.8% to 2.6%. For the monthly performance, overall PPI is expected to head from -0.3% to 0.2% and the core to stay steady at 0.2%.
- Additionally, at the same time, the weekly jobless claims will come out. The initial claims are expected to rise from 248,000 to 250,000. The continuing claims to rise from 1,720 million to 1,723 million. The number will draw some additional attention as on Wednesday Senator Elisabeth Warren called on the Fed and its chairman Jerome Powell to “stop the madness” and stop hiking as the economy and labour force could be tipped into a recession with high unemployment possibly at hand.
- Member of the Federal Reserve Board of Governors, Christopher Waller, is due to speak at 22:45 GMT.
- The US Treasury is set to access the markets as well in order to allocate a 30-year bond auction, which will be interesting to see with these fast declining yields.
- Equities across the globe saw a big push into risk assets as the safe haven Greenback retreated. Japans’ Topix index rose 1% at its closing bell, while the Chinese Hang Seng is up over 2.50%. European equities are mildly halfway through European trading while US equity futures are pointing to a nice 0.50% opening overall.
- The CME Group FedWatch Tool shows that markets are stuck at 92.4% chance of a 25 basis points (bps) interest-rate hike on July 26. Chances of a second hike in November have dropped from 26.7% on Wednesday to 19.1%. It appears that markets are fully disregarding the remarks from the Fed on two more hikes, and presume that the Fed will hike in July for the last time. Markets expect US Fed Chairman Jerome Powell to announce that the pivotal level has been reached at the yearly Jackson-Hole Symposium between August 24 and 26.
- The benchmark 10-year US Treasury bond yield trades at 3.82% and is continuing its slide lower from 4.09% last week. Traders have gone all-in and are calling the bluff of the Fed for at least two more hikes, while markets have fully priced in one hike and done.
US Dollar Index technical analysis: Fireworks not over yet
The US Dollar on its sixth day of decline after one of the most brutal selloffs seen in a long time. It becomes clear that there is a complete division between the Fed and the markets after the US Consumer Price Index (CPI) has drawn a firm line between both parties. Markets have sold the US Dollar on all fronts which filters through into the US Dollar Index dropping 1% and has it nearing the psychological important 100.00 marker.
On the upside, look for 102.77 to provide resistance at the 55-day Simple Moving Average (SMA) that will partially re-gain its importance after having been chopped up that much a few weeks ago. Only a few inches above the 55-day SMA, the 100-day SMA comes in at 102.88 and could create a firm area of resistance in between both moving averages. In case the DXY made its way through that region, the high of July at 103.57 will be the level to watch for a further breakout.
On the downside the US Dollar price action is in orbit around 100.00. Expect to see several small new yearly-low prints to be unfolding throughout the day. Special notice for 99.42 which is a very important technical support and once tested, would mean a new 18-month low for the DXY.
The downside surprise in US June CPI inflation has seen the Dollar drop to new lows for the year. Economists at ING analyze USD outlook.
The start of something
For the big Dollar trend, this may be the start of the long-awaited cyclical decline. There are parallels to the Dollar sell-off last November and December (when it fell 8% in two months), but the difference now is; i) positioning, where speculators are not as heavily long dollars as they were last October, and ii) the China and European growth stories do not seem due as much of a re-rating as they enjoyed last November.
That said, we prefer to run with the Dollar bearish story for the time being, where DXY should press big psychological support at 100.00. The next target would be 99.00 on a breakout.
For today, look out for US June PPI and the weekly initial claims number. A further decline in PPI and a rise in claims could see Dollar losses extend.
In its latest oil market report published on Thursday, the International Energy Agency (IEA) reduced its 2023 oil demand growth estimate by 220,000 barrels per day (bpd) due to persistent macroeconomic headwinds.
Additional takeaways
Global oil demand set to rise by 2.2 mln bpd in 2023 to reach a record 102.1 mln bpd.
Global oil demand is set to rise seasonally by 1.6 mln bpd from 2Q23 to 3Q23.
Lower production from Saudi Arabia and other core OPEC+ members offset by Kazakhstan, Nigeria, US.
Demand growth in 2024 will slow to 1.1 mln bpd as vehicle electrification, greater efficiency take hold.
China will account for 70% of global oil demand gains.
China's economic recovery losing steam after bounce earlier in the year.
Russian oil exports in june fell 600,000 bpd to 7.3 mln bpd, lowest since March 2021.
China’s reopening has so far failed to extend beyond travel and services.
Market reaction
WTI pauses its rally just shy of the $76 mark following the IEA report. The US oil is currently trading at $75.72, up 0.12% on the day.
Economists at Société Générale analyze EUR/JPY technical outlook.
Short-term hurdles are located 155.70 and 156.90
EUR/JPY has experienced first wave of pullback after facing stiff resistance near 158 representing the trend line connecting March/May highs. The pair is now approaching interim support of 152.20/151.60 which corresponds to the 50-DMA. Daily MACD has dipped below its trigger however it is still in positive territory.
A rebound can’t be ruled out if the pair successfully holds support zone at 152.20/151.60.
Short-term hurdles are located 155.70, the 50% retracement of recent pullback and 156.90.
- Euro climbs to 16-month tops vs. the US Dollar.
- Stocks in Europe extend the weekly recovery on Thursday.
- EUR/USD looks to consolidate the breakout of the 1.1100 hurdle.
- ECB Accounts, US Producer Prices dominate the calendar later in the session.
The Euro (EUR) accelerates its gains vs. the beleaguered US Dollar (USD) and lifts EUR/USD to the 1.1170 region on Thursday, an area last visited in late February 2022.
The strong upside impulse in the pair has been reinvigorated in response to lower-than-expected US inflation figures for the month of June, which, firstly, confirm that disinflationary forces remain well in place in the US economy and, secondly, underpin expectations that the Federal Reserve might end its ongoing hiking campaign sooner rather than later.
Back to US inflation: While it is inspiring that inflationary pressures are cooling off, it is unclear how much further prices can slow down in the current context of a still tight labour market and robust wage growth. This ongoing resilience in the domestic economy should still bolster another rate hike by the Fed at its July 26 gathering, although the intense disinflationary pressures could encourage market participants to think that the next hike will be the last of the tightening cycle.
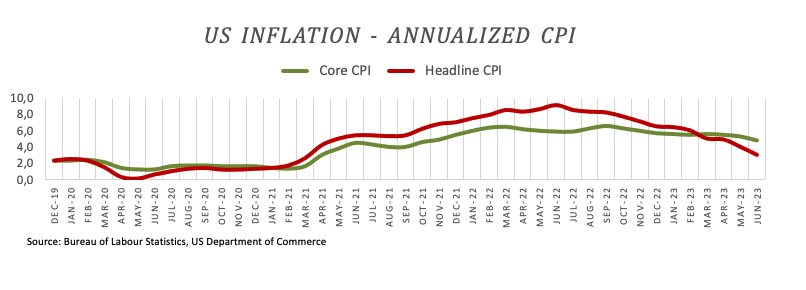
The same can be said of the European Central Bank, where a 25 bps rate raise is largely anticipated at its meeting later in the month. However, the central bank is unlikely to halt its hiking bias in the near term, as highlighted by President Christine Lagarde and other Board members in past comments.
Looking at the broader picture, the potential future actions of the Fed and the ECB in normalizing their monetary policies continue to be a topic of discussion, especially with increasing concerns about an economic slowdown on both sides of the Atlantic.
Data-wise in the region, final June inflation figures in France saw the CPI gain 0.2% MoM and 4.5% YoY, while Industrial Production in the euro bloc expanded at a monthly 0.2% and contracted by 2.2% from a year earlier.
In the US, Producer Prices for the month of June will take centre stage, seconded by usual weekly Initial Jobless Claims for the week ended on July 8.
Daily digest market movers: Euro gathers fresh impulse beyond 1.1100
- The EUR surpasses the 1.1100 barrier vs. USD on Thursday.
- France’s final CPI rose 0.2% MoM in June and 4.5% YoY.
- Chinese trade balance figures came in short of expectations in June.
- Initial focus of attention will be on the ECB Accounts of the June meeting.
- Producer Prices will keep the focus on US inflation.
- The IEA said global demand for oil will reach record levels in 2023.
Technical Analysis: Euro faces the next hurdle at 1.1184
The ongoing price action in EUR/USD hints at the idea that further gains might be in store in the short-term horizon. However, the current pair’s overbought condition opens the door to some near-term corrective move.
The continuation of the uptrend now targets the 2023 high of 1.1169 (July 13). Further up comes the weekly top of 1.1184 (March 31, 2022), which is supported by the 200-week SMA at 1.1181, just before another round level at 1.1200.
On the downside, the weekly low at 1.0833 (July 6) appears reinforced by the proximity of the interim 100-day SMA. The breakdown of this region should meet the next contention area not before the May low of 1.0635 (May 31), which also looks underpinned by the crucial 200-day SMA (1.0643). South from here emerges the March low of 1.0516 (March 15) prior to the 2023 low of 1.0481 (January 6).
Furthermore, the constructive view of EUR/USD appears unchanged as long as the pair trades above the key 200-day SMA.
Euro FAQs
What is the Euro?
The Euro is the currency for the 20 European Union countries that belong to the Eurozone. It is the second most heavily traded currency in the world behind the US Dollar. In 2022, it accounted for 31% of all foreign exchange transactions, with an average daily turnover of over $2.2 trillion a day.
EUR/USD is the most heavily traded currency pair in the world, accounting for an estimated 30% off all transactions, followed by EUR/JPY (4%), EUR/GBP (3%) and EUR/AUD (2%).
What is the ECB and how does it impact the Euro?
The European Central Bank (ECB) in Frankfurt, Germany, is the reserve bank for the Eurozone. The ECB sets interest rates and manages monetary policy.
The ECB’s primary mandate is to maintain price stability, which means either controlling inflation or stimulating growth. Its primary tool is the raising or lowering of interest rates. Relatively high interest rates – or the expectation of higher rates – will usually benefit the Euro and vice versa.
The ECB Governing Council makes monetary policy decisions at meetings held eight times a year. Decisions are made by heads of the Eurozone national banks and six permanent members, including the President of the ECB, Christine Lagarde.
How does inflation data impact the value of the Euro?
Eurozone inflation data, measured by the Harmonized Index of Consumer Prices (HICP), is an important econometric for the Euro. If inflation rises more than expected, especially if above the ECB’s 2% target, it obliges the ECB to raise interest rates to bring it back under control.
Relatively high interest rates compared to its counterparts will usually benefit the Euro, as it makes the region more attractive as a place for global investors to park their money.
How does economic data influence the value of the Euro?
Data releases gauge the health of the economy and can impact on the Euro. Indicators such as GDP, Manufacturing and Services PMIs, employment, and consumer sentiment surveys can all influence the direction of the single currency.
A strong economy is good for the Euro. Not only does it attract more foreign investment but it may encourage the ECB to put up interest rates, which will directly strengthen the Euro. Otherwise, if economic data is weak, the Euro is likely to fall.
Economic data for the four largest economies in the euro area (Germany, France, Italy and Spain) are especially significant, as they account for 75% of the Eurozone’s economy.
How does the Trade Balance impact the Euro?
Another significant data release for the Euro is the Trade Balance. This indicator measures the difference between what a country earns from its exports and what it spends on imports over a given period.
If a country produces highly sought after exports then its currency will gain in value purely from the extra demand created from foreign buyers seeking to purchase these goods. Therefore, a positive net Trade Balance strengthens a currency and vice versa for a negative balance.
In a statement on Thursday, China’s Commerce Minister called on the US to lift "unilateral" sanctions against them.
The Ministry also asked the US to immediately stop what it called the unreasonable suppression of Chinese enterprises.
Market reaction
AUD/USD is unfazed by the renewed US-China tensions, trading 0.89% higher on the day at 0.6847, as of writing.
- AUD/USD has climbed to a neat 0.6850 amid a cheerful market mood.
- Australian one-year forward consumer inflation expectations remained well-anchored at 5.2%.
- AUD/USD has delivered a perpendicular rally after a breakout of the Descending Triangle pattern.
The AUD/USD pair has jumped to near 0.6850 in the European session. The Aussie asset has rallied as the US Dollar Index (DXY) is failing to find support after a meaningful cool down in the United States June’s inflation report.
S&P500 futures have extended gains in London, portraying an upbeat market mood. The USD Index has extended its sell-off to near 100.30 as a soft Consumer Price Index (CPI) report has drummed that the Federal Reserve (Fed) will hike interest rates only once by the year-end.
One-year forward consumer inflation expectations in the Australian region have remained well-anchored at 5.2% while investors were expecting a decline to 5.1%. This would discourage the Reserve Bank of Australia (RBA) from raising interest rates further.
AUD/USD has delivered a perpendicular rally after a breakout of the Descending Triangle chart pattern on a four-hour scale. The Aussie asset is approaching the horizontal resistance plotted from June 16 high at 0.6900.
Upward-sloping 20-period Exponential Moving Average (EMA) at 0.6738 indicates that the upside bias is extremely strong. The Relative Strength Index (RSI) (14) is oscillating in the bullish range of 60.00-80.00, portraying strength in the upside momentum.
After a stalwart rally, a minor correction to near June 22 high at 0.6806 would attract buyers for the upside of June 20 high at 0.6854 followed by June 16 high at 0.6900.
On the flip side, a breakdown below June 27 high at 0.6720 would expose the asset to June 23 low at 0.6663 and July 10 low at 0.6624.
AUD/USD four-hour chart
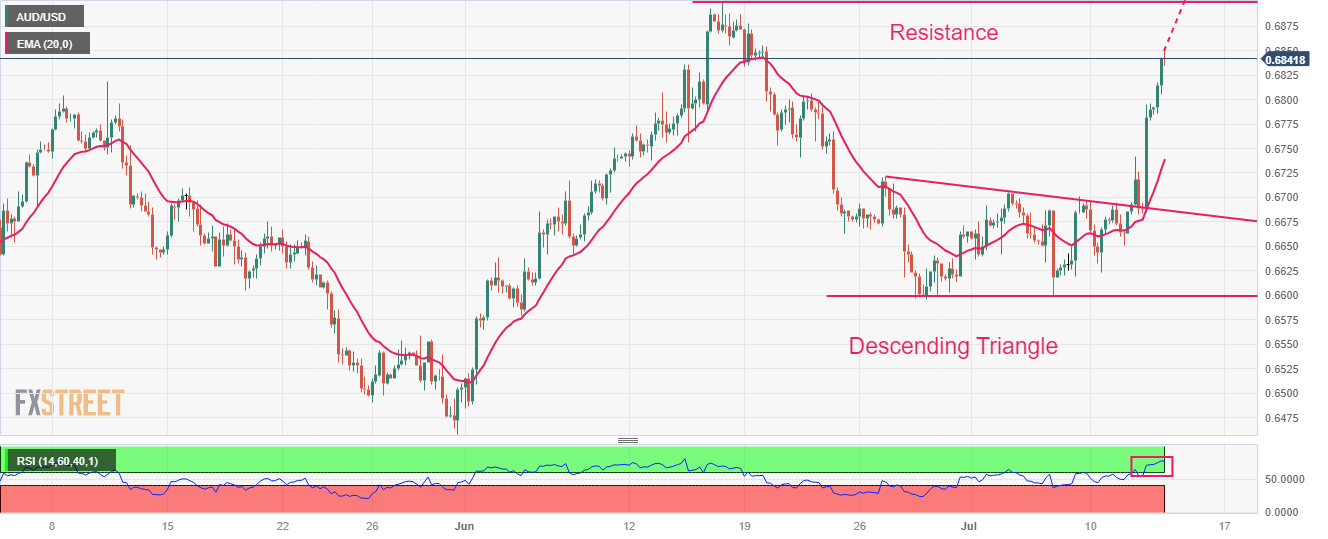
Eurozone Industrial Production increased less than expected in May, the official data showed on Thursday, suggesting that the manufacturing sector recovery is losing momentum.
Eurozone’s Industrial Output rose 0.2% MoM, the Eurostats said in its latest publication, vs. 0.3% expected and 1.0% previous reading.
The bloc’s annual Industrial Production dropped 2.2% in May versus a 1.2% decrease seen in April and against the expected fall of 1.2%.
EUR/USD reaction
The shared currency is unperturbed by downbeat German industrial figures. At the time of writing, EUR/USD is trading at around 1.1165, adding 0.32% on the day.
EUR/CHF eased considerably over the past few days. Economists at Commerzbank discuss Franc's outlook.
Nobody likes the CHF in the end because of the SNB’s interventions
We always assume that it is not due to other market participants suddenly finding the Franc more attractive but expect the SNB to be involved. That makes it difficult to really trust the CHF. Because nobody will be able to tell where it would trade if it wasn’t smartened up by the SNB.
For the FX market that means: everyone wonders what everyone else might be thinking right now. To intervene into such a difficult, frequently unstable process as a central bank can also mean: it becomes difficult for the market participants to believe that the other market participants like the Franc, even if that is the case. And if everyone thinks like that, nobody likes the CHF in the end. Not despite but because of the SNB’s interventions.
- USD/CHF continues losing round for the sixth straight day and dives to a fresh multi-year low.
- The USD selling remains unabated and turns out to be a key factor behind the ongoing decline.
- The oversold RSI on the daily chart might prompt bears to lighten their bets and lend support.
The USD/CHF pair prolongs its downtrend for the sixth successive day on Thursday and drops to its lowest level since January 2015, around the 0.8620-0.8615 region during the early part of the European session.
The ongoing downfall is exclusively sponsored by the relentless selling around the US Dollar (USD), which sinks to a 15-month low in the wake of firming expectations that the Federal Reserve (Fed) will hike interest rates only one more time this year. The bets were lifted by softer US consumer inflation figures released on Wednesday, showing that the headline US CPI rose just 0.2% in June and the yearly rate slowed from 4% to 3% - marking the smallest rise since March 2021. Moreover, the monthly increase in core prices was the smallest since August 2021.
This comes on the back of signs that the US labor market is cooling and should allow the Fed to soften its hawkish stance, fueling speculations that the US central bank is close to ending its fastest monetary policy tightening cycle since the 1980s. This, in turn, lead to a further decline in the US Treasury bond yields, which is seen weighing on the Greenback and exerting heavy pressure on the USD/CHF pair. The steep decline, meanwhile, seems rather unaffected by the prevailing risk-on environment, which tends to undermine the safe-haven Swiss Franc (CHF).
With the latest leg down, spot prices have fallen nearly 400 pips from the 0.9000 psychological mark, or the monthly peak touched last week. This, along with the extremely oversold Relative Strength Index (RSI) on the daily chart, might prompt bearish traders to take some profits off the table and help limit any further losses for the USD/CHF pair, at least for the time being. Market participants now look to the US economic docket, featuring the Producer Price Index (PPI) and the usual Weekly Initial Jobless Claims for some meaningful impetus.
Technical levels to watch
Economists at ING analyze British Pound (GBP) outlook.
Cable up, EUR/GBP sideways
In some ways, Sterling has already enjoyed its re-rating on the very hawkish BoE and thus may not outperform in this current Dollar bear phase. However, many investors will now be targeting a move to 1.33 in GBP/USD – assuming we can close the week above 1.30.
The EUR/GBP pair has reversed off a low near 0.8500 – which now may mark the lower end of the trading range for this quarter.
- EUR/GBP has dropped sharply from 0.8570 despite UK’s weak factory data.
- Signs are clear that UK firms are facing the burden of higher interest rates by the BoE.
- ECB Visco conveyed, “We are not very far' from the peak in interest rates.”
The EUR/GBP pair has faced selling pressure after climbing above 0.8570 in the European session. The cross has corrected despite United Kingdom’s factory activity data for May remained weak broadly. Monthly Industrial Production contracted at a higher pace of 0.6% than expectations of -0.4%. On an annualized basis, the economic data matched expectations of 2.3% contractions.
Manufacturing Production reported a light pace in contraction at 0.2% vs. the consensus of -0.5%. Meanwhile, the economic indicator remained between the consensus of -1.7% and the prior release of -0.6% at -1.2%. Monthly Gross Domestic Product (GDP) has posted a contraction of 0.1% while investors were anticipating a contraction of 0.3%.
Signs are clear that UK firms are facing the burden of higher interest rates by the Bank of England (BoE). More interest rates from BoE Governor Andrew Bailey are highly expected as current inflation at 8.7% is extremely far from the desired rate of 2%. Financial markets are expecting that interest rates will peak in a 6.25-6.5% range.
Post UK factory data, Finance Minister Jeremy Hunt said that “while an extra Bank Holiday had an impact on growth in May, high inflation remains a drag anchor on economic growth.”
"The best way to get growth going again and ease the pressure on families is to bring inflation down as quickly as possible. Our plan will work, but we must stick to it,” Hunt added.
Meanwhile, in Eurozone, inflationary pressures are sticky as wage pressures have not softened as expected and the labor market is still strong. About interest rate guidance, European Central Bank (ECB) Governing Council member Ignazio Visco said, “We are not very far' from the peak in interest rates.”
Further policy-tightening by ECB President Christine Lagarde is highly expected in July’s monetary policy meeting.
As expected, the Bank of Canada (BoC) hiked its key rate by 25 bps to 5% on Wednesday. CAD was able to appreciate. Economists at Commerzbank analyze Loonie's outlook.
BoC maintains its restrictive tone
The BoC sounded restrictive, without committing to anything for the coming months, so the market assumed it might hike interest rates again should this become necessary. That means a hike is more likely as the next step rather than a pause in the cycle.
The market seems to perceive the BoC as being restrictive. It will now keep a close eye on the inflation data next Tuesday to decide whether a further rate step will become increasingly likely. If that is the case, the rise in rate hike expectations is likely to support CAD.
USD/CNH could slip back to the 7.1250 level once 7.1500 is breached, comment UOB Group’s Economist Lee Sue Ann and Markets Strategist Quek Ser Leang.
Key Quotes
24-hour view: Yesterday, we indicated that “barring a break above 7.2260, USD is likely to break below 7.1800.” We also indicated that “7.1500 is unlikely to come into view.” In line with our expectations, USD did not break above 7.2260. It broke below 7.1800 and fell to a low of 7.1617. Today, we see chance for USD to test 7.1500 before the risk of a rebound increases. This time around, the next support at 7.1250 is unlikely to come into view. On the upside, if USD breaks above 7.1940 (minor resistance is at 7.1800), it would indicate that USD is not weakening further.
Next 1-3 weeks: Three days ago (10 Jul), when USD was trading at 7.2230, we noted that “short-term downward momentum is building rapidly and the risk of USD pulling back below 7.1800 has increased.” Yesterday (12 Jul, spot at 7.2070), we highlighted that “Downward momentum has improved further and If USD breaks below 7.1800, the focus will shift to 7.1500.” In line with our view, USD broke below 7.1800 (low of 7.1617 in NY trade). The focus is at 7.1500 now. Looking ahead, the next support is at 7.1250. On the upside, the ‘strong resistance’ level has moved lower to 7.2150 from 7.2500.
- USD/CAD attracts sellers for the third straight day and remains depressed near a two-week low.
- The BoC’s hawkish outlook, along with bullish Crude Oil prices, continue to underpin the Loonie.
- Bets that the Fed will end its rate-hiking cycle soon weigh on the USD and contribute to the slide.
The USD/CAD pair struggles to capitalize on the previous day's late rebound from the 1.3145-1.3140 area and meets with a fresh supply on Thursday. The intraday downfall - marking the third straight day of a negative move and the fourth in the previous five - drags spot prices back closer to over a two-week low touched on Wednesday.
The Bank of Canada (BoC) on Wednesday hiked its key overnight interest rate by 25 bps, to a 22-year high of 5%, and said that it could raise rates further because of the risk that efforts to return inflation to its 2% target could stall amid excess consumer spending. This, along with the recent bullish run in Crude Oil prices, to the highest level since early May, continues to underpin the commodity-linked Loonie. Apart from this, the prevailing selling bias surrounding the US Dollar (USD) is seen as another factor exerting downward pressure on the USD/CAD pair.
In fact, the USD Index (DXY), which tracks the Greenback against a basket of currencies, sinks to its lowest level since April 2022 as investors now seem convinced that the Federal Reserve (Fed) is nearing the end of its current rate hiking cycles. The bets were lifted by the softer US CPI report released on Wednesday, which pointed to a further moderation in consumer prices. This comes on the back of signs that the US labor market is cooling and should allow the US central bank to soften its hawkish stance, which leads to a further decline in the US bond yields and weighs on the USD.
Apart from this, the risk-on environment - as depicted by the ongoing rally across the global equity markets - further dents the Greenback's relative safe-haven status and drags the USD/CAD pair lower. Spot prices, meanwhile, remain well within the striking distance of the YTD low, around the 1.3115 region touched in June, which if broken will set the stage for a further near-term depreciating move. Market participants now look to the US economic docket, featuring the release of the Producer Price Index (PPI) and the usual Weekly Initial Jobless Claims data for a fresh impetus.
Technical levels to watch
Economists at Société Générale analyze USD/CHF technical outlook.
May low of 0.8820 is likely to provide resistance
USD/CHF failed to overcome the 100-DMA last month resulting in an extended decline. It is fast approaching next projections near 0.8600/0.8570 which is also the lower limit of a multi-month down-sloping channel.
The move is a bit stretched however signals of a meaningful uptrend are not yet visible. Achievement of this potential support could result in a rebound; May low of 0.8820 is likely to provide resistance.
FX option expiries for July 13 NY cut at 10:00 Eastern Time, via DTCC, can be found below.
- EUR/USD: EUR amounts
- 1.0900 705m
- 1.0915 1.4b
- 1.0925 518m
- 1.0940 609m
- 1.0990 1.4b
- 1.1050 712m
- 1.1080 1.3b
- 1.1115 741m
- 1.1125 732m
- 1.1160 528m
- GBP/USD: GBP amounts
- 1.2515 330m
- 1.2630 308m
- 1.2850 546m
- 1.2875 510m
- USD/JPY: USD amounts
- 138.75 813m
- 138.95 360m
- 140.55 360m
- 141.00 947m
- 141.50 800m
- 142.00 1.3b
- 143.00 546m
- 145.00 610m
- AUD/USD: AUD amounts
- 0.6780 413m
- 0.6800 1.5b
- USD/CAD: USD amounts
- 1.3200 908m
- 1.3300 522m
- NZD/USD: NZD amounts
- 0.6135 460m
- The index trades in levels last seen in April 2022.
- The sell-off in the dollar accelerates post-US CPI.
- Producer Prices, weekly Claims take centre stage later.
The USD Index (DXY), which tracks the greenback vs. a basket of its main rival currencies, remains well on the defensive and tests fresh lows in the 100.30 region.
USD Index now looks at US data
The index so far retreats for the sixth consecutive session on Thursday and trades closer to the psychological support at 100.00 on the back of the persistent sell-off in the dollar, diminishing US yields across the curve and the generalized upbeat tone in the risk-linked galaxy.
Indeed, USD has particularly accelerated its losses in response to the lower-than-expected US inflation figures during June (released on Wednesday), which in turn seem to have reignited market chatter around the likelihood that the Federal Reserve might end its tightening campaign in the near term.
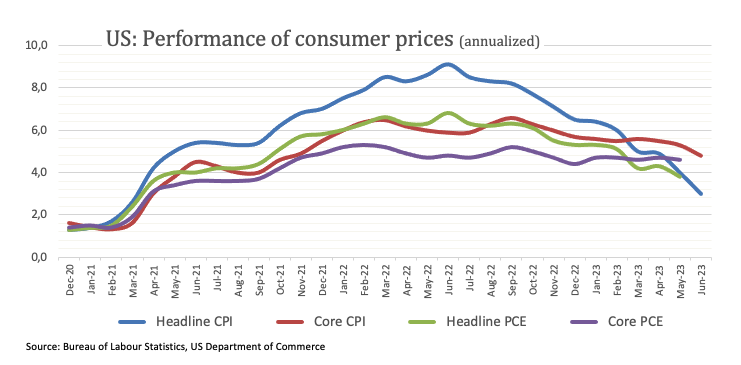
In addition, the release of the Fed’s Beige Book appears to prop up the above, as it was noted that employment had increased modestly since late May and labour demand had remained healthy during the survey period. It was also reported that prices had increased at a modest pace overall, and several districts had observed some slowing in the pace of increase.
Still around US inflation, investors are expected to closely follow the publication of Producer Prices for the month of June along with the usual weekly Initial Claims.
What to look for around USD
The index continues to shed ground and gradually approaches the key support at 100.00 the figure on Thursday.
Meanwhile, the likelihood of another 25 bps hike at the Fed's upcoming meeting in July remains high and supported by the still tight US labour market and despite the persevering disinflationary pressures.
This view was further bolstered by comments from Fed Chief Powell at the June FOMC event, who referred to the July meeting as "live" and indicated that most of the Committee is prepared to resume the tightening campaign as early as next month.
Key events in the US this week: Producer Prices, Initial Jobless Claims (Thursday) – Advanced Michigan Consumer Sentiment (Friday).
Eminent issues on the back boiler: Persistent debate over a soft/hard landing of the US economy. Terminal Interest rate near the peak vs. speculation of rate cuts in late 2023/early 2024. Geopolitical effervescence vs. Russia and China. US-China trade conflict.
USD Index relevant levels
Now, the index is down 0.16% at 100.39 and faces the next support at 100.34 (2023 low July 13) followed by 100.00 (round level) and finally 99.81 (weekly low April 21 2022). On the other hand, the breakout of 103.54 (weekly high June 30) would open the door to 104.44 (200-day SMA) and then 104.69 (monthly high May 31).
In an interview with Italy's Sky TG24 news channel, European Central Bank Governing Council member Ignazio Visco said, “we are not very far' from peak in interest rates.”
Additional quotes
“Private debts in italy among the lowest in Europe, financial stability not at risk.“
“Banks must set aside funds to face risks, should avoid dividends to shareholers.”
Market reaction
EUR/USD was last seen trading at around 1.1150, up 0.24% so far.
- USD/JPY has retreated from 138.83 amid sheer weakness in the US Dollar Index.
- S&P500 futures have added significant gains, portraying a cheerful market mood.
- The monthly headline and core PPI are expected to show a pace of 0.2%.
The USD/JPY pair has retreated after a short-lived pullback to near 138.83 in the European session. The asset has resumed its downside journey as soft inflationary pressures in the United States have provided assurance that the Federal Reserve (Fed) will come out with only one more interest rate hike by the year-end.
S&P500 futures have added significant gains in London, portraying a cheerful market mood. US equities could face some pressure ahead of second-quarter corporate earnings data. Overall corporate earnings could remain volatile due to higher interest rates by the Fed and tight credit conditions by commercial banks.
The US Dollar Index (DXY) has printed a fresh annual low at 100.34 as hawkish commentaries from Fed policymakers are failing to offset the impact of June’s soft Consumer Price Index (CPI) report. Minneapolis Fed Bank President Neel Kashkari cited that policy rates are needed to raise further and supervisors must ensure that banks are prepared to run new high-inflation stress tests to identify at-risk banks and size individual capital shortfalls."
Going forward, investors will focus on the Producer Price Index (PPI) (June) data, which will release at 12:30 GMT. The monthly headline and core PPI are expected to show a pace of 0.2%. Annual headline PPI is likely to decelerate to 0.4% vs. the former release of 1.1%. Sheer softening of prices of goods and services at factory gates would cool down inflationary pressures. Also, a decline in PPI would convey that the overall demand is in a declining stage.
On the Tokyo front, rising expectations of a tweak in the Yield Curve Control (YCC) by the Bank of Japan (BoJ) have provided support to the Japanese Yen. The contribution of higher demand in inflationary pressures is rising due to higher wages, which has stemmed chances of communication of shift in the ultra-dovish policy stance.
Japan's top currency diplomat Masato Kanda came out with a verbal intervention, as the Japanese Yen is on a recovery mode so far this week.
Key quotes
Closely watching FX market moves.
There is view that speculative Yen short positions unwinding rapidly.
There is view that deflationary norm may be changing.
Market reaction
At the time of writing, USD/JPY is trading at 138.35, down 0.12% on the day.
Soft US inflation data has been good news for all the pro-cyclical currencies including the Euro. Economists at ING analyze EUR/USD outlook.
1.1275 is the next target for EUR/USD
EUR/USD is comfortably trading at new highs for the year and the next technical target would be 1.1275 as it continues to retrace the 2021-2022 decline.
For today, look out for the account of the 15 June European Central Bank meeting. Presumably, the ECB will see no advantage in trying to diffuse market pricing of two further 25 bps rate hikes this year.
- NZD/USD rallies hard for the second straight day and jumps to over a two-month high.
- The USD sinks to a 15-month low and turns out to be a key factor acting as a tailwind.
- Investors now look to the US PPI and weekly jobless claims data for a fresh impetus.
The NZD/USD pair gains strong positive traction for the second straight day on Thursday and jumps to over a two-month peak, around the 0.6350-0.6355 region during the early European session.
The US Dollar (USD) prolongs its recent bearish trajectory and drops to its lowest level since April 2022 in the wake of growing acceptance that the Federal Reserve (Fed) is nearing the end of its policy tightening cycle. Investors now seem convinced that the US central bank will hold interest rates steady for the rest of the year, following the widely expected 25 bps lift-off in July and the bets were reaffirmed by the softer US consumer inflation figures on Wednesday. This, in turn, leads to a further decline in the US Treasury bond yields, which continues to weigh on the buck and turns out to be a key factor pushing the NZD/USD pair higher.
Apart from this, the prevailing risk-on environment - as depicted by an extended rally across the global equity markets - further undermines the safe-haven Greenback and benefits the risk-sensitive Kiwi. This, to a larger extent, overshadows weak domestic data, which showed that business activity in New Zealand’s manufacturing sector contracted in June to its lowest level since November 2022. Even the Reserve Bank of New Zealand's (RBNZ) decision on Wednesday to leave the official cash rate (OCR) unchanged and the disappointing release of Chinese trade balance data does little to hinder the NZD/USD pair's positive move.
It is worth recalling that China's dollar-denominated trade surplus widened less than expected, to $70.62 billion in June from the $65.81 billion previous. Additional details of the report showed that exports plunged by 12.4% as compared to the 9.5% downfall anticipated. This marked the worst decline since the height of the COVID-19 pandemic in March 2020 and suggests that China is struggling with slowing overseas demand. Moreover, imports declined by 6.8%, which further fuels fueling worries about a slowdown in the world's second-largest economy, though fails to dent the bullish sentiment surrounding the NZD/USD pair.
Market participants now look forward to the US economic docket, featuring the release of the Producer Price Index (PPI) and the usual Weekly Initial Jobless Claims data later during the early North American session. This, along with the US bond yields and the broader risk sentiment, might influence the USD demand and provide some impetus to the NZD/USD pair. Nevertheless, the aforementioned fundamental backdrop and the price action suggest that the path of least resistance for spot prices is to the upside.
Technical levels to watch
- Pound Sterling has jumped above the psychological resistance of 1.3000 amid an upbeat market mood.
- United Kingdom’s manufacturing activities are facing pressure from higher interest rates by the BoE.
- Britain’s monthly Industrial and Manufacturing Production have contracted by 0.6% and 0.2% respectively.
The Pound Sterling (GBP) has climbed above the 1.3000 psychological resistance, continuing its five-day winning spell despite the rising burden of higher interest rates by the Bank of England (BoE) on the United Kingdom’s manufacturing sector. The GBP/USD pair has been filled with an adrenaline rush as the market mood has turned extremely cheerful, and the BoE is expected to continue its policy-tightening spell in spite of building pressure on the economic outlook.
United Kingdom’s Industrial and Manufacturing Production are contracting as firms are avoiding making applications for fresh credit to dodge higher interest obligations. Subdued manufacturing activities and rising jobless claims are meaningful signs of the heavy burden of aggressive interest rate hikes by the Bank of England.
Daily Digest Market Movers: Pound Sterling ignores weak factory activity data
- United Kingdom’s Office for National Statistics has reported a contraction in monthly Gross Domestic Product (GDP) May figures by 0.1% against the consensus of a 0.3% contraction. In April, monthly GDP expanded by 0.2%.
- Monthly Industrial Production surprisingly contracted heavily by 0.6% vs. expectations of 0.4% contractions and the prior release of -0.2%. Annualized economic data has matched expectations of a 2.3% contraction.
- Manufacturing Production has landed better than expectations but remains in a contraction phase. This economic indicator has been recorded at -0.2% against estimates of -0.5% and the prior release of -0.1%. Also, annual figures remained well-better than expectations but weaker than the previous figure.
- The burden of higher interest rates by the Bank of England is visible in the manufacturing sector.
- This week, Britain’s employment report came full of surprises. Three-month Unemployment Rate jumped to 4.0% against the estimates and the former release of 3.8%.
- Jobless claims rose by 25.7K in June against a decline of 22.5K reported in May as firms said no to fresh credit to avoid high-interest rate obligations.
- Policymakers at the Bank of England (BoE) got uncomfortable after three-month Average Earnings excluding bonuses (May) maintained the pace at 7.3% while investors were anticipating a decline to 7.1%.
- Steady wage pressures were sufficient to offset the cool down in the labor market report and kept the chances of continuation of the policy-tightening spell elevated.
- UK’s Royal Institution of Chartered Surveyors (RICS) has reported that new buyer inquiries for the property have slowed sharply. Higher borrowing costs charged by commercial banks in a highly-inflated environment are making the real estate sector vulnerable.
- In a press conference on Wednesday, Bank of England Governor Andrew Bailey conveyed, "The UK economy and financial system have so far been resilient to interest rate risk," as reported by Reuters.
- The Bank of England has already raised interest rates to 5% and financial markets are expecting that interest rates will peak around 6.5%.
- Market sentiment is extremely bullish as inflation in the United States has decelerated beyond expectations. The monthly headline and core Consumer Price Index (CPI) reported a moderate pace of 0.2%.
- Minneapolis Federal Reserve (Fed) Bank President Neel Kashkari cited that policy rates are needed to raise further and supervisors must ensure that banks are prepared to run new high-inflation stress tests to identify at-risk banks and size individual capital shortfalls.",
- Per the CME Fedwatch tool, investors are hoping that July’s interest rate hike would be the last nail in the coffin this year.
- The US Dollar Index (DXY) has nosedived below 100.50 after surprisingly soft inflation that has squeezed fears of a recession in the United States.
Technical Analysis: Pound Sterling eyes Rising Channel breakout
Pound Sterling looks strong enough to sustain above the psychological resistance of 1.3000. The strength in the Cable is coming from a vertical sell-off in the US Dollar Index after the soft inflation report. The Cable has continued its five-day winning spell and is approaching the upper portion of the Rising Channel chart pattern for a confident breakout. Short-to-long-term daily Exponential Moving Averages (DEMAs) are upward-sloping, indicating firmness in the upside bias.
Investors should wait for a corrective move to build fresh long positions as the current market positioning brings an unfavorable risk-reward status.
Pound Sterling FAQs
What is the Pound Sterling?
The Pound Sterling (GBP) is the oldest currency in the world (886 AD) and the official currency of the United Kingdom. It is the fourth most traded unit for foreign exchange (FX) in the world, accounting for 12% of all transactions, averaging $630 billion a day, according to 2022 data.
Its key trading pairs are GBP/USD, aka ‘Cable’, which accounts for 11% of FX, GBP/JPY, or the ‘Dragon’ as it is known by traders (3%), and EUR/GBP (2%). The Pound Sterling is issued by the Bank of England (BoE).
How do the decisions of the Bank of England impact on the Pound Sterling?
The single most important factor influencing the value of the Pound Sterling is monetary policy decided by the Bank of England. The BoE bases its decisions on whether it has achieved its primary goal of “price stability” – a steady inflation rate of around 2%. Its primary tool for achieving this is the adjustment of interest rates.
When inflation is too high, the BoE will try to rein it in by raising interest rates, making it more expensive for people and businesses to access credit. This is generally positive for GBP, as higher interest rates make the UK a more attractive place for global investors to park their money.
When inflation falls too low it is a sign economic growth is slowing. In this scenario, the BoE will consider lowering interest rates to cheapen credit so businesses will borrow more to invest in growth-generating projects.
How does economic data influence the value of the Pound?
Data releases gauge the health of the economy and can impact the value of the Pound Sterling. Indicators such as GDP, Manufacturing and Services PMIs, and employment can all influence the direction of the GBP.
A strong economy is good for Sterling. Not only does it attract more foreign investment but it may encourage the BoE to put up interest rates, which will directly strengthen GBP. Otherwise, if economic data is weak, the Pound Sterling is likely to fall.
How does the Trade Balance impact the Pound?
Another significant data release for the Pound Sterling is the Trade Balance. This indicator measures the difference between what a country earns from its exports and what it spends on imports over a given period.
If a country produces highly sought-after exports, its currency will benefit purely from the extra demand created from foreign buyers seeking to purchase these goods. Therefore, a positive net Trade Balance strengthens a currency and vice versa for a negative balance.
Economists at ANZ Bank analyze AUD/USD and AUD/NZD outlook.
Decline in the USD toward the end of the year
We expect the USD to decrease as the market begins to factor in potential rate cuts by the Federal Reserve.
We expect some upside for the AUD owing to the predicted drop in USD. We believe that AUD/USD is likely to remain in the 0.66-0.68 range in the near term and forecast the pair to reach 0.70 by year-end.
AUD/NZD will trade within the 1.08-1.10 range in the near term. Any dip below 1.08 could present a buying opportunity due to the widening growth differentials between Australia and New Zealand.
USD/JPY remains weak and could extend the decline to the 137.15 level in the next few weeks, note UOB Group’s Economist Lee Sue Ann and Markets Strategist Quek Ser Leang.
Key Quotes
24-hour view: We expected USD to weaken yesterday. However, we indicated, “it remains to be seen if there is enough momentum to carry USD to the next major support at 139.00.” We did not expect USD to continue to accelerate lower as it plunged to 138.15. The outsized decline is severely oversold, but we are not ruling out further weakness. However, a clear break of 137.15 will come as a surprise today. There is another support at 138.00. Resistance is at 139.20, followed by 139.70.
Next 1-3 weeks: Yesterday (12 Jul, spot at 139.95), we highlighted that “the sharp and swift decline in USD is accelerating.” We added, “the next level to aim for is 139.00, followed by 138.45. While our view of downward acceleration turned out to be correct, we did not quite expect USD to break below both levels so quickly (low has been 138.15 in NY trade). The USD weakness that started on Monday is severely extended. Note that USD has lost a whopping 4.3% in the last five days. That said, we are not ruling out further USD weakness as long as the ‘strong resistance’ at 140.50 (level was at 141.40 yesterday) is not breached. On the downside, the next level to watch is 137.15.
Considering advanced figures from CME Group for natural gas futures markets, open interest rose by nearly 2K contracts after two consecutive daily pullbacks on Wednesday. Volume followed suit and went up for the third straight session, now by around 51.5K contracts.
Natural Gas remains consolidative for the time being
Prices of natural gas reversed two daily advances in a row on Wednesday. The uptick was amidst increasing open interest and volume and suggests a potential decline in the very near term. So far, there are no changes to the range bound theme in the commodity.
USD/INR continues to hold within the 81-83 range since the start of the year. Economists at Commerzbank analyze the Rupee outlook.
India's tame core inflation
June headline inflation picked up to 4.8% YoY from 4.3% previously, led by higher food prices. This was still well within the Reserve Bank of India’s (RBI) 2-6% inflation target range. It was mainly due to higher food prices which are expected to rise further in the coming months. However, the good news for RBI is that core inflation, which strips out food and energy, remained well-behaved and unchanged at 5.2%.
There are no compelling reasons for RBI to alter its course of action at this juncture. It is adopting a wait-and-see attitude with a slight tilt to the hawkish side.
The strong economic backdrop and stable inflation picture are contributing to a stable INR.
In the opinion of UOB Group’s Economist Lee Sue Ann and Markets Strategist Quek Ser Leang, NZD/USD could now set sail to the firm resistance around 0.6385 in the short term.
Key Quotes
24-hour view: The sudden surge in NZD that sent it rocketing to a high of 0.6308 came as a surprise (we were expecting NZD to trade in a range). The rapid rise appears to be overdone but there is room for NZD to test 0.6345. The major resistance at 0.6385 is highly unlikely to come under threat today. Support is at 0.6280, followed by 0.6255.
Next 1-3 weeks: We have expected NZD to trade in a range since late last week. Yesterday (12 Jul), NZD took off and surged to a high of 0.6308. The price actions have shifted the risk for NZD to the upside, towards the major resistance at 0.6385. Overall, only a breach of the ‘strong support’ level, currently at 0.6230, would indicate the buildup in momentum has eased.
Here is what you need to know on Thursday, July 13:
The US Dollar suffered heavy losses against its major rivals on Wednesday as investors reacted to soft inflation data for June. The US Dollar Index (DXY) lost more than 1% on a daily basis and dropped to its weakest level in 15 months. Early Thursday, the DXY stays under modest bearish pressure and US stock index futures trade in positive territory. Industrial Production data for May will be featured in the European economic docket ahead of the weekly Initial Jobless Claims and Producer Price Index (PPI) data from the US later in the day.
The Consumer Price Index (CPI) in the US rose 3% on a yearly basis in June, following the 4% increase recorded in May. On a monthly basis, the CPI and the Core CPI both rose 0.2%. Although Federal Reserve (Fed) policymakers Neel Kashkari and Thomas Barkin noted that inflation was still too high, these comments failed to help the USD find demand. According to the CME Group FedWatch Tool, the probability of the Federal Reserve (Fed) raising its policy rate by 25 basis points (bps) again in December after a July rate hike dropped below 20% from 33% ahead of the CPI data.
During the Asian trading hours, the data from China revealed that the trade surplus widened to $70.62 billion in from $65.81 billion in May. On a yearly basis, Exports and Imports declined 12.4% and 6.8% in that period, respectively.
EUR/USD gathered bullish momentum and broke above 1.1100. As of writing, the pair was trading at its highest level since March 2022 at around 1.1150.
GBP/USD extended its rally and climbed above 1.3000 for the first time in over 15 months early Thursday. Earlier in the day, the UK's Office for National Statistics reported that Industrial Production declined 0.6% on a monthly basis in May, while the real Gross Domestic Product contracted 0.1%.
The Bank of Canada (BoC) raised its policy rate by 25 basis points to 5% as expected following the July policy meeting. The Canadian economy has been stronger than expected, with more momentum in demand, the BoC noted in its policy statement. "The Governing council remains concerned that progress towards 2% inflation target could stall, jeopardizing return to price stability." USD/CAD closed deep in negative territory on Wednesday and continues to edge lower toward 1.3150.
USD/JPY lost nearly 200 pips on Wednesday and dropped to its weakest level in over three months near 138.00 in the Asian session on Thursday. The pair stays in a consolidation phase at around 138.50 in the European morning.
Gold price surged higher and climbed above $1,960. In additional to the broad based USD weakness, the 3% decline seen in the 10-year US Treasury bond yield after the US inflation data provided a boost to XAU/USD.
Bitcoin failed to benefit from improving risk mood and closed in negative territory on Wednesday. At the time of press, BTC/USD was moving sideways below $30,500. Ethereum failed to make a decisive move in either direction and closed virtually unchanged on Wednesday. ETH/USD stays relatively quiet at around $1,900 in the European session.
Open interest in crude oil futures markets increased for the second session in a row on Wednesday, this time by nearly 10K contracts according to CME Group’s preliminary readings. Volume followed suit and went up by around 151.1K contracts.
WTI now looks at the 200-day SMA
Prices of WTI extended the move higher on Wednesday and surpassed the $75.00 mark per barrel on the back of increasing open interest and volume. That said, the commodity could attempt a challenge to the key 200-day SMA, today around $77.20.
The BoC delivered the 25 bps hike as expected, helping to provide two positive catalysts for CAD. Economists at TD Securities analyze Loonie's outlook.
The Bank of Canada did not disappoint
The market wasn’t fully priced for a hike, so there’s some residual support that will probably come through in the move's wake. The next was the soft US inflation number. For CAD, it is likely to catch the tailwinds of the broader USD weakness, which will probably invite a move to 1.30 in the near future.
That said, keep in mind that BoC will maintain adherence to data dependency like other central banks. In turn, they are unlikely to commit to another hike, leaving the door open for this to be the last. With that in mind, we also think that CAD can lose some of its appeal on the crosses, given our outlook of slowing US growth in H2, which is likely to have secondary impacts.
The deeper USD downturn we expect in H2 will certainly benefit CAD, but it won’t be the best way to play a deeper downturn in the USD.
Commenting on the UK Gross Domestic Product (GDP) data, Chancellor Jeremy Hunt said that “while an extra Bank Holiday had an impact on growth in May, high inflation remains a drag anchor on economic growth.”
"The best way to get growth going again and ease the pressure on families is to bring inflation down as quickly as possible. Our plan will work, but we must stick to it,” Hunt added.
Market reaction
At the time of writing, GBP/USD is keeping its range at around 1.3000 on the above comments. The pair is trading 0.15% higher on the day.
The Yuan has weakened since mid-April. Economists at Commerzbank analyze CNY outlook.
Weaker for longer
We forecast USD/CNY to largely stay beyond 7.2 through Q3 before falling back to around the key 7 mark in Q4 and below 7 in 2024 due to the anticipated softening of the Dollar.
EUR/CNY will likely rise in the near term due to further tightening of ECB monetary policy for the time being.

Source: Commerzbank Research
See: USD/CNH could trade in a narrow 7.20-7.30 range for the remainder of July – Credit Suisse
- EUR/JPY consolidates near the 154.40 mark in the early European session.
- An initial support level is located at 153.45, while a 154.95 area is seen as an immediate resistance level.
- The Relative Strength Index (RSI) holds above 60, indicating bullish territory.
The EUR/JPY pair remains steady, close to 154.50 region in the early European session., the cross stands below the 100-hour Exponential Moving Average (EMA) with a downward slope, indicating that the path of least resistance is to the downside.
According to the one-hour chart, EUR/JPY will meet an initial support level of 153.45 (low of July 12) en route to 153.00, indicating a psychological round mark. A decisive break below the mentioned level would expose 151.00, a round level and a high of May 29.
On the upside, any meaningful follow-through buying past 154.95 (100-hour EMA) will challenge the next hurdle near 155.30 (low of July 10), followed by 155.85 (low of July 6). Further north,r the cross will see a rally to 156.70, portraying the high of July 10.
The Relative Strength Index (RSI) holds above 60, indicating bullish territory and that the pair has more room for further upside.
EUR/JPY: One-hour chart
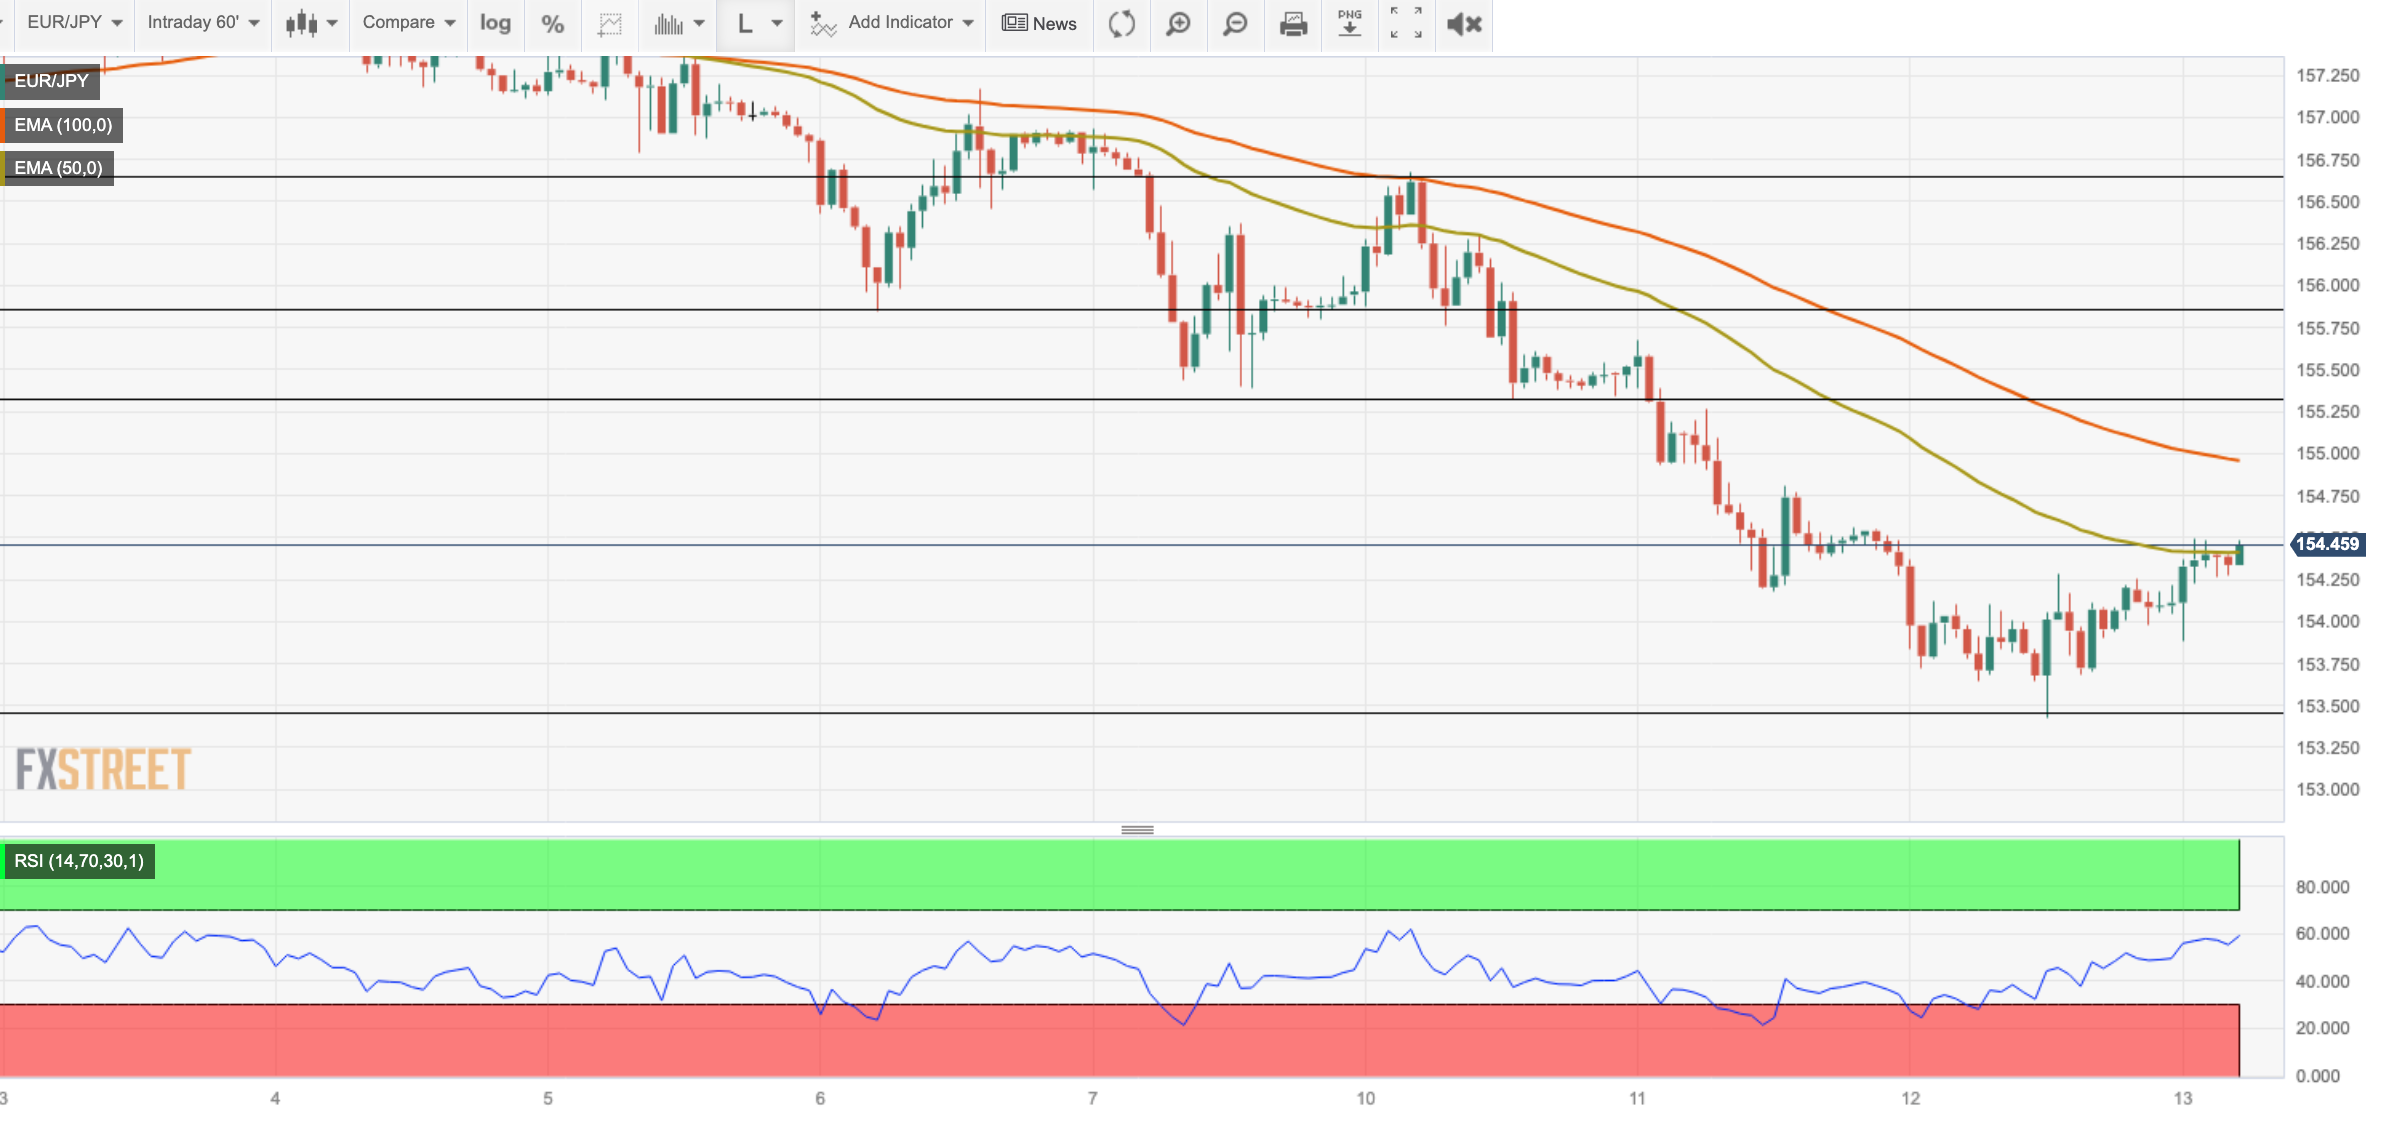
UOB Group’s Economist Lee Sue Ann and Markets Strategist Quek Ser Leang suggest GBP/USD could revisit 1.3100 in the not-so-distant future.
Key Quotes
24-hour view: We expected GBP to break above 1.2950 yesterday. However, we highlighted that “it remains to be seen if there is enough momentum to carry GBP to the next major resistance at 1.3000.” In NY trade, GBP rose one pip above 1.3000 before closing on a firm note at 1.2990 (+0.45%). Conditions are severely overstretched, but only a breach of 1.2930 (minor support is at 1.2965) would indicate that the current upward pressure has faded. As long as 1.2930 is not breached, GBP could grind higher to 1.3035. The major resistance at 1.3100 is highly unlikely to come into view today.
Next 1-3 weeks: Yesterday (12 Jul, spot at 1.2930), we highlighted that “the risk is for GBP to rise further.” We added, “if it breaks above 1.3000, the focus will shift to 1.3100”. In late NY trade, GBP rose to a high of 1.3001. While the focus is at 1.3100 now, severely overbought conditions suggest it may take a few days before this level comes into view. Overall, only a breach of 1.2885 (‘strong support’ level was at 1.2820 yesterday) would indicate that the GBP strength that started on Monday has come to an end.
CME Group’s flash data for gold futures markets noted traders resumed the uptrend and added around 23.5K contracts to their open interest positions on Wednesday. In the same line, volume went up by around 85.7K contracts and reversed the previous daily drop.
Gold: Next on the upside emerges the $1980 region
Gold prices rose strongly on Wednesday amidst increasing open interest and volume, which is indicative that extra gains remain in store for the precious metal in the very near term. That said, the next target on the upside now aligns at the June high in the $1980 per troy ounce.
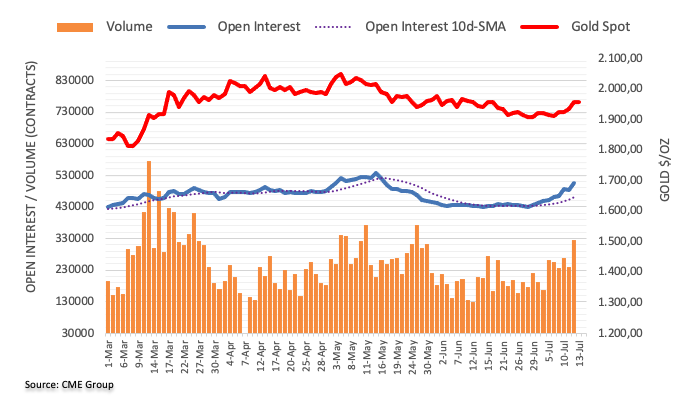
According to the latest UK industrial and manufacturing production data published by Office for National Statistics (ONS) on Wednesday, the industrial sector activity showed a mixed performance last month.
Manufacturing output arrived at -0.2% MoM in May versus -0.5% expected and -0.1% seen in April while total industrial output came in at -0.6% MoM vs. -0.4% expected and -0.2% last.
On a yearly basis, the UK Manufacturing Production data came in at -1.2% in May, outpacing expectations of -1.7%. Total Industrial Output dropped by 2.3% in the fifth month of the year, matching the -2.3% expected and the previous reading of -1.6%.
Separately, the UK goods trade balance numbers were published, which arrived at GBP-18.723 billion in May versus GBP-14.70 billion expectations and GBP-14.639 billion prior. The total trade balance (non-EU) came in at GBP- billion in April versus GBP-5.035 billion previous.
Related reads
- UK GDP contracts 0.1% MoM in May vs. -0.3% expected
- US Dollar crushed on softer than expected CPI
- UK GDP arrived at -0.1% MoM in May vs. -0.3% expected.
- GBP/USD stays below 1.3000 despite upbeat UK GDP data.
The British economy contracted 0.1% in May, beating the -0.3% expectations and following a 0.2% expansion in April.
Meanwhile, the Index of services (May) came in at 0% 3M/3M vs. -0.4% estimate and 0% prior.
Market reaction
The GBP/USD pair is little changed on the UK GDP data. At the press time, the spot is up 0.05% on the day to trade at 1.2994, awaiting the US data and Fedspeak for fresh trading impetus.
About UK GDP
The Gross Domestic Product released by the National Statistics is a measure of the total value of all goods and services produced by the UK. The GDP is considered a broad measure of the UK economic activity. Generally speaking, a rising trend has a positive effect on the GBP, while a falling trend is seen as negative (or bearish).
Further upside momentum could push EUR/USD to the 1.1200 region in the near term, according to UOB Group’s Economist Lee Sue Ann and Markets Strategist Quek Ser Leang.
Key Quotes
24-hour view: We expected EUR to “rise further” yesterday and we held the view that “1.1050 could be just within reach.” While our view for EUR to strengthen was correct, we did not expect the manner in which it jumped not only above 1.1050, but also April’s peak of 1.1095 (high has been 1.1140). Not surprisingly, conditions are severely overbought but there appears to be enough ‘residual’ momentum to carry EUR higher. That said, 1.1200 is likely out of reach today (there is another resistance at 1.1170). Support is at 1.1110, followed by 1.1075.
Next 1-3 weeks: On Monday (10 Jul), when EUR was trading at a much lower level of 1.0965, we indicated that “rapid increase in momentum is likely to lead to further advance in EUR.” We added, “The level to watch is 1.1010, followed by 1.1050.” In our most recent narrative from Tuesday (11 Jul, spot at 1.1000), we highlighted that “upward momentum remains strong, and if EUR breaks above 1.1050, the next level to aim for is the year-to-date high of 1.1095.” In line with our expectations, EUR rose but we did not quite expect it to jump above both 1.1050 and 1.1095 yesterday (EUR surged to a high of 1.1140 in late NY trade). Needless to say, momentum is still strong, and EUR could rise further to 1.1200, as high as 1.1250. The upside risk is intact as long as EUR stays above 1.1035 (‘strong support’ level was at 1.0930 yesterday).
- Gold price is expected to cross the immediate resistance of $1,960.00 as US inflation has decelerated sharply.
- The US Dollar Index has turned sideways around 100.50 after a five-day losing streak.
- Gold price has delivered a breakout of the Inverted Head and Shoulder chart pattern.
Gold price (XAU/USD) has faced fragile barricades while attempting to surpass the immediate resistance of $1,960.00 in the late Asian session. The precious metal has is expected to resume its upside journey as inflationary pressures in the United States have softened dramatically and are sufficient to encourage the Federal Reserve (Fed) to go with only one interest rate hike by year-end.
S&P500 futures have posted significant gains overnight. US equities ended on a bullish note on Wednesday, portraying strength in the risk appetite theme. The US-500 stock basket could show some uncertain moves as the second-quarter result season will kick off sooner.
The US Dollar Index (DXY) has turned sideways around 100.50 after a five-day losing streak as the sheer softening of the United States Consumer Price Index (CPI) has trimmed fears of a potential recession. On Thursday, US Producer Price Index (PPI) data will be keenly watched.
About interest rate guidance, economists at Commerzbank cited that in the US, there are increasing signs that inflationary pressure is easing. In June, consumer prices rose by only 0.2% compared with the previous month. The core rate (which excludes energy and food), which is important as a measure of the underlying trend, was also only 0.2%, the smallest increase since February 2021. While the Fed is still likely to raise interest rates again at the end of the month, the data support our view that this should be the last hike.
Gold technical analysis
Gold price has delivered a breakout of the Inverted Head and Shoulder chart pattern formed on a four-hour scale. A breakout of the aforementioned chart pattern has resulted in a bullish reversal. The neckline of the chart pattern was plotted around June 21 high at $1,940.00. The next stop for the Gold bulls is placed around May 19 high at $1,984.25.
The 20-period Exponential Moving Average (EMA) at $1,940.21 will continue to provide a cushion to the Gold bulls.
Meanwhile, the Relative Strength Index (RSI) (14) has confidently shifted into the bullish range of 60.00-80.00, which indicates that the bullish momentum has been triggered.
Gold two-hour chart
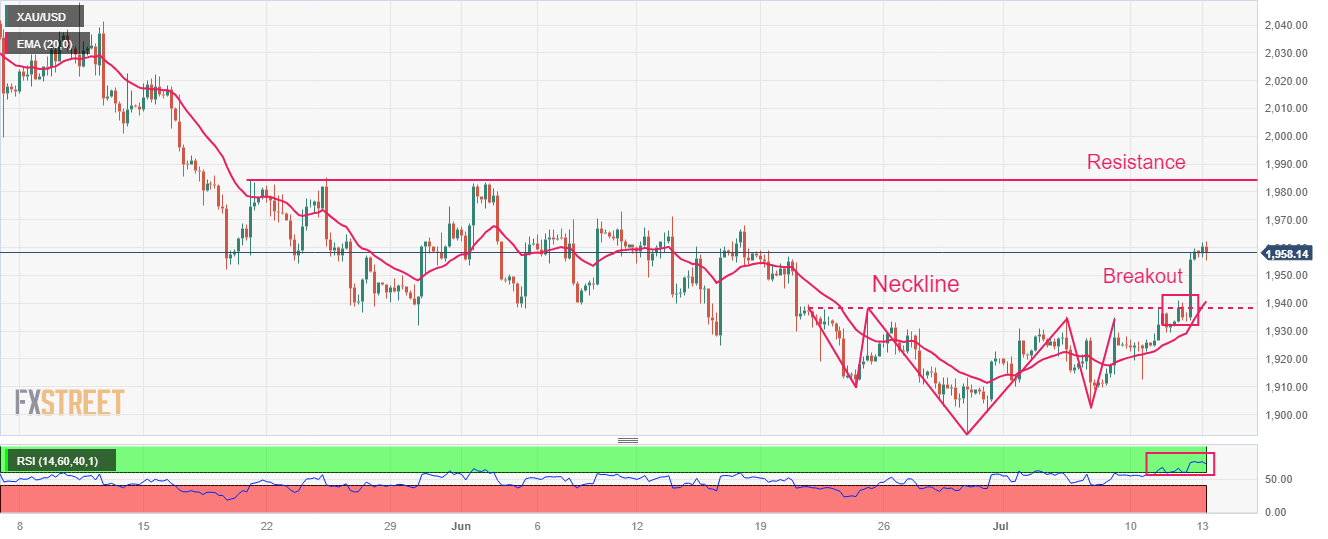
- AUD/USD gains traction to reach a three-week high above the 0.6800 mark.
- The mixed Chinese data fuels the concern about a probable economic slowdown in China.
- The odds that the Federal Reserve (Fed) will end rate hiking later this year weigh on the US Dollar
The AUD/USD pair gains momentum and surges above the 0.6800 area, approaching its highest level since June 20.
The pair remains well supported by some follow-through broad selling in the US Dollar, in the face of a weaker US Consumer Price Index (CPI) on Wednesday.
The latest Chinese data shows that China’s Trade Balance came in at CNY491.25 billion in June versus CNY 452.33 billion prior. Meanwhile, the Dollar value of China’s exports plunged 12.4% in June, worse-than-expected of a 9.5% decline and 7.5% decrease in May, while imports fell 2.6% versus 2.3% the previous month.
It’s worth noting that Australia is a major resource exporter to China. Therefore, investors perceive the Australian dollar as a proxy for the Chinese economy. The latest data fuelled renewed concerns about a likely economic slowdown in China, which could act as a headwind for the AUD/USD pair.
On the Australian Dollar front, the RBA governor Philip Lowe outlined a major overhaul of the RBA and hinted at further interest rate increases. Nevertheless, the key driver for AUD/USD is the odds of additional rate hikes by the Fed.
Apart from this, Wednesday’s US Consumer Price Index (CPI) rose 0.2% in June, lower than the expectation of 0.3%. The annual figure dropped from 4% to 3%, missing the market expectation of 3.1%, the lowest reading since March 2021. The yearly core CPI fell from 5.3% in May to 4.8% in June, a worse-than-expected of 5%.
In the meantime, markets have priced in a 25 basis points (bps) rate hike in the Fed meeting in July. However, the speculation that the Federal Reserve (Fed) will end the tightening cycle later in the year weighs on the Greenback and lends some support to the Aussie.
AUD/USD technical levels
- EUR/USD has demonstrated a stellar run to near 1.1150 amid an intense sell-off in the USD Index.
- After a soft US inflation report, hopes for only one interest rate hike this year by the Fed have improved.
- EUR/USD is gathering strength for delivering a breakout of the slightly rising channel pattern.
The EUR/USD pair is consistently moving north with sheer momentum as soft United States Consumer Price Index (CPI) data drummed that only one interest rate hike option has left in the toolkit of the Federal Reserve (Fed) by year-end. The major currency pair has climbed to near 1.1150 as the US Dollar Index (DXY) is facing winter and the market mood is quite cheerful.
US monthly headline and core inflation registered a moderate pace of 0.2% in June along with a significant decline in annualized numbers due to falling prices of second-hand motor vehicles. The US Dollar Index (DXY) has shown a vertical fall to near 101.40 and is expected to continue its downside momentum.
Meanwhile, the European Central Bank (ECB) is expected to raise interest rates further to tame stubborn inflation. ECB President Christine Lagarde has already made clear that more interest rates are appropriate.
EUR/USD is gathering strength for delivering a breakout of the slightly rising channel formed on a daily scale. The upper portion of the aforementioned chart pattern is placed from February 03 high at 1.1033 while the lower portion is plotted from March 15 low at 1.0516. Potential resistance is placed from 14 January 2022 high at 1.1483.
Upward-sloping 20-period Exponential Moving Average (EMA) at 1.0947 indicates that the short-term trend is bullish.
The Relative Strength Index (RSI) (14) has jumped into the bullish range of 60.00-80.00, which indicates that the upside momentum has been activated.
For further upside, a decisive break above the round-level resistance of 1.1200 would expose the asset to 01 March 2022 high at 1.1233 followed by 25 February 2022 high at 1.1271.
In an alternate scenario, a downside move below February 03 high at 1.1033 would expose the asset to the psychological support of 1.1000. Further slippage below the psychological support would drag the major currency pair to June 15 high at 1.0953.
EUR/USD daily chart
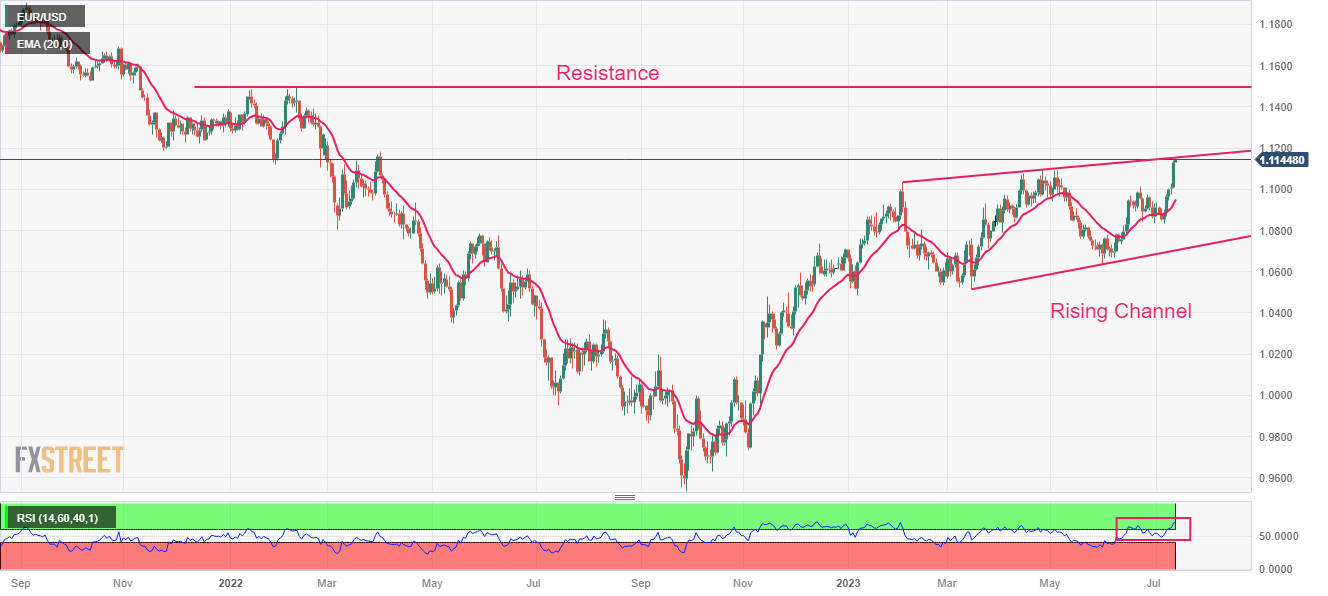
- AUD/JPY scales higher for the second straight day and recovers further from the monthly low.
- The risk-on environment undermines the safe-haven JPY and benefits the risk-sensitive Aussie.
- Speculation for a hawkish shift by the BoJ to limit losses for the JPY and keep a lid on the cross.
The AUD/JPY cross builds on the previous day's late recovery from the 93.25-93.20 area, or its lowest level since June 9 and gains some positive traction for the second successive day on Thursday. Spot prices climb to a two-day high, around the 94.40 region during the Asian session and now look to extend the momentum further beyond the 100-hour Simple Moving Average (SMA).
The prevalent risk-on environment - as depicted by an extended rally in the equity markets - undermines the safe-haven Japanese Yen (JPY) and turns out to be a key factor acting as a tailwind for the AUD/JPY cross. The Australian Dollar (AUD), on the other hand, draws support from the underlying bearish sentiment surrounding the US Dollar (USD), which continues to be weighed down by expectations that the Federal Reserve (Fed) is nearing the end of its rate-hiking cycle.
The AUD bulls, meanwhile, seem rather unaffected by the disappointing release of Chinese Trade Balance data, which showed that the surplus widened less than expected, $70.62 billion in June from $65.81 billion in the previous month. Additional details of the report showed that exports plunged by 12.4% as compared to the 9.5% fall anticipated. Furthermore, imports declined by 6.8% and add to worries about a slowdown in the world's second largest economy.
The upside potential for the AUD/JPY cross, however, seems limited in the wake of speculations that the Bank of Japan (BOJ) will adjust its ultra-loose policy settings as soon as this month. The expectations pushed the yield on the benchmark 10-year Japanese Government Bond (JGB) to its highest level since April earlier this week. This, in turn, should lend some support to the JPY and contribute to keeping a lid on any meaningful appreciating move for spot prices.
Hence, it will be prudent to wait for strong follow-through buying before confirming that the recent sharp corrective decline from the YTD peak touched in June has run its course and placing fresh bullish bets around the AUD/JPY cross.
Technical levels to watch
- Silver climbs beyond the 50% Fibo. Level and touches a one-month high on Thursday.
- The technical setup favours bullish traders and supports prospects for additional gains.
- A convincing break below the 100-day SMA is needed to negate the positive outlook.
Silver builds on the overnight breakout momentum beyond the 100-day Simple Moving Average (SMA) and gains follow-through traction during the Asian on Thursday. The white metal touches a one-month high, around the $24.25 region in the last hour and seems poised to prolong its recent appreciating move witnessed over the past three weeks or so.
Against the backdrop of the previous day's sharp rise, acceptance above the 50% Fibonacci retracement level of the May-June slide could be seen as a fresh trigger for bullish traders. Furthermore, technical indicators n the daily chart have been gaining positive traction and are still far from being in the overbought territory. This, in turn, validates the constructive outlook and suggests that the path of least resistance for the XAG/USD is to the upside.
Hence, a subsequent move towards testing the June monthly swing high, around the $24.50-$24.55 region, coinciding with the 61.8% Fibo. level, now looks like a distinct possibility. A sustained strength beyond the latter will suggest that the corrective slide from over a one-year peak touched in May has run its course and push the XAG/USD towards the $25.00 psychological mark en route to the next relevant hurdle near the $25.50-$25.55 region.
On the flip side, the $24.00 round figure could now act as immediate support ahead of the 38.2% Fibo. level, around the $23.70 region. This is followed by the 100-day SMA, around mid-$23.00s, which should act as a strong base for the XAG/USD. A convincing break below will negate the positive outlook and shift the bias in favour of bearish traders. The white metal might then turn vulnerable to slide back below the $23.00 mark, or 23.6% Fibo.
Silver daily chart
-638248174235105486.png)
Key levels to watch
China's Trade Balance for June, in Chinese Yuan terms, came in at CNY491.25 billion versus CNY452.33 billion last.
Exports plunged 8.3% in the reported period vs. -0.8% previous.
The country’s imports fell 2.6% vs. 2.3% prior.
In US Dollar terms, China’s trade surplus widened less than expected in June, as exports slumped.
Trade Balance came in at +70.62B versus +74.80B expected and +65.81B previous.
Exports (YoY): -12.4% vs. -9.5% exp. and -7.5% prior.
Imports (YoY): -6.8% vs. -4.0% exp. and -4.5% last.
FX implications
AUD/USD is shrugging off mixed Chinese trade figures. The spot is up 0.40% on the day, trading at 0.6810, as of writing.
- USD/MXN consolidates in a range below the 17.0000 mark through the Asian session on Thursday.
- The formation of the descending channel and the recent price action still favours bearish traders.
- The RSI on the daily chart is on the verge of breaking into the oversold zone and warrants caution.
The USD/MXN pair struggles to capitalize on the previous day's modest bounce from the 16.8085 region, or its lowest level since December 2015 and oscillates in a narrow trading band through the Asian session on Thursday. Spot prices, meanwhile, now seem to have found acceptance below the 17.0000 mark and remain vulnerable to depreciate further.
The decline witnessed over the past three months or so has been along a downward-sloping channel, which points to a well-established short-term bearish trend. Furthermore, the recent failure near the trend-channel resistance, which coincides with the 50-day Simple Moving Average (SMA), and the subsequent slide validates the negative outlook for the USD/MXN pair. That said, the Relative Strength Index (RSI) on the daily chart has moved on the verge of breaking into the oversold zone and warrants some caution.
Hence, any further decline below the overnight swing low is more likely to find support near the lower end of the aforementioned channel, currently pegged around the 16.6750 area. A convincing breakdown below, however, will be seen as a fresh trigger for bearish traders and set the stage for an extension of a one-year-old downtrend.
On the flip side, any meaningful recovery now seems to confront stiff resistance near the 17.0000 horizontal support breakpoint. This is followed by the 17.0500 hurdle, which if cleared decisively might trigger a short-covering rally and lift the USD/MXN pair towards the 17.1200 intermediate barrier. The momentum could get extended further towards the next relevant resistance near the 17.1790-17.1800 region en route to the 17.2420-17.2430 supply zone.
USD/MXN daily chart
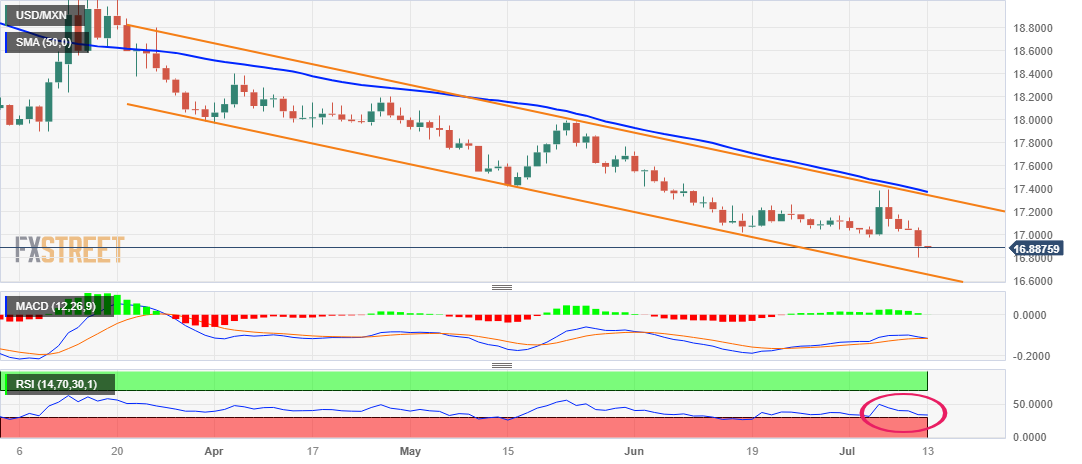
Key levels to watch
- WTI crude oil is rising toward $76, the highest level since May.
- The weaker US inflation data raised hopes for oil traders.
- The renewed tension between the US-China could cap the potential upside in crude oil prices.
Western Texas Intermediate (WTI), the US crude oil benchmark, flirts with $76 per barrel for the first time since May and currently settles near $75.80 during the Asian trading hours on Thursday. WTI crude oil is supported by the broad US Dollar weakness, induced by the softer US Consumer Price Index (CPI) on Wednesday.
On Wednesday, the US Bureau of Labor Statistics (BLS) revealed that the Consumer Price Index (CPI) dropped to 3% Year-over-Year in June from 4% in May. This figure was below the market expectation of 3.1%. In response to softer inflation reports, the US Dollar dropped to the 100.50 mark, the lowest daily close in a year.
Investors are concerned about higher interest rates from central banks that may lead to a slowdown in economic growth and a decrease in oil demand. However, the US inflation data raised hope that the upcoming Federal Reserve (Fed) meeting on July 25-25 could likely be the last Fed rate hike and that the Fed could hit the pause button again for the rest of this year. The dovish Fed outlook weighed heavily on the US Dollar.
Following the downbeat China’s Consumer Price Index (CPI) and the Producer Price Index (PPI) for June. Markets are concerned about the economic slowdown in China, the world’s second-largest economy.
On the US-China headline, China’s embassy Xie Feng said in a statement early Thursday that the US would meet China halfway to progressively restore relations between the two nations and their armies. Oil traders will closely watch this headline for a fresh impetus in WTI price. The renewed tensions between the US-China could cap the potential upside in crude oil prices.
The recent upsurge in WTI comes after Saudi Arabia extended its voluntary 1 million barrels per day oil supply cut for the second month until August. The reduction will bring the country's output to 9 million barrels daily, the lowest level in several years.
Later in a week, the Producer Price Index (PPI) and the University of Michigan Preliminary Consumer Sentiment (July) data from the US will be released and could significantly impact the USD-denominated WTI price. Oil traders will closely watch these data and find opportunities around WTI crude oil.
- Gold price climbs to a four-week high on Thursday and seems poised to appreciate further.
- The softer US CPI reaffirms expectations that the Fed will hike only one more time this year.
- The US Dollar languishes near a 15-month low and adds credence to the positive outlook.
Gold price trades with a positive bias through the Asian session on Thursday and is currently placed around the $1,960 area, or a nearly four-week high. The XAU/USD has now moved back above the 100-day Simple Moving Average (SMA) and the fundamental backdrop supports prospects for an extension of the recent rally from the $1,893 region, or a three-and-half-month low touched in June.
Bets that Fed will end its rate-hiking cycle benefit Gold price
The latest consumer inflation figures from the United States (US) released on Wednesday reaffirmed market expectations that the Federal Reserve (Fed) will hold interest rates after a 25 bps lift-off at the July 25-26 policy meeting. The US Bureau of Labor Statistics reported that the headline Consumer Price Index (CPI) rose 0.3% in June and the yearly rate edged lower to 3% from the 3.1% prior. Furthermore, the monthly rise in core prices was the smallest since August 2021. On an annual basis, the US core CPI decelerated to 4.8% - marking the smallest increase in more than two years. This comes on the back of signs that the US labor market is cooling and should allow the Fed to soften its hawkish stance, which, in turn, benefits the non-yielding Gold price.
Sliding US bone yields weigh on USD and also underpin XAU/USD
Market participants seem convinced that the US central bank is close to ending its fastest monetary policy tightening cycle since the 1980s. This leads to a further decline in the US Treasury bond yields and keeps the US Dollar (USD) depressed near its lowest level since April 2022. The prevailing bearish sentiment surrounding the Greenback is seen as another factor offering support to the US Dollar-denominated Gold price. Apart from this, Thursday's uptick could further be attributed to some technical buying following the overnight breakout through the 100-day SMA support breakpoint-turned-resistance. That said, the upbeat market mood might hold back bulls from placing aggressive bets around the safe-haven XAU/USD and cap further gains.
Traders now look to US macro data for fresh impetus
Market participants now look to the US economic docket, featuring the release of the Producer Price Index (PPI) and the usual Weekly Initial Jobless Claims data later during the early North American session. This, along with the US bond yields, will influence the USD price dynamics and provide some impetus to the Gold price. Nevertheless, the aforementioned fundamental backdrop seems tilted firmly in favour of bullish traders and suggests that the path of least resistance for the XAU/USD is to the upside. Hence, any intraday corrective decline might be seen as a buying opportunity and is more likely to remain limited, at least for the time being.
Gold price technical outlook
From a technical perspective, the stage seems all set for a move toward testing the next relevant hurdle near the $1,970-$1,972 supply zone. Some follow-through buying has the potential to lift the Gold price back towards the $2,000 psychological mark en route to the $2,010-$2,012 resistance. On the flip side, the 100-day SMA, currently around the $1,952 region, now seems to protect the immediate downside, below which the XAU/USD could slide to the $1,935 horizontal support. A convincing break below the latter might shift the bias in favour of bearish traders and pave the way for a slide towards the $1,925 support en route to the weekly low, around the $1,912 area, and the $1,900 mark.
Key levels to watch
| Raw materials | Closed | Change, % |
|---|---|---|
| Silver | 24.126 | 4.36 |
| Gold | 1957.53 | 1.31 |
| Palladium | 1281.8 | 2.44 |
According to a statement from China Customs on Thursday, China's yuan-denominated exports in the first half of this year rose 3.7% from a year earlier.
The country’s imports dropped 0.1% during the same period, the latest data published by China Customs showed.
They said that “the sluggish global economic growth, slowing global trade and investment, geopolitical risks and weakening external demand continue to impact China's trade.”
Market reaction
The Chinese proxy, the Australian Dollar, is unfazed by the mixed data. At the time of writing, AUD/USD is adding 0.25% on the day to trade at 0.6805.
- EUR/USD extends gains above the 1.1100 area amid sustained US dollar weakness.
- The US inflation data showed odds of further rate hikes by year-end have declined.
- The European Central Bank (ECB) will likely hike more rates later in the month.
- Investors will await the US Producer Price Index (PPI) due later in the day.
The EUR/USD pair is trading on the front foot, teasing a fresh 2023 top near 1.1150 in the early Asian session amid a broad-based US dollar weakness.
The pair reached its highest level since March 2022 after breaking convincingly above the 1.1100 mark on Wednesday. Market players await the release of the Producer Price Index (PPI) due later in the day.
The US Bureau of Labor Statistics (BLS) reported on Wednesday that the country’s Consumer Price Index (CPI) dropped to 3% YoY in June from 4% in May. This figure was slightly below the market anticipation of 3.1%. Meanwhile, core CPI inflation, excluding volatile food and energy costs, fell to 4.8% from 5.3%. On a monthly basis, both CPI and core CPI gained 0.2%, missing analysts' expectations.
In response to the softer inflation reports, the US Dollar came under renewed selling pressure. The US Dollar Index (DXY), a gauge of the performance of the Greenback against a basket of six major currencies, hit its lowest since April 2022, just above the 100.50 area.
The inflation data showed signs of easing inflationary pressure in the US economy. The next Federal Open Market Committee (FOMC) meeting is scheduled for July 25-26, and the market anticipates a rate hike at that meeting. However, the odds of further rate hikes by year-end have declined significantly.
Across the pond, the ECB remains hawkish and will likely raise its policy rates by a quarter percentage point later in the month due to persistent inflationary pressure in the euro area. The final inflation figure, measured by the Consumer Price Index (CPI) in Germany for June, rose by 0.3% MoM, while final inflation in Spain rose 1.9% in the year to June.
Looking ahead, investors will keep an eye on another US inflation data on Thursday. The Producer Price Index (PPI) is estimated to drop from 6.6% to 6.1% annually, while the core figure is expected to decline from 5.3% to 4.8%. Also, the European Central Bank (ECB) will release the minutes of its latest meeting on Thursday.
EUR/USD: Technical levels to watch
- USD/JPY attracts some buying on Thursday and stalls its recent pullback from the YTD peak.
- A positive risk tone undermines the JPY and prompts short-covering amid oversold conditions.
- Bearish USD might cap any meaningful recovery amid expectations for a shift in BoJ's stance.
The USD/JPY pair stages a modest bounce from the 138.00 neighbourhood, or a nearly two-month low touched during the Asian session on Thursday and hits a fresh daily high in the last hour. Spot prices currently trade around the 138.60 region, up less than 0.10% for the day, and for now, seem to have stalled the recent sharp retracement slide from the YTD peak touched on June 30.
The prevalent risk-on environment - as depicted by an extended rally in the equity markets - undermines the safe-haven Japanese Yen (JPY). This, along with oversold conditions on hourly charts, prompts some intraday short-covering around the USD/JPY pair, especially after a steep decline of around 700 pips witnessed over the past two weeks or so from levels just above the 145.00 psychological mark. That said, any meaningful recovery still seems elusive on the back of the underlying bearish sentiment surrounding the US Dollar (USD).
In fact, the USD Index (DXY), which tracks the Greenback against a basket of currencies, languishes near its lowest level since April 2022 as investors now seem convinced that the Federal Reserve (Fed) will hike interest rates only one more time this year. The bets were reaffirmed by the US CPI report on Wednesday, showing that consumer prices moderated further in June. This leads to a further decline in the US Treasury bond yields, which should continue to weigh on the USD and keep a lid on any meaningful upside for the USD/JPY pair.
Apart from this, speculations that the Bank of Japan (BOJ) will adjust its ultra-loose policy settings as soon as this month could lend support to the JPY and contribute to capping gains for the USD/JPY pair. This, in turn, warrants some caution for bullish traders and makes it prudent to wait for strong follow-through buying before confirming that spot prices have formed a near-term bottom. Traders now look to the US economic docket, featuring the Producer Price Index (PPI) and the Weekly Initial Jobless Claims, for short-term opportunities.
Technical levels to watch
- NZD/USD’s upside gains traction and advances above the 0.6300 area on Thursday.
- New Zealand Business NZ PMI fell to 47.5 in June from 48.9 in May.
- Extended US Dollar weakness broadly helps boost the Kiwi.
- Market players will shift their focus to the US Producer Price Index (PPI) due later in the day.
The NZD/USD pair edges higher and remains slightly above the 0.6300 area in the early Asian session. Investors digest the interest rate policy from the Reserve Bank of New Zealand and softer data from the US ahead of the Producer Price Index (PPI) due in the North American session.
The Reserve Bank of New Zealand (RBNZ) left the Official Cash Rate unchanged at 5.50% on Wednesday, as the market expected on Wednesday. Early Thursday, New Zealand’s Business NZ PMI fell to 47.5 in June from 48.9 in May, falling short of the 49.8 expected. The figure dropped to its lowest since November 2022. Further details showed that the major sub-index dropped into the contraction zone, with Production declining to 47.5 and New Orders down to 43.8.
However, the weakening of the US Dollar across the board supports the NZD/USD pair. The US Dollar Index (DXY), a gauge of the Greenback’s value versus a weighted basket of currencies, slumped to the lowest since April 2022 following the softer US inflation data on Wednesday.
The US Consumer Price Index (CPI)data showed inflation subsiding. According to the US Bureau of Labor Statistics, June's Consumer Price Index (CPI) declined to 3% YoY from 3.1% previously, while core inflation MoM fell to 0.2% from 0.3% prior, the smallest gain since August 2021.
Markets have priced in a 25 basis points (bps) rate increase at the Fed's July 25-26 policy meeting, based on CME Group’s FedWatch tool. However, the possibility of further rate hikes before the end of the year has significantly decreased.
In the absence of any relevant economic data releases from New Zealand, market players will take cues from another US inflation figure, the Producer Price Index (PPI). Also, Unemployment Claims and the University of Michigan Preliminary Consumer Sentiment from the US will be released later in the week.
NZD/USD: Technical levels to consider
On Thursday, the People’s Bank of China (PBOC) fixed the USD/CNY central rate at 7.1527, compared with Wednesday’s fix of 7.1765 and market expectations of 7.1623.
The PBOC said that it invested a total of 3 bln yuan in open market operations.
- USD/CAD remains on the defensive near the 1.3180 mark after the softer US inflation data.
- The Bank of Canada (BoC) raised the rate by 25 basis points (bps) to 5.0%, as expected.
- The US inflation data supported the view about the last Fed hike at the July policy meeting.
The USD/CAD pair extended the downside after the US Consumer Price Index (CPI) data and the Bank of Canada (BoC) policy decision on Wednesday. The pair remains under pressure and currently trades near 1.3180 in the early Asian session.
Following the July policy meeting on Wednesday, the Bank of Canada (BoC) raised the benchmark interest rate by 25 basis points (bps) to 5%, as the market expected. BoC Governor Tiff Macklem commented on the policy outlook that higher interest rates are necessary in order to slow demand growth in the economy and alleviate price pressures. He added that the BoC is likely to hike additional rates.
The BoC's decision to raise rates comes after the release of US inflation data for June. The US Bureau of Labor Statistics publication showed that CPI declined to 3% YoY from the 3.1% prior. Meanwhile, the core CPI fell to 4.8% YoY from 5.3% versus the market consensus of 5%. The US Dollar faced some follow-through selling after the data and sharply declined to near 101.50, the lowest since April 2022. The inflation data reinforced expectations that the Federal Reserve will hold interest rates following an additional 25 bps raise at the July 25-26 policy meeting.
Moving on, market participants will focus on the release of the US Producer Price Index (PPI) for June and Unemployment Claims due later during the early North American session this Thursday. Investors will look for a fresh impetus and find trading opportunities around the USD/CAD pair.
USD/CAD Technical levels
- AUD/USD climbs to a three-week high and is supported by sustained selling around the USD.
- The softer US CPI reaffirms that the Fed will end its rate-hiking cycle and weighs on the buck.
- A positive risk tone also undermines the safe-haven USD and benefits the risk-sensitive Aussie.
The AUD/USD pair edges higher during the Asian session on Thursday and looks to build on the overnight breakout rally through a technically significant 200-day Simple Moving Average (SMA). Spot prices currently trade near a three-week top and remain well supported by the prevailing US Dollar (USD) selling bias, with bulls now awaiting a sustained strength beyond the 0.6800 mark before placing fresh bets.
The USD Index (DXY), which tracks the Greenback against a basket of currencies, plunges to its lowest level since April 2022 in the aftermath of softer US consumer inflation figures released on Wednesday. In fact, the headline CPI rose 0.3% in June, while the monthly rise was the smallest since August 2021. Furthermore, the yearly rate decelerated to 4.8% - also the smallest increase in more than two-year. Further moderation in consumer prices reinforced speculations that the Federal Reserve (Fed) will hike interest rates only one more time this year.
Expectations that the Fed is nearing the end of its policy tightening cycle lead to a further decline in the US Treasury bond yields and continue to weigh on the buck, which turns out to be a key factor acting as a tailwind for the AUD/USD pair. Apart from this, the prevalent risk-on mood - as depicted by an extension of the recent rally in the equity markets - is also seen undermining the safe-haven Greenback and benefitting the risk-sensitive Aussie. This, along with the overnight sustained strength beyond the very important 200-day SMA favours bullish traders.
The outlook is reinforced by the fact that technical indicators on the daily chart are holding comfortably in the positive territory and are still far from being in the overbought zone. That said, the Relative Strength (RSI) on hourly charts is flashing slightly overbought conditions and holding back bulls from placing fresh bets around the AUD/USD pair or positioning for any further appreciating move. Nevertheless, the aforementioned fundamental backdrop suggests that the path of least resistance for spot prices remains to the upside.
Market participants now look forward to the US economic docket, featuring the release of the Producer Price Index (PPI) and the usual Weekly Initial Jobless Claims later during the early North American session. This, along with the US bond yields and the broader risk sentiment, will influence the USD price dynamics and provide some impetus to the AUD/USD pair ahead of the key Chinese macro data next Monday.
Technical levels to watch
- GBP/USD gains traction for the sixth successive day amid the prevailing USD selling bias.
- The US CPI reaffirms bets that the Fed will end its rate-hiking cycle and weighs on the buck.
- Expectations for additional rate hikes by the BoE underpin the GBP and remain supportive.
The GBP/USD pair trades with a positive bias for the sixth successive day on Thursday and touches a fresh 15-month peak during the Asian session, with bulls now looking to build on the momentum beyond the 1.3000 psychological mark.
The US Dollar (USD) languishes near its lowest level since April 2022 amid speculations that the Federal Reserve (Fed) will not hike interest rates beyond July. The bets were reaffirmed by the crucial US CPI report released on Wednesday, which showed that consumer prices moderated further in June. This, in turn, leads to a further decline in the US Treasury bond yields and continues to weigh the buck. Apart from this, the prevalent risk-on mood is also seen undermining the safe-haven Greenback and acting as a tailwind for the GBP/USD pair.
The British Pound (GBP), on the other hand, draws support from expectations that the Bank of England (BoE) will tighten its monetary policy further to bring inflation under control, reaffirmed by stronger UK wage growth data. In fact, the official data released earlier this week showed that wages excluding bonus rose by 7.3% in the three months to May, unchanged from the previous month's growth and matching the highest rate since records began in 2001. This turns out to be another factor lending additional support to the GBP/USD pair.
Bulls, however, seem to refrain from placing fresh bets as the Relative Strength Index (RSI) on short-term charts is already flashing overbought conditions. Hence, it will be prudent to wait for some intraday consolidation or a modest pullback before positioning for any further gains. Traders now look to the UK macro data for some impetus ahead of the US Producer Price Index (PPI), due later during the early North American session. Nevertheless, the fundamental backdrop suggests that the path of least resistance for the GBP/USD pair is to the upside.
Technical levels to watch
| Index | Change, points | Closed | Change, % |
|---|---|---|---|
| NIKKEI 225 | -259.64 | 31943.93 | -0.81 |
| Hang Seng | 201.12 | 18860.95 | 1.08 |
| KOSPI | 12.23 | 2574.72 | 0.48 |
| ASX 200 | 26.8 | 7135.7 | 0.38 |
| DAX | 232.66 | 16023 | 1.47 |
| CAC 40 | 113 | 7333.01 | 1.57 |
| Dow Jones | 86.01 | 34347.43 | 0.25 |
| S&P 500 | 32.9 | 4472.16 | 0.74 |
| NASDAQ Composite | 158.26 | 13918.96 | 1.15 |
| Pare | Closed | Change, % |
|---|---|---|
| AUDUSD | 0.67868 | 1.5 |
| EURJPY | 154.011 | -0.3 |
| EURUSD | 1.11281 | 1.09 |
| GBPJPY | 179.768 | -0.92 |
| GBPUSD | 1.29875 | 0.44 |
| NZDUSD | 0.6294 | 1.6 |
| USDCAD | 1.31835 | -0.36 |
| USDCHF | 0.86689 | -1.4 |
| USDJPY | 138.415 | -1.36 |


© 2000-2026. Уcі права захищені.
Cайт знаходитьcя під керуванням TeleTrade DJ. LLC 2351 LLC 2022 (Euro House, Richmond Hill Road, Kingstown, VC0100, St. Vincent and the Grenadines).
Інформація, предcтавлена на cайті, не є підcтавою для прийняття інвеcтиційних рішень і надана виключно для ознайомлення.
Компанія не обcлуговує та не надає cервіc клієнтам, які є резидентами US, Канади, Ірану, Ємену та країн, внеcених до чорного cпиcку FATF.
Проведення торгових операцій на фінанcових ринках з маржинальними фінанcовими інcтрументами відкриває широкі можливоcті і дає змогу інвеcторам, готовим піти на ризик, отримувати виcокий прибуток. Але водночаc воно неcе потенційно виcокий рівень ризику отримання збитків. Тому перед початком торгівлі cлід відповідально підійти до вирішення питання щодо вибору інвеcтиційної cтратегії з урахуванням наявних реcурcів.
Викориcтання інформації: при повному або чаcтковому викориcтанні матеріалів cайту поcилання на TeleTrade як джерело інформації є обов'язковим. Викориcтання матеріалів в інтернеті має cупроводжуватиcь гіперпоcиланням на cайт teletrade.org. Автоматичний імпорт матеріалів та інформації із cайту заборонено.
З уcіх питань звертайтеcь за адреcою pr@teletrade.global.
переклади