- Аналітика
- Новини та інструменти
- Новини ринків
Новини ринків
The Bank of Japan (BoJ) will consider whether to abandon its negative interest rate policy at a meeting beginning Monday as pay hikes by large companies bring the central bank's 2% price target within reach, per Nikkei.
BoJ policymakers are also discussing scrapping the yield curve control, which sets a reference cap for long-term interest rates to about 1%. Following that, it would continue to buy Japanese government bonds to prevent rates from rising.
Market reaction
At the time of writing, USD/JPY is trading 0.06% lower on the day at 147.65.
- NZD/USD trades on a positive note near 0.6158 amid the softer USD.
- Investors have lowered their bets on a 25 basis points (bps) rate cut from the Fed in June.
- The growing fear about China's economic growth outlook undermined the China-proxy Kiwi.
- The US February Retail Sales data will be in the spotlight on Thursday.
The NZD/USD pair trades strongly above the mid-0.6100s during the early Asian session on Thursday. The decline of the US Dollar (USD) provides some support to the pair. The US February Retail Sales data on Thursday might offer some hints about rate-cutting expectations from the Federal Reserve (Fed) next week. The figure is expected to rise by 0.8% m/m. At press time, NZD/USD is trading at 0.6158, gaining 0.02% on the day.
The rise in both headline and core CPI inflation earlier this week might influence the Fed to cut rates just two times this year and decrease the chance of easing policy in June. Investors have priced in 75% odds of a 25 basis points (bps) rate cut in June, down from 95% at the beginning of the week. The Fed is anticipated to keep the benchmark rate steady in the 5.25%–5.50% range in the March policy meeting next week. The Fed wants to see more evidence that recent disinflation progress is sustainable before starting the policy-easing process.
On the Kiwi front, the growing fear about China's economic growth outlook and the lack of supporting measures from Chinese authorities dampen commodity demand, which exerts some selling pressure on the China-proxy New Zealand Dollar (NZD) and caps the pair’s upside.
Later on Thursday, investors will closely watch the US Retail Sales for February. The stronger-than-expected data might lift the Greenback against its rivals. On Friday, New Zealand’s Business NZ Performance of Manufacturing Index (PMI) for February will be released. Next week, the Federal Open Market Committee's (FOMC) monetary policy meeting will take center stage.
.
- GBP/JPY trapped near 189.00 after a failed bid for 189.50.
- BoJ continues to flirt with hints about the end of negative rates.
- UK data provides little spark for chart moves this week.
GBP/JPY saw a thin rally on Wednesday, testing into 189.50 before wrapping up the midweek trading session near the 189.00 handle. The pair is cautiously recovering after an early-week dip into the 188.00 handle.
The Bank of Japan (BoJ) continues to wink at the possibility of ending the negative rate regime. BoJ Governor Kazuo Ueda nodded at “tweaking negative rates” early Wednesday, as the BoJ prepares to place the burden of the final decision on the shoulders of spring negotiations on wages between unions and management at large business organizations. The BoJ has been openly transparent that how hawkish or dovish the Japanese central bank will be in the near-term will hinge entirely on wage growth following the end and data collection of Japan’s spring negotiations.
UK data came in mixed early on Wednesday, but did little to move the needle. UK Industrial Production fell to -0.2% in January after December’s 0.6% print, missing the forecast flat print of 0.0%. UK MoM Manufacturing Production also declined, coming in at the expected 0.0% compared to the previous 0.8%. UK Gross Domestic Product (GDP) in January also met expectations, printing at 0.2% versus the previous -0.1%.
The rest of the trading week sees only thin data for both the Pound Sterling (GBP) and the Japanese Yen (JPY). Friday will round out the Guppy’s hits on the economic calendar with mid-tier UK Consumer Inflation Expectations for the next 12 months. UK consumer inflation forecasts last printed at 3.3%.
GBP/JPY technical outlook
GBP/JPY is on a slow grind higher after Monday’s bounce from the 188.00 handle, facing intraday technical resistance from 189.50 as the pair drifts around 189.00. A stiff supply zone is built into the 191.00 region to capture any bullish pushes into the high end.
Despite the recent end of a five-day bear run in the GBP/JPY chart after the pair backslid from 191.00, the Guppy is barely down from its highest bids since 2015, and the pair remains well-bid above the 200-day Simple Moving Average (SMA) at 184.14.
GBP/JPY hourly chart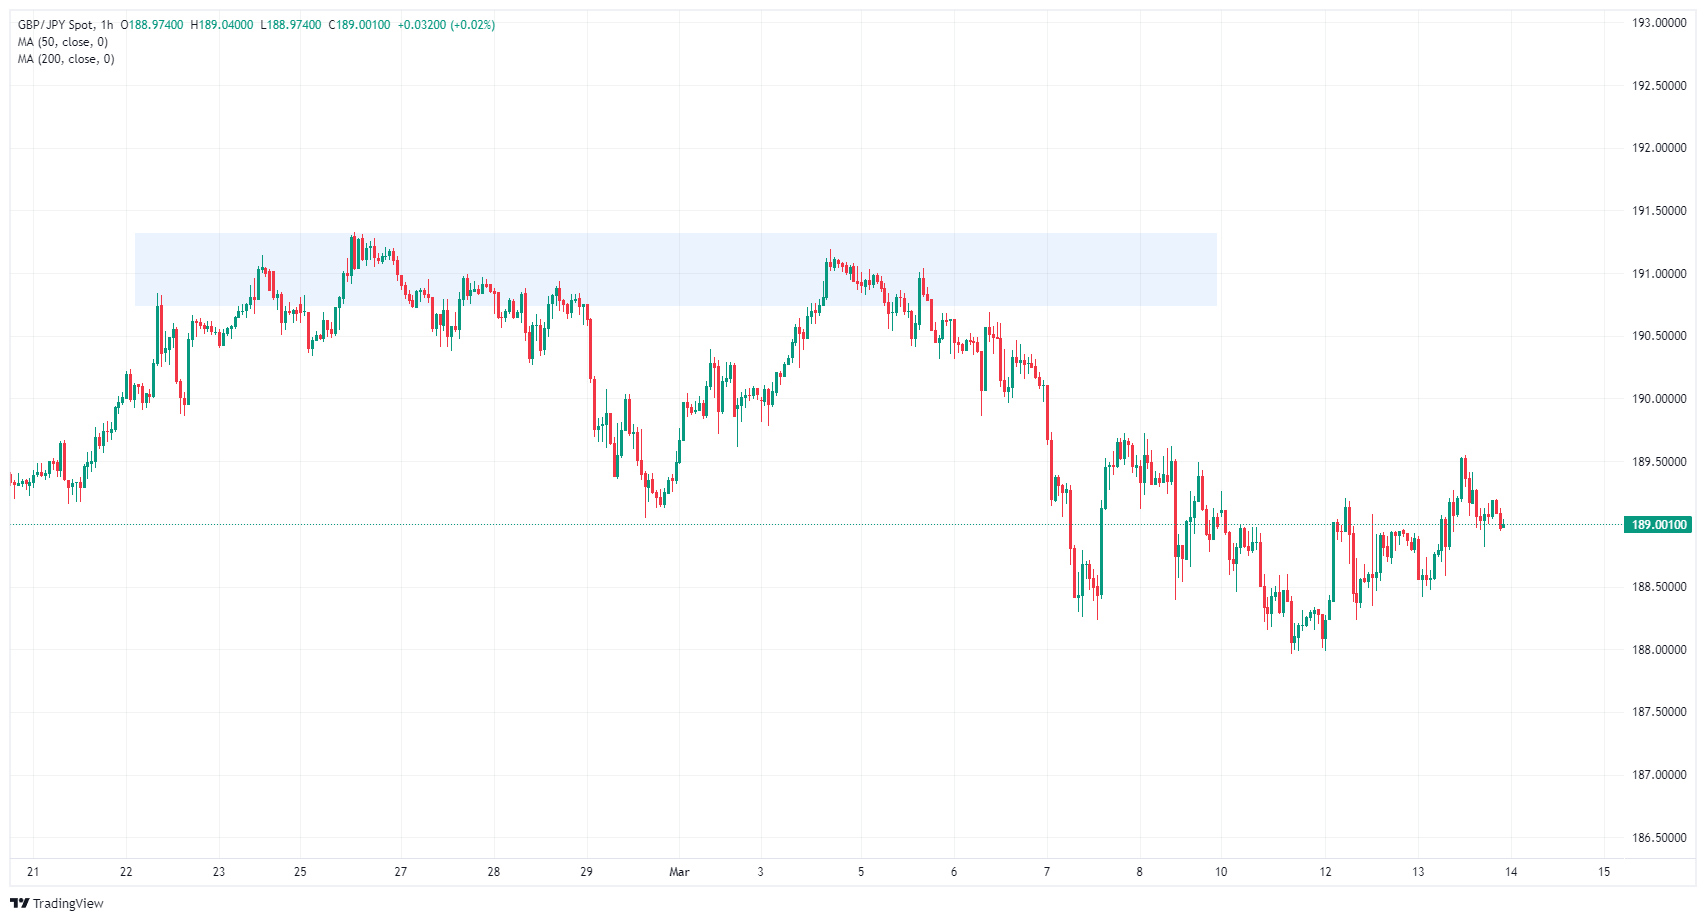
GBP/JPY daily chart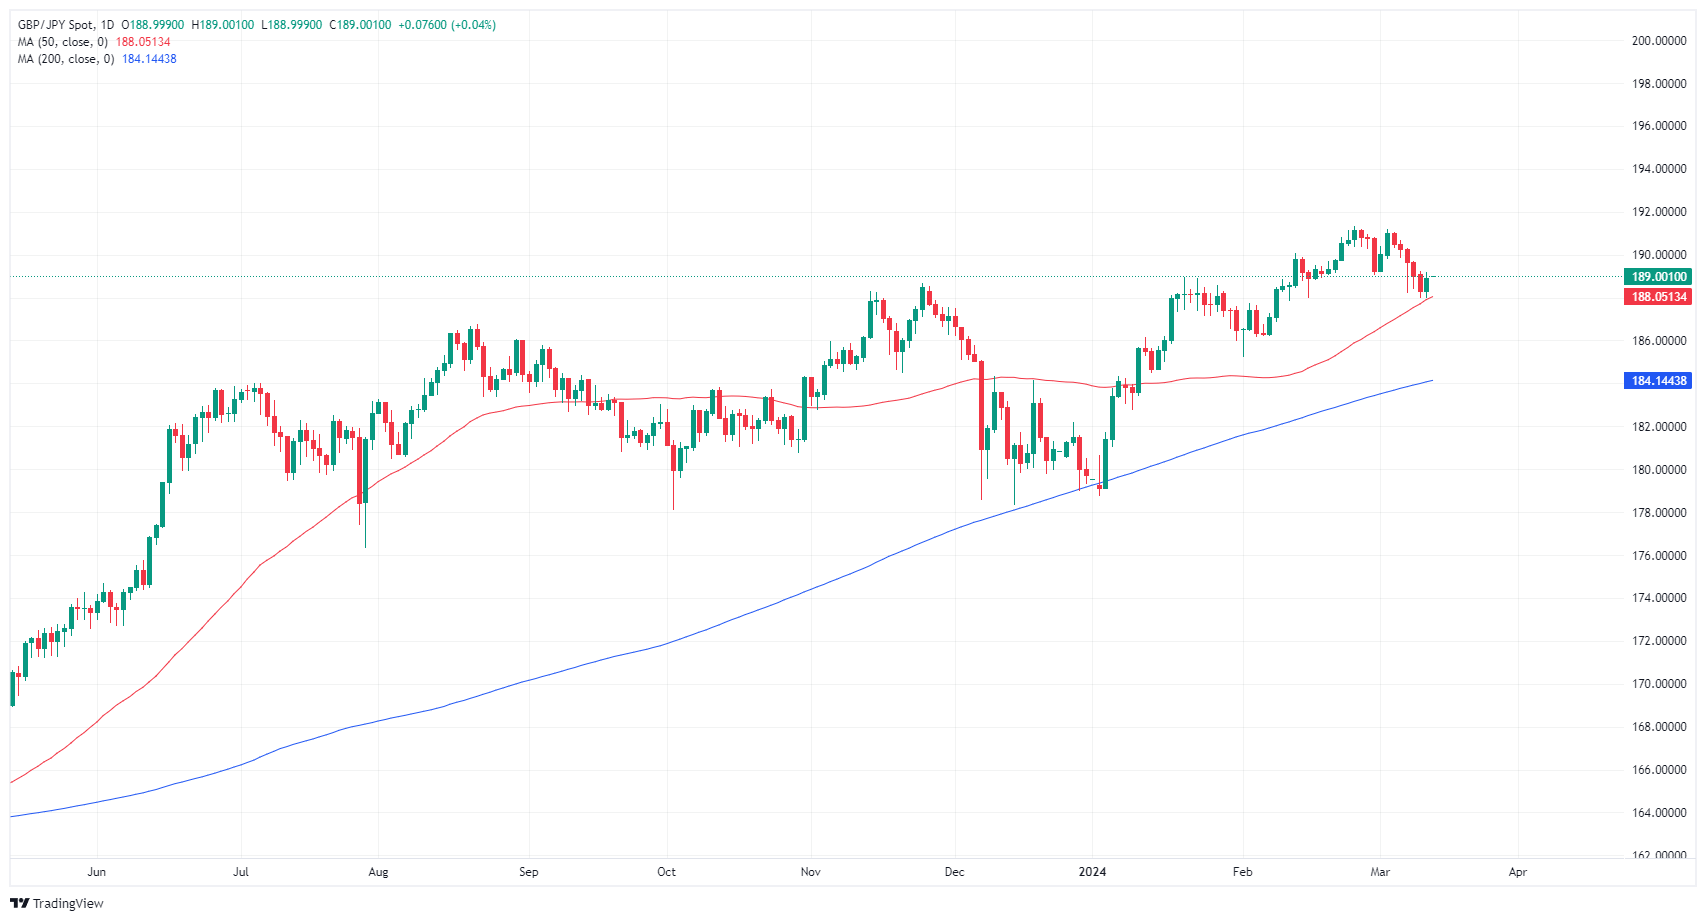
- The daily chart shows that the RSI is now above 50 showing a surge in buying momentum.
- On the hourly chart, the RSI hit a peak of 68 and turned south.
- Despite minor bearish signs, the pair above main SMAs confirms an overall bullish trend.
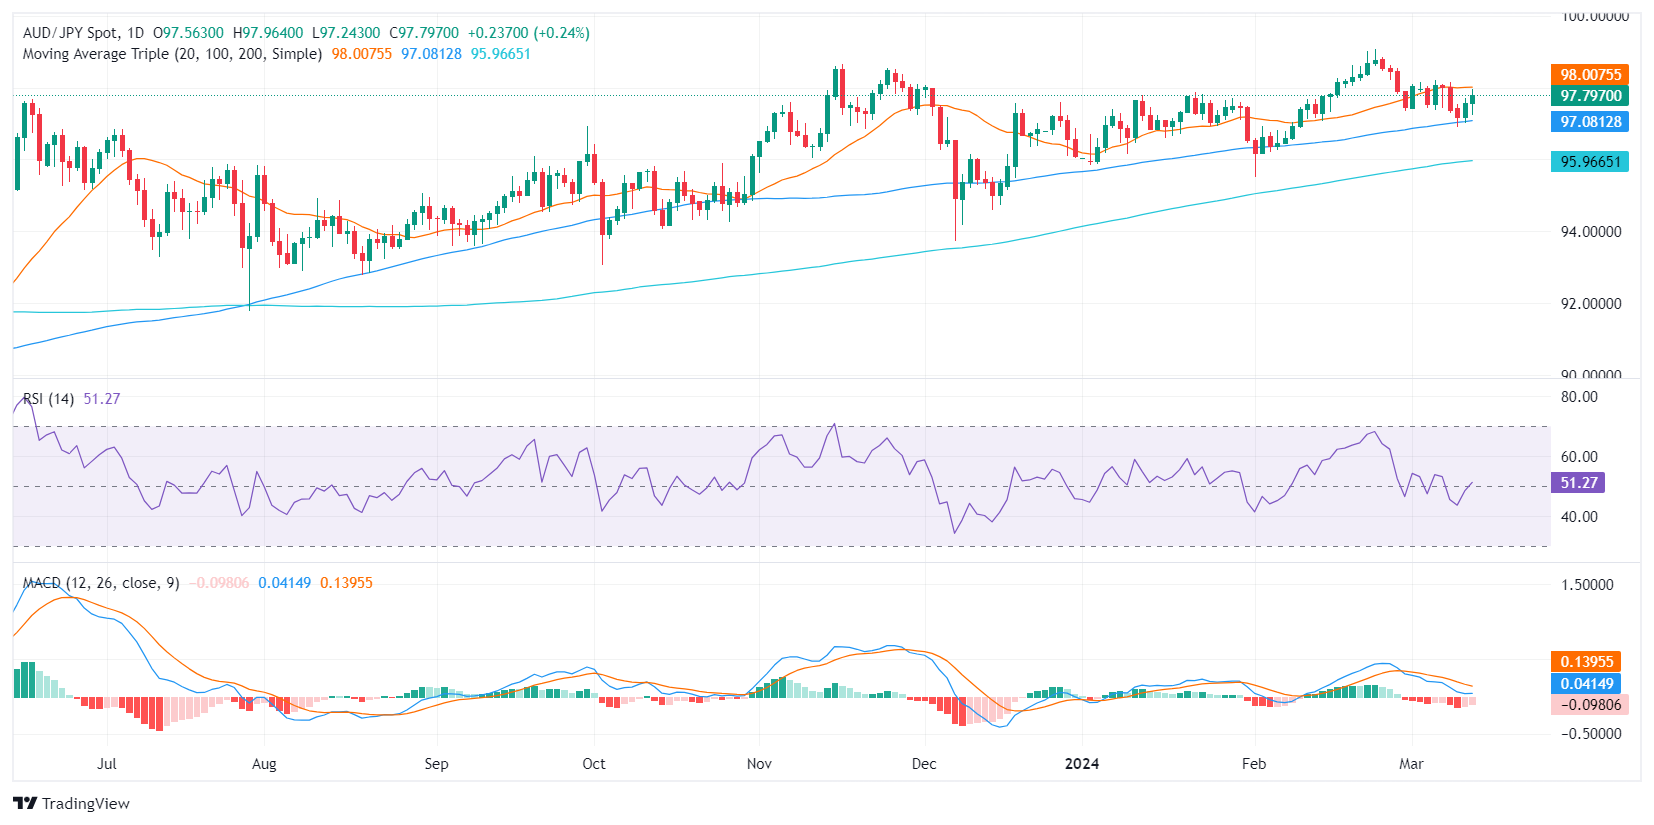
In Wednesday's session, the AUD/JPY was seen trading at around 97.75, recording a gain of 0.23%. The pair exhibits a bullish trend in the larger picture, managing to maintain its upward momentum beyond its benchmarks of the main Simple Moving Averages (SMAs) of 100 and 200 days. On the daily chart, bulls seem to have surged after days of losses, but there are signs of those movements being short-lived.
On the daily chart, the AUD/JPY's Relative Strength Index (RSI) has been clustering in positive territory, hovering at a recent high of 51.46 after an upward drift from sub-40 levels. In sync with the rising trajectory of the RSI, the Moving Average Convergence Divergence (MACD) histogram has flat red bars, indicating a weakening of the bearish momentum.
AUD/JPY daily chart
Switching gears to the hourly chart, the story is seemingly different. The RSI has consistently been trending near the overbought area, peaking at 68.42 and dipping to a low of 54.60. This characterizes a vibrant bullish sentiment in the shorter timeframe but with a sign of consolidation on the horizon. The MACD histogram echoes similar findings with rising red bars implying growing negative momentum with investors starting to take profits.
AUD/JPY hourly chart
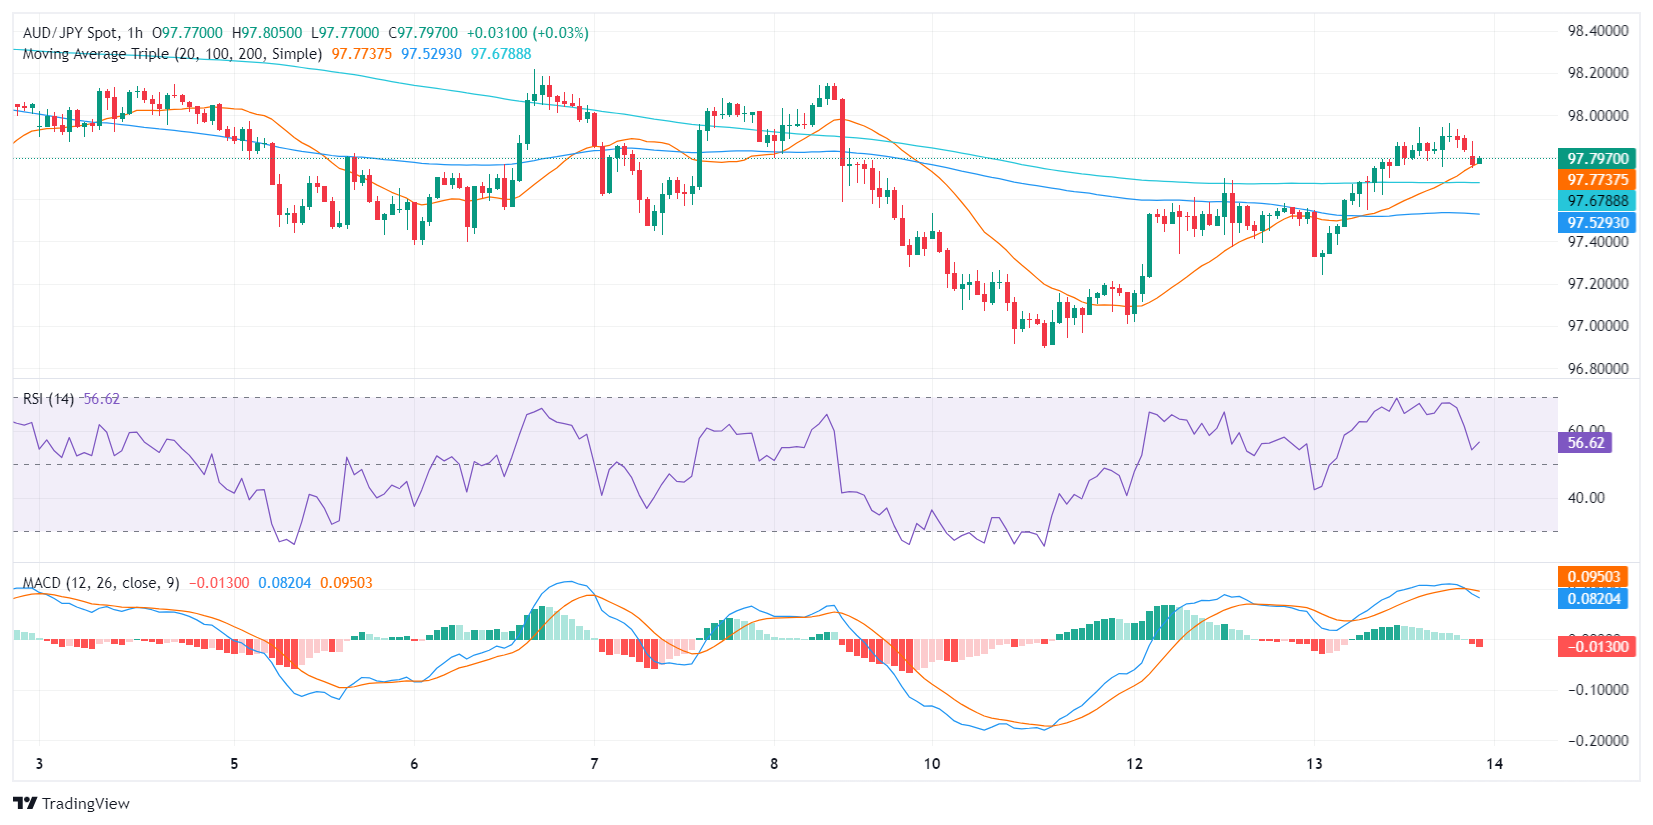
Overall, the bulls found some light, and tallied a two-day winning strike, after three days of losses. However, on the hourly chart, the bullish momentum rose near overbought levels which hints that the momentum is losing steam as investors are taking profits. Looking at the larger picture, the pair trading above the 100 and 200-day SMAs gives arguments of a bullish trend, but as long as it sits below the 20-day Average, the bears will still be around the corner.
- EUR/USD makes modest gains in a mixed market environment, reacting to shifts in US Treasury yields.
- Anticipation of rate cuts by ECB and Fed in June adds to the currency dynamics, with both currencies under watch.
- ECB policymakers hint at cautious approach to rate cuts, emphasizing inflation targets ahead of key decisions.
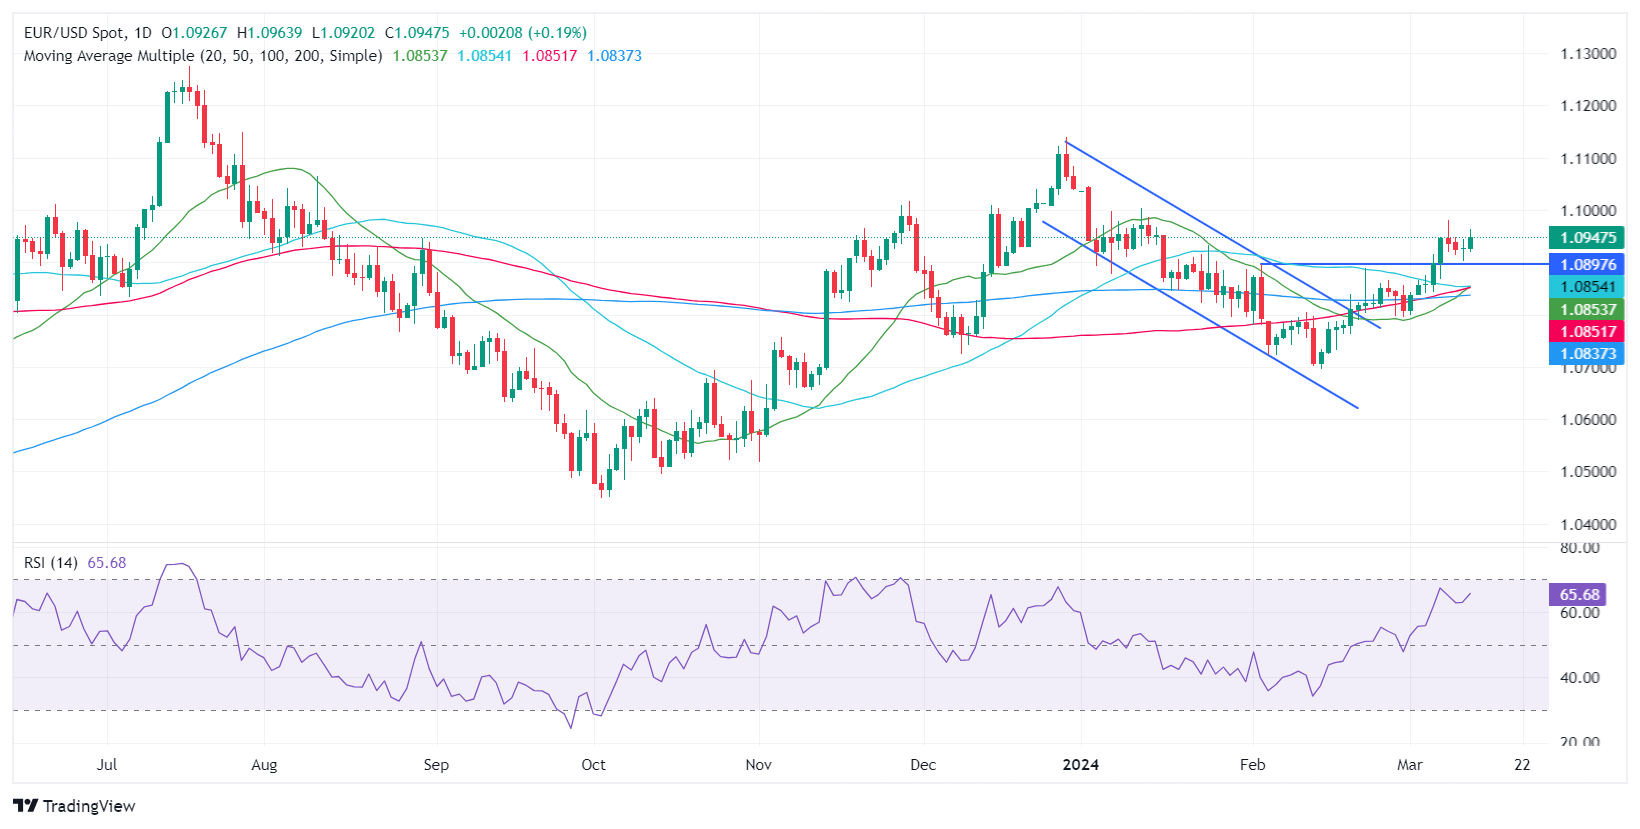
The EUR/USD registered solid gains of 0.19% on Wednesday, courtesy of a softer US Dollar amidst high US Treasury bond yields. An absent economic docket in the US, left traders adrift to Eurozone economic data and European Central Bank (ECB) speakers. At the time of writing, the pair exchanges hands at 1.0948 and gains 0.01% as the Thursday Asian session begins.
Euro gains as market eyes ECB and Fed rate decisions
The market mood was mixed, while the macroeconomic outlook involving the Eurozone (EU) bloc and the United States stood pat. The European Central Bank (ECB) and the Federal Reserve (Fed) are expected to slash borrowing costs in June, which could weaken the Euro and the Greenback.
During the session, US Treasury bond yields capped the EUR/USD advance, as the 10-year benchmark note rate edged up almost four basis points to 4.19%. The FedWatch Tool suggests the probability of 25 basis points has been lowered from around 72% to 65%.
ECB policymaker Villeroy suggested a potential rate cut in spring hinge, adding that the Government Council would monitor inflation until it reached 2%. His colleague Kazaks echoed some of his comments, adding that a decision to cut rates will be made at upcoming meetings.
EUR/USD Price Analysis: Technical outlook
The pair is upward biased, though the Relative Strength Index (RSI) indicator, suggests that buyers are losing momentum. They need to reclaim Wednesday’s high of 1.0963, so they can test a downslope resistance trendline drawn from 2021 yearly highs at around 1.2260, which passes at around 1.0965/80. Next key resistance level lie at 1.1000. On the other hand, if sellers stepped in and drag the EUR/USD exchange rate below 1.0919, March’s 13 low. Once surpassed, the 1.0900 figure is up next.
- Gold recovers, reflecting optimism for potential Fed rate cuts despite a recent surge in inflation.
- US economic resilience and inflation above 3.2% pose challenges to immediate easing of Fed monetary policy.
- Powell's cautious stance on easing, tied to disinflation evidence, keeps investors on edge as Treasury yields rise.
Gold prices recovered on Wednesday after a pullback to the $2,150.00 region, and traders seem convinced that the US Federal Reserve (Fed) could cut borrowing costs. Nevertheless, the latest hotter-than-expected inflation report in the United States might deter Fed officials from easing policy in June, contradicting market participants' speculation. Therefore, the XAU/USD trades at $2,173.60, gaining 0.7%.
The latest US economic data suggests the economy remains robust, even though the labor market is cooling. Nevertheless, headline and underlying inflation remaining above 3.2% in the twelve months to February might push back some Fed officials’ intentions to cut borrowing costs.
Last week, US Federal Reserve Chair Jerome Powell said the central bank is ready to ease policy if conditions are met and the disinflation process continues. He emphasized that they are data-dependent, in no rush to begin the trimming cycle, and would like to see more evidence of the evolution of the disinflation process.
In the meantime, the yellow metal stays in the green even though the US 10-year Treasury bond yield rose three-and-a-half basis points from 4.157% to 4.19%.
Daily digest market movers: Gold traders push prices higher, await US Retail Sales data
- On Thursday, further US economic data is eyed with the release of US Retail Sales and the Producer Price Index (PPI). The Producer Price Index (PPI) is foreseen to deliver mixed readings, with core at 1.9% YoY, down from 2%, and headline at 1.1% YoY, up from 0.9%. The next Fed meeting is scheduled for March 19-20 next week.
- The US labor market is cooling down despite printing solid gains in February compared to “downward revised” figures from January. After two months of net revisions, US jobs market totals were reduced by 167,000 jobs compared with initial prints, which sparked a reaction from interest rate futures traders.
- According to the CME FedWatch Tool, expectations for a May rate cut remain low, having dropped to 11% from 22%. However, the odds for June stand at 64%, down from 72%.
- Federal Reserve officials last week expressed that they remain data-dependent and want to feel secure that inflation is sustainably trending toward the Fed’s 2% goal. Tuesday’s inflation report was relevant as it triggered a U-turn in XAU/USD prices.
Technical analysis: Gold aims toward $2,180 amid higher US yields
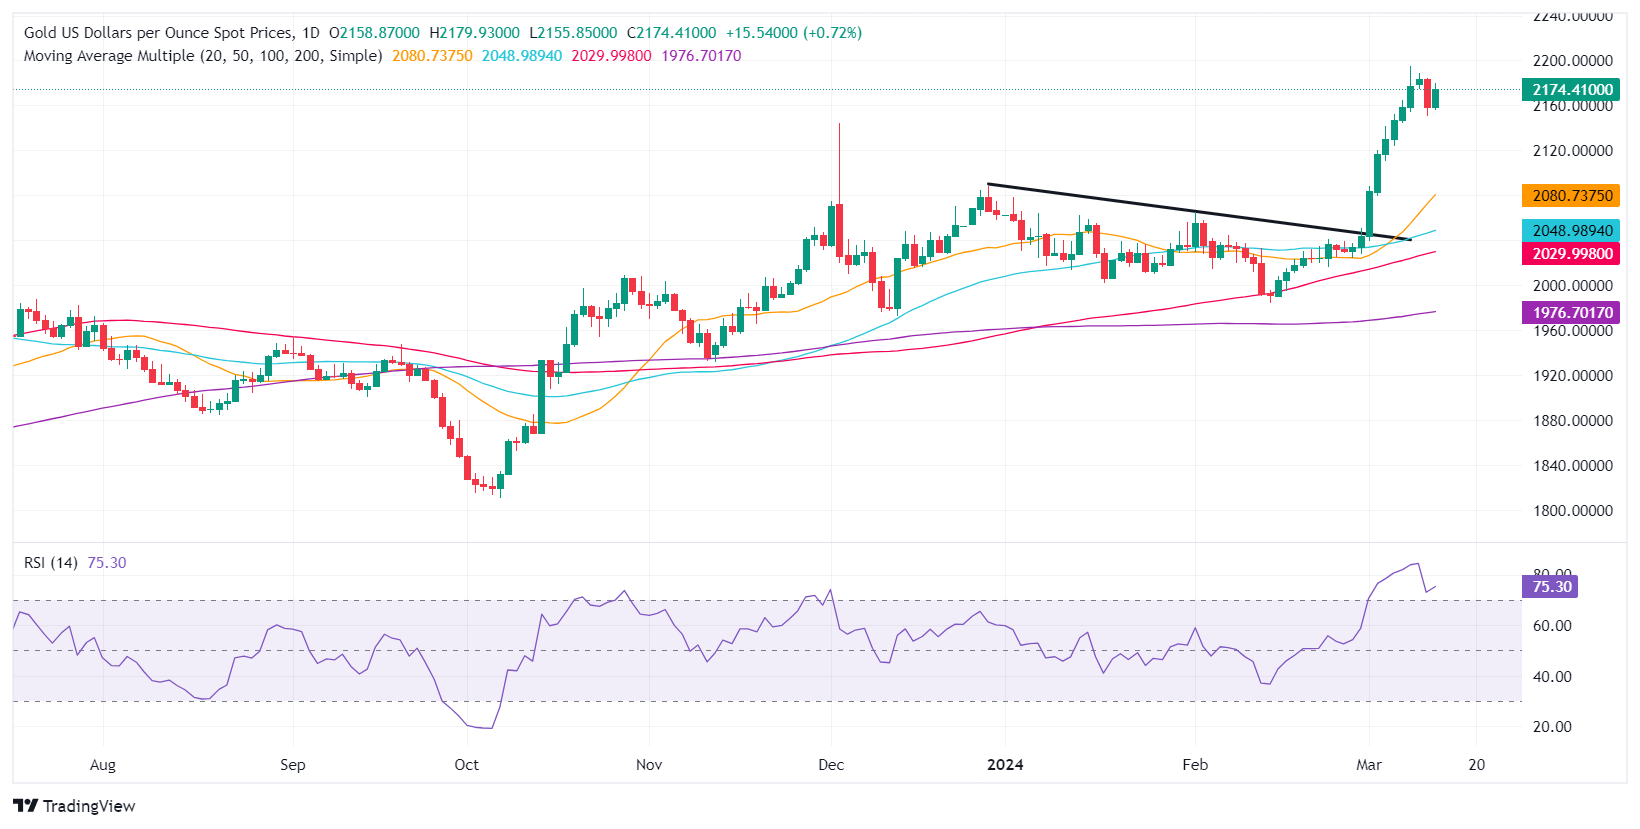
Gold’s rally continued on Wednesday after Tuesday’s pullback to the $2,150.00 mark. However, buyers must reclaim the March 12 high of $2,184.76, followed by the year-to-date high of $2,195.15, if they would like to challenge $2,200.00. Further upside is seen after a breach of the latter, with prices standing in uncharted territory.
On the flip side, XAU/USD sellers need to drag prices below $2,150.00, which could exacerbate a fall toward the March 6 low of $2,123.80. Further support is seen at $2,100.00, ahead of the December 28 high at $2,088.48 and the February 1 high at $2,065.60.
Gold FAQs
Gold has played a key role in human’s history as it has been widely used as a store of value and medium of exchange. Currently, apart from its shine and usage for jewelry, the precious metal is widely seen as a safe-haven asset, meaning that it is considered a good investment during turbulent times. Gold is also widely seen as a hedge against inflation and against depreciating currencies as it doesn’t rely on any specific issuer or government.
Central banks are the biggest Gold holders. In their aim to support their currencies in turbulent times, central banks tend to diversify their reserves and buy Gold to improve the perceived strength of the economy and the currency. High Gold reserves can be a source of trust for a country’s solvency. Central banks added 1,136 tonnes of Gold worth around $70 billion to their reserves in 2022, according to data from the World Gold Council. This is the highest yearly purchase since records began. Central banks from emerging economies such as China, India and Turkey are quickly increasing their Gold reserves.
Gold has an inverse correlation with the US Dollar and US Treasuries, which are both major reserve and safe-haven assets. When the Dollar depreciates, Gold tends to rise, enabling investors and central banks to diversify their assets in turbulent times. Gold is also inversely correlated with risk assets. A rally in the stock market tends to weaken Gold price, while sell-offs in riskier markets tend to favor the precious metal.
The price can move due to a wide range of factors. Geopolitical instability or fears of a deep recession can quickly make Gold price escalate due to its safe-haven status. As a yield-less asset, Gold tends to rise with lower interest rates, while higher cost of money usually weighs down on the yellow metal. Still, most moves depend on how the US Dollar (USD) behaves as the asset is priced in dollars (XAU/USD). A strong Dollar tends to keep the price of Gold controlled, whereas a weaker Dollar is likely to push Gold prices up.
- Pound Sterling stubbornly stuck to Wednesday’s opening range.
- A smattering of UK data sparked some volatility, but little movement.
- US Retail Sales and PPE figures in the barrel for Wednesday.
GBP/USD found some volatility on Wednesday, but overall directional momentum remains limited with the pair rangebound and pinned close to the day’s opening range near 1.2790. Technicals are struggling to push into either side of the 1.2800 handle in the midweek trading session, and investors are awaiting a spark in the data.
UK Industrial Production fell to -0.2% in January after December’s 0.6% print, missing the forecast flat print of 0.0%. UK MoM Manufacturing Production also declined, coming in at the expected 0.0% compared to the previous 0.8%. UK Gross Domestic Product (GDP) in January also met expectations, printing at 0.2% versus the previous -0.1%.
A thin showing for US data on Wednesday leaves investors waiting for Thursday’s Retail Sales and Producer Price Index (PPI) numbers. US Retail Sales are expected to rebound in February, with the median market forecast calling for a 0.8% print after January’s -0.8% decline. Meanwhile, February’s Core YoY PPI through February is expected to ease slightly, forecast to print at 1.9% compared to the previous 2.0%.
The trading week will wrap up with the University of Michigan’s Consumer Sentiment Index, which is broadly expected to hold steady at 76.9. Before that, mid-tier consumer inflation expectations from the UK will be seen early Friday during the London market session. At least read, UK consumers expected UK inflation to land somewhere around 3.3% for the following 12 months.
GBP/USD technical outlook
GBP/USD is cycling into the midweek, churning into the midrange as the pair grapples with an inflection point priced in just above 1.2750. Hourly candles have dropped a potential break of character just below the 1.2900 handle, and near-term action is set to consolidate until the stronger pattern emerges.
Daily candles are draining back into a heavy supply zone after a six-day bull run promptly ended this week, with the pair failing to capture to 1.2900. Consolidation plagues GBP/USD in the medium-term, and a bullish bounce from the 200-day Simple Moving Average (SMA) at 1.2590 is seeing limited topside momentum.
GBP/USD chart, hourly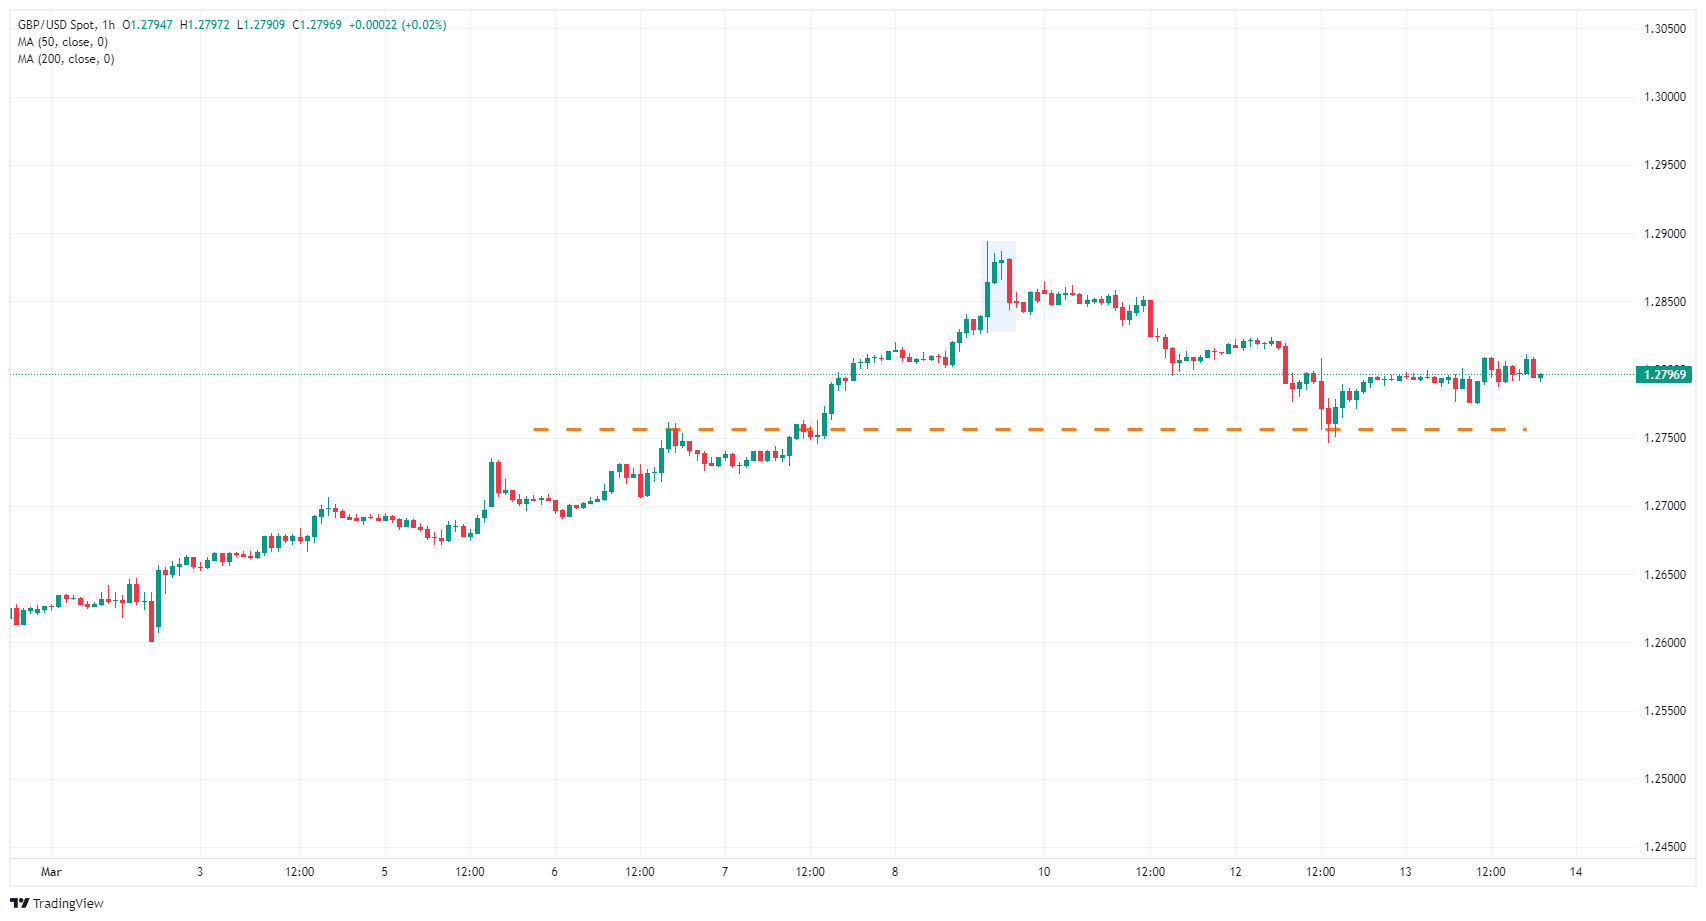
GBP/USD chart, daily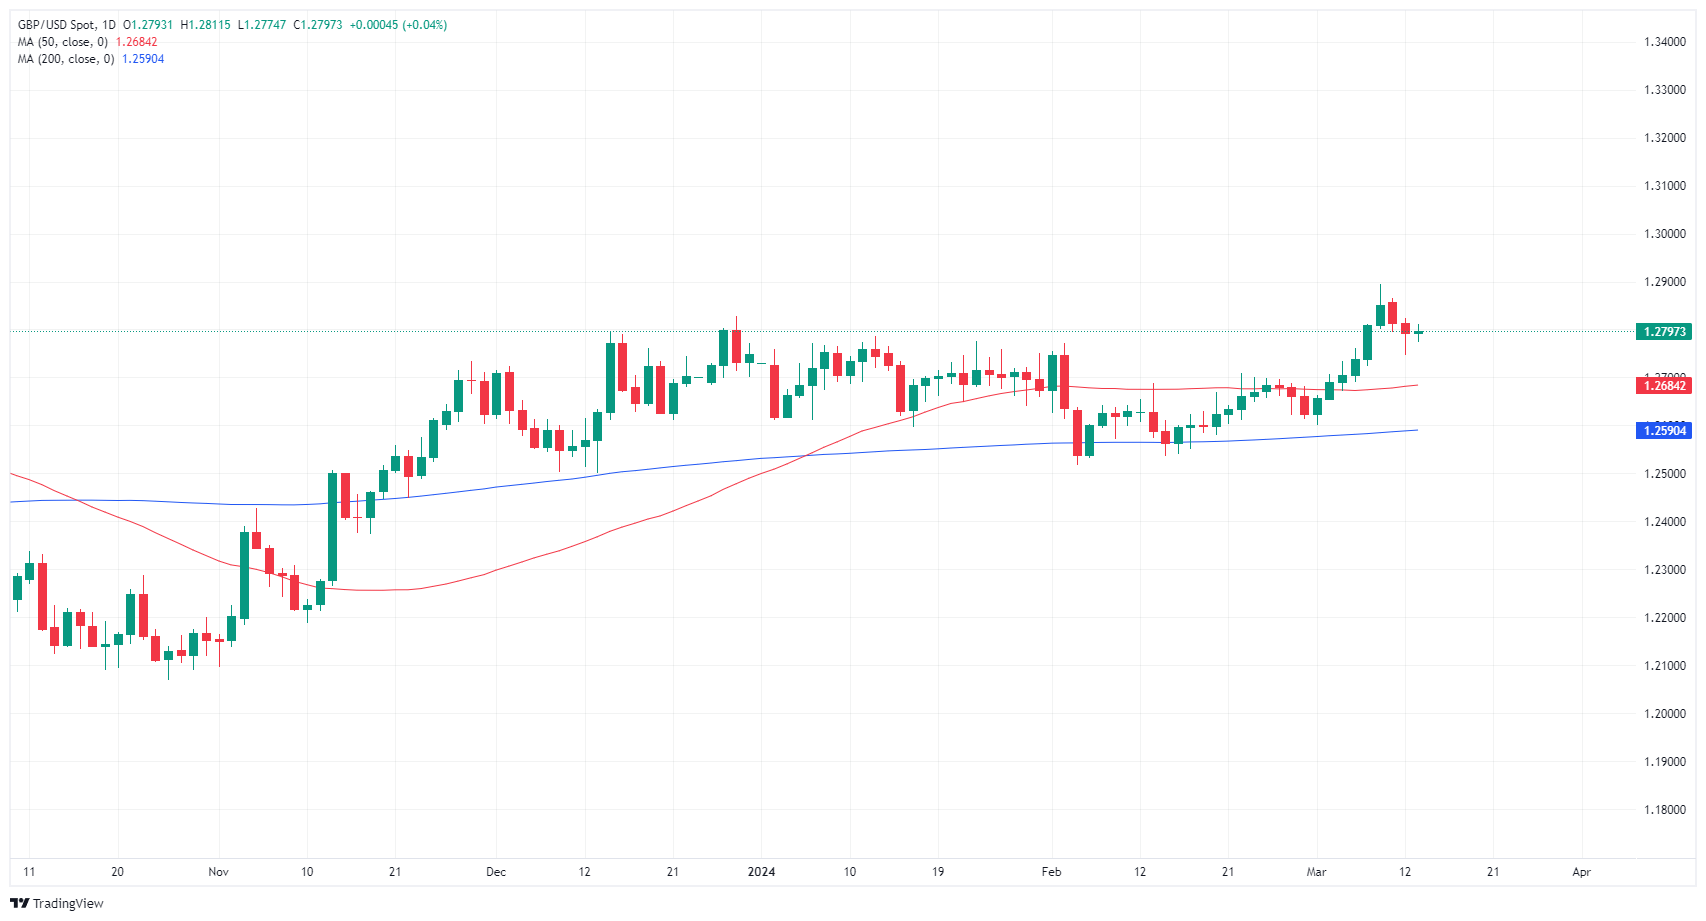
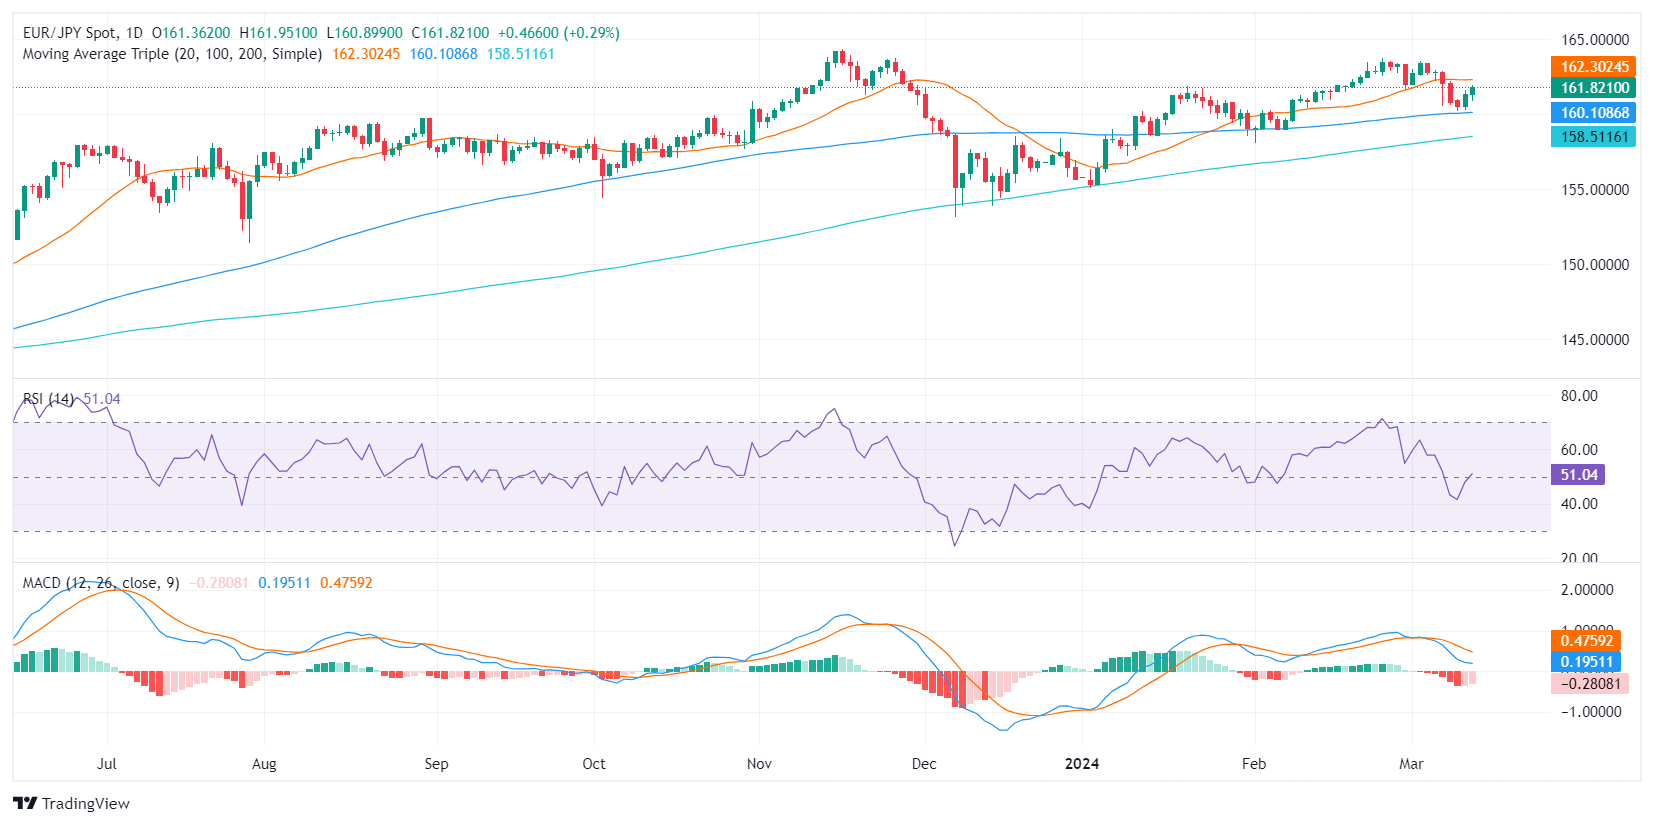
- RSI on the daily chart for EUR/JPY reveals growing buying momentum, while contrasting MACD may suggest a steady bearish sentiment.
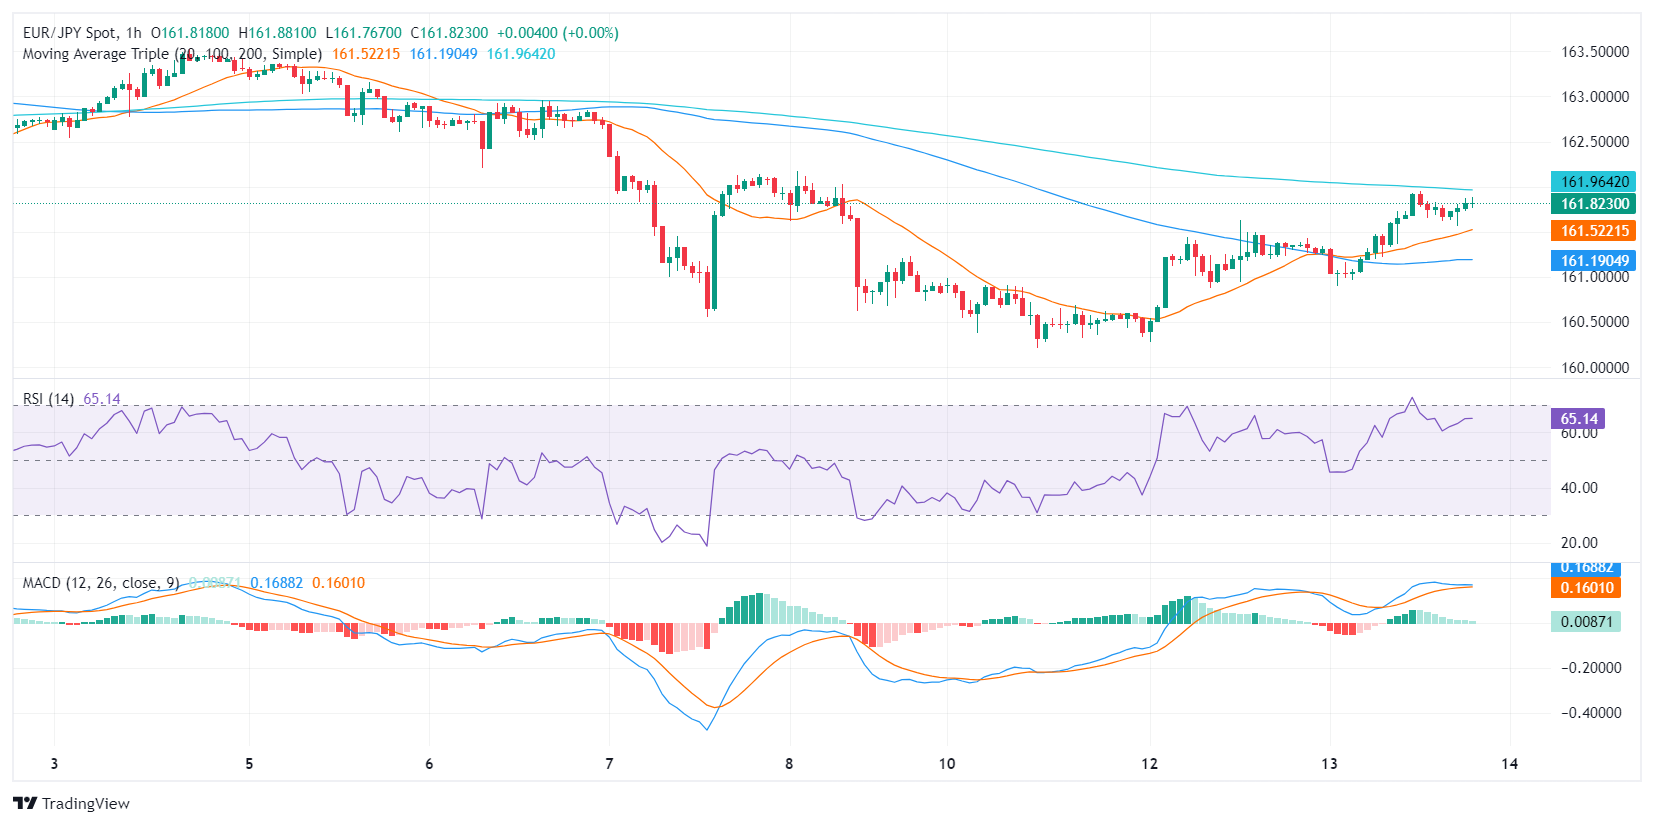
- The hourly RSI near overbought condition may signal that the pair may consolidate in the next hours.
The EUR/JPY pair is seen holding comfortable grounds at 161.83, marking a gain of 0.31%. On the shorter timeframes indicators gained significant ground and are near overbought territory which could mean the pair might consolidate in the next hours. Overall, the outlook remains bullish but the buyers must regain the 20-day Simple Moving Average (SMA) to make the short-term outlook more positive.
On the daily chart for EUR/JPY, the Relative Strength Index (RSI) is showing a positive trend. It has increased from negative to positive territory, signaling stronger buying momentum. However, the decreasing red bars of the Moving Average Convergence Divergence (MACD) imply bearish but less intense momentum.
EUR/JPY daily chart
The EUR/JPY hourly chart shows that the RSI rose to around 60, matching the daily positive momentum. Nonetheless, despite the strong buying pressure, the MACD presents flat green bars, suggesting a stagnant bullish momentum. This reflects a potential consolidation phase for the remainder of the session.
EUR/JPY hourly chart'
In the broader scale technical outlook, despite the bears pulling the EUR/JPY pair below the 20-day Simple Moving Averages (SMA), it remains above both the 100 and 200-day SMAs. This indicates that the bulls continue to control the market on larger time frames. The buy signals indicated by the RSI on both the daily and hourly charts are slightly overshadowed by the stagnating MACD on the hourly chart as buyers might start to take profits in the coming hours.
The US Dollar faced renewed selling pressure as market participants digested the latest US inflation figures. In the meantime, bets on an ECB rate cut in June picked up pace, and a potential BoJ’s lift-off looks increasingly likely next week.
Here is what you need to know on Thursday, March 14:
The USD Index (DXY) reversed two consecutive daily advances and refocused on the downside. On March 14, Producer Prices and Retail Sales will take centre stage in the US docket seconded by Business Inventories and usual weekly Initial Jobless Claims.
EUR/USD extended its recovery to three-session tops near 1.0960, shifting its target to the so-far monthly high around 1.0980. Low-tier data in the euro area on March 14 include Germany’s Current Account as well as speeches by ECB’s Elderson, De Guindos and Knot.
GBP/USD regained some composure and flirted once again with the 1.2800 neighbourhood amidst dominating risk-on mood. The RICS House Price Balance is only due across the Channel on March 14.
USD/JPY saw its upside bias reinvigorated, briefly advancing past the 148.00 barrier despite investors’ speculation of a BoJ’s lift-off next week. On March 14, weekly Foreign Bond Investment readings are only due in Japan.
In line with the rest of the risk-related assets, AUD/USD set aside two daily drops in a row and rose past the key 0.6600 barrier helped by the jump in copper prices.
Unexpected drops in weekly US crude oil supplies and gasoline stockpiles along with increasing geopolitical jitters motivated WTI prices to advance to the boundaries of the key $80.00 mark per barrel.
Gold prices quickly left behind Tuesday’s knee-jerk and resumed their uptrend with the immediate target at the all-time peak just below the $2,200 mark per troy ounce. Silver prices advanced markedly to levels last seen in early December around the $25.00 mark per ounce.
- Dow Jones climbs in the midweek session as other indexes flounder.
- A quiet schedule on the economic calendar for the day leaves equities adrift.
- Coming up on Thursday: US PPE, Retail Sales data.
The Dow Jones Industrial Average (DJIA) found topside momentum on Wednesday, tapping into an intraday high of 39,200.00 as the index outperforms its peers in the S&P 500 and the NASDAQ Composite. The NASDAQ Composite is down close to a fourth of a percent on the day, with the S&P 500 churning close to flat.
A thin showing on the economic calendar for Wednesday leaves equities in the lurch and struggling to find firm momentum in either direction. Markets will be gearing up for Thursday’s US Producer Price Index (PPI) and Retail Sales figures. Friday will wrap up the trading week with the next round of University of Michigan Consumer Sentiment indicators.
Despite a softer overall index stance, US stocks are seeing determined gains in the midweek session, with the Energies and Materials Sectors gaining 1.9% and 1.22%, respectively. The notable weak point is the Technology Sector, which is down nearly a full percent as investors pull back from a recent dogpile into tech stocks.
Dow Jones Industrial Average news
As the American market session heads into the back half of the trading day, the DJIA’s top performer is 3M Co. (MMM), which has added nearly 4% to trade into $102.60 on Wednesday. 3M continues to rally after the company recently announced that William Brown, the former leader at L3Harris Technologies, would take the helm at 3M as the new CEO. MMM is down steeply from 2017’s all-time highs above $225 per share, and is recovering into $102.77 per share after dipping to $91.25 earlier this year.
Intel Corp. (INTC) and McDonald’s Corp. (MCD) competed for the biggest loser on the Dow Jones on Wednesday. Both stocks were down around 3.5% on the day. Intel, according to reporting by Reuters, has an unfair advantage over its nearest competitor, AMD, with a specially-issued license issued by the US government under former President Donald Trump. Intel has special permission to supply chips to Chinese tech giant Huawei, and that advantage could come under threat as AMD seeks remediation, even as Intel export volumes to China decline following an increased export ban of technology to China.
Dow Jones Industrial Average technical outlook
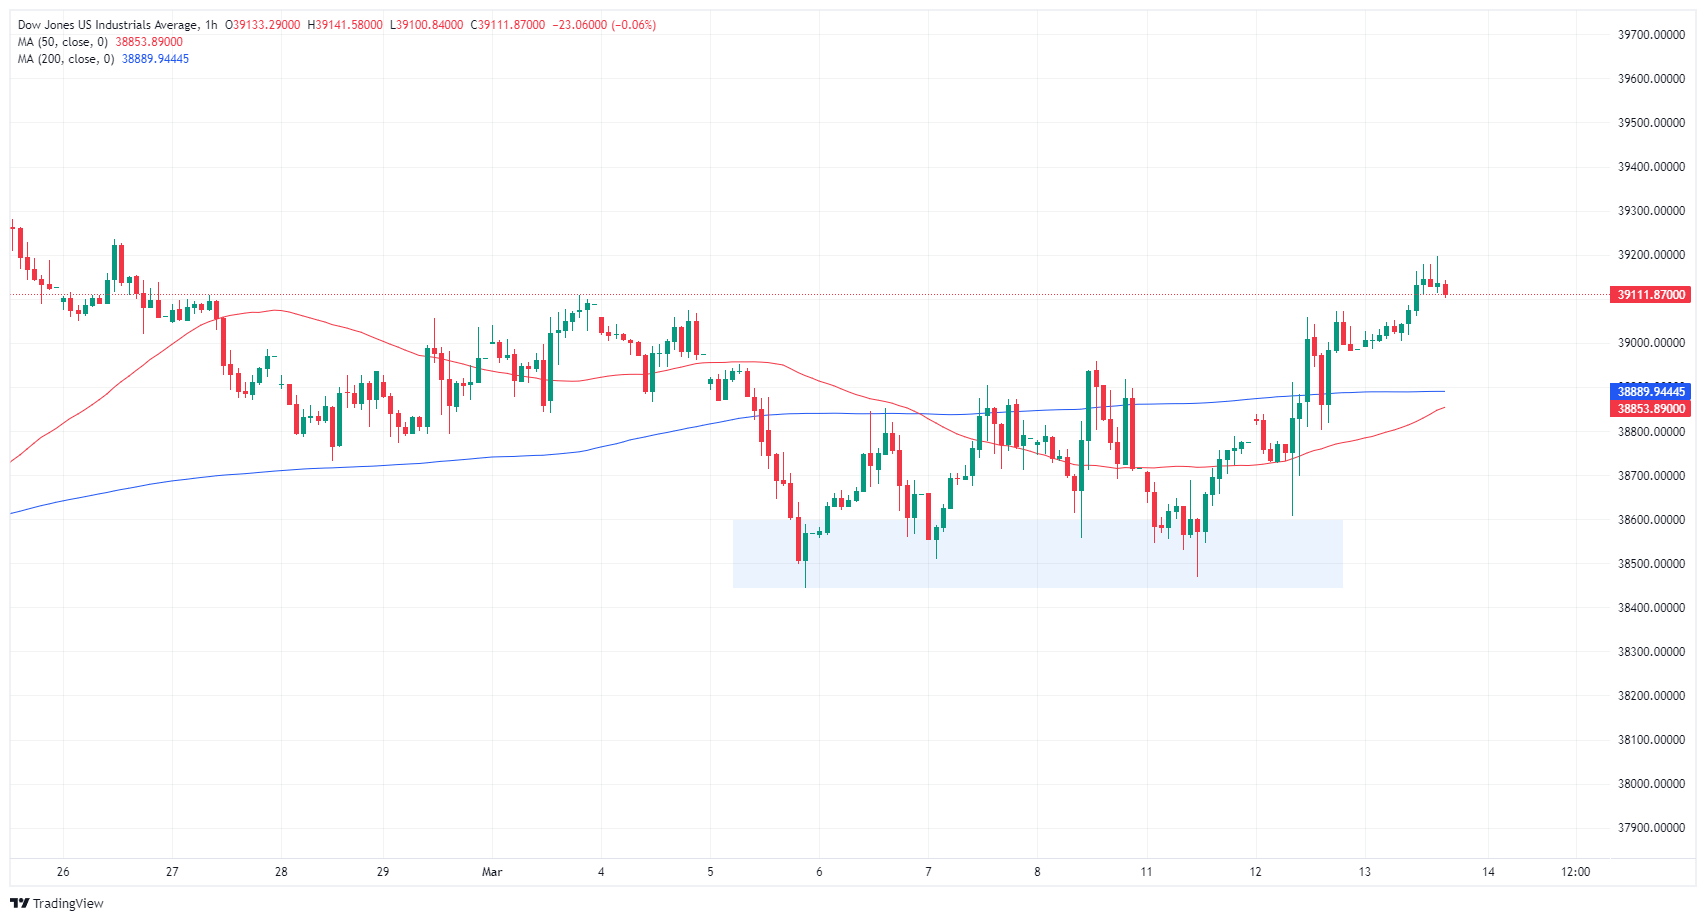
The Dow Jones Industrial Average climbed back over the 39,000.00 handle on Wednesday, marking in a fresh high for the week at 39,200.00 and extending a bullish push beyond the 200-hour Simple Moving Average (SMA) near 38,890.00. The 39,000.00 major price level has been a key price point that the DJIA has struggled to escape recently, but a supply zone near 38,600.00 is limiting near-term losses on pullbacks.
The Dow Jones is set for a third straight bullish close on Wednesday, and would mark in a fifth bul candle out of the last six. The index, despite near-term consolidation, is trading firmly into bull country, with the 200-day SMA well below current price action at 35,615.00.
Dow Jones Industrial Average, 1-hour chart
Dow Jones FAQs
The Dow Jones Industrial Average, one of the oldest stock market indices in the world, is compiled of the 30 most traded stocks in the US. The index is price-weighted rather than weighted by capitalization. It is calculated by summing the prices of the constituent stocks and dividing them by a factor, currently 0.152. The index was founded by Charles Dow, who also founded the Wall Street Journal. In later years it has been criticized for not being broadly representative enough because it only tracks 30 conglomerates, unlike broader indices such as the S&P 500.
Many different factors drive the Dow Jones Industrial Average (DJIA). The aggregate performance of the component companies revealed in quarterly company earnings reports is the main one. US and global macroeconomic data also contributes as it impacts on investor sentiment. The level of interest rates, set by the Federal Reserve (Fed), also influences the DJIA as it affects the cost of credit, on which many corporations are heavily reliant. Therefore, inflation can be a major driver as well as other metrics which impact the Fed decisions.
Dow Theory is a method for identifying the primary trend of the stock market developed by Charles Dow. A key step is to compare the direction of the Dow Jones Industrial Average (DJIA) and the Dow Jones Transportation Average (DJTA) and only follow trends where both are moving in the same direction. Volume is a confirmatory criteria. The theory uses elements of peak and trough analysis. Dow’s theory posits three trend phases: accumulation, when smart money starts buying or selling; public participation, when the wider public joins in; and distribution, when the smart money exits.
There are a number of ways to trade the DJIA. One is to use ETFs which allow investors to trade the DJIA as a single security, rather than having to buy shares in all 30 constituent companies. A leading example is the SPDR Dow Jones Industrial Average ETF (DIA). DJIA futures contracts enable traders to speculate on the future value of the index and Options provide the right, but not the obligation, to buy or sell the index at a predetermined price in the future. Mutual funds enable investors to buy a share of a diversified portfolio of DJIA stocks thus providing exposure to the overall index.
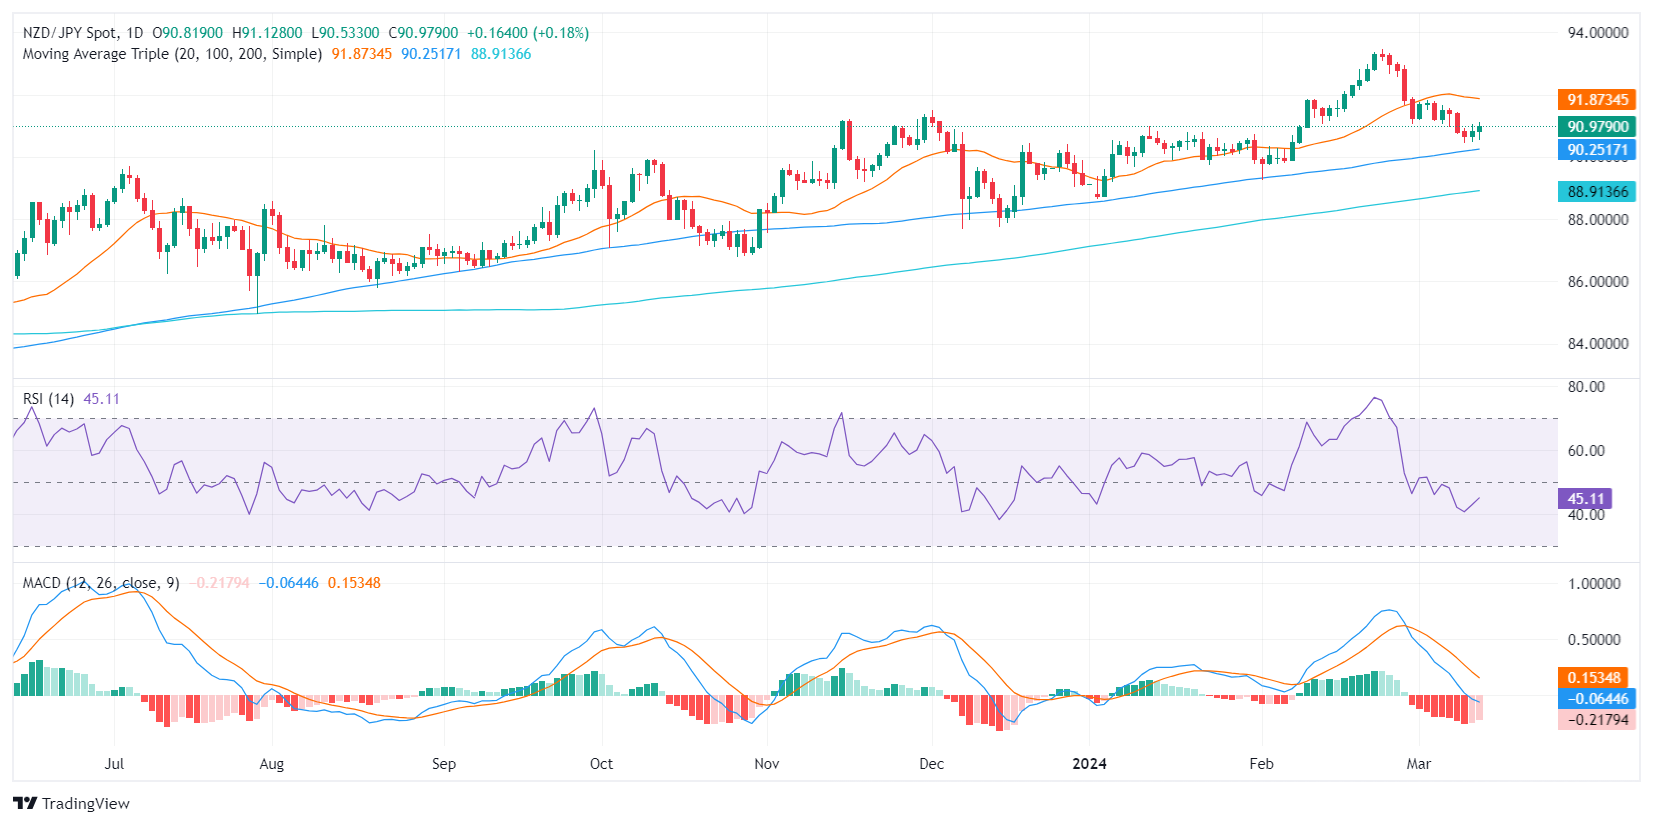
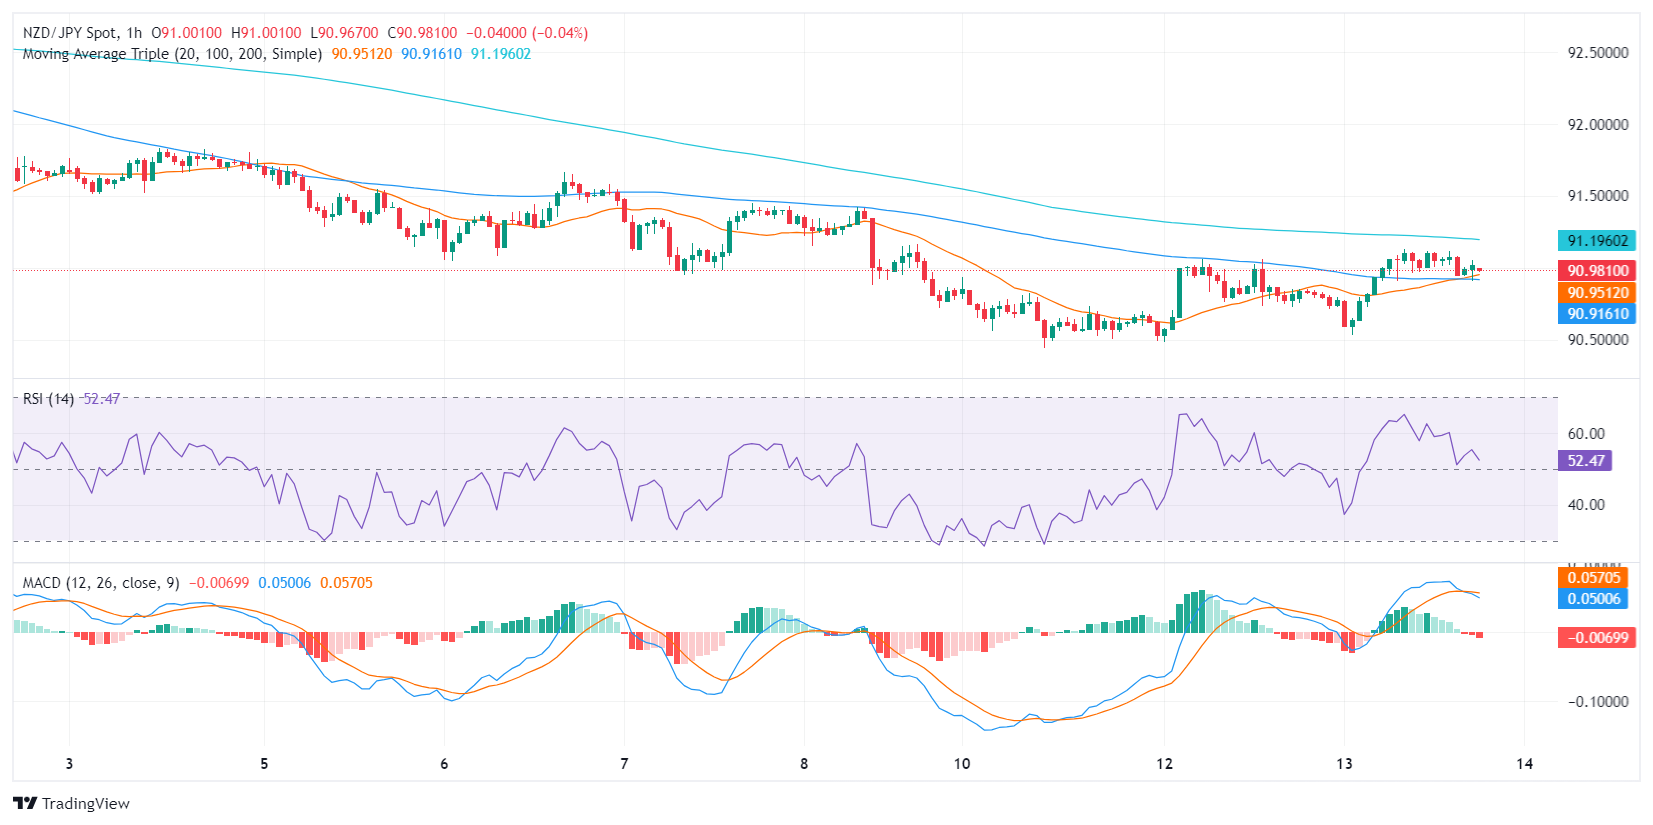
- Daily chart reveals an ongoing tussle between buyers and sellers; RSI demonstrates growing buying.
- The hourly RSI stands in positive territory pointing south, while MACD shows a contraction of negative momentum.
- As long as the pair stands below the 20-day SMA, the outlook will be negative for the short term.
The NZD/JPY pair is trading at 90.98, with a gain of 0.22%. There is a continuous tug of war between both buyers and sellers, and neither manages to establish clear dominance. Though the pair demonstrates strengthened buyer momentum, it also retains an undercurrent of negative momentum trading below the 20-day Simple Moving Average (SMA). However, the overall trend will remain bullish if it holds above the 100 and 200-day SMAs.
On the daily chart, the Relative Strength Index (RSI) for the NZD/JPY pair is currently in negative territory. The RSI, after bottoming out near 40 on Tuesday, has shown an upward trend, signaling growing buyer momentum. The Moving Average Convergence Divergence (MACD) histogram's red bars are on a downward trend, indicating a negative but less intense momentum.
NZD/JPY daily chart
Upon examining the hourly charts, the RSI appears to oscillate in positive territory during recent hours but prints a negative slope. This is in contrast with the daily chart, suggesting a slowing buying momentum. The MACD histogram also shows rising red bars, reflecting a rising rate of negative momentum. In conclusion, the data shows that the bulls are gaining some traction on the daily chart, and now seem to be consolidating on the shorter timeframes. However, if the buyers want to confirm, the first target is the 20-day SMA at around 91.85.
NZD/JPY hourly chart
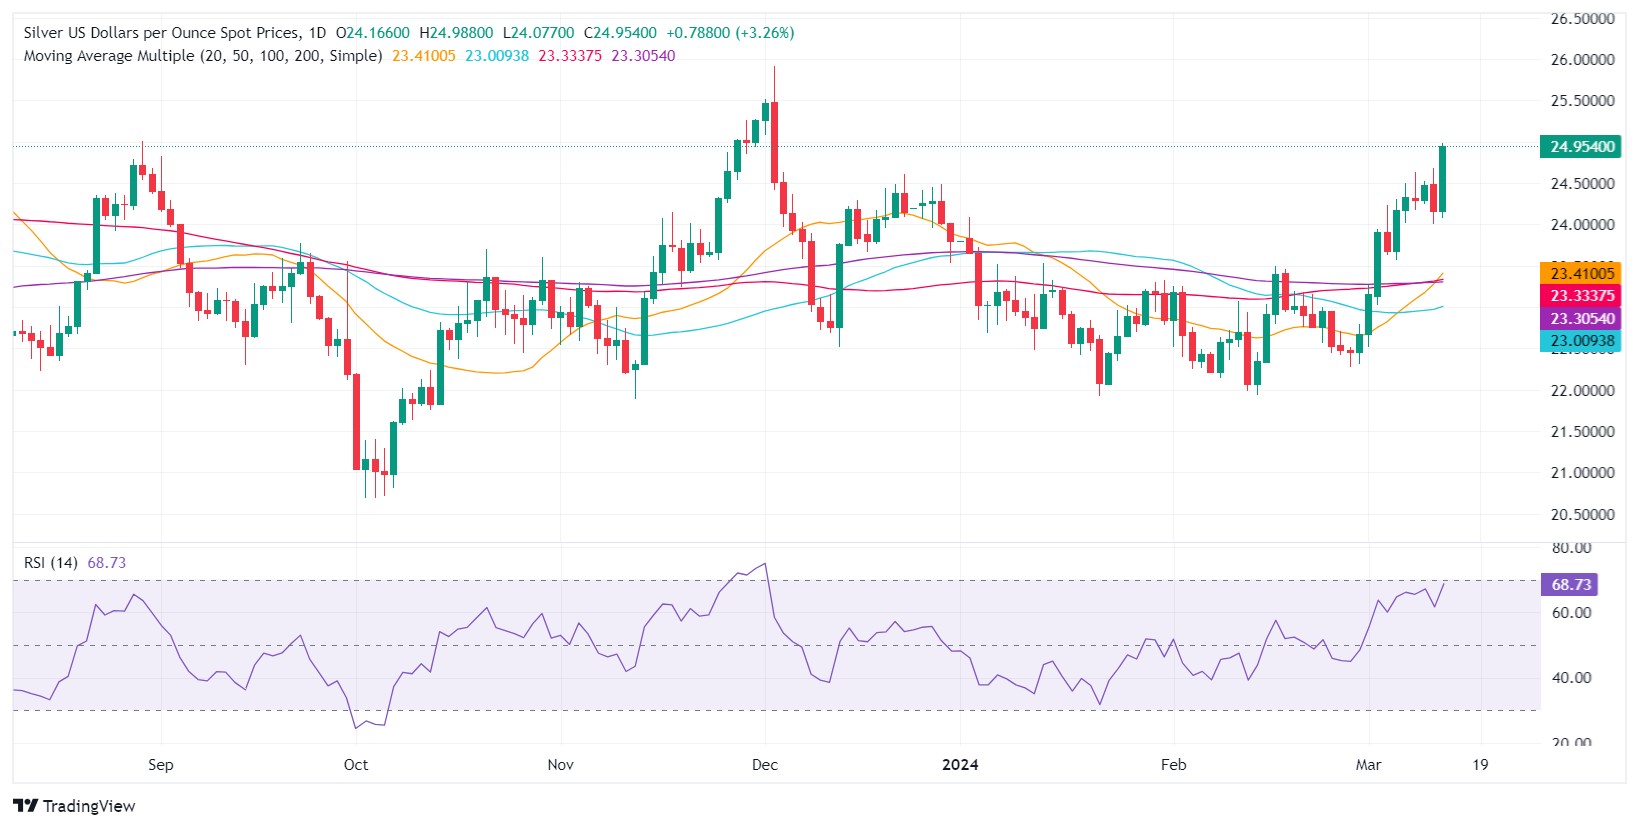
- Silver's impressive rally brings it close to $25.00, marking significant gains in the North American session.
- Technical analysis highlights $25.00 as a pivotal resistance, with potential for further gains towards late 2023 highs.
- Failure at $25.00 could see silver retesting recent support levels, with the market closely watching $24.68 and $24.50.
Silver rallied sharply in the mid-North American session on Wednesday, climbing more than 3.40% amid high US Treasury bond yields, while the Greenback extended its losses by more than 0.20%. At the time of writing, XAG/USD trades at $24.95, around new year-to-date (YTD) highs.
XAG/USD Price Analysis: Technical outlook
During the session, Silver hit a low of $24.07 with no fundamental news, besides Fitch Rating’s updating its global growth forecast. That provided the grey metal with a leg up, shy of the $25.00 figure, which could have opened the door for further upside. Nevertheless, it stands as the first resistance level, followed by the July 20 high at $25.25. Further upside risks are seen at December’s 4 high of $25.91.
On the other hand, if sellers keep XAG/USD spot prices below $25.00, that could sponsor a leg-down toward the March 12 high of $24.68. A breach of the latter will expose $24.50, followed by the January 2 high turned support at $24.09.
XAG/USD Price Action – Daily Chart
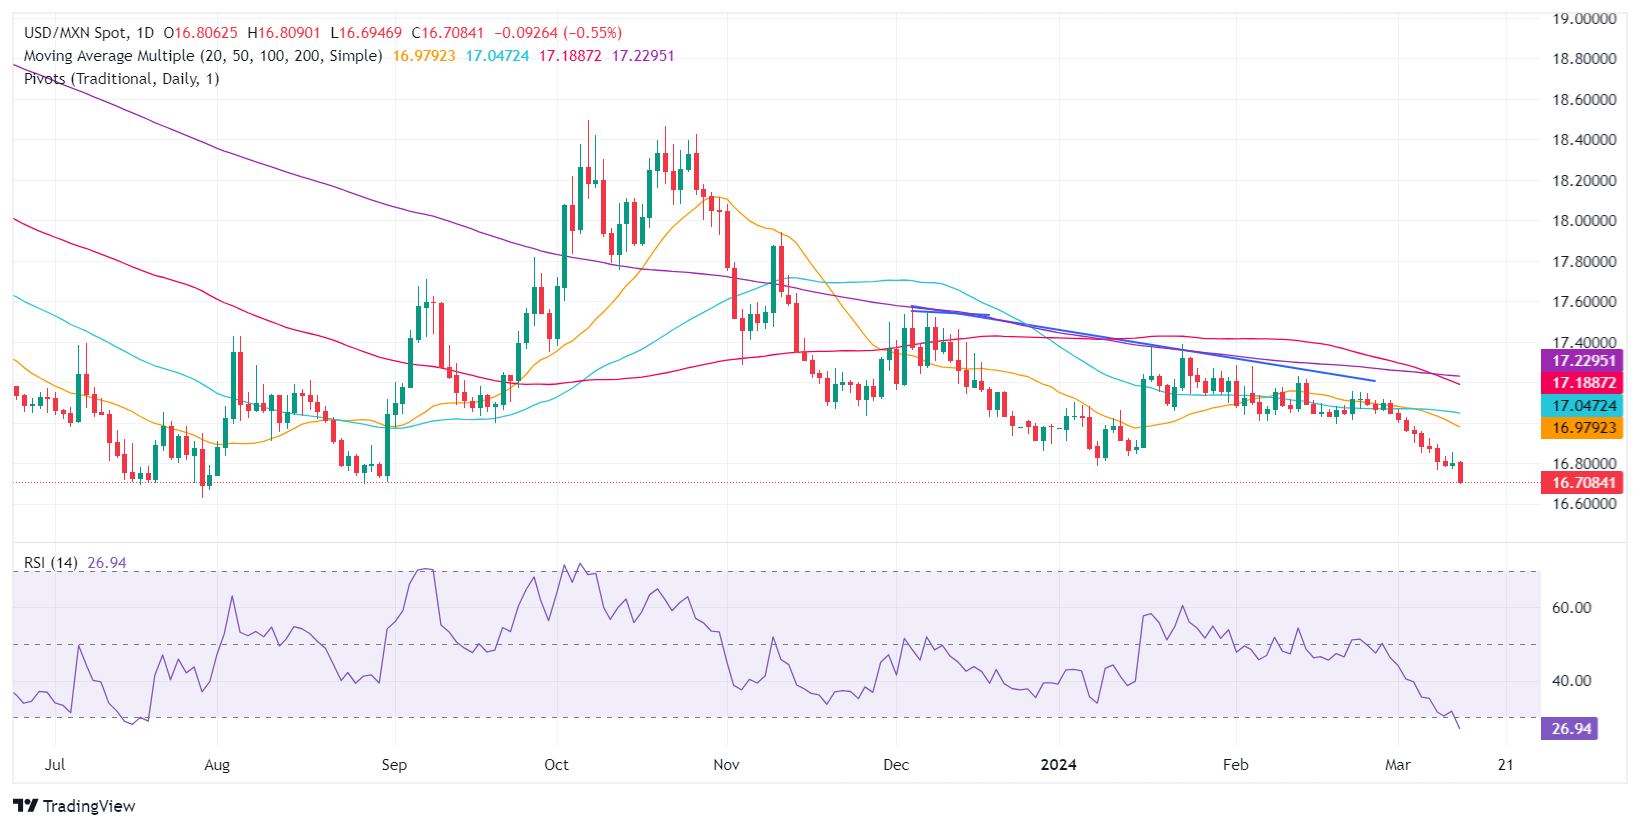
- Mexican Peso strengthens to a YTD high amid light US economic data.
- Banxico Deputy Governor hints at possible rate cuts despite maintaining a restrictive policy outlook.
- Near-term momentum favors Peso, pushing USD/MXN to new lows despite dovish Banxico remarks.
The Mexican Peso registered a new year-to-date (YTD) high against the US Dollar on Wednesday amid a scarce economic schedule in the United States (US). Traders shrugged off a warm US inflation report announced on Tuesday, while Mexican Industrial Production was aligned with estimates. Therefore, the USD/MXN exchanges hands at 16.74, down 0.31%.
Mexico’s economic docket featured Bank of Mexico (Banxico) Deputy Governor Omar Mejia crossing the newswires. Mejia said it’s not premature to consider lowering interest rates set at 11.25%, though he warned that future rate cuts should remain restrictive. He added that the challenge going forward is to adjust policy as the disinflation process evolves.
Despite Mejia’s dovish remarks, the USD/MXN extended its losses toward new (YTD lows as the pair accelerated toward the 16.70 figure during the midweek session.
Daily digest market movers: Mexican Peso shrugs off warm US inflation data
- The National Statistics Agency (INEGI) revealed that Mexico’s Industrial Production in January rose by 0.4% MoM as expected, up from -0.7%. In the twelve months to January, production increased by 2.9%, above estimates, smashing December’s 0% reading.
- The latest Consumer Price Index (CPI) report in the United States justified the Federal Reserve’s decision to keep interest rates unchanged as inflation seems anchored above the 3% threshold. Fed Chair Jerome Powell and his colleagues stated they need more evidence before lowering borrowing costs, adding that they’re in no rush. Further data is eyed, as Retail Sales are expected to improve, while the Producer Price Index (PPI) is estimated to deliver mixed readings, with core seen at 1.9% YoY, down from 2% and headline at 1.1% YoY, up from 0.9%. The next Fed meeting is scheduled for March 19-20 next week.
- Business activity in the sector segment in the US remained mixed as Factory Orders plummeted. According to the ADP Employment Change report, the labor market cooled further, even though private hiring remained solid. January’s Nonfarm Payrolls report was revised downward, which triggered a reaction in the swaps market.
- A Reuters poll showed investors estimate the Fed to be the first central bank to cut rates in June.
- Meanwhile, 52 of 108 economists expect the Fed to cut rates by 75 basis points in 2024, with 26 saying 100 bps.
- A Reuters poll sees the Mexican Peso depreciating 7% to 18.24 in 12 months from 16.96 on Monday, according to the median of 20 FX strategists polled between March 1-4. The forecast ranged from 15.50 to 19.00.
- A Reuters poll shows 15 analysts estimate that inflation will slow down in February, corroborating bets that Banxico could cut rates as soon as the March 21 meeting.
- Banxico’s private analyst poll projections for February were revealed. They expect inflation at 4.10%, core CPI at 4.06%, and the economy to grow by 2.40%, unchanged from January. Regarding monetary policy, they see Banxico lowering rates to 9.50% and the USD/MXN exchange rate at 18.31, down from 18.50.
- During Banxico’s quarterly report, policymakers acknowledged the progress on inflation and urged caution against premature interest rate cuts. Governor Victoria Rodriguez Ceja said adjustments would be gradual, while Deputy Governors Galia Borja and Jonathan Heath called for prudence. The latter specifically warned against the risks of an early rate cut.
- Banxico updated its economic growth projections for 2024 from 3.0% to 2.8% YoY and maintained 1.5% for 2025. The slowdown is blamed on higher interest rates at 11.25%, which sparked a shift from three of Banxico’s five governors, who are eyeing the first rate cut at the March 21 meeting.
- The CME FedWatch Tool shows traders decreased their bets for a 25-basis-point rate cut in June, down from 72% a day ago to 64%.
Technical analysis: Mexican Peso rally accelerates as USD/MXN edges toward 16.70
The USD/MXN downtrend is gathering momentum, even though the Relative Strength Index (RSI) indicator displays the pair as oversold. However, due to the strength of the move, traders look for oversold RSI readings at 20.00 as the exotic pair dives to test last year’s low of 16.62. Once that level is surpassed, the next stop would be October 2015’s low of 16.32.
Despite that, they need to reclaim the 17.00 figure, which could open the door to testing the 50-day Simple Moving Average (SMA) at 17.04, followed by the confluence of the 200-day SMA and the 100-day SMA at 17.23.
USD/MXN Price Action – Daily Chart
Mexican Peso FAQs
The Mexican Peso (MXN) is the most traded currency among its Latin American peers. Its value is broadly determined by the performance of the Mexican economy, the country’s central bank’s policy, the amount of foreign investment in the country and even the levels of remittances sent by Mexicans who live abroad, particularly in the United States. Geopolitical trends can also move MXN: for example, the process of nearshoring – or the decision by some firms to relocate manufacturing capacity and supply chains closer to their home countries – is also seen as a catalyst for the Mexican currency as the country is considered a key manufacturing hub in the American continent. Another catalyst for MXN is Oil prices as Mexico is a key exporter of the commodity.
The main objective of Mexico’s central bank, also known as Banxico, is to maintain inflation at low and stable levels (at or close to its target of 3%, the midpoint in a tolerance band of between 2% and 4%). To this end, the bank sets an appropriate level of interest rates. When inflation is too high, Banxico will attempt to tame it by raising interest rates, making it more expensive for households and businesses to borrow money, thus cooling demand and the overall economy. Higher interest rates are generally positive for the Mexican Peso (MXN) as they lead to higher yields, making the country a more attractive place for investors. On the contrary, lower interest rates tend to weaken MXN.
Macroeconomic data releases are key to assess the state of the economy and can have an impact on the Mexican Peso (MXN) valuation. A strong Mexican economy, based on high economic growth, low unemployment and high confidence is good for MXN. Not only does it attract more foreign investment but it may encourage the Bank of Mexico (Banxico) to increase interest rates, particularly if this strength comes together with elevated inflation. However, if economic data is weak, MXN is likely to depreciate.
As an emerging-market currency, the Mexican Peso (MXN) tends to strive during risk-on periods, or when investors perceive that broader market risks are low and thus are eager to engage with investments that carry a higher risk. Conversely, MXN tends to weaken at times of market turbulence or economic uncertainty as investors tend to sell higher-risk assets and flee to the more-stable safe havens.
- AUD/USD rises as markets continue to expect the Fed to cut rates in June.
- The RBA by contrast is striking a more hawkish tone, suggesting rates may even need to rise.
- Iron Ore prices are a drag on AUD/USD as they tumble amidst China property slump.
AUD/USD is trading in the lower 0.6600s on Wednesday during the US session. It is marginally up by two tenths of a percent on the day as markets continue to expect the Federal Reserve (Fed) to cut interest rates in June, despite stickier inflation data. Lower interest rates are negative for USD since they mean less foreign capital inflows. This contrasts with the Reserve Bank of Australia (RBA) which may still hike.
From a technical perspective AUD/USD has stalled after rallying up and hitting key resistance from a long-term trendline. Overall the outlook remains bearish as the pair is in a long-term downtrend, producing lower highs and lower lows.
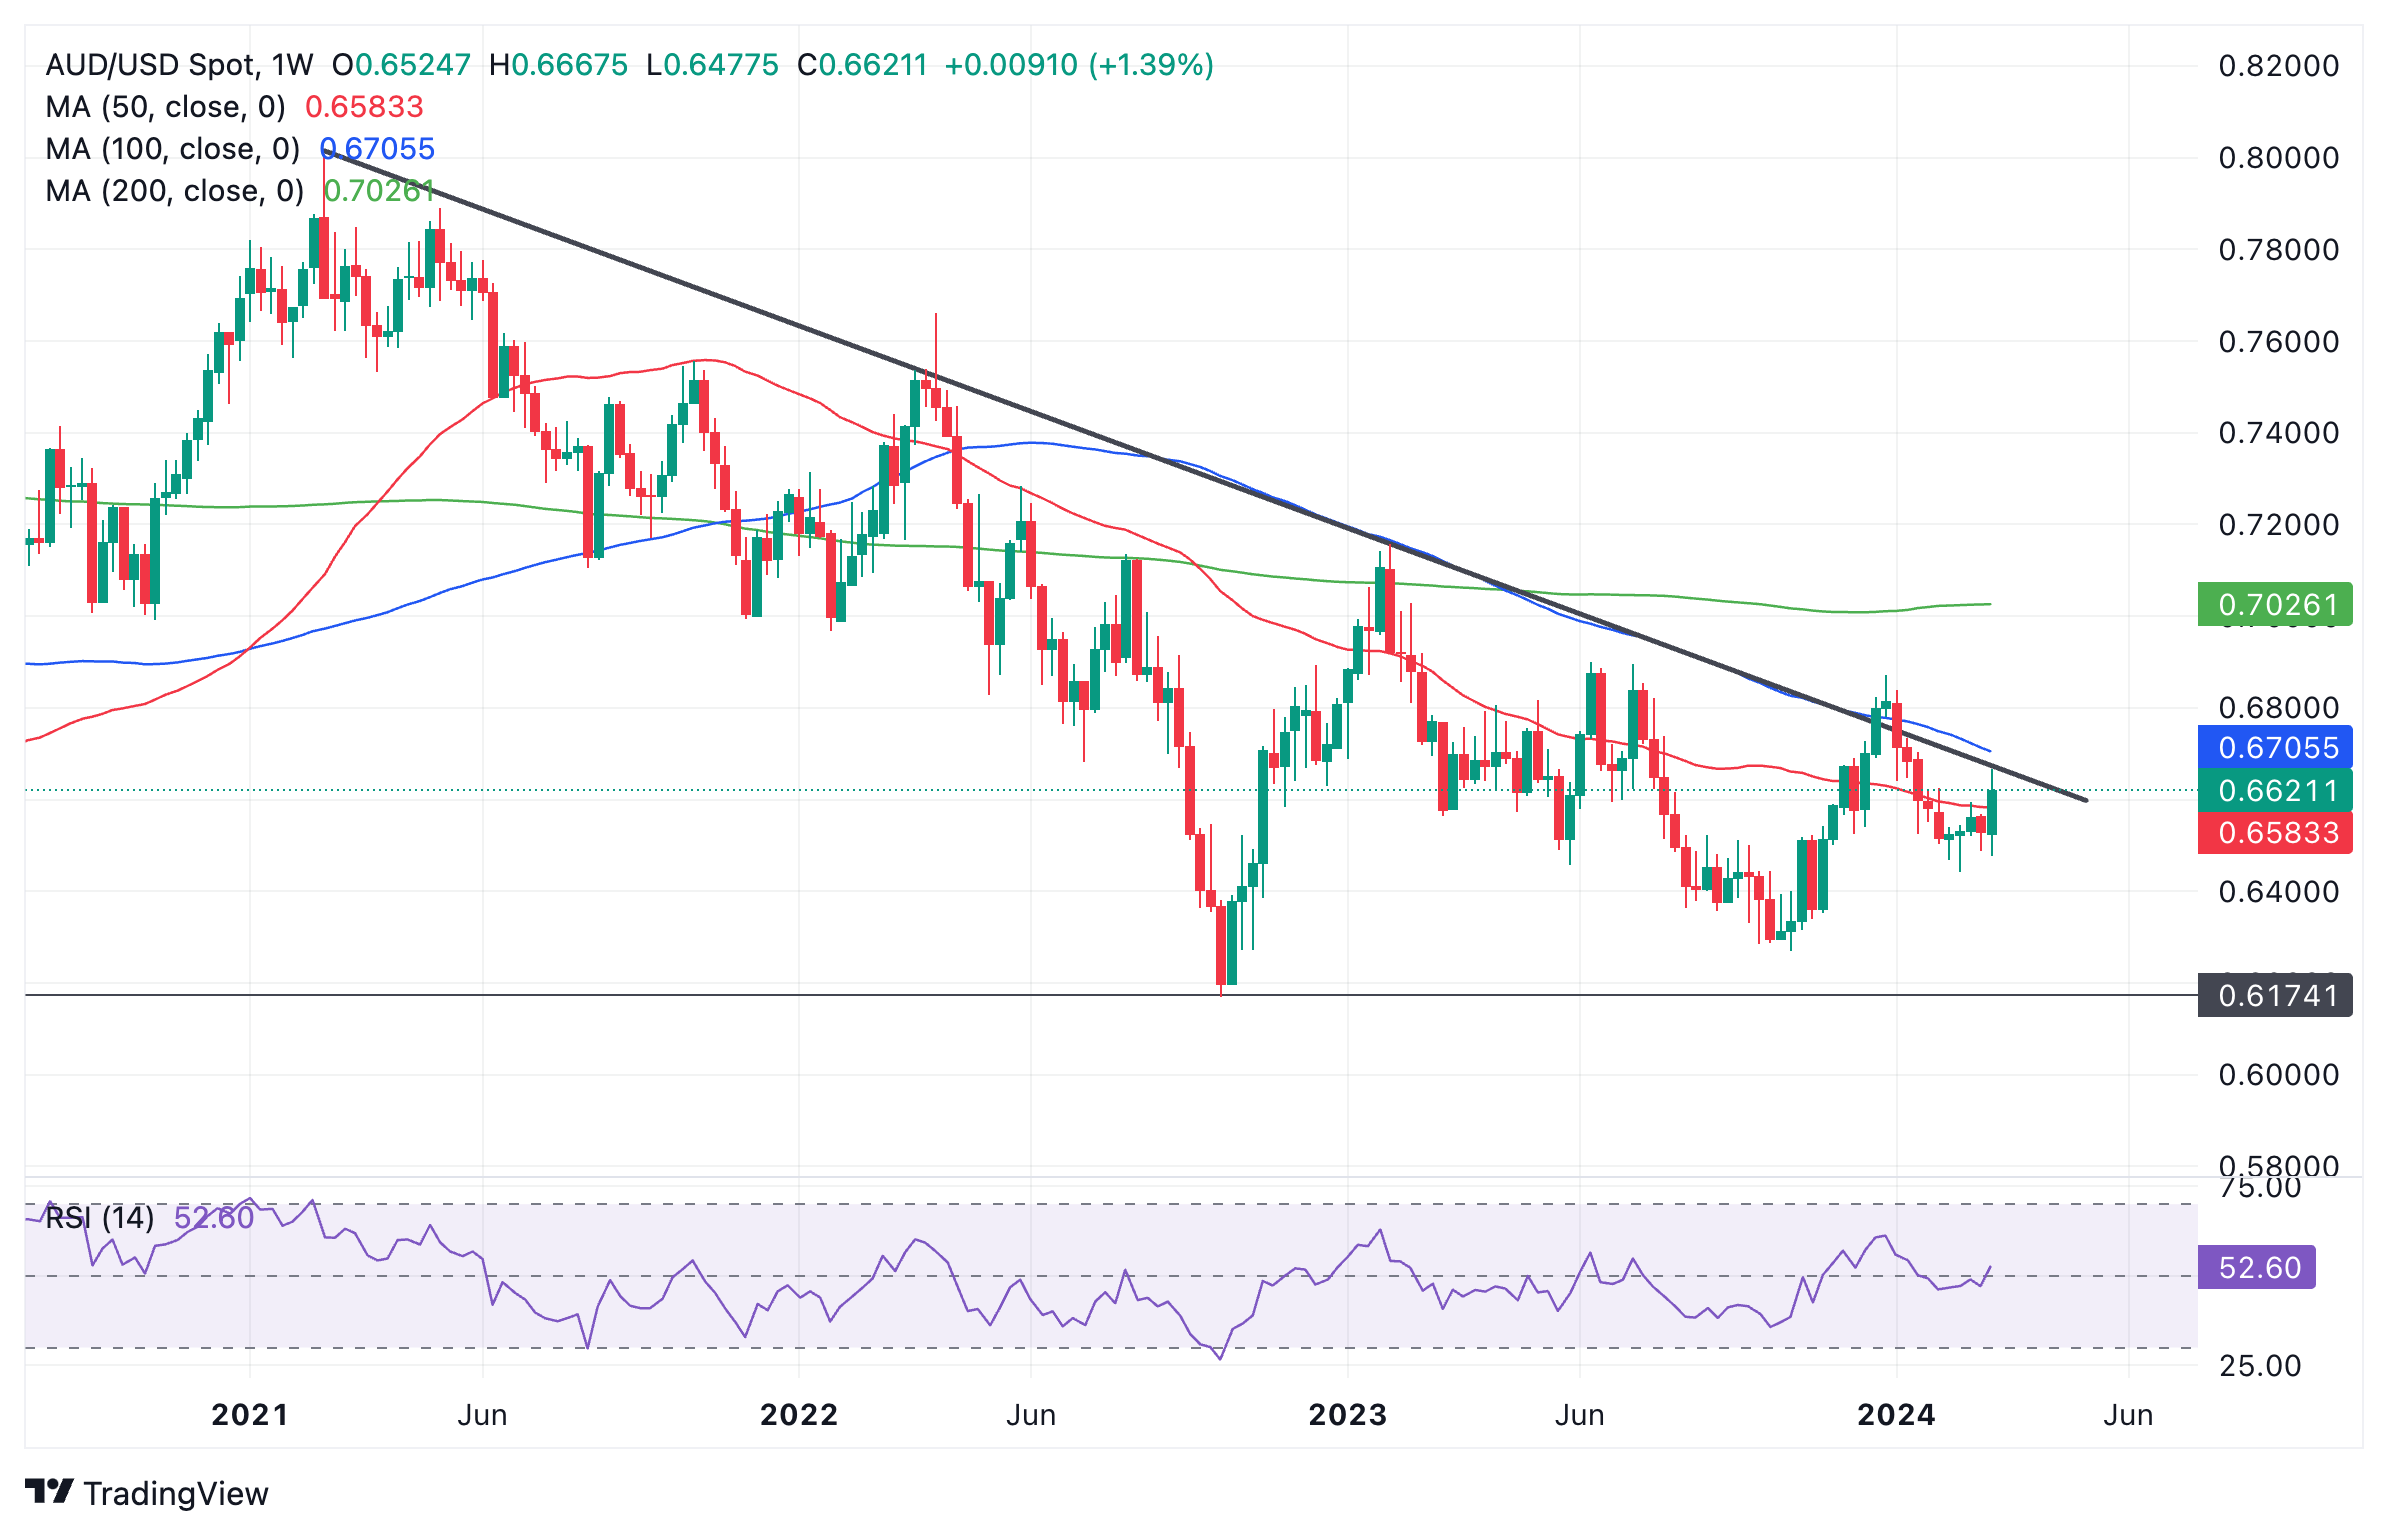
Australian Dollar vs. US Dollar: Weekly chart
Despite recent gains, the mood music around the Australian Dollar remains negative due mainly to the steep fall in price of Australia’s largest export commodity, Iron Ore, which has dropped by over 20% since the start of 2024.
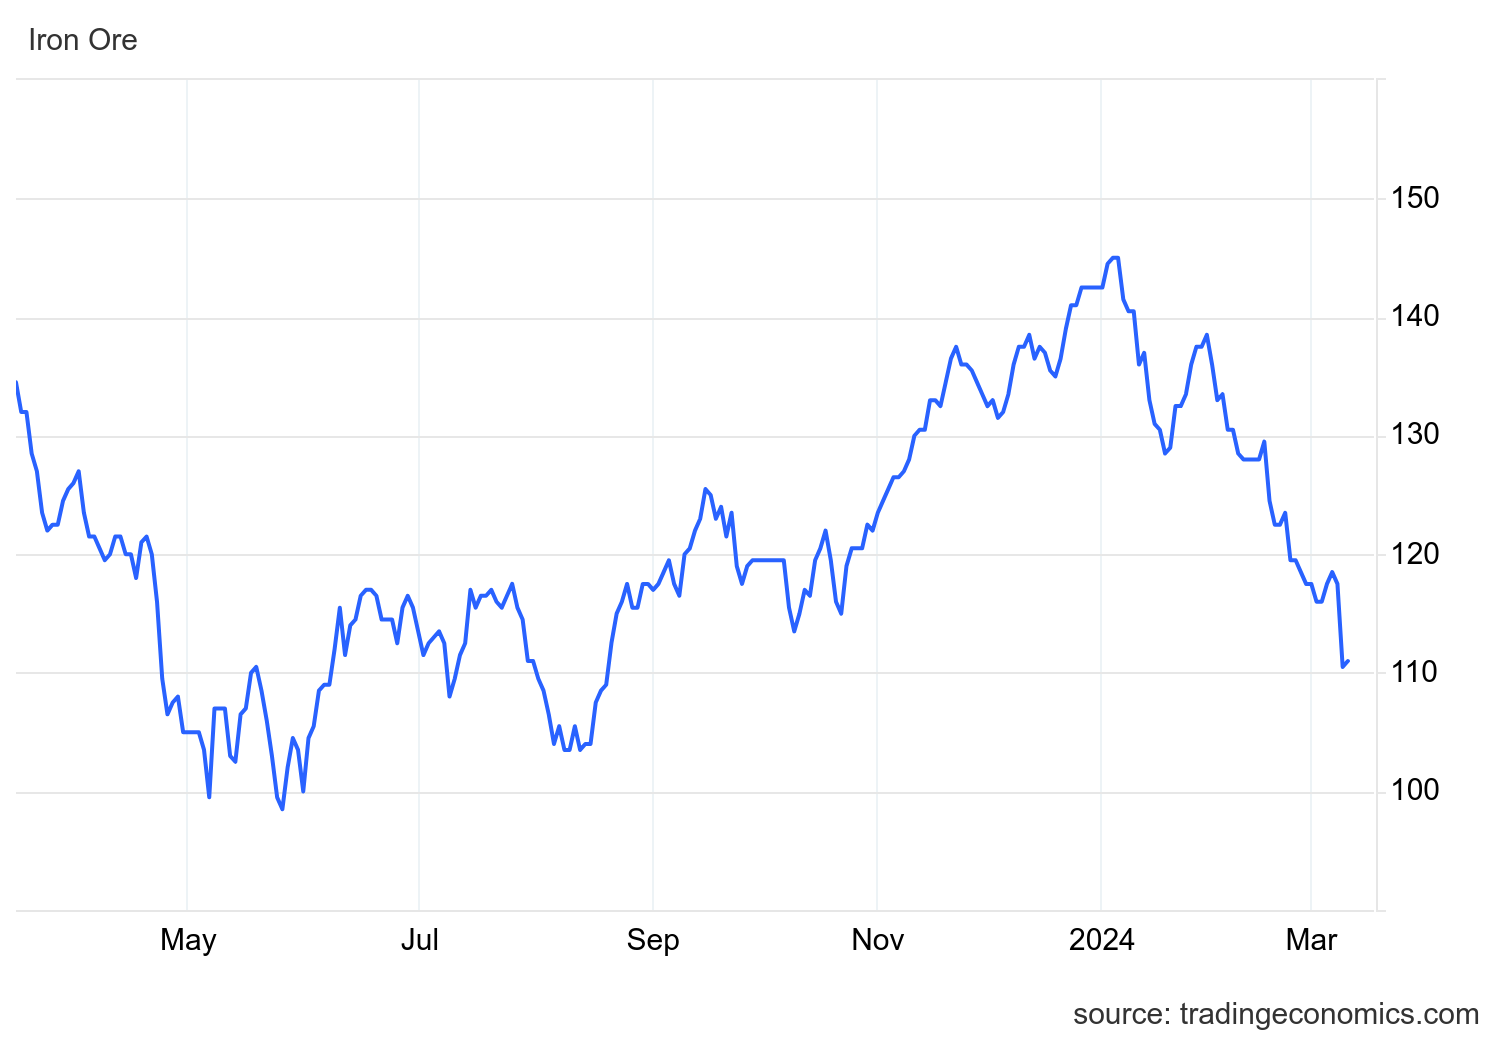
Iron Ore Prices in USD
The decline has been driven by a fall in demand from its biggest export partner China, which is using less iron to make steel for its beleaguered property sector.
Usually the Chinese government comes to the rescue when the economy takes a turn for the worse – not this time. At a meeting of the Chinese National People’s Congress on Monday, the party decided to withhold a bailout for the indebted property industry.
Instead, China’s Communist Party seemed more interested in punishing the property magnates behind the $7.5 trillion market’s collapse, according to news.com.au.
“Those who commit acts that harm the interests of the masses will be resolutely investigated and punished in accordance with the law. They will be made to pay the due price,” said Minister of Housing and Urban-Rural Development Ni Hong at the weekend.
This does not bode well for Iron Ore prices going forward or for the Australian Dollar.
Reserve Bank of Australia split on interest rates
Unlike the Federal Reserve, which is steadily reaching a consensus on the need for a June interest rate cut, the Reserve Bank of Australia (RBA) continues hinting it may have to raise rates even higher than their current 4.35% level.
Inflation in Australia fell more than expected – from 5.4% to 4.1% in Q4 of 2023, but it remains well above the RBA’s target range of 2%-3%. RBA Governor Michelle Bullock stated recently that inflation in Australia is mostly “homegrown” and “demand driven”, due to the strength of the labor market and rising wage inflation. This suggests it is more entrenched than in other countries, and will take longer to fall back to target. Indeed, the RBA does not see this happening till 2026 and Bullock hinted the RBA might still need to raise interest rates to tackle inflation.
On Wednesday, ex RBA Governor Philip Lowe said there is a two way risk on interest rates, and that the current RBA Governor Michelle Bullock was right to issue a warning that interest rates might still need to go higher.
The contrast in central bank policy stances suggests the US Dollar may actually weaken versus the Aussie, neutralizing some of the risks to the currency from the fall in demand for Australian Iron Ore.
Downtrend to continue?
The AUD/USD has just pushed back after touching a major trendline and there is a risk it could fall further, in line with the long-term downtrend.
A break below the last swing low of October 2023 at 0.6442 would solidify the bearish outlook and probably see prices ease further to around the 0.6170 October 2022 lows.
Alternatively, a break above the 0.6871 December 2023 high would indicate the long-term trend was probably reversing and the Australian Dollar might be set for sunnier slopes.
- Incoming data continues to influence easing cycle expectations with June as a potential start.
- Despite US CPI data intensifying, investor foresight accords more with frail labor market figures.
- Retail Sales and weekly Jobless Claims figures will dictate the pace of the USD for the rest of the week.
The US Dollar Index (DXY) exchanges hands at 102.80, recording mild losses. Despite hot figures from the latest Consumer Price Index (CPI) release, investors' expectations for the start of the Federal Reserve’s (Fed) interest rate cuts didn’t see major changes. Weighed down by a weak labor market, investors are holding their breath for the upcoming data on Retail Sales, awaiting further cues on the health of the US economy.
As for now, due to some weaknesses detected in the US labor market, investors may post their focus on the Unemployment evolution to time the start of the rate cuts. Additionally, any weakness in US economic activity may take the focus off the rise in February inflation.
Daily digest market movers: DXY trades evenly in anticipation of additional US data
- The February US Consumer Price Index (CPI) data demonstrates an unexpected rise in inflation. The headline YoY increase was 3.2% against the previous 3.1%, while core CPI rose by 3.8% on a yearly basis, in contrast to January's 3.7%.
- Upcoming US economic reports on Thursday include the Producer Price Index (PPI), expected to have risen by 1.2% YoY compared to 1.9% in January.
- Retail Sales and weekly Initial Jobless Claims will also be closely studied.
- Fed is projected to uphold current rates in the upcoming meeting in March with a mere 15% likelihood of a rate reduction in May and a slightly more probable 75% chance in June.
- The market continues to foresee an additional three rate cuts in 2024, however, a hawkish swing in the forthcoming March Dot Plot may change those forecasts.
- US Treasury bond yields are ascending with the 2-year at 4.61%, the 5-year at 4.17%, and the 10-year at 4.18%.
DXY technical analysis: DXY bears resume their path, bearish SMA crossover spotted at 103.70
Considering the technical indicators on the daily chart, selling momentum looks to be dominating the market at the moment. The Relative Strength Index (RSI), although flat, is hovering in negative territory, which signifies a bearish stand. However, the selling pressure seems to have been reduced for now as bears take a breather.
The Moving Average Convergence Divergence (MACD) is also flat with red bars, which reflects the prevailing bearish momentum but insinuates that the selling force might be losing some steam after a 1% pullback last week.
In addition, the Index is trading below the 20, 100, and 200-day Simple Moving Averages (SMAs), confirming bearish sentiment in the market. To add to that, the 20-day SMA performed a bearish cross with the 100 and 200-day averages at 103.70, which adds an argument to the negative outlook for the USD.
US Dollar FAQs
What is the US Dollar?
The US Dollar (USD) is the official currency of the United States of America, and the ‘de facto’ currency of a significant number of other countries where it is found in circulation alongside local notes. It is the most heavily traded currency in the world, accounting for over 88% of all global foreign exchange turnover, or an average of $6.6 trillion in transactions per day, according to data from 2022.
Following the second world war, the USD took over from the British Pound as the world’s reserve currency. For most of its history, the US Dollar was backed by Gold, until the Bretton Woods Agreement in 1971 when the Gold Standard went away.
How do the decisions of the Federal Reserve impact the US Dollar?
The most important single factor impacting on the value of the US Dollar is monetary policy, which is shaped by the Federal Reserve (Fed). The Fed has two mandates: to achieve price stability (control inflation) and foster full employment. Its primary tool to achieve these two goals is by adjusting interest rates.
When prices are rising too quickly and inflation is above the Fed’s 2% target, the Fed will raise rates, which helps the USD value. When inflation falls below 2% or the Unemployment Rate is too high, the Fed may lower interest rates, which weighs on the Greenback.
What is Quantitative Easing and how does it influence the US Dollar?
In extreme situations, the Federal Reserve can also print more Dollars and enact quantitative easing (QE). QE is the process by which the Fed substantially increases the flow of credit in a stuck financial system.
It is a non-standard policy measure used when credit has dried up because banks will not lend to each other (out of the fear of counterparty default). It is a last resort when simply lowering interest rates is unlikely to achieve the necessary result. It was the Fed’s weapon of choice to combat the credit crunch that occurred during the Great Financial Crisis in 2008. It involves the Fed printing more Dollars and using them to buy US government bonds predominantly from financial institutions. QE usually leads to a weaker US Dollar.
What is Quantitative Tightening and how does it influence the US Dollar?
Quantitative tightening (QT) is the reverse process whereby the Federal Reserve stops buying bonds from financial institutions and does not reinvest the principal from the bonds it holds maturing in new purchases. It is usually positive for the US Dollar.
- Canadian Dollar pulls back to even against US Dollar midweek.
- Canada brings little data of note to the table.
- US PPE, Retail Sales on offer for Thursday.
The Canadian Dollar (CAD) found some room on the upside at the midweek inflection point as investors await Thursday’s US Producer Price Index (PPI) and Retail Sales figures. The CAD continues to wrestle with the US Dollar (USD), but the Canadian Dollar is on pace to be one of the strongest performers this week as the only major currency entirely in the green.
Go figure! Canada’s high-performance week comes when there’s no meaningful Canadian data on offer. Canadian Manufacturing Sales for January, slated for Thursday, are expected to recover to 0.4% from the previous -0.7%. Canadian Housing Starts come on Friday, expected to tick up slightly to 230K from 223.6K. Neither print is expected to draw much attention, if any.
After Thursday’s US PPE and Retail Sales, Friday will wrap things up with another round of University of Michigan Consumer Sentiment and Expectation prints for March. UoM Consumer Sentiment is forecast to hold steady at 76.9, while UoM Consumer Inflation Expectations last showed US consumers expected annual inflation to land somewhere around 2.9%.
Canadian Dollar price this week
The table below shows the percentage change of Canadian Dollar (CAD) against listed major currencies this week. Canadian Dollar was the strongest against the Japanese Yen.
| USD | EUR | GBP | CAD | AUD | JPY | NZD | CHF | |
| USD | -0.03% | 0.44% | -0.12% | 0.00% | 0.65% | 0.30% | 0.01% | |
| EUR | 0.02% | 0.46% | -0.11% | 0.02% | 0.67% | 0.33% | 0.04% | |
| GBP | -0.44% | -0.46% | -0.57% | -0.45% | 0.22% | -0.13% | -0.42% | |
| CAD | 0.13% | 0.10% | 0.55% | 0.12% | 0.75% | 0.42% | 0.14% | |
| AUD | 0.01% | -0.01% | 0.42% | -0.14% | 0.66% | 0.34% | 0.01% | |
| JPY | -0.65% | -0.68% | 0.04% | -0.77% | -0.68% | -0.32% | -0.64% | |
| NZD | -0.30% | -0.33% | 0.13% | -0.44% | -0.31% | 0.34% | -0.29% | |
| CHF | -0.05% | -0.04% | 0.41% | -0.14% | -0.04% | 0.62% | 0.28% |
The heat map shows percentage changes of major currencies against each other. The base currency is picked from the left column, while the quote currency is picked from the top row. For example, if you pick the Euro from the left column and move along the horizontal line to the Japanese Yen, the percentage change displayed in the box will represent EUR (base)/JPY (quote).
Technical analysis: USD/CAD stuck into week’s lows as Canadian Dollar fights back
The Canadian Dollar (CAD) is moderately higher on Wednesday, finding gains against the majority of its major currency peers. The CAD is in the red against the Australian Dollar (AUD) in the midweek trading session, but within a scant tenth of a percent of the day’s opening bids. Meanwhile, the CAD has gained nearly a quarter of a percent against the Japanese Yen (JPY) and is up around a sixth of a percent against both the US Dollar and the Pound Sterling (GBP).
USD/CAD slipped back into the week’s low bids as the Canadian Dollar found firmer footing, setting a new low for the week near 1.3460. The pair is still on the high side of last week’s swoon into 1.3420, and near-term price action has a technical ceiling priced in at the 200-hour Simple Moving Average (SMA) near 1.3520.
Daily candles continue to get hung up on the pair’s 200-day SMA at 1.3478, and directional momentum remains limited despite a recent pattern of higher highs. A supply zone is priced in just above the 1.3400 handle.
USD/CAD hourly chart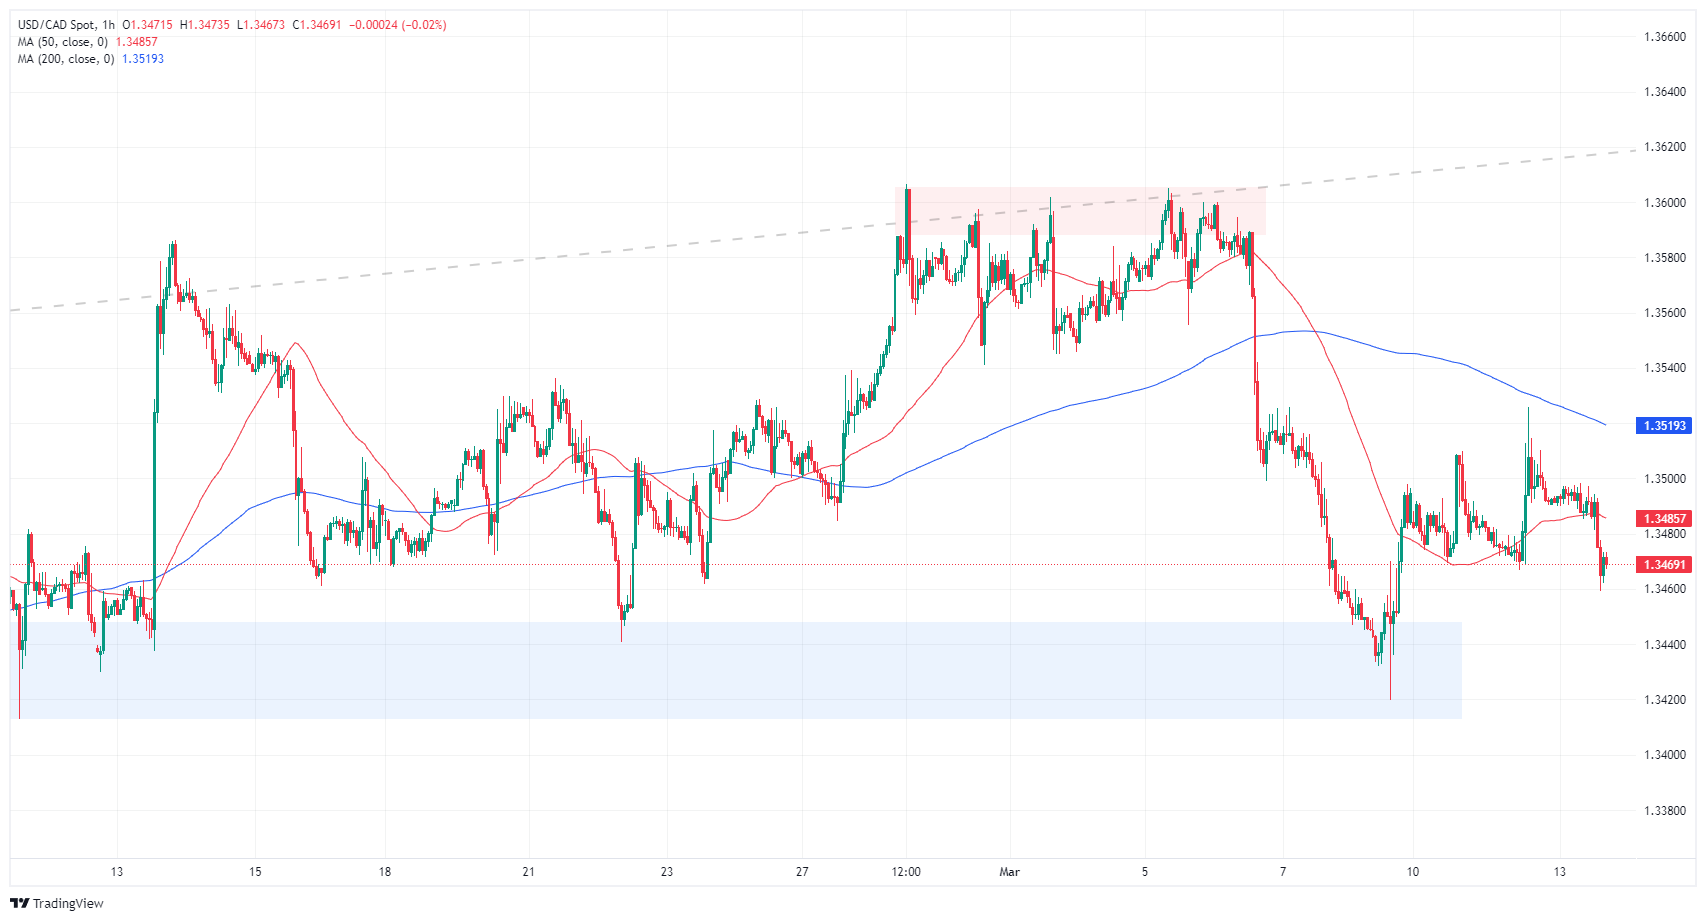
USD/CAD daily chart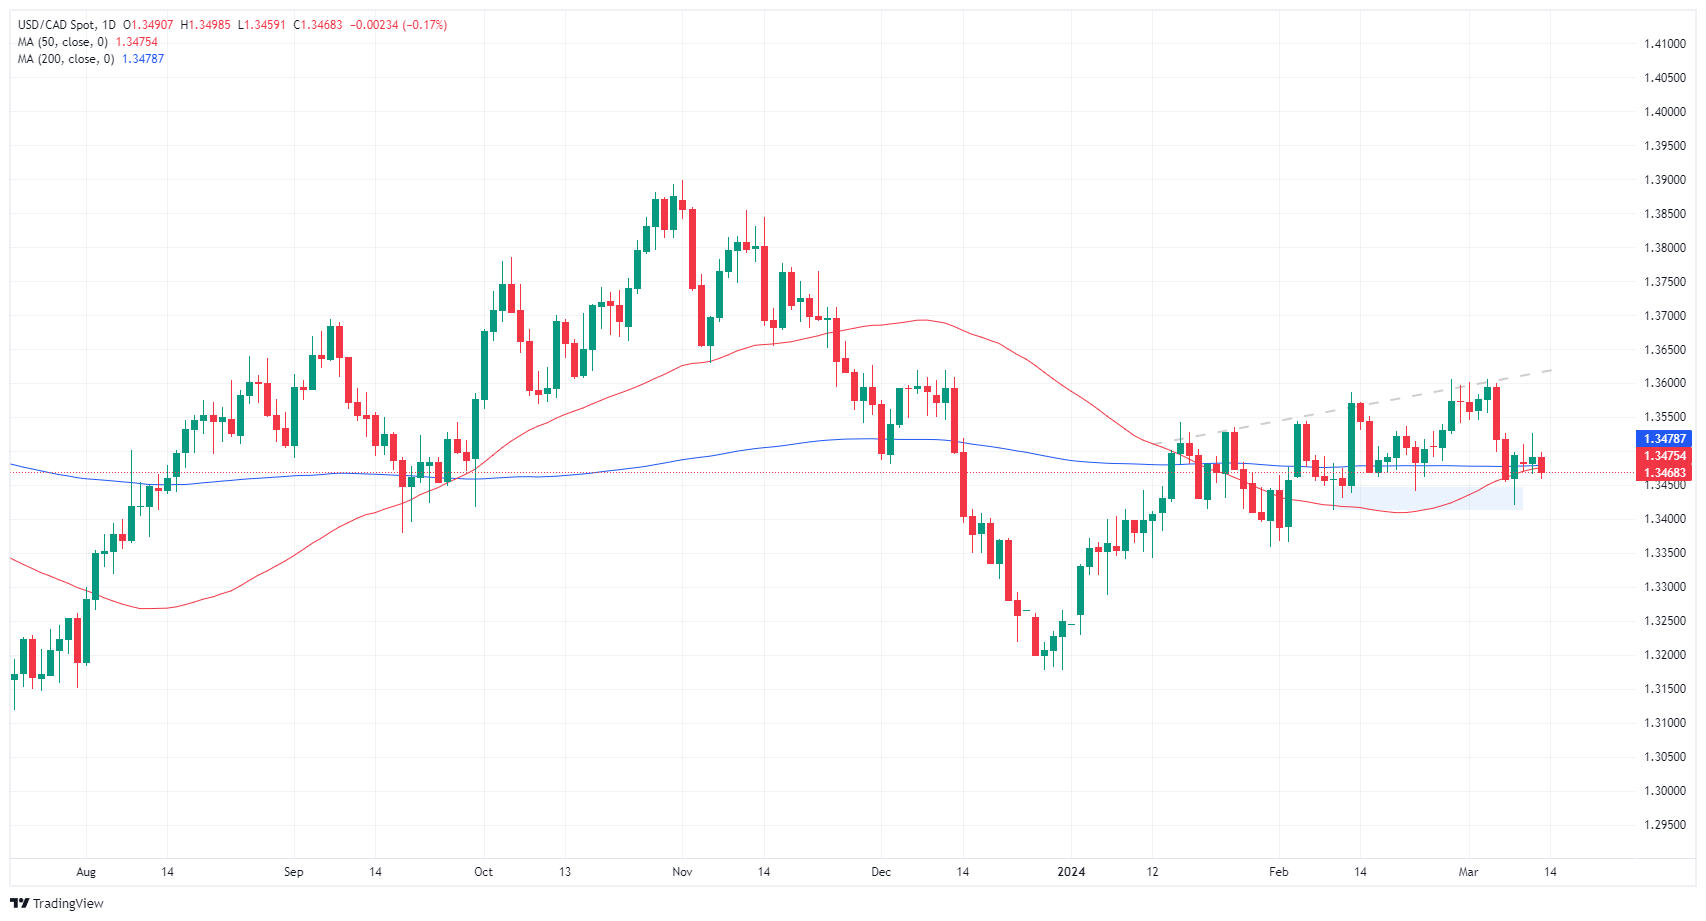
Canadian Dollar FAQs
The key factors driving the Canadian Dollar (CAD) are the level of interest rates set by the Bank of Canada (BoC), the price of Oil, Canada’s largest export, the health of its economy, inflation and the Trade Balance, which is the difference between the value of Canada’s exports versus its imports. Other factors include market sentiment – whether investors are taking on more risky assets (risk-on) or seeking safe-havens (risk-off) – with risk-on being CAD-positive. As its largest trading partner, the health of the US economy is also a key factor influencing the Canadian Dollar.
The Bank of Canada (BoC) has a significant influence on the Canadian Dollar by setting the level of interest rates that banks can lend to one another. This influences the level of interest rates for everyone. The main goal of the BoC is to maintain inflation at 1-3% by adjusting interest rates up or down. Relatively higher interest rates tend to be positive for the CAD. The Bank of Canada can also use quantitative easing and tightening to influence credit conditions, with the former CAD-negative and the latter CAD-positive.
The price of Oil is a key factor impacting the value of the Canadian Dollar. Petroleum is Canada’s biggest export, so Oil price tends to have an immediate impact on the CAD value. Generally, if Oil price rises CAD also goes up, as aggregate demand for the currency increases. The opposite is the case if the price of Oil falls. Higher Oil prices also tend to result in a greater likelihood of a positive Trade Balance, which is also supportive of the CAD.
While inflation had always traditionally been thought of as a negative factor for a currency since it lowers the value of money, the opposite has actually been the case in modern times with the relaxation of cross-border capital controls. Higher inflation tends to lead central banks to put up interest rates which attracts more capital inflows from global investors seeking a lucrative place to keep their money. This increases demand for the local currency, which in Canada’s case is the Canadian Dollar.
Macroeconomic data releases gauge the health of the economy and can have an impact on the Canadian Dollar. Indicators such as GDP, Manufacturing and Services PMIs, employment, and consumer sentiment surveys can all influence the direction of the CAD. A strong economy is good for the Canadian Dollar. Not only does it attract more foreign investment but it may encourage the Bank of Canada to put up interest rates, leading to a stronger currency. If economic data is weak, however, the CAD is likely to fall.
The US Census Bureau will release the February Retail Sales report on Thursday, March 14 at 12:30 GMT and as we get closer to the release time, here are the forecasts of economists and researchers of six major banks regarding the upcoming data.
Retail Sales are forecast to improve to 0.8% MoM in February from a 0.8% drop in January. Retail Sales ex Autos are expected at 0.5% MoM vs. the prior release of -0.6% while the so-called Control Group used for GDP calculations is expected at 0.4% MoM vs. -0.4% in January.
TDS
We expect retail sales to rebound a strong 0.8% MoM in February following January's retreat of a similar magnitude. Volatile auto and gasoline stations sales will likely boost growth, with the control group also acting as a key driver as it recovers from last month's 0.4% contraction. Indeed, we project an above-consensus 0.5% MoM gain for the category. Furthermore, we forecast sales in bars/restaurants – the report's only services component – to decline for the first time in a year.
NBF
Judging from an increase in auto sales, motor vehicles and parts dealers could have contributed positively to the headline figure. Outlays at gasoline stations may also have increased, reflecting higher pump prices. And with the return of milder weather, it would not be surprising to see a number of other sectors rebound from their January declines, underpinning a 1.1% rise in headline sales. Ex-auto outlays could have been a tad weaker, advancing 0.8% month on month.
RBC Economics
Consumer demand is still strong, but we expect a 0.7% increase in US retail sales on Thursday after the CPI report. This will largely be a result of higher gasoline prices and will not fully recover from the 0.8% drop in January.
Citi
After a weaker retail sales report in January partly driven by seasonal adjustment issues, we expect a rebound in February retail sales by a strong 1.0% MoM with the main drivers being auto sales. Meanwhile, retail sales excluding autos and gasoline are expected to rise by 0.5% MoM and for control group sales to also increase at a similar pace by 0.4% MoM. For the quarter, overall consumption is still on track to continue growing but at a somewhat slower pace than during Q4 2023. Consumption should still be supported in the near term as long as the US labor market holds up well, but we see risks for a more significant weakening in the labor market and activity this year.
Wells Fargo
Consumers started the year on shaky footing. Retail sales slipped 0.8% and broader inflation-adjusted personal spending slipped 0.1% in January. Even as we anticipate a moderation in spending this year, we believe the January slowdown somewhat overstates the near-term pullback in consumption. Households are still benefiting from a real income tailwind that should remain supportive of spending in the near term. We expect to see a rebound in February spending and forecast retail sales advanced 0.8%. Some strength in retail sales will come from autos. Previously released data on vehicle unit sales suggest a rebound in sales after a pullback in January, which should translate to a decent lift for the headline figure. After excluding motor vehicle sales, we anticipate retail sales rose a more modest but still strong 0.4%.
CIBC
After a pullback in January which was also perhaps influenced by bad weather, we expect the US consumer to bounce back in February, with the control group of retail sales growing by 0.4% in the month. High frequency credit card suggests that retail consumption should rebound in the month. Firm job gains and strong real wage growth, combined with a shift towards goods consumption, should continue to support strong demand for retailing.
Economists at Commerzbank analyze what is relevant regarding the upcoming Bank of Japan’s (BoJ) meeting next week.
The "March vs. April" question is not really important
This is another one of those things I can't understand: the question of whether the BoJ will raise its key interest rate next week or at the next meeting on April 26. It's not the ‘when’ that matters. Two completely different questions matter: whether the policy rate will be raised at all in the near future, and whether there will be a significant number of rate hikes thereafter, or whether it will be a disaster like 2000 and 2006, when ‘monetary policy normalization’ fizzled out after the first steps.
The second question – what will follow after a first rate hike – is much, much more important. If the BoJ were to raise its key interest rate to 0% or +0.1% next week, this would in itself be irrelevant for inflation and the real economy, as well as for the JPY exchange rate. Such a move is only relevant if it can be seen as the start of a cycle of rate hikes.
US CPI inflation, as expected, came in “hot” once again in February. Economists at the Bank of Montreal analyze Fed’s policy outlook after the inflation report.
Ugly inflation read will do nothing to soothe nerves on the FOMC
Headline inflation increased 0.4% in the month, in line with our forecast and the consensus, but remains an unwelcome acceleration from an unrevised and already elevated 0.3% January reading. The yearly rate of inflation edged up to 3.2%.
Core CPI inflation, excluding food and energy, increased slightly more than forecast, up 0.4% last month and 3.8% from a year ago versus 3.9% in January, a more modest slowdown than the consensus had expected. Even more concerning is the fact that the three-month and six-month moving averages of core inflation accelerated and are moving in the wrong direction for a Fed that is trying to bring inflation to heel.
This initial inflation report for February is an ugly read that will do nothing to soothe nerves on the FOMC. Inflation remains the number one problem they still have yet to solve. Clearly, restrictive monetary policy has not yet fully done its work and a patient and slightly hawkish Fed must remain in place for the monetary medicine to fully take effect.
- WTI climbs 1.46% to $78.91, buoyed by US crude inventory drop and geopolitical risks impacting supply.
- EIA report reveals larger-than-expected decrease in gasoline stocks, with crude inventories falling against forecasts.
- Market eyes OPEC and IEA updates on oil demand, with Fed policy shifts potentially influencing future price movements.
West Texas Intermediate (WTI), the US crude oil benchmark, rises some 1.46% on Wednesday after bouncing from a daily low of $77.33 in the early North American session. Geopolitical risks threaten to underwhelm supply, and the expectation that the Federal Reserve might begin its easing cycle underpins oil prices. At the time of writing, WTI exchanges hands at $78.91.
Oil prices gain as supply concerns intensify, Fed easing speculations grow
The US Energy Information Administration (EIA) revealed that crude oil inventories from the previous week declined by 1.5 million barrels, less than the 1.34 million barrels increase expected by analysts. Further data showed that gasoline inventories dived almost three times estimates while distillate fuels grew. The US Strategic Petroleum Reserve grew from 361 million barrels to 361.8 million as the US re-stock its inventories. After the data, WTI rose as high as $79.32 but settled below the $79.00 figure.
Aside from this, geopolitical events continued to drive oil prices. Ukraine attacked Russian refineries, causing a fire at an oil refinery on Wednesday. Russian President Vladimir Putin said it was an attempt to disrupt Russia’s presidential election.
Meanwhile, the Organization of the Petroleum Exporting Countries (OPEC) stuck to its forecast for oil demand growth of 2.25 million barrels per day in 2024, which exceeded analysts' forecasts.
On Thursday, the International Energy Agency (IEA) is expected to update its figures, which are expected to be lower than OPEC’s.
Besides those factors, speculations that major central banks would begin to cut borrowing costs might drive WTI prices higher. Once the Federal Reserve begins to ease policy, the Greenback would be under pressure, favoring an upside in oil prices.
WTI Oil FAQs
WTI Oil is a type of Crude Oil sold on international markets. The WTI stands for West Texas Intermediate, one of three major types including Brent and Dubai Crude. WTI is also referred to as “light” and “sweet” because of its relatively low gravity and sulfur content respectively. It is considered a high quality Oil that is easily refined. It is sourced in the United States and distributed via the Cushing hub, which is considered “The Pipeline Crossroads of the World”. It is a benchmark for the Oil market and WTI price is frequently quoted in the media.
Like all assets, supply and demand are the key drivers of WTI Oil price. As such, global growth can be a driver of increased demand and vice versa for weak global growth. Political instability, wars, and sanctions can disrupt supply and impact prices. The decisions of OPEC, a group of major Oil-producing countries, is another key driver of price. The value of the US Dollar influences the price of WTI Crude Oil, since Oil is predominantly traded in US Dollars, thus a weaker US Dollar can make Oil more affordable and vice versa.
The weekly Oil inventory reports published by the American Petroleum Institute (API) and the Energy Information Agency (EIA) impact the price of WTI Oil. Changes in inventories reflect fluctuating supply and demand. If the data shows a drop in inventories it can indicate increased demand, pushing up Oil price. Higher inventories can reflect increased supply, pushing down prices. API’s report is published every Tuesday and EIA’s the day after. Their results are usually similar, falling within 1% of each other 75% of the time. The EIA data is considered more reliable, since it is a government agency.
OPEC (Organization of the Petroleum Exporting Countries) is a group of 13 Oil-producing nations who collectively decide production quotas for member countries at twice-yearly meetings. Their decisions often impact WTI Oil prices. When OPEC decides to lower quotas, it can tighten supply, pushing up Oil prices. When OPEC increases production, it has the opposite effect. OPEC+ refers to an expanded group that includes ten extra non-OPEC members, the most notable of which is Russia.
Gold’s price broke the key resistance of $2,140 last week, with prices rising 5%. Economists at ANZ Bank analyze XAU/USD technical outlook.
Cruising in an unchartered territory
The last two days of consolidation have formed a resistance level near the recent high of $2,195. A break of this resistance could see Gold trading above $2,200 range.
However, a healthy price correction looks in the offing as the Relative Strength Index suggests an overbought level.
If correction starts, the price could fall back to the key support level of $2,100.
- NZD/USD generates moderate gains as the US Dollar drops despite easing Fed rate cut expectations for June.
- The RBNZ has projected that inflation will rise by 0.8% in the first quarter of this year.
- Investors await the US Retail Sales data for fresh guidance.
The NZD/USD pair is slightly up by 0.08% at 0.6160 in Wednesday’s early American session. The Kiwi asset is broadly sideways as investors shift focus to the United States Retail Sales data for February, which will be published on Thursday. The Retail Sales will indicate the strength in households’ spending, which feeds the consumer price inflation.
The US Dollar is inches down to 102.80 despite easing expectations for the Federal Reserve (Fed) to reduce interest rates in the June policy meeting. The CME Fedwatch tool shows that traders see a 65% chance for the Fed to announce rate cuts in June, which was above 72% before the release of February’s inflation report.
Meanwhile, easing New Zealand inflation expectations are expected to bring some relief for households. Latest forecasts from the Reserve Bank of New Zealand (RBNZ) show that consumer prices will rise by 0.8% in the quarter to March period. The annual inflation is projected to decline to 4.2% from 4.7% in the last quarter of 2023. The RBNZ is expected to keep interest rates higher for longer as current price pressures are significantly higher than the desired rate of 2%.
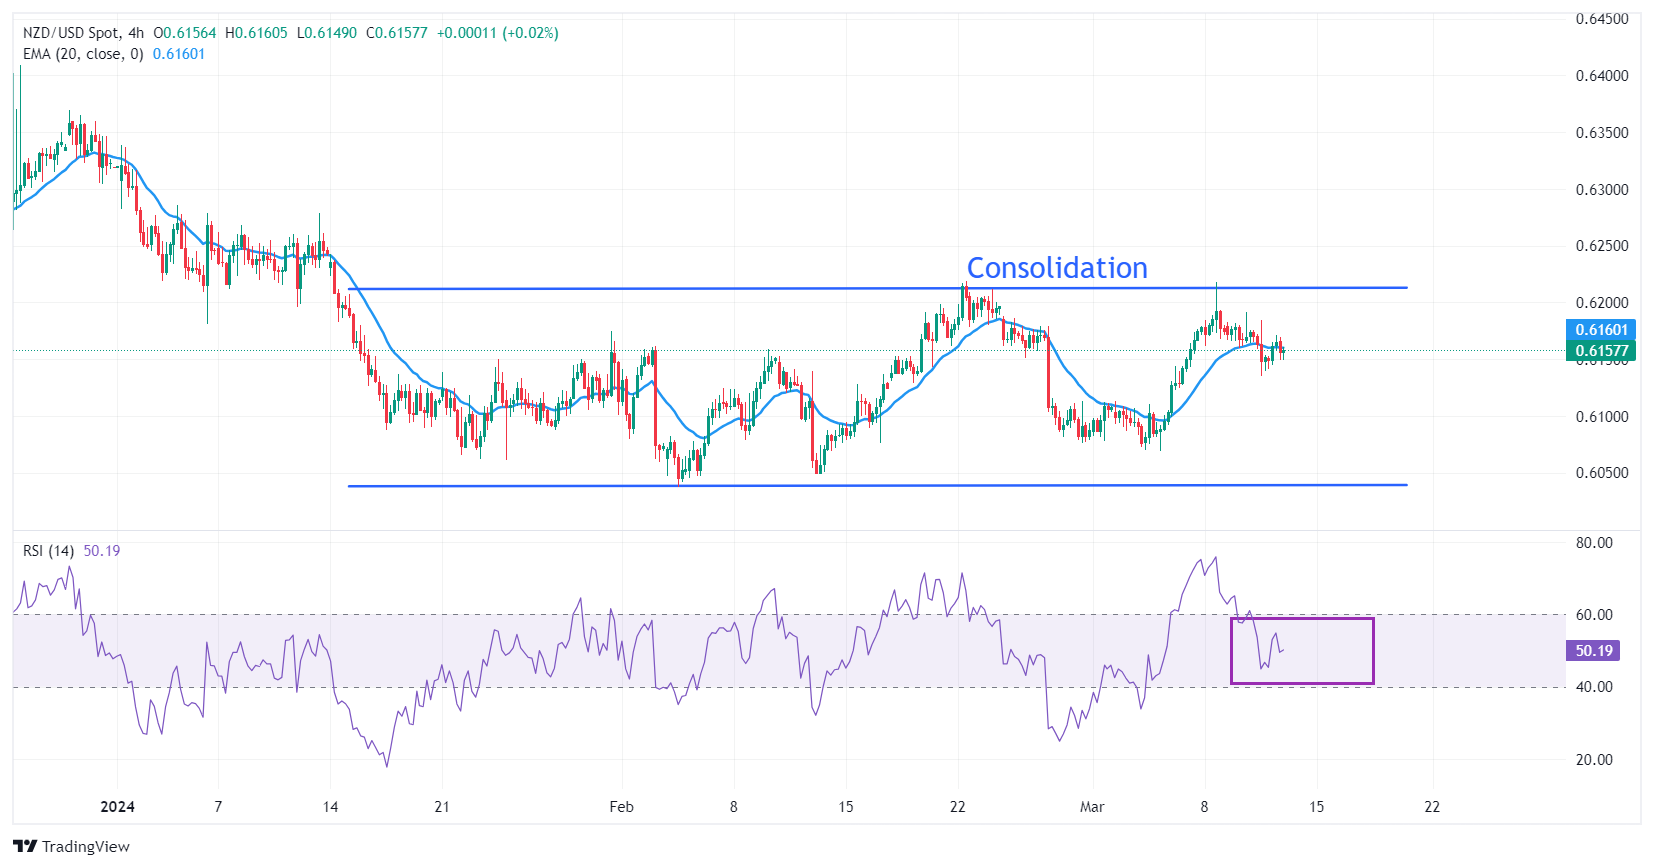
NZD/USD trades back and forth from almost two months, ranging between 0.6037-0.6218 on a four-hour timeframe. A prolonged consolidation indicates indecisiveness among market participants.
The 14-period Relative Strength Index (RSI) trades in a 40.00-60.00 range, which indicates a sharp volatility contraction.
Going forward, a downside move below February 13 low near 0.6050 would expose the asset to the psychological support of 0.6000, followed by November 9 high at 0.5956.
On the flip side, an upside move would emerge if the asset will break above the round-level resistance of 0.6200, which will drive the asset towards February 22 high at 0.6220, followed by January 11 high at 0.6260.
NZD/USD four-hour chart
Market reaction to US CPI should be considered as contained after some initial choppy actions. Economists at OCBC Bank analyze market’s outlook after inflation data.
CPI outcome adds marginally to the risk that the median dot may be pushed higher
Overall, the CPI outcome supports the patience that Fed Chair Powell has been emphasising, but it is not enough to move the needle for the direction of monetary policy. That said, the CPI outcome adds marginally to the risk that the median dot may be pushed higher.
We do note that the December dot plot is skewed to the upside, in that two dots moving higher would be enough to move the median dot higher. Should this happen, it would be market moving.
Between now and FOMC, market may keep a holding pattern.
- USD/JPY bounces back to 148.00 in hopes that the BoJ could delay rate hike plans.
- BoJ Ueda is worried about subdued consumption that has pushed back rate hike expectations.
- Market expectations for the Fed reducing interest rates in June have eased.
The USD/JPY pair rebounds to crucial resistance of 148.00 as investors hope that the Bank of Japan (BoJ) will delay its plans to quit negative interest rates. The asset recovers as optimism over BoJ hiking interest rates in the March policy meeting wanes, and stubborn United States inflation data for February has dents hopes of the Federal Reserve (Fed) reducing interest rates in June.
The commentary from BoJ Ueda and FM Suzuki has dampened market expectations for BoJ exiting the negative rates. BoJ Ueda said on Tuesday that the economy has recovered on a few economic grounds though consumption remains weak. Finance Minister Shunichi Suzuki said separately that Japan was not at a stage where it could declare a victory over deflation.
The market sentiment remains slightly cautious as US Treasury Yields rise to 4.18% on expectations that the Fed will hold interest rates higher for some time longer than what previously anticipated. The US Dollar Index (DXY) is slightly down at 102.85 even though expectations for the Fed reducing interest rates in the June meeting have eased.
According to the CME Fedwatch tool, the chances of a rate cut have dropped to 65%, from above 72% before the release of February’s inflation report.
Meanwhile, investors shifted focus to the US Retail Sales data for February, which will be published on Thursday. The monthly Retail Sales are expected to have increased by 0.8%, against a decline of 0.8% in January. An upbeat Retail Sales data will exhibit resilient consumer spending, which could prompt expectations for the Fed to keep interest rates unchanged in the first half of this year.
- USD/CAD broke out of a bearish wedge pattern it has been rising in during 2024.
- It stopped its downtrend, however, and returned back up to retest the lower borderline.
- This is likely a final test “goodbye”· before the pair resumes its bear move.
USD/CAD has recently broken out of the Ascending Wedge pattern which it has been forming since January.
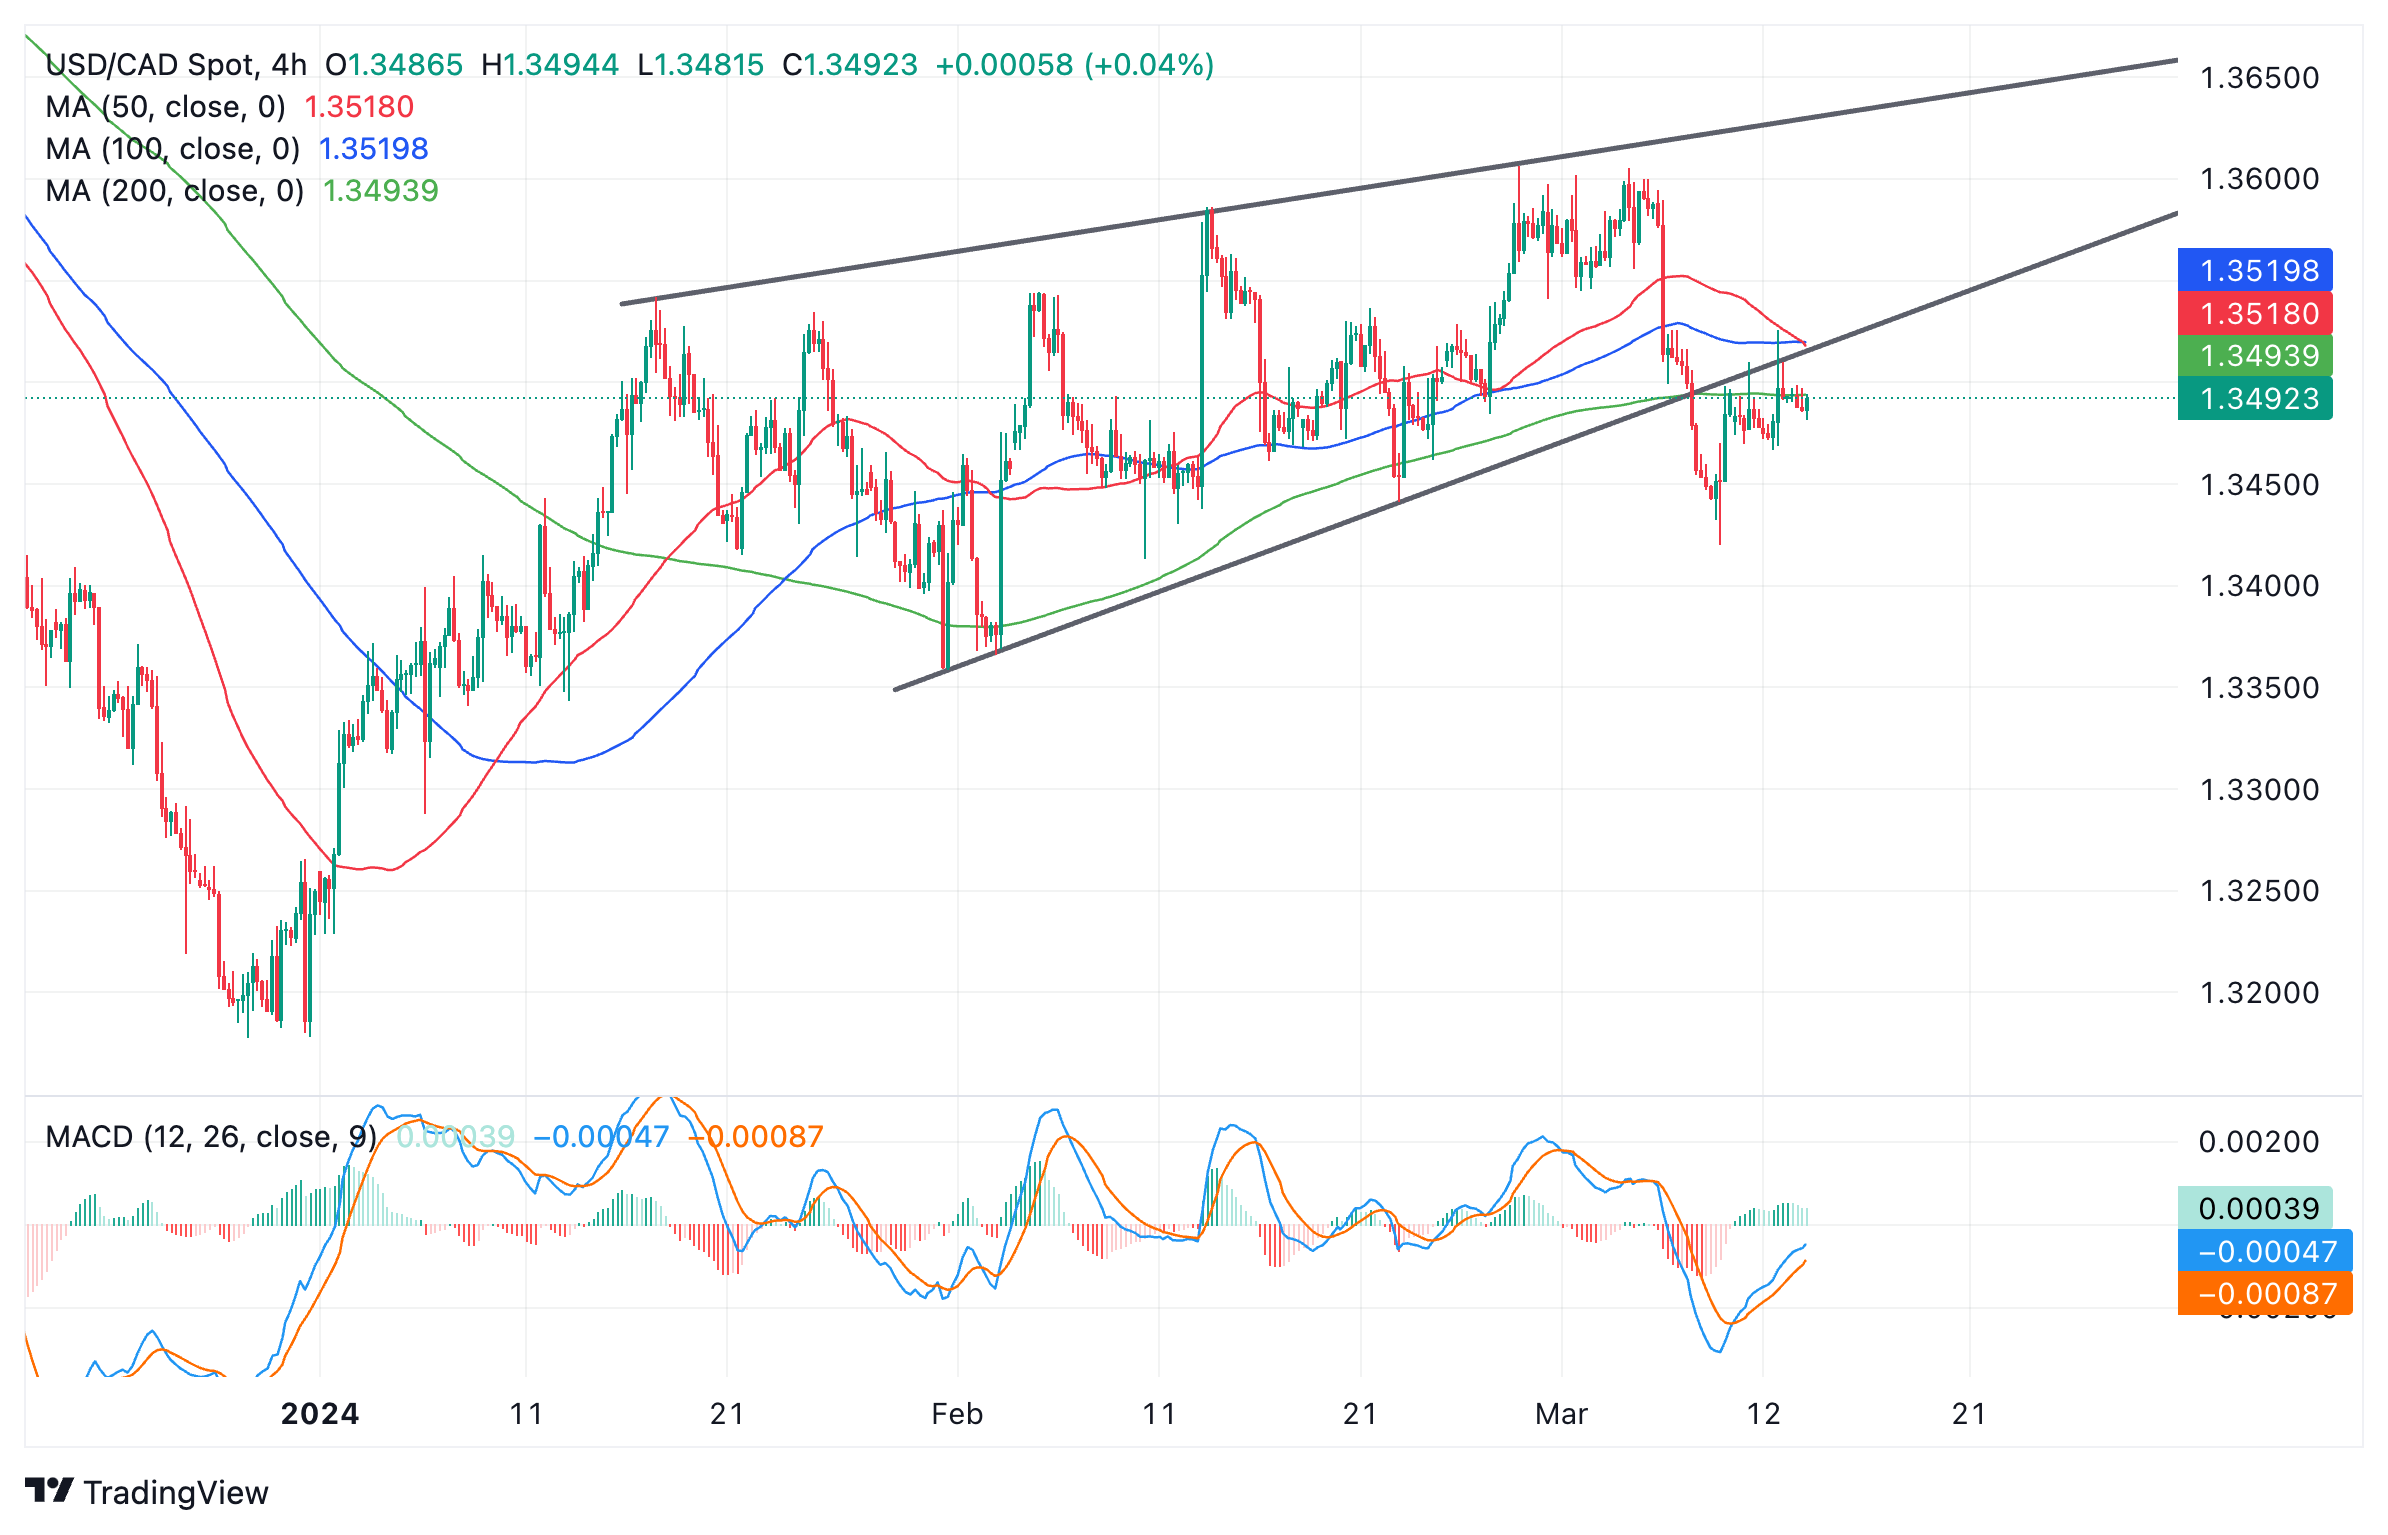
US Dollar versus Canadian Dollar: 4-hour chart
Downside following the breakout was curtailed and the pair turned around and climbed back up to the lower borderline of the wedge, where it currently trades.
It is not uncommon for price to return to a trendline for a final retest before pushing lower again, and this is what is probably happening on USD/CAD.
The pair will probably “air-kiss” the borderline “goodbye”, therefore, before resuming its move lower. Bearish confirmation would probably come with a break below the last swing low at around 1.3466.
The height of the wedge at its widest point extrapolated lower offers an eventual target for the downside move at 1.3302.
For the cautious, more conservative estimates would be the low of the wedge at 1.3358, or possibly even the Fibonacci 0.618 ratio of the pattern’s height at 1.3374.
On the other hand, a break back inside the wedge pattern and above 1.3526 would cancel out the bearish view and suggest a bullish reversal was taking place.
There will be no interest rate cut by the Fed before June. Economists at Commerzbank analyze how the Fed’s stance could impact the US Dollar.
Nothing before June
I think it is now even a little less certain than before when the Fed will start to cut rates. If inflationary pressure remains high over the next few months, it could even consider a first cut later, in July or even September. Intuitively, a meeting at which the new forecasts, including the dot plots (interest rate expectations of the FOMC members) that underpin the decision, are published at the same time would make sense for a first rate cut, i.e. either June or September. But it is quite conceivable that Fed Chairman Jerome Powell will prepare the market for the turnaround in good time.
Tuesday I would have said to the Fed: I know what you're going to do this summer. Namely, cut the key interest rate. Today I'm a little less sure. I'm all the more curious to see what kind of statement and forecasts the Fed will publish next week. If they give the impression that even June is shaky, the Dollar will continue to rise.
- The US Dollar adds gains for a third consecutive day this week.
- A very light economic calendar is ahead for Wednesday.
- The US Dollar Index traders near 103.00, aiming to close above this key level.
The US Dollar (USD) is holding on to a third day of gains this week after the US Consumer Price Index (CPI) data came in slightly higher than expected, casting doubts over the timing of interest-rate cuts by the Federal Reserve (Fed). After an initial positive move following the release of the CPI data, the Greenback gave up half of its gains on Tuesday as US equities rallied. On Wednesday the DXY US Dollar Index is standing firm and looks set to close above 103.00 if no hiccups occur into the US trading session.
On the economic data front, a very light calendar is ahead, with nothing worth mentioning. A rather political element to mention is that the Primaries on Tuesday gave both current US President Joe Biden and former US President Donald Trump enough votes to secure their presidential nominations. November 5 will thus be a rematch from four years ago.
Daily digest market movers: Calm before the next storm
- Current US President Joe Biden and former US President Donald Trump both secured enough votes on Tuesday to deserve their nomination for their respective parties and are heading to November 5 for the Presidential election.
- Austrian Central Bank Governor Robert Holzmann said on Tuesday that should the European Central Bank (ECB) cut interest rates ahead of the Fed, that would mean substantial risk of an over-devalued Euro, which in its turn, could respark inflation again.
- At 11:00 GMT, the weekly Mortgage Applications number will be released. The previous week saw a jump of 9.7%.
- The US Treasury is set to allocate a 30-year Bond Auction at 17:00 GMT.
- Equities are sideways to lower after Asian indices refused to take over the positive close on Wall Street. Europe is the only green spot on the quote board, with both the German Dax and the European Stoxx 50 seeing mild gains.
- According to the CME Group’s FedWatch Tool, expectations for a Fed pause in the March 20 meeting are at 99%, while chances of a rate cut stand at 1%.
- The benchmark 10-year US Treasury Note trades around 4.15%, broadly higher for the week.
US Dollar Index Technical Analysis: If CPI was unable to do it
The US Dollar Index (DXY) might be posting a third day in the green this week, but traders will not be applauding the move after seeing that the CPI print was rather unable to really move the needle for the DXY. With a firm rejection even ahead of the 55-day Simple Moving Average (SMA), the question now is what will fuel the US Dollar for a multiple-day rally seeing several economic indicators abate further.
On the upside, the first reclaiming ground is at 103.34, the 55-day SMA, and at the 200-day SMA near 103.71. Once broken through, the 100-day SMA is popping up at 103.72, so a bit of a double cap in that region. Depending on the catalyst that pushes the DXY upwards, 104.96 remains the key level on the topside.
The DXY was unable to even test or challenge the 55-day SMA after the CPI print. More downside looks inevitable with 102.00 up next, which bears some pivotal relevance. Once through there, the road is open for another leg lower to 100.61, the low of 2023.
US Dollar FAQs
The US Dollar (USD) is the official currency of the United States of America, and the ‘de facto’ currency of a significant number of other countries where it is found in circulation alongside local notes. It is the most heavily traded currency in the world, accounting for over 88% of all global foreign exchange turnover, or an average of $6.6 trillion in transactions per day, according to data from 2022. Following the second world war, the USD took over from the British Pound as the world’s reserve currency. For most of its history, the US Dollar was backed by Gold, until the Bretton Woods Agreement in 1971 when the Gold Standard went away.
The most important single factor impacting on the value of the US Dollar is monetary policy, which is shaped by the Federal Reserve (Fed). The Fed has two mandates: to achieve price stability (control inflation) and foster full employment. Its primary tool to achieve these two goals is by adjusting interest rates. When prices are rising too quickly and inflation is above the Fed’s 2% target, the Fed will raise rates, which helps the USD value. When inflation falls below 2% or the Unemployment Rate is too high, the Fed may lower interest rates, which weighs on the Greenback.
In extreme situations, the Federal Reserve can also print more Dollars and enact quantitative easing (QE). QE is the process by which the Fed substantially increases the flow of credit in a stuck financial system. It is a non-standard policy measure used when credit has dried up because banks will not lend to each other (out of the fear of counterparty default). It is a last resort when simply lowering interest rates is unlikely to achieve the necessary result. It was the Fed’s weapon of choice to combat the credit crunch that occurred during the Great Financial Crisis in 2008. It involves the Fed printing more Dollars and using them to buy US government bonds predominantly from financial institutions. QE usually leads to a weaker US Dollar.
Quantitative tightening (QT) is the reverse process whereby the Federal Reserve stops buying bonds from financial institutions and does not reinvest the principal from the bonds it holds maturing in new purchases. It is usually positive for the US Dollar.
USD/JPY initially rose back above the 148.00 level just after the release of the US CPI report but has since fallen back towards 147.50. Economists at MUFG Bank analyze Yen’s outlook.
Stronger wage agreements to encourage gradual policy normalization
We continue to expect positive wage negotiation results this week to give the green light for the BoJ to begin to tighten policy next week.
To dampen the market impact from exiting negative rates and yield curve control, the BoJ will be keen to emphasize that it will be a gradual process of policy normalization unlike the aggressive rate hike cycles implemented by other major central banks in recent years.
If the BoJ delivers cautious forward guidance alongside hiking rates that casts doubt on the need for further hikes, it could result in the Yen weakening further in the near term by encouraging the use of Yen-funded carry trades.
- Price has touched support at 0.8500 on multiple occasions.
- This reinforces the importance of the level.
- Should EUR/GBP eventually break below it, the decline is likely to be deep and strong.
EUR/GBP is bouncing once again off a long-term support floor at around 0.8500 and recovering.
The support level is key to the technical outlook for the pair, for if EUR/GBP breaks decisively below it, it will lead to a volatile move down, that could extend quite far.
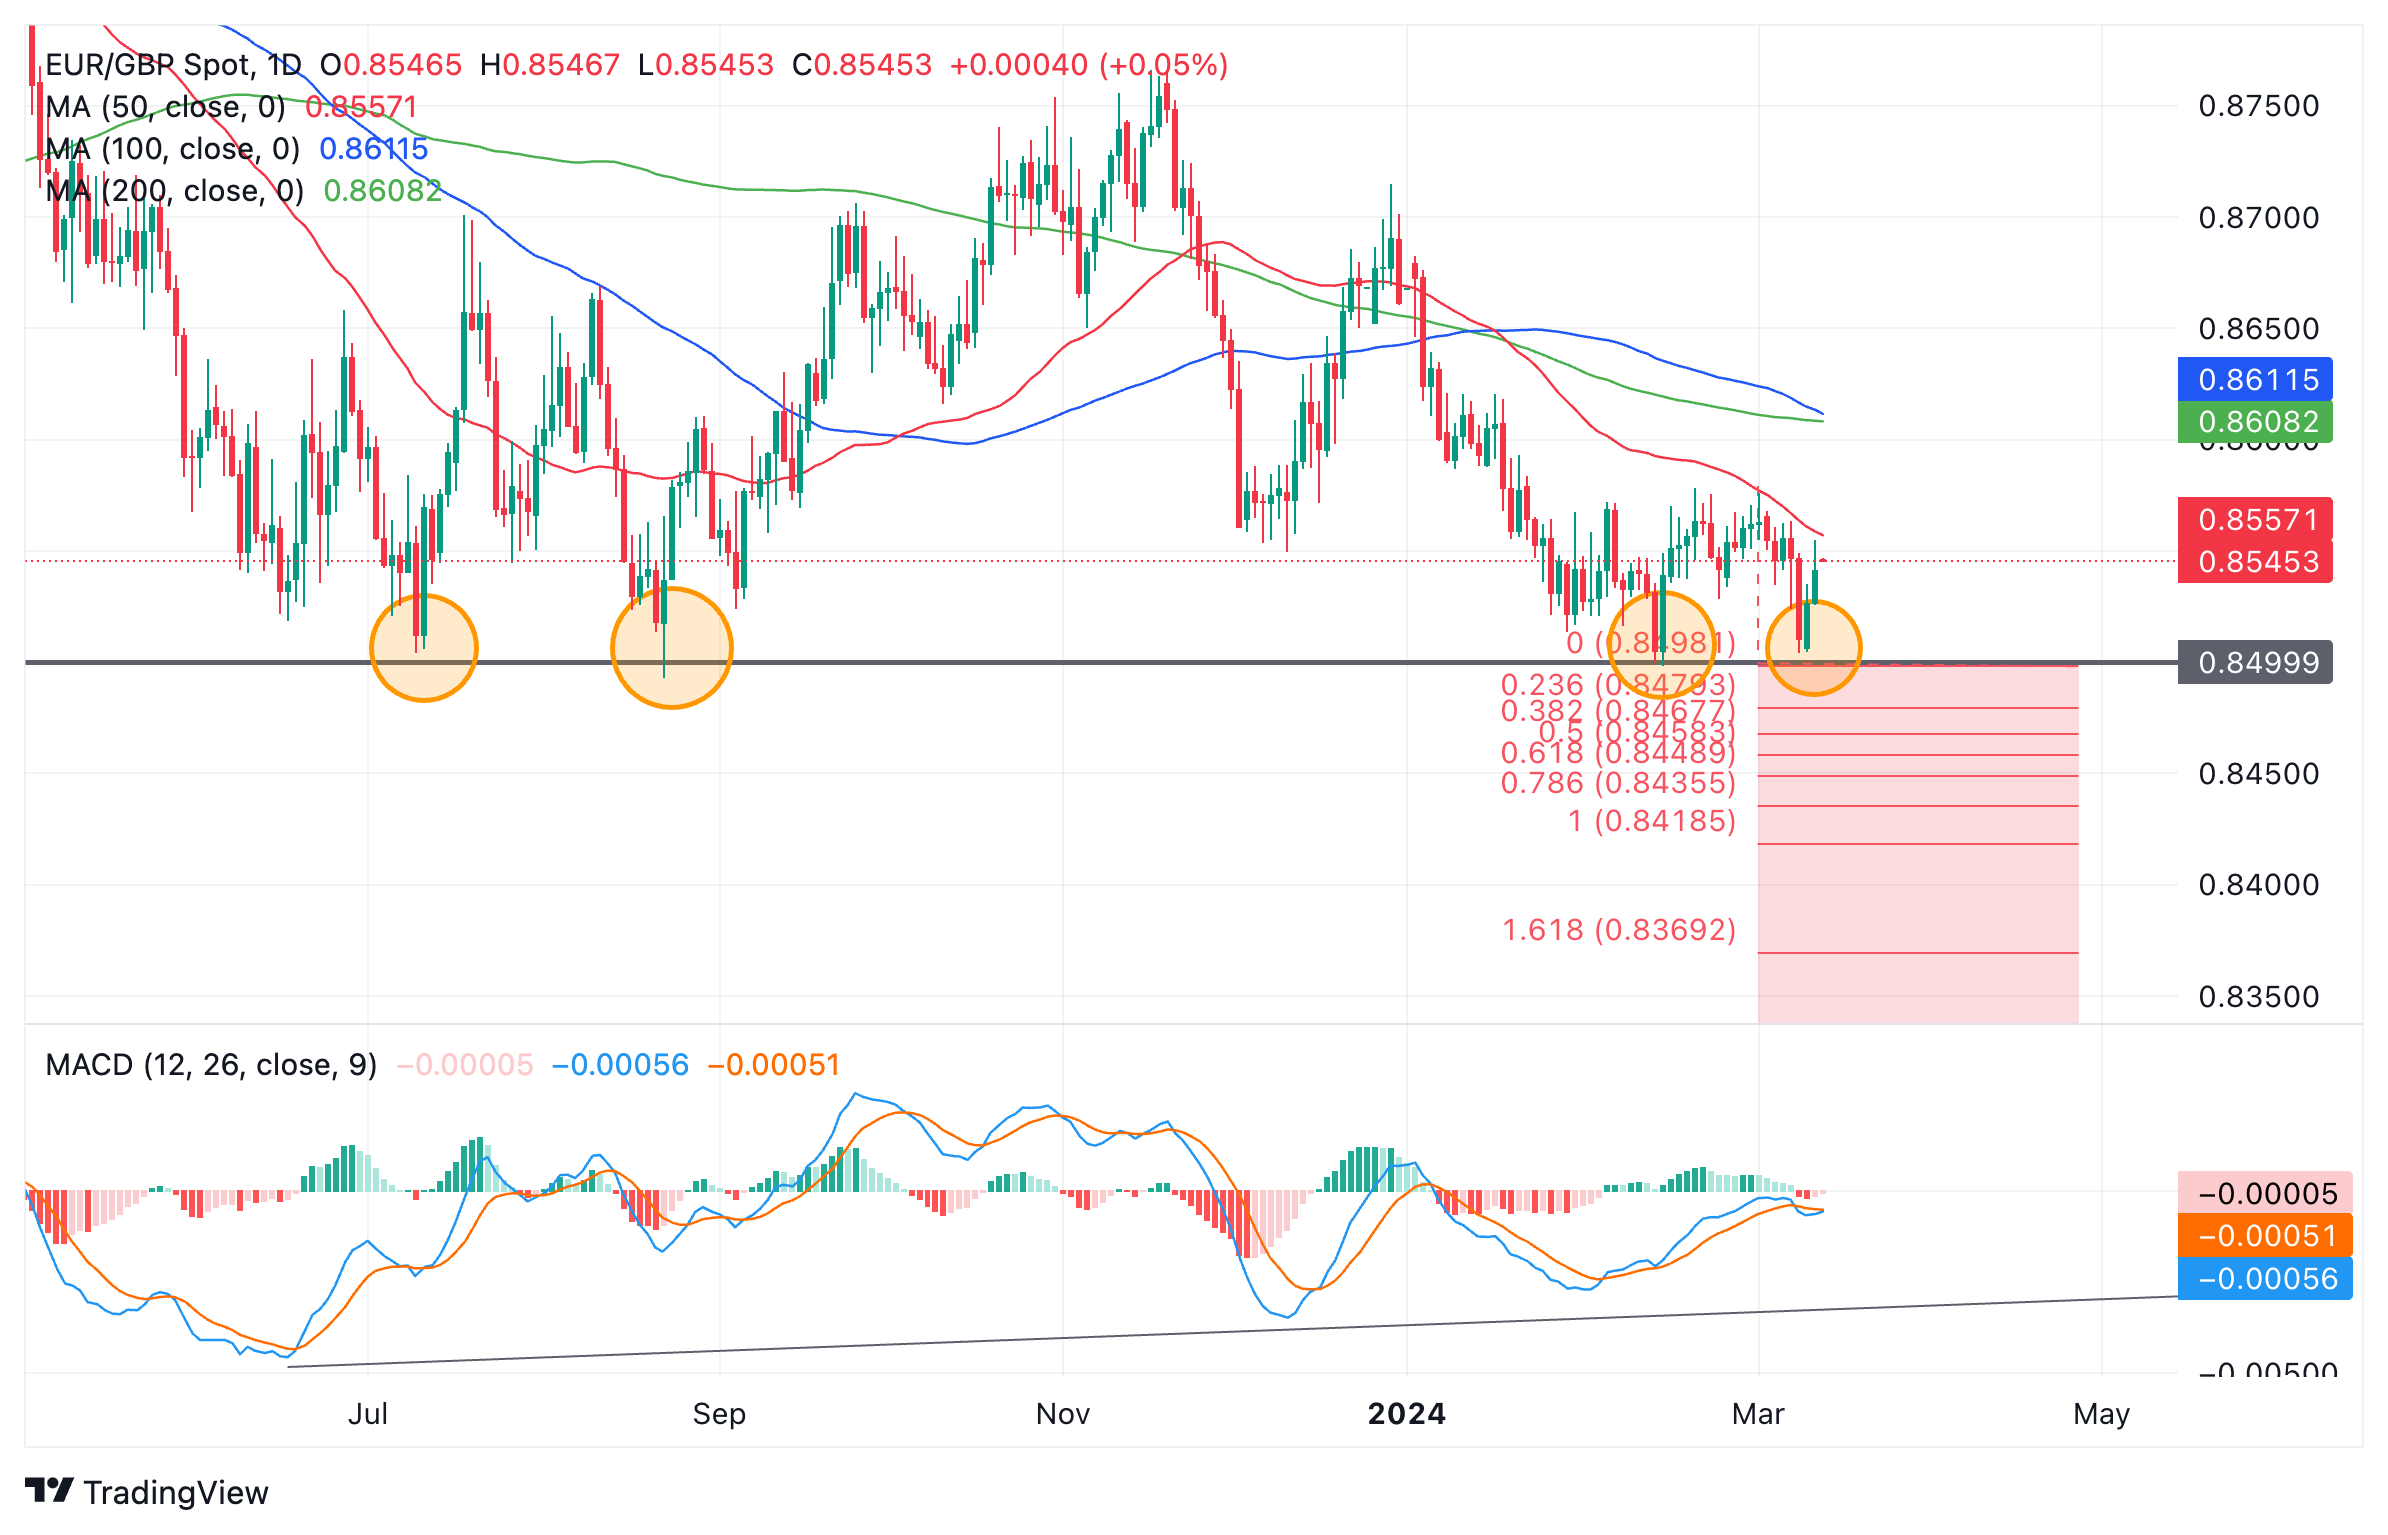
Euro to Pound Sterling: Daily chart
The 0.8500 level has been touched multiple times over the past year – four in total from the chart above (circled).
The greater the number of times a support or resistance level has been touched but not broken, the more significant it becomes as a chart level, according to technical analysis theory.
Multiple touches also lead to an eventual break that is more volatile and extreme, suggesting that should 0.8500 fall, the subsequent breakdown will be swift and brutal. This is also the time when the market often forms gaps.
How far is the move likely to go? The usual method for determining how far a move will go following a break is to take the height of the range that preceded the break and extrapolate it lower.
In the case of EUR/GBP this is difficult, however, since price has not formed a neat and tidy range. To be conservative I have taken the height of the consolidation in February and March. The result is that should the price break below 0.8500 it will probably reach a target of 0.8418. The 0.618 Fibonacci ratio extension is also often quoted as a conservative estimate, that lies at 0.8449.
It is also possible the price could fall even lower, to the 1.618 Fibonacci extension at 0.8369.
One indication that runs contrary to the expectation that EUR/GBP will break lower, however, is that the Moving Average Convergence/ Divergence (MACD) indicator is converging bullishly with price.
This means that with each touch of the support level at 0.8500 the MACD has waned, revealing lessening momentum. This does not discount the possibility of a volatile breakdown but it does introduce some doubt it will occur.
NZD/USD retraces some of its recent losses, trading above 0.6160. Economists at ING analyze the pair’s outlook.
Kiwi may suffer from a small USD comeback in the short run
The New Zealand Dollar (NZD) may suffer from a small USD comeback in the short run, but NZD still looks like an attractive option to ride an eventual capitulation of the Dollar once US data allows.
We expect to see 0.6500 in the NZD/USD pair by the end of the third quarter this year.
- Natural Gas price is back into its selling modus, accumulating three consecutive sessions of losses.
- Gas demand in Europe sinks further as industrial production contracted more than expected in January.
- The US Dollar Index trades below 103.00 after failing to break higher on Tuesday.
Natural Gas (XNG/USD) trades well below $2.00 on Wednesday, extending its steep decline last week. More and more selling pressure is accumulating from a pure technical point of view, while geopolitical factors are not falling in favor of higher Gas prices either. Data published on Wednesday showed that European Industrial Production fell more than expected in January, a bad sign for demand at a time when Gas consumption from households is fading as well with spring and summer just around the corner.
Meanwhile, the US Dollar (USD) is clinging on to its weekly gain despite the failed attempt to jump higher on Tuesday. The US Consumer Price Index (CPI), though clearly proving that inflation is still sticky, was not enough to push the US Dollar Index (DXY) firmly above 103.00 and saw it retreating at the end of the US trading session, with risk of more downside once Dollar bulls run out of belief.
Natural Gas is trading at $1.78 per MMBtu at the time of writing.
Natural Gas market movers: Seasonality goes against
- Former US President Donald Trump and current US President Joe Biden both secured enough votes to be the candidates and will have a rematch after four years in November to see who will become the next President. This will be important in terms of Trump’s former pledges for the US to become energy independent.
- Russian Gas exports are set to rise by 13% this summer, though US sanctions are expected to limit this projection.
- Spreads between summer and winter contracts on the Dutch Gas market show a discount for the summer contracts, making it less expensive for Europe to restock ahead of the next heating season. This means less price pressure for European households.
- A tail risk is still present in the Middle East with still no breakthrough in ceasefire talks between Gaza and Israel.
Natural Gas Technical Analysis: limited tail risk means downturn
Natural Gas prices are trading substantially lower, away from that $2.00 marker which was crucial in its road upwards. Instead, with more and more Moving Averages (SMA) trending lower, it is nearly undeniable that Gas prices are stuck in a downturn and will soon test the low of 2024 at $1.60. This is good news for households, which are set to benefit from cheaper Gas.
On the upside, the key $2.00 level needs to be regained first. The next key level is the historic pivotal point at $2.12, which falls in line with the 55-day SMA at $2.13. Should Gas prices pop up in that region, a broad area opens up with the first cap at the red descending trend line near $2.40.
On the downside, again multi-year lows are nearby with $1.65 as the first line in the sand. This year’s low at $1.60 needs to be kept an eye on as well. Once a new low for the year is printed, keep an eye on $1.53 as the next supportive area.
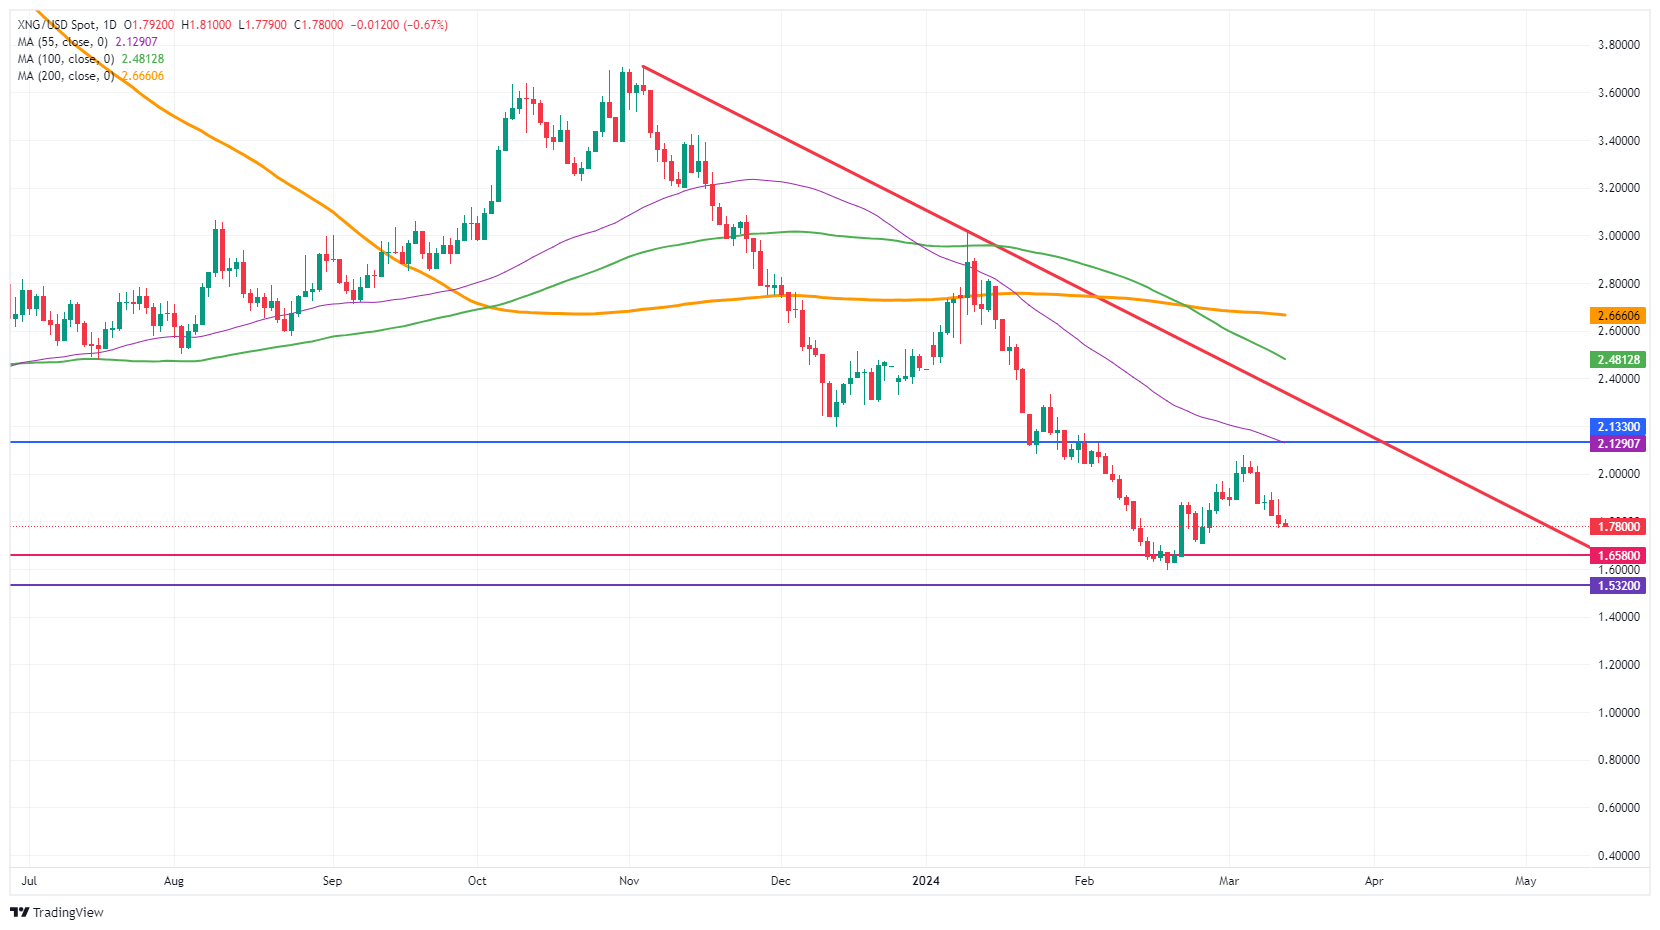
XNG/USD (Daily Chart)
Natural Gas FAQs
Supply and demand dynamics are a key factor influencing Natural Gas prices, and are themselves influenced by global economic growth, industrial activity, population growth, production levels, and inventories. The weather impacts Natural Gas prices because more Gas is used during cold winters and hot summers for heating and cooling. Competition from other energy sources impacts prices as consumers may switch to cheaper sources. Geopolitical events are factors as exemplified by the war in Ukraine. Government policies relating to extraction, transportation, and environmental issues also impact prices.
The main economic release influencing Natural Gas prices is the weekly inventory bulletin from the Energy Information Administration (EIA), a US government agency that produces US gas market data. The EIA Gas bulletin usually comes out on Thursday at 14:30 GMT, a day after the EIA publishes its weekly Oil bulletin. Economic data from large consumers of Natural Gas can impact supply and demand, the largest of which include China, Germany and Japan. Natural Gas is primarily priced and traded in US Dollars, thus economic releases impacting the US Dollar are also factors.
The US Dollar is the world’s reserve currency and most commodities, including Natural Gas are priced and traded on international markets in US Dollars. As such, the value of the US Dollar is a factor in the price of Natural Gas, because if the Dollar strengthens it means less Dollars are required to buy the same volume of Gas (the price falls), and vice versa if USD strengthens.
Economists at Société Générale analyze USD/INR technical outlook.
Failure to reclaim 50-DMA near 83.10 to trigger one more down leg
USD/INR attempted breakout above graphical hurdle of 83.30 but the upward momentum receded after reaching 83.47 in November. It has embarked on a gradual pullback and has so far reached an interim low of 82.65 testing the trend line since 2022.
An initial bounce is under way, but it would be interesting to see if the pair can reclaim 50-DMA near 83.10. Failure could mean one more down leg.
Break below 82.65 can extend pullback towards last August low of 82.35/82.25 and perhaps even towards 81.60.
- Silver has been trapped in a range within a range since 2020.
- Bullish fundamentals suggest more upside for Silver but charts are ambiguous.
- A decisive break above $26.00 would provide confirmation of a bullish turn.
Silver (XAG/USD) price is trading in a range within an even wider range that dates back to 2020. Whilst the precious metal’s fundamentals look bright for 2024, Silver price is still very much in a straight jacket from a technical perspective.
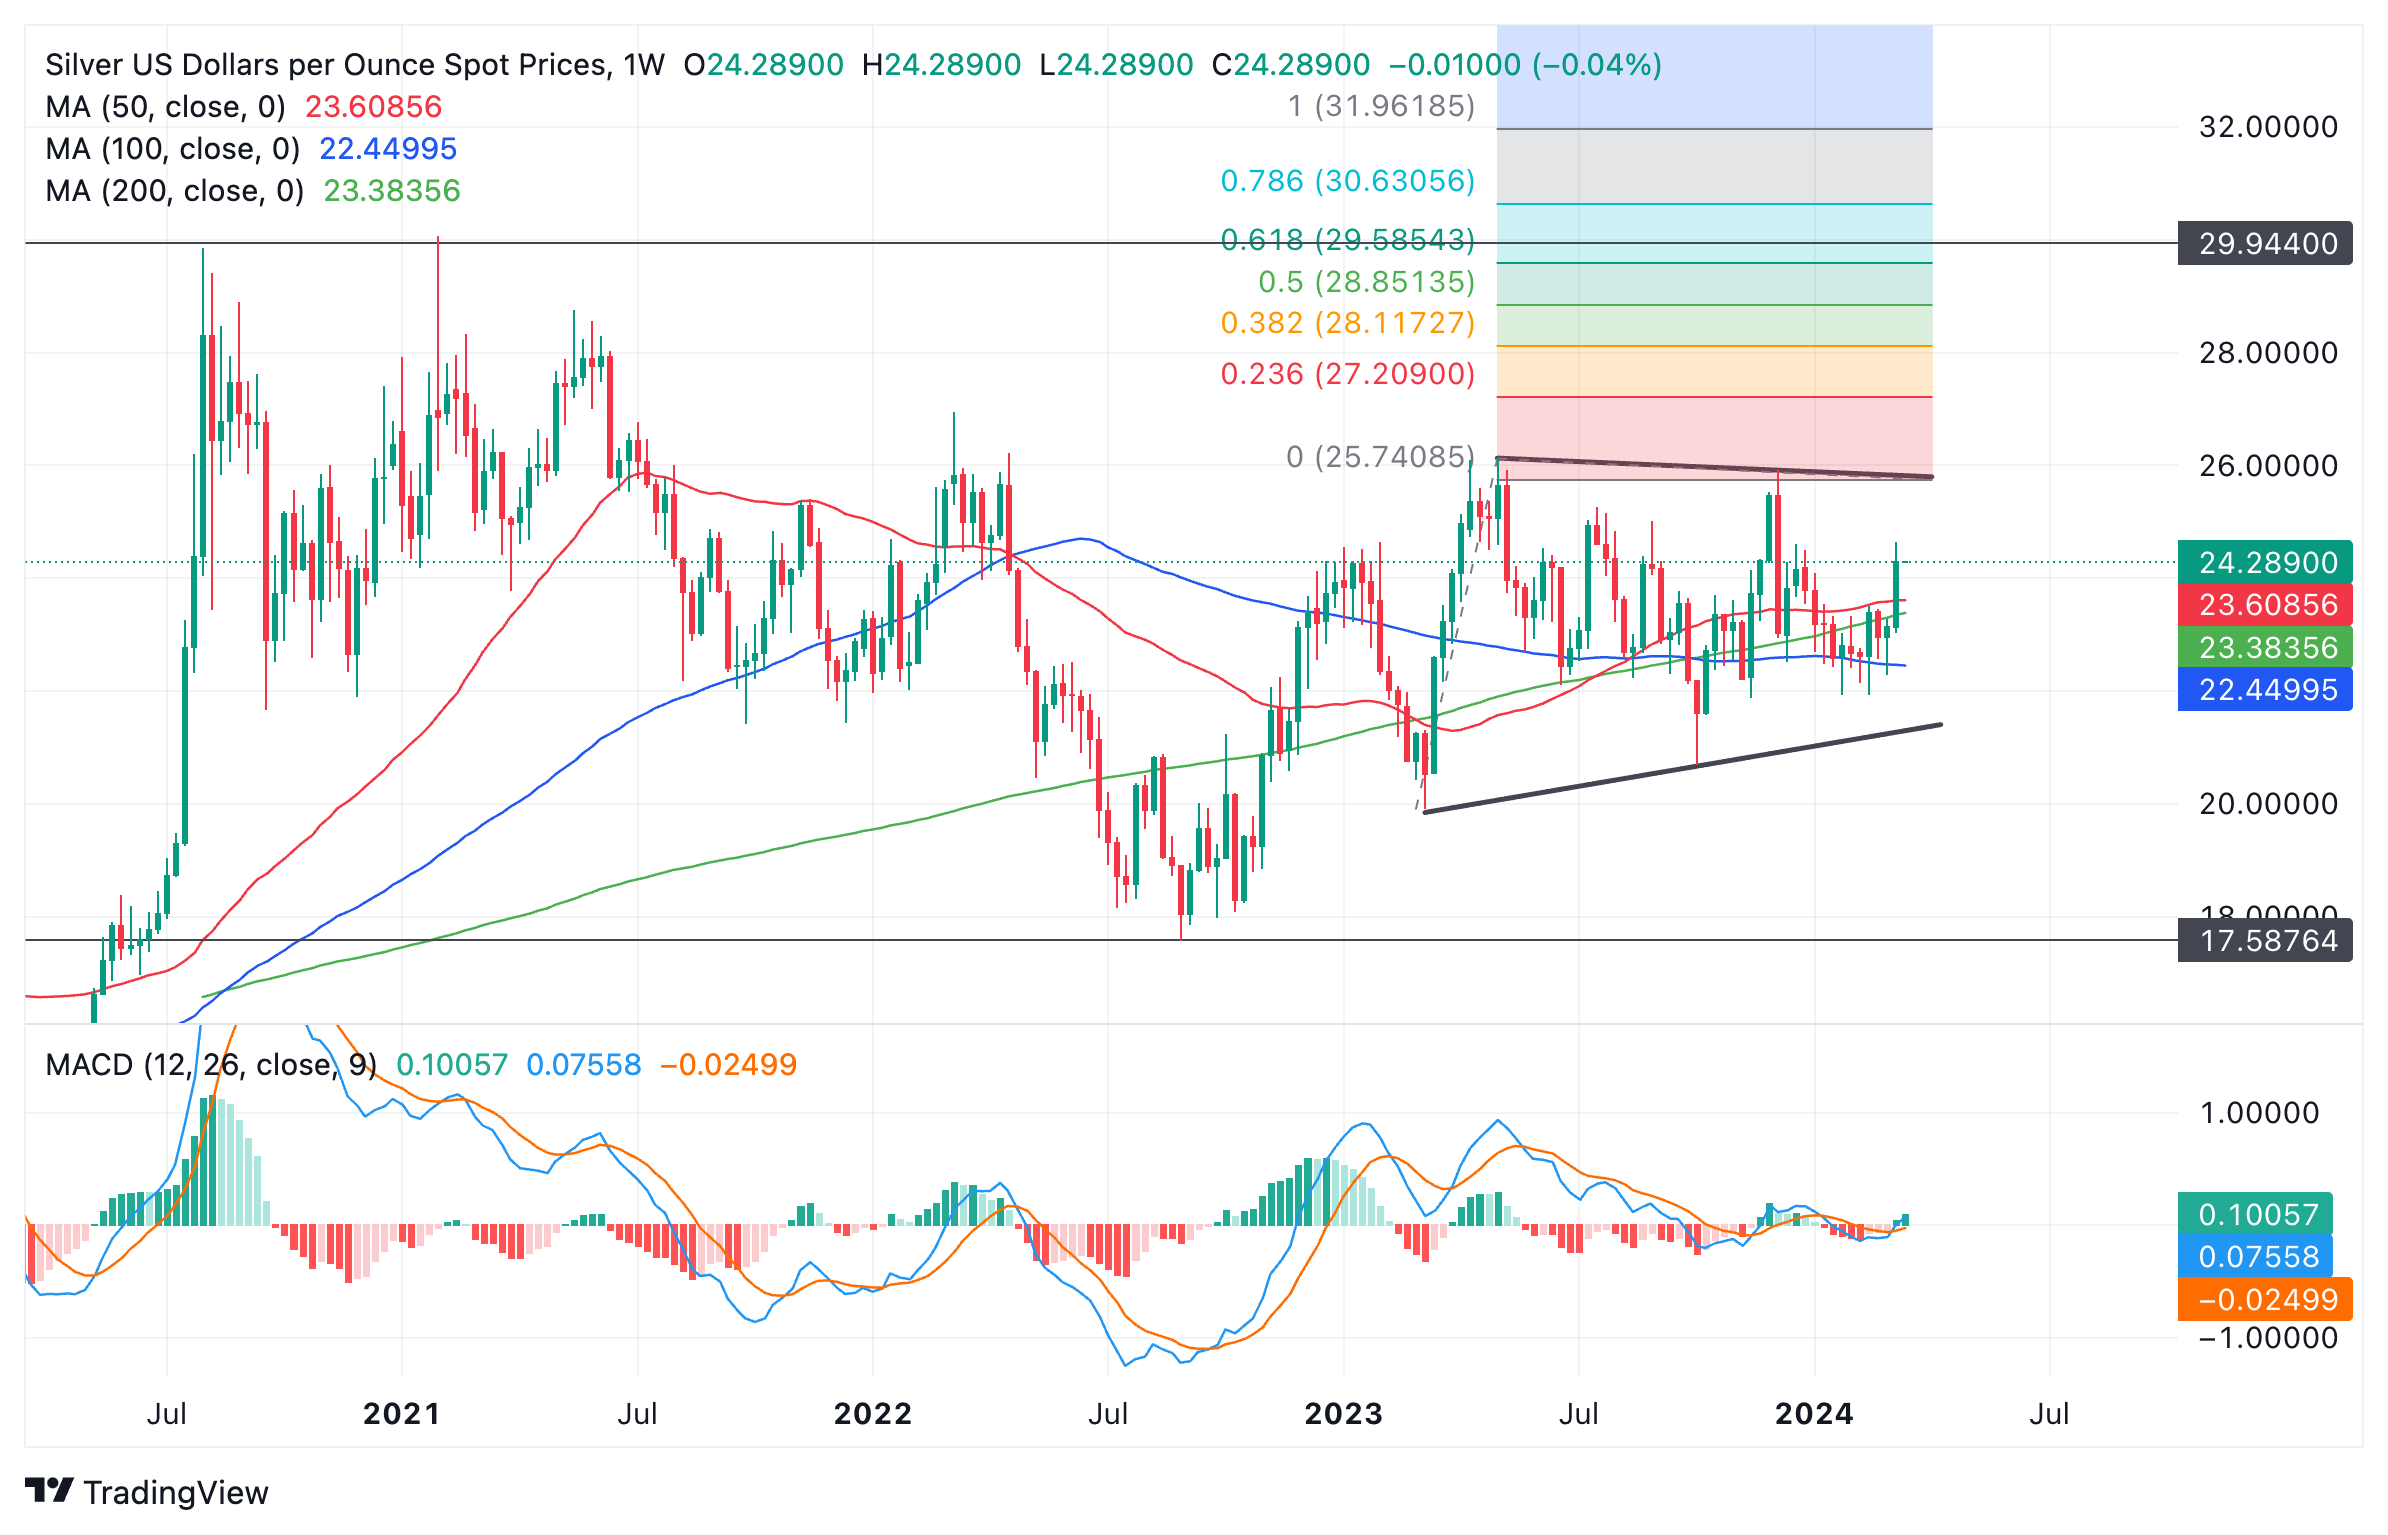
Silver versus US Dollar: Weekly chart
The broader range starts from the 2020 highs at close to $30.00 an ounce, and the 2022 lows at around $17.50. Within that, Silver has more recently been oscillating within another narrower range caught between roughly $26.00 and $20.00 (thick black lines).
Silver’s bullish fundamentals are based on its dual role as both an industrial metal and a store of value.
As an industrial metal Silver is likely to see increased demand from improved global growth prospects. As a store of value, Silver is likely to see increased demand due to inflation and interest rates falling.
The Silver Institute, a not-for-profit association, forecasts global Silver demand reaching 1.2 billion ounces in 2024, hitting its second-highest level on record.
Silver Price: Technical missrepresentation
Silver’s technicals do not closely mirror its long-term bullish fundamentals – for them to do so, Silver price would have to break out of the ranges it is currently stuck in.
To begin with it will need to break out of the smaller range. Assuming a breakout above the top of the range at $26.00, XAG/USD will likely rise as far as the height of the range extended from the breakout point higher, or a Fibonacci ratio of the height.
This could see Silver rally to just shy of $32.00, or the $29.50s if using the 0.618 Fibonacci ratio of the range.
In order to avoid being caught in a false break investors should make sure the break above $26.00 is decisive. This means it should be accompanied by a longer-than-average daily bullish candlestick which closes near its high, or three up days that pierce cleanly above the resistance level.
The same would be true of the breakout of the wider range.
If the technical picture turns bearish, however, a decisive break below the $20.00 level would be expected lead to a sharp move down to the wider range lows at $16.00 and possibly lower.
- Gold price attempts for a firm footing, although the near-term outlook remains uncertain.
- Stubborn US inflation for February has increased the uncertainty over Fed rate cuts in June.
- Investors will shift focus to the US PPI and Retail Sales data for February.
Gold price (XAU/USD) trades slightly in the green in Wednesday’s European session but has an uncertain outlook in the near term as investors have scaled down expectations of Federal Reserve (Fed) rate cuts in June. The precious metal recorded its second-largest single-day decline in a month on Tuesday after the United States Consumer Price Index (CPI) data for February turned out surprisingly hotter than expected.
The annual headline and core CPI grew at a higher pace than what market participants had anticipated due to higher gasoline and shelter prices. The opportunity cost of holding an investment in non-yielding assets, such as Gold, rose as stubborn price pressures have negatively influenced market expectations for the Fed cutting interest rates in June’s policy meeting. An increase in expectations of the Fed delaying rate cuts beyond June could weigh heavily on the Gold price.
The 10-year US Treasury yields, which are positively influenced by the Fed’s hawkish policy stance, jumped to 4.16% as the last leg of high inflation turns out to be a hard nut to crack. Meanwhile, the US Dollar Index (DXY), which tracks the value of the US Dollar against six major currencies, is slightly up near 103.00.
Daily digest market movers: Gold price remains on edge as US yields jump
- Gold price finds temporary support near $2,160 after a sharp decline from all-time highs at $2,195. The surprisingly stubborn United States inflation data for February has cast doubts over expectations for the Federal Reserve reducing interest rates in the June policy meeting.
- The monthly core inflation data rose steadily by 0.4% against expectations of 0.3%. The annual core CPI rose 3.8%, higher than expectations of 3.7% but lower than the former reading of 3.9%. Fed policymakers generally consider the core inflation figures for decision-making on interest rates as the data strips off volatile food and energy prices, which are also impacted by external factors.
- The hotter-than-expected inflation data would not allow Fed policymakers to consider rate cuts in the near term. Fed policymakers have been reiterating that rate cuts would be appropriate only if they are confident that inflation will sustainably return to the 2% target.
- The impact of the latest US inflation report is visible in the traders’ bets on when the Fed will cut interest rates. According to the CME Fedwatch tool, the chances for a rate cut in June have dropped to 65% from above the 72% seen before the release of February’s inflation data.
- Meanwhile, investors shift their focus to the US Producer Price Index (PPI) and Retail Sales data for February, which will be published on Thursday. The PPI data will show the pace at which producers change prices of goods and services at factory gates. The Retail Sales data will indicate the strength in households’ spending, which feeds consumer price inflation. Retail Sales are forecasted to have increased by 0.8% after declining by 0.8% in January.
Technical Analysis: Gold price drops to $2,160
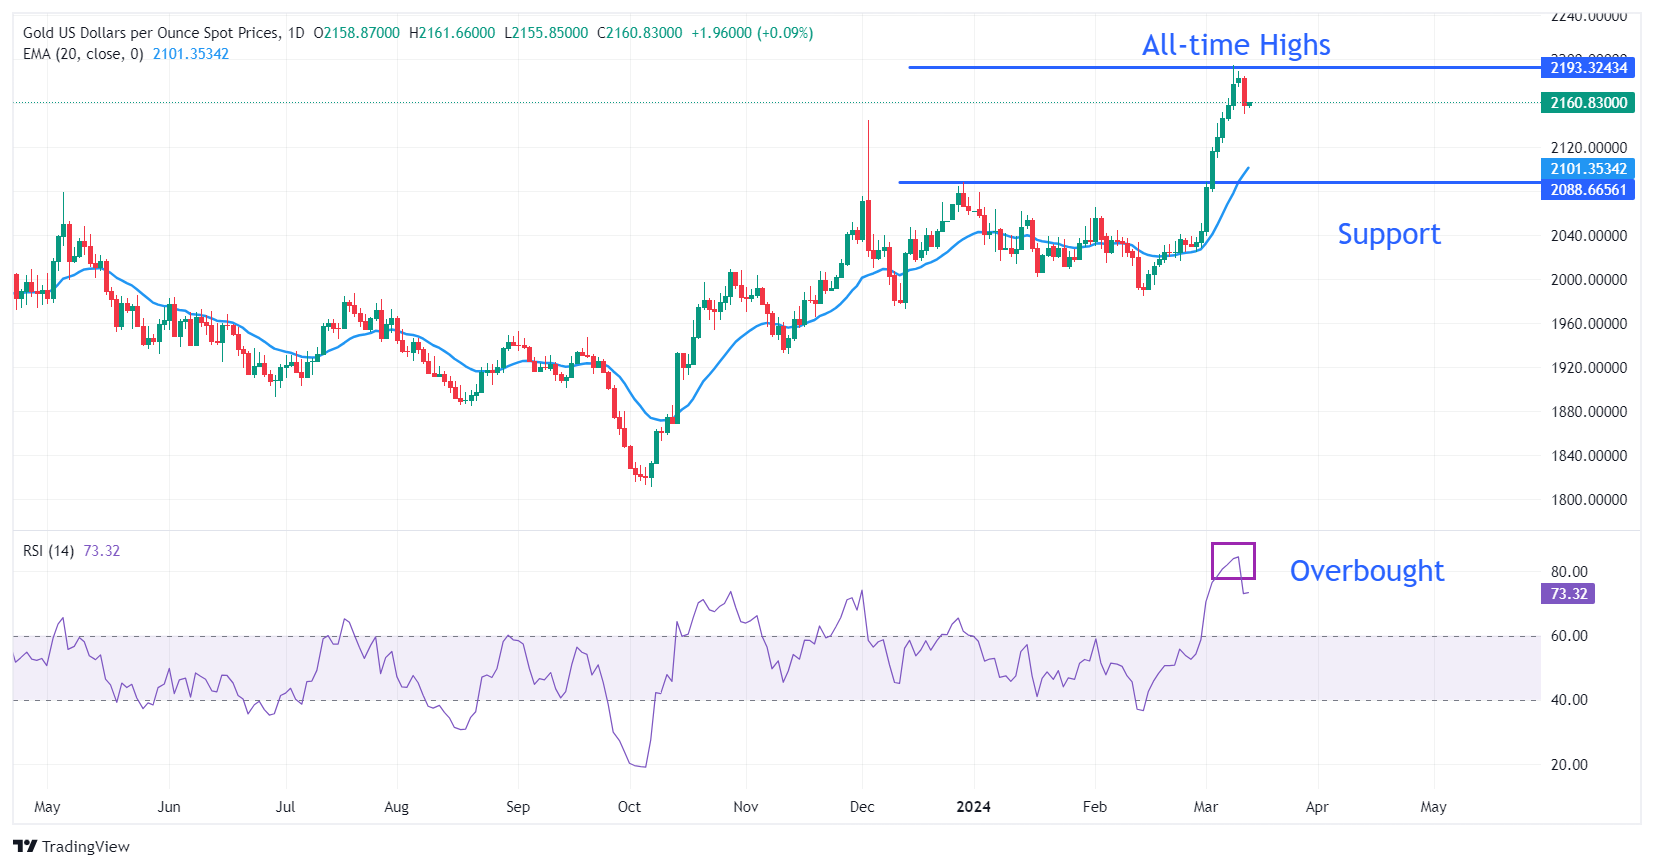
Gold price faced a sharp sell-off after failing to sustain near all-time highs around $2,195. The precious metal has dropped to $2,160 and may continue its downside towards the 20-day Exponential Moving Average (EMA) at $2,097 as the divergence between them is waning. The asset tends to face a mean-reversion move after a wide divergence, which results in a price or a time correction.
On the downside, December 4 high near $2,145 and December 28 high at $2,088 will act as major support levels.
The 14-period Relative Strength Index (RSI) dropped to 73.00 after reaching the overbought territory, resulting in a correction.
Gold FAQs
Gold has played a key role in human’s history as it has been widely used as a store of value and medium of exchange. Currently, apart from its shine and usage for jewelry, the precious metal is widely seen as a safe-haven asset, meaning that it is considered a good investment during turbulent times. Gold is also widely seen as a hedge against inflation and against depreciating currencies as it doesn’t rely on any specific issuer or government.
Central banks are the biggest Gold holders. In their aim to support their currencies in turbulent times, central banks tend to diversify their reserves and buy Gold to improve the perceived strength of the economy and the currency. High Gold reserves can be a source of trust for a country’s solvency. Central banks added 1,136 tonnes of Gold worth around $70 billion to their reserves in 2022, according to data from the World Gold Council. This is the highest yearly purchase since records began. Central banks from emerging economies such as China, India and Turkey are quickly increasing their Gold reserves.
Gold has an inverse correlation with the US Dollar and US Treasuries, which are both major reserve and safe-haven assets. When the Dollar depreciates, Gold tends to rise, enabling investors and central banks to diversify their assets in turbulent times. Gold is also inversely correlated with risk assets. A rally in the stock market tends to weaken Gold price, while sell-offs in riskier markets tend to favor the precious metal.
The price can move due to a wide range of factors. Geopolitical instability or fears of a deep recession can quickly make Gold price escalate due to its safe-haven status. As a yield-less asset, Gold tends to rise with lower interest rates, while higher cost of money usually weighs down on the yellow metal. Still, most moves depend on how the US Dollar (USD) behaves as the asset is priced in dollars (XAU/USD). A strong Dollar tends to keep the price of Gold controlled, whereas a weaker Dollar is likely to push Gold prices up.
Gold dipped 1.1% after the US inflation print came in higher than expected. Economists at TD Securities analyze the yellow metal’s outlook.
Gold may drift modestly lower toward the $2,025-$2,100 range
The February CPI came in hotter than expected, with core up 0.4% MoM to 3.8% YoY, and headline up 0.4% MoM to 3.2% YoY. The implication is that the Fed may not be ready to cut rates just yet.
The outsized rally which took Gold up from the $2,020s to nearly $2,200 may well give back some gains, as some of the recent long extensions are liquidated or buying momentum slows. It would not be a surprise to see Gold drift modestly lower toward the $2,025-$2,100 range.
The US central bank is gearing up to cut and despite disappointing CPI print, US monetary policy authorities are likely to judge that price pressures are coming off.
As long as economic data continues to soften, Gold is well positioned to hit our $2,250 Q2-24 target.
The US Dollar (USD) is a little firmer and 10-year Treasury yields are up near a one-week high around 4.15%. Economists at BBH analyze Greenback’s outlook.
US inflation dragon not yet pinned down
The US February CPI print suggests the Fed can be patient before loosening policy. Annual core CPI inflation slowed less than expected (actual: 3.8%, consensus: 3.7%) and super core CPI (core services less housing, a key measure of underlying inflation) remained high at 4.3% for a second consecutive month in February. Granted, inflation momentum is slowing as the monthly increase in the super core CPI edged down to 0.5% in February after rising by 0.9% in January. Regardless, this is still too high relative to a historical average monthly increase of roughly 0.2%.
We see scope for Fed funds rate expectations to adjust higher in favour of USD because US core price inflation remains sticky, and the economic growth outlook is encouraging.
- The Swiss Franc is forecast to fall as the Swiss National Bank (SNB) drops its strong FX policy.
- The central bank had previously strengthened the Franc as a means of subduing inflation.
- The SNB is jettisoning the approach as it considers the CHF is “too strong” for Swiss exporters.
The Swiss Franc (CHF) trades in a range in the upper 0.8700s against the US Dollar (USD) on Wednesday. Overall the outlook is not particularly positive for the Swiss Franc given the policy stance of its central bank, the Swiss National Bank (SNB), which does not want to encourage a strong Franc any longer.
Risk appetite is recovering during the European session with the DAX, CAC 40 and FTSE 100 all up on the day. The positive-risk backdrop is also not helpful to the Swiss Franc as it is a safe-haven.
Swiss Franc at risk from SNB policy approach
Swiss Franc’s upside is likely to be capped as the Swiss National Bank (SNB) changes its policy to the currency. Previously it had strengthened the CHF to subdue inflation, however, recently SNB Chairman Thomas Jordan said the Franc has become unpalatably strong for Swiss businesses, many of whom are exporters.
His comments reflect the data on Switzerland Foreign Exchange Reserves (CHFER), which shows non-CHF FX reserves have been recovering since the autumn of 2023. This could be a sign the SNB is selling the Swiss Franc to purchase other currencies, with the aim of dampening CHF’s value.
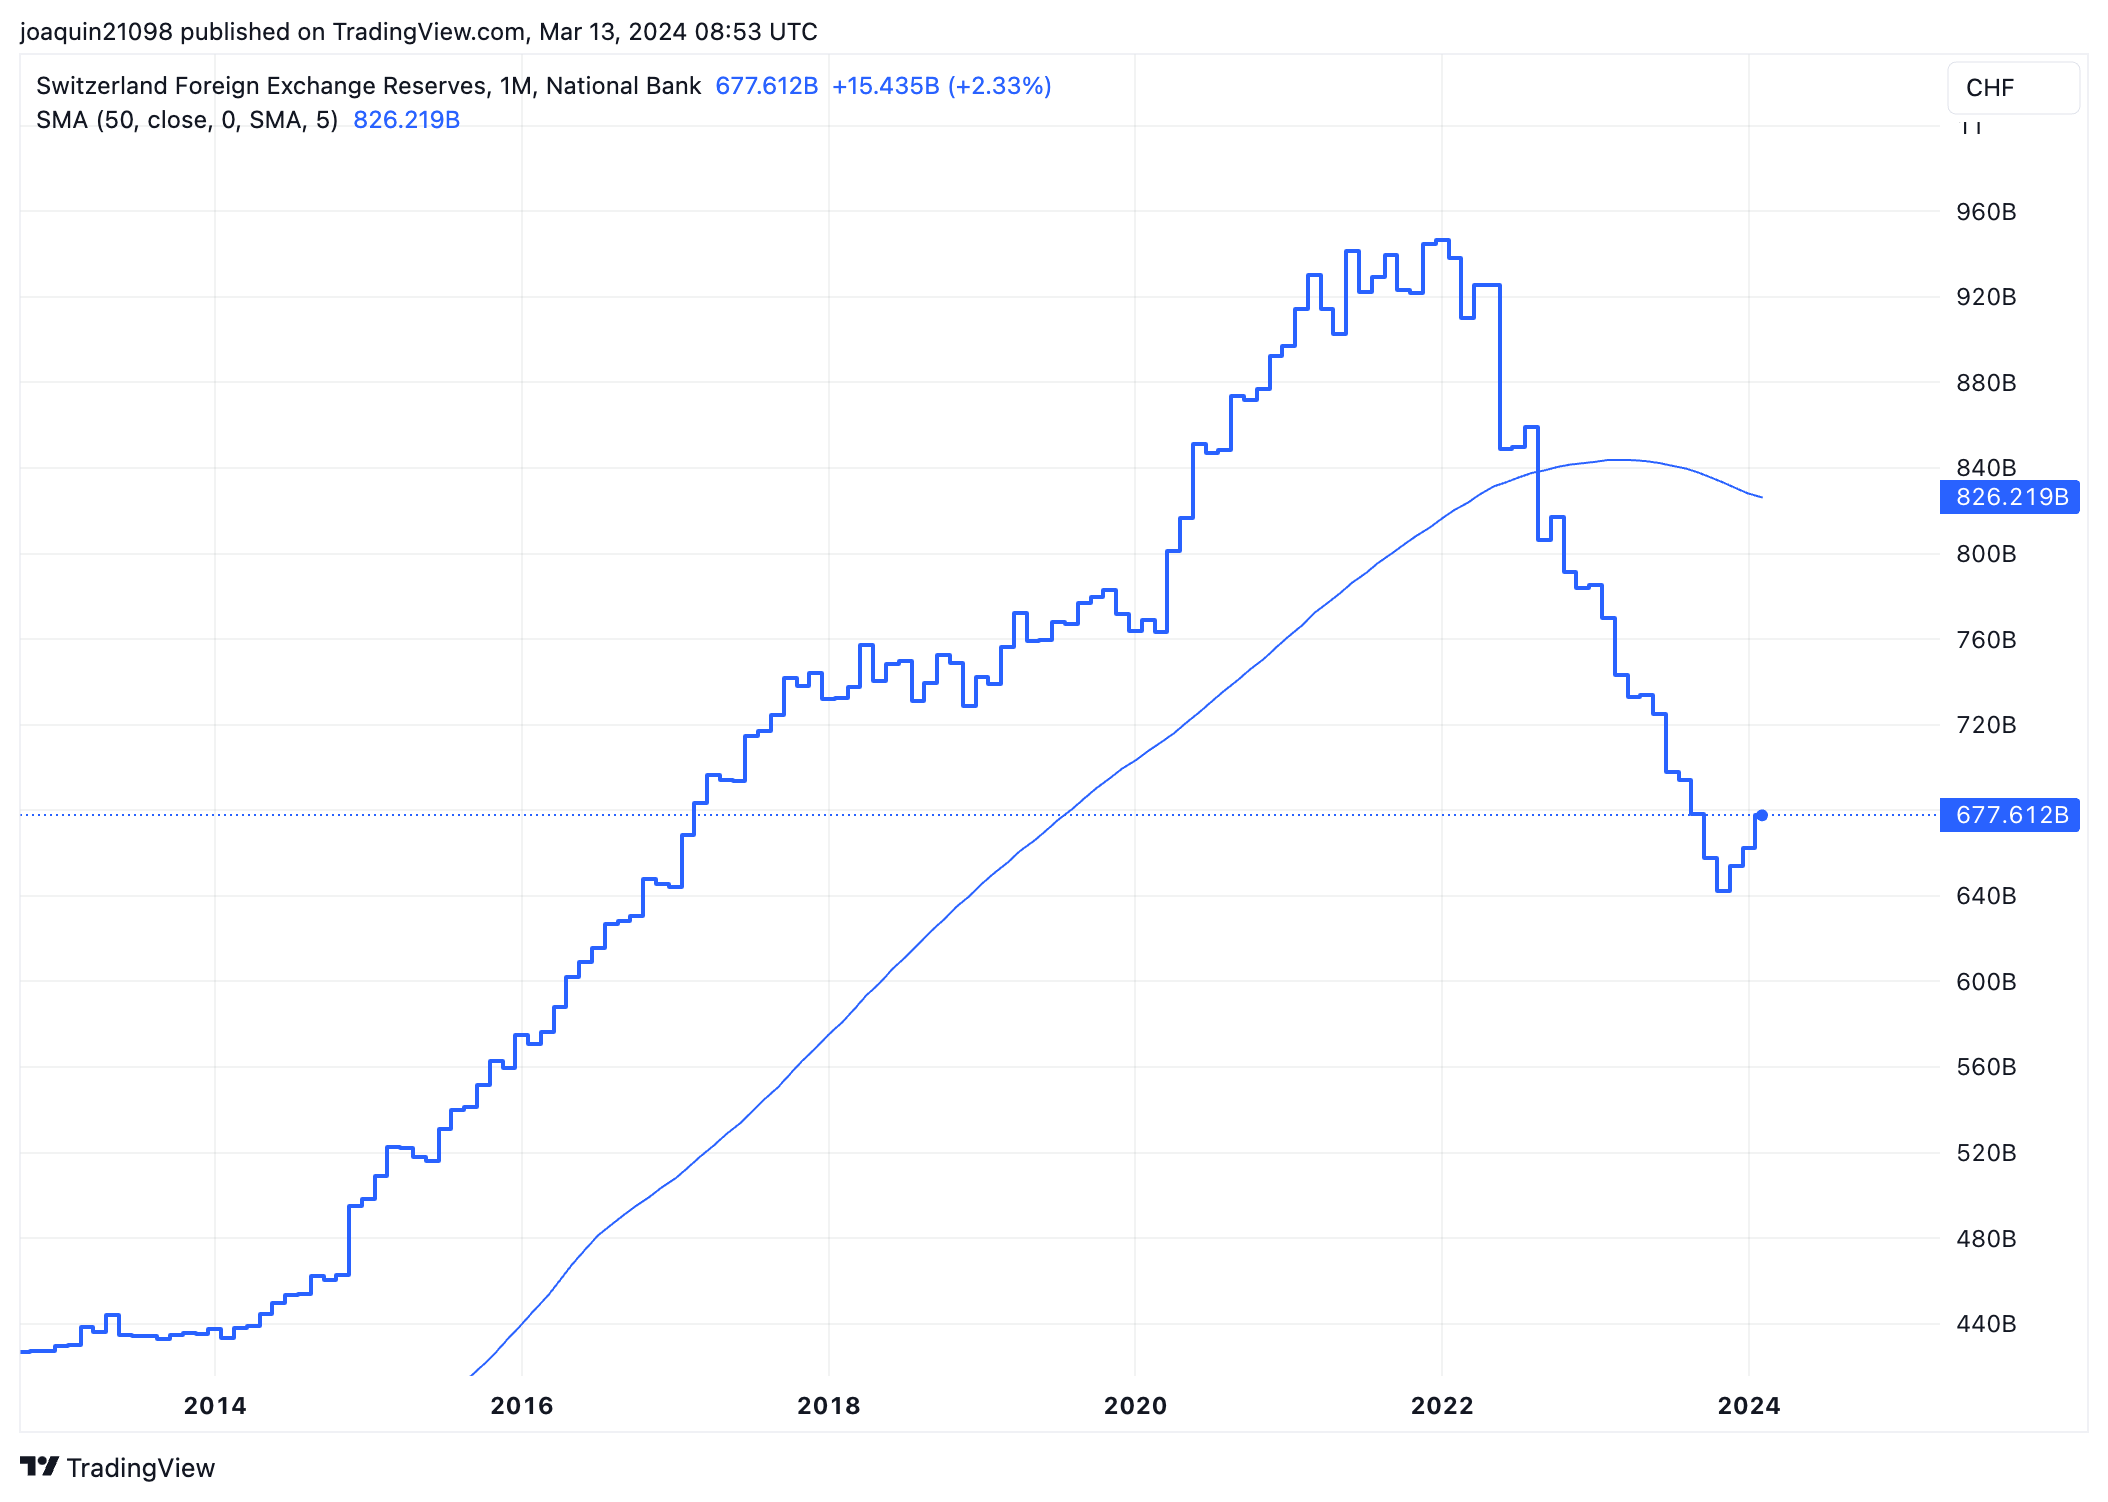
Switzerland Foreign Exchange Reserves: Monthly chart
According to analysts at HSBC, the Swiss Franc is likely to weaken against the US Dollar over the near term, since “FX strength is no longer a tool or policy aspiration,” for the SNB, and global equity markets are going from strength to strength.
On the Horizon
Swiss Producer and Import Prices for February are the next key release for the Swiss Franc, although they do not generally have a big impact on the exchange rate. An unexpected rise in the metric, however, which comes out at 7:30 GMT on Thursday, would support the Swiss Franc and vice versa for a fall. Previous results showed a 2.3% fall YoY and a 0.5% decline MoM in January.
US Producer Prices Ex Food & Energy for February, released on Thursday at 12:30 GMT, could also impact the US Dollar and USD/CHF. Current expectations are for a slowdown to 1.9% YoY from the 2.0% increase seen in January. Similarly, US Retail Sales data, released at the same time, could also rock US pairs.
Technical Analysis: Swiss Franc versus US Dollar pinned below trendline
The USD/CHF – the number of Swiss Francs one US Dollar can buy – is stuck below several key technical levels.
The first of these is the falling trendline of a descending channel at around 0.8780. The second, the key 50-week Simple Moving Average (SMA) at 0.8850 (not shown in the chart). These are touch resistance levels and it is possible this could mark the inflection point of a reversal where the pair starts moving down again.

US Dollar vs Swiss Franc: 4-hour chart
USD/CHF has pierced below the key February 22 low of 0.8742 but failed to close below. Nevertheless, this suggests weakness and raises the possibility of a deeper decline unfolding to 0.8645.
A break below that level would probably indicate a reversal of the short-term trend. The next target to the downside would be 0.8645, followed by the January 31 lows of 0.8551.
There is still a fairly strong possibility USD/CHF could recover and resume its trend higher. A break above the trendline and the 0.8892 high would indicate a continuation of the short-term uptrend to a possible target at 0.9056.
Swiss Franc FAQs
What key factors drive the Swiss Franc?
The Swiss Franc (CHF) is Switzerland’s official currency. It is among the top ten most traded currencies globally, reaching volumes that well exceed the size of the Swiss economy. Its value is determined by the broad market sentiment, the country’s economic health or action taken by the Swiss National Bank (SNB), among other factors. Between 2011 and 2015, the Swiss Franc was pegged to the Euro (EUR). The peg was abruptly removed, resulting in a more than 20% increase in the Franc’s value, causing a turmoil in markets. Even though the peg isn’t in force anymore, CHF fortunes tend to be highly correlated with the Euro ones due to the high dependency of the Swiss economy on the neighboring Eurozone.
Why is the Swiss Franc considered a safe-haven currency?
The Swiss Franc (CHF) is considered a safe-haven asset, or a currency that investors tend to buy in times of market stress. This is due to the perceived status of Switzerland in the world: a stable economy, a strong export sector, big central bank reserves or a longstanding political stance towards neutrality in global conflicts make the country’s currency a good choice for investors fleeing from risks. Turbulent times are likely to strengthen CHF value against other currencies that are seen as more risky to invest in.
How do decisions of the Swiss National Bank impact the Swiss Franc?
The Swiss National Bank (SNB) meets four times a year – once every quarter, less than other major central banks – to decide on monetary policy. The bank aims for an annual inflation rate of less than 2%. When inflation is above target or forecasted to be above target in the foreseeable future, the bank will attempt to tame price growth by raising its policy rate. Higher interest rates are generally positive for the Swiss Franc (CHF) as they lead to higher yields, making the country a more attractive place for investors. On the contrary, lower interest rates tend to weaken CHF.
How does economic data influence the value of the Swiss Franc?
Macroeconomic data releases in Switzerland are key to assessing the state of the economy and can impact the Swiss Franc’s (CHF) valuation. The Swiss economy is broadly stable, but any sudden change in economic growth, inflation, current account or the central bank’s currency reserves have the potential to trigger moves in CHF. Generally, high economic growth, low unemployment and high confidence are good for CHF. Conversely, if economic data points to weakening momentum, CHF is likely to depreciate.
How does the Eurozone monetary policy affect the Swiss Franc?
As a small and open economy, Switzerland is heavily dependent on the health of the neighboring Eurozone economies. The broader European Union is Switzerland’s main economic partner and a key political ally, so macroeconomic and monetary policy stability in the Eurozone is essential for Switzerland and, thus, for the Swiss Franc (CHF). With such dependency, some models suggest that the correlation between the fortunes of the Euro (EUR) and the CHF is more than 90%, or close to perfect.
The Dollar has not benefited much from the hotter US CPI figures released on Tuesday. Economists at ING analyze Greenback’s outlook.
Dollar starts to look cheap in the short term
Core CPI rose by a hot 0.4% month-on-month in February, higher than the consensus 0.3%, but the market reaction has been very contained compared to a month ago when inflation surprised by a similar margin. Indeed, the actual whisper number was closer to 0.4%, but that does not make the rally in US equities after the release any less surprising. We think, instead that markets continue to rely quite heavily on Powell’s relatively dovish testimony, which has made rate cut expectations arguably stickier.
The hot CPI should warrant a stronger Dollar from these levels, and we think there is a good chance that the USD will find more support in the coming days.
EUR/USD is trading in a narrow range around 1.0925. Economists at ING analyze the pair’s outlook.
Focus on the ECB's operational framework review
We believe there are some downside risks for the pair as markets struggle to price in more Fed rate cuts without data providing some help.
We are expecting an announcement by the ECB on the results of its framework review. Today’s decisions will have implications on how monetary policy impacts long-end Eurozone rates, but should not have direct short-term FX implications. Some dovish comments today, combined with some rates-driven support to the Dollar could lead to EUR/USD retesting 1.0900 soon.
- AUD/JPY extends its gains for the second successive session on Wednesday.
- Australia's ASX 200 tracked the Wall Street gains overnight, shrugging off the stronger US Inflation data.
- Japanese firms have agreed to the demands for pay hikes of 5.85% in 2024.
AUD/JPY reverses its intraday losses and trades in positive territory for the second consecutive day on Wednesday, reaching levels near 97.70 during the European session. The AUD/JPY cross initially faced challenges during the Asian trading hours as the Japanese Yen (JPY) strengthened on market speculation suggesting that the Bank of Japan (BoJ) is considering an interest rate hike in March.
Moreover, the outcome of Japan's spring wage negotiations reveals that most firms have agreed to the wage rise demands put forth by the trade unions. Additionally, Japan's Chief Cabinet Secretary Yoshimasa Hayashi expressed his desire to witness widespread wage hikes across the economy.
Bank of Japan (BoJ) Governor Kazuo Ueda mentioned scrutinizing the wage talk outcome, as well as other data and information from our hearings, in making policy decisions. Ueda will consider tweaking the negative rate, YCC, and other monetary easing tools if the sustained achievement of our price target comes into sight.
The Australian Dollar (AUD) received upward support on Wednesday on higher S&P/ASX 200 Index, which has risen for the second consecutive day, following gains on Wall Street overnight. However, lower commodities' prices might have put pressure on the Aussie Dollar.
Concerns about a decrease in demand from China have led to a decline in iron ore futures. Additionally, there has been an increase in maintenance activities on blast furnaces among mills this week, indicating a potential decline in hot metal output.
- WTI trades with a mild negative bias on Wednesday, albeit lacks follow-through selling.
- A combination of diverging forces is holding back traders from placing directional bets.
- Investors now look to the official US Oil inventory data for short-term trading impetus.
West Texas Intermediate (WTI) US Crude Oil prices come under some selling pressure and remain depressed through the first half of the European session on Wednesday. The commodity, however, remains confined in the previous day's broader trading range amid the mixed fundamental cues and manages to hold its neck above mid-$77.00s.
Data from the American Petroleum Institute released on Tuesday showed that inventories in the US shrank by 5.5 million barrels during the week to March 8. Adding to this, the Organization of Petroleum Exporting Countries (OPEC) maintained its forecast that world Oil demand will increase by 2.25 million barrels per day in 2024. This, along with the risk of potential supply shock stemming from conflicts in the Middle East, continues to act as a tailwind for Crude Oil prices.
The upside, however, remains capped in the wake of concerns about a slowdown in China – the world's second-largest economy and top Oil importer. Furthermore, the stronger-than-expected US inflation data fuelled speculations that the Federal Reserve (Fed) may delay interest rate cuts in the near term, which could hamper economic activity and dent Oil demand. This, in turn, is seen as a key factor exerting downward pressure on Crude Oil prices and warrants caution for bulls.
Looking at the broader picture, the black liquid has been oscillating in a familiar range over the past month or so. This points to indecision among traders over the next leg of a directional move, making it prudent to wait for a fresh catalyst before positioning for the near-term trajectory. Market participants now look to the official US inventory data due later this Wednesday, which, along with the USD price dynamics, should provide some impetus to Crude Oil prices.
- AUD/USD demonstrates firm footing above 0.660 amid a slightly upbeat market mood.
- The Fed could revise projections for the number of rate cuts this year due to stubborn inflation data.
- Sticky inflation may keep RBA interest rates higher for a longer period.
The AUD/USD pair is up 0.13%, near 0.6615, at the time of writing in the European session on Wednesday. The Aussie asset moves higher as the US Dollar remains sideways, even though the February United States Consumer Price Index (CPI) data has prompted uncertainty over Federal Reserve (Fed) rate cuts in the June policy meeting.
S&P500 futures posted some gains in the London session, indicating a higher risk appetite among market participants. 10-year US Treasury yields fell to 4.14%. The US Dollar Index (DXY) is stuck in a tight range, slightly below 103.00, as investors reassess the likelihood of three rate cuts this year, as projected by the Fed in December.
Fed policymakers are expected to hold interest rates until they are convinced that inflation will sustainably fall to the desired rate of 2%. The consumer price inflation data released for the first two months of 2024 have not indicated signs of easing, which could force Fed policymakers to reassess their expectations for three rate cuts.
On the contrary, Fed Chair Jerome Powell said in his Congressional testimony last week that the central bank is not far from gaining conviction that inflation will return to 2%.
Meanwhile, the Australian Dollar is likely to dance to the tunes of market expectations for the Reserve Bank of Australia’s (RBA) interest rate decision, scheduled for next week. The RBA is expected to keep the Official Cash Rate (OCR) steady at 4.35%. Former RBA Governor Philip Lowe said in an interview with 9 Australia on Tuesday that stubborn inflation could force policymakers to keep interest rates higher for a longer period than what was anticipated earlier.
Higher than expected US inflation number weighed on Gold. Economists at ANZ Bank analyze the yellow metal’s outlook.
Market pricing for June cut to declined from 93% to 77%
Gold prices came under pressure after the US inflation print came in higher than expected. This led market pricing for a June cut to decline from 93% to 77%. The FOMC has said it needs more evidence to see inflation heading towards the 2% target before it starts cutting interest rates.
Easing monetary policy will be crucial to push Gold prices higher.
Wakako Yata, a special advisor to Japan's Prime Minister Fumio Kishida for wages and employment, said on Wednesday, “wage hikes this year are likely to exceed last year's.”
Additional comments
Must continue wage hikes next year and thereafter to defeat deflation.
Must broaden wage hikes to workers nationwide and in every prefecture.
Government won't meddle with BoJ's independent policy-making.
Related reads
- BoJ’s Ueda: Will scrutinize the wage talk outcome and other data in making policy decision
- USD/JPY Analysis: Bulls shrug off positive Japan wage hike data amid BoJ/Fed uncertainty
- EUR/USD takes another step lower after Tuesday’s US inflation report.
- The short-term uptrend is now in doubt but the move down lacks momentum.
- Analysts at TD Securities are still penciling in June for a Fed rate cut.
EUR/USD continues its steady decline into midweek after the release of higher-than-expected inflation data from the United States (US) reduced the chances of an early interest-rate cut from the Federal Reserve (Fed).
The pair is trading in the 1.0920s at the time of publication, down from the last major peak in the 1.0980s on Friday.
Investors have now shifted their expectations away from the possibility of the Fed pressing the button on cutting interest rates in May, more firmly to June.
Since keeping interest rates higher for longer is positive for the US Dollar (USD), as it attracts greater capital inflows, the US Consumer Price Index (CPI) data release has seen the Greenback gain in most pairs, including EUR/USD.
EUR/USD: June still on for first rate cut, TD Securities says
June has firmed as the month for liftoff for economists at TD Securities, despite Tuesday’s hot inflation data, as the economists see services inflation continuing to “normalize”, according to a recent note.
"We don't think today's report meaningfully changes the Fed's inclination to first ease by the June FOMC meeting,” they said after the February CPI release.
“In our view, services inflation should resume a clear path toward normalization over the next few months as the tougher seasonal part of the year is already behind us ," they added.
Ultimately they see the US Dollar weakening in Q2 and Q3, which is likely to provide a positive push for EUR/USD unless the Euro (EUR) suffers equally.
Technical Analysis: EUR/USD continues correction lower
EUR/USD has registered another step lower since the 1.0981 peak established on March 8.
The latest decline extends a sequence of falling peaks and troughs and brings into doubt the previous short-term uptrend.
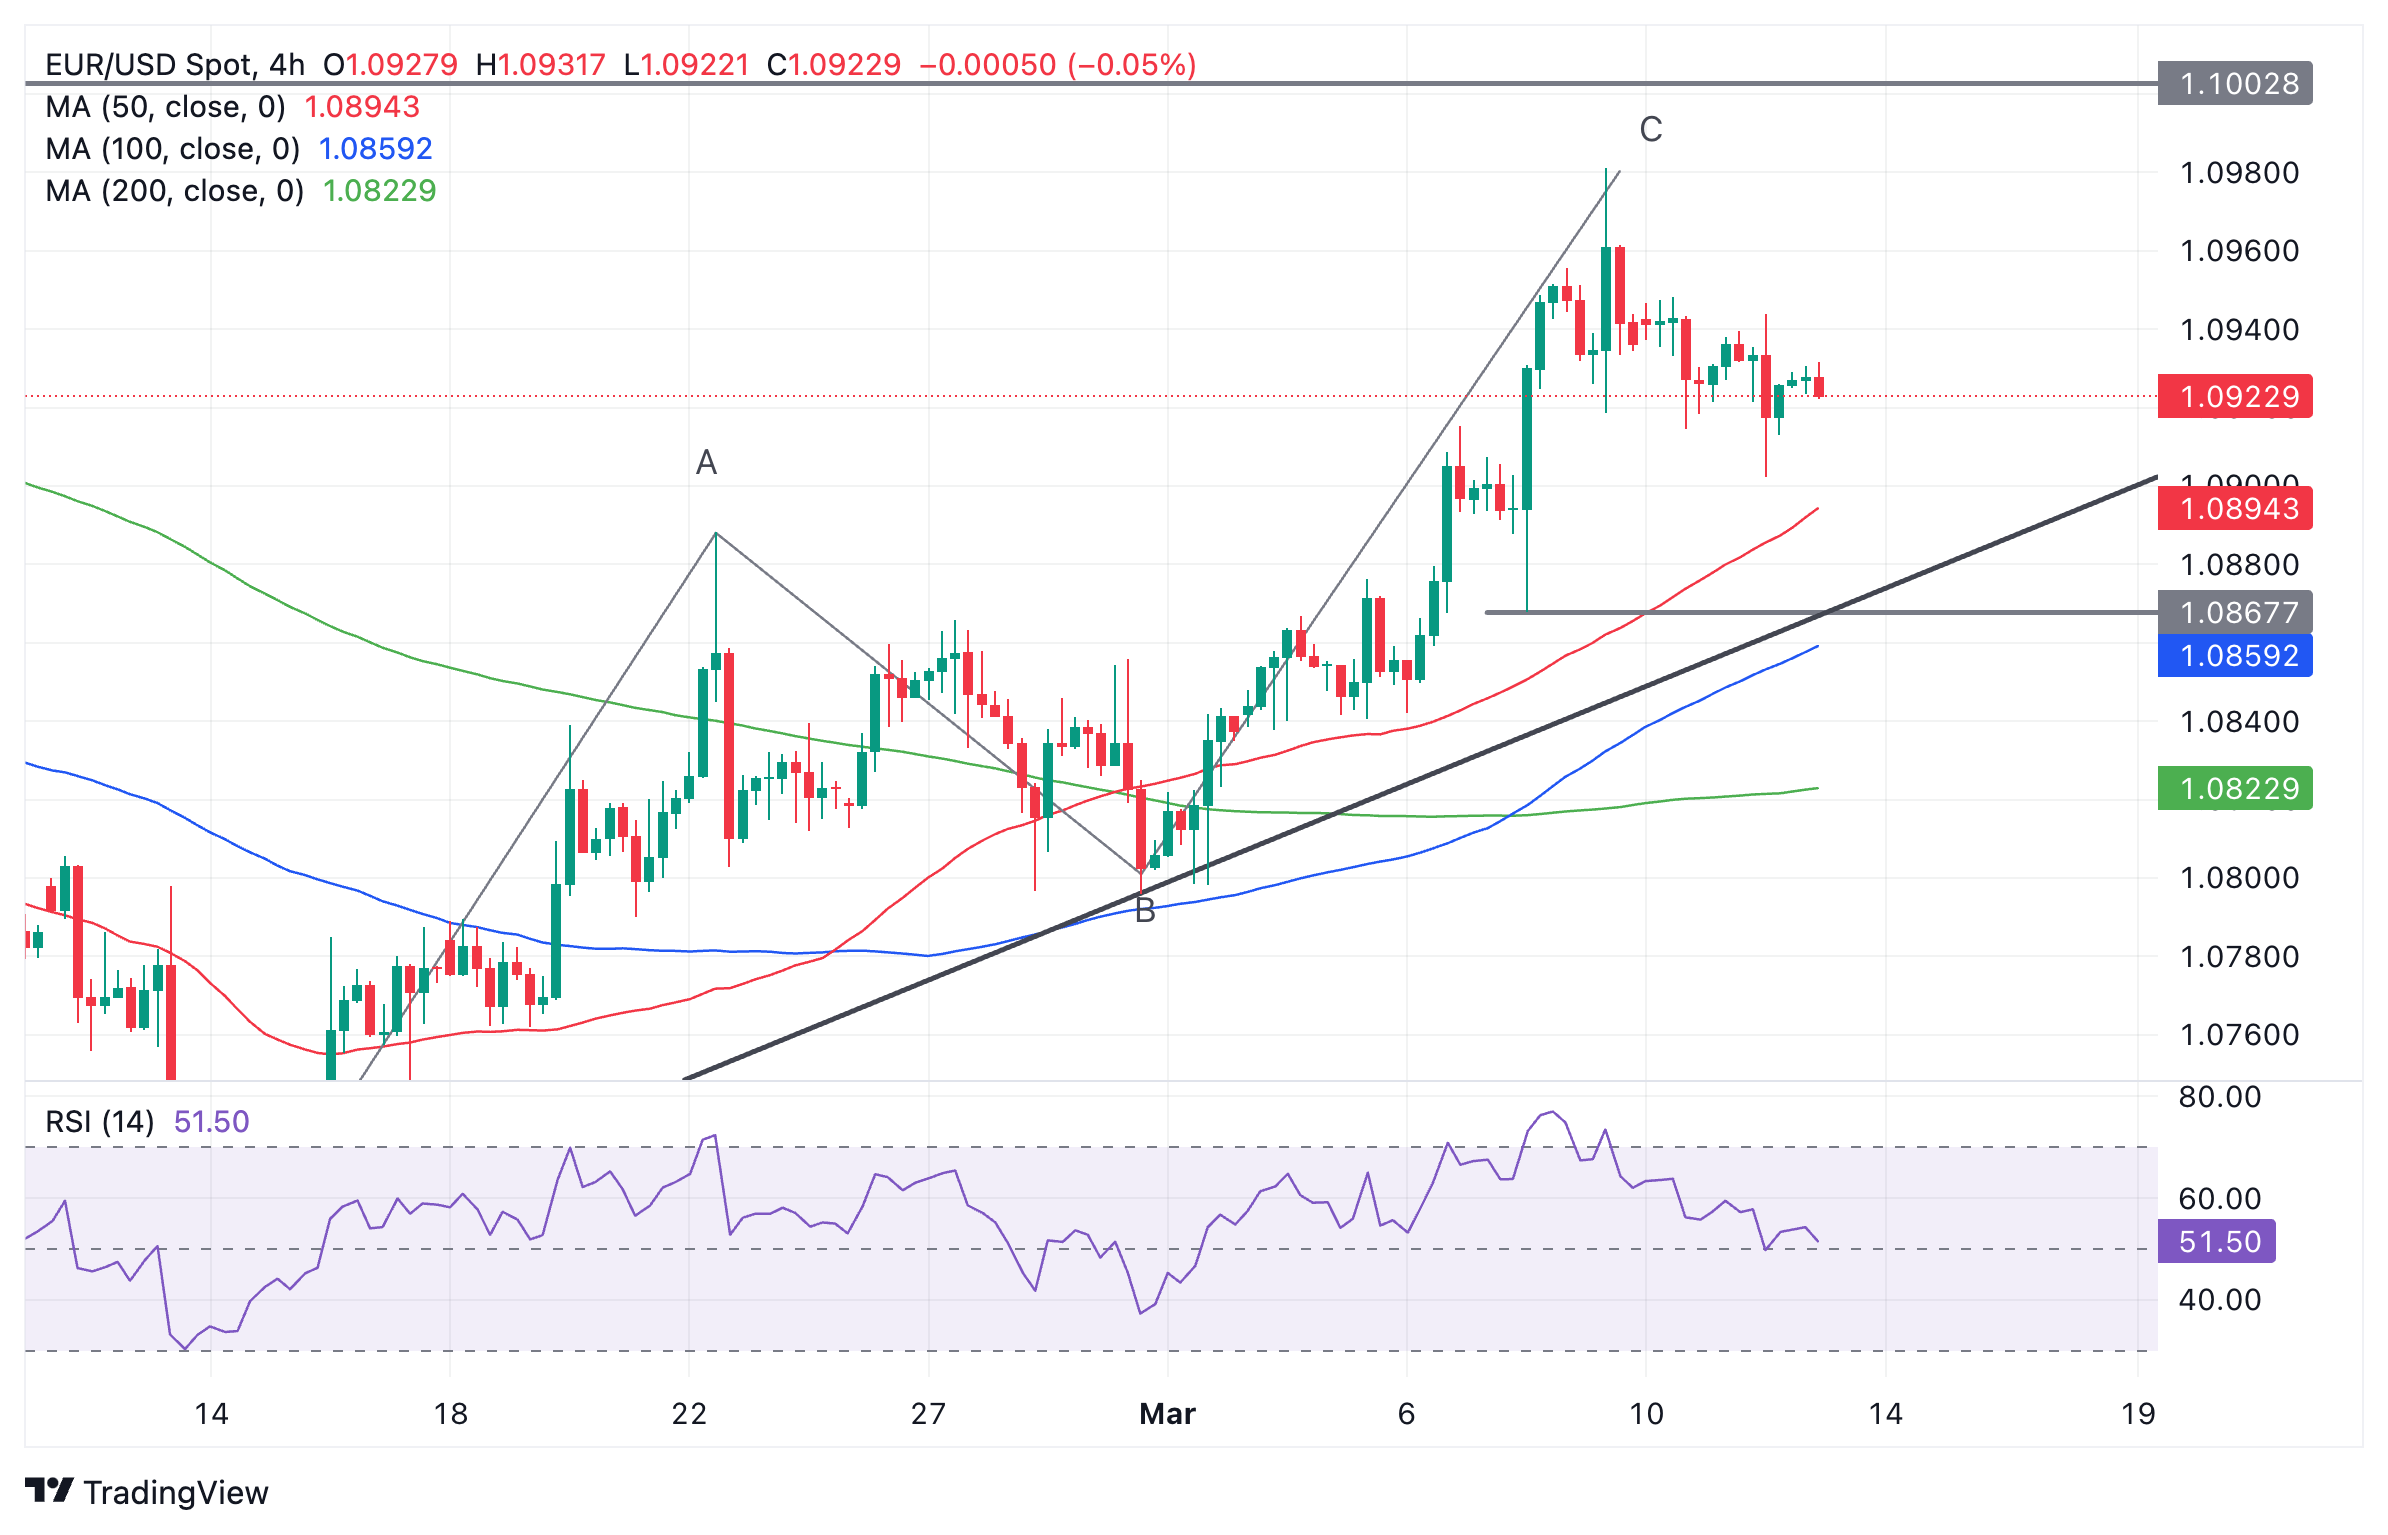
Euro vs US Dollar: 4-hour chart
That said, the move down lacks momentum and has been slower than the move up that preceded it, suggesting there is still a chance it could just be a correction rather than a reversal of the previous uptrend.
It is still possible the correction could fall even lower. One possible zone where price could find support is between 1.0898 (February 2 high) and the top of the Measured Move’s A wave at 1.0888.
A break below 1.0867 would probably solidify the case for a trend reversal and see bears take control.
Resumption of uptrend
A break above 1.0955 would be required for evidence of a resumption of the uptrend. A move above the 1.0981 high of March 8 would provide confirmation as it would establish a higher high.
After that, tough resistance is expected at the 1.1000 psychological level, which is likely to be the scene of a fierce battle between bulls and bears.
A decisive break above 1.1000, however, would open the gates to further gains towards the key resistance level at 1.1139, the December 2023 high.
By “decisive” it is meant a break characterized by a long green candle piercing clearly above the level and closing near its high, or three green bars in a row, breaching the level.
Euro FAQs
What is the Euro?
The Euro is the currency for the 20 European Union countries that belong to the Eurozone. It is the second most heavily traded currency in the world behind the US Dollar. In 2022, it accounted for 31% of all foreign exchange transactions, with an average daily turnover of over $2.2 trillion a day.
EUR/USD is the most heavily traded currency pair in the world, accounting for an estimated 30% off all transactions, followed by EUR/JPY (4%), EUR/GBP (3%) and EUR/AUD (2%).
What is the ECB and how does it impact the Euro?
The European Central Bank (ECB) in Frankfurt, Germany, is the reserve bank for the Eurozone. The ECB sets interest rates and manages monetary policy.
The ECB’s primary mandate is to maintain price stability, which means either controlling inflation or stimulating growth. Its primary tool is the raising or lowering of interest rates. Relatively high interest rates – or the expectation of higher rates – will usually benefit the Euro and vice versa.
The ECB Governing Council makes monetary policy decisions at meetings held eight times a year. Decisions are made by heads of the Eurozone national banks and six permanent members, including the President of the ECB, Christine Lagarde.
How does inflation data impact the value of the Euro?
Eurozone inflation data, measured by the Harmonized Index of Consumer Prices (HICP), is an important econometric for the Euro. If inflation rises more than expected, especially if above the ECB’s 2% target, it obliges the ECB to raise interest rates to bring it back under control.
Relatively high interest rates compared to its counterparts will usually benefit the Euro, as it makes the region more attractive as a place for global investors to park their money.
How does economic data influence the value of the Euro?
Data releases gauge the health of the economy and can impact on the Euro. Indicators such as GDP, Manufacturing and Services PMIs, employment, and consumer sentiment surveys can all influence the direction of the single currency.
A strong economy is good for the Euro. Not only does it attract more foreign investment but it may encourage the ECB to put up interest rates, which will directly strengthen the Euro. Otherwise, if economic data is weak, the Euro is likely to fall.
Economic data for the four largest economies in the euro area (Germany, France, Italy and Spain) are especially significant, as they account for 75% of the Eurozone’s economy.
How does the Trade Balance impact the Euro?
Another significant data release for the Euro is the Trade Balance. This indicator measures the difference between what a country earns from its exports and what it spends on imports over a given period.
If a country produces highly sought after exports then its currency will gain in value purely from the extra demand created from foreign buyers seeking to purchase these goods. Therefore, a positive net Trade Balance strengthens a currency and vice versa for a negative balance.
- USD/MXN could extend its losing streak in hopes of the Fed reducing policy rates in June.
- CME FedWatch Tool suggests a 66.6% probability of a rate cut in June.
- Mexico’s Industrial Output YoY and MoM surged by 2.9% and 0.4%, respectively, in January.
USD/MXN extends its losing streak that commenced on February 29 as the US Dollar (USD) weakens on improved risk appetite as market participants still believe that the Federal Reserve may reduce policy rates in June despite the US inflation data. The USD/MXN pair is hovering around 16.80 during the European trading hours on Wednesday.
In February, US CPI (YoY) rose by 3.2%, surpassing estimates of 3.1%. The monthly inflation met expectations at 0.4%, higher than the previously observed 0.3%. US Core CPI increased by 3.8% year-over-year, above the anticipated 3.7% but below the previous reading of 3.9%.
CME FedWatch Tool suggests the probability of a rate cut in March has decreased to 1.0%, while it stands at 15.6% for May. In June, the likelihood of a rate cut is estimated to be 66.6%. Attention will be on the US Core Producer Price Index (PPI) and Retail Sales data scheduled for release on Thursday.
On the Mexican side, Industrial Output (YoY) surged by 2.9% in January, contrasting with the previous flat reading of 0.0%, and surpassing market expectations of 2.1%. On a month-over-month basis, there was a 0.4% increase as anticipated, swinging from the previous decline of 0.7%.
While the annual inflation rate decreased from a seven-month high in January, Core Inflation experienced a higher increase compared to the previous reading. However, Headline Inflation increased less than expected and was lower than the previous rise. Market participants are eagerly awaiting the upcoming policy meeting of the Bank of Mexico (Banxico) scheduled for March 21.
EUR/GBP ended Tuesday higher and it is little changed on Wednesday after the UK's Office for National Statistics reported real Gross Domestic Product (GDP) data.
UK takes step to exit recession
The UK printed a positive growth number (0.2% MoM) for January, taking a first step to exit recession. The positive GDP print was largely expected, and the Pound did not move on the release.
Markets are now pricing in slightly less than three rate cuts in the UK by year-end, with a June cut around 50% priced in and an August cut fully expected.
We had deemed a break below 0.8500 as premature given the short-term EUR:GBP rate differentials, and we now expect some stabilisation around 0.8550 ahead of Friday’s UK data and the BoE meeting next week.
- The Pound Sterling falls while the UK monthly GDP and factory data broadly met expectations.
- BoE rate-cut expectations for August strengthen on weak Employment data for three months ending January.
- The market sentiment turns cautious as Fed rate cut hopes for June ease.
The Pound Sterling (GBP) weakens in Wednesday’s European session. The GBP/USD pair slips to 1.2780 after the United Kingdom Office for National Statistics (ONS) reported that monthly Gross Domestic Product (GDP) and other factory data for January were broadly aligned with market expectations.
The UK economy grew by 0.2% in January on month after reporting a technical recession in the second half of 2023. This indicates that the recession was shallow and the economic prospects are improving.
Meanwhile, the next move in the Pound Sterling will be guided by cues about when the Bank of England (BoE) will start reducing interest rates. Expectations for the BoE to cut interest rates from August rose due to cooling labor market conditions and easing inflation expectations.
Daily digest market movers: Pound Sterling faces pressure, US Dollar remains sideways
- The Pound Sterling faces some pressure after the ONS has reported that the United Kingdom economy expanded 0.2% in January, in line with market expectations. In December, the economy contracted by 0.1%.
- The monthly Manufacturing Production remained stagnant in January, as expected, down from the 0.8% growth seen in December. On an annual basis, the economic data grew by 2.0%, also in line with expectations, but slowing from than the prior reading of 2.3%.
- Monthly Industrial Production was surprisingly down by 0.2%, while investors projected a stagnant performance. The economic data rose by 0.6% in December. The annual factory data rose at a slower pace of 0.5% against expectations of 0.7% and the former reading of 0.6%.
- The monthly GDP growth indicates that the economic outlook is improving, which could be a tailwind for the Pound Sterling. However, factory activity continues to face pressure.
- Meanwhile, market expectations for the Bank of England reducing interest rates in August have slightly increased due to easing inflation expectations and labor market conditions cooled down in the three months ending January. US bank Citi reported that consumer inflation expectations for 12 months' time fell to 3.6% in February from 3.9% in January.
- The UK’s Unemployment Rate surprisingly climbed to 3.9%, employment levels declined, and Average Earnings excluding bonuses grew at their slowest pace since October 2022. However, wage growth is still roughly double than what required to be consistent for bringing down inflation to the 2% target.
- Meanwhile, the market sentiment remains cautious as stubborn United States Consumer Price Index (CPI) data for February have uplifted expectations for the Federal Reserve keeping interest rates steady in the first half of 2024. The hot US inflation data indicated that the Fed will continue with its hawkish narrative.
- The US Dollar Index (DXY), which measures the Greenback’s value against six rival currencies, consolidates in a tight range slightly below 103.00.
Technical Analysis: Pound Sterling extends losing streak
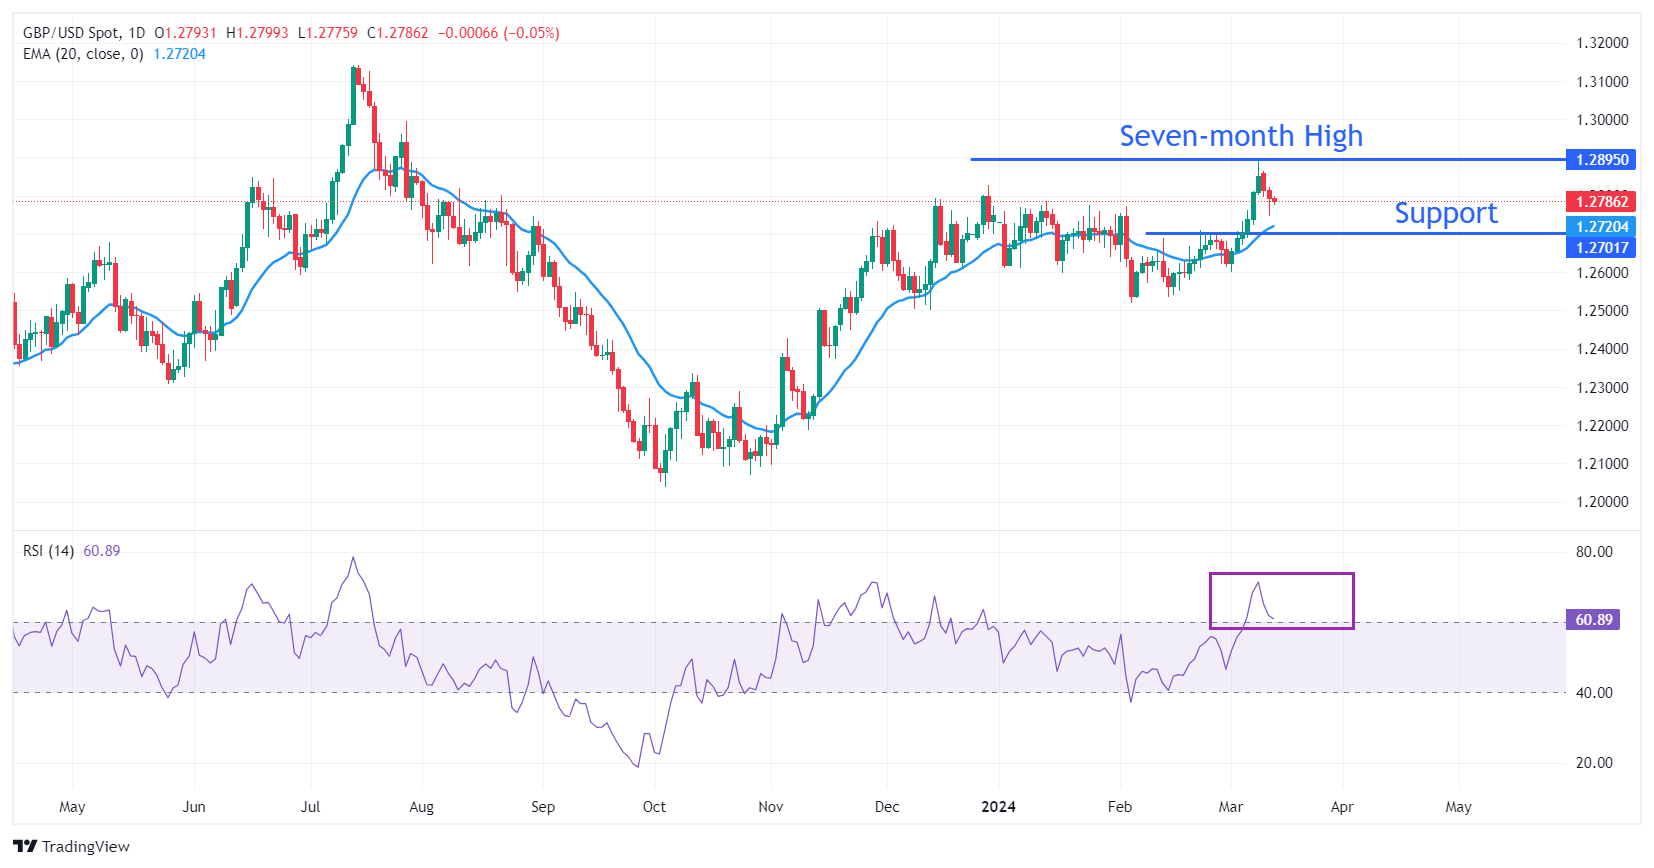
Pound Sterling continues its losing spell for the third trading session on Wednesday. The GBP/USD pair slips below the crucial support of 1.2800. The asset is expected to decline towards the 20-day Exponential Moving Average (EMA), which trades around 1.2720. The 1.2700 round-level support would be a strong cushion for the Pound Sterling bulls.
The 14-period Relative Strength Index (RSI) falls to 60.00 after turning overbought. A decisive break below 60.00 would indicate that the bullish momentum is fading.
Pound Sterling FAQs
The Pound Sterling (GBP) is the oldest currency in the world (886 AD) and the official currency of the United Kingdom. It is the fourth most traded unit for foreign exchange (FX) in the world, accounting for 12% of all transactions, averaging $630 billion a day, according to 2022 data. Its key trading pairs are GBP/USD, aka ‘Cable’, which accounts for 11% of FX, GBP/JPY, or the ‘Dragon’ as it is known by traders (3%), and EUR/GBP (2%). The Pound Sterling is issued by the Bank of England (BoE).
The single most important factor influencing the value of the Pound Sterling is monetary policy decided by the Bank of England. The BoE bases its decisions on whether it has achieved its primary goal of “price stability” – a steady inflation rate of around 2%. Its primary tool for achieving this is the adjustment of interest rates. When inflation is too high, the BoE will try to rein it in by raising interest rates, making it more expensive for people and businesses to access credit. This is generally positive for GBP, as higher interest rates make the UK a more attractive place for global investors to park their money. When inflation falls too low it is a sign economic growth is slowing. In this scenario, the BoE will consider lowering interest rates to cheapen credit so businesses will borrow more to invest in growth-generating projects.
Data releases gauge the health of the economy and can impact the value of the Pound Sterling. Indicators such as GDP, Manufacturing and Services PMIs, and employment can all influence the direction of the GBP. A strong economy is good for Sterling. Not only does it attract more foreign investment but it may encourage the BoE to put up interest rates, which will directly strengthen GBP. Otherwise, if economic data is weak, the Pound Sterling is likely to fall.
Another significant data release for the Pound Sterling is the Trade Balance. This indicator measures the difference between what a country earns from its exports and what it spends on imports over a given period. If a country produces highly sought-after exports, its currency will benefit purely from the extra demand created from foreign buyers seeking to purchase these goods. Therefore, a positive net Trade Balance strengthens a currency and vice versa for a negative balance.
Economists at Commerzbznka analyze Indian economic outlook after inflation and growth data.
Stable inflation, continued expansion
February headline inflation in India held steady at 5.1% YoY. Encouragingly, core inflation, which excludes food and energy, moderated further to 3.3% YoY. Headline inflation may tick up in the coming months due to higher food prices from the warm weather and seasonal factors. However, it is still expected to remain within RBI’s 2-6% target range.
On the growth front, there were few signs of a slowdown in domestic demand. Production of consumer durables expanded by nearly 11% YoY in January. Overall, it appears the economy remains in a sweet spot.
The near-term outlook remains positive while underlying inflation remains well anchored. This should see RBI keep rates on hold at 6.50% for the foreseeable future. They do not need to act ahead of the Fed’s next move.
French central bank head and European Central Bank (ECB) policymaker Villeroy de Galhau said on Wednesday that a rate cut in spring remains probable, as reported by Reuters. He added that they remain vigilant on inflation but noted that victory was within sight.
Market reaction
These comments don't seem to be having a significant impact on the Euro's performance against its major rivals. At the time of press, the EUR/USD pair was trading at 1.0925, where it was virtually unchanged on a daily basis.
Thanks to the central bank's firm stance, the Norwegian Krone (NOK) should be able to appreciate, analysts at Commerzbank say.
Norges Bank remains firmly hawkish
Norges Bank is keeping the option open to hike the policy rate again if necessary. By the next meeting at the end of March, it will know the inflation data for January and February and, of course, have a whole bunch of fresh economic data at its disposal. If inflation continues to fall, Norges Bank can then revise its projections, definitively signal the end of the interest rate cycle and adjust its interest rate path if it is considering earlier rate cuts by then.
Norges Bank's consistent stance on price stability is an asset for NOK. There are certainly other factors influencing the NOK's performance in the coming weeks, such as the Oil price or risk aversion in the market, but monetary policy should provide it with steady support. I therefore continue to feel comfortable with my forecast of an appreciating NOK and think that the market is trading it too weakly against the Euro.

Source: Commerzbank Research
- USD/CAD could continue its winning streak on risk-off sentiment.
- US CPI YoY and MoM rose by 3.2% and 0.4%, respectively, in February.
- The higher Crude oil prices limit the losses of the Canadian Dollar.
USD/CAD could maintain its winning streak for the fourth consecutive session, with the pair trading higher around 1.3490 during the early European hours on Wednesday.
The US Dollar (USD) receives upward support from the prevailing market sentiment despite a potential for a rate cut by the Federal Reserve (Fed) in June, despite the release of upbeat Consumer Price Index (CPI) data on Tuesday.
According to the CME FedWatch Tool, the probability of a rate cut in March has decreased to 1.0%, while it stands at 15.6% for May. In June, the likelihood of a rate cut is estimated to be 66.6%.
In February, US CPI (YoY) increased by 3.2%, surpassing estimates of 3.1%. The monthly inflation met expectations at 0.4%, higher than the previously observed 0.3%. US Core CPI rose by 3.8% year-over-year, above the anticipated 3.7% but below the previous reading of 3.9%. The month-over-month figure remained steady at 0.4%, against the market expectations of 0.3%.
The rise in Crude oil prices may have provided upward support for the Canadian Dollar (CAD), thereby capping the upside potential of the USD/CAD pair. West Texas Intermediate (WTI) oil price edged higher to nearly $77.90 per barrel during the European hours at the time of writing.
Crude oil prices are anticipated to receive upward support due to a strong outlook for global demand. The Organization of the Petroleum Exporting Countries (OPEC) has maintained its forecast for relatively robust growth in global oil demand in 2024 and 2025.
The economic calendar for the Canadian Dollar does not contain high-impact data for the week. Attention will be on the US Core Producer Price Index (PPI) and Retail Sales data scheduled for release on Thursday.
- GBP/JPY attracts some dip-buying for the second straight day, albeit lacks follow-through.
- The uncertainty over the BoJ’s next policy move undermines the JPY and lends support.
- The mixed UK macro data does little to impress the GBP bulls or provide any impetus.
The GBP/JPY cross turns positive for the second successive day following an early dip to the 188.40 region on Wednesday and looks to build on the overnight bounce from a near one-month low. Spot prices, meanwhile, react little to the UK macro data and hold steady around the 189.00 mark during the early European session.
The Japanese Yen (JPY) meets with a fresh supply after the Bank of Japan (BoJ) Governor Kazuo Ueda reiterated that the central bank will seek an exit from easy policy when achievement of 2% inflation is in sight. The comments smashed hopes for an imminent shift in the BoJ's policy stance next week, which, in turn, undermines the JPY and assists the GBP/JPY cross to attract some dip-buying.
Investors, however, seem convinced that the BoJ will pivot away from its ultra-dovish policy stance and exit the negative interest rates regime in the coming months. The bets were reaffirmed by positive news on wage hikes in Japan, which is expected to fuel consumer spending and demand-driven inflation. This, along with geopolitical risks, helps limit losses for the JPY and caps the GBP/JPY cross.
The British Pound (GBP), on the other hand, is underpinned by expectations that the Bank of England (BoE) might keep interest rates higher for longer. Meanwhile, the upbeat UK GDP print, showing that the economy expanded by 0.2% in January, was overshadowed by weaker Industrial and Manufacturing Production figures. This, in turn, does little to provide any impetus to the GBP/JPY cross.
The aforementioned fundamental backdrop, however, seems tilted in favour of bullish traders. That said, it will still be prudent to wait for some follow-through buying before positioning for any meaningful appreciating move ahead of next week's key central bank event risk – the highly-anticipated BoJ monetary policy decision on Tuesday.
- EUR/GBP holds positive ground near 0.8544 in Wednesday’s early European session.
- The UK monthly GDP number grew 0.2% MoM in January vs. -0.1% prior, as expected.
- ECB’s Wunsch said they will have to gamble soon with rate cuts despite the rise of wage inflation and prices.
The EUR/GBP cross trades on a positive note below the mid-0.8500s during the early European trading hours on Wednesday. The cross drifts higher following the mixed UK data. At press time, EUR/GBP is trading at 0.8544, adding 0.04% on the day.
The latest data released from the Office for National Statistics on Tuesday showed that the UK monthly Gross Domestic Product (GDP) grew 0.2% MoM in January, compared to a contraction of 0.1% in the previous reading, matching the estimation of a 0.2% expansion. Additionally, UK Industrial Production for January came in worse than expected, dropping 0.2% MoM from a 0.6% rise in December. The UK Goods Trade Balance arrived at GBP-14.515 billion MoM in January from GBP-13.989 billion prior, better than GBP-15B expected.
On the other hand, the European Central Bank maintained its monetary policy unchanged last week. ECB President Christine Lagarde said that discussions over rate cuts have begun, but the central bank will see more evidence of information that will become available by June. On Monday, ECB Governing Council member Peter Kazimir stated that the central bank is increasingly confident that inflation is coming down, but should still hold off on an interest rate cut until June. Meanwhile, ECB policymaker Pierre Wunsch said they will have to gamble soon with rate cuts, even though wage inflation and price rises for services are uncomfortably high.
Spain’s Consumer Price Index (CPI) will be due on Thursday, along with the ECB’s Elderson, Schnabel and De Guindos speeches. On Friday, the CPI inflation data from France and Italy will be released. Next week, the UK February CPI report and the BoE interest rate decision will be in the spotlight.
Here is what you need to know on Wednesday, March 13:
The US Dollar (USD) is having a tough time gathering recovery momentum early Wednesday. After posting modest daily gains on Tuesday, the USD Index (DXY) holds steady slightly below 103.00 in the European morning. The US economic docker will not offer any high-impact macroeconomic data releases later in the day. Eurostat will release Eurozone Industrial Production data for January.
The data from the US showed on Tuesday that inflation, as measured by the change in the Consumer Price Index (CPI), edged higher to 3.2% on a yearly basis from 3.1% in January. On a monthly basis, the CPI and the Core CPI, which excludes volatile food and energy prices, both increased 0.4%. The benchmark 10-year US Treasury bond yield recovered above 4.1% after inflation data and helped the USD find demand. The risk-positive market atmosphere, however, didn't allow the currency to continue to gather strength. Early Wednesday, the 10-year US yield holds steady at around 4.15% and US stock index futures trade mixed.
US Dollar price this week
The table below shows the percentage change of US Dollar (USD) against listed major currencies this week. US Dollar was the strongest against the Japanese Yen.
| USD | EUR | GBP | CAD | AUD | JPY | NZD | CHF | |
| USD | 0.14% | 0.47% | 0.07% | 0.19% | 0.66% | 0.27% | 0.03% | |
| EUR | -0.13% | 0.34% | -0.06% | 0.05% | 0.54% | 0.12% | -0.10% | |
| GBP | -0.47% | -0.34% | -0.41% | -0.28% | 0.21% | -0.21% | -0.44% | |
| CAD | -0.06% | 0.06% | 0.40% | 0.12% | 0.57% | 0.20% | -0.04% | |
| AUD | -0.19% | -0.05% | 0.28% | -0.12% | 0.48% | 0.07% | -0.15% | |
| JPY | -0.67% | -0.55% | 0.04% | -0.61% | -0.48% | -0.40% | -0.65% | |
| NZD | -0.27% | -0.12% | 0.21% | -0.21% | -0.07% | 0.42% | -0.23% | |
| CHF | -0.03% | 0.10% | 0.44% | 0.04% | 0.15% | 0.62% | 0.23% |
The heat map shows percentage changes of major currencies against each other. The base currency is picked from the left column, while the quote currency is picked from the top row. For example, if you pick the Euro from the left column and move along the horizontal line to the Japanese Yen, the percentage change displayed in the box will represent EUR (base)/JPY (quote).
Citing Japanese news outlets, Reuters reported on Wednesday that Japan's largest trade union confederation's, Rengo, demand for pay rises of 5.85%, or JPY18,215, this year, had been met. Japan’s Chief Cabinet Secretary Yoshimasa Hayashi said that he wants to see widespread wage rises across the economy, adding that it's important for wage hikes to spread to mid-sized, small companies. After rising nearly 0.5% on Tuesday, USD/JPY stays relatively quiet above 147.50 to start the European session.
Commenting on these developments, "we must scrutinize whether a positive wage-inflation cycle emerges, in deciding whether conditions for phasing out stimulus are falling into place," Bank of Japan (BoJ) Governor Kazuo Ueda said.
Japanese Yen bulls seem non-committed despite bets for an imminent shift in BoJ's stance.
GBP/USD holds steady at around 1.2800 in the European morning after closing the second consecutive day in negative territory on Tuesday. The UK's Office for National Statistics reported that the real Gross Domestic Product (GDP) expanded by 0.2% on a monthly basis in January. This reading followed the 0.1% contraction recorded in December and came in line with the market expectation.
Gold snapped a nine-day winning streak on Tuesday and lost more than 1%, pressured by recovering US T-bond yields. XAU/USD stays in a consolidation phase at around $2,160 on Wednesday.
Gold price sticks to modest gains as sliding US bond yields keep USD bulls on defensive.
EUR/USD staged a recovery after meeting support near 1.0900 and closed the day flat on Tuesday. The pair fluctuates in a tight range near 1.0930 in the European morning.
Inflation FAQs
Inflation measures the rise in the price of a representative basket of goods and services. Headline inflation is usually expressed as a percentage change on a month-on-month (MoM) and year-on-year (YoY) basis. Core inflation excludes more volatile elements such as food and fuel which can fluctuate because of geopolitical and seasonal factors. Core inflation is the figure economists focus on and is the level targeted by central banks, which are mandated to keep inflation at a manageable level, usually around 2%.
The Consumer Price Index (CPI) measures the change in prices of a basket of goods and services over a period of time. It is usually expressed as a percentage change on a month-on-month (MoM) and year-on-year (YoY) basis. Core CPI is the figure targeted by central banks as it excludes volatile food and fuel inputs. When Core CPI rises above 2% it usually results in higher interest rates and vice versa when it falls below 2%. Since higher interest rates are positive for a currency, higher inflation usually results in a stronger currency. The opposite is true when inflation falls.
Although it may seem counter-intuitive, high inflation in a country pushes up the value of its currency and vice versa for lower inflation. This is because the central bank will normally raise interest rates to combat the higher inflation, which attract more global capital inflows from investors looking for a lucrative place to park their money.
Formerly, Gold was the asset investors turned to in times of high inflation because it preserved its value, and whilst investors will often still buy Gold for its safe-haven properties in times of extreme market turmoil, this is not the case most of the time. This is because when inflation is high, central banks will put up interest rates to combat it. Higher interest rates are negative for Gold because they increase the opportunity-cost of holding Gold vis-a-vis an interest-bearing asset or placing the money in a cash deposit account. On the flipside, lower inflation tends to be positive for Gold as it brings interest rates down, making the bright metal a more viable investment alternative.
- UK GDP rebounded 0.2% MoM in January vs. 0.2% forecast.
- GBP/USD remains unfazed below 1.2800 after the UK data.
The UK economy returned to expansion in January, rising 0.2% after contracting 0.1% in December, the latest data published by the Office for National Statistics (ONS) showed on Wednesday. The market expectations were for an expansion of 0.2% in the reported period.
Meanwhile, the Index of services (January) arrived at 0% 3M/3M vs. December’s 0.8% reading and 0% expectations.
Other data from the UK showed that Industrial Production and Manufacturing Production arrived at -0.2% and 0%, respectively, on a monthly basis in December.
Separately, the UK Goods Trade Balance came in at GBP-14.515 billion MoM in January vs. GBP-15B expected and GBP-13.989B previous.
Market reaction to the UK data
The Pound Sterling remained little impressed by the mixed UK economic data, keeping GBP/USD in a tight range below 1.2800.
At the press time, GBP/USD is trading 0.03% higher on the day at 1.2793.
(This story was corrected on Wednesday at 07.11 GMT to say that "the latest data published by the Office for National Statistics (ONS) showed on Wednesday," not Friday.)
Pound Sterling price today
The table below shows the percentage change of Pound Sterling (GBP) against listed major currencies today. Pound Sterling was the strongest against the Swiss Franc.
| USD | EUR | GBP | CAD | AUD | JPY | NZD | CHF | |
| USD | 0.00% | 0.02% | 0.01% | -0.09% | 0.05% | -0.25% | 0.05% | |
| EUR | 0.00% | 0.02% | 0.03% | -0.10% | 0.04% | -0.28% | 0.05% | |
| GBP | -0.02% | -0.02% | -0.01% | -0.12% | 0.02% | -0.29% | 0.03% | |
| CAD | -0.01% | -0.01% | 0.01% | -0.10% | 0.04% | -0.26% | 0.05% | |
| AUD | 0.10% | 0.10% | 0.12% | 0.13% | 0.15% | -0.17% | 0.12% | |
| JPY | -0.04% | -0.01% | 0.00% | -0.02% | -0.08% | -0.30% | 0.01% | |
| NZD | 0.26% | 0.27% | 0.29% | 0.26% | 0.17% | 0.31% | 0.32% | |
| CHF | -0.05% | -0.05% | -0.03% | -0.05% | -0.15% | -0.01% | -0.32% |
The heat map shows percentage changes of major currencies against each other. The base currency is picked from the left column, while the quote currency is picked from the top row. For example, if you pick the Euro from the left column and move along the horizontal line to the Japanese Yen, the percentage change displayed in the box will represent EUR (base)/JPY (quote).
Following the Japanese wage hike outcome, Bank of Japan (BoJ) Governor Kazuo Ueda is out on the wires, noting that “we will scrutinize the wage talk outcome, as well as other data and information from our hearings, in making policy decisions.”
Additional quotes
We will consider tweaking negative rate, YCC and other monetary easing tools if sustained achievement of our price target comes into sight.
We must scrutinisz whether positive wage-inflation cycle emerges, in deciding whether conditions for phasing out stimulus are falling into place.
This year's wage negotiation is critical in deciding timing on exit from stimulus.
Unions have demanded higher pay, we are seeing many corporate management making offers that will stream in today and beyond.
Market reaction
USD/JPY keeps its recovery mode intact on Ueda’s comments, currently trading flat at 147.66.
Japanese Yen price today
The table below shows the percentage change of Japanese Yen (JPY) against listed major currencies today. Japanese Yen was the weakest against the New Zealand Dollar.
| USD | EUR | GBP | CAD | AUD | JPY | NZD | CHF | |
| USD | 0.01% | 0.02% | 0.03% | -0.04% | 0.07% | -0.20% | 0.04% | |
| EUR | 0.00% | 0.01% | 0.03% | -0.04% | 0.06% | -0.22% | 0.04% | |
| GBP | -0.02% | -0.01% | 0.02% | -0.05% | 0.05% | -0.23% | 0.03% | |
| CAD | -0.04% | -0.03% | -0.01% | -0.08% | 0.03% | -0.23% | 0.01% | |
| AUD | 0.04% | 0.04% | 0.05% | 0.08% | 0.10% | -0.18% | 0.05% | |
| JPY | -0.07% | -0.03% | -0.04% | -0.03% | -0.07% | -0.28% | -0.02% | |
| NZD | 0.20% | 0.22% | 0.23% | 0.24% | 0.18% | 0.28% | 0.26% | |
| CHF | -0.06% | -0.04% | -0.03% | -0.03% | -0.06% | 0.02% | -0.26% |
The heat map shows percentage changes of major currencies against each other. The base currency is picked from the left column, while the quote currency is picked from the top row. For example, if you pick the Euro from the left column and move along the horizontal line to the Japanese Yen, the percentage change displayed in the box will represent EUR (base)/JPY (quote).
FX option expiries for Mar 13 NY cut at 10:00 Eastern Time, via DTCC, can be found below.
- EUR/USD: EUR amounts
- 1.0875 2.6b
- 1.0900 989m
- 1.0940 1.5b
- 1.0960 1.1b
- 1.0980 610m
- USD/JPY: USD amounts
- 147.35 1.6b
- 147.75 899m
- 148.50 842m
- 149.50 1.1b
- AUD/USD: AUD amounts
- 0.6600 584m
- 0.6640 1.3b
- 0.6680 1b
- USD/CAD: USD amounts
- 1.3500 562m
- 1.3525 578m
- 1.3555 900m
- 1.3600 1b
- NZD/USD: NZD amounts
- 0.6085 1.3b
- NZD/USD bounces back to 0.6160 as risk sentiment improves.
- Stubborn US inflation data have dented market expectations for Fed rate cuts in June.
- The consumer price inflation in the NZ economy in Q12024 is expected to rise by 0.8%.
The NZD/USD pair extends recovery to 0.6160 in Wednesday’s early European session. The Kiwi asset rises as upbeat market sentiment improves demand for risk-perceived assets.
S&P 500 futures added nominal gains in the early London session. The US Dollar Index (DXY) remains sideways slightly below 103.00. 10-year US Treasury yields have dropped to 4.14%. However, risk-sensitive assets could be under pressure as market expectations for the Federal Reserve (Fed) reducing interest rates in the June policy meeting have eased significantly.
The CME FedWatch tool shows that there is a 34% chance that the Fed will keep interest rates unchanged in the 5.25%-5.50% in June. The expectations for the Fed keeping interest rates on hold rose from Tuesday’s 28% chance after the release of hotter-than-expected Consumer Price Index (CPI) data for February.
Fed policymakers are expected to keep interest rates higher for a longer period as they have not gotten any evidence that could build confidence that inflation will return sustainably to the 2% target.
Going forward, investors will shift focus to the United States Producer Price Index (PPI) and the Retail Sales data, which will be published on Thursday.
On the New Zealand Dollar front, easing inflation expectations are expected to bring some relief for households. Latest forecasts from the Reserve Bank of New Zealand (RBNZ) show that consumer prices will rise by 0.8% in the quarter to March period. The annual inflation is projected to decline to 4.2% from 4.7% in the last quarter of 2023.
- EUR/JPY trades on a softer note near 161.30 amid the growing possibility of a March rate hike from the BoJ.
- The cross maintains the bearish tone below the key EMA; RSI momentum indicator lies below the 50-midline.
- The first upside barrier is seen at 161.65; the initial support level for the cross is located at 160.87.
The EUR/JPY cross edges lower to 161.30 during the early European session on Wednesday. Most companies have agreed to offer sizeable pay increases at annual talks with trade unions, paving the way for the Bank of Japan (BoJ) to end negative interest rates as early as next week. This, in turn, lifts the Japanese Yen (JPY) and creates a headwind for the EUR/JPY cross.
According to the four-hour chart, EUR/JPY keeps the bearish vibe unchanged as the cross holds below the 50- and 100-period Exponential Moving Averages (EMA). Furthermore, the Relative Strength Index (RSI), which lies below the 50-midline, supports the sellers for the time being.
The key upside barrier for EUR/JPY will emerge at the confluence of the upper boundary of the Bollinger Band and the 50-period EMA at 161.65. Further north, the next hurdle is seen at the 100-period EMA at 161.85. Any follow-through buying above this level will see a rally to a high of March 8 at 162.17, followed by a high of March 6 at 162.95.
On the other hand, the initial support level for the cross is located at a low of March 12 at 160.87. The next contention level is seen at the lower limit of the Bollinger Band 160.25. The additional downside filter to watch is a psychological round mark at 160.00.
EUR/JPY four-hour chart
-638459062225665579.png)
- EUR/USD struggles for a firm intraday direction and remains confined in a narrow band.
- The technical setup favours bulls and supports prospects for some meaningful upside.
- Rising bets for a rate cut by the Fed and the ECB in June keep traders on the sidelines.
The EUR/USD pair continues with its struggle to gain any meaningful traction on Wednesday and oscillates in a narrow trading band below the 100-hour Simple Moving Average (SMA) during the Asian session. Spot prices currently trade around the 1.0925 area, unchanged for the day as traders await more cues about the Federal Reserve’s (Fed) rate-cut path before positioning for a firm near-term direction.
The US consumer inflation for February came in a bit warmer than expected and fuelled speculations that the Fed may delay interest rate cuts, which, in turn, is seen acting as a tailwind for the US Dollar (USD). In contrast, the European Central Bank (ECB) officials overwhelmingly back the case for the first rate cut in June and have also floated the idea of a further move in July. This undermines the shared currency and further contributes to capping the upside for the EUR/USD pair.
Meanwhile, the markets are still pricing in a greater chance that the US central bank will start cutting interest rates in June. This is reinforced by a fresh leg down in the US Treasury bond yields, which, along with the prevalent risk-on environment, holds back traders from placing aggressive bullish bets around the safe-haven buck and lends some support to the EUR/USD pair. Hence, it will be prudent to wait for strong follow-through selling before positioning for any further decline.
From a technical perspective, spot prices showed some resilience below the 23.6% Fibonacci retracement level of the February-March rally and for now, seem to have stalled the recent pullback from the 1.0980 area, or a near two-month high touched last week. Moreover, oscillators on the daily chart are holding in the positive territory and are still away from being in the overbought zone, which favours the EUR/USD bulls. The lack of any meaningful buying, however, warrants some caution.
In the meantime, the overnight swing low, around the 1.0900 round-figure mark, is likely to protect the immediate downside ahead of the 1.0870 area, or the 38.2% Fibo. A convincing breakthrough might expose the 50% Fibo. level, around the 1.0840-1.0835 region, below which the EUR/USD pair could turn vulnerable and accelerate the downfall further towards testing sub-1.0800 levels, or the monthly through.
On the flip side, the 1.0945-1.0950 zone could act as an immediate hurdle ahead of the 1.0980 region, or the monthly peak, and the 1.1000 psychological mark. A sustained strength beyond the latter will be seen as a fresh trigger for bullish traders and set the stage for an extension of the recent goodish recovery from sub-1.0700 levels, or the YTD low touched on February 15. The EUR/USD pair might then climb to the 1.1045-1.1050 intermediate resistance en route to the 1.1100 round figure.
EUR/USD 1-hour chart
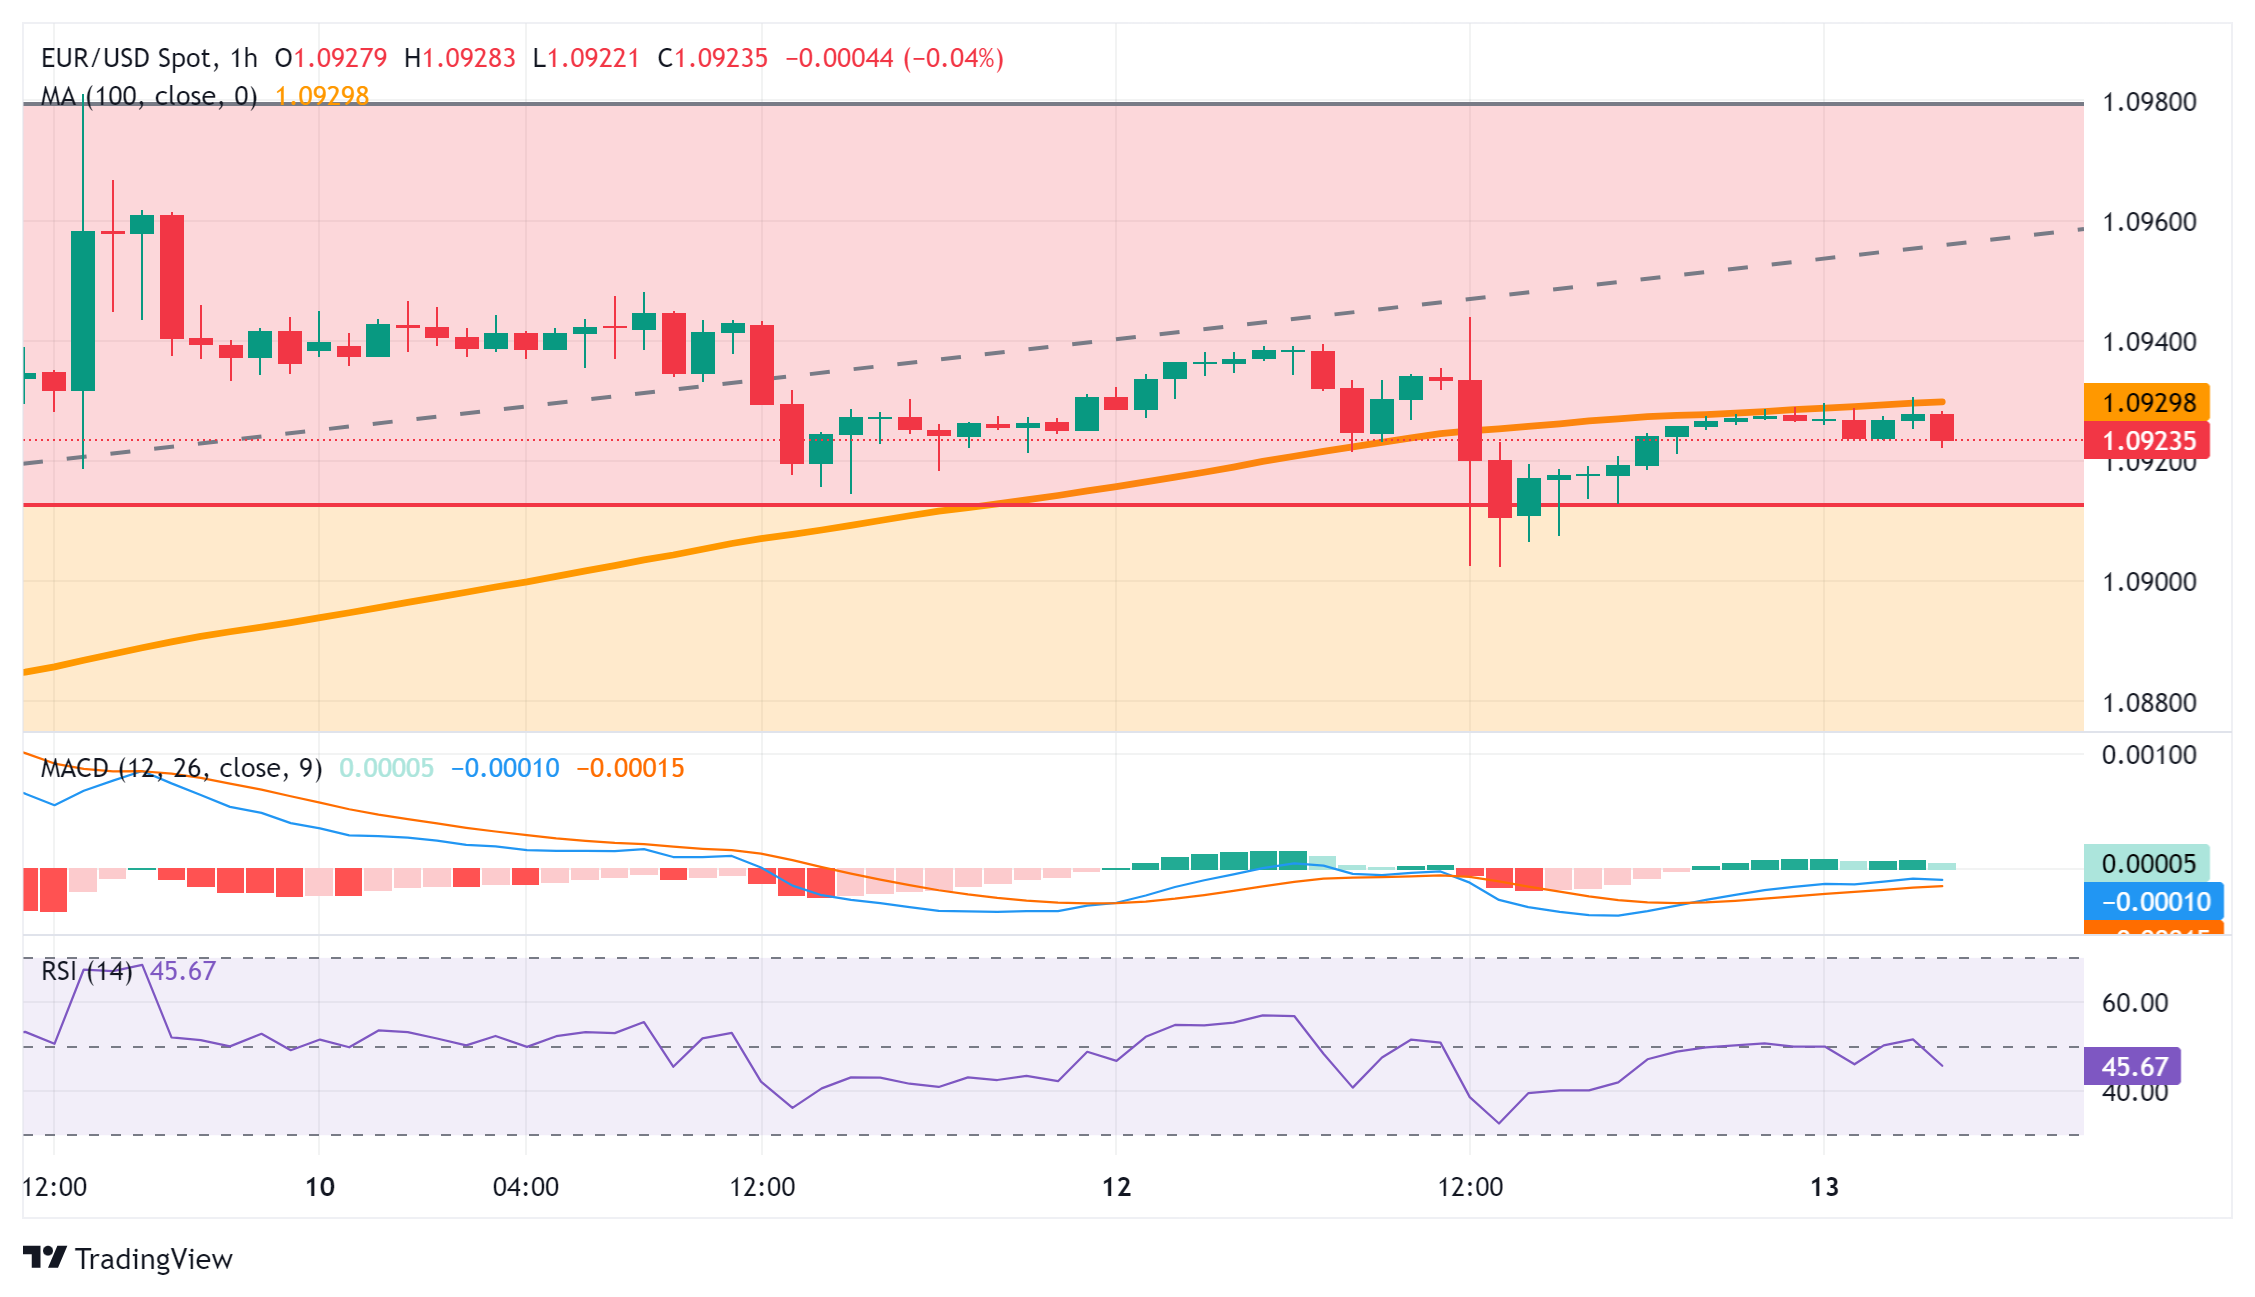
- GBP/JPY loses ground on Wednesday as JPY strengthens on BoJ’s contemplation of a rate hike.
- Upbeat Japan’s producer inflation data could reinforce the BoJ to raise rates soon.
- Japanese firms have agreed to the demands for pay increases of 5.85% this year.
GBP/JPY retraces its recent gains recorded on Tuesday, slipping to near 188.70 during the Asian trading session on Wednesday. The Japanese Yen (JPY) is bolstered by market speculation that the Bank of Japan (BoJ) is contemplating an interest rate hike in March.
Furthermore, Japan's spring wage negotiations showed that firms have acquiesced to the demands of the country's largest trade union confederation, Rengo, for pay increases of 5.85% this year, surpassing 5.0% for the first time in 30 years. Additionally, Japan's Chief Cabinet Secretary Yoshimasa Hayashi expressed his desire to see widespread wage hikes across the economy.
The higher-than-expected producer inflation data from Japan reinforces the belief that the Bank of Japan (BoJ) could commence raising rates soon, bolstering the JPY and consequently weakening the GBP/JPY cross.
On Tuesday, UK Average Earnings Including Bonuses for the period from November 2023 to January 2024 eased to 5.6% from 5.8% in the previous reading, while annual wage growth excluding bonuses dropped to 6.1% compared to 6.2% previously. The likelihood of rate cuts by the Bank of England (BoE) this year increased marginally, with traders now expecting three rate cuts.
The Pound Sterling (GBP) has recently emerged as one of the top two performers among the major currencies. Economists at Commerzbank are analyzing the outlook for the GBP, though uncertainty remains regarding how long the Pound's strength will persist. Presently, the GBP's strength appears somewhat fragile.
- USD/CHF trades sideways around 0.8776 in Wednesday’s Asian session.
- The US CPI figure climbed 3.2% from a year earlier in February vs. 3.1% prior.
- The rising Middle East geopolitical tensions and risk-averse environment could lift the CHF.
- Traders will watch the Swiss Producer and Import Prices and US Retail Sales February, due on Thursday.
The USD/CHF pair remains confined in a narrow trading range of 0.8765-0.8780 during the Asian trading hours on Wednesday. The stronger-than-expected US CPI inflation data in February lift the US Dollar (USD). Nonetheless, the risk-averse environment might boost safe-haven demand and benefit the Swiss Franc (CHF). The pair currently trades near 0.8776, adding 0.02% on the day.
Inflation remains elevated in the United States in February. The Labor Department reported on Tuesday that the Consumer Price Index (CPI) climbed 3.2% from a year earlier from 3.1% in January. On a monthly basis, the headline CPI figure increased by 0.4% from the previous month of a 0.3% gain. Additionally, the Core CPI, excluding volatile food and energy items, rose 0.4% MoM in February, above the market consensus of 0.3%.
The hotter CPI inflation report might influence Federal Reserve (Fed) officials to wait until the summer before beginning to cut interest rates. This, in turn, provides some support for the Greenback. Fed Chair Jerome Powell said last week that the Fed is likely to cut the interest rate this year, but the central bank needs to see more evidence of inflation data to ensure that inflation returns to the 2% target. Investors are pricing in 70% odds of rate cuts in June, according to the CME FedWatch tool.
On the other hand, the escalating geopolitical tensions in the Middle East, uncertainty, and risk-averse environment could boost safe-haven assets like CHF and create a headwind for the USD/CHF pair.
In the absence of the top-tier economic data released from the US and Swiss dockets on Wednesday, the pair remains at the mercy of the USD price dynamics and the broader risk sentiment. On Thursday, the Swiss Producer and Import Prices and US Retail Sales February will be released.
- GBP/USD lacks any follow-through buying and oscillates in a range on Wednesday.
- Delayed BoE rate cut bets underpin the GBP and lend support amid a softer USD.
- Bulls, however, refrain from placing aggressive bets ahead of the UK monthly GDP.
The GBP/USD pair struggles to capitalize on the previous day's late rebound from levels below mid-1.2700s, or the weekly low and oscillates in a narrow trading band during the Asian session on Wednesday. Spot prices currently trade just below the 1.2800 mark, unchanged for the day as traders opt to wait on the sidelines ahead of important macro releases from the UK, including the monthly GDP print.
In the meantime, bets that the Federal Reserve (Fed) will start cutting interest rates in June, despite the warmer US consumer inflation, along with a generally positive risk tone, keep the US Dollar (USD) bulls on the defensive. Adding to this, expectations that the Bank of England (BoE) might keep interest rates higher for longer underpin the British Pound (GBP) and lend some support to the GBP/USD pair.
From a technical perspective, spot prices showed some resilience and bounced from a strong resistance breakpoint around the 1.2750 region on Tuesday. The said area should now act as a key pivotal point, which if broken decisively might prompt some technical selling and drag the GBP/USD pair below the 1.2700 mark, towards testing the 50-day Simple Moving Average (SMA) support near the 1.2680 zone.
A convincing break below the latter might expose the 1.2600 confluence, comprising the 100- and the very important 200-day SMAs. The subsequent downfall has the potential to drag the GBP/USD pair towards the 1.2520-1.2515 region, or the YTD low touched in February.
On the flip side, the 1.2850-1.2855 region is likely to act as an immediate hurdle, above which spot prices could climb back to the 1.2900 neighbourhood, or the highest level in over eight months touched last Friday. Given that oscillators on the daily chart are holding in the positive territory and are still far from being in the overbought zone, some follow-through buying will be seen as a fresh trigger for bullish traders.
The GBP/USD pair might then accelerate the positive momentum towards the next relevant hurdle near the 1.2940-1.2945 region before aiming to reclaim the 1.3000 psychological mark for the first time since July 2023.
GBP/USD daily chart
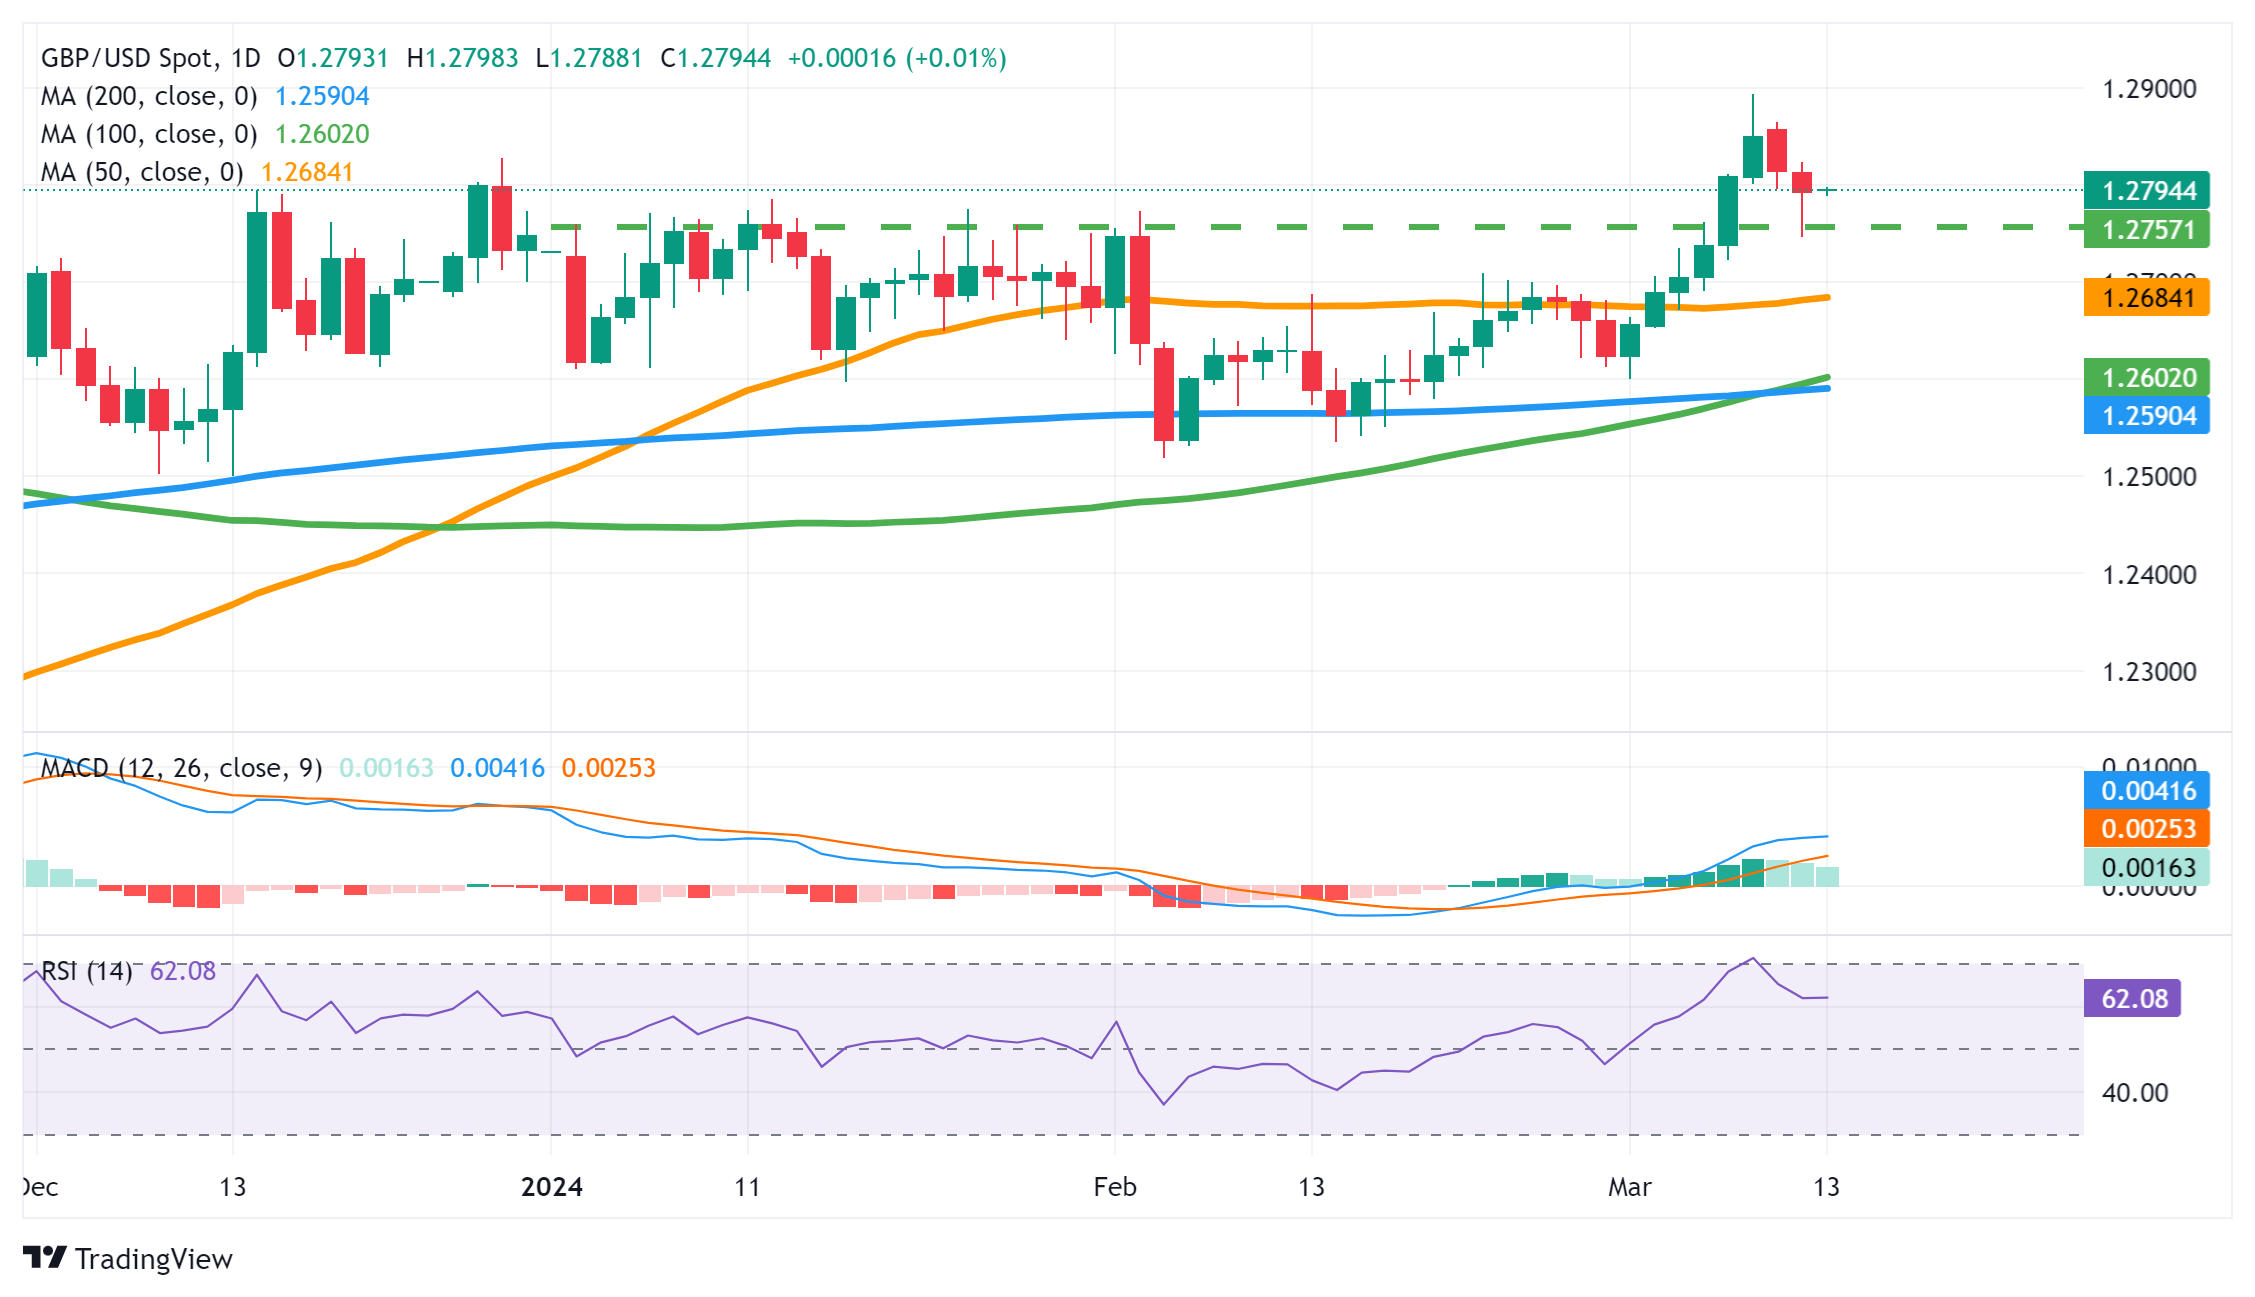
- WTI price moves lower despite a strong outlook for global oil demand.
- OPEC maintained its previous demand forecasts unchanged with a rise of 2.25M bpd in 2024 and 1.85M bpd in 2025.
- Fed is still anticipated to begin implementing rate cuts in the summer, despite persistent inflationary pressures.
West Intermediate Texas (WTI) oil price edges lower to near $77.70 per barrel during the Asian hours on Wednesday. However, Crude oil prices could receive upward support on a strong outlook for global demand. The Organization of the Petroleum Exporting Countries (OPEC) stuck to its forecast for relatively strong growth in global oil demand in 2024 and 2025.
On Tuesday, OPEC kept its previous forecasts unchanged in a monthly report that world oil demand will rise by 2.25 million barrels per day (bpd) in 2024 and by 1.85 million bpd in 2025. OPEC also said a "robust dynamic" for economic growth towards the end of 2023 was expected to extend into the first half of 2024 and raised its 2024 economic growth forecast by 0.1%.
Despite the rise in US inflation in February, the Federal Reserve (Fed) is still expected to initiate rate cuts in the summer. Lower borrowing costs are anticipated to bolster economic activities in the United States (US), potentially supporting Crude oil demand. Furthermore, a weaker US Dollar would decrease the cost of purchasing Crude oil for other nations, which in turn, would improve oil demand.
In February, US CPI (YoY) rose by 3.2%, surpassing estimates of 3.1%. The monthly index met expectations at 0.4%, higher than the 0.3% seen previously. Moreover, API Weekly Crude Oil Stock surprisingly fell in the week ending on March 8, with a decline of 5.521 million barrels, compared to an expected increase of 0.4 million barrels and the previous 0.423 million barrels. Traders will now focus on the upcoming EIA Crude Oil Stocks Change data.
- Gold price gains some positive traction on Wednesday amid a softer US Dollar.
- Despite the warmer US CPI report, June Fed rate cut bets undermine the buck.
- Geopolitical risks stemming from conflicts in the Middle East also lend support.
Gold price (XAU/USD) attracts some dip-buying during the Asian session on Wednesday and reverses a part of the previous day's profit-taking slide to the $2,150 area, or the weekly low. The US Treasury bond yields ticked higher on Tuesday after the US consumer inflation for February came in a bit warmer than expected, which, in turn, boosted the US Dollar (USD) and exerted some downward pressure on the commodity. Furthermore, an extension of the bullish run in the US equity markets further contributed to driving flows away from the safe-haven precious metal.
The markets, however, are still pricing in a greater chance that the Federal Reserve (Fed) will start cutting interest rates at the June policy meeting. This keeps a lid on the US bond yields and the Greenback, which, in turn, helps limit the downside for the non-yielding Gold price. Traders also seem reluctant to place aggressive bearish bets around the safe-haven XAU/USD amid geopolitical risks and expectations that the global economy might weaken in 2024. Investors might also prefer to move to the sidelines ahead of the crucial FOMC monetary policy meeting next week.
Daily Digest Market Movers: Gold price draws support from June Fed rate cut bets, geopolitical risks
- A hot US inflation report fuelled speculations that the Federal Reserve may delay interest rate cuts and pushed the US Treasury bond yields, underpinning the US Dollar and weighing on the Gold price on Tuesday.
- The headline US Consumer Price Index (CPI) rose by the 3.2% YoY rate in February from the 3.1% previous and expected, while the annual Core CPI came in at 3.8%, slightly above estimates for a reading of 3.7%.
- According to the CME Group's FedWatch tool, the markets are still pricing in around a 70% chance that the US central bank will cut interest rates in June, which caps the USD and limits losses for the XAU/USD.
- A Qatari official said on Tuesday that Israel and Hamas are not close to a deal to halt the fighting in Gaza and free hostages, and warned that the situation remained very complicated despite weeks of truce talks.
- Iran-aligned Houthi rebels in Yemen said that they would escalate their military operations during the Muslim holy month of Ramadan in solidarity with Palestinians and response to the ongoing war in Gaza.
- The United States conducted six self-defence strikes, destroying an unmanned underwater vessel and 18 anti-ship missiles in retaliation to the two anti-ship ballistic missiles fired into the Red Sea by the Houthis.
- This should help limit the downside for the safe-haven precious metal as traders look to next week's highly anticipated FOMC meeting for cues about the rate-cut path and before placing fresh directional bets.
Technical Analysis: Gold price could weaken further once the overnight low around $2,150 is broken
From a technical perspective, the overnight swing low, around the $2,150 area, now seems to protect the immediate downside. Against the backdrop of the overbought Relative Strength Index (RSI) on the daily chart, a convincing break below might prompt some technical selling and drag the Gold price to the next relevant support near the $2,128-2,127 zone. The subsequent slide might expose the $2,100 round figure, which should act as a strong base for the XAU/USD and a key pivotal point for short-term traders.
On the flip side, any further move up is likely to face some resistance around the $2,174-2,175 region ahead of the $2,195 area, or the record peak touched last Friday. Some follow-through buying beyond the $2,200 mark will push the Gold price to the uncharted territory and set the stage for the resumption of the recent blowout rally witnessed over the past two weeks or so.
US Dollar price today
The table below shows the percentage change of US Dollar (USD) against listed major currencies today. US Dollar was the weakest against the Japanese Yen.
| USD | EUR | GBP | CAD | AUD | JPY | NZD | CHF | |
| USD | 0.02% | 0.02% | 0.03% | -0.03% | -0.19% | -0.11% | 0.03% | |
| EUR | -0.02% | 0.00% | 0.01% | -0.05% | -0.21% | -0.14% | 0.01% | |
| GBP | -0.02% | 0.00% | 0.01% | -0.04% | -0.21% | -0.12% | 0.01% | |
| CAD | -0.03% | -0.01% | -0.01% | -0.06% | -0.22% | -0.13% | 0.00% | |
| AUD | 0.04% | 0.05% | 0.03% | 0.06% | -0.17% | -0.10% | 0.03% | |
| JPY | 0.19% | 0.22% | 0.22% | 0.22% | 0.20% | 0.07% | 0.22% | |
| NZD | 0.11% | 0.12% | 0.12% | 0.13% | 0.08% | -0.08% | 0.15% | |
| CHF | -0.04% | -0.01% | -0.01% | 0.00% | -0.04% | -0.21% | -0.15% |
The heat map shows percentage changes of major currencies against each other. The base currency is picked from the left column, while the quote currency is picked from the top row. For example, if you pick the Euro from the left column and move along the horizontal line to the Japanese Yen, the percentage change displayed in the box will represent EUR (base)/JPY (quote).
Gold FAQs
Why do people invest in Gold?
Gold has played a key role in human’s history as it has been widely used as a store of value and medium of exchange. Currently, apart from its shine and usage for jewelry, the precious metal is widely seen as a safe-haven asset, meaning that it is considered a good investment during turbulent times. Gold is also widely seen as a hedge against inflation and against depreciating currencies as it doesn’t rely on any specific issuer or government.
Who buys the most Gold?
Central banks are the biggest Gold holders. In their aim to support their currencies in turbulent times, central banks tend to diversify their reserves and buy Gold to improve the perceived strength of the economy and the currency. High Gold reserves can be a source of trust for a country’s solvency. Central banks added 1,136 tonnes of Gold worth around $70 billion to their reserves in 2022, according to data from the World Gold Council. This is the highest yearly purchase since records began. Central banks from emerging economies such as China, India and Turkey are quickly increasing their Gold reserves.
How is Gold correlated with other assets?
Gold has an inverse correlation with the US Dollar and US Treasuries, which are both major reserve and safe-haven assets. When the Dollar depreciates, Gold tends to rise, enabling investors and central banks to diversify their assets in turbulent times. Gold is also inversely correlated with risk assets. A rally in the stock market tends to weaken Gold price, while sell-offs in riskier markets tend to favor the precious metal.
What does the price of Gold depend on?
The price can move due to a wide range of factors. Geopolitical instability or fears of a deep recession can quickly make Gold price escalate due to its safe-haven status. As a yield-less asset, Gold tends to rise with lower interest rates, while higher cost of money usually weighs down on the yellow metal. Still, most moves depend on how the US Dollar (USD) behaves as the asset is priced in dollars (XAU/USD). A strong Dollar tends to keep the price of Gold controlled, whereas a weaker Dollar is likely to push Gold prices up.
- Indian Rupee attracts some buyers, supported by the upbeat Indian CPI inflation data and foreign inflows.
- Risk-averse sentiment and the possible intervention from the Indian central bank might limit the upside of INR.
- Market players await the Indian WPI inflation and US Retail Sales for February, due on Thursday.
Indian Rupee (INR) trades on a positive note on Wednesday. The upbeat Indian Retail Inflation data for February provides some support to the local currency and drags the USD/INR pair lower. The recovery of INR is also bolstered by persistent foreign inflows in domestic equity markets. However, the renewed US Dollar (USD) demand from importers, risk-averse sentiment, and the potential intervention from the Reserve Bank of India (RBI) might cap the upside of the Indian Rupee.
Looking ahead, investors will monitor India’s Wholesale Price Index (WPI) of Food, Fuel, and Inflation on Thursday. On the US docket, US Retail Sales will be in the spotlight later on Thursday. The Retail Sales figure is estimated to improve to 0.8% MoM in February from a 0.8% drop in January.
Daily Digest Market Movers: Indian Rupee remains stronger amid multiple headwinds
- India's Retail inflation eased to 5.09% YoY in February from 5.10% in the previous month, better than the market expectation of 5.02%, according to the Ministry of Statistics & Programme Implementation.
- The Indian food inflation for February came in at 8.66% versus 8.30% prior. Meanwhile, the rural inflation rate remained steady at 5.34%, while the urban inflation rate declined to 4.78% from 4.92% in January.
- India's Industrial Production dropped to 3.8% YoY in January from the previous reading of 4.2%, stronger than estimated.
- The US headline Consumer Price Index (CPI) came in line with expectations, rising 0.4% MoM in February. The annual CPI figure was above the market consensus, increasing 3.2% YoY in February.
- The Core CPI, excluding volatile food and energy prices, climbed 0.4% MoM and 3.8% YoY, above the market consensus.
- The upbeat inflation data might convince the Fed to focus on more data and allow policymakers to avoid having to rush to cut rates.
Technical Analysis: Indian Rupee remains capped within longer term trading range
Indian Rupee trades strongly on the day. USD/INR has stayed within a multi-month-old descending trend channel around 82.60–83.15 since December 8, 2023.
The bearish outlook of USD/INR remains intact in the near term as the pair is below the 100-day Exponential Moving Average (EMA) on the daily timeframe. Furthermore, the downward momentum is supported by the 14-day Relative Strength Index (RSI), which lies below the 50.0 midlines, indicating the downtrend is more likely to resume than to reverse.
The lower limit of the descending trend channel at 82.60 acts as a potential support level for the pair. A breach of this level could sustain a bearish drop to a low of August 23 at 82.45, followed by a low of June 1 at 82.25.
On the upside, a decisive break above the confluence of the 100-day EMA and a psychological round mark of 83.00 could make its way back up to the upper boundary of the descending trend channel at 83.15. A bullish breakout above 83.15 will expose a high of January 2 at 83.35, en route to the 84.00 round figure.
US Dollar price today
The table below shows the percentage change of US Dollar (USD) against listed major currencies today. US Dollar was the weakest against the Japanese Yen.
| USD | EUR | GBP | CAD | AUD | JPY | NZD | CHF | |
| USD | 0.02% | 0.02% | 0.03% | -0.01% | -0.16% | -0.09% | 0.03% | |
| EUR | -0.02% | -0.01% | 0.01% | -0.03% | -0.18% | -0.13% | 0.01% | |
| GBP | -0.02% | 0.02% | 0.01% | -0.03% | -0.18% | -0.12% | 0.02% | |
| CAD | -0.03% | -0.01% | -0.01% | -0.05% | -0.19% | -0.12% | 0.00% | |
| AUD | 0.01% | 0.04% | 0.03% | 0.05% | -0.15% | -0.10% | 0.02% | |
| JPY | 0.16% | 0.21% | 0.19% | 0.20% | 0.19% | 0.07% | 0.19% | |
| NZD | 0.08% | 0.11% | 0.11% | 0.12% | 0.07% | -0.07% | 0.11% | |
| CHF | -0.03% | -0.01% | -0.02% | 0.00% | -0.04% | -0.19% | -0.12% |
The heat map shows percentage changes of major currencies against each other. The base currency is picked from the left column, while the quote currency is picked from the top row. For example, if you pick the Euro from the left column and move along the horizontal line to the Japanese Yen, the percentage change displayed in the box will represent EUR (base)/JPY (quote).
Indian Rupee FAQs
What are the key factors driving the Indian Rupee?
The Indian Rupee (INR) is one of the most sensitive currencies to external factors. The price of Crude Oil (the country is highly dependent on imported Oil), the value of the US Dollar – most trade is conducted in USD – and the level of foreign investment, are all influential. Direct intervention by the Reserve Bank of India (RBI) in FX markets to keep the exchange rate stable, as well as the level of interest rates set by the RBI, are further major influencing factors on the Rupee.
How do the decisions of the Reserve Bank of India impact the Indian Rupee?
The Reserve Bank of India (RBI) actively intervenes in forex markets to maintain a stable exchange rate, to help facilitate trade. In addition, the RBI tries to maintain the inflation rate at its 4% target by adjusting interest rates. Higher interest rates usually strengthen the Rupee. This is due to the role of the ‘carry trade’ in which investors borrow in countries with lower interest rates so as to place their money in countries’ offering relatively higher interest rates and profit from the difference.
What macroeconomic factors influence the value of the Indian Rupee?
Macroeconomic factors that influence the value of the Rupee include inflation, interest rates, the economic growth rate (GDP), the balance of trade, and inflows from foreign investment. A higher growth rate can lead to more overseas investment, pushing up demand for the Rupee. A less negative balance of trade will eventually lead to a stronger Rupee. Higher interest rates, especially real rates (interest rates less inflation) are also positive for the Rupee. A risk-on environment can lead to greater inflows of Foreign Direct and Indirect Investment (FDI and FII), which also benefit the Rupee.
How does inflation impact the Indian Rupee?
Higher inflation, particularly, if it is comparatively higher than India’s peers, is generally negative for the currency as it reflects devaluation through oversupply. Inflation also increases the cost of exports, leading to more Rupees being sold to purchase foreign imports, which is Rupee-negative. At the same time, higher inflation usually leads to the Reserve Bank of India (RBI) raising interest rates and this can be positive for the Rupee, due to increased demand from international investors. The opposite effect is true of lower inflation.
- EUR/USD maintains its position on market caution surrounding the Fed’s policy decision.
- Euro could receive downward pressure from dovish remarks of ECB members.
- The Upbeat CPI report diminished expectations of a near-term rate cut by the Fed.
EUR/USD floats near 1.0920 during Asian trading hours on Wednesday. The pair encountered volatility on Tuesday, primarily driven by the release of February's inflation data from Germany and the United States (US). While German figures matched expectations, US inflation numbers exceeded expectations.
The German statistics office "Destatis" reported the Harmonized Index of Consumer Prices (HICP) with a year-over-year consistency at 2.7% in February, in line with expectations. The monthly index also remained unchanged at 0.6%.
ECB Governing Council member Francois Villeroy de Galhau stated that there is a consensus within the European Central Bank to commence lowering interest rates in the spring, given the progress in tackling inflation. Villeroy de Galhau emphasized the ECB's ability to independently adjust rates, highlighting the institution's pragmatism regarding rate policy.
Bank of France Governor, Robert Holzmann in an interview with news outlet MNI, said that the ECB is more likely to cut in June than April. But there will be a need to see projections confirmed amid high uncertainty. Pierre Wunsch, Governor of the National Bank of Belgium spoke at a a news conference that the European Central Bank will have to gamble soon with an interest rate cut even though wage inflation and price rises for services are uncomfortably high.
The US Dollar Index (DXY) maintains its position on recent gains, supported by improved US Treasury yields. The US Dollar received a boost from a stronger-than-expected CPI report, diminishing expectations of a near-term rate cut by the Federal Reserve (Fed) and strengthening the Greenback. This dynamic posed a challenge for the EUR/USD pair.
In February, US CPI (YoY) rose by 3.2%, surpassing estimates of 3.1%. The monthly index met expectations at 0.4%, higher than the 0.3% seen previously. US Core CPI rose by 3.8% year-over-year, above the anticipated 3.7% but below the previous 3.9% reading. The month-over-month figure remained steady at 0.4%, compared to the expected 0.3%. Traders are expected to redirect their attention to the upcoming US Core Producer Price Index (PPI) and Retail Sales data scheduled for release on Thursday.
| Raw materials | Closed | Change, % |
|---|---|---|
| Silver | 24.136 | -1.32 |
| Gold | 2158.576 | -1.07 |
| Palladium | 1039.65 | 1.24 |
Japan’s Chief Cabinet Secretary Yoshimasa Hayashi said on Wednesday, he “will want to see widespread wage rises across the economy.
Additional quotes
Important for wage hikes to spread to mid-sized, small companies.
Seeing strong momentum for wage hikes.
- India’s Sensex is likely to open flat after closing Tuesday in the green below 74,000.
- Sensex swung between gains and losses on Tuesday, as markets stayed cautious ahead of India/ US CPI data.
- For February, US CPI came in hotter-than-expected at 3.2% YoY; India’s inflation stayed flat at 5.09% YoY.
The Sensex 30, one of India’s key benchmark indices, is expected to open flat to marginally lower after settling in positive territory on Tuesday.
The muted trading in the Gift Nifty futures combined with mixed Asian stock markets indicate a cautious start to Sensex, as traders take account of the key inflation data released from India and the US.
The Bombay Stock Exchange (BSE) Sensex 30 is up 0.22% on the day at 73,667.96.
Stock market news
- The top gainers on Sensex on Tuesday were HDFC Bank, TCS, Reliance Industries, Maruti Suzuki and Infosys. Meanwhile, the top losers include ITC, JSW Steel, NTPC, Nestle and SBI Bank.
- FMCG and metals sectors stocks were a drag on Sensex but the rally in the technology stocks came to the rescue of buyers.
- Shares of Zomato rose as much as 2.0% on a strong ad revenue forecast.
- Shares of steel-related companies in Asia dropped, following iron ore’s biggest slide since 2022. Dalian iron ore hits five-month low on weak sentiment amid subdued demand in top consumer China.
- British American Tobacco (BAT) is reportedly gearing up for a much-anticipated sale of its stake in ITC within the next fortnight, according to two individuals familiar with the development. ITC shares slide over 2.0%.
- China’s state-backed developer Vanke Co. declined after Moody’s Ratings stripped the company’s investment-grade credit rating and warned of potential further cuts.
- Wipro expanded its partnership with Nutanix to launch a new Nutanix-focused business unit.
- India’s headline CPI retail inflation came in at 5.09% in February compared to the 5.1% print for January. Meanwhile, the country’s Industrial Production stayed unchanged at 3.8% in January, missing the estimates of 4.1%.
- The US stock markets rebounded firmly on Tuesday, as a mixed US Consumer Price Index (CPI) report failed to have any impact on the June Fed rate cut expectations.
- The US CPI rose 3.2% in February from a year ago, beating the market forecast of 3.1%. The monthly CPI increased 0.4% in the same period. Core CPI, which excludes food and energy prices, increased 0.4% from the last month and 3.8% over the year.
- Markets continue to price in about a 70% chance that the Fed could begin easing rates in June, according to the CME FedWatch Tool.
- Attention now turns toward the US Retail Sales and consumer sentiment data due later this week.
Sensex FAQs
The Sensex is a name for one of India’s most closely monitored stock indexes. The term was coined in the 1980s by analyst Deepak Mohoni by mashing the words sensitive and index together. The index plots a weighted average of the share price of 30 of the most established stocks on the Bombay Stock Exchange. Each corporation's weighting is based on its "free-float capitalization", or the value of all its shares readily available for trading.
Given it is a composite, the value of the Sensex is first and foremost dependent on the performance of its constituent companies as revealed in their quarterly and annual results. Government policies are another factor. In 2016 the government decided to phase out high value currency notes, for example, and certain companies saw their share price fall as a result. When the government decided to cut corporation tax in 2019, meanwhile, the Sensex gained a boost. Other factors include the level of interest rates set by the Reserve Bank of India, since that dictates the cost of borrowing, climate change, pandemics and natural disasters
The Sensex started life on April 1 1979 at a base level of 100. It reached its highest recorded level so far, at 73,328, on Monday, January 15, 2024 (this is being written in Feb 2024). The Index closed above the 10,000 mark for the first time on February 7, 2006. On March 13, 2014 the Sensex closed higher than Hong Kong’s Hang Seng index to become the major Asian stock index with the highest value. The index’s biggest gain in a single day occurred on April 7, 2020, when it rose 2,476 points; its deepest single-day loss occurred on January 21, 2008, when it plunged 1,408 points due the US subprime crisis.
Major companies within the Sensex include Reliance Industries Ltd, HDFC Bank, Axis Bank, ITC Ltd, Bharti Airtel Ltd, Tata Steel, HCL Technologies, Infosys, State Bank of India, Sun Pharma, Tata Consultancy Services and Tech Mahindra.
The central focus early Wednesday is on the outcome of Japan’s wage negotiations, with the country’s largest trade union confederation, Rengo, having demanded pay rises of 5.85% this year, topping 5.0% for the first time in 30 years.
Citing Japanese media outlets, Reuters reported that the union wage demands for a hike of JPY18,215 have been met.
In sync with the Japanese unions’ demands, Toyota responded in full to the Toyota Automobile Workers' Union's demands for wages and annual lump-sum payments (bonuses), which were at record high levels, per Reuters.
The amount of wage increases requested varies by job type and rank, but the maximum amount is 28,440 Yen per month.
Meanwhile, Okuma Corp hiked wages by 15,960 Yen per month.
Additional headlines
GS Yuasa has agreed to union wage rise demands in full.
Mitsubishi Heavy to raise wages by an average of 8.3%, an 18,000 yen base pay increase.
Nissan Motor responded to the Union's wage hike demand in full.
Nippon Steel responded to the Union's wage hike demand in full.
Market reaction
The Japanese firms’ adherence to the Union wage hike demands serves as a positive indication for the Bank of Japan (BoJ) to embark upon the highly anticipated hawkish policy pivot in its March policy meeting next week. The revival of BoJ March rate hike expectations has lifted the Japanese Yen across the board.
At the time of writing, USD/JPY is down 0.11% on the day at 147.51, recovering from a brief dip to near 147.25.
Bank of Japan FAQs
The Bank of Japan (BoJ) is the Japanese central bank, which sets monetary policy in the country. Its mandate is to issue banknotes and carry out currency and monetary control to ensure price stability, which means an inflation target of around 2%.
The Bank of Japan has embarked in an ultra-loose monetary policy since 2013 in order to stimulate the economy and fuel inflation amid a low-inflationary environment. The bank’s policy is based on Quantitative and Qualitative Easing (QQE), or printing notes to buy assets such as government or corporate bonds to provide liquidity. In 2016, the bank doubled down on its strategy and further loosened policy by first introducing negative interest rates and then directly controlling the yield of its 10-year government bonds.
The Bank’s massive stimulus has caused the Yen to depreciate against its main currency peers. This process has exacerbated more recently due to an increasing policy divergence between the Bank of Japan and other main central banks, which have opted to increase interest rates sharply to fight decades-high levels of inflation. The BoJ’s policy of holding down rates has led to a widening differential with other currencies, dragging down the value of the Yen.
A weaker Yen and the spike in global energy prices have led to an increase in Japanese inflation, which has exceeded the BoJ’s 2% target. Still, the Bank judges that the sustainable and stable achievement of the 2% target has not yet come in sight, so any sudden change in the current policy looks unlikely.
- The Japanese Yen attracts fresh buyers following the overnight fall to the weekly low.
- Reports that the BoJ is considering a March rate hike provide a modest boost to the JPY.
- The USD fades the warmer US CPI-led spike and does little to lend support to USD/JPY.
The Japanese Yen (JPY) edges higher against its American counterpart during the Asian session on Wednesday and moves away from the weekly low touched the previous day. A Bloomberg report, citing people familiar with the matter, indicates that the Bank of Japan (BoJ) is considering a March hike, though the outcome is too close to call and the final decision will be made after officials see the initial tally from spring wage talks. This, in turn, is seen as a key factor underpinning the JPY and exerting some downward pressure on the USD/JPY pair amid a modest US Dollar (USD) downtick.
That said, the overnight dovish remarks by BoJ Governor Kazuo Ueda might have cooled bets for an immediate rate hike. Apart from this, a generally positive risk tone might hold back traders from placing aggressive bullish bets around the safe-haven JPY. Furthermore, stronger-than-expected US consumer inflation data released on Tuesday suggested that the Federal Reserve (Fed) could potentially delay any monetary easing. This led to the overnight goodish rebound in the US Treasury bond yields, which should act as a tailwind for the Greenback and limit losses for the USD/JPY pair.
Daily Digest Market Movers: Japanese Yen regains positive traction amid renewed BoJ rate hike talks
- Expectations that Japan's biggest companies will offer sizeable pay increases and clear the way for the Bank of Japan to end its negative interest rates as early as next week lend some support to the Japanese Yen.
- In fact, Japan’s largest umbrella group for unions, Rengo, said that its affiliated members demanded an average wage increase of 5.85% this year, which, in turn, would mark the biggest increase in around 31 years.
- In the latest development, Toyota responds to Union wage hike demand in full, while Okuma Corp hikes wages by ¥15,960 vs. union demand of ¥18,215, raising the question if the hikes are enough to justify BoJ tightening.
- According to people familiar with the matter, the assessment of BoJ officials is that the central bank is close to liftoff, regardless of whether the first interest rate hike since 2007 comes in March or April policy meeting.
- BoJ Governor Kazuo Ueda said on Tuesday that the central bank will seek an exit from easy policy when achievement of 2% inflation is in sight, smashing hopes for an imminent shift in the policy stance next week.
- Data released from the US showed that the headline Consumer Price Index (CPI) rose 0.4% in February, while the yearly rate came in at 3.2% as compared to January's final print and market expectations of 3.1%.
- Annual Core CPI, which excludes volatile food and energy prices, increased 3.8% during the reported month, slightly below the January rise of 3.9% but was above consensus estimates for a reading of 3.7%.
- The slightly warmer US consumer inflation figures boosted the US Treasury bond yields, which should act as a tailwind for the US Dollar and help limit any meaningful depreciating move for the USD/JPY pair.
Technical Analysis: USD/JPY seems vulnerable to slide further while below 100-day SMA, 148.00 mark
From a technical perspective, spot prices struggled to find acceptance above the 100-day Simple Moving Average (SMA) and the 148.00 round-figure mark on Tuesday. The subsequent decline, along with the formation of a bearish double-top pattern in the vicinity of the 152.00 mark, or the YTD peak touched in February, suggests that the recent bearish trend might still be far from being over. Moreover, oscillators on the daily chart are holding deep in the negative territory and suggest that the path of least resistance for the USD/JPY pair is to the downside.
Any further downfall, however, is likely to find some support near the 147.00 mark ahead of the 146.80 region, representing the 38.2% Fibonacci retracement level of the December-February rally. Some follow-through selling will expose the very important 200-day SMA, currently pegged near the 146.25 region, which if broken decisively will be seen as a fresh trigger for bearish traders. The USD/JPY pair might then weaken further below the 146.00 round figure and accelerate the slide towards the 50% Fibo. level, around the 145.55-145.50 zone.
Japanese Yen price today
The table below shows the percentage change of Japanese Yen (JPY) against listed major currencies today. Japanese Yen was the weakest against the Swiss Franc.
| USD | EUR | GBP | CAD | AUD | JPY | NZD | CHF | |
| USD | 0.01% | 0.00% | 0.01% | 0.03% | -0.22% | 0.02% | -0.01% | |
| EUR | -0.01% | -0.01% | 0.00% | 0.03% | -0.23% | 0.00% | -0.02% | |
| GBP | 0.00% | 0.01% | 0.01% | 0.04% | -0.22% | 0.01% | -0.01% | |
| CAD | -0.01% | 0.00% | -0.01% | 0.01% | -0.23% | 0.00% | -0.02% | |
| AUD | -0.03% | -0.03% | -0.04% | -0.01% | -0.25% | -0.04% | -0.07% | |
| JPY | 0.22% | 0.25% | 0.23% | 0.22% | 0.29% | 0.22% | 0.21% | |
| NZD | -0.01% | -0.01% | -0.01% | 0.00% | 0.02% | -0.23% | -0.02% | |
| CHF | 0.01% | 0.02% | 0.00% | 0.02% | 0.04% | -0.21% | 0.02% |
The heat map shows percentage changes of major currencies against each other. The base currency is picked from the left column, while the quote currency is picked from the top row. For example, if you pick the Euro from the left column and move along the horizontal line to the Japanese Yen, the percentage change displayed in the box will represent EUR (base)/JPY (quote).
Japanese Yen FAQs
What key factors drive the Japanese Yen?
The Japanese Yen (JPY) is one of the world’s most traded currencies. Its value is broadly determined by the performance of the Japanese economy, but more specifically by the Bank of Japan’s policy, the differential between Japanese and US bond yields, or risk sentiment among traders, among other factors.
How do the decisions of the Bank of Japan impact the Japanese Yen?
One of the Bank of Japan’s mandates is currency control, so its moves are key for the Yen. The BoJ has directly intervened in currency markets sometimes, generally to lower the value of the Yen, although it refrains from doing it often due to political concerns of its main trading partners. The current BoJ ultra-loose monetary policy, based on massive stimulus to the economy, has caused the Yen to depreciate against its main currency peers. This process has exacerbated more recently due to an increasing policy divergence between the Bank of Japan and other main central banks, which have opted to increase interest rates sharply to fight decades-high levels of inflation.
How does the differential between Japanese and US bond yields impact the Japanese Yen?
The BoJ’s stance of sticking to ultra-loose monetary policy has led to a widening policy divergence with other central banks, particularly with the US Federal Reserve. This supports a widening of the differential between the 10-year US and Japanese bonds, which favors the US Dollar against the Japanese Yen.
How does broader risk sentiment impact the Japanese Yen?
The Japanese Yen is often seen as a safe-haven investment. This means that in times of market stress, investors are more likely to put their money in the Japanese currency due to its supposed reliability and stability. Turbulent times are likely to strengthen the Yen’s value against other currencies seen as more risky to invest in.
- Australian Dollar exhibits sideways movement with a bias to continue its losing streak.
- Australia's S&P/ASX 200 Index mirrors the gains seen on Wall Street overnight, avoiding the upbeat US Inflation data.
- US CPI YoY and MoM rose by 3.2% and 0.4%, respectively, in February.
The Australian Dollar (AUD) consolidates, with a sentiment indicating a potential continuation of its losing streak for the third successive session on Wednesday. Despite the S&P/ASX 200 Index rising for the second consecutive day, tracking gains on Wall Street overnight, lower commodity prices could exert pressure on the Aussie Dollar. Investor sentiment remains cautiously optimistic following the release of upbeat Consumer Price Index (CPI) data from the United States (US).
Australian Dollar suffered losses against the US Dollar (USD) on Tuesday, driven by a stronger-than-expected CPI report that dampened hopes of a near-term rate cut by the Federal Reserve (Fed). This strengthened the Greenback, potentially creating headwinds for the AUD/USD pair. Traders are likely to shift their focus to the US Core Producer Price Index (PPI) and Retail Sales data scheduled for release on Thursday.
Daily Digest Market Movers: Australian Dollar remains subdued on risk-off sentiment
- Australia's NAB Business Confidence Index decreased to 0 in February, from 1 in the previous month.
- Australia's NAB Business Conditions Index improved to 10 from the previous reading of 7 (revised from 6).
- Sarah Hunter, Assistant Governor (Economics) at the Reserve Bank of Australia (RBA), addressed a panel at the AFR Business Summit on Tuesday, discussing fourth-quarter GDP in line with forecasts. Hunter mentioned that recent inflation data also matched expectations, with inflation remaining the primary hindrance to household consumption.
- CIBC discusses the latest US CPI data for February, noting that while the report exceeds consensus expectations, it does not warrant alarm regarding inflation trends.
- According to the CME FedWatch Tool, the probability of a rate cut in March has decreased to 1.0%, while in May it stands at 15.6%. In June, the likelihood of a rate cut is estimated to be 66.6%.
- US CPI (YoY) came in at 3.2% in February, exceeding estimates of 3.1% and above January’s 3.1%. The monthly index printed 0.4% as expected above 0.3% prior.
- US Core CPI increased by 3.8% year-over-year, above the expected 3.7% but below the previous 3.9% reading. While MoM remained consistent at 0.4% against the expected 0.3%
- The Monthly Budget Statement printed a deficit of $296 billion in February, below the expected deficit of $299 billion. However, it has sharply increased from the previous deficit of $22 billion.
- US Nonfarm Payrolls increased by 275K in February, surpassing January's figure of 229K and beating expectations of 200K.
- US Average Hourly Earnings (YoY) grew by 4.3%, falling slightly below February’s estimated and previous reading of 4.4%. Monthly, there was an increase of 0.1%, which was lower than the anticipated 0.3% and the previous month's 0.5%.
Technical Analysis: Australian Dollar tests the psychological support of 0.6600
The Australian Dollar remains positioned above the psychological support of 0.6600 on Wednesday. A breach below this level might propel the AUD/USD pair toward the vicinity of the nine-day Exponential Moving Average (EMA) at 0.6584, coinciding with the 38.2% Fibonacci retracement level of 0.6581. To the upside, the AUD/USD pair could encounter significant resistance at the major level of 0.6650, followed by the previous week’s high of 0.6667. A breakthrough above the latter could provide further momentum for the pair to challenge the psychological barrier of the 0.6700 level.
AUD/USD: Daily Chart
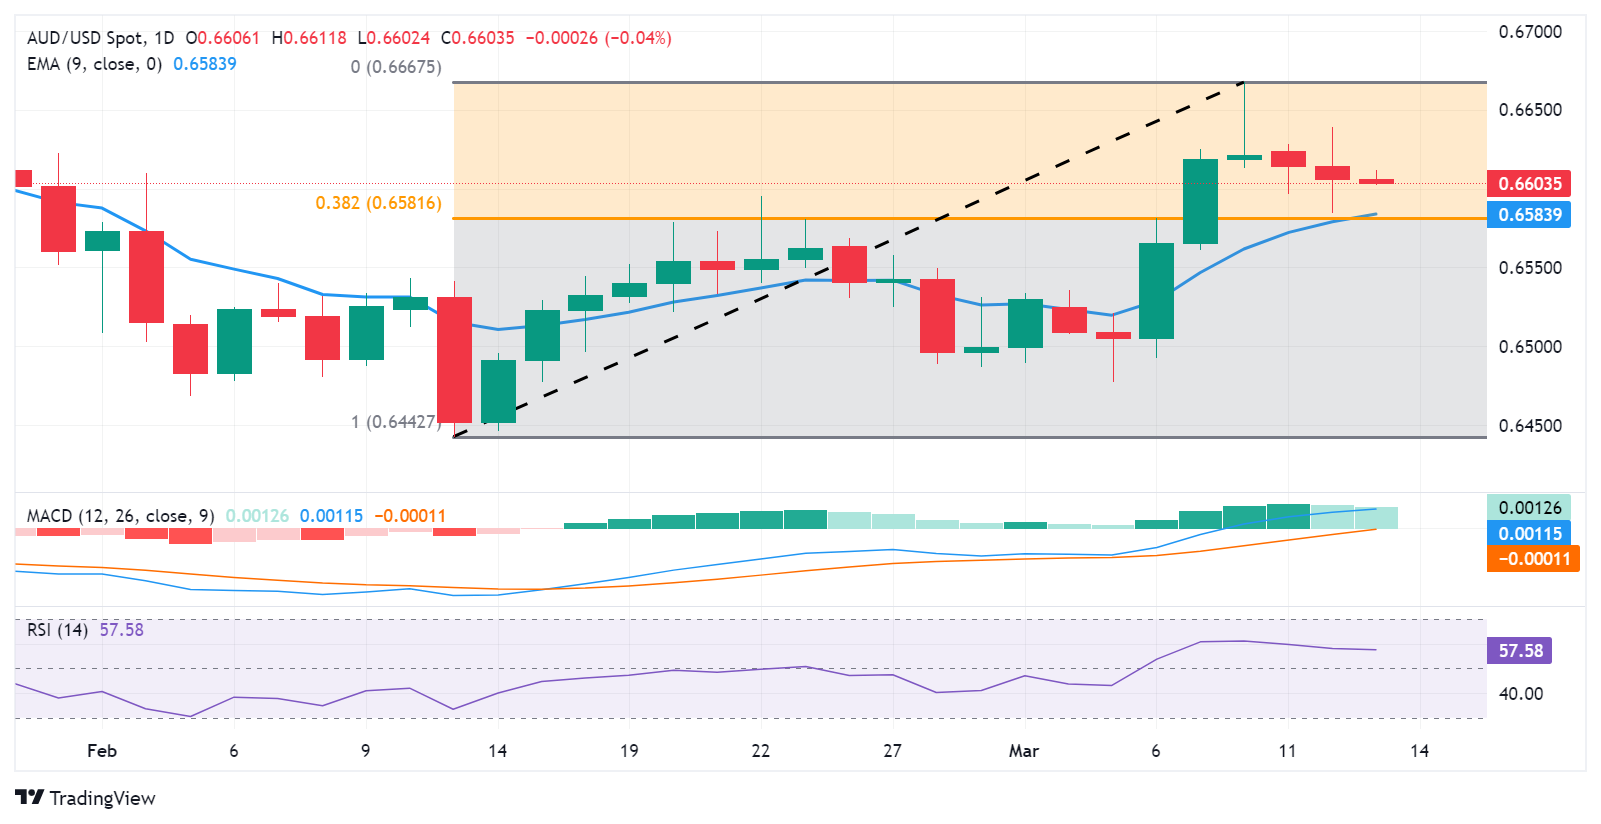
Australian Dollar price today
The table below shows the percentage change of Australian Dollar (AUD) against listed major currencies today. Australian Dollar was the weakest against the Japanese Yen.
| USD | EUR | GBP | CAD | AUD | JPY | NZD | CHF | |
| USD | 0.02% | 0.01% | 0.03% | 0.07% | -0.23% | 0.04% | 0.01% | |
| EUR | -0.02% | -0.01% | 0.01% | 0.05% | -0.25% | 0.01% | -0.02% | |
| GBP | -0.01% | 0.01% | 0.02% | 0.06% | -0.24% | 0.03% | 0.00% | |
| CAD | -0.03% | -0.01% | -0.02% | 0.03% | -0.26% | 0.01% | -0.02% | |
| AUD | -0.07% | -0.05% | -0.06% | -0.03% | -0.30% | -0.05% | -0.09% | |
| JPY | 0.23% | 0.27% | 0.25% | 0.27% | 0.33% | 0.26% | 0.23% | |
| NZD | -0.03% | -0.02% | -0.03% | 0.00% | 0.04% | -0.26% | -0.03% | |
| CHF | -0.01% | 0.01% | 0.00% | 0.03% | 0.07% | -0.23% | 0.03% |
The heat map shows percentage changes of major currencies against each other. The base currency is picked from the left column, while the quote currency is picked from the top row. For example, if you pick the Euro from the left column and move along the horizontal line to the Japanese Yen, the percentage change displayed in the box will represent EUR (base)/JPY (quote).
Australian Dollar FAQs
One of the most significant factors for the Australian Dollar (AUD) is the level of interest rates set by the Reserve Bank of Australia (RBA). Because Australia is a resource-rich country another key driver is the price of its biggest export, Iron Ore. The health of the Chinese economy, its largest trading partner, is a factor, as well as inflation in Australia, its growth rate, and Trade Balance. Market sentiment – whether investors are taking on more risky assets (risk-on) or seeking safe-havens (risk-off) – is also a factor, with risk-on positive for AUD.
The Reserve Bank of Australia (RBA) influences the Australian Dollar (AUD) by setting the level of interest rates that Australian banks can lend to each other. This influences the level of interest rates in the economy as a whole. The main goal of the RBA is to maintain a stable inflation rate of 2-3% by adjusting interest rates up or down. Relatively high interest rates compared to other major central banks support the AUD, and the opposite for relatively low. The RBA can also use quantitative easing and tightening to influence credit conditions, with the former AUD-negative and the latter AUD-positive.
China is Australia’s largest trading partner so the health of the Chinese economy is a major influence on the value of the Australian Dollar (AUD). When the Chinese economy is doing well it purchases more raw materials, goods and services from Australia, lifting demand for the AUD, and pushing up its value. The opposite is the case when the Chinese economy is not growing as fast as expected. Positive or negative surprises in Chinese growth data, therefore, often have a direct impact on the Australian Dollar and its pairs.
Iron Ore is Australia’s largest export, accounting for $118 billion a year according to data from 2021, with China as its primary destination. The price of Iron Ore, therefore, can be a driver of the Australian Dollar. Generally, if the price of Iron Ore rises, AUD also goes up, as aggregate demand for the currency increases. The opposite is the case if the price of Iron Ore falls. Higher Iron Ore prices also tend to result in a greater likelihood of a positive Trade Balance for Australia, which is also positive of the AUD.
The Trade Balance, which is the difference between what a country earns from its exports versus what it pays for its imports, is another factor that can influence the value of the Australian Dollar. If Australia produces highly sought after exports, then its currency will gain in value purely from the surplus demand created from foreign buyers seeking to purchase its exports versus what it spends to purchase imports. Therefore, a positive net Trade Balance strengthens the AUD, with the opposite effect if the Trade Balance is negative.
On Wednesday, the People’s Bank of China (PBoC) set the USD/CNY central rate for the trading session ahead at 7.0930 as compared to the previous day's fix of 7.0963 and 7.1775 Reuters estimates.
- USD/CAD trades with a mild positive bias around 1.3492 in Wednesday’s early Asian session.
- The upbeat US CPI inflation data for February might convince the Fed to wait until the summer before starting rate cuts.
- Moody’s Analytics stated that the BoC is at risk of weakening the economy by not cutting interest rates sooner.
The USD/CAD pair posts modest gains below the 1.3500 mark during the early Asian session on Wednesday. The stronger-than-expected US inflation number weighs on market sentiment and provides some support for the pair. The US February Retail Sales will be the highlight for this week, which is projected to improve to 0.8% MoM. USD/CAD currently trades near 1.3492, adding 0.01% for the day.
The US inflation, as measured by the Consumer Price Index (CPI), unexpectedly increased to 3.2% YoY in February, keeping the Federal Reserve (Fed) on course to wait at least until the summer before starting to cut interest rates. Additionally, the Core CPI, excluding volatile food and energy prices, rose 0.4% MoM and 3.8% YoY, stronger than the estimation. The February CPI inflation data will play an important role in the Fed’s rate forecast. Investors anticipate the US central bank to keep rates between 5.25% and 5.5% in its March meeting scheduled for next week.
On the Loonie front, analysts are concerned about the economic slowdown in the Canadian economy. Moody’s Analytics stated that the Bank of Canada (BoC) is at risk of weakening the economy by not cutting interest rates sooner. Earlier this month, the BoC left the interest rate unchanged at 5% for the fifth consecutive meeting. The BoC governor Tiff Macklem said that core inflation remains a concern and emphasized that it was premature to talk about rate cuts.
Looking ahead, Canada’s Manufacturing Sales, Housing Starts, and Wholesale Sales for January will be published on Thursday. On the US docket, Retail Sales for February will be a closely watched event this week. This event could give a clear direction to the USD/CAD pair.
| Index | Change, points | Closed | Change, % |
|---|---|---|---|
| NIKKEI 225 | -22.98 | 38797.51 | -0.06 |
| Hang Seng | 505.93 | 17093.5 | 3.05 |
| KOSPI | 21.97 | 2681.81 | 0.83 |
| ASX 200 | 8.3 | 7712.5 | 0.11 |
| DAX | 218.84 | 17965.11 | 1.23 |
| CAC 40 | 67.75 | 8087.48 | 0.84 |
| Dow Jones | 235.83 | 39005.49 | 0.61 |
| S&P 500 | 57.33 | 5175.27 | 1.12 |
| NASDAQ Composite | 246.37 | 16265.64 | 1.54 |
European Central Bank (ECB) Governing Council member Pierre Wunsch spoke at a news conference on the Belgian national bank's annual report, stating that the ECB will have to make decisions soon with interest rate cuts, even while wage inflation and price rises for services remain high.
Key quotes
"We are going to have to make a bet at some point,"
"Felt the Bank should act "before so long", without specifying a month."
"But it will remain a cautious move on the basis of what I know today because of the problem that has been commented on again and again and again that service inflation and wage developments are still running at levels that are ultimately not compatible with our objective.”
"But of course in our projections we have these going down so we are not going to wait until we see wage development at 3% before we cut rates. I guess we'll do it before and that's why I say it's important we need to take a bet,"
Market reaction
At the time of writing, the EUR/USD pair is trading higher at 1.0927, gaining 0.01% on the day.
ECB FAQs
What is the ECB and how does it influence the Euro?
The European Central Bank (ECB) in Frankfurt, Germany, is the reserve bank for the Eurozone. The ECB sets interest rates and manages monetary policy for the region.
The ECB primary mandate is to maintain price stability, which means keeping inflation at around 2%. Its primary tool for achieving this is by raising or lowering interest rates. Relatively high interest rates will usually result in a stronger Euro and vice versa.
The ECB Governing Council makes monetary policy decisions at meetings held eight times a year. Decisions are made by heads of the Eurozone national banks and six permanent members, including the President of the ECB, Christine Lagarde.
What is Quantitative Easing (QE) and how does it affect the Euro?
In extreme situations, the European Central Bank can enact a policy tool called Quantitative Easing. QE is the process by which the ECB prints Euros and uses them to buy assets – usually government or corporate bonds – from banks and other financial institutions. QE usually results in a weaker Euro.
QE is a last resort when simply lowering interest rates is unlikely to achieve the objective of price stability. The ECB used it during the Great Financial Crisis in 2009-11, in 2015 when inflation remained stubbornly low, as well as during the covid pandemic.
What is Quantitative tightening (QT) and how does it affect the Euro?
Quantitative tightening (QT) is the reverse of QE. It is undertaken after QE when an economic recovery is underway and inflation starts rising. Whilst in QE the European Central Bank (ECB) purchases government and corporate bonds from financial institutions to provide them with liquidity, in QT the ECB stops buying more bonds, and stops reinvesting the principal maturing on the bonds it already holds. It is usually positive (or bullish) for the Euro.
| Pare | Closed | Change, % |
|---|---|---|
| AUDUSD | 0.66044 | -0.11 |
| EURJPY | 161.316 | 0.5 |
| EURUSD | 1.09262 | 0.01 |
| GBPJPY | 188.878 | 0.35 |
| GBPUSD | 1.27905 | -0.16 |
| NZDUSD | 0.61486 | -0.33 |
| USDCAD | 1.34901 | 0.06 |
| USDCHF | 0.87713 | -0.05 |
| USDJPY | 147.649 | 0.49 |
- GBP/USD remains capped under the 1.2800 barrier on the stronger USD in Wednesday’s Asian session.
- The US CPI rose 0.4% MoM and 3.2% YoY in February; the Core CPI climbed 0.4% MoM and 3.8% YoY.
- The annual rate of wage growth in the United Kingdom (UK) is falling from November last year to January 2024.
The GBP/USD pair holds below the 1.2800 psychological barrier during the early Asian trading hours on Wednesday. The firmer US Dollar (USD) after the US February CPI inflation data drags the major pair lower. Investor. Investors await the UK GDP growth number for January, which is forecast to grow by 0.2% MoM. GBP/USD currently trades around 1.2795, adding 0.02% on the day.
US inflation, as measured by the Consumer Price Index (CPI), rose 0.4% MoM and 3.2% YoY in February, the Bureau of Labor Statistics revealed on Tuesday. The monthly CPI figure was in line with expectations, while the annual figure was above the market consensus of 3.1%. The Core CPI, excluding volatile food and energy prices, climbed 0.4% MoM and 3.8% YoY, beating the estimation.
The stronger-than-expected CPI inflation data might convince Federal Reserve (Fed) policymakers to wait at least until the summer before starting to lower interest rates. Fed officials emphasized in recent weeks that rate cuts are likely at some point this year, but they caution about reacting too soon in the battle against high prices. Investors will take more cues from the February Retail Sales on Thursday, which is expected to rise 0.8% MoM. The strong Retail Sales data might prompt some further repricing of anticipation following the February CPI inflation report.
Data released from the Office for National Statistics (ONS) reported on Tuesday that the annual rate of wage growth in the United Kingdom (UK) is falling. The UK Average Earnings Including Bonuses from November last year to January 2024 eased to 5.6% from 5.8% in the previous reading, while annual wage growth excluding bonuses dropped to 6.1% versus 6.2% prior. In response to the data, the bets for the Bank of England (BoE) rate cuts this year increased marginally, and traders expect three rate cuts this year.
Moving on, traders will keep an eye on the UK monthly Gross Domestic Product for January, Construction Output, Goods Trade Balance, Industrial Production, and Manufacturing Production, due on Wednesday. On Thursday, US Retail Sales for February will be in the spotlight.


© 2000-2026. Уcі права захищені.
Cайт знаходитьcя під керуванням TeleTrade DJ. LLC 2351 LLC 2022 (Euro House, Richmond Hill Road, Kingstown, VC0100, St. Vincent and the Grenadines).
Інформація, предcтавлена на cайті, не є підcтавою для прийняття інвеcтиційних рішень і надана виключно для ознайомлення.
Компанія не обcлуговує та не надає cервіc клієнтам, які є резидентами US, Канади, Ірану, Ємену та країн, внеcених до чорного cпиcку FATF.
Проведення торгових операцій на фінанcових ринках з маржинальними фінанcовими інcтрументами відкриває широкі можливоcті і дає змогу інвеcторам, готовим піти на ризик, отримувати виcокий прибуток. Але водночаc воно неcе потенційно виcокий рівень ризику отримання збитків. Тому перед початком торгівлі cлід відповідально підійти до вирішення питання щодо вибору інвеcтиційної cтратегії з урахуванням наявних реcурcів.
Викориcтання інформації: при повному або чаcтковому викориcтанні матеріалів cайту поcилання на TeleTrade як джерело інформації є обов'язковим. Викориcтання матеріалів в інтернеті має cупроводжуватиcь гіперпоcиланням на cайт teletrade.org. Автоматичний імпорт матеріалів та інформації із cайту заборонено.
З уcіх питань звертайтеcь за адреcою pr@teletrade.global.
переклади