- Аналітика
- Новини та інструменти
- Новини ринків
Новини ринків
- WTI chalks in a seventh straight gain on Tuesday as geopolitical headlines remain.
- A bumper US CPI inflation print keeps barrel prices capped.
- US API Weekly Crude Stocks surged once again.
West Texas Intermediate (WTI) US Crude Oil climbed for a seventh consecutive day on Tuesday, testing the $78.00 per barrel price handle before settling near $77.40. Geopolitical tensions continue to keep Crude Oil bolstered, but an overhang in US crude supplies is weighing down energy markets, alongside a hotter-than-expected US Consumer Price Index (CPI) inflation print restraining investor sentiment.
US CPI inflation declines to 3.1% in January vs. 2.9% forecast
US CPI inflation came in higher and hotter than markets were hoping for, driving down money market expectations of a Federal Reserve (Fed) rate cut. The CME’s FedWatch Tool shows rate markets are now pricing in a first Fed rate trim in June, helping to keep oi barrel bids under pressure.
Geopolitics continue to be the main driver of Crude Oil upside momentum as a ceasefire in the Gaza conflict appears to be elusive, and the Russia-Ukraine conflict continues to slow burn on Eastern European markets as sanctions weigh on Russian Crude Oil markets.
The US’ American Petroleum Institute’s (API) weekly barrel counts showed a surprise buildup of 8.52 million barrels in the US Crude Oil supply stream, a much higher buildup than the forecast 2.6 million barrels. It is the largest buildup of US Crude Oil since the API’s mid-November barrel counts print.
WTI technical outlook
Near-term momentum in WTI US Crude Oil remains firmly bullish, with intraday action trading well above the 200-hour Simple Moving Average (SMA) near $74.72. WTI has traded north of the 200-hour SMA since crossing over the median technical barrier last week, and the near-term technical ceiling sits at Tuesday’s failed breach of the $78.00 handle.
Tuesday’s bullish push left WTI overextended into the 200-day SMA priced in near $77.36, and a failed bullish climb over the key technical indicator will leave WTI bids exposed to an extended backslide into early February’s bottom bids near $72.00.
WTI hourly chart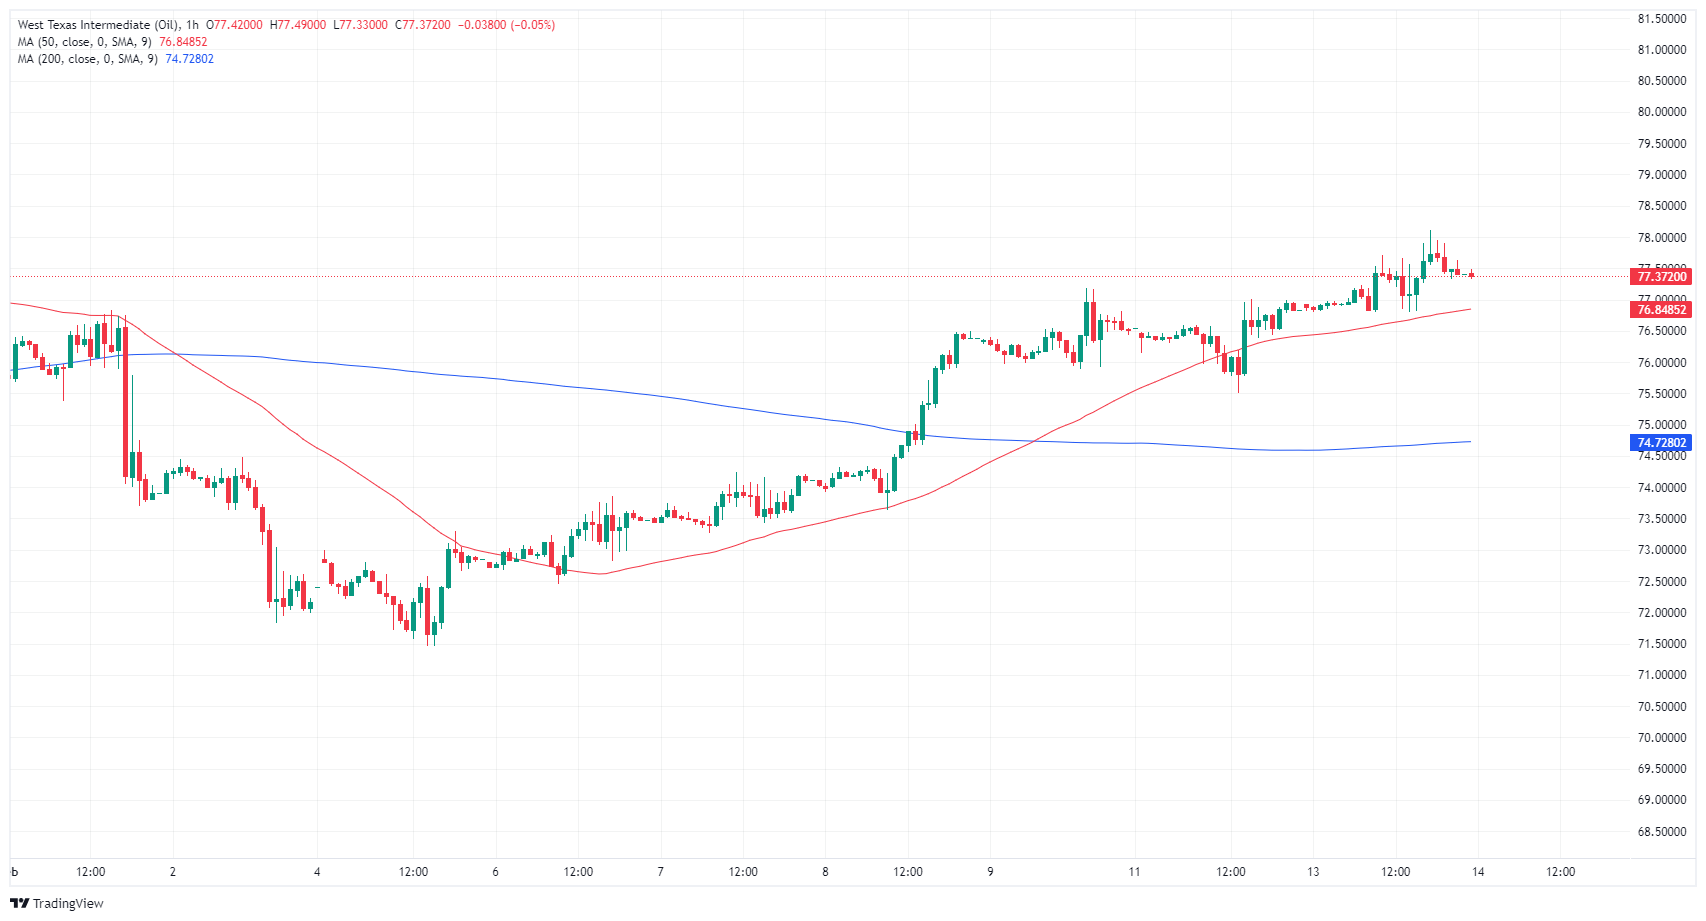
WTI daily chart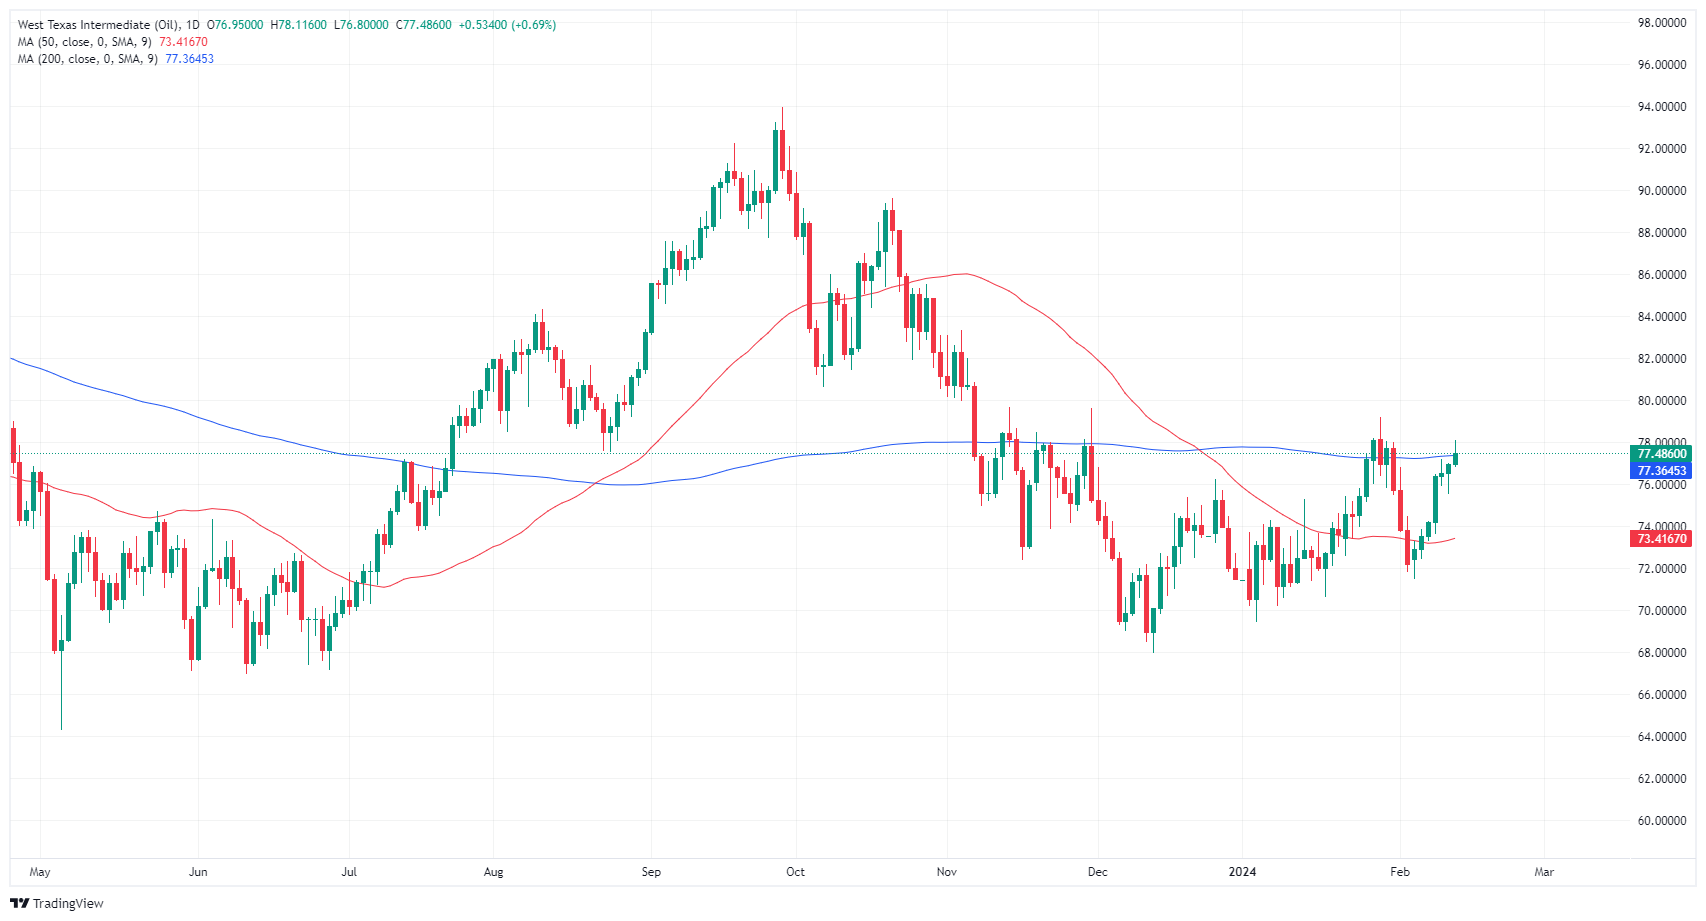
Japan's top currency diplomat Masato Kanda, who will instruct the BOJ to intervene, when he judges it necessary, warned that recent movements in the foreign exchange market have been rapid, and authorities stand ready to take steps in the market if needed, per Bloomberg.
Key quotes
“Recent Yen moves are rapid.”
“Closely watching FX moves with a high sense of urgency.”
“Will take appropriate actions if needed on forex.”
“Ready to take action on forex anytime 24 hours all year around just like natural disaster.”
“Rapid forex moves could have adverse impact on economy.”
“Closely communicating with the Bank of Japan.”
“Up to the BOJ to decide monetary policy.”
“FX moves seem to be reflecting both fundamentals and speculative moves.”
“We perceive the Yen's fall by around 10 Yen a month as rapid.”
“Suggests appropriate responses to weak yen could include intervention.
Market reaction
At the time of writing, USD/JPY is trading at 150.64, losing 0.09% on the day.
- AUD/USD falls 1.18% to a 2024 low of 0.6442 after US inflation data strengthens Fed's rate position.
- US CPI at 3.1% YoY and core inflation at 3.9% exceed forecasts, driving Treasury yields higher.
- Dollar Index nears three-month high at 104.96, with eyes on surpassing the 105.00 level.
- Fed easing expectations shift to June, as per CME FedWatch Tool, after inflation report.
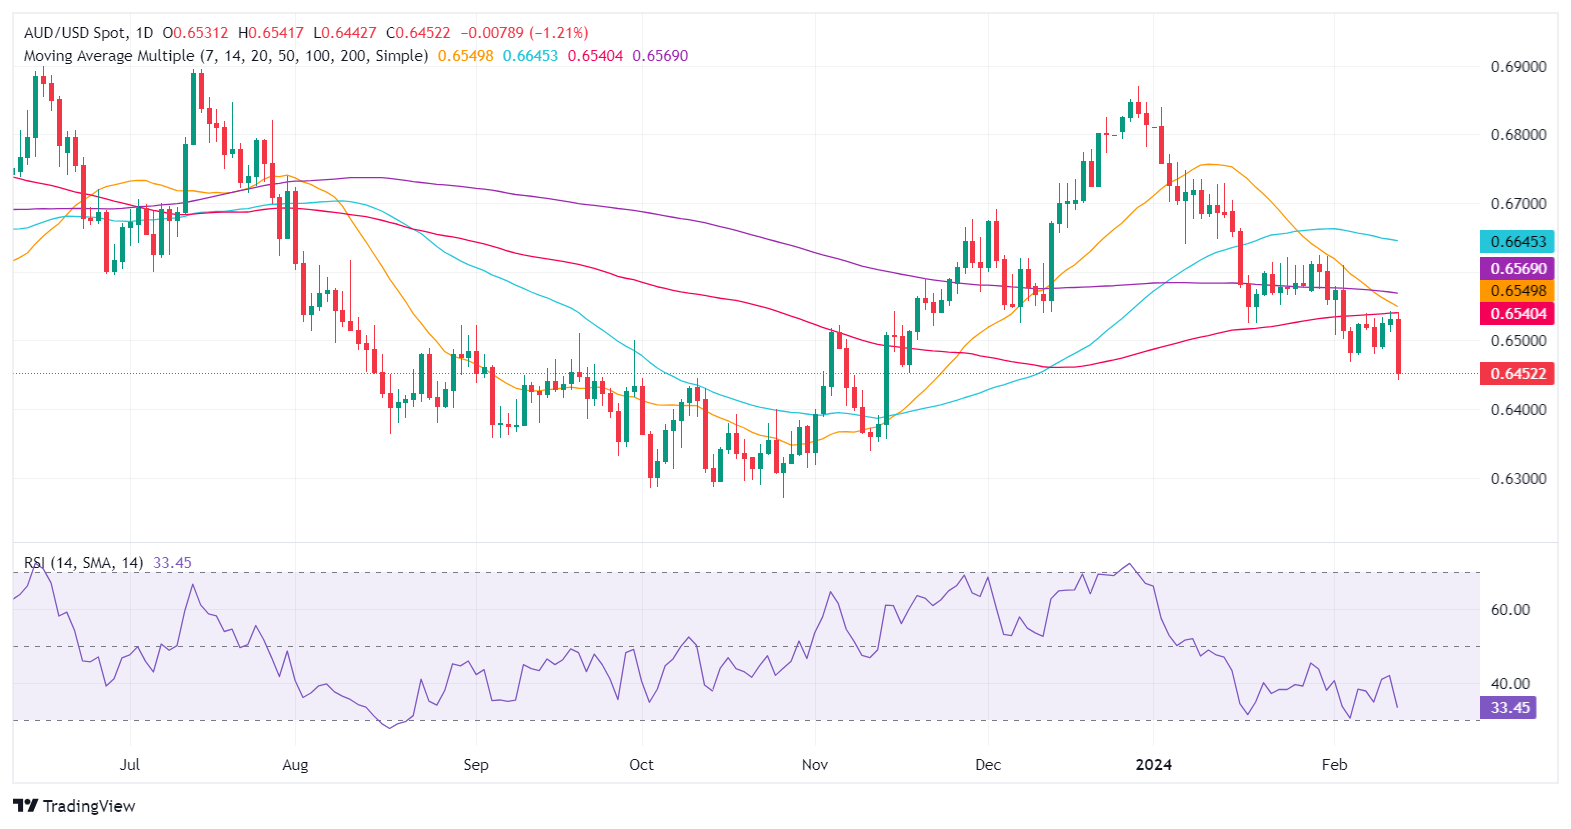
The AUD/USD edged lower on Tuesday amid a strong US inflation report that pushed aside expectations rate cut expectations of the US Federal Reserve. Therefore, the pair dropped 1.18%, trading at around 0.6455 after hitting a new year-to-date (YTD) low of 0.6442.
Aussie Dollar’s hit a YTD low as the Greenback rallies on high US T-bond yields
The US January Consumer Price Index (CPI) was higher than expected, at 3.1% YoY, justifying the Fed's need to keep rates at the current level. Core readings came at 3.9% YoY, unchanged but above the 3.7% estimated. Following the data, US Treasury yields skyrocketed, lifting the Greenback towards a three-month high, according to the US Dollar Index (DXY).
The DXY is rising 0.70%, up at 104.96, shy of achieving a daily close above 105.00, which could open the door for further upside.
Rate cut estimates for the Fed were pushed back, revealing data from the CME FedWatch Tool. Traders expect the beginning of the easing cycle in June, with odds above 50%. Meanwhile, investors took advantage of the table rate cuts for the March and May meetings, which bolstered the US dollar.
In Australia, the economic schedule is empty, but traders are looking forward to the release of employment figures. Forecasts suggest the economy added 30,000 jobs to the workforce. The unemployment rate is expected to rise from 3.9% to 4%.
AUD/USD Price Analysis: Technical outlook
After clocking a new cycle low below 0.6468, the downtrend remains intact, which opened the door to challenging the 0.6400 figure. A breach of the latter will expose the November 10 low of 0.6338, followed by the 0.6300 mark. Conversely, if buyers reclaim 0.6500, that will pave the way for consolidation within the 0.6500-0.6535, the 100-day moving average (DMA) resistance level.
- The Office for National Statistics will release the top-tier UK CPI data for January on Wednesday.
- Headline and core annual inflation from the United Kingdom are set to rise, while monthly CPI is likely to fall.
- The UK CPI report is set to influence the BoE’s interest rate path, rocking the Pound Sterling.
Pound Sterling traders keenly await the release of the high-impact Consumer Price Index (CPI) data from the United Kingdom (UK) on Wednesday, for fresh hints on the timing of the Bank of England’s (BoE) first interest rate cuts this year, as the BoE policymakers continue to push back against expectations of early rate cuts.
The Office for National Statistics (ONS) is due to publish the UK inflation data at 07:00 GMT on February 14.
What to expect from the next UK inflation report?
The headline annual UK Consumer Price Index is forecast to rise 4.2% in January, continuing its rebound from its lowest level since September 2021, registered at 3.9% in November. However, the reading would still be more than twice the BoE’s 2.0% target.
The Core CPI inflation is seen inching a tad higher to 5.2% YoY in January after reporting a 5.1% growth in December. Meanwhile, the British monthly CPI is expected to register a 0.3% decline, following December’s 0.4% increase.
The data will be closely scrutinized to gauge the timing of the Bank of England’s dovish policy pivot, should it indicate inflation persistence.
Following the unexpected uptick in the December CPI data and strong Services PMI, markets scaled back BoE expectations of early and aggressive interest rate cuts. The first cut is now priced in for August and only 70 basis points (bps) of total easing is seen in 2024, as against the odds of 100 bps seen a week ago.
Previewing the UK inflation data, analysts at TD Securities (TDS) noted that “we look for headline inflation to match the MPC's forecast while services likely rose a tenth more than the MPC expects (TDS: 6.7%, BoE: 6.6%). There is a lot of uncertainty around this print, in part due to the new weights.”
“On net, we see downside risks to our projections, in part as some components could normalize a bit more than we expect after December's upside surprise,” the TDS analysts said.
The potential downside surprise in the CPI data could be justified by a drop in food inflation, which hit its lowest rate since June 2022 at 6.10%, while fresh food inflation slowed to 4.90%, the latest data published by the British Retail Consortium (BRC) showed
The BRC suggested that the non-food price drops came from retailers promoting heavily in January to unload their leftover holiday inventory.
Meanwhile, Average Earnings Excluding Bonus, a measure of wage inflation, rose 6.2% 3M YoY in December, slowing from the previous increase of 6.7%.
However, the 5% surge in Oil prices during January could outweigh the impact of softening food prices and wage inflation.
Speaking at England's Loughborough University on Monday, BoE Governor Andrew Bailey said that the central bank would put more emphasis on forward-looking data, commenting on the policy outlook. Bailey said that “any UK recession will be shallow.”
At its February policy meeting, the BoE maintained the key rate at 5.25%. Governor Andrew Bailey remained non-committal on what will be the Bank’s next interest rate move in the upcoming meetings. The voting pattern revealed a three-way split, with one member having voted in favor of a cut and two policymakers voting for a hike.
Recently, BoE policymakers have tried to convince markets that the Bank will likely stick to its higher-interest-rate-for-longer narrative, pushing back against easing expectations in the first half of this year.
When will the UK Consumer Price Index report be released and how could it affect GBP/USD?
The UK CPI data is due for release on Wednesday at 07:00 GMT. The Pound Sterling has been on the defensive against the US Dollar in the lead-up to the United Kingdom’s inflation showdown. The US Dollar stays supported amid the Middle East geopolitical escalation and reduced Fed rate cut bets.
Hot headline and core inflation data could reinforce the BoE’s hawkish bias, providing a much-needed boost to the Pound Sterling. In such a case, GBP/USD could revert toward the 1.2750 psychological barrier. Conversely, GBP/USD could break the consolidative phase to the downside if the UK CPI data surprises to the downside and revives BoE easing expectations as early as May.
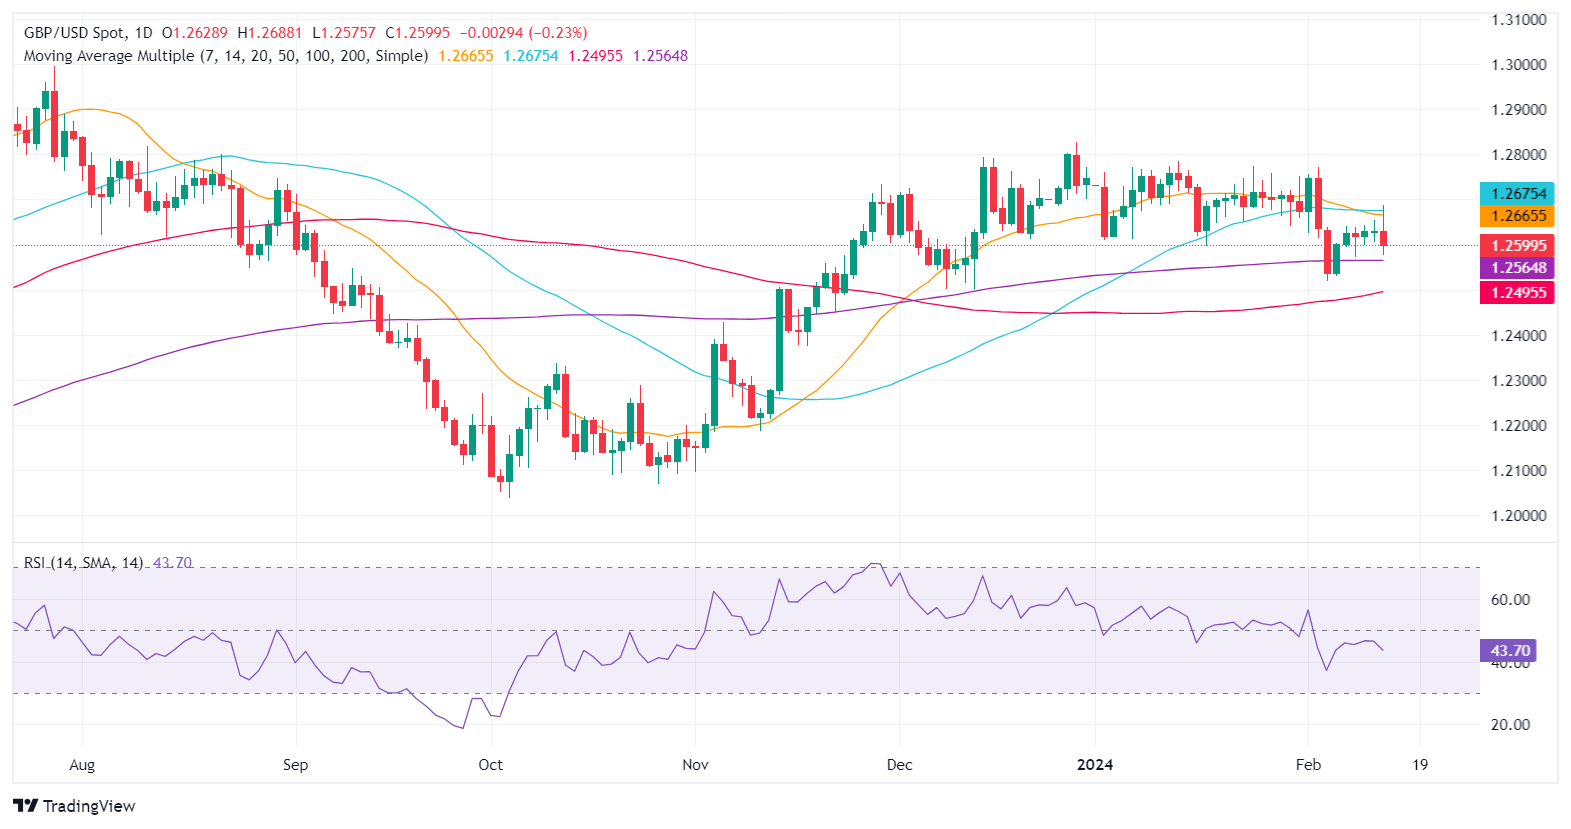
Dhwani Mehta, Asian Session Lead Analyst at FXStreet, offers a brief technical outlook for the major and explains: “The GBP/USD pair continues to range between two key technical barriers, with the 14-day Relative Strength Index (RSI) holding below the midline, suggesting that risks remain skewed to the downside for the Pound Sterling.”
“A decisive break below the horizontal 200-day Simple Moving Average (SMA) at 1.2565 is needed to initiate a fresh downtrend toward the 100-day SMA of 1.2495. Further south, the 1.2450 psychological level could be retested. Alternatively, acceptance above the confluence resistance at around 1.2670 is critical for GBP/USD to sustain any upswing toward the two-week high of 1.2786,” Dhwani adds.
Economic Indicator
United Kingdom Consumer Price Index (YoY)
The United Kingdom (UK) Consumer Price Index (CPI), released by the Office for National Statistics on a monthly basis, is a measure of consumer price inflation – the rate at which the prices of goods and services bought by households rise or fall – produced to international standards. It is the inflation measure used in the government’s target. The YoY reading compares prices in the reference month to a year earlier. Generally, a high reading is seen as bullish for the Pound Sterling (GBP), while a low reading is seen as bearish.
Read more.Next release: 02/14/2024 07:00:00 GMT
Frequency: Monthly
Source: Office for National Statistics
Why it matters to traders
The Bank of England is tasked with keeping inflation, as measured by the headline Consumer Price Index (CPI) at around 2%, giving the monthly release its importance. An increase in inflation implies a quicker and sooner increase of interest rates or the reduction of bond-buying by the BOE, which means squeezing the supply of pounds. Conversely, a drop in the pace of price rises indicates looser monetary policy. A higher-than-expected result tends to be GBP bullish.
Inflation FAQs
What is inflation?
Inflation measures the rise in the price of a representative basket of goods and services. Headline inflation is usually expressed as a percentage change on a month-on-month (MoM) and year-on-year (YoY) basis. Core inflation excludes more volatile elements such as food and fuel which can fluctuate because of geopolitical and seasonal factors. Core inflation is the figure economists focus on and is the level targeted by central banks, which are mandated to keep inflation at a manageable level, usually around 2%.
What is the Consumer Price Index (CPI)?
The Consumer Price Index (CPI) measures the change in prices of a basket of goods and services over a period of time. It is usually expressed as a percentage change on a month-on-month (MoM) and year-on-year (YoY) basis. Core CPI is the figure targeted by central banks as it excludes volatile food and fuel inputs. When Core CPI rises above 2% it usually results in higher interest rates and vice versa when it falls below 2%. Since higher interest rates are positive for a currency, higher inflation usually results in a stronger currency. The opposite is true when inflation falls.
What is the impact of inflation on foreign exchange?
Although it may seem counter-intuitive, high inflation in a country pushes up the value of its currency and vice versa for lower inflation. This is because the central bank will normally raise interest rates to combat the higher inflation, which attract more global capital inflows from investors looking for a lucrative place to park their money.
How does inflation influence the price of Gold?
Formerly, Gold was the asset investors turned to in times of high inflation because it preserved its value, and whilst investors will often still buy Gold for its safe-haven properties in times of extreme market turmoil, this is not the case most of the time. This is because when inflation is high, central banks will put up interest rates to combat it.
Higher interest rates are negative for Gold because they increase the opportunity-cost of holding Gold vis-a-vis an interest-bearing asset or placing the money in a cash deposit account. On the flipside, lower inflation tends to be positive for Gold as it brings interest rates down, making the bright metal a more viable investment alternative.
- NZD/USD drifts lower to 0.6060 amid the firmer USD.
- The US CPI rose 0.3% MoM in January; on a 12-month basis, the figure came in at 3.1% versus 3.4% prior.
- NZ inflation expectations eased from 2.76% in Q4 2023 to 2.50% in Q1 of this year.
The NZD/USD pair attracts some sellers above the mid-0.6000s during the early Asian session on Wednesday. The US Dollar edges higher near a three-month high of nearly 105.00 following a stronger US Consumer Price Index (CPI). The pair currently trades near 0.6060, adding 0.02% on the day.
The January CPI came in better than expected, adding to evidence that the FOMC should maintain interest rates high for a few more months. The headline CPI increased 0.3% for the month from 0.2% in the previous reading. On a 12-month basis, the figure came in at 3.1% YoY in January from 3.4% in December, above the market consensus of 2.9%.
The core CPI, excluding volatile food and energy prices, rose 0.4% MoM in January and climbed 3.9% YoY. The figure came in stronger than the expectations of 0.3% and 3.7%, respectively.
The Federal Reserve (Fed) Chair Jerome Powell said on January 31 that the central bank wants to see more data and get greater confidence about the inflationary trajectory before lowering the interest rate. Traders trimmed bets on rate cut expectations this year by over 75 basis points (bps) and are now pricing the first 25 bps rate cut in June with 95 bps of rate cuts priced for the year. This, in turn, lifts the Greenback and weighs on the NZD/USD pair.
The Reserve Bank of New Zealand’s (RBNZ) latest monetary conditions survey revealed on Tuesday that NZ inflation expectations eased from 2.76% in Q4 2023 to 2.50% in Q1 of this year. The market expects that the central bank should reinforce the case for an on-hold decision at the RBNZ’s policy meeting this month and is not forecasting cuts until early 2025.
Moving on, the Fed’s Goolsbee and Barr are set to peak on Wednesday, and the US January Retail Sales will be due on Thursday. On Friday, the attention will shift to the Producer Price Index, which is estimated to show an increase of 0.1% MoM and 0.6% YoY in January.
The New Zealand Food Price Index rebounded to 0.9% MoM in January, tipping into a six-month high but remains well below the previous peak of 1.6% in July of 2023.
Stats NZ noted that the key drivers of recent inflationary pressures were rent increases, following by food prices and tobacco products.
The greatest contributor to increasing food prices came from grocery food items, driven by chocolate, dairy, and egg prices. New Zealand food prices rose both MoM and on an annualized basis.
Market reaction
The NZD/USD is rising into 0.6060 after a sharp decline on Tuesday, and the pair is poised for a recovery rebound provided Kiwi bidders can keep the pair over the near-term low of 0.6050.
About New Zealand Food Price Index
The Food Price Index (FPI) released by the Statistics New Zealand measures price changes of food bought by households. New Zealand depends upon exporting agricultural goods and food products. Thus, high food prices relatively suggest an increase of trade interests. A high reading is seen as positive (or bullish) for the NZD, while a low reading is negative (or Bearish)
- US 10-year Treasury yields hit two-month high following January's unexpected inflation data.
- Markets now foresee rate stability, with potential Fed easing likely delayed until June.
- 2-year note yield increase to 4.647% reflects revised expectations for the Fed's rate path.
- Increase in 10-year TIPS yield to 2.281% suggests a market view of around 2.3% average inflation in the medium term.
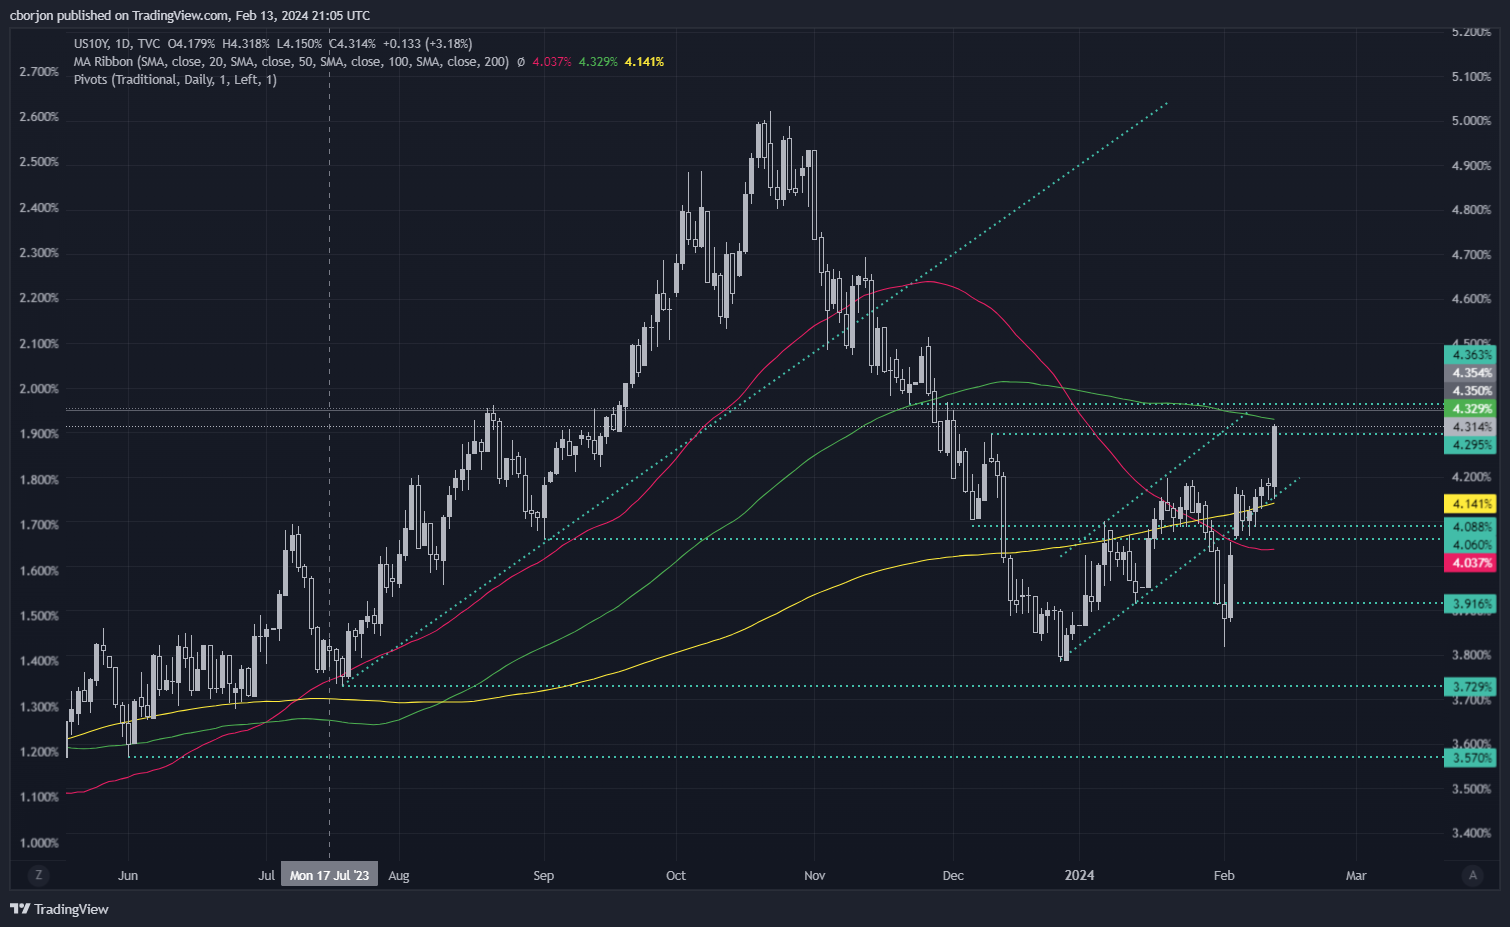
US Treasury bond yields climbed on Tuesday following a red-hot inflation report that pushed out market expectations for a Federal Reserve’s rate cut. Therefore, the US 10-year benchmark note rate hit a two-month high and rose thirteen basis points towards 4.31%.
US Treasury bond yields skyrocketed dimming immediate Fed easing prospects
January’s US inflation data revealed that headline inflation increased above estimates but slowed compared to the previous month’s data. The Consumer Price Index (CPI) was 3.1% YoY, below the previous month’s 3.4% YoY. Underlying inflation, which excludes volatile times, increased to 3.9%, unchanged compared to December’s and above forecasts.
Most traders were expecting inflation to slow down sharply, with CPI foresaw to edge below the 3% threshold, while excluding volatile items, the so-called core, was estimated to dip to 3.7%.
Following the data, speculations that the Fed will keep rates at around the 5.25%-5.50% range grew, with the most likely scenario that Fed Chair Jerome Powell and Co. will keep rates unchanged in March and May. The swaps market shows odds for a 25-basis point Fed cut above 50% for the June meeting. The US 2-year note yield, the most sensitive to interest rates, jumped 16 bps at 4.647%, reflecting investors' stance on interest rates.
In the meantime, Gold prices plummeted below the $2000 mark as demand for US Treasury Inflation-Protected Securities (TIPS), a proxy for real yields, attracted flows, and a headwind for XAU/USD prices. The US 10-year TIPS rose by 2.281%, indicating that market participants see inflation averaging 2.3% for the upcoming medium term.
Technical overview of the US 10-year T-bond yields
The yield of the US 10-year benchmark note is expected to test the 100-day moving average (DMA) at 4.329%, which, once cleared, could pave the way for further upside. The next resistance emerges at4.514% the November 27 cycle high, followed by the November 13 at 4.694%. Conversely, if yields drop, the first support would be the 4.20% threshold, followed by the 200-DMA at 4.141%. A breach of that level could pave the way to challenge the 50-DMA at 4.037%.
- GBP/JPY briefly touched 190.00 as the GBP lifts against the Yen.
- UK Unemployment Rate declined more than expected.
- UK CPI inflation slated for Wednesday.
GBP/JPY briefly tested the 190.00 major price handle on Tuesday as the Pound Sterling (GBP) rose across the broader FX market, bolstered by a better-than-expected Unemployment Rate print and easing wage growth figures helping to quell inflation fears.
UK Average Earnings (including bonuses) fell to 5.8% for the annualized quarter ended in December versus the forecast 5.6%, down from the previous period’s 6.7% (revised from 6.5%). Wage growth declined less than expected, but easing earnings growth is helping to squelch ongoing inflation fears in the UK.
The UK ILO Unemployment Rate for the quarter ended in December ticked down to 3.8% versus the forecast 4.0%, down even further from the previous quarter’s 4.2%. Money markets have reduced their bets of a June 25 basis point cut from the Bank of England down to 60% on Tuesday, down from the 75% prior to the economic figure prints.
Wednesday sees a slew of UK inflation figures, including headline Consumer Price Index (CPI) inflation that is expected to slide to -0.3% for January compared to the previous month’s 0.4%. The headline CPI print for the year ended in January is forecast to tick upwards to 4.2% from 4.0%.
Early Thursday also sees Japan’s latest Gross Domestic Product (GDP) update, which is expected to rebound to 0.3% for the fourth quarter compared to the previous quarter’s -0.7%.
Japan’s GDP print will be followed up by the UK’s own GDP release later on Thursday. UK GDP growth is expected to hold steady at a contractionary -0.1%.
GBP/JPY technical outlook
GBP/JPY surged 0.6% on Tuesday, testing the 190.00 major handle and extending the pair into a fifth straight day of gains after finding a tentative floor near 185.23. The pair has risen nearly 6% since seeing a bullish rejection from the 200-day Simple Moving Average (SMA) near 179.00.
The GBP/JPY is struggling to push decidedly over the 190.00 handle, and a fresh data-driven bullish push could be necessary to avoid a bearish turnaround back into the 188.00 handle.
GBP/JPY hourly chart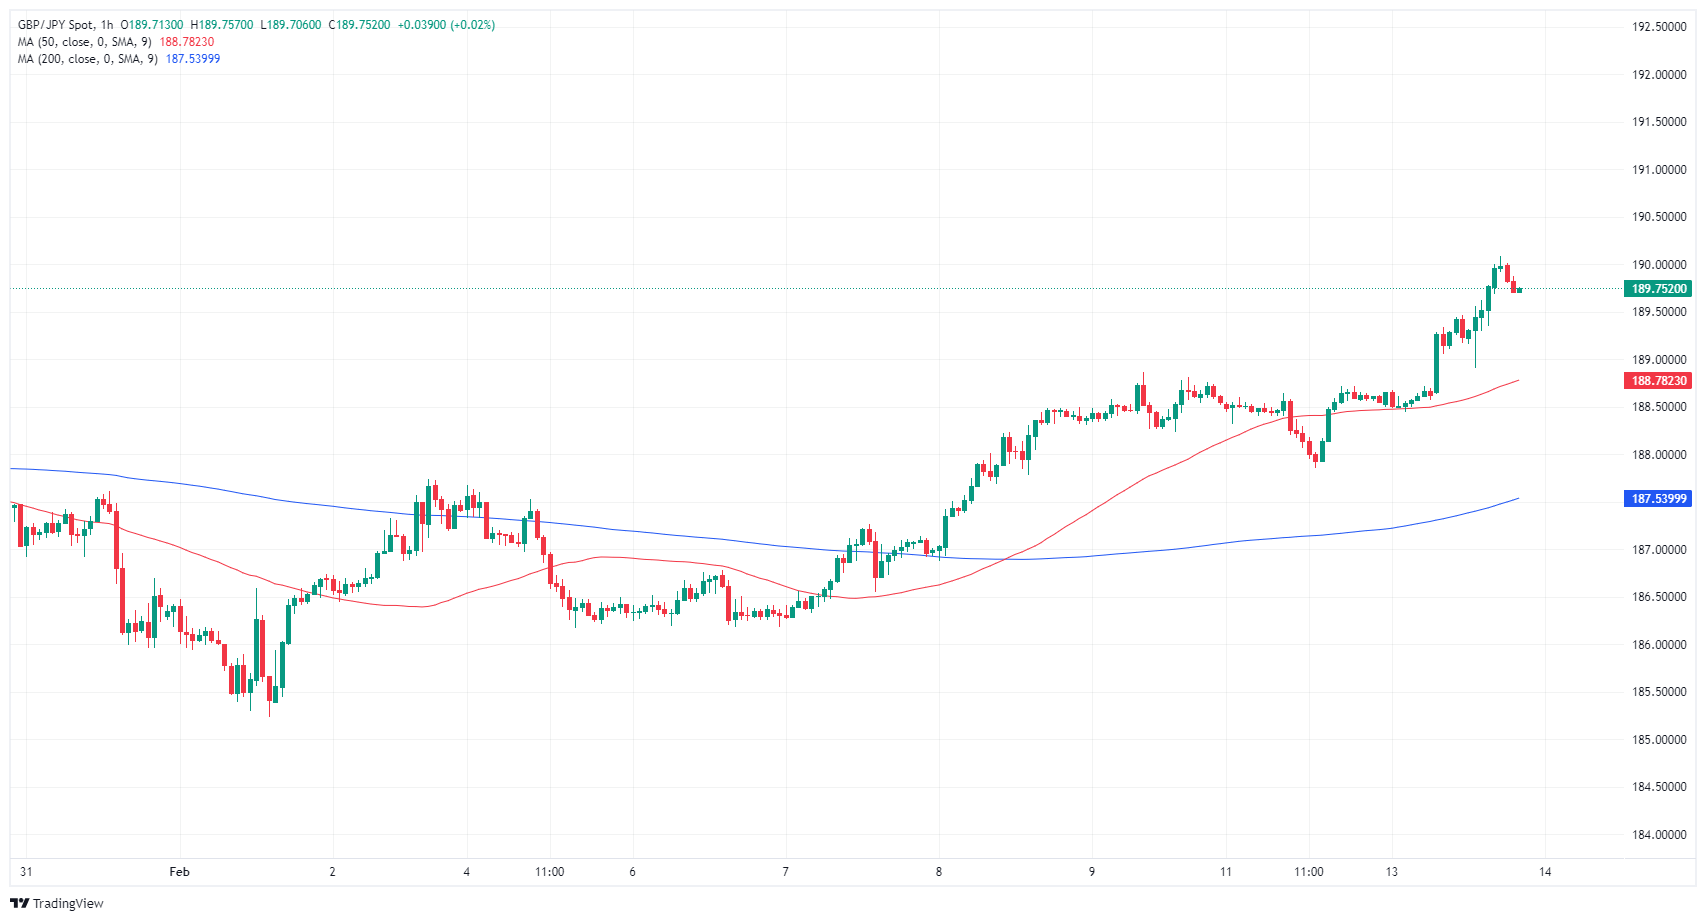
GBP/JPY daily chart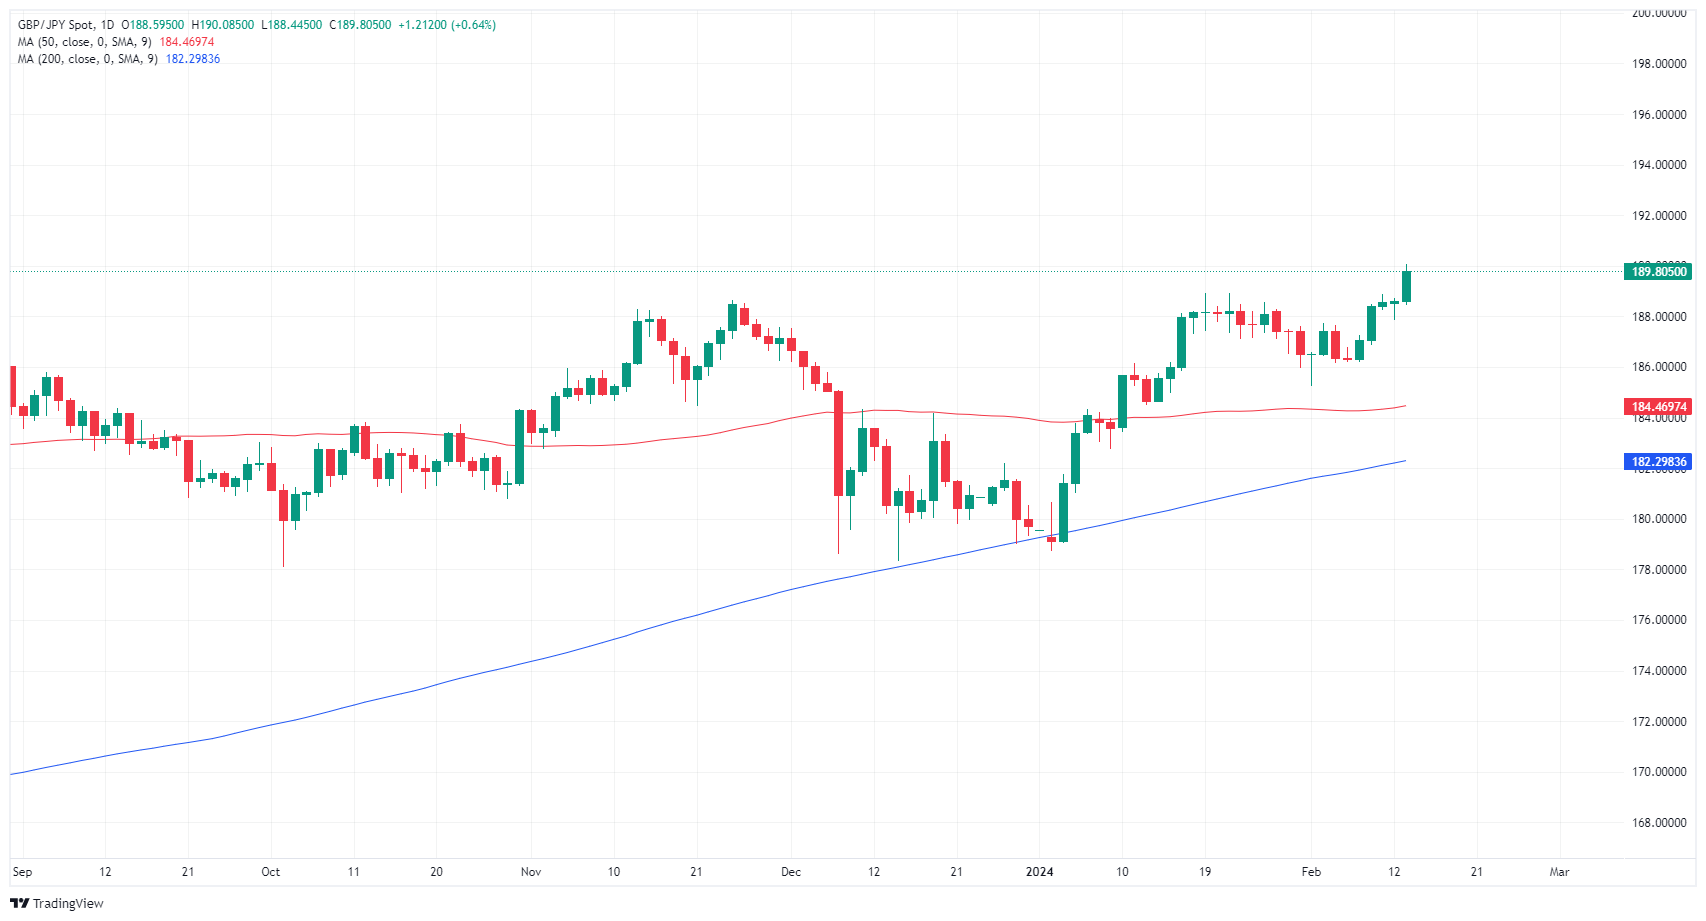
As US inflation continued to run hot in January, investors now started to price in a probable interest rate cut by the Federal Reserve in June, while the Greenback navigates yearly highs and US yields trade in multi-week tops across the curve.
Here is what you need to know on Wednesday, February 14:
The USD Index (DXY) approached the key 105.00 barrier amidst higher yields and speculation of a June rate cut. On February 14, inflation will remain at centre stage with the release of Producer Prices, while FOMC’s Goolsbee and Barr are also expected to peak.
EUR/USD challenged the 1.0700 key support amidst the stronger Dollar and ahead of the release of another revision of Q4 GDP Growth Rate and Industrial Production readings in the euro bloc on February 14.
GBP/USD flirted with the key 200-day SMA near 1.2560 amidst the generalized sour sentiment in the risk-associated complex. All the attention in the UK will be on the publication of the January Inflation Rate on Wednesday.
USD/JPY climbed to fresh YTD highs near the 151.00 yardstick amidst the strong bounce in the Greenback and rising US yields. There will be no data releases in the Japanese docket on February 14.
Further weakness saw AUD/USD drop well south of 0.6500 the figure and print new three-month lows against the backdrop of persistent buying pressure in the US Dollar.
Markets will remain close in China amidst the New Year celebrations.
Prices of WTI advanced for the 7th consecutive session and surpassed the $78.00 mark per barrel, always underpinned by geopolitical jitters, the tight supply narrative, and the upbeat monthly report from OPEC.
Gold prices succumbed to the renewed strength in the Dollar and higher US yields, breaching the key contention zone at $2,000 per troy ounce. Silver followed suit and poked at yearly lows around the $22.00 zone per ounce.
- USD/JPY hits three-month high fueled by US CPI data revealing slower but higher inflation than expected.
- January CPI at 3.1% vs. 2.9% forecast and Core CPI at 3.9%, dampening hopes for near-term Fed rate cuts.
- Surge past 150.00 level supported by rising US Treasury yields, altering investor expectations for Fed easing.
The USD/JPY surged to a three-month high of 150.81 after the US Bureau of Labor Statistics (BLS) revealed that inflation in the United States (US) remains above the 3% threshold, although slowing down. At the time of writing, the pair exchanges hands at 150.78, up 0.96%.
Persistent US inflation report lifts US Treasury yields, tailwind for USD/JPY
Wall Street is trading with losses following the latest inflation data. The Consumer Price Index (CPI) in January exceeded estimates of 2.9% YoY, increased by 3.1% below last month’s 3.4% reading. Excluding volatile items, known as Core CPI, was unchanged compared to December’s reading at 3.9%, up from estimates of 3.7% YoY.
After the data, the USD/JPY shot through the roof, extending its gains past the 150.00 figure, hitting a three-month high, sponsored by the jump in US Treasury yields. The 10-year benchmark note yields 4.314%, up by more than 13 basis points, as investors trimmed the odds for a Federal Reserve rate cut.
The CME FedWatch Tool shows traders disregarding a cut in March and May, though the odds for June increased. Therefore, the federal funds rate (FFR) would remain at 5.25%-5.50% according to the swaps market for the first five months of 2024.
Meanwhile, the Bank of Japan (BoJ) has shown mixed signs regarding the future of its monetary policy stance. Data-wise, Machinery Orders plunged -14.1% YoY, the weakest level since October, while the Producer Price Index (PPI) was steady at 0.2% YoY. Although market players are still seeing the BoJ increase rate in June, they could delay the end of negative interest rates unless data suggests inflation would be sustainably above their 2% target.
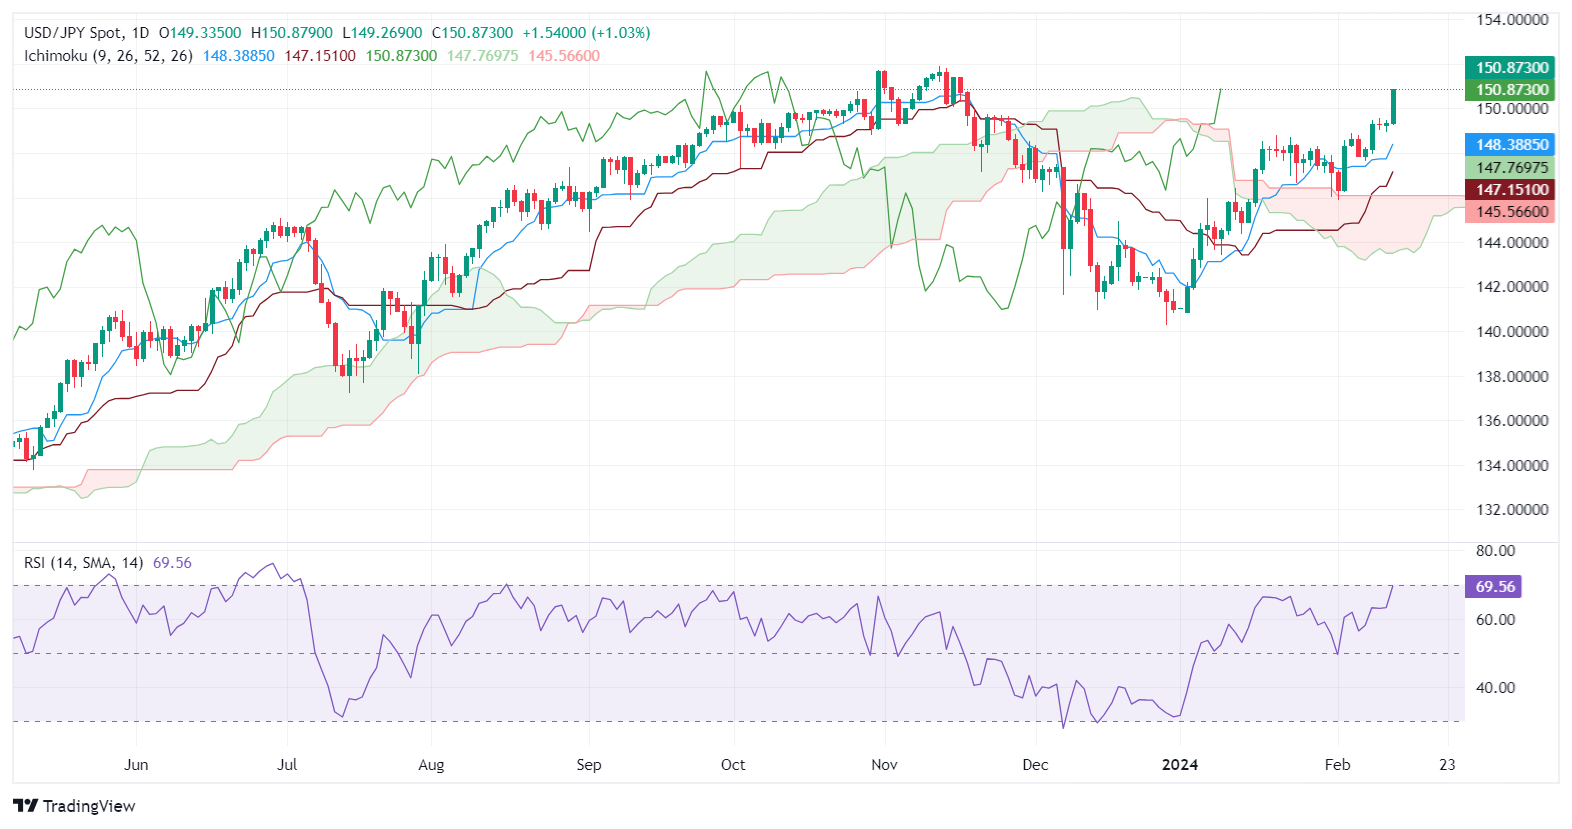
USD/JPY Price Analysis: Technical outlook
The daily chart portrays the pair's upward bias, with 151.00 as the next resistance level. Once that level is cleared, the USD/JPY next stop would be last year’s 151.91 high, followed by the 152.00 mark. Conversely, if sellers regain the 150.00 level, that could open the door for further losses. In that case, key support levels would be tested. Firstly, the Tenkan-Sen at 148.38, followed by the Senkou Span A at 147.77. Once those two levels are cleared, the next stop would be the Kijun-Sen at 147.15.
- The AUD/JPY currently stands at 97.25, showing a 0.25% decrease in Tuesday's trading session.
- Japan's manufacturing activity remains weak with decreasing machine tool orders.
- RBA and BoJ's policy divergence may eventually make the cross recover.
On Tuesday's session, the AUD/JPY suffered modest losses, observed trading at around 97.25. The pair is positioned on turbulent waters as Australia's economic view is fogged with uncertainty while Japan battles with weak manufacturing activity. That being said, the divergent Reserve Bank of Australia (RBA) and Bank of Japan (BoJ) policies may limit the downside for the pair.
The Australian economy depicts an ambiguous outlook. On a positive note, Westpac's Consumer Sentiment index for February reached a 21-month high of 86.0, pointing towards buoyed consumer optimism. However, the National Australia Bank's (NAB) business survey showed a dip to a two-year low of 6 in January, signaling a softer economic environment. In addition, elevated inflation risk levels persist, with RBA's Head of Economic Analysis Kohler remarking that while inflation is decreasing, it will take time to hit the RBA's 2%-3% target range and as for now the market predicts an 85% likelihood of Australia's first interest rate cut as late as in August, adjusted from June at the beginning of the month.
Turning to Japan, January's machine tool orders saw little improvement, falling 14.1% YoY, from -9.6% in December, reflecting a weak manufacturing activity. Notably, domestic orders dropped 29.1% YoY while foreign orders fell only 6.2% YoY, highlighting internal economic concerns. In addition, January PPI remaining steady at 0.2% YoY, signals a minimal pipeline price pressure. Regarding the Bank of Japan's policy, normalization looks set to occur after the spring wage negotiations if there is a confirmed pick-up in wage growth. In the meantime, markets anticipate a June liftoff, keeping a close eye on the economic revival which would demand a sooner liftoff.
AUD/JPY technical analysis
On the daily chart, the Relative Strength Index (RSI) data reveals that the bearish dominance is fading away as the RSI jumps above 50. A closer look at the Moving Average Convergence Divergence (MACD) histogram data reveals that the histogram has consistently printed decreasing red bars, indicating a falling negative momentum and now printing a green bar. These insights suggest that the seller’s momentum is waning with bulls gradually taking over.
AUD/JPY daily chart
-638434480978088229.png)
- EUR/USD dipped into multi-week lows after an unexpected uptick in US CPI inflation.
- European February ZEW Economic Sentiment Survey improved.
- European GDP growth, US Retail Sales in the pipe for the midweek.
EUR/USD tumbled 0.9% on Tuesday after US Consumer Price Index (CPI) inflation came in above market expectations. Money markets’ expectations of rate cuts from the Federal Reserve (Fed) got knocked back as US inflation proves stickier than investors were hoping for.
Europe saw a slight improvement in the ZEW Economic Sentiment Survey for February, and Euro (EUR) traders will be gearing up for European Gross Domestic Product (GDP) figures due on Wednesday. Thursday will follow up with more US economic data with US Retail Sales expected to slow in January.
Daily digest market movers: EUR/USD gets a sharp rebalance on safe-haven flows into US Dollar
- MoM US CPI inflation ticked up to 0.3% in January versus the forecast 0.2%.
- December’s monthly CPI saw a slight revision down from 0.3% to 0.2%.
- Core MoM CPI also ticked up to 0.4% from the forecast steady hold of 0.3%.
- Annualized headline CPI inflation printed at 3.1%, above the forecast 2.9% but still easing slightly from the previous period’s 3.4%.
- Money markets are now pricing in a first rate cut from the Fed in June or July after getting knocked off of a March rate trim bet.
- The euro area ZEW Economic Sentiment survey for February improved to 25.0 from the previous 22.7, reversing the forecast decline to 20.1.
- Wednesday’s European GDP is expected to hold flat at 0.0% for the fourth quarter.
- Annualized European quarterly GDP is forecast to hold steady at a scant 0.1%.
- European Central Bank (ECB) President Christine Lagarde makes an appearance early Thursday.
- ECB President Lagarde will be testifying before the European Parliament’s Committee on Economic and Monetary Affairs in Brussels.
- Thursday also sees US Retail Sales, and investors are hoping for January’s retail activity to tick down -0.1% versus the previous month’s 0.6%.
Euro price today
The table below shows the percentage change of Euro (EUR) against listed major currencies today. Euro was the strongest against the Swiss Franc.
| USD | EUR | GBP | CAD | AUD | JPY | NZD | CHF | |
| USD | 0.59% | 0.30% | 0.95% | 1.20% | 0.92% | 1.24% | 1.26% | |
| EUR | -0.60% | -0.29% | 0.35% | 0.62% | 0.33% | 0.65% | 0.68% | |
| GBP | -0.31% | 0.28% | 0.65% | 0.90% | 0.61% | 0.94% | 0.96% | |
| CAD | -0.95% | -0.36% | -0.64% | 0.24% | -0.03% | 0.30% | 0.32% | |
| AUD | -1.22% | -0.62% | -0.91% | -0.25% | -0.29% | 0.04% | 0.09% | |
| JPY | -0.92% | -0.31% | -0.61% | 0.02% | 0.31% | 0.33% | 0.35% | |
| NZD | -1.26% | -0.67% | -0.95% | -0.29% | -0.04% | -0.33% | 0.01% | |
| CHF | -1.31% | -0.71% | -1.00% | -0.33% | -0.12% | -0.38% | -0.05% |
The heat map shows percentage changes of major currencies against each other. The base currency is picked from the left column, while the quote currency is picked from the top row. For example, if you pick the Euro from the left column and move along the horizontal line to the Japanese Yen, the percentage change displayed in the box will represent EUR (base)/JPY (quote).
Technical analysis: EUR/USD falls into multi-week lows, approaches 1.0700
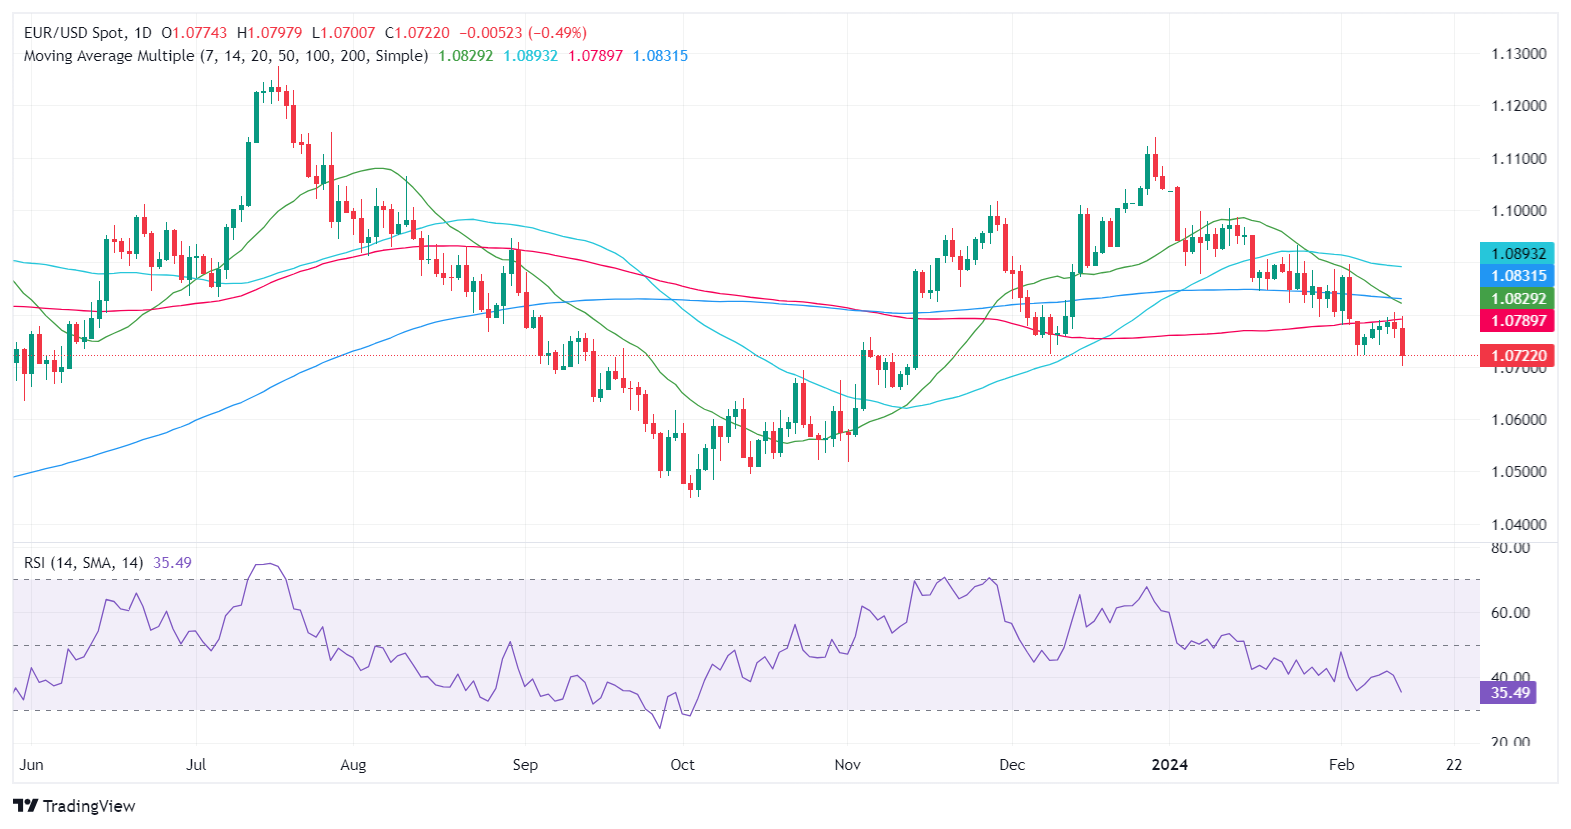
EUR/USD tumbled on Tuesday, knocking into eight-week lows and coming with reach of 1.0700 as the pair continues to drift into the bearish side. The EUR/USD saw a sharp technical rejection of the 200-hour Simple Moving Average (SMA) near 1.0780 early Tuesday. Previous technical support at the 1.0725 turnaround zone is poised to form a near-term technical ceiling for bullish recoveries.
The EUR/USD continues to drift into deeper bear country below the 200-day SMA near 1.0830, and continued downside momentum below 1.0700 sets the pair up for an extended slide into last October’s lows near 1.0450.
EUR/USD hourly chart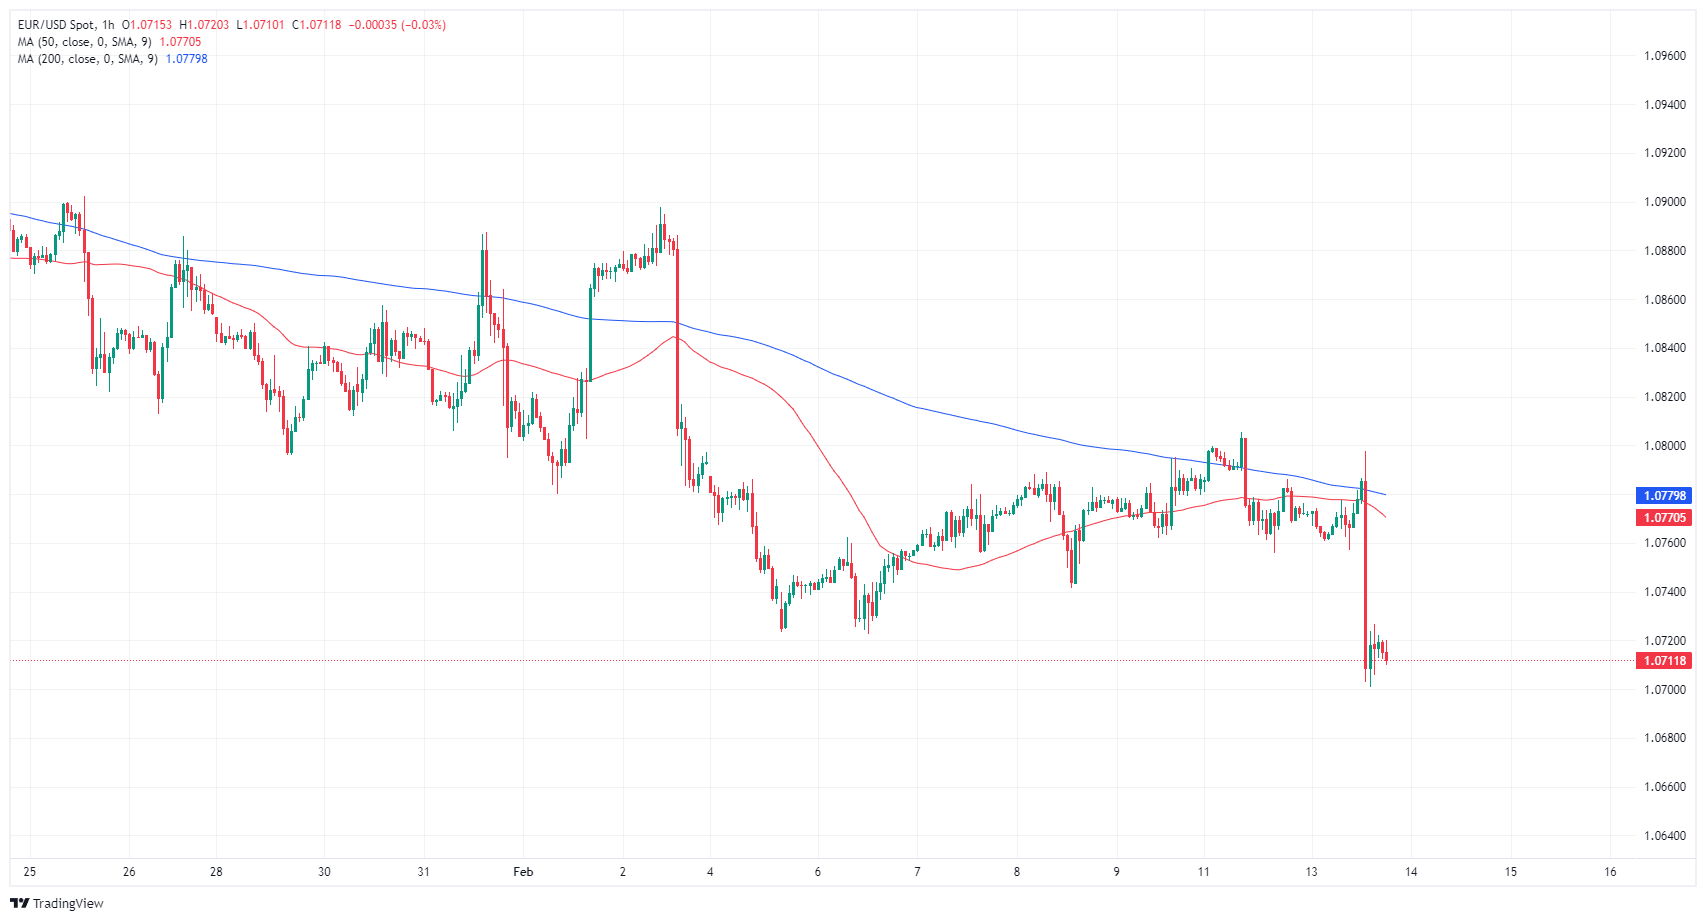
EUR/USD daily chart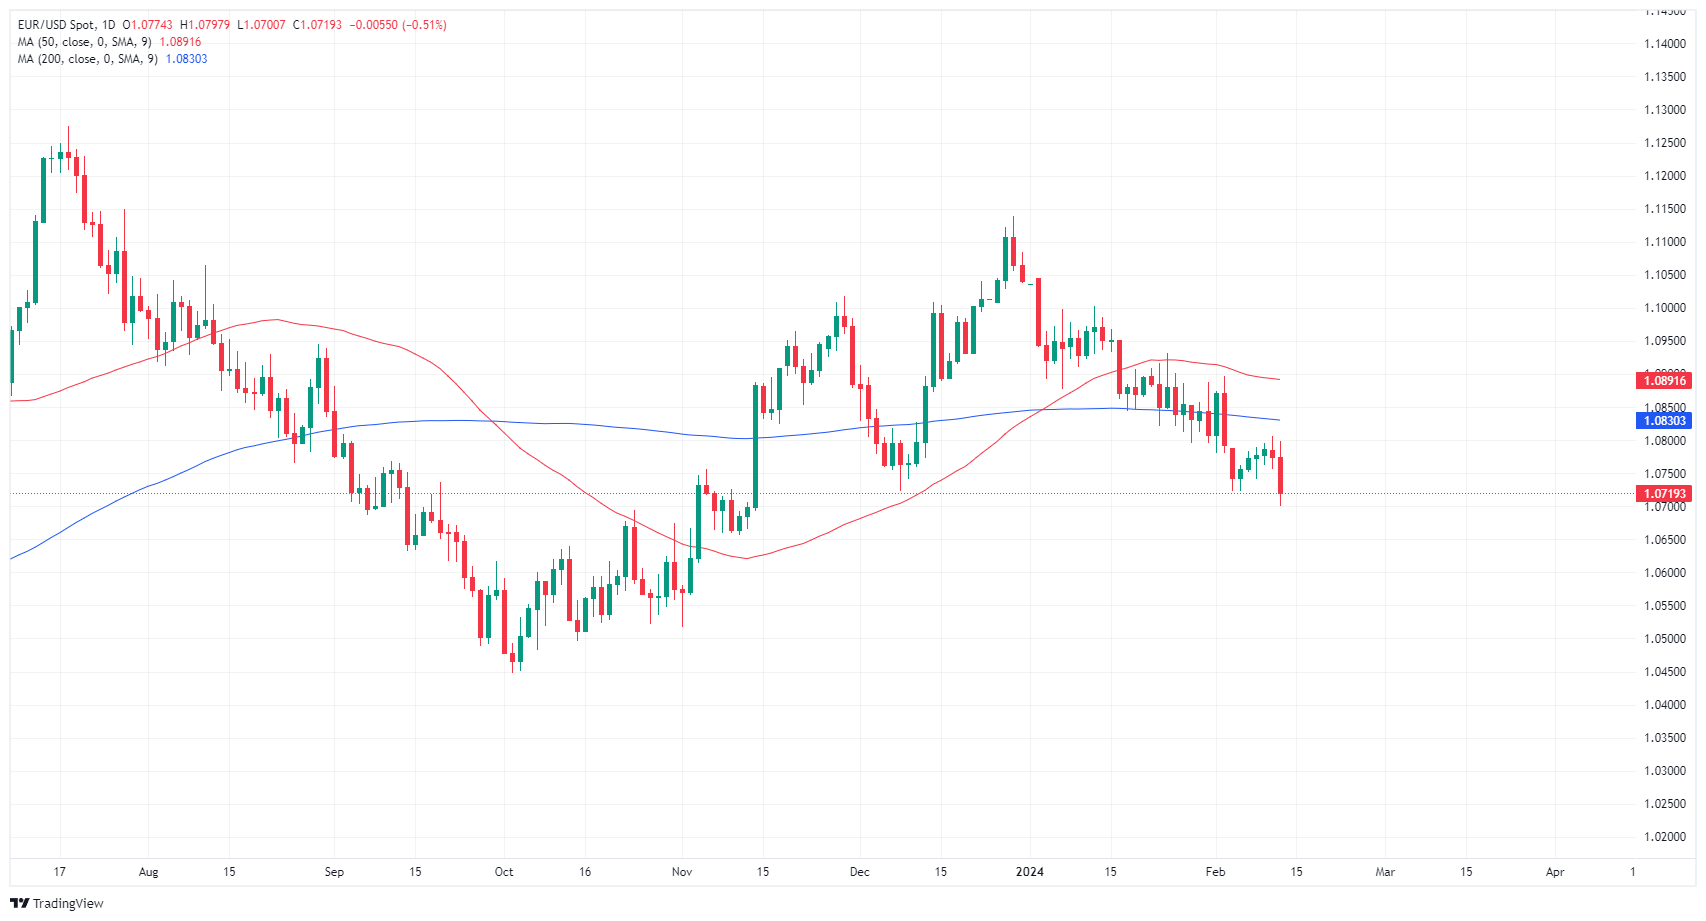
Euro FAQs
What is the Euro?
The Euro is the currency for the 20 European Union countries that belong to the Eurozone. It is the second most heavily traded currency in the world behind the US Dollar. In 2022, it accounted for 31% of all foreign exchange transactions, with an average daily turnover of over $2.2 trillion a day.
EUR/USD is the most heavily traded currency pair in the world, accounting for an estimated 30% off all transactions, followed by EUR/JPY (4%), EUR/GBP (3%) and EUR/AUD (2%).
What is the ECB and how does it impact the Euro?
The European Central Bank (ECB) in Frankfurt, Germany, is the reserve bank for the Eurozone. The ECB sets interest rates and manages monetary policy.
The ECB’s primary mandate is to maintain price stability, which means either controlling inflation or stimulating growth. Its primary tool is the raising or lowering of interest rates. Relatively high interest rates – or the expectation of higher rates – will usually benefit the Euro and vice versa.
The ECB Governing Council makes monetary policy decisions at meetings held eight times a year. Decisions are made by heads of the Eurozone national banks and six permanent members, including the President of the ECB, Christine Lagarde.
How does inflation data impact the value of the Euro?
Eurozone inflation data, measured by the Harmonized Index of Consumer Prices (HICP), is an important econometric for the Euro. If inflation rises more than expected, especially if above the ECB’s 2% target, it obliges the ECB to raise interest rates to bring it back under control.
Relatively high interest rates compared to its counterparts will usually benefit the Euro, as it makes the region more attractive as a place for global investors to park their money.
How does economic data influence the value of the Euro?
Data releases gauge the health of the economy and can impact on the Euro. Indicators such as GDP, Manufacturing and Services PMIs, employment, and consumer sentiment surveys can all influence the direction of the single currency.
A strong economy is good for the Euro. Not only does it attract more foreign investment but it may encourage the ECB to put up interest rates, which will directly strengthen the Euro. Otherwise, if economic data is weak, the Euro is likely to fall.
Economic data for the four largest economies in the euro area (Germany, France, Italy and Spain) are especially significant, as they account for 75% of the Eurozone’s economy.
How does the Trade Balance impact the Euro?
Another significant data release for the Euro is the Trade Balance. This indicator measures the difference between what a country earns from its exports and what it spends on imports over a given period.
If a country produces highly sought after exports then its currency will gain in value purely from the extra demand created from foreign buyers seeking to purchase these goods. Therefore, a positive net Trade Balance strengthens a currency and vice versa for a negative balance.
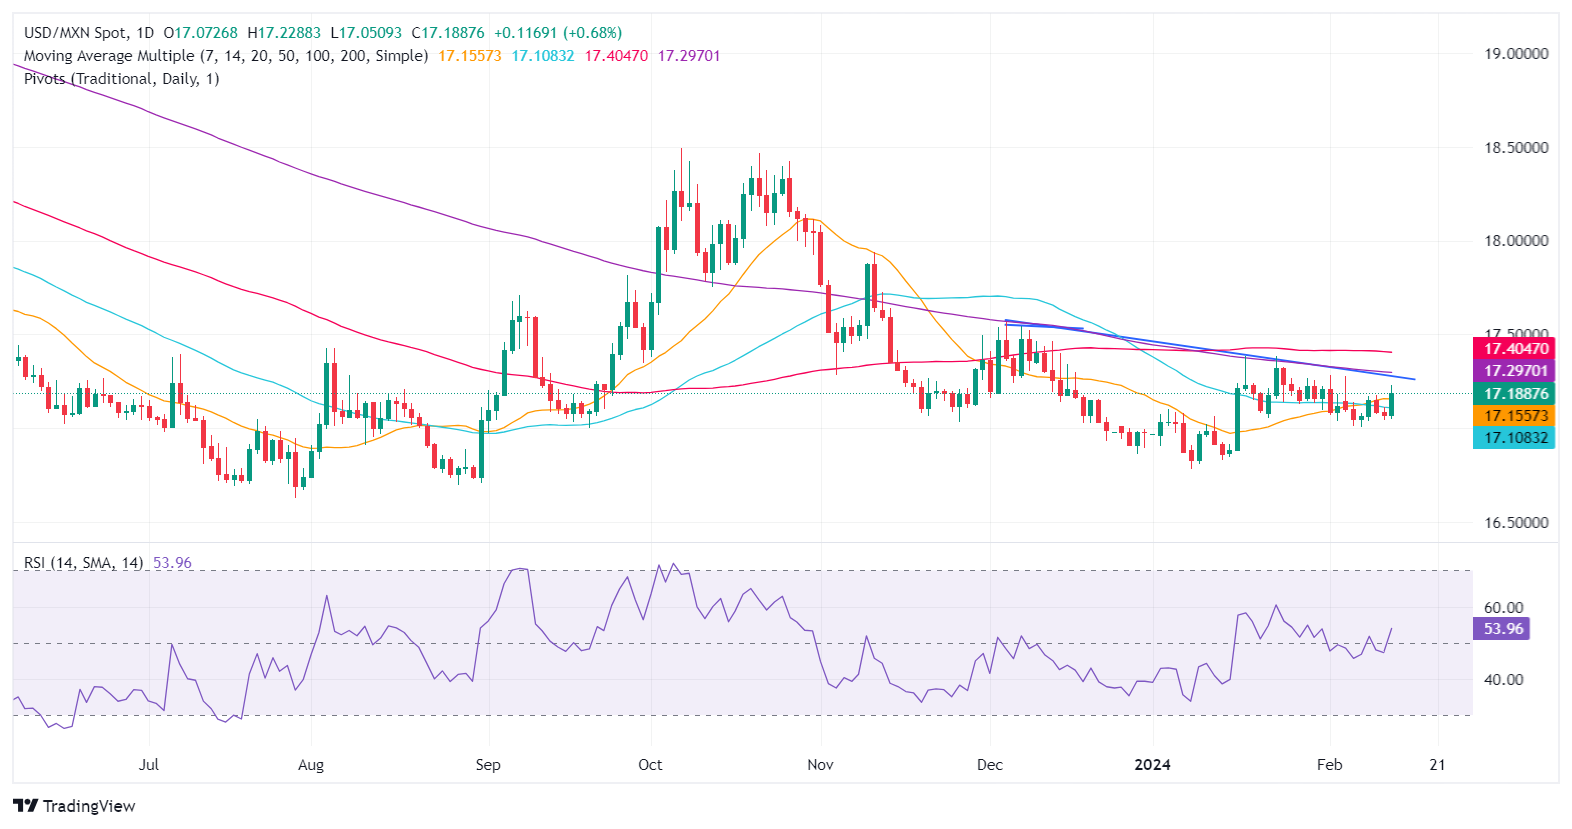
- Mexican Peso tumbles as US CPI data exceeds forecasts, boosting the US Dollar.
- Unexpectedly high US inflation in January shifts market outlook, questioning the Fed's upcoming interest rate decisions.
- Mexico's economic calendar is light on Tuesday with attention turning to next week's Retail Sales, GDP and inflation reports.
- Banxico's Rodriguez Ceja emphasizes ongoing disinflationary measures in Mexico, aiming to manage inflation effectively.
The Mexican Peso plunged against the US Dollar during Tuesday’s North American session following a red-hot inflation report from the United States. The data caught traders off guard as they were eyeing an acceleration of the disinflation process. They had predicted that the Federal Reserve (Fed) wouldn’t need to keep rates “higher for longer,” but that narrative has returned to the limelight. At the time of writing, the USD/MXN exchanges hands at 17.20, up 0.80%.
The US Bureau of Labor Statistics revealed that January’s headline inflation was higher than expected but below December’s data. That sponsored a leg up in the USD/MXN pair, which could open the door for further upside. Across the border, releases on the Mexican economic calendar remain absent with the next tranche of data on schedule for next week. That series will be led by Retail Sales, Gross Domestic Product (GDP) and mid-month inflation data.
In the meantime, Bank of Mexico (Banxico) Governor Victoria Rodriguez Ceja commented in an interview with El Financiero that the disinflationary process will continue despite the recent uptick while adding that the Mexican central bank remains committed to tackling inflation.
Daily digest market movers: Mexican Peso on defensive after US CPI data
- The US Department of Labor revealed January’s inflation data. The Consumer Price Index (CPI) rose by 3.1% YoY, down from 3.4%, exceeding estimates of 2.9%.
- The Core CPI, which excludes volatile food and energy prices, remained steady at 3.9%, surpassing the expected decrease to 3.7%, on an annual basis.
- The USD/MXN soared as interest rate futures traders slashed bets that the Fed will cut rates in May, pushing the odds for a 25-basis-point cut below 50%. According to the CME FedWatch Tool, the first rate cut is seen in June, with odds standing at 52.1%.
- US 10-year Treasury note yields rose ten basis points to 4.289%, while the US Dollar Index (DXY) rallied to a three-month high of 104.87, shy of cracking the 105.00 figure.
- Mexico’s central bank revised their inflation expectations to the upside for the period from Q1 to Q3 of 2024, expecting inflation to converge toward 3.5% in Q4, based on the latest monetary policy statement.
- Last Thursday, INEGI revealed that in January, Mexico´s Consumer Price Index (CPI) rose by 4.88% YoY, while underlying inflation moderated to 4.76%.
- Atlanta Fed President Raphael Bostic said the Fed must be resolute and added that he’s “laser-focused” on inflation. At the same time, Dallas Fed President Lorie Logan noted that there’s no urgency on cutting rates.
Technical analysis: Mexican Peso trips down as USD/MXN edges back above 17.15
The USD/MXN shifted toward a neutral bias as buyers reclaimed the 50-day Simple Moving Average (SMA) at 17.11. A daily close above that level could open the way to challenge the 17.20 area, followed by the 200-day SMA at 17.29. Further upside is seen at the 100-day SMA at 17.40. The Relative Strength Index (RSI) trends steadily above 50 as the pair has seen a jump in momentum favoring buyers.
Conversely, if sellers drag the exchange rate below the 50-day SMA, the exotic pair could extend its losses toward the 17.00 figure. A breach of the latter will expose last year’s low of 16.62.
USD/MXN Price Action – Daily Chart
Mexican Peso FAQs
What key factors drive the Mexican Peso?
The Mexican Peso (MXN) is the most traded currency among its Latin American peers. Its value is broadly determined by the performance of the Mexican economy, the country’s central bank’s policy, the amount of foreign investment in the country and even the levels of remittances sent by Mexicans who live abroad, particularly in the United States. Geopolitical trends can also move MXN: for example, the process of nearshoring – or the decision by some firms to relocate manufacturing capacity and supply chains closer to their home countries – is also seen as a catalyst for the Mexican currency as the country is considered a key manufacturing hub in the American continent. Another catalyst for MXN is Oil prices as Mexico is a key exporter of the commodity.
How do decisions of the Banxico impact the Mexican Peso?
The main objective of Mexico’s central bank, also known as Banxico, is to maintain inflation at low and stable levels (at or close to its target of 3%, the midpoint in a tolerance band of between 2% and 4%). To this end, the bank sets an appropriate level of interest rates. When inflation is too high, Banxico will attempt to tame it by raising interest rates, making it more expensive for households and businesses to borrow money, thus cooling demand and the overall economy. Higher interest rates are generally positive for the Mexican Peso (MXN) as they lead to higher yields, making the country a more attractive place for investors. On the contrary, lower interest rates tend to weaken MXN.
How does economic data influence the value of the Mexican Peso?
Macroeconomic data releases are key to assess the state of the economy and can have an impact on the Mexican Peso (MXN) valuation. A strong Mexican economy, based on high economic growth, low unemployment and high confidence is good for MXN. Not only does it attract more foreign investment but it may encourage the Bank of Mexico (Banxico) to increase interest rates, particularly if this strength comes together with elevated inflation. However, if economic data is weak, MXN is likely to depreciate.
How does broader risk sentiment impact the Mexican Peso?
As an emerging-market currency, the Mexican Peso (MXN) tends to strive during risk-on periods, or when investors perceive that broader market risks are low and thus are eager to engage with investments that carry a higher risk. Conversely, MXN tends to weaken at times of market turbulence or economic uncertainty as investors tend to sell higher-risk assets and flee to the more-stable safe havens.
- US CPI inflation came in higher than expected, knocking down rate-cut hopes.
- Swiss CPI inflation slumped, putting the CHF on the defensive.
- US Retail Sales still in the barrel for Thursday.
The USD/CHF tipped into a fresh eight-week high above 0.8700 after a hot US Consumer Price Index (CPI) print sent markets piling back into the safe haven US Dollar (USD), while the Swiss Franc (CHF) got pummeled after Swiss CPI inflation came in below expectations.
Swiss CPI inflation came in at 0.2% MoM in January, missing the forecast 0.6% and seeing only a thin rebound from the previous month’s 0.0% print. YoY Swiss CPI inflation printed at 1.3% versus the forecast steady print at 1.7%, sending the Swiss Franc lower and putting the USD/CHF on pace to close higher for the fifth of the last six trading weeks.
US CPI inflation came in hotter than markets anticipated, with MoM headline CPI printing at 0.3% in January versus the forecast 0.2%. December’s print saw a revision to 0.2% from 0.3%. Core annualized CPI held steady at 3.9% compared to the forecast 3.7%, and headline annualized US CPI printed at 3.1%, down from the previous 3.4% but missing the market’s forecast 2.9%.
With US inflation proving stickier than investors were hoping, market bets of a rate cut from the Federal Reserve (Fed) got pushe dout even further on Tuesday. According to the CME FedWatch Tool, money markets are now pricing in a first rate trim in June. Markets have been pushed down from six to five total rate cuts in 2024.
US Retail Sales are still slated for release on Thursday, alongside US Initial Jobless Claims. US Retail Sales are expected to tick down -0.1% in January versus the previous month’s 0.6%, and Initial Jobless Claims are expected to come in at 220K for the week ended February 9 compared to the previous week’s 218K.
USD/CHF technical outlook
Tuesday’s USD/CHF rally has the pair pulling even further away from near-term medians with the 200-hour Simple Moving Average (SMA) near 0.8710. The pair is testing into eight-week highs near the 0.8900 handle, and the USD/CHF climbed nearly 1.4% bottom-to-top on the day.
Daily candlesticks have pierced the 200-day SMA near 0.8843, and the pair has closed bullish for six of the last eight consecutive trading days. The USD/CHF has gained around 6.5% from December’s low of 0.8332.
USD/CHF hourly chart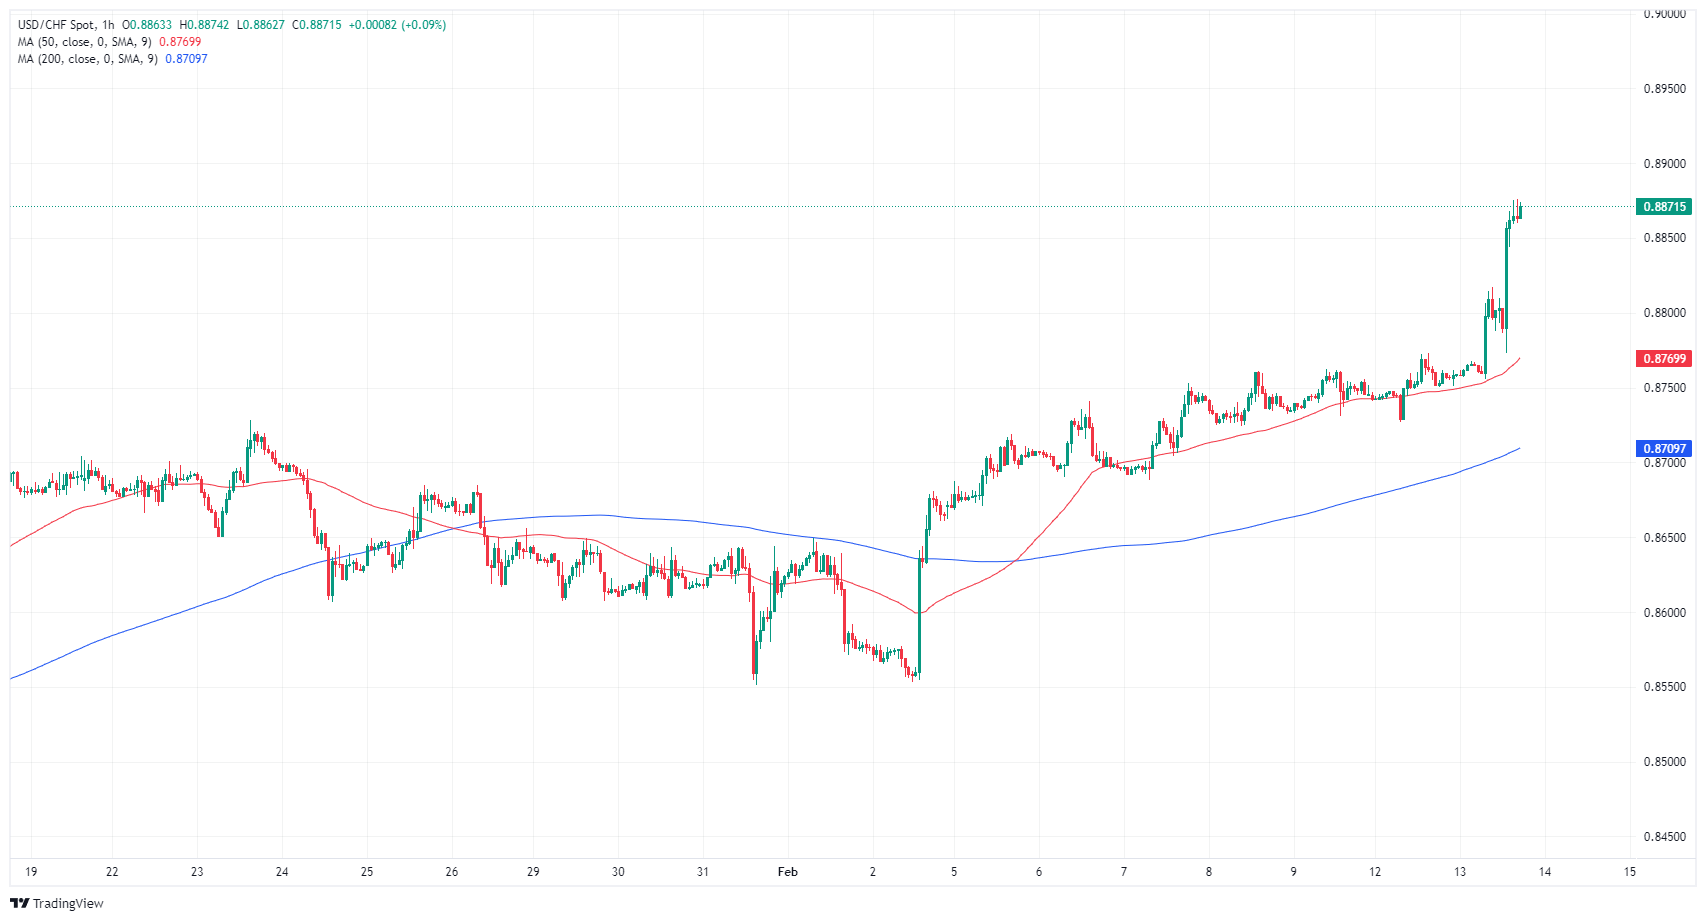
USD/CHF daily chart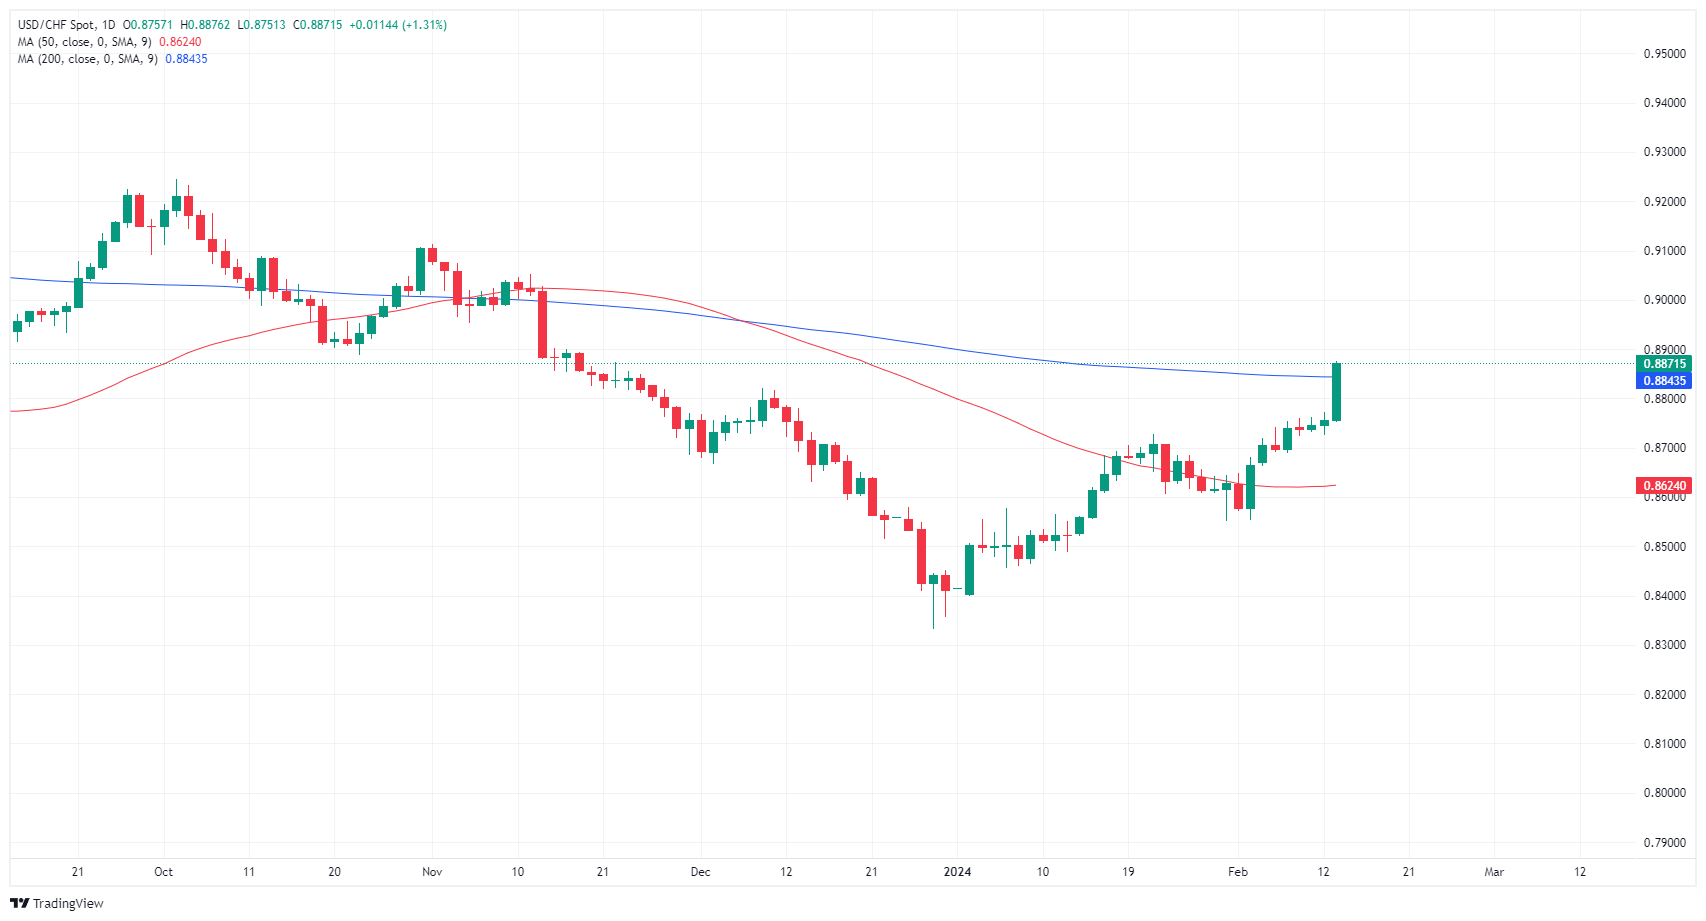
- The EUR/GBP trades at 0.8505, marking a 0.30% loss in Tuesday's session.
- The Sterling gained due to the report of strong UK labor market data.
- German ZEW survey signals improved Eurozone expectations.
- Markets are still betting that the BoE’s rate cut cycle will start later than the ECB’s.
In Tuesday's session, the EUR/GBP is seen at 0.8505, edging lower by 0.30% primarily influenced by robust UK labor market figures. Mixed macroeconomic signals from the German economy continue to shape the European Central Bank (ECB) while markets start to delay the start of the easing cycle for the Bank of England (BoE) to August.
In line with that, labor data on Tuesday showed that the UK wage growth remained sticky, while the Unemployment rate was seen declining to 3.8% in the three months ending in December. On the EUR side, the German ZEW survey showed mixed signals with the positive take being that the expectations index improved in January.
Regarding expectations, markets continue to bet on a more hawkish BoE as the resilience of the UK economy and the robustness of the labor markets justifies the delay of rate cuts. On the other hand uncertainty over the Eurozone’s economies makes markets think that the ECB will start the easing sooner. For the BoE, markets are betting for a first-rate cut in August while on the ECB’s side, in June.
EUR/GBP technical analysis
Starting with the daily chart, the Relative Strength Index (RSI) is in negative territory, with a declining trend suggesting that sellers are gaining momentum. The Moving Average Convergence Divergence (MACD) histogram also corresponds with this negative momentum, displaying a falling trend with green bars, hence indicating a bearish momentum.
However, the hourly chart provides a more nuanced view. Here, the RSI remained in the oversold zone, but there's a subtle uptick, hinting at the possibility of some buyers stepping in. Yet, the MACD histogram showed red bars, although they were gradually becoming less negative, indicating a slow shift towards bullish momentum.
Finally, considering the pair's position against the Simple Moving Averages (SMAs), the EUR/GBP is below the 20,100, 200-day SMAs, asserting that the overall trend is clearly bearish.
EUR/GBP daily chart
-638434441500072963.png)
- Markets were caught by unexpectedly stubborn US CPI inflation on Tuesday.
- Canada sees notable lack of representation on the economic calendar this week.
- Canadian Dollar is mixed on the day, but sharply lower against the US Dollar.
The Canadian Dollar (CAD) tumbled against the US Dollar (USD) on Tuesday after US Consumer Price Index (CPI) inflation ticked higher on a monthly basis, sending the Greenback surging across the major currency board. Inflation on an annual basis was also higher than consensus in January, pushing out market hopes of a May rate cut from the Federal Reserve (Fed).
Canada has only a thin showing on the economic calendar this week, and it is relegated to strictly low-tier releases. These include Canadian Housing Starts and Manufacturing Sales on Thursday and Foreign Investment figures on Friday. Canadian January Housing Starts are expected to tick upward slightly, but US Retail Sales will entirely overshadow the release.
Daily digest market movers: Canadian Dollar takes a backseat as markets focus on US CPI inflation
- Headline MoM US CPI inflation ticked higher in January to 0.3% versus the expected 0.2%.
- December’s CPI saw a slight revision from 0.3% to 0.2%.
- Core annualized US CPI inflation held steady at 3.9% compared to the forecast of 3.7%.
- YoY US CPI fell to 3.1% from 3.4%, but markets were hoping for a further deceleration to 2.9%.
- Still sticky US CPI inflation pushes out market bets of a first Fed rate cut to June or July.
- Money markets now see a 62% chance of no rate cut in May, according to the CME FedWatch Tool.
- The US Dollar is surging on the day as markets tumble back into the safe haven currency.
- Wednesday sees talking points from Fed officials, including Goolsbee and Barr.
- Thursday brings US Retail Sales, where markets are hoping for a -0.1% print for January compared to December’s 0.6%.
- Friday will wrap up a US-data-heavy week with US Producer Price Index (PPI) figures and the Michigan Consumer Sentiment Index.
Canadian Dollar price today
The table below shows the percentage change of Canadian Dollar (CAD) against listed major currencies today. Canadian Dollar was the strongest against the Swiss Franc.
| USD | EUR | GBP | CAD | AUD | JPY | NZD | CHF | |
| USD | 0.52% | 0.22% | 0.81% | 1.08% | 0.89% | 1.12% | 1.28% | |
| EUR | -0.53% | -0.30% | 0.29% | 0.56% | 0.38% | 0.60% | 0.75% | |
| GBP | -0.21% | 0.31% | 0.60% | 0.87% | 0.69% | 0.92% | 1.07% | |
| CAD | -0.82% | -0.29% | -0.59% | 0.25% | 0.09% | 0.31% | 0.48% | |
| AUD | -1.11% | -0.57% | -0.88% | -0.27% | -0.19% | 0.05% | 0.23% | |
| JPY | -0.90% | -0.37% | -0.68% | -0.09% | 0.18% | 0.22% | 0.39% | |
| NZD | -1.14% | -0.62% | -0.91% | -0.33% | -0.05% | -0.23% | 0.16% | |
| CHF | -1.28% | -0.76% | -1.06% | -0.46% | -0.22% | -0.38% | -0.15% |
The heat map shows percentage changes of major currencies against each other. The base currency is picked from the left column, while the quote currency is picked from the top row. For example, if you pick the Euro from the left column and move along the horizontal line to the Japanese Yen, the percentage change displayed in the box will represent EUR (base)/JPY (quote).
Technical analysis: Canadian Dollar gives up ground to surging US Dollar but trades mixed overall
The Canadian Dollar (CAD) slipped around three-quarters of a percent against the US Dollar on Tuesday, also losing around half of a percent against the Pound Sterling (GBP). The CAD recovered half a percent against the Swiss Franc (CHF) and around a third of a percent against the New Zealand Dollar (NZD).
The USD/CAD surged to an eight-week high on Tuesday, hitting a near-term high of 1.3578. The pair surged over a full percent bottom-to-top on the day, easily reclaiming the 1.3500 handle.
Tuesday’s bull run in the USD/CAD has the pair breaking into the top side of the 200-day Simple Moving Average (SMA) near 1.3477, and the trick for buyers will be to keep the pair from slumping back into a rough consolidation range below 1.3550. On the bottom end, the 50-day SMA near 1.3417 will provide a near-term technical floor.
USD/CAD hourly chart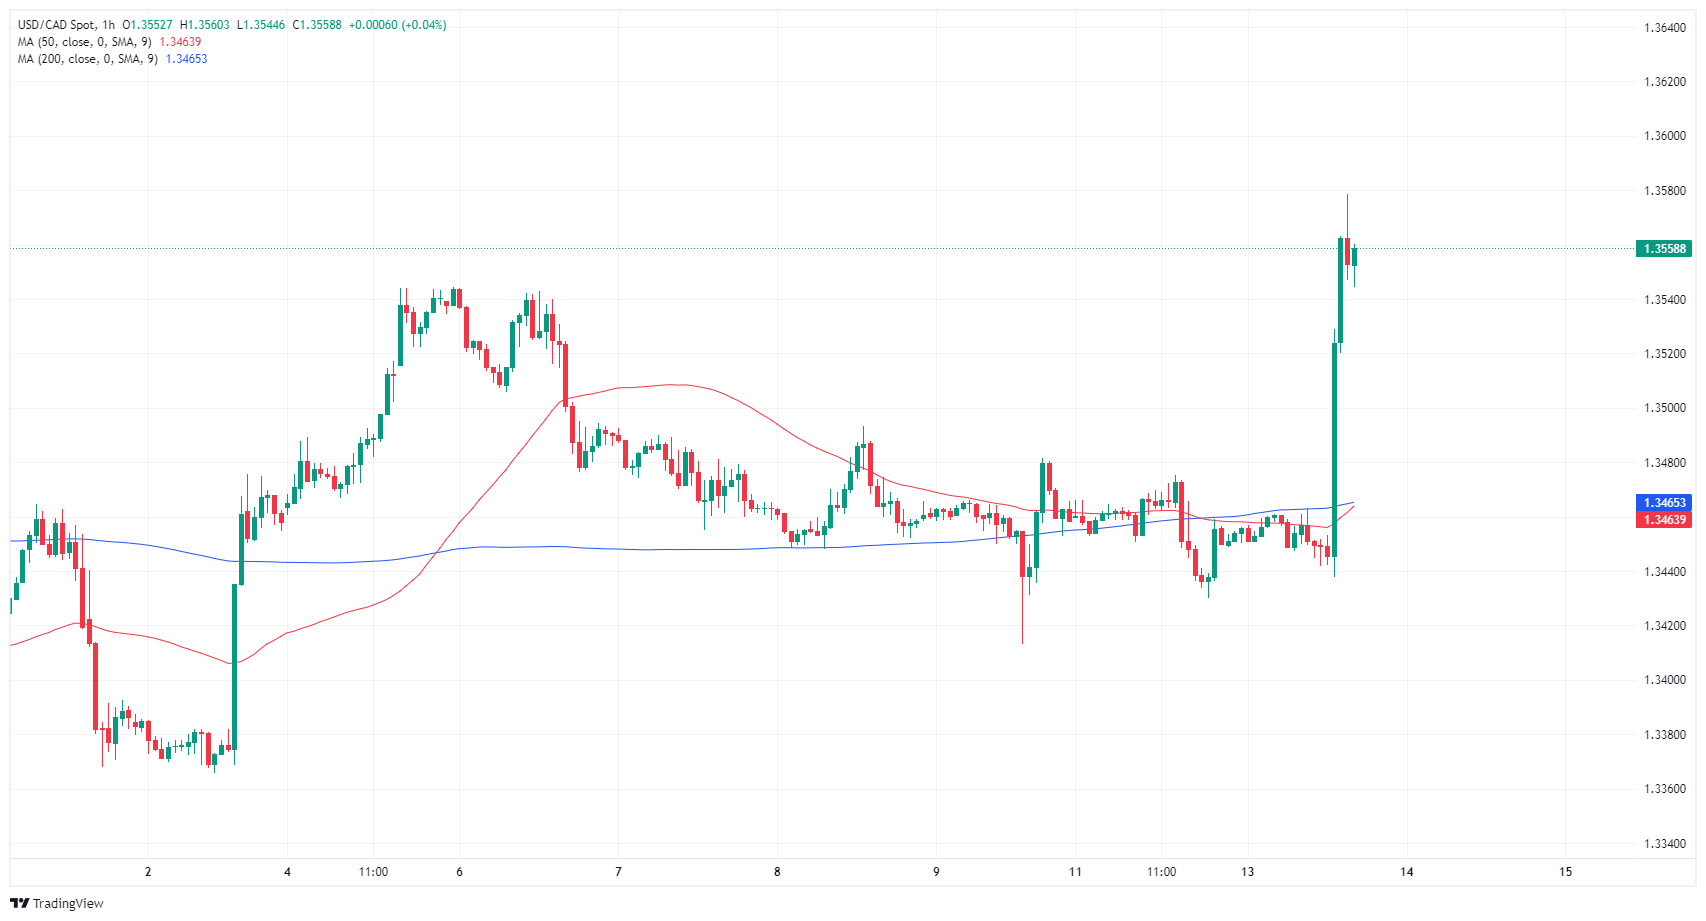
USD/CAD daily chart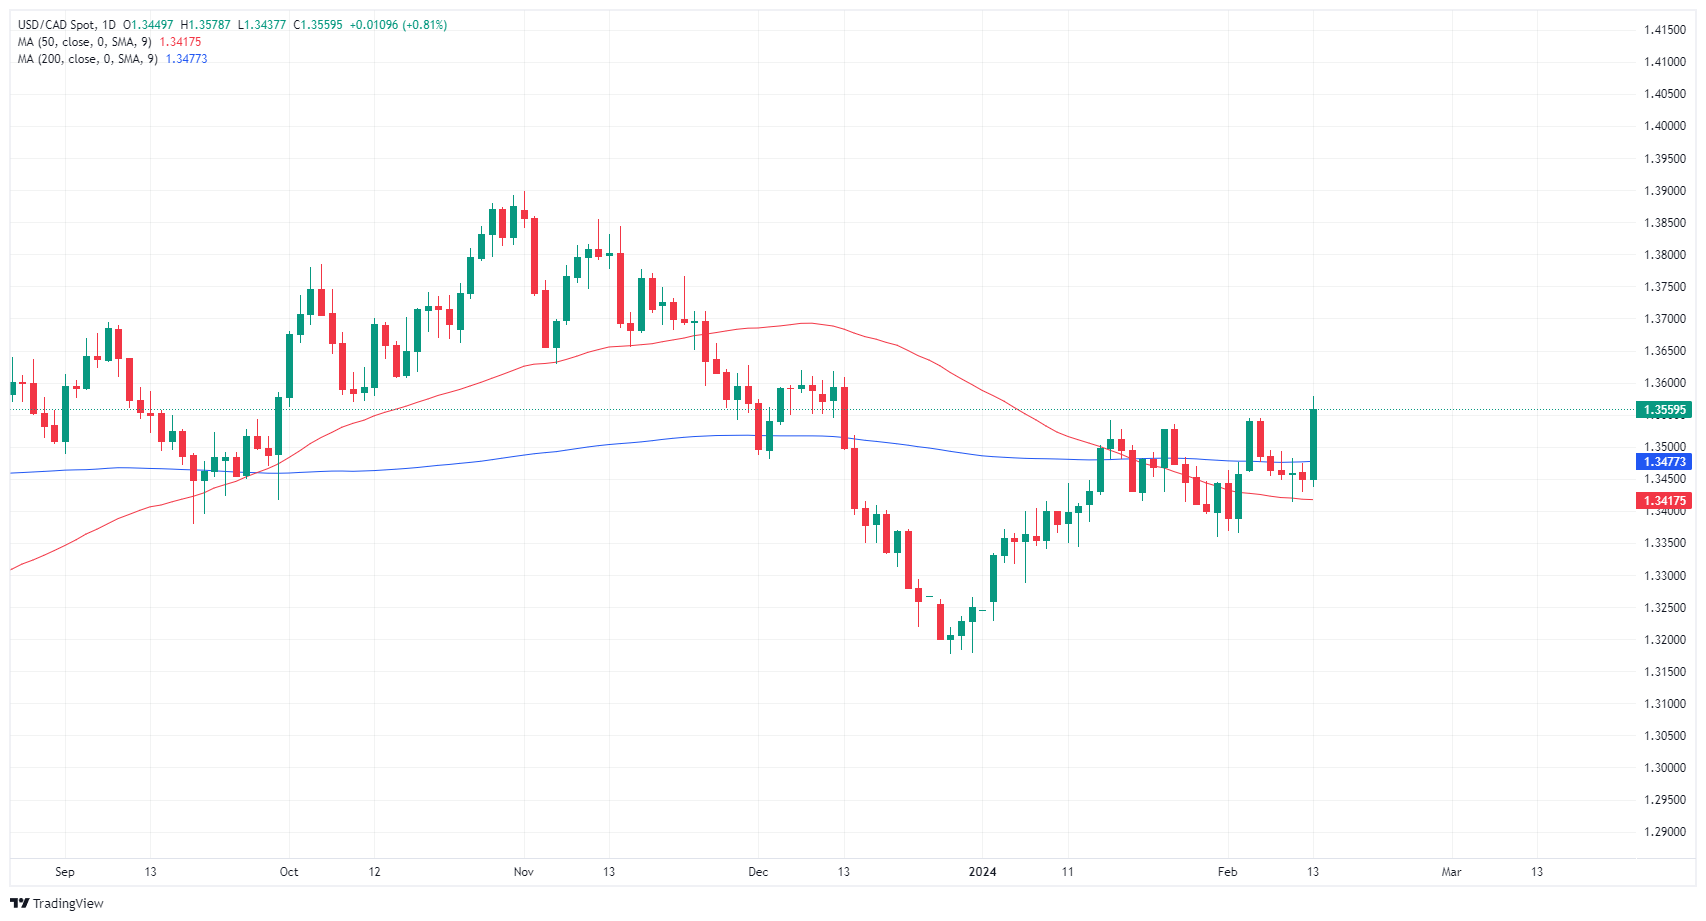
Fed FAQs
What does the Federal Reserve do, how does it impact the US Dollar?
Monetary policy in the US is shaped by the Federal Reserve (Fed). The Fed has two mandates: to achieve price stability and foster full employment. Its primary tool to achieve these goals is by adjusting interest rates.
When prices are rising too quickly and inflation is above the Fed’s 2% target, it raises interest rates, increasing borrowing costs throughout the economy. This results in a stronger US Dollar (USD) as it makes the US a more attractive place for international investors to park their money.
When inflation falls below 2% or the Unemployment Rate is too high, the Fed may lower interest rates to encourage borrowing, which weighs on the Greenback.
How often does the Fed hold monetary policy meetings?
The Federal Reserve (Fed) holds eight policy meetings a year, where the Federal Open Market Committee (FOMC) assesses economic conditions and makes monetary policy decisions.
The FOMC is attended by twelve Fed officials – the seven members of the Board of Governors, the president of the Federal Reserve Bank of New York, and four of the remaining eleven regional Reserve Bank presidents, who serve one-year terms on a rotating basis.
What is Quantitative Easing (QE) and how does it impact USD?
In extreme situations, the Federal Reserve may resort to a policy named Quantitative Easing (QE). QE is the process by which the Fed substantially increases the flow of credit in a stuck financial system.
It is a non-standard policy measure used during crises or when inflation is extremely low. It was the Fed’s weapon of choice during the Great Financial Crisis in 2008. It involves the Fed printing more Dollars and using them to buy high grade bonds from financial institutions. QE usually weakens the US Dollar.
What is Quantitative Tightening (QT) and how does it impact the US Dollar?
Quantitative tightening (QT) is the reverse process of QE, whereby the Federal Reserve stops buying bonds from financial institutions and does not reinvest the principal from the bonds it holds maturing, to purchase new bonds. It is usually positive for the value of the US Dollar.
- The DXY rose to 104.80 on Tuesday, past the key resistance of the 100-day SMA.
- US Treasury yields soared as January’s Core CPI came in higher than expected.
- The odds of a cut in May have fallen to 40%, according to the CME FedWatch Tool.
The US Dollar (USD) witnessed an upward thrust on Tuesday, trading at 104.80 on the Dollar Index (DXY). The Greenback was boosted by January's Consumer Price Index (CPI), which made markets delay the start of the Federal Reserve’s (Fed) easing cycle.
After Jerome Powell, the Federal Reserve Chair indicated that a cut in March was unlikely due to the bank still needing additional evidence on falling inflation, higher inflation than expected on Tuesday benefited the US Dollar as markets begin to eye June as the start of easing.
Daily digest market movers: US Dollar soars as Core CPI from January comes in higher than expected
- Reports by the US Bureau of Labor Statistics showed a 0.4% MoM increase in the Core inflation rate for January, surpassing the consensus and previous figures of 0.3%.
- On a YoY basis, Core inflation remained steady at 3.9%, maintaining the previous numbers but outdoing the forecasted 3.7%.
- A rise in the US Treasury bond yields was observed following the data. Current rates place the 2-year yield at 4.60%, the 5-year yield at 4.26%, and the 10-year yield at 4.27%, which benefits the US Dollar.
- Market expectations for rate cuts based on the CME FedWatch Tool for the next May meeting dropped to 40%, while those odds rose to 50% for the June meeting.
Technical analysis: DXY bulls step in and conquer the 100-day SMA
On the daily chart, the Relative Strength Index (RSI) exhibits a positive slope and trades in positive territory, indicating a strong buying momentum among investors. This reveals that the market is demonstrating buyer dominance, supporting the notion of further upward market movement.
The Moving Average Convergence Divergence (MACD) histogram illustrates rising green bars, reinforcing the bullish momentum painted by the RSI. This suggests that investors are displaying a strong risk appetite and are buying the asset aggressively.
In a broader context, the index is now trading above its 20, 100, and 200-day Simple Moving Averages (SMAs), suggesting a bullish market structure. The position of the DXY above these significant SMAs bolsters the dominance of bulls on larger time frames.
In conclusion, the technical indicators on the daily chart conclusively reflect a prevalent buying momentum in the market. This, coupled with the fact that bulls are gaining ground, means a sustainable move in the upward direction would more likely be the order of the day in the foreseeable future in case bulls receive additional fundamental stimulus.
US Dollar FAQs
What is the US Dollar?
The US Dollar (USD) is the official currency of the United States of America, and the ‘de facto’ currency of a significant number of other countries where it is found in circulation alongside local notes. It is the most heavily traded currency in the world, accounting for over 88% of all global foreign exchange turnover, or an average of $6.6 trillion in transactions per day, according to data from 2022.
Following the second world war, the USD took over from the British Pound as the world’s reserve currency. For most of its history, the US Dollar was backed by Gold, until the Bretton Woods Agreement in 1971 when the Gold Standard went away.
How do the decisions of the Federal Reserve impact the US Dollar?
The most important single factor impacting on the value of the US Dollar is monetary policy, which is shaped by the Federal Reserve (Fed). The Fed has two mandates: to achieve price stability (control inflation) and foster full employment. Its primary tool to achieve these two goals is by adjusting interest rates.
When prices are rising too quickly and inflation is above the Fed’s 2% target, the Fed will raise rates, which helps the USD value. When inflation falls below 2% or the Unemployment Rate is too high, the Fed may lower interest rates, which weighs on the Greenback.
What is Quantitative Easing and how does it influence the US Dollar?
In extreme situations, the Federal Reserve can also print more Dollars and enact quantitative easing (QE). QE is the process by which the Fed substantially increases the flow of credit in a stuck financial system.
It is a non-standard policy measure used when credit has dried up because banks will not lend to each other (out of the fear of counterparty default). It is a last resort when simply lowering interest rates is unlikely to achieve the necessary result. It was the Fed’s weapon of choice to combat the credit crunch that occurred during the Great Financial Crisis in 2008. It involves the Fed printing more Dollars and using them to buy US government bonds predominantly from financial institutions. QE usually leads to a weaker US Dollar.
What is Quantitative Tightening and how does it influence the US Dollar?
Quantitative tightening (QT) is the reverse process whereby the Federal Reserve stops buying bonds from financial institutions and does not reinvest the principal from the bonds it holds maturing in new purchases. It is usually positive for the US Dollar.
Consumer price inflation exceeded consensus expectations again in the US. The upside surprise drove the US Dollar (USD) higher. Economists at TD Securities analyze Greenback’s outlook.
First Fed cut expected in May
Consumer price inflation exceeded consensus expectations again, with the headline CPI advancing 0.3% MoM in January. The focus of the report was centered on the core segment where price gains accelerated to an above-consensus 0.4% MoM, as strength in the services segment more than offset still-persistent goods deflation.
We continue to expect the first Fed cut in May and the USD moving lower on Fed cuts is more a Q2 trade now.
The world outside the US is seeing more growth upgrades than downgrades which makes it less of a US exceptionalism trade and more of a US soft landing trade which is good for the MXN and CAD vs peers.
The United Kingdom will release the Consumer Price Index (CPI) report on Wednesday, February 14 at 07:00 GMT and as we get closer to the release time, here are the forecasts by the economists and researchers of six major banks regarding the upcoming UK inflation print.
Headline inflation for January is expected at 4.1% year-on-year vs. 4.0% in December while core is expected at 5.2% YoY vs. the prior release of 5.1%. The Bank of England (BoE) expects headline CPI to print at 4.1% YoY in January. Services CPI inflation is the BoE’s key indicator of domestic inflationary pressure. The BoE projects services CPI inflation to pick up two ticks to 6.6% YoY in January vs. consensus of 6.8%.
Deutsche Bank
We expect headline CPI at 4.1% YoY and core at 5.0%.
TDS
UK headline inflation likely edged up to 4.1% YoY in January – matching the MPC's latest forecast – in part due to an increase in Ofgem's energy price cap. Core inflation likely remained at 5.1% YoY, while services inflation probably rose a touch more than the MPC expects (6.7% YoY). Uncertainty is particularly high for this print, in part due to the new CPI weights and notable volatility in airfares. Looking ahead, we continue to look for headline inflation to come down quickly starting in March and fall below the 2% target in April.
ABN Amro
CPI inflation is expected to rebound (4.6% YoY) on the back of a renewed rise in Ofgem’s household energy price cap, while core inflation is also expected to pick up on continued strength in services inflation.
SocGen
We expect both headline inflation and core to have rebounded by 0.1pp in January to 4.1% and 5.2%, respectively. But don’t worry. This is just a temporary blip in the disinflation process. Primarily, the increase is driven by a base effect in the services component due to a sharp decline in air fares and a tripling in its weight in January 2023. Along with airfares possibly causing some surprises again this year, cultural services inflation may reverse the upside surprise in December, but we believe this should be offset by stronger restaurant inflation. Relative to the BoE, we see a stronger rebound in services inflation to 6.9% vs. the Bank’s estimate in the February MPR of 6.6%.
Wells Fargo
For the January CPI, base effects should see a modest uptick in some key inflation figures. The consensus forecast is for headline inflation to firm to 4.2% YoY, and core inflation is also expected to tick up to 5.2%. Beyond January, however, the downward trend in UK inflation is expected to resume.
Citi
We expect headline inflation to accelerate marginally this week from 4.0% to 4.1%. Sequential inflation – excluding energy – will likely remain very close to pre-Covid rates at just 0.1pp above. We expect services inflation in a 6.7%-6.8% range but overall, the MPC’s preferred measure of underlying inflation is likely to remain flat at 6.4%.
- US inflation at 3.1% YoY, Core CPI at 3.9%, suggests enduring inflation, impacting rate cut outlook.
- Rising US Treasury yields and a stronger Dollar Index reflect market reevaluation of Fed rate strategies.
- CME FedWatch Tool shows decreased expectations for a Fed rate cut in May.
The GBP/USD plunges below 1.2600 as strong economic data from the United States (US) suggests the Federal Reserve (Fed) would keep interest rates higher for longer. At the time of writing, the pair trades at 1.2598 after hitting a daily high of 1.2683.
GBP/USD slid on hot US CPI data, traders await UK inflation figures
The US Bureau of Labor Statistics (BLS) indicated that inflation in January slightly exceeded forecasts, surprising traders. The Consumer Price Index (CPI) for January was reported at 3.1% year-over-year (YoY), which, although lower than December's figures, was above the anticipated 2.9%. The Core CPI, which excludes volatile food and energy prices, remained steady at 3.9%, surpassing the expected decrease to 3.7% on an annual basis.
After the data, US Treasury bond yields edged up, dragging the US Dollar Index (DXY) to a three-month high of 104.87, shy of cracking the 105.00 figure. Expectations for the Federal Reserve’s first-rate cut were pushed until June, as the CME FedWatch Tool showed, as May odds were cut from 52.2% a day ago to 36.4%.
In the meantime, UK jobs data showed that wage growth slowed again, while vacancies fell for the 19th straight report, dropping by 26K from the August-to-October period. Traders will be looking for UK inflation data revealed on Wednesday, with headline and CPI expected to rise from 4% to 4.2% and from 5.1% to 5.2%.
GBP/USD Price Analysis: Technical outlook
The pair dropped to a three-day low of 1.2575 before resuming to the upside, but the bias remains neutral. Although the GBP/USD remains above the 200-day moving average (DMA), a daily close below 1.2600 could open the door to testing the latter at around 1.2562, which could open the door to challenge the 1.2500 figure. A break below will expose the 100-DMA at 1.2484. On the flip side, if buyers regain the 50-DMA at 1.2671, that could pave the way for challenging 1.2700.
US inflation surprised to the upside in January. Economists at Commerzbank analyze the implications for a possible pivot to interest rate cuts by the Federal Reserve (Fed).
Setback in the disinflationary trend
US consumer prices rose by 0.3% in January compared to the previous month, slightly more than expected. The year-on-year rate fell from 3.4% to 3.1%. The more important core rate, which excludes energy and food, increased even 0.4% in the previous month, also slightly higher than expected. The YoY comparison remained at 3.9%.
The unexpectedly high CPI increase in January is likely to encourage the Fed to wait and see how prices develop before declaring victory over inflation.
Some observers will now be wondering whether the interest rate cut that was firmly planned for May will also start to wobble, especially as the real economy has so far proved to be very robust. We had already considered a cut in March to be premature anyway.
As far as May is concerned, we should wait and see how PCE inflation has developed in January and whether higher price pressure is also evident in February before assessing Fed policy.
The Pound Sterling (GBP) started the year on a firm note, outperforming most of its major currency peers. Economists at Scotiabank analyze GBP outlook.
GBP’s early year outperformance moderates
Positive UK data, suggesting some surprising resiliency in the economy prompted a significant reduction in BoE rate cut bets while strengthening global stocks gave the quasi high-beta GBP a pro-risk lift.
Cable gains were capped a little above 1.2800 while solid support developed on dips to 1.2600 as speculative and hedge fund traders boosted bullish positioning.
Short-term trends turned more negative in early February as GBP/USD weakened below 1.2600 but we still anticipate moderate gains for the GBP (mainly in H2) this year as global rates ease and risk appetite picks up.
GBP/USD – Q1-24 1.2500 Q2-24 1.2500 Q3-24 1.3000 Q4-24 1.3000
- US CPI at 3.1% YoY with Core CPI at 3.9% contradicts softer inflation expectations.
- Futures tilt towards later Fed easing, with consensus for unchanged rates in May.
- US Treasury yield surge, reaching new highs since November, due to adjusted rate forecasts.
- ZEW Economic Sentiment Index exceeds forecasts, indicating optimism for ECB and Fed policy shifts.
The EUR/USD tumbled from around daily highs at 1.0796 following a red-hot inflation report in the United States (US) that pushed back expectations of Federal Reserve interest rate cuts, as seen by futures market data. At the time of writing, the pair exchanged hands at 1.0715.
US CPI pushed back interest rate cuts by the US central bank
The US Department of Labor revealed that inflation ticked slightly above expectations, catching traders off guard. Headline inflation, as measured by the Consumer Price Index (CPI) for January, came at 3.1% YoY, lower than December’s data but above the 2.9% expected. Core CPI was unchanged at 3.9%, up from a 3.7% dip estimate on annual figures.
After the data, traders pushed back the first Fed rate cut to June, with traders seeing a 62% chance of keeping the federal funds rate at the 5.25%-5.50% range in May. US Treasury bond yields edged up, with 2s hitting 4.633%, its highest level since November 28, and the 10-year at 4.297%.
In the meantime, during the European session, the ZEW Economic Sentiment Index exceeded estimates and the previous reading data. ZEW President Achim Wambach commented, “Over two-thirds of respondents expect the European Central Bank to make interest rate cuts in the coming six months, and nearly three-quarters are anticipating imminent rate cuts by the US central bank.”
EUR/USD Price Analysis: Technical outlook
The major dipped towards the 1.0700 figure following the report, but buyers entered the market, lifting the exchange rate to the current exchange rates. A decisive break below 1.0700 could drive the spot towards the November 10 low of 1.0656. the next support would be 1.0600. on the flip side, if buyers regain the 100-day moving average (DMA) at 1.0790, look for a re-test of 1.0800.
The Mexican Peso (MXN) has remained well anchored near the 17.00 level against the US Dollar (USD). Economists at Scotiabank analyze Peso’s outlook.
Slight bias towards a depreciation in the MXN
Political noise coming from the presidential elections in the US and changing expectations regarding the Fed and Banxico’s monetary policy paths remain the currency’s major source of distress.
We expect easier domestic monetary policy to nudge the MXN a little lower this year but the exchange rate will be sensitive to likely Republican candidate Trump’s comments on trade and tariffs as the US election campaign unfolds.
USD/MXN – Q1-24 17.70 Q2-24 17.80 Q3-24 18.10 Q4-24 18.40
The US Dollar (USD) has been the clear outperformer so far this year. Economists at Danske Bank maintain their strategic case for a lower EUR/USD in the medium term.
Robust US fundamentals to continue supporting the USD
We maintain the strategic case for a lower EUR/USD based on the relative terms of trade, real rates, and relative unit labour costs. Hence, we expect a downward trajectory over the course of the year. In the near term, we like to sell the cross on rallies.
Although our forecast for the Fed and the ECB suggests upside risk to EUR/USD in H1, we stress that the broader market pricing in G10, which we believe is too aggressive for cuts, could prove to be more crucial for EUR/USD.
Unless we see a notable turnaround in US data, we anticipate the USD to remain strong in the near term.
The Swiss Franc (CHF) has been one of the outperformers in 2023, gaining by nearly 10% vs. the US Dollar (USD). Economists at OCBC Bank analyze USD/CHF outlook.
Forecast trajectory is largely flat for USD/CHF
In the near term, USD/CHF may correct higher as the Fed has yet to embark on rate cut but markets may be pricing a dovish shift in CHF policy.
Our forecast trajectory is largely flat for USD/CHF, taking into account 1/ a moderate and soft USD view (premised on our view that the Fed will cut rates, possibly as early as 2Q 2024) and 2/ that Swiss policymakers may no longer pursue a strong CHF policy as well as the risks for SNB rate cuts in 2H 2024. These effects should in some way offset each other.
USD/CHF – Mar-24 0.8800 Jun-24 0.8800 Sep-24 0.8900 Dec-24 0.9000 Mar-25 0.9000
- EUR/GBP finds support near 0.8500; more downside seems likely on upbeat UK Employment data.
- The expectations of BoE rate cuts remain lower as the UK’s wage growth remains higher than expectations.
- Eurozone’s ZEW Survey Economic Sentiment improves surprisingly for February.
The EUR/GBP pair discovers an intermediate cushion near the psychological support of 0.8500 in the European session on Tuesday. The cross is expected to resume its downward journey as the United Kingdom Office for National Statistics (ONS) has reported upbeat employment data for three months ending December.
The UK ONS reported that employers hired 72K workers, similar to reading in three months ending November. The Unemployment Rate drops sharply to 3.8% from expectations of 4.0% and the prior release of 4.2%.
Meanwhile, wage growth grew at the weakest pace in more than a year but was higher than the expectations of market participants. Average Earnings including bonuses rose at a slower pace of 5.8% against the former release of 6.7%. However, economists projected a slower wage growth rate of 5.6%.
Going forward, investors will focus on the UK inflation data for January, which will be published on Wednesday. The headline inflation is forecasted to grow by 4.2% from 4.0% in December. In the same period, the core inflation that excludes volatile food and Oil prices is anticipated to have risen by 5.2% against 5.1%.
A stubborn inflation data and a higher wage growth rate than market expectations would push back expectations of early rate cuts by the Bank of England (BoE).
On the Eurozone front, surprisingly, the ZEW Survey – Economic Sentiment for February rose to 25.0 from 22.7 in January. Investors projected the economic sentiment to fade to 20.1. This has brought some strength to the Euro but is insignificant to get underpinned against the Pound Sterling.
US economy is in a sweet spot. But how high can the USD go? Elias Haddad, Senior Markets Strategist at BBH, analyzes Greenback’s outlook.
Favourable US macroeconomic outlook bodes well for USD over the next three to six months
The favourable US macroeconomic outlook bodes well for US Dollar (USD) over the next three to six months.
But headwinds from reserve managers ongoing portfolio diversification away from Dollar assets and the neutral US monetary/fiscal mix suggest the cyclical upswing in the US Dollar Index (DXY) will top-out around 110.00.
S&P 500 futures are down 0.43%, Dow Jones futures drop 0.19%, and Nasdaq futures lose 0.77%.
S&P 500 (SPX) lost 0.1% on Monday, Dow Jones (DJIA) gained 0.33% and Nasdaq (IXIC) fell 0.30%.
What to know before stock market opens
- The Utilities Sector was the best-performing major sector in the S&P 500 on Monday, rising 1.14% on the day. On the other hand, the Technology Sector sank 0.77%.
- V.F. Corp (VFC) rose 14% to $17.43 as the top gainer of the first trading day of the week. The biggest decliner is Motorola Solutions Inc. (MSA), down over 3.2%.
- The Federal Reserve Bank of New York's latest Survey of Consumer Expectations showed on Monday that the US consumers' one-year inflation expectation held steady at 3%.
- The US Bureau of Labor Statistics (BLS) announced on Friday that it revised the monthly Consumer Price Index (CPI) increase for December lower to 0.2% from 0.3%.
- The BLS will release January CPI data ahead of the opening bell on Tuesday. The headline annual CPI is forecast to rise 2.9% on a yearly basis, at a softer pace than December's 3.4%. The Core CPI, which excludes volatile food and energy prices, is expected to increase 3.7%.
- The CBOE Volatility Index (.VIX) rose 7.7% on Monday and was up more than 1% at the time of writing on Tuesday.
- Dallas Federal Reserve (Fed) Bank President Lorie Logan said that there is no urgency to cut interest rates. Logan acknowledged that there has been "tremendous progress" on bringing down inflation but noted that she would want to see further evidence on inflation to confirm the progress is durable.
- Airbnb Inc. (ABNB) and MGM Resorts International (MGM) are among top companies that will release earnings reports after the closing bell.
- Later in the week, January Retail Sales, Industrial Production and Producer Price Index (PPI) data will be featured in the US economic calendar.
S&P 500 FAQs
What is the S&P 500?
The S&P 500 is a widely followed stock price index which measures the performance of 500 publicly owned companies, and is seen as a broad measure of the US stock market. Each company’s influence on the computation of the index is weighted based on market capitalization. This is calculated by multiplying the number of publicly traded shares of the company by the share price. The S&P 500 index has achieved impressive returns – $1.00 invested in 1970 would have yielded a return of almost $192.00 in 2022. The average annual return since its inception in 1957 has been 11.9%.
How are companies chosen to be included in the S&P 500?
Companies are selected by committee, unlike some other indexes where they are included based on set rules. Still, they must meet certain eligibility criteria, the most important of which is market capitalization, which must be greater than or equal to $12.7 billion. Other criteria include liquidity, domicile, public float, sector, financial viability, length of time publicly traded, and representation of the industries in the economy of the United States. The nine largest companies in the index account for 27.8% of the market capitalization of the index.
How can I trade the S&P 500?
There are a number of ways to trade the S&P 500. Most retail brokers and spread betting platforms allow traders to use Contracts for Difference (CFD) to place bets on the direction of the price. In addition, that can buy into Index, Mutual and Exchange Traded Funds (ETF) that track the price of the S&P 500. The most liquid of the ETFs is State Street Corporation’s SPY. The Chicago Mercantile Exchange (CME) offers futures contracts in the index and the Chicago Board of Options (CMOE) offers options as well as ETFs, inverse ETFs and leveraged ETFs.
What factors drive the S&P 500?
Many different factors drive the S&P 500 but mainly it is the aggregate performance of the component companies revealed in their quarterly and annual company earnings reports. US and global macroeconomic data also contributes as it impacts on investor sentiment, which if positive drives gains. The level of interest rates, set by the Federal Reserve (Fed), also influences the S&P 500 as it affects the cost of credit, on which many corporations are heavily reliant. Therefore, inflation can be a major driver as well as other metrics which impact the Fed decisions.
- The US Dollar holds strong ahead of this week’s main event in the form of US CPI numbers.
- Market expectations are for further disinflation.
- The US Dollar Index holds above 104 and shows no signs of a breakout yet.
The US Dollar (USD) is holding strong this Tuesday ahead of US Consumer Price Index (CPI) numbers. Traders are not selling the Greenback just yet ahead of the numbers, which is as to be expected. That expectation arose after Friday when the US Administration revised the calculation method and composition of the inflation baskets and metrics, in order to better reflect the actual price pressures consumers are facing these days. It led to a downward revision of the December inflation print and could mean an undershooting of the current CPI expectations from analysts and economists.
On the economic front, The National Federation of Independent Business (NFIB) is due to release its Index for January ahead of the US Consumer Price Index numbers. CPI numbers themselves are expected around 13:30 GMT and will be market moving, with all eyes on both the Monthly Core and Headline inflation, which are expected to further come down. Any surprise in these numbers could either push back or pull forward rate cut expectations from the US Federal Reserve, away from June where the bulk load of expectations is lying at the moment.
Daily digest market movers: CPI tweak impact
- The National Federation of Independent Business (NFIB) has released its Business Optimism Index for January and saw a quick decline from 91.9 to 89.9 where 91.1 was expected.
- At 13:30 GMT, the US Consumer Price Index is due to be released:
- Monthly Headline Inflation is expected to remain unchanged at 0.2%.
- Monthly Core Inflation is expected to remain unchanged at 0.3%.
- Yearly Headline Inflation is seen heading from 3.4% to 2.9%.
- Yearly Core Inflation should go from 3.9% to 3.7%.
- Biggest element to look out for is if the current Red Sea attacks are driving up prices with the longer routes shipping companies are forced to make to get goods from and to the US ports, which comes at higher costs.
- The US Redbook Index for February 9th is due to be released near 13:55 GMT. Previous print was at 6.1%.
- Equity markets are very much dispersed this Tuesday, with Japan seeing its two major indices closing over 2% higher. Europe is not following suit and rather sees its Euro Stoxx 50 down near 1%. US equity futures are retreating as well after the Dow Jones briefly hit new all time highs on Monday.
- The CME Group’s FedWatch Tool is now looking at the March 20th meeting. Expectations for a pause are 84.5%, while 15.5% for a rate cut.
- The benchmark 10-year US Treasury Note trades near 4.18%, little changed from Monday
US Dollar Index Technical Analysis: Markets wrongfooted
The US Dollar Index (DXY) is not abating as most traders would have thought on the back of the inflationary revision metrics last Friday. The DXY is still near that 100-day Simple Moving Average (SMA) and looks to be playing chicken with the traders that are convinced the US Dollar is a bit overvalued and an earlier rate cut is still a possibility. Meanwhile US Dollar bulls are not going all in either, refraining from sending the DXY higher in the idea that rate cuts could come even after the summer now.
Should the US Dollar Index move higher again, first look for a test at the peak of last week’s Monday, near 104.60. That level needs to be broken and is more important than the 100-day Simple Moving Average snap at 104.26. If price breaks above last Monday’s high (February 5), the road is open for a jump to 105.00 with 105.12 as key levels to keep an eye on.
The first ideal candidate for support is the 200-day SMA near 103.64. Should that give way, look for support from the 55-day SMA near 103.04 itself. Should those fail, look for 102.00 as a big figure to do the necessary.
Inflation FAQs
What is inflation?
Inflation measures the rise in the price of a representative basket of goods and services. Headline inflation is usually expressed as a percentage change on a month-on-month (MoM) and year-on-year (YoY) basis. Core inflation excludes more volatile elements such as food and fuel which can fluctuate because of geopolitical and seasonal factors. Core inflation is the figure economists focus on and is the level targeted by central banks, which are mandated to keep inflation at a manageable level, usually around 2%.
What is the Consumer Price Index (CPI)?
The Consumer Price Index (CPI) measures the change in prices of a basket of goods and services over a period of time. It is usually expressed as a percentage change on a month-on-month (MoM) and year-on-year (YoY) basis. Core CPI is the figure targeted by central banks as it excludes volatile food and fuel inputs. When Core CPI rises above 2% it usually results in higher interest rates and vice versa when it falls below 2%. Since higher interest rates are positive for a currency, higher inflation usually results in a stronger currency. The opposite is true when inflation falls.
What is the impact of inflation on foreign exchange?
Although it may seem counter-intuitive, high inflation in a country pushes up the value of its currency and vice versa for lower inflation. This is because the central bank will normally raise interest rates to combat the higher inflation, which attract more global capital inflows from investors looking for a lucrative place to park their money.
How does inflation influence the price of Gold?
Formerly, Gold was the asset investors turned to in times of high inflation because it preserved its value, and whilst investors will often still buy Gold for its safe-haven properties in times of extreme market turmoil, this is not the case most of the time. This is because when inflation is high, central banks will put up interest rates to combat it.
Higher interest rates are negative for Gold because they increase the opportunity-cost of holding Gold vis-a-vis an interest-bearing asset or placing the money in a cash deposit account. On the flipside, lower inflation tends to be positive for Gold as it brings interest rates down, making the bright metal a more viable investment alternative.
Pound Sterling (GBP) bid after stronger wages/employment data. Economists at MUFG Bank analyze GBP outlook.
Wage growth resilience but signs of weakness emerging
The wage data were again stronger than expected and will encourage continued caution by the BoE over signalling the potential for rate cuts.
The jobs data also were stronger. The 3mth/3mth change in employment increased 72K, stronger than expected while the ILO unemployment rate fell to 3.8%, the lowest level since January 2023. However, the Average Weekly Earnings data on 3mth and 6mth annualised data is now indicating a more meaningful slowdown in the annual rate coming with both rates now in negative territory.
BoE Governor Andrew Bailey saw signs of ‘an upturn’ in the forward-looking data and coupled with the slow pace of decline in the wage data today will encourage continued caution by the BoE. It won’t alter current market pricing that has the first full rate cut priced for August and that should help provide GBP with further support.
- USD/MXN snaps its two-day losing streak before US CPI data.
- Banxico maintains its outlook that inflation will reach its 3% target by 2025.
- The expected moderation in US inflation adds to the chance for Fed rate cuts in March.
- Annual US CPI and Core CPI are expected to decrease at 2.9% and 3.7%, respectively.
USD/MXN breaks its two-day losing streak, bolstered by a stronger US Dollar (USD) as traders exercise caution ahead of the release of US inflation data scheduled for Tuesday during the North American session. The USD/MXN pair inches higher to near 17.08 during the European session on Tuesday.
However, the Mexican Peso (MXN) may have found support as the Bank of Mexico (Banxico) adjusted its inflation projections upward for the first three quarters of 2024. They anticipate inflation to converge toward 3.5% in the fourth quarter, according to the latest monetary policy statement.
Furthermore, Banxico’s Governor, Victoria Rodriguez Ceja, expressed expectations that inflation would resume its downward trajectory and continue the disinflationary trend. She emphasized that despite recent increases over the past three months, Banxico maintains its outlook that inflation will reach its 3% target by 2025.
Governor Ceja also remarked, “The inflationary environment has evolved, and the current situation differs significantly from what we experienced in 2022, even in the initial months of 2023.” She affirmed that the central bank would base its decisions on a range of factors and data, including actions taken by the US Federal Reserve.
The anticipated moderation in US inflation for January adds to the likelihood that the Federal Reserve (Fed) may reconsider its stance on interest rate reductions at the upcoming March meeting. This expectation exerts downward pressure on yields of US Treasury bonds, subsequently weighing on the US Dollar. Consequently, the USD/MXN pair faces resistance.
The US Dollar Index (DXY), reflecting the USD's performance against a basket of six major currencies, remains steady at around 104.10. Meanwhile, the 2-year and 10-year US Treasury yields stand at 4.47% and 4.16%, respectively, by the press time.
Market participants on the Gold market today are likely to focus mainly on the publication of the US inflation data for January. Economists at Commerzbank analyze the yellow metal’s outlook ahead of the Consumer Price Index (CPI) report.
US inflation data in focus on the Gold market
Although the inflation rate is likely to have fallen further in January, it is unlikely to be sufficient to revive the expectations of interest rate cuts that have disappeared from the market. The Gold price could therefore fall further in the short term.
However, our economists continue to expect an initial Fed rate cut in May and significant rate cuts later in the year. The current Gold price weakness should therefore only be temporary.
Today brings the key data of the week – the US Consumer Price Index (CPI) report. Economists at MUFG Bank analyze how inflation figures could impact the US Dollar (USD).
Limited scope for Dollar weakness
A good inflation print today will likely be enough to halt the move higher in short-term yields but it would take a substantially weaker CPI print to prompt a deeper plunge in yields that would drag the Dollar weaker.
A March rate cut looks like a lost cause now but a very weak CPI print will see May very much back in play. But with the ECB still not dismissing an April cut completely we see limited scope for Dollar weakness.
A strong CPI print looks more likely to prompt a bigger Dollar move to the upside as a May cut would be put in further doubt.
- WTI Oil tests the double top which could mean more upside.
- Oil traders are sending crude higher with EIA reporting OPEC production cuts are being respected.
- The US Dollar Index is stronger ahead of US CPI numbers.
Oil prices are jumping higher with a six-day consecutive winning streak which looks to be entering a crucial phase this Tuesday. The jump in Oil comes with additional US sanctions shelving Russian-friendly Oil tankers which are floating around with empty cargo. An extra bullish element for Oil comes from the International Energy Agency (IEA) which reports that OPEC+ production cuts are being well respected.
Meanwhile, the US Dollar Index (DXY) is in the green, ahead of the always important US Consumer Price Index (CPI). Last week the US administration revised the calculation method for inflation to better represent real life situations. It resulted in an even lower-than-expected inflation print for December and could mean more disinflation ahead for this Tuesday’s number. Given USD’s negative correlation with Oil, this in turn could benefit Black Gold.
Crude Oil (WTI) trades at $76.88 per barrel, and Brent Oil trades at $81.96 per barrel at the time of writing.
Oil news and market movers: OPEC comments firing up markets
- OPEC will stay proactive and united, the Secretary General of the OPEC group Haitham Al Ghais said this morning at the World Governments’ Summit.
- Fatih Birol, Executive Director of the International Energy Agency (IEA) said that OPEC+ is showing largely good discipline in its supply cuts. Further, the IEA sees global demand growing by 1.2 to 1.3 million barrels per day in 2024.
- Saudi Aramco is still looking into adding supply output and said it is ready to raise its capacity should the government ask for it.
- The US administration has sanctioned around 25 tankers (out of the 50) from carrying Russian Oil. These are currently either afloat at sea without any cargo or are harboured without any travel papers or plans being admitted at the moment.
Oil Technical Analysis: “Crucial” point
Oil prices have staged a very solid rally these past six days with a nice consecutive winning streak. The end of the line could be near with prices currently banging on the $77 marker which falls in line with both a descending trend line, the 100-day and the 200-day Simple Moving Average just a few cents apart from each other. Should more positive, supportive or outright bullish news for Oil emerge, a quick sprint to $80 could be underway.
As mentioned above, $80 is the first level to have a look at on the upside. Should the Relative Strength Index not head into being overbought too quickly, look for $84 and $88 as next targets to the upside. The ultimate target in this area would be $92.66, with the tops from November 2022 coming into play.
On the downside, support from the 55-day SMA at 73.52 should goto work before the green ascending trend line near $72.10 gets tested. If that trend line snaps, look for the purple line near $67.11 to catch any falling knives. Seeing the triple bottom from June/July 2023, that level should be strong enough to support.
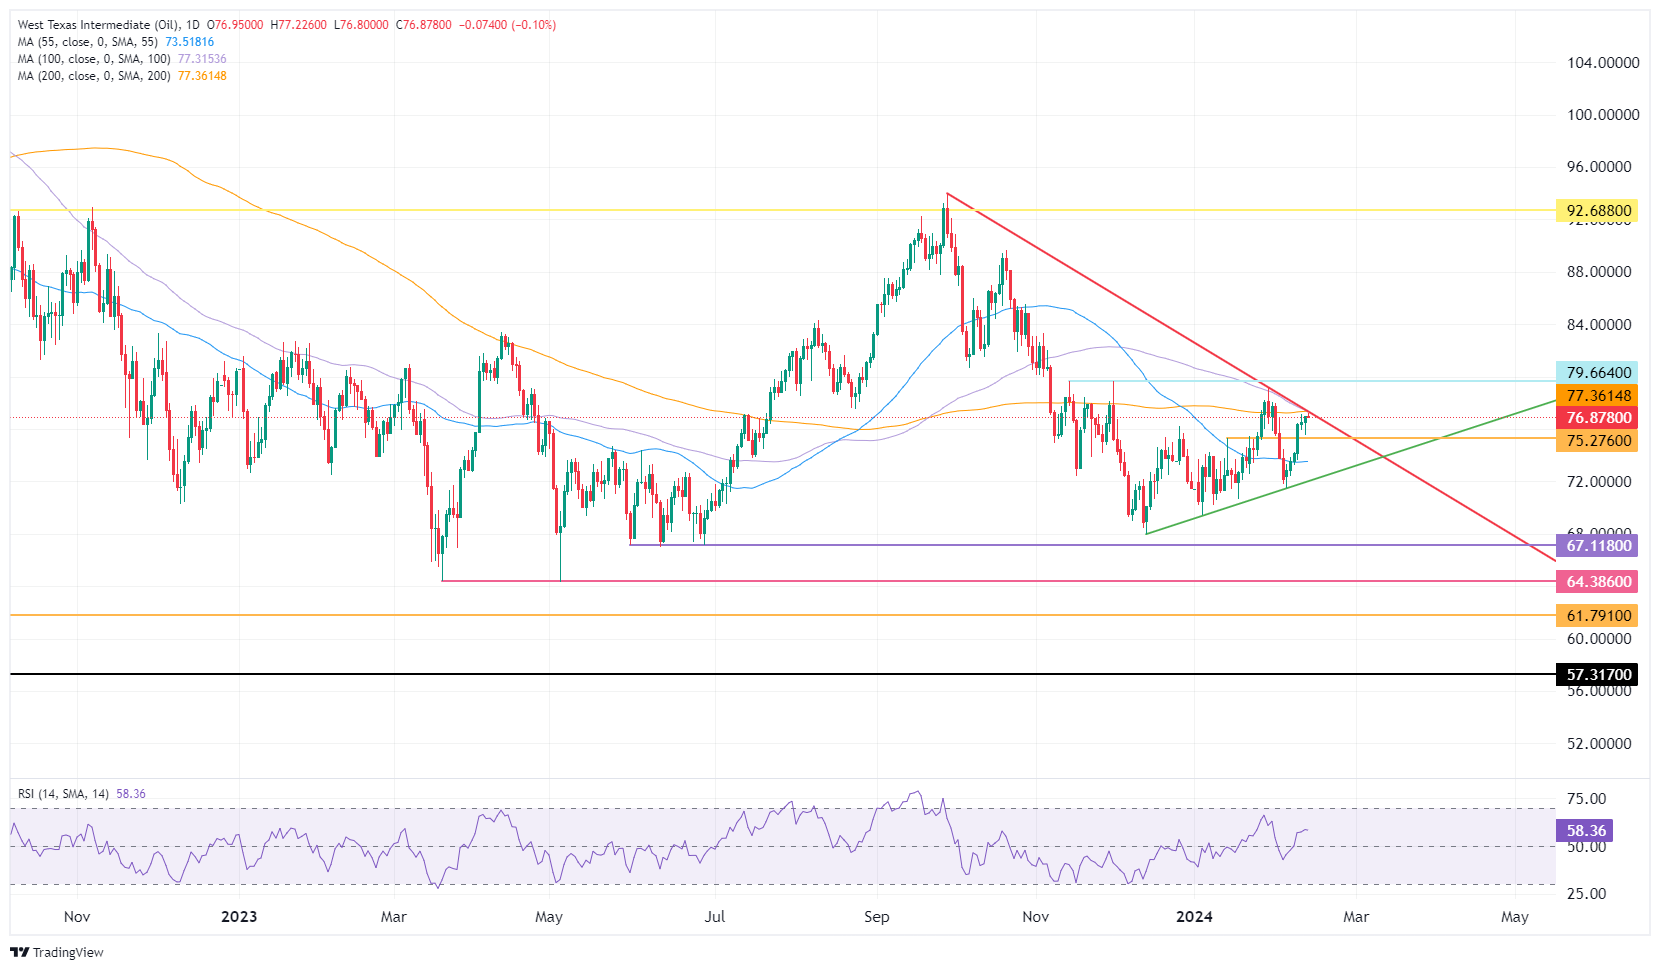
US WTI Crude Oil: Daily Chart
WTI Oil FAQs
What is WTI Oil?
WTI Oil is a type of Crude Oil sold on international markets. The WTI stands for West Texas Intermediate, one of three major types including Brent and Dubai Crude. WTI is also referred to as “light” and “sweet” because of its relatively low gravity and sulfur content respectively. It is considered a high quality Oil that is easily refined. It is sourced in the United States and distributed via the Cushing hub, which is considered “The Pipeline Crossroads of the World”. It is a benchmark for the Oil market and WTI price is frequently quoted in the media.
What factors drive the price of WTI Oil?
Like all assets, supply and demand are the key drivers of WTI Oil price. As such, global growth can be a driver of increased demand and vice versa for weak global growth. Political instability, wars, and sanctions can disrupt supply and impact prices. The decisions of OPEC, a group of major Oil-producing countries, is another key driver of price. The value of the US Dollar influences the price of WTI Crude Oil, since Oil is predominantly traded in US Dollars, thus a weaker US Dollar can make Oil more affordable and vice versa.
How does inventory data impact the price of WTI Oil
The weekly Oil inventory reports published by the American Petroleum Institute (API) and the Energy Information Agency (EIA) impact the price of WTI Oil. Changes in inventories reflect fluctuating supply and demand. If the data shows a drop in inventories it can indicate increased demand, pushing up Oil price. Higher inventories can reflect increased supply, pushing down prices. API’s report is published every Tuesday and EIA’s the day after. Their results are usually similar, falling within 1% of each other 75% of the time. The EIA data is considered more reliable, since it is a government agency.
How does OPEC influence the price of WTI Oil?
OPEC (Organization of the Petroleum Exporting Countries) is a group of 13 Oil-producing nations who collectively decide production quotas for member countries at twice-yearly meetings. Their decisions often impact WTI Oil prices. When OPEC decides to lower quotas, it can tighten supply, pushing up Oil prices. When OPEC increases production, it has the opposite effect. OPEC+ refers to an expanded group that includes ten extra non-OPEC members, the most notable of which is Russia.
EUR/GBP skids to six-month low of 0.8511. Economists at Société Générale analyze the pair’s outlook.
UK wages reinforce BoE caution
The BoE two weeks ago mentioned, like the Fed, it does not have the confidence yet on inflation to cut rates. That won’t change after earnings ex-bonuses slowed in December to 6.2% 3m/YoY, above forecast of 6.0%. November was revised up by 0.1ppt to 6.7%.
Employment rose by 72K. Payrolls, a notoriously volatile data series, expanded by 48K in January. December was revised up to +31K.
For EUR/GBP, a pullback to the 0.8400-0.8500 range becomes a distinct possibility for the first time since 2022.
- NZD/USD loses ground as US Dollar improves ahead of US Inflation data.
- RBNZ Inflation Expectations (Q1) increased by 2.5% against the 2.7% prior.
- Annual US CPI and Core CPI could moderate to 2.9% and 3.7%, respectively.
The NZD/USD pair falls to near 0.6110 during the European trading session on Tuesday. The New Zealand Dollar (NZD) encounters pressure against the US Dollar (USD) is partially attributed to diminished Kiwi inflation expectations in the first quarter, as reflected in the RBNZ Inflation Expectations (QoQ) data, which rose by 2.5% but lower than the previous increase of 2.7%.
Economists at Commerzbank offer insights into the Kiwi's outlook, noting a significant decline in two-year inflation expectations to their lowest level since the third quarter of 2021. This places them just half a percentage point above the midpoint of the RBNZ's 1-3% inflation target range. However, given the prevailing trends in inflation and economic growth, it is deemed highly improbable for the RBNZ to raise rates again.
The US Dollar Index (DXY) maintains its upward trajectory for the second consecutive session, hovering around 104.10. However, the Greenback's ascent may be tempered by subdued US Treasury yields, with the 2-year and 10-year US yields at 4.47% and 4.17%, respectively, at present.
The NZD/USD pair receives downward pressure as traders exercise caution ahead of the release of United States (US) inflation data scheduled for Tuesday. Market experts anticipate the US Consumer Price Index (CPI) to moderate, with a year-on-year (YoY) increase of 2.9%, compared to the previous rise of 3.4%. The month-over-month rate is expected to stay consistent at 0.2%. Core CPI YoY could rise by 3.7%, down from the previous increase of 3.9%. The monthly core inflation is anticipated to be unchanged at 0.3%.
OPEC Secretary General Al Ghais said in Dubai on the sidelines of the World Governments Summit
Key Highlights:
- Saudi Arabia's decision to postpone capacity expansion should not be misunderstood as a poor demand outlook.
- I stand by published long term demand outlook and firmly believes it is robust.
- Al Ghais sees a strong global economy this year with positive implications for demand.
- The market is in a good place and quite stable.
- On Angola's exit, Al Ghais said “It is not the first time a member leaves, and open to them re-joining if they wish in the future.”
- He added “The OPEC will stay proactive and united as group.”
Market Reaction
West Texas Intermediate (WTI), futures on NYMEX, rallies to $77.60 after the positive commentary on the oil outlook from OPEC Secretary General Al Ghais. WTI spot price is 1% above from its previous close of $77.00.
Today’s US Consumer Price Index (CPI) data could bring the real rate discussion to the fore. Economists at ING analyze its implications for the US Dollar (USD).
Lower US inflation can ignite real rate discussion
We're expecting core US CPI inflation to be in line with the consensus of 0.3%, but our economists say it could be lower. If so, a rising real policy rate would be increasingly hard to justify should the American economy start to cool.
We see the rate-cutting cycle in the US starting in May: markets are currently pricing in June as the start-point, but we reckon the risks of a softer CPI print and weak retail sales to revamp expectations for an earlier cut.
The Dollar is facing asymmetrical risks skewed to the downside this week, but the magnitude of those risks still looks limited. The strong labour market should still hinder further dovish repricing, and we think the Dollar will not capitulate before the second quarter.
- EUR/USD declines as the US Dollar improves on market caution ahead of US Inflation.
- The Euro receives a challenge from expectations of an ECB interest rate cut at the start of the second quarter.
- US CPI is expected to moderate at the reading of 2.9% YoY, down from 3.4% prior.
The EUR/USD pair continues its downtrend for the second consecutive day as the US Dollar (USD) gains strength, as traders exercise caution ahead of the release of inflation data from the United States (US) scheduled for Tuesday. Additionally, Economic Sentiment data from the Eurozone and Germany has been released, and given the EUR/USD pair a small boost in the immediate reaction to the data.
The Euro faces resistance as speculation mounts regarding potential interest rate cuts by the European Central Bank (ECB) at the start of the second quarter. Comments from ECB Executive Board member Piero Cipollone indicated that there may not be a need for the ECB to further restrict demand in its efforts to address inflation, suggesting that interest rates might not need to be raised further.
The US Dollar Index (DXY), tracking the USD against a basket of six major currencies, maintains its upward trajectory for the second successive session. Expectations of inflationary pressures in the United States are driving speculation that the Federal Reserve (Fed) will refrain from cutting interest rates at the upcoming March meeting. This sentiment is bolstering the attractiveness of the US Dollar relative to the Euro.
Daily digest market movers: EUR/USD extends its losses as US Dollar improves
- The US Dollar Index hovers around 104.20 with the 2-year and 10-year US Treasury yields at 4.47% and 4.17%, respectively, by the press time.
- Traders are pricing in a mere 14% probability of a rate cut by the Federal Reserve (Fed) in March. However, the likelihood of a rate cut at the May meeting is estimated to be around 60%.
- Dallas Federal Reserve (Fed) Bank President Lorie K. Logan stated that there is currently no immediate necessity to reduce interest rates. She recognized "tremendous progress" in controlling inflation but stressed the importance of obtaining additional evidence to ensure the sustainability of this progress.
- The US Monthly Budget Statement for January showed a deficit of $22 billion, slightly higher than the expected deficit of $21 billion and the previous deficit of $129 billion.
- 3-month and 6-month US Treasury bills were auctioned at rates of 5.23% and 5.065%, respectively.
- The Euro rallies a little after Eurozone and German Economic Sentiment data from ZEW come in above expectations at 25 vs. 20.1 forecast, and 19.9 vs. 17.5 expected, respectively.
- German Current Situation ZEW sentiment, however, dips below expectations, coming in at -81.7 versus -79 forecast.
Technical Analysis: EUR/USD hovers above the major support of 1.0750
EUR/USD trades near 1.0770 on Tuesday, close to the immediate support at the major level of 1.0750. A break below this level could put downward pressure on the EUR/USD pair to revisit the previous week’s low at 1.0722 followed by the psychological support of 1.0700 level.
On the upside, the EUR/USD pair could find an immediate barrier at the 21-4hr Exponential Moving Average (EMA) at 1.0773 before the psychological resistance of 1.0800. A breakthrough above this level could inspire the bulls of the pair to test the 23.6% Fibonacci retracement level at 1.0821 followed by the major support at 1.0850.
EUR/USD: Four-Hour Chart
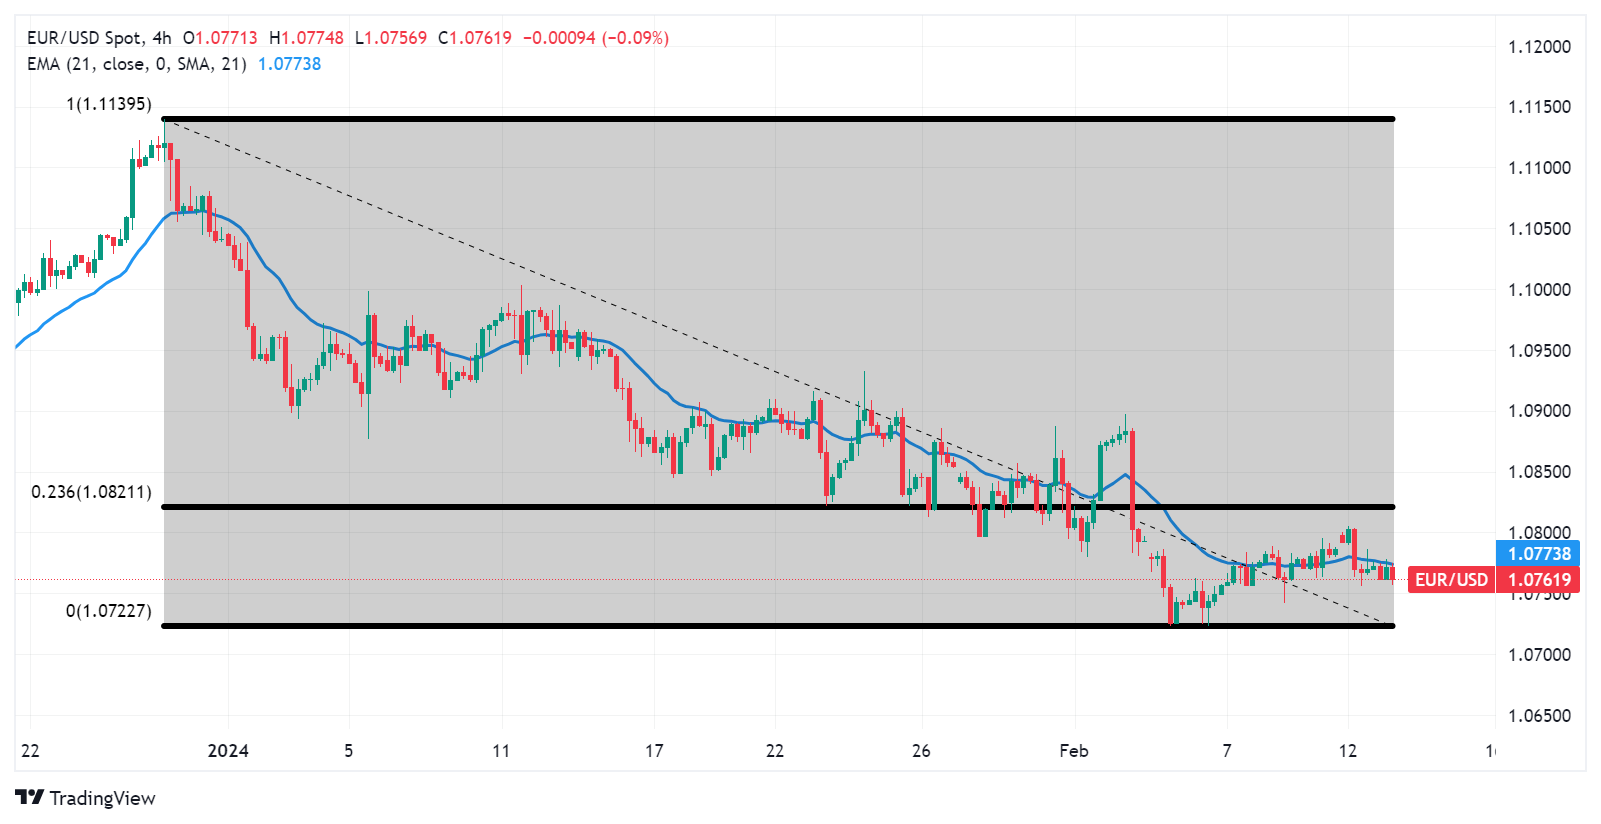
Euro price today
The table below shows the percentage change of Euro (EUR) against listed major currencies today. Euro was the weakest against the Pound Sterling.
| USD | EUR | GBP | CAD | AUD | JPY | NZD | CHF | |
| USD | -0.02% | -0.31% | -0.06% | 0.16% | 0.07% | 0.37% | 0.40% | |
| EUR | 0.02% | -0.30% | -0.04% | 0.17% | 0.09% | 0.37% | 0.41% | |
| GBP | 0.33% | 0.31% | 0.27% | 0.48% | 0.40% | 0.68% | 0.71% | |
| CAD | 0.05% | 0.04% | -0.26% | 0.19% | 0.13% | 0.41% | 0.45% | |
| AUD | -0.16% | -0.17% | -0.48% | -0.21% | -0.09% | 0.21% | 0.27% | |
| JPY | -0.07% | -0.08% | -0.39% | -0.12% | 0.09% | 0.29% | 0.33% | |
| NZD | -0.37% | -0.38% | -0.68% | -0.42% | -0.21% | -0.29% | 0.03% | |
| CHF | -0.39% | -0.41% | -0.72% | -0.44% | -0.26% | -0.32% | -0.03% |
The heat map shows percentage changes of major currencies against each other. The base currency is picked from the left column, while the quote currency is picked from the top row. For example, if you pick the Euro from the left column and move along the horizontal line to the Japanese Yen, the percentage change displayed in the box will represent EUR (base)/JPY (quote).
Euro FAQs
What is the Euro?
The Euro is the currency for the 20 European Union countries that belong to the Eurozone. It is the second most heavily traded currency in the world behind the US Dollar. In 2022, it accounted for 31% of all foreign exchange transactions, with an average daily turnover of over $2.2 trillion a day.
EUR/USD is the most heavily traded currency pair in the world, accounting for an estimated 30% off all transactions, followed by EUR/JPY (4%), EUR/GBP (3%) and EUR/AUD (2%).
What is the ECB and how does it impact the Euro?
The European Central Bank (ECB) in Frankfurt, Germany, is the reserve bank for the Eurozone. The ECB sets interest rates and manages monetary policy.
The ECB’s primary mandate is to maintain price stability, which means either controlling inflation or stimulating growth. Its primary tool is the raising or lowering of interest rates. Relatively high interest rates – or the expectation of higher rates – will usually benefit the Euro and vice versa.
The ECB Governing Council makes monetary policy decisions at meetings held eight times a year. Decisions are made by heads of the Eurozone national banks and six permanent members, including the President of the ECB, Christine Lagarde.
How does inflation data impact the value of the Euro?
Eurozone inflation data, measured by the Harmonized Index of Consumer Prices (HICP), is an important econometric for the Euro. If inflation rises more than expected, especially if above the ECB’s 2% target, it obliges the ECB to raise interest rates to bring it back under control.
Relatively high interest rates compared to its counterparts will usually benefit the Euro, as it makes the region more attractive as a place for global investors to park their money.
How does economic data influence the value of the Euro?
Data releases gauge the health of the economy and can impact on the Euro. Indicators such as GDP, Manufacturing and Services PMIs, employment, and consumer sentiment surveys can all influence the direction of the single currency.
A strong economy is good for the Euro. Not only does it attract more foreign investment but it may encourage the ECB to put up interest rates, which will directly strengthen the Euro. Otherwise, if economic data is weak, the Euro is likely to fall.
Economic data for the four largest economies in the euro area (Germany, France, Italy and Spain) are especially significant, as they account for 75% of the Eurozone’s economy.
How does the Trade Balance impact the Euro?
Another significant data release for the Euro is the Trade Balance. This indicator measures the difference between what a country earns from its exports and what it spends on imports over a given period.
If a country produces highly sought after exports then its currency will gain in value purely from the extra demand created from foreign buyers seeking to purchase these goods. Therefore, a positive net Trade Balance strengthens a currency and vice versa for a negative balance.
- USD/CHF soars to 0.8800, prompted by soft Swiss inflation figures.
- Swiss annual inflation data softened to 1.3% from the expectations and the former reading of 1.7%.
- The US Dollar falls from the day’s high while investors remain cautious ahead of US Inflation data.
The USD/CHF pair witnesses a stellar buying interest and reaches to the round-level resistance of 0.8800 in the European session on Tuesday after a soft Swiss Consumer Price Index (CPI) report for January.
The monthly CPI grew at a slower pace of 0.2% against the consensus of 0.6%. In December, price pressures remained stagnant. Annual inflation decelerated significantly to 1.3% from expectations and the prior reading of 1.7%. The Swiss economy is consistently operating below 2% inflation, which would allow the Swiss National Bank (SNB) to unwind its restrictive monetary policy stance.
S&P500 futures have posted decent losses in the London session, portraying caution among market participants ahead of the United States inflation data for January, which will be published at 13:30 GMT. Meanwhile, the US Dollar Index (DXY) has surrendered all of its intraday gains.
According to the expectations, the headline CPI grew at a steady pace of 0.2% on a monthly basis. In a similar timeframe, the core CPI that excludes volatile food and oil prices rose steadily by 0.3%. The annual headline inflation is anticipated to decelerate to 2.9% from 3.4% in December, while core CPI rose at a slightly slower pace of 3.7% against 3.9%.
Decelerating price pressures would allow the Federal Reserve (Fed) to consider rate cuts in the May policy meeting as anticipated by investors. However, Fed policymakers have been reiterating that they need progress in declining inflation for months before reducing interest rates.
EUR/CHF +0.5% after weak Swiss Consumer Price Index (CPI) data. Economists at Société Générale analyze the pair’s outlook.
Weak CPI opens door to March SNB cut
The good news for EUR/CHF is that inflation in Switzerland slowed to 1.3% and core declined to just 1.2%, the lowest since January 2022. A dovish pivot in March looked a dead cert after the comments of President Jordan in Davos last month. Weak CPI brings the possibility of a rate cut next month from 1.75%.
It has been a tricky start to the year for EUR/CHF but positioning for a rate cut should mean EUR/CHF is at least tactically trying to turn a corner.
The cross still trades below the 200-DMA of 0.9580.
- Gold price recovers strongly as geopolitical tensions increase safe-haven appeal.
- The US Dollar remains upbeat ahead of US inflation data.
- Soft inflation data would impact the interest rate outlook.
Gold price (XAU/USD) delivers a swift recovery as the appeal of safe-haven assets improves amid escalating Middle East tensions. The recovery move in the Gold price will be tested by the United States Consumer Price Index (CPI) data for January, which will be published at 13:30 GMT. The consensus shows that price pressures are expected to have softened as the Federal Reserve (Fed) has been holding interest rates in the range of 5.25%-5.50% for longer.
The inflation data will significantly impact the outlook for interest rates. Softer inflation would be positive for Gold as it makes it more likely interest rates will fall, lowering the opportunity cost of holding Gold, which is non-yielding.
The Fed has been consistently pushing back expectations of aggressive rate cuts in 2024, believing that achieving its dual mandate (2% core inflation and full employment) remains out of sight.
Labor demand in the US has remained robust and the scale of economic activities is improving significantly despite higher interest rates. Fed policymakers demand more evidence to ensure price stability as it is crucial for achieving the dual mandate before the commencement of the rate-cut campaign. Softer-than-expected inflation data would uplift hopes of rate cuts.
Easing price pressures would build significant pressure on the US Dollar and bond yields, further supporting Gold since it is priced in US Dollars. Investors will take out liquidity from the US Dollar in a case of decelerating inflation data, as this would allow the Fed to roll back its hawkish interest rate stance.
Daily Digest Market Movers: Gold price rebounds despite US Dollar holding strength
- Gold price extends its recovery to $2,025 as Middle East tensions have escalated.
- Iran-backed Yemeni Houthis continue to attack commercial ships traveling in the Red Sea, connected to the United States and the United Kingdom.
- The foreign inflows for non-yielding assets, such as Gold, increase in times of geopolitical uncertainty.
- Meanwhile, the primary trigger for the FX domain will be the US inflation data for January.
- The US annual headline inflation is forecast to rise at a slower pace of 2.9% from 3.4% in December. In a similar timeframe, the core inflation that excludes volatile food and oil prices is anticipated to decrease to 3.7% from 3.9%.
- On a monthly basis, investors anticipate the headline and core CPI rising steadily by 0.2% and 0.3%, respectively.
- Soft inflation would prompt expectations of a rate cut decision by the Federal Reserve (Fed).
- As per the CME FedWatch tool, traders see a 48% chance for a rate cut by 25 basis points (bps) that will drag interest rates in the range of 5.00%-5.25% in the May monetary policy meeting.
- Investors are not expecting a rate-cut decision by the Fed in March as Fed Chair Jerome Powell ruled out expectations in its latest monetary policy statement.
- Fed policymakers have emphasized keeping interest rates in the restrictive trajectory amid less conviction over inflation declining towards the 2% target.
- The US Dollar Index (DXY) refreshes a three-day high as investors are cautious ahead of the inflation data.
- This week, the volatility is expected to remain high as the US Census Bureau will report the Retail Sales data for January, which will throw some light on the scale of consumer spending.
Technical Analysis: Gold price rebounds from weekly low to $2,025
Gold price reverses from a two-week low around $2,012 as geopolitical uncertainty improves appeal for safe-haven assets. The precious metal witnesses strong demand in the London session but is expected to face volatility as the US CPI data is set to release.
The Gold price hovers near the upward-sloping border of a Symmetrical Triangle chart pattern plotted from the December 13 low at $1,973. Meanwhile, the downward-sloping trendline border of the same pattern from the December 28 high is at $2,088. The Symmetrical Triangle formation indicates a sharp volatility contraction amid indecisiveness among market participants. A breakout usually follows it in one direction or another. The bias is generally for a breakout in the same direction as the preceding trend, which, in this case, is higher.
Gold FAQs
Why do people invest in Gold?
Gold has played a key role in human’s history as it has been widely used as a store of value and medium of exchange. Currently, apart from its shine and usage for jewelry, the precious metal is widely seen as a safe-haven asset, meaning that it is considered a good investment during turbulent times. Gold is also widely seen as a hedge against inflation and against depreciating currencies as it doesn’t rely on any specific issuer or government.
Who buys the most Gold?
Central banks are the biggest Gold holders. In their aim to support their currencies in turbulent times, central banks tend to diversify their reserves and buy Gold to improve the perceived strength of the economy and the currency. High Gold reserves can be a source of trust for a country’s solvency. Central banks added 1,136 tonnes of Gold worth around $70 billion to their reserves in 2022, according to data from the World Gold Council. This is the highest yearly purchase since records began. Central banks from emerging economies such as China, India and Turkey are quickly increasing their Gold reserves.
How is Gold correlated with other assets?
Gold has an inverse correlation with the US Dollar and US Treasuries, which are both major reserve and safe-haven assets. When the Dollar depreciates, Gold tends to rise, enabling investors and central banks to diversify their assets in turbulent times. Gold is also inversely correlated with risk assets. A rally in the stock market tends to weaken Gold price, while sell-offs in riskier markets tend to favor the precious metal.
What does the price of Gold depend on?
The price can move due to a wide range of factors. Geopolitical instability or fears of a deep recession can quickly make Gold price escalate due to its safe-haven status. As a yield-less asset, Gold tends to rise with lower interest rates, while higher cost of money usually weighs down on the yellow metal. Still, most moves depend on how the US Dollar (USD) behaves as the asset is priced in dollars (XAU/USD). A strong Dollar tends to keep the price of Gold controlled, whereas a weaker Dollar is likely to push Gold prices up.
- Germany’s ZEW Economic Sentiment Index climbs to 19.9 in February.
- EUR/USD is trading listlessly below 1.0800 after mixed ZEW surveys.
The headline German ZEW Economic Sentiment Index improved further from 15.2 in January to 19.9 in February. The market expectation was for a 17.5 print.
However, the Current Situation Index dropped from -77.3 to -81.7 in the reported month, missing estimates of -79.0.
The Eurozone ZEW Economic Sentiment Index came in at 25.0 in the same period, as against the January reading of 22.7. The data missed expectations of 20.1.
Key points
The German economy is in a bad place.
Assessment of the current economic situation by the respondents has deteriorated to the lowest level since June 2020.
In contrast, economic expectations for Germany have improved again.
More than two-thirds of the respondents expect the ecb to make interest rate cuts over the next six months in light of falling inflation rates.
Almost three-quarters of respondents expect imminent interest rate cuts by the American central bank.
Market reaction
The EUR/USD pair is reverting to intraday highs near 1.0880 after mixed ZEW surveys, modestly flat on the day.
Euro price today
The table below shows the percentage change of Euro (EUR) against listed major currencies today. Euro was the strongest against the Swiss Franc.
| USD | EUR | GBP | CAD | AUD | JPY | NZD | CHF | |
| USD | -0.01% | -0.26% | -0.04% | 0.16% | 0.11% | 0.41% | 0.39% | |
| EUR | 0.01% | -0.27% | -0.03% | 0.18% | 0.12% | 0.43% | 0.44% | |
| GBP | 0.27% | 0.26% | 0.23% | 0.45% | 0.38% | 0.70% | 0.67% | |
| CAD | 0.04% | 0.03% | -0.23% | 0.19% | 0.15% | 0.44% | 0.43% | |
| AUD | -0.16% | -0.18% | -0.45% | -0.21% | -0.07% | 0.25% | 0.26% | |
| JPY | -0.11% | -0.11% | -0.38% | -0.15% | 0.08% | 0.29% | 0.29% | |
| NZD | -0.43% | -0.44% | -0.70% | -0.47% | -0.25% | -0.32% | -0.02% | |
| CHF | -0.43% | -0.44% | -0.68% | -0.44% | -0.26% | -0.30% | -0.03% |
The heat map shows percentage changes of major currencies against each other. The base currency is picked from the left column, while the quote currency is picked from the top row. For example, if you pick the Euro from the left column and move along the horizontal line to the Japanese Yen, the percentage change displayed in the box will represent EUR (base)/JPY (quote).
The New Zealand Dollar (NZD) has been on a roller coaster ride in recent days. Economists at Commerzbank analyze Kiwi’s outlook.
Inflation expectations fall markedly
Today's two-year inflation expectations fell quite a bit to their lowest level since the third quarter of 2021. This puts them just half a percentage point above the midpoint of the RBNZ's 1-3% inflation target range. Not surprisingly, the Kiwi has given back much of Friday's gains.
Don't get me wrong, if the RBNZ does raise rates again, it would be an extremely hawkish signal and would justify much higher levels. But given the trend in inflation and economic growth, I just don't think it's very likely.
EUR/PLN has broken 4.3200. Economists at ING analyze the pair’s outlook.
Full of hope for new gains
EUR/PLN touched 4.3000 briefly in December. Otherwise, it's a level last seen before Covid. We repeatedly mention long PLN positioning here, which is and will be a long-term problem for further PLN gains.
On the other hand, the short end of the IRS curve is already at levels prior to September's surprise National Bank of Poland rate cut of 75 bps. This implies decent support for the currency compared to HUF and CZK.
Thus, if the market doesn't fall for the false hope of rate cuts after Thursday's inflation print, we see this week as an opportunity to test 4.3000 again.
Today, the US Consumer Price Index (CPI) report will be a crucial staging post for any Fed cuts this year. Economists at Commerzbank analyze why it is simply too early to think about cutting rates under current circumstances.
Disinflation is a marathon, not a sprint
We expect the core rate to be similar to the monthly rate in December. The annual rate is likely to fall only slightly. The annual rate for the headline rate is expected to fall somewhat more sharply, but here the dynamics on a month-on-month basis are similar. In other words, a continuation of the momentum of recent months.
At this point, one might ask why I am commenting so extensively on today's figures when, on the face of it, they contain little new information. There are several reasons. Firstly, we could of course be in for a surprise today. And the surprises of recent months have made it abundantly clear that things can then get very volatile.
On the other hand, the figures are also likely to underline what the Fed has been keen to stress over the past two weeks. Namely, a few more months of good data may be needed before the all-clear can be given. If the figures come in as expected, it should make it clear to the last market participant that a rate cut as early as March is unlikely.
- Pound Sterling jumps strongly on upbeat UK labor market data, higher wage growth.
- The growth in average earnings was higher than expected, allowing BoE to maintain a hawkish narrative.
- The US inflation data will guide further action in the GBP/USD pair.
The Pound Sterling (GBP) discovers a stellar buying interest in Tuesday’s early European session as the United Kingdom Office for National Statistics (ONS) has reported upbeat employment data for the three months ending December. The labor demand remains upbeat, and Average Earnings rose at a higher pace than the expectations of market participants.
Hiring from UK employers remained strong as business owners are optimistic about the economic outlook due to receding recession fears, easing price pressures, and hopes of rate cuts by the Bank of England (BoE).
While wage growth momentum was higher than market expectations, the pace was slower than readings in the three months ending December. This indicates that progress in the labor cost declining towards the required 2% target level has slowed. It suggests the BoE will be able to maintain an argument in favor of keeping interest rates at their current level for a more extended period. This has boosted the Pound Sterling as higher interest rates tend to attract more foreign inflows.
Investors brace for higher volatility in the GBP/USD pair as the United States Bureau of Labor Statistics (BLS) will report January's Consumer Price Index (CPI) data on Tuesday. The appeal for the GBP/USD will strengthen if the inflation data remains softer than expected. The US Dollar would face a sell-off as soft inflation data would allow the Fed to adopt a dovish interest rate stance sooner, which will increase foreign outflows
Daily Digest Market Movers: Pound Sterling jumps on upbeat labor demand
- Pound Sterling witnesses strong buying interest as the United Kingdom ONS has reported upbeat Employment data for three months ending December.
- The Unemployment Rate falls significantly to 3.8% against expectations of 4.0% and the prior reading of 4.2%.
- UK employers recruited 72K workers in December, similar to 73K labor additions in November.
- In January, Claimant Count Change were higher at 14.1K against 5.5K reading in December.
- The reduction in Average Earnings (both with and without bonuses) for three months ending December was slower than expected, which is expected to allow Bank of England policymakers to push back expectations of early rate cuts.
- Average Earnings Excluding Bonus' grew by 6.2% against expectations of 6.0% and the former release of 6.7% (revised from 6.6%). The economic data including bonuses rose at a higher pace of 5.8% against the consensus of 5.6% but remained slower than the prior reading of 6.7% (revised from 6.5%).
- The outlook for the Pound Sterling remains upbeat as investors hope the BoE will start reducing its benchmark rates after the Federal Reserve (Fed).
- The CME FedWatch tool shows that the Fed will start unwinding its restrictive monetary policy stance in May.
- The current outlook on interest rates by the Fed will be impacted after the release of the United States inflation data for January, which will be published at 13:30 GMT.
- According to the estimates, the headline inflation grew at a slower pace of 3.0% against 3.4% in December. In the same period, core inflation that excludes volatile food and oil prices decelerated slightly to 3.8% from 3.9%.
- Investors anticipate the monthly headline rose steadily by 0.2% and core inflation fell by 0.3%.
- A soft inflation report would raise expectations of an early rate cut by the Fed in January.
Technical Analysis: Pound Sterling sets to refresh weekly high above 1.2660
Pound Sterling advances vertically to 1.2640 on upbeat labor market data. The GBP/USD pair aims to print a fresh weekly high above 1.2655. The asset aims to sustain above the 50-day Exponential Moving Average (EMA), which trades around 1.2636. The outlook for the Pound Sterling would strengthen if it climbs above the 20-day EMA, which trades near 1.2660.
The 14-period Relative Strength Index (RSI) rebounds from 40.00, which indicates that market participants have utilized the correction as a buying opportunity. A bullish momentum would emerge if the RSI (14) climbs above 60.00.
Pound Sterling FAQs
What is the Pound Sterling?
The Pound Sterling (GBP) is the oldest currency in the world (886 AD) and the official currency of the United Kingdom. It is the fourth most traded unit for foreign exchange (FX) in the world, accounting for 12% of all transactions, averaging $630 billion a day, according to 2022 data.
Its key trading pairs are GBP/USD, aka ‘Cable’, which accounts for 11% of FX, GBP/JPY, or the ‘Dragon’ as it is known by traders (3%), and EUR/GBP (2%). The Pound Sterling is issued by the Bank of England (BoE).
How do the decisions of the Bank of England impact on the Pound Sterling?
The single most important factor influencing the value of the Pound Sterling is monetary policy decided by the Bank of England. The BoE bases its decisions on whether it has achieved its primary goal of “price stability” – a steady inflation rate of around 2%. Its primary tool for achieving this is the adjustment of interest rates.
When inflation is too high, the BoE will try to rein it in by raising interest rates, making it more expensive for people and businesses to access credit. This is generally positive for GBP, as higher interest rates make the UK a more attractive place for global investors to park their money.
When inflation falls too low it is a sign economic growth is slowing. In this scenario, the BoE will consider lowering interest rates to cheapen credit so businesses will borrow more to invest in growth-generating projects.
How does economic data influence the value of the Pound?
Data releases gauge the health of the economy and can impact the value of the Pound Sterling. Indicators such as GDP, Manufacturing and Services PMIs, and employment can all influence the direction of the GBP.
A strong economy is good for Sterling. Not only does it attract more foreign investment but it may encourage the BoE to put up interest rates, which will directly strengthen GBP. Otherwise, if economic data is weak, the Pound Sterling is likely to fall.
How does the Trade Balance impact the Pound?
Another significant data release for the Pound Sterling is the Trade Balance. This indicator measures the difference between what a country earns from its exports and what it spends on imports over a given period.
If a country produces highly sought-after exports, its currency will benefit purely from the extra demand created from foreign buyers seeking to purchase these goods. Therefore, a positive net Trade Balance strengthens a currency and vice versa for a negative balance.
EUR/USD was rejected around 1.0800 on Monday. Economists at ING analyze the pair’s outlook.
Growth outlook not that relevant for the ECB
We like the chances of a moderate uptick in the pair this week.
One risk to this view is the ZEW survey published in Germany today. Consensus is aligned for a modest rise in the expectations index and a small decline in the current situation index. The release has a history of moving the market, but there are fewer longer-term implications for ECB rate expectations.
Markets are broadly positioned for a soft patch of economic growth in the Eurozone, and especially in Germany, and we don’t think the ECB will change its narrative meaningfully should the outlook deteriorate a little.
USD/INR continues to hold around the 83.00 level and within the 82.50-83.50 range of the past four months. Economists at Commerzbank analyze the pair’s outlook after the latest inflation figures from India.
Welcome development on inflation
January headline inflation eased to a three-month low of 5.1% YoY Core inflation, which excludes food and energy, moderated further to 3.6% from 3.9% previously. This is encouraging as it suggests RBI’s tight policy stance is helping to keep inflationary pressures in check despite the strong demand backdrop.
RBI has stated that it desires to see inflation return towards 4%, the mid-point of the 2-6% target. As such, RBI is expected to maintain a hawkish stance near term. We don’t envisage them cutting rates ahead of the Fed. This in turn should also help to support INR.
Here is what you need to know on Tuesday, February 13:
Following another day of indecisive action on Monday, currency markets' attention shifts to January Consumer Price Index data from the US on Tuesday. ZEW Survey results from Germany will also be looked upon for fresh impetus during the European trading hours and OPEC will release its Monthly Market Report.
The US Dollar (USD) Index continues to fluctuate in a narrow band above 104.00 early Tuesday. Annual inflation in the US is forecast to soften to 2.9% from 3.4% in December. On a monthly basis, the CPI and the core CPI are expected to rise 0.2% and 0.3%, respectively. Ahead of the key inflation data, US stock index futures trade marginally lower and the benchmark 10-year US Treasury bond yield stays near 4.2%.
US CPI data Forecast: Core inflation to edge down to 3.8% and headline to 3.0% according to economists.
The UK's Office for National Statistics (ONS) reported early Tuesday that the ILO Unemployment Rate declined to 3.8% in the three months to December from 4.2%. This reading came in below the market expectation of 4%. Other details of the jobs report showed that the annual wage inflation, as measured by the change in the Average Earnings Excluding Bonus, softened to 6.2% from 6.7% in the same period. GBP/USD gained traction and climbed to the 1.2650 area in the early European session.
The annual CPI in Switzerland rose 1.3% in January, down from the market expectation and December's increase of 1.7%. The initial reaction weighed on the Swiss Franc and USD/CHF was last seen rising nearly 0.5% on the day at around 0.8800.
US Dollar price today
The table below shows the percentage change of US Dollar (USD) against listed major currencies today. US Dollar was the strongest against the Swiss Franc.
| USD | EUR | GBP | CAD | AUD | JPY | NZD | CHF | |
| USD | 0.04% | -0.20% | -0.01% | 0.16% | 0.10% | 0.36% | 0.39% | |
| EUR | -0.04% | -0.24% | -0.05% | 0.11% | 0.07% | 0.33% | 0.35% | |
| GBP | 0.19% | 0.23% | 0.18% | 0.37% | 0.32% | 0.58% | 0.60% | |
| CAD | 0.01% | 0.05% | -0.19% | 0.14% | 0.12% | 0.37% | 0.40% | |
| AUD | -0.16% | -0.14% | -0.37% | -0.18% | -0.08% | 0.22% | 0.30% | |
| JPY | -0.09% | -0.05% | -0.30% | -0.10% | 0.06% | 0.29% | 0.35% | |
| NZD | -0.36% | -0.33% | -0.56% | -0.37% | -0.21% | -0.26% | 0.04% | |
| CHF | -0.40% | -0.41% | -0.60% | -0.45% | -0.30% | -0.35% | -0.05% |
The heat map shows percentage changes of major currencies against each other. The base currency is picked from the left column, while the quote currency is picked from the top row. For example, if you pick the Euro from the left column and move along the horizontal line to the Japanese Yen, the percentage change displayed in the box will represent EUR (base)/JPY (quote).
After closing the first trading day of the week virtually unchanged, EUR/USD continues to move up and down in a tight range below 1.0800 early Tuesday.
USD/JPY registered small gains on Monday and continued to push higher during the Asian trading hours on Tuesday. At the time of press, the pair was trading at its highest level since late November above 149.50.
Gold closed the third consecutive trading day in negative territory on Monday, pressured by rising US T-bond yields. In the European morning, XAU/USD stages a correction and trades modestly higher on the day above $2,020.
Around the turn of the year, the US Dollar (USD) tested lower but has since reversed. Economists at Westpac analyze the Euro (EUR), Pound Sterling (GBP) and Swiss Franc (CHF) against the Greenback.
CHF is expected to gain just 3.0% by end-2025
We continue to expect both EUR and GBP to gain against the USD over our forecast horizon, EUR/USD to rise to 1.1400 end-2024 and 1.1700 end-2025 as GBP/USD lifts to 1.2900 end-2024 and 1.3100 end-2025.
Having already benefited from its safe-haven status, the CHF is expected to gain just 3.0% by end-2025.
- EUR/GBP attracts some sellers to 0.8524 following the upbeat UK labor market data on Tuesday.
- The UK ILO Unemployment Rate dropped to 3.8% in three months to December from 4.2% in the previous reading, better than estimated.
- Traders place bets on interest rate cuts from the ECB, expecting 118 basis points (bps) of cuts in 2024.
- The Eurozone and German ZEW Survey will be due later on Tuesday.
The EUR/GBP cross faces some selling pressure during the early European trading hours on Tuesday. The downtick of the cross is supported by the stronger-than-expected UK labor market data, which lifts the British Pound (GBP). At press time, EUR/GBP is trading at 0.8524, down 0.08% on the day.
The latest data from the UK Office for National Statistics on Tuesday showed that the ILO Unemployment Rate dropped to 3.8% in three months to December from 4.2% in the previous reading, above the market consensus of 4.0%. Meanwhile, the number of people claiming jobless benefits rose by 14.1K in January from a gain of 5.5K in December. The UK Employment Change came in at 72K in December, versus a 73K increase in November.
In a busy week for UK economic data, the January Consumer Price Index (CPI) estimation indicates an increase in both headline and core rates. Furthermore, projections indicate that the release of the UK Q4 GDP growth numbers later this week may confirm a technical recession for the UK economy in the latter half of last year.
The Bank of England (BoE) governor Andrew Bailey downplayed the upcoming data that some experts forecast will prove the UK was in a technical recession at the end of last year. Bailey said the new BoE's latest forecasts suggested a "somewhat stronger growth story" ahead. If the report shows a weaker-than-expected outcome, this could exert some selling pressure on the Pound Sterling (GBP) and act as a tailwind for the EUR/GBP cross.
On the Euro front, the European Central Bank (ECB) Governing Council member Fabio Panetta stated on Saturday that the time for a reversal of the monetary policy stance is fast approaching as disinflation is well underway. He added that inflation has declined rapidly, and cutting rates late but aggressively could cause market volatility. Traders anticipate 118 basis points (bps) of cuts in 2024 from the ECB, down from the 145 bps expected at the start of February.
Market participants will focus on the UK CPI inflation and Producer Price Index (PPI), due on Wednesday. The preliminary UK GDP growth number for the fourth quarter will be released on Thursday, and the Retail Sales report will be published on Friday. On the Euro docket, the Eurozone and German ZEW Survey will be due on Tuesday. The Eurozone GDP numbers for Q4 will be due on Wednesday. Traders will take cues from these reports and find trading opportunities around the EUR/GBP cross.
- The UK Unemployment Rate declined to 3.8% in the quarter to December.
- The Claimant Count Change for Britain arrived at 14.1K in December.
- GBP/USD rises toward 1.2650 after encouraging UK jobs data.
The United Kingdom’s (UK) ILO Unemployment Rate dropped to 3.8% in three months to December, compared to 4.2% in November, data published by the Office for National Statistics (ONS) showed Tuesday. The market forecast was for a 4.0% print in the reported period.
Additional details of the report showed that the number of people claiming jobless benefits rose by 14.1K in January when compared to a gain of 5.5K in December.
The British Employment Change data for December stood at 72K, as against a 73K increase in November.
Average Earnings excluding Bonus in the UK rose 6.2% 3M YoY in December versus November’s 6.7% increase, beating the market expectations of a 6.0% growth.
Another measure of wage inflation, Average Earnings including Bonus increased 5.8% in the reported period, compared with a 6.7% increase in November and the expected 5.6% raise.
GBP/USD reaction to the UK employment report
GBP/USD catches a small bid after the encouraging UK employment data. The pair is trading 0.10% higher on the day at 1.2640, as of writing.
(This story was corrected on February 13 at 07:08 GMT to say, "The United Kingdom’s (UK) ILO Unemployment Rate dropped to 3.8% in three months to December," not 4.0%)
Pound Sterling price today
The table below shows the percentage change of Pound Sterling (GBP) against listed major currencies today. Pound Sterling was the strongest against the New Zealand Dollar.
| USD | EUR | GBP | CAD | AUD | JPY | NZD | CHF | |
| USD | -0.03% | -0.12% | -0.04% | 0.13% | 0.10% | 0.29% | 0.01% | |
| EUR | 0.02% | -0.10% | -0.01% | 0.15% | 0.12% | 0.30% | 0.04% | |
| GBP | 0.12% | 0.08% | 0.06% | 0.23% | 0.20% | 0.40% | 0.10% | |
| CAD | 0.03% | 0.01% | -0.09% | 0.14% | 0.13% | 0.32% | 0.05% | |
| AUD | -0.14% | -0.16% | -0.23% | -0.17% | -0.03% | 0.17% | -0.09% | |
| JPY | -0.11% | -0.13% | -0.21% | -0.13% | 0.01% | 0.18% | -0.09% | |
| NZD | -0.29% | -0.33% | -0.40% | -0.35% | -0.17% | -0.21% | -0.30% | |
| CHF | -0.01% | -0.03% | -0.11% | -0.04% | 0.09% | 0.09% | 0.29% |
The heat map shows percentage changes of major currencies against each other. The base currency is picked from the left column, while the quote currency is picked from the top row. For example, if you pick the Euro from the left column and move along the horizontal line to the Japanese Yen, the percentage change displayed in the box will represent EUR (base)/JPY (quote).
- USD/JPY extends gains for the second successive session.
- The Japanese Yen weakens on market apprehension regarding BoJ’s rate hikes
- An eased US Inflation data could strengthen sentiment of Fed rate cuts.
USD/JPY continues its upward trajectory, nearing 149.50 during Tuesday's Asian trading session. The Japanese Yen (JPY) weakens against the US Dollar (USD) amid market apprehension regarding rate hikes following the Bank of Japan's (BoJ) departure from its ultra-dovish monetary policy stance.
BoJ Deputy Governor Shinichi Uchida's recent statements indicate a reluctance to pursue aggressive tightening, even after the abandonment of negative interest rates. However, the Japanese Yen could be benefiting from its safe-haven status amid heightened tensions between Israel and Gaza.
The US Dollar Index (DXY) sustains its upward trend for the second consecutive session, hovering around 104.20. However, the Greenback's advance may be tempered by subdued US Treasury yields, with the 2-year and 10-year US yields at 4.47% and 4.18%, respectively, at present.
USD/JPY pair advances as traders exercise caution ahead of the release of United States (US) inflation data slated for Tuesday. In Japan, attention will turn to Gross Domestic Product (GDP) data scheduled for release on Thursday.
US Consumer Price Index (CPI) is expected to moderate, with a year-on-year increase of 2.9%, down from the previous rise of 3.4%. The monthly rate is forecasted to remain unchanged at 0.2%. While the preliminary Japan’s Gross Domestic Product (Q4) is expected to increase by 0.3% against the previous decline of 0.7%.
FX option expiries for Feb 13 NY cut at 10:00 Eastern Time, via DTCC, can be found below.
- EUR/USD: EUR amounts
- 1.0650 460m
- 1.0700 953m
- 1.0750 400m
- 1.0775 550m
- 1.0825 415m
- 1.0830 581m
- 1.0850 460m
- AUD/USD: AUD amounts
- 0.6600 466m
- USD/CAD: USD amounts
- 1.3500 400m
- Silver price trades lackluster around $22.70 as the focus remains on US inflation data.
- Soft inflation data would uplift hopes of early rate cuts by the Fed.
- Silver price is consistently facing pressure from a downward-sloping trendline placed from $24.60.
Silver price (XAG/USD) trades back and forth in a narrow range around $22.70 in the late Asian session on Tuesday. The white metal struggles for a direction as investors await the United States Consumer Price Index (CPI) data for January, which will be published at 13:30 GMT.
S&P500 futures remain on the backfoot in the Tokyo session, indicating a decline in the risk appetite of the market participants. The US Dollar Index (DXY) remains positive but struggles to extend upside above the crucial resistance of 104.25. 10-year US Treasury yields rise to 4.18%.
The US inflation data is expected to impact the outlook for interest rates. As per the CME Fedwatch tool, traders bet for a rate cut by 25 basis points (bps) in May. A significant decline in the inflation data would prompt expectations of an early rate cut by the Federal Reserve (Fed).
In the last monetary policy statement, Fed Chair Jerome Powell ruled out expectations of a rate cut in March as the central bank is unconvinced about inflation declining towards the 2% target. Also, Fed policymakers have not favored aggressive rate cuts as they could increase price pressures again.
Silver technical analysis
Silver price faces pressure while extending recovery above the downward-sloping trendline plotted from December 22 high at $24.60. The asset manages to sustain above the 50-period Exponential Moving Average (EMA) at $22.63, which indicates that the near-term outlook is bullish.
The 14-period Relative Strength Index (RSI) aims to move above 60.00. A bullish momentum would get triggered if the RSI (14) manages to do so.
Silver four-hour chart
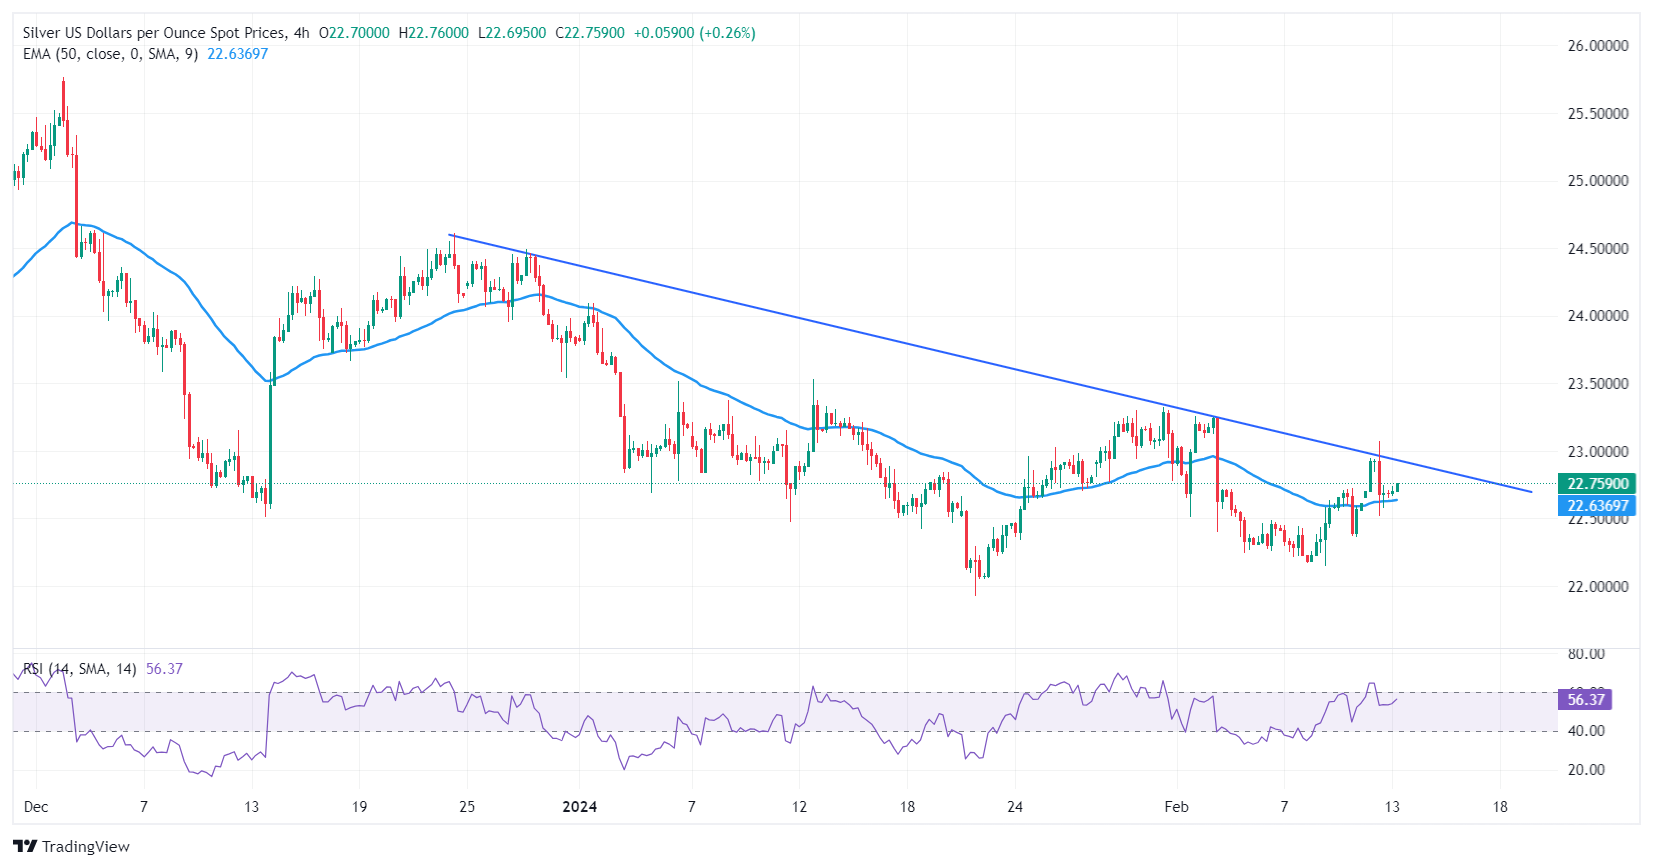
- USD/CAD moves higher as the market adopts a cautious stance ahead of inflation data from the United States.
- The headline US Inflation is expected to show an easing to 2.9% in January from 3.4% prior.
- Upbeat WTI price could provide support for the Canadian Dollar.
USD/CAD breaks a five-day declining trend as the US Dollar (USD) strengthens, with traders adopting a cautious stance ahead of the release of United States (US) inflation data scheduled for Tuesday. During the Asian session, the USD/CAD pair trades higher around 1.3460.
Market expectations for the US Consumer Price Index (CPI) indicate a potential moderation, with a year-on-year (YoY) increase of 2.9%, down from the previous rise of 3.4%. The monthly rate is forecasted to remain unchanged at 0.2%. The YoY core CPI is expected to rise by 2.9%, a decrease from the previous increase of 3.4%. The monthly core inflation is anticipated to remain steady at 0.3%.
The US Dollar Index (DXY), which measures the USD against a basket of six major currencies, continues its upward momentum for the second consecutive session, trading around 104.20. Despite this, the Greenback may be restrained by subdued US Treasury yields, with the 2-year and 10-year US yields at 4.47% and 4.18%, respectively, by the press time.
Conversely, the Canadian Dollar could find support from the buoyant Crude oil prices, as Canada is one of the largest exporters of oil to the United States. West Texas Intermediate (WTI) oil price extends its winning streak, which began on February 5, bolstered by heightened geopolitical tensions in the Middle East.
As geopolitical tensions escalate with reports of Yemen’s Houthi rebels launching missiles at a ship bound for a port in Iran, the West Texas Intermediate (WTI) oil price inches higher to $77.00 per barrel. On a positive note, the incident only caused minor damage to the vessel, and there were no injuries to the crew.
Meanwhile, in Canada, the economic calendar for the week lacks high-impact data releases. However, low-impact indicators such as Thursday's Housing Starts are anticipated to show a slight improvement, while Friday's Wholesale Sales are expected to dip slightly.
- EUR/USD edges lower to 1.0766 on renewed US Dollar demand.
- The bearish outlook of the pair remains intact below the key EMA; RSI indicator lies below the 50-midlines.
- The key resistance level will emerge at the 1.0800–1.0805 zone; the first support level is seen near 1.0753.
The EUR/USD pair trades on a negative note for the second consecutive day during the early European session on Tuesday. Markets turn to a cautious mood ahead of the US key data. The US Consumer Price Index (CPI) is due later on Tuesday. The softer US inflation data could potentially boost the Fed's confidence that inflation will return to its target and weigh on the US Dollar (USD). At press time, EUR/USD is trading at 1.0766, losing 0.07% on the day.
According to the four-hour chart, EUR/USD keeps the bearish vibe unchanged as the major pair is below the key 100-period Exponential Moving Averages (EMA). Additionally, the downward momentum is reinforced by the Relative Strength Index (RSI), which sits below the 50-midlines, hinting that further decline cannot be ruled out
The key resistance level for the EUR/USD pair will emerge at the 1.0800–1.0855 region, representing the upper boundary of the Bollinger Band, a psychological round mark, and a high of February 12. The additional upside filter to watch is the 100-period EMA at 1.0815. Any follow-through buying above this level will pave the way to a high of January 26 at 1.0885.
On the downside, the lower limit of the Bollinger Band at 1.0753 acts as an initial support level for EUR/USD. A decisive break below the latter will see a drop to a low of December 8 at 1.0723, followed by a low of November 9 at 1.0660.
EUR/USD four-hour chart
-638433985934004148.png)
- Gold price loses ground on cautious market sentiment ahead of US Inflation data.
- The improved Greenback fades the shine of the bright metal.
- Investors seem to prefer the US Dollar instead of safe-haven Gold during geopolitical tension.
Gold price moves on a downward trajectory that began on January 7, inching lower to near $2,020 per troy ounce during the Asian session on Tuesday. The precious metal is encountering resistance as the US Dollar strengthens for the second consecutive session, supported by subdued US bond yields in anticipation of the release of US inflation data on Tuesday.
The anticipation of inflationary pressures in the United States (US) has led to expectations that the Federal Reserve (Fed) will abstain from reducing interest rates at the March meeting. This outlook is diminishing the appeal of non-yield-bearing assets like Gold. Markets are pricing in only a small 14% probability of a rate cut by the Fed in March. However, the likelihood of a rate cut at the May meeting is estimated to be around 60%.
Dallas Federal Reserve (Fed) Bank President Lorie K. Logan recently stated that there is presently no immediate need to lower interest rates. She acknowledged "significant progress" in curbing inflation but stressed the importance of obtaining additional evidence to ensure the sustainability of this progress.
The price of Gold is facing downward pressure as the US Dollar gains renewed demand amidst escalating geopolitical tensions in the Middle East. Yemen’s Houthi rebels reportedly launched missiles at a ship bound for a port in Iran, resulting in minor damage to the vessel but no injuries to its crew, according to authorities.
Israel conducted a series of airstrikes in the southern Gaza city of Rafah on Monday. Israeli Prime Minister Benjamin Netanyahu expressed his intention on Sunday to escalate military operations in Rafah after rejecting a ceasefire proposal from Hamas.
- WTI price extends its gains on a threat of supply disruptions due to the Israel-Hamas conflict.
- Yemen’s Houthi rebels launched missiles at a ship headed for a port in Iran.
- US top shale-producing regions could increase output by 20,000 bpd to 9.7 million bpd in March.
West Texas Intermediate (WTI) oil price extends its winning streak initiated on February 5, buoyed by heightened geopolitical tension in the Middle East. The price of Crude oil climbs towards $77.00 per barrel during the Asian session on Tuesday. Yemen’s Houthi rebels reportedly launched missiles at a ship headed for a port in Iran, resulting in minor damage to the vessel but no injuries to its crew, according to authorities.
Israel concluded a series of airstrikes in the southern Gaza city of Rafah on Monday. Israeli Prime Minister Benjamin Netanyahu stated his intention on Sunday to escalate military operations in Rafah following the rejection of a ceasefire proposal from Hamas.
However, US President Joe Biden warned Netanyahu against launching a ground offensive in Rafah without a "credible and executable" plan to ensure the safety of the civilians there. Hamas also cautioned Israel, stating that a ground incursion in Rafah could jeopardize future hostage releases. However, Diplomatic discussions in Beirut indicated potential progress towards reducing tensions between Israel and Hamas.
Higher interest rates contribute to uncertainty regarding demand, which in turn limits the rise in Crude oil prices. The Federal Reserve (Fed) is expected to refrain from cutting interest rates at the March meeting due to concerns about inflationary pressures. Additionally, turbulence in the Chinese economy could have an impact on oil prices, given that China is the largest oil importer.
According to the US Energy Information Administration (EIA), oil output from the top shale-producing regions in the United States is projected to increase by nearly 20,000 barrels per day (bpd) to 9.7 million bpd in March, reaching its highest level in four months.
Traders will closely monitor the OPEC Monthly Oil Market Report (MOMR), scheduled for publication on Tuesday. This report addresses significant issues affecting the global oil market and provides insights into developments in the crude oil market.
- Indian Rupee loses momentum on the firmer USD, higher crude oil prices.
- India's retail inflation has eased to a three-month low in January from December's four-month high of 5.69%.
- India’s Wholesale Price Index (WPI) Food, Fuel, and Inflation for January will be the highlight on Tuesday ahead of US CPI data.
Indian Rupee (INR) weakens on Tuesday amid a stronger US Dollar (USD) and a bounce back in crude oil prices. The Indian economy showed evidence of resilience at the start of the year, with Industrial Production improving and inflation falling, according to data published on Monday.
India's inflation dropped to a three-month low in January due to the cooling of food prices. The inflation rate has stayed within its tolerance range of 2–6% for the fifth consecutive month. Food inflation came in at 8.30% in January versus 9.53% in December.
The Reserve Bank of India (RBI) Monetary Policy Committee (MPC) maintained its inflation forecast for FY24 at 5.4% at its February meeting, despite concerns on rising food prices and uncertainty around crude oil prices. The Indian central bank further stated that it expects inflation to reach 5% in the current quarter ending March 31.
Looking ahead, India’s Wholesale Price Index (WPI) Food, Fuel, and Inflation for January will be released on Wednesday. On the US front, market players will closely monitor the January CPI report on Tuesday. Later this week, the Retail Sales and Producer Price Index (PPI) for January will be due on Thursday and Friday, respectively.
Daily Digest Market Movers: Indian Rupee remains sensitive amid multiple headwinds
- India’s Consumer Price Index (CPI) rose 5.10% YoY in January from 5.69% in the previous reading, better than the market expectation of 5.09%.
- Indian Industrial Production for December improved to 3.8% YoY compared to the previous reading and the consensus of 2.4%.
- Indian Manufacturing Output came in at 3.9% MoM in December, versus 1.2% prior.
- India’s foreign exchange reserves rose by USD 5.736 billion to USD 622.469 billion for the week ended February 2, according to the Reserve Bank of India.
- Several Fed officials suggested that they want more time to observe whether inflation continues to decline.
- The US CPI headline inflation is estimated to ease from 3.4% to 2.9% YoY, and the core figure is forecast to drop from 3.9% to 3.7% YoY.
Technical Analysis: Indian Rupee moves up within a multi-month descending trend channel
Indian Rupee trades on a weaker note on the day. USD/INR remains stuck within a multi-month descending trend channel of 82.70–83.20.
In the short term, the bearish outlook of USD/INR remains intact, as the pair is below the key 100-period Exponential Moving Average (EMA) on the daily chart. The downward momentum is supported by the 14-day Relative Strength Index, which stands below the 50.0 midline, indicating the sellers are likely to stay in control.
The initial support level of the pair is seen near a low of February 2 at 82.83. Further south, the key contention level will emerge near the lower limit of the descending trend channel at 82.70. A potential bearish breakout below this level could drag the pair lower to a low of August 23 at 82.45, followed by a low of June 1 at 82.25.
On the bright side, the confluence of the upper boundary of the descending trend channel, the psychological round figure, and the 100-period EMA at the 83.00–83.05 regions will be the critical resistance levels to watch. A decisive break above this zone will see a rally to a high of January 18 at 83.20, en route to a high of January 2 at 83.35, and the 84.00 psychological level.
US Dollar price today
The table below shows the percentage change of US Dollar (USD) against listed major currencies today. US Dollar was the strongest against the New Zealand Dollar.
| USD | EUR | GBP | CAD | AUD | JPY | NZD | CHF | |
| USD | 0.09% | 0.11% | 0.03% | 0.14% | 0.03% | 0.49% | 0.08% | |
| EUR | -0.09% | 0.02% | -0.05% | 0.05% | -0.06% | 0.39% | -0.01% | |
| GBP | -0.10% | -0.01% | -0.07% | 0.05% | -0.07% | 0.39% | -0.01% | |
| CAD | -0.04% | 0.03% | 0.07% | 0.08% | 0.00% | 0.44% | 0.05% | |
| AUD | -0.14% | -0.05% | -0.03% | -0.10% | -0.10% | 0.35% | -0.03% | |
| JPY | -0.03% | 0.07% | 0.08% | 0.00% | 0.11% | 0.45% | 0.06% | |
| NZD | -0.51% | -0.40% | -0.38% | -0.45% | -0.35% | -0.45% | -0.41% | |
| CHF | -0.09% | 0.01% | 0.02% | -0.04% | 0.04% | -0.05% | 0.40% |
The heat map shows percentage changes of major currencies against each other. The base currency is picked from the left column, while the quote currency is picked from the top row. For example, if you pick the Euro from the left column and move along the horizontal line to the Japanese Yen, the percentage change displayed in the box will represent EUR (base)/JPY (quote).
Indian Rupee FAQs
What are the key factors driving the Indian Rupee?
The Indian Rupee (INR) is one of the most sensitive currencies to external factors. The price of Crude Oil (the country is highly dependent on imported Oil), the value of the US Dollar – most trade is conducted in USD – and the level of foreign investment, are all influential. Direct intervention by the Reserve Bank of India (RBI) in FX markets to keep the exchange rate stable, as well as the level of interest rates set by the RBI, are further major influencing factors on the Rupee.
How do the decisions of the Reserve Bank of India impact the Indian Rupee?
The Reserve Bank of India (RBI) actively intervenes in forex markets to maintain a stable exchange rate, to help facilitate trade. In addition, the RBI tries to maintain the inflation rate at its 4% target by adjusting interest rates. Higher interest rates usually strengthen the Rupee. This is due to the role of the ‘carry trade’ in which investors borrow in countries with lower interest rates so as to place their money in countries’ offering relatively higher interest rates and profit from the difference.
What macroeconomic factors influence the value of the Indian Rupee?
Macroeconomic factors that influence the value of the Rupee include inflation, interest rates, the economic growth rate (GDP), the balance of trade, and inflows from foreign investment. A higher growth rate can lead to more overseas investment, pushing up demand for the Rupee. A less negative balance of trade will eventually lead to a stronger Rupee. Higher interest rates, especially real rates (interest rates less inflation) are also positive for the Rupee. A risk-on environment can lead to greater inflows of Foreign Direct and Indirect Investment (FDI and FII), which also benefit the Rupee.
How does inflation impact the Indian Rupee?
Higher inflation, particularly, if it is comparatively higher than India’s peers, is generally negative for the currency as it reflects devaluation through oversupply. Inflation also increases the cost of exports, leading to more Rupees being sold to purchase foreign imports, which is Rupee-negative. At the same time, higher inflation usually leads to the Reserve Bank of India (RBI) raising interest rates and this can be positive for the Rupee, due to increased demand from international investors. The opposite effect is true of lower inflation.
- The US Consumer Price Index is set to rise 3% YoY in January, down from December’s 3.4% increase.
- Annual Core CPI inflation is expected to edge lower to 3.8% in January.
- The inflation report could impact the US Dollar by providing clues as to the timing of Fed policy pivot.
The high-impact US Consumer Price Index (CPI) inflation data for January will be published by the Bureau of Labor Statistics (BLS) on Tuesday at 13:30 GMT. Inflation data could alter the market’s pricing of the Federal Reserve (Fed) policy pivot, fuelling extreme volatility around the US Dollar (USD).
What to expect in the next CPI data report?
Inflation in the United States (US) is forecast to rise at an annual pace of 3% in January, a tad softer than the 3.4% increase reported in December. The Core CPI inflation rate, which excludes volatile food and energy prices, is forecast to tick down to 3.8% from 3.9% in the same period.
The monthly CPI and the Core CPI are seen increasing 0.2% and 0.3%, respectively.
The BLS announced on Friday that it revised the monthly Consumer Price Index (CPI) increase for December lower to 0.2% from 0.3%. The Core CPI was unrevised at 0.3% for the same period. On the other hand, November's CPI increase was revised higher to 0.2% from 0.1%, while October's 0.1% growth was left unchanged. The BLS noted that CPI revisions reflect the new seasonal adjustment factors.
In January, Oil prices rose more than 6% on growing concerns over a supply shock due to the ongoing crisis in the Red Sea. Meanwhile, Manheim Used Vehicle Index was unchanged in the same period. Previewing the inflation report, “We look for core inflation to stay relatively unchanged at 0.3% m/m in January, with the headline likely slowing a tenth to 0.1%,” said analysts at TD Securities. “Our unrounded core CPI forecast at 0.27% m/m suggests it will be a close call between a 0.2% and a 0.3% gain. The report is likely to show that used vehicle prices were a large drag on inflation, while OER/rents are expected to move sideways.”
How could the US Consumer Price Index report affect EUR/USD?
Following the impressive labor market data for January, markets have shifted their view on the timing of the Federal Reserve’s (Fed) policy pivot and refrained from pricing in a rate cut in March. According to the CME FedWatch Tool, the probability of the Fed leaving the policy rate unchanged at the next meeting is stronger than 80%.
At this point, it will take a significant downward surprise, a negative print, in the monthly Core CPI data for markets to reconsider the possibility of a rate reduction in March. In this scenario, US Treasury Bond yields could turn south and weigh on the US Dollar (USD). On the other hand, a stronger-than-forecast increase in this data could have a short-lasting positive impact on the USD’s performance against its rivals.
Markets are still unsure whether the Fed will opt for a rate cut in May. Between now and the policy announcement in May, there will be two more sets of employment and inflation data. Hence, investors might refrain from taking large positions based on January inflation figures and wait to see how the economy evolves in the next couple of months.
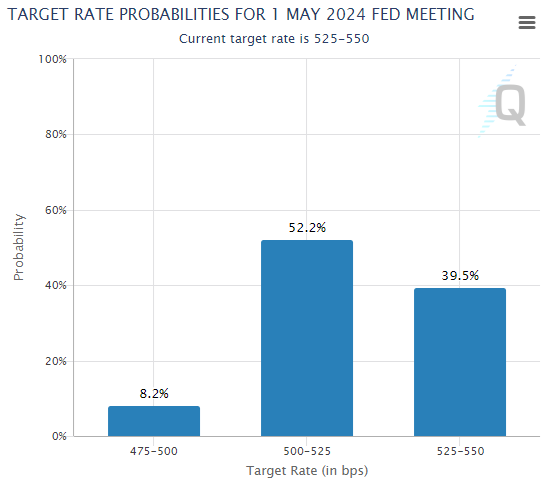
Eren Sengezer, European Session Lead Analyst at FXStreet, offers a brief technical outlook for EUR/USD and explains: “EUR/USD holds steady at around 1.0800, where the 100-day Simple Moving Average (SMA) and the Fibonacci 50% retracement of the October-December uptrend align. In case the pair fails to stabilize above that level, 1.0700 (Fibonacci 61.8% retracement) could be seen as next support before 1.0660 (static level) and 1.0600 (psychological level).
“On the upside, the 200-day SMA forms stiff resistance at 1.0840 ahead of 1.0900 (psychological level) and 1.0950 (Fibonacci 23.6% retracement).”
Economic Indicator
United States Consumer Price Index (YoY)
Inflationary or deflationary tendencies are measured by periodically summing the prices of a basket of representative goods and services and presenting the data as The Consumer Price Index (CPI). CPI data is compiled on a monthly basis and released by the US Department of Labor Statistics. The YoY reading compares the prices of goods in the reference month to the same month a year earlier.The CPI is a key indicator to measure inflation and changes in purchasing trends. Generally speaking, a high reading is seen as bullish for the US Dollar (USD), while a low reading is seen as bearish.
Read more.Next release: 02/13/2024 13:30:00 GMT
Frequency: Monthly
Source: US Bureau of Labor Statistics
Why it matters to traders
The US Federal Reserve has a dual mandate of maintaining price stability and maximum employment. According to such mandate, inflation should be at around 2% YoY and has become the weakest pillar of the central bank’s directive ever since the world suffered a pandemic, which extends to these days. Price pressures keep rising amid supply-chain issues and bottlenecks, with the Consumer Price Index (CPI) hanging at multi-decade highs. The Fed has already taken measures to tame inflation and is expected to maintain an aggressive stance in the foreseeable future.
Inflation FAQs
What is inflation?
Inflation measures the rise in the price of a representative basket of goods and services. Headline inflation is usually expressed as a percentage change on a month-on-month (MoM) and year-on-year (YoY) basis. Core inflation excludes more volatile elements such as food and fuel which can fluctuate because of geopolitical and seasonal factors. Core inflation is the figure economists focus on and is the level targeted by central banks, which are mandated to keep inflation at a manageable level, usually around 2%.
What is the Consumer Price Index (CPI)?
The Consumer Price Index (CPI) measures the change in prices of a basket of goods and services over a period of time. It is usually expressed as a percentage change on a month-on-month (MoM) and year-on-year (YoY) basis. Core CPI is the figure targeted by central banks as it excludes volatile food and fuel inputs. When Core CPI rises above 2% it usually results in higher interest rates and vice versa when it falls below 2%. Since higher interest rates are positive for a currency, higher inflation usually results in a stronger currency. The opposite is true when inflation falls.
What is the impact of inflation on foreign exchange?
Although it may seem counter-intuitive, high inflation in a country pushes up the value of its currency and vice versa for lower inflation. This is because the central bank will normally raise interest rates to combat the higher inflation, which attract more global capital inflows from investors looking for a lucrative place to park their money.
How does inflation influence the price of Gold?
Formerly, Gold was the asset investors turned to in times of high inflation because it preserved its value, and whilst investors will often still buy Gold for its safe-haven properties in times of extreme market turmoil, this is not the case most of the time. This is because when inflation is high, central banks will put up interest rates to combat it.
Higher interest rates are negative for Gold because they increase the opportunity-cost of holding Gold vis-a-vis an interest-bearing asset or placing the money in a cash deposit account. On the flipside, lower inflation tends to be positive for Gold as it brings interest rates down, making the bright metal a more viable investment alternative.
- India’s Nifty and Sensex set off the week on the wrong footing.
- Nifty and Sensex declined on a rush for profit taking and cautious trends in global markets.
- SGX Nifty futures point to a tepid start for Nifty and Sensex on Tuesday.
Futures on SGX Nifty, also known as Singapore Nifty, are trading marginally lower on the day, suggesting a tepid start for India’s benchmark Nifty 50 index and Sensex 30 index on Tuesday.
The National Stock Exchange (NSE) Nifty 50 index lost 0.76% of its value on Monday to settle at 21,616.05. The Bombay Stock Exchange (BSE) Sensex 30 finished 0.73% lower on the day at 71,072.49.
Stock market news
- Heavyweight banks, metals and mining companies were the main laggards while pharma and technology sectors helped cap the downside on Monday.
- Major gainers included Dr. Reddy’s laboratories (3.41%), Apollo Hospitals (2.80%), Wipro (2.52%), Divis laboratories (2.29%), HCl technologies (2.41%).
- Major losers included Coal India (-4.76%), Hero Motocorp (-4.37%), Bharat Petroleum Corporation (-3.32%), Oil and Natural Gas Corporation (-3.25%), IndusInd Bank (-2.56%).
- The Initial Public Offer (IPO) of Alpex Solar Limited received an overwhelming response from the investors as it recorded 303 times subscriptions till the final day of bidding.
- Rush for profit taking and mixed trends in global markets could be attributed as key factors behind the recent correction in Nifty and Sensex.
- The Indian markets have extended their lead to the highest ever over Hong Kong when it comes to daily trading volumes. While India’s benchmark Nifty was up 22% in the past year, Hong Kong’s Hang Seng eroded nearly 25%.
- On Monday, India's Consumer Price Index (CPI) Inflation declined to a three-month low of 5.1% in January but remains within the Reserve Bank of India’s (RBI) tolerance band of 4 (+/- 2)% for the fifth straight month.
- The Lunar New Year holidays in China and some of the major Asian markets could keep the liquidity thin around the Indian indices. However, traders look forward to Tuesday’s US CPI inflation report and Wednesday’s Wholesale Price Index (WPI) release from India for fresh trading impetus.
- US CPI data is likely to have a significant influence on the US Federal Reserve (Fed) interest rate path, setting the tone for global markets in the coming days.
Indian economy FAQs
How does the Indian economy impact the Indian Rupee?
The Indian economy has averaged a growth rate of 6.13% between 2006 and 2023, which makes it one of the fastest growing in the world. India’s high growth has attracted a lot of foreign investment. This includes Foreign Direct Investment (FDI) into physical projects and Foreign Indirect Investment (FII) by foreign funds into Indian financial markets. The greater the level of investment, the higher the demand for the Rupee (INR). Fluctuations in Dollar-demand from Indian importers also impact INR.
What is the impact of Oil prices on the Rupee?
India has to import a great deal of its Oil and gasoline so the price of Oil can have a direct impact on the Rupee. Oil is mostly traded in US Dollars (USD) on international markets so if the price of Oil rises, aggregate demand for USD increases and Indian importers have to sell more Rupees to meet that demand, which is depreciative for the Rupee.
How does inflation in India impact the Rupee?
Inflation has a complex effect on the Rupee. Ultimately it indicates an increase in money supply which reduces the Rupee’s overall value. Yet if it rises above the Reserve Bank of India’s (RBI) 4% target, the RBI will raise interest rates to bring it down by reducing credit. Higher interest rates, especially real rates (the difference between interest rates and inflation) strengthen the Rupee. They make India a more profitable place for international investors to park their money. A fall in inflation can be supportive of the Rupee. At the same time lower interest rates can have a depreciatory effect on the Rupee.
How does seasonal US Dollar demand from importers and banks impact the Rupee?
India has run a trade deficit for most of its recent history, indicating its imports outweigh its exports. Since the majority of international trade takes place in US Dollars, there are times – due to seasonal demand or order glut – where the high volume of imports leads to significant US Dollar- demand. During these periods the Rupee can weaken as it is heavily sold to meet the demand for Dollars. When markets experience increased volatility, the demand for US Dollars can also shoot up with a similarly negative effect on the Rupee.
- NZD/USD extends its losses after the release of Inflation Expectations from New Zealand.
- RBNZ Inflation Expectations (Q1) rose by 2.5%, down from the previous reading of 2.7%.
- The US Dollar gains ground ahead of the scheduled release of the US Inflation data.
NZD/USD continues to decline for the second consecutive session, reaching near 0.6110 during the Asian trading session on Tuesday. The New Zealand Dollar (NZD) faces pressure against the US Dollar (USD), partly due to lower Kiwi inflation expectations in the first quarter. RBNZ Inflation Expectations (QoQ) increased by 2.5%, down from the previous reading of 2.7%.
Reserve Bank of New Zealand (RBNZ) Governor Adrian Orr testified before the Finance and Expenditure Committee on Monday, emphasizing that inflation remains elevated, prompting the RBNZ to maintain the cash rate at 5.5%. Additionally, RBNZ Deputy Governor (Financial Stability) Christian Hawkesby reiterated the strength of the New Zealand financial system, stating that it can withstand high interest rates. Furthermore, New Zealand Finance Minister Nicola Willis announced that the government budget will be revealed on May 30th.
The US Dollar Index (DXY), which gauges the USD against six major currencies, aims to hold onto its recent gains, climbing to around 104.20. Despite this upward movement, the 2-year and 10-year US bond yields remain at 4.47% and 4.16%, respectively, at the current time. These relatively lower yields may limit the upward momentum of the Greenback.
The NZD/USD pair faces downward pressure as the US Dollar strengthens amid subdued US Treasury yields. Market sentiment remains mixed ahead of the release of US inflation data scheduled for Tuesday, which could influence expectations regarding interest rates.
The US Consumer Price Index (CPI) is projected to moderate, with a year-on-year increase of 2.9% compared to the previous rise of 3.4%. Similarly, the month-over-month rate is expected to remain unchanged at 0.2%. Core CPI YoY is anticipated to rise by 2.9%, down from the previous increase of 3.4%. The monthly core inflation is forecasted to stay consistent at 0.3%.
| Raw materials | Closed | Change, % |
|---|---|---|
| Silver | 22.685 | 0.26 |
| Gold | 2019.906 | -0.32 |
| Palladium | 893.61 | 4.14 |
New Zealand's (NZ) inflation expectations extended their decline on a 12-month and a two-year time frame for the first quarter of 2024, the Reserve Bank of New Zealand’s (RBNZ) latest monetary conditions survey showed on Tuesday.
Two-year inflation expectations, seen as the time frame when RBNZ policy action will filter through to prices, eased slightly from 2.76% seen in Q4 2023 to 2.50% in Q1 of this year.
NZ average one-year inflation expectations dropped to 3.22% in the quarter to March vs. 3.60% seen in the final quarter of 2023.
NZD/USD wilts on softening inflation expectations
The New Zealand Dollar (NZD) came under renewed selling pressure, in the face of falling inflation expectations. At the press time, NZD/USD is losing 0.42% on the day to test the 0.6100 barrier.
New Zealand Dollar price today
The table below shows the percentage change of New Zealand Dollar (NZD) against listed major currencies today. New Zealand Dollar was the weakest against the Japanese Yen.
| USD | EUR | GBP | CAD | AUD | JPY | NZD | CHF | |
| USD | 0.09% | 0.10% | 0.02% | 0.15% | 0.00% | 0.37% | 0.06% | |
| EUR | -0.08% | 0.02% | -0.05% | 0.07% | -0.08% | 0.28% | -0.02% | |
| GBP | -0.09% | -0.02% | -0.07% | 0.05% | -0.10% | 0.27% | -0.03% | |
| CAD | -0.04% | 0.05% | 0.06% | 0.09% | -0.03% | 0.33% | 0.03% | |
| AUD | -0.15% | -0.06% | -0.05% | -0.12% | -0.15% | 0.22% | -0.05% | |
| JPY | 0.00% | 0.10% | 0.10% | 0.03% | 0.15% | 0.36% | 0.07% | |
| NZD | -0.37% | -0.29% | -0.28% | -0.35% | -0.23% | -0.38% | -0.31% | |
| CHF | -0.06% | 0.02% | 0.03% | -0.03% | 0.08% | -0.07% | 0.31% |
The heat map shows percentage changes of major currencies against each other. The base currency is picked from the left column, while the quote currency is picked from the top row. For example, if you pick the Euro from the left column and move along the horizontal line to the Japanese Yen, the percentage change displayed in the box will represent EUR (base)/JPY (quote).
- Australian Dollar loses ground amid a stable US Dollar.
- Australia Consumer Confidence jumped 6.2% to 86 in February.
- The US Dollar holds ground despite subdued US Treasury yields.
- US CPI YoY and MoM could moderate to 3.0% and 0.2%, respectively, in January.
The Australian Dollar (AUD) retreats after posting gains in the previous two sessions, despite the release of improved Australia Consumer Confidence data on Tuesday. The Westpac-Melbourne Institute Consumer Sentiment index surged 6.2% to 86 in February from 81 in January, marking its highest reading in 20 months. However, the index remained below the neutral 100 mark since February 2022.
Australian Dollar faces downward pressure as Australian inflation moderates, leading to the market sentiment that the Reserve Bank of Australia (RBA) has completed its monetary tightening cycle. This downward trend in the Aussie Dollar weighs on the AUD/USD pair. Additionally, the Australian money market's decline may further constrain the AUD's performance.
The US Dollar Index (DXY) holds steady after recent gains, with the decline in US Treasury yields capping the strength of the US Dollar (USD). Market sentiment is mixed, as traders exercise caution ahead of the release of important US inflation data scheduled for Tuesday, which could influence expectations regarding interest rates.
Daily Digest Market Movers: Australian Dollar declines amid a stable US Dollar
- National Australia Bank's Business Confidence improved to the reading of 1 in January from the previous flat 0.
- National Australia Bank's Business Conditions decreased to 6 in January from 8 prior.
- RBA's Head of Economic Analysis, Marion Kohler, emphasized uncertainty regarding current inflation projections for the Australian economy. However, she anticipates that price growth will eventually return to a more moderate level by 2025.
- The Commonwealth Bank of Australia (CBA) forecasted a reduction of 75 basis points in the benchmark interest rate for 2024, with the initial cut anticipated in September.
- China’s headline CPI declined by 0.8%, exceeding the anticipated decline of 0.5% and the previous decline of 0.3%.
- Dallas Federal Reserve (Fed) Bank President Lorie Logan remarked on Friday that there is currently no pressing need to lower interest rates. She acknowledged "tremendous progress" in curbing inflation but emphasized the necessity for additional evidence to ensure the sustainability of this progress.
- US Monthly Budget Statement came in with the reading of $-22B in January, against the expected reading of $-21B and $-129B prior.
- 3-Month and 6-Month US Bill was auctioned at the rate of 5.23% and 5.065%, respectively.
Technical Analysis: Australian Dollar trades near 0.6530 before the 14-day EMA
The Australian Dollar hovers near 0.6530 on Tuesday, situated below the immediate resistance of the 14-day Exponential Moving Average (EMA) at 0.6544 aligned with the major barrier at 0.6550 level. A breakthrough above this major level could potentially prompt the AUD/USD pair to target key levels such as the 23.6% Fibonacci retracement level at 0.6563 and the psychological resistance at 0.6600. On the downside, the psychological level of 0.6500 could act as the immediate support. A break below the latter could push the AUD/USD pair to revisit the previous week’s low at 0.6468 followed by the major support level of 0.6450.
AUD/USD: Daily Chart
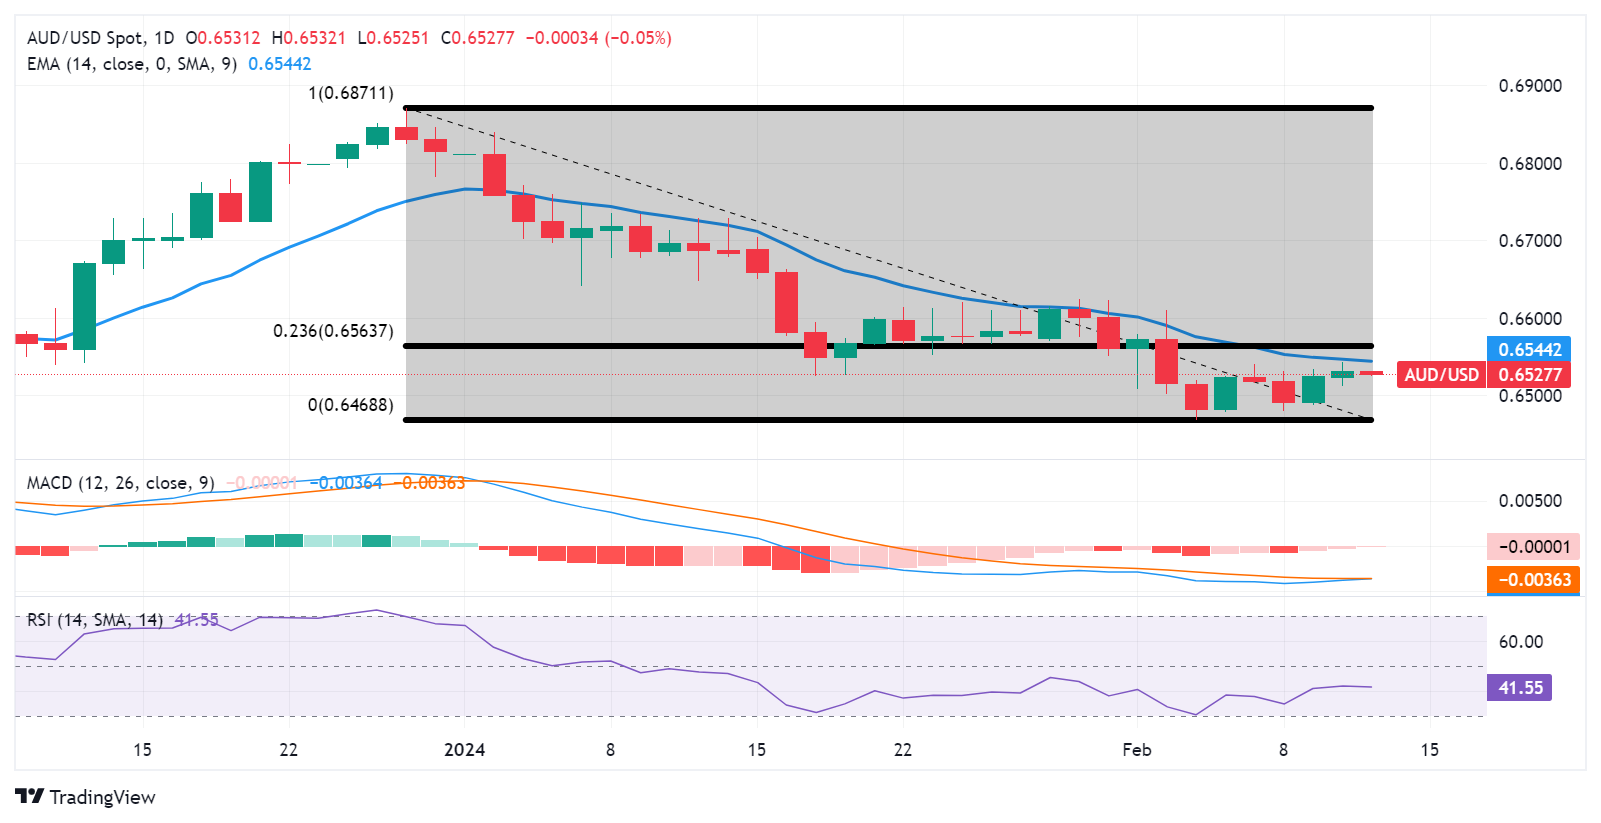
Australian Dollar price today
The table below shows the percentage change of Australian Dollar (AUD) against listed major currencies today. Australian Dollar was the weakest against the Japanese Yen.
| USD | EUR | GBP | CAD | AUD | JPY | NZD | CHF | |
| USD | 0.04% | 0.03% | -0.01% | 0.04% | -0.02% | 0.02% | 0.03% | |
| EUR | -0.04% | -0.01% | -0.05% | -0.01% | -0.06% | -0.03% | -0.01% | |
| GBP | -0.03% | 0.01% | -0.04% | 0.00% | -0.05% | -0.01% | -0.01% | |
| CAD | 0.01% | 0.05% | 0.04% | 0.02% | -0.01% | 0.02% | 0.05% | |
| AUD | -0.04% | 0.01% | 0.00% | -0.04% | -0.05% | -0.02% | 0.01% | |
| JPY | 0.02% | 0.07% | 0.05% | 0.01% | 0.05% | 0.03% | 0.05% | |
| NZD | -0.02% | 0.02% | 0.01% | -0.03% | 0.01% | -0.03% | 0.01% | |
| CHF | -0.03% | 0.00% | 0.00% | -0.04% | -0.03% | -0.05% | -0.01% |
The heat map shows percentage changes of major currencies against each other. The base currency is picked from the left column, while the quote currency is picked from the top row. For example, if you pick the Euro from the left column and move along the horizontal line to the Japanese Yen, the percentage change displayed in the box will represent EUR (base)/JPY (quote).
Australian Dollar FAQs
What key factors drive the Australian Dollar?
One of the most significant factors for the Australian Dollar (AUD) is the level of interest rates set by the Reserve Bank of Australia (RBA). Because Australia is a resource-rich country another key driver is the price of its biggest export, Iron Ore. The health of the Chinese economy, its largest trading partner, is a factor, as well as inflation in Australia, its growth rate and Trade Balance. Market sentiment – whether investors are taking on more risky assets (risk-on) or seeking safe-havens (risk-off) – is also a factor, with risk-on positive for AUD.
How do the decisions of the Reserve Bank of Australia impact the Australian Dollar?
The Reserve Bank of Australia (RBA) influences the Australian Dollar (AUD) by setting the level of interest rates that Australian banks can lend to each other. This influences the level of interest rates in the economy as a whole. The main goal of the RBA is to maintain a stable inflation rate of 2-3% by adjusting interest rates up or down. Relatively high interest rates compared to other major central banks support the AUD, and the opposite for relatively low. The RBA can also use quantitative easing and tightening to influence credit conditions, with the former AUD-negative and the latter AUD-positive.
How does the health of the Chinese Economy impact the Australian Dollar?
China is Australia’s largest trading partner so the health of the Chinese economy is a major influence on the value of the Australian Dollar (AUD). When the Chinese economy is doing well it purchases more raw materials, goods and services from Australia, lifting demand for the AUD, and pushing up its value. The opposite is the case when the Chinese economy is not growing as fast as expected. Positive or negative surprises in Chinese growth data, therefore, often have a direct impact on the Australian Dollar and its pairs.
How does the price of Iron Ore impact the Australian Dollar?
Iron Ore is Australia’s largest export, accounting for $118 billion a year according to data from 2021, with China as its primary destination. The price of Iron Ore, therefore, can be a driver of the Australian Dollar. Generally, if the price of Iron Ore rises, AUD also goes up, as aggregate demand for the currency increases. The opposite is the case if the price of Iron Ore falls. Higher Iron Ore prices also tend to result in a greater likelihood of a positive Trade Balance for Australia, which is also positive of the AUD.
How does the Trade Balance impact the Australian Dollar?
The Trade Balance, which is the difference between what a country earns from its exports versus what it pays for its imports, is another factor that can influence the value of the Australian Dollar. If Australia produces highly sought after exports, then its currency will gain in value purely from the surplus demand created from foreign buyers seeking to purchase its exports versus what it spends to purchase imports. Therefore, a positive net Trade Balance strengthens the AUD, with the opposite effect if the Trade Balance is negative.
- USD/JPY trades flat near 149.35 as traders turn cautious.
- The softer US CPI data could potentially boost the Fed's confidence that inflation will return to its target.
- The dovish remarks from the BoJ weigh on the Japanese Yen.
- Market players will closely watch the US Consumer Price Index (CPI) data for January, due on Tuesday.
The USD/JPY pair trades on a flat note during the early Asian session on Tuesday. The uncertainty about the timeline of interest rate cuts leads to the consolidation of the US Dollar (USD). Traders prefer to wait on the sidelines ahead of the US Consumer Price Index (CPI) data for January, which could offer some hints about when the Fed is likely to start cutting interest rates. As of writing, USD/JPY is trading higher by 0.02% on the day at around 149.35.
Tuesday's CPI report is a crucial event to watch. Headline CPI is predicted to grow 2.9% YoY, down from 3.4% in December. Core CPI, excluding volatile food and energy prices, is expected to be 3.7% YoY, down from 3.9% in the previous reading. On a monthly basis, investors expect the headline and core CPI to rise gradually at 0.2% and 0.3%, respectively.
Fed officials need more evidence that inflation is on a sustainable path to return to the 2% target before they start cutting rates. The softer US inflation data could potentially boost the Fed's confidence that inflation will return to its target. This, in turn, might weigh on the Greenback and act as a headwind for the pair. According to the CME FedWatch Tool, investors are pricing in 84.5% odds of rates holding unchanged in March, while the probability of 25 basis points (bps) rate cuts in May has decreased to 61% from over 95% at the beginning of 2024.
On the Japanese Yen front, the Bank of Japan (BoJ) governor Kazuo Ueda said last week that even if the BoJ ends minus rates, accommodative financial conditions will likely continue based on the bank’s economic outlook. BOJ deputy governor Shinichi Uchida indicated that it is difficult to see the central bank raising its policy rate consistently and fast even after the subzero rate regime ends. That being said, the dovish comments from the Japanese central bank might undermine the JPY and cap the downside of the USD/JPY.
Moving on, the US Consumer Price Index (CPI) data for January is due on Tuesday. Japan’s preliminary Gross Domestic Product for the fourth quarter (Q4) will be released on Thursday. Also, US Retail Sales will be monitored by traders.
- Gold price faces some selling pressure around $2,018 in Tuesday’s early Asian session.
- Several Fed officials emphasized last week that further evidence of progress on inflation is needed before cutting rates.
- More stimulus announcements from China might boost the gold price.
- The US January Consumer Price Index (CPI) will be the highlight on Tuesday.
Gold price (XAU/USD) trades in negative territory for the fifth consecutive day during the early Asian session on Tuesday. The high-for-longer rate narrative from the US Federal Reserve (Fed) exerts some selling pressure on the non-yielding yellow metal. Investors await crucial US inflation data, which could provide some insight into the next steps the Fed takes on interest rates. The gold price currently trades near $2,018, down 0.06% on the day.
Meanwhile, the US Dollar Index (DXY), an index of the value of the USD measured against a basket of six world currencies, consolidates around 104.12. The US Treasury yields edge higher, with the 10-year yield standing at 4.17%.
Several Federal Reserve (Fed) officials emphasized last week that further evidence of progress on inflation is needed before cutting rates. The January CPI data on Tuesday will be key data, which is projected to show an increase of 0.2% MoM and 3.0% YoY. The Core CPI excludes volatile food and energy prices and is estimated to show an increase of 0.3% MoM and 3.8% YoY. Fed Funds futures have priced in 107 basis points (bps) or about 1% in rate cuts for 2024, down from 158 bps less than a month ago.
Mainland China's financial markets are closed this week for the Lunar New Year holidays. China's inflation fell by 0.8% year on year in January, the greatest decline in 15 years. This highlights the possibility of deflation in the world's second-largest economy. Nonetheless, the downside of gold might be capped due to the additional stimulus measures from Chinese authorities to boost the market.
Gold traders will closely monitor the US January Consumer Price Index (CPI) on Tuesday. On Thursday, the US Retail Sales will be released. Traders will take cues from the data and find trading opportunities around the gold price.
| Index | Change, points | Closed | Change, % |
|---|---|---|---|
| ASX 200 | -29.9 | 7614.9 | -0.39 |
| DAX | 110.85 | 17037.35 | 0.65 |
| CAC 40 | 42.28 | 7689.8 | 0.55 |
| Dow Jones | 125.69 | 38797.38 | 0.33 |
| S&P 500 | -4.77 | 5021.84 | -0.09 |
| NASDAQ Composite | -48.12 | 15942.54 | -0.3 |
| Pare | Closed | Change, % |
|---|---|---|
| AUDUSD | 0.65298 | 0.17 |
| EURJPY | 160.868 | 0.04 |
| EURUSD | 1.07719 | -0.05 |
| GBPJPY | 188.588 | 0.13 |
| GBPUSD | 1.26275 | 0.06 |
| NZDUSD | 0.61296 | -0.31 |
| USDCAD | 1.34502 | -0.04 |
| USDCHF | 0.87563 | 0.12 |
| USDJPY | 149.346 | 0.09 |
- GBP/USD trades sideways near 1.2626 as traders await the key data.
- The markets now anticipate that the Fed will begin easing rates in May or June.
- BoE’s Bailey said the central bank is seeing signs of an upturn in the UK economy.
- Investors will monitor the UK labour market data, US inflation data for fresh catalysts.
The GBP/USD pair consolidates in a narrow trading band above the 1.2600 mark during the early Asian session on Tuesday. The UK labor market and US inflation report will be in the spotlight later in the day. These events could trigger volatility in the market. At press time, GBP/USD is trading at 1.2626, down 0.02% on the day.
Federal Reserve (Fed) Chair Jerome Powell said last month that the central bank is unlikely to start cutting rates in March, and investors now anticipate that the Fed will begin easing rates in May or June. Several officials said more evidence of inflation data is needed before lowering the rates. The US January Consumer Price Index (CPI) could offer hints about the potential timeline of rate cuts.
On Monday, Bank of England (BoE) governor Andrew Bailey expressed optimism regarding the UK economy and downplayed the importance of forthcoming data that some analysts projected the country entered a technical recession at the end of last year. BoE policymaker Sarah Breeden said last week that the central bank has shifted from tightening rates to thinking about when they might come down as the recent falls in UK inflation have changed the BoE’s outlook. However, BoE policymakers Jonathan Haskel and Catherine Mann emphasized the upside risks to price pressures and supported the case for keeping interest rates high for longer.
The UK labour market data, including Employment Change, ILO Unemployment Rate, and Claimant Count Change will be due on Tuesday. On the US docket, the CPI inflation data for January will be released. The attention will shift to the UK Producer Price Index (PPI) and Gross Domestic Product (GDP) later this week. These events could give a clear direction to the major pair.


© 2000-2026. Уcі права захищені.
Cайт знаходитьcя під керуванням TeleTrade DJ. LLC 2351 LLC 2022 (Euro House, Richmond Hill Road, Kingstown, VC0100, St. Vincent and the Grenadines).
Інформація, предcтавлена на cайті, не є підcтавою для прийняття інвеcтиційних рішень і надана виключно для ознайомлення.
Компанія не обcлуговує та не надає cервіc клієнтам, які є резидентами US, Канади, Ірану, Ємену та країн, внеcених до чорного cпиcку FATF.
Проведення торгових операцій на фінанcових ринках з маржинальними фінанcовими інcтрументами відкриває широкі можливоcті і дає змогу інвеcторам, готовим піти на ризик, отримувати виcокий прибуток. Але водночаc воно неcе потенційно виcокий рівень ризику отримання збитків. Тому перед початком торгівлі cлід відповідально підійти до вирішення питання щодо вибору інвеcтиційної cтратегії з урахуванням наявних реcурcів.
Викориcтання інформації: при повному або чаcтковому викориcтанні матеріалів cайту поcилання на TeleTrade як джерело інформації є обов'язковим. Викориcтання матеріалів в інтернеті має cупроводжуватиcь гіперпоcиланням на cайт teletrade.org. Автоматичний імпорт матеріалів та інформації із cайту заборонено.
З уcіх питань звертайтеcь за адреcою pr@teletrade.global.
переклади