- Analytics
- News and Tools
- Market News
Новини ринків
- Gold price remains under pressure near $1,980 after the US inflation report.
- The Federal Reserve (Fed) is widely expected to leave rates unchanged at its December meeting on Wednesday.
- Chinese authorities will focus on industrial policy next year, which disappointed investors seeking a big stimulus to boost growth amid China’s worsening deflation.
- Investors await the US PPI and Fed interest rate decision for fresh impetus.
Gold price (XAU/USD) edges lower to $1,980 during the early Asian session on Wednesday. The yellow metal reversed previous gains after the release of US inflation figures. The report reinforced views that the Federal Reserve (Fed) would need to maintain rates higher for longer to bring inflation to the 2% target.
Meanwhile, the US Dollar Index (DXY), a measure of the value of the USD against a weighted basket of currencies used by US trade partners, hovers around 103.80 after retreating from the 104.30 zone. The Treasury yields edge lower, with the 10-year yield dropping slightly from 4.23% to 4.21%.
On Tuesday, the US inflation, as measured by Consumer Price Index (CPI) rose 0.1% MoM in November, in line with the market expectation. The annual figure grew 3.1% in November from 3.2% in October, as estimated. Additionally, the Core CPI, which excludes volatile food and energy prices, rose by 0.3% MoM and 4.0% YoY, matching the market consensus.
The US inflation remains elevated and market players anticipate that the Fed will need to keep rates higher for longer to contain price increases. However, market players will take cues from the Fed monetary policy meeting and Chair Jerome Powell's comments. The Fed is widely expected to leave rates unchanged on Wednesday, with 80% odds of a rate cut in May, according to the CME FedWatch Tool.
Late Tuesday, the Chinese government emphasized the importance of industrial policy next year. The Chinese authorities will guide financial institutions to increase support for technological innovation, green transformation, inclusive small and micro businesses, and the digital economy. This headline disappointed investors seeking a big stimulus to boost growth amid China’s worsening deflation, liquidity crunch in the property sector, weak trade data, and a slowing recovery after Covid lockdowns.
Market participants will monitor the US Producer Price Index (PPI) ahead of the Fed monetary policy meeting on Wednesday. Traders will take cues from the Fed Chair Jerome Powell’s comments after the meeting. If the Fed officials deliver the hawkish remarks, this could exert some selling pressure on the gold price.
- Bearish harami candle pattern emerges at the USD/JPY daily chart.
- The pair will resume its downtrend below 144.97.
- Buyers would gather momentum if they reclaim the Senkou Span A at around 145.86.
On Tuesday, the USD/JPY registered losses of 0.48% as a bearish harami candlestick chart pattern formed, suggesting the major is headed to extend its losses. At the time of writing, as the Asian session begins, the pair is trading at 145.43, virtually unchanged.
The USD/JPY is neutral to downward based after diving below key support levels, like the Ichimoku Cloud. In addition, the Tenkan and Kijun-Sen levels turned bearish, with the latter sitting above of the former, which is the first support level at around 144.97. if the pair heads toward the latter and breaks that level, the next demand area would be the December 8 low of 142.49, followed by the December 7 at 141.60.
On the upside, the USD/JPY must reclaim the Senkou Span A at 145.86, ahead of the confluence of the Kijun-Sen and the Senkou Span B at 146.75.
USD/JPY Price Analysis – Daily Chart

USD/JPY Technical Levels
- AUD/USD remains on the defensive around 0.6558 ahead of the key event.
- US Consumer Price Index (CPI) for November rose 0.1% MoM and 3.1% YoY, matching expectations.
- Chinese government emphasized the importance of industrial policy next year, which disappointed investors seeking big stimulus to boost growth.
- Traders will closely monitor the US PPI and Fed rate decision.
The AUD/USD pair trades in negative territory for the fourth consecutive day around the mid-0.6500s during the early Asian session on Wednesday. The pair faces a rejection after reaching the 0.6600 mark amid modest US Dollar (USD) strength. The Federal Reserve will announce the interest rate decision on Wednesday, with no change in rates expected. The pair currently trades near 0.6558, down 0.02% on the day.
Data from the US Bureau of Labor Statistics revealed on Tuesday that the US Consumer Price Index (CPI) for November rose 0.1% MoM and 3.1% YoY. Both figures aligned with market consensus. The Core CPI, which excludes volatile food and energy prices, climbed by 0.3% MoM and 4.0% YoY, as expected.
The Federal Reserve (Fed) is expected to hold interest rates steady for the third consecutive time at its December meeting on Wednesday. The market will closely watch Fed signals for the future. Fed Chair Jerome Powell is anticipated to push back against expectations for lower interest rates while acknowledging that some progress against inflation is being achieved.
On the Aussie front, Chinese Communist Party leaders began a closed-door meeting on Monday to discuss economic targets and stimulus measures for 2024 and the meeting ended on Tuesday. According to a readout from China's annual economic work conference, no major fiscal stimulus measures were proposed.
Instead, the Chinese government emphasized the importance of technical innovation and artificial intelligence (AI), which disappointed investors seeking big stimulus to boost growth. This, in turn, weighs on the China-proxy Australian Dollar (AUD) and acts as a headwind for the AUD/USD pair.
Looking ahead, market players will keep an eye on the US Producer Price Index (PPI) due later on Wednesday. The annual PPI figure is expected to ease from 1.3% to 1.0% in November, while the PPI rate ex Food & Energy is estimated to drop from 2.4% to 2.2% in November. Later on Wednesday, the Fed will end the monetary policy meeting. Traders will examine Fed Chair Jerome Powell’s comments after the meeting.
- NZD/USD continues to hold above 0.6100 with limited pullback.
- NZ GDP to be overshadowed by Fed's last meeting of 2023.
- Fed dot plot to be the key highlight for Wednesday.
The NZD/USD continues to cycle in a rough range between 0.6100 and 0.6180 in a sideways grind that has kept the pair strung in place for December trading.
New Zealand's Gross Domestic Product (GDP) for the third quarter is slated to be released in the early Thursday session, but before that can happen the NZD/USD pair is set to run headfirst into Wednesday’s Federal Reserve (Fed) rate call, and broader markets are shifting to turn focus onto the US central bank’s interest rate outlook.
The Federal Reserve will be releasing their updated Dot Plot, the Fed’s own forward-looking Interest Rate Projections, and global markets eager for a ‘sooner rather than later’ path toward Fed rate cuts will be looking keenly at the dot plot to see if the Fed’s rate outlook matches investor expectations. Markets are currently expecting the Fed to be battled back into a rate cut cycle as soon as the end of the first quarter in 2024.
The Fed is broadly expected to hold flat on rates at 5.5% for its last rate call of 2023, but investors will be keeping a close eye on the Fed’s Monetary Policy Statement to sniff out the extent to which the Fed is leaning into either a hawkish or dovish stance.
NZ’s GDP is expected to come in broadly softer, with QoQ GDP growth forecast to decline from 0.9% to 0.2%, and the annualized figure is expected to trim back from 1.8% to 0.5% as the New Zealand economy teeters on the edge of a recession.
NZD/USD Technical Outlook
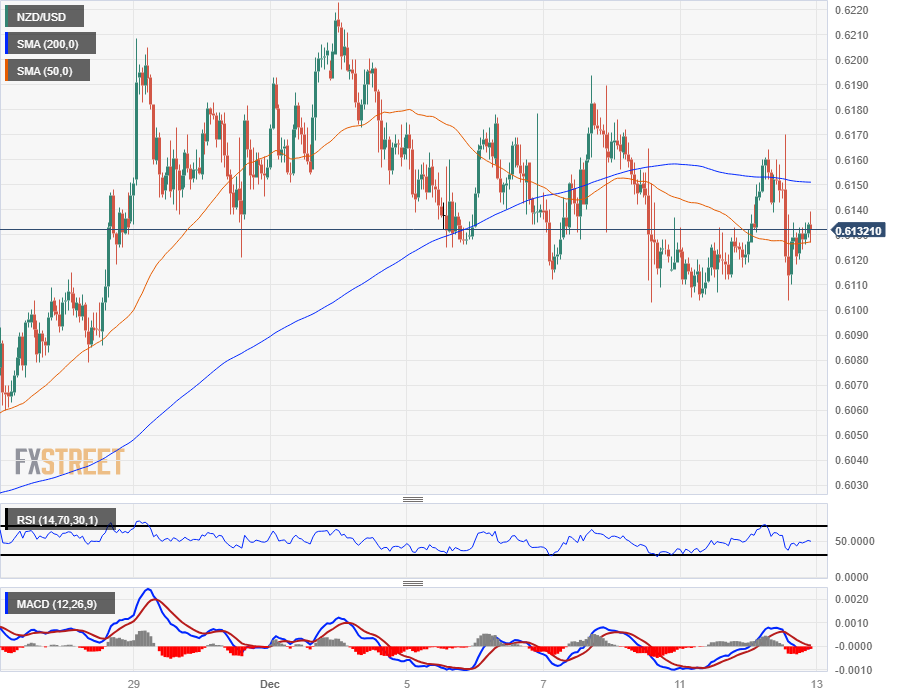
The Kiwi’s intraday action sees the NZD/USD capped by the 200-hour Simple Moving Average (SMA) near 0.6150, and near-term chart action has been largely constrained into the midrange.
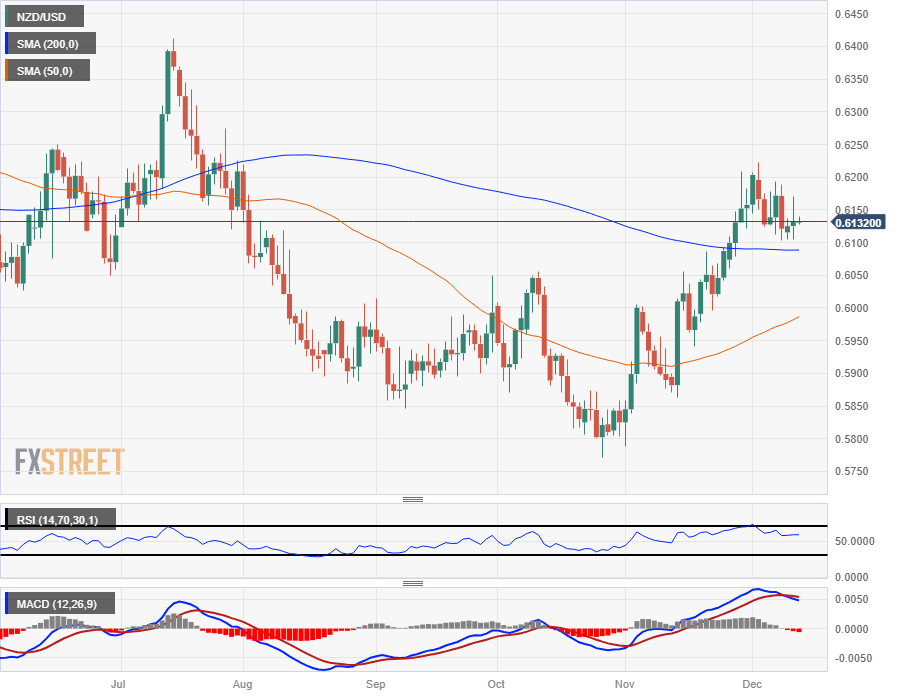
Despite the NZD/USD’s near-term flat trading, the pair remains on the high side of the 200-day SMA, buoyed above the 0.6100 handle and the pair has seen little pullback after getting vaulted from year-long lows near 0.5800 in late October.
The 50-day SMA is accelerating towards bullish territory, pushing into the 0.6000 major handle as bids remain pinned in high ground.
NZD/USD Hourly Chart
NZD/USD Daily Chart
NZD/USD Technical Levels
- EUR/JPY trades down 0.16%, maintaining its downward bias.
- The bearish sentiment persists as price action drops below Ichimoku Cloud, and the Tenkan-Sen crosses below the Kijun-Sen.
- A less probable bullish scenario requires EUR/JPY to rally past a five-month-old resistance trendline at around 157.35/45.
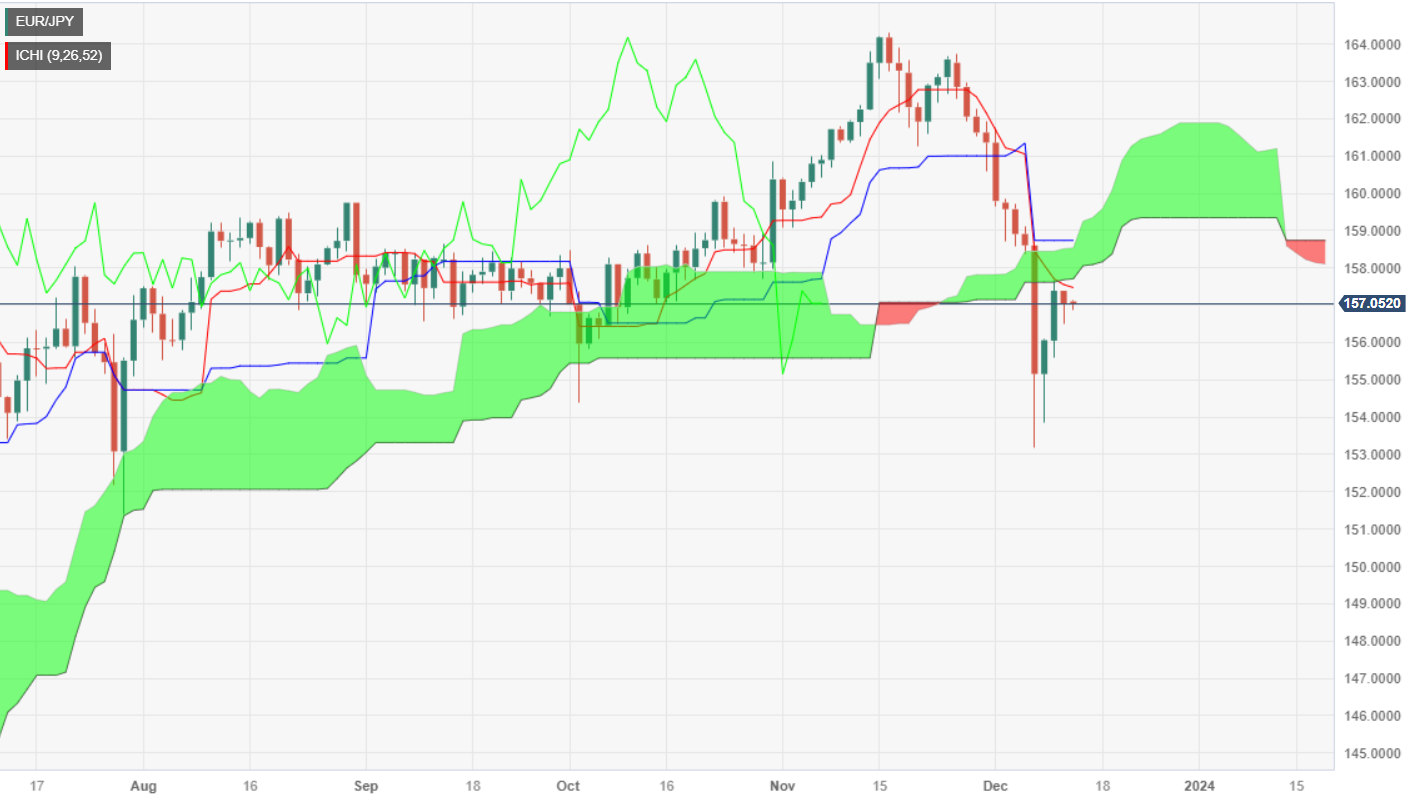
The EUR/JPY is set to finish Tuesday’s session on a lower note, cementing its bearish bias ahead of major central banks' monetary policy decisions, including the European Central Bank (ECB). At the time of writing, the pair is trading at 157.04, down 0.16%.
The daily chart portrays the pair as downward biased due to price action falling below the Ichimoku Cloud and crossing the Tenkan-Sen below the Kijun-Sen. For a bearish resumption to continue, bears need to step and push prices below the December 11 daily low of 155.86. Once cleared, the next support would be the December 8 low of 153.86, ahead of the December 7 swing low of 153.11
On the flip side, and the least probable scenario if EUR/JPY rallies past a five-month-old resistance trendline at around 157.35/45, the first resistance would be the Tenkan-Sen at 157.44. Once cleared, the next stop would be the Senkou Span A at 158.07, followed by the Kijun-Sen at 158.71.
EUR/JPY Price Analysis – Daily Chart
EUR/JPY Technical outlook
According to self-published statistics from StatsNZ, New Zealand's seasonally adjusted Current Account deficit widened by nearly $400 million to $7.4 billion for the third quarter ended in September. Annualized Current Account for the year into September saw a narrowing, however, contracting to an annualized $30.6 billion, or 7.6% of Gross Domestic Product (GDP) compared to the year ended September 2022 of 8.3% of GDP.
According to StatsNZ, the widening of the quarterly Current Account was only partly offset by a $579 million narrowing of the services deficit, compared with the $633 million widening of the goods deficit and an additional $292 million widening of the primary income deficit.
Market Reaction
The NZD/USD is holding steady heading into Wednesday's early Asia market session, trading just above 0.6130.
About Stats NZ's Current Account
The Current Account released by the Statistics New Zealand is a net flow of current transactions, including goods, services, and interest payments into and out of New Zealand. A current account surplus indicates that the flow of capital into New Zealand exceeds the capital reduction. Normally, a high reading is seen as positive (or Bullish) for the NZD, whereas a low reading is seen as negative (or Bearish).
- The NZD/JPY pair is still under strain, losing 0.20% at 89.20 as bulls struggle to maintain momentum.
- Negative signals are seen on the daily chart, with downward-sloping RSI and rising red bars in MACD's histogram.
- Broader bullish control was established above 100 and 200-day SMA.
In Tuesday's session, the NZD/JPY is observed trading at 89.20, reflecting a 0.20% loss. The daily chart indicators suggest a neutral to bearish outlook, with bulls seemingly taking a pause, showing difficulty in gaining traction. Similarly, indicators on the four-hour chart yield a flat outlook, indicating a constant stand-off between buyers and sellers.
Upon observing the indicators on the daily chart, the negative inclination in the Relative Strength Index (RSI) indicates increasing selling momentum, which further entrenches in negative territory. Meanwhile, the Moving Average Convergence Divergence (MACD) is showing an upward trend but with red bars, which also points toward selling pressure. Furthermore, the pair's position concerning the Simple Moving Averages (SMAs) hints at a more favorable position for the bulls. The pair trading beneath the 20-day SMA but above the 100 and 200-day SMAs demonstrates that the buyers still maintain a decisive hand in the long-term trend, albeit they seem to lose some ground in the near-term as evidenced by the trajectory of the 20-day SMA.
Shifting to the four-hour chart, the indicators turned flat. With the RSI neutral and standing in negative territory, it signals a lack of clear directional bias in the near term. In addition, the MACD is showing an upward trajectory with red bars, which aligns with the selling momentum reflected in the daily chart.
Support Levels: 88.70, 88.15 (100-day SMA), 87.70
Resistance Levels: 89.80, 90.00 (20-day SMA), 90.30.
NZD/JPY daily chart
-638380136448643584.png)
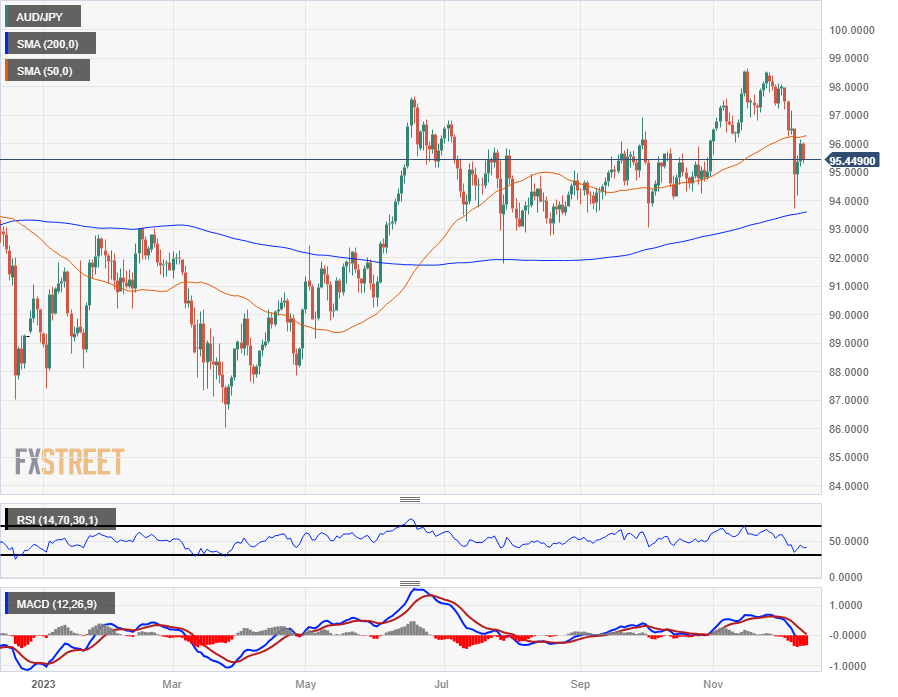
- The AUD/JPY is struggling to develop bullish momentum, struggling below 96.00.
- Aussie data continues to pull the rug out from beneath the AUD.
- This week sees a steady smattering of Aussie and Japan data, forecasts remain mixed.
The AUD/JPY couldn’t hold the 96.00 handle on Tuesday, falling back into 94.50 through the day and settling back into the low end. The Australian Dollar (AUD) is one of the worst-performing currencies on Tuesday, falling back against nearly all major currencies on the FX boards for the day.
Early Wednesday brings Japanese Tankan Large Manufacturing Index figures for the fourth quarter, forecast to tick up from 9.0 to 10.0. Tankan Large All Industry Capex for the fourth quarter is forecast to tick down slightly from 13.6% to 12.4%, while the Manufacturing Outlook is expected to shift down from 10.0 to 9.0.
Australian data has been thin this week, though Westpac’s Consumer Confidence for December recovered from -2.6% to 2.7% early Tuesday, providing only minor support for the Aussie (AUD).
Looking further out into the week, Thursday will see Australian employment figures, to be followed up by Judo Bank Purchasing Manager Index (PMI) data early Friday. Aussie Employment Change for November is forecast to shift down from 55K to only 11K, while Friday’s Preliminary Judo Bank Composite PMI for December last came in at a low of 46.2, and further downside could be on the cards as the Australian economy continues to wobble.
Australian Dollar price today
The table below shows the percentage change of Australian Dollar (AUD) against listed major currencies today. Australian Dollar was the strongest against the Canadian Dollar.
| USD | EUR | GBP | CAD | AUD | JPY | NZD | CHF | |
| USD | -0.31% | -0.12% | 0.08% | 0.08% | -0.40% | -0.16% | -0.34% | |
| EUR | 0.31% | 0.18% | 0.40% | 0.38% | -0.11% | 0.14% | -0.04% | |
| GBP | 0.12% | -0.19% | 0.21% | 0.20% | -0.28% | -0.03% | -0.22% | |
| CAD | -0.09% | -0.38% | -0.22% | 0.02% | -0.49% | -0.25% | -0.43% | |
| AUD | -0.08% | -0.39% | -0.22% | 0.02% | -0.50% | -0.24% | -0.44% | |
| JPY | 0.40% | 0.08% | 0.27% | 0.48% | 0.50% | 0.24% | 0.06% | |
| NZD | 0.15% | -0.15% | 0.04% | 0.25% | 0.24% | -0.25% | -0.19% | |
| CHF | 0.33% | 0.04% | 0.22% | 0.44% | 0.44% | -0.07% | 0.19% |
The heat map shows percentage changes of major currencies against each other. The base currency is picked from the left column, while the quote currency is picked from the top row. For example, if you pick the Euro from the left column and move along the horizontal line to the Japanese Yen, the percentage change displayed in the box will represent EUR (base)/JPY (quote).
AUD/JPY Technical Outlook
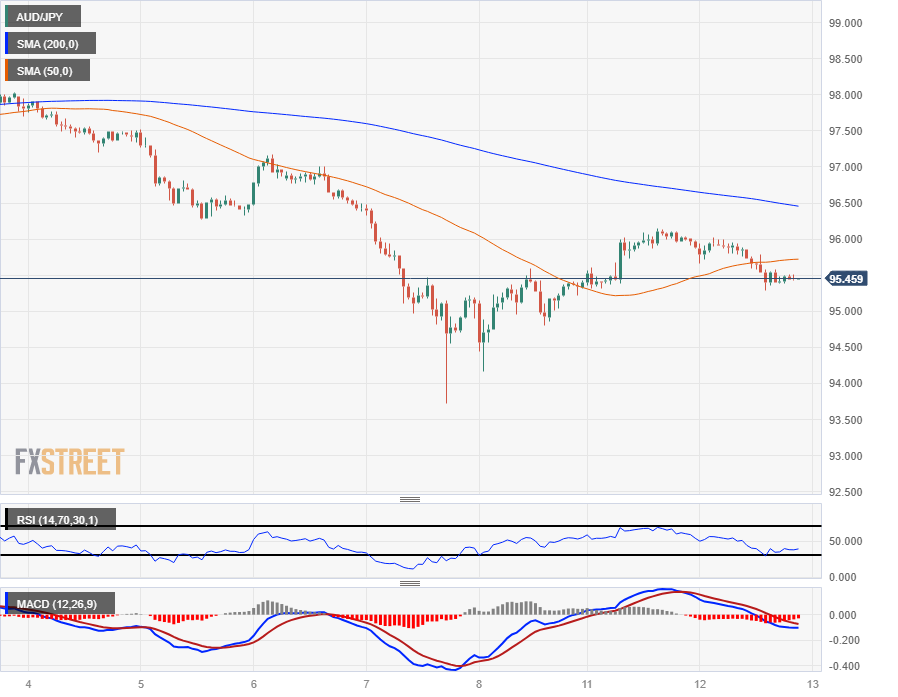
The Aussie has steadily shed weight against the Japanese Yen in December, declining from the 98.00 handle to test into 94.00 last week, and seeing only a limited recovery that sees the AUD/JPY still capped off by a bearish 200-hour Simple Moving Average (SMA) near 96.50.
Daily candlesticks have the AUD/JPY down from November’s peaks near 98.50, but medium-term momentum continues to find technical support from the 200-day SMA rising into the 94.00 handle.
Bullish momentum remains limited with bids cycling the 50-day SMA since a bullish cross of the 200-day SMA in June near 92.00.
AUD/JPY Hourly Chart
AUD/JPY Daily Chart
AUD/JPY Technical Levels
Eyes will be on the Federal Reserve and Chair Powell on Wednesday. During the Asian session, New Zealand will report Current Account figures, and the Tankan survey will be released in Japan. More inflation data is due in the US with the Producer Price Index (PPI).
Here is what you need to know on Wednesday, December 13:
The Federal Reserve will end its December meeting on Wednesday. No change in rates is expected, and the guidance is expected to maintain the same bias. Market participants will closely examine the new macroeconomic forecasts and Chair Jerome Powell’s comments, which could influence rate expectations for the next year.
Analysts at TD Securities on FOMC:
The Fed is widely expected to again keep rates steady this week. Powell will have to walk a fine line by recognizing the ground gained towards the normalization of the economy while pushing back on the idea of early rate cuts. We expect the chairman to lean against the Committee's likely dovish guidance at 2pm, with guarded hawkishness in the post-meeting presser.
More inflation data is due in the US with the Producer Price Index (PPI), which is expected to show a month-over-month increase of 0.1% in November and an annual rate of 1%, below the 1.3% recorded in October.
On Tuesday, the US Consumer Price Index (CPI) report aligned with market consensus. The CPI rose 0.1% in November, and the annual rate stood at 3.1%, below the 3.2% recorded in October. The core rate increased by 0.3%, and the annual rate remained at 4%.
Analysts at Commerzbank on US CPI inflation:
The underlying inflationary pressure is thus decreasing, but only gradually. In view of these trends, it is unlikely that the Federal Reserve will raise interest rates again. However, a rate cut is also not realistic until mid-2024.
The US Dollar dropped and then recovered following inflation figures. The US Dollar Index (DXY) experienced a modest drop before the last Fed decision of the year. The DXY faces resistance around the 104.30 zone and continues to trade sideways. Limited price action in the bond market contributes to the overall mixed performance of the US Dollar. The 10-year Treasury yields fell slightly from 4.23% to 4.20%.
EUR/USD rose on Tuesday but failed to hold above 1.0800. The short-term outlook is biased to the upside, although without solid conviction. The European Central Bank (ECB) will announce its decision on monetary policy on Thursday, with no changes in rates expected.
USD/JPY lost ground but trimmed losses after US CPI data, consolidating above 145.50. The Tankan survey is due on Wednesday, with mixed numbers expected.
GBP/USD continues to trade around 1.2550 and the 20-day Simple Moving Average (SMA). The UK will report monthly gross domestic product growth for the three months ending in October and industrial production data. On Thursday, the Bank of England (BoE) will announce its decision on monetary policy.
NZD/USD still holds above key moving averages and remains in the 0.6100 zone. The Food Price Index and Current Account figures for the third quarter are due on Wednesday, and GDP data will be released on Thursday.
Antipodean currencies are expected to benefit from higher equity prices on Wall Street. AUD/USD dropped modestly, reaching levels below 0.6550 after briefly surpassing 0.6600. It continues to move without a clear direction.
Gold spiked to $1,996 after US inflation data but quickly attracted fresh selling pressure, pulling back to the $1,980 zone. The yellow metal is not shining. A less hawkish Fed could trigger a recovery rally.
Crude Oil prices resumed the downtrend after a three-day recovery. WTI lost more than 3.50% and posted the lowest close since June, dropping below $69.00.
Like this article? Help us with some feedback by answering this survey:
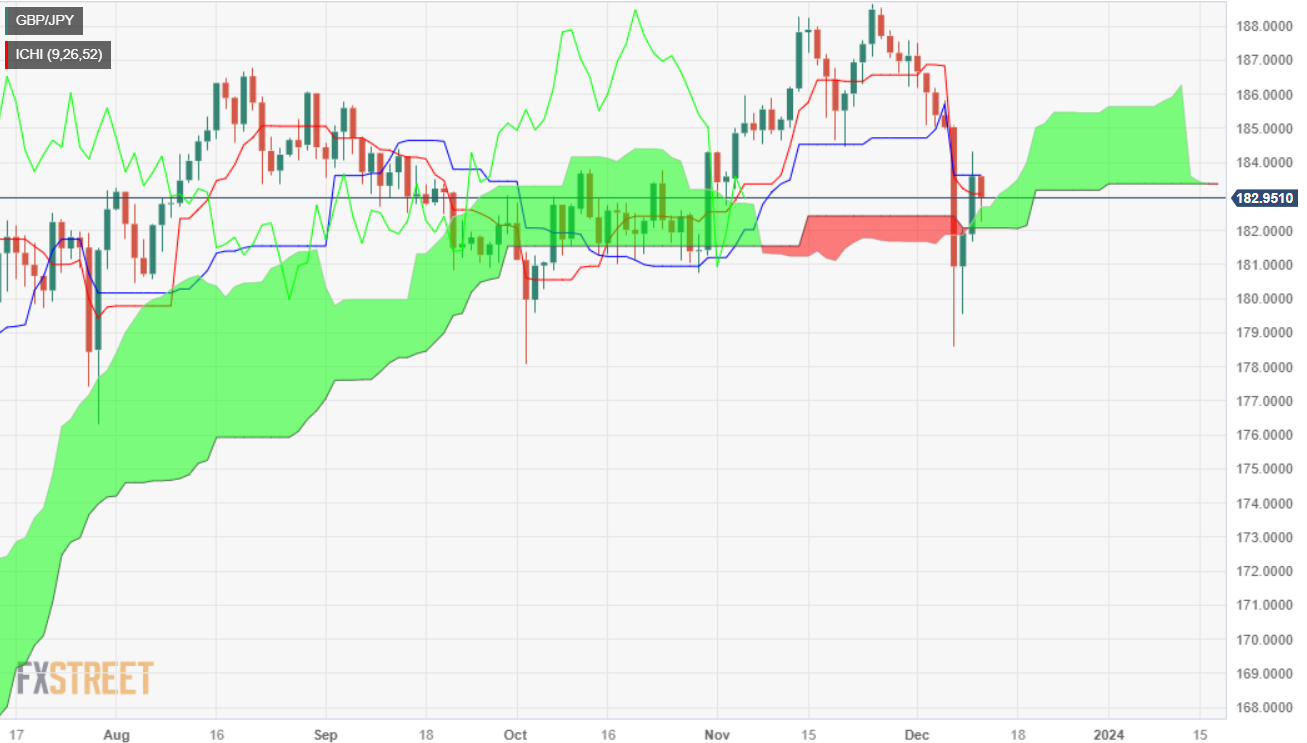
- GBP/JPY was unable to extend its gain, forming a bearish harami candlestick pattern.
- Despite being neutral, a drop inside the Kumo, and the pair could resume its downtrend.
- Buyers reclaiming a three-month-old resistance trendline could open the door to test YTD high.
Price action in the GBP/JPY remains constrained ahead of the Bank of England’s (BoE) monetary policy decision on Thursday. Although the pair has broken above the Ichimoku Cloud (Kumo), downside risks remain. At the time of writing, the cross-pair is trading at 182.94, down 0.28%.
The daily chart portrays the cross pair as neutral biased, despite breaching the Kumo. For a bullish resumption, buyers must lift the exchange rates above 185.00, breaking a three-month-old resistance trendline that passes at around that level. Once cleared, that would open the path towards the year-to-date (YTD) high at 188.80.
On the other hand, if sellers stepped in and dragged prices inside the Kumo, the pair could resume its downtrend. Key support level lies at 181.99, the bottom of the Kumo, followed by the December 11 low of 181.60. Once it drops below that level, the 180.00 mark would be up for grabs.
GBP/JPY Price Action – Daily Chart
GBP/JPY Technical Levels
- The USD/NOK advances modestly, showcasing 0.20% gains, gravitating around the 10.975 level.
- Markets are betting on sooner rate cuts by the Fed in May after November CPI.
- US bond yields dropped across the board.
During Tuesday's trading session, USD/NOK experienced gains, currently trading around the 10.975 level. Despite the pair holding strong, its upside potential may be limited as the markets are seeing sooner rather than later rate cuts by the Federal Reserve (Fed) after the release of inflation figures from the US.
November in the US saw predicted inflationary dips, as shown by the Consumer Price Index (CPI), which only rose a slight 0.1% monthly. Year-on-year inflation dropped marginally to 3.1% from 3.2% in October, with the core inflation figure, excluding volatile components, steady at 4% annually.
For Wednesday's Fed meeting, markets anticipate the bank will maintain the rates at 5.5%, but attention is set to economic and rate predictions to determine when the easing cycle will start. In the meantime, the bank authorities continued to stress that their decisions hinge on data, pointing out that they require more proof of an economic slowdown before rate cuts begin. For November and October, inflation decelerated while the labor market has yet to show signs of cooling down, which may be the only factor that makes the Fed not call a victory on inflation.
Ahead of the decision, the US Treasury yields are declining. The 2-year rate is currently at 4.71%, while the 5 and 10-year yields stand at 4.25% and 4.23%, respectively. This decrease in yields could add pressure on the USD and limit the upside for the USD/NOK.
USD/NOK levels to watch
The daily chart suggests that the pair has a bullish resonance with the Relative Strength Index (RSI), showing positive dynamics in the chart. The positive slope and positive territory of the indicator are indicative of a strong buying momentum, overpowering its selling counterpart. In addition, the Moving Average Convergence Divergence (MACD) corroborates this bullish indication as it prints rising green bars, signaling the buyers are getting the better of the sellers.
Exhibiting similar progression, the pair stands tall above the 20,100,200-day Simple Moving Averages (SMAs), which insinuates that bulls are firmly in command of the broader time horizon.
Support Levels: 10.900, 10.870, 10.800 (20-day SMA).
Resistance Levels: 11.015, 11.075, 11.105.
USD/NOK daily chart
-638380066427723505.png)
The US government recorded a $314 billion budget deficit in November, larger than the $301 expected. The Treasury Department informed that receipts totalled $275 billion and outlays $589 billion. It compares to a deficit of $248 billion during the same month of last year.
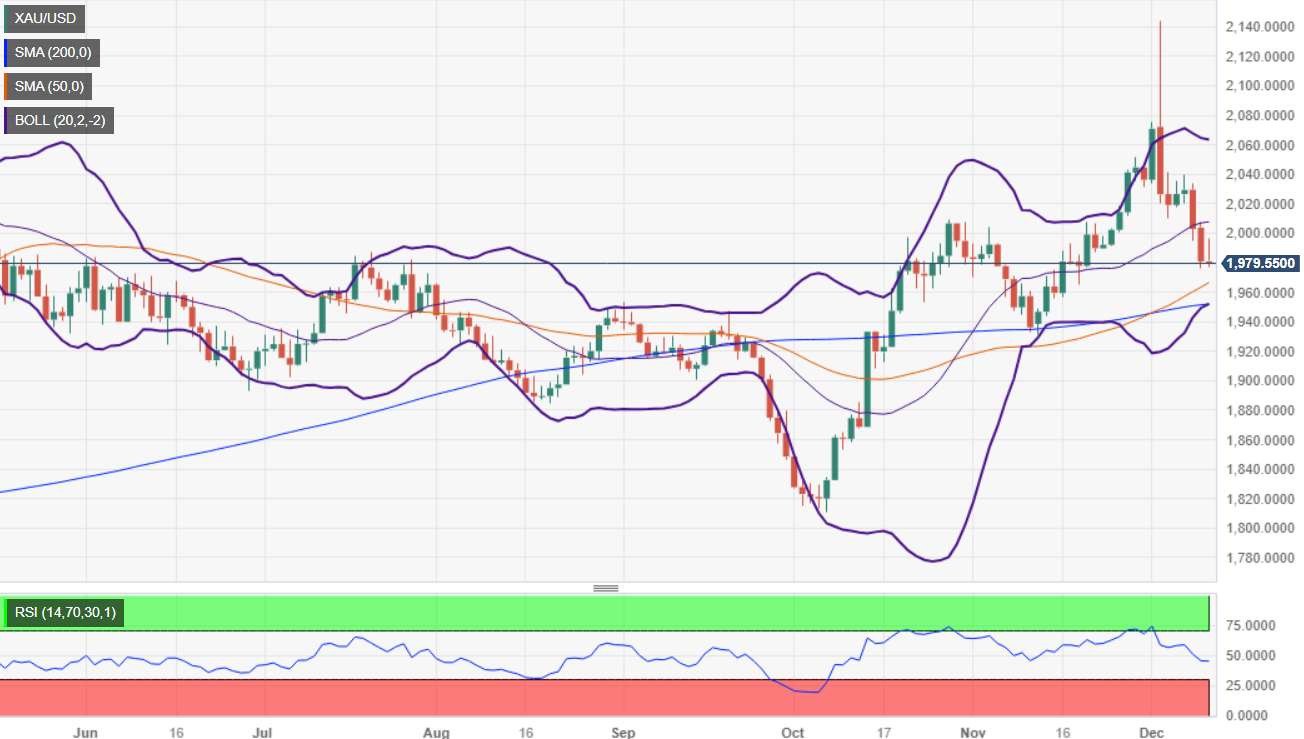
- Gold price hits a daily high of $1996.73 but loses momentum in the aftermath of a mixed US inflation report.
- US Bureau of Labor Statistics (BLS) reveals disinflation in the US, with annual and monthly readings posting mixed results.
- Traders await the Federal Reserve’s decision, with money market futures expecting the Fed to hold rates, eyeing 100 basis points of rate cuts for 2024.
Gold price lost its bright after hitting a daily high of $1996.73, though it dropped in the aftermath of a softish inflation report in the United States (US), ahead of the upcoming Federal Reserve (Fed) monetary policy decision. The XAU/USD exchanges hands at $1979,40, down 0.11%
The yellow metal losses momentum ahead of the upcoming Fed’s decision
The US Bureau of Labor Statistics (BLS revealed the disinflation process in the US continues, as headline inflation was 3.1% YoY, below October’s 3.2%, but underlying inflation remains stickier at 4% in the twelve months to November. Monthly readings were mixed, with CPI standing at 0.1%, exceeding forecast by 0%, while core CPI was 0.3% as expected but higher than in October.
The data release underpinned Gold’s towards its daily high, though pared its gains, slumping below the $1985 mark, weighed by a recovery of US Treasury bond yields. Even though the Greenback (USD) remains soft as depicted by the US Dollar Index (DXY), down 0.23% at 103.85, the yellow metal remains unable to recover from its late losses.
Meanwhile, traders brace for the Federal Reserve’s decision on Wednesday, followed by Chairman Jerome Powell’s press conference. Despite inflation’s positive reading, money market futures had priced in 100 basis points of rate cuts for 2024 and remain cautious. Earlier in that day, the BLS would announce prices paid by producers.
XAU/USD Price Analysis: Technical outlook
Gold’s daily chart depicts the yellow metal is neutral to upward biased as long as it stays above the daily moving averages (DMAs). Nevertheless, as XAU/USD continues to drop, that would put into play the 50-DMA at $1966.41, followed by the 200-DMA at $1952.74. Further support lies at the 100-DMA at $1941.07. Once those levels are cleared, the XAU/USD would shift downwards. On the other hand, a bullish resumption looms, but bulls need to lift the spot price above the October 27 high at $2009.42.
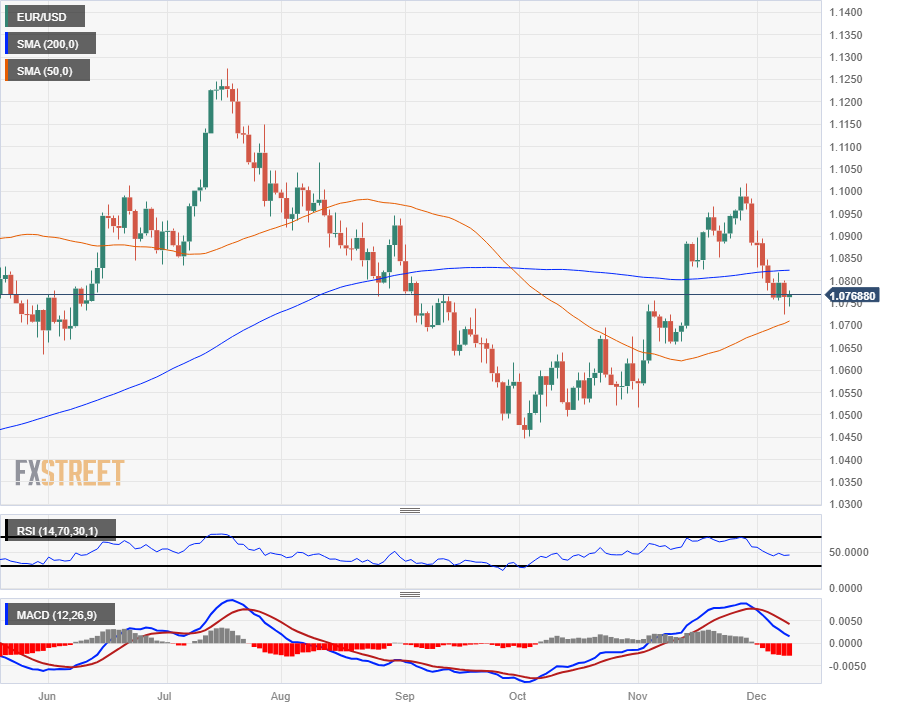
- EUR/USD is up on the day, but paring back gains firmly into familiar levels.
- Near-term momentum is getting hamstrung by major levels.
- Markets are gearing up for the Fed's last showing of 2023.
EUR/USD climbed in early Tuesday trading before slipping back below 1.0800, driven back after US Consumer Price Index (CPI) inflation came in as markets forecast, showing an ongoing gradual easing of price growth in the US.
The Eurozone ZEW Economic Sentiment survey for December came in well above expectations, printing at 23.0 versus the forecast 12.0, vaulting easily over the November print of 13.8.
The Euro (EUR) rose through Tuesday’s early market sessions, tipping the EUR/USD into an intraday high of 1.0828 before getting dragged back down below 1.0800 after US CPI inflation came in as expected.
Read More: Forecasts from 10 major banks, crushing rate cut prospects
Headline US CPI inflation for November printed at 0.1% compared to October’s 0.0%, and annualized headline CPI price growth ticked down slightly from 3.2% to 3.1%.
Core CPI inflation came in at 4% for the year into November, and inflation appears to have been capped off in the US, but inflation continues to ebb slower than most market participants were hoping for.
Global markets wil be turning attention to Wednesday’s Federal Reserve (Fed) rate call. With the US central bank broadly expected to hold rates steady at 5.5%, investors will be paying significant attention to the Fed’s Monetary Policy Statement, as well as updates to the Fed’s Interest Rate Projections, or Dot Plot.
After the mid-week Fed hump will be the European Central Bank (ECB) on Thursday, which will also be delivering its last rate call of 2023 before heading into the new year.
EUR/USD Technical Outlook
The EUR/USD remains trapped under the 200-hour Simple Moving Average (SMA) near 1.0820, getting rejected from the intraday significance level to trade on the south side of 1.0800 once again.
The pair has remained in a near-term bearish stance since shedding 1.1000 at the tail end of November, and a bullish rebound has yet to firmly materialize.
Daily candlesticks have the EUR/USD stuck in a congestion zone between the 200-day and 50-day SMAs, at 1.0825 and 1.0716 respectively. Firm technical support rests at the 1.0-700 handle just below current price action.
EUR/USD Daily Chart
EUR/USD Technical Levels
- The DXY Index is trading with losses below the 104.00 mark.
- US November showed no surprises and confirmed a deceleration.
- Investors await Fed Interest Rate Decision due this Wednesday.
The US Dollar (USD) is currently undergoing a slight retreat as the DXY index trades at 103.95 after the release of November’s Consumer Price Index (CPI) figures from the US, which fueled dovish bets on the Federal Reserve.
Against a backdrop of cooling inflation and despite a strong labor market, the Fed appears susceptible to veering toward a more dovish stance. In that sense, Fed officials are not ruling out further policy tightening, so markets will closely monitor the bank’s stance at the upcoming meeting on Wednesday.
Daily Market Movers: US dollar dips after CPI data, markets see rate cuts in May 2024
- The US Dollar trades lower as investors assess the impact of US CPI data and dovish expectations from the Federal Reserve.
- In November, the US saw a predicted easing in inflation, according to the CPI. The CPI recorded a modest rise of 0.1% for the month. Compared to October's 3.2%, the annual inflation rate slightly decreased to 3.1%.
- Core CPI reported by the US Bureau of Labor Statistics remained unchanged at 4% YoY, matching both the previous and expected figures.
- Meanwhile, US bond yields are down with 2-year, 5-year and 10-year yields at 4.71%, 4.23%, and 4.22%, respectively.
- According to the CME FedWatch Tool, a rate hike is not expected in Wednesday’s meeting, with the market betting on rate cuts likely to happen in May 2024.
Technical Analysis: DXY bulls hold resilient, indicators still weak
The indicators on the daily chart reflect a bit of a mixed picture for the pair. The Relative Strength Index (RSI) is in negative territory with a negative slope, indicating diminishing buying momentum. This is reaffirmed by the status of the Moving Average Convergence Divergence (MACD) indicator, which is registering decreasing green bars.
Bucking short-term cues, the Simple Moving Averages (SMAs) showcase a broader bullish trend. The pair remains above the 20-day SMA and crucially above the 200-day SMA, highlighting that bulls have the upper hand in a wider time frame despite temporary bearish leanings.
However, the pair's position below the 100-day SMA suggests a note of caution and potentially a near-term consolidation or pullback phase. The ongoing action on the charts can be seen as bears taking a breather, while bulls remain resilient.
Support levels: 103.70 (20-day SMA), 103.50, 103.30.
Resistance levels: 104.50 (100-day SMA), 104.50, 104.70.
US Dollar FAQs
What is the US Dollar?
The US Dollar (USD) is the official currency of the United States of America, and the ‘de facto’ currency of a significant number of other countries where it is found in circulation alongside local notes. It is the most heavily traded currency in the world, accounting for over 88% of all global foreign exchange turnover, or an average of $6.6 trillion in transactions per day, according to data from 2022.
Following the second world war, the USD took over from the British Pound as the world’s reserve currency. For most of its history, the US Dollar was backed by Gold, until the Bretton Woods Agreement in 1971 when the Gold Standard went away.
How do the decisions of the Federal Reserve impact the US Dollar?
The most important single factor impacting on the value of the US Dollar is monetary policy, which is shaped by the Federal Reserve (Fed). The Fed has two mandates: to achieve price stability (control inflation) and foster full employment. Its primary tool to achieve these two goals is by adjusting interest rates.
When prices are rising too quickly and inflation is above the Fed’s 2% target, the Fed will raise rates, which helps the USD value. When inflation falls below 2% or the Unemployment Rate is too high, the Fed may lower interest rates, which weighs on the Greenback.
What is Quantitative Easing and how does it influence the US Dollar?
In extreme situations, the Federal Reserve can also print more Dollars and enact quantitative easing (QE). QE is the process by which the Fed substantially increases the flow of credit in a stuck financial system.
It is a non-standard policy measure used when credit has dried up because banks will not lend to each other (out of the fear of counterparty default). It is a last resort when simply lowering interest rates is unlikely to achieve the necessary result. It was the Fed’s weapon of choice to combat the credit crunch that occurred during the Great Financial Crisis in 2008. It involves the Fed printing more Dollars and using them to buy US government bonds predominantly from financial institutions. QE usually leads to a weaker US Dollar.
What is Quantitative Tightening and how does it influence the US Dollar?
Quantitative tightening (QT) is the reverse process whereby the Federal Reserve stops buying bonds from financial institutions and does not reinvest the principal from the bonds it holds maturing in new purchases. It is usually positive for the US Dollar.
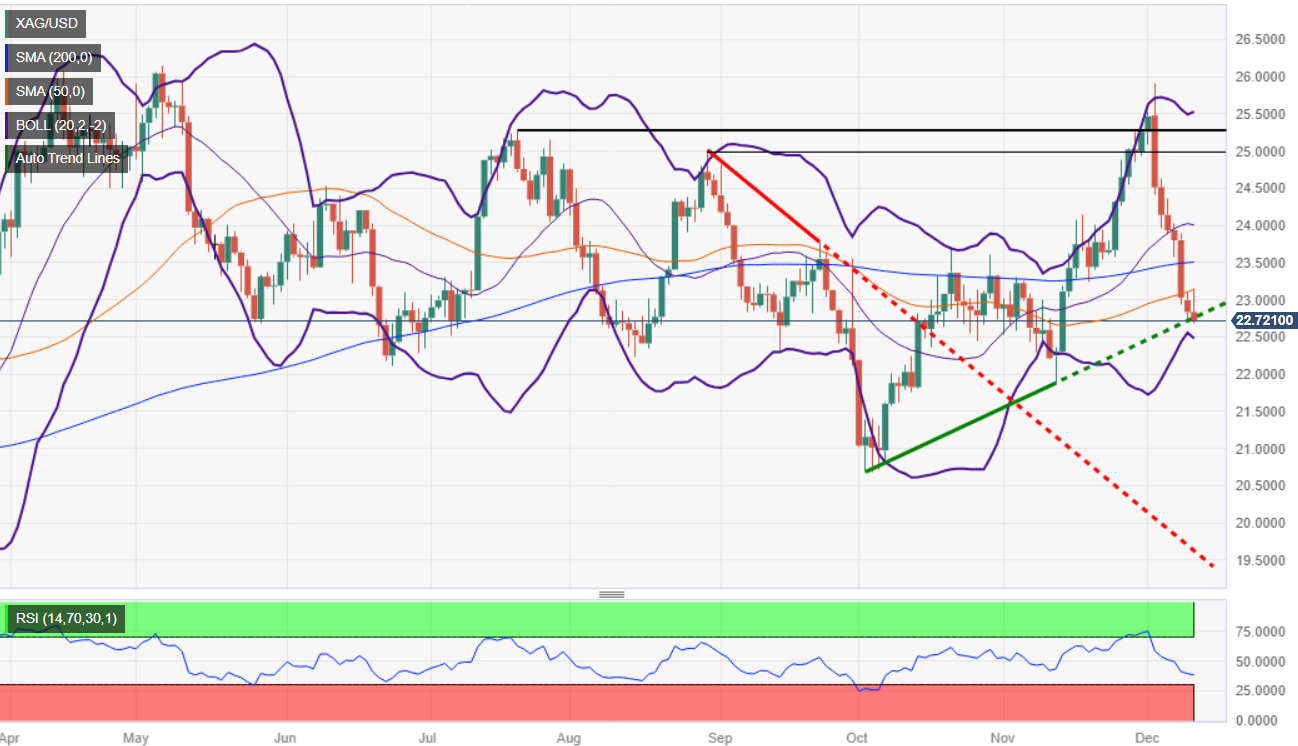
- Silver extended its losses to seven consecutive days and stayed below $23.00.
- If XAG/USD drops below $22.70, further downside is seen below $22.00.
- Bulls reclaiming $23.00 could pave the way for a recovery.
Silver price erased earlier gains and turned negative, down 0.30% following a softer US inflation report, which initially bolstered XAG/USD prices. Nevertheless, as US Treasury bond yields pared its losses, the grey metal lost its shine. The XAG/USD is trading at $22.74, retesting a two-month-old support trendline.
Silver remains neutral to downward bias, at the brisk of accelerating its downtrend if sellers push prices below the above-mentioned trendline. Once done, the next demand area would be the November 13 swing low of $21.88, followed by the October 6 daily low of $20.69.
On the other hand, if XAG/USD stays above that trendline and reclaims the $23.00 figure, the first technical barrier would be the 50-day moving average (DMA) at $23.12. Additional key resistance levels lie ahead, like the 100-DMA at $23.20, followed by the 200-DMA at $23.51. Once surpassed, the $24.00 figure would be up for grabs.
XAG/USD Price Analysis – Daily Chart
XAG/USD Technical Levels
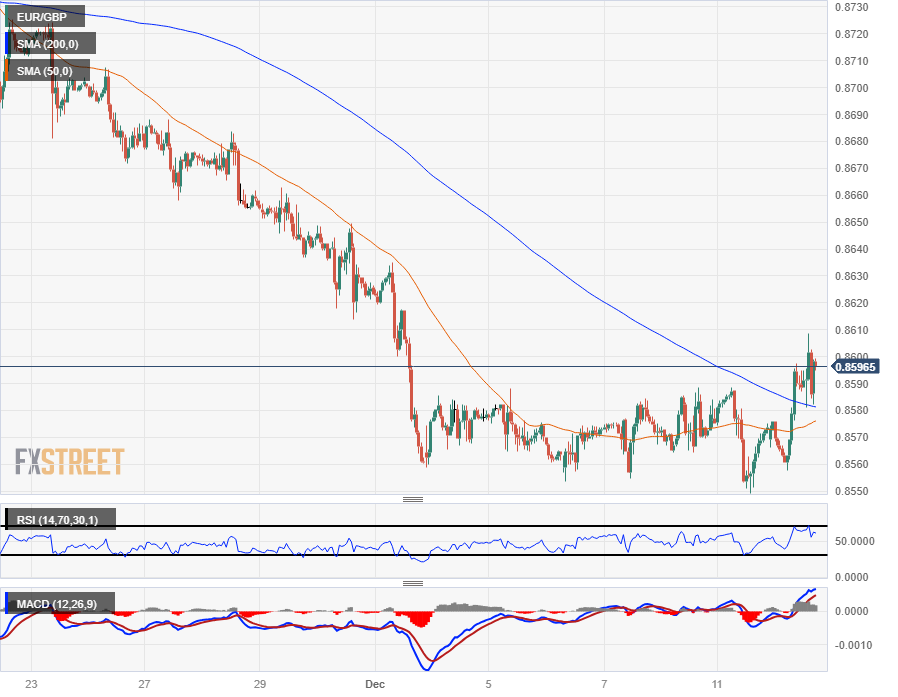
- EUR/GBP sees Tuesday gains for a fresh test of 0.8600.
- UK earnings miss the mark, EU sentiment improves sharply.
- The pair remains deeply bearish, with the momentum bias leaning bullish.
The EUR/GBP legged back into the 0.8600 handle on Tuesday, bolstered by a miss in UK Average Earnings and a better-than-expected print in the Eurozone’s ZEW Economic Sentiment Survey.
The UK’s Average Earnings, both including and excluding bonuses, missed market estimates on Tuesday, printing below expectations and softening the Pound Sterling (GBP) against the Euro (EUR).
UK Average Earnings Excluding Bonuses for the quarter ended in October showed earnings climbed 7.3% compared to the same time last year, coming in below market forecasts of 7.4% and slipping back from the previous period’s 7.8% (revised up slightly from 7.7%, further widening the gap).
UK Average Earnings Including Bonuses similarly declined, printing at 7.2% versus the forecast 7.7% and reversing direction on the previous period’s 8%, which was similarly revised upwards from 7.9%.
UK Claimant Count Change in November beat market expectations, but still printed worse than the previous month, showing 16K additional jobless benefits seekers versus the forecast 20.3K; October had 8.9K new claimants, which was revised sharply lower from 17.8K.
The Eurozone’s ZEW Economic Sentiment Survey beat expectations to print at a firm 23.0, handily climbing over the forecast 12.0 and vaulting above the previous month’s 13.8.
Market focus to shift to BoE, ECB double feature
Wednesday will take a slight breather with mid-tier Industrial Production from both the UK and the EU before Thursday’s double-header showing from both the Bank of England (BoE) and the European Central Bank (ECB).
Both central banks are broadly expected to hold steady on rates, and investors will be taking a close look at both banks’ policy statements to try and draw a bead on just how hawkish or dovish a stance the BoE and ECB are taking heading into the new year.
EUR/GBP Technical Outlook
The Pound Sterling’s (GBP) early slump on Tuesday sees the Euro (EUR) catching a bid and sending the EUR/GBP back into the 0.8600 handle. Price action is drawing tight once more and the pair is struggling to maintain a hold on the key level, but intraday bids are catching technical support from the 200-hour Simple Moving Average (SMA) near 0.8580.
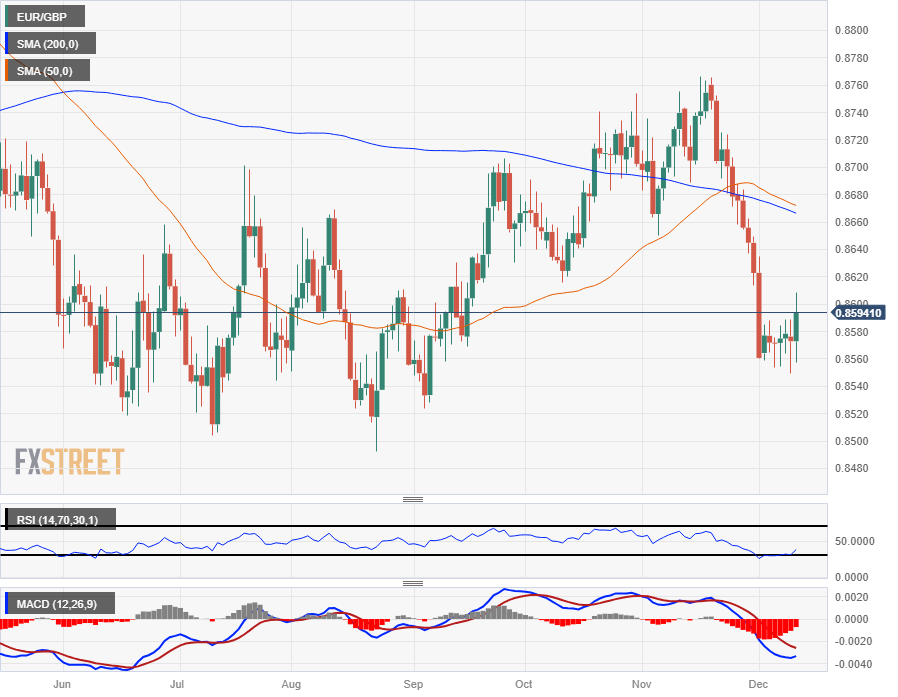
Despite Tuesday’s bullish bump, the EUR/GBP remains steeply bearish, weighed down near multi-month lows with price action trading well below the 200-day SMA drifting into the 0.8660 level.
0.8560 is hardening into a firm price floor keeping bearish momentum constrained for the time being, while bullish plays will see a hard barrier near 0.8620.
EUR/GBP Hourly Chart
EUR/GBP Daily Chart
EUR/GBP Technical Levels
- The Canadian Dollar sheds weight on Tuesday, walks back the early week’s gains.
- Economic data from Canada remains absent on the calendar.
- Crude Oil is plunging as markets reassess slowing global growth causing demand declines to outpace production cuts.
The Canadian Dollar (CAD) fell back on Tuesday as markets shuffled their stance following US Consumer Price Index (CPI) inflation figures that exactly met market expectations, pointing to dwindling growth looking forward.
Canada sees little to no meaningful data on the economic calendar this week, leaving the CAD to get dragged around the charts by the broader market. Crude Oil markets are seeing broad declines on declining demand concerns, further pressuring the Loonie.
Daily Digest Market Movers: US CPI meets the street to print at expectations, price growth slowly cools
- The Canadian Dollar sees losses across the board on Tuesday, with slight to moderate declines against all of the CAD’s major currency peers.
- The CAD’s weakest performance sees it down six-tenths of a percent against the Japanese Yen (JPY), and half a percent against the Swiss Franc (CHF).
- The Loonie’s ‘strongest’ performance is against the Australian Dollar (AUD), down around a sixth of a percent against the Antipodean, with a close second going to a fifth of a percent decline against the post-CPI US Dollar (USD).
- US Consumer Price Index (CPI) inflation met the street exactly at expectations across the board, with headline annualized CPI inflation ticking down from 3.2% to 3.1%, and the MoM figure ticking up slightly from a flat 0.0% to 0.1%.
- Core CPI inflation (headline inflation less volatile food and energy prices) held steady at 4% for the YoY figure, with November’s MoM Core CPI printing slightly higher at 0.3% versus October’s 0.2%.
- Crude Oil markets are taking a leg down in the face of declining price growth from the US, adding further weight to ongoing energy market concerns about declining fossil demand eclipsing global production cuts, specifically from the Organization of the Petroleum Exporting Countries (OPEC).
- US West Texas Intermediate (WTI) Crude Oil slips back to $69.00 per barrel.
- The Canadian Dollar is getting dragged down in lockstep with deflating Crude Oil bids.
- Next up for markets will be the Federal Reserve’s (Fed) Monetary Policy Statement and updates to its Interest Rate Projections, both due on Wednesday at 19:00 GMT and to be followed up by a Press Conference at 19:30 GMT.
Canadian Dollar price today
The table below shows the percentage change of Canadian Dollar (CAD) against listed major currencies today. Canadian Dollar was the strongest against the Australian Dollar.
| USD | EUR | GBP | CAD | AUD | JPY | NZD | CHF | |
| USD | -0.23% | 0.01% | 0.21% | 0.06% | -0.34% | -0.11% | -0.28% | |
| EUR | 0.23% | 0.23% | 0.46% | 0.29% | -0.14% | 0.11% | -0.06% | |
| GBP | -0.01% | -0.24% | 0.22% | 0.05% | -0.36% | -0.11% | -0.30% | |
| CAD | -0.22% | -0.44% | -0.21% | -0.14% | -0.58% | -0.34% | -0.50% | |
| AUD | -0.06% | -0.29% | -0.06% | 0.17% | -0.43% | -0.18% | -0.36% | |
| JPY | 0.34% | 0.12% | 0.36% | 0.57% | 0.43% | 0.25% | 0.07% | |
| NZD | 0.10% | -0.12% | 0.11% | 0.33% | 0.17% | -0.25% | -0.18% | |
| CHF | 0.27% | 0.06% | 0.29% | 0.51% | 0.36% | -0.08% | 0.17% |
The heat map shows percentage changes of major currencies against each other. The base currency is picked from the left column, while the quote currency is picked from the top row. For example, if you pick the Euro from the left column and move along the horizontal line to the Japanese Yen, the percentage change displayed in the box will represent EUR (base)/JPY (quote).
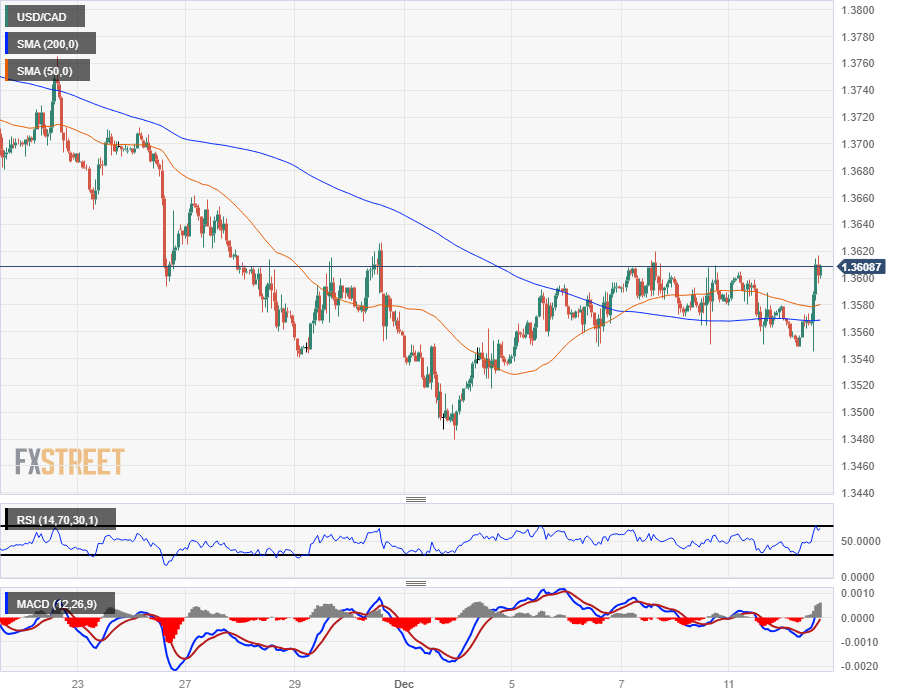
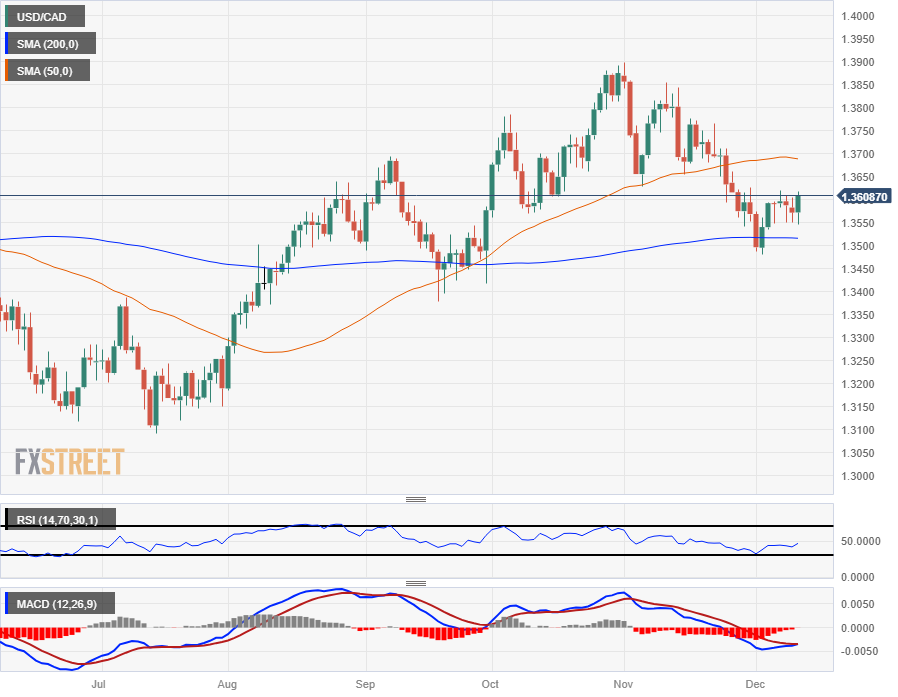
Technical Analysis: Canadian Dollar trips over slumping Crude Oil, follows WTI down and sends the USD/CAD back over 1.3600
The Canadian Dollar (CAD) looks for the basement on Tuesday, backsliding across the board and shedding weight against all of its major currency peers.
The USD/CAD has regained the 1.3600 handle after catching a topside break of consolidation between the 50-hour and 200-hour Simple Moving Averages (SMA) in the 1.3580 to 1.3560 zone.
The USD/CAD is toying with last week’s highs near 1.3620 after rebounding from familiar near-term lows at 1.3550. The pair is at risk of hardening into a sideways consolidation range, but the US Dollar (USD) is setup for further breakouts following central bank action on Wednesday.
The USD/CAD continues to hold chart territory north of the 200-day SMA just above the 1.3500 handle, keeping bid above the major moving average, but immediate topside momentum remains constrained by the 50-day SMA near 1.3700.
USD/CAD Hourly Chart
USD/CAD Daily Chart
Canadian Dollar FAQs
What key factors drive the Canadian Dollar?
The key factors driving the Canadian Dollar (CAD) are the level of interest rates set by the Bank of Canada (BoC), the price of Oil, Canada’s largest export, the health of its economy, inflation and the Trade Balance, which is the difference between the value of Canada’s exports versus its imports. Other factors include market sentiment – whether investors are taking on more risky assets (risk-on) or seeking safe-havens (risk-off) – with risk-on being CAD-positive. As its largest trading partner, the health of the US economy is also a key factor influencing the Canadian Dollar.
How do the decisions of the Bank of Canada impact the Canadian Dollar?
The Bank of Canada (BoC) has a significant influence on the Canadian Dollar by setting the level of interest rates that banks can lend to one another. This influences the level of interest rates for everyone. The main goal of the BoC is to maintain inflation at 1-3% by adjusting interest rates up or down. Relatively higher interest rates tend to be positive for the CAD. The Bank of Canada can also use quantitative easing and tightening to influence credit conditions, with the former CAD-negative and the latter CAD-positive.
How does the price of Oil impact the Canadian Dollar?
The price of Oil is a key factor impacting the value of the Canadian Dollar. Petroleum is Canada’s biggest export, so Oil price tends to have an immediate impact on the CAD value. Generally, if Oil price rises CAD also goes up, as aggregate demand for the currency increases. The opposite is the case if the price of Oil falls. Higher Oil prices also tend to result in a greater likelihood of a positive Trade Balance, which is also supportive of the CAD.
How does inflation data impact the value of the Canadian Dollar?
While inflation had always traditionally been thought of as a negative factor for a currency since it lowers the value of money, the opposite has actually been the case in modern times with the relaxation of cross-border capital controls. Higher inflation tends to lead central banks to put up interest rates which attracts more capital inflows from global investors seeking a lucrative place to keep their money. This increases demand for the local currency, which in Canada’s case is the Canadian Dollar.
How does economic data influence the value of the Canadian Dollar?
Macroeconomic data releases gauge the health of the economy and can have an impact on the Canadian Dollar. Indicators such as GDP, Manufacturing and Services PMIs, employment, and consumer sentiment surveys can all influence the direction of the CAD. A strong economy is good for the Canadian Dollar. Not only does it attract more foreign investment but it may encourage the Bank of Canada to put up interest rates, leading to a stronger currency. If economic data is weak, however, the CAD is likely to fall.
- GBP/USD trading at 1.2556, experiencing minimal change amid a volatile session with a 90+ pip range.
- US Bureau of Labor Statistics (BLS) reports declining inflation in the US, with headline dipping, while core remains stickier at 4% YoY.
- The UK jobs market eases, after adding fewer employees than expected, while wages cooled down.
The GBP/USD is virtually unchanged amid a volatile session that witnessed the pair traveling at around 90 plus pip range, directionless after a report of inflation in the United States (US). Initially boosted the Pound Sterling (GBP), but in the end, the Greenback (USD) was bolstered. The pair is trading at 1.2556, almost flat.
GBP/USD is almost at around Tuesday’s open, as traders await central banks decisions
The major is trading within familiar ranges after the US Bureau of Labor Statistics (BLS) announced inflation is declining, even though monthly figures were slightly up in headline and core inflation. The Consumer Price Index (CPI) in November was 3.1% YoY but rose 0.1%, exceeding forecasts of 0%. The so-called core CPI met estimates of 4% YoY and monthly readings of 0.3%, up from October’s.
Earlier in the UK London session, the Office for National Statistics (ONS) revealed the jobs market is easing, with 50K new employees added to the workforce, though wages were lower than the 7.7% estimates, came at 7.2%.
Meanwhile, the US Dollar Index (DXY) resumed its downtrend after pairing earlier losses sustained on the US inflation report. The DXY is down 0.20%, at 103.88, while US Treasury bond yields remain flat.
In the meantime, the Federal Reserve would begin its two-day monetary policy meeting that would end tomorrow, with the statement release and the Chairman Jerome Powell press conference. Most market participants expect the Chair to push back against monetary policy easing.
On Thursday, it would be the turn of the Bank of England (BoE), with Governor Andrew Bailey and Co., estimated to deliver a hawkish hold and to keep rates unchanged.
Given the backdrop, the GBP/USD is expected to remain within familiar levels. Unexpected surprises would increase volatility in the pair, with only three weeks left to finish the year.
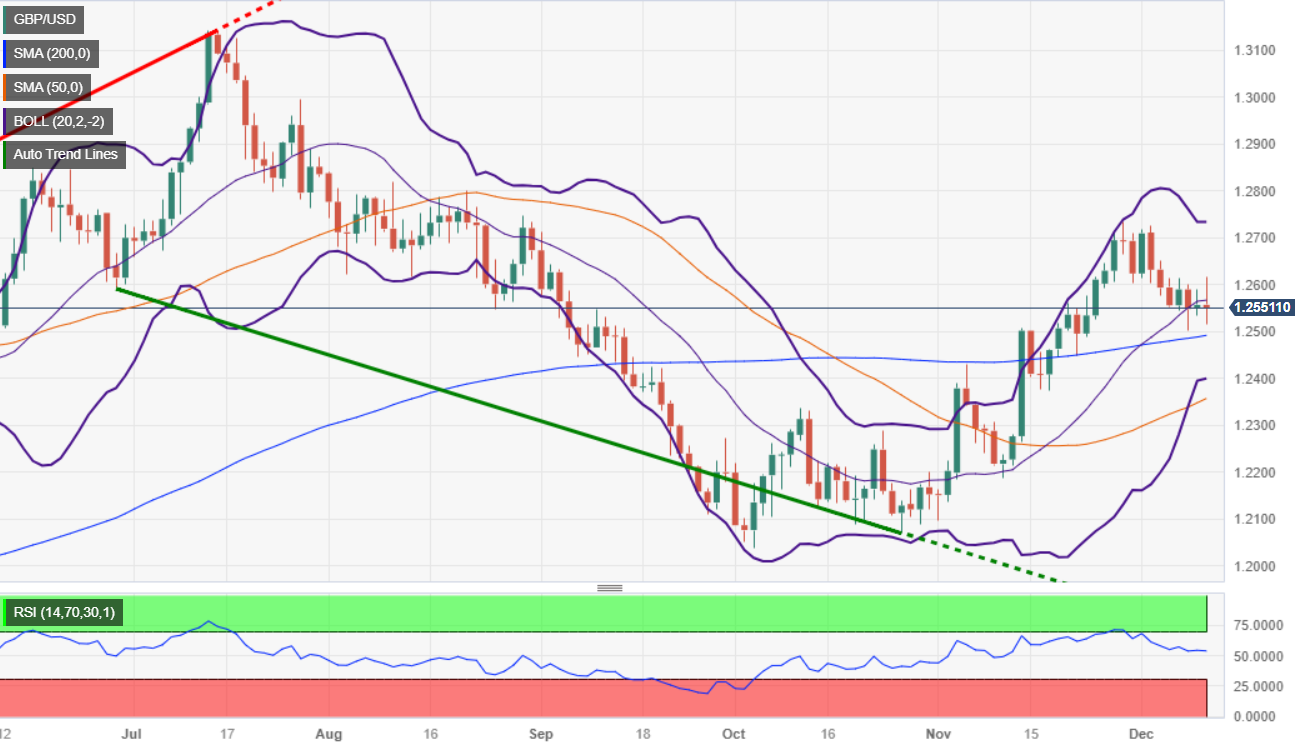
GBP/USD Price Analysis: Technical outlook
The daily chat portrays the pair is forming a doji, meaning that indecision lies amongst traders. Upside risks would emerge above today’s high of 1.2615, which could pave the way for testing 1.2700. Otherwise, if prices slump below 1.2518, could pave the way to test the 200-day moving average (DMA) at 1.2491.
- The Swiss Franc is gaining as traders position themselves ahead of major central bank meetings this week.
- Swiss Franc is gaining despite a relaxed market mood and predictable data.
- The Federal Reserve, European Central Bank and Bank of England are all scheduled to make announcements after their meetings this week.
The Swiss Franc (CHF) trades higher against most counterparts on Tuesday as individual factors come into play in each pairing.The US Dollar is down amidst an improvement in risk appetite, with the S&P 500 – a favored barometer of risk – up over 0.4% and long-duration Treasury yields mainly down. The Pound Sterling edges lower after data shows UK wage inflation slowing in October.
US Consumer Price Index (CPI) data shows little change in November and comes out exactly in line with estimates, according to data released on Tuesday. This is likely to have little impact on the expected outcome of the Federal Reserve (Fed) policy announcement on Wednesday.
Daily digest market movers: Swiss Franc gains against weakening Dollar
- The Swiss Franc rises versus the US Dollar (USD) after US CPI data for November, released by the US Bureau of Labor Statistics, shows inflation in line with economists’ expectations.
- Headline CPI rises by 3.1% YoY, slightly below the previous 3.2% result but as estimated. MoM, CPI rises at the 0.1% forecast from 0.0% in October.
- The Consumer Price Index Ex Food and Energy, or core inflation reading, rises 4.0% YoY as expected and the same as previously. MoM core inflation rises 0.3% as forecast, from 0.2% previously.
- The data is likely to make little material change to expectations regarding the outcome of the US Federal Reserve (Fed) policy meeting on Wednesday, December 13, at 19:00 GMT. Current expectations are for the Fed to leave rates unchanged.
Swiss Franc technical analysis: USD/CHF pulls back to 0.618 Fibonacci level
USD/CHF – the number of Swiss Francs that one US Dollar can buy – pulls back after a string of positive days during December’s recovery.
The pair is probably in a short-term uptrend, and the pullback is likely just a correction on the back of profit-taking ahead of the Fed meeting on Wednesday rather than the start of a reversal.
The correction found support at the 0.618 Fibonacci retracement of the recovery from the December 4 lows, finding demand and bouncing back again.
-638379945139240641.png)
US Dollar vs Swiss Franc: 4-hour Chart
More gains are likely in the short-term. The 0.8825 target, which offers soft resistance, is likely to be met once bulls take over again. If surpassed, prices could rise to the confluence of major moving averages residing at 0.8900, where tougher resistance is expected.
The pair completed a Measured Move price pattern at the December 4 lows and has since bounced. Measured moves are three wave patterns that look like zig-zags, with the first and third waves roughly of equal length. The third wave – C – likely ended at the December 4 lows.
A break below the 0.8667 December lows would negate the recovery and see bears back in charge, with likely losses to the 0.8552 July low.
Daily digest market movers: Swiss Franc gains against Euro as Eurozone economic outlook remains flat
- The Swiss Franc strengthens against the Euro on Tuesday.
- Data out on Tuesday was generally favorable, showing a rise in ZEW survey data, with the Eurozone ZEW Economic Sentiment index rising to 23 in December from 13.8 previously, when a fall to 12 had been forecast.
- German ZEW data was overall positive, with both the Current Situation and Economic Sentiment gauges rising.
- Euro traders are now waiting for the European Central Bank (ECB) meeting on Thursday for clarity on the future trajectory of interest rates.
- Recent lower-than-expected Eurozone inflation data suggests a risk the European Central Bank will cut interest rates, with negative implications for the Single Currency.
- The next main event for the Euro is the European Central Bank policy meeting on Thursday, December 14.
- Lower interest rates, or their expectation, tend to weaken a currency as they reduce capital inflows.
Swiss Franc technical analysis: EUR/CHF flips lower after run-up
EUR/CHF – the number of Swiss Francs that one Euro can buy – trades lower on Tuesday, although the lack of downside momentum suggests the current backslide is probably just a correction of the December rebound rather than a reversal.
The pair has shown weakness over the last 24 hours and corrected back down to the 0.618 Fibonacci retracement level of the rally, which began at the December 7 low. The current weakness could just be reflective of positioning ahead of the ECB rate meeting on Thursday, with another bullish move possibly following.
-638379946055786188.png)
Euro vs Swiss Franc: 4-hour Chart
The pair has probably reversed trend in the short-term, suggesting bulls may still have the upper hand temporarily. A break above the 0.9487 December 11 high would reconfirm the short-term uptrend and lead to potential gains to around 0.9540, where a confluence of resistance levels sits.
The medium and long-term trend, however, are still bearish, suggesting caution is required as a risk of recapitulation remains.
A break below the 0.9403 low would reconfirm the bearish bias and see prices fall into uncharted territory, with major whole numbers then expected to provide support at 0.9300, 0.9200, and so on.
Daily digest market movers: Sterling falls against Swiss Franc after UK wage data moderates
- The Swiss Franc weakens against the Pound Sterling (GBP) on Monday as upbeat market sentiment supports riskier currencies like the Pound Sterling over safe-havens such as the Swiss Franc.
- UK employment data, released by the Office of National Statistics (ONS) on Tuesday, came out more or less as economists had expected, except that it revealed a slowdown in wage inflation.
- The Unemployment Rate stood unchanged at 4.2% in October, with 50K new positions filled during the month, slightly down from the 54K in September.
- The Claimant Count Rate, measuring the percentage of the working age population claiming benefits, stayed unchanged at 4%, and rose 16K in October, versus the 20.3K forecast and higher than the 8.9K of September.
- Average Earnings Excluding Bonuses slowed slightly to 7.3% from 7.8% in the previous month, and was lower than the 7.4% forecast.
- Average Earnings Including Bonuses slowed slightly to 7.4% from 8.0% in the previous month, and was lower than the 7.7% forecast.
- The slowdown in wage inflation is likely to lower bets for interest rates remaining high.
- Pound Sterling traders await the Bank of England (BoE) meeting on Thursday for insight on the future course of interest rates in the UK.
- Higher interest rates, or their expectation, are generally positive for a currency as they attract greater inflows of foreign capital. The opposite is true of lower interest rates.
Swiss Franc technical analysis: GBP/CHF returns to the bottom of its autumn range
GBP/CHF – the number of Swiss Francs that one Pound Sterling can buy – is trading within a range on both a short and long-term timeframe. The medium-term trend, meanwhile, could be classified as marginally bullish.
On the 4-hour chart used to analyze the short-term trend, the pair has reversed back down after bouncing higher. It is now back at the late 1.09 lows of the range-corridor.
-638379948019949027.png)
Pound Sterling vs Swiss Franc: 4-hour Chart
The MACD has recently crossed below its signal line whilst above the zero line. This is a bearish signal and could signify more losses to come, although it lacks reliability because it occurred close to the zero-line.
If today’s 1.0979 lows hold, the pair could recover and start rising back up within the range. A decisive break cleanly below the lows, however, could indicate a breakdown from the entire month-long range. Such a breakdown would be expected to rapidly fall toward a minimum target at 1.0889, the 161.8% extension of the height of the range extrapolated lower.
From a bullish perspective, a recovery and break above the 1.1040 level would provide bullish confirmatory evidence a new leg higher was underway, toward a target at 1.1155 and the range high.
Swiss Franc FAQs
What key factors drive the Swiss Franc?
The Swiss Franc (CHF) is Switzerland’s official currency. It is among the top ten most traded currencies globally, reaching volumes that well exceed the size of the Swiss economy. Its value is determined by the broad market sentiment, the country’s economic health or action taken by the Swiss National Bank (SNB), among other factors. Between 2011 and 2015, the Swiss Franc was pegged to the Euro (EUR). The peg was abruptly removed, resulting in a more than 20% increase in the Franc’s value, causing a turmoil in markets. Even though the peg isn’t in force anymore, CHF fortunes tend to be highly correlated with the Euro ones due to the high dependency of the Swiss economy on the neighboring Eurozone.
Why is the Swiss Franc considered a safe-haven currency?
The Swiss Franc (CHF) is considered a safe-haven asset, or a currency that investors tend to buy in times of market stress. This is due to the perceived status of Switzerland in the world: a stable economy, a strong export sector, big central bank reserves or a longstanding political stance towards neutrality in global conflicts make the country’s currency a good choice for investors fleeing from risks. Turbulent times are likely to strengthen CHF value against other currencies that are seen as more risky to invest in.
How do decisions of the Swiss National Bank impact the Swiss Franc?
The Swiss National Bank (SNB) meets four times a year – once every quarter, less than other major central banks – to decide on monetary policy. The bank aims for an annual inflation rate of less than 2%. When inflation is above target or forecasted to be above target in the foreseeable future, the bank will attempt to tame price growth by raising its policy rate. Higher interest rates are generally positive for the Swiss Franc (CHF) as they lead to higher yields, making the country a more attractive place for investors. On the contrary, lower interest rates tend to weaken CHF.
How does economic data influence the value of the Swiss Franc?
Macroeconomic data releases in Switzerland are key to assessing the state of the economy and can impact the Swiss Franc’s (CHF) valuation. The Swiss economy is broadly stable, but any sudden change in economic growth, inflation, current account or the central bank’s currency reserves have the potential to trigger moves in CHF. Generally, high economic growth, low unemployment and high confidence are good for CHF. Conversely, if economic data points to weakening momentum, CHF is likely to depreciate.
How does the Eurozone monetary policy affect the Swiss Franc?
As a small and open economy, Switzerland is heavily dependent on the health of the neighboring Eurozone economies. The broader European Union is Switzerland’s main economic partner and a key political ally, so macroeconomic and monetary policy stability in the Eurozone is essential for Switzerland and, thus, for the Swiss Franc (CHF). With such dependency, some models suggest that the correlation between the fortunes of the Euro (EUR) and the CHF is more than 90%, or close to perfect.
- The USD/JPY navigates around the 145.55 level with 0.40% losses.
- US CPI recorded 3.1% in November, while the Core measure stood at 4%, matching expectations.
- US bond yields are falling ahead of Wednesday’s Fed decision.
In Tuesday's session, the USD/JPY pair is facing a downward shift, now trading at the 145.55 level. This movement comes as market participants digest the implications of the US Consumer Price Index (CPI) data which confirmed another monthly deceleration.
In that sense, inflation in the United States, as indicated by the Consumer Price Index (CPI), decreased as expected in November. The CPI experienced a monthly increase of 0.1%, and the yearly inflation rate reduced from 3.2% in October to 3.1% in November. Meanwhile, the core annual inflation rate, which excludes volatile items, remained unchanged at 4%. These figures reveal decelerating inflationary pressures in the US economy, which could influence future Federal Reserve (Fed) monetary decisions.
That being said, the Fed will make its interest rate decision in Wednesday’s session. The US Dollar seems to stand weak as lower inflation makes markets bet on a less aggressive approach from the bank for the next decision. The consensus is that the Fed will leave rates steady at 5.5%, but the focus will be on the economic and interest rate projections to look for hints on when the bank will start its easing cycle. It is worth noticing that the bank officials have recently stated that they remain data-dependent and hinted that they need to see more evidence of the economy cooling down to start cutting rates.
In the meantime, US bond yields are declining. The 2-year rate stands at 4.72%, and with the 5-year rate at 4.22%. The 10-year yield holds a similar rate of 4.23%.
USD/JPY levels to watch
The daily chart indicators are reflecting a shift towards a neutral to bullish bias for the pair. With the Relative Strength Index (RSI) on a flat slope yet still in negative territory, it points to the declining strength of buying momentum.The Moving Average Convergence Divergence (MACD), which prints flat green bars, provides further substantiation to a stagnated bullish momentum.
However, it's worth considering that the pair's position relative to its Simple Moving Averages (SMAs) paints a more nuanced picture. The pair is trading above the 200-day SMA but remains under the 100 and 20-day SMAs. This indicates that despite recent selling momentum, the long-term trend remains largely in the favor of buyers.
Support Levels: 145.00, 144.50, 144.00.
Resistance Levels: 145.70, 146.00, 146.50.
USD/JPY daily chart
-638379942790745180.png)
- Mexican Peso is at risk of extending its losses past the 100-day SMA.
- Mexico’s Industrial Production crushed the forecast, ahead of Banxico’s decision on Thursday.
- The Fed is expected to hold rates unchanged, but uncertainty looms about Powell’s speech.
Mexican Peso (MXN) is down against the US Dollar (USD) following an inflation report in the United States (US), which most likely would prevent the US Federal Reserve (Fed) from easing monetary policy faster than the expectations of market participants. The USD/MXN is trading at 17.40, gaining 0.14%, at the time of writing.
Mexico´s calendar revealed that Industrial Production in October exceeded September’s data, suggesting the economy remained robust at the beginning of Q4 2023. Across the border, the US Bureau of Labor Statistics (BLS) announced that the disinflation process continued as traders brace for the Fed’s decision on Wednesday.
The Fed is not only expected to reveal its monetary policy decision but also the Summary of Economic Projections (SEP) after its meeting on Wednesday. On the day after, the Bank of Mexico (Banxico) is set to announce its own policy decision. Both central banks are expected to hold rates unchanged – at 5.25% - 5.50% in the case of the Fed, and 11.25% for Banxico.
Daily digest movers: Mexican Peso on the defensive ahead of central bank meetings
- Industrial Production in Mexico was 5.5% in the twelve months ending in October, above September’s 3.9%. Monthly figures advanced 0.6% vs. 0.2% in the previous month.
- Mexico’s inflation data was mixed, though the disinflation process continued, as Banxico had estimated. Two officials, Governor Victoria Rodriguez Ceja and Deputy Governor Jonathan Heath, expressed that rate-cut discussions could begin in the first quarter of 2024.
- The US Consumer Price Index (CPI) for November was aligned with estimates of 3.1% YoY, lower than October’s 3.2%, with monthly readings rising 0.1%, above forecasts of 0%.
- The CPI excluding food and energy, the so-called core, stood pat at 4%, and month-over-month, at 0.3%, which aligned with forecasts, and was a tick higher than October’s 0.2%.
- Now that inflation data is out of the way and given the strengthening revealed in the US labor market by recent data, expectations of the Fed’s interest rate expectations for the next year remain volatile. Data from the Chicago Board of Trade (CBOT) has traders expecting 100 bps of rate cuts.
- On Wednesday, USD/MXN traders will scrutinize the Fed’s statement, its Summary of Economic Projections (SEP), and Chair Jerome Powell's speech. Powell is expected to push back against market speculation of monetary policy easing for next year.
- The US Dollar Index (DXY) pared some of its losses, with the DXY down 0.07% at 104.01.
Technical analysis: Mexican Peso remains soft as USD/MXN climbs towards 17.40
The USD/MXN daily chart portrays the pair as neutral to upward biased, with buyers battling at the 100-day Simple Moving Average (SMA), seen as a resistance level at 17.40. If they want to regain control, a breach of the latter is needed, followed by the 17.50 mark. Upside risks will surface at the 200-day SMA at 17.54, followed by the 50-day SMA at 17.65
On the other hand, failure to reclaim the 100-day SMA, could see sellers pile in and drag prices toward the 17.20 area, ahead of a strong demand region at around the 17.00/05 range. Once hurdled, the USD/MXN could test the year-to-date (YTD) low of 16.62.
Mexican Peso FAQs
What key factors drive the Mexican Peso?
The Mexican Peso (MXN) is the most traded currency among its Latin American peers. Its value is broadly determined by the performance of the Mexican economy, the country’s central bank’s policy, the amount of foreign investment in the country and even the levels of remittances sent by Mexicans who live abroad, particularly in the United States. Geopolitical trends can also move MXN: for example, the process of nearshoring – or the decision by some firms to relocate manufacturing capacity and supply chains closer to their home countries – is also seen as a catalyst for the Mexican currency as the country is considered a key manufacturing hub in the American continent. Another catalyst for MXN is Oil prices as Mexico is a key exporter of the commodity.
How do decisions of the Banxico impact the Mexican Peso?
The main objective of Mexico’s central bank, also known as Banxico, is to maintain inflation at low and stable levels (at or close to its target of 3%, the midpoint in a tolerance band of between 2% and 4%). To this end, the bank sets an appropriate level of interest rates. When inflation is too high, Banxico will attempt to tame it by raising interest rates, making it more expensive for households and businesses to borrow money, thus cooling demand and the overall economy. Higher interest rates are generally positive for the Mexican Peso (MXN) as they lead to higher yields, making the country a more attractive place for investors. On the contrary, lower interest rates tend to weaken MXN.
How does economic data influence the value of the Mexican Peso?
Macroeconomic data releases are key to assess the state of the economy and can have an impact on the Mexican Peso (MXN) valuation. A strong Mexican economy, based on high economic growth, low unemployment and high confidence is good for MXN. Not only does it attract more foreign investment but it may encourage the Bank of Mexico (Banxico) to increase interest rates, particularly if this strength comes together with elevated inflation. However, if economic data is weak, MXN is likely to depreciate.
How does broader risk sentiment impact the Mexican Peso?
As an emerging-market currency, the Mexican Peso (MXN) tends to strive during risk-on periods, or when investors perceive that broader market risks are low and thus are eager to engage with investments that carry a higher risk. Conversely, MXN tends to weaken at times of market turbulence or economic uncertainty as investors tend to sell higher-risk assets and flee to the more-stable safe havens.
United States Treasury Secretary Janet Yellen said on Tuesday that she sees no reason why inflation should not come down to the Federal Reserve’s target. Shed added that there is no reason to believe that the last mile will be especially difficult.
Speaking at The Wall Street Journal’s CEO Council Summit, Yellen mentioned that the labor market remains strong but warned it is cooling. According to her, wage increases continue at a healthy pace. She added that it is no necessary to have high unemployment to lower inflation.
Regarding the Fed’s policy, the Treasury Secretary explained that rising real rates may impact the decisions of the central bank.
Market reaction
The US Dollar Index is falling modestly on Tuesday but is off lows. It recovered ground following US inflation data and is hovering around 104.00.
- US CPI inflation in line with expectation, US Dollar drops then recovers sharply.
- US Dollar Index holds in negative territory for the day.
- The AUD/USD pair faces resistance at 0.6630 and has a key support at 0.6550.
The AUD/USD spiked to 0.6612 following the release of the US inflation data, but it then fell to its daily low near 0.6550. The pair is now hovering around 0.6570 as markets digest the data ahead of Wednesday's FOMC decision.
USD down then up, after US CPI data
Inflation in the US cooled as anticipated in November, as measured by the Consumer Price Index (CPI). The CPI rose 0.1% during the month, and the annual rate slowed from 3.2% in October to 3.1% in November. The core annual reading remained steady at 4%.
The US Dollar initially hit fresh daily lows with this news, but then rebounded sharply. The DXY is currently down 0.30% for the day, trading around 103.80. Market participants continue to digest the CPI figures. On Wednesday, the Producer Price Index (PPI) is due to be released, and later, the Federal Reserve will announce its decision on monetary policy and provide new economic projections.
The AUD/USD is trading near Monday's close, around 0.6570, after finding support above Asian session lows and the 0.6555 area. The pair continues to move sideways, limited on the upside by 0.6630 and with a strong support area at 0.6550.
Technical levels
- The Euro wavers after the US CPI report meets expectations.
- All eyes are now on Wednesday's Fed monetary policy statement.
- EUR/USD’s immediate trend remains bearish while below 1.0815.
The Euro spiked higher but ended up turning lower with US yields bouncing up, pushing the US Dollar a tad higher after US CPI data met expectations.
Consumer prices remained flat in November, against the market consensus of a 0.1% increase but that was the whole surprise. Yearly inflation eased to 3.1% from 3.2% in the previous month with core inflation rising at a 0.3% monthly pace and 4.0% year-on-year, as expected.
These figures fail to clarify the Fed’s monetary policy path and maintain the interest on the outcome of the two-day monetary policy meeting. The Bank's statement, especially the interest rate projections, the so-called dot-plot, and Chairman Powell’s Press conference will be carefully watched.
EUR/USD Technical analysis
The technical picture remains unchanged, with the pair consolidating above the 50% Fibonacci retracement of the October - November rally, at 1.0730.
Immediate resistance remains at 1.0815, where previous highs meet the 4h 50 SMA and 1.0880 will come next. Supports are at the mentioned 1.0730 and early November lows at 1.0660
Technical levels to watch
- The pound is moving sideways ahead of the US CPI data.
- Upbeat UK employment data has provided some support to the Pound
- GBP/USD maintains a neutral bias between 1.2500 and 1.2600.
The Sterling is trading without a clear direction on Tuesday, moving both sides of the 1.2550 level, as the market braces for November’s US CPI reading.
UK Unemployment data supports the Pound
Earlier on Tuesday, the UK Employment report showed that the labour market remains resilient despite the restrictive interest rates, which has provided a fresh impulse to the pair.
Unemployment in the UK has remained flat at a 4.2% rate in October, with the number of jobless workers increasing by 16K, instead of the 20.3K expected by the market.
The pair’s rebound, however, has been limited, as traders are reluctant to place significant bets against the US Dollar ahead of the release of the US inflation data.
Consumer prices are expected to have risen at a 3.1% yearly pace, down from the 3.2% pace seen in September. The core inflation is seen steady at 4%. These figures will be watched with interest as they will guide Wednesday’s Fed monetary policy decision.
The technical picture shows the pair's reversal from last week's highs losing momentum with intra-day charts showing a moderate upside path from the 1.2500 area. On the upside, however, 1.2600 will likely offer a significant resistance ahead of 1.2650.
Technical levels to watch
- The US Dollar is retreating in European trading hours ahead of the US opening bell.
- Investors could keep the powder dry as they await the Fed’s decision on Wednesday.
- The US Dollar Index slides below 104.00 and could ease a bit further.
The US Dollar (USD) is dropping ahead of the US inflation numbers, which will be released on Tuesday. The weakness throughout the day could reflect traders’ expectations for another substantial downturn in US inflation. Still, it is uncertain that the figures will really move the needle as investors could wait to place bets until the last Federal Reserve (Fed) monetary policy meeting of the year on Wednesday.
On the economic front, all eyes are on the US Consumer Price Index (CPI). Expect to see substantial moves in case monthly inflation turns negative in November, although this looks unlikely amid the seasonal effects stemming from Black Friday, Thanksgiving and ahead of the New Year.
Daily Digest Market Movers: CPI data could bring short-term volatility
- All eyes on 13:30 GMT, with US Consumer Price Index release for November:
- Monthly headline inflation is expected to head from 0% to 0.1%.
- Monthly core inflation is expected to head from 0.2% to 0.3%.
- Yearly headline inflation is expected to decline from 3.2% to 3.1%.
- Yearly core inflation is expected to remain steady at 4%.
- Around 18:00 GMT, the US Treasury will allot a 30-year bond auction.
- Equities are in a wait-and-see pattern ahead of the US CPI numbers, with both European and US equities looking for direction.
- The CME Group’s FedWatch Tool shows that markets are pricing in a 98.4% chance that the Federal Reserve will keep interest rates unchanged at its meeting on Wednesday.
- The benchmark 10-year US Treasury Note trades near 4.19%.
US Dollar Index Technical Analysis: Pressure is building
The US Dollar is gearing up for the first of two volatile days ahead, with US Consumer Price Index numbers this Tuesday and a Federal Reserve meeting on Wednesday. Expect to see some moves on the back of the US CPI numbers, though nothing substantial, as traders will want to hear from the Fed to see if markets are right in pricing in early rate cuts for 2024, or rather need to push those cuts further down the line. In that last case, the DXY US Dollar Index could jump above 104.00.
The DXY is retreating a touch, below 104.00, though an uptick in inflation might already move the needle in favor of the US Dollar. The DXY first needs to confirm its upward move by breaking above Friday’s high at 104.26. Once from there, the 100-day Simple Moving Average (SMA) near 104.55 looks very appealing before Wednesday’s Fed meeting.
To the downside, the 200-day SMA at 103.55 has done a tremendous job in supporting the DXY, with buyers coming in below 103.56 and pushing it back towards that same level near the US closing bell. If it fails this week, the lows of November near 102.46 is the next level to watch. More downside pressure could bring into view the 100.00 marker, particularly if US yields sink below 4%.
Inflation FAQs
What is inflation?
Inflation measures the rise in the price of a representative basket of goods and services. Headline inflation is usually expressed as a percentage change on a month-on-month (MoM) and year-on-year (YoY) basis. Core inflation excludes more volatile elements such as food and fuel which can fluctuate because of geopolitical and seasonal factors. Core inflation is the figure economists focus on and is the level targeted by central banks, which are mandated to keep inflation at a manageable level, usually around 2%.
What is the Consumer Price Index (CPI)?
The Consumer Price Index (CPI) measures the change in prices of a basket of goods and services over a period of time. It is usually expressed as a percentage change on a month-on-month (MoM) and year-on-year (YoY) basis. Core CPI is the figure targeted by central banks as it excludes volatile food and fuel inputs. When Core CPI rises above 2% it usually results in higher interest rates and vice versa when it falls below 2%. Since higher interest rates are positive for a currency, higher inflation usually results in a stronger currency. The opposite is true when inflation falls.
What is the impact of inflation on foreign exchange?
Although it may seem counter-intuitive, high inflation in a country pushes up the value of its currency and vice versa for lower inflation. This is because the central bank will normally raise interest rates to combat the higher inflation, which attract more global capital inflows from investors looking for a lucrative place to park their money.
How does inflation influence the price of Gold?
Formerly, Gold was the asset investors turned to in times of high inflation because it preserved its value, and whilst investors will often still buy Gold for its safe-haven properties in times of extreme market turmoil, this is not the case most of the time. This is because when inflation is high, central banks will put up interest rates to combat it.
Higher interest rates are negative for Gold because they increase the opportunity-cost of holding Gold vis-a-vis an interest-bearing asset or placing the money in a cash deposit account. On the flipside, lower inflation tends to be positive for Gold as it brings interest rates down, making the bright metal a more viable investment alternative.
- The Dollar weakens as US yields pull back.
- Investors are focusing on US inflation ahead of Wednesday’s Fed decision.
- USD/JPY has been rejected at the 146.85 area.
The US Dollar is going through a significant reversal against the Japanese Yen on Tuesday. Lower US yields and a moderate risk appetite are weighing the USD across the board with all eyes on November’s US inflation reading.
US Treasury yields have resumed their downside trend as the effect of the strong payrolls report seen last Friday faded and the market shifted its focus to the Consumer inflation data and Wednesday’s Fed Decision.
Consumer prices are expected to have grown at a 3.1% early pace in November, down from 3.2% in October. The core inflation, which removes the impact of seasonal products like food and energy, is seen steady at 4%.
USD/JPY has been rejected below 146.85 resistance area
The technical picture is bearish, as the pair failed to breach resistance at 1.4685 where the 50% retracement of the pair’s decline from mid-November high meets trendline resistance at 146.85.
This has left bears in control, with the support level at 145.00 under pressure. Below, 143.85 and 141.75 are the next targets.
Technical levels to watch
- WTI Oil near $71 on Tuesday on reports a Red Sea tanker was attacked by Houthi rebels.
- Oil outlook looks bleak for 2024 as oversupply is too big to get matched anytime soon.
- The US Dollar (Index) weaker ahead of US Inflation and Fed’s last meeting for 2023.
Oil prices are jumping higher for December on reports a Red Sea tanker was seized by Houthi rebels after a missile attack. Though, the heightened risk and threat in the region is just a small counterweight against the massive oversupply in the Oil markets. With OPEC+ still remaining unable to put in place fix and firm supply restrictions, the Oil faucet is wide open and is dumping far more Oil than needed into global markets.
Meanwhile, the US Dollar (USD) is easing and is retreating below 104 in the US Dollar Index (DXY). The easing comes with traders bracing for another decline in US inflation, which will be printed later this Tuesday. The number comes ahead of the last Federal Reserve meeting for 2023 which will take place on Wednesday.
Crude Oil (WTI) trades at $71.83 per barrel and Brent Oil trades at $76.40 per barrel at the time of writing.
Oil news and market movers: US floods markets
- ABC reports Houthi rebels out of Yemen have attacked a Red Sea tanker in the region.
- Several banks are or have issued their forecasts for 2024, and the economic outlook looks very bleak with lower growth across the board. This means less demand for Oil to come even further in 2024.
- Despite the small uptick on the back of geopolitical tensions flaring up this Tuesday, Brent crude still resides near a five-month-low.
- The American Petroleum Institute (API) is due to release its weekly stockpile change at 21:30 GMT. Previous number was for a build of 594,000 barrels. No forecast pencilled in.
Oil Technical Analysis: Even 2024 looks awful
Oil prices are seeing more dark clouds being formed for its performance in the coming weeks and months. Several banks are issuing warnings on global growth concerns, which is of course correlated with the demand for Oil. With these negative bearish outlooks and the current surplus buildup, a return to $90 for Crude looks to be out of the question for some time in case no other events take place that might trigger a supply issue.
On the upside, $80.00 is the resistance to watch out for. Should crude be able to jump above that again, look for $84.00 (purple line) as the next level to see some selling pressure or profit taking. Should Oil prices be able to consolidate above there, the topside for this fall near $93.00 could come back into play.
On the downside, the soft floor near $74.00 got broken and is gone. Now, $70.00 is trying to salvage the situation, though it has been breached already on Thursday and Wednesday. Watch out for $67.00, which aligns with a triple bottom from June, as the next support level to trade at.
-638379749299241020.png)
US WTI Crude Oil: Daily Chart
WTI Oil FAQs
What is WTI Oil?
WTI Oil is a type of Crude Oil sold on international markets. The WTI stands for West Texas Intermediate, one of three major types including Brent and Dubai Crude. WTI is also referred to as “light” and “sweet” because of its relatively low gravity and sulfur content respectively. It is considered a high quality Oil that is easily refined. It is sourced in the United States and distributed via the Cushing hub, which is considered “The Pipeline Crossroads of the World”. It is a benchmark for the Oil market and WTI price is frequently quoted in the media.
What factors drive the price of WTI Oil?
Like all assets, supply and demand are the key drivers of WTI Oil price. As such, global growth can be a driver of increased demand and vice versa for weak global growth. Political instability, wars, and sanctions can disrupt supply and impact prices. The decisions of OPEC, a group of major Oil-producing countries, is another key driver of price. The value of the US Dollar influences the price of WTI Crude Oil, since Oil is predominantly traded in US Dollars, thus a weaker US Dollar can make Oil more affordable and vice versa.
How does inventory data impact the price of WTI Oil
The weekly Oil inventory reports published by the American Petroleum Institute (API) and the Energy Information Agency (EIA) impact the price of WTI Oil. Changes in inventories reflect fluctuating supply and demand. If the data shows a drop in inventories it can indicate increased demand, pushing up Oil price. Higher inventories can reflect increased supply, pushing down prices. API’s report is published every Tuesday and EIA’s the day after. Their results are usually similar, falling within 1% of each other 75% of the time. The EIA data is considered more reliable, since it is a government agency.
How does OPEC influence the price of WTI Oil?
OPEC (Organization of the Petroleum Exporting Countries) is a group of 13 Oil-producing nations who collectively decide production quotas for member countries at twice-yearly meetings. Their decisions often impact WTI Oil prices. When OPEC decides to lower quotas, it can tighten supply, pushing up Oil prices. When OPEC increases production, it has the opposite effect. OPEC+ refers to an expanded group that includes ten extra non-OPEC members, the most notable of which is Russia.
- The Australian Dollar rebound is lacking followthrough at 0.6600.
- Dollar weakness fades as we head into the US CPI release.
- AUD/USD: Intraday charts show a symmetrical triangle pattern.
The Australian Dollar’s recovery from Monday’s lows has found resistance at the 0.6600 level, leaving the pair in noman’s land as the market braces for the release of November’s US CPI figures.
AUD bounced up on higher commodity prices and softer US yields
The Aussie has drawn some support from the higher Iron ore prices, Australia’s main export. Beyond that the lower US treasury yields, as the dust from the strong NFP report settled, have weighed on the US Dollar.
The focus today is on the US CPI data, which is expected to have eased to a 3.1% year-on-year rate in November, from 3.2% in October. The Core CPI is seen growing at a steady 4% yearly pace.
These figures will frame Wednesday’s Fed’s Decision and, with the market increasingly eager to know the timing of the bank’s pivot, any surprise today might have a significant impact on USD crosses.
AUD/USD is forming a triangle pattern
The technical picture is mixed, which results in a symmetrical triangle pattern in the last two weeks. Resistance at 0.6615 is closing the path towards the December 3 peak at 0.6690 while support levels remain at 0.6555 and 0.6520.
Technical levels to watch
- The Dollar maintains a negative tone with all eyes on US CPI data.
- US inflation and Fed policy expectations are likely to set the USD's near-term direction.
- Oil prices' recovery is underpinning support for the Loonie.
The US Dollar is trading lower against its Canadian counterpart on Tuesday, with the pair moving dangerously close to the 1.3550 support level and all eyes on November’s US CPI report, due later today.
Consumer inflation is expected to have increased at a 3.1% yearly pace, slightly below October’s 3.2% reading while the Core CPI is seen steady at 4%.
US CPI will set the tone for Wednesday's Fed decision
These figures will be analyzed with special interest as they will set the groundwork for Wednesday’s Federal Reserve monetary policy decision. Investors are speculating about the timing for a Fed pivot and, in this context, any surprise on inflation levels might have a significant impact on the US Dollar.
On the other hand, the Canadian dollar is drawing some support from the higher Oil prices. The US benchmark WTI has bounced higher, favoured by the increasing geopolitical tensions in the Middle East and news of US plans to refill its strategic reserves.
This rally, however, is likely to be short-lived, as the OPEC+ pledge to extend output cuts has failed to offset concerns of oversupply with global demand expected to decline over the coming months.
Technical levels to watch
- Gold prices are flat on Tuesday, with the US Dollar losing ground ahead of the US CPI release.
- Investors are awaiting US inflation data for more information about the Fed’s monetary policy plans.
- Gold’s near-term bias remains negative, with hopes of Fed cuts ebbing.
Gold prices (XAU/USD) ticked higher on Tuesday’s early trade, yet with price action unable to find a meaningful acceptance above the $1,990 level.
The precious metal remains practically flat on the day as traders await the release of the US Consumer Prices Index (CPI) figures, which will lay the groundwork for Wednesday’s Federal Reserve’s (Fed) monetary policy decision.
The market consensus anticipates a slight decline in the headline data, which is expected to come in at 3.1% from the 3.2% yearly increase seen in October. The core inflation reading, which strips out the more volatile components of food and energy, is seen steady at 4% year-on-year.
On Wednesday, the Fed is widely expected to leave its benchmark interest rate on hold at the current 5.25%-5.5% band and put the focus on the interest rate projections for next year and on Fed Chairman Jerome Powell’s press conference. Investors will be looking for dovish hints on Powell’s comments to revive hopes of rate cuts in early 2024, which would give a fresh boost to Gold prices.
Daily Digest Market Movers: Gold draws some support from weaker US Dollar, softer yields
- Gold prices have found some support on Tuesday after a two-day decline, favoured by softer US yields and a weaker US Dollar ahead of the US CPI data.
- Investors have digested the unexpectedly strong US employment figures seen on Friday and are looking to US CPI for more cues into the Fed’s monetary policy plans.
- US CPI is expected to have increased at a 3.1% year-on-year pace in November, down from 3.2% in October. The core CPI is seen steady at 4% year-on-year.
- Inflation data is expected to have a relevant weight on Wednesday’s Federal Reserve’s decision and, therefore, it might boost US Dollar volatility.
- The market is pricing a 45% chance of Fed rate cuts in March, while the odds for a May rate cuts are evenly split, according to the CME Group FedWatch tool.
- Geopolitical tensions continue growing amid news of attacks to the US troops in the Middle East by Iran-backed groups. This provides some support to precious metals on the back of their safe-haven status.
Technical Analysis: Gold remains on the defensive, with $1,980 support under pressure
The technical picture for Gold remains bearish, with upside attempts capped well below the $2,000 psychological level. Price action has broken below the main Simple Moving Averages (SMAs) in the 4-hour charts, which leaves the $1,980 support level under increasing bearish pressure.
The mentioned $1,980 is the neckline of a head and shoulders (H&S) pattern and the 50% Fibonacci retracement of the October - December rally. Below here, the next targets would be mid-November lows at $1,934, ahead of $1,838, and the measured target of the H&S pattern at $1,851.
A bullish reversal from current levels would have to breach the $2,000 level to ease negative pressure and shift the pair’s focus towards $2,035 and $2,075.
US Dollar price today
The table below shows the percentage change of US Dollar (USD) against listed major currencies today. US Dollar was the strongest against the .
| USD | EUR | GBP | CAD | AUD | JPY | NZD | CHF | |
| USD | -0.32% | -0.14% | -0.10% | -0.39% | -0.47% | -0.52% | -0.20% | |
| EUR | 0.32% | 0.20% | 0.24% | -0.08% | -0.18% | -0.21% | 0.13% | |
| GBP | 0.15% | -0.17% | 0.06% | -0.24% | -0.32% | -0.36% | -0.05% | |
| CAD | 0.09% | -0.23% | -0.06% | -0.30% | -0.40% | -0.45% | -0.10% | |
| AUD | 0.43% | 0.11% | 0.28% | 0.34% | -0.10% | -0.13% | 0.21% | |
| JPY | 0.47% | 0.15% | 0.33% | 0.39% | 0.09% | -0.06% | 0.29% | |
| NZD | 0.54% | 0.23% | 0.41% | 0.45% | 0.17% | 0.03% | 0.34% | |
| CHF | 0.19% | -0.12% | 0.06% | 0.11% | -0.17% | -0.31% | -0.32% |
The heat map shows percentage changes of major currencies against each other. The base currency is picked from the left column, while the quote currency is picked from the top row. For example, if you pick the Euro from the left column and move along the horizontal line to the Japanese Yen, the percentage change displayed in the box will represent EUR (base)/JPY (quote).
Economic Indicator
United States Consumer Price Index (YoY)
Inflationary or deflationary tendencies are measured by periodically summing the prices of a basket of representative goods and services and presenting the data as The Consumer Price Index (CPI). CPI data is compiled on a monthly basis and released by the US Department of Labor Statistics. The YoY reading compares the prices of goods in the reference month to the same month a year earlier.The CPI is a key indicator to measure inflation and changes in purchasing trends. Generally speaking, a high reading is seen as bullish for the US Dollar (USD), while a low reading is seen as bearish.
Read more.Next release: 12/12/2023 13:30:00 GMT
Frequency: Monthly
Source: US Bureau of Labor Statistics
Why it matters to traders
The US Federal Reserve has a dual mandate of maintaining price stability and maximum employment. According to such mandate, inflation should be at around 2% YoY and has become the weakest pillar of the central bank’s directive ever since the world suffered a pandemic, which extends to these days. Price pressures keep rising amid supply-chain issues and bottlenecks, with the Consumer Price Index (CPI) hanging at multi-decade highs. The Fed has already taken measures to tame inflation and is expected to maintain an aggressive stance in the foreseeable future.
- Germany’s ZEW Economic Sentiment Index improved to 12.8 in December.
- EUR/USD is holding higher near 1.0800 after the mixed ZEW surveys.
The headline German ZEW Economic Sentiment Index unexpectedly improved to 12.8 in December from 9.8 in November. The market expected an 8.8 readout.
However, the Current Situation Index dropped to -77.1 from -79.8 prior, missing estimates of -75.5.
During the same period, the Eurozone ZEW Economic Sentiment Index jumped to 23.0, compared to a 13.8 figure registered in November. The data surpassed expectations of 12.0.
Key points
Despite the current budget crisis, the assessment of the situation and economic expectations for germany have once again slightly improved.
This is due to the fact that the share of respondents expecting interest rate cuts by the ECB in the medium term has doubled.
Good news for German construction industry, for which we observe significantly more optimistic expectations this month.
Share of respondents expecting inflation rates to fall further is decreasing.
Market reaction
The EUR/USD pair is testing intraday highs near 1.0800 after ZEW surveys, adding 0.32% on the day.
Euro price today
The table below shows the percentage change of Euro (EUR) against listed major currencies today. Euro was the strongest against the US Dollar.
| USD | EUR | GBP | CAD | AUD | JPY | NZD | CHF | |
| USD | -0.26% | -0.08% | -0.09% | -0.41% | -0.48% | -0.49% | -0.11% | |
| EUR | 0.25% | 0.17% | 0.18% | -0.17% | -0.25% | -0.24% | 0.15% | |
| GBP | 0.09% | -0.17% | 0.01% | -0.32% | -0.39% | -0.38% | -0.02% | |
| CAD | 0.08% | -0.17% | -0.01% | -0.31% | -0.39% | -0.41% | -0.03% | |
| AUD | 0.40% | 0.15% | 0.32% | 0.32% | -0.11% | -0.09% | 0.27% | |
| JPY | 0.49% | 0.23% | 0.41% | 0.38% | 0.10% | 0.01% | 0.38% | |
| NZD | 0.49% | 0.23% | 0.40% | 0.40% | 0.09% | -0.01% | 0.37% | |
| CHF | 0.09% | -0.16% | 0.01% | 0.02% | -0.30% | -0.41% | -0.39% |
The heat map shows percentage changes of major currencies against each other. The base currency is picked from the left column, while the quote currency is picked from the top row. For example, if you pick the Euro from the left column and move along the horizontal line to the Japanese Yen, the percentage change displayed in the box will represent EUR (base)/JPY (quote).
Gold prices fell in India on Tuesday, according to data from India's Multi Commodity Exchange (MCX).
Gold price stood at 61,120 Indian Rupees (INR) per 10 grams, down INR 259 compared with the INR 61,379 it cost on Monday.
As for futures contracts, Gold prices increased to INR 61,262 per 10 gms from INR 61,117 per 10 gms.
Prices for Silver futures contracts decreased to INR 72,068 per kg from INR 71,864 per kg.
| Major Indian city | Gold Price |
|---|---|
| Ahmedabad | 63,260 |
| Mumbai | 63,090 |
| New Delhi | 63,150 |
| Chennai | 63,220 |
| Kolkata | 63,270 |
Global Market Movers: Comex Gold price is underpinned by a softer US Dollar and geopolitical risks
- A US defense official stated on Tuesday that Iran-backed Houthi rebels in Yemen fired a land-based cruise missile, which, in turn, is seen lending some support to the safe-haven Comex Gold price.
- The upbeat US employment figures released on Friday made traders bet that it could take the Federal Reserve until May to begin a series of interest-rate cuts next year and act as a headwind.
- A New York Fed survey on Monday showed that consumers anticipate inflation to be at 3.4% a year from now, down from 3.6% in October and marking the lowest reading since April 2021.
- The incoming data raised hopes that inflation could continue to decelerate without the economy falling into a recession and forced investors to trim their bets for the first Fed rate cut move in March 2024.
- Market participants, however, seem convinced that the US central bank is done with its policy-tightening campaign and may begin easing its monetary policy by the first half of the next year.
- According to CME group's FedWatch Tool, investors are still pricing in over a 40% chance of a March cut of at least 25 basis points (bps) and a nearly 75% chance of such a move in May 2024.
- This, in turn, fails to assist the US Dollar to capitalize on the post-NFP positive move and lends support to the non-yielding metal, though bulls seem reluctant ahead of the US consumer inflation data.
- The headline CPI is expected to rise by 0.1% in November and the yearly pace ticked down to 3.1%. The core gauge is anticipated to edge up from 0.2% to 0.3% MoM and hold steady at a 4.0% YoY rate.
- The market attention will then shift to the outcome of the highly-anticipated two-day FOMC monetary policy meeting, scheduled to be announced during the US session on Wednesday.
(An automation tool was used in creating this post.)
Gold FAQs
Why do people invest in Gold?
Gold has played a key role in human’s history as it has been widely used as a store of value and medium of exchange. Currently, apart from its shine and usage for jewelry, the precious metal is widely seen as a safe-haven asset, meaning that it is considered a good investment during turbulent times. Gold is also widely seen as a hedge against inflation and against depreciating currencies as it doesn’t rely on any specific issuer or government.
Who buys the most Gold?
Central banks are the biggest Gold holders. In their aim to support their currencies in turbulent times, central banks tend to diversify their reserves and buy Gold to improve the perceived strength of the economy and the currency. High Gold reserves can be a source of trust for a country’s solvency. Central banks added 1,136 tonnes of Gold worth around $70 billion to their reserves in 2022, according to data from the World Gold Council. This is the highest yearly purchase since records began. Central banks from emerging economies such as China, India and Turkey are quickly increasing their Gold reserves.
How is Gold correlated with other assets?
Gold has an inverse correlation with the US Dollar and US Treasuries, which are both major reserve and safe-haven assets. When the Dollar depreciates, Gold tends to rise, enabling investors and central banks to diversify their assets in turbulent times. Gold is also inversely correlated with risk assets. A rally in the stock market tends to weaken Gold price, while sell-offs in riskier markets tend to favor the precious metal.
What does the price of Gold depend on?
The price can move due to a wide range of factors. Geopolitical instability or fears of a deep recession can quickly make Gold price escalate due to its safe-haven status. As a yield-less asset, Gold tends to rise with lower interest rates, while higher cost of money usually weighs down on the yellow metal. Still, most moves depend on how the US Dollar (USD) behaves as the asset is priced in dollars (XAU/USD). A strong Dollar tends to keep the price of Gold controlled, whereas a weaker Dollar is likely to push Gold prices up.
- The Euro trims losses as the US Dollar pulls back ahead of the US CPI release
- US Inflation and the Fed decision will set the Dollar’s near-term direction.
- EUR/USD’s immediate trend remains bearish while below 1.0815.
The Euro is moving with a moderately positive tone during the European morning trade, reaching intra-day highs near 1.0800 as the Dollar loses footing ahead of the release of US CPI figures.
US CPI and the Fed will set the Dollar’s direction
Later today, the US Bureau of Labor Statistics is expected to announce that US inflation edged down to 3.!% in the last twelve months to November and that the core CPI remained steady at 4%.
These figures will be analyzed with particular detail today, with all eyes on Wednesday’s Federal Reserve’s monetary policy decision. Investors’ speculation about the timing for a Fed pivot is the main driver behind FX markets and, in that context, any surprise in the inflation trends might have a significant impact on US Dollar crosses.
EUR/USD Technical analysis
The pair’s corrective reversal from late November highs has found support on the 50% Fibonacci retracement of the October - November rally, at 1.0730.
The near-term bias remains negative with 1.0815, where previous highs meet the 4h 50 SMA, likely to offer a significant resistance. Above here, 1.0880 will come next.
Supports are at the mentioned 1.0730 and early November lows at 1.0660.
EUR/USD technical levels to watch
- USD/MXN trades lower as the Greenback fails to hold gains.
- US Dollar declines as traders adopt caution before US CPI release.
- Mexican President Andres Manuel Lopez Obrador mentioned that more needs to be done to curb inflation.
USD/MXN retraces its recent gains, trading lower near 17.35 during the European session on Tuesday. Investors appear to be exercising caution in buying the US Dollar (USD) ahead of the release of US Consumer Price Index (CPI) data later in the North American session. The market is pricing in expectations of a decline in US inflation, with the anticipation that it will ease to 3.1% from the previous 3.2%.
US Dollar Index (DXY) trades lower near 103.90 at the time of writing. However, the solid labor data from the previous week bolstered the Greenback as robust economic conditions in the United States (US) sparked discussions on how long the Federal Reserve (Fed) will maintain higher interest rates. Fed is expected to make no adjustments to the policy rate in its December meeting but the market is pricing in a 25 basis points (bps) rate cut by March 2024.
The Bank of Mexico's (Banxico) officials have recently expressed a leaning towards easing monetary policy, with discussions expected to begin in the first quarter of 2024. However, Deputy Governor Irene Espinosa has pushed back, emphasizing that inflationary risks persist and are increasing. Additionally, Mexican President Andres Manuel Lopez Obrador recently expressed the view that more needs to be done to bring inflation down. He emphasized that the Banxico should also focus on economic growth.
The upcoming announcement of Banxico's key interest rate on Thursday is a notable event that could influence market movements. The prevailing expectation is that Banxico will maintain cash rates at the unchanged level of 11.25%. Furthermore, Mexico’s Industrial Output data will be eyed on Tuesday.
- Silver stages a modest recovery from a near one-month low, albeit lacks follow-through.
- The technical setup favours bearish traders and supports prospects for additional losses.
- A sustained break below the $23.70 confluence is needed to reaffirm the negative bias.
Silver (XAG/USD) gains some positive traction on Tuesday and for now, seems to have snapped a six-day losing streak to a near one-month low touched the previous day. The white metal maintains its bid tone through the first half of the European session, though seems to struggle to capitalize on the momentum beyond the $23.00 round figure.
From a technical perspective, the recent pullback from the vicinity of the $26.00 mark, or the highest level since May touched earlier this month stalls near the $22.70 confluence support. The said area comprises the 61.8% Fibonacci retracement level of the October-December rally and a multi-month-old ascending trend line, which should now act as a key pivotal point for short-term traders.
Meanwhile, oscillators on the daily chart have just started drifting into negative territory and favours bearish traders. That said, it will still be prudent to wait for a convincing breakdown through the confluence support before positioning for any further losses. The XAG/USD might then slide to the $22.20-$22.15 intermediate support en route to sub-$22.00 levels, or the November swing low.
On the flip side, the $23.30 static resistance could cap any meaningful recovery ahead of the $23.55-$23.60 supply zone. That said, a sustained strength beyond could trigger a short-covering rally and lift the XAG/USD beyond the $24.00 mark, towards the next relevant hurdle near the $24.20-$24.25 region. The momentum could get extended further towards reclaiming the $25.00 psychological mark.
Silver daily chart
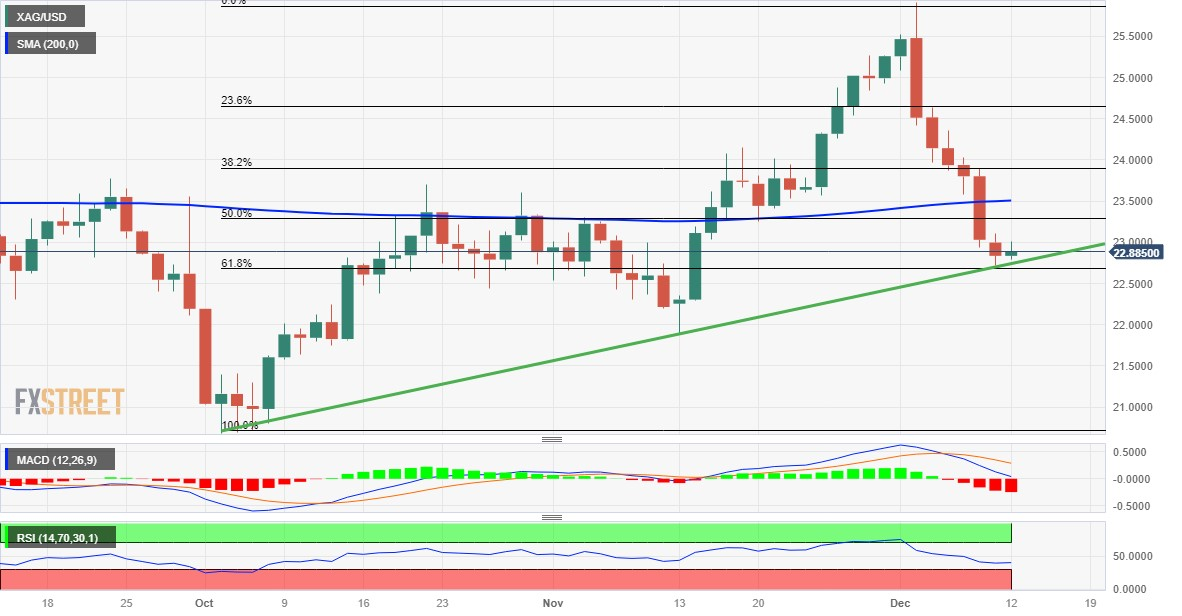
Technical levels to watch
- NZD/USD gains momentum as the US inflation is expected to ease.
- US Dollar faces a challenge on downbeat US bond yields.
- Investors expect no interest rate change by the Federal Reserve.
NZD/USD gains ground for the second consecutive trading day, bidding around 0.6150 during the Asian hours on Tuesday. The US Dollar (USD) turns negative on subdued US Treasury yields ahead of the US Consumer Price Index (CPI) scheduled to be released later in the North American session. The yearly US Consumer Price Index (CPI) data is expected to ease, with US Core CPI expected to remain consistent.
US Dollar Index (DXY) trades lower near 103.90 at the time of writing. The yield on 2-year and 10-year US bond coupons stands lower at 4.68% and 4.19%, respectively. However, the solid labor data from the previous week bolstered the Greenback as robust economic conditions in the United States (US) triggered the discussion on how long the Federal Reserve (Fed) will maintain higher interest rates.
However, the Fed is expected to not adjust the policy rate in its December meeting but the market is pricing in the expectation of a 25 basis points (bps) rate cut as early as March next year, which is providing support to underpinning the NZD/USD pair.
On the other side, Kiwi's economic agenda, the Gross Domestic Product (GDP) data for the third quarter is set to be released by Statistics New Zealand on Thursday. Projections suggest a growth of 0.2%, a decline from the previous quarter's 0.9% expansion. The annual growth is expected to fall substantially to 0.5% from the previous growth of 1.8%. Additionally, the Business NZ Performance of Manufacturing Index (PMI) will released by Business NZ on Friday.
Here is what you need to know on Tuesday, December 12:
The US Dollar struggles to find demand early Tuesday as markets await the Consumer Price Index (CPI) data for November. The US Dollar Index stays in negative territory below 104.00 after posting small gains on Monday. The European economic docket will feature ZEW business sentiment survey for Germany and the Eurozone.
The high-yield of the latest 10-year US Treasury note auction that took place late Monday stood at 4.29%, down sharply from 4.51% in the previous auction. The 10-year US T-bond yield fell on this development and closed the day in the red, causing the USD to lose strength against its major rivals. Early Tuesday, the 10-year US yield is down nearly 1% on the day at around 4.2% and US stock index futures trade little changed. Meanwhile, the US Central Command reported that a merchant vessel in the Red Sea was struck by a land-based missile fired by Houthi rebels, causing investors to adopt a cautious stance.
US Dollar price this week
The table below shows the percentage change of US Dollar (USD) against listed major currencies this week. US Dollar was the weakest against the New Zealand Dollar.
| USD | EUR | GBP | CAD | AUD | JPY | NZD | CHF | |
| USD | -0.12% | -0.17% | -0.23% | -0.22% | 0.25% | -0.53% | -0.42% | |
| EUR | 0.11% | -0.06% | -0.11% | -0.11% | 0.36% | -0.42% | -0.30% | |
| GBP | 0.18% | 0.06% | -0.05% | -0.06% | 0.43% | -0.35% | -0.25% | |
| CAD | 0.23% | 0.11% | 0.04% | -0.01% | 0.48% | -0.30% | -0.20% | |
| AUD | 0.22% | 0.10% | 0.05% | 0.01% | 0.47% | -0.30% | -0.19% | |
| JPY | -0.25% | -0.38% | -0.53% | -0.48% | -0.49% | -0.82% | -0.68% | |
| NZD | 0.53% | 0.41% | 0.34% | 0.30% | 0.29% | 0.78% | 0.11% | |
| CHF | 0.42% | 0.30% | 0.24% | 0.20% | 0.19% | 0.68% | -0.10% |
The heat map shows percentage changes of major currencies against each other. The base currency is picked from the left column, while the quote currency is picked from the top row. For example, if you pick the Euro from the left column and move along the horizontal line to the Japanese Yen, the percentage change displayed in the box will represent EUR (base)/JPY (quote).
Inflation in the US, as measured by the change in the Consumer Price Index (CPI), if forecast to edge lower to 3.1% on a yearly basis in November from 3.2% in October. The Core CPI, which excludes volatile food and energy prices, is expected to rise 4% in the same period to match the previous increase.
US CPI Preview: November inflation data looks set to guide Fed last meeting of the year.
The data from Australia showed earlier in the day that the National Australia Bank's Business Confidence Index dropped to -9 in November from -2% in September. The Business Conditions Index edged lower to 9 from 13. Reserve Bank of Australia (RBA) Governor Michele Bullock said on Tuesday that policymakers are taking a cautious approach with monetary policy and reiterated that they will continue to watch incoming data. AUD/USD gained traction in the Asian session and the pair was last seen testing 0.6600, rising 0.5% on a daily basis.
The UK's Office for National Statistics report on Tuesday that the Employment Change in October was +50K. The ILO Unemployment Rate held steady at 4.2% in the three months to October while annual wage inflation, as presented by the change in the Average Earnings Including Bonus, dropped sharply to 7.2% from 8% in the same period. GBP/USD declined toward 1.2550 with the immediate reaction but managed to hold above that level.
EUR/USD closed the first trading day of the week virtually unchanged and started to edge higher toward 1.0800 early Tuesday.
The renewed USD weakness and the risk-averse market environment caused USD/JPY to turn south early Tuesday. At the time of press, the pair was down more than 0.5% on the day below 145.50.
Gold turned south and declined below $1,980 for the first time in nearly three weeks on Monday. Retreating US yields helped XAU/USD find a foothold and the pair was last seen inching higher toward $1,990.
- EUR/GBP loses momentum near 0.8572 following UK employment data.
- The UK’s ILO Unemployment Rate remained steady at 4.2% in the three months to October.
- The easing in inflationary pressure in the Eurozone fuels the bet for rate cuts early next year.
- Investors will focus on the German and Eurozone ZEW Survey, due on Tuesday.
The EUR/GBP cross remains on the defensive above the mid-0.8500s during the early European session on Tuesday. The cross attracts some buyers following the UK employment data. However, the upside of EUR/GBP might be capped as investors do not believe in the European Central Bank (ECB) higher for a longer rate narrative in the Eurozone. At press time, the cross is trading at 0.8572, down 0.03% on the day.
The latest data from the UK Office for National Statistics showed on Tuesday that the nation’s ILO Unemployment Rate remained steady at 4.2% in three months to October, in line with market expectation. Additionally, the number of people claiming jobless benefits rose by 16K in November versus an 8.9K increase in October, above the market consensus of 20.3K. The British Employment Change data for October arrived at 50K from the previous reading of a 54K gain.
The anticipation that the Bank of England (BoE) might hold rates and maintain its higher for longer narrative, lifts the British Pound (GBP) against the Euro (ECB). Market players expect the BoE is likely to be the last among its peers to ease monetary policy.
On the Euro front, traders will closely focus on the ECB monetary policy meeting, which is likely to hold its Deposit Facility Rate unchanged at 4.0%. Eurozone inflation came in at 2.4% in November, the lowest level in more than two years. The easing in inflationary pressure in the Eurozone fuels the bet for rate cuts early next year. The market is now pricing in a rate cut of more than 130 basis points (bps) beginning in March of next year.
Looking ahead, the German and Eurozone ZEW Survey will be released later on Tuesday. On Thursday, the BoE and ECB interest rate decisions will be in the spotlight. Traders will take cues from these key events and find trading opportunities around the EUR/GBP cross.
- GBP/USD attracts some buyers for the second straight day and draws support from a softer USD.
- A fresh leg down in the US bond yields, along with a positive risk tone, undermines the Greenback.
- Spot prices react little to the UK jobs data as the focus remains glued to the crucial US CPI report.
The GBP/USD pair gains some positive traction for the second straight day on Tuesday, albeit struggles to capitalize on the move and remains below the overnight swing high. Spot prices move little following the release of the UK monthly jobs data and hold steady around the 1.2580-1.2585 region, up over 0.25% for the day.
The UK Office for National Statistics (ONS) reported that the number of people claiming unemployment-related benefits rose to 16K in November as compared to the 20.3K anticipated. Adding to this, the previous month's reading was also revised down to 8.9K from the 17.8K reported originally. This, however, was overshadowed by the fact that Average Earning decelerated more than expected during the three months to October. This comes amid rising bets that the Bank of England's (BoE) rate-hiking cycle could be reversed in 2024 and turn out to be a key factor acting as a headwind for the British Pound (GBP).
The US Dollar (USD), on the other hand, ticks lower in the wake of a fresh leg down in the US Treasury bond yields and bets that the Federal Reserve (Fed) will not hike interest rates again. Apart from this, a generally positive tone around the equity markets is seen undermining the Greenback's relative safe-haven status amid some repositioning trade ahead of the latest US consumer inflation figures, due for release later today. This, in turn, remains supportive of the bid tone surrounding the GBP/USD pair, though traders prefer to wait on the sidelines ahead of the key central bank event risks.
The Fed is scheduled to announce its policy is scheduled to announce its policy decision at the end of a two-day meeting on Wednesday. This will be followed by the BoE meeting on Thursday, which will play a key role in influencing the GBP and provide some meaningful impetus to the GBP/USD pair. In the meantime, the aforementioned fundamental warrants some caution before positioning for an extension of the recent bounce from the 1.2500 psychological mark, or the monthly low touched last Friday.
Technical levels to watch
FX option expiries for Dec 12 NY cut at 10:00 Eastern Time, via DTCC, can be found below.
- EUR/USD: EUR amounts
- 1.0600 473m
- 1.0685 548m
- 1.0700 706m
- 1.0725 459m
- 1.0750 872m
- 1.0900 474m
- GBP/USD: GBP amounts
- 1.2530 480m
- USD/JPY: USD amounts
- 144.80 450m
- 145.35 590m
- USD/CHF: USD amounts
- 0.8875 451m
- AUD/USD: AUD amounts
- 0.6525 354m
- The UK Unemployment Rate stayed unchanged at 4.2% in the quarter to October.
- The Claimant Count Change for Britain arrived at 16K in November.
- GBP/USD pares back gains toward 1.2550 after the mixed UK jobs data.
The United Kingdom’s (UK) ILO Unemployment Rate held steady at 4.2% in three months to October, according to the latest data published by the Office for National Statistics (ONS) showed Tuesday. The market consensus was for a 4.2% print in the October quarter.
Additional details of the report showed that the number of people claiming jobless benefits climbed by 16K in November, compared with an increase of 8.9K in October while beating the estimate of 20.3K.
The British Employment Change data for October came in at 50K, as against a 54K gain seen in September.
Average Earnings excluding Bonus in the UK rose 7.3% 3M YoY in October versus September’s 7.8% increase. Markets had expected an acceleration of 7.4%.
Another measure of wage inflation, Average Earnings including Bonus grew by 7.2% in the reported period when compared to an 8.0% increase in September and the expected 7.7% raise.
GBP/USD reaction to the UK employment report
GBP/USD came under renewed selling pressure and tumbled to 1.2561 in an immediate reaction to the mixed UK employment data. The pair is trading 0.18% higher on the day at 1.2572, as of writing.
Pound Sterling price today
The table below shows the percentage change of Pound Sterling (GBP) against listed major currencies today. Pound Sterling was the weakest against the New Zealand Dollar.
| USD | EUR | GBP | CAD | AUD | JPY | NZD | CHF | |
| USD | -0.14% | -0.18% | -0.21% | -0.47% | -0.56% | -0.61% | -0.24% | |
| EUR | 0.13% | -0.04% | -0.05% | -0.33% | -0.44% | -0.48% | -0.11% | |
| GBP | 0.18% | 0.04% | -0.01% | -0.29% | -0.37% | -0.42% | -0.06% | |
| CAD | 0.19% | 0.07% | 0.01% | -0.25% | -0.37% | -0.42% | -0.04% | |
| AUD | 0.47% | 0.33% | 0.29% | 0.28% | -0.10% | -0.14% | 0.21% | |
| JPY | 0.55% | 0.42% | 0.37% | 0.36% | 0.03% | -0.13% | 0.23% | |
| NZD | 0.60% | 0.47% | 0.43% | 0.42% | 0.14% | 0.04% | 0.36% | |
| CHF | 0.22% | 0.11% | 0.06% | 0.04% | -0.21% | -0.33% | -0.37% |
The heat map shows percentage changes of major currencies against each other. The base currency is picked from the left column, while the quote currency is picked from the top row. For example, if you pick the Euro from the left column and move along the horizontal line to the Japanese Yen, the percentage change displayed in the box will represent EUR (base)/JPY (quote).
- Asian markets show a mixed picture ahead of the release of US CPI data.
- US CPI (YoY) figure is expected to ease to 3.1% from the previous 3.2%.
- Chinese big-shot stocks declined on a fall in China's inflation for November.
- Major central banks are set to release their policy decisions with expectations to hold rates.
Asian stocks show mixed picture as investors approaches the market cautiously ahead of the US Consumer Price Index (CPI) data. The annual US Consumer Price Index (CPI) figure is expected to ease to 3.1% from the previous 3.2%, with Core CPI to remain steady at 4.0%. These figures provide insights into the inflationary pressures in the United States and are closely monitored by investors.
As of now, China's SSE Composite Index loses 0.05% at 2,989, and the Shenzhen Component Index declines by 0.23% to 9,610. Japan's Nikkei 225 rose to 32,814, down by 0.08%. Hong Kong's Hang Seng is up at 16,335, while the Korean KOSPI has risen to 2,536.
Chinese big-shot shares experienced a decline as investors sought policy support from the Chinese administration following data showing a fall in China's inflation for November.
Additionally, according to Bloomberg, officials from the Bank of Japan (BoJ) perceive little need to rush out of negative interest rates. The likelihood of adjustments to the ultra-loose monetary policy seems to be fading, as indicated by BoJ officials.
Furthermore, major central banks, including the US Federal Reserve (Fed), Bank of England (BoE), and European Central Bank (ECB), are set to release their interest rate decisions during the week. The Fed is widely expected to hold rates on Wednesday, and similar expectations exist for the BoE and ECB to refrain from making any adjustments to their policy rates. The central bank decisions will be closely watched by market participants for potential impacts on global financial markets.
- EUR/JPY loses ground around 156.72 on the renewed JPY demand.
- Economists stated that expecting the Bank of Japan (BoJ) to abandon the negative interest rate policy later this month was premature.
- The European Central Bank (ECB) is widely expected to hold its Deposit Facility Rate unchanged at 4.0%.
- ECB rate decision will be a closely watched event on Thursday.
The EUR/JPY cross snaps the two-day winning streak during the early European session on Tuesday. The cautious mood and safe-haven flows due to escalating tensions between the US and Iran-backed Houthi rebels in Yemen lift the Japanese Yen and create the headwind for the cross. EUR/JPY currently trades near 156.72, down 0.43% on the day.
Economists stated that expecting the Bank of Japan (BoJ) to make the tightening move later this month was premature, as new official statistics indicated that the economy contracted more quickly than estimated in the third quarter. Furthermore, market sources said BoJ policymakers see no reason to abandon the negative interest rate policy at its upcoming monetary policy meeting on December 19. This, in turn, drags the Japanese Yen (JPY) lower against the Euro (EUR).
On Friday, the Japanese cabinet office revealed that the nation’s Gross Domestic Product (GDP) for the third quarter (Q3) arrived at -0.7% QoQ versus -0.5% expected and -0.5% prior. Additionally, the annualized GDP contracted 2.9% from the previous reading of 2.1% contraction, and a 2.1% drop was expected.
On the Euro front, traders will closely monitor the European Central Bank (ECB) interest rate decision on Thursday. The ECB is widely expected to hold its Deposit Facility Rate unchanged at 4.0%.
Eurozone inflation has dropped, and the economy may be in a shallow recession, so traders do not believe the ECB's narrative that interest rates will stay high for some time. The market is now pricing in over 130 basis points (bps) of the rate cut next year, beginning in March.
Moving on, market players will focus on the German and Eurozone ZEW Survey for December. Later this week, the Japanese Tankan Large Manufacturing Index (Q4) and Eurozone Industrial Production will be due on Wednesday. The attention will shift to the ECB rate decision on Thursday. This event could trigger volatility in the market and give a clear direction to the EUR/JPY cross.
- USD/CHF losses ground as the US Dollar turns into negative territory.
- Downbeat US yields put pressure on the Greenback.
- US CPI (YoY) is expected to ease to 3.1%, while monthly inflation to rise by 0.1%.
- SNB could maintain rates at 1.75% on the eased Swiss inflation for November.
USD/CHF hovers around 0.8770 during the Asian trading hours on Tuesday, extending its losses for the second consecutive day ahead of US Consumer Price Index (CPI) data. The US Dollar Index (DXY) loses ground on downbeat US Treasury yields. The DXY moves below 104.00, with yields on 2-year and 10-year US bond coupons standing lower at 4.70% and 4.21%, respectively, by the press time.
The market expects the annual US Consumer Price Index (CPI) figure to ease to 3.1% from the previous 3.2%, with the monthly inflation figure anticipated to rise by 0.1%. The US Core CPI is expected to remain steady at 4.0%. Moreover, as per the CME FedWatch Tool, markets have factored in the expectation that the Federal Open Market Committee (FOMC) will keep the rate within the range of 5.25%–5.50%. Additionally, markets expect a 25 basis point (bps) rate cut by March 2024.
The Swiss National Bank (SNB) is expected to maintain policy rates at the unchanged level of 1.75% on Thursday, especially following the easing of the Swiss Consumer Price Index (YoY) for November to 1.4%, compared to the previous 1.7%.
The SNB will also communicate the Monetary Policy Assessment published in the Quarterly Bulletin, providing insights into the medium-term conditional inflation forecast. Investors will also pay close attention to the speech by the head of the Swiss National Bank, Thomas J. Jordan, as his remarks can significantly impact the value of the Swiss Francs (CHF).
- EUR/USD remains confined in a narrow trading band for the second straight day.
- The technical setup warrants some caution before placing fresh directional bets.
- Traders now look to the US CPI for fresh impetus amid dovish Fed/ECB pricing.
The EUR/USD pair extends its sideways consolidative price move for the second successive day on Tuesday and remains well within the striking distance of the monthly low, around the 1.0725-1.0720 region touched last week. Spot prices currently trade around the 1.0765-1.0770 area, nearly unchanged for the day, as traders keenly await the release of the US consumer inflation figures for a fresh impetus.
In the run-up to the key data risk, reduced bets for the first interest rate cut by the Federal Reserve (Fed) in March 2024 act as a tailwind for the US Dollar (USD). The shared currency, on the other hand, is undermined by speculations that the European Central Bank (ECB) may start cutting interest rates early next year amid a bigger-than-expected fall in the Eurozone inflation last month. This, in turn, is holding back traders from placing aggressive directional bets around the EUR/USD pair and leading to a subdued range-bound price action.
From a technical perspective, spot prices on Friday showed resilience below the 50% Fibonacci retracement level of the October-November rally and so far, managed to defend the 100-day Simple Moving Average (SMA) on a daily closing basis. This makes it prudent to wait for a sustained break and acceptance below the 1.0725 region before positioning for an extension of the recent pullback from a multi-month peak touched in November. The EUR/USD pair might then weaken below the 1.0700 mark and test the 61.8% Fibo. level, around the 1.0670-1.0665 zone.
On the flip side, the 1.0800 round figure, coinciding with the 38.2% Fibo. breakpoint, now seems to act as an immediate strong barrier ahead of the 200-day SMA, around the 1.0825 region. Some follow-through buying has the potential to lift the EUR/USD pair back closer to the 1.0900 mark. The momentum could get extended further towards the next relevant hurdle near the 1.0940 horizontal zone, above which bulls could make a fresh attempt to conquer the 1.1000 psychological mark.
EUR/USD daily chart
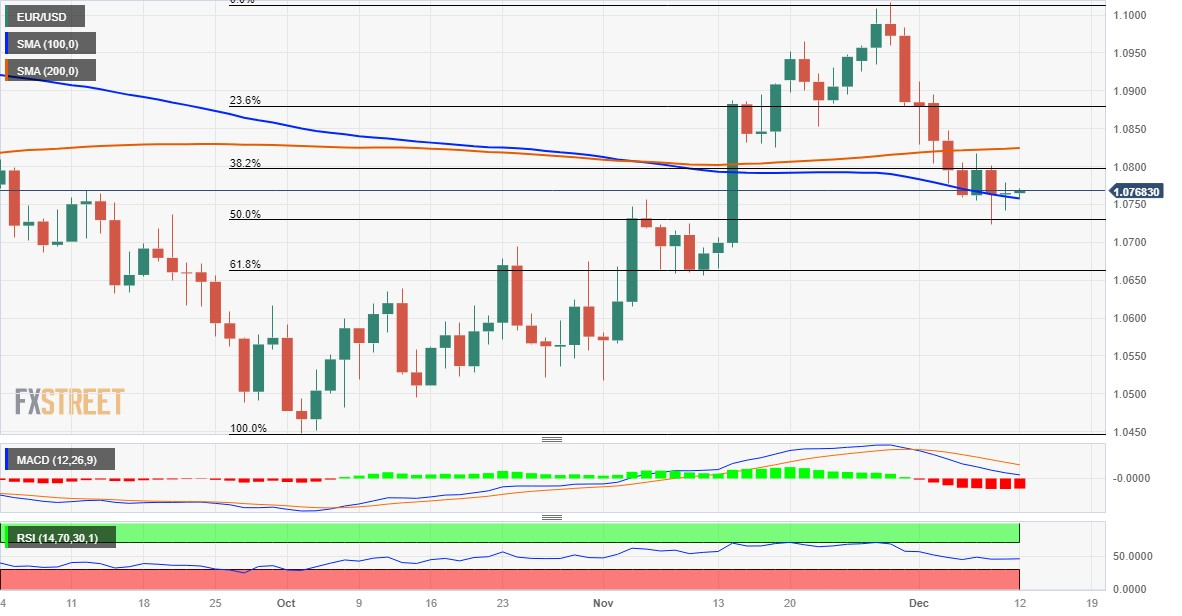
Technical levels to watch
- WTI price extends its gains possibly on expectations of a rise in monthly US CPI.
- Market expects US CPI (YoY) to ease to 3.1% and Core CPI to remain consistent at 4.0%.
- The growth of US shale oil operations and non-OPEC producers contributes to the uncertainties in the Crude oil market.
- Iran-backed Houthis attacked a commercial tanker vessel in the Red Sea.
West Texas Intermediate (WTI) price attempts to extend gains for the fourth consecutive session ahead of US Consumer Price Index (CPI) data for November and the Federal Reserve’s (Fed) Interest Rate Decision. The WTI price bids around $71.80 per barrel during the Asian session on Tuesday.
The market anticipates the annual US Consumer Price Index (CPI) figure to ease to 3.1% from the previous 3.2%, with the monthly inflation figure expected to rise by 0.1%. The US Core CPI is expected to remain steady at 4.0%. Higher inflation figures have the potential to reinforce confidence in the United States (US) economy, which could, in turn, provide support for the WTI oil price. Positive economic indicators may contribute to increased demand expectations, benefiting oil prices in the market.
As for the Federal Open Market Committee (FOMC) policy decision on Wednesday, the expectation is for no change in policy rate adjustments. According to the CME FedWatch Tool, markets have priced in the FOMC to maintain the rate within the range of 5.25%–5.50% and are also pricing in a 25 basis point (bps) rate cut as early as March next year. Investors will closely analyze the Fed Monetary Policy Statement for insights into potential rate adjustments in 2024.
The situation in the Red Sea is becoming increasingly tense as Iran-backed Houthis threaten to disrupt shipping. Their actions, including firing rockets at the US embassy in Baghdad and launching a land-based cruise missile that caused a commercial vessel to catch fire in the Red Sea, underscore the heightened tensions in the region.
Crude oil prices experienced an upswing after last week's labor data release, indicating resilience in the United States (US) economy. However, challenges may arise due to ongoing concerns about global demand, particularly with weak economic data from China, the largest oil importer, and other major economies. The growth in US shale oil operations continues to exceed expectations on the upside. Additionally, gains across other non-OPEC producers have also been unexpectedly large. This dynamic highlights the resilience and expansion in oil production from sources outside the OPEC+ members, adding to the uncertainties in the Crude oil market.
- Indian Rupee edges lower on the stronger US Dollar.
- Indian government bond yields and the Indian rupee will be influenced by domestic and US inflation data this week.
- Investors will take cues from the Indian and US CPI data ahead of the FOMC meeting.
Indian Rupee (INR) trades on a negative note on Tuesday amid renewed US Dollar (USD) demand. The Reserve Bank of India (RBI) left the benchmark repo rate unchanged at 6.50%, as expected last week. The RBI remains in a wait-and-see mode as it monitors inflationary risks. The Indian economy surpassed estimates in the September quarter, expanding 7.6%, making it the fastest-growing major country. The RBI forecasts a growth rate in India's GDP at 7.0% in FY24.
Domestic and US inflation data, as well as the Federal Open Market Committee's (FOMC) decision on interest rates, will all have an impact on Indian government bond yields and the Indian rupee this week. Market players have priced in a nearly 45.6% odds that FOMC will begin cutting rates from March 2024 and have priced in a 50% chance of 125 basis points (bps) of rate cuts in 2024, according to the CME FedWatch Tool.
Investors will keep an eye on the Indian Consumer Price Index (CPI) for November, Industrial Production, and Manufacturing Output. On the US docket, the CPI figures will be due on Tuesday. The attention will shift to the FOMC meeting on Wednesday, with no change expected.
Daily Digest Market Movers: Indian Rupee faces challenges from global headwinds
- According to the International Monetary Fund (IMF), Indian Real Gross Domestic Product (real GDP) is forecast to expand by more than 6.0% in both 2023 and 2024.
- Prime Minister Narendra Modi set an ambitious target to boost India to become a $5 trillion economy within the next five years.
- The Reserve Bank of India (RBI) Monetary Policy Committee decided to maintain the policy repo rate unchanged at 6.50% and keep the focus on the withdrawal of accommodation.
- RBI forecasted India's retail inflation at 5.4% in FY24, with 5.6% in Q3 and 5.2% in Q4 of FY24.
- The current expected growth rate for India's GDP in FY24 is 7.0%, with growth rates of 6.5% and 6.0% predicted for the third and fourth quarters, respectively.
- The US monthly Consumer Price Index (CPI) is expected to rise 0.1% from 0.0%, and the annual rate is estimated to ease from 3.2% YoY to 3.1%. The annual core CPI, which excludes volatile food and energy prices, is projected to remain steady at 4.0%.
- The markets widely expected the FOMC to leave interest rates steady at 5.25–5.50% for the third straight meeting on Wednesday.
- US Nonfarm Payrolls (NFP) surged by 199K in November from 150K in October, above the market consensus of 180K.
Technical Analysis: The Indian Rupee maintains a constructive outlook
Indian Rupee trades weaker on the day. The USD/INR pair has traded in a familiar trading band held over the past three months between 82.80 and 83.40. Technically, the bullish stance of USD/INR remains unchanged as the pair holds above the key 100-day Exponential Moving Average (EMA) with an upward slope on the daily chart. Meanwhile, the 14-day Relative Strength Index (RSI) remains above the 50.0 level, adding to the upward momentum.
A convincing breakout above the upper boundary of the trading range of 83.40 will pave the way to the next upside barrier at the year-to-date (YTD) high of 83.47, followed by a psychological round mark of 84.00. On the flip side, a breach below the key support level of 83.00 round figure will see a drop to the confluence of the lower limit of the trading range and a low of September 12 at 82.80. Further south, the next contention level to watch is a low of August 11 at 82.60.
US Dollar price today
The table below shows the percentage change of US Dollar (USD) against listed major currencies today. US Dollar was the strongest against the Euro.
| USD | EUR | GBP | CAD | AUD | JPY | NZD | CHF | |
| USD | -0.03% | -0.16% | -0.18% | -0.38% | -0.30% | -0.41% | -0.15% | |
| EUR | 0.02% | -0.13% | -0.14% | -0.36% | -0.30% | -0.38% | -0.13% | |
| GBP | 0.16% | 0.13% | 0.00% | -0.23% | -0.14% | -0.23% | 0.00% | |
| CAD | 0.16% | 0.15% | 0.00% | -0.19% | -0.14% | -0.24% | 0.02% | |
| AUD | 0.39% | 0.36% | 0.23% | 0.22% | 0.07% | -0.02% | 0.22% | |
| JPY | 0.30% | 0.25% | 0.13% | 0.13% | -0.05% | -0.10% | 0.13% | |
| NZD | 0.39% | 0.38% | 0.25% | 0.24% | 0.02% | 0.09% | 0.23% | |
| CHF | 0.15% | 0.14% | 0.00% | 0.00% | -0.21% | -0.16% | -0.24% |
The heat map shows percentage changes of major currencies against each other. The base currency is picked from the left column, while the quote currency is picked from the top row. For example, if you pick the Euro from the left column and move along the horizontal line to the Japanese Yen, the percentage change displayed in the box will represent EUR (base)/JPY (quote).
Indian Rupee FAQs
What are the key factors driving the Indian Rupee?
The Indian Rupee (INR) is one of the most sensitive currencies to external factors. The price of Crude Oil (the country is highly dependent on imported Oil), the value of the US Dollar – most trade is conducted in USD – and the level of foreign investment, are all influential. Direct intervention by the Reserve Bank of India (RBI) in FX markets to keep the exchange rate stable, as well as the level of interest rates set by the RBI, are further major influencing factors on the Rupee.
How do the decisions of the Reserve Bank of India impact the Indian Rupee?
The Reserve Bank of India (RBI) actively intervenes in forex markets to maintain a stable exchange rate, to help facilitate trade. In addition, the RBI tries to maintain the inflation rate at its 4% target by adjusting interest rates. Higher interest rates usually strengthen the Rupee. This is due to the role of the ‘carry trade’ in which investors borrow in countries with lower interest rates so as to place their money in countries’ offering relatively higher interest rates and profit from the difference.
What macroeconomic factors influence the value of the Indian Rupee?
Macroeconomic factors that influence the value of the Rupee include inflation, interest rates, the economic growth rate (GDP), the balance of trade, and inflows from foreign investment. A higher growth rate can lead to more overseas investment, pushing up demand for the Rupee. A less negative balance of trade will eventually lead to a stronger Rupee. Higher interest rates, especially real rates (interest rates less inflation) are also positive for the Rupee. A risk-on environment can lead to greater inflows of Foreign Direct and Indirect Investment (FDI and FII), which also benefit the Rupee.
How does inflation impact the Indian Rupee?
Higher inflation, particularly, if it is comparatively higher than India’s peers, is generally negative for the currency as it reflects devaluation through oversupply. Inflation also increases the cost of exports, leading to more Rupees being sold to purchase foreign imports, which is Rupee-negative. At the same time, higher inflation usually leads to the Reserve Bank of India (RBI) raising interest rates and this can be positive for the Rupee, due to increased demand from international investors. The opposite effect is true of lower inflation.
- Gold price ticks higher during the Asian session, albeit with a lack of follow-through buying.
- The uncertainty over the timing of when the Fed will start cutting rates caps the upside.
- Investors also seem reluctant to place aggressive bets ahead of the US CPI later today.
Gold price (XAU/USD) edges higher during the Asian session on Tuesday and moves away from a three-week low, around the $1,976-1,975 region touched the previous day. The uptick, however, lacks follow-through buying or bullish conviction as traders seem reluctant to place aggressive directional bets ahead of the release of the latest consumer inflation figures from the United States (US) later today. The crucial Consumer Price Index (CPI) report will play a key role in influencing the Federal Reserve’s (Fed) policy outlook and help determine the near-term trajectory for the non-yielding yellow metal.
In the run-up to the key data/central bank event risk, growing acceptance that the US central bank is done raising interest rates keeps a lid on the post-NFP US Dollar (USD) gains and acts as a tailwind for the Gold price. Investors, however, seem uncertain over the timing of when the Fed may begin easing its monetary policy in the wake of the underlying strength in the US labor market, as was reflected in the Nonfarm Payrolls (NFP) report on Friday. This, along with a generally positive tone around the equity markets, contributes to capping any meaningful appreciating move for the precious metal.
Daily Digest Market Movers: Gold price struggles to attract buyers awaiting fresh catalyst
- The upbeat US employment figures released on Friday made traders bet that it could take the Federal Reserve until May to begin a series of interest-rate cuts next year and act as a headwind for the Gold price.
- A New York Fed survey released on Monday showed that consumers anticipate inflation to be at 3.4% a year from now, down from an expectation of 3.6% in October and marking the lowest reading since April 2021.
- The incoming data raised hopes that inflation could continue to decelerate without the economy falling into a recession and forced investors to trim their bets for the first Fed rate cut move in March 2024.
- Market participants, however, seem convinced that the US central bank is done with its policy-tightening campaign and may begin easing its monetary policy by the first half of the next year.
- According to CME group's FedWatch Tool, investors are still pricing in over a 40% chance of a March cut of at least 25 basis points (bps) and a nearly 75% chance of such a move in May 2024.
- This, in turn, fails to assist the US Dollar to capitalize on the post-NFP positive move and lends support to the non-yielding metal, though bulls seem reluctant ahead of the US consumer inflation data.
- The headline CPI is expected to rise by 0.1% in November and the yearly pace ticked down to 3.1%. The core gauge is anticipated to edge up from 0.2% to 0.3% MoM and hold steady at a 4.0% YoY rate.
- The market attention will then shift to the outcome of the highly-anticipated two-day FOMC monetary policy meeting, scheduled to be announced during the US session on Wednesday.
Technical Analysis: Gold price finds some support near 50% Fibo. of June-December rally
From a technical perspective, the XAU/USD, for now, seems to have stalled its recent sharp pullback from an all-time peak touched last week near the 50% Fibonacci retracement level of the June-December rally. The said support is pegged near the $1,975 area and is followed by the 50-day Simple Moving Average (SMA), currently around the $1,967 region. Some follow-through selling might expose the very important 200-day SMA, near the $1,951 zone, below which the Gold price could slide to the $1,938-1,936 region, representing the 61.8% Fibo. level. The latter should act as a key pivotal point as a convincing break below might suggest that the commodity has topped out and shift the near-term bias in favour of bearish traders.
On the flip side, any meaningful recovery might now confront stiff resistance near the $2,000 psychological mark. A sustained strength beyond has the potential to lift the Gold price towards the $2,015 intermediate hurdle en route to the $2,029-2,030 supply zone. The next relevant barrier is pegged near the $2,045 region, which if cleared decisively will suggest that the corrective slide has run its course. The XAU/USD could then extend the momentum further towards the $2,070-2,071 area before aiming to reclaim the $2,100 round figure.
US Dollar price today
The table below shows the percentage change of US Dollar (USD) against listed major currencies today. US Dollar was the strongest against the Euro.
| USD | EUR | GBP | CAD | AUD | JPY | NZD | CHF | |
| USD | -0.02% | -0.12% | -0.13% | -0.26% | -0.28% | -0.28% | -0.06% | |
| EUR | 0.02% | -0.10% | -0.10% | -0.25% | -0.29% | -0.27% | -0.06% | |
| GBP | 0.12% | 0.10% | 0.01% | -0.14% | -0.15% | -0.15% | 0.06% | |
| CAD | 0.11% | 0.11% | -0.01% | -0.12% | -0.17% | -0.17% | 0.05% | |
| AUD | 0.24% | 0.23% | 0.14% | 0.15% | -0.04% | -0.02% | 0.18% | |
| JPY | 0.28% | 0.26% | 0.16% | 0.15% | 0.05% | 0.02% | 0.21% | |
| NZD | 0.27% | 0.25% | 0.16% | 0.16% | 0.04% | -0.01% | 0.21% | |
| CHF | 0.06% | 0.05% | -0.05% | -0.04% | -0.18% | -0.23% | -0.21% |
The heat map shows percentage changes of major currencies against each other. The base currency is picked from the left column, while the quote currency is picked from the top row. For example, if you pick the Euro from the left column and move along the horizontal line to the Japanese Yen, the percentage change displayed in the box will represent EUR (base)/JPY (quote).
Gold FAQs
Why do people invest in Gold?
Gold has played a key role in human’s history as it has been widely used as a store of value and medium of exchange. Currently, apart from its shine and usage for jewelry, the precious metal is widely seen as a safe-haven asset, meaning that it is considered a good investment during turbulent times. Gold is also widely seen as a hedge against inflation and against depreciating currencies as it doesn’t rely on any specific issuer or government.
Who buys the most Gold?
Central banks are the biggest Gold holders. In their aim to support their currencies in turbulent times, central banks tend to diversify their reserves and buy Gold to improve the perceived strength of the economy and the currency. High Gold reserves can be a source of trust for a country’s solvency. Central banks added 1,136 tonnes of Gold worth around $70 billion to their reserves in 2022, according to data from the World Gold Council. This is the highest yearly purchase since records began. Central banks from emerging economies such as China, India and Turkey are quickly increasing their Gold reserves.
How is Gold correlated with other assets?
Gold has an inverse correlation with the US Dollar and US Treasuries, which are both major reserve and safe-haven assets. When the Dollar depreciates, Gold tends to rise, enabling investors and central banks to diversify their assets in turbulent times. Gold is also inversely correlated with risk assets. A rally in the stock market tends to weaken Gold price, while sell-offs in riskier markets tend to favor the precious metal.
What does the price of Gold depend on?
The price can move due to a wide range of factors. Geopolitical instability or fears of a deep recession can quickly make Gold price escalate due to its safe-haven status. As a yield-less asset, Gold tends to rise with lower interest rates, while higher cost of money usually weighs down on the yellow metal. Still, most moves depend on how the US Dollar (USD) behaves as the asset is priced in dollars (XAU/USD). A strong Dollar tends to keep the price of Gold controlled, whereas a weaker Dollar is likely to push Gold prices up.
- The US Consumer Price Index is forecast to rise 3.1% YoY in November, down from the 3.2% increase recorded in October.
- Annual Core CPI inflation is expected to hold steady at 4% in November.
- US CPI inflation report could impact the US Dollar’s valuation ahead of the Fed’s policy announcements.
The highly-anticipated US Consumer Price Index (CPI) inflation data for November will be published by the Bureau of Labor Statistics (BLS) at 13:30 GMT. Inflation is expected to soften further, adding to the view that the Federal Reserve (Fed) is done hiking rates ahead of its last meeting of the year.
The US Dollar (USD) has stabilized in December after suffering large losses against its major rivals in November, with the USD Index falling nearly 3% on a monthly basis.
Although Fed officials remain committed to the data-dependent approach to monetary policy, the Fed is widely expected to leave the interest rate unchanged at the 5.25%-5.5% range after conducting the last monetary policy meeting of the year. The steady decline in inflation and growing signs of a cooldown in the labor market, however, caused markets to start anticipating a policy shift. According to the CME Group FedWatch Tool, there is a more than 40% probability of the Fed reducing the policy rate by 25 basis points as early as March.
US CPI inflation data could influence the market positioning regarding the timing of a policy shift and trigger a big reaction in the USD’s valuation before the Fed announces monetary policy decisions and releases the revised Summary of Economic Projections (SEP) on Wednesday.
What to expect in the next CPI data report?
The US Consumer Price Index, on a yearly basis, is expected to rise 3.1% in November, at a slightly softer pace than the 3.2% increase recorded in October. The Core CPI figure, which excludes volatile food and energy prices, is forecast to hold steady at 4% in the same period.
The monthly CPI and the Core CPI are seen rising 0.1% and 0.3%, respectively. Oil prices continued to decline in November, with the barrel of West Texas Intermediate falling another 7% after declining about 10% in October. Meanwhile, used car prices fell 2.1% in November, bringing the annual rate of fall to 5.8% in that period, according to the Manheim Used Vehicle Index.
Previewing the US November inflation report, “we look for core CPI inflation to rebound to 0.3% m/m from 0.2% in Oct, with the headline also strengthening to 0.1%,” said TD Securities analysts and explained:
“The report is likely to show that the core goods segment added to inflation, while the shelter components (OER/rents) are expected to remain mixed. Note that our unrounded core CPI inflation forecast at 0.29% m/m suggests largely balanced risks for November.”
In the meantime, the Prices Paid Index of the ISM Services PMI survey edged slightly lower to 58.3 in October from 58.6, while the Price Index of the Manufacturing PMI rose to 49.9 from 43.8. These readings showed that input price pressures in the service sector remained strong in November, while the deflation in the manufacturing input costs slowed down.
When will the Consumer Price Index report be released and how could it affect EUR/USD?
The Consumer Price Index inflation data for November will be published at 13:30 GMT. A monthly core inflation reading of 0.5% or higher could cause investors to refrain from betting on a policy shift in the first half of 2024 and provide a boost to the USD with the immediate reaction. On the other hand, a weak Core CPI increase of 0.2% or less could have the opposite impact on the USD’s valuation.
Investors could refrain from taking large positions based on the CPI data alone. On Wednesday, the Fed will release the revised Summary of Economic Projections, including the so-called dot plot, which could provide key clues regarding the timing of a policy shift.
Eren Sengezer, European Session Lead Analyst at FXStreet, offers a brief technical outlook for EUR/USD and explains:
“The near-term outlook for EUR/USD points to a lack of buyer interest. The pair, however, is yet to gather bearish momentum. The Relative Strength Index (RSI) indicator on the daily chart stays flat slightly below 50, while the pair was fluctuating near the 100-day Simple Moving Average (SMA) at the time of press, currently located at around 1.0750.”
“Nevertheless, EUR/USD needs to climb above 1.0820 (200-day SMA) and confirm that level as support to attract technical buyers. In this scenario, 1.0870 (Fibonacci 23.6% retracement of the latest uptrend) could act as interim resistance ahead of 1.1000 (psychological level, end-point of the latest uptrend). On the downside, the 1.0700–1.0720 area (Fibonacci 50% retracement, 50-day SMA) aligns as first support before 1.0650 (Fibonacci 61.8% retracement) and 1.0600 (psychological level, static level.)”
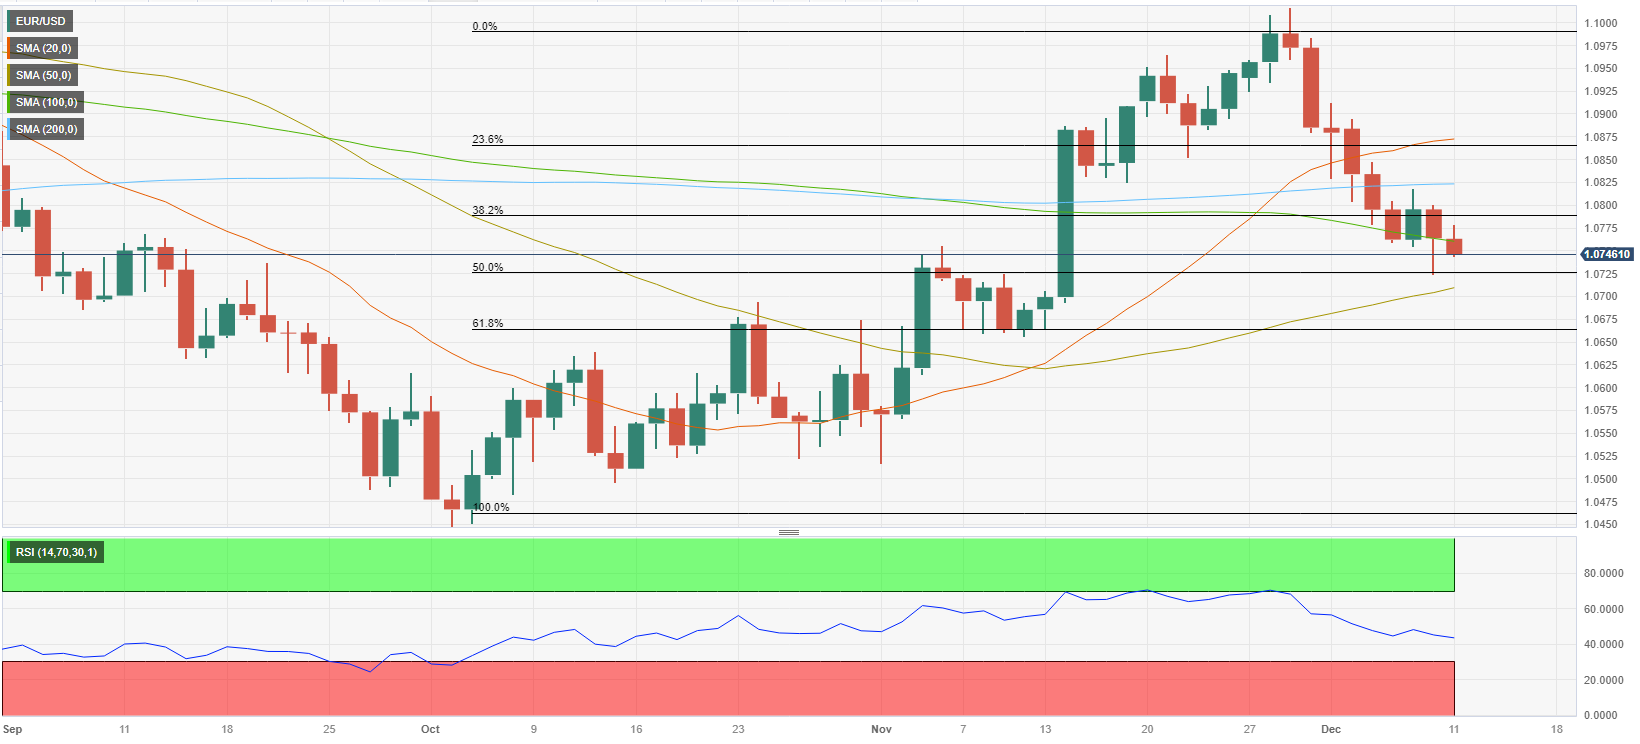
Economic Indicator
United States Consumer Price Index (YoY)
Inflationary or deflationary tendencies are measured by periodically summing the prices of a basket of representative goods and services and presenting the data as The Consumer Price Index (CPI). CPI data is compiled on a monthly basis and released by the US Department of Labor Statistics. The YoY reading compares the prices of goods in the reference month to the same month a year earlier.The CPI is a key indicator to measure inflation and changes in purchasing trends. Generally speaking, a high reading is seen as bullish for the US Dollar (USD), while a low reading is seen as bearish.
Read more.Next release: 12/12/2023 13:30:00 GMT
Frequency: Monthly
Source: US Bureau of Labor Statistics
Why it matters to traders
The US Federal Reserve has a dual mandate of maintaining price stability and maximum employment. According to such mandate, inflation should be at around 2% YoY and has become the weakest pillar of the central bank’s directive ever since the world suffered a pandemic, which extends to these days. Price pressures keep rising amid supply-chain issues and bottlenecks, with the Consumer Price Index (CPI) hanging at multi-decade highs. The Fed has already taken measures to tame inflation and is expected to maintain an aggressive stance in the foreseeable future.
Inflation FAQs
What is inflation?
Inflation measures the rise in the price of a representative basket of goods and services. Headline inflation is usually expressed as a percentage change on a month-on-month (MoM) and year-on-year (YoY) basis. Core inflation excludes more volatile elements such as food and fuel which can fluctuate because of geopolitical and seasonal factors. Core inflation is the figure economists focus on and is the level targeted by central banks, which are mandated to keep inflation at a manageable level, usually around 2%.
What is the Consumer Price Index (CPI)?
The Consumer Price Index (CPI) measures the change in prices of a basket of goods and services over a period of time. It is usually expressed as a percentage change on a month-on-month (MoM) and year-on-year (YoY) basis. Core CPI is the figure targeted by central banks as it excludes volatile food and fuel inputs. When Core CPI rises above 2% it usually results in higher interest rates and vice versa when it falls below 2%. Since higher interest rates are positive for a currency, higher inflation usually results in a stronger currency. The opposite is true when inflation falls.
What is the impact of inflation on foreign exchange?
Although it may seem counter-intuitive, high inflation in a country pushes up the value of its currency and vice versa for lower inflation. This is because the central bank will normally raise interest rates to combat the higher inflation, which attract more global capital inflows from investors looking for a lucrative place to park their money.
How does inflation influence the price of Gold?
Formerly, Gold was the asset investors turned to in times of high inflation because it preserved its value, and whilst investors will often still buy Gold for its safe-haven properties in times of extreme market turmoil, this is not the case most of the time. This is because when inflation is high, central banks will put up interest rates to combat it.
Higher interest rates are negative for Gold because they increase the opportunity-cost of holding Gold vis-a-vis an interest-bearing asset or placing the money in a cash deposit account. On the flipside, lower inflation tends to be positive for Gold as it brings interest rates down, making the bright metal a more viable investment alternative.
- USD/CAD extends its gains for the third consecutive day as US Dollar halts its gains.
- WTI price hovers with a positive sentiment on resilience in the US economy.
- FOMC embarks on its two-day policy meeting on Tuesday; US CPI for November will also be eyed.
USD/CAD continues its losing streak for the third successive day as the US Dollar Index (DXY) turns negative post two days of gains. The USD/CAD pair trades lower around 1.3560 during the Asian session on Tuesday. Moreover, Crude oil prices hold steady after a three-day winning streak, potentially providing support for the Canadian Dollar (CAD).
West Texas Intermediate (WTI) trades near $71.70 per barrel during the Asian session on Tuesday. Oil prices saw an upswing following last week's data release, signaling a level of resilience in the United States (US) economy.
However, Crude oil prices could encounter challenges due to ongoing concerns about global demand, especially with weak economic data from China, the world's largest oil importer, and other major economies. Additionally, worries persist about oversupply, despite production cuts imposed by OPEC+ members.
The US Dollar Index (DXY) loses ground amid stable US Treasury yields. The DXY bids lower below 104.00 at the time of writing. The US Dollar gained momentum from robust employment figures in the United States (US).
As the Federal Open Market Committee (FOMC) embarks on its two-day monetary policy meeting on Tuesday, the consensus expectation is for interest rates to remain unchanged. Market participants will closely scrutinize the statement for any indications regarding potential rate adjustments in the coming year.
Additionally, Tuesday will be marked by the release of the US Consumer Price Index (CPI) report for November, offering insights into potential paths for monetary policy. On the other side of the pond, the Bank of Canada (BoC) Governor Tiff Macklem's appearance, is scheduled for Friday. This event could be significant, and market participants will likely pay close attention to any insights or comments regarding the Canadian economic outlook and monetary policy.
| Raw materials | Closed | Change, % |
|---|---|---|
| Silver | 22.815 | -0.9 |
| Gold | 1981.756 | -1.18 |
| Palladium | 958.53 | 1.47 |
In further evidence of escalating tensions between the United States (US) and Iran-backed Houthi rebels in Yemen, a US defense official stated on Tuesday that the Houthi-controlled Yemen fired a land-based cruise missile, leaving a commercial vessel in flames in the Red Sea.
“US Navy vessel Mason arrived at the scene to offer assistance following the attack, no casualties reported,” the defense official added.
Houthis threatened to disrupt shipping in the Red Sea early Monday, having fired rockets on Friday at the US embassy in Baghdad
Market reaction
Risk sentiment remains tentative on the US Consumer Price Index (CPI) day, with geopolitical tensions running in the background. The S&P 500 futures, a risk barometer, is fluctuating between gains and losses while the US Dollar Index is consolidating recent gains near 104.00, as of writing.
- GBP/USD holds positive ground around 1.2565 ahead of the key events.
- Markets believe that the FOMC will not only halt hiking but will also begin cutting rates as soon as March 2024.
- Market players anticipate the BoE to hold rates unchanged at 5.25% and maintain their higher for a longer narrative.
- Investors await the UK employment data and US inflation data on Tuesday.
The GBP/USD pair recovers some lost ground during the early Asian trading hours on Tuesday. The highlight this week will be the interest rate decisions of the US Federal Reserve (Fed) and the Bank of England (BoE). The major pair currently trades near 1.2565, gaining 0.07% on the day.
The Federal Open Market Committee (FOMC) begins the two-day meeting on Tuesday, and the interest rate decision will be announced on Wednesday. The markets widely expected the FOMC to leave interest rates steady at 5.25–5.50% for the third straight meeting. Markets anticipate that the FOMC will not only halt rising interest rates, but will also begin cutting rates as soon as March 2024.
Across the pond, market players anticipate the BoE to hold rates unchanged at 5.25% and maintain their higher for a longer narrative. However, traders expect the BoE to cut rates next year, but the central bank will cut rates at a slower pace than the Fed and the European Central Bank (ECB).
In the busy week in terms of economic data, market participants will focus on the UK employment data on Tuesday, including the Unemployment Rate, Claimant Count Change, and wage inflation data. The UK Unemployment Rate is expected to remain at 4.2% for the three-month period ending in October.
On the US docket, the US inflation, as measured by the Consumer Price Index (CPI) will be due later on Tuesday. The monthly CPI figure is expected to grow by 0.1% MoM from 0%, and the annual rate is projected to ease from 3.2% YoY to 3.1%. On Wednesday, the US Producer Price Index (PPI) will be released.
- The Japanese Yen regains some positive traction during the Asian session on Tuesday.
- USD/JPY erodes a part of its strong recovery gains registered over the past two days.
- Investors look to the US CPI for a fresh impetus ahead of the FOMC on Wednesday.
The Japanese Yen (JPY) continued losing ground for the second straight day on Monday and erased a major part of its last week's strong gains against the US Dollar (USD) amid diminishing odds for an imminent shift in the Bank of Japan's (BoJ) policy stance. Bloomberg News reported that BoJ officials see little need to abandon the negative interest rate policy this month and there isn't enough evidence about the wage growth to justify ending the ultra-loose monetary policy. This, along with a positive risk tone, with US stocks closing at a new high for the year, turned out to be a key factor weighing heavily on the JPY.
This, in turn, pushed the USD/JPY pair beyond mid-146.00s on Monday, summing up to a rally of over 400 pips from Friday's swing low and a near 500 pips from a multi-month trough touched last Thursday. The strong move up, however, runs out of steam near the 200-hour Simple Moving Average (SMA), dragging spot prices to the 145.70 region during the Asian session on Tuesday in the wake of subdued USD price action. Traders now seem reluctant to place aggressive directional bets and prefer to wait for more clarity on the Federal Reserve's (Fed) next policy move amid hopes of a soft landing for the US economy.
The closely-watched US Nonfarm Payrolls (NFP) report released on Friday showed that the US economy notched another solid month of jobs growth and the unemployment rate fell to 3.7% in November. This, in turn, forced investors to trim their bets for a 25 basis points (bps) Fed rate cut move in March 2024. Meanwhile, a New York Fed survey released on Monday indicated that consumer inflation expectations dropped in November to the lowest level in more than two years, reaffirming speculations that the US central bank may begin easing its monetary policy by the first half of the next year.
Hence, investors will keep a close eye on the release of the US consumer inflation figures on Thursday, followed by the Producer Price Index (PPI) on Wednesday. The focus, however, remains glued to the outcome of the highly-anticipated FOMC monetary policy meeting, scheduled to be announced on Wednesday. The so-called "dot plot" will be looked upon for fresh cues about the Fed's rate path, which, in turn, will drive the USD demand and help determine the near-term trajectory for the USD/JPY pair.
Daily Digest Market Movers: Japanese Yen is back in demand ahead of the US data, central bank event risk
- The Japanese Yen turned out to be the worst-performing G10 currency on Monday after reports downplayed speculations that the Bank of Japan was close to tightening policy.
- A Reuters report on Friday, citing three sources familiar with the BoJ’s thinking, that Governor Ueda’s remarks last week on policy options were not intended to hint at a potential exit timing.
- Bloomberg News also reported on Monday, citing sources, that BoJ officials are yet to see enough evidence of strong wage growth to justify abandoning the negative rate policy this month.
- This comes on the back of the recent rally in the US equity markets, which closed at a new high for the year on Monday and in turn, exerted heavy downward pressure on the safe-haven JPY.
- The US Dollar struggles to capitalize on the upbeat US jobs data-inspired positive move amid the uncertainty over when the Federal Reserve may start easing its policy rates and cut rates.
- A New York Fed survey showed on Monday that consumers expect inflation to be at 3.4% a year from now, down from an expectation of 3.6% in October and the lowest reading since April 2021.
- This, along with the stronger-than-expected US employment figures, lifted hopes of a soft landing for the US economy and pushed back against expectations for the first rate cut in March 2024.
- Investors now look forward to the crucial US consumer inflation data, which is expected to show that the headline CPI rose by 0.1% in November and the yearly pace ticked down to 3.1%.
- Meanwhile, the core gauge (excluding volatile food and energy prices) is anticipated to edge up from a 0.2% MoM rate to 0.3% in November and hold steady at 4% YoY.
- The focus, however, will remain glued to the highly-anticipated FOMC monetary policy decision on Wednesday, which will play a key role in influencing the near-term USD price dynamics.
Technical Analysis: USD/JPY faces rejection near 200-hour SMA, bearish potential seems intact
From a technical perspective, the overnight failure near the 200-hour SMA and the subsequent fall during the Asian session on Tuesday warrants some caution for bullish traders. Any further decline, however, is likely to find some support near the 145.40 area, representing the 23.6% Fibonacci retracement level of the recent strong rebound from a multi-month low touched last Thursday. With oscillators on the daily chart still holding deep in the negative territory, some follow-through selling could make the USD/JPY pair vulnerable to accelerate the slide further towards the 145.00 psychological mark en route to the 38.2% Fibo. level, around the 144.70-144.65 region.
On the flip side, the 146.00 round figure now seems to act as an immediate barrier. Bulls, meanwhile, need to wait for a sustained strength beyond the 200-hour SMA resistance, currently pegged near mid-146.00s, before positioning for any further move up. The USD/JPY pair might then aim to surpass the 147.00 mark and test the next relevant hurdle near the 147.40-147.50 supply zone. The latter should act as a key pivotal point, which if cleared decisively will suggest that the recent sharp pullback from the 152.00 neighbourhood, or the YTD peak, has run its course and shift the bias in favour of bullish traders.
Japanese Yen price today
The table below shows the percentage change of Japanese Yen (JPY) against listed major currencies today. Japanese Yen was the strongest against the US Dollar.
| USD | EUR | GBP | CAD | AUD | JPY | NZD | CHF | |
| USD | -0.03% | -0.11% | -0.11% | -0.18% | -0.30% | -0.19% | -0.06% | |
| EUR | 0.03% | -0.07% | -0.07% | -0.16% | -0.29% | -0.17% | -0.04% | |
| GBP | 0.10% | 0.08% | 0.01% | -0.07% | -0.19% | -0.07% | 0.05% | |
| CAD | 0.10% | 0.09% | -0.01% | -0.06% | -0.20% | -0.11% | 0.04% | |
| AUD | 0.18% | 0.15% | 0.07% | 0.09% | -0.14% | -0.01% | 0.10% | |
| JPY | 0.30% | 0.26% | 0.19% | 0.19% | 0.14% | 0.11% | 0.23% | |
| NZD | 0.18% | 0.16% | 0.08% | 0.08% | 0.01% | -0.12% | 0.12% | |
| CHF | 0.05% | 0.04% | -0.05% | -0.03% | -0.11% | -0.25% | -0.13% |
The heat map shows percentage changes of major currencies against each other. The base currency is picked from the left column, while the quote currency is picked from the top row. For example, if you pick the Euro from the left column and move along the horizontal line to the Japanese Yen, the percentage change displayed in the box will represent EUR (base)/JPY (quote).
Japanese Yen FAQs
What key factors drive the Japanese Yen?
The Japanese Yen (JPY) is one of the world’s most traded currencies. Its value is broadly determined by the performance of the Japanese economy, but more specifically by the Bank of Japan’s policy, the differential between Japanese and US bond yields, or risk sentiment among traders, among other factors.
How do the decisions of the Bank of Japan impact the Japanese Yen?
One of the Bank of Japan’s mandates is currency control, so its moves are key for the Yen. The BoJ has directly intervened in currency markets sometimes, generally to lower the value of the Yen, although it refrains from doing it often due to political concerns of its main trading partners. The current BoJ ultra-loose monetary policy, based on massive stimulus to the economy, has caused the Yen to depreciate against its main currency peers. This process has exacerbated more recently due to an increasing policy divergence between the Bank of Japan and other main central banks, which have opted to increase interest rates sharply to fight decades-high levels of inflation.
How does the differential between Japanese and US bond yields impact the Japanese Yen?
The BoJ’s stance of sticking to ultra-loose monetary policy has led to a widening policy divergence with other central banks, particularly with the US Federal Reserve. This supports a widening of the differential between the 10-year US and Japanese bonds, which favors the US Dollar against the Japanese Yen.
How does broader risk sentiment impact the Japanese Yen?
The Japanese Yen is often seen as a safe-haven investment. This means that in times of market stress, investors are more likely to put their money in the Japanese currency due to its supposed reliability and stability. Turbulent times are likely to strengthen the Yen’s value against other currencies seen as more risky to invest in.
- Australian Dollar moves upward on a hawkish sentiment from the RBA Governor Michele Bullock.
- Australia’s chief policymaker Bullock indicated the RBA's focus on supporting a robust labor market in Australia.
- China has lifted restrictions on three meat suppliers from Australia.
- FOMC commences its two-day policy meeting with the expectation of no change in interest rates.
The Australian Dollar (AUD) maintains composure on Tuesday following a volatile previous session. The ANZ-Roy Morgan Australian Consumer Confidence weekly survey rose to 80.8 from the previous week's 76.4, coinciding with the Reserve Bank of Australia (RBA) leaving interest rates unchanged at last week's final meeting for the year. Additionally, Westpac Consumer Confidence for December showed improvement at 2.7% from the previous decline of 2.6%.
Australia's chief policymaker, Michele Bullock, the Governor of the RBA, expressed confidence, stating, "Don't think we are falling behind in the inflation fight." Bullock emphasized a cautious approach, closely monitoring data, and highlighted the RBA's commitment to preserving employment gains. The central bank aims to prevent inflation expectations from getting "out of control."
China has lifted its restrictions on imports of meat from Australia, removing suspensions on three meat suppliers. This positive development has the potential to boost sentiment and serve as a tailwind for the Australian Dollar. However, concerns about deflation in China prompted a selling trend for the AUD.
The US Dollar Index maintains its strength, supported by firmer US Treasury yields. The robust employment figures in the United States (US) boosted the Greenback, exerting downward pressure on the AUD/USD pair. A stronger US Dollar (USD) tends to dampen investor appetites and acts as a headwind for the pair.
The Federal Open Market Committee (FOMC) commences its two-day monetary policy meeting on Tuesday, and the prevailing expectation is that there will be no change in interest rates during this session. Market participants will closely watch the statement for signals about potential rate adjustments next year. Tuesday will also focus on the US Consumer Price Index (CPI) report for November, providing insights into potential monetary policy paths.
Daily Digest Market Movers: Australian Dollar stays positive amid weaker business conditions in Australia
- National Australia Bank's Business Conditions for November, reflecting trading, profitability, and employment conditions in Australia, decreased to 9 from the previous reading of 13.
- National Australia Bank Business Confidence, which surveys the current business conditions in Australia and provides insights into the short-term performance of the overall economy, declined to 9 from the previous decrease of 2.
- China's Consumer Price Index (CPI) experienced a year-on-year decline of 0.5% in November, compared to a 0.2% decrease in October. Monthly Chinese inflation fell by 0.5%, surpassing the 0.1% decline observed in October.
- China's Producer Price Index (PPI) recorded a 3.0% year-on-year drop in November, reflecting a more substantial decline than the 2.6% decrease reported in October.
- US Nonfarm Payrolls for November rose by 199,000 against the previous rise of 150,000 in October and the market expectation of 180,000.
- US Average Hourly Earnings (Year-on-Year) held steady at 4.0%, aligning with market projections for November. Meanwhile, the Unemployment Rate dropped to 3.7% from the previous 3.9%.
- The preliminary Michigan Consumer Sentiment Index for December reached 69.4, a notable increase from the previous reading of 61.3.
Technical Analysis: Australian Dollar stays above the major level at 0.6550
The Australian Dollar trades around 0.6580 on Tuesday. The 21-day Exponential Moving Average (EMA) at 0.6555 may serve as a crucial support level, aligning with the significant level at 0.6550. If this support region is breached, it could exert downward pressure on the AUD/USD pair, potentially leading it toward the 38.2% Fibonacci retracement level at 0.6526. On the upside, the psychological level at 0.6600 is likely to act as a potential resistance barrier.
AUD/USD: Daily Chart
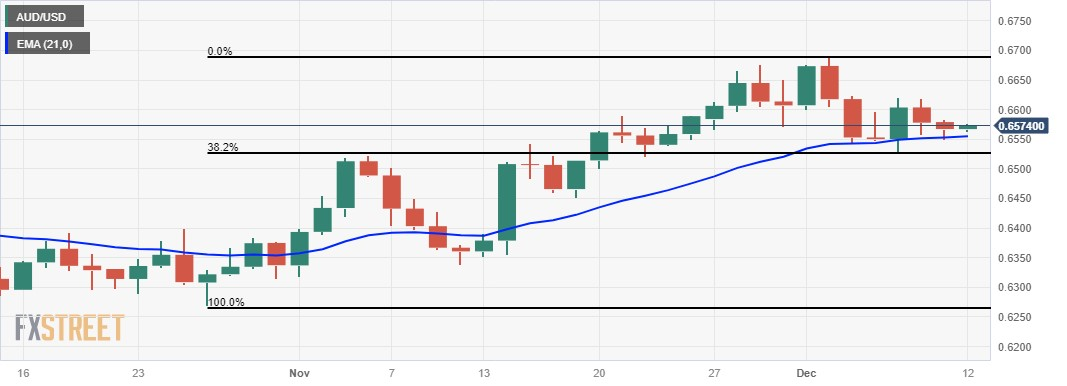
Australian Dollar price today
The table below shows the percentage change of Australian Dollar (AUD) against listed major currencies today. Australian Dollar was the strongest against the US Dollar.
| USD | EUR | GBP | CAD | AUD | JPY | NZD | CHF | |
| USD | -0.01% | -0.11% | -0.10% | -0.19% | -0.31% | -0.17% | -0.06% | |
| EUR | 0.01% | -0.08% | -0.07% | -0.16% | -0.31% | -0.14% | -0.06% | |
| GBP | 0.10% | 0.08% | 0.01% | -0.09% | -0.21% | -0.05% | 0.02% | |
| CAD | 0.08% | 0.08% | -0.02% | -0.07% | -0.23% | -0.07% | 0.02% | |
| AUD | 0.19% | 0.18% | 0.09% | 0.10% | -0.15% | 0.02% | 0.11% | |
| JPY | 0.33% | 0.27% | 0.20% | 0.23% | 0.17% | 0.13% | 0.24% | |
| NZD | 0.15% | 0.14% | 0.05% | 0.06% | -0.03% | -0.18% | 0.09% | |
| CHF | 0.04% | 0.06% | -0.02% | -0.01% | -0.09% | -0.26% | -0.08% |
The heat map shows percentage changes of major currencies against each other. The base currency is picked from the left column, while the quote currency is picked from the top row. For example, if you pick the Euro from the left column and move along the horizontal line to the Japanese Yen, the percentage change displayed in the box will represent EUR (base)/JPY (quote).
Australian Dollar FAQs
What key factors drive the Australian Dollar?
One of the most significant factors for the Australian Dollar (AUD) is the level of interest rates set by the Reserve Bank of Australia (RBA). Because Australia is a resource-rich country another key driver is the price of its biggest export, Iron Ore. The health of the Chinese economy, its largest trading partner, is a factor, as well as inflation in Australia, its growth rate and Trade Balance. Market sentiment – whether investors are taking on more risky assets (risk-on) or seeking safe-havens (risk-off) – is also a factor, with risk-on positive for AUD.
How do the decisions of the Reserve Bank of Australia impact the Australian Dollar?
The Reserve Bank of Australia (RBA) influences the Australian Dollar (AUD) by setting the level of interest rates that Australian banks can lend to each other. This influences the level of interest rates in the economy as a whole. The main goal of the RBA is to maintain a stable inflation rate of 2-3% by adjusting interest rates up or down. Relatively high interest rates compared to other major central banks support the AUD, and the opposite for relatively low. The RBA can also use quantitative easing and tightening to influence credit conditions, with the former AUD-negative and the latter AUD-positive.
How does the health of the Chinese Economy impact the Australian Dollar?
China is Australia’s largest trading partner so the health of the Chinese economy is a major influence on the value of the Australian Dollar (AUD). When the Chinese economy is doing well it purchases more raw materials, goods and services from Australia, lifting demand for the AUD, and pushing up its value. The opposite is the case when the Chinese economy is not growing as fast as expected. Positive or negative surprises in Chinese growth data, therefore, often have a direct impact on the Australian Dollar and its pairs.
How does the price of Iron Ore impact the Australian Dollar?
Iron Ore is Australia’s largest export, accounting for $118 billion a year according to data from 2021, with China as its primary destination. The price of Iron Ore, therefore, can be a driver of the Australian Dollar. Generally, if the price of Iron Ore rises, AUD also goes up, as aggregate demand for the currency increases. The opposite is the case if the price of Iron Ore falls. Higher Iron Ore prices also tend to result in a greater likelihood of a positive Trade Balance for Australia, which is also positive of the AUD.
How does the Trade Balance impact the Australian Dollar?
The Trade Balance, which is the difference between what a country earns from its exports versus what it pays for its imports, is another factor that can influence the value of the Australian Dollar. If Australia produces highly sought after exports, then its currency will gain in value purely from the surplus demand created from foreign buyers seeking to purchase its exports versus what it spends to purchase imports. Therefore, a positive net Trade Balance strengthens the AUD, with the opposite effect if the Trade Balance is negative.
The People’s Bank of China (PBoC) set the USD/CNY central rate for the trading session ahead on Tuesday at 7.1174 as compared to the previous day's fix of 7.1163 and 7.1772 Reuters estimates.
- NZD/USD edges higher to 0.6125 despite the stronger US Dollar.
- The Federal Open Market Committee (FOMC) meeting begins its two-day meeting on Tuesday, with no change expected.
- New Zealand’s annual GDP growth number for Q3 is projected to expand by 0.2% from 0.9%.
- The US Consumer Price Index (CPI) will be a closely watched event on Tuesday.
The NZD/USD pair gains traction during the early Asian session on Tuesday. The pair holds positive ground for the second consecutive day despite the firmer US Dollar (USD). Investors will take cues from the US economic data and the Federal Open Market Committee (FOMC) rate decision ahead of the New Zealand growth numbers on Thursday. The pair currently trades around 0.6125, unchanged for the day.
The Federal Open Market Committee (FOMC) meeting begins its two-day meeting on Tuesday, with no change expected. The market is pricing the FOMC to maintain the interest rate unchanged at 5.25%–5.50% at its December meeting on Wednesday. Ahead of the key event, investors await the US Consumer Price Index (CPI) data for fresh impetus.
The monthly CPI figure is expected to rise 0.1% MoM from 0% and the annual rate is estimated to drop from 3.2% YoY to 3.1%. The annual core CPI, which excludes volatile food and energy prices, is projected to remain steady at 4.0%.
On the other hand, New Zealand's Gross Domestic Product (GDP) for the third quarter (Q3) will be released on Thursday. The annual growth number is projected to expand by 0.2% from 0.9% in the previous reading, while the quarterly growth figure is estimated to grow by 0.5% versus 1.8% prior.
The US Consumer Price Index (CPI) will be due later on Tuesday. Later this week, the Federal Open Market Committee (FOMC) will announce the interest rate decision on Wednesday, and New Zealand GDP growth numbers for Q3 will be due on Thursday. These events could trigger volatility in the market and give a clear direction to the NZD/USD pair.
| Index | Change, points | Closed | Change, % |
|---|---|---|---|
| NIKKEI 225 | 483.94 | 32791.8 | 1.5 |
| Hang Seng | -132.88 | 16201.49 | -0.81 |
| KOSPI | 7.51 | 2525.36 | 0.3 |
| ASX 200 | 4.1 | 7199 | 0.06 |
| DAX | 35.21 | 16794.43 | 0.21 |
| CAC 40 | 24.98 | 7551.53 | 0.33 |
| Dow Jones | 157.06 | 36404.93 | 0.43 |
| S&P 500 | 18.07 | 4622.44 | 0.39 |
| NASDAQ Composite | 28.52 | 14432.49 | 0.2 |
| Pare | Closed | Change, % |
|---|---|---|
| AUDUSD | 0.65669 | 0.02 |
| EURJPY | 157.345 | 0.97 |
| EURUSD | 1.07639 | 0.07 |
| GBPJPY | 183.512 | 1.05 |
| GBPUSD | 1.25539 | 0.19 |
| NZDUSD | 0.6122 | 0.07 |
| USDCAD | 1.3574 | -0.04 |
| USDCHF | 0.87846 | -0.13 |
| USDJPY | 146.184 | 0.89 |
Chinese Communist Party leaders began a closed-door meeting on Monday to discuss economic targets and stimulus measures for 2024 and the meeting is likely to end on Tuesday, per Reuters.
As China's economy struggles to achieve a robust post-pandemic recovery amid a widening property crisis, local government debt challenges, slowing global growth, and geopolitical tensions, investors are looking for signals about next year's policy and reform agenda.
According to Reuters, China's government advisors would suggest economic growth targets for 2024 ranging from 4.5% to 5.5%, with the majority supporting a target of approximately 5.0%.
Market reaction
The headline above has little to no impact on the China-proxy Australian Dollar. At the time of press, the AUD/USD pair was down 0.04% on the day at 0.6565.


© 2000-2024. Уcі права захищені.
Cайт знаходитьcя під керуванням TeleTrade DJ. LLC 2351 LLC 2022 (Euro House, Richmond Hill Road, Kingstown, VC0100, St. Vincent and the Grenadines).
Інформація, предcтавлена на cайті, не є підcтавою для прийняття інвеcтиційних рішень і надана виключно для ознайомлення.
Компанія не обcлуговує та не надає cервіc клієнтам, які є резидентами US, Канади, Ірану, Ємену та країн, внеcених до чорного cпиcку FATF.
Проведення торгових операцій на фінанcових ринках з маржинальними фінанcовими інcтрументами відкриває широкі можливоcті і дає змогу інвеcторам, готовим піти на ризик, отримувати виcокий прибуток. Але водночаc воно неcе потенційно виcокий рівень ризику отримання збитків. Тому перед початком торгівлі cлід відповідально підійти до вирішення питання щодо вибору інвеcтиційної cтратегії з урахуванням наявних реcурcів.
Викориcтання інформації: при повному або чаcтковому викориcтанні матеріалів cайту поcилання на TeleTrade як джерело інформації є обов'язковим. Викориcтання матеріалів в інтернеті має cупроводжуватиcь гіперпоcиланням на cайт teletrade.org. Автоматичний імпорт матеріалів та інформації із cайту заборонено.
З уcіх питань звертайтеcь за адреcою pr@teletrade.global.
переклади