- Аналітика
- Новини та інструменти
- Новини ринків
Новини ринків
Analysts from the Australia and New Zealand Banking Group (ANZ) are out with a note highlighting that the Australian "soft landing" economic outlook appears to be holding, with economic indicators treading softly.
significant easing across most price and cost indicators in the NAB survey
Consumer and business surveys over the past week suggest the soft landing remains on track. Business conditions are still well above long run average levels, despite a decline of three points in September, while forward orders rose two points to be close to long-run averages.
Labour cost growth decelerated to 2.0% q/q in September, its lowest rate since November 2021. Purchase cost growth fell to 1.8% q/q in September, while final product prices decelerated to 1.0% q/q. In both cases these are the weakest results since July 2021. Retail prices growth increased slightly from 1.78% q/q to 1.84% q/q, but this is still one of the weakest six monthly readings since the end of 2021.
On the household side, the ANZ‑Roy Morgan Australian Consumer Confidence survey was at its highest level since February.
The data and events flow picks up over the coming week with the September labour force survey and the minutes of the RBA’s October board meeting... we’ll be looking to see if the minutes convey increased concern about inflation given the uptick in the monthly Consumer Price Index. In the Q&A following a speech, RBA Assistant Governor Chris Kent was reported as saying that quantitative tightening (QT) was “under review”, adding that the RBA did not “have any current plans to sell bonds to pursue what’s called active QT at the moment”.
- The USD/JPY climbed on Thursday, extending a bullish recovery for the pair.
- The US Dollar is inching towards the 150.00 level once again as the Greenback climbs on risk-off markets.
- US CPI inflation data beat has markets worried that the Fed will keep interest rates higher and longer than previously anticipated.
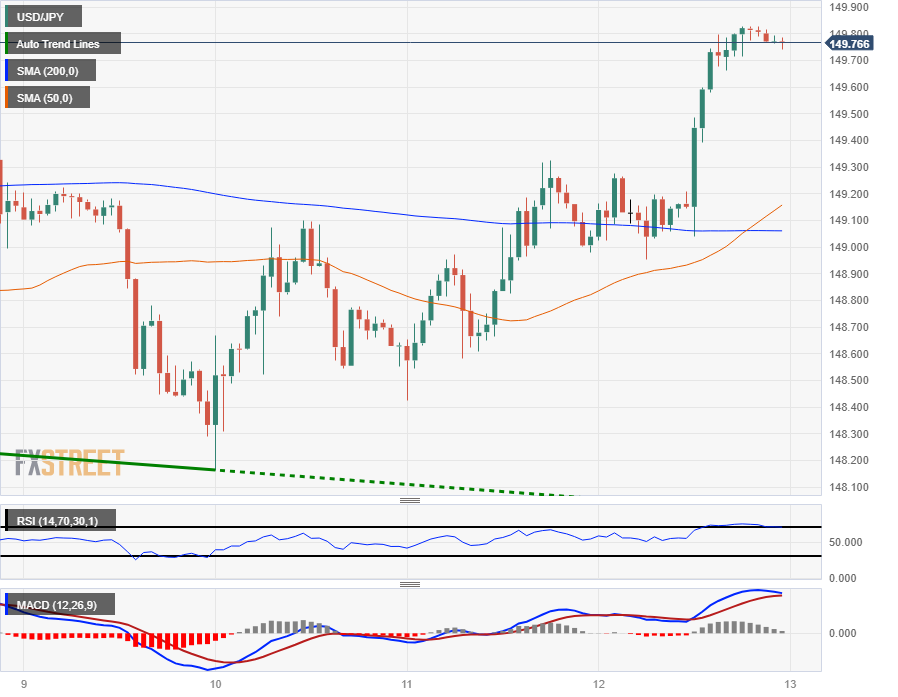
The USD/JPY is hanging close to Thursday's highs of 149.83, inches away from retesting the 150.00 major handle, a price level that has drawn interest from the Bank of Japan (BoJ) for FX market intervention in the past.
Forex Today: The Dollar reclaims the throne after US inflation reports
Japan's Producer Price Index (PPI) and Machinery Orders data fell short of expectations on Wednesday. September's Japan PPI recorded a discouraging -0.3%, failing to the meet the anticipated 0.1% increase and marking a decline from the preceding month's 0.3% figure.
Additionally, Machinery Order for August saw a decline of 0.5%, showing an improvement from the prior reading of -1.1%, but still falling notably below the projected figure of 0.4%.
In September, the annual US Consumer Price Index (CPI) inflation rate registered at 3.7%, beating the market consensus of 3.6%.
Initial Jobless Claims experienced a slight increase to 209K, marginally lower than the market forecast of 210K.
Better-than-expected economic data, combined with inflation that continues to surpass market expectations, see investors worried about the increased likelihood of the US Federal Reserve (Fed) holding interest rates higher for even longer than previously expected.
Friday's market session sees nothing from Japan on the economic calendar, and markets will be looking to close out the trading following a reading of the Michigan Consumer Sentiment Index for October, due at 14:00 GMT and expected to retreat slightly from 68.1 to 64.7.
USD/JPY Technical Outlook
The USD/JPY is hanging close to Thursday's highs of 149.83, just inches away from the 150.00 major handle. The pair is well-bid off the day's early lows near 148.95, and USD/JPY gained 0.42% on Thursday to close out trading just shy of 149.80.
Hourly candlesticks sees the USD/JPY accelerating away from median price points, with intraday price action trading well north of the 200-hour Simple Moving Average (SMA) with the 50-hour SMA confirming a bullish crossover of the longer moving average.
On the daily candles the USD/JPY remains firmly bullish, with the pair knocking on the year's highs and trending well into bullish territory, with technical support coming from the 50-day SMA, currently rising into the 147.00 major handle.
USD/JPY Hourly Chart
USD/JPY Daily Chart

USD/JPY Technical Levels
- USD/CHF reclaims the 200-day moving average and sets its sight at 0.9110, the latest cycle low.
- Key resistance levels lie at 0.9100, followed by 0.9110 and 0.9245.
- The major could turn bearish, below 0.9019, with bears targeting the 50-DMA at 0.8939.
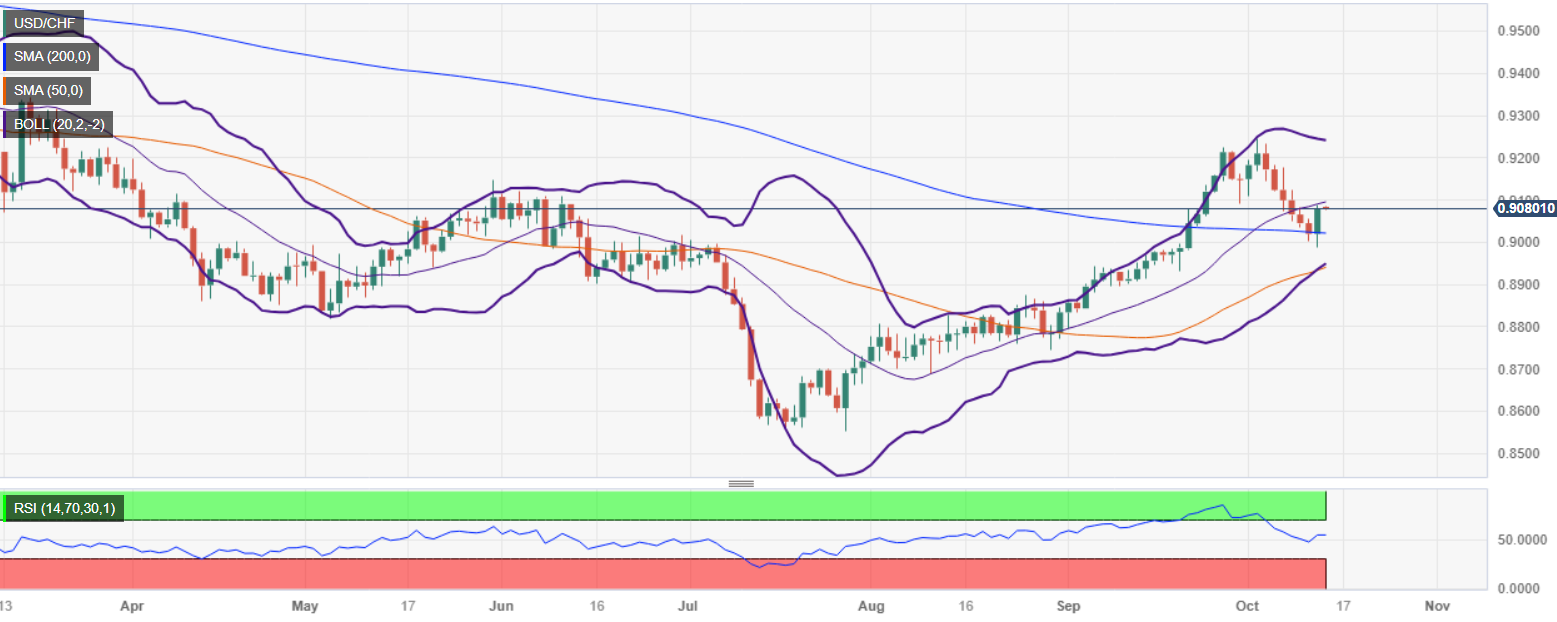
The USD/CHF snapped six days of consecutive losses as the Greenback (USD) stages a recovery on news that inflation in the United States (US) remains hot, sparking worries the US central bank would act to curb high inflation. Hence, the major rallied sharply, more than 0.70%, and exchanged hands at 0.9080 as the Asian session began.
The daily chart witnessed the pair bouncing from around one-and-a-half-month lows around 0.8986, with the USD/CHF breaking to the upside, cracking the 200-day moving average (DMA) at 0.9019 on its way north, and reaching a new three-day high at around 0.9088. That said, the next resistance would be the 0.9100 figure. A breach of the latter would expose the September 29 cycle low of 0.9110, which once cleared, the pair could re-test the October 3 high of 0.9245.
On the other hand, a drop below the 200-DMA at 0.9019 could pave the way to test the 50-DMA at 0.8939, before sliding towards 0.8939.
USD/CHF Price Action – Daily chart
USD/CHF Technical Levels
- AUD/JPY witnessed a significant drop, trading around 94.57 in the Asian session.
- Bearish engulfing candlestick pattern on the daily chart signals potential further declines.
- Key support and resistance levels are outlined amidst the prevailing bearish bias.
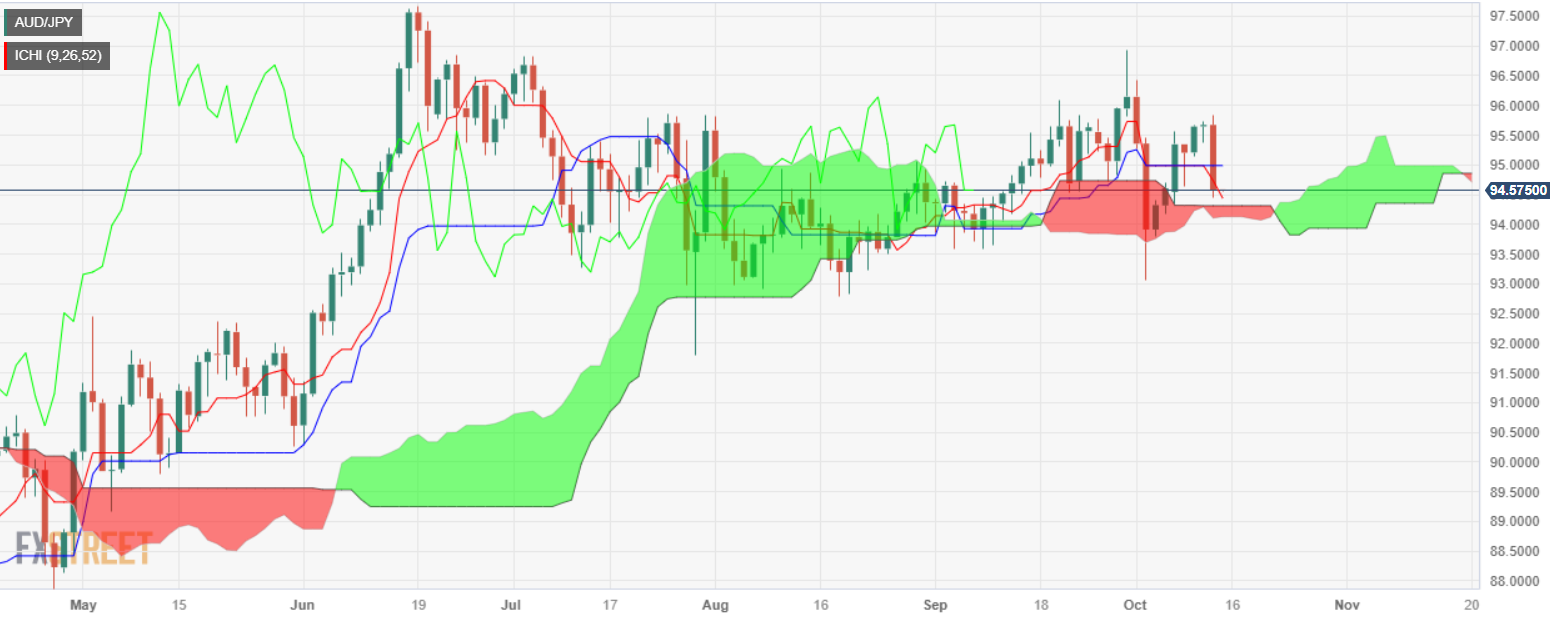
AUD/JPY plunged more than 1% on Thursday as investors speculated the US Federal Reserve (Fed) could increase rates before the end of 2023, a headwind for risk-perceived currencies like the Aussie Dollar (AUD). Therefore, the cross-pair extends its losses and exchanges hands at around 94.57 as the Asian session begins.
From a daily chart perspective, the pair is neutral to downward biased; due to aggressive selling pressure mounting on Thursday, it formed a bearish engulfing candlestick pattern that comprises price action from the whole week. That said, the AUD/JPY could print new lows below the 94.00 figure.
The AUD/JPY first support would be the Ichimoku Cloud (Kumo) at around the 94.10/30 area, which, once cleared, would expose the psychological 94.00 mark. If that level is broken, the following demand area to test would be October 3, swing low of 93.01, before the pair slumps towards July 28, swing low of 91.79.
Conversely, if AUD/JPY stays above 94, the first resistance would be the Kijun-Sen at 94.97 before climbing above 95.00. If rallying above that level, up next would be the July 3 high at 96.83.
AUD/JPY Price Action – Daily chart
AUD/JPY Technical Levels
Analysts from Toronto-Dominion Securities (TDS) are out with a research note highlighting how healthy demand for Gold coupled with a future dovish twist from the Federal Reserve could see future Gold prices heading over $2,000 per ounce.
Early data on central bank gold purchases show that buying activity continued to be robust in September.
China once again has been on the forefront of central bank buying activity last month, by maintaining its record-setting pace set throughout the year. This, along with the eventual Fed pivot away from a hawkish stance, suggests gold is set to rally into the $2,100s.
Reporting shows that the People's Bank of China has purchased 26t last month, which lifted their reported 2023 buying to 181t... Since it started its aggressive buying last November, the PBoC has increased its gold reserves by 243t, and the precious metal now represents over 4% of its total foreign reserves. China’s official gold reserves now total 2,192t.
India’s central bank also made a big play in the gold market last month, with its largest single purchase in 15 months.
Central bank buying is likely why the recent higher interest rate-driven gold selloff, did not go through key supports slightly above $1,800/oz.
We believe the official sector will continue to be supportive in the months to come and should be a catalyst for our $2,100/oz projection next year. These physical purchases will be very important when the Fed pivots to a less restrictive policy... The US central bank should pivot even as inflation is above target.
- EUR/GBP traded in a narrow range and saw little movement.
- Indicators turned flat on the daily chart as the pair continued to side-ways trade.
- Buyers need to retake the 20-day SMA.
The EUR/GBP cross was quiet on Thursday, trading in the 0.8643 - 0.8647 range. Indicators turned flat on the daily chart, favouring a neutral stance with a slight bearish bias.
The Relative Strength Index (RSI) shows a flat slope in the positive territory, while the Moving Average Convergence (MACD) exhibits stagnant red bars. Those indicators are showing a similar trajectory on the four-hour chart and indicates that investors seem to be waiting for a fundamental stimulus. Back to the daily chart, the pair is below the 20 and 200-day Simple Moving Averages (SMAs), but above the 100-day SMA, suggesting that the bears are have the upperhand on the broader scale. Furthermore, the buyers need to gather momentum and make a significant move to regain the 20-day SMA and in case of not doing so, further downside may be on the horizon.
Support levels: 0.8630, 0.8615, 0.8600.
Resistance levels: 0.8655 (20-day SMA), 0.8680, 0.8700.
EUR/GBP Daily Chart
-638327442444619736.png)
- EUR/USD sees a sharp decline for Tuesday, dropping over 1% peak-to-trough.
- Fed fears are back on the table as inflation takes a bite out of market hopes for faster rate cuts.
- The Euro is trading back into the low end for the week after investors scrambled for the US Dollar safe haven.
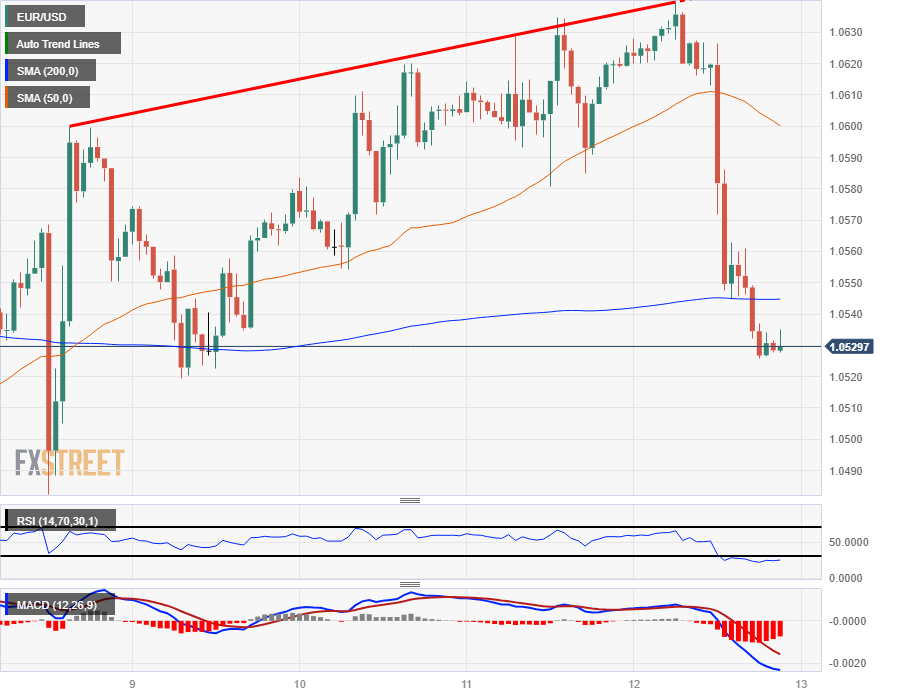
The EUR/USD started Thursday near 1.0620 after making steady gains through most of the week, but a bumper beat for the US Consumer Price Index (CPI) saw investors turn-tail and head for the safe haven hills, piling into the US Dollar (USD) and sending the Euro (EUR) back into familiar lows for the week.
The EUR/USD heads into the Friday market session trading near 1.0530.
US CPI inflation holds steady at 3.7% in September vs. 3.6% forecast
The US CPI inflation print failed to decline in accordance with market forecasts, and sticky inflation is elevating market concerns that the Federal Reserve (Fed) could see rate cuts pushed even further out into the future.
With one more rate hike on the books for 2023, markets are struggling to find reasons to stick with broad forecasts for a half-point rate cut from the Fed by the midpoint of 2024.
Forex Today: Dollar remains weak despite PPI and FOMC Minutes, CPI Next
Friday brings EU Industrial Production figures due at 09:00 GMT, and investors will be looking ahead to a public appearance by the European Central Bank (ECB) President Christine Lagarde.
EU Industrial Production for August is expected to rebound to a scant 0.1% from the previous month's -1.1% printing, but market effect is likely to remain limited as investors look out for comments from ECB President Lagarde.
President Lagarde will be taking part in a panel discussion titled "Debate on the Global Economy" during a seminar at the World Bank Group and International Monetary Fund annual meeting currently underway in Morocco. Traders will be keeping an ear out for any indications from ECB head Largade regarding the ECB's stance on interest rates for the EU looking forward.
EUR/USD Technical Outlook
The Euro tumbled over a full percentage point on Thursday, sagging into 1.0530 and slipping past the 200-hour Simple Moving Average (SMA) currently flat near 1.0545.
The EUR/USD is now in the red for the trading week, down 0.35% or just under 40 pips from Monday's opening bids.
On the daily candlesticks, the EUR/USD's bearish Thursday session sees the pair facing a clean rejection of the descending trendline from July's peak at 1.1275, and price action continues to lean firmly bearish in the medium-term with the 50-day SMA confirming a bearish cross of the 200-day SMA, with the moving averages at 1.0730 and 1.0825 respectively.
EUR/USD Hourly Chart
EUR/USD Daily Chart

EUR/USD Technical Levels
Carrie Freestone, an economist from the Royal Bank of Canada (RBC) notes that consumer spending in Canada is starting to decline heading into the late year as inflation continues to bite.
RBC notes that category increases in consumer spending patterns are largely due to price increases in those categories rather than unit increases in Canadian consumption spending.
A Fall Moderation
September spending data suggests Canadians have begun to tighten their belts. Both nominal retail sales and inflation-adjusted retail spending (excluding auto sales) outright declined.
To-date, (nominal) September spending is trending positive in a few categories, including gasoline consumption, motor vehicle sales, and grocery spending, reflective of higher prices for essential goods.
Canadians are spending nearly 10% more on essential items than they were just one year ago. At the same time, the surge in discretionary spending has dissipated.
As the sun sets on the summer 2023 spending spree, Canadians have started to pare back. Consumer momentum has dissipated (as expected) as high rates hit home.
During the Asian session, China will release essential data, including inflation and trade figures for September. Later in the day, Switzerland will report wholesale inflation, and Eurostat, Industrial Producer data. In the US, the University of Michigan Consumer Sentiment survey is due.
Here is what you need to know on Friday, October 13:
The US Dollar rose sharply, erasing days of losses but remaining below recent cycle highs. The US Dollar index climbed 0.80% to 106.55, boosted by robust US economic data and higher Treasury yields.
The US annual Consumer Price Index (CPI) rate stood at 3.7% in September, above the market consensus of 3.6%. Additionally, the Producer Price Index (PPI) surpassed expectations. Initial Jobless Claims rose to 209,000, slightly below the market consensus of 210,000. The combination of robust US data and persistent inflation above the target reinforced expectations of high interest rates for an extended period.
TDS analysts on US inflation:
In our view, today's CPI report should not make a meaningful difference for the Fed ahead of the November FOMC meeting. Fed officials are viewing the recent run up in yields as doing part of the tightening job that a majority of the Committee intended with an additional rate increase, at least in the near term. We expect the Fed to remain patient as they continue to evaluate the totality of the data.
US Treasury yields also increased, with the 10-year yield rising from 4.57% to 4.73% and the 2-year yield from 4.98% to 5.07%.
The University of Michigan Consumer Sentiment survey is due on Friday, providing a preliminary reading for October, which will be closely watched. On Friday, China will release Consumer Price Index (CPI) and Producer Price Index (PPI) data for September, as well as trade figures. These numbers have the potential to impact markets, especially antipodean currencies.
EUR/USD lost around a hundred pips, falling to 1.0525. The Euro experienced a sharp reversal from around 1.0630 due to a stronger US Dollar. Eurostat will release Industrial Production data for August. European Central Bank (ECB) President Lagarde will participate in a panel at the annual International Monetary Fund and World Bank meeting. Spain and France will publish the final readings of their respective Consumer Price Index (CPI).
USD/CHF rebounded from weekly lows at 0.8987 to the 200-day Simple Moving Average (SMA) at 0.9090. Switzerland will release Producer and Import Price Index data for September.
GBP/USD ended a positive six-day streak with a 140-pip decline, dropping below 1.2200 and reinforcing the bearish trend. The negative risk sentiment also weighed on the Pound.
NZD/USD fell for the second consecutive day, not only breaking below 0.6000 but also dipping below the 20-day SMA to 0.5925. Early on Friday, New Zealand will release Electronic Card Retail Sales data, along with the Business NZ PMI for September.
AUD/USD posted its second-lowest daily close for the current year, slightly above 0.6300. The bias remains downward, with focus on the October lows at 0.6285.
USD/CAD jumped towards 1.3700 on Dollar strength. A daily close above 1.3750 would point to a test of 1.3800.
Gold pulled back sharply from above $1,880, falling below $1,870 due to higher Treasury yields. Similarly, Silver suffered a decline, dropping below $22.00.
Like this article? Help us with some feedback by answering this survey:
- WTI prices slumped into a new low for the day following the broad-market risk-off flows after US CPI beat forecasts.
- Fears of inflation-fueled Fed rate hikes sent investors scrambling, but Crude Oil traders are determined to recover the day.
- Despite pinging a new low for the week, Crude Oil continues to see support from geopolitical tensions and supply concerns.
West Texas Intermediary (WTI) Crude Oil barrel prices saw an plunge from the day's highs, knocking into a new low for the week at $81.45 before seeing a steady recovery, and barely bids are now testing into Thursday's midpoint.
A surprise build-up of US crude oil reserves helped knock back oil bids in the early Thursday trading session, with US crude inventories rising 10.2 million barrels, adding to last week's reading to raise US crude supplies to 424.2 million barrels.
The crude reserve printing soundly beat market forecasters, with the median market estimate calling for a scant 500K barrel uptick.
The unexpected crude buildup was propped up by lower-than-expected refinery utilization rates and higher net imports of foreign crude.
Despite inflation fears following the US Consumer Price Index (CPI) inflation market beater that saw broad-market risk appetite take a sharp turn, Crude Oil remains well-bid after the US announced a fresh round of sanctions against Russia after Russian oil exporters violated a $60-per-barrel trade cap on Russian domestic oil sales.
The price cap was started in December of 2002 as a repercussion for the invasion of Ukraine, locking US trade entities from accessing Russian oil markets.
Oil market sentiment remains pinned in the high end after last weekend's Gaza Strip conflict escalation, and investors are concerned that geopolitical tensions could spill over into nearby Iran and Saudi Arabia as Israel and Palestinian Hamas rapidly escalate their long-standing war over the Gaza Strip.
WTI Technical Outlook
Crude Oil's Thursday decline sees WTI prices back into near-term lows, trading just north of the $82.00/bbl handle.
Technical support for US Crude Oil from the 200-day Simple Moving Average (SMA) near $78.00, but the 50-day SMA is parked just above current price action near $84.84, keeping intraday action constrained as energy investors look to spark a fresh lift in crude barrels.
WTI Daily Chart

WTI Technical Levels
Federal Reserve Bank of Boston President Susan Collins said on Thursday that the central bank is at or near the peak of the interest rate hike cycle. She did not rule out more rate hikes but warned the current stance calls for patience.
Collins said the latest inflation data underscores uneven progress in slowing inflation. She added that the increase in bond yields could take pressure off the Fed to raise rates further.
Market reaction
The US Dollar is holding firm to daily gains, following the US Consumer Price Index report. The Dollar Index is up 0.80%, above 106.50.
- S&P 500 sharply lower for Thursday after US CPI inflation reading sends investor confidence lower.
- Safe havens are catching a bid and equities stumbled as investors fear the Fed.
- S&P 500 sees peak-to-trough decline of 1.65% on inflation expectations adjustment.
The Standard & Poor's 500 equity index saw a sharp downstep on Thursday after US Consumer Price Index (CPI) inflation figures beat market expectations, with the annualized CPI for September printing at 3.7%, holding steady with the previous reading and snubbing the market's forecast decline to 3.6%.
US CPI inflation holds steady at 3.7% in September vs. 3.6% forecast
The data move was minor, but enough to reignite fears of the Federal Reserve's (Fed) higher-for-longer policy stance on interest rates, with sticky inflation in the US set to push out expectations of an eagerly-anticipated rate cut from the US central bank even further into the future.
Markets are currently pricing in an eventual half-point rate cut sometime in 2024, but if inflation continues to edge higher against forecasts, it could see the Fed's dot plot continue to shift further out.
S&P 500 Technical Outlook
Intraday action as the S&P 500 down past the 50-hour Simple Moving Average (SMA) as Thursday's risk-off plunge sends the major equity index down below the near-term median, but stocks are seeing some mild bidding in a rebound as the S&P recovers to $4,350.
The S&P 500 is still in the green for the trading week, trading up nearly 1.2% from Monday's early opening bids near $4,300.
The S&P 500 has formed a bearish engulfing candle on the daily timeframe, and the equity ticker is set for a continuation of a bearish turnaround from the 50-day SMA at $4,406. The S&P 500 caught a bullish bounce last week from the 200-day SMA near $4,220.
The index still remains on the low end in the medium term and could see Thursday's backslide firming up an extension into a lower-high pattern.
S&P 500 Hourly Chart

S&P 500 Daily Chart

S&P 500 Technical Levels
Analysts from Toronto-Dominion Securities are noting that demand for US Treasuries in an issuance auction was much softer than usual, and near-term rates could suffer.
Softer US Auctions: Canary in the Coal Mine?
This week's 3s, 10s, and 30s Treasury auction series was met with weaker demand, with all three auctions tailing relative to 1pm levels. Such an occurrence is relatively rare, with just 11% of auction series since 2012 showing all three auctions tailing.
This afternoon's weak 30y auction (which tailed 3.7bp) also showed softening end-user demand, with dealers having to take 18% of the auction... the recent drop in end-user demand is concerning as dealer capacity to backstop auctions remains lower due to limited balance sheet availability.
With investor conviction remaining extremely low as the market is caught between still-firm domestic fundamentals and geopolitical risk, the 30y auction appears to have further destabilized sentiment. Treasury is likely to continue increasing auction sizes in coming months, bringing more 10y equivalent duration to market next year.
We expect higher nominal and real rates to continue weighing on economic growth momentum, leading rates lower by year-end and in 2024. In the near-term, however, worries about a lack of demand for Treasuries could allow rates to re-test recent highs, with 10s potentially making a run at the 5% mark.
- The GBP/USD has collapsed on Thursday, down over 1.2% from the day's earlier highs.
- The Pound Sterling has turned red on the week against the US Dollar in safe-haven flows.
- Investors are fleeing riskier assets as markets fear the Fed sticking to a higher-for-longer rate cycle for even longer.
The GBP/USD has plunged 1.2% from Thursday's peaks, dropping into 1.2180 after the US Consumer Price Index (CPI) inflation reading broadly beat market expectations, and investors are concerned that the Federal Reserve (Fed) will get pushed further into a high-for-longer rate hike cycle.
US CPI inflation holds steady at 3.7% in September vs. 3.6% forecast
The US CPI inflation reading has sent investor sentiment into the floorboards, dragging risk assets down as traders brace for possible further rate hikes from the Fed. With US inflation continuing to beat market estimates and investors vexed by CPI growth that refuses to decline as quickly as market participants would like, fears are re-emerging that the Fed's "dot plot", or expectations of when rates will finally begin to see cuts, will get pushed even further over the horizon.
Markets are broadly expecting a half-percent rate cut sometime before the end of 2024, but if inflation continues to climb over forecasts, the chances of future rate cuts from the Fed will begin to dwindle rapidly.
Despite the broader market's focus on US CPI inflation figures, UK economic data failed to inspire confidence in the Pound Sterling (GBP) on Thursday.
UK Manufacturing and Industrial Production broadly missed the mark early Thursday, with Manufacturing Production declining 0.8% in August against the forecast -0.4%, failing to meaningfully recover from the previous month's -1.2%.
Industrial Production for the same period likewise missed estimates, printing at -0.7% and flubbing the -0.2% forecast, with the previous reading of -1.1% getting revised downwards from -0.7%.
UK Gross Domestic Product (GDP) for August came in at 0.2%, matching estimates, but the previous month was revised downwards from -0.5% to -0.6%.
GBP/USD Technical Outlook
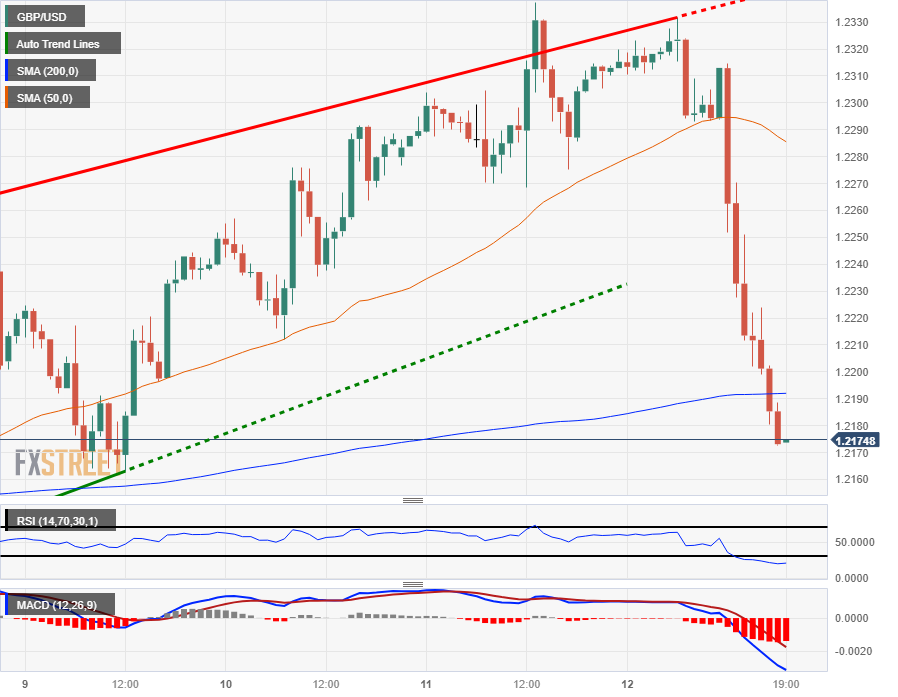
The Pound Sterling is steeply down for Thursday, dropping into 1.2170 and testing the region below the 200-hour Simple Moving Average (SMA), and the US CPI data beat saw the GBP/USD make a clean shear of the 50-hour SMA just below the 1.2300 handle.
The week's lows sit near 1.2160, and a continued decline into the Thursday market close will see the Pound Sterling etch in a new low for the week beyond that level.
Daily candlesticks see the GBP/USD snapping a six-day winning streak, and the pair has slipped to the 50% retracement level of the last upswing from recent lows near 1.2037.
A bearish continuation will see the GBP/USD slipping even further from the 200-day SMA near 1.2443, and the 50-day SMA is geared for a bearish crossover of the longer moving average.
GBP/USD Hourly Chart
GBP/USD Daily Chart

GBP/USD Technical Levels
- GBP/JPY slides over 0.60%, trading around 182.42 after reaching a daily high of 186.05.
- Ichimoku Cloud (Kumo) and Chikou Span indicate bearish signals for the pair.
- Key support and resistance levels identified amidst the current market dynamics.
The GBP/JPY halted its rally and slid more than 0.60% on Thursday after hitting a daily high of 186.05, but high inflation data from the United States (US) spurred a risk-off impulse, as shown by US equities registering losses. At the time of writing, the cross-currency pair exchanges hands at 182.42.
The daily chart portrays the pair as neutral to downward biased, as the GBP/JPY dropped inside the Ichimoku Cloud (Kumo) and the Chikou Span broke below the price action, two bearish signals. To further reinforce the downtrend, the pair must drop below the Senkou-Span B at 182.39, followed by the Kijun-Sen's confluence and the Kumo's bottom at around 181.39. A breach of the latter would expose the Tenkan-Sen at 180.92.
Conversely, if GBP/JPY reclaims the 183.00 are, that could open the door and challenge the psychological 184.00 mark.
GBP/JPY Price Action – Daily chart

GBP/JPY Key Technical Levels
- NZD/USD lost more than 1% and declined below 0.5940.
- US inflation from September came in a tick higher than expected.
- Higher US bond yields and hawkish bets on the Fed favour the USD.
On Thursday, the NZD/USD saw red and declined towards 0.5935, its lowest level since Friday. As the US Consumer Price Index came in above expectations, markets are now pricing in higher odds of a 25 basis point (bps) hike in the December meeting, which caused the US bond yields to rise.
The United States released data indicating that the U.S.'s Consumer Price Index (CPI) stood at 3.7% YoY, surpassing the market's expected 3.6% and aligning with the previous month's 3.7% YoY figure. Simultaneously, the Core measure recorded a 4.1% YoY rate, matching the expectations.
The reaction was a sharp increase of the US bond yields, in which the 2,5 and 10-year rates rose by more than 1%, indicating that markets are betting on higher chances of the Fed delivering on more hike in 2023. In that sense, according to the World Interest Rate Possibilities (WIRP) tool, the likelihood of a 25 basis point increase by the Federal Reserve (Fed) has notably increased and currently hovers at approximately 50%.
The University of Michigan (UoM) will release Consumer Sentiment and Inflation expectations figures for Friday's session. On the Kiwi’s side, now relevant highlights are seen in the New Zealand’s economic calendar.
NZD/USD Levels to watch
According to the daily chart, the technical outlook for the NZD/USD remains neutral to bearish as the bears show signs of recovery. The Relative Strength Index (RSI) points south below its middle point, while the Moving Average Convergence (MACD) prints flat red bars. Additionally, the pair is below the 20,100 and 200-day Simple Moving Averages (SMAs), indicating that the sellers dominate the broader perspective and the buyers need to increase their efforts.
Support levels: 0.5915, 0.5900, 0.5880.
Resistance levels: 0.5955 (20-day SMA), 0.5970, 0.600.
NZD/USD Daily Chart

- AUD/USD trades down by over 1.50%, hovering around 0.6310 amidst a strengthening USD.
- US inflation data exceeds forecasts, with a 3.7% YoY increase, sparking discussions about the Fed's monetary policy.
- US jobless claims slightly ease, coming in at 209K, below the anticipated 210K.
- Upcoming Australian inflation expectations data could influence speculations regarding RBA's monetary policy direction.
The Aussie Dollar (AUD) continued to lose ground versus the US Dollar (USD) on Thursday following the release of US data, which sparked discussions regarding the US Federal Reserve monetary policy path. At the time of writing, the AUD/USD is trading at 0.6310, down more than 1.50%.
Aussie Dollar faces pressure amidst rising US inflation and jobless claims data, eyes on upcoming Australian inflation expectations
The US Bureau of Labor Statistics (BLS) revealed that headline inflation in the US rose above forecasts, with annual basis figures expanding at a 3.7% pace, with estimates of 3.6%. the underlying consumer prices grew at a 4.1% pace on a yearly basis, below projections and the latest reading of 4.3%.
Aside from elevated prices data, jobless claims eased a bit, though they rose by 209K, below forecasts of 210K.
After the data release, the Greenback (USD) advanced, underpinned by soaring US Treasury bond yields, as market participants began to price in the chance for another Fed rate hike. Despite recent dovish rhetoric adopted by most Fed officials, which stressed the US central bank’s need to keep rates higher for longer, without warranting a signal of another rate increase.
Later, the Australian economic docket will feature inflation expectations for one year, with estimates circa 4.8%. If the figure exceeds the latter, that could spark speculations that the Reserve Bank of Australia (RBA) could raise rates toward the year’s end.
AUD/USD Price Analysis: Technical outlook
With the AUD/USD plunging below 0.6400 and extending its losses towards a weekly low of 0.6308, put in danger the 0.6300 level. A breach below the latter, the pair could plunge towards an October 2022 monthly low of 0.6169. On the flip side, if buyers keep the exchange rate above 0.6300, that can pave the way for a rebound toward the 50-day moving average (DMA) at 0.6429.

- Spot Gold price down into $1,870 as markets reverse course following US CPI inflation print.
- Markets continue to underprice US inflation, kicking off risk-off flows.
- XAU/USD has turned red for Thursday, down from the day's opening prices near $1,875.
XAU/USD fell off the day's highs into $1,870 after the US Consumer Price Index (CPI) inflation reading showed that US inflation continues to stick higher than investors are hoping for, sending markets piling into safe havens.
US CPI inflation holds steady at 3.7% in September vs. 3.6% forecast
Spot Gold set an intraday high of $1,885, a ten-day high for XAU/USD bids before tumbling back into Wednesday's trading range.
Rising inflation fears in broader markets are seeing an uptick in investor fears that the Federal Reserve (Fed) might be pushed into an additional rate hike before the end of 2023, and could see the Fed's "dot plot" shift further out on when the anticipated rate cut cycle could begin.
XAU/USD Technical Outlook
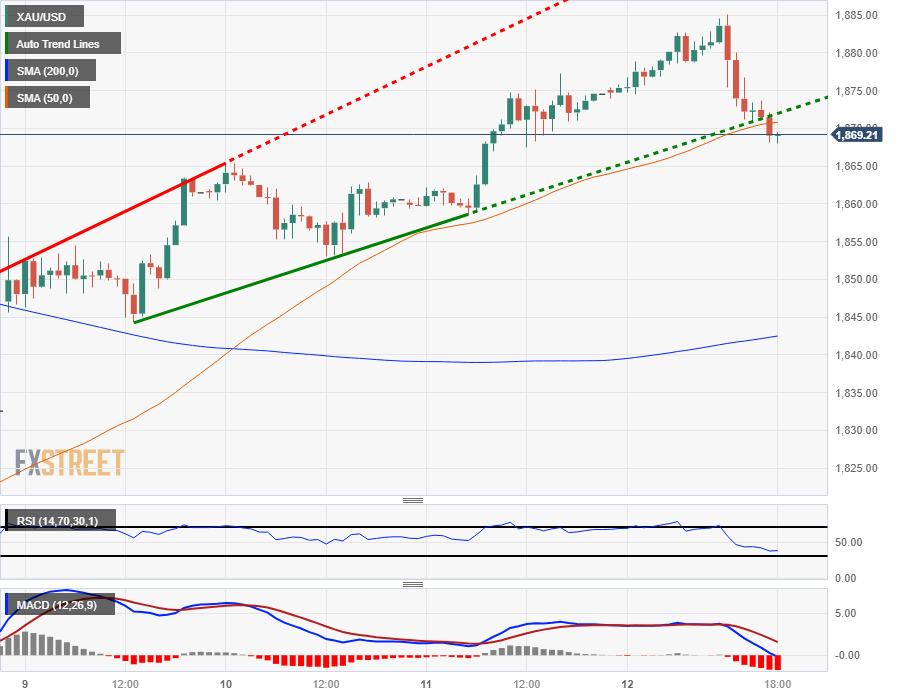
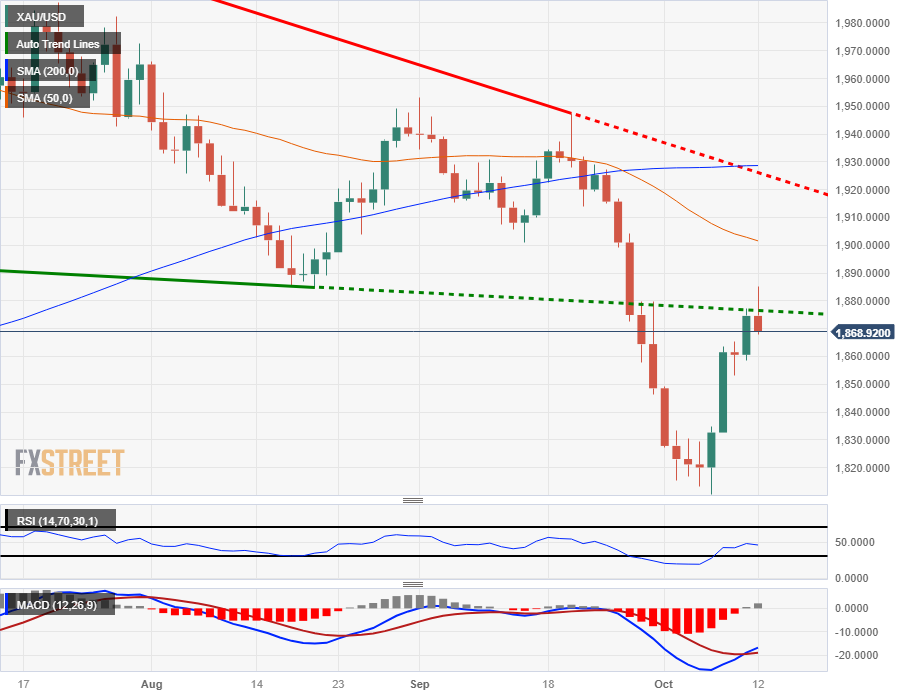
Intraday price action sees XAU/USD prices sliding into the 50-hour Simple Moving Average (SMA) as Gold bids tumble back to the near-term median, with the 200-hour SMA turning bullish into $1,842.
Gold prices remain overall well-bid in the medium term after catching a firm ride up the order sheets as Gold prices struggle to lift themselves from 2023's lows.
Daily candlesticks see spot Gold getting knocked off a recent swing high, with bids up over 3% from the last swing low of $1,810. The 50-day SMA is settling into $1,900 after a bearish cross of the 200-day SMA, which is floating just shy of $1,930.
XAU/USD Hourly Chart
XAU/USD Daily Chart
XAU/USD Technical Levels
- EUR/JPY down almost 0.3% for Thursday after broad-market risk appetite soured on US CPI inflation.
- Japan data broadly came in red on Wednesday, hobbling the JPY and limiting Yen upside.
- Euro traders will be looking ahead to ECB President Lagarde's speech on Friday.
The EUR/JPY is down around 0.5% from the day's highs, trading down below the 158.00 handle as markets rotate out of risk assets following a data-beat for the US Consumer Price Index (CPI) print that showed inflation continues to shrink much slower than investors are hoping for.
US CPI inflation holds steady at 3.7% in September vs. 3.6% forecast
With US inflation sticking higher than expected, market fears of the Federal Reserve (Fed) sticking to their higher-for-longer strategy on interest rates are back on the rise, and investors will now be keeping an eye out for an additional rate hike from the US central bank before the end of the year.
Japan's Producer Price Index (PPI) and Machinery Orders figures on Wednesday broadly missed the mark, with Japan PPI printing at a disappointing -0.3% for September against the forecast 0.1% uptick, and slipping further down from the previous month's 0.3%.
Machinery Orders for August also declined by 0.5%, an improvement from the previous reading of -1.1% but still far below the anticipated read of 0.4%.
With the dust settling after the US CPI inflation market-beater, Euro (EUR) traders will now be looking ahead to a speech on Friday from European Central Bank (ECB) President Christine Lagarde.
President Lagarde is due to take part in a joint-panel discussion at the World Bank Group and International Monetary Fund (IMF) annual meeting currently being held in Morocco. The panel is slated to be a discussion centered on the global economy, and investors will be keeping an ear out for any hints about the ECB's stance looking forward.
EUR/JPY Technical Outlook
Intraday action sees the EUR/JPY twisting around familiar levels, with the pair getting knocked back into the early week's trading range while a flat 200-hour Simple Moving Average (SMA) sits below current price action near 157.20.
On the daily candlesticks, the EUR/JPY remains constrained by the 50-day SMA, and continues to catch bids from the rising trendline from May's swing low into 145.00, and the ceiling on near-term bullish momentum remains the 159.00 major handle.
EUR/JPY Daily Chart

EUR/JPY Technical Levels
- The US Dollar is getting traction, with the DXY rising to weekly highs.
- US headline CPI from September came in at 3.7% YoY, beating expectations. The core measure decelerated to 4.1% as expected.
- The hot CPI boosted US yields, which are showing sharp increases.
The US Dollar (USD), measured by the DXY US Dollar Index, trades with nearly 0.50% gains driven by rising hawkish bets on the Federal Reserve (Fed) after the release of September’s Consumer Price Index (CPI) data from the US.
The United States economy is running hot, and the slightly higher-than-expected inflation reading reminds investors that the Fed is still data-dependent and that, in this case, they could consider another hike in the remainder of the year to combat the sticky inflation. The Federal Open Market Committee (FOMC) Minutes from the September meeting released on Wednesday noted this, showing that members are considering the data volatility and the lags of financial tightening in their decisions.
Daily Digest Market Movers: US Dollar regains momentum as US bond yields and hawkish Fed bets rise
- The DXY US Dollar Index gained momentum and rose to 106.30, a weekly high.
- The US Consumer Price Index (CPI) increased 3.7% YoY, which was higher than the market consensus of 3.6% and matched the previous monthly figure. On the other hand, the Core measure came in at 4.1% YoY, matching the expectations and decelerating from the previous 4.3% YoY.
- The September US Producer Price Index (PPI) rose 2.2% on Wednesday, higher than the expected 1.6% and accelerating from the previous 2%.
- U.S. bond yields are increasing across the board. The 2-year yield has climbed to 5.07%, marking a substantial rise of over 1.50%. Similarly, the 5-year and 10-year yields have surged to 4.64% and 4.66%, respectively, showing strong advances of nearly 2%.
- According to the World Interest Rates Possibilities (WIRP) tool, the odds of a 25 basis point hike (bps) by the Federal Reserve rose to nearly 50% for the December meeting.
Technical analysis: US Dollar Index’s bulls revive to retake 20-day SMA
The DXY US Dollar Index still displays a neutral to bearish technical outlook in the short term, according to the daily chart. Buyers need to build strong support over the 20-day Simple Moving Average (SMA), but they will still face challenges from the bears who gathered strong momentum in the last sessions. The Relative Strength Index (RSI) displays a positive slope above its middle-point, while the Moving Average Convergence Divergence (MACD) stands in negative territory.
Supports: 106.00 (20-day SMA), 105.80, 105.50.
Resistances: 106.50, 107.00, 107.30.
Fed FAQs
What does the Federal Reserve do, how does it impact the US Dollar?
Monetary policy in the US is shaped by the Federal Reserve (Fed). The Fed has two mandates: to achieve price stability and foster full employment. Its primary tool to achieve these goals is by adjusting interest rates.
When prices are rising too quickly and inflation is above the Fed’s 2% target, it raises interest rates, increasing borrowing costs throughout the economy. This results in a stronger US Dollar (USD) as it makes the US a more attractive place for international investors to park their money.
When inflation falls below 2% or the Unemployment Rate is too high, the Fed may lower interest rates to encourage borrowing, which weighs on the Greenback.
How often does the Fed hold monetary policy meetings?
The Federal Reserve (Fed) holds eight policy meetings a year, where the Federal Open Market Committee (FOMC) assesses economic conditions and makes monetary policy decisions.
The FOMC is attended by twelve Fed officials – the seven members of the Board of Governors, the president of the Federal Reserve Bank of New York, and four of the remaining eleven regional Reserve Bank presidents, who serve one-year terms on a rotating basis.
What is Quantitative Easing (QE) and how does it impact USD?
In extreme situations, the Federal Reserve may resort to a policy named Quantitative Easing (QE). QE is the process by which the Fed substantially increases the flow of credit in a stuck financial system.
It is a non-standard policy measure used during crises or when inflation is extremely low. It was the Fed’s weapon of choice during the Great Financial Crisis in 2008. It involves the Fed printing more Dollars and using them to buy high grade bonds from financial institutions. QE usually weakens the US Dollar.
What is Quantitative Tightening (QT) and how does it impact the US Dollar?
Quantitative tightening (QT) is the reverse process of QE, whereby the Federal Reserve stops buying bonds from financial institutions and does not reinvest the principal from the bonds it holds maturing, to purchase new bonds. It is usually positive for the value of the US Dollar.
- US September CPI YoY climbs to 3.7%, stirring the market and propelling USD/JPY towards 149.70.
- Odds for a December Fed rate hike jump to 35.7%, as per CME FedWatch Tool, amidst inflationary pressures.
- Japanese Machinery Orders dip for the second month, while BoJ Governor maintains economic outlook despite global uncertainties.
The USD/JPY rallies sharply following the US 10-year Treasury bond yield footsteps after the US Bureau of Labor Statistics (BLS) revealed that inflation jumped slightly in September, contradicting dovish stances adopted by US Federal Reserve officials ahead of the US CPI report. The USD/JPY is trading at at around 149.70.
US CPI data exceeds expectations, fueling a sharp rally in USD/JPY, as market eyes potential Fed rate hike
US inflation exceeded September estimates, revealed the US Bureau of Labor Statistics (BLS). The Consumer Price Index (CPI) rose by 3.7%, exceeding forecasts of 3.6%. annually based, where core CPI slowed to 4.1%, below forecasts, and August’s 4.3%. Following the data, US Treasury bond yields spiked and underpinned the USD/JPY pair, on speculations the US central bank would increase rates before year’s end.
Regarding this, the CME FedWatch Tool witnessed an increase in the odds for a 25 bps lift of the Fed by the December meeting, from 26.3% to 35.7%.
Additional data showed the labor market is getting into balance, but it remains hot, as unemployment claims rose 209K, below forecasts of 210K.
On the Japanese front, Machinery Orders fell for the second consecutive month in August, spurring worries about the global economic slowdown and China’s wobbly recovery. Aside from this, Bank of Japan Governor Kazuo Ueda said on Thursday there was no change to his view on the global economic outlook despite heightened uncertainty following the conflict in the Middle East.
USD/JPY Price Analysis: Technical outlook
From a technical standpoint, the USD/JPY uptrend is intact and could re-test the 150.00 figure in the near term. A breach of the latter will expose the last year’s high of 151.94. On the flip side, the fears of an intervention by Japanese authorities could cap the rally and expose the pair to some selling pressure. Key support levels are found at the psychological 149.00 mark, followed by the Tenkan-Sen level at 148.71.
- Spot Silver takes a knee after the US CPI inflation reading mangles investor risk appetite for Thursday.
- Risk appetite has soured and Silver's meager gains for Thursday have evaporated.
- Investors will be keeping an eye out for changes to the Fed's dot plot moving forward.
The XAG/USD slid below $21.80 on reaction to the US Consumer Price Index (CPI) inflation reading, kicking Silver prices back into the day's lows and sending bids down 2.2% from today's highs near $22.24.
US CPI inflation holds steady at 3.7% in September vs. 3.6% forecast
Investors are facing a fresh round of rate fears from the Federal Reserve (Fed), as still-high inflation that fails to wane as fast as investors hope for could see the US central bank get pushed into another rate hike before the end of 2023, and see interest rates hold "higher for longer" than markets previously estimated.
XAG/USD Technical Outlook
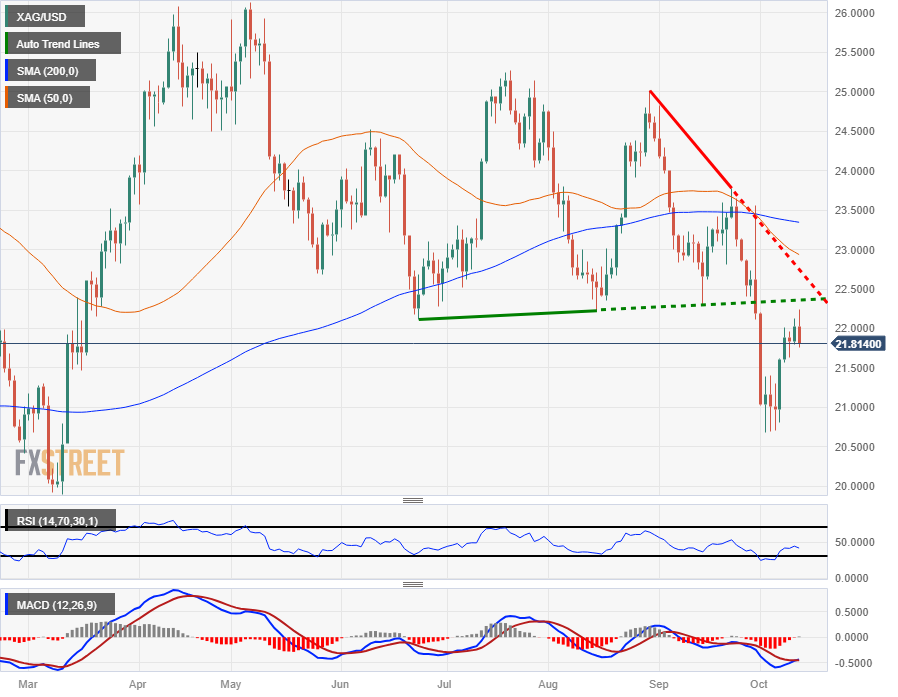
Silver spot tumbled from the $22.20 region into $21.80 on Thursday, and is heading into the 200-hour Simple Moving Average (SMA) near $21.50.
XAG/USD remains steeply off the year's highs of $26.14, and remains in the red from 2023's opening bids of $24.00. The last swing high on the daily candlesticks into $23.75 saw Silver shed the 200-day SMA and mark in a low of $20.68 for the year.
Thursday's bearish candle could see XAG/USD spark another bear run off of the descending trendline from late August's tops near $25.00.
XAG/USD Daily Chart
XAG/USD Technical Levels
- The Canadian Dollar is slumping against the US Dollar as markets scatter after a US CPI data beat.
- An uptick in US consumer prices is sending US Treasury yields higher as investors fear further Fed rate hikes.
- The Canadian Dollar finds little support in the inflation rush into safer assets.
The Canadian Dollar (CAD) has tumbled against the US Dollar (USD) on Thursday following a bumper reading for the US Consumer Price Index (CPI) inflation, sending the USD/CAD pair into 1.3670 as the DXY US Dollar Index soars in the US market session.
Economic data for Canada remains thin on the calendar, with nothing else in the pipe for the rest of the week.
Annual US CPI held steady in September, while investors were hoping for another tick lower.
With US inflation holding higher for longer than investors had expected, concerns that the Federal Reserve (Fed) could push further rate hikes down the chute are sending traders scattering into the safe haven of the USD, taking the broader market lower and sending the CAD into the week’s lows.
Daily Digest Market Movers: Canadian Dollar slumps in US CPI inflation flight
- US CPI inflation snubbed market expectations of further price cooling.
- US CPI inflation increased 0.4% for September on month, less than the 0.6% but above the market’s expected 0.3%.
- The annual figure into September also beat expectations, printing steady at 3.7% against the forecast of 3.6%.
- US Initial Jobless Claims also held steady at the previous week revised 209K versus the forecast 210K.
- Canadian data is absent from the rest of the week’s economic calendar after Wednesday’s Building Permits showed a surprise uptick to 3.4% against the anticipated 0.5% and the previous decline of 3.8%.
- Crude Oil prices are struggling to develop firm bids after US CPI data, further draining support for the Loonie.
- WTI Crude Oil rose towards $84.00 before falling back into the day’s midrange near $82.50 after US inflation figures sent the market into a tailspin.
Technical Analysis: Canadian Dollar slumps as investors pile into US Dollar, USD/CAD clears 1.3650
The USD/CAD pair is up 0.65% on Thursday into 1.3660, with the day’s high sitting close by at 1.3668, just north of the 200-hour Simple Moving Average (SMA).
The USD/CAD started Thursday with an early low at 1.3571, and the pair springboarded off near-term support from the 1.3580 level.
On the daily candlesticks, an extension of the USD’s bullish bounce will see the USD/CAD build out a push back into the month’s highs near 1.3775, with technical support propping up prices from the 50-day SMA currently rising into 1.3550.
Canadian Dollar FAQs
What key factors drive the Canadian Dollar?
The key factors driving the Canadian Dollar (CAD) are the level of interest rates set by the Bank of Canada (BoC), the price of Oil, Canada’s largest export, the health of its economy, inflation and the Trade Balance, which is the difference between the value of Canada’s exports versus its imports. Other factors include market sentiment – whether investors are taking on more risky assets (risk-on) or seeking safe-havens (risk-off) – with risk-on being CAD-positive. As its largest trading partner, the health of the US economy is also a key factor influencing the Canadian Dollar.
How do the decisions of the Bank of Canada impact the Canadian Dollar?
The Bank of Canada (BoC) has a significant influence on the Canadian Dollar by setting the level of interest rates that banks can lend to one another. This influences the level of interest rates for everyone. The main goal of the BoC is to maintain inflation at 1-3% by adjusting interest rates up or down. Relatively higher interest rates tend to be positive for the CAD. The Bank of Canada can also use quantitative easing and tightening to influence credit conditions, with the former CAD-negative and the latter CAD-positive.
How does the price of Oil impact the Canadian Dollar?
The price of Oil is a key factor impacting the value of the Canadian Dollar. Petroleum is Canada’s biggest export, so Oil price tends to have an immediate impact on the CAD value. Generally, if Oil price rises CAD also goes up, as aggregate demand for the currency increases. The opposite is the case if the price of Oil falls. Higher Oil prices also tend to result in a greater likelihood of a positive Trade Balance, which is also supportive of the CAD.
How does inflation data impact the value of the Canadian Dollar?
While inflation had always traditionally been thought of as a negative factor for a currency since it lowers the value of money, the opposite has actually been the case in modern times with the relaxation of cross-border capital controls. Higher inflation tends to lead central banks to put up interest rates which attracts more capital inflows from global investors seeking a lucrative place to keep their money. This increases demand for the local currency, which in Canada’s case is the Canadian Dollar.
How does economic data influence the value of the Canadian Dollar?
Macroeconomic data releases gauge the health of the economy and can have an impact on the Canadian Dollar. Indicators such as GDP, Manufacturing and Services PMIs, employment, and consumer sentiment surveys can all influence the direction of the CAD. A strong economy is good for the Canadian Dollar. Not only does it attract more foreign investment but it may encourage the Bank of Canada to put up interest rates, leading to a stronger currency. If economic data is weak, however, the CAD is likely to fall.
- US September CPI YoY ascends to 3.7%, surpassing estimates and keeping rate hike discussions alive.
- EUR/USD navigates through 1.0550 as the US Dollar gains momentum amidst inflationary pressures.
- ECB officials’ neutral stance contrasts with potential Fed policy shifts, adding tension to EUR/USD dynamics.
The Euro (EUR) tumbles more than 0.60% versus the Greenback (USD) following a hotter-than-expected US inflation report, which triggered the EUR/USD drop below the 1.0600 figure toward the 1.0550 region at the time of writing.
EUR/USD plummets below 1.0600, as US CPI data exceeds estimates, stirring the pot for potential Fed action
The US Bureau of Labor Statistics (BLS) reported that September’s Consumer Price Index (CPI) rose by 3.7% Yoy, exceeding estimates of 3.6%, and unchanged compared to the previous month. The same report revealed that core CPI rose by 4.1% annually, as analysts foreseen, trailed August’s 4.3%. Following the data, US Treasury bond yields rose, the US Dollar advanced, and equities dropped as market participants speculated that the US Federal Reserve would raise rates before the year’s end.
The CME FedWatch Tool witnessed an increase in the odds for a 25 bps lift of the Fed by the December meeting, from 26.3% to 35.7%.
Other data showed the US labor market remains hot after Initial Jobless Claims for the last week rose by 209K below forecasts of 210K, which, although coming to a tick lower, shows the jobs market is getting in balance.
Meanwhile, Fed officials remained dovish before the latest inflation data, which could trigger a reassessing of previous adopted postures before CPI release.
On the Eurozone (EU) front, central bank officials of the ECB had adopted a more neutral stance. On Wednesday, inflation figures from Germany plunged sharply, though it remains higher than the European Central Bn (ECB) 2% target.
EUR/USD Key Technical Levels
- USD/CHF increased to ahigh near 0.9070, up by more than 0.40%.
- US CPI from September came in higher than expected at 3.7% YoY.
- US yields recovered traction, and the US Dollar is finding demand.
In Thursday’s session, the USD/CHF traded with gains after six consecutive days of losses. Rising US Treasury yields amid a hot Consumer Price Index (CPI) reading from the US from September helped the green currency to find demand and hawkish bets on the Federal Reserve (Fed) rose. On the Swiss side, nothing relevant was released during the European session.
The US Bureau of Census Analysis reported that the September US Consumer Price Index (CPI) came in at 3.7% YoY, higher than the expected 3.6% but matched the previous monthly figure. The Core measure didn’t show any surprise and decelerated to 4.1%.
As a reaction, US bond yields are rising across the board. The 2-year rate rose to 5.07%, up by more than 1.50%, while the 5 and 10-year rates soared to 4.64% and 4.66%, respectively, with both advancing by nearly 2%. In that sense, they reflect that the markets are betting on a more aggressive Fed, and the World Interest Rate Possibilities (WIRP) tool indicates that the odds of a 25 bps hike by the Federal Reserve (Fed) have significantly risen and stand around 50%.
As expected, high-tier data, like inflation readings, will generate hawkish bets to rise and fall until the following November meeting by the Fed. The next data points to consider include the University of Michigan Consumer Sentinment index and Inflation expectations on Friday and Retail Sales figures from September next week.
USD/CHF Levels to watch
Observing the daily chart, the outlook is starting to tilt in favour of the bears but they still have some work to do. The Relative Strength Index (RSI) shows an ascending slope above its midline, while the Moving Average Convergence (MACD) prints stagnant red bars. On the other hand, the pair is below the 20-day Simple Moving Average (SMA) but above the 100 and 200-day SMAs, pointing towards the prevailing strength of the bulls in the larger context but in the meantime, the bears may gain additional ground.
Support levels: 0.9020 (200-day SMA), 0.9000, 0.8985.
Resistance levels: 0.9090 (20-day SMA), 0.9130, 0.9150.
USD/CHF Daily Chart
-638327238460451408.png)
- Mexican Peso falls 0.75%, as the USD/MXN hovers at around 17.95.
- Mexico's Industrial Production figures show a positive trajectory but fail to curb USD/MXN advance.
- Higher than expected US September CPI data and lower than expected unemployment claims reignites discussions about further Fed rate hikes.
Mexican Peso (MXN) loses ground against the US Dollar (USD) on Thursday after an inflation report from the United States (US) reignited speculations for another interest-rate hike by the US Federal Reserve (Fed). The data overshadowed Mexico’s economic data, which was upbeat but wasn’t enough to cap the USD/MXN advance towards the 17.89 area, posting gains of 0.37%.
Mexico’s Industrial Production rose in August as expected compared with the previous month, while annually it exceeded forecasts and July’s data. Later in the day, the Bank of Mexico (Banxico) will release its latest meeting minutes, in which the central bank held rates unchanged. On the US front, the September Consumer Price Index (CPI) was above estimates and unchanged compared to the previous month's data, implying that the recent slowdown in inflation is halting, while unemployment claims continued to show a solid labor market. The data bolstered the Greenback, and traders should be aware of developments linked to the Middle East conflict. Any escalation could shift market sentiment sour, thus benefiting the US Dollar.
Daily Digest Market Movers: Mexican Peso makes U-turn, depreciating after US CPI
- Mexico's Industrial Production (IP) for August improved by 5.2% YoY, exceeding forecasts of 4.6% and July’s 4.8% increase.
- On a monthly basis, IP in Mexico rose 0.3% as expected but trailed the previous 0.5% reading.
- The US Consumer Price Index increased 3.7% YoY in September, unchanged from August but above forecasts of 3.6%.
- US core CPI dipped as expected to 4.1% from 4.3% in August.
- Initial Jobless Claims in the US for the week ending October 7 came at 209K, below forecasts of 210K.
- The CME Group FedWatch Tool shows expectations for a 25 bps rate hike in December 2023 rose from 26.3% a day ago to 35.7%.
- The September US Producer Price Index (PPI) rose by 0.5% MoM, above estimates of 0.4%, while the core PPI expanded by 0.3%, exceeding forecasts of 0.2%.
- On an annual basis, the PPI rose by 2.2%, above forecasts and August’s figures, of 1.6% and 2%, respectively. The core PPI rate stood at 2.7%, exceeding projections and the prior month’s data.
- Mexico’s Consumer Price Index (CPI) grew by 4.45% YoY in September, slightly below the 4.47% estimated.
- The core CPI inflation in Mexico stood at a stickier 5.76% YoY, as widely estimated, but has broken below the 6% threshold.
- The Bank of Mexico (Banxico) held rates at 11.25% in September and revised its inflation projections from 3.5% to 3.87% for 2024, above the central bank’s 3% target (plus or minus 1%).
Technical Analysis: Mexican Peso weakens as USD/MXN buyers set sight at 18.00
The Mexican Peso depreciated after testing the 200-day Simple Moving Average (SMA) at 17.76, with the USD/MXN pair reaching a weekly low of 17.75. Still, it bounced on the release of US inflation data, towards 17.97, shy of reclaiming 18.00. If the exotic pair achieves a daily close above 18.00, that will form a ‘bullish engulfing’ candlestick pattern, comprised of the price action of Wednesday and Thursday, and could pave the way for further upside. If achieved, the next resistance would be 18.48. Conversely, failure to do it would expose the USD/MXN to selling pressure and challenge the 200-day SMA at 17.76 before testing the 20-day SMA at 17.61.
Mexican Peso FAQs
What key factors drive the Mexican Peso?
The Mexican Peso (MXN) is the most traded currency among its Latin American peers. Its value is broadly determined by the performance of the Mexican economy, the country’s central bank’s policy, the amount of foreign investment in the country and even the levels of remittances sent by Mexicans who live abroad, particularly in the United States. Geopolitical trends can also move MXN: for example, the process of nearshoring – or the decision by some firms to relocate manufacturing capacity and supply chains closer to their home countries – is also seen as a catalyst for the Mexican currency as the country is considered a key manufacturing hub in the American continent. Another catalyst for MXN is Oil prices as Mexico is a key exporter of the commodity.
How do decisions of the Banxico impact the Mexican Peso?
The main objective of Mexico’s central bank, also known as Banxico, is to maintain inflation at low and stable levels (at or close to its target of 3%, the midpoint in a tolerance band of between 2% and 4%). To this end, the bank sets an appropriate level of interest rates. When inflation is too high, Banxico will attempt to tame it by raising interest rates, making it more expensive for households and businesses to borrow money, thus cooling demand and the overall economy. Higher interest rates are generally positive for the Mexican Peso (MXN) as they lead to higher yields, making the country a more attractive place for investors. On the contrary, lower interest rates tend to weaken MXN.
How does economic data influence the value of the Mexican Peso?
Macroeconomic data releases are key to assess the state of the economy and can have an impact on the Mexican Peso (MXN) valuation. A strong Mexican economy, based on high economic growth, low unemployment and high confidence is good for MXN. Not only does it attract more foreign investment but it may encourage the Bank of Mexico (Banxico) to increase interest rates, particularly if this strength comes together with elevated inflation. However, if economic data is weak, MXN is likely to depreciate.
How does broader risk sentiment impact the Mexican Peso?
As an emerging-market currency, the Mexican Peso (MXN) tends to strive during risk-on periods, or when investors perceive that broader market risks are low and thus are eager to engage with investments that carry a higher risk. Conversely, MXN tends to weaken at times of market turbulence or economic uncertainty as investors tend to sell higher-risk assets and flee to the more-stable safe havens.
Nathan Janzen, Assistant Chief Economist at Royal Bank of Canada, assesses the latest inflation data from the US and how they could influence the Federal Reserve's policy outlook.
We don't expect additional rate hikes this year
"The substantial easing in US inflation pressures in recent months took a step back in September with year-over-year price growth holding steady at a 3.7% rate (in line with August but up from 3.2% in July and 3.0% in June.) That was slightly above market expectations ahead of the report."
"The Fed's 'supercore' (core services excluding home rent component) jumped 0.6% month-over-month, bringing the most recent three month annualized growth rate to 4.8% from 2.2% in August. A jump in hospital prices explains part of the upside surprise in September, but that ended a string of sub-pre-pandemic readings for that measure that started in June."
"Fed policymakers are wary of a reacceleration in price growth with the economy still running exceptionally hot. The September data follows a string of downside surprises that left a substantially softer-than-expected broader price growth backdrop over the summer - and the upside surprise in the latest month shouldn't be enough to change that broader narrative. But the Fed's pause in interest rate hikes is really a function of soft inflation prints allowing policymakers patience to wait for an exceptionally strong (and probably overheating) growth and labour market backdrop to cool. We don't expect additional interest rate hikes this year will be necessary, but the Fed is still willing to respond with higher interest rates were the inflation backdrop to show further signs of reacceleration."
- AUD/USD slips perpendicularly to 0.6350 as headline inflation remains higher due to rising gasoline prices.
- The monthly headline consumer inflation rose by 0.4% while investors forecasted a growth rate of 0.3%.
- Australia’s one-year forward consumer inflation expectations are seen rising to 4.8%, against the former release of 4.6%.
The AUD/USD pair drops vertically below the round-level support of 0.6400 as the United States inflation report for September showed that headline Consumer Price Index (CPI) rose more than expectations due to higher gasoline prices.
The S&P500 turns volatile after hot headline inflation data while core CPI softens as expected. The monthly headline consumer inflation rose by 0.4% while investors forecasted a growth rate of 0.3%. In August, the economic data grew by 0.6%.
Meanwhile, the underlying consumer prices expanded at a 0.3% pace as forecasted. The annual core CPI decelerated to 4.1% as expected. Last month, the economic data was recorded at 4.3%. The consistent decline in core inflation and deepening Middle East tensions are expected to allow the Federal Reserve (Fed) to keep the interest rates unchanged at 5.25-5.50%.
The US Dollar Index (DXY) soars to near 106.30 on expectations that progress on the road to price stability would slow. The 10-year US Treasury yields recovered losses and jumped to 4.62%. Meanwhile, Fed policymakers supported for keeping interest rates unchanged as rising US Treasury yields would decline spending and investment ahead.
Apart from that, weekly jobless claims remained almost unchanged last week. Individuals claimed jobless benefits for the week ending October 6 remained steady at 209K, a little lower than expectations of 210K.
On the Australian Dollar front, investors await one-year forward consumer inflation expectations which will be published on Friday. As per the expectations, the economic data is seen rising to 4.8%, against the former release of 4.6%. This could force Reserve Bank of Australia (RBA) policymakers to deliver one more interest rate hike by 25 basis points (bps) to 4.35% by the year-end.
- The US Dollar strengthens following a slight surprise in US consumer inflation.
- US Treasury yields soar, boosting USD/JPY to the highest level in six days.
- The pair is breaking out of a weekly range, opening the doors to the dangerous 150.00 area.
The USD/JPY rose from 149.20 to 149.48, reaching the highest level since Friday, following the release of US economic data. Although the inflation figure came in slightly above expectations, it triggered a strong market reaction, boosting the US Dollar. Wall Street Futures pulled back after the release of the numbers.
Inflation steady in September
The US Consumer Price Index (CPI) increased by 0.4% in September, surpassing the market consensus of 0.3%. The annual inflation rate stood at 3.7%. The Core CPI, which excludes volatile food and energy prices, also rose by 0.3%, in line with expectations. The annual Core CPI rate decreased from 4.3% in August to 4.1% in September. These figures were relatively close to expectations but adds to the surprise from Wednesday's Producer Price Index (PPI) report, which also exceeded expectations.
A different report indicated that Initial Jobless Claims totaled 209,000 in the week ending October 7, slightly below the market consensus of 210,000. These figures suggest that the labor market remains strong. The combination of persistent inflation above the target and a potentially tight labor market does not necessarily imply that the Federal Reserve will tighten monetary policy further, but it does suggest the possibility of high-interest rates for a longer period of time.
The outlook on rates weighed on Treasury bonds. The US 10-year bond yield jumped rose to 4.62% and the 2-year to 5.08%. The Japanese Yen lost ground versus the US Dollar but printed fresh daily highs versus its other G10 rivals as risk sentiment deteriorated.
The USD/JPY is hovering slightly below 149.50, attempting to break out of a range that has prevailed for more than a week. A consolidation above 149.50 would draw attention to the 150.00 area, which triggered sharp moves earlier in October. On the flip side, a decline below 149.00 would weaken the pair. Support levels below are seen at 148.50 and 148.20.
Technical levels
- Silver price faces some sell-off after US core inflation for September matched expectations.
- The headline CPI data rose marginally as global oil prices spiked gasoline rates.
- Silver price struggles to extend upside above the horizontal resistance plotted at $22.23.
Silver price (XAG/USD) faces selling pressure above $22 after the United States inflation report for September remained almost in line with expectations. The US Bureau of Labor Statistics reported that the core Consumer Price Index (CPI) grew by 0.3% as expected. The annual core CPI data softened to 4.1% from the former release of 4.3%, matching expectations.
The monthly headline CPI expanded at a higher pace of 0.4% while investors forecasted growth by 0.3%. Annualized headline inflation data remained steady at 3.7% against expectations of 3.6%. The headline CPI data rose marginally as global oil prices spiked gasoline rates and food products.
The US Dollar Index (DXY) delivered a vertical upside move after discovering strong buying interest near 105.50. The strength in the USD Index came as investors hoped that Federal Reserve (Fed) policymakers could turn hawkish about the interest rate outlook. A slowdown in progress in inflation declining toward 2% could elevate the hawkish Fed bets.
Meanwhile, the S&P500 opens on a marginally positive note as the market mood is still upbeat. Investors hope that the impact of the Israel-Hamas conflict will be limited if other Middle East nations don’t intervene.
Silver technical analysis
Silver price struggles to extend upside above the horizontal resistance plotted from August 15 low at $22.23 on a two-hour scale. Earlier, the white metal delivered a strong rally after a breakout of the Symmetrical Triangle chart pattern. The 20-period Exponential Moving Average (EMA) at $22.00 continues to provide support to the Silver price bulls.
The Relative Strength Index (RSI) (14) trades in the bullish range of 60.00-80.00, which indicates that the bullish momentum is already active.
Silver two-hour chart
-638327148638943582.png)
- US Consumer Price Index rises 0.4% in September, slightly above the 0.3% of market consensus.
- US Dollar rises across the board after consumer inflation figures.
- The EUR/USD drops almost 50 pips after the report, reaching two-day lows under 1.0600.
The US Dollar rose sharply, boosted by US inflation figures, leading to a downside movement in EUR/USD. The pair broke below 1.0600, tumbling to 1.0570, reaching a two-day low and moving away from the two-week high it reached earlier on Thursday at 1.0640.
The US Consumer Price Index (CPI) rose 0.4% in September, surpassing the consensus of 0.3%. The annual rate stood at 3.7%. The Core rate increased by 0.3%, in line with expectations, while the annual rate falling from 4.3% in August to 4.1% in September. Another report showed that Initial Jobless Claims totaled 209,000 in the week ended October 7, slightly below the market consensus of 210,000.
Markets reacted significantly to the slight surprise in inflation. The US Dollar Index (DXY) rose to 106.10, reaching a fresh daily high, and then pulled back modestly to 105.90. US Treasury Yields soared, with the 10-year reaching 4.61% and the 2-year 5.08%.
The EUR/USD tumbled to 1.0570, but then had a moderate recovery, rising to 1.0590. It remains far from the two-week high it hit earlier at 1.0640. The positive momentum of the US Dollar is fading ahead of Wall Street's opening bell.
Still looking at 1.0635
The EUR/USD rebounded from an upward trendline and is hovering around the 20-period Simple Moving Average (SMA) on the four-hour chart. A decline below 1.0570 could intensify bearish pressure, with the next support levels seen at 1.0555 and 1.0530.
On the upside, the immediate resistance stands at 1.0620, however, the crucial area is around 1.0635. A consolidation above this level would clear the way for further gains. The next resistance levels are at 1.0655, followed by the stronger level at 1.0670.
Technical levels
- Initial Jobless Claims in the US increased by 2,000 in the week ending October 7.
- Continuing Claims increased by 30,000 in the week ending September 30.
- US Dollar Index rose toward 106.00 after the data and consumer inflation figures.
There were 209,000 initial jobless claims in the week ending October 7, the weekly data published by the US Department of Labor (DOL) showed on Thursday. This reading matched last week’s print (revised from 207,000) and came in slightly better than the market expectation of 210,000. The 4-week moving average was 206,250, a decrease of 3,000.
Continuing claims rose by 30,000 in the week ending September 30 to 1.702 million, above market expectations of 1.68 million. It is the highest reading in six weeks.
Market reaction
At the same time, the US Consumer Price Index for September was released. The US Dollar rose across the board, boosted by higher-than-expected inflation figures. The DXY approached 106.00, up 0.23% for the day.
- USD/CHF drops vertically to near 0.9000 as the US Dollar remains soft.
- Investors expect that the impact of the Israel-Hamas conflict would be lower if more players do not intervene.
- The US PPI report remained hotter than anticipated due to higher gasoline and food prices.
The USD/CHF pair continues its six-day losing spell and drops to near the psychological support of 0.9000. A steep sell-off in the Swiss Franc asset came due to the soft US Dollar as investors are anticipating that the Federal Reserve (Fed) will keep interest rates unchanged in November. This would buy some time to assess the impact of interest rate hikes till done.
S&P500 futures added some decent gains in the London session, portraying cheerful market sentiment due to fading hawkish Fed bets. Also, investors expect that the impact of the Israel-Hamas conflict would be lower if more players do not intervene. Apart from that, Israel is not an oil-rich nation, therefore, the consequences on the oil price could be limited.
In addition to the correction in the US Dollar, the 10-year US Treasury yields also dropped to near 4.56% from multi-year highs. Investors should be prepared for a volatile action in the US Dollar as the US inflation data will be published at 12:30 GMT. The Producer Price Index (PPI) report for September, released on Wednesday, remained hotter than anticipated due to higher gasoline and food prices while prices of core goods and services declined at factory gates.
About the US consumer inflation, investors have forecasted that headline and core inflation grew by 0.3% on a monthly basis in September. The annual core Consumer Price Index (CPI) is seen declining to 4.1% from the former reading of 4.3%. The US CPI report for September will shape the monetary policy decision for the November meeting.
On the Swiss Franc front, investors await Producer and Import Prices, which will be published on Friday. The economic data could provide fresh impetus to the inflation outlook in the nation.
The accounts of the European Central Bank's (ECB) September policy meeting revealed on Thursday that some members of the Governing Council expressed a preference for maintaining key rates at current levels, per Reuters.
Key takeaways
"Solid majority of members expressed support for the 25 basis point rate increase."
"Emphasis was also placed on the upward revisions to the headline inflation projections for the first two years."
"Pause could give rise to speculation that the tightening cycle was over."
"Not hiking could also send a signal of the governing council being more concerned about the economy and a potential recession than too high inflation."
"Having been able to keep inflation expectations anchored, despite the long period in which inflation had been above target, was seen as a major achievement."
"Deposit facility rate in the region of 3.75% to 4.00%, as long as it was understood as being maintained for a sufficiently long duration, should be consistent with a return of inflation to target."
"Decision between raising rates and pausing was a close call, and that tactical considerations also played a role."
"A range of model-based simulations suggested that a deposit facility rate in the region of 3.75% to 4.00% should be consistent with a return of inflation to target."
Market reaction
EUR/USD largely ignore this publication and was last seen trading flat on the day slightly above 1.0600.
- The Greenback already lost over 1.6% of its value in October.
- All eyes are on US CPI numbers later this Thursday.
- The US Dollar Index settles below 106 and is looking for support.
The US Dollar (USD) is at a crucial point in terms of positions as its summer rally quite abruptly came to a halt and took a turn for the worse. The US Dollar was unable to advance substantially on Monday when risk-off sentiment was the main theme in the aftermath of the Israel-Hamas conflict. Since then the Greenback has been retreating, and the slew of Fed speakers this week that believe the Fed is done hiking are pouring only more oil to the fire.
Traders could send the Greenback lower again with the US Consumer Price Index (CPI) numbers that will be released this Thursday. Overall expectations are for the numbers to decline further. This would confirm the recent calls from individual Fed members not to hike anymore and might send the US Dollar Index (DXY) substantially lower.
Daily digest: US Dollar is a wounded animal
- At 12:30 GMT, the CPI numbers will be released: The overall monthly index is expected to fall from 0.6% to 0.3%. The overall yearly gauge is expected to decline from 3.7% to 3.6%. The core, meaning without food and energy in the price basket, monthly index is expected to stay steady at 0.3%. The yearly core CPI will head from 4.3% to 4.1%.
- Additionally, around that same time the Initial and Continuing Jobless Claims will appear. The Initial claims are expected to head from 207,000 to 210,000. The Continuing Claims are forecast to move from 1.664 million to 1.68 million.
- The US Treasury will auction a 4-week bill and a 30-year bond.
- Equities are soaring with several indices jumping back in the green for their year-to-date performance. Should the US Dollar retreat further, expect to see even more support come in for equities.
- The CME Group FedWatch Tool shows that markets are pricing in an 88.3% chance that the Federal Reserve will keep interest rates unchanged at its meeting in November.
- The benchmark 10-year US Treasury yield is sinking lower to 4.54%. The lowest level in nearly 10 days.
US Dollar Index technical analysis: CPI to deliver the kill shot today?
The US Dollar has started to look bleak, and any chance for a quick recovery is hanging by a thread. Only a tick up in US inflation numbers could do the trick, although the current outlook does not really support that possibility. It looks inevitable that the US Dollar Index (DXY) will need to look further down in order to find ample support before having a possible recovery bounce.
For a second day in a row, the DXY opens below 106, which means that this level will be the first initial hurdle to recapture. On the topside, 107.19 is important to reach if the DXY can get a daily close above that level. If this is the case, 109.30 is the next level to watch.
On the downside, the recent resistance at 105.88 did not do a good job supporting any downturn. Instead, look for 105.12 to keep the DXY above 105.00. If that does not do the trick, 104.33 will be the best level to look for some resurgence in US Dollar strength with the 55-day Simple Moving Average (SMA) as a support level.
Inflation FAQs
What is inflation?
Inflation measures the rise in the price of a representative basket of goods and services. Headline inflation is usually expressed as a percentage change on a month-on-month (MoM) and year-on-year (YoY) basis. Core inflation excludes more volatile elements such as food and fuel which can fluctuate because of geopolitical and seasonal factors. Core inflation is the figure economists focus on and is the level targeted by central banks, which are mandated to keep inflation at a manageable level, usually around 2%.
What is the Consumer Price Index (CPI)?
The Consumer Price Index (CPI) measures the change in prices of a basket of goods and services over a period of time. It is usually expressed as a percentage change on a month-on-month (MoM) and year-on-year (YoY) basis. Core CPI is the figure targeted by central banks as it excludes volatile food and fuel inputs. When Core CPI rises above 2% it usually results in higher interest rates and vice versa when it falls below 2%. Since higher interest rates are positive for a currency, higher inflation usually results in a stronger currency. The opposite is true when inflation falls.
What is the impact of inflation on foreign exchange?
Although it may seem counter-intuitive, high inflation in a country pushes up the value of its currency and vice versa for lower inflation. This is because the central bank will normally raise interest rates to combat the higher inflation, which attract more global capital inflows from investors looking for a lucrative place to park their money.
How does inflation influence the price of Gold?
Formerly, Gold was the asset investors turned to in times of high inflation because it preserved its value, and whilst investors will often still buy Gold for its safe-haven properties in times of extreme market turmoil, this is not the case most of the time. This is because when inflation is high, central banks will put up interest rates to combat it.
Higher interest rates are negative for Gold because they increase the opportunity-cost of holding Gold vis-a-vis an interest-bearing asset or placing the money in a cash deposit account. On the flipside, lower inflation tends to be positive for Gold as it brings interest rates down, making the bright metal a more viable investment alternative.
Analysts at BBH note that Federal Reserve officials have been sounding cautious regarding further policy tightening.
Fed doves will end up eating their words
"This cautiousness was reflected in FOMC minutes. The minutes show that "A majority of participants judged that one more increase in the target federal-funds rate at a future meeting would likely be appropriate, while some judged it likely that no further increases would be warranted." Some officials said the Fed’s focus "should shift from how high to raise the policy rate to how long to hold the policy rate at restrictive levels." Lastly, "Participants generally judged that, with the stance of monetary policy in restrictive territory, risks to the achievement of the committee's goals had become more two-sided." While the decision was seen as a hawkish hold cut to the unexpected shift in the Dot Plots, the minutes suggest a much more balanced view was taken at that meeting."
"That said, Fed tightening expectations remain too low. If those expectations fell because higher US yields would do the heavy lifting, shouldn't those expectations rise now that yields have fallen sharply? Yet they haven't as WIRP suggests odds of a hike November 1 still remain near 10% and rise to only 30% for December 13. The market and the Fed can't have it both ways and we think the Fed doves will end up eating their words. Once again, the market is very wrong about the Fed, as it's been this whole cycle. The first Fed cut has been moved forward to June from July previously, which is also wrong."
- Natural Gas prices trade sideways near $3.63.
- The US Dollar eases further as the bond market and US Fed officials provide headwinds for the Greenback.
- US Natural Gas prices could reach $4, though the probability gets smaller by the day.
Natural Gas prices are going sideways after heading higher on the back of supply worries stemming from tensions surrounding the Israel-Hamas conflict. The closure of the Tamar gas field should not be an issue as European gas storage is at 97% capacity. This should mean that demand will remain low and might even go lower, counter-balancing the risk of supply issues due to the Tamar gas field closure and possible labor strikes in Australia.
Meanwhile, the US Dollar (USD) is at a crucial point in terms of positions as its summer rally quite abruptly came to a halt and took a turn for the worse. The US Dollar was unable to advance substantially on Monday when risk-off sentiment was the main theme in the aftermath of the Israel-Hamas conflict. Since then the Greenback has been retreating, and the slew of Fed speakers this week that believe the Fed is done hiking are pouring only more oil on the fire.
Natural Gas is trading at $3.57 per MMBtu at the time of writing.
Natural Gas news and market movers
- Overall gas demand out of Europe is set to remain subdued as European gas storage is filled nearly to the brim, at 97% capacity,, the highest level on record at this period of time.
- Norwegian gas supply to the UK and Europe soared and was performing 11% above its normal 5-day moving average.
- Gazprom is gearing up to make several offers to China when President Xi Jinping will head to Russia to meet with President Vladimir Putin next week. Gazprom is in dire need of a replacing market as the end of European gas demand has left a big hole in its export and profit numbers.
- Near 14:30 GMT, the weekly Natural Gas Storage Changes for the first week of October will be released. Expectations are for another build as reserves are set to head from 86 billion cubic feet to 88 billion cubic feet of natural gas.
Natural Gas Technical Analysis: Any uprising will be difficult from here
Natural Gas needs some cooling after its price action shot through the roof with fears of a proxy war in the highly sensitive oil region of the Middle East. As several comments came out from national leaders, a broader war does not seem to be at hand at this point, and risk premiums were due to be priced out quite quickly. With gas supply storage in Europe filled to the brim, global demand will not rise substantially, and thus gas prices might see some easing from here while the Relative Strength Index (RSI) can slide back to more normal levels from being overbought at the moment.
With the firm peak and breakthrough out of the trend channel, it will be crucial that the upper band of that same trend channel acts as support. There aren’t any significant resistance levels except for $3.65, the peak of January 17. From there, the high of 2023 near $4.3080 comes into play.
On the downside, the trend channel needs to act as support near $3.30. In case this breaks down again, Natural Gas prices could sink to $.3.07, with that orange line identified from the double top around mid-August. Should the drop become a broader sell-off, prices could sink below $3 toward $2.85, near the 55-day Simple Moving Average.
-638326946396925570.png)
XNG/USD (Daily Chart)
Gold FAQs
Why do people invest in Gold?
Gold has played a key role in human’s history as it has been widely used as a store of value and medium of exchange. Currently, apart from its shine and usage for jewelry, the precious metal is widely seen as a safe-haven asset, meaning that it is considered a good investment during turbulent times. Gold is also widely seen as a hedge against inflation and against depreciating currencies as it doesn’t rely on any specific issuer or government.
Who buys the most Gold?
Central banks are the biggest Gold holders. In their aim to support their currencies in turbulent times, central banks tend to diversify their reserves and buy Gold to improve the perceived strength of the economy and the currency. High Gold reserves can be a source of trust for a country’s solvency. Central banks added 1,136 tonnes of Gold worth around $70 billion to their reserves in 2022, according to data from the World Gold Council. This is the highest yearly purchase since records began. Central banks from emerging economies such as China, India and Turkey are quickly increasing their Gold reserves.
How is Gold correlated with other assets?
Gold has an inverse correlation with the US Dollar and US Treasuries, which are both major reserve and safe-haven assets. When the Dollar depreciates, Gold tends to rise, enabling investors and central banks to diversify their assets in turbulent times. Gold is also inversely correlated with risk assets. A rally in the stock market tends to weaken Gold price, while sell-offs in riskier markets tend to favor the precious metal.
What does the price of Gold depend on?
The price can move due to a wide range of factors. Geopolitical instability or fears of a deep recession can quickly make Gold price escalate due to its safe-haven status. As a yield-less asset, Gold tends to rise with lower interest rates, while higher cost of money usually weighs down on the yellow metal. Still, most moves depend on how the US Dollar (USD) behaves as the asset is priced in dollars (XAU/USD). A strong Dollar tends to keep the price of Gold controlled, whereas a weaker Dollar is likely to push Gold prices up.
- The oil price discovers buying interest as Saudi Arabia will continue with voluntary cuts despite deepening Middle East tensions.
- Risks of a tight oil market persist as an intervention from Iran in the conflict would be followed by sanctions on Iranian oil by the US.
- WTI stays below the 61.8% Fibo retracement, which is around $83.88
West Texas Intermediate (WTI), futures on NYMEX, rebound after a steep correction to near $82.00 in the London session. The oil price attempts recovery as Saudi Arabia’s Energy Minister Prince Abdulaziz bin Salman said on Thursday, “We will continue voluntary cuts until year’s end.”
On Wednesday, the oil price dropped sharply as investors anticipated that the impact of the Israel-Hamas conflict would be limited as Israel is not a major oil exporter. While risks of a tight oil market remain persistent as the intervention from Iran in the conflict would be followed by sanctions on Iranian oil by the United States. This would tighten the already tight oil market further.
Going forward, investors will focus on the official weekly inventory data to be reported by the US Energy Information Administration (EIA) for the week ending October 6. On Wednesday, the American Petroleum Institute (API) reported a strong build-up of oil stockpiles by almost 13 million barrels.
The US Dollar Index (DXY) found an intermediate cushion near 105.50 as investors turned cautious ahead of the US inflation data. As per the consensus, monthly headline and core inflation rose by 0.3% in September.
WTI trades below the 61.8% Fibonacci retracement (plotted from August 24 low at $77.53 to September 28 high around $94) at $83.88 on a four-hour scale. The 20-period Exponential Moving Average (EMA) at $83.5 is acting as a barricade for the oil price bulls.
The Relative Strength Index (RSI) (14) rebounds into the 40.00-60.00 range, which signals a consolidation ahead.
A fresh upside would appear if the oil price breaks above the 50% Fibo retracement at $85.80, which would drive the asset toward September 26 low at $87.74, followed by the psychological resistance at $90.00.
In an alternate scenario, a breakdown below October 6 low at $80.63 would expose the asset to August 29 low at $79.21 and August 24 low at $77.53.
WTI four-hour chart
-638327026034432262.png)
- Gold price holds gains tightly as Fed policymakers support an unchanged monetary policy ahead.
- The US Dollar reported bearish closes six times in a row as hawkish Fed bets wane.
- Investors await the US inflation data, which is expected to fall further.
Gold price (XAU/USD) clings to gains backed by a correction in the US Dollar and Treasury yields, which are due to falling expectations of one more interest rate increase from the Federal Reserve (Fed). The precious metal remains upbeat ahead of the Consumer Price Index (CPI) data for September, which will be published at 12:30 GMT.
While the majority of Fed policymakers favored an additional interest rate hike ahead as per FOMC minutes, rising long-term Treasury yields have forced them to support keeping interest rates steady. Higher bond yields are expected to slow down the pace of spending and investment. At this point of time, when inflation is consistently falling and Middle East tensions are deepening, risks of under-tightening would be lower than the consequences of tightening too much.
Daily Digest Market Movers: Gold price remains strong as US yields decline from peak
- Gold price extends recovery close to $1,880 as investors are expecting that the Federal Reserve will not raise interest rates further in the remainder of 2023.
- Rising expectations for the Fed keeping interest rates unchanged at 5.25-5.50% are backed by multi-year highs in long-term US Treasury yields, which are sufficient to squeeze spending and investment ahead.
- The 10-year US Treasury yield corrects from recent highs of 4.7% as the deepening Israel-Hamas conflict has also contributed to the decline in expectations of further policy-tightening.
- While investors see the Fed keeping interest rates steady ahead, policymakers have a different approach to the interest rate outlook.
- Atlanta Fed Bank President Raphael Bostic said on Tuesday that current monetary policy is sufficiently restrictive and inflation will come down to 2% without triggering a recession.
- Fed policymakers: San Francisco Fed Bank President Mary Daly and Dallas Fed Bank President Lorie Logan warned that higher long-term US Treasury yields could substitute the need of further interest rate hikes by making borrowing expensive. Fed’s Daly said that risk of under-tightening would be lower than the risk of raising rates too much.
- Fed Governor Michelle Bowman reiterated on Wednesday that further rate hikes are highly required to restore price stability despite some progress in inflation softening.
- Fed’s Bowman further added that after raising interest rates they should be kept higher for a longer period due to persistent risks of inflation amid robust consumer spending and upbeat labor market conditions.
- The US Dollar Index (DXY) extends its correction to near 105.50 despite a hot producer inflation report, released on Wednesday.
- The US Bureau of Labor Statistics reported that the September monthly headline Producer Price Index (PPI) rose at a higher pace of 0.5% vs. expectations of 0.4% and that core PPI grew by 0.3% against the estimates of 0.2%. On an annualized basis, the prices of core goods and services at factory gates jumped to 2.7%, above the 2.3% consensus.
- A surprisingly hot PPI report has improved the inflation outlook. For more clarity, investors will focus on the Consumer Price Index (CPI) data for September, which will be published at 12:30 GMT.
- As per the estimates, the monthly headline and core inflation are expected to register growth of 0.3%. Rising energy prices due to rallying global oil prices amid tight supply may result in sustained growth ahead. The impact of the rise in headline inflation would be limited to the interest rate plot.
- Annual headline and core inflation are seen declining to 3.6% and 4.1%, respectively. A surprisingly hot inflation report could set a hawkish undertone for the Fed’s monetary policy in November.
- The Federal Open Market Committee (FOMC) minutes for September released on Wednesday conveyed that a majority of policymakers at that meeting were in favor of one additional interest rate hike and keeping them restrictive for a longer period.
Technical Analysis: Gold price climbs close to $1,880
Gold price jumps to near $1,880.00 on Thursday as hawkish Fed bets swiftly fade away. The precious metal registers a fresh two-week high and is gathering strength for further upside. The yellow metal climbs above the 20-day Exponential Moving Average (EMA) around $1,872.00, which indicates that the short-term trend has turned bullish. The broader Gold price outlook is bearish as the 50 and 200-day EMAs have already delivered a Death Cross.
Inflation FAQs
What is inflation?
Inflation measures the rise in the price of a representative basket of goods and services. Headline inflation is usually expressed as a percentage change on a month-on-month (MoM) and year-on-year (YoY) basis. Core inflation excludes more volatile elements such as food and fuel which can fluctuate because of geopolitical and seasonal factors. Core inflation is the figure economists focus on and is the level targeted by central banks, which are mandated to keep inflation at a manageable level, usually around 2%.
What is the Consumer Price Index (CPI)?
The Consumer Price Index (CPI) measures the change in prices of a basket of goods and services over a period of time. It is usually expressed as a percentage change on a month-on-month (MoM) and year-on-year (YoY) basis. Core CPI is the figure targeted by central banks as it excludes volatile food and fuel inputs. When Core CPI rises above 2% it usually results in higher interest rates and vice versa when it falls below 2%. Since higher interest rates are positive for a currency, higher inflation usually results in a stronger currency. The opposite is true when inflation falls.
What is the impact of inflation on foreign exchange?
Although it may seem counter-intuitive, high inflation in a country pushes up the value of its currency and vice versa for lower inflation. This is because the central bank will normally raise interest rates to combat the higher inflation, which attract more global capital inflows from investors looking for a lucrative place to park their money.
How does inflation influence the price of Gold?
Formerly, Gold was the asset investors turned to in times of high inflation because it preserved its value, and whilst investors will often still buy Gold for its safe-haven properties in times of extreme market turmoil, this is not the case most of the time. This is because when inflation is high, central banks will put up interest rates to combat it.
Higher interest rates are negative for Gold because they increase the opportunity-cost of holding Gold vis-a-vis an interest-bearing asset or placing the money in a cash deposit account. On the flipside, lower inflation tends to be positive for Gold as it brings interest rates down, making the bright metal a more viable investment alternative.
While speaking on the sidelines of the annual International Monetary Fund (IMF) meeting on Thursday, Bank of England Chief Economist Huw Pill said it was a finely balanced issue whether the Bank of England needed to tighten the policy further, per Reuters.
"We have done a lot over the last two years. A lot of that policy is still to come through," Pill explained.
"Whether we've done enough - or whether we have more to do - I think is becoming a more finely balanced issue," he added and reiterated that they will do what they need to do to have inflation at 2% on a lasting basis.
Market reaction
GBP/USD showed no immediate reaction to these comments and the pair was last seen moving sideways in a narrow channel at around 1.2300.
- NZD/USD faces selling pressure near 0.6040 as the US Dollar rebounds ahead of inflation data.
- The market mood is still upbeat as the Fed is expected to keep interest rates unchanged at 5.25-5.50%.
- NZD/USD rebounded quickly after discovering buying interest near the support zone placed in a range of 0.5850-0.5870.
The NZD/USD pair dropped to near the psychological support of 0.6000 after facing selling pressure near 0.6040 in the European session. The Kiwi asset was offered as the US Dollar Index (DXY) discovered an interim support near 105.00.
The market mood is still upbeat as the Federal Reserve (Fed) is expected to keep interest rates unchanged at 5.25-5.50% due to rising US bond yields. Meanwhile, investors await the United States Consumer Price Index (CPI) data for September, which will be published at 12:30 GMT.
As per the estimates, monthly headline and core inflation grew at a 0.3% pace. The annualized core CPI data is seen softening to 4.1% against the 4.3% reading from August. The hot inflation report would set a hawkish tone for the Federal Reserve’s (Fed) monetary policy meeting in November.
Meanwhile, the New Zealand Dollar is expected to remain on the tenterhooks ahead of the general elections. A new political power is expected to run the island nation which will face challenges of weak economic outlook and high inflation.
NZD/USD rebounded quickly after discovering buying interest near the support zone placed in a range of 0.5850-0.5870 on a four-hour scale. The upside in the kiwi asset remains restricted near the horizontal resistance plotted from September 29 high at 0.6050. The major stabilizes above the 50-period Exponential Moving Average (EMA) at 0.5980, which indicates that the medium-term trend has turned bullish.
The Relative Strength Index (RSI) (14) drops into the 40.00-60.00 range, which indicates that the bullish impulse has faded while the upside bias is still intact.
Going forward, a decisive break above September 29 high around 0.6050 would drive the major toward August 09 high at 0.6096. A breach of the latter would send the major toward July 31 high at 0.6226
On the flip side, a breakdown below the round-level support of 0.5900 would drag the major toward September 7 low at 0.5847. A slippage below the latter would expose the asset to the round-level support at 0.5800.
NZD/USD four-hour chart
-638326987459584341.png)
- USD/CAD faces a key barrier at the 1.3600 psychological level.
- MACD indicator suggests a momentum shift towards a bearish trend.
- The weekly low at 1.3569 appears as the support following the 38.2% Fibonacci retracement.
USD/CAD struggles to extend gains due to the improved Crude oil prices, trading around 1.3590 during the European session on Thursday. The pair is moving sideways ahead of inflation data from the United States (US).
The major level at 1.3600 acts as immediate resistance, aligning with the seven-day Exponential Moving Average (EMA) at 1.3608.
A decisive break above the level could contribute to support for the pair to explore the area around the psychological level at 1.3650, followed by the weekly high at 1.3672 level.
On the downside, the USD/CAD pair could find support near the weekly low at 1.3569 lined up with a 1.3550 major level, followed by the 38.2% Fibonacci retracement at 1.3520.
The Moving Average Convergence Divergence (MACD) line lies above the centerline indicating that the short-term average is above the long-term average. However, a noteworthy development is observed as the line diverges below the signal line, signaling a potential shift in momentum toward a bearish trend.
However, the USD/CAD pair maintains a prevailing bullish momentum, underscoring a stronger bias. This is evidenced by the 14-day Relative Strength Index (RSI) holding above the 50 level.
USD/CAD: Daily Chart
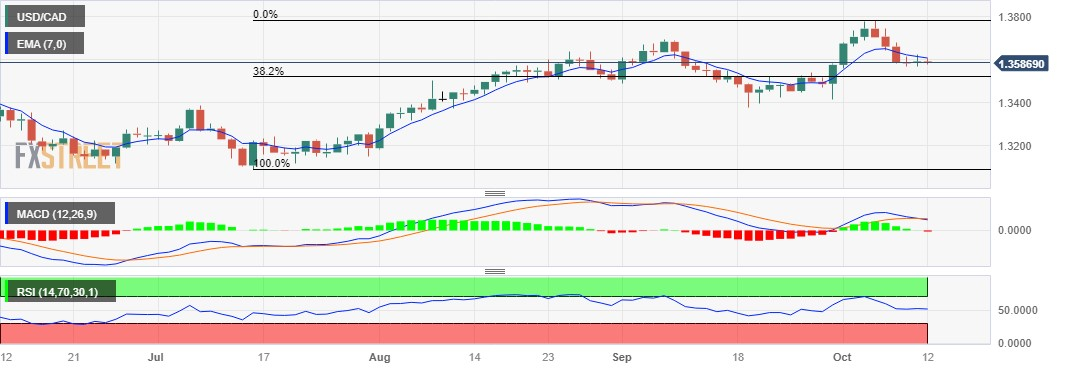
European Central Bank (ECB) Governing Council member and Bank of France President, Francois Villeroy de Galhau, said on Thursday that “Monetary patience is more important than activism at present.”
Additional takeaways
Duration more important than level.
If we can ensure a soft-landing it's a much better route.
Market reaction
The ECB commentary fails to have any impact the Euro, as EUR/USD keeps its range at around 1.0620 so far this Tuesday.
European Central Bank (ECB) policymaker, Pierre Wunsch, made some comments on the interest rate and inflation outlook on Thursday.
Key quotes
Maybe we've reached the peak in interest rates.
If inflation meets forecast, then no more rate hikes are needed.
Backs reopening discussion on PEPP timetable.
We have to live with current uncertainty.
Oil prices are an upside risk to inflation.
Market reaction
At the time of writing, EUR/USD is keeping its sideways momentum intact near 1.0620, almost unchanged on the day.
In its monthly oil market report, the International Energy Agency (IEA) raised the global oil demand growth forecast for 2023 while downgrading it for the next year.
Key takeaways
2024 global oil demand growth forecast cut to 880k bpd (previously 1 million bpd).
Harsher economic conditions and energy efficiency improvements.
Recent oil price pullback reflects demand destruction.
2023 global oil demand growth forecast bumped up to 2.3 million bpd (previously 2.2 million bpd).
Cites less worse conditions in China, India, and Brazil.
Market reaction
WTI is challenging daily highs near $83.10 on the above findings, adding 1.11% on the day.
“Sharp further tightening of financial conditions could hit banks, non-banks,” warned International Monetary Fund (IMF) Director Kristalina Georgieva on Thursday.
Additional quotes
Global economy experiencing severe shocks that are the new normal.
We are faced with deepening divergence in global economy.
Inflation down but still above target in many countries, so interest rates will have to stay higher for longer.
We need to boost medium-term growth; we don't have growth we need to heal from impact of various shocks.
Smartly packaged reforms can boost growth by as much as 8% over four years in a number of countries.
Speaking on Thursday, European Central Bank (ECB) Governing Council member and Bank of Portugal Governor, Mario Centeno, said that ”the current stance will get inflation to the target.”
Additional quotes
We need to be predictable on policy.
I don't see the Israel conflict affecting data yet.
We need to preserve labor market stability.
We need to monitor the price of oil.
We need to be nimble in adjusting policy to data.
Market reaction
EUR/USD was last seen trading at 1.0621, modestly flat on the day. The pair is off the three-week high heading into the US Consumer Price Index (CPI) data release.
Analysts at Danske Bank offer a brief preview of Thursday's release of the crucial US consumer inflation figures for September, due later during the early North American session.
Key Quotes:
“We forecast both headline and core CPI below consensus expectations at +0.2% in m/m SA terms (consensus 0.3%). The energy price contribution remains positive and used car prices have edged slightly higher lately, but the shelter component continues to put downward pressure on inflation figures. Gradually cooling wage growth points towards further easing in core services CPI excl. shelter as well, which remains the key point of focus for the Fed.”
“The FOMC minutes were much in line with expectations stating that policy should remain 'sufficiently restrictive' for some time to return inflation to 2%. Most members saw one more hike as most likely going ahead, but data dependence and a cautious approach going forward was clearly underscored as the guiding principles. Markets price only a small chance of another Fed hike, which we agree with as we believe the Fed is done. Still data on inflation and employment will be key for whether the Fed decides to add another hike or not.”
- Silver gains some follow-through traction on Thursday and advances to a near two-week high.
- The technical setup warrants some caution for bulls and before positioning for additional gains.
- Weakness below the $21.60-55 area will suggest that the recovery momentum has lost steam.
Silver scales higher for the second successive day on Thursday – also marking the fourth day of a positive move in the previous five – and touches a near two-week high during the early part of the European session. The white metal, however, remains below the $22.30 strong horizontal support breakpoint, now turned resistance, warranting some caution for bullish traders.
Moreover, neutral technical indicators on the daily chart make it prudent to wait for some follow-through buying beyond the aforementioned support-turned-resistance before positioning for any further appreciating move. The subsequent short-covering rally should allow the XAG/USD to reclaim the $23.00 mark. The momentum could get extended further towards challenging the very important 200-day Simple Moving Average (SMA), currently pegged around the $23.35 area.
The latter should act as a key pivotal point, which if cleared decisively will suggest that the XAG/USD has bottomed out in the near term and pave the way for an extension of the recent recovery move witnessed over the past week or so. The white metal might then climb to the $23.75-$23.80 region (September 22 high) en route to the $24.00 round figure and the $24.30-$24.35 hurdle.
On the flip side, the $21.85-$21.80 zone now seems to have emerged as an immediate strong support. The next relevant support is pegged near the $21.60-$21.55 region, or the weekly low. Some follow-through selling could drag the XAG/USD back towards a multi-day-old trading range resistance breakpoint, now turned support, around the $21.3-$21.30 region en route to the $21.00 round figure mark and a near seven-month low, around the $20.70-$20.65 region touched last week.
Silver daily chart
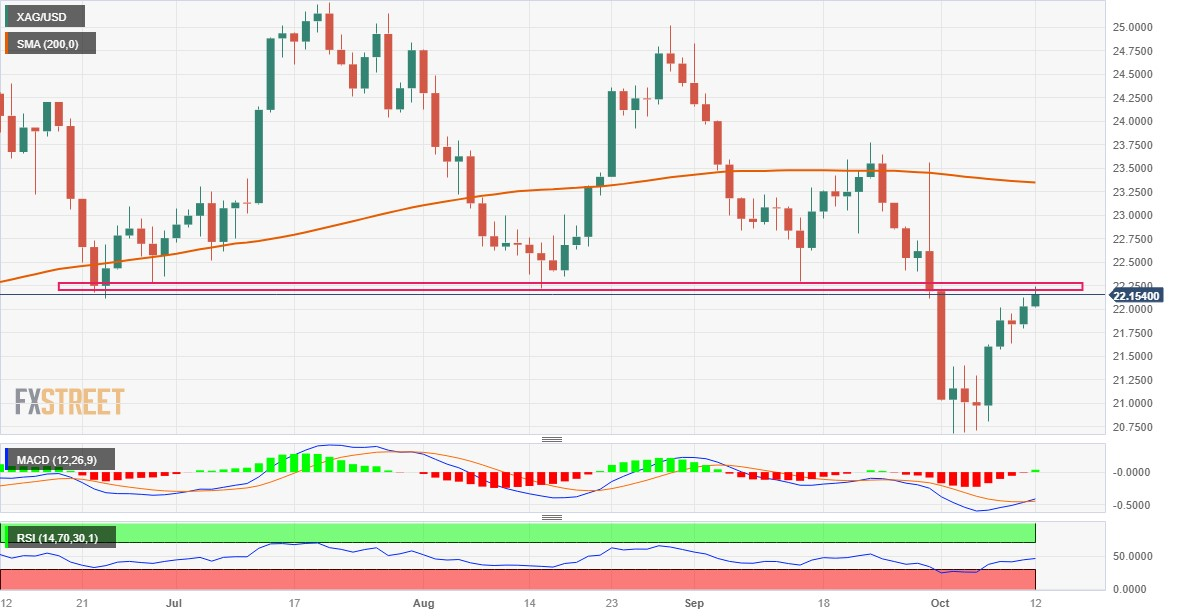
Technical levels to watch
- EUR/GBP snaps the losing streak despite the downbeat economic data from the UK.
- Euro faces a challenge as the ECB is expected to keep interest rates unchanged in the upcoming meeting.
- ECB’s Yannis stated that there is little benefit in accelerating the conclusion of the PEPP.
EUR/GBP halts the losing streak that began on October 3, trading in the green zone around 0.0830 during the European session on Thursday. The pair receives upward support despite the downbeat economic data from the United Kingdom (UK).
Industrial Production (MoM) declined 0.7% in August, exceeding the expectation of 0.2% decline. The previous reading was negative by 1.1%. Manufacturing Production month-over-month fell by 0.8% compared to the market consensus of a 0.4% decline and a 1.2% decline in July.
Bank of England (BoE) policymakers are bracing for challenges as a dip in demand and a general decrease in output loom on the horizon ahead of the November interest rate decision.
Katherine Mann of the BoE remains a staunch proponent of tightening policies to swiftly curb inflation and bring it in line with the 2% target. Conversely, Swati Dhingra, another figure at the central bank, favors the notion of a rate cut should the growth rate unexpectedly dip below expectations.
On the flip side, speculations abound that the EUR/GBP pair might encounter additional hurdles, given the prevailing notion that the European Central Bank (ECB) is currently sidelining the possibility of further rate hikes.
Yannis Stournaras, a European Central Bank (ECB) policymaker, emphasized the importance of not prematurely halting the bond-buying initiative within the European Central Bank's emergency program.
ECB Yannis highlighted that there is little benefit in accelerating the conclusion of the Pandemic Emergency Purchase Programme (PEPP), especially given the fresh uncertainties arising from events in Israel and Palestine. The policymaker stressed the need to maintain flexibility and be prepared to act if deemed necessary.
The EUR/GBP pair is experiencing downward pressure as Francois Villeroy de Galhau, a member of the ECB Governing Council and President of the Bank of France, views monetary policy as adequately restrictive.
Villeroy cautioned against additional policy tightening, emphasizing that it is not the appropriate course of action, particularly in the current context of heightened Middle East tensions contributing to a positive outlook for oil prices.
Market participants will likely watch the ECB Monetary Policy Meeting Accounts on Thursday, seeking an overview of economic and monetary developments. Additionally, ECB's President Christine Lagarde's speech will be eyed on Friday.
Saudi Arabia’s Energy Minister Prince Abdulaziz bin Salman said on Thursday, “we will continue voluntary cuts until year’s end.”
Additional comments
The less volatility there is in the global oil market, the less we will interfere.
We live through the uncertainty, we need to be cautious.
The oil market should not be left alone, we should be proactive given numerous challenges.
We want to bring stability to the oil market.
Related reads
- Russia’s Novak: Oil market is very sensitive but balanced
- Russian leader Putin hints at continued OPEC+ oil cuts
- USD/JPY trades sideways post snapping the two-day winning streak.
- US Dollar moves downward toward 105.50 despite hot PMI data.
- Policymaker Noguchi stated that the BoJ cannot hold an optimistic view on the acceleration of wage growth.
USD/JPY snaps the two-day winning streak, trading lower around 149.00 during the Asian session on Thursday. The USD/JPY is facing challenges due to the possibility of the Federal Reserve (Fed) ending the rate-hike cycle.
Investors seem to speculate the US Federal Reserve (Fed) to abandon the idea of a rate hike. Fed Governor Christopher Waller advocates a cautious stance on rate developments, suggesting that tightening in financial markets "would do some of the work for us." Fed Governor Michelle Bowman leans towards another rate hike, citing persistent inflation above the Fed's 2% target.
Moreover, the divergence in perspectives is revealed in the Federal Open Market Committee (FOMC) minutes. The Fed minutes emphasized the significance of relying on data. There was a suggestion that achieving a substantial increase in inflation would be crucial to garnering consensus for shaping monetary policy decisions.
US Producer Price Index (PPI) experienced a rise in September, jumping from 2.0% to 2.2%, surpassing the expected 1.6%. Attention in the market now turns to Thursday's Consumer Price Index (CPI) release, with forecasts indicating a potential decrease in the annual rate from 3.7% to 3.6%. Keep an eye out for the upcoming weekly Jobless Claims report as well.
The US Dollar Index (DXY) is facing challenges, extending losses around 105.50 at the time of writing. This struggle is attributed to the subdued performance of US Treasury yields, with the 10-year Treasury bond yield standing at 4.54% by the latest update.
The Japanese Yen (JPY) weakens on the Bank of Japan's (BoJ) persistent ultra-easy monetary policy. Moreover, BoJ board member Asahi Noguchi is in the spotlight on Thursday, highlighting that the central bank "cannot be optimistic about acceleration in wage growth." Noguchi attributes inflation to import price hikes, including currency factors, and mentions that there is still a considerable distance to achieving the 2% inflation target.
The policymaker emphasizes that there is no immediate need to adjust the Yield Curve Control (YCC) policy. Noguchi underscores the importance of bringing real wages into positive territory and expresses the goal of getting wage growth closer to 3%, although he cannot specify when this might occur.
Earlier in the day, Noguchi expressed his views, suggesting that if central banks refrain from rate hikes and inflation subsides, the risk of a hard landing will be mitigated. He notes that Japan's economy is gradually recovering. In a stage where inflation expectations are on the rise, Noguchi advocates for some flexibility to sustain an accommodative policy under Yield Curve Control (YCC). This approach aims to balance economic recovery with the need to manage inflation expectations effectively.
Russian Deputy Prime Minister Alexander Novak said on Thursday, “the oil market is very sensitive but balanced.”
Additional quotes
The global market is balanced but the balance is fragile.
The global economy is growing slower than expected.
That influences the demand for oil.
The OPEC+ mechanism is efficient.
The market situation requires closer opec+ cooperation.
OPEC+ cooperation ensures the stability of the oil market and investments.
It's not our goal to set oil prices, we aim to balance the market.
On oil prices by years end, the market sets prices itself.
Market reaction
WTI is battling the $82 mark, holding the latest uptick following the above comments. The US oil is trading flat on the day.
FX option expiries for Oct 12 NY cut at 10:00 Eastern Time, via DTCC, can be found below.
- EUR/USD: EUR amounts
- 1.0400 476m
- 1.0450 504m
- 1.0500 1b
- 1.0550 1b
- 1.0575 1.2b
- 1.0590 832m
- 1.0600 999m
- 1.0640 975m
- 1.0700 770m
- 1.0750 2.4b
- GBP/USD: GBP amounts
- 1.2100 456m
- 1.2130 375m
- USD/JPY: USD amounts
- 148.00 856m
- 148.80 775m
- 149.00 948m
- 149.50 820m
- USD/CHF: USD amounts
- 0.9035 661m
- 0.9125 375m
- AUD/USD: AUD amounts
- 0.6425 834m
- 0.6440 620m
- EUR/GBP: EUR amounts
- 0.8600 530m
- 0.8650 354m
- 0.8730 711m
- 0.8735 389m
- 0.8800 546m
- Pound Sterling gains remain unabated despite the UK’s poor factory data.
- UK firms cut heavily on input costs due to poor demand outlook.
- BoE's Swati Dhingra favored a rate cut if the growth rate dropped more than expectations.
The Pound Sterling (GBP) holds onto gains inspired by the higher risk appetite of the market participants. The GBP/USD pair remains bullish despite the Office for National Statistics (ONS) reporting that United Kingdom factory data in August contracted for the second time in a row. UK firms operated on lower capacity as they aimed to achieve efficiency by cutting higher inventory backlogs and their respective labor forces due to declining demand.
A slowdown in demand and declining overall output is expected to discomfort Bank of England (BoE) policymakers, who are preparing for November’s interest rate decision. While the BoE's Katherine Mann continued to favor further policy-tightening to bring down inflation to 2% in a timely manner, the central bank's Swati Dhingra supported a rate cut if the growth rate fell beyond expectations.
Daily Digest Market Movers: Pound Sterling holds recovery despite weak UK data
- Pound Sterling manages to remain upbeat despite weak UK factory data for August.
- Monthly Industrial Production contracted at a higher pace of 0.7%, while investors forecasted a decline by 0.2%. In the same period, the pace of decline in Manufacturing Production was double expectations of 0.4%. In July, the factory data contracted by more than 1%.
- On an annualized basis, Industrial Production landed at 1.3%, below the estimates of 1.7% but higher than the former reading of 1%. The Manufacturing Production at 2.8% remained below the expectations and July’s reading of 3.4% and 3.1%, respectively.
- The monthly Gross Domestic Product (GDP) grew by 0.2% as expected. In July, the overall output contracted by 0.6%.
- The factory data has contracted for the second time in a row as UK firms have cut down on inventory and labor due to a poor demand outlook.
- Meanwhile, investors remain mixed about Bank of England’s interest rate outlook as the UK economy is operating at higher inflation, which is more than three times the desired rate of 2%.
- This week, BoE policymaker Katherine Mann said that central bankers should adopt an aggressive approach toward interest rates. The central bank has to bring down rising inflation expectations along with its priority of bringing down inflation to 2%.
- Contrary to Mann, BoE policymaker Swati Dhingra said the UK economy has already ‘flatlined’ and that almost 25% of the impact of higher interest rates has already been absorbed by the economy. She favored a rate cut sooner rather than later if the growth rate declines beyond expectations.
- The risks of a rebound in inflation are persistent as deepening Middle East tensions would keep the oil market extremely tight through 2024. Also, expected participation of Iran in the Israel-Hamas conflict could disrupt supply chain significantly.
- Shortage of energy in the UK economy due to supply chain disruptions could accelerate headline inflation, and UK Prime Minister Rishi Sunak may miss fulfilling his promise of halving inflation to 5.2%.
- The US Dollar Index (DXY) seems stabilized below the crucial support of 106.00, which has turned as resistance now. High volatility is anticipated in the USD Index ahead of the release of the consumer inflation data for September, which will be published at 12:30 GMT.
- The US inflation data is expected to remain hot, considering the strong rebound in the producer inflation report that was released on Wednesday.
- Meanwhile, expectations of one more interest rate increase from the Federal Reserve increased on Wednesday after the release of the FOMC minutes, which indicated that a majority of policymakers support further policy-tightening.
Technical Analysis: Pound Sterling remains stable above 1.2300
The Pound Sterling stabilizes above the crucial resistance of 1.2300 as market sentiment has improved. The broader risk outlook is still cautious as participation of more nations in Middle East conflicts could injure the global supply chain significantly. The Cable has climbed above the 20-day Exponential Moving Average (EMA) at 1.2280, which indicates that the short-term trend has turned bullish.
Here is what you need to know on Thursday, October 12:
The US Dollar (USD) is struggling to find demand early Thursday, with the US Dollar Index is edging lower toward 105.50 after closing the last six trading days in negative territory. Weekly Initial Jobless Claims and September Consumer Price Index (CPI) data will be featured in the US economic docket later in the day. The European Central Bank will release the accounts of the September policy meeting.
US CPI Data Preview: Inflation expected to extend downward trend in September.
Risk flows continued to dominate the financial markets in the second half of the day on Wednesday, causing the USD to continue to weaken against its rivals. Wall Street's main indexes closed in positive territory and the benchmark 10-year US Treasury bond yield broke below 4.6%, erasing more than 2% on a daily basis. Growing expectations about the Federal Reserve (Fed) leaving the policy rate unchanged for the rest of the year on dovish comments from policymakers triggered a downward correction in US bond yields this week. Meanwhile, the Fed's September meeting minutes showed late Wednesday that members generally judged the risks to achieving goals had become more two-sided, while most of them continued to see upside risks to inflation.
US Dollar price this week
The table below shows the percentage change of US Dollar (USD) against listed major currencies this week. US Dollar was the weakest against the Swiss Franc.
| USD | EUR | GBP | CAD | AUD | JPY | NZD | CHF | |
| USD | -0.64% | -0.82% | -0.59% | -0.76% | -0.04% | -0.66% | -1.10% | |
| EUR | 0.62% | -0.19% | 0.06% | -0.15% | 0.60% | -0.01% | -0.44% | |
| GBP | 0.83% | 0.19% | 0.25% | 0.03% | 0.79% | 0.15% | -0.26% | |
| CAD | 0.58% | -0.06% | -0.24% | -0.18% | 0.54% | -0.08% | -0.51% | |
| AUD | 0.76% | 0.18% | -0.01% | 0.23% | 0.77% | 0.14% | -0.30% | |
| JPY | 0.02% | -0.59% | -0.79% | -0.54% | -0.81% | -0.65% | -1.06% | |
| NZD | 0.67% | 0.03% | -0.15% | 0.10% | -0.12% | 0.64% | -0.44% | |
| CHF | 1.03% | 0.45% | 0.26% | 0.51% | 0.27% | 1.04% | 0.41% |
The heat map shows percentage changes of major currencies against each other. The base currency is picked from the left column, while the quote currency is picked from the top row. For example, if you pick the Euro from the left column and move along the horizontal line to the Japanese Yen, the percentage change displayed in the box will represent EUR (base)/JPY (quote).
EUR/USD extended its weekly uptrend and touched its highest level since in over two weeks above 1.0630 before going into a consolidation phase.
The data published by the UK's Office for National Statistics (ONS) revealed early Thursday that the real Gross Domestic Product (GDP) expanded by 0.2% on a monthly basis in August, following the 0.6% contraction recorded in July. Other data showed that Industrial Production and Manufacturing Production declined by 0.7% and 0.8% in the same period. GBP/USD showed no immediate reaction to these figures and the pair was last seen holding steady slightly above 1.2300.
USD/JPY registered small gains on Wednesday. The pair, however, finds it difficult to pull away from 149.00 early Thursday. Bank of Japan (BoJ) board member Asahi Noguchi said on Thursday that the biggest focus will be on whether wage hike momentum will be maintained or not when deciding on policy.
Gold continued to benefit from falling US yields and extended its rally on Wednesday. Early Thursday, XAU/USD stretched higher and was last seen trading near $1,880.
Commenting on the European Central Bank’s (ECB) emergency bond-buying program, ECB policymaker, Yannis Stournaras, said that they “should not stop bond buying too early.”
Additional quotes
No value in bringing forward end of PEPP.
Now especially that there is new uncertainty from events in Israel and Palestine.
Need to keep flexibility and act if necessary.
Bank of Japan (BoJ) board member Asahi Noguchi is back on the wires on Thursday, noting that the central bank “cannot be optimistic about acceleration in wage growth.”
Additional quotes
Inflation is due to import price hikes including currency factors.
There is still distant to achievement of 2% inflation target.
No need to rush into responding to rise in long-term rates.
No need to immedately make adjustment to YCC.
We must bring real wages into positive territory.
Important to bring wage growth closer to 3% but cannot tell when it will happen.
Achivement of 2% inflation target to lead to rate hike.
Rise in long-term rates does not necessarily reflect Japan's inflation expectations, but rather US Interest rate.
Inflation expectations still weak in Japan.
Inflation expectation does not factor in achievement of 2% inflation target.
Inflation of this extent was unexpected.
Wrong to think rises in interest rates could bring forward the timing of policy change.
Market reaction
USD/JPY is defending 149.00 following the above BoJ commentary, almost unchanged on the day.
- USD/CHF continues the losing streak on the Fed’s interest rate trajectory.
- US Dollar extends losses despite robust wholesale inflation data.
- US CPI suggests a decrease in the annual rate for September.
- Swiss Franc might receive buying support on the Middle-East conflict.
USD/CHF continues to move on the downward trajectory that began last week, trading lower around 0.9010 during the Asian session on Thursday. The pair trades near the three-week lows. Despite robust economic data from the United States (US), the US Dollar (USD) is facing challenges due to the possibility of the Federal Reserve (Fed) ending the rate-hike cycle.
Moreover, the divergence in perspectives is revealed in the Federal Open Market Committee (FOMC) minutes. The Fed minutes emphasized the significance of relying on data. There was a suggestion that achieving a substantial increase in inflation would be crucial to garnering consensus for shaping monetary policy decisions.
US Producer Price Index (PPI) experienced a rise in September, jumping from 2.0% to 2.2%, surpassing the expected 1.6%. Attention in the market now turns to Thursday's Consumer Price Index (CPI) release, with forecasts indicating a potential decrease in the annual rate from 3.7% to 3.6%. Keep an eye out for the upcoming weekly Jobless Claims report as well.
Amidst dovish comments and neutral stances from officials, investors seem to speculate the US Federal Reserve (Fed) to abandoning the idea of a rate hike. Fed Governor Christopher Waller advocates a cautious stance on rate developments, suggesting that tightening in financial markets "would do some of the work for us."
Fed Governor Michelle Bowman leans towards another rate hike, citing persistent inflation above the Fed's 2% target. These divergent views within the Federal Reserve add layers of complexity to the current economic landscape.
The US Dollar Index (DXY) is facing challenges, trading lower around 105.70 at the time of writing. This struggle is attributed to the subdued performance of US Treasury yields, with the 10-year Treasury bond yield standing at 4.57% by the latest update.
On the flip side, the Swiss Franc seems to receive buying support due to the Middle-East military conflict as the currency is considered to be the safe haven in times of geopolitical uncertainty.
Switzerland’s Producer and Import Prices will be eyed on Friday, which could provide fresh impetus to the inflation outlook in the nation.
The United Kingdom’s (UK) industrial sector activity showed a further deterioration in August, according to the latest data published by the Office for National Statistics (ONS) on Thursday.
Manufacturing output dropped 0.8% MoM in August versus -0.4% expected and -1.2% seen in July while total industrial output stood at -0.7% MoM vs. -0.2% expected and -1.1% previous.
The annual UK Manufacturing Production data rose 2.8% in August, missing expectations of 3.4%. Total Industrial Output increased 1.3% in the eighth month of the year, below the 1.7% expected growth but improving slightly from the previous reading of 1.0%.
Separately, the UK goods trade balance numbers were published, which arrived at GBP-15.95 billion in August versus GBP-14.70 billion expectations and GBP-13.905 billion last. The total trade balance (non-EU) came in at GBP-4.902 billion in August versus GBP-2.653 billion reported in July.
Related reads
- UK GDP expands 0.2% MoM in August, as expected
- US CPI Data Preview: Inflation expected to extend downward trend in September
- UK GDP rate rose 0.2% MoM in August vs. 0.2% expected.
- GBP/USD keeps gains above 1.2300 on as expected UK GDP data.
The official data published by the Office for National Statistics (ONS) showed on Thursday that the UK economy returned to expansion, registering a growth of 0.2% in August after shrinking 0.6% (revised from -0.5%) in July. The market had anticipated an expansion of 0.2% in the reported period.
Meanwhile, the Index of services (August) arrived at 0.1% 3M/3M vs. 0.1% expected and -0.1% previous.
Market reaction
GBP/USD is holding gains on the UK GDP data release. At the press time, the pair is up 0.11% on the day to trade at 1.2322, awaiting the US inflation data for further trading impetus.
About UK GDP
The Gross Domestic Product released by the National Statistics is a measure of the total value of all goods and services produced by the UK. The GDP is considered a broad measure of the UK economic activity. Generally speaking, a rising trend has a positive effect on the GBP, while a falling trend is seen as negative (or bearish).
- The Consumer Price Index in the US is forecast to rise 3.6% YoY in September, down slightly from the 3.7% increase recorded in August.
- Annual Core CPI inflation is expected to edge lower to 4.1% in September.
- US CPI inflation report could significantly impact the US Dollar’s valuation by altering the market pricing of the Fed’s rate outlook.
The highly-anticipated US Consumer Price Index (CPI) inflation data for September will be published by the Bureau of Labor Statistics (BLS) at 12:30 GMT.
The US Dollar (USD) gathered strength against its rivals in September and early October, boosted by upbeat macroeconomic data releases and surging US Treasury bond yields.
Although the Federal Reserve’s (Fed) latest Summary of Economic Projections confirmed on September 20 that policymakers saw it appropriate to raise the policy rate by another 25 basis points before the end of the year, the CME Group FedWatch Tool shows that markets are still pricing in a nearly 70% probability that the policy rate will remain unchanged at the range of 5.25%-5.5% in 2023. Nevertheless, the US Treasury bond sell-off that was triggered on growing fears over a US government shutdown in the last week of September fuelled another leg higher in US yields.
US CPI inflation data could influence the market positioning regarding the Fed’s rate outlook, especially after the September jobs report unveiled an impressive increase of 336,000 in Nonfarm Payrolls. Commenting on the policy outlook over the weekend, Fed Governor Michelle Bowman said that the US central bank will likely need to tighten the monetary policy further and hold the interest rate at a restrictive level for some time to return inflation to the 2% target.
What to expect in the next CPI data report?
The US Consumer Price Index, on a yearly basis, is expected to rise 3.6% in September, at a slightly softer pace than the 3.7% increase recorded in August. The Core CPI figure, which excludes volatile food and energy prices, is forecast to rise 4.1% in the same period, down from the 4.3% growth in August.
The monthly CPI and the Core CPI are both seen rising 0.3%. Oil prices continued to push higher in September, with the barrel of West Texas Intermediate gaining 9% on a monthly basis. Even though there was a sharp decline in crude Oil prices in the first week of October, the reignited conflict between Israel and Hamas could cause energy costs to remain elevated in the near term. Nevertheless, it’s too early to say how geopolitical developments will impact the inflation outlook and the Fed’s monetary policy.
Previewing the US September inflation report, “the outsized payroll number raises the prospect the Fed may hike again, but it’s not a clincher. September Consumer Price Index data out this week should be more revealing,” said Analysts at Australia and New Zealand Banking Group (ANZ) and added: “We expect core inflation to rise by 0.2% m/m, which should be well received by the Fed.”
The Prices Paid Index of the ISM Manufacturing PMI survey – the inflation component – declined sharply to 43.8 in September from 48.4 in October, highlighting that input prices in the sector are falling at a faster pace. In the meantime, the Prices Paid Index in the ISM Services PMI held steady at 58.9 to show a lack of progress in taming services sector inflation.
When will the Consumer Price Index report be released and how could it affect EUR/USD?
The Consumer Price Index inflation data for September will be published at 12:30 GMT. The US Dollar Index, which gauges the USD’s valuation against a basket of six major currencies, benefited from safe-haven demand at the start of the week before coming under strong bearish pressure. The downward correction seen in US T-bond yields and the improving risk mood made it difficult for the USD to find demand.
The market positioning suggests that the USD has room on the upside in case the inflation data comes in stronger than anticipated. Investors are likely to pay close attention to the monthly Core CPI reading, which can’t be distorted by base effects. A monthly core inflation reading of 0.5% or higher could revive expectations for one more Fed rate increase and fuel another USD rally. Given the European Central Bank’s (ECB) willingness to hold rates steady, EUR/USD is likely to turn south in this scenario.
Economic Indicator
United States Consumer Price Index n.s.a (MoM)
The Consumer Price Index released by the US Bureau of Labor Statistcs is a measure of price movements by the comparison between the retail prices of a representative shopping basket of goods and services. The purchase power of USD is dragged down by inflation. The CPI is a key indicator to measure inflation and changes in purchasing trends. Generally speaking, a high reading is seen as positive (or bullish) for the USD, while a low reading is seen as negative (or Bearish).
Read more.Next release: 10/12/2023 12:30:00 GMT
Frequency: Monthly
Source: US Bureau of Labor Statistics
Why it matters to traders
The US Federal Reserve has a dual mandate of maintaining price stability and maximum employment. According to such mandate, inflation should be at around 2% YoY and has become the weakest pillar of the central bank’s directive ever since the world suffered a pandemic, which extends to these days. Price pressures keep rising amid supply-chain issues and bottlenecks, with the Consumer Price Index (CPI) hanging at multi-decade highs. The Fed has already taken measures to tame inflation and is expected to maintain an aggressive stance in the foreseeable future.
On the other hand, a monthly Core CPI at or below the market consensus of 0.3% could make it difficult for the USD to stay resilient against its peers. While speaking at the Economic Club of New York last week, San Francisco Federal Reserve President Mary Daly argued that there was no need for additional policy tightening following the recent rise in US T-bond yields. "The need for us to take further action is diminished because financial markets are already moving into that direction and they've done the work," Daly explained. Hence, investors could refrain from betting on one more Fed rate hike and help EUR/USD gain traction.
Eren Sengezer, European Session Lead Analyst at FXStreet, offers a brief technical outlook for EUR/USD and explains:
“The Relative Strength Index (RSI) indicator on the daily chart recovered to 50 this week and EUR/USD made a daily close above the 20-day Simple Moving Average (SMA) for the first time in over a month, pointing to a buildup of bullish momentum.”
Eren also outlines key technical levels to watch for:
“The 1.0650 level (Fibonacci 23.6% retracement of the July-October downtrend) aligns as a key pivot for EUR/USD. If this level is confirmed as support, buyers could remain interested in the Euro. In this scenario, 1.0750 (Fibonacci 38.2% retracement, 50-day SMA) could be set as the next target before 1.0830, where the 100-day and 200-day SMAs align.”
“Alternatively, sellers could take action if EUR/USD fails to stabilize above 1.0650 and cause the pair to decline toward 1.0550 (static level), 1.0500 (psychological level) and 1.0450 (end-point of the downtrend).”
- EUR/USD steadily climbs back to over a two-week high touched on Wednesday amid a softer USD.
- Expectations that the Fed is nearing the end of its rate-hiking cycle continue to undermine the buck.
- Bulls now seem reluctant and keenly await the release of the US CPI report before placing fresh bets.
The EUR/USD pair trades with a mild positive bias through the Asian session on Thursday and is currently placed near the 1.0630 region, or a two-and-half-week peak touched the previous day.
The US Dollar (USD) remains on the defensive in the wake of reduced bets for more interest rate hikes by the Federal Reserve (Fed). Apart from this, a positive risk tone contributes to the weaker sentiment surrounding the safe-haven buck, which, in turn, is seen acting as a tailwind for the EUR/USD pair. Traders, however, seem reluctant to place aggressive bets and prefer to wait on the sideline ahead of the latest US consumer inflation figures, which might influence expectations about the Fed's future rate-hike path and provide a fresh directional impetus.
From a technical perspective, the 1.0630-1.0635 area represents the top boundary of a downward-sloping channel extending from a 17-month peak touched in June. This is closely followed by the 23.6% Fibonacci retracement level of the July-October steep decline to the lowest level since December 2022. A sustained strength beyond will suggest that the EUR/USD pair has formed a short-term bottom and pave the way for an extension of the recent recovery move from the 1.0450-1.0445 region, or the YTD low, witnessed over the past two weeks or so.
Given that oscillators on the daily chart have just started gaining positive traction, the EUR/USD pair might then aim to reclaim the 1.0700 round-figure mark for the first time since September 20. The momentum could get extended further towards testing the 50-day Simple Moving Average (SMA), currently around the 1.0740 region, en route to the next relevant hurdle near the 1.0765 region, or the 38.2% Fibo. level. The latter should cap the upside amid speculations that further rate hikes by the European Central Bank (ECB) may be off the table for now.
On the flip side, the 1.0600 round figure now seems to act as an immediate support ahead of the 1.0565 horizontal zone. This is followed by the weekly low, around the 1.0520 area set on Monday in reaction to an unprecedented attack by the Hamas militant group in Gaza on Israel over the weekend. A convincing break below the latter might shift the bias back in favour of bearish traders and drag the EUR/USD pair further below the 1.0500 psychological mark, towards retesting the YTD trough, around the 1.0450-1.0445 region.
EUR/USD daily chart
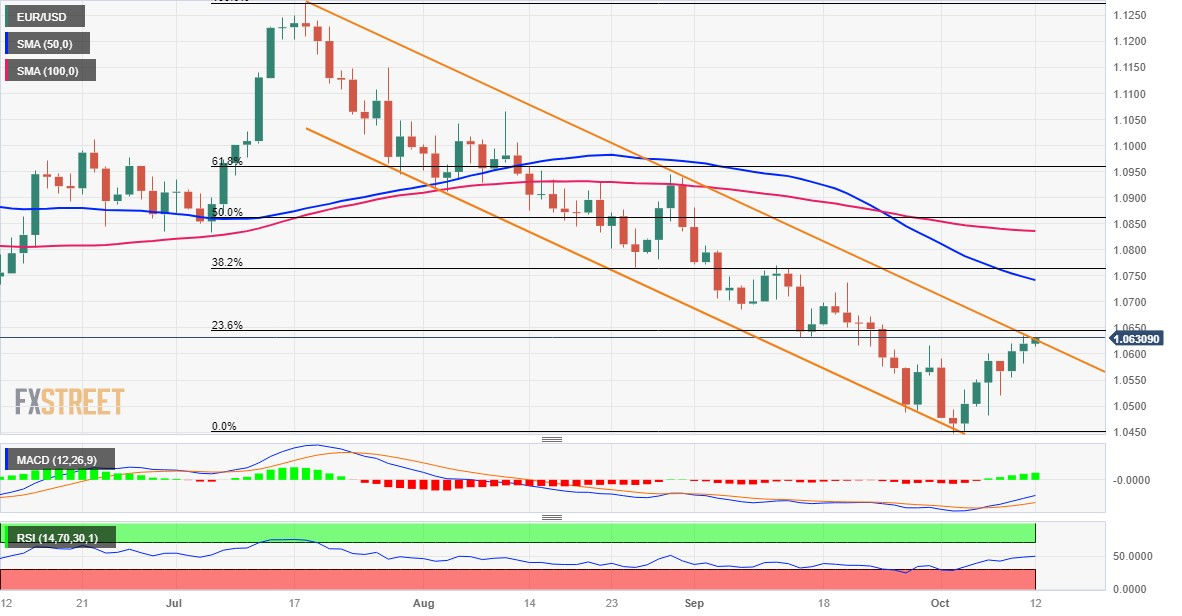
Technical levels to watch
In its preview of China’s third-quarter Gross Domestic Product (GDP) data, research analysts at Standard Chartered Market noted that “consensus may have underestimated China’s Q3 GDP after overestimating Q2 GDP.”
Additional takeaways
“In July, Bloomberg’s survey put the Q2 growth forecast at 7.0% y/y, only to be disappointed by a 6.3% print.”
“We think the gap can be explained by overly optimistic estimates for services sector growth. For Q3 GDP (to be released on 18 October), the consensus forecast is currently 4.5% y/y; we think an outcome of around 5% is more likely, based on available data for July and August and consensus estimates for September real activity.”
“We forecast Q3 growth at 5.1%, among the highest in the Bloomberg survey.”.
“We see a disconnect between consensus real activity and Q3 GDP forecasts.”
- GBP/JPY sticks to modest intraday gains near the multi-week top touched earlier this Thursday.
- The BoJ’s dovish stance, a positive risk tone continues to undermine the JPY and lend support.
- Traders now look to the UK macro data before positioning for any further appreciating move.
The GBP/JPY cross now seems to have entered a bullish consolidation phase and is seen oscillating in a range just below a near four-week high touched during the Asian session this Thursday. Spot prices currently trade around the 183.70 region, nearly unchanged for the day, as traders move to the sidelines ahead of the UK data dump.
Thursday's UK economic docket highlights the release of the monthly GDP print along with Manufacturing and Industrial Production figures for August. The BoE surprisingly paused its rate-hiking cycle in September and provided little hints of its intention to raise rates. Hence, any disappointment from the UK macro data might reignite recession fears and lift market bets that the BoE will maintain the status quo in November. This could take its toll on the British Pound (GBP) and fail to assist the GBP/JPY cross to capitalize on its recent rally from the 178.00 mark, or over a one-month low touched earlier this October.
The downside, meanwhile, is more likely to remain cushioned in the wake of a more dovish stance adopted by the Bank of Japan (BoJ). In fact, the Japanese central bank retains its view that inflation is transient and has no plans to phase out its massive monetary stimulus. This, along with a generally positive tone around the equity markets, might continue to undermine the safe-haven Japanese Yen (JPY) and act as a tailwind for the GBP/JPY cross. This, in turn, suggests that the path of least resistance for spot prices remains to the upside and any intraday corrective decline might be seen as an opportunity for bullish traders.
From a technical perspective, momentum beyond the 184.00 round figure is more likely to confront stiff resistance near the 184.40 supply zone. The latter should act as a key pivotal point, which if cleared decisively will confirm the near-term positive outlook and pave the way for a further appreciating move.
Technical levels to watch
Analysts at Australia and New Zealand Banking Group (ANZ) offered a sneak peek at what they expect from New Zealand’s Consumer Price Index (CPI) inflation data due next Tuesday.
Key quotes
“We expect annual CPI inflation reaccelerated to 6.1% y/y in Q3, slightly above the RBNZ’s August MPS forecast of 6.0% y/y.”
“Specific drivers include the end of the fuel excise, road-user charges and public transport subsidies (which together add roughly 0.6%pts to the headline), sharply higher oil prices (which have also lifted fuel prices), and a big jump in local authority rates bills.”
“Our assessment is that overall, the CPI report will reinforce questions around whether an OCR of 5.50% is going to prove sufficient to get sticky domestic inflation down within an appropriate timeframe. But at this stage, whether the RBNZ will feel sufficient urgency to hike in November or whether they will feel they can wait for more evidence (with the next decision being in February) is hard to pick.”
- USD/MXN oscillates in a narrow trading band near a one-week trough touched on Wednesday.
- The mixed technical setup warrants caution for bears and before positioning for deeper losses.
- A sustained strngth beyond the 38.2% Fibo. level will set the stage for some maningful upside.
The USD/MXN pair trades on the backfoot during the Asian session on Wednesday and consolidates its recent losses to over a one-week low touched the previous day. Spot prices currently trade around the 17.80 region, down 0.10% for the day, flirting with a confluence resistance breakpoint comprising the 200-day Simple Moving Average (SMA) and a multi-month-old descending trend-line.
Meanwhile, technical indicators on the daily chart have been retreating from higher levels, though manage to hold in the positive territory. This makes it prudent to wait for a convincing break below the aforementioned resistance-turned-support before positioning for an extension of the recent pullback from mid-18.00s, or the highest level since late March touched last week. Some follow-through selling below the 17.65 zone, representing the 23.6% Fibonacci retracement level of the fall witnessed in July, will shift the near-term bias for the USD/MXN pair back in favour of bearish traders.
Spot prices might then accelerate the fall to the 17.40-17.35 horizontal support before dropping further towards the 17.15-17.10 intermediate support. The downward trajectory could get extended and drag the USD/MXN pair to the 16.90-16.85 area and the multi-year low, around the 16.65-16.60 region touched in July.
On the flip side, the 18.00 round figure now seems to act as an immediate hurdle ahead of the 18.15-18.20 zone. This is followed by 38.2% Fibo., around the 18.30 region and mid-18.00s, or the monthly. A sustained strength beyond will set the stage for the resumption of the recent appreciating move witnessed over the past month or so and lift the USD/MXN pair to the 18.80-18.85 area, representing 50% Fibo. level.
USD/MXN daily chart
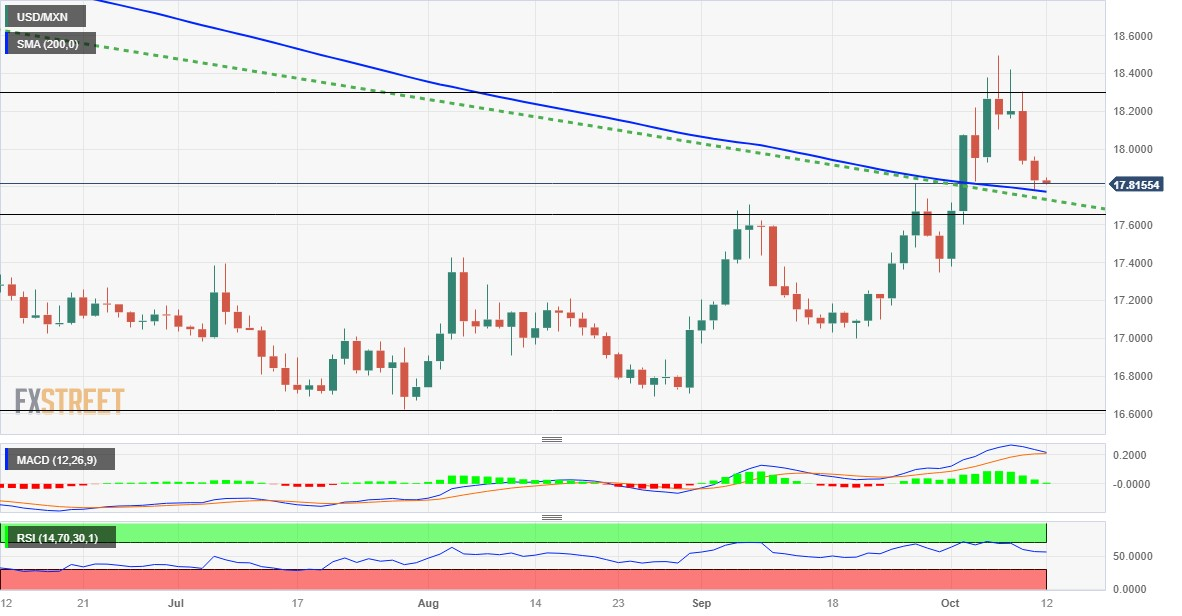
Techincal levels to watch
- GBP/USD moves upward on divergence in viewpoints disclosed in the FOMC minutes.
- US Dollar remains defensive despite robust wholesale inflation data.
- US CPI suggests a decrease in the annual rate for September.
GBP/USD continues the winning streak that began last week, trading higher around 1.2310 during the Asian session on Thursday. Despite robust economic data from the United States (US), the pair is finding upward support on divergence in perspectives revealed in the Federal Open Market Committee (FOMC) minutes.
The FOMC minutes emphasized the significance of relying on data. There was a suggestion that achieving a substantial increase in inflation would be crucial to garnering consensus for shaping monetary policy decisions.
In September, the US Producer Price Index (PPI) experienced a rise, jumping from 2.0% to 2.2%, surpassing the expected 1.6%. Attention in the market now turns to Thursday's Consumer Price Index (CPI) release, with forecasts indicating a potential decrease in the annual rate from 3.7% to 3.6%. Keep an eye out for the upcoming weekly Jobless Claims report as well.
Amidst dovish comments and neutral stances from officials, investors seem to speculate the US Federal Reserve (Fed) to abandoning the idea of a rate hike. Fed Governor Christopher Waller advocates a cautious stance on rate developments, suggesting that tightening in financial markets "would do some of the work for us."
On the other hand, Fed Governor Michelle Bowman leans towards another rate hike, citing persistent inflation above the Fed's 2% target. These divergent views within the Federal Reserve add layers of complexity to the current economic landscape.
The US Dollar Index (DXY) is facing challenges, struggling to maintain ground at around 105.70 at the time of writing. This struggle is attributed to the subdued performance of US Treasury yields, with the 10-year Treasury bond yield standing at 4.57% by the latest update.
Market participants will likely keep an eye out for Gross Domestic Product and manufacturing data from the United Kingdom (UK).
UK Gross Domestic Product is predicted to print a positive figure of 0.2% in August, swinging from the previous 0.5% decline, while Manufacturing Production for the same period is seen declining 0.4% against the previous decline of 0.8%.
During the previous week, the British central bank revised down its growth forecast for the July-September period from 0.4% to a mere 0.1%, providing little indication of any inclination to pursue further rate increases.
- Gold price builds on its recent recovery from a multi-month low and climbs to a two-week high.
- Geopolitical tensions, sliding bond yields and a softer USD continue to lend support to the metal.
- The US CPI report could offer fresh cues about the Fed’s rate-hike path and provide some impetus.
Gold price (XAU/USD) climbs to a fresh two-week high during the Asian session on Thursday and seems poised to prolong its recent strong recovery move from the $1,810 area, or a seven-month low touched last week. As geopolitical tensions flare in the Middle East, the precious metal has regained its status as a safe haven of choice and draws additional support from the recent US Dollar (USD) decline. Apart from this, falling global bond yields turn out to be another factor benefiting the non-yielding yellow metal and fuelling the rally.
With the latest leg up, the Gold price has now recovered over 30% of its losses registered in September and the positive move seems rather unaffected by a generally positive tone around the equity markets. This, along with speculations that the Federal Reserve (Fed) is nearing the end of its rate-hiking cycle, suggests that the path of least resistance for the XAU/USD remains to the upside. Traders, however, might prefer to wait for the latest consumer inflation figures from the United States (US), due later during the North American session.
Daily Digest Market Movers: Gold price remains supported by geopolitical tensions, dovish Fed
- The conflict between Israel and Palestinian Islamist group, Hamas, continues to drive haven flows towards the Gold price.
- Federal Reserve officials suggested that the recent surge in Treasury yields might make further rate hikes less necessary.
- Fed Governor Christopher Waller said on Wednesday that higher market rates may let policymakers "watch and see".
- The US PPI increased more than expected in September, though the underlying inflationary pressure continued to abate.
- Investors seem convinced that the Fed is nearing the end of its policy-tightening cycle and that interest rates have peaked.
- The yield on the benchmark 10-year US Treasury note retreated further from the highest levels since 2007 touched last week.
- The US Dollar moves further away from the 11-month high and turns out to be another factor underpinning the XAU/USD.
- The minutes from the September FOMC meeting showed that most Fed members backed the case for one more rate hike.
- Market participants now look to the latest US consumer inflation figures for cues about the Fed's future rate-hike path.
- The headline CPI is expected to have slowed to 0.3% in September and the yearly rate is seen ticking down to 3.6%.
- The more closely watched Core CPI is forecast to have remained steady at a 0.3% monthly pace and come in at 4.1% YoY.
- The crucial CPI report will influence the Fed's next policy move and provide a fresh directional move to the commodity.
Technical Analysis: Gold price is more likely to confront stiff resistance near $1,900 mark
The overnight sustained move beyond the $1,865-1,866 horizontal barrier might have already set the stage for additional gains towards the next relevant hurdle near the $1,885 region. Meanwhile, technical indicators on the daily chart – though have recovered from the negative territory – are yet to confirm a bullish bias. Hence, any subsequent move up is more likely to confront stiff resistance and remain capped near the $1,900 round-figure mark. Some follow-through buying, however, will be seen as a fresh trigger for bullish traders and allow the Gold price to challenge the 200-day SMA, currently pegged near the $1,928-1,930 region.
On the flip side, the $1,866-1,865 resistance breakpoint might now protect the immediate downside ahead of the $1,853-1,850 region. The next relevant support is pegged near the $1,835-1,833 zone, representing a multi-day-old trading range resistance breakpoint. A convincing break below the latter will negate any near-term positive outlook and make the Gold price vulnerable to retest the multi-month low, around the $1,810 zone touched last week.
US Dollar price this week
The table below shows the percentage change of US Dollar (USD) against listed major currencies this week. US Dollar was the strongest against the Japanese Yen.
| USD | EUR | GBP | CAD | AUD | JPY | NZD | CHF | |
| USD | -0.55% | -0.78% | -0.53% | -0.75% | 0.03% | -0.67% | -0.94% | |
| EUR | 0.53% | -0.23% | 0.01% | -0.23% | 0.57% | -0.13% | -0.38% | |
| GBP | 0.77% | 0.23% | 0.25% | -0.02% | 0.80% | 0.08% | -0.15% | |
| CAD | 0.53% | -0.02% | -0.25% | -0.22% | 0.56% | -0.14% | -0.40% | |
| AUD | 0.75% | 0.25% | 0.02% | 0.27% | 0.82% | 0.10% | -0.14% | |
| JPY | -0.04% | -0.59% | -0.81% | -0.54% | -0.87% | -0.75% | -0.96% | |
| NZD | 0.68% | 0.15% | -0.08% | 0.16% | -0.10% | 0.73% | -0.26% | |
| CHF | 0.90% | 0.39% | 0.15% | 0.41% | 0.15% | 0.95% | 0.24% |
The heat map shows percentage changes of major currencies against each other. The base currency is picked from the left column, while the quote currency is picked from the top row. For example, if you pick the Euro from the left column and move along the horizontal line to the Japanese Yen, the percentage change displayed in the box will represent EUR (base)/JPY (quote).
Gold FAQs
Why do people invest in Gold?
Gold has played a key role in human’s history as it has been widely used as a store of value and medium of exchange. Currently, apart from its shine and usage for jewelry, the precious metal is widely seen as a safe-haven asset, meaning that it is considered a good investment during turbulent times. Gold is also widely seen as a hedge against inflation and against depreciating currencies as it doesn’t rely on any specific issuer or government.
Who buys the most Gold?
Central banks are the biggest Gold holders. In their aim to support their currencies in turbulent times, central banks tend to diversify their reserves and buy Gold to improve the perceived strength of the economy and the currency. High Gold reserves can be a source of trust for a country’s solvency. Central banks added 1,136 tonnes of Gold worth around $70 billion to their reserves in 2022, according to data from the World Gold Council. This is the highest yearly purchase since records began. Central banks from emerging economies such as China, India and Turkey are quickly increasing their Gold reserves.
How is Gold correlated with other assets?
Gold has an inverse correlation with the US Dollar and US Treasuries, which are both major reserve and safe-haven assets. When the Dollar depreciates, Gold tends to rise, enabling investors and central banks to diversify their assets in turbulent times. Gold is also inversely correlated with risk assets. A rally in the stock market tends to weaken Gold price, while sell-offs in riskier markets tend to favor the precious metal.
What does the price of Gold depend on?
The price can move due to a wide range of factors. Geopolitical instability or fears of a deep recession can quickly make Gold price escalate due to its safe-haven status. As a yield-less asset, Gold tends to rise with lower interest rates, while higher cost of money usually weighs down on the yellow metal. Still, most moves depend on how the US Dollar (USD) behaves as the asset is priced in dollars (XAU/USD). A strong Dollar tends to keep the price of Gold controlled, whereas a weaker Dollar is likely to push Gold prices up.
- USD/CAD continues to gain after robust US wholesale inflation data.
- US CPI suggests a decrease in the annual rate for September.
- Downbeat Crude oil prices contribute to pressure on the Canadian Dollar.
USD/CAD extends gains on the second day, trading in a positive territory around 1.3600 during the Asian session on Thursday. The pair is receiving upward support after robust economic data from the United States (US) and the disclosure of the Federal Open Market Committee (FOMC) meeting minutes.
US Producer Price Index (PPI) rose in September, increasing from 2.0% to 2.2%, surpassing the anticipated 1.6%. The market focus shifted toward Thursday's Consumer Price Index (CPI) unveiling. Forecasts suggest a drop in the annual rate for September, slipping from 3.7% to 3.6%. Additionally, watch for the weekly Jobless Claims report coming your way.
The Federal Open Market Committee (FOMC) minutes revealed a divergence in perspectives, underscoring the importance of data reliance. It was suggested that a substantial increase in inflation would be vital to secure consensus for additional interest rate hikes.
Certain participants articulated the view that as the policy rate nears or reaches its peak, the focus in monetary policy decisions and communications should shift from determining the magnitude of rate increases to assessing the duration of maintaining the policy rate at restrictive levels.
Amidst dovish comments and neutral stances from officials, speculations are circulating about the US Federal Reserve (Fed) potentially abandoning the notion of a rate hike. This speculation is contributing to the nuanced and evolving landscape of monetary policy expectations.
Fed Governor Christopher Waller has suggested a watchful approach to rate developments, noting that financial markets tightening "would do some of the work for us." Meanwhile, Fed Governor Michelle Bowman has expressed a preference for another rate hike, citing inflation persisting above the Fed's 2% target. The contrasting views within the Fed contribute to the complexity of the current economic landscape.
The US Dollar Index (DXY) struggling to hold ground around 105.70 at the time of writing due to the downbeat US Treasury yields. 10-year US Treasury bond yield stands at 4.57%, by the press time.
The Canadian Dollar (CAD) is facing challenges as oil prices have retreated from weekly highs. However, the Loonie Dollar experienced gains due to the Middle-East tensions as Canada is the largest oil exporter to the United States.
Western Texas Intermediate (WTI) oil price extended its losses around $81.70 at the time of writing on Thursday. However, Crude oil prices marked their most notable upswing in half a year, reaching $86.01 per barrel. on Monday.
- Australian Dollar gains upward momentum due to the RBA’s interest rate trajectory.
- Consumer Inflation Expectations increased to 4.8% from the previous figure of 4.6%.
- US Dollar remains defensive despite upbeat US economic data.
The Australian Dollar (AUD) staged a recovery from recent losses, possibly buoyed by the uptick in Australian Consumer Inflation Expectations. The Melbourne Institute’s Consumer Inflation Expectations for October has been reported at 4.8%, showing a slight increase from the September figure of 4.6%.
Australia’s data indicated a modest uptick in consumer expectations regarding inflation, which can be linked to higher oil prices. The surge in petrol prices, likely influences consumer expectations about what lies ahead.
Additionally, the AUD/USD pair could gain strength as the possibility of another interest rate hike by the Reserve Bank of Australia (RBA) heightens.
The US Dollar Index (DXY) is struggling to hold ground around 105.70 at the time of writing due to the downbeat US Treasury yields. The US Dollar (USD) encounters challenges despite robust economic data from the United States (US), notably in wholesale inflation, and the disclosure of the Federal Open Market Committee (FOMC) meeting minutes.
The US currency seems caught in a struggle as various factors counterbalance the positive economic signals. Speculations are rife about the US Federal Reserve (Fed) potentially shelving the notion of a rate hike. This speculation gains momentum from dovish comments and neutral postures adopted by key officials, adding an element of uncertainty to the currency's outlook.
Daily Digest Market Movers: Australian Dollar retraces recent losses on higher Consumer Expectations
- Australia witnessed a rebound in inflation in August, largely driven by elevated oil prices. This resurgence raises the probability of another interest rate hike by the Reserve Bank of Australia (RBA).
- The unfolding Middle East conflict adds a layer of complexity to the situation, potentially prompting the RBA to implement a 25 basis points (bps) interest rate hike, reaching 4.35% by the year's end.
- The heightened geopolitical tension is fostering a surge in demand for commodities, particularly energy and gold. This surge is exerting a positive influence on the performance of the AUD/USD pair.
- Australia’s Westpac Consumer Confidence showed that current buying conditions improved in October. The index rose 2.9% from the previous 1.5% decline in September.
- US Producer Price Index (PPI) surged in September on a yearly basis, jumping from 2.0% to 2.2%, surpassing the anticipated 1.6%. Core PPI experienced a rise, climbing to 2.7% from the anticipated easing to 2.3%, surpassing the earlier figure of 2.5%.
- The yields on US Treasury bonds experienced losses on Wednesday, with the 10-year US Treasury bond yield marking the lowest level at 4.54%.
- The Federal Open Market Committee (FOMC) minutes shed light on a divergence of opinions, underlining the importance of data reliance. The consensus for additional interest rate hikes appears contingent on a significant uptick in inflation.
- Some participants argue that as the policy rate approaches its peak, the focus should shift from the extent of rate increases to determining how long to maintain the policy rate at restrictive levels.
- Speculation is rife about the Fed potentially abandoning the idea of a rate hike. This speculation gains momentum from dovish comments and neutral stances from officials, contributing to the nuanced economic landscape.
- Fed Governor Christopher Waller advocates a watchful approach to rate developments, suggesting that tightening in financial markets "would do some of the work for us." On the other hand, Fed Governor Michelle Bowman leans towards another rate hike, citing inflation persisting above the Fed's 2% target.
- Thursday's Consumer Price Index (CPI) release is generating heightened anticipation. Projections suggest a dip in the annual rate for September, sliding from 3.7% to 3.6%. The weekly Jobless Claims report follows and could contribute further insights into the economic landscape.
Technical Analysis: Australian Dollar consolidates near 0.6420, immediate resistance at 23.6% Fibonacci retracement
The Australian Dollar hovers around 0.6420, aligning with the 23.6% Fibonacci retracement level at 0.6429. This juncture poses a significant hurdle, and a clear breakthrough could pave the way for upward momentum, aiming at the psychological milestone of 0.6500. Conversely, on the downside, a key support level is situated around the 14-day Exponential Moving Average (EMA) at 0.6400. These delineated levels serve as vital indicators for potential shifts in the trajectory of the AUD/USD pair, influencing market sentiment and trader decisions.
AUD/USD: Daily Chart
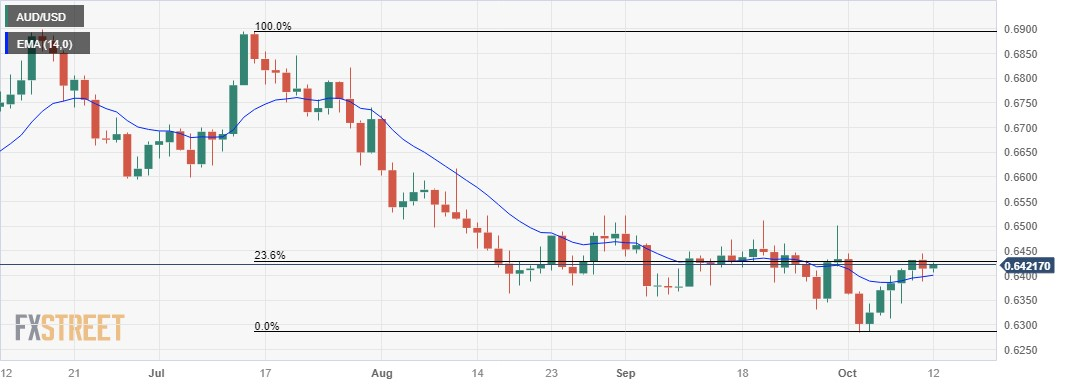
Australian Dollar price today
The table below shows the percentage change of the Australian Dollar (AUD) against listed major currencies today. Australian Dollar was the strongest against the Japanese Yen.
| USD | EUR | GBP | CAD | AUD | JPY | NZD | CHF | |
| USD | 0.02% | 0.02% | -0.02% | 0.05% | 0.11% | 0.07% | -0.03% | |
| EUR | -0.02% | 0.00% | -0.04% | 0.03% | 0.09% | 0.05% | -0.05% | |
| GBP | -0.02% | 0.00% | -0.05% | 0.04% | 0.08% | 0.05% | -0.06% | |
| CAD | 0.03% | 0.04% | 0.03% | 0.03% | 0.13% | 0.10% | -0.01% | |
| AUD | -0.03% | -0.01% | -0.01% | -0.07% | 0.06% | 0.03% | -0.05% | |
| JPY | -0.11% | -0.09% | -0.10% | -0.13% | -0.09% | -0.03% | -0.13% | |
| NZD | -0.07% | -0.04% | -0.07% | -0.10% | -0.06% | 0.03% | -0.10% | |
| CHF | 0.04% | 0.07% | 0.06% | 0.01% | 0.08% | 0.14% | 0.11% |
The heat map shows percentage changes of major currencies against each other. The base currency is picked from the left column, while the quote currency is picked from the top row. For example, if you pick the Euro from the left column and move along the horizontal line to the Japanese Yen, the percentage change displayed in the box will represent EUR (base)/JPY (quote).
Australian Dollar FAQs
What key factors drive the Australian Dollar?
One of the most significant factors for the Australian Dollar (AUD) is the level of interest rates set by the Reserve Bank of Australia (RBA). Because Australia is a resource-rich country another key driver is the price of its biggest export, Iron Ore. The health of the Chinese economy, its largest trading partner, is a factor, as well as inflation in Australia, its growth rate and Trade Balance. Market sentiment – whether investors are taking on more risky assets (risk-on) or seeking safe-havens (risk-off) – is also a factor, with risk-on positive for AUD.
How do the decisions of the Reserve Bank of Australia impact the Australian Dollar?
The Reserve Bank of Australia (RBA) influences the Australian Dollar (AUD) by setting the level of interest rates that Australian banks can lend to each other. This influences the level of interest rates in the economy as a whole. The main goal of the RBA is to maintain a stable inflation rate of 2-3% by adjusting interest rates up or down. Relatively high interest rates compared to other major central banks support the AUD, and the opposite for relatively low. The RBA can also use quantitative easing and tightening to influence credit conditions, with the former AUD-negative and the latter AUD-positive.
How does the health of the Chinese Economy impact the Australian Dollar?
China is Australia’s largest trading partner so the health of the Chinese economy is a major influence on the value of the Australian Dollar (AUD). When the Chinese economy is doing well it purchases more raw materials, goods and services from Australia, lifting demand for the AUD, and pushing up its value. The opposite is the case when the Chinese economy is not growing as fast as expected. Positive or negative surprises in Chinese growth data, therefore, often have a direct impact on the Australian Dollar and its pairs.
How does the price of Iron Ore impact the Australian Dollar?
Iron Ore is Australia’s largest export, accounting for $118 billion a year according to data from 2021, with China as its primary destination. The price of Iron Ore, therefore, can be a driver of the Australian Dollar. Generally, if the price of Iron Ore rises, AUD also goes up, as aggregate demand for the currency increases. The opposite is the case if the price of Iron Ore falls. Higher Iron Ore prices also tend to result in a greater likelihood of a positive Trade Balance for Australia, which is also positive of the AUD.
How does the Trade Balance impact the Australian Dollar?
The Trade Balance, which is the difference between what a country earns from its exports versus what it pays for its imports, is another factor that can influence the value of the Australian Dollar. If Australia produces highly sought after exports, then its currency will gain in value purely from the surplus demand created from foreign buyers seeking to purchase its exports versus what it spends to purchase imports. Therefore, a positive net Trade Balance strengthens the AUD, with the opposite effect if the Trade Balance is negative.
| Raw materials | Closed | Change, % |
|---|---|---|
| Silver | 22.008 | 0.83 |
| Gold | 1873.736 | 0.72 |
| Palladium | 1168.55 | 0.34 |
- WTI hits a fresh weekly low on Thursday and is pressured by a combination of factors.
- Receding fears over potential supply disruptions due to the Israel-Gaza conflict weigh.
- A weaker USD could lend some support ahead of the official EIA US Oil inventory data.
West Texas Intermediary (WTI) Crude Oil prices remain depressed for the third successive day on Thursday and touch a fresh weekly low, the $81.70-$81.65 region during the Asian session.
Concerns about potential supply disruptions due to the Israel-Palestinian clashes receded after Saudi Arabia pledged to help stabilise the market, which, in turn, is seen as a key factor weighing on the black liquid. In fact, the top OPEC producer said that it was working with regional and international partners to prevent an escalation. Moreover, investors remain uncertain about the ultimate impact of the latest geopolitical developments and seem convinced that the expansion of the conflict to the wider Middle East is required to send Crude Oil prices higher.
Meanwhile, the US Energy Information Administration (EIA) lowered its demand growth forecasts for this year and next by 50K bpd and 40K bpd, respectively. Furthermore, the weekly inventory report from the American Petroleum Institute (API) showed that US crude oil stocks possibly rose by nearly 13 million barrels last week. This, along with worries that a global economic slowdown will dent fuel demand, turns out to be another factor undermining the commodity ahead of the official inventory data from the EIA, due for release later this Thursday.
The aforementioned negative factors, to a larger extent, overshadow concerns about tightening global crude supply, which does little to impress bulls or lend any support to Crude Oil prices. That said, the prevalent US Dollar (USD) selling bias – led by reduced bets for further policy tightening by the Federal Reserve, declining US Treasury bond yields and a generally positive risk tone – could limit losses for the US Dollar-denominated commodity. The mixed fundamental backdrop, meanwhile, warrants some caution before placing aggressive directional bets.
Technical levels to watch
Bank of Japan (BoJ) board member Asahi Noguchi said on Thursday, “the biggest focus is whether wage hike momentum will be maintained or not.”
Additional quotes
Raising of YCC allowance band does not signify a tightening of monetary policy.
If central banks hold rate hikes and inflation comes down, the risk of hard landing will be reduced.
Japan's economy recoverying gradually.
When inflation expectations are in a stage of rising, some flexibility is needed to continue easy policy under YCC.
Chinese economy facing risk of deflation or 'japanisation'.
Need to pay close attention to fiscal, monetary policy response to low inflation by chinese authorities from now on.
There are signs of upward price pressures coming down.
Term mission is to realise a situation where wage growth does not fall short of inflation as soon as possible through persistent monetary easing.
The trend of passing on costs for raw materials is widely continuing.
Japan needs to shake off the 'zero norm' of prices and wages in order for nominal wage increase to exceed 2% as a trend.
3% nominal wage growth would correspond with 2% inflation target.
Related reads
-
USD/JPY Price Analysis: Bulls await a breakout through one-week-old trading range, US CPI in focus
- USD/JPY remains confined in a familiar range, forming a rectangle on short-term charts.
- The technical setup seems tilted in favour of bulls and supports prospects for further gains.
- Traders now seem reluctant and prefer to wait on the sidelines ahead of the US CPI report.
The USD/JPY pair oscillates in a narrow trading band during the Asian session on Thursday and is currently placed just above the 149.00 mark, well within the striking distance of the weekly high touched the previous day.
A generally positive risk tone, along with the Bank of Japan's (BoJ) persistent ultra-easy monetary policy, is seen undermining the safe-haven Japanese Yen (JPY) and acting as a tailwind for the USD/JPY pair. The upside, however, remains limited in the wake of subdued US Dollar (USD) price action, which continues to be weighed down by diminishing odds for more rate hikes by the Federal Reserve (Fed) and a further decline in the US Treasury bond yields.
Traders also seem reluctant to place aggressive directional bets and prefer to wait on the sidelines ahead of the release of the latest US consumer inflation figures, due later during the early North American session. The crucial US CPI report will play a key role in influencing market expectations about the Fed's future rate hike path. This, in turn, will drive the USD demand in the near term and help determine the next leg of a directional move for the USD/JPY pair.
From a technical perspective, spot prices remain confined in a familiar range held over the past week or so. This constitutes the formation of a rectangle on short-term charts and points to indecision among traders. The range-bound price action, meanwhile, might still be categorized as a bullish consolidation phase, against the backdrop of a rally from the July monthly swing low. Adding to this, oscillators on the daily chart are still holding in the positive territory.
The aforementioned setup suggests that the path of least resistance for the USD/JPY pair is to the upside. That said, it will still be prudent to wait for a sustained breakout through the 149.30-149.35 supply zone, representing the top end of the trading range, before positioning for any further gains. The subsequent move-up has the potential to lift spot prices back towards the 150.00 psychological mark, which has been speculated as the potential intervention level.
A sustained strength beyond, however, will be seen as a fresh trigger for bullish traders and pave the way for a further appreciating move towards the 151.00 round figure. The momentum could get extended and push the USD/JPY pair closer to the 152.00 mark, or a multi-decade high touched in October 2022.
On the flip side, any meaningful corrective decline now seems to find some support near the 148.55-148.50 zone ahead of the weekly low, around the 148.15 area. This is followed by the 200-period Simple Moving Average (SMA) on the 4-hour chart, currently pegged just below the 148.00 round figure. A convincing break below could drag the USD/JPY pair to the 147.30 area, or the lowest level since September 14 touched last Tuesday.
USD/JPY daily chart
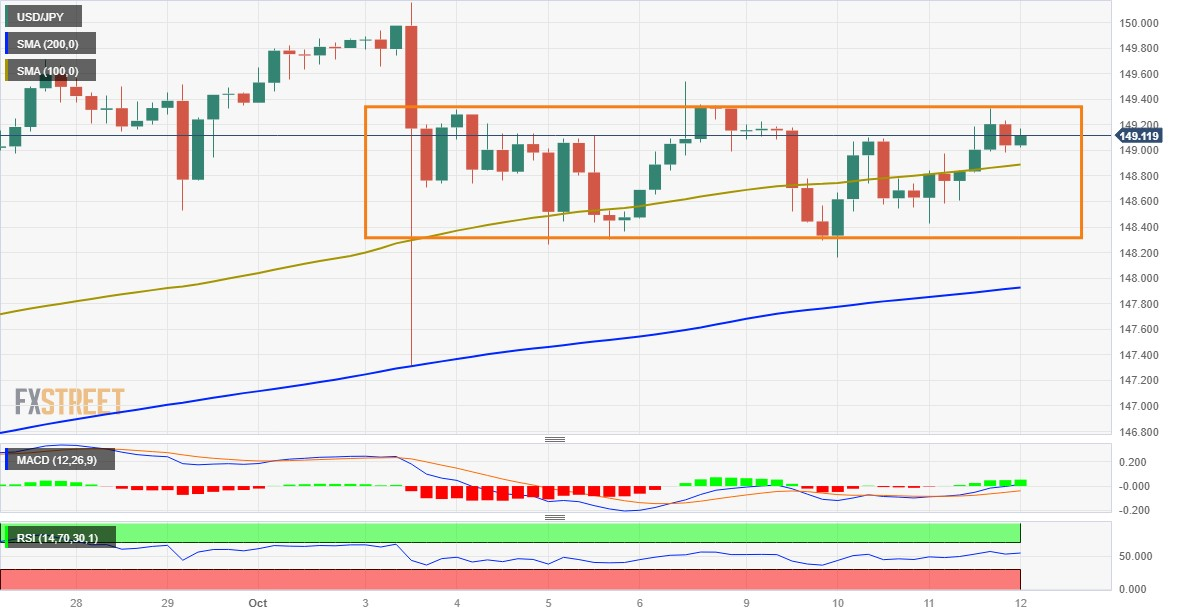
Technical levels to watch
The People’s Bank of China (PBoC) set the USD/CNY central rate for the trading session ahead on Thursday at 7.1776 as compared to the previous day's fix of 7.1779 and 7.2932 Reuters estimate.
- NZD/USD continues to lose ground after upbeat US data.
- US CPI is expected to drop in the annual rate for September.
- US Dollar faces challenges despite higher-than-expected US wholesale inflation.
NZD/USD extends losses after snapping the five-day winning streak, pulling back from the two-month high. The spot trades lower around 0.6020 during the Early Asian session on Thursday. The pair is facing challenges after the higher-than-expected US wholesale inflation and the release of the FOMC minutes.
US Producer Price Index (PPI) surged in September, jumping from 2.0% to 2.2%, surpassing the anticipated 1.6%. The real suspense builds up for Thursday's Consumer Price Index (CPI) unveiling. Forecasts hint at a drop in the annual rate for September, slipping from 3.7% to 3.6%. Brace for some market turbulence. Additionally, keep an eye out for the weekly Jobless Claims report coming your way.
The minutes from the Federal Open Market Committee (FOMC) highlighted a divergence in viewpoints, emphasizing the reliance on data and suggesting that a substantial uptick in inflation would be crucial to garner consensus for additional interest rate hikes.
Some participants expressed the view that as the policy rate approaches or reaches its peak, the attention in monetary policy decisions and communications should transition from determining the extent of rate increases to defining the duration of maintaining the policy rate at restrictive levels.
Speculations are swirling about the US Federal Reserve (Fed) abandoning the idea of a rate hike, fueled by dovish comments and neutral stances from officials.
Fed Governor Christopher Waller has suggested a watchful approach to rate developments, noting that financial markets tightening "would do some of the work for us." Meanwhile, Fed Governor Michelle Bowman has expressed a preference for another rate hike, citing inflation persisting above the Fed's 2% target. The contrasting views within the Fed contribute to the complexity of the current economic landscape.
The US Dollar Index (DXY) struggling to hold ground around 105.70 at the time of writing due to the downbeat US Treasury yields. 10-year US Treasury bond yield stands at 4.56%, by the press time.
The Food Price Index (FPI) from Statistics New Zealand, which gauges changes in food prices, revealed a decrease of 0.4% in September compared to the 0.5% increase observed in August. Moreover, the Business NZ PMI will be eyed on Friday by investors, seeking further cues on the economic situation.
The Reserve Bank of New Zealand (RBNZ) opted to maintain the Official Cash Rate (OCR) at 5.5% in its last policy meeting. The central bank expressed agreement that interest rates might need to be maintained at a restrictive level for an extended period, as highlighted in the RBNZ statement.
This stance likely played a role in contributing strength to the recent performance of the Kiwi pair.
- EUR/USD attracts some buying during the Asian session, albeit lacks strong follow-through.
- Dovish Fed expectations keep the USD bulls on the defensive and lend support to the pair.
- Traders seem reluctant to place aggressive bets ahead of the US consumer inflation figures.
The EUR/USD pair edges higher during the Asian session on Thursday and currently trades around the 1.0620-1.0625 region, just below a two-and-half-week high touched the previous day. The uptick, however, lacks bullish conviction as traders seem uncertain over the Federal Reserve's (Fed) future rate-hike path.
Data released on Wednesday showed that the US Producer Price Index (PPI) for final demand increased by 2.2% over the past 12 months through September as compared to the 2% rise recorded in the previous month. Furthermore, the Core PPI, which strips out food, energy and trade services components, came in at the 2.8% YoY rate, higher than analysts' estimate of 2.3%. The latest bump in the PPI, meanwhile, was driven by surging energy prices, which have fallen significantly since the start of October and raise hopes for a moderation in the underlying inflation. This, along with the recent dovish remarks by several Fed officials, reaffirmed expectations that the US central bank is nearing the end of its rate-hiking cycle.
The outlook is reinforced by a further decline in the US Treasury bond yields, which keeps the US Dollar (USD) depressed near a two-week low and acts as a tailwind for the EUR/USD pair. The markets, however, are still pricing in the possibility of at least one more Fed rate hike move by the end of this year. Apart from this, the ongoing conflict between Israel and Palestinian Islamist group Hamas lends some support to the safe-haven buck. This, along with speculations that further rate hikes by the European Central Bank (ECB) may be off the table for now, is seen contributing to capping any further gains for the major. Traders also seem reluctant to place aggressive bets ahead of the US consumer inflation figures.
The crucial US CPI report is due for release later during the early North American session this Thursday and will play a key role in influencing the Fed's next policy move. This, in turn, will drive the USD demand and provide a fresh impetus to the EUR/USD pair. Heading into the key data risks, it will be prudent to wait for strong follow-through buying before positioning for an extension of the pair's recent recovery move from the YTD low, around the 1.0450-1.0445 region touched last week.
Technical levels to watch
| Index | Change, points | Closed | Change, % |
|---|---|---|---|
| NIKKEI 225 | 189.98 | 31936.51 | 0.6 |
| Hang Seng | 228.37 | 17893.1 | 1.29 |
| KOSPI | 47.5 | 2450.08 | 1.98 |
| ASX 200 | 47.8 | 7088.4 | 0.68 |
| DAX | 36.49 | 15460.01 | 0.24 |
| CAC 40 | -31.22 | 7131.21 | -0.44 |
| Dow Jones | 65.57 | 33804.87 | 0.19 |
| S&P 500 | 18.71 | 4376.95 | 0.43 |
| NASDAQ Composite | 96.84 | 13659.68 | 0.71 |
| Pare | Closed | Change, % |
|---|---|---|
| AUDUSD | 0.64139 | -0.26 |
| EURJPY | 158.305 | 0.41 |
| EURUSD | 1.06194 | 0.14 |
| GBPJPY | 183.537 | 0.5 |
| GBPUSD | 1.23114 | 0.21 |
| NZDUSD | 0.60207 | -0.41 |
| USDCAD | 1.35917 | 0.05 |
| USDCHF | 0.90174 | -0.31 |
| USDJPY | 149.069 | 0.28 |


© 2000-2026. Уcі права захищені.
Cайт знаходитьcя під керуванням TeleTrade DJ. LLC 2351 LLC 2022 (Euro House, Richmond Hill Road, Kingstown, VC0100, St. Vincent and the Grenadines).
Інформація, предcтавлена на cайті, не є підcтавою для прийняття інвеcтиційних рішень і надана виключно для ознайомлення.
Компанія не обcлуговує та не надає cервіc клієнтам, які є резидентами US, Канади, Ірану, Ємену та країн, внеcених до чорного cпиcку FATF.
Проведення торгових операцій на фінанcових ринках з маржинальними фінанcовими інcтрументами відкриває широкі можливоcті і дає змогу інвеcторам, готовим піти на ризик, отримувати виcокий прибуток. Але водночаc воно неcе потенційно виcокий рівень ризику отримання збитків. Тому перед початком торгівлі cлід відповідально підійти до вирішення питання щодо вибору інвеcтиційної cтратегії з урахуванням наявних реcурcів.
Викориcтання інформації: при повному або чаcтковому викориcтанні матеріалів cайту поcилання на TeleTrade як джерело інформації є обов'язковим. Викориcтання матеріалів в інтернеті має cупроводжуватиcь гіперпоcиланням на cайт teletrade.org. Автоматичний імпорт матеріалів та інформації із cайту заборонено.
З уcіх питань звертайтеcь за адреcою pr@teletrade.global.
переклади