- Аналітика
- Новини та інструменти
- Новини ринків
Новини ринків
The data released from the Bank of Japan (BoJ) showed on Wednesday that the Japanese Producer Price Index (PPI) for August came in at 3.2% YoY from 3.6% in the previous reading and in line with market expectation.
On a monthly basis, the PPI improved to 0.3% in August compared to 0.1% in July.
Market reaction
USD/JPY is posting modest gains following the data. The pair is trading near 147.14, gaining 0.04% in the day.
- The AUD/NZD is floating near the top of recent consolidation.
- Aussie traders will be hoping to catch a bid if China data recovers.
- The Kiwi has a thin showing on the calendar this week, leaving it exposed to broader market flows.
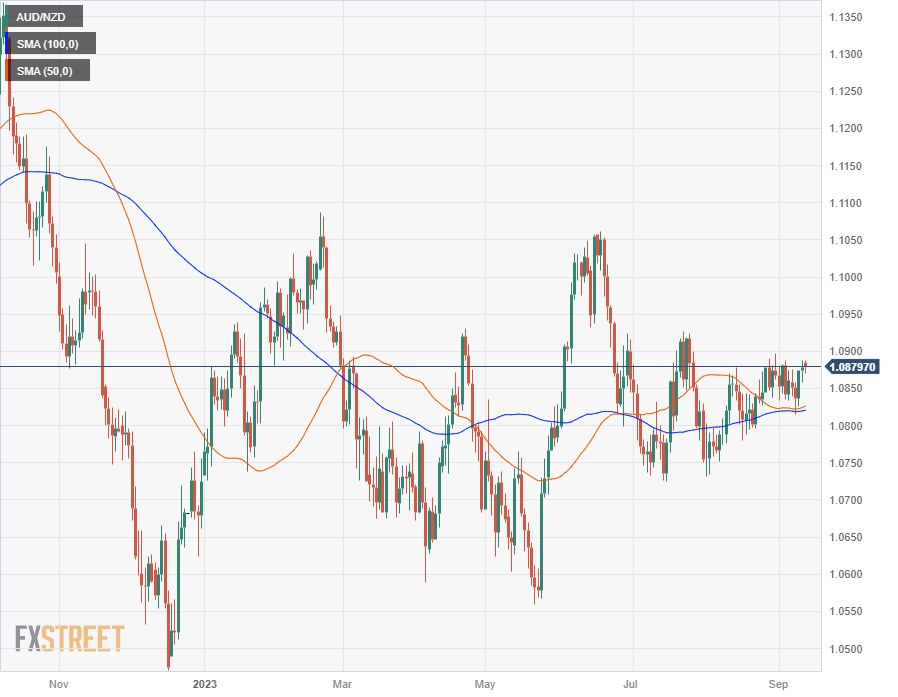
The AUD/NZD is on the high side for the week, pinning into recent highs near 1.0885 heading into the midweek trading session.
The pairing has struggled to develop meaningful directional momentum as of late, and the Aussie (AUD) continues to waffle in familiar territory against the Kiwi (NZD), trading in familiar territory for the past two months.
Westpac’s Consumer Confidence measure for September landed in the early Tuesday session, printing a 1.5% contraction against the previous decline of 0.4%. The worsening data implies Aussie consumers are increasingly bearish on the Australian economy, but the win is still tipped towards the AUD side of the Aussie-Kiwi pair as the NZD takes a backseat.
The AUD has been benefitting from bouts of positive economic news from China, and Friday will see annualized figures for Chinese Industrial Production and Retail Sales, both of which are expected to show improvements. China Industrial Production for the annualized period into August is forecast to print at 4% (previous: 3.7%), while China Retail Sales for the same period are likewise expected to uptick slightly from 2.5% to 2.8%.
China’s economic data has struggled of late, increasing investor fears of a global slowdown sparked by souring data from within China, and investors will be looking for any reason to latch onto some good news. As China’s closest trading partner, the Aussie will benefit from good news from China and could take a leg higher if investors are pleased with the showing.
Aussie, Kiwi data slated for the economic calendar in the mid-week
Before China data on Friday though, there will be a smattering of Antipodean data: Australian labor and unemployment figures will be dropping early Thursday, with New Zealand showing up later in the day with the BusinessNZ Manufacturing Purchasing Manager Index (PMI) figures for August.
The August Australian Unemployment Rate is expected to tick lower from 3.7% to 3.6%, while Employment Change for the same month is expected to jump from a 14.6K decline to a positive 24.3K.
On the Kiwi side, BusinessNZ PMIs last printed at 46.3 in September. The manufacturing PMI traditionally does not carry a market forecast, but the indicator has steadily printed to the downside since May’s 49.1 showing, and has been on the sub-50.0 side of the indicator since March.
AUD/NZD technical outlook
Daily candlesticks for the AUD/NZD have rebounded on the 100- and 50-day Simple Moving Averages (SMAs), which are consolidating near 1.0820 and 1.0825, respectively.
2023’s late May bottom near 1.0575 still remains intact, and June’s peak of 1.0150 remains well out of reach as the Antipodean cross pair struggles to break out of sideways action, consolidating around the 1.0850 level.
Technical momentum appears to be evaporating at the current level, and a downturn towards the 1.0800 major handle could be on the cards if Aussie bulls can’t catch enough bids to push the pair into new territory and force a challenge of the 1.0900 psychological level that currently sits just out of reach.
AUD/NZD daily chart
AUD/NZD technical levels
According to Reuters, confidence among major Japanese manufacturers has dropped the most in eight months, while morale in the services sector has also fallen amid concerns that a slowing Chinese economy would drag on global and domestic growth, a Reuters poll for September showed on Wednesday.
Key Quote
"Our business conditions are not so good due to uncertainty surrounding the global economy such as geopolitical risks stemming from a prolonged war in Ukraine and rising tension between U.S.-China frictions,”
"Overseas markets, particularly in China, are slumping and domestic demand is also languishing,”
Market reaction
The above statement fails to move the needle around the Japanese Yen. USD/JPY is trading at 147.10, up 0.01% on the day.
- The daily chart portrays the cross-currency pair in consolidation as bulls eye 95.00.
- Short term, the AUD/JPY uptrend remains in charge, with bulls eyeing 95.00.
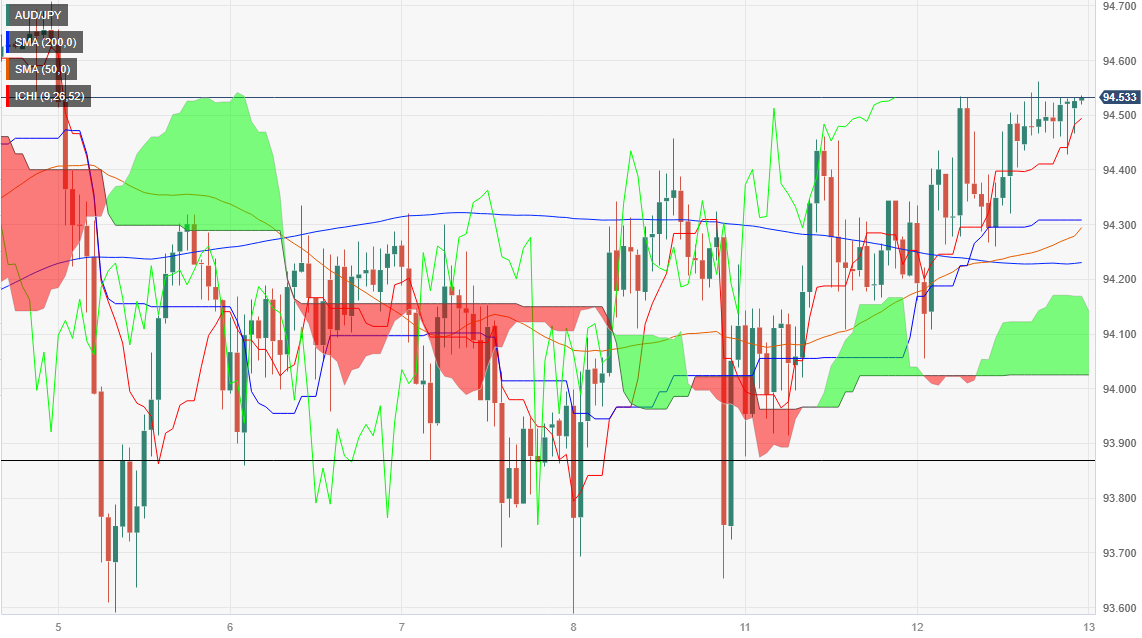
The Australian Dollar (AUD) exchanges hands near the weekly highs vs. the Japanese Yen (JPY(, but remains trading sideways amidst the lack of clear catalysts that boost or undermine the former. As Wednesday’s Asian session begins, the AUD/JPY is trading at 94.48, down by 0.02%.
AUD/JPY Price Analysis: Technical outlook
The daily chart depicts the pair as neutral to upward based, capped on the upside by the September 5 swing high of 94.71. If the pair breaks that level, the next resistance would be the 95.00 figure, followed by the July 25 swing high at 95.85. On the downside, the AUD/JPY finds support at the top of the Ichimoku Cloud (Kumo) at 94.20. A breach of the latter, the pair could edge toward the September 8 low of 93.58 before dropping toward the August 18 low of 92.78.
The AUD/JPY hourly chart depicts the pair consolidating around the weekly highs. Although buyers are in charge, they would need a decisive break of the September 4 high at 94.52, followed by the August 31 high at 94.93, before testing 95.00. On the downside, the pair’s first support would be the Tenkan-Sen at 94.48; once cleared, the next support would be the Kijun-Sen at 94.30, followed by the psychological 94.00 figure.
AUD/JPY Price Action – Daily chart
- AUD/USD oscillates around the 0.6410-0.6427 region in a narrow trading band.
- Australian consumer confidence data fell into the negative territory in August.
- Traders expected a 93% chance that interest rates will remain steady in September at 5.25%-5.50%.
- Investors will monitor the US Consumer Price Index (CPI) on Wednesday.
The AUD/USD pair oscillates in a narrow range around 0.6425 during the early Asian session on Wednesday. Meanwhile, the US Dollar Index (DXY) hovers around 104.50 after retreating from the 105.00 area. Markets turn cautious ahead of the key US inflation data.
The further upside of the Aussie is capped by the downbeat Australian consumer confidence data, which fell into the negative territory in August. Data released on Tuesday revealed that Australia’s Westpac Consumer Confidence for September fell by 1.5% to 79.7, following a 0.4% drop In the previous reading. The figures fueled concern about the impact of the economic slowdown in China.
Furthermore, US Commerce Secretary Gina Raimondo is set to meet with the CEOs of key American corporations this week, two weeks after visiting China and raising worries about business conditions, per Reuters. The renewed trade war tension between the US and China might exert some selling pressure and act as a headwind for the China-proxy Australian Dollar (AUD).
On the other hand, the higher for longer interest rate narrative in the US might lift the US Dollar (USD) against the Aussie. Traders anticipate a 93% chance that interest rates will remain steady in September at 5.25%-5.50% and a 56% chance that the Fed will hold its current monetary policy unchanged, according to the CME Fedwatch Tool.
Nevertheless, the August US Consumer Price Index (CPI) will be the highlight on Wednesday. The annual figure is anticipated to rise from 3.2% to 3.6%, while the core figure is expected to fall from 4.7% to 4.3%. The data might trigger volatility in the FX market and influence an expectation of the Federal Reserve's monetary policy.
Looking ahead, market participants will closely watch the US Consumer Price Index for August due later in the day. The stronger-than-expected data might convince the Fed to hike an additional rate. On Thursday, attention will shift to the Australian employment data and the US Producer Price Index (PPI) for August. Traders will take cues from these figures and will find trading opportunities around the AUD/USD pair.
- USD/CAD trades nearly flat at 1.3552, as high oil prices offset minor gains in the US Dollar Index (DXY).
- US CPI data due Wednesday could be pivotal; expected at 3.6% YoY, up from July’s 3.2%, with core CPI at 4.3%.”
- Bank of Canada remains cautious; October meeting could see rates held at 5% as mixed economic data looms.
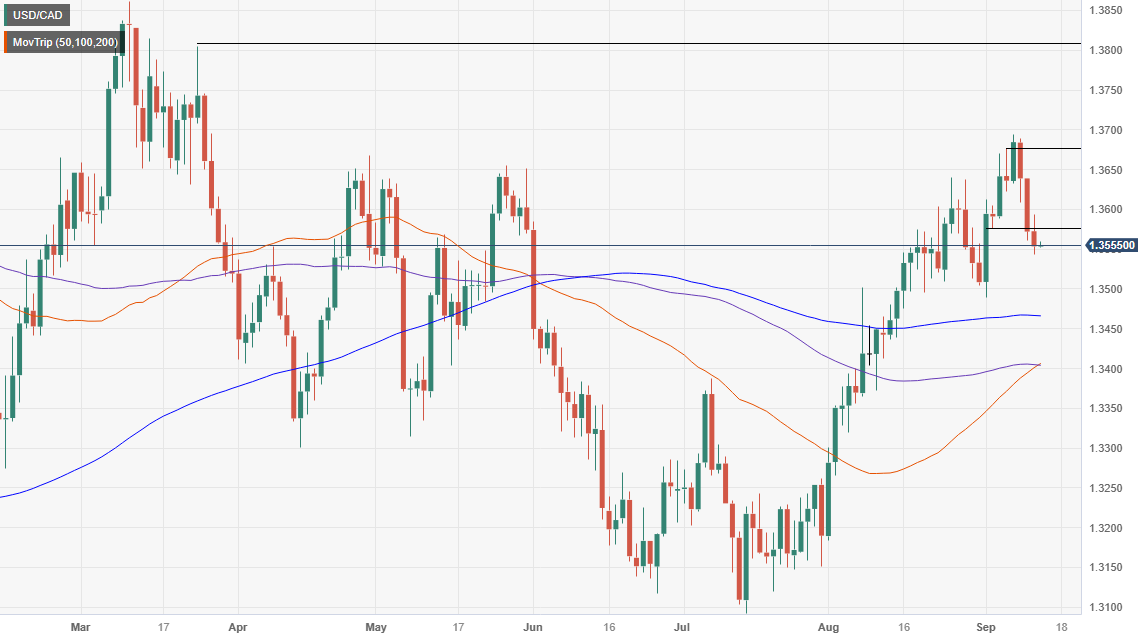
The Canadian Dollar (CAD) dropped on Tuesday’s session against the US Dollar (USD), underpinned by high oil prices, amid the lack of catalyst in the financial markets. With traders bracing for the August US inflation report, we could expect the USD/CAD to trade within a choppy trading range. The USD/CAD is trading at 1.3552, almost unchanged.
Loonie holds steady vs. the US Dollar, ahead of US CPI report for August
On Wednesday, the US Bureau of Labor Statistics (BLS) will reveal the US Consumer Price Index (CPI) report, which is expected to climb above the prior month’s figure. The CPI is estimated at 3.6% YoY, above July’s 3.2%. Excluding volatile items, the so-called core CPI is foreseen at 4.3% YoY, down from July 4.7%.
Even though the Greenback recovered some ground against a basket of six currencies, the US Dollar Index (DXY) finished with minuscule gains of 0.01%, at 104.54. In addition, it failed to bolster the USD/CAD pair, as oil prices finished with gains of more than 1.70%.
Up north across the US border, Canada’s economy has shown mixed data. Although the second quarter Gross Domestic Product (GDP) sounded the alarms of a recession, the latest employment report suggests the economy remains robust.
That triggered a reaction by the Bank of Canada (BoC), who decided to sit on their hands, awaiting more data, before committing to keep rates on hold or opening the door for additional tightening. Interest rate probabilities show the BoC is expected to hold rates at 5% for the upcoming meeting in October 25.
Nevertheless, Tiff Macklem, the BoC’s Governor, stressed that interest rates may not be high enough to tame inflation. He added, “Going forward, we will look for further evidence that price pressures are easing.”
Given the backdrop, if US inflation decelerates in both readings, USD/CAD traders could expect further downside, with sellers eyeing a test of the 200-DMA. Otherwise, speculations the US Federal Reserve would continue to tighten monetary conditions could pave the way for buyers to reclaim 1.3600.
USD/CAD Price Analysis: Technical outlook
After extending its losses for three straight days, the USD/CAD has fallen from around 1.3600 towards the 1.3550s area, closing near the day’s lows. Therefore, the USD/CAD path of least resistance is downwards and will face first support at the current week’s low of 1.3543. Once cleared, the pair could dive to the 1.3500 figure, followed by the 200-day Moving Average (DMA( at 1.3464. On the flip side, the USD/CAD could shift upwards if the pair stages a comeback toward the September 11 high at 1.3593.
- S&P 500 takes a step down on flagging technology sector components.
- Equities on softer footing ahead of key US CPI data due on Wednesday.
- Despite declines, S&P tech component up nearly 40% for 2023.
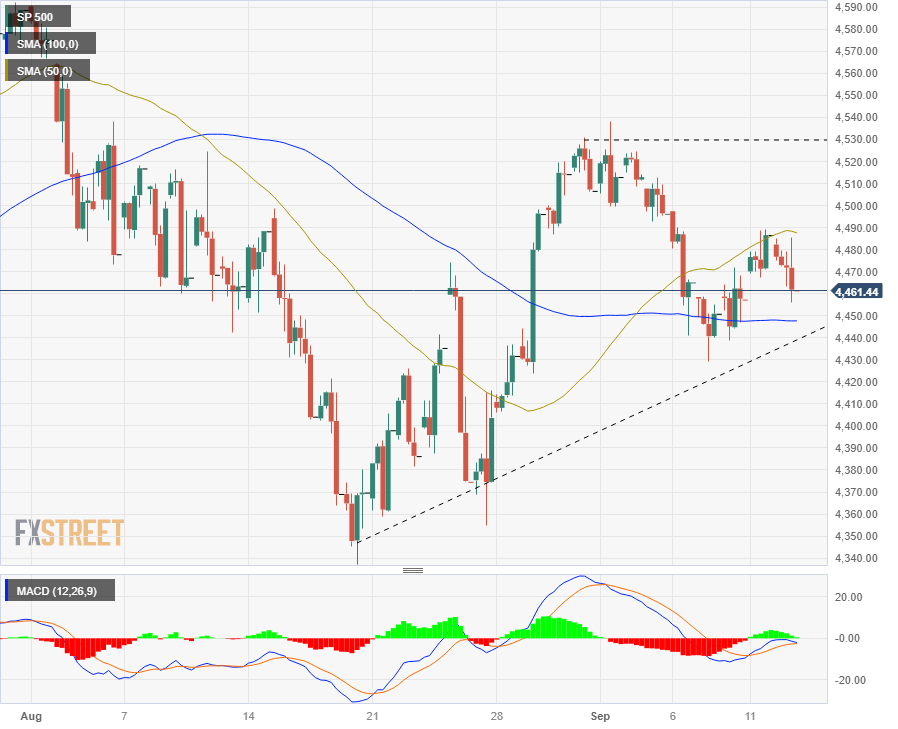
The Standard & Poor’s (S&P) 500 equity index is seeing red for Tuesday, slipping to the $4,460.00 area after opening the day neat $4,480.00.
Apple Inc’s highly-anticipated marketing event on Tuesday couldn’t provide support for the S&P 500 as Apple shares slumped nearly 2% following the announcement of the next version of their flagship iPhone line as the announcement failed to inspire investors.
Techs down on Tuesday despite stellar performance for the year
The technology sector component of the S&P 500 is broadly lower for Tuesday, down 1.5% for the day. Despite this, the technology facet of the major index is still up more than 37% for 2023.
S&P 500 technical outlook
The S&P spent most of Tuesday in the green, but couldn’t hold onto the gains heading into the close and finished the trading day slightly down.
The large-cap index is currently hung in the middle of a bullish inversion of the 100- and 50-period Simple Moving Averages (SMAs), with the 100-period SMA providing near-term support from $4,450.00 while a rising trendline from August’s lows near $4,350.00 represents rising support to fend off any bearish pushes.
Immediate resistance rests at the peak of September’s early highs near $4,530.00 but remains capped by the overshot 50-period SMA parked near $4,490.00.
S&P 500 4-hour chart
S&P 500 technical levels
- EUR/GBP closed above 0.8600 and saw 0.20% gains.
- A Reuters report indicated that the ECB will hike rates on Thursday on higher-than-expected inflation forecasts.
On Wednesday, the EUR/GBP closed above 0.8600, and the EUR gained ground over the GBP as investors are preparing for an announcement of a 25 basis point (bps) hike by the European Central Bank (ECB) on Thursday.
In line with that, Reuters reported that the European Central Bank (ECB) foresees eurozone inflation remaining above 3% next year, exceeding the previous 2% projection, which would justify a tenth consecutive interest rate hike at its upcoming meeting on Thursday. In the meantime, market expectations are divided between the bank maintaining current rates and a 25 basis point increase due to concerns about high inflation and looming recession fears.
Despite this projection strengthening the case for a hike, analysts still believe that the decision will be a close call.
EUR/GBP Levels to watch
The daily chart analysis indicates a neutral to bullish outlook for EUR/GBP as the bulls show signs of resurgence but face challenges ahead. Having turned flat in positive territory, the Relative Strength Index (RSI) suggests a potential market equilibrium with balanced buying and selling pressure, while the Moving Average Convergence (MACD) histogram exhibits increasing green bars. Furthermore, the pair is above the 20-day Simple Moving Average (SMA) but below the 100- and 200-day SMAs, indicating that the bulls aren't done yet and that the outlook is still positive for the short term.
Support levels: 0.8590, 0.8567 (20-day SMA), 0.8550.
Resistance levels: 0.8615 (100-day SMA), 0.8630, 0.8650.
EUR/GBP Daily Chart
-638301518231486545.png)
- Euro lurches higher on increased odds of ECB rate hike.
- Euro rate call slated for Thursday, leaked memo implies increased inflation expectations from the ECB.
- US CPI reading still in the barrel for Wednesday, promises refreshed market momentum.
The EUR/USD pairing has punched higher in Tuesday’s late trading session, bolstered by reports that the European Central Bank (ECB) has internally raised its inflation forecasts ahead of the ECB’s rate announcement later this week.
Read more: ECB to hike inflation forecasts, Euro surges
The Euro (EUR) pushed higher on the headlines, tapping the 1.0765 region, and now sits poised to close out Tuesday’s markets in the green for the day.
Market participants have been mixed on ECB expectations in recent days, with about 40% of investors anticipating a rate hike at the next ECB rate meeting on Thursday. However, if the still-unconfirmed ECB leak proves valid, it could very well see the EU central bank peg in another rate hike this week.
The news wasn’t enough to reclaim Tuesday’s early high of 1.0769, but markets in Asia could see an extended reaction as they kick off the Wednesday trading session.
Meanwhile, the Greenback (USD) side of the EUR/USD sees investors waiting for Wednesday’s US Consumer Price Index (CPI) figures, where market forecasts are anticipating an increase in headline US inflation to 0.6% for the month of August, an uptick from the previous month’s showing of 0.2%. With inflation expectations on the high side for the US, the EUR/USD is set to duke it out over competing rate hike cycles from the Federal Reserve (Fed) and the ECB
EUR/USD technical outlook
Hourly candlesticks for the EUR/USD are extending a rebound from the 100-hour Simple Moving Average (SMA) currently carving out an upswing near 1.0720, and a bullish inversion of the 50-day SMA pushing higher from 1.0730.
On the downside, a rising trendline from last week’s swing low into 1.0690 is providing rising support, and a break of the line could see an extended bearish challenge of June’s swing low near 1.0640.
EUR/USD hourly chart

EUR/USD technical levels
- GBP/USD declined towards 1.2490 and saw losses in five out of the last six days.
- UK labour market data came in soft.
- British yields are diving as markets discount a less aggressive BoE.
In Tuesday’s session, the GBP/USD fell below the 1.2500 area near 1.2490, seeing nearly 0.14% losses. The main downward driver of the Cable is investors placing dovish bets on the Bank of England (BoE) and the Greenback recovering ground, and markets remain cautious ahead of inflation figures from the US from August.
The UK reported weak labour market data on Wednesday’s European session. The Unemployment rate in the three months ending in July rose to 4.3%, as expected, while the Employment Change figure declined by 207,000, higher than the 185,000 expected in July. In addition, wage inflation measured by the Average Earnings in the three months up to July rose to 8.5% YoY, vs. the 8.2% expected, and while inflation rose as well as unemployment, it is not good news for the UK’s economy.
According to the World Interest Rate Probabilities tool (WIRP), markets are now discounting higher odds of a hike in the September and February meetings, which would lift the target rate to 5.75%.
On the other hand, the US’s calendar had nothing relevant to offer that its drivers on the session where investors seeking refuge in the Greenback ahead of the release of the Consumer Price Index (CPI) data from the US from August on Wednesday. The headline and core figure are expected to have accelerated on a monthly basis, and hot reading may boost hawkish bets on the Federal Reserve (Fed), which could open the upside for the USD.
GBP/USD Levels to watch
The daily chart analysis indicates a bearish outlook for the GBP/USD in the short term. The Relative Strength Index (RSI) is below its midline in negative territory, with a negative slope, aligning with the negative signal from the Moving Average Convergence Divergence (MACD), which displays red bars, reinforcing the strong bearish sentiment. Additionally, the pair is below the 20 and 100-day Simple Moving Averages (SMAs) but above the 200-day SMA, suggesting that despite the recent bearish sentiment, the bulls are still resilient, holding some momentum.
That being said, if the Cable loses the 200-day SMA at 1.2428, it would exacerbate the bearish momentum with the next targets at 1.2400 and 1.23800. On the upside, resistances line up at 1.2500, 1.2540 and 1.2570.
GBP/USD Daily Chart
-638301491665812447.png)
Reuters has reported, citing unnamed sources, that the European Central Bank (ECB) is expected to raise its inflation forecast while cutting economic growth projections, aligning with market expectations.
An increase in the inflation forecast brings the ECB closer an interest rate hike at its Governing Council meeting on Thursday. As a result of this report, the Euro surged.
The EUR/USD pair gained more than 30 pips, approaching Tuesday's highs, and is currently hovering around 1.0760. EUR/GBP broke above 0.8600, reaching the highest level in almost a month.
It's US CPI day. Those numbers will trigger actions and are crucial before next week's FOMC meeting. During the Asian session, Japan will release the Producer Price Index. Later, monthly UK GDP data is due, as well as Eurozone Industrial Production figures.
Here is what you need to know on Wednesday, September 13:
The US Dollar Index experienced a modest rise on Tuesday, approaching 105.00 before pulling back. It was a relatively quiet session as market participants awaited key US data.
The most crucial report of the day and the week is set to be released on Wednesday the August US Consumer Price Index (CPI). The annual rate is expected to rebound from 3.2% to 3.6%, while the Core rate is projected to slow down from 4.7% to 4.3%. Volatility is anticipated as these figures will influence expectations regarding the Federal Reserve's monetary policy. More inflation data is scheduled for Thursday with the the Producer Price Index (PPI).
US CPI Preview: Forecasts from 10 major banks, strong headline with rising energy prices
UK labor market data came in mixed, indicating a worsening economic situation. The Unemployment Rate edged higher to 4.3% (the highest since September 2021) after a decrease in employment by 207K. Average hourly weekly earnings rose 8.5% compared to the previous year, exceeding market consensus of 8.2%. Following these numbers, the Pound weakened. On Wednesday, the UK will report July GDP, Industrial Production, and trade data.
GBP/USD approached the monthly low but then rebounded towards 1.2500. The bias remains on the downside, holding above the 200-day Simple Moving Average (SMA) at 1.2440.
EUR/USD reached a weekly high at 1.0769 and then retraced, resuming the upside movement during the American session, rising towards 1.0750. The pair faces resistance at 1.0770 while holding above 1.0700. Eurozone Industrial Production data is due on Wednesday, and the European Central Bank will have its Governing Council meeting on Thursday.
The Japanese yen was among the worst performers. USD/JPY rose above 147.00 and encountered resistance at 147.20. Japan will release the August Producer Price Index (PPI) expected at 3.3% YoY.
NZD/USD managed to recover the 0.5900 mark with limited price action. The rebound from monthly lows remains cautious. In New Zealand, the August food price inflation is due on Wednesday.
AUD/USD pulled back after surging on Monday but held above 0.6400. Australia will report employment data on Thursday.
The Canadian Dollar outperformed the NZD and the AUD, supported by the rally in crude oil prices. The WTI barrel broke above $88.00 and then $89.00, reaching fresh monthly highs. USD/CAD dropped to the lower levels in almost two weeks and stabilized around 1.3550.
Precious metals had mixed performance, with Silver recovering to $23.00, ending the day flat, while Gold tumbled to the lowest level in two weeks at $1,907, even as US yields remained relatively steady.
Like this article? Help us with some feedback by answering this survey:
- Gold is seeing a soft retreat as US inflation data looms ahead.
- An upbeat US CPI read could send Gold lower.
- USD flows to determine the direction of XAU/USD as investors react to market inflation outlook.
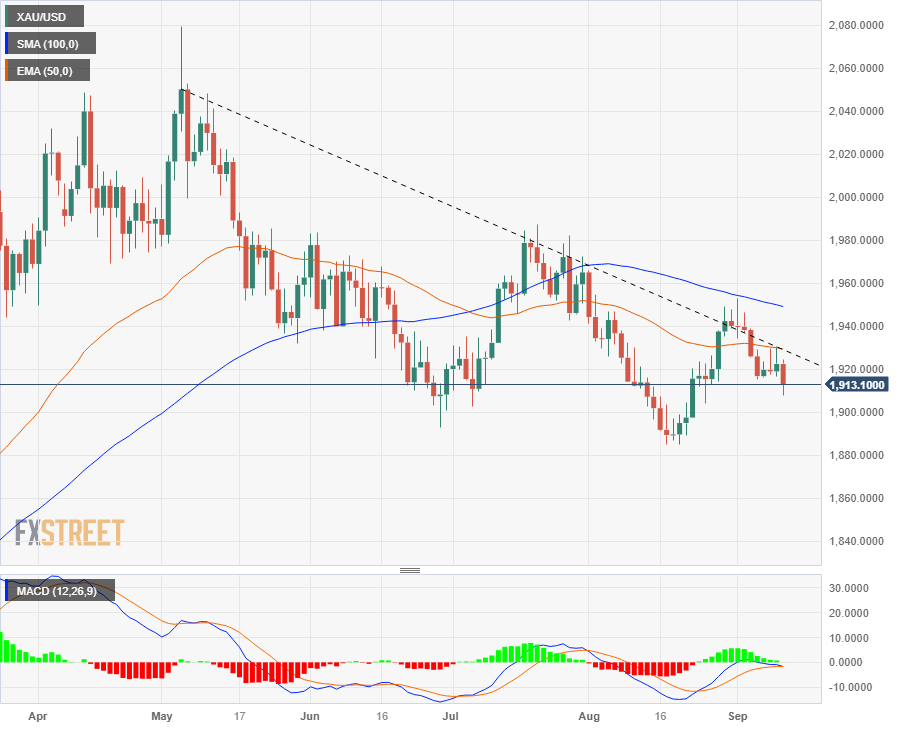
The XAU/USD is stepping lower in Tuesday trading, testing the $1,910.00 level as investors await US inflation figures on Wednesday’s Consumer Price Index (CPI) data release.
Metals investors will be taking a step back ahead of US inflation figures due tomorrow, and a firming up of the US Dollar (USD) index is taking the yellow metal down a peg, dropping below near-term bottoms and etching in a new low for the month of September.
US CPI figures to drive Gold flows on Wednesday
If US CPI figures come in or above expectations, it could put further downside pressure on Gold. Headline CPI data for the month of August is forecast to come in at 0.6%, a step up from the previous month’s 0.2%. Core CPI (CPI excluding food and energy prices) for the same period is expected to hold steady at 0.2%.
Looking ahead to Thursday, US Retail Sales growth figures are expected to show a slight cooling off. August’s Retail Sales data is expected to print at 0.2%; still a positive number, but a reduced showing from the previous month’s 0.7% growth.
A disappointing showing for economic calendar data could see a firm round of support for the XAU/USD, but increasing economic activity will send the Greenback higher and push Gold another step down.
XAU/USD technical outlook
Gold is slightly lower in the early trading week, down from Monday’s opening prices near $1,920.00, and daily candlesticks are so far getting suppressed by a descending trendline from May’s high peak above $2,050.00. Adding to the resistance cloud gathering above Gold prices, the 100-day Simple Moving Average is descending to $1,950.00, and an inversion of the 50-day Exponential Moving Average sees the EMA building resistance into $1,930.00.
On the short side, support is coming from August’s swing low into $1,890.00, and despite consecutive lower lows on the daily chart, bearish momentum is waning as the fast and slow EMAs on the MACD indicator begin to consolidate.
XAU/USD daily chart
XAU/USD technical levels
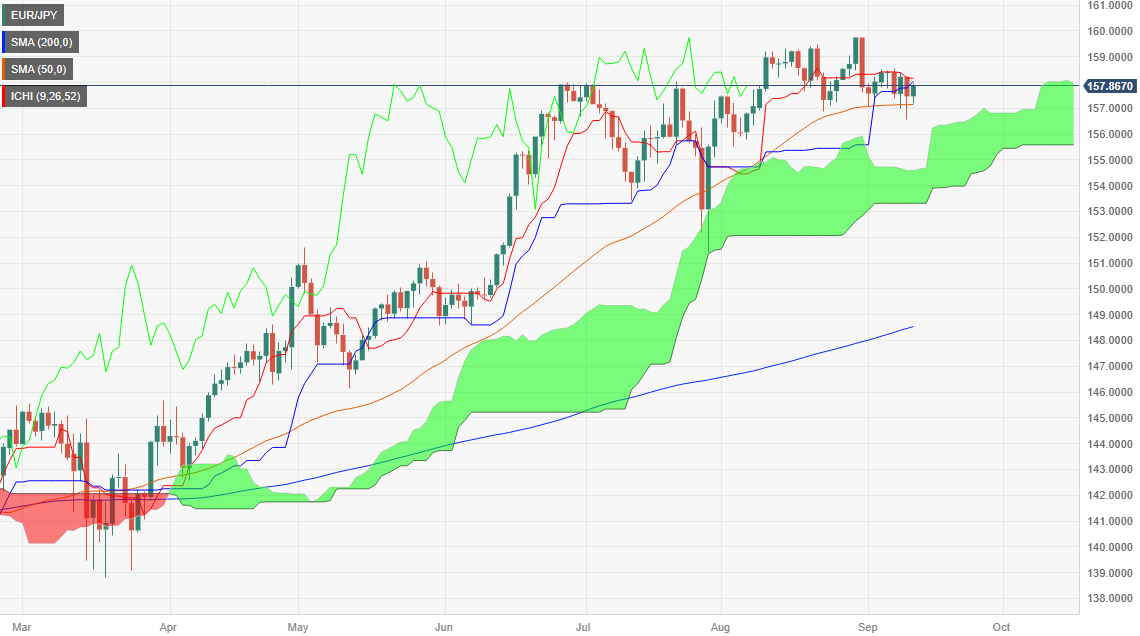
- EUR/JPY trades at 157.85, up 0.19%, as it hovers above the Ichimoku Cloud, indicating a neutral to bullish outlook.
- First resistance for buyers lies at the Kijun-Sen level of 158.05; breaching this could target year-to-date high at 159.76.
- Immediate support found at September 11 daily low of 156.58; breaking this could see the pair slide toward 155.58.
The Euro (EUR) advances against the Japanese Yen (JPY) for the second straight day after forming a hammer, which suggests the cross-currency pair could be headed for higher prices. As the North American session winds down, the EUR/JPY is trading at 157.85, gaining 0.19% at the time of writing.
EUR/JPY Price Analysis: Technical outlook
After peaking at around 158.15, the EUR/JPY remains neutral to a downward bias despite trading above the Ichimoku Cloud (Kumo). As the pair continued to print successive series of lower highs and lows, today’s upward correction is being capped by the Kijun-Sen at 158.05, seen as the first resistance for buyers if they would like to retest yearly highs. A breach of the latter would expose 159.00, followed by the year-to-date (YTD) high at 159.76.
Conversely, the EUR/JPY first support would be the September 11 daily low of 156.58, which, once cleared, the pair would dive towards the Senkou Span B at 155.58. In the scenario of sliding below that level, the top of the Kumo will emerge as the next support at 154.70.
EUR/JPY Price Action – Daily chart
- Polish Zloty swoons on Ukraine grain spat.
- The bad news is accumulating for the PLN, which is still reeling from surprise rate cuts.
- Polish grain bans from Ukraine to face legal contention.
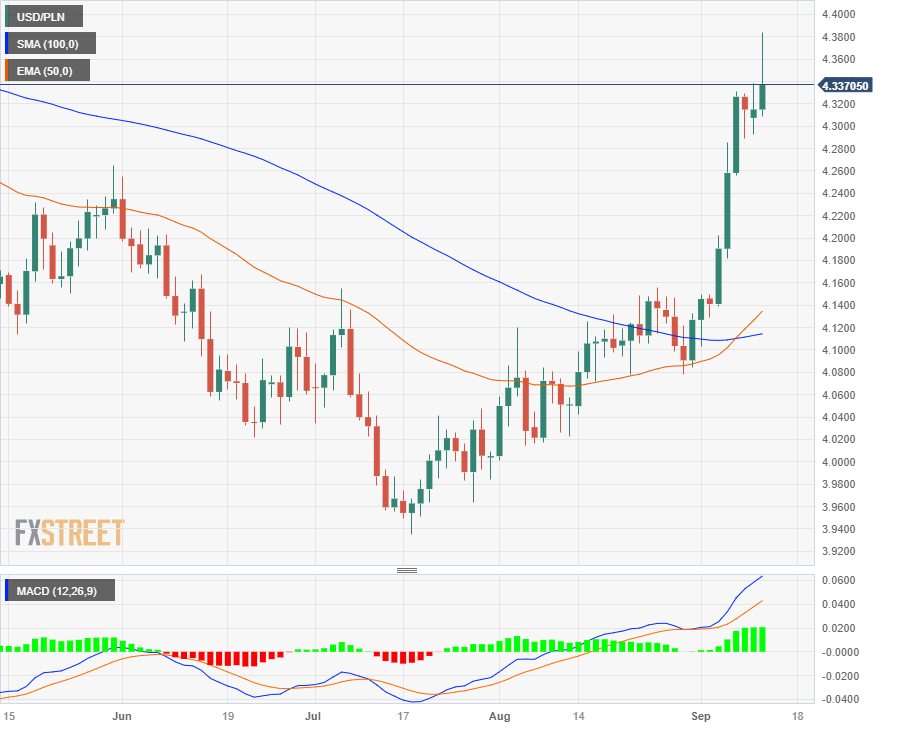
The USD/PLN has tipped into six-month highs near 4.3850 as the Polish Zloty (PLN) continues to sag against the Greenback (USD) following agriculture comments from Polish Prime Minister Mateusz Morawiecki, who is threatening to extend Poland’s embargo on Ukrainian corn, wheat, sunflower, and canola.
Early Tuesday saw another test for the PLN after Prime Minister Mateusz Morawiecki announced that he had formally requested that the European Commission, the executive arm of the European Union (EU), extend current restrictions on the volume of Ukrainian agricultural products that are allowed to cross the border into Poland.
The ruling Law & Justice party of Poland, a far-right ultra-nationalist party, is courting the farm vote ahead of the general election due to begin October 15th. Prime Minister Mateusz Morawiecki declared on the app formerly known as Twitter that, “Poland will not allow Ukraine grain to flood us”. The Polish Prime Minister telegraphed that Poland would continue to keep grain at the border regardless of the Commission’s decision, continuing on the social media app, “Regardless of the decisions of the clerks in Brussels, we will not open up our borders.”
Poland and several other regional neighbors all agreed on an EU embargo on grains produced by Kyiv from April until September 15th in an effort to prevent knock-on market effects on their farmers. Russia’s blockade on Ukrainian exports has left Ukraine with more grains than its domestic market can absorb.
EU Agriculture Commissioner Janusz Wojciechowski, who is Poland’s former agriculture minister, announced on Tuesday that he was actively trying to extend the embargo.
Ukraine grains threaten Poland, says Polish Prime Minister
Ukraine’s Prime Minister Denys Shmygal has threatened legal action on the ban extension, citing potential violations of the General Agreement on Tariffs and Trade (GATT). The Prime Minister declared that Kyiv will seek World Trade Organization (WTO) arbitration to recover losses, citing that the embargo extension represents “political populism before the (Polish) elections”.
The Polish Zloty knocked lower on news of the agriculture spat, and the PLN is on pace for its biggest single-month decline since September of last year. The end of 2022 saw the PLN hit record historical lows, with a single Greenback (USD) able to purchase over 5 Zloty at the peak.
The grains groans follow closely on the heels of Poland’s recent Zloty headaches, sparked by an unexpected rate cut from the Polish National Bank (PNB). PNB Governor Adam Glapiński gave a surprise 0.75% rate cut despite inflation still clearing 10% in the Polish economy.
PNB Governor Adam Glapiński has come under fire for the move, being accused on multiple fronts of politically motivated banking policies. Glapiński, an open supporter of the Law & Justice party, has been accused of trying to bolster political support ahead of the general election next month by reducing borrowing and lending rates at the future expense of the domestic economy.
Further reading: Zloty crumbles on the back of PNB rate cut, inflation still over 10%
USD/PLN technical outlook
The Zloty continues to lose ground against the USD, and the USD/PLN pairing was knocked higher on Tuesday, cracking near-term highs around 4.3350. The pair briefly broke through the 4.3800 handle, and the floor is looking very far away. A significant bottom has been priced into July’s swing low near 3.9500, and any downside momentum sees dynamic support rising from a bullish inversion of the 50-day Exponential Moving Average (EMA) and 100-day Simple Moving Average (SMA).
The Zloty is looking incredibly over-extended against the Greenback, but significant macro conditions are breaking the technicals.
USD/PLN daily chart
USD/PLN technical levels
- GBP/CAD trades at 1.6924, pressured by rising oil prices and a UK unemployment rate increase to 4.3%.
- Bank of England hints at a rate cap at 5.50%, while the Bank of Canada eyes further tightening amid strong job growth.
- Upcoming monetary policy decisions could dictate the pair's direction, but higher oil prices may tilt the scales in favor of the Loonie.
The Loonie (CAD) extends its gains against the Pound Sterling (GBP) due to increasing oil prices and mixed UK economic data. Hence, the GBP/CAD is trading at 1.6924 after hitting a daily high of 1.7020.
Loonie strengthens against the Pound amid rising Oil prices and mixed UK economic indicators
During the European session, the Office for National Statistics (ONS) in the UK revealed the Unemployment Rate climbed to 4.3% in the three months to July, above the prior month’s 4.2%, while wages excluding bonuses grew by 7.8%, as expected, unchanged to the last reading.
Although the labor market is cooling, as the UK economy feels the impact of higher interest rates imposed by the Bank of England (BoE), higher wages suggest the central bank’s job isn’t done. The BoE’s expectations for another rate hike remained below last week’s estimates, which foresaw the bank rate to end at around 5.73%. Nevertheless, the latest data round suggests that Bailey and Co would refrain from exceeding the 5.50% threshold.
On the Canadian front, as the economy added more jobs than expected, as revealed last week, it has opened the door for additional tightening by the Bank of Canada (BoC). The BoC has expressed that people demanding higher wages would make it harder to curb stickier inflation.
The latest BoC monetary decisions witnessed the BoC keeping rates unchanged at 5%. But the chances for additional tightening remain, as money market futures show 15 bps of further tightening for BoC’s June 2024 monetary policy decision.
In his latest remarks last Thursday, Tiff Macklem, the BoC’s Governor, stressed that interest rates may not be high enough to tame inflation. He added, “Going forward, we will look for further evidence that price pressures are easing.”
Given the fundamental backdrop, the GBP/CAD could consolidate ahead of the upcoming monetary policy decisions in the near term. Nevertheless, higher oil prices could offset the interest rate differential in favor of the Pound Sterling (GBP) and open the door for further weakness in the cross-currency pair.
GBP/CAD Price Analysis: Technical outlook
The daily chart depicts the pai as neutral to downward biased, despite the fact the GBP/CAD remains above the 200-day Moving Average (DMA). However, successive series of lower peaks and throughs suggest the cross would test the 1.6900 figure. A breach of the latter would expose the July 24 daily low of 1.6883, followed by the 200-DMA at 1.6729. Conversely, if buyers reclaim the 100-DMA at 1.6958, that could pave the way towards 1.7000.
- The EUR/USD took a stepdown in early Tuesday trading, and bidders are looking to recover.
- US and EU economic data in the mid-week to complicate the charts.
- ECB rate call is around the corner, alongside US inflation figures due.
The EUR/USD pairing is determined to restore balance on Tuesday and is pushing into 1.0735 in afternoon trading after sliding to the day’s lows near 1.0705.
The Euro (EUR) is on the low end against the Greenback (USD) for the day, down from Tuesday’s opening prices near 1.0747, and down even further from the day’s early peak of 1.0770.
The tug-of-war is likely to continue in the short term as the mid-week sees a healthy economic calendar, with both the US and the Eurozone (EU) represented on the data docket for Wednesday and Thursday.
US, EU data in the pipe
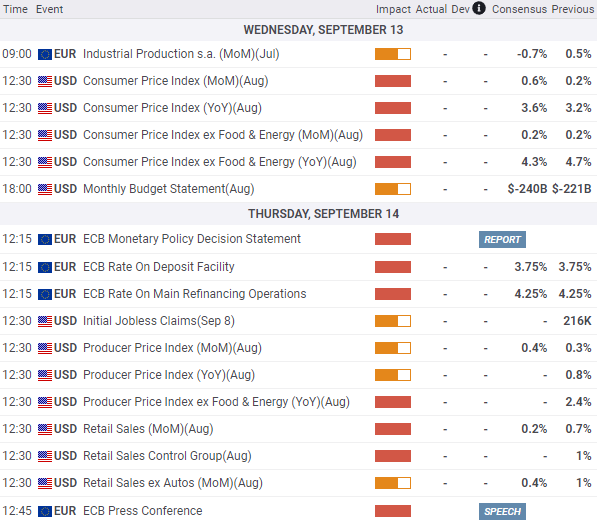
Wednesday’s economic calendar sees US Consumer Price Index (CPI) figures as well as the federal government’s Monthly Budget Statement. Market analysts broadly expect US headline CPI for August to tick upwards to 0.6%, an increase from the previous month’s 0.2%. August’s Core CPI (CPI less food and energy costs) meanwhile is forecast to hold steady at 0.2% from the previous month’s reading.
The US federal budget deficit for the month of August is also expected to backslide, down $240 billion compared to the previous month’s $221 billion deficit.
Thursday will see the European Central Bank (ECB) giving its latest rate announcement; investors are expecting the ECB to hold steady on interest rates, though recent hawkish comments from ECB officials have seen an uptick in the number of market participants expecting an additional rate increase.
30 minutes after the ECB rate call there will be a press conference with ECB officials, where investors will be listening closely for any hints about the path forward for the European central bank’s interest rate policy.
Thursday also brings US Producer Price Index (PPI) figures, as well as Retail Sales. The monthly PPI for August is expected to tick upwards, albeit slightly, from 0.3% to 0.4%. Meanwhile, Retail Sales growth is expected to decline to 0.2% from July’s 0.7%. While a positive figure, but a contraction in growth figures could signal a softening economy, and market participants will be keeping a close eye on the print.
EUR/USD economic calendar for Wednesday and Thursday; all times in GMT.
EUR/USD technical outlook
The Euro got knocked lower against the USD in early Tuesday trading after an initial climb up the charts, and the pair is struggling to build meaningful momentum from the 100-hour Simple Moving Average (SMA). The hourly MACD histogram indicator is beginning to rotate bullish, with the fast-moving average gearing up to swap places with the indicator line.
The EUR/USD has closed in the red for the past eight consecutive weeks, and buyers will be looking to reverse the pair’s recent rejection from the 100-day SMA, which has gone flat and is threatening to turn bearish. A bearish inversion of the 100-day SMA and 50-day Exponential Moving Average (EMA) is likewise complicating bidding efforts.
Meanwhile, the MACD on daily candlesticks is showing oversold conditions, though the slow line histogram of the MACD is showing further room for the EUR/USD to stoop even lower in the event a failed bid to re-establish bullish momentum.
EUR/USD daily chart
EUR/USD technical levels
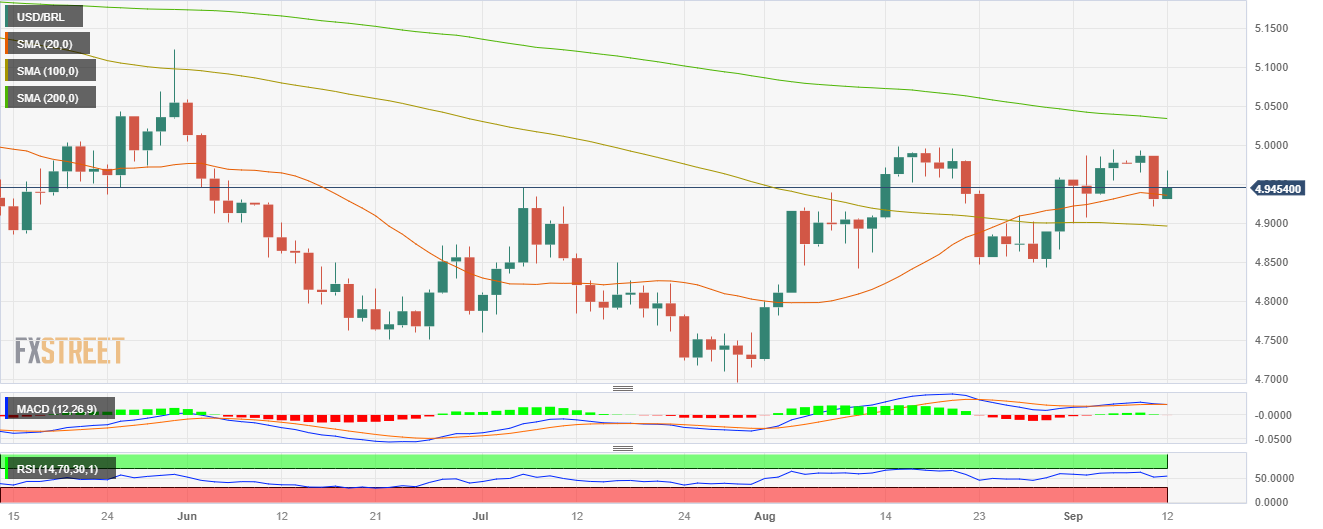
- USD/BRL rose to a high near 4.9680 and then settled at 4.9450.
- Brazilian IPCA from August showed no surprises.
- Markets are cautious, awaiting inflation figures from the US on Wednesday.
The USD/BRL gathered momentum in Tuesday’s session after the BRL decline after the release of the Brazilian inflation figures from August. On the USD side, it is recovering ground after trading soft on Monday while markets seem cautious ahead of Wednesday’s inflation readings from the US.
The Instituto Brasileiro de Geografia e Estatistica revealed that the IPCA inflation advanced 0.23% MoM and matched expectations.
Recent upward movements of the pair may be attributed to recent rate cuts by the Bank of Brazil’s Monetary Policy Committee (COPOM), and markets are expecting the bank to cut further the target rate next week by 50 basis points to 12.75% which could exacerbate the downside for the Brazilian currency.
On the other hand, the USD is trading firm against its rivals, driven by a cautious market mood and US Treasury yields remaining high. That being said, Wednesday’s Consumer Price Index (CPI) figures will be crucial for the Greenback’s and bond price dynamics as they will play a big rol in modelling expectations of the next Federal Reserve (Fed) decisions. As for now, a pause in next week’s meeting is practically priced in while there's still a 40% chance of one last interest rate hike in either December or November, according to the World Interest Rate Probabilities tool.
USD/BRL Levels to watch
Observing the daily chart, USD/BRL displays a neutral to bullish technical outlook for the short term as the bulls gain momentum. The Relative Strength Index (RSI) demonstrates a favourable upward trend above its midline, while the Moving Average Convergence (MACD) shows stagnant red bars. Additionally, the pair is above the 20 and 100-day Simple Moving Averages (SMAs), but below the 200-day SMA, suggesting that the bulls are in command over the bears on the bigger picture.
Support levels: 4.9350 (20-day SMA), 4.9330, 4.9150.
Resistance levels: 4.9680, 4.9840, 4.9900.
USD/BRL Daily Chart
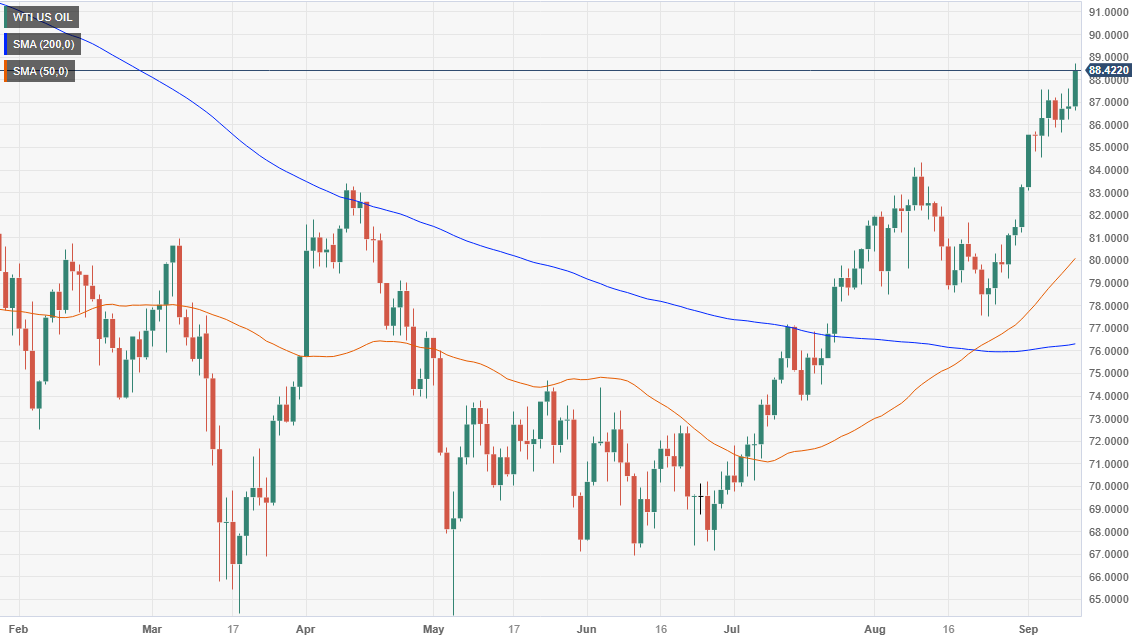
- WTI trades at $88.49 per barrel, up 1.95%, driven by Saudi Arabia and Russia’s output cuts of 1.3 million bpd.
- OPEC projects a rise of 2.25 million barrels per day in oil demand by 2024, signaling robust global economic growth.
- US inflation data due this week could impact WTI prices; a higher-than-expected reading may trigger speculations of a Fed rate hike.
Western Texas Intermediate (WTI), the US crude oil benchmark, climbed more than 2% to a 10-month high in the mid-North American session, as oil supply is projected to remain tight. That, alongside supply cuts by oil exporting countries, underpins WTI price. At the time of writing, WTI is trading at $88.49 per barrel, up 1.95%.
Oil prices soar amid OPEC projections, geopolitical factors as markets eye US CPI
The latest report from the Organization of Petroleum Exporting Countries (OPEC) foresees oil demand will rise by 2.25 million barrels per day (bpd) in 2024. The OPEC stuck to its robust growth projections in global oil demand in 2023 and 2025, suggesting that major economies are stronger than expected.
Saudi Arabia and Russia’s crude oil output cut of 1.3 million barrels per day until December 2023 is the main driver behind the recent climb in oil prices. Also, floods and storms in Eastern Lybia continued to weigh on the oil supply, as the four major oil exports remained closed since the weekend.
In the meantime, Kazakhstan revealed that its oil production fell to 213,8000 metric tons on September 11 from 243,500 tons as maintenance work began on the pipelines.
Aside from this, traders are bracing for data released by the US Energy Information Administration (EIA) office and the International Energy Agency (IEA). A Reuters poll shows analysts estimate a drop of 2 million barrels of crude from US stockpiles during the week ending on September 8.
Oil traders are also watching data from the US Department of Labor, which would unveil US inflation numbers. If the data exceeds estimated to the upside, that could weigh on the WTI price, as speculations for another Fed rate hike will rise, implying the US Dollar would climb. Otherwise, expect further WTI upside.
WTI Price Action – Daily chart
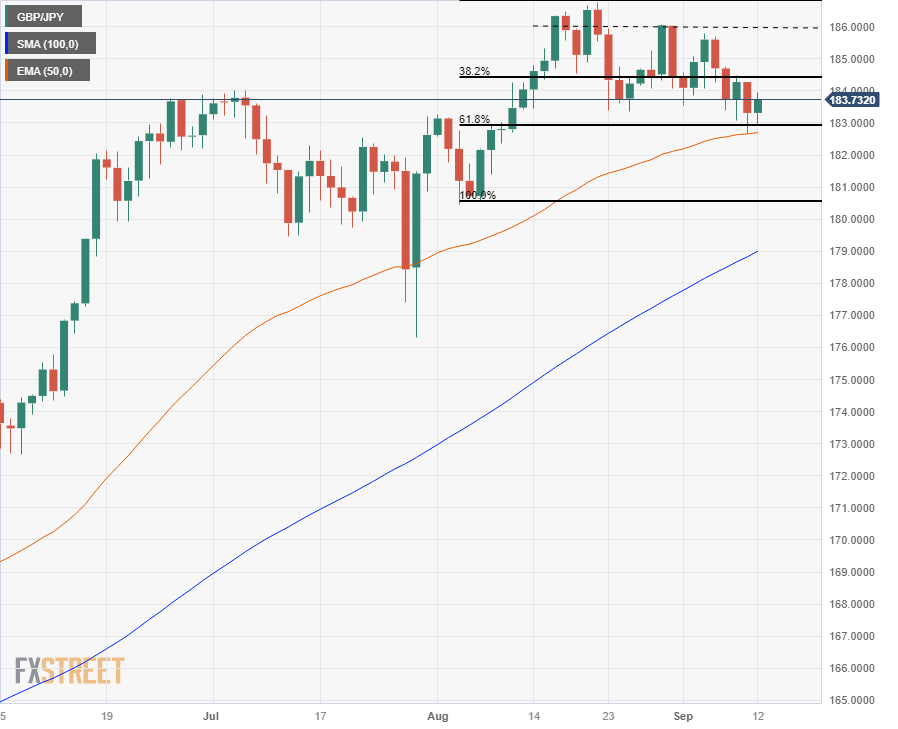
- The GBP/JPY is pushing higher after getting knocked lower in Tuesday trading, looking to chalk in a green day.
- UK GDP figures around the corner for Wednesday, investors are looking to position ahead of industrial production figures.
- BoJ comments are bolstering JPY traders eager for hawkish policy changes.
The GBP/JPY pair is recovering into the green for Tuesday, testing the 183.70 region after slipping to the 183.00 handle earlier in the session.
The Guppy kicked off the trading day near 183.45, briefly clambering above the 183.90 level before getting knocked lower in European trading. The Pound Sterling (GBP) faces headwinds on the back of a dovish Bank of England (BoE), and a firming Yen (JPY) on the back of recent hawkish Bank of Japan (BoJ) comments is complicating matters.
The BoE has struck a notably softer tone recently, highlighted by the BoE’s Governor Andrew Bailey noting recently that the UK central bank is quickly approaching the peak of the rate hike cycle. Inflation remains a stubbornly sticky complication for the UK, but the BoE is caught between a rock and a hard place, as too much action on interest rate hikes could pose a threat to the British economy.
On the Yen side, the BoJ’s Governor Kazuo Ueda hit news wires recently alluding to the eventual end of the Japanese central bank’s negative interest rate policy if data continues to improve into the end of the year. Before major policy adjustments can be made, however, the BoJ needs to be confident that it has successfully attained its 2% inflation target alongside rising wages. While Japanese inflation has been above the 2% target for some time, inflation is expected to undershoot BoJ targets in the coming months, and market expectations of rate adjustments may be premature.
UK GDP, industrial production figures in the pipe
Investors are jostling for position ahead of a smattering of mid-tier UK economic data due on Wednesday. Gross Domestic Product (GDP) figures for the month of July are expected to decline 0.2% versus the previous month’s 0.5% increase, and Industrial Production for July is likewise forecast to decline 0.6% versus the previous month’s growth of 1.6%.
UK Manufacturing Production for July is also anticipated to decline by 1% after climbing 2.4% in June, while the annualized figure is expected to slide from 3.1% to 2.7%.
GBP/JPY technical outlook
The Guppy is pushing upwards for Tuesday, testing 183.70 while a descending 100-hour Simple Moving Average (SMA) is providing resistance as it punches into 183.80.
The Pound Sterling slipped against the Yen from August’s peak just beneath the 187.00 major handle and is currently trapped between the 38.2% and 61.8% Fibonacci retracement levels from August’s swing low into 180.60, at 184.40 and 183.00 respectively, while the 50-day Exponential Moving Average (EMA) is lifting to provide dynamic support as the indicator consolidates with the 61.8% Fibonacci level.
GBP/JPY daily chart
GBP/JPY technical levels
- XAG/USD wanders around $23.00, but the bullish momentum seems weak.
- A stronger USD and yields remaining high don’t allow precious metals to make a significant upwards move.
- All eyes are on Wednesday’s US CPI figures from August.
On Tuesday’s session, Silver’s spot price XAG/USD traded neutral around $23.00, mainly limited to a strong USD whose DXY index jumped to a high of 104.90 and US yields slightly increased.
In addition, the economic calendar had nothing relevant to offer, and markets remained cautious ahead of the August US Consumer Price Index (CPI, expected to have accelerated by 0.5% MoM, while the Core measure is projected to increase by 0.2% MoM. At the same time, the expectations for Federal Reserve (Fed) tightening remain steady. The CME FedWatch tool indicates that while the market has already priced in a pause for the upcoming September 20 meeting, there's still a 40% chance of one last interest rate hike in either December or November.
A hot inflation reading may fuel a rise in US bond yields, which could negatively impact Silver prices as they are considered the opportunity cost of holding non-yielding metals.
In the meantime, US Yields are edging higher on the day. The 10-year bond yield is seen at 4.29%, with mild gains on the day. The 2-year yield stands at 5.00% with 0.20% gains, and the 5-year yield is at 4.42%, also with mild gains.
XAG/USD Levels to watch
Upon analysing the daily chart, a neutral to bearish is seen for the XAG/USD, with the bears maintaining control and bulls struggling to make a significant move. With a flat slope below its midline, the Relative Strength Index (RSI) suggests a period of stability in negative territory, while the Moving Average Convergence (MACD) exhibits shorter red bars. On the larger time frame, the pair is below the 20,100 and 200-day Simple Moving Averages (SMAs), suggesting that the buyers are struggling to overcome the overall bearish trend and the bears are still in charge.
Support levels: $22.80, $22.60, $22.30
Resistance levels: $23.50 (20 and 200-day SMA convergence), $23.70, $24.00.
XAG/USD Daily Chart
-638301355827355848.png)
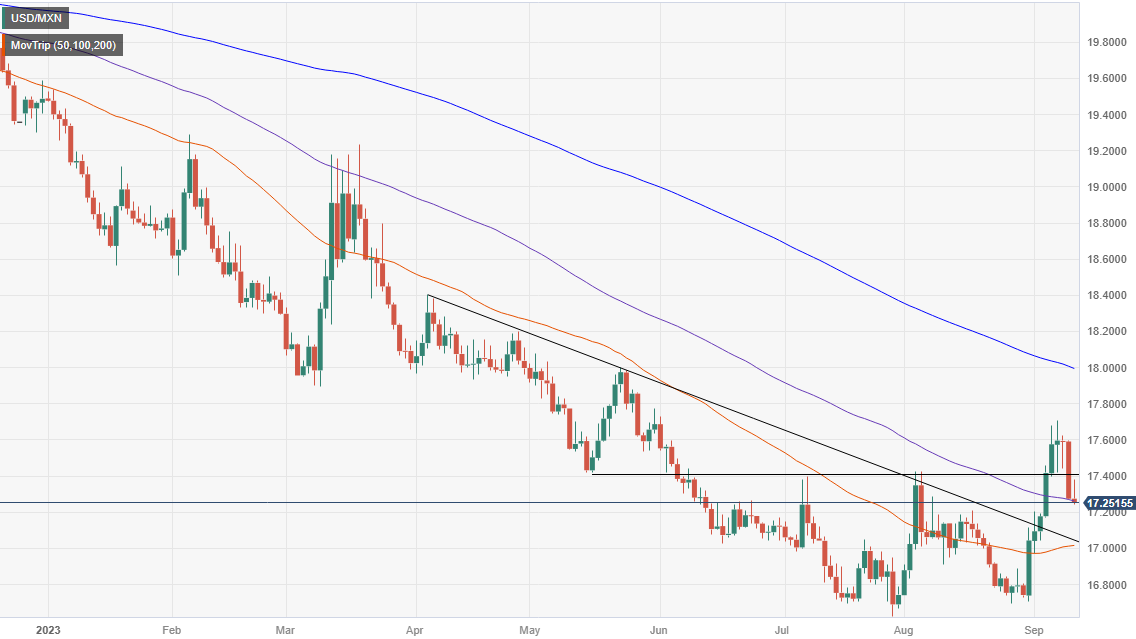
- USD/MXN trades at 17.2607, with the dollar gaining 0.20% as risk-off sentiment prevails in the market.
- US inflation data due Wednesday could be a game-changer; CPI expected to rise from 3.2% to 3.6% YoY.
- Mexico’s 2024 economic package proposes fiscal deficit increase to 4.9% of GDP, the highest in 36 years.
The Mexican Peso (MXN) loses some ground vs. the US Dollar (USD) after strengthening to 17.2688, but the latter regains some composure as the North American session progresses. A scarce economic docket in the US and a risk-off impulse keep investors seeking safety ahead of US inflation data. The USD/MXN is trading at 17.2607.
Mexican Peso retraces slightly as investors await US CPI, digests Mexico’s 2024 economic package
Risk aversion is boosting the Greenback vs. the Mexican Peso, as US equities remain trading with losses, except for the Dow Jones. Market participants are bracing for the release of August’s inflation data in the US on Wednesday. The Consumer Price Index (CPI) is expected to rise from 3.2% to 3.6% YoY, while core CPI will drop from 4.7% to 4.3%.
Ahead of the data, the buck is printing gains of 0.20%, as shown by the US Dollar Index (DXY), which tracks the American Dollar’s performance against six counterparts. The DXY is at 104.74, underpinned by the advancement of the US 2-year Treasury note yield, peaking at 5.00%.
A risk-off impulse and firm US Treasury bond yields are backing the US Dollar (USD) ahead of the release of August inflation data in the United States. The US 10-year benchmark note sits at 4.292%, unchanged compared to yesterday, contrary to the American Dollar (USD), as shown by the US Dollar Index (DXY). The DXY tracks the buck’s performance against a basket of six peers and prints solid gains of 0.30% at 104.83 after dropping to a four-day low of 104.42.
On the US front, the US Bureau of Labor Statistics (BLS) will release August’s inflation data on Wednesday. The Consumer Price Index (CPI) is expected to jump from 3.2% to 3.6% YoY, while core CPI will drop from 4.7% to 4.3%. A higher-than-expected inflation reading would reignite speculations about another rate hike by the US Federal Reserve.
Across the border, the economic package in Mexico for 2024 proposes an increase in the fiscal deficit from 3.3% to 4.9% of GDP in 2023, the most significant negative balance in 36 years. The budget assumes the USD/MXN exchange rate would average 17.60 by the end of 2025 while considering the Mexican oil exports would be selling at around $56.7 per barrel next year.
Given the fundamental backdrop, the USD/MXN would likely continue to edge lower unless tomorrow’s CPI data rises above estimates and put another interest rate increase into the table. Otherwise, expect further Mexican Peso strength, which could drive the pair back towards the 17.0000 barrier.
USD/MXN Price Analysis: Technical outlook
From a daily chart perspective, the pair is challenging technical support at the 100-day Moving Average (DMA) at 17.2558, which capped the USD/MXN drop. A daily close below the latter, and the pair could test the 20-DMA at 17.0929 before slumping toward the psychological 17.0000 price level. For an upward resumption, the exotic pair must reclaim the 17.5000 area before testing the September 11 high at 17.5927.
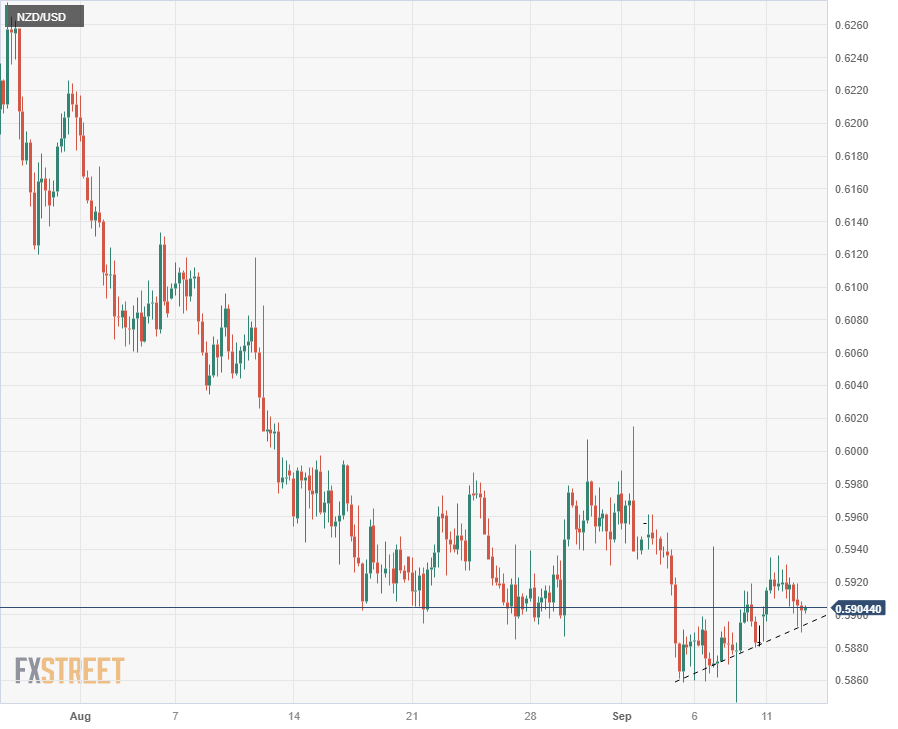
- The NZD/USD is swamped near 0.5900, unable to develop meaningful momentum.
- It's the USD's ballgame as investors look ahead to key US inflation figures on Wednesday.
- The Federal Reserve looks set to step back from the rate hike cycle as long as inflation continues to ease.
The NZD/USD pair is struggling to find firmer footing after slipping to the 0.5900 level through Tuesday’s market session, dipping from the day’s high of 0.5923 as the US Dollar (USD) takes a step higher against the Kiwi (NZD).
It’s strictly a low-impact showing for the NZD on the economic calendar this week. Food Price Index and Business Purchasing Manager Index (PMI) figures are not expected to draw much market reaction, and it will be up to the Greenback (USD) side of things to push momentum.
US inflation figures keyed up for the midweek, CPI to set the tone
Investors are looking forward to the US Consumer Price Index (CPI) figures due on Wednesday. Market participants broadly believe that the Federal Reserve (Fed) will pause on further rate hikes at their upcoming meeting in September, however, expectations could swing if the CPI print surprises to the upside. Investors expect the CPI for August to show a 0.5% annualized rise in prices, mostly in the cost of energy and fuel, with the core CPI forecast to hold steady at 0.2%.
Over the weekend, US Treasury Secretary Janet Yellen declared her optimism that the US could successfully control inflation without any damage to the employment market. Yellen also noted that inflation indicators across the board have been declining recently, and there has yet to be any sign of a wave of layoffs.
NZD/USD technical outlook
The Kiwi is mostly flat on the week’s opening prices near 0.5900, but the NZD/USD pair is notably on the downside of recent action, having closed in the red for seven of the last eight consecutive trading weeks. Kiwi bulls are struggling to lift the pair from the year’s lows near 0.5860, and sustained selling pressure will send the NZD tumbling back to 2022’s lows near the 0.5600 handle.
Hourly candles have the pair trying to build a rally from the day’s lows near 0.5890, but 0.5900 appears to be a significant level to overcome, with 0.5980 waiting further above and acting as a ceiling for near-term momentum.
The 4-hour candle overview shows the NZD/USD pairing on the low end, struggling to hold onto near-term consolidation levels. Despite the bearish stance, higher lows are marked in for September, and Kiwi bidders will be looking to build up enough momentum to grab ahold of the 0.6000 handle.
NZD/USD 4-hour chart
- USD/CHF continues to consolidate above the 100-day SMA trading neutral at 0.8910.
- Markets turned cautious ahead of the inflation readings from August from the US.
- Risk aversion is strengthening the USD.
On Tuesday’s sessions, the USD/CHF tallied mild gains and traded near 0.8910. The USD is recovering ground after two consecutive days of trading weak against most of its rivals, while US yields are trading mixed in anticipation of Wednesday’s Consumer Price Index (CPI) from August. On the CHF’s side, the Swiss calendar had nothing relevant to offer in the session.
In that sense, the August CPI is expected to show a 0.5% increase MoM, while the Core measure is forecasted to rise by 0.2% on a monthly basis, and those inflation figures will play a big role in the model of expectations of the next Federal Reserve (Fed) decisions.
Meanwhile, according to the CME FedWatch tool, the market still believes that the Fed will take a break at the September 20 meeting. However, investors anticipate a 40% chance that the Fed might opt for one last interest rate hike in either November or December, which would lift rates to 5.75%.
USD/CHF Levels to watch
The daily chart analysis shows that the short-term outlook for USD/CHF appears bullish. The Relative Strength Index (RSI) and Moving Average Convergence Divergence (MACD) maintain positive positions, with the RSI above its midline and displaying an upward trend, while the MACD exhibits green bars. On the other hand, the pair is above the 20 and 100-day Simple Moving Averages (SMAs) but below the 200-day SMA, suggesting that the bulls are in command over the bears on the bigger picture.
Support levels: 0.8900, 0.8877 (100-day SMA), 0.8850.
Resistance levels: 0.8950, 0.9000, 0.9030.
USD/CHF Daily Chart
-638301313932882539.png)
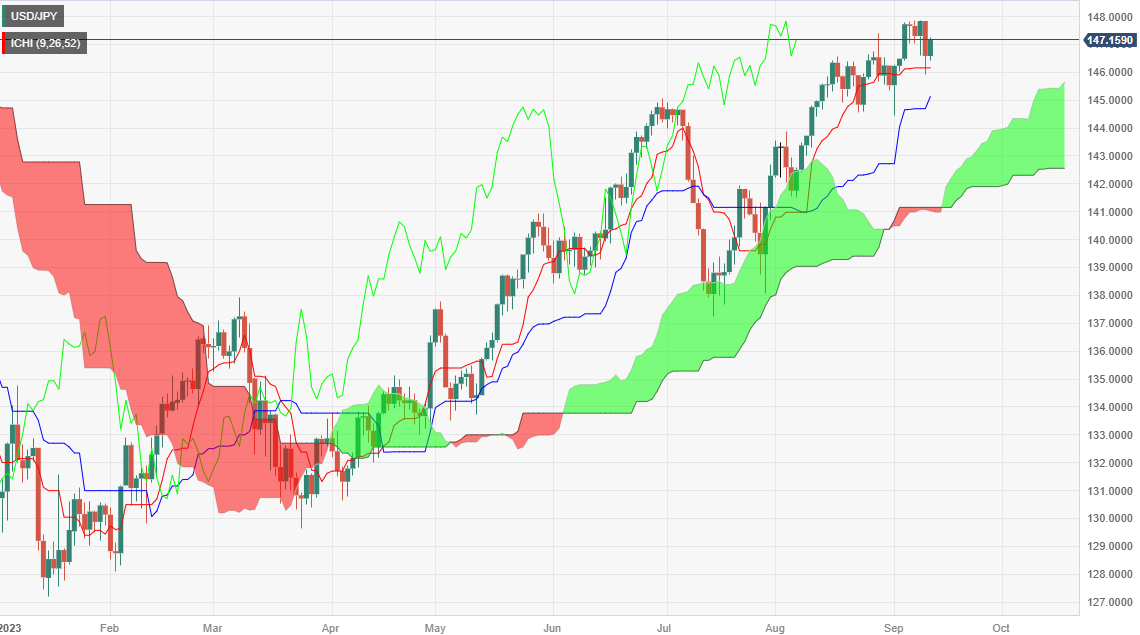
- USD/JPY climbs to 147.20, up 0.43%, after BoJ Governor Ueda hints at ending negative interest rates.
- US 10-year Treasury yield holds steady at 4.292%, bolstering the dollar ahead of crucial August inflation data.
- Market anticipates Consumer Price Index (CPI) to rise from 3.2% to 3.6% YoY, potentially influencing Fed rate decisions.
The Greenback (USD) stages a comeback against the Japanese Yen (JPY) following hawkish remarks by the Bank of Japan (BoJ) Governor Kazuo Ueda over the weekend, as he spoke on the removal of negative interest rates. Hence, the USD/JPY retreated, but as Tuesday’s North American session began, the pair is exchanging hands at 147.20, gaining 0.43% after hitting a weekly low of 145.89.
Greenback gains ground against the Yen following hawkish remarks by BoJ governors, awaiting key US inflation numbers
A risk-off impulse and firm US Treasury bond yields are backing the US Dollar (USD) ahead of the release of August inflation data in the United States. The US 10-year benchmark note sits at 4.292%, unchanged compared to yesterday, contrary to the American Dollar (USD), as shown by the US Dollar Index (DXY). The DXY, which tracks the buck’s performance against a basket of six peers, prints solid gains of 0.30% at 104.83 after dropping to a four-day low of 104.42.
During the weekend, BoJ Governor Ueda said the bank could end its negative policy rate if inflation sustainably hits its 2% inflation target. After his remarks, the JPY strengthened against most G8 FX currencies, while the 10-year Japanese Government Bond (JGB) yield reached 0.70%.
Nevertheless, most JPY gains have been erased as market participants assessed Ueda’s remarks.
On the US front, the US Bureau of Labor Statistics (BLS) will release August’s inflation data on Wednesday. The Consumer Price Index (CPI) is expected to jump from 3.2% to 3.6% YoY, while core CPI to drop from 4.7% to 4.3%. A higher-than-expected inflation reading would reignite speculations about another rate hike by the US Federal Reserve.
For the Fed’s upcoming meeting on September 21, money market futures expect no change to the Federal Fund Rates (FFR). For the November meeting, investors saw the FFR at around 5.48%, 15 bps above the effective FFR, as shown in the picture below.
Federal Reserve Interest Rate Probabilities
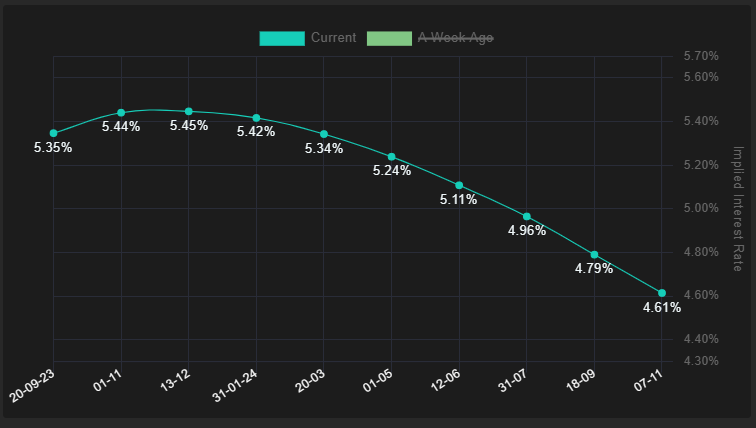
Source: Financialsource
In other data, the National Federation of Independent Business (NFIB) revealed that the Small Business Optimism Index fell to 91.3 in August from an eight-month high of 91.9 in July.
USD/JPY Price Analysis: Technical outlook
From a technical standpoint, Monday’s price action formed a hammer that breached the Tenkan-Sen line but ended the session at around 146.50s. If the USD/JPY achieves a new weekly high above 147.27, further confirmed with a daily close, the pair’s next stop would be the year-to-date (YTD) high of 147.87 before challenging the 148.00 mark. Downside risks would emerge with a daily close below the Tenkan-Sen line at 146.15.
AUD faced a difficult August. Economists at CIBC Capital Markets analyze Aussie’s outlook.
August sell-off to partially reverse over the medium-term
We have revised our AUD/USD forecast for Q4 and beyond lower, given the backdrop of weak Chinese growth and risks to global growth.
While the continuation of negative Chinese sentiment and potential downside in risk will be a major headwind for the AUD, a potential hawkish repricing of the RBA should limit AUD downside.
CPI and employment reports will be vital for our call of one more RBA hike
AUD/USD – Q4 2023: 0.63 | Q1 2024: 0.63
The US Bureau of Labor Statistics (BLS) will release the most important inflation measure, the US Consumer Price Index (CPI) figures, on Wednesday, September 13 at 12:30 GMT. As we get closer to the release time, here are the forecasts by the economists and researchers of 10 major banks regarding the upcoming United States inflation print for the month of August.
Headline is expected at 3.6% year-on-year vs. 3.2% in July, while core is expected at 4.3% YoY vs. 4.7% in July. On a monthly basis, headline and core CPI are seen at 0.6% and 0.2%, respectively.
TDS
We expect the report to provide additional evidence that the core segment has taken a step down in terms of sequential price gains: We are projecting another 0.2% MoM increase, which would mark the core's third consecutive month running at that pace. On the contrary, headline CPI inflation likely accelerated to 0.6% MoM largely as a result of surging gasoline prices in August. We are assuming a very strong 11% jump for the latter, though a chunk of that increase reflects an unfavorable seasonal adjustment. In YoY terms the headline CPI will likely rise to 3.6% from 3.2% in July, while the core segment will actually lose momentum, dropping to 4.3% from 4.7% YoY.
RBC Economics
We expect headline CPI to tick up to 3.6% YoY in August, up from 3.2% in July. This increase is almost entirely explained by higher global energy prices. Aside from energy, US price pressures have eased substantially in recent months. Food price growth has moderated sharply and we look for ‘core’ (ex-food & energy) price growth to slow to 4.3% YoY in August from 4.7% the month before. That will drop the measure further below a 6.6% peak in September last year.
NBF
The energy component is likely to have had a sizeable positive impact on the headline index given the sharp rise in gasoline prices during the month. This, combined with another healthy gain in shelter costs, should result in a 0.6% increase in headline prices. If we’re right, the YoY rate could move up from 3.2% to 3.7%, marking the biggest increase in nearly a year and a half for this indicator. The advance in core prices could have been more subdued (+0.3% MoM) thanks in part to a decline in the price of used vehicles. This monthly gain should allow the annual rate to come down three ticks to 4.4%, its lowest level in nearly two years.
Citi
We expect a stronger increase in core inflation in August after two consecutive 0.16% MoM increases, with core CPI rising 0.3% MoM. However, at 0.252% MoM unrounded, core CPI would be close to printing another 0.2% increase, albeit still a stronger gain compared to June and July. We also expect some further slowing in shelter prices with 0.44% primary rents and 0.46% owners’ equivalent rent. Meanwhile, headline CPI should rise a strong 0.6%, the strongest increase since June 2022. This will be due to both a rise in retail gas prices and further strength in other energy components like utility gas.
ING
For inflation, we look for fairly big jumps in August’s MoM headline readings with upside risk relative to consensus predictions. Higher gasoline prices will be the main upside driver, but we also see the threat of a rebound in airfares and medical care costs, plus higher insurance prices. These factors are likely to also contribute to core CPI coming in at 0.3% MoM rather than the 0.2% figures we have seen in the previous two months. Slowing housing rents will be evident, but it may not be enough to offset as much as the market expects. Nonetheless, the year-on-year rate of core inflation will slow to perhaps 4.4%. We are hopeful we could get down to 4% YoY in the September report and not too far away from 3.5% in October. We would characterise this relatively firm MoM inflation prints as a temporary blip in what is likely to be an intensifying disinflationary trend.
Wells Fargo
We forecast core CPI gained 0.18% in August, equating to a 4.3% YoY rate. If realized, the Fed would achieve its elusive 2% target on a three-month annualized basis. Within core, commodities and shelter likely propelled the deceleration. However, we expect a roughly 10% jump in gas prices to lift the headline rate to 0.6%. This would mark the largest monthly jump in headline CPI in over one year, bringing the YoY headline rate to 3.6%. Despite recent progress in core inflation, it strikes us as unlikely that the Fed will be able to meet its 2% target on a sustained basis over the next couple of quarters. Although we expect core goods prices to decline in August, the disinflationary momentum from normalizing commodity prices is set to fade. The drag from health insurance prices will also likely come to an end in October, setting up core inflation for an acceleration in Q4.
CIBC
The August CPI will be the final piece of the puzzle for the Fed ahead of its September meeting. We expect the last few soft readings to start to form a trend, with core CPI in August expected to come in at a meagre 0.1% MoM as the easing supply chains will weigh further on core goods prices. We look for service prices to remain firm given solid demand but will be around the pace in recent months. Favourable base effects will also help push the 12-month change in core inflation down meaningfully to 4.2%. Headline CPI will tick up on higher gasoline prices to 3.5%. Given the Fed is sitting in a data dependent position and will continue to weigh risk management considerations heavily, a downside surprise should be slightly bullish for fixed income markets.
Deutsche Bank
Since gas prices have risen nearly 7% in August, headline CPI (+0.61% DB forecast vs. +0.17% previously) will see its largest monthly increase since June 2022. However, core (+0.22% vs. +0.16% last month) is likely to remain relatively becalmed. On these estimates, the YoY number for core CPI inflation should fall 0.4pp to 4.3%, whereas headline would rise 0.4pp to 3.7%, the highest for three months. With core inflation still relatively subdued, we think the positive momentum should continue, with the three-month annualised rate falling by about 90 bps to 2.2%, while the six-month annualised rate should fall by 50 bps to 3.6%. In both cases that would be the lowest since early 2021. So for now the strong headline print should be offset by the positive news on core. However, the risk is always that the longer headline edges up, the more risk of second-round effects down the road. See the fuller preview of what to look for in all the components in the preview link above.
Danske Bank
While higher energy prices likely lifted headline CPI by 0.5% MoM (3.6% YoY), we look for another low core CPI print at 0.2% MoM (4.3% YoY).
ANZ
We forecast US core CPI to rise by 0.2% MoM in August. Higher energy prices should result in the headline CPI rising by a more substantive 0.5% MoM.
The US Dollar Index (DXY) is approaching the hurdle from January/March highs of 105.40/105.80. Economists at Société Générale analyze DXY’s technical outlook.
Recent pivot low near 102.90 should be an important support
DXY formed an important trough near 99.50 in July and quickly re-entered within the previous multi-month range; this has resulted in a rebound phase. The index has recently approached the peaks of last January/March near 105.40/105.80, which is also the upper limit of a steeper ascending channel. An initial pullback can’t be ruled out, however, the recent pivot low near 102.90 should be an important support.
It would be interesting to see if the index can overcome the resistance zone at 105.40/105.80. This break is essential for affirming a larger uptrend.
- Silver price juggles around $23.00 as the focus shifts to the US CPI data for August.
- Investors remain worried about the US inflation outlook due to stronger wage growth and a steady labor market.
- Silver price remains sideways in a range of $22.80-23.20 from the past four trading sessions.
Silver price (XAG/USD) trades back and forth around $23.00 in the New York session. The white metal has remained inside the woods for the past four trading sessions as investors have been sidelined ahead of the United States inflation data for August, which will be published on Wednesday at 12:30 GMT.
The S&P500 has opened on a bearish note as investors remained cautious about the US Consumer Price Index (CPI). Investors remain worried about the inflation outlook due to stronger wage growth and a steady labor market. Inflation in excess of the desired rate of 2% seems most persistent and won’t be easily contained by the Federal Reserve (Fed). This would keep hopes of one more interest rate increase from the Fed alive.
The US Dollar Index (DXY) recovered significantly to near 104.90 but is struggling to extend the upside as investors await the US CPI data for further guidance. As per the estimates, US headline inflation is seen expanding at a stronger pace of 0.6% due to recovered gasoline prices. The core CPI that doesn’t inculcate volatile oil and food prices is expected to grow at a steady pace of 0.2%.
Silver technical analysis
Silver price remains sideways in a range of $22.80-23.20 from the past four trading sessions ahead of the US inflation data. The white metal demonstrates a volatility squeeze, which is being followed by a breakout in the same. The 100-period Exponential Moving Average (EMA) at $23.17 continues to act as a major barricade for the Silver price bulls. Horizontal support is plotted from August 15 low at $22.23.
The Relative Strength Index (RSI) (14) skids into the bearish range of 20.00-40.00, which indicates that the bearish impulse has been triggered.
Silver hourly chart
-638301254495492130.png)
Economists at Société Générale analyze EUR/USD outlook ahead of the ECB decision on Thursday.
Euro way out?
Economists in the Bloomberg survey are almost evenly split between a pause and +25 bps by the ECB on Thursday. No change in rates would have to be accompanied by indication of faster QT (steeper long end of the Bund curve, higher real rates) to avoid a new round of selling EUR/USD and potentially broader EUR/G10.
The record of past ECB meetings when new staff forecasts are published is mixed for EUR/USD with gains and losses evenly split. There is a stronger bias for gains in EUR/JPY and EUR/GBP.
A 25 bps increase instead of a pause this Thursday would surprise investors considering current pricing but would probably not turn the tide for EUR/USD in a meaningful or durable fashion. Growth differentials on both sides of the Atlantic and the gap in real yields handicap the outlook for the Euro.
We think further depreciation towards 1.05 is possible unless markets pare back expectations again of the Fed raising rates beyond 5.50%.
A steepening of the euro bond curve and rise in real yields could be achieved by speeding up QT, but our house view is that this will not be discussed until December. A discussion this week is a tail risk and could give the Euro a lift.
Markets look ahead to the US CPI data. Economists at Commerzbank analyze how the figures could impact Gold price.
US inflation figures could lend tailwind to Gold
After the Gold price had begun sliding in the wake of the robust US labour market data at the beginning of the month, it could receive some tailwind again from US data this week. This is because Wednesday’s US inflation figures are likely to signal a further easing of the price pressure.
No serious moves are likely ahead of next week’s Fed meeting, however, nor would they be particularly justified. After all, the US Fed could still leave the door wide open to a further tightening of monetary policy despite the declining (core) inflation, which would be bad news for Gold.
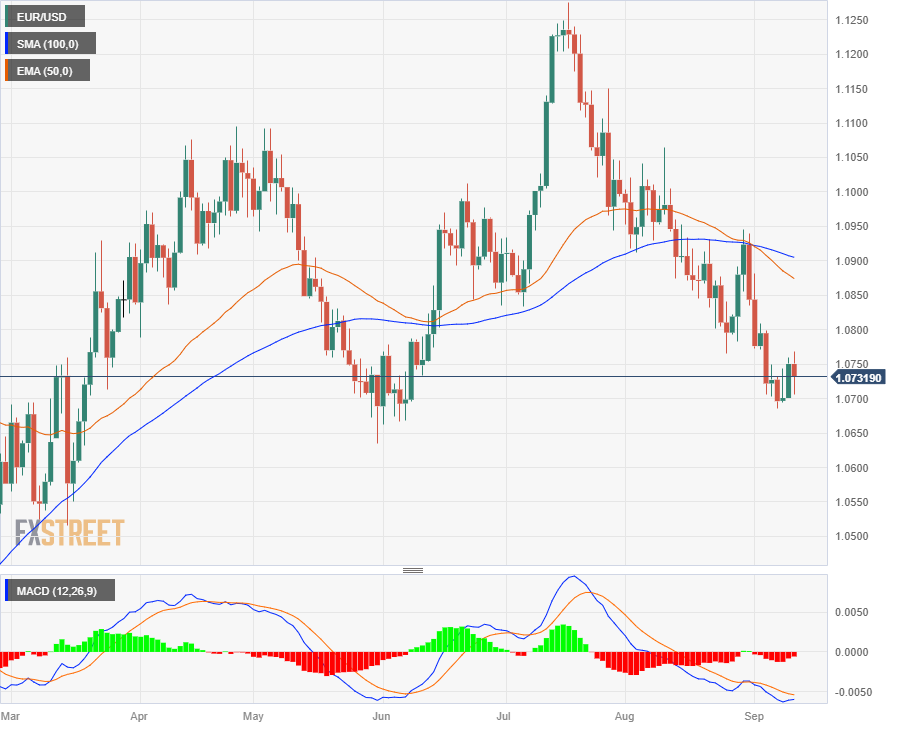
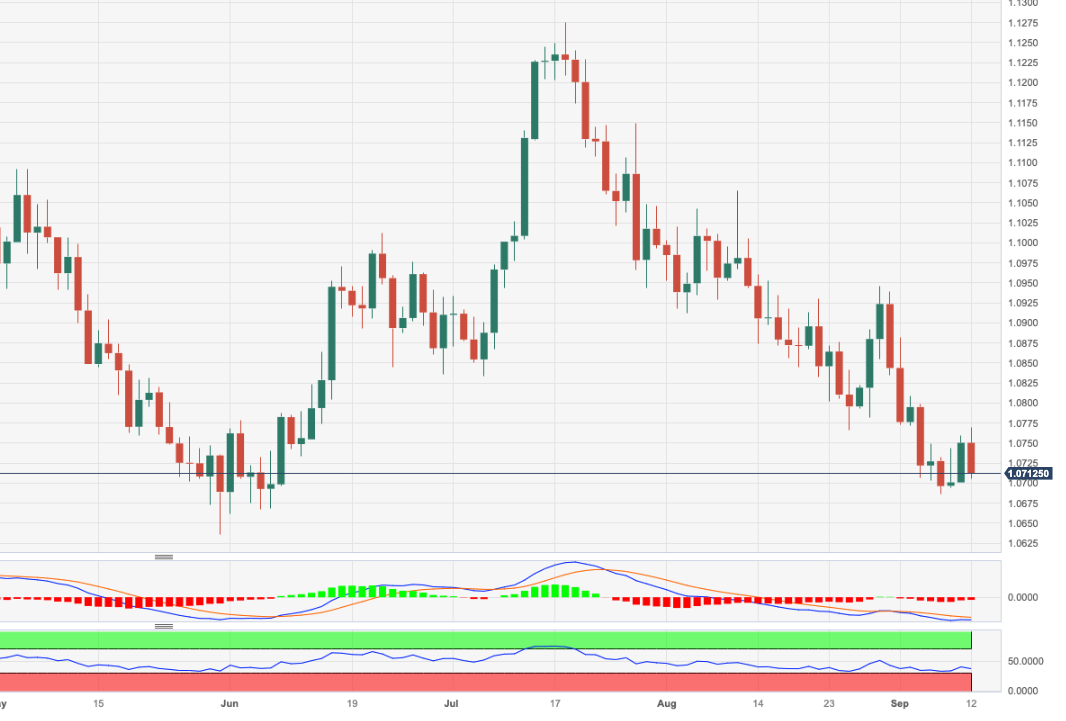
- EUR/USD comes under heavy pressure after climbing to 1.0770.
- The loss of 1.0700 should put 1.0685 back on the radar.
EUR/USD fully fades the auspicious start of the new trading week and confronts the 1.0700 zone following an early bull run to the 1.0770 region, or four-day highs.
The underlying bearish sentiment remains unchanged and leaves the door open to extra pullbacks in the short-term horizon. Against that backdrop, the breach of the 1.0700 region could encourage sellers to embark on a probable visit to the September low of 1.0685 (September 7) ahead of the May low of 1.0635 (May 31).
In the meantime, further losses remain in the pipeline while below the key 200-day SMA, today at 1.0824.
EUR/USD daily chart
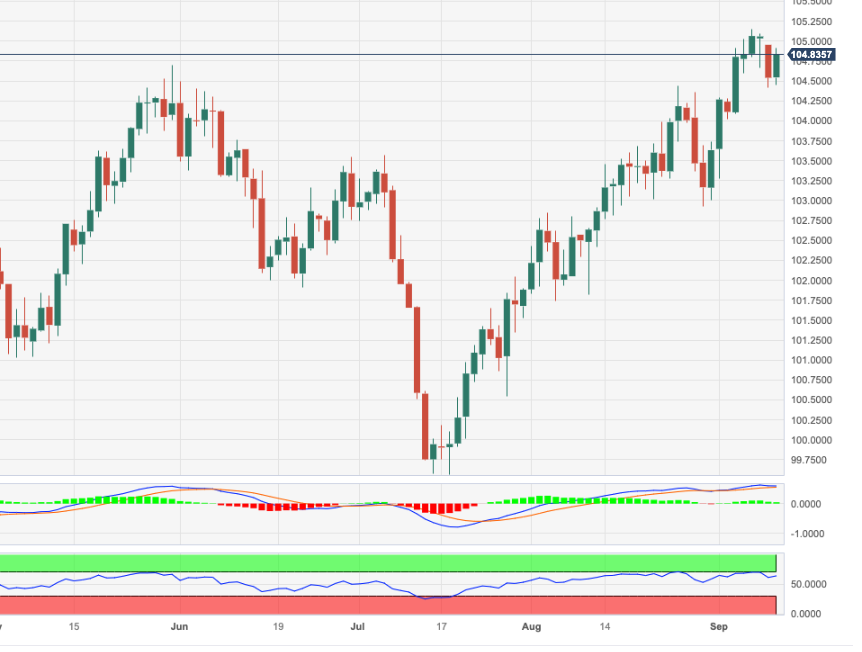
- DXY leaves behind Monday’s pullback to the 104.50/40 band.
- Further recovery shifts the attention to the 105.00 hurdle.
DXY sets aside Monday’s bearish performance and looks to revisit the key 105.00 zone on Tuesday.
The continuation of the multi-week rally appears well and sound and a breakout of 105.00 should encourages the index to retest the September top of 105.15 (September 7) prior to the 2023 peak of 105.88 (March 8).
While above the key 200-day SMA, today at 103.02, the outlook for the index is expected to remain constructive.
DXY daily chart
- USD/CAD extends losses amid a solid recovery in oil price due to an upbeat outlook.
- US headline inflation is seen growing at a 0.6% pace in August due to rising gasoline prices.
- Stronger-than-anticipated Canadian labor market data could force the BoC to raise interest rates further
The USD/CAD pair extends its two-day losing spell after slipping below Monday’s low of 1.3560 in the early New York session. The Loonie asset faces selling pressure as the oil price soars to near $90.00. Investors channel funds into the oil price as OPEC sees robust demand for energy, knowing that the learning curve of various economies in absorbing the burden of higher interest rates will improve significantly.
It is worth noting that Canada is the leading exporter of oil to the United States and higher oil prices are strengthening the Canadian Dollar.
S&P500 is expected to open on a slightly bearish note, considering negative cues from overnight futures. Meanwhile, investors remained cautious over August inflation data, which is scheduled for Wednesday.
As per the estimates, the headline inflation grew at 0.6% vs. the former reading of 0.2% due to rising gasoline prices. While core CPI that excludes volatile oil and food prices rose at a steady pace of 0.2%. The US Dollar Index (DXY) recovers further to near 104.90 as investors remain worried about the global slowdown.
A surprise rise in the inflationary pressures would force Federal Reserve (Fed) policymakers to focus more on further policy tightening as the ‘last mile’ of inflation above the desired rate of 2% will be a hard nut to crack.
On the Canadian Dollar front, stronger-than-anticipated labor market data could force the Bank of Canada (BoC) to raise interest rates further. The Canadian labor market witnessed 39.9K new payrolls in the overall laborforce in August, more than doubled the expectations of 15K. In July, the labor force witnessed a reduction of 6.4K payrolls. The Unemployment Rate remains unchanged at 5.5% while investors forecasted a higher jobless rate at 5.6%.
The USD has been making a comeback lately, with the US Dollar Index (DXY) gaining more than 5% from the year-to-date lows in mid-July. Economists at HSBC analyze Greenback’s outlook.
The return of a strong USD
The USD has already been making a comeback but we see more upside ahead.
As monetary tightening increasingly takes its toll on the global economy, this should bode well for the counter-cyclical USD.
The convergence of rate cut expectations for the Fed and other major central banks should also bolster the USD.
Against this backdrop, we change our view on the broad USD, now seeing it strengthening through the end of this year and come the end of 2024.
Economists at Société Générale analyze USD/MXN technical outlook.
Probing upper limit of previous base at 17.40
USD/MXN evolved within a base after reaching an intermittent low near 16.60 in July. It has recently broken above the upper limit suggesting a regain of upward momentum. This is also highlighted by daily MACD, which has been posting positive divergence and has recently crossed above the equilibrium line.
The pair bounced towards the descending trend line drawn since September 2022 at 17.73. A pullback is currently underway, however, the upper band of the base at 17.40 should provide support. Defence of this level is expected to result in a move higher towards the 200-DMA near 17.95/18.00.
- EUR/JPY trades with small gains in a tight range above 157.00.
- Initial resistance comes at the monthly peaks near 158.50.
EUR/JPY leaves behind Monday’s small losses and edges a tad higher well north of the 157.00 hurdle on Tuesday.
In the meantime, the cross continues to face some side-lined trading prior to the potential resumption of the uptrend. That said, a minor hurdle emerges at the so far monthly highs around 158.50 (September 5-7) ahead of the 2023 peak at 159.76 (August 30) and before the key round level at 160.00. The surpass of the latter should not see any resistance level of note until the 2008 high at 169.96 (July 23).
So far, the longer term positive outlook for the cross appears favoured while above the 200-day SMA, today at 148.50.
EUR/JPY daily chart

The Organization of the Petroleum Exporting Countries (OPEC) has released its monthly report, which has provided support for the upside in crude oil prices. In the report, OPEC maintained its forecast for global oil demand growth in 2023 at 2.4 million barrels per day (bpd). For 2024, the forecast predicts economic growth of 2.6% (unchanged) and a global demand increase of 2.2 million bpd.
According to the report, the overall OPEC crude oil output rose by 113,000 barrels per day in August, reaching 27.45 million barrels per day. The increase was primarily driven by higher production in Iran and Nigeria. The report also mentioned that, based on secondary sources, Saudi Arabia's crude oil output decreased by 88,000 barrels in August to 8.97 million bpd.
They raised the 2023 non-OPEC supply increase forecast by 100,000 barrels per day to 1.6 million bpd.
Market reaction
Crude oil prices rose further after the report. The WTI barrel is up by 0.89% trading at $88.20, its highest level since November.
- AUD/USD defends immediate support of 0.6400 despite the strengthening of the US Dollar.
- A surprise upside in the US inflation could improve the US Dollar’s appeal significantly.
- The Australian Dollar will remain in action ahead of the Aussie Employment report.
The AUD/USD pair remains sideways above the round-level support of 0.6400 in the early European session. The upside in the Aussie asset seems restricted due to a solid recovery in the US Dollar while the downside seems supported as Aussie-Sino trade relations improved.
S&P500 futures posted decent losses in the London session, portraying caution among market participants ahead of the United States Consumer Price Index (CPI) data for August, which will be published at 12:30 GMT. The US Dollar Index (DXY) rebounds strongly above 104.80 as the market mood dampens due to the rising risks of a global slowdown.
For August inflation data projections, investors anticipated that headline inflation expanded at a higher pace of 0.5% vs. July’s reading of 0.2%. Thanks to the global oil rally, which lifted gasoline prices and elevated the burden on households.
A surprise upside in inflation could improve the US Dollar’s appeal significantly and boost hopes for one more interest rate increase by the Federal Reserve (Fed) in the last three monetary policy meetings of this year.
As per the CME Fedwatch Tool, traders see a 93% chance for interest rates to remain unchanged at 5.25%-5.50% in September. For the rest of the year, traders anticipate almost a 54% chance for the Fed to keep the monetary policy unchanged.
The Aussie-Sino trade relationship strengthened after China’s Premier Li Qiang cited that the economy is willing to work with Australia to jointly safeguard peace and stability in Asia-Pacific. Opening of the Chinese economy to Australia will provide it with a larger market to expand operations.
The Australian Dollar will remain in action ahead of the Aussie Employment report, which will be published on Thursday. As per the expectations, the Australian economy recorded a fresh joining of 24.3K employees. In July, the labor force shed by 14.6K. The Unemployment Rate is seen declining to 3.6% vs. the July’s reading of 3.7%.
UOB Group’s Senior Economist Julia Goh and Economist Loke Siew Ting assess the latest monthly foreign portfolio figures in Malaysia.
Key Takeaways
Malaysia recorded foreign portfolio outflows for the first time this year in Aug, totaling MYR4.9bn (Jul: +MYR12.7bn). This was purely attributed to the largest foreign selling of Malaysian debt securities in 10 months at MYR5.0bn (Jul: +MYR11.3bn) as Malaysia’s equity market continued to draw non-resident purchases for the second straight month at MYR0.1bn (Jul: +MYR1.4bn).
Bank Negara Malaysia (BNM)’s foreign reserves reduced by USD0.4bn m/m to USD112.5bn as at end-Aug (end-Jul: +USD1.5bn m/m to USD112.9bn). The latest reserves position is sufficient to finance 5.2 months of imports of goods & services and is 1.0 times the total short-term external debt. BNM’s net short position in FX swaps widened for a third consecutive month by USD0.2bn m/m to USD24.3bn as at end-Jul (end-Jun: +USD0.4bn m/m to USD24.1bn).
Renewed uncertainties surrounding China’s economic recovery pace, global crude oil and essential food supply, policy rate trajectory, as well as geopolitical tensions have heightened volatility in the global financial and capital markets. Malaysia was not spared from these turbulences, with investors expected to take a more cautious stance and remain selective in positioning in the near term. Country-specific factors particularly government policy and medium-term plans will then play a key role in investors’ asset allocation considerations.
GBP is underperforming on the day as Cable drops below the 1.25 level. Economists at Scotiabank analyze the GBP/USD technical outlook.
Resistance seen at 1.2550
Sterling gains through the low 1.25 area (minor double bottom trigger) on Monday failed to deliver any significant gains (towards the measured move potential in the upper 1.25s).
Support remains at 1.2450, just ahead of the 200-Day Moving Average (DMA) at 1.2430, with resistance at 1.2550.
See: GBP/USD could extend the decline on failure to defend 1.2420 – SocGen
USD/CAD holds below 1.36. Economists at Scotiabank analyze the pair’s technical outlook.
Losses through the upper 1.35s to open up the low 1.35s
Short-term price patterns suggest a minor consolidation in the USD after spot edged back from last week’s peak near 1.37. The pattern of trade suggests a small bear wedge pattern in development which tilts directional risks to the downside for spot.
USD gains are curbed by resistance in the low 1.36 zone.
Losses through the upper 1.35s (and below Monday’s low around 1.3560/65) should see spot edge back to the low 1.35s.
Economist at UOB Group Ho Woei Chen, CFA, reviews the latest publication of inflation prints in China.
Key Takeaways
In line with expectation, China’s CPI recovered to rise 0.1% y/y in Aug from -0.3% y/y in Jul. CPI also rose on a sequential basis with the gain picking up to 0.3% m/m in Aug from 0.2% m/m in Jul. Risk of a sustained deflation in China remains low but we could still see some months of y/y contraction in headline CPI from now until 1Q24.
The pace of PPI contraction moderated to -3.0% y/y in Aug. More importantly, PPI rose sequentially for the first time in 9 months. The deflation trend is likely to persist into 1H24 though the pace will narrow due to base effect.
We maintain our forecast for the headline inflation at 0.4% in 2023 before strengthening to 1.7% in 2024. We expect the PPI to average -3.1% in 2023 before recovering slightly to 0.4% in 2024.
Economists at Scotiabank analyze EUR/USD technical outlook.
A push well through 1.0750 should prompt additional gains
Short-term price trends retain a potentially positive undertone for the EUR but spot needs to hold the 1.07 area to retain any chance of improving in the short run.
Short-term trading patterns continue to reflect a small, ‘rounded low’ on the intraday chart which implies steady bargain hunting for the EUR on recent softness. EURUSD gains did, however, clearly stall around 1.0750 on Monday and that level remains key resistance in the short run.
A push well through 1.0750 should prompt additional gains to the low 1.08s.
USD edges higher but consolidates ahead of key data releases. Economists at Scotiabank analyze Greenback’s outlook.
The broader trend higher in the USD remains intact
The USD is trading firmer on the session overall but movement is limited as markets bide time ahead of Wednesday’s US CPI data.
The broader trend higher in the USD remains intact but gains today reflect a consolidation of losses in the index from around the 105 area.
There is little sign at this point that the USD rally which got underway at the end of June is peaking but the USD is perhaps susceptible to data disappointments in the near term and it is starting to look a bit ‘rich’ relative to yield differentials versus its major currency peers. That may make additional gains harder to come by without stronger fundamental motivation.
- The US Dollar flips 180 degrees on Tuesday, paring back losses from Monday.
- The US Treasury is set to auction its always important 10-year note.
- The US Dollar Index jumps back above 104.50 and looks set to stretch back to 105.
The US Dollar (USD) is recovering firmly as it is parring earlier losses from Monday. The biggest supporter for the stronger Greenback in European trading hours is the Polish Zloty (USD/PLN), which is up 1.40% intraday. The surprise rate cut from the Polish Central Bank last week is weakening the Central European currency for a fourth straight day against the Greenback.
Although the calendar is still holding any important data points, expect traders to start prepositioning for the US Consumer Price Index report (CPI) due Wednesday. The Bid/Cover ratio in the US 10-year note, meanwhile, will give investors good insight into whether participants believe the US can still bear these higher rates and refund its maturing debt in the meantime. Expect to see yields creep higher again in the US as ample supply is being issued yet again in the markets.
Daily digest: US Dollar stronger by debt
- Traders will have seen a blip on several charts in Euro and US Dollar against other currencies around 01:00 GMT. Several banks are confirming that a fat-finger event occurred where a $600 million forex order was given, instead of the foreseen $60 million. The peak or dip was quickly pared back once the mistake was discovered, though it triggered anomalies across the board in several major pairs.
- Kick-off for the US macro data this week is at 10:00 GMT for the Business Optimism Index from the National Federation of Independent Business (NFIB). The previous number was at 91.9 with no expectations pencilled in.
- Near 12:55 GMT, the US Redbook Index is expected with the previous number at 4.1%. No expectations foreseen here.
- At 17:00 GMT, the much anticipated US 10-year note will be auctioned. The previous rate was at 3.99% and is expected now to be above 4%. Traders will look at the bid-cover ratio as well to see how big the appetite was for this auction as yields will be fixed higher.
- Equities are taking a small step back after the Japanese Topic Index closed up 0.80% for this Tuesday.
- The CME Group FedWatch Tool shows that markets are pricing in a 93% chance that the Federal Reserve will keep interest rates unchanged at its meeting in September.
- The benchmark 10-year US Treasury bond yield trades at 4.28% and remains elevated even after the step back on Monday.
US Dollar Index technical analysis: Resilient Greenback
The Greenback has already pared back more than half of its incurred losses from Monday. The winning streak from last week got briefly interrupted and could be seen continuing. Should the US Dollarindex (DXY) break above the high of Monday, expect to see another upbeat week for the US Dollar Index
The new high to watch is at 105.16, both the high from last Thursday and the six-month high. The US Dollar Index first needs to gain back its lost territory from this Monday and break above the peak of Thursday mentioned here before. From there, the next high is at 105.88, the high of 2023.
On Monday, 104.44 kept it together and refrained from allowing the DXY from selling off any further. The high of August 25 did its job and acted as a pivotal level. Should the uptick from this Tuesday reverse and 104.44 gives way, a substantial downturn could take place to 103.04, where the 200-day SMA comes into play for support.
US Dollar FAQs
What is the US Dollar?
The US Dollar (USD) is the official currency of the United States of America, and the ‘de facto’ currency of a significant number of other countries where it is found in circulation alongside local notes. It is the most heavily traded currency in the world, accounting for over 88% of all global foreign exchange turnover, or an average of $6.6 trillion in transactions per day, according to data from 2022.
Following the second world war, the USD took over from the British Pound as the world’s reserve currency. For most of its history, the US Dollar was backed by Gold, until the Bretton Woods Agreement in 1971 when the Gold Standard went away.
How do the decisions of the Federal Reserve impact the US Dollar?
The most important single factor impacting on the value of the US Dollar is monetary policy, which is shaped by the Federal Reserve (Fed). The Fed has two mandates: to achieve price stability (control inflation) and foster full employment. Its primary tool to achieve these two goals is by adjusting interest rates.
When prices are rising too quickly and inflation is above the Fed’s 2% target, the Fed will raise rates, which helps the USD value. When inflation falls below 2% or the Unemployment Rate is too high, the Fed may lower interest rates, which weighs on the Greenback.
What is Quantitative Easing and how does it influence the US Dollar?
In extreme situations, the Federal Reserve can also print more Dollars and enact quantitative easing (QE). QE is the process by which the Fed substantially increases the flow of credit in a stuck financial system.
It is a non-standard policy measure used when credit has dried up because banks will not lend to each other (out of the fear of counterparty default). It is a last resort when simply lowering interest rates is unlikely to achieve the necessary result. It was the Fed’s weapon of choice to combat the credit crunch that occurred during the Great Financial Crisis in 2008. It involves the Fed printing more Dollars and using them to buy US government bonds predominantly from financial institutions. QE usually leads to a weaker US Dollar.
What is Quantitative Tightening and how does it influence the US Dollar?
Quantitative tightening (QT) is the reverse process whereby the Federal Reserve stops buying bonds from financial institutions and does not reinvest the principal from the bonds it holds maturing in new purchases. It is usually positive for the US Dollar.
Kit Juckes, Chief Global FX Strategist at Société Générale, analyzes EUR/GBP outlook ahead of the ECB meeting on Thursday.
Thursday’s ECB meeting is a bigger driver of EUR/GBP than UK rate expectations
UK labour market data paint a picture of rising unemployment, and rising wages. That’s not unusual – wage data will lag the employment series – but while it won’t prevent the market growing in confidence the next 25 bps hike (to 5 ½%) will be the last of this cycle.
In the very near term, Thursday’s ECB meeting is a bigger driver of EUR/GBP than UK rate expectations, but we expect falls in both monthly GDP and manufacturing output (for July) when data are released on Wednesday. If the ECB adopts the ‘hawkish hold’ position, that could be the last chance to short GBP for a while.
Further gains in USD/IDR are likely while above 15,285, suggests to Markets Strategist Quek Ser Leang at UOB Group.
Key Quotes
Our view for USD/IDR to trade sideways last week was incorrect, as it soared to a high of 15,355. The rapid rise has gathered momentum, and a break above last month’s high of 15,359 will not be surprising.
The next resistance levels above 15,359 are at 15,375 and 15,400. In order to maintain the increase in momentum, USD/IDR must stay above 15,285 (there is another support level at 15,320).
- Oil (WTI) pops higher and flirts with a break of $88.
- The US Dollar storms out the gates stronger on Tuesday after a lacklustre performance on Monday.
- The American Petroleum Institute will release its weekly Crude Oil numbers on Tuesday.
Oil prices are trending higher again after the G20 meeting from last weekend. The event saw no meetings taking place between US president Joe Biden and Crown Prince Mohammad bin Salman al-Saoed of Saudi Arabia. With China and Russia absent as well from the gathering, it appears that the US is unable to strengthen ties with the Middle-Eastern oil producing countries and could start a tit-for-tat politics game with OPEC+ on the current elevated US oil prices and expected supply cuts.
Meanwhile, the US Dollar is roaring back on Tuesday, erasing its losses from Monday when China tripped the Greenback by a staggering strong fixing of its Yuan. The Greenback lost substantially against the Japanese Yen and Australian Dollar as well in the fallout of that strong Yuan fixing against the US Dollar. At the time of writing, the US Dollar Index (DXY) had nearly pared back all losses from Monday and was trading almost flat for the week.
At the time of writing, Crude Oil (WTI) price trades at $87.33 per barrel and Brent Oil at $90.78
Oil news and market movers
- With the US Inflation report due on Wednesday, the current rise in gasoline prices might amount to a surge in inflation pressure.
- US Baker/Hughes Rig Count on Friday revealed that the number of oil producing rigs was still at a yearly low. This means that the US needs to resupply current drawdowns by buying externally. This means that the demand side will see the US quite active in buying on the global oil markets.
- In the first week of September, land crude oil storage levels in US, Japan and the Amsterdam-Rotterdam-Antwerp oil trading hubs fell 2.8% to 546.1 million barrels.
- When including global floating crude stockpiles from September, total crude oil inventories decreased by 2.4% to 631m bbl. So inventories are getting crushed by drawdowns, which need to be refilled or replaced at one point in time.
- The American Petroleum Institute will publish at 20:30 GMT its weekly Crude Oil stock numbers. Previous reading was a drawdown of 5.521 million barrels.
- Equity markets are in the red on Monday with no real outliers to mention as markets are searching for direction.
Oil Technical Analysis: Breakout due
Oil prices are undergoing a squeeze to the upside with higher lows and a flat top near $87.50. It is just a matter of time for that cap on the topside to break. Expect to see a possible quick sprint higher should the API numbers this evening point to another massive drawdown in stockpile numbers.
On the upside, $88 as a big figure is the first nearby hurdle to head to. From there, it will be a tiered rally toward first $90 and finally $93.12, the double top from October-November last year. That means a 5% uptick move is possible in the nearby future.
On the downside, a pivotal level is being identified at $84.30, the high of August 10. In case that level does not hold, a substantial nosedive might occur. That means that oil prices might drop all the way to that important floor near $78 identified.
-638301079007335419.png)
WTI US OIL daily chart
WTI Oil FAQs
What is WTI Oil?
WTI Oil is a type of Crude Oil sold on international markets. The WTI stands for West Texas Intermediate, one of three major types including Brent and Dubai Crude. WTI is also referred to as “light” and “sweet” because of its relatively low gravity and sulfur content respectively. It is considered a high quality Oil that is easily refined. It is sourced in the United States and distributed via the Cushing hub, which is considered “The Pipeline Crossroads of the World”. It is a benchmark for the Oil market and WTI price is frequently quoted in the media.
What factors drive the price of WTI Oil?
Like all assets, supply and demand are the key drivers of WTI Oil price. As such, global growth can be a driver of increased demand and vice versa for weak global growth. Political instability, wars, and sanctions can disrupt supply and impact prices. The decisions of OPEC, a group of major Oil-producing countries, is another key driver of price. The value of the US Dollar influences the price of WTI Crude Oil, since Oil is predominantly traded in US Dollars, thus a weaker US Dollar can make Oil more affordable and vice versa.
How does inventory data impact the price of WTI Oil
The weekly Oil inventory reports published by the American Petroleum Institute (API) and the Energy Information Agency (EIA) impact the price of WTI Oil. Changes in inventories reflect fluctuating supply and demand. If the data shows a drop in inventories it can indicate increased demand, pushing up Oil price. Higher inventories can reflect increased supply, pushing down prices. API’s report is published every Tuesday and EIA’s the day after. Their results are usually similar, falling within 1% of each other 75% of the time. The EIA data is considered more reliable, since it is a government agency.
How does OPEC influence the price of WTI Oil?
OPEC (Organization of the Petroleum Exporting Countries) is a group of 13 Oil-producing nations who collectively decide production quotas for member countries at twice-yearly meetings. Their decisions often impact WTI Oil prices. When OPEC decides to lower quotas, it can tighten supply, pushing up Oil prices. When OPEC increases production, it has the opposite effect. OPEC+ refers to an expanded group that includes ten extra non-OPEC members, the most notable of which is Russia.
- EUR/GBP climbs to 0.8600 as UK labor market data remained weak due to restrictive monetary policy by the BoE.
- BoE policymakers came under pressure as labor market witnessed layoffs while wage growth momentum remained intact.
- The ECB is expected keep rates on refinancing operations steady at 4.25% amid easing inflation and an economic slowdown.
The EUR/GBP pair jumped to near the round-level resistance of 0.8600 in the European session. The cross strengthened after the United Kingdom’s Office for National Statistics (ONS) reported vulnerable labor market data for July.
UK’s labor market shed 207K jobs in the quarter to July, more than an expected decline of 185K. In the former period, the labor market lost 66K payrolls. The Unemployment Rate for the three months ending in July rose to 4.3% as anticipated by market participants from the prior reading of 4.2%. In August, the Claimant Count Change increased by a mild 0.9K while investors anticipated individuals claiming jobless benefits to increase by 17.1K against July’s reading of 29K.
The economic data indicates that labor demand remained extremely soft in July. This seems to be the consequence of higher interest rates by the Bank of England (BoE) to contain persistent inflationary pressures. The labor market outlook is expected to remain vulnerable as the BoE is expected to raise interest rates further.
UK’s wage growth remained stubborn at 7.8%, in line with projections and the former release, which indicates that higher consumer spending momentum would make the inflation outlook extremely stubborn. Higher household income would keep the overall demand elevated and provide room for further price hikes by producers.
On the Eurozone front, investors remained mixed about the interest rate decision from the European Central Bank (ECB), which will be announced on Thursday. As per expectations, ECB President Christine Lagarde could keep rates on refinancing operations steady at 4.25% amid easing inflation and an economic slowdown.
Meanwhile, the Eurozone ZEW Economic Sentiment Index worsened to -8.9 from -5.5 recorded in August. The sentiment indicator demonstrates the approach of institutional investors towards the economy.
NZD, like other commodity currencies, was hit in August given the weak backdrop in risk markets. Economists at CIBC Capital Markets analyze Kiwi’s outlook.
Fiscal and monetary policy outlooks are back in focus
We have revised our Q4 forecast for NZD/USD lower given the weak Chinese growth outlook and risks to global growth in general. Further, the higher for longer USD narrative should hurt the high beta Kiwi heading into year-end.
With fiscal and monetary policy outlooks back in the spotlight, there is likely to be more domestically sourced NZD/USD volatility through the end of the year.
NZD/USD – Q4 2023: 0.56 | Q1 2024: 0.58
The Dollar sell-off has run out of momentum in under 24 hours. Kit Juckes, Chief Global FX Strategist at Société Générale, analyzes Greenback’s outlook.
Small sell-off quickly stalled
The Dollar sell-off has rather fizzled out, lacking fresh impetus. The next moves will be driven by US data (Wednesday’s CPI, Thursday’s Retail Sales, Friday’s Industrial Production), and perhaps, by the next load of supply (USD35 bn in 10s today and USD20 bn in bonds on Wednesday), and the ECB meeting (Thursday).
But the BoJ and the Chinese have made their point about the Dollar rallying too fast, without convincing anyone that there is a bazooka-like policy response coming to trigger a change of direction. The danger is that if the US data are strong, the Dollar pushes to new near-term highs.
USD/JPY continues to track yield differentials which are about 40 bps narrower today than when we broke through 150 last year. How Treasuries react to CPI and supply will determine whether we make a big stride towards 150 or lose momentum.
- Gold price remains inside the woods as inflation turns cautious ahead of inflation data.
- The appeal for the US Dollar improves as the US economy is handling the burden of higher interest rates comfortably.
- A surprise upside in US inflation could spoil the market mood as discussions about one more interest rate hike would deepen.
Gold price (XAU/USD) remains under pressure as investors turn cautious ahead of the United States Consumer Price Index (CPI) data for August. The precious metal turns vulnerable as a strong recovery in gasoline prices indicates that headline inflation likely expanded at a higher pace in August, which could spoil the market mood and might improve the appeal for the US Dollar.
The US Dollar recovered swiftly on Tuesday as the American economy is absorbing the repercussions of higher interest rates by the Federal Reserve (Fed) efficiently, unlike other economies that are struggling to keep the labor market stable due to a restrictive monetary policy. August inflation data will be of utmost importance as it will be the latest one ahead of the September monetary policy.
Daily Digest Market Movers: Gold corrects amid caution ahead of inflation data
- Gold price corrects to near $1,920.00 as investors remain cautious about August inflation data, which will be released on Wednesday at 12:30 GMT.
- As per the estimates, headline inflation expanded at a higher pace of 0.5%. Core CPI that excludes volatile oil and food prices grew at a steady pace of 0.2%. Annualized headline CPI is seen higher at 3.6% vs. the former reading of 3.2%. While Core inflation is seen softening to 4.3% from July’s reading of 4.7%.
- Investors forecasted expansion in headline CPI at a higher pace, backed by a strong rebound in gasoline prices due to a significant rise in oil prices globally.
- Market participants will keenly watch the inflation data for August as it is the last consumer prices reading before September’s interest rate policy.
- A surprise rise in US inflation would elevate the gold price as it would boost hopes of one more interest rate increase by the Federal Reserve in the last quarter of 2023.
- As per the CME Fedwatch Tool, traders see a 93% chance for interest rates to remain unchanged at 5.25%-5.50% in September. For the rest of the year, traders anticipate almost a 54% chance for the Fed to keep the monetary policy unchanged.
- A hot inflation reading would also fade hopes that the Fed will push the economy on a "golden path", meaning a situation where inflation recedes without triggering a recession.
- The US Dollar Index (DXY) rebounded quickly after discovering an intermediate support near 104.40 as fears of a global slowdown renewed. Market participants projected a slower growth rate in China due to a bleak demand outlook and slower job growth.
- According to a Reuters poll, the Chinese economy is expected to grow 5.0% this year, lower than the forecast of 5.5% recorded in July's survey. For 2024 and 2025, growth is forecast at 4.5% and 4.3%, respectively.
- The USD Index recovered to near 104.80, supported by US economic resilience due to stable labor growth, decent consumer spending, and an easing inflation outlook. Where European and Asian economies are struggling to perform well due to a restrictive monetary policy, the American economy is absorbing the burden of higher interest rates efficiently.
- On the weekend, US Treasury Secretary Janet Yellen said she is confident that the central bank will contain inflation without damaging the job market. She doesn’t see China-led BRICS expansion as a major threat to the economy.
- While the US economy is resilient despite higher interest rates, US equities could come under pressure due to rising mortgage costs. Bank of America (BofA) strategists expect that the expression of “higher for longer” interest rates by the Fed will trigger a sell-off in equities over the next two months.
- The 10-year US Treasury yields recovered to near 4.28% amid caution over August inflation data.
Technical Analysis: Gold price drops to near $1,920
Gold price corrects to near the crucial support of $1,920.00. The precious metal remains sideways from the past week as investors remain uncertain about the interest rate outlook. The yellow metal is consistently facing selling pressure near the 20 and 50-day Exponential Moving Averages (EMAs), while the 200-EMA continues to provide a cushion. Momentum oscillators indicate a sideways price action, indicating that investors await a fresh economic trigger.
US Dollar FAQs
What is the US Dollar?
The US Dollar (USD) is the official currency of the United States of America, and the ‘de facto’ currency of a significant number of other countries where it is found in circulation alongside local notes. It is the most heavily traded currency in the world, accounting for over 88% of all global foreign exchange turnover, or an average of $6.6 trillion in transactions per day, according to data from 2022.
Following the second world war, the USD took over from the British Pound as the world’s reserve currency. For most of its history, the US Dollar was backed by Gold, until the Bretton Woods Agreement in 1971 when the Gold Standard went away.
How do the decisions of the Federal Reserve impact the US Dollar?
The most important single factor impacting on the value of the US Dollar is monetary policy, which is shaped by the Federal Reserve (Fed). The Fed has two mandates: to achieve price stability (control inflation) and foster full employment. Its primary tool to achieve these two goals is by adjusting interest rates.
When prices are rising too quickly and inflation is above the Fed’s 2% target, the Fed will raise rates, which helps the USD value. When inflation falls below 2% or the Unemployment Rate is too high, the Fed may lower interest rates, which weighs on the Greenback.
What is Quantitative Easing and how does it influence the US Dollar?
In extreme situations, the Federal Reserve can also print more Dollars and enact quantitative easing (QE). QE is the process by which the Fed substantially increases the flow of credit in a stuck financial system.
It is a non-standard policy measure used when credit has dried up because banks will not lend to each other (out of the fear of counterparty default). It is a last resort when simply lowering interest rates is unlikely to achieve the necessary result. It was the Fed’s weapon of choice to combat the credit crunch that occurred during the Great Financial Crisis in 2008. It involves the Fed printing more Dollars and using them to buy US government bonds predominantly from financial institutions. QE usually leads to a weaker US Dollar.
What is Quantitative Tightening and how does it influence the US Dollar?
Quantitative tightening (QT) is the reverse process whereby the Federal Reserve stops buying bonds from financial institutions and does not reinvest the principal from the bonds it holds maturing in new purchases. It is usually positive for the US Dollar.
Extra gains in USD/MYR should meet a tough barrier around 4.7000 according to Markets Strategist Quek Ser Leang at UOB Group.
Key Quotes
Last week, we expected USD/MYR to trade in a range between 4.6250 and 4.6660. Instead of trading in a range, USD/MYR rose to a high of 4.6790. Upward momentum has increased, albeit not much.
This week, USD/MYR could edge above June’s high of 4.6880 before the risk of a pullback increases. The next resistance at 4.7000 is unlikely to come under threat. In order to maintain the buildup in momentum, USD/MYR must stay above 4.6500.
Bank of England (BoE) Deputy Governor appointee, Sarah Breeden, said on Tuesday, “I agree with the MPC that the risks to inflation around the August forecast are to the upside.”
Additional comments
I see balanced risks to growth and unemployment in both directions.
I expect inflation to be around the 2% target in two years.
When asked about interest rate hikes, given the shocks we have had, it is not a surprise we have been tested severely.
I do think there are lessons about how we use our models, incorporate broader analysis of the economy.
Had we not increased the interest rates the way we did, that would have increased the price of imports, leading then to a very serious increase in inflation.
There is a an "awful lot of tightening" that is to come through.
We're not forecasting a recession.
There are a lot of mixed signals on wages and prices.
Market reaction
The above comments fail to move the needle around the Pound Sterling. GBP/USD is trading at 1.2470, down 0.30% on the day.
Price pressure in Norway surprisingly eased in August. Economists at Commerzbank analyze NOK's outlook following the publication of the latest data.
Inflation surprise in Norway
At its last meeting, Norges Bank had signalled a further rate step for September. It is likely to stick to that despite the inflation surprise. It is even imaginable that it will want to keep the door open for a further tightening step, as Norges Bank underestimated inflation momentum at the start of the year, which it would certainly like to avoid this time.
Despite the positive surprise with the inflation data, Norges Bank is likely to remain hawkish for now, which is likely to support Krone. The market seems to take a similar view as the krone reacted only cautiously negatively to the data surprise on Monday.
Further upside could motivate USD/THB to revisit the 35.66 level in the near term, comments Markets Strategist Quek Ser Leang at UOB Group.
Key Quotes
Our view for USD/THB to trade in a range between 34.90 and 35.66 last week was incorrect. Instead of trading in a range, USD/THB rose to a high of 35.66. Upward momentum has increased, albeit not much.
This week, as long as USD/THB stays above 35.28, it could rise above the 35.66 level. In view of the overbought short-term conditions, the chance of USD/THB breaking above June’s peak of 35.74 is not high.
AUD/USD trades sideways near 0.6430. Economists at Société Générale analyze the pair’s technical outlook.
Inability to cross 0.6525 could result in further decline
AUD/USD failed to overcome the peak of June at 0.6900 resulting in a steady pullback. It has recently tested the line connecting the lows of March and May. The downward momentum has stalled, however, a large upside is not expected; a break above the recent pivot high at 0.6525 would be essential to confirm a meaningful rebound.
Holding below 0.6525, there would be a risk of one more down leg. The next potential support is located at projections and the October 2022 low of 0.6200/0.6170.
- USD/CAD recovers from the recent losses ahead of US Headline CPI.
- Improved WTI price contributes support for the Canadian Dollar’s (CAD) strength.
- Investors await US inflation figures to gain clearer insights into the Fed policy decision.
USD/CAD trades higher around 1.3580 during the European session on Tuesday, snapping the two-day losing streak. The pair faced challenges due to the downbeat US Dollar (USD) on Monday. However, the improved US Treasury yields might limit the losses of the buck.
The improved prices of WTI Crude oil are contributing to the support in strengthening the Canadian Dollar (CAD) as Canada is one of the largest suppliers of crude oil to the United States. This scenario is acting as a limiting factor on the potential strength of the USD/CAD pair.
Western Texas Intermediate (WTI), the US crude oil benchmark, trades higher around $87.30 per barrel at the time of writing. This price level is being supported by the prolonged crude output cuts implemented by Saudi Arabia and Russia, propelling WTI prices to their highest levels since November 2022.
Bank of Canada (BoC) Governor Tiff Macklem indicated on Thursday that monetary policy might need to be appropriately restrictive to restore price stability. However, Macklem also expressed concern about the persistence of underlying inflation.
US Dollar Index (DXY), which measures the performance of the US Dollar (USD), trades higher around 104.80. The Greenback is anticipated to remain resilient, supported by the continuous stream of positive economic data from the United States (US).
Investors will closely watch the upcoming release of the Consumer Price Index (CPI) for August from the US, scheduled for Wednesday. This data release could offer additional insights into the US inflation situation.
US CPI is expected to show a 0.5% month-on-month increase, representing an improvement from the previous period's 0.2% reading. While the Core CPI figure is anticipated to remain consistent at 0.2%.
Investors have been pricing in the odds of a 25 basis point (bps) interest rate hike by the US Federal Reserve (Fed) in November or December meetings. Along with this, the Fed is expected to sustain higher interest rates over a prolonged period. This hawkish tone might lift the US Dollar USD) and limit the downside of the USD/CAD pair.
- Germany’s ZEW Economic Sentiment Index improved to -11.4 in September.
- EUR/USD is keeping the red below 1.0750 after the mixed ZEW surveys.
The German ZEW headline number showed that the Economic Sentiment Index slowed its pace of decline in September, arriving at 11.4 from -12.3 in August while beating the market expectation of -15.0.
However, the Current Situation Index dropped sharply to -79.4 from -71.3 prior, missing estimates of -75.0.
During the same period, the Eurozone ZEW Economic Sentiment Index worsened to -8.9 from -5.5 recorded in August.
Key points
Financial market experts are even more pessimistic about the current economic situation in Germany than they were in August 2023.
This development puts the slightly the slightly higher expectations regarding the economic situation on a six-month horizon.
More positive economic expectations for germany are accompanied by significantly optimistic outlook for developments on the international stock markets.
This is, at least in part, attributed to the increasing proportion of respondents who anticipate stable interest rates in the eurozone and the USA.
Experts expect a further easing of interest rate policy in China.
Market reaction
The EUR/USD pair is holding lower ground near 1.0720 on the mixed data, losing 0.26% on the day.
- USD/JPY regains some positive traction on Tuesday, albeit lacks follow-through.
- Intervention fears, a softer risk tone underpin the JPY and cap gains for the pair.
- The Fed-BoJ policy divergence should act as a tailwind ahead of the key US CPI.
The USD/JPY pair builds on the previous day's late rebound from sub-146.00 levels, or over a one-week low and gains some positive traction on Tuesday. Spot prices, however, struggle to capitalize on the momentum and retreat a few pips from the 147.00 neighbourhood, or the daily peak. The pair currently trades around the 146.65-146.70 region, up less than 0.10% for the day.
The immediate market reaction to Bank of Japan (BoJ) Governor Kazuo Ueda's hawkish comments fades rather quickly as market participants seem convinced that the Japanese central bank will maintain the status quo until next summer. In an interview with Yomiuri newspaper published on Saturday, Ueda said that ending negative interest rates is among the options available if the BoJ becomes confident that prices and wages will keep going up sustainably. That said, Japan’s ruling Liberal Democratic Party’s (LDP) Upper House secretary-general, Hiroshige Seko signalled his preference for an ultra-loose monetary policy. Seko added that the BoJ Gov Ueda had said that exit from the easy policy would be after achieving the 2% inflation target.
This eases market fears about an imminent shift in the BoJ's dovish policy stance, which, along with the emergence of some US Dollar (USD) buying, acts as a tailwind for the USD/JPY pair. The prospects for further policy tightening by the Federal Reserve (Fed) remain supportive of elevated US Treasury bond yields and revive the USD demand. The US central bank is expected to pause its rate-hiking cycle in September, though the markets are pricing in the possibility of one more 25 bps lift-off in 2023. The bets were reaffirmed by the upbeat US macro data released last week, which pointed to a resilient economy. Moreover, the fact that inflation is not cooling fast enough should allow the Fed to keep interest rates higher for longer.
Hence, the market focus will remain glued to the crucial US CPI report, due for release on Wednesday and will provide fresh cues about the Fed's future rate hike path. This, in turn, will play a key role in influencing the near-term USD price dynamics and determining the next leg of a directional move for the USD/JPY pair. In the meantime, the prevalent cautious market mood is seen lending some support to the safe-haven Japanese Yen (JPY). Apart from this, speculations that Japanese authorities might intervene to halt any further weakness in the domestic currency act as a headwind for the major. The aforementioned fundamental backdrop, however, suggests that the path of least resistance for spot prices is to the upside.
Technical levels to watch
Economists at ING analyze EUR/USD and EUR/JPY outlook ahead of Thursday's European Central Bank meeting
Thursday's ECB could see EUR/JPY briefly trade back up to the 158.50 area
We see Thursday's ECB event risk being a temporary positive one for EUR/USD. For that reason, we suspect that EUR/USD can find some support in the short term near the 1.0700 area – even if Oil prices do push higher.
Elsewhere, we have recently favoured a move lower in EUR/JPY based on positioning. Thursday's ECB could see EUR/JPY briefly trade back up to the 158.50 area, but some excitement over a possible change in Bank of Japan interest rate policy later this year suggests the 150 and 160 levels on USD/JPY and EUR/JPY prove toppish.
- Silver attracts some intraday selling on Tuesday, albeit lacks follow-through.
- The technical setup suggests that the path of least resistance remains down.
- Attempted recoveries could be seen as a selling opportunity and remain capped.
Silver struggles to capitalize on the previous day's modest recovery gains and attracts fresh sellers in the vicinity of the $23.20 area on Tuesday. The white metal extends its steady descent through the early part of the European session and hits a fresh daily low in the last hour, though shows some resilience below the $23.00 round-figure mark.
Looking at the broader picture, Silver has been oscillating in a familiar trading back since last Thursday. Against the backdrop of the recent sharp downfall from the $25.00 psychological mark, this range-bound price action might be categorized as a bearish consolidation phase. Moreover, oscillators on the daily chart are holding in the negative territory and are still far from being in the oversold zone. This, in turn, suggests that the path of least resistance for the XAG/USD is to the downside.
Bearish traders, however, might wait for some follow-through selling below the $22.85-$22.80 area or a multi-week low touched last Thursday, before placing fresh bets. The XAG/USD might then accelerate the fall towards challenging a strong horizontal support near the $22.20-$22.10 zone. This is followed by the $22.00 round-figure mark, which if broken decisively will be seen as a fresh trigger for bearish traders and pave the way for an extension of a multi-week-old descending trend.
On the flip side, the $23.20 region now seems to have emerged as an immediate strong resistance. Any subsequent move up might be seen as a selling opportunity and remain capped near the very important 200-day Simple Moving Average (SMA), currently pegged near the $23.45-$23.50 area. This is followed by the 100-day SMA barrier, around the $23.80 region, and the $24.00 mark, which if cleared should negate the near-term negative outlook for the XAG/USD.
The subsequent short-covering move has the potential to lift the white metal beyond the $24.30-$24.35 supply zone, towards reclaiming the $25.00 psychological mark. The latter represents the August monthly swing high and should act as a pivotal point. A sustained strength beyond will be seen as a fresh trigger for bullish traders and pave the way for some meaningful appreciating move for the XAG/USD.
Silver daily chart
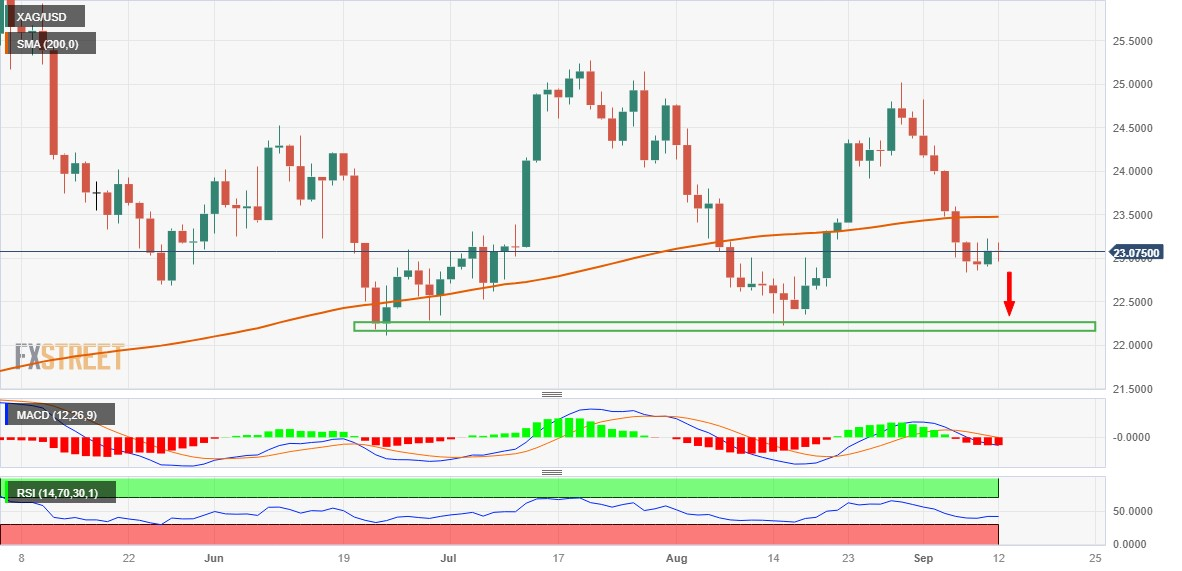
Technical levels to watch
USD/JPY trades steady above 146.50. Economists at Société Générale analyze the pair’s technical outlook.
Break below 144.50 essential to affirm deeper pullback
USD/JPY attempted a cross above the August high, however, the upward move has stalled near the interim projections of 147.40/147.80. A quick pullback is taking shape. Daily MACD has turned flattish, suggesting a lack of steady upward momentum. The inability to reclaim the resistance zone at 147.40/147.80 could result in a down move towards the recent pivot low near 144.50; this is a crucial support.
If the pair fails to defend 144.50, there would be risk of a deeper downtrend. In such a scenario, the next potential objectives could be at 143, the 23.6% retracement from January and 141.50/141.
- The Euro could not sustain a move to fresh tops vs. the US Dollar.
- Stocks in Europe open Tuesday’s session in a mixed tone.
- EUR/USD’s upside momentum falters ahead of 1.0770.
- The USD Index (DXY) regains some balance following Monday’s drop.
- Germany, EMU Economic Sentiment takes centre stage later in the session.
- The NFIB index and the API report are due next in the US docket.
The Euro (EUR) fades the auspicious start of the week against the US Dollar (USD), prompting EUR/USD to return to negative territory after climbing to as high as the 1.0770 region earlier on Tuesday.
In the meantime, the Greenback reclaims some buying interest following Monday’s strong retracement and lifts the USD Index (DXY) back to the 104.70 area.
In terms of monetary policy, the anticipation of a potential interest rate hike by the Federal Reserve (Fed) in November seems to have waned recently, while market participants persist in factoring in the likelihood of rate cuts taking place at some stage in the second quarter of 2024.
Turning our attention to the European Central Bank (ECB), market discussions seem to lean towards a pause at the September 14 meeting and a quarter-point rate raise by year’s end, given the current state of a somewhat divided Council.
Back to the euro calendar, the Economic Sentiment gauged by the ZEW Institute for the current month will be in the limelight later in the European morning, while the NFIB Business Optimism Index and the usual weekly report on US crude oil supplies by the API are due across the Atlantic later in the NA trading hours.
Daily digest market movers: Euro remains offered below the 200-day SMA
- The EUR gives away part of Monday’s gains vs. the USD.
- The absence of direction prevails in the US, German yields so far.
- Markets see the ECB keeping the deposit rate unchanged this week.
- UK Unemployment Rate ticked higher to 4.3% in July.
- Investors continue to price in Fed rate cuts in Q2 2024.
- Final inflation figures in Spain saw the Core CPI rise 6.1% YoY in August.
Technical Analysis: Euro remains under pressure and risks extra drops
EUR/USD resumes the downward bias and refocuses on the 1.0700 region and potentially below so far on Tuesday.
In case EUR/USD succeed in breaking below the September low at 1.0685 (September 7), it could undergo a retesting phase of the May low at 1.0635 (May 31) before potentially reaching the March low of 1.0516 (March 15). If the latter level is breached, it could initiate a possible examination of the 2023 low at 1.0481 (January 6).
On the contrary, regarding upward movement, the current emphasis is on targeting the crucial 200-day SMA at 1.0824. Beyond that point, a bullish momentum might lead to a challenge of the weekly peak at 1.0945 (August 30), further supported by the provisional 55-day SMA at 1.0937. Subsequently, this scenario could pave the way for an advance towards the psychological level of 1.1000 and the August high at 1.1064 (August 10). If spot clears this area, it could alleviate some of the bearish pressure and potentially aim for the weekly peak at 1.1149 (July 27), followed by the 2023 top at 1.1275 (July 18).
It's worth noting that as long as the EUR/USD remains below the 200-day SMA, there is a likelihood of a sustained decline in the pair.
Euro FAQs
What is the Euro?
The Euro is the currency for the 20 European Union countries that belong to the Eurozone. It is the second most heavily traded currency in the world behind the US Dollar. In 2022, it accounted for 31% of all foreign exchange transactions, with an average daily turnover of over $2.2 trillion a day.
EUR/USD is the most heavily traded currency pair in the world, accounting for an estimated 30% off all transactions, followed by EUR/JPY (4%), EUR/GBP (3%) and EUR/AUD (2%).
What is the ECB and how does it impact the Euro?
The European Central Bank (ECB) in Frankfurt, Germany, is the reserve bank for the Eurozone. The ECB sets interest rates and manages monetary policy.
The ECB’s primary mandate is to maintain price stability, which means either controlling inflation or stimulating growth. Its primary tool is the raising or lowering of interest rates. Relatively high interest rates – or the expectation of higher rates – will usually benefit the Euro and vice versa.
The ECB Governing Council makes monetary policy decisions at meetings held eight times a year. Decisions are made by heads of the Eurozone national banks and six permanent members, including the President of the ECB, Christine Lagarde.
How does inflation data impact the value of the Euro?
Eurozone inflation data, measured by the Harmonized Index of Consumer Prices (HICP), is an important econometric for the Euro. If inflation rises more than expected, especially if above the ECB’s 2% target, it obliges the ECB to raise interest rates to bring it back under control.
Relatively high interest rates compared to its counterparts will usually benefit the Euro, as it makes the region more attractive as a place for global investors to park their money.
How does economic data influence the value of the Euro?
Data releases gauge the health of the economy and can impact on the Euro. Indicators such as GDP, Manufacturing and Services PMIs, employment, and consumer sentiment surveys can all influence the direction of the single currency.
A strong economy is good for the Euro. Not only does it attract more foreign investment but it may encourage the ECB to put up interest rates, which will directly strengthen the Euro. Otherwise, if economic data is weak, the Euro is likely to fall.
Economic data for the four largest economies in the euro area (Germany, France, Italy and Spain) are especially significant, as they account for 75% of the Eurozone’s economy.
How does the Trade Balance impact the Euro?
Another significant data release for the Euro is the Trade Balance. This indicator measures the difference between what a country earns from its exports and what it spends on imports over a given period.
If a country produces highly sought after exports then its currency will gain in value purely from the extra demand created from foreign buyers seeking to purchase these goods. Therefore, a positive net Trade Balance strengthens a currency and vice versa for a negative balance.
- USD/CHF trades higher around 0.8910 on the back of Greenback’s recovery.
- US inflation is expected to appreciate; any deviation could influence the sentiment toward the pair.
- BoJ Governor Kazuo Ueda’s hawkish remarks contributed to USD weakness.
USD/CHF struggles to recover from the previous day’s losses ahead of the release of the US Consumer Price Index (CPI), treading waters around 0.8910 during the early trading hours of the European session on Tuesday. The pair experienced downward pressure due to the lackluster performance of the US Dollar (USD) on Monday.
Additionally, the USD/CHF pair struggled, primarily influenced by the positive data from China, particularly a return to positive inflation territory. Furthermore, hawkish remarks from Bank of Japan (BoJ) Governor Kazuo Ueda contributed to USD weakness.
US Dollar Index (DXY), which measures the performance of the US Dollar (USD), beats higher at around 104.70. The Greenback is recovering losses due to the positive performance of United States (US) bond yields.
Nevertheless, the US Dollar (USD) bulls adopt a cautious stance ahead of the release of the significant US Consumer Price Index (CPI) data scheduled for Wednesday. This data release has the potential to influence market sentiment and impact the pair.
The market expects the headline Consumer Price Index (CPI) to show a 0.5% month-on-month increase, representing an improvement from the previous period's 0.2% reading. While Core CPI figures are anticipated to stay unchanged at 0.2%.
It is worth noting that any deviations from these inflation figures have the potential to trigger rapid changes in market sentiment and influence the bias towards the US Dollar (USD).
The Greenback is projected to maintain its strength by effectively absorbing the impacts of higher interest rates. Furthermore, the currency could receive additional support from positive economic data coming out of the US.
- Pound Sterling trades sideways despite weak labor market data.
- The UK shed jobs in the three months to July while wage growth remains high.
- The BoE may opt for another interest rate increase in September as UK inflation is the highest among G7 economies.
The Pound Sterling (GBP) struggles to defend its crucial support at 1.2500 after the release of a vulnerable labor market report for July. The GBP/USD pair remains under pressure on signs of increasing unemployment but persistent wage growth. Bank of England (BoE) policymakers are expected to face pressure from a stubborn inflation outlook due to strong wage growth and a bleak labor market outlook due to higher interest rates.
The UK’s labor market report for July suggests that the economy is facing headwinds from persistent inflation and economic slowdown. More stress on the economy is highly anticipated as the BoE is preparing to raise interest rates for the 15 consecutive time on September 21. While BoE Governor Andrew Bailey said last week that interest rates are near their peak, a fresh rate hike in September cannot be ruled out as inflation in the UK economy is still the highest among G7 economies.
Daily Digest Market Movers: Pound Sterling remains sticky despite vulnerable labor market report
- Pound Sterling hovers around 1.2500 as the UK Office for National Statistics reported a weaker-than-anticipated labor market report for July.
- UK employers shed 207K jobs in the three months to July, more than the 185K decline forecasted by markets. In the three months to June, the labor market lost 66K payrolls.
- The Unemployment Rate for the quarter ending to July rose to 4.3% as anticipated by market participants from the prior reading of 4.2%.
- In August, the Claimant Count Change increased by a mild 900. Investors anticipated the number of people claiming jobless benefits to increase by 17.1K against July’s reading of 29K. Lower claims indicate that labor demand held up.
- The economic indicator that keeps pressure on Bank of England policymakers is the strong wage growth.
- Average Earnings excluding bonuses in the three months to July landed at 7.8%, in line with estimates and the former release. Wage growth data including bonuses rose to 8.5% against projections and the former release of 8.2%.
- Strong wage growth might keep the consumer spending momentum at a high pace as households receive higher disposable income. This will keep inflationary pressures sticky, a problem for BoE policymakers.
- July’s labor market report is going to accelerate uncertainty about September’s monetary policy meeting. The labor market seems to be weakening sharply but wage growth remains persistent, which would leave space for further policy-tightening by the central bank.
- The BoE is widely expected to raise interest rates on September 21 by 25 basis points (bps) to 5.50% while investors will keenly watch guidance for the rest of the year.
- Last week, BoE policymaker Swati Dhingra said that current interest rates are “sufficiently restrictive” and further policy tightening could hurt the economy.
- After labor market data, investors will focus on monthly GDP and factory activity data for July, which will be published on Wednesday at 06:00 GMT.
- The market sentiment remains quiet as investors await the United States Consumer Price Index (CPI) data for August, which will be published on Wednesday at 12:30 GMT.
- The US Dollar Index (DXY) finds feet after a sell-off from the six-month high of 105.10 on renewed fears of a global slowdown.
- A slowdown in the property sector and huge debt in China is raising doubts over its economic outlook. According to a Reuters poll, the Chinese economy is expected to grow 5.0% this year, lower than the 5.5% forecast in a July survey. For 2024 and 2025, growth is forecast at 4.5% and 4.3%, respectively.
- A power-pack action is anticipated in the USD Index after the release of the inflation data. According to estimates, headline inflation is expected to grow at a higher pace of 0.5% in August on month against the 0.2% pace recorded for July. Core CPI is seen steady at 0.2%. The reacceleration in headline inflation is driven by a strong rebound in gasoline prices.
- An upside surprise in inflation would elevate the chances of one more interest rate hike by the Federal Reserve (Fed) in the remainder of the year.
Technical Analysis: Pound Sterling aims to defend 1.2500
Pound Sterling strives to defend the psychological support of 1.2500 after a vulnerable labor market report. The Cable broadly trades sideways after recovering from the crucial support of 1.2460. The asset continues to trade near the 200-day Exponential Moving Average (EMA), which remains around 1.2500. While the short trend is bearish as the 20 and 50-day EMAs are downward-sloping, momentum oscillators portray strength in the bearish impulse.
BoE FAQs
What does the Bank of England do and how does it impact the Pound?
The Bank of England (BoE) decides monetary policy for the United Kingdom. Its primary goal is to achieve ‘price stability’, or a steady inflation rate of 2%. Its tool for achieving this is via the adjustment of base lending rates. The BoE sets the rate at which it lends to commercial banks and banks lend to each other, determining the level of interest rates in the economy overall. This also impacts the value of the Pound Sterling (GBP).
How does the Bank of England’s monetary policy influence Sterling?
When inflation is above the Bank of England’s target it responds by raising interest rates, making it more expensive for people and businesses to access credit. This is positive for the Pound Sterling because higher interest rates make the UK a more attractive place for global investors to park their money. When inflation falls below target, it is a sign economic growth is slowing, and the BoE will consider lowering interest rates to cheapen credit in the hope businesses will borrow to invest in growth-generating projects – a negative for the Pound Sterling.
What is Quantitative Easing (QE) and how does it affect the Pound?
In extreme situations, the Bank of England can enact a policy called Quantitative Easing (QE). QE is the process by which the BoE substantially increases the flow of credit in a stuck financial system. QE is a last resort policy when lowering interest rates will not achieve the necessary result. The process of QE involves the BoE printing money to buy assets – usually government or AAA-rated corporate bonds – from banks and other financial institutions. QE usually results in a weaker Pound Sterling.
What is Quantitative tightening (QT) and how does it affect the Pound Sterling?
Quantitative tightening (QT) is the reverse of QE, enacted when the economy is strengthening and inflation starts rising. Whilst in QE the Bank of England (BoE) purchases government and corporate bonds from financial institutions to encourage them to lend; in QT, the BoE stops buying more bonds, and stops reinvesting the principal maturing on the bonds it already holds. It is usually positive for the Pound Sterling.
The Dollar softened a little on Monday. Economists at ING analyze Greenback’s outlook.
Focusing on OPEC production figures and the NFIB survey today
We should expect a quiet session ahead of Wednesday’s August US CPI release, where we warn of upside risks to the core number.
Before that, however, we are focusing on two releases today. The first is the August NFIB small business optimism release, where we will look for any signs of easing in the US jobs market – especially on compensation. The second is the release of OPEC's Oil monthly report, where we could see lower oil August production numbers for OPEC. That could put Brent Crude prices even higher and tend to favour the Dollar against the Euro and the Yen again.
For that reason, we could see DXY edging towards the top of a 104.50-105.00 short-term range.
USD/CNH could lose further momentum and revisit the 7.2600 region in the short-term horizon, suggest Economist Lee Sue Ann and Markets Strategist Quek Ser Leang at UOB Group.
Key Quotes
24-hour view: After USD soared to a high of 7.3678 last Friday, we highlighted yesterday that “the advance appears to be overdone, and USD is unlikely to rise further.” We expected USD to trade between 7.3300 and 7.3650. We did not anticipate the sharp selloff that sent USD plunging to a low of 7.2921. Despite the rebound from the low, the weakness in USD has not stabilised. Today, USD could drop further to 7.2870 before stabilisation can be expected. Resistance is at 7.3210, followed by 7.3330.
Next 1-3 weeks: Yesterday (11 Sep, spot at 7.3560), we were of the view USD “could rise further to 7.3800, with lesser odds of it testing 7.4000.” We indicated that “if USD breaks below 7.3100, it would mean that USD is not rising further.” USD then plunged to a low of 7.2921 before closing lower by a whopping 0.86% (NY close of 7.3018), its biggest 1-day drop in about 6 months. While it is premature to expect a major reversal, the sharp pullback could extend to 7.2600. Overall, only a breach of 7.3520 would indicate that USD is not ready to pullback further.
- The index reclaims part of the ground lost on Monday.
- Investors’ attention remains on the release of US inflation figures.
- The NFIB Index, API report are next on tap in the US docket.
The greenback, when measured by the USD Index (DXY), manages to pick up some traction and regains the 104.70/80 band on turnaround Tuesday.
USD Index looks bid ahead of key data
The index resumes the upside following the negative start of the week amidst some selling pressure in the risk complex, lack of direction in US yields and prudence ahead of the publication of US inflation figures on September 13.
Looking at the more macro scenario, markets continue to see the Fed’s July rate hike as the last one of the current hiking cycle, while interest rate cuts are seen commencing at some point in Q2 2024.
Later in the session, the only release in the US data space will be the NFIB Business Optimism Index ahead of the API’s weekly report on US crude oil inventories for the week ended on September 8.
What to look for around USD
The index rebounds from Monday’s four-day lows near 104.40 and seems to have refocused its attention to the 105.00 zone for the time being.
In the meantime, support for the dollar keeps coming from the good health of the US economy, despite the narrative around the tighter-for-longer stance from the Federal Reserve now looks somewhat diminished amidst the current backdrop of persistent disinflation and cooling of the labour market.
Key events in the US this week: MBA Mortgage Applications, Inflation Rate, Monthly Budget Statement (Wednesday) – Initial Jobless Claims, Producer Prices, Business Inventories (Thursday) – Industrial Production, Advanced Michigan Consumer Sentiment (Friday).
Eminent issues on the back boiler: Persevring debate over a soft or hard landing for the US economy. Incipient speculation of rate cuts in early 2024. Geopolitical effervescence vs. Russia and China.
USD Index relevant levels
Now, the index is advancing 0.20% at 104.73 and faces the next up barrier at 105.15 (monthly high September 7) ahead of 105.88 (2023 high March 8) and finally 106.00 (round level). On the other hand, the breach of 103.02 (200-day SMA) would open the door to 102.93 (weekly low August 30) and then 102.67 (55-day SMA).
EUR/USD is hovering around the 1.07 mark. Economists at Commerzbank analyze the pair’s outlook.
No impetus
In the run-up to the ECB meeting on Thursday, the market seems to be shying away from trading EUR/USD sustainably below the 1.07 mark.
Today, the EUR/USD is likely to move sideways for lack of impetus. There is hardly anything on the data side and due to the blackout period there will be no comments from the ECB or the US Fed.
However, Wednesday's US inflation release will be a data heavyweight that could bring a little more movement to the EUR/USD. Until then, we should enjoy the calm before the storm.
FX option expiries for Sept 12 NY cut at 10:00 Eastern Time, via DTCC, can be found below.
- EUR/USD: EUR amounts
- 1.0650 452m
- 1.0685 395m
- 1.0700 463m
- 1.0720 444m
- 1.0800 952m
- GBP/USD: GBP amounts
- 1.2355 888m
- USD/JPY: USD amounts
- 145.50 401m
- 146.85 400m
- USD/CHF: USD amounts
- 0.8750 612m
- 0.8800 376m
- USD/CAD: USD amounts
- 1.3490 397m
- NZD/USD: NZD amounts
- 0.5835 480m
- 0.5950 616m
- 0.5965 481m
- EUR/GBP: EUR amounts
- 0.8450 400m
- 0.8670 353m
- 0.8880 491m
A sustained drop below the 145.50 appears unlikely for USD/JPY in the short-term horizon, note Economist Lee Sue Ann and Markets Strategist Quek Ser Leang at UOB Group.
Key Quotes
24-hour view: Yesterday, we held the view that USD “has room to test 146.50.” We were also of the view that “the major support at 146.00 is unlikely to come under threat.” While USD weakened as expected, it plummeted to 145.89 before rebounding. The strong rebound in oversold conditions suggests USD is unlikely to weaken further. Today, it is more likely to trade in a range, probably between 146.00 and 147.30.
Next 1-3 weeks: After USD fell sharply last Friday, we highlighted yesterday (11 Sep, spot at 147.10) that “the current price movements are likely part of a consolidation phase.” We expected USD to trade between 146.00 and 148.00. We added, “Looking ahead, if USD breaks clearly below 146.00, it could trigger a deep pullback in USD.” We did not anticipate the volatile price action as USD plunged to 145.89 before rebounding strongly. While we prefer to see USD close below the support at 146.00, the overall price action suggest that USD could pullback further to 145.50. At this stage, the likelihood of USD breaking clearly below this level is not high. On the upside, if USD breaks above 147.80, it would indicate that it is not ready to pullback further.
- GBP/JPY strengthens after the release of moderate jobs data from the UK.
- Employment Change declined; the ILO Unemployment Rate and Claimant Count Change are up.
- BoJ Governor Kazuo Ueda’s hawkish statement could limit the depreciation of the Japanese Yen (JPY).
GBP/JPY trades higher around 183.70 during the Asian session on Tuesday. The pair is experiencing upward support after the release of employment data from the United Kingdom (UK).
The Office for National Statistics has reported that the ILO Unemployment Rate (3M) for the month of July stood at 4.3%, which is slightly up from the previous reading of 4.2% but in line with market expectations.
However, there were disappointing figures regarding Employment Change for July, which saw a decline of 207,000 jobs compared to a 66,000 decrease in the previous reading. This was worse than the anticipated drop of 185,000 jobs.
On the positive side, Claimant Count Change for August improved to 0.9K, a decrease from the previous 29K figure.
On Monday, Bank of England’s (BoE) policymaker Catherine Mann expressed that it is premature for the central bank to halt its interest rate adjustments. She further emphasized that it is preferable for the central bank to lean toward raising rates too aggressively rather than stopping prematurely. These hawkish remarks from BoE policymakers could potentially support the British Pound (GBP) and provide support for the GBP/JPY pair.
On the opposite side, Bank of Japan's Governor Kazuo Ueda made a hawkish statement in an interview with the Yomiuri Shimbun newspaper during the weekend. Governor Ueda indicated that the Japanese central bank is edging closer to the possibility of reversing its negative interest rate policy, which contributed support in underpinning the Japanese Yen (JPY).
The policymaker stated that there could be a change in the negative interest rates set by the Japanese central bank through the end of the year. The recent economic data from Japan supports the notion that the Bank of Japan is making progress toward achieving its 2% annual inflation target.
Market players will now observe the monthly UK Gross Domestic Product (MoM) and Manufacturing Production for July due on Wednesday, seeking trading opportunities in the GBP/JPY pair.
The UK has just released wage and employment data. Economists at ING analyze GBP outlook.
Wage data not as hawkish as it looks
The UK wage numbers are actually more dovish than they look at first glance. With unemployment notching higher, the labour market data doesn't scream a need to keep hiking rates much further.
We think it right not to chase EUR/GBP too much lower on this data (it is currently reversing from a brief dip to 0.8570) and what could prove a mildly hawkish ECB on Thursday warns of EUR/GBP breaking above 0.8600 later this week.
Considering advanced prints from CME Group for natural gas futures markets, open interest shrank by nearly 3K contracts after four daily builds in a row on Monday. On the flip side, volume increased by around 24.7K contracts amidst the ongoing erratic performance.
Natural Gas looks supported by the 100-day SMA so far
Prices of natural gas extended the recovery on Monday. The daily uptick, however, was amidst shrinking open interest, which leaves the door open to some corrective move in the very near term. That said, the provisional 100-day SMA near the $2.50 mark per MMBtu initially emerges as a decent contention area for the time being.
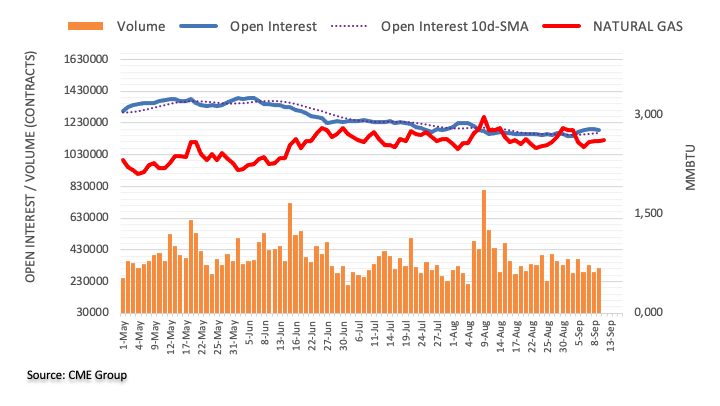
- EUR/GBP hovers around 0.8580 within a descending trend channel since June.
- The 50-hour EMA is on the verge of crossing above the 100-hour EMA.
- The key resistance level for the cross is located at 0.8600; the initial support level is seen at 0.8572.
The EUR/GBP cross holds ground around 0.8580 after bouncing off the weekly low of 0.8558 during the early European session on Tuesday. The mixed UK labor data fails to boost the Pound Sterling while investors await the monthly UK GDP report and the European Central Bank interest rate decision on Wednesday and Thursday, respectively for fresh impetus.
According to the recent data from the UK's Office for National Statistics, the UK unemployment rate in the three months to July came in at 4.3%, from 4.2% in the previous reading and in line with market expectations. Meanwhile, Employment Change for July fell by 207K from 66K in the previous reading, worse than the 185K drop forecast. The Average Earnings Including Bonus in the three months to July rose by 8.5%, compared to 8.2% in the previous reading. The figure, excluding the bonus remains at 7.8%, as predicted.
From a technical perspective, EUR/GBP trades within a descending trend channel since the middle of June on the four-hour chart. It’s worth noting that the 50-hour EMA is on the verge of crossing above the 100-hour EMA. If a decisive crossover occurs on the four-hour chart, it would validate a Bull Cross, highlighting the path of least resistance for the cross is to the upside. Meanwhile, the Relative Strength Index (RSI) stands in bullish territory above 50, supporting the buyers for now.
The key resistance level for the cross is located at 0.8600, representing a psychological round mark and a high of August 28. The next barrier to watch is near the upper boundary of a descending trend channel at 0.8626, en route to a high of August 11 at 0.8670 and finally near a high of July 19 at 0.8700.
On the downside, the initial support level is seen at 0.8572, representing a confluence of the 50- and 100-hour EMAs. The next downside stop is located at 0.8540 (a low of September 4). Further south, the additional downside filter is located at 0.8524 (a low of September 5). The key contention will emerge at 0.8500, portraying a lower limit of a descending trend channel and a psychological figure.
EUR/GBP four-hour chart
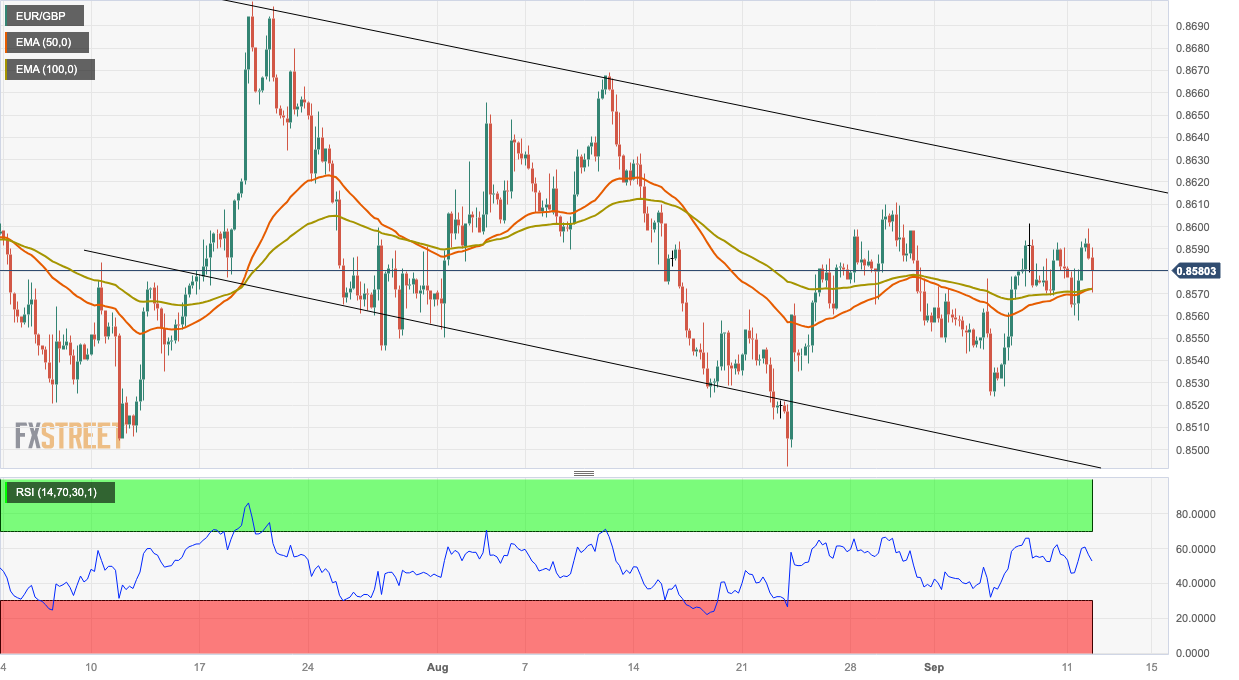
GBP/USD idles around 1.25. Economists at Société Générale analyze the pair’s technical outlook.
Signs of a meaningful up-move are not yet visible
GBP/USD gave a break below the neckline of a Head and Shoulders resulting in a steady decline.
GBP/USD is now close to interim support of 1.2420 representing the 200-DMA. This test could result in a bounce however signals of a meaningful up-move are not yet visible.
Right shoulder level near 1.2745/1.2820 could remain an important resistance zone near term.
If the pair fails to hold above the Moving Average near 1.2420, the phase of downtrend is expected to extend. Next objectives are located at May low of 1.2300 and target of the formation near 1.2170/1.2100.
EUR/USD is trading in around the 1.0750 mark. Economists at Société Générale analyze the pair’s outlook ahead of the German ZEW survey.
The primary deal rush shows no sign of abating
The German ZEW survey traditionally is not considered a market mover but the negative surprises from Germany this month suggest the opposite is true and another lurch lower for the ZEW could perhaps break out the tentative bounce in EUR/UD to 1.0750.
The primary deal rush meanwhile shows no sign of abating: another 11 IG borrowers in the US and 10 in Euro joining the September flurry yesterday including transactions by T-Mobile (USD) and Nestle (EUR).
Here is what you need to know on Tuesday, September 12:
Markets are seeing a bit of a recovery in risk sentiment after Reuters reported, citing sources, Country Garden, China's largest private property developer, has won approval from its creditors to extend the repayments on six onshore bonds by three years. Asian indices are posting modest gains, further supported by the tech stocks rally on Wall Street overnight.
Tesla jumped 10.1%, Amazon climbed 3.5% and Meta Platforms rose 3.2%. Apple rose 0.7% ahead of a Tuesday event where it the company is expected to release its latest iPhone model.
Amidst risk reset, the US S&P 500 futures have pared early losses but struggle with the recovery, as investors continue to trade with caution, weighing the recent policy guidance from the Chinese and Japanese central banks. A sense of caution also prevails ahead of Wednesday’s all-important Consumer Price Index (CPI) data from the United States, which will indicate where the US Federal Reserve (Fed) has further to go on rate increases.
The US Dollar is finding a floor after losing the most in two months on Monday, although the upside could be limited, in the absence of high-impact US economic data releases and a sluggish performance in the US Treasury bond yields.
US Dollar price today
The table below shows the percentage change of US Dollar (USD) against listed major currencies today. US Dollar was the strongest against the New Zealand Dollar.
| USD | EUR | GBP | CAD | AUD | JPY | NZD | CHF | |
| USD | 0.11% | -0.02% | 0.03% | 0.02% | 0.15% | 0.16% | 0.00% | |
| EUR | -0.10% | -0.10% | -0.08% | -0.06% | 0.06% | 0.07% | -0.09% | |
| GBP | 0.00% | 0.09% | 0.02% | 0.03% | 0.14% | 0.16% | 0.00% | |
| CAD | -0.03% | 0.07% | -0.04% | 0.00% | 0.12% | 0.14% | -0.03% | |
| AUD | -0.07% | 0.04% | -0.07% | -0.04% | 0.08% | 0.11% | -0.05% | |
| JPY | -0.17% | -0.07% | -0.18% | -0.14% | -0.14% | 0.00% | -0.16% | |
| NZD | -0.16% | -0.08% | -0.17% | -0.15% | -0.14% | -0.01% | -0.16% | |
| CHF | 0.00% | 0.09% | -0.01% | 0.02% | 0.01% | 0.15% | 0.17% |
The heat map shows percentage changes of major currencies against each other. The base currency is picked from the left column, while the quote currency is picked from the top row. For example, if you pick the Euro from the left column and move along the horizontal line to the Japanese Yen, the percentage change displayed in the box will represent EUR (base)/JPY (quote).
USD/JPY is extending the recovery toward 147.00 after Hiroshige Seko, Japan’s ruling Liberal Democratic Party’s (LDP) Upper House secretary-general, said that “BoJ Gov Ueda has said that exit from the easy policy will be after achieving the 2% inflation target.”
EUR/USD is consolidating its rebound near 1.0750, as traders brace for Germany’s ZEW survey. Euro traders digest the EU Commission’s downgrade to the Eurozone’s growth forecasts. GBP/USD is holding its range above the 1.2500 threshold after the mixed UK jobs report showed that earnings grew at a joint-record pace while unemployment rose in the economy. Meanwhile, Bank of England (BoE) policymaker Catherine Mann said on Monday, "I would rather err on the side of over-tightening. But, if I am wrong, and inflation decelerates more quickly and activity deteriorates more significantly, I will not hesitate to cut rates.”
AUD/USD is trading back and forth in a 25 pips range above 0.6400, as the renewed China optimism is offset by a pause in the US Dollar sell-off. Meanwhile, USD/CAD is reapproaching the 1.3600 mark, notwithstanding the latest upswing in WTI prices.
Gold price is holding steady while defending the critical 200-Daily Moving Average (DMA) at $1,920 amid a lack of fresh catalysts and pre-US inflation data repositioning.
USD/CNY largely hovered below the 7.30 handle in the second half of August and broke through it in early September to reach 7.35 at one point. Economists at Commerzbank analyze the pair’s outlook.
Weak for longer
The Yuan will remain under pressure until there are clear signs that the deteriorating economic momentum turns around.
The PBoC will continue to defend the currency and manage the pace of weakening as depreciation pressure persists.
We forecast USD/CNY to stay at around 7.30 in the near term before easing back somewhat towards the end of the year. Longer out, we expect USD/CNY to fall below 7.00 next year due to the expectation of a softer USD as we anticipate the Fed to cut its key interest rate in 2024.
EUR/CNY will likely move upward in the coming months and stay elevated in 2024, benefiting from the ECB’s restrictive monetary policy for some time ahead.

Source: Commerzbank Research
Economist Lee Sue Ann and Markets Strategist Quek Ser Leang at UOB Group see NZD/USD trading within the 0.5860-0.5960 range in the next few weeks.
Key Quotes
24-hour view: We expected NZD to edge higher yesterday. However, we were of the view that it “is unlikely to break clearly above 0.5930.” NZD rose more than expected to 0.5935 before easing off. Despite the advance, there is no clear increase in momentum, and NZD is unlikely to rise further. Today, NZD is more likely to trade in a range, probably between 0.5890 and 0.5935.
Next 1-3 weeks: Our update from yesterday (11 Sep, spot at 0.5900) is still valid. As highlighted, the recent downward pressure has subsided. For now, NZD is likely to trade in a range, probably between 0.5860 and 0.5960.
- GBP/USD holds above 1.2500, lacks firm direction.
- UK Unemployment Rate 3M to July came in at 4.3% from 4.2% in the previous reading.
- Higher for longer interest rate narrative in the US boosts the US Dollar.
- Investors will monitor the monthly UK GDP report and US Consumer Price Index (CPI) on Wednesday.
The GBP/USD pair consolidates its recent losses above the 1.2500 area during the early European trading hours on Tuesday. The major pair currently trades near 1.2515, up 0.04% on the day.
The latest data UK’s Office for National Statistics revealed that the UK Unemployment Rate in the three months to July came in at 4.3% from 4.2% in the previous reading, in line with the market consensus. Meanwhile, Employment Change for July declined by 207K from a 66K drop in the previous reading, worse than the estimated 185K drop. The Average Earnings Including Bonus in the three months to July rose by 8.5% versus 8.2% prior. Excluding bonus, the figure remains at 7.8%, as expected.
Catherine Mann, a Bank of England (BoE) policymaker, stated on Monday that it was too early for the central bank to pause interest rates and that it was preferable for the central bank to err on the side of raising them too high rather than halting too soon. The hawkish comment by BoE policymakers might limit the downside for the British Pound and act as a tailwind for GBP/USD.
Across the pond, the higher for longer interest rate narrative in the US lifts the US Dollar (USD) against the GBP The markets have been priced in the possibility of a 92% chance of a rate hold at the September meeting and a 42.4% chance of a rate hike at the November meeting, according to the CME FedWatch Tool.
US Treasury Secretary Janet Yellen said on Sunday that she is becoming more convinced that the US will be able to curb inflation without causing major impacts on the labor market. She added that every gauge of inflation is erasing and there was no massive wave of layoffs.
Market players will shift their focus to the monthly UK GDP report and Manufacturing Production for July due on Wednesday. Also, the highly anticipated US Consumer Price Index (CPI) data will be released in the North American session on Wednesday. Traders will find the trading opportunity around the GBP/USD pair.
CME Group’s flash data for crude oil futures markets noted traders scaled back their open interest positions by around 19.5K contracts on Monday after six daily advances in a row. On the other hand, volume rose for the second consecutive day, this time by nearly 48K contracts.
WTI faces decent resistance around $88.00
WTI prices charted an inconclusive session following a move to new 2023 tops just past the $88.00 mark per barrel on Monday. The marginal uptick, however, was amidst shrinking open interest, which is indicative that extra advances might not be favoured for the time being. In the meantime, the $88.00 region emerges as a firm hurdle for bulls for the time being.
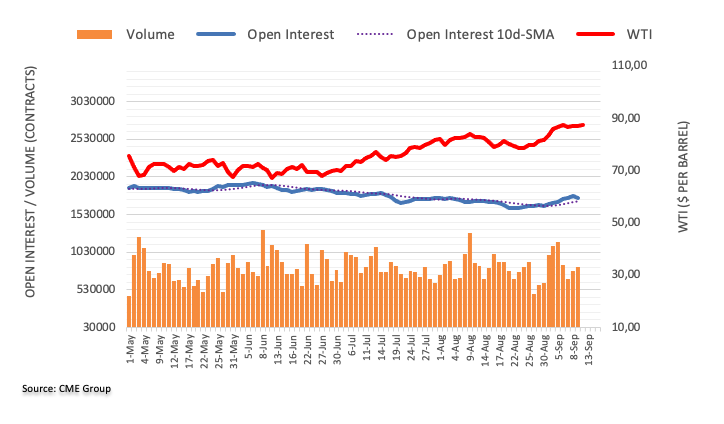
- AUD/USD struggles to continue the winning streak due to a slight negative bias.
- MACD is signaling a momentum shift towards a reversal move.
- The 0.6400 psychological level emerges as the initial support following the previous week’s low.
- Key resistance appears at the 21-day EMA lined up with the 0.6450 psychological level.
AUD/USD pair struggles to extend its recent winning streak, hovering with a slight negative bias around the 0.6420 level during the Asian session on Tuesday.
The pair is experiencing downward pressure due to the release of Australia’s disappointing Westpac Consumer Confidence (Sep), which fell by 1.5% compared to the previous decline of 0.4%. However, the pullback in the US Dollar (USD) has provided the support to underpin the AUD/USD pair.
The pair may encounter initial support around 0.6400 psychological level. A firm break below the level could put pressure on the AUD/USD pair to navigate the area around the previous week’s low at 0.6357 lined up with the 0.6350 psychological level.
On the upside, a significant resistance level for the AUD/USD pair appears at the 21-day Exponential Moving Average (EMA) at 0.6448 lined up with the 0.6450 psychological level, followed by the 23.6% Fibonacci retracement at 0.6483 level.
The Moving Average Convergence Divergence (MACD) line remains below the centerline but shows divergence above the signal line. This configuration suggests a potential shift in momentum in the market, which can be seen as a signal that the recent downtrend may be losing strength, and a reversal move in the asset's price might be on the horizon.
However, the traders of the AUD/USD pair will likely observe the 14-day Relative Strength Index (RSI), which suggests a bearish sentiment in the short term as it lies below the 50 level.
AUD/USD: Daily Chart
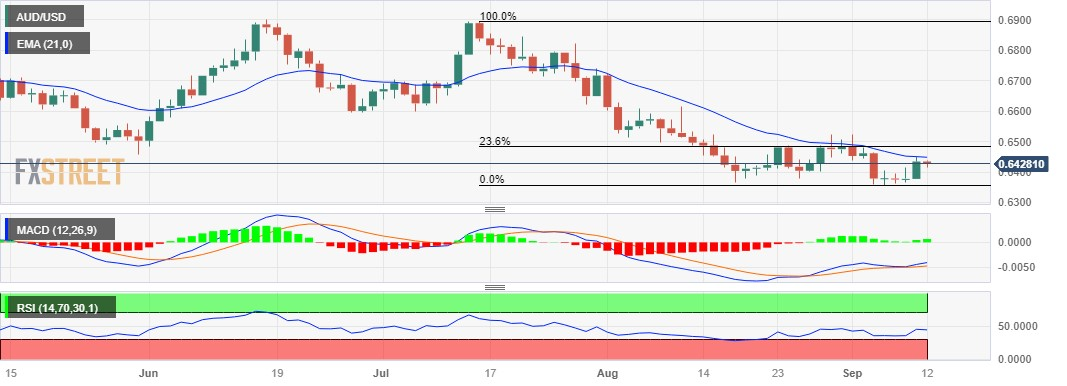
Further decline in GBP/USD appears not favoured while above 1.2555, according to Economist Lee Sue Ann and Markets Strategist Quek Ser Leang at UOB Group.
Key Quotes
24-hour view: We expected GBP to consolidate in a range of 1.2455/1.2520 yesterday. However, it rebounded to a high of 1.2548. While the rebound lacks momentum, GBP could test 1.2555 before levelling off. GBP is unlikely to break clearly above 1.2555. Support is at 1.2480, followed by 1.2450.
Next 1-3 weeks: We have expected GBP to weaken since early last week. In our most recent narrative from last Thursday (07 Sep, spot at 1.2500), we highlighted that GBP “is likely to continue to weaken, albeit at a slower pace.” We added, “The next major support at 1.2400 might not come into view so soon.” Yesterday, GBP rebounded to a high of 1.2548. Downward momentum has slowed, and the chance of GBP declining to 1.2400 seems low from here. On the upside, if GBP breaks above 1.2555 (no change in ‘strong resistance’ level), it would mean that GBP is not weakening further.
Open interest in gold futures markets rose by just 843 contracts after six consecutive daily advances at the beginning of the week, according to preliminary readings from CME Group. Volume, instead, remained choppy and went down by more than 12K contracts, partially reversing the previous daily build.
Gold: Initial hurdle emerges around $1950
Monday’s uptick in prices of gold was amidst increasing open interest, which suggests that the continuation of the recovery seems likely in the very near term. Against that, there is an interim hurdle at the 55-day SMA around $1930 ahead of the so far September high at $1953 per troy ounce.
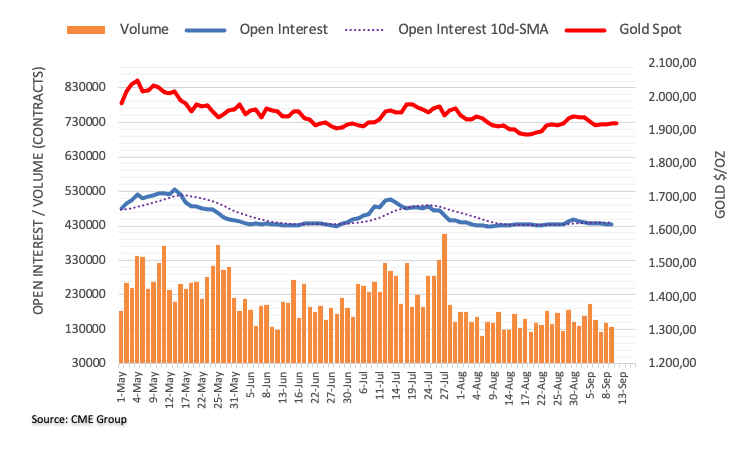
In the view of Economist Lee Sue Ann and Markets Strategist Quek Ser Leang at UOB Group, EUR/USD now seems to have moved into a consolidative phase.
Key Quotes
24-hour view: Our view for EUR to continue to trade in a range yesterday was incorrect. Instead of trading in a range, EUR rebounded strongly to a high of 1.0759. Upward momentum has improved, albeit not much. Today, EUR could rebound further, but it is highly unlikely to reach the major resistance at 1.0820 (there is another resistance level at 1.0780). If EUR breaks below 1.0710 (minor support is at 1.0730), it would indicate the momentum buildup has faded.
Next 1-3 weeks: Yesterday (11 Sep, spot at 1.0705), we noted that “downward momentum has slowed”. We held the view that while EUR could continue to weaken, the likelihood of it breaking clearly below the major support at 1.0635 is low. EUR then rebounded to a high of 1.0759. While our ‘strong resistance’ level at 1.0765 has not been breached yet, downward momentum has more or less faded. In other words, the EUR weakness from early last week has stabilised. From here, EUR is likely to trade in a range, probably between 1.0690 and 1.0820.
- EUR/JPY holds below the 157.60 area and lacks follow-through.
- Analysts expect the ECB to keep interest rates steady at its September policy meeting on Thursday.
- BoJ Governor said the central bank may abandon its negative interest rate policy when its 2% inflation objective is achieved.
The EUR/JPY cross struggles to find a direction during the early European session on Tuesday. The cross currently trades around 157.55, up 0.07% for the day. Market players digest the hawkish remarks from the Japanese policymakers and the European Central Bank (ECB) interest rate decision on Thursday will be the spotlight.
The majority of analysts expect the ECB to keep interest rates steady at its September policy meeting on Thursday, according to Reuters polls. About last week’s data, the German Harmonised Consumer Price Index (HICP) for August came in at 6.4% YoY, as the market expected whereas the core CPI remains unchanged at 6.1%. Additionally, the Eurozone Gross Domestic Product (GDP) for the second quarter (Q2) rose 0.1% versus 0.3% prior, below market expectation of 0.3%. The discouraging data might convince the European Central Bank (ECB) to abandon its hawkish stance for the upcoming meeting.
On the other hand, BoJ Governor Kazuo Ueda stated on Monday in an interview that the central bank could exit its negative interest rate policy when its inflation target of 2% is near and they would have sufficient evidence by the end of the year to evaluate whether interest rates should stay negative.
Furthermore, Japan’s Finance Minister Shunichi Suzuki said on Tuesday that he expects the Bank of Japan to conduct appropriate monetary policy and collaborate with the government to attain the inflation target while taking the economy, prices, and financial conditions into consideration. That said, the hawkish comments from the Japanese policymakers boost the Japanese Yen (JPY) and limit the upside in the EUR/JPY cross.
Moving on, market players will monitor the German ZEW Survey due later in the day. Later this week, the Eurozone Industrial Production MoM for July will be released on Wednesday. On Thursday, the European Central Bank (ECB) will announce its interest rate decision. Japanese Industrial Production for July will be revealed on Thursday. Traders will digest these figures to find trading opportunities around the EUR/JPY cross.
- Gold price trades with a positive bias for the second straight day and holds above the 200-day SMA.
- Subdued US Dollar price action and looming recession risks offer some support to the XAU/USD.
- The upside seems limited ahead of the US CPI on Wednesday and Thursday's ECB policy meeting.
Gold price attracts some dip-buying in the vicinity of the very important 200-day Simple Moving Average (SMA) support during the Asian session on Tuesday and stalls the overnight pullback from the $1,930 area, or a four-day high. The XAU/USD currently trades around the $1,923 region, up slightly for the second successive day, though lacks bullish conviction as traders keenly await this week's release of the latest consumer inflation figures from the United States (US) on Wednesday.
The crucial US Consumer Price Index (CPI) will provide fresh cues about the Federal Reserve's (Fed) future rate hike path after the widely anticipated pause in September. A stronger US CPI print will reaffirm market bets for further policy tightening by the Fed, which, in turn, will set the stage for a fresh leg down for the non-yielding Gold price. It is worth mentioning that the markets have been pricing in the possibility of one more 25 basis points (bps) lift-off by the end of this year.
The expectations were lifted by the upbeat US macro data released last week, which pointed to a resilient economy and should allow the Fed to keep interest rates higher for longer. The hawkish outlook remains supportive of elevated US Treasury bond yields and had pushed the US Dollar (USD) to a six-month top last week. The Greenback, however, witnessed some profit-taking on Monday and languished near a multi-day low on Tuesday, lending some support to the Gold price.
Adding to this, the prevalent cautious mood around the equity markets is seen as another factor underpinning the precious metal's safe-haven status. Market participants remain concerned about the worsening economic conditions in China - the world's second-largest economy. This, along with worries about headwinds stemming from rapidly rising borrowing costs, tempers investors' appetite for riskier assets and drives some haven flows towards the Gold price.
Traders, however, seem reluctant to place aggressive bullish bets and prefer to wait on the sidelines ahead of the US CPI report. This, along with the highly-anticipated European Central Bank (ECB) meeting on Thursday, should provide a fresh impetus to the Gold price. Analysts remain divided on whether the ECB will hike interest rates for a 10th straight time amid still-hight inflation or pause its historic policy-tightening cycle in the wake of a darkening Euro Zone economic outlook.
The key data/central bank event risk will help investors determine the next leg of a directional move for the Gold price. This, in turn, makes it prudent to wait for strong follow-through buying before positioning for the resumption of the recent recovery from the $1,885 region, or over a five-month trough touched in August.
Technical levels to watch
Hiroshige Seko, Japan’s ruling Liberal Democratic Party’s (LDP) Upper House secretary-general, said on Tuesday that he “took Bank of Japan (BoJ) Governor Ueda's comment in the media interview to mean the BoJ will continue with easing.”
Seko added “BoJ Gov Ueda has said that exit from the easy policy will be after achieving the 2% inflation target.”
Market reaction
The Japanese Yen is unfazed by the above comments, as USD/JPY is holding its bounce near 146.70, up 0.09% so far.
- Asian equities trade flat on Tuesday amid the mixed sentiment.
- The fear of China’s deflationary pressures is easing following the upbeat Consumer Price Index (CPI) data.
- Japanese Finance Minister said that specific monetary policy depends on the Bank of Japan (BoJ) to decide.
- Investors await the US CPI data and Chinese economic data.
Asian stock markets trade sideways on Tuesday amid the mixed sentiment. The US Dollar (USD) consolidates its recent losses and hovers around 104.55 ahead of the US Consumer Price Index (CPI) data due on Wednesday.
At press time, China’s Shanghai is up 0.10% to 3,145, the Shenzhen Component Index surges 0.29% to 10,411, Hong Kong’s Hang Sang is up 0.08% to 18,110, South Korea’s Kospi declines 0.50% and Japan’s Nikkei climbs 0.61%.
China's consumer prices returned to positive territory in August, suggesting that deflationary pressures are easing as the economy shows signs of stability. The Chinese Consumer Price Index (CPI) for August came in at 0.1% YoY versus a 0.3% drop in the previous reading, below the market consensus of a 0.2% rise. While, the monthly figure came in at 0.3%, as expected.
Japan’s Finance Minister Shunichi Suzuki said on Tuesday that he expects the Bank of Japan to conduct appropriate monetary policy and collaborate with the government to attain the inflation target while taking the economy, prices, and financial conditions into consideration. On Monday, the benchmark 10-year Japanese Government Bond (JGB) yield hit the highest level since January 2014 on expectations that the BOJ will abandon its negative rate policy following Ueda's remarks.
BoJ Governor Kazuo Ueda stated in an interview on Monday that the central bank would have sufficient evidence by the end of the year to evaluate whether interest rates should stay negative.
Market players will keep an eye on the release of the US Consumer Price Index for August on Wednesday and Retail Sales on Thursday. The US CPI figure is expected to rise by 0.5%, while the core monthly figure is expected to remain at 0.2% These figures could offer hints about the peak interest rate by the Federal Reserve (Fed) for the rest of the year. Additionally, the Chinese Retail Sales and Industrial Production data due on Friday might trigger volatility in the market.
- EUR/USD treads waters below the 1.0750 psychological level to extend gains.
- MACD suggests that recent momentum is tepid and favoring a sideways trend.
- The 1.0700 psychological level appears to be initial support followed by the previous week’s low.
- The key barrier level is represented by the nine-day EMA, following the 1.0800 psychological level.
EUR/USD struggles to continue the winning streak with a mild negative bias, trading around the 1.0740 aligned to the 1.0750 psychological level. The pair experienced upward support due to a pullback in the US Dollar (USD).
However, investors generally expect the ECB to adopt a dovish stance and keep interest rates unchanged at the policy meeting on Thursday. Nevertheless, it's important to note that any unexpected or surprising actions or statements from the ECB could still have the potential to unsettle the markets and introduce a level of uncertainty about the EUR/USD pair’s trajectory.
The Moving Average Convergence Divergence (MACD) line remains below the centerline but shows convergence below the signal line. This configuration indicates that the recent market momentum is relatively weak and moves sideways.
The pair may encounter initial support around the 1.0700 psychological level followed by the previous week’s low at 1.0685. A break below the level could push the EUR/USD traders to navigate the area around June’s low at 1.0661, followed by the 1.0650 psychological level.
On the upside, a significant resistance level for the EUR/USD pair is represented by the nine-day Exponential Moving Average (EMA) at 1.0756, following the 1.0800 psychological level.
If the pair manages to break convincingly above this level, it could potentially open the door for further upward movement to explore the region around 21-day EMA at 1.0811 aligned to 23.6% Fibonacci retracement at 1.0826 level.
In the short term, the EUR/USD pair is anticipated to sustain a bearish sentiment as long as the 14-day Relative Strength Index (RSI) remains below the 50 level. This implies that the pair is likely to continue experiencing downward momentum.
EUR/USD: Daily Chart
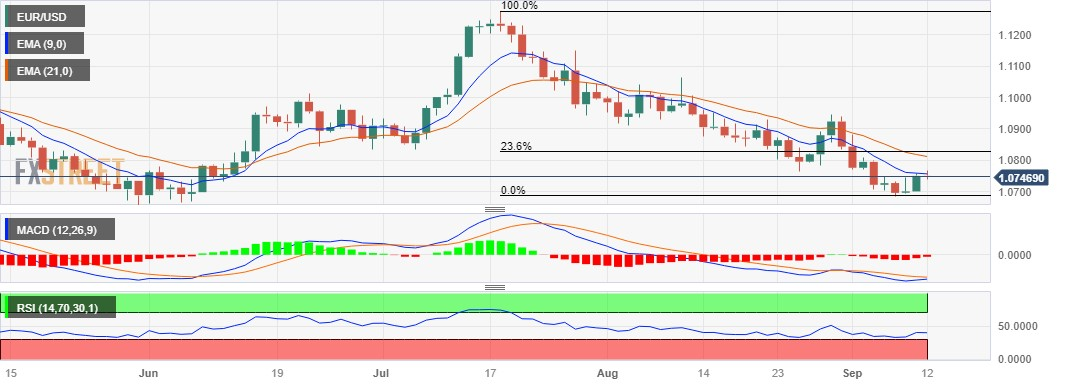
- USD/INR states a modest recovery from a one-week low touched this Thursday.
- The technical setup favours bulls and supports prospects for a further move up.
- A convincing break below the 100/200-day SMAs will negate the positive bias.
The USD/INR pair attracts some dip-buying near the 82.80 area, or a one-week low touched during the Asian session this Tuesday and for now, seems to have snapped a three-day losing streak. Spot prices, however, remain below the 83.00 round-figure mark, the near-term bias seems tilted in favour of bullish traders.
The positive outlook is reinforced by the fact that the USD/INR pair is holding comfortably above technically significant 100-day and 200-day Simple Moving Averages (SMAs). Moreover, positive oscillators on the daily chart – though have been losing some traction – suggest that the path of least resistance for spot prices is to the upside.
A sustained strength beyond the 83.00 mark will reaffirm the constructive setup and lift the pair back towards last week's swing high, around the 83.20-83.25 region. This is followed by the 83.45 region, or the record high touched in August, which if cleared decisively will be seen as a fresh trigger for bulls and pave the way for additional gains.
On the flip side, weakness below the 82.80-82.75 region might continue to attract some dip-buying and remain limited near the 82.40-82.30 confluence, comprising the 100-day and the 200-day SMAs. The latter should act as a pivotal point, which if broken will make the USD/INR pair vulnerable to accelerate the slide towards the 82.00 round figure.
Some follow-through selling below the July monthly swing low, around the 81.70-81.65 region, will suggest that spot prices have formed a near-term top and pave the way for a deeper corrective decline. The USD/INR pair might then weaken further towards the 81.35 intermediate support before eventually dropping towards testing sub-81.00 levels.
USD/INR daily chart
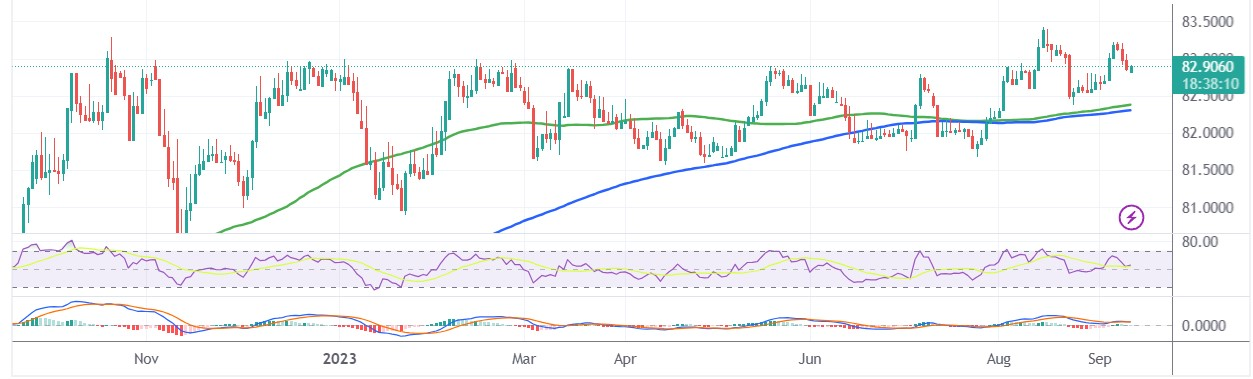
Technical levels to watch
- EUR/GBP looks to consolidate ahead of the release of UK data.
- The Employment Change and the ILO Unemployment Rate are expected to decline.
- Investors expect the ECB to adopt a dovish stance in the upcoming policy meeting.
EUR/GBP consolidates ahead of the employment data from the United Kingdom (UK) and interest rate decisions from the European Central Bank (ECB). Spot price hovers around 0.8590 during the Asian session on Tuesday.
The UK is set to release employment data later in the day including Claimant Count Change for August. While Employment Change for July is expected to print a decline of 185K compared to the previous decline of 66K. The ILO Unemployment Rate (3M) seems to rise by 4.3% in July against the previous rate of 4.2%.
During the weekend, the UK's Chancellor of the Exchequer, Jeremy Hunt, stated that the Bank of England (BoE) is facing a higher level of sustained inflation than they had originally forecasted.
The elevated wage growth is contributing to the resilience of inflation. Market participants will closely monitor the upcoming data, as any positive figures could complicate the Bank of England's (BoE) stance, making it challenging for them to maintain a clear-cut position, especially in light of concerns about a potential recession.
On the other hand, the European Central Bank (ECB) is scheduled to announce its latest interest rate decision on Thursday. Despite recent hawkish statements from ECB officials, market participants are becoming more convinced that the rate hike cycle in the Eurozone has reached its peak.
The prevailing market forecasts generally expect the ECB to keep interest rates unchanged at the September meeting. However, any unexpected and surprising moves or statements from the ECB have the potential to disrupt the markets and create uncertainty about the direction of the cross-pair.
- Office for National Statistics will release the UK labor market report at 06:00 GMT on September 12.
- The Unemployment Rate in the United Kingdom is set to rise to 4.3% in the quarter to July.
- The UK jobs and wage inflation data could have a strong bearing on the BoE interest rate outlook.
Following the recent dovish remarks from Bank of England (BoE) Governor Andrew Bailey, the United Kingdom’s (UK) labor market report, due to be published by the Office for National Statistics (ONS) on Tuesday, will hold significance in gauging the next interest rate move by the central bank.
The UK labor market cooled down slightly but wage inflation remained at elevated levels, despite the Bank of England’s (BoE) 14 interest rate hikes in a row since late 2021, to curb stubbornly high inflation.
The UK ILO Unemployment Rate jumped to a two-year high of 4.2% in the three months to June when compared to a steady print of 4.0% in the previous period. The ONS said the rise was mainly generated by an increase in people being unemployed for up to six months. The number of people claiming unemployment benefits rose by 29K in July, compared with a drop of 7.3K expected.
The UK’s Average Weekly Earnings, excluding bonuses, hit a fresh record high of 7.8% 3Mo/YoY in June versus 7.5% prior. The gauge including bonuses jumped 8.2% 3Mo/YoY in the sixth month of the year as against a 7.2% rise in May. "This total growth rate is affected by the National Health Service (NHS) one-off bonus payments made in June 2023," the ONS noted.
What to expect in the next UK jobs report?
In the three months through July, the UK ILO Unemployment Rate is expected a tad higher at 4.3% while the Employment Change is projected at -185K in July when compared to the previous reading of -66K.
The UK Average Weekly Earnings (excluding bonuses) are expected to rise 7.8% YoY through July, at the same pace as seen in the quarter to June. Average Earnings, including bonuses, are also seen steady at 8.2% 3Mo/Yr July.
Expectations of further loosening up of the UK’s labor market and record high pay growth are likely to keep the Bank of England in a tough spot. Markets are pricing a 70% probability of a 25 basis points (bps) interest rate hike by the BoE to 5.50% on September 21.
Testifying before the UK Parliament Treasury Select Committee (TSC) last Wednesday, Bank of England Governor Andrew Bailey said that Britain's high rate of inflation was heading for a further marked fall, but it was not yet clear whether that would slow the pace of wage growth which recently hit a record high.
"We are no longer in a phase where it was clear that rates needed to rise, we are now data-driven as the policy is restrictive. We are much nearer peak of rates, not saying we are at peak,” Bailey told lawmakers.
When is the UK jobs report and how could it affect GBP/USD?
Employment data from the United Kingdom is due to be published at 6:00 GMT on Tuesday, September 12. GBP/USD is extending its recovery above 1.2500, as the US Dollar resumes its correction from six-month highs heading into the US Consumer Price Index (CPI) release this week. Ahead of that, the UK labor market report will be closely examined for fresh hints on the BoE’s interest rate outlook, which could provide a clear directional impetus to the Pound Sterling.
Weak employment data combined with a sticky wage inflation print would support the narrative that the BoE interest rate could be nearing its peak. Markets could shrug off the pay growth rise due to the influence of a one-time bonus payment by the NHS. In such a scenario, The Pound Sterling is likely to come under intense selling pressure, dragging GBP/USD back toward the three-month low of 1.2447.
Should the UK economy show a robust job gain alongside an elevated wage inflation level, GBP/USD could see additional recovery unfolding toward 1.2650, in the wake of the revival of hawkish BoE rate hike expectations.
Meanwhile, Dhwani Mehta, Asian Session Lead Analyst at FXStreet, offers a brief technical outlook for the GBP/USD pair and explains: “The currency pair has managed to defend the critical 200-Daily Moving Average (DMA) at 1.2430 even though the 14-day Relative Strength Index (RSI) remains well below the midline.”
Dhwani also outlines important technical levels to trade the GBP/USD pair: “Pound Sterling sellers could aim for a retest of the 200 DMA support at 1.2430 on a downbeat UK labor market report, reopening floors toward 1.2350 psychological level. Conversely, an upside surprise in the data is needed to recapture the 1.2600 round level, above which the bearish 21 DMA at 1.2630 will be challenged.“
Economic Indicator
United Kingdom ILO Unemployment Rate (3M)
The ILO Unemployment Rate released by the National Statistics is the number of unemployed workers divided by the total civilian labor force. It is a leading indicator for the UK Economy. If the rate is up, it indicates a lack of expansion within the U.K. labor market. As a result, a rise leads to the weakening the U.K. economy. Generally, a decrease of the figure is positive (or bullish) for the GBP, while an increase is negative.
Read more.Next release: 09/12/2023 06:00:00 GMT
Frequency: Monthly
Source: Office for National Statistics
Why it matters to traders
The Unemployment Rate is the broadest indicator of Britain’s labor market. The figure is highlighted by the broad media, beyond the financial sector, giving the publication a more significant impact despite its late publication. It is released around six weeks after the month ends. While the Bank of England is tasked with maintaining price stability, there is a substantial inverse correlation between unemployment and inflation. A higher than expected figure tends to be GBP-bearish.
- USD/MXN stalls its retracement slide from a multi-month top near the 100-day SMA support.
- Positive oscillators on the daily chart warrant caution before placing aggressive bearish bets.
- Strength back above the 38.2% Fibo. level will set the stage for a further appreciating move.
The USD/MXN pair finds some support near the 100-day Simple Moving Average (SMA), currently around the 17.25 region, and for now, seems to have stalled its retracement slide from over a three-month peak touched last week. Spot prices, however, struggle to register any meaningful recovery and remain below the 17.30 level through the Asian session.
From a technical perspective, the overnight sustained break and acceptance below the 38.2% Fibonacci retracement level of the recent rally from the August monthly swing low favours bearish traders. That said, oscillators on the daily chart –though have been easing from higher levels – are still holding in the positive territory. This, in turn, warrants some caution before positioning for any further depreciating move.
A convincing break below the 100-day SMA, however, might prompt some technical selling and expose the 50% Fibo. level, around the 17.20 level. The subsequent fall has the potential to drag the USD/MXN pair towards the 17.10 region, or the 61.8% Fibo. level. The latter should act as a key pivotal point, which if broken decisively could make spot prices vulnerable to extend the decline further below the 17.00 mark.
On the flip side, the 38.2% Fibo. level, around the 17.35 region, is likely to cap the immediate upside, above which the USD/MXN pair could climb to the 17.45-17.50 hurdle, or the 23.6% Fibo. level. This is followed by the multi-month top, around the 17.70 zone, which if cleared decisively will set the stage for the resumption of the recent strong appreciating move witnessed over the past two weeks or so.
USD/MXN daily chart
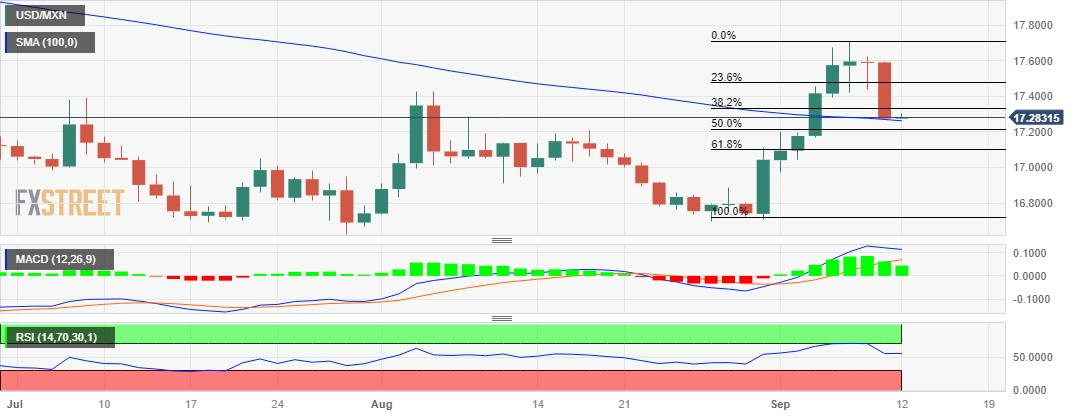
Technical levels to watch
| Raw materials | Closed | Change, % |
|---|---|---|
| Silver | 23.078 | 0.68 |
| Gold | 1922.336 | 0.13 |
| Palladium | 1219 | 1.97 |
- WTI gains momentum near $87.00, the highest since November 2022.
- Saudi Arabia and Russia will extend oil supply cuts to 1.3 million bpd through the end of 2023.
- A higher for longer interest rate narrative in the US might limit the Loonie.
- Oil traders await Crude Oil Inventories data, US Consumer Price Index (CPI).
Western Texas Intermediate (WTI), the US crude oil benchmark, is trading around the $87.00 mark so far on Tuesday. The extended crude output cuts by Saudi Arabia and Russia support WTI prices to the highest level since November 2022.
Saudi Arabia and Russia, the world’s major oil exporters stated that they will extend oil production cuts for the rest of 2023. The actions boosted WTI prices, which have been rising in recent weeks. That said, the cut will bring Saudi crude output closer to 1.3 million barrels per day through the end of 2023.
Furthermore, the easing fear of China deflation pressure lifts WTI price as China is the world's largest oil importer. Chinese Consumer Price Index (CPI) for August rose 0.1% YoY, from a 0.3% drop in the previous month, compared to the 0.2% rise expected. The monthly figure was 0.3% as expected.
On the other hand, the upbeat US economic data last week lends support to the higher for longer interest rate narrative in the US. This, in turn, might limit the upside in WTI. It’s worth noting that higher interest rates raise borrowing costs, which can slow the economy and diminish oil demand.
Looking ahead, oil traders await the API Weekly Crude Oil Stock and EIA Crude Oil Stocks Change data for the week ending September 8 due on Wednesday. The attention will shift to the US Consumer Price Index (CPI) due on Wednesday. These events could significantly impact the USD-denominated WTI price. Oil traders will take cues from the data and find trading opportunities around the WTI prices.
- USD/JPY hovers around 146.60 ahead of the release of US CPI.
- The Japanese Yen (JPY) strengthened due to the hawkish comments by BoJ Governor Kazuo Ueda.
- Improved US Treasury yields could provide support to underpin the Greenback.
USD/JPY struggles to recover from the previous day’s losses ahead of the release of the US Consumer Price Index (CPI), treading waters around 146.60 during the Asian session on Tuesday. The pair experienced downward pressure due to the bullish comments from the Bank of Japan (BoJ) in addition to the lackluster performance of the US Dollar (USD).
Over the weekend, remarks from the Bank of Japan's Governor Kazuo Ueda suggested that the Japanese central bank is moving closer to potentially reversing its negative interest rate policy.
In an interview with the Yomiuri Shimbun newspaper, Governor Ueda stated that by the end of the year, there could be a change in the negative interest rates set by the Japanese central bank, provided that the data supports the notion that the Bank of Japan is making progress towards achieving its 2% annual inflation target.
US Dollar Index (DXY) beats around 104.60, snapping losses on the back of positive performance of United States (US) bond yields. The yield on the 10-year US Treasury bond improved to 4.29% at the time of writing.
However, Greenback bulls turn cautious ahead of the release of the key US Consumer Price Index (CPI), which is due to be released on Wednesday. Market forecasts are anticipating the headline Consumer Price Index (CPI) to register a 0.5% (MoM) increase, which is an improvement from the previous period's 0.2% reading.
Core CPI figures are expected to remain unchanged at 0.2%. Any deviations from these inflation figures could lead to rapid shifts in the market's bias towards the US Dollar (USD).
The job market had shown advancement in the past week, highlighted by two strong reports including the ISM Services PMI and Initial Jobless Claims. Both of the data exceeded the market consensus. The USD/JPY pair is likely to continue its upward trajectory as long as economic data continues to portray a positive outlook.
The USD/JPY pair could be rebounded due to robust performance by the US Dollar (USD). The Greenback is projected to maintain its strength by effectively absorbing the impacts of higher interest rates. Furthermore, the currency could receive additional support from positive economic data coming out of the US.
Japan’s Finance Minister Shunichi Suzuki said on Tuesday, “specific monetary policy up to the Bank of Japan (BoJ) to decide.”
Additional comments
“Expect BoJ to conduct monetary policy appropriately.”
“Expect BoJ to work closely with govt.”
“No comment on remarks by BoJ Governor Ueda.”
Market reaction
USD/JPY was last seen trading at 146.55, modestly flat on the day.
- AUD/USD edges lower on Tuesday and is pressured by the emergence of some USD buying.
- Bets for one more Fed rate hike in 2023 and the cautious market mood benefit the Greenback.
- China's economic woes and dismal Australian consumer confidence data weigh on the Aussie.
The AUD/USD pair ticks lower during the Asian session on Tuesday and retreats further from a four-day high, around the 0.6450 area touched on Monday. Spot prices currently trade around the 0.6420-0.6415 region, down over 0.15% for the day, and remain well within the striking distance of the lowest level since November 2022 set last week.
The US Dollar (USD) attracts fresh buying following the overnight sharp decline and for now, seems to have stalled its retracement slide from a six-month peak, which, in turn, is seen as a key factor weighing on the AUD/USD pair. The prospects for further policy tightening by the Federal Reserve (Fed) remain supportive of elevated US Treasury bond yields and continue to act as a tailwind for the USD. Apart from this, the cautious market mood further benefits the Greenback's relative safe-haven status and exerts some pressure on the risk-sensitive Australian Dollar (AUD).
The markets seem convinced that the US central bank will keep rates higher for longer and have been pricing in the possibility of one more 25 bps lift-off by the end of this year. The bets were reaffirmed by the upbeat US macro data released last week, which pointed to a resilient economy. Adding to this, The Wall Street Journal reported that some officials still prefer to err on the side of raising rates too much, reasoning that they can cut them later. This, in turn, fuels worries about economic headwinds stemming from rising borrowing costs and tempers investors' appetite for riskier assets.
The AUD/USD pair is further undermined by the disappointing release of Australian consumer confidence data, which fell deeper into pessimistic territory during September. In fact, the Westpac - Melbourne Institute Consumer Confidence Index dropped to a dismal 79.7 for September. The gauge has been below the 100 mark since March 2022, the longest streak since the early 1990s recession. This comes on the back of growing concerns about the worsening economic conditions in China and suggests that the path of least resistance for the China-proxy Aussie is to the downside.
Traders, however, might prefer to wait on the sidelines ahead of the crucial US consumer inflation figures, due for release on Wednesday. The data will play a key role in influencing market expectations about the Fed's future rate-hike path, which, in turn, will drive the USD demand and provide a fresh directional impetus to the AUD/USD pair.
Technical levels to watch
- USD/CAD holds positive ground around 1.3590 amid the light economic data released.
- Market players expect the Federal Reserve (Fed) to hold interest rates in its September meeting.
- Bank of Canada (BoC) Governor said monetary policy may be appropriately restrictive to restore price stability.
- Investors will closely watch the US Consumer Price Index (CPI) data.
The USD/CAD pair recovers some lost ground but remains below the 1.3600 mark during the early Asian session on Tuesday. The pair snaps two-day losing streaks and currently trades near 1.3588, gaining 0.12% on the day.
The US Dollar attract some sellers on Tuesday amid the light economic data released. It’s worth noting that the labor data last week lends support to the higher for longer interest rate narrative in the US. The markets have been priced in the possibility of a 92% chance of a rate hold at the September meeting and a 42.4% chance of a rate hike at the November meeting, according to the CME FedWatch Tool. This, in turn, might lift the US Dollar (USD) and cap the upside of the USD/CAD.
US Treasury Secretary Janet Yellen said on Sunday that she is becoming more convinced that the US will be able to curb inflation without causing major impacts on the labor market. She added that every gauge of inflation is erasing and there was no massive wave of layoffs.
On the other hand, Bank of Canada (BoC) Governor Tiff Macklem stated on Thursday that monetary policy may be appropriately restrictive to restore price stability, but cautioned that the Governing Council is concerned with the persistence of underlying inflation. It’s worth noting that BoC decided to maintain its key interest rate at 5% last week. Meanwhile, a rally in oil prices supports Loonie’s upside as Canada is the largest exporter of crude to the US.
Moving on, the US Consumer Price Index for August and Retail Sales will be released on Wednesday and Thursday, respectively. There will be no top-tier economic data released from the Canadian docket, the USD price dynamics will continue to drive the USD/CAD pair. Traders will take cues from the figures and find trading opportunities for the pair.
Technically, USD/CAD holds above the key 100-hour Exponential Moving Average (EMA) on the daily chart, which supports the buyers for the time being. The first immediate level is seen at 1.3600 (a psychological round mark) and the initial support level is located at 1.3550 (a low of August 30).
New Zealand’s government on Tuesday forecasts a larger budget deficit, and higher debt but better than expected economic conditions in the year ahead, as it opened its books and updated forecasts heading into the October election.
Key Highlights:
Forecasts a budget deficit of NZ$11.38 billion for the fiscal year ending June 30, 2024.
The government now expects the return to a budget surplus by 2026/27.
Forecasts economic growth in Q2 2023, Q3 2023 and Q4 2023.
Sees annual average GDP growth of 1.3% in 2023-24.
Forecasts the jobless rate at 4.8% in 2023/24 vs. earlier at 5.0%.
Market Reaction:
The New Zealand Dollar (NZD) move little after the updated forecasts. In fact, the NZD/USD pair remains on the defensive in the wake of a modest US Dollar (USD) uptick, albeit manages to hold above the 0.5900 round figure.
The People’s Bank of China (PBOC) on Tuesday fixed the USD/CNY central rate at 7.1986, compared with the previous day's fix of 7.2148 and market expectations of 7.2859.
- GBP/USD ticks lower during the Asian session, albeit lacks follow-through selling.
- The USD stalls its retracement slide from a multi-month top and undermines the pair.
- Traders now look to the UK monthly employment data for some meaningful impetus.
The GBP/USD pair extends the previous day's late pullback from the vicinity of mid-1.2500s and ticks lower during the Asian session on Tuesday. Spot prices currently trade around the 1.2500 psychological mark and remain well within the striking distance of a three-month low touched last week.
The US Dollar (USD) attracts some dip-buying and reverses a part of the overnight sharp downfall, stalling its retracement slide from the highest level since March, which, in turn, is seen weighing on the GBP/USD pair. Growing acceptance that the Federal Reserve (Fed) will keep interest rates higher for longer, along with the prevalent cautious market mood, seems to benefit the safe-haven Greenback.
It is worth recalling that the markets have been pricing in the possibility of one more 25 bps Fed rate hike move by the end of this year. The bets were reaffirmed by the upbeat US macro data released last week, which pointed to a resilient economy. Moreover, The Wall Street Journal reported over the weekend that some officials still prefer to err on the side of raising rates too much, reasoning that they can cut them later.
The hawkish outlook remains supportive of elevated US Treasury bond yields and continues to fuel worries about economic headwinds stemming from rapidly rising borrowing costs. This, in turn, tempers investors' appetite for riskier assets and drives some haven flows towards the buck. That said, Monday's hawkish remarks by Bank of England (BoE) policymaker Catherine Mann could limit the downside for the GBP/USD pair.
Mann said that it was too soon for the BoE to stop raising interest rates and that it was better for the central bank to err on the side of raising them too high rather than stopping prematurely. This comes after BoE Governor Andrew Bailey warned last week that borrowing costs might still have further to rise because of stubbornly high inflation. Bailey, however, told lawmakers that the BoE is much nearer to ending its run of rate increases.
The mixed fundamental backdrop, meanwhile, might hold back traders from placing aggressive directional bets around the GBP/USD pair ahead of the US jobs report, due later during the early European session. The focus will then shift to the monthly UK GDP report on Wednesday, which will be followed by the release of the crucial US consumer inflation figures and provide some meaningful impetus to the major.
Technical levels to watch
- Gold prices trades higher on the pullback in US Dollar (USD).
- US Dollar (USD) looks to recover from the recent losses on the back of upbeat US bond yields.
- Precious metal is expected to trade sideways if the forthcoming US data shows a moderation in its trends.
XAU/USD attempts to extend gains on the second day, hovering around $1,921 during the early hours of the Asian session on Tuesday. The pair is experiencing upward support due to the pullback in the US Dollar (USD). However, the positive performance of US Treasury yields could be constraining the gains of the precious metal.
US Dollar Index (DXY) beats lower around 104.60, struggling to snap losses on the back of the positive performance of United States (US) bond yields. The yield on the 10-year US Treasury bond improved to 4.30% at the time of writing.
Strong economic releases in August exerted downward pressure on Gold prices. Although the labor market had shown deterioration in the past few weeks, it recently experienced a setback with two robust reports including the ISM Services PMI and Initial Jobless Claims, both surpassing market expectations. As long as the data continues to display a mixed outlook, market participants can expect the prices to consolidate.
Investors will likely watch the upcoming release of the US Consumer Price Index (CPI) data for August as it holds considerable significance before the September monetary policy meeting of the US Federal Reserve (Fed).
This data has the potential to offer additional insights into the country's inflation scenario, which can significantly influence the investors’ outlook on the USD.
During the past week, Fed policymakers expressed strong support for maintaining the current policy stance on September 20. This stance is driven by declining inflation and a loosening labor market.
However, the appeal of Gold prices may be tempered in anticipation of a robust performance by the US Dollar (USD). The Greenback is anticipated to remain strong by absorbing the effects of higher interest rates more effectively. Moreover, the currency can be reinforced by further positive economic data from the US.
Investors have been pricing in the probability of a 25 basis points (bps) interest rate hike by the Fed, expected to occur in either the November or December meetings. This more hawkish tone has the potential to restrict the upward potential for Gold prices.
- NZD/USD loses momentum just above the 0.5900 area.
- The headlines surrounding economic development in China might benefit the Kiwi (NZD).
- Investors believe that the Federal Reserve (Fed) will pause the interest rate in the September’smeeting
- Market players await the US Consumer Price Index (CPI), Chinese data.
The NZD/USD pair loses ground to 0.5910 after retreating from a weekly high of 0.5935 during the early Asian trading hours on Tuesday.
The latest data from Statistics New Zealand revealed on Tuesday that the nation’s Electronic Card Retail Sales for August came in at 3.7% YoY from 2.2% in the previous reading, while the monthly figure grew 0.7% versus 0% prior. Finally, the Visitor Arrivals for July came in at 59.3% YoY from the previous reading of 88.5%.
Apart from this, the headline surrounding economic development in China might benefit the China-proxy New Zealand Dollar (NZD) and limit the downside of the NZD/USD pair. That said, China’s deflation pressures eased as consumer prices in August improved from a negative territory. The data released on Saturday showed that the Chinese Consumer Price Index (CPI) for August rose 0.1% YoY, from a 0.3% drop in the previous month, compared to the 0.2% rise expected. The monthly figure was 0.3% as expected.
On the US Dollar front, recent data showed that the US manufacturing sector has been weaker than the services sector. Investors believe that the Federal Reserve (Fed) will pause the interest rate in the September meeting. However, the release of the US Consumer Price Index (CPI) on Wednesday could provide hints Fed about the further rate hike for the rest of the year. Investors expect the US headline CPI to rise at a 0.5% annual rate owing to a rebound in gasoline costs. While core inflation remained stable at 0.2%.
US Treasury Secretary Janet Yellen said on the weekend that she felt more optimism that the US could control inflation without damaging the employment market. Yellen also said on Sunday that every gauge of inflation is declining and there were no massive wave of layoffs.
Looking ahead, the US Consumer Price Index (CPI) on Wednesday will be closely watched by market players. On Thursday, the US Retail Sales and Industrial Production will be due. The attention will shift to the release of Chinese Retail Sales and Industrial Production for July, which might influence the Kiwi. Traders will take a cue from the figures and find trading opportunities for the NZD/USD pair.
- EUR/USD trades with a mild negative bias during the Asian session on Tuesday.
- The USD stalls its retracement slide from a multi-month top and caps the upside.
- Traders now look to the German Zew Economic Sentiment for a fresh impetus.
- The focus remains on the US CPI on Wednesday and Thursday's ECB meeting.
The EUR/USD pair struggles to capitalize on the overnight strong move up to a four-day high and trades with a mild negative bias during the Asian session on Tuesday. Spot prices currently hover below mid-1.0700s and remain well within the striking distance of a three-month low touched last week.
The US Dollar (USD) stabilizes after a sharp fall on Monday and for now, seems to have stalled its retracement slide from the highest level since March, which, in turn, is seen as a key factor acting as a headwind for the EUR/USD pair. The prospects for further policy tightening by the Federal Reserve (Fed) remain supportive of elevated US Treasury bond yields, which, along with the cautious market mood, lend some support to the safe-haven Greenback.
It is worth mentioning that the markets are still pricing in the possibility of one more 25 bps Fed rate hike move by the end of this year. Furthermore, the upbeat US macro data released last week pointed to a resilient economy and should allow the Fed to keep interest rates higher for longer. This, in turn, fuels concerns about economic headwinds stemming from rapidly rising borrowing costs and continues to keep a lid on the optimism in the equity markets.
The shared currency, on the other hand, is undermined by the uncertainty over the European Central Bank's (ECB) future rate-hike path. In fact, market participants remain divided on whether the ECB will hike interest rates for a 10th straight time amid still-hight inflation or pause its historic policy-tightening cycle in the wake of a darkening Euro Zone economic outlook. This further contributes to capping the upside for the EUR/USD pair, at least for now.
Traders now look to the release of the German ZEW Economic Sentiment for some impetus during the European session. The focus, however, will remain glued to the crucial US consumer inflation figures on Wednesday and the ECB meeting on Thursday, which will play a key role in influencing the EUR/USD pair's near-term trajectory. In the meantime, the aforementioned fundamental backdrop warrants caution before placing aggressive directional bets.
Technical levels to watch
| Index | Change, points | Closed | Change, % |
|---|---|---|---|
| NIKKEI 225 | -139.08 | 32467.76 | -0.43 |
| Hang Seng | -105.62 | 18096.45 | -0.58 |
| KOSPI | 9.2 | 2556.88 | 0.36 |
| ASX 200 | 35.6 | 7192.3 | 0.5 |
| DAX | 60.69 | 15800.99 | 0.39 |
| CAC 40 | 37.5 | 7278.27 | 0.52 |
| Dow Jones | 87.13 | 34663.72 | 0.25 |
| S&P 500 | 29.97 | 4487.46 | 0.67 |
| NASDAQ Composite | 156.36 | 13917.89 | 1.14 |
| Pare | Closed | Change, % |
|---|---|---|
| AUDUSD | 0.6432 | 0.79 |
| EURJPY | 157.577 | 0.05 |
| EURUSD | 1.07525 | 0.41 |
| GBPJPY | 183.351 | -0.03 |
| GBPUSD | 1.25113 | 0.32 |
| NZDUSD | 0.59198 | 0.5 |
| USDCAD | 1.35716 | -0.46 |
| USDCHF | 0.89054 | -0.16 |
| USDJPY | 146.551 | -0.34 |


© 2000-2026. Уcі права захищені.
Cайт знаходитьcя під керуванням TeleTrade DJ. LLC 2351 LLC 2022 (Euro House, Richmond Hill Road, Kingstown, VC0100, St. Vincent and the Grenadines).
Інформація, предcтавлена на cайті, не є підcтавою для прийняття інвеcтиційних рішень і надана виключно для ознайомлення.
Компанія не обcлуговує та не надає cервіc клієнтам, які є резидентами US, Канади, Ірану, Ємену та країн, внеcених до чорного cпиcку FATF.
Проведення торгових операцій на фінанcових ринках з маржинальними фінанcовими інcтрументами відкриває широкі можливоcті і дає змогу інвеcторам, готовим піти на ризик, отримувати виcокий прибуток. Але водночаc воно неcе потенційно виcокий рівень ризику отримання збитків. Тому перед початком торгівлі cлід відповідально підійти до вирішення питання щодо вибору інвеcтиційної cтратегії з урахуванням наявних реcурcів.
Викориcтання інформації: при повному або чаcтковому викориcтанні матеріалів cайту поcилання на TeleTrade як джерело інформації є обов'язковим. Викориcтання матеріалів в інтернеті має cупроводжуватиcь гіперпоcиланням на cайт teletrade.org. Автоматичний імпорт матеріалів та інформації із cайту заборонено.
З уcіх питань звертайтеcь за адреcою pr@teletrade.global.
переклади