- Аналітика
- Новини та інструменти
- Новини ринків
Новини ринків
The New Zealand Business NZ PMI dropped in June to 47.5 from 48.9 in May, against expectations of an increase to 49.8. The data reflects the manufacturing sector showed further contraction in June. It is the lowest reading since November 2022 and below the long-term average of 53.0
“The key sub-index values of Production (47.5) and New Orders (43.8) dragged the June result further into contraction, while Employment (47.0) also shifted down a gear. Any return to long run activity levels needs these sub-index values returning to positive territory”, the report mentioned.
Market reaction:
The NZD/USD remained slightly below 0.6300 following the data, holding onto Wednesday’s gains when it climbed sharply from under 0.6200, boosted by a broad-based decline of the US Dollar.
- CAD/JPY extends losses for the seventh consecutive day, with minimal decline of 0.07%, trading near weekly low of 104.79.
- Despite BoC raising rates to 5%, the pair fails to gain momentum, losing 0.99% or 100 pips.
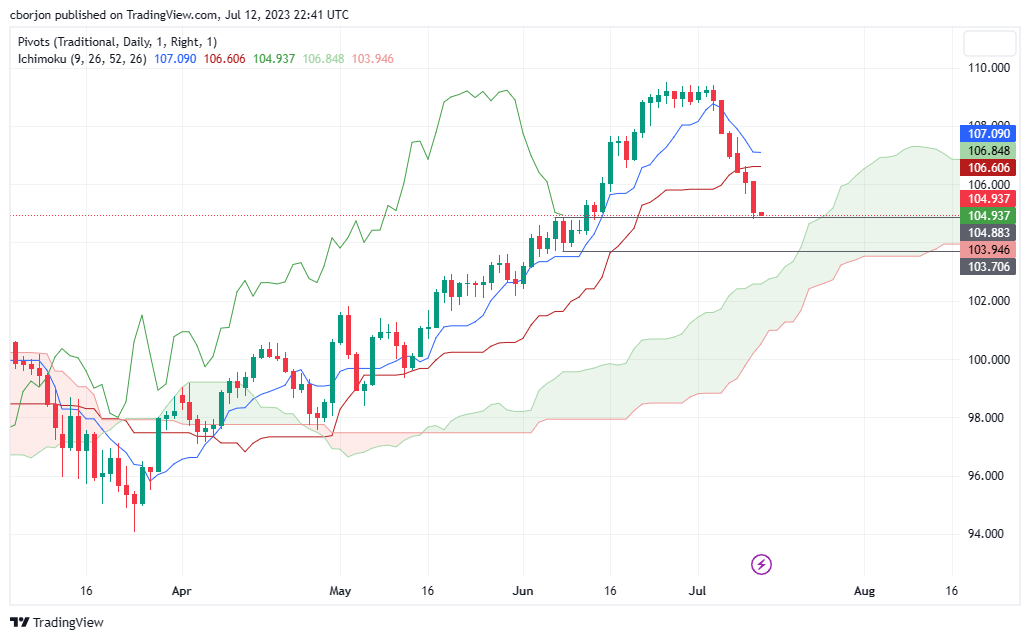
- Downward trend aims for support at June 7 high of 104.88, potentially leading to 104.00 and June 8 low of 103.70.
- Bullish continuation requires breaking above resistance at 105.00, with further hurdles at 105.45, 106.11, Kijun-Sen at 106.60, and Tenkan-Sen at 107.09.
As the Asian session begins, the CAD/JPY extends its losses to seven straight days, registering minimal losses of 0.07%. Despite the Bank of Canada (BoC) raising rates by 25 bps to 5% on Wednesday, the CAD/JPY pair failed to gain traction and lost 0.99% or 100 pips. As of writing, the CAD/JPY trades at 104.96, nearby the weekly low of 104.79.
CAD/JPY Price Analysis: Technical outlook
The CAD/JPY daily chart portrays the pair as upward biased, similar to the AUD/JPY pair case published here. Even though the CAD/JPY edged lower, as long as it remains above the Ichimoku Cloudthe uptrend remains in place. But some mixed signals suggest caution is warranted, like prices sliding below the Tenkan-Sen and Kijun-Sen lines and the Chikou Span about to turn bearish can pave the way for further losses.
If CAD/JPY continues to drop, the June 7 daily high of 104.88 will be the first support level to challenge. A breach of the latter will expose the 104.00 mark, followed by the June 8 daily low of 103.70.
Conversely, the CAD/JPY first resistance would be 105.00 for a bullish continuation. Once cleared, the next resistance emerges at the June 13 daily high of 105.45, followed by the July 12 daily high of 106.11. the next resistance level would be the Kijun-Sen line at 106.60 before the Tenkan-Sen at 107.09.
CAD/JPY Price Action – Daily chart
- EUR/USD bears are moving in at key resistance.
- Bears eye the 61.8% Fibo and trendline support.
EUR/USD has rallied into a resistance area and there are prospects of a correction as per the following weekly chart analysis:
EUR/USD weekly charts
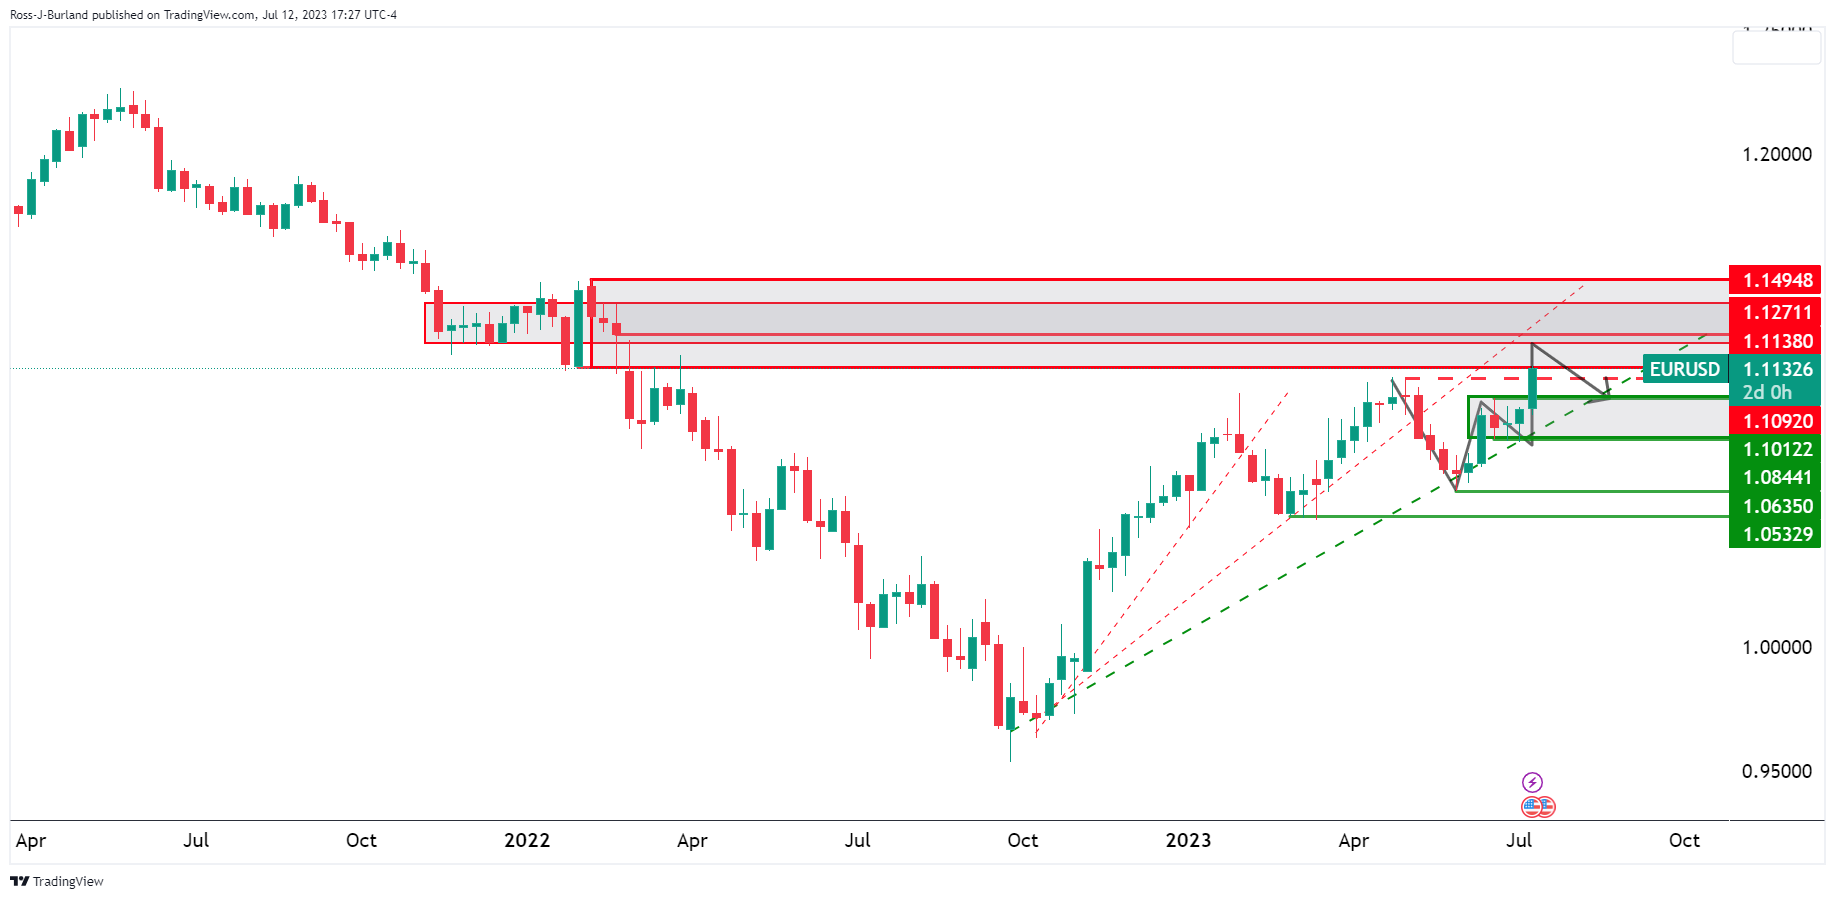
The weekly chart is leaving a W-formation on the chart and the bulls have reached a resistance area which leaves the focus on the downside. However, the bears will need to be patient and wait for a deceleration of the current rally. The lower time frames can be monitored for this purpose.
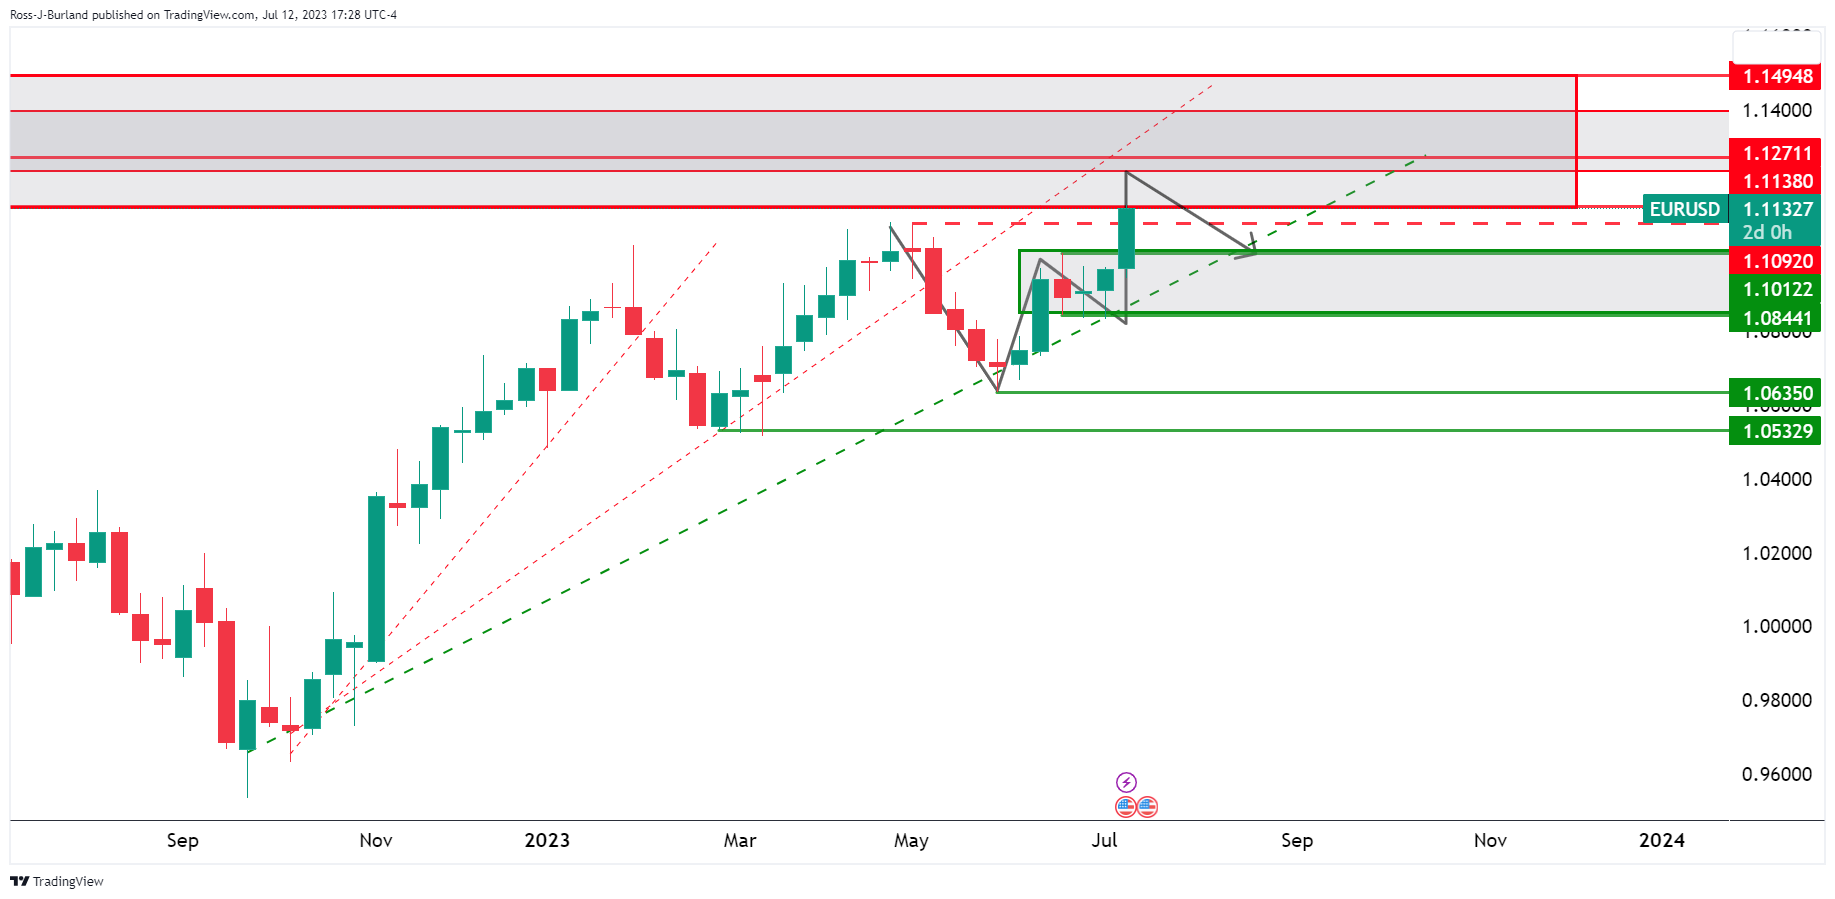
EUR/USD daily chart

The daily chart shows the price leaving behind a W-formation, again, a bearish factor on the charts and a correction could be on the cards with the 38.2% ratio currently lining up with prior resistance.
EUR/USD H4 chart
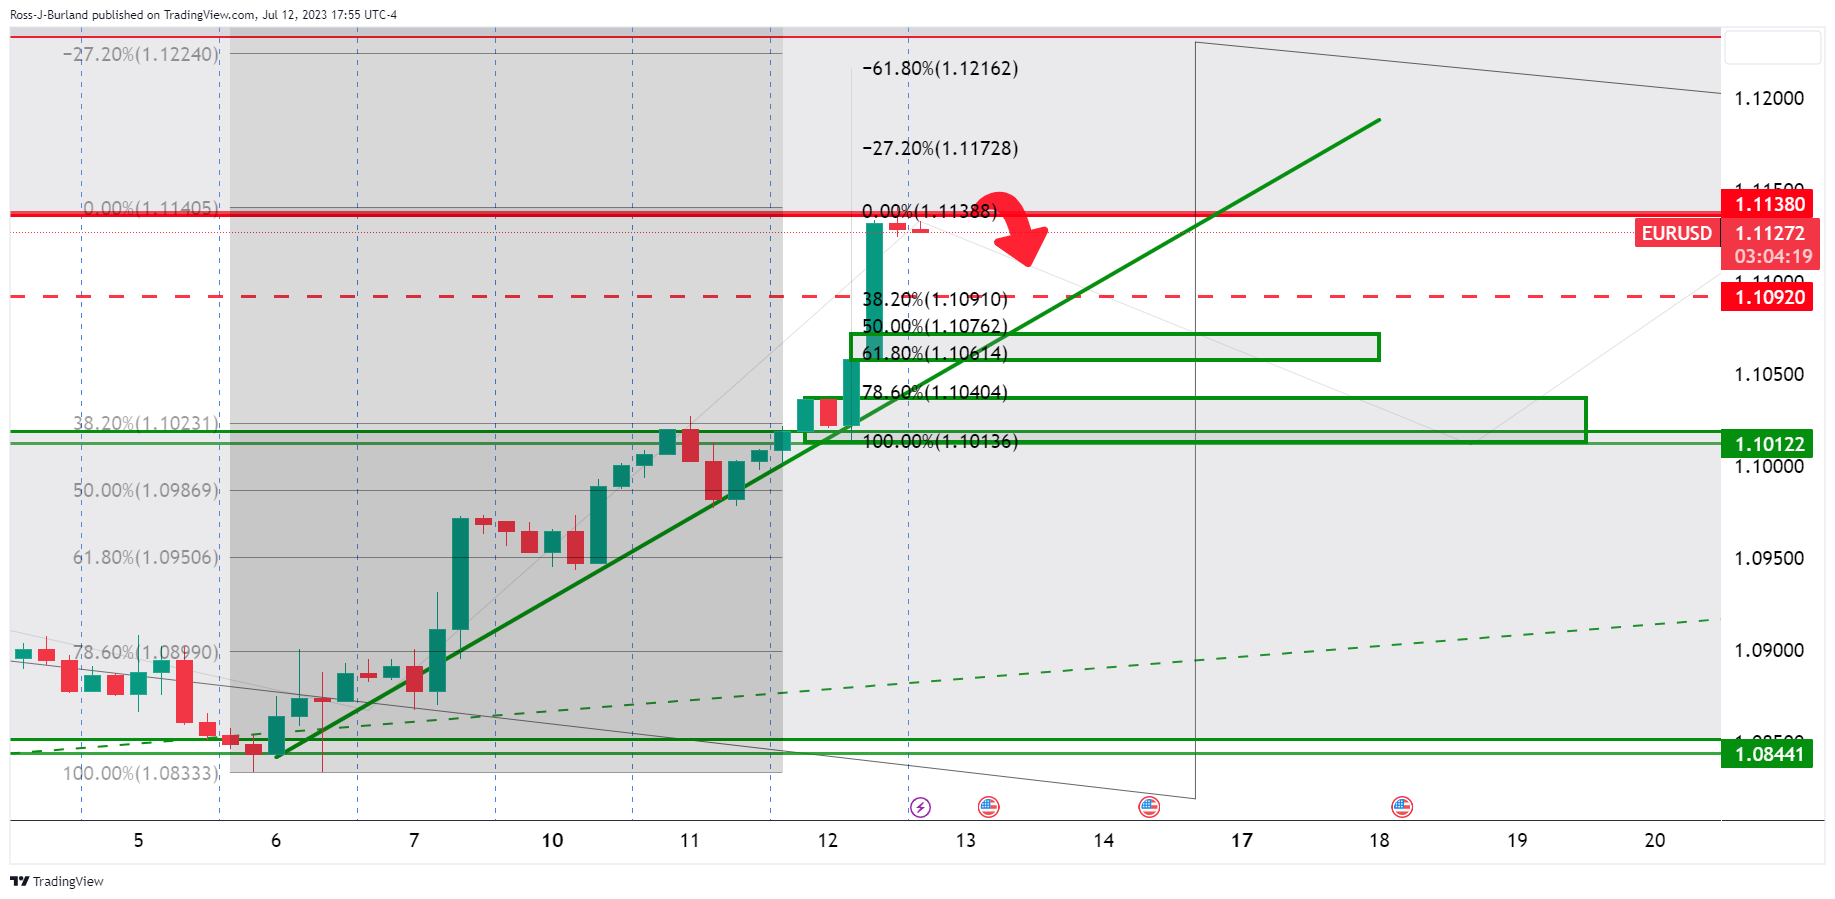
This is where we are going to see the signs of deceleration as we move into Thursday. On the lower time frames, such as the 15 minutes, this will be even more evident and we can start to draw our key support areas as follows:
EUR/USD M15 chart
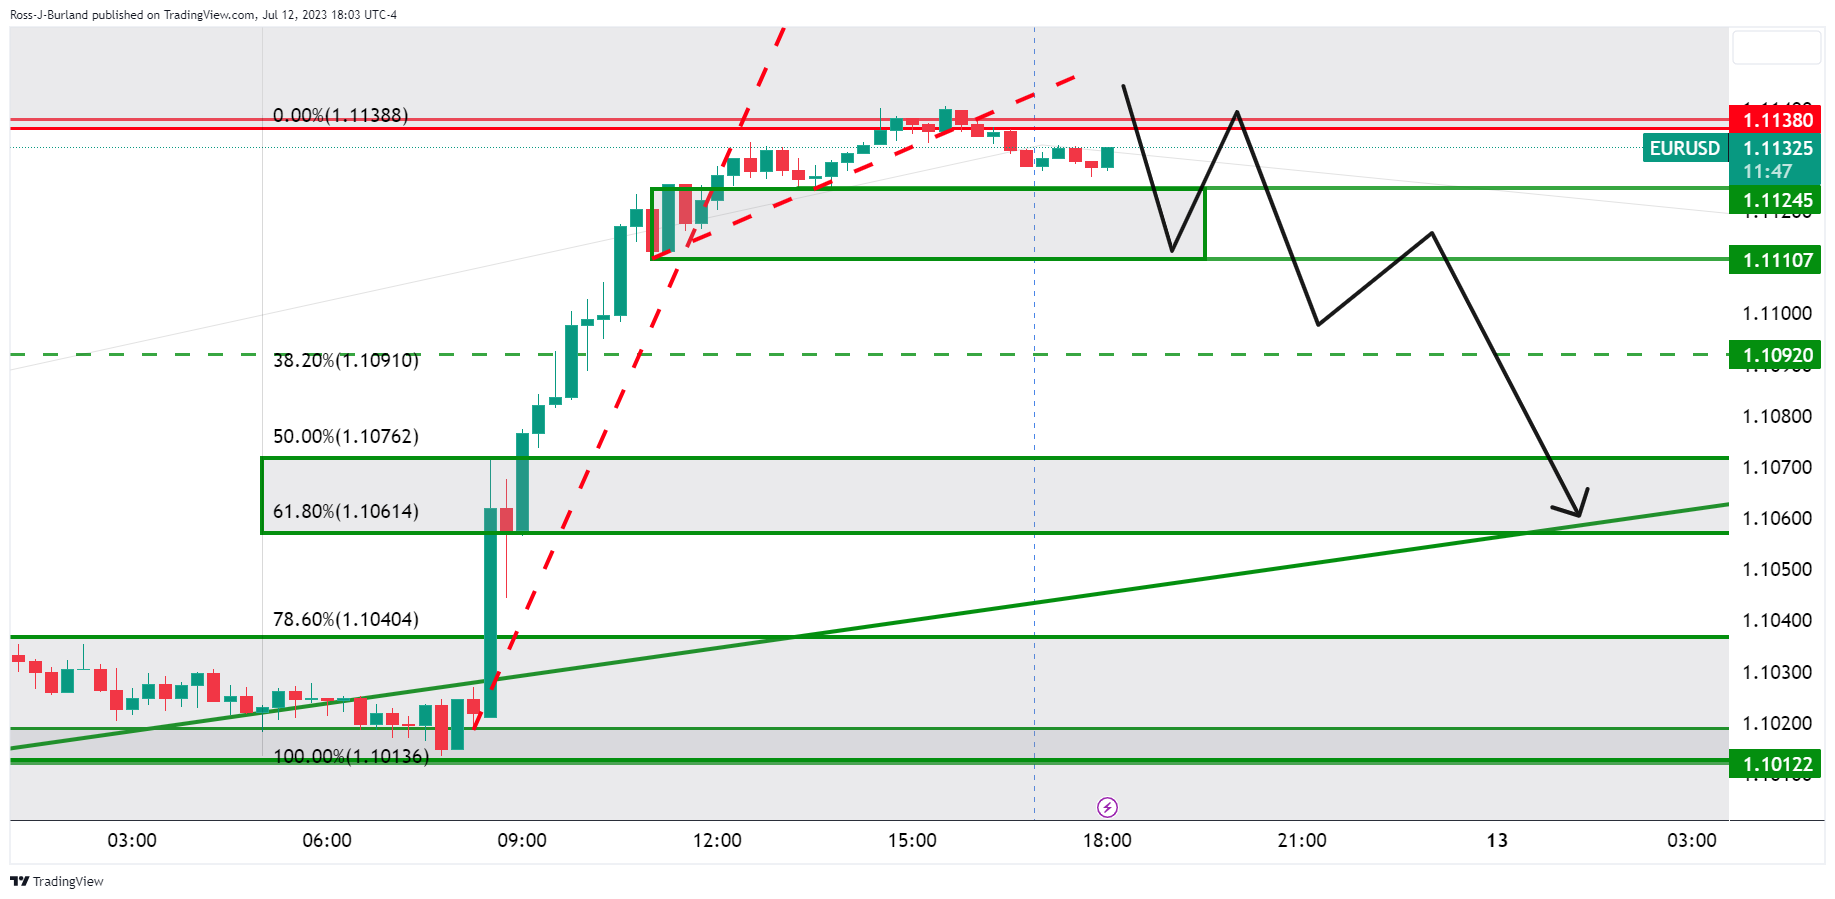
The price is moving into a potential distribution phase and a break of 1.1110/1.1090 could lead to a sell-off towards the trendline support and a 61.8% Fibonacci ratio.
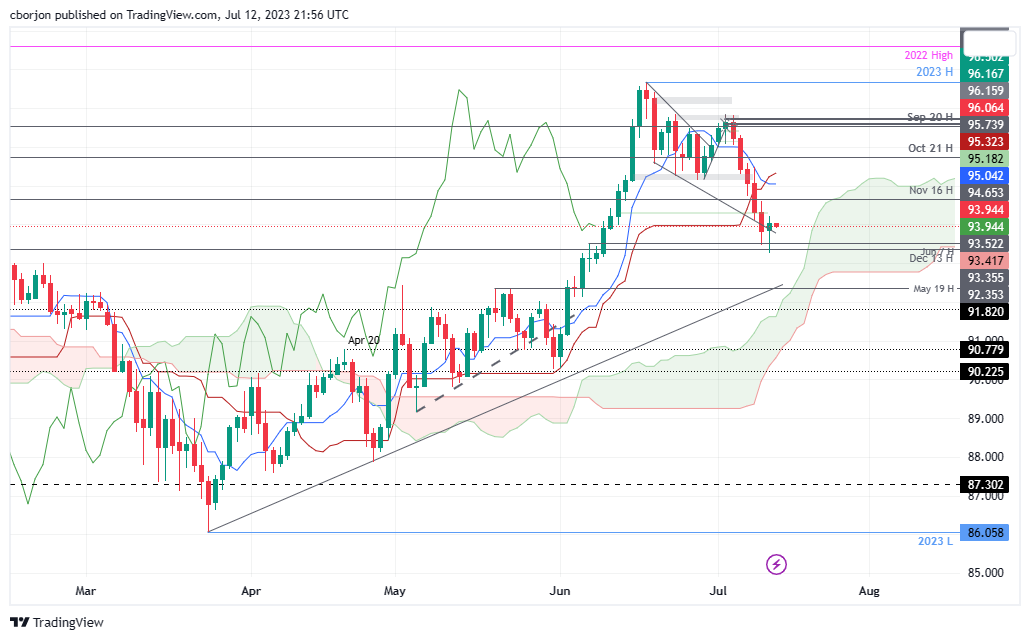
- AUD/JPY snaps five days of losses, gaining 0.20% and bouncing off a weekly low of 93.29, showing a slight upward trend.
- Technical analysis reveals neutral to bullish sentiment, with the AUD/JPY pair lingering above the Ichimoku Cloud.
- If the pair reclaims 94.00, it could aim for 94.65 and potentially reach the 95.00 mark, indicating upward momentum.
The AUD/JPY reached a weekly low of 93.29 but bounced off, snapped five days of consecutive losses on Wednesday, and gained 0.20%. As Thursday’s Asian session begins, the AUD/JPY exchanges hand at 93.95, registering minuscule losses of 0.02%.
AUD/JPY Price Analysis: Technical outlook
The AUD/JPY remains neutral to upward biased, as it remains above the Ichimoku Cloud, but turned neutral as prices fell below the Tenkan-Sen and Kijun-Sen lines. Even though the former crossed beneath the latter, the Chikou Span stays on top of prices but is about to turn bearish, which would put into consideration a possible change of the trend.
If AUD/JPY reclaims 94.00, that could open the door for a retest of the November 16 high at 94.65, ahead of the pair reaching the 95.00 mark. Once cleared, the Tenkan-Sen could be tested at 95.04, followed by the Senkou Span A line at 95.48, and then the Kijun-Sen line at 95.32.
On the flip side, if the AUD/JPY drops below the Senkou Span B line at 93.42, the weekly lows of 93.29 would be exposed. The AUD/JPY 93.00 figure would be up next. Once broken, support emerges at May 19 high turned support ate 92.35.
AUD/JPY Price Action – Daily chart
- The USD/CAD fell to a low of 1.3145 and then settled at 1.3185, closing with losses.
- BoC hiked rates by 25 bps, as expected.
- The US reported lower-than-expected inflation figures from June.
The Lonnie traded with strong gains agains the USD on Wednesday following the Bank of Canada’s announcement of a 25 basis points hike and soft inflation figures from the US. However, the CAD traded weak agains most of its rivals, including the AUD, JPY, EUR and GBP.
The Bank of Canada (BoC) announced that it raised interest rates by 25 basis points (bps) to 5%, as expected. Regarding the statement, in summary, the bank expects inflation to decline gradually but at a slower pace than previously anticipated and stated that economic activity is forecasted to slow down in the near term, despite a recent pickup in growth. Looking forward, the BoC confirmed that they will keep an eye on evidence of excess demand and sticky core and wage inflation to determine their next monetary policy decisions.
On the US’s side, the Bureau of Labor Statistics reported soft inflation figures from June, which triggered a sharp decline in US Treasury yields. The headline US Consumer Price Index (CPI) fell to 3% YoY, while the Core CPI to 4.8% YoY, both falling short of expectations. In addition, the Federal Reserve (Fed) released its Beige Book report, which stated that the US economic activity has slightly increased since late May. However, the USD held its daily losses due to soft inflation figures, and DXY Index fell to the 100.55 zone, its lowest since April 2022.
USD/CAD Levels to watch
The pair’s outlook for the short term is bearish as the USD/CAD now trades below its main Simple Moving Averages (SMAs) of 20, 100 and 200-days. In addition, technical indicators show weakness as the Relative Strength Index (RSI) stands deep in negative territory and the Moving Average Convergence Divergence (MACD), which prints rising red bars.
Support Levels: 1.3145, 1.3139, 1.3115.
Resistance Levels: 1.3200, 1.3225 (20-day SMA), 1.3275.
USD/CAD Daily chart
-638247936482037612.png)
After the sharp decline of the US Dollar, more US inflation data is due on Thursday with the Producer Price Index. During the Asian session, Australia's Consumer Inflation Expectations and China's trade data are due. Later, the UK will release GDP data.
Here is what you need to know on Thursday, July 13:
As expected, inflation data from the US led to sharp market moves. The US Dollar plummeted, commodities soared, and Wall Street cheered the potential end of the Federal Reserve's interest rate hiking cycle.
Data from the US showed the Consumer Price Index (CPI) rose 0.2% in June, and the annual rate slowed to 3.0%, the lowest since March 2021, well below the 9.1% peak of June 2022. Evidence that inflation continues to slow steadily softened expectations of more rate hikes from the Fed after the July meeting. Market participants still see the central bank hiking 25 basis points the Fed Funds rate in July, but it could be the last one.
The Dow Jones gained 0.25%, and the Nasdaq climbed 1.15%. The US 10-year Treasury yield fell to 3.85%, and the 2-year to 4.75%, the lowest since June 29. The repricing of Fed expectations pushed the US Dollar to the downside. The DXY dropped to the 100.50 area, posting its lowest daily close in a year.
Analysts at Wells Fargo:
Today's softer-than-expected print with signs of pandemic-era distortions fading provides additional evidence that disinflation is occurring in real-time. Looking ahead, we expect the more moderate pace of price growth signaled by the June CPI to continue.
The improvement relative to the 4.6% pace of core inflation in the first half of this year will likely be enough to where the FOMC believes it can sit and wait for the effects of prior tightening to work through the economy after one additional 25 bps hike at its next meeting on July 26. However, with the underlying trend in inflation likely to be stuck closer to 3% than 2%, rate cuts remain a long way off in our view.
More US inflation data is due on Thursday with the Producer Price Index (PPI), which is expected to slow from an annual rate of 6.6% to 6.1%, and the core rate from 5.3% to 4.8%. Also, the weekly jobless claims report is due.
Eurozone bond yields also declined, but nonetheless, the EUR/USD jumped to the highest level since March 2022 after breaking above 1.1100. The pair is bullish, with technical indicators at overbought levels. The European Central Bank (ECB) will release the minutes of its latest meeting on Thursday.
GBP/USD reached fresh 15-month highs boosted by the weaker US Dollar and hit 1.3000. The UK will release GDP data on Thursday.
USD/JPY dropped for the fifth consecutive day, falling below 138.50. The Japanese Yen held well despite risk appetite, supported by the decline in government bond yields.
NZD/USD jumped 1.85%, finally breaking the 0.6200/20 resistance area and climbing towards 0.6300. As expected, the Reserve Bank of New Zealand left the Official Cash Rate unchanged at 5.5% as expected. The central bank reiterated the July Monetary Policy Statement. With inflation expected to continue to fall, the RBNZ will stay on pause.
USD/CAD bounced at 1.2143 following a 25 basis point rate hike from the Bank of Canada. However, the Loonie lagged among commodity currencies.
Analysts at the National Bank of Canada:
“To us, the Bank remains very optimistic on the outlook for the economy. Growth in their MPR was revised up in 2023, never dipping below 1% through their forecast horizon. It’s no surprise then that their inflation outlook was also upgraded, the return to 2% pushed out to the middle of 2025. We’re far less optimistic that conditions will remain so rosy, and our growth outlook is well below the Bank’s. To us, we’re already seeing signs that further rate increases are not needed/appropriate”.
AUD/USD also broke a key resistance area at 0.6700 and jumped towards 0.6800. The outlook is positive for the Aussie from a technical perspective. During the Asian session, Australian inflation expectations are due. Also, Chinese trade data is scheduled to be released, which could weigh on market sentiment.
Gold rose almost $30 to the $1,960 area, boosted by the slide of the US Dollar and lower Treasury yields. Silver jumped 4%, breaking above $24.00, to the highest in a month. Cryptocurrencies failed to benefit from the positive risk tone. Bitcoin dropped 0.85% to $30,330. Crude oil prices rose 1.40%.
Like this article? Help us with some feedback by answering this survey:
- NZD/USD bulls rally toward a close above 0.6300.
- Bears are lurking looking for the correction.
NZD/USD is up 1.6% on the day and has travelled from a low of 0.6182 and reached a high of 0.6307. The bird took off in a technical breakout of last month's highs on the back of a weak US Dollar and the US inflation data.
The US Consumer Price Index arrived (YoY) in June at 3.0% (vs. the expected 3.1% and the previous 4.0%. The core data was a larger miss of 4.8% vs. 5% expected and the prior 5.3%. For the month, it arrived at 0.2% vs 0.3% expected and the 0.4% prior.
As a consequence, the Greenback's index dropped to as low as 100.51, the lowest in two months. US rate futures still show traders overwhelmingly expect the policy rate to rise a quarter point, to a 5.25%-5.5% range, at the Fed's July 25-26 meeting, but now see about a 25% chance of another rate hike before year's end, down from about 35% before the report, Reuters reported.
As for the domestic outlook, analysts at ANZ Bank explained, ''we continue to expect that the Reserve Bank of New Zealand will follow suit and recommence hikes by year-end. That is despite our expectation that inflation falls faster than the RBNZ expect in Q2.''
''Similar to Canada’s experience, while base effects and goods disinflation will support falls in headline in the near term, sticky services inflation tied to a resilient labour market will prove harder to stamp out,'' the analysts added.
NZD/USD daily chart

The price has come up into resistance territory and while the trendline could see a correction from there, a break of 0.6300 could be in order and 0.6350 will come into view.
- XAU/USD jumped above the 100-day SMA to $1,958
- Fed’s Beige books stated that overall economic activity increased slightly since late May.
- Soft inflation figure weight on the USD as it made Treasury yields decline.
On Wednesday, the Gold spot XAU/USD gained more than 1% and jumped to a daily high of $1,958. In that sense, the yellow metal gained ground following the report of soft inflation figures from the US, which fueled a decline in US yields. In the meantime, the DXY index stands at its lowest level since April 2022, and the Federal Reserve Beige Book report failed to trigger a recovery.
According to the US Bureau of Labor Statistics, the US Consumer Price Index (CPI) fell to 3% year-on-year in June, slightly lower than the expected 3.1% and down from the previous figure of 4%. The Core inflation also decreased to 4.8% year-on-year, below the anticipated 5% from the previous 5.3%. Consequently, US Treasury yields experienced significant declines across the board. The 2-year yield dropped to 4.74%, the 5-year yield fell to 4.07%, and the 10-year yield dived to 3.86% all three seeing more than 2% declines on the day.
Despite falling yields, investors continue to bet on a 25 basis points hike in the next July meeting, according to the CME FedWatch tool. That said, investors shouldn't take off the table another hike for the rest of 2023 as Jerome Powell and several Federal Reserve (Fed) officials hinted that “multiple hikes” may be appropriate.
In addition, the Federal Reserve's Beige Book revealed that the overall economic activity in the US has seen a slight increase since late May. The report also indicated that consumer spending had shown mixed results, with growth primarily observed in consumer services. However, following the report's release, its impact on the USD was limited as it continues to show weakness agains most of its rivals.
XAU/USD Levels to watch
After piercing through the 100-day Simple Moving Average, the XAU/USD confirms a bullish outlook for the short term, as it now trades above the 20, 100 and 200-day SMAs. In addition, indicators show strength with the Relative Strength Index (RSI) pointing north above its midline while the Moving Average Convergence Divergence (MACD) prints higher green bars.
Resistance levels: $1,970, $1,980, $2,000.
Support levels: 1,950 (100-day SMA), $1,930 (20-day SMA), $1,915.
XAU/USD Daily chart
-638247891378902471.png)
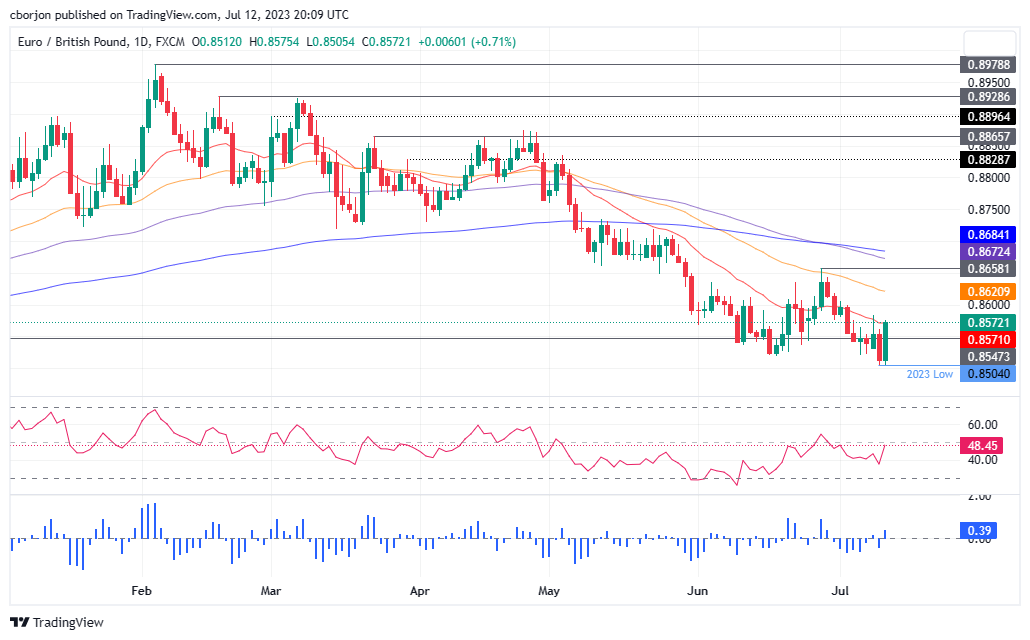
- EUR/GBP sees a significant bounce from YTD lows, climbing 70 pips and gaining 0.72%, spurred by rising EUR/USD.
- A bullish engulfing candlestick pattern indicates the possibility of further upside for the EUR/GBP pair, targeting 0.8600.
- Technical indicators, including the RSI and three-day RoC, show buyers gathering momentum, suggesting near-term bullishness.
EUR/GBP jumps from year-to-date (YTD) lows of 0.8504, climbs 70 pips, and gains 0.72% on Wednesday, underpinned by the rise of the EUR/USD pair. The EUR/GBP is exchanging hands at 0.8571 after hitting a daily low of 0.8505.
EUR/GBP Price Analysis: Technical outlook
After diving to a new YTD low of 0.8504, the EUR/GBP has risen sharply toward the 20-day Exponential Moving Average (EMA) at 0.8571. During the last couple of days, EUR/GBP’s price action formed a bullish engulfing candlestick pattern, suggesting further upside is expected; nevertheless, a daily close above the latter is needed to keep bulls’ hopes alive.
The EUR/GBP first supply zone to test would be the 0.8600 mark. Once cleared, the next stop will be the 50-day EMA at 0.8621, followed by the June 28 swing high at 0.8658. A breach of the latter will shift the cross-pair bias to neutral and expose key resistance levels. The next resistance will be the 200-day EMA at 0.8684, ahead of testing at 0.8700.
Notably, the Relative Strength Index (RSI) is about to turn bullish, while the three-day Rate of Change (RoC) depicts buyers gathering momentum. That said, the EUR/GBP is upward in the near term.
EUR/GBP Price Action – Daily chart
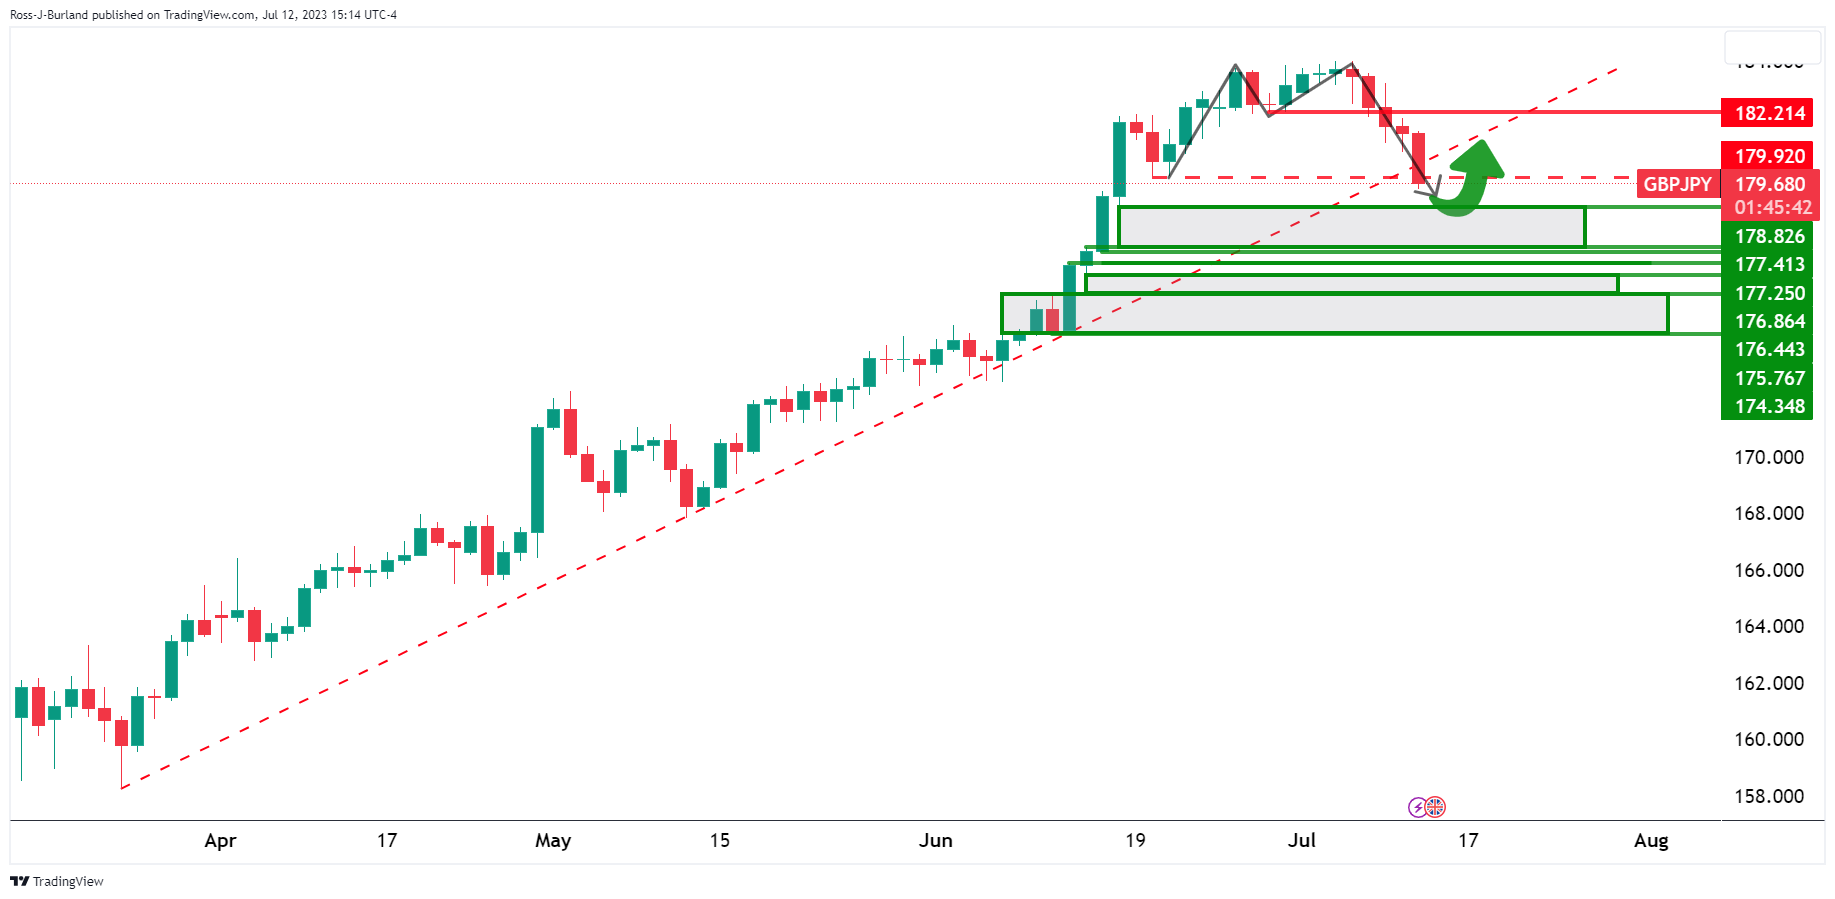
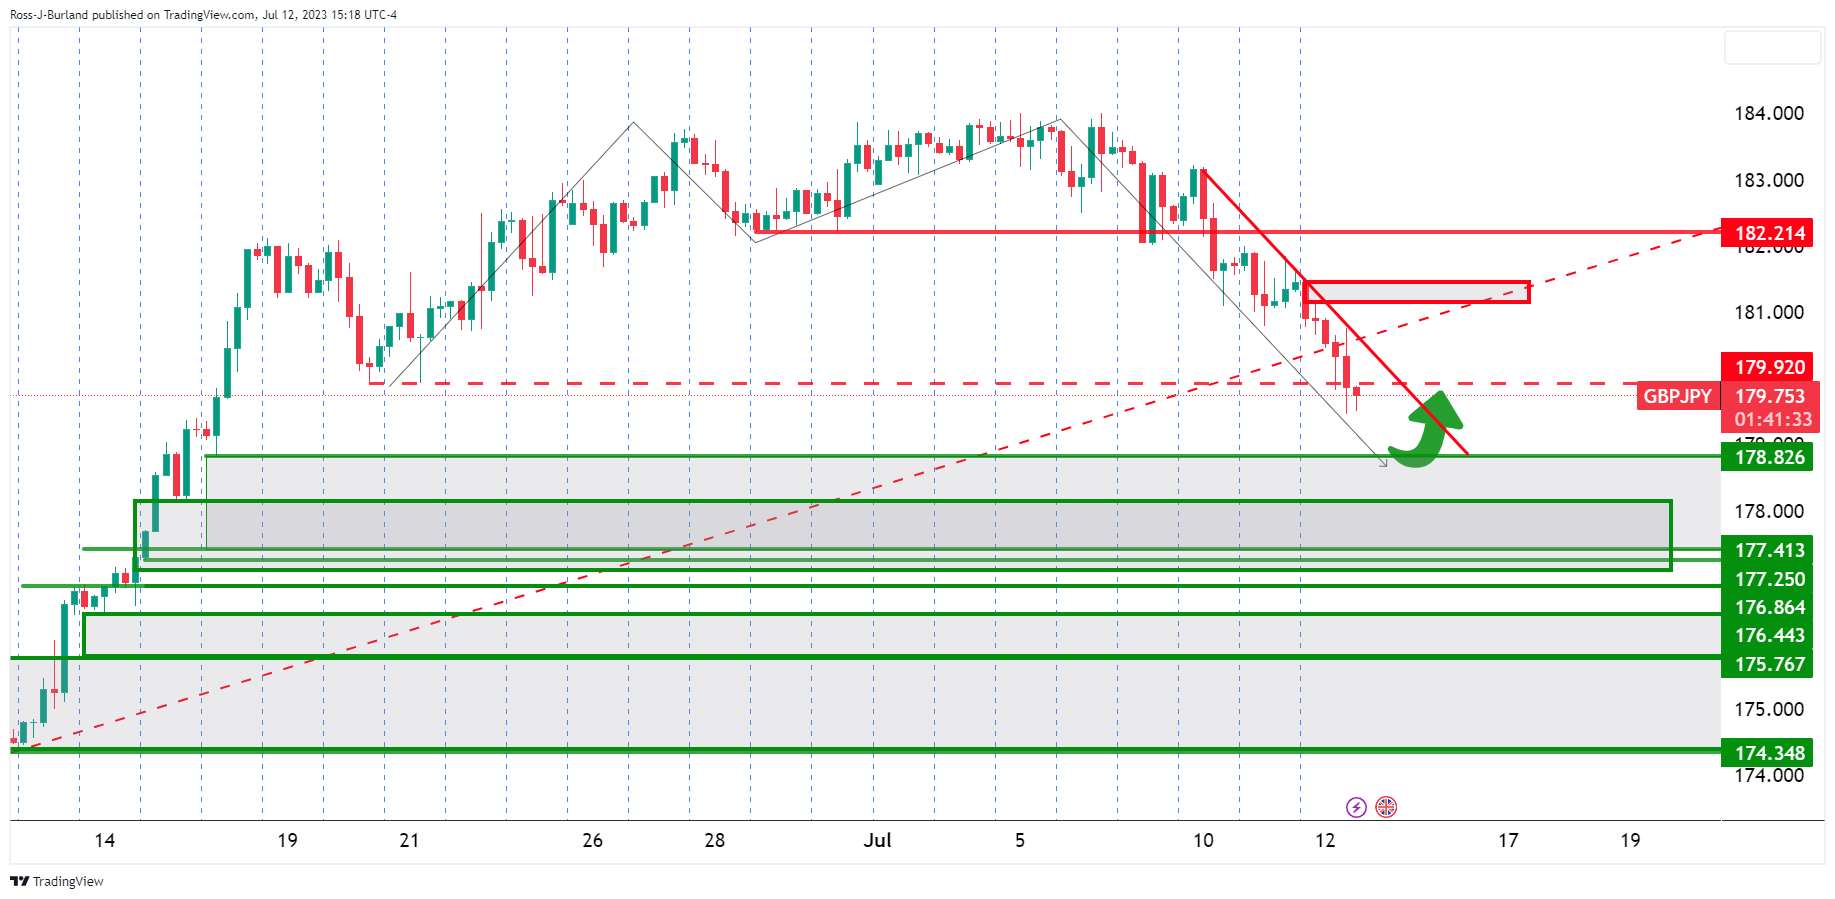
- GBP/JPY bulls have stepped in on the lower time frames.
- Bulls eye a daily M-formation neckline.
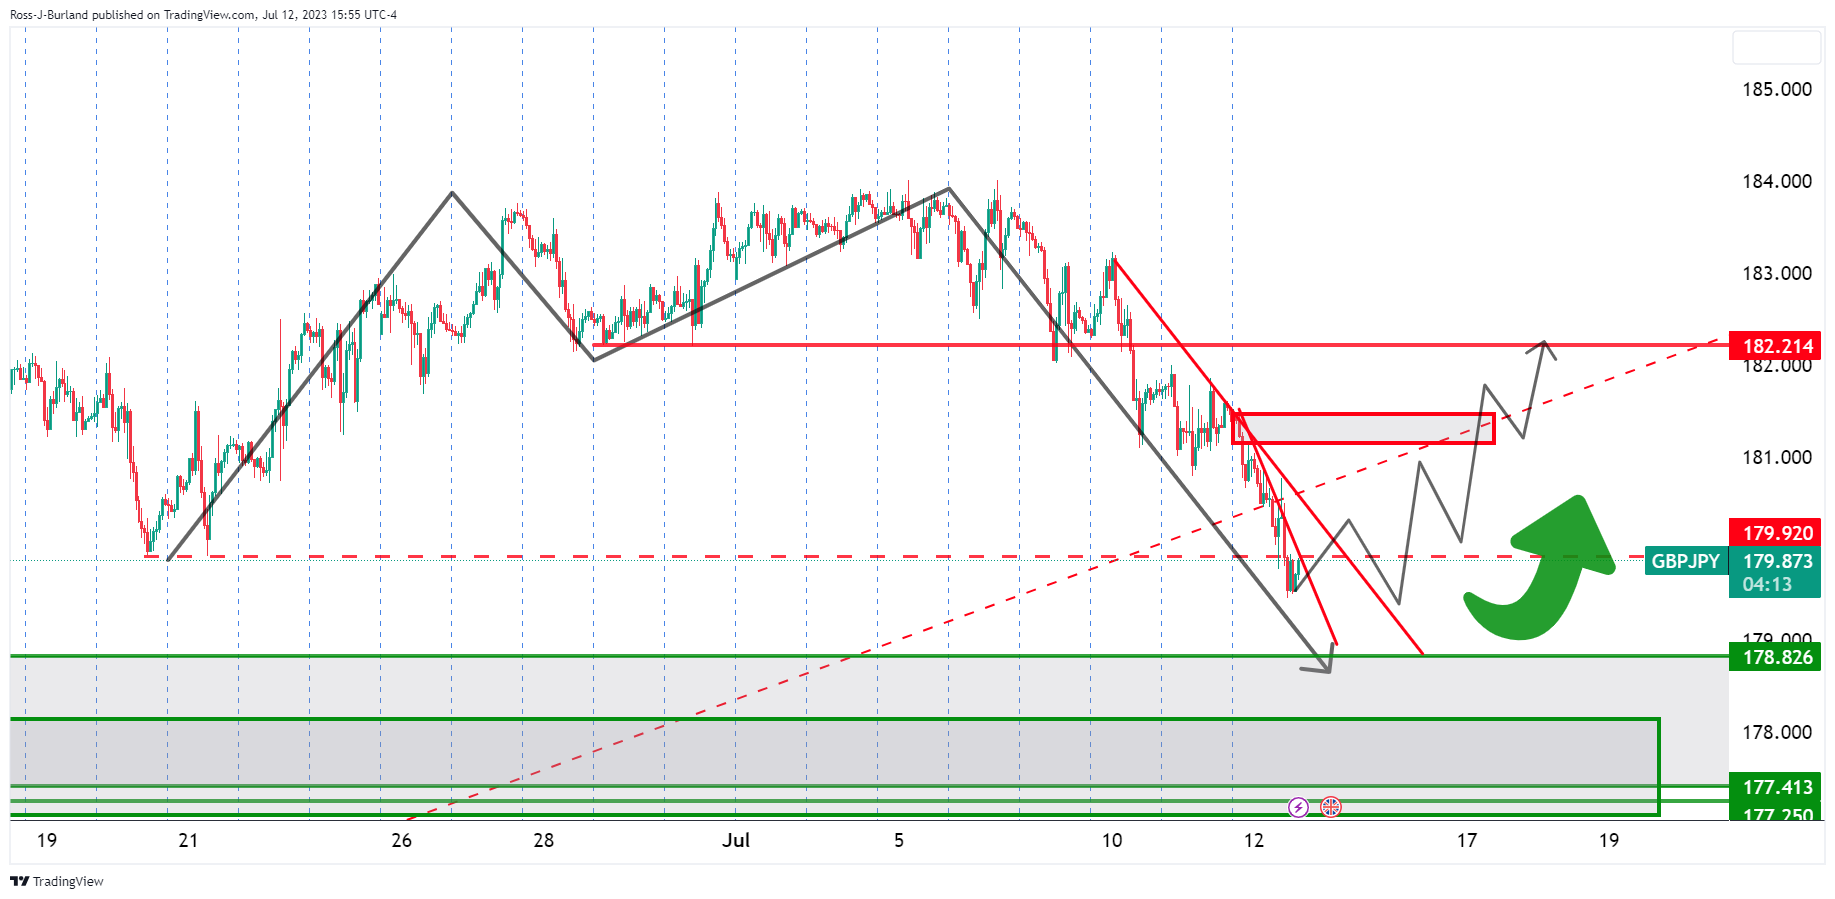
GBP/JPY is down some 0.9% and has fallen from a high of 181.51 to a low of 179.46 so far. The daily chart shows the price breaking the support structure near 179.90 which puts the emphasis on the downside, medium term, but potentially supports a meanwhile bullish bias into the bearish impulse. The M-formation is a reversion pattern that would be expected to draw in the price towards the neckline.
GBP/JPY daily chart
GBP/JPY H4 chart
GBP/JPY 4-hour chart shows a series of bearish closes with little signs of a deceleration in the offer, so far,
GBP/JPY H1 charts
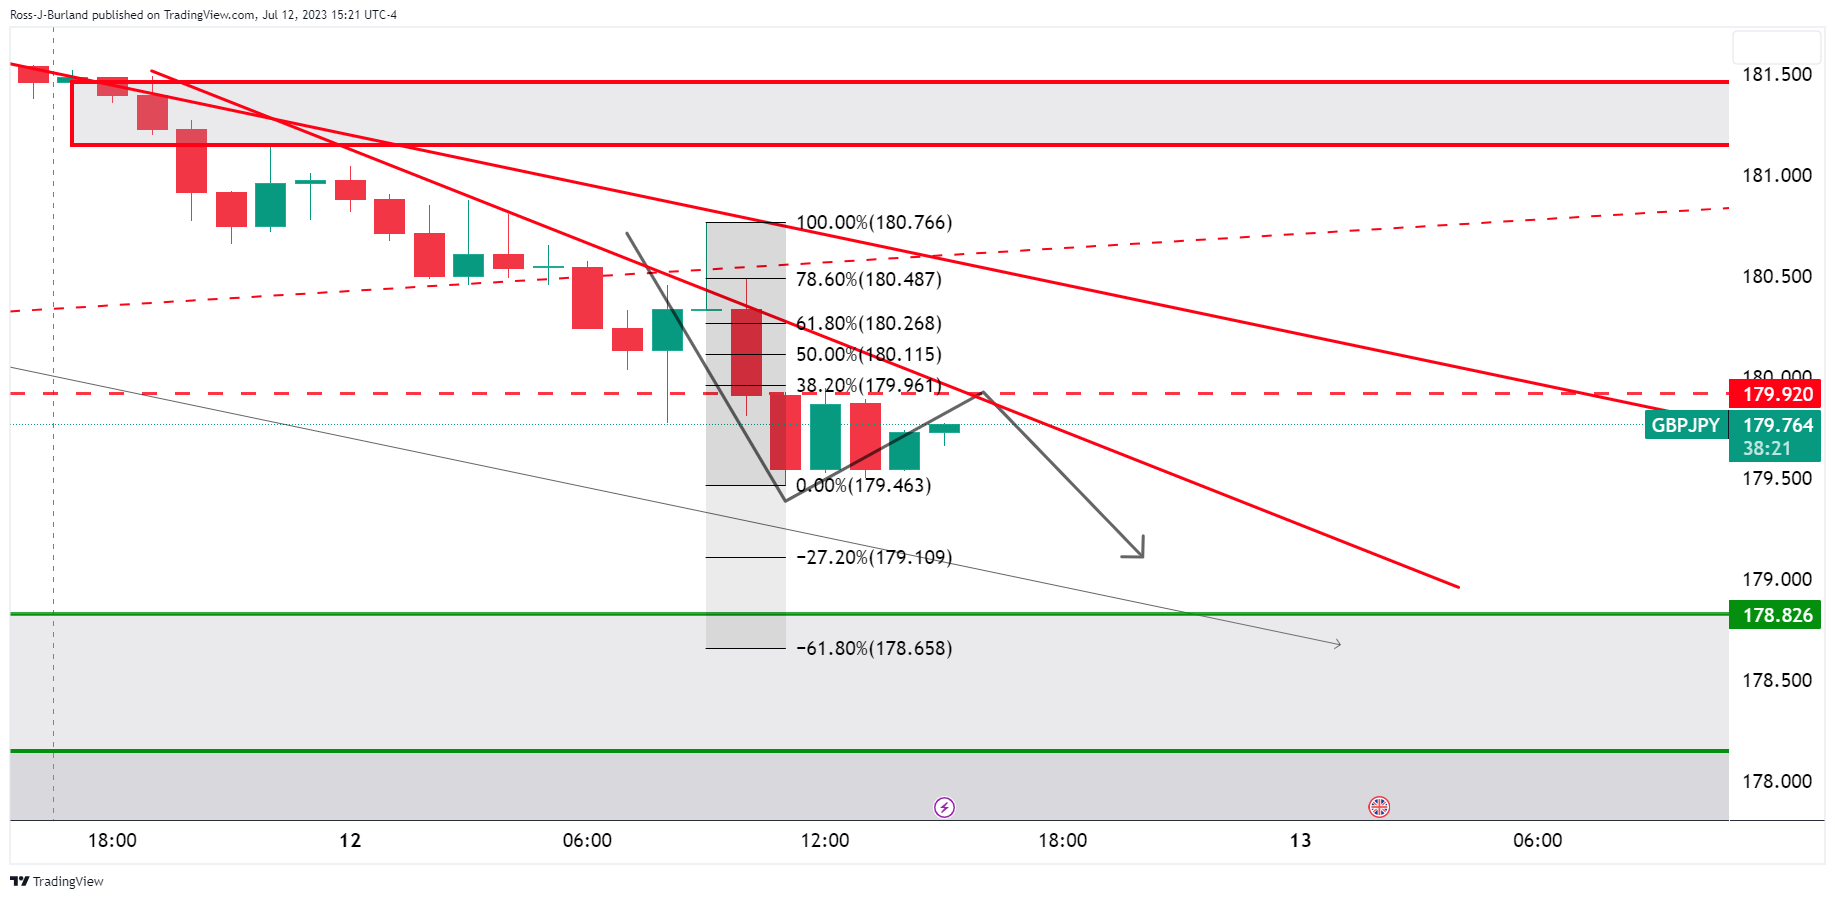
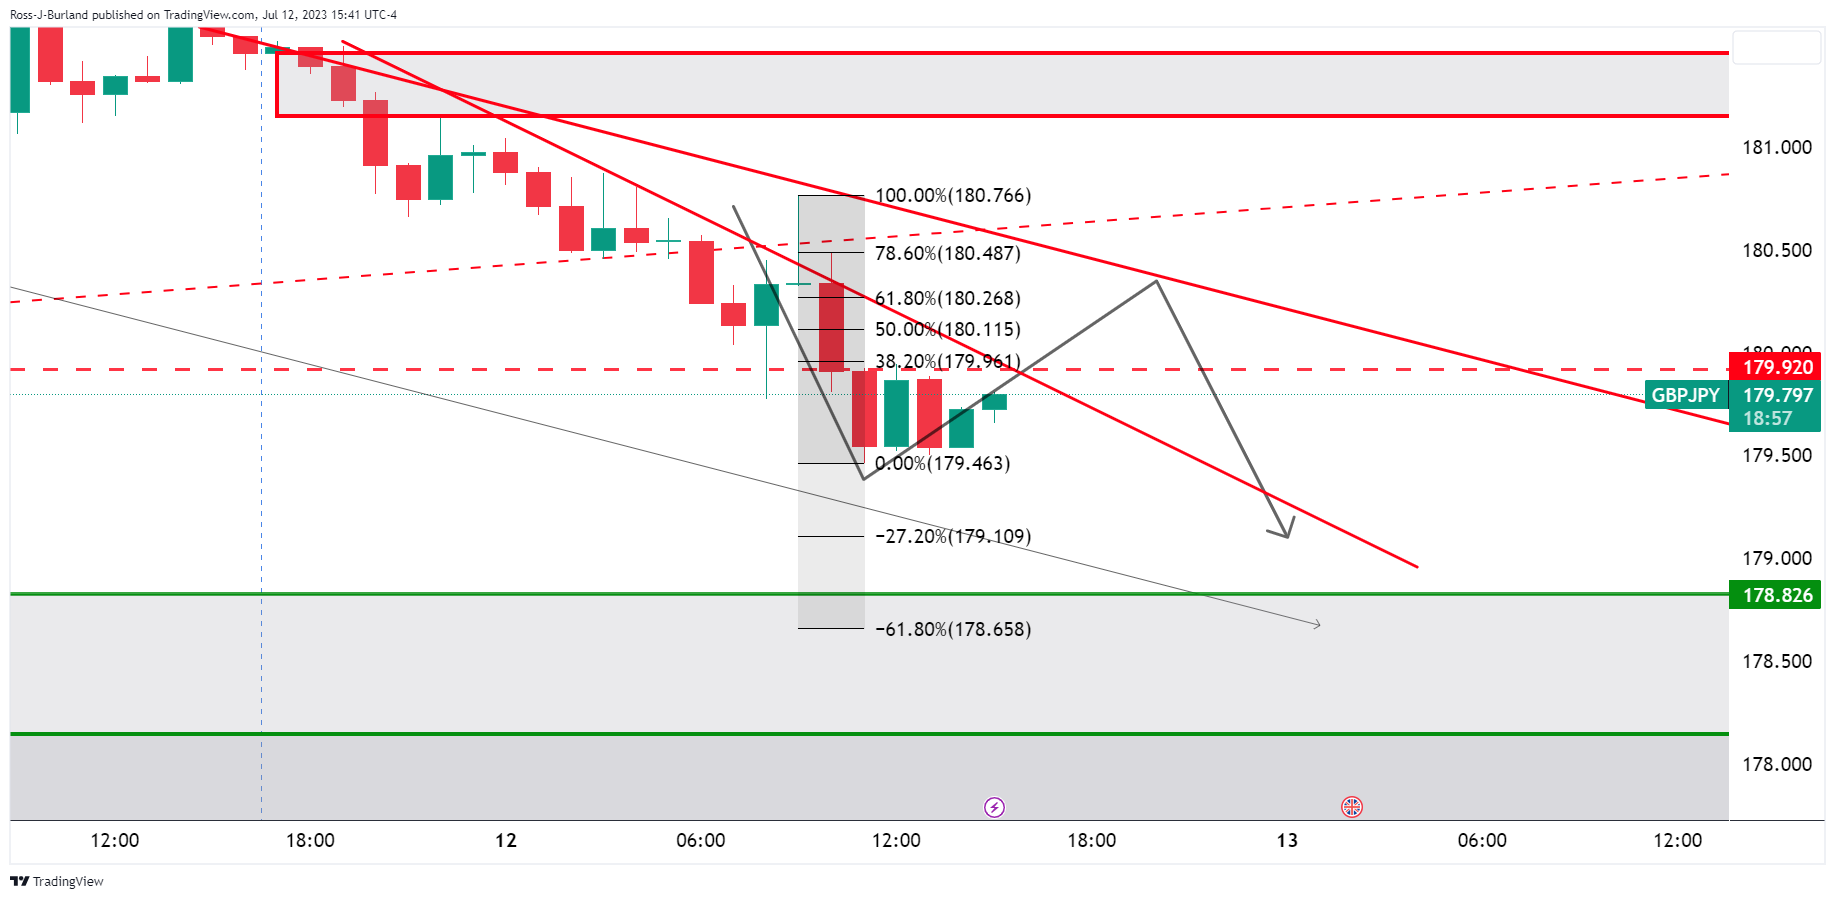
GBP/JPY hourly charts are showing that the price is decelerating on the offer and has moved into a 38.2% Fibonacci retracement of the prior hourly bearish impulse. We have two trendline resistances eyed with prospects of a move towards a 78.6% Fibonacci area near 180.50.
Meanwhile, a break of resistance opens risk to the neckline of the daily M-formation.
- USD/JPY pair plunges to a one-month low as US inflation data surprise and Treasury yields fall, putting pressure on USD.
- Despite inflation dropping closer to the target, a dovish stance from the Fed weighs on the already battered USD.
- The disappointing Japanese core machinery orders data hints at a potential global economic slowdown, supporting the BoJ’s dovish outlook.
USD/JPY sinks to new one-month lows after reaching 138.15 in the North American session after US Consumer Price Index (CPI) figures for June revealed that prices are slowing down as CPI dips to its lowest level in two years. In addition, falling US Treasury bond yields weighed on the USD/JPY pair, which correlates closely to the US 10-year Treasury note yield. At the time of writing, the USD/JPY trades at 138.30, down 1.45%.
The Yen's win: Decelerating US inflation and falling bond yields undercut the US Dollar
US CPI, revealed by the US Bureau of Labor Statistics (BLS), showed inflation in the United States experiencing a significant slowdown in June. CPI annually based increased by 3.0%, below the estimated 3.1%. Furthermore, the Core CPI, which excludes volatile items such as food and energy, decreased by 0.5%, dropping from 5.3% in May to 4.8% last month. Although the report showed inflation deflating towards the Fed’s 2% target, Federal Reserve (Fed) officials stated their priority is bringing it down, as expressed today by Richmond and Minnesota Fed Presidents Thomas Barkin and Neil Kaskhari.
Barkind stated that inflation is too high while favoring higher rates. Kashkari echoed some of his comments, commenting that the Fed’s fight vs. inflation needs to be won, and rates must be lifted if prices remain elevated.
In the meantime, the already battered US Dollar (USD) continued to weaken to new two-month lows, as shown by the US Dollar Index (DXY). The DXY, a measure of the buck’s performance against a basket of peers, tumbles more than 1%, down at 100.560.
Expectations for additional tightening by the Fed remain unchanged at 92.4% for a 25 bps rate hike in July. However, further increases past the current month are off the table, as shown by the CME FedWatch Tool.
On the Japanese front, the economic docket revealed that Core Machinery Orders fell -7.6%, below estimates of a 1% gain, crushing April’s 5.5% expansion, suggesting a deceleration of the Japanese economy. Although the wages rise In Japan is the largest since 1993, the latest inflation figures in China, alongside disappointing machinery orders, put into play a possible global economic slowdown. That said, it justifies the Bank of Japan’s (BoJ) dovish stance, at least in the medium term.
USD/JPY Price Analysis: Technical outlook
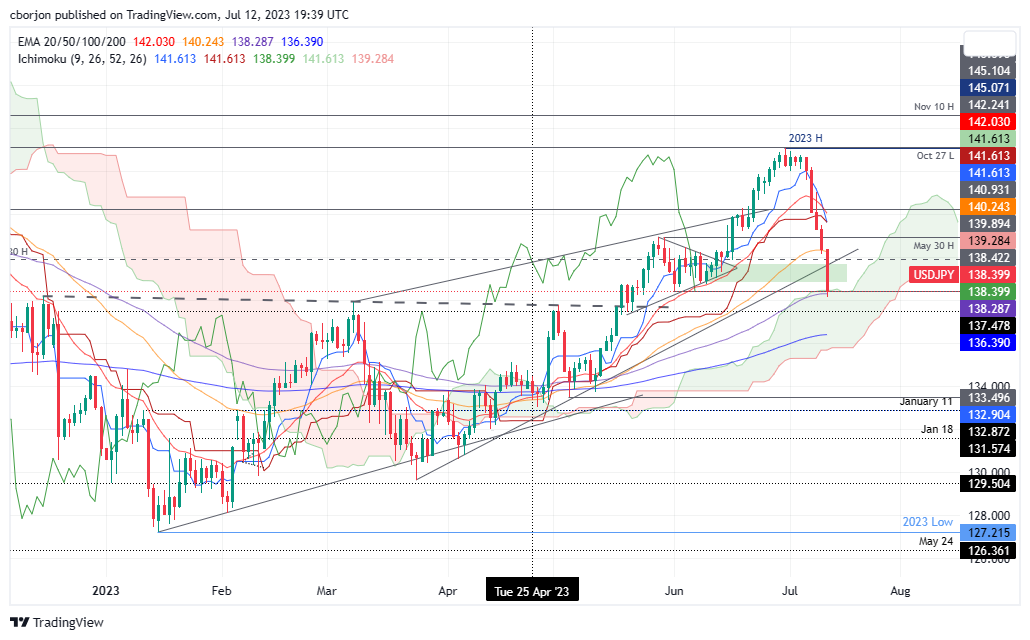
The USD/JPY daily chart shows the pair hovering above the Ichimoku Cloud, which intersects with the 100-day Exponential Moving Average (EMA) at around 138.28/38. That area is considered solid support, but the ip below the cross-over of the Tenkan-Sen below the Kijun-Sen is seen as a bearish signal. But the size of the drop, with twice the Average True Range of 100 pips, suggests the USD/JPY price could be overextended. A bearish continuation will occur if USD/JPY slips past 138.00, which would put in play the 200-day EMA at 136.38 as the next support. Contrarily, if USD/JPY bounces off the weekly lows and reclaims 139.00, that could pave the way for recovery and resumption of the uptrend.
- The EUR/JPY records a seven-day losing streak and fell to a low near 153.40 for the first time since mid-June.
- Japan reported weak PPI and Machinery Orders data.
- Investors continue to bet on a YCC tweak by the BoJ in July.
In Wednesday’s session, the JPY gained further ground agains the EUR and managed to hold gains despite weak economic data reported during the Asian session. Despite inventors continue to bet on a liftoff by the Bank of Japan, analyst at Rabobank think otherwise.
The Cabinet Office reported that Machinery Orders dropped 7.6% in May MoM, far above the 1% decline expected, and recorded a yearly decrease of 8.7%. In addition, the Statistics Bureau reported that Produce Price Inflation (PPI) decline to 4.1% in June, below the 4.3% expected, from the previous 5.2% figure.
Investors shouldn’t be so confident about a potential BoJ monetary policy pivot as the economy is softening. That being said, analysts at Rabobank stated that concerns about the global economy outlook amid the tight monetary policy of the US suggest the BoJ’s possibility of a pivot is likely to be “narrow” and “non-existent”. In addition, China’s economic situation should be closely watched because it is showing weakness and may contribute to the downturn of Japan’s economic activity. In that sense, Thursday’s Trade Balance data from China from June will be closely watched as it can fuel volatility in the JPY’s price dynamics.
On the Euro’s side, its economic calendar had non-high-tier data released. Spain confirmed its Consumer Price Index declined below 2% to 1.9% YoY in June. Regarding the European Central Bank's (ECB) next movements, a 25 basis points (bps) hike is already priced in July, and investors bet on high probabilities of additional increases in September and October. In that sense, hawkish bets on the ECB may limit the Euro’s losses.
EUR/JPY Levels to watch
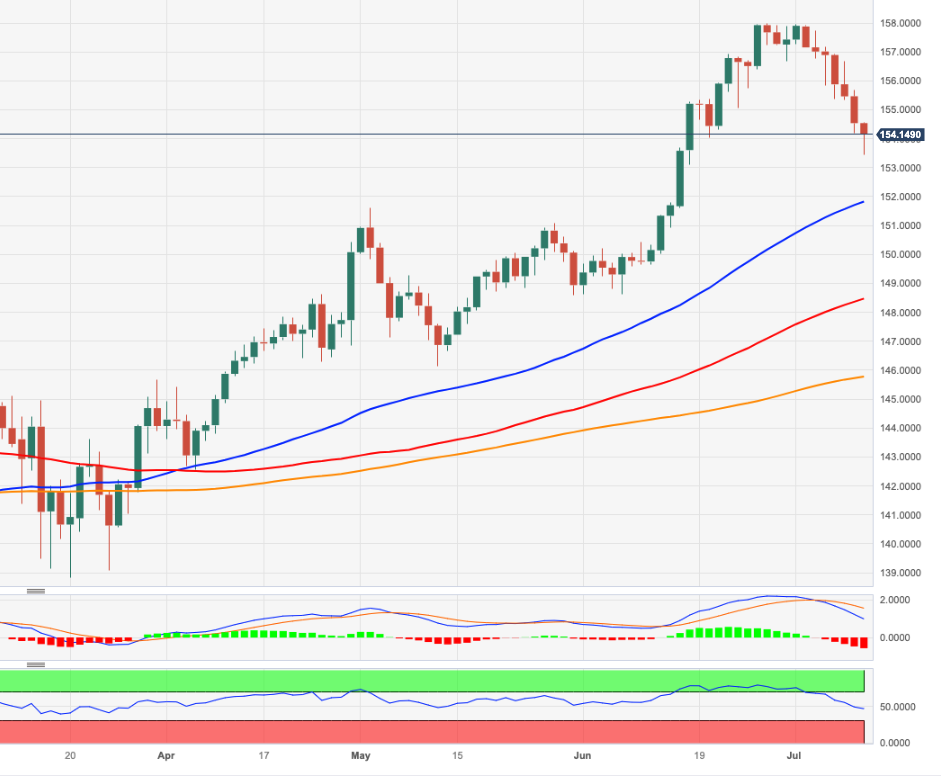
According to the daily chart, the bears are clearly in command, and oversold conditions are already seen in the 4-hour chart. That being said, after seven days of losses, an upwards technical correction should be taken of the table as bears may start to lose some traction. Meanwhile, the Relative Strength Index (RSI) points south in negative territory, while the Moving Average Convergence Divergence (MACD) stands with higher red bars.
Support Levels: 153.40, 153.00, 152.50.
Resistance Levels: 155.40, 156.11 (20-day SMA), 157.00.
EUR/JPY Daily chart
-638247871825048693.png)
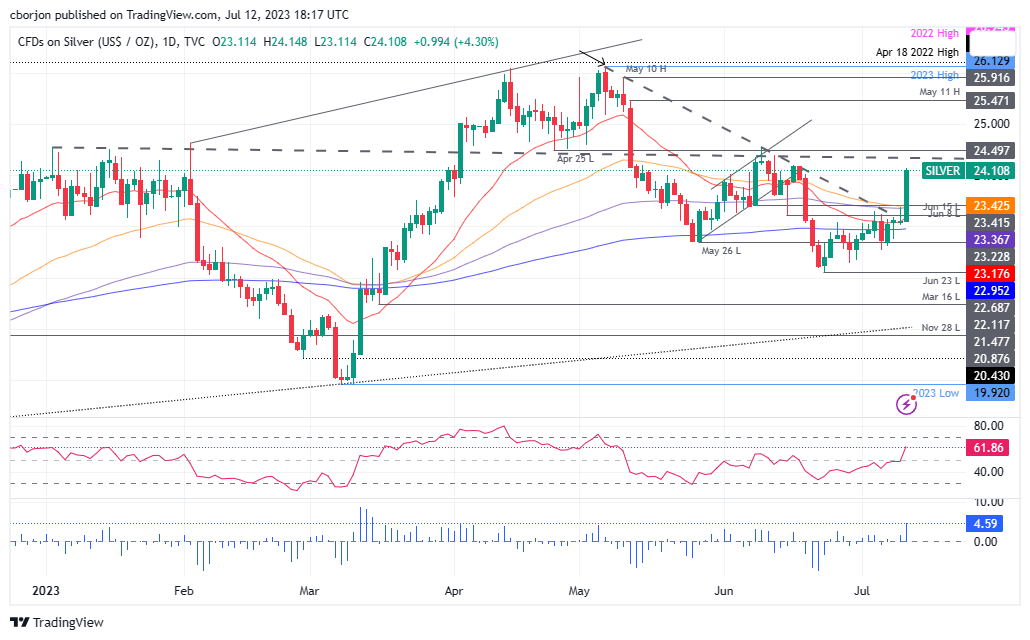
- Silver price leaps toward $24.00, gaining over 4% as US inflation decelerates, indicating a softer stance from the Fed.
- Technical outlook shows the XAG/USD uptrend could gather strength with a break above $24.20.
- Should XAG/USD fail to hold above $24.00, potential losses with critical support levels are highlighted in the $23-$23.50 range.
Silver price surged toward the $24.00 region on Wednesday following the release of the US Consumer Price Index (CPI), which showed inflationary pressures tumbling, suggesting the Federal Reserve (Fed) would not need to tighten as aggressively expected. The XAG/USD is trading at $24.07, gaining more than 4%, after hitting a low of $23.11.
XAG/USD Price Analysis: Technical outlook
The XAG/USD shifted from a neutral-downward biased to upward as price action broke technical resistance levels, with buyers eyeing a downslope resistance trendline, previously broken, which remains in play at around $24.30/45. If XAG/USD surpasses the latter, April’s 29 daily low at $24.49 would be up for grabs before XAG/USD threatens $25.00 per troy ounce.
Conversely, XAG/USD’s failure to achieve a daily close above $24.00 will expose the non-yielding metal to further losses. First, support will emerge at the 50-day EMA at $23.43, the 100-day EMA at $23.36, and then the 20-day EMA at $23.17. Once those levels are cleared, the 200-day EMA is up next at $22.95.
The Relative Strength Index (RSI) at bullish territory, the same as the three-day Rate of Change (RoC), suggests XAG buyers remain in charge. The XAG/USD uptrend is in play but look for breaks above $24.20 to gather further strength.
XAG/USD Price Action – Daily chart
According to Federal Reserve’s Beige Book, “overall economic activity increased slightly since late May.” It added that “reports on consumer spending were mixed; growth was generally observed in consumer services, but some retailers noted shifts away from discretionary spending.”
This Beige Book will be used for the next FOMC meeting on July 25-26. It mentioned that employment increased modestly and prices increased at a modest pace overall, with “ several Districts noted some slowing in the pace of increase.”
Key takeaways from the Beige Book:
“Business activity expanded at a slight pace in recent weeks, with modest increases in employment and roughly even prices. Consumer spending increased by a small margin, as retail sales increased modestly and tourism was flat.”
“Manufacturers reported mixed results but sales growth was moderate on average.”
“Residential home sales increased slightly in May from the previous month but remained below seasonal norms.”
“The outlook was mostly optimistic among contacts outside of real estate.”
“Employment increased modestly and wage growth continued to moderate as labor market imbalances eased further.”
“Wage pressures were described as stable or, in most cases, declining, as wage growth rates continued to fall back to more moderate levels.”
“Prices were mostly stable, with some exceptions, as cost pressures abated further.”
“The outlook called for further moderation of pricing pressures moving forward.”
Market reaction:
The US Dollar is experiencing a sharp decline on Wednesday, largely affected by the US inflation data. The DXY is down by more than 1%, trading at its lowest level since April 2022.
- GBP/USD pair skyrockets to a 15-month high as cooling US inflation data curtails Dollar’s strength.
- Despite a potential 25 basis points rate hike in July, Fed’s further tightening seems less probable amid diminishing inflation.
- UK’s high inflation rate and expectations of a 50 basis point rate hike by the BoE provide additional buoyancy to GBP.
GBP/USD advanced sharply and touched a new 15-month high at 1.3000 during the North American session as data revealed before Wall Street opened showed the Consumer Price Index (CPI) in the US hitting its lowest level in two years, as inflation abates following 500 basis points of tightening. Hence, the GBP/USD is exchanging hands at 1.2989, gains 0.45%, after hitting a low of 1.2902.
Pound Sterling gains ground as Fed rate hikes seem uncertain
According to the latest data from the US Bureau of Labor Statistics (BLS), inflation in the United States experienced a significant deceleration in June. The Consumer Price Index (CPI) revealed a year-on-year increase of 3.0%, falling below the estimated 3.1%. Furthermore, the Core CPI, which excludes volatile items such as food and energy, decreased by 0.5%, dropping from 5.3% in May to 4.8% last month.
The latest inflation report shows that inflation is approaching the 2% target faster than expected, according to Federal Reserve (Fed) projections delivered at June’s monetary policy meeting. That could refrain policymakers from increasing rates past the July FOMC’s decision.
According to the CME FedWatch Tool, there is a high probability of 92.4% for a 25 basis points rate increase in the upcoming July meeting. However, the likelihood of additional interest rate hikes has diminished significantly, falling below 30%.
The US Dollar Index (DXY), which measures the value of the US dollar against a basket of other major currencies, continues to face downward pressure and is currently trading near its two-year lows. The DXY is at 100.597, reflecting a decline of 1.04%.
Federal Reserve speakers had crossed the wires earlier in the New York session, led by Richmond Fed President Thomas Barking, saying. that inflation is too high and emphasizing he’s comfortable doing more to tackle inflation. Recently, the Minnesota Fed President Neil Kashkari noted that the Fed’s fight against inflation must be won and that if it gets higher, hikes must be raised.
On the UK front, the latest employment report increased the odds for further tightening by the Bank of England (BoE), with the inflation level still at an 8.6% annualized rate. Expectations lie for a 50 basis point rate hike, while upcoming growth data could weigh on the BoE’s decision, which walks a fine line between raising rates to tackle inflation without slowing the economy to the point of triggering a recession.
GBP/USD Price Analysis: Technical outlook
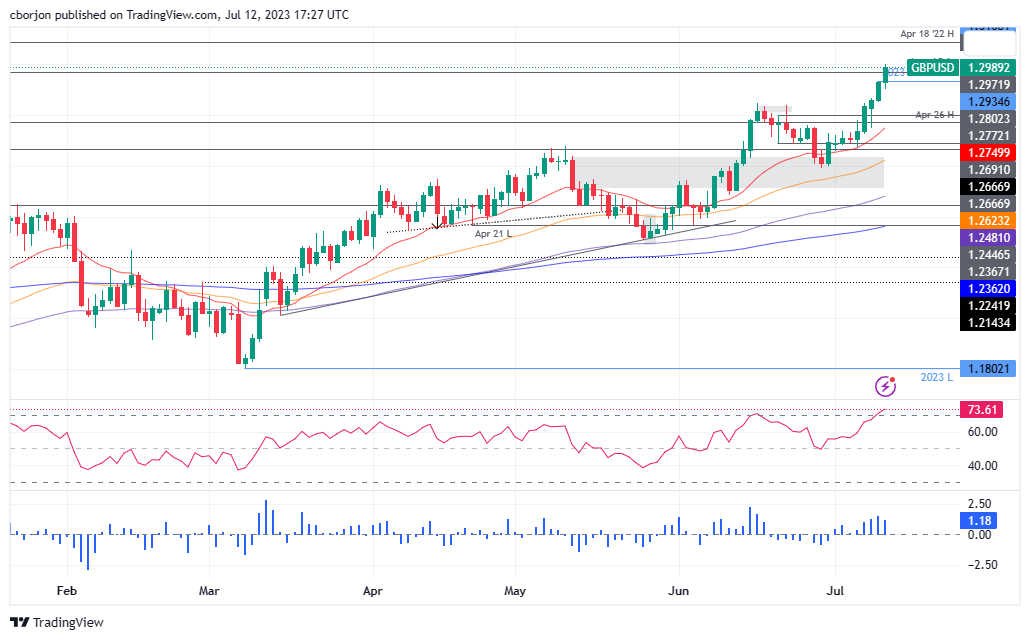
From a technical perspective, the GBP/USD daily chart shows the pair is in a strong uptrend, with buyers eyeing an April 22, 2022, daily high of 1.3035, below the 2021 yearly low of 1.3160. It should be said the Relative Strength Index (RSI) entered overbought conditions, but in a strong uptrend, the indicator could reach its extreme readings at around or past the 80.00 mark. That said, the GBP/USD could threaten 1.3000 and extend its gains to 1.3100. Conversely, if GBP/USD slumps below the July 11 low of 1.2853, that could exacerbate a test of the 1.2800 figure, followed by the 20-day Exponential Moving Average (EMA) at 1.2750.
- WTI rose to a high of $76.11 and threatens the 200-day SMA at $77.23.
- US Inflation declined more than the expectations in June.
- Stocks jumped, and US Treasury yields declined following the inflation figures signalling a positive market environment.
On Wednesday, the West Texas Intermediate (WTI) rose to its highest level since May amid a risk-on market environment fueled by soft inflation figures reported by the US. In that sense, the black gold jumped to a daily high of $76.11 en route to test the 200-day Simple Moving Average at $77.23.
The US Bureau of Labor Statistics reported that the US Consumer Price Index declined to 3% YoY vs the 3.1% expected from its last figure of 4%, while the Core inflation to 4.8% YoY vs the 5% expected from 5.3%.
As a reaction, US Treasury yields decreased across the board. The 2-year yield declined to 4.72%, the 5-year yield to 4.09 and the 10-year yield to 3.90%, respectively.
Elsewhere, the US main stock indexes are displaying yearly highs. The S&P 500 (SPX) jumped to its highest level since April 2022, while the Nasdaq Composite (NDX) to a high since January 2022. The Dow Jones Industrial Average (DJI) stands near highs since December 2022. In that sense, a positive market environment signalled by rising riskier assets allowed the black gold to advance.
However, investors shouldn’t bet on a dovish Federal Reserve. According to the CME FedWatch tool, a 25 basis points(bps) hike continues to be priced in for the next meeting in July, and another hike this year shouldn’t be taken off the table. Both Jerome Powell and several Fed officials signalled their compromise with price stability and confirmed that they considered appropriate “multiple” hikes for the rest of 2023.
Attention for the rest of the session turns to the release of the Fed’s Beige Book, which would give markets a better outlook on the US economic activity outlook.
WTI Levels to watch
According to the daily chart, the technical outlook is favourable for the WTI. The price consolidated above the 20- and 100-day SMA while the technical indicators are gaining momentum in positive territory.
Resistance Levels: $77.23 (200-day SMA), $78.00, $80.00.
Support Levels: $73.52 (100-day SMA), $71.21 (20-day SMA), $69.00.
WTI Daily chart
-638247795015144650.png)
- NZD/USD rose above 0.6295, its highest since May 23.
- US CPI declined to 3% YoY vs the 3.1% expected, fuelling a decline in US Treasury yields.
- RBNZ held rates steady, just as expected.
On Wednesday, the NZD/USD gained bullish momentum following soft Consumer Price Index (CPI) inflation figures. As a reaction, the US DXY index fell to lows not seen since 2022 on the back of falling US yields giving room for the Kiwi asset to advance.
US reported soft CPI figures while the RBNZ paused
The US Bureau of Labor Statistics reported that the US Consumer Price Index declined to 3% YoY vs the 3.1% expected from its last figure of 4%, while the Core inflation fell to 4.8% YoY vs the 5% expected from 5.3%.
As a reaction, US Treasury yields displayed sharp declines across the board. The 2-year yield declined 3.20% to 4.72%, the 5-year yield to 4.09%, with a 3.38% fall and the 10-year yield to 3.90%, a 2.00% decline on the day. As lower bond yields tend to weaken the local currency, the USD, measured by the DXY index, retreated to its lowest level since April 2022, to 100.80, seeing a 0.85% loss on the day. Focus now shifts to the Federal Reserve’s (Fed) Beige book to be released later in the session.
The Reserve Bank of New Zealand (RBNZ) kept rates steady at 5.5% for the first time since the tightening cycle began in 2021. The Bank noted that high-interest rates are “constraining spending and inflation as anticipated and required”, noting that they are confident that rates remaining at a restrictive level of inflation will return to their target. However, the Bank didn’t update its macroeconomic forecast, nor did Governor Orr deliver a press conference.
According to World Interest Rate Probabilities (WIRP), markets discount only a 10% probability of the RBNZ hiking in August and 25% and 50% odds of raising rates in October and November, respectively.
NZD/USD Levels to watch
According to the daily chart, the NZD/USD has confirmed a bullish outlook for the short term. Regarding the convergence of the 20, 100 and 200-day Simple Moving Averages at 0.6170-0.6190, the pair managed to consolidate above, and the 20-day SMA is about to perform a bullish cross with the 200-day average which could give further support to the Kiwi.
Support levels: 0.6220, 0.6190 (100-day SMA), 0.6180 (200-day SMA).
Resistance levels: 0.6385 (May’s highs), 0.6420, 0.6450.
NZD/USD Daily chart
-638247755033873986.png)
- USD/CHF plunges to an 8-year low as unexpected slowing US inflation raises doubts about Fed’s future rate hikes.
- Consumer Price Index shows inflation cooling, with core CPI indicating a more balanced supply-demand situation.
- With inflation above Fed’s 2% target, odds for a significant rate increase shrink, pressuring the US Dollar further.
USD/CHF plummeted in the North American session due to data from the United States (US) showing inflation is slowing at a fast pace, which means, the US Federal Reserve (Fed) might refrain from increasing rates twice toward the end of the year. Consequently, the USD/CHF dropped to an 8-year low at 0.8659. At the time of writing, the USD/CHF pair exchanges hands at 0.8682, down more than 1%.
US Dollar’s dip: Fed’s future rate hikes in question amid cooling inflation
The US Bureau of Labor Statistics (BLS) revealed that inflation in June in the US decelerated sharply, hitting 3.0% YoY, below estimates of 3.1%, as shown by the Consumer Price Index (CPI). Core CPI, which excludes the price of volatile items like food and energy, downtick 0.5%, from 5.3% YoY in May to 4.8% last month, indicating that supply and demand are more balanced. Nevertheless, inflation remains above the US Federal Reserve (Fed) 2% target, though it might refrain the Fed from increasing rates by two times toward the year-end.
In the meantime, the CME FedWatch Tool shows that the odds for a 25 basis points rate increase in the July meeting are at 92.4%, while the chances for additional interest rate increases diminished below 30%.
Hence, the USD/CHF pair extended its losses, as the major has fallen more than 100 pips of 1.30% in the day after hitting a daily high of 0.8794. Failure to crack the 0.8800 figure, alongside weaker data in the US, opened the door to extending the USD/CHF’s downtrend.
Federal Reserve had crossed the wires earlier in the New York session, led by Richmond Fed President Thomas Barking, saying. that inflation is too high and emphasizing he’s comfortable doing more to tackle inflation. Recently, the Minnesota Fed President Neil Kashkari noted that the fight against inflation must be won and that if it gets higher, hikes must be raised.
The US Dollar Index (DXY), a gauge of the buck’s value against a basket of peers, remained downward pressured, exchanging hands near two-year lows. The DXY sits at 100.597, losses 1.04%, undermined by US Treasury bond yields plunge.
USD/CHF Price Analysis: Technical outlook
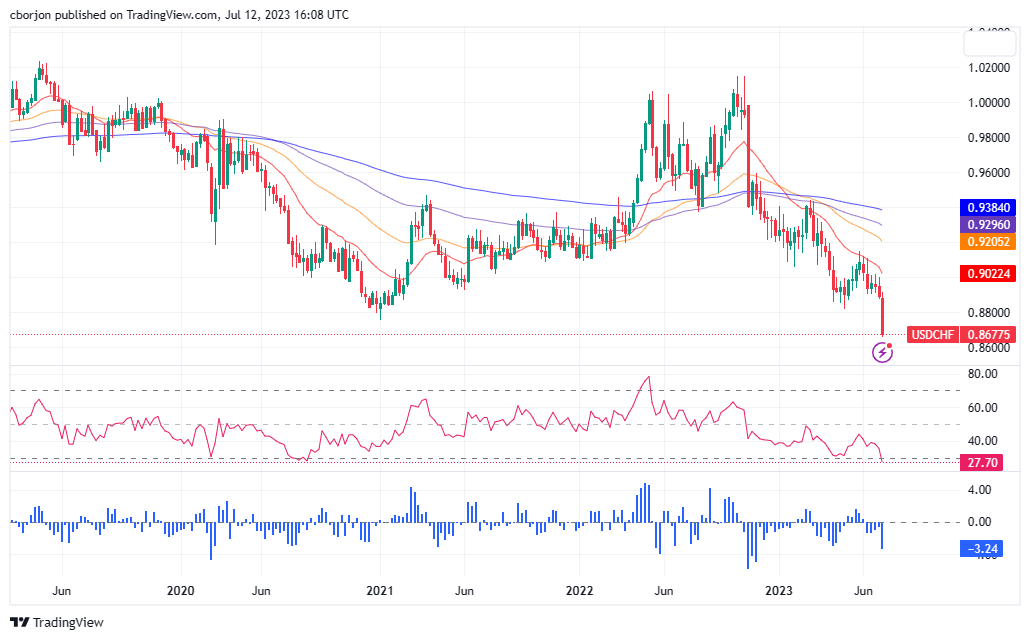
From a weekly chart perspective, the USD/CHF remains downward biased, extending its losses past the 2021 yearly low of 0.8757, which exacerbated a drop below the 0.8700 figure. Should be said, the Relative Strength Index (RSI) has turned oversold, though still showing signs the downtrend is solid. That said, USD/CHF’s next support would emerge at the psychological 0.8600 price level, with sellers eyeing a challenge of 2015 low at 0.8300. Conversely, USD/CHF buyers must reclaim 0.8700 if they aim to shift the pair bias from downwards to neutral.
Bank of Canada (BoC) Governor Tiff Macklem and Senior Deputy Governor Carolyn Rogers comment on the policy outlook following the BoC's decision to raise its policy rate by 25 basis points to 5% in July.
Key takeaways
"We are concerned, if we're not careful, the progress to price stability could stall."
"There was a clear consensus among the Governing Council there was not a big benefit of waiting to raise rates."
"In BoC's forecast, there is a path back to price stability while maintaining growth."
- The US Dollar accelerated its slide across the board after the release of US CPI data.
- Inflation slowed down in the US, and the markets are now looking at a final Fed rate hike in July.
- The EUR/USD pair gains more than a hundred pips, climbing to its highest level since March 2022.
The EUR/USD pair continued to rise after the beginning of the American session, climbing to 1.1125, which is the highest level seen since March 2022. The pair remains near the top as the US Dollar continues under pressure following the release of US inflation data.
Inflation slows down, Dollar tumbles, and Wall Street rises
In June, the Consumer Price Index (CPI) rose 0.2% in the US, which was below the expected 0.3%, and the annual rate slowed to 3%, the lowest since March 2021 and below the expected 3.1%. Following the report, the US Dollar tumbled across the board, and US yields slid.
The US Dollar Index is trading at its lowest level in a year, at 100.60, falling for the fifth consecutive day. The US 10-year bond yield is at 3.87%, down 2.50%, and at a one-week low, far from the 4.09% it reached on Monday.
Market participants still expect a rate hike at the next FOMC meeting on July 25-26. However, bets of another rate hike before year-end have significantly reduced after the inflation data.
EUR/USD above 1.1100
The EUR/USD pair is having its biggest daily gains in months. In the daily chart, the Relative Strength Index is reaching 70; however, no signs of a correction are seen, and the momentum remains firm for the Euro. The 1.1090/1.1100 area has become the immediate support. On the upside, a strong resistance level emerges around 1.1170.
Technical levels
Bank of Canada (BoC) Governor Tiff Macklem comments on the policy outlook following the BoC's decision to raise its policy rate by 25 basis points to 5% in July.
Key takeaways
"Further rate decisions will be guided by assessment of incoming data and outlook for inflation."
"Monetary policy is working but underlying inflationary pressures are proving more stubborn."
"Higher interest rates are needed to slow growth of demand in the economy and relieve price pressures."
"Labor market remains tight, even if there are some signs of easing."
"BoC is prepared to raise rates further."
"We are trying to balance the risks of under and over tightening monetary policy."
"If we don't do enough now, we'll likely have to do even more later."
"Governing Council's decision to raise the policy rate reflected persistence in both excess demand and underlying inflationary pressures."
"Consensus in Governing Council was that monetary policy needed to be more restrictive too bring inflation back to 2% target."
"Governing Council did discuss possibility of keeping rates unchanged, but cost of delaying action was larger than the benefit of waiting."
"With increases in policy rate in June and July, our outlook has inflation going gradually back to 2% target."
EUR/CHF has fallen with the contraction in Swiss bank sight deposits. Economists at Société Générale analyze the pair’s outlook.
CHF spurred by tighter liquidity
EUR/CHF is coming under strong selling pressure this week, moving below 0.97 and thus testing the support area prevailing since last October.
The pair has disconnected from EUR/USD and its own interest differential and, since the start of the year, the best driver explaining CHF appreciation is the contraction in Swiss banks’ sight deposits. The total level of sight deposits at the SNB can only be changed through monetary policy operations or through exchange against cash, and FX reserves diminished again in June.
As long as the SNB has to sell foreign assets, the Franc is likely to feel bullish pressure.
- USD/MXN plunges below 17.0000 as softer US inflation data reduces expectations of further rate hikes, while upbeat Industrial Production in Mexico boosts MXN.
- US CPI report shows inflation decelerating faster than expected, easing pressure on the Fed for aggressive tightening.
- Minnesota and Richmond Fed Presidents express concerns about high inflation and stress the need to combat it through rate increases.
USD/MXN plummets below the 17.0000 figure as a softer-than-expected inflation report in the United States (US) has traders paring bets of further rate hikes. Also, upbeat Industrial Production (IP) data in Mexico was cheered by Mexican Peso (MXN) bulls. The USD/MXN is trading at multi-year lows, exchanging hands at 16.8386 after printing a daily high of 17.0632, with more than 1% losses.
Unexpectedly low CPI figures in the US alleviate pressures for aggressive tightening of monetary policy
The US Department of Labor (DoL) showed inflation is decelerating at a higher pace, as the June Consumer Price Index (CPI) report revealed. CPI came at 3.0%, below estimates of 3.1%. Excluding volatile items like food and energy, the so-called core CPI rose by 4.8% YoY, beneath forecasts of 5.0%, and lower than May’s 5.3%. Data eases pressure on the US Federal Reserve (Fed) to continue tightening monetary policy aggressively, as most speakers throughout the week stressed the need for two rate increases. Nevertheless, traders pared November’s meeting chances for a quarter of a percentage rate hike, with odds dropping from 38.2% to 25% after the CPI report, as shown by the CME FedWatch Tool.
The central bank bonanza continued with Minnesota and Richmond’s Fed Presidents Neil Kashkari and Thomas Barkin crossing the wires. Thomas Barkin said that inflation is too high and emphasized he’s comfortable doing more to tackle inflation, while Kashkari noted that the inflation fight must be won and that if inflation gets higher, rates must be raised further.
The greenback plunges across the board, with the US Dollar Index down 0.94%, at 100.703, at its lowest level since April 2022, weighed by falling US Treasury bond yields, which are nosediving.
On the Mexican front, Industrial Production rose 1% in May from April. It was above estimates of a 1.9% expansion on yearly figures. It came at 3.9%, flashing a robust economy benefiting from a possible nearshoring, which has failed to gain more pace, as investors eye the 2024 general election.
USD/MXN Price Analysis: Technical outlook
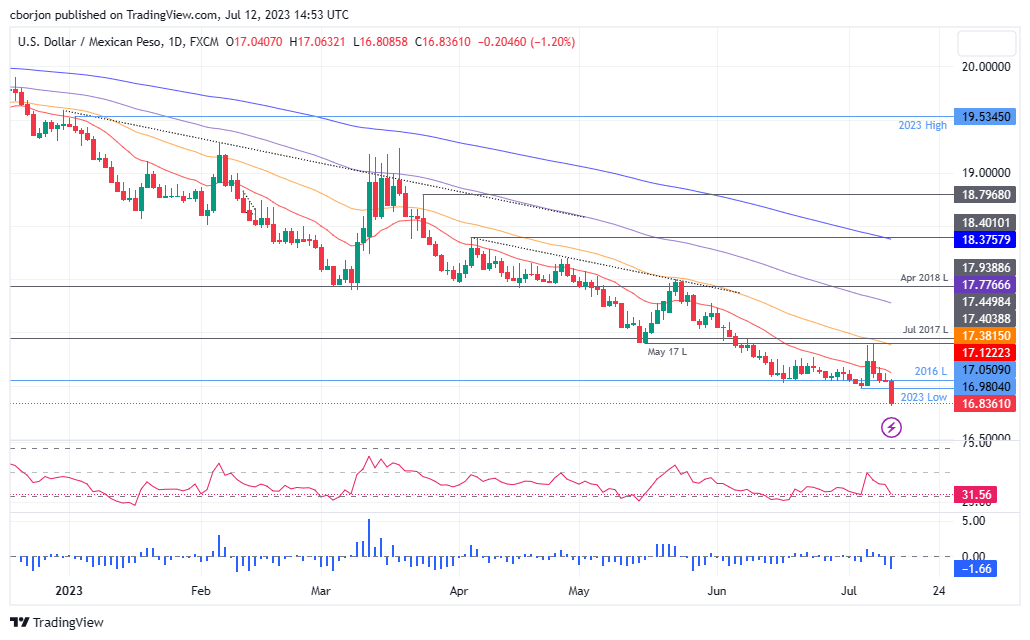
From a technical perspective, the USD/MXN is set to continue to weaken as price action continues to show the Mexican Peso (MXN) strength, with traders eyeing the October 2015 swing low of 16.3267. Still, speculators will face solid support at 16.5000. Although the Relative Strength Index (RSI) shows the indicator approaching oversold conditions, it still warrants further USD/MXN downside. Contrarily, if USD/MXN buyers enter the market, they must reclaim the 17.0000 mark to have the opportunity to shift the pair’s bias to neutral.
Silver is currently trending at a paltry $23. Economists at TD Securities analyze XAG/USD outlook.
Silver to trend near $23 for much of the next three months
Silver is projected to trend near a low of $23 for much of the next three months.
As it becomes clear that the Fed and other central banks will start to pivot to a more dovish monetary policy stance in the early months of 2024, boosting the prospects for economic recovery on the horizon, we expect the white metal will set its sights towards $26 in the final days 2023.
In the very long term, silver is expected to trade significantly above the $26 mark and should increasingly decouple from Gold, as its ties to the interest/lease rate environment weaken.
After a turbulent year in 2022, the excitement in the European Gas market has subsided. Economists at Commerzbank the outlook for Gas prices.
Calm before the (winter) storm?
There has been no real shortage in the European Gas market. On the contrary, thanks to massive savings and the development of new supply sources, the supply situation this summer is even better than usual. Looking ahead to the winter, however, nervousness is high. We expect a mild recession to slow the recovery in European Gas demand.
Provided the winter is not too harsh, the drawdown in inventories should be slow and the Gas price should not rise as much as many analysts currently expect. However, supply risks and the expected economic recovery justify higher prices next summer than this year.
Economists at Société Générale analyze EUR outlook.
The Euro needs a helping hand – from the economy
Consensus growth forecasts for 2024 are moving in the Euro’s favour, but only because 2023 ones are going the other way!
The Euro needs underlying sentiment about growth to improve, which means it needs better economic data because it’s now doing much better than rate expectations would suggest.
The last month or so has seen the Euro recover without relative rates moving in its favour. Short-covering, or a mood shift? Whatever it is, it needs to find some solid foundations soon.
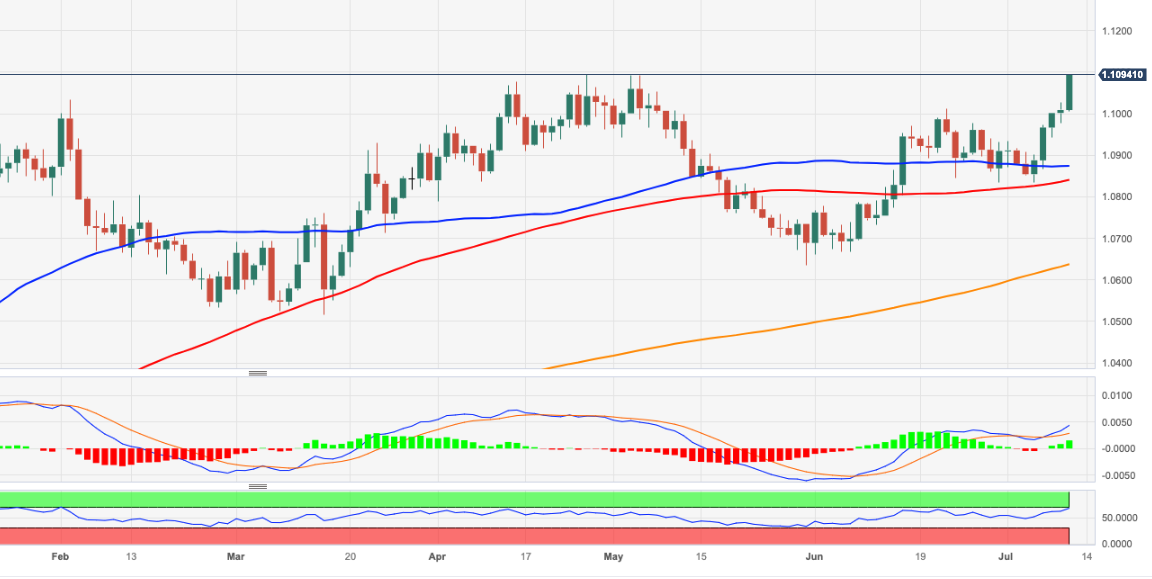
- EUR/USD advances to new highs near 1.1100.
- The surpass of 1.1095 exposes 1.1184 near term.
EUR/USD gathers further steam and puts the 2023 top around 1.1090 to the test on Wednesday.
The surpass of the 2023 high at 1.1095 (April 26) should rapidly visit the round level at 1.1100 ahead of the weekly top at 1.1184 (March 31 2022).
Looking at the longer run, the positive view remains unchanged while above the 200-day SMA, today at 1.0635.
EUR/USD daily chart
- USD/JPY bears move in on interest rate expected convergence between BoJ and Fed.
- Bears eye a test of the key swing point at 138.42 while bulls look for a correction towards 38.2% Fibo.
138.42 is a prior swing point on the daily chart that could prove to be a key level. On the upside, if there is an immediate correction, there is an area of imbalance between 140.36 and 141.28 around a 38.2% Fibonacci retracement area.
USD/JPY is on the back foot again on Wednesday due to a deviation in the US Consumer Price Index that arrived (YoY) in June at 3.0% (vs. the expected 3.1% and the previous 4.0%. The core data was a larger miss of 4.8% vs. 5% expected and the prior 5.3%. For the month, it arrived at 0.2% vs 0.3% expected and the 0.4% prior.
The US Dollar index dived to as low as 100.876, the lowest in two months while US rate futures still show traders overwhelmingly expect the policy rate to rise a quarter point, to a 5.25%-5.5% range, at the Fed's July 25-26 meeting, but now see about a 25% chance of another rate hike before year's end, down from about 35% before the report, Reuters reported.
Meanwhile, there are expectations in the market that the Bank of Japan could tweak its yield-curve-control policy at its meeting later this month and this has also been giving a boost to the Japanese yen. However, analysts at Rabobank argued that the ''concerns about the outlook for the global economy amid tighter monetary policy in the US and other G10 economies suggest that the window of opportunity for a tweak in BoJ policy is likely to be narrow, and possibility non-existent.''
The analysts are also of the mind that while the CPI data was soft, the US dollar will be supported due to a low-world growth outlook that ''is likely to keep risk appetite in check and lend support to the safe-haven USD medium term.''
''Thus, while a soft US CPI inflation report today is set to weigh on the USD near-term,'' they said, ''we do not anticipate that this will mark the start of a long-term trend of sustained USD selling.''
USD/JPY technical analysis
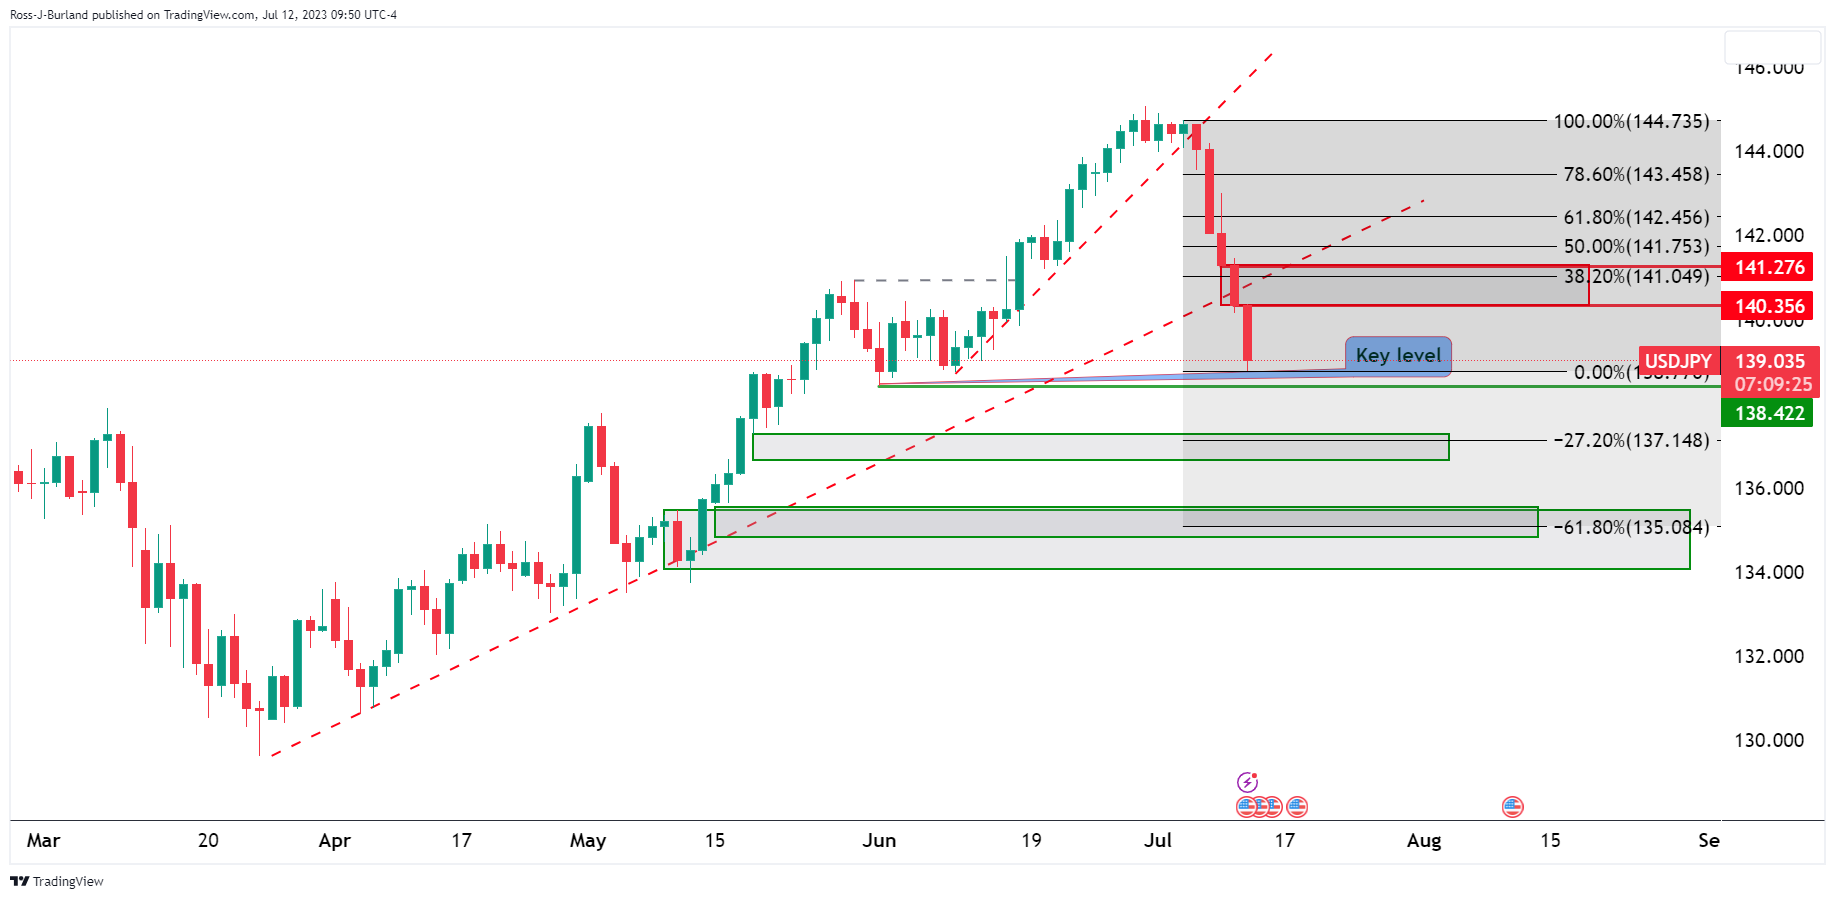
138.42 is a prior swing point on the daily chart that could prove to be a key level. On the upside, if there is an immediate correction, there is an area of imbalance between 140.36 and 141.28 around a 38.2% Fibonacci retracement area.
Minneapolis Federal Reserve President Neel Kashkari stated during a panel discussion titled "Banking Solvency and Monetary Policy" in Boston that entrenched inflation could prompt the central bank to hike interest rates further.
Kashkari mentioned that higher interest rates could increase the pressure on banks.
Key takeaways from speech:
“If inflation falls as markets currently expect, allowing policy rates to fall, bank balance sheet pressures would likely reduce as longer-term rates fall, causing asset prices to climb.”
“If inflation proves to be more entrenched than expected, policy rates might need to go higher, which could further reduce asset prices, increasing pressure on banks. In such a scenario, policymakers could be forced to choose between aggressively fighting inflation or supporting banking stability.”
“Anchored inflation expectations have been foundational for economic growth over the past four decades. Central banks’ fight to bring inflation back to target and preserve anchored expectations must succeed.”
“Supervisors should consider what actions could be taken now to build resilience among regional banks in case high inflation proves to be more persistent than is currently expected by market participants.”
Market reaction:
The US Dollar is falling sharply on Wednesday following the US Consumer Price Index report that came in below expectations. The DXY is trading below 101.00, down more than 0.50% for the day, at its lowest level since mid-April.
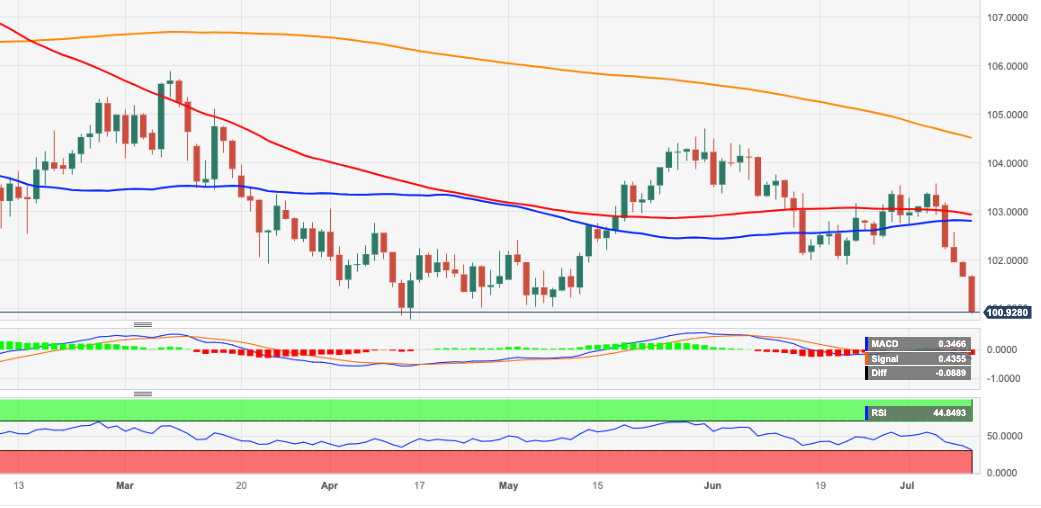
- DXY breaks below the 101.00 support on Wednesday.
- The 2023 low near 100.80 emerges as the next target of note.
DXY’s downside picks up pace and now puts the 2023 low near 100.80 to the test.
The continuation of the decline looks the most likely scenario for the time being. Against that, the dollar now targets the YTD low in the 100.80/75 band prior to the psychological 100.00 yardstick.
Looking at the broader picture, while below the 200-day SMA at 104.50, the outlook for the index is expected to remain negative.
DXY daily chart
- EUR/JPY drops further and revisits the 153.30 zone on Wednesday.
- The breach of this level opens the door to the 55-day SMA.
EUR/JPY accelerates its losses and revisits the low-153.00s as the selling pressure in the cross remains everything but abated on Wednesday.
The cross extends further its monthly retracement and leaves the door open to extra downside in the very near term. In case losses gather impulse, then the next contention area appears at the provisional 55-day SMA at 151.78.
The daily RSI around 46 still allows for the continuation of the downward move in the very near term.
So far, the longer term positive outlook for the cross appears favoured while above the 200-day SMA, today at 145.75.
EUR/JPY daily chart
- Silver price has climbed above $23.80 as the US inflation has softened more than expected.
- Fed Barkin still believes that more interest rate hikes are appropriate for confirmation that inflation will return to 2% target.
- Silver price has delivered a breakout of the Rising Channel chart pattern.
Silver price (XAG/USD) has overstepped the crucial resistance of $23.80 quickly as the United States Consumer Price Index (CPI) data for June has landed softer-than-expectations. The monthly headline and core inflation were recorded at a moderate pace of 0.2% against expectations of a 0.3% pace.
On an annualized basis, headline inflation posted a deceleration to 3.0% vs. the consensus of 3.1% and the former release of 4.0%. Core CPI that excludes volatile oil and food prices has eased sharply to 4.8% than the estimates of 5.0% and the prior figure of 5.3%.
Investors would keenly watch commentaries from Federal Reserve (Fed) policymakers to understand whether the current pace of decline in inflation data is sufficient to discourage the Fed from hiking interest rates further. Considering past commentary from Fed chair Jerome Powell, two more interest rate hikes are appropriate by the year-end.
Following US inflation data, Richmond Fed Bank President has stated that more policy tightening is warranted if incoming data does not confirm that inflation will go down to the desired target. He pointed out that a relevant question is whether inflation can settle while the labor market remains as strong as it is.
Meanwhile, S&P500 futures have added stellar gains post significant softening of price pressures as decelerated inflation data has receded fears of a recession in the United States. The US Dollar Index (DXY) has dived to near the critical support of 101.00 as investors are hoping that Fed policymakers would re-discuss the monetary policy roadmap.
Silver technical analysis
Silver price has delivered a breakout of the Rising Channel chart pattern on a two-hour scale, which indicated immense strength in bulls. The 50-period Exponential Moving Average (EMA) at $23.10 is consistently providing support to the Silver bulls.
The Relative Strength Index (RSI) (14) has jumped into the 60.00-80.00 range, indicating that the bullish momentum has been triggered.
Silver two-hour chart
-638247654747472570.png)
The weaker US CPI print has seen Gold regain some of its shine. Economists at TD Securities analyze the yellow metal’s outlook.
A final 25 bps rate increase in Fed funds is still in the cards for the July FOMC meeting
While lower inflation is likely to prompt some short covering from traders and ultimately offer the yellow metal some much-needed support, the accumulation of broadly firmer-than-expected activity over the past few weeks and the Fed's clear inclination to hike again, suggests a final 25 bps rate increase in Fed funds is still in the cards for the July FOMC meeting.
Nonetheless, as fears were rising that the Fed's bark could be as bad as its bite, weaker inflation is likely to tame these concerns and could see the yellow metal solidify in a higher range as markets look toward the easing of Fed policy.
US consumer prices rose only slightly in June. The pressure for further rate hikes has eased noticeably, in the view of economists at Commerzbank.
US inflation is on the right track
In the US, there are increasing signs that inflationary pressure is easing. In June, consumer prices rose by only 0.2% compared with the previous month. The core rate (which excludes energy and food), which is important as a measure of the underlying trend, was also only 0.2%, the smallest increase since February 2021.
While the Federal Reserve is still likely to raise interest rates again at the end of the month, the data support our view that this should be the last hike.
Thomas Barkin, President of the Federal Reserve Bank of Richmond, said on Wednesday, following the release of the US Consumer Price Index (CPI), that inflation remains too high. The data showed inflation continues to slow in the US with the annual rate falling to 3% in June, the lowest since March 2021.
Barkin stated that he is comfortable with doing more policy tightening if incoming data does not confirm that inflation will return to the 2% target. He pointed out that a relevant question is whether inflation can settle while the labor market remains as strong as it is. He also warned that demand remains elevated while supply is constrained.
Market reaction:
The US Dollar is experiencing a sharp decline on Wednesday, as it was affected by the US Consumer Price Index report that came in below expectations. The DXY is currently trading at its lowest levels since early May, just slightly above 101.00 and down 0.50% for the day.
- USD/CAD is pressured on a soft US CPI print ahead of the BoC.
- USD/CAD bears are squeezing longs back to test below 1.3200 support.
USD/CAD is blowing off following a large deviation in the US Consumer Price Index that arrived (YoY) in June at 3.0% (vs. the expected 3.1% and the previous 4.0%. The core data was a larger miss of 4.8% vs. 5% expected and the prior 5.3%. For the month, it arrived at 0.2% vs 0.3% expected and the 0.4% prior.
USD/CAD was testing the London and Asian lows below 1.32 the figure within the range of between 1.3233 and 1.3197 so far. Markets are in the process of reviewing US Dollar forecasts and today’s CPI inflation release is one of the factors that is being considered.
Short-term weak US Dollar, longer-term not
Analysts at Rabobank explained that the USD tends to perform weakly when US rates are low and the outlook for global growth is good. ''In this scenario appetite for higher-yielding risky assets is high. Currently, China’s economic recovery has disappointed. Soft demand for manufactured goods in addition to pressures on domestic consumption in China stemming from factors such as falling property prices and higher youth unemployment have resulted in lacklustre growth,'' the analysts explained. ''Germany’s exposure to China through its external sector and a weak performance for its own manufacturing sector suggests low growth in the Eurozone.''
All in all, in this view, the analysts explained that this low-worth growth outlook is likely to keep risk appetite in check and lend support to the safe-haven USD medium term. ''Thus, while a soft US CPI inflation report today is set to weigh on the USD near-term, we do not anticipate that this will mark the start of a long-term trend of sustained USD selling.''
Bank of Canada eyed
The next catalyst for USD/CAD will be the Bank of Canada. The central bank is expected to hike another 25bps to 5.00% in July. Upward revisions in the July MPR would be expected to provide the main catalyst.
''We're wary of chasing the strong CAD story in the short-term as positioning looks elevated,'' analysts at TD Securities said. ''Still, the USDCAD downside will require the data to comply with our out-of-consensus view on US CPI tomorrow and a BoC hike. If realized, expect a near-term test of the recent lows ahead of 1.31.''
USD/CAD daily charts

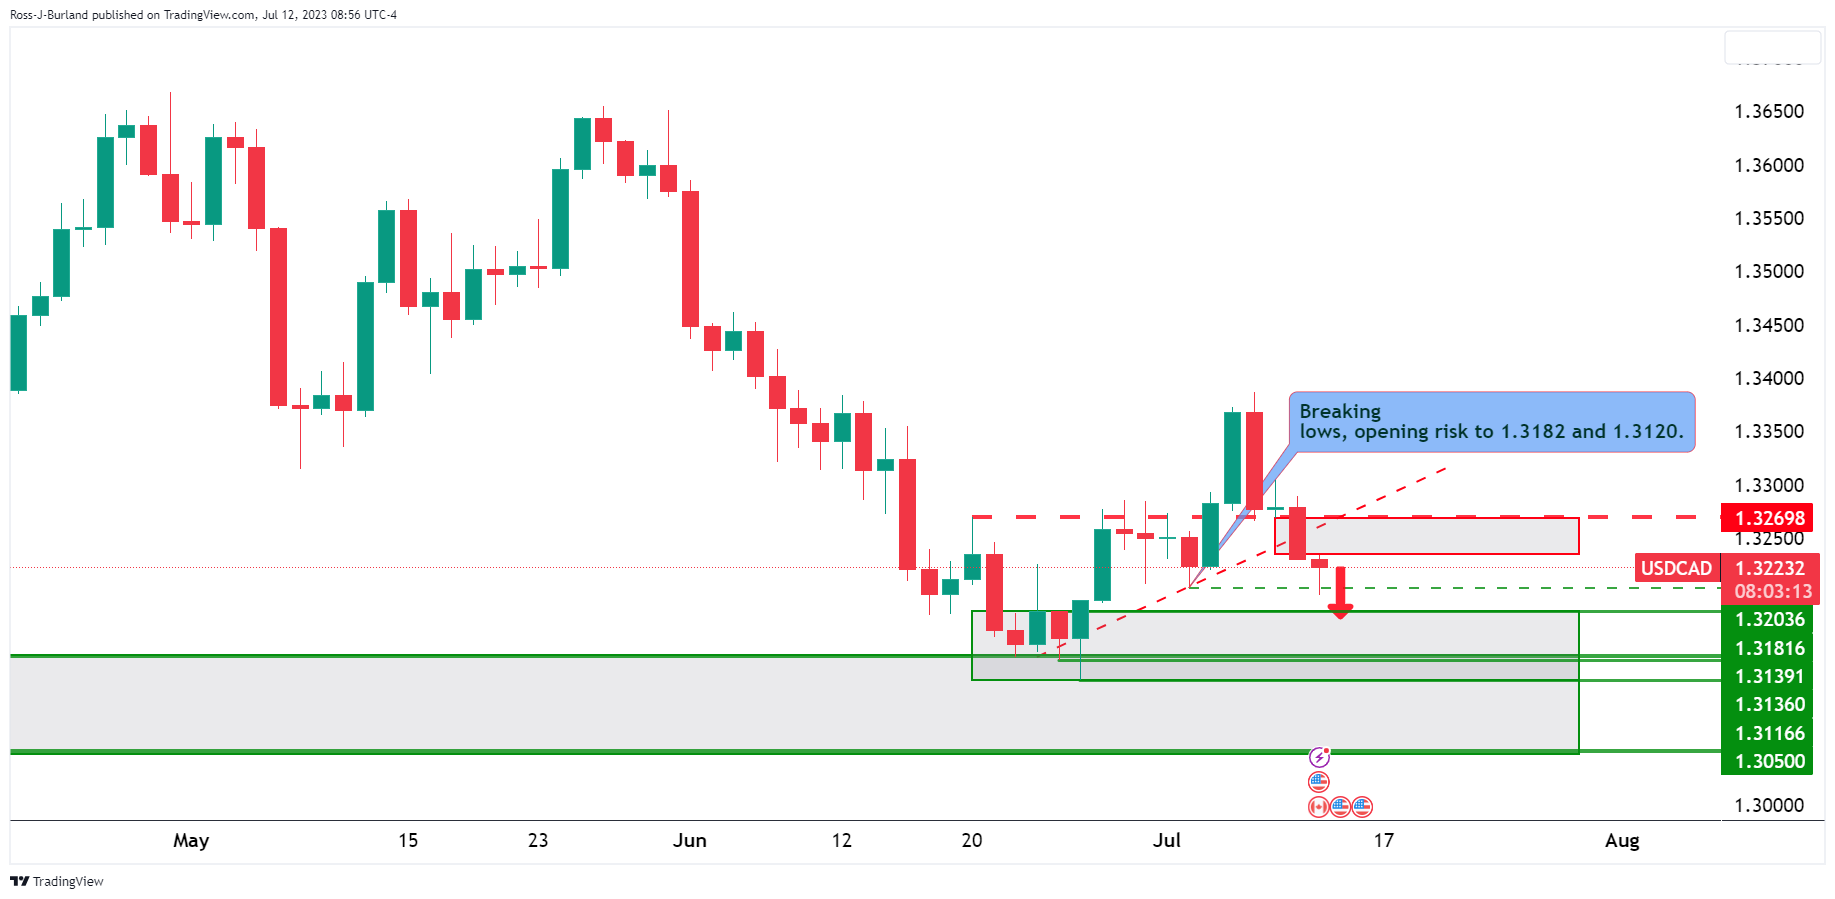
Despite the recent rally through the prior resistance structure of 1.3270, the bears have moved in again and are squeezing longs back to test below 1.3200 support. The price is back to 1.3230 but the volatility and break of 1.3200 opens the risk of a move to 1.3182 which guards a run towards 1.3120.
Gold is set to find a floor as analysts at Credit Suisse look for following the decline to their $1,900/1,890 target, for an eventual retest of the $2,063/2,075 record highs.
Weekly close below $1,868 to reinforce the longer-term sideways range
Gold is showing signs of stabilization as looked for at our target of price support and the 38.2% retracement of the 2022/2023 uptrend at $1,900/1,890. With the key rising 200-DMA seen not far below at $1,868 and with the USD starting to weaken again, our bias remains for a major floor to be found here.
We look for a test of resistance at the 55-DMA at $1,962 initially, a close above which can add weight to our view for a retest of major resistance at the $2,063/2,075 record highs. We still stay biased to an eventual break to new record highs later in the year, which would then be seen to open the door to a move above $2,300.
A weekly close below $1,868 though would be seen to reinforce the longer-term sideways range, and a fall to support next at $1,810/05.
- US annual CPI slowed to 3%, the lowest reading since March 2021.
- US Dollar tumbled across the board after the release of the US inflation data.
- AUD/USD hit its highest level in almost three weeks, reaching 0.6752.
After the release of the US consumer inflation data, which came in below expectations, the AUD/USD pair surged from 0.6685 to 0.6752, reaching its highest level since June 23. The pair remains near the highs as markets digest the new data.
Inflation continues to slow in the US
The US Consumer Price Index (CPI) increased 0.2% in June, below the expected 0.3%. The annual rate fell from 4% to 3%, which is below the market consensus of 3.1%, and the lowest since March 2021. The annual Core rate also fell from 5.3% in May to 4.8% in June, which is below the estimated 5%.
As a result of the lower-than-expected US CPI figures, markets have priced in lower odds of a second rate hike from the Fed this year. However, a rate hike in the July meeting is almost fully priced in.
Following the release of the US CPI figures, US Treasury yields tumbled, with the US 10-year dropping from 3.95% to 3.88%, and the 2-year from 4.84% to 4.73%. The US Dollar Index (DXY) also fell to test June lows, trading near 101.00. Wall Street futures rose, and commodity prices jumped. The current context favors the upside in AUD/USD, with increased risk appetite and lower US yields.
The 0.6750 area represents immediate resistance for the pair, and consolidation above it could open the doors to more gains. The next resistance stands at 0.6765, followed by a strong barrier at 0.6800. The 0.6700/05 area is the immediate support and while above, risks are tilted towards the upside.
Technical levels
- Gold price has climbed strongly to $1,950.00 as US inflation has softened more than expectations.
- The US Dollar Index has plunged as the Fed would have the luxury of skipping interest rates further.
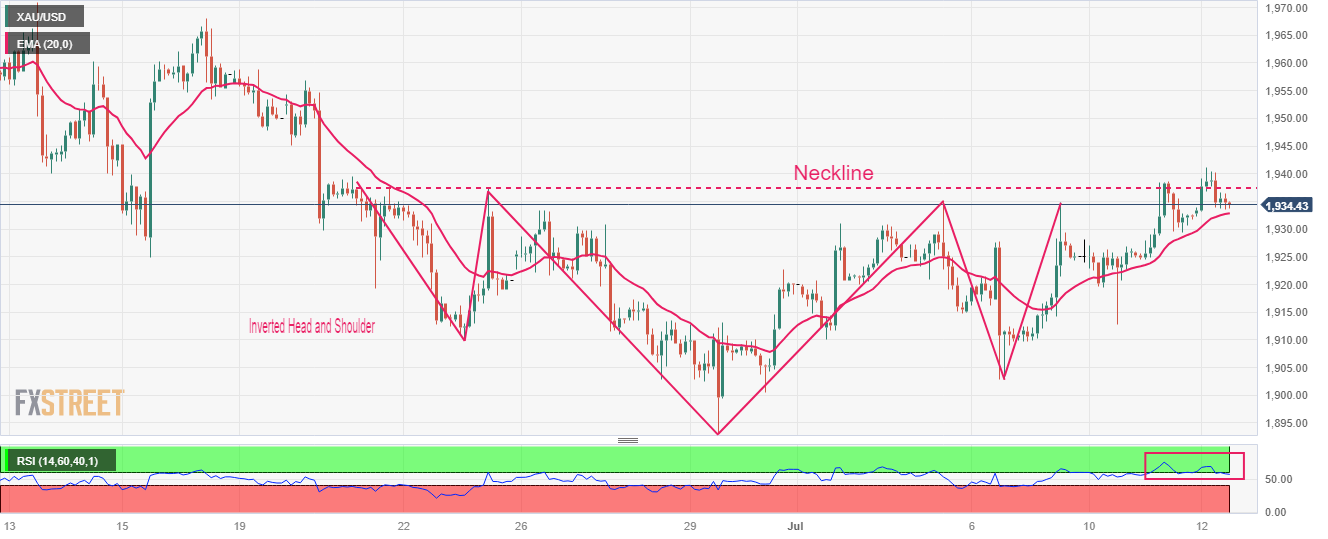
- Gold price is expected to deliver an Inverted H&S breakout after surpassing the neckline plotted around $1,940.00.
Gold price (XAU/USD) has displayed a stellar run as the United States Bureau of Labor Statistics has reported softer-than-expected June Consumer Price Index (CPI) data. The monthly headline and core inflation has reported a pace of 0.3% while investors were anticipating a higher velocity of 0.3%.
Annualized headline CPI has softened to 3.0% vs. the consensus of 3.1% and the former release of 4.0%. While annualized inflation has decelerated to 4.8% against the estimates of 5.0% and the prior release of 5.3%. More-than-anticipated cool-down in inflationary pressures would trim expectations of an interest rate hike by the Federal Reserve (Fed) in its July monetary policy meeting.
Meanwhile, S&P500 futures have jumped strongly as soft inflation figures have eased fears of a recession in the United States. The US Dollar Index (DXY) has demonstrated a vertical fall to near the crucial support of 101.00. The yields offered on 10-year US Treasury bonds have sharply dropped to 3.88%.
Going forward, investors will focus on Thursday’s Producer Price Index (PPI) data. As per the consensus, monthly PPI is expected to register a pace of 0.2% vs. a contraction of 0.3%. It looks like a mild recovery in gasoline prices has propelled factory gate prices.
Gold technical analysis
Gold price is gathering strength to deliver a breakout of the Inverted Head and Shoulder chart pattern formed on a two-hour scale. A breakout of the aforementioned chart pattern will result in a bullish reversal. The neckline of the chart pattern is plotted around June 21 high at $1,940.00.
The 20-period Exponential Moving Average (EMA) at $1,932.90 is providing cushion to the Gold bulls.
Meanwhile, the Relative Strength Index (RSI) (14) has confidently shifted into the bullish range of 60.00-80.00, which indicates that the bullish momentum has been triggered.
Gold two-hour chart
GBP/USD slips back from intraday high. Economists at Scotiabank analyze the pair’s outlook.
Scope for losses is limited
Intraday price action is reflecting some – potential – softness.
Price action suggests some caution is warranted but solidly bullish underlying trends should mean that scope for GBP losses is limited. Support should emerge around the figure, or through the mid/upper 1.28s at worst at this point.
There is some (psychological) resistance at 1.30 but the broadly bullish technical set up suggests gains may extend towards the 1.33 area.
EUR/USD pushes through 1.10. Economists at Scotiabank analyze the pair’s outlook.
EUR/USD needs spread support for stronger advance
Short-term EZ-US rate spreads have narrowed over the past week, with the 2Y spread reaching –155 bps, supporting EUR gains. But spreads will have to narrow further still to lift the EUR meaningfully and make a run above the 1.11 zone. Soft US inflation data may be the catalyst.
EUR/USD is within reach of the 1.1095 April high but there is little reason to expect spot gains to stop there. A push higher to 1.12/1.13 is a growing risk.
- NZD/USD has surrendered its entire gains as the focus shifts to US inflation.
- The RBNZ was expected to keep interest rates steady at 5.5% as the economy has already reported a technical recession.
- S&P500 futures have posted decent gains in the London session, portraying strength in the appeal for US equities.
The NZD/USD pair has sharply dropped below the round-level support of 0.6200 after facing significant offers near 0.6240. The Kiwi asset is under severe pressure as the Reserve Bank of New Zealand (RBNZ) kept the interest rate decision unchanged as expected by the market participants.
RBNZ Governor Adrian Orr was expected to keep interest rates steady at 5.5% as the economy has already reported a technical recession and further policy restriction could has weighed more pressure on the economic outlook.
After analyzing RBNZ’s decision, economists at ANZ Bank conveyed we continue to expect a 25 bps hike in the November Monetary Policy Statement (MPS), but this is not today’s story. For now, inflation indicators continue to fall obediently, and the RBNZ’s pause is highly credible.
Meanwhile, S&P500 futures have posted decent gains in the London session, portraying strength in the appeal for US equities. The US Dollar Index (DXY) is demonstrating a non-directional performance after a fragile pullback around 101.50. Volatility in the USD Index has squeezed as investors have been sidelined ahead of the Consumer Price Index (CPI) data, which will release at 12:30 GMT.
Analysts at Well Fargo have forecasted the headline CPI to rise a modest 0.2% in June. Favorable base comparisons due to last year's surge in energy and food prices should set up the year-over-year rate to fall nearly a full percentage point to 3.1%. We look for the core CPI to downshift alongside a decline in core goods prices. The ongoing improvement in supply chains has helped to ease pressure on goods, and we expect vehicle prices to contract in June.
The USD is trading defensively ahead of the US CPI report. Economists at Scotiabank analyze the greenback’s outlook.
Slowing inflation to weigh on the USD
CPI is expected to reflect a sharp fall in headline prices in June year. The consensus call is for a drop to 3.1%, with prices rising 0.3% in the month. But a number of Wall St banks are looking for a milder 0.2%-ish rise in headline inflation that will pin inflation back to 3%.
Even if core prices growth remains slower to decelerate (forecast at 5.0% YoY, from 5.3% in May), markets may find some comfort in a low core MoM read (a 0.2% MoM gain would be the lowest since 2021).
Slowing inflation – and thoughts of perhaps a 2-handle on headline CPI in the next few months – will encourage market expectations that the Fed may have little (or no) more work to do on monetary policy after the July meeting and weigh on the USD generally.
DXY is within reach of its 2023 lows (tested in January and April) at 100.82; weakness below this point will add to already strong bearish momentum and point to a further 2-3% drop in the index in the coming months to the 98/99 region.
UOB Group’s Senior Economist Julia Goh and Economist Loke Siew Ting review the latest jobs report in Malaysia.
Key Takeaways
The national unemployment rate and labour force participation rate held unchanged at 3.5% and 70.0% respectively in May, signaling stable labour market conditions. Labor conditions are still some way from tightness as the number of unemployed persons and workers outside the labour force remained higher than pre-pandemic amid constrained wage growth.
Total employment hit an all-time high of 16.28mn in May (Apr: 16.25mn) following positive monthly gains since Aug 2021. Hiring was broad-based across all economic sectors, led by the services industry particularly in food & beverage services, wholesale & retail trade, and information & communication activities. The employment-to-population ratio inched up to 67.6% (from 67.5% in Apr), marking a fresh record high, which indicates the ability for Malaysia’s growing economy to create employment.
We maintain our 2023 year-end unemployment rate forecast at 3.2% (BNM est: 3.3%, end-2022: 3.6%). Renewed expectations of tighter monetary and financial conditions in the advance economies coupled with a slower post-pandemic economic recovery in China have raised concerns about a more subdued global demand and growth outlook for 2H23 and 2024. Should conditions slow further in the next few months, this could delay reaching full employment by year-end.
USD/CAD tests 1.32 ahead of US data and the BoC policy decision. Economists at Scotiabank analyze the pair’s outlook.
Losses to extend back to the 1.3100/25 area on a push under 1.3200
The CAD nudged just under 1.3250 into the close of trade Tuesday and has made a little more progress on Wednesday to test 1.32. Soft US CPI and a somewhat hawkish BoC hike should drive spot through the figure.
A push under 1.3200 should see USD losses extend back to the 1.3100/25 area.
See:
- BoC Preview: Forecasts from eight major banks, enough evidence to pull the trigger on another 25 bps rate hike
-
US CPI Banks Preview: Inflation to step meaningfully lower in June
The USD has been on the backfoot ahead of the US CPI inflation report. Economists at Rabobank analyze the greenback’s outlook.
Disinflation?
The headline number is expected at 3.1% YoY, down from the May number of 4.0% YoY. This would be the lowest number since early 2021. While core inflation is stickier, the Bloomberg survey median stands at 5% for the June number down from 5.3% the previous month.
A number in line or below expectations will likely allow EUR/USD to become more comfortable above the 1.10 level in the near-term. However, continued risk of recession in the US suggests that the USD is likely to avoid a strong sell-off on a three-to-six month horizon.
See – US CPI Banks Preview: Inflation to step meaningfully lower in June
- AUD/JPY has sensed selling pressure around 93.50 as the BoJ is expected to tweak its YCC.
- Inflation in Japan is becoming more demand-driven due to rising wages and the contribution of higher import prices has started fading.
- Philip Lowe has opened doors for further policy-tightening as the picture of inflation and its outlook is complex.
The AUD/JPY pair is consistently declining for the past five trading sessions as investors are anticipating that the Bank of Japan (BoJ) could tweak its Yield Curve Control (YCC) in its upcoming interest rate policy on July 28.
The BoJ has maintained an ultra-dovish monetary policy for a decade considering the fact that overall demand is extremely weak due to which inflation has remained below the desired rate. As inflation in Japan is becoming more demand-driven due to rising wages and the contribution of higher import prices in inflationary pressures has started fading. A recovery in the overall demand could allow BoJ Governor Kazuo Ueda to tweak its YCC.
Meanwhile, the Australian Dollar is struggling to find support despite a hawkish commentary from Reserve Bank of Australia (RBA) Governor Philip Lowe. RBA Lowe has opened doors for further policy-tightening as the picture of inflation and its outlook is complex. Philip Lowe warned that economic growth will remain subdued in the next couple of years.
The RBA has made a fresh amendment to its monetary policy structure. Australian central bank will conduct monetary policy eight times from next year against 11 policy meetings.
Meanwhile, the Australian government is also looking for a new candidate to handle monetary policy operations as the tenure of Philip Lowe will be over soon.
Going forward, investors will focus on forward-year consumer inflation expectations, which will release on Thursday at 1:00 GMT. The economic data is expected to soften to 5.1% vs. the former release of 5.2%.
Economists at TD Securities discuss the Bank of Canada (BoC) Interest Rate Decision and its implications for the USD/CAD pair.
Dovish (20%)
Hold at 4.75%. BoC leaves rates unchanged despite upward revisions to GDP/CPI in July MPR. Statement cites further erosion of BOS/CSCE and expected return to below-trend growth in Q2. Core inflation momentum still elevated, but headline getting closer to target. Forward guidance left unchanged as Bank keeps the door open to hikes. USD/CAD +1.15%.
Base-Case (80%)
Hike to 5.00%. BoC delivers another 25 bps rate hike, citing substantial upgrades in July MPR. Tightening is required to ensure inflation does not get stuck above target, especially with a larger output gap in Q1. Statement cites some progress on capacity pressures and wage growth but leaves guidance open-ended. USD/CAD -0.25%.
Economists at MUFG Bank analyze how the US Dollar tends to perform after the release of the CPI report.
There is scope for downside surprises
The Dollar tends to perform poorly in the immediate period after the CPI data. In a six-hour period following the data, the USD has weakened in eight of the last ten months of CPI data releases with the data weaker than expected or in line with expectations in seven of those ten months.
The hurdle for a surprise to the downside is becoming lower in the core readings given the sharp declines in headline CPI will soon be behind us and we believe there is scope for downside surprises given those sharp falls in headline inevitably feed into underlying inflation. If that were to be evident today we would expect further falls in US rates and the Dollar albeit less than what we expected a few days ago given the Dollar selling of late.
See – US CPI Banks Preview: Inflation to step meaningfully lower in June
- US Dollar down against nearly every G10 currency.
- The economic calendar takes the spotlight with US inflation numbers this Wednesday.
- The US Dollar Index continues its slide lower and starts to get in orbit around 101.00.
The US Dollar (USD) is in the red across the board against every major currency. Although no real outliers to notice, it is worth wild mentioning that the Greenback is eyeballing a few one-year-low levels against Polish Zloty (USD/PLN), the Swiss Franc (USD/CHF) and inverted nearing a one-year-high against the Euro (EUR/USD). This filters through in a fifth consecutive negative performance for the US Dollar Index which is starting to head 101.00.
The economic calendar is bearing a main event this Wednesday with the US Consumer Price Index (CPI) gauge. In all the equivalents on monthly and yearly performances, the core inflation will be the one to watch for any market-moving reactions. Seeing the recent data points in terms of services, expectations are that the core will remain sticky near 5% while any lower number will trigger further US Dollar weakness.
Daily digest: US Dollar sinks to the bottom
- Some mild data to start at 11:00 GMT with the Mortgage Bankers Association issuing the Mortgage Applications for the first week of July.
- Main event to take place at 12:30 GMT with the US Consumer Price Index (CPI) coming in. The overall CPI is expected to decelerate from 4% to 3.1% on a yearly basis, while the monthly is expected to pick up some pace from 0.1% to 0.3%. Main driver will be the core CPI which is forecast to stick to a 5% rise, coming from 5.3% on a yearly basis, while the monthly core inflation numbers are expected to slide from 0.4% to 0.3%.
- The estimates for the US core CPI number are between 4.8% and 5.1%. This means that any number below 4.8% will see a substantially weaker US Dollar, while a print above 5.1% will see a substantially stronger USD. A release in between will rather result in a muted and short-lived move in any direction.
- Quite a few Fed speakers today: Neel Kashkari of the Ninth District Federal Reserve Bank at Minneapolis will speak at 13:45 GMT on monetary policy and banking solvency. Raphael W. Bostic from the Federal Reserve Bank of Atlanta will speak around 17:00 GMT at the Atlanta’s Fed Payments Forum. To close off the batch of Fed speakers, president of the Federal Reserve Bank of Cleveland Loretta Mester will speak on FedNow at 20:00 GMT.
- The US Treasury is set to access the markets as well in order to allocate a 10-year bond auction.
- The Japanese Topix heads lower and closes this Wednesday off by -0.67% after Machine Orders sinked into negative territory. China on the contrary was able to again eke out gains near 1%. European equities firmly in the green and US futures are mildly up.
- The CME Group FedWatch Tool shows that markets are pricing in a 92.4% chance of a 25 basis points (bps) interest-rate hike on July 26. Chances of a second hike in November are down to 26.7%. It appears that markets are pricing out again the possibility of a second rate hike and presume that the Fed will hike in July for the last time. Markets expect US Fed Chairman Jerome Powell to announce that the pivotal level has been reached at the yearly Jackson-Hole Symposium between August 24 and 26 in Kansas.
- The benchmark 10-year US Treasury bond yield trades at 3.94% and is continuing its slide lower from 4.09% last week. Traders are again doubling down on whether there will be more than one rate hike from the Fed.
US Dollar Index technical analysis: Implosion possible on the back of US data
The US Dollar is in the ropes and does not seem to be able to trigger any turnaround at the moment. For a fifth consecutive day, the US Dollar is losing substantial ground. On Tuesday, it was Asian currencies which were weighing the Greenback, while this Wednesday the US Dollar is losing ground against nearly every major G10 traded currency. This smashes the US Dollar Index (DXY) again to the floor, with the 101 level coming into play, a nearly one-year-low.
On the upside, look for 102.811 at the 55-day Simple Moving Average (SMA) that will partially re-gain its importance after having been chopped up that much a few weeks ago. Only a few inches above the 55-day SMA, the 100-day SMA comes in at 102.93 and could create a firm area of resistance in between both moving averages. In case the DXY makes its way through that region, the high of July at 103.57 will be the level to watch for a further breakout.
On the downside, 101.50 has been broken and the US Dollar price action is starting to get into orbit around 101.00. Once that level is breached, expect to see the Greenback printing near one-year-lows against most major pairs. Special notice for 100.75, as that level has been a floor since February 2nd and could open the door for a slide below 100.00 once broken through it.
US Dollar FAQs
What is the US Dollar?
The US Dollar (USD) is the official currency of the United States of America, and the ‘de facto’ currency of a significant number of other countries where it is found in circulation alongside local notes. It is the most heavily traded currency in the world, accounting for over 88% of all global foreign exchange turnover, or an average of $6.6 trillion in transactions per day, according to data from 2022.
Following the second world war, the USD took over from the British Pound as the world’s reserve currency. For most of its history, the US Dollar was backed by Gold, until the Bretton Woods Agreement in 1971 when the Gold Standard went away.
How do the decisions of the Federal Reserve impact the US Dollar?
The most important single factor impacting on the value of the US Dollar is monetary policy, which is shaped by the Federal Reserve (Fed). The Fed has two mandates: to achieve price stability (control inflation) and foster full employment. Its primary tool to achieve these two goals is by adjusting interest rates.
When prices are rising too quickly and inflation is above the Fed’s 2% target, the Fed will raise rates, which helps the USD value. When inflation falls below 2% or the Unemployment Rate is too high, the Fed may lower interest rates, which weighs on the Greenback.
What is Quantitative Easing and how does it influence the US Dollar?
In extreme situations, the Federal Reserve can also print more Dollars and enact quantitative easing (QE). QE is the process by which the Fed substantially increases the flow of credit in a stuck financial system.
It is a non-standard policy measure used when credit has dried up because banks will not lend to each other (out of the fear of counterparty default). It is a last resort when simply lowering interest rates is unlikely to achieve the necessary result. It was the Fed’s weapon of choice to combat the credit crunch that occurred during the Great Financial Crisis in 2008. It involves the Fed printing more Dollars and using them to buy US government bonds predominantly from financial institutions. QE usually leads to a weaker US Dollar.
What is Quantitative Tightening and how does it influence the US Dollar?
Quantitative tightening (QT) is the reverse process whereby the Federal Reserve stops buying bonds from financial institutions and does not reinvest the principal from the bonds it holds maturing in new purchases. It is usually positive for the US Dollar.
Economists at Credit Suisse discuss British Pound (GBP) outlook.
GBP/USD to target 1.3000 and EUR/GBP 0.8450 near term
We think GBP will continue to benefit from supportive yield differentials and are not subscribers to the view that it should be sold due to either negative real rates in the United Kingdom or because the economy could eventually suffer a major slump.
We continue to target GBP/USD 1.3000 and EUR/GBP 0.8450 near term.
See: GBP/USD is poised to move into the low 1.30’s – MUFG
Economists at MUFG Bank analyze CAD's outlook ahead of the Bank of Canada decision.
USD/CAD seen higher in 2024 as economic weakness is more pronounced in Canada than elsewhere
After a long pause the BoC in June hiked again and market pricing implies a 75% probability of another hike today. We remain unconvinced of the need to move. Yes, the jobs market was strong (59.9K increase in employment vs 20K expected) but wage inflation was weak with the hourly wage YoY rate falling from 5.1% to 3.9%. Does the BoC need to hike with the core Median YoY CPI rate down at 3.9% with further tightening still to feed into the real economy?
Any benefit today for CAD from a rate hike is unlikely to be sustained over the medium term.
We now forecast little change in USD/CAD through to year-end even as the Dollar weakens across G10 and then see USD/CAD higher in 2024 as economic weakness is more pronounced in Canada than elsewhere.
See – BoC Preview: Forecasts from eight major banks, enough evidence to pull the trigger on another 25 bps rate hike
- GBP/JPP has sharply dropped to near 180.50 as hopes of a tweak in BoJ’s YCC have strengthened.
- Inflation in Japan is becoming more demand-driven after wage growth.
- UK firms are avoiding their dependence on credit to avoid higher interest obligations.
The GBP/JPY pair has stretched its south-side run to near the critical support of 180.50 in the London session. The cross has faced immense selling pressure as investors are hoping a tweak in the Yield Curve Control (YCC) by the Bank of Japan (BoJ) in its monetary policy on July 28.
Inflation in Japan is becoming more demand-driven after Japan's Monthly Labor Survey for May showed confirmation of quickening wage growth after enormous efforts from the BoJ by keeping the interest rate policy ultra-dovish. Earlier, higher import prices were majorly driving inflationary pressures.
The Pound Sterling is struggling to find traction against the Japanese Yen despite accelerating fears of more fat interest rate hikes from the Bank of England (BoE). UK Finance Minister Jeremy Hunt conveyed this week that Britain’s government and the BoE will do whatever is necessary to bring down inflation.
The employment report released on Tuesday showed that wage pressures are sticky but jobless claims rose as job offers have dropped sharply. UK firms are avoiding their dependence on credit to avoid higher interest obligations. Also, households are facing the burden of higher interest rates, which has impacted demand for the housing sector dramatically.
Meanwhile, directors at International Monetary Fund (IMF) have praised BoE policymakers for raising interest rates by half-a-percent to 5%. About the interest rate guidance, IMF believes that the UK central bank may have to keep interest rates high for an extended period if inflation pressures persist, as reported by Reuters.
USD is starting to come under pressure and economists at Credit Suisse see scope for a retest of key support from the range lows for the year at 100.82/78 in the US Dollar Index (DXY).
Move back above 103.57 needed to clear the way for strength back to the recent high and 200-DMA
DXY has quickly moved back below its 55-DMA and late June low and this sees downside pressure increase again to warn of a retest of key support from the lower end of the range for the year and February/April lows at 100.82/78.
A break below 100.82/78 would be seen to resolve the range for the year lower to warn of a fresh and potentially concerted bear phase with initially support seen at 100.00, then 99.50 and eventually what we would look to be better support at the 61.8% retracement of the 2021/2022 uptrend and 200-week average at 98.98/98.25.
A move back above 103.57 is seen needed to clear the way for strength back to the recent high and 200-DMA, now at 104.60/70. Only above here though would be seen to rekindle thoughts of a potential basing story for a test of 105.88/106.13 – the March highs and 38.2% retracement of the 2022/2023 fall.
- USD/JPY prolongs its downfall for the fifth straight day and drops to a nearly one-month trough.
- Bets the Fed will end its rate-hiking cycle soon weighs on the USD and exerts downward pressure.
- Expectations that the BoJ will shift its policy stance boosts the JPY and contributes to the decline.
- The oversold RSI on hourly charts helps limit any further losses ahead of the crucial US CPI report.
The USD/JPY pair extends its recent sharp pullback from the YTD peak - levels just above the 145.00 psychological mark - and continues drifting lower for the fifth successive day on Wednesday. The downward trajectory drags spot prices to the 139.30 level, or a nearly one-month low during the early European session, though pauses near the 38.2% Fibonacci retracement level of the March-June rally.
The bearish pressure surrounding the US Dollar (USD) remains unabated in the wake of speculations that the Federal Reserve (Fed) will end its rate-hiking cycle following a 25 bps lift-off in July. The Japanese Yen (JPY), on the other hand, draws support from expectations that the Bank of Japan (BOJ) will adjust its ultra-loose policy settings as soon as this month, which, in turn, contributes to the USD/JPY pair's downfall witnessed over the past week or so.
That said, a generally positive tone around the equity markets undermines demand for the safe-haven Japanese Yen (JPY) and lends some support to spot prices. Traders also seem reluctant to place aggressive bets and prefer to wait on the sidelines ahead of the US consumer inflation figures, due for release later during the early North American session. The crucial US CPI report should influence the USD and provide some meaningful impetus to the USD/JPY pair.
In the meantime, the extremely oversold Relative Strength Index (RSI) on hourly charts is seen helping limit the downside, at least for the time being. That said, acceptance below the 50-day Simple Moving Average (SMA) and bearish technical indicators on the daily chart suggest that the path of least resistance for the USD/JPY pair is to the downside. Bears, however, might still wait for some intraday consolidation or a modest bounce before placing fresh bets.
From current levels, the 38.2% Fibo. level could protect the immediate downside ahead of the 139.00 mark, which if broken will be seen as a fresh trigger for bearish traders. The USD/JPY pair might then accelerate the depreciating move towards testing sub-138.00 levels, representing the 61.8% Fibo. level.
On the flip side, the 140.00 psychological mark now seems to act as an immediate hurdle, above which a bout of a short-covering move could lift the USD/JPY pair towards the 140.60 area, representing the 50% Fibo. level. Any subsequent move up, however, might still be seen as a selling opportunity around the 141.00 mark and remain capped near the 141.20-141.25 region. A sustained strength beyond the latter is needed to negate the negative outlook.
USD/JPY daily chart
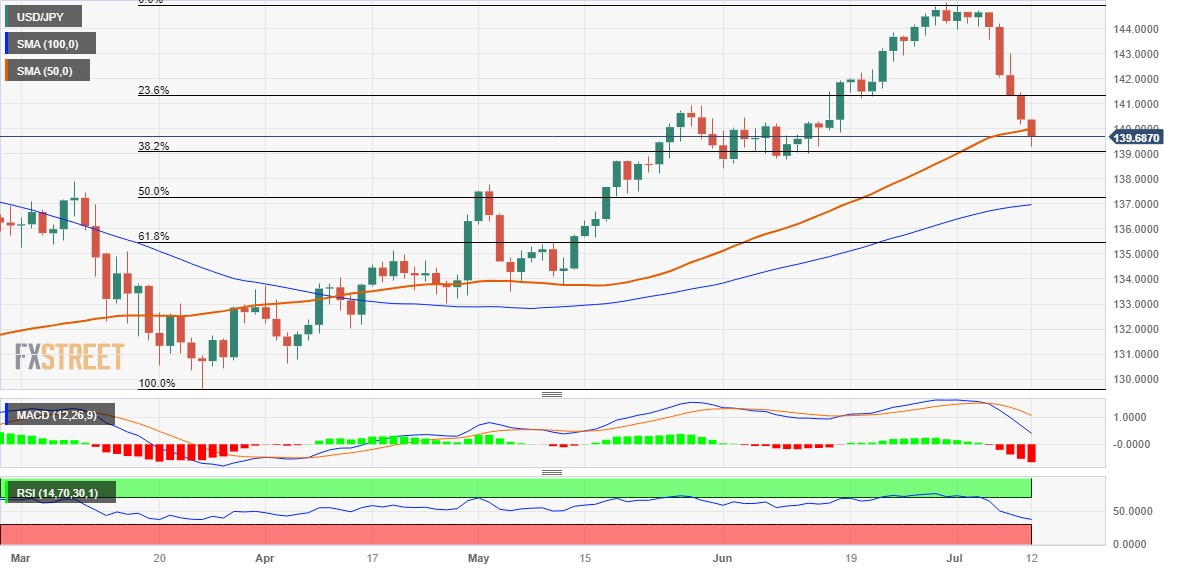
Key levels to watch
"I think there are some interesting pieces of evidence in labour market data, it's a continuation in some cases - if you look at the vacancy to unemployment ratio, for instance - of some signs of the labour market cooling," Bank of England (BoE) Governor Andrew Bailey said on Wednesday.
Bailey further noted that the current level of pay increases was not consistent with the inflation target.
Market reaction
GBP/USD continues to pull away from the 15-month high it set at 1.2970 earlier in the day. As of writing, the pair was virtually unchanged at 1.2930.
Economists at Société Générale analyze CAD outlook ahead of the Bank of Canada Interest Rate Decision.
BoC to hike 25 bps
In Canada, another 25 bps increase to 5% is in the balance today, following a spectacular gain of 110K in full-time employment in June. However, wage growth did slow sharply, to 3.9% YoY, as more jobseekers entered the labour force.
Whether rates are hoisted to 5% will depend on whether the central bank believes inflation is still on target to return to target by the middle of 2024. The BoC pointed out in June that three-month measures of core inflation have been running in the 3.5-4% range for several months and that excess demand persists.
We are upbeat on the outlook for the CAD over the medium term, based on solid growth fundamentals and attractive FX valuation.
- EUR/GBP has picked strength near 0.8500 despite expectations of a higher interest rate peak from the BoE.
- UK’s higher disposable income would allow households to make more purchasing and might allow inflation to remain sticky.
- ECB Lagarde has already confirmed that further policy tightening is appropriate to tame stubborn inflation.
The EUR/GBP pair has rebounded after building a base marginally above the round-level support of 0.8500 in the European session. For fetching immense strength in the recovery move, the cross is yet to pass plenty of filters.
On Tuesday, the Pound Sterling went through a rough phase after the release of June’s labor market report. Claimant Count Change has jumped to 25.7K while there was a decline of 22.5K claims last month. Three-month Unemployment Rate has increased to 4.0% vs. the expectations and the former release of 3.8%.
An economic indicator that has made Bank of England (BoE) policymakers and United Kingdom delegates uncomfortable is the steady three-month Average Earnings data. Average Earnings excluding bonuses maintained an ongoing pace at 7.3% while investors were anticipating a decline to 7.1%.
Higher disposable income would allow households to make more purchasing and might allow inflationary pressures to remain sticky. Investors are anticipating that interest rates by the BoE would peak in a 6.25-6.50% range.
Going forward, investors will focus on UK’s Gross Domestic Product (GDP) data. Monthly Industrial Production and Gross Domestic Product (GDP) are expected to contract by 0.4%. And Manufacturing Production is seen contracting by 0.5%.
On the Eurozone front, European Central Bank (ECB) Governing Council member Francois Villeroy de Galhau said on Tuesday that inflation will continue to decline and will be back at 2% by 2025.
ECB President Christine Lagarde has already confirmed that further policy tightening is appropriate to tame stubborn inflation.
GBP/USD has successfully held its confirmed uptrend from last September and economists at Credit Suisse stay bullish for their 1.2973/1.3000 target.
Move below 1.2661 can see the uptrend from last September broken
GBP/USD has pushed strongly higher after successfully holding its uptrend from last September, now seen at 1.2661 and we still see scope for a test of the March/April 2022 lows at 1.2973/1.3000. Our bias remains to then look for a cap here. Should strength directly extend though, we would see resistance next at 1.3299, then the 78.6% retracement of the 2021/2022 fall at 1.3414.
Below 1.2661 can see the uptrend from last September broken but with a move below the recent reaction low and 55-DMA at 1.2590 needed to suggest we have seen an important break lower, exposing support next at 1.2310.
Economist at UOB Group Lee Sue Ann sees the Bank of Korea (BoK) keeping its policy rate unchanged at 3.5% at its meeting later in the week.
Key Quotes
While all six BOK board members (excluding the Governor) signaled room to bring the rate to a terminal level of 3.75% at the May meeting, we think the BOK’s hands are tied due to the growth risks.
As such, we maintain our forecast for the benchmark interest rate to stay at 3.50% through 2023 and that the BOK will start cutting interest rate in 1Q24.
- USD/CHF drifts lower for the fifth straight day and drops to a 2-1/2 year trough on Wednesday.
- Expectations that the Fed is done with its rate-hiking cycle weigh on the USD and exert pressure.
- A positive risk tone undermines the CHF and lends some support ahead of the key US CPI report.
The USD/CHF pair remains under some selling pressure for the fifth successive day on Wednesday and drops to its lowest level since January 2021 during the early European session. Spot prices, however, manage to recover a few pips in the last hour and currently trade around the 0.8780-0.8785 region, down only 0.10% for the day.
The recent US Dollar (USD) downtrend witnessed over the past week or so, to a two-month low, remains uninterrupted in the wake of speculations that the Federal Reserve (Fed) is nearly done with its policy tightening. Investors now seem convinced that the US central bank will end its rate-hiking cycle following the expected lift-off in July, which is reinforced by the ongoing retracement slide in the US Treasury bond yields. This, in turn, is seen weighing on the USD and turning out to be a key factor dragging the USD/CHF pair lower.
The closely-watched US employment details released on Friday showed that the economy added the fewest jobs in 2-1/2 years in June and indicated that the labor market is cooling. Furthermore. the New York Fed's monthly survey revealed on Monday that the one-year consumer inflation expectation dropped to 3.8% in June - the lowest level since April 2021. This, in turn, fueled speculations about a further deceleration in US consumer inflation, which should allow the US central bank to soften its hawkish stance sooner rather than later.
Hence, the market focus remains glued to the release of the latest US consumer inflation figures, due later during the early North American session. Heading into the key data risk, a modest recovery in the global risk sentiment - as depicted by a generally positive tone around the equity markets - undermines the safe-haven Swiss Franc (CHF) and helps limit losses for the USD/CHF pair, at least for the time being. The fundamental backdrop, however, favours bearish traders and suggests that the path of least resistance for spot prices is to the downside.
Technical levels to watch
Today, we will get the Bank of Canada’s latest policy decision. Economists at Commerzbank analyze how could CAD react to the Monetary Policy Report.
The market is uncertain about what comes next
The market is not entirely certain that there will be a further rate step today, even if the majority is pricing it in, including us. If the BoC hikes today, the CAD is likely to appreciate somewhat.
However, the market is uncertain about what comes next. It is therefore likely to hope for clear signals on the part of the BoC. If the Boc should remain vague and only repeat its commitment to price stability (which should be self-understood anyway) while the inflation data for June, due for publication on Tuesday, surprises to the upside, things might end badly for CAD.
See – BoC Preview: Forecasts from eight major banks, enough evidence to pull the trigger on another 25 bps rate hike
- Bank of Canada is set to raise rates by 25 bps rate hike to 5.0% on Wednesday.
- BoC will publish its updated economic projections, Governor Macklem’s presser to follow.
- BoC’s rate outlook and Macklem speech to ramp up volatility around the Canadian Dollar.
The Bank of Canada (BoC) is widely expected to announce another 25 basis points (bps) rate hike at its July monetary policy meeting due this Wednesday, bringing rate hikes back on the table after hitting the pause button in March.
Bracing for the BoC showdown, USD/CAD is maintaining its corrective mode from a monthly high of 1.3389, as the Canadian Dollar remains underpinned by improving domestic economic activity and tighter labor market conditions.
Bank of Canada interest rate decision: What to know in markets on Wednesday, July 12
- USD/CAD is sitting at two-week lows near 1.3200 amid persistent US Dollar (USD) weakness and a sharp rally in WTI prices.
- Recent speeches by the Fed officials signaled that the Fed could be nearing an end to its tightening cycle. The benchmark 10-year US Treasury bond yields are trading under pressure below 4.0%.
- Markets are trading with caution ahead of the critical US Consumer Price Index (CPI) data. The US S&P 500 futures are modestly flat on the day.
- The annual headline US CPI is seen rising 3.1% in June, compared with 4.0% booked previously. Core CPI inflation is expected to soften to 5.0% in the reported month. On a monthly basis, US CPI is likely to increase 0.3% in June vs. 0.1% recorded in May. Core monthly CPI inflation is seen a tad lower at 0.3% vs. 0.4% prior.
- The BoC policy announcements and Macklem’s presser will be key to the short-term direction in the USD/CAD pair in the aftermath of the US CPI data-led market volatility.
Analysts at TD Securities (TDS) offered a more hawkish outlook on the BoC policy decision this Wednesday, stating, “we look for the BoC to hike another 25bps to 5.00% in July. Upward revisions to projections in the July MPR will provide the main catalyst for the hike but we do expect a more balanced statement relative to June after some further erosion of sentiment.”
“We also look for the Bank to leave its guidance open-ended, although we believe 5.00% will mark the terminal rate for the BoC,” they added.
When is the BoC monetary policy decision and how could it affect USD/CAD?
The Bank of Canada will announce its policy decision at 14:00 GMT. The policy announcements will be accompanied by the central bank’s quarterly economic forecasts and its assessment of risks. BoC Governor Tiff Macklem will hold a press conference at 15:00 GMT.
The Bank of Canada is likely to raise rates to 5.0% in July from 4.75% seen in June when the central bank delivered a surprise 25 bps lift-off. Markets are pricing about a 68% probability of a quarter percentage point hike by the central bank this week.
Strengthening Canadian economy along with a strong labor market justifies the case for a July rate hike even though the country’s annual Consumer Price Index (CPI) rose at its slowest pace in two years at 3.4% in May. According to Statistics Canada, Canadian Gross Domestic Product (GDP) expanded 0.4% during the month. Meanwhile, the county’s employment data published by the agency showed Canada added 60,000 jobs despite a rise in the Unemployment Rate to 5.4% in the reported month.
However, should the BoC hike interest rates by another 25 bps in July with no clarity on the future policy path, the Canadian Dollar could come under selling pressure, driving the USD/CAD pair back toward 1.3400. The major could also see a sustained rally in case the central bank surprises and holds rates at 4.75%. On the other hand, USD/CAD sellers could flex their muscles and target 1.3100 if the BoC hints at extending its tightening cycle until it brings down inflation to its 2.0% target.
Dhwani Mehta, Asian Session Lead Analyst at FXStreet, offers a brief technical outlook for the USD/CAD: “The pair has breached critical daily support lines to reach the lowest level in two weeks ahead of the BoC rates decision. The Relative Strength Index (RSI) is pointing south below the midline, justifying the USD/CAD weakness.”
Dhwani also outlines important technical levels to trade the major: “Sellers are likely to challenge the 1.3150 psychological level if the Canadian Dollar gathers upside traction on the BoC policy announcements. The next key support is seen at the June 26 low of 1.3117. Alternatively, immediate resistance awaits at the bearish 21-Daily Moving Average (DMA), pegged at 1.3234. Acceptance above the latter is critical to initiate a meaningful recovery toward the 1.3400 round figure.”
- USD/CAD has shown a recovery move from 1.3200 amid a mild rebound in the USD Index.
- Investors are hoping that the Fed will hike interest rates just once more this year.
- The BoC is expected to raise interest rates further as inflation is still above the desired rate.
The USD/CAD pair has found support near the round-level cushion of 1.3200 in the European session. The Loonie asset has rebounded following the recovery action in the US Dollar Index (DXY). The USD Index has attempted recovery after building a base around 101.35.
S&P500 futures are showing topsy-turvy moves after posting mild gains in the London session, portraying a quiet market mood ahead of the United States Consumer Price Index (CPI) data. However, the overall market mood is extremely cheerful.
The USD Index is expected to remain on the tenterhooks as the release of the inflation data will provide meaningful cues about the interest rate guidance. Annualized headline inflation is expected to soften as the impact of a slight rise in gasoline prices must be offset by a drop in utility gas services.
Core inflation could show some persistence as wage pressures have remained elevated due to labor shortages. Although investors are hoping that the Federal Reserve (Fed) will hike interest rates just once more this year Fed policymakers are still conveying two more interest rate hikes as inflation is still stubborn due to the strong labor market.
The Canadian Dollar will show a power-pack action ahead of the interest rate decision by the Bank of Canada (BoC). Analysts at ING expect “BoC hiked interest rates 25 bps last month having left them untouched since the last hike in January. We don’t see last month’s move as a one-off. To restart the hiking process means that the BoC feels it has unfinished business, and with the jobs market looking tight and inflation running above target we expect the BoC to hike by a further 25 bps.”
On the oil front, oil prices are facing delicate barricades around $75.00 as global central banks are preparing for a fresh interest rate hike cycle. It is worth noting that Canada is the leading exporter of oil to the United States and higher oil prices support the Canadian Dollar.
Further weakness lies ahead for USD/CNH if it breaches 7.1800, comment Economist Lee Sue Ann and Markets Strategist Quek Ser Leang at UOB Group.
Key Quotes
24-hour view: We noted yesterday that “the underlying tone still appears to be soft” and we expected USD to trade with a downward bias. However, we held the view that “7.1800 is still likely out of reach.” Our view turned out to be correct as USD fell to a low of 7.1950. Downward momentum has improved, and today, barring a break above 7.2260 (minor resistance is at 7.2170), USD is likely to break below 7.1800. The next support at 7.1500 is unlikely to come into view today.
Next 1-3 weeks: Our latest narrative was from two days ago (10 Jul, spot at 7.2230) wherein “the risk of USD pulling back below 7.1800 has increased.” Yesterday (11 Jul, USD fell to a low of 7.1950. Downward momentum has improved further. If USD breaks below 7.1800, the focus will shift to 7.1500. Only a breach of 7.2500 (‘strong resistance’ level previously at 7.2650) would indicate that USD is not ready to head lower.
The immediate matter of interest is today’s June CPI data – which is tough to trade in the FX space, in the opinion of economists at Credit Suisse.
A “weak” number would allow the market to toy with the idea of pricing in no further hikes after this month
The bottom line is that if the number surprises strongly like last time, the USD is likely to quickly reverse yet again its losses of the past week as the market prices more aggressively for more Fed hikes in September and beyond. Conversely, a number that can be termed ‘weak’ would allow the market to toy with the idea of pricing in no further hikes after this month, compared to the roughly 40% chance of a further 25 bps after this month’s hike now priced in.
From our perspective, EUR/USD is still too far from the upper end of our expected Q3 1.0500-1.1250 range (same as Q2) to make a short trade a good risk/reward one, even if we tend to line up on the side of upside CPI surprises. Similarly, at around 140, USD/JPY is not yet close enough to the extremes of our expected Q3 range of 135-152 to present a compelling case to buy. While frustrating, we feel it is best to stay focused on trade location at a time of high sensitivity to individual data points.
See – US CPI Banks Preview: Inflation to step meaningfully lower in June
- AUD/USD struggles to capitalize on its intraday positive move to a nearly three-week high.
- Bulls opt to lighten their positions ahead of the release of the US consumer inflation data.
- Bets that the Fed will end its rate-hiking cycle undermine the USD and should limit losses.
The AUD/USD pair retreats over 50 pips from a nearly three-week high touched this Wednesday and slides back below the 0.6700 round-figure mark during the early European session.
In the absence of any fresh fundamental development, the intraday pullback from the 0.6740 area could be attributed to some repositioning trade ahead of the key data risk - the release of the latest US consumer inflation figures. The crucial US CPI report is due for release later during the early North American session and will play a key role in influencing the Federal Reserve's (Fed) rate-hike path. This, in turn, will drive the US Dollar (USD) demand in the near term and provide a fresh directional impetus to the AUD/USD pair.
In the meantime, speculations that the US central bank will end its current rate-hiking cycle after the widely expected lift-off in July continues to weigh on the buck. In fact, the USD Index (DXY), which tracks the Greenback against a basket of currencies, sinks to a two-month low as investors now seem convinced that the US central bank has limited headroom to continue tightening the monetary policy. Furthermore, signs of easing inflationary pressure could allow the Fed to soften its hawkish stance sooner rather than later.
This, in turn, leads to a further decline in the US Treasury bond yields, which, along with a generally positive risk tone, might continue to undermine the safe-haven USD and lend some support to the risk-sensitive. This, in turn, suggests that the path of least resistance for the AUD/USD pair is to the upside. That said, failure to find acceptance above a technically significant 200-day SMA warrants some caution for aggressive bullish traders and positioning for any further appreciating move, at least for the time being.
Technical levels to watch
- The index extends its rout to multi-week lows near 101.30.
- US inflation is expected to have receded further in June.
- Fed’s Beige Book, Mester next on tap in the docket.
The greenback, in terms of the USD Index (DXY), extends the bearish move to new 2-month lows in the 101.30 region on Wednesday.
USD Index now looks at US CPI, Beige Book
The index drops for the fifth consecutive session and accelerates the decline to 9-week lows in the 101.35/30 band on Wednesday.
Indeed, the dollar remains well offered in a context where the appetite for the risk complex prevails ahead of the publication of key US inflation figures tracked by the CPI for the month of June.
In the meantime, US consumer prices are expected to have receded further during last month, which in turn fuel hopes that the Federal Reserve might end its hiking campaign in the near term, despite a 25 bps rate hike later in July is largely anticipated.
Other than the June CPI, the US calendar will see the usual weekly Mortgage Applications measured by MBA, the EIA weekly report on US crude oil inventories, the Fed’s Beige Book and the speech by Cleveland Fed L. Mester (2024 voter, hawk).
What to look for around USD
The index loses further ground and extends the pessimism seen so far this week, this time revisiting the 101.30 zone ahead of the US CPI results.
Meanwhile, the likelihood of another 25 bps hike at the Fed's upcoming meeting in July remains high, supported by the continued strength of key US fundamentals such as employment and prices.
This view was further bolstered by comments from Fed Chief Powell at the June FOMC event, who referred to the July meeting as "live" and indicated that most of the Committee is prepared to resume the tightening campaign as early as next month.
Key events in the US this week: MBA Mortgage Applications, Inflation Rate, Fed’s Beige Book (Wednesday) – Producer Prices, Initial Jobless Claims (Thursday) – Advanced Michigan Consumer Sentiment (Friday).
Eminent issues on the back boiler: Persistent debate over a soft/hard landing of the US economy. Terminal Interest rate near the peak vs. speculation of rate cuts in late 2023/early 2024. Fed’s pivot. Geopolitical effervescence vs. Russia and China. US-China trade conflict.
USD Index relevant levels
Now, the index is down 0.19% at 101.46 and faces the next support at 101.67 (monthly low July 11) followed by 101.01 (weekly low April 26) and finally 100.78 (2023 low April 14). On the other hand, the breakout of 103.54 (weekly high June 30) would open the door to 104.50 (200-day SMA) and then 104.69 (monthly high May 31).
Economists at Credit Suisse preview today’s Bank of Canada meeting and its implications for the CAD.
Quacking like a hawk
We expect the BoC to stay hawkish by hiking 25 bps and signalling willingness to do more via upward tweaks of GDP and CPI forecasts (April MPR CPI estimates were 2.5% YoY for Q423 and 2.1% YoY for Q424, whereas GDP was estimated at 1.1% YoY and 1.9% YoY respectively). We think markets will react by firming up near-term policy tightening expectations, with positive rate support implications for CAD.
We remain constructive on CAD and hold on to our end-Q3 1.3100 USD/CAD target.
See – BoC Preview: Forecasts from eight major banks, enough evidence to pull the trigger on another 25 bps rate hike
In the view of Economist Lee Sue Ann and Markets Strategist Quek Ser Leang at UOB Group, further decline could force USD/JPY to revisit the 139.00 zone.
Key Quotes
24-hour view: We indicated yesterday that the USD weakness had not stabilized. We expected USD to weaken, but we were of the view that “the next major support at 140.05 is unlikely to come under threat.” While our view was not wrong, as USD fell to a low of 140.21, it broke below 140.05 in early Asian trade today. The risk for today is still clearly on the downside. That said, it remains to be seen if there is enough momentum to carry USD to the next major support at 139.00. On the upside, if USD breaks above 140.90 (minor resistance is at 140.40), it would suggest that USD is not weakening further.
Next 1-3 weeks: Two days ago (10 Jul), when USD was trading at 142.50, we turned negative in USD. While our view was not wrong, the pace of the decline has exceeded our expectations. Note that it was only yesterday (11 Jul, spot at 141.30) that we stated that USD could weaken further, and the next level to watch is 140.05. Today, in early Asian trade, USD fell below 140.05. Instead of slowing, the sharp and swift decline over the past few days is accelerating. Looking ahead, the next level to aim for is 139.00, followed by 138.45. All in all, we will continue to expect a lower USD as long as it stays below 141.40 (‘strong resistance’ level was at a much higher level of 143.00 yesterday).
CME Group’s flash data for natural gas futures markets noted traders scaled back their open interest positions for the second session in a row on Tuesday, this time by around 3.7K contracts. Volume, instead, went up for the second consecutive day, now by around 34.2K contracts.
Natural Gas remains supported around the $2.50 zone
Prices of natural gas maintained the optimism and climbed to multi-session highs past the $2.70 zone on Tuesday. The move, however, was on the back of shrinking open interest, which should remove some strength from the weekly rebound. In the meantime, the $2.50 region per MMBtu continues to hold the downside for the time being.
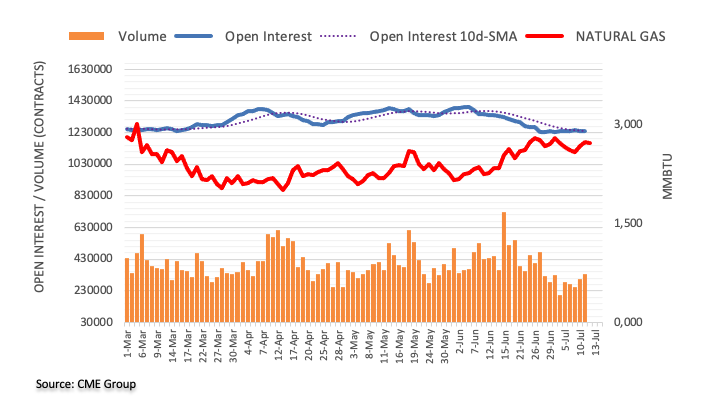
The US Dollar has retreated recently against the Yen. Economists at UBS analyze USD/JPY outlook.
Same set of conditions that caused the Yen to appreciate in late 2022 are in place again
We believe the latest bout of dollar weakness is a sign of things to come, and we see the USD/JPY pairing falling to around 124 by next June.
The same set of conditions that caused the Yen to appreciate in late 2022 are in place again. Even though we cannot rule out near-term spikes in the pairing above 145 so long as the Fed remains hawkish and the BoJ stays dovish, we believe any further Dollar strength would be short-lived. As in late 2022, we expect a moderation in US economic data and an adjustment in BoJ's yield-curve control policy. We also see stretched net short JPY positioning in the market – which could accelerate any move higher in the Japanese currency.
- NZD/USD has sensed support near 0.6212 as the overall market mood is quite upbeat.
- A steady interest rate policy by the RBNZ seems healthy for NZ’s economic outlook.
- NZD/USD is gathering strength to deliver a breakout of the Inverted Head and Shoulder pattern.
The NZD/USD pair has resumed its upside journey after a marginal correction to near 0.6212 in the early London session. The Kiwi asset has remained in the upside trajectory after the Reserve Bank of New Zealand (RBNZ) kept interest rates unchanged at 5.5%.
NZ economy is already going through a technical recession, therefore, the interest rate decision of maintaining the status quo by RBNZ Governor Adrian Orr seems healthy for the economic outlook.
The US Dollar Index (DXY) is demonstrating a non-directional performance after sharply correcting to near 101.34 ahead of the Consumer Price Index (CPI) data for June. Investors are anticipating a decline in inflationary pressures amid declining gasoline prices.
NZD/USD is gathering strength to deliver a breakout of the Inverted Head and Shoulder chart pattern on a two-hour scale. A breakout of the neckline plotted from June 22 high around 0.6220 will result in a bullish reversal.
The Relative Strength Index (RSI) (14) is consistently oscillating in the 40.00-60.00, which indicates a sideways performance.
Going forward, a decisive break above the intraday high around 0.6240 will drive the asset towards May 17 high at 0.6274 followed by the round-level resistance at 0.6300.
Alternatively, a downside move below June 23 low at 0.6116 will expose the asset June 05 low at 0.6041. A slippage below the latter would expose the asset to psychological support at 0.6000.
NZD/USD two-hour chart
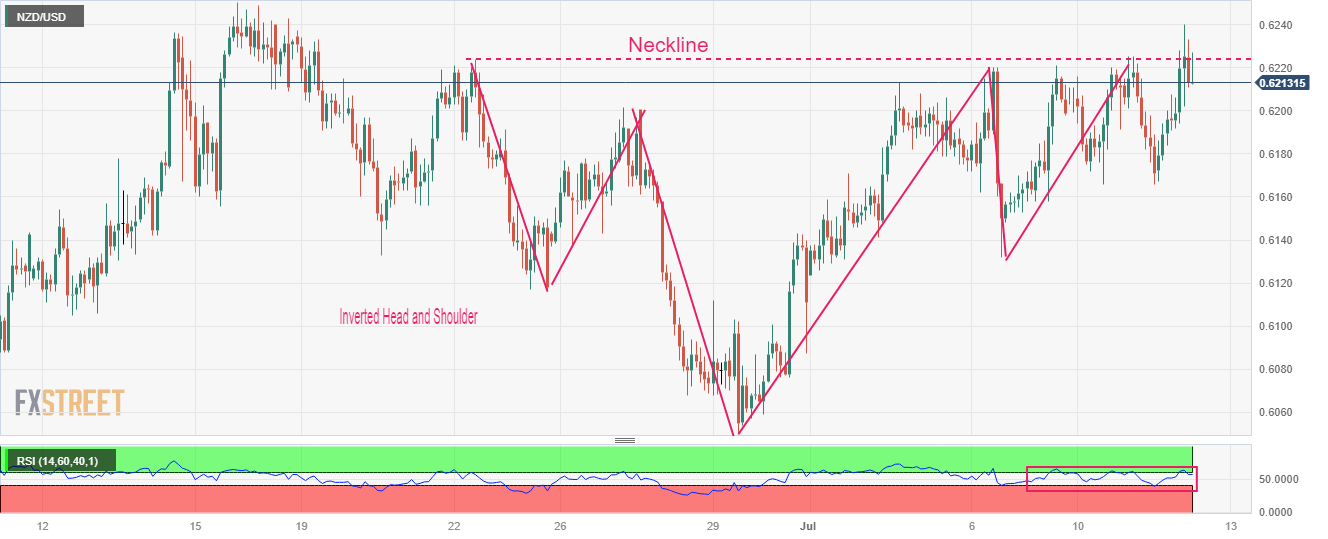
The highlight of the week is on the agenda for today: the new inflation data from the US for June. Economists at Commerzbank analyze how the Dollar could react to the figures.
Price pressure should also have eased for core inflation
Contrary to the situation in May price pressure should also have eased for core inflation. The market expects 3.1% for the overall rate and 5.0% for the core rate.
Of course, these are still rates that justify a Fed rate step in July, but anything after that is uncertain. Even though the FOMC signalled two further 25 bp rate hikes at the June meeting. As a result, the market is likely to increasingly price out this additional step, which it sees sceptically anyway, with any indication that inflation is falling even more quickly; that is likely to put pressure on the Dollar.
If additionally, the economic data over the coming weeks suggest that the past rate steps are increasingly having an effect on the economy, not only is the last step going to be priced out but existing rate cut expectations are likely to increase further.
See – US CPI Banks Preview: Inflation to step meaningfully lower in June
Economist Lee Sue Ann and Markets Strategist Quek Ser Leang at UOB Group expect AUD/USD to extend its consolidative range in the short-term horizon.
Key Quotes
24-hour view: Our expectations for AUD to rise to 0.6710 yesterday did not materialize as it traded in a range of 0.6652/0.6695. The underlying tone still appears to be firm, and we continue to see chance for AUD to rise to 0.6710. The next resistance at 0.6750 is highly unlikely to come into view. Support is at 0.6670, followed by 0.6650.
Next 1-3 weeks: Our update from Monday (10 Jul, spot at 0.6685) still stands. As highlighted, AUD is likely to trade in a range between 0.6620 and 0.6750 for now.
Considering advanced prints from CME Group for crude oil futures markets, open interest increased by around 14.3K contracts after three consecutive daily drops on Tuesday. In the same direction, volume rose by around 78.7K contracts after three straight daily pullbacks.
WTI now targets the 200-day SMA above $77.00
WTI prices rose markedly to the boundaries of the $75.00 mark per barrel on Tuesday amidst rising open interest and volume. That said, the door now appears open to the continuation of the ongoing rebound to, initially, the key 200-day SMA just above the $77.00 yardstick.
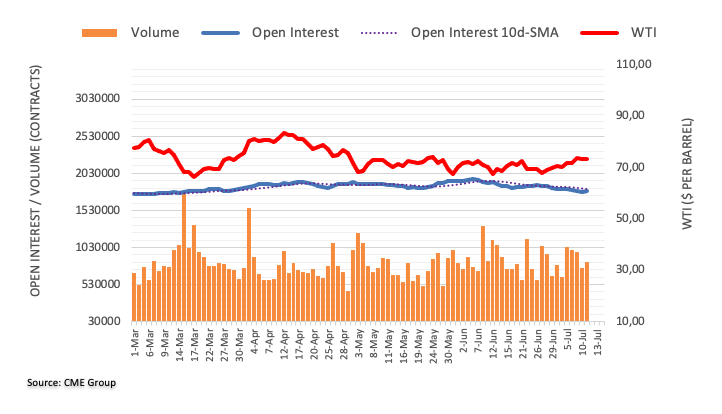
Economists at Credit Suisse discuss Yuan's outlook.
USD/KRW will be more reactive to China sentiment and US data
Despite the short-term stability in the Yuan, we think that the fundamentals still point to Yuan weakness, and we re-iterate our Q3 USD/CNH target of 7.50. We think the PBoC is slowing (but not halting) Yuan's weakness ahead of key levels (such as 7.30). Fed-PBoC divergence, broad Dollar weakness and a weak export outlook point to higher USD/CNH.
We suspect CNH could trade in a narrow 7.20-7.30 range for the remainder of July. Thereafter, we think the PBoC will ‘permit’ gradual USD strength vs the yuan. While the PBoC suppresses volatility, we think USD/KRW will be more reactive to China sentiment and US data. We maintain a bearish Won bias within a 1,250-1,350 range in USD/KRW.
Here is what you need to know on Wednesday, July 12:
The US Dollar continues to weaken against its rivals, with the US Dollar Index (DXY) dropping to its lowest level in two months below 101.50 early Wednesday. June Consumer Price Index (CPI) data from the US will be watched closely by market participants. The Bank of Canada will announce monetary policy decisions and Governor Tiff Macklem will speak on the policy outlook. In the late American session, the US Federal Reserve will publish its Beige Book.
The positive shift witnessed in risk sentiment after Wall Street's opening bell on Tuesday caused the USD to come under renewed selling pressure. The Dow Jones Industrial Average gained nearly 1% and the S&P 500 rose 0.7%, while the DXY closed in negative territory for the fourth straight day. Early Wednesday, US stock index futures trade modestly higher. Annual CPI inflation in the US is forecast to decline to 3.1% in June from 4% in May.
CPI Data Preview: US inflation expected to slow down in June.
During the Asian trading hours, the Reserve Bank of New Zealand announced that it left the policy rate unchanged at 5.5% as expected and noted that rates will need to remain at a restrictive level for the foreseeable future. "Committee agreed that monetary conditions are restricting spending and reducing inflationary pressure as anticipated," RBNZ noted in its press release. Despite the pause in tightening, NZD/USD gathered bullish momentum and was last seen trading in positive territory above 0.6200.
The BoC is forecast to raise its policy rate by 25 basis points to 5%. USD/CAD trades at its lowest level since late June near 1.3200 in the early European session.
Bank of Canada Preview: Three reasons to expect a CAD rally on an interest rate hike.
EUR/USD registered small gains on Tuesday and continued to stretch higher in the Asian session on Wednesday. The pair holds comfortably above 1.1000 in the European morning
Following a technical correction that saw the pair dropped to the 1.2750 area on Tuesday, GBP/USD gathered bullish momentum and surged beyond 1.2900. The pair was last seen trading at its strongest level in 15 months at around 1.2950.
USD/JPY broke below 140.00 and fell to a fresh monthly low. The pair trades deep in negative territory below 139.50 mid-week.
Gold price edged higher on Tuesday as the benchmark 10-year US Treasury bond yield returned below 4%. XAU/USD clings to small daily gains above $1,930 in the European morning.
Bitcoin stays relatively quiet and posts small daily gains near $30,700. Ethereum continues to fluctuate in a tight channel at around $1,900.
Economists at Commerzbank analyze EUR/USD outlook.
EUR is likely to appreciate against the USD short-term
If any signals from the ECB remain relatively hawkish because the doves on the council continue to receive less attention than the hawks, EUR/USD might well return above the 1.11 mark.
Only once the ECB’s interest rates have peaked too and when it becomes clear that it is not doing enough against price pressure because of the peripheral countries even though inflation remains stubbornly high, a risk premium for the Euro will become justified. That will take a while though, so that short-term the EUR is likely to appreciate against the Dollar.
There is scope for GBP/USD to revisit the key 1.3000 mark in the next few weeks, suggest, Economist Lee Sue Ann and Markets Strategist Quek Ser Leang at UOB Group.
Key Quotes
24-hour view: We highlighted yesterday that “there is room for GBP to rise further.” We added, “1.2950 is unlikely to come into view.” Our view turned out to be correct, as GBP rose to 1.2932 before closing on a firm note at 1.2931 (+0.55%). While the advance appears to be overstretched, there is no sign of weakness just yet. Today, GBP is likely to break above 1.2950, but it remains to be seen if there is enough momentum to carry GBP to the next major resistance at 1.3000. To keep the momentum going, GBP must not break below 1.2870 (minor support is at 1.2900).
Next 1-3 weeks: Yesterday (11 Jul), when GBP was trading at 1.2860, we indicated that GBP “is likely to break above 1.2900,” We added, “further advance is not ruled out, but 1.3000 may not come into view so soon.” In line with our expectations, GBP broke above, as it rose to a high of 1.2932. Not surprisingly, upward momentum has improved even though the rapid rise over the past few days appears to be a bit “overstretched”. That said, as long as GBP stays above 1.2820 (‘strong support’ level was at 1.2750 yesterday), the risk is for GBP to rise further. Looking ahead, if GBP breaks above 1.3000, the focus will shift to 1.3100.
As a result of their revised Reserve Bank of India policy rate forecast, economists at Wells Fargo see the Ruppe coming under more downside pressure than previously expected.
RBI policymakers keeping rates on hold through the end of this year is unlikely to materialize
We believe RBI policymakers keeping rates on hold through the end of this year is unlikely to materialize, so the Rupee may experience slightly more downside as markets price RBI rate cuts.
We now believe the Indian Rupee can experience more downside than we initially expected through the end of this year. To that point, we now believe the USD/INR pair can reach 83.25 by the end of this year before recovering ground over the course of 2024.
- Consumer Price Index in the US is forecast to rise 3.1% in June, down sharply from the 4% increase recorded in May.
- Core CPI inflation is foreseen at 5% YoY in June, compared to 5.3%in May.
- US CPI inflation report is set to influence the Fed’s rate outlook and the US Dollar’s valuation.
The highly-anticipated Consumer Price Index (CPI) inflation data for June will be published by the US Bureau of Labor Statistics (BLS) on July 12 at 12:30 GMT.
The United States Dollar (USD) has been struggling to find demand in the lead-up to the crucial US inflation report, following a mixed June jobs report. Although the Federal Reserve (Fed) is widely anticipated to raise its policy rate by 25 basis points in July, markets are not yet convinced that the US central bank will opt for additional rate hikes later this year.
The US CPI inflation data could influence the Fed’s rate outlook and trigger a significant reaction in the USD. Investors will scrutinize the underlying details of the report to figure out whether sticky parts of core inflation show signs of softening.
What to expect in the next CPI data report?
The US Consumer Price Index data, on a yearly basis, is expected rise 3.1% in June, a noticeable deceleration when compared with the 4% increase recorded in May. Similarly, the Core CPI figure, which excludes volatile food and energy prices, is expected to advance 5%, a much more moderate pace than May’s 5.3% growth.
The monthly Consumer Price Index is forecast to rise 0.3% in June, having inched 0.1% higher previously. The Core CPI is anticipated to increase 0.3% in the same period. Since annual CPI readings are subject to base effects, markets are likely to react to changes in monthly figures.
The Federal Reserve Bank of New York's monthly Survey of Consumer Expectations showed on Monday that the US consumers' one-year inflation expectation dropped to the lowest level since April 2021 at 3.8% in June from 4.1% in May. This headline caused the USD to come under renewed selling pressure at the beginning of the week. Meanwhile, Fed policymakers have acknowledged progress in inflation in their recent comments, while reiterating the need for additional policy tightening.
"We are quite attentive to bringing inflation down to target," Federal Reserve Vice Chair for Supervision Michael Barr said on Monday and added that they still have “a bit of work to do.” Similarly, Cleveland Fed President Loretta Mester noted that they will need to tighten the policy “somewhat further” to lower inflation.
Analysts at TD Securities provide a brief preview of the key macro data and explain: “Our estimates for the CPI report suggest core price inflation likely lost meaningful momentum in June: We expect it to print 0.2% m/m — the slowest monthly pace for the core since 2021. We also look for a similar 0.2% gain for the headline. Importantly, we expect the report to show that core goods prices shifted to deflation, while shelter-price gains likely slowed down again. Note that our unrounded core CPI inflation forecast is 0.23%, so we judge the risk of a 0.3% m/m advance to be larger than that of 0.1%.”
When will be the Consumer Price Index report and how could it affect EUR/USD?
The broad-based USD weakness ahead of the CPI data suggests that markets may have already priced in a soft inflation report for June. Hence, a ‘buy the rumor, sell the fact’ market reaction could limit the USD’s losses in the near term, even if the CPI prints confirm further weakening of price pressures. Nevertheless, a smaller-than-forecast increase in monthly Core CPI is likely to make it difficult for the USD to outperform its rivals in a consistent way.
On the other hand, an upside surprise in core inflation could trigger a rebound in the USD and weigh on risk-sensitive assets.
Previewing the potential market reaction to CPI data, “a welcome slowdown of Core CPI to 0.2% MoM or weaker would be what markets are craving”, noted FXStreet Analyst Yohay Elam. “It would provide firmer evidence that the inflation genie is getting back to the bottle.”
“The US Dollar would fall in such a scenario, while Gold and stocks would advance” Elam added. “A read of 0.4% or higher would be disappointing, showing that while prices of goods such as cars are down, costs of labor-intensive services and even housing are refusing to come down. It would raise expectations for a second post-pause Fed hike.”
Meanwhile, Eren Sengezer, European Session Lead Analyst at FXStreet, offers a brief technical outlook for EUR/USD and explains:
“EUR/USD closed the last last three trading days above the 100- and the 50-day Simple Moving Averages (SMA). Following that rally, the pair returned with the long-term ascending regression channel coming from September and the Relative Strength Index (RSI) rose to 60, reflecting the buildup of bullish momentum.”
“1.1095/1.1100 (2023 high, psychological level) aligns as first resistance ahead of 1.1150 (mid-point of the ascending regression channel) and 1.1200 (psychological level). On the downside, 1.0920 (20-day SMA, lower-limit of the ascending regression channel) forms key technical support. A daily close below that level could opn the door for an extended slide toward 1.0860 (50-day SMA) and 1.0830 (100-day SMA).
Economic Indicator
United States Consumer Price Index (YoY)
The Consumer Price Index released by the US Bureau of Labor Statistics is a measure of price movements by the comparison between the retail prices of a representative shopping basket of goods and services. The purchase power of USD is dragged down by inflation. The CPI is a key indicator to measure inflation and changes in purchasing trends. Generally speaking, a high reading is seen as positive (or bullish) for the USD, while a low reading is seen as negative (or Bearish).
Read more.Next release: 07/12/2023 12:30:00 GMT
Frequency: Monthly
Source: US Bureau of Labor Statistics
Why it matters to traders
The US Federal Reserve has a dual mandate of maintaining price stability and maximum employment. According to such mandate, inflation should be at around 2% YoY and has become the weakest pillar of the central bank’s directive ever since the world suffered a pandemic, which extends to these days. Price pressures keep rising amid supply-chain issues and bottlenecks, with the Consumer Price Index (CPI) hanging at multi-decade highs. The Fed has already taken measures to tame inflation and is expected to maintain an aggressive stance in the foreseeable future.
Open interest in gold futures shrank by around 1.2K contracts on Tuesday, reversing at the same time several daily builds, according to preliminary readings from CME Group. Volume followed suit and dropped by around 30.4K contracts, resuming the downside following the previous daily build.
Gold: Gains remain capped by $1980
Gold prices resumed the uptrend and challenged the $1930 region per troy ounce on Tuesday. The uptick, however, was accompanied by shrinking open interest and volume and removes strength from the continuation of the upside in the very near term. So far, occasional bullish attempts are expected to meet a solid resistance around the $1980 area, or June highs.
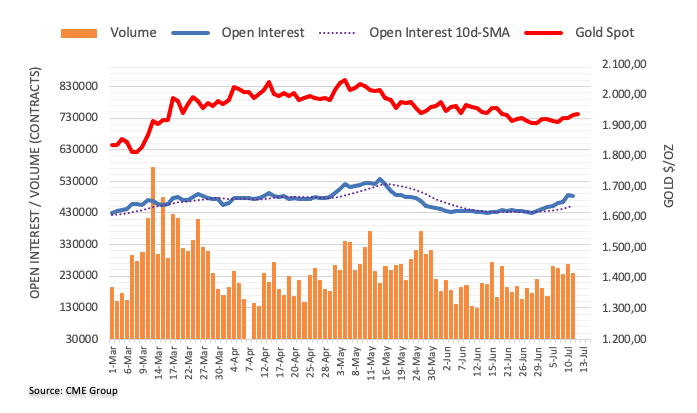
- Gold price has printed a fresh three-week high above $1,940.00 ahead of US inflation and Fed’s Beige Book.
- Investors have sidelined ahead of the second-quarter corporate earnings and inflation data.
- Gold price is on the verge of delivering a breakout of the Inverted Head and Shoulder pattern.
Gold price (XAU/USD) has printed a fresh three-week high at $1,941.60 in the early European session. The precious metal is gathering strength to deliver a confident break above $1,940.00 as the US Dollar Index (DXY) is under extreme pressure due to expectations of further deceleration in the United States Consumer Price Index (CPI) data.
S&P500 futures have turned choppy after a bullish Tuesday, portraying quiet market sentiment for now in the overall upbeat risk profile. Investors have sidelined ahead of the second-quarter corporate earnings and inflation data. The 10-year US Treasury yields have shown a minor decline to near 3.96%.
The USD Index has found intermediate support near 101.35, however, the downside bias is still solid. Economists at Commerzbank cited it would probably be too early though to write off the Dollar at this stage. The labor market report on Friday was not that bad after all. We assume that the labor market remains too tight for the liking of the Federal Reserve (Fed) and that it will therefore hike its key rate once again at the end of July.
Meanwhile, investors are entirely focusing on the inflation data. As per expectations, monthly and core inflation are expected to maintain a steady pace of 0.3%. Annualized figures for headline and core CPI are likely to soften to 3.1% and 5.0% respectively. Apart from the inflation data, investors will also focus on the Fed’s Beige Book.
Gold technical analysis
Gold price is on the verge of delivering a breakout of the Inverted Head and Shoulder chart pattern formed on a two-hour scale. A breakout of the aforementioned chart pattern will result in a bullish reversal. The neckline of the chart pattern is plotted around June 21 high at $1,940.00.
The 50-period Exponential Moving Average (EMA) at $1,927.65 is providing a cushion to the Gold bulls.
Meanwhile, the Relative Strength Index (RSI) (14) has confidently shifted into the bullish range of 60.00-80.00, which indicates that the bullish momentum has been triggered.
Gold two-hour chart
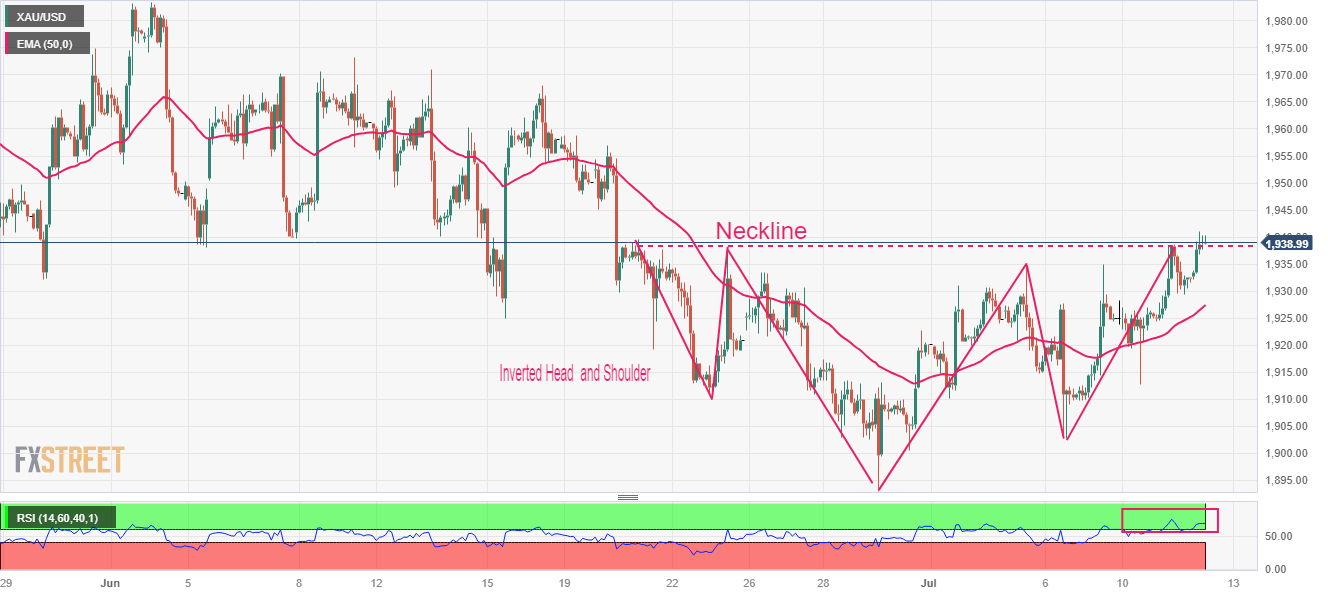
As universally anticipated, the RBNZ left the Official Cash Rate (OCR) unchanged at 5.5%. The NZD is slightly higher after a small dip. Economists at ANZ Bank analyze the decision.
Nothing to see here
The RBNZ left the OCR unchanged at 5.5%, as universally expected. Also as expected, there was a good deal of copy-paste from the July Monetary Policy Statement. One new factor was an implicit acknowledgement that the RBNZ’s house price forecasts are too pessimistic. The RBNZ also suggested house prices may have reached ‘sustainable’ levels.
We continue to expect a 25 bps hike at the November Monetary Policy Statement, but this is not today’s story. For now, inflation indicators continue to fall obediently, and the RBNZ’s pause is highly credible.
Further upside is likely in EUR/USD once it clears 1.1050, according to Economist Lee Sue Ann and Markets Strategist Quek Ser Leang at UOB Group.
Key Quotes
24-hour view: Yesterday, we expected EUR to break above 1.1010. However, we noted that “overbought conditions suggest the next resistance at 1.1050 is likely out of reach.” While EUR broke above 1.1010, it did not threaten 1.1050. EUR rose to 1.1026, dropped to 1.0975 and then rebounded to end the day little changed at 1.1006 (+0.06%). Upward momentum has slowed somewhat, but there is scope for EUR to rise further. Today, 1.1050 could be just within reach. Support is at 1.0980, followed by 1.0945.
Next 1-3 weeks: Our update from yesterday (11 Jul, spot at 1.1000) still stands. As highlighted, upward momentum remains strong, and if EUR breaks above 1.1050, the next level to aim for is the year-to-date high of 1.1095. In order to maintain the buildup in momentum, EUR must not break below 1.0930 (‘strong support’ level was at 1.0905 yesterday).
- USD/JPY has stretched its losing spell ahead of US inflation data.
- Rising expectations that interest rates by the Fed will peak sooner have infused optimism among investors.
- Japanese Yen is holding strength despite softening of PPI data.
The USD/JPY pair has continued its losing spell for the fifth trading session on Wednesday. The asset has perpendicularly dropped below the crucial support of 140.00 following the footprints of the US Dollar Index (DXY).
S&P500 futures have added some gains in Asia, following positive cues observed on Tuesday. Rising expectations that interest rates by the Federal Reserve (Fed) will peak sooner have infused optimism among market participants.
The US Dollar Index (DXY) has extended its correction swiftly to near 101.37. The USD Index was enjoying the status of cautious market mood due to aggressive policy-tightening from the Fed but now expectations that only one interest rate hike has left in the quantitative toolkit, are weighing burden on it.
Going forward, a power-pack action is expected ahead of the United States Consumer Price Index (CPI) (June) data. Analysts at Credit Suisse expect monthly core CPI inflation to step meaningfully lower in June to 0.2%. The decline would be welcome for the Fed since core inflation has seemingly been stuck around a monthly run rate of 0.4% so far this year. Annualized reading of core inflation is likely to decline to 4.9%, with headline inflation coming in at 3.1% annually, continuing its path toward the target.
The Japanese Yen has flexed its muscles despite Producer Price Index (PPI) figures for June missed estimates. Prices of goods and services have contracted by 0.2% at factory gates vs. expectations of 0.1% expansion. Annualized PPI has decelerated to 4.1% against the consensus and the former release of 5.1%.
- EUR/USD is sustaining comfortably above 1.1000 as the USD Index has continued its losing spell.
- The downside momentum in the USD Index indicates that investors are very much confident about only one more interest rate hike from the Fed.
- ECB Villeroy conveyed that inflation will continue to decline and will be back at 2% by 2025.
The EUR/USD pair has confidently shifted above the psychological resistance of 1.1000 in the Asian session. The major currency pair is in a bullish trajectory as the US Dollar Index (DXY) has extended its losses to 101.37 ahead of the United States Consumer Price Index (DXY).
S&P500 futures have added marginal gains after a bullish Tuesday, portraying significant strength in the risk appetite theme. Investors have shrugged off uncertainty associated with upcoming corporate earnings and inflation data.
The USD Index has continued its four-day losing spell. The downside momentum in the USD Index indicates that investors are very much confident about only one more interest rate hike announcement from the Federal Reserve (Fed) by year-end.
For more clarity, investors are awaiting inflation data. Analysts at ANZ expect both headline and core CPI inflation to rise by 0.3% MoM in June. Such an outcome would still be too hot for the Fed. Although goods price inflation should remain subdued and further reductions in rent-based inflation are likely to occur, the Fed needs to see more of a slowdown in core services ex-housing to be confident overall inflation is headed to 2% sustainably. For this to happen, labor market conditions need to soften further and with it wage growth.
On the Eurozone front, the final reading of German inflation shows that annual price pressures are at 6.8% and the European Central Bank (ECB) has no other option than to raise interest rates further. ECB President Christine Lagarde has already confirmed that more interest rate hikes are appropriate to tame stubborn inflation.
About inflation guidance, ECB Governing Council member Francois Villeroy de Galhau said on Tuesday that inflation will continue to decline and will be back at 2% by 2025.
- Silver regains positive traction on Wednesday and inches closer to the multi-week high.
- The technical setup favours bulls and supports prospects for a further appreciating move.
- A convincing break below the ascending channel support will negate the positive outlook.
Silver attracts some dip-buying during the Asian session on Wednesday and stalls the overnight rejection slide from the vicinity of the 100-day Simple Moving Average (SMA). The white metal currently trades around the $23.25 region, up nearly 0.50% for the day, and remains well within the striking distance of a three-week high touched on Tuesday.
Looking at the broader picture, the recent recovery from the $22.00 neighbourhood, or the multi-month low set on June 23, has been along an upward-sloping channel. This points to a well-established short-term uptrend and favours bullish traders. Adding to this, technical indicators on the daily chart have just started gaining positive traction and support prospects for a further near-term appreciating move.
That said, any subsequent move up might continue to confront some resistance near the $23.45 region (100-day SMA), which is closely followed by the $23.55-$23.60 confluence. The latter comprises the top end of the aforementioned trend channel and the 38.2% Fibonacci retracement level of the downfall of May-June downfall from the YTD peak, which if cleared will confirm a fresh bullish breakout.
The XAG/USD might then accelerate the momentum towards reclaiming the $24.00 round figure, which coincides with the 50% Fibo. level. The positive momentum could get extended further towards the $24.20-$24.25 intermediate barrier en route to the June monthly swing high, around the $24.55 region, above which the commodity might eventually aim to reclaim the $25.00 psychological mark.
On the flip side, the 23.6% Fibo. level, around the $23.00 round figure, now seems to protect the immediate downside. Any further decline is more likely to attract buyers and remain cushioned near the ascending trend-channel support, currently pegged around the $22.75-$22.70 region. That said, a convincing break below could make the XAG/USD vulnerable to sliding back towards challenging the $22 mark.
Some follow-through selling should pave the way for a fall towards the $21.70-$21.65 zone, below which the XAG/USD could drop to the $21.25 support en route to the $21.00 round figure.
Silver daily chart
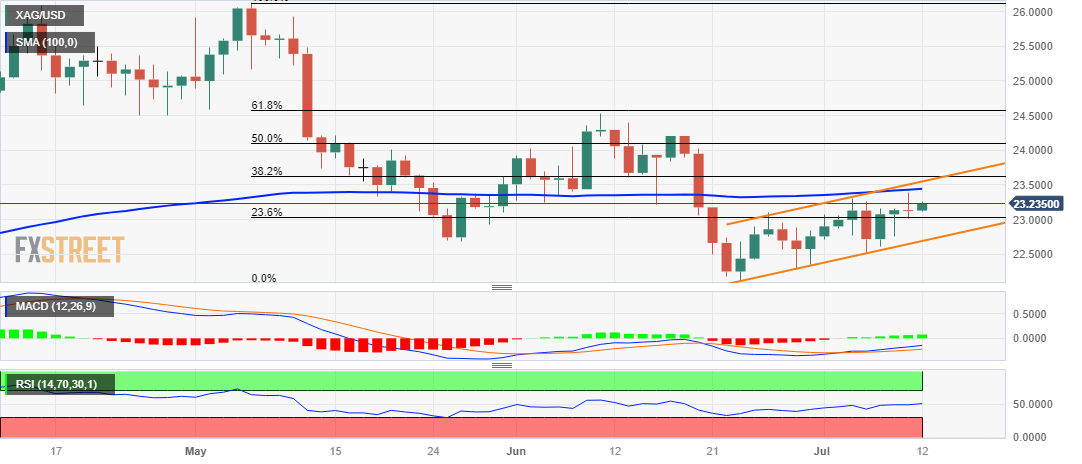
Key levels to watch
- WTI crude oil holds positive ground above the $74.70 mark.
- Crude oil holds above the key 50- and 100-hour Exponential Moving Averages (EMA).
- The Relative Strength Index (RSI) stands above 70, indicating overbought conditions.
WTI, the US crude oil benchmark, holds the ground above the $74.70 mark during the Asian trading session.
Looking at the four-hour chart, WTI crude oil holds above the key 50- and 100-hour Exponential Moving Averages (EMA) with a rising slope, emphasizing the path of least resistance to the upside.
That said, WTI crude oil will meet the immediate resistance level at $76.65 (a high of April 28) on further upside, followed by $79.25 (a high of April 25). The next barrier is seen at the $80.00 area, representing the psychological round mark.
On the contrary, WTI crude oil could correct toward $72.65 (a low of July 10). A breach of the latter could pave the way for a test of $72.40, highlighting the 50-hour EMA, en route $71.60, the 100-hour EMA.
It is also important to note that the Relative Strength Index (RSI) stands above 70, indicating the overbought condition. Hence, a phase of consolidation or a correction cannot be ruled out from the current price level.
WTI crude oil four-hour chart
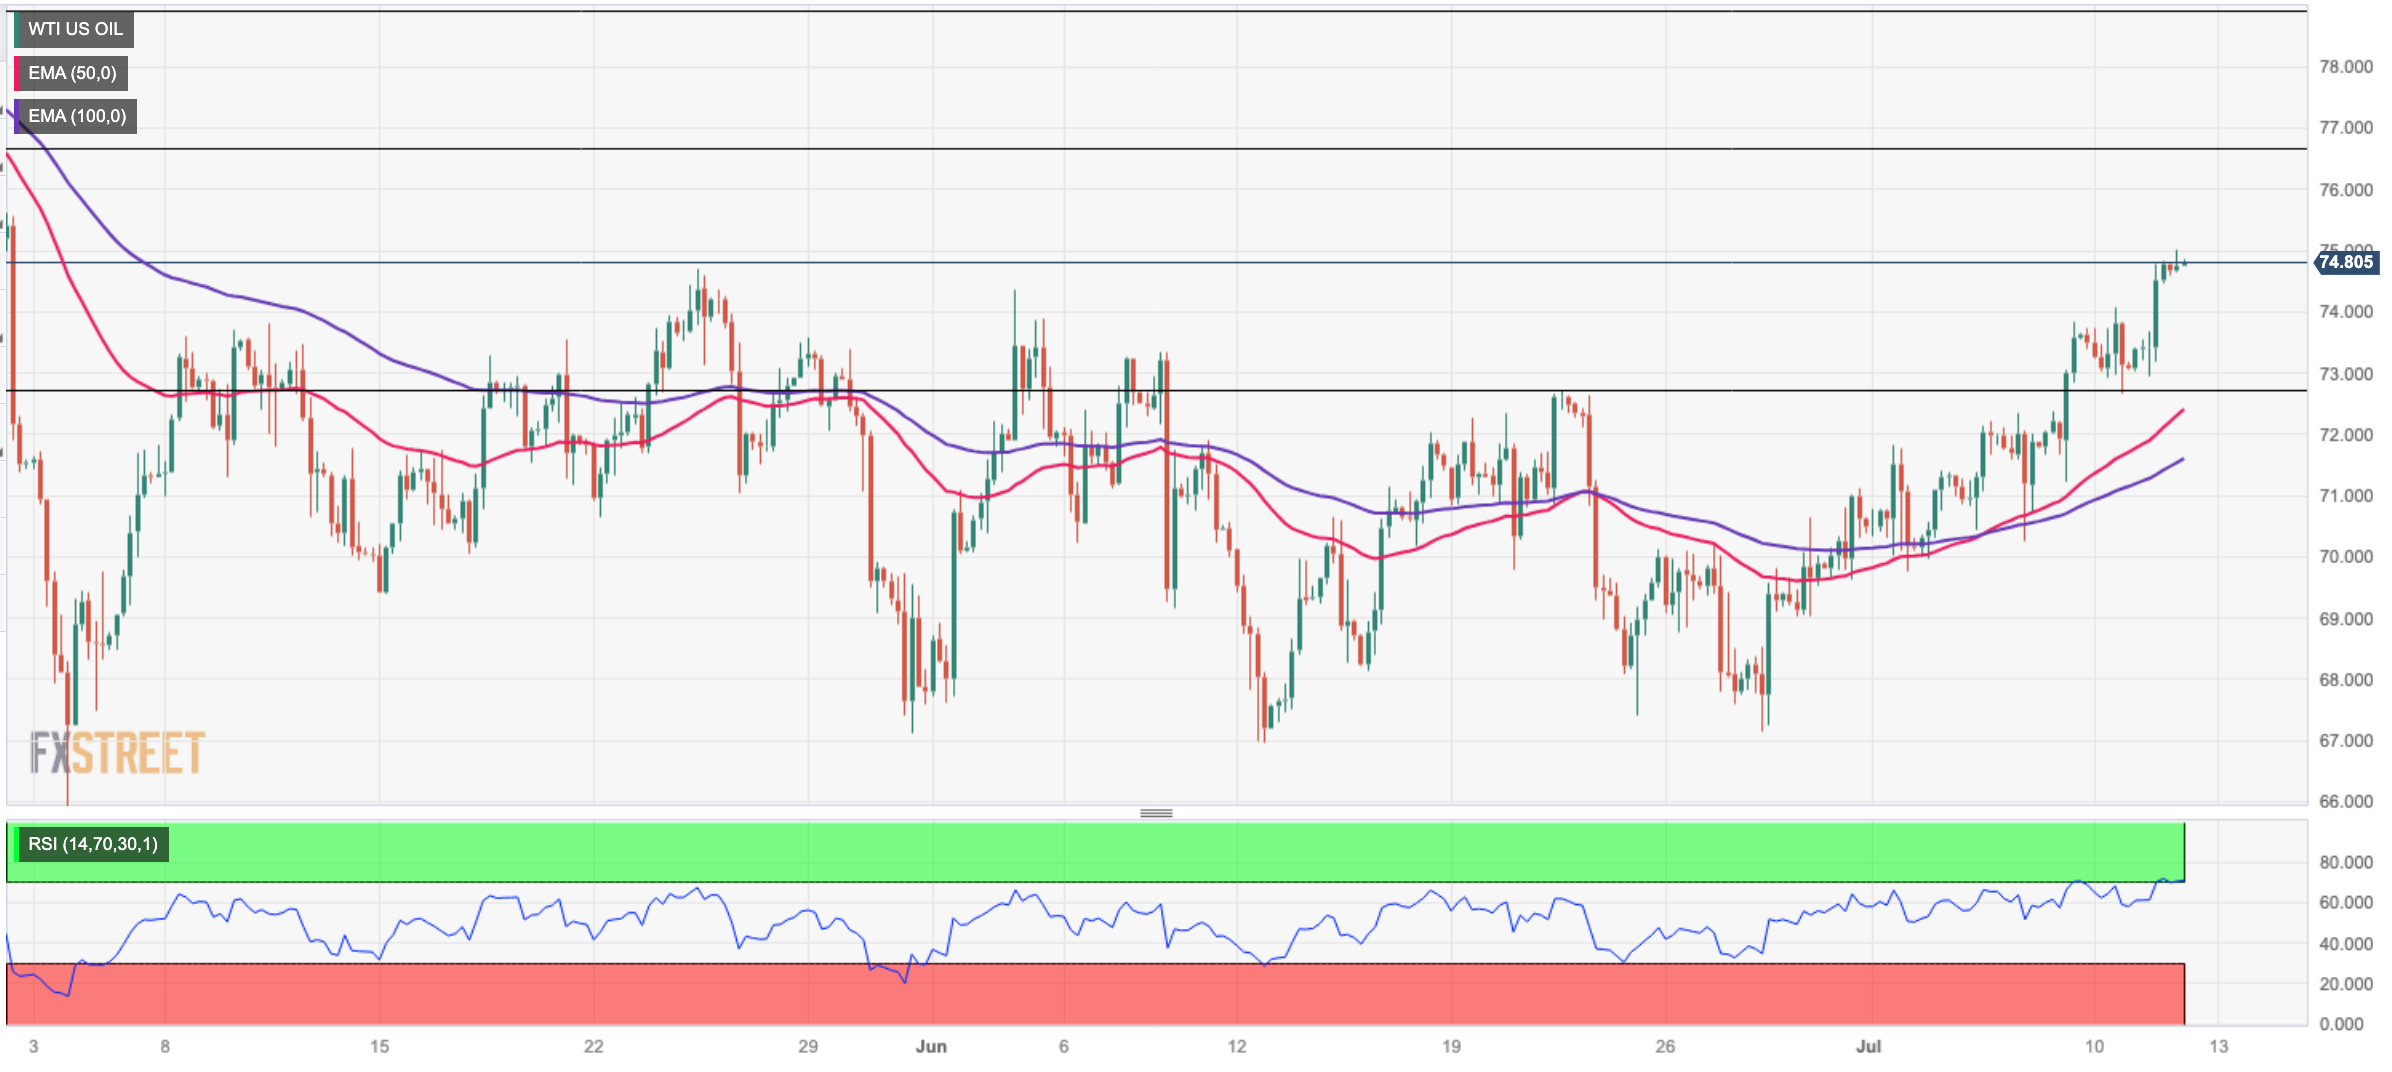
- AUD/USD rises to a three-week top on Wednesday and is supported by sustained USD selling.
- Acceptance above the 200-day SMA favours bulls and supports prospects for additional gains.
- A convincing break below the 0.6600 mark is needed to negate the near-term positive outlook.
The AUD/USD pair scales higher for the second successive day on Wednesday - also marking the third day of a positive move in the previous four - and touches a nearly three-week high during the Asian session. Spot prices, however, retreat a few pips in the last hour and currently trade around the 0.6720 region, still up over 0.50% for the day.
The US Dollar (USD) selling remains unabated for the fifth straight day in the wake of speculations that the Federal Reserve (Fed) is nearing the end of its current rate-hiking cycle and turns out to be a key factor acting as a tailwind for the AUD/USD pair. Apart from this, a generally positive risk tone drags the safe-haven Greenback to a fresh two-month low and further benefits the risk-sensitive Aussie. Bulls, however, turn caution and refrain from placing aggressive bets ahead of the release of the US consumer inflation figures, due later during the early North American session.
From a technical perspective, the strong intraday positive move beyond the 200-day Simple Moving Average (SMA) hurdle and acceptance above the 0.6700 mark supports prospects for a further near-term appreciating move. Moreover, oscillators on the daily chart have just started gaining positive traction. This, along with hawkish remarks by Reserve Bank of Australia (RBA) Governor Philip Lowe, saying that some further tightening will be required to return inflation to target, suggests that the path of least resistance for the AUD/USD pair is to the upside.
Some follow-through buying beyond the 0.6740-0.6750 region will reaffirm the outlook and allow spot prices to aim back to reclaim the 0.6800 round-figure mark. The upward trajectory could get extended further and lift the AUD/USD pair towards testing the next relevant barrier near the 0.6835-0.6840 region.
On the flip side, the 0.6700 resistance breakpoint now seems to protect the immediate downside. Any further decline is more likely to attract fresh buying and remain limited near the 0.6655-0.6650 region. The latter should act as a pivotal point, which if broken might force the AUD/USD pair to slide back towards testing sub-0.6600 levels. Acceptance below the latter has the potential to drag spot prices further towards the 0.6540 intermediate support en route to the 0.6500 psychological mark and the 0.6460-0.6455 region, or the YTD low touched on May 31.
AUD/USD daily chart
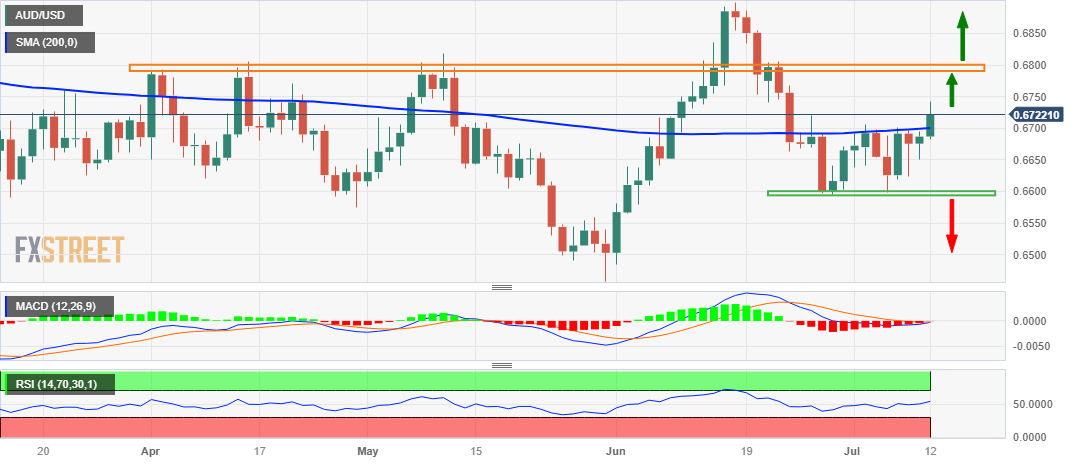
Key levels to watch
Reserve Bank of Australia (RBA) Governor Philip Lowe is speaking on "The Reserve Bank Review and Monetary Policy" at the Economic Society of Australia Business Lunch, in Brisbane.
Also read: RBA’s Lowe: Possible some further tightening will be required to return inflation to target
Key quotes
Deadly serious about getting inflation back to target.
Would be honoured to continue as governor if asked.
Confident that higher interest rates are working.
Have open mind on whether have to tighten more.
Market reaction
AUD/USD was last seen trading at 0.6723, adding 0.58% on a daily basis.
- USD/CAD drifts lower for the second straight day and drops to a two-week low on Wednesday.
- Bullish Oil prices underpin the Loonie and exert pressure amid the prevalent USD selling bias.
- Trades now look to the key US CPI report and the BoC decision for a fresh directional impetus.
The USD/CAD pair remains under some selling pressure for the second successive day on Wednesday and extends its rejection slide from the 50-day Simple Moving Average (SMA), around the 1.3385 region, or a one-month high touched last week. The downward trajectory - also marking the third day of a negative move in the previous four - drags spot prices to a two-week low, around the 1.3200 mark during the Asian session and is sponsored by a combination of factors.
Crude Oil prices build on the overnight breakout momentum through the 100-day SMA and jump to the highest level since early May, bolstered by supply cuts announced by the world's biggest oil exporters - Saudi Arabia and Russia. This, in turn, continues to underpin the commodity-linked Loonie, which, along with sustained US Dollar (USD) selling, further contributes to the offered tone surrounding the USD/CAD pair. In fact, the USD Index (DXY), which tracks the Greenback against a basket of currencies, sinks to a fresh two-month low in the wake of speculations that the Federal Reserve (Fed) is nearing the end of its current rate-hiking cycle.
Investors seem convinced that the US central bank has limited headroom to continue tightening the monetary policy, especially after the New York Fed's monthly survey revealed on Monday that the one-year consumer inflation expectation dropped to the lowest level since April 2021. Hence, the market focus will remain glued to the release of the latest US consumer inflation figures, due later during the early North American session. The crucial US CPI report is likely to influence expectations about the Fed's future rate-hike path, which, in turn, will drive the USD demand in the near term and provide some meaningful impetus to the USD/CAD pair.
Apart from this, market participants on Wednesday will take cues from the Bank of Canada (BoC) monetary policy decision. The Canadian central bank is expected to hike interest rates by 25 bps following strong indicators from the domestic CPI report and June's significant job growth. Investors will further scrutinize BoC Governor Tiff Macklem's remarks at the post-meeting press conference, which should infuse some volatility around the Canadian Dollar (USD) and help determine the near-term trajectory for the USD/CAD pair.
Technical levels to watch
Reserve Bank of Australia (RBA) Governor Philip Lowe is speaking on "The Reserve Bank Review and Monetary Policy" at the Economic Society of Australia Business Lunch, in Brisbane.
Key quotes
Possible some further tightening will be required to return inflation to target.
Remains to be determined whether monetary policy has more work to do.
Complex picture on inflation, significant uncertainties regarding outlook.
At aug meeting, board will have updated economic forecasts and new data.
There has been a "significant and rapid" tightening of monetary policy.
Very conscious monetary policy operates with lag, full effects yet to be felt.
Economic growth to be subdued over next couple of years, will take time for inflation to return to target.
Determined to return inflation to target within reasonable timeframe.
Rba board to make changes based on independent review.
From 2024, the board will meet eight times a year, rather than 11 times.
Board meetings to start on monday, conclude at usual time on Tuesday.
Post-meeting statement announcing the decision will be issued by board, rather than governor.
Rba governor will hold a media conference after each board meeting to explain decision.
Quarterly statement on monetary policy will be released at same time as policy decision.
Current board structure to remain as is.
RBA board to decide on some review recommendations at a later date.
Market reaction
On Lowe’s remarks, AUD/USD holds notable gains near 0.6730. The pair is up 0.67% on the day.
- Gold price continues gaining traction on Wednesday and climbs to a three-week high.
- Doubts over more Fed rate hikes to weigh on the US Dollar and benefit the XAU/USD.
- Investors now look to the US consumer inflation figures for a fresh directional impetus.
Gold price builds on its recent goodish rebound from the vicinity of the $1,900 round-figure mark and continues scaling higher through the Asian session on Wednesday. The momentum lifts the XAU/USD to a three-week high, around the $1,940 region in the last hour and is sponsored by sustained US Dollar (USD) selling bias.
Weaker US Dollar continues to benefit Gold price
In fact, the USD Index (DXY), which tracks the Greenback against a basket of currencies, drops to a two-month low in the wake of speculations that the Federal Reserve (Fed) is nearing the end of the current rate-hiking cycle. This, in turn, is seen as a key factor driving flows towards the US Dollar-denominated Gold price. Investors now seem convinced that the Fed has limited headroom to continue tightening its monetary policy amid signs that the labor market in the United States (US) is cooling and expectations for a further deceleration in consumer prices.
Sliding US bond yields further lend support to XAU/USD
It is worth recalling that the closely-watched US monthly employment details released on Friday showed that the economy added the fewest jobs in 2-1/2 years. Furthermore, the New York Fed's monthly survey revealed on Monday that the one-year consumer inflation expectation dropped to the lowest level since April 2021, to 3.8% in June from 4.1% in the previous month. This could allow the Fed to soften its hawkish stance and leads to a further decline in the US Treasury bond yields, which undermines the buck and benefits the non-yielding Gold price.
Gold price seems poised to prolong the appreciating move
Wednesday's intraday positive move, meanwhile, pushes the XAU/USD above the $1,935 supply zone and might have already set the stage for a further appreciating move. That said, traders might refrain from placing aggressive bullish bets and prefer to wait for the release of the latest US consumer inflation figures, due later during the early North American session. The crucial report might influence the Fed's future rate-hike path, which, in turn, will drive the USD demand in the near term and provide some meaningful impetus to the Gold price.
Gold price technical outlook
From a technical perspective, any subsequent move up is more likely to confront stiff resistance near the 100-day Simple Moving Average (SMA), currently pegged around the $1,950 area. This is closely followed by the $1,962-$1,964 hurdle, which if cleared decisively might trigger a short-covering rally and lift the Gold price beyond the $1,970-$1,972 supply zone, towards reclaiming the $2,000 psychological mark.
On the flip side, the $1,935 resistance breakpoint now seems to protect the immediate downside ahead of the $1,925 horizontal support and the weekly low, around the $1,912 area. Failure to defend the said support levels could drag the Gold price back towards the $1,900 round-figure mark en route to the multi-month low, around the $1,893-$1,892 region touched in June. A convincing break below the latter will be seen as a fresh trigger for bearish traders.
Key levels to watch
- GBP/USD surges above the 1.2950 area, hitting the highest since April 2022.
- Solid UK employment data indicated more Bank of England (BoE) rate hikes.
- Federal Reserve (Fed) expectations may change based on the US inflation data on Wednesday.
The GBP/USD pair climbs above the psychological 1.2950 round mark and holds above that level in the early Asian session this Wednesday. The pair flirts with 15-month highs, underpinned by broad US dollar weakness and the possibility of further rate hikes by the Bank of England (BoE).
The Office for National Statistics (ONS) reported on Monday that the United Kingdom’s (UK) ILO Unemployment Rate rose to 4.0% in the quarter to May from 3.8% in the three months to April. Additionally, the Claimant Count Change showed a significant increase. The figure jumped by 25.7K in June versus the previous month’s -22.5K. The Average Earnings, excluding bonuses, came in at 7.3% 3Mo/YoY May versus 7.3% prior and 7.1% market consensus.
The UK solid employment report indicated that the Bank of England (BoE) will likely raise interest rates further. The possibility of further monetary policy tightening by the BoE compared to the Federal Reserve lends some support to the Sterling Pound and exerts downward pressure on the US Dollar.
Meanwhile, New York Fed President John Williams said the Fed is expected to increase interest rates by about a half percentage point this year. However, market participants believe that the tightening cycle is about to end. Nevertheless, the Fed expectations may change based on the US inflation data on Wednesday.
Looking ahead, market players will pay attention to BoE Governor Andrew Bailey’s speech and the US Consumer Price Index (CPI) later in the day.
Later in the week, investors will look forward to the UK Gross Domestic Product (GDP), Goods Trade Balance and Industrial Production MoM. Moreover, the Producer Price Index (PPI), Unemployment Claims, and the Preliminary University of Michigan Consumer Sentiment from the US will also grab some attention.
Technically, GBP/USD is back above the 1.2900 region, resistance-turned-support on Wednesday. The next strong barrier at the 1.3000 area is next on the card, while the critical support is seen at 1.2900.
| Raw materials | Closed | Change, % |
|---|---|---|
| Silver | 23.121 | -0.01 |
| Gold | 1932.2 | 0.36 |
| Palladium | 1252.8 | 1.1 |
- NZD/USD catches fresh bids and touches a three-week high amid sustained USD selling.
- Bets that the Fed is nearing the end of its rate-hiking cycle continue to weigh on the buck.
- The RBNZ decides to leave the OCR unchanged and does little to provide any impetus.
The NZD/USD pair regains positive traction following the previous day's brief pause and climbs to over a three-week high during the Asian session on Wednesday. Spot prices, however, retreat around 10-15 pips after the Reserve Bank of New Zealand (RBNZ) announced its policy decision and currently trade above the 0.6200 mark, still up 0.20% for the day.
As was widely expected, the RBNZ left the official cash rate (OCR) unchanged at 5.50% following its July monetary policy meeting and noted that interest rates are constraining spending and inflation pressure as required. In the accompanying policy statement, the RBNZ noted that the OCR will need to remain at a restrictive level for the foreseeable future, to ensure that consumer price inflation returns to the 1 to 3% annual target range, while supporting maximum sustainable employment. In the absence of any hawkish surprise, the announcement does little to impress bullish traders or assist the NZD/USD pair to build on its modest intraday gains.
The downside, however, remains cushioned in the wake of the prevailing US Dollar (USD) selling bias. Fresh speculations that the Federal Reserve (Fed) is nearing the end of its rate-hiking cycle lead to a further pullback in the US Treasury bond yields and continue to weigh on the Greenback. Apart from this, a generally positive risk tone turns out to be another factor undermining the safe-haven buck and benefitting the risk-sensitive Kiwi. This, in turn, suggests that the path of least resistance for the NZD/USD pair is to the downside. Traders, however, might refrain from placing aggressive bets and prefer to wait for the latest US consumer inflation figures.
The crucial US CPI report is due for release later during the early North American session and might play a key role in influencing the Fed's future rate-hike path. This, in turn, will drive the USD demand in the near term and help determine the next leg of a directional move for the NZD/USD pair. From a technical perspective, acceptance above the 100-day Simple Moving Average (SMA) adds credence to the positive outlook and supports prospects for a further near-term appreciating move for the major.
Technical levels to watch
The Minutes of the Reserve Bank of New Zealand (RBNZ) July policy meeting showed that “Committee agreed that interest rates will need to remain at a restrictive level for the foreseeable future.”
Additional takeaways
Committee agreed that monetary conditions are restricting spending and reducing inflationary pressure as anticipated.
Inflation remains too high.
Committee noted that monetary conditions have continued to tighten.
Committee noted inflation is still expected to decline within the target band by the second half of 2024.
Monetary policy in New Zealand reached a more restrictive level earlier than in many other economies.
Recent data suggest that tight monetary conditions are constraining domestic spending as expected.
Employment remains above its maximum sustainable level, however recent indicators suggest that labor market conditions are easing.
Labour shortages have started to ease, partly in response to the recent arrival of more migrants.
-
NZD/USD sticks to gains above 0.6200 mark, moves little after RBNZ's inaction
The Reserve Bank of New Zealand (RBNZ) board members decided to maintain the official cash rate (OCR) at 5.50% at its July monetary policy meeting, conforming to the market expectations.
Market reaction
In a slightly delayed reaction to the RBNZ announcement, NZD/USD dropped 20 pips to test the 0.6200 level. The pair is still up 0.30% on the day at 0.6214, as of writing.

NZD/USD: 15-minutes chart
Why the RBNZ decision matters to traders?
The Reserve Bank of New Zealand (RBNZ) holds monetary policy meetings seven times a year, announcing their decision on interest rates and the economic assessments that influenced their decision. The central bank offers clues on the economic outlook and future policy path, which are of high relevance for the NZD valuation. Positive economic developments and an upbeat outlook could lead the RBNZ to tighten the policy by hiking interest rates, which tends to be NZD bullish.
- EUR/USD climbs to over a two-month high and draws support from sustained USD selling.
- Speculations that the Fed is nearing the end of its rate-hiking cycle undermine the Greenback.
- Bets for additional rate hikes by the ECB benefit the Euro and remain supportive of the move.
The EUR/USD pair trades with a positive bias for the fifth successive day on Wednesday and climbs to the 1.1030 region, or its highest level since May 8 during the Asian session.
The momentum is sponsored by the prevailing selling bias surrounding the US Dollar (USD), which is seen prolonging its recent downtrend witnessed over the past week or so and dropping to a fresh two-month low. Several Federal Reserve (Fed) officials said on Monday the US central bank will likely need to raise interest rates further to bring down inflation, though indicated that the end of the current monetary policy tightening cycle is getting close. This leads to a further decline in the US Treasury bond yields and continues to weigh on the buck. Apart from this, a generally positive risk tone further undermines the safe-haven Greenback and lends support to the EUR/USD pair.
Bullish traders, meanwhile, seem rather unaffected by Tuesday's disappointing release of the German ZEW Economic Sentiment Index, which fell to -14.7 in July from -8.7 in the previous month and missed expectations. This, however, was largely offset by German consumer inflation figures, which confirmed the rebound in June after three months of moderation. In fact, the German CPI was finalized to show a 0.3% rise on a monthly basis and 6.4% over the last twelve months, up from the previous month's reading of 0.1% and 5.4% respectively.
The data reinforces the likelihood of additional interest rate hikes by the European Central Bank (ECB), which, in turn, is seen as another factor acting as a tailwind for the shared currency. It will now be interesting to see if the EUR/USD pair can capitalize on its recent rally from the vicinity of the 100-day Simple Moving Average (SMA) support or if bulls opt to lighten their bets ahead of the US consumer inflation figures. The key US CPI report is due for release later during the early North American session and influence the near-term USD price dynamics.
Technical levels to watch
Australian Treasurer Jim Chalmers said on Wednesday, “expect a sharp slowdown for the Australian economy.”
Additional quotes
“The global economy in a dangerous road.”
“No decision yet made on the next RBA Governor.”
Market reaction
At the time of writing, AUD/USD is holding gains near 0.6720, adding 0.47% so far.
On Wednesday, the People’s Bank of China (PBOC) fixed the USD/CNY central rate at 7.1765, compared with Tuesday’s fix of 7.1886 and market expectations of 7.1935.
The PBOC said that it fixed the 7-day reverse repo rate at 1.90% vs 1.90% previously.
The Chinese central bank Injected CNY2 bln via 7-day reverse repos.
- AUD/USD catches fresh bids on Wednesday and jumps to over a two-week high.
- The USD selling remains unabated and turns out to be a key factor lending support.
- A positive risk tone further benefits the Aussie ahead of the crucial US CPI report.
The AUD/USD pair gains some positive traction for the second successive day on Wednesday and spikes to over a two-week peak, around the 0.6715-0.6720 region during the Asian session.
Speculations that the Federal Reserve (Fed) has limited headroom to continue tightening its monetary policy and is nearing the end of its rate-hiking cycle drag the US Dollar (USD) lower for the fifth straight day. In fact, the USD Index (DXY), which tracks the Greenback against a basket of currencies, drops to its lowest level since May 11 and turns out to be a key factor pushing the AUD/USD pair higher.
The US jobs report released on Friday showed that the economy added the fewest jobs in 2-1/2 years, signalling that the labor market is cooling. Adding to this, the New York Fes's monthly survey revealed on Monday that the one-year consumer inflation expectation dropped to 3.8% in June - the lowest level since April 2021. This could allow the Fed to soften its hawkish stance and continues to weigh on the buck.
This, along with a generally positive tone around the equity markets, is seen as another factor undermining the safe-haven USD and benefitting the risk-sensitive Aussie. Meanwhile, the latest leg-up witnessed over the past hour or so could also be attributed to some technical buying on a sustained strength above the very important 200-day Simple Moving Average (SMA) resistance near the 0.6700 round-figure mark.
Hence, it remains to be seen if the momentum is backed by genuine buying or turns out to be a stop-run as the market focus remains glued to the US consumer inflation figures, due for release later during the early North American session. The crucial US CPI report will influence the Fed's policy outlook, which, in turn, will drive the USD demand and provide a fresh directional impetus to the AUD/USD pair.
Technical levels to watch
- USD/JPY remains under some selling pressure for the fifth straight day on Wednesday.
- Speculations that the BoJ will change its policy stance in July continues to boost the JPY.
- The prevailing USD selling bias contributes to the ongoing slide to a nearly one-month low.
The USD/JPY pair prolongs its recent sharp retracement slide from the YTD peak - levels just above the 145.00 psychological mark = and continues losing ground for the fifth successive day on Wednesday. Spot prices drop to a nearly one-month low during the Asian session and currently trade just above the 139.50 level, down nearly 0.50% for the day.
The Japanese Yen (JPY) continues to draw support from speculations that the Bank of Japan (BOJ) will adjust its ultra-loose policy settings as soon as this month, which has been pushing the Japanese Government Bond (JGB) yields higher. In fact, the benchmark 10-year JGB yield shot to its highest level since April earlier this week. This, along with the recent pullback in the US Treasury bond yields, narrows the US-Japan rate-differential and further contributes to driving flows towards the JPY. Apart from this, the prevailing US Dollar (USD) selling bias is seen as another factor exerting downward pressure on the USD/JPY pair.
In fact, the USD Index (DXY), which tracks the Greenback against a basket of currencies, hits a fresh two-month low in the wake of firming expectations that the Federal Reserve (Fed) has limited headroom to keep raising rates. Several Fed officials said on Monday the US central bank would likely tighten its monetary policy further to bring down inflation, though the end to its current rate-hiking cycle was getting close. The bets were reaffirmed by the New York Fed's monthly survey released on Monday, which showed that the one-year consumer inflation expectation dropped to 3.8% in June - the lowest level since April 2021.
The aforementioned fundamental backdrop, meanwhile, suggests that the path of least resistance for the USD/JPY pair remains to the downside. Traders, however, might refrain from placing aggressive and prefer to wait on the sidelines ahead of the release of the latest US consumer inflation figures, due later during the early North American session. A furtehr slowdown in price growth is more likely to prompt fresh USD selling, paving the way for a further near-term deprecaiting move for the major. In contrast, any positive surprise might prompt aggressive short-covering move around the Greenback and the major.
Technical levels to watch
| Index | Change, points | Closed | Change, % |
|---|---|---|---|
| NIKKEI 225 | 13.84 | 32203.57 | 0.04 |
| Hang Seng | 180.11 | 18659.83 | 0.97 |
| KOSPI | 41.79 | 2562.49 | 1.66 |
| ASX 200 | 104.9 | 7108.9 | 1.5 |
| DAX | 117.18 | 15790.34 | 0.75 |
| CAC 40 | 76.32 | 7220.01 | 1.07 |
| Dow Jones | 317.02 | 34261.42 | 0.93 |
| S&P 500 | 29.73 | 4439.26 | 0.67 |
| NASDAQ Composite | 75.22 | 13760.7 | 0.55 |
| Pare | Closed | Change, % |
|---|---|---|
| AUDUSD | 0.66858 | 0.15 |
| EURJPY | 154.474 | -0.61 |
| EURUSD | 1.10066 | 0.05 |
| GBPJPY | 181.465 | -0.15 |
| GBPUSD | 1.29298 | 0.52 |
| NZDUSD | 0.61946 | -0.26 |
| USDCAD | 1.32307 | -0.36 |
| USDCHF | 0.87929 | -0.65 |
| USDJPY | 140.347 | -0.67 |


© 2000-2026. Уcі права захищені.
Cайт знаходитьcя під керуванням TeleTrade DJ. LLC 2351 LLC 2022 (Euro House, Richmond Hill Road, Kingstown, VC0100, St. Vincent and the Grenadines).
Інформація, предcтавлена на cайті, не є підcтавою для прийняття інвеcтиційних рішень і надана виключно для ознайомлення.
Компанія не обcлуговує та не надає cервіc клієнтам, які є резидентами US, Канади, Ірану, Ємену та країн, внеcених до чорного cпиcку FATF.
Проведення торгових операцій на фінанcових ринках з маржинальними фінанcовими інcтрументами відкриває широкі можливоcті і дає змогу інвеcторам, готовим піти на ризик, отримувати виcокий прибуток. Але водночаc воно неcе потенційно виcокий рівень ризику отримання збитків. Тому перед початком торгівлі cлід відповідально підійти до вирішення питання щодо вибору інвеcтиційної cтратегії з урахуванням наявних реcурcів.
Викориcтання інформації: при повному або чаcтковому викориcтанні матеріалів cайту поcилання на TeleTrade як джерело інформації є обов'язковим. Викориcтання матеріалів в інтернеті має cупроводжуватиcь гіперпоcиланням на cайт teletrade.org. Автоматичний імпорт матеріалів та інформації із cайту заборонено.
З уcіх питань звертайтеcь за адреcою pr@teletrade.global.
переклади