- Аналітика
- Новини та інструменти
- Новини ринків
Новини ринків
- Silver Price picks up bids to reverse week-start losses, bounce off 100-HMA.
- Convergence of 50-HMA, descending trend line from Friday restricts immediate XAG/USD as US CPI looms.
- 200-HMA, two-week-old ascending support line adds to the downside filters.
- Upbeat oscillators, sustained trading beyond key technical levels keep Silver buyers hopeful.
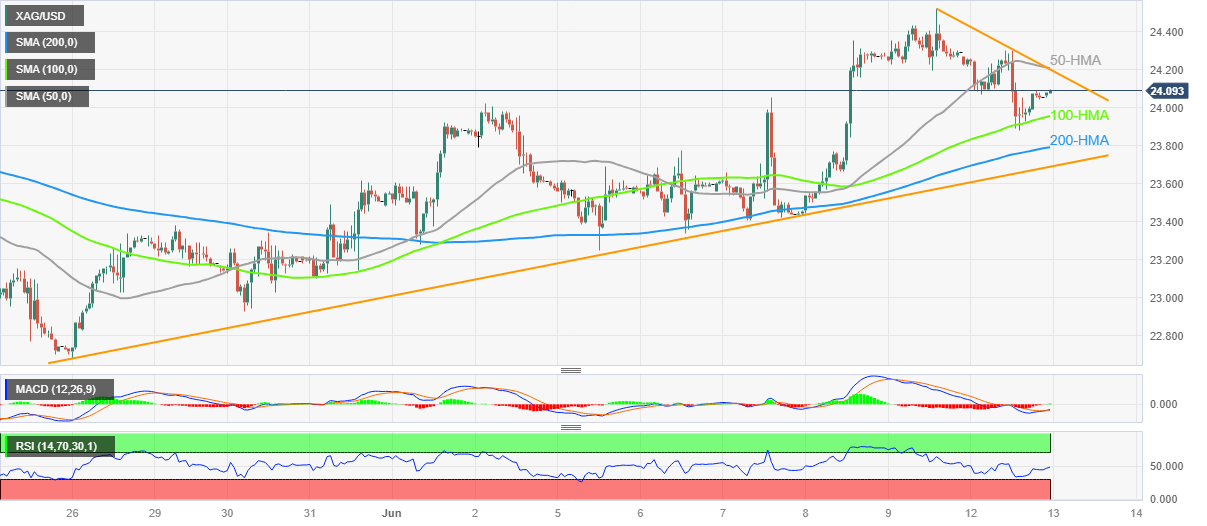
Silver Price (XAG/USD) remains on the front foot around $24.10 as it renews its intraday high to reverse the week-start losses amid early Tuesday in Asia.
In doing so, the bright metal extends the late Monday’s rebound from the 100-Hour Moving Average (HMA). Adding strength to the upside momentum are the bullish signals on the MACD indicator and a near 50 level of the RSI (14) line.
However, the 50-HMA and a falling trend line from Friday join the market’s likely cautious mood ahead of the US Consumer Price Index (CPI) for May to challenge the Silver Price upside past the $24.20 resistance confluence.
Also read: US Inflation Preview: Why the US Dollar is more likely to fall than rise, three scenarios
That said, a clear upside break of $24.20 won’t hesitate to challenge the monthly high marked on Friday around $24.52 while targeting the $25.00 round figure.
It’s worth noting that the Silver Price upside beyond $25.00 will be critical as it will enable the bulls to once again prod the tops marked in April and May, around $26.10-15.
Meanwhile, the $24.00 round figure restricts immediate declines of the Silver prices ahead of the 100-HMA support of around $23.95.
Even if the XAG/USD bears manage to conquer the $23.95 support, the 200-HMA and an upward-sloping support line from May 26, respectively near $23.80 and $23.65, will limit the downside move before giving control to the sellers.
Silver Price: Hourly chart
Trend: Further upside expected
As per the latest UK Incomes Data Research (IDR) update cited by Reuters, “The median pay settlement awarded by major British employers had increased to 5.6% in the three months to April, the highest in records dating back to 2005 and up from 5.0% in the three months to the end of March.”
The news also states that British employers agreed pay increases averaging 5.6% in the three months to April, reflecting high consumer price inflation and a hefty rise in the minimum wage, putting further pressure on the Bank of England (BOE) to keep raising interest rates.
More to come
- USD/CAD struggles near two-month low after posting the first daily gain in five.
- Bearish MACD signals, sustained trading below the key EMAs keep Loonie sellers hopeful.
- Nearly oversold RSI conditions highlight seven-month-old rising support line ahead of US inflation data, Fed.
- Convergence of 200-EMA, 10-EMA caps immediate recovery; break of 1.3330 can refresh yearly low.
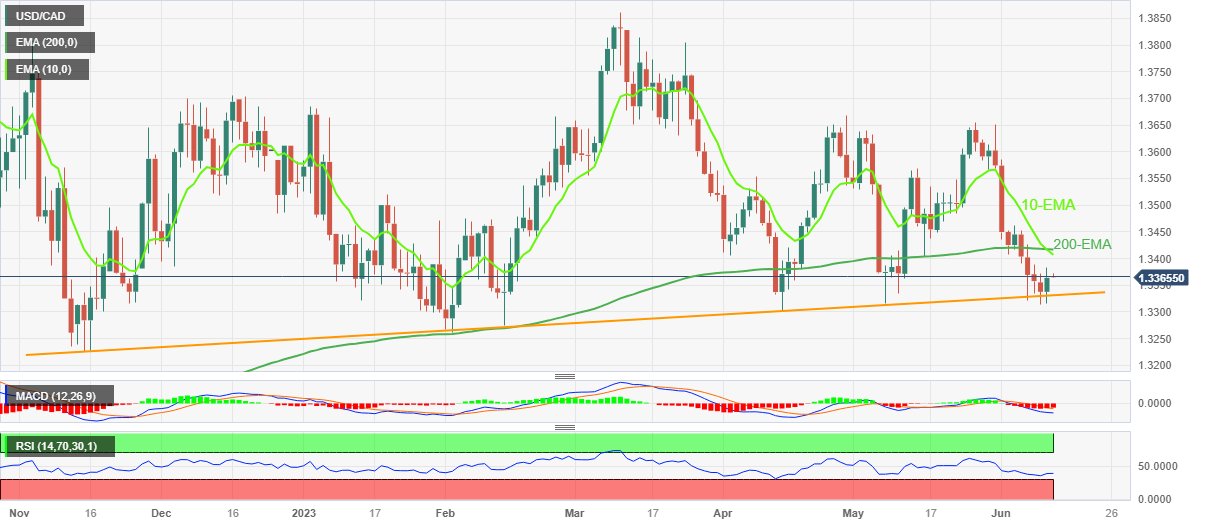
USD/CAD retreats from 1.3383, sidelined near 1.3365 amid early hours of Tuesday’s Asian session. In doing so, the Loonie pair fails to defend the previous day’s corrective bounce off a seven-month-old ascending support line while staying near the lowest levels in two months.
That said, the below 50.0 levels of the RSI (14) line joins an upward-sloping support line from the mid-November 2022 to restrict short-term downside of the USD/CAD pair around 1.3330.
However, the bearish MACD signals and the Loonie pair’s sustained trading below the 200-day Exponential Moving Average (EMA), close to 1.3410 by the press time, keeps the sellers hopeful.
Adding strength to the 200-EMA hurdle is the 10-EMA level surrounding 1.3420, which in turn highlights the 1.3410-20 as the short-term upside limit for the USD/CAD pair.
Should the quote manage to cross the 1.3420 resistance, the previous weekly high of around 1.3460 can act as an extra filter towards the north before welcoming the USD/CAD buyers.
On the flip side, a daily closing below the aforementioned key support line, around 1.3330 at the latest, can quickly fetch the USD/CAD price towards the yearly low of 1.3262. However, the bottoms marked in May and April, respectively near 1.3315 and 1.3300 will challenge the Loonie bears.
It should be noted that the November 2022 low of near 1.3226 can act as the extra downside filter for the Loonie pair bears to watch before taking control.
USD/CAD: Daily chart
Trend: Further downside expected
“In the face of what’s likely to be Republican skepticism when she testifies on Capitol Hill, Yellen will laud institutions like the International Monetary Fund (IMF) and the World Bank (WB) that ‘reflect American values,’” said Bloomberg early Tuesday in Asia as it released transcript of US Treasury Secretary Janet Yellen’s scheduled Testimony in front of the House Financial Services Committee, up for publishing later in the US Session.
The news also adds that the Treasury chief’s remarks showcase the battle lines between the world’s two largest economies as they vie for influence in the developing world.
More comments
Our leadership at these institutions is one of our core ways of engaging with emerging markets and developing countries.
The IFIs (International Financial Institutes) provide real resources to tackle the challenges the world faces — from weathering economic storms to spurring long-term economic development.
Serves as an important counterweight to nontransparent, unsustainable lending from others, like China.
FX implications
The news challenges the market sentiment and allows the US Dollar to lick its wounds, while challenging the Gold Price, ahead of the US inflation data. That said, the US Dollar Index (DXY) struggles to defend the week-start rebound near 103.65 while the Gold Price stays depressed near $1,960 at the latest.
Also read: Gold Price Forecast: XAU/USD stays defensive near $1,965 hurdle ahead of US inflation
- AUD/JPY nears weekly high at 94.22, gaining for the sixth consecutive day.
- The pair shows upward bias, but RSI and three-day RoC indicators suggest a potential retreat.
- Following support for AUD/JPY lies at a June 12 low of 93.84, followed by the 93.00 mark.
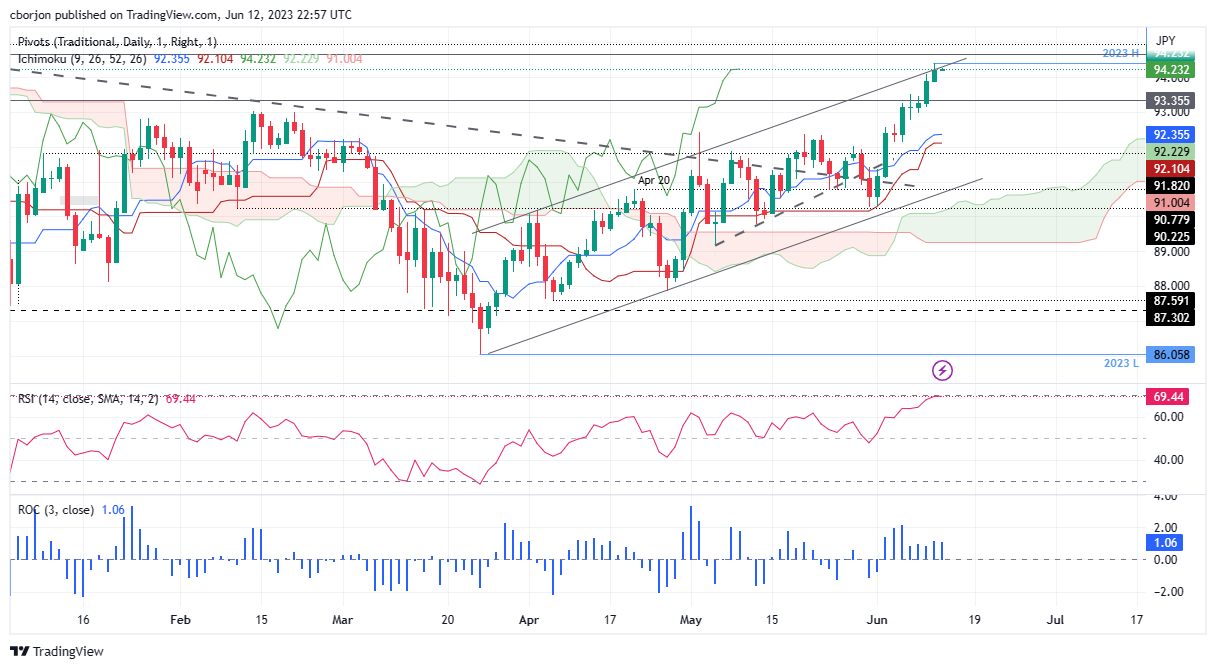
AUD/JPY stays on track toward its six straight days of gains as the Asian session begins. A risk-on impulse underpins the Australian Dollar (AUD), which is still gaining momentum after last week’s rate hike by the Reserve Bank of Australia (RBA). At the time of writing, the AUD/JPY trades at 94.22, nearby the weekly high of 94.41, with minuscule gains of 0.02%.
AUD/JPY Price Analysis: Technical outlook
The AUD/JPY daily chart portrays the pair as upward biased, at the brisk of breaking the November 16 high at 94.65, which could open the door for further upside. That would clear the path toward a new year-to-date (YTD) high and propel the Aussie towards challenging resistance at around the 95.00 psychological price level.
Even though the Ichimoku cloud supports the uptrend thesis, the Relative Strength Index (RSI) indicator signals the pair is overbought, warranting a pullback is expected. Another factor suggests the pair could retrace the three-day Rate of Change (RoC), showing that buying pressure is easing.
If AUD/JPY drops below 94.00, the following support to be tested would be the June 12 low of 93.84. Once cleared, the AUD/JPY next stop would be December’s 13 high turned support at 93.35 before testing the psychological 93.00 mark.
AUD/JPY Price Action – Daily chart
- Gold Price pares losses after reversing from a convergence of 21-EMA, 50-EMA.
- Pre-Fed positioning, firmer United States Treasury bond yields allow US Dollar to grind higher, weigh on XAU/USD.
- Dicey markets, US-China tussles also exert downside pressure on the Gold Price.
- US Core Inflation will be crucial to determine Fed moves even as markets seem prepared for hawkish FOMC halt.
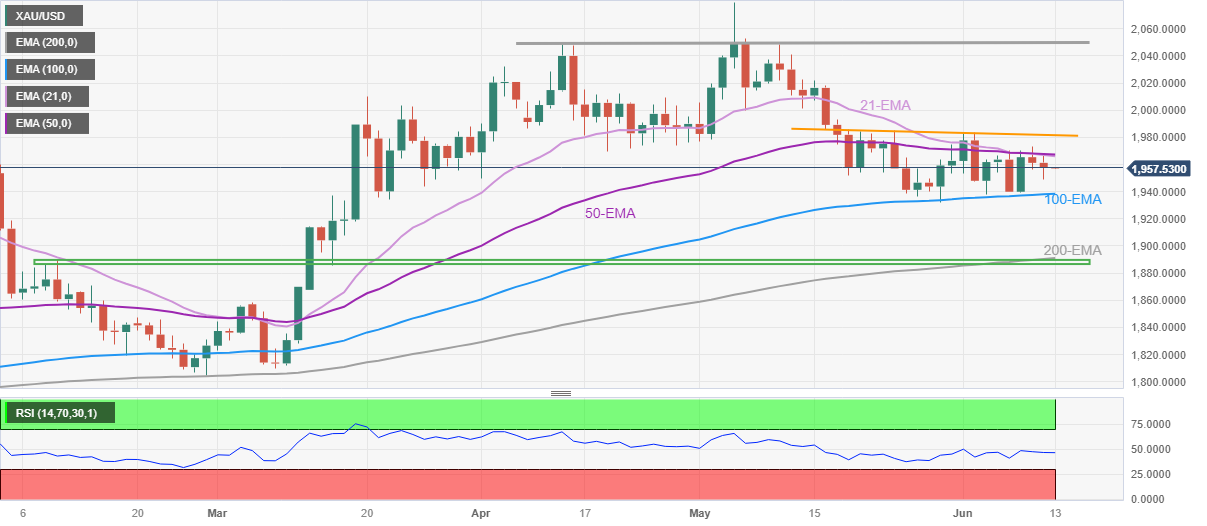
Gold Price (XAU/USD) prods a two-day downtrend with the latest corrective bounce off $1,950, grinding higher as it approaches the key $1,967 resistance confluence during early Tuesday in Asia, close to $1,958 at the latest. That said, the XAU/USD began the week on a back foot amid the market’s indecision ahead of the top-tier central bank events and doubts about the major consensus favoring no rate hike from the Federal Reserve (Fed). However, the US Dollar’s failure to stay strong joins the mixed headlines about the central banks and Treasuries, as well as geopolitics, to allow the precious metal to consolidate recent losses ahead of the key United States Consumer Price Index (CPI) data for May.
Gold Price prods bears amid Federal Reserve concerns
Gold Price dropped in the last two consecutive days while reversing from a crucial Exponential Moving Average (EMA) resistance confluence (see technical analysis). Even so, the metal buyers remain hopeful and print a corrective bounce off the $1,950 mark on Monday as the United States Federal Reserve (Fed) appears to have many reasons to not go forward with its rate hike trajectory.
That said, a study from the San Francisco Fed about the correlation between wage growth and inflation could be cited as the first reason for the US central bank to remain less hawkish. The survey concluded that wage growth has a very small impact on inflation, which in turn raises doubts about the central bankers’ emphasis on wage cost numbers as a source of information to gauge inflation pressure.
Additionally, challenges for the US central bank and grim concerns about the same also prod the US Dollar and allow the Gold Price to consolidate the previous losses. Former Fed vice chair Richard Clarida came out with comments that it may be more difficult to get inflation near 2% than in the past 15 years. Further, “Expect a hawkish skip this week,” Former President of Bosteon Federal Reserve Bank, Eric Rosengren, tweeted early Monday.
With this in mind, the market players place heavy bets on the Federal Reserve’s (Fed) inaction on Wednesday’s Federal Open Market Committee (FOMC) while also expecting a 0.25% rate hike in July.
Even so, firmer yields and fears of economic slowdown, as well as a likely pressure on the banking system due to the bond market moves backed by the debt-ceiling deal, seem to restrict the Gold Price rebound ahead of the key US Consumer Price Index (CPI) data.
As per the latest updates, the US Treasury Department, a $240 billion deficit could be found, which in turn pushed the officials to issue more bonds. The same drives down the prices of traditional haven and propel the yields. It’s worth noting that the concerns about the Fed’s no rate hike and previously downbeat US data exert downside pressure on the Treasury bond coupons and the US Dollar.
Additional challenges for XAU/USD
Apart from the Federal Reserve (Fed) concerns and fears of inflation, challenges emanating from the US-China tension and growing fears of easing economic recovery in the top-tier nations also challenge the Gold Price upside.
That said, a trade dispute is developing after the US expands its ban on imports from Xinjiang. China vows to protect China firms against any US sanctions. On the other hand, global institutions like the International Monetary Fund (IMF) and the Organisation for Economic Co-operation and Development (OECD) earlier flagged concerns about the global economic challenges emanating from higher interest rates. The same could join the latest easy data from top-tier economies to weigh on the Gold Price.
Moving on, the US Consumer Price Index (CPI) figures for May will be in the spotlight as the Fed decision looms on Wednesday. That said, the market forecasts of witnessing no change in the Core CPI MoM figure of 0.4% gain major attention as softer figures could push back the July rate hike concerns and may not allow the Fed to sound hawkish, which in turn can drown the US Dollar and propel the Gold Price.
Also read: US Inflation Preview: Why the US Dollar is more likely to fall than rise, three scenarios
Gold Price technical analysis
Gold Price stays depressed after reversing from a convergence of the 21-Exponential Moving Average (EMA) and the 50-EMA, following a two-week winning streak.
While the clear U-turn from the key EMA confluence keeps the XAU/USD sellers hopeful, the below 50.0 levels of the Relative Strength Index (RSI) line, placed at 14, suggests lower room for the commodity towards the south. The same highlights the 100-EMA support of around $1,937 as the short-term important level for the Gold bears to conquer to keep the reins.
Should the quote XAU/USD bears manage to smash the $1,937 support, which is less likely, the odds of witnessing a gradual fall towards the $1,890-85 support zone comprising multiple levels marked since early February and the 200-EMA can’t be ruled out.
Meanwhile, an upside break of the previously mentioned EMA confluence, around $1,965-70 by the press time, needs to cross a one-month-old resistance line, close to $1,982 at the latest, to restrict the short-term upside of the Gold Price.
Following that, a run-up toward the $2,000 psychological magnet and then to the two-month-long resistance near $2,050 can’t be ruled out.
Overall, the Gold Price remains on the back foot but the downside room appears limited.
Gold Price: Daily chart
Trend: Further downside expected
- EUR/USD picks up bids to reverse the late Monday’s retreat from three-week high.
- Markets place comparatively more hawkish bets on ECB than Fed as recent US data arrives softer.
- Today’s German, US inflation data, ZEW Survey figures will be crucial ahead of Wednesday’s FOMC.
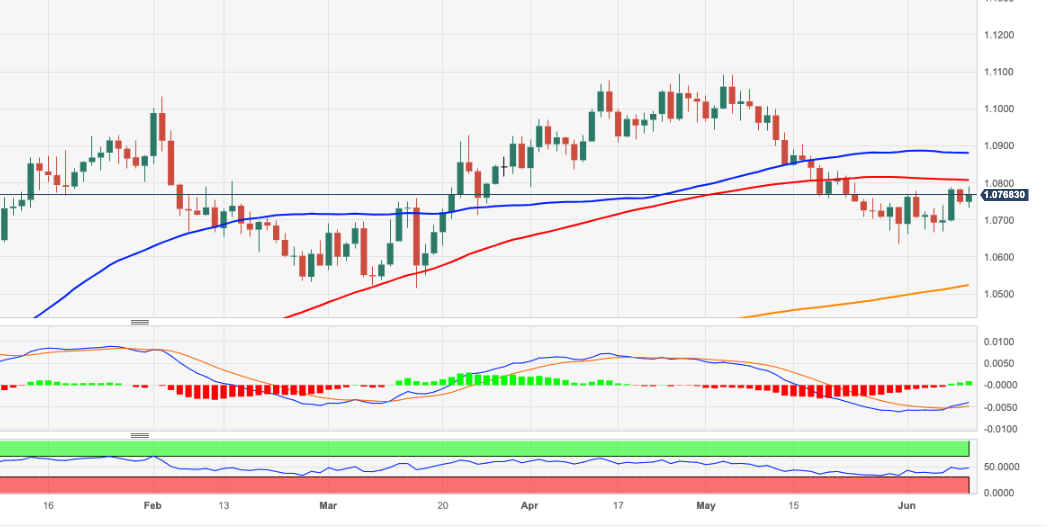
EUR/USD defends the week-start gains around the highest levels since late May, despite retreating from the multi-day top amid late Monday, as Euro bulls brace for the key day. That said, the major currency pair remains on the front foot at around 1.0760 during the early hours of Tuesday’s Asian session.
That said, the quote began the day on a front foot amid broad US Dollar weakness as markets keep expecting no rate hike from the US Federal Reserve (Fed). Challenges to sentiment, however, pared the EUR/USD pair’s daily gains during the US session after a jump in the United States Treasury bond yields joined fears that the Eurozone economy isn’t immune to the slowdown, which in turn could probe the European Central Bank (ECB) hawks soon, if not now.
As per the latest data from the US Treasury Department, a $240 billion deficit could be found, which in turn pushed the officials to issue more bonds. The same drives down the prices of traditional haven and propel the yields. It’s worth noting that the concerns about the Fed’s no rate hike and previously downbeat US data exert downside pressure on the Treasury bond coupons and the US Dollar.
Elsewhere, a study from the San Francisco Fed concluded that wage growth has a very small impact on inflation, which in turn raises doubts about the central bankers’ emphasis on wage cost numbers as a source of information to gauge inflation pressure. The same could allow the Fed to remain hawkish and offer a hawkish halt.
With that in mind, Former Fed vice chair Richard Clarida came out with comments that it may be more difficult to get inflation near 2% than in the past 15 years. Further, “Expect a hawkish skip this week,” Former President of Bosteon Federal Reserve Bank, Eric Rosengren, tweeted early Monday.
It should be noted that the recently downbeat Eurozone growth data and early signals for inflation haven’t been positive even if most of the ECB Officials tried to defend the hawkish moves, which in turn raised doubts on the capacity of the bloc’s central bank to fuel the rates. That said, market players put heavy bets on the ECB’s 0.25% rate hike on Thursday.
Hence, today’s final readings of Germany’s Harmonized Index of Consumer Prices (HICP) for May, expected to confirm 6.3% YoY, and ZEW Survey data for June, together with Eurozone ZEW figures, will be eyed closely for clear directions. However, major attention will be given to the US Consumer Price Index (CPI) figures for May as the Fed decision looms on Wednesday, as well as the market forecasts of witnessing no change in the Core CPI MoM figure of 0.4%.
Also read: US Inflation Preview: Why the US Dollar is more likely to fall than rise, three scenarios
Technical analysis
A convergence of the 100-day and 21-day Exponential Moving Average (EMA), around 1.0770 at the latest, restricts short-term EUR/USD upside.
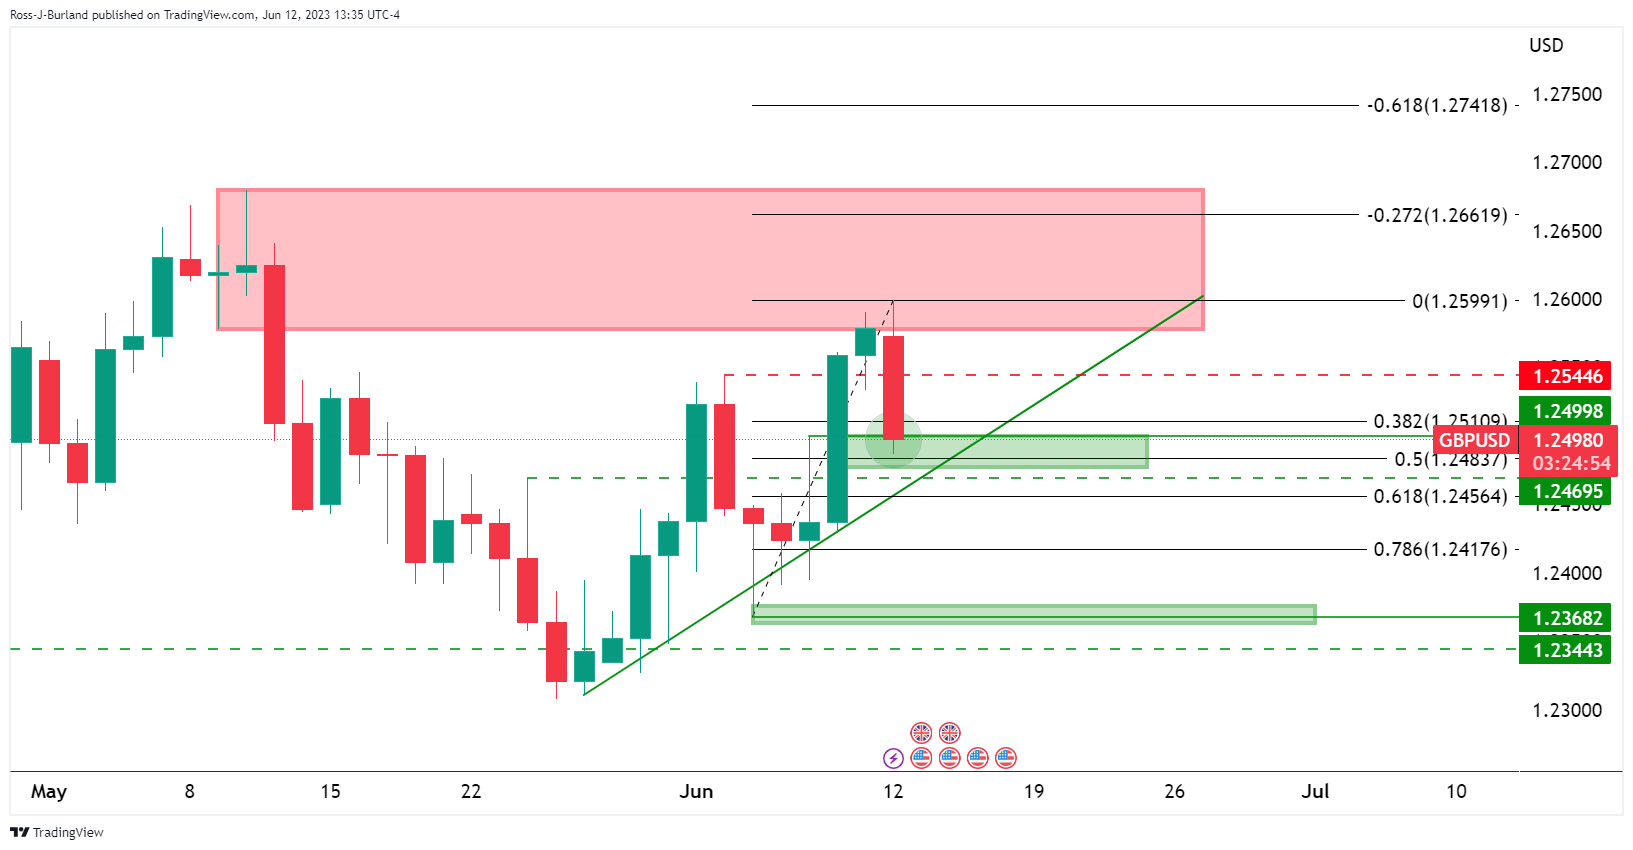
- GBP/USD dips after failing to breach 1.2600, now trading at 1.2497 amid climbing US Treasury bond yields.
- GBP/USD traders lean on last week’s US PMI, highlighting an ongoing economic slowdown.
- BoE’s rate hike hints echo amid inflation concerns as the market keenly awaits US CPI and UK employment figures.
GBP/USD slumps in the North American session after reaching a fresh five-week high at 1.2599 amidst a light economic calendar, which would gain interest since Tuesday. Rising US Treasury bond yields and some US Dollar (USD) strength keep the Sterling (GBP) under downward pressure following the GBP/USD failure to crack 1.2600. At the time of writing, the GBP/USD is trading at 1.2513.
Sterling struggles against strengthening USD and climbing US Treasury yields as the market awaits US and UK economic indicators.
Wall Street continues to trade in a positive direction. At the same time US Treasury bond yields climb, as the 10-year US T-note yields 3.774%, three basis points (bps) up from its opening yield. Consequently, the DXY is printing modest gains of 0.15% at 103.706.
Given the lack of economic data revealed on Monday, GBP/USD traders lean onto the last week’s US data. The ISM revealed its Services PMI, which expanded but is dangerously edging towards the 50 lines, seen as an expansionary/recessionary level, suggesting the economy continues to deteriorate. That, alongside the jump in unemployment claims for the week ending June 2, justified the US Federal Reserve (Fed) stance to pause rate increases.
Aside from this, a parade of Bank of England (BoE) policymakers crossed newswires, led by Jonathan Haskel, who said the BoE “may need to raise rates more than once, from the current 4.5% level to control inflation.
Echoing some of his comments, Catherine Mann said that inflation expectations remain high, but the latest drop was important to shift her stance from a 50 to a 25 bps hike in the latest meeting. She said service inflation and wage price increases are a concern “for achieving the 2% CPI target.” Mann added, “Monetary policy is not good at fine-tuning, should focus on inflation.”
Upcoming events
On Tuesday, the US economic docket will feature May’s Consumer Price Index (CPI), the NFIB Business Optimism Index, followed by Wednesday’s Fed decision. On the UK front, employment figures will be featured on Tuesday, ahead of growth figures on Wednesday.
GBP/USD Price Analysis: Technical outlook
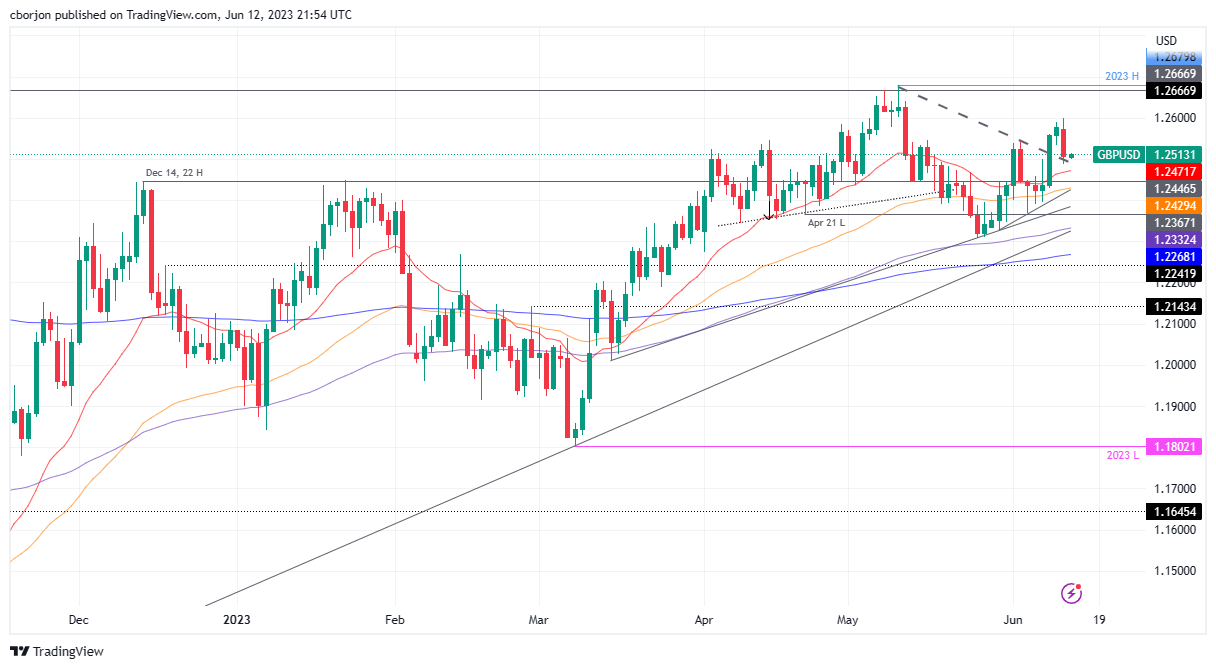
From a technical perspective, the GBP/USD is upward biased, trending well above the Exponential Moving Averages (EMAs) on the daily chart. Still, the pullback could put at risk support at the 20-day EMA at 1.2466. If GBP/USD falls below 1.2500, that could put the latter in the sellers’ eyesight, followed by dynamic support at the 50-day EMA at 1.2426. A break below will expose the 1.2400 figure. Conversely, the GBP/USD first resistance would be the 1.2600 mark, followed by the year-to-date (YTD) high of 1.2680.
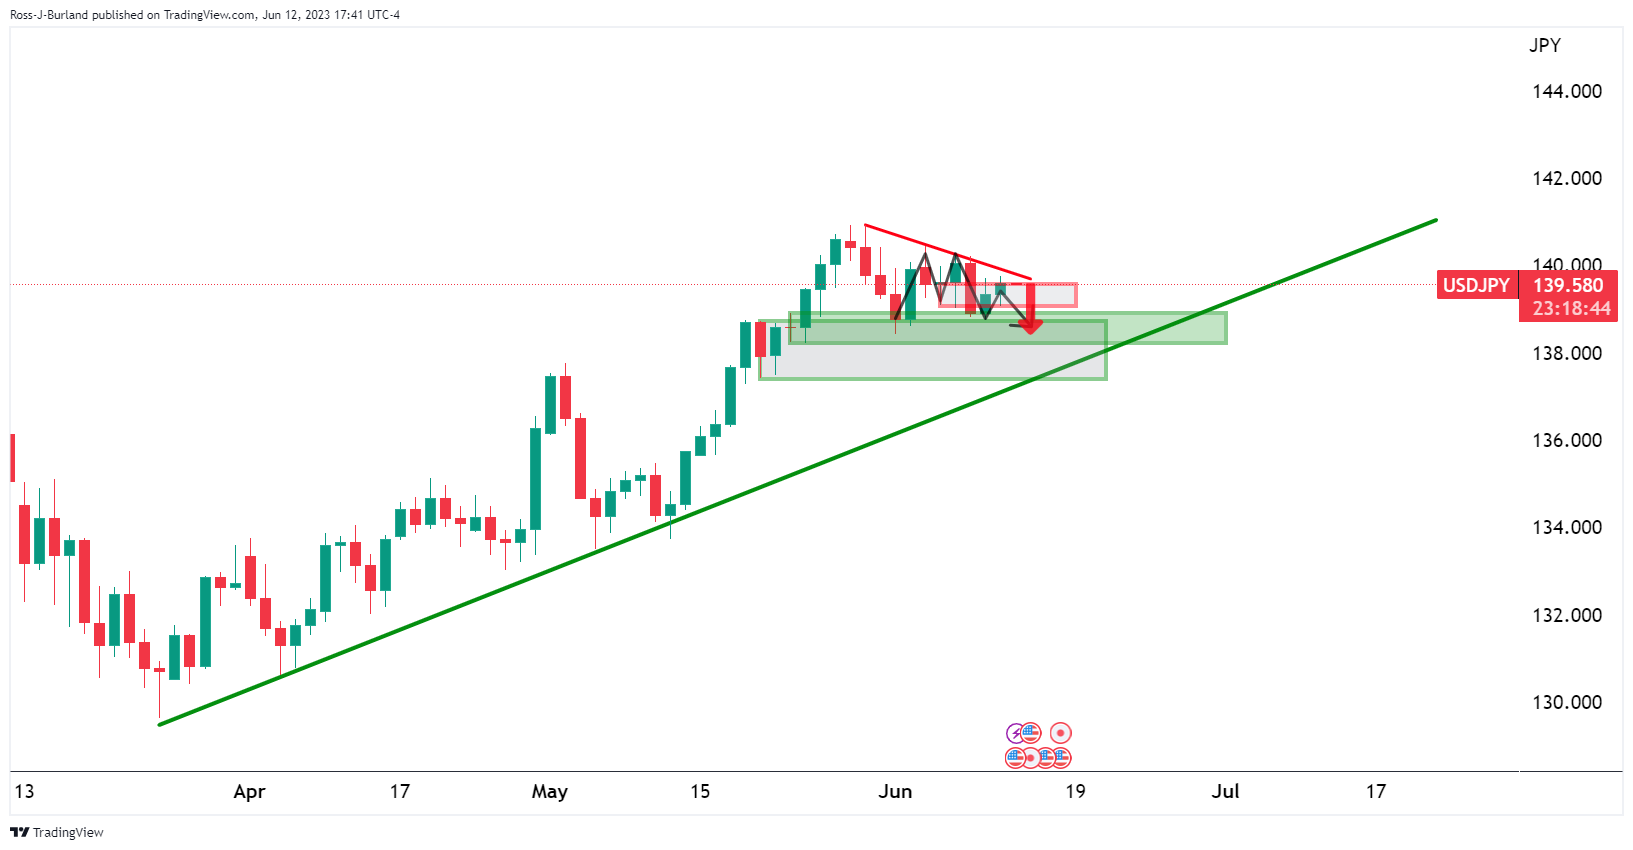
- USD/JPYbears eye a test of the trendline support.
- USD/JPY bulls look for a break of key dynamic resistance.
USD/JPY rallied on Monday but within a bearish structure on the charts. Nevertheless, the pair now consolidates ahead of key events on the US calendar this week, starting Tuesday. The May inflation rate on Tuesday will be a key focus and could shift the needle ahead of the Federal Reserve interest rate decision.
Trading could be quiet for the Asian and European day, however, as investors remain cautious ahead of several key policy decisions due this week, with the Federal Reserve expected to keep rates on hold for the first time since January 2022.
USD/JPY daily charts
Zoomed in...
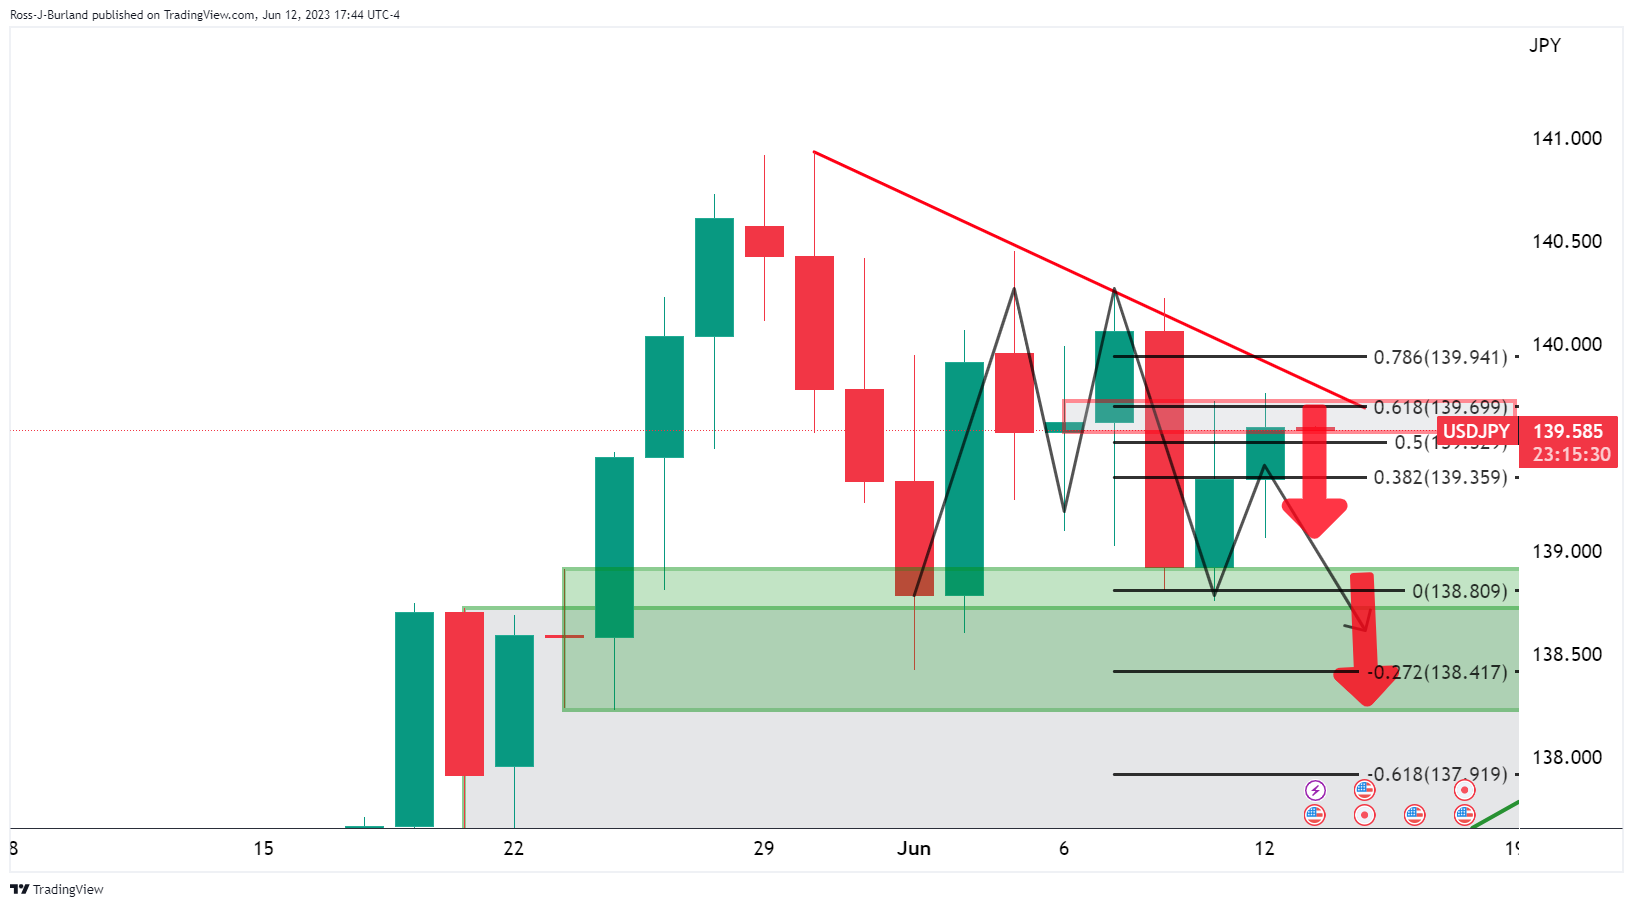
As illustrated, the price is meeting the resistance of the M-formation's neckline. This could act as a resistance and the bias remains below the bearish trendline. If so, the bears will eye the daily chart's dynamic support line. On the other hand, a break of the trend line resistance opens the risk for a bullish extension with the price respecting the bullish trend.
- USD/MXN trades at 17.2807, nearing a seven-year low, as MXN capitalizes on risk-on sentiment.
- USD/MXN loses nearly 11.32% in 2023 due to the rate difference between US and Mexico’s central banks.
- Market awaits US CPI data and Fed’s decision, with Banxico’s commitment to restrictive monetary policy underpinning MXN.
USD/MXN continues its way towards plunging below the 17.0000 figure, printing another seven-year low of 17.2402 due to a risk-on impulse that generally boosts risk-sensitive currencies like the Mexican Peso (MXN). Albeit the US Dollar (USD) strengthened vs. most G10 FX, it slipped against the MXN. At the time of writing, the USD/MXN is trading at 17.2807, down 0.01%.
MXN benefits from interest rate differential with the US, while upcoming US inflation data and Fed decision hold sway
There’s an old saying amongst traders that the trend is your friend, and that’s what is happening with the USD/MXN pair. According to Reuters, since the beginning of 2023, the USD/MXN has been losing close to 11.32%, benefitted by the interest rate differential between the United States (US) and Mexico.
The US Federal Reserve (Fed) in the US raised rates by 500 basis points (bps) since March 2022, toward the 5.00%-5.25% range, while the Bank of Mexico (Banxico) lifted rates by 725 basis points since June 2021, towards 11.25%, as inflation began to rise, a consequence Covid-19 pandemic.
On Wednesday, the Fed is expected to hold its main rates reference unchanged amidst a labor market flashing signs of easing, as well as manufacturing and services PMIs, - revealed by the ISM, portrayed an economic slowdown. That increased the likelihood of a recession, hence one of the reasons behind Powell’s decision.
Nevertheless, the US Bureau of Labor Statistics (BLS) is set to reveal Tuesday’s Consumer Price Index (CPI) for May. Analysts estimate inflation would dip toward 4.1% YoY against the prior’s month reading of 4.9%, while Core CPI, which strips volatile items, is calculated to slow toward 5.3% YoY, vs. 5.5% in April.
Any upward inflation revision could change the Fed’s skipping playbook and rock the boat in the financial markets. Money market futures show a 20% chance of a 25 bps hike on Wednesday, vs. 80% odds for keeping the Federal Funds Rate (FFR) unmoved.
Another factor that underpins the USD/MXN pair is Banxico Governor Jonathan Heath, saying that monetary policy must remain restrictive “as long as possible,” to ensure inflation reaches its target. Heath forward guided the markets, “We want to keep the monetary policy in the restrictive zone for as long as possible — and that’s way more than three decisions,” according to an interview in Bloomberg News.
USD/MXN Price Analysis: Technical outlook
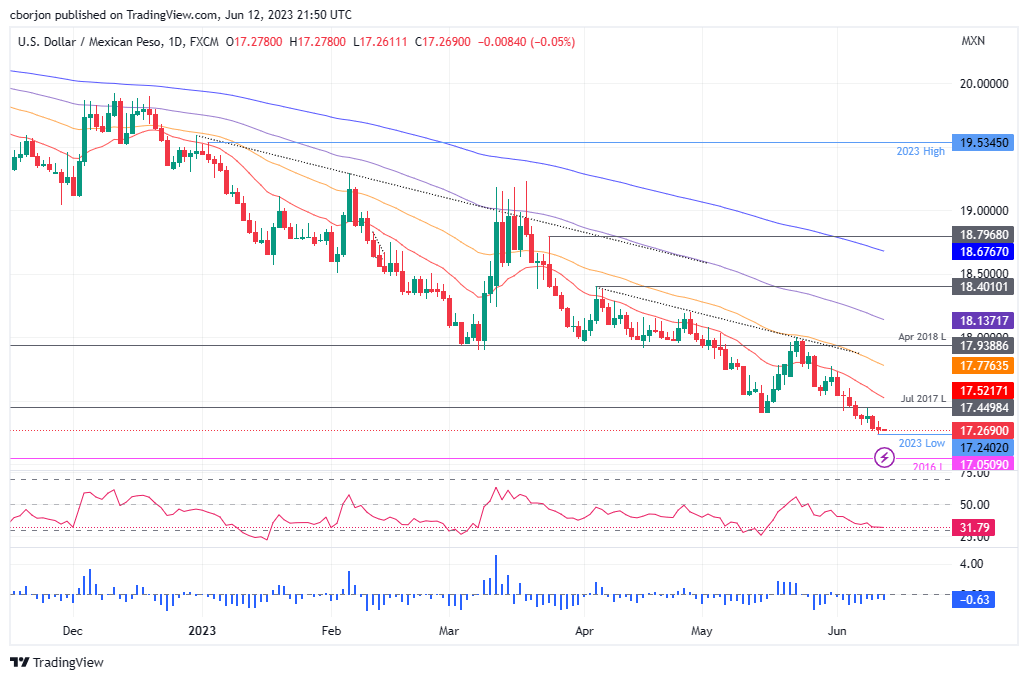
The USD/MXN remains downward biased after reaching new multi-year lows at 17.2402. Although the Relative Strength Index (RSI) remains close to oversold conditions, it is still bearish, suggesting that further downside is expected. That would put the 2016 low of 17.0500 into play, ahead of reaching the 17.0000 figure. Conversely, if USD/MXN buyers reclaim, the psychological 17.50 would put the 20-day EMA up for grabs at around 17.5218 before rallying toward the 50-day EMA at 17.7764.
- The NZD/USD faced strong resistance at the 100-day SMA of 0.6150 and retreated to 0.6120.
- Migration data will be the highlight of the early Tuesday session.
- US CPI is the main highlight of Tuesday.
The NZD/USD was rejected at the 0.6150 level and the pair retraced to the 0.6120 area. As the market awaits significant economic data on Tuesday, visitor arrivals figures and the US Consumer Price Index (CPI) is expected to dominate investor sentiment and shape the trajectory of the currency pair in the short term.
Eyes on Visitors Arrivals and US CPI
As the tourist industry from New Zealand dominates a large total of its GDP, the Visitor's Arrivals released by Stats NZ are closely watched by investors. The flow of tourists is expected to increase by 2.1% YoY in April, decelerating from the previous record in March.
Investors are eagerly awaiting the release of the US Consumer Price Index (CPI) data for May, as it is expected to provide crucial guidance for market direction. Analysts predict that the headline figure will reflect a slowdown in the year-on-year (YoY) rate to 4.1%, while the Core measure is projected to decrease from the previous YoY rate of 5.5% to 5.3%. In that sense, the inflation outlook is closely monitored by the Federal Reserve as one of its long-term objectives is to assure price stability.
Meanwhile, markets are expecting a hike pause for Wednesday’s meeting but a strong likelihood of 25 basis points in July. That being said, both Chair Powell's press conference and the updated macroeconomic forecast of the Federal Open Market Committee will shape the expectations regarding the Federal Reserve's (Fed) next moves.
NZD/USD Levels to watch
According to the daily chart, the NZD/USD holds a neutral tilt with a bullish bias for the short term. Despite indicators losing some traction, there are still in positive territory, suggesting that there may be more upside potential.
Resistance Levels to watch: 0.6150,100-day Simple Moving Average (SMA), 0.6180, 0.6200.
Supports Levels to watch: 0.6125, 20-day Simple Moving Average (SMA), 0.6100, 0.6080.
NZD/USD Daily chart
-638222029332910501.png)
- AUD/USD bears eye a downside correction around key US events.
- The bears are on the backside of the prior bullish trendline, leaving the bias bearish.
AUD/USD was pressured on Monday from bullish cycle highs near 0.6773 and the pair now consolidates ahead of key events on the US calendar this week, starting Tuesday. The May inflation rate on Tuesday will be a key focus and could shift the needle ahead of the Federal Reserve interest rate decision. Meanwhile, the US Dollar inched higher on Monday, trading in a narrow range as investors remained cautious ahead of several key policy decisions due this week, with the Federal Reserve expected to keep rates on hold for the first time since January 2022.
On the charts, traders will note the resistance that the pair has run into as follows:
AUD/USD weekly chart
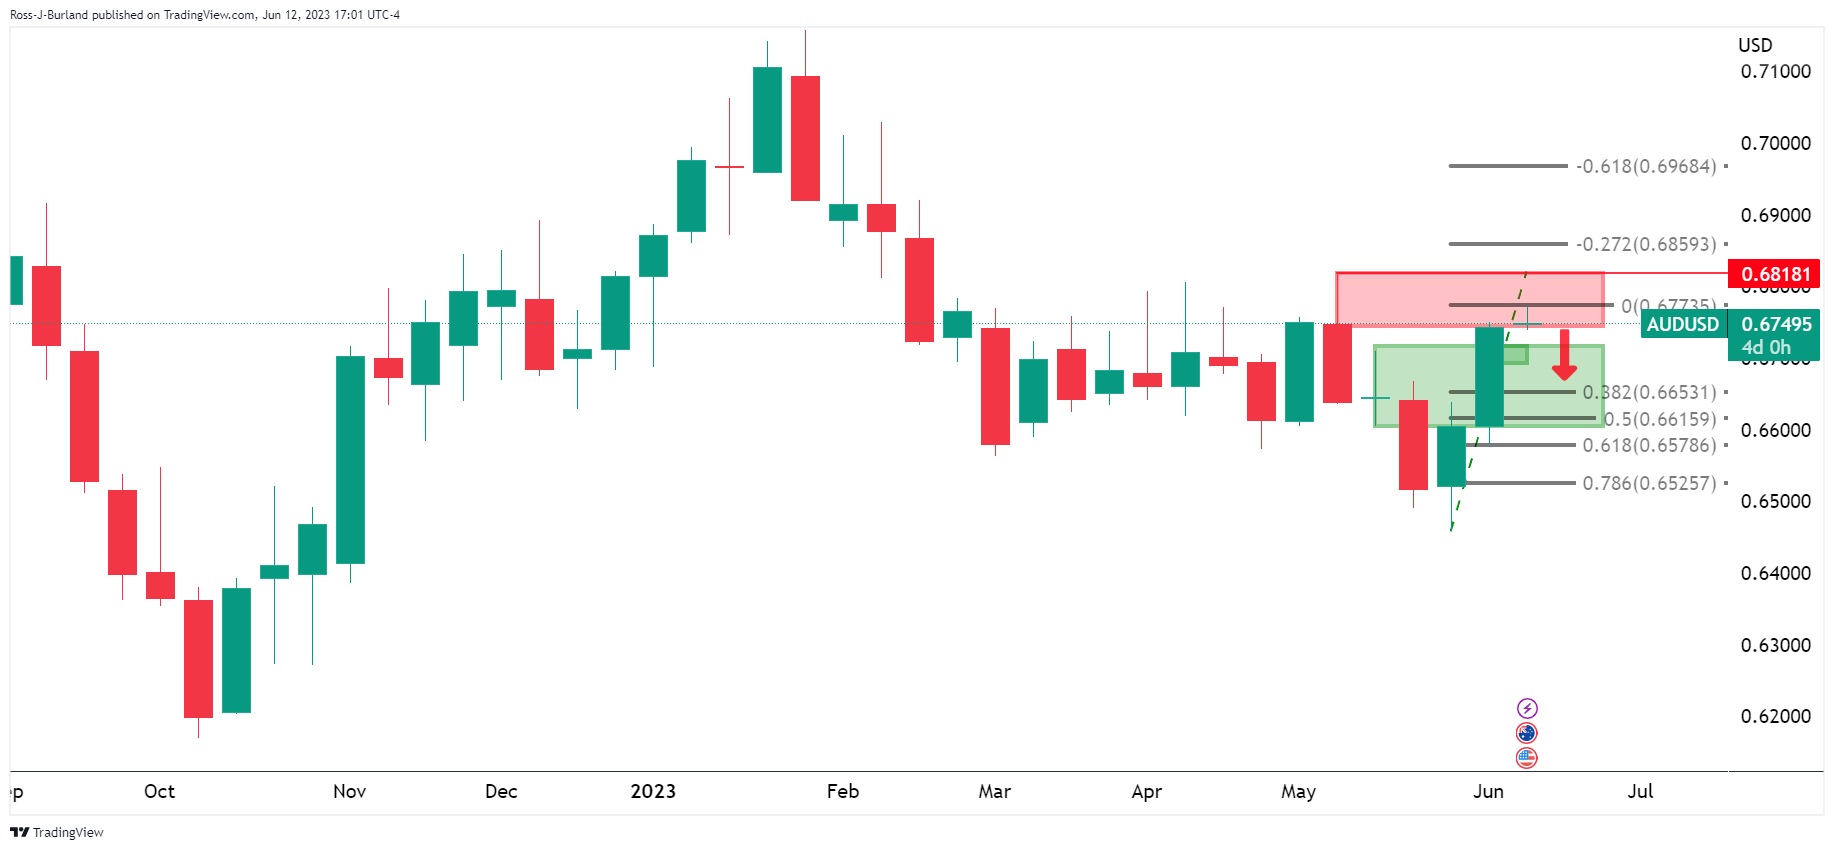
AUD/USD daily chart

A bearish correction could come into play as the charts above show.
AUD/USD H4 chart
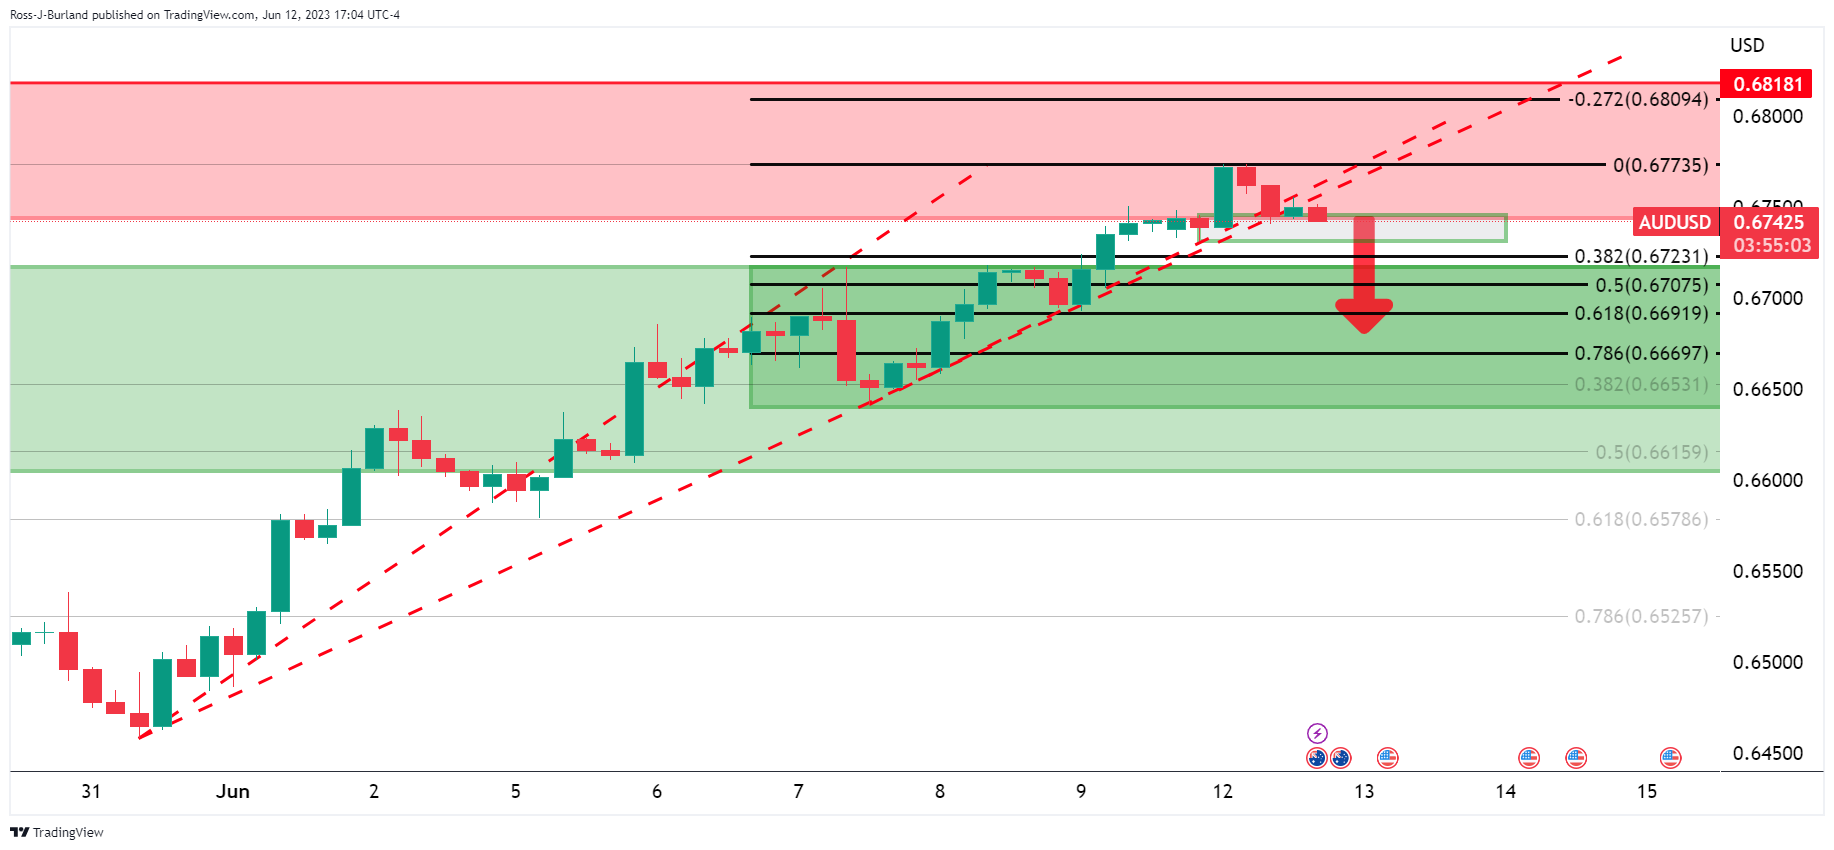
From a 4-hour perspective, the pair is on the backside of the prior bullish trendlines and this leaves a bearish bias on the charts for the days ahead.
During Tuesday's Asian session, New Zealand will report April visitor arrivals. The Westpac Australian Consumer Confidence Index for June, and the NAB Business Survey for May are due. The key event of the day will be the US Consumer Price Index, which will offer critical data ahead of Wednesday's FOMC decision.
Here is what you need to know on Tuesday, June 13:
Stocks opened the week in a positive mode ahead of key data and events. Markets appear to be cheering at the possibility of the Federal Reserve (Fed) ending its rate hike cycle. Incoming economic data will be crucial. The Dow Jones gained 0.56% and the Nasdaq climbed 1.53%. US Treasury yields pulled back during the American session and ended the day modestly lower.
The Federal Reserve begins its two-day meeting on Tuesday. On Wednesday, the central bank is expected to hit the pause button; however, some analysts warn that another 25 basis points seem possible. The key report on Tuesday will be the US Consumer Price Index (CPI), which is expected to have risen 0.2% in May and 4.1% from a year ago, down from 4.9%; the Core CPI is seen advancing 0.4% in the month and 5.3% from a year ago, compared to the 5.5% of the previous month. Those numbers will be critical for expectations regarding the Fed’s monetary policy.
The US Dollar Index rose marginally on Monday, ending above 103.50. It is moving without a clear direction, still above the 103.30 support.
EUR/USD hit fresh weekly highs but then pulled back, settling around 1.0750. The pair is moving sideways, awaiting fresh data and ahead of the European Central Bank (ECB) meeting on Thursday. On Tuesday, Germany and Spain will report the final reading of the Consumer Price Index for May, which should not show surprises. The German and Eurozone June ZEW Survey are also due.
GBP/USD ended a positive three-day streak, falling sharply. It managed to recover above 1.2500 during US hours. The Pound lagged despite hawkish comments from Bank of England (BoE) officials. EUR/GBP had the best day in weeks, rebounding from monthly lows to 0.8600. The UK will release employment data on Tuesday. The Unemployment Rate is expected to rise from 3.9% to 4% in the three months ended in May. BoE Bailey testifies to the House of Lords.
USD/JPY continued to move sideways around 139.50, as it has been the case since the beginning of the month. With the Fed and the Bank of Japan meetings ahead, the current range between 138.50 and 140.00 will be challenged.
AUD/USD rose for the third consecutive day, posting the highest daily close in a month at 0.6750 as the Aussie outperformed. The Westpac-Melbourne Institute Consumer Sentiment (June) is due on Tuesday, and the National Australia Bank Monthly Business Survey (May) will be released.
NZD/USD is facing resistance at the 200-day Simple Moving Average (SMA) at 0.6120. The pair is moving with an upside bias, but some exhaustion signs are seen. The next move will likely be USD-dependent. New Zealand migration data is due on Tuesday.
USD/CAD rebounded from the important support area above 1.3300 to 1.3385/90. The bias is to the downside, but the Loonie needs to break under 1.3300 to clear the way to more gains. The 4% decline in crude oil prices weighed down the Canadian Dollar which lagged on Monday.
Gold found support at $1,950 on Monday and trimmed losses during the Asian session, rising to $1,960. Silver lost 0.95% and finished around $24.00. Cryptocurrencies performed mixed, with Bitcoin losing 1%, falling below $36,000.
Like this article? Help us with some feedback by answering this survey:
- Gold price is trapped by support and resistance ahead of key events.
- Bears eye a continuation of the broken-down market.
Gold price was a touch lower on Monday towards the close on Wall Street. closed with a small loss on Monday as the dollar moved higher ahead of the Wednesday end of the two-day meeting of the Federal Reserve's policy committee. At the time of writing, Gold price was 0.11% offered and had travelled between a high of $1,967.01 and reached a low of $1,949.28.
The main focus for the week will be on the US Consumer Price Index on Tuesday and then the outcome of the Federal Reserve's two-day meeting. The CME Fedwatch tool seeing a 74% chance the meeting will end Wednesday without another rise in interest rates.
''is likely to come down to the wire, but we maintain our long-held view that the Fed will tighten by a final 25bp in June to a range of 5.25%-5.50%. If the Fed decides to 'skip' the June meeting, we expect the decision to be accompanied by communication that leans hawkish (ie. statement, dot plot, and presser), signaling a likely hike in July,'' analysts at TD Securities explained.
Meanwhile, the May inflation rate on Tuesday will be a key focus and could shift the needle in that regard. Markets are expecting prices last month to have risen by 4% annualized last month, this is lower than the 4.9% marked in April.
''Core prices likely stayed firm in May, with the index rising a strong 0.4% m/m for a second straight month, also matching the m/m avg since June 2022,'' analysts at TD Securities said. ''Goods inflation likely stayed positive, with shelter prices remaining the key wildcard (expect slowing). Retreating gas prices (-6% MoM) will drag non-core inflation. Our m/m forecasts imply 4.0%/5.3% YoY for total/core prices.''
Leading into the events, bond yields were mixed. The US two-year note was last seen paying 4.577%, down 2.9 basis points, while the 10-year note was up 3.0 points to 3.772%. The ICE dollar index was last seen trading near 103.62 after moving up from a low of 103.242 and scoring a nearby high of 103.75.
Gold technical analysis
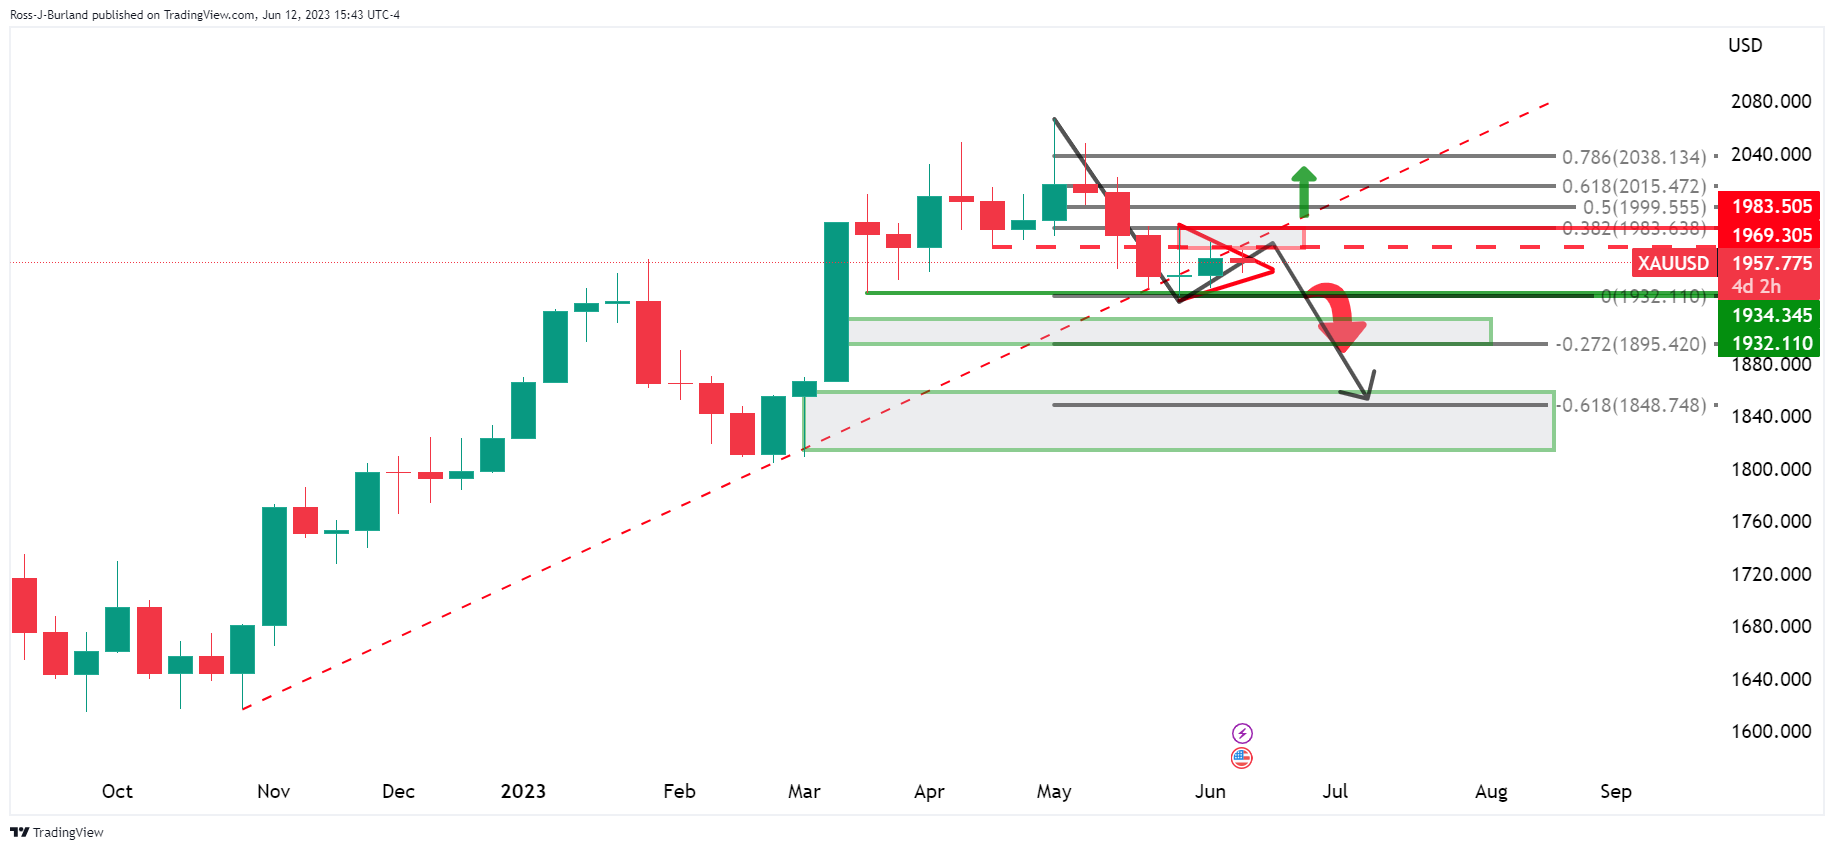
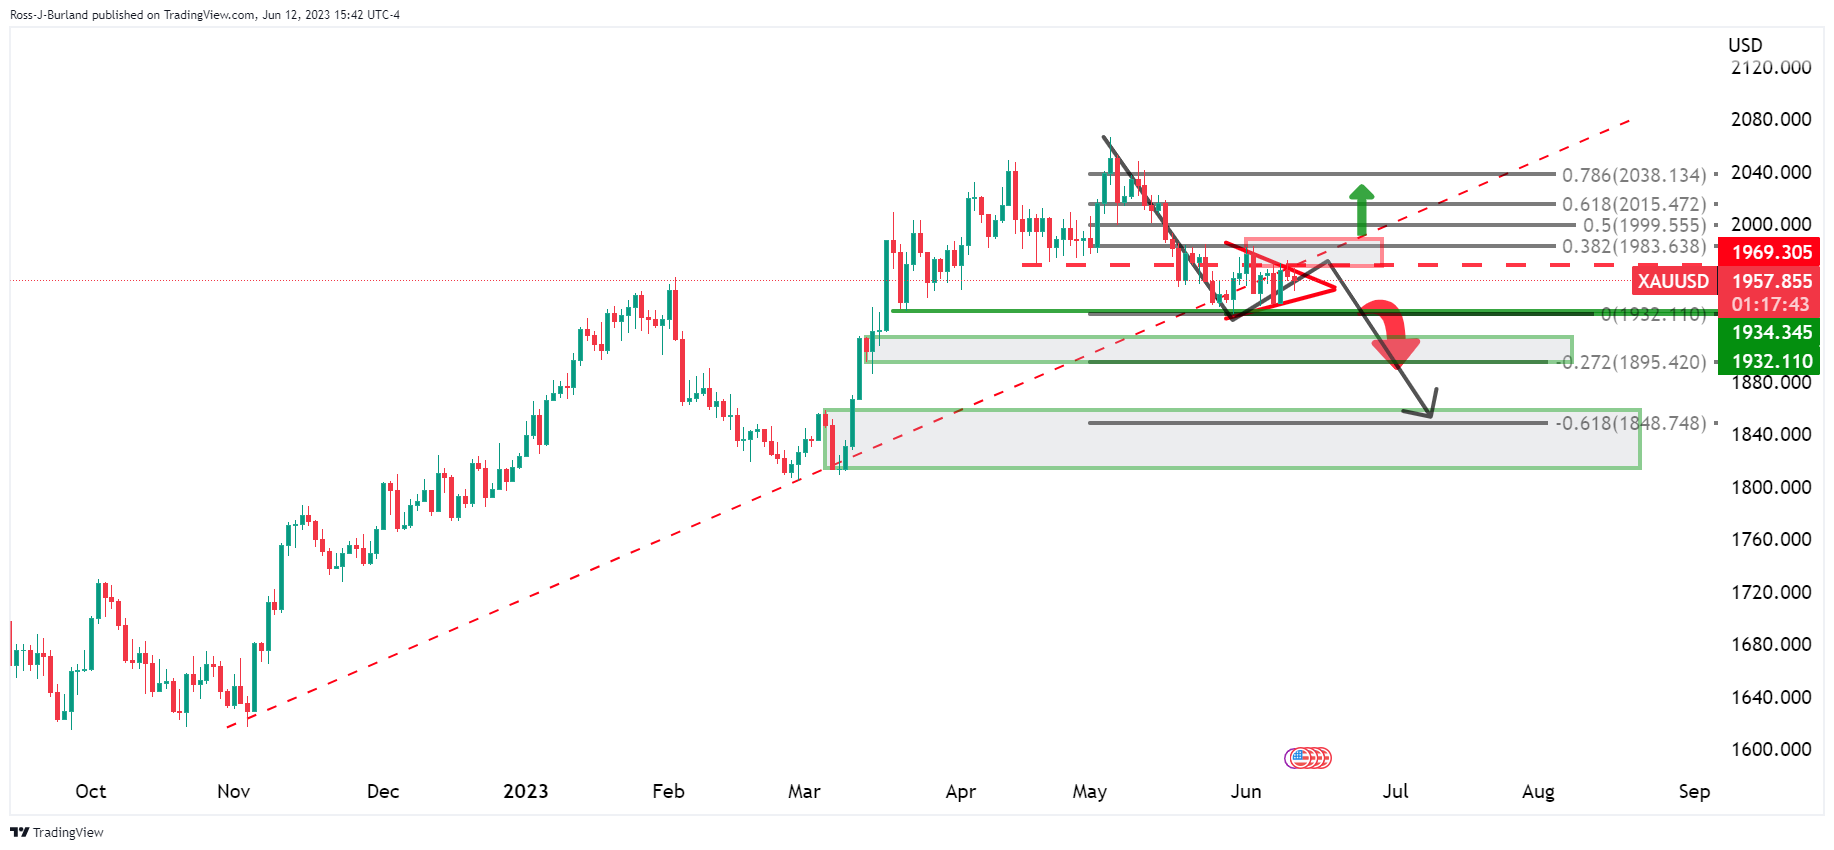
The price is trapped between key breakout support and resistance as illustrated in the daily and 4-hour charts above.
- WTI nosedives to $66.80, influenced by global economic deceleration and reduced oil price forecasts.
- Goldman Sachs revises WTI year-end forecast to $81 per barrel amid potential increased supplies.
- Upcoming US CPI data and Fed’s decisions are closely watched; the Saudi production cut provides a slight cushion.
Western Texas Intermediate (WTI), the US crude oil benchmark, plunges sharply due to see an ongoing global economic deceleration, as well as analysts slashing oil price forecasts ahead of the release of inflation in the United States (US), and the Federal Reserve (Fed) meeting on Wednesday. WTI is trading at $66.80, plummeting almost 5% after hitting a daily high of $70.22.
Anticipated US inflation data and Fed’s meeting influence the oil market, as Goldman Sachs trims year-end WTI estimate
Wall Street is trading with solid gains at the start of the week. Expectations for an increase of supplies from Russia and Iran triggered a forecast revision from Goldman Sachs, which downward revised WTI from $89 a barrel to $81 by the year’s end.
Weaker than expected, last week’s data from China, showing that exports contracted above estimates showed a grim outlook for global demand amongst developed markets. Alongside speculations that the People’s Bank of China (PboC) will reduce rates to stimulate the economy triggered Monday’s drop despite OPEC+’s efforts to cushion oil prices.
In the meantime, the US will reveal the Consumer Price Index (CPI) for May, which is expected to show the impact of 500 basis points (bps) of rate hikes by the Fed. Upward surprises on the data would likely trigger a reaction by the Fed, as Jerome Powell and Co would reveal its decision on Wednesday at around 18:00 GMT.
Further Fed increases would boost the US Dollar (USD), a headwind for dollar-denominated assets. However, WTI’s fall was capped by the Saudis, which pledged to cut oil production in July.
WTI Price Analysis: Technical outlook
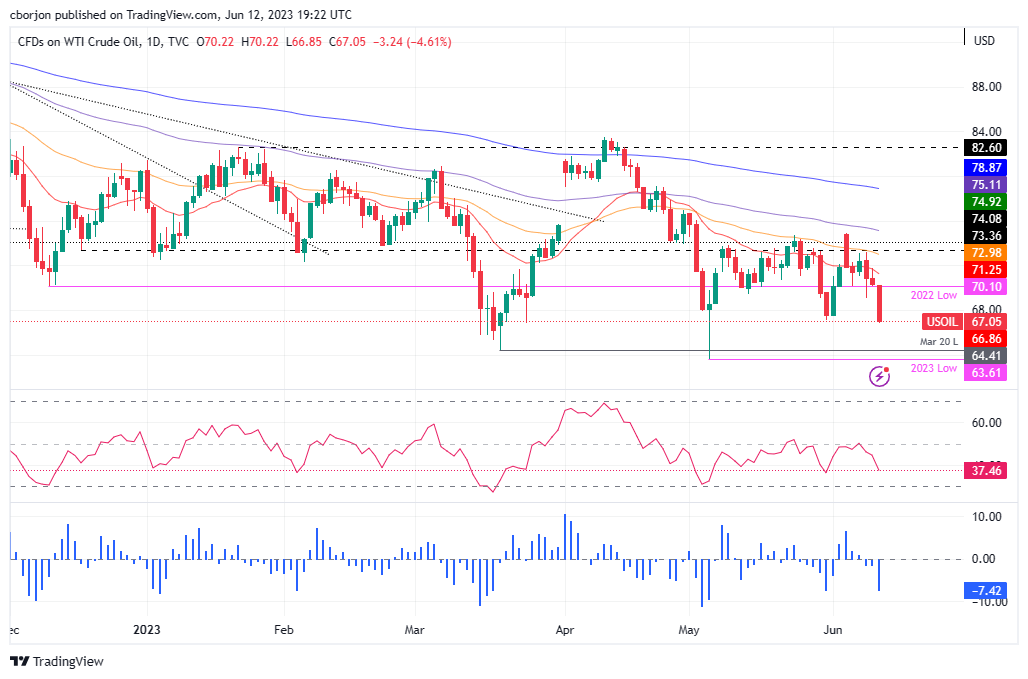
The US crude oil benchmark fell below May’s low of $67.08, opening the door for further losses, beneath the $67.00 mark, putting into play March’s 20 swing low at $64.41, ahead of challenging the year-to-date (YTD) low of $63.61. On the upside, WTI’s first resistance would be the 2022 low of $70.10, followed by the 20-day Exponential Moving Average (EMA) at $71.23. A breach of the latter will expose the 50-day EMA at $72.97.
The Relative Strength Index (RSI) and the three-day Rate of Change (RoC) portray sellers gathering momentum, so more downside is expected.
- On Monday's session, the GBP/JPY traded at the 174.36 - 175.77 range, setting a fresh cycle high.
- Rising US yields and weak Japanese data weigh on the Yen.
- Investors eye UK labor-market data due on Tuesday.
The GBP/JPY soared to a fresh cycle high of 175.77 and then turned course to negative territory finding support at the 174.50 area. In that sense, rising US bond yields and dovish bets on Bank of Japan’s (BoJ) decision on Friday apply further pressure on the Yen. Markets await labor-market data from the UK on Tuesday and US inflation.
Labor market data from the UK set to shape next BoE decision
For Tuesday’s session, labor-market data from the UK is anticipated to show that the number of individuals claiming jobless benefits decreased by 9.6K in May, compared to the previous figure of 46.7 K. The unemployment rate is projected to increase slightly to 4%, while average earnings, both including and excluding bonuses, are expected to accelerate during the same period. As central banks tend to have a “full employment” policy, the health of the labor-market is closely followed by policymakers and hence shapes the expectation of their decisions.
That being said, Bank of England´s (BoE) Jonathan Haskel highlighted the importance of closely monitoring inflation momentum and persistence, indicating the possibility of further interest rate hikes to counter inflation risks. In addition, Catherine Mann showed on Monday her concerns with sticky core inflation figures and added that she is waiting for an “analysis of data” to decide the next vote. In that sense, the hawkish stance from the BoE provides traction for the Pound Sterling.
On the other hand, Japan's PPI contracted by 0.7% MoM in May, exceeding the expected decline of 0.2%, while Machine Tool Orders saw a substantial contraction of 22%. These weak economic data and slowing inflation have raised expectations for a more dovish stance from Governor Ueda and policymakers, indicating a preference for accommodative monetary policies. WIRP (World Interest Rate Possibilities) suggests a less than 10% chance of a policy liftoff for Friday’s BoJ meeting, with probabilities increasing to 55% by December.
GBP/JPY Levels to watch
According to the daily chart, the GBP/JPY holds a neutral to the bullish outlook for the short term as the bulls seemed to have taken a step back after being rejected at the overbought area. However, technical indicators remain positive, indicating that the market may be preparing for another leg up.
If GBP/JPY manages to move higher, the next resistances to watch are at the daily high at 175.75, followed by the 176.00 area and the 176.50 zone. On the other hand, if the cross loses ground, immediate support levels are seen at the 174.45 area, followed by the 174.00 zone and the 20-day Simple Moving Average (SMA) at 173.10.
GBP/JPY Daily chart
-638221939266023398.png)
- USD/CHF bears are lurking in resistance.
- All eyes on key US events and market structure.
USD/CHF is up by some 0.7% and has rallied from a low of 0.9015 to a high of 0.9109 so far. Meanwhile, investors remained cautious ahead of key policy decisions this week from several central banks, The key event will be the Federal Reserve and according to the CME FedWatch tool, money markets are leaning toward a pause from the Fed when it announces its rate decision on Wednesday
Meanwhile, the technical outlook is clouded by a break of key structure to the downside followed by a strong move to the upside:
USD/CHF daily

USD/CHF broke to the backside of the bullish trendline at the start of June. The pair broke a key structural point on Thursday but has since rallied back to the origin of the move.
USD/CHF H4 charts

While there could be more to come from the bulls, we are at resistance. A correction towards old resistance could be on the cards as we head into key events this week, including Tuesday's US Consumer Price Index.
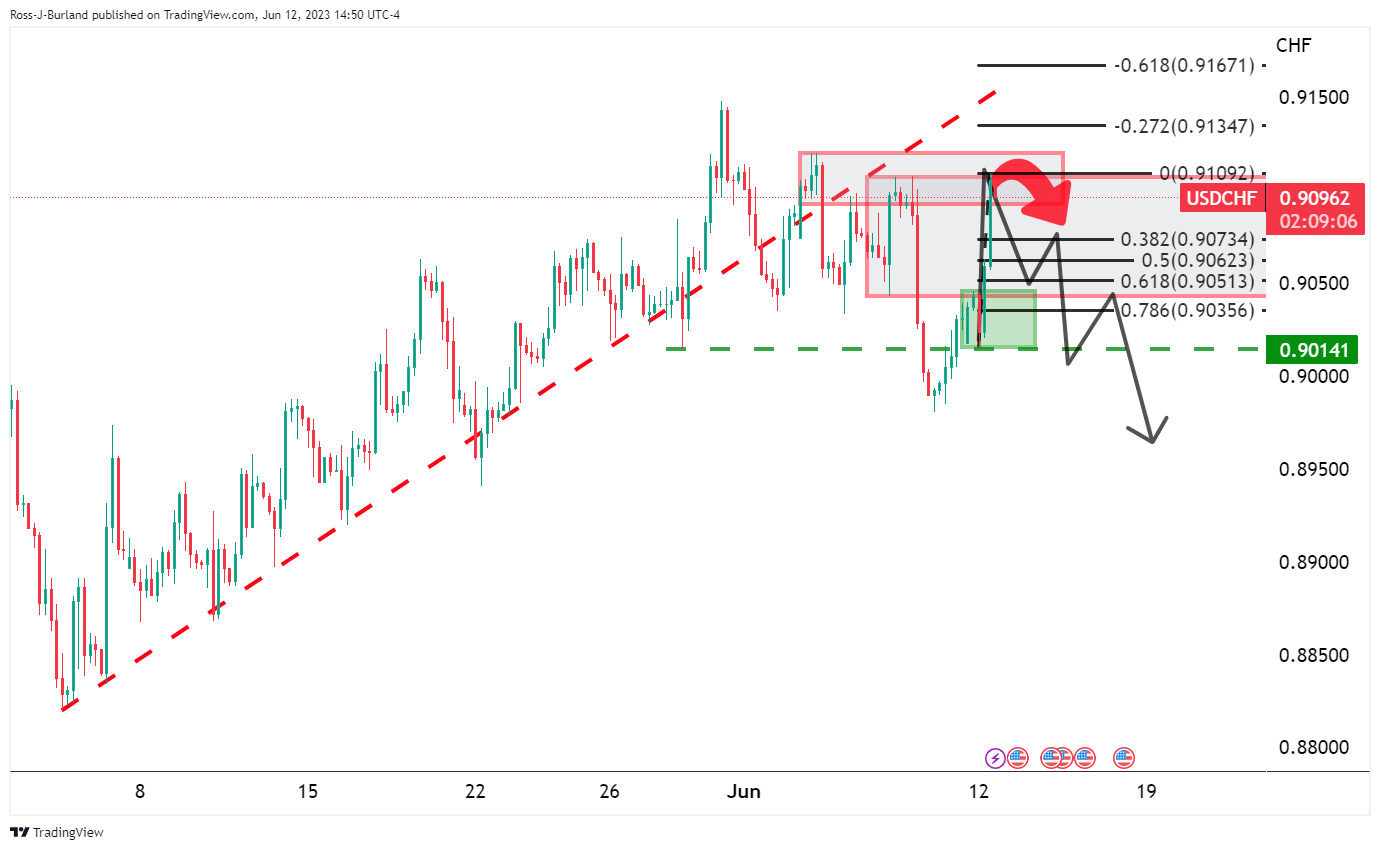
A negative outcome across the events could lead to a break below 0.9000 to target 0.8950.
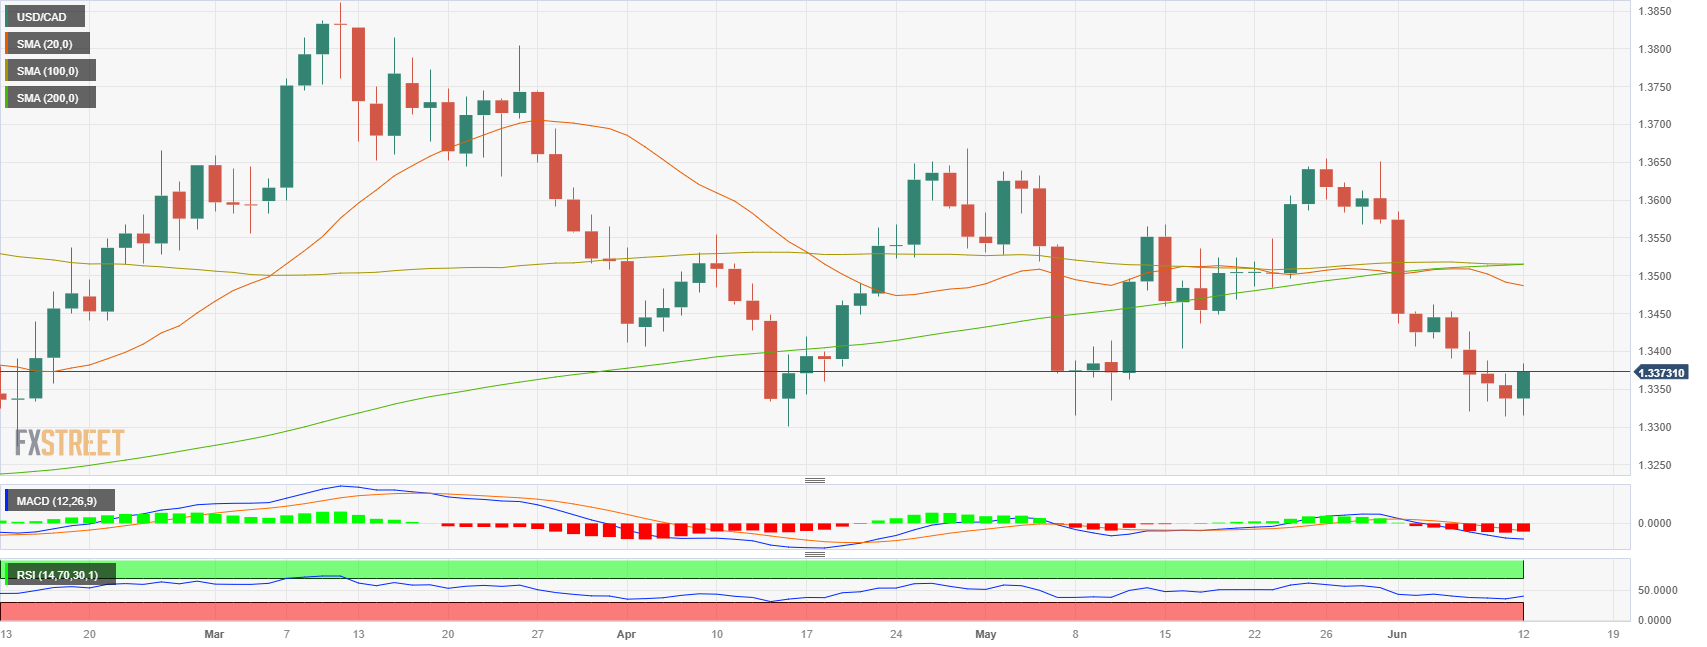
- USD/CAD jumped to a daily high of 1.3384 following four days of losses.
- Strong Dollar and falling Oil prices weigh on the CAD.
- All eyes are on Tuesday’s inflation data from the US.
During Monday’s session, the USD/CAD cut a four-day losing streak jumping to a daily high of 1.3384 as the US Dollar held its footing ahead of an eventful week. On the other hand, the Lonnie seems to be suffering from the plunge in Oil prices which have seen losses of more than 3% on the day.
Attention shifts to CPI data and Fed decision
Markets seem to be awaiting the upcoming release of the US Consumer Price Index (CPI) data for May to define direction. It is anticipated that the headline figure will show a slowdown to a year-on-year (YoY) rate of 4.1%, while the Core measure is expected to decline from the previous 5.5% YoY to 5.3%.
In addition, the CME FedWatch Tool, currently suggests a 25% chance of an interest rate hike for the upcoming Wednesday’s Federal Reserve (Fed) decision. Moreover, rate cuts are no longer anticipated by the end of the year, so market participants will keep an eye on Fed Chair Powell’s presser on Wednesday looking for clues regarding forward guidance
On the Canadian side, the CAD bulls seem to have taken a step back and are consolidating gains from last week’s Bank of Canada (BoC) surprising 25 basis point (bps) hike. Moreover, the Loonie seems to be facing further weakness amid Oil’s heavy losses as the WTI (Western Texas Intermediate) is down by 3.60% on the day, trading at the $67.45 level.
USD/CAD levels to watch
According to the daily chart, the USD/CAD shows a neutral to bearish perspective for the short term. Despite indicators having gained some traction, they are still operating in negative territory. The Relative Strength Index (RSI) sits below its midline but exhibits a positive slope. while, the Moving Average Convergence Divergence (MACD) printed a decreasing red bar, indicating diminishing selling momentum.
The 1.3350 zone level is key for USD/CAD to maintain its upside bias. If breached, the price could see a steeper decline towards the 1.3310 area and towards the multi-month low at 1.3300. Furthermore, upcoming resistance for USD/CAD is seen at the zone at 1.3380 level, followed by the psychological mark at 1.3400 and the 1.3450 area.
USD/CAD daily chart
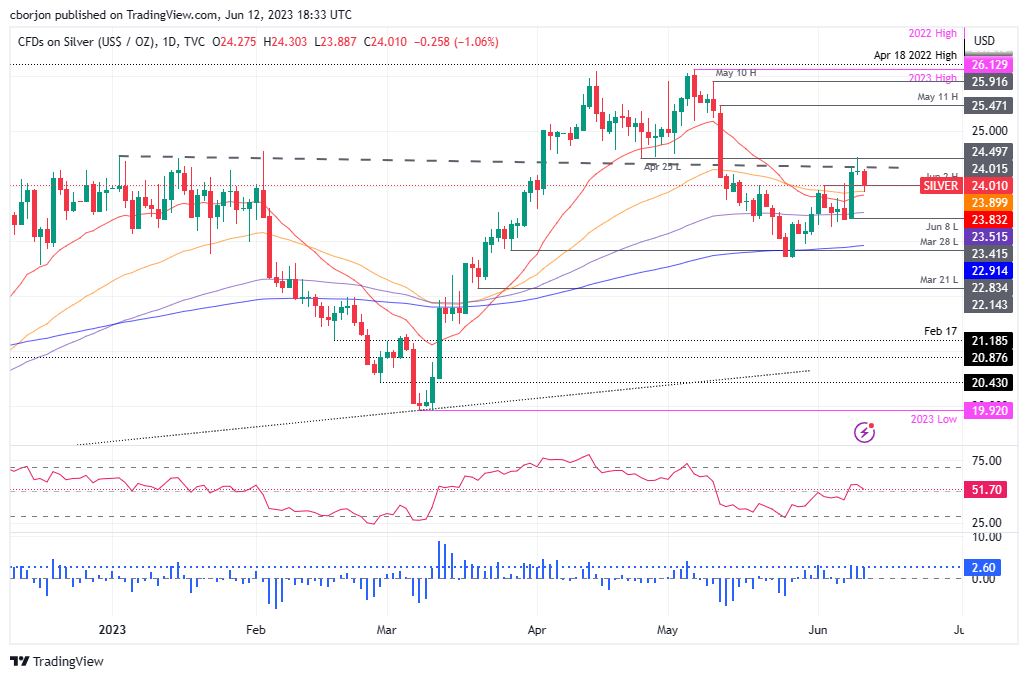
- XAG/USD dips 1.13% to $24.00, supported by 50-day and 20-day EMA.
- RSI and three-day RoC indicators suggest a downward trend.
- Support and resistance at $23.51 and $24.52, respectively; $25.00 remains crucial.
Silver price retreats as it forms a three-candlestick pattern “evening-star” at around $24.00, though cushioned by the presence of the 50-day Exponential Moving Average (EMA) at $23.89, ahead of the 20-day EMA at $23.83. At the time of writing, the XAG/USD is trading at $24.00, below its opening price by 1.13%.
XAG/USD Price Analysis: Technical outlook
From a daily chart perspective, the XAG/USD is neutral to downward tilted, as the pair remained well below the May 11 high of $25.47. Even though support levels lie at around the $23.83/89 area, the Relative Strength Index (RSI) indicator aims downward, warranting further downside. The three-day Rate of Change (RoC) also portrays buying pressure waning. That said, the XAG/USD pullback could extend further.
The XAG/USD next support would be the 100-day EMA at $23.51, followed by June 8 daily low at $23.41, ahead of testing the 200-day EMA at $22.91. Conversely, the XAG/USD first resistance would be June 9 at $24.52, followed by the $25.00 figure.
XAG/USD Price Action – Daily chart
The US government recorded a $240 billion budget deficit in May 2023, according to the Treasury Department. Total receipts for the month were $307 billion, while outlays rose to $548 billion.
In May of the previous year, the deficit was $66 billion, indicating a significant increase in the deficit in May 2023. So far during the fiscal year 2023, which began in October 2022, the deficit has reached $1.164 trillion. In comparison, during the same period last year, the deficit amounted to $426 billion.
- GBP/USD bears are moving and eyes are on trendline support.
- Bulls are firming at a prior resistance structure on the daily chart.
GBP/USD bears have come into the market ahead of key economic data. UK labour market figures and UK Gross Domestic Product data will be up for grabs ahead of the US central bank interest rate decision. US Consumer Price Index will also be watched on Tuesday.
Meanwhile, technically, the market has dropped into a support area and the following illustrates prospects of a firmer test of the trendline support over the coming days.
GBP/USD daily chart
The drop meets a prior area of structure on the daily chart that is now acting as support. This coincides with a 50% mean reversion area on the charts but it is still some way away from the trendline support area.
GBP/USD H4 chart
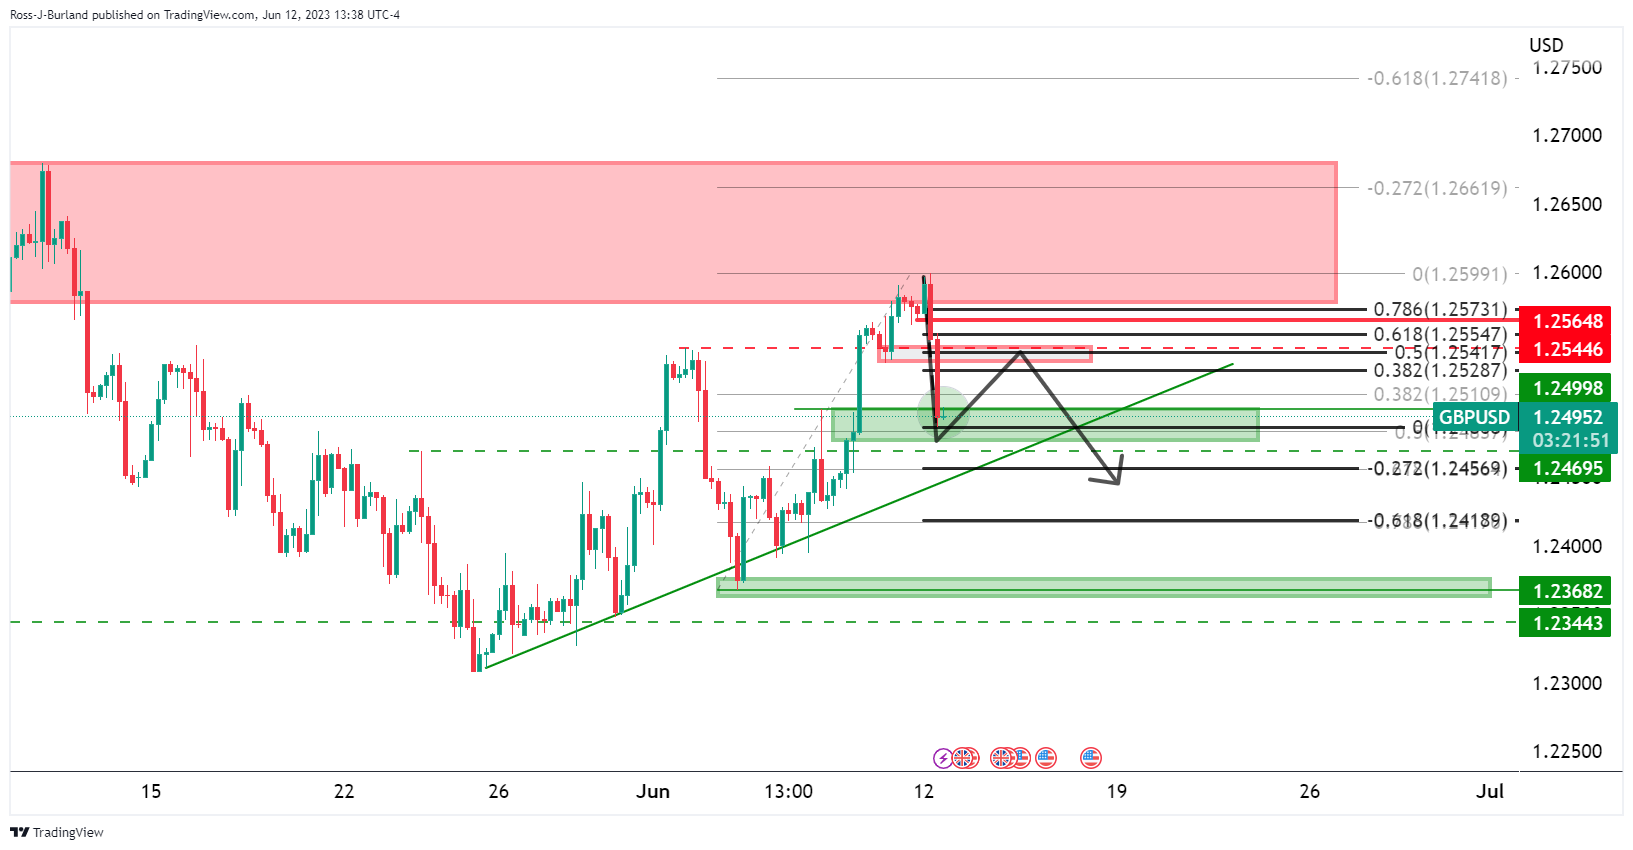
The 4-hour chart shows that there could be resistance in a 61.8% Fibonacci retracement before supply that could be the bear's last-ditch effort to take on the bullish commitments at the trend line support.
- On Monday's session, the EUR/GBP traded in the 0.8540 - 0.8608 range.
- HICP and CPI data from Germany and Spain are due on Tuesday.
- The Eurozone's inflation outlook may have an impact on future ECB decisions.
On Monday, the EUR/GBP rose by 70 pips towards the 0.8605 area recovering from the multi-month low struck on Friday. With nothing relevant in the macroeconomic calendar, stocks set the session’s pace with the German DAX displaying more than 0.90% gains while investors await inflation data from Germany and Spain and labour market data from the UK on Tuesday.
German inflation is expected to stagnate and the British labour market to see some pain
On Tuesday, Destatis, the national statistical office of Germany, is set to release the Harmonized Index of Consumer Prices (HICP) data for the month of May. The headline figure, which represents the year-on-year change in consumer prices, is anticipated to remain unchanged at 6.3% rewarding its preliminary reading and the monthly measure is expected to show a 0.2% decrease. Likewise, the Spanish HICP is expected to show a 0.2% monthly decline with its headline figure remaining stagnant at 2.9% YoY. While markets have practically priced in a 25 basis points (bps) hike by the European Central Bank (ECB) on Thursday, the inflation reports may have an impact on future ECB decision expectations and hence on the Euro’s price dynamics.
On the British side, the Office for National Statistics will release labour market data on Tuesday. In that sense, the change in the number of those claiming jobless benefits is expected to have contracted in May by 9.6K from its previous 46.7K measure. In addition, the Unemployment Rate is seen slightly increasing to 4% while average earnings both including and excluding bonuses are expected to accelerate in the same period of time.
Ahead of next week’s Bank of England (BoE) decision, investors are expecting a 25 bps hike with only 15% odds of a bigger one as per World Interest Rate Possibilities (WIRP). On Monday, BoE’s Catherine Mann delivered slightly hawkish messages, showing her concerns for sticky core inflation and stating that she is waiting for analysis of data to decide the next vote. In that sense, the BoE’s hawkish stance may limit the GBP’s losses.
EUR/GBP levels to watch
According to the daily chart, the EUR/GBP holds a neutral to a bearish outlook for the short term as indicators lost traction but still stand in negative territory. The Relative Strength Index (RSI) sits below its midline but displays a positive slope, while the Moving Average Convergence Divergence (MACD) prints decreasing red bars suggesting that the bears are running out of steam.
The multi-month low at the 0.8540 level remains the key support level for EUR/GBP. If broken, the 0.8520 zone and psychological mark at 0.8500 could come into play. Furthermore, a move above the 0.8600 zone may reignite the upside momentum for the cross , with next resistances at the 0.8620 area and 20-day Simple Moving Average (SMA) at 0.8640.
-638221886320297200.png)
- EUR/JPY jumped above the zone hitting a daily high of 150.35.
- Producer Price Index (PPI) from Japan came in at -0.70% (MoM) in May, below the consensus.
- Machine Tool Orders contracted by 22.00% (YoY) in the same month.
The EUR/JPY traded with gains on Monday after the Producer Price Index (PPI) from Japan was reported to fall to its lowest point since June 2021 and Machine Tool Orders contracted by 22% YoY. In that sense, dovish bets ahead of the Bank of Japan (BoJ) meeting on Friday, and rising US bond yields are weakening the Yen. On the Euro’s side, nothing relevant will be published on Monday, and attention turns to inflation data on Tuesday and the European Central Bank (ECB) decision on Thursday.
Weak Japanese data fueled dovish bets on BoJ
Producer Price Index (PPI), from Japan, contracted by 0.7% MoM in May vs the 0.2% decline expected, and the annualized rate stands at 5.1%. A different report showed that the Machine Tool Orders from May contracted by 22%.
In that sense, weak economic data and inflation decelerating make investors expect a more dovish stance taken by Governor Ueda and his fellow policymakers implying a preference for accommodative monetary policies. That being said, according to WIRP (World Interest Rate Possibilities), the chances of a policy liftoff this week are estimated to be less than 10%, but the likelihood increases to around 10% in July, 25% in September, 40% in October, and 55% in December.
For Tuesday’s session, investors will eye the release of Harmonized Index of Consumer Prices (HICP) data from May from Germany with its headline figure expected to confirm the preliminary reading of 6.3% YoY.
EUR/JPY levels to watch
From a technical perspective, the EUR/JPY suggests a neutral to bullish outlook for the short term. Despite the bull’s struggles for dominance, technical indicators continue to be favourable, implying the potential for further upside.
Upcoming resistance for EUR/JPY is seen at the 150.50 level, followed by the 151.00 area and the multi-year high at 151.60. On the other hand, the psychological mark at 150.00 remains the key support level for EUR/JPY. If broken, the 20-day Simple Moving Average (SMA) at 149.60 and 149.00 area could come into play.
EUR/JPY daily chart
-638221883899430161.png)
- USD/JPY experiences a modest gain of 0.22%, influenced by rising US Treasury bond yields.
- Despite signs of economic slowdown, upbeat US market sentiment sees the greenback recover, with DXY at 103.722.
- Japanese PPI figures undershoot estimates, increasing focus on upcoming US CPI and Japanese Balance of Trade data.
USD/JPY turned positive at the beginning of the week, lifted by higher US Treasury bond yields as investors prepared for the US Federal Reserve (Fed) monetary policy decision, followed by the Bank of Japan (BoJ). The USD/JPY is trading at 139.65, printing modest gains of 0.22% after hitting a daily low of 139.06.
Increased US Treasury yields bolster the USD/JPY
US equities portray an upbeat market sentiment, despite rising US bond yields. The 10-year benchmark note rate sits at 3.778%, up three and a half basis points (bps), a tailwind for the USD/JPY. The greenback is recovering lost ground, climbing 0.16%, per the US Dollar Index (DXY), at 103.722, shy of reclaiming the 104.000 figure.
Fundamentally speaking, an absent US economic docket keeps investors focused on the last week’s data. The Non-Manufacturing ISM, although at expansionary territory, dipped close to 50, suggesting an ongoing economic slowdown. That, alongside Initial Jobless Claims (IJC) rising above estimates, hitting its highest figures since October 2021, justified the Fed’s need to pause its tightening cycle and wait for upcoming data.
On the Japanese front, the latest data revealed the Producer Price Index (PPI) for May, climbed 5.1% YoY, below estimates of 5.6%, while month-over-month figures showed a plunge of -0.7%, compared to April’s 0.3% gain. Annual-based PPI hit its slowest since July 2021 after hitting 5.9% in April.
Upcoming events
On Tuesday, the US economic docket will feature May’s Consumer Price Index (CPI), the NFIB Business Optimism Index, followed by Wednesday’s Fed decision. On the Japanese front, the calendar will feature the Balance of Trade ahead of the Bank of Japan’s (BoJ) monetary policy meeting.
USD/JPY Price Analysis: Technical outlook
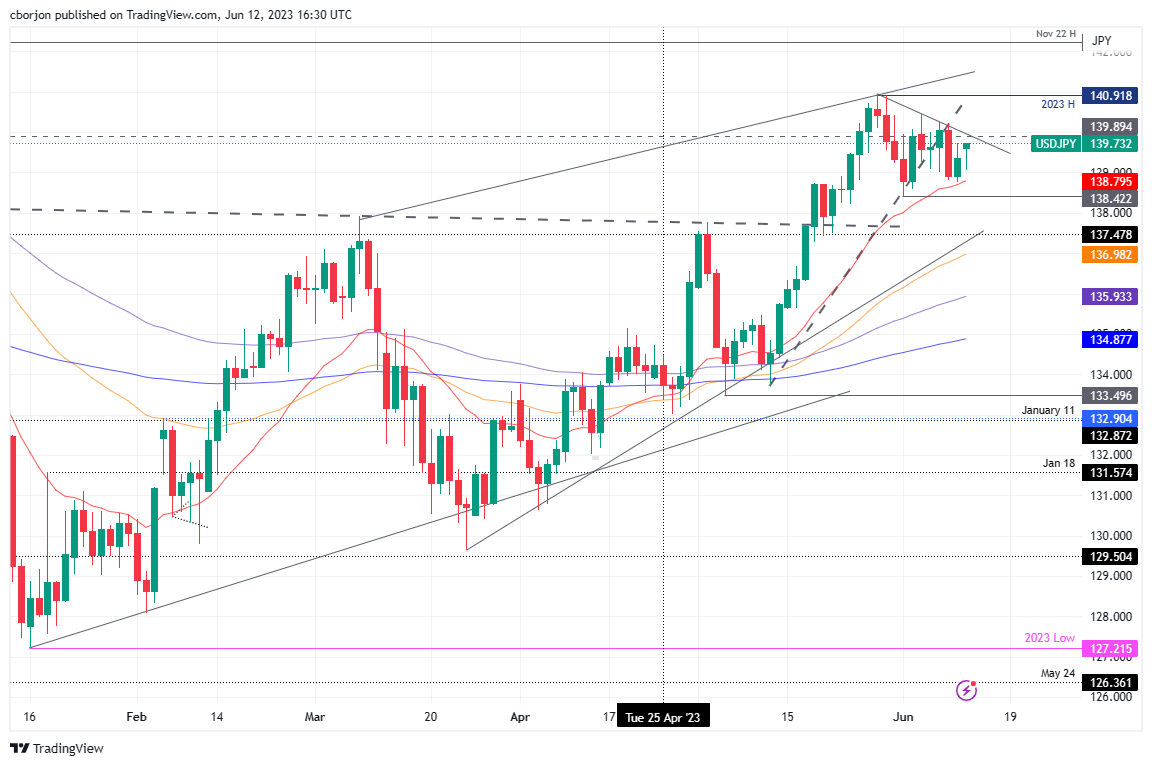
The USD/JPY is neutrally biased after failing to crack below/above the boundaries of a 200-pip range at around 138.40/140.45. However, from a medium-term view, with the daily Exponential Moving Averages (EMAs) positioned below the spot price, the pair is upward, but it needs to crack the top of the range, so the USD/JPY can test the year-to-date (YTD) high of 140.92. In the case of being broken, the USD/JPY next stop is 141.00, ahead of the November 22 high at 142.24. Conversely, a drop below the 20-day EMA at 138.79 will expose the bottom of the range at 138.40, ahead of 138.00.
Economists at Commerzbank assume that Gold will be able to regain ground in the coming months.
Fed will not raise rates further
Our experts assume that the Fed will not raise rates further, as it does not want to risk raising interest rates too far in light of the recent tightening of credit conditions. If our experts are right, the Gold price should rise in the coming months.
We assume that the interest rate hikes so far will take their toll, i.e. US economic momentum is likely to weaken considerably in the second half of the year. Compared to the market, we expect the first interest rate cuts only at a somewhat later point in time, at the beginning of 2024 to be precise. As this should become apparent at the end of the year, the Gold price should then also begin to sustainably establish itself above $2,000 and even reach a new record high next year.

Source: Commerzbank Research
- USD strengthens, yet Euro holds firm, with EUR/USD at 1.0746 amid policy shifts anticipation.
- Anticipated Fed’ skip and hike’ could reshape US-EU interest rate dynamics, potentially favoring Euro.
- Possible US economic downturn might trigger ‘dollar smile’ as markets eye key economic indices.
EUR/USD pares some of its earlier gains, still trading in a positive territory amidst a busy week in the economic agenda, with major central banks set to adjust their monetary policies. The US Dollar (USD) strengthened ahead of Wednesday’s Fed decision but is yet to overshadow a solid Euro (EUR). At the time of writing, the EUR/USD exchanges hands at 1.0746, almost flat.
Market awaits key monetary moves as USD strengthens against the resilient Euro
Wall Street is trading with modest gains ahead of the Federañ Reserve’s (Fed) June monetary policy meeting. The Fed is expected to keep rates unchanged, as shown by money market futures, with the CME Fed WatchTool odds for no change in June at around 71%. Nonetheless, for the next month, odds for a 25 bps lie above the 50% threshold, cementing the case for a Fed skip followed by a rate increase.
However, the recent two monetary policy decisions of significant central banks surprised the markets with unexpected decisions by the Reserve Bank of Australia (RBA) and the Bank of Canada (BoC). Although, at a minimum, EUR/USD traders should be aware the Fed could rock the boat and lift rates in June.
On the Eurozone (EU) front, the economic calendar on Monday was light, but it would increase the tone on Tuesday with Germany’s inflation. On Thursday, the European Central Bank (ECB) is expected to raise rates by 25 bps, which, according to estimates for the Fed and the ECB’s decision, would reduce the interest rate differential between the US and the EU, favoring the latter.
That said, upside pressure on the EUR/USD is expected. Still, economic deterioration in the US could trigger the “dollar smile” theory, which supports the greenback in phases of global economic stress.
Upcoming events
The US economic agenda will feature May’s Consumer Price Index (CPI) and the NFIB Business Optimism Index. On the EU front, the German and Spain Harmonised Index of Consumer Prices (HICP) for both countries and the ZEW Economic Sentiment.
EUR/USD Price Analysis: Technical outlook
The EUR/USD has been consolidated within the 1.0670/1.0790 area for the last eight days, unable to break beyond the boundaries of the range, but with the 100, 20, and 50-day Exponential Moving Averages (EMAs), sitting above the spot price. Hence, the EUR/USD is slightly tilted downwards in the near term. For a bearish continuation, the EUR/USD needs to clear the June 9 daily low at 1.0742, which could open the door for further losses once cleared. The next support would be the 1.0700 figure, followed by the last week’s low of 1.0667, before dripping towards the lows of 2020 at around 1.0635. Conversely, the EUR/USD resistance levels lie at the confluence of the 100 and 20-day EMAs at 1.0766/68, followed by the 1.0800 mark. The next resistance emerges at 1.0811, the 50-day EMA.
The US Bureau of Labor Statistics (BLS) will release the most important inflation measure, the US Consumer Price Index (CPI) figures, on Tuesday, June 13 at 13:30 GMT. As we get closer to the release time, here are the forecasts by the economists and researchers of 10 major banks regarding the upcoming United States inflation print for the month of May.
The annual inflation is expected to suffer a sharp fall to 4.1% in May vs. 4.9% in April. On a monthly basis, headline is expected at 0.2% vs. 0.4% last month. Meanwhile, US underlying inflation is expected to have risen by 0.4% month-on-month in May and 5.2% YoY vs. 0.4% and 5.5% in April, respectively.
Danske Bank
We expect the May CPI, released just ahead of the FOMC meeting, to slow down to 0.2% MoM (4.2% YoY) driven by negative contribution from energy prices. We also forecast Core CPI to continue cooling to 0.3% MoM (5.2% YoY).
Commerzbank
Across all goods and services, consumer prices are likely to have risen by only 0.1% in May compared to April. The YoY rate would then fall significantly from 4.9% to 4.1%. However, one should not conclude from this that the inflation problem is gradually disappearing. We expect the core rate, which excludes volatile energy and food prices and better reflects the underlying trend, to be high again. We forecast a core rate of 0.4% in MoM terms, which would be roughly in line with the increase in recent months. A clear easing of inflationary pressure is therefore still not in sight for this important indicator.
ANZ
We expect core CPI inflation to rise by 0.4% MoM and headline CPI by 0.3% in May.
TDS
Core prices likely stayed firm in May, with the index rising a strong 0.4% MoM for a second straight month, also matching the MoM avg since June 2022. Goods inflation likely stayed positive, with shelter prices remaining the key wildcard (expect slowing). Retreating gas prices (-6% MoM) will drag non-core inflation. Our MoM forecasts imply 4.0%/5.3% YoY for total/core prices.
RBC Economics
We expect YoY growth in the US CPI to slow substantially to 4.1% in May from 4.9% in April. Gas prices were 20% below year-ago levels in May. Oil prices are down after surging in the wake of Russia’s invasion of Ukraine. And soaring food inflation has cooled in recent months with back-to-back MoM declines in grocery prices over March and April.
NBF
The energy component may have had a negative impact on the headline index as prices likely fell in both the gasoline and natural gas segments. Expected gains for shelter could still result in a 0.2% monthly increase in headline prices. If we’re right, the YoY rate should come down from 4.9% to a 2-year low of 4.1%. The core index, meanwhile, could have advanced 0.3% on a monthly basis, something which would translate into a 5.1% annual gain.
Deutsche Bank
We expect a wafer-thin +0.01% MoM advance for headline CPI (vs. +0.37% previously) and a +0.37% increase for core (vs. +0.41%). This would lead the former to drop by about a full percentage point to 4.0% YoY, with the latter down -0.2% to 5.3%, with the 3, 6 and 12-month core readings all still struggling to gain much downward momentum below 5% at the moment.
CIBC
With prices at the pump averaging lower over the month, the total CPI was likely limited to a 0.1% increase in May, masking a hotter advance in categories outside of energy and food. Indeed, core CPI prices could have risen by 0.4%, extending April’s momentum, in line with continued strength in the labor market that will have worked to support demand, implying an acceleration in the Fed’s preferred sub-category of services ex. housing. The risks to the core figure could be slightly to the downside, as the rent measures could have resumed their deceleration following a temporary pause in April, and used car prices could have declined following a sharp increase in April. Moreover, the ISM services prices paid measure also fell in May.
Wells Fargo
Overall consumer price inflation likely moderated in May. We forecast the headline CPI was flat during the month, as gasoline prices fell and food prices appeared to hold steady. Core inflation, on the other hand, likely remained firm. Auction data suggest used vehicle prices rose again last month, and we look for ongoing strength in core services. Specifically, we suspect the core CPI rose 0.4% for the third consecutive month, which would leave the YoY change little improved at 5.3% in May.
Credit Suisse
We expect core CPI inflation to decline to 0.3% MoM in May, a welcome step lower after five consecutive months of registering 0.4% MoM. The YoY reading is likely to decline to 5.2%. Headline inflation is likely to decline to 0.1% MoM.
Economists at Rabobank discuss EUR/USD outlook ahead of Fed and ECB meetings.
A ‘hawkish hold’ in policy rates should be USD supportive
The market is already priced for two more 25 bps rate hikes from the ECB this cycle. This suggests that for the EUR to make sustainable gains on the back of this week’s policy meeting, the hawkish signalling would have to be surprisingly strong.
In our view, the ECB may keep its 2025 inflation projection slightly above target in order to chase away market forecasts of rate cuts early next year. This should be broadly EUR-supportive. However, since we also expect a ‘higher for longer’ theme from the Fed this week and a ‘hawkish hold’, we expect that the EUR may be hard-pressed to sustain gains vs. the greenback.
Despite the recovery in EUR/USD above 1.07 at the end of last week, we maintain our H2 target of EUR/USD 1.06.
Upside surprises in UK inflation readings since May have been in core goods and food prices, Bank of England (BoE) Monetary Policy Committee member Catherine Mann noted on Monday, as reported by Reuters.
Additional takeaways
"UK output data and business surveys have remained positive since May's BoE forecasts."
"Services price inflation is also a concern for achieving 2% CPI target."
"Wage increases of 4% would be a challenge to returning CPI to 2%."
"UK inflation expectations remain too high."
"There's still a question in my mind how tight UK financial conditions really are."
"Drop in inflation expectations was important for me to switch my vote to 25 bps rate hike from 50 bps."
"Monetary policy is not good at fine-tuning, should focus on inflation."
"Inflation expectations are now on the down swing."
Market reaction
GBP/USD stays on the back foot following these comments and was last seen losing 0.45% on the day at 1.2510.
The Loonie rallied after the Bank of Canada opted to hike rates. Economists at CIBC Capital Markets discuss CAD outlook.
CAD to rely on external factors
A clearer end to Fed hikes should begin to unwind US Dollar strength against overseas majors, helping push USD/CAD to 1.32 by the end of Q3, with more firming for the Loonie in store for 2024.
The USD still looks unsustainably strong against other major currencies, and higher inflation in Europe will keep the threat of additional monetary tightening alive a bit longer overseas, taking some of the shine off of the greenback. We don’t see that taking USD/CAD below 1.28 next year, a bit less of a Loonie appreciation than expected for some other majors that have more room to run.
Oil prices could firm up later in 2024 as markets eye a global economic rebound, but these days it takes a much larger move for that to meaningfully lift the loonie relative to other majors, given the reduced response in Canadian oil and gas capital spending in a tighter regulatory climate.
Economists at Commerzbank discuss EUR/USD direction depending on ECB and Fed policy outlooks.
EUR/USD first up, then down
We see upside potential for the Euro against the USD in the short term. In our view, the Fed is likely to cut interest rates again at the beginning of next year, whereas the ECB is likely to hold on to the interest rate level it will soon reach. This makes the ECB policy appear more attractive for the time being.
In the long run, however, it will turn out that the ECB has less control over inflation because it acts less decisively than the Fed. Therefore, the likely Euro strength of the next few months should not last.
Economists at CIBC Capital Markets discuss GBP/USD outlook.
Recessions risks are overpriced
In the wake of core prices gaining a full percentage point since the start of the year, the market has materially boosted BoE terminal rate assumptions towards 5.50%, stoking renewed recession concerns. However, we expect the terminal rate to top out at 5.00%, as rates in excess of such levels would amplify recession risks.
Early signs of a rollover in food prices, while labour markets and wages appear set to moderate, point towards a graduated reduction in UK terminal rate assumptions in the next few months.
But looking beyond, we don’t expect a recession in the UK. As such, an easing in recession fears combined with a softer USD should support the broad GBP recovery narrative.
GBP/USD – Q3 2023: 1.24 | Q4 2023: 1.27
Economists at Société Générale analyze EUR/USD outlook ahead of a monumental week for monetary policy decisions.
ECB statement and press conference to guide toward another 25 bps in July
The ECB appears to be a more straightforward affair compared to the Fed. A 25 bps increase in all rates is our house (and the street’s) view and would bring down the spread vs Fed funds to 175 bps. So in theory this would augur well for higher EUR/USD.
The ECB statement and press conference are likely to guide toward another 25 bps in July. September is a much closer call, but the ECB will be tight-lipped on what happens after August and will have three more CPI releases when it reconvenes after the summer break.
The more downbeat credit conditions survey and optimism among households that inflation is subsiding could temper the hawkish ECB message and frustrate EUR/USD bulls.
- USD/TRY advances to fresh record high around 23.6500.
- Türkiye Unemployment Rate edged a tad higher in April.
- Markets’ focus remains on the domestic economic scenario.
USD/TRY climbs to new all-time peak around the 23.6500 region at the beginning of the week.
USD/TRY: Next on the upside comes 24.00
USD/TRY adds to Friday’s advance and surpassed the 23.50 region with marked conviction to print a new record high on Monday.
The intense sell-off in the lira remains so far unabated amidst rising scepticism among investors at home and abroad regarding the potential next steps on monetary policy by the newly appointed economic team.
It is worth recalling that President R. T. Erdogan named M. Simsek as Treasury and Finance Minister, while former First Republic Bank Hafize Gaye Erkan will be at the helm of the Turkish central bank (CBRT). This move by Erdogan is expected to show a more market-friendly approach to the country’s economic front and may (a big "may") open the door to a more orthodox view of domestic monetary policy.
It remains to be seen, however, whether Erkan can impose her monetary will under Erdogan's leadership. The first round of this match is expected on June 22, when the CBRT will hold its monetary policy meeting amidst a pretty divided consensus between small rate hikes and a "shock and owe" strategy of a large rate raise.
So far, the Turkish currency has already depreciated nearly 28% since the start of the new year, while the drop has reached around 185% since the Turkish central bank (CBRT) embarked on its easing cycle in August 2021.
Also in the centre of the debate later this week appears to be a meeting between finmin M. Simsek and top bank executives.
On the domestic docket, the Unemployment Rate in Türkiye rose slightly to 10.2% in April and the Current Account deficit widened to $5.40B in the same month.
What to look for around TRY
USD/TRY maintains its upside bias well in place, always underpinned by the relentless meltdown of the Turkish currency.
In the meantime, investors are expected to closely monitor upcoming decisions on monetary policy, particularly after President R. T. Erdogan named former economy chief M. Simsek as the new finance minister following the cabinet reshuffle in the wake of the May 28 second round of general elections.
The appointment of Simsek has been welcomed with optimism by market members in spite of the fact that it is not yet clear whether his orthodox stance on monetary policy can survive within Erdogan’s inclination to battle inflation via lower interest rates.
In a more macro scenario, price action around the Turkish lira is supposed to continue to spin around the performance of energy and commodity prices - which are directly correlated to developments from the war in Ukraine, broad risk appetite trends, and dollar dynamics.
Key events in Türkiye this week: Current Account, Unemployment Rate (Monday) – Retail Sales (Tuesday) – Budget Balance (Thursday) – End Year CPI Forecast (Friday).
Eminent issues on the back boiler: Persistent skepticism over the CBRT credibility/independence. Absence of structural reforms. Bouts of geopolitical concerns.
USD/TRY key levels
So far, the pair is gaining 1.49% at 23.6430 and faces the next hurdle at 23.6504 (all-time high June 5) followed by 22.00 (round level). On the downside, a break below 19.8906 (55-day SMA) would expose 19.4306 (100-day SMA) and finally 18.9930 (200-day SMA).
In May, the MXN appreciated marginally from 18.005 to 17.718 against the USD. Economists at MUFG Bank discuss USD/MXN outlook.
Peso unlikely to weaken sharply
We expect the Fed to leave their policy rate unchanged and a US default to be avoided dampening upside risks for USD/MXN.
Looking ahead, we keep our view for a moderate MXN weakening in the coming quarters influenced by a set of factors. The concerns with global economic slowdown, and especially a slowdown in the US that could curtail USD inflows into Mexico.
On the local side, fear of additional government interference in private industry may be souring sentiment. But we don´t expect a sharp MXN weakening.
USD/MXN: Q2 2023 17.800 Q3 2023 18.000 Q4 2023 18.200 Q1 2024 18.200.
- Gold price is showing back-and-forth action above $1,960.00 as investors are mixed about Fed policy.
- Investors are worried that US CPI could turn out more persistent.
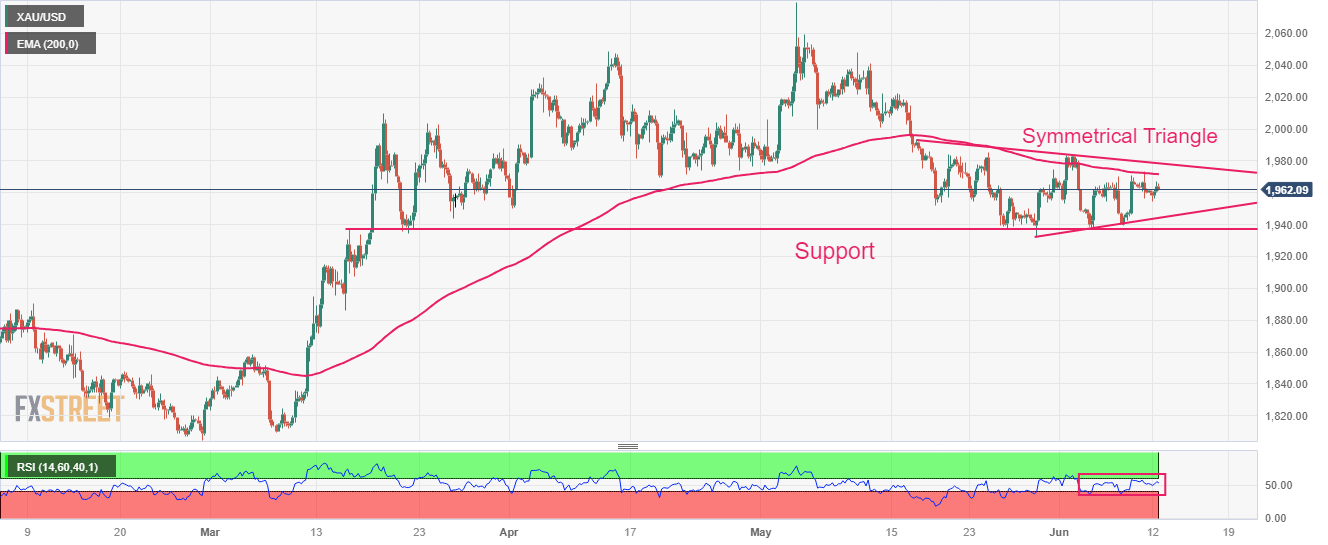
- Gold price is auctioning in a Symmetrical Triangle, which indicates a volatility contraction.
Gold price (XAU/USD) is demonstrating topsy-turvy moves around $1,963.00 in the early New York session. The precious metal has turned choppy as the street is showing mixed responses toward the interest rate decision by the Federal Reserve (Fed).
At one place where US labor market conditions are releasing heat, investors are still worried that US Consumer Price Index (CPI) could turn out more persistent.
US equities are expected to open on a positive note as the S&P500 futures have generated significant gains in the European session. Market sentiment is quite upbeat as the United States economy is expected to show resilience ahead.
The latest data from the Fed showed that lending and deposit activities have increased straight for three weeks in commercial banks in the week ended May 31. The demand for credit by firms seems solid despite an aggressive policy-tightening spell by Fed chair Jerome Powell.
The US Dollar Index (DXY) is struggling in extending its recovery above 103.50 as investors are preparing for the US opening after the weekend.
Gold technical analysis
Gold price is auctioning in a Symmetrical Triangle on a four-hour scale, which indicates a volatility contraction. The upward-sloping trendline of the aforementioned chart pattern is plotted from May 30 low at $1,932.12 while the downward-sloping trendline is placed from May 17 high at $1,993.13. Horizontal support is placed from March 15 high at $1,943.58.
The 200-period Exponential Moving Average (EMA) at $1,971.77 is acting as a barricade for the Gold bulls.
Meanwhile, the Relative Strength Index (RSI) (14) is oscillating in the 40.00-60.00 range, portraying a non-directional performance.
Going forward, a comfortable break above June 01 high at $1,982.72, Gold bulls will further march toward May 05 low around $2,000.00 followed by April 17 high around $2,017.00.
On the contrary, a breakdown below June 07 low at $1,939.72 will drag the Gold bulls toward May 18 low at $1,918.31 and round-level support at $1,900.00.
Gold four-hour chart
Year-to-date, global equities have rallied 11.2%. This week could turn out to be one of the keenest tests for the increasingly prevalent “soft landing” thesis. Economists at UBS analyze how stocks could be impacted.
Stay cautious on stocks amid “soft landing” scrutiny
We do not expect this week’s heavy data and central bank calendar to prove the market’s ‘soft landing’ thesis conclusively. Uncertainty around the economic and market outlook is likely to endure in the second half of the year, with potential for cross-asset volatility to rise on increased data-dependency and shifts in market leadership.
While we cannot rule out further equity gains if US consumer prices undershoot expectations of a 4.1% year-over-year (YoY) headline rate and 5.1% YoY core reading, we believe investors should stay cautiously positioned in equities relative to highly-rated fixed income.
UOB Group’s Senior Economist Julia Goh and Economist Loke Siew Ting review the latest decision by the BSP to reduce the RRR.
Key Takeaways
Bangko Sentral ng Pilipinas (BSP) announced on Thu (8 Jun) that it will reduce the reserve requirement ratios (RRRs) by 250bps for big banks to 9.5%, 200bps for digital banks to 6.0%, 100bps for thrift banks to 2.0%, as well as 100bps for rural and cooperative banks to 1.0%. These new ratios will apply to the local currency deposits and deposit substitute liabilities of banks and non-banks, effective 30 Jun. It will unleash fresh funds of as much as PHP300bn in the financial system.
This announcement comes as no surprise as BSP Governor Felipe Medalla has hinted such move in mid-May and former BSP Governor Benjamin Diokno (who is now Finance Secretary) had previously committed to bring down the RRR for big banks to single digits before his governor term ends on 3 Jul this year. This 2023 deadline for the RRR reduction to single-digit levels was first announced by the late BSP Governor Nestor A. Espenilla Jr. in 2017.
The central bank emphasized that the lower reserve requirements do not constitute any shift in the BSP’s monetary policy settings but it is an operational adjustment to ensure stable domestic liquidity and credit conditions. Recognizing this assertion and expectations of a persistent downtrend in the country’s inflation towards the central bank’s 2.0%-4.0% target range by 4Q23, we stick to our view that BSP will extend its rate pause for the rest of the year. In other words, the overnight reverse repurchase (RRP) rate will be left unchanged at 6.25% until year-end, with forward US rate trajectory being the key swing factor.
Turkish Lira opens already notably weaker. Economists at Commerzbank analyze USD/TRY outlook.
Perhaps the FX market is getting ready for the first rate hike by CBT
Perhaps the FX market is getting ready for the first rate hike by CBT as a result of the new economic team taking over – Hafize Gaye Erkan as CBT governor – but can’t decide whether this will be delivered at the scheduled 22 June rate meeting, or even sooner via emergency meeting.
We are all aware that the ‘unconventionalness’ of Turkish economic policy comes straight from one man at the top. Very few, even of his loyalists, wanted to implement such policies when they were actually put in charge. Hence, now it will be a wait-and-see exercise about Erdogan’s patience with this new change. No other factor is relevant.
The FX market mostly sees through this problem – hence, any let up in FX interventions by CBT and banks could be followed by explosive USD/TRY moves.
- EUR/USD advances to new multi-week highs around 1.0790.
- There is a tough barrier at the 1.0800 zone so far.
EUR/USD resumes the upside bias following Friday’s marked pullback and approaches the 1.0800 region.
A more serious bullish attempt is expected to quickly surpass the so far monthly high at 1.0790 (June 12), which is closely followed by the round level at 1.0800. The latter, in turn, appears propped up by the temporary 100-day SMA at 1.0805.
Looking at the longer run, the constructive view remains unchanged while above the 200-day SMA, today at 1.0522.
EUR/USD daily chart
- GBP/USD has reported a corrective move to near 1.2560 after a solid recovery in the USD Index.
- The USD Index has recovered firmly to near 103.50 as investors getting anxious ahead of US inflation.
- Higher UK earnings could weigh more pressure on the BoE, which is already struggling to tame stubbornly high inflation.
The GBP/USD pair has shown a corrective move to near 1.2560 in the European session. The Cable faced some barriers around 1.2600 as the US Dollar Index (DXY) has shown a solid recovery. Investors have displayed interest in the USD Index as anxiety among investors is accelerating ahead of the interest rate decision by the Federal Reserve (Fed).
S&P500 futures have turned choppy as investors have sidelined ahead of crucial United States economic events. The overall market mood is still upbeat as the odds of a neutral interest rate policy by the Fed are extremely solid. According to the CME Fedwatch tool, around 75% of chances are in favor of a neutral interest rate policy stance.
The USD Index has recovered firmly to near 103.50 as investors getting anxious ahead of US inflation. The pace in monthly headline Consumer Price Index (CPI) is seen contracting to 0.2% vs. the former pace of 0.4%. While the velocity in core CPI that doesn’t include oil and food prices is seen unchanged at 0.4%.
At the current juncture, easing US labor market conditions and weak economic activities have divided the street. However, signs of persistence in the US inflation could force Fed chair Jerome Powell to continue its policy-tightening spell.
Analysts at Rabobank see the Fed resuming the hiking cycle in July. For now, they expect one rate hike of 25 bps in July, followed by a longer pause, at least through the end of the year.”
On the Pound Sterling front, investors are awaiting the release of the United Kingdom Employment data (May). As per the estimates, Claimant Count Change is seen declining by 9.6K vs. a sheer addition of 46.7K reported in April. The Unemployment Rate for three months is seen higher at 4.0% against the prior release of 3.9%.
In addition to that, the catalyst that will keep investors on their toes is the Average Earnings data including bonuses. Three months' earnings data is seen accelerating to 6.1% vs. the prior pace of 5.8%. Higher earnings could weigh more pressure on the Bank of England (BoE), which is already struggling to tame stubbornly high inflation. Apart from the UK labor market data, the speech from BoE Governor Andrew Bailey will be keenly watched.
Economists at Scotiabank analyze USD/CAD technical outlook.
Runs of successive daily losses rarely run deep into double digits
The technical backdrop is solidly USD-bearish, spot is trading below all major short, medium and long-term MA signals and trend momentum is bearish across intraday, daily and weekly DMI studies. That is usually a pretty strong signal for losses to extend. But spot is getting caught up by this band of support in the low 1.33 zone and the (near-term) risk is growing that unless we see a break lower soon, the USD could rebound.
Runs of successive daily losses (or gains, for that matter) in spot rarely run deep into double digits.
AUD/USD is approaching key hurdle of 0.6810/0.6850. Economists at ociété Générale analyze the pair's technical outlook.
Defence of the 200-DMA near 0.6690 would be crucial for persistencein up move
Daily MACD has been posting positive divergence denoting receding downward momentum.
The pair has recently reclaimed the 200-DMA; it is worth noting that it had similar breaks above this MA in April/May however the upward momentum failed to regain. Thus, defence of this MA near 0.6690 would be crucial for persistence in up move.
AUD/USD is approaching the peak achieved in April near 0.6810/0.6850; this remains a key resistance zone. If the pair establishes above this hurdle, the rebound is likely to extend towards 0.6910 and perhaps even towards 0.7000, the 76.4% retracement from February.
EUR/USD rebound extends but gains through low 1.08s needed to extend, economists at Scotiabank report.
Investors continue to scoop it up on minor corrections
EUR gains from the late May low point have extended a little more as investors continue to scoop it up on minor corrections.
Gains perhaps need to extend a bit more clearly through 1.08 to generate more momentum; 1.0810 is the 38.2% retracement of the 1.1091/1.0635 decline through May. Above here targets a return to the 1.09 zone.
Support is 1.0740/50.
- NZD/USD has witnessed a minor decline around 0.6150 due to a decent recovery in the USD Index.
- NZ's quarterly GDP is seen contracting by 0.1% against a prior contraction of 0.6%.
- Further persistence in the US core inflation could accelerate the odds of one more interest rate hike from the Fed.
The NZD/USD pair has witnessed a halt in the upside momentum around 0.6150 in the European session. The Kiwi asset has faced delicate barriers as the US Dollar Index (DXY) has attempted a solid recovery. Sheer volatility in the US Dollar Index is highly expected as investors are turning anxious ahead of the United States inflation and the interest rate decision by the Federal Reserve (Fed).
The USD Index has shown a solid rebound after testing territory below 103.30 as the street is mixed about the interest rate policy. Investors will keep focus on the US Consumer Price Index (CPI) data and further persistence in core inflation could accelerate the odds of one more interest rate hike from the Fed.
On the New Zealand Dollar front, Q1 Gross Domestic Product (GDP) will remain in the spotlight. Quarterly GDP is seen contracting by 0.1% against a prior contraction of 0.6%. On an annualized basis, the economic data is expected to expand by 2.6%, higher than the prior contraction of 2.2%.
NZD/USD has climbed above the horizontal resistance plotted from April 26 low at 0.6111, which has turned into a cushion for the Kiwi bulls. The downward-sloping trendline plotted from May 11 high at 0.6385 is acting as a barricade of the New Zealand Dollar.
Also, the 200-Exponential Moving Average (EMA) at 0.6147 is restricting the New Zealand Dollar from any upside move.
The Relative Strength Index (RSI) (14) has shifted into the bullish range of 60.00-80.00, which indicates that upside momentum has been triggered.
A confident break above May 01 low at 0.6160 will drive the Kiwi asset toward the round-level resistance at 0.6200 followed by May 17 high at 0.6261.
Alternatively, a downside move below the intraday low at 0.6015 will expose the asset for a fresh six-month low toward 11 November 2022 low at 0.5984. A slippage below the latter would expose the asset toward 02 November 2022 high at 0.5941.
NZD/USD four-hour chart
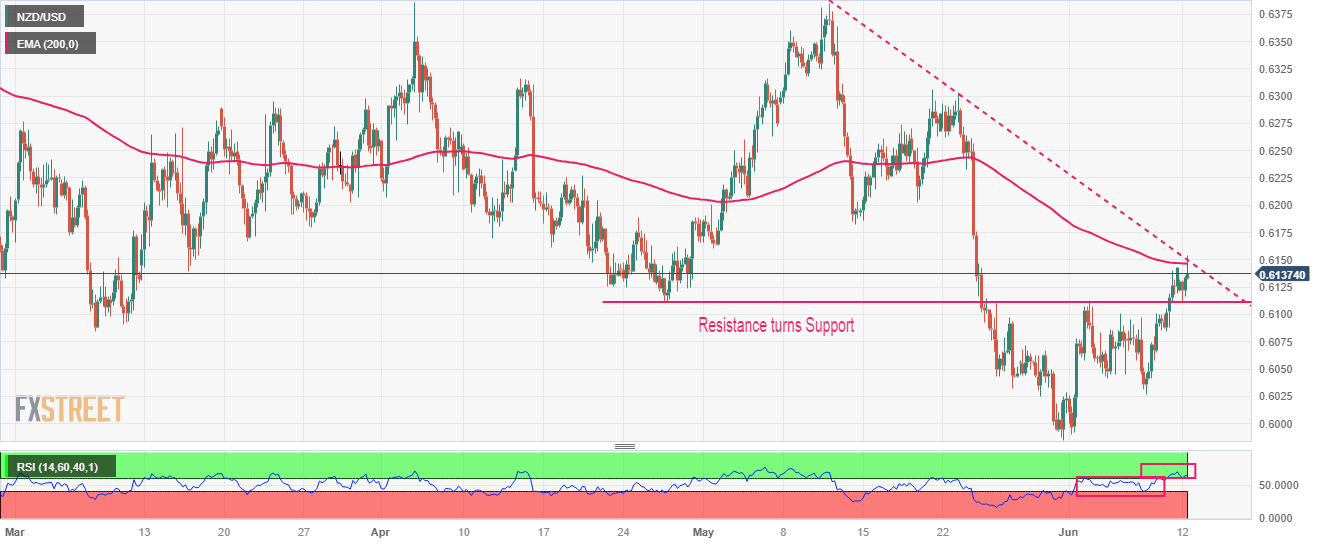
Kit Juckes, Chief Global FX Strategist at Société Générale, analyzes how a major central bank week could be overshadowed by US data.
Maybe US data matter more than Fed/ECB?
Last week’s Dollar softness was mostly down to weak ISM and claims data, and a downside surprise to core CPI for example (the market looks for +0.4% MoM) could shake up sentiment, as could a second week of climbing claims and/or a soft retail sales print.
Absent any signs of weakness in the US data, I struggle to see how the Euro gets much of a lift from an as-expected 25 bps rate hike – even one accompanied by a very clear signal that there is more to come from the ECB.
But if the data were to provide support for the idea that the US economy is slowing, the fact that 2-year note yields are almost 20 bps higher than they were just before the payroll data 10 days ago, suggests there’s room for yields and the Dollar to drop back.
- DXY resumes the decline and drops to new lows.
- The 103.00 zone emerges as the next support.
DXY leaves behind Friday’s decent advance and refocuses on the downside, clocking at the same time new multi-week lows in the 103.25/20 band on Monday.
In case the index extends the retracement, it could then put the transitory 100-day SMA around 103.00 to the test ahead of the provisional 55-day SMA at 102.52.
Looking at the broader picture, while below the 200-day SMA at 105.42 the outlook for the index is expected to remain negative.
DXY daily chart
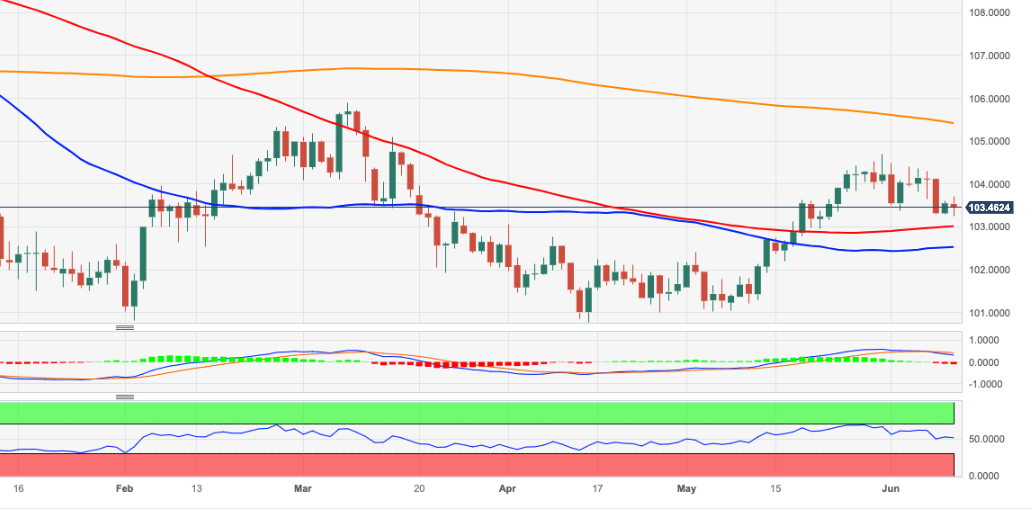
Economists at Société Générale analyze GBP/USD technical outlook.
1.2300 support is crucial to avert deeper pullback
GBP/USD up move faltered near the trend line drawn since 2021 at 1.2670/1.2750 resulting in an initial pullback. This remains a crucial resistance zone.
The pair has so far defended a rising support line near 1.2300. Currently, a bounce is under way however failure to cross above aforementioned hurdle could mean persistence in down move.
A break below 1.2300 can lead to a deeper decline towards 1.2130, the 23.6% retracement from last September and the 200-DMA at 1.2000.
According to Markets Strategist Quek Ser Leang at UOB Group, USD/IDR could face some selling pressure in the short-term horizon.
Key Quotes
USD/IDR closed 1.00% lower at 14,835 last week. Downward momentum has increased somewhat and this week, USD/IDR is likely to edge lower but a sustained drop below 14,740 appears unlikely for now. Resistance is at 14,900, followed by 14,950.
- EUR/JPY starts the week on a positive mood around 150.00.
- Further upside is expected to re-target the 151.00 zone.
EUR/JPY reverses two consecutive daily pullbacks and regains upside traction around the 150.00 region on Monday.
In case bulls remain in control, there is an immediate hurdle at the weekly top at 151.07 (May 29), while a convincing breakout of this level exposes a probable move to the 2023 peak at 151.61 (May 2).
So far, further upside looks favoured while the cross trades above the 200-day SMA, today at 144.26.
EUR/JPY daily chart
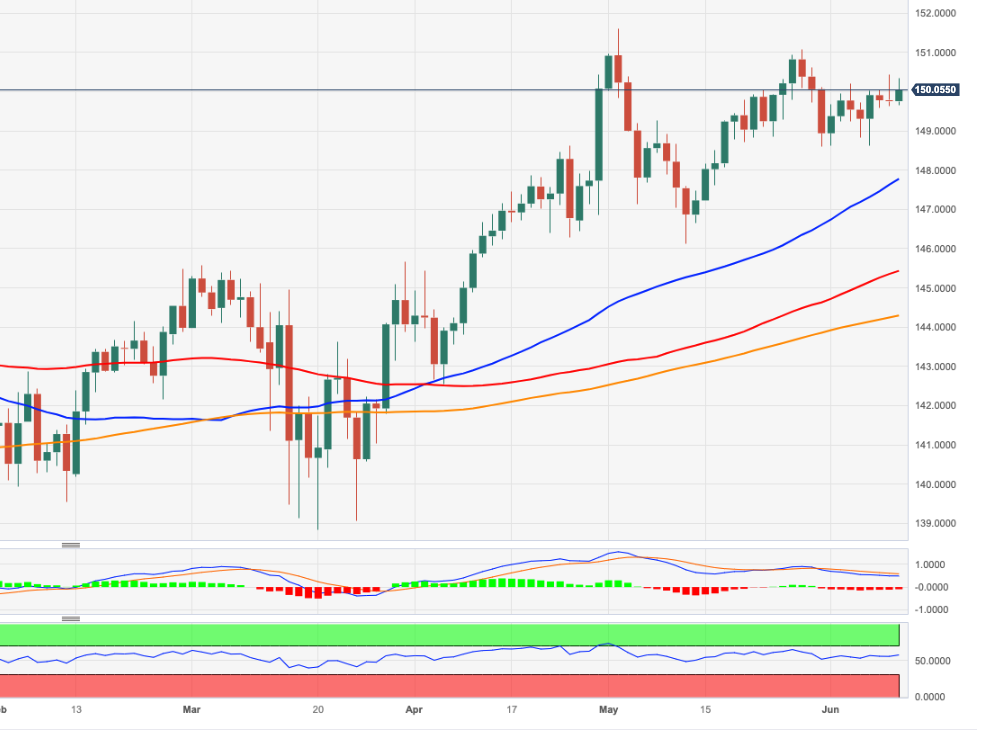
The US Dollar has corrected modestly lower ahead of the upcoming FOMC meeting. Softer USD is anticipating that Fed will slow pace of hikes, economists at MUFG Bank report.
Will the Fed rock the boat in the week ahead?
The last test will be the release tomorrow of the latest US CPI report for May just ahead of the FOMC meeting on Wednesday. Unless there is a significant upside surprise for core inflation measures, we expect the Fed to leave rates on hold this week but signal that it is not the end of the hiking cycle and leave the door open for another hike as soon as July. It should help to dampen further downside for the US Dollar.
The most disruptive outcome for the FX market would be another hike forcing the US rate market to price in a higher peak for the tightening cycle beyond 5.50%. It could trigger at least a temporary shake out of popular carry trade positions.
- AUD/USD is looking to reclaim 0.6800 despite the USD index has attempted a recovery.
- Investors are turning cautious ahead of the release of the US CPI data, however, the overall market mood is still positive.
- The Australian Dollar is showing resilience despite weaker demand in China.
The AUD/USD pair is aiming to reclaim the round-level resistance of 0.6800 in the European session. The Aussie asset is expected to continue to march higher despite a mild recovery in the US Dollar Index (DXY). The USD Index has witnessed some buying interest by investors below 103.30, however, more downside seems solid as a neutral interest rate policy by the Federal Reserve (Fed) is widely anticipated.
S&P500 futures have trimmed some gains added in London, portraying a minor decline in the risk appetite of the market participants. Investors are turning cautious ahead of the release of the United States Consumer Price Index (CPI) data, which will be announced on Tuesday, however, the overall market sentiment is still positive.
The USD Index is expected to remain extremely volatile as the street is majorly divided about the Fed’s policy guidance. One school of thought believes that the Fed should skip hiking rates this time as labor market conditions have started easing, US factory activities have been contracting straight for seven months, and the service sector is merely showing expansion.
While another expression is in favor of more rate hikes as inflation in the US economy is more than twice the desired. Meanwhile, a resumption of interest rate hikes by the Reserve Bank of Australia (RBA) and the Bank of Canada (BoC) indicates that the battle against stubborn inflation is far from over. This could add some conviction for Fed policymakers to continue its policy-tightening further.
The Australian Dollar is showing resilience despite weaker demand in China. Lower interest rates by the People’s Bank of China (PBoC) and supportive fiscal policies are failing to push the overall growth back on track. China’s factory deflation is indicating a bleak domestic demand and no signs of recovery look appeared.
It is worth noting that Australia is the leading trading partner of China and weak economic prospects in China impact the Australian Dollar.
Economists at Crédit Agricole discuss their expectations for the upcoming European Central Bank (ECB) meeting and how could impact the Euro.
Euro bulls to be selective
We expect a 25 bps rate hike along with indications from the ECB that it expects persisting inflation in the Eurozone and does not believe financial conditions have tightened enough to threaten growth, could spur further front-loading of rate hikes and support the Euro. However, we expect the Euro to consolidate mainly against currencies with dovish central banks or banks that have signaled the peak of their tightening cycle, such as the Japanese Yen and the New Zealand Dollar.
We highlight that the recent weakening of the Eurozone growth outlook, along with renewed concerns about China's economic future, could make Euro bulls selective about which Euro-crosses to buy.
Economists at OCBC Bank discuss USD/JPY outlook ahead of Friday’s Bank of Japan meeting.
Still looking for downside play
Support at 138.40/50 levels (recent low, 21 DMA).
Resistance at 140.20 and 142.50 (61.8% fibo retracement of 2022 high to 2023 low).
Recall at the last BoJ MPC (28 Apr), a policy review was unveiled as expected but the projected timeframe for the review (up to 1-1.5years) was much longer than expected. BoJ Governor Ueda did clarify that policy change is still possible during policy review. We opined BoJ is buying time, and this suggests that JPY bulls may have to be more patient.
We doubt BoJ will use the full 18 months review duration, but it also appears that the Friday MPC (16th Jun) may be too soon to expect any policy shift. Nevertheless, we are still in favour of BoJ policy normalisation amid broadening inflationary pressures and wage growth seen in Japan.
Markets Strategist Quek Ser Leang at UOB Group suggests USD/MYR could surpass the key resistance level at 4.6360 in the short term.
Key Quotes
While the recent advance in USD/MYR appears to have slowed somewhat, there is no sign of a possible reversal just yet.
This week, while there is room for USD/MYR to break above last month’s high of 4.6360, it might not be able to maintain a foothold above this level. The next resistance at 4.6600 is unlikely to come into view. Support is at 4.6050, a break of 4.5850 would suggest the current upward pressure has faded.
Economists at Morgan Stanley discuss the US Dollar (USD) and Japanese Yen (JPY) outlook.
Holding USD/JPY shorts is challenging
We believe that the USD has the potential to continue to gradually strengthen this year. We point out that even if the global economy manages to circumvent a full-scale recession, the asymmetry in central banks' reactions coupled with uninspiring economic growth rates indicates that investors are likely to maintain a defensive stance in the markets. Furthermore, the positive carry that the USD offers makes it an attractive option for investors.
The US Dollar is expected to offer approximately a 2% annual carry in the G10 through at least 2024.
We expect the JPY to lead gains in the G10, possibly even surpassing the USD. This is anticipated to be driven by narrowing rate differentials as further adjustments to the Bank of Japan’s yield curve control program coincide with long-end US yields moving closer to local rates. However, holding a short position in USD/JPY could be challenging due to the cost of carry eroding the projected spot return in its entirety.
Economists at Commerzbank analyze NOK outlook after another inflation surprise from Norway.
Norges will have to deliver
The April inflation data has already surprised on the upside, now the May data provided another surprise. Both overall inflation, as well as core inflation, reached 6.7% YoY.
Norges Bank had already signalled a rate hike for the upcoming central bank meeting on 22nd June, but it had left all doors open for the time after that. Recent inflation developments suggest though that the June rate step will not be the last one.
The market clearly expects further rate hikes in Norway. However, Norges Bank will actually have to deliver. If it meets market expectations with hawkish comments and a hawkish rate decision in June NOK might appreciate further over the coming weeks.
Kit Juckes, Chief Global FX Strategist at Société Générale, analyzes how central banks' policies could impact their currencies.
CAD and AUD to benefit from a Fed pause/skip
That a clear signal from the BoJ hasn’t weakened the Yen much at all, suggests that a lack of policy change is priced-in, and may leave USD/JPY in a range, but the options market is right to price for greater downside than upside potential in USD/JPY.
Elsewhere, last week’s hikers (RBA and Bank of Canada) should see their currencies benefit from a Fed pause/skip, and we continue to like NOK/SEK on the grounds that expectations of a hike next week can grow. BoE and SNB hikes, however, are already fully priced.
- US Dollar stabilised after losing substantial ground against its peers at the end of last week.
- Traders are on edge with several important US economic data points and the Fed Interest Rate Decision on the agenda.
- US Dollar Index holds just above 103.25 and will be data dependent on its path forward for this week.
The US Dollar (USD) is in wait-and-see mode at the start of this week with traders gearing up for what will be an eventful week after the lacklustre performance last week. Biggest highlights to have in mind for this week are the US Consumer Price Index (CPI) numbers on Tuesday, Industrial Production on Thursday and the Michigan Consumer Sentiment survey on Friday. As if that is not enough, traders will have the opportunity to dissect the latest stance of the US Federal Reserve (Fed) with its June interest rate decision, including the press conference from Fed chairman Jerome Powell, on Wednesday.
For this Monday, the Dollar Index (DXY) is making a small recovery after its slide lower at the end of last week, dipping below 103.25. In the Asia-Pacific session, traders revalued the US Dollar back above 103.50 as Monday already holds an important event, the auction of 3-year and 10-year Treasury notes. The Federal Budget Balance for May will be printed as well on Monday.
Daily digest: US Dollar to be mostly data-driven this week
- Not much comments expected in the run-up to the Fed Interest Rate Decision on Wednesday as the Fed speakers are in their blackout period.
- Sentiment during the Asian session showed some mild appetite for risk, with Japan Topix Index up 0.60% near its closing bell. European indices are taking over the positive tone with the German DAX up 0.50% in early trading, at the time of writing.
- US equity futures had a positive close for the week on Friday and several indices have been breaking out of the bearish patterns, underlining the positive sentiment in the aftermath of the US debt ceiling agreement.
- The CME Group FedWatch Tool shows that markets are pricing in a 30% chance of rate hike for June and an 85% chance for a hike in July. The pause this week could trigger some further easing in the DXY.
- The benchmark 10-year US Treasury bond yield trades at 3.75%. A touch lower since the US Initial Jobless Claims showed an uptick, coming out at 261,000 against 233,000 previous. The numbers account for the second highest print for this year.
US Dollar Index technical analysis: USD bears have some room to move
The US Dollar Index (DXY) has been on a tear the past two weeks and nearly touched 105.00 to the upside at the end of May. Since then, the DXY has refrained from making new highs and is showing a bearish patterns with lower highs and lower lows. Support in the form of the 100-day SImple Moving Average (SMA), near 103.00, is expected to be tested soon for support
On the upside, 105.47 (200-day SMA) still acts as long-term price target to hit, as the next upside key level for the US Dollar Index is at 105.00 (psychological, static level), and acts as an intermediary element to cross the open space.
On the downside, 103.00 (100-day SMA) aligns as the first support level to confirm a change of trend. In the case that breaks down, watch how the DXY reacts at the 55-day SMA at 102.53 in order to assess any further downturn or upturn.
Fed FAQs
What does the Federal Reserve do, how does it impact the US Dollar?
Monetary policy in the US is shaped by the Federal Reserve (Fed). The Fed has two mandates: to achieve price stability and foster full employment. Its primary tool to achieve these goals is by adjusting interest rates.
When prices are rising too quickly and inflation is above the Fed’s 2% target, it raises interest rates, increasing borrowing costs throughout the economy. This results in a stronger US Dollar (USD) as it makes the US a more attractive place for international investors to park their money.
When inflation falls below 2% or the Unemployment Rate is too high, the Fed may lower interest rates to encourage borrowing, which weighs on the Greenback.
How often does the Fed hold monetary policy meetings?
The Federal Reserve (Fed) holds eight policy meetings a year, where the Federal Open Market Committee (FOMC) assesses economic conditions and makes monetary policy decisions.
The FOMC is attended by twelve Fed officials – the seven members of the Board of Governors, the president of the Federal Reserve Bank of New York, and four of the remaining eleven regional Reserve Bank presidents, who serve one-year terms on a rotating basis.
What is Quantitative Easing (QE) and how does it impact USD?
In extreme situations, the Federal Reserve may resort to a policy named Quantitative Easing (QE). QE is the process by which the Fed substantially increases the flow of credit in a stuck financial system.
It is a non-standard policy measure used during crises or when inflation is extremely low. It was the Fed’s weapon of choice during the Great Financial Crisis in 2008. It involves the Fed printing more Dollars and using them to buy high grade bonds from financial institutions. QE usually weakens the US Dollar.
What is Quantitative Tightening (QT) and how does it impact the US Dollar?
Quantitative tightening (QT) is the reverse process of QE, whereby the Federal Reserve stops buying bonds from financial institutions and does not reinvest the principal from the bonds it holds maturing, to purchase new bonds. It is usually positive for the value of the US Dollar.
- Gold price is approaching the $1,970.00 resistance as the USD Index has resumed its downside journey.
- S&P500 futures have posted stellar gains as investors have underpinned the risk-appetite theme.
- More interest rate hikes by the Fed are less certain as tight lending conditions by US commercial banks have trimmed liquidity.
Gold price (XAU/USD) is marching towards the crucial resistance of $1,970.00 after a strong recovery from $1,956.00 in the London session. The precious metal has attracted significant bids after a sell-off in the US Dollar Index (DXY).
S&P500 futures have posted stellar gains in Europe as investors have underpinned the risk-appetite theme. US equities are becoming the talk of the town as investors are hoping that the Federal Reserve (Fed) will choose a steady interest rate policy.
Earlier, Fed chair Jerome Powell announced that more interest rate hikes are less certain as tight lending conditions by United States commercial banks are barricading inflationary pressures. And, now easing labor market conditions is a cherry on the cake, which is providing the Fed the luxury of keeping interest rates steady.
Meanwhile, the US economic activities are also demonstrating a poor show as manufacturing activities are consistently contracting and services activities are barely showing expansion.
The US Dollar Index is looking to resume its downside journey amid the inability of sustaining above the intermediate support around 103.30. Contrary to that, the US Treasury yields are choppy. The returns generated on 10-year US Treasury bonds are holding above 3.75%.
Gold technical analysis
Gold price is consolidating in a narrow range of $1,954-1,970 on a two-hour scale, which indicates a volatility contraction followed by wider ticks and heavy volume. On a broader note, the upside of the Gold price is restricted from May 18 high around $1,986.00 while the downside is limited to May 26 low around $1,936.77.
A straight 50-period Exponential Moving Average (EMA) at $1,959.70 indicates that the overall trend is non-directional.
Also, the Relative Strength Index (RSI) (14) is oscillating in the 40.00-60.00 range, which conveys that investors are awaiting a potential trigger.
Gold four-hour chart
-638221602281891429.png)
This week will be the week. The Fed and ECB central bank decisions are due. Economists at Commerzbank discuss EUR/USD outlook.
Will the Doller be able to defend gains?
Whether the Dollar will be able to defend the gains made over the past weeks will depend heavily on how clearly the Fed leaves the door open for future rate hikes and of course on whether and if so to what extent the ECB closes the door to further rate hikes on Thursday.
In view of the high uncertainty about how quickly and to what extent the rate hikes already implemented will affect the real economy in the US and in the Eurozone it is quite plausible that ECB and Fed do not want to commit to a predetermined path at this stage. That means it is possible that by the end of the week we will be none the wiser than now and that EUR/USD levels around 1.07/1.08 might turn into a new ‘wait and see’ level.
Economists at ING analyze US Dollar outlook ahead of the all-important US Consumer Price Index (CPI) data due out on Tuesday,
Holding pattern ahead of tomorrow's May CPI release
Low levels of FX volatility will continue to favour carry trade strategies unless we see some major dislocation in the US rates market or some financial system stress re-appear. Against that backdrop, the Dollar should stay reasonably bid and its first major challenge this week will be tomorrow's May US CPI.
DXY should trade in a narrow range (103.30-104.00) into tomorrow's CPI number, with bigger moves coming later in the week when we hear from the Fed, the ECB, and the BoJ.
Markets Strategist Quek Ser Leang at UOB Group sees USD/THB trading within the 34.55-34.90 range in the near term.
Key Quotes
USD/THB traded in a range of 34.55/34.92 last week before settling at 34.62 (-0.55%). The price actions offer no fresh clues and this week, we expect USD/THB to continue to trade in a range, likely between 34.55 and 34.90.
- EUR/USD has shown a perpendicular recovery to near 1.0784 as investors have underpinned the risk appetite theme.
- US headline CPI is seen softening due to lower oil prices while core inflation is expected to remain persistent.
- EUR/USD had strongly rebounded after sensing buying interest near the 61.8% Fibonacci retracement at 1.0738.
The EUR/USD pair has displayed a vertical recovery from 1.0740 in the European session. The major currency pair has shifted into a bullish trajectory as the market mood has turned cheerful on hopes that the Federal Reserve (Fed) could postpone an interest rate hike for July monetary policy meeting.
S&P500 futures have added significant gains in the London session amid a solid appeal for the risk-sensitive assets. Before the Fed’s policy decision, United States inflation data will be keenly watched. Headline Consumer Price Index (CPI) is seen softening due to lower oil prices while core inflation is expected to remain persistent.
Also, investors are awaiting the interest rate decision by the European Central Bank (ECB), which will be announced on Thursday. ECB President Christine Lagarde is expected to raise interest rates further by 25 basis points (bps) to 4%.
EUR/USD had strongly rebounded after sensing buying interest near the 61.8% Fibonacci retracement (plotted from March 15 low at 1.0516 to April 26 high at 1.1095) at 1.0738.
A bull cross, represented by the 20-and 50-period Exponential Moving Averages (EMAs) at 1.0725, adds to the upside filters.
The Relative Strength Index (RSI) (14) is attempting to shift into the bullish range of 60.00-80.00. An occurrence of the same will be followed by an upside momentum.
A confident move above June 08 high at 1.0787 will drive the shared currency pair toward May 22 high at 1.0831, followed by the 38.2% Fibo retracement at 1.0874.
In an alternate scenario, the downside move will resume if the shared currency pair drops below the June 05 low at 1.0675. This will drag the asset towards May 31 low at 1.0635 followed by March 03 low at 1.0588.
EUR/USD four-hour chart

- EUR/USD resumes the upside and re-targets 1.0800.
- Investors’ attention remains on the Fed and the ECB.
- German yields rise a tad near the 2.40% on Monday.
The single currency regains balance and propels EUR/USD back to the upper end of the range near 1.0780 at the beginning of the week.
EUR/USD now focused on 1.0800
EUR/USD quickly leaves behind Friday’s pullback and advances markedly following the opening bell on the old continent on Monday.
The strong uptick in the pair came on the back of the resumption of selling pressure in the greenback, which in turn relegates the USD Index (DXY) to navigate in the area of multi-week lows near 103.30.
In the meantime, market participants are expected to closely follow the release of US inflation figures tracked by the CPI on Tuesday and the interest rate decisions by the Federal Reserve on Wednesday and the ECB on Thursday.
So far, the Fed is largely anticipated to leave rates on hold, while the ECB is predicted to tighten its policy by another 25 bps rate hike.
There are no scheduled releases in the euro docket on Monday.
What to look for around EUR
EUR/USD trades close to the 1.0800 zone amidst further selling pressure hurting the dollar on Monday.
In the meantime, the pair’s price action is expected to closely mirror the behaviour of the US Dollar and will likely be impacted by any differences in approach between the Fed and the ECB with regards to their plans for adjusting interest rates.
Moving forward, hawkish ECB speak continues to favour further rate hikes, although this view appears to be in contrast to some loss of momentum in economic fundamentals in the region.
Key events in the euro area this week: Germany Final Inflation Rate, Economic Sentiment, EMU Economic Sentiment (Tuesday) – EMU Industrial Production (Wednesday) – Eurogroup Meeting, EMU Balance of Trade, ECB Interest Rate Decision, ECB Lagarde (Thursday) – ECOFIN Meeting, Final EMU Inflation Rate (Friday).
Eminent issues on the back boiler: Continuation of the ECB hiking cycle in June and July (and September?). Impact of the Russia-Ukraine war on the growth prospects and inflation outlook in the region. Risks of inflation becoming entrenched.
EUR/USD levels to watch
So far, the pair is gaining 0.26% at 1.0776 and the surpass of 1.0787 (monthly high June 8) would target 1.0805 (100-day SMA) en route to 1.0879 (55-day SMA). On the other hand, the next support at 1.0635 (monthly low May 31) seconded by 1.0516 (low March 15) and finally 1.0481 (2023 low January 6).
- USD/CAD turns lower for the fifth straight day and is pressured by renewed USD selling.
- Bearish Crude Oil prices could undermine the Loonie and help limit losses for the major.
- Traders also seem reluctant ahead of the US CPI on Tuesday and the FOMC on Wednesday.
The USD/CAD pair meets with a fresh supply following an early uptick to the 1.3355-1.3360 region on Monday and turns lower for the fifth successive day - also marking the eighth day of a negative move in the previous nine. Spot prices extend the intraday descent through the first half of the European session and drop to the 1.3320-1.3315 region in the last hour, closer to over a one-month low touched on Friday.
A positive tone around the equity markets fails to assist the safe-haven US Dollar (USD) to capitalize on Friday's bounce from its lowest level since May 24 and attracts fresh sellers on the first day of a new week. Apart from this, the Bank of Canada's (BoC) surprise 25 bps rate hike last week continues to underpin the Canadian Dollar (CAD) and exerts some downward pressure on the USD/CAD pair. That said, a combination of factors might hold back traders from placing fresh bearish bets around the major and help limit losses for the major, at least for the time being.
The uncertainty over the Federal Reserve's (Fed) rate hike path, along with a modest uptick in the US Treasury bond yields, could act as a tailwind for the Greenback. It is worth recalling that the recent dovish rhetoric by a slew of influential Fed officials fueled speculations that the US central bank will skip raising interest rates at the end of a two-day meeting on Wednesday. The markets, however, are still pricing in the possibility of another 25 bps lift-off at the July FOMC meeting on the back of expectations that the fight against stubbornly high inflation is not over yet.
Furthermore, worries that a global economic slowdown will dent fuel demand continue to weigh heavily on Crude Oil prices, which could undermine the commodity-liked Loonie and lend some support to the USD/CAD pair. Traders might also prefer to wait on the sidelines ahead of the latest US consumer inflation figures, due for release on Tuesday, and the highly-anticipated FOMC policy decision on Wednesday. This, in turn, will play a key role in driving the USD demand and help traders to determine the next leg of a directional move for the major.
Technical levels to watch
Economists at Commerzbank discuss SNB policy outlook and its implications for the EUR/CHF pair.
SNB’s tolerance for Ffranc depreciation to increase
A further rate hike at the SNB’s meeting next week is likely to be a fait accompli. A further significant tightening beyond that hardly seems credible though.
A lot can happen until the SNB’s next meeting in September, of course, but in view of the fact that inflation in Switzerland has recently eased more than the SNB had expected and was close to the upper limit of 0-2% at 2.2% in May means that the need for further rate hikes seems limited. Instead, a further fall in inflation is likely to increase the SNB’s tolerance for Franc depreciation so that we see increased possibilities on the upside as regards EUR/CHF.
Sterling is now the best-performing currency in the G10 space this year at +4.08%. Economists at ING discuss GBP outlook.
Tuesday will set the near term tone for Sterling
The highlight for Sterling this week will be tomorrow's release of April wage data and the employment report for May. We think softer wage and price data could emerge at any time and that market pricing of the Bank Rate (now at 5.50% for 24 January) is subject to a sharp downward revision.
Let's see whether tomorrow's data gives BoE Governor Andrew Bailey the chance to push back against those aggressive tightening expectations when he testifies to a House of Lords committee tomorrow afternoon. Expect Sterling to hold onto its gains today, however.
EUR/GBP is currently testing big support at 0.8540/50 - levels we see as worthwhile to hedge GBP receivables.
- Silver price has sensed barricades around $24.20 as the focus shifts to the US Inflation.
- Catalysts that are supporting more rate hikes by the Fed are persistence in core CPI and a recovery in US lending activities.
- Silver price showed a vertical sell-off after the formation of the Double Top pattern.
Silver price (XAG/USD) has sensed selling pressure around $24.20 in the London session. The white metal is broadly showing a sideways action ahead of the release of the United States Consumer Price Index (CPI) and the announcement of the interest rate decision by the Federal Reserve (Fed).
S&P500 futures have accelerated their rally on hopes that the Federal Reserve (Fed) would call for a pause in the rate-hiking spell considering the fact that US labor market conditions are releasing the heat and factory activities are consistently contracting for the past seven months. The risk profile is upbeat and has improved the appeal for risk-perceived assets.
Catalysts that are supporting more interest rate hikes by the Fed are persistence in core inflation and a recovery in lending activities by US commercial banks. The latest data from the Fed showed that ending and deposit activities have increased straight for three weeks by commercial banks in the week ended May 31.
In spite of higher interest rates and tight credit disbursal conditions by the US commercial banks, lending activities have soared, which shows resilience in the US economy.
The US Dollar Index (DXY) has shown a sheer sell-off as the odds of a steady interest rate policy by the Fed are extremely solid. As per the CME Fedwatch tool, more than 73% of chances are in favor of a steady interest rate policy announcement.
Silver technical analysis
Silver price has faced stiff barricades near the horizontal resistance plotted from April 25 low at $25.00, which was previously acting as a support. Earlier, the asset showed a vertical sell-off after the formation of the Double Top chart pattern.
For now, the white metal has climbed above the 200-period Exponential Moving Average (EMA), which indicates that the long-term trend is still bullish.
The Relative Strength Index (RSI) (14) is struggling in keeping itself in the bullish range of 60.00-80.00.
Silver four-hour chart
-638221550361217231.png)
Further upside could motivate USD/CNH to challenge the 7.1800 and 7.2000 levels in the next few weeks, comment UOB Group’s Markets Strategist Quek Ser Leang and Senior FX Strategist Peter Chia.
Key Quotes
24-hour view: USD traded between 7.1171 and 7.1465 last Friday, higher than our expected range of 7.1100/7.1400. USD traded on a firm note in early Asian trade today but while the risk is on the upside, any advance is unlikely to break above 7.1800 today. Support is at 7.1360, followed by 7.1200.
Next 1-3 weeks: Last Friday (09 Jun, spot at 7.1500), we highlighted that if USD breaks below 7100, it will suggest that 7.1552 could be an interim top. Not only did USD not break 7.1100, it also rose above 7.1500 again in early Asian trade today. While upward momentum has been rejuvenated, it remains to be seen if USD has enough momentum to rise to 7.1800 and 7.2000. On the downside, the key support level remains unchanged at 7.1100.
- AUD/USD gains positive traction for the third straight day and climbs to a fresh one-month high.
- The RBA’s hawkish outlook and a positive risk tone push spot prices beyond the 100-day SMA.
- The Fed rate hike uncertainty and economic woes might cap any meaningful upside for the pair.
- Traders might also prefer to wait ahead of the US CPI on Tuesday and the FOMC on Wednesday.
The AUD/USD pair scales higher for the third successive day - also marking the seventh day of a positive move in the previous eight - and climbs to a fresh one-month high during the early European session on Monday. The pair is currently placed around the 0.6760-0.6765 region, up over 0.25% for the day, and seems to have confirmed a fresh bullish breakout through a technically significant 100-day Simple Moving Average (SMA).
The Australian Dollar (AUD) continues to draw support from the Reserve Bank of Australia's (RBA) surprise 25 bps rate hike last week and a more hawkish policy statement. Adding to this, a generally positive tone around the equity markets act as a headwind for the safe-haven US Dollar (USD) and further benefits the risk-sensitive Aussie. That said, a modest uptick in the US Treasury bond yields should lend support to the USD losses and keep a lid on the AUD/USD pair.
Furthermore, worries about a global economic slowdown, particularly in China, could contribute to limiting the downside for the Greenback and capping gains for the China-proxy AUD. Traders might also refrain from placing aggressive bets and prefer to wait for this week's release of the crucial US consumer inflation data on Tuesday. This will be followed by the highly-anticipated FOMC decision on Wednesday, which will provide a fresh impetus to the AUD/USD pair.
The aforementioned fundamental backdrop makes it prudent to wait for sustained strength and acceptance above the 0.6800 mark before positioning for any further appreciating move. The AUD/USD pair might then accelerate the momentum towards the next relevant hurdle near the 0.6865-0.6870 horizontal zone en route to the 0.6900 round figure. Bulls might eventually aim to reclaim the 0.7000 psychological mark with some intermediate hurdle near the 0.6970-0.6975 area.
On the flip side, the 0.6735 area (100-day SMA), now seems to protect the immediate downside. This is followed by the 0.6700 mark and the very important 200-day SMA, currently around the 0.6680 region. Failure to defend the said support levels might prompt some technical selling and make the AUD/USD pair vulnerable. The subsequent downfall has the potential to drag spot prices further below the 0.6645 support, towards retesting the 0.6600 round-figure mark.
AUD/USD daily chart
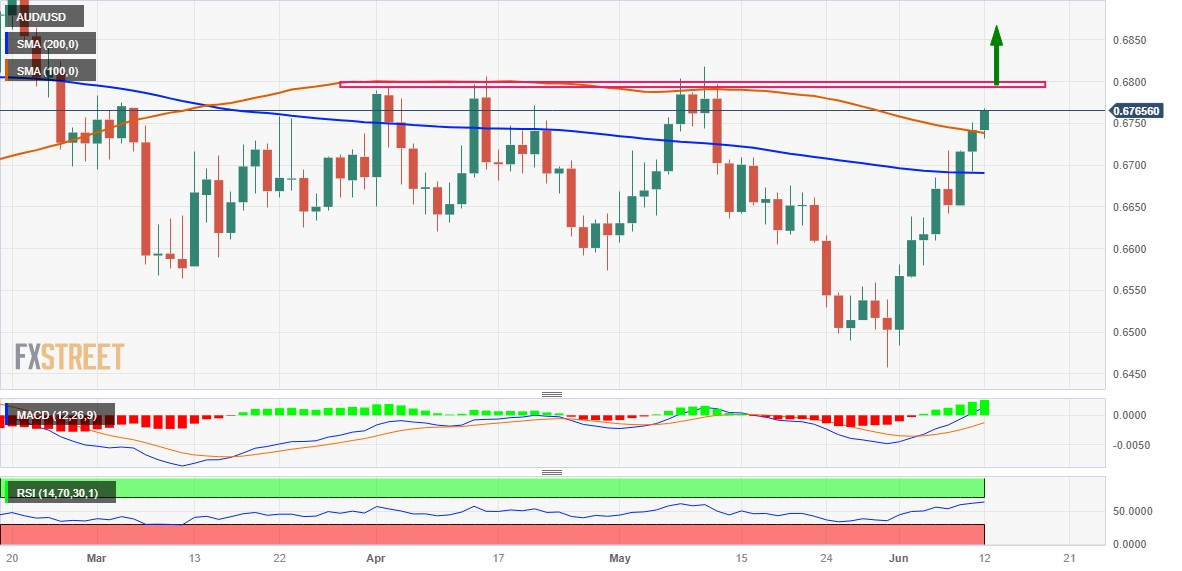
Key levels to watch
Economists at Société Générale analyze EUR/CZK technical outlook.
50-DMA near 23.50 is near term support
EUR/CZK has formed a series of higher peaks and troughs after carving out a low near 23.20 in April. It has evolved within a small base and is now challenging a multi month descending trend line.
Daily MACD is anchored within positive territory denoting prevalence of upward momentum.
Once a break above the upper limit of the base near 23.80 materializes, EUR/CZK is likely to extend the rebound towards March high of 24.10.
The 50-DMA near 23.50 is near term support.
- The index appears somewhat offered around 103.40.
- Cautiousness is expected to increase ahead of CPI, Fed.
- The Monthly Budget Statement will be the sole release on Monday.
The greenback, when measured by the USD Index (DXY), starts the week slightly on the defensive and around the 103.40 region.
USD Index focuses on key data, FOMC
The index navigates the lower end of the recent range near the 103.50 area amidst some tepid bounce at the beginning of the week.
The daily pullback in spot so far contrasts with the small uptick in US yields across the curve, while expectations of a Fed pause at the June 14 meeting appear firmer and a 25 bps rate hike in July looks favoured for the time being.
In the US data space, the only release of note will be the May’s Monthly Budget Statement, due later at the end of the NA session.
What to look for around USD
The index seems to have met some initial contention around the 103.30 region so far this month.
In the meantime, bets of another 25 bps at the Fed’s next gathering in June reversed course in spite of the steady resilience of key US fundamentals (employment and prices, mainly) and have dented the recent rally in the dollar.
Bolstering a pause by the Fed instead appears to be the extra tightening of credit conditions in response to uncertainty surrounding the US banking sector.
Key events in the US this week: Monthly Budget Statement (Monday) – Inflation Rate (Tuesday) – MBA Mortgage Applications, Producer Prices, FOMC Interest Rate Decision, Powell press conference (Wednesday) – Initial Jobless Claims, Philly Fed Manufacturing Index, Retail Sales, NY Empire State Index, Industrial Production, Business Inventories, TIC Flows (Thursday) – Flash Michigan Consumer Sentiment (Friday).
Eminent issues on the back boiler: Persistent debate over a soft/hard landing of the US economy. Terminal Interest rate near the peak vs. speculation of rate cuts in late 2023/early 2024. Fed’s pivot. Geopolitical effervescence vs. Russia and China. US-China trade conflict.
USD Index relevant levels
Now, the index is losing 0.8% at 103.36 and faces the next support at at 103.29 (monthly low June 8) seconded by 103.00 (100-day SMA) and finally 102.51 (55-day SMA). On the flip side, the breakout of 104.69 (monthly high May 31) would open the door to 105.41 (200-day SMA) and then 105.88 (2023 high March 8).
EUR/USD continues to trade well above 1.07. Economists at ING analyze the pair’s outlook.
EUR/USD will find a base in the 1.05/1.07 area this month
The good demand for commodity currencies plus a re-rating of the Real, Rand and Shekel seem to suggest that investors could be moving onto their next big thing – which is the cyclical Dollar decline in the second half of the year. That happens to be our baseline view and one of the reasons we think EUR/USD will find a base in the 1.05/1.07 area this month before pushing to 1.15+ by year-end.
Beyond the US data and the Fed meeting, this week's focus will be on Thursday's ECB meeting. It seems too early for the ECB to drop its inflation guard, but a hawkish Fed story could be dominating and EUR/USD could see a retest of last week's low at 1.0635.
Here is what you need to know on Monday, June 12:
Major currency pairs fluctuate in narrow ranges at the beginning of the week as investors gear up for this week's key macroeconomic events. There will not be any high-impact data releases featured in the US economic docket on Monday. On Tuesday, the US Bureau of Labor Statistics will release the Consumer Price Index (CPI) data for May ahead of the Federal Reserve and the European Central Bank's (ECB) policy announcements on Wednesday and Thursday, respectively.
US stock index futures trade modestly higher in the European morning and the benchmark 10-year US Treasury bond yield holds steady near 3.75%, reflecting a neutral risk mood. The US Dollar Index, which gauges the US Dollar's (USD) performance against a basket of six major currencies, moves sideways at around mid-103.00s.
EUR/USD lost its traction on Friday and erased a large portion of the gains it recorded on Thursday. Nevertheless, the pair snapped a five-week losing streak. Early Monday, EUR/USD stays calm near 1.0750.
GBP/USD gained more than 100 pips last week. In the European morning, the pair clings to small daily gains while holding comfortably above 1.2550. On Tuesday, the UK's Office for National Statistics will release the jobs report.
USD/JPY edges higher early Monday but stays below 140.00. On Friday, the Bank of Japan (BoJ) will unveil monetary policy decisions. “It’s still too early to call that this inflation has been sustainable and stable," Bank of Japan (BoJ) policymaker Masazumi Wakatabe told Bloomberg earlier in the day.
Gold price corrected lower on Friday but closed the week in positive territory. XAU/USD moves up and down in a tight channel around $1,960 in the European session.
USD/CAD recovered modestly following the disappointing jobs report on Friday but failed to gather further bullish momentum. The pair stays on the back foot below 1.3350 on Monday.
Bitcoin continued to edge lower over the weekend and ended up losing more than 4% last week. BTC/USD inches lower early Monday and stays below $26,000. Ethereum suffered heavy losses on Sunday and closed the week below $1,800. ETH/USD remains under modest bearish early Monday and trades near $1,750.
Bank of England (BoE) policymaker Jonathan Haskel wrote in the Scotsman newspaper, reported by Bloomberg on Monday, “Further increases in interest rates cannot be ruled out.”
Key Quotes
“The BoE is monitoring indicators of inflation momentum and persistence closely.”
“Policy should ‘lean against’ the risk of inflation.”
Must Read: GBP/USD gathers strength for a break towards 1.2600, US CPI and UK Employment eyed
Economists at CIBC Capital Markets analyze EUR/NOK outlook.
A higher rate path
We expect additional 25 bps rate hikes for both June and September, taking the deposit rate to 3.75%. This is also supported by other evidence – including a robust profile for activity, with the uptick in consumer sentiment and labour market surveys which continue to point to further tightening in conditions.
A more constructive macro backdrop underlines the view of EUR/NOK looking overbought and ready for a correction into H2.
EUR/NOK – Q3 2023: 11.50 | Q4 2023: 11.35
- Gold price reverses a modest intraday dip, though the upside remains capped.
- The US Dollar struggles to preserve its gains and lends support to the XAU/USD.
- Traders keenly await the US CPI report and key central bank event risks this week.
Gold price attracts some dip-buying near the $1,954 region on the first day of a new week and climbs to the top end of its daily trading range during the early European session. The XAU/USD currently trades around the $1,960 level, nearly unchanged for the day, and for now, seems to have stalled its retracement slide from a one-week high touched on Friday.
Despite a modest uptick in the US Treasury bond yields, the US Dollar (USD) struggles to preserve its modest intraday gains and turns out to be a key factor lending some support to Gold price. The downside for the USD, however, seems cushioned, at least for the time being, as traders seem reluctant in the wake of the uncertainty over the Federal Reserve's (Fed) rate hike path. It is worth recalling that a slew of Fed officials recently fueled speculations about an imminent pause in the central bank's year-long policy tightening cycle. That said, the markets are still pricing in the possibility of another 25 bps lift-off at the next Federal Open Market Committee (FOMC) policy meeting in July.
The bets were lifted following surprise rate hikes by the Reserve Bank of Australia (RBA) and the Bank of Canada (BoC) last week, which suggested that the fight against inflation is not over yet. This, in turn, might hold back traders from placing aggressive bullish bets around Gold price ahead of this week's release of the latest consumer inflation figures from the United States (US), due on Tuesday. A stronger US Consumer Price Index (CPI) will support prospects for further policy tightening by the Fed, which is scheduled to announce its policy decision at the end of the highly-anticipated two-day meeting on Wednesday, and should provide a fresh impetus to the XAU/USD.
In the meantime, firming expectations for additional interest rate hikes by the European Central Bank (ECB), due to announce its decision on Thursday, and the Bank of England (BoE) might contribute to capping the non-yielding Gold price. Investors this week will further take cues from the Bank of Japan (BoJ) meeting on Friday. This makes it prudent to wait for strong follow-through buying before positioning for an extension of the recent bounce from the 100-day Simple Moving Average (SMA) support, currently near the $1,941 area, held over the past two weeks or so.
Technical levels to watch
USD/JPY is likely to extend the 138.50-141.00 range in the next few weeks, according to UOB Group’s Markets Strategist Quek Ser Leang and Senior FX Strategist Peter Chia.
Key Quotes
24-hour view: We highlighted last Friday that “there is room for USD to test 138.50 before the risk of a rebound increases”. However, USD rebounded from 138.74 to 139.72 and then traded mostly sideways for the rest of the sessions. The price actions are likely part of a consolidation and today, USD is likely to trade between 139.00 and 139.90.
Next 1-3 weeks: Our most recent narrative was from last Thursday (08 Jun, spot at 139.95) wherein USD “is likely to trade between 138.50 and 141.00”. There is no change in our view for now.
CME Group’s flash data for natural gas futures markets noted traders reduced their open interest positions by just 830 contracts on Friday, adding to the previous daily drop. In the same line, volume reversed four consecutive daily builds and went down by around 107.3K contracts.
Natural Gas: Imminent barrier appears at the 100-day SMA
Friday’s pullback in prices of natural gas came on the back of declining open interest and volume, allowing for some bounce in the short-term horizon. On this, the immediate up-barrier is seen at the $2.40 region per MMBtu, where the 100-day SMA and the monthly high converge.
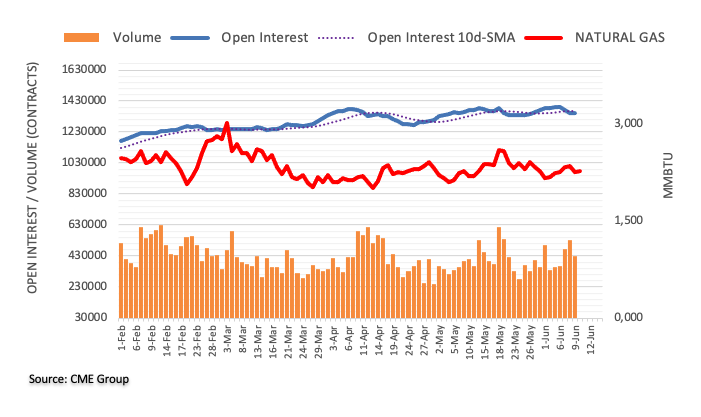
- USD/CHF is facing fragile barricades around 0.9040 amid a marginal correction in the USD Index.
- Market mood is cheerful on hopes that the Fed would skip hiking interest rates on Wednesday.
- SNB Jordan believes that the central bank should not wait for increasing inflation but should act now by raising interest rates.
The USD/CHF pair has faced delicate barricades around 0.9040 in the European session. A volatile action from the Swiss Franc asset cannot be ruled out as investors are awaiting the release of the United States Consumer Price Index (CPI) for further guidance.
S&P500 futures have added significant gains in London, portraying a cheerful market mood. US equities are attracting significant bets on hopes that the Federal Reserve (Fed) would skip hiking interest rates on Wednesday.
Former President of Boston Fed Bank, Eric Rosengren, tweeted early Monday that “Those projections are likely to show a hawkish dot plot reflecting still sticky inflation and tighter labor markets - tighter than many had previously expected.”
The US Dollar Index (DXY) has reported a mild correction from 103.70 as investors are preparing for Tuesday’s inflation data. Headline US inflation is expected to decelerate sharply as oil prices have corrected dramatically. While core CPI that strips off oil and food prices is expected to remain persistent.
No doubt, US labor market conditions have started easing now and the economy has also loosened its resilience. In spite, the Fed could raise interest rates to improve conviction that inflation should reach 2%.
Meanwhile, the Swiss Franc is expected to show some strength as the Swiss National Bank (SNB) is expected to raise interest rates further. SNB Chairman Thomas J. Jordan believes that the central bank should not wait for increasing inflation but should act now by raising interest rates as the impact of higher interest rates would be lower than of stubborn inflation.
Once 0.6755 is cleared, AUD/USD could head towards the 0.6800 region in the near term, suggest UOB Group’s Markets Strategist Quek Ser Leang and Senior FX Strategist Peter Chia.
Key Quotes
24-hour view: Last Friday, we expected AUD to rise further. However, we noted that “the chance of it breaking above 0.6755 today is not high”. Our view turned out to be correct as AUD rose to a high of 0.6751. Today, there is a chance for AUD to break 0.6755 but it is highly unlikely to have enough momentum to challenge the next resistance at 0.6800 (minor resistance is at 0.6780). Support is at 0.6720, followed by 0.6700.
Next 1-3 weeks: Last Thursday (08 Jun, spot at 0.6660), we highlighted that AUD could rise further but any advance is expected to encounter solid resistance at 0.6755. After AUD rose, we stated last Friday (09 Jun, spot at 0.6710) that “the chance of AUD breaking above 0.6755 has increased”. We continue to hold the same view. A break of 0.6755 will shift the focus to 0.6800. On the downside, a breach of 0.6670 (‘strong support’ level was at 0.6645 last Friday) would indicate that AUD is not advancing further.
Considering advanced prints from CME Group for crude oil futures markets, open interest went down for the third session in a row on Friday, this time by around 22.3K contracts. In the same line, volume reversed the previous daily build and dropped by nearly 40K contracts.
WTI: Next support emerges near $67.00
Prices of WTI dropped for the second consecutive session on Friday. The downtick came amidst shrinking open interest and volume and removes strength for a sustained decline for the time being. In the meantime, the next support of note is expected around the late May low near the $67.00 mark per barrel.
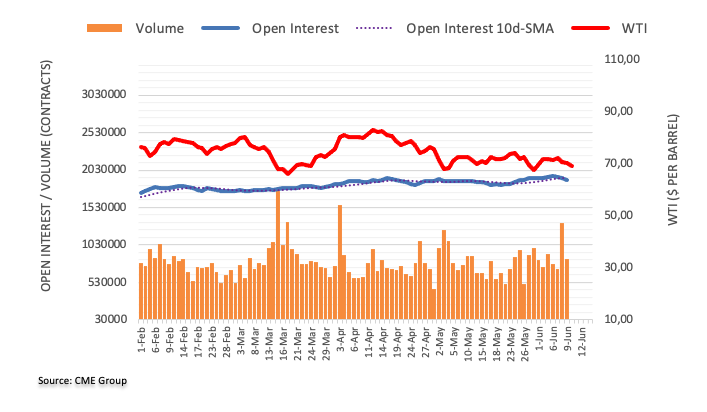
- GBP/JPY sticks to mild gains at the highest levels since January 2016.
- Mixed concerns about the UK’s growth fail to tease sellers as BoJ officials keep defending easy money policy.
- Bond markets portray heavy selling pressure ahead of the key central bank decision.
- Downbeat Japan PPI adds strength to bullish bias ahead of UK employment data, BoJ monetary policy meeting.
GBP/JPY remains on the front foot for the fourth consecutive day as bulls prod the highest levels since early 2016 amid the initial hours of Monday’s European session. In doing so, the cross-currency pair prints mild gains to justify the market’s acceptance of the monetary policy divergence between the Bank of England (BoE) and the Bank of Japan (BoJ). Adding strength to the upside momentum are the firmer bond yields preparations for this week’s top-tier data/events.
Hawkish concerns about the BoE fail to justify the latest comments from the policymakers as BoE’s Catherine Mann said earlier in the day that the UK government needs long-term agenda to defend the growth prospects. However, the UK’s Confederation of British Industry (CBI) trade body said on Monday that Britain's economy now looks likely to sidestep recession entirely this year but deep-rooted problems like weak business investment will persist.
The same join too high inflation in the UK compared to Japan to keep the BoE vs. BoJ divergence in favor of the GBP/JPY bulls.
On the other hand, Japan’s Producer Price Index (PPI) for May dropped for the fifth consecutive month to 5.1% YoY from 5.8% previous readings and 5.5% market forecasts. That said, monthly figures also disappointed Yen traders with -0.7% MoM outcome, versus -0.2% expected and 0.2% prior. After witnessing downbeat Japan inflation data, BoJ Deputy Governor Masazumi Wakatabe rules out any change in the BoJ monetary policy during this week’s meeting as he said, “Don't expect a change from BOJ at this week's meeting.”
Elsewhere, Bloomberg cites heavy selling pressure in the Treasury bond market to favor the yields and the GBP/JPY prices. “Hedge funds extended their record selling streak of short-dated Treasuries amid bets the Federal Reserve’s fight with inflation is far from done,” said the news.
On the contrary, recent hawkish bets supporting the BoJ’s exit from the ultra-easy monetary policy seem to challenge the GBP/JPY bulls. The yields on Japanese Government Bonds (JGBs) fell on Monday as investors strengthened bets for the Bank of Japan to leave stimulus settings unchanged at its meeting this week, reported Reuters.
Moving on, Tuesday’s UK employment data will be important for the pair watchers ahead of Friday’s BoJ.
Technical analysis
A daily closing below the previous resistance line stretched from early May, around 175.20 by the press time, becomes necessary for the GBP/JPY pair’s short-term pullback. Even so, the late 2022 peak of around 173.00 challenges the sellers.
Meanwhile, the 180.00 round figure and September 2015 low near 180.30 appear to restrict the cross-currency pair’s upside moves.
- GBP/USD is looking to come out of the woods for a break towards 1.2600 amid a mild correction in the USD Index.
- Overall market sentiment is quite positive as a pause in the policy-tightening spell by Fed is easing fears of a US recession.
- The speech from BoE Bailey is likely to provide cues about the likely monetary policy action.
The GBP/USD pair has turned sideways around 1.2580 after an upside move in the early London session. The Cable is making efforts for resuming its upside journey and recapture the round-level resistance of 1.2600 as the US Dollar Index (DXY) has shown a corrective move after facing stiff barricades around the 103.70 resistance.
S&P500 futures have added more gains in the European session as the odds of a neutral interest rate policy stance by the Federal Reserve (Fed) are skyrocketing. Overall market sentiment is quite positive as a pause in the policy-tightening spell by Fed chair Jerome Powell is easing fears of a recession in the United States. A report from Goldman Sachs shows that the possibility of a recession in the US economy has been trimmed to 25% from prior chances of 35%.
The US Dollar Index (DXY) is expected to remain on the tenterhooks ahead of the US Consumer Price Index (CPI) data, which will be announced on Tuesday. As per the estimates, monthly headline CPI is expected to accelerate by 0.3% at a slower pace than the 0.4% recorded in April. The pace in monthly core inflation is seen steady at 0.4%.
Fed chair Jerome Powell and his teammates are worried about persistence in core inflation as demand for durables and services is extremely solid. Investors should note that the US service sector contributes two-thirds of the overall Gross Domestic Product (GDP) of the US economy.
On the Pound Sterling front, investors are awaiting the release of the United Kingdom Employment data (May). As per the estimates, Claimant Count Change is seen declining by 9.6K vs. a sheer addition of 46.7K reported in April. The Unemployment Rate for three months is seen higher at 4.0% against the prior release of 3.9%.
Apart from the UK Employment data, the speech from Bank of England (BoE) Governor Andrew Bailey will be in focus. BoE Bailey is likely to provide cues about the likely monetary policy action ahead.
In the view of UOB Group’s Markets Strategist Quek Ser Leang and Senior FX Strategist Peter Chia, GBP/USD could advance further in the near term.
Key Quotes
24-hour view: We expected GBP to continue to rally last Friday but we were of the view that it “is highly unlikely to threaten the resistance at 1.2680”. We stated, “there is another resistance at 1.2600”. GBP rose less than expected to 1.2590 before trading sideways. Today, we see room for GBP to edge higher but it is still highly unlikely to threaten the resistance level at 1.2680. Minor resistance is at 1.2615. On the downside, a breach of 1.2505 (minor support is at 1.2540) would indicate that the current upward pressure has eased.
Next 1-3 weeks: There is not much to add to our update from last Friday (09 Jun, spot at 1.2555). As highlighted, while GBP is likely to rise further, it remains to be seen if it has enough momentum to revisit last month’s high near 1.2680. On the downside, a breach of 1.2450 (no change in ‘strong support’ level) would indicate that 1.2680 is not coming into view.
- NZD/USD holds steady above 0.6100, though a modest USD strength caps any further gains.
- An intraday uptick in the US bond yields lends support to the buck and acts as a headwind.
- Traders also seem reluctant ahead of the US CPI on Tuesday and the FOMC on Wednesday.
The NZD/USD pair struggles to capitalize on its gains registered over the past two trading days and oscillates in a narrow band, just above the 0.6100 mark heading into the European session on Monday.
The US Dollar (USD) edges higher for the second successive day and turns out to be a key factor that keeps the NZD/USD pair below a two-and-half-week top, around the 0.6135-0.6140 region touched on Friday. A modest uptick in the US Treasury bond yields acts as a tailwind for the Greenback. The uncertainty over the Federal Reserve's (Fed) rate-hike path, however, caps any meaningful upside for the buck and continues to lend some support to the major.
It is worth recalling that the recent dovish rhetoric by several Fed officials boosted expectations for an imminent pause in the US central bank's rate-hiking cycle. That said, surprise rate hikes by the Reserve Bank of Australia (RBA) and the Bank of Canada (BoC) last week suggested that the fight against inflation is not over. This, in turn, supports prospects for further policy tightening by the Fed and reinforces markets bets for another 25 bps lift-off in July.
Hence, the focus will remain glued to the release of the latest US consumer inflation figures on Tuesday, which will be followed by the outcome of the highly-anticipated two-day FOMC monetary policy meeting on Wednesday. Investors will look for fresh cues about the Fed's near-term policy outlook. This, in turn, will play a key role in influencing the USD price dynamics and help traders to determine the next leg of a directional move for the NZD/USD pair.
In the meantime, worries about a global economic slowdown, particularly in China, could act as a headwind for antipodean currencies, including the Kiwi, in the absence of any relevant market-moving economic releases from the US. Apart from this, the Reserve Bank of New Zealand's (RBNZ) explicit signal that it was done with its most aggressive hiking cycle since 1999 warrants some caution before positioning for any further appreciating move for the NZD/USD pair.
Technical levels to watch
- WTI takes offers to refresh intraday low, down for the third consecutive day in a row.
- Fears of higher Oil supply, back of demand join US Dollar rebound to please bears.
- Sustained trading below the key moving averages, mostly steady RSI suggest further downside of energy benchmark.
- Bulls remain cautious below $83.40; $64.30 can prod WTI bears.
WTI renews its intraday low around $69.50 as it drops for the third consecutive day heading into Monday’s European session. In doing so, the black gold justifies fears of oversupply and lack of energy demand amid the sluggish market conditions.
Also read: WTI bears attack $70.00 as Oil producers, major economics shake demand-supply matrix
That said, the steady RSI (14) line and the black gold’s inability to cross the 50-DMA, as well as the 200-DMA, keeps the energy benchmark on the bear’s radar.
Even so, a 1.5-month-old symmetrical triangle restricts immediate Oil moves between $73.00 and $68.30.
Should the quote breaks the triangle formation towards the south, the double bottoms around $64.30, appear a tough nut to crack for the Oil sellers to crack before retaking control.
On the flip side, a clear run-up beyond the stated triangle’s top line, currently around $73.00, could challenge the 50-DMA hurdle of $74.55.
Following that, the 200-DMA level surrounding $78.50 and the $80.00 round figure can challenge WTI bulls.
It’s worth noting, however, that a broad resistance area comprising multiple levels marked since early December 2022, between $83.40 and $82.60, could challenge the black gold’s further upside past $80.00.
WTI crude oil: Daily chart

Trend: Limited downside expected
- USD/JPY is consolidating above 139.00 as Fed/BoJ policy comes into the picture.
- Market sentiment is quite positive as the odds of a neutral policy stance by the Fed are extremely solid.
- The interest rate policy by the BoJ is expected to remain unaltered as more monetary stimulus is required to keep inflation steadily above 2%.
The USD/JPY pair is oscillating in a narrow range around 139.50 in the late Asian session. The asset is expected to remain on tenterhooks as investors have shifted their focus toward the United States Consumer Price Index (CPI) data, which will release on Tuesday.
S&P500 futures have added significant gains in Asia, portraying a strong addition to the risk appetite of the market participants. Market sentiment is quite positive as the odds for the interest rate decision by the Federal Reserve (Fed) are more tilted toward a neutral policy stance.
The US Dollar Index (DXY) has shown a mild correction to near 103.60 after a decent rally. A sideways performance is widely anticipated from the USD Index as the release of the US CPI is going to provide further guidance. The US Treasury yields are also choppy ahead of the inflation data. The yields offered on 10-year US Treasury bonds have climbed above 3.76%.
As per the preliminary report, headline inflation is seen softening to 4.2R% vs. the prior release of 4.9% on an annualized basis. It seems that lower oil prices have decelerated the pace of overall inflation. While core CPI that excludes the impact of oil and food prices is expected to accelerate marginally to 5.6% from the former release of 5.5%.
Scrutiny of the US preliminary inflation report shows that households’ demand for durables and services is consistently rising, which would keep pressure on Fed policymakers for hawkish guidance.
Meanwhile, the Japanese Yen will also remain in the spotlight ahead of the interest rate decision by the Bank of Japan (BoJ). The interest rate policy by BoJ Governor Kazuo Ueda is expected to remain unaltered as more monetary stimulus is required to keep inflation steadily above 2%.
Open interest in gold futures markets shrank by just 702 contracts on Friday according to preliminary readings from CME Group. Volume followed suit and dropped by around 64.3K contracts after two consecutive daily builds.
Gold: Further consolidation remains on the cards
Friday’s small downtick in gold prices was on the back of diminishing open interest and volume. That said, extra decline appears unlikely for the time being, leaving the yellow metal exposed to the continuation of the current consolidative fashion. Against that, the metal appears decently supported around the $1930 region per ounce troy so far.
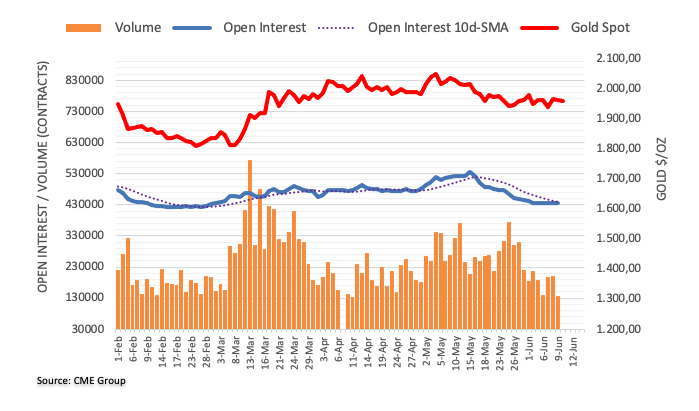
- EUR/USD attracts some buying and stalls its retracement slide from over a two-week high.
- A modest USD strength caps the upside in the absence of any relevant fundamental trigger.
- Traders also seem reluctant ahead of the US CPI on Tuesday and the FOMC on Wednesday.
The EUR/USD pair recovers a few pips from the Asian session low and for now, seems to have stalled its retracement slide from over a two-week high touched on Friday. Spot prices currently trade just below mid-1.0700s, nearly unchanged for the day, as traders seem reluctant to place aggressive bets on the first day of a crucial week.
The latest US consumer inflation figures are due for release on Tuesday and will be followed by the highly anticipated FOMC monetary policy decision on Wednesday. The key data/event will provide more cues on the Federal Reserve's near-term policy outlook, which, in turn, will determine the next leg of a directional move for the US Dollar (USD) and provide some meaningful impetus to the EUR/USD pair.
In the meantime, a modest uptick in the US Treasury bond yields assists the USD to build on Friday's bounce from its lowest level since May 24. That said, the uncertainty over the Fed's rate-hike path is holding back the USD bulls from positioning from any further appreciating move. This, along with rising bets for additional rate hikes by the European Central Bank (ECB), continues to lend support to the EUR/USD pair.
It is worth recalling that the recent dovish rhetoric by a slew of Fed officials reaffirmed market expectations for an imminent pause in the US central bank's year-long policy tightening cycle. That said, surprise rate hikes by the Reserve Bank of Australia (RBA) and the Bank of Canada (BoC) last week suggest that the fight against inflation is not over yet, supporting prospects for further tightening by the Fed.
In fact, Fed fund futures indicate that markets have been pricing in the possibility of another 25 bps lift-off at the July FOMC meeting and a stronger US CPI print this week will reaffirm bets. In the meanwhile, the aforementioned fundamental backdrop warrants some caution before positioning for a firm intraday direction in the absence of any relevant market-moving economic releases, either from the Eurozone or the US.
Technical levels to watch
- EUR/GBP licks its wounds at the lowest levels since August 2022, recently bouncing off multi-day low.
- Mixed concerns about UK’s growth recently triggered pair’s rebound but ECB vs. BoE bias keeps sellers hopeful.
- British employment, BoE Quarterly Bulletin can entertain traders.
- Major attention will be on how ECB manages to tame inflation amid recession woes.
EUR/GBP remains on the back foot at the lowest level since August 2022, despite recently paring intraday losses near 0.8545 heading into Monday’s London open. In doing so, the cross-currency pair justifies comparatively downbeat economic concerns about the Eurozone more than the UK. However, the cautious mood ahead of this week’s top-tier UK data and the European Central Bank (ECB) Monetary Policy Meeting allows bears to take a breather.
Earlier in the day, Bank of England (BoE) policymaker Catherine Mann said the UK government needs long-term agenda to defend the growth prospects. However, the UK’s Confederation of British Industry (CBI) trade body said on Monday that Britain's economy now looks likely to sidestep recession entirely this year but deep-rooted problems like weak business investment will persist.
On a different page, growth numbers from the Eurozone and Germany, as well as final readings of the inflation catalysts, haven’t been impressive to justify the ECB policymakers’ hawkish bias. That said, concerns about the economic slowdown in the old continent unearth after the recently downbeat statistics, which in turn suggests that the ECB might not be able to increase the rates past this week’s 0.25% rate hike.
Alternatively, the UK’s inflation problems are way more complex and the price pressure is too high in London than in Brussels, which in turn pushes the ECB versus BoE divergence in favor of the EUR/GBP bears.
Looking ahead, there prevails no major data/event on Monday and hence the EUR/GBP may remain depressed near the multi-month low. However, Tuesday’s UK employment data will be important for the pair watchers ahead of Thursday’s ECB decision. While the upbeat UK jobs report may allow the pair sellers to remain happy, any surprises need validation from the ECB to recall the bulls.
Technical analysis
Although the oversold RSI (14) line challenges EUR/GBP bears, the pair’s recovery needs validation from the short-term falling wedge bullish chart formation’s top line, currently around 0.8595.
UOB Group’s Markets Strategist Quek Ser Leang and Senior FX Strategist Peter Chia note the upside bias in EUR/USD seems to be picking up pace.
Key Quotes
24-hour view: We highlighted last Friday that “further EUR strength is not ruled out”. We added, “support is at 1.0760, a break of 1.0740 would suggest the current upward pressure has faded”. EUR rose to 1.0785 and then dropped to a low of 1.0741. The price actions are likely part of a consolidation and EUR is likely to trade between 1.0730 and 1.0775 today.
Next 1-3 weeks: Last Friday (09 Jun, spot at 1.0780), we noted that “upward momentum is building tentatively and it is not clear for now if EUR has enough momentum to rise to 1.0850”. EUR fell to a low of 1,0741 in NY trade. We continue to hold the same view but a clear breach of 1.0730 (no change in ‘strong support’ level) would indicate that EUR is not ready to move to 1.0850.
- EUR/JPY is oscillating in a narrow range below 150.00 as ECB/ BoJ policy has come under the spotlight.
- ECB Lagarde would raise rates to 4% despite galloping signs of a recession in the Eurozone.
- The BoJ might let the monetary policy unchanged as inflation is need to remain above 2% steadily.
The EUR/JPY pair is displaying a back-and-forth action below the psychological resistance of 150.00 in the early European session. The cross is struggling to find directions as investors have been sidelined ahead of the interest rate decision by the European Central Bank (ECB) and the Bank of Japan (BoJ), which will be announced this week.
An interest rate hike of 25 basis points (bps) by the ECB to 4% is widely anticipated by the market participants despite deepening signs of recession in the Eurozone. The final reading of Q1 Gross Domestic Product (GDP) contracted by 0.1%. Investors should note that factory activities in the shared continent are constantly declining, which bolsters the odds of further contraction in GDP figures.
Investors should note that the German economy has already registered a recession after reporting two consecutive quarters of contraction.
However, ECB President Christine Lagarde has no other option than to raise interest rates further despite fears of recession. The inflation rate in Eurozone is at 6.1%, which is three times more than the desired rate. Also, severe persistence in core inflation advocates the need for more interest rates.
On the Japanese Yen front, investors are hoping that the Bank of Japan (BoJ) will not make any adjustments in the current ultra-dovish stance. BoJ Governor Kazuo Ueda has made clear that achievement of stable inflation above 2% is highly required, which could be achieved by pushing wages higher bolstering the overall demand.
Investors should be aware that the majority of inflation in Japan is being contributed by higher import prices, which is ineffective to keep inflation comfortable above 2%.
Meanwhile, BoJ policymaker Masazumi Wakatabe said in a Bloomberg TV interview early Monday, “The communication would be very interesting” at the upcoming policy meeting this Friday. He further added, “It’s still too early to call that this inflation has been sustainable and stable.”
- USD/MXN fades bounce off the lowest level since May 2016.
- Fortnight-old support line, oversold RSI (14) line challenge Mexican Peso buyers.
- 50-SMA restricts short-term USD/MXN upside ahead of the key 200-SMA hurdle.
- Multiple support lines, year 2016 bottom stand tall to challenge pair sellers.
USD/MXN consolidates the biggest daily loss in nearly two weeks at the lowest levels since May 2016 heading into Monday’s European session. In doing so, the Mexican Peso (MXN) pair traces the market’s cautious mood, as well as positioning for the US inflation and Federal Reserve (Fed) monetary policy decision.
Technically, the USD/MXN pair struggle to defend the previous day’s bounce off a downward-sloping support line from May 29 amid oversold RSI (14).
Not only the oversold RSI conditions and the short-term support line, around 17.23 by the press time, but a three-month-old descending trend line, close to 17.21 at the latest, also challenge the USD/MXN bears.
It’s worth noting that a falling support line from early April, close to 17.06, precedes the year 2016 bottom of around 17.05 and the 17.00 round figure to challenge the Mexican Peso pair’s further declines.
On the contrary, the 50-SMA level of around 17.47 restricts the immediate upside of the USD/MXN pair ahead of the 200-SMA hurdle of 17.69.
In a case where the USD/MXN bulls manage to keep the reins past 17.69, as well as cross the 17.70 round figure, the corrective bounce may aim for the late May peak of around 17.99.
USD/MXN: Four-hour chart
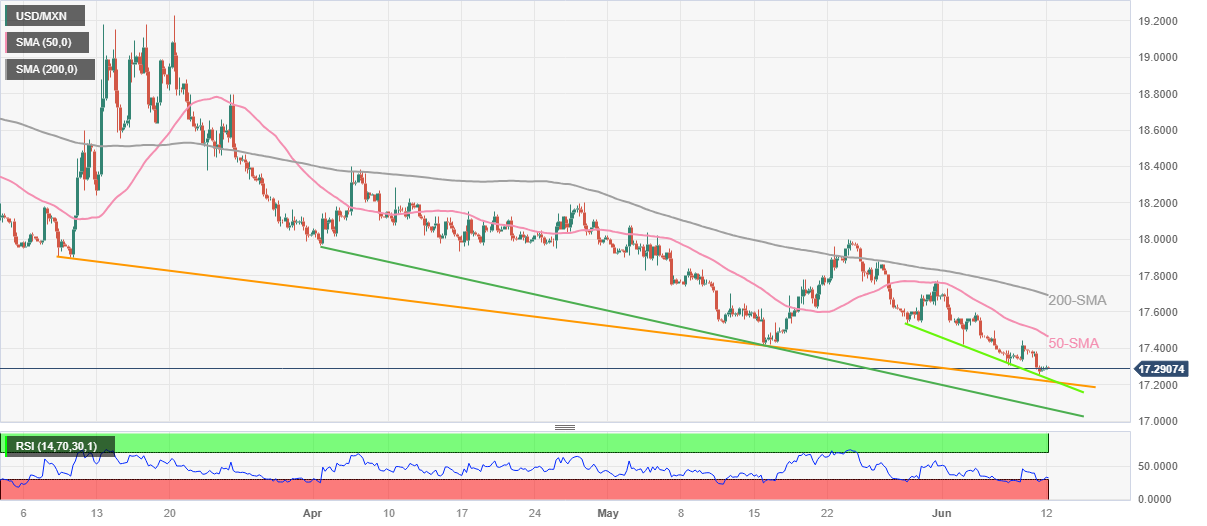
Trend: Limited downside expected
- USD/CAD is gathering strength for a fresh upside move above 1.3360 as the focus shifts to US CPI and Fed policy.
- The US Dollar Index (DXY) has deliberating reached to near 103.70 as investors are divided about Fed’s policy decision.
- USD/CAD has witnessed decent buying interest after testing the demand zone plotted in a narrow range of 1.3300-1.3315.
The USD/CAD pair is gathering strength for a fresh rally around 1.3350 ahead of the release of the United States Consumer Price Index (CPI) and the interest rate decision by the Federal Reserve (Fed). The Loonie asset is expected to remain in the bullish trajectory as anxiety among investors is deepening due to critical economic events.
S&P500 futures have posted decent gains in the Asian session. US equities remained choppy on Friday but managed to settle on a positive note. The overall market sentiment is risk-on, however, mild caution cannot be ruled out.
The US Dollar Index (DXY) has deliberating reached to near 103.70 as investors are divided about Fed’s policy decision. No doubt, United States labor market conditions are easing, the current inflation rate is more than twice the desired rate.
USD/CAD has witnessed decent buying interest after testing the demand zone plotted in a narrow range of 1.3300-1.3315 on a four-hour scale. The 20-period Exponential Moving Average (EMA) at 1.3363 is still acting as a barricade for the US Dollar bulls. Horizontal resistance is plotted around June 05 high at 1.3462.
The Relative Strength Index (RSI) (14) has tried to ditch the bearish range of 20.00-40.00 and enter into the 40.00-60.00 range, indicating an attempt of a bullish reversal.
Should the asset break above June 08 high at 1.3388, US Dollar bulls will drive the asset toward June 05 high at 1.3462 and the psychological resistance at 1.3500.
On the flip side, a breakdown below the round-levels support of 1.3300 will expose the Loonie asset to a fresh four-month low around 1.3274 followed by 15 November 2022 low at 1.3226.
USD/CAD four-hour chart
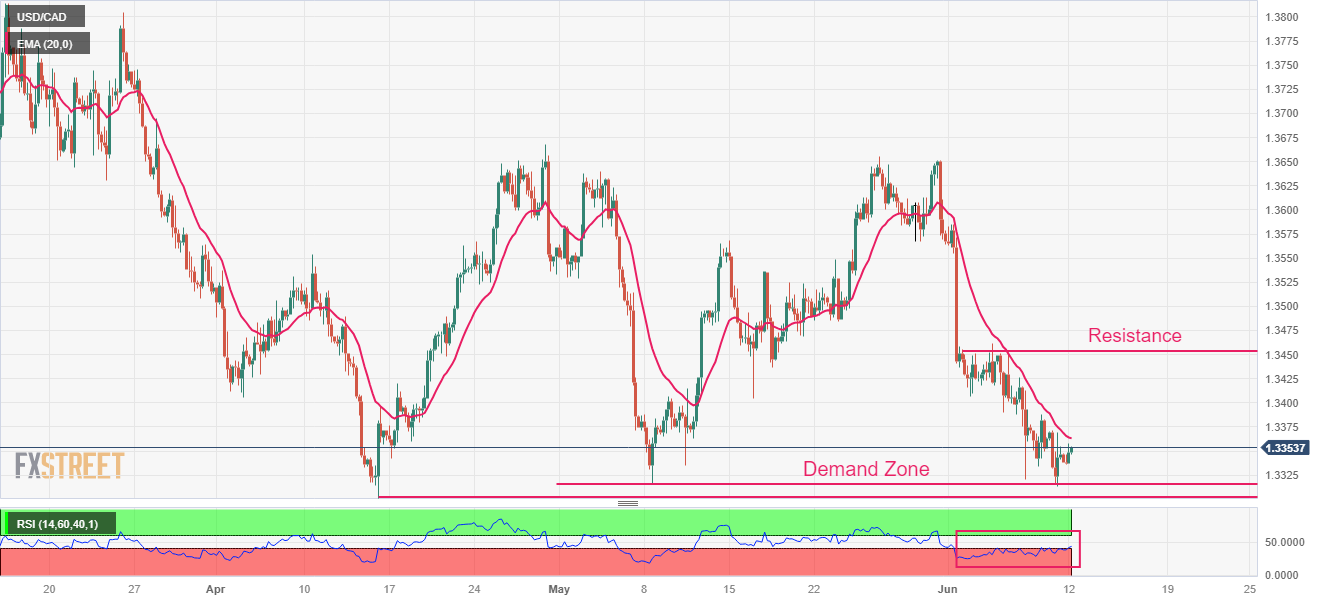
- USD/TRY refreshes all-time high amid two-day winning streak, grinds near the top of late.
- US Dollar pares recent losses as traders reassess Fed bets ahead of US inflation.
- Cautious mood, pre-event positioning also favor greenback buyers amid sluggish start to the key week.
- Preparations for more rate hikes from newly appointed CBRT Governor, geopolitical tension in Turkiye also justify Turkish lira’s latest fall.
USD/TRY stays on the front foot at the all-time high of around 24.00 as markets brace for this week’s central bank decisions and top-tier data during early Monday. That said, the Turkish Lira (TRY) pair refreshed the record high to 23.95 amid the US Dollar’s broad run-up before retreating to 23.62 heading into the European session.
That said, the Turkish Lira (TRY) pair previously ignored the appointment of a new Governor for the Governor of the Central Bank of the Republic of Türkiye (CBRT). The reason could be linked to the US Dollar’s broad rebound, as well as the TRY trader’s positioning for the rate hikes.
In the last week, Turkish President Erdogan appointed Hafize Gaye Erkan, a finance executive in the US to lead the CBRT while trying to reverse the course of previous rate cuts and battle with the heavy inflation at home. Additionally, news of a blast in a factory in the Turkish capital Ankara and the seizing of $1 billion of counterfeit Turkish money in Istanbul seem to also weigh on the TRY.
It should be noted that the markets remain dicey as traders await the US inflation data and the Federal Reserve (Fed) Interest Rate Decision. That said, Turkish Unemployment Rate and Current Account data for April can offer immediate moves.
US Dollar Index (DXY) dropped in the last two consecutive weeks, mildly bid near 103.60 at the latest, even as downbeat prints of the US activity numbers for May joined disappointing employment clues to weigh on the US Dollar. The reason could be linked to the market’s cautious mood ahead of Tuesday’s US Consumer Price Index (CPI) and concerns that the US employment and inflation conditions aren’t yet suitable for the rate hike pause. Recently, Former President of Boston Federal Reserve Bank, Eric Rosengren, tweeted in favor of expecting a hawkish skip this week.
That said, the latest United States Initial Jobless Claims jumped to the highest levels since September 2021 whereas the US ISM Services PMI, S&P Global PMIs and Factory Orders also printed softer outcomes for May and pushed back the Fed hawks, which in turn weighed the US Dollar.
While portraying the mood, the US Treasury bond yields grind higher and allow the US Dollar to lick its wounds even as Wall Street and S&P500 Futures prod greenback bulls by printing upbeat outcomes.
Technical analysis
Unless declining below the latest bottom surrounding 23.00, the USD/TRY pair remains on the way to refreshing the record top. That said, the 25.00 round figure gains immediate attention.
- Gold Price remains pressured below short-term key resistances as key data, events loom.
- Doubts about dovish Fed verdict, US Dollar consolidation exert downside pressure on XAU/USD.
- Light calendar may allow Gold buyers to take a breather after two-week dominance, US inflation appears crucial for clear directions.
Gold Price (XAU/USD) pares intraday losses, after posting a two-week uptrend, as the key week comprising the top-tier central bank announcements and US inflation data loom. That said, the market’s cautious optimism fails to keep pressuring the US Dollar amid reassessment of the previous dovish bias about the Federal Reserve (Fed).
Furthermore, hopes of witnessing no rate change from China, Japan and a pause in the US Treasury bond yields prod the Gold buyers as they look to the US inflation data for confirming a no rate hike consensus from the Fed. That said, CME’s FedWatch Tool suggests a nearly 70% chance of the US central bank’s no change to the benchmark rate.
Looking ahead, Tuesday’s US Core Consumer Price Index (CPI) will be the key to determining near-term Gold Price moves as markets do expect a pause in the Fed’s hawkish trajectory even as the inflation fears loom.
Also read: Gold Price Forecast: XAU/USD appears vulnerable below 21 DMA ahead of key event risks
Gold Price: Key levels to watch
Our Technical Confluence Indicator suggests that the Gold Price edges lower past the $1,960 key resistance comprising Fibonacci 23.6% in one-day and the middle band of the Bollinger on the hourly play.
Also acting as the immediate upside hurdle is the convergence of 10-DMA and 5-DMA, around $1,958.
It should be noted, however, that the Fibonacci 61.8% in the one-day and 23.6% in the one-month, near $1,970, appears a short-term key resistance for the Gold buyers to cross.
Meanwhile, the 10-DMA joins the Pivot Point one-week S1 to highlight short-term support around $1,941, a break of which could make the Gold Price vulnerable to challenging the yearly low marked in March around $1,932.
In a case where the Gold Price remains bearish past $1,932, the odds of witnessing a fresh fall toward the $1,900 round figure can’t be ruled out.
Here is how it looks on the tool
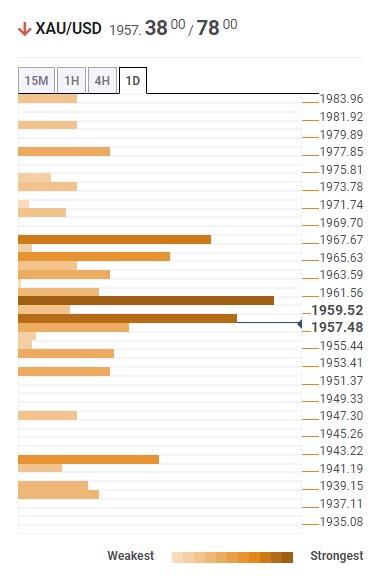
About Technical Confluences Detector
The TCD (Technical Confluences Detector) is a tool to locate and point out those price levels where there is a congestion of indicators, moving averages, Fibonacci levels, Pivot Points, etc. If you are a short-term trader, you will find entry points for counter-trend strategies and hunt a few points at a time. If you are a medium-to-long-term trader, this tool will allow you to know in advance the price levels where a medium-to-long-term trend may stop and rest, where to unwind positions, or where to increase your position size.
Bank of Japan (BoJ) policymaker Masazumi Wakatabe said in a Bloomberg TV interview early Monday, “the communication would be very interesting” at the upcoming policy meeting this Friday.
Key quotes
“It’s still too early to call that this inflation has been sustainable and stable.”
“My guess is that at the June meeting, there will be nothing.”
“There are the overwhelming cases for the continuation of this policy,”
“But, of course down the road, they may want to change some sort of particularities. Then the question is how do they communicate to change these two things, the strategy part and the tool part. The communication would be very interesting.”
- AUD/USD consolidates its recent strong gains to a one-month top touched on Friday.
- Worries about the slowing global economy and modest USD strength cap the major.
- The RBA’s hawkish outlook acts as a tailwind ahead of this week’s data/event risks.
The AUD/USD pair enters a bullish consolidation phase on the first day of a new week and oscillates in a narrow trading band, just below mid-0.6700s or a one-month high touched on Friday. Bulls still await a sustained strength beyond the 100-day Simple Moving Average (SMA) before placing fresh bets and positioning for an extension of the recent upward trajectory witnessed since the beginning of the current month.
The Reserve Bank of Australia's (RBA) surprise 25 bps rate hike last week and a more hawkish policy statement continue to underpin the Australian Dollar (AUD). In fact, RBA Governor Lowe on Wednesday defended the move to lift the benchmark rates above 4% for the first time in nearly 12 years and reiterated that interest rates may need to rise further in order to curb overheated inflation. This, in turn, acts as a tailwind for the AUD/USD pair, though a combination of factors is holding back bulls from placing aggressive bets and capping the upside, at least for the time being.
Growing worries about a global economic downturn, particularly in China, assists the safe-haven US Dollar (USD) to gain some follow-through positive traction for the second straight day and caps gains for the China-proxy Aussie. Any further USD move up, meanwhile, seems limited in the wake of the uncertainty over the Federal Reserve's (Fed) next policy move. In fact, the recent dovish rhetoric by Fed officials reaffirmed expectations for an imminent pause in the US central bank's policy tightening cycle. The markets, however, are still pricing in the possibility of another 25 bps lift-off in July.
Hence, the focus will remain glued to the outcome of the highly-anticipated two-day FOMC monetary policy meeting, scheduled to be announced on Wednesday. Investors will look for fresh clues about the Fed's near-term policy outlook, which will play a key role in influencing the USD price dynamics and determine the next leg of a directional move for the AUD/USD pair. Heading into the key central bank event risk, the release of the US consumer inflation figures on Tuesday should infuse some volatility in the markets and produce short-term trading opportunities around the major.
Technical levels to watch
- Asia-Pacific shares grind near one-month highs amid cautious mood.
- Softer Japan inflation, hopes of no PBOC rate hike underpin mildly positive risk appetite.
- Holidays in Australia, light calendar elsewhere join pre-Fed anxiety to limit market moves.
Asia-Pacific markets aptly portray the pre-data anxiety as it kick-starts the key week on a softer footing despite refreshing monthly highs earlier in the day. That said, the holiday in Australia and the light calendar can also be held responsible to restrict the trading volatility as multiple central banks stay ready to rock the markets.
Against this backdrop, MSCI’s index of Asia-Pacific shares outside Japan prints mild losses after rising to nearly a five-week high earlier in the day whereas Japan’s Nikkei 225 rises 0.40% intraday to 32,370 by the press time of early Monday morning.
It’s worth noting that Japan’s Producer Price Index (PPI) for May dropped for the fifth consecutive month while Bank of Japan (BoJ) Deputy Governor Masazumi Wakatabe ruled out any change in the BoJ monetary policy during this week’s meeting as he said, “Don't expect a change from BOJ at this week's meeting.”
Elsewhere, multiple rate cuts from several lenders in China raise expectations of no rate hike from the People’s Bank of China (PBoC). Even so, indecision about the region’s biggest economy’s transition from the Covid-led recession prods the optimists in China. The same joins the absence of traders from Australia to portray a sluggish day for the Pacific markets.
On a different page, South Korea’s KOSPI drops half a percent as Bank of Korea (BoK) Governor Rhee Chang-yong cites economic fears of the economy.
Above all, the market’s anxiety ahead of this week’s monetary policy meetings from the US Federal Reserve (Fed), European Central Bank (ECB), PBoC and BoJ keep the traders on a dicey floor even if hopes of no rate hikes tease buyers.
Amid these plays, US stock futures manage to trace Wall Street’s gains at a slower pace while the Treasury bond yields remain sidelined. Further, the US Dollar Index (DXY) licks its wounds after a two-week downtrend while prices of Gold and WTI crude oil remain depressed.
Also read: S&P 500 giving back gains into the close, Fed and US CPI eyed
- GBP/USD retreat from the highest level in a month, snaps three-day uptrend.
- UK’s economic fears join US Dollar consolidation to push back Cable buyers.
- Six-week-old horizontal resistance challenges Pound Sterling bulls amid overbought RSI.
- Sellers need validation from 200-SMA to retake control.
GBP/USD holds lower ground near the intraday bottom as it prints the first daily loss in four amid early Monday in Europe, mildly offered near 1.2570 at the latest. That said, the Cable pair rose in the last two consecutive weeks amid a broad US Dollar fall but concerns about the UK’s economic health and the market’s positioning for this week’s key data/events weigh on the Pound Sterling pair of late.
Also read: GBP/USD holds steady near multi-week top as traders await this week's key data/event risks
Technically, a horizontal area comprising multiple levels marked since late April, around 1.2580-85, joins the overbought RSI (14) line to favor the latest weakness in the Cable pair. Adding strength to the downside bias is the looming bear cross on the MACD indicator.
With this, the quote is likely to extend the latest fall towards a one-month-long horizontal support zone of around 1.2540-35. Though, the 200-SMA level surrounding 1.2480 could challenge the GBP/USD bears afterward.
In a case where the Pound Sterling pair remains weak past 1.2535, the odds of witnessing a slump toward the previous monthly low of around 1.2310 can’t be ruled out.
Meanwhile, a successful upside break of the aforementioned horizontal resistance area near 1.2580-85 needs validation from the 1.2600 round figure to convince GBP/USD bulls.
Following that, a run-up to cross the previous monthly high of 1.2680 can be expected without hesitation.
GBP/USD: Four-hour chart
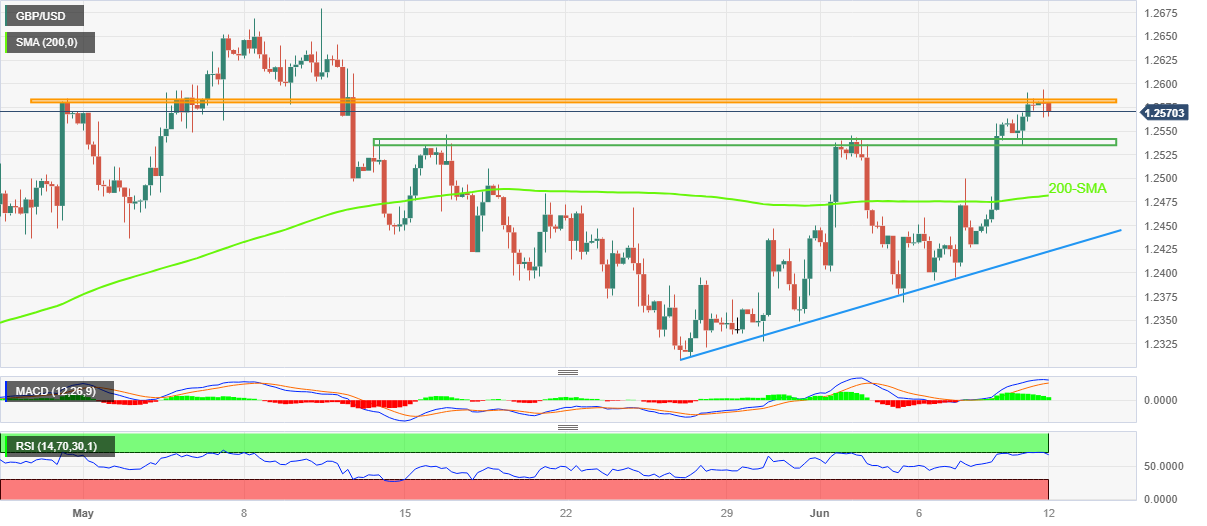
Trend: Pullback expected
- USD/JPY scales higher for the second straight day, though the upside potential seems limited.
- Expectations that the BoJ will stick to its dovish stance weigh on the JPY and act as a tailwind.
- A modest USD strength further lends support and contributes to the modest intraday uptick.
- Traders might refrain from placing fresh bets ahead of this week’s key central bank event risks.
The USD/JPY pair gains some positive traction for the second successive day and climbs back above mid-139.00s during the Asian session on Monday.
The Japanese Yen (JPY) weakens a bit on the first day of a new week in reaction to the dismal domestic data, showing that Japan's Producer Price Index (PPI) decelerated more than anticipated, to 5.1% YoY in May from the 5.9% previous. Adding to this, the Bank of Japan Deputy Governor Masazumi Wakatabe ruled out the possibility of any change in the central bank's monetary policy stance later this week. This, along with a modest mildly positive risk tone, undermines the safe-haven JPY and acts as a tailwind for the USD/JPY pair.
The US Dollar (USD), on the other hand, builds on Friday's modest bounce from its lowest level since May 24 and gains some follow-through traction, which is seen as another factor that contributes to the bid tone surrounding the USD/JPY pair. The USD uptick, however, lacks bullish conviction as investors remain uncertain over the Federal Reserve's (Fed) rate hike path. In fact, the recent dovish rhetoric by several Fed officials reaffirmed market expectations that the US central bank is more likely to skip raising interest rates in June.
That said, surprise rate hikes by the Reserve Bank of Australia (RBA) and the Bank of Canada (BoC) last week suggested that the fight against inflation is not over yet. This, in turn, supports prospects for further policy tightening by the Fed and keeps alive hopes for another 25 bps lift-off in July. Hence, the market focus will remain glued to this week's release of the latest US consumer inflation figures on Tuesday, which will be followed by the outcome of the highly-anticipated FOMC monetary policy meeting on Wednesday.
Investors will look for fresh clues about the Fed's near-term policy outlook, which will play a key role in influencing the USD price dynamics. Apart from this, the BoJ policy meeting on Thursday should assist market participants to determine the next leg of a directional move for the USD/JPY pair. In the meantime, traders might refrain from placing aggressive bets in the absence of any relevant market-moving economic releases from the US, warranting some caution before positioning for any further intraday appreciating move.
Technical levels to watch
- USD/INR clings to mild gains after two-day losing streak.
- RBI status quo, hawkish signal fail to impress Indian Rupee buyers much.
- Expectations of no rate hike from Fed in June weigh on prices but US inflation data appears crucial for clear directions.
- India CPI, Output data can entertain USD/INR traders ahead of Tuesday’s key US Core CPI.
USD/INR remains depressed while paring the losses marked in the last two consecutive days, mildly bid near 82.45 amid early Monday. In doing so, the Indian Rupee (INR) pair portrays the market’s positioning for the key data from India and the US, as well as the key Federal Reserve (Fed) monetary policy meeting announcements, amid a sluggish start of the crucial week.
That said, downbeat prices of Oil and hawkish comments from the Reserve Bank of India (RBI) joined the broad US Dollar weakness to please the USD/INR bears in the last two days. Also exerting downside pressure on the quote could be the cautious optimism in the Asia-Pacific zone.
During the last week, RBI kept its benchmark rates unchanged, as expected, but showed readiness to further tighten the monetary policy by citing inflation fears. It should be noted that India’s upbeat growth numbers allow the Asian central bank to turn hawkish despite pausing the rate hikes of late.
Elsewhere, WTI crude oil drops 1.45% to $69.30 as it bears the burden of likely more supplies and easing energy demand, due to updates from the Middle East and recession woes respectively. It should be observed that India’s heavy reliance on imported Oil makes INR vulnerable to energy price shifts.
Talking about the risk appetite, markets remain dicey as traders await the top-tier data/events amid mixed feelings. That said, hopes of easy economic recovery in China join expectations of the policy pivot at major central banks keep the USD/INR bears hopeful. While portraying the mood, the US Treasury bond yields grind higher and allow the US Dollar to lick its wounds even as Wall Street and S&P500 Futures prod greenback bulls by printing upbeat outcomes.
Looking forward, India Consumer Price Index (CPI) for May, expected to rise to 5.09% versus 4.7% prior, may recall the USD/INR pair sellers in case of the upbeat data as the RBI has been hawkish in its latest monetary policy announcement, despite keeping rates intact. Also important to watch will be Manufacturing Output, Industrial Output and Cumulative Industrial Output for May.
Above all, Tuesday’s US Core Consumer Price Index (CPI) for May becomes crucial as it will help determine the Fed’s next moves even if markets do expect no rate hike in this week’s Federal Open Market Committee (FOMC) monetary policy decision.
Technical analysis
Bearish MACD signals and steady RSI (14) line suggests further downside of the USD/INR pair towards the 50-day Exponential Moving Average (EMA) support of around 82.33. That said, the Indian Rupee (INR) pair’s recovery remains elusive unless crossing a 13-day-old resistance line, close to 82.60 at the latest.
- Silver retreats further from a nearly one-month high touched on Friday.
- The technical setup supports prospects for the emergence of dip-buying.
- A break below the $23.60-55 confluence will negate the positive outlook.
Silver extends Friday's retracement slide from the $24.50-$24.55 area, or its highest level since May 11 and continues losing ground on the first day of a new week. The steady descent drags the white metal to the 38.2% Fibonacci retracement level of the downfall witnessed in May, around the $24.00 round-figure mark during the Asian session.
The said handle represents a strong horizontal resistance breakpoint and should act as a pivotal point for intraday traders. Any subsequent fall, meanwhile, could be seen as a buying opportunity and remain limited near the $23.60-$23.55 confluence - comprising the 200-period SMA on the 4-hour chart and the 23.6% Fibo. level. Against the backdrop of positive oscillators on daily/4-hour charts, the said area should act as a strong base for the XAG/USD and limit the downside.
That said, a convincing break below the aforementioned confluence support will shift the bias in favour of bearish traders and prompt aggressive technical selling. The XAG/USD might then accelerate the fall towards the $22.00 mark and then slide further towards challenging a nearly two-month low, around the $22.70-$22.65 region touched in May. The downward trajectory could get extended further towards the next relevant support near the $22.00 round figure.
On the flip side, bullish traders might now wait for some follow-through buying beyond the $24.45-$24.50 area, or the 50% Fibo. level, before placing fresh bets and positioning for an extension of the recent rally witnessed over the past two-and-half weeks or so. The XAG/USD might then aim to reclaim the $25.00 psychological mark and climb further towards the $25.35-$25.40 intermediate hurdle. Bulls might then make a fresh attempt towards conquering the $26.00 round figure.
Silver 4-hour chart
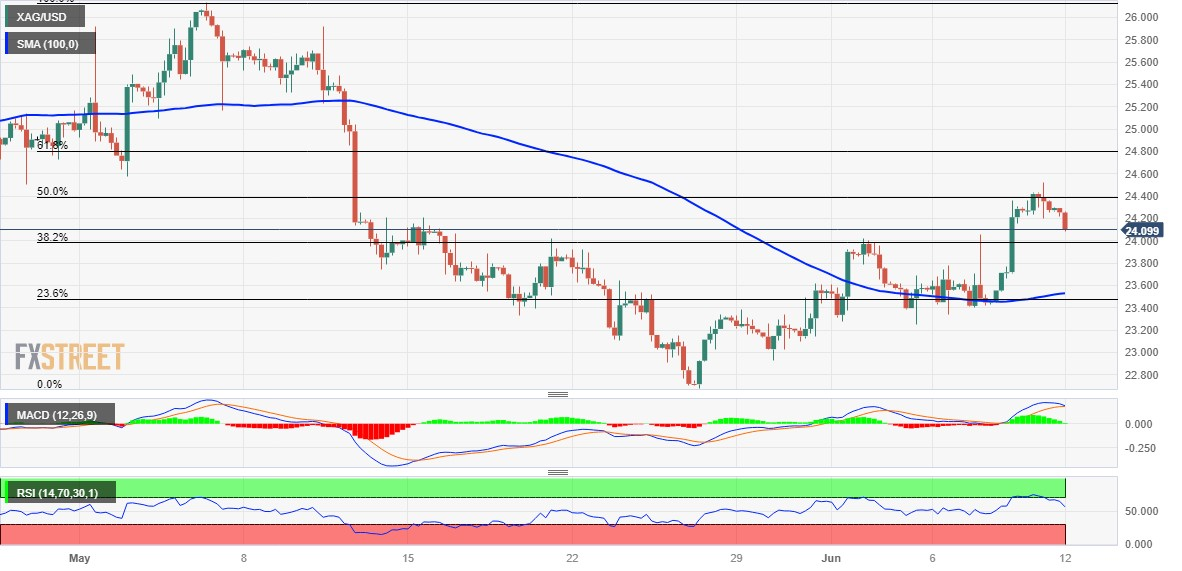
Key levels to watch
| Raw materials | Closed | Change, % |
|---|---|---|
| Silver | 24.281 | 0.04 |
| Gold | 1960.54 | -0.28 |
| Palladium | 1322.52 | -2.37 |
- USD/CNH scales higher for the second straight day and climbs to a fresh YTD top on Monday.
- The formation of an ascending channel favours bulls and supports prospects for further gains.
- A slightly overbought RSI on the daily chart might cap any further upside, for the time being.
The USD/CNH pair gains some positive traction for the second successive day and climbs to its highest level since November 2022, around the 7.1575 region during the Asian session on Monday.
The upward trajectory witnessed over the past four weeks or so has been along an ascending channel and points to a well-established bullish trend. This, along with the recent breakout through the 7.0000 psychological mark, supports prospects for a further near-term appreciating move. That said, the Relative Strength Index (RSI) on the daily chart has moved on the verge of breaking into the overbought territory and warrants some caution.
Hence, any subsequent move up is likely to confront stiff resistance and remain capped near the top end of the aforementioned trend channel, currently pegged around the 7.1765-7.1770 region. A sustained strength beyond, however, will be seen as a fresh trigger for bulls and allow the USD/CNH pair to reclaim the 7.2000 mark for the first time since November 2022.
On the flip side, any meaningful pullback seems to find decent support and attract fresh buyers near the 7.1200-7.1150 horizontal zone. This should help limit the downside for the USD/CNH pair near the trend-channel support, currently around the 7.1030 area, which is closely followed by the 7.1000 round-figure mark. A convincing break below the latter will negate the constructive setup and shift the near-term bias in favour of bearish traders.
USD/CNH 4-hour chart
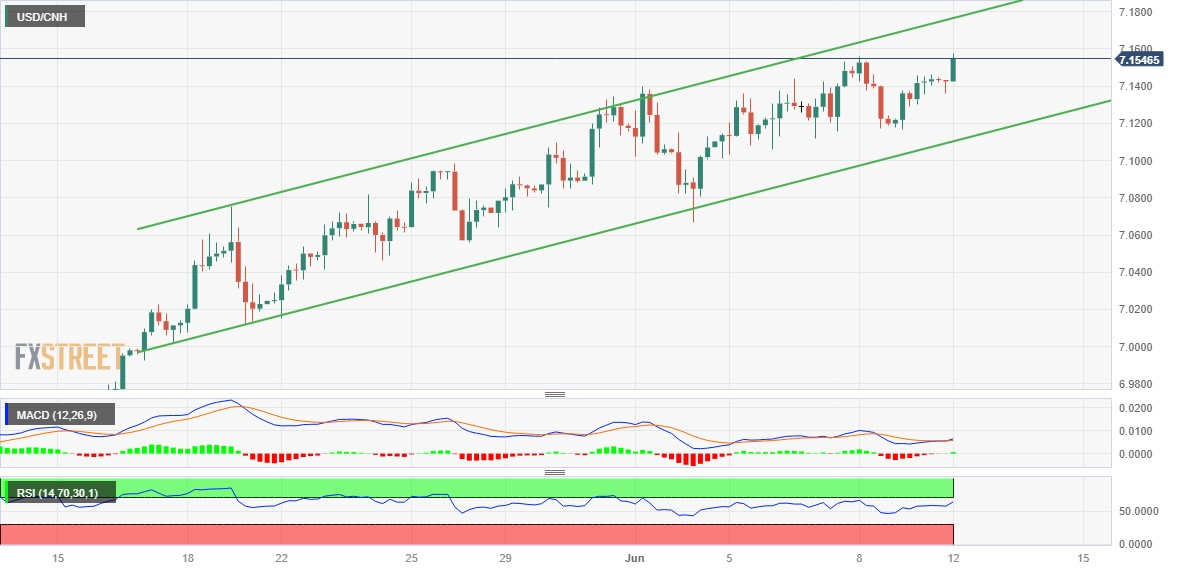
Key levels to watch
- USD/CHF picks up bids to refresh intraday high, extends bounce off three-week low.
- Looming bull cross on MACD, clear recovery from 200-SMA suggest further advances.
- Previous support line, one-week-old falling trend line prod Swiss Franc pair buyers.
USD/CHF remains on the front foot for the second consecutive day after bouncing off the key moving average in the last week, mildly bid near 0.9045 while refreshing the daily top on early Monday.
In doing so, the Swiss Franc (CHF) pair extends the previous rebound from the 200-SMA amid an impending bull cross on the MACD indicator.
Given the quote’s sustained bounce off the key moving average and upbeat MACD signals, the USD/CHF is likely to extend the latest rebound towards the previous support line stretched from early May, around 0.9080 by the press time.
However, a one-week-old ascending resistance line, near the 0.9100 round figure, challenges the pair buyers before giving them control.
In a case where the quote remains firmer past 0.9100, the odds of witnessing a rally toward the previous monthly high of around 0.9150 can’t be ruled out.
On the contrary, the 38.2% Fibonacci retracement level of the pair’s May-June upside, near 0.9020 at the latest, precedes the 0.9000 psychological magnet to restrict the short-term downside of the USD/CHF pair.
Following that, the 200-SMA and 50% Fibonacci retracement, respectively near 0.8990 and 0.8980, will be in the spotlight.
Should the USD/CHF bears dominate past 0.8980, their further ruling won’t hesitate to challenge the yearly low marked in May around 0.8820.
USD/CHF: Four-hour chart
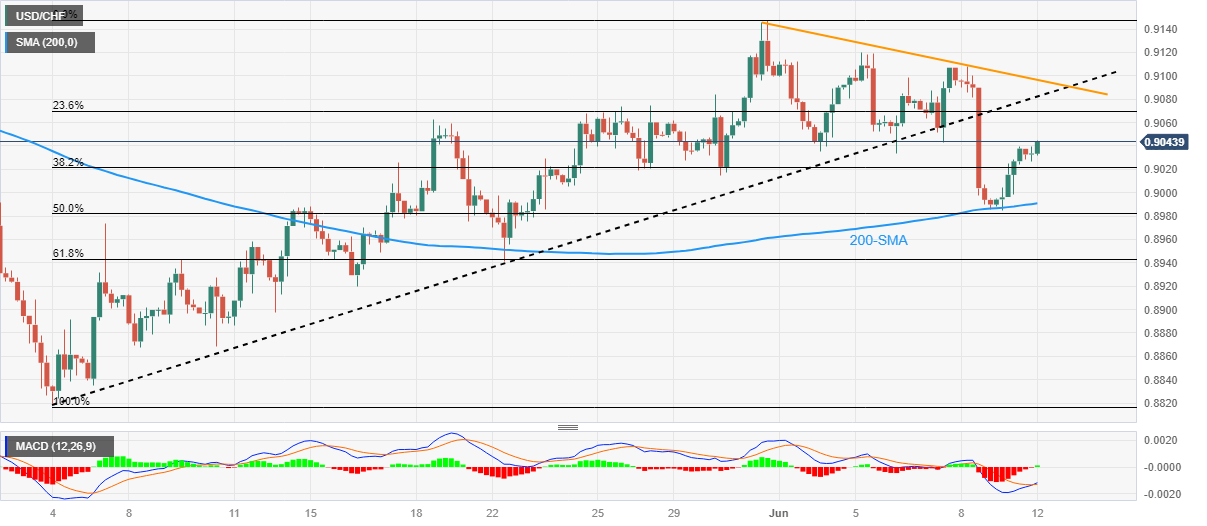
Trend: Limited upside expected
- AUD/JPY grinds near intraday high, stays firmer around the highest levels since late November 2022.
- Hawkish RBA concerns versus disappointment from Japan PPI, dovish comments from BoJ’s Wakatabe favor pair buyers.
- Yields, stock futures struggle to justify cautious optimism in the markets amid lack of major data/evens and holiday in Australia.
AUD/JPY stays defensive around 94.00 as the key week comprising multiple central bank announcements and top-tier data begins with the Aussie holidays.
Even if the pre-data anxiety and the King’s Birthday in Australia limit the cross-currency pair’s momentum, the bulls keep the reins at the highest levels since late November 2022, marked the previous day, amid divergence of the monetary policy bias surrounding the Reserve Bank of Australia (RBA) and the Bank of Japan (BoJ). Furthermore, downbeat Japan inflation clues and the BoJ officials’ dovish comments also keep the pair buyers hopeful.
Earlier in the day, Japan’s Producer Price Index (PPI) for May dropped for the fifth consecutive month to 5.1% YoY from 5.8% previous readings and 5.5% market forecasts. That said, monthly figures also disappointed Yen traders with -0.7% MoM outcome, versus -0.2% expected and 0.2% prior.
On the other hand, BoJ Deputy Governor Masazumi Wakatabe rules out any change in the BoJ monetary policy during this week’s meeting as he said, “Don't expect a change from BOJ at this week's meeting.”
It’s worth noting that the Reserve Bank of Australia’s (RBA) surprise rate hike joined the firmer China Caixin Services PMI to underpin the bullish bias about the AUD/JPY pair. Additionally, dovish comments from BoJ Governor Kazuo Ueda add strength to the AUD/JPY pair’s upside momentum.
However, the market’s lack of conviction ahead of the top-tier data/events joins the mixed signals from China to challenge the AUD/JPY pair’s upside. That said, concerns about the People’s Bank of China’s (PBoC) rate hike gains momentum of late as the Chinese central bank’s Governor Yi Gang said in a statement on Friday that China's Q2 GDP YoY growth is expected to be high mainly due to base effects. The policymaker added, “There is plenty of room for policy adjustment.”
Looking ahead, AUD/JPY pair may witness a lackluster day amid the Aussie holiday. However, Thursday’s Australia jobs report and Friday’s BoJ monetary policy announcements are the keys for the pair traders to watch. Given the dovish bias from the BoJ and expectations of upbeat Aussie data, as well as the recent hawkish surprise from the RBA, the quote may remain firmer.
Technical analysis
The overbought RSI (14) line joins multiple hurdles marked during late November 2022, around 94.10-15, to challenge the AUD/JPY buyers. The downside move, however, remains doubtful until breaking the 200-DMA support of 91.77.
- Gold price edges lower for the second successive day, albeit the downside seems cushioned.
- A positive risk tone and a modest US Dollar strength exert some pressure on the XAU/USD.
- Traders keenly await the US CPI print on Tuesday ahead of the FOMC decision on Wednesday.
Gold price kicks off the new week on a softer note and moves further away from a one-week high, around the $1,973 area touched on Friday. The XAU/USD trades just above the $1,955 level during the Asian session, albeit lacks any follow-through selling and manages to hold comfortably above the 100-day Simple Moving Average (SMA) pivotal support.
A positive risk tone and a modest US Dollar uptick weigh on Gold price
A generally positive tone around the equity markets is seen as a key factor acting as a headwind for the safe-haven Gold price. Apart from this, a modest US Dollar (USD) uptick exerts some pressure on the US Dollar-denominated commodity. Any meaningful downside, however, seems cushioned as traders might refrain from placing aggressive bets and prefer to wait on the sidelines ahead of this week's important data/central bank event risks.
Focus remains on the US CPI and the FOMC policy decision
The latest consumer inflation figures from the United States (US) are due for release on Tuesday, which will be followed by the outcome of a two-day Federal Open Market Committee (FOMC) policy meeting on Wednesday. In the meantime, the uncertainty over the Federal Reserve's (Fed) rate-hike path acts as a headwind for the USD. This, along with worries about a global economic downturn, should lend some support to the non-yielding Gold price.
Fed rate hike uncertainty could act as a tailwind for XAU/USD
The recent dovish rhetoric by several Fed officials reinforced market expectations for an imminent pause in the US central bank's rate-hiking cycle. That said, last week's surprise rate hikes by the Reserve Bank of Australia (RBA) and the Bank of Canada (BoC) suggested that the fight against inflation is not over, supporting prospects for further policy tightening by the Fed. This, in turn, keeps alive hopes for another 25 basis point (bps) lift-off in July.
Downside for Gold price seems limited
Hence, investors will look for fresh clues about the Fed's near-term policy outlook, which will play a key role in influencing the USD price dynamics and provide a fresh directional impetus to the Gold price. In the meantime, traders are more likely to wait on the sidelines in the absence of any relevant market-moving economic releases from the US on Monday. This, in turn, could further contribute to limiting losses for the XAU/USD, at least for now.
Gold price technical outlook
From a technical perspective, any subsequent slide might continue to attract fresh buyers and find decent support near the 100-day SMA, currently pegged around the $1,941 area. A convincing break below will make the Gold price vulnerable to accelerate the fall towards the $1,900 mark. Some follow-through selling will expose the very important 200-day SMA, around the $1,842 area, with some intermediate support near the $1,876-$1,875 horizontal zone.
On the flip side, Friday's swing high, around the $1,973 region, now seems to act as an immediate resistance ahead of the $1,983-$1,985 supply zone. A sustained strength beyond might trigger a short-covering move and lift Goldp rice to reclaim the $2,000 psychological mark. The XAU/USD could extend the upward trajectory and eventually climb to the next relevant hurdle near the $2,010-$2,012 region.
Key levels to watch
- EUR/USD grinds lower within bearish chart formation ahead of US inflation, Fed and ECB announcements.
- Looming bear cross on MACD, RSI retreat from overbought territory favor sellers.
- 50-SMA adds strength to 1.0720 support; Euro buyers have a bumpy road to travel.
EUR/USD takes offers to refresh intraday low as it prints mild losses near 1.0745 while extending the previous day’s fall amid early Monday. In doing so, the major currency pair drops with a one-week-old rising wedge bearish chart formation after snapping a four-week downtrend in the last.
Also read: EUR/USD grinds near mid-1.0700s as Fed vs. ECB play gains attention
It’s worth noting that an impending bear cross on the MACD indicator and the RSI (14) line’s U-turn from the overbought territory, towards the 50.0 levels of late, add strength to the Euro pair’s downside bias.
However, a convergence of the 50-SMA and the aforementioned rising wedge’s bottom line, close to 1.0720, appears a tough nut to crack for the EUR/USD bears to crack.
Following that, the previous weekly low of around 1.0670 may act as an intermediate halt before directing the bears toward the yearly low marked in May surrounding 1.0635.
It should be observed that the rising wedge’s confirmation ultimately directs the Euro bears toward the theoretical target of around 1.0570.
Alternatively, EUR/USD recovery needs to defy the rising wedge bearish chart pattern by crossing the 1.0790 hurdle, quickly followed by the 1.0800 psychological resistance, to convince the Euro buyers.
Even so, multiple stops marked in late May around 1.0830 and 1.0845-50 can challenge the Euro pair buyers before giving them control.
EUR/USD: Four-hour chart
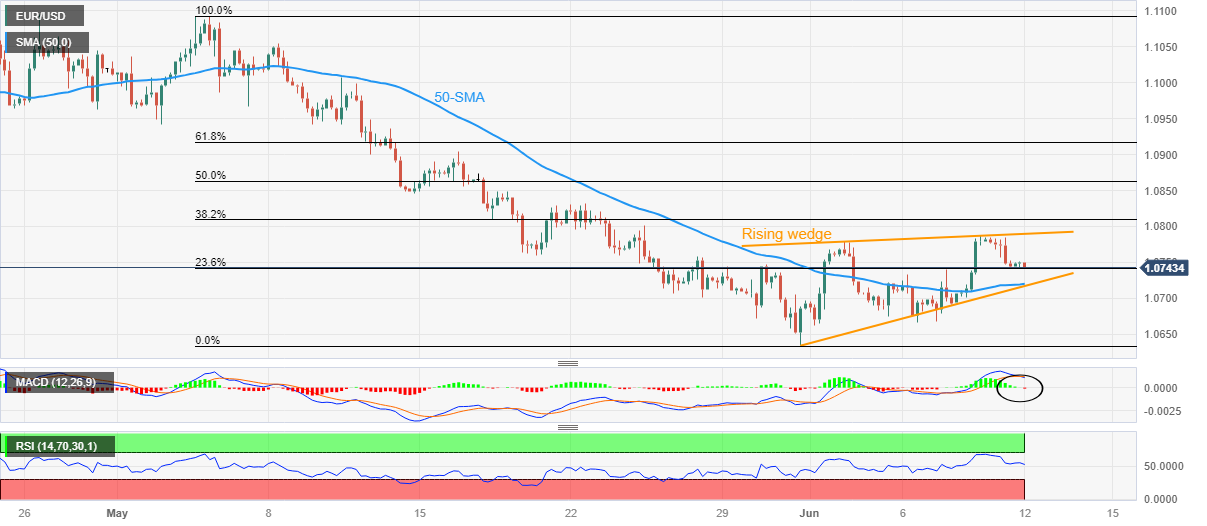
Trend: Further downside expected
Former President of Bosteon Federal Reserve Bank, Eric Rosengren, tweeted early Monday, sharing his view on the upcoming Fed interest rates decision.
Key quotes
“Expect a hawkish skip this week.”
“FOMC participants will be providing their summary of economic projections.”
“Those projections are likely to show a hawkish dot plot reflecting still sticky inflation and tighter labor markets - tighter than many had previously expected.”
Market reaction
The US Dollar Index is consolidating the previous rebound at around 103.60, adding 0.04% on the day.
On Monday, the People’s Bank of China (PBOC) set the USD/CNY central rate at 7.1212, compared with Friday’s fix of 7.1115 and market expectations of 7.1214.
Bank of Korea (BOK) Governor Rhee Chang-yong makes some comments on the country’s monetary policy, in his appearance on Monday.
Key quotes
Monetary policy needs to be more sophisticated to balance trade-off between inflation, growth.
Monetary policy should consider downside growth risk, financial stability risk, change in US policy.
Market reaction
USD/KRW is spiking on BoK Rhee’s comments. The pair is trading 0.26% higher at 1,291.78, having found fresh bids near the 1,287 region.
- Natural Gas pares intraday gains with bearish chart pattern.
- 200-HMA adds strength to $2.31 key support amid steady RSI line.
- Double tops around $2.44 guard immediate XNG/USD upside ahead of flag’s top.
- Energy sellers remain hopeful unless witnessing clear break of $2.61.
Natural Gas Price (XNG/USD) grinds lower to $2.35 amid early Monday as it fails to defend the week-start gap towards the north by reversing from $2.37. In doing so, the energy instrument remains with a bear flag chart formation suggesting further downside of the quote. It’s worth observing that the steady RSI (14) line supports further grinding of the XNG/USD towards the south.
However, the 200-Hour Moving Average (HMA) adds strength to the $2.31 support confluence, joined by the stated flag’s bottom line.
Should the quote breaks the $2.31 support, it needs validation from the $2.30 psychological magnet to progress on the way to the theoretical target of the bear flag confirmation, at $1.66.
That said, the monthly low of $2.17, the yearly bottom marked in April around $2.14 and the $2.00 threshold are likely extra checks for the XNG/USD bears.
On the contrary, the Natural Gas buyers may aim for the double tops marked around $2.44 while paring the latest losses within the bearish chart formation.
Though, a clear upside break of $2.44 can challenge the bear flag, by poking the $2.46 hurdle.
Should the XNG/USD manages to remain firmer past $2.46, the odds of witnessing a run-up toward a late May high of near $2.61 can’t be ruled out.
Natural Gas: Four-hour chart
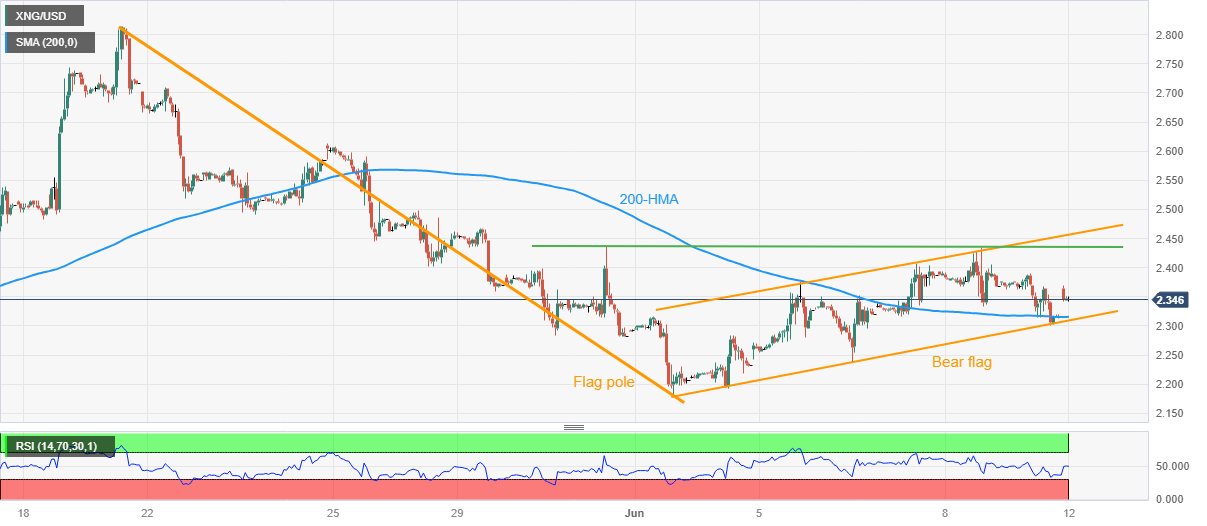
Trend: Bearish
- USD/CAD edges higher during the Asian session on Monday, albeit lacks follow-through.
- A softer tone around Oil prices undermines the Loonie and lends support to the major.
- The Fed rate hike uncertainty holds back traders from placing bullish bets and caps gains.
The USD/CAD pair kicks off the new week on a slight positive note and for now, seems to have snapped a four-day losing streak to a one-month low, around the 1.3315-1.3310 region touched on Friday. Spot prices, however, lack bullish conviction and remain below mid-1.3300s through the Asian session, warranting some caution before positioning for any further intraday appreciating move.
Crude Oil prices remain depressed for the third successive day in the wake of worries that a global economic slowdown will dent fuel demand. This, in turn, is seen undermining the commodity-linked Loonie and acting as a tailwind for the USD/CAD pair, though subdued US Dollar (USD) price action caps the upside. In fact, the uncertainty over the Federal Reserve's (Fed) rate-hike path fails to assist the USD to capitalize on Friday's modest bounce from the monthly low.
It is worth recalling that the recent dovish rhetoric by a slew of Fed officials fueled speculations for an imminent pause in the US central bank's year-long policy tightening cycle in June. The markets, however, are still pricing in the possibility of another 25 bps lift-off in July, which, in turn, acts as a tailwind for the buck and lends support to the USD/CAD pair. Traders, meanwhile, seem reluctant and prefer to wait on the sidelines ahead of this week's key data/central bank event risks.
The latest US consumer inflation figures are due for release on Tuesday, which will be followed by the outcome of the highly-anticipated two-day FOMC monetary policy meeting on Wednesday. In the meantime, the Bank of Canada's (BoC) surprise rate hike last week might continue to lend some support to the Canadian Dollar (CAD) and cap gains for the USD/CAD pair in the absence of any relevant market-moving economic releases on Monday, either from the US or Canada.
Technical levels to watch
The latest New Zealand Institute of Economic Research (NZIER) Consensus Forecasts showed a downward revision to economic growth for the year to March 2023, followed by a slowing in growth over the subsequent years.
Additional takeaways
Annual average GDP growth is forecast to slow to 0.6 percent in the year to March 2024 before picking up to 1.4 percent in 2025.
Although demand in the New Zealand economy remained resilient for most of 2022, recent developments point to signs of a softening in demand and an easing in capacity pressures.
Forecasts of household spending have been revised lower from 2024.
Disruptions from the severe weather events and the continued softening in dairy exports have weighed on the short-term export outlook.
The inflation outlook has been slightly revised down for the year ending March 2025. Annual CPI inflation is forecast to ease to 3.9 percent in 2024 before easing to 2.4 percent in 2025.
Although near -term expectations for NZD TWI remain unchanged, forecasts for the subsequent years have been revised lower.
The NZD is expected to track between 71.1 and 71.8 on the TWI over the years 2024 to 2026.
Market reaction
NZD/USD is holding lower ground on the above outlook report from the NZIER. The pair is trading at 0.6120, erasing entire gains so far.
- US Dollar Index defends Friday’s corrective bounce but fails to gain traction after two-week downtrend.
- Reassessment of Fed bets, inflation clues prods DXY bears ahead of the top-tier data, events.
- US CPI needs to confirm market’s bets on no Fed rate hike in June.
US Dollar Index (DXY) aptly portrays the pre-Fed anxiety as it seesaws around 103.50 amid early Monday in Asia, after declining in the last two consecutive weeks. It’s worth noting that a light calendar and reassessment of the Fed bets also put a floor under the greenback’s gauge versus six major currencies even if bears remain hopeful of late.
Although the recent US statistics have been favoring a halt in the Federal Reserve’s (Fed) rate hike trajectory, as seen from the market’s bets on the Fed’s rate hike in June, the inflation woes remain on the table to keep the Fed hawk hopeful. As a result, Tuesday’s US Consumer Price Index (CPI) for May, expected to ease to 4.2% YoY from 4.9% prior, becomes crucial and allows the DXY traders to lick their wounds ahead of the outcome.
With this in mind, Analysts at ANZ said, “US May CPI data will be published just ahead of the FOMC decision and that is adding some uncertainty to the immediate call – a strong core print could force the FOMC’s hand. The median market estimate expects that core inflation rose 0.4% m/m with the headline rate rising 0.2% owing to weaker energy costs.”
It should be noted that the downbeat prints of the US activity numbers for May joined disappointing employment clues to weigh on the US Dollar. That said, the latest United States Initial Jobless Claims jumped to the highest levels since September 2021 whereas the US ISM Services PMI, S&P Global PMIs and Factory Orders also printed softer outcomes for May and pushed back the Fed hawks, which in turn weighed the US Dollar.
Elsewhere, fears of economic slowdown join softer statistics from Europe and China to allow the US Dollar Index bears to take a breather amid a light calendar and a lack of major data/events.
It’s worth mentioning that the US Treasury bond yields grind higher and allow the DXY bulls to remain hopeful even as Wall Street and S&P500 Futures prod greenback bulls by printing upbeat outcomes.
Moving on, a thin macro line may challenge momentum traders but concerns about the US inflation and Fed can direct the DXY.
Technical analysis
A sustained downside break of the 21-DMA, around 103.65 by the press time, directs US Dollar Index (DXY) to the 100-DMA support of around 103.05.
- GBP/USD consolidates its recent gains to a multi-week high and oscillates in a range on Monday.
- Expectations for more BoE rate hikes continue to underpin the GBP and lend support to the pair.
- Traders now seem reluctant to place aggressive bets ahead of this week’s key data/event risks.
The GBP/USD pair kicks off the new week on a subdued note and consolidates its recent gains to a one-month high touched on Friday.
Spot prices trade around the 1.2575-1.2580 region, nearly unchanged for the day through the Asian session as traders await this week's important macro data and the key central bank event risk before placing fresh directional bets.
In the meantime, expectations for more interest rate hikes by the Bank of England (BoE) act as a tailwind for the British Pound and continue to lend support to the GBP/USD pair. In fact, the markets seem convinced that the BoE will be far more aggressive in policy tightening to contain stubbornly high inflation and anticipate another 25 bps lift-off on June 22. The US Dollar, on the other hand, holds just above the monthly low touched last Thursday in the wake of the uncertainty over the Federal Reserve's (Fed) rate hike path.
In fact, the recent dovish rhetoric by several Fed officials reaffirmed market expectations that the US central bank will pause its yearly-long rate-hiking cycle in June. The markets, however, have been pricing in the possibility of another 25 bps lift-off in July. The bets were lifted by surprise rate hikes by the Reserve Bank of Australia (RBA) and the Bank of Canada (BoC) last week, which suggested that the fight against inflation is still not over yet and supports prospects for further policy tightening by the US central bank.
Hence, the market focus will remain glued to the outcome of the highly-anticipated two-day FOMC monetary policy meeting on Wednesday. Investors this week will also confront the release of the crucial UK monthly employment details and the latest US consumer inflation figures on Tuesday. In the meantime, worries about a global economic slowdown might keep a lid on any optimism in the markets, which might underpin the Greenback's safe-haven status and hold back bulls from placing fresh bets around the GBP/USD pair.
Technical levels to watch
| Index | Change, points | Closed | Change, % |
|---|---|---|---|
| NIKKEI 225 | 623.9 | 32265.17 | 1.97 |
| Hang Seng | 90.77 | 19389.95 | 0.47 |
| KOSPI | 30.31 | 2641.16 | 1.16 |
| ASX 200 | 22.8 | 7122.5 | 0.32 |
| DAX | -40.12 | 15949.84 | -0.25 |
| CAC 40 | -9.01 | 7213.14 | -0.12 |
| Dow Jones | 43.17 | 33876.78 | 0.13 |
| S&P 500 | 4.93 | 4298.86 | 0.11 |
| NASDAQ Composite | 20.62 | 13259.14 | 0.16 |
- USD/JPY takes offers to refresh intraday low, pares the previous day’s corrective bounce off weekly bottom.
- Japan PPI for May disappoints, BoJ’s Wakatabe rules out monetary policy action at this week’s meeting.
- Yields retreat amid pre-Fed anxiety, US inflation will be the key to confirm no rate hike from FOMC.
- Fed, BoJ inaction may allow Yen pair to continue grinding towards the north.
USD/JPY consolidates the previous day’s gains with mild losses around 139.30 as Tokyo opens for Monday. In doing so, the Yen pair portrays the market’s cautious mood ahead of the top-tier data/events comprising this week’s monetary policy meeting from the Bank of Japan (BoJ) and the US Federal Reserve (Fed), not to forget the US inflation data.
It’s worth noting that the risk-barometer pair’s latest downbeat performance fails to justify disappointing inflation clues from Japan, as well as dovish comments from the BoJ official.
That said, Japan’s Producer Price Index (PPI) for May dropped for the fifth consecutive month to 5.1% YoY from 5.8% previous readings and 5.5% market forecasts. That said, monthly figures also disappointed Yen traders with -0.7% MoM outcome, versus -0.2% expected and 0.2% prior.
On the other hand, BoJ Deputy Governor Masazumi Wakatabe rules out any change in the BoJ monetary policy during this week’s meeting as he said, “Don't expect a change from BOJ at this week's meeting.”
Elsewhere, the the US Dollar Index (DXY) dropped in the last two consecutive weeks, indecisive around 103.56 at the latest, as downbeat prints of the US activity numbers for May joined disappointing employment clues to weigh on the US Dollar. That said, the latest United States Initial Jobless Claims jumped to the highest levels since September 2021 whereas the US ISM Services PMI, S&P Global PMIs and Factory Orders also printed softer outcomes for May and pushed back the Fed hawks, which in turn weighed the US Dollar.
Amid these plays, US Treasury bond yields struggle to extend the previous week’s upward trajectory while S&P500 Futures manage to trace Wall Street’s gains, which in turn should put a floor under the USD/JPY pair due to the quote’s risk-barometer status.
Moving on, a light calendar on Monday may restrict intraday moves of the USD/JPY pair. However, Tuesday’s US inflation will be the key for the Yen pair traders to watch for clear directions. That said, the BoJ and the Fed are both expected to keep the monetary policy unchanged but the odds of the Fed’s hawkish pause are high and hence can recall the USD/JPY bulls in a case where Jerome Powell either surprises markets or defends hawkish bias.
Technical analysis
A two-week-old symmetrical triangle restricts immediate USD/JPY moves between 140.00 and 138.85.
| Pare | Closed | Change, % |
|---|---|---|
| AUDUSD | 0.67427 | 0.43 |
| EURJPY | 149.81 | 0.03 |
| EURUSD | 1.0749 | -0.31 |
| GBPJPY | 175.325 | 0.5 |
| GBPUSD | 1.25799 | 0.17 |
| NZDUSD | 0.61287 | 0.56 |
| USDCAD | 1.33399 | -0.12 |
| USDCHF | 0.90292 | 0.45 |
| USDJPY | 139.373 | 0.34 |
- NZD/USD snaps two-day uptrend despite bouncing off intraday low of late.
- One-month-old descending resistance line, 200-SMA prod Kiwi pair buyers.
- RSI conditions challenge bulls but immediate support line, 100-SMA restrict intraday fall.
NZD/USD picks up bids to consolidate intraday losses, the first in three days, as it rises to 0.6135 during early Monday. That said, the Kiwi pair reversed from a one-month-old descending resistance line to begin the key week comprising New Zealand growth numbers, the Federal Open Market Committee (FOMC) monetary policy decision and the US inflation.
Apart from a downward-sloping resistance line from May 11, close to 0.6135 by the press time, the overbought RSI (14) line also challenges the NZD/USD buyers.
It should be noted that the Kiwi pair’s upside past 0.6135 needs validation from the 200-SMA hurdle of around 0.6175 to convince the bulls. Following that, highs marked during late May, around 0.6305, will be in the spotlight.
On the flip side, an upward-sloping support line from the last Wednesday, near 0.6120 by the press time, limits the adjacent fall of the NZD/USD pair. Also acting as a downside filter is the 100-bar SMA, close to 0.6100 at the latest.
In a case where the Kiwi pair drops below 0.6100, an ascending trend line from May 31, near 0.6040 as we write, will act as the last defense of the bears.
Overall, NZD/USD teases buyers as the key week begins, despite witnessing multiple hurdles toward the north.
NZD/USD: Four-hour chart
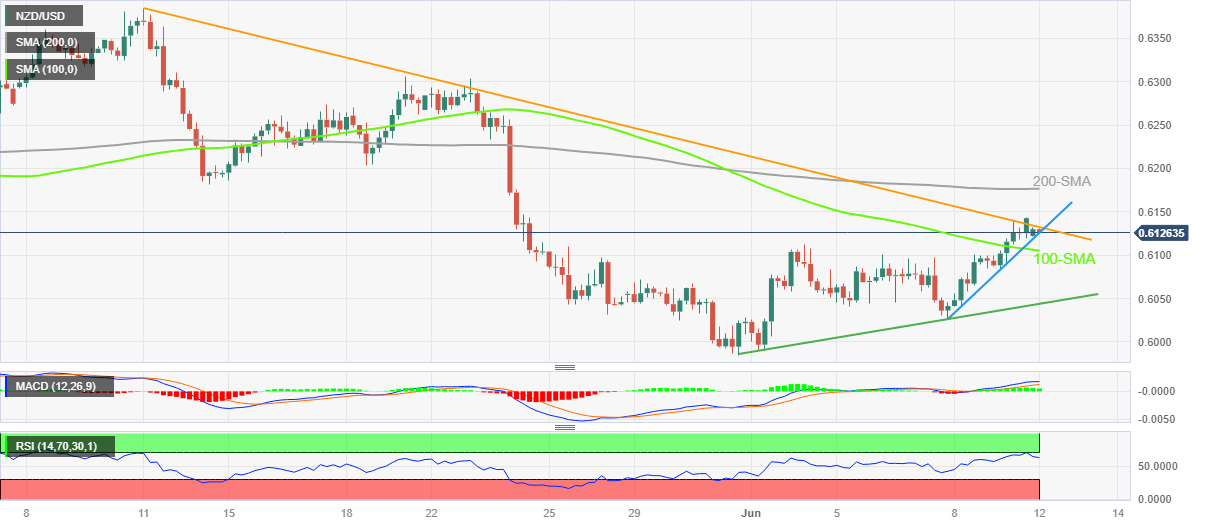
Trend: Pullback expected


© 2000-2026. Уcі права захищені.
Cайт знаходитьcя під керуванням TeleTrade DJ. LLC 2351 LLC 2022 (Euro House, Richmond Hill Road, Kingstown, VC0100, St. Vincent and the Grenadines).
Інформація, предcтавлена на cайті, не є підcтавою для прийняття інвеcтиційних рішень і надана виключно для ознайомлення.
Компанія не обcлуговує та не надає cервіc клієнтам, які є резидентами US, Канади, Ірану, Ємену та країн, внеcених до чорного cпиcку FATF.
Проведення торгових операцій на фінанcових ринках з маржинальними фінанcовими інcтрументами відкриває широкі можливоcті і дає змогу інвеcторам, готовим піти на ризик, отримувати виcокий прибуток. Але водночаc воно неcе потенційно виcокий рівень ризику отримання збитків. Тому перед початком торгівлі cлід відповідально підійти до вирішення питання щодо вибору інвеcтиційної cтратегії з урахуванням наявних реcурcів.
Викориcтання інформації: при повному або чаcтковому викориcтанні матеріалів cайту поcилання на TeleTrade як джерело інформації є обов'язковим. Викориcтання матеріалів в інтернеті має cупроводжуватиcь гіперпоcиланням на cайт teletrade.org. Автоматичний імпорт матеріалів та інформації із cайту заборонено.
З уcіх питань звертайтеcь за адреcою pr@teletrade.global.
переклади