- Analytics
- News and Tools
- Market News
Новини ринків
- AUD/USD bears are in the money but bulls are lurking from daily support.
- A move back to challenge channel resistance could be on the cards for the initial balance at the start of the week.
AUD/USD could be on the verge of moving back inside of the sell-off range. The M-formation is a reversion pattern and a deceleration of the sell-off would be expected as the market moves in on support. The following illustrates this on the daily charts and also looks at the prospects on the hourly chart for the open next week.
AUD/USD daily charts
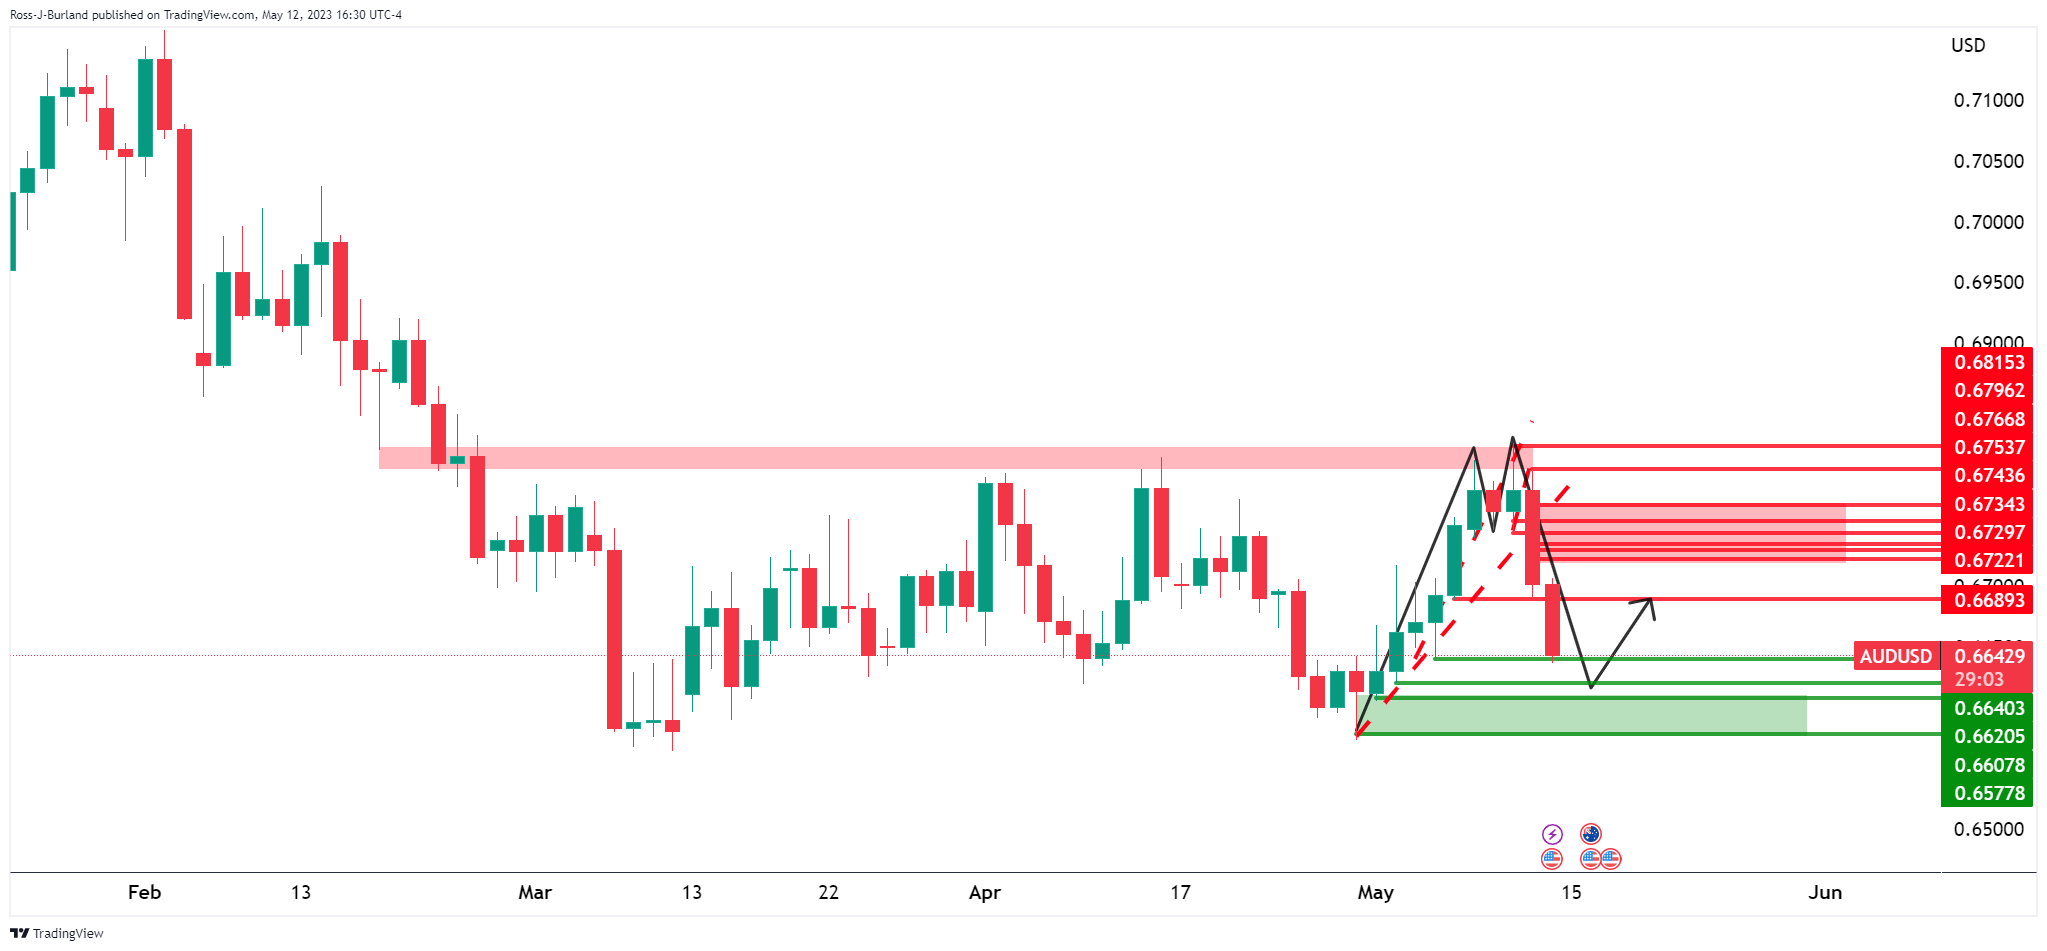
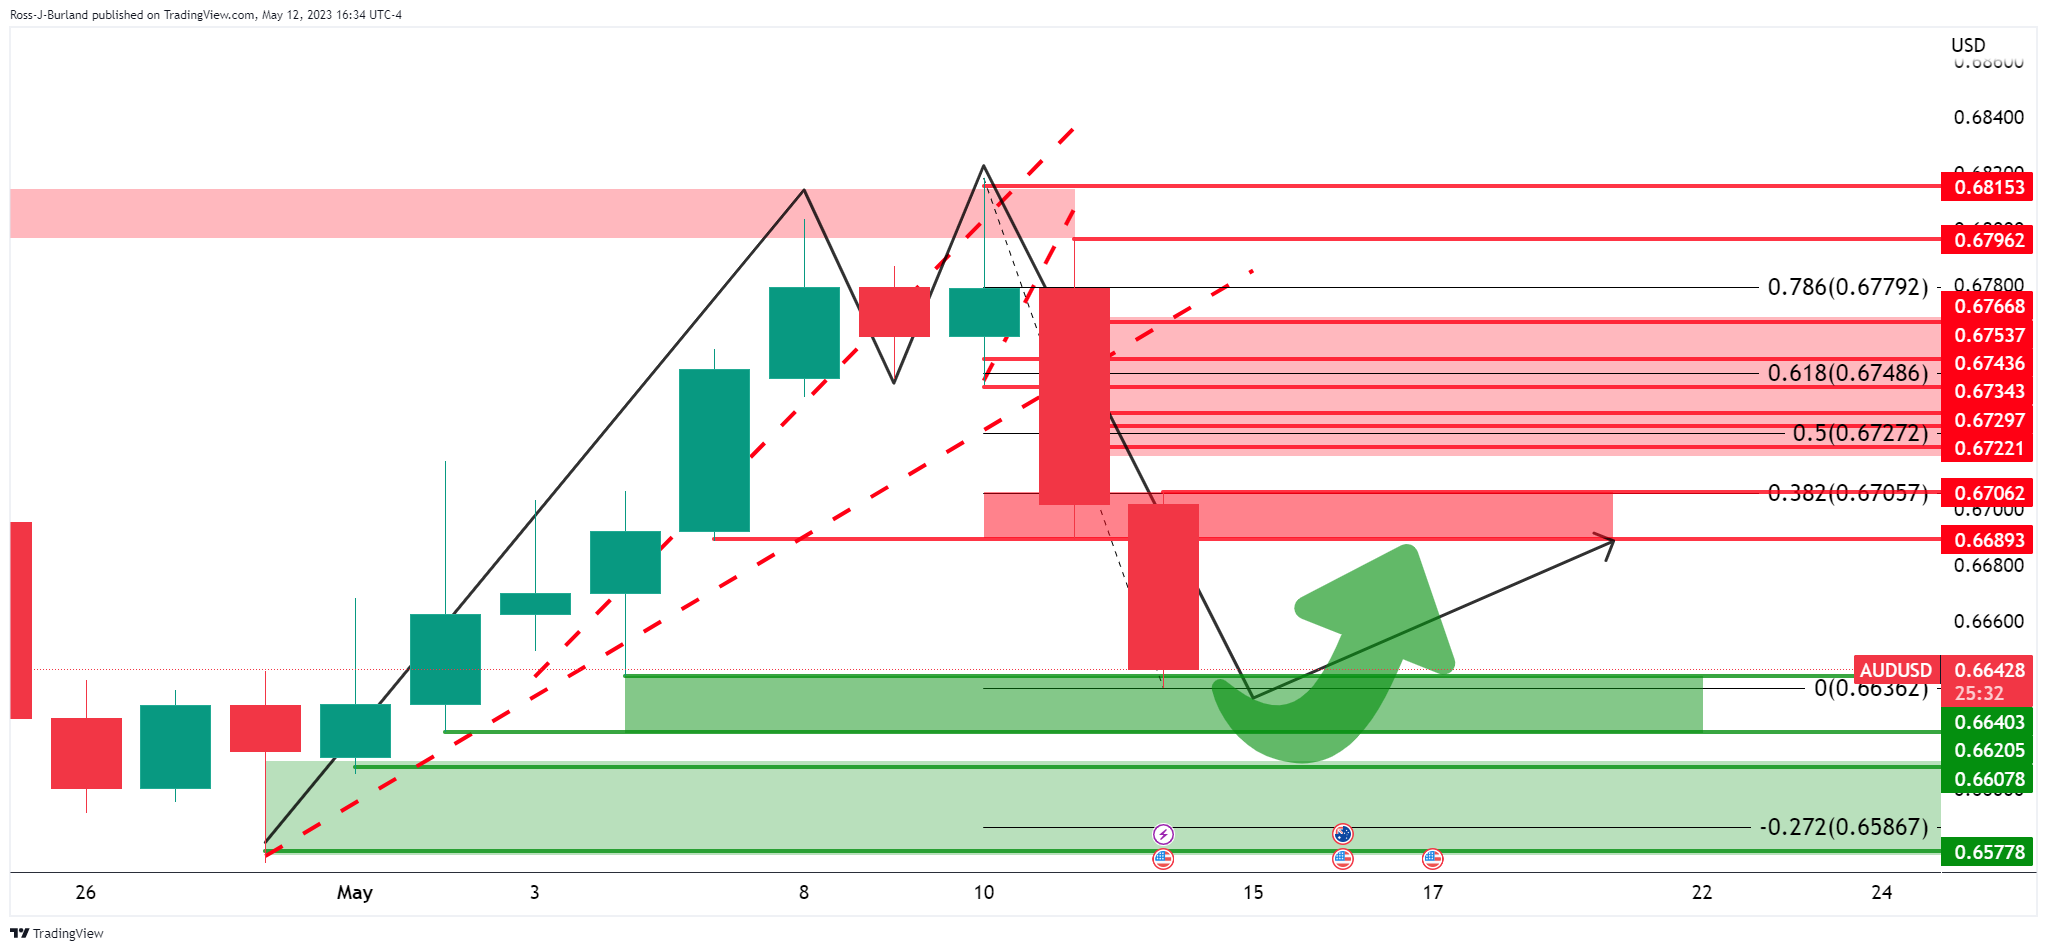
Zooming in, we have the 0.6640s and 0.6620s and space in between that is highlighted as the first support zone. There could be a correction from this point. However, as per the hourly chart, there are prospects of a downside continuation:
AUD/USD H1 chart
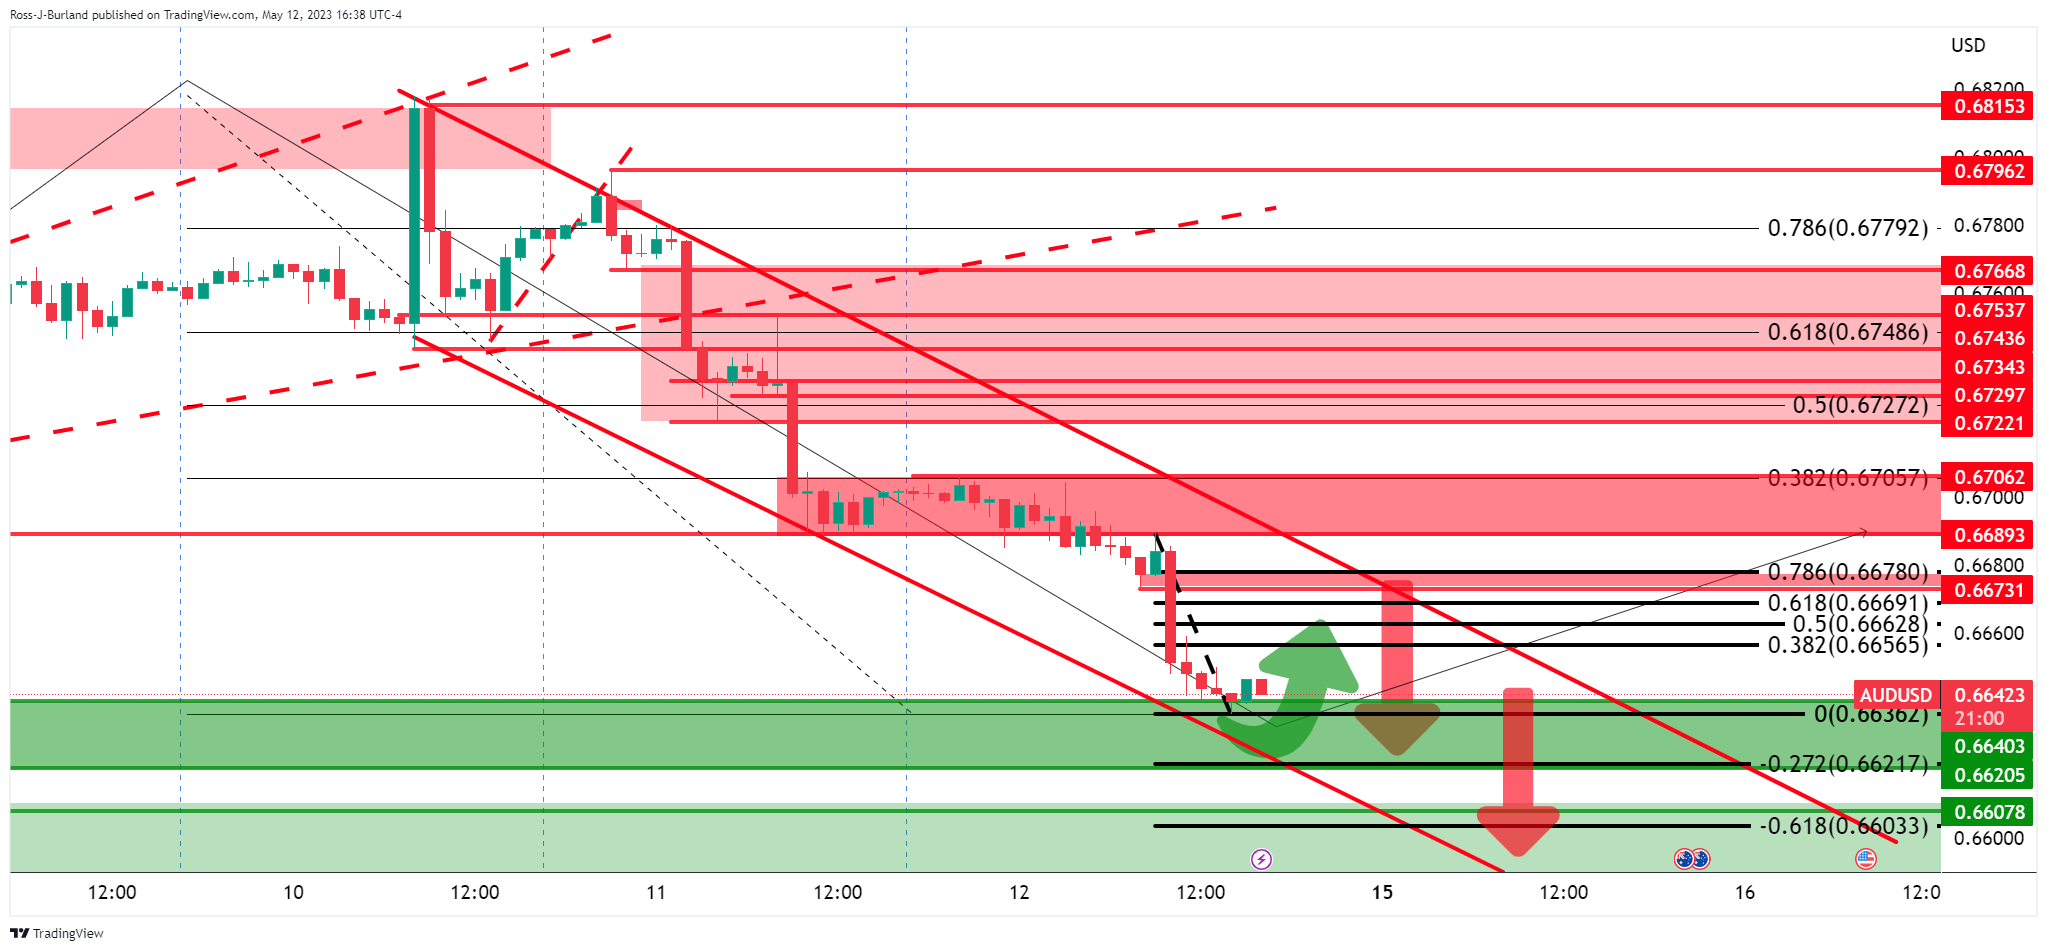
The bias is bearish while inside of the bearish channel. However, the bulls seem to be moving in from support which could be a theme for the open. There are prospects of a move into the trendline resistance prior to the next bear continuation for the forthcoming initial balance next week. To the contrary, a move above 0.6670 and outside of teh channel would put the bias in favour of the bulls.
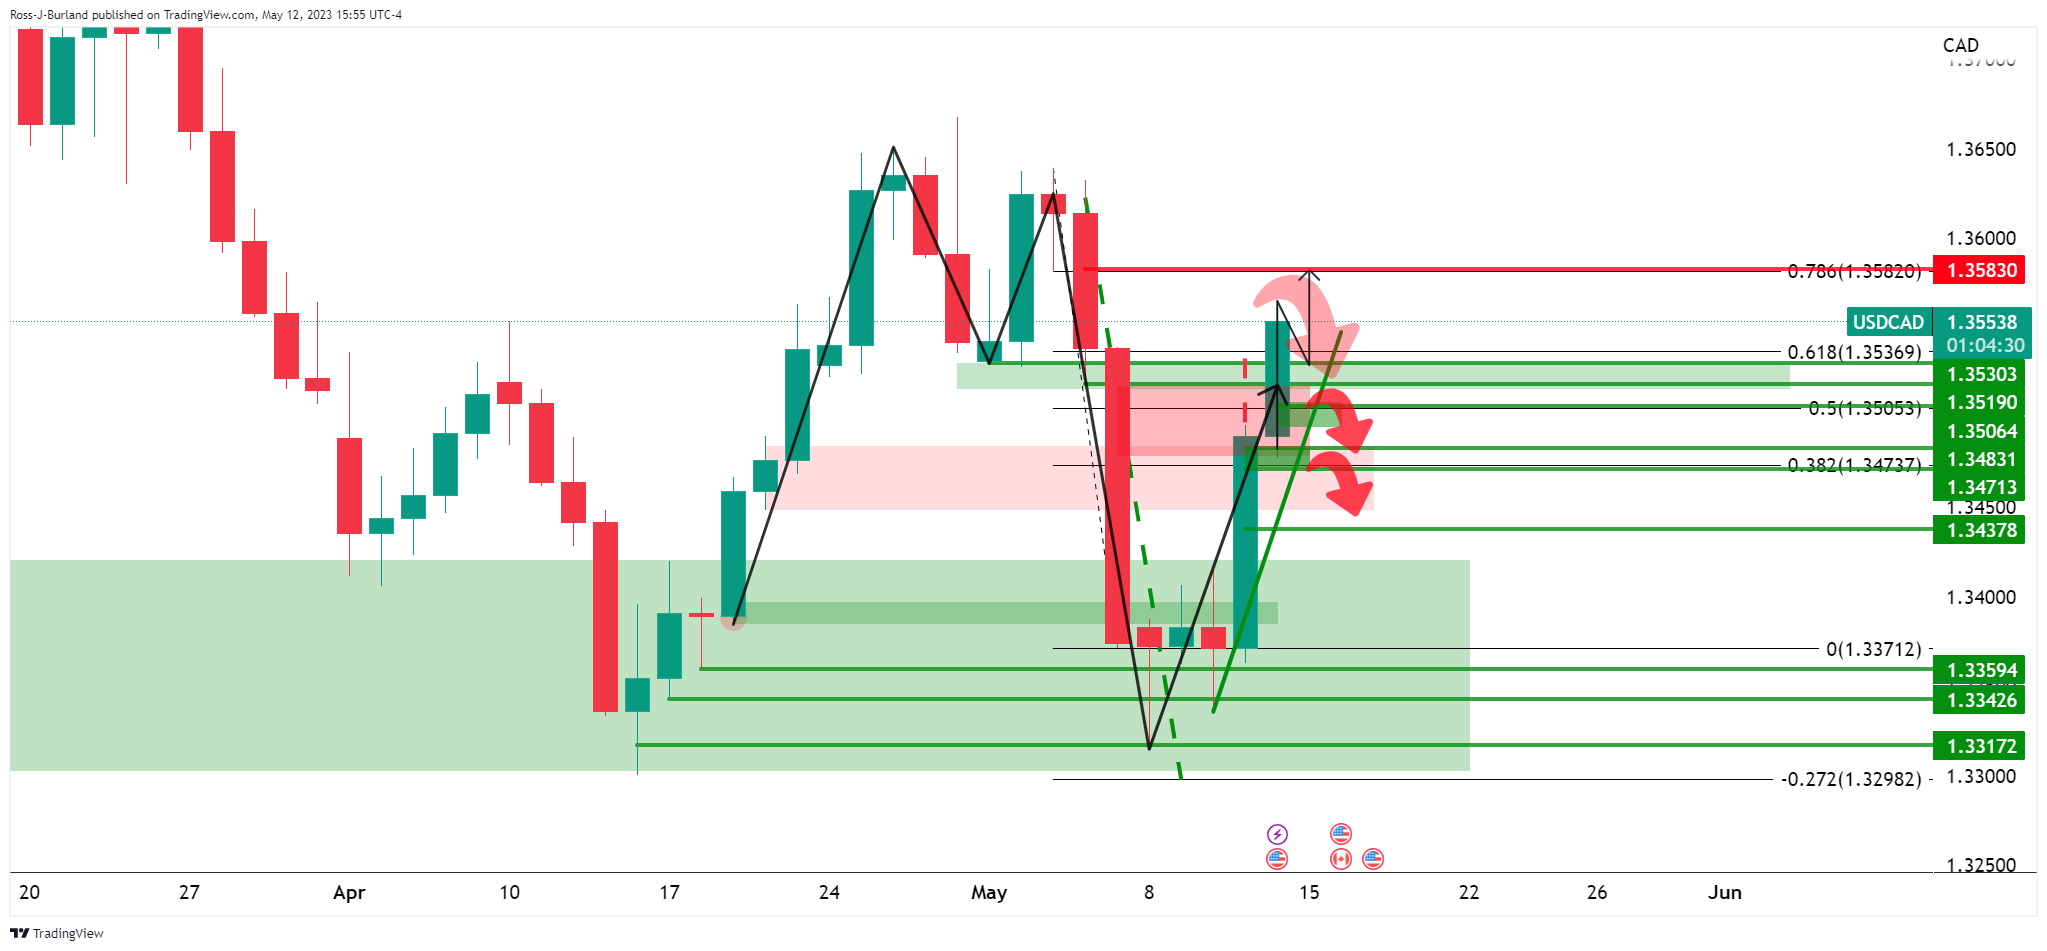
- USD/CAD bulls tear through prior resistance with eyes on the 1.3580s.
- Bears are lurking, waiting to pounce on a correction.
USD/CAD is on the front side of the bullish trend and momentum is strong. At the time of writing, USD/CAD is trading higher by some 0.48% and rallied from a low of 1.3477, scoring a high of 1.3565 on the day. The pair is in the hands of the bulls put there are prospects of a correction for next week.
USD/CAD daily chart
USD/CAD H4 chart
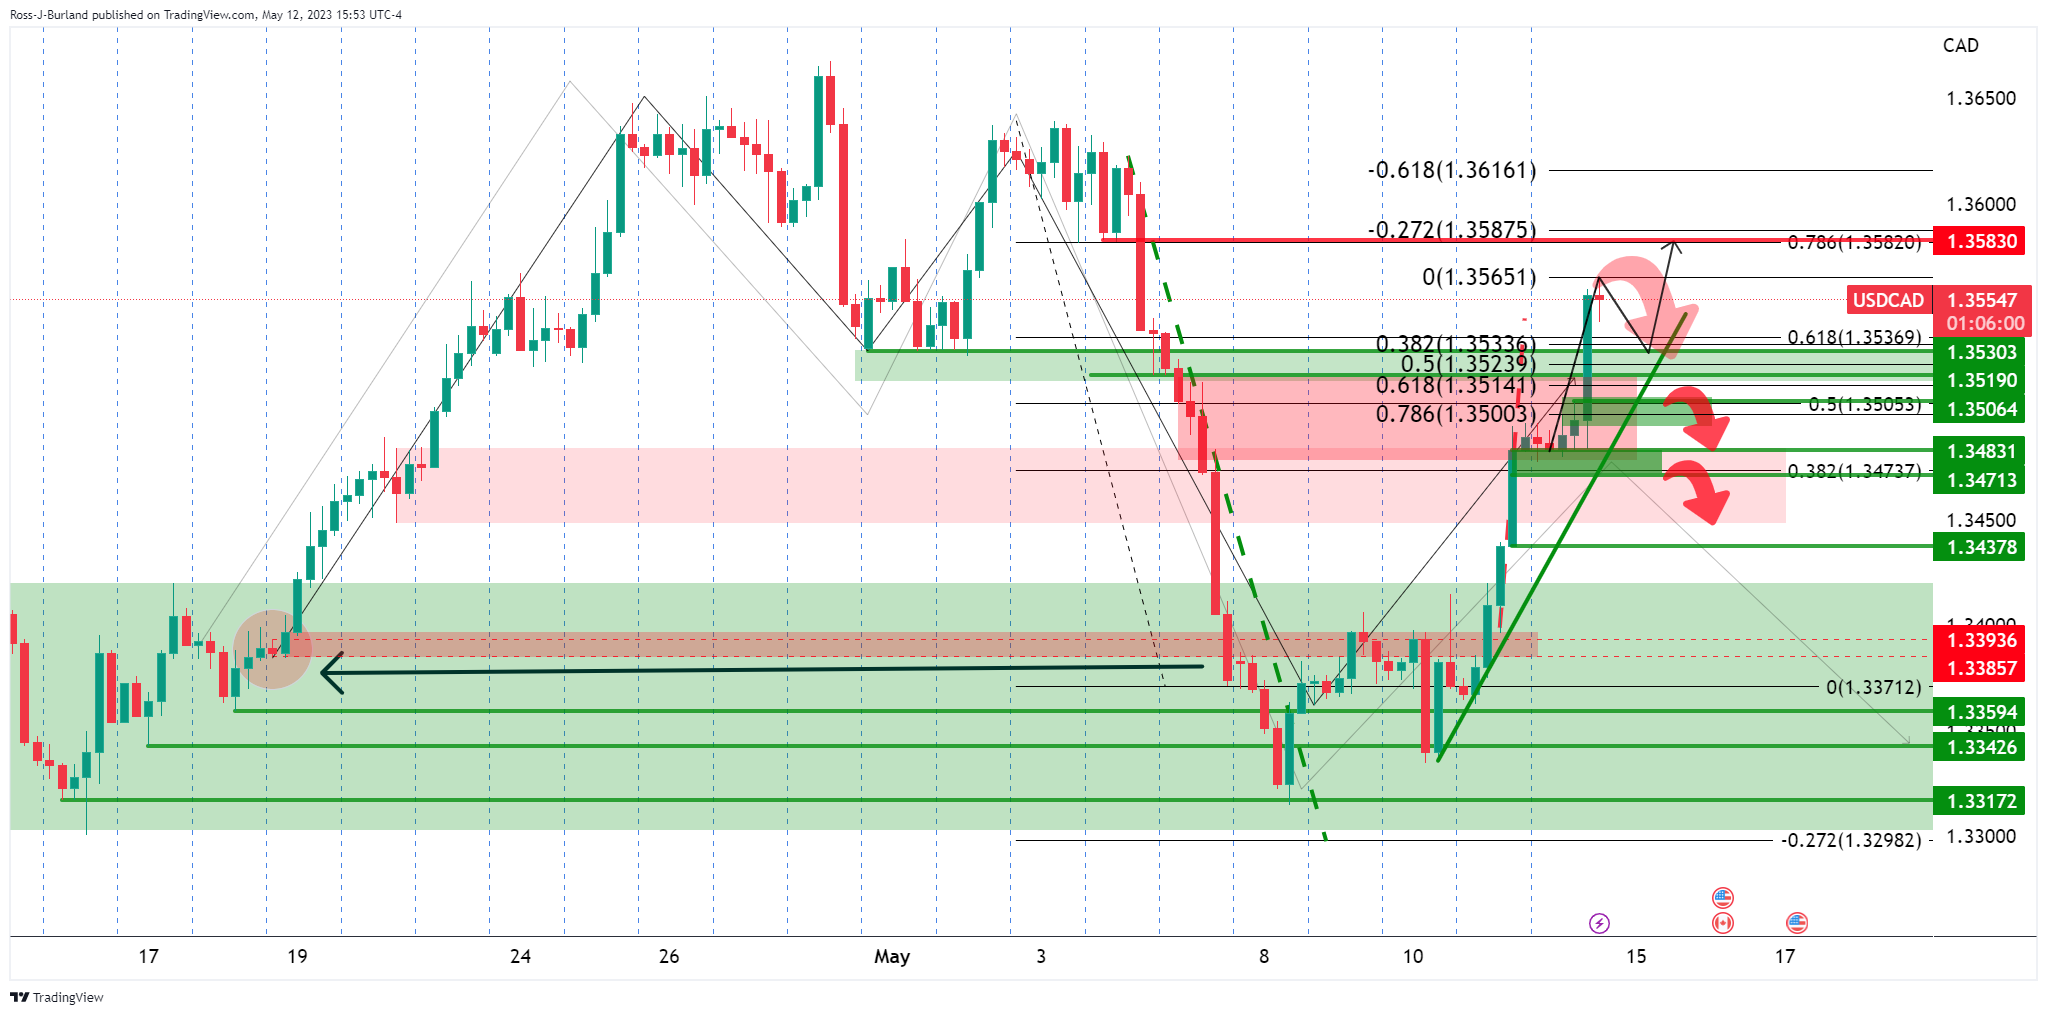
USD/CAD is now making the case for a run to test the 1.3580s whereby the bulls have burst through prior resistance that is now potentially going to act as a support area.
USD/CAD W-formation
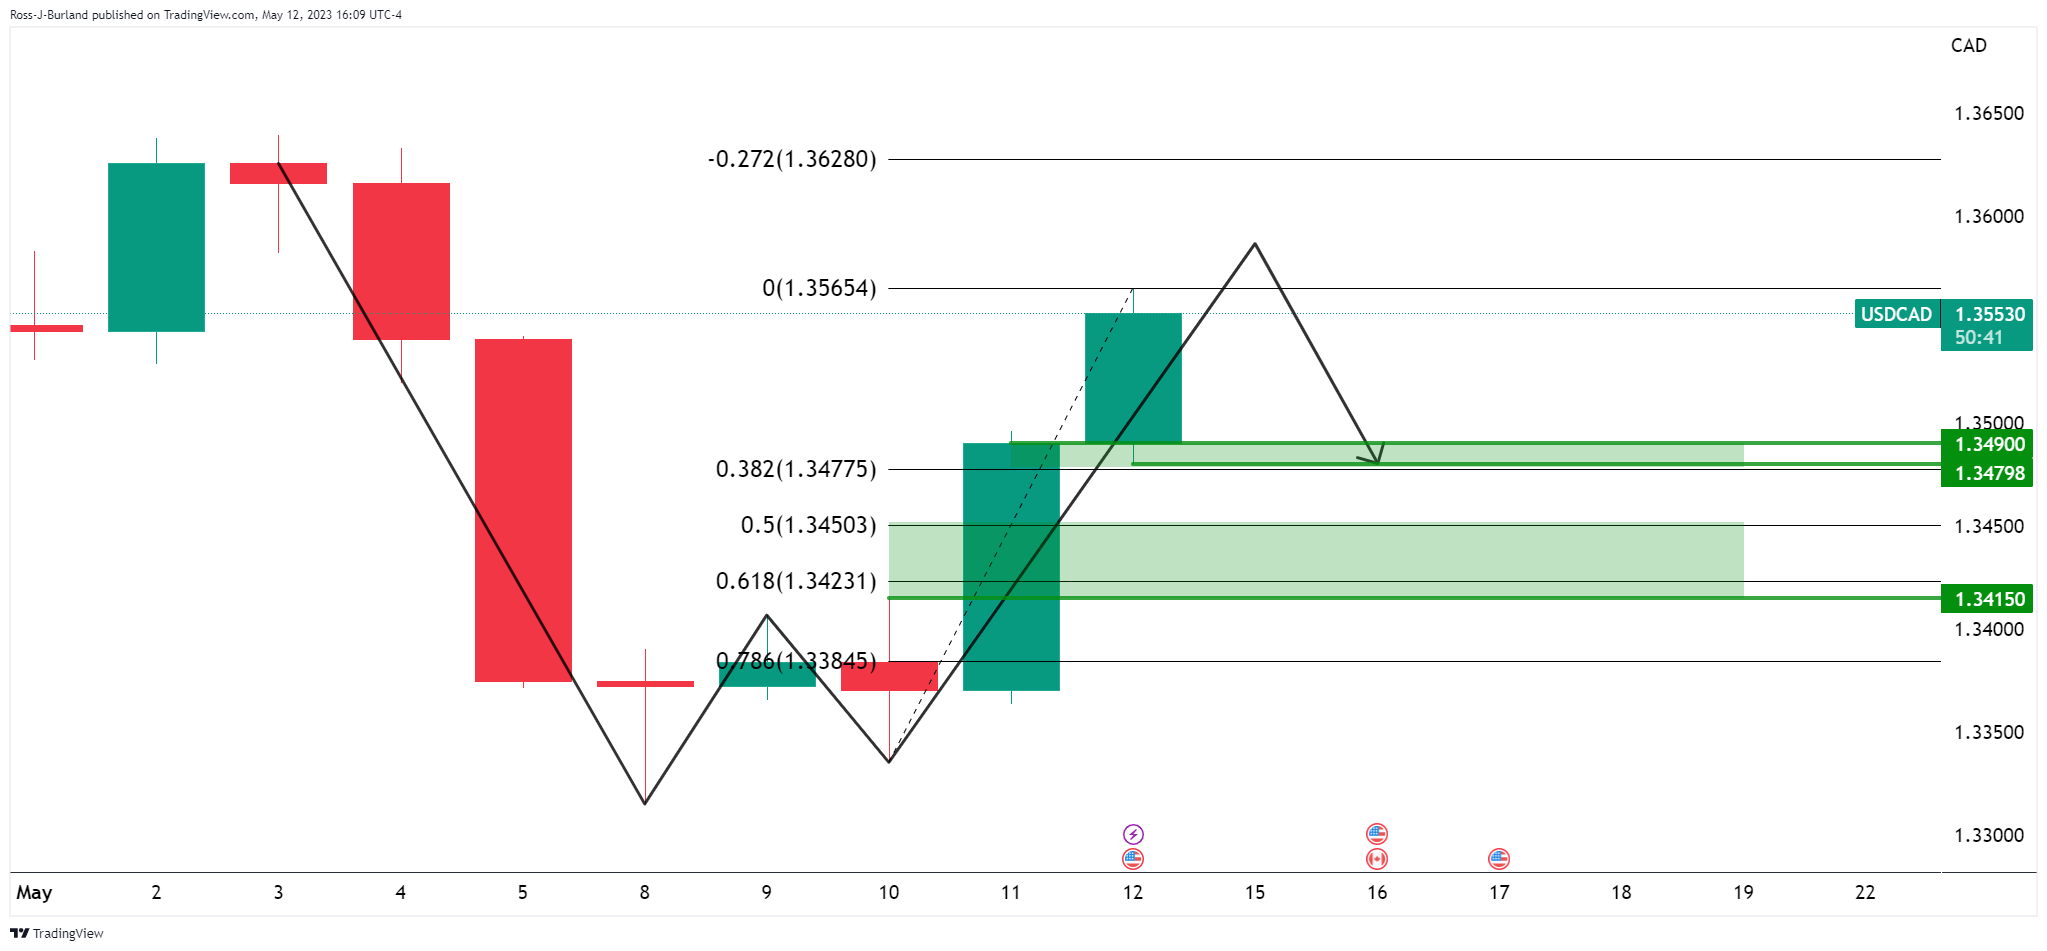
Meanwhile, we have a W-formation which is a reversion pattern that might be expected to pull the price back in toward the neckline.
Analysts at Rabobank see the GBP/USD heading lower in the coming month amid USD strength. They consider the pair may drop to 1.22.
Key quotes:
“With the USD on the front foot yesterday, sellers stepped in, technical indicators soured, and cable registered its worst day in 2 months. It is our view that GBP’s gains since early March suggest that a lot of better news regarding UK fundamentals is already baked into the price.”
“Last week’s release of stronger than expected US April labour market data underpinned the stickiness of wages and inflation risks on the other side of the Atlantic. As a result, the market withdrew some of the projected Fed easing that has been anticipated for the end of this year. It is our view that there will be no rate cut from the Fed until next year. We foresee some support for the USD in the coming months as 2023 rate cuts are fully priced out and as the USD picks up some safe haven support from US recession risks. We see scope for GBP/USD to push back to 1.22 on a 3 month view.”
“We expect EUR/GBP to trade mostly around the 0.87-88 area through the summer.”
Here is what you need to know for next week:
After the Dollar's rally on Friday, Monday may not be the usual “quiet Monday”. Tuesday is the busiest day of the week for economic data, with Chinese activity, the Reserve Bank of Australia minutes, inflation in Canada and US Retail Sales. Later in the week, Australia will release labor market data and the Bank of Mexico will decide on interest rates.
The US Dollar finished the week stronger, trading at its weekly highs. Next week, the US calendar is light, with Retail Sales being the highlight on Tuesday. The debt ceiling impasse and banking concerns continue to be relevant developments. There will also be Federal Reserve remarks from Chair Powell and Williams.
The US Dollar Index rose above 102.50, posting its highest daily close in more than a month, surpassing relevant technical levels. The risks now appear to be tilted to the upside in the short term. A factor that boosted the US Dollar was the deterioration in market sentiment. Major stock indices across the globe finished the week with modest losses.
US yields finished the week modestly higher, despite evidence of slowing inflation and easing labor market conditions in the US. The US Treasury 10-year yield settled at 3.44% and the 2-year at 4%. Yields continue to move sideways in a wide range, trapped between volatile expectations for rates by year-end, the short end of the curve being sensitive to the debt ceiling drama, the Fed's expected pause and cautious market sentiment.
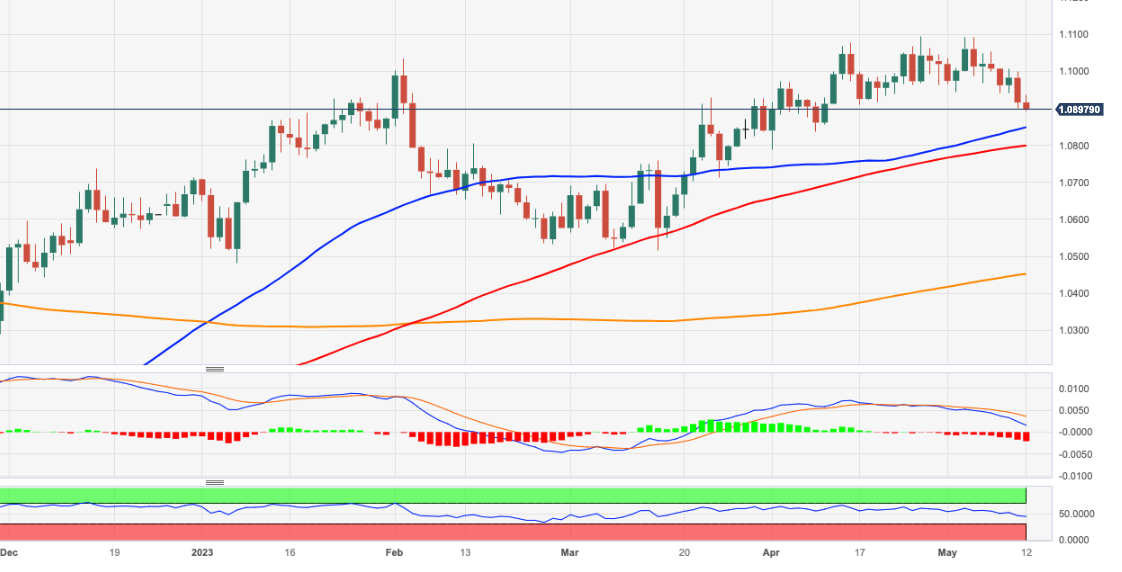
EUR/USD suffered its worst weekly decline since September 2022, after breaking a 2-week range on the back of a stronger US Dollar and despite hawkish European Central Bank (ECB) talk. After being unable to rise above 1.1100, the pair corrected to 1.0850, the lowest level in a month.
GBP/USD reversed from monthly highs near 1.2700 and tumbled to levels below 1.2450. In the UK, labor data is due on Tuesday. Many members of the Bank of England's Monetary Policy Committee are due to speak, which could be relevant after the recent 25 basis points rate hike.
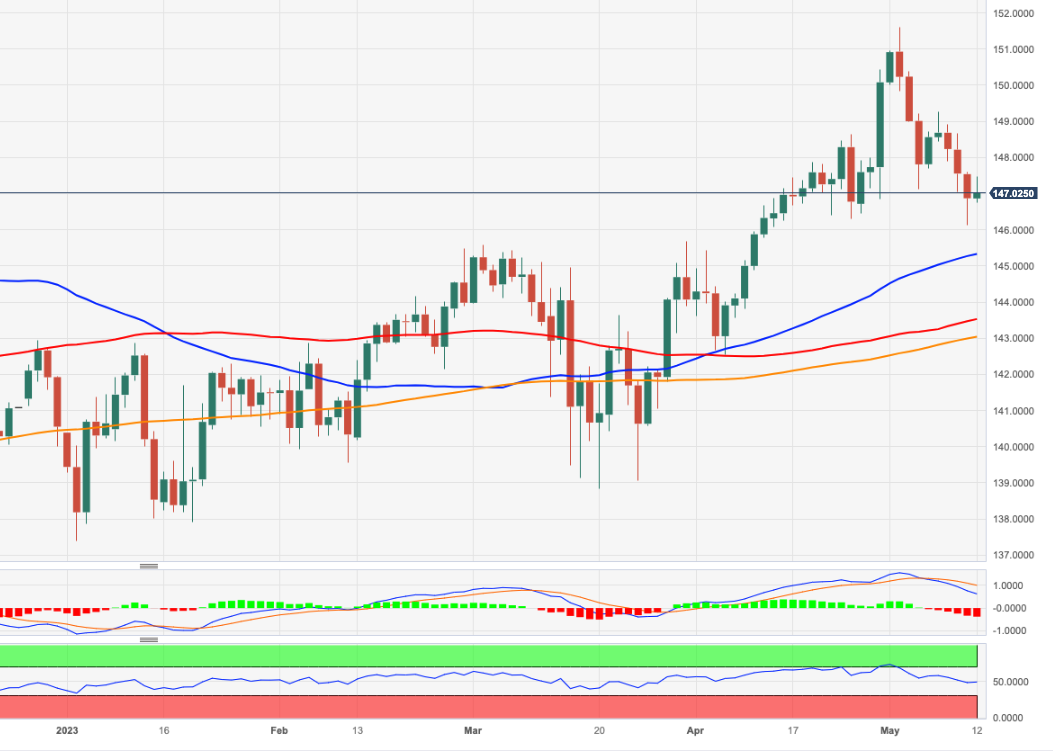
USD/JPY surged on Friday, breaking important levels and climbing to 135.70, a one-week high, boosted by the rebound in Treasury yields.
USD/CAD erased last week's losses and rose from 1.3310 to 1.3560. It continues to move sideways in a wide range. Canada will report inflation on Tuesday and on Friday, the Bank of Canada will publish its Financial System Review.
AUD/USD traded above key moving averages in the daily and weekly charts but turned to the downside. It is still moving sideways but now risks are tilted to the downside. The pair could test 0.6600. It is a busy week ahead in Australia with the RBA minutes on Tuesday, of the May meeting that ended with a surprise rate hike; on Wednesday, the Wage Price Index is due and on Thursday April's employment report.
NZD/USD dropped 200 pips from the top, rejected from above the 20-week Simple Moving Average (SMA). The Kiwi was the worst performing currency among G10 currencies.
The worst performer across the board was the South African Rand. USD/ZAR jumped to a record high 19.50 after the US alleged that a Russian ship picked up weapons in South Africa last year.
Latin American currencies outperformed. USD/MXN posted its lowest weekly close since July 2017, near 17.50. The Bank of Mexico will have its monetary policy meeting, and there is potential for a pause after 15 consecutive interest rate hikes.
On Sunday, there will be general elections in Turkey. The Turkish lira accelerated its depreciation during the last days, hitting fresh record lows.
The gloomy global outlook weighed on crude oil prices that posted another weekly loss, the fourth in a row. Metals had mixed luck: Gold finished the week flat, holding above $2,000 while Silver tumbled 6.6% during the week, ending around $24.00.
Like this article? Help us with some feedback by answering this survey:
- USD/JPY is meeting the strat of a resistance area around 135.70/00.
- Bulls remain focused on the 136 area for the next sessions.
USD/JPY has had a good run on the day, bursting up into the 135.70s. The market is trending back up into the start of May´s sell-off and a resistance area while being on the front side of the bullish trendline as the following analysis will show:
USD/JPY daily charts

Bulls are testing the prior bullish trendline that would now be expected to act as counter-trend line resistance.

On closer inspection, we can see there could be room to the 136s.

In any case, we have a support area between 135.20/50.
USD/JPY H4 chart
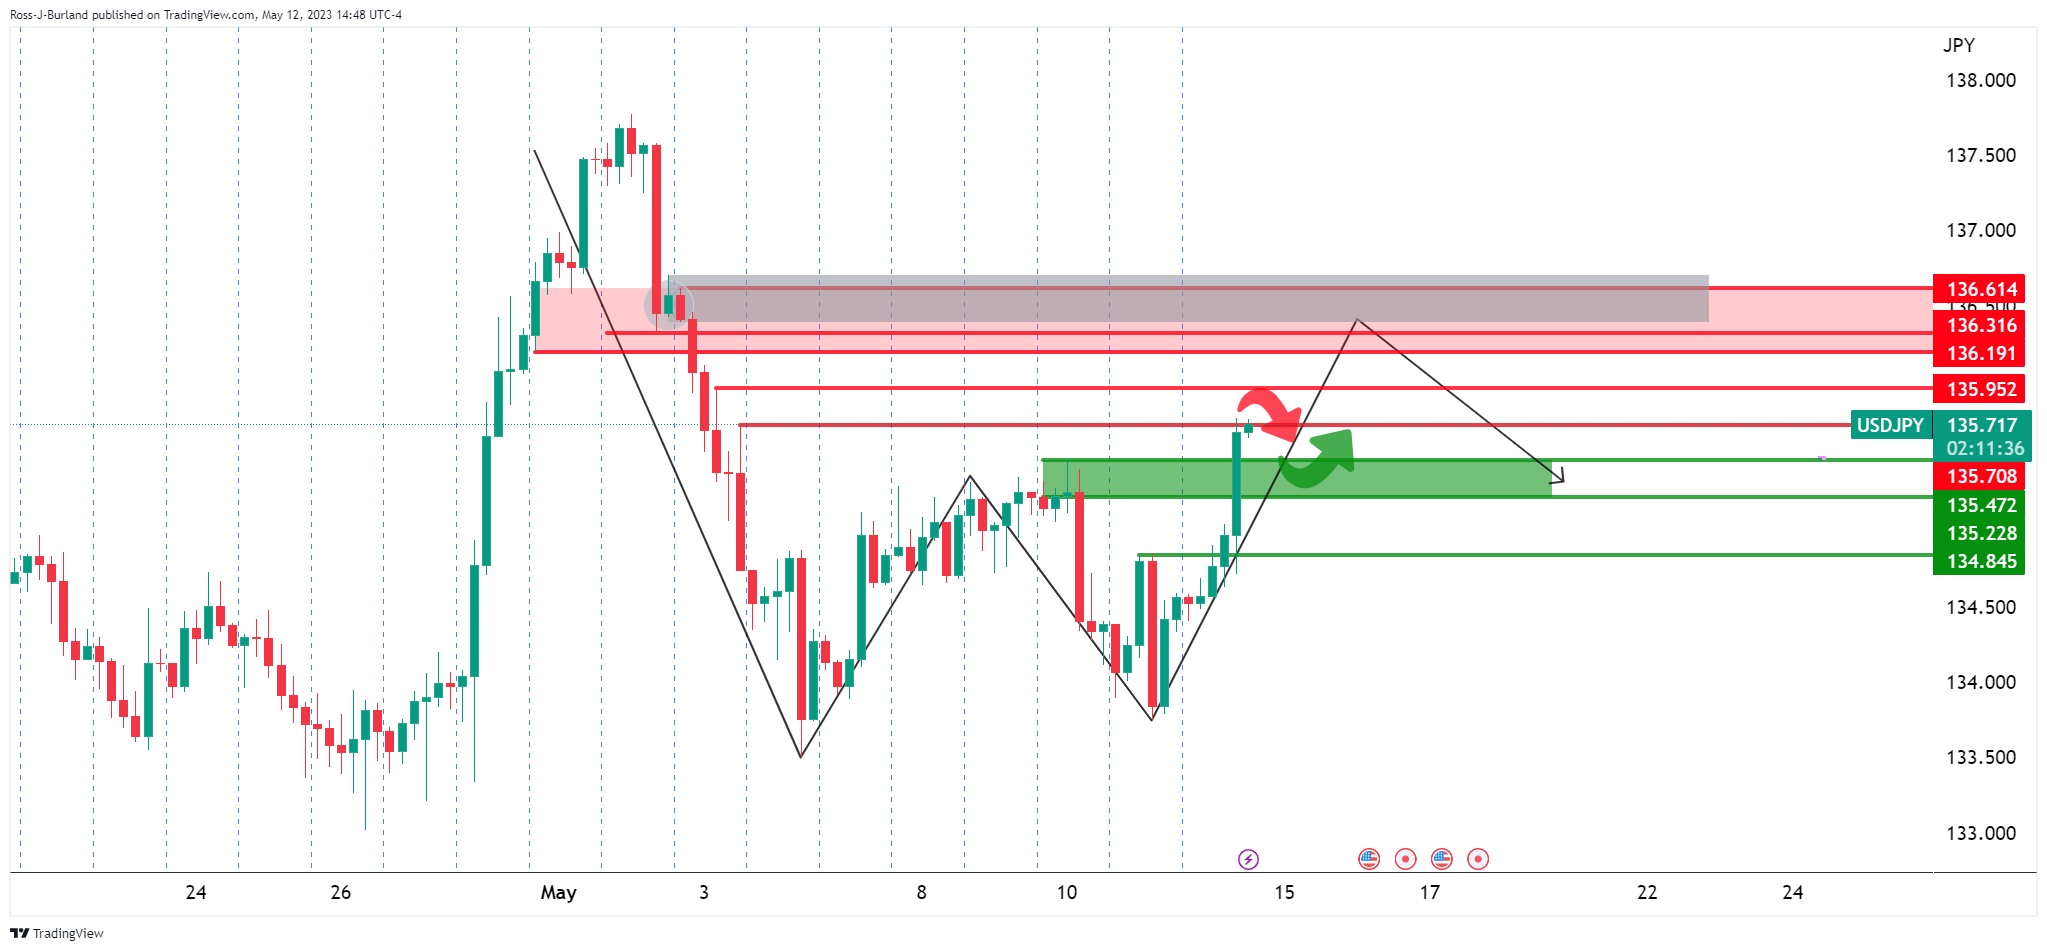
The rally could be regarded as a touch over-extended so late in the day and this may have run its course into the close.
The Board of Directors of the Bank of Canada (BoC) announced on Friday the appointment of Rhys R. Mendes as Deputy Governor, effective July 17, 2023.
“As Deputy Governor, Mr. Mendes will join the Bank’s Governing Council, which sets the strategic direction of the Bank and is its policy-making body. He will oversee the Bank’s economic and financial research, its analysis of international economic developments, and he will serve as the Bank’s G7 and G20 Deputy”, the BoC said in a statement.
The Governing Council makes the final decision regarding monetary policy.
- GBP/USD bears move into the 1.2450s that are holding up currently.
- 1.2480/2500 is eyed to the upside should the bulls take over.
GBP/USD is down on the day by some 0.45% and has fallen from a high of 1.2540 to a low of 1.2448 on the day as speculators continue to cut their short GBP positions. However, the pair is running into a potential area of support as the following technical analysis will illustrate:
GBP/USD daily chart

We have the last leg of the M-formation playing out on Friday. The M-formation is a reversion pattern and at some point, as the moment decelerates, bulls will be looking to buy in.
GBP/USD H1 chart
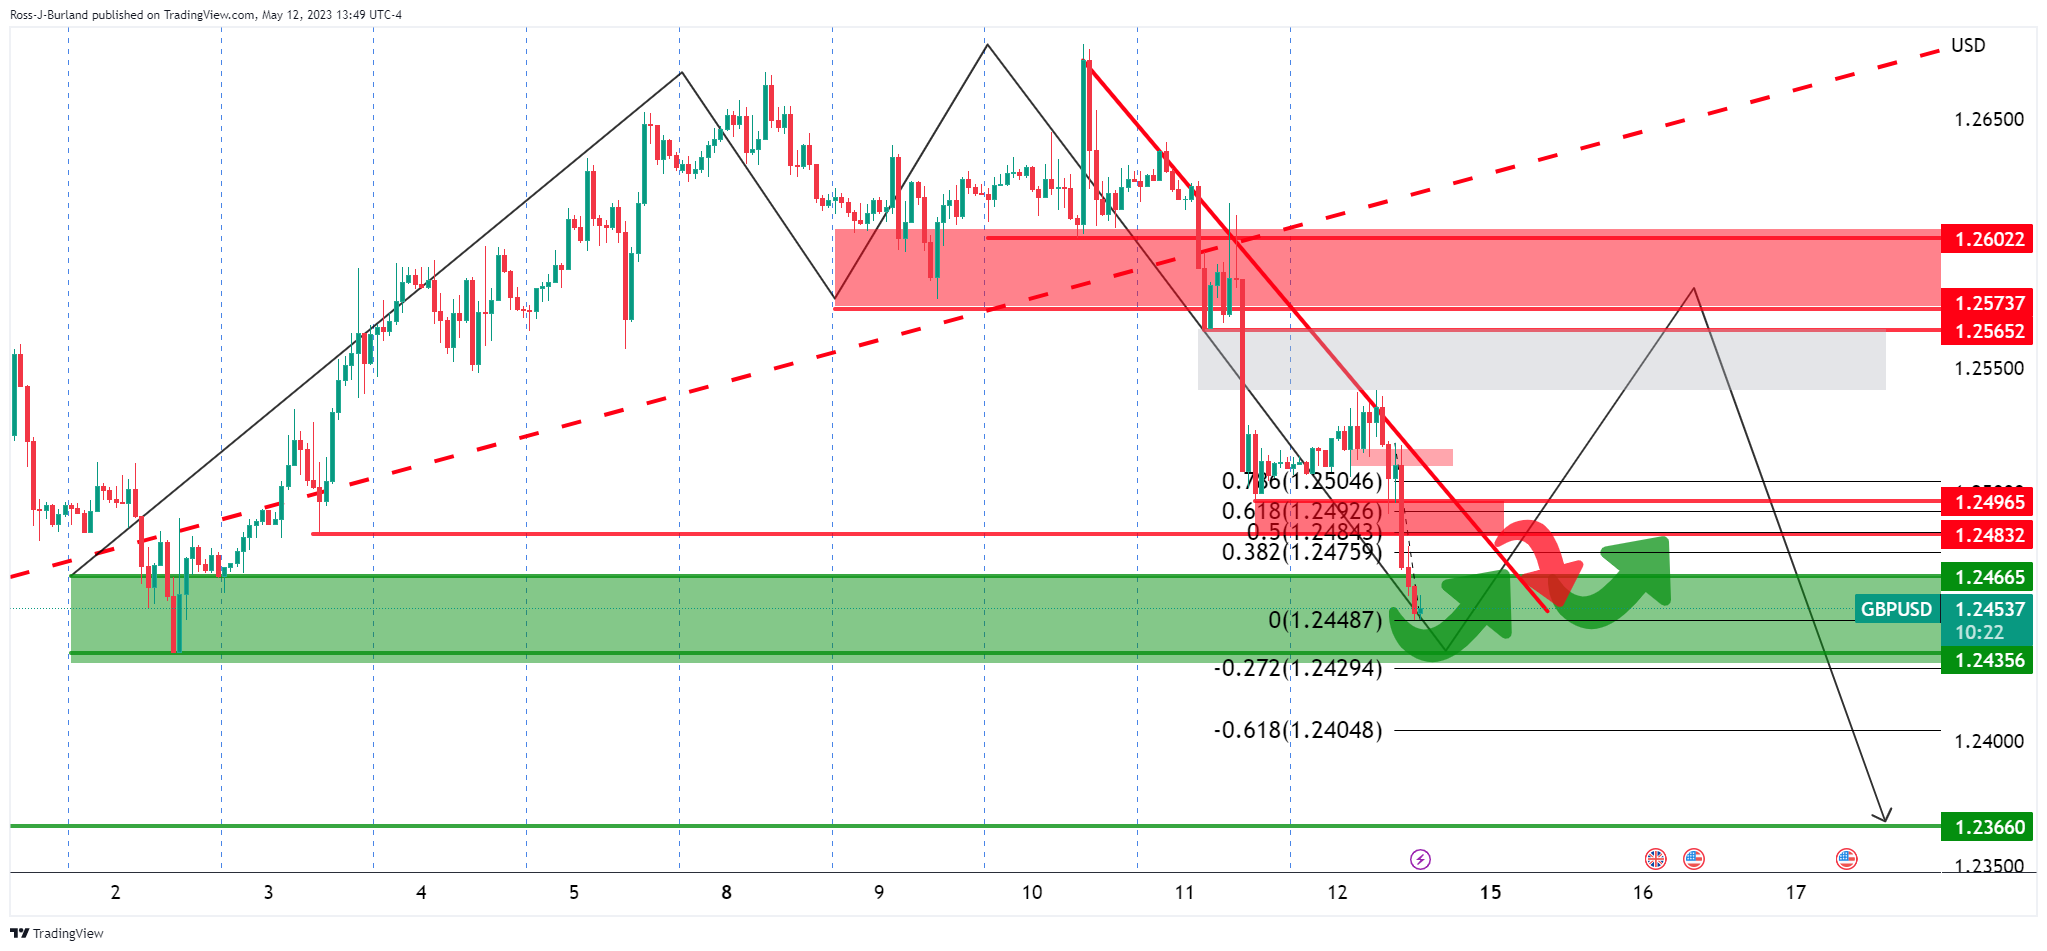
On the hourly time frame, we can see prospects of a move into the lows of the month, but the 1.2450s are holding-up currently. 1.2480/2500 is eyed to the upside should the bulls take over.
- US Dollar heads for important weekly gains across the board.
- Higher US yields and weaker sentiment weigh on EUR/USD.
- The pair is having its worst week since September 2022.
The EUR/USD is falling on Friday, the fourth time in the last five days, extending its weekly losses. The pair is hovering near 1.0850, at the lowest level in a month, consolidating a weekly loss of more than 150 pips.
The key driver is a stronger US Dollar across the board. The combination of a cautious tone in equity markets and higher US yields is boosting the Greenback.
The US Dollar Index is up by 0.60% on Friday, trading above 102.50, at the highest level in a month. The Dow Jones is down by 0.31% and the Nasdaq is dropping by 0.53%. The US 10-year stands at 3.44% and the 2-year is approaching 4%.
Short-term outlook
The Euro is having its worst week against the US Dollar since September 2022 so far. The short-term bias for EUR/USD is bearish. “The 1.0800 level is the natural immediate support, en route to 1.0745, the 61.8% retracement of the 2022 yearly decline. A break below the latter should open the door for a long-term USD rally. The 1.0980/1.1000 area will be a tough bone to break now, although if the pair manages to recover above it, 1.1100 is a possible target”, said Valeria Bednarik, Chief Analysts at FXStreet.
Technical levels
The Congressional Budget Office (CBO) projects that if the debt limit remains unchanged, “there is a significant risk that at some point in the first two weeks of June, the government will no longer be able to pay all of its obligations”. The CBO updated its budget outlook.
Key takeaways from the report:
“CBO estimates that if the limit is not raised or suspended, there is a significant risk that the Treasury will run out of funds at some point in the first two weeks of June.”
“CBO projects that if the debt limit remains unchanged, there is a significant risk that at some point in the first two weeks of June, the government will no longer be able to pay all of its obligations.”
“CBO’s updated baseline projections show a federal budget deficit of $1.5 trillion in 2023. Those projections reflect the assumption that current laws generally remain unchanged and that no further legislation affecting the federal budget is enacted this year.”
“Deficits generally increase over the coming years in CBO’s projections, totaling about $20 trillion over the 2024–2033 period. As a result of those deficits, debt held by the public grows significantly in CBO’s projections, rising from 98 percent of gross domestic product (GDP) this year to 119 percent in 2033—which would be the highest level of U.S debt ever recorded. Debt would continue to grow beyond 2033 if current laws generally remained unchanged.”
“The projected cumulative deficit for the 2024– 2033 period is now $51 billion greater than CBO estimated in February.”
The White House announced that President Biden has nominated Philip Jefferson for Vice Chair and Adriana Kugler as a Member on the Board of Governors of the Federal Reserve System. Biden has also announced that he will renominate Lisa Cook for an additional full term as a member.
The US Senate has to approve nominees for the Fed before they can take office.
- Australian Dollar under pressure due to risk aversion and lower commodity prices.
- US Dollar extends weekly gains despite weaker-than-expected US Consumer Sentiment data.
- The AUD/USD has lost another key support level after falling below 0.6680.
The AUD/USD accelerated to the downside after Wall Street's opening bell, as the US dollar strengthened and equity and commodity prices declined. The pair dropped to 0.6650, the lowest level in more than a week.
US data
The US Import and Export Price Index declined as expected, but less than forecast. The significant decrease in annual rates will help bring inflation closer to the Federal Reserve's target.
A separate report showed that the University of Michigan's Consumer Sentiment Index fell to 57.7 in May from 63 in April, below the 63.5 expected by market consensus.
The US Dollar briefly weakened after the Consumer Sentiment data, only to regain strength. The Greenback is trading at daily highs across the board, extending its weekly gains, supported by risk aversion. Commodity prices are weakening again, adding pressure to the Australian Dollar.
Extending the reversal
The AUD/USD peaked during the week at 0.6817, the highest level since February, before reversing its course. Over the last two days, it has lost more than a hundred pips, slipping below the 20-day Simple Moving Average (SMA).
On Friday, it broke below the 0.6680 support area. The next relevant support zone is around 0.6635; below this, attention will turn to 0.6600. To alleviate the bearish pressure, the Aussie needs to regain 0.6680 initially.
Next week's US data includes Retail Sales on Tuesday. In Australia, it will be a busy week with the release of the Reserve Bank of Australia minutes (Tuesday), the Wage Price Index (Wednesday) and Employment Change (Thursday).
Technical levels
After the strong rise over the last few months, the Gold price is close to its all-time high. But Gold is likely to come under pressure yet again, economists at Commerzbank report.
Gold to climb again towards the end of the year
“Gold is likely to come under pressure yet once again, as the expectations of interest rate cuts in the second half of the year should be disappointing. But since the rate cuts are probably only postponed, the price decline should be limited.”
“Towards the end of the year and next year, the Gold price is likely to rise again.”
“For the end of the year, we foresee a price of $2,050 and a further rise to $2,100 by the middle of next year.”
Strategists at ANZ Bank discuss Silver's (XAG/USD) outlook.
Institutional investors to come back this year
“Strong fundamental backdrop and macroeconomic challenges should see institutional investors coming back this year.”
“While some demand is likely to level-off, we estimate supply will fall short by 140moz (12% of demand).”
“We continue to hold our bullish view and expect Silver prices to reach $26 by the end of this year.”
“A break of $24 could turn market sentiment bearish.”
See – Gold Price Forecast: XAU/USD could trade in the unchartered territory of $2,100 – ANZ
The negotiations to avert the US default were postponed to next week at short notice. Economists at Commerzbank note that this issue is not a concern for FX markets at the moment.
Sentiment could change at any moment
“The fact that the Dollar appreciated yesterday proves that the USD reaction to a hypothetical US default would be anything but trivial, as the Dollar benefitted yesterday as a result of resurging fears about the stability of regional US banks, which underlines the significance of the USD as a safe haven currency.”
“This should not, however, lead to the conclusion that the subject of the US debt ceiling will remain of no concern to the FX market. Sentiment could change at any moment, and the likelihood of that happening increases the more the time of a possible default approaches. That means the currently low vol levels could constitute an attractive hedging possibility.”
- Long-run inflation expectations rose to their highest reading since 2011.
- US Dollar loses momentum, but remains in positive ground for the day.
Consumer sentiment in the US deteriorated in early May with the University of Michigan's (UoM) Consumer Confidence Index falling to 57.7 (preliminary) from 63.5 in April. This reading came in below the market expectation of 63.
“Consumer sentiment tumbled 9% amid renewed concerns about the trajectory of the economy, erasing over half of the gains achieved after the all-time historic low from last June,” the UoM noted in its report. “While current incoming macroeconomic data show no sign of recession, consumers’ worries about the economy escalated in May alongside the proliferation of negative news about the economy, including the debt crisis standoff.”
Inflation expectations for one year dropped from 4.6% to 4.5% in May. On the contrary, 5-year inflation expectations rose from 3.0% to 3.2%, the highest reading since 2011.
Market reaction
The US Dollar pulled back across the board after the report but remained in positive territory for the day. The DXY was up by 0.15%, trading at one-week highs.
- GBP/USD struggles to capitalize on its intraday uptick and meets with a fresh supply on Friday.
- The BoE’s less hawkish tilt overshadows slightly better UK macro data and undermines the GBP.
- The USD climbs to a nearly two-week high and further exerts downward pressure on the major.
The GBP/USD pair attracts fresh sellers following an early uptick to the 1.2540 region on Friday and drops to a one-and-half-week low during the early North American session. Spot prices slip below the 1.2500 psychological mark, with bears now awaiting a break below through the lower end of an ascending trend channel extending from the April swing low before placing fresh bets.
The British Pound continues to be undermined by the Bank of England (BoE) Governor Andrew Bailey's less hawkish comments on Thursday, indicating the possibility of a sharp fall in UK inflation. This, to a larger extent, overshadows mostly in-line UK GDP print for the first quarter of 2023 and the better-than-expected UK Manufacturing/Industrial Production figures for March. Apart from this, some follow-through US Dollar (USD) buying for the second straight day prompts some intraday selling around the GBP/USD pair.
In fact, the USD Index (DXY), which tracks the Greenback against a basket of currencies, hits a one-and-half-week high amid fears about a global economic slowdown. The market worries resurfaced following the mixed release of Chinese inflation figures and the US labor market report on Thursday. That said, concerns about the US debt ceiling, along with a generally positive tone around the equity markets, keeps a lid on any further gains for the safe-haven Greenback and lends support to the GBP/USD pair, at least for now.
The USD bulls also seem reluctant amid the uncertainty over the Federal Reserve's (Fed) next policy move. In fact, the US CPI report released earlier this week pointed to signs of easing inflationary pressures, which could allow the US central bank to pause its rate-hiking cycle. Investors, however, remain divided over the possibility of rate cuts later this year. This makes it prudent to wait for strong follow-through selling before positioning for an extension of the GBP/USD pair's pullback from over a one-year high, around the 1.2680 region touched earlier this week.
Technical levels to watch
Economist at the National Bank of Canada discard to invest in equities.
Sell in May and go away
“As the economic impact of the most aggressive monetary tightening cycle in a generation becomes more apparent in the second half of 2023, we believe equity prices are vulnerable to negative earnings surprises.”
“If history is any guide, a deeply inverted yield curve does not bode well for the economy. At this stage, we also don’t think that the Fed will meet current market expectations for rate cuts as early as this summer. That could be problematic for the S&P 500 given that it is already trading at a lofty level. This month, we are further reducing our equity allocation in favor of cash. This increase comes at the expense of US equities as we adopt a ‘sell in May and go away’ strategy.”
- WTI bounces off multi-day lows near $70.00.
- Traders remain divided between recession fears and Chinese recovery.
- Baker Hughes will publish its oil rig count later in the session.
Prices of the barrel of the West Texas Intermediate (WTI) cling to daily gains above the $71.00 mark following an earlier pullback to multi-session lows near the key $70.00 mark on Friday.
WTI looks at China, recession jitters
Crude oil prices now alternate gains with losses above the $71.00 mark and remain on track to close the first week with gains after three consecutive pullbacks.
In the meantime, the debate among traders remains well in place amidst the perception of an incipient US recession and dark clouds over the prospects for a Chinese recovery post-pandemic, while the still unresolved debt ceiling issue and unabated banking jitters also collaborate with the cautious scenario around the commodity for the time being.
A couple of news limiting the daily decline came from the announcement that the US government will start re-filling its SPR and the decrease to multi-month lows in Nigerian oil output during April.
Later in the NA session, Baker Hughes will publish its weekly report on the US drilling activity.
WTI significant levels
At the moment the barrel of WTI is up 0.11% at $71.47 and faces the next resistance at $73.83 (weekly high May 10) seconded by $76.92 (high April 28) and finally $79.14 (weekly high April 24). On the other hand, the breach of $63.97 (monthly low May 3) would open the door to $64.41 (2023 low March 20) and then $61.76 (monthly low August 23 2021).
- Gold rebounds despite stronger US Dollar.
- XAU/USD find support above $2,000 and rises erasing daily losses.
Gold prices rose significantly during the last hour, turning positive for the day. XAU/USD bottomed at $2,000, the lowest level in a week, before quickly rising to the $2,020 zone, where it remains at its daily highs with a bullish sentiment.
The move higher followed the release of the US Import and Export Price Index, which, as expected, showed notable declines from a year ago. These figures will help bring US inflation closer to the Federal Reserve's target. The next report to be released will be the US Consumer Confidence Index.
The move higher in Gold is taking place even as the US Dollar trades at daily and weekly highs against its main rivals. EUR/USD is below 1.0900, the lowest since mid-April, while AUD/USD holds below 0.6700, at one-week lows.
If XAU/USD continues to rise, the next resistance level is seen at $2,025, followed by the $2,045 area. A retreat below $2,010 would weaken the intraday outlook, exposing the $2,000 mark again.
Gold is headed toward a small weekly gain, the second in a row. The trend is up, but the fact that it is far from the weekly high and from the recent top indicates that the momentum is waning.
Technical levels
Day-to-day moves are fine, but the Dollar’s valuation is not, Kit Juckes, Chief Global FX Strategist at Société Générale, reports.
A Yen recovery is only a matter of waiting for the BoJ to act
“The current state of the global economy, or the state of global geopolitics, doesn’t, in our view, come anywhere close to justifying the USD holding on to so much of its 2021-2022 gains.”
“On a day-to-day basis, positioning, yield moves, geopolitical uncertainty and economic data trends all suggest we may be stuck in narrow ranges for a while. But the sense that the Dollar is simply too highly-valued here, isn’t going to be easy to shrug off. Nor is the sense that a Yen recovery is only a matter of waiting for the BoJ to act.”
Senior Economist at UOB Group Alvin Liew comments on the latest US inflation figures released on May 10.
Key Takeaways
“US headline consumer price index (CPI) increased by 0.4% m/m, 4.9% y/y in Apr (from 0.1% m/m, 5.0% y/y in Mar), the lowest headline reading, and the first below 5% inflation print since Apr 2021 (4.2%). However, core CPI (which excludes food and energy) proved to be stickier, as it rose sequentially at 0.4% m/m, (same as Mar), and compared to one year ago, it eased slightly to 5.5% y/y in Apr (from 5.6% in Mar).”
“US Inflation Outlook – For 2023, we still expect both headline and core inflation to ease to an average of 3.0%, and above the Fed’s 2% objective. Even as the shelter costs rose at a slower pace and food prices stayed flat for two months in a row, the latest CPI data showed that the balance of risk for US inflation remains far from being one-sided disinflation as reflected by surprise return of goods inflation and higher gasoline prices. Core and services inflation remain elevated (y/y) and rising (m/m), while the re-acceleration in Apr wage growth may still add to services cost pressure.”
Economists at Commerzbank expect the USD/BRL to move back higher amid Brazil's political issues.
BCB's hawkish stance remains under fire
“The BCB's hawkish stance is already fully priced into the USD/BRL exchange rate, which is why we see little further appreciation potential for the BRL. Rather, we are concerned that the FX market risks underestimating the consequences of increased government influence on monetary policy.”
“The BCB will find it increasingly difficult to provide a credible counterweight to a presumably more expansionary government, especially when BCB president Roberto Campos Neto's term ends at the end of 2024. This could affect the BCB's credibility in terms of sustainable inflation control, which is the main argument for our forecast of higher USD/BRL prices next year.”
“At present, the BRL is still benefiting from the still attractive real interest rate outlook, but we see increasing risks that the USD/BRL could turn faster than we expect.”
- USD/CAD touches a fresh weekly high on Friday, though remains below the 100-day SMA.
- Sliding Oil prices undermines the Loonie and lends support amid a modest USD strength.
- A positive risk tone caps the safe-haven buck and caps any further gains for the major.
The USD/CAD pair attracts some buying near the 1.3475 region on Friday and climbs to a fresh weekly high heading into the North American session. The pair is currently placed around the 1.3500 round-figure mark, up for the second straight day, with bulls now awaiting a move beyond the 100-day Simple Moving Average (SMA) before placing fresh bets.
Crude Oil prices remain under some selling pressure for the third successive day amid doubts over fuel demand this year, led by concerns about a global economic slowdown. The worries resurfaced following the release of the mixed Chinese inflation figures and weaker US labor market data on Thursday, which continue to weigh on the black liquid. This, in turn, is seen undermining the commodity-linked Loonie, which, along with some follow-through US Dollar (USD) buying, acts as a tailwind for the USD/CAD pair.
In fact, the USD Index (DXY), which tracks the Greenback against a basket of currencies, hits a nearly two-week high in the wake of a modest uptick in the US Treasury bond yields. That said, the uncertainty about the Federal Reserve's (Fed) next policy move might hold back the USD bulls from placing aggressive bets and cap gains for the USD/CAD pair. In fact, the US CPI report released earlier this week pointed to signs of easing inflationary pressures and might allow the Fed to pause its year-long rate-hiking cycle.
Investors, however, remain divided over the possibility of rate cuts later this year. Apart from this, concerns about the US debt ceiling and a generally positive risk tone might further contribute to keeping a lid on the safe-haven buck. This makes it prudent to wait for a sustained move beyond a technically significant 100-day SMA before positioning for an extension of the USD/CAD pair’s weekly rise from the 1.3315 region. Traders now look to the release of the Preliminary Michigan US Consumer Sentiment Index for a fresh impetus.
Technical levels to watch
- EUR/USD accelerates the decline and drops to 1.0890.
- The following contention area appears around 1.0830.
The pessimism around EUR/USD gathers further traction in the second half of the week and drags the pair back to the 1.0890 region, or multi-week lows, on Friday.
If bears remain in control, spot could initially revisit the interim 55-day SMA at 1.0847 ahead of the weekly low at 1.0831 (April 10).
Looking at the longer run, the constructive view remains unchanged while above the 200-day SMA, today at 1.0451.
EUR/USD daily chart
- Pound Sterling vs US Dollar falls by over 100 pips on “Super Thursday”.
- BoE Governor Bailey suggests inflation may show a sharp fall in April data, UK growth data paints a more optimistic picture.
- US Dollar strengthens on safe-haven flows after PacWest records large deposit outflows, renewing banking jitters.
The Pound Sterling (GBP) finds a floor after dropping off a cliff against the US Dollar (USD) on Thursday, following the Bank of England (BoE) monetary policy meeting. GBP/USD is currently trading in the lower 1.25s, trading slightly higher after UK GDP data confirms the country has averted a feared recession.
The pair fell on Thursday after the Bank of England published its decision, and deepened its decline following BoE Chairman Andrew Bailey’s dovish opening comments. Although it recovered later in the press conference as Bailey moderated his tone, GBP/USD ended the day just above 1.2500, as a further factor – renewed banking crisis woes – took its toll.
From a technical perspective, GBP/USD is showing short-term bearish signs but overall remains in a long-term uptrend, advantaging long over short holders.
GBP/USD market movers
- The Pound Sterling finds its feet after a sharp downswing following the release of UK GDP data, which it had been feared would show the UK falling into a recession.
- Quarterly GDP, however, came out positive at 0.1%, in line with estimates. GDP YoY showed a 0.2% rise, also in line with forecasts. The month-on-month figure, however, showed a below-expectations decline of -0.3% when a 0.1% rise had been expected.
- On Thursday, a combination of dovish commentary at the BoE meeting and renewed banking crisis fears, supporting safe-haven flows to the US Dollar, led to a sharp decline in GBP/USD on Thursday.
- GBP/USD initially fell following the BoE’s announcement of its decision by a vote of 7-2 (the same ratio as last meeting) to raise interest rates by 0.25% bringing the Bank Rate to 4.50%.
- The pair continued lower after BoE Chairman Andrew Bailey said, “The committee had good reason to believe headline inflation would fall considerably from April onwards”.
- Although the Pound Sterling recovered later when Bailey emphasized secondary effects and how “risks to inflation continue to be skewed to the upside as secondary effects persist”.
- GBP/USD renewed its sell-off after the US Dollar strengthened on safe-haven demand following the release of a securities filing by struggling US lender PacWest renewed US banking crisis fears. The filing revealed that the bank’s deposits had dropped nearly 10%, leading to a 20% sell-off in the bank's shares.
- Headline inflation in the UK is at 10.1% which is more than double the 4.9% reading in the US. US and UK Core inflation are more similar, however, with US at 6.2% versus 5.5% in the UK. Nevertheless it suggests the UK will have to continue raising rates after the Federal Reserve (Fed) has stopped. This should benefit GBP over USD as global investors favor currencies with higher interest rates to park their money.
- The CME Group FedWatch Tool is showing a 90% probability of no further interest rate hikes by the Fed.
- In addition, the Fed removed wording from its last statement saying that further monetary tightening would be appropriate if conditions warranted. The BoE, on the other hand, kept similar wording in its statement.
- The US Dollar is at risk from US debt ceiling default risk. US Treasury Secretary Janet Yellen warned on Thursday that a US default on a failure to raise the debt ceiling would produce an "economic and financial catastrophe." Most analysts believe this would be USD-negative.
- The main release for the US Dollar on Friday is Michigan Consumer Sentiment Index which is forecast to fall to 63.0 in May for its preliminary reading.
GBP/USD technical analysis: Shooting star reversal receives confirmation
GBP/USD sells off to 1.2500 and shows signs it may extend lower, however, this does not change the broadly bullish long-term picture. The uptrend remains intact as long as the 1.2435 May lows hold, and thus still favors Pound Sterling longs over shorts, for now.
-638194906504815376.png)
GBP/USD: Daily Chart
On Wednesday, the market formed a shooting star Japanese candlestick reversal pattern on GBP/USD, indicating the possibility of a short-term bearish reversal. The pattern gained confirmation after Thursday’s bearish close. The expectation is for more downside in the short-term, probably to support at the base of the rising channel/wedge, located at around 1.2475.
-638194906991617937.png)
GBP/USD: Daily Chart
The Relative Strength Index (RSI) is falling sharply after showing mild bearish divergence between price at the May peaks and RSI. This is indicative of underlying weakness, and further suggests more short-term downside.
That said, given the overall trend is bullish, the GBP/USD exchange rate will probably recover and continue rallying. The May 2022 highs at 1.2665 provide the first resistance level, but once breached they open the way to the 100-week Simple Moving Average (SMA) situated at 1.2713, and finally at the 61.8% Fibonacci retracement of the 2021-22 bear market, at 1.2758. All provide potential upside targets for the pair. Each level will need to be decisively breached to open the door to the next. Likewise for the bull trend to reverse, the 1.2435 lows will need to be decisively breached.
Decisive breaks are characterized by long daily candles that break through key resistance levels in question and close near their highs or lows of the day (depending on whether the break is bullish or bearish). Alternatively, three consecutive candles that break through the level can also be decisive. Such insignia provide confirmation that the break is not a ‘false break’ or bull/bear trap.
Pound Sterling FAQs
What is the Pound Sterling?
The Pound Sterling (GBP) is the oldest currency in the world (886 AD) and the official currency of the United Kingdom. It is the fourth most traded unit for foreign exchange (FX) in the world, accounting for 12% of all transactions, averaging $630 billion a day, according to 2022 data.
Its key trading pairs are GBP/USD, aka ‘Cable’, which < href="https://fxssi.com/the-most-traded-currency-pairs">accounts for 11% of FX, GBP/JPY, or the ‘Dragon’ as it is known by traders (3%), and EUR/GBP (2%). The Pound Sterling is issued by the Bank of England (BoE).
How do the decisions of the Bank of England impact on the Pound Sterling?
The single most important factor influencing the value of the Pound Sterling is monetary policy decided by the Bank of England. The BoE bases its decisions on whether it has achieved its primary goal of “price stability” – a steady inflation rate of around 2%. Its primary tool for achieving this is the adjustment of interest rates.
When inflation is too high, the BoE will try to rein it in by raising interest rates, making it more expensive for people and businesses to access credit. This is generally positive for GBP, as higher interest rates make the UK a more attractive place for global investors to park their money.
When inflation falls too low it is a sign economic growth is slowing. In this scenario, the BoE will consider lowering interest rates to cheapen credit so businesses will borrow more to invest in growth-generating projects.
How does economic data influence the value of the Pound?
Data releases gauge the health of the economy and can impact the value of the Pound Sterling. Indicators such as GDP, Manufacturing and Services PMIs, and employment can all influence the direction of the GBP.
A strong economy is good for Sterling. Not only does it attract more foreign investment but it may encourage the BoE to put up interest rates, which will directly strengthen GBP. Otherwise, if economic data is weak, the Pound Sterling is likely to fall.
How does the Trade Balance impact the Pound?
Another significant data release for the Pound Sterling is the Trade Balance. This indicator measures the difference between what a country earns from its exports and what it spends on imports over a given period.
If a country produces highly sought-after exports, its currency will benefit purely from the extra demand created from foreign buyers seeking to purchase these goods. Therefore, a positive net Trade Balance strengthens a currency and vice versa for a negative balance.
The NOK has reclaimed some ground vs. the EUR since the start of the month. A more hawkish Norges Bank should allow this month's recovery in the NOK vs. the EUR to extend a little further, economists at Rabobank report.
Risks of further Norges Bank rate hikes
“The market is currently priced for a peak in the policy rate of 3.53% suggesting that just one more 25 bps rate hike is fully priced in. By contrast market pricing suggests that the peak in ECB rates will be 44 bps above current levels.”
“A more hawkish Norges Bank could allow for EUR/NOK to push back towards the 11.40 level on a three-month view.”
The Dollar rebounded yesterday. Markets are set to remain very sensitive to US debt ceiling news into the weekend, and the Dollar’s support may linger barring positive developments.
Washington holds the key to the Dollar’s correction
“We still think investors are worryingly eyeing a scenario where it would ultimately take an adverse market reaction to break the impasse, and lack of any progress towards a deal can definitely continue to offer some support to the Dollar.”
“On the other hand, a benign scenario where a bipartisan deal has a positive impact on sentiment can leave the Dollar quite vulnerable given the quite aggressive rate cuts being priced into the USD curve, which the Dollar is not currently negatively discounting thanks to safe-haven demand.”
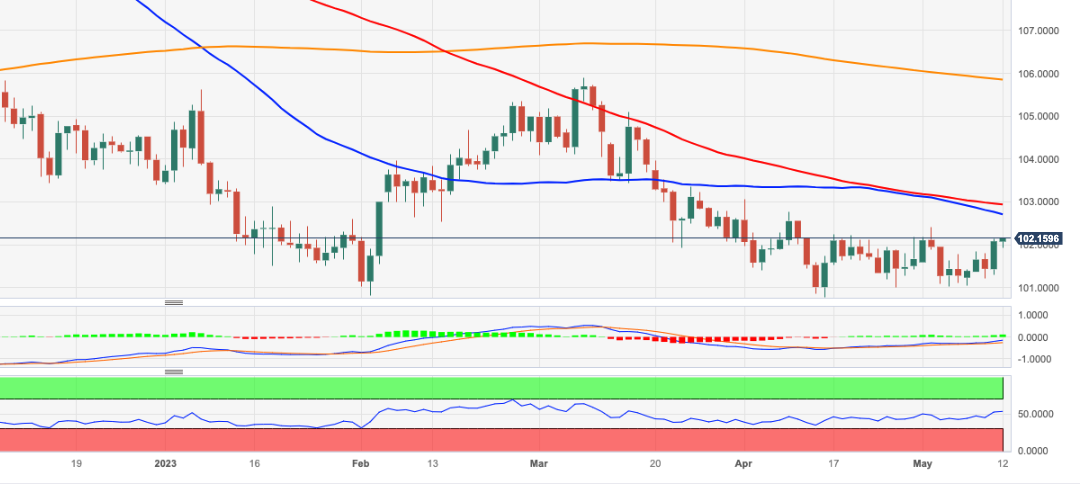
- DXY extends the advance further north of 102.00.
- Further upside should target the monthly high at 102.40.
DXY adds to the weekly recovery past the 102.00 mark on Friday.
A more serious bullish attempt should clear the monthly high at 102.40 (May 2) to mitigate the downside pressure and allow for a potential advance to the provisional 55- and 100-day SMAs at 102.70 and 102.93, respectively.
On the downside, there is a formidable contention around the 101.00 neighbourhood for the time being.
Looking at the broader picture, while below the 200-day SMA, today at 105.84, the outlook for the index is expected to remain negative.
DXY daily chart
Technically, Gold prices are consolidating near $2,020. If prices breach recent highs, strategists at ANZ bank expect Gold to advance towards $2,100.
Bullish trend remains intact
“The technical chart shows sustained bullish momentum, as the upward channel suggests a broad range of $1,900-2,100.”
“Prices face a key resistance at $2,062. A break above this level could trigger fresh technical buying, and prices could trade in the unchartered territory of $2,100.”
“On the downside, any disappointment on the rate hike front could pull prices back to the trend line support of $1,900.”
UOB Group’s Lee Sue Ann reviews the recently unveiled 2023/24 Federal Budget.
Key Takeaways
“The Labor government unveiled its Federal Budget 2023-24 late Tue (9 May) – the second budget since winning power in May 2022. These cost of living measures include AUD3bn of energy bill relief, AUD3.5bn on Medicare bulk billing incentives, AUD4.9bn for an across-the-board Jobseeker increase and increasing rent assistance by 15%. Other areas of focus include Medicare, improving aged care services and supporting the energy transition through incentives to small business for green investments and a AUD2bn Hydrogen Head Start program to develop the industry.”
“Australia’s GDP is expected to grow below trend over each of the next two years at 1.5% in 2023-24 and 2.25% in 2023-24. Inflation, which is currently at 7%, is forecast to fall to 3.25% next year. This inflation level returns to the Reserve Bank of Australia (RBA)’s target band for 2024-25. Real wage growth of 0.75% is expected for the year to Jun 2024, which is up half a point since the Oct budget. Unemployment is expected to rise from current lows to 4.25% by 202324 and 4.5% by 2024-25.”
“The AUD14.6bn suite of measures to help with the high cost of living are over four years. Threatening to eclipse the cost-of-living relief package was the surprising fact of the budget surplus, coming in at AUD4.2bn this financial year. This is the first surplus in 15 years, and the first since the 2007-08 Global Financial Crisis. The small surplus is a vast improvement from the AUD36.9bn deficit that the government predicted in its mini-Budget 2022-23 in Oct.”
- NZD/USD adds to the previous day’s heavy losses and drifts lower for the second straight day.
- Break below the 200-day SMA and the 50% Fibo. level could be seen as a fresh trigger for bears.
- An oversold RSI (14) on the hourly chart warrants caution before positioning for further losses.
The NZD/USD pair remains under intense selling pressure for the second successive day on Friday and retreats further from a nearly three-month top, around the 0.6380 region touched the previous day. Spot prices continue losing ground through the mid-European session and dive to over a one-week low, around the 0.6230 region in the last hour.
The New Zealand Dollar (NZD) is weighed down heavily by the Reserve Bank of New Zealand's (RBNZ) survey, which showed that inflation expectations for the first quarter eased to 2.79% from 3.30% in the previous quarter. This, in turn, lessens the need for further rate hikes by the RBNZ and prompts aggressive selling around the NZD/USD pair. Bulls, meanwhile, seem rather unimpressed by subdued US Dollar (USD) price action and a generally positive tone around the equity markets, which tends to benefit the risk-sensitive Kiwi.
From a technical perspective, a convincing break through the very important 200-day Exponential Moving Average (EMA), which coincides with the 50% Fibonacci retracement level of the April-May rally, could be seen as a fresh trigger for bearish traders. Adding to this, oscillators on the daily chart have just started drifting into negative territory and support prospects for a further depreciating move. That said, the Relative Strength (RSI) on the 1-hour chart is flashing extremely oversold conditions and warrants some caution for bears.
Hence, it will be prudent to wait for some intraday consolidation or a modest rebound before traders start positioning for any further depreciating move. Nevertheless, the aforementioned setup suggests that the path of least resistance for the NZD/USD pair is to the downside and any attempted recovery back above the 50% Fibo. level, around mid-0.6200s, might still be seen as a selling opportunity. This, in turn, should cap spot prices near a technically significant 200-day SMA, which should act as a pivotal for short-term traders.
On the flip side, any further downfall could find some support near the 61.8% Fibo. level, around the 0.6215 region. This is closely followed by the 0.6200 mark, below which the NZD/USD pair is likely to accelerate the fall towards the 0.6170-0.6165 intermediate support. Spot prices could drop further to the 0.6135 intermediate support before aiming to challenge the 0.6100 round figure or the April swing low.
NZD/USD daily chart
-638194866114914720.png)
Key levels to watch
USD has proven more resilient this week. The US Dollar Index (DXY) faces the next crucial resistance level at 102.40, economists at MUFG Bankr report.
More resilient price action as US debt ceiling comes into focus
“The DXY is rising back up to the 102.00 level as it moves further above the intra-day low from 4th May at 101.03. The next important resistance level comes in at 102.40 which is the intra-day high from 2nd May which is the top of its recent tight trading range.”
“The resilience of the US Dollar over the past week could reflect in part more investor unease over the global growth outlook.”
“The USD could be deriving more support in the near-term from more unease amongst market participants over risks to financial stability and growth posed by the ongoing loss of confidence in US regional banks and looming US debt ceiling stand-off that could be helping to temporarily disrupt the weakening US Dollar trend that has been in place driven by expectations of looser Fed policy.”
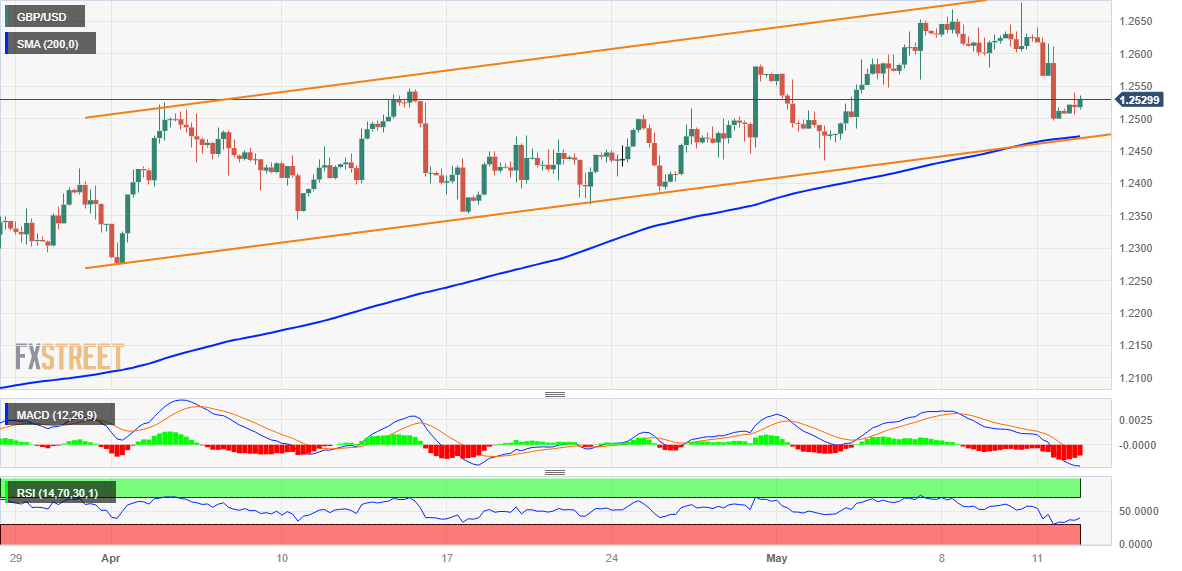
- GBP/USD bounce off a one-month-old ascending channel support, though lacks follow-through.
- The technical setup warrants some caution before positioning for any further near-term decline.
- A convincing break below the ascending channel support is needed to confirm a bearish break.
The GBP/USD pair attracts some buying near the 1.2500 psychological mark, which coincides with the lower end of a short-term ascending trend line extending from early April and recovers a part of the previous day's slump to over a one-week low. The pair sticks to its mildly positive tone, around the 1.2525-1.2530 region through the first half of the European session and for now, seems to have stalled a pullback from its highest level since April 2022 touched on Wednesday.
The US Dollar (USD) struggles to gain any meaningful traction and is seen consolidating the previous day's strong move up, which, in turn, is seen as a key factor lending some support to the GBP/USD pair. The upside, however, remains capped in the wake of the Bank of England (BoE) Governor Andrew Bailey's less hawkish remarks on Thursday, indicating the possibility of a sharp fall in UK inflation. This, to a larger extent, overshadows mostly in line UK GDP print for the first quarter of 2023 and the better-than-expected UK Manufacturing/Industrial Production figures for March.
From a technical perspective, the recent failure near the aforementioned trend-channel resistance and the subsequent downfall might have already shifted the near-term bias in favour of bearish traders. That said, oscillators on the daily chart - though have been losing positive traction - are still holding in the bullish territory. This, in turn, makes it prudent to wait for a convincing break below the 1.2500 mark, or the ascending trend-channel support, before positioning for any further depreciating move. The GBP/USD pair might then accelerate the slide towards the 1.2440-1.2435 region.
This is followed by the 1.2400 round figure, below which the downward trajectory could get extended further towards the next relevant support near the 1.2370-1.2465 region en route to the mid-1.2300s. The GBP/USD pair could eventually weaken further below the 1.2300 round-figure mark and test the 1.2275-1.2270 horizontal support.
On the flip side, any subsequent move-up is likely to confront stiff resistance near the 1.2550-1.2560 region. A sustained strength beyond will reaffirm the trend-channel support and trigger a near-term short-covering move. The GBP/USD pair might then aim to reclaim the 1.2600 round figure and test the 1.2635-1.2640 supply zone. The upward trajectory has the potential to push spot prices towards the 1.2700 mark, which coincides with the top end of the ascending channel. The latter should act as a pivotal point, which if cleared will be seen as a fresh trigger for bullish traders.
GBP/USD 4-hour chart
Key levels to watch
- EUR/JPY rebounds from earlier monthly lows near 146.00.
- Extra losses should not be ruled out of the time being.
EUR/JPY so far reverses three consecutive daily pullbacks and reclaims the area above the 147.00 mark on Friday.
The monthly leg lower looks unchallenged so far. Against that, the cross could now put the May low of 146.13 (May 11) to the test prior to the provisional 55-day SMA at 145.29.
So far, further upside looks favoured while the cross trades above the 200-day SMA, today at 143.00.
EUR/JPY daily chart
Economists at Commerzbank discuss ECB and Fed outlook and its implications for the EUR/USD pair.
The ECB appears to be more hawkish than the Fed
“Even if the ECB (as our ECB watcher expects) will only raise its key rate once more (in June), the EUR is likely to appreciate in the second half of the year if (as we expect) it becomes foreseeable that the Fed will cut its key rate, but the ECB will remain rock-solid on its ‘terminal rate’.”
“In the long run, however, EUR strength is unlikely to be sustainable. According to our economists, the ECB is likely to succeed in controlling inflation to a lesser extent than the Fed in the long term. Regardless of which of the two central banks offers the highest real interest rate on its respective currency, this is likely to result in the Euro suffering from an increased inflation risk premium.”
- US Dollar holds its ground following Thursday's decisive rebound.
- US Dollar Index stays near 102.00, looks to post strong weekly gains.
- US banking woes and debt ceiling headlines could continue to drive US Dollar's valuation.
The US Dollar benefited from souring risk mood on Thursday and registered strong gains against its major rivals. Markets stay relatively quiet early Friday and the US Dollar Index (DXY) consolidates its weekly gains.
Although there will not be any high-tier macroeconomic data releases from the United States ahead of the weekend, market participants will keep a close eye on headlines surrounding the banking crisis and the debt ceiling. Nevertheless, the US Dollar remains on track to register its best weekly performance since mid-March.
Daily digest market movers: US Dollar stays resilient for now
- Beth Hammack, Chair of the Treasury Borrowing Advisory Committee and Co-Head of Goldman's Global Financing Group, said recently that a political deadlock over the US debt ceiling poses a "real risk" for the USD.
- President Joe Biden and top Republican lawmakers have postponed the next round of negotiations on debt limit to next week.
- Securities filing submitted by PacWest revealed on Thursday that the bank's deposits dropped nearly 10% last week. As the bank's shares lost more than 20% following this development, the financial heavy Dow Jones Industrial Average lost nearly 0.7% on the day.
- Commenting on the Federal Reserve's (Fed) policy outlook, "inflation is coming down, but so far it's been pretty darn persistent, that means we are going to have to keep at it for an extended period of time," said Minneapolis Federal Reserve President Neel Kashkari.
- US Treasury Secretary Janet Yellen warned on Thursday that a US default on a failure to raise the debt ceiling would produce an "economic and financial catastrophe." On Friday, Yellen reassured that she is working full-time with Congress to raise debt ceiling.
- Fed Governor Christopher Waller said that they are worried about things like bank deposit runs, not climate change, when it comes to financial stability.
- The Core CPI inflation, which excludes volatile food and energy prices, edged lower to 5.5% in April from 5.6% in March as expected. On a monthly basis, the CPI and the Core CPI rose 0.4%, matching analysts' estimates.
- The BLS reported on Thursday that the Producer Price Index (PPI) for final demand in the US rose 2.3% on a yearly basis in April, down from the 2.7% increase recorded in March.
- The weekly data published by the US Department of Labor showed that Initial Jobless Claims totaled 264,000 in the week ending May 6. This print followed the previous week’s unrevised 242,000 and came in above the market expectation of 245,000.
- Commenting on the US inflation report, "the CPI report comes on top of the Nonfarm Payrolls (NFP) figures released less than a week ago, and together there is a compelling case for pausing," said FXStreet Analyst Yohay Elam. "Investors already see a growing chance of rate cuts, and that weighs on the Greenback."
- The CME Group FedWatch Tool shows that markets are pricing in a more than 80% probability of the Fed leaving its policy rate unchanged at the next policy meeting.
- The benchmark 10-year US Treasury bond yield fell nearly 2% on Thursday before stabilizing near 3.4% early Friday.
- Earlier in the week, the Fed noted in its Loan Officer Survey for the first quarter that respondents reported tighter standards and weaker demand for commercial and industrial (C&I) loans to large and middle-market firms. "Banks reported tighter standards and weaker demand for all commercial real estate loan categories," the publication further read.
- On Monday, Federal Reserve Bank of New York President John Williams told the Economic Club of New York on Tuesday that the Fed needs to be data-dependent with monetary policy and reminded that the Fed will raise rates again if needed.
Technical analysis: US Dollar Index holds above key support
The US Dollar Index (DXY) climbed above 102.00 for the first time on Thursday and closed the day above the 20-day Simple Moving Average after having failed to do so earlier this week. 102.50 (50-day SMA) aligns as the next bullish target for the DXY ahead of 103.00 (psychological level, 100-day SMA) and 103.60 (static level from February).
Meanwhile, the Relative Strength Index (RSI) indicator on the daily chart rose slightly above 50, pointing to a buildup of bullish momentum.
On the downside, 101.65 (20-day SMA) forms first support. A daily close below that level could attract sellers and open the door for an extended decline toward 101.00 (static level, psychological level) and 100.00.
How does Fed’s policy impact US Dollar?
The US Federal Reserve (Fed) has two mandates: maximum employment and price stability. The Fed uses interest rates as the primary tool to reach its goals but has to find the right balance. If the Fed is concerned about inflation, it tightens its policy by raising the interest rate to increase the cost of borrowing and encourage saving. In that scenario, the US Dollar (USD) is likely to gain value due to decreasing money supply. On the other hand, the Fed could decide to loosen its policy via rate cuts if it’s concerned about a rising unemployment rate due to a slowdown in economic activity. Lower interest rates are likely to lead to a growth in investment and allow companies to hire more people. In that case, the USD is expected to lose value.
The Fed also uses quantitative tightening (QT) or quantitative easing (QE) to adjust the size of its balance sheet and steer the economy in the desired direction. QE refers to the Fed buying assets, such as government bonds, in the open market to spur growth and QT is exactly the opposite. QE is widely seen as a USD-negative central bank policy action and vice versa.
BoE offered few reasons to turn bearish on the Pound, in the opinion of economists at ING.
EUR/GBP should climb back to 0.9000 in the second half of the year
“The BoE retained its flexibility and kept the door open for more rate hikes if inflation proves persistent. While we don’t exclude one final June hike, our base case is that we have reached the peak of the BoE tightening cycle as inflation will start to rapidly decelerate this year.”
“Still, the Sonia curve continues to price in around 38bp of tightening to the peak, which leaves the pound at risk of a rate-driven negative impact down the stretch. We feel this will materialise in EUR/GBP, which should climb back to 0.9000 in the second half of the year as EUR and GBP rates re-converge, in our projections.”
“For now, however, there aren’t many convincing reasons to call for GBP underperformance against its main peers in the near term.”
- AUD/USD drifts lower for the second successive day and hits a fresh weekly low on Friday.
- Worries about a global economic slowdown drive flow away from the risk-sensitive Aussie.
- A positive risk tone undermines the safe-haven USD and helps limit losses for the major.
The AUD/USD pair adds to the previous day's heavy losses and remains under some selling pressure for the second successive day on Friday. The pair maintains its offered tone through the first half of the European session and is currently placed just below the 0.6700 mark, with bears flirting with the 50-day Simple Moving Average (SMA).
Concerns about a global economic slowdown resurfaced on Thursday following the release of the mixed Chinese inflation figures and weaker US labor market report, which, in turn, is seen as a key factor weighing on the risk-sensitive Aussie. The US Dollar (USD), on the other hand, is seen consolidating the previous day's strong gains to over a one-week high and draws some support from a modest uptick in the US Treasury bond yields. This, in turn, exerts additional downward pressure on the AUD/USD pair, though the downside seems limited.
The uncertainty over the Federal Reserve's (Fed) next policy move is holding back the USD bulls from placing aggressive bets. In fact, the US CPI report released earlier this week pointed to signs of easing inflationary pressure and could allow the US central bank to pause its year-long rate-hiking cycle. Investors, however, remain divided over the possibility of rate cuts later this year. This, along with a generally positive tone around the equity markets, keeps a lid on any further gains for the safe-haven buck and lends support to the AUD/USD pair.
Apart from this, the Reserve Bank of Australia's (RBA) hawkish outlook, indicating that some further tightening of monetary policy may be required to ensure that inflation returns to target in a reasonable time, warrants caution for bearish traders. Hence, it will be prudent to wait for strong follow-through selling before positioning for an extension of this week's rejection slide from the 100-day SMA. Nevertheless, the AUD/USD pair remains on track to end the week in the red and reverse a major part of its gains recorded over the past week or so.
Technical levels to watch
According to Economist Lee Sue Ann and Markets Strategist Quek Ser Leang at UOB Group, further upside in USD/CNH is likely to meet tough hurdles at 6.9700 prior to 7.0000 in the next few weeks.
Key Quotes
24-hour view: “We did not expect USD to soar to a high of 6.9640 yesterday (we were expecting it trade in a range). The rapid increase in momentum is likely to lead to further USD strength even though the major resistance at 6.9750 is likely out of reach today. Support is at 6.9480; a breach of 6.9400 would indicate that USD is not advancing further.”
Next 1-3 weeks: “Yesterday (11 May, spot at 6.9330), we indicated that ‘there does not appear to be any directional bias and for the time being’ and we expected USD to ‘trade in a range of 6.9100/6.9630’. We did not expect USD to rise so quickly to the top of the expected range (high of 6.9640). Upward momentum is beginning to build and USD is likely to trade with an upward bias. However, it is worth noting the resistance at 6.9750 and the significant level at 7.0000. On the downside, a breach of 6.9250 would suggest USD is not ready to head higher.”
- USD/JPY gains traction for the second straight day, albeit lacks any follow-through.
- A combination of factors undermines the JPY and acts as a tailwind for the major.
- The USD stands tall near a one-week high and remains supportive of the move up.
The USD/JPY pair builds on the overnight goodish rebound from the 133.75 region, or a one-week low. and gains some follow-through traction for the second successive day on Friday. The pair maintains its bid tone through the early part of the European session and is currently placed around the 134.70 region, up over 0.20% for the day.
A generally positive tone around the equity markets, along with the Bank of Japan's (BoJ) dovish outlook, undermines the safe-haven Japanese Yen (JPY) and turns out to be a key factor acting as a tailwind for the USD/JPY pair. It is worth recalling that the BoJ Governor Kazuo Ueda, speaking in parliament earlier this week, said it was too early to discuss specific plans for an exit from the massive stimulus programme.
The US Dollar (USD), on the other hand, reverses a modest intraday dip and stands tall near a one-and-half-week high touched on Thursday, which, in turn, lends additional support to the USD/JPY pair. The uncertainty over the Federal Reserve's (Fed) next policy move, along with a modest uptick in the US Treasury bond yields, continue to underpin the Greenback, though the US debt ceiling concerns act as a headwind.
The US CPI report released earlier this week pointed to signs of easing inflationary pressure and reaffirmed market expectations about an imminent pause in the Fed's year-long rate-hiking cycle. Investors, however, remain divided over the possibility of rate cuts later this year. This, in turn, holds back the USD bulls from placing aggressive bets and might keep a lid on any meaningful upside for the USD/JPY pair, at least for now.
Market participants now look forward to the release of the Preliminary Michigan Consumer Sentiment Index from the US, due later during the early North American session. This, along with the US bond yields, will influence the USD price dynamics and provide some impetus to the USD/JPY pair. Apart from this, traders will take cues from the broader risk sentiment to grab short-term opportunities on the last day of the week.
Technical levels to watch
During his visit to Beijing on Friday, Australian Trade Minister Don Farrell said that he “can see the benefits for Australian and Chinese businesses and consumers that continue to flow from the China-Australia free trade agreement.”
“We still have some way to go to establish usual trade across the board,” Farrell said.
Market reaction
AUD/USD is a little impressed by the above comments, staying on the back foot just beneath 0.6700, as of writing.
Downward bias continues to pick up pace in USD/JPY comment Economist Lee Sue Ann and Markets Strategist Quek Ser Leang at UOB Group.
Key Quotes
24-hour view: “While we expected USD to weaken yesterday, we indicated that ‘a clear break of last week’s low near 133.50 is unlikely’. USD dropped briefly to 133.73 in early NY trade and then rebounded. USD appears to have moved into a consolidation phase and it is likely to trade in a range of 134.00/135.00 today.”
Next 1-3 weeks: “There is not much to add to our update from yesterday (11 May, spot at 134.20). As highlighted, while downward momentum is building again, the likelihood of USD dropping to 133.00 has not increased much. On the upside, a break of 135.50 (no change in ‘strong resistance’ level) would indicate 133.00 is not coming into view.”
US Treasury Secretary Janet Yellen said on Friday that “they will be meeting with senior bankers on debt ceiling next week.”
Additional quotes
“Will be meeting with senior bankers on debt ceiling next week.”
“Working full-time to work with Congress to raise debt ceiling.”
“If Congress fails, we face financial and economic catastrophe.”
Related reads
- Forex Today: US Dollar consolidates weekly gains ahead of mid-tier data
- US Treasury yields to rise amid debt ceiling standoff – Reuters poll
FX option expiries for May 12 NY cut at 10:00 Eastern Time, via DTCC, can be found below.
- EUR/USD: EUR amounts
- 1.1100 896m
- 1.1050 696m
- 1.1020 567m
- GBP/USD: GBP amounts
- 1.2430 301m
- USD/JPY: USD amounts
- 135.00 1.31b
- 133.00 981m
- 125.00 875m
- AUD/USD: AUD amounts
- 0.6740 742m
- USD/CAD: USD amounts
- 1.3700 821m
- 1.3500 770m
- 1.3250 737m
- USD/CNY: USD amounts
- 6.9447 491m
- 6.9000 438m
Federal Reserve (Fed) Governor Michelle Bowman said Friday, “policy rate will need to remain sufficiently restrictive for some time.”
Additional quotes
Additional rate hikes 'likely appropriate' if inflation stays high, labor market stays tight.
Policy is now restrictive but uncertain if it is sufficiently restrictive to bring down inflation.
Inflation is still much too high.
Policy action is not on a pre-set course.
Recent data have not provided consistent evidence that inflation is on a downward path.
Market reaction
The US Dollar Index is trading almost unchanged on the day at 102.07, having caught a fresh bid on the above comments.
Speaking on the sidelines of a Group of Seven (G7) meeting in Japan, European Central Bank (ECB) policymaker and Bundesbank Chief Joachim Nagel said on Friday, the latest interest rate hike won't be the last as it needs to ensure the current wave of inflation comes to an end.
Key quotes
“Current data did not indicate that the ECB should change its thinking on the need for further rate hikes.”
"We need to be sure that the latest inflation wave ends.”
Market reaction
Despite the hawkish comments from Nagel, EUR/USD is erasing gains to trade flat at 1.0910, as of writing.
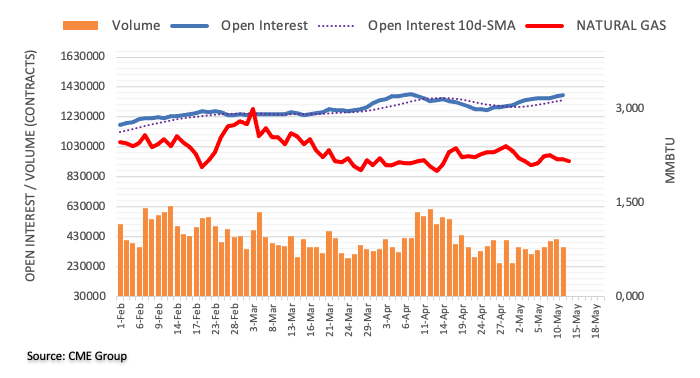
Considering advanced prints from CME Group for natural gas futures markets, open interest rose for the third straight session on Thursday, now by around 3.6K contracts. Volume, on the other hand, dropped by nearly 50K contracts after four daily builds in a row.
Natural Gas: Immediately to the downside emerges $2.00
On Thursday, natural gas prices fell even lower. The move was prompted by growing open interest and dropping volume, which maintains the current broad consolidative theme for the time being. Meanwhile, the important $2.00 mark per MMBtu has been a significant support for the commodity thus far.
- EUR/USD regains some balance and rebounds from 1.0900.
- The greenback appears slightly offered following recent strength.
- Investors’ attention will be on the flash US Consumer Sentiment.
Following fresh multi-week lows in the 1.0900 neighbourhood, EUR/USD now manages to pick up some upside traction and reclaims the 1.0930 zone on Friday.
EUR/USD looks bid on risk-on mood
EUR/USD partially reverses Thursday’s strong decline to the 1.0900 area on the back of the better tone in the risk complex, which in turn forces the Greenback to give away some of its recent strong gains.
The uptick in the pair, as well as the improvement in the risk appetite, appears also reflected in the US and German money markets, where yields reverse part of the recent weakness and attempt a tepid bounce.
Around the ECB, usual hawk Board member J. Nagel reiterated that inflation remains too high and advocated for a faster pace of the quantitative tightening (QT) process from July.
Nothing to write home about from the euro docket on Friday should leave the attention to the release of the advanced Michigan Consumer Sentiment for the current month later in the NA session.
What to look for around EUR
EUR/USD attempts a mild rebound following the reversal to 4-week lows in the 1.0900 neighbourhood recorded on Thursday.
The movement of the euro's value is expected to closely mirror the behaviour of the US Dollar and will likely be impacted by any differences in approach between the Fed and the ECB with regards to their plans for adjusting interest rates.
Moving forward, hawkish ECB-speak continue to favour further rate hikes, although this view appears in contrast to some loss of momentum in economic fundamentals in the region.
Eminent issues on the back boiler: Continuation (or not) of the ECB hiking cycle. Impact of the Russia-Ukraine war on the growth prospects and inflation outlook in the region. Risks of inflation becoming entrenched.
EUR/USD levels to watch
So far, the pair is gaining 0.06% at 1.0921 and the surpass of 1.1095 (2023 high April 26) would target 1.1100 (round level) en route to 1.1184 (weekly high March 21 2022). Conversely, the next contention level emerges at 1.0899 (monthly low May 11) seconded by 1.0831 (monthly low April 10) and finally 1.0798 (100-day SMA).
- NZD/USD drifts lower for the second successive day and dives to over a one-week low on Friday.
- Worries about a global economic slowdown continue to weigh heavily on the risk-sensitive Kiwi.
- A modest USD downtick lends support, though the fundamental backdrop favours bearish traders.
The NZD/USD pair extends the previous day's sharp retracement slide from the 0.6385 region, or a nearly three-month high and remains under heavy selling pressure for the second successive day on Friday. The pair drops to over a one-week low during the early European session, albeit shows some resilience below a technically significant 200-day Simple Moving Average (SMA) and currently trades around the 0.6260-0.6250 area, still down over 0.60% for the day.
The mixed Chinese inflation data and a weaker US labor market report released on Thursday raised concerns about a global economic slowdown, which, in turn, is seen as a key factor driving flows away from the risk-sensitive Kiwi. That said, a modest uptick in the US equity futures and a softer US Dollar hold back traders from placing fresh bearish bets around the NZD/USD pair. Apart from this, expectations for further rate hikes by the Reserve Bank of New Zealand (RBNZ) lend some support to the major, at least for the time being.
The USD downtick, meanwhile, is likely to remain cushioned amid the uncertainty over the Federal Reserve's (Fed) next policy move. The US CPI report released on Wednesday pointed to further signs of easing inflationary pressures and should allow the US central bank to pause its year-long rate-hiking cycle. Investors, however, remain divided over the possibility of a rate cut later this year. This, in turn, acts as a tailwind for the US Treasury bond yields, which should limit the USD losses and cap any intraday recovery for the NZD/USD pair.
The aforementioned fundamental backdrop supports prospects for a further near-term depreciating move, though traders need to wait for a break and acceptance below the 200 DMA is needed before placing fresh bearish bets. Market participants now look to the release of the Preliminary Michigan Consumer Sentiment Index from the US later during the early North American session. This, along with the broader risk sentiment and the US bond yields, will influence the USD price dynamics and provide some impetus to the NZD/USD pair.
Technical levels to watch
In the opinion of Economist Lee Sue Ann and Markets Strategist Quek Ser Leang at UOB Group, AUD/USD is now likely to navigate within the 0.6630-0.6780 range in the next few weeks.
Key Quotes
24-hour view: “Yesterday, we highlighted that ‘while upward momentum has not improved much, AUD could retest the 0.6820 level before a more sustained pullback is likely’. However, instead of retesting 0.6820, AUD plunged by 1.13% (0.6702), its biggest 1-day drop since early March. Not surprisingly, the outsized drop is oversold. That said, the weakness has not stabilized and barring a break above 0.6745 (minor resistance is at 0.6725), AUD could drop further to 0.6670 before stabilization is likely. The major support at 0.6635 is not expected to come under threat.”
Next 1-3 weeks: “We have held a positive AUD view since last Wednesday, 03 May (see annotations in the chart below). After AUD rose to 0.6818 and pulled back, we highlighted yesterday (11 May, spot at 0.6780) that ‘while the outlook for AUD is still positive, it remains to be seen if it has enough momentum to advance to the next objective of 0.6860’. We did not expect the sharp reversal as AUD plummeted below our ‘strong support’ level of 0.6720 in NY trade (low of 0.6689). The breach of 0.6720 indicates that AUD strength has ended. Despite the sharp drop, it is too early to expect a major reversal in AUD. For the time being, the bias is tilted to the downside but we view any AUD weakness as part of a 0.6630/0.6780 range. In other words, a sustained drop below 0.6630 is unlikely for now.”
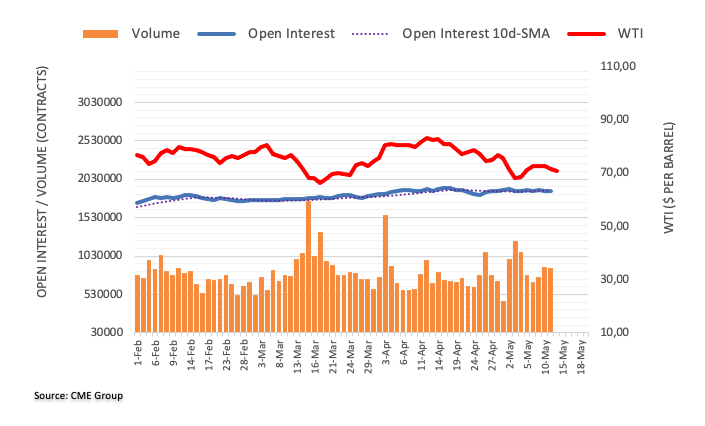
CME Group’s flash data for crude oil futures markets noted traders reduced their open interest positions for the second session in a row on Thursday, this time by nearly 3K contracts. In the same line, volume shrank by around 9.1K contracts after two daily pullbacks in a row.
WTI: Upside remains capped by $74.00
Thursday’s daily decline in prices of the WTI came along declining open interest and volume, hinting at the idea that a deeper correction seems out of favour for the time being. On the upside, in the meantime, gains remain limited by the $74.00 region per barrel.
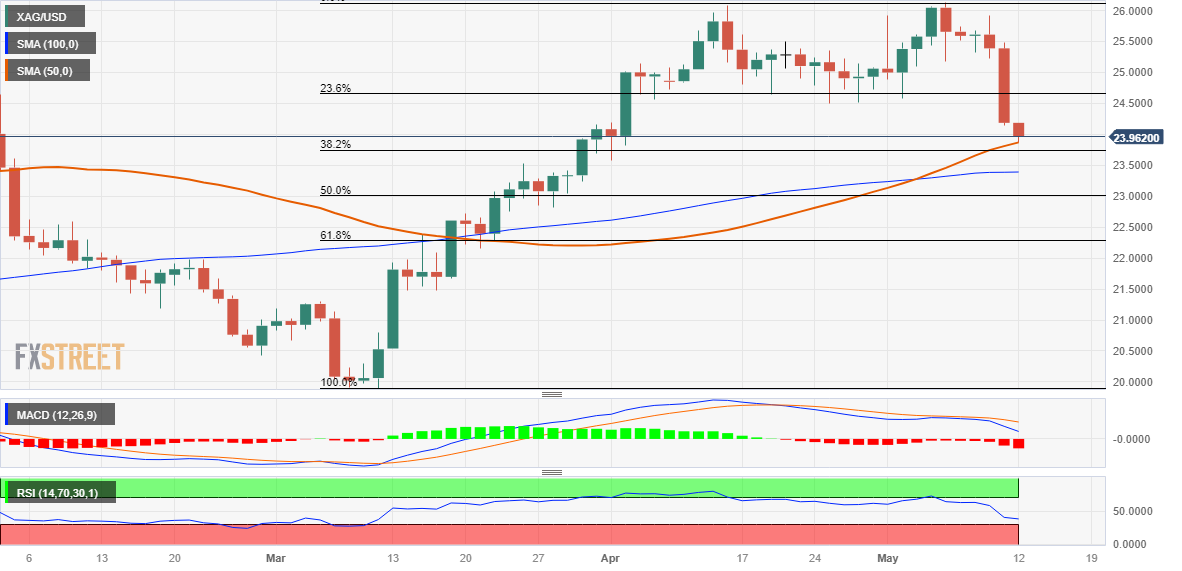
- Silver drifts lower for the third successive day and hits over a one-month low on Friday.
- The overnight breakthrough the $24.50-40 horizontal support favours bearish traders.
- Some follow-through selling below the 38.2% Fibo. will set the stage for deeper losses.
Silver remains under some selling pressure for the third successive day on Friday and drops to sub-$24.00 levels, or over a one-month low heading into the European session.
From a technical perspective, the recent repeated failures near the $26.00 round-figure mark and the subsequent steep break through the $24.50-$24.40 strong horizontal support favours bearish traders. Moreover, oscillators on the daily chart are holding deep in the negative territory and are still far from being in the oversold zone. This might have already set the stage for a further near-term depreciating move for the XAG/USD.
The white metal, however, manages to find some support near the 50-day Simple Moving Average (SMA). This is followed by the 38.2% Fibonacci retracement level of the March-April rally, around the $23.75-$23.70 area, which if broken will reaffirm the negative bias. The XAG/USD might then test the 100-day SMA, currently pegged near the $23.40-$23.45 area, before eventually dropping to the 50% Fibo. level, around the $23.00 mark.
On the flip side, any meaningful recovery attempt might now confront stiff resistance near the $24.40-$24.40 support breakpoint, which coincides with the 23.6% Fibo. level. A sustained strength beyond could negate the bearish outlook and lift the XAG/USD to the $25.00 psychological mark en route to the $25.55-$25.60 resistance. Bulls might then make a fresh attempt to conquer the $26.00 mark and test the YTD peak, around the $26.10-$26.15 area.
Silver daily chart
Key levels to watch
Economists at ING expect the EUR/USD pair to eventually break under the 1.09 level.
No domestic drivers
“EUR/USD continues to follow primarily USD dynamics, and a quiet calendar in the Eurozone means this should continue to be the case today.”
“For now, the USD appreciation was not enough to trigger a break below 1.0900 in the pair, but the lack of some encouraging news on the US debt ceiling story means –in our view – that 1.0900 will hardly prove to be a sturdy support for much longer.”
“ECB speakers have had a limited impact on the Euro after the latest ECB meeting and this should not change for now.”
- Gold price snaps two-week winning streak, slides beneath $2,030 confluence level.
- US debt ceiling talks, banking woes join hawkish Fed bets to propel US Dollar and weigh on XAU/USD.
- US policymakers will gather early next week to overcome default fears, Fed’s Powell also up for a speech.
Gold price (XAU/USD) prints a three-day downtrend to recall the bears, after their fortnight-old recess, as mixed sentiment allows the US Dollar to remain firmer. Adding strength to the XAU/USD bearish bias could be the fears of US debt ceiling expiry after the policymakers pushed back the much-awaited talks of Friday to early next week. On the same line are the fears of witnessing an economic slowdown as US bank deposits slump.
It should be noted, however, that the hopes of recovery in China inflation and the US policymakers’ optimism challenge the Gold bears ahead of some more clues of the US inflation, which in turn can justify the latest hawkish Fed concerns. Apart from the US inflation signals, the next week’s US Retail Sales and a speech from Federal Reserve (Fed) Chairman Jerome Powell will also be important to watch for near-term Gold price moves.
Also read: Gold Price Forecast: For how long can XAU/USD defend 21 DMA support?
Gold Price: Key levels to watch
As per our Technical Confluence Indicator, the Gold price remains bearish below the key $2,025 support confluence comprising the middle band of the Bollinger on the four-hour (4H) play and Fibonacci 23.6% on one month.
That said, the metal recently slipped beneath the $2,010 level and pleased bears to cheer the first weekly loss in three. The said support, now immediate resistance, encompasses Fibonacci 38.2% on one-month, previous daily low and lower band of the Bollinger on the four-hour chart.
It’s worth noting that 5-DMA and Fibonacci 38.2% on one-day together highlight $2,023 as a short-term key upside hurdle.
Meanwhile, there prevails a smooth road towards the south for the Gold price even as it flirts with the $2,000 round figure. That said, Pivot Point one-day S2 acts as an extra downside filter around $1,990.
Following that, Fibonacci's 61.8% level on one-month can act as the last defense of the Gold buyers near $1,985.
Here is how it looks on the tool
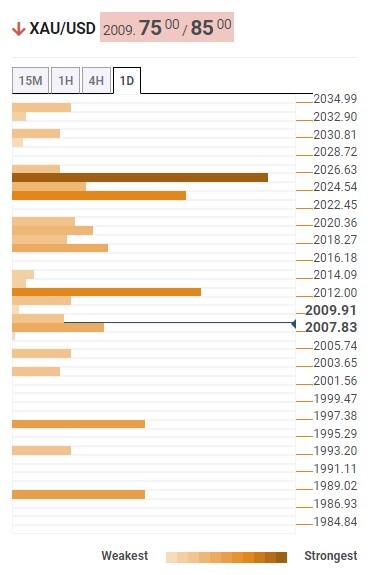
About Technical Confluences Detector
The TCD (Technical Confluences Detector) is a tool to locate and point out those price levels where there is a congestion of indicators, moving averages, Fibonacci levels, Pivot Points, etc. If you are a short-term trader, you will find entry points for counter-trend strategies and hunt a few points at a time. If you are a medium-to-long-term trader, this tool will allow you to know in advance the price levels where a medium-to-long-term trend may stop and rest, where to unwind positions, or where to increase your position size.
Here is what you need to know on Friday, May 12:
Markets stay relatively quiet on Friday as investors assess the latest data releases while keeping an eye on headlines surrounding the banking crisis in the US. Later in the day, Import and Export Price Index data will be featured in the US economic docket. Ahead of the weekend, the University of Michigan (UoM) will release the Consumer Sentiment Survey for May.
Michigan Consumer Sentiment Index Preview: Modest improvement not enough to boost the mood
Escalating fears over a deepening banking crisis caused investors to seek refuge on Thursday and the US Dollar Index climbed to its highest level in 10 days above 102.00 before going into a consolidation phase near that level early Friday. PacWest said in a securities filing on Thursday that its deposits dropped nearly 10% and the bank's shares lost more than 20%. The financial heavy Dow Jones Industrial Average lost nearly 0.7% on a daily basis. In the European morning, US stock index futures trade modestly higher on the day.
The Bank of England (BoE) raised its policy rate by 25 basis points to 4.5% as expected and repeated in its policy statement, "If there were to be evidence of more persistent pressures, then further tightening of monetary policy would be required." Although the BoE revised inflation projections higher, Governor Andrew Bailey said there were good reasons to think that the Consumer price Index will fall sharply from April.
GBP/USD came under heavy bearish pressure after the BoE event on Thursday and lost more than 100 pips on the day. Early Friday, the data from the UK revealed that the Gross Domestic Product contracted by 0.3% on a monthly basis in March. In the same period, Industrial Production and Manufacturing Production both expanded by 0.7%. GBP/USD, however, largely ignored these data and was last seen posting small recovery gains above 1.2500.
EUR/USD fell to its weakest level in a month at 1.0900 on Thursday. In the European morning, the pair stages a technical correction but continues to trade below 1.0950. European Central Bank (ECB) Vice President Luis de Guindos will be delivering a speech later in the day.
Although USD/JPY edged higher amid broad-based USD strength on Thursday, the risk-averse market atmosphere didn't allow the pair to gather bullish momentum. Early Friday, the pair trades modestly higher on the day above 134.50.
Gold price failed to benefit from retreating US Treasury bond yields on Thursday and closed in negative territory below $2,020. XAU/USD stays on the back foot in the European session and trades at around $2,010.
Following a two-day consolidation, Bitcoin came under renewed selling pressure on Thursday and continued to stretch lower early Friday. BTC/USD was last seen trading at its weakest level in nearly two months below $26,300. Ethereum lost mode than 2% on Thursday and closed below $1,800. Sellers retain control in the European session and ETH/USD trades in the red at around $1,750.
Economists at Commerzbank note that the GBP could struggle as the Bank of England continues to merely react hesitantly.
The risk that the BoE will do more has certainly increased
“What is likely to be negative for Sterling is that the BoE continues to merely react hesitantly and might therefore risk its credibility when it comes to fighting inflation.”
“The market seems confirmed in its rate hike expectations following yesterday’s meeting. It is certainly pricing in at least one more rate hike step and with a slightly smaller likelihood even one after that. We see some potential for disappointment there.”
“In the end future data will be decisive for the BoE’s next rate decision though, in addition to the April inflation data the May data will also be published. If a swift fall were to become obvious here, as the BoE expects, it is likely to refrain from further rate hikes and that would put pressure on Sterling. However, the risk that the BoE will do more has certainly increased since yesterday.”
Following the release of the March Gross Domestic Product (GDP) data on Friday, UK Finance Minister Jeremy Hunt said, “good news the economy is growing, but need to stay focus on tax, labor supply and productivity.”
“We will keep going until the job is done and we have the high wage, high growth economy we need,” Hunt added.
Market reaction
GBP/USD has bounced off daily lows at 1.2506 on the UK data releases, now trading at 1.2520. The spot is up 0.10% on the day.
Economists at the National Bank of Canada expect the EUR/USD pair to come under pressure.
Euro may be overreaching at this time
“The EUR has for the better part of the last month outperformed many of its peers. While this may appear surprising considering the still uncertain economic situation facing the common currency area, a combination of less severe than expected headwinds, stronger than forecasted data and a still hawkish central bank have kept a bid on the currency. Notwithstanding, we think the Euro may be overreaching at this time.”
“We think the USD could make a bit of a comeback assuming a scenario of no debt crisis.”
“The Euro could lose a bit of ground in the short term but find renewed strength later in forecast on the basis of policy narrowing between the ECB and the Fed.”
Open interest in gold futures markets rose for the fourth session in a row on Thursday, this time by just 665 contracts according to preliminary readings from CME Group. Volume followed suit and advanced for the third straight session, now by around 49.2K contracts.
Gold risks another drop to $2000
Gold prices added to the corrective decline on Thursday amidst increasing open interest and volume, paving the way for further retracement in the very near term and with the next target of note at the key $2000 mark per ounce troy.
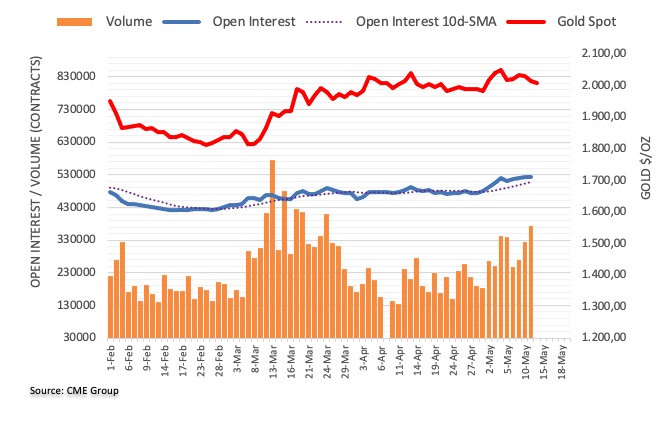
- GBP/USD picks up bids to pare BoE induced losses after upbeat UK growth, activity data.
- UK Q1 GDP matches downbeat market forecasts on QoQ and YoY basis, per preliminary estimations.
- US Dollar consolidates Thursday’s gains ahead more inflation clues.
- Hopes of avoiding US default, absence of major disappointment from banks favor corrective pullback.
GBP/USD takes offers to renew intraday low near 1.2500 as it bears the burden of the disappointing UK data heading into Friday’s London open. In doing so, the Cable pair fails to cheer the US Dollar’s consolidation of the biggest daily jump in two months ahead of the key US data. It’s worth noting, however, that the US inflation clues and risk catalysts are still capable of recalling the Cable bears.
That said, the preliminary readings of the UK’s first quarter (Q1) Gross Domestic Product (GDP) mark 0.1% QoQ growth versus 0.1% expected and prior readouts. That said, the monthly GDP for March, however, dropped -0.3% compared to 0.0% market forecasts and previous readings. Further, the British Manufacturing and Industrial Production details for March marked mixed outcomes.
Also read: UK Preliminary GDP expands 0.1% QoQ in Q1 2023, as expected
Due to the mostly downbeat British data, the US Dollar Index (DXY) retreat from the weekly high to 102.00 by the press time fails to put a floor under the Cable pair. That said, the greenback’s gauge versus the six major currencies marked the biggest daily gains in two months the previous day. However, expectations of recovery in China's inflation data and hopes of witnessing softer US inflation clues join an absence of fresh disappointment from the US banking, debt-ceiling front to underpin the DXY’s latest corrective pullback.
It’s worth noting that the latest easing in the UK data joins the Bank of England (BoE) Governor Andrew Bailey’s hopes of witnessing a sharp fall in inflation to weigh on the GBP/USD prices.
Looking forward, the first readings of the University of Michigan’s (UoM) Consumer Sentiment Index (CSI) for May, as well as the UoM 5-year Consumer Inflation Expectations for the said month, will also be important to watch for clear directions. Should the US inflation precursors match downbeat forecasts, the GBP/USD may have another chance to rebound, given the risk appetite remains even.
Technical analysis
Unless providing a daily closing beyond a two-month-old previous support line, around 1.2540 by the press time, the GBP/USD buyers remain off the table. The Cable pair’s fresh selling needs validation from an upward-sloping trend line from late March, around 1.2500 round figure at the latest.
Economist Lee Sue Ann and Markets Strategist Quek Ser Leang at OB Group note further downside could push GBP/USD to the 1.2445 level in the next weeks.
Key Quotes
24-hour view: “We expected GBP to trade in a range of 1.2580/1.2680 yesterday. However, GBP fell sharply by 0.90% (1.2513). The oversold decline has room to extend, but a clear break below the major support at 1.2445 is unlikely, at least not today (the next support is at 1.2395). The downside risk in GBP is intact as long as it stays below 1.2570 (minor resistance is at 1.2540).”
Next 1-3 weeks: “Yesterday (11 May, spot at 1.2625), we indicated that ‘there is still chance, albeit not a high one for GBP strength to extend to 1.2720 before the risk of a pullback increases’. We did not quite expect the sudden and sharp reversal as GBP plunged to a low of 1.2497. The break of our ‘strong support’ level of 1.2540 indicates that the GBP strength that started last Friday has ended. The burst in downward momentum indicates that the downside risk is building quickly. From here, we expect GBP to drop to 1.2445; if it can break below this major support level, it could trigger a rapid decline to 1.2390. On the upside, a breach of 1.2615 (current ‘strong resistance’ level) would indicate that the downside risk has eased.”
The industrial sector activity rebounded in March, the latest UK industrial and manufacturing production data published by Office for National Statistics (ONS) showed on Friday.
Manufacturing output arrived at 0.7% MoM in March versus -0.1% expected and -0.1% seen in February while total industrial output came in at 0.7% MoM vs. 0% expected and -0.1% last.
On an annualized basis, the UK Manufacturing Production data came in at -1.3% in March, beating expectations of -2.5%. Total industrial output dropped by 2.0% in the third month of the year against -2.9% expected and the previous print of -2.7%.
Separately, the UK goods trade balance numbers were published, which arrived at GBP-16.356 billion in March versus GBP-17.50 billion expectations and GBP-16.635 billion last. The total trade balance (non-EU) came in at GBP-5.458 billion in March versus GBP-5.794 billion previous.
Related reads
- UK Preliminary GDP expands 0.1% QoQ in Q1 2023, as expected
- Quarterly GDP for the UK came in at 0.1% in Q1 vs. 0.1% expected.
- UK GDP arrived at -0.3% MoM in March vs. 0% expected.
- GBP/USD defends 1.2500 on mixed UK GDP data.
The UK economy grew 0.1% QoQ in the three months to March, compared with a 0.1% expansion booked in the final quarter of 2022 and 0.1% expectations.
On an annualized basis, the UK GDP expanded 0.2% in Q1 vs. 0.2% expected and a 0.6% growth registered in the previous quarter.
The UK GDP monthly release showed that the economy unexpectedly contracted 0.3% in March vs. 0% expected and 0% previous.
Meanwhile, the Index of services (March) arrived at 0.1% 3M/3M and 0.1% prior and 0.2% estimated.
Market reaction
GBP/USD managed to defend the 1.2500 level on the release of the mixed UK growth numbers. At the time of writing, the spot is modestly flat on the day at 1.2512.
Economists at ANZ Bank share their NZD/USD and NZD/AUD forecasts.
NZD/USD higher, NZD/AUD lower
“Our forecasts have NZD/USD appreciating gradually to 0.65 by the end of 2023 and 0.66 by the end of 2024.”
“Our expectation of a downward adjustment in the USD is a key driver of our forecast of gradual NZD/USD appreciation.”
“By contrast, the NZD/AUD pair is expected to fall to around 0.90 by year-end. Given our expectation of NZD/USD appreciation, this is expected to be the result of AUD outperformance.”
- USD/CAD clings to mild losses near one-week high after rising the most on a day since early March.
- Downbeat Oil price, firmer US Dollar previously favored Loonie pair buyers amid risk-off mood.
- Market’s consolidation fails to inspire USD/CAD bears as WTI crude oil remains downbeat.
- US inflation clues, debt ceiling updates and banking news eyed for clear directions.
USD/CAD bulls take a breather around 1.3490 amid early Friday, after posting the biggest daily jump in nine weeks the previous day. In doing so, the Loonie pair fails to cheer the US Dollar’s retreat as the Oil price remains bearish. Also keeping the buyers hopeful is the cautious mood ahead of the US inflation clues, as well as challenges to sentiment emanating from the US debt ceiling talks and banking fallouts.
WTI crude oil price remains pressured at the weekly low, near $70.60 by the press time, down for the third consecutive day as economic fears join the firmer US Dollar to weigh on the commodity prices. That said, recently downbeat inflation data from China, the world’s biggest commodity user, join the looming fears of US default and banking fallouts to exert downside pressure on the black gold prices.
On the other hand, the US Dollar Index (DXY) retreats from a one-week high to 102.00 after posting the biggest daily gains in two months the previous day despite mostly downbeat prints of the US Producer Price Index (PPI) and Initial Jobless Claims. It should be noted that the hawkish comments from Minneapolis Fed President Neel Kashkari joined the postponement of the debt ceiling talks between US President Joe Biden and House Speaker McCarthy and a slump in the share price of PacWest Bancorp to favor the US Dollar bulls.
Elsewhere, expectations of recovery in China inflation data and hopes of witnessing softer US inflation clues join an absence of fresh disappointment from the US banking, debt-ceiling front to underpin the market’s latest corrective bounce.
While portraying the mood, the US stock futures print mild gains while the Asia-Pacific equities grind higher amid downbeat US Treasury bond yields.
Looking ahead, a light calendar in Canada allows the USD/CAD traders to concentrate on preliminary readings of the University of Michigan’s (UoM) Consumer Sentiment Index (CSI) for May, as well as the UoM 5-year Consumer Inflation Expectations for the said month, for possible moves.
Technical analysis
Despite the previous day’s run-up, USD/CAD stays on the bear’s radar unless providing a daily closing beyond the 100-DMA hurdle of around 1.3520.
- The upside momentum in the index loses traction on Friday.
- US yields appear on the defensive early in the European session.
- Flash Consumer Sentiment, Fed’s Bowman next on tap.
The greenback, in terms of the USD Index (DXY), exchanges gains with losses around the 102.00 region, or weekly highs, on Friday.
USD Index looks at risk aversion, data
The index sees its recent strong upside somewhat trimmed near the 102.00 region on the back of the mild recovery in the risk-associated universe and dwindling risk aversion at the end of the week.
In the meantime, speculation over a potential impasse in the Fed’s hiking cycle as soon as at the June 14 event continues to run high. This view was particularly exacerbated following softer-than-expected CPI results (Wednesday) and somewhat confirmed later by the weaker Producer Prices and increasing weekly Claims (Thursday).
In the US docket, the advanced Michigan Consumer Sentiment for the month of May will be the salient event on Friday seconded by the speech by FOMC’s M. Bowman (permanent voter, centrist).
What to look for around USD
The index keeps the trade near weekly peaks around 102.00 against the backdrop of some rebound in the risky assets.
The index seems to be facing downward pressure in light of the recent indication that the Fed will probably pause its normalization process in the near future. That said, the future direction of monetary policy will be determined by the performance of key fundamentals (employment and prices mainly).
Favouring an impasse by the Fed appears the persevering disinflation – despite consumer prices remain well above the target – incipient cracks in the labour market, the loss of momentum in the economy and rising uncertainty surrounding the US banking sector.
Key events in the US this week: Flash Michigan Consumer Sentiment (Friday).
Eminent issues on the back boiler: Persistent debate over a soft/hard landing of the US economy. Terminal Interest rate near the peak vs. speculation of rate cuts in 2024. Fed’s pivot. Geopolitical effervescence vs. Russia and China. US-China trade conflict.
USD Index relevant levels
Now, the index is down 0.08% at 101.98 and faces the next support at 101.01 (weekly low April 26) prior to 100.78 (2023 low April 14) and finally 100.00 (psychological level). On the other hand, the break above 102.15 (weekly high May 12) would open the door to 102.40 (monthly high May 2) and then 102.80 (weekly high April 10).
- AUD/USD fades bounce off one-week low marked earlier in the day amid mixed sentiment.
- Hopes that Aussie budget will propel inflation and allow RBA to stay hawkish recently gained momentum.
- Expectations of China inflation recovery also made rounds; Aussie-China trade talks prod bears.
- Fears about US debt ceiling expiry, banking fallouts joins hawkish Fed talks to weigh on AUD/USD ahead of US data.
AUD/USD stays defensive at the weekly low of around 0.6700, retreating of late, as market sentiment remains dicey heading into Friday’s European session.
In doing so, the Aussie pair fails to cheer recent hawkish expectations from the Reserve Bank of Australia (RBA) and the beginning of the Aussie-China trade talks, not to forget the hopes of “V” shape rebound in China inflation. The reason could be linked to the US Dollar’s ability to cheer sour sentiment and hawkish Fed bets ahead of the inflation clues.
Upbeat surplus news from Australian Federal Budget, released on Tuesday, pushed Goldman Sachs to unveil hawkish hopes about the RBA's next move, mainly due to a likely increase in inflation. With this, the GS forecasts another RBA rate hike in July and warns there are further to come after that.
On the other hand, Chinese media mentioned, “Prices are expected to show a "V"-shaped trend throughout the year.” The news quotes Guo Liyan, Director of the Comprehensive Situation Office of the China Academy of Macroeconomic Research, to also mention that looking forward to the whole year, my country's overall price level will fluctuate slightly and moderately within a reasonable range
Elsewhere, Bloomberg said that China and Australia’s trade ministers will hold their first in-person economic dialog since 2019 on Friday as Canberra hopes to negotiate an end to sanctions on billions of dollars worth of its agricultural exports.
Above all, US Dollar Index (DXY) retreats from a one-week high to 102.00 after posting the biggest daily gains in two months the previous day despite mostly downbeat prints of the US data. That said, the US Producer Price Index (PPI) improved to 0.2% MoM for April versus 0.3% expected and -0.4% prior. More importantly, PPI ex Food & Energy, known as Core PPI, rose on MoM but eased on YoY. Further, US Initial Jobless Claims rose by 264,000 to push the level to the highest level since October 2021. Despite the unimpressive data, Minneapolis Fed President Neel Kashkari mentioned on Thursday that inflation has eased but warned it is above the Fed's 2% target.
Talking about the main risks, fears surrounding the US debt ceiling expiry and banking fallouts seem to allow the US Dollar Index to brace for the first weekly gain in three while pushing down the US Treasury bond yields for the third consecutive week.
Looking ahead, the outcome from the Aussie-China trade meeting and the US University of Michigan’s (UoM) Consumer Sentiment Index (CSI) for May, as well as the UoM 5-year Consumer Inflation Expectations for the said month, will be the key for AUD/USD traders to watch for clear directions.
Technical analysis
Multiple failures to cross the 100-DMA join a clear downside break of the one-week-old ascending trend line, near 0.6740 by the press time, to keep AUD/USD bears hopeful.
UK Economic Data Overview
Friday's packed UK economic docket highlights the release of the preliminary Gross Domestic Product (GDP) print for the first quarter (Q1) of 2023 at 06:00 GMT. The UK economy is expected to have expanded by a modest 0.1% during the January-March period and the yearly growth is anticipated to decelerate from 0.6% to 0.2%.
This will be accompanied by Manufacturing Production and Industrial Production data for the month of March. Manufacturing output, which makes up around 80% of total Industrial Production, is seen contracting by -0.1% MoM during the reported month. Meanwhile, the total Industrial Production is expected to remain flat in March as compared to the 0.2% decline recorded in the previous month. The UK Goods Trade Balance will also be reported at the same time, which is likely to show a deficit of £17.5 billion in March.
How could the data affect GBP/USD?
Ahead of the key releases, the GBP/USD pair edges higher and recovers a part of the previous day's post-Bank of England (BoE) slump to over a one-week low amid subdued US Dollar (USD) price action. A surprisingly stronger UK macro data, especially the GDP print, could provide a modest lift to the British Pound and allow the major to capitalize on its modest intraday uptick. Conversely, even a slight disappointment should be enough to exert additional pressure on the Sterling and pave the way for an extension of the pair's recent sharp pullback from over a one-year high touched on Wednesday.
Key notes
• GBP/USD licks BoE-inflicted wounds below 1.2540 hurdle ahead of UK GDP, US inflation clues
• GBP/USD Price Analysis: Cable bears need validation from 1.2500 and UK GDP to keep the reins
• GBP/USD could still attempt a move above 1.2700 – UOB
About UK Economic Data
The Gross Domestic Product released by the Office for National Statistics (ONS) is a measure of the total value of all goods and services produced by the UK. The GDP is considered a broad measure of the UK economic activity. Generally speaking, a rising trend has a positive effect on the GBP, while a falling trend is seen as negative (or bearish).
The Manufacturing Production released by the Office for National Statistics (ONS) measures the manufacturing output. Manufacturing Production is significant as a short-term indicator of the strength of UK manufacturing activity that dominates a large part of total GDP. A high reading is seen as positive (or bullish) for the GBP, while a low reading is seen as negative (or bearish).
The trade balance released by the Office for National Statistics (ONS) is a balance between exports and imports of goods. A positive value shows trade surplus, while a negative value shows trade deficit. It is an event that generates some volatility for the GBP.
EUR/USD risks a sustained drop once 1.0850 is cleared, suggest Economist Lee Sue Ann and Markets Strategist Quek Ser Leang at OB Group.
Key Quotes
24-hour view: “We did not anticipate EUR to drop sharply to a low of 1.0898 yesterday (we were expecting it to trade sideways). Strong downward momentum is likely to lead to further EUR weakness even though oversold conditions suggest it is unlikely to break the major support at 1.0850 today (minor support is at 1.0880). On the upside, any rebound is likely to stay below 1.0960 (minor resistance is at 1.0940).”
Next 1-3 weeks: “Two days ago (10 May, spot at 1.0960), we noted that ‘short-term downward momentum appears to be building’ and we were of the view that EUR ‘has to break and stay below 1.0920 before a sustained decline is likely’. Yesterday, EUR lurched lower and plummeted to a low of 1.0898 before closing at a 1-month low of 1.0914 (-0.60%). The rapid increase in momentum indicates that EUR is likely to head lower in the coming days. The level to watch is 1.0850, as a break of this key support could potentially trigger a sharp and rapid drop in EUR. Overall, we hold a negative EUR view now as long as it does not break above 1.0990 (‘strong resistance’ level previously at 1.1035). Looking ahead, the next significant support below 1.0850 is at 1.0800.”
- USD/JPY remains confined in a narrow trading band through the Asian session on Friday.
- Reviving safe-haven demand benefits the JPY and acts as a headwind amid a softer USD.
- Traders now look to the Michigan US Consumer Sentiment Index for a fresh impetus.
The USD/JPY pair struggles to capitalize on the overnight bounce from the 133.75 area, or a one-week low and oscillates in a narrow trading band through the Asian session on Friday. The pair is currently placed just above mid-134.00s, nearly unchanged for the day, and is influenced by a combination of diverging forces.
The market sentiment remains fragile amid worries over a global economic slowdown, magnified by softer Chinese inflation figures and US labor market data on Thursday. This, along with concerns about the US debt ceiling, dents investors' appetite for riskier assets, which lends some support to the safe-haven Japanese Yen (JPY) and acts as a headwind for the USD/JPY pair. The US Dollar (USD), on the other hand, is undermined by the recent decline in the US Treasury bond yields. This further contributes to capping gains for the major.
That said, the downside for the USD seems cushioned amid the uncertainty over the Federal Reserve's (Fed) ned policy move. The US CPI report released on Wednesday pointed to further signs of inflationary pressures and should allow the US central bank to pause its year-long rate-hiking cycle. Investors, however, remain divided over the possibility of a rate cut later this year. This, along with a more dovish stance adopted by the Bank of Japan (BoJ), should hold back traders from placing aggressive bearish bets around the USD/JPY pair.
The aforementioned fundamental backdrop seems tilted slightly in favour of bullish traders and supports prospects for some intraday positive move. Hence, some follow-through strength back towards reclaiming the 135.00 psychological mark, en route to the weekly high, around the 135.45-135.50 region, looks like a distinct possibility. Market participants now look forward to the release of the Preliminary Michigan Consumer Sentiment Index from the US, which might influence the USD price dynamics and provide some impetus to the USD/JPY pair.
Technical levels to watch
- USD/INR retreats from three-week high while paring the biggest weekly gain in two months.
- Downbeat Oil price joins market’s reassessment of risk catalysts to trigger Indian Rupee bounce from multi-day low.
- India CPI, output data precedes US Michigan CSI and Inflation Expectation to decorate economic calendar.
- Comparatively more hawkish Fed, challenges to risk appetite favor USD/INR bulls.
USD/INR prints mild losses around 82.10 as it consolidates the biggest weekly gains since March ahead of the key statistics from India and the US, up for publishing during Friday’s European session. In doing so, the Indian Rupee (INR) pair also takes clues from the softer Oil price and the market’s cautious optimism.
Oil price remains pressured near $70.40, down for the third consecutive day as economic fears join the firmer US Dollar to weigh on the commodity prices. That said, recently downbeat inflation data from China, the world’s biggest commodity user, join the looming fears of US default and banking fallouts to exert downside pressure on the black gold prices. It should be noted that India’s heavy reliance on energy imports and record-high deficit keep the INR vulnerable to Oil price moves.
US Dollar Index (DXY) retreats from a one-week high to 102.00 after posting the biggest daily gains in two months the previous day despite mostly downbeat prints of the US data. That said, the US Producer Price Index (PPI) improved to 0.2% MoM for April versus 0.3% expected and -0.4% prior. More importantly, PPI ex Food & Energy, known as Core PPI, rose on MoM but eased on YoY. Further, US Initial Jobless Claims rose by 264,000 to push the level to the highest level since October 2021.
Despite the unimpressive data, Minneapolis Fed President Neel Kashkari mentioned on Thursday that inflation has eased but warned it is above the Fed's 2% target.
Recently escalating market fears surrounding the US debt ceiling expiry and banking fallouts, seem to allow the US Dollar Index to brace for the first weekly gain in three while pushing down the US Treasury bond yields for the third consecutive week. It should be noted that the postponement of the debt ceiling talks between US President Joe Biden and House Speaker McCarthy and a slump in the share price of PacWest Bancorp appear the main negative developments to weigh on the sentiment. Additionally, warnings from US Treasury Secretary Janet Yellen and Beth Hammack, Chair of the Treasury Borrowing Advisory Committee and Co-Head of Goldman's Global Financing Group, about US default, also threaten the risk profile.
Amid these plays, the US stock futures print mild gains while the Asia-Pacific equities grind higher amid downbeat US Treasury bond yields.
Moving on, India’s Consumer Price Index (CPI) for April and various Output figures for March will precede the US University of Michigan’s (UoM) Consumer Sentiment Index (CSI) for May, as well as the UoM 5-year Consumer Inflation Expectations for the said month, to direct USD/INR moves.
Given the likely easing in the inflation pressure in India, coupled with the comparatively hawkish Fed bias of the Reserve Bank of India (RBI), the USD/INR may witness further upside in a case where the scheduled data match the market consensus.
Technical analysis
A clear upside break of the two-month-old resistance line, now immediate support near 82.00, favors the USD/INR buyers. However, a downward-sloping trend line stretched from early April, near 82.30 at the latest, restricts the short-term upside of the Indian Rupee pair.
- GBP/USD bears take a breather around weekly low after BoE-induced slump.
- Cautious mood ahead of the key UK Q1 GDP, US inflation clues join mixed sentiment to prod Cable buyers.
- BoE couldn’t inspire Pound Sterling buyers despite 0.25% rate hike as Governor Bailey signalled sharp fall in British inflation.
- US debt ceiling talks, banking news also appear important to watch for fresh impulses.
GBP/USD stays defensive near 1.2520 even as it renews intraday high ahead of the all-important UK Gross Domestic Product (GDP) data during early Friday. Not only the pre-data positioning but the market’s downbeat expectations and fears of a positive surprise also allow the Pound Sterling to pare recent losses, especially amid the US Dollar inaction ahead of the US inflation clues.
The Cable pair slumped the most in seven weeks the previous day even after the Bank of England (BoE) lifted the policy rate by 25 basis points (bps) to 4.5%. Following the interest rate decision, BoE Governor Andrew Bailey delivered his remarks while saying, “We are not giving a directional steer on rates.” BoE’s Bailey added, “Good reasons to think CPI will fall sharply from April,” the same seemed to have drowned GBP/USD price following the news.
On the other hand, US Dollar Index (DXY) marked the biggest daily gains in two months the previous day despite mostly downbeat prints of the US data. That said, the US Producer Price Index (PPI) improved to 0.2% MoM for April versus 0.3% expected and -0.4% prior. More importantly, PPI ex Food & Energy, known as Core PPI, rose on MoM but eased on YoY. Further, US Initial Jobless Claims rose by 264,000 to push the level to the highest level since October 2021, which in turn escalated the risk-off mood and favored the US Dollar.
While tracing the greenback’s run-up, the market’s rush for safety amid fears surrounding the US debt ceiling expiry and banking fallouts seem to gain major attention. The risk-off mood not only propelled the US Dollar but also favored the US Treasury bonds.
As per the latest update, the postponement of the debt ceiling talks between US President Joe Biden and House Speaker McCarthy and a slump in the share price of PacWest Bancorp appear the main negative developments to weigh on the sentiment. Additionally, warnings from US Treasury Secretary Janet Yellen and Beth Hammack, Chair of the Treasury Borrowing Advisory Committee and Co-Head of Goldman's Global Financing Group, about US default, also threaten the market sentiment.
Moving on, the monthly data dump from the UK joins the preliminary readings of the first quarter (Q1) British GDP to direct immediate GBP/USD moves. That said, the UK think-tank National Institute of Economic and Social Research (NIESR) recently forecasted 0.3% GDP for 2023 and 0.6% for 2024 versus 0.2% and 1.0% previous estimations.
Apart from the UK Q1 GDP, preliminary readings of the University of Michigan’s (UoM) Consumer Sentiment Index (CSI) for May, as well as the UoM 5-year Consumer Inflation Expectations for the said month, will also be important to watch for clear directions.
Technical analysis
GBP/USD justifies the downside break of a two-month-old ascending trend line, around 1.2540 by the press time, as well as bearish MACD signals, to favor the Cable pair sellers. However, an upward-sloping trend line from late March, around 1.2500 round figure by the press time, joins the oversold RSI (14) line suggesting a corrective bounce in the Pound Sterling price.
- NZD/USD takes offers to renew weekly low, extends the previous day’s pullback from five-week high.
- RBNZ Inflation Expectations slump to 2.79% QoQ for Q2 2023 versus 3.30% prior.
- Downside break of 12-day-old ascending trend line, 50-SMA favors sellers.
- 200-SMA, nearly oversold RSI (14) line can prod the Kiwi pair bears.
NZD/USD stands on slippery grounds as it takes offers to extend the previous day’s U-turn from the monthly high to renew the weekly low around 0.6260 during early Friday. In doing so, the Kiwi pair justifies disappointing inflation clues from amid broad US Dollar strength to break the short-term key technical supports.
Reserve Bank of New Zealand’s (RBNZ) Inflation Expectations for the second quarter (Q2) of 2023 dropped to the lowest levels since the Q3 of 2021 while falling to 2.79% versus 3.30% previous readings. Earlier in the day, New Zealand’s Business NZ PMI for April dropped to 49.1 versus 50.7 expected and 48.1 prior whereas Visitor Arrivals eased to 805% in March versus prior growth of 4,998%.
With this, the Kiwi pair broke an upward-sloping trend line from late April and the 50-SMA, respectively near 0.6300 and 0.6290.
Apart from the NZ data and downside break of the technical supports, the bearish MACD signals also favor the NZD/USD sellers to renew the weekly low near 0.6260.
However, the nearly oversold RSI conditions highlight the 200-SMA level of around 0.6230 as short-term key support to watch for the Kiwi pair bears.
Should the quote fails to respect the 0.6230 support, the 0.6200 round figure and the late April swing high around 0.6190 will be in the spotlight.
On the contrary, the 50-SMA and the previous support line, near 0.6290 and 0.6300 in that order, guard immediate recovery moves of the NZD/USD pair.
Following that, a one-month-old horizontal resistance area near 0.6315 and double tops marked near 0.6385 appear crucial to watch for the NZD/USD bulls.
NZD/USD: Four-hour chart

Trend: Limited downside expected
The latest monetary conditions survey, conducted by the Reserve Bank of New Zealand (RBNZ), revealed on Friday that New Zealand's (NZ) inflation expectations decline further across the time horizon in the second quarter of 2023.
Two-year inflation expectations, seen as the time frame when RBNZ policy action will filter through to prices, dropped sharply to 2.79% from 3.30% prior.
NZ Q1 2023 average one-year inflation expectations fell to 4.28% vs. 5.11% seen in the first quarter of this year.
Kiwi dips on softer inflation expectations
Having heard the details of the Australian Federal Budget on Tuesday, Goldman Sachs recently came out with hawkish hopes about the Reserve Bank of Australia’s (RBA) next move, mainly due to a likely increase in inflation.
With this, the GS forecasts another Reserve Bank of Australia rate hike in July and warns there are further to come after that.
Key analysis from GS
At a time when the RBA is lifting rates to contain elevated inflation and accelerating labor costs, we assess the budget’s near-term boost to household incomes to have an incrementally hawkish read-through for monetary policy.
Especially given surging migration-led population growth and the recent strong rebound in house prices, we see a firming case for further policy tightening by the RBA over the coming months.
Also read: AUD/USD attempting to correct from US session lows
- EUR/USD licks its wounds at the lowest levels in a month, braces for the biggest weekly loss since late February.
- ECB, Fed policymakers try to show hawkish moves but challenges to sentiment favor US Dollar.
- US CPI, PPI have been unimpressive and highlight importance of Michigan CSI, inflation expectations for clear directions.
EUR/USD retreats from an intraday high of 1.0925 but stays sluggish during early Friday in Europe as traders lick their wounds on the way to posting the biggest weekly loss in three months. That said, the US Dollar’s latest rebound and a lack of confirmatory hawkish signals from the European Central Bank (ECB), as well as fears of the US debt ceiling, keep the Euro bears hopeful at the lowest levels in a month.
Multiple ECB Officials including President Christine Lagarde, tried to defend the bloc’s central bank’s hawkish bias as some among the team consider the latest easing in the European and German statistics to suggest nearness to the policy pivot. With this in mind, Bloomberg quotes people familiar with the debate while saying, “ECB officials are starting to accept that interest-rate increases might need to continue in September to bring inflation fully under control.” ECB policymaker and Bundesbank Chief Joachim Nagel reaffirmed on Thursday, the “meeting-by-meeting approach is the right path for the ECB.” The policymaker also added that they're moving closer to restrictive territory but not there yet.
On the other hand, Minneapolis Fed President Neel Kashkari mentioned on Thursday that inflation has eased but warned it is above the Fed's 2% target while speaking at the Marquette CEO Town Hall in Michigan.
That said, the recently escalating market fears surrounding the US debt ceiling expiry and banking fallouts, seem to allow the US Dollar to brace for the first weekly gain in three while pushing down the US Treasury bond yields for the third consecutive week.
It should be noted that the postponement of the debt ceiling talks between US President Joe Biden and House Speaker McCarthy and a slump in the share price of PacWest Bancorp appear the main negative developments to weigh on the sentiment. Additionally, warnings from US Treasury Secretary Janet Yellen and Beth Hammack, Chair of the Treasury Borrowing Advisory Committee and Co-Head of Goldman's Global Financing Group, about US default, also threaten the risk profile.
Alternatively, the market’s consolidation amid a light calendar and cautious mood ahead of today’s preliminary readings of the University of Michigan’s (UoM) Consumer Sentiment Index (CSI) for May, as well as the UoM 5-year Consumer Inflation Expectations for the said month, prod the US Dollar buyers of late. Should the scheduled inflation clues and central bank comments manage to convince markets of the ECB’s comparatively more hawkish policy bias than the Fed, the EUR/USD may witness further upside. However, the aforementioned risk catalysts will still be the key to watching for clear directions.
Also read: Michigan Consumer Sentiment Index Preview: Modest improvement not enough to boost the mood
Technical analysis
Despite the latest corrective bounce, the EUR/USD pair remains well below the 1.0970 resistance confluence comprising the 21-day Exponential Moving Average (EMA) and the bottom line of a one-month-old bullish channel. The same joins bearish MACD signals to keep Euro sellers hopeful.
Also read: EUR/USD Price Analysis: Euro bears struggle to justify 1.0970 support break
- Natural Gas price pares weekly gains as sellers approach short-term key support zone.
- Failure to cross 100-SMA, downbeat oscillators keep XNG/USD bears hopeful.
- Clear break of $2.27 becomes necessary for the Natural Gas Price to renew monthly low.
Natural Gas Price (XNG/USD) remains pressured around $2.29 during early Friday, reversing the previous day’s corrective bounce to consolidate the weekly gains.
In doing so, the XNG/USD price extends Thursday’s U-turn from the 100-SMA towards a one-week-old horizontal support area surrounding $2.28-27.
Not only the failure to cross the 100-SMA but bearish MACD signals and mostly steady RSI (14) line also suggests further downside of the Natural Gas Price.
As a result, the aforementioned horizontal support area is less likely to hold the XNG/USD bears captive for a long.
Following that, the monthly low marked the last Friday around $2.14 and the yearly bottom of $2.11, flashed during late April, will be in the spotlight. It’s worth observing that the XNG/USD weakness past $2.11 makes it vulnerable to dropping toward the $2.00 psychological magnet.
On the contrary, the 100-SMA joins the 50% Fibonacci retracement level of the commodity’s April-May run-up to highlight $2.35 as the short-term key resistance confluence.
However, a clear upside break of $2.35 isn’t an open invitation to the Natural Gas buyers as a downward-sloping resistance line from April 19, close to $2.38 by the press time, quickly followed by the $2.40 round figure, could challenge the XNG/USD bulls.
Natural Gas Price: Four-hour chart

Trend: Further downside expected
| Raw materials | Closed | Change, % |
|---|---|---|
| Silver | 24.184 | -4.67 |
| Gold | 2015.08 | -0.73 |
| Palladium | 1552.06 | -3.05 |
- Gold price remains pressured for third consecutive day, eyes the first weekly loss in three.
- Mixed sentiment in the market, downbeat Treasury bond yields underpin US Dollar rebound and weigh on XAU/USD.
- Debt ceiling fears, banking woes allow Gold sellers to sneak in ahead of Michigan CSI, inflation expectations.
Gold price (XAU/USD) takes offers to refresh intraday low near $2,012 amid early Friday in Europe, marking the consecutive third daily loss amid the market’s fears emanating from the US debt ceiling negotiations and banking woes. Also exerting downside pressure on the Gold price could be the softer yields and a cautious mood ahead of more clues of the US inflation.
While portraying the mood, S&P 500 Futures print mild gains to differ from Wall Street’s mixed closing. However, the US 10-year and two-year Treasury bond yields remain pressured around 3.37% and 3.88% by the press time.
The recently escalating market fears surrounding the US debt ceiling expiry and banking fallouts, seem to allow the US Dollar to brace for the first weekly gain in three while pushing down the US Treasury bond yields for the third consecutive week.
Recently, the postponement of the debt ceiling talks between US President Joe Biden and House Speaker McCarthy and a slump in the share price of PacWest Bancorp appear the main negative developments to weigh on the sentiment. Additionally, warnings from US Treasury Secretary Janet Yellen and Beth Hammack, Chair of the Treasury Borrowing Advisory Committee and Co-Head of Goldman's Global Financing Group, about US default, also threaten the market sentiment.
Alternatively, the softer US Consumer Price Index (CPI) and Producer Price Index (PPI) for April join mixed Federal Reserve (Fed) talks to prod the risk appetite.
Looking ahead, further developments to avoid the US default and defend the banking system may entertain Gold traders ahead of the preliminary readings of the University of Michigan’s (UoM) Consumer Sentiment Index (CSI) for May, as well as the UoM 5-year Consumer Inflation Expectations for the said month.
Also read: Michigan Consumer Sentiment Index Preview: Modest improvement not enough to boost the mood
Gold price technical analysis
Gold price remains bearish while justifying the downside break of a one-week-old symmetrical triangle and the 200-Hour Moving Average (HMA). Apart from the 200-HMA and the stated triangle’s bottom line, respectively near $2,024 and $2,027, bearish MACD signals and downbeat RSI, not oversold, also underpin bearish bias about the Gold price.
That said, the XAU/USD bears may currently target the previous Friday’s bottom of around the $2,000 round figure.
However, the monthly bottom of around $1,977, quickly followed by a late April swing low of around $1,974, can prod the Gold sellers afterward.
On the contrary, the 200-HMA and the stated triangle’s bottom line, close to $2,024 and $2,027 in that order, restrict short-term recovery moves of the Gold price.
Even so, a convergence of the triangle’s top line and the 38.2% Fibonacci retracement level, near $2,040, may challenge the XAU/USD upside.
In a case where the Gold Price remains firmer past $2,040, the metal buyers may witness the $2,050 hurdle as the last defense of the bears.
Gold price: Hourly chart
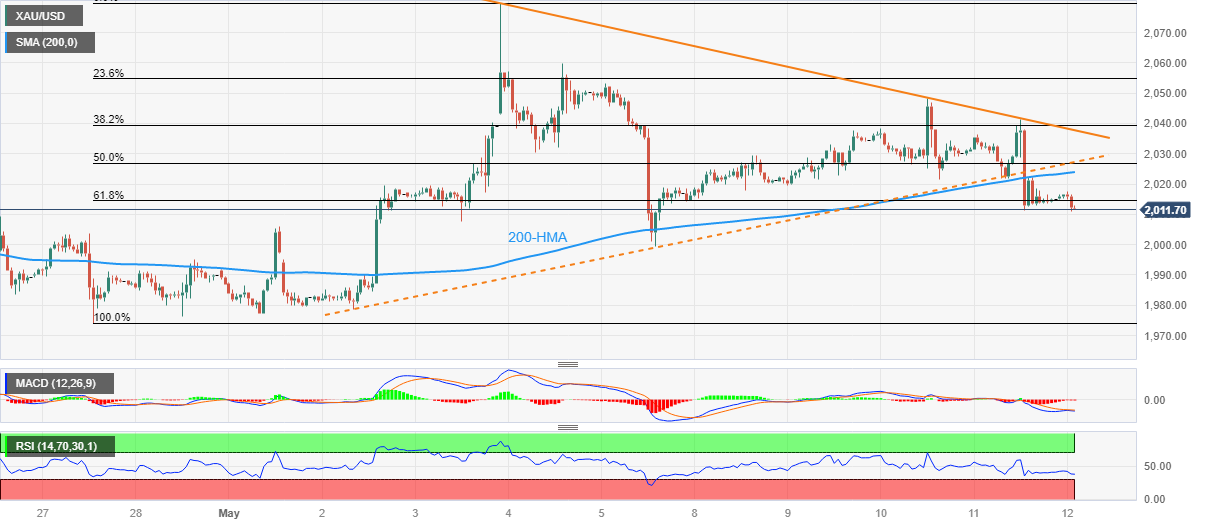
Trend: Further downside expected
- AUD/USD has started to correct but is slowing in Asia.
- AUD/USD bulls stepped in at US session lows, a steeper correction is eyed toward a 50% mean reversion.
AUD/USD is flat at around 0.6700 in Tokyo, correcting from the US session lows. In the US data, prices are rising, but more slowly than expected. The PPI data for April increased 0.2% MoM with annual growth now at 2.3% YoY. Petrol prices in the US lifted more slowly than expected, while food prices actually fell. Core prices are now up 3.4% YoY. ´´The data indicates ongoing price pressures in core services,´´ analysts at ANZ Bank explained.
Elsewhere, the number of Americans filing new claims for unemployment benefits leaped to a 1-1/2-year high last week, and producer prices rebounded modestly in April. US Weekly Initial Unemployment Claims Rose +22,000 to 264,000, showing a weaker labor market than expectations of 245,000.
Domestically, the analysts at ANZ Bank explained that the Western Australian budget estimates a AUD4.2bn surplus in 2022-23, the same as the federal budget.
´´This is AUD 1.8bn larger than was expected in the Mid-Year Financial Projections Statement, published in December 2022. The state treasury forecasts a smaller net operating surplus of AUD3.3bn in 2023-24, AUD1bn lower than in the mid-year update,´´ the analysts explained, adding, ´´the smaller surplus reflects the increase in expenses to provide cost-of-living support and additional investment in front-line service delivery in the health, education and disability services sectors.´´
AUD/USD technical analysis
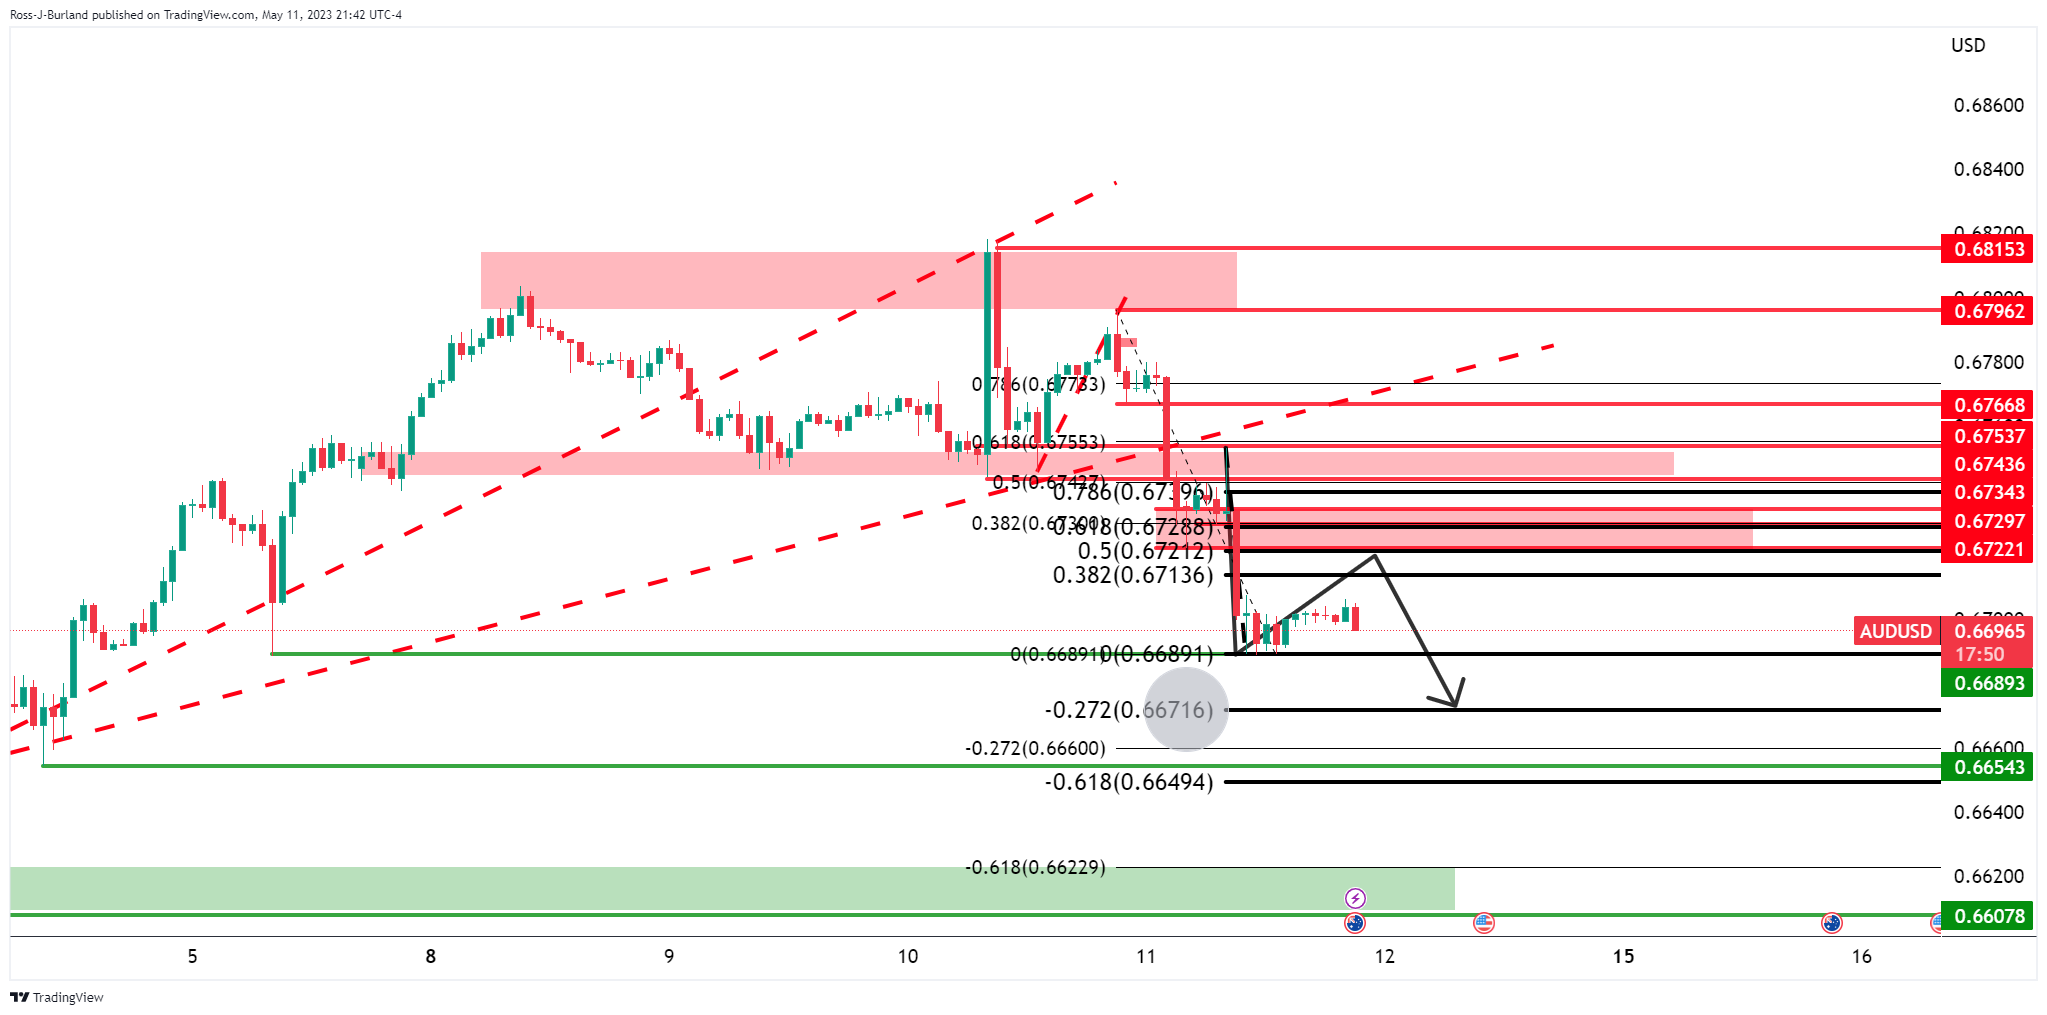
- AUD/USD Price Analysis: Bulls move in at key support, 0.6720s eyed
A drive into the hourly resistance could equate to a downside continuation towards 0.6670 initially.
- WTI crude oil takes offers to refresh intraday low, drops for the third consecutive day.
- Clear downside break of key HMAs, sluggish oscillators favor the black gold’s further declines.
- One-week-old horizontal support can prod energy bears amid nearly oversold RSI, looming bull cross on MACD.
WTI crude oil remains pressured for the third consecutive day after reversing from a one-week high, taking offers to refresh intraday bottom around $71.10 amid early Friday.
In doing so, the energy benchmark justifies the previous day’s downside break of the 100 and 200 Hourly Moving Averages (HMAs). Adding strength to the bearish bias about the black gold are the sluggish conditions of the MACD and RSI indicators, also known as the oscillators.
It’s worth noting that a one-week-old horizontal support area surrounding $70.70-60 joins nears the oversold RSI (14) line to restrict the immediate downside of the WTI crude oil.
Following that, the $70.00 psychological magnet and $69.50 may entertain the Oil sellers before directing them to the recently flashed multi-month low of around $64.30.
On the contrary, a convergence of the 200-HMA and a 50% Fibonacci retracement level of the Oil Price weakness from April 24 to May 03, near $71.70, appears a tough nut to crack for the energy buyers to convince the markets.
Even so, a successful break of the 100-HMA and 61.8% Fibonacci retracement level, also known as the golden Fibonacci ratio, respectively near $72.55 and $73.50, becomes necessary for the WTI bulls to retake control.
WTI crude oil: Hourly chart
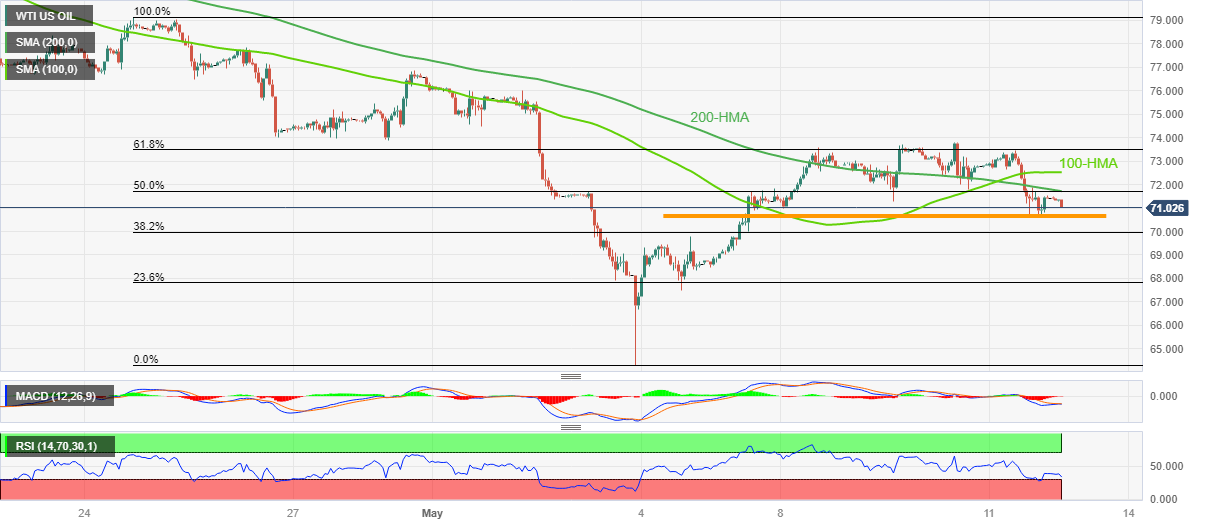
Trend: Limited downside expected
US Treasury yields will rise significantly over the coming month, per a survey of nearly 28 analysts by Reuters conducted during May 05 to 11. The poll also states that the respondents were split over whether the risk of a US default was higher or the same as prior stand-offs over the debt ceiling.
Key findings
Half of the respondents said the risk of a default was higher this time compared to prior episodes of debt ceiling brinkmanship.
Analysts, however, warned that the current situation may be riskier owing to widening political divides.
U.S. 2-year and 10-year yields are forecast to rise over the coming month by around 20 and 10 basis points, respectively.
Asked in what range the 10-year yield, currently at 3.38%, would trade over the coming month, the median response from strategists who were polled was 3.30%-3.60%.
Individual responses ranged from as low as 3.0% to as high as 4.0%.
Also read: USD/JPY fades bounce off weekly low around mid-134.00s amid downbeat yields, mixed mood
In recent trade today, the People’s Bank of China (PBOC) set the yuan at 6.9481 vs the last close of 6.9495 and vs. the estimate of 6.9472.
About the fix
China maintains strict control of the yuan’s rate on the mainland.
The onshore yuan (CNY) differs from the offshore one (CNH) in trading restrictions, this last one is not as tightly controlled.
Each morning, the People’s Bank of China (PBOC) sets a so-called daily midpoint fix, based on the yuan’s previous day's closing level and quotations taken from the inter-bank dealer.
- USD/CAD bulls eye a run to test 1.3520.
- CAD is under pressure, consolidating at fresh cycle lows vs. the US Dollar.
USD/CAD is flat in the Toyo opening hour on Friday whereby the pair rallied from a low of 1.3375 to a high of 1.3495. CAD was therefore posting its biggest decline since early March, as oil prices dropped and US economic data added to evidence that the economy is slowing down.
First, in the US data, the number of Americans filing new claims for unemployment benefits leaped to a 1-1/2-year high last week, and producer prices rebounded modestly in April. U.S. weekly initial unemployment claims rose +22,000 to 264,000, showing a weaker labor market than expectations of 245,000.
In other related market events, crude oil and gasoline prices on Thursday posted moderate losses..Canada sends about 75% of its exports to the United States, including oil. Demand concerns weighed on crude prices as Thursday's weaker-than-expected economic news from China and the US, the world's two biggest crude consumers, sparked fears about a slowdown in the global economy that is bearish for energy demand.
´´The OPEC put, along with an expected resurgence in Chinese demand later this year, should keep oil prices on a firming trajectory. At the same time, CTA positioning remains near max-short levels, which suggests that this cohort will not contribute much to the additional downside,´´ analysts at TD Securities said.
Meanwhile, there has been an improved inflation outlook for the US and this has lowered Treasury yields on two-year notes (which can move in step with interest rate expectations, to 3.90% from above 4% at the end of last week. The yield on 10-year notes fell 5 basis points to 3.386%.
As a consequence, the futures markets are showing the probability that the Fed will raise rates again in June was 10.7%, up from 2.1% soon after the data's release. The odds that the Fed cuts rates later this year also rose.
USD/CAD technical analysis
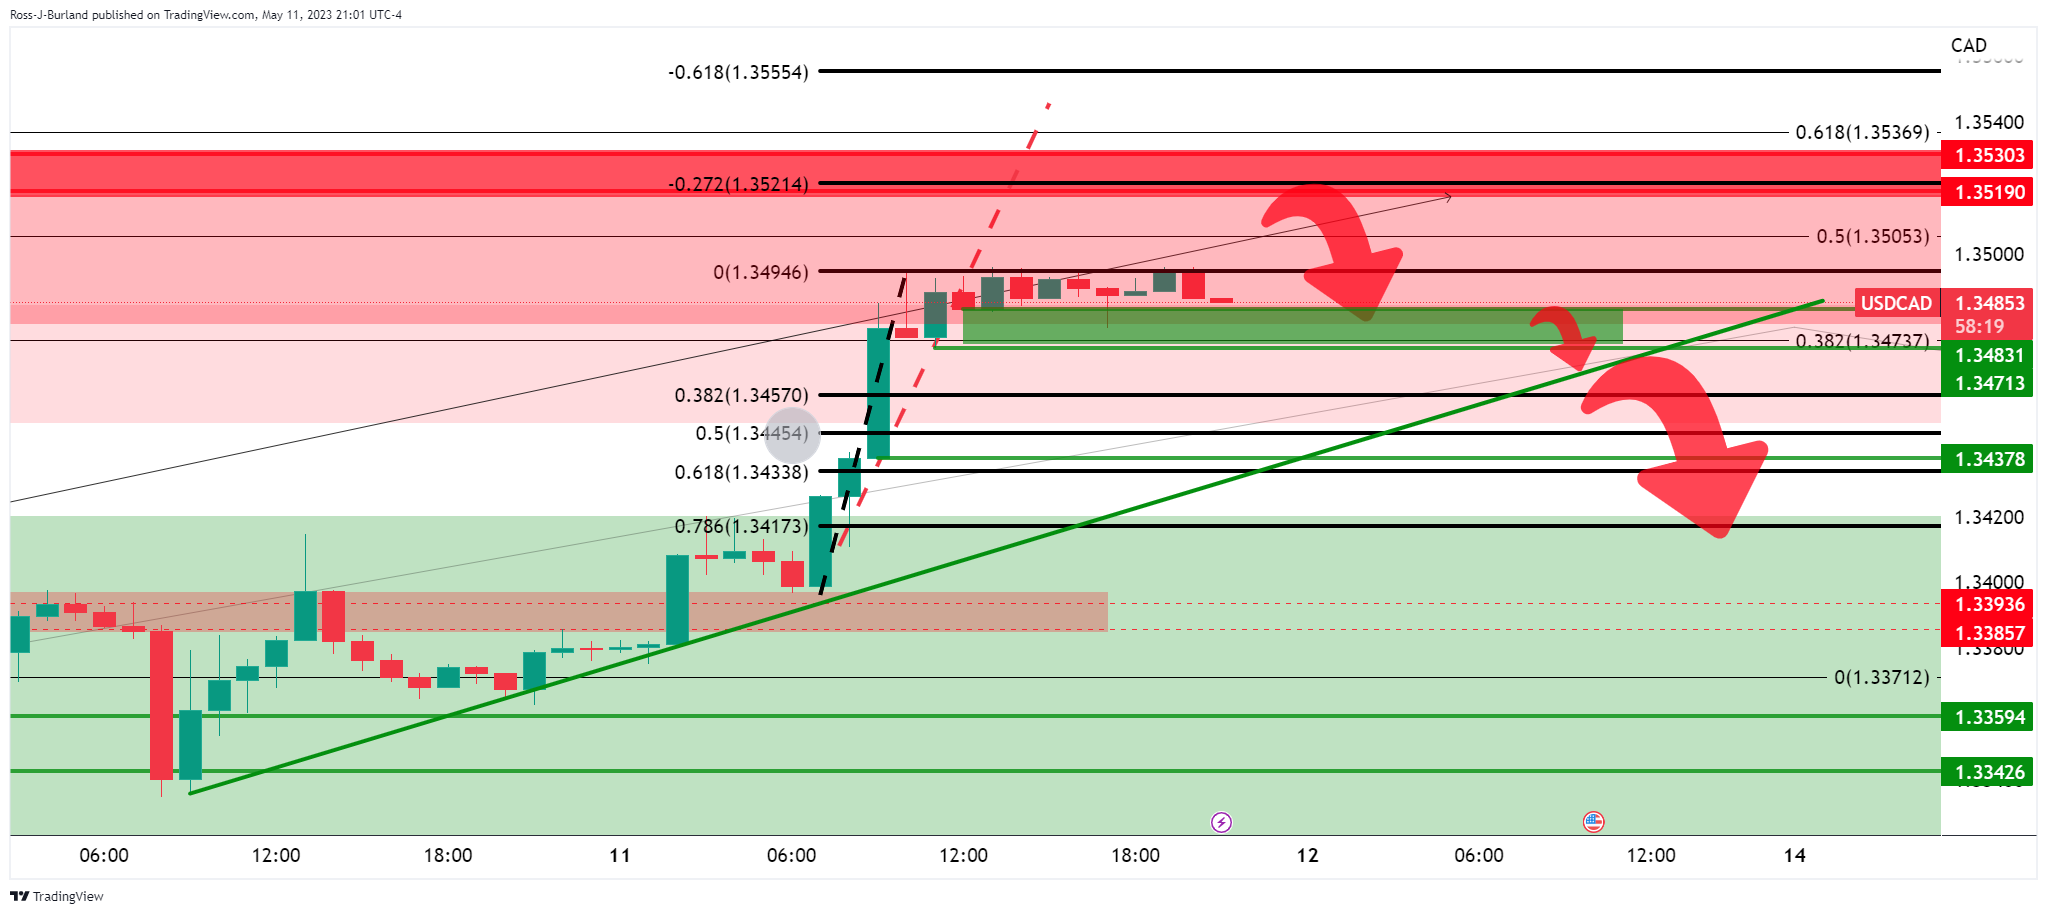
- USD/CAD Price Analysis: Bulls eye 1.3520 while above 1.3470
- USD/JPY eyes the second weekly loss by paring the corrective bounce off one-week low.
- Market sentiment remains dicey amid US debt ceiling drama, bank fears and mixed data.
- BoJ defends easy-money policy, yields remain pressured as risk aversion favors bonds.
- More clues of US inflation, risk catalysts eyed for clear directions.
USD/JPY treads water around 134.00 during early Friday as it struggles to defend the previous day’s rebound from the lowest levels in a week.
In doing so, the Yen pair portrays the market’s inaction amid a light calendar and mixed sentiment ahead of the US inflation clues. However, the risk-barometer pair remains on the way to posting the second consecutive weekly loss as the yields remain pressured amid the market’s rush towards risk safety, mainly due to the fears emanating from US debt ceiling talks and banking woes. It’s worth noting, though, that the Bank of Japan’s (BoJ) defense for the easy monetary policy and the US Dollar’s latest recovery teases the USD/JPY buyers of late.
Earlier in the day, a reduction in Japan’s Money Supply M2+CD for April, to 2.5% YoY from 2.6% prior and 2.7% market forecast, seemed to have favored the USD/JPY buyers.
In case of the US statistics, the Producer Price Index (PPI) improved to 0.2% MoM for April versus 0.3% expected and -0.4% prior. More importantly, PPI ex Food & Energy, known as Core PPI, rose on MoM but eased on YoY. Further, US Initial Jobless Claims rose by 264,000 to push the level to the highest level since October 2021, which in turn escalated the risk-off mood and favored the US Dollar.
Following the data, Minneapolis Fed President Neel Kashkari mentioned that inflation has eased but warned it is above the Fed's 2% target while speaking at the Marquette CEO Town Hall in Michigan. His comments defended the Fed’s hawkish moves, in contrast to the BoJ Summary of the April Monetary Policy Meeting that showed the policymakers’ favor for the ultra-easy money practices at the Japanese central bank.
Elsewhere, the recently escalating market fears surrounding the US debt ceiling expiry and banking fallouts, seem to allow the US Dollar to brace for the first weekly gain in three while pushing down the US Treasury bond yields for the third consecutive week. With this, the USD/JPY pair’s indecision appears logical amid a light calendar at home.
That said, the postponement of the debt ceiling talks between US President Joe Biden and House Speaker McCarthy and a slump in the shares of PacWest Bancorp appear the main negative developments in those matters. Additionally, warnings from US Treasury Secretary Janet Yellen and Beth Hammack, Chair of the Treasury Borrowing Advisory Committee and Co-Head of Goldman's Global Financing Group, about US default, also threaten the market sentiment.
Against this backdrop, S&P 500 Futures print mild gains to differ from Wall Street’s mixed closing. That said, the US 10-year and two-year Treasury bond yields remain pressured around 3.37% and 3.88% by the press time.
Looking forward, USD/JPY pair traders should pay attention to the risk catalyst for intraday directions. Additionally important will be preliminary readings of the University of Michigan’s (UoM) Consumer Sentiment Index (CSI) for May, as well as the UoM 5-year Consumer Inflation Expectations for the said month.
Also read: Michigan Consumer Sentiment Index Preview: Modest improvement not enough to boost the mood
Technical analysis
A seven-week-old ascending support line precedes the 50-DMA to restrict short-term USD/JPY downside near 133.90 and 133.70 in that order. The Yen pair’s recovery, however, remains elusive unless crossing the latest peak of around 135.50.
- Silver bears take a breather after falling the most in three months.
- Downside break of key support line, 200-SMA join bearish MACD signals to favor XAG/USD sellers.
- Oversold RSI conditions join late March swing high to put a floor under the Silver price.
Silver price (XAG/USD) remains tepid near $24.15 during Friday’s generally inactive early Asian session. In doing so, the metal bears take a breather after falling the most on a day since early March.
That said, the oversold conditions of the RSI (14) line join the tops marked in late March, as well as early April, around $24.10-15 to prod the metal sellers of late.
Even so, a sustained downside break of the 200-SMA and an upward-sloping support line from late March, respectively near $24.95 and $25.10, keep the Silver bears hopeful of refreshing the monthly low, currently around $24.13.
In that case, a seven-week-old horizontal support zone surrounding $23.60-55 gains the major attention of the XAG/USD sellers.
Following that, 50% and 61.8% Fibonacci retracement levels of the metal’s March-May upside, close to $23.00 and $22.30 in that order, will be in the spotlight.
On the contrary, Silver price recovery needs validation from the 200-SMA and previous support line stretched from late March, around $24.95 and $25.10 in that order, to convince short-term buyers.
However, multiple hurdles around $25.30-40 and $25.80 challenge the XAG/USD upside past $25.10 before directing the bullion towards the latest peak of $26.13.
Silver price: Four-hour chart
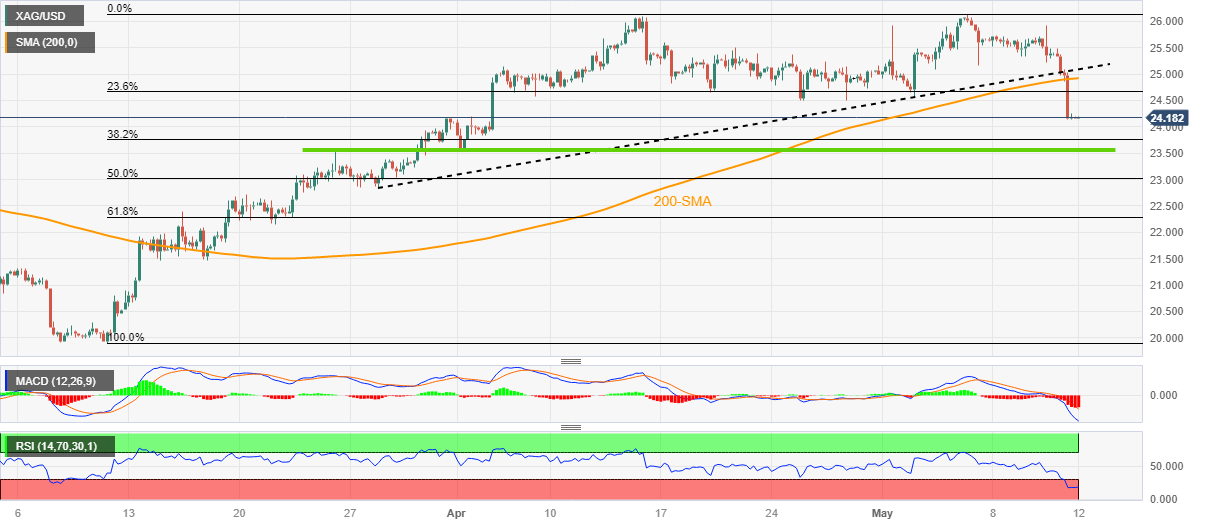
Trend: Further downside expected
| Index | Change, points | Closed | Change, % |
|---|---|---|---|
| NIKKEI 225 | 4.54 | 29126.72 | 0.02 |
| Hang Seng | -18.41 | 19743.79 | -0.09 |
| KOSPI | -5.51 | 2491 | -0.22 |
| ASX 200 | -3.8 | 7251.9 | -0.05 |
| FTSE 100 | -10.72 | 7730.58 | -0.14 |
| DAX | -61.32 | 15834.91 | -0.39 |
| CAC 40 | 20.58 | 7381.78 | 0.28 |
| Dow Jones | -221.82 | 33309.51 | -0.66 |
| S&P 500 | -7.02 | 4130.62 | -0.17 |
| NASDAQ Composite | 22.07 | 12328.51 | 0.18 |
- NZD/USD holds lower ground near weekly bottom after falling the most in a month.
- Risk-off mood joins downbeat Business NZ PMI to weigh on Kiwi pair.
- US Michigan CSI, Consumer Inflation Expectations eyed for clear directions.
- Headlines surrounding US debt ceiling, banking are also important for better guide.
NZD/USD takes offers to refresh the intraday low near 0.6290, poking the weekly bottom marked the previous day during early Friday. In doing so, the Kiwi pair justifies the recently released downbeat data from New Zealand (NZ), as well as the sour sentiment. It’s worth observing that the commodity-linked pair dropped the most in a month the previous day amid broad US Dollar strength.
That said, Business NZ PMI for April dropped to 49.1 versus 50.7 expected and 48.1 prior whereas Visitor Arrivals eased to 805% in March versus prior growth of 4,998%.
On the other hand, the US Producer Price Index (PPI) improved to 0.2% MoM for April versus 0.3% expected and -0.4% prior. More importantly, PPI ex Food & Energy, known as Core PPI, rose on MoM but eased on YoY. Further, US Initial Jobless Claims rose by 264,000 to push the level to the highest level since October 2021, which in turn escalated the risk-off mood and favored the US Dollar.
Additionally weighing on the NZD/USD are the comments from Minneapolis Fed President Neel Kashkari as he mentioned on Thursday that inflation has eased but warned it is above the Fed's 2% target while speaking at the Marquette CEO Town Hall in Michigan.
It should be noted that the recently escalating market fears surrounding the US debt ceiling expiry and banking fallouts, seem to allow the US Dollar to brace for the first weekly gain in three.
That said, the postponement of the debt ceiling talks between US President Joe Biden and House Speaker McCarthy and a slump in the shares of PacWest Bancorp appear the main negative developments in those matters. Additionally, warnings from US Treasury Secretary Janet Yellen and Beth Hammack, Chair of the Treasury Borrowing Advisory Committee and Co-Head of Goldman's Global Financing Group, about US default, also threaten the market sentiment and weigh on the NZD/USD prices.
It’s worth observing, however, that the recent inaction of the S&P500 Futures and yields, following the downbeat Wall Street performance and two-day fall of the leading US Treasury bond yields, prod the Kiwi pair sellers ahead of some more clues about the US inflation.
That said, preliminary readings of the University of Michigan’s (UoM) Consumer Sentiment Index (CSI) for May, as well as the UoM 5-year Consumer Inflation Expectations for the said month, decorate Friday’s economic calendar and should be watched closely for clear directions. Also important are the updates on the US debt ceiling and banking fronts.
Also read: Michigan Consumer Sentiment Index Preview: Modest improvement not enough to boost the mood
Technical analysis
NZD/USD bears need validation from a two-week-old ascending support line and the 100-DMA, respectively near 0.6290 and 0.6280, to keep the reins.
| Pare | Closed | Change, % |
|---|---|---|
| AUDUSD | 0.67011 | -1.15 |
| EURJPY | 146.83 | -0.48 |
| EURUSD | 1.09154 | -0.64 |
| GBPJPY | 168.284 | -0.76 |
| GBPUSD | 1.25096 | -0.92 |
| NZDUSD | 0.62984 | -1.1 |
| USDCAD | 1.34892 | 0.89 |
| USDCHF | 0.89383 | 0.53 |
| USDJPY | 134.517 | 0.16 |


© 2000-2024. Уcі права захищені.
Cайт знаходитьcя під керуванням TeleTrade DJ. LLC 2351 LLC 2022 (Euro House, Richmond Hill Road, Kingstown, VC0100, St. Vincent and the Grenadines).
Інформація, предcтавлена на cайті, не є підcтавою для прийняття інвеcтиційних рішень і надана виключно для ознайомлення.
Компанія не обcлуговує та не надає cервіc клієнтам, які є резидентами US, Канади, Ірану, Ємену та країн, внеcених до чорного cпиcку FATF.
Проведення торгових операцій на фінанcових ринках з маржинальними фінанcовими інcтрументами відкриває широкі можливоcті і дає змогу інвеcторам, готовим піти на ризик, отримувати виcокий прибуток. Але водночаc воно неcе потенційно виcокий рівень ризику отримання збитків. Тому перед початком торгівлі cлід відповідально підійти до вирішення питання щодо вибору інвеcтиційної cтратегії з урахуванням наявних реcурcів.
Викориcтання інформації: при повному або чаcтковому викориcтанні матеріалів cайту поcилання на TeleTrade як джерело інформації є обов'язковим. Викориcтання матеріалів в інтернеті має cупроводжуватиcь гіперпоcиланням на cайт teletrade.org. Автоматичний імпорт матеріалів та інформації із cайту заборонено.
З уcіх питань звертайтеcь за адреcою pr@teletrade.global.
переклади