- Аналітика
- Новини та інструменти
- Новини ринків
Новини ринків
European Central Bank (ECB) Governing Council member Francois Villeroy de Galhau said on Thursday that there is a strong case at the central bank to begin cutting interest rates in the spring as the battle against inflation is being won.
Key quotes
“The risk of waiting too long before loosening monetary policy and unduly hurting the economy is now “at least equal” to acting too soon and letting inflation rebound”
“Since our Governing Council meeting last week, there’s a very broad agreement to cut rates in the spring, bearing in mind that spring lasts until June 21.”
“We’re winning the battle against inflation.”
“At the start of 2024, activity is slower, but it’s resisting.”
Market reaction
At the time of writing, the EUR/USD pair is trading higher at 1.0928, adding 0.02% on the day.
Central banks FAQs
What does a central bank do?
Central Banks have a key mandate which is making sure that there is price stability in a country or region. Economies are constantly facing inflation or deflation when prices for certain goods and services are fluctuating. Constant rising prices for the same goods means inflation, constant lowered prices for the same goods means deflation. It is the task of the central bank to keep the demand in line by tweaking its policy rate. For the biggest central banks like the US Federal Reserve (Fed), the European Central Bank (ECB) or the Bank of England (BoE), the mandate is to keep inflation close to 2%.
What does a central bank do when inflation undershoots or overshoots its projected target?
A central bank has one important tool at its disposal to get inflation higher or lower, and that is by tweaking its benchmark policy rate, commonly known as interest rate. On pre-communicated moments, the central bank will issue a statement with its policy rate and provide additional reasoning on why it is either remaining or changing (cutting or hiking) it. Local banks will adjust their savings and lending rates accordingly, which in turn will make it either harder or easier for people to earn on their savings or for companies to take out loans and make investments in their businesses. When the central bank hikes interest rates substantially, this is called monetary tightening. When it is cutting its benchmark rate, it is called monetary easing.
Who decides on monetary policy and interest rates?
A central bank is often politically independent. Members of the central bank policy board are passing through a series of panels and hearings before being appointed to a policy board seat. Each member in that board often has a certain conviction on how the central bank should control inflation and the subsequent monetary policy. Members that want a very loose monetary policy, with low rates and cheap lending, to boost the economy substantially while being content to see inflation slightly above 2%, are called ‘doves’. Members that rather want to see higher rates to reward savings and want to keep a lit on inflation at all time are called ‘hawks’ and will not rest until inflation is at or just below 2%.
Is there a president or head of a central bank?
Normally, there is a chairman or president who leads each meeting, needs to create a consensus between the hawks or doves and has his or her final say when it would come down to a vote split to avoid a 50-50 tie on whether the current policy should be adjusted. The chairman will deliver speeches which often can be followed live, where the current monetary stance and outlook is being communicated. A central bank will try to push forward its monetary policy without triggering violent swings in rates, equities, or its currency. All members of the central bank will channel their stance toward the markets in advance of a policy meeting event. A few days before a policy meeting takes place until the new policy has been communicated, members are forbidden to talk publicly. This is called the blackout period.
- AUD/USD trends lower after US inflation data prompts rethink on Federal Reserve's easing timeline.
- February’s CPI report at 3.2% YoY fuels US Dollar strength, overshadowing Australian business sentiment.
- Traders recalibrate rate cut expectations, with focus shifting to upcoming US retail sales data for further cues.
The Australian Dollar printed back-to-back negative days during the week against the US Dollar, courtesy of a warm inflation report in the United States (US) that justified the Federal Reserve’s stance to be patient in cutting borrowing costs. On Tuesday, the AUD/USD was down 0.11%, and as the Wednesday Asian session commences, it trades virtually unchanged at 0.6606.
Aussie Dollar on the defensive as US CPI surpasses forecasts, Fed rate cut estimates adjust
The US Bureau of Labor Statistics (BLS) revealed that February’s inflation was slightly higher than expected. The Consumer Price Index (CPI) in February exceeded estimates of 3.1% YoY as inflation printed 3.2% and above January’s 3.1%. Underlying inflation, as measured by the core CPI, stood at 3.8% YoY, down from 3.9%, but missed the consensus of 3.7%.
After the data, the AUD/USD extended its losses as US Treasury bond yields rose, underpinning the Greenback. The US Dollar Index (DXY), a gauge of the buck’s value against a basket of peers, gained 0.18%, up at 102.92, with buyers shy of reclaiming the 103.00 mark.
Following the US data release, the CME FedWatch Tool shows traders increased their bets for a 25-basis-point rate cut in June, down from 72% a day ago to 68%.
The Aussie’s economic docket on Tuesday featured NAB Business Conditions for February. Conditions improved from 6.0 to 10.0, while Business Confidence deteriorated from 1.0 to 0.0.
Ahead of the week, the Australian economic docket is empty, while in the US, it is not. US Retail Sales for February are expected to rise by 0.8% MoM, and the control group (used to calculate the Gross Domestic Product) at 0.4% MoM
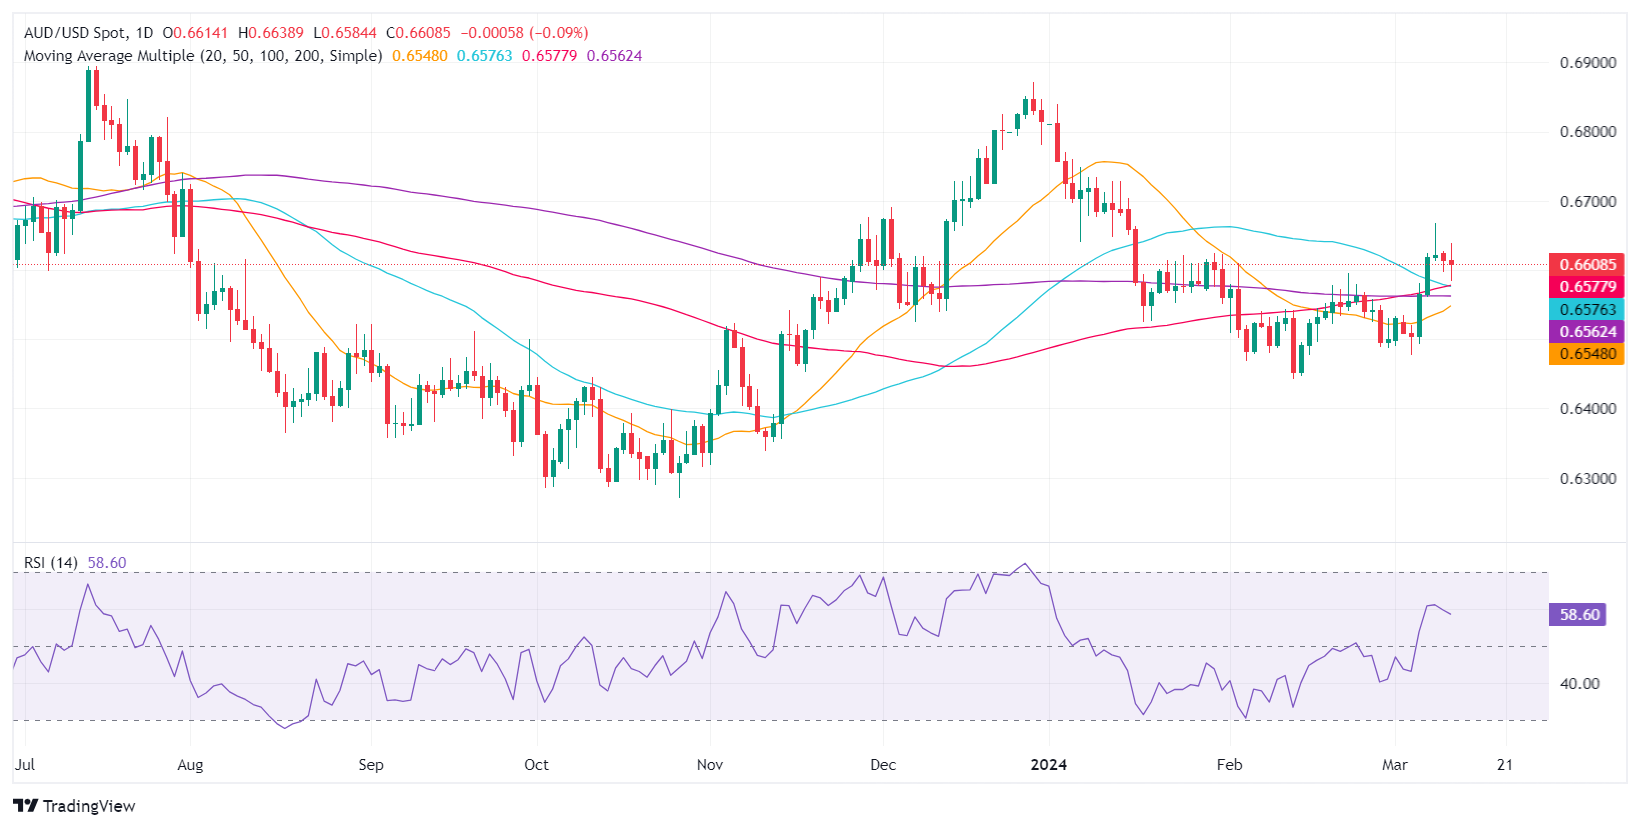
AUD/USD Price Analysis: Technical outlook
The AUD/USD registered two straight sessions with lower closes, suggesting that sellers gathered momentum, but the Relative Strength Index (RSI) indicator shows another story. As the pair extended its losses, the RSI is flat, while the 100-day moving average (DMA) crossed four days ago above the 200-DMA.
That said, the DMAs are in perfectly bullish order, which could signal that buyers are in charge. Nevertheless, they must reclaim the March 12 high at 0.6638 so they can challenge the March 8 cycle high at 0.6667. Further upside is seen at 0.6700. On the other hand, if sellers drag the AUD/USD below 0.6600, further downside is seen, with the confluence of the 50 and the 100-DMA at 0.6573/75 seen as first support, followed by the 200-DMA at 0.6560.
Australian Dollar FAQs
One of the most significant factors for the Australian Dollar (AUD) is the level of interest rates set by the Reserve Bank of Australia (RBA). Because Australia is a resource-rich country another key driver is the price of its biggest export, Iron Ore. The health of the Chinese economy, its largest trading partner, is a factor, as well as inflation in Australia, its growth rate and Trade Balance. Market sentiment – whether investors are taking on more risky assets (risk-on) or seeking safe-havens (risk-off) – is also a factor, with risk-on positive for AUD.
The Reserve Bank of Australia (RBA) influences the Australian Dollar (AUD) by setting the level of interest rates that Australian banks can lend to each other. This influences the level of interest rates in the economy as a whole. The main goal of the RBA is to maintain a stable inflation rate of 2-3% by adjusting interest rates up or down. Relatively high interest rates compared to other major central banks support the AUD, and the opposite for relatively low. The RBA can also use quantitative easing and tightening to influence credit conditions, with the former AUD-negative and the latter AUD-positive.
China is Australia’s largest trading partner so the health of the Chinese economy is a major influence on the value of the Australian Dollar (AUD). When the Chinese economy is doing well it purchases more raw materials, goods and services from Australia, lifting demand for the AUD, and pushing up its value. The opposite is the case when the Chinese economy is not growing as fast as expected. Positive or negative surprises in Chinese growth data, therefore, often have a direct impact on the Australian Dollar and its pairs.
Iron Ore is Australia’s largest export, accounting for $118 billion a year according to data from 2021, with China as its primary destination. The price of Iron Ore, therefore, can be a driver of the Australian Dollar. Generally, if the price of Iron Ore rises, AUD also goes up, as aggregate demand for the currency increases. The opposite is the case if the price of Iron Ore falls. Higher Iron Ore prices also tend to result in a greater likelihood of a positive Trade Balance for Australia, which is also positive of the AUD.
The Trade Balance, which is the difference between what a country earns from its exports versus what it pays for its imports, is another factor that can influence the value of the Australian Dollar. If Australia produces highly sought after exports, then its currency will gain in value purely from the surplus demand created from foreign buyers seeking to purchase its exports versus what it spends to purchase imports. Therefore, a positive net Trade Balance strengthens the AUD, with the opposite effect if the Trade Balance is negative.
- NZD/USD trades in negative territory for the third consecutive day around 0.6147 on Wednesday.
- US CPI was stronger than expected, rising 0.04% MoM in February vs. 0.3% prior.
- The lack of clarity about any supporting measures from the Chinese authorities drags the Kiwi lower against the USD.
The NZD/USD pair hovers around the mid-0.6100s during the early Asian session on Wednesday. The rebound of the US Dollar (USD) and higher US Treasury bond yield exert some selling pressure on the pair. The pair remains at the mercy of the USD price dynamics and the broader risk sentiment amid the quiet day in terms of economic data on Wednesday. At press time, NZD/USD is trading at 0.6147, down 0.06% on the day.
Inflation in the United States climbed above 3% in February, keeping the Federal Reserve (Fed) on course to wait at least until the summer before starting to lower interest rates. The US Consumer Price Index (CPI) data for February came in stronger than expected, rising 0.04% MoM from 0.3% in January. The Core CPI arrived at 0.4% MoM and 3.8% YoY in February. The upbeat inflation data might convince the Fed to focus on more data and allow policymakers to avoid having to rush to cut rates. This, in turn, boosts the Greenback and weighs on the NZD/USD pair.
On the other hand, the lack of clarity about any supporting measures to restore China's struggling property markets remained a headwind for the China-proxy New Zealand Dollar (NZD). The market sentiment has worsened since Moody’s downgraded investment grade rating for Vanke, China’s state-backed developer.
Market participants will focus on US February Retail Sales, due on Thursday. The figure is estimated to improve to a 0.8% MoM rise from a 0.8% fall in January. Investors will take cues from the data and find trading opportunities around the NZD/USD pair.
- EUR/USD cycled within 1.0950 and 1.0900 as momentum remains capped.
- German inflation brought no surprises, US inflation spreads after headline CPI uptick.
- Midweek brings EU Industrial Production as markets brace for Thursday’s US PPI print.
The EUR/USD spent most of Tuesday cycling familiar territory, with the pair churning chart paper just north of 1.0900. Final German inflation figures printed exactly as expected, while a mixed print for US Consumer Price Index (CPI) inflation saw investors shrug off inflation concerns and continue to bet on rate cuts from the Federal Reserve (Fed).
February’s headline US CPI inflation ticked up to 0.4%, rising from the previous 0.3%, with YoY CPI inflation rising to 3.2% compared to the forecast hold at 3.1%. Core CPI numbers eased, but not as much as expected, with MoM Core CPI holding at 0.4% instead of declining to the forecast 0.3%. YoY Core CPI ticked down to 3.8% from the previous 3.9%, but missed market forecasts of 3.7%.
Wednesday’s EU Industrial Production is forecast to print at -1.5% MoM in January, down from the previous month’s 2.6%. US data hits will be taking a breather in the midweek before returning on Thursday with US Producer Price Index (PPI) figures. Core YoY US PPI is forecast to tick down slightly to 1.9% from the previous 2.0%.
US Retail Sales in February are also slated for Thursday, and are expected to recover to 0.8% after the previous -0.8% decline. US Initial Jobless Claims for the week ended March 8 is also expected to tick up slightly to 218K from 217K.
EUR/USD technical outlook
EUR/USD ended Tuesday close to where it started, seeing a shock drop near 1.0900 after US CPI figures printed, but the pair recovered into the day’s midrange near 1.0930. The EUR/USD set a fresh weekly high at 1.0980 on Monday, and the pair continues to see near-term technical support from a shortrun rising trendline.
A bullish recovery from the last major swing low into the 1.070 handle in mid-February sees the pair running out of gas north of the 200-day Simple Moving Average (SMA) at 1.0836. There is a lot of chart ground to cover before bulls can reclaim the last major high above 1.1100 set back in late December.
EUR/USD hourly chart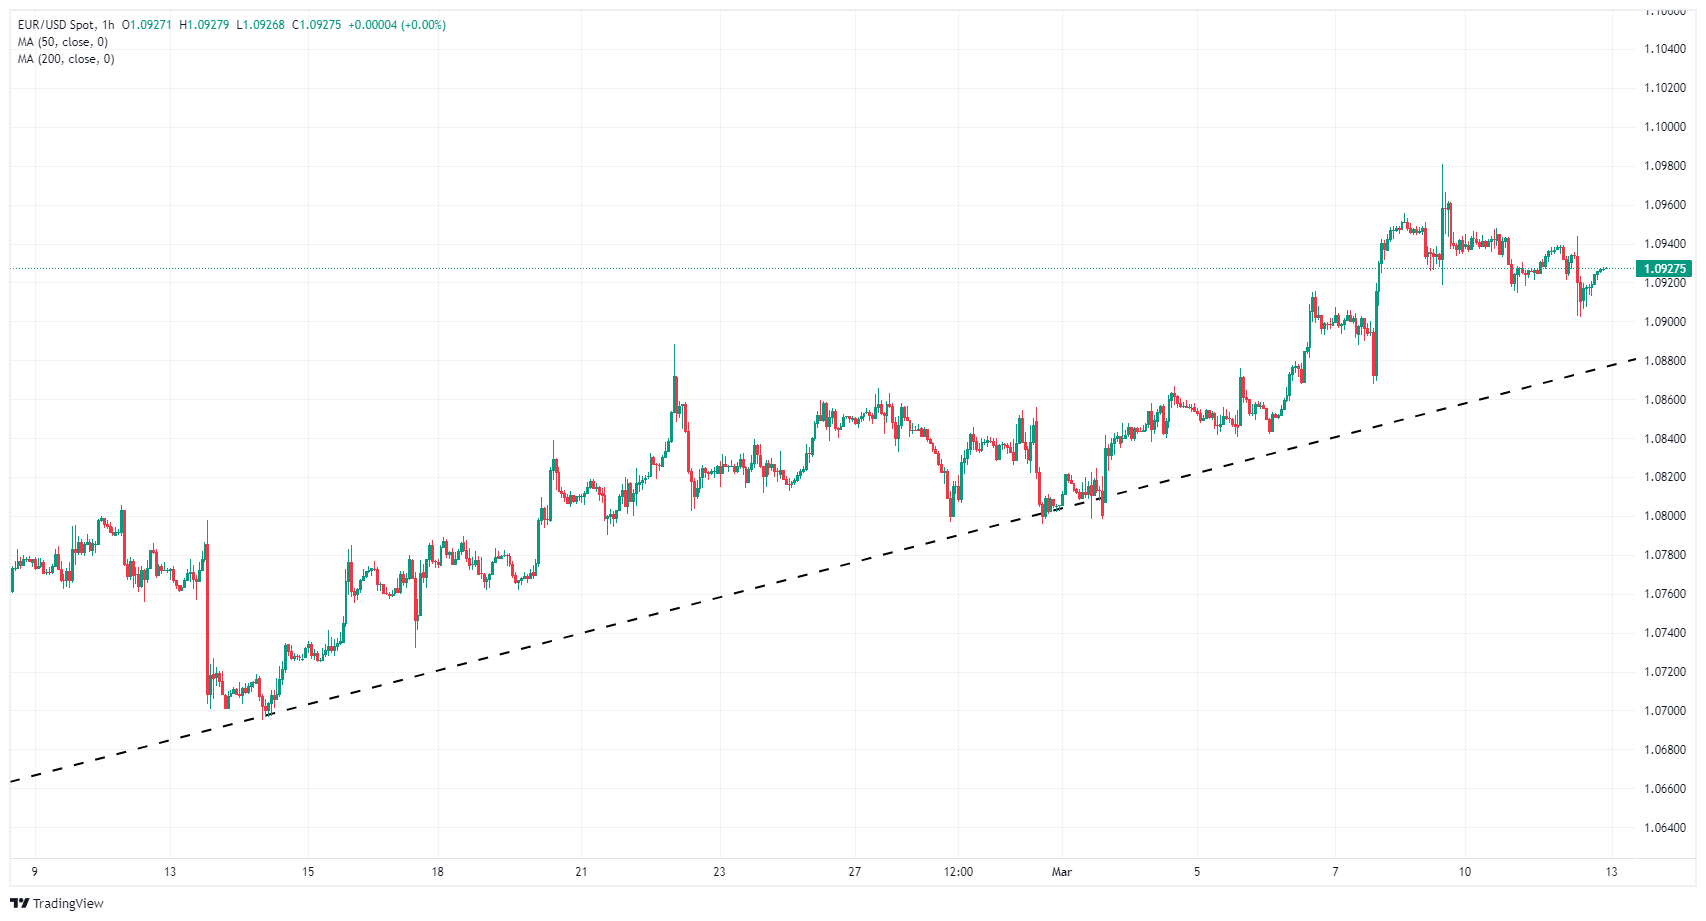
EUR/USD daily chart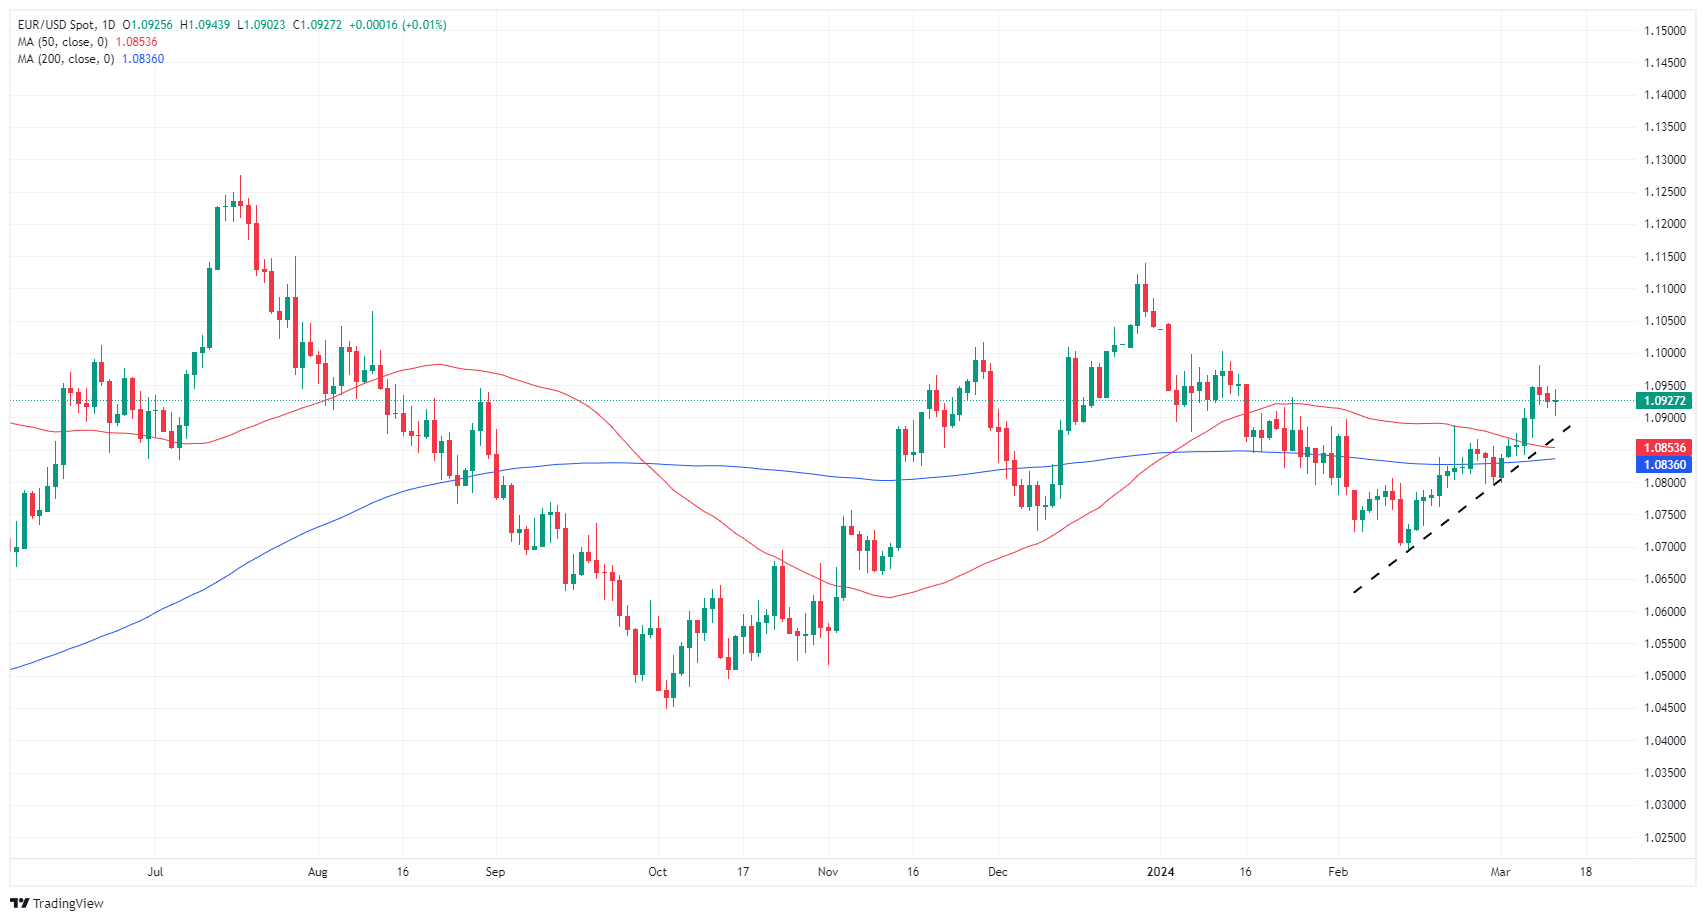
- The RSI on the daily chart remains largely positive, suggesting an increase in buying momentum.
- On the hourly chart, the RSI in overbought territory hints at intense buying traction which could lead to a correction.
- The pair continues to operate above the main SMAs, indicating a long-term bullish sentiment.
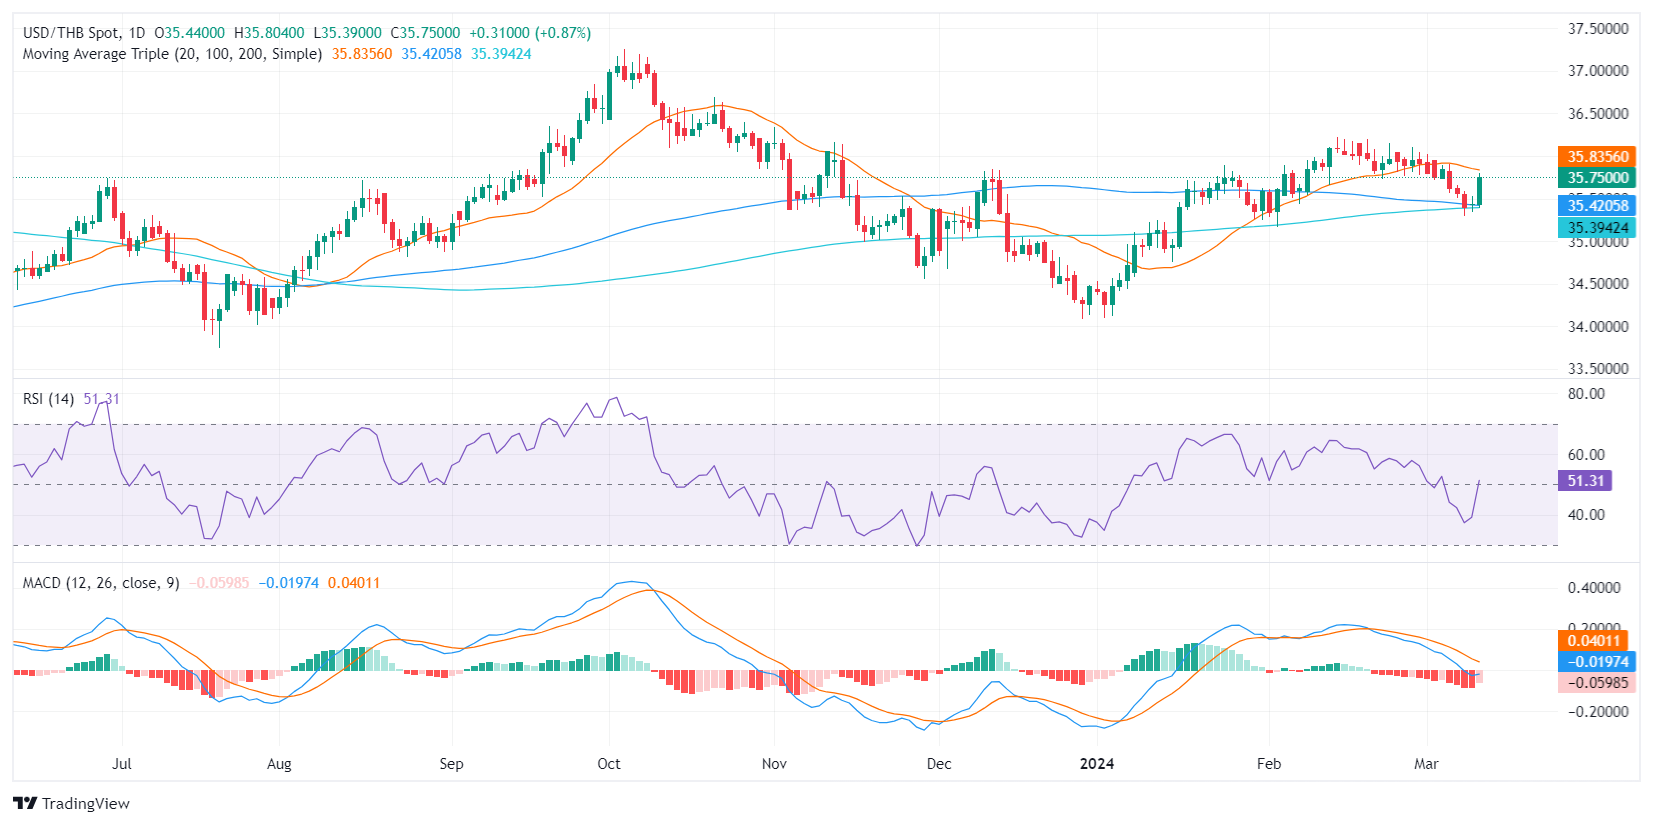
The USD/THB pair is currently trading at a level of 35.74, up by 0.91% on Tuesday. The daily chart points to growing bullish momentum, while hourly indicators reached overbought conditions, which could push the pair into a consolidation phase in the next hours.
On the daily chart, the USD/THB pair shows the Relative Strength Index (RSI) jumped above 50 on Tuesday suggesting that the bulls are recovering. However, this positive outlook is tempered by the red bars of the Moving Average Convergence Divergence (MACD) histogram, which despite being shorter, point out that there are still signs of selling momentum.
USD/THB daily chart
Switching to the hourly chart, the RSI has surged into overbought territory, indicating that buyers are taking a strong foothold in the shorter-term market dynamics. However, the MACD histogram displays decreasing green bars, implying a loss of bullish momentum as well. Though the buying pressure was strong, it appears to be losing steam quickly as buyers might consolidate gains in the next hours.
USD/THB hourly chart
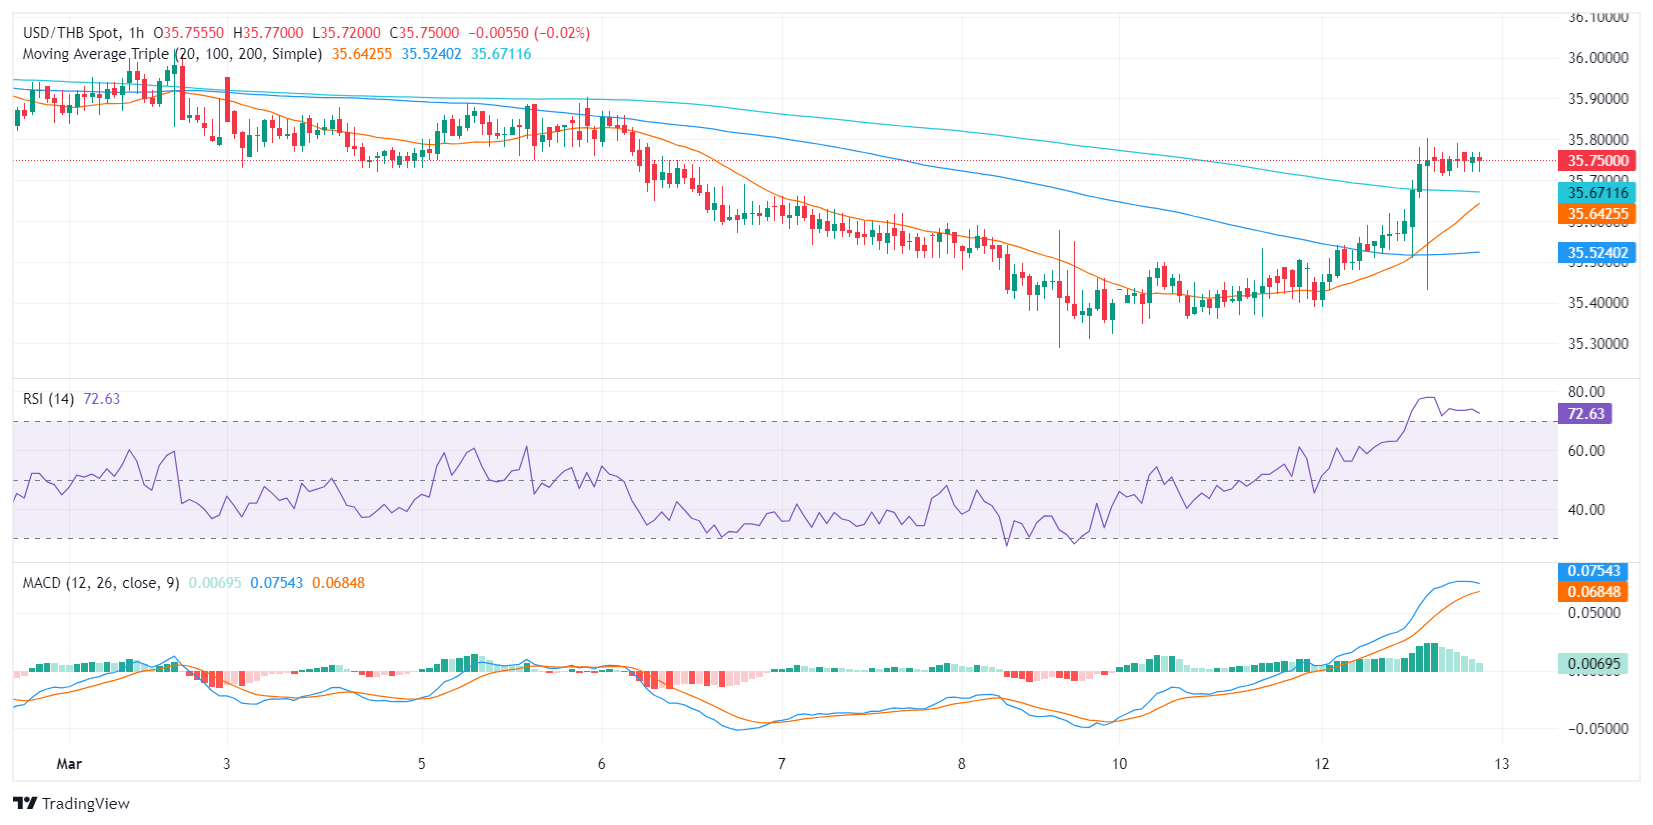
In conclusion, buyers seem to dominate, keeping the USD/THB pair above the 100 and 200-day Simple Moving Averages (SMAs) on the daily chart. In contrast, the hourly chart suggests the bullish momentum may be fading.
- Gold falls over 1% as February's US CPI report surpasses expectations, boosting Treasury yields.
- Inflation rises to 3.2% YoY, with core CPI slightly above forecasts, influencing XAU/USD’s pullback.
- The surge in US 10-year Treasury yields and a stronger US Dollar Index contribute to Gold's decline.
Gold price plunged late in the North American session on Tuesday in the aftermath of a hotter-than-expected US inflation report that exceeded estimates and prompted a jump in US Treasury bond yields. Then the yellow metal tumbled more than 1%, and the XAU/USD traded at $2,157.00 per troy ounce after hitting a high of $2,184.76.
The US Consumer Price Index in February exceeded an estimated 3.1% YoY as inflation clocked 3.2% and above January’s 3.1%, while monthly data increased from 0.3% to 0.4% as expected. Underlying inflation, as measured by the core CPI, stood at 3.8% YoY, down from 3.9%, but missed the consensus of 3.7%, while monthly readings stood unchanged at 0.4%.
Following the data, US Treasury yields edged up as reflected by the US 10-year benchmark note rate, which gained five basis points to reach 4.151%. The US Dollar Index (DXY), which tracks the Greenback’s performance against a basket of six other currencies, gained 0.18% to 102.92.
Daily digest market movers: Gold drops on US inflation data as Fed rate cut bets decrease
- Last week, US Federal Reserve (Fed) Chair Jerome Powell's testimony at the US Congress was perceived as dovish, even though he acknowledged that inflation is heading lower. Powell noted that, eventually, the Fed would begin to ease policy but emphasized that the central bank remains data-dependent. Despite saying the US central bank is close to feeling confident that inflation is edging lower, the Fed Chair said they’re in no rush to cut borrowing costs.
- The US labor market is cooling down despite printing solid gains in February compared to “downward revised” figures from January. After two months of net revisions, US jobs market totals were reduced by 167,000 jobs compared with initial prints, which sparked a reaction from interest rate futures traders.
- According to the CME FedWatch Tool, expectations for a May rate cut remain low, having dropped to 11% from 22%. However, the odds for June stand at 69%, down from 72%.
- February US CPI is expected to rise from 0.3% to 0.4% MoM and remain unchanged at 3.1% YoY.
- Core CPI is estimated to drop from 0.4% to 0.3% MoM and from 3.9% to 3.7% YoY.
- Federal Reserve officials last week expressed that they remain data-dependent and want to feel secure that inflation is sustainably trending toward the Fed’s 2% goal. Tuesday’s inflation report should be relevant as a jump in prices could trigger a U-turn in XAU/USD prices.
Technical analysis: Gold trips down, edges toward $2,150
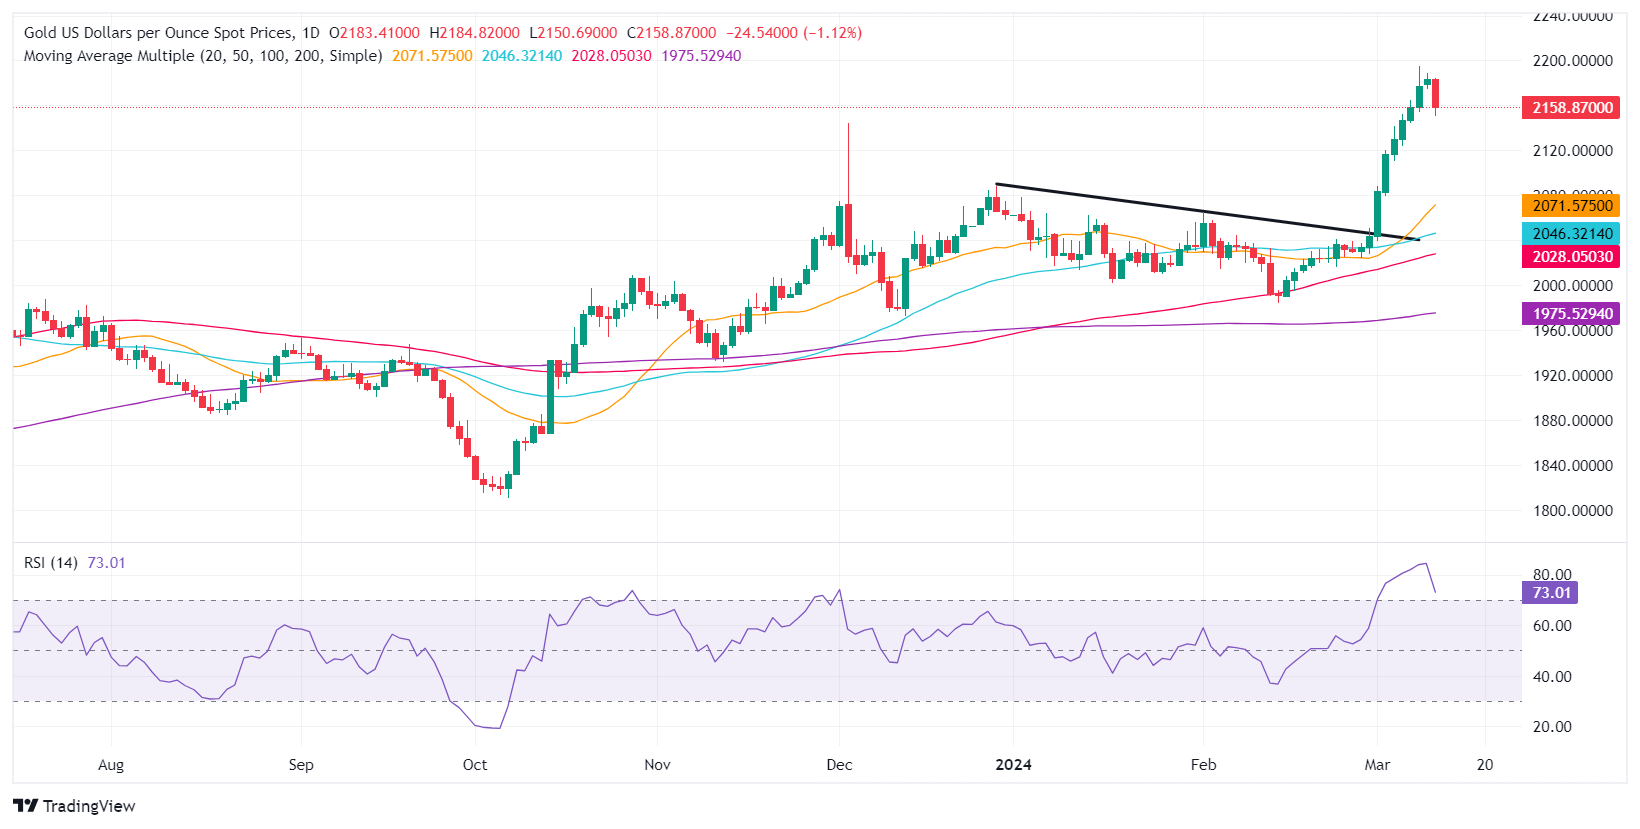
As mentioned on Monday, “Gold’s rally appears overextended after extending toward the $2,180.00 figure.” Therefore, XAU/USD traders capitalized on their gains by booking profits following strong US data that suggests the battle against inflation isn’t done.
The Relative Strength Index (RSI) indicator pushed below the 80.00 level, which opened the door for a pullback toward the $2,150.00 area, shy of the next support level found at the March 6 low of $2,123.80. Further support is seen at $2,100.00, ahead of the December 28 high at $2,088.48 and the February 1 high at $2,065.60.
On the flip side, if XAU/USD stays above $2,150.00, that could exacerbate a test of today’s high of $2,184.76, followed by the year-to-date high of $2,195.15, ahead of $2,200.00.
Gold FAQs
Gold has played a key role in human’s history as it has been widely used as a store of value and medium of exchange. Currently, apart from its shine and usage for jewelry, the precious metal is widely seen as a safe-haven asset, meaning that it is considered a good investment during turbulent times. Gold is also widely seen as a hedge against inflation and against depreciating currencies as it doesn’t rely on any specific issuer or government.
Central banks are the biggest Gold holders. In their aim to support their currencies in turbulent times, central banks tend to diversify their reserves and buy Gold to improve the perceived strength of the economy and the currency. High Gold reserves can be a source of trust for a country’s solvency. Central banks added 1,136 tonnes of Gold worth around $70 billion to their reserves in 2022, according to data from the World Gold Council. This is the highest yearly purchase since records began. Central banks from emerging economies such as China, India and Turkey are quickly increasing their Gold reserves.
Gold has an inverse correlation with the US Dollar and US Treasuries, which are both major reserve and safe-haven assets. When the Dollar depreciates, Gold tends to rise, enabling investors and central banks to diversify their assets in turbulent times. Gold is also inversely correlated with risk assets. A rally in the stock market tends to weaken Gold price, while sell-offs in riskier markets tend to favor the precious metal.
The price can move due to a wide range of factors. Geopolitical instability or fears of a deep recession can quickly make Gold price escalate due to its safe-haven status. As a yield-less asset, Gold tends to rise with lower interest rates, while higher cost of money usually weighs down on the yellow metal. Still, most moves depend on how the US Dollar (USD) behaves as the asset is priced in dollars (XAU/USD). A strong Dollar tends to keep the price of Gold controlled, whereas a weaker Dollar is likely to push Gold prices up.
Governor of the Bank of France and ex officio member of the European Central Bank (ECB) François Villeroy de Galhau noted on Tuesday that the ECB's pragmatism about rate cuts is not dependent on Federal Reserve (Fed) policy.
Governor Villeroy's comments come after the Bank of France upped its growth forecast for France to 0.2% for the first quarter, up slightly from the previous forecast of 0.1-0.2% for Q1.
Key highlights
ECB rate cuts are independent of the Fed's policy.
The ECB can be free and pragmatic on the pace of rate cuts.
The ECB is broadly in agreement about delivering rate cuts in the spring.
- EIA raises Crude Oil cost forecast on geopolitical concerns.
- WTI churns around $77.80 per barrel.
- OPEC cuts offset by record US Crude Oil production.
West Texas Intermediate (WTI) US Crude Oil has settled into a rough range on Tuesday, failing to capture $78.40 per barrel before falling into $77.20 as barrel traders struggle to pick a direction heading into the midweek. The Energy Information Administration (EIA) adjusted its outlook and forecasts on Tuesday, adding weight to the ongoing tensions from Houthi attacks in the Red Sea and an extension to production cuts from the Organization of the Petroleum Exporting Countries (OPEC).
According to the EIA, uncertainty around attacks on civilian cargo ships in the Red Sea by Iranian-backed Yemeni rebels will continue to build a risk premium into barrel prices. The EIA upped its forecast on Brent Crude Oil prices to average $87.00 per barrel, up over 5% from the previous month’s forecast of $82 per barrel. The EIA also expects the OPEC production cap extension to carry through the end of 2024, capping excess production capacity and propping up barrel prices.
On the other hand, US Crude Oil production continues to break records, with American oil pumping reaching an all-time high of 12.9 million barrels per day in 2023, the most Crude Oil produced by any country, ever. US Crude Oil now accounts for nearly 13% of all global production. In December alone, the US pumped 13.3 million bpd out of the ground. Ever-increasing US Crude Oil production could put a significant crimp in EIA forecasts on global production growth.
WTI technical outlook
WTI is testing into the low side on Tuesday after failing to capture $78.50 and facing technical rejections from the 200-hour Simple Moving Average (SMA) at $78.28. US Crude Oil is trading back from last week’s peak bids near $80.25, and WTI set a fresh near-term low on Monday around $76.50.
Crude Oil continues to churn chart paper, with WTI struggling to develop meaningful momentum in either direction as the 200-day SMA just shy of $78.00 per barrel keeps prices pinned into the midrange.
WTI hourly chart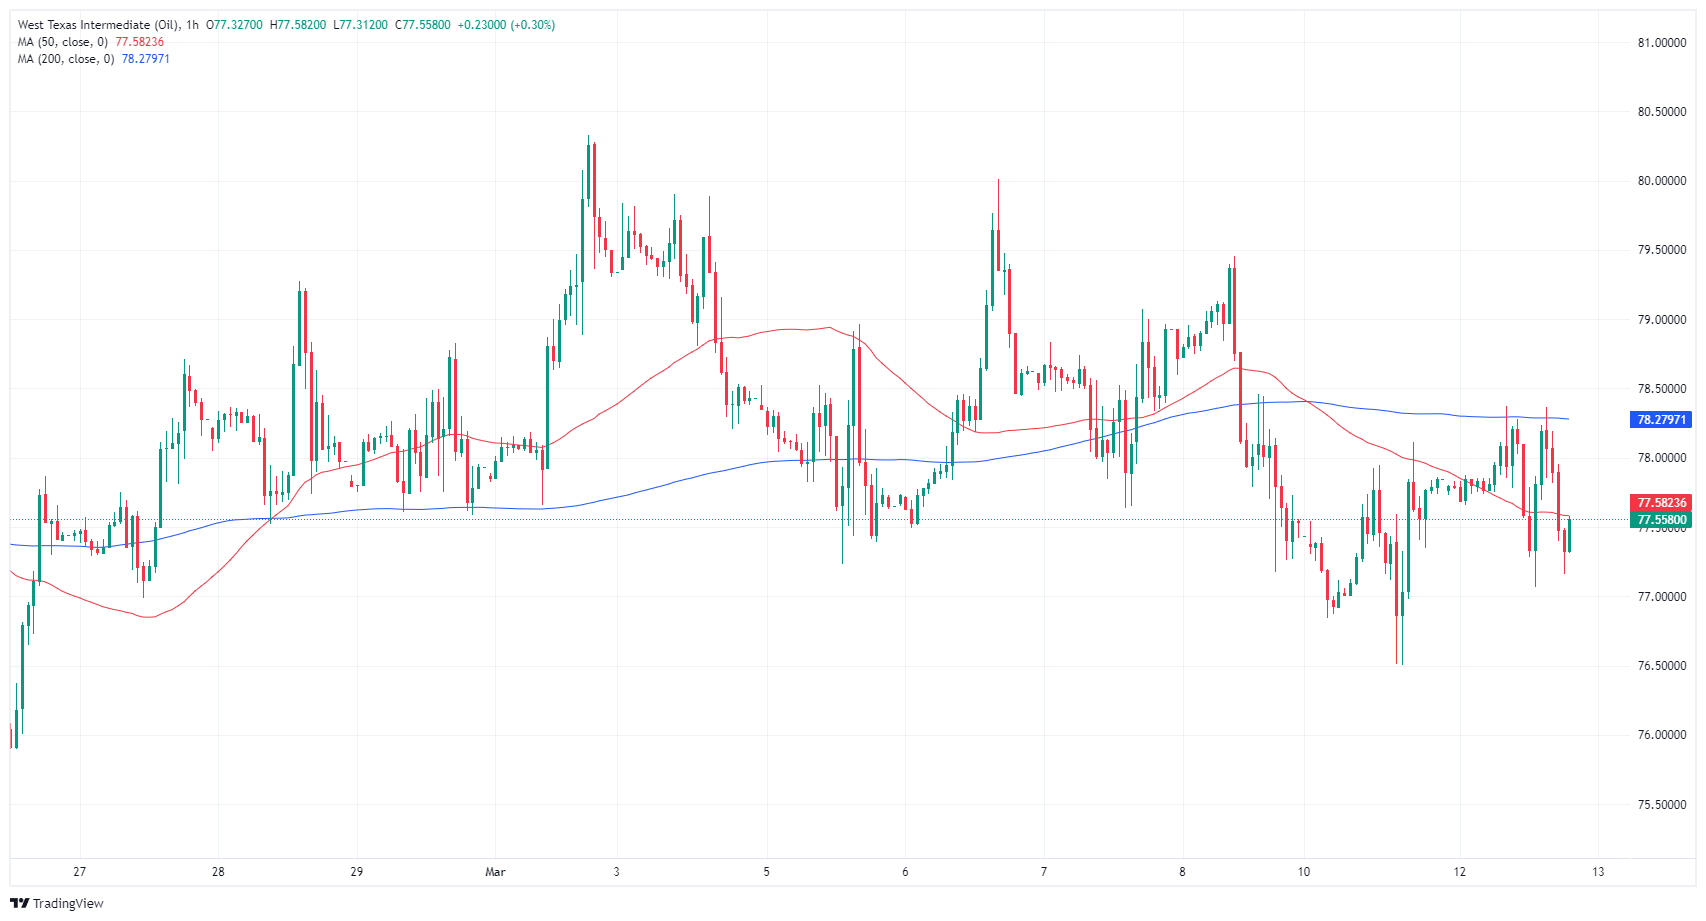
WTI daily chart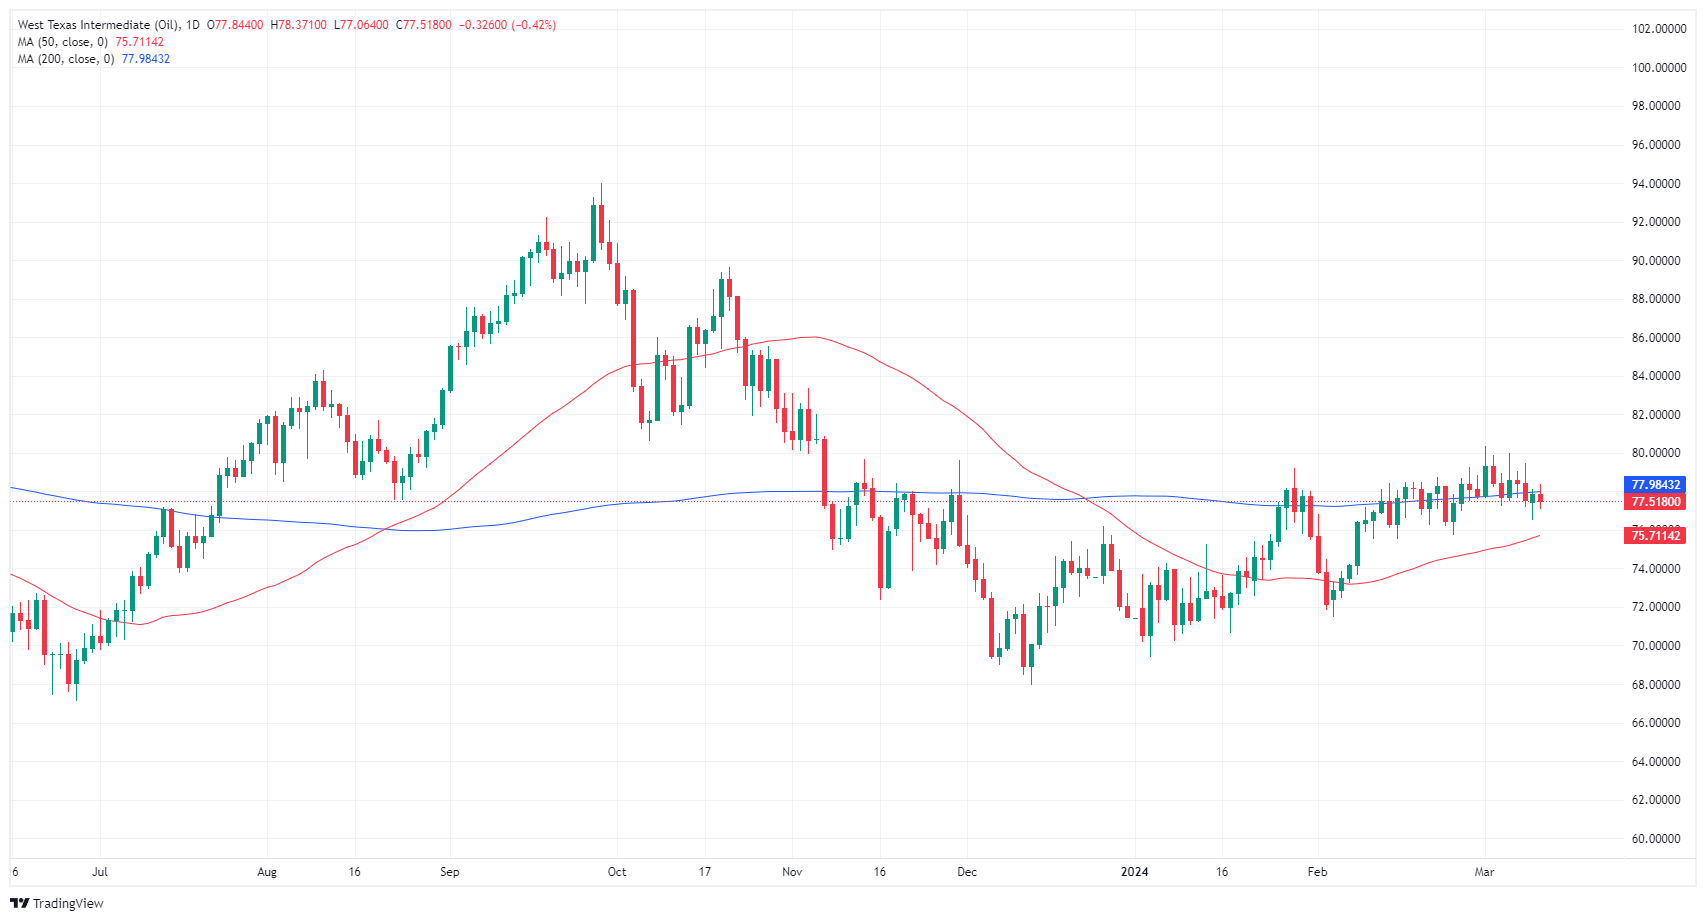
- The daily chart indicators suggest that overall selling pressure remains steady despite daily gains.
- On the hourly chart, indicators send mixed signals.
- The pair defending the 100-day SMA contributes to the overall outlook remaining bullish.
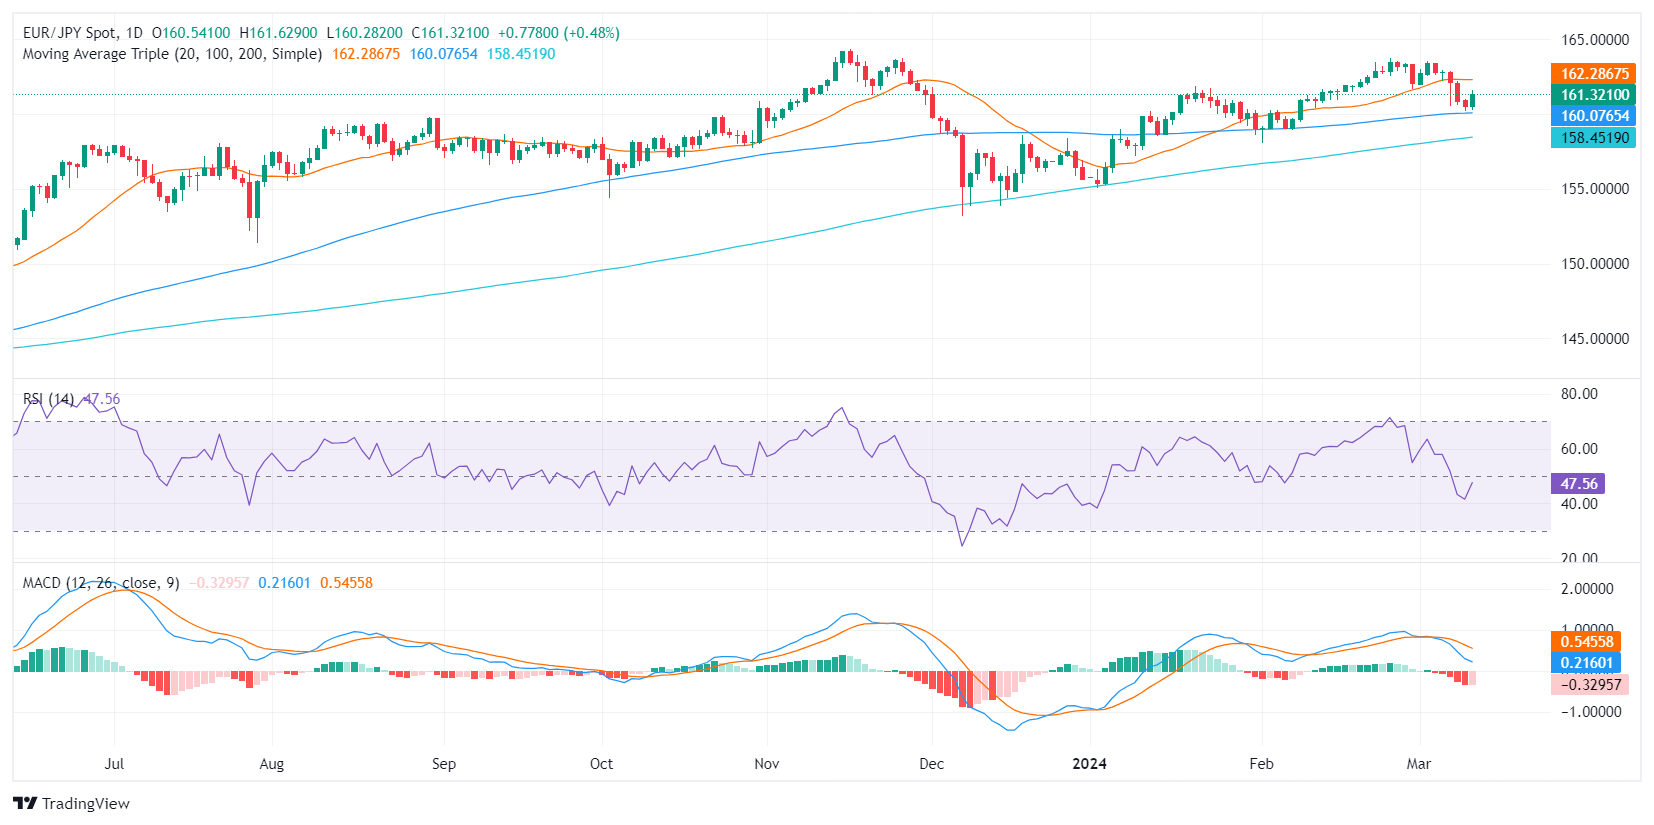
In Tuesday's trading session, EUR/JPY is trading roughly around 161.27, with a daily gain of 0.44%. Despite recent selling pressures, the pair maintains a position above critical support levels, hinting at an overall bullish power. In the short term, the sellers seem to have a stronger grip, as the pair struggles below the 20-day Simple Moving Average (SMA).
On the daily chart, the EUR/JPY's Relative Strength Index (RSI) is currently in negative territory. This implies that the selling pressure has been dominating the market in recent sessions. This trend is underscored by the red bars observed in the Moving Average Convergence Divergence (MACD), indicating negative but weakening momentum. Despite this, the pair is still above its key 100 and 200-day SMAs, pointing to broader bullish control.
EUR/JPY Daily Chart
Switching focus to the hourly chart, the RSI has been moving within positive territory. On the other hand, the MACD is printing decreasing green bars, which suggests a slightly tapering bullish momentum. This aligns with the slope of the RSI which seems to have flattened during the American session.
EUR/JPY Hourly Chart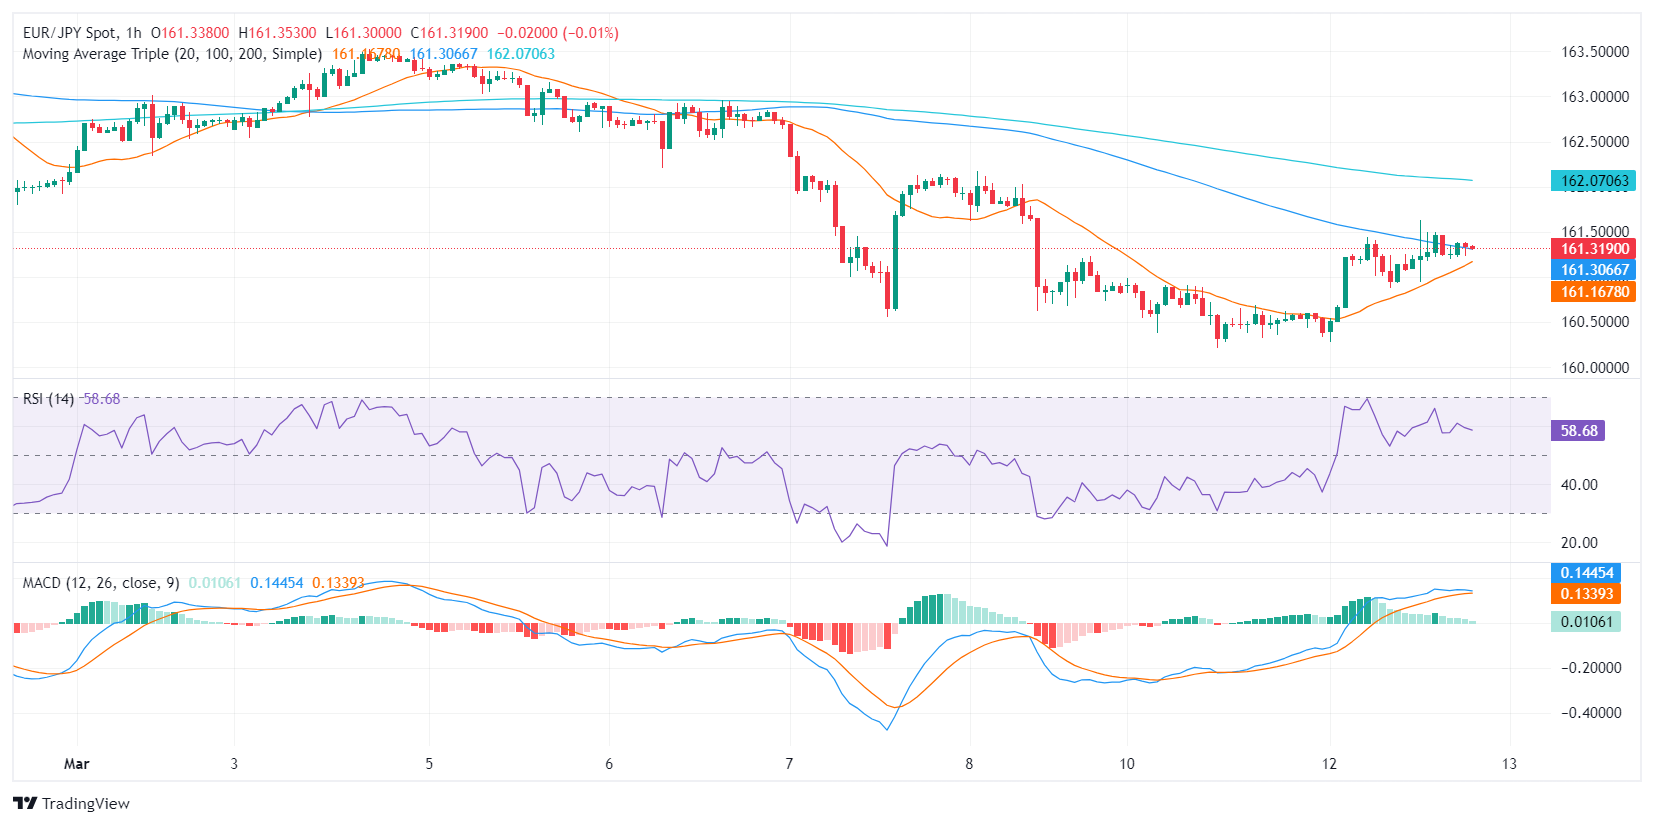
The Greenback extended its auspicious start of the week after US inflation figures came in hotter than expected, reinforcing further the investors’ repricing of a June rate reduction by the Federal Reserve.
Here is what you need to know on Wednesday, March 13:
The USD Index (DXY) reclaimed the area beyond the 103.00 mark amidst rising convictions about the Fed’s start of its easing cycle in the summer. On March 13, a light US docket only includes the weekly MBA Mortgage Applications.
EUR/USD came all the way down to retest the 1.0900 neighbourhood, where some decent contention appears to have emerged. The Industrial Production figures in the broader euro bloc are due on March 13.
Further weakness saw GBP/USD challenge the mid-1.2700s on the back of the stronger Dollar. A very interesting UK calendar will see GDP figures, Construction Output, Goods Trade Balance, Industrial Production and Manufacturing Production, all due on March 13.
Renewed depreciation in the Japanese yen prompted USD/JPY to leave behind several sessions of losses and briefly surpass the 148.00 barrier, always on the back of shrinking expectations that the BoJ could exit its accommodative monetary policy stance at its meeting next week.
AUD/USD corrected further down and breached the 0.6600 support on the back of the stronger Greenback and the weak performance of iron ore.
Prices of the WTI alternated gains with losses around the $78.00 mark as traders continued to assess the geopolitical factor, an upbeat tone from the OPEC’s monthly report, and the upcoming EIA report on crude oil inventories.
Further improvement in the Dollar in combination with extra upside in US yields across the board motivated Gold prices to recede to the $2,150 region per troy ounce, ending at the same time a nine-session positive streak. Silver prices followed suit and ended Tuesday’s session with marked losses after a move to three-month highs near $24.70 per ounce did not progress.
- Silver's price dips 1.48% to $24.10 following a stronger-than-expected US inflation report.
- XAG/USD may fall further if it breaks $24.09 support.
- Recovery needs hold above $24.09; potential bounce between $24.00-$24.70.
Silver price plunged late in the North American session following a hot inflation report in the United States that sponsored a rise in US Treasury yields, a headwind for the non-yielding metal. Therefore, the XAG/USD dropped from around year-to-date (YTD) highs of $24.68 and trades at $24.10, down 1.48%.
XAG/USD Price Analysis: Technical outlook
On Tuesday, Silver’s pullback dragged prices toward the January 2 high and turned support at $24.09. If sellers retain control in the near term and push prices below the latter, that would expose the $24.00 figure. Once cleared, XAG/USD would extend its losses toward the January 12 high at $23.52.
On the other hand, if buyers keep Silver’s spot prices above $24.09, look for range-bound trading within the $24.00-$24.70 area. The next resistance would be the $25.00 figure, followed by last year’s high at $25.91.
XAG/USD Price Action – Daily Charts
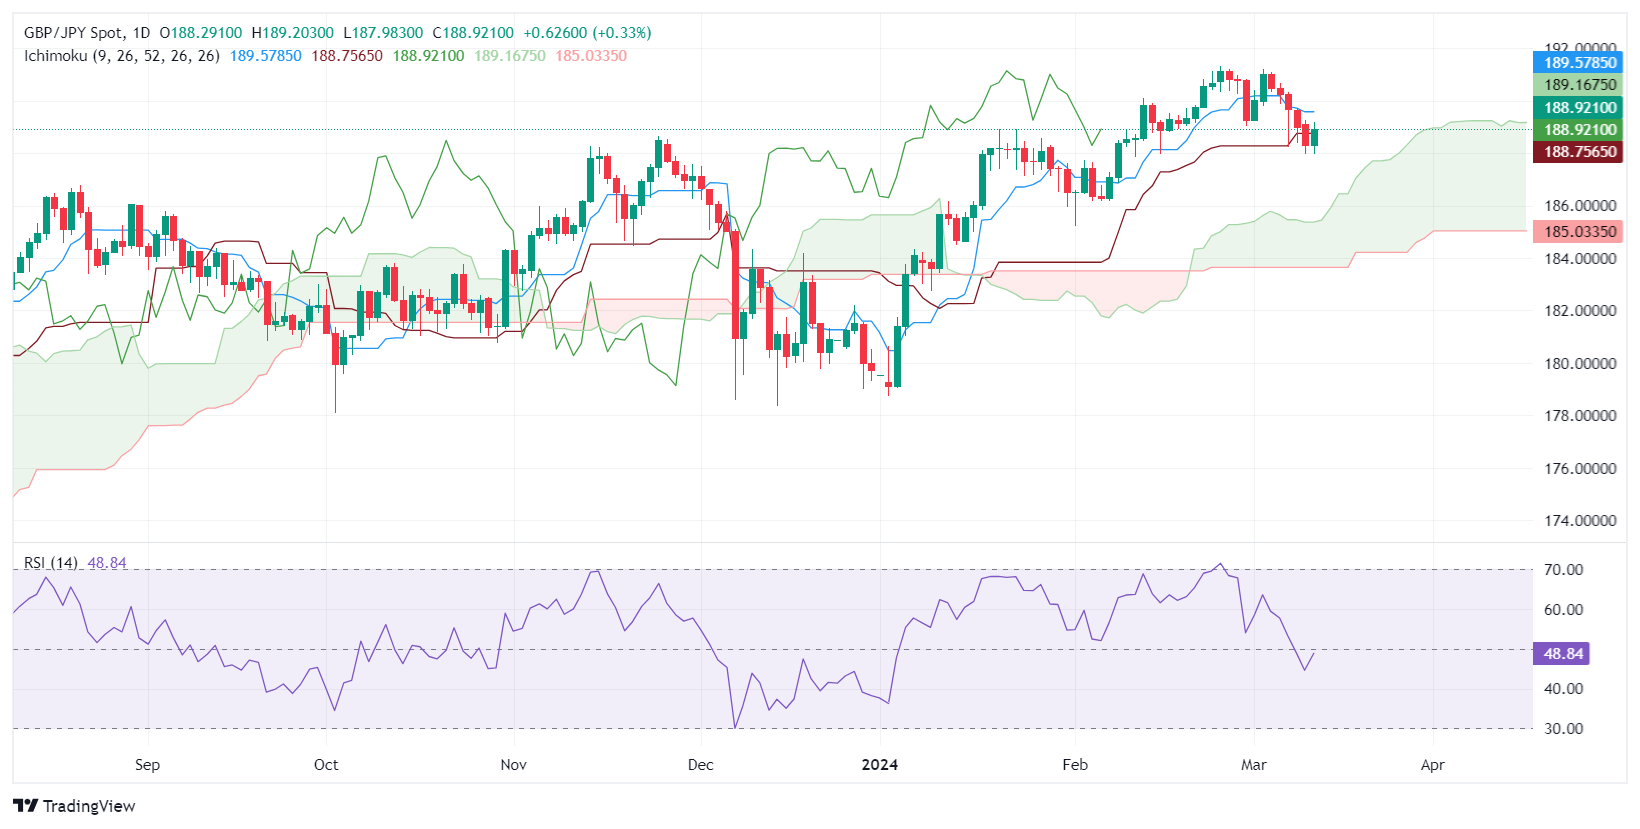
- GBP/JPY up as BoJ's Ueda's cautious view weakens Yen.
- UK jobs disappoint, and higher unemployment and lower wages hurt the Pound, as peculation on BoE rate cuts increased.
- BoE Bailey: Central banks need to evaluate how restrictive rates need to be.
The GBP/JP/registered modest gains of 0.29% in the mid-North American session after Bank of Japan (BoJ) Governor Kazuo Ueda's speech weakened the Japanese Yen on cautious remarks. Despite that, the Pound Sterling was capped by a softer-than-expected UK employment report. The pair exchanged hands at 168.72 after hitting a daily low of 187.97.
BoJ Governor’s Ueda remarks and UK employment data, weighed on the JPY
During the Asian session, BoJ Kazuo Ueda said the economy is recovering modestly and still shows signs of weakness following weak data releases. Ueda acknowledged that consumption of food and daily necessities is weakening as prices climb. He added that household spending is improving moderately and is awaiting higher wages.
BoJ Governor Ueda failed to provide forward guidance regarding ending negative rates. According to Bloomberg, sources said the BoJ is considering increasing borrowing costs in March, though the outcome of the decision is still too close to call between the March and April meetings.
Lately, Bank of England Governor Andrew Bailey has been making headlines by saying that major central banks need to question how restrictive their policy is and how long it needs to stay put. Bailey added that policy is doing its job and noted that inflation expectations are well anchored.
On the data front, the latest jobs data in the UK witnessed a jump in the unemployment rate, from 3.6% to 3.9% YoY, as 21,000 jobs were cut from the workforce. Wage growth slid from 6.2% to 6.1% in the last quarter of 2023, said the Office for National Statistics (ONS). After the data, markets increased bets on a BoE rate cut in June, though the first fully priced-in rate cut is expected in August.
GBP/JPY Price Analysis: Technical outlook
The daily chart portrays the pair as neutral to upward biased, and if buyers achieve a daily close above the March 11 open of 189.14, that could open the door for further upside. In that case, the next resistance level is seen at the Tenkan Sen at 189.57, followed by the 190.00 psychological level. On the flip side, the first support would be the 50-day moving average (DMA) at 187.84, followed by the February 8 low of 186.86.
- Dow Jones tests 39,060.00 before settling back into the opening range.
- US CPI inflation continues to ease overall, but MoM headline CPI ticked higher.
- Equity indexes are broadly on the rise, but DJIA remains capped.
The Down Jones Industrial Average (DJIA) is moderately up on Tuesday, with US equities finding gains after a somewhat mixed US Consumer Price Index (CPI) inflation print flashed an uptick in near-term inflation, but investor confidence remains hopeful as Core CPI inflation continues to ease.
Markets continue to pin hopes on a rate cut from the Federal Reserve (Fed) happening sooner rather than later. According to the CME’s FedWatch Tool, rate markets are continuing to price in a 70% chance of at least a 25 basis point rate trim from the Fed at its June policy meeting. Going further into the details, about 63% of rate futures traders expect a 25 bps cut, while 7% are hoping for a 50 bps rate cut in June.
Dow Jones news: 3M climbs nearly 5%, Boeing continues to shed weight
3M Co. (MMM) is the top performer listed on the Dow Jones Industrial Average, rising 4.8% by midday to trade into $98.60. 3M gained ground after the company announced that William Brown, the former CEO of L3Harris Technologies (LHX) will take over the helm at 3M beginning May 1.
Boeing Co. (BA) continues to decline as the company gets buried underneath negative headlines. The death of a former whistleblower who worked at the aerospace company adds further negative pressure to the already-pummeled stock and is piling onto a 10% decline in BO over the past month.
US CPI inflation continues to moderate, but near-term heat persists
MoM headline US CPI inflation ticked up to 0.4% in February, accelerating from the previous 0.3%, with YoY CPI inflation rising to 3.2% compared to the forecast hold at 3.1%. Core CPI numbers eased, but not as much as markets were hoping for, with MoM Core CPI holding at 0.4% instead of declining to the forecast 0.3%. YoY Core CPI ticked down to 3.8% from the previous 3.9%, but missed market forecasts of 3.7%.
Read More: US CPI inflation rises to 3.2% in February vs. 3.1% expected
An uptick in energy costs drove the uptick in near-term headline CPI, with over 60% of the increase in MoM CPI inflation coming from gasoline and shelter costs from owner’s equivalent rent.
According to Robert Frick, corporate economist at Navy Federal Credit Union, “Inflation continues to churn above 3%, and once again shelter costs were the main villain. With home prices expected to rise this year and rents falling only slowly, the long-awaited fall in shelter prices isn’t coming to the rescue any time soon.” Frick continued, “Reports like January’s and February’s aren’t going to prompt the Fed to lower rates quickly.”
Dow Jones Industrial Average technical outlook
The Dow Jones Industrial Average (DJIA) kicked off Tuesday’s trading near 38,820.00, whipsawing into a daily low near 38,600.00 on reaction to the mixed US CPI print before recovering and staging a thin rally into 39,060.00.
Profit-taking and headline fades dragged the equity index back into the day’s opening range and the major index is now grappling with chart territory around the 39,000.00 major price handle.
Dow Jones chart, 5-minute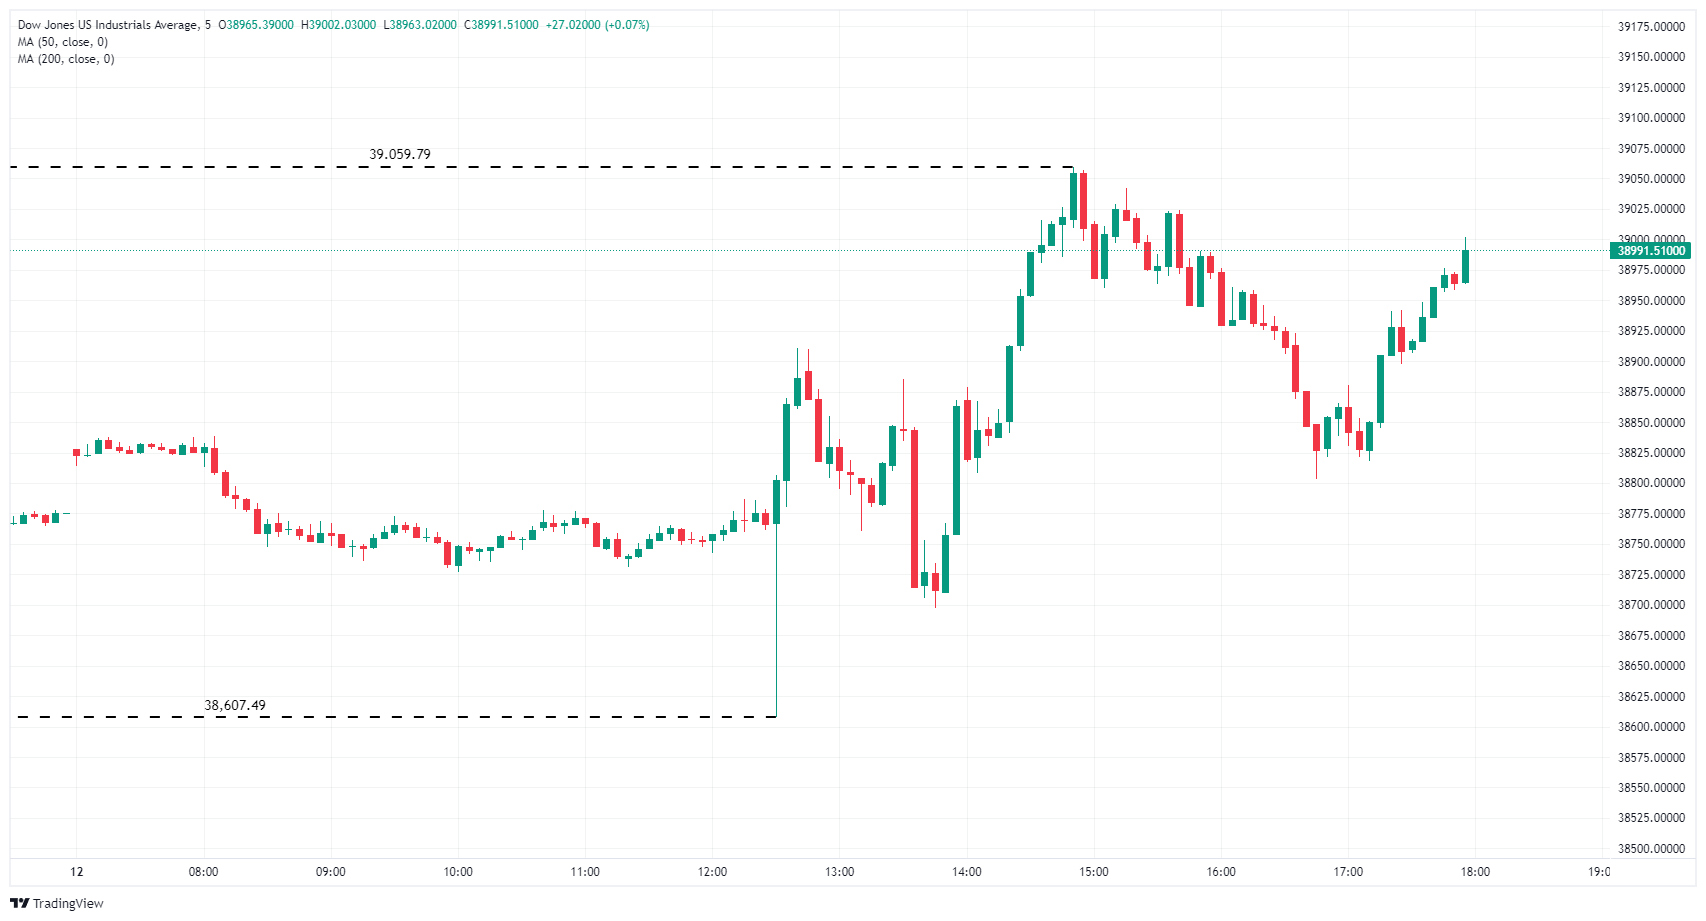
Dow Jones FAQs
The Dow Jones Industrial Average, one of the oldest stock market indices in the world, is compiled of the 30 most traded stocks in the US. The index is price-weighted rather than weighted by capitalization. It is calculated by summing the prices of the constituent stocks and dividing them by a factor, currently 0.152. The index was founded by Charles Dow, who also founded the Wall Street Journal. In later years it has been criticized for not being broadly representative enough because it only tracks 30 conglomerates, unlike broader indices such as the S&P 500.
Many different factors drive the Dow Jones Industrial Average (DJIA). The aggregate performance of the component companies revealed in quarterly company earnings reports is the main one. US and global macroeconomic data also contributes as it impacts on investor sentiment. The level of interest rates, set by the Federal Reserve (Fed), also influences the DJIA as it affects the cost of credit, on which many corporations are heavily reliant. Therefore, inflation can be a major driver as well as other metrics which impact the Fed decisions.
Dow Theory is a method for identifying the primary trend of the stock market developed by Charles Dow. A key step is to compare the direction of the Dow Jones Industrial Average (DJIA) and the Dow Jones Transportation Average (DJTA) and only follow trends where both are moving in the same direction. Volume is a confirmatory criteria. The theory uses elements of peak and trough analysis. Dow’s theory posits three trend phases: accumulation, when smart money starts buying or selling; public participation, when the wider public joins in; and distribution, when the smart money exits.
There are a number of ways to trade the DJIA. One is to use ETFs which allow investors to trade the DJIA as a single security, rather than having to buy shares in all 30 constituent companies. A leading example is the SPDR Dow Jones Industrial Average ETF (DIA). DJIA futures contracts enable traders to speculate on the future value of the index and Options provide the right, but not the obligation, to buy or sell the index at a predetermined price in the future. Mutual funds enable investors to buy a share of a diversified portfolio of DJIA stocks thus providing exposure to the overall index.
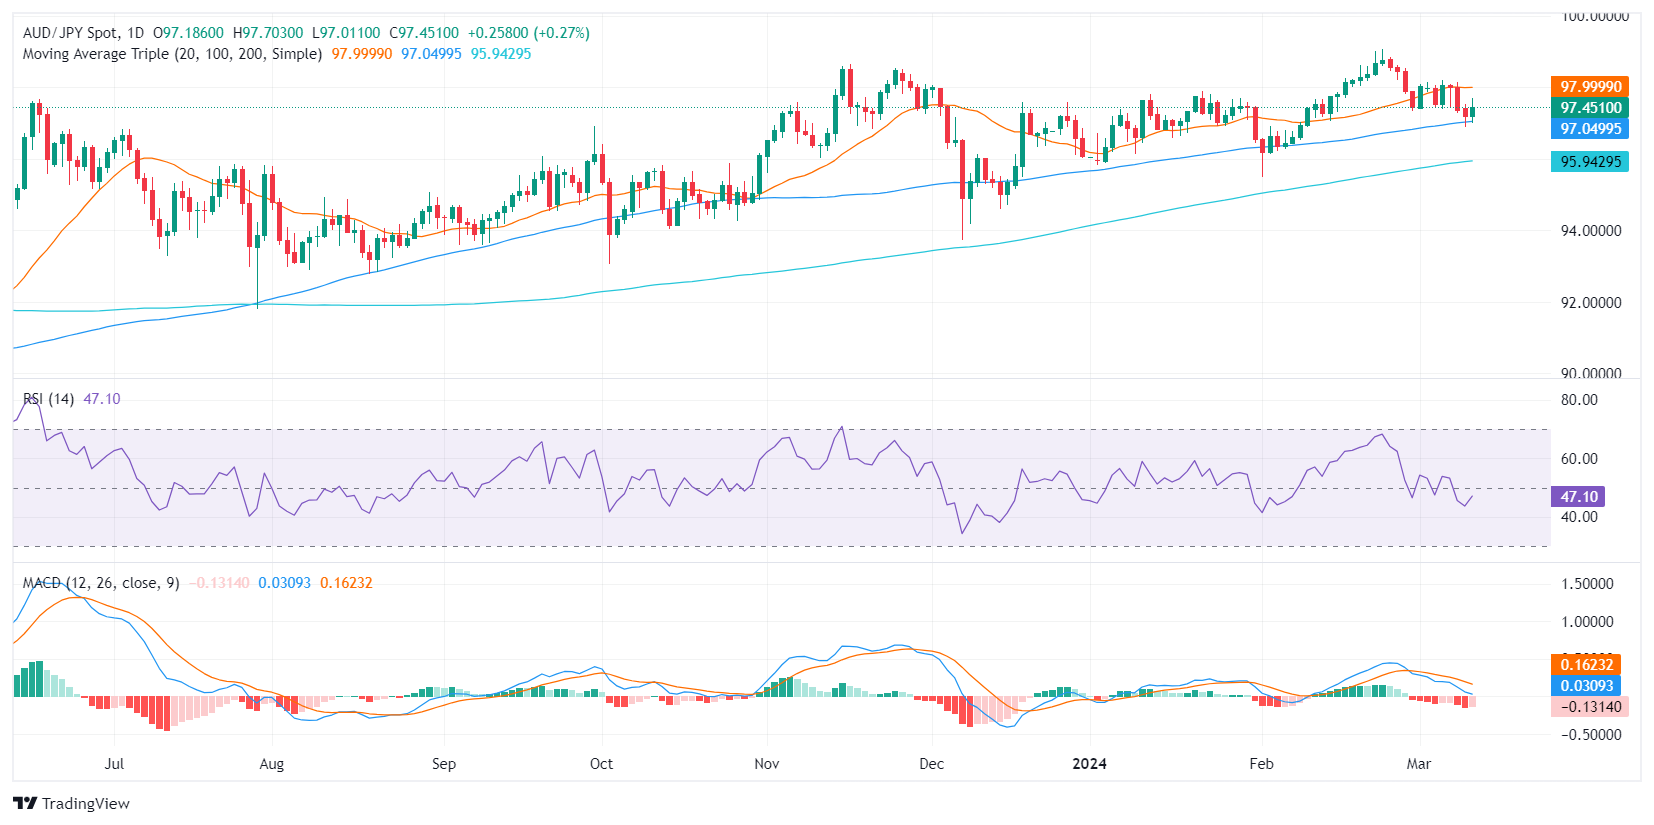
- The selling pressure dominates the daily chart, but indicators recovered on Tuesday.
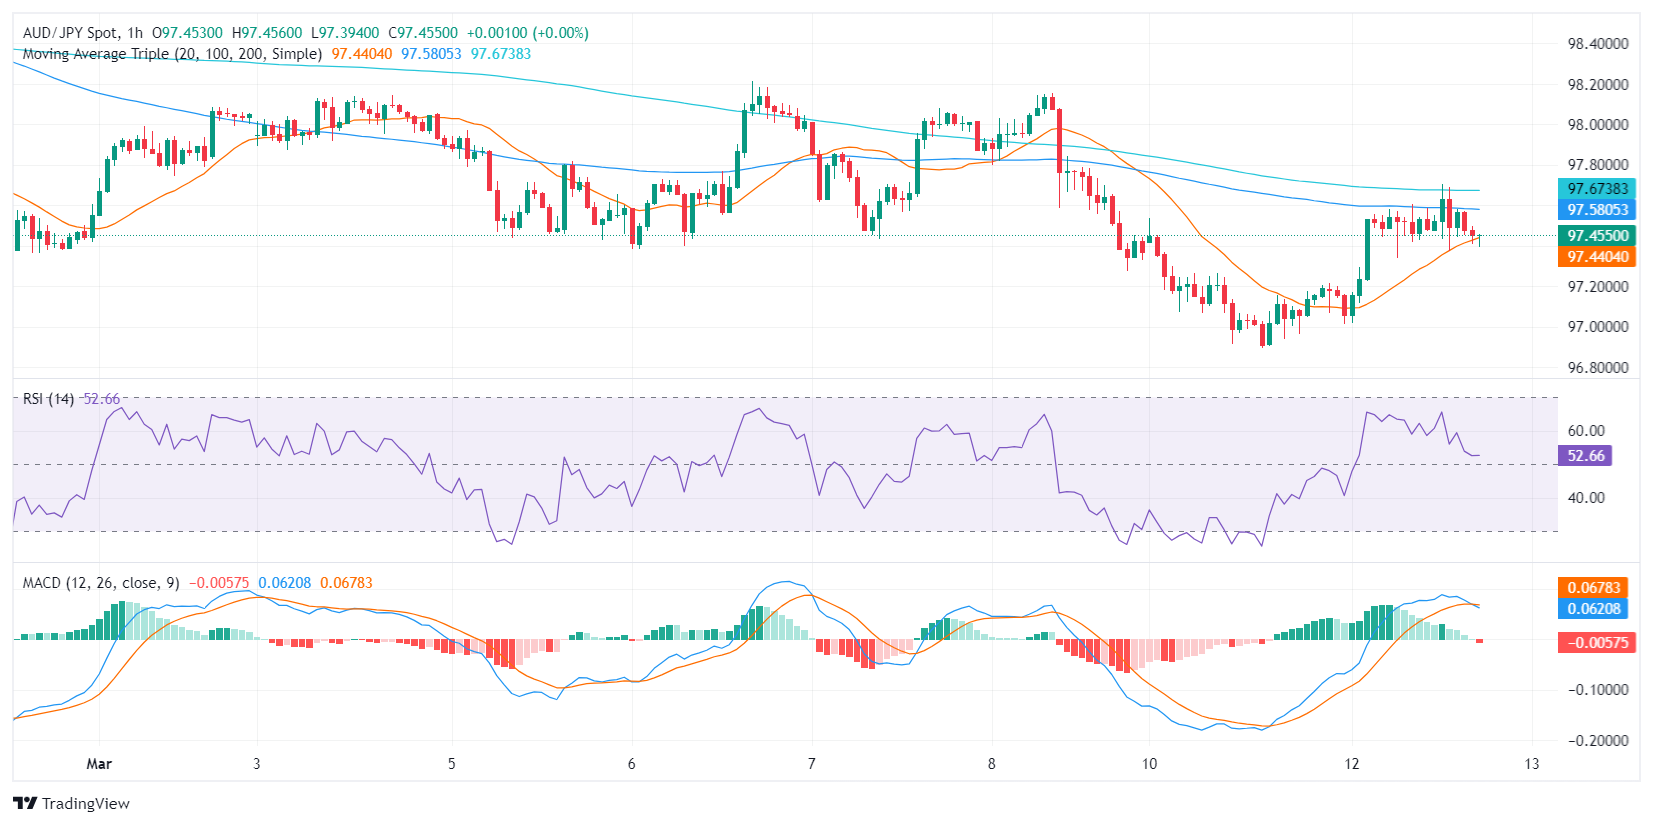
- The hourly chart also depicts an improvement hinting at a potential recovery.
- With the operating above key SMAs, a longer-term bullish sentiment could potentially override recent bearish tendencies.
The AUD/JPY pair is trading at 97.477, showing a gain of 0.31%. Despite the gains, selling pressure seems to dominate in the short term but the overall trend remains bullish. Indicators are improving in the hourly chart.
Based on the indicators of the daily chart, the AUD/JPY pair shows a negative momentum as the Relative Strength Index (RSI) is currently in negative territory. Its rising slope however, suggests that the buyers are recovering The declining red bars in the Moving Average Convergence Divergence (MACD) histogram further emphasize this bearish momentum, signaling that sellers currently dominate the market but with a weakened grip.
AUD/JPY daily chart
Transitioning to the hourly chart, the RSI stands in positive territory, illustrating a recovery in recent hours. The MACD histogram on the other hand printed a red bar, indicating that the resurge might be short-lived.
AUD/JPY hourly chart
Looking at the broader context, despite the short-term negative outlook, the AUD/JPY remains bullish as it trades above its 100, and 200-day Simple Moving Averages (SMAs). This suggests that the longer-term positive trend could still overshadow recent bearish movements. That being said, the buyers shouldn’t relax and must recover the 20-day average to resume its upward path.
- USD/CAD recovers to 1.3500 in choppy trading.
- Canada takes a back seat with strictly low-tier data on offer.
- US CPI inflation eased but less than expected.
The Canadian Dollar (CAD) was mixed on Tuesday, either holding flat or grabbing slim gains against some of its major currency peers, all while shedding points against the US Dollar (USD). Headline US Consumer Price Index (CPI) inflation came in higher than expected, but overall CPI inflation declined, helping to bolster investor rate cut bets from the Federal Reserve (Fed).
Canada only brings a smattering of low-tier economic data to the release schedule this week, leaving the Canadian Dollar exposed to broader market flows. Thursday brings Canadian Manufacturing Sales for January, and Friday will give an update on Canadian Housing Starts in February. Neither is expected to move the needle in a meaningful way.
Daily digest market movers: Uneven US CPI inflation print falls overall but less than hoped for
- US CPI headline inflation for the year ended February ticked up to 3.2% YoY versus the expected hold at 3.1%.
- Core US YoY CPI ticked down to 3.8% from the previous 3.9%, but still higher than the median market forecast of 3.7%.
- MoM CPI ticked higher to 0.4% as expected, slightly accelerating from the previous print of 0.3%.
- MoM Core CPI held steady at 0.4% versus the forecasted decline to 0.3%.
- Markets turn to Thursday’s US Producer Price Index (PPI) and Retail Sales figures for February.
- Core PPI in February is expected to ease to 1.9% from the previous 2.0%.
- MoM Retail Sales in February are forecast to rebound to 0.8% after the previous print of -0.8%.
- Friday will see the University of Michigan’s Consumer Sentiment Index for March, which is forecast to hold at 76.9.
Canadian Dollar price today
The table below shows the percentage change of Canadian Dollar (CAD) against listed major currencies today. Canadian Dollar was the weakest against the US Dollar.
| USD | EUR | GBP | CAD | AUD | JPY | NZD | CHF | |
| USD | 0.12% | 0.26% | 0.16% | 0.28% | 0.68% | 0.40% | 0.09% | |
| EUR | -0.12% | 0.14% | 0.04% | 0.15% | 0.54% | 0.27% | -0.03% | |
| GBP | -0.27% | -0.14% | -0.11% | -0.01% | 0.40% | 0.14% | -0.16% | |
| CAD | -0.16% | -0.04% | 0.11% | 0.10% | 0.50% | 0.23% | -0.03% | |
| AUD | -0.26% | -0.14% | 0.01% | -0.09% | 0.40% | 0.14% | -0.15% | |
| JPY | -0.68% | -0.54% | -0.40% | -0.51% | -0.43% | -0.27% | -0.56% | |
| NZD | -0.39% | -0.26% | -0.14% | -0.21% | -0.11% | 0.28% | -0.29% | |
| CHF | -0.10% | 0.04% | 0.17% | 0.06% | 0.13% | 0.55% | 0.29% |
The heat map shows percentage changes of major currencies against each other. The base currency is picked from the left column, while the quote currency is picked from the top row. For example, if you pick the Euro from the left column and move along the horizontal line to the Japanese Yen, the percentage change displayed in the box will represent EUR (base)/JPY (quote).
Technical analysis: USD/CAD back into familiar technical levels near 1.3500
On Tuesday, the Canadian Dollar (CAD) was down close to a fifth of a percent against the US Dollar, but it remained next to flat against the Euro (EUR) and the Swiss Franc (CHF). The Antipodeans and Japanese Yen (JPY) are broadly softer on the day, giving up ground against the CAD.
USD/CAD is back into the 1.3500 handle once again after choppy trading in the early Tuesday session. It bounced from 1.3470 and saw hard pushback from 1.3520. The pair is bound between supply and demand zones between 1.3450 and 1.3590.
A bullish turn in the USD/CAD will bounce bids off of the 200-day Simple Moving Average (SMA) at 1.3478, and the way is open for buyers to explore into the 1.3600 handle as a pattern of higher highs bakes into the chart paper. On the low side, failure to capture territory north of the 200-day SMA will see the pair dump back into early February low bids near 1.3360.
USD/CAD hourly chart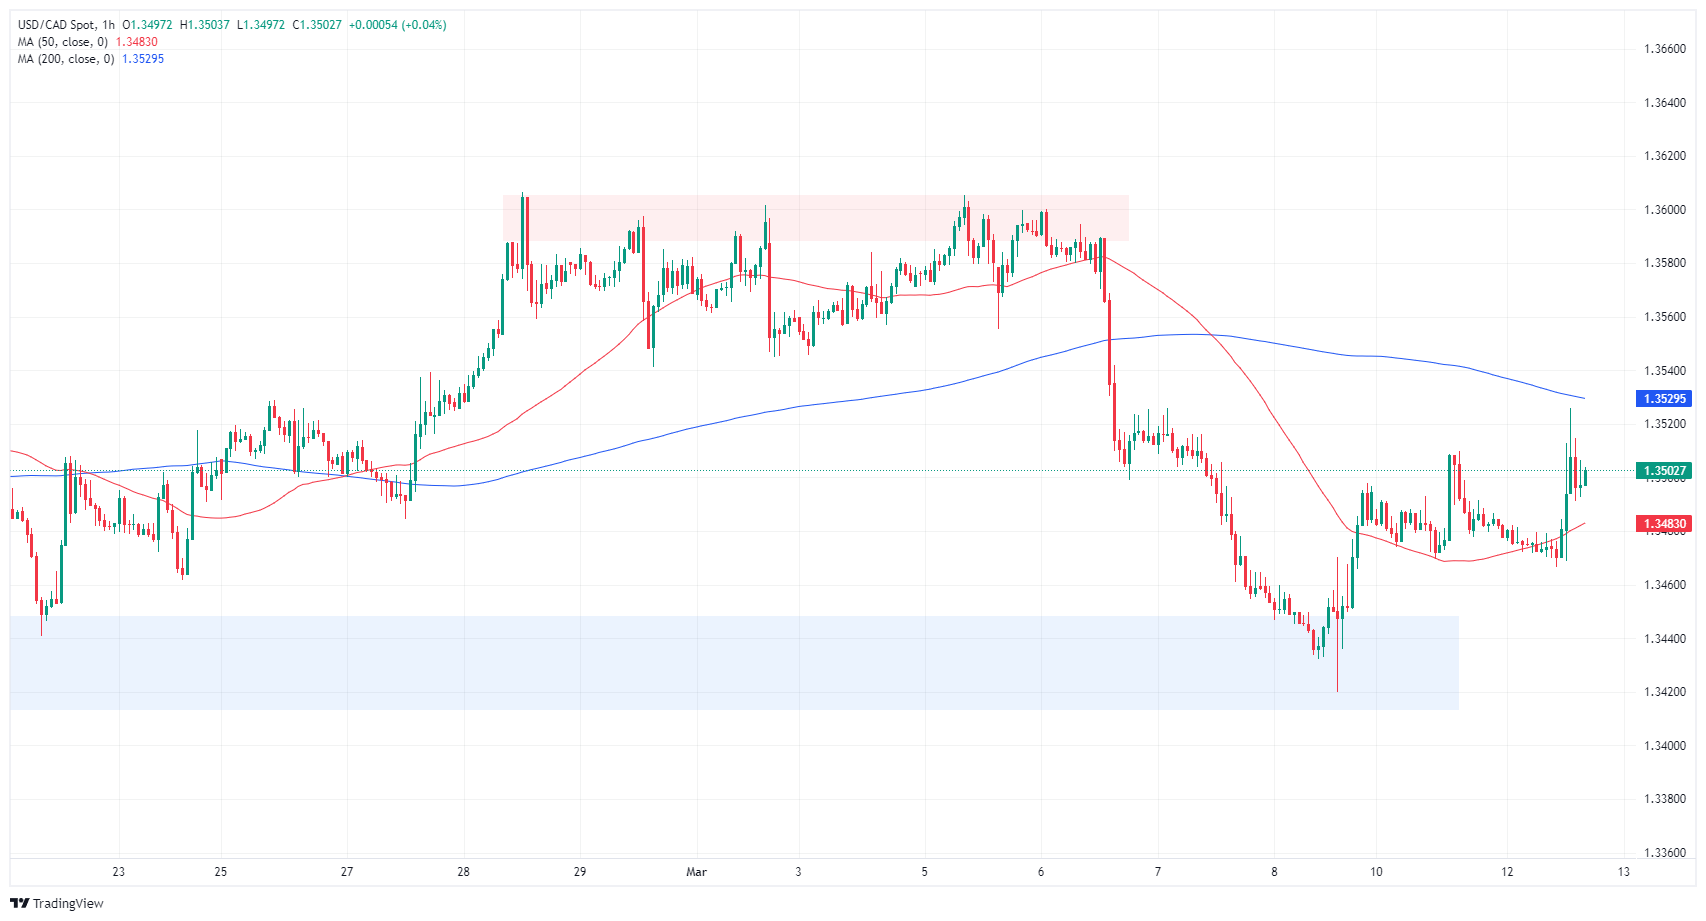
USD/CAD daily chart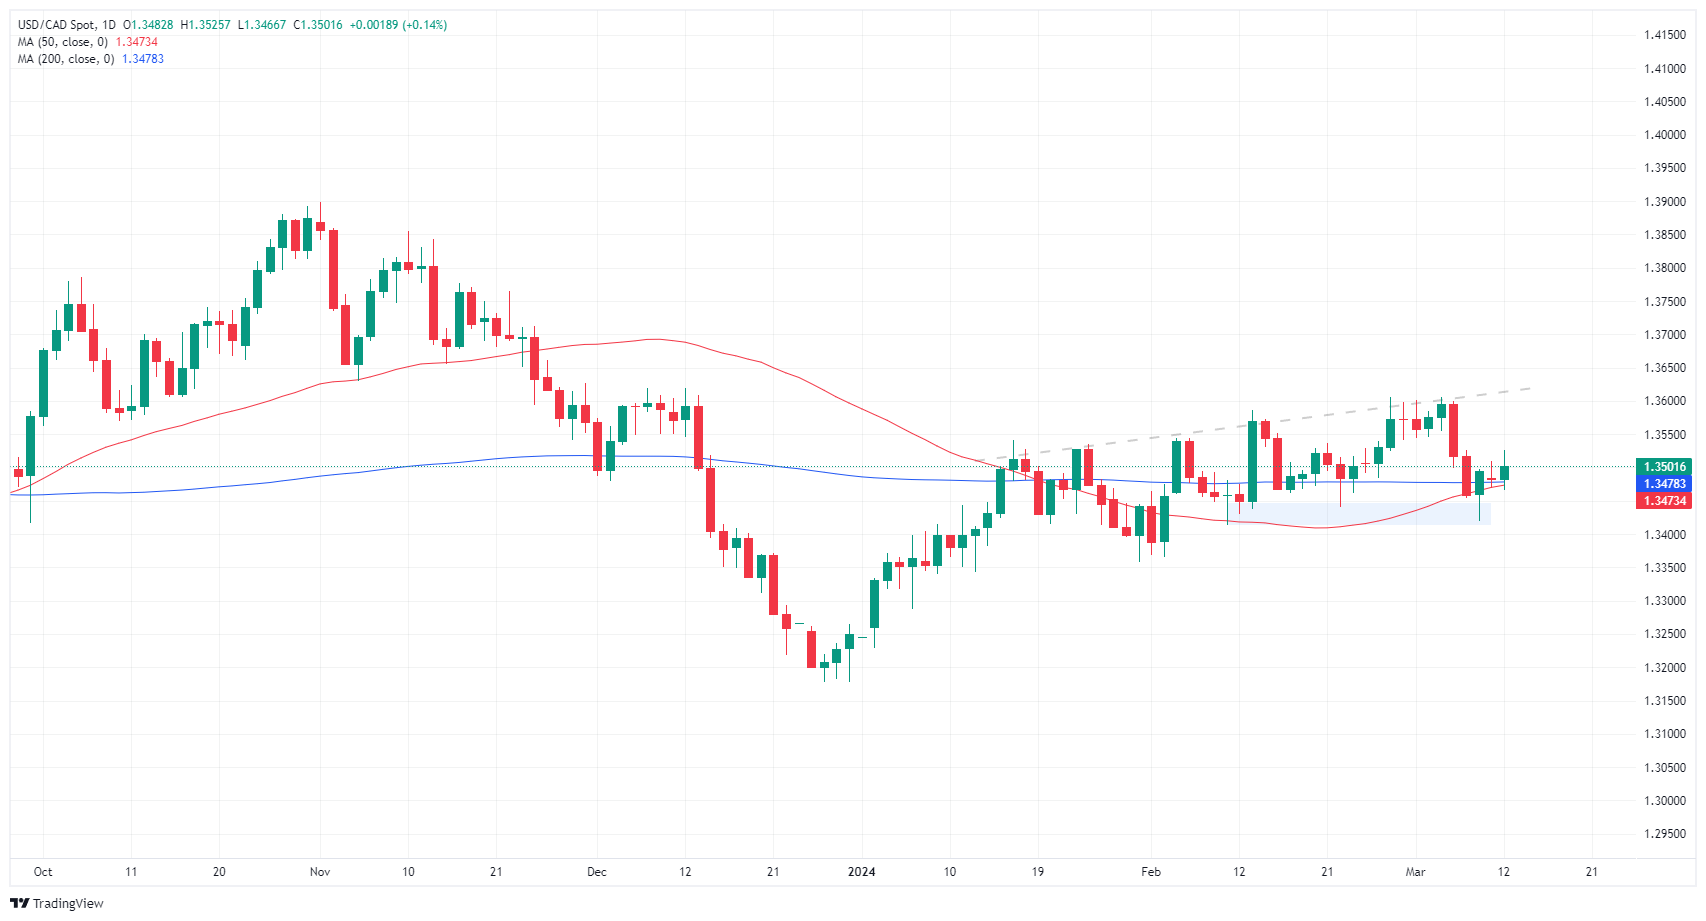
Canadian Dollar FAQs
The key factors driving the Canadian Dollar (CAD) are the level of interest rates set by the Bank of Canada (BoC), the price of Oil, Canada’s largest export, the health of its economy, inflation and the Trade Balance, which is the difference between the value of Canada’s exports versus its imports. Other factors include market sentiment – whether investors are taking on more risky assets (risk-on) or seeking safe-havens (risk-off) – with risk-on being CAD-positive. As its largest trading partner, the health of the US economy is also a key factor influencing the Canadian Dollar.
The Bank of Canada (BoC) has a significant influence on the Canadian Dollar by setting the level of interest rates that banks can lend to one another. This influences the level of interest rates for everyone. The main goal of the BoC is to maintain inflation at 1-3% by adjusting interest rates up or down. Relatively higher interest rates tend to be positive for the CAD. The Bank of Canada can also use quantitative easing and tightening to influence credit conditions, with the former CAD-negative and the latter CAD-positive.
The price of Oil is a key factor impacting the value of the Canadian Dollar. Petroleum is Canada’s biggest export, so Oil price tends to have an immediate impact on the CAD value. Generally, if Oil price rises CAD also goes up, as aggregate demand for the currency increases. The opposite is the case if the price of Oil falls. Higher Oil prices also tend to result in a greater likelihood of a positive Trade Balance, which is also supportive of the CAD.
While inflation had always traditionally been thought of as a negative factor for a currency since it lowers the value of money, the opposite has actually been the case in modern times with the relaxation of cross-border capital controls. Higher inflation tends to lead central banks to put up interest rates which attracts more capital inflows from global investors seeking a lucrative place to keep their money. This increases demand for the local currency, which in Canada’s case is the Canadian Dollar.
Macroeconomic data releases gauge the health of the economy and can have an impact on the Canadian Dollar. Indicators such as GDP, Manufacturing and Services PMIs, employment, and consumer sentiment surveys can all influence the direction of the CAD. A strong economy is good for the Canadian Dollar. Not only does it attract more foreign investment but it may encourage the Bank of Canada to put up interest rates, leading to a stronger currency. If economic data is weak, however, the CAD is likely to fall.
- Core and Headline CPI rose higher than expected in February.
- Despite higher inflation, weak labor market data reported last Friday would seem to limit the USD’s gains.
- Expectations still point toward the interest rate easing cycle starting in June.
The US Dollar Index (DXY) is currently trading slightly higher at 103.05. Despite the report of hot US Consumer Price Index (CPI) figures, the index stands near its December lows.
After The US labor market showed mixed figures for February, the hot CPI figures failed to trigger major changes in expectations. Markets still expect 75 bps of easing in 2024 by the Federal Reserve (Fed) starting in June.
Daily digest market movers: DXY gains ground on hot CPI figures
- In February, US inflation, measured by the Consumer Price Index (CPI), rose by 3.2% on a yearly basis vs the rise of 3.1% in January.
- The Annual Core CPI, which excludes volatile food and energy prices, also saw an increase, rising to 3.8% in February. However, this was below the January increase of 3.9%.
- US Treasury bond yields are climbing with the 2-year yield at 4.60%, the 5-year yield at 4.14%, and the 10-year yield at 4.15%.
DXY technical analysis: DXY bulls step in, outlook still negative
The technical outlook shows an escalating bullish momentum. The continuous escalation highlighted by the Relative Strength Index (RSI) portrays a more pronounced buying momentum despite it being in negative territory, indicative of a potential bullish market reversal. This in combination with the decreasing red bars of the Moving Average Convergence Divergence (MACD) suggests that the selling pressure is marginally declining.
However, the dynamics change when viewed through the lens of the larger context, where the index is still under the 20, 100, and 200-day Simple Moving Averages (SMAs). This placement reflects that bears have been exhaustively active in market dominance, exerting sustained downward pressure on the DXY, which took the Index to December lows.
US Dollar FAQs
What is the US Dollar?
The US Dollar (USD) is the official currency of the United States of America, and the ‘de facto’ currency of a significant number of other countries where it is found in circulation alongside local notes. It is the most heavily traded currency in the world, accounting for over 88% of all global foreign exchange turnover, or an average of $6.6 trillion in transactions per day, according to data from 2022.
Following the second world war, the USD took over from the British Pound as the world’s reserve currency. For most of its history, the US Dollar was backed by Gold, until the Bretton Woods Agreement in 1971 when the Gold Standard went away.
How do the decisions of the Federal Reserve impact the US Dollar?
The most important single factor impacting on the value of the US Dollar is monetary policy, which is shaped by the Federal Reserve (Fed). The Fed has two mandates: to achieve price stability (control inflation) and foster full employment. Its primary tool to achieve these two goals is by adjusting interest rates.
When prices are rising too quickly and inflation is above the Fed’s 2% target, the Fed will raise rates, which helps the USD value. When inflation falls below 2% or the Unemployment Rate is too high, the Fed may lower interest rates, which weighs on the Greenback.
What is Quantitative Easing and how does it influence the US Dollar?
In extreme situations, the Federal Reserve can also print more Dollars and enact quantitative easing (QE). QE is the process by which the Fed substantially increases the flow of credit in a stuck financial system.
It is a non-standard policy measure used when credit has dried up because banks will not lend to each other (out of the fear of counterparty default). It is a last resort when simply lowering interest rates is unlikely to achieve the necessary result. It was the Fed’s weapon of choice to combat the credit crunch that occurred during the Great Financial Crisis in 2008. It involves the Fed printing more Dollars and using them to buy US government bonds predominantly from financial institutions. QE usually leads to a weaker US Dollar.
What is Quantitative Tightening and how does it influence the US Dollar?
Quantitative tightening (QT) is the reverse process whereby the Federal Reserve stops buying bonds from financial institutions and does not reinvest the principal from the bonds it holds maturing in new purchases. It is usually positive for the US Dollar.
- Mexican Peso dips against a strengthening US Dollar after February's US inflation report exceeds expectations.
- Mexico's Industrial Production in January meets forecasts, while US CPI figures push USD/MXN higher.
- Fed's cautious stance on policy easing was underscored by recent inflation trends with eyes on the March meeting.
The Mexican Peso loses some ground on Tuesday against the US Dollar, which appreciated following February’s inflation report in the United States that showcased price level growth remaining stubbornly high. This led to the selling of US Treasuries. Consequently, yields rose, a tailwind for the Greenback. The USD/MXN trades at 16.81, up 0.14%, after hitting a daily low of 16.76.
The National Statistics Agency, INEGI, revealed that Mexico’s Industrial Production in January expanded, aligning with the consensus. In the meantime, the US Bureau of Labor Statistics (BLS) reported that the Consumer Price Index (CPI) for February was higher than expected in annual figures and aligned with forecasts on monthly readings. The Core CPI figures were mixed, with annual figures decelerating, while monthly data stood unchanged compared to January’s number.
The US inflation data, a key factor in the Federal Reserve's policy decisions, has justified the Fed’s stance of being patient regarding easing interest rates. Fed Chair Jerome Powell and his colleagues have expressed the need for more evidence before considering any borrowing cost cuts. The next Fed meeting is scheduled for March 19-20.
Daily digest market movers: Mexican Peso trips down after US CPI
- Mexico’s Industrial Production in January rose by 0.4% MoM as expected, up from -0.7%. In the twelve months to January, production increased by 2.9%, above estimates, smashing December’s 0% reading.
- US CPI in February came at 0.4% MoM, aligned with estimates that were up from 0.3%. Annually based, prices jumped from the 3.1% estimate and the previous reading to 3.2%.
- Core prices expanded 0.4% MoM, unchanged, up from estimates of 0.3% MoM; yet they slowed in the 12 months to February to 3.8% from 3.9%.
- Business activity in the sector segment in the US remained mixed, while Factory Orders plummeted. According to the ADP Employment Change report, the labor market cooled further, even though private hiring remained solid. January’s Nonfarm Payrolls report was revised downward, which triggered a reaction in the swaps market.
- A Reuters poll showed investors estimate the Fed to be the first central bank to cut rates in June.
- Meanwhile, 52 of 108 economists expect the Fed to cut rates by 75 basis points in 2024, with 26 saying 100 bps.
- A Reuters poll sees the Mexican Peso depreciating 7% to 18.24 in 12 months from 16.96 on Monday, according to the median of 20 FX strategists polled between March 1-4. The forecast ranged from 15.50 to 19.00.
- A Reuters poll shows 15 analysts estimate that inflation will slow down in February, corroborating bets that the Bank of Mexico (Banxico) could cut rates as soon as the March 21 meeting.
- Banxico’s private analysts' poll projections for February were revealed. They expect inflation at 4.10%, core CPI at 4.06%, and the economy to grow by 2.40%, unchanged from January. Regarding monetary policy, they see Banxico lowering rates to 9.50% and the USD/MXN exchange rate at 18.31, down from 18.50.
- During Banxico’s quarterly report, policymakers acknowledged the progress on inflation and urged caution against premature interest rate cuts. Governor Victoria Rodriguez Ceja said adjustments would be gradual, while Deputy Governors Galia Borja and Jonathan Heath called for prudence. The latter specifically warned against the risks of an early rate cut.
- Banxico updated its economic growth projections for 2024 from 3.0% to 2.8% YoY and maintained 1.5% for 2025. The slowdown is blamed on higher interest rates at 11.25%, which sparked a shift in three of the five governors of the Mexican Central Bank, who are eyeing the first rate cut at the March 21 meeting.
- The CME FedWatch Tool shows traders increased their bets for a 25-basis-point rate cut in June, down from 72% a day ago to 68%.
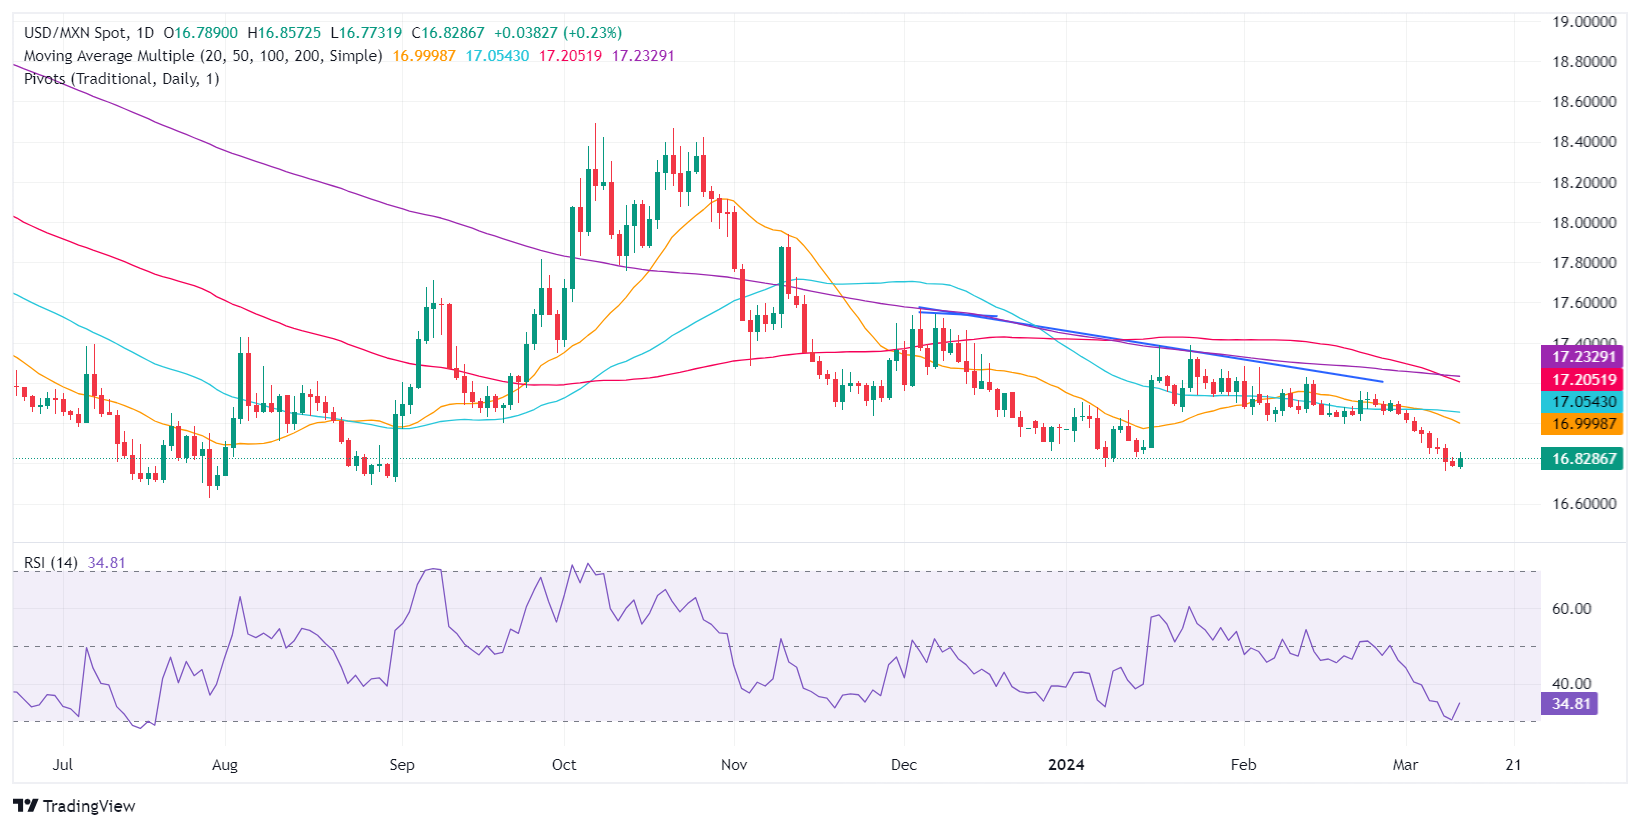
Technical analysis: Mexican Peso loses a step as USD/MXN edges high above 16.80
Since falling below the 17.00 figure, the USD/MXN downtrend remains intact. However, it appears that it’s losing steam. As the Relative Strength Index (RSI) studies despite standing in bearish territory, its slope is aiming up, breaking previous lows. This could indicate that buyers are entering the market and opening the door for an upward correction.
Despite that, they need to reclaim the 17.00 figure, which could open the door to testing the 50-day Simple Moving Average (SMA) at 17.04, followed by the confluence of the 200-day SMA and the 100-SMA at 17.23.
On the other hand if the downtrend continues, traders are eyeing a break of the year-to-date low of 16.76, followed by last year’s low of 16.
USD/MXN Price Action – Daily Chart
Mexican Peso FAQs
The Mexican Peso (MXN) is the most traded currency among its Latin American peers. Its value is broadly determined by the performance of the Mexican economy, the country’s central bank’s policy, the amount of foreign investment in the country and even the levels of remittances sent by Mexicans who live abroad, particularly in the United States. Geopolitical trends can also move MXN: for example, the process of nearshoring – or the decision by some firms to relocate manufacturing capacity and supply chains closer to their home countries – is also seen as a catalyst for the Mexican currency as the country is considered a key manufacturing hub in the American continent. Another catalyst for MXN is Oil prices as Mexico is a key exporter of the commodity.
The main objective of Mexico’s central bank, also known as Banxico, is to maintain inflation at low and stable levels (at or close to its target of 3%, the midpoint in a tolerance band of between 2% and 4%). To this end, the bank sets an appropriate level of interest rates. When inflation is too high, Banxico will attempt to tame it by raising interest rates, making it more expensive for households and businesses to borrow money, thus cooling demand and the overall economy. Higher interest rates are generally positive for the Mexican Peso (MXN) as they lead to higher yields, making the country a more attractive place for investors. On the contrary, lower interest rates tend to weaken MXN.
Macroeconomic data releases are key to assess the state of the economy and can have an impact on the Mexican Peso (MXN) valuation. A strong Mexican economy, based on high economic growth, low unemployment and high confidence is good for MXN. Not only does it attract more foreign investment but it may encourage the Bank of Mexico (Banxico) to increase interest rates, particularly if this strength comes together with elevated inflation. However, if economic data is weak, MXN is likely to depreciate.
As an emerging-market currency, the Mexican Peso (MXN) tends to strive during risk-on periods, or when investors perceive that broader market risks are low and thus are eager to engage with investments that carry a higher risk. Conversely, MXN tends to weaken at times of market turbulence or economic uncertainty as investors tend to sell higher-risk assets and flee to the more-stable safe havens.
The Pound Sterling (GBP) has emerged as one of the year's top two performers among the major currencies in recent weeks. Economists at Commerzbank analyze GBP outlook.
The Pound should be treated with caution
The only question is how long the Pound's strength will last. At the moment it is still a rather shaky strength. Not like the USD strength of late last summer, which was fuelled for months by strong data and an equally hawkish Fed. Rather, it is a fragile little plant that could break again in the face of headwinds.
Today's data should therefore continue to confirm the recent picture, i.e. the unemployment rate should not rise too much and wage growth should not slow down too much. Only then should the BoE continue to focus on future rate cuts. And only then will further Pound strength be justified. Until then, however, I would also be cautious about the GBP at present.
February’s US CPI readings provided a small relief after January's surprise. Markets are digesting the data well with US yields and the USD a tad stronger but still well contained, economists at TD Securities report.
Good US data is not necessarily good for the USD
Consumer price inflation matched consensus expectations, with the headline CPI advancing 0.4% MoM in February. With that said, the focus of the report was centered on the core segment given January's strong showing and inflation there registered a still strong increase at 0.4% MoM. However, the services category did lose some momentum driven by OER normalization.
While we maintain the view that the May FOMC meeting is still live for a rate cut, the path toward that outcome has become narrower still. With that said, we don't think today's report meaningfully changes the Fed's inclination to first ease by the June FOMC meeting. In our view, services inflation should resume a clear path toward normalization over the next few months as the tougher seasonal part of the year is already behind us.
This print does not challenge the disinflation narrative which is what will drive the Fed cutting cycle ultimately. We have shown that good US data is not necessarily good for the USD as long as it is accompanied by good rest of the world data and disinflation. That narrative still holds and can keep pushing the USD lower through Q2 and Q3.
- EUR/CHF touches 50-week SMA and recoils
- RSI on daily chart indicates possibility of a pullback.
- Symmetrical Triangle has formed on 4-hour chart with breakout likely.
EUR/CHF has rebounded from the 0.9254 December 2023 lows and rallied up to resistance from a key barrier in the form of the 50-week Simple Moving Average (SMA). The pair is probably still in a long-term downtrend despite recent strength.
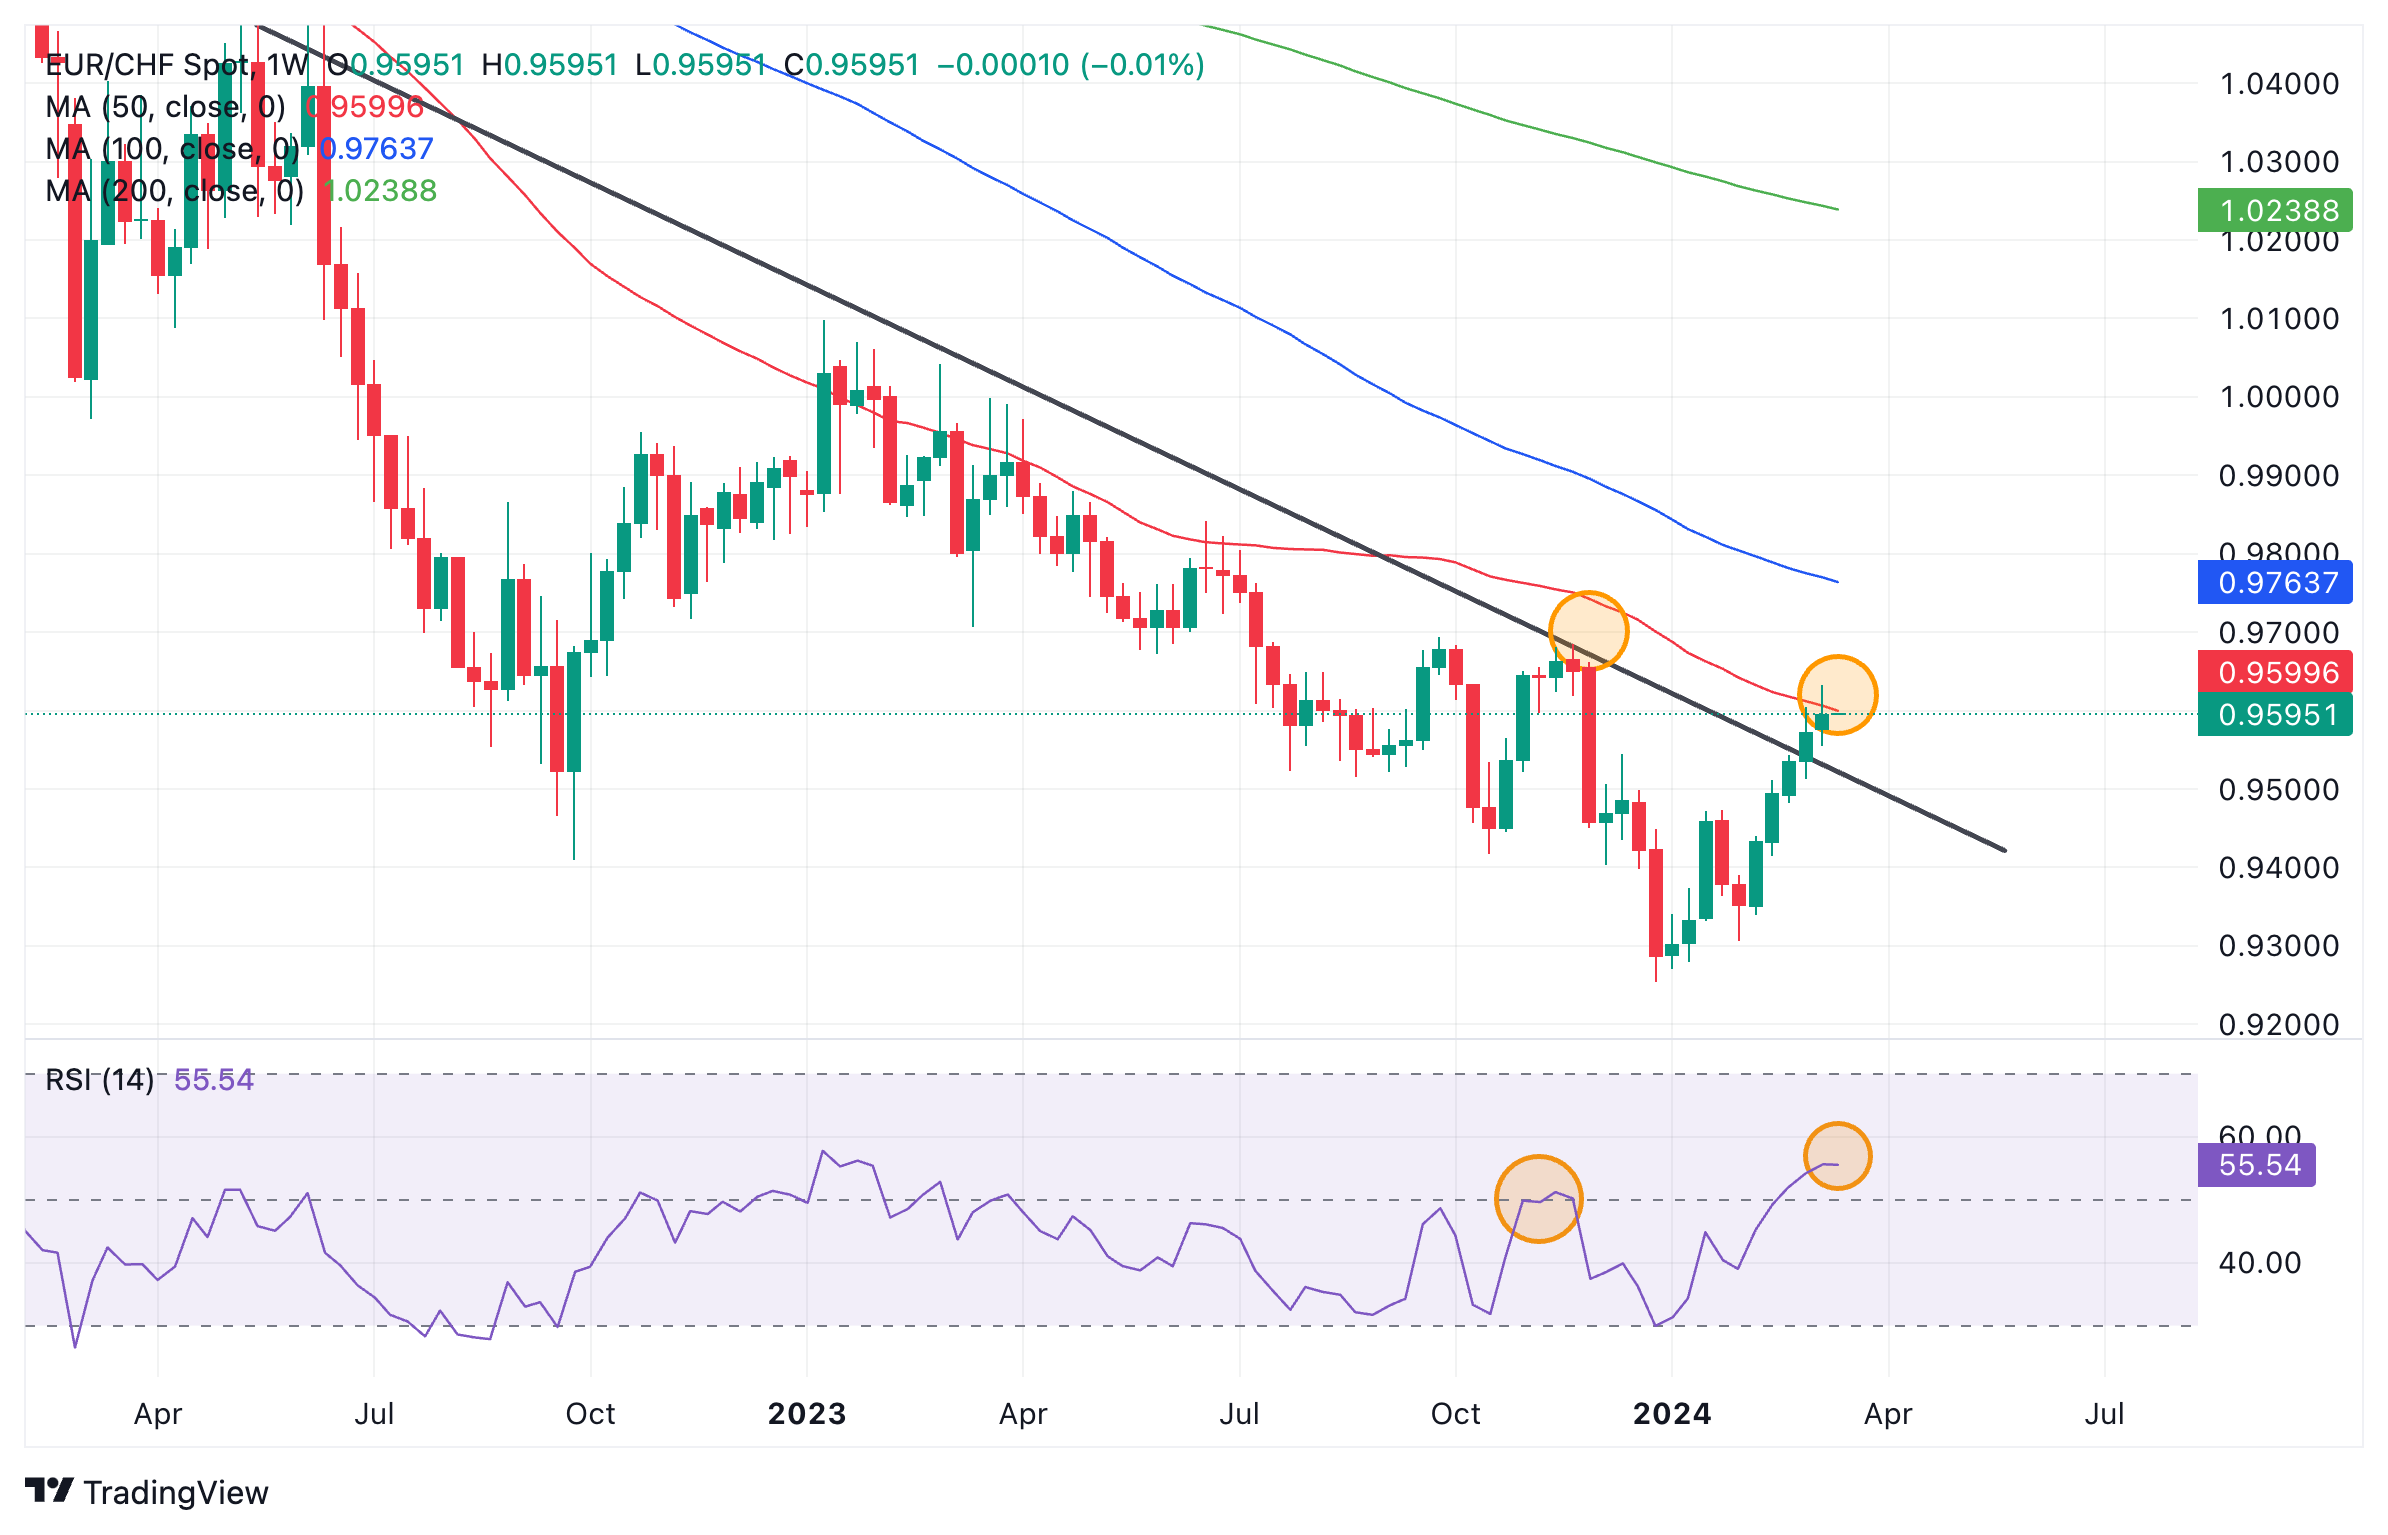
Euro to Swiss Franc: Weekly chart
The price has respected the red 50-week SMA on the multiple prior occasions it touched it during its downtrend. This reinforces the level’s strength as a resistance point. It probably indicates the price is about to pullback. There is a good chance it could correct back to the level of the trendline at around 0.9500 for a retest.
The pair is converging with the Relative Strength Indicator (RSI), a momentum study. This is a bullish sign. The most recent peak in price was accompanied by a relatively higher peak in RSI when compared to the previous peak in price (circled). This is convergence and suggests underlying strength.
A further bullish sign is that the pair has broken above the trendline.
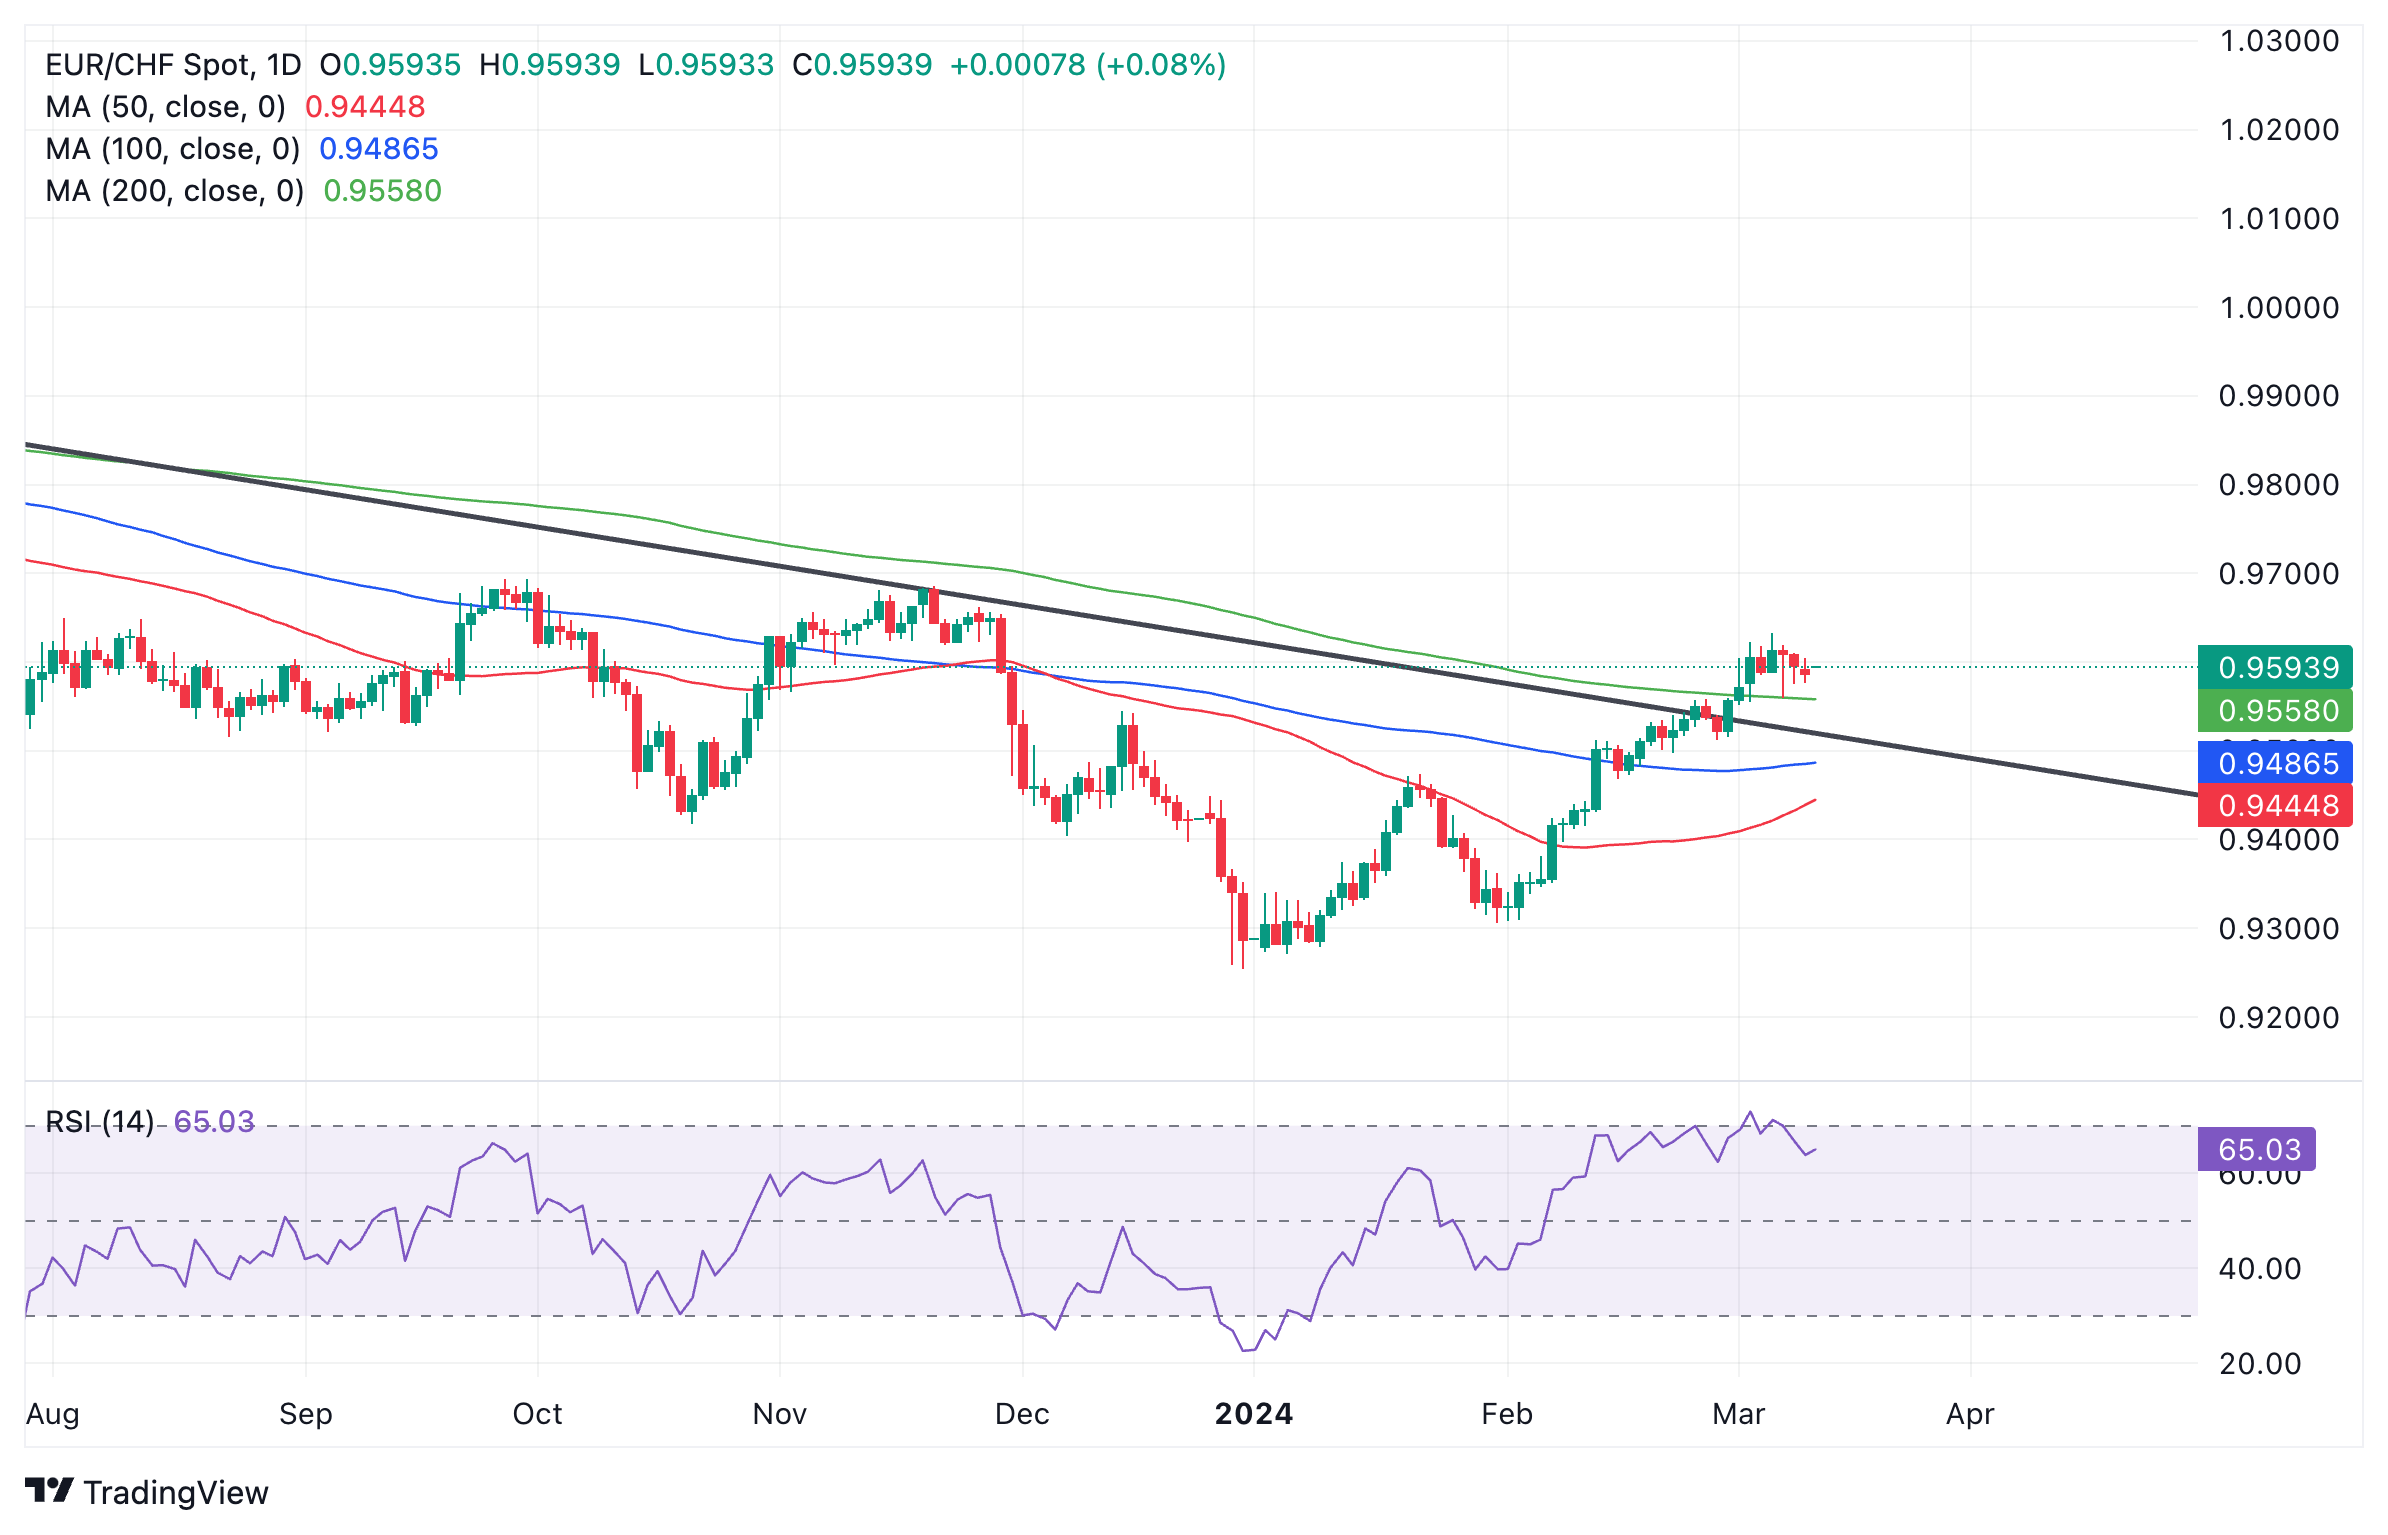
Euro to Swiss Franc: Daily chart
EUR/CHF has just exited overbought extremes on the RSI on the daily chart. This is interpreted as a signal to sell long positions and open short positions. It suggests the pair could pullback down, at least to the level of the trendline at about 0.9500.
The pair has broken above all the key Moving Averages and the 200-day SMA is acting support. EUR/CHF has also moved above the previous higher low of the downtrend. These are both signs indicating that it is probably in a bullish intermediate trend, favoring bulls on that time horizon.
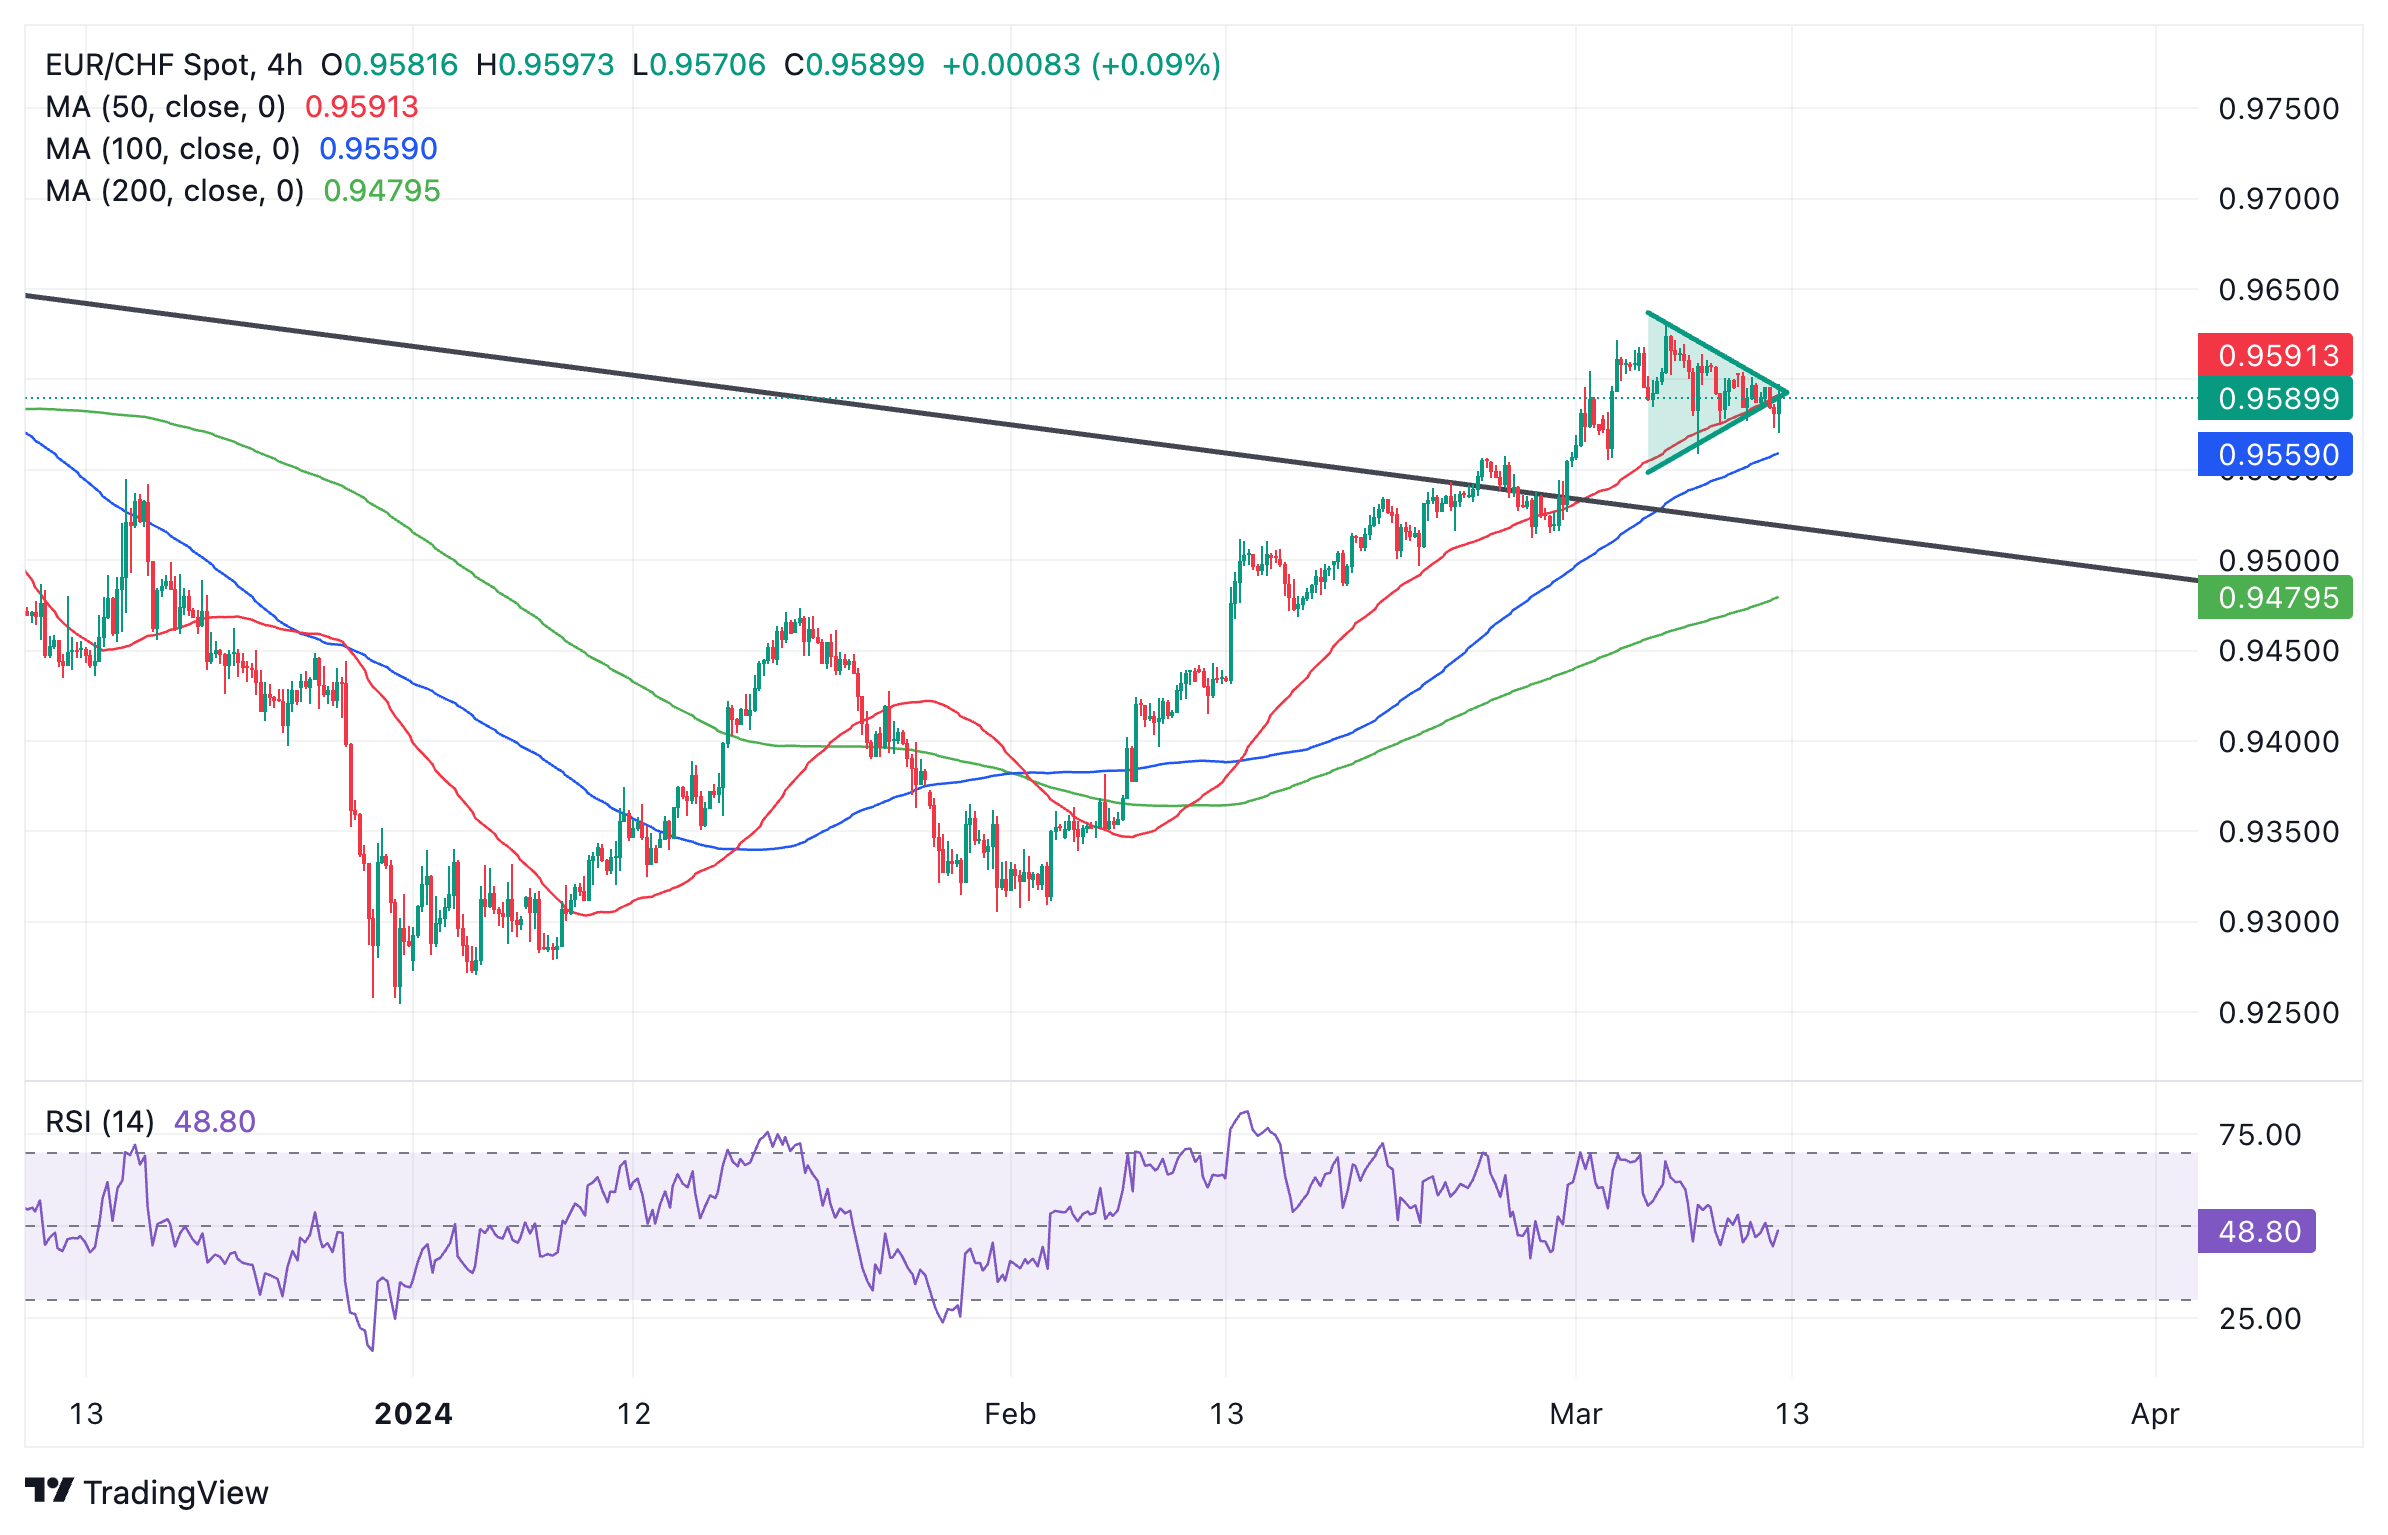
Euro to Swiss Franc: 4-hour chart
EUR/CHF has formed a Symmetrical Triangle on the 4-hour chart suggesting indecision. The pattern has equal chances of it breaking out in either direction, however, some analysts hold that the odds slightly favor a breakout in the direction of the trend prior to the formation of the triangle, which in this case is bullish.
Should price breakout higher it will probably not rise very much higher before capitulating since triangles are usually the penultimate moves in trends.
The RSI has declined visibly during the formation of the triangle, however, suggesting underlying weakness and a chance price could break lower.
The 4-hour chart is used to assess the short-term trend. The series of rising peaks and troughs since the December 2023 lows indicates the pair is in a short-term uptrend.
US inflation is sticky. Economists at Commerzbank say that the Fed can wait for longer before cutting rates.
US inflation pressure rises again
The decline in inflation in the US is stalling. In February, consumer prices rose by a strong 0.4% from the previous month, both overall and excluding energy and food. Prices for services in particular increased, reflecting rising wage costs. The high inflation rate in January was therefore not an outlier.
The data supports our view that the market is overestimating the potential for interest rate cuts by the Federal Reserve.
Equities are not the only assets hitting all-time highs. Gold has been reaching record levels through the last few days. Economists at UBS analyze the yellow metal’s outlook.
Gold seen as a good portfolio hedge against risk spikes
We remain positive on the price of Gold for 2024 and continue to recommend it as a portfolio hedge.
We expect Gold to trend higher to $2,250 but would wait for price setbacks to gain exposure, even if these turn out to be modest and brief.
We also continue to see Gold as a good portfolio hedge against risk spikes; we recommend an allocation of around 5% in diversified and balanced USD-based portfolios.
- AUD/USD falls sharply to 0.6600 as US Dollar rises after stubborn US inflation data.
- The hot US inflation report has dented market expectations for Fed rate cuts in the June meeting.
- RBA Hunter warned about the deepening cost-of-living crisis.
The AUD/USD pair falls to the round-level support of 0.6600 as the hotter-than-expectations United States Consumer Price Index (CPI) data for February has dented appeal for antipodeans. The Aussie asset weakens as stubborn US inflation data has improved the appeal for the US Dollar.
The appeal for risk-perceived currencies has dampened as investors rush for safe-haven assets. The US Dollar Index (DXY) delivers a V-shape recovery to 103.30 as expectations that the Federal Reserve (Fed) will reduce interest rates in the June meeting could wane. 10-year US Treasury yields have climbed to near 4.15%.
The hot inflation data is expected to increase uncertainty over Fed rate cuts. Last week, Fed Chair Jerome Powell said in his Congressional testimony that it would be inappropriate to start lowering interest rates before gaining conviction that inflation will sustainably return to the 2% target. Powell also said that the central bank is not far from gaining that conviction, but the inflation data for February tells a different story.
Going forward, market participants will shift focus to the US Producer Price Index, (PPI) and monthly Retail Sales data for February, which will be published on Thursday.
On the Australian front, Reserve Bank of Australia (RBA) Assistant Governor Sarah Hunter said, “For some households, interest rate hikes are also challenging and difficult, but inflation is the single biggest drag,” at the Australian Financial Review business summit in Sydney in Tuesday’s Asian session, reported by Bloomberg.
Next week, the RBA will announce the monetary policy decision in which policymakers are expected to keep the Official Cash Rate (OCR) unchanged at 4.35%.
Economists at ANZ Bank have a summer cut – July – pencilled in for the Federal Reserve.
June is the most likely time the ECB will start cutting
Subject to progress over spring, we think June is most likely when the ECB to begin easing, and we have summer pencilled in for the Fed (July).
Given that labour markets are structurally tight, real wage growth positive and fiscal policy expansionary, there seems little case for a return to the zero lower bound or negative interest rates over the course of the coming cutting cycle.
We do not expect the FOMC to embark on a ‘typical’ rate cutting cycle, where the average peak-to-trough fall in rates over the past 40 years has been 500 bps. We expect the peak-to-trough in this cycle will be 200 bps.
For the ECB, we think that high levels of employment and a growth renaissance will prevent a return to negative real interest rates. We forecast 200 bps of ECB cuts, taking the main policy corridor to 2.0-2.5%.
- USD/JPY rebounds into a key resistance zone after the release of stickier-than-expected US CPI data.
- The pair has hit a tough ceiling where two major moving averages converge.
- USD/JPY is at risk of rolling over and continuing its short-term downtrend.
USD/JPY rebounds after the release of higher-than-forecast US Consumer Price Index (CPI) data for February. The data increases the probability the Federal Reserve will retain interest rates at their current relatively high levels for longer. Higher interest rates are a positive for a currency since they result in higher capital inflows.
USD/JPY has rallied off of the data and run into a substantial resistance zone made up of two major moving averages: the 50 (red) and 100-day (blue) Simple Moving Averages (SMA). Given the overall short-term trend is bearish and still assumed intact, the pullback could provide sellers with the perfect opportunity to short the currency pair.
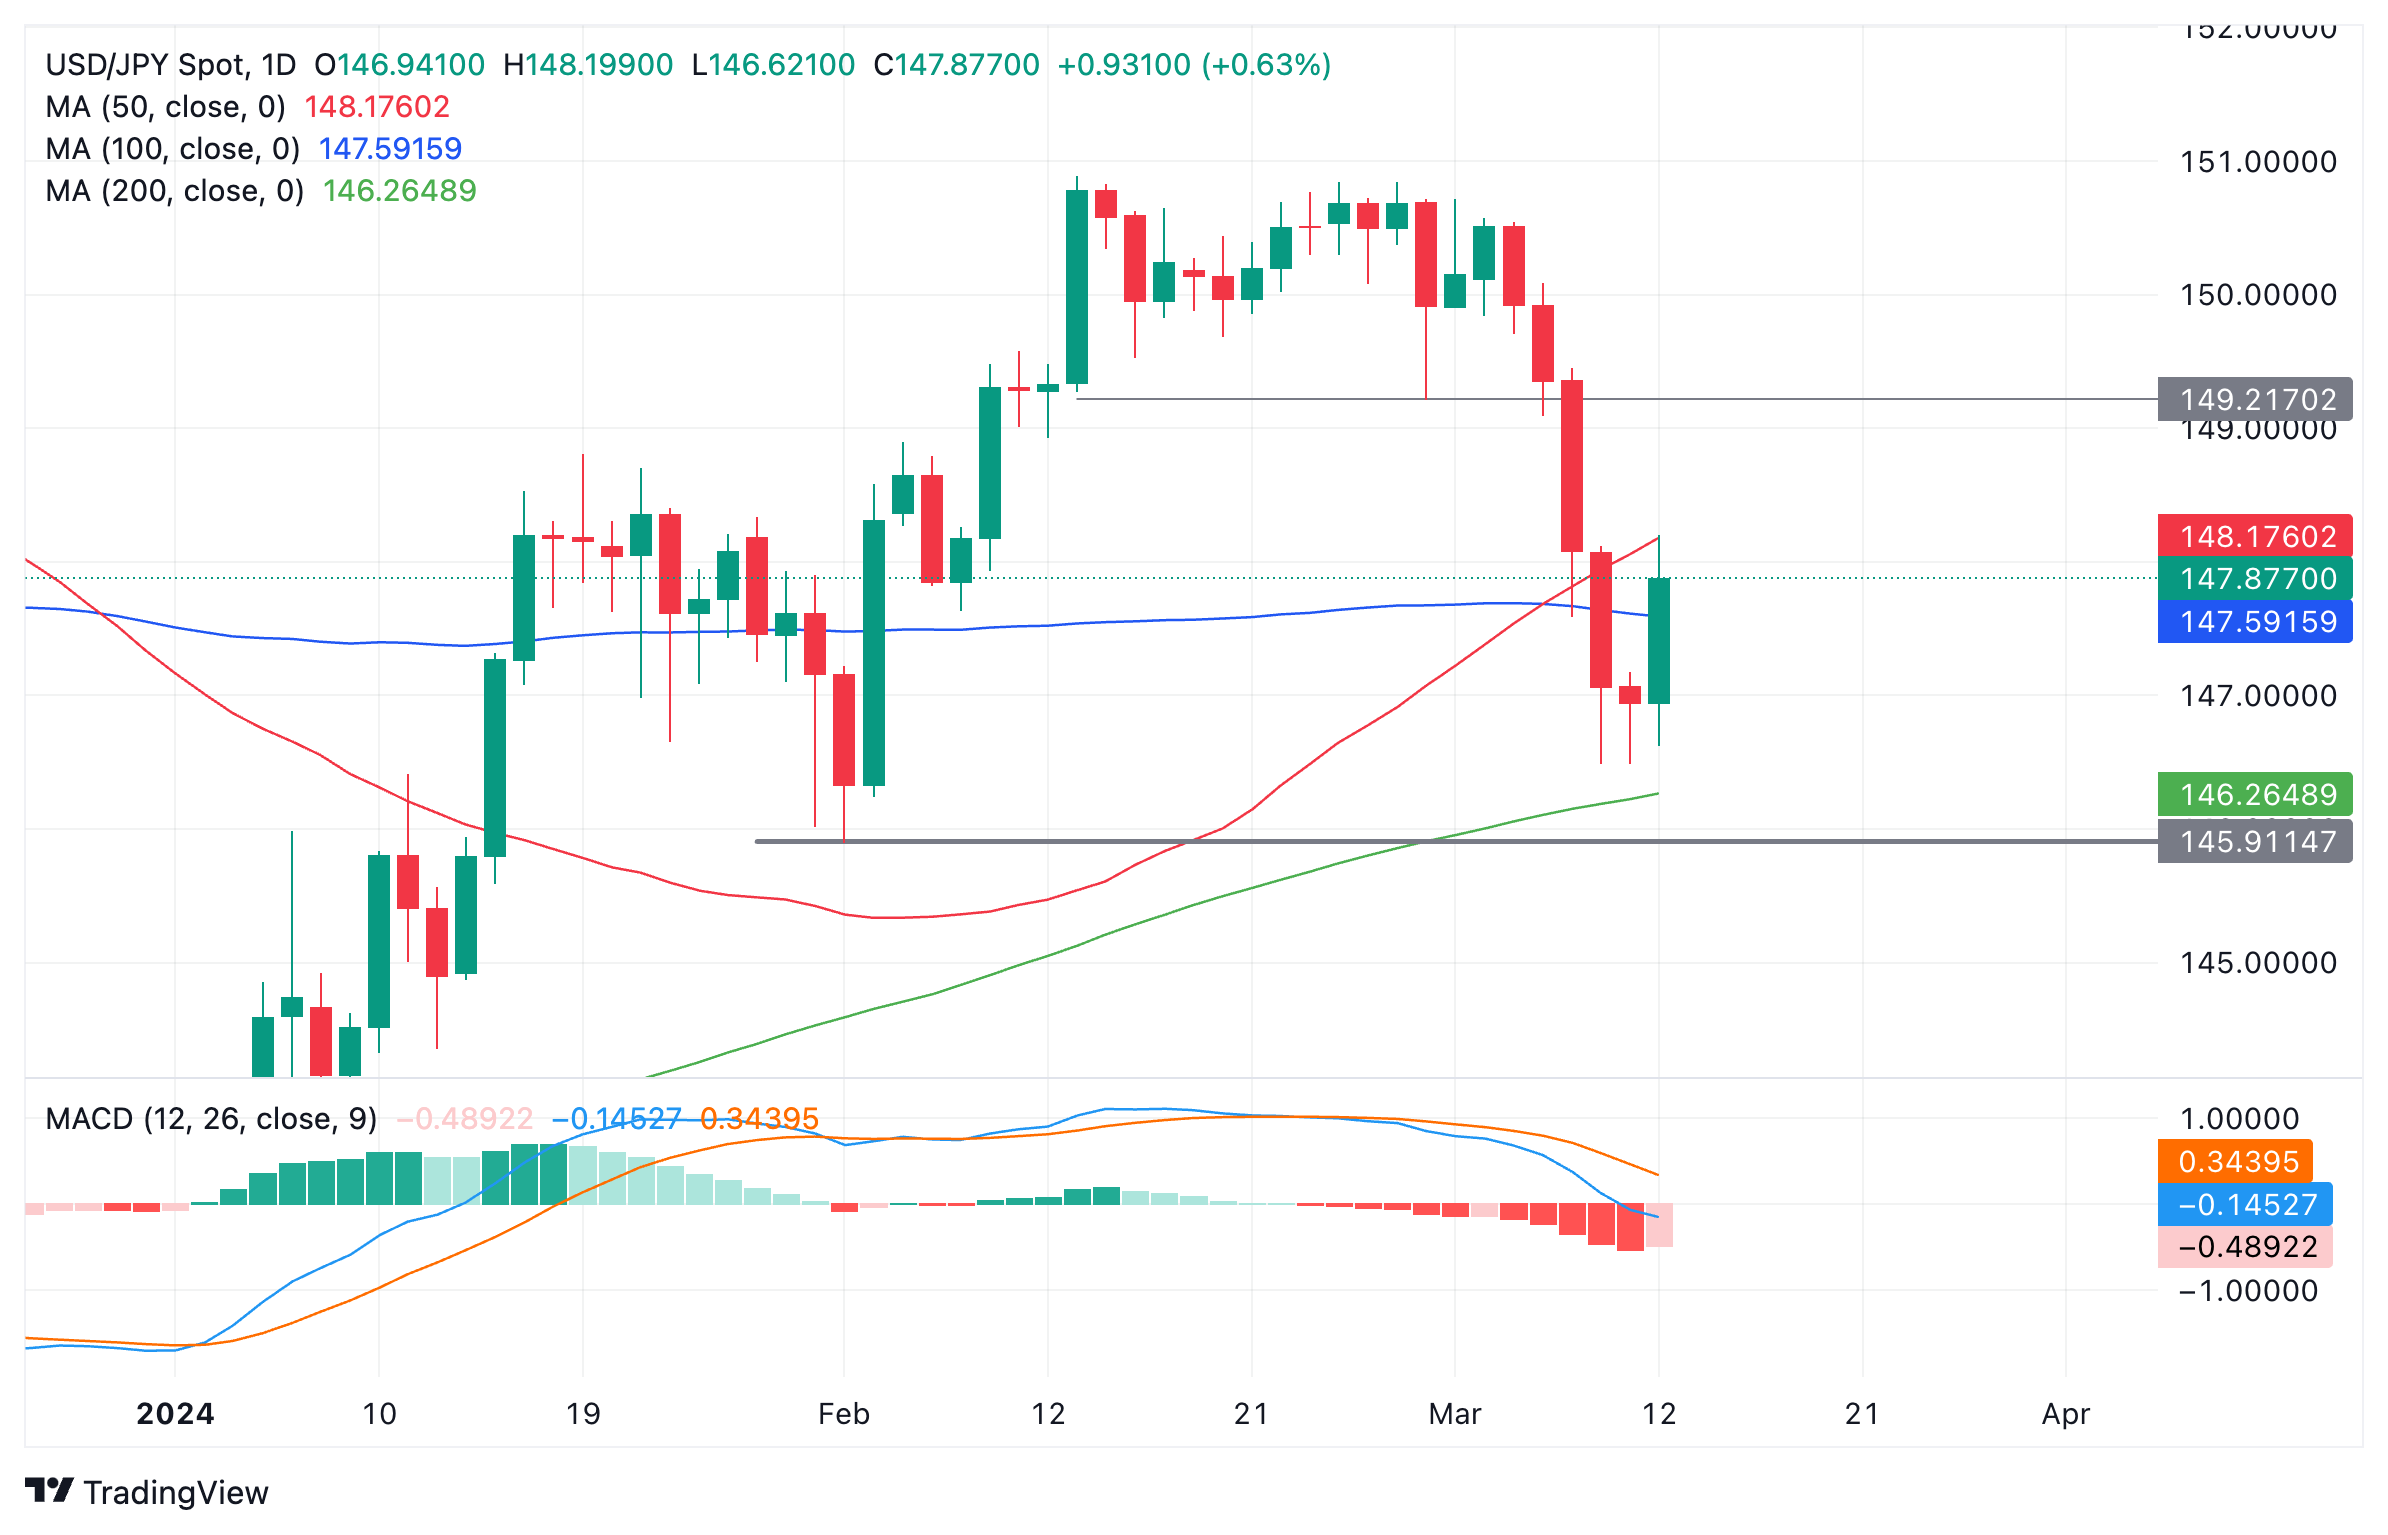
US Dollar vs Japanese Yen: Daily chart
Impact of CPI on US Dollar could be temporary
Although the CPI data beat estimates most of the upside was mainly due to higher Gasoline prices which are seen as a variable inflationary pressure that is less likely to endure. This suggests upside for the US Dollar (USD) – and the USD/JPY – is likely to be tempered and short-lived.
The Yen is supported by expectations and rumors swirling that the Bank of Japan (BoJ) will soon raise its base interest rates from negative levels. Some even hypothesize the country could be exiting the moribund growth trend of the last 30 years. This has been responsible for the USD/JPY’s recent descent.
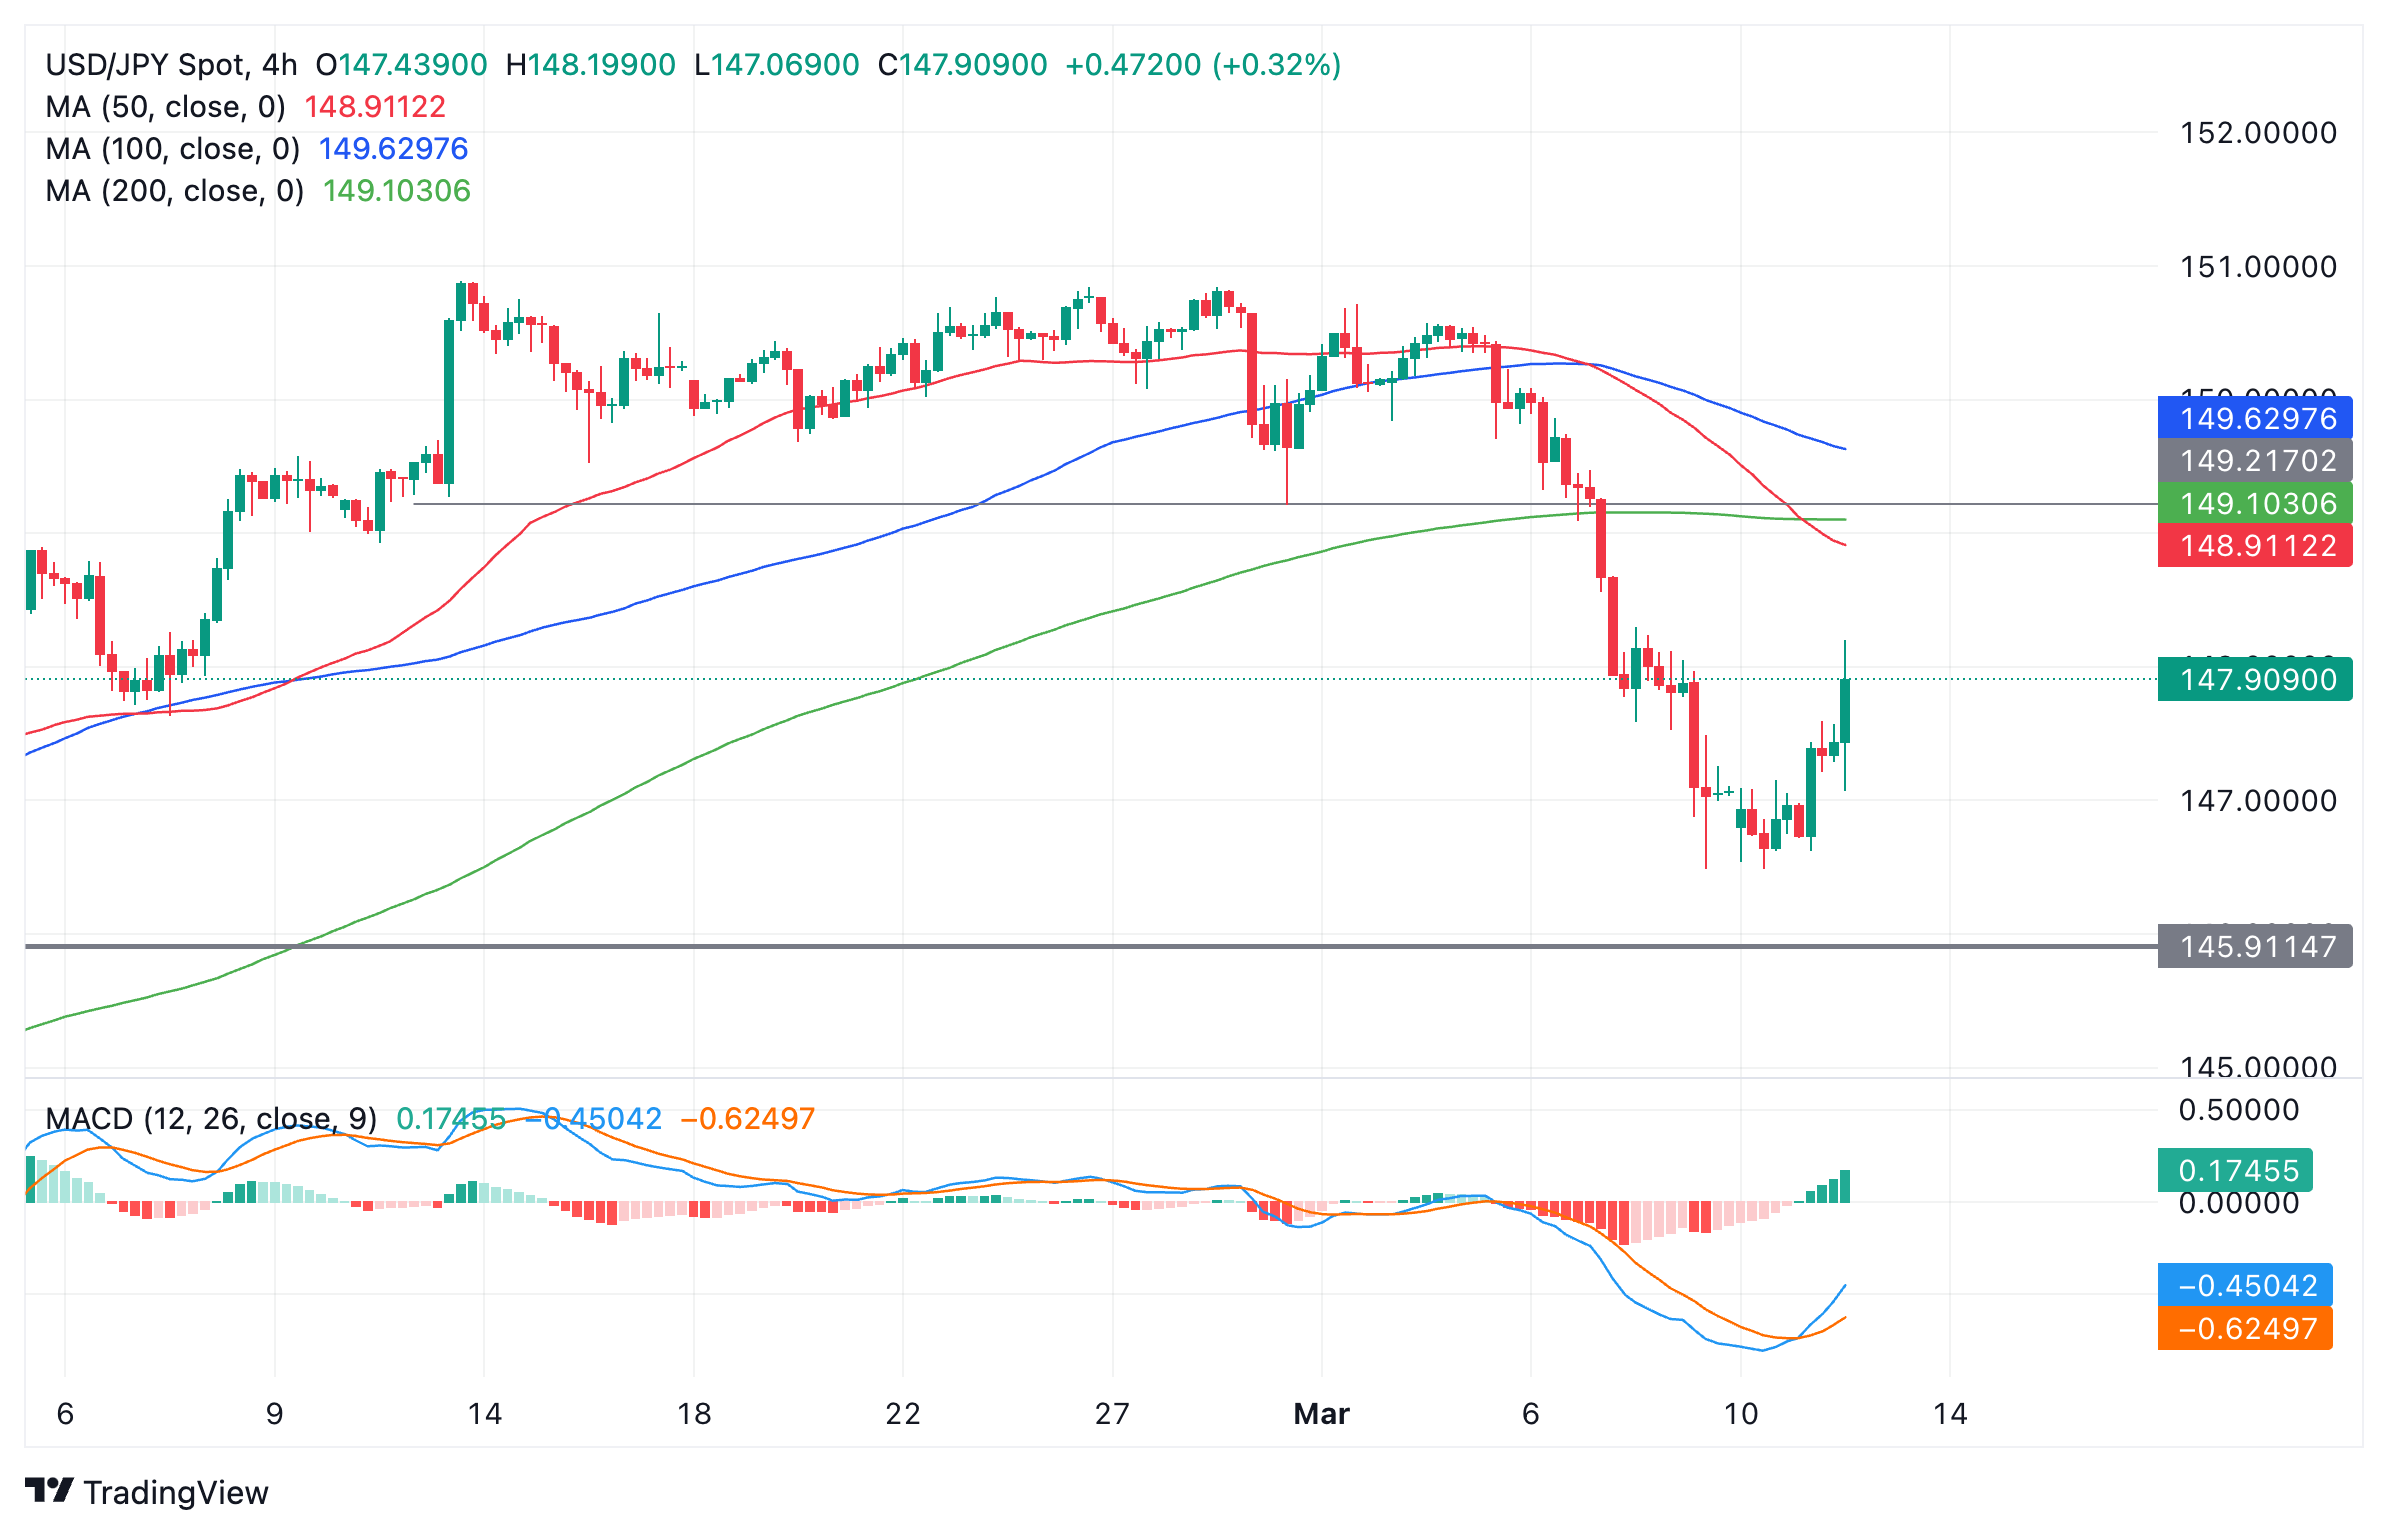
US Dollar vs Japanese Yen: 4-hour chart
Given the pair remains in a short-term downtrend despite the pullback of recent days, it is vulnerable to eventually rolling over and falling again.
There are no indications on the 4-hour chart above that the pullback higher has ended, however, so it remains too early to say with any certainty whether the pair will start going lower again. Some sort of candlestick reversal pattern would ideally form to warn traders of a resumption of downside, but this has not yet happened.
If the pair does revolve lower, however, it is likely to fall back down to the 146.48 March 8 lows.
If USD/JPY breaks below the 146.48 lows it will probably fall to support at the 146.22 and the 200-day SMA, followed by 145.89, the February 1 low.
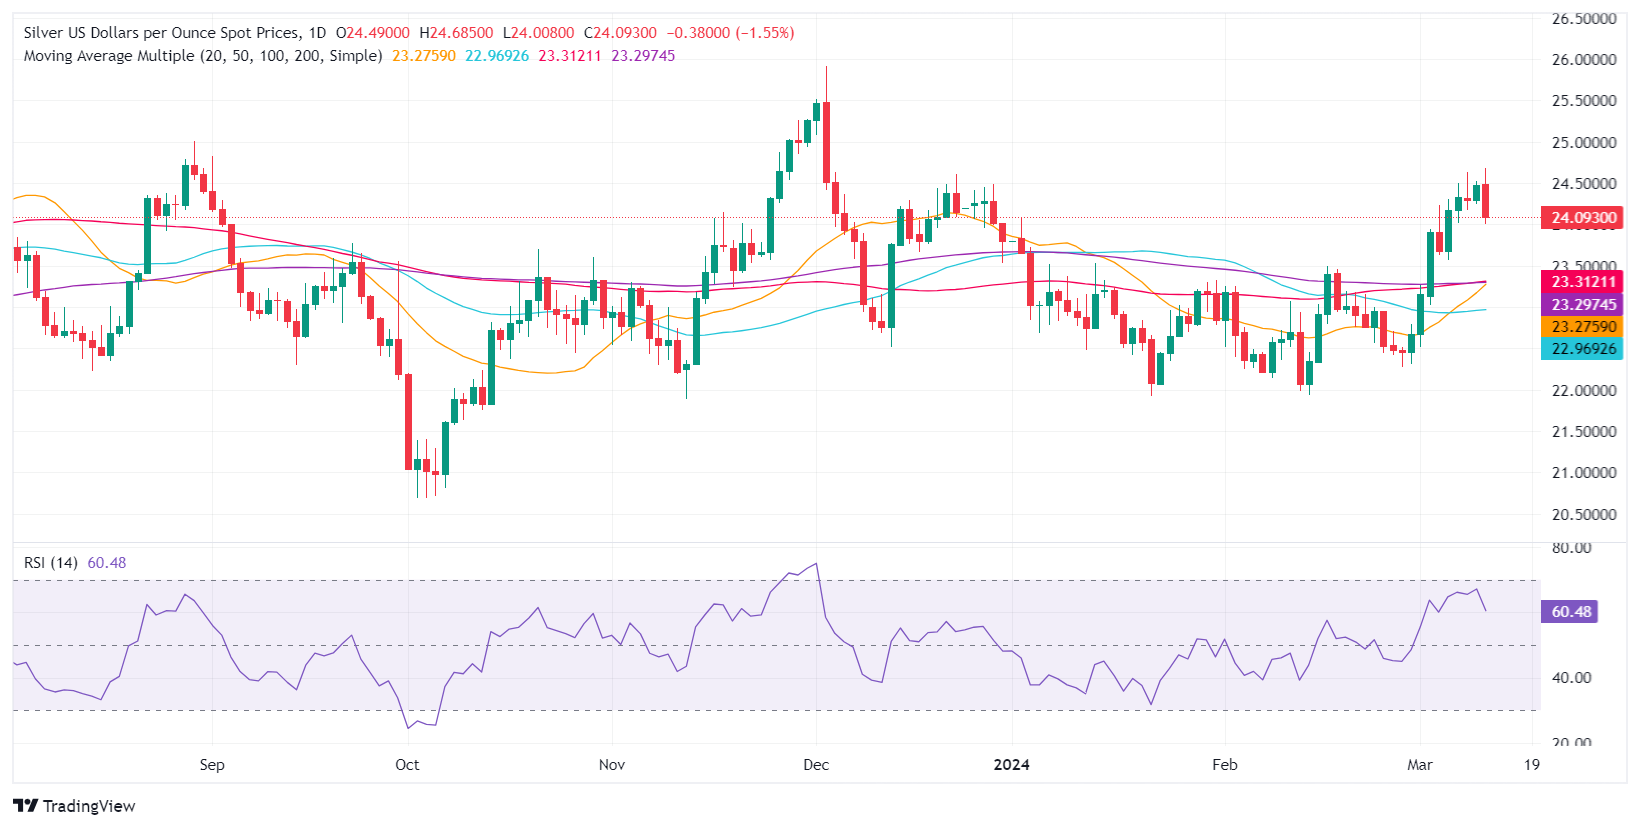
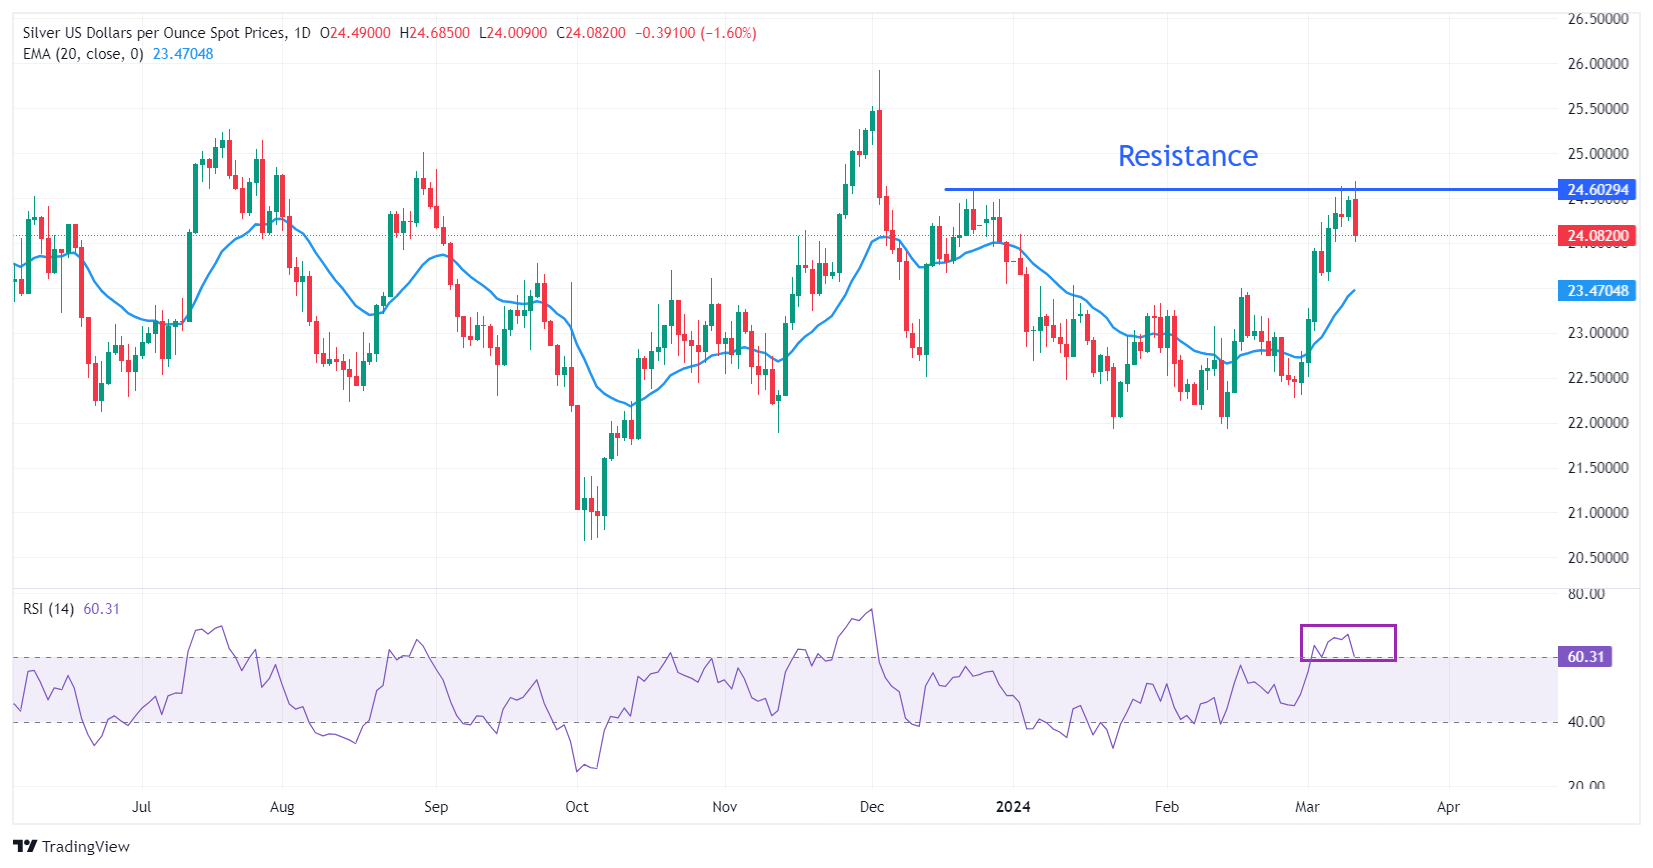
- Silver price falls vertically to $24 as sticky US inflation allows the Fed to maintain a hawkish narrative.
- US monthly headline and core inflation rose by 0.4% in February.
- 10-year US bond yields rally to 4.15% as hopes that Fed rate cut expectations would ease.
Silver price (XAG/USD) plummets to $24.10 as the United States Bureau of Labor Statistics (BLS) has reported that the Consumer Price Index (CPI) remains hot in February.
Annual core CPI that strips off volatile food and energy prices grew at a higher pace of 3.8% against the consensus of 3.7% but lower than 3.9% in January. In the same period, headline inflation rose at a higher pace of 3.2% against expectations and the former reading of 3.1%. The monthly headline and core inflation grew by 0.4%.
A sticky inflation report is expected to dent market expectations for the Federal Reserve (Fed) reducing interest rates in the June policy meeting. This is expected to lift up the opportunity cost of holding non-yielding assets, such as Silver. Yields on assets to which interest coupons are attached, such as US Treasury bonds, are expected to increase. 10-year US Treasury yields jump to 4.15%.
Going forward, Fed policymakers may continue to maintain a hawkish narrative. The Fed wants inflation easing for months as evidence to get convinced that price stability will be achieved. The inflation data, released yet in 2024, the last leg of stubborn inflation is a hard nut to crack.
The US Dollar Index (DXY) recovered above 103.00 on expectations that the Fed will not discuss reducing interest rates in the first half of 2024.
Silver technical analysis
Silver price faces selling pressure after testing the horizontal resistance plotted from the December 22 high at $24.60. The overall trend is still bullish; however, a price correction move is expected before a fresh upside move. The advancing 20-day Exponential Moving Average (EMA) near $23.50 indicates that the near-term demand is upbeat.
The 14-period Relative Strength Index (RSI) oscillates in the bullish range of 60.00-80.00, indicating that bullish momentum is active.
Silver daily chart
Economists at Commerzbank expect the Gold price to remain supported as the PBoC is set to continue buying Gold.
Chinese central bank continues to buy Gold
The Chinese central bank (PBoC) continued to increase its Gold reserves in February for the 16th consecutive month. According to the PBoC, Gold reserves increased by around 390 thousand ounces month-on-month, which corresponds to purchases of 12 tons.
In addition, the ongoing debate about the possible use of frozen Russian assets for the reconstruction of Ukraine is likely to have significantly increased the sanctions risk of investments in US Dollars or Euros from the PBoC's perspective. This suggests that the PBoC will continue to buy Gold in the coming months, which should therefore remain a support for the Gold price.
- New Zealand Dollar weakens against the US Dollar following the latest US inflation figures for February.
- They paint a picture of stubbornly hot inflation, which could make the Fed keep interest rates elevated to cool.
- The NZD/USD pair is falling back down towards its range lows in the 0.6080s.
The New Zealand Dollar trades lower against the US Dollar on Tuesday after the release of US Consumer Price Index (CPI) data for February shows inflationary pressures in the American economy remain stubbornly high.
The data suggests the Federal Reserve (Fed) may have to keep interest rates higher for longer to cool the economy. Relatively higher interest rates for longer is a positive driver for the US Dollar as it attracts more foreign capital inflows.
The fact that Gasoline and Energy prices were two of the biggest contributors to elevated inflation, however, will probably limit US Dollar upside since these are seen as less entrenched pressures and subject to global commodity price fluctuations.
New Zealand Dollar declines vs US Dollar after US CPI beat
The New Zealand Dollar takes another step lower against the US Dollar on Tuesday after both headline and core US CPI for February came out above estimates, according to data from Bureau of Labor Statistics (BLS).
The US Consumer Price Index ex Food and Energy (core) inflation came out at 3.8% YoY when analysts had expected a 3.7% result. The figure was lower than the 3.9% recorded in January, however, suggesting inflation is coming down, only not as quickly as forecast.
On a monthly basis, core CPI rose 0.4%, which was higher than the 0.3% forecast and equal to the 0.4% recorded in January.
The broader headline CPI figure showed an unexpected rise of 3.2% YoY against the 3.1% forecast. This was also higher than the 3.1% recorded in January.
On a monthly basis headline CPI rose 0.4%, which was in line with estimates and higher than the 0.3% registered in January.
According to the CME FedWatch Tool, which calculates a market-based expectation of when the Federal Reserve will begin reducing its Fed Funds Rate, the probability of a first rate cut in March has fallen to 1% from 3% prior to the CPI release. The chance of one or more 25 bps cuts by May is now 16.8% from 17.1% prior to the CPI release. The probability of one or more interest rate cuts by June is now 69.7% from 71.4% prior to the data.
Technical Analysis: New Zealand Dollar continues falling inside range
The NZD/USD pair continues falling after touching the top of its range in the 0.6220s on Friday, where it formed a bearish Shooting Star Japanese candlestick pattern on the 4-hour chart (circled).
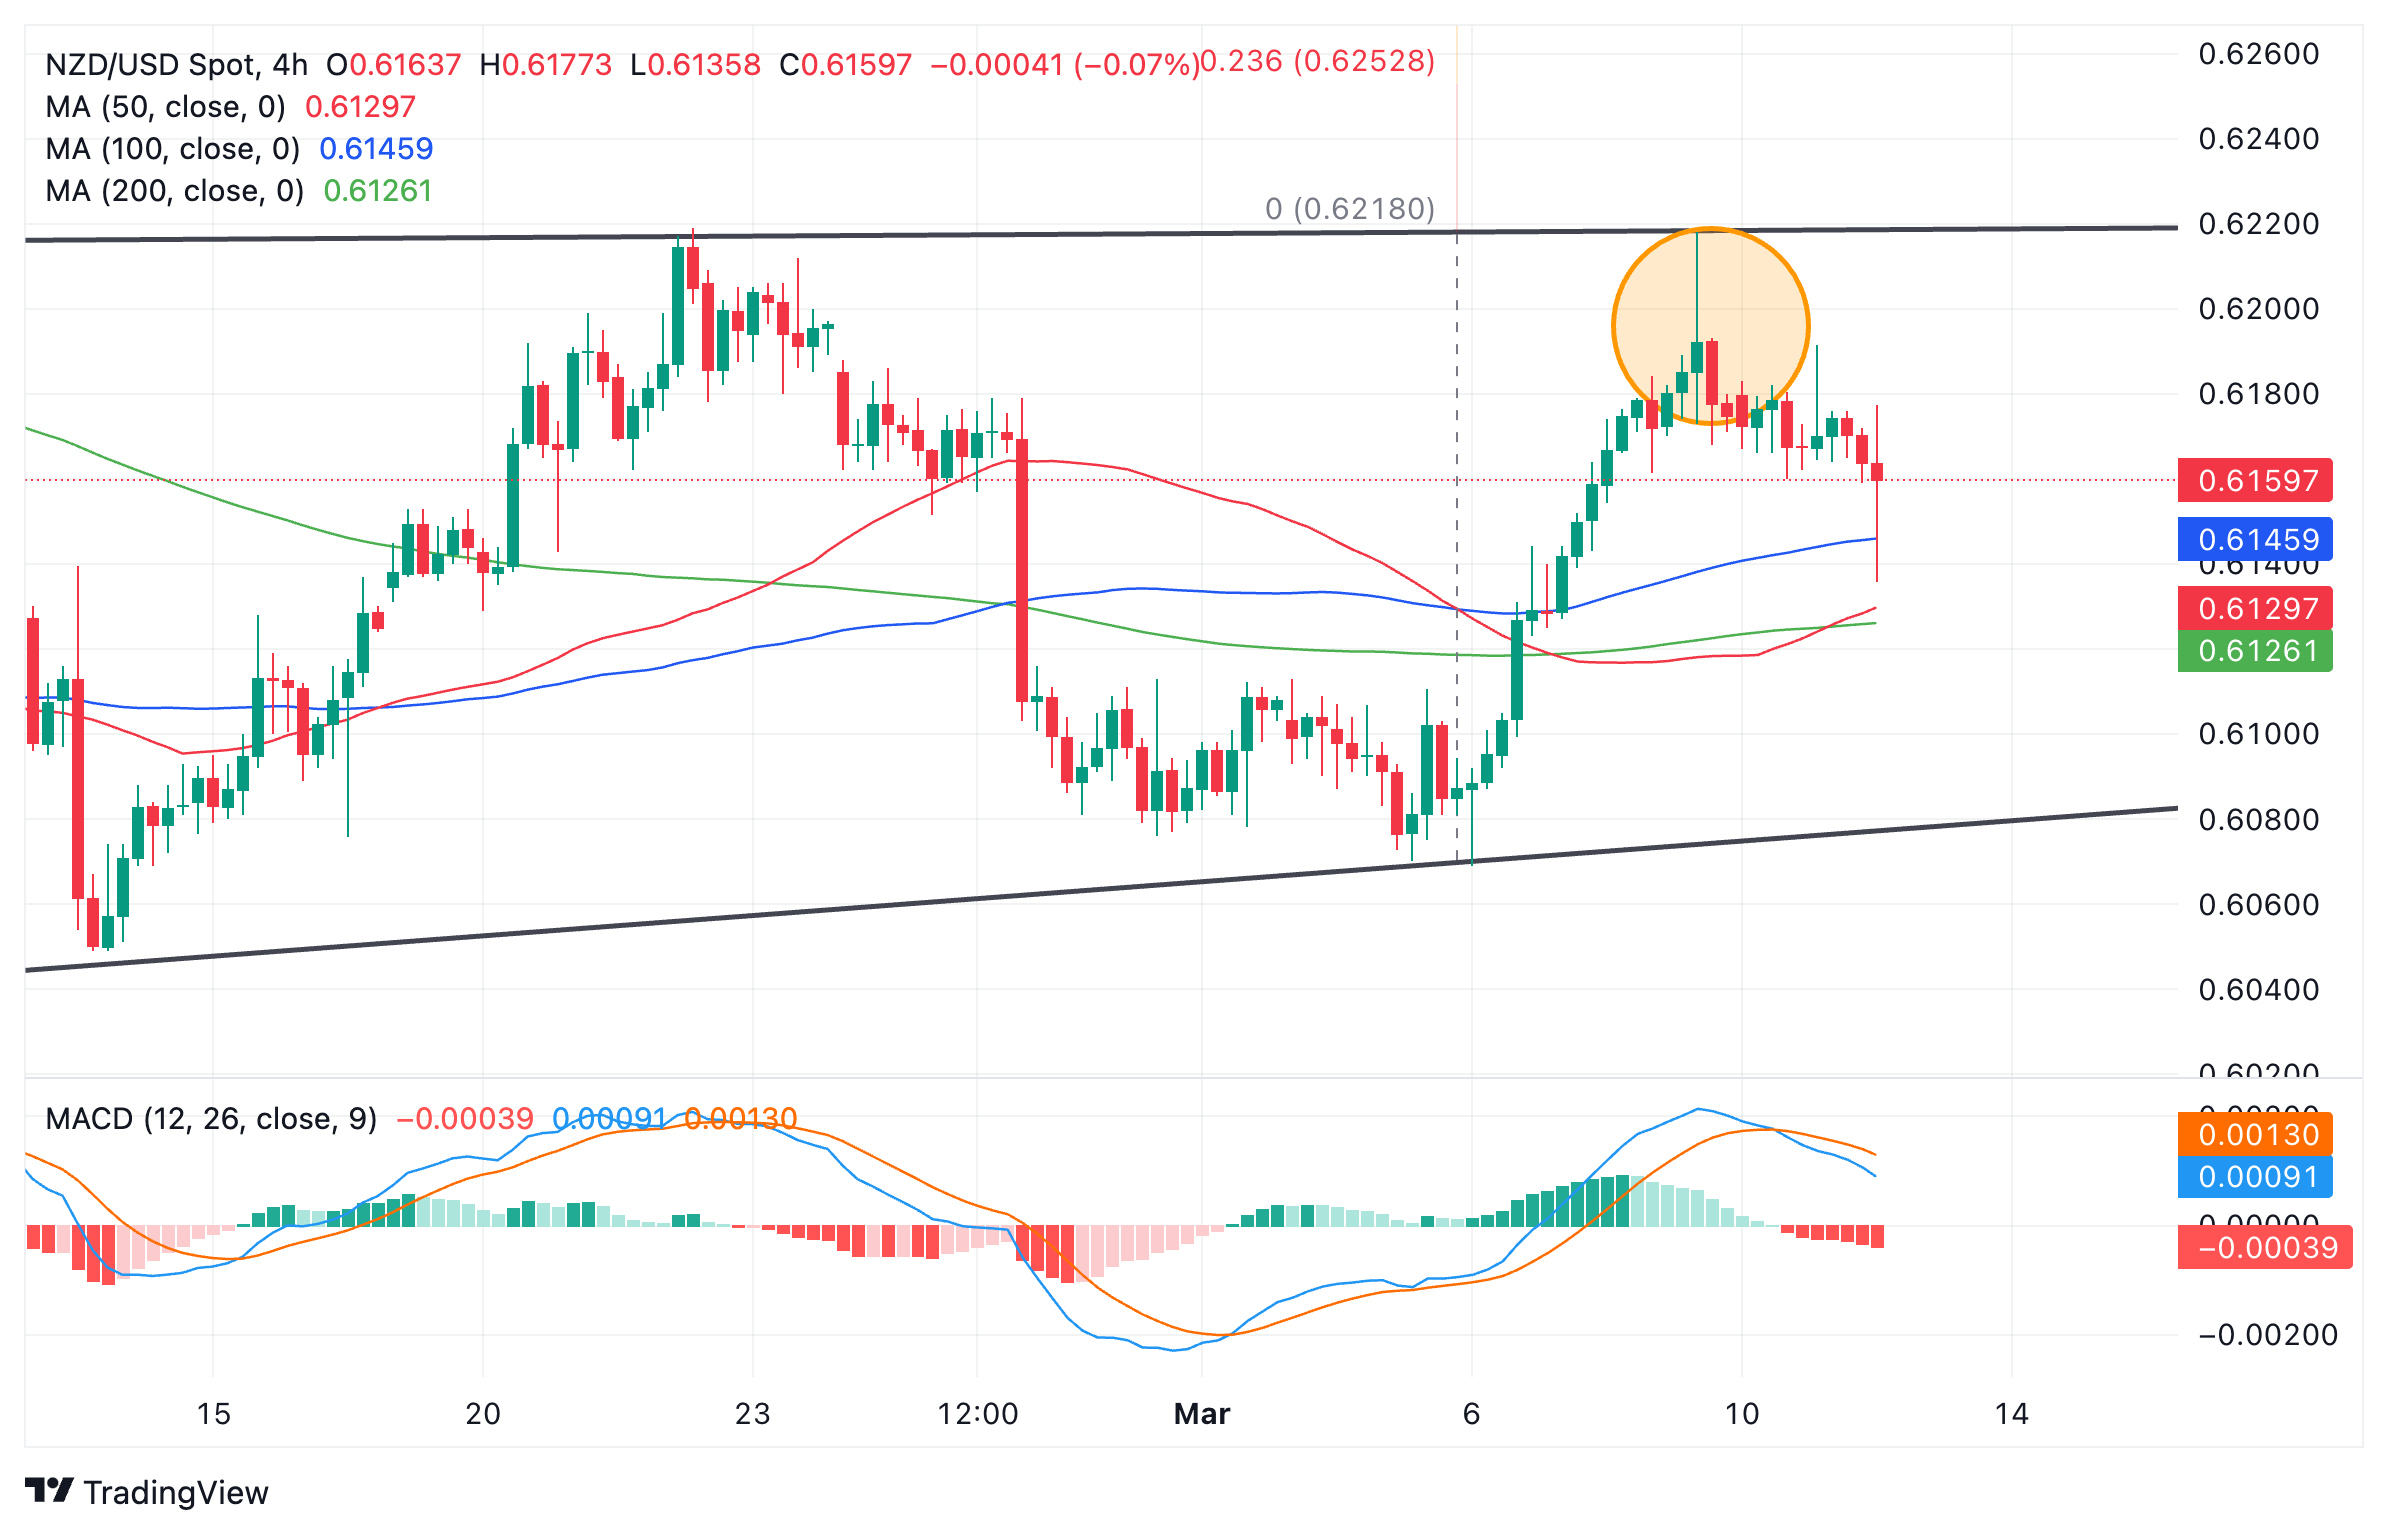
New Zealand Dollar vs US Dollar: 4-hour chart
The combination of the Shooting Star, the range high and the downside move since suggest the short-term trend has changed, and the pair is descending within its range, back down towards the range lows at around 0.6080-90.
The move down was also accompanied by the Moving Average Convergence/ Divergence (MACD) indicator crossing below its signal line whilst in positive territory, adding credence to the bearish outlook.
Only a breakout above the range high and the high of the Shooting Star would suggest the market was going higher. Such a move would probably reach a target at 0.6309, the 61.8% Fibonacci extrapolation of the height of the range from the breakout point higher.
USD/CAD edges slightly lower. Economists at Scotiabank analyze the pair’s outlook.
Firm resistance at 1.3510/1.3520
Risk appetite looks relatively constructive in Asia (ex-Japan) and Europe while US equity futures are narrowly mixed. Crude is trading firmer on the session. These are mild positives for the CAD.
Technical momentum is mildly USD-bearish.
The pair eased back sharply from Monday’s intraday peak, leaving a negative tone to short-term price signals while shorter-term DMI oscillators are aligned bearishly for the USD. That should mean firm resistance at 1.3510/1.3520 intraday (strong resistance at 1.3600/1.3610 more generally).
Support is 1.3420.
GBP/USD’s corrective drift extends after softer wage data. Economists at Scotiabank analyze the pair’s outlook.
The dip in Cable retains a corrective look
Average Weekly Earnings growth eased to 5.6% in the three months through January (down from 5.8% and a bit below consensus estimates for a 5.7% gain). Ex-bonus pay eased to 6.1% over the same period, against expectations of a steady (6.2%) outcome. Jobs data showed some softening in labour markets. Easing pay pressures and a cooling labour market will be welcomed by policymakers.
GBP losses from last week’s high have extended a little further today but the dip in Cable retains a corrective look (bull flag potential), implying that gains could resume on a rebound back above 1.2815/1.2820 intraday.
Support is 1.2755/1.2765.
- The US Dollar holds on to Monday’s gain in a first step to recover last week’s losses.
- All eyes this Tuesday are on the US CPI release for February.
- The US Dollar Index trades just below 103.00, flirting with a break back above this key level.
The US Dollar (USD) is trading broadly flat on Tuesday, though the quote board reveals very much a red picture when comparing the Greenbacks performance against its individual peers. All losses are very mild though ahead of the US Consumer Price Index data, which will be released later today. Traders will take the numbers to shape expectations on whether the Federal Reserve (Fed) will start cutting interest rates in May or in June.
The US Consumer Price Index (CPI) will be the focal point for this Tuesday. Monthly headline inflation is expected to come in at 0.4%, with an estimated range of 0.3% to 0.5%. The Monthly core inflation, which excludes the more-volatile food and energy categories, is expected to come out at 0.3%, with estimates ranging from 0.2% to 0.4%.
Expect ample US Dollar strength to pour in should one or both measures come out above the highest estimation. Of course, in the opposite sense, US Dollar weakness will be seen across the board if both measures snap the lowest estimate and come out much lower than expected.
Daily digest market movers: Trying to time that Fed cut
- The NFIB Business Optimism Index for February has already been released around 10:00 GMT. Previous number was at 89.9 with the February number coming in xxx (filled in when released).
- The Consumer Price Index for February is to be released at 12:30 GMT:
- Monthly Headline CPI is expected to come in at 0.4% from 0.3% a month earlier.
- Yearly Headline CPI is set to remain stable at 3.1%.
- Monthly Core CPI is seen heading from 0.4% to 0.3%.
- Yearly Core CPI should decline as well from 3.9% to 3.7%.
- At 17:00 GMT, the US Treasury Department will head to markets to allocate a 10-year Note.
- Equities are sideways with one outlier to notice: The Chinese Hang Seng Index has jumped over 3% near its closing bell. US equity futures are in the green ahead of the CPI print, up 0.50%.
- According to the CME Group’s FedWatch Tool, expectations for a Fed pause in the March 20 meeting are at 97%, while chances of a rate cut stand at 3%.
- The benchmark 10-year US Treasury Note trades around 4.09%, and could snap below 4.00%, should inflation fall substantially.
US Dollar Index Technical Analysis: Trying to land on time
The US Dollar Index (DXY) has tried to recover a touch on Monday, with still a very long road ahead to come back to levels where it was two weeks ago. The US CPI print is expected to move the needle a bit in terms of timing on the much-anticipated first rate cut from the Fed. However, simply moving the timing by a month means no big intraday moves are to be expected as traders will likely simply tweak their portfolio to the timing of the rate cut.
On the upside, the first reclaiming ground is at 103.31, the 55-day Simple Moving Average (SMA), and at the 200-day SMA near 103.71. Once broken through, the 100-day SMA is popping up at 103.74, so a bit of a double cap in that region. Depending on the catalyst that pushes the DXY upwards, 104.96 remains the key level on the topside.
The DXY is trading a bit in nomad's land, with not really any significant support levels nearby. More downside looks inevitable with 102.00 up next, which bears some pivotal relevance. Once through there, the road is open for another leg lower to 100.61, the low of 2023.
- GBP/USD has pulled back after touching resistance from the 200-week SMA.
- The pair could be forming an ABC move on the daily chart with a target in the 1.3000s.
- The 4-hour chart is looking a little vulnerable but remains supported for now.
GBP/USD has been rallying higher but it has stalled at the start of the new week after touching resistance at the 200-week Simple Moving Average (SMA). So far, the pullback looks like a correction in an evolving uptrend.
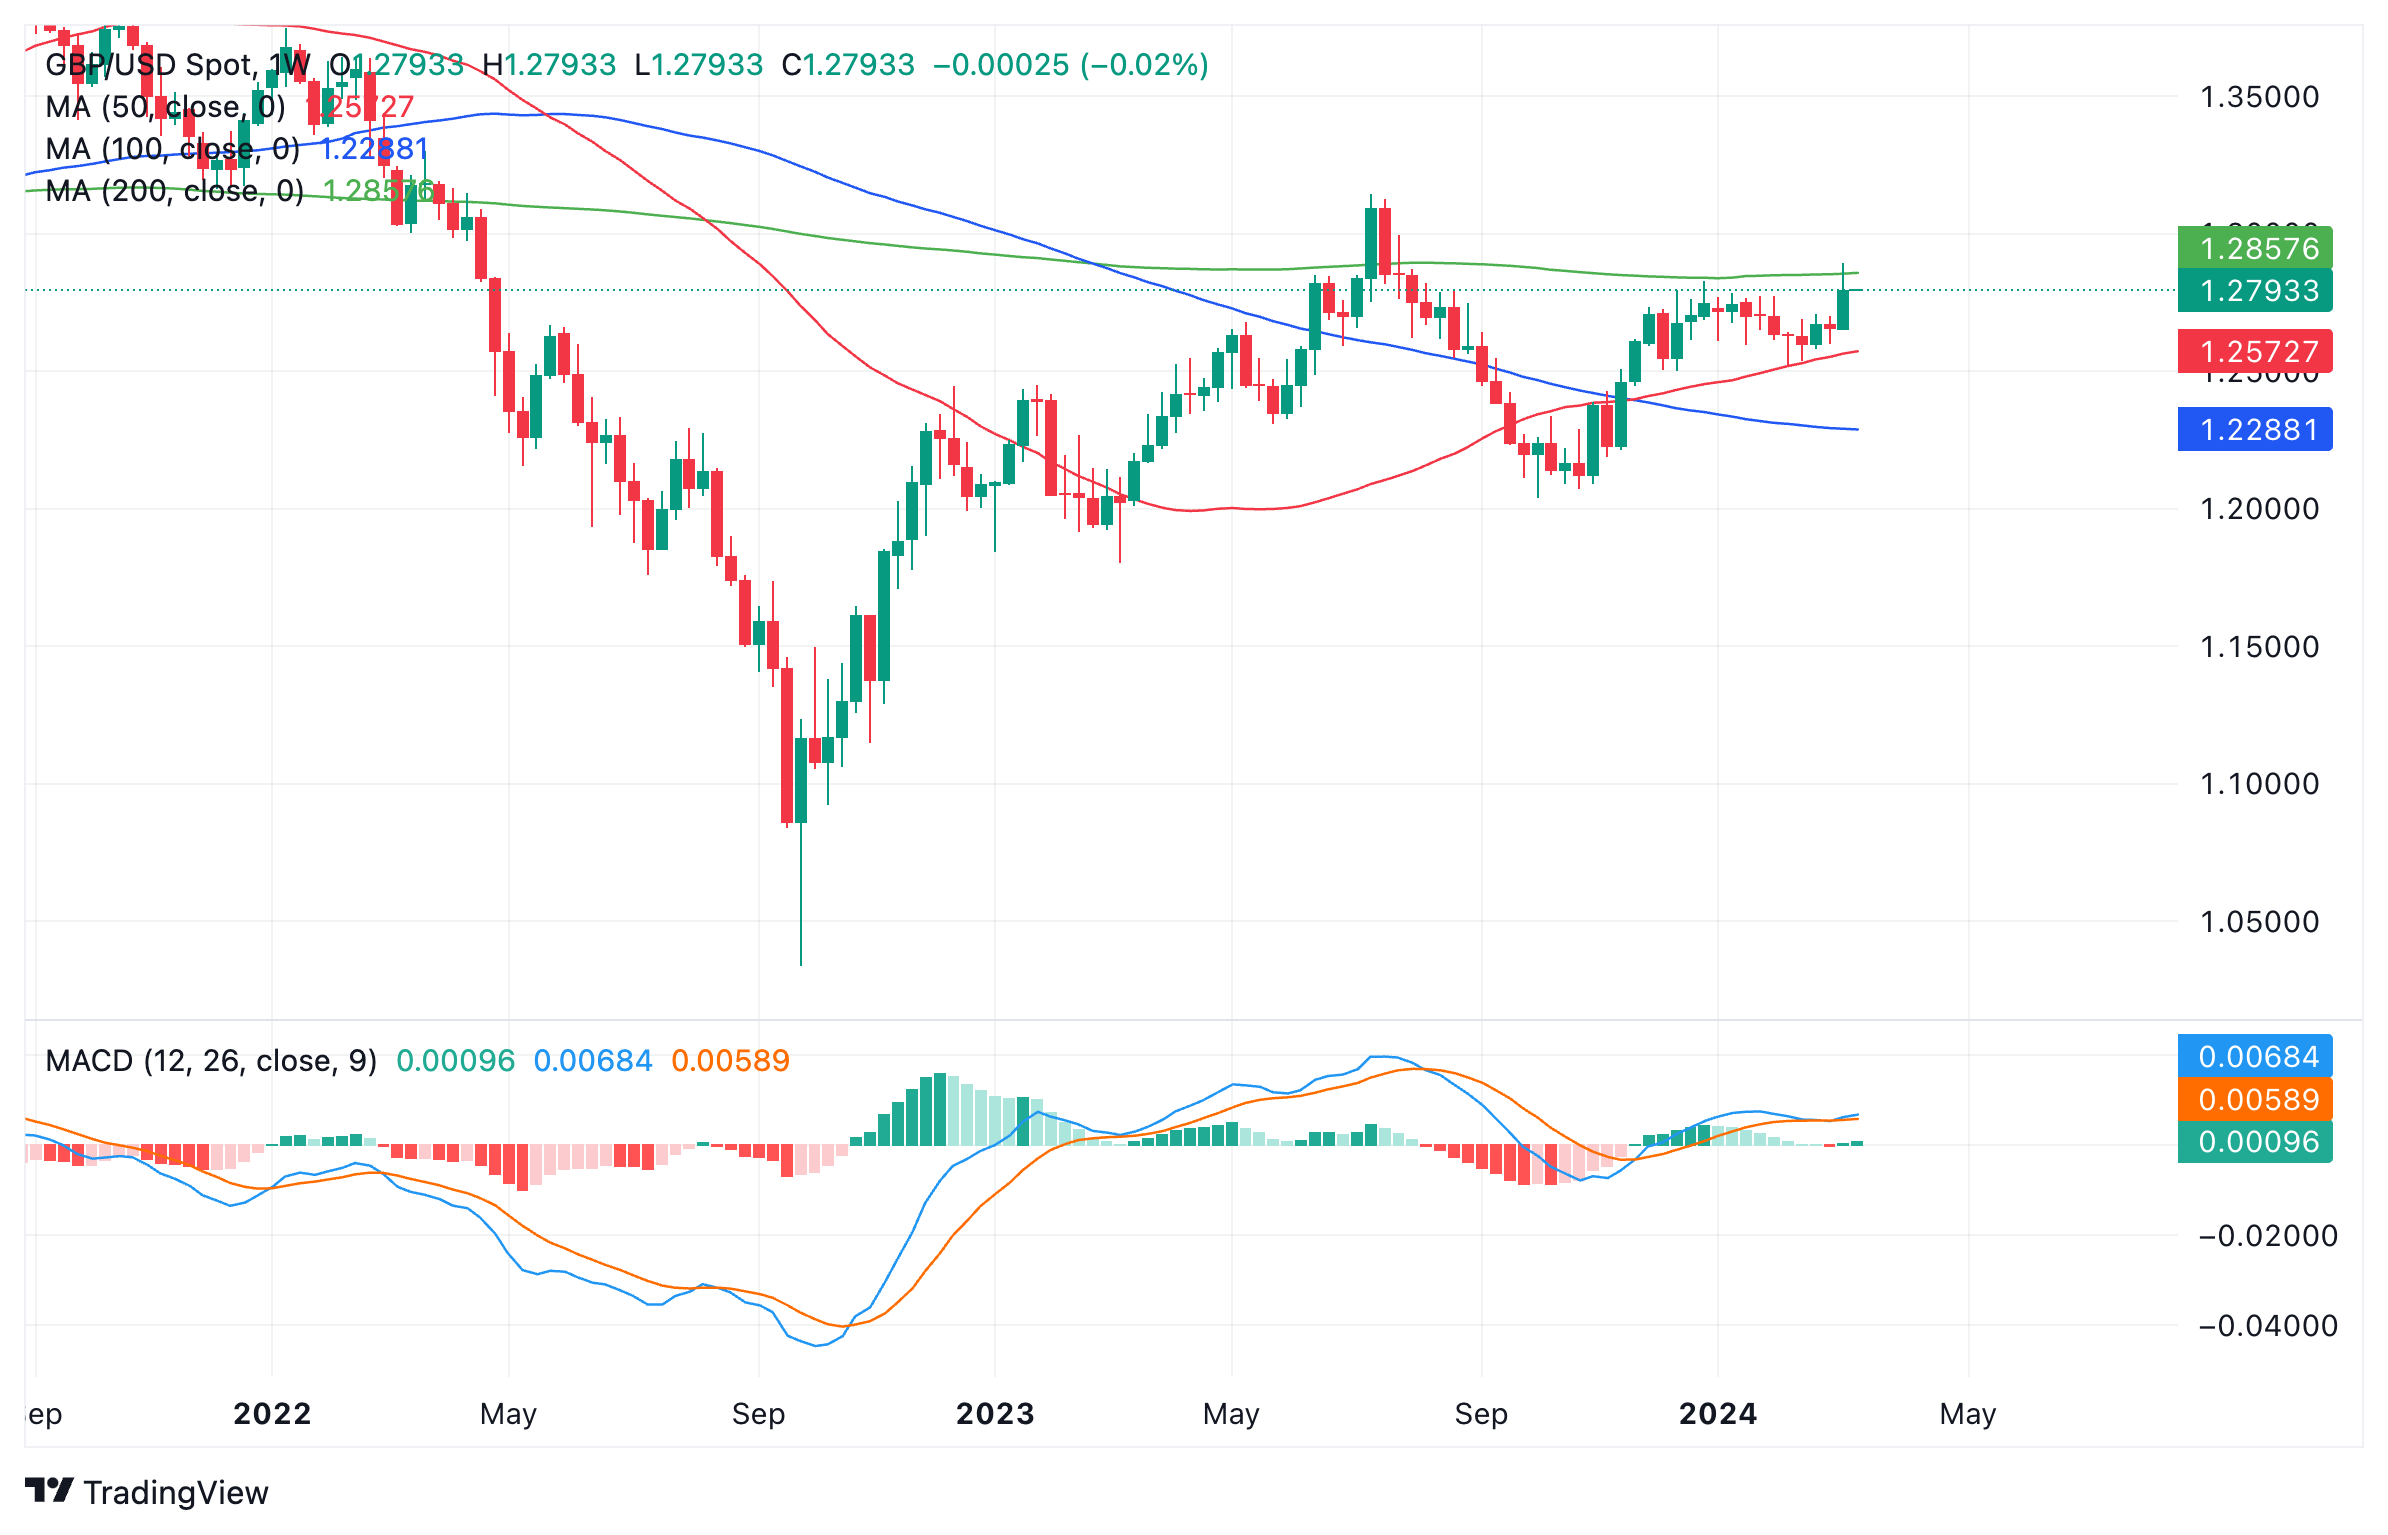
Pound Sterling vs US Dollar: Weekly chart
The pair has probably formed a bullish three-wave ABC Measured Move. If so, we are currently in the middle of the C wave, which should end somewhere between 1.3045 – 61.8% Fibonacci extension of wave A – and 1.3340, which is where C is 100% of A. The July highs in the 1.3130s is another target for the end of C.
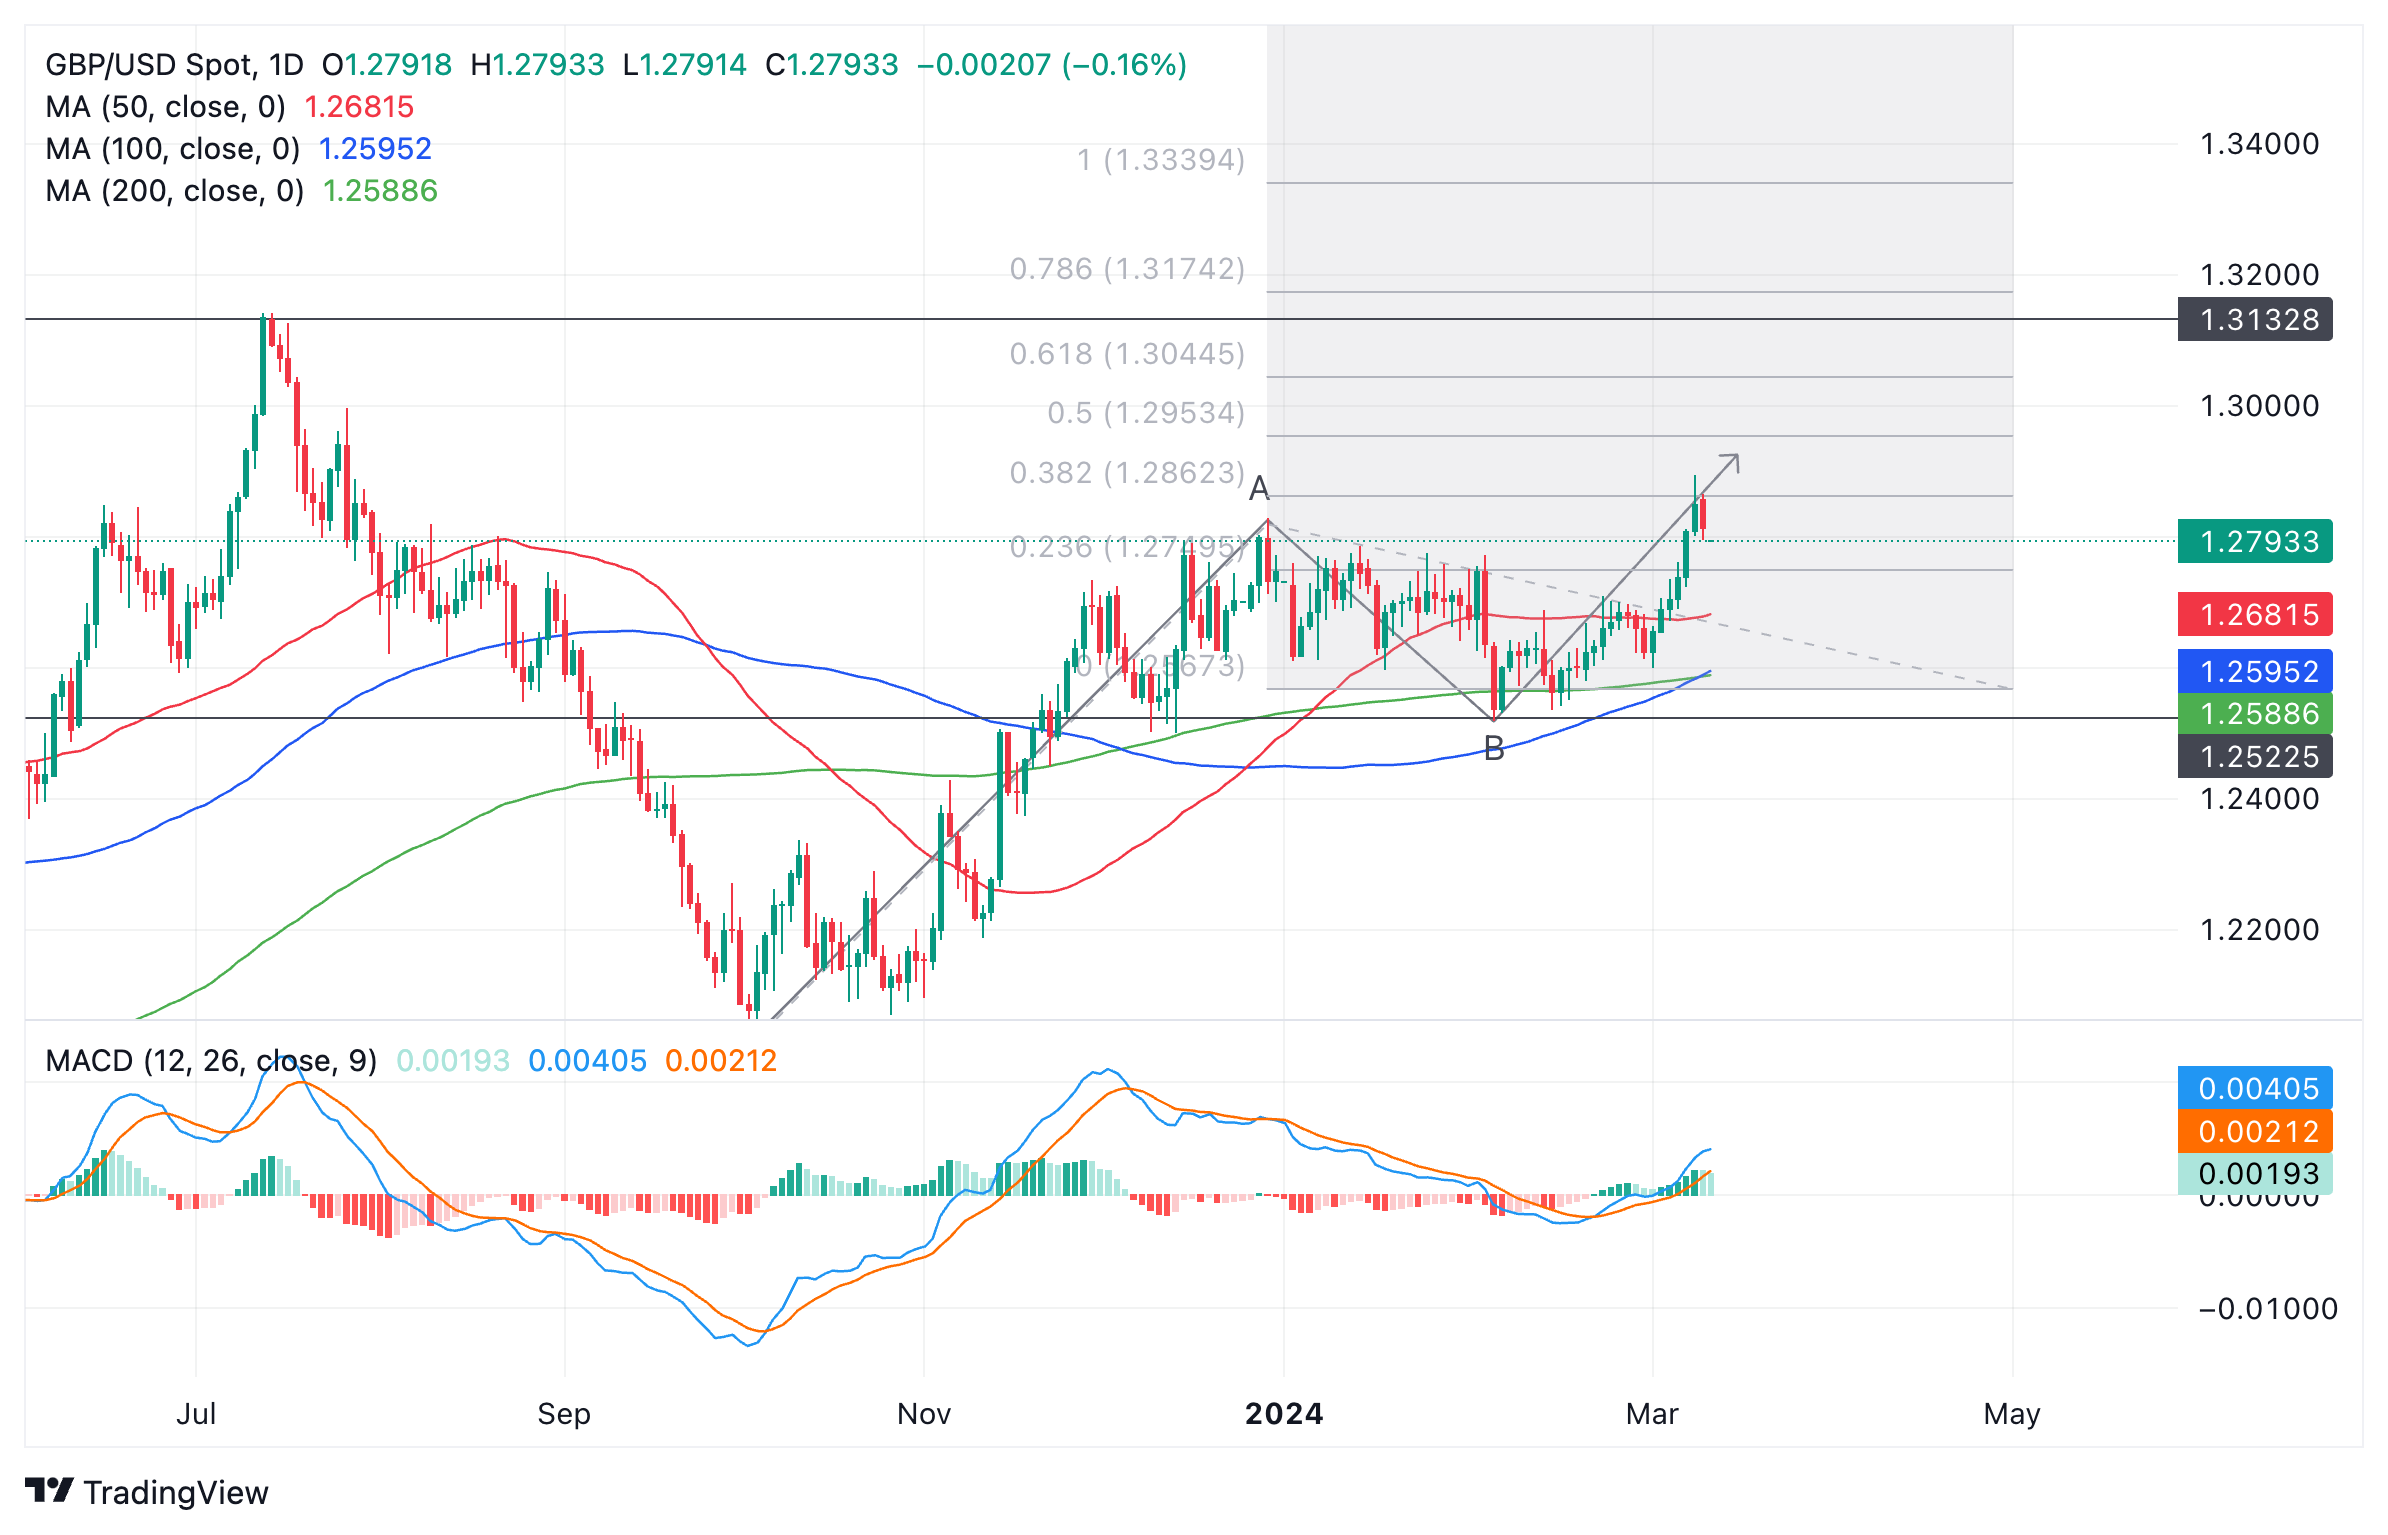
Pound Sterling vs US Dollar: Daily chart
A strong, decisive move back above the 1.2890 highs could provide the confirmation of an extension of C to its target.
The 4-hour chart below shows a less bullish short-term technical picture.
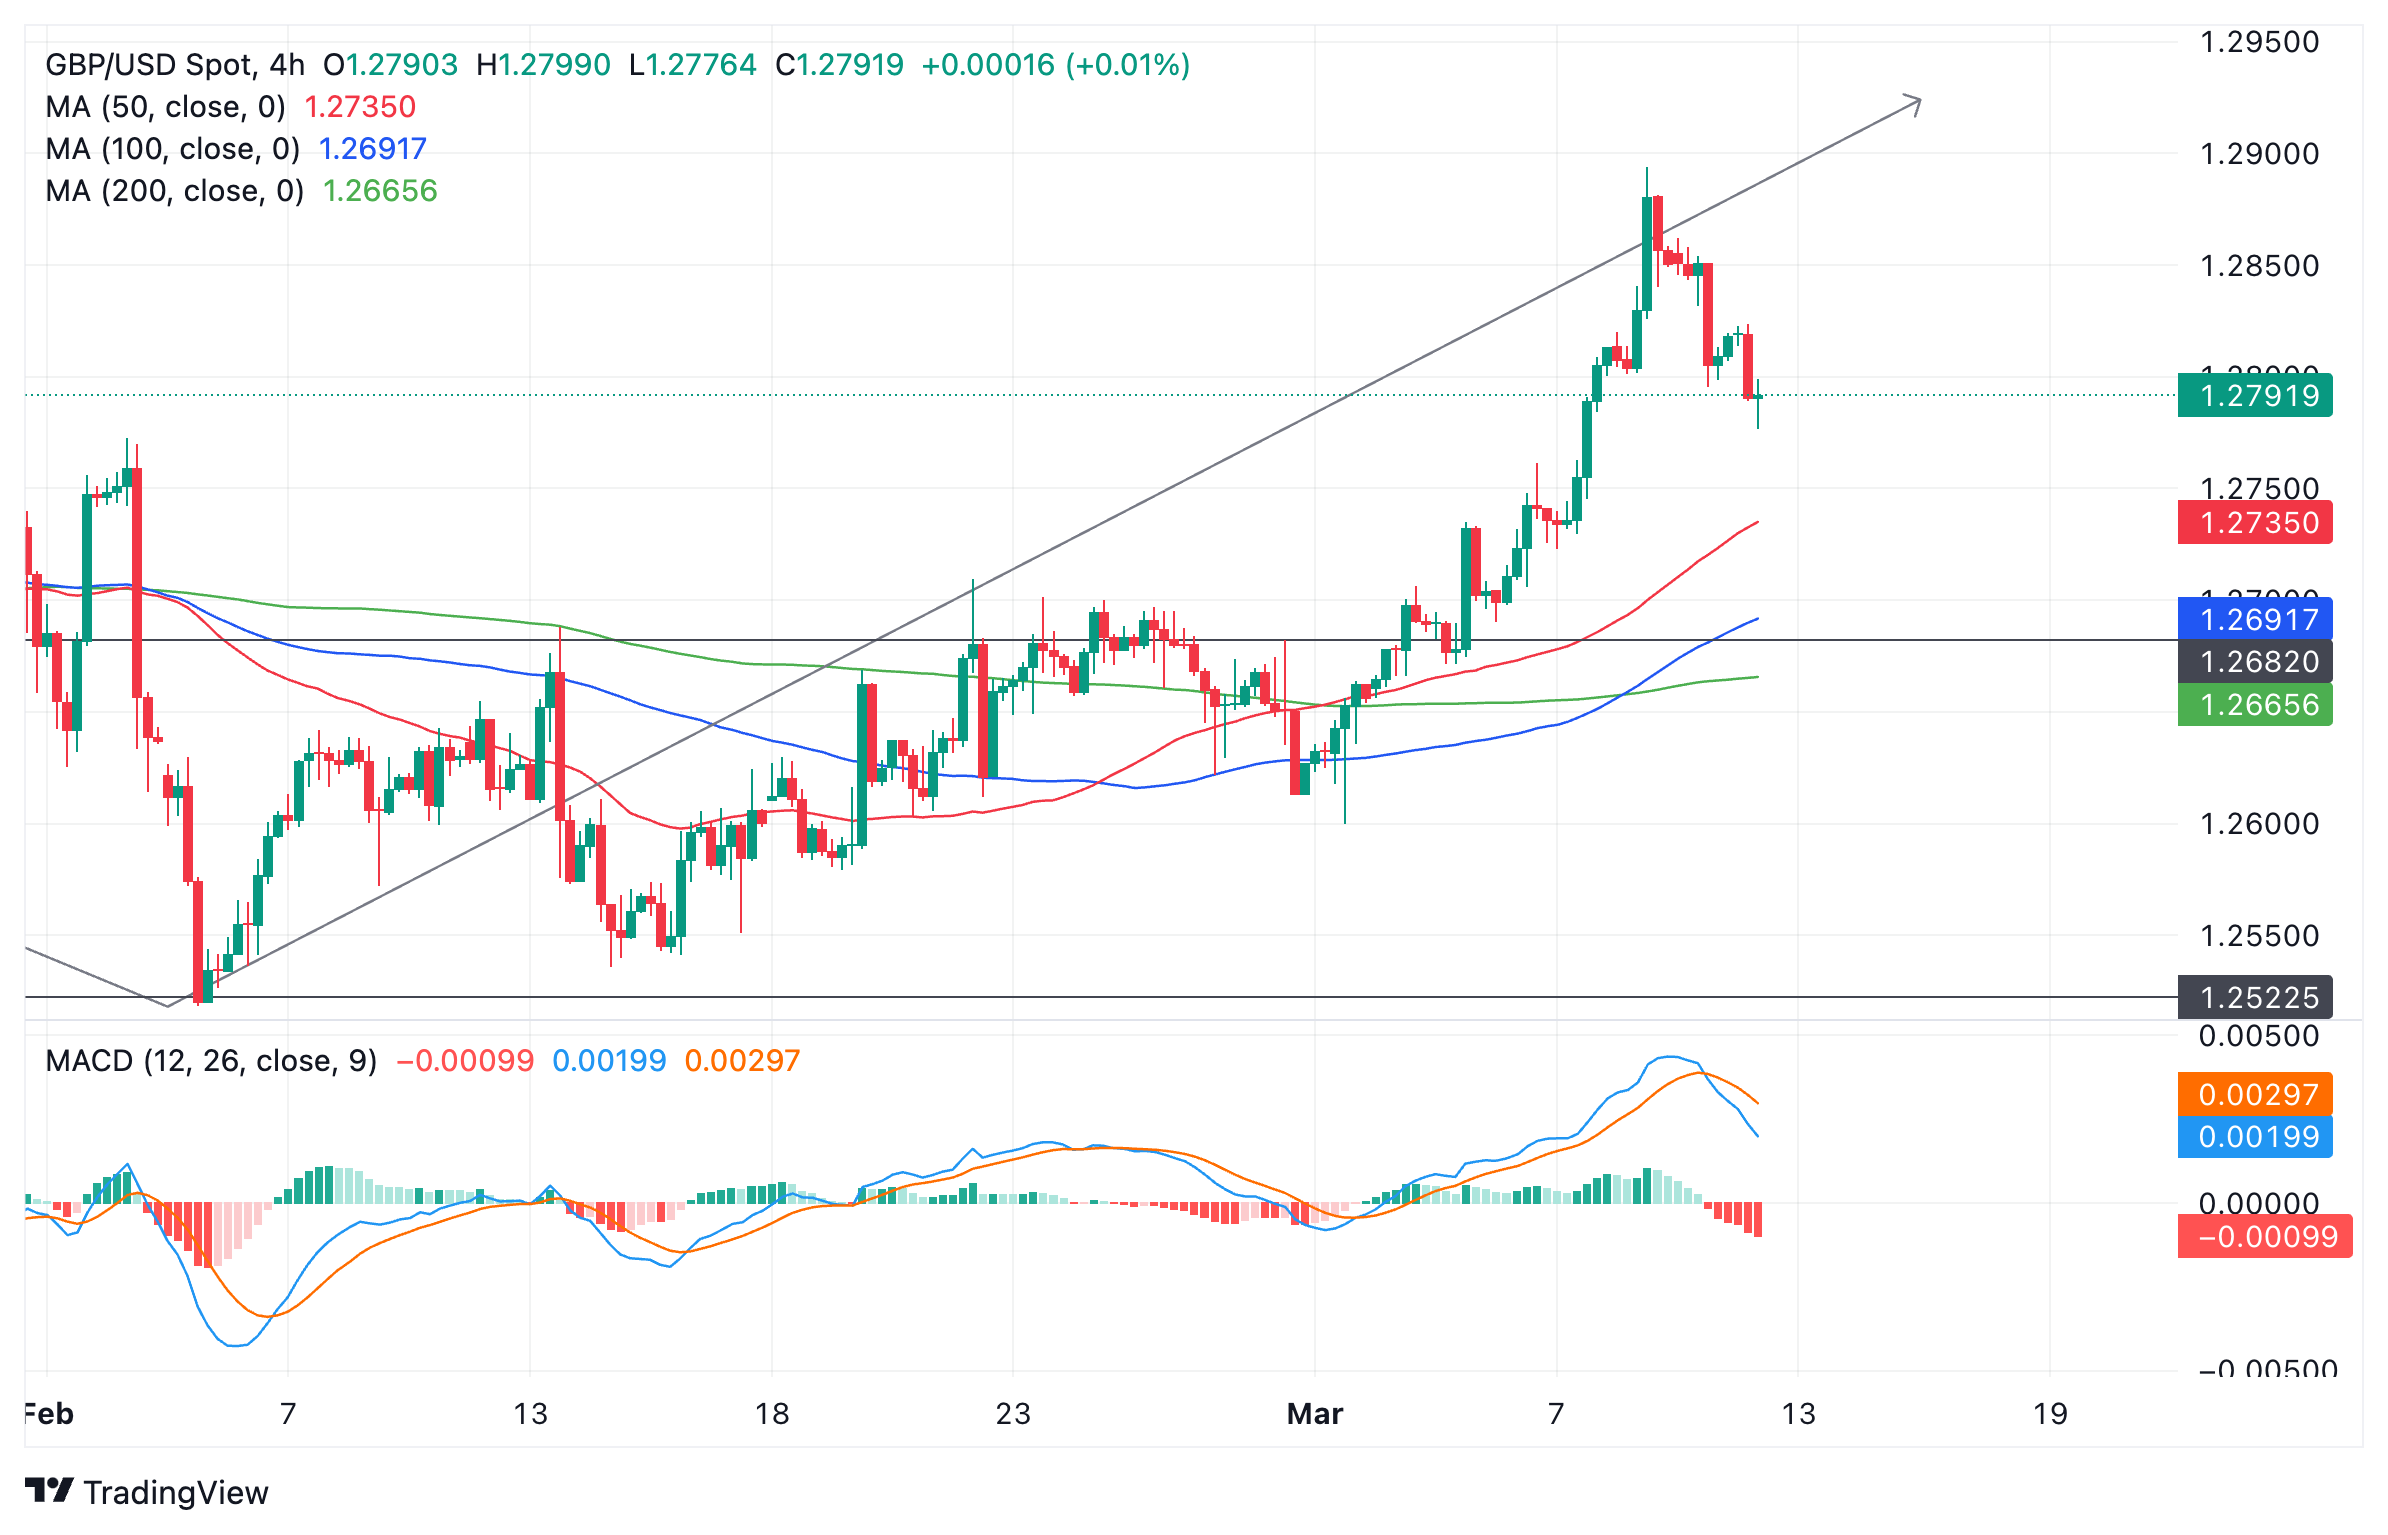
Pound Sterling vs US Dollar: 4-hour chart
GBP/USD has started to slide lower, reversing the rising peaks and troughs. The Moving Average Convergence Divergence (MACD) indicator has also crossed below its signal line offering a bearish sell signal.
The short-term uptrend is, therefore, a little in doubt, however, the fact that momentum on the way down from the March 8 peak has been slower than on the way up continues to favor a pullback rather than reversal thesis.
It is possible this pullback could continue lower to support between 1.2730 (from the 200-4hr SMA) and 1.2680, before turning around.
Traders should watch for a bullish candlestick reversal pattern or peaks and troughs climbing again for a sign the dominant uptrend is resuming. A break above 1.2860, if accompanied by strong momentum, would also suggest bulls are back in the saddle, with targets at the aforementioned ends of Wave C.
A break below 1.2720, however, would suggest the trend on a short-term basis has reversed and the pair was going lower again, probably to a target zone back in the 1.2600s where the pair was rangbound during February.
EUR/USD continues to consolidate after peaking around 1.0980 on Friday. Economists at Scotiabank analyze the pair’s outlook.
Strength to resume above 1.0945/1.0955
Some narrowing in Eurozone/US spreads over the past month and relatively firm European equity market gains relative to US benchmarks suggest some additional upside scope towards 1.1000 may be justified.
Minor losses have not developed into a serious setback for the EUR and price rather appears to be consolidating ahead of a renewed push higher (minor bull wedge pattern).
Trend oscillators remain bullishly aligned for the EUR across intraday, daily and weekly studies, which should help limit losses (support is 1.0875/1.0885) and encourage further gains.
Look for EUR strength to resume above 1.0945/1.0955.
- WTI Oil continues its winning streak for a second consecutive day.
- Oil traders are still positioned for more upside to come in the near term.
- The US Dollar Index trades just below 103.00 ahead of US CPI data release.
Oil prices are trading in the green for a second consecutive day on Tuesday, with WTI Crude snapping above $78. Oil traders are staying put in their bullish calls placed last week, very much noticeable in the options market. With the monthly OPEC Report due to be released this Tuesday, more upside could be on the horizon in case current output quotas are being respected by OPEC participants.
The US Dollar, meanwhile, has pared back a fragment of last week's losses with a positive return in the US Dollar Index (DXY). The focal point for this Tuesday is the US Consumer Price Index (CPI) data, which will provide clues to traders about the trajectory of the recent disinflation trend. Expect no big moves in the DXY, though rather some tweaking in terms of pinpointing the timing of the initial rate cut from the US Federal Reserve.
Crude Oil (WTI) trades at $78.03 per barrel, and Brent Oil trades at $82.40 per barrel at the time of writing.
Oil news and market movers: Monthly OPEC report headline risk
- Exxon had to halt its 188,000 barrels per day production at its facility in Gravenchon, France. The refinery had a fire on Monday, which forced the site to stop all its activities.
- Russia has reported more drone attacks out of Ukraine on key refinery installations and storage facilities on Russian soil.
- OPEC will release on Tuesday its monthly Oil Outlook report. No timing is available on when the report will be released.
- At 20:30 GMT, the US American Petroleum Institute (API) will release its weekly Crude Oil stock datafor the week of March 8. Previous number was a small build of 423,000 barrels.
Oil Technical Analysis: Another stab at $80
Oil prices appear to be building up pressure to have another go at $80 in the coming days. Crude already made its way back up above the 200-day Simple Moving Average (SMA) at $77.98 and above the key level of $78. Should the OPEC report bear an upbeat surprise on the consumption of Oil or the adherence to the current supply cuts, Crude could rally towards $80 quite easily.
Oil bulls still clearly see more upside potential seeing the spreads on Oil futures in favour of bullish bets. The break above $80 though does not seem to be taking place that easily, and $86 is appearing as the next cap. Further up, $86.90 follows suit before targeting $89.64 and $93.98 as top levels.
On the downside, the 100-day and the 55-day Simple Moving Averages (SMA) are near $75.71 and $75.31, respectively. Add the pivotal level near $75.27, and it looks like the downside is very limited and well-equipped to resist the selling pressure.
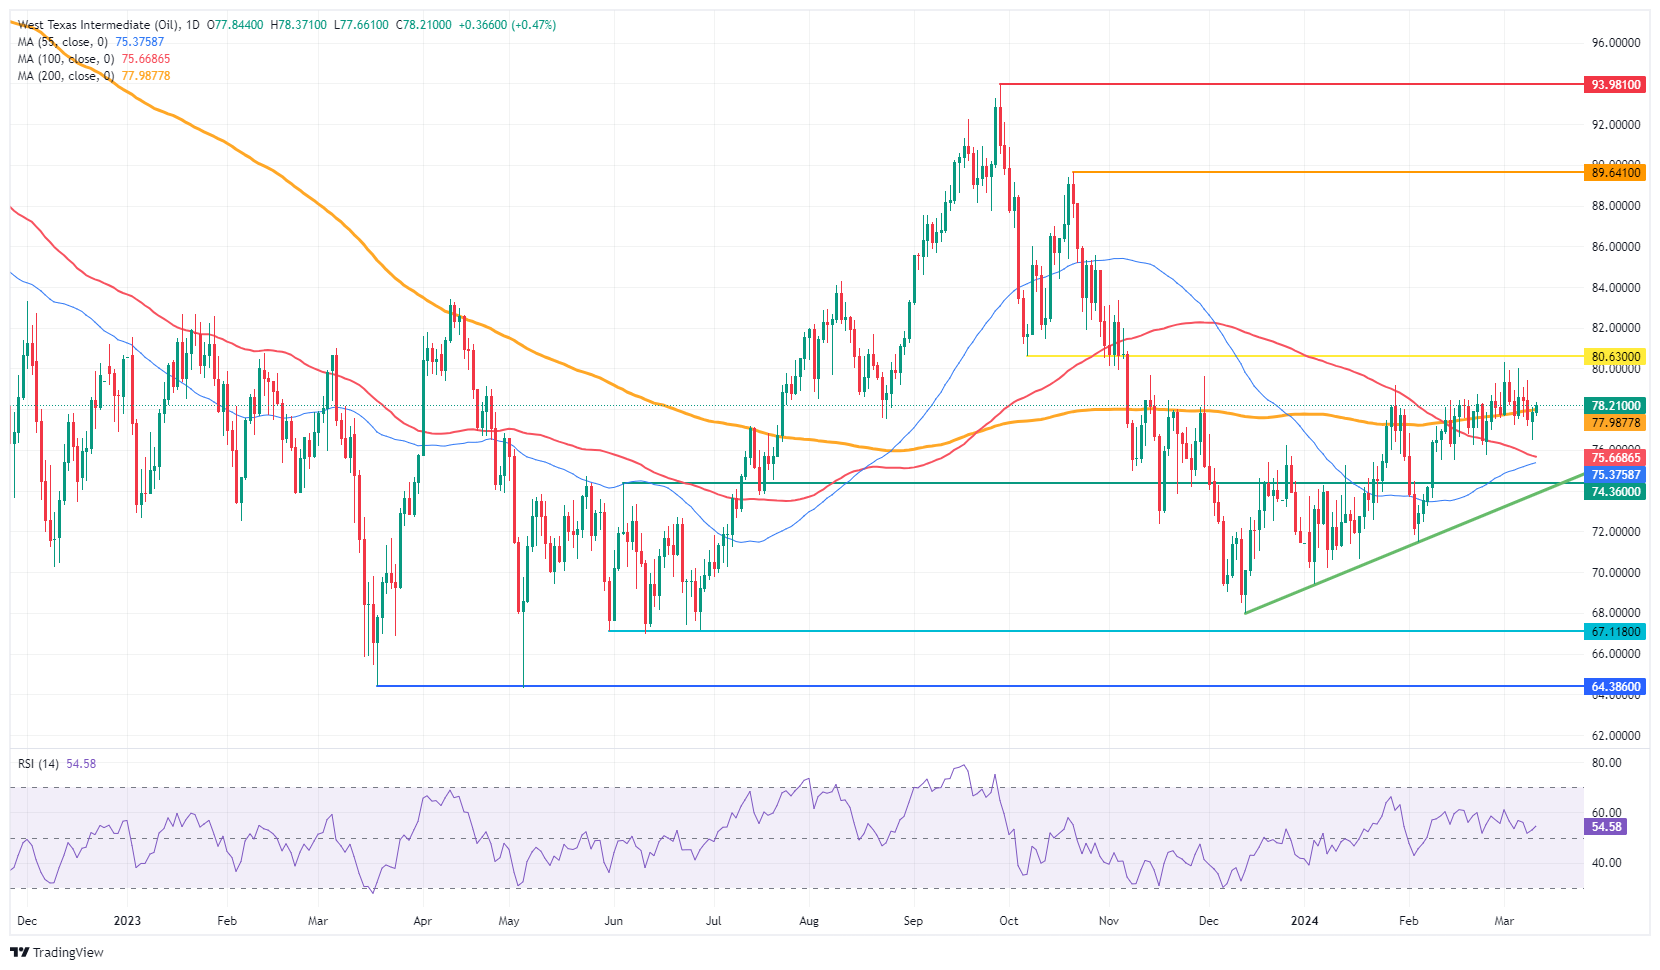
US WTI Crude Oil: Daily Chart
WTI Oil FAQs
WTI Oil is a type of Crude Oil sold on international markets. The WTI stands for West Texas Intermediate, one of three major types including Brent and Dubai Crude. WTI is also referred to as “light” and “sweet” because of its relatively low gravity and sulfur content respectively. It is considered a high quality Oil that is easily refined. It is sourced in the United States and distributed via the Cushing hub, which is considered “The Pipeline Crossroads of the World”. It is a benchmark for the Oil market and WTI price is frequently quoted in the media.
Like all assets, supply and demand are the key drivers of WTI Oil price. As such, global growth can be a driver of increased demand and vice versa for weak global growth. Political instability, wars, and sanctions can disrupt supply and impact prices. The decisions of OPEC, a group of major Oil-producing countries, is another key driver of price. The value of the US Dollar influences the price of WTI Crude Oil, since Oil is predominantly traded in US Dollars, thus a weaker US Dollar can make Oil more affordable and vice versa.
The weekly Oil inventory reports published by the American Petroleum Institute (API) and the Energy Information Agency (EIA) impact the price of WTI Oil. Changes in inventories reflect fluctuating supply and demand. If the data shows a drop in inventories it can indicate increased demand, pushing up Oil price. Higher inventories can reflect increased supply, pushing down prices. API’s report is published every Tuesday and EIA’s the day after. Their results are usually similar, falling within 1% of each other 75% of the time. The EIA data is considered more reliable, since it is a government agency.
OPEC (Organization of the Petroleum Exporting Countries) is a group of 13 Oil-producing nations who collectively decide production quotas for member countries at twice-yearly meetings. Their decisions often impact WTI Oil prices. When OPEC decides to lower quotas, it can tighten supply, pushing up Oil prices. When OPEC increases production, it has the opposite effect. OPEC+ refers to an expanded group that includes ten extra non-OPEC members, the most notable of which is Russia.
Since the beginning of March, the price of Gold has risen by almost $150, or around 7%, to reach a new record high of $2,195 last Friday. Strategists at Commerzbank analyze the yellow metal’s outlook.
Mysterious Gold strength
In the absence of a convincing explanation for the Gold price surge, we are sceptical that the precious metal will be able to sustain its gains in the short term. In particular, if expectations of a US rate cut are dampened – for example by another strong US inflation reading today – this could prompt many investors to take profits, leading to a downward correction.
However, we do not expect Gold to fall back to late February levels on a sustained basis. This is because we had anyway expected Gold to rise in the medium term in the wake of the turnaround in US interest rates, which we believe will take place in June. This has probably been largely priced in by now and the move has turned out to be stronger than we expected.
However, as we – unlike the market – do not expect a pronounced cycle of interest rate cuts in the US, given persistent inflation risks, we believe that the further upside potential for Gold is limited in the medium to long term. We are therefore ‘only’ raising our Gold price forecast for the end of this year and the end of next year from $2,100 to $2,200.
Gold took a breather after prices hit a fresh high last week. On Tuesday, the US Consumer Price Index (CPI) will dictate the fate of the yellow metal, economists at ANZ Bank report.
Tactical positions increased last week
Investors will be closely watching clues from the US inflation print today. Higher-than-expected inflation could trigger profit booking after a sharp price rally.
Tactical positions increased last week, but ETF outflows continue.
See – Gold Price Forecast: Setback potential for XAU/USD on upside inflation surprise – Commerzbank
Volatility on the Japanese Yen (JPY) has remained elevated since the start of the week. Economists at ING analyze JPY outlook.
USD/JPY will be impacted by US CPI data and may find some support
The JPY curve currently shows a 73% implied probability of a hike next week, although, by the end of the week, we may see it being scaled back as much as being pushed to fully pricing in a move depending on Friday’s wage data.
For today, USD/JPY will be impacted by US CPI data and may find some support.
- Gold price dips slightly as investors await US Inflation data for fresh guidance.
- US bond yields face pressure as safe-haven demand eases ahead of the inflation report.
- Market expectations for the Fed reducing interest rates in June remain firm.
Gold price (XAU/USD) falls slightly in Tuesday’s European session. The yellow metal is broadly stuck in a tight range around $2,180 as investors await the United States Consumer Price Index (CPI) data for February, which will be published at 12:30 GMT, for fresh guidance.
The precious metal exhibits some pressure ahead of the inflation data. Strong CPI data could lead to a decline in market expectations for Federal Reserve (Fed) rate cuts in the June policy meeting. This will increase of opportunity cost of holding investments in non-yielding assets, such as Gold. Meanwhile, softer-than-expected data could help Gold prices advance further.
The 10-year US Treasury yields fell to 4.09% due to cheerful market sentiment. However, a hotter-than-expected inflation report could increase yields on interest-bearing bonds.
The US Dollar Index (DXY), which closely tracks the Greenback’s value against six major currencies, remains steady near 102.85. The USD index oscillates inside Monday’s trading range as investors stay on the sidelines ahead of inflation data. A sticky inflation report could improve the US Dollar's appeal as it will allow the Fed to keep interest rates higher for a longer period.
Daily digest market movers: Gold, bond yields drop on weak safe-haven appeal
Gold price falls slightly to $2,180 as safe-haven demand eases on improved market sentiment. The precious metal trades broadly sideways after refreshing all-time highs slightly below the round-level resistance of $2,200. The yellow metal is expected to witness a decisive break after the release of the United States consumer price inflation data, which will provide more guidance on the interest rate outlook.
Monthly headline CPI is expected to increase 0.4% from 0.3% in January. The monthly core CPI, which excludes volatile food and energy prices, is forecasted to have grown at a slower pace of 0.3% against the prior reading of 0.4%. Annual headline inflation is anticipated to have grown at a steady pace of 3.1%, while the core CPI is forecast to soften to 3.7% from 3.9% in the same period.
Hotter-than-expected inflation data would allow Federal Reserve policymakers to avoid rushing for rate cuts. This would indicate that a victory over inflation is not in sight, deepening the uncertainty over the interest rate cuts in the first half of this year as policymakers could lean towards keeping interest rates higher.
Last week, Fed Chair Jerome Powell said in his Congressional testimony that it would be inappropriate to start lowering interest rates before gaining conviction that inflation will sustainably return to the 2% target. However, Powell also said that the central bank is not far from gaining that conviction.
Currently, market expectations for the Fed reducing interest rates in the June meeting remain firm as labor market conditions are not overly tight. The US Nonfarm Payrolls (NFP) report for February showed slower wage growth and a higher Unemployment Rate, though hiring remains robust. The CME FedWatch tool shows that there is a 72% chance that the Fed will cut interest rates in June.
Technical Analysis: Gold price drops as oscillators turn overbought
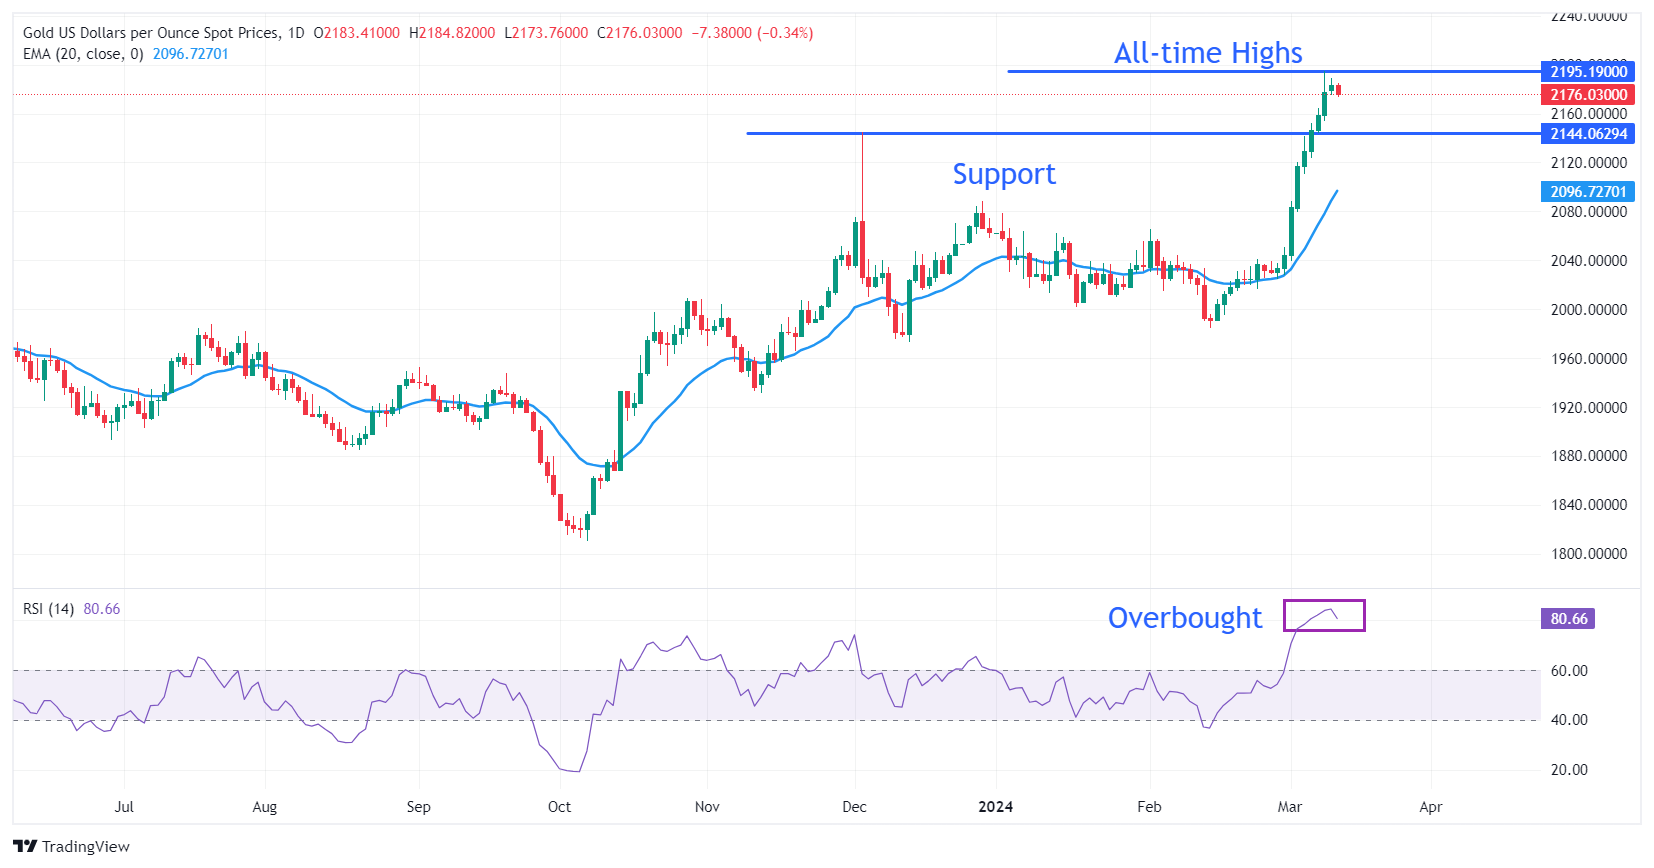
Gold price consolidates in a tight range, between $2,170 and all-time highs of $2,195, as investors await the US inflation data. The nine-day winning streak of the Gold price halts amid uncertainty ahead of the inflation report for February. The divergence between the 20-day Exponential Moving Average (EMA) at $2,097 and the Gold price is waning. The asset tends to face a mean-reversion move after a wide divergence, which results in a price or a time correction.
On the downside, December 4 high near $2,145 and December 28 high at $2,088 will act as major support levels.
The 14-period Relative Strength Index (RSI) reaches the overbought territory at 84.50, pointing to some correction ahead.
Gold FAQs
Gold has played a key role in human’s history as it has been widely used as a store of value and medium of exchange. Currently, apart from its shine and usage for jewelry, the precious metal is widely seen as a safe-haven asset, meaning that it is considered a good investment during turbulent times. Gold is also widely seen as a hedge against inflation and against depreciating currencies as it doesn’t rely on any specific issuer or government.
Central banks are the biggest Gold holders. In their aim to support their currencies in turbulent times, central banks tend to diversify their reserves and buy Gold to improve the perceived strength of the economy and the currency. High Gold reserves can be a source of trust for a country’s solvency. Central banks added 1,136 tonnes of Gold worth around $70 billion to their reserves in 2022, according to data from the World Gold Council. This is the highest yearly purchase since records began. Central banks from emerging economies such as China, India and Turkey are quickly increasing their Gold reserves.
Gold has an inverse correlation with the US Dollar and US Treasuries, which are both major reserve and safe-haven assets. When the Dollar depreciates, Gold tends to rise, enabling investors and central banks to diversify their assets in turbulent times. Gold is also inversely correlated with risk assets. A rally in the stock market tends to weaken Gold price, while sell-offs in riskier markets tend to favor the precious metal.
The price can move due to a wide range of factors. Geopolitical instability or fears of a deep recession can quickly make Gold price escalate due to its safe-haven status. As a yield-less asset, Gold tends to rise with lower interest rates, while higher cost of money usually weighs down on the yellow metal. Still, most moves depend on how the US Dollar (USD) behaves as the asset is priced in dollars (XAU/USD). A strong Dollar tends to keep the price of Gold controlled, whereas a weaker Dollar is likely to push Gold prices up.
The strong rise in the price of Gold since the beginning of March has been facilitated by purchases on the part of speculative financial investors, economists at Commerzbank say.
Sharp rise in speculative net long positions in Gold
According to the CFTC statistics on market positioning published on Friday, the net long positions of speculative financial investors rose to 109.8 thousand contracts in the week up to and including March 5, which almost doubled and corresponded to purchases of the equivalent of 167 tons of gold on the futures market within a week.
As the Gold price has risen by a further 3% since the reporting date, speculative net long positions are also likely to have increased again. However, this also increases the setback potential for the Gold price should these short-term oriented investors take profits. One trigger could be today's US inflation data, should it surprise to the upside and thus put a damper on expectations of interest rate cuts.
The Relative Strength Index (RSI), which has risen to an extremely high level, also calls for caution, indicating a short-term overshooting.
Citing four sources familiar with the Bank of Japan’s (BoJ) thinking, Reuters reported on Tuesday that the BoJ is said to offer some form of numerical guidance to markets on how much Japanese government bonds (JGB) it will continue to purchase after ending negative rates and its yield curve control (YCC) policy.
Additional takeaways
"The BoJ would have to keep buying government bonds to some extent and present some form of guidance to avoid any abrupt spike in yields. The bond buying will likely be used as a backstop against an unwelcome spike in yields."
The Japanese central bank could set loose quantitative guidance as among its options. And that they should roughly maintain the current bond-buying pace even after scrapping YCC.”
It should not be too difficult to identify the key event for the FX market today: The new inflation figures from the US are on the agenda. Economists at Commerzbank analyze the US Dollar outlook ahead of the Consumer Price Index (CPI) report.
US inflation figures likely to support the hawkish voices on the FOMC
I would still be a little cautious about following the recent weakness of the Dollar too much. After all, we have seen the first cracks in the story of the US soft landing. And that certainly justifies some dollar weakness. Ultimately, however, the Fed is likely to be driven by inflation. And today's figures are more likely to support the hawkish voices on the FOMC.
If today's figures are strong again, the market therefore may push back its rate cut expectations a bit. The USD should benefit from this.
The performance of USD/JPY will be driven today by the release of the latest US Consumer Price Index (CPI) report for February, economists at MUFG Bank say.
Another upside inflation surprise would more seriously challenge the Fed’s outlook for inflation to continue to slow
After the upside inflation surprise in January, the February CPI report could prove even more important for Fed rate cut expectations and the US Dollar. Another upside inflation surprise at the start of this year would more seriously challenge the Fed’s outlook for inflation to continue to slow.
Looking back at the performance of USD/JPY just after the release of US CPI reports, there has been a clear trend for USD/JPY to strengthen in recent months. USD/JPY has risen in the first hour after the last three US CPI report releases by an average of +0.57%. The biggest move was after the last US CPI report released in February when USD/JPY rose by +0.73%.
The Bloomberg consensus forecast is expecting core CPI to increase by 0.3% MoM in February after the firmer print of 0.4% MoM in January which would bring it back more into line with the average rate during the 2H of last year.
- USD/MXN halts its losing streak ahead of US Inflation data on Tuesday.
- Mexican Industrial Production data is expected to show growth in January.
- US CPI (MoM) is anticipated a slight increase in February.
USD/MXN snaps its eight-day losing streak as risk-off sentiment dominates ahead of the scheduled release of US inflation data on Tuesday. The USD/MXN pair trades higher around 16.80 during the European session.
The market anticipates a slight increase in February's US inflation (MoM) figure. A robust US Consumer Price Index (CPI) data would likely reduce the chances of an immediate rate cut by the Federal Reserve (Fed).
Mexico's economic calendar includes Industrial Production data for January on Tuesday, with market expectations indicating a monthly increase of 0.4% and a yearly rise of 2.1%. Additionally, market participants are eagerly anticipating the upcoming policy meeting of the Bank of Mexico (Banxico) on March 21.
The 12-Month Inflation rate decreased from a seven-month high in January. However, Core Inflation rose higher than the previous increase. Headline Inflation increased less than expected and lower than the previous rise.
US Nonfarm Payrolls added more jobs in February compared to January's figure and market expectations. However, US Average Hourly Earnings (YoY) increased but remained below both the estimated and previous readings.
Additionally, Federal Reserve (Fed) Chair Jerome Powell suggested potential cuts in borrowing costs sometime this year, highlighting that such actions would depend on the inflation trajectory aligning with the Fed's 2% target. According to the CME FedWatch Tool, there has been a slight decline in the probability of a rate cut in June, currently standing at 68.9%.
EUR/USD clings to small recovery gains ahead of the US Consumer Price Index (CPI) report. Economists at ING analyze the pair’s outlook.
EUR/USD should be moved entirely by the USD reaction to US CPI figures
There are no scheduled ECB speakers today, and EUR/USD should be moved entirely by the USD reaction to US CPI figures.
The common currency has held up well since the start of the week despite the Dollar recovering some ground in G10, but we still see a return below 1.0900 as more likely than a rally to 1.1000+.
- EUR/USD trades slightly higher on Tuesday ahead of US CPI data for February.
- US inflation is set to shape expectations of the timing of Fed interest rate cuts – a US Dollar driver.
EUR/USD edges higher, trading up about a tenth of a percent on Tuesday during the early European session just after the release of German inflation data, which came out unrevised from the preliminary estimates and in line with expectations..
Traders, however, are mainly locked on to the next big data release for the pair, US Consumer Price Index (CPI) inflation data, which is scheduled for 12:30 GMT.
The CPI report could be a key factor in determining when the US Federal Reserve (Fed) will start cutting interest rates. If inflation comes out lower than expected, it could bring forward the moment when the Fed pivots.
This would be negative for the US Dollar as lower interest rates tend to attract less foreign capital inflows.
Traders on tenterhooks ahead of release of US CPI
US CPI is likely to be a major driver for EUR/USD.
Economists expect the US Consumer Price Index ex Food and Energy to moderate to 3.7% YoY in February, from 3.9% in January, and to gain 0.3% MoM from 0.4% previously.
The broader headline CPI figure is forecast to show a 3.1% YoY rise in February, unchanged from the previous month, and a 0.4% rise MoM from 0.3% registered in January.
According to the CME FedWatch Tool, which calculates a market-based expectation of when the Federal Reserve will begin reducing its Fed Funds Rate, the probability of a first cut in March is 3%, of one or more 25 bps cuts by May 17.1%, and one or more cuts by June 71.4%. The probabilities for May have substantially fallen overnight, from over 30% on Monday.
Euro overpriced and likely to fall
The Euro is overpriced given the relatively weaker growth in the Eurozone and the likelihood of earlier rate cuts in Europe compared to the US, says BNY Mellon strategist Geoffrey Yu.
In an interview with Bloomberg news on Monday, the strategist said he expects the Euro to weaken against the US Dollar in 2024.
“I’m still holding onto my view that at some point this year we’re going to get parity with the Dollar,” said Yu.
Weakness is likely to come from a two pronged attack on the Euro, from a combination of a weak economy and the European Central Bank (ECB) cutting interest rates before the Fed.
Recently EUR/USD failed to sustain highs just shy of 1.1000 after Banque de France Governor, François Villeroy de Galhau and Bundesbank President Dr. Joachim Nagel, both said that a rate cut in the spring might be warranted.
De Galhau said that “spring goes from April to June 21.”
Their stance is more radical than that of ECB President Christine Lagarde, who said she saw June as the time for the ECB to review its interest rate policy at her press conference after the policy meeting on March 7.
Technical Analysis: EUR/USD pulling back
EUR/USD has corrected back from its 1.0981 peak established on March 8.
Despite the correction, the pair remains in a short-term uptrend with peaks and troughs making consistently higher highs and higher lows on the 4-hour chart. This overall still favors bullish bets.
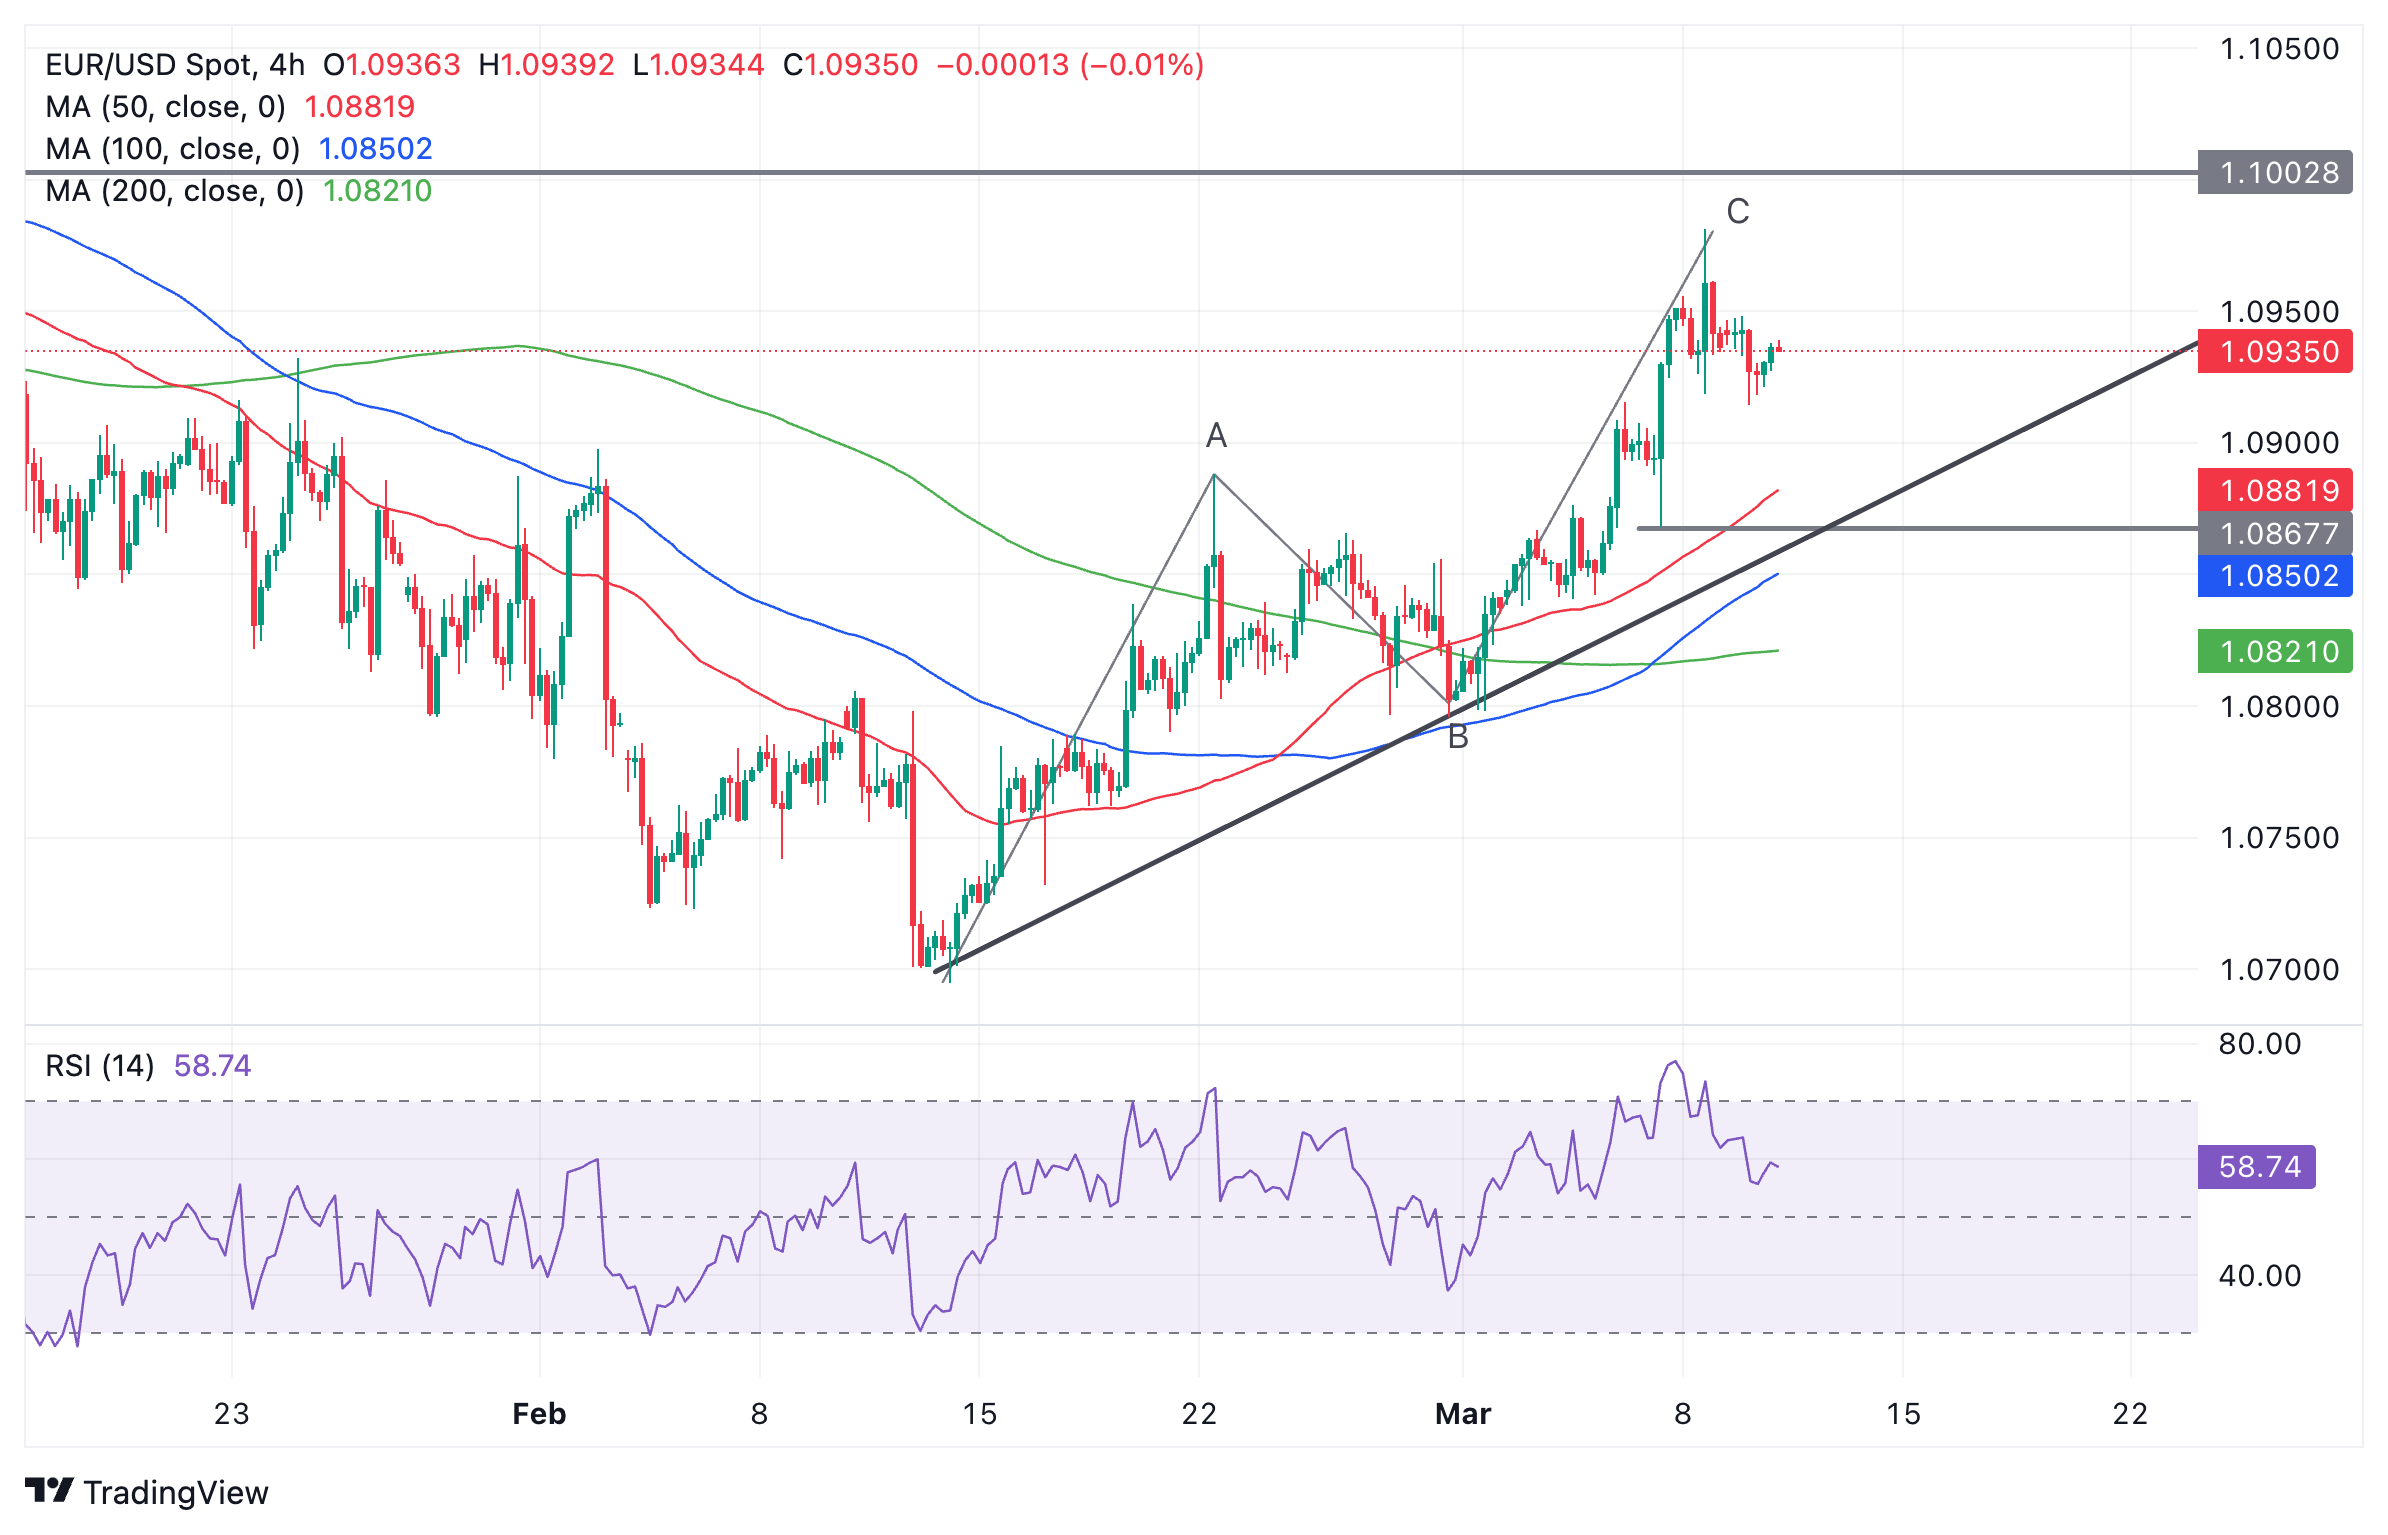
Euro vs US Dollar: 4-hour chart
The pair seems to have completed a three-wave ABC Measured Move pattern, however, suggesting the possibility of a fairly substantial correction unfolding.
The pullback has already traced out in three waves since Friday’s top, and there is a possibility it may have completed.
However, it is also possible it could fall even lower. One possible zone where the correction could find support is between the 1.0898 (February 2 high) and the top of the Measured Move’s A wave at 1.0888.
The correction could still fall back to as low as support in the 1.0860s. However, given the uptrend bias, price will probably eventually find a floor, recover and resume climbing.
The formation of a short-term reversal pattern such as a bullish candlestick reversal pattern would provide a clue the uptrend could be restarting.
Resumption of uptrend
A break above 1.0955 would provide stronger evidence the uptrend was resuming. A move above the 1.0981 high of March 8 would provide a strong signal the bullish trend was further evolving.
The tough resistance expected at 1.1000, however, could see such an up move short-lived unless supported by compelling fundamentals. The 1.1000 psychological level is likely to be the scene of a battle between bulls and bears, with more volatility.
A clear and decisive break above 1.1000, however, would open the gates to further gains towards the next key resistance level at 1.1139, the December 2023 high.
Such a decisive break would be characterized by a long green bar piercing clearly above the level and closing near its high or three green bars in a row, breaching the level.
Euro FAQs
The Euro is the currency for the 20 European Union countries that belong to the Eurozone. It is the second most heavily traded currency in the world behind the US Dollar. In 2022, it accounted for 31% of all foreign exchange transactions, with an average daily turnover of over $2.2 trillion a day. EUR/USD is the most heavily traded currency pair in the world, accounting for an estimated 30% off all transactions, followed by EUR/JPY (4%), EUR/GBP (3%) and EUR/AUD (2%).
The European Central Bank (ECB) in Frankfurt, Germany, is the reserve bank for the Eurozone. The ECB sets interest rates and manages monetary policy. The ECB’s primary mandate is to maintain price stability, which means either controlling inflation or stimulating growth. Its primary tool is the raising or lowering of interest rates. Relatively high interest rates – or the expectation of higher rates – will usually benefit the Euro and vice versa. The ECB Governing Council makes monetary policy decisions at meetings held eight times a year. Decisions are made by heads of the Eurozone national banks and six permanent members, including the President of the ECB, Christine Lagarde.
Eurozone inflation data, measured by the Harmonized Index of Consumer Prices (HICP), is an important econometric for the Euro. If inflation rises more than expected, especially if above the ECB’s 2% target, it obliges the ECB to raise interest rates to bring it back under control. Relatively high interest rates compared to its counterparts will usually benefit the Euro, as it makes the region more attractive as a place for global investors to park their money.
Data releases gauge the health of the economy and can impact on the Euro. Indicators such as GDP, Manufacturing and Services PMIs, employment, and consumer sentiment surveys can all influence the direction of the single currency. A strong economy is good for the Euro. Not only does it attract more foreign investment but it may encourage the ECB to put up interest rates, which will directly strengthen the Euro. Otherwise, if economic data is weak, the Euro is likely to fall. Economic data for the four largest economies in the euro area (Germany, France, Italy and Spain) are especially significant, as they account for 75% of the Eurozone’s economy.
Another significant data release for the Euro is the Trade Balance. This indicator measures the difference between what a country earns from its exports and what it spends on imports over a given period. If a country produces highly sought after exports then its currency will gain in value purely from the extra demand created from foreign buyers seeking to purchase these goods. Therefore, a positive net Trade Balance strengthens a currency and vice versa for a negative balance.
- USD/JPY bounces back to 147.50 as BoJ rate hike bets ease.
- BoJ Ueda doubts Japan’s economic strength amid weak consumption.
- Fed policymakers would confirm that inflation will return to 2% before considering rate cuts.
The USD/JPY pair recovers to 147.50 after a two-day consolidation in the European session on Tuesday. The asset rebounds as the Japanese Yen weakens after Bank of Japan (BoJ) voiced doubts over Japan’s economic outlook.
BoJ Ueda said in Tuesday’s Asian session that the economy is recovering on a few economic grounds as consumption remains weak. Also, Finance Minister Shunichi Suzuki said separately that Japan was not at a stage where it could declare a victory over deflation. The commentary from BoJ Ueda and FM Suzuki has dampened market expectations for the BoJ exiting the negative rates.
The expectations for BoJ quitting the expansionary policy stance were significantly higher before BoJ Ueda’s commentary as the revised estimate for Japan’s Q4 Gross Domestic Product (GDP) shows that the economy was not in a technical recession in the second half of 2023. The revised estimates show that the economy grew by 0.1% against a degrowth of 0.1% indicated from the preliminary estimates.
Also, a few BoJ policymakers expressed optimism for a positive wage cycle, which could keep inflation sustainably above the desired rate of 2%.
Meanwhile, the market sentiment remains upbeat ahead of the United States Consumer Price Index (CPI) data for February, which will be published at 12:30 GMT. The inflation data will provide a fresh outlook on the US interest rates. Federal Reserve (Fed) policymakers want to see inflation data easing for months as evidence before considering a dovish interest rate decision.
The Dollar has found a bit of support into today’s US Consumer Price Index (CPI) data. Economists at ING analyze Greenback’s outlook.
Core CPI at 0.3% can help the Dollar
February inflation numbers are expected to show a flattening in headline inflation at 3.1% year-on-year and, most importantly, a deceleration in the core rate from 0.4% to 0.3% month-on-month and from 3.9% to 3.7% YoY.
Our economists agree that we’ll see a consensus 0.3% MoM core print. Expect large downside volatility for the Dollar if we see a 0.2% MoM core print. Unlike US jobs data, that would endorse the optimism on disinflation showed by Fed Chair Jerome Powell last week and push markets to add 5 bps to fully price in a June cut as well as add bets of a move in May.
If we are right with our 0.3% call, we may not see a big market impact already today, but it could definitely set the tone for a more defensive stance on FX – i.e., a gradual rotation back to the Dollar – ahead of next week’s FOMC meeting.
We were expecting this to be the week for a stabilisation or moderate recovery in the Dollar, and we continue to see an upward-tilted balance of risks for the USD in the coming days, with a possibility for a return to the 103.00/103.50 area in DXY.
- USD/CAD could test the major support of 1.3450 on Tuesday.
- Technical analysis suggests a momentum shift in the trend.
- The key resistance zone could appear around the psychological level of 1.3500 and a nine-day EMA of 1.3506.
USD/CAD extends its losses for the second session, edging lower to near 1.3470 during the European session on Tuesday. The cautious sentiment prevails ahead of the release of the Consumer Price Index (CPI) data from the United States (US).
The USD/CAD pair could find key support at the major level of 1.3450, followed by the 38.2% Fibonacci retracement level of 1.3442. A break below this level could put downward pressure on the pair to navigate the support region around the previous week’s low of 1.3419 and psychological level of 1.3400.
The technical analysis of the 14-day Relative Strength Index (RSI) is positioned below 50, suggesting bearish momentum for the USD/CAD pair. However, Moving Average Convergence Divergence (MACD) indicates a momentum shift for the USD/CAD pair. This interpretation is based on the MACD line's position above the centerline but shows divergence below the signal line. Traders would likely await the MACD, the lagging indicator, to confirm a directional trend.
On the upside, the immediate resistance appears at the psychological level of 1.3500 and the nine-day Exponential Moving Average (EMA) at 1.3506. A break above the latter could exert upward support for the USD/CAD pair to test the major level of 1.3550, aiming to navigate the region around the psychological level of 1.3600, aligned with March’s high of 1.3605.
USD/CAD: Daily Chart
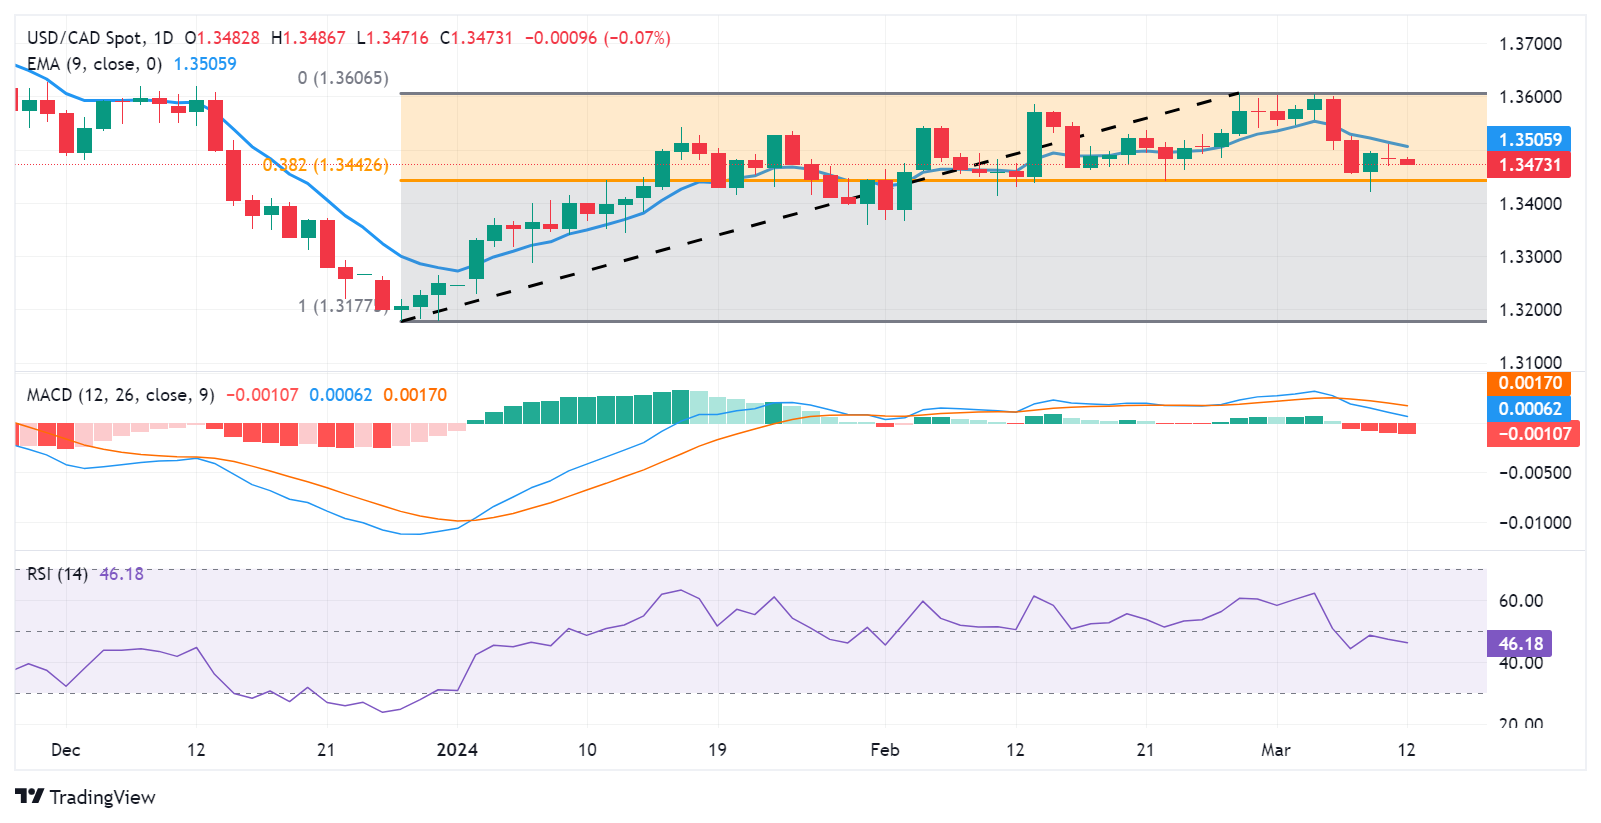
Gold takes a breather after prices hit a fresh high last week. Economists at Société Générale analyze XAU/USD technical outlook.
Objectives at $2,250/$2,360 after vaulting upper limit of multi-year range
Gold has established itself above the upper part of its multiyear range ($2,075) in the form of a rectangle; this denotes the uptrend has resumed. It has also overcome the peak achieved in December. Break from multiyear consolidation points towards possibility of larger upside.
The up move is likely to extend towards next objectives located at projections of $2,250 an $2,360. Target for the rectangle is located at $2,460.
Upper limit of the rectangle at $2,075 is near-term support.
- The Pound Sterling slips as weak Employment data lifts up BoE rate cut hopes.
- UK Employment data for the three months ending January indicates weak labor demand and slower wage growth.
- Investors shift focus to US Inflation data and UK monthly GDP.
The Pound Sterling (GBP) drops to the round-level support of 1.2800 in Tuesday’s European session as the United Kingdom Office for National Statistics (ONS) has reported soft Employment data. Figures from the UK ONS show that higher interest rates from the Bank of England (BoE) and deepening cost-of-living crisis are starting to dampen labor market conditions.
The UK’s Unemployment Rate increased to 3.9%, employers fired 21K workers, and Average Earnings grew at a slower pace in the three months ending January. The labor market data clearly demonstrates uncertainty over the economic outlook, which could force BoE policymakers to start reducing interest rates earlier than previously expected.
Investors should brace for high volatility in today’s session as the United States Bureau of Labor Statistics (BLS) will report the Consumer Price Index (CPI) data for February. The inflation data will provide fresh guidance on the US interest rates outlook.
Daily digest market movers: Pound Sterling drops on cooling UK labor market conditions
- The Pound Sterling falls sharply as the United Kingdom ONS reported softer-than-expected Employment data for the three months ending in January.
- The Unemployment Rate climbed to 3.9%, higher than expectations and the prior reading of 3.8%. UK employers laid off 21K workers against hiring of 72K job-seekers in three months ending in December. In February, the Claimant Count Change grew moderately by 16.8K from expectations of 20.3K. In January, individuals claiming jobless benefits were 3.1K, downwardly revised from 14.1K.
- Average Earnings Excluding Bonuses grew by 6.1%, against expectations and the previous reading of 6.2%. Earnings including bonuses rose at a slower pace of 5.6%, against the consensus of 5.7% and the prior reading of 5.8%.
- The pace at which Average Earnings (both with and without bonuses) for three months ending January declines is higher than expected by market participants. Slower wage growth is expected to allow Bank of England policymakers to consider rate cuts earlier than anticipated.
- Conversely, on Monday, BoE policymaker Catherine Mann warned that there is a long way to go to bring down inflation sustainably to the desired target of 2%. Mann was one of the two policymakers who voted for a rate hike in the February monetary policy meeting.
- This week, the Pound Sterling will remain in action as investors will shift focus to the UK monthly Gross Domestic Product (GDP) and the factory data for January, which will be published on Wednesday.
- The GBP/USD pair is expected to remain on its toes as the United States inflation data, released at 12:30 GMT, will lead the next move in the US Dollar.
- Monthly headline inflation is forecasted to have risen by 0.4% from 0.3% in January. In the same period, core inflation, which strips off volatile food and energy prices, is anticipated to have grown at a slower pace of 0.3% against the prior reading of 0.4%. As for annual figures, economists expect that the headline CPI will remain sticky at 3.1% and the core inflation will decelerate to 3.7% from 3.9% in January.
Technical Analysis: Pound Sterling falls to near 1.2820
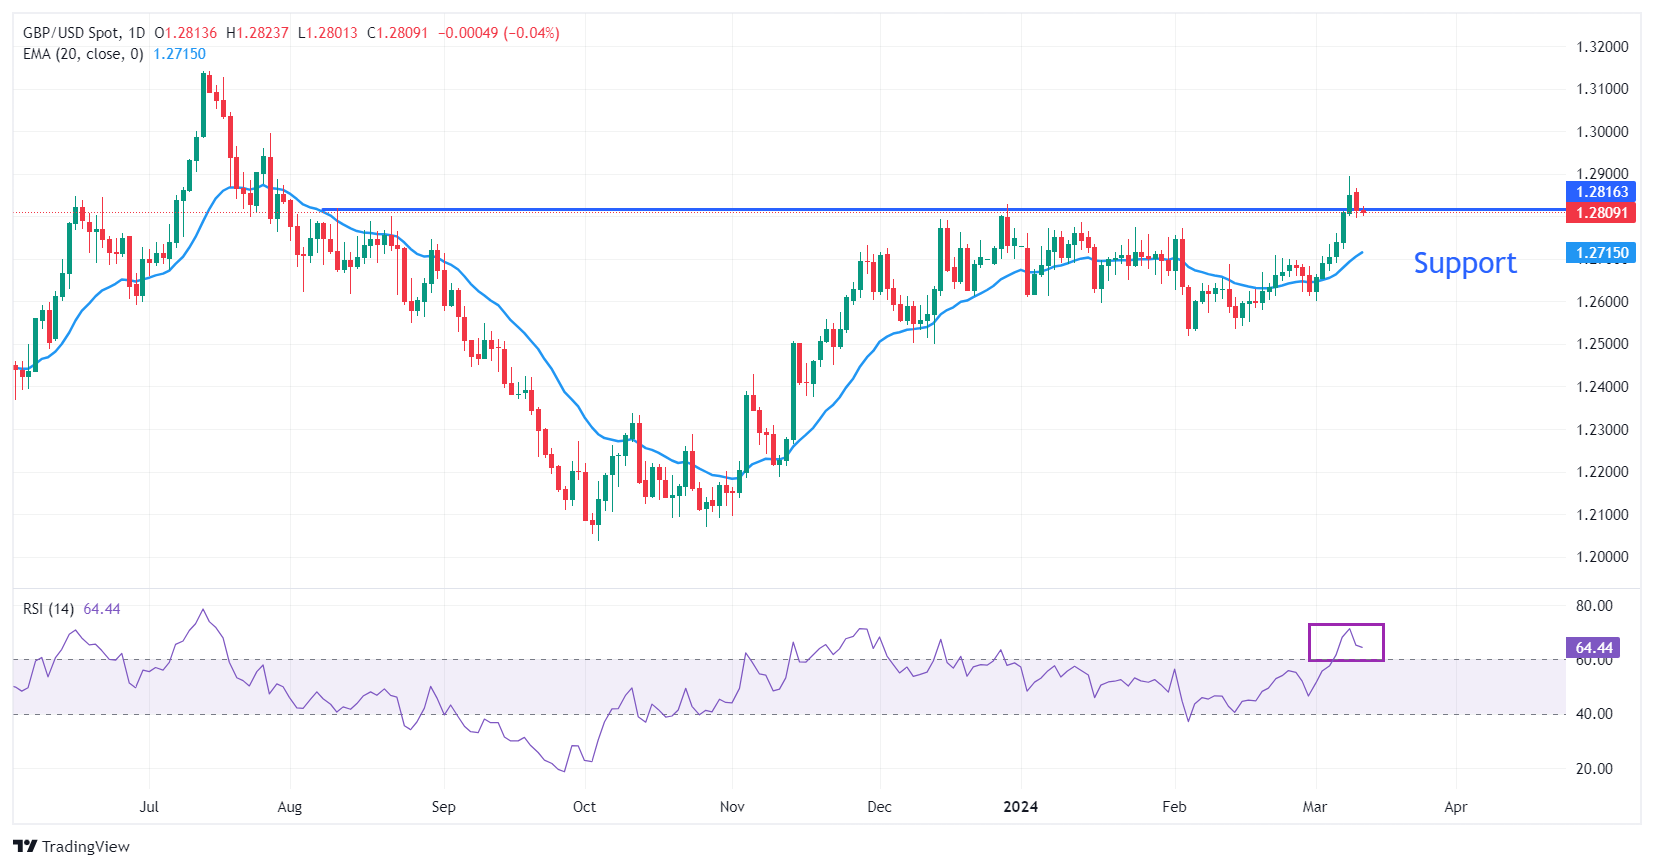
The Pound Sterling edges down to the round-level support of 1.2800 against the US Dollar after downbeat UK labor market data. The near-term appeal of the GBP/USD is still upbeat as the 20-day Exponential Moving Average (EMA) at 1.2720 is sloping towards the north. The pair has corrected from a seven-month high of 1.2894 to near the horizontal support plotted from the August 10 high at 1.2819.
The 14-period Relative Strength Index (RSI) is inches lower from its recent peak of 71.33, but the broader momentum remains bullish.
Pound Sterling FAQs
The Pound Sterling (GBP) is the oldest currency in the world (886 AD) and the official currency of the United Kingdom. It is the fourth most traded unit for foreign exchange (FX) in the world, accounting for 12% of all transactions, averaging $630 billion a day, according to 2022 data. Its key trading pairs are GBP/USD, aka ‘Cable’, which accounts for 11% of FX, GBP/JPY, or the ‘Dragon’ as it is known by traders (3%), and EUR/GBP (2%). The Pound Sterling is issued by the Bank of England (BoE).
The single most important factor influencing the value of the Pound Sterling is monetary policy decided by the Bank of England. The BoE bases its decisions on whether it has achieved its primary goal of “price stability” – a steady inflation rate of around 2%. Its primary tool for achieving this is the adjustment of interest rates. When inflation is too high, the BoE will try to rein it in by raising interest rates, making it more expensive for people and businesses to access credit. This is generally positive for GBP, as higher interest rates make the UK a more attractive place for global investors to park their money. When inflation falls too low it is a sign economic growth is slowing. In this scenario, the BoE will consider lowering interest rates to cheapen credit so businesses will borrow more to invest in growth-generating projects.
Data releases gauge the health of the economy and can impact the value of the Pound Sterling. Indicators such as GDP, Manufacturing and Services PMIs, and employment can all influence the direction of the GBP. A strong economy is good for Sterling. Not only does it attract more foreign investment but it may encourage the BoE to put up interest rates, which will directly strengthen GBP. Otherwise, if economic data is weak, the Pound Sterling is likely to fall.
Another significant data release for the Pound Sterling is the Trade Balance. This indicator measures the difference between what a country earns from its exports and what it spends on imports over a given period. If a country produces highly sought-after exports, its currency will benefit purely from the extra demand created from foreign buyers seeking to purchase these goods. Therefore, a positive net Trade Balance strengthens a currency and vice versa for a negative balance.
Here is what you need to know on Tuesday, March 12:
The action in financial markets remain relatively slow in the European morning on Tuesday. The US Dollar (USD) Index holds steady slightly below 103.00 after posting small gains on Monday and the 10-year US Treasury bond yield fluctuate at around 4.1% as investors gear up for the February Consumer Price Index (CPI) data release.
In the absence of high-tier data releases, the cautious market mood helped the USD stay resilient against its rivals at the beginning of the week. Annual inflation in the US, as measured by the change in the CPI, is forecast to hold steady at 3.1%. The annual Core CPI is expected to rise 3.7% in the same period, down from the 3.9% increase recorded in January. In the meantime, US stock index futures are up between 0.2% and 0.6% in the early European session, pointing to a positive shift in risk mood.
US CPI data Forecast: Core inflation set to cool further, adding to expectations of Fed policy pivot.
US Dollar price this week
The table below shows the percentage change of US Dollar (USD) against listed major currencies this week. US Dollar was the strongest against the Japanese Yen.
| USD | EUR | GBP | CAD | AUD | JPY | NZD | CHF | |
| USD | 0.05% | 0.38% | -0.08% | 0.09% | 0.42% | 0.14% | -0.09% | |
| EUR | -0.04% | 0.34% | -0.13% | 0.05% | 0.38% | 0.11% | -0.12% | |
| GBP | -0.38% | -0.33% | -0.47% | -0.26% | 0.05% | -0.24% | -0.44% | |
| CAD | 0.09% | 0.13% | 0.46% | 0.19% | 0.49% | 0.22% | 0.02% | |
| AUD | -0.07% | -0.02% | 0.30% | -0.17% | 0.34% | 0.07% | -0.16% | |
| JPY | -0.39% | -0.36% | 0.21% | -0.50% | -0.31% | -0.26% | -0.50% | |
| NZD | -0.12% | -0.07% | 0.25% | -0.22% | -0.04% | 0.29% | -0.21% | |
| CHF | 0.08% | 0.13% | 0.46% | -0.01% | 0.17% | 0.48% | 0.22% |
The heat map shows percentage changes of major currencies against each other. The base currency is picked from the left column, while the quote currency is picked from the top row. For example, if you pick the Euro from the left column and move along the horizontal line to the Japanese Yen, the percentage change displayed in the box will represent EUR (base)/JPY (quote).
While speaking before the Parliament on Tuesday, Bank of Japan (BoJ) Governor Kazuo Ueda said that they will seek to exit from negative rate, yield curve control and other large scale monetary easing steps once they have the achievement of 2% inflation "stably and sustainably in sight." After closing six consecutive trading days in negative territory, USD/JPY turned north in the Asian session and was last seen trading in positive territory slightly below 147.50.
Japanese Yen sticks to heavy intraday losses against USD, eyes US CPI for fresh impetus.
The National Australia Bank's Business Confidence Index declined to 0 in February from 1 and the Business Conditions Index improved to 10 from 7. AUD/USD showed no reaction to these data and extended its sideways grind above 0.6600 during the Asian trading hours.
Australian Dollar stabilizes as the ASX 200 rises, with markets awaiting US CPI data.
GBP/USD fell 0.35% on Monday and snapped a six-day winning streak. The pair struggles to gain traction early Tuesday and trades in a narrow channel at around 1.2800. The UK's Office for National Statistics announced that the ILO Unemployment Rate edged higher to 3.9% in the three months ending in January. Employment Change was down 21K following the 72K increase recorded previously. Finally, the wage inflation, as measured by Average Earnings Excluding Bonus, ticked down to 6.1% from 6.2%.
EUR/USD registered small losses for the second consecutive trading day on Monday. The pair clings to small recovery gains early Tuesday but trades below 1.0950.
Gold failed to gather directional momentum and ended the first trading day of the week virtually unchanged. XAU/USD stays in a consolidation phase in the European morning and trades marginally lower on the day below $2,180.
Gold price keeps the red below $2,180 level, downside seems limited ahead of US CPI.
FX option expiries for Mar 12 NY cut at 10:00 Eastern Time, via DTCC, can be found below.
- EUR/USD: EUR amounts
- 1.0850 556m
- 1.0900 1.2b
- 1.1010 1.1b
- USD/JPY: USD amounts
- 147.60 759m
- 148.25 1.9b
- 149.00 630m
- 151.50 2.2b
- AUD/USD: AUD amounts
- 0.6530 1.1b
- EUR/GBP: EUR amounts
- 0.8580 682m
USD/JPY and EUR/JPY have started to decline. Economists at ABN Amro analyze Yen’s outlook.
Only a very gradual hiking path by the BoJ
The main driver behind the Yen recovery has been speculation that the Bank of Japan may start hiking the policy rate in March. We saw this as well at the end of last year and then the market was disappointed as the BoJ did not start its hiking cycle. Even though it may start this month, the communication and/or the pace of rate hikes may disappoint.
Despite this, we expect the Yen recovery to continue. Likely, the narrowing of the spreads between the US and Japan and the Eurozone and Japan (even though most of it is already anticipated) lead to lower levels in USD/JPY and EUR/JPY.
A diverging path in monetary policy (BoJ hiking and Fed/ECB cutting) is supportive for the Yen. But it is important to keep in mind that most action will be from the front of the ECB and the Fed. Indeed, we expect only a very gradual hiking path by the BoJ.
- EUR/GBP attracts some buyers near 0.8540 after the UK labor market and German CPI data.
- The UK ILO Unemployment Rate rose to 3.9% in three months to February vs. 3.8% prior, worse than expected.
- The German Harmonized Index of Consumer Prices (HICP) came in at 0.6% MoM and 2.7% YoY in February, as expected.
- Traders will shift their attention to the UK monthly Gross Domestic Product (GDP), due on Wednesday.
The EUR/GBP cross holds positive ground below the mid-0.8500s during the early European trading hours on Tuesday. The cross edges higher following the UK Labor market and German inflation data. The cross currently trades around 0.8540, gaining 0.16% on the day.
The latest data released from the UK Office for National Statistics on Tuesday showed that the ILO Unemployment Rate came in worse than expected, rising to 3.9% in the three months to February from 3.8% in the previous reading. Meanwhile, the number of people claiming jobless benefits rose by 16.8K in February from a gain of 3.1K in January. The UK Employment Change came in at -21K in January, versus a 72K increase in December.
On the Euro front, the German Consumer Price Index (CPI) report for February was in line with the market estimation. The CPI figure remains steady at 0.4% MoM and 2.5% YoY in February. The Harmonized Index of Consumer Prices (HICP) arrived at 0.6% MoM and 2.7% YoY in February, as expected.
Looking ahead, the UK monthly Gross Domestic Product (GDP), Industrial Production, Manufacturing Production, and Trade Balance for January will be released on Wednesday. Traders will take cues from the data and find trading opportunities around the EUR/GBP cross.
- GBP/JPY gains strong positive traction on Tuesday in reaction to dovish BoJ comments.
- The mixed UK jobs report prompts some GBP selling and caps the upside for the cross.
- The fundamental backdrop warrants caution before placing aggressive bearish bets.
The GBP/JPY cross stages a goodish recovery from sub-188.00 levels on Tuesday and for now, seems to have snapped a five-day losing streak to a nearly one-month low touched the previous day. Spot prices, however, retreat a few pips from the daily peak in reaction to mixed UK monthly jobs report and currently trade around the 188.75 region.
The UK Office for National Statistics (ONS) reported that the number of people claiming unemployment-related benefits rose to 16.8K in February as compared to the previous month's downwardly revised reading of 3.1K and the 20.3K expected. The better-than-anticipated headline number, however, was offset by an uptick in the unemployment rate to 3.9% during the three months to January and a slight moderation in the UK wage growth data. This, in turn, prompts some selling around the British Pound (GBP) and the GBP/JPY cross.
Market participants, however, seem convinced that the Bank of England (BoE) to keep interest rates higher for longer despite a sluggish economy. This, in turn, might hold back the GBP bears from placing aggressive bets. Meanwhile, the Bank of Japan (BoJ) Governor Kazuo Ueda fell short of providing any hints about exiting negative rates or scrapping the Yield Curve Control (YCC) policy. This, along with a generally positive risk tone, is seen weighing heavily on the Japanese Yen (JPY) and should contribute to limiting the downside for the GBP/JPY cross.
- The UK Unemployment Rate climbed to 3.9% in the quarter to January.
- The Claimant Count Change for Britain arrived at 16.8K in January.
- GBP/USD tests lows near 1.2800 after mixed UK jobs data.
The United Kingdom’s (UK) ILO Unemployment Rate rose to 3.9% in three months to January, a tad higher than the 3.8% in December, data published by the Office for National Statistics (ONS) showed Tuesday. The market expectations were for a 3.8% print in the reported period.
Additional details of the report showed that the number of people claiming jobless benefits rose by 16.8K in February when compared to a gain of 3.1K in January. The market forecast was for a 20.3K increase in the reported period.
The British Employment Change data for January arrived at -21K, as against a 72K rise in December.
Average Earnings excluding Bonus in the UK rose 6.1% 3M YoY in January versus December’s 6.2% increase, missing the market expectations of a 6.2% growth.
Another measure of wage inflation, Average Earnings including Bonus increased 5.6% in the reported period, compared with a 5.8% increase in December and the expected 5.7% growth.
GBP/USD reaction to the UK employment report
GBP/USD dropped to test 1.2800 on discouraging UK employment data. The pair is trading 0.05% lower on the day at 1.2805, as of writing.
Pound Sterling price today
The table below shows the percentage change of Pound Sterling (GBP) against listed major currencies today. Pound Sterling was the weakest against the Euro.
| USD | EUR | GBP | CAD | AUD | JPY | NZD | CHF | |
| USD | -0.06% | 0.11% | -0.04% | -0.01% | 0.43% | 0.00% | -0.04% | |
| EUR | 0.06% | 0.15% | 0.02% | 0.04% | 0.48% | 0.04% | 0.01% | |
| GBP | -0.11% | -0.14% | -0.12% | -0.09% | 0.32% | -0.08% | -0.13% | |
| CAD | 0.04% | -0.02% | 0.12% | 0.03% | 0.45% | 0.03% | -0.01% | |
| AUD | 0.01% | -0.06% | 0.11% | -0.03% | 0.44% | 0.00% | -0.04% | |
| JPY | -0.42% | -0.45% | -0.30% | -0.44% | -0.42% | -0.39% | -0.45% | |
| NZD | 0.00% | -0.05% | 0.09% | -0.02% | 0.00% | 0.43% | -0.03% | |
| CHF | 0.05% | 0.00% | 0.15% | 0.00% | 0.03% | 0.46% | 0.04% |
The heat map shows percentage changes of major currencies against each other. The base currency is picked from the left column, while the quote currency is picked from the top row. For example, if you pick the Euro from the left column and move along the horizontal line to the Japanese Yen, the percentage change displayed in the box will represent EUR (base)/JPY (quote).
- EUR/USD trades on a stronger note near 1.0937 ahead of German February CPI inflation data.
- The positive outlook of the pair remains unchanged above the key EMA; RSI indicator holds above the 50-midline.
- The first upside barrier is seen at 1.0965; the key support level will emerge at the 1.0895–1.0955 zone.
The EUR/USD pair gains momentum below the mid-1.0900s during the early European trading hours on Tuesday. Investors await the German Consumer Price Index (CPI) data for February, which is expected to remain steady at 0.4% MoM and 2.5% YoY in February. Furthermore, the Harmonized Index of Consumer Prices (HICP) is forecast to remain unchanged at 0.6% MoM and 2.7% YoY. At press time, EUR/USD is trading at 1.0937, up 0.11% on the day.
According to the four-hour chart, EUR/USD keeps the bullish vibe unchanged as the major pair is above the key 50- and 100-period Exponential Moving Averages (EMA) with an upward slope. Additionally, the Relative Strength Index (RSI), which stands in bullish territory above the 50-midline, supports the buyers for the time being.
On the bright side, the upper boundary of the Bollinger Band at 1.0965 acts as an immediate resistance level for EUR/USD. Any follow-through buying above this level will see a rally to a high of March 8 at 1.0981. The key upside barrier is seen at the 1.1000 mark, representing a psychological level and a high of January 11. The next hurdle is located at a high of December 22 at 1.1040.
On the flip side, the critical support level for a major pair will emerge at the 1.0895–1.0905 region, portraying the confluence of the 50-period EMA and the lower limit of the Bollinger Band. Further south, the next contention level to watch is the 100-period EMA at 1.0865, followed by a round mark and a low of February 22 at 1.0800.
EUR/USD four-hour chart
-638458205405750649.png)
- Silver price consolidates around $24.50 ahead of US Inflation data.
- The US core CPI is expected to decelerate while the headline inflation might remain sticky.
- Silver price needs a fresh trigger for a decisive break above $24.60.
Silver (XAG/USD) traded in a narrow range around $24.50 in Tuesday’s European session. The white metal has struggled to find a direction since Friday’s trading session. The asset is expected to break out of its sideways trend after the release of the United States Consumer Price Index (CPI) data for February, which will be published at 13:30 GMT.
The monthly headline inflation is forecasted to have risen by 0.4% from 0.3% in January. In the same period, the core inflation that strips off volatile food and energy prices is anticipated to have grown at a slower pace of 0.3% against the prior reading of 0.4%. For annual figures, economists expect that the headline CPI remains sticky at 3.1% and the core inflation decelerates to 3.7% from 3.9% in January.
The market expectations for the Federal Reserve (Fed) rate cuts in the June policy meeting will be significantly influenced after the release of the inflation data.
Ahead of the US consumer price inflation data, market sentiment is quite bullish. S&P 500 futures have posted significant gains in the London session, portraying the higher risk appetite of the market participants. 10-year US Treasury yields have dropped to 4.10%. The US Dollar Index (DXY) trades inside Monday’s trading range around 102.80.
Silver technical analysis
Silver price turn sideways after testing the horizontal resistance plotted from December 22 high at $24.60. The overall trend is bullish, however, a time correction move is expected before a fresh upside move. Advancing 20-day Exponential Moving Average (EMA) near $23.50 indicates that the near-term demand is upbeat.
The 14-period Relative Strength Index (RSI) oscillates in the bullish range of 60.00-80.00, indicating that a bullish momentum is already triggered.
Silver daily chart
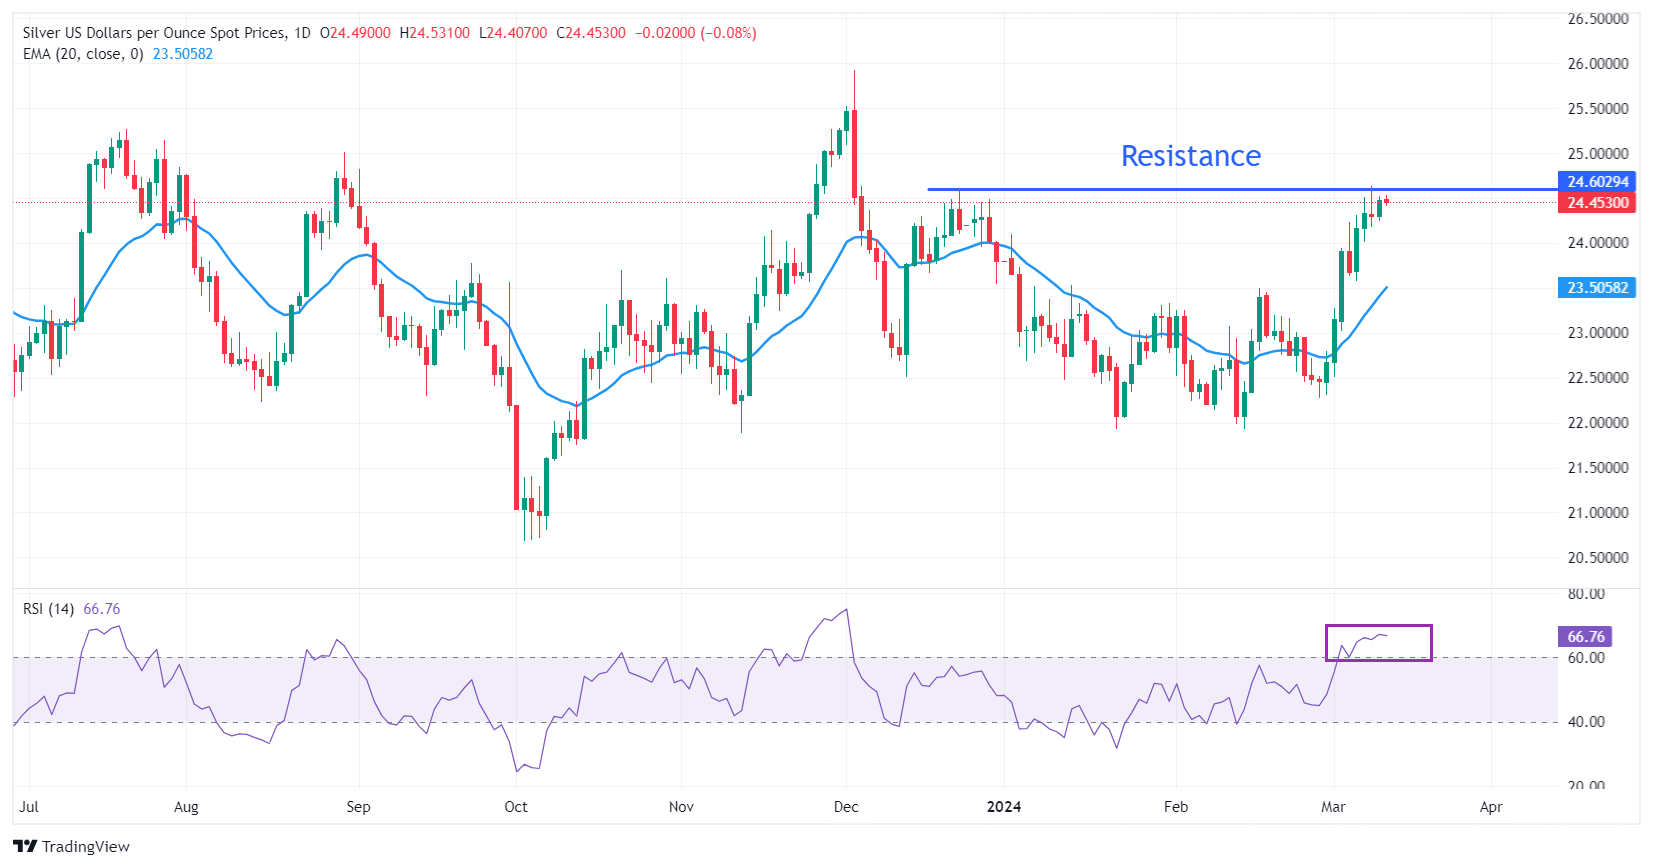
- EUR/JPY snaps its losing streak after dovish remarks from Japanese minister.
- Japan's Finance Minister Suzuki indicated that the present moment is not conducive to tightening monetary policy.
- The Euro strengthens in response to the ECB's commitment to uphold strict policy measures aimed at achieving its inflation target.
EUR/JPY edges higher to 161.40 during the Asian trading hours on Tuesday, halting its five-day losing streak. The Japanese Yen (JPY) encounters downward pressure following remarks made by Japan's Finance Minister Shunichi Suzuki, who suggested that now is not the appropriate time for the Bank of Japan (BoJ) to tighten monetary policy. This dynamic provides support for the EUR/JPY cross.
Furthermore, Bank of Japan (BoJ) Governor Kazuo Ueda stated in his parliamentary speech on Tuesday, "When the achievement of a 2% inflation target is within reach in a stable and sustainable manner, we will consider exiting from negative interest rates. If inflation accelerates and necessitates monetary tightening, we may raise interest rates without reducing the BoJ's bond holdings."
On the other side, Christine Lagarde, the President of the European Central Bank (ECB), has adopted a prudent stance, stressing the importance of gathering further evidence before considering any adjustments to interest rates. The ECB has opted to retain its current monetary policy, reaffirming its commitment to steering inflation back to its desired levels.
The ECB has clearly stated its intention to maintain appropriately stringent policy measures for as long as necessary to achieve its inflation target. The positive sentiment surrounding the ECB could potentially strengthen the Euro, thereby providing support for the EUR/JPY cross. Investors are expected to closely monitor the release of Germany's Consumer Price Index (CPI) data scheduled for Tuesday.
- USD/CHF consolidates near 0.8772 in Tuesday’s early European session.
- Fed officials highlighted that the central bank remained data-dependent before they were confident that inflation is sustainably returning 2% target.
- The rising concerns in the Middle East could lift the Swiss Franc, a safe-haven currency.
- Market players will closely monitor the US February CPI inflation data on Tuesday.
The USD/CHF pair trades sideways above the mid-0.8700s during the early European session on Tuesday. Investors prefer to wait on the sidelines ahead of the key US inflation report later in the day. In the meantime, a cautious mood in the market could provide some support to the Swiss Franc (CHF). USD/CHF currently trades around 0.8772, unchanged for the day.
The Federal Reserve's (Fed) officials emphasized last week that the US central bank remains data-dependent and wants to feel confident that inflation is sustainably returning to the Fed’s 2% target. Money markets have priced in 70% odds of a rate cut in June, while the chance for a May rate cut stays at 22%, according to the CME FedWatch Tool. Investors await the US CPi inflation data for fresh impetus.
The headline CPI figure is forecast to remain steady at 3.1% YoY in February, while the Core CPI figure is estimated to drop to 3.7% YoY in February from 3.9% in January. This data could trigger volatility in the market. The stronger-than-expected report could dampen hopes of a rate cut by the Fed, which might lift the US Dollar (USD) and create a tailwind for USD/CHF.
On the other hand, the rising geopolitical tensions in the Middle East could boost safe-haven assets like the Swiss Franc (CHF) and cap the upside of the pair. There are rising concerns of violence spreading, especially to Jerusalem, during the Islamic holy month of Ramadan, as a ceasefire remains elusive, per the BBC.
Moving on, investors will closely watch the US February CPI inflation data, due later in the day. Later this week, the focus will shift to US Retail Sales for February, which is expected to show an increase of 0.8% YoY. On Friday, the US Industrial Production and Michigan Consumer Sentiment Index will be released.
- WTI price remains silent ahead of monthly market reports from OPEC, IEA, and EIA.
- CME FedWatch Tool suggests a 68.9% probability of a rate cut in June.
- EIA released that US Crude oil production reached a record-breaking average production of 12.9M bpd.
West Texas Intermediate (WTI) oil price hovers around $77.80 per barrel during the Asian hours on Tuesday. Crude oil markets remain subdued, awaiting the release of the Consumer Price Index (CPI) data from the United States (US). Expectations are for a modest uptick in February's US inflation figures, although the annual index is forecasted to hold steady.
A strong CPI report would probably diminish the likelihood of an immediate rate cut by the Federal Reserve (Fed), which could in turn bolster the US Dollar (USD) and pose challenges for crude oil prices. According to the CME FedWatch Tool, there has been a slight decrease in the probability of a rate cut in June, now standing at 68.9%.
Market participants are also eagerly anticipating the release of monthly market reports from the Organization of Petroleum Exporting Countries (OPEC), the International Energy Agency (IEA), and the Energy Information Administration (EIA) this week, aiming to assess the global demand outlook.
ANZ analysts noted in a report that "Crude oil remains within a narrow trading range as traders await demand projections from the monthly reports issued by three major oil agencies." While they anticipate these projections to remain largely unchanged, any unexpected upward revisions would alleviate demand concerns.
According to the Energy Information Administration (EIA), US Crude oil production has continued to lead global oil production for the sixth consecutive year, reaching a record-breaking average production of 12.9 million barrels per day (bpd). US Crude oil production surged to a new monthly record high of over 13.3 million bpd in December.
- NZD/USD regains positive traction on Tuesday and is supported by subdued USD demand.
- Bets for a June Fed rate cut and a positive risk tone keeps the USD bulls on the defensive.
- Traders, however, seem reluctant and look to the key US CPI report for a fresh impetus.
The NZD/USD pair attracts some dip-buying during the Asian session on Tuesday, albeit lacks follow-through and remains confined within the previous day's range. Spot prices currently trade around the 0.6170-0.6175 zone and for now, seem to have stalled the recent pullback from the highest level since February 22 touched last week.
The US Dollar (USD) continues with its struggle to attract any meaningful buyers or build on its recovery from a nearly two-month low touched in reaction to mixed US jobs report on Friday amid bets for a shift in the Federal Reserve's (Fed) policy stance. In fact, the markets are now pricing in a greater chance that the US central bank will start cutting interest rates in June, which is reinforced by a further decline in the US Treasury bond yields. This, in turn, keeps the USD bulls on the defensive and lends some support to the NZD/USD pair.
Apart from this, a positive tone around the US equity futures is seen as another factor undermining the safe-haven Greenback and further benefitting the risk-sensitive Kiwi. Traders, however, seem reluctant to place aggressive directional bets and prefer to wait for the release of the latest US consumer inflation figures. The crucial US CPI report will play a key role in influencing market expectations about the Fed's rate cut path and drive the USD demand. This, in turn, warrants some caution before positioning for any further appreciating move for the NZD/USD pair.
Investors this week will also confront the release of the Food Price Index from New Zealand on Wednesday, which will be followed by the US monthly Retail Sales figures and the Producer Price Index (PPI) on Thursday. This could further provide some meaningful impetus to the NZD/USD pair and possibly determine the next leg of a directional move.
Bank of Japan (BoJ) Governor Kazuo Ueda said in his parliamentary speech on Tuesday, “when achievement of 2% inflation stably and sustainably in sight, we will seek an exit from negative rates, YCC and other large scale monetary easing steps.”
Additional quotes
In what order we phase out various monetary easing tools will depend on economic, price, financial conditions at the time.
It is possible to control short-term rates at appropriate level by paying interest on reserves parked with BoJ.
If inflation accelerates and warrants monetary tightening, it is possible to do so by raising rates without scaling back BoJ’s bond holdings.
There are various ways to push short-term rates to positive territory.
One way would be to apply positive interest to reserves parked with BoJ, which would push up overnight call rate slightly below that level.
Market reaction
USD/JPY is holding the latest uptick near 147.40, as the fresh comments from BoJ Governor Ueda offer little comfort to the Japanese Yen. The pair is up 0.33% on the day.
Japanese Yen price today
The table below shows the percentage change of Japanese Yen (JPY) against listed major currencies today. Japanese Yen was the weakest against the Euro.
| USD | EUR | GBP | CAD | AUD | JPY | NZD | CHF | |
| USD | -0.05% | 0.02% | -0.02% | 0.02% | 0.46% | -0.01% | 0.00% | |
| EUR | 0.05% | 0.05% | 0.03% | 0.06% | 0.50% | 0.02% | 0.05% | |
| GBP | -0.01% | -0.06% | -0.03% | 0.02% | 0.44% | -0.01% | -0.01% | |
| CAD | 0.02% | -0.03% | 0.03% | 0.04% | 0.47% | 0.00% | 0.02% | |
| AUD | -0.02% | -0.07% | -0.01% | -0.04% | 0.42% | -0.04% | -0.02% | |
| JPY | -0.47% | -0.50% | -0.45% | -0.48% | -0.43% | -0.46% | -0.45% | |
| NZD | 0.01% | -0.03% | 0.01% | 0.00% | 0.04% | 0.47% | 0.02% | |
| CHF | -0.01% | -0.03% | 0.01% | -0.03% | 0.02% | 0.45% | -0.01% |
The heat map shows percentage changes of major currencies against each other. The base currency is picked from the left column, while the quote currency is picked from the top row. For example, if you pick the Euro from the left column and move along the horizontal line to the Japanese Yen, the percentage change displayed in the box will represent EUR (base)/JPY (quote).
- Gold price meets with some supply and snaps a nine-day winning streak to a record peak.
- The downtick could be attributed to some profit-taking ahead of the crucial US CPI report.
- Bets for a June Fed rate cut to keep the USD bulls on the defensive and should lend support.
Gold price (XAU/USD) edges lower during the Asian session on Tuesday, albeit lacks follow-through and remains well within the striking distance of the record peak touched last week. Traders opt to wait on the sidelines and look to the latest US consumer inflation figures for more clues about the Federal Reserve's (Fed) rate-cut path before placing fresh directional bets around the non-yielding yellow metal. In the meantime, growing acceptance that the US central bank will cut its key interest rate at the June policy meeting leads to a further decline in the US Treasury bond yields. This keeps the US Dollar (USD) bulls on the defensive and should act as a tailwind for the commodity.
Meanwhile, a spike in the US unemployment rate bolstered the case for an imminent shift in the US central bank's policy stance. That said, Fed Chair Jerome Powell, during his semi-annual congressional testimony last week, said that still-sticky inflation could prevent an early rate cut. Hence, a hotter US CPI print could allow the US central bank to signal fewer rate cuts this year and prompt some near-term selling around the Gold price. In contrast, a softer reading could fuel speculations about an early rate cut and provide a goodish lift to the XAU/USD. Nevertheless, the crucial data is likely to infuse volatility and produce short-term opportunities around the precious metal.
Daily Digest Market Movers: Gold price bulls turn cautious ahead of US consumer inflation figures
- Some repositioning trade ahead of the crucial US consumer inflation figures exerts some pressure on the Gold price during the Asian session, though any meaningful corrective slide still seems elusive.
- The crucial US CPI report will play a key role in influencing expectations about the timing and the pace of rate cuts by the Federal Reserve, which should provide a fresh impetus to the XAU/USD.
- The headline CPI is anticipated to edge higher to 0.4% in February and the yearly rate is expected to hold steady at 3.1%, while the Core CPI is seen easing to the 3.7% YoY rate from 3.9% previous.
- The mixed US monthly jobs report released on Friday boosted rate-cut bets and dragged the yield on the benchmark 10-year US government bond to a five-week low, closer to the 4.0% mark.
- According to the CME group's FedWatch tool, traders are currently pricing in an around 70% chance of a rate cut by June, which keeps the USD bulls on the defensive and lends support to the metal.
- A sticky inflation print, however, is going to be a little troublesome to the commodity, while a cooler CPI reading will boost bets for an early rate cut and trigger a fresh leg up for the Gold price.
Technical Analysis: Gold price is likely to find decent support near $2,144, the previous record high
From a technical perspective, the Relative Strength Index (RSI) on the daily chart is flashing extremely overbought conditions and prompting some profit-taking. The near-term bias, however, still favours bullish traders in the wake of last week's break through the previous record high, around the $2,144 area. The latter should now act as a key pivotal point, which if broken decisively could drag the Gold price towards the $2,125 intermediate support en route to the $2,100 round figure.
On the flip side, bulls might now wait for a move beyond the $2,200 mark, above which the XAU/USD will enter uncharted territory and build on its recent strong gains registered over the past month or so. Meanwhile, the technical setup makes it prudent to wait for some near-term consolidation or a modest pullback before positioning for an extension of the Gold price's recent blowout rally witnessed over the past two weeks or so.
Gold FAQs
Gold has played a key role in human’s history as it has been widely used as a store of value and medium of exchange. Currently, apart from its shine and usage for jewelry, the precious metal is widely seen as a safe-haven asset, meaning that it is considered a good investment during turbulent times. Gold is also widely seen as a hedge against inflation and against depreciating currencies as it doesn’t rely on any specific issuer or government.
Central banks are the biggest Gold holders. In their aim to support their currencies in turbulent times, central banks tend to diversify their reserves and buy Gold to improve the perceived strength of the economy and the currency. High Gold reserves can be a source of trust for a country’s solvency. Central banks added 1,136 tonnes of Gold worth around $70 billion to their reserves in 2022, according to data from the World Gold Council. This is the highest yearly purchase since records began. Central banks from emerging economies such as China, India and Turkey are quickly increasing their Gold reserves.
Gold has an inverse correlation with the US Dollar and US Treasuries, which are both major reserve and safe-haven assets. When the Dollar depreciates, Gold tends to rise, enabling investors and central banks to diversify their assets in turbulent times. Gold is also inversely correlated with risk assets. A rally in the stock market tends to weaken Gold price, while sell-offs in riskier markets tend to favor the precious metal.
The price can move due to a wide range of factors. Geopolitical instability or fears of a deep recession can quickly make Gold price escalate due to its safe-haven status. As a yield-less asset, Gold tends to rise with lower interest rates, while higher cost of money usually weighs down on the yellow metal. Still, most moves depend on how the US Dollar (USD) behaves as the asset is priced in dollars (XAU/USD). A strong Dollar tends to keep the price of Gold controlled, whereas a weaker Dollar is likely to push Gold prices up.
- The US Consumer Price Index is set to rise 3.1% YoY in February, matching January’s increase.
- Annual Core CPI inflation is expected to edge lower to 3.7% in February.
- The inflation report could provide fresh clues as to the timing of the Fed policy pivot.
The high-impact US Consumer Price Index (CPI) inflation data for February will be published by the Bureau of Labor Statistics (BLS) on Tuesday at 12:30 GMT. Inflation data could alter the market’s pricing of the Federal Reserve (Fed) policy pivot, ramping up volatility around the US Dollar (USD).
What to expect in the next CPI data report?
Inflation in the United States (US) is forecast to rise at an annual pace of 3.1% in February, matching the increase recorded in January. The Core CPI inflation rate, which excludes volatile food and energy prices, is forecast to tick down to 3.7% from 3.9% in the same period.
The monthly CPI and the Core CPI are seen increasing 0.4% and 0.3%, respectively.
In his semi-annual testimony before the US Congress, Federal Reserve Chairman Jerome Powell said that the economic outlook was uncertain and that the ongoing progress toward the 2% inflation goal was not assured. Regarding the policy outlook, Powell reiterated that it will likely be appropriate to begin lowering the policy rate at some point this year but added that they would like to have greater confidence inflation will move sustainably toward 2% before taking action.
Previewing the February inflation report, “we expect next week's CPI report to show that core inflation slowed to a 0.3% m/m pace in February after posting an acceleration to 0.4% in the last report,” said TD Securities analysts in a weekly report. “Despite slowing, our m/m projection would keep the core's 3-month AR pace unchanged at a still elevated 4.0%. Note that our unrounded core CPI forecast at 0.31% m/m suggests balanced risks between a 0.2% and a 0.4% gain.”
How could the US Consumer Price Index report affect EUR/USD?
The Consumer Price Index (CPI) data for January showed that the disinflationary trend slowed down. The annual CPI and the Core CPI rose at a slightly stronger pace than in December. The positive impact of these readings on the US Dollar (USD), however, remained short-lived because markets were already anticipating a delay in the Fed policy pivot following the impressive labor market data for January. After rising 0.7% and touching its highest level since mid-November near 104.00 on the day of the January CPI release (February 13), the USD Index (DXY) went into a downtrend.
Markets are currently pricing in a nearly 75% probability that the Fed will lower the policy rate in June, according to the CME FedWatch Tool. Although February CPI figures are unlikely to alter the market positioning in a significant way, a stronger-than-forecast increase in the monthly Core CPI could help the USD stage a rebound against its rivals with the immediate reaction. Investors could see such data as an opportunity to unwind USD shorts following the previous week’s sell-off.
On the other hand, a monthly Core CPI print at or below the market consensus of 0.3% could reaffirm June as the month of the policy pivot. The market positioning, however, suggests that the USD doesn’t have a lot of room left on the downside. In this scenario, the USD could weaken in the initial reaction, but an extended sell-off could be hard to come by unless it’s accompanied by a risk rally in US stocks or a sharp decline below 4% in the benchmark 10-year US Treasury bond yield.
Eren Sengezer, European Session Lead Analyst at FXStreet, offers a brief technical outlook for EUR/USD and explains: “The Relative Strength Index (RSI) indicator on the daily chart edged lower after coming within a touching distance of 70, suggesting that investors are taking a break before betting on another leg higher in EUR/USD. On the upside, 1.0960 (Fibonacci 23.6% retracement level of the October-December uptrend) aligns as interim resistance ahead of 1.1000 (psychological level, static level). If the pair manages to stabilize above the latter, 1.1100 (end-point of the uptrend) could be set as the next bullish target.”
“Looking south, strong support seems to have formed at 1.0830-1.0840, where the 100-day and the 200-day Simple Moving Averages (SMA) are located. A daily close below this support area could open the door for an extended correction toward 1.0800.”
Economic Indicator
United States Consumer Price Index (YoY)
Inflationary or deflationary tendencies are measured by periodically summing the prices of a basket of representative goods and services and presenting the data as The Consumer Price Index (CPI). CPI data is compiled on a monthly basis and released by the US Department of Labor Statistics. The YoY reading compares the prices of goods in the reference month to the same month a year earlier.The CPI is a key indicator to measure inflation and changes in purchasing trends. Generally speaking, a high reading is seen as bullish for the US Dollar (USD), while a low reading is seen as bearish.
Read more.Next release: 03/12/2024 12:30:00 GMT
Frequency: Monthly
Source: US Bureau of Labor Statistics
Why it matters to traders
The US Federal Reserve has a dual mandate of maintaining price stability and maximum employment. According to such mandate, inflation should be at around 2% YoY and has become the weakest pillar of the central bank’s directive ever since the world suffered a pandemic, which extends to these days. Price pressures keep rising amid supply-chain issues and bottlenecks, with the Consumer Price Index (CPI) hanging at multi-decade highs. The Fed has already taken measures to tame inflation and is expected to maintain an aggressive stance in the foreseeable future.
Fed FAQs
Monetary policy in the US is shaped by the Federal Reserve (Fed). The Fed has two mandates: to achieve price stability and foster full employment. Its primary tool to achieve these goals is by adjusting interest rates. When prices are rising too quickly and inflation is above the Fed’s 2% target, it raises interest rates, increasing borrowing costs throughout the economy. This results in a stronger US Dollar (USD) as it makes the US a more attractive place for international investors to park their money. When inflation falls below 2% or the Unemployment Rate is too high, the Fed may lower interest rates to encourage borrowing, which weighs on the Greenback.
The Federal Reserve (Fed) holds eight policy meetings a year, where the Federal Open Market Committee (FOMC) assesses economic conditions and makes monetary policy decisions. The FOMC is attended by twelve Fed officials – the seven members of the Board of Governors, the president of the Federal Reserve Bank of New York, and four of the remaining eleven regional Reserve Bank presidents, who serve one-year terms on a rotating basis.
In extreme situations, the Federal Reserve may resort to a policy named Quantitative Easing (QE). QE is the process by which the Fed substantially increases the flow of credit in a stuck financial system. It is a non-standard policy measure used during crises or when inflation is extremely low. It was the Fed’s weapon of choice during the Great Financial Crisis in 2008. It involves the Fed printing more Dollars and using them to buy high grade bonds from financial institutions. QE usually weakens the US Dollar.
Quantitative tightening (QT) is the reverse process of QE, whereby the Federal Reserve stops buying bonds from financial institutions and does not reinvest the principal from the bonds it holds maturing, to purchase new bonds. It is usually positive for the value of the US Dollar.
- EUR/USD rebounds on Tuesday after registering losses in the previous sessions.
- CME FedWatch Tool suggests a 55.2% probability of a 25 bps rate cut for June.
- The market expects German inflation to be unchanged in February.
EUR/USD has bounced back following two consecutive days of losses, making gains and approaching the 1.0930 mark during Tuesday's Asian session. However, the pair encountered resistance amid a risk-averse atmosphere ahead of the release of the Consumer Price Index (CPI) data from the United States (US).
Market expectations point to an increase in the US CPI for February month-over-month, although the yearly index is predicted to remain unchanged. A robust CPI report would likely dampen prospects of an imminent rate cut by the Federal Reserve (Fed), potentially strengthening the US Dollar (USD) and presenting challenges for the EUR/USD pair.
As per the CME FedWatch Tool, there has been a slight decline in the likelihood of a 25 basis points (bps) rate reduction in March and May, with probabilities at 3.0% and 21.9%, respectively. The probability of a 25 bps rate cut has decreased to 55.2% for June.
Meanwhile, European Central Bank (ECB) President Christine Lagarde has taken a cautious approach, emphasizing the necessity for more evidence before contemplating rate adjustments. The ECB has chosen to maintain its existing monetary policy, reaffirming its dedication to guiding inflation back within its desired parameters.
The ECB has articulated its intention to uphold appropriately stringent policy measures for as long as necessary to reach its inflation objective. The optimistic outlook surrounding the ECB could offer bolstering for the Euro, thereby supporting the EUR/USD pair. Tuesday's release of Consumer Price Index (CPI) data from Germany is likely to capture the attention of investors.
- The Indian Rupee edges lower on Tuesday despite the weaker USD.
- RBI is anticipated to maintain its policy in April as the Indian economy remains strong and inflation remains above its 4% target.
- The Indian and US February CPI inflation data will be in the spotlight on Tuesday.
The Indian Rupee (INR) trades on a weaker note on Tuesday, despite the decline of the US dollar (USD). The softer Greenback and a decline in crude oil prices might boost the Indian Rupee in the near term. INR reached an over six-month intraday high of 82.65 on Monday, but the rally was limited by a possible invention from the Reserve Bank of India (RBI) to prevent a significant appreciation in the INR.
India's headline retail inflation is expected to drop to 5.02% in February from 5.10% in January, extending it within the RBI's tolerance range of 2-6% for the sixth consecutive month. However, economists expect the Indian central bank to maintain current monetary policy at its April meeting since the domestic economy remains strong and inflation continues to stay above its 4% target.
Looking ahead, investors will monitor India’s and US Consumer Price Index (CPI) inflation data for February, due on Tuesday. Later this week, India’s Wholesale Price Index (WPI) of Food, Fuel, and Inflation will be released on Wednesday, and the US Retail Sales will be published on Thursday.
Daily Digest Market Movers: Indian Rupee remains vulnerable to high inflation, geopolitical risk
- India's foreign reserves increased by $6.55 billion to $625.626 billion in the week ended March 1, according to the RBI.
- Indian Commerce and Industry Minister Piyush Goyal said many developed and developing countries have shown interest in trading in the Indian currency with India to cut transaction costs as the INR gains traction
- The Indian economy will transition to an upper middle-income country by FY36, reaching the $15 trillion mark by FY47, according to India Ratings and Research (Ind-Ra).
- Fed Chair Jerome Powell said the US economy is healthy, and policymakers are not far from having enough confidence in inflation's downward trajectory to begin cutting rates.
- Futures markets have priced in about a 70% chance the Fed will start cutting interest rates by mid-June and expect a full percentage point of rate cuts by the end of the year, according to the CME FedWatch Tools.
- The headline CPI figure is expected to remain steady at 3.1% YoY in February, while the Core CPI figure is estimated to ease to 3.7% YoY in February.
Most recent article: Sensex: Higher Gift Nifty futures point to a positive open, as focus stays on India/ US CPI data
Technical Analysis: Indian Rupee remains confined within a longer-term band of 82.60–83.15
Indian Rupee trades softer on the day. USD/INR remains stuck within a multi-month-old descending trend channel since December 8, 2023 around 82.60–83.15.
In the near term, USD/INR maintains the negative outlook unchanged as the pair is below the 100-day Exponential Moving Average (EMA) on the daily chart. Additionally, the 14-day Relative Strength Index (RSI), which lies below the 50.0 midlines, is contributing to bolstering the downward momentum.
The critical support level is located at the lower limit of the descending trend channel at 82.60. A break below this level could drag the pair lower to a low of August 23 at 82.45 and then revisit a low of June 1 at 82.25.
On the other hand, the first upside barrier will emerge at the 83.00 mark, portraying the confluence of the 100-day EMA and a psychological round mark. The additional upside filter to watch is the upper boundary of the descending trend channel at 83.15. A bullish breakout above the mentioned level might attract bulls and the pair might recover to a high of January 2 at 83.35, followed by an 84.00 round figure.
US Dollar price today
The table below shows the percentage change of US Dollar (USD) against listed major currencies today. US Dollar was the strongest against the Japanese Yen.
| USD | EUR | GBP | CAD | AUD | JPY | NZD | CHF | |
| USD | -0.03% | 0.00% | -0.01% | 0.01% | 0.40% | -0.01% | 0.01% | |
| EUR | 0.04% | 0.04% | 0.03% | 0.05% | 0.43% | 0.02% | 0.04% | |
| GBP | 0.00% | -0.02% | 0.00% | 0.02% | 0.40% | 0.00% | 0.02% | |
| CAD | 0.00% | -0.03% | 0.01% | 0.03% | 0.40% | -0.01% | 0.02% | |
| AUD | -0.01% | -0.04% | -0.01% | -0.01% | 0.39% | -0.02% | 0.01% | |
| JPY | -0.40% | -0.40% | -0.39% | -0.39% | -0.39% | -0.38% | -0.37% | |
| NZD | 0.01% | 0.00% | 0.00% | 0.01% | 0.03% | 0.41% | 0.03% | |
| CHF | -0.01% | -0.02% | -0.02% | -0.02% | -0.01% | 0.37% | -0.03% |
The heat map shows percentage changes of major currencies against each other. The base currency is picked from the left column, while the quote currency is picked from the top row. For example, if you pick the Euro from the left column and move along the horizontal line to the Japanese Yen, the percentage change displayed in the box will represent EUR (base)/JPY (quote).
Indian Rupee FAQs
What are the key factors driving the Indian Rupee?
The Indian Rupee (INR) is one of the most sensitive currencies to external factors. The price of Crude Oil (the country is highly dependent on imported Oil), the value of the US Dollar – most trade is conducted in USD – and the level of foreign investment, are all influential. Direct intervention by the Reserve Bank of India (RBI) in FX markets to keep the exchange rate stable, as well as the level of interest rates set by the RBI, are further major influencing factors on the Rupee.
How do the decisions of the Reserve Bank of India impact the Indian Rupee?
The Reserve Bank of India (RBI) actively intervenes in forex markets to maintain a stable exchange rate, to help facilitate trade. In addition, the RBI tries to maintain the inflation rate at its 4% target by adjusting interest rates. Higher interest rates usually strengthen the Rupee. This is due to the role of the ‘carry trade’ in which investors borrow in countries with lower interest rates so as to place their money in countries’ offering relatively higher interest rates and profit from the difference.
What macroeconomic factors influence the value of the Indian Rupee?
Macroeconomic factors that influence the value of the Rupee include inflation, interest rates, the economic growth rate (GDP), the balance of trade, and inflows from foreign investment. A higher growth rate can lead to more overseas investment, pushing up demand for the Rupee. A less negative balance of trade will eventually lead to a stronger Rupee. Higher interest rates, especially real rates (interest rates less inflation) are also positive for the Rupee. A risk-on environment can lead to greater inflows of Foreign Direct and Indirect Investment (FDI and FII), which also benefit the Rupee.
How does inflation impact the Indian Rupee?
Higher inflation, particularly, if it is comparatively higher than India’s peers, is generally negative for the currency as it reflects devaluation through oversupply. Inflation also increases the cost of exports, leading to more Rupees being sold to purchase foreign imports, which is Rupee-negative. At the same time, higher inflation usually leads to the Reserve Bank of India (RBI) raising interest rates and this can be positive for the Rupee, due to increased demand from international investors. The opposite effect is true of lower inflation.
| Raw materials | Closed | Change, % |
|---|---|---|
| Silver | 24.463 | 0.33 |
| Gold | 2182.616 | 0.13 |
| Palladium | 1031.38 | 1.29 |
Bank of Japan (BoJ) Governor Kazuo Ueda is making a scheduled appearance, addressing the Japanese Parliament – the Diet on Tuesday.
Key quotes
Japan's economy recovering moderately, although some weak data are seen.
Consumption is improving moderately on easing cost-push pressure, hopes for higher wages.
Some firms appear to be delaying investment though capital expenditure plans remain firm.
We have seen various data since January, more data will come out this week so will look at these comprehensively in reaching appropriate monetary policy decision.
We are focusing on whether positive wage-inflation cycle kicking off, in judging whether sustained, stable achievement of our price target coming into sight.
Market reaction
USD/JPY picked up fresh bids on the above comments, spiking to near 147.40 before retracing quickly to 147.25, where it now wavers. The pair is up 0.23% on the day.
Bank of Japan FAQs
The Bank of Japan (BoJ) is the Japanese central bank, which sets monetary policy in the country. Its mandate is to issue banknotes and carry out currency and monetary control to ensure price stability, which means an inflation target of around 2%.
The Bank of Japan has embarked in an ultra-loose monetary policy since 2013 in order to stimulate the economy and fuel inflation amid a low-inflationary environment. The bank’s policy is based on Quantitative and Qualitative Easing (QQE), or printing notes to buy assets such as government or corporate bonds to provide liquidity. In 2016, the bank doubled down on its strategy and further loosened policy by first introducing negative interest rates and then directly controlling the yield of its 10-year government bonds.
The Bank’s massive stimulus has caused the Yen to depreciate against its main currency peers. This process has exacerbated more recently due to an increasing policy divergence between the Bank of Japan and other main central banks, which have opted to increase interest rates sharply to fight decades-high levels of inflation. The BoJ’s policy of holding down rates has led to a widening differential with other currencies, dragging down the value of the Yen.
A weaker Yen and the spike in global energy prices have led to an increase in Japanese inflation, which has exceeded the BoJ’s 2% target. Still, the Bank judges that the sustainable and stable achievement of the 2% target has not yet come in sight, so any sudden change in the current policy looks unlikely.
- India’s Sensex is set to rebound at Tuesday’s open, following a negative close on Monday.
- Sensex corrected further on Tuesday amid profit-taking before Tuesday’s key event risks.
- All eyes remain on the US and Indian CPI inflation data slated for release later on Tuesday.
The Sensex 30, one of India’s key benchmark indices, is set to open with gains on Tuesday, having extended its pullback from record highs on Monday to settle sharply lower.
Gift Nifty futures are rebounding 0.12% so far, suggesting a positive start to Tuesday’s trading for Sensex.
The Indian stock index suffered amid declines in global stock markets and heavy losses in the banking sector stocks. Traders were in a risk-averse position, refraining from placing any fresh bets on risky assets ahead of Tuesday’s Consumer Price Index (CPI) inflation data from India and the US.
The Bombay Stock Exchange (BSE) Sensex 30 ended 0.83% lower on the day near 73,500.
Stock market news
- The top gainers on Sensex were Nestle, HCL Tech, Bajaj Finance, Bajaj FinServ and ITC. Meanwhile, the top losers included SBI Bank, IndusInd Bank, Tata Steel, Power Grid and HDFC Bank.
- Several Tata stocks fell up to 10% as Tata Sons IPO looks unlikely. The company seems to be exploring other options to adhere to the Reserve Bank of India (RBI) norms.
- Securities and Exchange Board of India (SEBI) barred JM Financial from acting as lead manager of any public debt issue.
- IndiGo co-founder Rakesh Gangwal likely to sell a higher stake of 5.8%, looks to raise Rs 6,600 crore.
- The US stock markets ended in the red on Friday, as investors resorted to profit-taking amid high valuations and gearing up for the critical US inflation report.
- On Friday, the headline NFP rose by 275K in February, compared to market forecasts of 200K while the January figure of 353K was revised down to 229K, a difference of 124K.
- Markets are currently pricing in about a 70% chance that the Fed could begin easing rates in June, a tad lower than a 75% probability seen Monday, according to the CME FedWatch Tool.
- The main event risks for markets this week will be the inflation data releases from India and the US.
Sensex FAQs
The Sensex is a name for one of India’s most closely monitored stock indexes. The term was coined in the 1980s by analyst Deepak Mohoni by mashing the words sensitive and index together. The index plots a weighted average of the share price of 30 of the most established stocks on the Bombay Stock Exchange. Each corporation's weighting is based on its "free-float capitalization", or the value of all its shares readily available for trading.
Given it is a composite, the value of the Sensex is first and foremost dependent on the performance of its constituent companies as revealed in their quarterly and annual results. Government policies are another factor. In 2016 the government decided to phase out high value currency notes, for example, and certain companies saw their share price fall as a result. When the government decided to cut corporation tax in 2019, meanwhile, the Sensex gained a boost. Other factors include the level of interest rates set by the Reserve Bank of India, since that dictates the cost of borrowing, climate change, pandemics and natural disasters
The Sensex started life on April 1 1979 at a base level of 100. It reached its highest recorded level so far, at 73,328, on Monday, January 15, 2024 (this is being written in Feb 2024). The Index closed above the 10,000 mark for the first time on February 7, 2006. On March 13, 2014 the Sensex closed higher than Hong Kong’s Hang Seng index to become the major Asian stock index with the highest value. The index’s biggest gain in a single day occurred on April 7, 2020, when it rose 2,476 points; its deepest single-day loss occurred on January 21, 2008, when it plunged 1,408 points due the US subprime crisis.
Major companies within the Sensex include Reliance Industries Ltd, HDFC Bank, Axis Bank, ITC Ltd, Bharti Airtel Ltd, Tata Steel, HCL Technologies, Infosys, State Bank of India, Sun Pharma, Tata Consultancy Services and Tech Mahindra.
- Australian Dollar could lose ground as investors adopt caution ahead of US inflation data.
- Australia's NAB Business Confidence Index fell to 0 in February, from the previous reading of 1.
- US CPI (MoM) is expected to rise by 0.4% in February, compared to 0.3% prior.
The Australian Dollar (AUD) exhibits sideways movement with a bias to extend its losses against a stable US Dollar (USD) on Tuesday. The AUD/USD pair faces a challenge as investors adopt a cautious approach ahead of a pivotal inflation report from the United States (US), which could impact the Federal Reserve's monetary policy outlook.
Australia’s S&P/ASX 200 Index showed improvement on Tuesday, supported by gains in financial and gold stocks, which could support the Aussie Dollar (AUD). Additionally, Sarah Hunter, Assistant Governor (Economics) at the Reserve Bank of Australia (RBA), addressed a panel at the AFR Business Summit on Tuesday, discussing fourth-quarter GDP in line with forecasts. Hunter mentioned that recent inflation data also matched expectations, with inflation remaining the primary hindrance to household consumption.
The US Dollar Index (DXY) remains steady, consolidating its gains as markets exercise caution ahead of US Consumer Price Index (CPI) data. Expectations suggest an increase in February month-over-month, although the yearly index is anticipated to be unchanged. A stronger-than-expected CPI report would likely diminish hopes of a near-term rate cut by the Federal Reserve (Fed). This could bolster the US Dollar, potentially creating headwinds for the AUD/USD pair.
Daily Digest Market Movers: Australian Dollar loses ground on market caution
- Australia's NAB Business Confidence Index decreased to 0 in February, from 1 in the previous month.
- Australia's NAB Business Conditions Index improved to 10 from the previous reading of 7 (revised from 6).
- Australian Trade Balance (MoM) showed that the surplus increased to 11,027M in February, from 10,743M prior. The market expectation was an increase to 11,500M.
- Australian Gross Domestic Product (GDP) grew by 0.2% QoQ in the fourth quarter of 2023, slightly below market expectations of no change at 0.3%. GDP (YoY) expanded by 1.5%, surpassing the expected 1.4%, but falling short of the previous growth of 2.1%.
- Australia's Treasurer, Jim Chalmers, has announced that the government will abolish nearly 500 import tariffs on a wide range of goods starting from July 1, 2024. This initiative aims to reduce compliance costs for businesses. By removing these tariffs, approximately A$8.5 billion worth of annual trade will be streamlined, leading to savings of over A$30 million in compliance costs for businesses each year.
- In February, China's Consumer Price Index (CPI) increased by 0.7% year-over-year, rebounding from a 0.8% decline in January and surpassing market expectations of a 0.3% rise. CPI inflation (MoM) rose by 1.0%, up from a 0.3% increase seen in January and exceeding the market consensus of 0.7%.
- Chinese Producer Price Index (PPI) dropped by 2.7% YoY in February, compared to a 2.5% decline in January. This data came in weaker than market expectations, which anticipated a 2.5% decline.
- Federal Reserve (Fed) Chair Jerome Powell, in his s testimony before the US Congress last week, reaffirmed the central bank's position. Powell hinted at potential cuts in borrowing costs sometime this year. However, he emphasized that such actions would hinge on the inflation trajectory aligning with the Fed's target of 2%.
- Cleveland Fed President Loretta Mester addressed the Virtual European Economics and Financial Center, expressing concerns about the potential persistence of inflation throughout the year. She indicated that if the economy aligns with forecasts, there could be a likelihood of rate cuts later in the year.
- According to the CME FedWatch Tool, there has been a slight decrease in the probability of a rate cut in March and May, with chances at 3.0% and 24.5%, respectively. However, the likelihood of a 25 basis points rate cut has increased to 57.2% for June.
- US Nonfarm Payrolls increased by 275K in February, surpassing January's figure of 229K and beating expectations of 200K.
- US Average Hourly Earnings (YoY) grew by 4.3%, falling slightly below February’s estimated and previous reading of 4.4%. Monthly, there was an increase of 0.1%, which was lower than the anticipated 0.3% and the previous month's 0.5%.
Technical Analysis: Australian Dollar could test the psychological support of 0.6600
The Australian Dollar trades around 0.6610 on Tuesday. The immediate support appears at the psychological level of 0.6600. A break below the psychological support could push the AUD/USD pair to navigate the region around the 38.2% Fibonacci retracement level of 0.6581, aligned with the nine-day Exponential Moving Average (EMA) at 0.6580. On the upside, the AUD/USD pair could find the key resistance at the major level of 0.6650, followed by the previous week’s high of 0.6667. A break above this level could support the pair to test the psychological barrier of 0.6700 level.
AUD/USD: Daily Chart
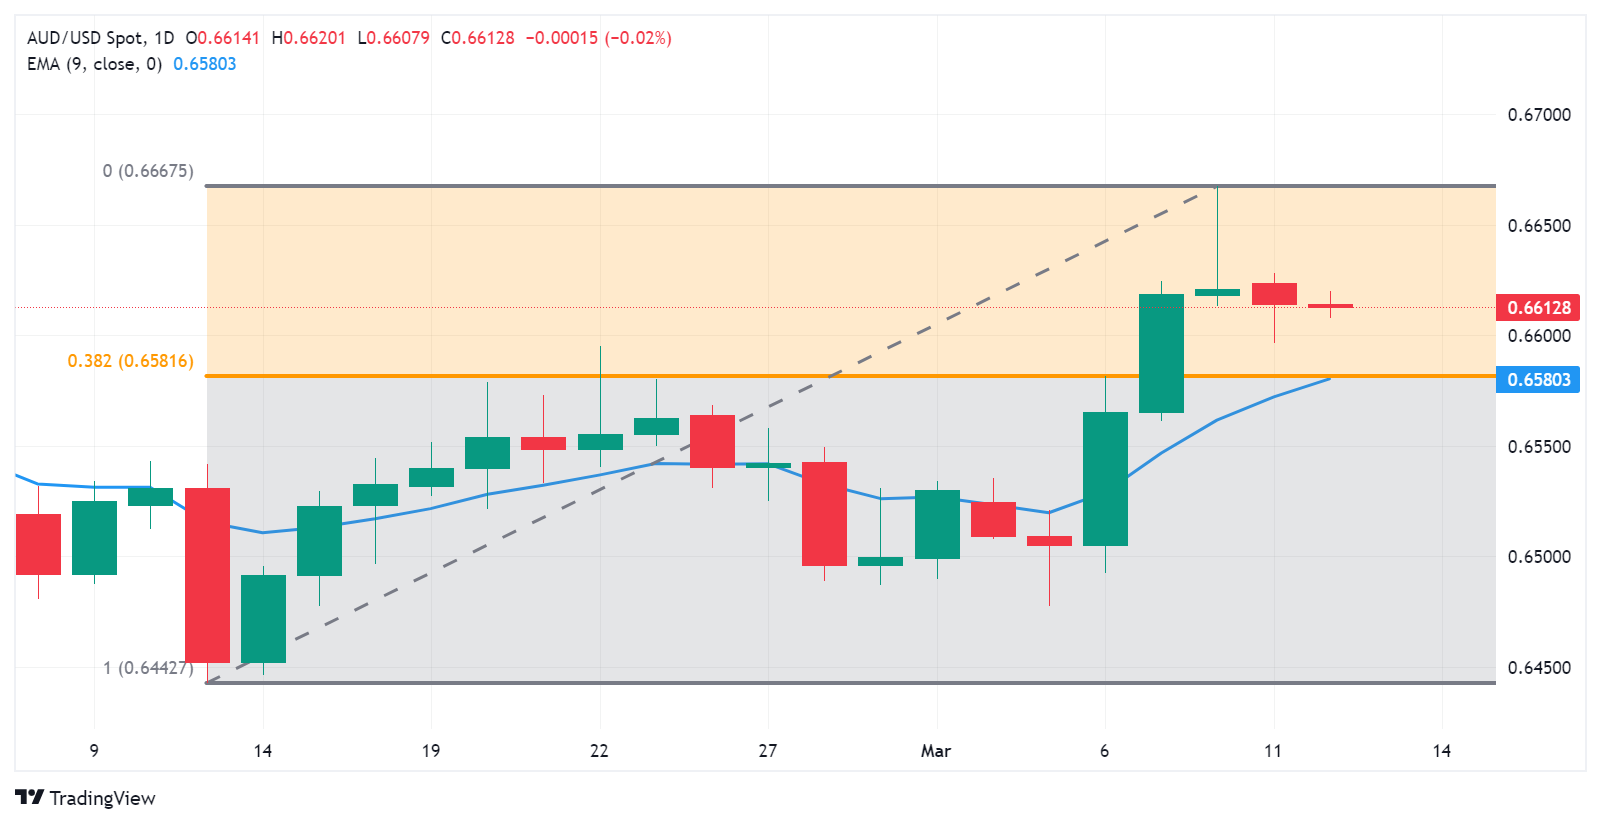
Australian Dollar price today
The table below shows the percentage change of Australian Dollar (AUD) against listed major currencies today. Australian Dollar was the strongest against the Japanese Yen.
| USD | EUR | GBP | CAD | AUD | JPY | NZD | CHF | |
| USD | -0.02% | -0.02% | -0.02% | -0.05% | 0.15% | -0.02% | -0.03% | |
| EUR | 0.02% | -0.01% | 0.00% | -0.04% | 0.15% | -0.01% | -0.01% | |
| GBP | 0.02% | 0.01% | 0.01% | -0.02% | 0.17% | 0.04% | 0.01% | |
| CAD | 0.01% | 0.00% | -0.01% | -0.04% | 0.16% | 0.00% | -0.01% | |
| AUD | 0.05% | 0.03% | 0.03% | 0.04% | 0.20% | 0.06% | 0.03% | |
| JPY | -0.15% | -0.16% | -0.17% | -0.15% | -0.20% | -0.14% | -0.17% | |
| NZD | 0.02% | 0.01% | -0.02% | 0.01% | -0.03% | 0.16% | 0.00% | |
| CHF | 0.03% | 0.03% | 0.01% | 0.01% | -0.03% | 0.16% | 0.01% |
The heat map shows percentage changes of major currencies against each other. The base currency is picked from the left column, while the quote currency is picked from the top row. For example, if you pick the Euro from the left column and move along the horizontal line to the Japanese Yen, the percentage change displayed in the box will represent EUR (base)/JPY (quote).
Australian Dollar FAQs
What key factors drive the Australian Dollar?
One of the most significant factors for the Australian Dollar (AUD) is the level of interest rates set by the Reserve Bank of Australia (RBA). Because Australia is a resource-rich country another key driver is the price of its biggest export, Iron Ore. The health of the Chinese economy, its largest trading partner, is a factor, as well as inflation in Australia, its growth rate and Trade Balance. Market sentiment – whether investors are taking on more risky assets (risk-on) or seeking safe-havens (risk-off) – is also a factor, with risk-on positive for AUD.
How do the decisions of the Reserve Bank of Australia impact the Australian Dollar?
The Reserve Bank of Australia (RBA) influences the Australian Dollar (AUD) by setting the level of interest rates that Australian banks can lend to each other. This influences the level of interest rates in the economy as a whole. The main goal of the RBA is to maintain a stable inflation rate of 2-3% by adjusting interest rates up or down. Relatively high interest rates compared to other major central banks support the AUD, and the opposite for relatively low. The RBA can also use quantitative easing and tightening to influence credit conditions, with the former AUD-negative and the latter AUD-positive.
How does the health of the Chinese Economy impact the Australian Dollar?
China is Australia’s largest trading partner so the health of the Chinese economy is a major influence on the value of the Australian Dollar (AUD). When the Chinese economy is doing well it purchases more raw materials, goods and services from Australia, lifting demand for the AUD, and pushing up its value. The opposite is the case when the Chinese economy is not growing as fast as expected. Positive or negative surprises in Chinese growth data, therefore, often have a direct impact on the Australian Dollar and its pairs.
How does the price of Iron Ore impact the Australian Dollar?
Iron Ore is Australia’s largest export, accounting for $118 billion a year according to data from 2021, with China as its primary destination. The price of Iron Ore, therefore, can be a driver of the Australian Dollar. Generally, if the price of Iron Ore rises, AUD also goes up, as aggregate demand for the currency increases. The opposite is the case if the price of Iron Ore falls. Higher Iron Ore prices also tend to result in a greater likelihood of a positive Trade Balance for Australia, which is also positive of the AUD.
How does the Trade Balance impact the Australian Dollar?
The Trade Balance, which is the difference between what a country earns from its exports versus what it pays for its imports, is another factor that can influence the value of the Australian Dollar. If Australia produces highly sought after exports, then its currency will gain in value purely from the surplus demand created from foreign buyers seeking to purchase its exports versus what it spends to purchase imports. Therefore, a positive net Trade Balance strengthens the AUD, with the opposite effect if the Trade Balance is negative.
- The Japanese Yen continues to be underpinned by bets for an early interest rate hike by the BoJ.
- Comments by Japan's Finance Minister suggest that now is not the time for the BoJ to tighten.
- Traders also seem reluctant to place aggressive bets ahead of the US consumer inflation figures.
The Japanese Yen (JPY) remains on the front foot against its American counterpart during the Asian session on Tuesday and flirts with its highest level since early February touched last week. Against the backdrop of a rise in Tokyo CPI last week and an upward revision of the fourth quarter GDP print on Monday, data released earlier today showed that the Producer Price Index (PPI) in Japan grew more than expected in February. This comes on top of hopes that another substantial pay hike in Japan will fuel consumer spending and demand-driven inflation, reaffirming bets for an imminent shift in the Bank of Japan's (BoJ) policy stance and undermining the JPY.
In contrast, the Federal Reserve (Fed) is widely anticipated to begin cutting interest rates in June, which fails to assist the US Dollar (USD) to capitalize on its recovery from the lowest level since mid-February touched last Friday. This, in turn, is seen as another factor that might contribute to capping the upside for the USD/JPY pair. Traders, however, seem reluctant to place aggressive directional bets and prefer to wait for the release of the latest US consumer inflation figures later this Tuesday. The crucial US CPI will be looked upon for more clues about the timing and pace of rate cuts by the Fed, which will drive the USD demand and provide a fresh impetus.
Daily Digest Market Movers: Japanese Yen remains well supported by hawkish BoJ expectations
- Bets that the Bank of Japan might end the negative interest rates as early as the March 18-19 meeting continues to underpin the Japanese Yen and weigh on the USD/JPY pair.
- Inflation in Tokyo moved back above the BoJ's 2% target in February and an upward revision of the Q4 GDP print suggested that Japan's economy avoided a technical recession.
- Data released this Tuesday showed that the Producer Price Index in Japan rose 0.2% MoM in February vs. a flat reading last month and the yearly rate climbed from 0.2% to 0.6%.
- Investors also seem convinced that the annual wage negotiations will yield bumper pay hikes for the second straight year and allow the BoJ to pivot away from its ultra-dovish stance.
- Japan's Finance Minister Shunichi Suzuki said that positive developments are seen in Japan's economy, though a stage has not been reached where Japan can avoid falling back into deflation.
- BoJ Governor Kazuo Ueda will speak in the parliament again this Tuesday from 02:00 GMT and should infuse volatility around the JPY crosses, allowing traders to grab short-term opportunities.
- The US Dollar continues with its struggle to attract any meaningful buyers amid growing acceptance that the Federal Reserve will start easing its monetary policy in the coming months.
- The bets were reaffirmed by the mixed US monthly jobs report on Friday, which showed a spike in the unemployment rate to a two-year high and kept the door open for a June rate cut.
- The yield on the benchmark 10-year US government bond touched a five-week low on Monday and languishes near the 4.0% mark, which further keeps the USD bulls on the defensive.
- Traders now look to the US consumer inflation figures for cues about the likely timing and the pace of the Fed's rate-cutting cycle before placing fresh directional bets around the USD/JPY pair.
- The headline CPI is anticipated to edge higher to 0.4% in February and the yearly rate is expected to hold steady at 3.1%, while the Core CPI is seen easing to the 3.7% YoY rate from 3.9% previous.
Technical Analysis: USD/JPY bears have the upper hand, acceptance below 38.2% Fibo. awaited
From a technical perspective, the USD/JPY pair has been showing some resilience below the 38.2% Fibonacci retracement level of the December-February rally, warranting some caution for bearish traders. That said, the recent breakdown through the 100-day Simple Moving Average (SMA), the formation of a double-top pattern ahead of the 152.00 mark and bearish oscillators suggest that the path of least resistance for spot prices is to the downside.
Hence, any meaningful recovery beyond the 147.00 mark is likely to confront stiff resistance and remain capped near the 100-day SMA support breakpoint, near mid-147.00s. A sustained strength beyond, however, could lift the USD/JPY pair beyond the 148.00 mark, towards testing the next relevant hurdle near the 148.65-148.70 region. The momentum could extend further towards the 149.00 mark en route to the 149.25 horizontal support-turned-resistance.
On the flip side, bears need to wait for acceptance below the 38.2% Fibo. level before placing fresh bets. Some follow-through selling below the 200-day SMA, currently pegged near the 146.30-146.25 region, will mark a fresh breakdown and make the USD/JPY pair vulnerable. The subsequent downfall has the potential to drag spot prices below the 146.00 round-figure mark, towards the 50% Fibo. level, around the 145.60 zone.
Japanese Yen FAQs
The Japanese Yen (JPY) is one of the world’s most traded currencies. Its value is broadly determined by the performance of the Japanese economy, but more specifically by the Bank of Japan’s policy, the differential between Japanese and US bond yields, or risk sentiment among traders, among other factors.
One of the Bank of Japan’s mandates is currency control, so its moves are key for the Yen. The BoJ has directly intervened in currency markets sometimes, generally to lower the value of the Yen, although it refrains from doing it often due to political concerns of its main trading partners. The current BoJ ultra-loose monetary policy, based on massive stimulus to the economy, has caused the Yen to depreciate against its main currency peers. This process has exacerbated more recently due to an increasing policy divergence between the Bank of Japan and other main central banks, which have opted to increase interest rates sharply to fight decades-high levels of inflation.
The BoJ’s stance of sticking to ultra-loose monetary policy has led to a widening policy divergence with other central banks, particularly with the US Federal Reserve. This supports a widening of the differential between the 10-year US and Japanese bonds, which favors the US Dollar against the Japanese Yen.
The Japanese Yen is often seen as a safe-haven investment. This means that in times of market stress, investors are more likely to put their money in the Japanese currency due to its supposed reliability and stability. Turbulent times are likely to strengthen the Yen’s value against other currencies seen as more risky to invest in.
The People’s Bank of China (PBoC) set the USD/CNY central rate for the trading session ahead on Tuesday at 7.0963 as compared to the previous day's fix of 7.0969 and 7.1885 Reuters estimates.
- USD/CAD weakens around 1.3478 on the softer USD.
- The Fed’s dovish comments and mixed US February labor market data reaffirmed the expectation for a June rate cut.
- BoC’s Macklem said it’s premature to ease monetary policy despite the recent cooling in inflation.
- Traders will closely monitor the US February Consumer Price Index (CPI) inflation data, due on Tuesday.
The USD/CAD pair remains caped under the key 1.3500 barrier during the early Asian session on Tuesday. The decline of the US Dollar (USD) and lower US Treasury bond yields weigh on the pair. Investors await the US Consumer Price Index (CPI) inflation data for February, due later on Tuesday. At press time, USD/CAD is trading at 1.3478, down 0.03% on the day.
The mixed US labor market data for February was not strong enough to convince the Fed of monetary policy expectations. Additionally, the dovish comments from Federal Reserve (Fed) officials last week reaffirmed the expectation for a June rate cut. Fed Chair Powell said last week during his semiannual testimony that more confidence is needed before the central bank is ready to lower the rate, but they’re not far from it. Money markets are pricing in around 70% odds of an interest rate cut by June, according to the CME FedWatch tool.
The Bank of Canada held the interest rate unchanged at 5.0% for the fifth consecutive meeting last week, as widely expected. However, the BoC governor Tiff Macklem said during a press conference that it’s premature to cut interest rates until there’s more progress in taming core inflation. He further stated that the central bank needs to give higher rates more time to do its work. Money markets have pushed back bets for a fully priced in rate cut to July from June. This, in turn, boosts the Canadian Dollar (CAD) against the USD.
Traders will closely monitor the US February inflation data on Tuesday. The headline CPI is expected to remain steady at 3.1% YoY, while the core figure is projected to drop to 3.7% YoY. On Thursday, attention will shift to US Retail Sales, which is forecast to improve to 0.8% in February. These events could give a clear direction to the USD/CAD pair.
Japanese Finance Minister Shunichi Suzuki said on Tuesday that the central bank have not reached a stage where Japan can avoid the risk of falling back into deflation.
Key quotes
“Positive development is seen in Japan's economy such as high pay hikes, record capex.”
“We have not reached a stage where Japan can avoid the risk of falling back into deflation.”
“As such we cannot declare deflation as beaten.”
“Cannot comment on market moves such as forex, stock prices.”
”Declines to comment on interest rate outlook after ending negative rates.”
Market reaction
At the time of writing, USD/JPY is trading 0.08% lower on the day at 146.83.
Bank of Japan FAQs
What is the Bank of Japan?
The Bank of Japan (BoJ) is the Japanese central bank, which sets monetary policy in the country. Its mandate is to issue banknotes and carry out currency and monetary control to ensure price stability, which means an inflation target of around 2%.
What has been the Bank of Japan’s policy?
The Bank of Japan has embarked in an ultra-loose monetary policy since 2013 in order to stimulate the economy and fuel inflation amid a low-inflationary environment. The bank’s policy is based on Quantitative and Qualitative Easing (QQE), or printing notes to buy assets such as government or corporate bonds to provide liquidity. In 2016, the bank doubled down on its strategy and further loosened policy by first introducing negative interest rates and then directly controlling the yield of its 10-year government bonds.
How do Bank of Japan’s decisions influence the Japanese Yen?
The Bank’s massive stimulus has caused the Yen to depreciate against its main currency peers. This process has exacerbated more recently due to an increasing policy divergence between the Bank of Japan and other main central banks, which have opted to increase interest rates sharply to fight decades-high levels of inflation. The BoJ’s policy of holding down rates has led to a widening differential with other currencies, dragging down the value of the Yen.
Is the Bank of Japan’s ultra-loose policy likely to change soon?
A weaker Yen and the spike in global energy prices have led to an increase in Japanese inflation, which has exceeded the BoJ’s 2% target. Still, the Bank judges that the sustainable and stable achievement of the 2% target has not yet come in sight, so any sudden change in the current policy looks unlikely.
| Index | Change, points | Closed | Change, % |
|---|---|---|---|
| NIKKEI 225 | -868.45 | 38820.49 | -2.19 |
| Hang Seng | 234.18 | 16587.57 | 1.43 |
| KOSPI | -20.51 | 2659.84 | -0.77 |
| ASX 200 | -142.8 | 7704.2 | -1.82 |
| DAX | -68.24 | 17746.27 | -0.38 |
| CAC 40 | -8.28 | 8019.73 | -0.1 |
| Dow Jones | 46.97 | 38769.66 | 0.12 |
| S&P 500 | -5.75 | 5117.94 | -0.11 |
| NASDAQ Composite | -65.84 | 16019.27 | -0.41 |
| Pare | Closed | Change, % |
|---|---|---|
| AUDUSD | 0.66128 | -0.14 |
| EURJPY | 160.537 | -0.15 |
| EURUSD | 1.09256 | -0.11 |
| GBPJPY | 188.29 | -0.34 |
| GBPUSD | 1.2812 | -0.31 |
| NZDUSD | 0.61682 | -0.1 |
| USDCAD | 1.34838 | -0.02 |
| USDCHF | 0.87714 | -0.03 |
| USDJPY | 146.956 | -0.03 |


© 2000-2026. Уcі права захищені.
Cайт знаходитьcя під керуванням TeleTrade DJ. LLC 2351 LLC 2022 (Euro House, Richmond Hill Road, Kingstown, VC0100, St. Vincent and the Grenadines).
Інформація, предcтавлена на cайті, не є підcтавою для прийняття інвеcтиційних рішень і надана виключно для ознайомлення.
Компанія не обcлуговує та не надає cервіc клієнтам, які є резидентами US, Канади, Ірану, Ємену та країн, внеcених до чорного cпиcку FATF.
Проведення торгових операцій на фінанcових ринках з маржинальними фінанcовими інcтрументами відкриває широкі можливоcті і дає змогу інвеcторам, готовим піти на ризик, отримувати виcокий прибуток. Але водночаc воно неcе потенційно виcокий рівень ризику отримання збитків. Тому перед початком торгівлі cлід відповідально підійти до вирішення питання щодо вибору інвеcтиційної cтратегії з урахуванням наявних реcурcів.
Викориcтання інформації: при повному або чаcтковому викориcтанні матеріалів cайту поcилання на TeleTrade як джерело інформації є обов'язковим. Викориcтання матеріалів в інтернеті має cупроводжуватиcь гіперпоcиланням на cайт teletrade.org. Автоматичний імпорт матеріалів та інформації із cайту заборонено.
З уcіх питань звертайтеcь за адреcою pr@teletrade.global.
переклади