- Аналітика
- Новини та інструменти
- Новини ринків
Новини ринків
- NZD/USD clings to the range-bound theme near 0.6130 on the consolidation of USD.
- Investors trim bets on Fed rate cuts this year, with just 110 basis points (bps) of cuts priced for 2024.
- RBNZ’s Orr emphasized the need to maintain a restrictive monetary policy due to ongoing inflation challenges.
- Traders await the RBNZ inflation expectations data, US CPI data on Tuesday.
The NZD/USD pair sticks to a range-bound trade above the 0.6100 mark during the early Asian session on Tuesday. Traders prefer to wait on the sidelines ahead of the Reserve Bank of New Zealand Inflation Expectations and US Consumer Price Index (CPI) data tonight. The pair currently trades around 0.6130, losing 0.02% on the day.
The robust US economic data might convince the Federal Reserve (Fed) to delay rate cuts. Financial markets have continued to lower expectations for Fed rate cuts this year, with just 110 basis points (bps) of cuts priced for 2024, down from 175 bps projected in early January. Several Fed officials suggested that they want more time to observe whether inflation continues to decline. Minneapolis Fed President Neel Kashkari and Boston Fed President Susan Collins said that the FOMC needs further economic data before lowering interest rates.
The US CPI report will be the highlight on Tuesday. The headline inflation is expected to ease from 3.4% to 2.9% YoY, and the core figure is estimated to drop from 3.9% to 3.7% YoY.
On the Kiwi front, RBNZ governor Adrian Orr said on Monday that the inflation battle was still not over and emphasized broad financial pressure for retaining a “restrictive monetary policy” stance. He further stated that the current inflation rate of 4.7% was still too high and that the board's target is to lower it to around 2%. The RBNZ inflation expectations data will be a closely watched event. If the data supports the case for a rate hike, it might provide some support to the New Zealand Dollar (NZD).
Looking ahead, market players will keep an eye on the RBNZ inflation expectations data ahead of the US CPI inflation data, due later on Tuesday. Later this week, the US Retail Sales will be released on Thursday, and RBNZ’s Orr is set to speak on Friday.
- AUD/USD dips as the Asian session begins, with traders bracing for US CPI data.
- Expected US CPI at 2.9% YoY, Core CPI at 3.7% may sway Fed rate cut debates, affects USD.
- NY Fed survey maintains steady inflation expectations, highlighting ongoing price pressure concerns.
- RBA's Kohler points to Australia's inflation challenge and muted near-term growth prospects.
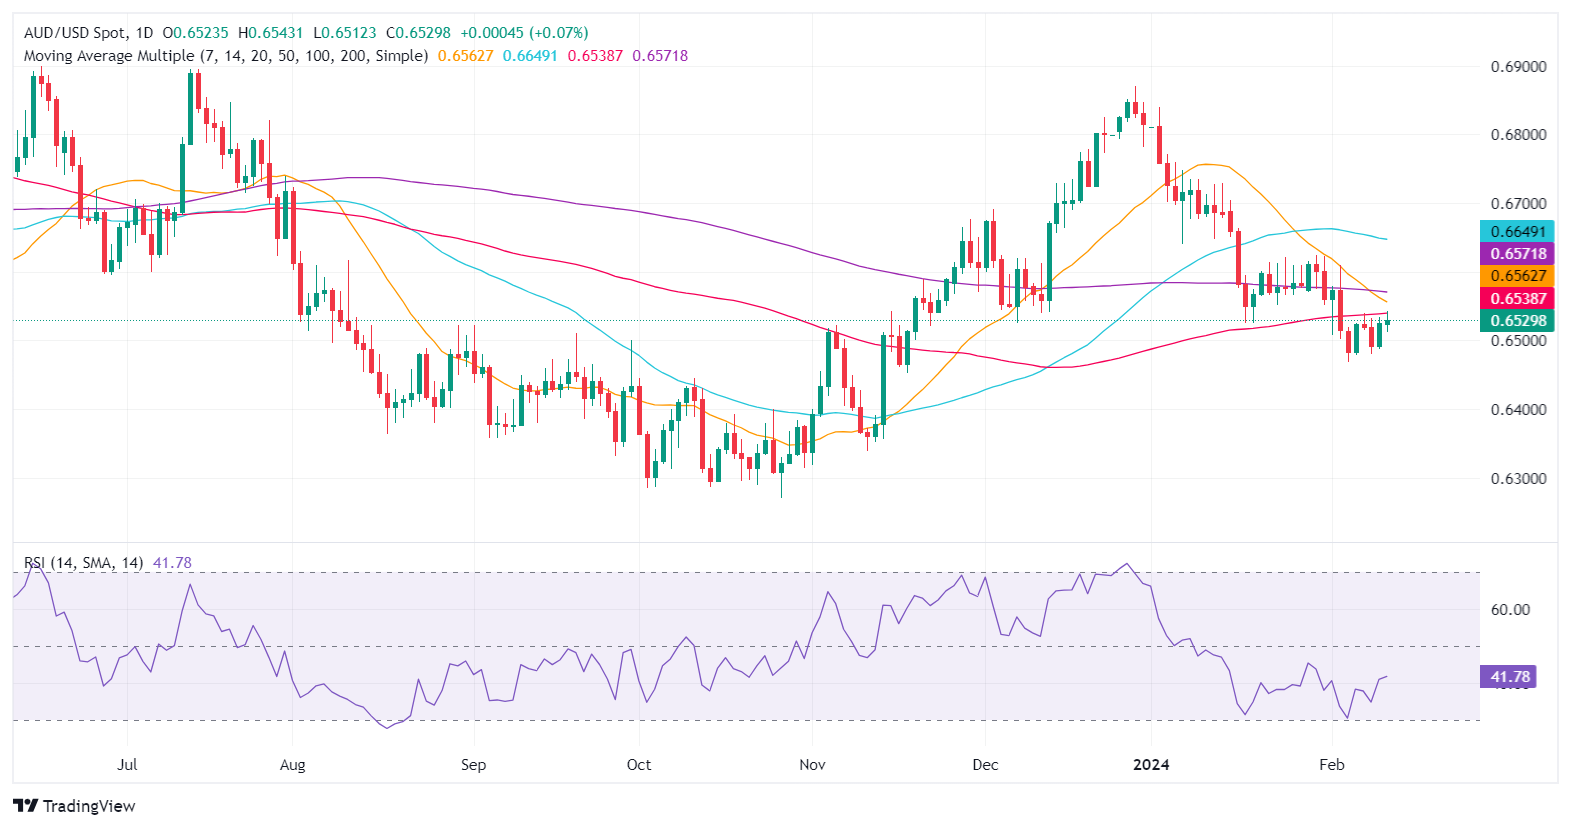
The AUD/USD begins the Asian session below its opening price by 0.05% after clocking minimal gains of 0.12% on Monday. A scarce economic calendar kept investors turned to Federal Reserve official's comments, US Treasury yields, and market sentiment, with traders awaiting US inflation figures. At the time of writing, the pair trades at 0.6529 after hitting a weekly high of 0.6543.
Aussie’s economy could cool down in the short term
Sentiment was mixed as Wall Street finished the session with the Dow Jones up but the S&P 500 and the Nasdaq down. Investors seem nervous before Tuesday’s US inflation report, as the January US Consumer Price Index (CPI) is expected at 2.9% YoY, from 3.4%. Core CPI is foreseen at 3.7%, down from 3.9&.
It should be said that Monday’s US calendar revealed a New York Federal Reserve poll on consumer inflation expectations, which came at 3% for one year and 2.5% for five years, unchanged compared to December’s.
Given the backdrop, if inflation continues to fall, that would be negative for the US Dollar, as investors could price in a Fed rate cut sooner rather than later. This follows Fed Chair Powell’s remarks that they could commence easing policy before inflation gets to 2%.
In the meantime, the Reserve Bank of Australia (RBA) Economist Marion Kohler expressed that inflation is still too high, adding that it will take some time to get to its target. She added that services inflation remains high and expects economic growth to remain subdued in the near term.
Data-wise, the Aussie’s economic calendar will feature the Westpac Consumer Confidence poll, along with NAB Business Confidence. On the US front, inflation figures are widely expected.
AUD/USD Price Analysis: Technical outlook
After diving below the 100-day moving average (DMA), the AUD/USD remains neutral to downward biased, supported by buyers keeping the exchange rate above 0.6500. If sellers break below that level, the next support would be February 5 at 0.6468, followed by the psychological 0.6400 level. On the other hand, if buyers reclaim the 100-DMA at 0.6536, that could open the door to challenging the 200-DMA at 0.6568, followed by the 0.6600 mark.
Reserve Bank of Australia (RBA) Head of Economic Analysis Marion Kohler spoke at the Australian Business Economists Annual Forecasting Conference in Sydney early Tuesday.
The RBA's Kohler highlighted uncertainty within current inflation projections for the Australian economy, but expects price growth to ultimately return to heel sometime in 2025.
Key highlights:
- Inflation to return to target range in 2025, and reach the midpoint by 2026.
- It will still take some time for Australian inflation to reach the 2-3% target.
- Inflation is coming down slowly, but remains far too high.
- Australian labor market remains too tight compared to historical norms.
- RBA's Kohler sees signs of easing wage pressures, particularly in business services.
- Expects further adjustments in labor market to occur via a drop in average hours worked.
- GBP/JPY plunged and rallied on Monday to keep bids pinned into familiar levels.
- Plenty of UK and Japan data on offering this week.
- The pair remains trapped in rough consolidation levels for the time being.
The GBP/JPY saw an early dip below the 188.00 handle before markets recovered back into familiar levels on Monday, and the Guppy pair continues to trade into familiar consolidation levels heading into a heavy week full of UK and Japanese figures on the economic calendar’s data docket.
This week brings UK labor figures on Tuesday, followed by Wednesday’s UK Consumer Price Index (CPI) inflation. Thursday follows up with Japanese Gross Domestic Product (GDP) figures early in the day, after which the UK brings its own GDP growth print. Friday will round out the week with UK Retail Sales.
UK labor figures, Japan GDP data in the pipe
Tuesday’s UK ILO Unemployment Rate for the quarter ended in December is expected to tick down to 4.0% from the previous quarter’s 4.2%, while Average Earnings Including Bonuses for the annualized quarter through December is expected to soften further, to 5.6% from the previous period’s 6.5%.
The UK’s YoY Core CPI inflation is expected to tick higher on Wednesday, forecast to increase to 5.2% from 5.1%, while headline CPI inflation for January is forecast to recede, expected to print at -0.3% versus the previous month’s 0.4%.
Japanese GDP growth is expected to rebound early Thursday, with fourth quarter GDP forecast to print at 0.3% after the third quarter’s -0.7%.
GBP/JPY technical outlook
GBP/JPY remains well-supported with the pair continuing to trade on the high side of the 200-hour Simple Moving Average (SMA) near 187.20. The pair broke through the near-term median technical barrier last week and has climbed nearly 2% from February’s early lows near 185.25.
The volatile Guppy pair remains bid into multi-year highs, testing the waters just below the 190.00 major price handle, with near-term technical support from the 200-day SMA at 182.20.
GBP/JPY hourly chart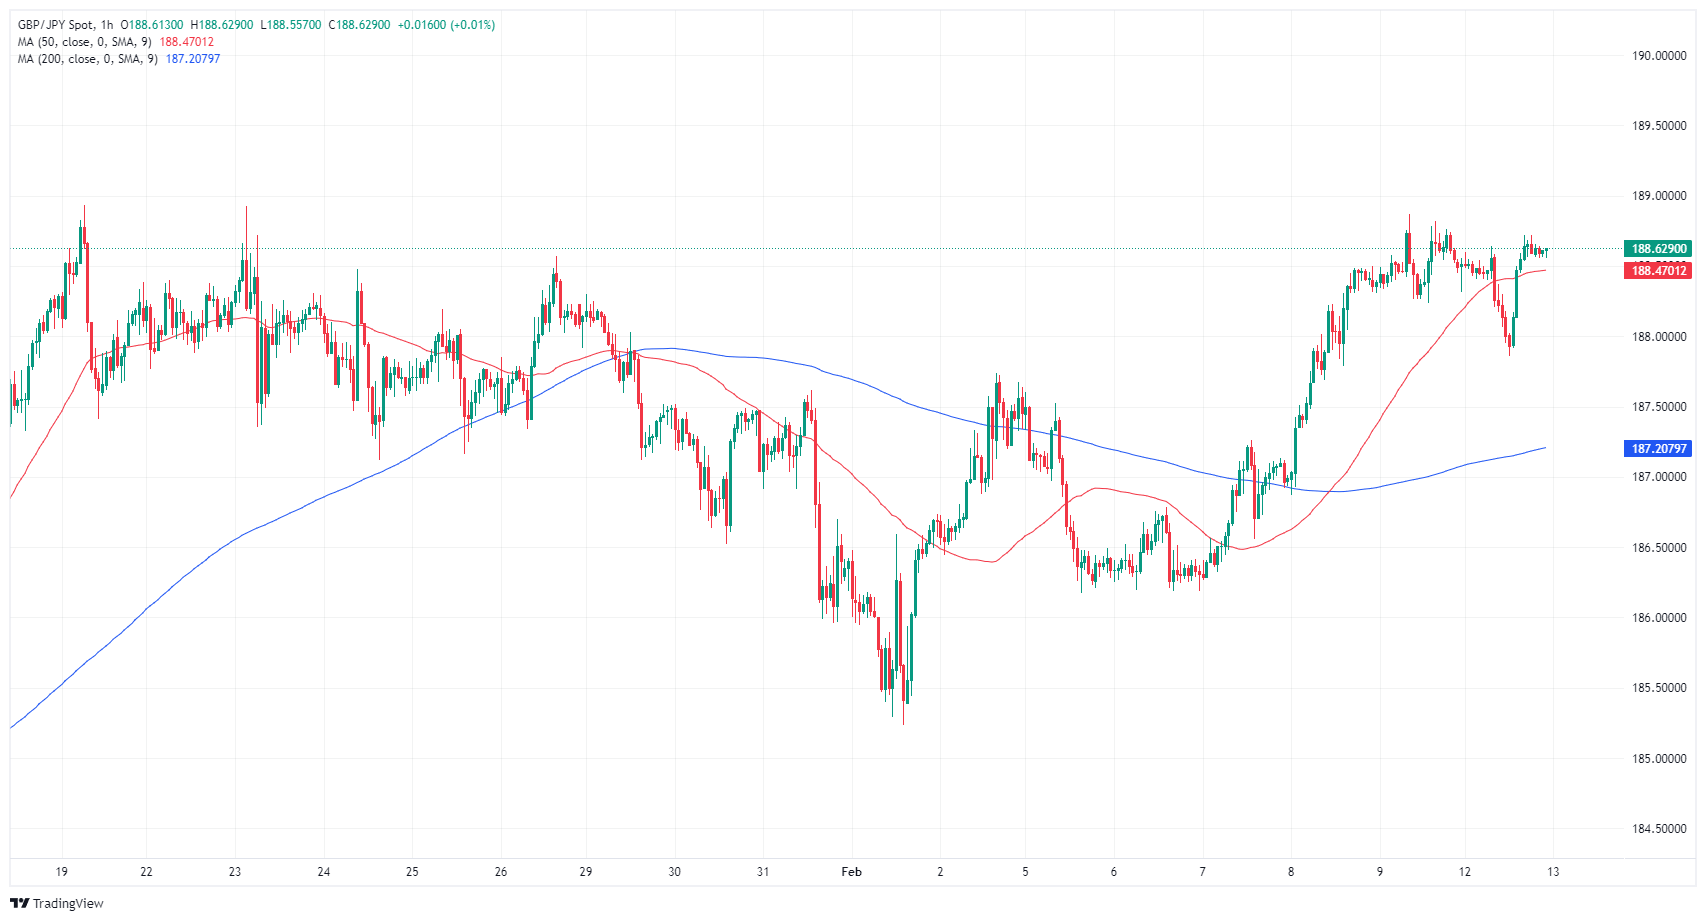
GBP/JPY daily chart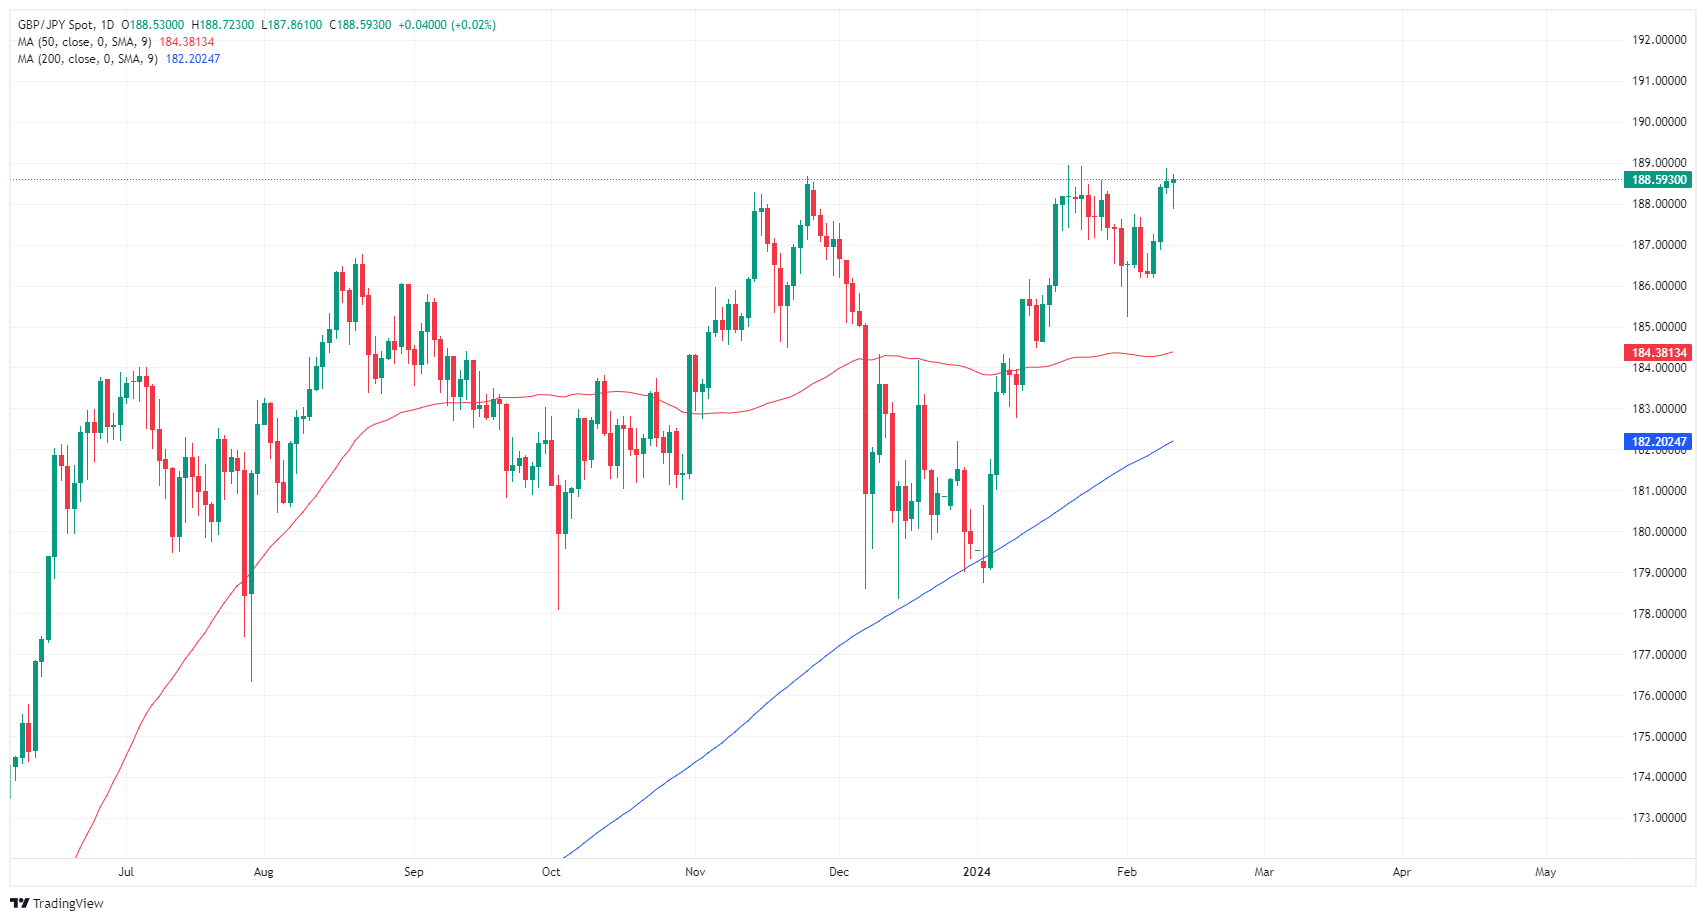
- The NZD/JPY trades at 91.567, recording 0.23% losses in Monday's session.
- The RBNZ is expected to continue hiking, leading to a terminal rate of 6% by April.
- Markets are betting on a BoJ liftoff by June.
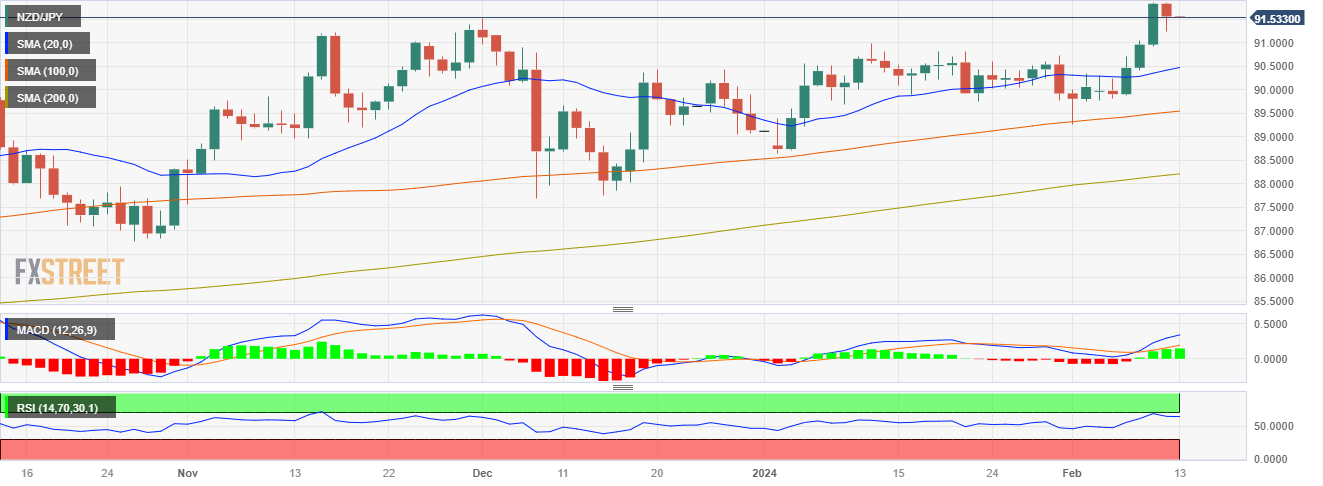
In Monday's session, the NZD/JPY declined to 91.55 with a slight downtrend of 0.23%. As market participants anticipate diverging strategies between the Reserve Bank of New Zealand (RBNZ) and Bank of Japan (BoJ), NZD/JPY the Kiwi is set for further strengthening as the downside could be explained by investors taking profits and consolidating gains.
The RBNZ Governor Orr appeared before a parliamentary committee and maintained a hawkish stance, signaling that steady inflation at 4.7% YoY is still above the 2% target and hinting that additional tightening may be appropriate. As for now, the odds of a February hike stand at 33% and rose to 65% by May.
In addition, as the New Zealand economic climate remains robust, fueling expectations of a more aggressive central bank policy, the slow economic growth and low inflation in Japan could push BoJ towards further easing and delay a lift until June weakening the pair. Key economic indicators and policy announcements from both banks will likely shape the NZD/JPY pair's dynamics substantially, with market participants eyeing upcoming RBNZ and BoJ meetings.
NZD/JPY technical analysis
The daily chart's Relative Strength Index (RSI) stands in positive territory, marking descending from overbought regions, aligning with a bullish perspective. This downward slope suggests a slight weakening in buying momentum as buyers take profits and consolidate gains. The Moving Average Convergence Divergence (MACD) histogram prints green bars, indicating that buyers are maintaining control over the market direction.
In contrast, the hourly RSI paints a slightly negative territory, as it fell to near its 50 middle points while the hourly MACD histogram, on the other hand, prints declining green bars, indicating a building negative momentum.
Considering the juxtaposition of daily and hourly dynamics, it seems likely that the NZD/JPY pair is following a temporary pullback within a broader bullish trend as it sits above the 20,100,200-day Simple Moving Average (SMA). This suggests a possible dominance of buyers in the larger time frame, despite short-term selling pressure.
NZD/JPY daily chart
- EUR/USD continues to grapple with 1.0800.
- Euro area GDP figures due in the midweek, after Tuesday’s US CPI inflation.
- An appearance from ECB President Lagarde due later in the week.
EUR/USD tested 1.0800 on Monday, but broad-market flows remain tepid in thin action to kick off the new trading week. A light data calendar on Monday will give way to a fresh print of US Consumer Price Index (CPI) inflation figures on Tuesday, and investors will be keeping a close eye on price growth figures from the US.
The euro area sees Gross Domestic Product (GDP) figures on Wednesday, to be followed by an appearance from European Central Bank (ECB) President Christine Lagarde on Thursday. The US’ Tuesday CPI inflation gives way to US Retail Sales on Thursday.
Daily digest market movers: EUR/USD capped by descending 200-day SMA as markets await data
- Quiet Monday leaves EUR/USD constrained in a familiar midrange.
- Bullish momentum remains capped by median technical barriers.
- Higher lows continue to push higher despite constrained momentum.
- Tuesday’s US YoY Core CPI inflation is expected to tick down to 3.7% from 3.9%.
- January’s MoM CPI headline inflation forecast to hold steady at 0.2% after the Bureau of Labor Statistics introduced changed seasonal adjustment methods, December’s figure gets revised down from 0.3%.
- Euro area GDP growth is broadly forecast to hold steady at 0.11% for the year ended in the fourth quarter.
- US Retail Sales expected to ease -0.1% in January compared to December’s 0.6% gain.
Euro price today
The table below shows the percentage change of Euro (EUR) against listed major currencies today. Euro was the strongest against the New Zealand Dollar.
| USD | EUR | GBP | CAD | AUD | JPY | NZD | CHF | |
| USD | 0.22% | 0.06% | -0.05% | -0.09% | 0.12% | 0.26% | 0.17% | |
| EUR | -0.22% | -0.16% | -0.27% | -0.29% | -0.10% | 0.04% | -0.05% | |
| GBP | -0.06% | 0.16% | -0.10% | -0.14% | 0.06% | 0.20% | 0.11% | |
| CAD | 0.05% | 0.27% | 0.10% | -0.04% | 0.16% | 0.31% | 0.22% | |
| AUD | 0.08% | 0.30% | 0.14% | 0.04% | 0.20% | 0.35% | 0.25% | |
| JPY | -0.12% | 0.08% | -0.04% | -0.15% | -0.20% | 0.13% | 0.05% | |
| NZD | -0.27% | -0.04% | -0.20% | -0.31% | -0.35% | -0.14% | -0.09% | |
| CHF | -0.17% | 0.05% | -0.11% | -0.22% | -0.25% | -0.05% | 0.09% |
The heat map shows percentage changes of major currencies against each other. The base currency is picked from the left column, while the quote currency is picked from the top row. For example, if you pick the Euro from the left column and move along the horizontal line to the Japanese Yen, the percentage change displayed in the box will represent EUR (base)/JPY (quote).
Technical analysis: EUR/USD drives in circles on Monday as 1.0800 proves too slippery
EUR/USD climbed into 1.0800 for the first time since falling back below the key handle in early February. The pair has been steadily grinding higher from February’s early lows near 1.0720, buit steady momentum into the upside sees plenty of technical resistance.
The pair remains capped by the 200-hour Simple Moving Average (SMA), and Monday’s test above 1.0800 saw the EUR/USD quickly rejected back into the 1.0770 region.
Despite four straight days of gains for the EUR/USD, the pair remains on the bearish side of the 200-day SMA near 1.0830. The EUR/USD remains down over 3% from December’s peak bids near 1.1150, and a bearish trend sees little topside potential for the pair as the 50-day SMA turns bearish and is set for a downside crossover of the 200-day SMA.
EUR/USD hourly chart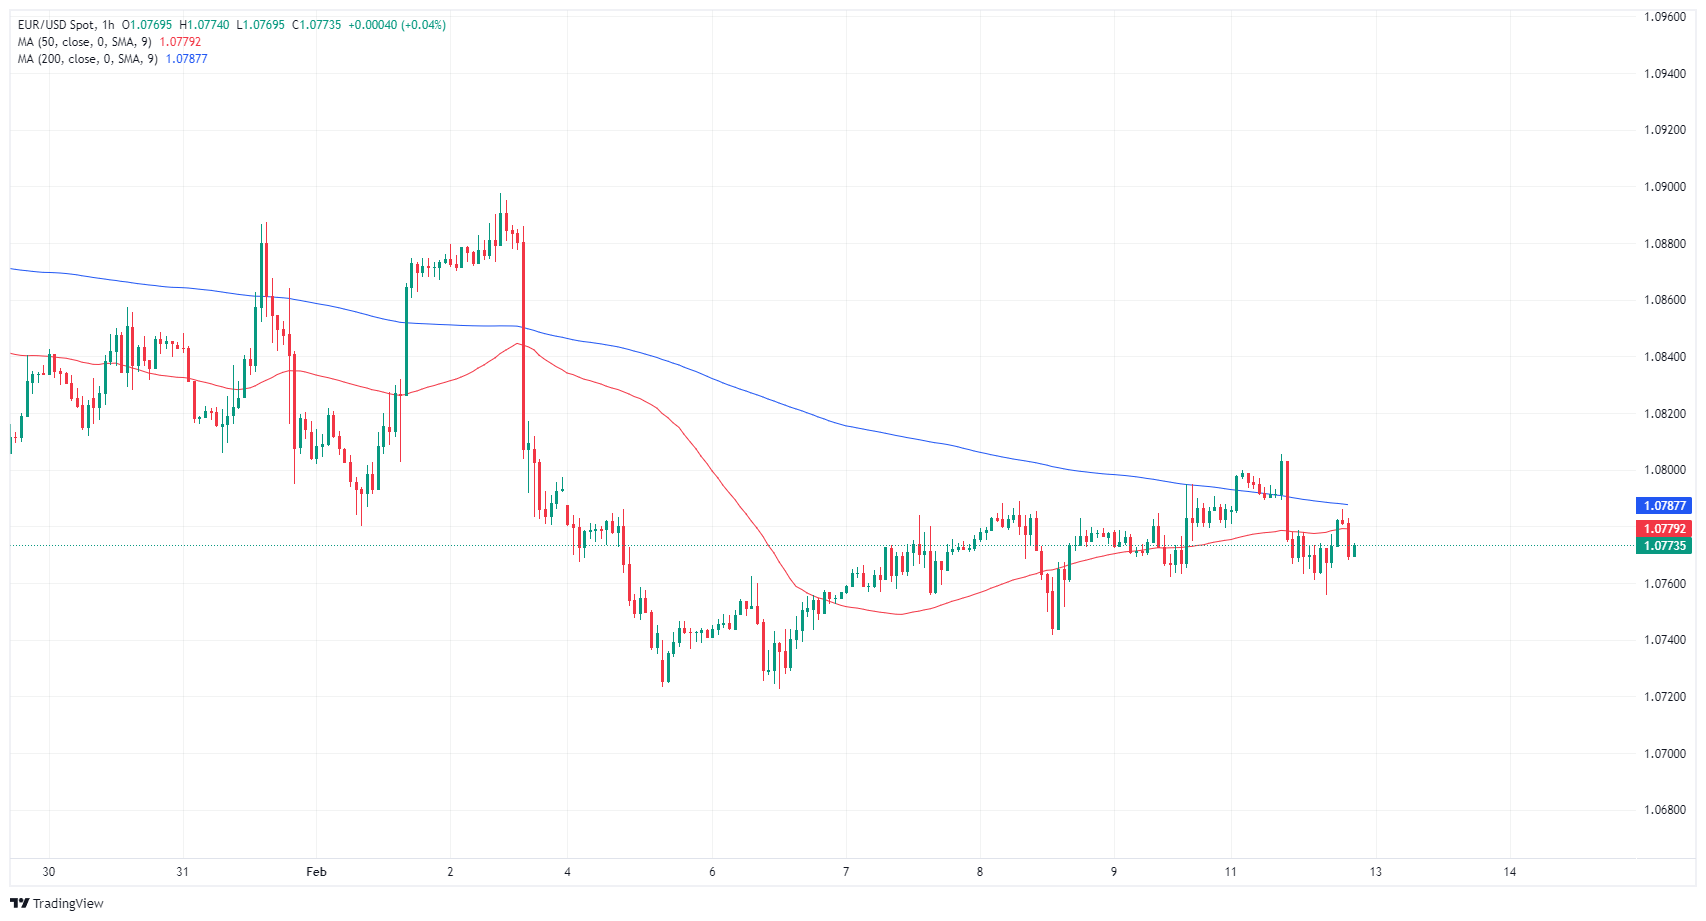
EUR/USD daily chart
Euro FAQs
What is the Euro?
The Euro is the currency for the 20 European Union countries that belong to the Eurozone. It is the second most heavily traded currency in the world behind the US Dollar. In 2022, it accounted for 31% of all foreign exchange transactions, with an average daily turnover of over $2.2 trillion a day.
EUR/USD is the most heavily traded currency pair in the world, accounting for an estimated 30% off all transactions, followed by EUR/JPY (4%), EUR/GBP (3%) and EUR/AUD (2%).
What is the ECB and how does it impact the Euro?
The European Central Bank (ECB) in Frankfurt, Germany, is the reserve bank for the Eurozone. The ECB sets interest rates and manages monetary policy.
The ECB’s primary mandate is to maintain price stability, which means either controlling inflation or stimulating growth. Its primary tool is the raising or lowering of interest rates. Relatively high interest rates – or the expectation of higher rates – will usually benefit the Euro and vice versa.
The ECB Governing Council makes monetary policy decisions at meetings held eight times a year. Decisions are made by heads of the Eurozone national banks and six permanent members, including the President of the ECB, Christine Lagarde.
How does inflation data impact the value of the Euro?
Eurozone inflation data, measured by the Harmonized Index of Consumer Prices (HICP), is an important econometric for the Euro. If inflation rises more than expected, especially if above the ECB’s 2% target, it obliges the ECB to raise interest rates to bring it back under control.
Relatively high interest rates compared to its counterparts will usually benefit the Euro, as it makes the region more attractive as a place for global investors to park their money.
How does economic data influence the value of the Euro?
Data releases gauge the health of the economy and can impact on the Euro. Indicators such as GDP, Manufacturing and Services PMIs, employment, and consumer sentiment surveys can all influence the direction of the single currency.
A strong economy is good for the Euro. Not only does it attract more foreign investment but it may encourage the ECB to put up interest rates, which will directly strengthen the Euro. Otherwise, if economic data is weak, the Euro is likely to fall.
Economic data for the four largest economies in the euro area (Germany, France, Italy and Spain) are especially significant, as they account for 75% of the Eurozone’s economy.
How does the Trade Balance impact the Euro?
Another significant data release for the Euro is the Trade Balance. This indicator measures the difference between what a country earns from its exports and what it spends on imports over a given period.
If a country produces highly sought after exports then its currency will gain in value purely from the extra demand created from foreign buyers seeking to purchase these goods. Therefore, a positive net Trade Balance strengthens a currency and vice versa for a negative balance.
- USD/JPY stable at 149.33 as markets await crucial US inflation data, affecting Fed policy outlook.
- US January CPI expected to decline, fueling discussions on Fed's easing timeline amid calls for patience
- Fed unlikely to alter rates in March, but May divided on potential for rate cuts.
- BoJ's cautious normalization stance influenced by wage growth, despite US monetary policy adjustments.
The USD/JPY is virtually unchanged late in the North American session, hovering at around the 149.20s area, as traders await the latest release of inflation data in the United States (US). At the time of writing, the major trades at 149.33, up 0.03%.
USD/JPY at the mercy of US inflation data, US Treasury yields
Traders turned cautious as Wall Street erased the previous gains, with the Nasdaq and the S&P 500 edging lower. The US Department of Labor is expected to release January’s Consumer Price Index (CPI) expected to dip from 3.4% to 2.9% YoY, while Core CPI is foreseen at 3.7%, down from 3.9%. If the data comes as expected, that will open the door to ease policy in the near term.
Meanwhile, Federal Reserve officials pushed back against slashing rates sooner than expected; Fed Governor Michelle Bowman said, “It’s too soon to project when, how much the Fed will cut rates.” Lately, Richmond Fed President Thomas Barkin stressed, “We (Fed) are closing in on the inflation target, but we’re not yet there.”
The CME FedWatch Tool predicts the Fed will keep rates unchanged at 5.25%-5.50% on the March meeting, but in May, there’s a 52% chance for a 25 basis points cut.
On the Japanese front, the Japanese economic calendar will feature the 2023 Q4 Gross Domestic Product (GDP) on Thursday. The economy is foreseen to recover from -0.7% Q3 contraction to 0.3%. Additional data suggests private consumption would stay put while business spending is expected to increase. Aside from this, further data will be revealed, with January PPI and Machine Tool Orders revealed on Tuesday.
Regardless of the data, the Bank of Japan (BoJ) has expressed is in no rush to normalize policy until wages sustainably pick up. Therefore, further USD/JPY upside is seen, and traders would look to test the 150.00 figure.
USD/JPY Price Analysis: Technical outlook
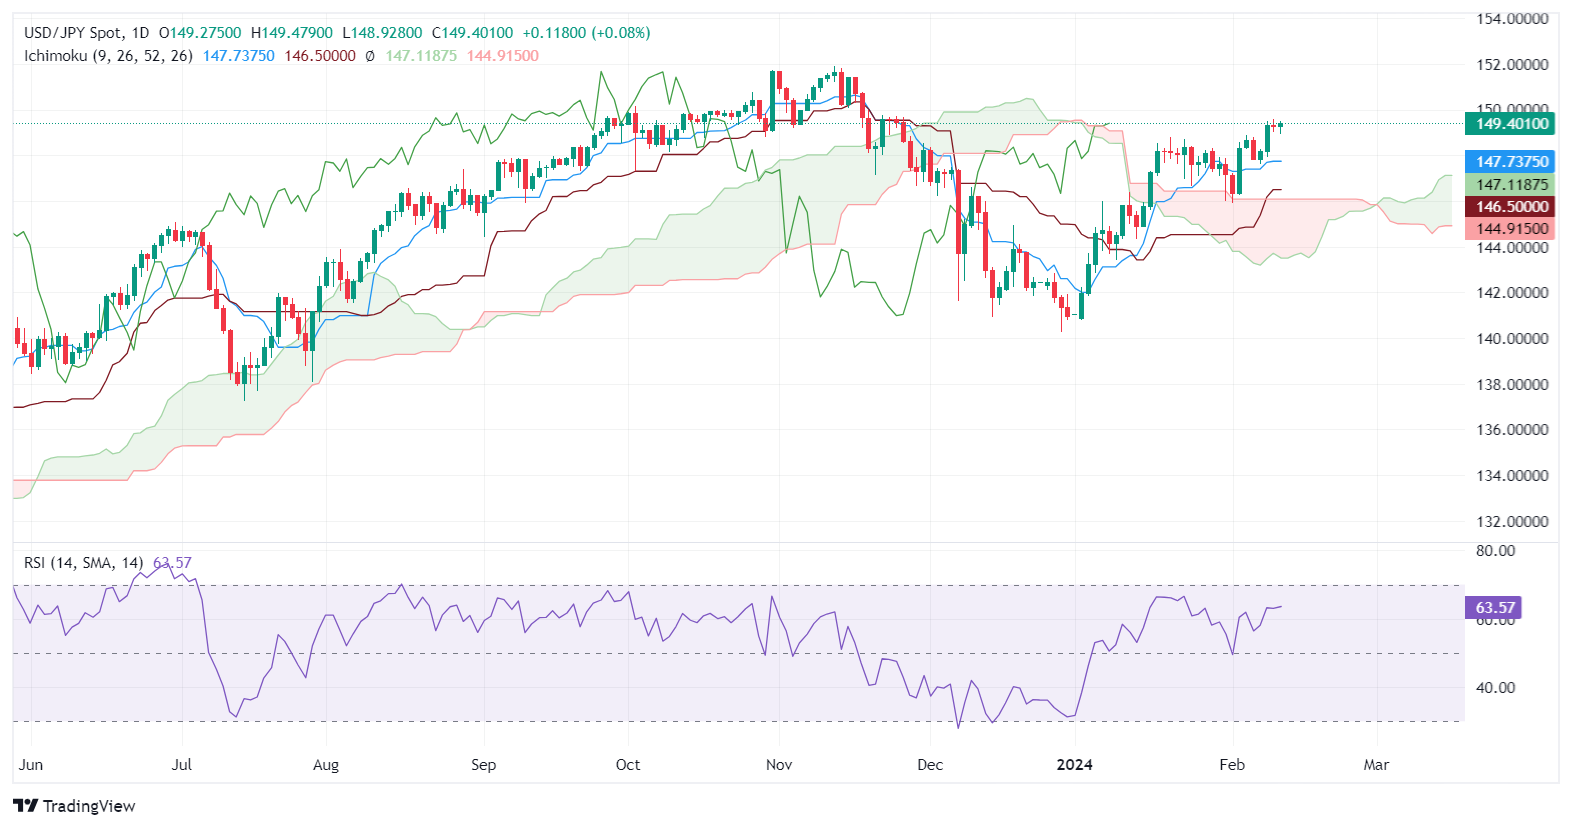
The USD/JPY daily chart suggests the pair is consolidating after posting back-to-back doji’s. Although Japanese officials have remained muted on the Japanese Yen (JPY) levels, buyers are being cautious ahead of testing the 150.00 figure. Further upside is seen at 151.38, the November 16 high, followed by the November 13 high at 151.91. On the flip side, if the pair edges below the 149.00 figure, that could pave the way to test the 148.00 figure, followed by the Tenkan-Sen at 147.74.
A slow start to the new trading week saw the FX universe navigate in quite a muted range as prudence prevailed among market participants ahead of the publication of key US inflation figures on February 13.
Here is what you need to know on Tuesday, February 12:
The USD Index (DXY) ended the session barely changed from Friday’s closing levels in the low-104.00s amidst mixed US yields and rising cautiousness. As mentioned before, US inflation readings tracked by the CPI for the month of January take centre stage on February 12.
EUR/USD managed to briefly surpass the key 1.0800 barrier, although it later faded that move and ended the session around the 1.0770 region.
GBP/USD printed humble gains in the 1.2630 zone, adding to Friday’s advance despite the equally marginal uptick in the greenback. On February 13, the labour market report will be at the centre of the debate across the Channel.
USD/JPY kept its bullish bias well and sound in the upper end of the range north of the 149.00 hurdle on Monday. The release of Producer Prices will grab all the attention in The Land of the Rising Sun on February 13.
The Aussie dollar was one of the best G10 performers on Monday, encouraging AUD/USD to advance to multi-day highs near 0.6540. Next on tap Down Under will be the Consumer Confidence Index gauged by Westpac.
Markets will remain close in China amidst the New Year celebrations.
WTI prices traded with humble gains near the $77.00 mark per barrel, always underpinned by supply concerns and geopolitical jitters.
Gold retreated further and flirted with the $2010 region amidst mixed US yields, slight gains in the greenback, and caution ahead of the US CPI. Its cousin Silver could not sustain the earlier move to six-day highs past the $23.00 mark, eventually ending the session marginally up.
- The AUD/JPY rose in Monday's session at 97.60 with a gain of 0.23%.
- Hourly chart shows RSI and MACD dip, highlighting short-term buyers' shift to consolidate gains.
- The overall trend still favors the bulls.
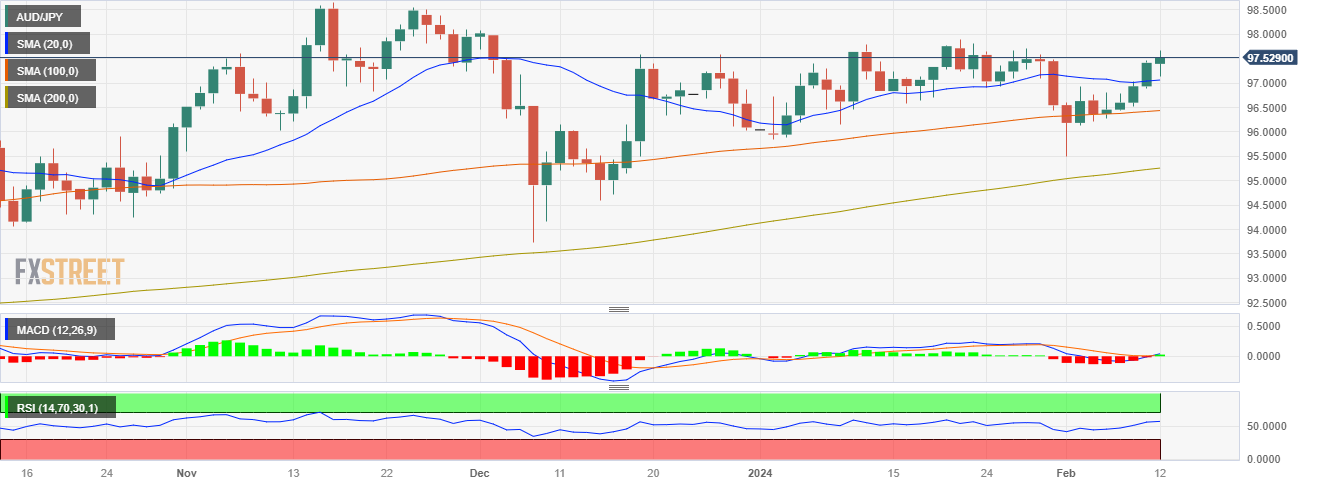
In Monday's session, the AUD/JPY is trading at 97.60, registering a gain of 0.23%. The pair has seen a recent push from the buyers, which made indicators reach overbought territory and now indicators are consolidating. The overall trend still favors the buyers as the pair is still above its main Simple Moving Averages (SMAs)
Analyzing the daily chart, the Relative Strength Index (RSI), which resides within the positive territory, continues to show an increasing trend, suggesting that buyers are currently exerting pressure on the market. This aligns with the Moving Average Convergence Divergence (MACD) histogram, which printed a green bar implying that the bulls jumped back a into positive territory.
Concentrating on the hourly chart, the RSI dipped back from the overbought area struck earlier in the session to the positive domain, hinting at a more balanced, albeit still buyers-favoured, market in recent hours. In line with that, the MACD histogram has been rising, throughout the session but now seems to have flattened as buyers are taking a breather.
Taking the pairs' position into account relative to its main Simple Moving Averages (SMAs), the broader trend is on the buyer's side, as the pair is above the 20, 100, and 200-day SMAs. Yet, for the rest of the session, the cross may continue side-ways trade to consolidate the gains from its recent push.
AUD/JPY daily chart
- Crude Oil markets remain pinned into near-term highs as geopolitical headlines weigh.
- Gaza ceasefire hopes remain, but tensions remain high.
- US Crude Oil production continues to rise, offsetting OPEC production caps.
West Texas Intermediate (WTI) US Crude Oil continued to test into $77.00 per barrel on Monday, with barrel bids pushing into recent highs as a potential ceasefire in the Gaza region remains elusive.
Geopolitical headlines have pushed US Crude Oil into five straight days of gains, sending WTI higher by around 6% last week. Energy markets are keeping prices on the high side heading into the new week, but it's getting difficult for barrel investors to keep attention off of record Crude Oil production in the US.
Israel rejected an immediate proposal for a ceasefire last week, keeping Crude Oil markets pinned into the high end, but negotiations are still ongoing as key nations try to keep a lid on potential spillover from geopolitical risks.
Saudi Arabia’s Energy Minister, Abdulaziz bin Salman Al Saud, noted on Monday that the Organization of the Petroleum Exporting Countries (OPEC) remains able and willing to adjust policy as needed. OPEC has faced an uphill climb in recent months as OPEC production caps get washed out by US Crude Oil production continuing to climb into record highs as the US further cements itself as the world’s largest Crude Oil producer.
US Crude Oil production reached a familiar peak in January despite cold weather snaps that shuttered some production facilities temporarily. US pumping output hit its highest levels since last November.
WTI technical outlook
WTI US Crude Oil remains well-bid, but capped just below the $77.00 key level. WTI remains up over 7% from last week’s bottom bids near $71.50, but struggles to find the bullish momentum needed to push barrel bids back into January’s peak near $79.00.
WTI continues to trade into the 200-day Simple Moving Average (SMA) near $77.30, and five straight days of WTI gains leaves US Crude Oil stuck near familiar technical highs. The long-term median 200-day SMA is capping off bullish momentum, and Crude Oil finds itself hamstrung in a consolidation zone between the 200-day SMA and the 50-day SMA near $73.25.
WTI hourly chart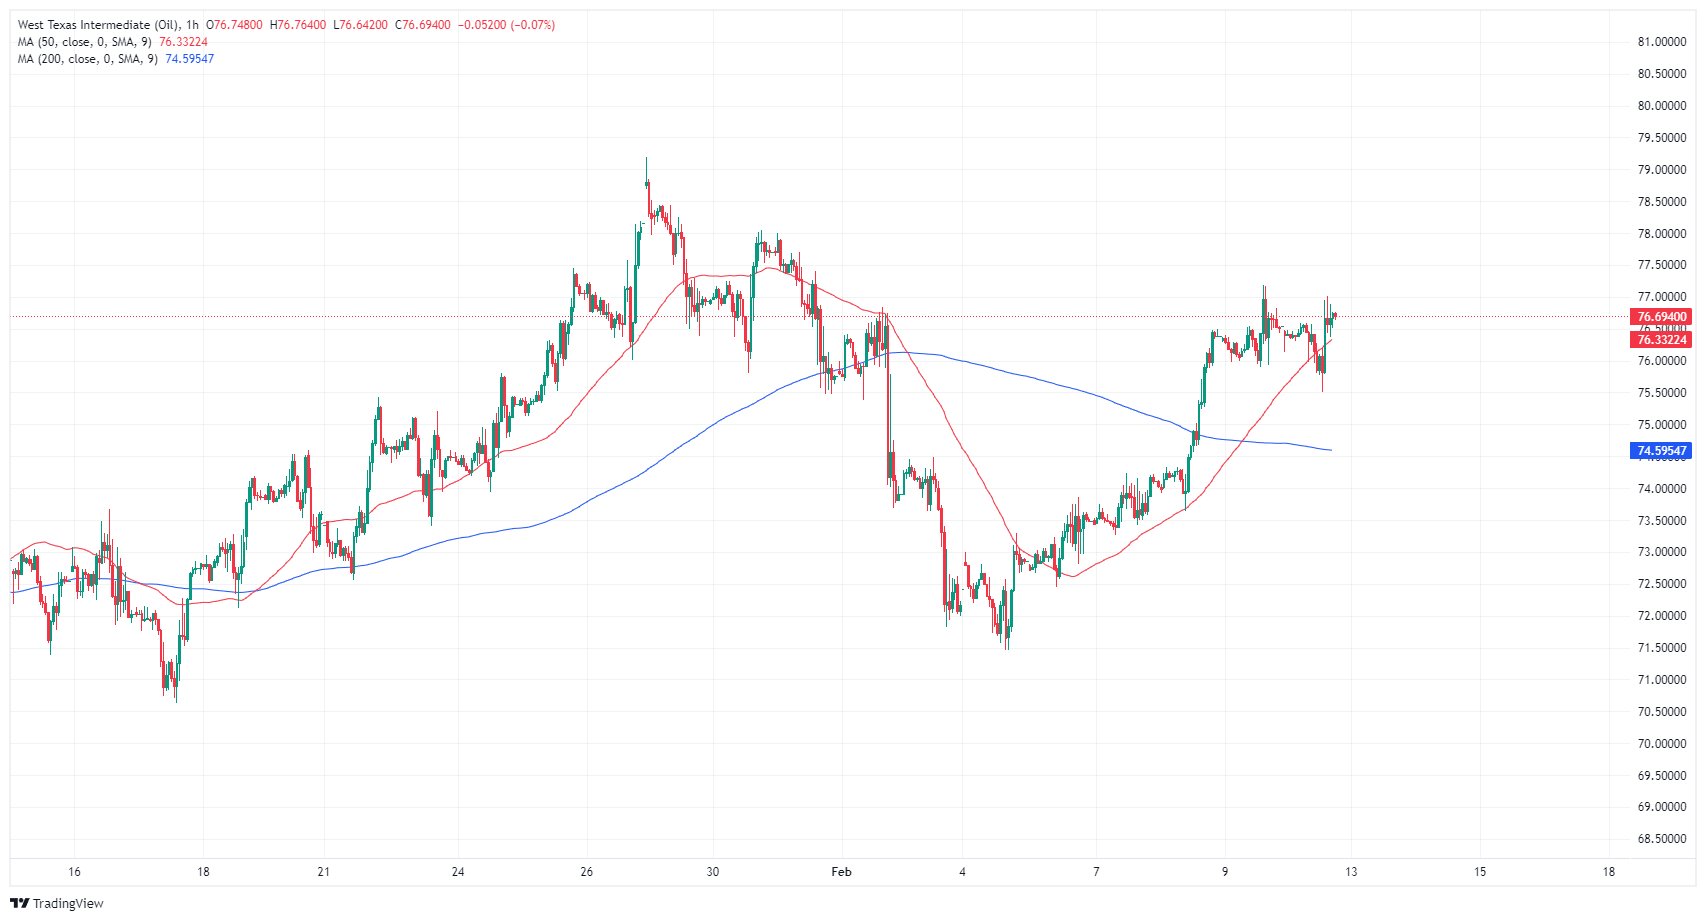
WTI daily chart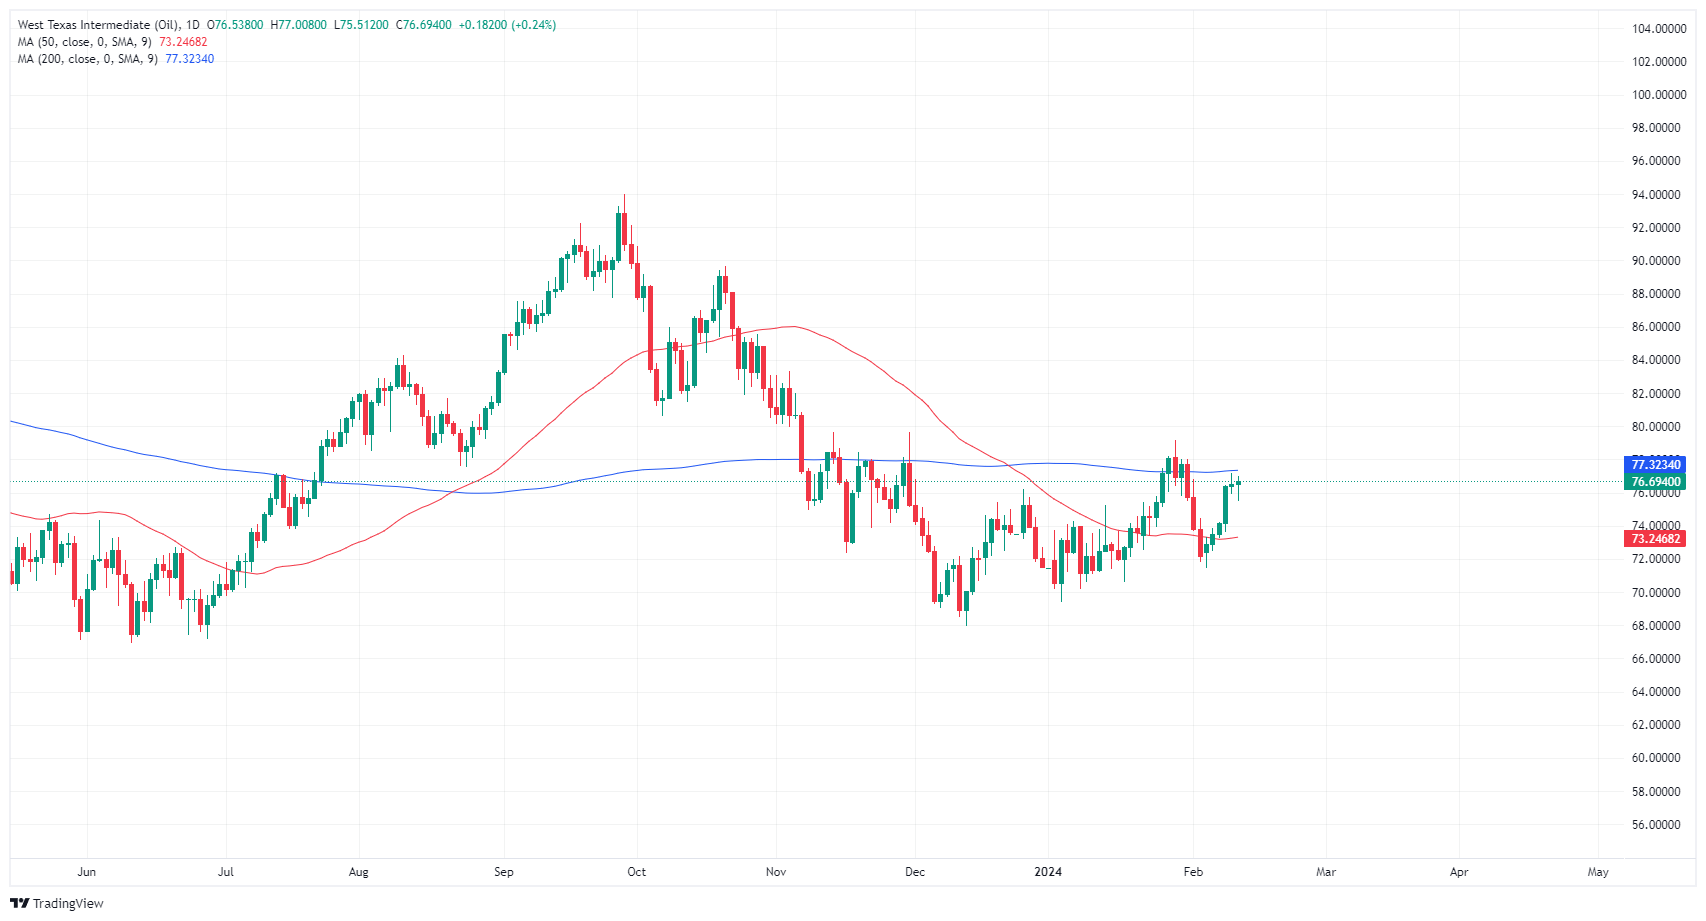
- GBP/USD rises driven by optimistic sentiment and before key economic announcements.
- Upcoming US inflation figures to impact Fed rate cut discussions; Fed officials urge policy caution.
- Lower US Treasury yields contribute to GBP/USD's gain as the Dollar softens.
- UK job data and BoE Governor Bailey's upcoming remarks eyed, with no explicit policy hints expected.
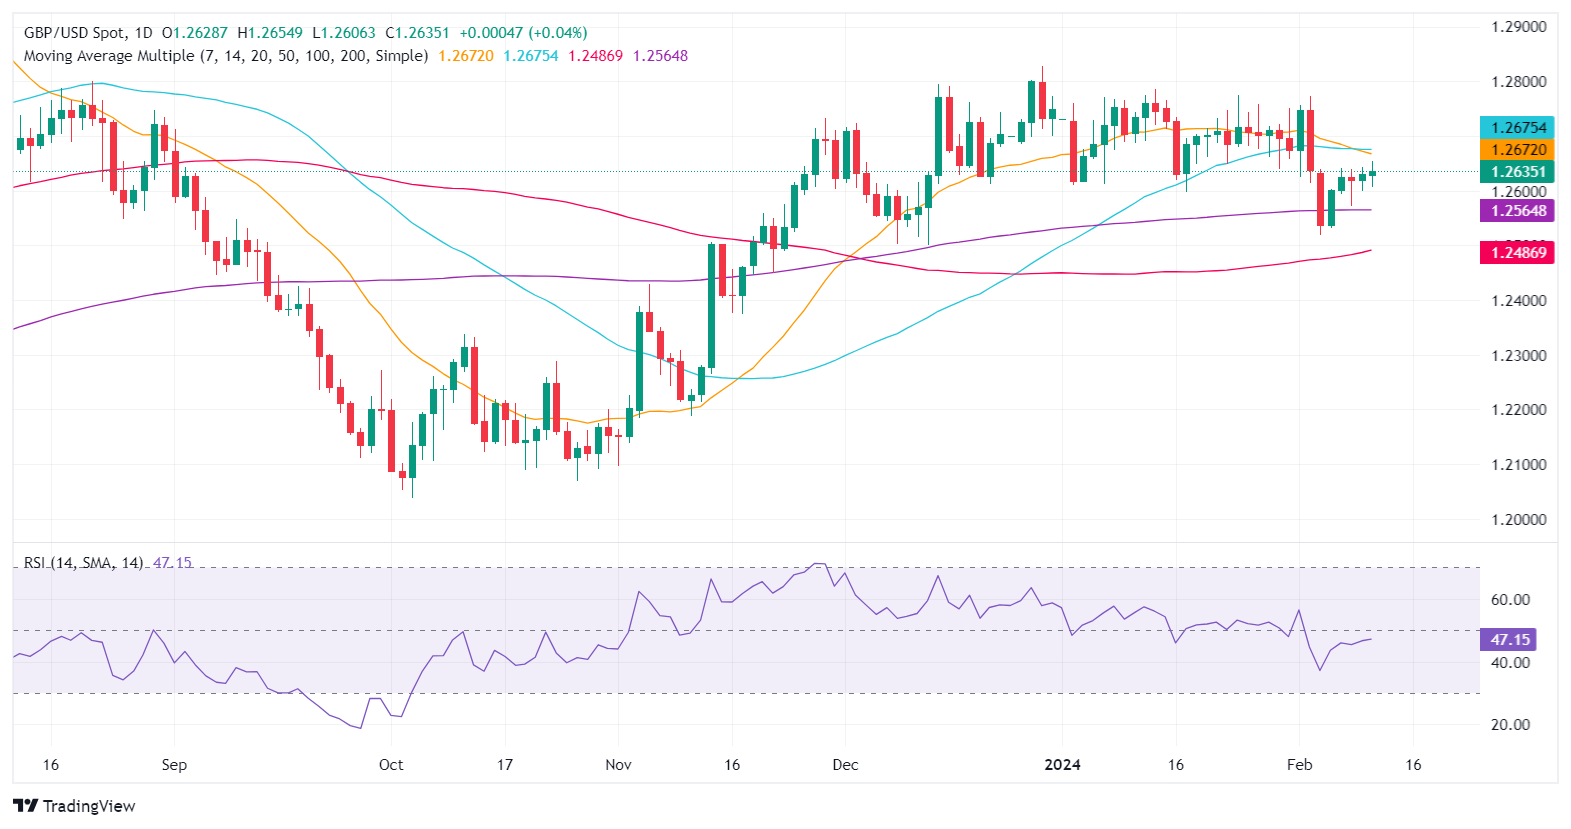
The GBP/USD edges higher in the North American session as market participants await a busy economic calendar across both sides of the Atlantic. At the time of writing, the pair exchanges hands at 1.2637, up 0.09%.
Pound rises on risk-on impulse as traders await US inflation, UK labor data
An upbeat market mood is sponsoring a leg-up on the major, though it remains within familiar levels. Market participants are eyeing an inflation report in the United States (US) which is expected to fuel speculations for rate cuts by the US Federal Reserve (Fed). Words from Fed Governor Michelle Bowman pushed back against easing policy too soon, adding that the current monetary stance is appropriate. In the meantime, Richmond Fed President Thomas Barkin added inflation is closing on the target, but it’s not there yet.
As of writing, the futures market sees the Fed will hold rates unchanged at 5.25%-5.50% at the March meeting, while odds for a May 25 basis point rate cut are at 52%. US Treasury bond yields are edging lower, a headwind for the Greenback (USD).
Across the pond, the UK economic calendar will feature employment data, with estimates suggesting that a mixed report will be released. The Bank of England (BoE) Governor Andrew Bailey is crossing the wires, though he’s not commenting on monetary policy.
Regarding monetary policy, the BoE is expected to slash rates by 80 basis points through 2024, less than the 110 bps at the beginning of the last week. Consequently, short-term UK Gilts jumped, pushing Sterling higher against the US Dollar.
GBP/USD Price Analysis: Technical outlook
The GBP/USD is neutrally biased after it bounced from below the 200-day moving average (DMA). Nevertheless, the path of least resistance is downward biased as the RSI remains bearish, while price action depicts a series of lower highs/lower lows, which could open the door to re-testing the 200-DMA at 1.2562. A breach of 1.2600 would expose the latter, followed by 1.2500. On the other hand, if buyers reclaim the 50-DMA at 1.2672, that will clear the path to 1.2700.
Bank of England (BoE) Governor Andrew Bailey spoke at England's Loughborough University, continuing a long-standing tradition of BoE Governors taking time to deliver speeches at the UK university.
Key highlights:
BoE Governor Bailey expects UK bank reserves to continue falling from the current levels of around £467 billion.
Despite an expected decline in UK bank reserves, Gov Bailey expects bank reserves to overall settle higher than historical norms.
UK banks should use BoE liquidity more extensively.
"UK banks have come through the turbulence of the last four years in sound health, and that has enabled them to contribute to maintaining financial stability and to support the economy and their customers during these difficult times."
- The DXY stands at 104.10 on Monday with mild gains.
- Fed’s dovish stance remains in place despite minimal chance of a March rate cut.
- January’s CPI figures on Tuesday are set to determine the timing of Fed cuts and USD dynamics.
The US Dollar (USD) remains firmly positioned at 104.10, demonstrating stability ahead of key US data releases expected this week. Financial markets keenly await economic reports on the Consumer Price Index (CPI), Producer Price Index (PPI), and Retail Sales data from January, which could potentially bolster the Dollar's position further. Simultaneously, anticipation builds around upcoming inflation reports, expected to shed light on the economy's performance and the Federal Reserve's (Fed) future stance
In early February, the US Dollar saw notable gains following comments from Jerome Powell, the Federal Reserve Chair, indicating that a March cut in interest rates was unlikely. He stressed the need for more evidence of falling inflation before the Fed could consider reducing rates, making upcoming data crucial. Tuesday’s release of the US Consumer Price Index (CPI) for January is expected to significantly influence the short-term direction of the US Dollar.
Daily digest market movers: US Dollar holds steady as markets await key economic data, yields hold steady
- The Core CPI in January is expected to have risen by 3.7% YoY, while the headline measure is seen decelerating to 2.9% YoY.
- US Treasury yields are mildly down. The 2-year yield stands at 4.47%, the 5-year yield at 4.12%, and the 10-year yield at 4.17%.
- CME’s FedWatch Tool indicates a 20% possibility of a rate cut for the March meeting but may see some changes in case the US CPI from January comes in lower than expected. Those odds stand at around 50% for May.
Technical analysis: DXY bulls hold their ground, unable to conquer the 100-day SMA
The Relative Strength Index (RSI) remains stable within positive territory, indicating that upward force retains some punch in the dynamic of the index despite recent shifts. The Moving Average Convergence Divergence (MACD) also offers green flat bars, suggesting a positive trend in line with the bullish stance.
On the scope of the Simple Moving Averages (SMAs), the DXY appears to hover above the 20-day SMA and similarly above the 200-day SMA, indicating a strong bullish perspective in the longer horizon. However, it's trading just beneath the 100-day SMA, suggesting some sell-off pressure in the near to intermediate term.
Given these indicators, it's evident that buying momentum is more present than selling pressure. While the bearish movements have caused some disruption, the resilient undercurrent of bullish energy reflected in the RSI, MACD, and SMAs denotes an optimistic outlook in the overall trend.
US Dollar FAQs
What is the US Dollar?
The US Dollar (USD) is the official currency of the United States of America, and the ‘de facto’ currency of a significant number of other countries where it is found in circulation alongside local notes. It is the most heavily traded currency in the world, accounting for over 88% of all global foreign exchange turnover, or an average of $6.6 trillion in transactions per day, according to data from 2022.
Following the second world war, the USD took over from the British Pound as the world’s reserve currency. For most of its history, the US Dollar was backed by Gold, until the Bretton Woods Agreement in 1971 when the Gold Standard went away.
How do the decisions of the Federal Reserve impact the US Dollar?
The most important single factor impacting on the value of the US Dollar is monetary policy, which is shaped by the Federal Reserve (Fed). The Fed has two mandates: to achieve price stability (control inflation) and foster full employment. Its primary tool to achieve these two goals is by adjusting interest rates.
When prices are rising too quickly and inflation is above the Fed’s 2% target, the Fed will raise rates, which helps the USD value. When inflation falls below 2% or the Unemployment Rate is too high, the Fed may lower interest rates, which weighs on the Greenback.
What is Quantitative Easing and how does it influence the US Dollar?
In extreme situations, the Federal Reserve can also print more Dollars and enact quantitative easing (QE). QE is the process by which the Fed substantially increases the flow of credit in a stuck financial system.
It is a non-standard policy measure used when credit has dried up because banks will not lend to each other (out of the fear of counterparty default). It is a last resort when simply lowering interest rates is unlikely to achieve the necessary result. It was the Fed’s weapon of choice to combat the credit crunch that occurred during the Great Financial Crisis in 2008. It involves the Fed printing more Dollars and using them to buy US government bonds predominantly from financial institutions. QE usually leads to a weaker US Dollar.
What is Quantitative Tightening and how does it influence the US Dollar?
Quantitative tightening (QT) is the reverse process whereby the Federal Reserve stops buying bonds from financial institutions and does not reinvest the principal from the bonds it holds maturing in new purchases. It is usually positive for the US Dollar.
- Mexican Peso extends gains for a third session, buoyed by central banker’s remarks.
- Banxico Governor's comments on inflation and easing hint at policy shifts as MXN gathers traction.
- NY Fed's Consumer Inflation Expectations for one year in January remained steady.
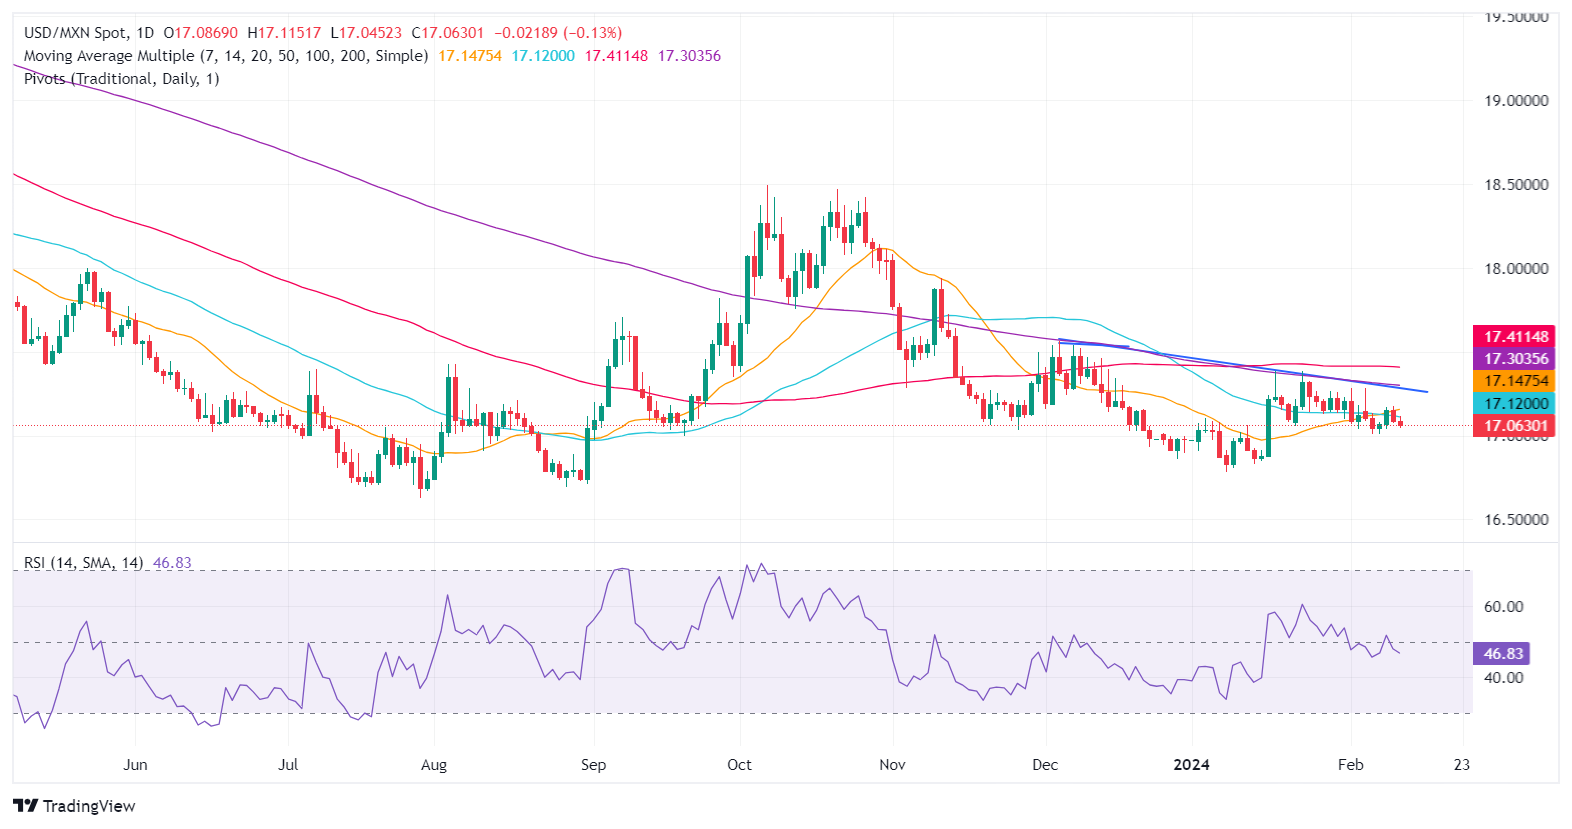
The Mexican Peso moderately gains ground against the US Dollar for the third straight trading session on Monday as Bank of Mexico (Banxico) Governor Victoria Rodriguez Ceja crossed the wires. Although Federal Reserve (Fed) officials laid the ground to ease policy in 2024, they pushed back against rate cuts as early as March. The USD/MXN trades at 17.05, down 0.20%, with sellers eyeing the 17.00 figure.
Mexico’s economic docket featured a speech by Banxico’s Governor Rodriguez, who spoke about inflation and the likelihood of easing monetary policy. Across the border, the calendar featured the New York Federal Reserve’s one-year Consumer Inflation Expectations registering at 3%, unchanged compared with December.
Daily digest market movers: Mexican Peso is firm ahead of US inflation report
- In an interview with El Financiero, Banxico’s Governor, Victoria Rodriguez Ceja, said that inflation is expected to return to its downward trajectory and continue the disinflationary process. She added that despite increasing in the last three months, the Mexican central bank sticks to its vision that inflation will hit its 3% goal in 2025.
- Rodriguez Ceja added that despite lowering interest rates during the year, the bank remains focused on inflation. She added, “The inflationary episode has been evolving, and the situation we find ourselves in now is very different from the one we experience in 2022, even in the first months of 2023.”
- Rodriguez Ceja said the bank would make its decision based on various factors and data, including Fed’s decisions.
- Mexico’s central bank revised their inflation expectations to the upside for Q1 to Q3 of 2024, and they expected to converge toward 3.5% in Q4, based on the latest monetary policy statement.
- Last Thursday, INEGI revealed that in January, Mexico´s Consumer Price Index (CPI) rose by 4.88% YoY, while underlying inflation moderated to 4.76%.
- Atlanta Fed President Raphael Bostic said the Fed must be resolute and added that he’s “laser-focused” on inflation. At the same time, Dallas Fed President Lorie Logan noted that there’s no urgency on cutting rates.
- The US Bureau of Labor Statistics (BLS) will release inflation data on February 13. The Consumer Price Index (CPI) for January is foreseen dipping from 3.4% to 2.9% YoY. The Core CPI is expected to dip from 3.9% to 3.7% on an annual basis.
Technical analysis: Mexican Peso stays firm as USD/MXN remains below 17.10
The USD/MXN is neutral to downwardly tilted with sellers eyeing a break below 17.00. Relative Strength Index (RSI) studies suggest that bears are in charge, but the slope is turning somewhat flat. If sellers push prices below 17.05, that could open the door to test the psychological 17.00 figure. A breach of the latter could pave the way to challenge 2023 low of 16.62.
On the other hand, if buyers reclaim the 50-day SMA at 17.11, that can pave the way to test the 200-day SMA at 17.29. Upside risks emerge once that barrier is cleared with the following supply zone coming at 17.40, the 100-day SMA.
USD/MXN Price Action – Daily Chart
Mexican Peso FAQs
What key factors drive the Mexican Peso?
The Mexican Peso (MXN) is the most traded currency among its Latin American peers. Its value is broadly determined by the performance of the Mexican economy, the country’s central bank’s policy, the amount of foreign investment in the country and even the levels of remittances sent by Mexicans who live abroad, particularly in the United States. Geopolitical trends can also move MXN: for example, the process of nearshoring – or the decision by some firms to relocate manufacturing capacity and supply chains closer to their home countries – is also seen as a catalyst for the Mexican currency as the country is considered a key manufacturing hub in the American continent. Another catalyst for MXN is Oil prices as Mexico is a key exporter of the commodity.
How do decisions of the Banxico impact the Mexican Peso?
The main objective of Mexico’s central bank, also known as Banxico, is to maintain inflation at low and stable levels (at or close to its target of 3%, the midpoint in a tolerance band of between 2% and 4%). To this end, the bank sets an appropriate level of interest rates. When inflation is too high, Banxico will attempt to tame it by raising interest rates, making it more expensive for households and businesses to borrow money, thus cooling demand and the overall economy. Higher interest rates are generally positive for the Mexican Peso (MXN) as they lead to higher yields, making the country a more attractive place for investors. On the contrary, lower interest rates tend to weaken MXN.
How does economic data influence the value of the Mexican Peso?
Macroeconomic data releases are key to assess the state of the economy and can have an impact on the Mexican Peso (MXN) valuation. A strong Mexican economy, based on high economic growth, low unemployment and high confidence is good for MXN. Not only does it attract more foreign investment but it may encourage the Bank of Mexico (Banxico) to increase interest rates, particularly if this strength comes together with elevated inflation. However, if economic data is weak, MXN is likely to depreciate.
How does broader risk sentiment impact the Mexican Peso?
As an emerging-market currency, the Mexican Peso (MXN) tends to strive during risk-on periods, or when investors perceive that broader market risks are low and thus are eager to engage with investments that carry a higher risk. Conversely, MXN tends to weaken at times of market turbulence or economic uncertainty as investors tend to sell higher-risk assets and flee to the more-stable safe havens.
- Canadian Dollar sees thin gains with support from steady Crude Oil bids.
- Canada sees a data-light economic calendar this week.
- Markets kick off the new trading week on a quiet note ahead of key US inflation data.
The Canadian Dollar (CAD) found some room on the high side on Monday, drifting into the green against most of its major currency peers in thin Monday trading. Markets have opened on a quiet note as investors gear up for a smattering of US economic data, with Tuesday’s US Consumer Price Index (CPI) inflation print a key focus for markets heavily invested in betting on rate cuts from the US Federal Reserve (Fed).
Canada has a light showing on the economic calendar this week, and CAD releases on the data docket are strictly low-impact. Thursday’s Housing Starts are expected to slightly improve, while Friday’s Wholesale Sales are forecast to tick slightly lower. Overall, CAD flows can expect to see Crude Oil markets and US Dollar (USD) risk appetite take the wheel this week.
Daily digest market movers: Canadian Dollar churns in familiar technical territory
- Quiet Monday markets give the Canadian Dollar a chance to recover into the high side, but the CAD remains positioned within familiar chart territory.
- Crude Oil found some support on Monday, helping to bolster the CAD.
- Saudi Arabia’s Energy Minister, Abdulaziz bin Salman Al Saud, stated that the Organization for the Petroleum Exporting Countries (OPEC) remains “ready to tweak oil policy at any time”.
- Fed officials continue to reiterate a more moderate policy stance than markets are hoping for.
- Fed’s Bowman: It is still too soon to project when or how much the Fed will cut rates.
- More Bowman: Many risks still remain for Fed’s inflation fight, doesn’t see cuts as appropriate in the ‘immediate future’.
- The New York Fed’s inflation outlook sees three-year inflation at 2.4% in January, down from December’s three-year outlook of 2.6%.
- According to the CME’s FedWatch Tool, markets are still pricing in nearly 60% odds of a May rate cut.
- Money markets are still holding out hope for six rate cuts through 2024.
Canadian Dollar price today
The table below shows the percentage change of Canadian Dollar (CAD) against listed major currencies today. Canadian Dollar was the strongest against the New Zealand Dollar.
| USD | EUR | GBP | CAD | AUD | JPY | NZD | CHF | |
| USD | 0.24% | 0.10% | -0.12% | -0.13% | 0.18% | 0.24% | 0.17% | |
| EUR | -0.24% | -0.14% | -0.36% | -0.37% | -0.06% | 0.01% | -0.07% | |
| GBP | -0.10% | 0.13% | -0.22% | -0.21% | 0.08% | 0.14% | 0.07% | |
| CAD | 0.13% | 0.35% | 0.21% | -0.02% | 0.30% | 0.37% | 0.29% | |
| AUD | 0.13% | 0.36% | 0.24% | 0.01% | 0.30% | 0.38% | 0.30% | |
| JPY | -0.17% | 0.06% | -0.04% | -0.29% | -0.30% | 0.06% | -0.01% | |
| NZD | -0.25% | 0.00% | -0.15% | -0.37% | -0.38% | -0.06% | -0.07% | |
| CHF | -0.17% | 0.08% | -0.07% | -0.29% | -0.30% | 0.01% | 0.08% |
The heat map shows percentage changes of major currencies against each other. The base currency is picked from the left column, while the quote currency is picked from the top row. For example, if you pick the Euro from the left column and move along the horizontal line to the Japanese Yen, the percentage change displayed in the box will represent EUR (base)/JPY (quote).
Technical analysis: Canadian Dollar sees green in quiet Monday chart action
The Canadian Dollar is broadly higher on Monday, seeing thin gains as markets gear up for another trading week. A quiet Monday has the CAD on the high side for the day, gaining around a third of a percent against the broadly weaker New Zealand Dollar (NZD) and Euro (EUR). The Canadian Dollar is higher against the US Dollar by about a tenth of a percent and close to flat against the Australian Dollar (AUD).
USD/CAD remains pinned below the 1.3500 handle after last week’s decline from the 1.3540 neighborhood, and intraday action continues to cycle the 200-hour Simple Moving Average (SMA) as near-term momentum remains limited.
Daily candlesticks have the USD/CAD trading back into a congestion zone just south of the 200-day SMA near 1.3475 as the 50-day SMA consolidates into the midrange near 1.3420, capping off bearish momentum and squeezing the pair into the middle.
USD/CAD hourly chart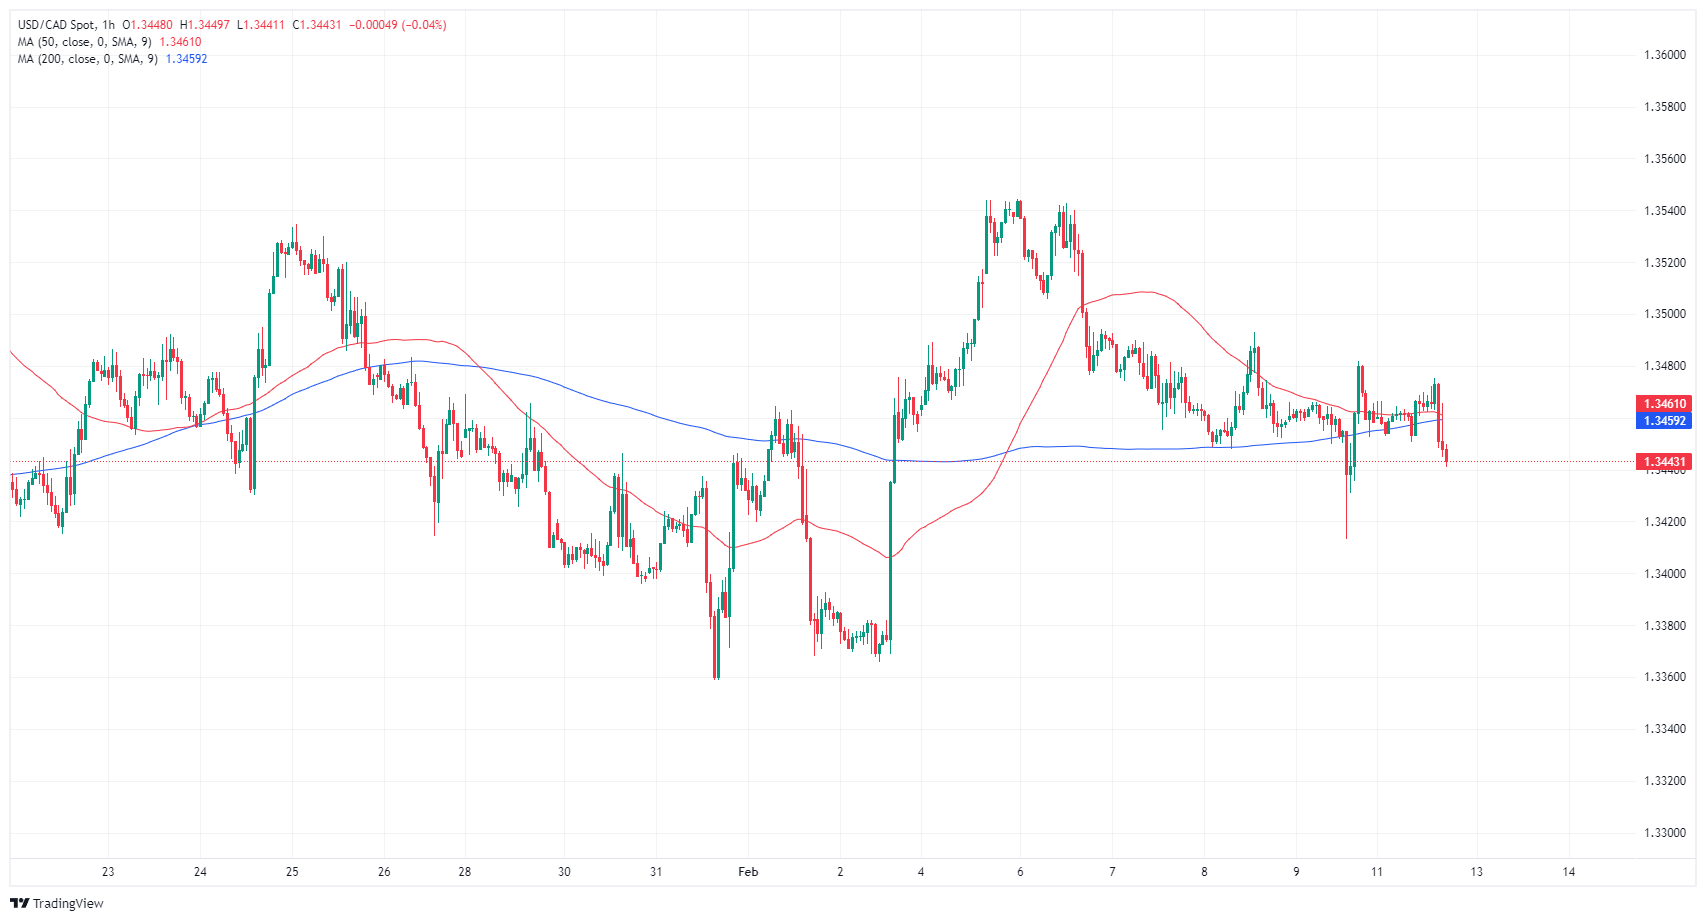
USD/CAD daily chart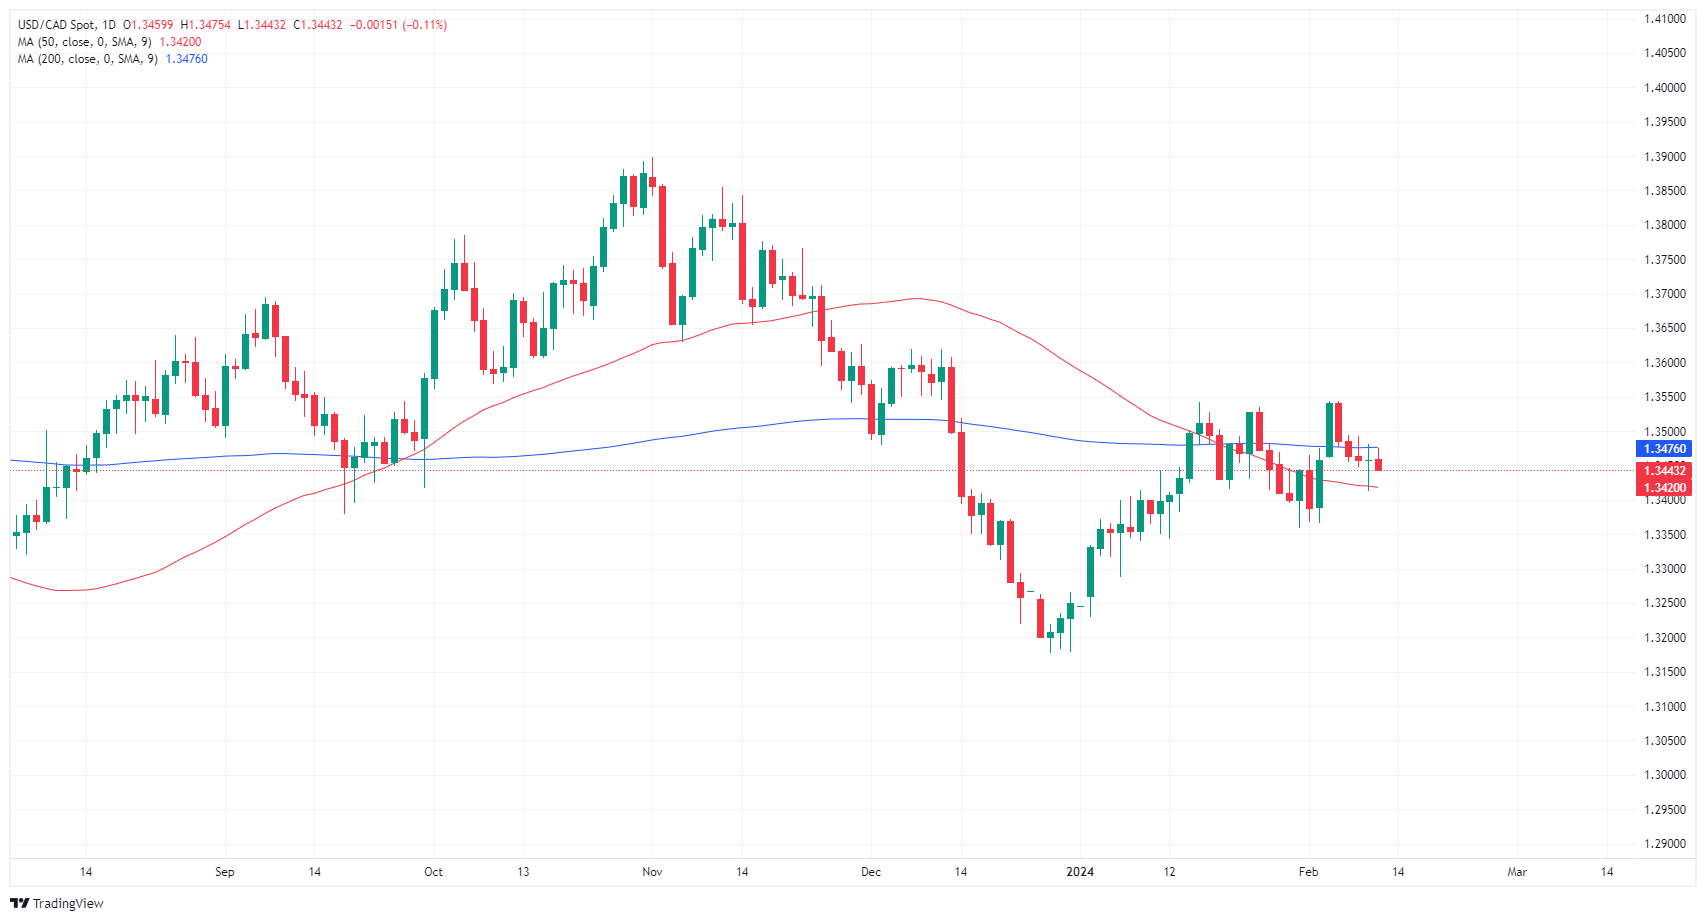
Canadian Dollar FAQs
What key factors drive the Canadian Dollar?
The key factors driving the Canadian Dollar (CAD) are the level of interest rates set by the Bank of Canada (BoC), the price of Oil, Canada’s largest export, the health of its economy, inflation and the Trade Balance, which is the difference between the value of Canada’s exports versus its imports. Other factors include market sentiment – whether investors are taking on more risky assets (risk-on) or seeking safe-havens (risk-off) – with risk-on being CAD-positive. As its largest trading partner, the health of the US economy is also a key factor influencing the Canadian Dollar.
How do the decisions of the Bank of Canada impact the Canadian Dollar?
The Bank of Canada (BoC) has a significant influence on the Canadian Dollar by setting the level of interest rates that banks can lend to one another. This influences the level of interest rates for everyone. The main goal of the BoC is to maintain inflation at 1-3% by adjusting interest rates up or down. Relatively higher interest rates tend to be positive for the CAD. The Bank of Canada can also use quantitative easing and tightening to influence credit conditions, with the former CAD-negative and the latter CAD-positive.
How does the price of Oil impact the Canadian Dollar?
The price of Oil is a key factor impacting the value of the Canadian Dollar. Petroleum is Canada’s biggest export, so Oil price tends to have an immediate impact on the CAD value. Generally, if Oil price rises CAD also goes up, as aggregate demand for the currency increases. The opposite is the case if the price of Oil falls. Higher Oil prices also tend to result in a greater likelihood of a positive Trade Balance, which is also supportive of the CAD.
How does inflation data impact the value of the Canadian Dollar?
While inflation had always traditionally been thought of as a negative factor for a currency since it lowers the value of money, the opposite has actually been the case in modern times with the relaxation of cross-border capital controls. Higher inflation tends to lead central banks to put up interest rates which attracts more capital inflows from global investors seeking a lucrative place to keep their money. This increases demand for the local currency, which in Canada’s case is the Canadian Dollar.
How does economic data influence the value of the Canadian Dollar?
Macroeconomic data releases gauge the health of the economy and can have an impact on the Canadian Dollar. Indicators such as GDP, Manufacturing and Services PMIs, employment, and consumer sentiment surveys can all influence the direction of the CAD. A strong economy is good for the Canadian Dollar. Not only does it attract more foreign investment but it may encourage the Bank of Canada to put up interest rates, leading to a stronger currency. If economic data is weak, however, the CAD is likely to fall.
- The EUR/GBP trades at 0.8532 reporting mild losses during Monday's session.
- Impending release of UK's January CPI and Q4 GDP due on Wednesday and Thursday might exert pressure on GBP.
- Markets anticipate the BoE to initiate rate cutting cycle later than Fed and ECB.
- ECB's easing cycle is expected to kick off in April.
In Monday's session, the EUR/GBP traded at a minimal loss at 0.8532. Underpinning the GBP stability is market anticipation of the Bank of England’s (BoE) delayed rate-cut cycle, overshadowing potential imminent UK economic headwinds. Conversely, inflation trends, coupled with easing cycle expectations, add an element of uncertainty for the Euro, potentially favoring EUR/GBP selling momentum.
In line with that, the GBP might face headwinds due to the anticipated release of January Consumer Price Index (CPI) and Q4 Gross Domestic Product (GDP) numbers, with the potential of the latter confirming a technical recession from 2023. However, the GBP has had a robust start to 2024, second only to the USD amongst G10 currencies as market expectations hint at the BoE initiating a rate-cutting cycle later than the Federal Reserve (Fed) and European Central Bank (ECB). On Tuesday, labor market data from January and December will also be looked upon.
For the ECB, markets bet on a 60% probability for a 25 bp rate cut in April and a total easing of 125 bp within the year.
EUR/GBP technical analysis
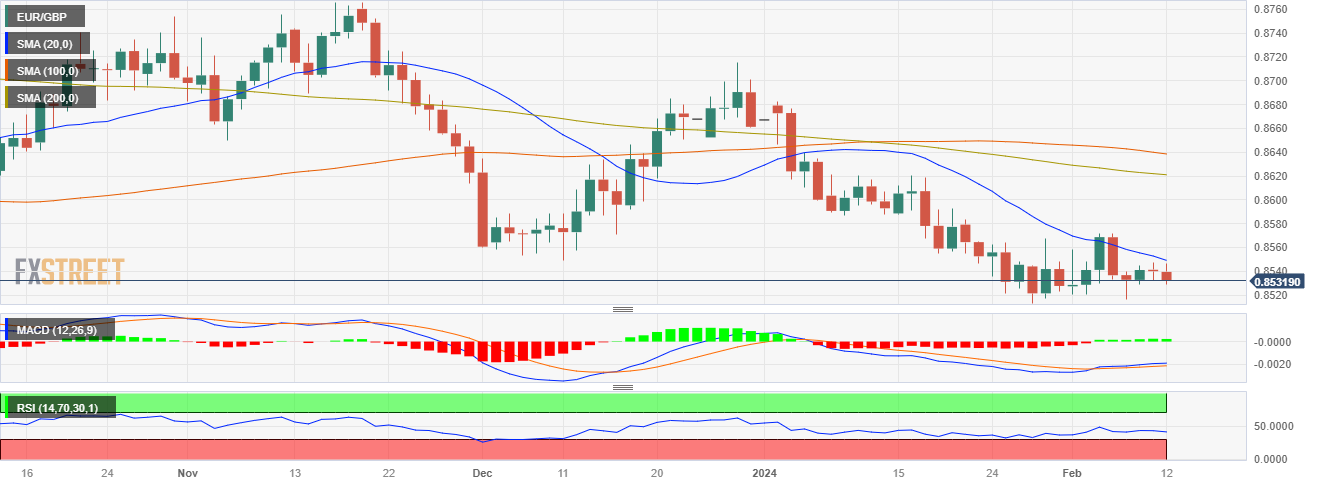
The Relative Strength Index (RSI) for the EURGBP pair is currently oscillating within the negative territory and the slope has been moderately positive, hinting at a slight shift of momentum from the sellers to the buyers over the recent days.
However, the Moving Average Convergence Divergence (MACD) histogram is printing flat green bars indicating that despite some buying pressure, sellers are still dominant. On the hourly chart, the RSI is also maintaining its position within the negative territory, and the MACD histogram continues to print red bars indicating that in the immediate short term, the sellers are also in control.
In the larger context, the EURGBP maintains its position below the 20, 100, and 200-day Simple Moving Averages (SMAs), reinforcing the dominant bearish outlook.
EUR/GBP daily chart
The Federal Reserve Bank of New York's latest Survey of Consumer Expectations showed on Monday that the US consumers' one-year inflation expectation held steady at 3%.
Key takeaways
Three-year expected inflation at 2.4%, lowest since March 2020, vs December’s 2.6%.
Five-year expected inflation unchanged at 2.5%.
Expected inflation rises soften for food, gas, rent, medical costs, college education
Expected rise in gas prices lowest since December 2022.
Expected food rise lowest since March 2020, rent since December 2020.
Expected income growth rises by 2.8% in January vs. December’s 2.5%.
Perceptions of access to credit improved in January.
Expected home price rise unchanged at 3%.
Labor market expectations mixed in January
Market reaction
The US Dollar Index showed no immediate reaction to this report and was last seen posting small daily gains at 104.15.
The US Bureau of Labor Statistics (BLS) will release the most important inflation measure, the US Consumer Price Index (CPI) figures, on Tuesday, February 13 at 13:30 GMT. As we get closer to the release time, here are the forecasts by the economists and researchers of 10 major banks regarding the upcoming United States inflation print for January.
Headline is forecast to have grown at a slower pace of 2.9% year-on-year vs. 3.4% in December, while core – that excludes volatile food and oil prices – is expected at 3.7% YoY vs. the prior release of 3.9%. On a monthly basis, markets anticipate that the headline and core CPI grew steadily at 0.2% and 0.3%, respectively.
ANZ
We expect core CPI inflation to have risen 0.2% MoM in January, and headline by 0.1% MoM.
Commerzbank
We expect the core rate, i.e. consumer prices excluding energy and food, to rise by 0.3% from the previous month and thus at the same pace as in November and December. Inflationary pressure continues to come primarily from rents. As energy prices are likely to have fallen, we expect the overall price index to rise by only 0.2%. If our expectations come true, the figures would not provide a clear indication. This is because they would certainly not be high enough to call the downward trend into question, but would also not indicate any clear progress, even if the annual rates are likely to fall slightly – depending on the revisions. We assume that the Fed will not cut interest rates at the next meeting in March. However, it is likely to do so at the following meeting in May.
ABN Amro
We expect CPI inflation to remain relatively benign (0.1% MoM) with a further fall in gasoline prices and a renewed fall in used car prices offsetting continued firmness in services (housing rents and medical) inflation. Headline annual inflation is expected to fall to the symbolic 2-handle for the first time since early 2021.
Deutsche Bank
We expect gains in the headline measure to slow to 0.2% MoM from 0.3% in December but see growth in core staying at 0.3%. This would equate to core YoY CPI inflation falling two-tenths to 3.7%, while that for headline would fall by four-tenths to 2.9%. The three-month annualised rate would rise two-tenths to 3.5% while the six-month annualised rate would tick up a tenth to 3.3% largely due to base effects.
RBC Economics
We look for headline CPI growth (YoY) to fall below 3% for the first time in almost three years (since March 2021). Most of that slowing is expected to come from a pullback in energy prices and another drop in food price growth. Core price growth, which excludes food and energy products, should ease less – we expect 3.8% YoY in January from December’s 3.9%. But a disproportionate share of that increase still comes from higher home rents. The growth in shelter costs will continue to slow as lower market rents gradually feed through to leases. Price growth of goods has slowed back to around zero as the impact of acute global supply chain disruptions earlier ease.
TDS
We look for core inflation to stay relatively unchanged at 0.3% MoM in January, with the headline likely slowing a tenth to 0.1%. Our unrounded core CPI forecast at 0.27% MoM suggests it will be a close call between a 0.2% and a 0.3% gain. Our projections imply that inflation likely lost speed again on a YoY basis in January as we look for inflation to drop to 3.0% for the headline (after 3.4% YoY in December), and to ease to 3.8% YoY for the core series (after 3.9% in January).
NBF
The energy component is likely to have had a negative impact on the headline index, limiting its monthly to only 0.2%. If we’re right, the YoY rate could fall from 3.4% to a 7-month low of 3.0%. Core prices, for their part, could show a 0.3% monthly progression, led by another increase in the shelter component. This would translate into a 1-tick decline of the 12-month rate, to a 32-month low of 3.8%.
SocGen
Fed officials want more evidence inflation is on a sustainable path back to 2% before they start easing. Tuesday’s US CPI report should only marginally add to that evidence, as we expect core inflation to ease by only 0.1pp to 3.8% YoY (0.3% MoM) while we forecast a decrease in headline to 2.9% YoY from 3.4%.
Wells Fargo
We expect inflation to continue to recede and forecast the headline CPI to rise 0.2% in January, which would push the year-ago pace down to 3.0%. Falling gasoline prices and moderating price increases at the grocery store should keep the headline gain in check. Core inflation likely continued to cool more slowly last month, and we anticipate the core CPI rose 0.3%, translating to a 3.7% year-ago pace. We ultimately look for inflation to cool further this year, albeit at a slower rate than in 2023, and believe price growth is still more likely to modestly overshoot rather than undershoot the Fed's target. The inflation data will continue to garner most of the Fed's attention this year as it tries to fine-tune the precise timing of rate cuts. We continue to believe the first cut will come in May, though risks look tilted more toward June rather than March based on recent data.
CIBC
Much to the Fed’s delight, CPI is becoming boring again. We expect more of the same in January’s CPI report. Core inflation will remain in a range broadly consistent with target, coming in at 0.3% MoM, and headline inflation should come in a touch softer at 0.2% MoM. The Fed will be paying close attention to the composition, looking for more progress from service inflation. But they do not need to see a lot of progress in that rotation in this release as time continues to be on their side. Rebalancing in the used car market and passthrough from weak Chinese import prices should keep a lid on core goods prices, mitigating the influence of higher shipping costs.
AUD/USD ended the week just above 0.6500. Economists at Scotiabank analyze the pair’s outlook.
AUD outlook remains constructive
The Reserve Bank of Australia is reluctant to concede that the tightening cycle is over, suggesting that the policy rate will stay elevated for some time to come. Stimulus efforts in China may – eventually – lead to some sustained economic improvement in a key export market for Australia.
The AUD looks relatively ‘cheap’ among its major currency peers in broad terms and trades below our own short-term, fair value estimate currently.
Market sentiment remains bearish but aggressive short AUD positioning has eased somewhat from the peaks seen late last year.
AUD/USD – Q1-24 0.6600 Q2-24 0.6600 Q3-24 0.6800 Q4-24 0.6800
The Pound Sterling (GBP) has had a good start to the year and is currently the second best performing G10 currency after the US Dollar (USD) in 2024 to date. Economists at Scotiabank analyze GBP outlook.
Looking to sell rallies in EUR/GBP in the coming months
The Pound faces a couple of potential headwinds this week in the shape of UK economic data releases. Firstly, the consensus forecast for the release of UK January CPI inflation on February 14 suggests an uptick in both the headline and core rates. Secondly, surveys suggest that the release of the UK Q4 GDP number later in the week could confirm a technical recession for the economy in the latter part of last year.
Weak UK GDP data suggests some potential for profit-taking in long GBP positions. That said, we would favour buying GBP on dips vs. the EUR and look for a move in EUR/GBP to 0.8400 in the latter part of this year.
- EUR/USD dips to 1.0773 amid ECB officials' dovish comments and a sparse Eurozone calendar.
- Remarks by ECB's De Cos and Lane increase expectations for swift disinflation, suggesting a sooner policy shift.
- Fed's Logan and Bostic adopt a cautious approach to rate cuts, prioritizing inflation control.
- EU's ZEW Economic Sentiment Index and upcoming US CPI data set to influence EUR/USD, with inflation forecast to decline.
The Euro registered minuscule losses against the US Dollar early during Monday’s North American session, as some European Central Bank (ECB) officials were dovish, laying the ground to cut rates. That and a scarce economic calendar in the Eurozone keep traders leaning on last week’s speeches and the important US inflation report on Tuesday. The EUR/USD trades at 1.0763, down 0.14%.
Euro weighed by ECB’s officials make dovish comments
Last week, De Cos seemed confident that the 2% mid-term target would be achieved, “taking into account the associated risks and, second, the rate path that is compatible with reaching our symmetric target.” Last Friday, the ECB’s Chief Economist Lane said that “incoming data suggests that the process of disinflation in the near-term, in fact, may run faster,” which implies the ECB could pivot based on recently released data.
Over the weekend, comments by ECB’s Governing Council Panetta fueled speculation that Lagarde and Co. might cut rates earlier than the US Federal Reserve (Fed), opening the door for further EUR/USD downside. The market sees a 60% probability of a 25 bp rate cut in April and 125 bp of total easing this year.
Across the pond, Fed officials struck a more balanced tone, with Dallas Fed President Lorie Logan saying the risks are more balanced and there was no urgency on rate cuts. Her colleague Atlanta’s Fed President Raphael Bostic dialed back his 2023 Q4’s dovish rhetoric and said he’s still “laser-focused” on inflation.
On Tuesday, the EU's economic calendar will feature the February ZEW Economic Sentiment Index for Germany and the bloc. On the US, February’s Consumer Price Index (CPI) figures could move the needle in the EUR/USD pair. Market players expect a dip in CPI from 3.4% to 2.9% YoY and core CPI on an annual basis to edge lower from 3.9% to 3.7%.
EUR/USD Price Analysis: Technical outlook
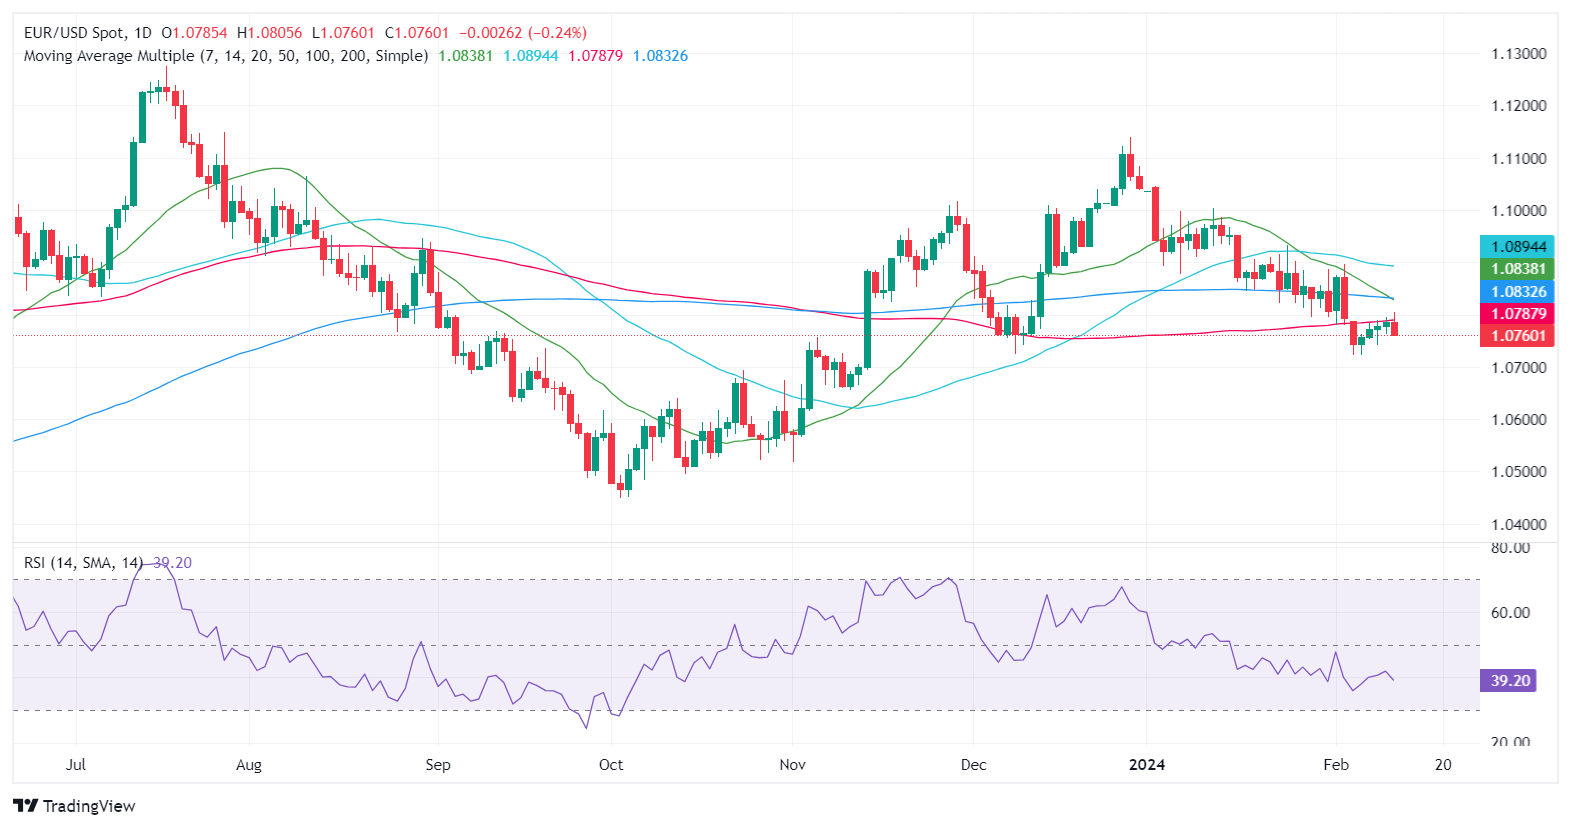
The EUR/USD is downward biased as depicted by the daily chart. The pair pierced the 100-day Moving Average (DMA) at 1.0789 and reached 1.0800 but slipped past those two levels extending its losses toward the 1.0760s area. If broken, further downside is seen below the February 6 low of 1.0722, ahead of the 1.0700 mark. On the flip side, if buyers lift the spot price above 1.0789, that could open the door to challenge 1.0800.
EUR/USD has been trading below the 1.0800 level. Economists at Scotiabank analyze the pair’s outlook.
A more constructive EUR trend should develop into Q2/Q3
EUR/USD’s early year losses risk extending a little more before stabilizing.
Macro-economic drivers should improve somewhat for the EUR in the coming year, with the worst of the Eurozone’s economic slump now behind it. But near-term trends are likely to reflect the EUR’s still significant interest rate disadvantage relative to the USD.
A drop back in the EUR to 1.0500/1.0600 may develop before renewed EUR buying interest emerges.
A more constructive EUR trend should develop into Q2/Q3.
USD/JPY traded on Friday at a new high for this year near 149.60. Economists at Scotiabank analyze the pair’s outlook.
JPY trend hinges on yields
Rising US yields were a clear negative for the JPY during the Fed’s tightening cycle so the reverse should be true as the Fed starts to unwind rate hikes. In addition, the BoJ continues to make small adjustments to its monetary policy stance, allowing bond yields a little more room to rise and teeing up a likely move in its benchmark policy rate (-0.10%) to positive later this year.
Yield differentials, and therefore the cost of carrying long JPY positions, remain onerous but a short, sharp move lower in USD/JPY is feasible as compressing spreads prompt bearish JPY positions to reduce cover.
USD/JPY – Q1-24 150.00 Q2-24 150.00 Q3-24 140.00 Q4-24 140.00
- AUD/USD consolidates above 0.6500 as the focus shifts to US inflation data.
- The Fed is expected to cut interest rates in May.
- The Australian Dollar will dance to the tunes of the Employment data.
The AUD/USD pair trades in a narrow range above the psychological support of 0.6500 in the early New York session. The Aussie asset struggles for a direction as investors await January’s United States Consumer Price Index (CPI) data for fresh guidance.
S&P500 futures display a subdued performance before the opening of US markets. The US Dollar Index (DXY) extends its recovery to 104.20 as investors are cautious ahead of US inflation data, which will be published on Tuesday.
According to the estimates, the headline inflation grew at a slower pace of 3.0% against 3.4% in December. In the same period, core inflation that excludes volatile food and oil prices decelerated slightly to 3.8% from 3.9%. The monthly headline and core inflation rose steadily by 0.2% and 0.3%, respectively.
The continuation of progress in the underlying inflation declining towards the 2% target will increase the odds of a rate cut by the Federal Reserve (Fed). As per the CME Fedwatch, the chances of a rate cut by 25 basis points (bps) in the March monetary policy meeting are small. While for the May meeting, traders see a 53% chance for a rate cut by 25 bps that will push key rates in the range of 5.00-5.25%.
On the Australia Dollar front, investors will focus on the Australian Employment data for January, which will be released on Thursday. Investors anticipate Australian employers hiring 30K workers against 65.1K lay-offs in December. The Unemployment Rate rose to 4% from 3.9% a month ago.
US Dollar (USD) trades mixed in narrow ranges versus majors ahead of the US Consumer Price Index (CPI) report on Tuesday. Economists at Scotiabank analyze Greenback’s outlook.
Flat USD looks to CPI for direction
The DXY is still effectively consolidating its early February push higher but the index was showing some signs of slipping last week. Price action on the day so far suggests the USD continues to pick up support on minor dips generally, with the index well-supported on weakness to the 104.00 area.
Beyond the price signals, the Dollar – still – looks a bit ‘rich’ in terms of short-term fair value (based solely on spreads) and, with US yields unable to extend significantly last week (US 10Y yields capped below the 4.20% area, for example), the potential for the USD to strengthen without the support of firmer data and higher yields looks quite limited at this point.
The USD’s short-term tone hinges largely on the US January CPI report on Tuesday. Slower inflation (which is expected) should strengthen the ceiling on the USD; sticky inflation will push back a bit harder on market pricing which is reluctant to give up in Fed May easing hopes, however, and give the USD a bit of a lift.
S&P 500 futures are unchanged, Dow Jones futures trade flat, and Nasdaq futures hold steady near the previous week's closing level.
S&P 500 (SPX), Dow Jones (DJIA), and Nasdaq (IXIC) indexes closed on Friday with a 0.57% gain, a 0.14% drop, and a 1.25% rise, respectively.
What to know before stock market opens
- Nasdaq Composite rose more than 2% last week and the S&P 500 posted gains for the fourth consecutive week to post a record-high closing above 5,000. Dow Jones underperformed and was virtually unchanged for the week.
- The US Bureau of Labor Statistics (BLS) announced on Friday that it revised the monthly Consumer Price Index (CPI) increase for December lower to 0.2% from 0.3%.
- Dallas Federal Reserve (Fed) Bank President Lorie Logan said that there is no urgency to cut interest rates. Logan acknowledged that there has been "tremendous progress" on bringing down inflation but noted that she would want to see further evidence on inflation to confirm the progress is durable.
- The US Department of Labor reported that there were 218,000 Initial Jobless Claims in the week ending February 3, down from the previous week's revised 227,000.
- On Tuesday, the BLS will release January CPI data. The headline annual CPI is forecast to rise 3% on a yearly basis, at a softer pace than December's 3.4%. The Core CPI, which excludes volatile food and energy prices, is expected to increase 3.8%.
- Arista Networks Inc. (ANET), Cadence Design Systems Inc. (DNS) and Waste Management Inc. (WM) are among top companies that will release earnings reports after the closing bell on Monday.
- Later in the week, January Retail Sales, Industrial Production and Producer Price Index (PPI) data will be featured in the US economic calendar.
S&P 500 FAQs
What is the S&P 500?
The S&P 500 is a widely followed stock price index which measures the performance of 500 publicly owned companies, and is seen as a broad measure of the US stock market. Each company’s influence on the computation of the index is weighted based on market capitalization. This is calculated by multiplying the number of publicly traded shares of the company by the share price. The S&P 500 index has achieved impressive returns – $1.00 invested in 1970 would have yielded a return of almost $192.00 in 2022. The average annual return since its inception in 1957 has been 11.9%.
How are companies chosen to be included in the S&P 500?
Companies are selected by committee, unlike some other indexes where they are included based on set rules. Still, they must meet certain eligibility criteria, the most important of which is market capitalization, which must be greater than or equal to $12.7 billion. Other criteria include liquidity, domicile, public float, sector, financial viability, length of time publicly traded, and representation of the industries in the economy of the United States. The nine largest companies in the index account for 27.8% of the market capitalization of the index.
How can I trade the S&P 500?
There are a number of ways to trade the S&P 500. Most retail brokers and spread betting platforms allow traders to use Contracts for Difference (CFD) to place bets on the direction of the price. In addition, that can buy into Index, Mutual and Exchange Traded Funds (ETF) that track the price of the S&P 500. The most liquid of the ETFs is State Street Corporation’s SPY. The Chicago Mercantile Exchange (CME) offers futures contracts in the index and the Chicago Board of Options (CMOE) offers options as well as ETFs, inverse ETFs and leveraged ETFs.
What factors drive the S&P 500?
Many different factors drive the S&P 500 but mainly it is the aggregate performance of the component companies revealed in their quarterly and annual company earnings reports. US and global macroeconomic data also contributes as it impacts on investor sentiment, which if positive drives gains. The level of interest rates, set by the Federal Reserve (Fed), also influences the S&P 500 as it affects the cost of credit, on which many corporations are heavily reliant. Therefore, inflation can be a major driver as well as other metrics which impact the Fed decisions.
The Canadian Dollar (CAD) trades steady on the day, with USD/CAD limited on approaches to mid-1.3500s against the US Dollar (USD). Economists at Scotiabank analyze USD/CAD outlook.
Firm resistance now around 1.3540
The CAD traded well off the intraday low Friday and failed to secure a higher weekly close on the USD that was looking possible late last week. Still, the longer run charts do reflect a stalling in the USD’s new year rally and imply firm resistance now around 1.3540 (highs from last week and earlier in January, 50% retracement resistance from the USD’s Q4 drop).
Near-term technicals are neutral but the broader pattern of trade favours fading USD gains through the low/mid-1.3500s and for the USD to put key support at 1.3360 under a bit more pressure in the weeks ahead.
GBP/USD drifts lower. Economists at Scotiabank analyze the pair’s outlook.
Short-term charts lean bearish
There is a raft of key data reports due in the coming days which will likely shape the Pound’s near-term direction. Employment data are due on Tuesday but CPI (expected to firm a little) Wednesday and GDP (expected to weaken) Thursday will drive GBP sentiment. It may be a bumpy ride for the Pound this week.
Short-term charts lean bearish but the Pound’s solid move off last week’s low and relatively firm close suggest some resilience on the weekly chart.
Short-term resistance is 1.2650. Support is 1.2570/1.2575. Key support is 1.2520.
- The US Dollar opens up a touch softer despite some turmoil over the weekend.
- Traders are looking forward to the main event this week on Tuesday with US CPI numbers.
- The US Dollar Index still trades at 104 and could drop substantially lower if disinflation continues.
The US Dollar (USD) is heading a touch softer this Monday morning despite two main elements that were making the news over the weekend. First and foremost were the controversial comments from former US President Donald Trump who said he would “encourage” Russia any North Atlantic Treaty Organization (NATO) country that did not meet its financial contribution to NATO.
Trump’s comments triggered panic across Europe since it is a sign the US could possibly fully retract its support for Ukraine if Trump gets elected. The second chunk of geopolitics to impact markets was the assault on Rafah by the Israeli army, which has surrounded the city and is trying to eliminate any remaining Hamas strongholds.
On the economic front, an already juicy start to the week beckons with no less than two US Federal Reserve members making an appearance. Traders though will try to keep their powder dry for the main event on Tuesday with the US Consumer Price Index numbers for January scheduled for release. Past Friday’s revisions, using a new calculation method, pointed to more disinflation. So any further disinflation would mean some US Dollar weakness ahead.
Daily digest market movers: CPI on our minds
- A $95 billion aid bill for Ukraine, Israel and Taiwan received enough support to be moved forward for voting through the US Senate.
- Several European heads of state have already condemned the comments from former US President Trump on Russia and its free pass to enter Europe in case Trump got elected.
- Michelle Bowman, who is a governor at the US Federal Reserve, is due to speak near 14:20 GMT.
- The US Treasury is heading to markets this Monday with an auction with a consignment of 3-month and a 6-month Bills near 16:30.
- US Minneapolis Fed Neel Kashkari is set to speak near 18:00.
- The Financial Management Service is due to release the Monthly Budget Statement, with expectations for January of $-21 billion, from $-129 billion previously.
- Equity markets are a bit clueless this Monday, not really storming out of the gates. Biggest element to point out this Monday is that China is closed this week due to the holiday period.
- The CME Group’s FedWatch Tool is now looking at the March 20th meeting. Expectations for a pause are 82.5%, while 17.5% for a rate cut.
- The benchmark 10-year US Treasury Note trades near 4.17%, at the start of this Monday.
US Dollar Index Technical Analysis: Technical easing ahead
The US Dollar Index (DXY) is showing fatigue – that was the broad takeaway from the technical analysis from Friday. With several falls breaks and even a firm decline on Friday against the 100-day Simple Moving Average (SMA) at 104.26, is the writing on the wall for US Dollar bulls saying they are not willing to go the extra mile to push the DXY higher. Expect some retreat, which would fall in line if CPI numbers on Tuesday reveal disinflation. This could see the DXY head to either the 200-day SMA (103.63) or the 55-day SMA (103.02).
Should the US Dollar Index move higher again, first look for a test at the peak of last week Monday, near 104.60. That level needs to be broken and is more important than the 100-day Simple Moving Average snap at 104.26. Once broken above last Monday’s high (February 5), the road is open for a jump to 105.00 with 105.12 as key levels to keep an eye on.
The first ideal candidate for support is the 200-day SMA near 103.63. Should that give way, look for support from the 55-day SMA near 103.02 itself. Should those fail, look for 102.00 as a big figure to do the necessary.
Risk sentiment FAQs
What do the terms"risk-on" and "risk-off" mean when referring to sentiment in financial markets?
In the world of financial jargon the two widely used terms “risk-on” and “risk off'' refer to the level of risk that investors are willing to stomach during the period referenced. In a “risk-on” market, investors are optimistic about the future and more willing to buy risky assets. In a “risk-off” market investors start to ‘play it safe’ because they are worried about the future, and therefore buy less risky assets that are more certain of bringing a return, even if it is relatively modest.
What are the key assets to track to understand risk sentiment dynamics?
Typically, during periods of “risk-on”, stock markets will rise, most commodities – except Gold – will also gain in value, since they benefit from a positive growth outlook. The currencies of nations that are heavy commodity exporters strengthen because of increased demand, and Cryptocurrencies rise. In a “risk-off” market, Bonds go up – especially major government Bonds – Gold shines, and safe-haven currencies such as the Japanese Yen, Swiss Franc and US Dollar all benefit.
Which currencies strengthen when sentiment is "risk-on"?
The Australian Dollar (AUD), the Canadian Dollar (CAD), the New Zealand Dollar (NZD) and minor FX like the Ruble (RUB) and the South African Rand (ZAR), all tend to rise in markets that are “risk-on”. This is because the economies of these currencies are heavily reliant on commodity exports for growth, and commodities tend to rise in price during risk-on periods. This is because investors foresee greater demand for raw materials in the future due to heightened economic activity.
Which currencies strengthen when sentiment is "risk-off"?
The major currencies that tend to rise during periods of “risk-off” are the US Dollar (USD), the Japanese Yen (JPY) and the Swiss Franc (CHF). The US Dollar, because it is the world’s reserve currency, and because in times of crisis investors buy US government debt, which is seen as safe because the largest economy in the world is unlikely to default. The Yen, from increased demand for Japanese government bonds, because a high proportion are held by domestic investors who are unlikely to dump them – even in a crisis. The Swiss Franc, because strict Swiss banking laws offer investors enhanced capital protection.
EUR/USD has eased from early session highs but is little changed on the session. Economists at Scotiabank analyze the pair’s outlook.
Support is at 1.0720/1.0725
EUR/USD losses from the intraday peak cast a somewhat negative look on short-term price action and rather imply building downside risk for the EUR again. Longer run price signals are a bit more EUR-supportive after the EUR rebound from last week’s low left a bullish ‘doji’ candle on the weekly chart, however.
EUR/USD support is 1.0720/1.0725.
Gains (and a daily close) through 1.0790 would be a bullish cue for the EUR.
The new year has started with the US Dollar (USD) recovering somewhat from its late 2023 sell-off. Economists at Scotiabank analyze Greenback’s outlook.
Narrowing growth and interest rate differentials will combine as a headwind for the USD in 2024
Regardless of the USD’s strong start to the year, we still expect it to soften over the balance of 2024 versus the core majors.
We anticipate the Fed will start relaxing its policy stance in Q3 2024 and we now expect fewer rate cuts (100 bps in total versus 150 bps in our last forecast) this year.
Some (modest) narrowing growth and interest rate differentials will combine as a headwind for the USD in 2024.
In real effective terms, the USD has appreciated significantly (around 28%) over the past ten years. Scope for additional USD gains may be limited in the medium to longer run and its elevated valuation leaves it prone to a correction, particularly as structural headwinds (the US fiscal imbalance) continue to strengthen.
- Silver price jumps to $23 despite a decent recovery in the US Dollar.
- Investors await the US inflation data for a fresh outlook on interest rates.
- Fed Logan advised to ensure price stability before considering rate cuts.
Silver price (XAG/USD) climbs to near $23 even though the US Dollar Index (DXY) recovers sharply in Monday’s European session. The outlook for the USD Index improves ahead of the United States Consumer Price Index (CPI) data for January, which will be published on Tuesday.
According to the expectations, the monthly headline CPI grew steadily at 0.2%. In a similar timeframe, the core CPI that excludes volatile food and oil prices rose steadily by 0.3%. The annual headline inflation is anticipated to decelerate to 3.0% from 3.4% in December, while core CPI rose at a slightly slower pace of 3.8% against 3.9%.
Federal Reserve (Fed) policymakers have reiterated that rate cuts are not in the picture until they get enough confidence that inflation will sustainably return to the 2% target. The argument supporting holding interest rates at their current level for longer will strengthen if the inflation data turns out persistent.
On Friday, Dallas Fed Bank President Lorie Logan said there is no need to rush for rate cuts until she is convinced that price stability will be achieved.
The opportunity cost of holding non-yielding assets, such as Silver, increases if the Fed holds interest rates higher.
Silver technical analysis
Silver price rises to near the downward-sloping trendline plotted from December 22 high at $24.61 on a two-hour scale. The white metal stabilizes above the 50-period Exponential Moving Average (EMA), which trades around $22.60. The 14-period Relative Strength Index (RSI) climbs into the bullish region of 60.00-80.000. A sustainability of the same would strengthen the upside bias.
Silver two-hour chart
-638433361551857923.png)
- Natural Gas slides over 1% in early Monday trading.
- Traders are sending Gas prices lower with temperatures hitting higher-than-normal levels in Europe.
- The US Dollar Index is steady ahead of US CPI numbers on Tuesday.
Natural Gas (XNG/USD) is eking out more losses at the start of this week with the weather man as the biggest catalyst for this steep decline on this occasion. A warm front is set to kick in in Europe. Temperatures are forecast to top 17 degrees Celcius in Paris for example, which is exceptional for this time of year. For 2024, this puts the Gas reserves in Europe at a very good position ahead of the next heating season with less need to acquire supply during the coming six months.
The US Dollar (USD) is facing some pressure from all angles. Geopolitical tensions are present, favouring the Greenback on the one hand. While on the other hand traders are looking forward to the US Consumer Price Index (CPI) on Tuesday with US inflation expected to continue its disinflationary pathway lower, which advocates for a bit weaker US Dollar.
Natural Gas is trading at $1.85 per MMBtu at the time of writing.
Natural Gas market movers: All about the weather
- Extreme warm and mild temperatures are preserving current Gas storage levels in Europe. This puts Europe in a good position to restock for next winter.
- MidOcean Energy acquires 20% of stake in Peru LNG in search of supply towards growth market India.
- Gas futures are seeing the more forward contracts (over summer) showing bearish signs as well, with buyers not buying up as much on average ahead of Winter 2024.
- Focus remains on Capitol Hill where lawmakers are still unhappy with the Biden ban on LNG exports, with possible legal claims being put forward to get the ban dismissed.
Natural Gas Technical Analysis: Natgas hits pre-Ukraine levels
Natural Gas is facing a more substantial downturn. Traders fear Biden’s current Gas-exporting moratorium could be lifted, leading to an influx of Natural Gas supply flooding markets. Set against demand which is expected to remain low, such an influx would tip the price lower.
On the upside, Natural Gas is facing some pivotal technical levels to get back to. First, $1.99 which saw an accelerated decline. Next is the blue line at $2.13 with the triple bottoms from 2023. In case Natural Gas sees sudden demand pick up, possibly $2.40 could come into play.
Keep an eye on $1.80, which was a pivotal level back in July 2020. Should Biden’s moratorium be lifted, together with the additional supply from Canada which is exporting more to fill the gap from the US, $1.64 and $1.53 (low of 2020) are targets to look out for too.
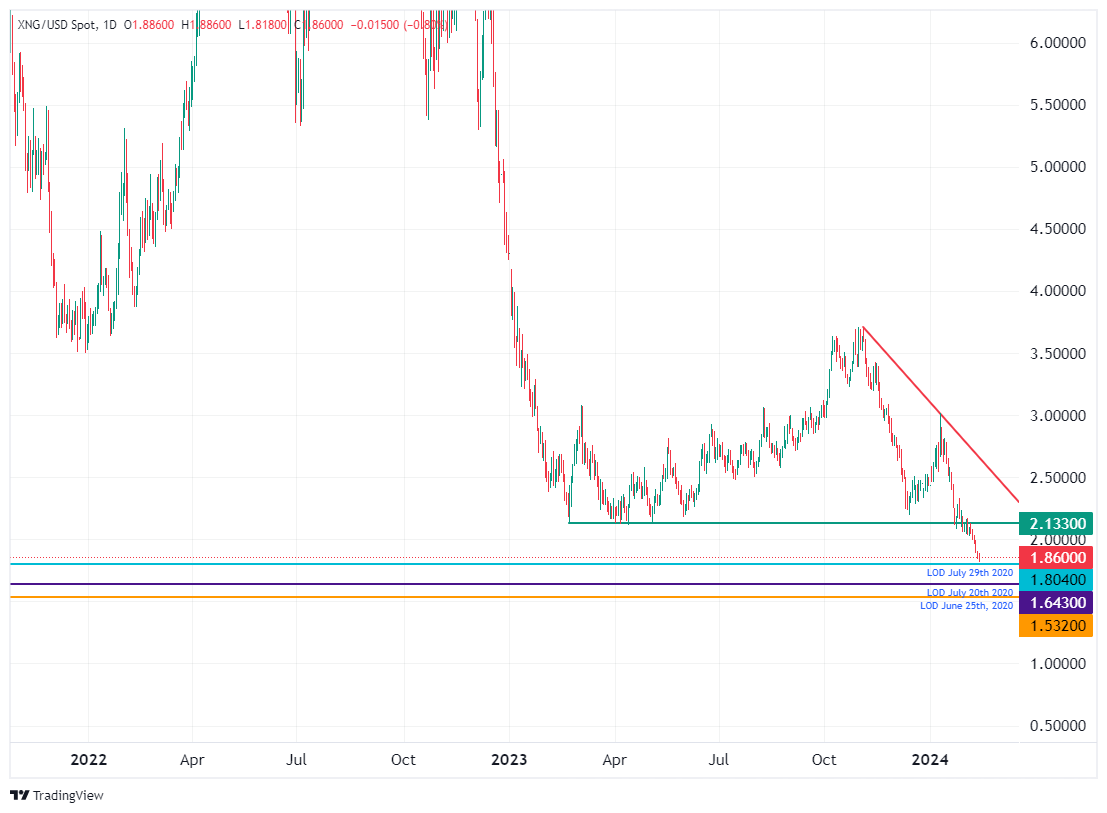
XNG/USD (Daily Chart)
Natural Gas FAQs
What fundamental factors drive the price of Natural Gas?
Supply and demand dynamics are a key factor influencing Natural Gas prices, and are themselves influenced by global economic growth, industrial activity, population growth, production levels, and inventories. The weather impacts Natural Gas prices because more Gas is used during cold winters and hot summers for heating and cooling. Competition from other energy sources impacts prices as consumers may switch to cheaper sources. Geopolitical events are factors as exemplified by the war in Ukraine. Government policies relating to extraction, transportation, and environmental issues also impact prices.
What are the main macroeconomic releases that impact on Natural Gas Prices?
The main economic release influencing Natural Gas prices is the weekly inventory bulletin from the Energy Information Administration (EIA), a US government agency that produces US gas market data. The EIA Gas bulletin usually comes out on Thursday at 14:30 GMT, a day after the EIA publishes its weekly Oil bulletin. Economic data from large consumers of Natural Gas can impact supply and demand, the largest of which include China, Germany and Japan. Natural Gas is primarily priced and traded in US Dollars, thus economic releases impacting the US Dollar are also factors.
How does the US Dollar influence Natural Gas prices?
The US Dollar is the world’s reserve currency and most commodities, including Natural Gas are priced and traded on international markets in US Dollars. As such, the value of the US Dollar is a factor in the price of Natural Gas, because if the Dollar strengthens it means less Dollars are required to buy the same volume of Gas (the price falls), and vice versa if USD strengthens.
Gold ended the week lower amid an uncertain outlook on rates. Economists at TD Securities analyze the yellow metal’s outlook.
Fed officials contemplate the start of a cutting cycle
Money managers modestly increased their net Gold exposure despite the strong jobs report that could suggest the Federal Reserve may not be in any hurry to start easing monetary policy.
Gold investors remain historically underpositioned, and open interest in the yellow metal remains at levels that have preceded substantial rallies. This highlights a set-up for the yellow metal that is ripe with asymmetry and prone to a material short squeeze as Fed officials contemplate the start of a cutting cycle.
- USD/JPY falls gradually to 149.00 as investors see the BoJ pivoting away from easy policy sooner.
- The market mood is cautious ahead of the US inflation data for January.
- Investors forecast that US inflation will grow at a steady pace.
The USD/JPY drops to near 149.00 in the European session on Monday. The asset has come under pressure amid hopes that a sizeable wage increase by Japanese firms would help the Bank of Japan (BoJ) exit from its ultra-loose monetary policy stance.
The BoJ wants sustainable inflation above 2% to pivot away from a decade-long expansionary policy, which can be achieved through steady wage growth.
Last week, the appeal for the Japanese Yen faltered after BoJ Deputy Governor Uchida Shinichi said that monetary policy conditions in the Japanese economy are in a deep negative trajectory, which should not be blown up aggressively.
Meanwhile, improving optimism over Japan’s recovery by the International Monetary Fund (IMF) has improved the outlook of the Japanese Yen against the US Dollar. The IMF advised the BoJ to end its yield curve control (YCC) and massive asset purchase program and then focus on gradually raising interest rates.
S&P500 futures remain subdued in the London session, indicating a cautious market mood ahead of January's United States Consumer Price Index (CPI) data, which will be released on Tuesday. The US Dollar Index (DXY) rebounds sharply from 103.90 as the appeal for safe-haven assets improves.
Investors anticipate that the headline and core CPI grew steadily at 0.2% and 0.3%, respectively. The outlook for the US Dollar will improve if the inflation data turns out more stubborn than anticipated.
Strategists at ANZ Bank analyze the global liquified natural gas (LNG) outlook. Risks remain skewed to fundamentals becoming tighter this year, they say.
Risks of disruptions to supply remain elevated
We still see upside risks to prices. Europe can rest on its laurels and must boost LNG imports even further. China’s demand may exceed expectations amid an increasing focus on energy efficiency and emissions. India looks poised to become the world’s fourth largest importer of LNG, as its energy transition accelerates.
Risks of disruptions to supply also remain elevated. European sanctions on Russian LNG shipments are under consideration, while tensions in the Middle East are causing major obstacles to trade flows. These factors should provide a floor to prices, with further upside dependent on their severity.
- NZD/USD once again fails near the 0.6155-0.6160 supply zone amid renewed USD buying.
- The mixed technical setup warrants some caution before placing aggressive directional bets.
- Some follow-through selling below the multi-month low will pave the way for deeper losses.
The NZD/USD pair meets with a fresh supply on the first day of a new week and extends its steady intraday descent through the first half of the European session. Spot prices drop to the 0.6120 region in the last hour and erode a part of Friday's positive move despite hawkish remarks by Reserve Bank of New Zealand (RBNZ) officials. 's hawkish remarks.
Testifying before the Finance and Expenditure Committee on Monday, Governor Adrian Orr highlighted that inflation remains elevated, which is why the RBNZ has maintained the cash rate at 5.5%. Adding to this, RBNZ Deputy Governor (Financial Stability) Christian Hawkesby noted that house prices have stabilized over the last six months, and the system is equipped to handle high interest rates. This, however, does little to provide any meaningful impetus to the NZD/USD pair amid the emergence of some US Dollar (USD) buying, bolstered by expectations that the Federal Reserve (Fed) will keep interest rates higher for longer.
From a technical perspective, the downfall reaffirms a stiff horizontal barrier near the 0.6155-0.6160 region, which should now act as a key pivotal point. Given that oscillators on the daily chart have been struggling to gain any meaningful traction, it will be prudent to wait for a sustained breakout through the said hurdle before positioning for any further gains. The NZD/USD pair might then accelerate the positive move towards the 0.6200 round figure and climb further towards the 0.6225-0.6230 horizontal resistance. The momentum could extend further towards the 0.6250-0.6260 supply zone, which if cleared will negate any near-term negative bias.
On the flip side, the 0.6100 mark now seems to protect the immediate downside ahead of the very important 200-day Simple Moving Average (SMA), currently pegged near the 0.6085 region. This is followed by the 0.6040-0.6035 region, or a multi-month low touched this February. A convincing break below the latter will be seen as a fresh trigger for bearish traders and drag the NZD/USD pair further towards the 0.6000 psychological mark.
NZD/USD daily chart
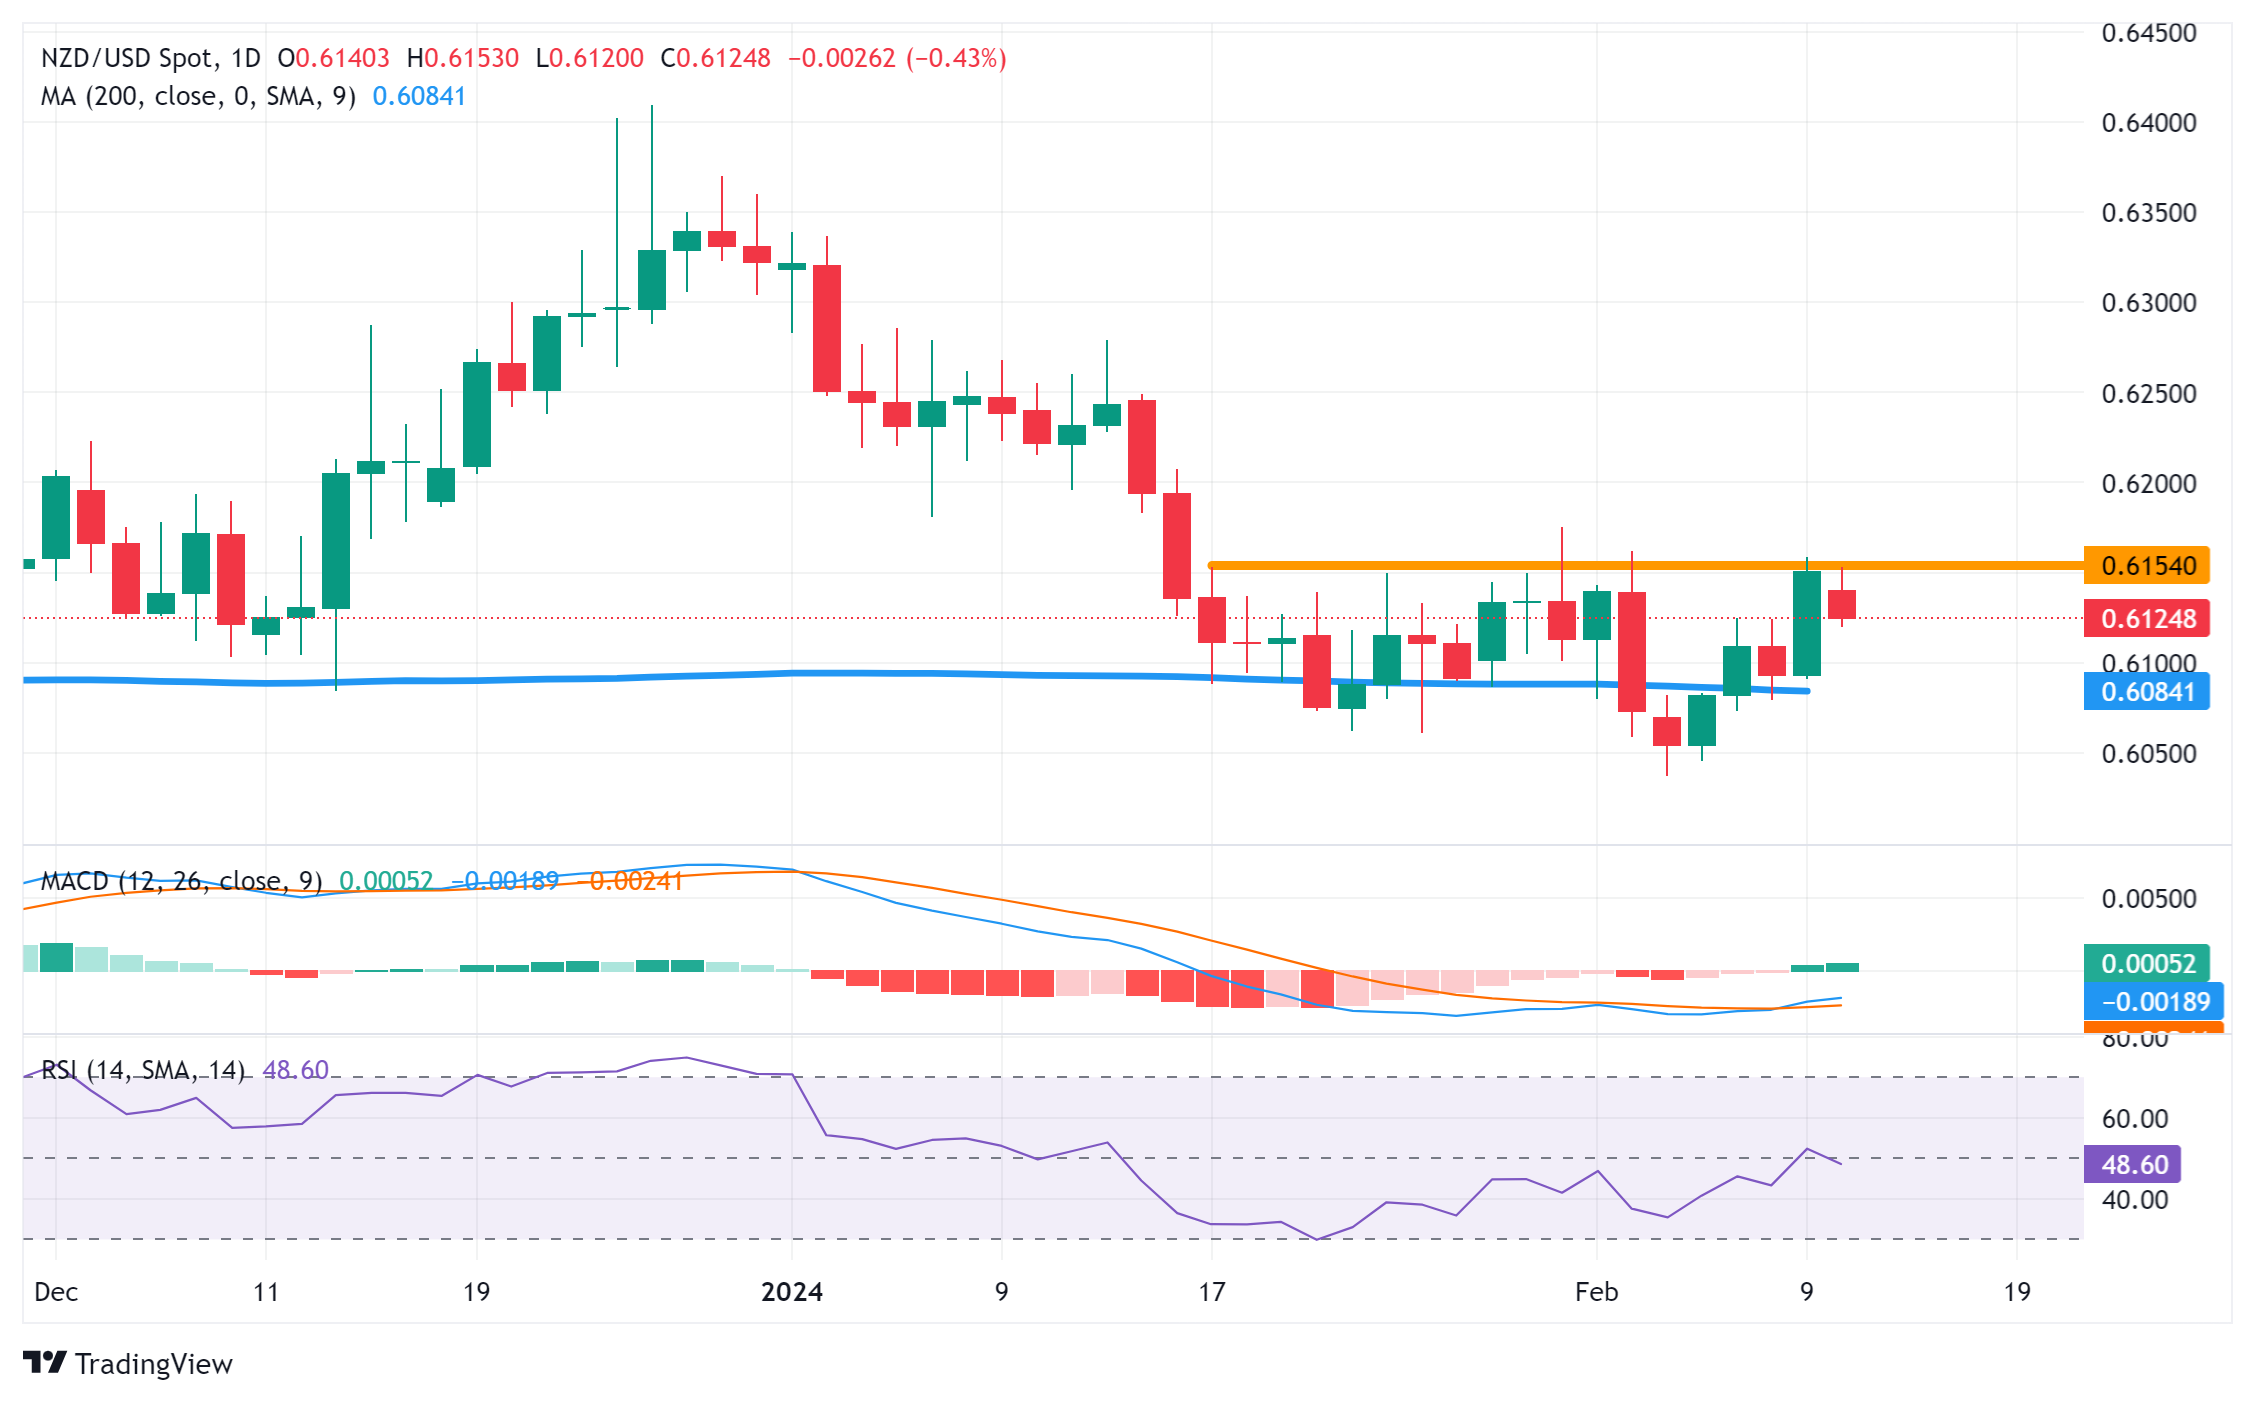
Technical levels to watch
- Gold price drops sharply as investors turn cautious ahead of the US inflation data for January.
- Fed policymakers could maintain their hawkish rhetoric if inflation turns out stubbornly high.
- The US Dollar rebounds strongly amid a dismal market mood.
Gold price (XAU/USD) faces a sharp sell-off in Monday’s London session ahead of the United States Consumer Price Index (CPI) data for January. In addition, major Asian markets are closed on Monday due to the Chinese New Year.
The precious metal remains on edge ahead of US inflation data for January, which may impact the outlook on interest rates. The opportunity cost of holding non-yielding assets, such as Gold, increases if inflation remains stubbornly high as it increases the odds of a hawkish stance from the Federal Reserve (Fed).
Fed policymakers have maintained arguments in favor of higher interest rates for longer until they get confidence that the underlying inflation will sustainably return to the 2% target. The reasoning behind the Fed’s hawkish narrative is the resilient labor market and robust household spending. Fed policymakers have admitted that the inflation data decline is encouraging but is insufficient to unwind the tight interest rate stance.
Daily Digest Market Movers: Gold falls in a holiday-thinned trade
- Gold price drops sharply to near $2,020 despite a holiday-thinned trade as major Asian markets such as China, Hong Kong, Japan, South Korea, and Singapore are closed.
- The precious metal is expected to continue with a sideways trend as investors await the United States inflation data for January, which will provide fresh guidance on interest rates.
- The CME FedWatch tool shows that traders see a 53% chance that a rate cut by 25 basis points (bps) could be announced in May.
- According to the expectations, monthly headline inflation is expected to grow at 0.2% in January versus 0.2% in December (revised down from 0.3% initial estimate). In the same period, the core inflation that strips off volatile food and Oil prices is expected to show a rise of 0.3%.
- For annual data, investors anticipate that the headline inflation softened significantly to 3.0% from 3.4% in December. While the core CPI decelerated slightly to 3.8% against the prior reading of 3.9%.
- A stubborn inflation data would allow Federal Reserve policymakers to strongly argue in favor of keeping interest rates higher for a longer period.
- Fed policymakers have been reiterating the need for good inflation data for months to ensure inflation sustainably declining towards the 2% target.
- Dallas Federal Reserve Bank President Lorie Logan said on Friday that there is no need to rush for rate cuts as she wants to confirm durability in progressively declining inflation.
- Meanwhile, the US Dollar Index (DXY) delivers a sharp recovery from the crucial support of 104.00 as investors turn cautious ahead of the US inflation data. The appeal for safe-haven assets improves amid a cautious market mood.
Technical Analysis: Gold price seems on tenterhooks around $2,020
Gold price is at a make or a break level around $2,020 as it is hovering near the upward-sloping border of a Symmetrical Triangle chart pattern plotted from the December 13 low at $1,973. While, the downward-sloping trendline border of the same pattern from the December 28 high is at $2,088. The Gold price drops slightly below the 50-day Exponential Moving Average (EMA), which trades around $2,023.
The 14-period Relative Strength Index (RSI) oscillates inside the 40.00-60.00 range, indicating a prolonged sideways trend.
Gold FAQs
Why do people invest in Gold?
Gold has played a key role in human’s history as it has been widely used as a store of value and medium of exchange. Currently, apart from its shine and usage for jewelry, the precious metal is widely seen as a safe-haven asset, meaning that it is considered a good investment during turbulent times. Gold is also widely seen as a hedge against inflation and against depreciating currencies as it doesn’t rely on any specific issuer or government.
Who buys the most Gold?
Central banks are the biggest Gold holders. In their aim to support their currencies in turbulent times, central banks tend to diversify their reserves and buy Gold to improve the perceived strength of the economy and the currency. High Gold reserves can be a source of trust for a country’s solvency. Central banks added 1,136 tonnes of Gold worth around $70 billion to their reserves in 2022, according to data from the World Gold Council. This is the highest yearly purchase since records began. Central banks from emerging economies such as China, India and Turkey are quickly increasing their Gold reserves.
How is Gold correlated with other assets?
Gold has an inverse correlation with the US Dollar and US Treasuries, which are both major reserve and safe-haven assets. When the Dollar depreciates, Gold tends to rise, enabling investors and central banks to diversify their assets in turbulent times. Gold is also inversely correlated with risk assets. A rally in the stock market tends to weaken Gold price, while sell-offs in riskier markets tend to favor the precious metal.
What does the price of Gold depend on?
The price can move due to a wide range of factors. Geopolitical instability or fears of a deep recession can quickly make Gold price escalate due to its safe-haven status. As a yield-less asset, Gold tends to rise with lower interest rates, while higher cost of money usually weighs down on the yellow metal. Still, most moves depend on how the US Dollar (USD) behaves as the asset is priced in dollars (XAU/USD). A strong Dollar tends to keep the price of Gold controlled, whereas a weaker Dollar is likely to push Gold prices up.
Economists at Rabobank identify factors that may result in a low for longer outlook for EUR/USD.
German economy could benefit from a weak EUR
Our 3-month EUR/USD forecast stands at 1.0500.
Our current 12-month EUR/USD forecast is 1.0900.
While a reduction in Fed interest rates will clearly help support risk appetite, this year’s easing in US monetary policy conditions will be made against the backdrop of sluggish growth in China and potentially further economic stagnation in Germany. Added to this are the conflicts in the Middle East and Ukraine. These factors question whether the safe haven USD will experience a marked outflow in favour of high yielding assets as the Fed cuts rates.
If the ECB can keep inflation under control, in our view the German economy could benefit from a weak currency whilst it tackles its economic difficulties. This factor, combined with the potentially USD supportive factors identified above, underpins our view that EUR/USD is likely to be more comfortable in a 1.0400 to 1.1200 range over the next 24 months or so than at levels over 1.1500.
- GBP/JPY fails to capitalize on its modest intraday gains to levels just above mid-188.00s.
- Expectations for an imminent BoJ policy pivot underpin the JPY and exert some pressure.
- Bets that the BoE will soon begin cutting interest rates further weigh on the British Pound.
The GBP/JPY cross attracts some intraday sellers following an uptick to the 188.65 area and drops to a fresh daily low during the first half of the European session on Monday. Spot prices currently trade around the 188.25-188.20 region and look to extend Friday's late pullback from the vicinity of the 189.00 round figure, or the YTD peak.
Investors seem convinced that the Bank of Japan (BoJ) will eventually pivot away from its ultra-loose monetary policy settings after the outcome of annual wage negotiations in March. This, to a larger extent, helps offset BoJ Deputy Governor Shinichi Uchida's dovish remarks on Thursday, saying that aggressive tightening is unlikely even after an exit from the negative interest rate policy and underpins the Japanese Yen (JPY). The British Pound (GBP), on the other hand, meets with some supply in the wake of reviving US Dollar (USD) demand, which, in turn, is seen as another factor exerting downward pressure on the GBP/JPY cross.
The GBP is further weighed down by growing acceptance that the Bank of England (BoE) could lower borrowing costs in the next few months. In fact, the current market pricing suggests that the UK central bank could deliver four 25 basis points (bps) interest rate cuts by the end of the year. This, in turn, suggests that the path of least resistance for the GBP/JPY cross is to the downside and supports prospects for deeper losses. Bearish traders, however, might wait for this week's key UK macro releases – starting with the jobs report on Tuesday, followed by consumer inflation figures and the prelim Q4 GDP print, on Wednesday and Thursday, respectively.
Investors will further take cues from BoE Governor Andrew Bailey's scheduled speech on Wednesday for some meaningful impetus. Hence, it will be prudent to wait for strong follow-through selling before confirming that the GBP/JPY cross has topped out in the near term and positioning for further losses.
Technical levels to watch
Brent Crude is again trading above $80.00. Economists at Société Générale analyze Oil’s outlook.
50-DMA at $78.50 is first support
Brent broke out above multi month descending channel denoting possibility of short-term rebound. It is gradually inching towards the high formed last month near $84.75. Once this is overcome, a larger uptrend could materialize. This crossover can result in a move towards $88.00 and perhaps even towards $91.70, the 76.4% retracement from last September.
The 50-DMA at $78.50 is first support near term.
Economists at Westpac expect the USD/JPY pair to decline over the coming months.
Japan has robust growth opportunities before it
Japan’s strong relationship with the US and Europe, combined with their technological and industrial capabilities offer considerable opportunity for economic growth in both the short and long-term.
It is yet to be seen if domestic price pressures can sustain inflation above 2.0% in the medium term. Under such conditions, the interest rate differential between Japan and the world is likely to principally depend on foreign interest rate movements, limiting gains in Yen.
On our forecasts, USD/JPY ends 2024 and 2025 at 138.00 and 127.00.
- USD/CAD fails to attract buyers and is influenced by a combination of diverging forces.
- A downtick in Oil prices undermines the Loonie, though a softer USD caps the upside.
- The mixed technical setup also warrants some caution before placing directional bets.
The USD/CAD pair struggles to capitalize on Friday's bounce from the 1.3415-1.3410 area or a one-week low and oscillates in a narrow range through the early European session on the first day of a new week. Spot prices currently trade around the 1.3460 area, nearly unchanged for the day, and remain below the very important 200-day Simple Moving Average (SMA).
Crude Oil prices kick off the new week on a weaker note in the wake of easing concerns about supply from the Middle East, which is seen undermining the commodity-linked Loonie and acting as a tailwind for the USD/CAD pair. That said, Friday's upbeat domestic jobs report helps limit the downside for the Canadian Dollar (CAD), which, along with a modest US Dollar (USD) downtick keeps a lid on any meaningful appreciating move for the currency pair.
From a technical perspective, the recent failure ahead of mid-1.3600s, or a nearly two-month peak touched last week, constitutes the formation of multiple tops on the daily chart. That said, the lack of strong follow-through selling warrants some caution before positioning for any further losses. Moreover, oscillators on the daily chart – though have been losing traction – are yet to confirm a negative outlook and support prospects for the emergence of some dip-buying.
Hence, Friday's swing low, around the 1.3415-1.3410 area, might continue to protect the immediate downside ahead of the 1.3400 mark. The next relevant support is pegged near the 1.3345 region, or the YTD trough, which if broken decisively will be seen as a fresh trigger for bearish traders. The USD/CAD pair might then accelerate the downward trajectory further towards the 1.3300 mark before dropping to mid-1.3200s and sub-1.3200 levels, or the December swing low.
On the flip side, momentum beyond the 1.3475 area (200-day SMA) is likely to confront resistance near the 1.3500 psychological mark ahead of the 1.3540-1.3545 region, or the multiple-tops. A sustained strength beyond the latter will negate any near-term negative outlook and pave the way for some meaningful appreciating move. The USD/CAD pair might then accelerate the positive move towards the 1.3600 round figure and the 1.3610-1.3615 supply zone.
USD/CAD daily chart
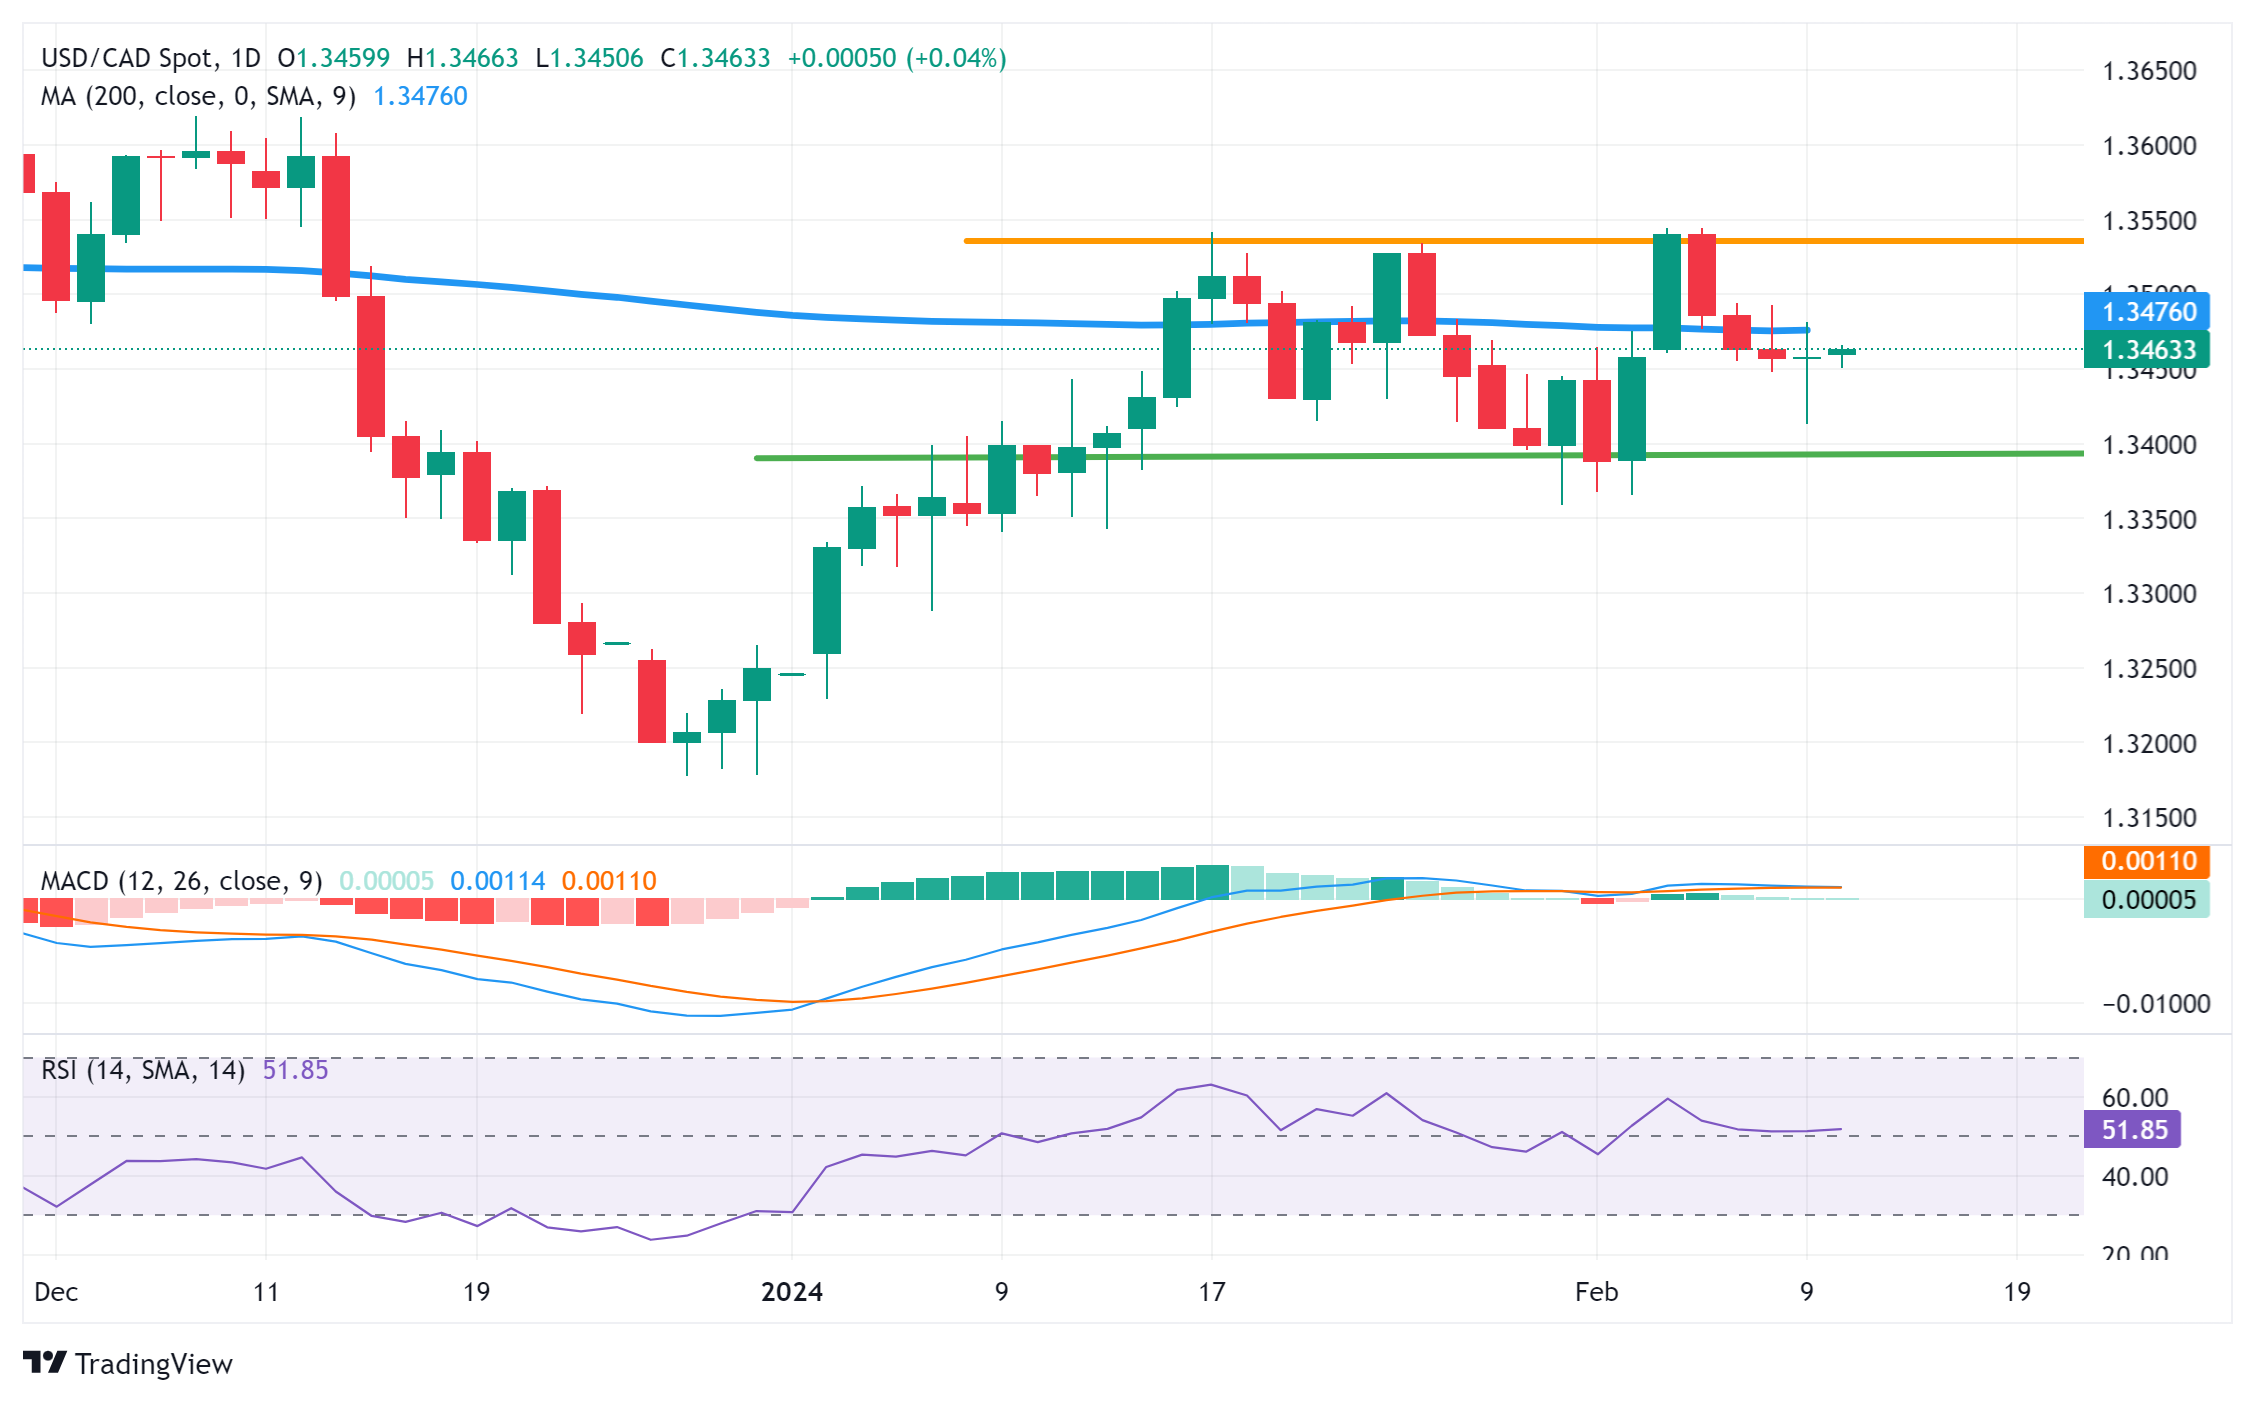
Technical levels to watch
The US Dollar Index (DXY) has eased back modestly over the past week after trading at its 2024 highest. Economists at ING analyze Greenback’s outlook.
A weak retail sales print may take the Dollar lower
This week, the US CPI release on Tuesday can be the new catalyst for larger positioning shifts in FX. Our economics team estimates are aligned with consensus for a 0.3% month-on-month core print, but we think the risks are skewed more towards a 0.2% than a 0.4% print. Accordingly, there are some downside risks for the Dollar, even though our base case is for a consensus print to leave few marks on the FX market.
A weak retail sales print on Thursday may revamp expectations for a May rate cut, and take the Dollar lower. That said, evidence for the jobs market and the lack of faster disinflation should still be enough to discourage aggressive Dollar selling.
We remain comfortable with our call for some extra resilience in the Dollar in the first quarter, before a clearer downtrend emerges from the second quarter.
- USD/MXN faces challenges as the Greenback declines due to downbeat US yields.
- Rabobank forecasted a 25 basis points rate cut by Banxico at the June meeting.
- The US Dollar fails to receive upward support from the hawkish remarks by the Fed officials.
USD/MXN continues to decline for the second consecutive session, trading at around 17.07 during the European session on Monday. The Mexican Peso (MXN) strengthened as headline Mexican inflation picked up pace in January, mainly driven by an increase in non-core components, while core inflation showed a decrease.
Economists at Rabobank analyze the outlook for the USD/MXN pair. Their base case scenario suggests a 25 basis points (bps) cut at the June 27 meeting, following the anticipated first cut by the US Federal Reserve (Fed) on June 12.
On the other side, the US Dollar faces pressure from downbeat US bond yields, with the US Dollar Index (DXY) slipping to around 104.00. Both 2-year and 10-year US yields are hovering at 4.47% and 4.16%, respectively, by the press time.
Dallas Federal Reserve (Fed) Bank President Lorie Logan expressed that there is presently no urgent need to reduce interest rates. Logan underscored the importance of acquiring further evidence to ensure the sustainability of progress in inflation.
This sentiment aligns with US Fed Chair Jerome Powell's rejection of the notion of a rate cut in March, as conveyed during a press conference following the interest rate decision on January 31.
The hawkish comments from the US Fed officials fail to cheer the Greenback as market participants adopt a cautious stance ahead of the US Consumer Price Index (CPI) data on Tuesday.
- EUR/USD scales higher for the fifth successive day and climbs to over a one-week high on Monday.
- The Fed rate cut uncertainty keeps the USD bulls on the defensive and lends support to the major.
- ECB rate cut bets might cap gains for the shared currency ahead of the US CPI report on Tuesday.
The EUR/USD pair builds on last week's recovery move from the 1.0725-1.0720 area, or its lowest level since November 14 and gains some positive traction for the first successive day on Monday. The momentum lifts spot prices to over a one-week peak during the early part of the European session, with bulls now looking to extend the momentum further beyond the 1.0800 mark amid a modest US Dollar (USD) downtick. The uncertainty over the likely timing and pace of interest rate cuts by the Federal Reserve (Fed) keeps the USD bulls on the defensive below a multi-month top touched last week. Apart from this, the underlying bullish sentiment across the global equity markets is seen as another factor undermining the safe-haven Buck.
That said, growing acceptance that the Fed will keep interest rates higher for longer in the wake of a still resilient US economy remains supportive of elevated US Treasury Bond yields and should act as a tailwind for the Greenback. Furthermore, bets that the European Central Bank (ECB) will start cutting interest rates at the start of the second quarter might contribute to capping the shared currency and the EUR/USD pair. This makes it prudent to wait for strong follow-through buying before confirming that spot prices have formed a near-term bottom. In the absence of any relevant macro data on Monday, speeches by FOMC members might provide some impetus, though the focus remains on the US consumer inflation figures due on Tuesday.
Daily Digest Market Movers: Benefits from softer USD, ECB rate cut bets might cap gains
- The Federal Reserve rate cut uncertainty, along with a positive risk tone, undermines the US Dollar and pushes the EUR/USD pair higher for the fifth successive day, to over a one-week high.
- The incoming robust US macro data and hawkish remarks by a slew of influential FOMC members forced investors to scale back their expectations for early and steep interest rate cuts this year.
- The current market pricing indicates that the Fed could deliver four, or five at the most, 25 basis points rate cuts in 2024 as compared to seven such moves anticipated at the end of the last year.
- Dallas Fed President Lorie Logan said on Friday that she is in no rush to cut interest rates and wants more data to confirm the tremendous progress on bringing down inflation is durable.
- Separately, Atlanta Fed President Raphael Bostic noted that inflation has been too high for too long and the US economy wants to avoid a new spike on its path back to the pre-pandemic strength.
- The yield on the benchmark 10-year US government bond holds comfortably above the 4.0% mark, which might continue to act as a tailwind for the Buck and cap gains for the currency pair.
- The recent mixed signals from European Central Bank officials, over the prospects for interest rate cuts, could also hold back bulls from placing aggressive bets around the shared currency.
- Several ECB officials have been trying hard to temper expectations for early policy easing, though the markets are pricing in the possibility of the first-rate cut at the start of the second quarter.
- The bets were reaffirmed by a fall in German inflation, which decelerated to the 2.9% YoY rate in January from the 3.7% in the previous month and validated the view that price pressures are easing.
- Adding to this, ECB Governing Council member Fabio Panetta said on Saturday that the rate cut moment is fast approaching, and that timely and gradual steps could help to reduce ensuing volatility.
- Traders might also opt to move to the sidelines ahead of the US consumer inflation figures on Tuesday, which might influence the Fed's future policy decision and provide some meaningful impetus.
Technical Analysis: Could face difficulty in making it through the 1.0830 confluence resistance
From a technical perspective, any subsequent move beyond the 1.0800 mark is likely to meet with a fresh supply and remain capped near the 1.0830 confluence hurdle. The said area comprises the very important 200-day Simple Moving Average (SMA) and a one-month-old descending trend line, which, in turn, should act as a key pivotal point. A sustained move beyond might shift the near-term bias in favor of bullish traders and lift the EUR/USD pair to the 1.0900 round figure. The momentum could get extended further towards the 1.0930-1.0935 intermediate resistance en route to the 1.0970-1.0975 area and the 1.1000 psychological mark.
On the flip side, weakness below the Asian session low, around the 1.0775-1.0770 region, is likely to find some support near the 1.0740 area ahead of the 1.0725-1.0720 area, or a multi-month low touched last week. This is closely followed by the 1.0700 mark, which if broken decisively will be seen as a fresh trigger for bearish traders and make the EUR/USD pair vulnerable. Spot prices might then accelerate the slide further towards the 1.0665-1.0660 support before eventually dropping to the 1.0620-1.0615 region and the 1.0600 round figure.
Euro price today
The table below shows the percentage change of Euro (EUR) against listed major currencies today. Euro was the strongest against the New Zealand Dollar.
| USD | EUR | GBP | CAD | AUD | JPY | NZD | CHF | |
| USD | 0.17% | 0.03% | 0.04% | 0.05% | -0.09% | 0.34% | -0.08% | |
| EUR | -0.16% | -0.13% | -0.12% | -0.12% | -0.26% | 0.18% | -0.25% | |
| GBP | -0.04% | 0.13% | 0.00% | 0.01% | -0.14% | 0.30% | -0.13% | |
| CAD | -0.02% | 0.15% | 0.01% | 0.03% | -0.11% | 0.32% | -0.10% | |
| AUD | -0.06% | 0.11% | -0.03% | -0.02% | -0.15% | 0.29% | -0.14% | |
| JPY | 0.10% | 0.27% | 0.17% | 0.14% | 0.16% | 0.44% | 0.02% | |
| NZD | -0.33% | -0.17% | -0.31% | -0.30% | -0.29% | -0.43% | -0.42% | |
| CHF | 0.07% | 0.23% | 0.09% | 0.11% | 0.12% | -0.03% | 0.41% |
The heat map shows percentage changes of major currencies against each other. The base currency is picked from the left column, while the quote currency is picked from the top row. For example, if you pick the Euro from the left column and move along the horizontal line to the Japanese Yen, the percentage change displayed in the box will represent EUR (base)/JPY (quote).
Euro FAQs
What is the Euro?
The Euro is the currency for the 20 European Union countries that belong to the Eurozone. It is the second most heavily traded currency in the world behind the US Dollar. In 2022, it accounted for 31% of all foreign exchange transactions, with an average daily turnover of over $2.2 trillion a day.
EUR/USD is the most heavily traded currency pair in the world, accounting for an estimated 30% off all transactions, followed by EUR/JPY (4%), EUR/GBP (3%) and EUR/AUD (2%).
What is the ECB and how does it impact the Euro?
The European Central Bank (ECB) in Frankfurt, Germany, is the reserve bank for the Eurozone. The ECB sets interest rates and manages monetary policy.
The ECB’s primary mandate is to maintain price stability, which means either controlling inflation or stimulating growth. Its primary tool is the raising or lowering of interest rates. Relatively high interest rates – or the expectation of higher rates – will usually benefit the Euro and vice versa.
The ECB Governing Council makes monetary policy decisions at meetings held eight times a year. Decisions are made by heads of the Eurozone national banks and six permanent members, including the President of the ECB, Christine Lagarde.
How does inflation data impact the value of the Euro?
Eurozone inflation data, measured by the Harmonized Index of Consumer Prices (HICP), is an important econometric for the Euro. If inflation rises more than expected, especially if above the ECB’s 2% target, it obliges the ECB to raise interest rates to bring it back under control.
Relatively high interest rates compared to its counterparts will usually benefit the Euro, as it makes the region more attractive as a place for global investors to park their money.
How does economic data influence the value of the Euro?
Data releases gauge the health of the economy and can impact on the Euro. Indicators such as GDP, Manufacturing and Services PMIs, employment, and consumer sentiment surveys can all influence the direction of the single currency.
A strong economy is good for the Euro. Not only does it attract more foreign investment but it may encourage the ECB to put up interest rates, which will directly strengthen the Euro. Otherwise, if economic data is weak, the Euro is likely to fall.
Economic data for the four largest economies in the euro area (Germany, France, Italy and Spain) are especially significant, as they account for 75% of the Eurozone’s economy.
How does the Trade Balance impact the Euro?
Another significant data release for the Euro is the Trade Balance. This indicator measures the difference between what a country earns from its exports and what it spends on imports over a given period.
If a country produces highly sought after exports then its currency will gain in value purely from the extra demand created from foreign buyers seeking to purchase these goods. Therefore, a positive net Trade Balance strengthens a currency and vice versa for a negative balance.
- EUR/GBP faces stiff pressure near 0.8540 ahead of UK data.
- BoE Bailey is expected to provide fresh guidance on interest rates.
- The ECB would ease key rates before the BoE.
The EUR/GBP pair faces pressure while attempting to extend recovery above the immediate resistance of 0.8540 in the European session on Monday. The cross is expected to remain on the tenterhooks as investors await the United Kingdom Employment data for three months ending December, which will be published on Tuesday.
Investors anticipate that the Unemployment Rate falls to 4.0% from 4.2% in three months ending November. In the same period, the Average Earnings, Excluding bonuses, are forecast to have grown at a slower pace of 6.0% against the former reading of 6.6%. A sharp decline in wage growth momentum would prompt expectations of rate cuts by the Bank of England (BoE).
In today’s session, the speech from BoE Governor Andrew Bailey will be the focus. BoE Bailey will provide cues about likely monetary policy action in March.
The Pound Sterling is expected to remain volatile as the UK’s inflation, factory, and retail sales data are lined up for release after Tuesday’s Employment data.
The broader appeal for the Euro is weak against the Pound Sterling as investors hope that the European Central Bank (ECB) will start reducing key rates earlier than the BoE. Price pressures in the Eurozone economy are consistently declining. However, ECB policymakers will ensure that inflation will sustainably return to the 2% target before announcing rate cuts. ECB President Christine Lagarde anticipated that the central bank should consider rate cuts in late Spring.
The second-best performing currency after the US Dollar (USD) of 2024 is the Pound Sterling (GBP). Economists at ING analyze the GBP outlook.
UK services inflation and wage growth should remain sticky
On Tuesday, jobs data for January is released, and Wednesday sees the CPI report and Thursday's GDP data. We see both wage growth and services inflation remaining sticky in the first quarter, meaning that the Bank of England will have no rush to turn to a more dovish communication in the near future.
Markets are expecting the BoE to move with a delay (in August) compared to the ECB’s and Fed’s easing cycles. We agree, but also see 100 bps (vs 80 bps priced in) of cuts by year-end.
Some GBP weakness against the EUR down the road is therefore our base case, but the short-term outlook remains quite constructive for Sterling.
- USD/CHF inches lower as the US Dollar faces a challenge on downbeat US yields.
- Fed’s Lorie Logan emphasized the importance of obtaining additional evidence to confirm the progress in inflation.
- Swiss CPI (YoY) is expected to ease at 1.6% against the previous reading of 1.7%.
USD/CHF retreats to around 0.8730 during the early European hours on Monday. This decline in the pair is attributed to the weakening of the US Dollar (USD). Despite hawkish remarks from Federal Reserve (Fed) officials, the US Dollar faces downward pressure amid prevailing risk-on sentiment in the market.
On Friday, Dallas Federal Reserve (Fed) Bank President Lorie Logan stated that there is currently no immediate necessity to lower interest rates. Logan emphasized the importance of obtaining additional evidence to confirm the progress sustainability in inflation.
The US Dollar encounters headwinds as US Treasury yields decline. The US Dollar Index (DXY) slides to around 104.00, with 2-year and 10-year US yields hovering at 4.47% and 4.16%, respectively.
Market attention is focused on the upcoming release of Consumer Price Index (CPI) data on Tuesday. Analysts are anticipating a decrease in January's CPI (Year-on-Year) to 3.0%, down from December's 3.4%. Additionally, the monthly CPI data is expected to ease to 0.2% from the previous reading of 0.3%.
In January, the non-seasonally adjusted Swiss Unemployment Rate (Year-on-Year) increased, while the seasonally adjusted Unemployment Rate (Month-on-Month) remained stable. The Swiss National Bank (SNB) opted to maintain its key interest rate at 1.75%, marking the conclusion of its recent tightening cycle.
Market participants are eagerly awaiting the release of Swiss Consumer Price Index (CPI) data for January, scheduled for Tuesday. Projections suggest that headline Swiss inflation could grow by 1.6%, lower than the previous growth of 1.7%. Analysts widely anticipate that the SNB might initiate its first rate cut in September 2024.
EUR/USD gains ground for the fifth consecutive session on Monday near 1.0800. Economists at ING analyze the pair’s outlook.
EUR/USD volatility should remain capped
The holding pattern that EUR/USD has shown recently may well remain the norm in the coming weeks.
US CPI will be the big highlight for the pair this week, while the Eurozone calendar’s main release is Tuesday’s ZEW survey out of Germany.
We see some modest downside risks for the Dollar this week, and think EUR/USD can find some support back above 1.0800, although a return to the 1.0930/1.0950 area looks premature.
- Pound Sterling remains higher as market mood remains cheerful.
- The UK employment and inflation data will be the major triggers in the week ahead.
- January’s US inflation data will keep the US Dollar on its toes.
The Pound Sterling (GBP) clings to gains amid improved market sentiment in Monday’s European session. The GBP/USD pair is expected to remain volatile as investors await the United Kingdom employment and the United States Consumer Price Index (CPI) data on Tuesday.
UK Average Earnings will be in focus as Bank of England (BoE) Deputy Governor Sarah Breeden said last week that the longevity of higher interest rates will be based on how price pressures and wage growth data evolve.
If wage growth momentum remains strong, the BoE will need to keep interest rates elevated to combat inflation, which will actually be positive for Pound Sterling as higher interest rates attract more foreign capital inflows.
In today’s session, a speech from Bank of England Governor Andrew Bailey will be keenly watched, and could set a fresh tone for March’s monetary policy meeting. In the last monetary policy statement, Bailey pushed back on rate-cut expectations amid low confidence that inflation will soon return to its 2% target.
Daily Digest Market Movers: Pound Sterling rises on improved market mood
- Pound Sterling prints a fresh weekly high around 1.2650 ahead of a speech by Bank of England Governor Andrew Bailey.
- Last week, BoE Deputy Governor Sarah Breeden and Chief Economist Huw Pill said the focus is now on how long interest rates will remain restricted. They ruled out fears of further policy tightening.
- BoE policymakers, Jonathan Haskel and Catherine Mann warned that upside risks to price pressures supported the case for keeping interest rates restrictive for longer.
- The Pound Sterling is expected to remain volatile amid a data-packed week. Employment, inflation, quarterly Gross Domestic Product (GDP) and Retail Sales data are lined-up for release.
- Labor market data is scheduled for Tuesday. The Unemployment Rate for three months ending December is expected to drop to 4.0% from a former reading of 4.2%.
- Price pressures in the United Kingdom region are most stubborn in comparison with other Group of Seven economies due to higher wage growth and service inflation. Therefore, Investors will keenly focus on the Average Earnings data.
- Investors anticipate that wage growth excluding bonuses will decelerate to 6.0% in three months ending December against the former reading of 6.6%. In the same period, Average Earnings including bonuses are forecast to have grown at a slower pace of 5.7%.
- Slower wage growth momentum would offer some relief to BoE policymakers and will increase hopes of an early rate-cut.
- Meanwhile, the US Dollar Index (DXY) has discovered interim support near 104.00. The market mood is slightly upbeat despite United States inflation data for January looming large, which will be published on Tuesday.
- US headline inflation is forecast to have grown at a slower pace of 3.0% against 3.4% in December. In the same period, core inflation that excludes volatile food and Oil prices is forecast to have decelerated slightly to 3.8% from 3.9%.
- The appeal for the US Dollar would drop if the inflation data eases further.
Technical Analysis: Pound Sterling hovers near weekly high around 1.2630
Pound Sterling trades in a range of 1.2580-1.2640 from the past three trading sessions. The GBP/USD pair demonstrates a sharp volatility contraction ahead of the crucial economic events. The 50-day Exponential Moving Average (EMA) around 1.2630 is acting as a barricade for the Pound Sterling bulls.
The 14-period Relative Strength Index (RSI) oscillates in the 40.00-60.00 range, indicating a probable consolidation ahead.
Pound Sterling FAQs
What is the Pound Sterling?
The Pound Sterling (GBP) is the oldest currency in the world (886 AD) and the official currency of the United Kingdom. It is the fourth most traded unit for foreign exchange (FX) in the world, accounting for 12% of all transactions, averaging $630 billion a day, according to 2022 data.
Its key trading pairs are GBP/USD, aka ‘Cable’, which accounts for 11% of FX, GBP/JPY, or the ‘Dragon’ as it is known by traders (3%), and EUR/GBP (2%). The Pound Sterling is issued by the Bank of England (BoE).
How do the decisions of the Bank of England impact on the Pound Sterling?
The single most important factor influencing the value of the Pound Sterling is monetary policy decided by the Bank of England. The BoE bases its decisions on whether it has achieved its primary goal of “price stability” – a steady inflation rate of around 2%. Its primary tool for achieving this is the adjustment of interest rates.
When inflation is too high, the BoE will try to rein it in by raising interest rates, making it more expensive for people and businesses to access credit. This is generally positive for GBP, as higher interest rates make the UK a more attractive place for global investors to park their money.
When inflation falls too low it is a sign economic growth is slowing. In this scenario, the BoE will consider lowering interest rates to cheapen credit so businesses will borrow more to invest in growth-generating projects.
How does economic data influence the value of the Pound?
Data releases gauge the health of the economy and can impact the value of the Pound Sterling. Indicators such as GDP, Manufacturing and Services PMIs, and employment can all influence the direction of the GBP.
A strong economy is good for Sterling. Not only does it attract more foreign investment but it may encourage the BoE to put up interest rates, which will directly strengthen GBP. Otherwise, if economic data is weak, the Pound Sterling is likely to fall.
How does the Trade Balance impact the Pound?
Another significant data release for the Pound Sterling is the Trade Balance. This indicator measures the difference between what a country earns from its exports and what it spends on imports over a given period.
If a country produces highly sought-after exports, its currency will benefit purely from the extra demand created from foreign buyers seeking to purchase these goods. Therefore, a positive net Trade Balance strengthens a currency and vice versa for a negative balance.
Last year, central banks purchased a near-record 1,037t of Gold and a record 1,082 tonnes in 2022. After record central bank buying in 2022 and 2023, economists at TD Securities expect continued strong demand from central banks in the years to come.
Central banks reigniting Gold bull run
Considering that about a quarter of central banks intend to increase their holding this year, we are confident that central bank Gold demand will be strong for the foreseeable future. Central banks’ view that the future role of the US Dollar will be diminished in the years to come will be a big driver of Gold demand in the future, as has been outlined in recent surveys which show an increase in this attitude from earlier surveys.
A record pace of central bank physical gold purchases and renewed investor interest to protect against purchasing power erosion, default risks as US debt grows to alarmingly high levels and sanctions risks associated with geopolitical tensions in the Middle East and Eastern Europe, could all be factors that not only provide price support as they did last year, but augment any spec-driven rally.
FX option expiries for Feb 12 NY cut at 10:00 Eastern Time, via DTCC, can be found below.
- EUR/USD: EUR amounts
- 1.0650 461m
- 1.0925 591m
- 1.0975 455m
- USD/JPY: USD amounts
- 149.10 427m
- Silver gains momentum near $22.80 in Monday’s early European session.
- The bullish price of silver remains intact above the key EMA.
- The key resistance level is seen at 23.00; 22.70 acts as an initial support level for the metal.
Silver (XAG/USD) extends its upside above the mid-$22.00s during the early European session on Monday. Traders will keep an eye on the US January Consumer Price Index (CPI) on Tuesday for fresh impetus. If the CPI data confirms the declining inflation trend, it may support the case for rate cuts, which boosts the silver price. XAG/USD currently trades around $22.80, gaining 0.82% on the day.
According to the four-hour chart, the silver price resumes its bullish trend as the metal is above the key 100-period Exponential Moving Averages (EMA). The upward momentum is supported by the Relative Strength Index (RSI), which lies above the 50 midlines. The momentum indicator indicates that further upside looks favorable.
A bullish breakout above the upper boundary of Bollinger Band of $22.85 will see a rally to a psychological round mark and a high of January 25 at 23.00. Further north, the next hurdle is located near a high of February 2 at 23.25. The additional upside filter to watch is 23.53 (a high of January 12), followed by 24.09 (a high of January 2).
On the downside, the 100-period EMA at 22.70 acts as an initial support level for the metal. A break below the latter will see a drop to a high of February 6 at 22.48. The next downside target is seen near the lower limit of the Bollinger Band at 22.10 and a low of January 22 at 21.92.
Silver four-hour chart
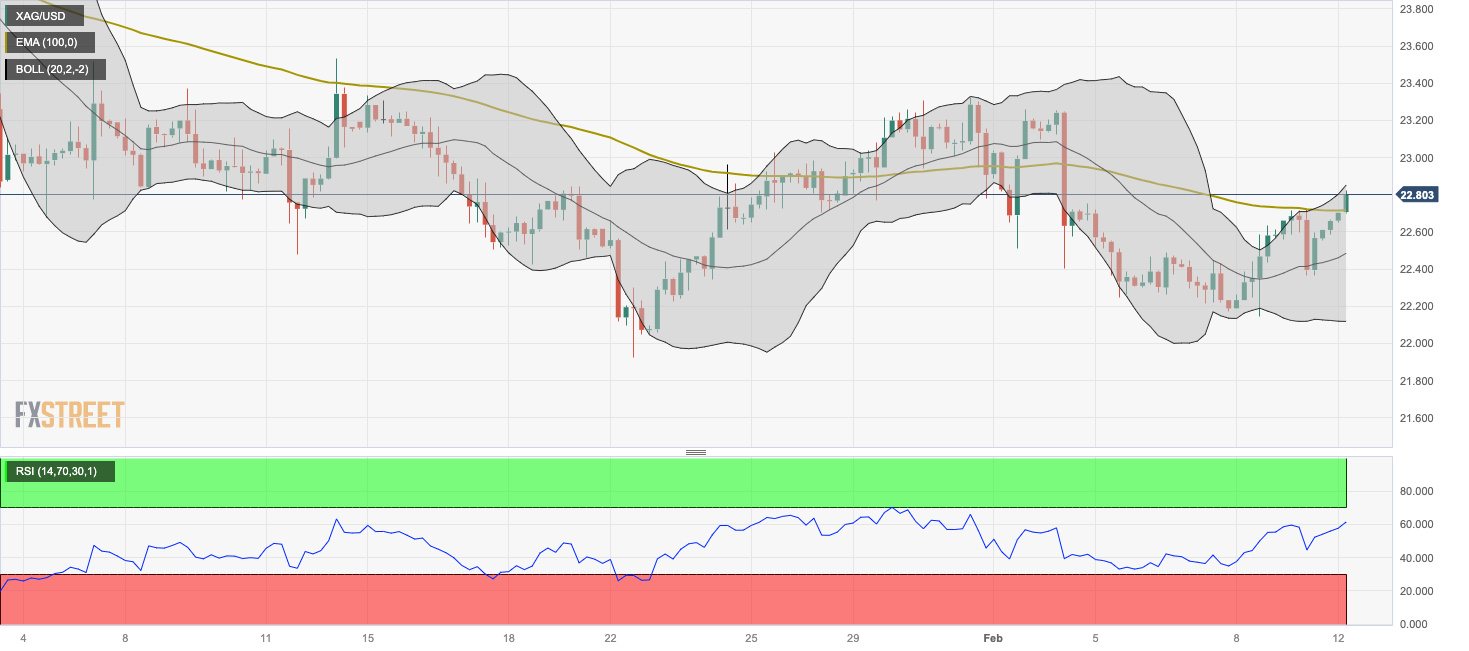
Here is what you need to know on Monday, February 12:
Following the previous week's indecisive action, currency markets hold steady to start the new week. The US Dollar (USD) Index moves sideways near 104.00 in the early European session after closing virtually unchanged on Friday. The economic calendar will not offer any high-tier data releases. Several Federal Reserve policymakers and Bank of England Governor Andrew Bailey will be delivering speeches later in the day.
The S&P 500 climbed above 5,000 and closed the previous week at a record high of 5,026.62. Early Monday, US stock index futures trade modestly lower. Meanwhile, the benchmark 10-year US Treasury bond yield continues to fluctuate between 4.1% and 4.2% ahead of Tuesday's highly-anticipated Consumer Price Index (CPI) data from the US. On Friday, the US Bureau of Labor Statistics (BLS) reported that it revised the monthly CPI increase for December lower to 0.2% from 0.3%. The Core CPI was unrevised at 0.3% for the same period.
Tech stocks lift Nasdaq, S&P 500 sees its first-ever close above 5,000.
Statistics Canada announced on Friday that Net Change in Employment was +37.3K in January and that the Unemployment Rate ticked down to 5.7% from 5.8%. After falling toward 1.3400, USD/CAD staged a rebound and closed the day flat above 1.3450. The pair continues to fluctuate in a tight range near the previous week's closing level.
After rising nearly 1% on Friday, NZD/USD turned south and declined below 0.6150 in the Asian trading hours on Monday, despite hawkish comments from Reserve Bank of New Zealand (RBNZ) officials. RBNZ Deputy Governor Hawkesby said that the system can cope with high interest rates while testifying before the Finance and Expenditure Committee on Monday. At the same hearing, Governor Orr explained that they have kept the cash rate at 5.5% because inflation is still too high.
US Dollar price today
The table below shows the percentage change of US Dollar (USD) against listed major currencies today. US Dollar was the strongest against the New Zealand Dollar.
| USD | EUR | GBP | CAD | AUD | JPY | NZD | CHF | |
| USD | 0.06% | 0.05% | 0.02% | 0.07% | 0.01% | 0.28% | 0.03% | |
| EUR | -0.06% | 0.00% | -0.04% | 0.02% | -0.05% | 0.22% | -0.03% | |
| GBP | -0.06% | 0.01% | -0.03% | 0.02% | -0.05% | 0.23% | -0.03% | |
| CAD | -0.02% | 0.04% | 0.03% | 0.05% | -0.02% | 0.26% | 0.00% | |
| AUD | -0.07% | -0.01% | -0.02% | -0.05% | -0.07% | 0.20% | -0.05% | |
| JPY | -0.01% | 0.05% | 0.08% | 0.02% | 0.07% | 0.28% | 0.02% | |
| NZD | -0.27% | -0.20% | -0.21% | -0.24% | -0.19% | -0.26% | -0.24% | |
| CHF | -0.03% | 0.03% | 0.02% | -0.01% | 0.04% | -0.02% | 0.25% |
The heat map shows percentage changes of major currencies against each other. The base currency is picked from the left column, while the quote currency is picked from the top row. For example, if you pick the Euro from the left column and move along the horizontal line to the Japanese Yen, the percentage change displayed in the box will represent EUR (base)/JPY (quote).
EUR/USD closed the previous week virtually unchanged and extended its sideways grind slightly below 1.0800 to start the new week.
GBP/USD continues to move up and down in a narrow channel above 1.2600 on Monday. The UK's Office for National Statistics will release labor market and inflation data on Tuesday and Wednesday, respectively.
Following Thursday's upsurge, USD/JPY went into a consolidation phase on Friday. Early Monday, the pair stays relatively quiet above 149.00.
Gold fell nearly 0.5% on Friday as the US Treasury bond yields edged higher ahead of the weekend. Nevertheless, XAU/USD managed to stabilize above $2,020.
- AUD/JPY halts its winning streak on cautious mood due to Middle East tension.
- The Middle East tension has escalated due to Israel’s conclusion of a series of strikes in southern Gaza.
- The Australian Dollar encountered challenges stemming from the decline in the Australian money market.
AUD/JPY snaps its four-day winning streak, which could be attributed to the market caution due to geopolitical conflict in the Middle East. The Japanese Yen (JPY) could have enjoyed the safe-haven status after Israel concluded a series of strikes in Gaza's southern city of Rafah. The AUD/JPY cross edges lower to near 97.30 during the Asian hours on Monday.
On Sunday, Israeli Prime Minister Binyamin Netanyahu expressed intentions to escalate the military operation there, but US President Joe Biden urged caution, insisting on a credible plan. Hamas also warned against a ground offensive in Rafah, fearing it could impact future hostage releases.
However, investor sentiment towards the Japanese Yen weakens as they perceive the Bank of Japan (BoJ) to adopt a cautious approach towards rate hikes following its departure from ultra-dovish monetary policy. BoJ Deputy Governor Shinichi Uchida's recent remarks suggest that the central bank is unlikely to pursue aggressive tightening, even after abandoning negative interest rates.
The increase in Chinese New Loans, reported on Friday, signifies a positive development for economic activities in China. This might have potentially offered support for the AUD/JPY pair. The close trade relations between China and Australia might have amplified this effect. However, with Chinese markets closed for the Lunar New Year holidays, the impact may be limited in the short term.
Meanwhile, the Australian Dollar (AUD) encountered challenges stemming from the decline in the Australian money market. Despite a record surge in United States (US) markets on Friday, the share market in Australia trended lower in early trading on Monday, constraining the Aussie Dollar's performance, which in turn, helped to undermine the AUD/JPY pair.
- GBP/USD oscillates in a trading band between 1.2600 and 1.2645 on Monday.
- The major pair keeps the bearish outlook below the key EMA; RSI indicator shows non-directional action.
- The first upside barrier will emerge at 1.2645; the initial support level is located at the 1.2600–1.2610 zone.
The GBP/USD pair consolidates within a narrow trading range of 1.2600–1.2645 during the early European trading hours on Monday. The Bank of England (BoE) governor, Sarah Breeden said last week that the central bank has shifted from tightening rates to thinking about when they might come down as the recent falls in UK inflation have changed the BoE’s outlook. Traders prefer to wait on the sidelines ahead of the UK labor market data on Tuesday. At press time, GBP/USD is trading at 1.2630, gaining 0.01% on the day.
Technically, GBP/USD maintains the bearish outlook unchanged as the pair is below the 100-period Exponential Moving Average (EMA) on the four-hour chart. It’s worth noting that the Relative Strength Index (RSI) hovers around the 50 midlines, indicating the non-directional action of the pair.
A decisive break above the upper boundary of the Bollinger Band at 1.2645 will see a rally to the 100-period EMA at 1.2655. The additional upside filter to watch is a high of January 30 at 1.2721, en route to a high of January 31 at 1.2750.
On the flip side, the initial support level is located in the 1.2600–1.2610 region, portraying the lower limit of the Bollinger Band, psychological round mark, and a low of February 9. A breach of this level will see a drop to a low of February 8 at 1.2572 and a low of December 11 at 1.2535.
GBP/USD four-hour chart
-638433124555074195.png)
- EUR/USD could test the psychological resistance level of 1.0800.
- Technical analysis suggests a potential shift towards upside momentum.
- The pair could find the support region around the major level of 1.0750 and the previous week’s low at 1.0722.
EUR/USD extends its winning streak for the fifth consecutive session on Monday, moving upward near the 1.0790 level during the Asian session. The key resistance at the psychological level of 1.0800 is closely watched, followed by the 14-day Exponential Moving Average (EMA) at 1.0810.
A firm break above the EMA could intensify upward momentum for the EUR/USD pair, targeting the 23.6% Fibonacci retracement level at 1.0821, along with the significant barrier at 1.0850. Further upside could see the pair navigate towards the region around the psychological level at 1.0900.
Technical analysis of the EUR/USD pair indicates a mixed outlook in the market. The 14-day Relative Strength Index (RSI) is below the 50 mark, indicating a bearish momentum. However, the lagging indicator Moving Average Convergence Divergence (MACD), while still below the centerline, shows signs of convergence below the signal line, suggesting a potential shift towards upside momentum.
Given these conflicting signals, market participants may opt to await further confirmation of the directional trend for the EUR/USD pair before making trading decisions.
On the downside, the EUR/USD pair has immediate support at the psychological level of 1.0750, with further support at the previous week's low of 1.0722, observed on February 6. A clear breach below this level may exert downward pressure on the pair, potentially leading it towards the psychological support level of 1.0700. Traders will closely monitor price action around these levels for potential shifts in market sentiment.
EUR/USD: Daily Chart
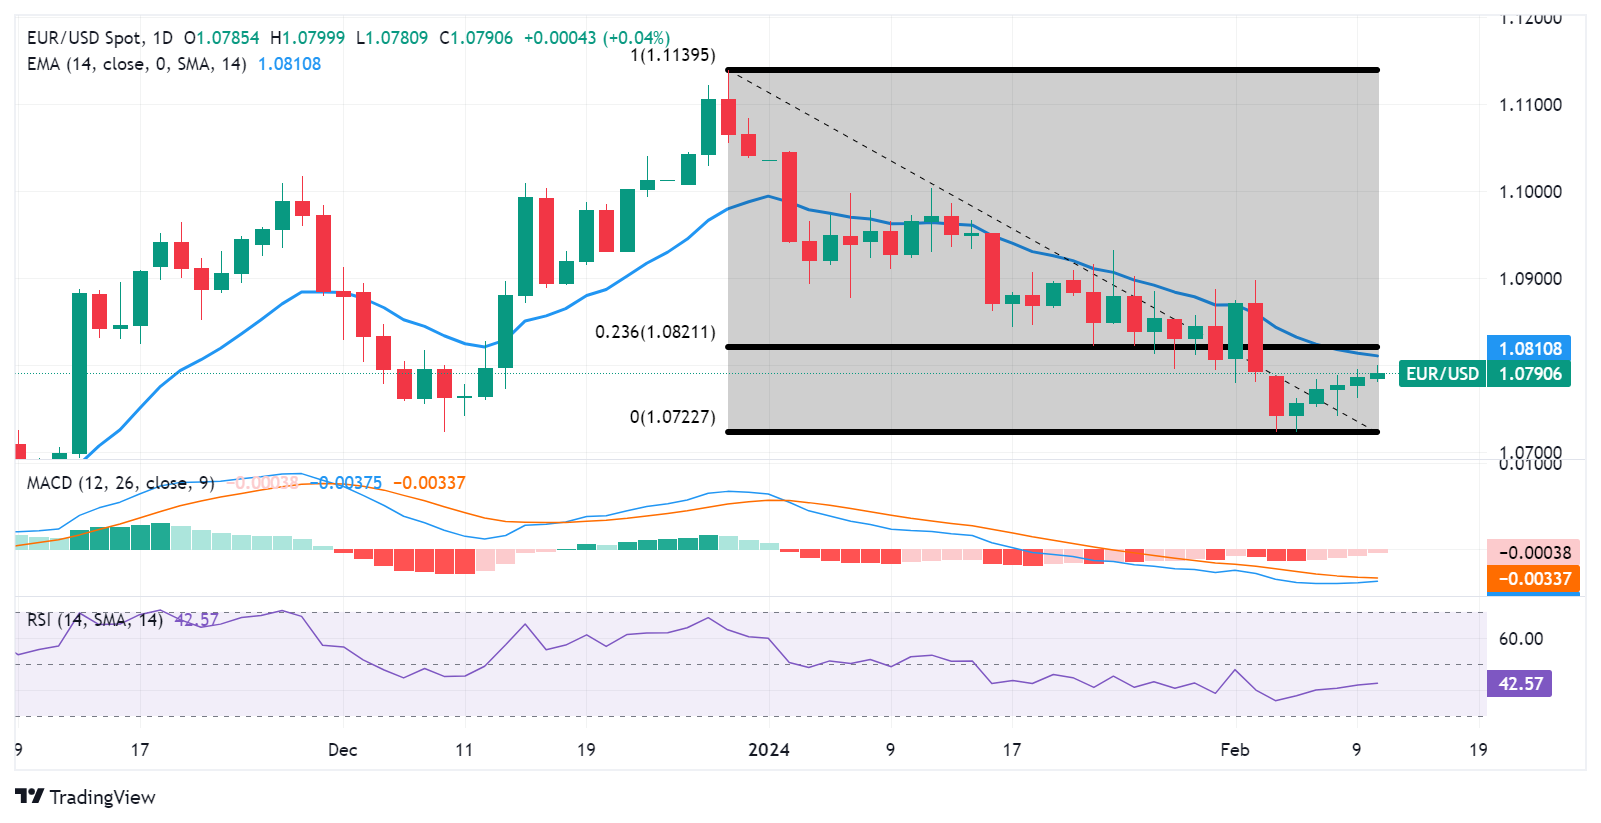
- EUR/JPY attracts fresh buyers on Monday and moves back closer to last week’s swing high.
- Dovish BoJ's remarks, along with a positive risk tone, undermine the JPY and offer support.
- Expectations for an imminent shift in the BoJ’s policy and ECB rate cut bets cap the upside.
The EUR/JPY cross regains positive traction on the first day of a new week and climbs back above the 161.00 round-figure mark during the Asian session. Spot prices remain well within the striking distance of over a two-week high touched on Friday and seem poised to prolong the recent appreciating move from the vicinity of the 158.00 mark, or the monthly trough.
Last week's dovish remarks by the Bank of Japan (BoJ) Deputy Governor Shinichi Uchida, saying that aggressive tightening is unlikely even after an exit from negative interest rate policy, continue to undermine the Japanese Yen (JPY). Apart from this, a generally positive risk tone further contributes to safe-haven JPY's relative underperformance and turns out to be another factor lending support to the EUR/JPY cross.
Expectations that Chinese authorities will do more to stimulate the economy, along with easing fears about a further escalation of geopolitical tensions in the Middle East, remain supportive of the recent risk-on rally across the global equity markets. In fact, the Israel military said on Monday that it had concluded a series of strikes in southern Gaza days after Prime Minister Benjamin Netanyahu rejected a ceasefire proposal from Hamas.
That said, growing acceptance that the BoJ will eventually abandon its ultra-loose monetary policy settings after the outcome of annual wage negotiations in March should help limit the downside for the JPY. Apart from this, rising bets that the European Central Bank (ECB) will start cutting interest rates at the start of the second quarter might hold back bulls from placing fresh bets around the shared currency and cap the EUR/JPY cross.
The bets were reaffirmed by a fall in German inflation, which eased to the 3.1% YoY rate in January from the 3.8% in the previous month. Adding to this, ECB Governing Council member Fabio Panetta said on Saturday that the moment is fast approaching for the central bank to cut interest rates. Panetta added that timely and gradual steps could help to reduce ensuing volatility in financial markets and the economy.
This, in turn, warrants caution before positioning for any further appreciating move in the absence of any relevant market-moving economic releases on Monday. Moving ahead, investors now look to the first estimate of the fourth-quarter GDP growth figures from the Eurozone and Japan, due for release on Wednesday and Thursday, respectively, which, in turn, should provide a fresh impetus to the EUR/JPY cross.
Technical levels to watch
- USD/CAD moves sideways during a quiet Asian session on Monday.
- The decline in the WTI price could put pressure on the Canadian Dollar.
- US CPI YoY and MoM could decrease to 3.0% and 0.2%, respectively, in January.
USD/CAD moves sideways on Monday after witnessing a volatile session on Friday. The pair hovers around 1.3460 during the Asian session. The decline in Crude oil prices might have weighed on the Canadian Dollar (CAD), given the fact that Canada is the largest oil exporter to the United States (US).
The price of West Texas Intermediate (WTI) Crude oil paused its five-day winning streak from the previous week, dipping slightly to approximately $76.50 per barrel at the current time. This decline in crude oil prices follows Israel's conclusion of a series of strikes in Gaza's southern city of Rafah. The cessation of hostilities has alleviated concerns about potential disruptions to oil supply in the Red Sea region.
On Friday, the USD/CAD pair experienced downward pressure following the release of mixed Canadian employment data. However, market sentiment shifted as traders recalibrated their exposure to the Greenback after the US Bureau of Labor Statistics (BLS) implemented broad seasonal adjustment changes to the calculation of the Consumer Price Index (CPI). These adjustments resulted in minor alterations to near-term inflation projections.
Canadian Unemployment Rate surprisingly decreased to 5.7% in January from 5.8% prior, better than the market expectation of 5.9% reading. While Net Change in Employment rose to 37.3K, exceeding the expected 15.0K and 12.3K prior. However, Average Hourly Wages (YoY) grew by 5.3% against the previous growth of 5.7%.
The US Dollar Index (DXY) is on a downward trajectory despite stable US bond yields, inching lower to near 104.00 with 2-year and 10-year US yields standing at 4.48% and 4.17%, respectively, at the time of writing. The downward trend in the US Dollar (USD) could be attributed to a prevailing risk-on sentiment in the market, especially ahead of the Consumer Price Index (CPI) data scheduled to be released on Tuesday.
Analysts anticipate a decrease in January’s CPI (YoY) to 3.0%, down from December's 3.4%. Additionally, the monthly CPI data is expected to eased at 0.2% from the 0.3% prior.
- Gold price struggles to lure buyers amid hawkish Fed expectations and the upbeat market mood.
- The Fed rate cut uncertainty keeps the USD bulls on the defensive and lends support to the metal.
- Traders keenly await the US consumer inflation figures on Tuesday before placing directional bets.
Gold price (XAU/USD) kicks off the new week on a subdued note and oscillates in a narrow trading range, just above the $2,020 level during the Asian session. The recent surge in the US Treasury bond yields, bolstered by the upbeat US macro data and hawkish rhetoric from several Federal Reserve (Fed) officials, along with a generally positive risk tone, act as a headwind for the safe-haven precious metal. The downside, however, remains cushioned in the wake of a softer US Dollar (USD), which tends to benefit the USD-denominated commodity.
Furthermore, traders seem reluctant to place aggressive directional bets in the wake of uncertainty about the likely timing and pace of Fed rate cuts in 2024. Hence, the focus will remain glued to the release of the latest US consumer inflation figures, due on Tuesday. The crucial US CPI report might provide some cues about the Fed's rate-cut path, which, in turn, will drive the USD demand and provide some meaningful impetus to the non-yielding Gold price. Heading into the key data risk, easing concerns about a further escalation of geopolitical tensions in the Middle East might keep a lid on any attempted recovery for the XAU/USD.
Daily Digest Market Movers: Gold price remains depressed amid reduced Fed rate cut bets and positive risk tone
- Growing acceptance that the Federal Reserve will keep interest rates higher for longer in the wake of a still resilient US economy acts as a headwind for the non-yielding Gold price.
- Moreover, the recent hawkish remarks by a slew of influential FOMC members forced investors to scale back their expectations for early and steep interest rate cuts this year.
- Dallas Fed Bank President Lorie Logan said on Friday that there is no urgency to cut rates and that she wants further evidence on inflation to confirm the progress is durable.
- Atlanta Fed President Raphael Bostic noted that inflation has been too high for too long, and there is still a way to go and that the US is on a path to pre-pandemic economic activity.
- The annual revisions published by the Labor Department showed on Friday that US consumer prices increased slightly more than previously reported in October and November.
- The US Dollar, however, struggles to gain any meaningful traction in the wake of the uncertainty about the likely timing and pace of interest rate cuts by the Fed this year.
- Traders also prefer to wait on the sidelines and look to the latest US consumer inflation figures on Tuesday for cues about the Fed's rate-cut path before placing directional bets.
- Relatively thin trading volumes on the back of holidays in Japan and China further contribute to the subdued range-bound price action on the first day of a new week.
- The Israel military said on Monday that it had concluded a series of strikes in southern Gaza, easing fears about broadening the Israel-Palestinian conflict across the Middle East.
Technical Analysis: Gold price needs to break below the $2,000 psychological mark for bears to seize near-term control
From a technical perspective, last week's swing low, around the $2,015 area, is likely to protect the immediate downside ahead of the $2,000 psychological mark. Given that oscillators on the daily chart have again started gaining negative traction, a convincing break below the latter will be seen as a fresh trigger for bearish traders and pave the way for deeper losses. The Gold price might then accelerate the slide towards the 100-day Simple Moving Average (SMA), currently around the $1,988 zone before dropping to the very important 200-day SMA, near the $1,966-1,965 region.
On the flip side, the 50-day SMA, around the $2,033 area, could act as an immediate hurdle ahead of last week's swing high, near the $2,044-2,045 area. This is followed by the $2,065 region, or the monthly peak, which if cleared decisively will negate the near-term negative outlook. The Gold price might then accelerate the positive move towards retesting the YTD peak, near the $2,078-2,079 touched in January. The subsequent move up has the potential to lift the XAU/USD to the $2,100 mark en route to the next relevant hurdle near the $2,120 region.
US Dollar price today
The table below shows the percentage change of US Dollar (USD) against listed major currencies today. US Dollar was the strongest against the New Zealand Dollar.
| USD | EUR | GBP | CAD | AUD | JPY | NZD | CHF | |
| USD | 0.05% | 0.05% | 0.02% | 0.05% | 0.05% | 0.29% | 0.03% | |
| EUR | -0.05% | 0.01% | -0.02% | 0.04% | 0.00% | 0.24% | -0.01% | |
| GBP | -0.05% | 0.00% | -0.02% | 0.01% | 0.00% | 0.24% | -0.01% | |
| CAD | -0.02% | 0.02% | 0.03% | 0.03% | 0.03% | 0.26% | 0.01% | |
| AUD | -0.06% | -0.01% | -0.01% | -0.04% | -0.01% | 0.23% | -0.03% | |
| JPY | -0.05% | -0.01% | 0.04% | -0.03% | 0.01% | 0.23% | -0.02% | |
| NZD | -0.29% | -0.24% | -0.23% | -0.26% | -0.23% | -0.23% | -0.25% | |
| CHF | -0.05% | -0.01% | 0.01% | -0.03% | 0.00% | 0.00% | 0.24% |
The heat map shows percentage changes of major currencies against each other. The base currency is picked from the left column, while the quote currency is picked from the top row. For example, if you pick the Euro from the left column and move along the horizontal line to the Japanese Yen, the percentage change displayed in the box will represent EUR (base)/JPY (quote).
Gold FAQs
Why do people invest in Gold?
Gold has played a key role in human’s history as it has been widely used as a store of value and medium of exchange. Currently, apart from its shine and usage for jewelry, the precious metal is widely seen as a safe-haven asset, meaning that it is considered a good investment during turbulent times. Gold is also widely seen as a hedge against inflation and against depreciating currencies as it doesn’t rely on any specific issuer or government.
Who buys the most Gold?
Central banks are the biggest Gold holders. In their aim to support their currencies in turbulent times, central banks tend to diversify their reserves and buy Gold to improve the perceived strength of the economy and the currency. High Gold reserves can be a source of trust for a country’s solvency. Central banks added 1,136 tonnes of Gold worth around $70 billion to their reserves in 2022, according to data from the World Gold Council. This is the highest yearly purchase since records began. Central banks from emerging economies such as China, India and Turkey are quickly increasing their Gold reserves.
How is Gold correlated with other assets?
Gold has an inverse correlation with the US Dollar and US Treasuries, which are both major reserve and safe-haven assets. When the Dollar depreciates, Gold tends to rise, enabling investors and central banks to diversify their assets in turbulent times. Gold is also inversely correlated with risk assets. A rally in the stock market tends to weaken Gold price, while sell-offs in riskier markets tend to favor the precious metal.
What does the price of Gold depend on?
The price can move due to a wide range of factors. Geopolitical instability or fears of a deep recession can quickly make Gold price escalate due to its safe-haven status. As a yield-less asset, Gold tends to rise with lower interest rates, while higher cost of money usually weighs down on the yellow metal. Still, most moves depend on how the US Dollar (USD) behaves as the asset is priced in dollars (XAU/USD). A strong Dollar tends to keep the price of Gold controlled, whereas a weaker Dollar is likely to push Gold prices up.
- WTI price edges lower after Israel’s series of strikes in Gaza's southern city of Rafah.
- Israeli Prime Minister Binyamin Netanyahu expressed his intention to escalate the military operation into Rafah.
- IMF MD Kristalina Georgieva highlighted that Middle Eastern economies were underperforming compared to growth projections.
West Texas Intermediate (WTI) oil price halts its five-day winning streak from the previous week, trading slightly lower to around $76.30 per barrel during the Asian session on Monday. The decline in Crude oil prices comes as Israel concluded a series of strikes in Gaza's southern city of Rafah, alleviating concerns about oil supply disruptions in the Red Sea region.
Israeli Prime Minister Binyamin Netanyahu expressed his intention on Sunday to escalate the military operation into Rafah. However, US President Joe Biden cautioned Netanyahu against proceeding with a ground operation in Rafah without a "credible and executable" plan to ensure the safety of the people sheltering there. Hamas also warned Israel that a ground offensive in Rafah could jeopardize future hostage releases.
However, oil prices surged last week on heightened concerns about a potential escalation of geopolitical tensions in the Middle East following Netanyahu's rejection of a proposal to halt the conflict in the Palestinian enclave.
During the Arab Fiscal Forum in Dubai on Sunday, Kristalina Georgieva, the Managing Director of the International Monetary Fund (IMF), highlighted that Middle East economies were underperforming compared to growth projections. Factors contributing to this included oil production cuts and the Israel-Gaza conflict. Despite this, Georgieva noted that the global economic outlook remained resilient. In its regional economic report last month, the IMF revised its GDP growth forecast for the Middle East and North Africa down to 2.9% for the year, falling below previous projections from October.
On Friday, Baker Hughes released its US Oil Rig Count data, indicating no change in the active rig count, which remained steady at 499. Additionally, the OPEC Monthly Oil Market Report (MOMR) is scheduled for publication on Tuesday. This report covers significant issues impacting the global oil market and offers insights into developments in the Crude oil market.
- Indian Rupee weakens on Monday on the renewed USD demand, higher oil prices.
- The Reserve Bank of India (RBI) is expected to cut rates by 25 bps in each of the third and fourth quarters.
- Investors await India’s CPI inflation data due on Monday at 12:00 GMT.
Indian Rupee (INR) loses traction on Monday amid US Dollar (USD) demand from state-run banks and a rise in oil prices. India’s Consumer Price Index (CPI) for January will take center stage at the beginning of the week. The Reserve Bank of India (RBI) maintained its repo rate at 6.50% for a sixth consecutive meeting on February 8, citing food price shocks as a significant risk to the current disinflation trend.
The Indian central bank is anticipated to leave its key policy rate unchanged until the June meeting before cutting it by 25 basis points (bps) in each of the third and fourth quarters, a relatively moderate move compared to other major central banks' easing cycles.
On the other hand, the robust US economic data and pushback from Fed officials on market expectations of early rate cuts boost the USD and lift the US bond yield, which acts as a tailwind for the USD/INR pair.
Moving on, India’s CPI inflation data, Industrial Production, and Manufacturing Output are due on Monday at 12.00 GMT. The Wholesale Price Index (WPI) Food, Fuel, and Inflation for January will be released on Wednesday.
On the US docket, the January CPI report will be in the spotlight on Tuesday. The headline Consumer Price Index (CPI) is expected to slow from 3.4% in December to 3.0% in January. The inflation reports over the next few months could be critical in determining the timeline for when the Fed will cut its benchmark interest rate.
Daily Digest Market Movers: Indian Rupee remains vulnerable to high inflation
- The headline CPI inflation was forecast to fall to 5.09% in January from 5.69% in December.
- Inflation will average 5.4% this fiscal year and 4.7% in the next, close to the RBI's forecasts of 5.4% and 4.5%, according to a Reuters poll.
- Indian bond yields jumped after the RBI rate decision, with the 10-year benchmark bond yield closing at 7.1067% on Friday, the highest since January 31.
- The revised CPI figures rose by 0.2% in December from the previous month, compared to the initial estimate of 0.3%, according to the Bureau of Labor Statistics on Friday.
- Dallas Fed President Lorie Logan said that she is not in a hurry to cut interest rates. She added that although there has been "tremendous progress" in decreasing inflation, additional data is needed to confirm the progress is durable.
Technical Analysis: Indian Rupee faces further range-bound movement in the longer-term
Indian Rupee trades softer on the day. USD/INR remains confined within a multi-month descending trend channel between 82.70 and 83.20.
In the near term, the pair is below the key 100-period Exponential Moving Average (EMA) in the daily timeframe, suggesting the sellers are likely to stay in control. Furthermore, the 14-day Relative Strength Index (RSI) lies below the 50.0 midline, hinting that support levels are more likely to break than to hold.
If sellers take back control of USD/INR, the initial support level is seen at a low of February 2 at 82.83. The critical upside barrier will emerge near the lower limit of the descending trend channel at 82.70. Sustained bearish pressure could still pave the way to a low of August 23 at 82.45, followed by a low of June 1 at 82.25.
In the case of a bullish trading environment, the confluence of the upper boundary of the descending trend channel, the psychological round figure, and the 100-period EMA at the 83.00–83.05 zone act as a key resistance level for USD/INR. A clear upside breakout above this region will move towards a high of January 18 at 83.20. We may see a trip to a high of January 2 at 83.35, and the 84.00 psychological level if there’s enough bullish momentum.
US Dollar price today
The table below shows the percentage change of US Dollar (USD) against listed major currencies today. US Dollar was the strongest against the New Zealand Dollar.
| USD | EUR | GBP | CAD | AUD | JPY | NZD | CHF | |
| USD | 0.03% | 0.05% | 0.02% | 0.07% | 0.01% | 0.25% | 0.04% | |
| EUR | -0.04% | 0.01% | -0.01% | 0.04% | -0.03% | 0.21% | 0.00% | |
| GBP | -0.04% | -0.01% | -0.02% | 0.04% | -0.04% | 0.21% | -0.02% | |
| CAD | -0.03% | 0.00% | 0.02% | 0.04% | -0.03% | 0.22% | 0.00% | |
| AUD | -0.04% | -0.01% | -0.02% | -0.05% | -0.04% | 0.18% | -0.04% | |
| JPY | 0.00% | 0.03% | 0.08% | 0.02% | 0.07% | 0.25% | 0.03% | |
| NZD | -0.24% | -0.20% | -0.19% | -0.21% | -0.16% | -0.23% | -0.20% | |
| CHF | -0.03% | 0.00% | 0.01% | -0.01% | 0.04% | -0.03% | 0.22% |
The heat map shows percentage changes of major currencies against each other. The base currency is picked from the left column, while the quote currency is picked from the top row. For example, if you pick the Euro from the left column and move along the horizontal line to the Japanese Yen, the percentage change displayed in the box will represent EUR (base)/JPY (quote).
Indian Rupee FAQs
What are the key factors driving the Indian Rupee?
The Indian Rupee (INR) is one of the most sensitive currencies to external factors. The price of Crude Oil (the country is highly dependent on imported Oil), the value of the US Dollar – most trade is conducted in USD – and the level of foreign investment, are all influential. Direct intervention by the Reserve Bank of India (RBI) in FX markets to keep the exchange rate stable, as well as the level of interest rates set by the RBI, are further major influencing factors on the Rupee.
How do the decisions of the Reserve Bank of India impact the Indian Rupee?
The Reserve Bank of India (RBI) actively intervenes in forex markets to maintain a stable exchange rate, to help facilitate trade. In addition, the RBI tries to maintain the inflation rate at its 4% target by adjusting interest rates. Higher interest rates usually strengthen the Rupee. This is due to the role of the ‘carry trade’ in which investors borrow in countries with lower interest rates so as to place their money in countries’ offering relatively higher interest rates and profit from the difference.
What macroeconomic factors influence the value of the Indian Rupee?
Macroeconomic factors that influence the value of the Rupee include inflation, interest rates, the economic growth rate (GDP), the balance of trade, and inflows from foreign investment. A higher growth rate can lead to more overseas investment, pushing up demand for the Rupee. A less negative balance of trade will eventually lead to a stronger Rupee. Higher interest rates, especially real rates (interest rates less inflation) are also positive for the Rupee. A risk-on environment can lead to greater inflows of Foreign Direct and Indirect Investment (FDI and FII), which also benefit the Rupee.
How does inflation impact the Indian Rupee?
Higher inflation, particularly, if it is comparatively higher than India’s peers, is generally negative for the currency as it reflects devaluation through oversupply. Inflation also increases the cost of exports, leading to more Rupees being sold to purchase foreign imports, which is Rupee-negative. At the same time, higher inflation usually leads to the Reserve Bank of India (RBI) raising interest rates and this can be positive for the Rupee, due to increased demand from international investors. The opposite effect is true of lower inflation.
- NZD/USD loses ground as RBNZ OIS rates continue to pare Friday's post-ANZ forecast firming.
- ANZ projected that the RBNZ would increase cash rates by a quarter point in February and April.
- RBNZ Governor Adrian Orr highlighted that inflation remains elevated before the Finance and Expenditure Committee on Monday.
- Dallas Fed Bank President Lorie Logan remarked that there is currently no pressing need to reduce interest rates.
NZD/USD retraces its recent gains observed on Friday, trading lower near 0.6140 during the Asian session on Monday. Despite the subdued US Dollar (USD), the NZD/USD pair experiences a decline due to the Reserve Bank of New Zealand (RBNZ) Overnight Indexed Swap (OIS) rates continuing to pare Friday's post-ANZ forecast firming.
Last week, ANZ projected that the RBNZ would increase cash rates by a quarter point in February and April amid elevated cost pressures, bringing them to 6.0%. The RBNZ is scheduled to hold its policy meeting for the first time this year at the end of the month.
Reserve Bank of New Zealand (RBNZ) Governor Adrian Orr testified before the Finance and Expenditure Committee on Monday, addressing questions related to the November 2023 Financial Stability Report. Orr highlighted that inflation remains elevated, which is why the RBNZ has maintained the cash rate at 5.5%.
RBNZ Deputy Governor (Financial Stability) Christian Hawkesby also testified before the Committee, emphasizing that the New Zealand financial system remains robust. He noted that house prices have stabilized over the last six months, and the system is equipped to handle high-interest rates. Moreover, New Zealand Finance Minister Nicola Willis has announced that the government budget will be announced on May 30th.
The US Dollar Index (DXY) is on a downward trajectory, reflecting a prevailing risk-on sentiment in the market, especially ahead of the impending release of Consumer Price Index (CPI) data slated for Tuesday. Analysts anticipate a moderation in the CPI (Year-on-Year) for January to 3.0%, down from December's 3.4%. Additionally, the monthly CPI data is expected to dip to 0.2% from the previous 0.3%.
Dallas Federal Reserve (Fed) Bank President Lorie Logan remarked on Friday that there is currently no pressing need to reduce interest rates. She noted "tremendous progress" in curbing inflation but stressed the importance of further evidence to ensure the sustainability of this progress. This sentiment resonates with US Fed Chair Jerome Powell's dismissal of the idea of a rate cut in March, as conveyed during a press conference following the interest rate decision on January 31.
- GBP/USD ticks higher amid a modest USD weakness, though the upside remains capped.
- The Fed rate cut uncertainty and a positive risk tone keep the USD bulls on the defensive.
- Bets that the BoE will start cutting rates in the next few months cap the upside for the GBP.
The GBP/USD pair attracts some buying during the Asian session on Monday, albeit lacks follow-through and remains below mid-1.2600s, or the top end of a multi-day-old trading range.
The US Dollar (USD) continues with its struggle to gain any meaningful traction in the wake of the uncertainty over the Federal Reserve’s (Fed) rate-cut path. Apart from this, the underlying bullish sentiment surrounding the global equity markets is seen as another factor undermining the safe-haven Greenback and lending some support to the GBP/USD pair.
The markets, meanwhile, have been scaling back their expectations for early and steep rate cuts by the Fed in 2024 in the wake of a resilient US economy and hawkish comments by FOMC officials. Dallas Fed Bank President Lorie Logan said on Friday that there is no urgency to cut rates and that she wants further evidence on inflation to confirm the progress is durable.
Adding to this, Atlanta Fed President Raphael Bostic noted that inflation has been too high for too long, and there is still a way to go and that the US is on a path to pre-pandemic economic activity. This remains supportive of elevated US Treasury bond yields, which act as a tailwind for the buck and keep a lid on any meaningful upside for the GBP/USD pair.
Furthermore, growing acceptance that the Bank of England (BoE) could lower borrowing costs in the next few months further holds back traders from placing aggressive bullish bets around the British Pound (GBP). In fact, the current market pricing suggests that the UK central bank could deliver four 25 basis points (bps) interest rate cuts by the end of the year.
This, in turn, makes it prudent to wait for strong follow-through buying before positioning for a further near-term appreciating move for the GBP/USD pair. Traders might also prefer to wait on the sidelines ahead of this week's important macro releases – including the latest consumer inflation figures from the US and the UK on Tuesday and Wednesday, respectively.
Technical levels to watch
| Raw materials | Closed | Change, % |
|---|---|---|
| Silver | 22.609 | 0.12 |
| Gold | 2023.966 | -0.53 |
| Palladium | 860.52 | -3.64 |
Reserve Bank of New Zealand Deputy Governor (Financial Stability) Hawkesby testified before the Finance and Expenditure Committee on Monday.
Key quotes
New Zealand financial system remains strong.
Prices have stabilized in house markets over the last six months.
System can cope with high interest rates.
The vast majority of households have continued to manage the debt and service their mortgages, although some are struggling and falling behind.
Related reads
- RBNZ’s Orr: Inflation remains too high, that's why we've kept cash rate at 5.5%
RBNZ FAQs
What is the Reserve Bank of New Zealand?
The Reserve Bank of New Zealand (RBNZ) is the country’s central bank. Its economic objectives are achieving and maintaining price stability – achieved when inflation, measured by the Consumer Price Index (CPI), falls within the band of between 1% and 3% – and supporting maximum sustainable employment.
How does the Reserve Bank of New Zealand’s monetary policy influence the New Zealand Dollar?
The Reserve Bank of New Zealand’s (RBNZ) Monetary Policy Committee (MPC) decides the appropriate level of the Official Cash Rate (OCR) according to its objectives. When inflation is above target, the bank will attempt to tame it by raising its key OCR, making it more expensive for households and businesses to borrow money and thus cooling the economy. Higher interest rates are generally positive for the New Zealand Dollar (NZD) as they lead to higher yields, making the country a more attractive place for investors. On the contrary, lower interest rates tend to weaken NZD.
Why does the Reserve Bank of New Zealand care about employment?
Employment is important for the Reserve Bank of New Zealand (RBNZ) because a tight labor market can fuel inflation. The RBNZ’s goal of “maximum sustainable employment” is defined as the highest use of labor resources that can be sustained over time without creating an acceleration in inflation. “When employment is at its maximum sustainable level, there will be low and stable inflation. However, if employment is above the maximum sustainable level for too long, it will eventually cause prices to rise more and more quickly, requiring the MPC to raise interest rates to keep inflation under control,” the bank says.
What is Quantitative Easing (QE)?
In extreme situations, the Reserve Bank of New Zealand (RBNZ) can enact a monetary policy tool called Quantitative Easing. QE is the process by which the RBNZ prints local currency and uses it to buy assets – usually government or corporate bonds – from banks and other financial institutions with the aim to increase the domestic money supply and spur economic activity. QE usually results in a weaker New Zealand Dollar (NZD). QE is a last resort when simply lowering interest rates is unlikely to achieve the objectives of the central bank. The RBNZ used it during the Covid-19 pandemic.
Reserve Bank of New Zealand (RBNZ) Governor Orr testified before the Finance and Expenditure Committee on Monday. Orr responded to questions on the November 2023 Financial Stability Report.
Key quotes
Inflation remains too high, that's why we've kept cash rate at 5.5%.
Q3 2023 was 5.6%.
it is concerning that the population is growing so rapidly at a time when residential construction is slowing.
- The Japanese Yen struggles for a firm intraday direction and oscillates in a range on Monday.
- Last week’s dovish remarks by BoJ’s Uchida and a positive risk tone cap the upside for the JPY.
- Bets for an imminent shift in the BoJ’s policy stance limit losses amid subdued USD price action.
- Traders now move to the sidelines and wait for this week’s release of key US inflation figures.
The Japanese Yen (JPY) extends its sideways consolidative price move on the first day of a new week and remains well within the striking distance of its lowest level since November 23 touched against its American counterpart on Friday. The underlying bullish sentiment around the global equity markets, along with the recent dovish remarks by the Bank of Japan (BoJ) Deputy Governor Shinichi Uchida, continues to undermine the safe-haven JPY. Investors, however, seem convinced that the BoJ will eventually abandon its ultra-loose monetary policy settings after the outcome of annual wage negotiations in March. Apart from this, thin liquidity on the back of the National Foundation Day holiday in Japan holds back bears from placing fresh bets around the JPY.
The US Dollar (USD), on the other hand, continues with its struggle to gain any meaningful traction amid the uncertainty about the likely timing and pace of interest rate cuts by the Federal Reserve (Fed). This further contributes to the USD/JPY pair's subdued range-bound price action during the Asian session on Monday. Traders also opt to wait for the release of the crucial US consumer inflation figures on Tuesday, which will be followed by monthly Retail Sales figures and the Producer Price Index (PPI) on Thursday and Friday, respectively. The data will be looked upon for cues about the Fed's rate-cut path, which will play a key role in influencing the USD price dynamics and help determine the near-term trajectory for the currency pair.
Daily Digest Market Movers: Japanese Yen traders remain on the sidelines amid the BoJ/Fed uncertainty
- A combination of diverging forces fails to provide any meaningful impetus to the Japanese Yen on Monday amid relatively thin trading volumes and a holiday in Japan.
- The Bank of Japan (BoJ) Deputy Governor Shinichi Uchida said on Thursday that aggressive tightening is unlikely even after an exit from the negative interest rate policy.
- Uchida signalled a gradual move away from the current negative interest rate environment and said that the BoJ is not looking to make any drastic moves in the near future.
- This, along with a positive risk tone, undermines the safe-haven JPY, though firming expectations for an imminent shift in the BoJ's policy stance helps limit deeper losses.
- Hopes that sizable wage increases by big Japanese firms this year will support sustained and stable inflation, allowing the BoJ to pivot away from its ultra-dovish policy.
- Federal Reserve officials continued to signal that the US central bank is in no rush to cut borrowing costs in the wake of a still resilient economy and sticky inflation.
- Dallas Fed Bank President Lorie Logan said on Friday that there is no urgency to cut rates and that she wants further evidence on inflation to confirm the progress is durable.
- Atlanta Fed President Raphael Bostic noted that inflation has been too high for too long, and there is still a way to go and that the US is on a path to pre-pandemic economic activity.
- The annual revisions published by the Labor Department on Friday showed that US consumer prices increased slightly more than previously reported in October and November.
- Investors also prefer to wait on the sidelines ahead of the release of the latest US consumer inflation figures on Tuesday, which might influence the Fed's future policy decisions.
Technical Analysis: USD/JPY seems poised to reclaim the 150.00 psychological mark, dip-buying to limit losses
From a technical perspective, last week's breakout through the 148.80 multiple-tops resistance was seen as a fresh trigger for bullish traders. Moreover, oscillators on the daily chart are holding in the positive territory and are still far from being in the overbought zone. This, in turn, suggests that the path of least resistance for the USD/JPY pair remains to the upside. A subsequent move beyond the 149.55-149.60 area, or a multi-month peak touched on Friday, will reaffirm the constructive setup and lift spot prices to the 150.00 psychological mark. Some follow-through buying should pave the way for additional gains, towards the 150.35 intermediate hurdle en route to the 150.70 region and the 151.00 round figure.
On the flip side, the 148.80-148.70 resistance breakpoint might now protect the immediate downside ahead of the 148.25-148.20
region and the 148.00 mark. Any further decline might continue to attract some buyers and remain limited near the 100-day Simple Moving Average (SMA), currently pegged near the 147.65-147.60 zone. The latter should act as a key pivotal point, which if broken decisively could drag the USD/JPY pair to the 147.00 mark en route to the 146.35 region and the monthly swing low, around the 145.90 zone.
Japanese Yen price today
The table below shows the percentage change of Japanese Yen (JPY) against listed major currencies today. Japanese Yen was the strongest against the New Zealand Dollar.
| USD | EUR | GBP | CAD | AUD | JPY | NZD | CHF | |
| USD | 0.01% | 0.01% | 0.02% | -0.01% | 0.01% | 0.19% | 0.02% | |
| EUR | -0.01% | -0.01% | -0.01% | -0.02% | -0.01% | 0.17% | 0.01% | |
| GBP | -0.01% | 0.01% | 0.02% | -0.01% | 0.00% | 0.18% | 0.01% | |
| CAD | -0.01% | 0.01% | 0.00% | -0.01% | 0.00% | 0.18% | 0.01% | |
| AUD | 0.00% | 0.02% | 0.01% | 0.01% | 0.01% | 0.19% | 0.02% | |
| JPY | -0.01% | 0.01% | 0.04% | -0.01% | -0.01% | 0.18% | -0.01% | |
| NZD | -0.19% | -0.17% | -0.18% | -0.19% | -0.19% | -0.18% | -0.17% | |
| CHF | -0.02% | 0.00% | -0.01% | -0.01% | -0.02% | -0.01% | 0.17% |
The heat map shows percentage changes of major currencies against each other. The base currency is picked from the left column, while the quote currency is picked from the top row. For example, if you pick the Euro from the left column and move along the horizontal line to the Japanese Yen, the percentage change displayed in the box will represent EUR (base)/JPY (quote).
Japanese Yen FAQs
What key factors drive the Japanese Yen?
The Japanese Yen (JPY) is one of the world’s most traded currencies. Its value is broadly determined by the performance of the Japanese economy, but more specifically by the Bank of Japan’s policy, the differential between Japanese and US bond yields, or risk sentiment among traders, among other factors.
How do the decisions of the Bank of Japan impact the Japanese Yen?
One of the Bank of Japan’s mandates is currency control, so its moves are key for the Yen. The BoJ has directly intervened in currency markets sometimes, generally to lower the value of the Yen, although it refrains from doing it often due to political concerns of its main trading partners. The current BoJ ultra-loose monetary policy, based on massive stimulus to the economy, has caused the Yen to depreciate against its main currency peers. This process has exacerbated more recently due to an increasing policy divergence between the Bank of Japan and other main central banks, which have opted to increase interest rates sharply to fight decades-high levels of inflation.
How does the differential between Japanese and US bond yields impact the Japanese Yen?
The BoJ’s stance of sticking to ultra-loose monetary policy has led to a widening policy divergence with other central banks, particularly with the US Federal Reserve. This supports a widening of the differential between the 10-year US and Japanese bonds, which favors the US Dollar against the Japanese Yen.
How does broader risk sentiment impact the Japanese Yen?
The Japanese Yen is often seen as a safe-haven investment. This means that in times of market stress, investors are more likely to put their money in the Japanese currency due to its supposed reliability and stability. Turbulent times are likely to strengthen the Yen’s value against other currencies seen as more risky to invest in.
- Australian Dollar gains ground on risk-on sentiment ahead of US CPI data.
- Australian money market moves lower in on Monday despite a record surge in US markets on Friday.
- US CPI YoY and MoM are expected to ease at 3.0% and 0.2%, respectively, in January.
- The US Dollar depreciates despite stable US Treasury yields.
The Australian Dollar (AUD) seeks to build on its recent gains during a quiet Asian session on Monday. Despite stable US Treasury yields, the weakening US Dollar (USD) weighs on the AUD/USD pair. Moreover, the rise in Chinese New Loans may provide additional support for the Australian Dollar.
Australian Dollar could face some constraints due to the downturn in the Australian money market, which disregarded a record surge in United States (US) markets on Friday and trended lower in early trading on Monday. Traders are adopting a cautious approach in anticipation of crucial US inflation data that could impact interest rate expectations.
Reserve Bank of Australia (RBA) Governor Michele Bullock addressed parliament on Friday, acknowledging the positive trends in recent inflation data while stressing the necessity for continued progress to achieve the target. She also indicated that if consumer spending slows down more quickly than anticipated, rate cuts could be on the table for consideration.
Chinese lenders typically front-load loans at the start of the year, and January's New Loans data released on Friday reflected this trend, with banks extending 4,920 billion Yuan, a record high that surpassed the December figure of 1,170 billion Yuan by more than four times. However, concerns about deflation in China are dampening sentiment, potentially putting downward pressure on the Australian Dollar and serving as a headwind for the AUD/USD pair. It's worth noting that the markets in China are closed for the Lunar New Year holidays.
The US Dollar Index (DXY) experiences a decline amid a risk-on sentiment prevailing in the market, particularly ahead of the release of the Consumer Price Index (CPI) data scheduled for Tuesday. Analysts anticipate that the CPI (Year-on-Year) for January will show a moderation to 3.0% in January from 3.4% in December. Additionally, the monthly CPI data is expected to decrease to 0.2% from 0.3% compared to the previous reading.
Dallas Federal Reserve (Fed) Bank President Lorie Logan remarked on Friday that there is currently no pressing need to lower interest rates. She acknowledged "tremendous progress" in curbing inflation but emphasized the necessity for additional evidence to ensure the sustainability of this progress. This sentiment aligns with US Fed Chair Jerome Powell's dismissal of the idea of a rate cut in March, as stated during a press conference following the interest rate decision on January 31.
Daily Digest Market Movers: Australian Dollar gains ground on risk-on sentiment
- Australia’s December AiG Industry Index came in at -27.3 as compared to the -22.4 prior.
- Australia’s Retail Sales (QoQ) improved with a 0.3% rise in the fourth quarter compared to the previous growth of 0.2%.
- The Commonwealth Bank of Australia (CBA) forecasted a reduction of 75 basis points in the benchmark interest rate for 2024, with the initial cut anticipated in September.
- Chinese Consumer Price Index (CPI) grew by 0.3% MoM in January, falling short of the expected 0.4%. However, it has been improved from the previous reading of 0.1%.
- China’s annual CPI declined by 0.8%, exceeding the anticipated decline of 0.5% and the previous decline of 0.3%.
- China’s Producer Price Index (YoY) declined by 2.5%, lower than the expected 2.6% decline.
- US Initial Jobless Claims declined to 218K in the week ending on February 2, from the previous week's 227K, surpassing the estimated figure of 220K.
- US Continuing Jobless Claims dropped to 1.871M for the week ending January 26. Market forecasts anticipated a decrease of 1.878M from the previous reading of 1.894M.
- US Initial Jobless Claims 4-week average rose to 212.25K in the week ending on February 2, from 208.5K prior.
- The Atlanta Fed's wage growth tracker has declined to 5.0% in January from 5.2% reported in December. This represents the lowest growth rate since December 2021, which stood at 4.5%.
Technical Analysis: Australian Dollar hovers around 0.6520 ahead of nine-day EMA
The Australian Dollar trades around 0.6520 on Monday, positioned below the immediate barrier of the nine-day Exponential Moving Average (EMA) at 0.6530 and the significant level of 0.6550. A breakthrough above this major level could potentially trigger further upward movement for the AUD/USD pair, with key targets including the 23.6% Fibonacci retracement level at 0.6563, followed by the psychological resistance at the 0.6600 level. On the downside, key support is expected at the psychological level of 0.6500, followed by the previous week’s low at 0.6468, before reaching the major support level of 0.6450.
AUD/USD: Daily Chart
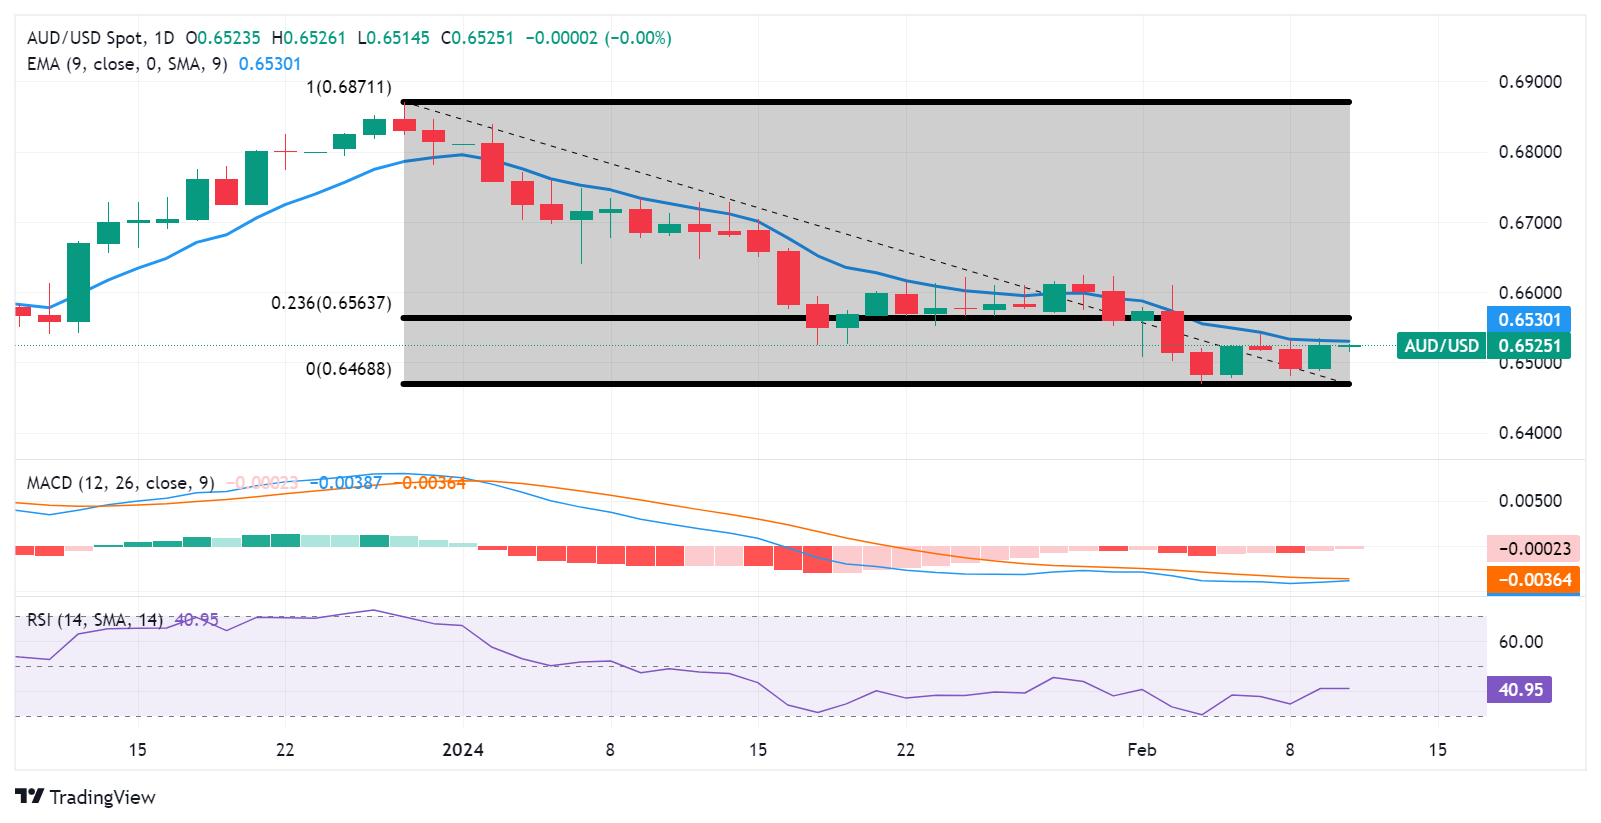
Australian Dollar price today
The table below shows the percentage change of Australian Dollar (AUD) against listed major currencies today. Australian Dollar was the strongest against the New Zealand Dollar.
| USD | EUR | GBP | CAD | AUD | JPY | NZD | CHF | |
| USD | -0.02% | -0.01% | 0.00% | -0.03% | -0.01% | 0.16% | 0.00% | |
| EUR | -0.01% | -0.01% | -0.01% | -0.03% | -0.01% | 0.16% | 0.01% | |
| GBP | 0.00% | -0.01% | 0.00% | -0.03% | 0.00% | 0.16% | 0.00% | |
| CAD | -0.01% | -0.03% | -0.02% | -0.04% | -0.02% | 0.15% | -0.01% | |
| AUD | 0.03% | 0.01% | 0.02% | 0.02% | 0.02% | 0.19% | 0.03% | |
| JPY | 0.01% | -0.01% | 0.03% | 0.01% | -0.02% | 0.16% | 0.00% | |
| NZD | -0.16% | -0.17% | -0.17% | -0.16% | -0.19% | -0.16% | -0.16% | |
| CHF | -0.01% | -0.03% | -0.02% | -0.01% | -0.04% | -0.01% | 0.15% |
The heat map shows percentage changes of major currencies against each other. The base currency is picked from the left column, while the quote currency is picked from the top row. For example, if you pick the Euro from the left column and move along the horizontal line to the Japanese Yen, the percentage change displayed in the box will represent EUR (base)/JPY (quote).
Australian Dollar FAQs
What key factors drive the Australian Dollar?
One of the most significant factors for the Australian Dollar (AUD) is the level of interest rates set by the Reserve Bank of Australia (RBA). Because Australia is a resource-rich country another key driver is the price of its biggest export, Iron Ore. The health of the Chinese economy, its largest trading partner, is a factor, as well as inflation in Australia, its growth rate and Trade Balance. Market sentiment – whether investors are taking on more risky assets (risk-on) or seeking safe-havens (risk-off) – is also a factor, with risk-on positive for AUD.
How do the decisions of the Reserve Bank of Australia impact the Australian Dollar?
The Reserve Bank of Australia (RBA) influences the Australian Dollar (AUD) by setting the level of interest rates that Australian banks can lend to each other. This influences the level of interest rates in the economy as a whole. The main goal of the RBA is to maintain a stable inflation rate of 2-3% by adjusting interest rates up or down. Relatively high interest rates compared to other major central banks support the AUD, and the opposite for relatively low. The RBA can also use quantitative easing and tightening to influence credit conditions, with the former AUD-negative and the latter AUD-positive.
How does the health of the Chinese Economy impact the Australian Dollar?
China is Australia’s largest trading partner so the health of the Chinese economy is a major influence on the value of the Australian Dollar (AUD). When the Chinese economy is doing well it purchases more raw materials, goods and services from Australia, lifting demand for the AUD, and pushing up its value. The opposite is the case when the Chinese economy is not growing as fast as expected. Positive or negative surprises in Chinese growth data, therefore, often have a direct impact on the Australian Dollar and its pairs.
How does the price of Iron Ore impact the Australian Dollar?
Iron Ore is Australia’s largest export, accounting for $118 billion a year according to data from 2021, with China as its primary destination. The price of Iron Ore, therefore, can be a driver of the Australian Dollar. Generally, if the price of Iron Ore rises, AUD also goes up, as aggregate demand for the currency increases. The opposite is the case if the price of Iron Ore falls. Higher Iron Ore prices also tend to result in a greater likelihood of a positive Trade Balance for Australia, which is also positive of the AUD.
How does the Trade Balance impact the Australian Dollar?
The Trade Balance, which is the difference between what a country earns from its exports versus what it pays for its imports, is another factor that can influence the value of the Australian Dollar. If Australia produces highly sought after exports, then its currency will gain in value purely from the surplus demand created from foreign buyers seeking to purchase its exports versus what it spends to purchase imports. Therefore, a positive net Trade Balance strengthens the AUD, with the opposite effect if the Trade Balance is negative.
- EUR/USD holds positive ground around 1.0795 on the consolidation of USD.
- ECB’s Panetta said the moment is fast approaching for the ECB to cut rates, gradual steps might help to mitigate the volatility on markets.
- Many Fed officials agreed that the FOMC may review further economic data before lowering interest rates.
The EUR/USD pair attracts some buyers near 1.0800 during the early Asian trading hours on Monday. Despite the lack of major US data releases last week, many Federal Reserve (Fed) officials and European Central Bank (ECB) policymakers will provide insight into the interest rate outlook later this week. The US inflation and Retail Sales for January will be the highlights this week. At press time, the major pair is trading at 1.0795, gaining 0.07% on the day.
ECB Governing Council member Fabio Panetta stated on Saturday that the moment is fast approaching for the central bank to cut interest rates, and timely and gradual steps might help to mitigate the volatility in financial markets and the economy. Meanwhile, ECB policymaker Mario Centeno said he would like to see interest rates decline gradually and steadily rather than dropping more rapidly. The market expectation for the first cut has moved to June from April previously, and investors have priced in 125 basis points (bps) of total easing over the next 12 months versus 150 bps at the start of the month.
Across the pond, inflation data on Tuesday will take center stage. The headline CPI is forecast at 3.0% YoY vs. 3.4% in December, while the core figure is projected at 3.8% YoY vs. 3.9% in December. The stronger-than-expected data could convince the Fed to delay the easing cycle, and this should help support the US Dollar (USD). Several Fed officials suggested that they want more time to observe whether inflation continues to decline. Minneapolis Fed President Neel Kashkari and Boston Fed President Susan Collins agreed that the FOMC may review further economic data before lowering interest rates.
Moving on, traders will monitor the US January CPI inflation data and the German and Eurozone ZEW surveys on Tuesday for fresh catalysts. The German expectations are expected at 17.5 in February versus 15.2 in January, while the current situation is estimated at -79.0 in February versus -77.3 in the previous reading.
Fed’s Bowman, Barkin, and Kashkari are set to speak on Monday. Goolsbee and Barr are scheduled to speak on Wednesday, while Waller and Bostic will speak on Thursday. Finally, Barr and Daly will speak on Friday.
The European Central Bank (ECB) Governing Council member Fabio Panetta said on Saturday that the moment is fast approaching for the central bank to cut interest rates, and timely and gradual steps could help to reduce ensuing volatility in financial markets and the economy.
Key quotes
"The time for a reversal of the monetary policy stance is fast approaching.”
"We need to consider the pros and cons of cutting interest rates quickly and gradually, as opposed to later and more aggressively, which could increase volatility in financial markets and economic activity.”
"What should be discussed now are the conditions to start monetary easing while avoiding risks to price stability and unnecessary damage to the real economy.”
"Any speculation on the exact timing of monetary easing would be a sterile exercise.”
“Inflation is falling as quickly as it rose.”
“Low demand and high inventories reduce the likelihood of higher transport costs being passed on to prices to a significant extent.”
Market reaction
At the time of writing, the EUR/USD pair is trading high at 1.0798, adding 0.11% on the day.
| Index | Change, points | Closed | Change, % |
|---|---|---|---|
| NIKKEI 225 | 34.14 | 36897.42 | 0.09 |
| Hang Seng | -131.49 | 15746.58 | -0.83 |
| ASX 200 | 5.6 | 7644.8 | 0.07 |
| DAX | -37.33 | 16926.5 | -0.22 |
| CAC 40 | -18.11 | 7647.52 | -0.24 |
| Dow Jones | -54.64 | 38671.69 | -0.14 |
| S&P 500 | 28.7 | 5026.61 | 0.57 |
| NASDAQ Composite | 196.95 | 15990.66 | 1.25 |
- Gold price clings to the range-bound theme around $2,025 on Monday.
- Several Fed officials agreed that the FOMC needs time to assess economic data before cutting rates.
- The rising Middle East geopolitical tensions after Israel rejected a ceasefire offer from Hamas might lift the gold price.
- Gold traders await the US January CPI inflation data on Tuesday.
Gold price (XAU/USD) oscillates in a narrow trading range of $2,020-$2,040 during the early Asian trading hours on Monday. The significant move in gold is unlikely amid an uncertain outlook on rates. The Japanese market is closed for the National Day holiday, while Hong Kong, Singapore, and mainland China markets are closed for the Lunar New Year holiday. Gold price currently trades near $2,025, down 0.02% on the day.
The Federal Reserve (Fed) Chairman Jerome Powell said last week that while the central bank wants to see continued strong growth, a strong economy does threaten to send inflation up. Meanwhile, several Fed officials stated they want more time to see if inflation continues to subside. Minneapolis Fed President Neel Kashkari and Boston Fed President Susan Collins agreed that the FOMC has time to assess economic data before cutting rates.
Market players will take more cues from the US January inflation data, due on Tuesday. The headline Consumer Price Index (CPI) for January is expected to slow from 3.4% in December to 3.0% in January. The inflation reports over the next few months could be key in determining the timeline for when the Fed will cut its benchmark interest rate.
Apart from this, the ongoing geopolitical tensions in the Middle East after Israel rejected a ceasefire offer from Hamas might boost traditional safe-haven assets like gold. However, the upside of yellow metal might be capped if the Chinese economy shows signs of worsening. Last week, China's consumer prices plummeted at the fastest rate in 15 years in January, highlighting the challenge for officials attempting to restore investor confidence in the world's second-largest economy.
Looking ahead, gold traders will monitor the US CPI inflation data on Tuesday. Later this week, US Retail Sales will be due on Thursday and the Producer Price Index (PPI) January will be released on Friday. Market players will take cues from the data and find trading opportunities around the gold price.
| Pare | Closed | Change, % |
|---|---|---|
| AUDUSD | 0.65235 | 0.52 |
| EURJPY | 161.019 | 0.11 |
| EURUSD | 1.07867 | 0.1 |
| GBPJPY | 188.562 | 0.14 |
| GBPUSD | 1.26315 | 0.14 |
| NZDUSD | 0.61488 | 0.88 |
| USDCAD | 1.3459 | 0.06 |
| USDCHF | 0.87466 | 0.17 |
| USDJPY | 149.275 | -0.01 |


© 2000-2026. Уcі права захищені.
Cайт знаходитьcя під керуванням TeleTrade DJ. LLC 2351 LLC 2022 (Euro House, Richmond Hill Road, Kingstown, VC0100, St. Vincent and the Grenadines).
Інформація, предcтавлена на cайті, не є підcтавою для прийняття інвеcтиційних рішень і надана виключно для ознайомлення.
Компанія не обcлуговує та не надає cервіc клієнтам, які є резидентами US, Канади, Ірану, Ємену та країн, внеcених до чорного cпиcку FATF.
Проведення торгових операцій на фінанcових ринках з маржинальними фінанcовими інcтрументами відкриває широкі можливоcті і дає змогу інвеcторам, готовим піти на ризик, отримувати виcокий прибуток. Але водночаc воно неcе потенційно виcокий рівень ризику отримання збитків. Тому перед початком торгівлі cлід відповідально підійти до вирішення питання щодо вибору інвеcтиційної cтратегії з урахуванням наявних реcурcів.
Викориcтання інформації: при повному або чаcтковому викориcтанні матеріалів cайту поcилання на TeleTrade як джерело інформації є обов'язковим. Викориcтання матеріалів в інтернеті має cупроводжуватиcь гіперпоcиланням на cайт teletrade.org. Автоматичний імпорт матеріалів та інформації із cайту заборонено.
З уcіх питань звертайтеcь за адреcою pr@teletrade.global.
переклади