- Аналітика
- Новини та інструменти
- Новини ринків
Новини ринків
- US equities initially embraced a miss in US PPI figures, but downside factors weigh.
- Large bank earnings broadly missed the mark on Friday, plaguing US equities.
- Next Wednesday’s US Retail Sales to be the linchpin in sentiment next week.
US equity markets rallied in early NY trading hours on Friday after the US Producer Price Index (PPI) declined faster than market models predicted as producer-level inflation continues to ease, even after Thursday’s US Consumer Price Index (CPI) showed consumer inflation accelerated unexpectedly in December.
US annual PPI inflation rises to 1% in December vs. 1.3% expected
The US PPI print came in broadly below forecasts, with the MoM PPI for December declining -0.1%, in-line with the previous month’s -0.1% decline (revised down from 0.0%), missing the median market forecast of a 0.1% rebound.
Core PPI figures in December also missed expectations also missed the mark, printing a flat 0.0% to match the previous month while markets were anticipating a 0.2% step up.
The good mood in US equities saw limited impact as traders pulled back heading into the closing bell, with investors gearing up for next Wednesday’s US Retail Sales print, where markets are hoping for a step up to 0.4% MoM in December compared to November’s 0.3%.
Large bank earnings reports disappointed on Friday, further hampering sentiment despite an overall decline in Treasury yields on the day, with major indexes getting dragged down by banks reporting less-than-stellar earnings reports. Inflation continues to take the priority spot for investors, as money markets hope that Thursday’s CPI uptick was merely a one-off with traders pricing in up to 160 basis points in rate cuts from the Federal Reserve by the end of 2024, compared to 154 bps from earlier this week. Airlines also disappointed investors, adding to index woes as travel growth continues to struggle.
The Standard & Poor’s 500 and NASDAQ Composite both posted slight gains of 0.8% and 0.3% respectively, with the S&P 500 climbing 3.59 points to end Friday at $4,783.83 while the NASDAQ rose 2.57 points, ending the trading week at $14,972.76.
The Russell 2000 index fell -0.23% to close at $1,950.96, while the Dow Jones Industrial Average (DJIA) fell nearly 120 points, closing down around three-tenths of a percent to wrap up the trading week at $37,592.98.
DJIA Technical Outlook
The DJIA remains trapped in near-term consolidation, trading into familiar levels that have plagued the major equity index since climbing to record highs in December. A hard ceiling has been priced into intraday charts from $37,800.00 as intraday price action trades back into the 200-hour Simple Moving Average (SMA) just above $37,500.00.
The DJIA’s rise on daily candlesticks has the equity index trading well above the 200-day SMA near $34,500. The 50-day SMA is climbing through the $36,000 major handle, and could chalk in a technical floor to fend off any bearish downturns.
DJIA Hourly Chart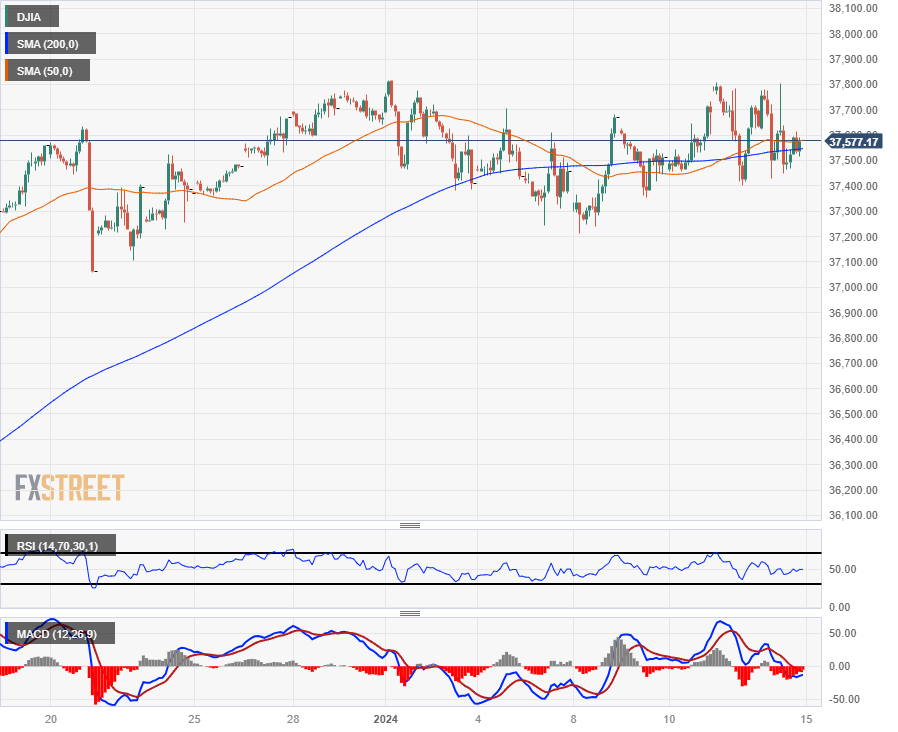
DJIA Daily Chart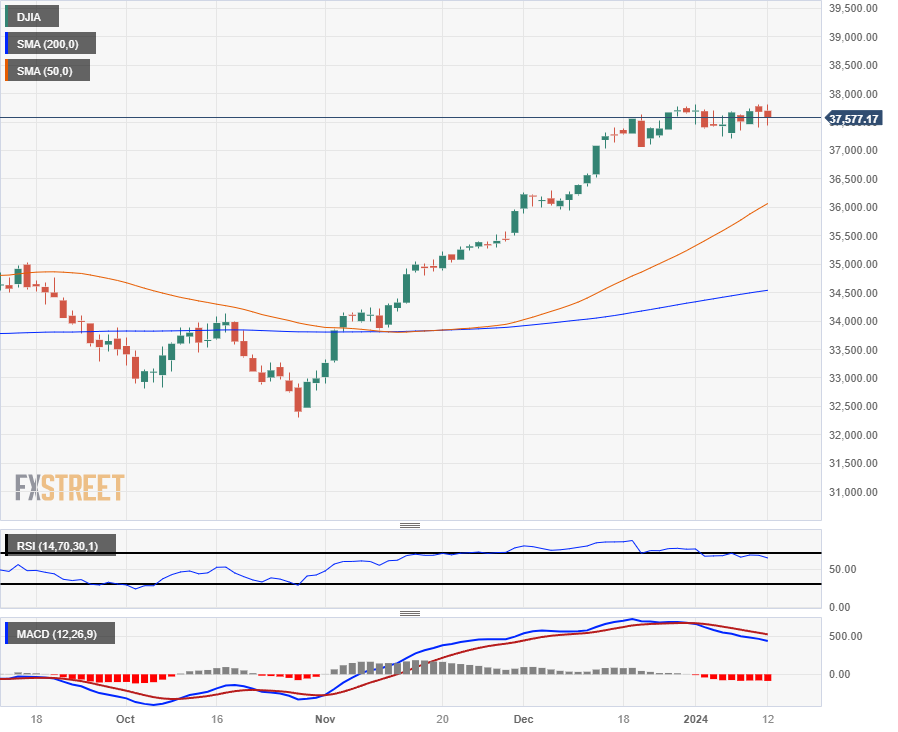
DJIA Technical Levels
- EUR/JPY's loss may indicate a bearish shift, with a possible close below Ichimoku Cloud signaling further downtrend.
- Immediate support levels include 159.50 and Tenkan-Sen at 157.62, with significant downside risk at Kijun Sen at 156.64.
- For a bullish reversal, EUR/JPY needs to stay above Senkou Span B at 158.71, targeting 159.00 and 160.18.
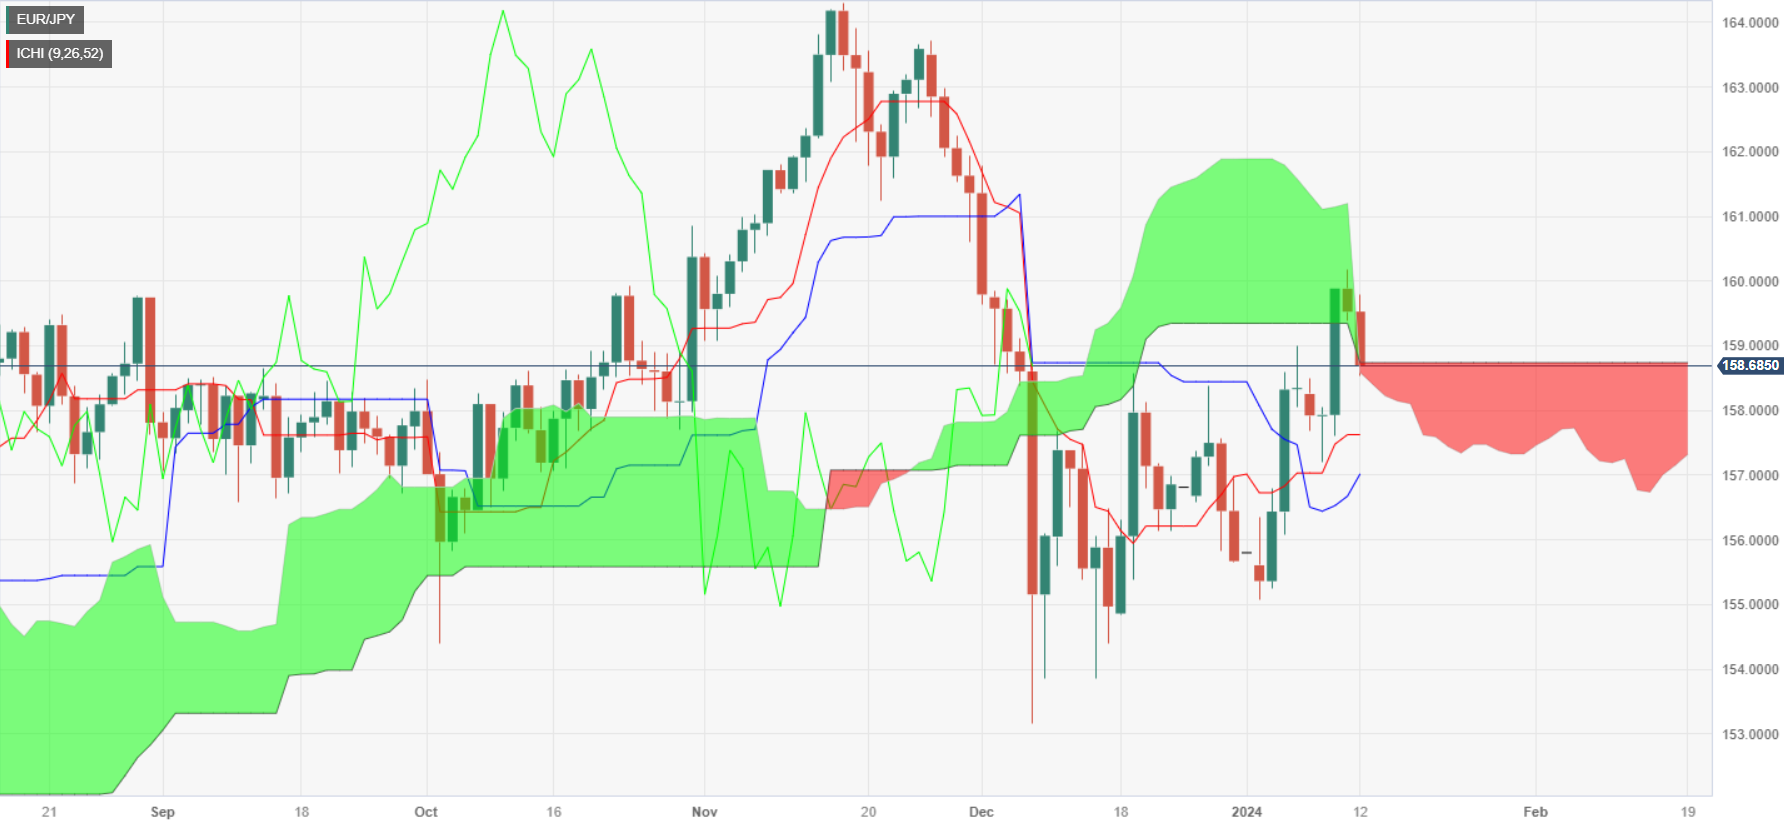
The Euro (EUR) is at the brink of turning decisively bearish against the Japanese Yen (JPY), printing losses of 0.44% on Friday, though set to finish the week with 0.26% gains. Nevertheless, as price action cracks inside the Ichimoku Cloud (Kumo), sellers pressure the pain, which, if it prints a daily close below the Kumo, would pave the way for further losses. The EUR/JPY trades at 158.61, after hitting a high of 159.57.
As mentioned above, EUR/JPY bears are gathering momentum, which could extend if they reclaim the December 19 swing high of 159.57, which could pave the way for breaking the next support seen at the 159.50 area, the bottom of the Kumo. In that outcome, the cross-pair could plunge sharply and challenge the Tenkan-Sen at 157.62, followed by the Senkou Span A at 157.14. Further downside is seen at the Kijun Sen at 156.64.
On the flip side, if buyers' momentum increases, and they keep the EUR/JPY above the Senkou Span B at 158.71, that could sponsor a move toward the 159.00 mark Once broken, the next intermediate resistance level would be the January 11 high at 160.18.
EUR/JPY Price Action – Daily Chart
EUR/JPY Technical Levels
- WTI rose on Friday after markets were gripped once more by geopolitical concerns.
- Chinese Crude Oil demand recovered on Friday, further boosting the day’s bids.
- Oil markets settled back into familiar lows as the trading week drew to a close.
West Texas Intermediate (WTI) US Crude Oil rose to a new 2024 high of $75.27 on Friday, with energy markets growing increasingly nervous about spill-over from ongoing geopolitical tensions after naval forces from the US and UK launched attacks on Houthi rebel forces that have been targeting civilian cargo and tanker ships off the coast of Yemen. Houthi attacks on ships bound for the Suez Canal have gripped oil markets in recent weeks as supply chains connecting Europe and the Middle East see shipping lanes diverted around the African continent.
Chinese demand for Crude Oil set a record high in 2023, easing market concerns about declining fossil fuel demand from China, who is grappling with a slowing economy and lopsided growth.
Crude Oil markets surged on combined headlines, driving WTI briefly above $75.00 before US Producer Price Index (PPI) figures missed market expectations. Markets broadly pivoted into renewed expectations of Federal Reserve (Fed) rate hikes before global markets settled back, dragging Crude Oil lower once more. WTI settled back below $73.00 per barrel as investors take stock and gear up for another weekend thick with geopolitical headlines.
WTI Technical Levels
Friday saw WTI US Crude Oil attempt a run higher before getting knocked back towards near-term median bids, climbing to WTI’s highest bids since late December before slipping back into familiar consolidation that has plagued Crude Oil since a tumble late in Q3 2023.
Near-term price action remains constrained close to the 200-hour Simple Moving Average (SMA) near $72.50, with an immediate technical floor priced in at the last swing low just above $71.00.
Upside momentum in WTI remains capped by a declining 50-day SMA falling into $74.00, with long-term price action on the south side of the 200-day SMA near $78.00.
WTI Hourly Chart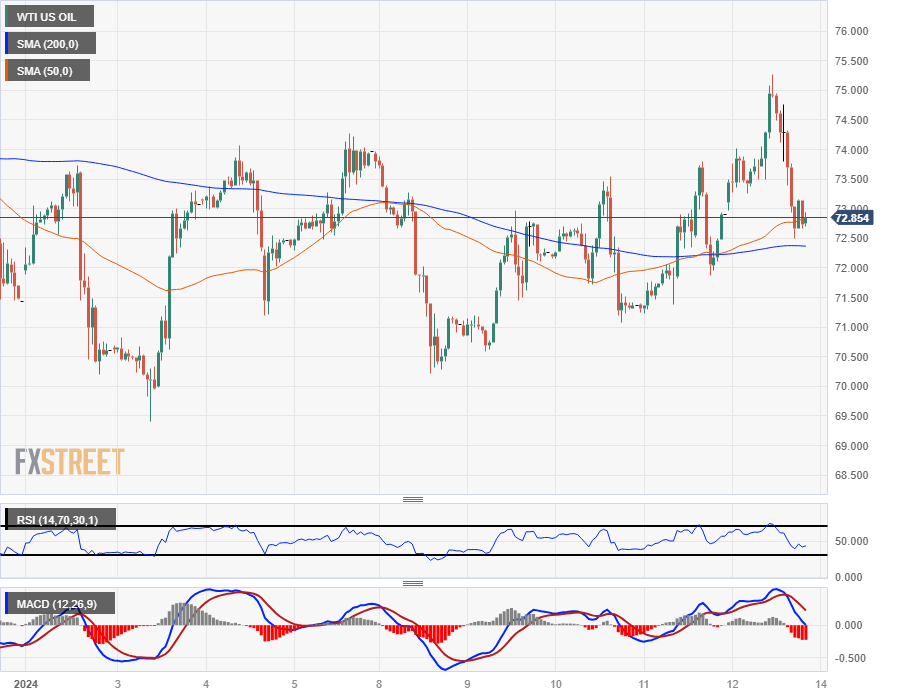
WTI Daily Chart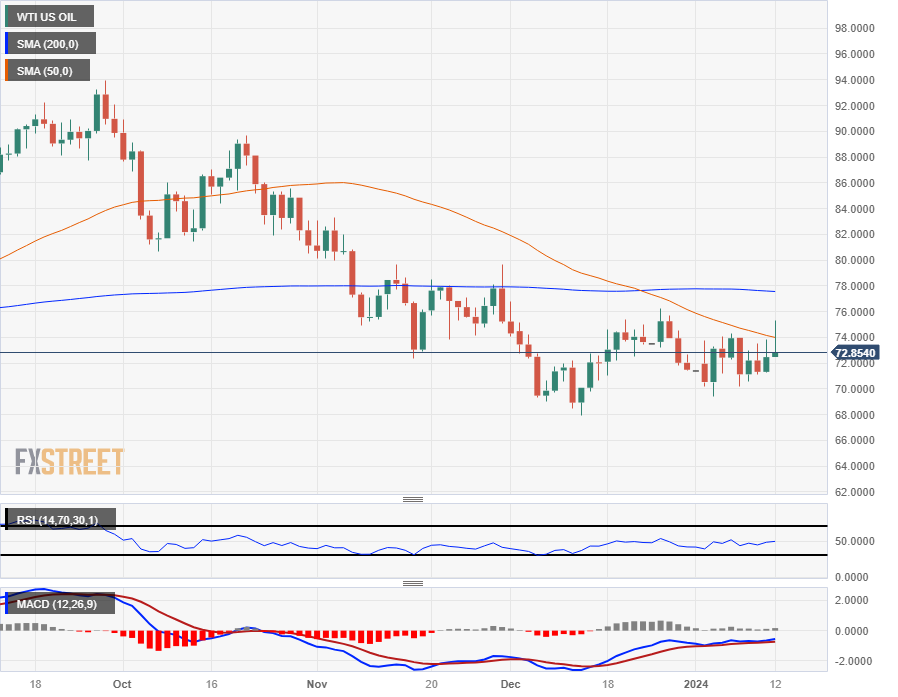
WTI Technical Levels
- Silver's recent rally to $23.52 curbed by resistance at 50 and 200-DMAs, leading to a slight pullback in prices.
- Technical analysis shows Silver trading in a sideways trend; immediate support at $23.00, followed by $22.48.
- Potential for further gains if Silver breaks above the 100-DMA at $23.25, targeting the $23.60/65 resistance zone.
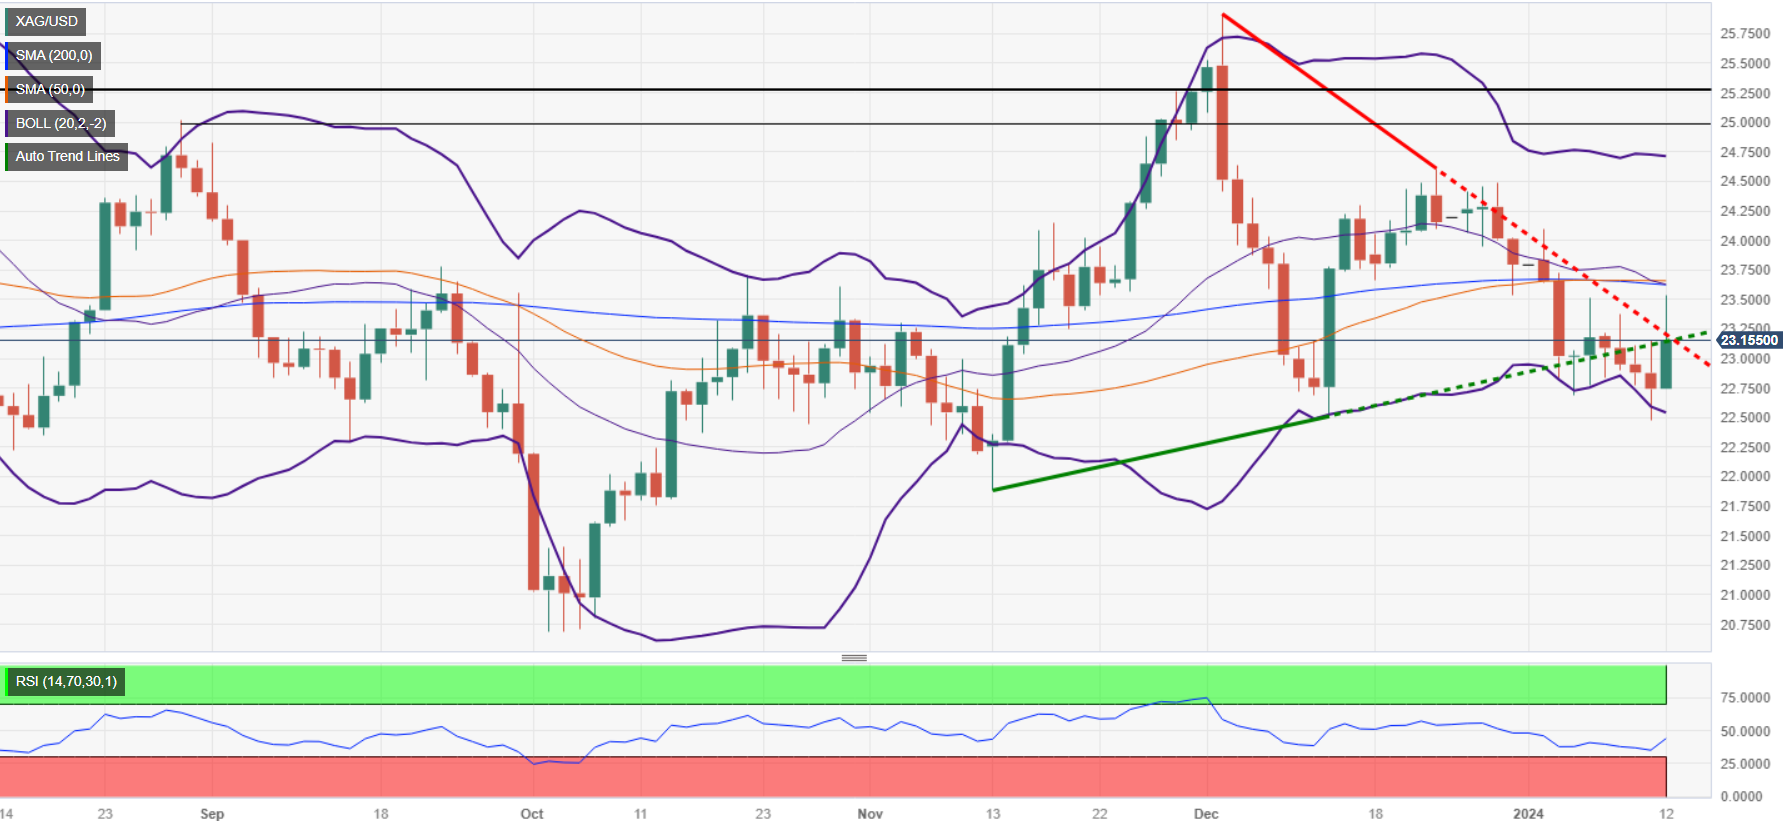
Silver price trims its losses, but it remains below the 100-day moving average (DMA) after hitting a new five-day high of $23.52 on Friday. Geopolitical tensions bolstered the grey metal, which aimed towards the confluence of the 50 and 200-DMAs, but buyers' failure to crack that area opened the door for a pullback. The XAG/USD trades at $23.15, up by 1.85%.
The non-yielding metal remains sideways, though slightly tilted to the downside after buyers failed to conquer the confluence of the 50 and 200-DMAs. With Silver spot price trading below the 200-DMA, the first support is seen at $23.00 a troy ounce. A breach of the latter will expose the January 11 low at $22.48, followed by the $22.00 mark. Once that support level is broken, up next would be the November 13 cycle low of $21.88.
In the outcome of buyers stepping in, they would clash with the 100-DMA at $23.25. A breach of the latter will expose the confluence of the 50 and 200-DMAs at around $23.60/65, before opening the path toward $24.00.
XAG/USD Price Action – Daily Chart
XAG/USD Technical Levels
- The NZD/JPY is currently at 90.46 with mild losses.
- Despite indicators suggesting negative momentum, the overall trend is in favor of the bulls.
- The four-hour chart stresses a more evident negative outlook.
On Friday's trading session, the NZD/JPY pair was spotted around 90.46, enduring mild losses. The neutral to bearish prevalence on the daily chart complexity informs that sellers are gradually asserting dominance, while the four-hour chart indicates an increasingly notable negative tilt.
The indicators on the daily chart, namely the Relative Strength Index (RSI) and the Moving Average Convergence Divergence (MACD) and moving averages, are showing mixed signals but overall negative ones. The RSI's trajectory appears downward-bound inside the positive area, suggesting some buying exhaustion, while the MACD histogram displays fading green short bars, reinforcing the weakened bullish impulse. Moreover, the currency pair manages to stay above the key Simple Moving Averages (SMAs) of 20, 100, and 200, signaling a bull-dominated broader time frame, although some struggle is apparent for the short term.
Downscaling to the four-hour chart portrays a significantly more bearish sentiment. The Relative Strength Index (RSI) pursues a southward direction within the negative domain, an evident indication of increased bearish propulsion. This is further confirmed by the fading green bars of the Moving Average Convergence Divergence (MACD), which suggests that the bulls are ceding ground to the bears, at least in the short term. The intensified selling momentum in this lower time frame might impose a tug of war with the broader bullish bias, suggesting a potential period of further downside.
NZD/JPY technical levels
NZD/JPY daily chart
-638406909617439678.png)
- AUD/JPY extends a decline, testing back below 97.00.
- Australian Trade Balance climbs after Imports steeply contract.
- Aussie home lending growth falls back, Chinese CPI contracts further.
The AUD/JPY extended declines into a second day on Friday, with the Aussie (AUD) shedding weight against the Japanese Yen (JPY) with broader markets bidding up the Yen with the AUD set to round out the week’s trading as the single worst performer of the major currency bloc.
The AUD/JPY is set to close in the red for the fourth of the last five consecutive trading days as Australian economic data continues to miss the mark. Australian Retail Sales beat expectations on a seasonally-adjusted basis early Wednesday, helping to keep the AUD bid into the midweek, but a steep decline in Australian Imports leading to a surprise buildup in the Aussie Trade Balance swamped out AUD bulls on Thursday, wit the downtrend continuing on Friday after Australian Investment Lending for Homes declined to 1.9% MoM in November compared to October’s 4.9% (revised down slightly from 5.0%).
China’s annualized Consumer Price Index (CPI) beat market expectations on Friday, but still contracted in December compared to the same month a year prior, declining 0.3% compared to November’s -0.5% YoY decline, slipping below the median market forecast of a -0.4% contraction.
Japan’s Current Account grew less than expected on Friday, printing at ¥1,925.6 billion in November versus October’s print of ¥2,582.8 billion. Markets were hoping for a final reading of ¥2,385.1 billion.
Next week will see Australian Westpac Consumer Confidence for January which last grew by 2.7%, as well as Japan’s Producer Price Index (PPI) figures for December. Australian Securities Inflation follows closely behind, and early Wednesday will see Gross Domestic Product (GDP), Industrial Production, and Retail Sales figures from China.
AUD/JPY Technical Outlook
The Aussie’s dip against the Japanese Yen on Friday sends the AUD/JPY falling back into the 200-hour Simple Moving Average (SMA) near 96.90, and the pair is at risk of further entrenching into a medium-term consolidation pattern that has plagued the AUD/JPY since November.
Daily candlesticks have been pinned to the 50-day SMA for close to six months as the AUD/JPY struggles to develop meaningful momentum, buoyed by a 200-day SMA rotating higher into 94.50.
The pair hasn’t claimed any meaningful territory above 98.00 despite breaking above the key handle several times since September of 2022 as bulls struggle to develop momentum.
AUD/JPY Hourly Chart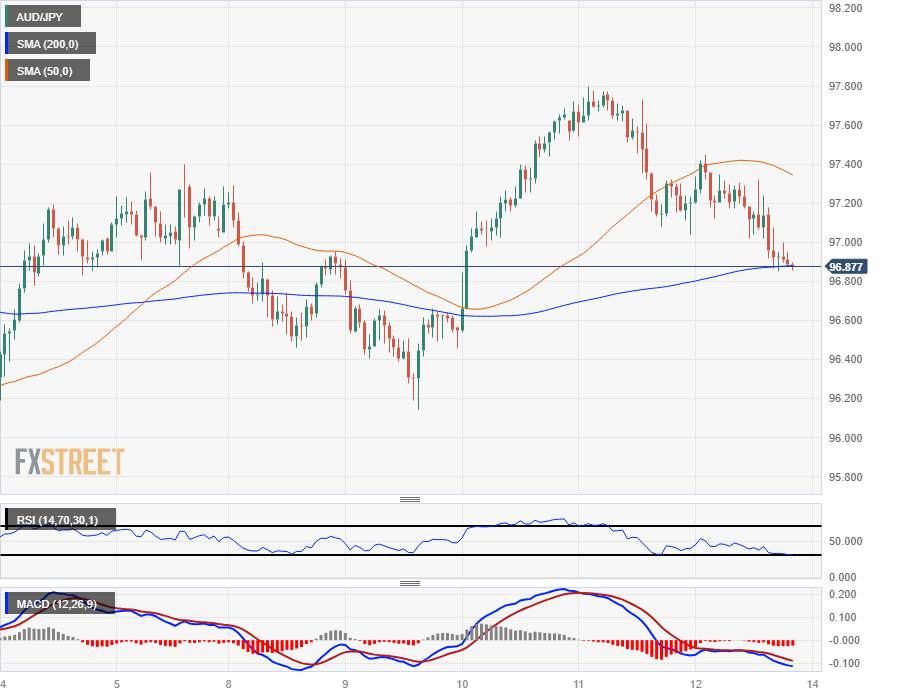
AUD/JPY Daily Chart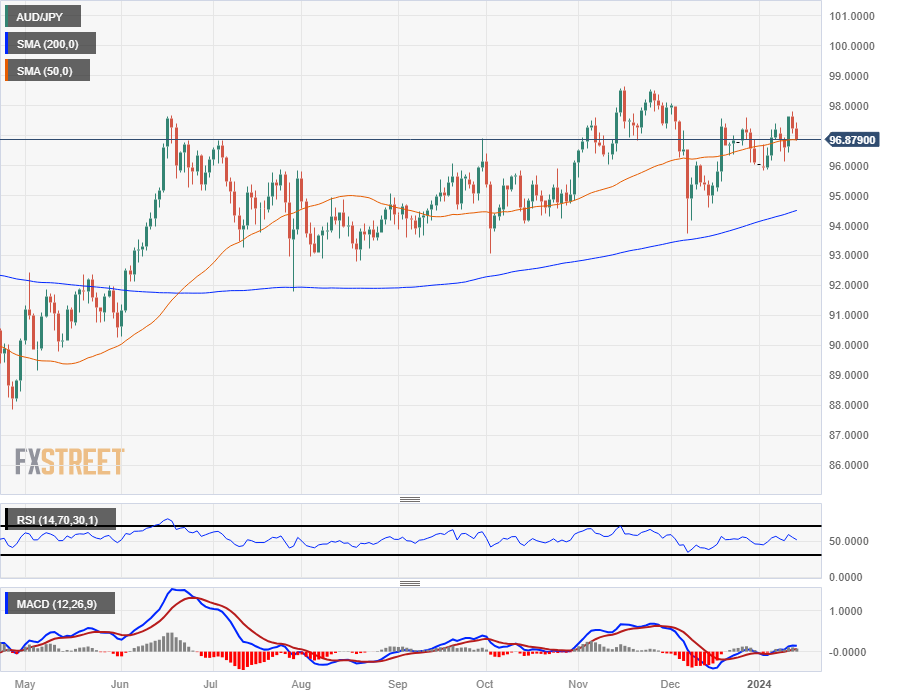
AUD/JPY Technical Levels
- EUR/GBP trades neutral at 0.8597, set to close a third straight weekly loss.
- Key technical indicators suggest a bearish momentum, despite slight gains, with RSI and MACD on the daily chart in negative.
- Mixed readings are seen on the four-hour indicators.
In Friday's session, the EUR/GBP pair was observed trading flat at around 0.8600. From a broader perspective, the daily chart showcases a neutral to bearish sentiment, with bears firmly defending their territory. Additionally, in the four-hour timeframe, the indicators present a mixed landscape.
Looking at the daily chart indicators, the prevailing force is evidently the selling momentum. The Relative Strength Index (RSI) is leveling off in the negative territory, which is usually a signal for a possible continuation of a downward trend. Moreover, with the Moving Average Convergence Divergence (MACD) showing flat red bars, there is a clear indication of sustained bearish action.
Furthermore, the pair is located under its 20, 100, and 200-day Simple Moving Averages (SMAs), which signifies the controlled supremacy of sellers over an extensive time frame. Given this current state, any reversal to the upside will need a significant effort from buyers.
Moving on to the shorter time frame and focusing on the four-hour chart, a similar pattern in indicators to the daily chart, with both the Relative Strength Index (RSI) and Moving Average Convergence Divergence (MACD) presenting a rather flat and inactive landscape in the negative sector. This state of affairs suggests that the bears are still holding their positions and maintaining tight control over the buyers.
EUR/GBP technical levels
EUR/GBP daily chart
-638406836774065104.png)
- European stocks climbed, bolstered by improving risk appetite on rate cut hopes.
- The UK saw a slight return to growth as UK GDP rebounds.
- US PPI fell more than expected, driving sentiment even higher.
Major European equity indexes broadly gained ground on Friday, stepping up ahead of the trading week’s close after UK Gross Domestic Product (GDP) grew more than expected. Bullish sentiment was sent even higher at the outset of the US trading session after US Producer Price Index (PPI) figures also fell below expectations, increasing bets of a sooner rate cut from the Federal Reserve (Fed).
UK GDP came in at 0.3% in November versus the forecast 0.2% rebound from October’s -0.3%, helping to spark a mild bull run in hesitant European markets.
The bullish sentiment swing pinned further into the high end after US PPI figures broadly slumped, with producer-level inflation cooling more than expected, sending a spike through money market expectations of an accelerated pace of rate cuts from the Fed, with investors now pricing in around 160 basis points in rate cuts through 2024 compared to yesterday’s upper limit of 154 bps.
Next week sees European Industrial Production for November, slated to print Monday, while Tuesday brings UK labor and wage earnings. UK Employment Change last came in at 50K in October, while Average Earnings is expected to fall back in both the Including & Excluding Bonuses, with Average Earnings Including Bonuses forecast to decline from 7.2% to 6.8% for the annualized quarter ended November.
Germany’s DAX climbed 0.95%, closing at €16,704.56, up by 0.95%, while France’s CAC 40 gained 1.05%, climbing 77.52 points to €7,465.14.
The pan-European STOXX600 index gained just under 4 points to climb 0.84% into €476.76, while London’s FTSEO major index rose 0.64% to close up 48.34 points at £7,624.93.
FTSE Technical Outlook
Despite a moderate gain on Friday, the FTSE 100 major London equity index is still off of recent highs, down from late December’s seven-month high of £7,763.54, slipping back into the 200-day Simple Moving Average (SMA) near £7,572.
Near-term action sees the FTSE 100 drifting steadily lower after slumping below the 200-hour SMA near the £7,700 handle, and the index continues to grind lower in lockstep with a bearish 50-hour SMA that confirmed a bearish cross off the 200-hour SMA near £7,670.
FTSE Hourly Chart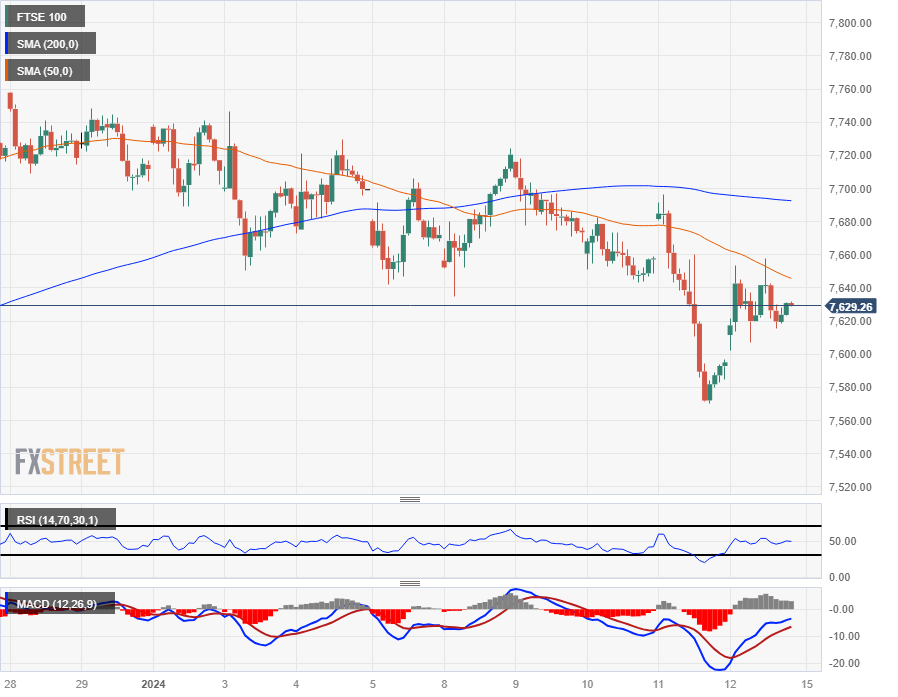
FTSE Daily Chart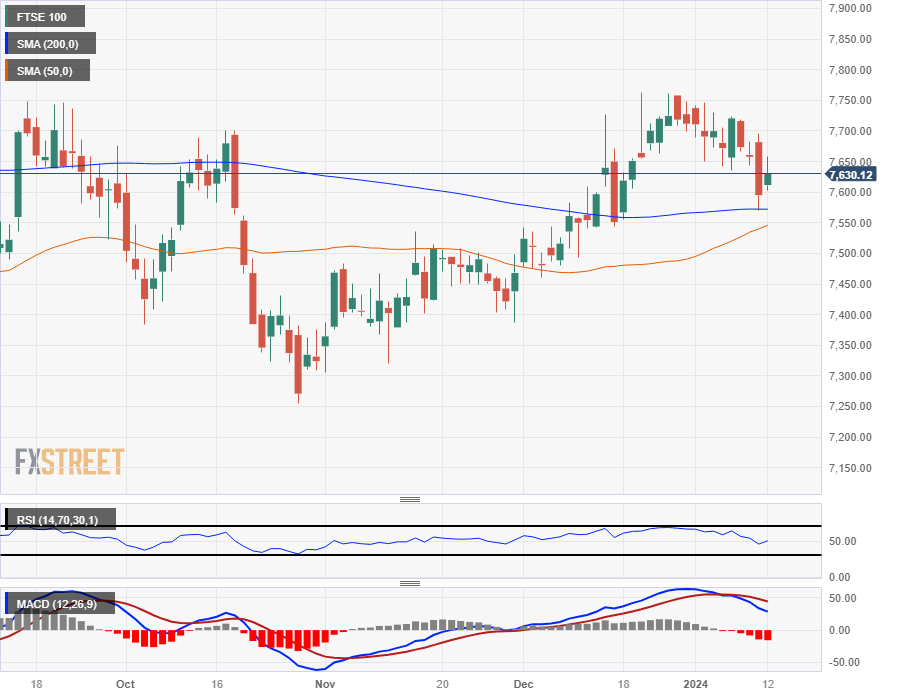
FTSE Technical Levels
- AUD/USD's modest increase driven by market reactions to US-UK military actions in Yemen and mixed US inflation reports.
- Market overlooks China’s deflationary data, focusing instead on interest rate differentials and economic implications for Australia.
- Resilient Aussie inflation data suggests potential stability in RBA's monetary policy, influencing AUD/USD dynamics.
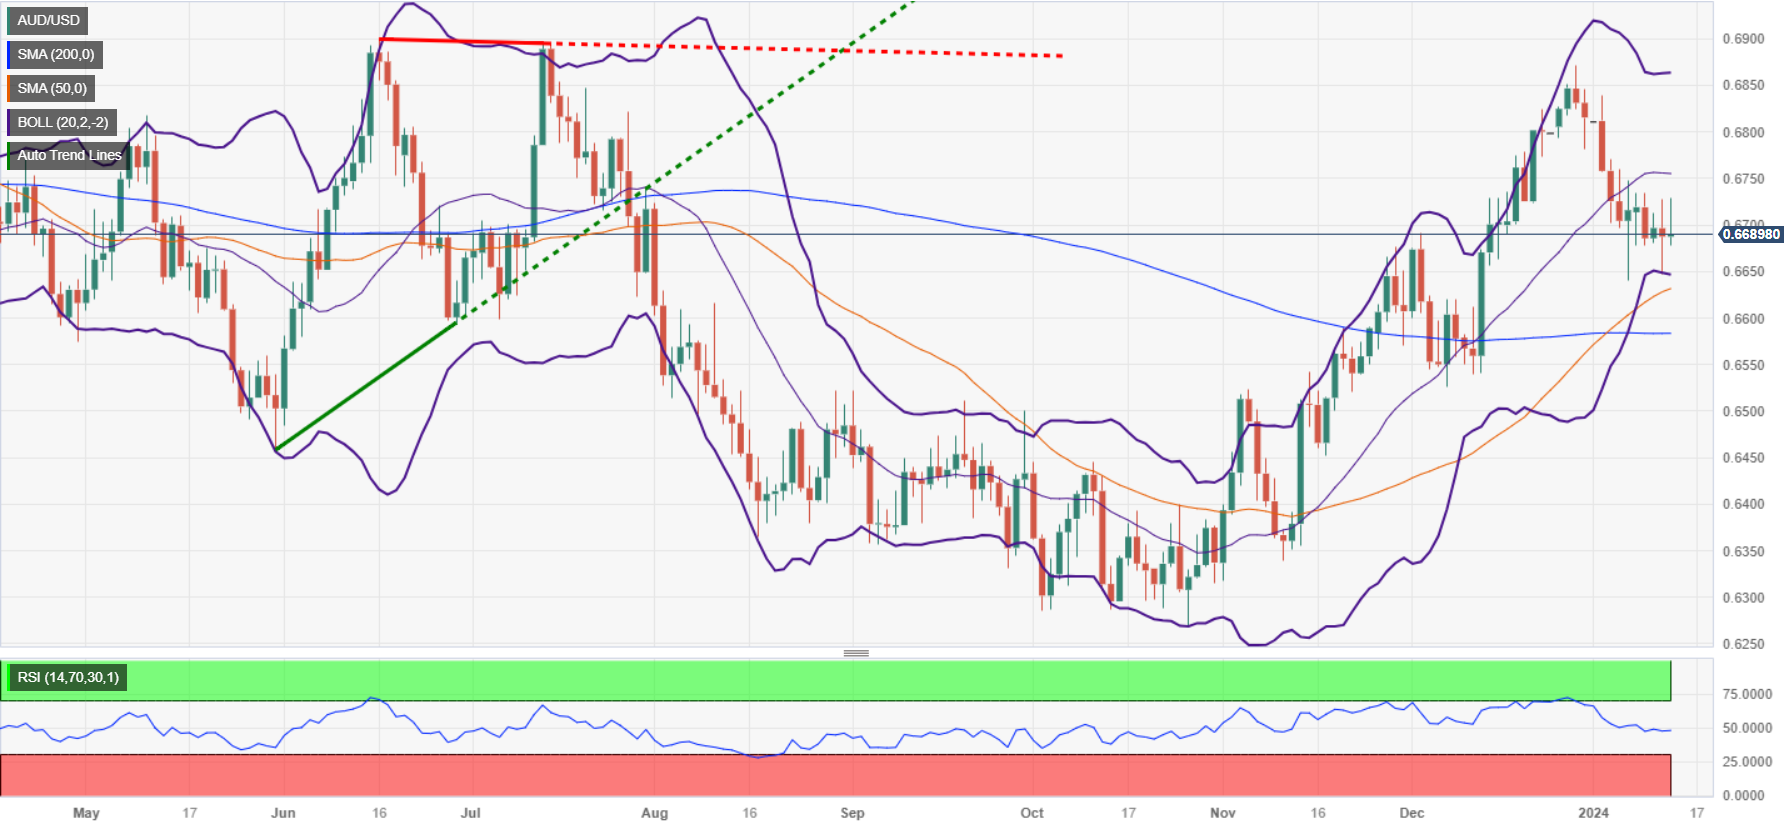
The Australian Dollar (AUD) registered minuscule gains against the US Dollar (USD) on Friday, shrugging off risk aversion due to tensions arising in the Red Sea, along with softer-than-expected economic data from the United States (US). The AUD/USD trades at 0.6690, up by 0.06%
AUD/USD at crossroads affected by weak data from the US and China
During the overnight session, newswires revealed that the US and the UK attacked Houthi's positions in Yemen in retaliation to an attack on a US ship in the Red Sea. According to Reuters, White House spokesman John Kirby said #the strikes had targeted the Houthis' ability to store, launch and guide missiles or drones, and that their impact was being assessed.”
Aside from this, the latest inflation reports on the producer and consumer side in the US were mixed. Even though the former justifies market participants' expectations for the Federal Reserve’s (Fed) rate cuts in 2024, the latter portrays a picture that households witnessed a rise in prices, mainly focused on shelter and healthcare.
Nevertheless, AUD/USD traders ignored the abovementioned backdrop. They lifted the spot price towards its highest level since January 8, at 0.6728, even though Fed officials stressed that a rate cut in March is not an option.
On the Aussie’s (AUD) front, China’s deflationary data, revealed on Friday, was brushed aside by traders, which remain focused on the reduction of interest rate differentials between Australia and the US. That could hurt economic growth in Australia, as weaker activity in China implies less demand for Aussie goods and services. Meanwhile, the latest inflation report in Australia was positive for households and might prevent the Reserve Bank of Australia (RBA) from tightening monetary policy.
AUD/USD Price Analysis: Technical outlook
During the last six days, the AUD/USD has been trading within familiar levels, unable to decisively crack the 0.6640/0.6740 range. Despite that, the pair is upward biased after a ‘golden cross’ was formed on January 3, seen as a bullish signal. For a bullish resumption, buyers must reclaim the 0.6740 area, which would expose the 0.6800 figure. On the flip side, the first key support is seen at 0.6640, followed by the 50-day moving average (DMA) at 0.6624, ahead of the 0.6600 mark.
Australian Dollar price this week
The table below shows the percentage change of Australian Dollar (AUD) against listed major currencies this week. Australian Dollar was the strongest against the Canadian Dollar.
| USD | EUR | GBP | CAD | AUD | JPY | NZD | CHF | |
| USD | -0.16% | -0.25% | 0.30% | 0.40% | 0.08% | 0.04% | 0.21% | |
| EUR | 0.16% | -0.09% | 0.47% | 0.57% | 0.25% | 0.22% | 0.40% | |
| GBP | 0.27% | 0.09% | 0.56% | 0.67% | 0.34% | 0.31% | 0.47% | |
| CAD | -0.30% | -0.45% | -0.55% | 0.10% | -0.20% | -0.26% | -0.08% | |
| AUD | -0.40% | -0.56% | -0.65% | -0.10% | -0.31% | -0.36% | -0.19% | |
| JPY | -0.11% | -0.23% | -0.34% | 0.24% | 0.34% | -0.02% | 0.13% | |
| NZD | -0.04% | -0.19% | -0.31% | 0.26% | 0.35% | 0.04% | 0.16% | |
| CHF | -0.21% | -0.40% | -0.47% | 0.09% | 0.19% | -0.12% | -0.16% |
The heat map shows percentage changes of major currencies against each other. The base currency is picked from the left column, while the quote currency is picked from the top row. For example, if you pick the Euro from the left column and move along the horizontal line to the Japanese Yen, the percentage change displayed in the box will represent EUR (base)/JPY (quote).
- GBP/JPY slips back on Friday as Japanese Yen sees broad but light recovery.
- Markets are pivoting back into the Yen as UK data hits and misses.
- Up next: UK labor and wages figures next Tuesday, UK CPI Wednesday.
The GBP/JPY backslid on Friday, slipping back from the week’s peak bids near 186.17 as the Pound Sterling (GBP) broadly softens and markets bid up the Japanese Yen (JPY).
Japan’s Current Account grew less than expected early Friday, printing growth of ¥1,925.6 billion in net exports and imports through November, missing the market forecast of ¥2,385.1 billion and falling away unexpectedly from October’s ¥2,582.8 billion.
UK Manufacturing & Industrial Production mixed at multiple levels on Friday, with MoM Manufacturing Production rising slightly more than expected in November but missing annualized forecasts, while YoY Industrial Production contracted. UK Gross Domestic Product (GDP) came in better than expected, printing a 0.3% uptick in November versus the forecast 0.2% and rebounding from the previous month’s 0.3% contraction.
Japanese wages stunned markets with a steeper contraction in earnings this week, with real wages (Labor Cash Earnings growth less inflation) declining by 3% for the year ended November. Labor Cash Earnings also missed forecasts, printing a nearly-flat 0.2% against the market’s expected steady reading of 1.5%.
The UK’s BRC Like-For-Like Retail Sales also missed the mark earlier in the week, showing similar-product Retail Sales grew by 1.9% for the year ended December, below the previous period’s 2.6%.
Despite Friday’s pullback for the GBP and moderate rebound in the JPY, the Pound Sterling remains in the green across the board of major currencies for the week, while the Yen remains mixed from Monday’s opening bids as the market heads into the closing bell for Friday.
GBP/JPY Technical Outlook
The GBP/JPY has softened back towards the 184.50 level on Friday, easing back from the week’s peak bids near 186.15 set on Thursday. The pair has gained steadily in 2024 trading and despite Friday’s soft pullback remains up 3.3% from January’s early bottom bids near 178.75.
January’s swing low saw the GBP/JPY take a firm bounce from the 200-day Simple Moving Average (SMA) just below the 180.00 handle, and the pair remains firmly entrenched in a rough consolidation range on the daily candlesticks.
The Guppy has traded closely with the 50-day SMA since the current consolidation pattern began in late July, and the near-term target for bidders will be successfully cracking the hard technical barrier baked in near 188.00.
GBP/JPY Hourly Chart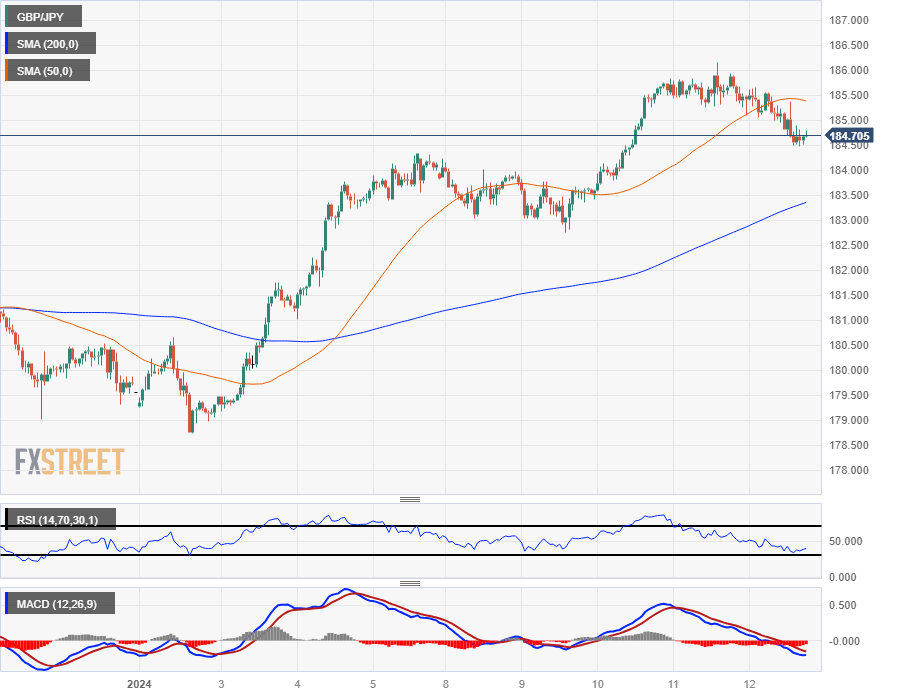
GBP/JPY Daily Chart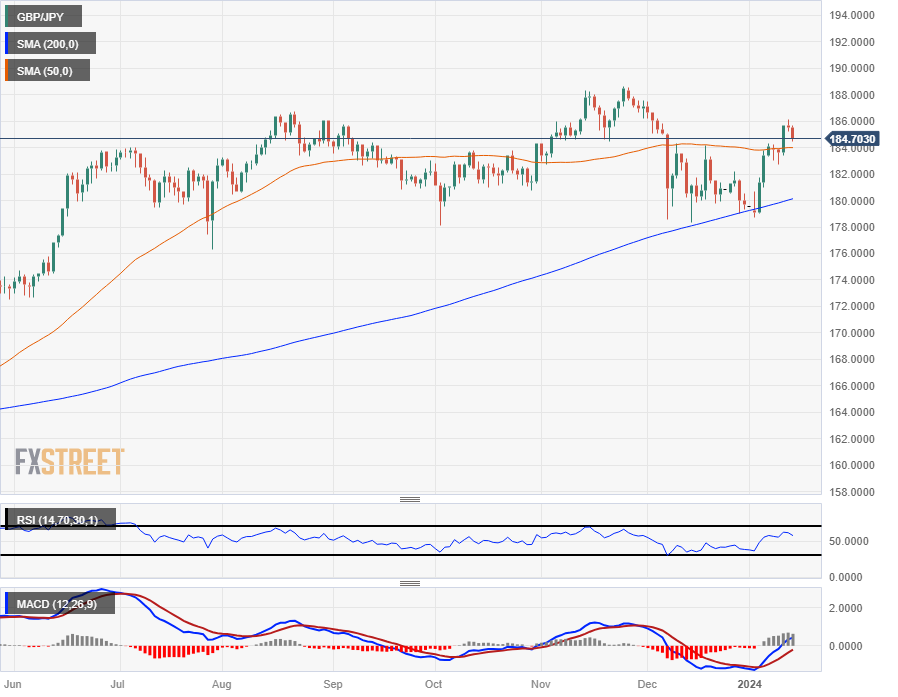
GBP/JPY Technical Levels
- Gold's rally fueled by increased geopolitical risks in the Red Sea region and a shift towards risk-averse trading.
- US Producer Price Index data falls short of expectations, bolstering speculation of imminent Fed policy easing.
- Decline in US Treasury yields and a mixed Dollar performance further support Gold's upward momentum.
Gold price rallied sharply on Friday, spurred by a risk-off impulse due to tensions arising around the Red Sea, as the US and the UK retaliated against Houthi's attack on a US ship on Thursday. Therefore, XAU/USD’s refreshed five-day highs at around $2062, and trades at $2045, up 0.70%.
XAU/USD hits five-day high at $2062, sponsored by mixed US data, increased odds for Fed rate cuts
Traders bought Gold due to the escalation of the conflict in the Middle East. Besides that, the yellow metal was boosted by the drop in US Treasury bond yields, as bets that the US Federal Reserve would cut rates aggressively beginning as soon as March increased.
In the meantime, the latest inflation report in the United States (US), revealed that prices paid by producers, also known as the PPI, slid below estimates, with the PPI monthly dropping -0.1%, below forecasts of 0.1%. In a year-over-year number, the PPI rose by 1%, below forecasts of 1.9%. Core PPI was unchanged at 0% compared with November’s data but below estimates, while year-over-year figures dipped below projections and the previous reading, from 2% to 1.8%.
Although today’s data is supportive of a dovish approach by the Fed, on Thursday consumer inflation data was higher than expected. It should be said that some Fed officials made comments on December’s data, and pushed back against expectations for a rate cut in March.
The yellow metal was also supported by the drop in US yields, particularly the short-end of the curve, with the 2-year Treasury note plunging almost ten basis points to 4.16%, reducing the US 2s-10s yield curve inversion. That weighed on the Greenback, which according to the US Dollar Index (DXY) clings to decent gains of 0.15%, up at 102.47.
XAU/USD Price Analysis: Technical outlook
Gold’s daily chart remains upward-biased after bouncing off the weekly lows of $2013, which exacerbated XAU’s rally toward the $2060 area, before sliding toward the 20-day moving average (DMA) at $2046. If buyers crack that level and the $2050 figure, that could open the door to retesting weekly highs. Further upside is seen at $2100. On the flip side, XAU/USD’s buyers' failure to reclaim $2050 could open the door for further losses. First support is seen at today’s low of $2028, followed by the week’s low of $2013.
- The DXY Index recovered toward 102.40 after falling close to 102.20.
- December PPIs came in lower than expected at 1.8% YoY.
- The US 2-year yield fell to lows not seen since May 2023.
The US Dollar (USD), as gauged by the DXY Index, has experienced downward pressure, trading as low as 102.20 amidst weak Producer Price Index (PPI) data from December but then recovered toward 102.40. Following the readings, US bond yields are declining, while dovish bets on the Federal Reserve (Fed) intensified.
The Fed's dovish stance, based on welcoming the cooling inflation and projecting no rate hikes in 2024, has recently weakened the USD and seems to be offsetting the resilience of the US economy while other economic blocks are weakening. Despite higher CPI numbers, the market remains stubborn and expects the Fed to initiate its easing cycle sooner rather than later, and the soft PPI readings gave markets a reason to bet on a less aggressive approach.
Daily digest market movers: US Dollar pressured down by soft PPI and falling US yields
- US Producer Price Index (PPI) for final demand rose by 1% on a yearly basis in December, slightly below market expectations of 1.3% and up from the revised 0.8% increase in November.
- The annual core PPI, which excludes volatile food and energy prices, increased by 1.8% in December, falling below both the November reading and analysts' estimates of 2% and 1.9%, respectively. The monthly core PPI remained unchanged for the third consecutive month.
- US bond yields are declining. The 2-year yield is currently at 4.13%, its lowest since May 2023, while the 5-year yield rests at 3.83% and the 10-year yield sits at 3.94%.
- The CME FedWatch Tool reveals no rate hike predictions for the January meeting. Instead, March and May 2024 meeting expectations indicate increased probabilities for rate cuts despite Thursday’s hot inflation reading for the CPI.
- The odds of a cut in March rose to 77%, while the odds of another one in May jumped to 70%.
- As tensions rise in the Red Sea between the US and Houthis rebels, the downside is limited for the index.
Technical Analysis: DXY index buyers hold their ground, indicators still in positive territory
The daily Relative Strength Index (RSI), which is currently flat and in positive territory, indicates that buyers have halted their momentum but still maintain control in the short run. Adding to this narrative of tentative bullish strength is the Moving Average Convergence Divergence (MACD). Despite being flat, it's displaying green bars that suggest buying pressure is maintaining a steady pace.
Meanwhile, when examining the Simple Moving Averages (SMAs) in the short-term, the buyer's strength is still in play, given that the pair is trading above the 20-day SMA. Nevertheless, trading under both the 100 and 200-day SMAs, a more significant time frame, indicates sellers hold the upper hand in the middle and long-term perspective.
Support levels: 102.15, 102.00 (20-day SMA), 101.80.
Resistance levels: 102.50, 102.70, 102.80.
US Dollar FAQs
What is the US Dollar?
The US Dollar (USD) is the official currency of the United States of America, and the ‘de facto’ currency of a significant number of other countries where it is found in circulation alongside local notes. It is the most heavily traded currency in the world, accounting for over 88% of all global foreign exchange turnover, or an average of $6.6 trillion in transactions per day, according to data from 2022.
Following the second world war, the USD took over from the British Pound as the world’s reserve currency. For most of its history, the US Dollar was backed by Gold, until the Bretton Woods Agreement in 1971 when the Gold Standard went away.
How do the decisions of the Federal Reserve impact the US Dollar?
The most important single factor impacting on the value of the US Dollar is monetary policy, which is shaped by the Federal Reserve (Fed). The Fed has two mandates: to achieve price stability (control inflation) and foster full employment. Its primary tool to achieve these two goals is by adjusting interest rates.
When prices are rising too quickly and inflation is above the Fed’s 2% target, the Fed will raise rates, which helps the USD value. When inflation falls below 2% or the Unemployment Rate is too high, the Fed may lower interest rates, which weighs on the Greenback.
What is Quantitative Easing and how does it influence the US Dollar?
In extreme situations, the Federal Reserve can also print more Dollars and enact quantitative easing (QE). QE is the process by which the Fed substantially increases the flow of credit in a stuck financial system.
It is a non-standard policy measure used when credit has dried up because banks will not lend to each other (out of the fear of counterparty default). It is a last resort when simply lowering interest rates is unlikely to achieve the necessary result. It was the Fed’s weapon of choice to combat the credit crunch that occurred during the Great Financial Crisis in 2008. It involves the Fed printing more Dollars and using them to buy US government bonds predominantly from financial institutions. QE usually leads to a weaker US Dollar.
What is Quantitative Tightening and how does it influence the US Dollar?
Quantitative tightening (QT) is the reverse process whereby the Federal Reserve stops buying bonds from financial institutions and does not reinvest the principal from the bonds it holds maturing in new purchases. It is usually positive for the US Dollar.
- Euro struggles to gain momentum on Friday, pares back week’s performance.
- A slew of ECB talking points this week have bid down rate cut hopes.
- Next week’s economic calendar is light on eurozone data.
The Euro (EUR) is softening on Friday, backsliding against the majority of its major currency peers as dovish talking points from the European Central Bank (ECB) weigh on rate cut hopes. Next week sees limited eurozone data releases, with mid-tier Industrial Production and final Harmonized Index of Consumer Prices (HICP) due in the first half of the week.
A consensus miss on the US Producer Price Index (PPI) is the driving headlines on Friday as producer-level inflation recedes faster than expected. Slumping producer inflation kicked market expectations of Fed rate cuts into overdrive heading into the week’s final trading hours.
Daily digest market movers: Euro broadly weaker in Friday trading amidst dour outlook
- The Euro is down against most of the major currency bloc on Friday, declining 0.15% against the US Dollar (USD).
- ECB's President Lagarde: Rates have probably reached peak, EU not in recession.
- Multiple ECB officials have hit the wires this week, easing back market hopes of rate cuts.
- The ECB’s Economic Bulletin begrudgingly admitted the eurozone was in a “technical recession” with a soft landing scenario all but guaranteed.
- US annual PPI inflation rises to 1% in December vs. 1.3% expected.
- MoM US PPI in December held at -0.1%, in-line with November’s -0.1% (revised downward from 0.0%), missing the market forecast of 0.1% growth.
- Annualized core PPI also missed the mark, declining to 1.8% from November’s YoY figure of 2.0% and coming in below the median market forecast of 1.9%.
- Easing PPI inflation sparked a pop in Federal Reserve (Fed) rate cut expectations.
- Markets once again see 160 basis points in Fed rate cuts through 2024, up from 154 bps.
Euro price today
The table below shows the percentage change of Euro (EUR) against listed major currencies today. Euro was the strongest against the Pound Sterling.
| USD | EUR | GBP | CAD | AUD | JPY | NZD | CHF | |
| USD | 0.24% | 0.30% | 0.20% | 0.15% | -0.09% | -0.04% | 0.21% | |
| EUR | -0.24% | 0.05% | -0.06% | -0.11% | -0.34% | -0.32% | -0.02% | |
| GBP | -0.30% | -0.06% | -0.11% | -0.15% | -0.39% | -0.38% | -0.08% | |
| CAD | -0.21% | 0.04% | 0.11% | -0.07% | -0.26% | -0.23% | 0.03% | |
| AUD | -0.15% | 0.10% | 0.12% | 0.05% | -0.23% | -0.20% | 0.09% | |
| JPY | 0.11% | 0.33% | 0.37% | 0.29% | 0.28% | 0.01% | 0.30% | |
| NZD | 0.05% | 0.30% | 0.34% | 0.24% | 0.20% | -0.01% | 0.29% | |
| CHF | -0.22% | 0.02% | 0.08% | -0.02% | -0.06% | -0.29% | -0.26% |
The heat map shows percentage changes of major currencies against each other. The base currency is picked from the left column, while the quote currency is picked from the top row. For example, if you pick the Euro from the left column and move along the horizontal line to the Japanese Yen, the percentage change displayed in the box will represent EUR (base)/JPY (quote).
Technical Analysis: EUR/USD lower on Friday in chunky trading
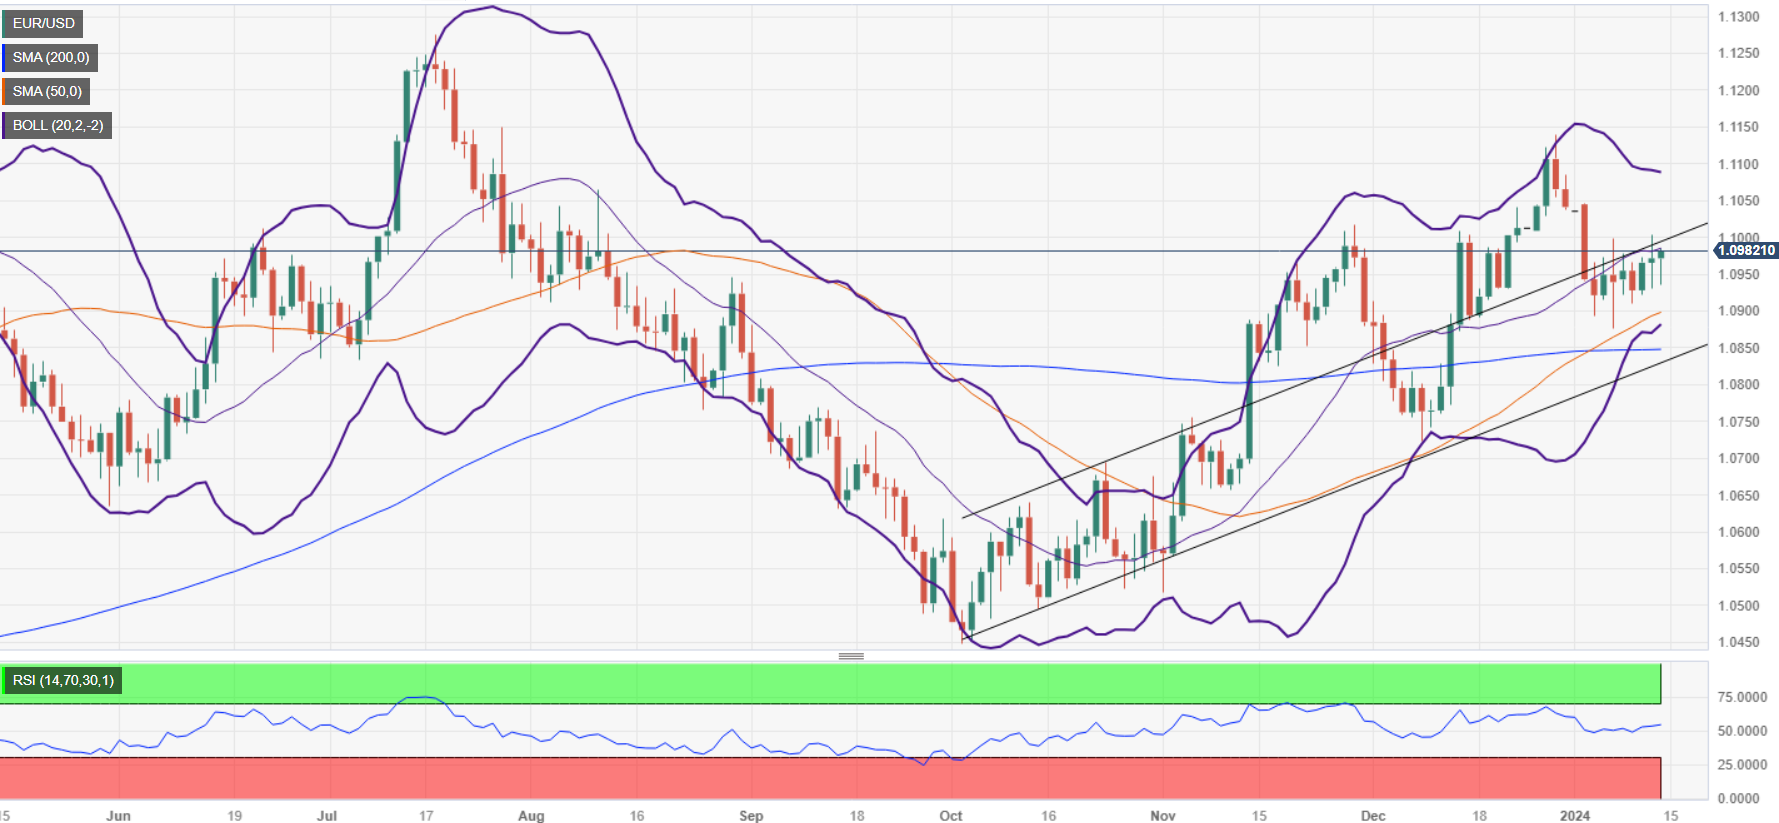
The EUR/USD kicked off Friday’s trading near 1.0980, going back and forth in a rough intraday range as the pair grapples with bids near 1.0950. Intraday action continues to get hamstrung on the 200-hour Simple Moving Average (SMA). Near-term chart action is getting drawn into the midrange as the Fiber churns in rough consolidation.
According to daily candles, the pair is doing well, up nearly 5% from October’s bottom bids near 1.0450. Despite a pullback toward the 200-day SMA, a bullish cross of the 50-day and 200-day SMAs is building out a near-term price floor around 1.0900.
Continued selling pressure will drive the Fiber back into the long-term 200-day SMA near 1.0850. The challenge will be to drag the EUR/USD down to the last swing low near 1.0750. Bidders will be looking for topside momentum to carry the pair back into late December’s swing high near 1.1150.
EUR/USD Hourly Chart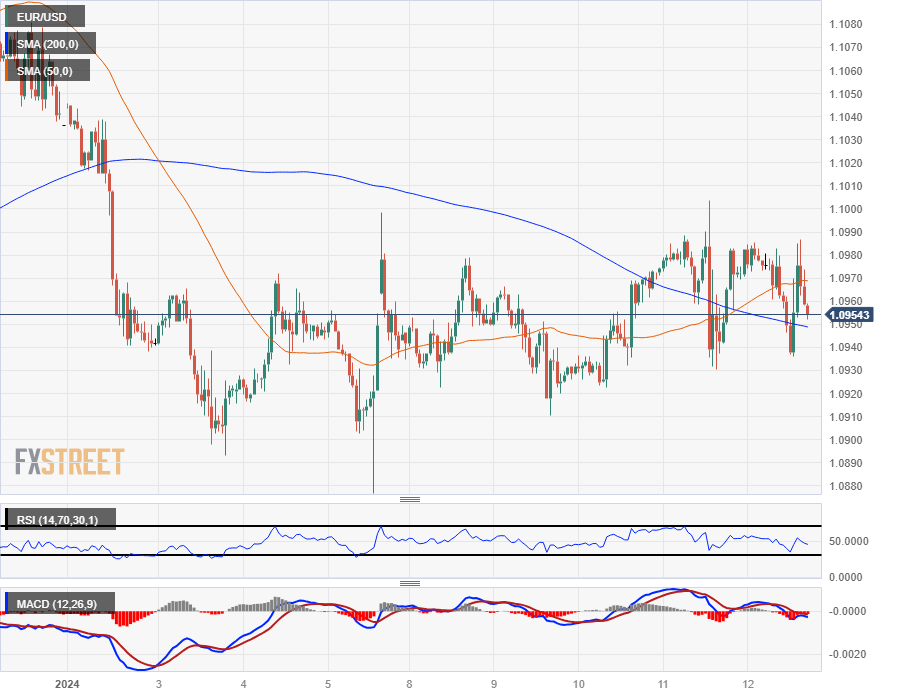
EUR/USD Daily Chart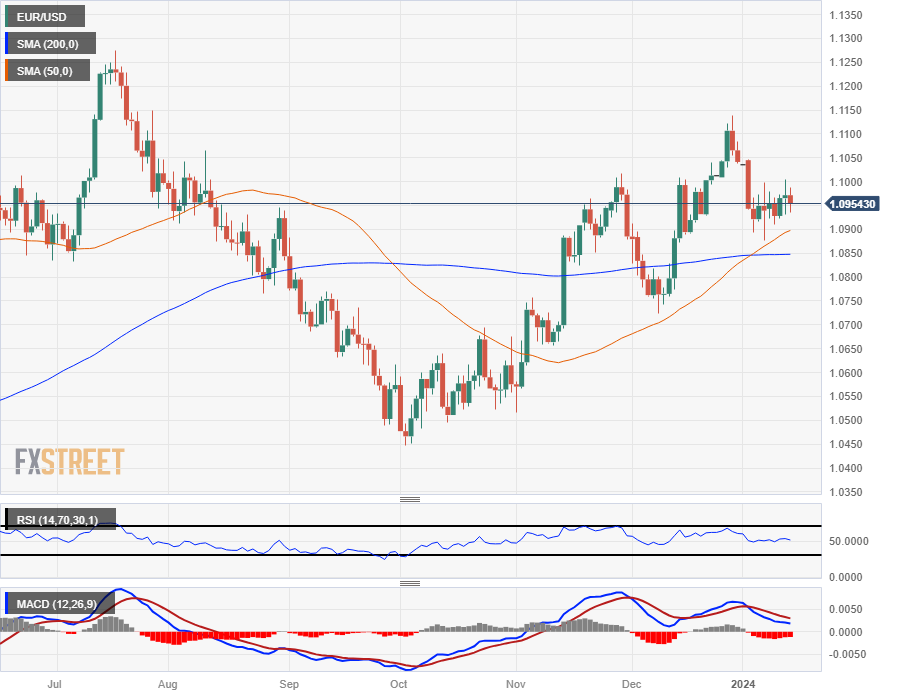
Euro FAQs
What is the Euro?
The Euro is the currency for the 20 European Union countries that belong to the Eurozone. It is the second most heavily traded currency in the world behind the US Dollar. In 2022, it accounted for 31% of all foreign exchange transactions, with an average daily turnover of over $2.2 trillion a day.
EUR/USD is the most heavily traded currency pair in the world, accounting for an estimated 30% off all transactions, followed by EUR/JPY (4%), EUR/GBP (3%) and EUR/AUD (2%).
What is the ECB and how does it impact the Euro?
The European Central Bank (ECB) in Frankfurt, Germany, is the reserve bank for the Eurozone. The ECB sets interest rates and manages monetary policy.
The ECB’s primary mandate is to maintain price stability, which means either controlling inflation or stimulating growth. Its primary tool is the raising or lowering of interest rates. Relatively high interest rates – or the expectation of higher rates – will usually benefit the Euro and vice versa.
The ECB Governing Council makes monetary policy decisions at meetings held eight times a year. Decisions are made by heads of the Eurozone national banks and six permanent members, including the President of the ECB, Christine Lagarde.
How does inflation data impact the value of the Euro?
Eurozone inflation data, measured by the Harmonized Index of Consumer Prices (HICP), is an important econometric for the Euro. If inflation rises more than expected, especially if above the ECB’s 2% target, it obliges the ECB to raise interest rates to bring it back under control.
Relatively high interest rates compared to its counterparts will usually benefit the Euro, as it makes the region more attractive as a place for global investors to park their money.
How does economic data influence the value of the Euro?
Data releases gauge the health of the economy and can impact on the Euro. Indicators such as GDP, Manufacturing and Services PMIs, employment, and consumer sentiment surveys can all influence the direction of the single currency.
A strong economy is good for the Euro. Not only does it attract more foreign investment but it may encourage the ECB to put up interest rates, which will directly strengthen the Euro. Otherwise, if economic data is weak, the Euro is likely to fall.
Economic data for the four largest economies in the euro area (Germany, France, Italy and Spain) are especially significant, as they account for 75% of the Eurozone’s economy.
How does the Trade Balance impact the Euro?
Another significant data release for the Euro is the Trade Balance. This indicator measures the difference between what a country earns from its exports and what it spends on imports over a given period.
If a country produces highly sought after exports then its currency will gain in value purely from the extra demand created from foreign buyers seeking to purchase these goods. Therefore, a positive net Trade Balance strengthens a currency and vice versa for a negative balance.
- Mexican Peso advances due to investors expecting substantial US rate cuts, a headwind for the US Dollar.
- Mexico's higher-than-expected inflation and industrial production slump puts Banxico at a crossroads.
- USD/MXN retreats below 16.85 with traders eyeing a new multi-year low below 16.62.
The Mexican Peso (MXN) climbed during the North American session against the US Dollar (USD) due to investors increasing bets that the US Federal Reserve (Fed) would aggressively ease policy, pricing in more than 170 basis points of cuts. Therefore, the Greenback remains pressured, a headwind for the USD/MXN, which has dropped 0.31% to trade at 17.85 after hitting a three-day low of 16.82.
Mexico’s economic docket remains scarce, though the current week revealed that inflation was higher than expected in December, which could deter the Bank of Mexico (Banxico) from easing monetary policy in the first quarter. Nevertheless, higher interest rates are beginning to impact the country's industry as Industrial Production plunged, hurting growth prospects for 2024.
In regard to that, Mexican President Andres Manual Lopez Obrador entered the arena of economic projections, projecting that the economy would grow by 3.5%, exceeding the World Bank forecast of 2.6%.
Across the border, the US Department of Labor announced that prices paid by producers slipped in December, which triggered a repricing for additional rate cuts by the US central bank, consequently weakening the Greenback.
Daily digest market movers: Mexican Peso climbs on investor expectation of a dovish Fed
- The Producer Price Index (PPI) fell short of expectations, with the monthly PPI decreasing by -0.1%, which is below the forecasted 0.1%. In a YoY comparison, the PPI experienced a rise of 1%, which is also below the anticipated 1.9%. The core PPI remained unchanged at 0% compared to November's data, falling below estimates. Additionally, the YoY core PPI figures declined from the previous reading of 2% to 1.8%, also falling short of projections.
- Given the fact that Industrial Production plunged in Mexico, the scenario of the country is becoming uncertain, which could weigh on the Mexican Peso.
- On Wednesday, the World Bank revised its economic projections for Mexico in 2024. The updated forecast anticipates that Mexico's Gross Domestic Product (GDP) will grow by 2.6%, an increase from the bank’s initial prediction of 1.9%. Analysts at the bank attribute this expected growth to the rise in near-shoring activities, which they believe will positively impact the Mexican economy.
- Although the recent meeting minutes from Banxico (the Central Bank of Mexico) suggest that the central bank might contemplate easing its monetary policy, the inflation report for December could hinder any move toward policy relaxation.
- On Tuesday, Mexico's Consumer Price Index (CPI) recorded a YoY increase of 4.66% in December, surpassing the expected 4.55%. This is a significant jump from November's figure of 4.32%.
- Core inflation figures, which exclude volatile items like food and energy, showed a YoY increase of 5.09%, which was slightly lower than the consensus and the previous month's figures of 5.15% and 5.30%, respectively.
- On January 5, a Reuters poll suggested the Mexican Peso could weaken 5.4% to 18.00 per US Dollar in the 12 months following December.
- On Thursday, Fed policymakers reiterated that cutting rates in March is too soon, while adding that even though progress on inflation had been achieved, December’s data bucked the trend.
Technical analysis: Mexican Peso counterattacks as USD/MXN tumbles below 16.90
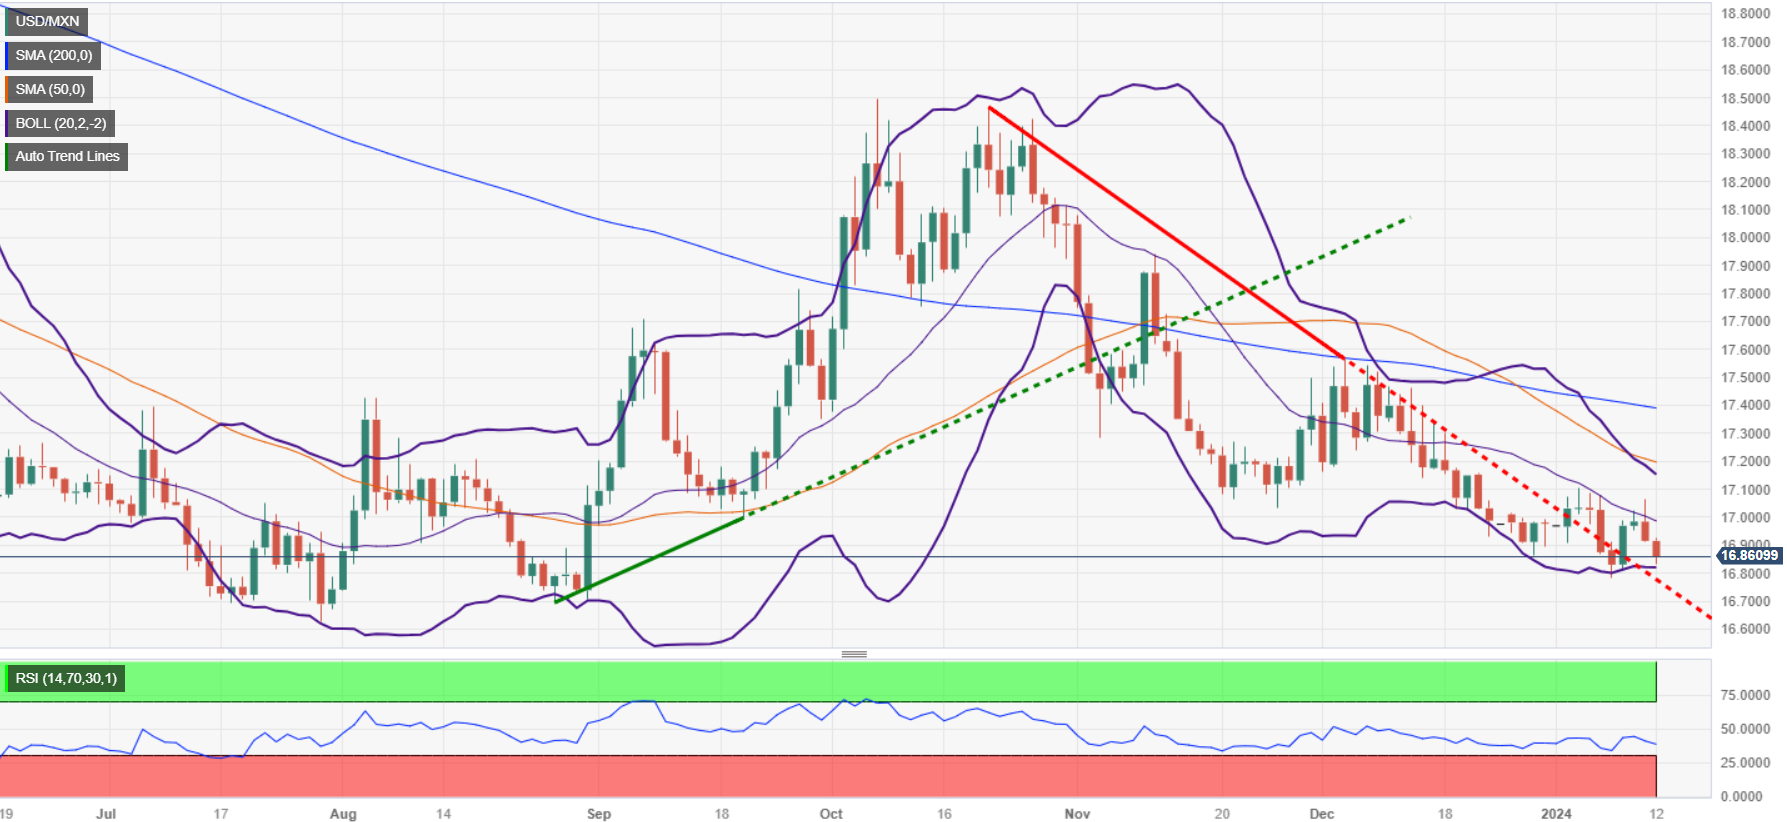
The USD/MXN pair resumed its uptrend after a bullish impulsive correction that lifted the spot price toward its weekly high of 17.07 before reversing course below the 17.00 figure. As the downtrend advances, the next key support levels to be tested would be August 28’s 16.69, followed by the 2023 low of 16.62.
Further upside will only be seen if buyers step in, pushing the USD/MXN exchange rate above 17.00. The first resistance would be 17.20, followed by the 50-day Simple Moving Average (SMA) at 17.20, ahead of challenging the confluence of the 100 and 200-day SMAs at around 17.39/40.
USD/MXN Price Action – Daily Chart
Mexican Peso FAQs
What key factors drive the Mexican Peso?
The Mexican Peso (MXN) is the most traded currency among its Latin American peers. Its value is broadly determined by the performance of the Mexican economy, the country’s central bank’s policy, the amount of foreign investment in the country and even the levels of remittances sent by Mexicans who live abroad, particularly in the United States. Geopolitical trends can also move MXN: for example, the process of nearshoring – or the decision by some firms to relocate manufacturing capacity and supply chains closer to their home countries – is also seen as a catalyst for the Mexican currency as the country is considered a key manufacturing hub in the American continent. Another catalyst for MXN is Oil prices as Mexico is a key exporter of the commodity.
How do decisions of the Banxico impact the Mexican Peso?
The main objective of Mexico’s central bank, also known as Banxico, is to maintain inflation at low and stable levels (at or close to its target of 3%, the midpoint in a tolerance band of between 2% and 4%). To this end, the bank sets an appropriate level of interest rates. When inflation is too high, Banxico will attempt to tame it by raising interest rates, making it more expensive for households and businesses to borrow money, thus cooling demand and the overall economy. Higher interest rates are generally positive for the Mexican Peso (MXN) as they lead to higher yields, making the country a more attractive place for investors. On the contrary, lower interest rates tend to weaken MXN.
How does economic data influence the value of the Mexican Peso?
Macroeconomic data releases are key to assess the state of the economy and can have an impact on the Mexican Peso (MXN) valuation. A strong Mexican economy, based on high economic growth, low unemployment and high confidence is good for MXN. Not only does it attract more foreign investment but it may encourage the Bank of Mexico (Banxico) to increase interest rates, particularly if this strength comes together with elevated inflation. However, if economic data is weak, MXN is likely to depreciate.
How does broader risk sentiment impact the Mexican Peso?
As an emerging-market currency, the Mexican Peso (MXN) tends to strive during risk-on periods, or when investors perceive that broader market risks are low and thus are eager to engage with investments that carry a higher risk. Conversely, MXN tends to weaken at times of market turbulence or economic uncertainty as investors tend to sell higher-risk assets and flee to the more-stable safe havens.
- The USD/JPY is gravitating towards the 144.70 level with notable losses.
- Soft PPI data for December weakened the US Dollar.
- Red Sea tensions may limit the downside for the pair.
In Friday's trading session, USD/JPY encountered a setback, currently trading around 144.70 with losses of 0.40%. This downward movement is driven by the soft Producer Price Index (PPI), but escalating tensions in the Red Sea region may drive demand back to the US Dollar.
On the data front, the US Final Demand Producer Price Index (PPI) reported a 1% annual rise in December, a slight increase from November's revised increase of 0.8%, according to Friday's data from the Bureau of Labor Statistics. This reported percentage falls below the anticipated 1.3% market projection. The Core measure came in at 1.9%, lower than the 1.9% expected.
That being said, the US economy shows an upward trend in overall inflation, with the Consumer Price Index (CPI) rising from 3.1% to 3.4% annually, indicating the potential for higher interest rates if the Federal Reserve aims to control it, which may limit any US Dollar losses. Additionally, strong labor market conditions are suggested by lower weekly jobless claims, which may favor hawkish rhetoric from the bank.
Additionally, as tensions rise in the Red Sea between the US and Houthis rebels, markets fear potential escalation and may seek refuge in the Greenback, which could eventually push the pair upwards.
USD/JPY levels to watch
From the daily chart, the pair shows that the overall trend is bullish. This interpretation is drawn from the position of Simple Moving Averages (SMAs), where the pair is found below the 100-day SMA while staying above the 20-day and 200-day SMAs, implying that the buying strength continues to resist bearish pullback attempts.
Further, the Relative Strength Index (RSI) shows a negative dynamic, elaborating on the fact that the pair is in a negative territory. For now, it highlights that the potential bearish influences on the pair need to be watched, although the overall momentum could still see the bulls holding ground.
Additionally, the Moving Average Convergence Divergence (MACD) hints at a possible shift back towards bullish positions. Although green bars are decreasing, the fact they are still present suggests that the buying momentum, albeit slowing down, hasn't entirely faded. Nevertheless, should these bars continue to decrease, it could signal an increase in the selling sentiment.
In summary, the technical landscape reflects neutral to slightly bearish conditions. Despite recent bearish movements, the buying sentiment still appears strong enough to challenge the selling momentum.
USD/JPY daily chart
-638406729170481954.png)
One of the topics that is likely to occupy us for much of 2024 is the US election. Would a second Donald Trump presidency be USD positive or negative? Economists at Commerzbank analyze the possible scenarios.
USD-supportive factors will predominate in the short term if Trump keeps his hands off the Fed
If Trump keeps his hands off the Fed and does not pursue a USD-weakening intervention policy, USD-supportive factors will prevail in the short term. Therefore, we will have to watch whether Trump makes credible statements on Fed independence and USD exchange rate policy during the election campaign.
At the same time, however, we need to keep an eye on whether a Trump victory could actually lead to a lasting change in the US political system, i.e. whether his policies would be relevant for more than four years. If the campaign makes such a scenario seem likely, a higher probability of a Trump victory would not necessarily lead to USD strength.
- Canadian Dollar (USD) sees slight gains against US Dollar following US PPI miss.
- Canada economic calendar empty of meaningful data until next Tuesday’s CPI.
- Crude Oil up again on supply chain fears.
The Canadian Dollar is a mixed bag in Friday trading, seeing moderate gains against the US Dollar (USD) after a downside print in the US Producer Price Index forced the Greenback lower across the board. With a mixed performance on the day for the CAD, the Loonie is in the red against most of its major currency peers for the week, save for a slight uptick against the USD from Monday’s opening bids.
Loonie traders will have to wait until next Tuesday for the next print of Canada’s Consumer Price Index (CPI) inflation. However, Monday sees low-impact Manufacturing Sales from November as well as the Bank of Canada’s (BoC) latest Business Outlook Survey.
Crude Oil markets remain tense about Middle East conflicts potentially impacting the global barrel trade. As the ongoing spat with Houthi rebels continues, more firms continue to divert tankers and cargo ships from the Red Sea and the Suez Canal in order to take a longer trip around the continent of Africa.
Daily digest market movers: Canadian Dollar gets a slight leg up on lower than expected US PPI
- The Canadian Dollar is up a tenth of a percent against the Greenback on Friday as the US Dollar gets sold off amidst markets increasing their rate-cut bets from the Federal Reserve (Fed).
- US PPI figures missed the mark on Friday.
- December’s US PPI declined by 0.1% versus the forecasted 0.1% increase, adding to November’s print which saw a downside revision from 0.0% to -0.1% as well.
- US Core annualized PPI through December came in at 1.8%, down from the previous period’s and below the median market forecast of 1.9%.
- With inflation easing back faster than expected at the producer level, markets are once again ramping up bets of a faster, deeper pace of rate cuts from the Fed.
- Fed swaps are pricing in additional monetary easing through 2024, with short-term interest-rate futures on the rise and markets betting on 160 basis points of cuts from the Fed for the year, up from 154 bps.
- Crude Oil market tensions over Middle East turmoil are on the rise once again as US and UK naval forces launch strikes against Houthi targets, a move that is sure to draw ire from Iran, which openly backs Houthi activities in and around Yemen.
Canadian Dollar price today
The table below shows the percentage change of Canadian Dollar (CAD) against listed major currencies today. Canadian Dollar was the strongest against the Pound Sterling.
| USD | EUR | GBP | CAD | AUD | JPY | NZD | CHF | |
| USD | 0.04% | 0.03% | -0.11% | -0.20% | -0.25% | -0.41% | -0.12% | |
| EUR | -0.03% | 0.00% | -0.16% | -0.24% | -0.28% | -0.47% | -0.14% | |
| GBP | -0.03% | 0.01% | -0.14% | -0.24% | -0.29% | -0.45% | -0.17% | |
| CAD | 0.11% | 0.13% | 0.13% | -0.11% | -0.14% | -0.30% | 0.00% | |
| AUD | 0.20% | 0.23% | 0.24% | 0.10% | -0.05% | -0.23% | 0.10% | |
| JPY | 0.27% | 0.28% | 0.28% | 0.15% | 0.06% | -0.19% | 0.14% | |
| NZD | 0.41% | 0.46% | 0.46% | 0.30% | 0.23% | 0.18% | 0.32% | |
| CHF | 0.11% | 0.15% | 0.14% | 0.01% | -0.08% | -0.14% | -0.30% |
The heat map shows percentage changes of major currencies against each other. The base currency is picked from the left column, while the quote currency is picked from the top row. For example, if you pick the Euro from the left column and move along the horizontal line to the Japanese Yen, the percentage change displayed in the box will represent EUR (base)/JPY (quote).
Technical Analysis: Canadian Dollar finds a slight foothold against US Dollar on Friday
The Canadian Dollar (CAD) is slightly up against the Greenback heading into the end of the trading week, pushing the USD/CAD pair down into the 1.3350 neighborhood.
The pair rose to a new 2024 high of 1.3443 on Thursday, but price action is drifting back into the midrange with intraday chart action knocking against the 200-hour Simple Moving Average (SMA) near 1.3360. A near-term pattern of higher lows is set to break down as the USD/CAD drifts sideways heading into next week.
Daily candlesticks have the USD/CAD continuing to trade on the low side of the 200-day SMA near 1.3500, and a descending 50-day SMA is set for a bearish crossover of the longer moving average, which could form a technical ceiling for the pair moving forward. The pair is currently up 0.73% from 2024’s opening bids and has climbed 1.26% from December’s late low of 1.3775.
USD/CAD Hourly Chart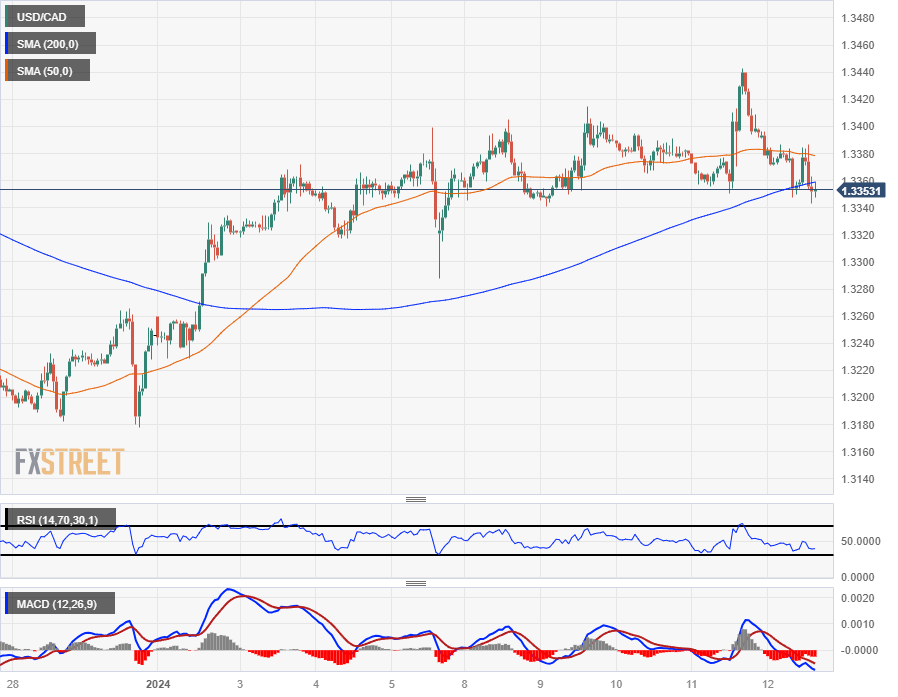
USD/CAD Daily Chart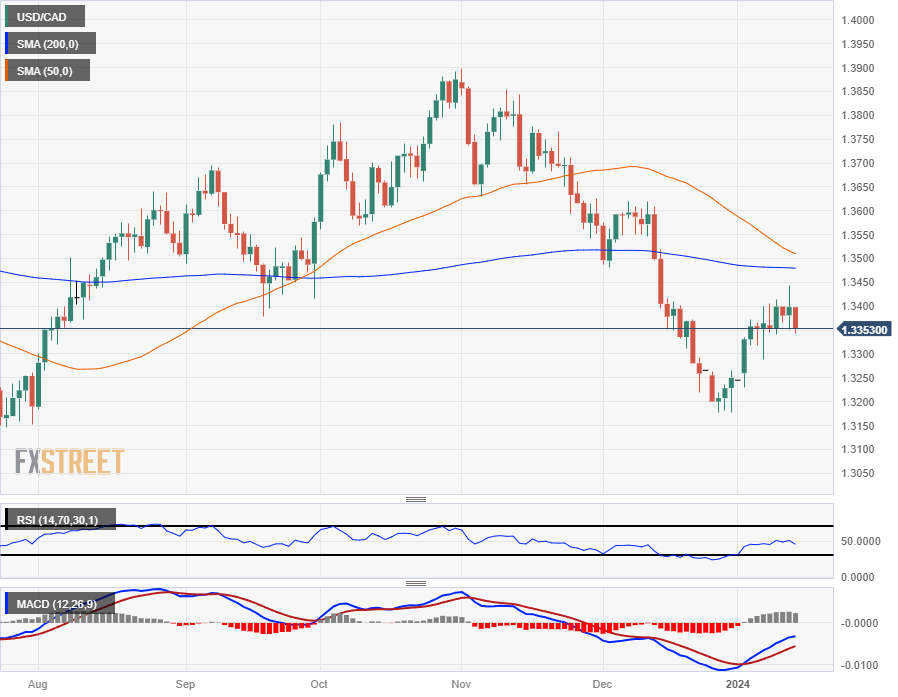
Canadian Dollar FAQs
What key factors drive the Canadian Dollar?
The key factors driving the Canadian Dollar (CAD) are the level of interest rates set by the Bank of Canada (BoC), the price of Oil, Canada’s largest export, the health of its economy, inflation and the Trade Balance, which is the difference between the value of Canada’s exports versus its imports. Other factors include market sentiment – whether investors are taking on more risky assets (risk-on) or seeking safe-havens (risk-off) – with risk-on being CAD-positive. As its largest trading partner, the health of the US economy is also a key factor influencing the Canadian Dollar.
How do the decisions of the Bank of Canada impact the Canadian Dollar?
The Bank of Canada (BoC) has a significant influence on the Canadian Dollar by setting the level of interest rates that banks can lend to one another. This influences the level of interest rates for everyone. The main goal of the BoC is to maintain inflation at 1-3% by adjusting interest rates up or down. Relatively higher interest rates tend to be positive for the CAD. The Bank of Canada can also use quantitative easing and tightening to influence credit conditions, with the former CAD-negative and the latter CAD-positive.
How does the price of Oil impact the Canadian Dollar?
The price of Oil is a key factor impacting the value of the Canadian Dollar. Petroleum is Canada’s biggest export, so Oil price tends to have an immediate impact on the CAD value. Generally, if Oil price rises CAD also goes up, as aggregate demand for the currency increases. The opposite is the case if the price of Oil falls. Higher Oil prices also tend to result in a greater likelihood of a positive Trade Balance, which is also supportive of the CAD.
How does inflation data impact the value of the Canadian Dollar?
While inflation had always traditionally been thought of as a negative factor for a currency since it lowers the value of money, the opposite has actually been the case in modern times with the relaxation of cross-border capital controls. Higher inflation tends to lead central banks to put up interest rates which attracts more capital inflows from global investors seeking a lucrative place to keep their money. This increases demand for the local currency, which in Canada’s case is the Canadian Dollar.
How does economic data influence the value of the Canadian Dollar?
Macroeconomic data releases gauge the health of the economy and can have an impact on the Canadian Dollar. Indicators such as GDP, Manufacturing and Services PMIs, employment, and consumer sentiment surveys can all influence the direction of the CAD. A strong economy is good for the Canadian Dollar. Not only does it attract more foreign investment but it may encourage the Bank of Canada to put up interest rates, leading to a stronger currency. If economic data is weak, however, the CAD is likely to fall.
- The Swiss Franc gains against the Greenback on Friday after US Producer Price Index data falls short of estimates.
- Overall PPI fell and core factory gate prices flatlined for three consecutive months.
- The data substantially increases the probabilities of interest rates falling in the US in the future.
The Swiss Franc (CHF) rises against the US Dollar (USD) on Friday after the release of factory-gate inflation in the form of the US Producer Price Index (PPI). The data shows wholesale price gains in December were lower than economists had estimated. This increases the probability interest rates in the US will fall earlier than had been expected. Since lower interest rates tend to attract less foreign capital inflows, the news is bearish for the US Dollar.
Daily digest market movers: Swiss Franc rises after factory gate prices fall for third consecutive month
- The Swiss Franc gains against the US Dollar after US PPI inflation data for the month of December shows overall wholesale prices falling for the third consecutive month. The data is likely to feed through into consumer prices, leading to lower overall inflation in the future.
- Overall PPI on a monthly basis declined for the third month in a row in December, dropping by 0.1% when a 0.1% rise had been forecast. The 0% initial reading for the previous month of November was revised down to a 0.1% fall.
- The Producer Price Index ex Food and Energy, which is seen as the more representative reading, rose by 1.8% in December compared to a year ago. This was lower than the 1.9% gain forecast and the 2.0% registered in November.
- On a monthly basis the PPI ex Food and Energy data showed prices flatlining for three consecutive months, something which the US Federal Reserve will probably take note of at its next meeting when it next comes to set interest rates. PPI stood unchanged in December compared to the previous month, which was lower than the 0.2% rise estimate, and the same as the flat reading in November.
- Overall PPI inflation on a yearly basis came out at 1.0% YoY, undercutting the 1.3% expected but higher than the 0.8% of November.
- The release of the PPI data led to a surge in the market-gauged probability of the Federal Reserve (Fed) cutting interest rates at its meeting in March 2024. The estimated odds rose to 77% at the time of writing after the PPI on Friday, from around 63% after the Consumer Price Index data released on Thursday.
- The odds now strongly favor the Fed cutting interest rates from 5.5% to 5.25% in March.
- This stands in stark contrast to the Swiss National Bank (SNB), which has not said it is considering cutting interest rates at all.
Swiss Franc technical analysis: USD/CHF could resume long-term downtrend
USD/CHF – the number of Swiss Francs (CHF) that one US Dollar (USD) can buy – declines on Friday, falling back into lockstep with the longer-term bear trend, Since the trend is likely to extend the move favors short-holders.
-638406709096115663.png)
US Dollar vs Swiss Franc: 4-hour Chart
The current four-hour bar is painted red as the pair sells off after the release of the PPI data. A break below the January consolidation range lows at 0.8465 would add confirmatory technical evidence to the view the downtrend is resuming, and see prices likely fall back to the November lows at 0.8332.
It would take a break above the major trendline for the downmove at around 0.8600 to confirm a change in the short-term bear trend and more upside. But the next target after that would be the 200-four-hour Simple Moving Average (SMA) not much higher at circa 0.8630.
Swiss Franc FAQs
What key factors drive the Swiss Franc?
The Swiss Franc (CHF) is Switzerland’s official currency. It is among the top ten most traded currencies globally, reaching volumes that well exceed the size of the Swiss economy. Its value is determined by the broad market sentiment, the country’s economic health or action taken by the Swiss National Bank (SNB), among other factors. Between 2011 and 2015, the Swiss Franc was pegged to the Euro (EUR). The peg was abruptly removed, resulting in a more than 20% increase in the Franc’s value, causing a turmoil in markets. Even though the peg isn’t in force anymore, CHF fortunes tend to be highly correlated with the Euro ones due to the high dependency of the Swiss economy on the neighboring Eurozone.
Why is the Swiss Franc considered a safe-haven currency?
The Swiss Franc (CHF) is considered a safe-haven asset, or a currency that investors tend to buy in times of market stress. This is due to the perceived status of Switzerland in the world: a stable economy, a strong export sector, big central bank reserves or a longstanding political stance towards neutrality in global conflicts make the country’s currency a good choice for investors fleeing from risks. Turbulent times are likely to strengthen CHF value against other currencies that are seen as more risky to invest in.
How do decisions of the Swiss National Bank impact the Swiss Franc?
The Swiss National Bank (SNB) meets four times a year – once every quarter, less than other major central banks – to decide on monetary policy. The bank aims for an annual inflation rate of less than 2%. When inflation is above target or forecasted to be above target in the foreseeable future, the bank will attempt to tame price growth by raising its policy rate. Higher interest rates are generally positive for the Swiss Franc (CHF) as they lead to higher yields, making the country a more attractive place for investors. On the contrary, lower interest rates tend to weaken CHF.
How does economic data influence the value of the Swiss Franc?
Macroeconomic data releases in Switzerland are key to assessing the state of the economy and can impact the Swiss Franc’s (CHF) valuation. The Swiss economy is broadly stable, but any sudden change in economic growth, inflation, current account or the central bank’s currency reserves have the potential to trigger moves in CHF. Generally, high economic growth, low unemployment and high confidence are good for CHF. Conversely, if economic data points to weakening momentum, CHF is likely to depreciate.
How does the Eurozone monetary policy affect the Swiss Franc?
As a small and open economy, Switzerland is heavily dependent on the health of the neighboring Eurozone economies. The broader European Union is Switzerland’s main economic partner and a key political ally, so macroeconomic and monetary policy stability in the Eurozone is essential for Switzerland and, thus, for the Swiss Franc (CHF). With such dependency, some models suggest that the correlation between the fortunes of the Euro (EUR) and the CHF is more than 90%, or close to perfect.
The US Dollar has bounced this month, though Sterling is 2024’s top G10 currency. Economists at Société Générale analyze FX market outlook.
GBP is vulnerable to a weak economy
We expect the Fed to cut rates much more aggressively than the ECB in 2024, allowing the Euro to make modest gains despite weak growth, but the data we have seen so far this month hasn’t shifted market sentiment.
Lower US rates should also help the Yen, but that may be a story for the spring rather than mid-winter. Certainly, there is no indication that the Bank of Japan is going to help yen bulls by adjusting monetary policy in the near term.
GBP may be doing well for now but is vulnerable to a weak economy and the Bank of England has more room than the ECB to cut rates.
NOK and SEK look more attractive, as they continue to get respite as relative rates move back a little in their favour. Meanwhile, AUD/NZD looks increasingly low relative to yield differentials.
- EUR/USD's early losses trimmed following military actions in Yemen, driving investors towards safe-haven assets.
- US PPI data falls short of expectations, fueling speculation of a potential Fed rate cut in March.
- Eurozone inflation aligns with projections; ECB officials' comments on rate cuts add to market considerations.
The Euro (EUR) trimmed some of its losses in early trading during the North American session after it dived toward its daily low of 1.0935 amid an escalation of the conflict in the Middle East. The US and the UK launching attacks against Houthi shifted sentiment sour, which had subsided lately. Hence, the EUR/USD trades at 1.0970, up 0.02%.
EUR/USD marginally up following developments on Middle East, as sentiment improved
According to Reuters, US, and British airplanes, ships, and submarines launched dozens of air strikes across Yemen overnight in retaliation to Houthi, which has been attacking ship vessels in the Red Sea. Therefore, market participants seeking safety bought Gold and safe-haven peers, which weighed on the EUR/USD in the overnight session.
Aside from geopolitical events, the US Bureau of Labor Statistics (BLS) revealed the Producer Price Index (PPI) slid below estimates, with the PPI monthly dropping -0.1%, below forecasts of 0.1%. In a 12-month reading, the PPI rose by 1%, below estimates of 1.9%. Core PPI was unchanged at 0% compared with November’s data but below estimates, while year-over-year figures dipped below projections and the previous reading, from 2% to 1.8%.
After the data, traders had increased the chances for a March rate cut from 70% yesterday up to 84% at the time of writing and projected that the US Federal Reserve will cut rates by 170 basis points toward the year’s end.
Even though the latest consumer inflation report in the US showed that prices remained elevated, investors seem confident that the US central bank would ease policy sooner than expected. In the latest Summary of Economic Projections (SEP), Fed officials projected three 25 basis points of rate cuts toward the end of 2024.
Meanwhile, Fed policymakers reiterated that cutting rates in March is too soon while adding that even though progress on inflation had been achieved, December’s data bucked the trend.
On the Eurozone (EU) front, it revealed that inflation in France was aligned with forecasts of 3.7% and higher than November’s 3.5%. Besides that, European Central Bank (ECB) officials had crossed the wires, as Chief Economist Philip Lane said that rate cuts are “not a topic for the near term.”
EUR/USD Price Analysis: Technical outlook
From a technical perspective, the EUR/USD is neutral to upward biased, though back-to-back doji’s confirm indecision amongst traders. For a bullish resumption, the Euro needs to crack the 1.1000 figure to challenge a two-and-a-half-year resistance trendline at around 1.1030/50, followed by the 1.1100 mark. On the flip side, bears must drag prices below 1.0900, followed by a decisive break below Friday’s 9 daily low of 1.0876 on its path to 1.0800.
The Mexican Peso appreciated further in December. Economists at MUFG Bank analyze MXN outlook.
MXN weakening path ahead
Regarding the perspectives during 2024, considering a gradual rate cut by Banxico starting sometime in the first half of the year, and policy rate ending at 9.00%, the carry-trade return might remain attractive in times of a gradual decrease of policy rates worldwide, so giving some support to MXN. And the outcome of the presidential election is not a source of concern, as Ms. Claudia Sheinbaum from Morena party is favourite to win the presidential election scheduled for the 2nd of June, on the back of the high approval rating of incumbent president Mr. Lopez Obrador.
However, we expect gradual MXN weakening during 2024 due to some uncertainties over the economic policies to be adopted by the next administration, once although signalling economic policy continuity, the influence of incumbent president and other Morena party leaders might constrain Ms. Sheinbaum's authority. On top of that, likely, Morena party will not have the required two-thirds majority in Congress to pass reforms.
There is a risk of disappointment on the Gold market if market participants have to scale back their expectations of rapid interest rate cuts, according to strategists at Commerzbank.
Gold ETFs with significant outflows
As the timing of the Fed's first rate cut is still uncertain and we do not expect it to happen before May, we do not see any further upside potential for the time being.
Rather, the longer waiting period could lead to disappointment and in the short term to setbacks. The continuing outflows from Gold ETFs also speak in favour of this.
- Silver price rises vertically to near $23.35 as US PPI report surprisingly turns out softer.
- Deepening Middle East tensions have improved the safe-haven appeal.
- Silver price recovers sharply and approaching the downward-sloping trendline of the Descending Triangle chart pattern.
Silver price (XAG/USD) has rallied to near $23.35 as the United States Bureau of Labor Statistics (BLS) has reported a softer-than-anticipated Producer Price Index (PPI) report for December. The headline PPI contracts by 0.1% and core PPI remains stagnant for the second month in a row. Investors projected headline and core PPI rising by 0.1% and 0.2% respectively.
Producers at factory gates rose prices of goods and services at a slower pace of 1.0% against 1.3% as anticipated by investors. The core PPI decelerated sharply to 1.8% vs. consensus of 1.9% and the prior reading of 2.0%.
A soft PPI data has strengthened bets in favour of an interest rate cut decision by the Federal Reserve (Fed) in March. As per the CME Fedwatch tool, market participants see the likelihood of the Fed cutting interest rates by 25 basis points (bps) in March at 76%, which were earlier at 66%.
The market mood has turned risk-off as the US and UK military groups have launched airstrikes on Iran-backed Houthi rebels amid retaliation for attacks at merchant vessels shipping from Red Sea. This has escalated risks of Iran entering into Israel-Hamas war at Gaza. Deepening Middle East tensions have improved appeal for non-yielding assets.
Meanwhile, the US Dollar Index (DXY) has fallen vertically as soft PPI data has empowered geopolitical tensions.
Silver technical analysis
Silver price has delivered a V-shape recovery after discovering buying interest near the horizontal support plotted from December 13 low at $22.51 placed on a two-hour scale. The white metal has climbed above the 20- and 50-period Exponential Moving Averages (EMAs), which indicates that the near-term demand has turned bullish.
Broadly, the asset is forming a Descending Triangle chart pattern, which indicates a sheer volatility contraction. The Relative Strength index (RSI) (14) is on the verge of shifting into the bullish range of 60.00-80.00. If the 14-period RSI manages to do so, a bullish momentum would be activated.
Silver two-hour chart
-638406661196012055.png)
The USD is ending the week little changed overall. Economists at Scotiabank analyze Dollar’s outlook.
Revised Fed bets should support USD
US CPI data came in a bit hotter than expected and underlying trends in (services especially) remain elevated. Market-driven estimates of inflation reflect confidence that headline prices will be running nearer to 2% by mid-year. But achieving anything even close to that will require a sustained (and perhaps very unlikely) run of very soft inflation prints in the next few months. If inflation proves even slightly resilient and the broader economy continues to hold up, some further adjustment in expectations for the March FOMC seems likely.
Higher yields will help lift the USD in the near-term.
Recall that USD seasonals and broader technical pointers are leaning bullish.
USD/CAD’s rebound tested the mid-1.34 resistance area on Thursday. Economists at Scotiabank analyze the pair’s outlook.
Trend dynamics remain USD-bullish
Trend dynamics remain USD-bullish, with steady progress in the USD since late December backed by some strengthening in the intraday and daily DMIs.
USD gains peaked on Thursday near the 38.2% Fib retracement resistance at 1.3453 (from the Q4 USD sell-off) and the mid-1.34 area may remain firm resistance in the near-term (note the 40-DMA at 1.3449).
USD support should remain firm on dips to the upper 1.33s. More corrective USD gains to the mid-1.35s remain a likelihood in the next few weeks.
- Producer inflation in the US edged slightly higher in December.
- US Dollar Index retreated below 102.50 with the immediate reaction.
The Producer Price Index (PPI) for final demand in the US rose 1% on a yearly basis in December, up from the 0.8% increase (revised from 0.9%) recorded in November, the data published by the US Bureau of Labor Statistics revealed on Friday. This reading came in lower than the market expectation of 1.3%.
The annual Core PPI increased 1.8% in the same period, below the November reading and analysts' estimate of 2% and 1.9%, respectively. On a monthly basis, the Core PPI was unchanged for the third consecutive month.
Market reaction
The US Dollar Index came under modest bearish pressure with the immediate reaction and was last seen trading flat on the day near 102.30.
GBP underperforms after mixed GDP data for November. Economists at Scotiabank analyze Cable’s outlook.
Intraday support is 1.2690/1.2700
UK November GDP rose a stronger than expected 0.3% MoM but fell slightly more than forecast in the 3M/3M comparison (-0.2%). November GDP data suggest economic growth trends remained weak late last year, with a Q4 contraction still a risk.
Sterling is softer on the session but the technical picture for Cable remains a little more nuanced than elsewhere.
Price signals on the daily and weekly charts are more neutral, with spot holding a 1.26/1.2850 range over the turn of the year. Spot needs to push under 1.26 decisively to put a negative spin on price action.
Intraday support is 1.2690/1.2700.
- EUR/USD falls sharply below 1.0950 on deepening geopolitical tensions.
- Fears of widening conflicts in Middle East region have improved the safe-haven appeal.
- The ECB is not required to raise interest rates further.
The EUR/USD pair has slipped below the crucial support of 1.0950 as the market mood has turned risk-averse amid deepening Middle East tensions. The major currency pair has been hit hard as demand for safe-haven assets has improved significantly.
S&P500 futures are facing significant losses in the late European session, indicating a sharp decline in the risk-appetite of the market participants. Fears of widening conflicts in the Middle East region after US airstrikes on Iran-backed Houthi rebels in retaliation for striking on commercial oil shipments from Red Sea has dampened the market sentiment.
The US Dollar Index (DXY) has rebounded sharply above 102.50, supported by stubbornly higher United States inflation and geopolitical tensions. The US headline inflation accelerated sharply in December amid elevating rental prices and healthcare costs. While bets supporting a rate cut by the Federal Reserve (Fed) in March are still firm.
As per the CME Fedwatch tool, chances in favour of a rate cut by 25 basis points (bps) in March are slightly above 68%.
Meanwhile, investors await the US Producer Price Index (PPI) data for December, which will be published at 13:30 GMT. The annual headline PPI is forecasted to grow strongly by 1.3% against 0.9% gain in November. In the same period, core PPI that excludes volatile food and oil prices is seen decelerating to 1.9% against 2.0%.
On the Eurozone front, European Central Bank (ECB) President Christine Lagarde has confirmed that the central bank is done with hiking interest rates. She added that worst about inflation is behind us but rate cuts would come if the central bank gets certain about inflation declining towards 2%. While asked about economic shrinkage, Lagarde said the Euro zone is not in an official recession.
EUR/USD drifts lower. Economists at Scotiabank analyze the pair’s outlook.
Technicals point to more softness ahead
EUR/USD looks vulnerable to renewed softness in the near term if or when markets start to reprice Fed easing probabilities.
The EUR’s recent bull trend remains intact on the daily chart but trend support at 1.0925 today appears more vulnerable to attack as 1.10 is holding.
Broader technical signals still suggest a major peak/reversal formed around the EUR’s peak above 1.11 around the turn of the year.
Risks are tilted towards some further corrective weakness towards the mid/upper 1.07s.
- The US Dollar is unable to bank on hot inflation numbers and Fed pushback on rate cuts.
- Traders see tensions in the Middle East head an echelon higher with UK and US bombing Houthi rebels.
- The US Dollar Index steadies at 102 and is going nowhere for now.
The US Dollar (USD) should be expected to be trading around 103 in its US Dollar Index (DXY) after the red-hot inflation data from Thursday. The headline inflation rate was the biggest omen for Greenback bears who are betting on quick interest rate cuts, while US Cleveland Federal Reserve President Loretta Mester poured more fuel on the fire by saying cuts in March are too early. Though, the Greenback is not moving in any direction and remains stuck at 102 all the while that geopolitical tension in the Middle East is ramping up. This comes after the United Kingdom and United States held an organised joint air strike on Houthi rebels positions in Yemen.
On the economic data front the Producer Price Index numbers are on the docket. Traders will get to see if the pickup in inflation was only for the end consumer, or is as well notable on the producer side. If the latter is the case, that means that commodity prices are set to pick up again as well, with a possible rise in inflation in the coming months to come.
Daily digest market movers: Pickup in PPI might mean issues ahead
- Cleveland Fed member Loretta Mester already spoke overnight and dampened hopes for quick rate cuts by saying that March is off the table.
- The UK and US have performed joint airstrikes on Houthi positions in Yemen. Houthi rebels said retaliation will be taking place soon.
- Producer Price Index (PPI) numbers for December to be released near 13:30 GMT:
- Monthly headline PPI is expected to head from 0% to 0.1%.
- Yearly headline PPI is expected to head from 0.9% to 1.3%.
- Monthly core PPI is seen heading from 0% to 0.2%.
- Yearly core PPI will contract a touch from 2% to 1.9%.
- Minneapolis Fed President Neel Kashkari is due to speak around 15:00.
- Equity markets are not really reacting to any news with a very dispersed image on the quote board: Japan already closed off for the week, both this Friday and this week with positive returns. European equities are showing near 1% gains during European trading, while US futures are flat ahead of the US session.
- The CME Group’s FedWatch Tool shows that markets are pricing in a 95.3% chance that the Federal Reserve will keep interest rates unchanged at its January 31 meeting. Around 4.7% expect the first cut already to take place.
- The benchmark 10-year US Treasury Note holds near 3.96%, and is trading near the low for this week. The move comes as a surprise given the uptick in inflation.
US Dollar Index Technical Analysis: Can you spot the triangle?
The US Dollar Index (DXY) is stuck in a rut, and is not going anywhere it seems, even with recent inflation numbers not providing fuel for the DXY to jump back above 103. From a pure technical point of view, lower lows are coming in, while a sort of floor is forming, pointing to a descending triangle. Pressure is building and once the floor, around 102 snaps, it seems a given that the DXY will tank towards 101.
The first level on the upside to watch is 102.70, which falls nearly in line with the trend line from the top of October 3 and December 8. If broken and closed above, the 200-day Simple Moving Average (SMA) at 103.43 comes into play. The 104.00 level might be too far off, with 103.63 (55-day SMA) coming in as the next resistance.
A rejection by the descending trendline will give fuel to Greenback bears leading to a further downturn. The line in the sand here is 101.74 – the floor which held halfway through December before breaking down in the last two weeks. In case the DXY snaps this level, expect to see a test at the low near 100.80.
US Dollar FAQs
What is the US Dollar?
The US Dollar (USD) is the official currency of the United States of America, and the ‘de facto’ currency of a significant number of other countries where it is found in circulation alongside local notes. It is the most heavily traded currency in the world, accounting for over 88% of all global foreign exchange turnover, or an average of $6.6 trillion in transactions per day, according to data from 2022.
Following the second world war, the USD took over from the British Pound as the world’s reserve currency. For most of its history, the US Dollar was backed by Gold, until the Bretton Woods Agreement in 1971 when the Gold Standard went away.
How do the decisions of the Federal Reserve impact the US Dollar?
The most important single factor impacting on the value of the US Dollar is monetary policy, which is shaped by the Federal Reserve (Fed). The Fed has two mandates: to achieve price stability (control inflation) and foster full employment. Its primary tool to achieve these two goals is by adjusting interest rates.
When prices are rising too quickly and inflation is above the Fed’s 2% target, the Fed will raise rates, which helps the USD value. When inflation falls below 2% or the Unemployment Rate is too high, the Fed may lower interest rates, which weighs on the Greenback.
What is Quantitative Easing and how does it influence the US Dollar?
In extreme situations, the Federal Reserve can also print more Dollars and enact quantitative easing (QE). QE is the process by which the Fed substantially increases the flow of credit in a stuck financial system.
It is a non-standard policy measure used when credit has dried up because banks will not lend to each other (out of the fear of counterparty default). It is a last resort when simply lowering interest rates is unlikely to achieve the necessary result. It was the Fed’s weapon of choice to combat the credit crunch that occurred during the Great Financial Crisis in 2008. It involves the Fed printing more Dollars and using them to buy US government bonds predominantly from financial institutions. QE usually leads to a weaker US Dollar.
What is Quantitative Tightening and how does it influence the US Dollar?
Quantitative tightening (QT) is the reverse process whereby the Federal Reserve stops buying bonds from financial institutions and does not reinvest the principal from the bonds it holds maturing in new purchases. It is usually positive for the US Dollar.
Economists at the Bank of America expect the USD/CAD pair to embark on a downward trajectory over the course of the year.
Fed’s rate cuts to overshadow the BoC’s policy adjustments
We expect the Federal Reserve to implement 100 bps of rate cuts starting in March 2024. For the Bank of Canada, we foresee 125 bps of cuts beginning in June.
As long as the Fed cuts rates as anticipated in 2024, USD/CAD could continue its downtrend, regardless of slightly more aggressive cuts by the BoC.
We predict a continued downtrend for USD/CAD, targeting a level of 1.30 by the end of 2024.
What does Thursday's US inflation data tell us? Ulrich Leuchtmann, Head of FX and Commodity Research at Commerzbank, analyzes why USD exchange rates did not make huge jumps after the data was released.
Where is the USD euphoria?
US consumer prices rose 0.3% in December from November on a seasonally adjusted basis. The median estimate of analysts was for a 0.2% increase. The core rate was 0.3% vs. November, in line with the median estimate. This was not a massive shock, but a small deviation from the analyst consensus, hardly significant.
Shouldn't we have expected more USD euphoria? After all, this result calls into question the image of a Fed that (a) will soon have room to cut rates and (b) will use it boldly. Well, with his recent very dovish comments at the December FOMC press conference, Fed Chairman Jay Powell may have given some observers the impression that he is not the tough inflation fighter (a sort of Paul Volcker 2.0) that he liked to portray himself as not so long ago.
However, this possible new image of the Fed changes the elasticity of USD exchange rates to inflation news. The less the US monetary authorities appear to be active inflation fighters, the less USD-positive high inflation data will appear.
In fact, if monetary policy is perceived to be too dovish, surprisingly high inflation can actually hurt the Dollar. We are nowhere near that point. But Thursday's reaction in the currency market already points to a bit of an image problem that the Fed is facing right now. This is something to keep an eye on in the near future!
- WTI Oil pops above $74 after US, UK perform joint strikes on Houthi positions in Yemen.
- Tensions build up further in the region with further escalations from the Houthi side confirmed.
- The DXY US Dollar Index holds above 102, though moves nowhere despite hot inflation report and Fed members dampening hopes on March rate cuts.
Oil prices are jumping higher after overnight strikes from the United Kingdom and the United States against Houthi positions in Yemen. The strikes are the next step in the story around the Red Sea where vessels and freight ships have been attacked by Houthi rebels out of Yemen during December. Meanwhile all big freight shipping companies are taking the long route around Africa, the US and UK have built a task force to restore safe passage in the Red Sea, with these strikes intended to create a new safe passage.
Meanwhile, the DXY US Dollar Index keeps facing selling pressure, with US Dollar bulls unable to rely on a stronger inflation report, tight labour market conditions or Fed officials pushing back on March rate cuts to supply uplift. One question on the table now is what could actually move the US Dollar Index up, as there is little left. This Friday the Producer Price Index is on the docket.
Crude Oil (WTI) trades at $75.02 per barrel, and Brent Oil trades at $80.25 per barrel at the time of writing.
Oil News and Market Movers: The last drop
- Overnight a UK and US task force performed missile strikes on Houthi rebel positions in Yemen.
- In recent weeks the option markets were short on Oil, with a risk of sellers now facing a short squeeze on the ramped up geopolitical tensions.
- With the eruption of tensions in the Middle East and Red Sea, passage in the area might further decline and see shipping fees soar. Which in its turn will add to inflation.
- Reuters reported that China’s Oil imports have hit record levels in 2023, up over 11% against 2022.
Oil Technical Analysis: And just like that…
Oil prices are hurting short sellers that have built up quite a position in these past few weeks. Since the fall of 2023 Oil has been in steep decline with short sellers being quick to add more shorts to their positions. With the UK and US now performing attacks on Houthi rebels in Yemen, geopolitical tensions will start to rise further with Iran and other Middle Eastern countries could soon join the tensions, pushing up uncertainty on Oil supply worldwide.
On the upside, $74 is getting broken and opens a lot of room to the upside for Oil to move into. Although quite far off, $80 comes into the picture should tensions build up further. Once $80 is broken, $84 is next on the topside once Oil sees a few daily closes above the $80 level.
Below $74, the $67 level could still come into play as the next support to trade at, as it aligns with a triple bottom from June. Should that triple bottom break, a new low for 2023 could be close at $64.35 – the low of May and March – as the last line of defence. Although still quite far off, $57.45 is worth mentioning as the next level to keep an eye on if prices fall sharply.
-638406521495338876.png)
US WTI Crude Oil: Daily Chart
WTI Oil FAQs
What is WTI Oil?
WTI Oil is a type of Crude Oil sold on international markets. The WTI stands for West Texas Intermediate, one of three major types including Brent and Dubai Crude. WTI is also referred to as “light” and “sweet” because of its relatively low gravity and sulfur content respectively. It is considered a high quality Oil that is easily refined. It is sourced in the United States and distributed via the Cushing hub, which is considered “The Pipeline Crossroads of the World”. It is a benchmark for the Oil market and WTI price is frequently quoted in the media.
What factors drive the price of WTI Oil?
Like all assets, supply and demand are the key drivers of WTI Oil price. As such, global growth can be a driver of increased demand and vice versa for weak global growth. Political instability, wars, and sanctions can disrupt supply and impact prices. The decisions of OPEC, a group of major Oil-producing countries, is another key driver of price. The value of the US Dollar influences the price of WTI Crude Oil, since Oil is predominantly traded in US Dollars, thus a weaker US Dollar can make Oil more affordable and vice versa.
How does inventory data impact the price of WTI Oil
The weekly Oil inventory reports published by the American Petroleum Institute (API) and the Energy Information Agency (EIA) impact the price of WTI Oil. Changes in inventories reflect fluctuating supply and demand. If the data shows a drop in inventories it can indicate increased demand, pushing up Oil price. Higher inventories can reflect increased supply, pushing down prices. API’s report is published every Tuesday and EIA’s the day after. Their results are usually similar, falling within 1% of each other 75% of the time. The EIA data is considered more reliable, since it is a government agency.
How does OPEC influence the price of WTI Oil?
OPEC (Organization of the Petroleum Exporting Countries) is a group of 13 Oil-producing nations who collectively decide production quotas for member countries at twice-yearly meetings. Their decisions often impact WTI Oil prices. When OPEC decides to lower quotas, it can tighten supply, pushing up Oil prices. When OPEC increases production, it has the opposite effect. OPEC+ refers to an expanded group that includes ten extra non-OPEC members, the most notable of which is Russia.
The TWD is languishing ahead of the presidential election on Saturday. Economists at Société Générale analyze USD/TWD outlook.
Positioning for Taiwan presidential election may spur safe haven-demand for Bonds, Gold, Swissie
Safe-haven demand ahead of the presidential election in Taiwan on Saturday could see investors buying government debt, the Swiss Franc and Gold.
USD/TWD has experienced a quick bounce after testing the trend line drawn since 2022 near 30.48. Cross above the upper band of a pattern resembling falling wedge denotes possibility of further upside.
Recent gap at 30.80 is near term support. Defence of this level can lead to continuation in up move towards 50-DMA and recent pivot high at 31.50/31.58; this is an important hurdle. If the pair overcomes this zone, the uptrend is likely to extend.
- The oil price rises significantly as airstrikes from the US and its allies on Houthi rebels have deepened supply disruption concerns.
- The likelihood of a retaliation from Iran-backed Houthis is high, which could widespread conflicts in Middle East.
- Investors are optimistic about interest rate cuts by the Fed in March.
West Texas Intermediate (WTI), futures on NYMEX, has climbed strongly to near $74.50 as investors worry about deepening oil supply concerns due to mounting tensions for merchant vessels through Red Sea. The US military has launched multiples airstrikes on Iran-backed Houthi group in retaliation for attacking commercial shipments of oil.
The airstrikes from the US military and its allies are expected to disrupt trade flows through Suez Canal and will also escalate Middle East tensions. A widespread conflict in the Middle East will elevate oil supply disruptions this 2024 and will keep prices of WTI higher.
The upside risks to oil prices have elevated amid a likelihood of oil supply disruption in times when the global economy is recovering from pessimism of restrictive interest rate environment and high price pressures.
Meanwhile, investors’ confidence towards a rate cut by the Federal Reserve (Fed) in March despite higher consumer price inflation has provided some strength to the oil price. A sharp recovery in the global economy is highly anticipated if the Fed plans an early rate cut as predicted by market participants. This will also spurt the global oil demand and eventually its prices.
Going forward, investors will focus on China’s Q4 Gross Domestic Product (GDP) and Industrial Production data for further action. The Chinese economy has been struggling for a firm-footing due to lower export orders and vulnerable domestic demand post Covid. It is worth noting that China is the leading importer of oil in the world and an economic slowdown in the Asian giant impacts the oil price.
US Consumer Price Index (CPI) data came in a bit hotter than expected. The Dollar jumped after the release. Economists at ING analyze USD outlook.
The conditions for a higher Dollar this month are surely there
Rate expectations were not moved by slightly hotter-than-expected US CPI, and support for the Dollar has mostly come through the risk-sentiment channel.
The conditions for a higher Dollar this month are surely there, but we have observed numerous indications that markets remain reluctant to make short-term USD bullish positions coexist with the longer-lasting view that US rates will take the Dollar structurally lower by year-end.
The chances of rangebound trading until we receive clearer messages by activity data and the Fed are high.
- Gold price extends recovery to near $2,040 as investors are optimistic about Fed rate cuts.
- Investors ignore United States’ high consumer inflation data.
- Fed policymakers reiterate a restrictive monetary policy stance to achieve price stability.
Gold price (XAU/USD) delivers a swift recovery as investors are confident about an interest rate cut by the Federal Reserve (Fed) at its monetary policy meeting on March 20 – such a move would support non-yielding assets such as Gold. The probabilities of an early interest rate cut are assessed as firmer despite consumer price inflation in the United States remaining stubbornly high in December, amid a significant increase in rental prices and healthcare costs.
While market participants continue to commit funds toward Gold amid optimism over early rate cuts, Fed policymakers will stick to a restrictive interest rate stance as price pressures in addition to the required rate of 2% are highly sticky, due mainly to stable labor market conditions. Fed policymakers have been reiterating that a lot of work has yet to be done in order to gain confidence that the underlying inflation will return to 2% in a sustainable manner.
Bank of Chicago Federal Reserve President Austan Goolsbee, on Thursday, stressed a data-dependent approach and said that there were weeks and months of data to come, to help guide when and how much rates should be reduced. Cleveland Fed President Loretta Mester said she needed more evidence to confirm inflation declining towards 2% in a timely manner before jumping on the bandwagon of rate-cut discussions.
Daily Digest Market Movers: Gold price recovers entire losses while US Dollar falls back
- Gold price moves sharply higher, close to $2,040 as investors remain optimistic about a rate cut by the Federal Reserve in March despite a healthy increase in the headline inflation and sticky core CPI data for December.
- The annual core inflation rate decelerated slightly to 3.9% (from 4.0% in November) while headline CPI rose significantly to 3.4% due to elevated rentals and healthcare costs. Gasoline and food prices were up at a moderate pace of 0.2%.
- According to the CME FedWatch tool, chances lean towards an interest rate cut by 25 basis points (bps) in March, with a probability of above 66%.
- Investors are ignoring the fact that US labor market conditions are still healthy and the last mile in achieving price stability is turning out extremely stubborn. This could allow Fed policymakers to maintain arguments towards keeping interest rates elevated, at least until the second quarter ends.
- Stubbornly higher US inflation has set a hawkish undertone for the first interest rate policy of 2024 on January 31.
- The Fed is widely anticipated to keep interest rates unchanged in the range of 5.25-5.50% for the fourth straight time, but the outlook for interest rates in March is expected to remain slightly hawkish.
- After Fed policymakers: Raphael Bostic and John Williams, Cleveland Fed President Loretta Mester said March is probably too early for an interest rate cut decision as the Fed needs to see more evidence to be confident that inflation is progressively declining towards 2%.
- Loretta Mester added that there is more work to do including the continued maintenance of a restrictive monetary policy. She further added that goods, housing and shelter costs need to ease further along with a slowdown in wage growth.
- The US Dollar Index (DXY) struggles for a firm-footing as investors are not ready to ditch support for rate cuts in March.
- The FX domain will see more action ahead as the US PPI for December is due to release at 13:30 GMT.
- Monthly headline and core PPI are expected to expand by 0.1% and 0.2% respectively against a flat growth in November. The annual headline PPI rose strongly by 1.3% versus. previous growth of 0.9%. On the contrary, the core PPI decelerated slightly ro 1.9% against 2.0% growth in November.
Technical Analysis: Gold price climbs to near $2,040
Gold price delivers a V-shape recovery after printing a fresh three-week low below $2,015. The 50-day Exponential Moving Average (EMA) has acted as a strong support for the Gold price bulls. The precious metal has managed to climb slightly above the 20-day EMA, which trades around $2,036. While the upside bias is intact, a bullish momentum has faded as the 14-period Relative Strength Index (RSI) is oscillating near 50.00.
Gold FAQs
Why do people invest in Gold?
Gold has played a key role in human’s history as it has been widely used as a store of value and medium of exchange. Currently, apart from its shine and usage for jewelry, the precious metal is widely seen as a safe-haven asset, meaning that it is considered a good investment during turbulent times. Gold is also widely seen as a hedge against inflation and against depreciating currencies as it doesn’t rely on any specific issuer or government.
Who buys the most Gold?
Central banks are the biggest Gold holders. In their aim to support their currencies in turbulent times, central banks tend to diversify their reserves and buy Gold to improve the perceived strength of the economy and the currency. High Gold reserves can be a source of trust for a country’s solvency. Central banks added 1,136 tonnes of Gold worth around $70 billion to their reserves in 2022, according to data from the World Gold Council. This is the highest yearly purchase since records began. Central banks from emerging economies such as China, India and Turkey are quickly increasing their Gold reserves.
How is Gold correlated with other assets?
Gold has an inverse correlation with the US Dollar and US Treasuries, which are both major reserve and safe-haven assets. When the Dollar depreciates, Gold tends to rise, enabling investors and central banks to diversify their assets in turbulent times. Gold is also inversely correlated with risk assets. A rally in the stock market tends to weaken Gold price, while sell-offs in riskier markets tend to favor the precious metal.
What does the price of Gold depend on?
The price can move due to a wide range of factors. Geopolitical instability or fears of a deep recession can quickly make Gold price escalate due to its safe-haven status. As a yield-less asset, Gold tends to rise with lower interest rates, while higher cost of money usually weighs down on the yellow metal. Still, most moves depend on how the US Dollar (USD) behaves as the asset is priced in dollars (XAU/USD). A strong Dollar tends to keep the price of Gold controlled, whereas a weaker Dollar is likely to push Gold prices up.
The Swedish Krona fell sharply after Thursday’s speech by Per Jansson, the Deputy Governor of the Riksbank. Economists at Commerzbank analyze SEK outlook.
There are arguments to suspect that the Riksbank is not in a position to fight inflation decisively
Per Jansson, Deputy Governor of the Riksbank ranted that the favorable inflation trend in recent months might allow the Riksbank to cut interest rates quite quickly (and thus quicker than previously assured). Jansson's statement would be justified if the market shared his view. But it does not, as the market reaction to his comments showed: the SEK fell sharply and was the worst performing G10 currency during Thursday's session.
The Riksbank currently presents a sad picture all round: Its far too cautious rate hikes during the inflation shock, its refusal to openly describe its FX operations as FX interventions (we observers are not so stupid, chaps!) and now a looming rush to cut rates again.
I don't blame those who are beginning to suspect that the Riksbank is not in a position to fight inflation decisively. There are arguments for this view, such as the too much debt of too many private households. We at Commerzbank Research are not so pessimistic. But we will find out much later who is right. Until then, a risk premium is justified. A higher one if statements like Jansson's are made more often.
USD/JPY retreats after rejecting the 50-Day Moving Average at 146.41 on Thursday. Economists at Société Générale analyze the pair’s technical outlook.
Break above 146.60/147.40 essential for confirming extension in rebound
USD/JPY has rebounded sharply after forming interim low near 140.20 late last month. It has reclaimed the 200-DMA and approached October low of 146.60/147.40 which is an interim resistance zone. An initial pullback is taking shape.
It would be interesting to see if the pair can defend the 200-DMA near 143.40. Failure would mean risk of one more down leg towards 140.20/139.60.
Break above 146.60/147.40 is essential for confirming extension in rebound.
- USD/CAD moves on a downward path as Crude oil prices improve.
- The weekly low at 1.3340 could act as immediate support followed by the psychological level at 1.3300.
- A break above 1.3400 could prompt the pair to approach the 38.2% Fibonacci retracement level at 1.3450 and the 50-day EMA at 1.3454.
USD/CAD retraces its recent gains recorded on Thursday, trading lower near 1.3350 during the European session on Friday. The Canadian Dollar (CAD) is strengthening, influenced by the positive movement in Crude oil prices. This uptick in oil prices is attributed to escalating tensions in the Middle East following military attacks by the US and UK on Iran-backed Houthi locations in Yemen.
The weekly low at 1.3340 is seen as the immediate support for the USD/CAD pair. If this level is breached, it could potentially lead the pair to test the psychological level at 1.3300, with further downside potential towards the major support at the 1.3250 level.
A break below the 1.3250 level could result in the USD/CAD pair navigating the region around the previous week's low at 1.3228, followed by the psychological level at 1.3200.
The technical analysis of the Moving Average Convergence Divergence (MACD) for the USD/CAD pair indicates a potential trend shift, as the MACD line is positioned below the centerline but exhibits divergence above the signal line.
However, the lagging indicator, the 14-day Relative Strength Index (RSI), is positioned below 50. Traders are likely to exercise caution and await confirmation, suggesting that the USD/CAD pair may be on the verge of changing its direction.
The analysis suggests that on the upside, the psychological level at 1.3400 could act as the key resistance. A breakthrough above the key resistance zone could lead the USD/CAD pair to approach the 38.2% Fibonacci retracement level at 1.3450 aligned with the 50-day Exponential Moving Average (EMA) at 1.3454.
USD/CAD: Daily Chart
-638406472576537900.png)
China’s consumer prices remained in deflationary territory. Economists at Commerzbank analyze Yuan’s outlook after China’s Consumer Price Index (CPI) report.
Subdued prices give room for rate cut next week
Prices continued falling in China. Subdued consumer prices reflect weak demand following the short-lived post-Covid rebound in Q1 last year.
Subdued prices provide room for the PBoC to cut interest rates to support growth. The US Fed's pivot has allowed the PBoC to focus more on growth as the China-US interest rate differentials will likely turn narrower this year. The market now expects the PBoC to cut its 1-year Medium-Term Lending Facility (MLF) rate by 10 bps to 2.4%.
The Yuan will likely remain weak in the near term, with USD/CNY trading in the 7.10-7.20 range.
- NZD/USD scales higher for the second straight day and is supported by a combination of factors.
- Expectations for additional stimulus from China boosts antipodean currencies, including the Kiwi.
- The Fed rate uncertainty keeps the USD bulls on the defensive and acts as a tailwind for the pair.
The NZD/USD pair builds on the overnight bounce from the sub-0.6200 levels, or the weekly low, and gains positive traction for the second successive day on Friday. Spot prices stick to modest intraday gains through the first half of the European session and currently trade around the mid-0.6200s, closer to the top end of the weekly range.
The National Bureau of Statistics reported that consumer prices in China remained in deflationary territory for the third straight month in December. Furthermore, the Producer Price Index (PPI), which measures costs for goods at the factory gate, fell for the 15th straight month. This, in turn, fuels speculations about additional government stimulus and provides a modest lift to antipodean currencies, including the New Zealand Dollar (NZD).
Meanwhile, the US Dollar (USD) remains confined in a familiar range held over the past week or so amid the uncertainty over the Federal Reserve's (Fed) interest rate trajectory. This turns out to be another factor lending support to the NZD/USD pair. That said, diminishing odds for a more aggressive policy easing acts as a tailwind for the US Treasury bond yields, which, along with geopolitical risks, limit losses for the safe-haven Greenback.
Apart from this, persistent worries about the worsening economic conditions in China might hold back traders from placing fresh bullish bets around the NZD/USD pair and should cap any meaningful appreciating move. The fears resurfaced after data showed that China's imports grew less than expected in December, which pointed to still weak domestic demand. This offsets upbeat export figures, which indicate that global trade is starting to recover.
The aforementioned mixed fundamental backdrop, along with the NZD/USD pair's recent range-bound price action witnessed over the past week or so, makes it prudent to wait for strong follow-through buying before placing fresh bullish bets. Traders now look to the release of the US Producer Price Index (PPI). This, along with a scheduled speech by Minneapolis Fed President Neel Kashkari, might provide some impetus during the North American session.
Technical levels to watch
Gold prices rose in India on Friday, according to data from India's Multi Commodity Exchange (MCX).
Gold price stood at 62,066 Indian Rupees (INR) per 10 grams, up INR 16 compared with the INR 62,050 it cost on Thursday.
As for futures contracts, Gold prices increased to INR 62,210 per 10 gms from INR 61,788 per 10 gms.
Prices for Silver futures contracts decreased to INR 72,034 per kg from INR 71,354 per kg.
| Major Indian city | Gold Price |
|---|---|
| Ahmedabad | 64,250 |
| Mumbai | 64,065 |
| New Delhi | 64,270 |
| Chennai | 64,250 |
| Kolkata | 64,285 |
Global Market Movers: Comex Gold price cheers Middle East tensions, subdued USD demand
- The mixed US consumer inflation figures raised expectations that the Federal Reserve could delay a much-anticipated rate cut in March and dragged the Comex Gold price to a one-month low on Thursday.
- The headline US CPI accelerated from the 3.1% YoY rate to 3.4% in December, while the core gauge (excluding volatile food and energy prices) registered its smallest yearly gains since May 2021.
- Cleveland Fed President Loretta Mester commented on the latest CPI figures and said that it would likely be too soon for the US central bank to cut its interest rates at the March policy meeting.
- Adding to this, Richmond Fed chief Tom Barkin noted that the central bank needs to be convinced that inflation is headed to target and will be open to lowering rates once inflation is on track to 2%.
- Separately, Chicago Fed President Austan Goolsbee said that the central bank is still on a comfortable path forward on inflation and will have to evaluate policy restrictiveness as inflation continues to decline.
- According to the CME group's FedWatch Tool, the markets are still pricing in over a 65% probability of a rate cut in March, which is seen acting as a tailwind for the non-yielding yellow metal.
- The yield on the benchmark 10-year US government bond remains depressed below the 4.0% threshold, which keeps the US Dollar bulls on the defensive and benefits the non-yielding metal.
- The US and UK forces carried out attacks against multiple Houthi targets in reaction to drone and missile attacks on ships in the Red Sea, raising the risk of a further escalation of geopolitical tensions.
- The Chinese inflation figures released this Friday fuel deflationary risks, while a 0.3% fall in imports during 2023 pointed to sluggish domestic demand and added to worries about slow economic recovery.
- Comex Gold price remains on track to end in the red for the second successive week as traders now look to the US Producer Price Index and Minneapolis Fed President Neel Kashkari's speech for a fresh impetus.
(An automation tool was used in creating this post.)
Gold FAQs
Why do people invest in Gold?
Gold has played a key role in human’s history as it has been widely used as a store of value and medium of exchange. Currently, apart from its shine and usage for jewelry, the precious metal is widely seen as a safe-haven asset, meaning that it is considered a good investment during turbulent times. Gold is also widely seen as a hedge against inflation and against depreciating currencies as it doesn’t rely on any specific issuer or government.
Who buys the most Gold?
Central banks are the biggest Gold holders. In their aim to support their currencies in turbulent times, central banks tend to diversify their reserves and buy Gold to improve the perceived strength of the economy and the currency. High Gold reserves can be a source of trust for a country’s solvency. Central banks added 1,136 tonnes of Gold worth around $70 billion to their reserves in 2022, according to data from the World Gold Council. This is the highest yearly purchase since records began. Central banks from emerging economies such as China, India and Turkey are quickly increasing their Gold reserves.
How is Gold correlated with other assets?
Gold has an inverse correlation with the US Dollar and US Treasuries, which are both major reserve and safe-haven assets. When the Dollar depreciates, Gold tends to rise, enabling investors and central banks to diversify their assets in turbulent times. Gold is also inversely correlated with risk assets. A rally in the stock market tends to weaken Gold price, while sell-offs in riskier markets tend to favor the precious metal.
What does the price of Gold depend on?
The price can move due to a wide range of factors. Geopolitical instability or fears of a deep recession can quickly make Gold price escalate due to its safe-haven status. As a yield-less asset, Gold tends to rise with lower interest rates, while higher cost of money usually weighs down on the yellow metal. Still, most moves depend on how the US Dollar (USD) behaves as the asset is priced in dollars (XAU/USD). A strong Dollar tends to keep the price of Gold controlled, whereas a weaker Dollar is likely to push Gold prices up.
- USD/MXN faces challenges as traders bet on speculations of Fed rate interest cuts.
- US Dollar fails to cheer the improved US bond yields and upbeat inflation data.
- Mexican Peso moves on an upward trajectory despite softer production data.
USD/MXN extends its losses for the second straight day, possibly due to the improved risk appetite as traders price in the possibility of resuming rate cuts in March and May. The USD/MXN pair trades lower near 16.87 during the European session on Friday.
The improved US Treasury yields seem failing to provide any support to the US Dollar (USD). The US Dollar Index (DXY) trades lower near 102.20 with the 2-year and 10-year yields on US bond coupons standing at 4.27% and 3.96%, respectively, at the time of writing.
The favorable US inflation data were not successful in maintaining the strength of the US Dollar as traders are more inclined toward Fed rate cuts. December's US Consumer Price Index (CPI) reported a year-on-year increase of 3.4%, surpassing both November's 3.1% and the expected market figure of 3.2%. Additionally, the monthly CPI growth for December showed a 0.3% increase, exceeding the market projection of 0.2%.
Traders are likely awaiting the release of the US Producer Price Index (PPI) data for December. Additionally, they may keenly observe the upcoming speech by Federal Reserve member Neel Kashkari in the North American session. These events are expected to provide further insights into the economic landscape of the United States.
On Mexico’s side, INEGI revealed November’s Industrial Output (MoM) on Thursday, showing a decline of 1.0%, swinging from the previous growth of 0.6%. While the annual data contracted to 2.8% against the 4.8% as expected. These softer figures might have capped the advances of the Mexican Peso (MXN). Market participants will eye Retail Sales data in the upcoming week.
EUR/CZK has jumped up to 24.70, last week's levels. Economists at ING analyze the pair’s outlook.
Czech Koruna will have to be at weaker levels for a bit longer than we expected
The likely range for today will be 24.70-24.80, but we don't expect more weakness.
CZK has proven resilient enough, and the market is already in short positioning. Therefore, we remain rather positive here, but the CZK will have to be at weaker levels for a bit longer than we expected.
On Thursday, EUR/USD was rejected at the 1.1000 key resistance level. Economists at ING analyze the pair’s outlook.
Wide potential for the Euro to benefit from an unwinding of ECB dovish bets in the coming months
We now expect some more days of rangebound trading, with some modest downside risks for EUR/USD.
One factor that we wish to keep highlighting, though, is the rather wide potential for the Euro to benefit from an unwinding of ECB dovish bets in the coming months.
Markets continue to price in 140 bps of easing by year-end, while our economics team only forecasts 75 bps. We expect to see those benefits to the Euro more clearly in pairs such as EUR/CHF in the short term rather than in EUR/USD, at least until a clearer Dollar downtrend emerges (in our view, a 2Q story).
- EUR/GBP faces challenges on improved production data from the United Kingdom.
- UK Manufacturing Output MoM rose by 0.4%. While Manufacturing Production YoY increased by 1.3% in November.
- ECB President Christine Lagarde’s dovish remarks contributed to the downward pressure on the Euro.
EUR/GBP continues to move on a downward trajectory for the second successive session, trading near 0.8590 during the early European session on Friday. The EUR/GBP pair loses ground on improved production data from the United States (US).
United Kingdom’s (UK) industrial sector activity rebounded in November. Office for National Statistics (ONS) on Friday, revealed that Manufacturing Output rose by 0.4% MoM in November versus 0.3% expected, swinging from the previous decline of 1.2%. Total Industrial Production (MoM) remained consistent at 0.3% as expected against the previous decline of 1.3%. Meanwhile, the annual UK Manufacturing Production increased by 1.3% in November, missing expectations of 1.7%. Total Industrial Output declined by 0.1% in the same period, as against the 0.7% estimated growth and the previous print of -0.5%.
However, the UK Total Trade Balance for November showed a deficit of GBP14.189B versus GBP15.70B expectations and GBP15.936M prior. UK labor market data will be eyed by the traders on Tuesday.
On the other side, the Euro has suffered losses possibly due to remarks made by European Central Bank (ECB) President Christine Lagarde on Thursday. Lagarde stated that the most challenging phase was likely behind, and interest rates would be reduced if the ECB had a certainty that inflation had declined to the 2.0% level. Lagarde also added that interest rates in the eurozone had reached their peak after a rapid increase in response to high inflation last year.
November’s Industrial Production data for the Eurozone’s manufacturing sector is scheduled to be released on Monday. The focus will be shifted to German and European Monetary Union Consumer Inflation data on Tuesday and Wednesday, respectively.
- Pound Sterling experiences a sell-off after mixed UK factory data.
- The UK economy is expected to report a technical recession despite 0.3% growth in November GDP.
- Investors await the US PPI, UK labor market and inflation data for further action.
The Pound Sterling (GBP) faces a correction after the United Kingdom Office for National Statistics (ONS) reported mixed factory data for November. Monthly growth in the manufacturing sector was slightly higher while annual data failed to match expectations. Overall economic data was slightly better than expectations but seems incapable of taming fears of a technical recession happening in the UK economy.
Going forward, the Pound Sterling will be guided by the labor market and inflation data, which are due to be released next week. Cooling labor market conditions and a further decline in price pressures will deepen hopes of a dovish interest rate outlook from the Bank of England (BoE) in its first monetary policy announcement of 2024 on February 01.
Meanwhile, near-term demand for the Pound Sterling is upbeat due to improved market sentiment. The GBP/USD pair remains in the bullish trajectory as chances of an interest rate cut from the Federal Reserve (Fed) remain firm despite a sticky United States Consumer Price Index (CPI) report for December.
Daily Digest Market Movers: Pound Sterling drops while US Dollar attempts recovery
- Pound Sterling has surrendered intraday gains after the United Kingdom ONS reported mixed factory data for November.
- Monthly Manufacturing Production rose by 0.4% against expectations of 0.3% – in October it contracted by 1.2%. On an annual basis, the economic data gained at a slower pace of 1.3% against expectations of 1.7% but significantly outperformed the former reading of 0.2%.
- Monthly Industrial Production was up by 0.3% as expected against a contraction of 1.3% in October. The annual factory data surprisingly shrank by 0.1% while investors projected a significant growth of 0.7%. Previously the data point showed a contraction of 0.5%.
- Monthly GDP grew slightly higher by 0.3% against the estimates of 0.2%. The UK economy shrank by 0.3% in October.
- The economic data is insufficient to give confidence among market participants that the UK economy will dodge a technical recession in the final quarter of 2023.
- It will be tough for Bank of England (BoE) policymakers to make choices between higher price pressures and vulnerable economic outlook.
- While no discussions have come from BoE policymakers about rate cuts, investors see the central bank lowering borrowing costs this year to avoid ‘over-tightening’ consequences.
- Next week, action in the Pound Sterling will be guided by the labor market for November and inflation data for December, which will set an undertone for February’s monetary policy meeting.
- UK labor market conditions are cooling swiftly as employers posted 32% less job vacancies in December from a year ago. The Recruitment and Employment Confederation (REC) department said that permanent jobs have declined all over 2023.
- The demand for risk-perceived assets is upbeat while the US Dollar Index (DXY) has fallen back to its crucial support of 102.30.
- The USD Index fails to capitalize on stubbornly high inflation data as bets in favour of a rate cut from the Federal Reserve (Fed) remain firm.
- Gains generated after the release of the inflation by the USD Index were surrendered as core inflation continues to soften while headline inflation rose sharply and Fed policymakers generally consider the core CPI data for decision-making.
- In today’s session, the USD Index will see an action after the release of the United States Producer Price Index (PPI) data for December, which will be published at 13:30 GMT.
Technical Analysis: Pound Sterling aims to recapture 1.2800
-638406430023683986.png)
Pound Sterling faces pressure from two-week high around 1.2790 after the release of UK factory data. The broader appeal for the GBP/USD pair is upbeat as 20 and 50-day Exponential Moving Averages (EMAs) are sloping higher. The Cable aims to sustain above the 61.8% Fibonacci retracement at 1.2710 (of the move from 13 July 2023 high at 1.3142 to 4 October 2023 low at 1.2037).
The 14-period Relative Strength Index (RSI) attempts to break above 60.00. A bullish momentum would trigger if the RSI (14) manages to do so.
Pound Sterling FAQs
What is the Pound Sterling?
The Pound Sterling (GBP) is the oldest currency in the world (886 AD) and the official currency of the United Kingdom. It is the fourth most traded unit for foreign exchange (FX) in the world, accounting for 12% of all transactions, averaging $630 billion a day, according to 2022 data.
Its key trading pairs are GBP/USD, aka ‘Cable’, which accounts for 11% of FX, GBP/JPY, or the ‘Dragon’ as it is known by traders (3%), and EUR/GBP (2%). The Pound Sterling is issued by the Bank of England (BoE).
How do the decisions of the Bank of England impact on the Pound Sterling?
The single most important factor influencing the value of the Pound Sterling is monetary policy decided by the Bank of England. The BoE bases its decisions on whether it has achieved its primary goal of “price stability” – a steady inflation rate of around 2%. Its primary tool for achieving this is the adjustment of interest rates.
When inflation is too high, the BoE will try to rein it in by raising interest rates, making it more expensive for people and businesses to access credit. This is generally positive for GBP, as higher interest rates make the UK a more attractive place for global investors to park their money.
When inflation falls too low it is a sign economic growth is slowing. In this scenario, the BoE will consider lowering interest rates to cheapen credit so businesses will borrow more to invest in growth-generating projects.
How does economic data influence the value of the Pound?
Data releases gauge the health of the economy and can impact the value of the Pound Sterling. Indicators such as GDP, Manufacturing and Services PMIs, and employment can all influence the direction of the GBP.
A strong economy is good for Sterling. Not only does it attract more foreign investment but it may encourage the BoE to put up interest rates, which will directly strengthen GBP. Otherwise, if economic data is weak, the Pound Sterling is likely to fall.
How does the Trade Balance impact the Pound?
Another significant data release for the Pound Sterling is the Trade Balance. This indicator measures the difference between what a country earns from its exports and what it spends on imports over a given period.
If a country produces highly sought-after exports, its currency will benefit purely from the extra demand created from foreign buyers seeking to purchase these goods. Therefore, a positive net Trade Balance strengthens a currency and vice versa for a negative balance.
As we kick off 2024, China's economic outlook remains clouded. Economists at TD Securities lay out their expectations for fiscal and monetary policy this year.
China is starting 2024 on soft footing
China is starting 2024 on soft footing, even after the stimulus measures announced in 23Q4.
As fiscal funds raised late last year get deployed into the economy, authorities will be paying close attention to the 24Q1 economic data before reassessing the economic trajectory.
We believe authorities won't take their foot off the pedal and will employ fiscal and monetary policy tools to ensure China GDP growth reaches around the 5% mark this year.
FX option expiries for Jan 12 NY cut at 10:00 Eastern Time, via DTCC, can be found below.
- EUR/USD: EUR amounts
- 1.0875 1.1b
- 1.1000 1.7b
- 1.1050 933m
- 1.1055 1.1b
- GBP/USD: GBP amounts
- 1.2600 656m
- 1.2730 508m
- USD/JPY: USD amounts
- 144.00 690m
- 145.00 1.6b
- 146.00 1.3b
- 146.15 623m
- USD/CHF: USD amounts
- 0.8450 385m
- 0.8540 535m
- 0.8550 446m
- 0.8575 809m
- AUD/USD: AUD amounts
- 0.6675 910m
- 0.6800 768m
- 0.6850 945m
- USD/CAD: USD amounts
- 1.3300 681m
- 1.3330 480m
- 1.3375 397m
- 1.3425 584m
- 1.3445 776m
- 1.3450 462m
- NZD/USD: NZD amounts
- 0.6200 480m
- 0.6245 869m
Here is what you need to know on Friday, January 12:
The US Dollar (USD) outperformed its peers with the initial reaction to December inflation figures on Thursday but failed to preserve its strength as US Treasury bond yields turned south later in the American session. Although markets stay relatively quiet early Friday, Producer Price Index (PPI) data for December from the US could ramp up volatility ahead of the weekend.
US PPI Preview: Another positive surprise in the pipeline?
Inflation in the US, as measured by the change in the Consumer Price Index (CPI), rose to 3.4% on a yearly basis in December, the US Bureau of Labor Statistics (BLS) reported on Thursday. This print followed 3.1% in November and came in stronger than the market expectation of 3.2%. The Core CPI, which excludes volatile food and energy prices, rose 0.3% on a monthly basis as forecast. The USD Index climbed to a five-day high of 102.76 after the inflation report but closed the day flat below 102.50 as the benchmark 10-year US Treasury bond yield failed to hold above 4%.
US Dollar price this week
The table below shows the percentage change of US Dollar (USD) against listed major currencies this week. US Dollar was the weakest against the Pound Sterling.
| USD | EUR | GBP | CAD | AUD | JPY | NZD | CHF | |
| USD | -0.30% | -0.47% | 0.12% | 0.23% | 0.24% | 0.11% | 0.14% | |
| EUR | 0.32% | -0.14% | 0.44% | 0.55% | 0.57% | 0.42% | 0.47% | |
| GBP | 0.49% | 0.19% | 0.61% | 0.72% | 0.74% | 0.61% | 0.62% | |
| CAD | -0.11% | -0.41% | -0.58% | 0.12% | 0.15% | 0.00% | 0.03% | |
| AUD | -0.23% | -0.54% | -0.71% | -0.11% | 0.04% | -0.14% | -0.09% | |
| JPY | -0.27% | -0.56% | -0.72% | -0.11% | -0.01% | -0.11% | -0.10% | |
| NZD | -0.08% | -0.39% | -0.55% | 0.04% | 0.15% | 0.16% | 0.05% | |
| CHF | -0.13% | -0.48% | -0.63% | -0.02% | 0.10% | 0.10% | -0.05% |
The heat map shows percentage changes of major currencies against each other. The base currency is picked from the left column, while the quote currency is picked from the top row. For example, if you pick the Euro from the left column and move along the horizontal line to the Japanese Yen, the percentage change displayed in the box will represent EUR (base)/JPY (quote).
During the Asian trading hours, the data from China revealed that the Consumer Price Index rose 0.1% on a monthly basis in December, up from the 0.5% decrease seen in November. Other data from China showed that the trade surplus widened to $75.34 billion in December from $68.39 billion. This reading surpassed the market forecast for a surplus of $74.75 billion. Nevertheless, the Shanghai Composite and the Hang Seng indexes both were last seen trading flat on the day. Meanwhile, US stock index futures post small losses in the early European session.
Following some volatile action in the American session, EUR/USD settled above 1.0950. European Central Bank Chief Economist Philip Lane will be delivering a speech during the European trading hours on Friday.
The UK's Office for National Statistics (ONS) reported on Friday that the Gross Domestic Product grew by 0.3% on a monthly basis in November following the 0.3% contraction recorded in October. The ONS also announced that Industrial Production and Manufacturing Production expanded by 0.3% and 0.4%, respectively, in the same period. GBP/USD showed no immediate reaction to these data and was last seen moving up and down in a narrow range above 1.2750.
After advancing to its highest level in a month near 146.50, USD/JPY reversed its direction and closed in the red on Thursday. The pair stays on the back foot early Friday and trades at around 145.00.
Gold benefited from retreating US bond yields in the second half of the day on Thursday and continued to edge higher in the Asian session on Friday. At the time of press, XAU/USD clings to marginal daily gains above $2,030.
The United Kingdom’s (UK) industrial sector activity rebounded in November, according to the latest data released by the Office for National Statistics (ONS) on Friday.
Manufacturing Output rose 0.4% MoM in November versus 0.3% expected and -1.2% seen in October while total Industrial Production arrived at 0.3% MoM vs. 0.3% expected and -1.3% previous.
The annual UK Manufacturing Production increased 1.3% in November, missing expectations of 1.7%. Total Industrial Output declined by 0.1% in the same period, as against the 0.7% estimated growth and the previous print of -0.5%.
Separately, the UK Goods Trade Balance numbers were published, which came in at GBP-14.189 billion in November versus GBP -15.70 billion expectations and GBP -15.936 billion last. The total Trade Balance (non-EU) came in at GBP-2.838 billion in November versus GBP-3.919 billion reported in October.
Related reads
- UK GDP rebounds 0.3% MoM in November vs. 0.2% expected
Pound Sterling FAQs
What is the Pound Sterling?
The Pound Sterling (GBP) is the oldest currency in the world (886 AD) and the official currency of the United Kingdom. It is the fourth most traded unit for foreign exchange (FX) in the world, accounting for 12% of all transactions, averaging $630 billion a day, according to 2022 data.
Its key trading pairs are GBP/USD, aka ‘Cable’, which accounts for 11% of FX, GBP/JPY, or the ‘Dragon’ as it is known by traders (3%), and EUR/GBP (2%). The Pound Sterling is issued by the Bank of England (BoE).
How do the decisions of the Bank of England impact on the Pound Sterling?
The single most important factor influencing the value of the Pound Sterling is monetary policy decided by the Bank of England. The BoE bases its decisions on whether it has achieved its primary goal of “price stability” – a steady inflation rate of around 2%. Its primary tool for achieving this is the adjustment of interest rates.
When inflation is too high, the BoE will try to rein it in by raising interest rates, making it more expensive for people and businesses to access credit. This is generally positive for GBP, as higher interest rates make the UK a more attractive place for global investors to park their money.
When inflation falls too low it is a sign economic growth is slowing. In this scenario, the BoE will consider lowering interest rates to cheapen credit so businesses will borrow more to invest in growth-generating projects.
How does economic data influence the value of the Pound?
Data releases gauge the health of the economy and can impact the value of the Pound Sterling. Indicators such as GDP, Manufacturing and Services PMIs, and employment can all influence the direction of the GBP.
A strong economy is good for Sterling. Not only does it attract more foreign investment but it may encourage the BoE to put up interest rates, which will directly strengthen GBP. Otherwise, if economic data is weak, the Pound Sterling is likely to fall.
How does the Trade Balance impact the Pound?
Another significant data release for the Pound Sterling is the Trade Balance. This indicator measures the difference between what a country earns from its exports and what it spends on imports over a given period.
If a country produces highly sought-after exports, its currency will benefit purely from the extra demand created from foreign buyers seeking to purchase these goods. Therefore, a positive net Trade Balance strengthens a currency and vice versa for a negative balance.
- UK GDP rate rose 0.% MoM in November vs. 0.2% forecast.
- GBP/USD remains unfazed below 1.2800 on upbeat UK GDP data.
The UK economy returned to expansion in November, rising 0.3% after contracting 0.3% in October, the latest data published by the Office for National Statistics (ONS) showed on Friday. The market had forecast an expansion of 0.2% in the reported period.
Meanwhile, the Index of services (November) arrived at 0% 3M/3M vs. October’s -0.1% reading and 0.2% expectations.
Market reaction to the UK GDP report
The upbeat UK GDP data seems to have failed to move the needle around the Pound Sterling. At the press time, the pair is up 0.07% on the day to trade at 1.2770.
Pound Sterling price today
The table below shows the percentage change of Pound Sterling (GBP) against listed major currencies today. Pound Sterling was the strongest against the Swiss Franc.
| USD | EUR | GBP | CAD | AUD | JPY | NZD | CHF | |
| USD | 0.05% | 0.01% | -0.04% | -0.05% | 0.09% | -0.02% | 0.16% | |
| EUR | -0.05% | -0.04% | -0.10% | -0.12% | 0.03% | -0.09% | 0.11% | |
| GBP | -0.02% | 0.04% | -0.06% | -0.07% | 0.07% | -0.05% | 0.15% | |
| CAD | 0.04% | 0.08% | 0.05% | -0.03% | 0.12% | 0.02% | 0.19% | |
| AUD | 0.05% | 0.11% | 0.07% | 0.02% | 0.14% | 0.02% | 0.22% | |
| JPY | -0.07% | -0.03% | -0.08% | -0.13% | -0.14% | -0.12% | 0.08% | |
| NZD | 0.02% | 0.09% | 0.05% | -0.02% | -0.01% | 0.13% | 0.20% | |
| CHF | -0.15% | -0.10% | -0.14% | -0.19% | -0.20% | -0.07% | -0.17% |
The heat map shows percentage changes of major currencies against each other. The base currency is picked from the left column, while the quote currency is picked from the top row. For example, if you pick the Euro from the left column and move along the horizontal line to the Japanese Yen, the percentage change displayed in the box will represent EUR (base)/JPY (quote).
- EUR/JPY weakens amid the geopolitical tensions in the Middle East.
- The cross maintains a positive outlook above the key EMA; RSI indicator stands in a bullish zone above the 50 midline.
- The key resistance level will emerge at 160.00; the initial support level is seen at 158.60.
The EUR/JPY cross trades on a softer note for the second consecutive day during the early European session on Friday. The risk-off mood due to a further escalation of geopolitical tensions in the Middle East boosts the safe-haven currency like the Japanese Yen (JPY) and acts as a headwind for the EUR/JPY cross. The cross currently trades near 159.30, down 0.15% for the day.
Technically, EUR/JPY keeps the bullish vibe unchanged as the cross holds above the key 100-hour Exponential Moving Averages (EMA) on the four-hour chart. The upward momentum is also supported by the 14-day Relative Strength Index (RSI) which stands above 50 midline, indicating the path of least resistance level is to the upside.
The key resistance level will emerge near a high of January 10 at the 160.00 psychological round mark. Any follow-through buying above the latter will see a rally to the upper boundary of Bollinger Band at 160.62. Further north, the next upside barrier is seen near a high of December 1 at 161.77.
On the downside, the initial support level for EUR/JPY is seen near a high of January 4 at 158.60. The additional downside filter to watch is the 50-EMA at 158.25, followed by the 100-EMA at 157.82. A breach of this level will see a drop to the lower limit of the Bollinger Band at 157.09.
EUR/JPY four-hour chart
-638406376934461183.png)
- Silver price rebounded to near $23.00 as investors digest higher US inflation data.
- Investors remain confident that the Fed will cut interest rates in March.
- Silver price could slip to $21.88 if the RSI (14) settles below 40.00.
Silver price (XAG/USD) discovered a significant buying interest after printing a fresh seven-week low at $22.50. The white metal has recovered to near $23.00 as bets in favour of a rate-cut decision by the Federal Reserve (Fed) in March remains firmer despite stubbornly higher United States Consumer Price Index (CPI) report for December.
S&P500 futures have generated some losses in the Asian session, portraying a decline in the risk-appetite of the market participants. The US Dollar Index (DXY) has surrendered entire gains generated after the release of the higher-than-projected inflation figures.
The headline inflation expanded at an annual pace of 3.4% against the consensus of 3.2% and the prior reading of 3.1%. While the core CPI that strips of volatile food and oil prices decelerated slightly to 3.9% versus. the prior reading of 4.0%.
Investors remain confident that the Fed will start the ‘rate-cut’ campaign from March despite a sticky inflation report. As per the CME Fedwatch tool, chances in favour of a rate cut by 25 basis points (bps) to 5.00-5.25% remained steady at around 68%.
Silver technical analysis
Silver price discovers some buying interest near the horizontal support plotted from December 13 low at $22.51. The 50-period Exponential Moving Average (EMA) at $23.17 continues to act as a barricade for the Silver price bulls. The Silver price would expose to November 13 low at $21.88 if the asset faces sell-off again.
A bearish momentum would activate if the 14-period Relative Strength Index (RSI) slips into the lower range of 20.00-40.00.
Silver four-hour chart
-638406372026093115.png)
- EUR/USD extends gains as the US Dollar declines on risk-on mood.
- MACD suggests waiting for the confirmation of bullish sentiment in the pair.
- A break above 1.1000 could propel the pair to reach the previous week’s high at 1.1038.
EUR/USD continues to gain ground for the third successive day, trading higher around 1.0980 during the Asian session on Friday. The EUR/USD pair receives upward support due to the subdued US Dollar (USD), a trend attributed to the market's expectations of five rate cuts by the Federal Reserve by the end of 2024, beginning with anticipated cuts in March and May.
The EUR/USD pair could face resistance at the psychological level of 1.1000. A successful breakthrough above this level could potentially provide support for the pair to revisit the high from the previous week at 1.1038. The 14-day Relative Strength Index (RSI) for the EUR/USD pair is positioned above the 50 mark, indicating a bullish momentum in the market.
However, the Moving Average Convergence Divergence (MACD) line, despite being positioned above the centerline, is converging below the signal line. This indicates a potential momentum shift toward an upward trend for the EUR/USD pair. Traders are likely to exercise caution and await confirmation before making aggressive bets in the pair, taking into consideration the signals provided by this lagging indicator.
On the downside, the EUR/USD pair faces the possibility of breaking below the immediate support at the 23.6% Fibonacci retracement level, marked at 1.0964, followed by the key level of 1.0950. If the immediate support area is breached, it could prompt the pair to approach the psychological level of 1.0900.
A decisive break below the latter could intensify downward pressure on the EUR/USD pair, potentially guiding it toward the 50-day Exponential Moving Average (EMA) at 1.0895 and the 38.2% Fibonacci retracement level at 1.0867. Further downside movement may lead to a significant support level at 1.0850. Traders may closely monitor these key levels for potential shifts in market dynamics.
EUR/USD: Daily Chart
-638406355573260417.png)
- USD/CHF oscillates in a trading band around 0.8520 on Friday.
- The upbeat US inflation and labor market data could challenge an expected March rate cut by the Federal Reserve (Fed).
- The escalating tension in the Middle East might benefit the safe haven currency like the Swiss Franc (CHF).
- The December US Producer Price Index (PPI) will be the highlight on Friday.
The USD/CHF pair remains confined within a multi-week trading range of 0.8400-0.8575 during the early European trading hours on Friday. The firmer US Dollar (USD) following the upbeat US inflation data might lend some support to the pair. However, the upside of USD/CHF might be limited due to the escalating tension in the Middle East. At press time, the pair is trading at 0.8520, losing 0.02% on the day.
Inflation ticked higher in the United States in December. According to the Bureau of Labor Statistics, the US headline Consumer Price Index (CPI), rose at an annual pace of 3.4% in December from 3.1% in the previous month, beating expectations of 3.2%. On a monthly basis, the CPI figure grew by 0.3% from 0.1% in November. That being said, the upbeat US inflation and labor market data could potentially push back an expected March rate cut by the Federal Reserve (Fed).
On the other hand, the escalating tension in the Middle East might lift the safe haven flow like the Swiss Franc (CHF). On Thursday, the US and UK forces carried out attacks against multiple Houthi targets in Houthi-controlled regions of Yemen. US President Joe Biden said that “these strikes are in direct response to Houthi attacks against international maritime vessels in the Red Sea.”
Earlier this week, the Swiss Consumer Price Index (CPI) for December came in better than expected, climbing to 1.7% YoY from 1.4% in the previous reading. The Real Retail Sales arrived at 0.7% in November versus -0.3% prior, beating the estimation.
Moving on, the December US Producer Price Index (PPI) will be due later on Friday, which is forecast to rise 0.1% MoM and 1.3% YoY. Traders will take more cues from these data and find trading opportunities around the USD/CHF pair.
- USD/CAD retraces its recent gains as Crude prices continue to gain ground.
- WTI price moves upward over escalated concern of Middle-East conflict.
- US and UK military forces conducted air strikes on Iran-led Houthi targets in Yemen.
- The risk-on mood weakens the US Dollar despite upbeat US CPI data and improved US yields.
USD/CAD retraces its recent gains registered in the previous session, edging lower to near 1.3380 during the Asian session on Friday. The Canadian Dollar (CAD) has strengthened in response to the increase in crude oil prices, which can be linked to the heightened tensions in the Middle East.
The military forces of the United States (US) and United Kingdom (UK), supported by Australia, Bahrain, Canada, and the Netherlands, conducted air strikes on Houthi targets in Yemen led by Iran. This action was taken in an effort to safeguard maritime vessels in the Red Sea. West Texas Intermediate (WTI) price trades near $73.40 per barrel at the time of writing.
In the absence of Economic data from Canada for the entire week, traders waiting for next week’s Canada Consumer Price Index data for December and Retail Sales figures for November on Tuesday and Friday, respectively.
The US Dollar (USD) faces challenges on improved risk appetite as traders move away from the Greenback, which could be attributed to the speculation of Federal Reserve’s (Fed) rate cuts in March and May. The US Dollar Index (DXY) trades slightly lower around 102.20 despite improved US Treasury yields.
On Thursday, the positive US inflation data provided support for the US Dollar, enabling it to gain some upward traction. The US Consumer Price Index (CPI) recorded a 3.4% year-on-year increase in December, surpassing both November's 3.1% and the expected market figure of 3.2%. Additionally, the monthly CPI growth for December exhibited a 0.3% increase, surpassing the market projection of 0.2%. However, the annual Core CPI slightly eased to 3.9% from the previous reading of 4.0%, while the monthly figure remained stable at 0.3%, aligning with expectations.
Traders await the release of the US Producer Price Index (PPI) data for December, along with the speech by Federal Reserve member Neel Kashkari later in the North American session, seeking additional insights into the economic landscape of the United States.
- WTI price moves upward over the escalation of the Israel-Gaza conflict.
- US and UK military forces have carried out air strikes against various Houthi locations in Yemen.
- Iran has captured a civilian oil tanker “Marshall Islands-flagged St Nikolas” carrying Iraqi Crude destined for Turkey.
- The improved Chinese Trade Balance data could support reinforcing the Crude oil prices.
West Texas Intermediate (WTI) price rises on the second consecutive day, driven by heightened concerns over potential oil supply disruptions in the Red Sea. Air strikes carried out by the United States (US) and United Kingdom (UK) targeted Iran-backed Houthis in Yemen, raising fears that the situation could escalate the Israel-Gaza conflict into a regional conflict. The WTI price improves near $73.50 per barrel during the Asian session on Friday.
President Joe Biden announced that, in collaboration with the United Kingdom and with the assistance of Australia, Bahrain, Canada, and the Netherlands, US military forces have carried out successful strikes against various Houthi locations in Yemen. Additionally, Biden emphasized that he is ready to take further actions without hesitation following the airstrikes on Houthi targets in Yemen.
Crude oil prices gained upward momentum following Iran's announcement of the capture of a civilian oil tanker “Marshall Islands-flagged St Nikolas” carrying Iraqi Crude destined for Turkey in the Gulf of Oman on Thursday. Official Iranian state media declared the seizure as a retaliatory measure against the United States' seizure of the same ship a year ago, which was headed for Iran at that time. The incident is anticipated to contribute to continued volatility in crude oil prices in the coming days.
Additionally, the recently released better-than-expected Chinese trade data for December could potentially bolster support for Crude oil products, given China's status as the largest oil importer. The Chinese Trade Balance in USD for December rose to $75.34B from the previous $68.39B, surpassing the expected $74.75B. The Exports (YoY) figure exhibited a growth of 2.3%, surpassing the expected 1.7%. Meanwhile, the yearly Imports in CNY increased by 1.6%, compared to the previous 0.6%. These positive trade figures from China may contribute to a favorable environment for Crude oil prices.
- Gold price builds on the overnight bounce from a one-month low amid a softer USD.
- Despite a slightly hot US CPI, bets for a March Fed rate cut undermine the Greenback.
- Geopolitical risks and China’s economic woes further benefit the safe-haven XAU/USD.
Gold price (XAU/USD) attracts some buyers for the second successive day on Friday and builds on the overnight bounce from a one-month low, around the $2,013 region, representing the 50-day Simple Moving Average (SMA). The precious metal, however, remains confined in a multi-day-old trading range, warranting some caution for bullish traders amid the uncertainty over the Federal Reserve's (Fed) rate-cut path.
Data released on Thursday showed consumer prices in the United States (US) increased more than expected in December. This, along with hawkish remarks from Fed officials, fuelled speculations that interest rates could stay higher for longer. The markets, however, are pricing in a greater chance of a rate cut in March, which continues to undermine the US Dollar (USD) and lends support to the non-yielding Gold price.
Apart from this, geopolitical risks stemming from the Israel-Hamas war and persistent worries about a slow economic recovery in China further seem to benefit the safe-haven XAU/USD. That said, the aforementioned fundamental backdrop makes it prudent to wait for strong follow-through buying before confirming that the Gold price has formed a near-term bottom and positioning for any meaningful appreciating move.
Daily Digest Market Movers: Gold price benefits from a softer USD, safe-haven demand
- The mixed US consumer inflation figures raised expectations that the Federal Reserve could delay a much-anticipated rate cut in March and dragged the Gold price to a one-month low on Thursday.
- The headline US CPI accelerated from the 3.1% YoY rate to 3.4% in December, while the core gauge (excluding volatile food and energy prices) registered its smallest yearly gains since May 2021.
- Cleveland Fed President Loretta Mester commented on the latest CPI figures and said that it would likely be too soon for the US central bank to cut its interest rates at the March policy meeting.
- Adding to this, Richmond Fed chief Tom Barkin noted that the central bank needs to be convinced that inflation is headed to target and will be open to lowering rates once inflation is on track to 2%.
- Separately, Chicago Fed President Austan Goolsbee said that the central bank is still on a comfortable path forward on inflation and will have to evaluate policy restrictiveness as inflation continues to decline.
- According to the CME group's FedWatch Tool, the markets are still pricing in over a 65% probability of a rate cut in March, which is seen acting as a tailwind for the non-yielding yellow metal.
- The yield on the benchmark 10-year US government bond remains depressed below the 4.0% threshold, which keeps the US Dollar bulls on the defensive and benefits the non-yielding metal.
- The US and UK forces carried out attacks against multiple Houthi targets in reaction to drone and missile attacks on ships in the Red Sea, raising the risk of a further escalation of geopolitical tensions.
- The Chinese inflation figures released this Friday fuel deflationary risks, while a 0.3% fall in imports during 2023 pointed to sluggish domestic demand and added to worries about slow economic recovery.
- The XAU/USD remains on track to end in the red for the second successive week as traders now look to the US Producer Price Index and Minneapolis Fed President Neel Kashkari's speech for a fresh impetus.
Technical Analysis: Gold price remains confined in a multi-day-old trading range
From a technical perspective, the overnight bounce from the 50-day SMA and the subsequent move up as well as positive oscillators on the daily chart favour bullish traders. That said, it will still be prudent to wait for a sustained strength beyond the $2,040-2,042 supply zone before positioning for additional gains. The Gold price might then accelerate the momentum towards last Friday's swing high, around the $2,064 area, en route to the $2,077 area. Some follow-through buying will negate any near-term negative outlook and set the stage for a move towards reclaiming the $2,100 round figure.
On the flip side, the $2,022 area now seems to protect the immediate downside ahead of the multi-week low, around the $2,013 region, or the 50-day SMA tested on Thursday. A convincing break below the latter will be seen as a fresh trigger for bearish traders and drag the Gold price to the $2,000 psychological mark. The downward trajectory could extend further towards the December swing low, around the $1,973 region before the XAU/USD eventually drops to the $1,965-1,963 confluence, comprising the 100- and 200-day SMAs.
US Dollar price today
The table below shows the percentage change of US Dollar (USD) against listed major currencies today. US Dollar was the strongest against the Swiss Franc.
| USD | EUR | GBP | CAD | AUD | JPY | NZD | CHF | |
| USD | 0.03% | 0.01% | -0.03% | -0.15% | -0.09% | -0.13% | 0.09% | |
| EUR | -0.02% | -0.02% | -0.07% | -0.18% | -0.12% | -0.18% | 0.09% | |
| GBP | -0.01% | 0.02% | -0.04% | -0.15% | -0.10% | -0.16% | 0.10% | |
| CAD | 0.03% | 0.05% | 0.03% | -0.13% | -0.06% | -0.10% | 0.13% | |
| AUD | 0.15% | 0.17% | 0.15% | 0.11% | 0.05% | -0.01% | 0.25% | |
| JPY | 0.11% | 0.12% | 0.09% | 0.05% | -0.04% | -0.06% | 0.19% | |
| NZD | 0.12% | 0.18% | 0.15% | 0.10% | -0.01% | 0.05% | 0.24% | |
| CHF | -0.08% | -0.08% | -0.09% | -0.12% | -0.23% | -0.19% | -0.22% |
The heat map shows percentage changes of major currencies against each other. The base currency is picked from the left column, while the quote currency is picked from the top row. For example, if you pick the Euro from the left column and move along the horizontal line to the Japanese Yen, the percentage change displayed in the box will represent EUR (base)/JPY (quote).
Gold FAQs
Why do people invest in Gold?
Gold has played a key role in human’s history as it has been widely used as a store of value and medium of exchange. Currently, apart from its shine and usage for jewelry, the precious metal is widely seen as a safe-haven asset, meaning that it is considered a good investment during turbulent times. Gold is also widely seen as a hedge against inflation and against depreciating currencies as it doesn’t rely on any specific issuer or government.
Who buys the most Gold?
Central banks are the biggest Gold holders. In their aim to support their currencies in turbulent times, central banks tend to diversify their reserves and buy Gold to improve the perceived strength of the economy and the currency. High Gold reserves can be a source of trust for a country’s solvency. Central banks added 1,136 tonnes of Gold worth around $70 billion to their reserves in 2022, according to data from the World Gold Council. This is the highest yearly purchase since records began. Central banks from emerging economies such as China, India and Turkey are quickly increasing their Gold reserves.
How is Gold correlated with other assets?
Gold has an inverse correlation with the US Dollar and US Treasuries, which are both major reserve and safe-haven assets. When the Dollar depreciates, Gold tends to rise, enabling investors and central banks to diversify their assets in turbulent times. Gold is also inversely correlated with risk assets. A rally in the stock market tends to weaken Gold price, while sell-offs in riskier markets tend to favor the precious metal.
What does the price of Gold depend on?
The price can move due to a wide range of factors. Geopolitical instability or fears of a deep recession can quickly make Gold price escalate due to its safe-haven status. As a yield-less asset, Gold tends to rise with lower interest rates, while higher cost of money usually weighs down on the yellow metal. Still, most moves depend on how the US Dollar (USD) behaves as the asset is priced in dollars (XAU/USD). A strong Dollar tends to keep the price of Gold controlled, whereas a weaker Dollar is likely to push Gold prices up.
- Indian Rupee trades on a softer note amid a firmer US Dollar and a stronger US inflation report.
- Reserve Bank of India (RBI) Governor Das emphasized that the Indian banking system is well-placed to support India’s growth outlook.
- Market players will focus on the US Producer Price Index (PPI) and the Indian Consumer Price Index (CPI) on Friday.
Indian Rupee (INR) weakens on the renewed US dollar (USD) demand on Friday. The upbeat US inflation data on Thursday has boosted the Greenback as investors now see the Federal Reserve (Fed) potentially delaying its first interest rate cut.
India’s Prime Minister Narendra Modi said on Wednesday that India is set to become one of the top three global economies, while Reserve Bank of India (RBI) Governor Shaktikanta Das has emphasized that the Indian banking system is well-placed to support India’s growth story as all key indicators of scheduled commercial banks (SCBs) have shown improvement in the last four years.
Investors will closely monitor the US Producer Price Index (PPI) for December, due later on Friday. The PPI figure is estimated to show an increase of 1.3% YoY. Additionally, Fed’s Neel Kashkari is set to speak. On the Indian docket, the December CPI, Industrial Production, and Manufacturing Output will be released.
Daily Digest Market Movers: Indian Rupee loses traction amid strong US inflation data and uncertainties
- India's outward Foreign Direct Investment (FDI) commitments declined sharply to $2.25 billion in December 2023 from $4.0 billion in November 2023, according to Reserve Bank of India (RBI) data.
- India’s Finance Minister Nirmala Sitharaman will unveil the 2024/25 budget on February 1.
- The World Bank maintained its FY25 economic growth forecast for India at 6.4%, attributing it to robust private-sector credit growth, rising public infrastructure spending, and solid domestic demand.
- Finance Minister Nirmala Sitharaman projected that India's economy would reach $5 trillion by 2027–28, making it the third largest in the world.
- US Consumer Price Index (CPI) came in better than expected in December, rising 3.4% YoY from the 3.1% increase seen the month prior. On a monthly basis, the headline CPI grew 0.3% MoM from 0.1% in the previous reading, above the market consensus of 0.2%.
- The Core CPI figure, which excludes volatile food and energy prices, grew 0.3% MoM while the annual rate climbed 3.9% YoY in December versus 4.0% prior, above the market consensus of 3.8%.
- The upbeat US CPI inflation data prompted investors to question that the Federal Reserve (Fed) might delay cutting interest rates in the second quarter.
- Chicago Fed President Austan Goolsbee said 2023 was a "hall-of-fame" year for falling inflation, setting the path for a couple of interest rate cuts in the United States in 2024 if the trend continued.
Technical Analysis: Indian Rupee remains bearish in the shorter term
Indian Rupee trades weaker on the day. The USD/INR pair has traded within a familiar trading range of 82.80-83.40 since September 2023. From the technical perspective, USD/INR maintains a bearish tone as the pair holds below the key 100-period Exponential Moving Average (EMA). Furthermore, the 14-day Relative Strength Index (RSI) is below the 50.0 midpoint, indicating a further decline cannot be ruled out.
A decisive break below the 83.00 psychological level will pave the way to the critical support level of 82.80. The mentioned level is the confluence of the lower limit of the trading range and a low of September 12. Any follow-through selling will see the next contention level near a low of August 11 at 82.60. On the upside, the upper boundary of the trading range at 83.40 will be a tough nut to crack for USD/INR. If the upside breakout of 83.40 is confirmed, the next upside barrier is seen at a 2023 high of 83.47, en route to the psychological figure at 84.00.
US Dollar price today
The table below shows the percentage change of US Dollar (USD) against listed major currencies today. US Dollar was the strongest against the Swiss Franc.
| USD | EUR | GBP | CAD | AUD | JPY | NZD | CHF | |
| USD | 0.00% | -0.02% | -0.06% | -0.20% | -0.09% | -0.22% | 0.06% | |
| EUR | 0.01% | -0.02% | -0.06% | -0.22% | -0.09% | -0.25% | 0.08% | |
| GBP | 0.02% | 0.02% | -0.04% | -0.20% | -0.07% | -0.23% | 0.09% | |
| CAD | 0.06% | 0.05% | 0.04% | -0.17% | -0.03% | -0.17% | 0.12% | |
| AUD | 0.20% | 0.21% | 0.19% | 0.15% | 0.12% | -0.04% | 0.28% | |
| JPY | 0.10% | 0.08% | 0.06% | 0.01% | -0.11% | -0.17% | 0.15% | |
| NZD | 0.23% | 0.25% | 0.23% | 0.18% | 0.04% | 0.16% | 0.32% | |
| CHF | -0.06% | -0.07% | -0.08% | -0.12% | -0.26% | -0.15% | -0.29% |
The heat map shows percentage changes of major currencies against each other. The base currency is picked from the left column, while the quote currency is picked from the top row. For example, if you pick the Euro from the left column and move along the horizontal line to the Japanese Yen, the percentage change displayed in the box will represent EUR (base)/JPY (quote).
Indian Rupee FAQs
What are the key factors driving the Indian Rupee?
The Indian Rupee (INR) is one of the most sensitive currencies to external factors. The price of Crude Oil (the country is highly dependent on imported Oil), the value of the US Dollar – most trade is conducted in USD – and the level of foreign investment, are all influential. Direct intervention by the Reserve Bank of India (RBI) in FX markets to keep the exchange rate stable, as well as the level of interest rates set by the RBI, are further major influencing factors on the Rupee.
How do the decisions of the Reserve Bank of India impact the Indian Rupee?
The Reserve Bank of India (RBI) actively intervenes in forex markets to maintain a stable exchange rate, to help facilitate trade. In addition, the RBI tries to maintain the inflation rate at its 4% target by adjusting interest rates. Higher interest rates usually strengthen the Rupee. This is due to the role of the ‘carry trade’ in which investors borrow in countries with lower interest rates so as to place their money in countries’ offering relatively higher interest rates and profit from the difference.
What macroeconomic factors influence the value of the Indian Rupee?
Macroeconomic factors that influence the value of the Rupee include inflation, interest rates, the economic growth rate (GDP), the balance of trade, and inflows from foreign investment. A higher growth rate can lead to more overseas investment, pushing up demand for the Rupee. A less negative balance of trade will eventually lead to a stronger Rupee. Higher interest rates, especially real rates (interest rates less inflation) are also positive for the Rupee. A risk-on environment can lead to greater inflows of Foreign Direct and Indirect Investment (FDI and FII), which also benefit the Rupee.
How does inflation impact the Indian Rupee?
Higher inflation, particularly, if it is comparatively higher than India’s peers, is generally negative for the currency as it reflects devaluation through oversupply. Inflation also increases the cost of exports, leading to more Rupees being sold to purchase foreign imports, which is Rupee-negative. At the same time, higher inflation usually leads to the Reserve Bank of India (RBI) raising interest rates and this can be positive for the Rupee, due to increased demand from international investors. The opposite effect is true of lower inflation.
- NZD/USD intensifies on Chinese inflation and trade data.
- Chinese CPI year-over-year fell by 0.3%. Meanwhile, the monthly figure eased to 0.1%.
- Chinese Trade Balance USD increased to $75.34B in December and the yearly Imports CNY rose by 1.6%.
- US CPI YoY and MoM rose by 3.4% and 0.3%, respectively, in December.
NZD/USD moves higher on an upward trajectory for the second consecutive session on Friday, improving near 0.6250 during the Asian session. The NZD/USD pair receives upward support on improved risk appetite as traders bet on speculation of Federal Reserve’s (Fed) rate cuts in March and May despite upbeat inflation data from the United States (US). Additionally, the moderate Chinese inflation data seems to reinforce the strength of the New Zealand Dollar (NZD), given the close trade ties between the two nations.
In December, the Chinese Consumer Price Index (YoY) showed a decrease of 0.3%, diverging from the anticipated 0.4% decline. The monthly Consumer Price Index displayed a more modest easing at 0.1%, compared to the market expectation of 0.2%. Meanwhile, the yearly Producer Price Index recorded a decline of 2.7%, slightly surpassing the expected decrease of 2.6%.
Additionally, the Chinese Trade Balance USD for December increased to $75.34B from $68.39B prior, exceeding the expected $74.75B. Exports (YoY) figure showed a growth of 2.3% against the 1.7% as expected. Meanwhile, the yearly Imports CNY increased by 1.6% from 0.6% prior. Traders further expect the release of the US Producer Price Index (PPI) data for December, seeking additional insights into the economic landscape of the United States (US).
The US Dollar Index (DXY) treaded water to build on recent gains in the early Asian hours on Friday following the positive US inflation data. However, the DXY trades slightly lower near 102.20, notwithstanding the improved US Treasury yields. The 2-year and 10-year yields on US bond coupons trades at 4.26% and 3.97%, respectively, by the press time.
Furthermore, the upbeat US inflation data helped the US Dollar to achieve some upward traction. US Consumer Price Index (CPI) rose by 3.4% YoY in December, exceeding both November's 3.1% and the anticipated market figure of 3.2%. The monthly CPI growth for December showed a 0.3% increase, exceeding the market projection of 0.2%. The annual Core CPI eased to 3.9% from the previous reading of 4.0%, while the monthly figure remained consistent at 0.3%, in line with expectations.
China's Trade Balance for December, in Chinese Yuan terms, came in at CNY540.90 billion, widening from the previous figure of CNY490.82 billion.
Exports jumped 3.8% YoY in December vs. 1.7% seen in November. The country’s imports climbed 1.6% YoY in the same period vs. 0.6% booked previously.
In US Dollar terms, China’s trade surplus grew in December.
Trade Balance came in at +75.34B versus +74.75B expected and +68.39B previous.
Exports (YoY): 2.3% vs. 1.7% exp. and 0.5% previous.
Imports (YoY): 0.2% vs. 0.3% exp. and -0.6% last.
Additional takeaways
China Jan-Dec USD-denominated exports -4.6% YoY.
China Jan-Dec USD-denominated Imports -5.5% YoY.
FX implications
AUD/USD is holding the recent gains on mixed China’s trade figures. The pair is up 0.29% on the day, trading at 0.6706 at the time of writing.
Australian Dollar FAQs
What key factors drive the Australian Dollar?
One of the most significant factors for the Australian Dollar (AUD) is the level of interest rates set by the Reserve Bank of Australia (RBA). Because Australia is a resource-rich country another key driver is the price of its biggest export, Iron Ore. The health of the Chinese economy, its largest trading partner, is a factor, as well as inflation in Australia, its growth rate and Trade Balance. Market sentiment – whether investors are taking on more risky assets (risk-on) or seeking safe-havens (risk-off) – is also a factor, with risk-on positive for AUD.
How do the decisions of the Reserve Bank of Australia impact the Australian Dollar?
The Reserve Bank of Australia (RBA) influences the Australian Dollar (AUD) by setting the level of interest rates that Australian banks can lend to each other. This influences the level of interest rates in the economy as a whole. The main goal of the RBA is to maintain a stable inflation rate of 2-3% by adjusting interest rates up or down. Relatively high interest rates compared to other major central banks support the AUD, and the opposite for relatively low. The RBA can also use quantitative easing and tightening to influence credit conditions, with the former AUD-negative and the latter AUD-positive.
How does the health of the Chinese Economy impact the Australian Dollar?
China is Australia’s largest trading partner so the health of the Chinese economy is a major influence on the value of the Australian Dollar (AUD). When the Chinese economy is doing well it purchases more raw materials, goods and services from Australia, lifting demand for the AUD, and pushing up its value. The opposite is the case when the Chinese economy is not growing as fast as expected. Positive or negative surprises in Chinese growth data, therefore, often have a direct impact on the Australian Dollar and its pairs.
How does the price of Iron Ore impact the Australian Dollar?
Iron Ore is Australia’s largest export, accounting for $118 billion a year according to data from 2021, with China as its primary destination. The price of Iron Ore, therefore, can be a driver of the Australian Dollar. Generally, if the price of Iron Ore rises, AUD also goes up, as aggregate demand for the currency increases. The opposite is the case if the price of Iron Ore falls. Higher Iron Ore prices also tend to result in a greater likelihood of a positive Trade Balance for Australia, which is also positive of the AUD.
How does the Trade Balance impact the Australian Dollar?
The Trade Balance, which is the difference between what a country earns from its exports versus what it pays for its imports, is another factor that can influence the value of the Australian Dollar. If Australia produces highly sought after exports, then its currency will gain in value purely from the surplus demand created from foreign buyers seeking to purchase its exports versus what it spends to purchase imports. Therefore, a positive net Trade Balance strengthens the AUD, with the opposite effect if the Trade Balance is negative.
- AUD/JPY catches fresh bids on Friday and reverses a part of the overnight retracement slide.
- Hopes for additional stimulus from China boosts the Aussie and lends support to the cross.
- Dovish BoJ expectations undermine the JPY, though geopolitical risks cap gains for spot prices.
The AUD/JPY cross attracts some dip-buying near the 100-hour Simple Moving Average (SMA), around the 97.00 mark, and climbs to a fresh daily peak following the release of Chinese inflation figures. Spot prices currently trade just below mid-97.00s, up nearly 0.20% for the day, reversing a part of the previous day's retracement slide from the highest level since December 4.
The National Bureau of Statistics reported that the Consumer Price Index (CPI) in China declined for the third consecutive month, by the 0.3% YoY rate in December. Adding to this, The Producer Price Index (PPI), which measures costs for goods at the factory gate, fell 2.7% YoY in December, marking the 15th straight month of drop. The data fuelled speculations that the government may announce additional stimulus to address deflationary risks.
Furthermore, China's Customs reported that the country's 2023 exports and imports of goods were better than expected, boosting the China-proxy Aussie and assisting the AUD/JPY cross to gain positive traction. In fact, China's 2023 Yuan-denominated exports rose by 0.6% YoY, signalling that global trade is starting to recover. However, imports were down 0.3% YoY, suggesting sluggish domestic demand and adding to worries about slow economic recovery.
Apart from this, geopolitical risks stemming from the Israel-Hamas war benefit the Japanese Yen's (JPY) relative safe-haven status and contribute to capping the AUD/JPY cross. Any meaningful downside, however, still seems elusive in the wake of expectations that the Bank of Japan (BoJ) is unlikely to pivot away from its ultra-dovish policy stance anytime soon in the wake of the government stimulus measures following a devastating earthquake in Japan.
The aforementioned mixed fundamental backdrop warrants some caution before placing aggressive directional bets around the AUD/JPY cross. Even from a technical perspective, spot prices have been oscillating in a familiar band over the past three weeks or so. This further makes it prudent to wait for a sustained breakout through the trading range before positioning for a firm near-term trajectory for spot prices.
Technical levels to watch
| Raw materials | Closed | Change, % |
|---|---|---|
| Silver | 22.745 | -0.55 |
| Gold | 2028.736 | 0.17 |
| Palladium | 990.2 | -1.14 |
China's Customs is out with the country’s annual exports and imports data for 2023, noting that “China’s 2023 exports and imports of goods are better than expected.”
Additional details
China 2023 Yuan-denominated exports +0.6% YoY.
China 2023 Yuan-denominated imports -0.3% YoY.
Market reaction
At the time of writing, AUD/USD is trading 0.39% higher near session highs of 0.6715.
Australian Dollar FAQs
What key factors drive the Australian Dollar?
One of the most significant factors for the Australian Dollar (AUD) is the level of interest rates set by the Reserve Bank of Australia (RBA). Because Australia is a resource-rich country another key driver is the price of its biggest export, Iron Ore. The health of the Chinese economy, its largest trading partner, is a factor, as well as inflation in Australia, its growth rate and Trade Balance. Market sentiment – whether investors are taking on more risky assets (risk-on) or seeking safe-havens (risk-off) – is also a factor, with risk-on positive for AUD.
How do the decisions of the Reserve Bank of Australia impact the Australian Dollar?
The Reserve Bank of Australia (RBA) influences the Australian Dollar (AUD) by setting the level of interest rates that Australian banks can lend to each other. This influences the level of interest rates in the economy as a whole. The main goal of the RBA is to maintain a stable inflation rate of 2-3% by adjusting interest rates up or down. Relatively high interest rates compared to other major central banks support the AUD, and the opposite for relatively low. The RBA can also use quantitative easing and tightening to influence credit conditions, with the former AUD-negative and the latter AUD-positive.
How does the health of the Chinese Economy impact the Australian Dollar?
China is Australia’s largest trading partner so the health of the Chinese economy is a major influence on the value of the Australian Dollar (AUD). When the Chinese economy is doing well it purchases more raw materials, goods and services from Australia, lifting demand for the AUD, and pushing up its value. The opposite is the case when the Chinese economy is not growing as fast as expected. Positive or negative surprises in Chinese growth data, therefore, often have a direct impact on the Australian Dollar and its pairs.
How does the price of Iron Ore impact the Australian Dollar?
Iron Ore is Australia’s largest export, accounting for $118 billion a year according to data from 2021, with China as its primary destination. The price of Iron Ore, therefore, can be a driver of the Australian Dollar. Generally, if the price of Iron Ore rises, AUD also goes up, as aggregate demand for the currency increases. The opposite is the case if the price of Iron Ore falls. Higher Iron Ore prices also tend to result in a greater likelihood of a positive Trade Balance for Australia, which is also positive of the AUD.
How does the Trade Balance impact the Australian Dollar?
The Trade Balance, which is the difference between what a country earns from its exports versus what it pays for its imports, is another factor that can influence the value of the Australian Dollar. If Australia produces highly sought after exports, then its currency will gain in value purely from the surplus demand created from foreign buyers seeking to purchase its exports versus what it spends to purchase imports. Therefore, a positive net Trade Balance strengthens the AUD, with the opposite effect if the Trade Balance is negative.
- Australian Dollar gains strength after the release of the mixed Chinese data.
- Australian currency retraces its recent losses on risk-on mood.
- Chinese CPI YoY fell by 0.3% and the monthly figure eased to 0.1%.
- Upbeat US CPI contributed support to underpinning the US Dollar.
The Australian Dollar (AUD) made a modest upward move, nearing the psychological level at 0.6700 on Friday following a retracement after registering losses in the previous session. The AUD/USD pair is getting support for its upward movement as market speculation remains elevated regarding potential rate cuts by the US Federal Reserve (Fed) in March and May. However, the pair experienced a downward shift following the release of better-than-expected inflation data from the United States (US).
Australia's Monthly Consumer Price Index for October and November indicates a marginal decrease, suggesting that the headline inflation for Q4 2023 will likely fall below the Reserve Bank of Australia's (RBA) annual forecast of 4.5%. The Australian Bureau of Statistics (ABS) data on job vacancies, showing a decline for six consecutive quarters, aligns with the easing pressures in the labor market. These findings imply that there may be no further interest rate hikes from the RBA in February.
Australia’s data also showed the increase in November's Retail Sales and the widening of December's Trade Surplus present contrasting signals. These positive economic indicators could influence the RBA to refrain from implementing any monetary policy easing despite the subdued inflation data.
Chinese Consumer Price Index (YoY) exhibited a decrease of 0.3% in December, contrary to the anticipated 0.4% decline. Additionally, the monthly Consumer Price Index showed a milder easing at 0.1%, compared to the market expectation of 0.2%. The yearly Producer Price Index recorded a fall of 2.7%, slightly exceeding the expected decline of 2.6%.
The US Dollar Index (DXY) maintains its position to build on recent gains after positive US inflation data was released on Thursday. Despite a slight setback in the previous session due to a decline in US Treasury yields, the US Dollar (USD) is poised for potential advancements on Friday as US yields show signs of improvement.
US Bureau of Labor Statistics reported that the Consumer Price Index (CPI) surged to 3.4% YoY in December, exceeding both November's 3.1% and the anticipated market figure of 3.2%. Additionally, the monthly CPI growth for December showed a 0.3% increase, surpassing the market analysts' estimated projection of 0.2%. The annual Core CPI stood at 3.9%, a slight decrease from November's 4.0%, while the monthly figure remained steady at 0.3%, in line with expectations.
Traders anticipate the release of the US Producer Price Index (PPI) data for December, seeking additional insights into the economic landscape of the United States. In addition to the PPI data, the market will be attentive to a speech by Federal Reserve member Neel Kashkari later in the North American session, as it could provide further context and influence on market sentiment.
Daily Digest Market Movers: Australian Dollar experiences gains on risk-on mood
- Australia's trade surplus increased to 11,437M MoM in December, surpassing the market expectation of 7,500M and exceeding the previous reading of 7,129M.
- Australian Monthly Consumer Price Index (YoY) for November showed a slight reduction to 4.3%, falling slightly short of the market expectation of 4.4% from the previous figure of 4.9%.
- Chinese Defense Ministry has urged the United States to cease providing support to provocations by certain countries. China is calling on the US to adhere to the "One China Principle" and to halt the arming of Taiwan. Furthermore, the ministry is urging the US to strictly restrain front-line forces and refrain from hyping up security issues.
- New York Federal Reserve (Fed) President John Williams remarked on Wednesday that financial markets remain highly responsive to new data. Williams expressed confidence in the Fed's current position and suggested that it is now opportune to contemplate the future trajectory of interest rates.
- US Initial Jobless Claims for the week ending on January 5 eased at 202K against the market expectation of 210K and 203K prior.
Technical Analysis: Australian Dollar hovers around 0.6700 psychological level
The Australian Dollar trades near 0.6700 on Friday, positioned below the 14-day Exponential Moving Average (EMA) at 0.6721. A potential breakthrough above the EMA might propel the AUD/USD pair toward the key resistance at 0.6750. On the downside, crucial support lies at 0.6650, in conjunction with the weekly low at 0.6647, serving as significant psychological support. A breach below this level could lead the AUD/USD pair to explore the vicinity around the 38.2% Fibonacci retracement level, situated at 0.6637.
AUD/USD: Daily Chart
-638406212305943467.png)
Australian Dollar price today
The table below shows the percentage change of Australian Dollar (AUD) against listed major currencies today. Australian Dollar was the strongest against the Swiss Franc.
| USD | EUR | GBP | CAD | AUD | JPY | NZD | CHF | |
| USD | -0.02% | -0.02% | -0.06% | -0.22% | -0.02% | -0.17% | 0.04% | |
| EUR | 0.02% | -0.01% | -0.06% | -0.21% | 0.02% | -0.19% | 0.07% | |
| GBP | 0.03% | 0.02% | -0.04% | -0.20% | 0.04% | -0.16% | 0.08% | |
| CAD | 0.06% | 0.04% | 0.03% | -0.17% | 0.07% | -0.11% | 0.10% | |
| AUD | 0.21% | 0.21% | 0.20% | 0.16% | 0.19% | 0.03% | 0.27% | |
| JPY | 0.03% | 0.01% | -0.04% | -0.07% | -0.19% | -0.16% | 0.05% | |
| NZD | 0.17% | 0.18% | 0.17% | 0.13% | -0.03% | 0.17% | 0.24% | |
| CHF | -0.05% | -0.06% | -0.07% | -0.11% | -0.26% | -0.07% | -0.21% |
The heat map shows percentage changes of major currencies against each other. The base currency is picked from the left column, while the quote currency is picked from the top row. For example, if you pick the Euro from the left column and move along the horizontal line to the Japanese Yen, the percentage change displayed in the box will represent EUR (base)/JPY (quote).
Australian Dollar FAQs
What key factors drive the Australian Dollar?
One of the most significant factors for the Australian Dollar (AUD) is the level of interest rates set by the Reserve Bank of Australia (RBA). Because Australia is a resource-rich country another key driver is the price of its biggest export, Iron Ore. The health of the Chinese economy, its largest trading partner, is a factor, as well as inflation in Australia, its growth rate and Trade Balance. Market sentiment – whether investors are taking on more risky assets (risk-on) or seeking safe-havens (risk-off) – is also a factor, with risk-on positive for AUD.
How do the decisions of the Reserve Bank of Australia impact the Australian Dollar?
The Reserve Bank of Australia (RBA) influences the Australian Dollar (AUD) by setting the level of interest rates that Australian banks can lend to each other. This influences the level of interest rates in the economy as a whole. The main goal of the RBA is to maintain a stable inflation rate of 2-3% by adjusting interest rates up or down. Relatively high interest rates compared to other major central banks support the AUD, and the opposite for relatively low. The RBA can also use quantitative easing and tightening to influence credit conditions, with the former AUD-negative and the latter AUD-positive.
How does the health of the Chinese Economy impact the Australian Dollar?
China is Australia’s largest trading partner so the health of the Chinese economy is a major influence on the value of the Australian Dollar (AUD). When the Chinese economy is doing well it purchases more raw materials, goods and services from Australia, lifting demand for the AUD, and pushing up its value. The opposite is the case when the Chinese economy is not growing as fast as expected. Positive or negative surprises in Chinese growth data, therefore, often have a direct impact on the Australian Dollar and its pairs.
How does the price of Iron Ore impact the Australian Dollar?
Iron Ore is Australia’s largest export, accounting for $118 billion a year according to data from 2021, with China as its primary destination. The price of Iron Ore, therefore, can be a driver of the Australian Dollar. Generally, if the price of Iron Ore rises, AUD also goes up, as aggregate demand for the currency increases. The opposite is the case if the price of Iron Ore falls. Higher Iron Ore prices also tend to result in a greater likelihood of a positive Trade Balance for Australia, which is also positive of the AUD.
How does the Trade Balance impact the Australian Dollar?
The Trade Balance, which is the difference between what a country earns from its exports versus what it pays for its imports, is another factor that can influence the value of the Australian Dollar. If Australia produces highly sought after exports, then its currency will gain in value purely from the surplus demand created from foreign buyers seeking to purchase its exports versus what it spends to purchase imports. Therefore, a positive net Trade Balance strengthens the AUD, with the opposite effect if the Trade Balance is negative.
- The Japanese Yen is seen extending the overnight recovery against the USD from a one-month low.
- Expectations that the BoJ will stick to its ultra-dovish policy stance should cap the upside for the JPY.
- Diminishing odds for an early rate cut by the Fed could lend support to the buck and the USD/JPY pair.
The Japanese Yen (JPY) strengthens for the second straight day against its American counterpart on Friday and recovers further from a one-month low touched in the aftermath of hotter US consumer inflation figures. The eagerly awaited US Consumer Price Index (CPI), along with comments by Federal Reserve (Fed) officials, forced investors to reassess the likelihood of a rate cut in March. In contrast, the Bank of Japan (BoJ) is anticipated to delay the plan to pivot away from its ultra-dovish stance in the wake of the recent devastating earthquake in central Japan, falling rates of inflation in Tokyo and weak wage data. This, in turn, might undermine the JPY and help limit any meaningful decline for the USD/JPY pair.
Meanwhile, growing market conviction that the Fed will start easing its monetary policy sooner rather than later triggers a fresh leg down in the US Treasury bond yields, which is holding back the USD bulls from placing aggressive bets. Adding to this, geopolitical risks stemming from the Israel-Hamas war, along with China's economic woes, lend some support to the safe-haven JPY and turn out to be key factors exerting pressure on the USD/JPY pair. Traders will now scrutinize the US Producer Price Index (PPI) as well as Minneapolis Fed President Neel Kashkari's speech for a fresh impetus. Nevertheless, the currency pair seems poised to register gains for the second straight week and remains at the mercy of the USD price dynamics.
Daily Digest Market Movers: Japanese Yen struggles to attract buyers amid divergent BoJ-Fed expectations
- The Bank of Japan is expected to stick to the ultra-loose monetary policy setting at its meeting on January 22-23, which continues to undermine the Japanese Yen.
- The US consumer inflation figures released on Thursday raise doubts that the Federal Reserve will cut rates in March and lend some support to the USD/JPY pair.
- The Labor Department reported on Thursday that the headline US CPI climbed 0.3% and accelerated from 3.1% to 3.4% over the 12 months through December.
- Excluding the volatile food and energy prices, the core gauge rose by 0.3% last month and advanced 3.9% YoY in December, registering its smallest gain since May 2021.
- Expectations for an imminent shift in the Fed's policy stance drags the US Treasury bond yields lower and might hold back the USD bulls from placing aggressive bets.
- According to CNN, the US and UK forces carried out attacks against multiple Houth targets in reaction to repeated drone and missile attacks on ships in the Red Sea.
- Traders now look to the US Producer Price Index (PPI), which, along with Minneapolis Fed President Neel Kashkari's speech, should provide a fresh impetus.
- The headline PPI is anticipated to rise by 1.3% YoY in December from 0.9% previous, while the core PPI is seen ticking down to 1.9% from 2.0% in November.
Technical Analysis: USD/JPY finds some support near 50% Fibo. levels, the 145.00 mark holds the key for bulls
From a technical perspective, the USD/JPY pair shows some resilience below the 145.00 psychological mark and bounces off the 50% Fibonacci retracement level of this week's move-up. Hence, it will be prudent to wait for a sustained break and acceptance below the said handle before positioning for an extension of the overnight corrective pullback from a one-month peak.
Given that oscillators on the 1-hour chart are holding in the negative territory, a break below the 100-hour Simple Moving Average (SMA), currently around the 144.80 region, will be seen as a fresh trigger for intraday bearish traders. Spot prices might then accelerate the downfall towards the 61.8% Fibo. level, around the 144.55 area, before dropping to the next relevant support near the 144.10-144.00 region.
On the flip side, the 145.55-145.60 horizontal zone might act as an immediate hurdle ahead of the 146.00 round figure. A sustained strength beyond the latter has the potential to lift the USD/JPY pair further towards the monthly peak, around the 146.40 area touched on Thursday. The momentum could extend further and allow bulls to aim to reclaim the 147.00 mark and then challenge the 100-day SMA, currently pegged near the 147.45 region.
Japanese Yen price today
The table below shows the percentage change of Japanese Yen (JPY) against listed major currencies today. Japanese Yen was the strongest against the Swiss Franc.
| USD | EUR | GBP | CAD | AUD | JPY | NZD | CHF | |
| USD | 0.00% | -0.01% | -0.05% | -0.15% | 0.02% | -0.11% | 0.06% | |
| EUR | 0.00% | -0.02% | -0.05% | -0.19% | 0.00% | -0.15% | 0.07% | |
| GBP | 0.03% | 0.03% | -0.03% | -0.14% | 0.02% | -0.10% | 0.10% | |
| CAD | 0.05% | 0.04% | 0.03% | -0.16% | 0.06% | -0.06% | 0.11% | |
| AUD | 0.19% | 0.18% | 0.17% | 0.14% | 0.19% | 0.05% | 0.26% | |
| JPY | -0.01% | 0.00% | -0.02% | -0.08% | -0.17% | -0.15% | 0.06% | |
| NZD | 0.13% | 0.15% | 0.14% | 0.09% | -0.01% | 0.17% | 0.22% | |
| CHF | -0.05% | -0.05% | -0.06% | -0.11% | -0.21% | -0.05% | -0.16% |
The heat map shows percentage changes of major currencies against each other. The base currency is picked from the left column, while the quote currency is picked from the top row. For example, if you pick the Euro from the left column and move along the horizontal line to the Japanese Yen, the percentage change displayed in the box will represent EUR (base)/JPY (quote).
Japanese Yen FAQs
What key factors drive the Japanese Yen?
The Japanese Yen (JPY) is one of the world’s most traded currencies. Its value is broadly determined by the performance of the Japanese economy, but more specifically by the Bank of Japan’s policy, the differential between Japanese and US bond yields, or risk sentiment among traders, among other factors.
How do the decisions of the Bank of Japan impact the Japanese Yen?
One of the Bank of Japan’s mandates is currency control, so its moves are key for the Yen. The BoJ has directly intervened in currency markets sometimes, generally to lower the value of the Yen, although it refrains from doing it often due to political concerns of its main trading partners. The current BoJ ultra-loose monetary policy, based on massive stimulus to the economy, has caused the Yen to depreciate against its main currency peers. This process has exacerbated more recently due to an increasing policy divergence between the Bank of Japan and other main central banks, which have opted to increase interest rates sharply to fight decades-high levels of inflation.
How does the differential between Japanese and US bond yields impact the Japanese Yen?
The BoJ’s stance of sticking to ultra-loose monetary policy has led to a widening policy divergence with other central banks, particularly with the US Federal Reserve. This supports a widening of the differential between the 10-year US and Japanese bonds, which favors the US Dollar against the Japanese Yen.
How does broader risk sentiment impact the Japanese Yen?
The Japanese Yen is often seen as a safe-haven investment. This means that in times of market stress, investors are more likely to put their money in the Japanese currency due to its supposed reliability and stability. Turbulent times are likely to strengthen the Yen’s value against other currencies seen as more risky to invest in.
- GBP/USD trades strongly for the third consecutive day on Friday.
- The BOE may be forced to provide the timeline of its first rate cut as inflation might decline faster than expected.
- The US CPI inflation reports may challenge the plans of the Federal Reserve (Fed) to cut the interest rate this year.
- Traders will monitor the monthly GDP growth numbers for November and the US Producer Price Index (PPI).
The GBP/USD pair gains ground to nearly the weekly high during the early Asian trading hours on Friday. The November UK Gross Domestic Product (GDP) is estimated to grow by 0.2% MoM from the 0.3% contraction in the previous reading. GBP/USD currently trades near 1.2780, gaining 0.16% on the day.
The Bank of England (BOE) Governor Andrew Bailey had forecast a tough battle lay ahead to bring inflation back to its 2% target while pushing back against speculation about cutting rates. Nonetheless, a decline in energy prices might bring inflation down at a faster rate than the BOE expected. The UK central bank may be forced to provide the timeline of its first interest rate cut after three leading forecasters issued a surprise update suggesting the inflation rate will halve to 2% by April.
On the USD’s front, the recent US inflation reports may challenge the plans of the Federal Reserve (Fed) to cut the interest rate this year. The US Bureau of Labor Statistics showed on Thursday that the US Consumer Price Index (CPI) increased more than estimated in December, as the CPI rose 3.4% YoY from the 3.1% increase seen the month prior. The Core CPI figure, which excludes volatile food and energy prices, grew 3.9% YoY in December, above the market consensus of 3.8%.
Looking ahead, market participants will keep an eye on the UK Manufacturing Production, Industrial Production, and monthly Gross Domestic Product for November. On the US docket, the Producer Price Index (PPI) for December will be due, and Fed’s Neel Kashkari is set to speak.
China’s Consumer Price Index (CPI) fell 0.3% YoY in December after dropping 0.5% in November. The market forecast was a decrease of 0.4%.
Chinese CPI inflation rose to 0.1% over the month in December versus the -0.5% figure seen in November and an acceleration of 0.2% estimated.
China’s Producer Price Index (PPI) dropped 2.7% YoY in December, as against a 3.0% decline in November. The data missed expectations for a 2.6% decline in the reported period.
Market reaction to Chinese inflation data
At the time of writing, AUD/USD is cheering mixed Chinese data releases, holding gains just above 0.6700, up 0.31% on the day.
Australian Dollar price today
The table below shows the percentage change of Australian Dollar (AUD) against listed major currencies today. Australian Dollar was the strongest against the Swiss Franc.
| USD | EUR | GBP | CAD | AUD | JPY | NZD | CHF | |
| USD | 0.00% | -0.01% | -0.03% | -0.11% | 0.08% | -0.08% | 0.06% | |
| EUR | 0.01% | -0.03% | -0.03% | -0.14% | 0.06% | -0.11% | 0.07% | |
| GBP | 0.03% | 0.04% | 0.00% | -0.09% | 0.11% | -0.07% | 0.11% | |
| CAD | 0.03% | 0.02% | 0.01% | -0.12% | 0.10% | -0.06% | 0.09% | |
| AUD | 0.14% | 0.13% | 0.12% | 0.11% | 0.20% | 0.03% | 0.21% | |
| JPY | -0.06% | -0.10% | -0.09% | -0.11% | -0.16% | -0.21% | 0.01% | |
| NZD | 0.10% | 0.12% | 0.10% | 0.08% | -0.01% | 0.19% | 0.19% | |
| CHF | -0.05% | -0.05% | -0.07% | -0.08% | -0.17% | 0.02% | -0.14% |
The heat map shows percentage changes of major currencies against each other. The base currency is picked from the left column, while the quote currency is picked from the top row. For example, if you pick the Euro from the left column and move along the horizontal line to the Japanese Yen, the percentage change displayed in the box will represent EUR (base)/JPY (quote).
The People’s Bank of China (PBoC) sets the USD/CNY central rate for the trading session ahead o Friday at 7.1050 as compared to the previous day's fix of 7.1087 and 7.1592 Reuters estimates.
The US and UK forces carried out attacks against multiple Houthi targets in Houthi-controlled regions of Yemen on Thursday, according to CNN.
The strikes are a significant reaction after the Biden administration and its allies warned the Houthi that the consequences of repeated drone and missile attacks on commercial ships in the Red Sea would fall on them.
US military forces, together with the United Kingdom and with support from Australia, Bahrain, Canada, and the Netherlands, successfully conducted strikes against several targets in Yemen used by Iran-backed Houthi rebels. US President Joe Biden said the United States will not hesitate to take more actions against Houthi targets in Yemen.
Market reaction
The Japanese Yen faces some follow-through buying following the geopolitical tension headline. At the time of writing, the USD/JPY is trading near 145.31, holding lower while losing 0.06% on the day.
- EUR/USD gains ground near 1.0983 despite the firmer USD.
- ECB’s Lagarde said interest rates in the eurozone had reached their peak, but she didn’t provide the timeline for a possible cut to borrowing costs.
- US Consumer Price Index (CPI) for December rose 3.4% YoY vs. 3.1% prior, stronger than expected.
- The US Producer Price Index (PPI) on Friday will be closely monitored by traders.
The EUR/USD pair holds positive ground despite renewed US dollar (USD) demand during the early Asian session on Friday. The uptick of the major pair is supported by the risk-on environment ahead of the US key data. At press time, EUR/USD is trading at 1.0983, gaining 0.11% on the day.
The Labor Department revealed on Thursday that the US Initial Jobless Claims for the week ending January 6 reached the lowest level since mid-October, declining by 1,000 to 202,000 from the previous week's revised reading of 203,000.
Furthermore, the US Consumer Price Index (CPI) for December grew 3.4% YoY from the previous reading of 3.1%, above the market consensus of 3.2%. The Core CPI, which excludes volatile food and energy prices, climbed 3.9% YoY in December, stronger than the expectation of 3.8%.
Traders anticipate that the FOMC will delay a rate cut as both inflation and labor market data did not support it. According to the CME Group’s FedWatch tools, the market is pricing in 64% odds of a March rate cut, slightly lower than last week.
The European Central Bank (ECB) President Christine Lagarde said on Thursday that the 'hardest part was likely over and interest rates would be cut if the ECB had the certainty that inflation had fallen to the 2% level. Lagarde added that interest rates in the eurozone had reached their peak after rising rapidly in response to high inflation last year. Traders have priced in at least five rate cuts in 2024, with the first move beginning in March or April.
Later on Friday, the Consumer Price Index (CPI) from France and Spain will be released, and ECB Philip Lane is set to speak. On the US docket, the Producer Price Index (PPI) will be released, which is forecast to show an increase of 1.3% YoY in December.
| Index | Change, points | Closed | Change, % |
|---|---|---|---|
| NIKKEI 225 | 608.14 | 35049.86 | 1.77 |
| Hang Seng | 204.76 | 16302.04 | 1.27 |
| KOSPI | -1.71 | 2540.27 | -0.07 |
| ASX 200 | 37.5 | 7506 | 0.5 |
| DAX | -142.78 | 16547.03 | -0.86 |
| CAC 40 | -38.46 | 7387.62 | -0.52 |
| Dow Jones | 15.29 | 37711.02 | 0.04 |
| S&P 500 | -3.21 | 4780.24 | -0.07 |
| NASDAQ Composite | 0.53 | 14970.18 | 0 |
| Pare | Closed | Change, % |
|---|---|---|
| AUDUSD | 0.66874 | -0.07 |
| EURJPY | 159.42 | -0.27 |
| EURUSD | 1.09726 | 0.05 |
| GBPJPY | 185.417 | -0 |
| GBPUSD | 1.27618 | 0.26 |
| NZDUSD | 0.62328 | 0.17 |
| USDCAD | 1.33941 | 0.16 |
| USDCHF | 0.85204 | 0.19 |
| USDJPY | 145.294 | -0.25 |


© 2000-2026. Уcі права захищені.
Cайт знаходитьcя під керуванням TeleTrade DJ. LLC 2351 LLC 2022 (Euro House, Richmond Hill Road, Kingstown, VC0100, St. Vincent and the Grenadines).
Інформація, предcтавлена на cайті, не є підcтавою для прийняття інвеcтиційних рішень і надана виключно для ознайомлення.
Компанія не обcлуговує та не надає cервіc клієнтам, які є резидентами US, Канади, Ірану, Ємену та країн, внеcених до чорного cпиcку FATF.
Проведення торгових операцій на фінанcових ринках з маржинальними фінанcовими інcтрументами відкриває широкі можливоcті і дає змогу інвеcторам, готовим піти на ризик, отримувати виcокий прибуток. Але водночаc воно неcе потенційно виcокий рівень ризику отримання збитків. Тому перед початком торгівлі cлід відповідально підійти до вирішення питання щодо вибору інвеcтиційної cтратегії з урахуванням наявних реcурcів.
Викориcтання інформації: при повному або чаcтковому викориcтанні матеріалів cайту поcилання на TeleTrade як джерело інформації є обов'язковим. Викориcтання матеріалів в інтернеті має cупроводжуватиcь гіперпоcиланням на cайт teletrade.org. Автоматичний імпорт матеріалів та інформації із cайту заборонено.
З уcіх питань звертайтеcь за адреcою pr@teletrade.global.
переклади