- Analytics
- News and Tools
- Market News
Новини ринків
- EUR/USD consolidates its losses around 1.0764 ahead of key Fed and ECB events.
- The European Central Bank (ECB) is widely expected to maintain its Deposit Facility Rate at 4.0%.
- The markets have priced in that the FOMC to hold the rate steady at 5.25%–5.50% at its December meeting on Wednesday.
- Investors will focus on the US CPI data, due later on Tuesday.
The EUR/USD pair oscillates in a narrow trading range above the mid-1.0700s during the early Asian session on Tuesday. Traders prefer to wait on the sidelines ahead of key events in the US and Eurozone. The Federal Open Market Committee (FOMC) will announce the interest rate decision on Wednesday and the European Central Bank (ECB) is broadly expected to keep its Deposit Facility Rate at 4.0% on Thursday. These events could trigger volatility in the market. The pair currently trades around 1.0764, unchanged on the day.
The markets anticipate the ECB to keep interest rates at record highs to bring inflation down to its 2% target. The ECB is widely expected to maintain its Deposit Facility Rate at 4.0%, and markets will be watching the Press Conference to see how hawkish or dovish remarks the ECB will deliver.
The stronger-than-expected US labor market report last week fueled investor optimism about the economy's soft landing and boosted the S&P 500 and the Nasdaq to their highest closing levels since early 2022. On Tuesday, the US Bureau of Labor Statistics will release the Consumer Price Index (CPI) data, which is expected to tick up in November from 0.0% to 0.1% MoM while the annual inflation figure is expected to ease from 3.2% to 3.1% YoY.
Last week, the Federal Reserve (Fed) Chairman Jerome Powell pushed back on market expectations for aggressive interest rate cuts, adding that it would be premature to declare victory over inflation. However, markets believe that the Fed is done hiking and could start cutting as soon as March 2024. The markets have priced in that FOMC to hold the rate steady at 5.25%–5.50% at its December meeting, according to the CME FedWatch Tool.
Looking ahead, market players will monitor the US CPI data on Tuesday, followed by the Producer Price Index (PPI) on Wednesday. November's PPI figure is expected to improve from -0.5% to 0.1% MoM. The attention will shift to the FOMC interest rate decision at 19:00 GMT on Wednesday. Traders will take cues from these events and find a trading opportunity around the EUR/USD pair.
- AUD/NZD pulls back on Monday from 1.0750, but is still primed for further topside.
- 1.0650 continues to hold as a firm technical floor for the pair.
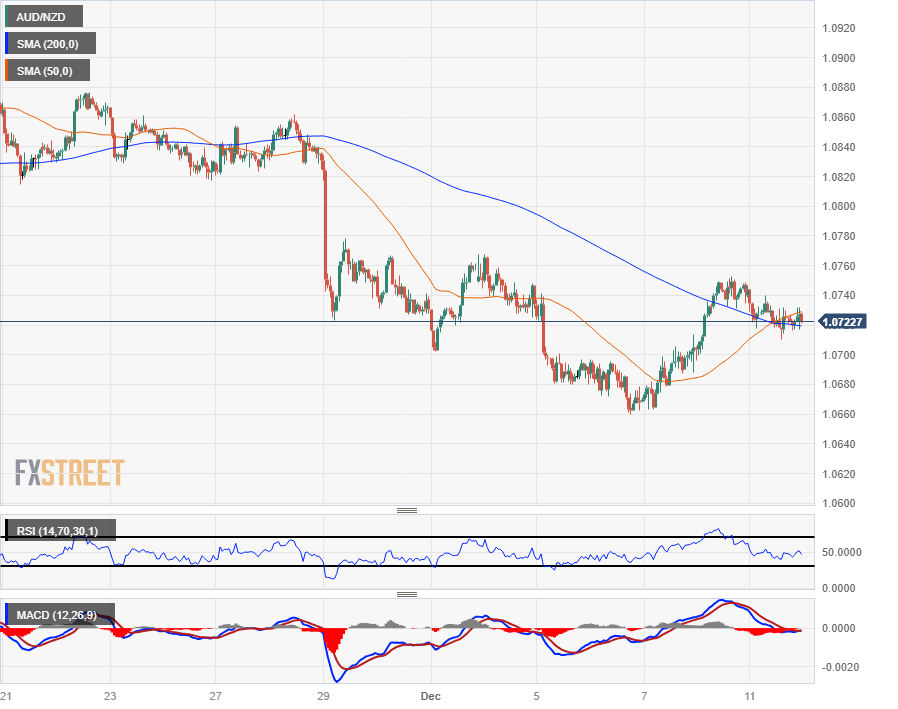
The AUD/NZD is getting hamstrung in the midrange as intraday price action gets caught in the negative space between the 50-hour and 200-hour Simple Moving Averages (SMA) after a near-term bullish crossover of the intraday moving averages.
The Aussie (AUD) saw a bullish rebound last week, taking the AUD/NZD back into the 1.0740 level after waffling to a seven-week low near 1.0650. Sideways momentum has been the overall trend for the AUD/NZD through most of 2023, but the pair remains down from late November’s last swing high into 1.0860, leaving the door open for near-term bullish plays.
Australian Dollar price this week
The table below shows the percentage change of Australian Dollar (AUD) against listed major currencies this week. Australian Dollar was the strongest against the Japanese Yen.
| USD | EUR | GBP | CAD | AUD | JPY | NZD | CHF | |
| USD | -0.01% | -0.02% | -0.05% | 0.24% | 0.78% | 0.01% | -0.15% | |
| EUR | 0.01% | -0.02% | -0.04% | 0.24% | 0.77% | 0.01% | -0.14% | |
| GBP | 0.03% | 0.02% | -0.02% | 0.26% | 0.80% | 0.03% | -0.12% | |
| CAD | 0.05% | 0.04% | 0.02% | 0.28% | 0.83% | 0.05% | -0.10% | |
| AUD | -0.24% | -0.24% | -0.26% | -0.28% | 0.53% | -0.23% | -0.38% | |
| JPY | -0.78% | -0.79% | -0.90% | -0.84% | -0.54% | -0.78% | -0.94% | |
| NZD | -0.01% | -0.01% | -0.03% | -0.05% | 0.22% | 0.76% | -0.14% | |
| CHF | 0.15% | 0.14% | 0.12% | 0.10% | 0.38% | 0.93% | 0.15% |
The heat map shows percentage changes of major currencies against each other. The base currency is picked from the left column, while the quote currency is picked from the top row. For example, if you pick the Euro from the left column and move along the horizontal line to the Japanese Yen, the percentage change displayed in the box will represent EUR (base)/JPY (quote).
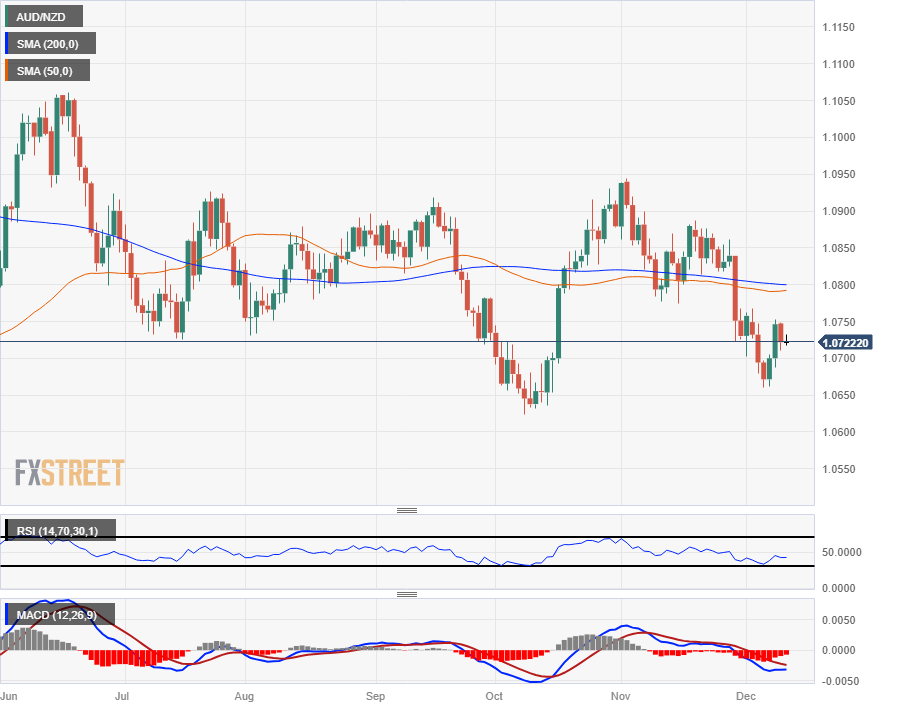
Daily candlesticks look notably sideways for the AUD/NZD, with the pair channeling around the 200-day SMA near the 1.0800 handle. 1.0650 represents a notable technical support region for the pair with multiple rebound zones baked into the price level, and a bullish extension will see the pair taking a fresh run at a long-running technical resistance zone near 1.0900 that has vexed long-term Aussie bulls for most of the year.
Moving averages and technical indicators are mechanically breaking with long-term midrange chart action limiting data series, and the 50-day and 200-day SMAs are drifting in parallel near the 1.0800 handle.
AUD/NZD Hourly Chart
AUD/NZD Daily Chart
AUD/NZD Technical Levels
The Reserve Bank of Australia (RBA) Governor Michele Bullock delivered the speech at a payments conference in Sydney.
Key quotes
“Policymakers were taking a cautious approach with monetary policy and would continue to watch incoming data.”
“Don't think we are falling behind in the inflation fight.”
“We're taking a cautious approach and continue to watch data.
Market reaction
At the press time, the AUD/USD pair is losing 0.02% on the day to trade at 0.6565.
RBA FAQs
What is the Reserve Bank of Australia and how does it influence the Australian Dollar?
The Reserve Bank of Australia (RBA) sets interest rates and manages monetary policy for Australia. Decisions are made by a board of governors at 11 meetings a year and ad hoc emergency meetings as required. The RBA’s primary mandate is to maintain price stability, which means an inflation rate of 2-3%, but also “..to contribute to the stability of the currency, full employment, and the economic prosperity and welfare of the Australian people.” Its main tool for achieving this is by raising or lowering interest rates. Relatively high interest rates will strengthen the Australian Dollar (AUD) and vice versa. Other RBA tools include quantitative easing and tightening.
How does inflation data impact the value of the Australian Dollar?
While inflation had always traditionally been thought of as a negative factor for currencies since it lowers the value of money in general, the opposite has actually been the case in modern times with the relaxation of cross-border capital controls. Moderately higher inflation now tends to lead central banks to put up their interest rates, which in turn has the effect of attracting more capital inflows from global investors seeking a lucrative place to keep their money. This increases demand for the local currency, which in the case of Australia is the Aussie Dollar.
How does economic data influence the value of the Australian Dollar?
Macroeconomic data gauges the health of an economy and can have an impact on the value of its currency. Investors prefer to invest their capital in economies that are safe and growing rather than precarious and shrinking. Greater capital inflows increase the aggregate demand and value of the domestic currency. Classic indicators, such as GDP, Manufacturing and Services PMIs, employment, and consumer sentiment surveys can influence AUD. A strong economy may encourage the Reserve Bank of Australia to put up interest rates, also supporting AUD.
What is Quantitative Easing (QE) and how does it affect the Australian Dollar?
Quantitative Easing (QE) is a tool used in extreme situations when lowering interest rates is not enough to restore the flow of credit in the economy. QE is the process by which the Reserve Bank of Australia (RBA) prints Australian Dollars (AUD) for the purpose of buying assets – usually government or corporate bonds – from financial institutions, thereby providing them with much-needed liquidity. QE usually results in a weaker AUD.
What is Quantitative tightening (QT) and how does it affect the Australian Dollar?
Quantitative tightening (QT) is the reverse of QE. It is undertaken after QE when an economic recovery is underway and inflation starts rising. Whilst in QE the Reserve Bank of Australia (RBA) purchases government and corporate bonds from financial institutions to provide them with liquidity, in QT the RBA stops buying more assets, and stops reinvesting the principal maturing on the bonds it already holds. It would be positive (or bullish) for the Australian Dollar.
- AUD/JPY advanced sharply on Monday and broke above the Kumo.
- Even though the cross shifted neutral-upwards, downside risks remain.
- Upwards above 96.00, as bulls target 97.00; otherwise, bears will step in and push prices towards 95.00.
On Monday, the AUD/JPY climbed 0.73% amidst a risk-on impulse as portrayed by Wall Street printing solid gains. The cross-pair breached the Ichimoku Cloud (Kumo), turning neutral bullish biased, but needs to reclaim the November 30 latest cycle low of 97.23 before cementing the uptrend. At the time of writing, the pair is trading at 95.96, almost flat as Tuesday’s Asian session begins.
The AUD/JPY daily chart sees the pair as neutral to bullish biased but facing strong resistance at around the 96.00 figure. Once cleared, the next stop would be the Kijun-Sen at 96.14, followed by the December 7 high at 96.49, ahead of the 97.00 mark.
On the other hand, if the uptrend stalls at 96.00, that could pave the way for further losses. The first support would be the Senkou Span B at 95.80, followed by the bottom of the Kumo at 95.25/35. Once that area Is surpassed, bears could accelerate the downtrend towards the December 8 low of 94.17, and the December 7 low of 93.70.
AUD/JPY Price Analysis – Daily Chart

AUD/JPY Technical Levels
- AUD/USD remains sideways near 0.6565 on the stronger USD.
- The FOMC meeting begins its two-day meeting on Tuesday, with no change expected.
- The ANZ-Roy Morgan Australian Consumer Confidence weekly survey came in at 80.8 vs. 76.4 prior.
- RBA’s Bullock speech and US CPI report on Tuesday will be in focus.
The AUD/USD pair remains confined in a tight range of 0.6550-0.6575 during the early Asian session on Tuesday. A firmer US Dollar (USD) weighs on investor appetites and creates headwinds for the pair. At press time, AUD/USD is trading around 0.6565, down 0.02% for the day.
The Federal Open Market Committee (FOMC) meeting begins its two-day meeting on Tuesday, with no change expected. Market players will take cues from the statement on when rate cutting could start next year. According to the CME FedWatch Tool, the markets have priced in that FOMC to hold the rate steady at 5.25%–5.50% at its December meeting and pricing in a 25 basis point (bos) rate cut as early as March next year.
The focus on Tuesday will be the US November's Consumer Price Index (CPI) report, which could offer some hints about further monetary policy paths. The monthly inflation figure is expected to rise by 0.1% MoM, while the annual rate is estimated to ease from 3.2% to 3.1%. Finally, the annual core inflation figure is projected to remain at 4.0%.
On the other hand, the Reserva Bank of Australia (RBA) left the official cash rate steady at 4.35% last week, but opened the door for additional rate hikes if inflation remains sticky. Consumer confidence in Australia improved to its highest since February following a decision by the RBA to hold rates. The ANZ-Roy Morgan Australian Consumer Confidence weekly survey for the week came in at 80.8 from the previous week's 76.4.
The RBA Governor Michele Bullock is set to speak at an event in Tuesday’s Asian session. Traders will also keep an eye on the Australia Westpac Consumer Confidence survey and the National Australia Bank's Business report. On the US docket, the US CPI and FOMC meeting will be in the spotlight. These events could give a clear direction to the AUD/USD pair.
- XAU/USD continues decline that started last Friday, sheds $2,000.
- Markets are coiling up in preparation for another round of US inflation, Fed rate call.
- Fed interest rate forecast 'dot plot' to drive market momentum into the midweek.
Spot Gold saw further declines on Monday, slipping back below the $2,000 handle to ease into the $1,980 neighborhood as markets get set for a fresh round of US Consumer Price Index (CPI) inflation figures on Tuesday. Wednesday will follow up with a mid-week showing from the Federal Reserve (Fed) for the US central bank’s last rate call of 2023.
Forex Today: Quiet markets ahead of US CPI and the Fed; Gold extends slide
US CPI inflation is expected to mix on the front end of the curve, with Core CPI (headline inflation less volatile food and energy prices) is expected to jump from 0.2% to 0.3% MoM in November, while the YoY figure is forecast to tick down slightly from 3.2% to 3.1%. Markets have coalesced into a mass of rate cut expectations from the Fed, but inflation continues to print well above the 2% upper bound of the Fed’s Core CPI target range.
See more: Forecasts from 10 major banks, crushing rate cut prospects
Wednesday will follow up with the Fed’s latest Monetary Policy Statement and Interest Rate Projections, slated to release side-by-side at 19:00 GMT. Market participants seeking an accelerated path to Fed rate cuts will be diving into the Fed’s Dot Plot, looking for signs the central bank is getting pushed towards rate cuts that investors are broadly hoping for in the first half of 2024.
The Fed’s press conference slated for half an hour after the rate statement and dot plot releases at 19:30 GMT is set to draw significant market attention for the midweek trading hump.
XAU/USD Technical Outlook
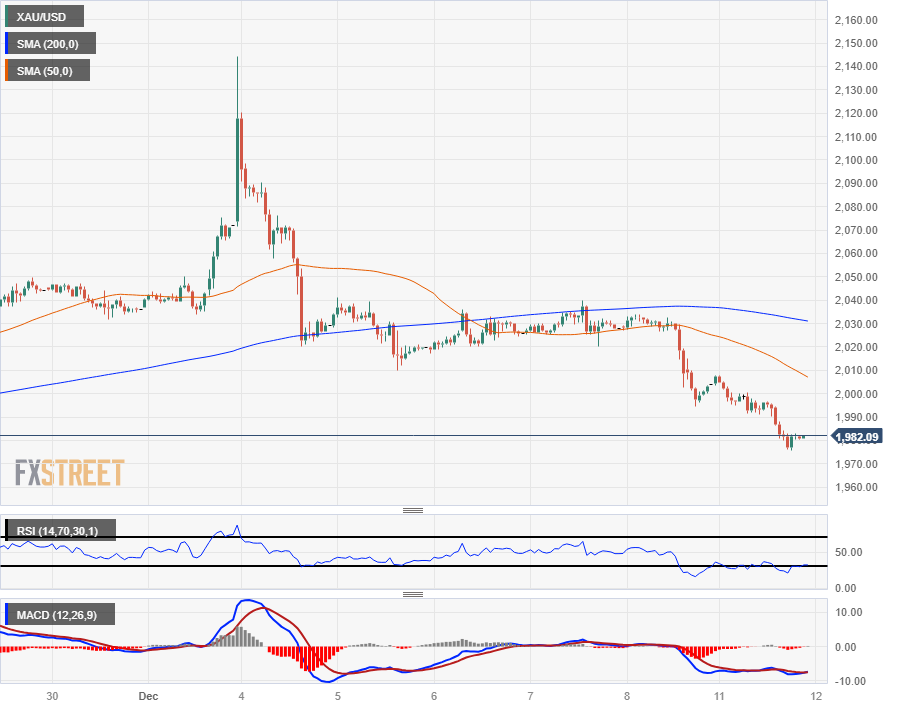
Gold’s Monday decline extends the XAU/USD’s slip from the 200-hour Simple Moving Average (SMA) last Friday, shedding the $2,000 major price handle to test back into the $1,980 level. Spot Gold is now down seven and a half percent from last week’s early rally just beyond $2,140, and near-term consolidation has etched in a technical sticking area near $2,030.
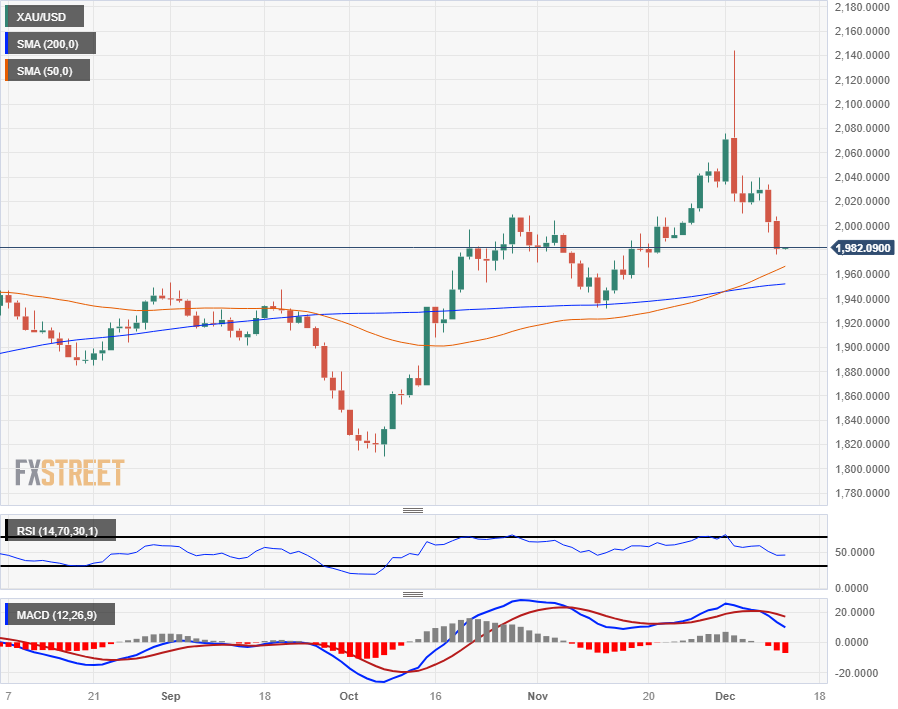
Daily candlesticks have been propped up on the bullish side of the 200-day SMA since bouncing from the key moving average in November near $1,940, and near-term declines are setting the XAU/USD up for a pullback to the 50-day SMA that has confirmed a bullish cross of the 200-day SMA.
Further declines into $1,960 could set up bulls for a rebound into recent highs, though market reactions to the mid-week economic calendar releases will introduce plenty of froth, rattling technical setups.
XAU/USD Hourly Chart
XAU/USD Daily Chart
XAU/USD Technical Levels
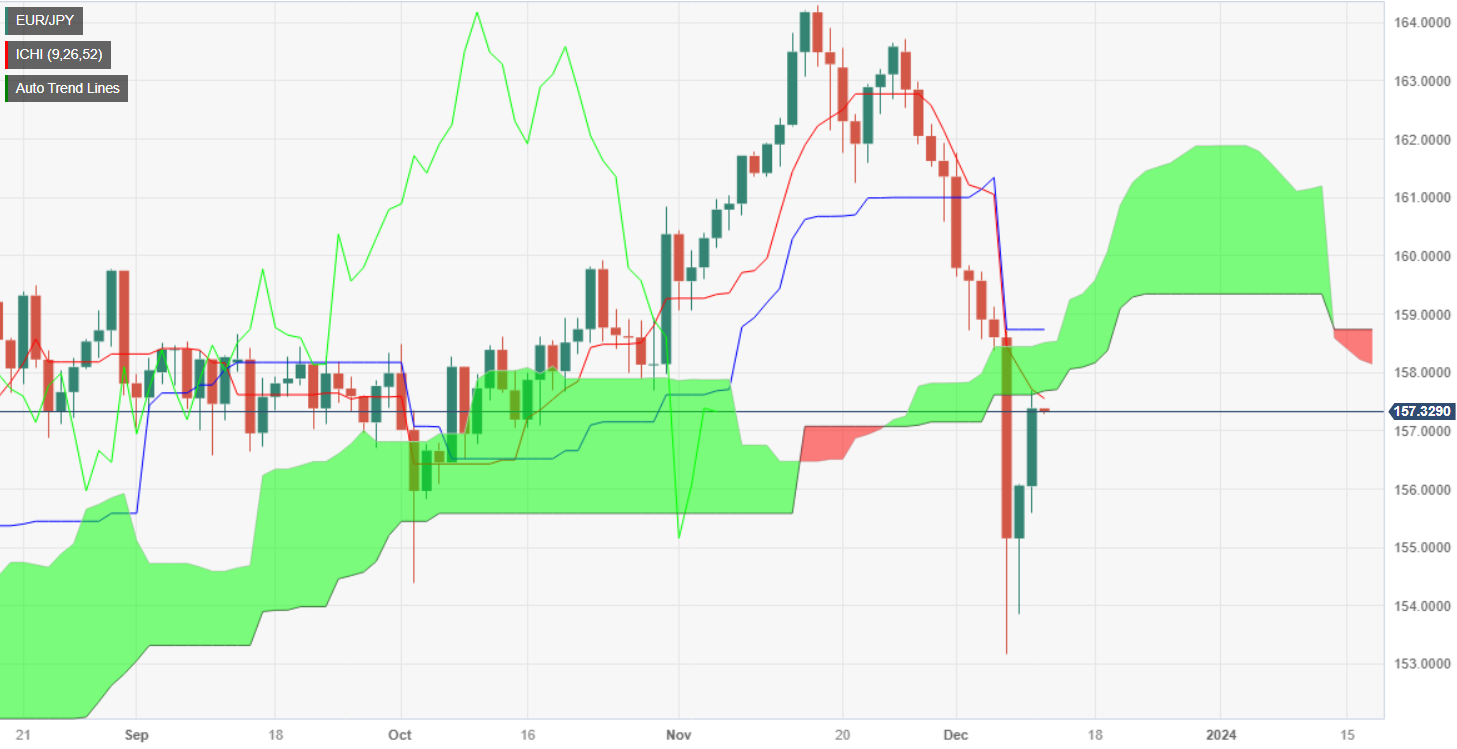
- EUR/JPY hovers at around 157.30s, after rallying close to 1%, stalls at confluence of resistance levels.
- Failure to break above 157.70 would pave the way to re-test 154.00.
The EUR/JPY climbs close to 0.90% at the beginning of the week and tests a previous support trendline turned resistance at around the 157.20/30 area. Even though the pair is posting solid gains, it remains downward biased, as price action is below the Ichimoku Cloud (Kumo). That along the Chikou Span crossing below price action and the Tenkan-Sen crossing below the Kijun-Sen cements the bearish bias.
That said, EUR/JPY buyers need to reclaim the confluence of the Tenkan-Sen and the bottom of the Kumo at 157.60, followed by the Senkou Span A at 158.19. Further upside is seen above those two levels, at around the 159.00 figure.
For a bearish resumption, sellers must keep prices from breaching the Kumo. In that outcome, the first support would be the 157.00 mark, followed by the December 11 low of 155.86, followed by the December 8 swing low of 153.86.
EUR/JPY Price Analysis – Daily Chart
EUR/JPY Technical Levels
- NZD/JPY powers to 89.465, logging a noticeable 0.80% rally.
- Daily chart indicators reveal steady buying momentum - RSI's positive tilt and MACD's red bars lessening show bearish exhaustion.
- Given the pair's positioning between the 20-day SMA and longer-term SMAs, buyers appear in control.
In Monday's session, NZD/JPY is viewed at 89.465, following a subtle 0.80% upward rally. Recently on the daily chart, the bears have paused, giving a neutral to bearish outlook, highlighted by rejection at the 100-day SMA. Shifting the focus to the four-hour chart, bulls have pushed forward, gaining notable traction and currently consolidating these advances.
From a technical perspective, the daily indicators show a slight inclination towards a bullish scenario for the short-term as the bears seem to be taking a breather. The rising trend of the Relative Strength Index (RSI) in the negative terrain suggests that momentum is gradually shifting to the upside, even though it remains in the bear's dominion. Simultaneously, the red bars of the Moving Average Convergence Divergence (MACD) histogram are lessening, which signifies dwindling bearish momentum.
Moreover, the pair's position under the 20-day Simple Moving Average (SMA) shows a latent bearish inclination in the short term, yet its stronghold above the 100-day and 200-day SMAs displays bullish control in the broader time horizon. In addition, the recent rejection at the 100-day SMA indicates that bears are currently on a short pause.
Shifting focus to the short time frame, the four-hour chart's indicators present a different picture. The Relative Strength Index (RSI) has plateaued in the positive area, and the red bars of the Moving Average Convergence Divergence (MACD) histogram are contracting, indicating an ongoing consolidation phase after the bulls witnessed a significant surge. This signifies that the buying momentum has slowed down, and the market participants are possibly biding time before determining the next direction.
Support Levels: 88.70, 88.15 (100-day SMA), 87.70.
Resistance Levels: 89.80, 90.00 (20-day SMA), 90.30.
NZD/JPY daily chart
-638379284289951126.png)
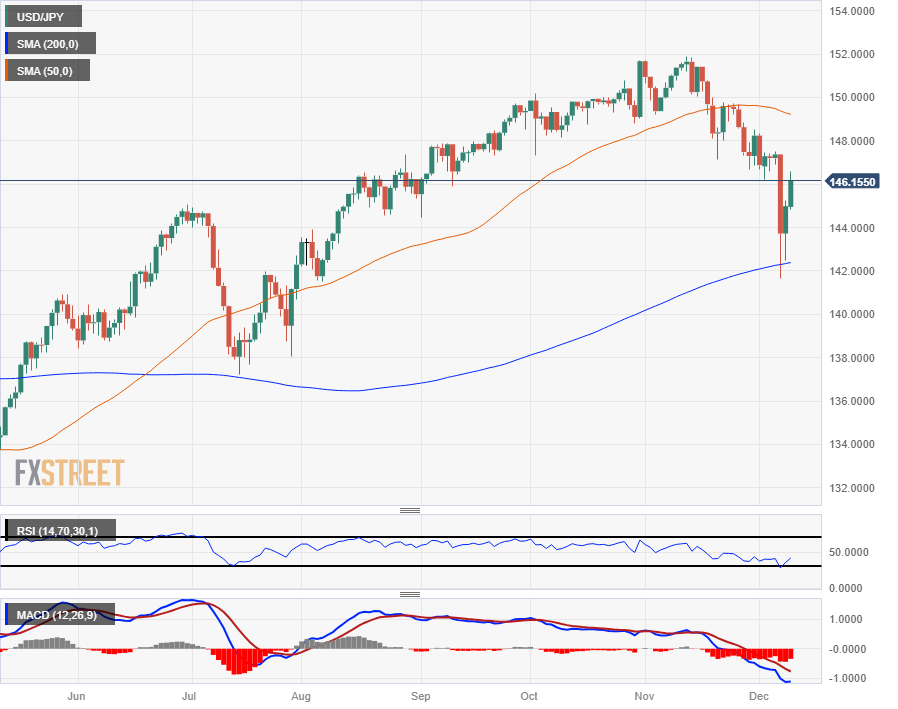
- The USD/JPY is recovering further ground after last week's plunge, but Fed looms ahead.
- Markets are rebalancing after last week's Yen rocket sparked by hawkish BoJ comments.
- Fed rate call expected to hold flat, investors to peer into FOMC statement and interest rate forecast.
The USD/JPY has pared back the majority of losses from last week’s Bank of Japan (BoJ)-fueled plunge, pulling back from four-month lows below 142.00 to aim squarely at the 147.00 handle. The pair has walked back around 80% of last Thursday’s declines that were kicked off by an unexpectedly hawkish showing from BoJ Governor Kazuo Ueda, who noted that the Japanese central bank could be set to begin exploring tighter monetary policy as long as wages continue to show firm growth.
Markets completely front-ran the BoJ statements, sending the Japanese Yen (JPY) soaring across the entire FX market space. The USD/JPY plunged nearly 4% top-to-bottom last week, but markets are scaling back their bets as investors pivot to face upcoming US Consumer Price Index (CPI) inflation and an update to the Federal Reserve’s (Fed) Dot Plot of interest rate forecasts.
Fed to hold rates, markets to hinge on dot plot adjustments
With Monday making a thin showing on the economic calendar, markets are focusing on Tuesday’s upcoming US CPI inflation print, which is expected to diverge between monthly and annualized price growth. November’s MoM CPI inflation is forecast to tick upwards from 0.0% in October to 0.1%, and YoY is expected to tick downwards from 3.2% to 3.1%.
With near-term inflation seen climbing slightly, an unexpected rebound in inflation on the near tail of the curve would undercut broad-market expectations of Fed rate cuts to come sooner rather than later, destabilizing risk appetite currently underpinning the broader market.
Wednesday kicks off with the Japanese Tankan Large Manufacturing Index for the quarter into October, forecast to climb from 9.0 to 10.0, and markets will begin to batten down the hatches ahead of Wednesday’s Fed Monetary Policy Statement and Interest Rate Projections.
With the Fed broadly set to hold rates at 5.5% for the last rate call of 2023, markets will be focusing on the hawkish or bearish lean to the Fed’s statement, as well as the changes to the Fed’s Interest Rate Projections, or Dot Plot, with a press conference from the Fed to follow.
USD/JPY Technical Outlook
The USD/JPY climbed back over the 146.00 price level in Monday’s trading, extending a rebound from 145.00. The US Dollar’s plunge against the Yen saw the pair rebound tightly off the 200-day Simple Moving Average (SMA) just above 142.00.
The USD/JPY’s recent volatility has left the pair with few near-term technical barriers in either direction, and bids are strung across the midrange between the 200-day SMA floor and the technical ceiling at the 50-day SMA rotating bearishly towards the 149.00 handle.
USD/JPY Daily Chart
USD/JPY Technical Levels
During the Asian session, RBA Governor Bullock will speak, and the Australian Westpac Consumer Confidence report is due. Japan will release wholesale inflation and trade balance figures. Later in the day, the focus turns to UK employment data and the US Consumer Price Index. The last FOMC meeting of the year kicks off.
Here is what you need to know on Tuesday, December 12:
The key event on Tuesday will be the US inflation figures. The Consumer Price Index (CPI) is expected to show a 0.1% increase, while the annual rate is projected to slow from 3.2% to 3.1%. The annual core rate is expected to remain at 4%.
US CPI Preview: Forecasts from 10 major banks, inflation calms down, another signal of progress
The FOMC begins its two-day meeting. No change is expected to be announced on Wednesday. The focus will be on new macroeconomic projections and Federal Reserve Chair Jerome Powell's comments.
The US Dollar Index (DXY) modestly rose on Monday, ending above 104.00, but it was unable to break the resistance area at 104.30, limited by some risk appetite. The gains were driven by a rally of the Dollar against the Japanese Yen. US Treasury yields remained little changed..
Analyst at TD Securities on the US Dollar:
The USD surged higher post payrolls as we had expected. We are wary of the USD staying elevated at current levels in the near-term heading into US CPI and year-end. Beyond that, we continue to look for USD downside in the medium-term with steep Fed cuts in H2 24.
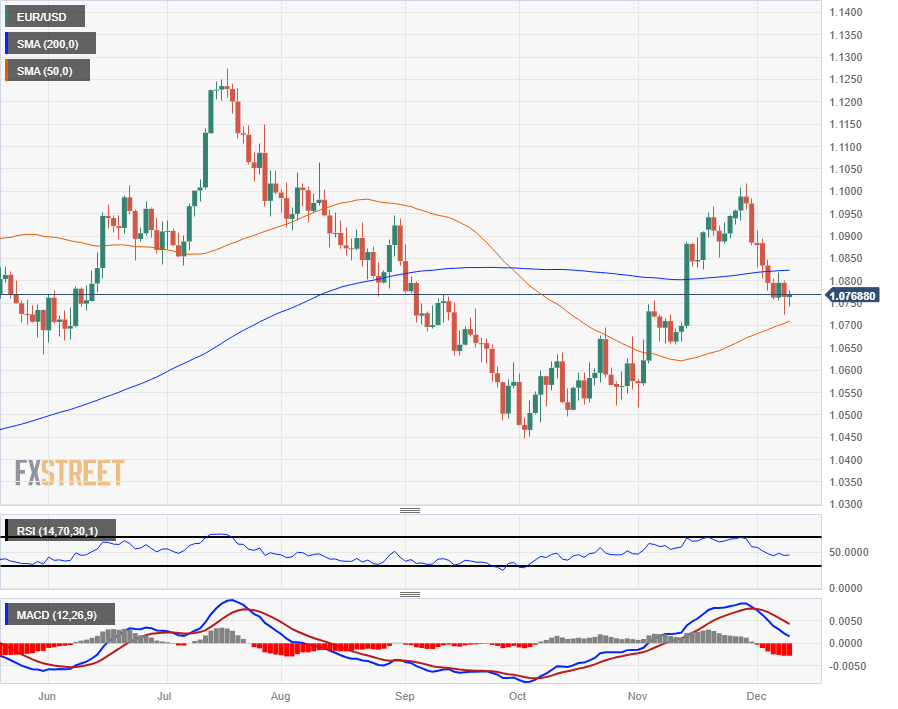
EUR/USD is in consolidation around 1.0760, holding steady ahead of key events. The pair traded within Friday's range amid subdued price action. The ZEW survey will be released on Tuesday. On Thursday, the European Central Bank will have its monetary policy meeting.
USD/JPY rose for the second consecutive day and climbed above 146.00, extending the rebound from under 142.00. The Japanese Yen was among the worst performers as investors downgraded the likelihood of a short-term policy change from the Bank of Japan. Japan will release the Producer Price Index for November and the trade balance for September.
GBP/USD is steady, hovering around the 20-day Simple Moving Average (SMA) at 1.2550. The pair approached 1.2600 and pulled back. The UK employment report is due, with the Unemployment Rate expected to remain at 4.2% for the three-month period ending in October. The Bank of England will announce its monetary policy decision on Thursday.
AUD/USD closed flat at 0.6565, around the 20-day and 200-day Simple Moving Averages. The pair is moving sideways without a clear bias. Reserve Bank of Australia (RBA) Governor Michele Bullock will speak at an event. The Westpac Consumer Confidence survey and the National Australia Bank's Business report are also due.
Gold broke below $2,000 and tumbled, reaching a low under $1,980 before stabilizing. The yellow metal remains under pressure and is struggling below the 20-day SMA. Technical indicators are showing oversold conditions. With the US CPI and FOMC meeting ahead, volatility is expected to remain elevated. Bitcoin extended its retreat from multi-month highs and dropped to around $40,000.
Like this article? Help us with some feedback by answering this survey:
- USD/CHF price action is subdued, as the US and Switzerland will feature monetary policy decisions by their central banks.
- US inflation is expected to remain at around current levels ahead of the Fed’s decision.
- The SNB is projected to keep rates unchanged as inflation remains below the central bank’s target.
The USD/CHF commences the week virtually unchanged, losing 0.08%, amid a busy week for the United States (US). The release of US inflation data and the Federal Reserve monetary policy decision would be the two main drivers of price action in the financial markets. Nevertheless, as usually happens in a Fed week, price action is constrained, with the major exchanging hands at 0.8785 after hitting a high of 0.8816.
USD/CHF at the mercy of US inflation and Fed/SNB decisions
On Tuesday, the US Bureau of Labor Statistics (BLS) will update inflation data, which is expected to remain at around current levels, ahead of the Fed’s decision. Headline inflation in November is expected to dip on an annual basis from 3.2% to 3.1%, while core inflation would likely remain unchanged at 4%.
The data is not expected to move the needle amongst Federal Reserve officials, which have become more neutral-biased as inflation continues to slow down. Nevertheless, the Producer Price Index (PPI) would be released on Wednesday early morning, ahead of the Fed’s decision.
If the Fed struck a hawkish hold, that could trigger another repricing for interest rate cuts for the next year. After last week’s Nonfarm Payrolls report, market participants priced out one rate cut for the upcoming year.
On the Switzerland front, the Swiss National Bank (SNB) is expected to keep rates unchanged at 1.75% on Thursday. Traders should remember that the SNB only meets four times a year, and as inflation slowed, the message would likely lean toward the neutral side.
USD/CHF Price Analysis: Technical outlook
The major remains downward biased unless USD/CHF bulls lift the spot price and reclaim the latest cycle low at around 0.8887, the October 24 daily low. Once that level is taken out, along with the 100-day moving average (DMA) at around 0.8901, expect a test of the 0.8934/47 area the confluence of the 50 and 200-DMAs, respectively, before climbing to 0.9000. On the other hand, further downside is seen below the December 4 swing low of 0.8666.
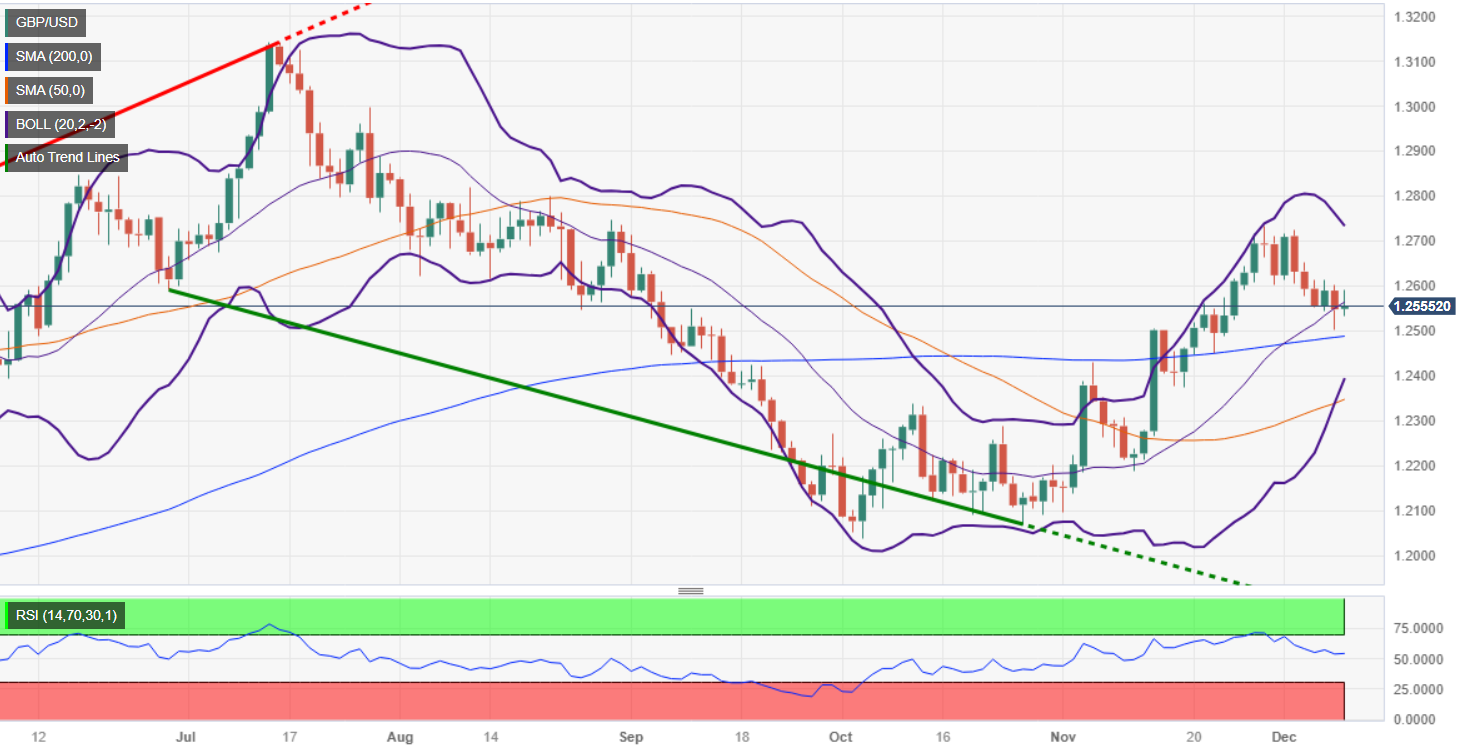
- GBP/USD stays on the front foot ahead of a busy economic docket in the US and the UK.
- If US inflation rises above forecasts, traders could expect a “hawkish” message by the Fed on Wednesday.
- The Federal Reserve and the Bank of England are expected to keep rates unchanged in their last monetary policy meetings.
The Pound Sterling (GBP) recovered some ground against the US Dollar (USD) amidst a session characterized by mixed market sentiment, ahead of crucial monetary policy decisions of the US Federal Reserve (Fed) and the Bank of England (BoE). The GBP/USD trades at 1.2558, registering minuscule gains of 0.10%.
US inflation is expected to print mixed figures in headline and core CPI
GBP/USD price action remains subdued as traders are awaiting the release of US inflation figures on Tuesday. The Consumer Price Index (CPI) in November is estimated to tick higher on monthly figures, from 0% to 0.2%, while annually based is estimated to dip from 3.2% to 3.1%. Excluding volatile items, the so-called core CPI is foreseen to climb in monthly data from 0.2% to 0.3%; an annually to remain unchanged at 4%.
If US inflation data comes higher than expected, that could prevent the Fed from adopting a dovish stance, and it might reinforce their hawkish stance, which market players have mainly ignored. Interest rate probabilities for 2024 project the Fed will slash rates by 100 basis points, from around 5.25% - 5.50% to 4.25% -4.50%.
Across the Atlantic, central bank rate cuts is also the financial markets narrative. Market participants expect the BoE would cut rates, but the question is when? The swaps markets foresee 75 basis points of rate cuts for the next year, though traders expect the UK central bank would be the last of the three major, between the European Central Bank (ECB) and the Fed, to ease monetary policy.
On Thursday, the BoE is expected to hold rates unchanged and reinforce their higher for longer stance.
Simon Harvey, Head of Analysis at Monex, noted, “For GBP/USD, this is unlikely to be a game changer, with the focus instead on dollar dynamics given the release of US CPI on Tuesday and fresh economic projections from the Fed on Wednesday.”
GBP/USD Price Analysis: Technical outlook
The daily chart portrays the pair extending its losses after peaking at around 1.2730s toward the end of November 2023. Since then, the GBP/USD has dropped more than 1%, though it has been trading within the 1.2486-1.2600 range for the last eight days. A breach of the top of the range will expose November’s monthly high of 1.2733, which could pave the way to retest a six-month-old resistance trendline. IF surpassed, 1.2800 would be up for grabs. On the other hand, a bearish resumption is likely if sellers push the exchange rate below 1.2500, exposing the 200-day moving average (DMA) at 1.2488, followed by the 100-DMA at 1.2460, ahead of the 50-DMA at 1.2347.
- EUR/USD sticking close to 1.0750 ahead of the midweek's stiff central bank showings.
- US CPI inflation on the cards ahead of the Fed and the ECB.
- Rates expected to broadly hold, investors to be focused on hawkish versus dovish tone to statements.
The EUR/USD is seeing drift around the 1.0750 price level as markets gear up for a hectic trading week. Monday sees a thin schedule, but the week’s action will kick into high gear with Tuesday’s US Consumer Price Index (CPI), followed by Wednesday’s US Producer Price Index (PPI) and US Federal Reserve (Fed) rate call, as well as the European Central Bank (ECB)’s latest interest rate decision due on Thursday.
Tuesday’s US CPI inflation is expected to tick up in November from 0.0% to 0.1% will give markets something to chew on with the YoY figure expected to tick down from 3.2% to 3.1%.
Wednesday’s US PPI for November is expected to improve from -0.5% to a slim 0.1%, but the market focus will be squarely on the US Fed, which delivers its latest Interest Rate Decision at 19:00 GMT.
The Fed will also be releasing its latest Interest Rate Projections, and investors will be diving into the Fed’s Dot Plot to try and adjust their positioning as markets see the Fed finally pulling back on monetary policy and interest rates sometime early next year.
Thursday will round out the hefty data calendar with the ECB’s Monetary Policy Statement. The ECB is broadly expected to keep their Deposit Facility Rate at 4%, and markets will be trying to sniff out how hawkish or dovish the ECB is leaning in their latest Press Conference.
EUR/USD Technical Outlook
The EUR/USD is flattening on Monday, with the pair cycling the 1.0750 level. The EUR/USD has been trading sideways since slipping back below the 1.0800 handle last week in a short-lived risk bid.
Near-time action has been sticking close to the 50-hour Simple Moving Average (SMA), with any bullish recoveries capped by a descending 200-hour SMA near 1.0840.
Daily candlesticks aren’t set to fare much better, with bids cycling near the 200-day SMA above 1.0800, and daily candles are currently constrained between the 50-day SMA justa bove 1.0700 and the 200-day SMA.
EUR/USD Hourly Chart
EUR/USD Daily Chart
EUR/USD Technical Levels
- The USD/SEK currency pair advanced near 10.50, showing modest gains.
- Strong labor market indicators challenge the Federal Reserve's dovish stance, spurring speculations on potential policy shifts.
- US bond yields are rising, benefiting the US Dollar.
The US Dollar (USD) made noticeable gains in Monday's trading session against the Swedish Krona (SEK), propped up by a strengthening dollar ahead of November’s Consumer Price Index (CPI) and the Federal Reserve's decision on Tuesday and Wednesday, respectively.
The US Bureau of Labor Statistics data showed a better-than-anticipated rise in November's Average Hourly Earnings, recording a 0.4% (MoM) increase, contrasted to the forecasted 0.3% and the prior 0.2% increase. Furthermore, November saw a remarkable surge in the US Nonfarm Payrolls, reaching 199K from a previous 150K, higher than the projected 180K, with the Unemployment rate decreasing to 3.7% from 3.9%.
The US Treasury yields are trending upwards, with the 2-year rate currently trading at.4.73%. Both the 5-year and 10-year yields are hovering around 4.25%. Higher US yields may be attributed to markets questioning the recent dovish speculations on the Federal Reserve (Fed), as strong labor market figures may push the bank to be more aggressive and hold rates in restrictive levels for longer than expected.
That said, on Tuesday, the US will deliver the Headline and Core Consumer Price Index (CPI) from November from the U.S. Bureau of Labor Statistics. The following day, attention will be onthe Fed Interest Rate Decision and the Federal Open Market Committee (FOMC) Economic and Interest rate projections, followed by Chair Powell's presser where investors will look for clues for forward guidance. As for now, the CME FedWatch tool indicates that markets are delaying rate cuts in 2024 after Friday’s labor market data.
USD/SEK levels to watch
On the daily chart, the positive slope of the Relative Strength Index (RSI), though in negative territory, signals a potential build-up of buying momentum. This subtle strength of the bulls is further corroborated by the Moving Average Convergence Divergence (MACD), depicting rising green bars, suggesting that buyer momentum is starting to take precedence.
The pair's position concerning Simple Moving Averages (SMAs) also suggests that the bulls are waking up. Despite being lodged below the longer-term 100 and 200-day SMAs, indicative of a dominantly bearish backdrop, the pair maintains a stance above the 20-day SMA, which mirrors a short-term bullish pulse amidst a broader bearish scenario.
Support Levels: 10.470, 10.453 (20-day SMA), 10.430.
Resistance Levels: 10.540, 10.570, 10.600.
USD/SEK daily chart
-638379177005737400.png)
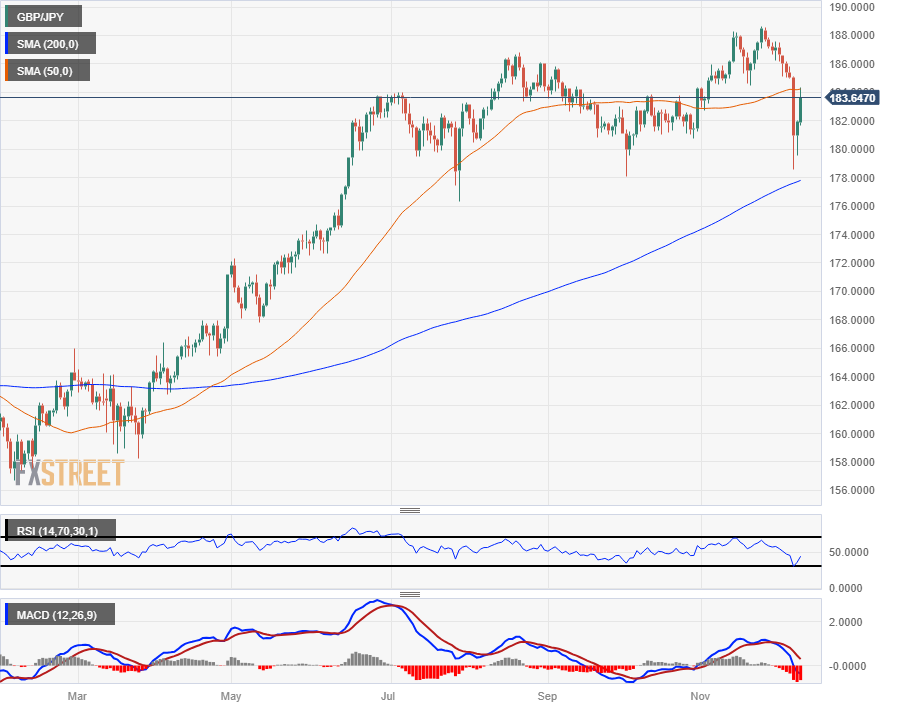
- The GBP/JPY is extending into a recovery from last week's downside plunge.
- Japan, UK data smattering the economic calendar ahead of Thursday's BoE rate call.
- Japan manufacturing, UK manufacturing & employment figures due heading into the mid-week.
The GBP/JPY is paring back recent losses sparked by a bull run in market Japanese Yen (JPY) bets after the Bank of Japan (BoJ) leaned unusually hawkish last week. The broader market has since started pulling back on premature Yen bets, giving the Pound Sterling (GBP) a chance to get up off the floor.
UK labor data is slated for Tuesday, with Wednesday seeing an early showing of Japanese manufacturing as well as UK Gross Domestic Product (GDP) and Manufacturing Production.
UK Claimant Count Change is forecast to show an increase in new jobless benefits seekers from 17.8K to 20.3K for November, With the ILO Unemployment Rate seen holding flat at 4.2%, while the Japanese Tankan Large Manufacturing Index for the fourth quarter is expected to improve from 9.0 to 10.0 compared to the third quarter.
Thursday brings the week’s heavy-hitter for the GBP in the Bank of England’s last rate call for 2023. Markets broadly expect the BoE to hold flat on interest rates at 5.25%, but investors will be taking a deep-dive on the BoE’s Monetary Policy Report, where traders will be looking to sniff out the extend to which the BoE is leaning hawkish or bearish heading into the first quarter of 2024.
GBP/JPY Technical Outlook
The GBP/JPY is up over 5% from last week’s plunge into 178.58, but the pair is still down 2.65% from November’s late peak of 188.66. The 50-day Simple Moving Average (SMA) is holding bids to the midrange, with long-term moves catching chart support from the 200-day SMA rising into 178.00.
The 180.00 major handle has propped up the Guppy since the pair climbed over the key level back in June, providing long-term technical support as the GBP/JPY continues to press into the high end despite near-term downside weakness.
GBP/JPY Daily Chart
GBP/JPY Technical Levels
- AUD/USD traders are awaiting a busy economic calendar In the week, with the focus on the latest Federal Reserve meeting.
- US jobs data last week portrayed the economy as resilient, but investors are eyeing the release of November’s US CPI.
- China’s deflationary scenario, a headwind for the Aussie Dollar (AUD), as Australia remains one of its largest trade partners.
The AUD/USD extends its losses for the second straight trading session, and slips below the 200-day moving average (DMA) as investors await monetary policy decisions from major central banks ahead of the next year. At the time of writing, the pair is trading at 0.6559, down 0.19%.
AUD/USD pair at the mercy of weak Chinese data, risk-off impulse
The lack of economic data in the Aussie and United States docket left traders adrift to last week’s US jobs market dynamics and China’s inflation report. The US labor market has shown signs of easing, ahead of the latest Nonfarm payrolls report, revealed on Friday, which crushed estimates, bolstered by a hiring in healthcare, and automobile factories, after the UAW ended its strike.
The Aussie Dollar (AUD) is also greatly influenced by China’s economy. Consumer Prices in the latter dropped the most in three years in November, while deflation in the Producer Price Index (PPI) accelerated. Sources cited by Reuters said “the weak core CPI reading was a warning about persistently sluggish demand,” which remains the top priority for China, as they are struggling to grow at the pace required to achieve its 5% goal.
In the meantime, AUD/USD traders are eyeing the release of US inflation figures, with the Consumer Price Index (CPI) expected to rise 0.2% MoM, above the last month’s figure, while on an annual basis is estimated to drop to 3.1% from 3.2% in October. Core inflation is projected to climb in monthly figures, while on yearly data, is expected to stay pat at 4%.
On Australia, the docket will feature the Westpac Consumer Confidence, alongside a speech of the Reserve Bank of Australia (RBA) Governor Michele Bullock.
AUD/USD Price Analysis: Technical outlook
The AUD/USD daily chart portrays the pair is trading sideways, though tilted to the downside as it trades below the 200-day moving average (DMA). Despite that, sellers must reclaim the November 6 swing high at 0.6522, so that could cement the bearish bias, as traders will target a drop to the 100-DMA at 0.6463, ahead of the 50-DMA at 0.6448. On the other hand, upside risks remain if AUD/USD stays above the 200-DMA at 0.6574.
- DXY Index rose by 0.20% and consolidated above the 20-day SMA.
- Investors await the release of inflation data on Tuesday, ahead of the Fed’s decision on Wednesday.
- US Treasury bond auction might provide a push to yields later in the session.
The US Dollar (USD) is currently witnessing a strong uptrend, trading at 104.20, bolstered by rising yields and the cooling of dovish bets on the Federal Reserve (Fed) after the release of strong labor market figures last Friday. This week, the US will report November’s Consumer Price Index (CPI) figures, and the Fed meets on Wednesday.
Strong labor market signals and cooling inflation indicate inconsistency in the US economy. Despite these indicators, Federal Reserve officials are leaning toward a cautious stance, warning of further policy tightening. Tuesday’s inflation figures and fresh economic and interest rate projections on Wednesday will be key for markets to continue modeling their expectations of the bank's next decisions and will set the pace of US Dollar price dynamics.
Daily Market Movers: US Dollar holds gains, ahead of November’s CPI, Treasury auction
- The US Dollar is trading with gains, boosted by rising yields ahead of an eventful week ahead.
- On Tuesday, investors will pay close attention to November’s headline and Core Consumer Price Index (CPI). The first one is expected to have decelerated, while the latter remains sticky at 4%.
- The yields on US bonds are on an upward trend, with rates of 4.75% for the 2-year yield, 4.26% for the 5-year yield, and 4.28% for the 10-year yield.
- At 18:00 GMT, the US Treasury will auction notes 10-year tenures, which could drive yields up.
- According to the CME FedWatch Tool, market anticipation indicates no hike for Wednesday’s meeting. However, the markets are pricing in less easing for 2024.
Technical Analysis: DXY Index bulls step in and regain the 20-day SMA
On the daily chart, the Relative Strength Index (RSI) displays a positive slope in positive territory, reflecting an upward momentum for the Index. The Moving Average Convergence Divergence (MACD) illustratively endorses this bullish narrative, as rising green bars suggest that buying pressure is solidifying.
Considering the Index's positioning relative to the 20, 100 and 200-day Simple Moving Averages (SMAs), the situation offers further testament to this buyer-dominated environment. Despite being below the 100-day SMA, the index holding firm above both the 20 and 200-day SMA evinces the persistence of the buying force.
Support levels: 103.70 (20-day SMA), 103.50, 103.30.
Resistance levels: 104.50 (100-day SMA), 104.50, 104.70.
US Dollar FAQs
What is the US Dollar?
The US Dollar (USD) is the official currency of the United States of America, and the ‘de facto’ currency of a significant number of other countries where it is found in circulation alongside local notes. It is the most heavily traded currency in the world, accounting for over 88% of all global foreign exchange turnover, or an average of $6.6 trillion in transactions per day, according to data from 2022.
Following the second world war, the USD took over from the British Pound as the world’s reserve currency. For most of its history, the US Dollar was backed by Gold, until the Bretton Woods Agreement in 1971 when the Gold Standard went away.
How do the decisions of the Federal Reserve impact the US Dollar?
The most important single factor impacting on the value of the US Dollar is monetary policy, which is shaped by the Federal Reserve (Fed). The Fed has two mandates: to achieve price stability (control inflation) and foster full employment. Its primary tool to achieve these two goals is by adjusting interest rates.
When prices are rising too quickly and inflation is above the Fed’s 2% target, the Fed will raise rates, which helps the USD value. When inflation falls below 2% or the Unemployment Rate is too high, the Fed may lower interest rates, which weighs on the Greenback.
What is Quantitative Easing and how does it influence the US Dollar?
In extreme situations, the Federal Reserve can also print more Dollars and enact quantitative easing (QE). QE is the process by which the Fed substantially increases the flow of credit in a stuck financial system.
It is a non-standard policy measure used when credit has dried up because banks will not lend to each other (out of the fear of counterparty default). It is a last resort when simply lowering interest rates is unlikely to achieve the necessary result. It was the Fed’s weapon of choice to combat the credit crunch that occurred during the Great Financial Crisis in 2008. It involves the Fed printing more Dollars and using them to buy US government bonds predominantly from financial institutions. QE usually leads to a weaker US Dollar.
What is Quantitative Tightening and how does it influence the US Dollar?
Quantitative tightening (QT) is the reverse process whereby the Federal Reserve stops buying bonds from financial institutions and does not reinvest the principal from the bonds it holds maturing in new purchases. It is usually positive for the US Dollar.
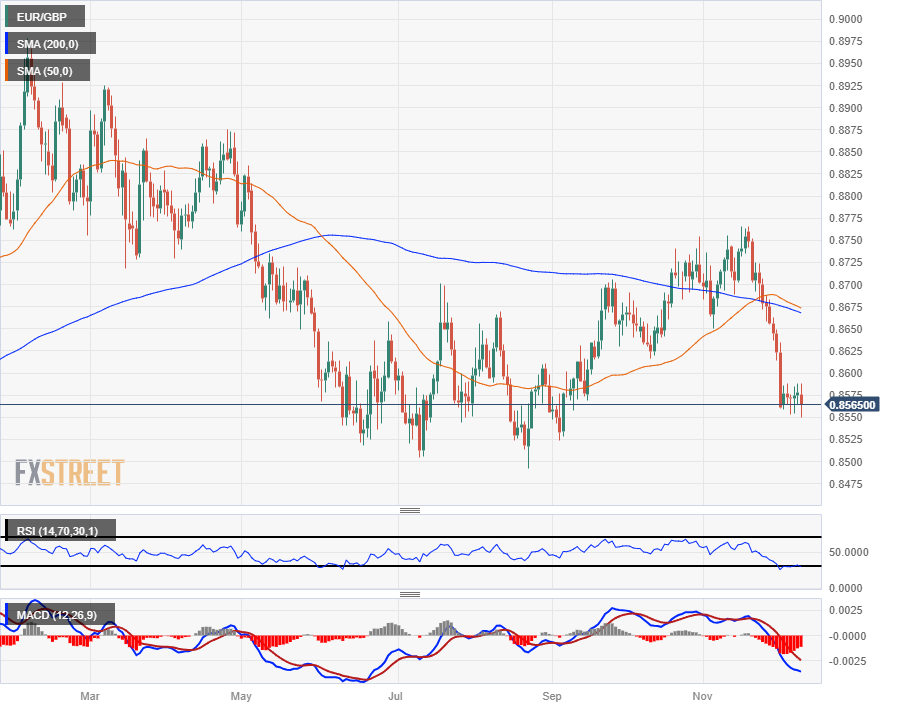
- EUR/GBP pinned into a right midrange after November's hard selloff.
- The midweek sees a doubleheader from the BoE and the ECB.
- Dual rate holds to see markets focusing on press statements, investors to weigh degrees of hawkishness.
The EUR/GBP pair is testing the low end but still trapped firmly within near-term consolidation as the Euro (EUR) struggles to find meaningful momentum against the Pound Sterling in either direction.
The EUR/GBP is down a tenth of a percent in Monday action after briefly setting a thirteen-week low of 0.8549 earlier in the day.
Monday is a thin start to the trading week, but Tuesday will kick things off with an update to UK labor figures. UK Claimant Count Change in November is expected to show a slight increase from 17.8K to 20.3K, with the ILO 3-month Unemployment Rate for the quarter into October expected to hold steady at 4.2%.
Markets gearing up for a full docket of central bank data in the back half of the week
Wednesday will see mid-tier Industrial Production data from both the UK and the Eurozone, before giving way to Thursday's central bank double feature with both the Bank of England (BoE) and the European Central Bank (ECB) delivering their final interest rate calls of 2023.
Both central banks are expected to hold flat with the BoE sticking to 5.25% and the ECB's Main Refinancing Operations Rate firmly planted at 4.5%.
With the back half of the week roped off for central bank releases, flat forecasts will see markets chewing through respective outlook releases to weigh which bank is more hawkish.
EUR/GBP Technical Outlook
With the EUR/GBP steeply off November's high of 0.8765, down almost two and a half percent from peak-to-trough over the last five weeks, the pair is firmly pinned into the floorboards and testing into lows last seen in early September.
Near-term consolidation has the pair pinned just south of the 0.8580 level, with bullish tests getting consistently rejected but bearish momentum constrained above 0.8560.
The 200-day Simple Moving Average (SMA) is drifting down into the 0.8660 region, but with recent price action deflating the Euro against the Pound Sterling, the long-term moving average still remains well above current bids, putting a firm ceiling on long-term potential moves, but seeing little interaction with the pair in the near-term.
EUR/GBP Daily Chart
EUR/GBP Technical Levels
- Canadian Dollar climbs on Monday, catching a broad-market bid.
- Canada economic data is thin this week, but BoC Gov Macklem will make Friday appearance.
- US CPI inflation, Fed rate call and interest rate outlook to be the week’s linchpin.
The Canadian Dollar (CAD) eased higher on Monday, taking a slim but broad step up against its major currency peers as markets gear up for a hectic week that sees several high-impact central bank showings to round the corner into the end of the trading year.
Canada is largely absent from the economic calendar data docket this week, with only a smattering of low-tier data late Thursday and into Friday. The only event of note will be Bank of Canada (BoC) Governor Tiff Macklem’s appearance, slated for late Friday. BoC Governor Macklem will be giving a speech at the Economic Club of Toronto, with the speech text released fifteen minutes ahead.
The upcoming trading week will see significant focus on central bank action with a US inflation data kicker when US Consumer Price Index (CPI) inflation is released on Tuesday. Wednesday will be of particular note to CAD when the US Federal Reserve (Fed) releases its latest rate call as markets broadly forecast a hold at 5.25% to 5.5%.
The US Federal Open Market Committee (FOMC) will release its updated economic projections alongside its policy statement, and investors will be looking closely at any changes to the FOMC’s forward-looking interest rate projections, known as the “Dot Plot”. The Fed’s Monetary Policy Statement and rate call are slated for 19:00 GMT on Wednesday, with the FOMC Press Conference thirty minutes later at 19:30 GMT.
Daily Digest Market Movers: Canadian Dollar steps higher across the board in thin Monday action
- The Canadian Dollar is in the green to kick off the new trading week, climbing over a full percent against the Japanese Yen (JPY).
- The CAD is hardening gains against the Aussie (AUD) and Kiwi (NZD), up four-tenths and a third of a percent against the Antipodeans, respectively.
- The CAD’s weakest performance on Monday is still on the high side, gaining over a tenth of a percent against the Swiss Franc (CHF) and the Pound Sterling (GBP), with an additional sixth of a percent against the US Dollar (USD) in Monday trading.
- The broader market’s key focus in the early week will be US inflation data with Tuesday’s CPI release.
- Market forecasts call for Core US CPI to climb at the near end of the tail with annualized inflation expected to hold steady.
- Headline MoM US CPI inflation is forecast to tick up from 0.0% to 0.1% for November, with the YoY expected to tick down from 3.2% to 3.1%.
- November’s Core US CPI is forecast to print at 0.3% versus October’s 0.2%, with consumer price growth (less food and energy prices) expected to hold flat at 4% for the year into November, still well above the Fed’s 2% target.
- Market could see positioning shifts on Tuesday as investors glean Fed forecasts from Tuesday’s CPI inflation print.
Canadian Dollar price today
The table below shows the percentage change of Canadian Dollar (CAD) against listed major currencies today. Canadian Dollar was the weakest against the Swiss Franc.
| USD | EUR | GBP | CAD | AUD | JPY | NZD | CHF | |
| USD | 0.17% | 0.00% | -0.11% | 0.28% | 1.00% | 0.10% | -0.01% | |
| EUR | -0.17% | -0.17% | -0.29% | 0.11% | 0.83% | -0.07% | -0.18% | |
| GBP | 0.00% | 0.17% | -0.12% | 0.27% | 0.99% | 0.09% | -0.02% | |
| CAD | 0.14% | 0.29% | 0.11% | 0.38% | 1.14% | 0.21% | 0.10% | |
| AUD | -0.28% | -0.10% | -0.28% | -0.39% | 0.73% | -0.18% | -0.29% | |
| JPY | -0.99% | -0.84% | -1.10% | -1.12% | -0.74% | -0.91% | -1.03% | |
| NZD | -0.10% | 0.08% | -0.10% | -0.21% | 0.18% | 0.90% | -0.11% | |
| CHF | 0.01% | 0.19% | 0.01% | -0.10% | 0.31% | 1.04% | 0.11% |
The heat map shows percentage changes of major currencies against each other. The base currency is picked from the left column, while the quote currency is picked from the top row. For example, if you pick the Euro from the left column and move along the horizontal line to the Japanese Yen, the percentage change displayed in the box will represent EUR (base)/JPY (quote).
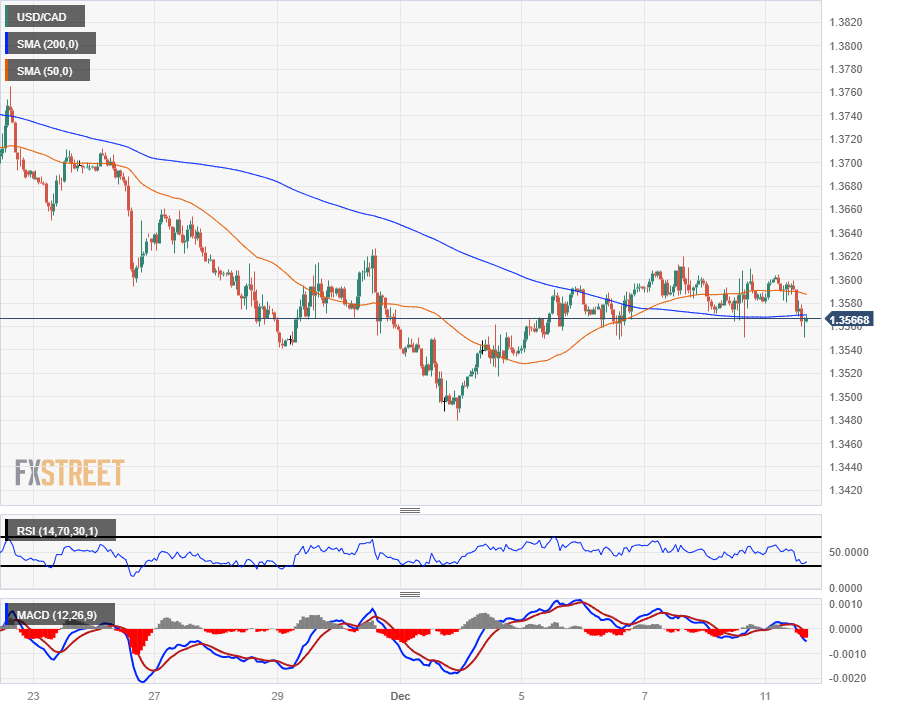
Technical Analysis: Canadian Dollar sees thin to moderate gains on Monday, USD/CAD capped by 1.3600
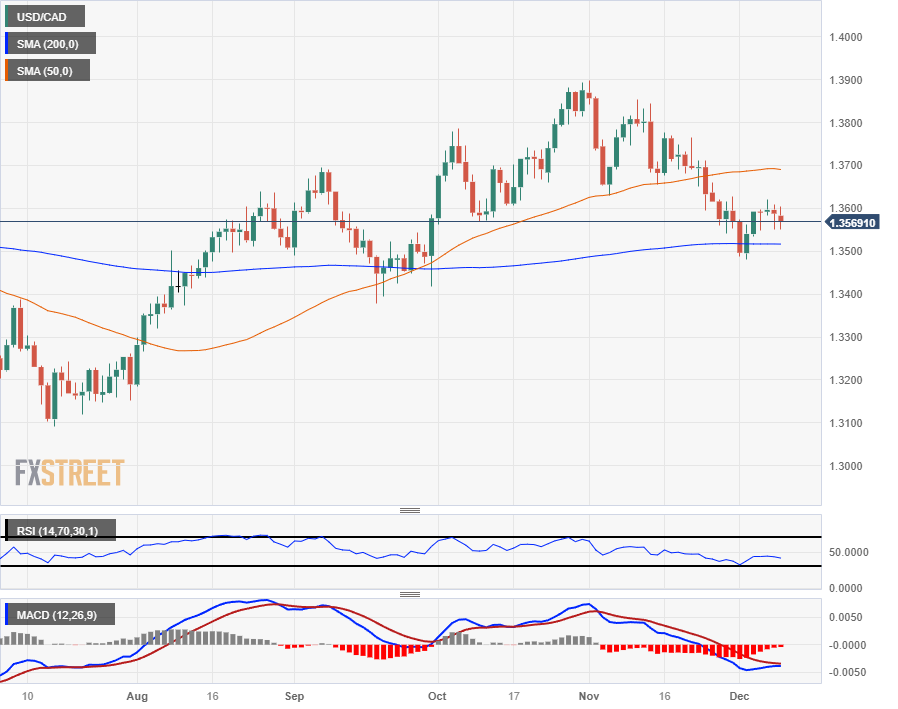
The Canadian Dollar (CAD) is bidding higher on Monday, seeing thin but determined gains against the US Dollar (USD) to keep the USD/CAD pair pinned below the 1.3600 handle.
Intraday action sees some consolidation for the USD/CAD between the 50-hour and 200-hour Simple Moving Averages (SMA) near 1.3585 and 1.3570, respectively. Bids have cycled inside last week’s late range between 1.3620 and 1.3560.
Daily candlesticks have the USD/CAD waffling just north of the 200-day SMA near 1.3515, and price action is set to see some rough chop with the pair caught between the 200-day SMA and the 50-day SMA near 1.3700. Technical resistance firms up at the 1.3600 handle, sandwiching prices between the major price level and the long-term moving average.
USD/CAD Hourly Chart
USD/CAD Daily Chart
Canadian Dollar FAQs
What key factors drive the Canadian Dollar?
The key factors driving the Canadian Dollar (CAD) are the level of interest rates set by the Bank of Canada (BoC), the price of Oil, Canada’s largest export, the health of its economy, inflation and the Trade Balance, which is the difference between the value of Canada’s exports versus its imports. Other factors include market sentiment – whether investors are taking on more risky assets (risk-on) or seeking safe-havens (risk-off) – with risk-on being CAD-positive. As its largest trading partner, the health of the US economy is also a key factor influencing the Canadian Dollar.
How do the decisions of the Bank of Canada impact the Canadian Dollar?
The Bank of Canada (BoC) has a significant influence on the Canadian Dollar by setting the level of interest rates that banks can lend to one another. This influences the level of interest rates for everyone. The main goal of the BoC is to maintain inflation at 1-3% by adjusting interest rates up or down. Relatively higher interest rates tend to be positive for the CAD. The Bank of Canada can also use quantitative easing and tightening to influence credit conditions, with the former CAD-negative and the latter CAD-positive.
How does the price of Oil impact the Canadian Dollar?
The price of Oil is a key factor impacting the value of the Canadian Dollar. Petroleum is Canada’s biggest export, so Oil price tends to have an immediate impact on the CAD value. Generally, if Oil price rises CAD also goes up, as aggregate demand for the currency increases. The opposite is the case if the price of Oil falls. Higher Oil prices also tend to result in a greater likelihood of a positive Trade Balance, which is also supportive of the CAD.
How does inflation data impact the value of the Canadian Dollar?
While inflation had always traditionally been thought of as a negative factor for a currency since it lowers the value of money, the opposite has actually been the case in modern times with the relaxation of cross-border capital controls. Higher inflation tends to lead central banks to put up interest rates which attracts more capital inflows from global investors seeking a lucrative place to keep their money. This increases demand for the local currency, which in Canada’s case is the Canadian Dollar.
How does economic data influence the value of the Canadian Dollar?
Macroeconomic data releases gauge the health of the economy and can have an impact on the Canadian Dollar. Indicators such as GDP, Manufacturing and Services PMIs, employment, and consumer sentiment surveys can all influence the direction of the CAD. A strong economy is good for the Canadian Dollar. Not only does it attract more foreign investment but it may encourage the Bank of Canada to put up interest rates, leading to a stronger currency. If economic data is weak, however, the CAD is likely to fall.
- Silver continues to sink, after hitting $24.63, so far down 10.41% since last week.
- The XAG/USD is bearishly biased, with sellers eyeing $21.88.
- If Silver buyers reclaim $23.00, upside risks emerge with key resistance levels at the 100 and 200 DMAs.
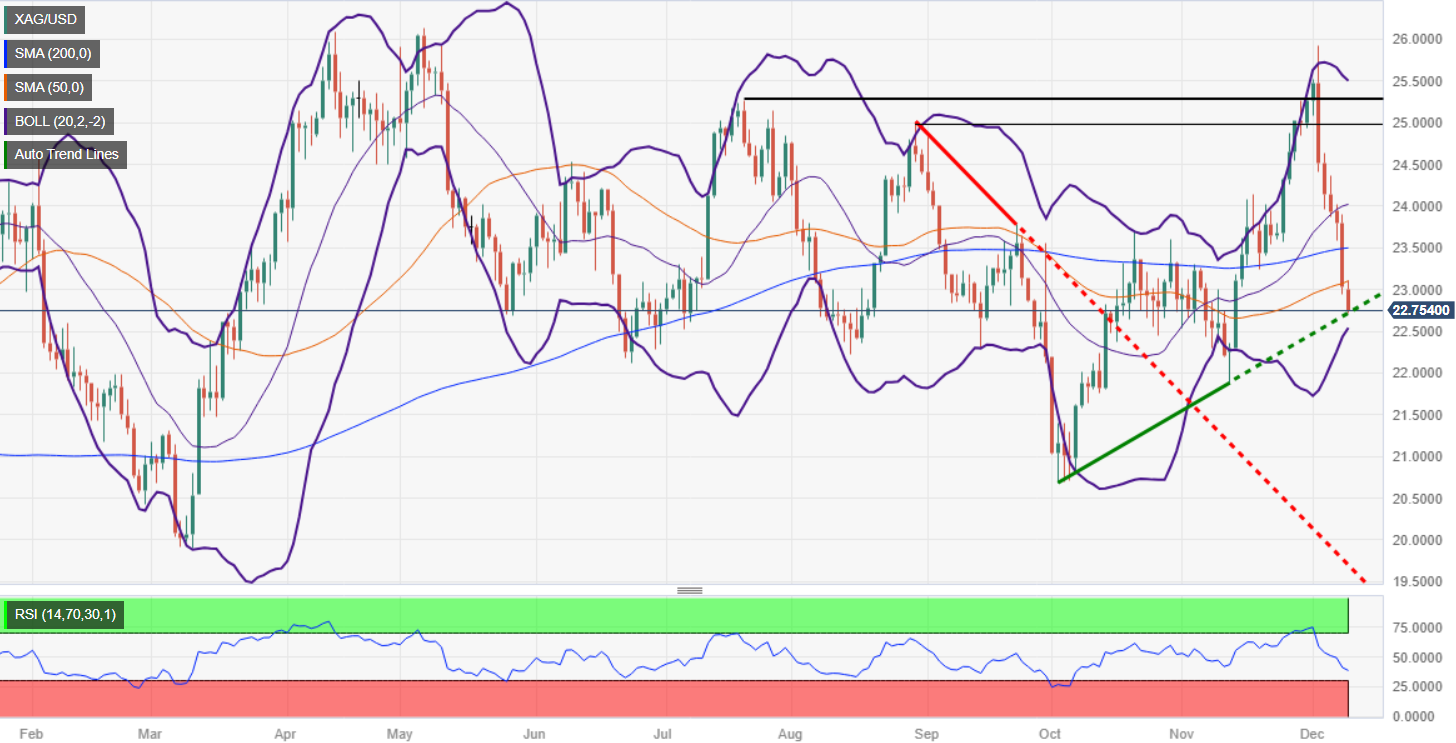
Silver price (XAG/USD) dives during the North American session, though it remains above a two-month-old support trendline that passes at around the $22.70 area. At the time of writing, the XAG/USD is trading at around $22.74, down by 1.02%.
XAG/USD’s daily chart portrays the grey metal as downward biased but its downtrend stalled at a support level. If sellers would like to challenge the November 13 swing low, they must regain the $22.50 area, followed by the $22.00 per troy ounce figure. That would keep the bears in charge and could open the door to test October’s low of $20.69.
For a bullish resumption, XAG/USD buyers need to reclaim the $23.00 mark and the 50-day moving average (DMA) at $23.09. If those two levels are surpassed, bulls could target the 100 and 200-DMAs, each at $23.22 and $23.50, respectively. Once cleared the $24.00 figure would emerge as the next stop.
XAG/USD Price Analysis – Daily Chart
XAG/USD Technical Levels
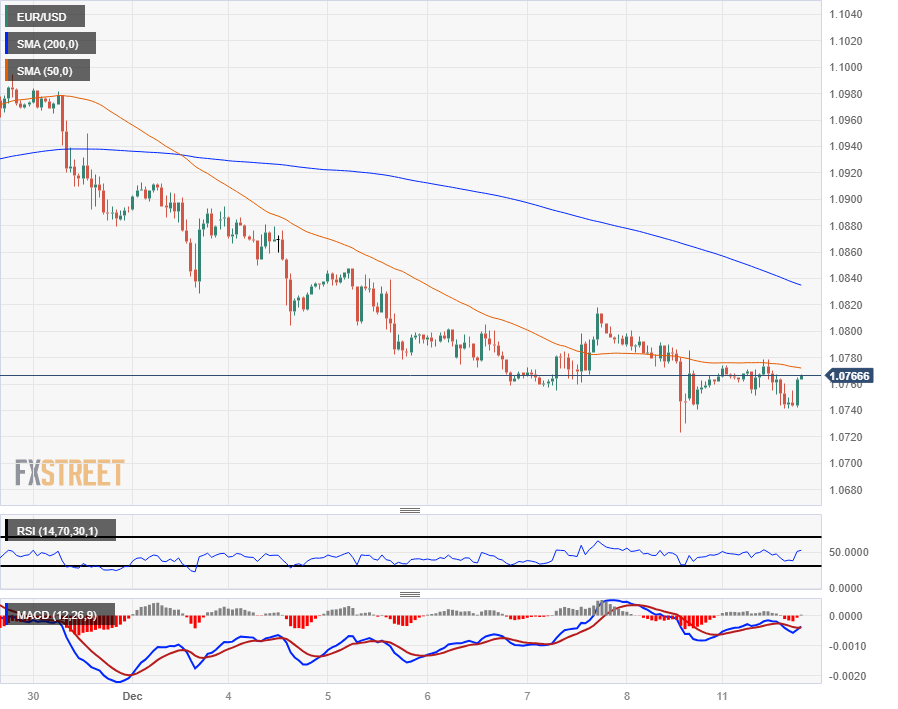
- The EUR/USD trades near the 1.0750 level, suffering minor losses of 0.20%.
- Ahead of the US 10-year bond auction, US bond yields are rising, pushing the pair lower.
- Markets await the US CPI figures from November.
In Monday's session, the EUR/USD pair is experiencing a downturn, currently trading around the 1.0745 mark. The downward trend is primarily fueled by robust labor market figures from the US reported on Friday, instigating investors to gravitate toward the Greenback ahead of Wednesday's Federal Reserve (Fed) decision. Market participants are also keeping a keen eye on the upcoming US Treasury auction, which might provide further traction to the bond yields.
The latest data from the US Bureau of Labor Statistics showed an uptick in November's Average Hourly Earnings, with a 0.4% MoM rise, outpacing the anticipated 0.3% growth and surpassing the prior 0.2% gain. Additionally, US Nonfarm Payrolls unexpectedly leaped to 199K in November, topping its preceding 150K count and the projection of 180K, combined with a drop in the Unemployment rate to 3.7% from the previous 3.9%.
In that sense, the strong labor figures pushed the US Dollar and American bond yields higher as the Fed's dovish narrative seemed to be put into question. In the meantime, the 2-year rate is trading at 4.75%, while the 5 and 10-year yields are trending at around 4.25%. A rise in these yields typically bodes well for the USD, so the Shared Currency edged downwards.
In addition, investors will keep an eye on the UST bond auction at 18:00 GMT as supply from Treasury auctions, totaling $108 billion in 3-year, 10-year, and 30-year securities, could drive yields up.
On Tuesday, the US is set to release inflation metrics, carefully watched by investors for potential impact on the USD and expectations on the next Fed decisions. The headline Consumer Price Index (CPI) from November is seen declining to 3.1% from 3.2% YoY, while the Core Measure is seen remaining sticky at 4% YoY.
EUR/USD levels to watch
The Relative Strength Index (RSI), with its negative slope and position in negative territory, illustrates a dominance of selling pressure further reinforced by the rising red bars of the Moving Average Convergence Divergence (MACD), indicating increasing bearish momentum.
Meanwhile, the pair's position in relation to its Simple Moving Averages (SMAs) continues to provide crucial insight. Remaining below the 20, 100, and 200-day SMAs suggests that bearish pressure is not only prevalent but also seen in the larger time frames.
Support Levels: 1.0700,1.0680,1.0650.
Resistance Levels: 1.0760 (100-day SMA), 1.0800, 1.0850.
EUR/USD daily chart
-638379083421444330.png)
A significant move lower in USD/MXN did come to fruition in November. Economists at Rabobank analyze the pair’s outlook.
USD/MXN will remain at the mercy of interest rate differentials
USD/MXN will remain at the mercy of interest rate differentials, and we expect to see some reversal of the March Fed rate cut currently implied by the USD front-end. This should provide some support for USD and push USD/MXN higher.
That said, we remain bullish MXN on the crosses. While some upside is likely to occur, our base case is for USD/MXN to average around 17.20 over the next month, and we expect the pair to trade around there in early 2024 before heading up to the 17.80 region heading into the end of the first quarter.
- Mexican Peso slides vs. the US Dollar ahead of a busy week for Mexico and the United States.
- Mexico’s economic docket will feature Industrial Production and the Bank of Mexico's monetary policy decision.
- USD/MXN traders are awaiting the US inflation report alongside the Federal Reserve’s decision.
Mexican Peso (MXN) starts the week with a negative tone and loses traction against the US Dollar (USD) in early morning trading during the North American session. The economic docket during the week across both sides of the borders will feature monetary policy decisions by the US Federal Reserve (Fed) on Wednesday and the Bank of Mexico (Banxico) on Thursday. Both central banks are expected to keep rates unchanged despite uncertainty about the Fed’s tone on their monetary policy statement. The USD/MXN is trading at 17.43, posting gains of 0.60% on the day.
Last week’s economic data from Mexico depicted the disinflation process continuing at a time when some of Banxico’s Governors had opened the door to ease monetary policy. However, they stressed that discussions will begin in the first quarter of 2024. On the US front, a tight labor market led to decreasing expectations for rate cuts by the Fed next year.
Daily digest movers: Mexican Peso trades with losses at the beginning of a busy week
- Mexico’s inflation on the producer and consumer side diverged. However, prices continue to ease, increasing the chances for rate cuts by Banxico, as Governor Victoria Rodriguez Ceja and Deputy Governor Jonathan Heath have suggested.
- Nevertheless, there is a dissenter as Deputy Governor Irene Espinosa pushed back and said inflationary risks are growing.
- China’s latest Consumer Price Index (CPI) report paints a deflationary scenario in the second-largest economy worldwide, spurring flows toward safe-haven currencies.
- The US Dollar Index (DXY) is bolstering the USD/MXN pair, with the DXY gaining 0.10%, up at 104.09, underpinned by elevated US Treasury bond yields.
- The US 10-year benchmark note rate is up three basis points at 4.262%.
- US jobs market data was mixed, indicating the labor market is cooling down at a slow pace. Following last week’s US Nonfarm Payrolls report for November, traders slashed the odds for potential rate cuts by the US Federal Reserve for next year.
- Ahead in the week, Mexico’s economic docket will feature Industrial Production for October and Banxico’s monetary policy decision on December 14.
- On the US front, inflation figures on the consumer and producer side will be released ahead of the Federal Reserve’s last decision of the year. After that, the unemployment claims, Industrial Production, and Fed Regional Manufacturing Indices will be released.
Technical analysis: Mexican Peso on the defensive as USD/MXN climbs towards 17.50
The USD/MXN daily chart shows the pair is gathering upward momentum, above the 100-day Simple Moving Average (SMA) at 17.39, which could pave the way for further upside. Nevertheless, buyers must reclaim the 17.50 psychological figure so that the exotic pair can challenge the 18.00 mark. On its way toward the latter, buyers must regain the 200-day SMA at 17.54, followed by the 50-day SMA at 17.67.
Contrarily, if USD/MXN sellers drag prices below the 100-day SMA, they could remain hopeful the pair could slump further. The first support would be the 17.00/05 area, before challenging the current current’s year low of 16.62.
Mexican Peso FAQs
What key factors drive the Mexican Peso?
The Mexican Peso (MXN) is the most traded currency among its Latin American peers. Its value is broadly determined by the performance of the Mexican economy, the country’s central bank’s policy, the amount of foreign investment in the country and even the levels of remittances sent by Mexicans who live abroad, particularly in the United States. Geopolitical trends can also move MXN: for example, the process of nearshoring – or the decision by some firms to relocate manufacturing capacity and supply chains closer to their home countries – is also seen as a catalyst for the Mexican currency as the country is considered a key manufacturing hub in the American continent. Another catalyst for MXN is Oil prices as Mexico is a key exporter of the commodity.
How do decisions of the Banxico impact the Mexican Peso?
The main objective of Mexico’s central bank, also known as Banxico, is to maintain inflation at low and stable levels (at or close to its target of 3%, the midpoint in a tolerance band of between 2% and 4%). To this end, the bank sets an appropriate level of interest rates. When inflation is too high, Banxico will attempt to tame it by raising interest rates, making it more expensive for households and businesses to borrow money, thus cooling demand and the overall economy. Higher interest rates are generally positive for the Mexican Peso (MXN) as they lead to higher yields, making the country a more attractive place for investors. On the contrary, lower interest rates tend to weaken MXN.
How does economic data influence the value of the Mexican Peso?
Macroeconomic data releases are key to assess the state of the economy and can have an impact on the Mexican Peso (MXN) valuation. A strong Mexican economy, based on high economic growth, low unemployment and high confidence is good for MXN. Not only does it attract more foreign investment but it may encourage the Bank of Mexico (Banxico) to increase interest rates, particularly if this strength comes together with elevated inflation. However, if economic data is weak, MXN is likely to depreciate.
How does broader risk sentiment impact the Mexican Peso?
As an emerging-market currency, the Mexican Peso (MXN) tends to strive during risk-on periods, or when investors perceive that broader market risks are low and thus are eager to engage with investments that carry a higher risk. Conversely, MXN tends to weaken at times of market turbulence or economic uncertainty as investors tend to sell higher-risk assets and flee to the more-stable safe havens.
- The Swiss Franc weakens in most pairs as stronger US data continues to buoy market sentiment.
- Swiss Franc is a safe-haven currency which tends to appreciate in times of crisis.
- The Federal Reserve, European Central Bank and Bank of England are all scheduled to make announcements after their meetings this week.
The Swiss Franc (CHF) edges lower in most pairs on Monday as investors digest the strong US labor market data and bide their time ahead of the action expected later in the week when several major central banks will make their policy decisions.
The improved outlook for the US on the back of Friday’s strong jobs report has lent a mildly positive air to sentiment, providing a slight headwind to the safe-haven Swiss Franc.
Daily digest market movers: USD/CHF edges higher ahead of US CPI data and Fed meeting
- The Swiss Franc continues to edge lower versus US Dollar (USD) on Monday after the release of the US Nonfarm Payrolls report for November showed an above-expectations improvement in most metrics, including the Unemployment Rate, which fell to 3.7% from the 3.9% forecast.
- The data indicates the US economy is healthier than many economists had thought and that fresh inflationary pressures may still emerge.
- This could make the US Federal Reserve (Fed) keep interest rates higher for longer and delay any rate cuts the market was anticipating in 2024.
- Higher-for-longer interest rates will benefit the US Dollar since they attract higher capital inflows.
- The next big data release for the US Dollar is US CPI data for November, scheduled for release at 13:30 GMT on Tuesday, December 12.
Swiss Franc technical analysis: USD/CHF continues short-term bullish trend
USD/CHF – the number of Swiss Francs that one US Dollar can buy – continues to gently push higher on Monday.
The pair is rising after having completed a Measured Move price pattern during October and November. Measured Moves are three wave patterns that look like large zig-zags. The first and third waves are usually of a similar length. Wave C completed after achieving the same length as A. This further reinforces the bullish reversal since the December 4 lows.
-638379057166438572.png)
US Dollar vs Swiss Franc: Daily Chart
The MACD has completed a bullish cross (circled) in negative territory, adding more evidence, signaling potentially more upside on the horizon.
The short-term trend is bullish, and more gains are possible. The 0.8825 target, which offers soft resistance, has almost been met. If surpassed, prices could rise to the confluence of major moving averages residing at 0.8900, where tougher resistance is expected.
A break below the 0.8667 lows would negate the recovery and see bears back in charge, with likely losses to the 0.8552 July lows.
Daily digest market movers: EUR/CHF trades flat ahead of ECB meeting
- The Swiss Franc reverses a weak open and edges higher against the Euro on Monday.
- Euro traders are waiting for the European Central Bank (ECB) meeting later in the week.
- Lower-than-expected Eurozone inflation data as a whole suggests a risk the European Central Bank will cut interest rates, which is limiting gains for the Single Currency.
- The next main event for the Euro is the European Central Bank policy meeting on Thursday, December 14.
- The most recent Inflation release from Germany came out in line with expectations, with the country’s Harmonized Index of Consumer Prices (HICP) rising 2.3% YoY in November but falling 0.7% MoM, according to data from the Federal Statistics Office of Germany.
- Lower interest rates, or their expectation, tend to weaken a currency as they reduce capital inflows.
Swiss Franc technical analysis: EUR/CHF edges lower after run-up
EUR/CHF – the number of Swiss Francs that one Euro can buy – trades flat after bottoming on December 7.
Last Thursday’s Bullish Engulfing Japanese candlestick reversal pattern (see rectangle on chart below) at the level of a major support and resistance level was confirmed by the green bullish day on Friday. This provides a short-term bullish signal for the pair.
-638379057987866545.png)
Euro vs Swiss Franc: Daily Chart
The pair has also probably reversed trend in the short-term, suggesting bulls have the upper hand temporarily. The medium and long-term trend, however, are still probably bearish, suggesting a risk of recapitulation remains.
A break below the 0.9403 lows would reconfirm the bearish bias and see prices fall into uncharted territory, with major whole numbers then expected to provide support at 0.9300, 0.9200, and so on.
Daily digest market movers: GBP/CHF rises as risk appetite favors Sterling
- The Swiss Franc falls versus the Pound Sterling (GBP) pair on Monday as strong US labor market data eases global recession fears, supporting riskier currencies like the Pound Sterling over safe-havens such as the Swiss Franc.
- Pound Sterling traders are now awaiting the Bank of England (BoE) meeting on Thursday for a steer on the future course of interest rates in the UK.
- Higher interest rates, or their expectation, are generally positive for a currency as they attract greater inflows of foreign capital. The opposite is true of lower interest rates.
- The market view of the course of future interest rates in the UK has turned more dovish recently, in line with most of the rest of the world. Traders in interest rate futures saw a relatively high chance of the BoE cutting interest rates by 0.75% (three 0.25% cuts) in 2024, as per data reported on Thursday, December 7.
Swiss Franc technical analysis: GBP/CHF rising from range lows
GBP/CHF – the number of Swiss Francs that one Pound Sterling can buy – is rising within sideways short and long-term timeframes – the medium-term trend, meanwhile, could be classified as marginally bullish.
On the 4-hour chart used to analyze the short-term trend, the pair continues to bounce higher within the parameters of a range-corridor between 1.0990 and 1.1155.
-638379058930056450.png)
Pound Sterling vs Swiss Franc: 4-hour Chart
It is possible to see the outline of a complete measured move in the zig-zag of price action down from the November 29 high, with wave C completing at the November 7 low.
The MACD has risen above its signal line whilst well below the zero line, further adding weight to the short-term bullish outlook. Indeed, looked at throughout December, the MACD looks like it might have formed a wide double-bottom bullish reversal pattern, further amplifying the strength of the bullish crossover buy signal.
All in all, the short-term chart suggests the GBP/CHF pair is in the midst of a bullish ascent back up to the range highs at 1.1155. A break above the 1.1040 level would provide further confirmatory evidence a new leg higher was underway.
Swiss Franc FAQs
What key factors drive the Swiss Franc?
The Swiss Franc (CHF) is Switzerland’s official currency. It is among the top ten most traded currencies globally, reaching volumes that well exceed the size of the Swiss economy. Its value is determined by the broad market sentiment, the country’s economic health or action taken by the Swiss National Bank (SNB), among other factors. Between 2011 and 2015, the Swiss Franc was pegged to the Euro (EUR). The peg was abruptly removed, resulting in a more than 20% increase in the Franc’s value, causing a turmoil in markets. Even though the peg isn’t in force anymore, CHF fortunes tend to be highly correlated with the Euro ones due to the high dependency of the Swiss economy on the neighboring Eurozone.
Why is the Swiss Franc considered a safe-haven currency?
The Swiss Franc (CHF) is considered a safe-haven asset, or a currency that investors tend to buy in times of market stress. This is due to the perceived status of Switzerland in the world: a stable economy, a strong export sector, big central bank reserves or a longstanding political stance towards neutrality in global conflicts make the country’s currency a good choice for investors fleeing from risks. Turbulent times are likely to strengthen CHF value against other currencies that are seen as more risky to invest in.
How do decisions of the Swiss National Bank impact the Swiss Franc?
The Swiss National Bank (SNB) meets four times a year – once every quarter, less than other major central banks – to decide on monetary policy. The bank aims for an annual inflation rate of less than 2%. When inflation is above target or forecasted to be above target in the foreseeable future, the bank will attempt to tame price growth by raising its policy rate. Higher interest rates are generally positive for the Swiss Franc (CHF) as they lead to higher yields, making the country a more attractive place for investors. On the contrary, lower interest rates tend to weaken CHF.
How does economic data influence the value of the Swiss Franc?
Macroeconomic data releases in Switzerland are key to assessing the state of the economy and can impact the Swiss Franc’s (CHF) valuation. The Swiss economy is broadly stable, but any sudden change in economic growth, inflation, current account or the central bank’s currency reserves have the potential to trigger moves in CHF. Generally, high economic growth, low unemployment and high confidence are good for CHF. Conversely, if economic data points to weakening momentum, CHF is likely to depreciate.
How does the Eurozone monetary policy affect the Swiss Franc?
As a small and open economy, Switzerland is heavily dependent on the health of the neighboring Eurozone economies. The broader European Union is Switzerland’s main economic partner and a key political ally, so macroeconomic and monetary policy stability in the Eurozone is essential for Switzerland and, thus, for the Swiss Franc (CHF). With such dependency, some models suggest that the correlation between the fortunes of the Euro (EUR) and the CHF is more than 90%, or close to perfect.
A combination of better risk appetite and lower US yields has driven the USD weaker. Economists at HSBC analyze Greenback’s outlook.
High hurdles for sustained weakness
With so much Fed easing already priced in, the scope for a dovish extension lower in the USD seems limited.
For the USD to weaken for a sustained period of time, a lot more optimism is required. That is, the global economy shows green shoots, inflation pressures in major economies fall faster, and risk appetite accelerates even further. The bar seems high.
We remain confident in our medium-term USD bullishness, based on soft global growth and comparatively high US yields. Nevertheless, unless a catalyst triggers a market re-pricing, the USD is expected to consolidate into the end of 2023.
The Bank of England (BoE) will announce its Interest Rate Decision on Thursday, December 14 at 12:00 GMT and as we get closer to the release time, here are the expectations forecast by the economists and researchers of eight major banks.
The BoE is set to keep the benchmark rate unchanged for a third consecutive meeting at 5.25%. The “Old Lady” is also likely to push back against market easing expectations.
Deutsche Bank
We expect a hold, with the Bank Rate staying at 5.25%, and see some caution from the Bank around the inflation outlook, coupled with little changes to the forward guidance.
Rabobank
We expect the BoE to keep rates on hold at 5.25% for a third consecutive time. A hawkish vote split could signal MPC unease with current market pricing. Having been so unlucky with inflation in 2021/22, we think the MPC will remain wedded to a 'higher-for-longer' strategy until it becomes painfully obvious that this isn’t tenable. Labour is still a seller’s market. It will take time before the labour market weakening we anticipate becomes painful enough to fully uproot inflation. Even as we see a 5.25% policy rate as unsustainably high for the UK economy, we only expect to see the first cut in November 2024.
TDS
Soft inflation data coupled with signs of deteriorating household demand should deliver another hold from the MPC. The vote will likely be 6-3, with three hawkish dissenters and the tone will likely remain virtually unchanged relative to November.
SocGen
The data since the previous meeting likely won’t sway MPC members to change their vote from the November meeting. If anything, the still-strong persistent inflation elements, namely services inflation and wage growth, and improving forward-looking growth indicators may reinforce the more hawkish members’ views. Still, looking past the year-over-year growth rates in the key data, we believe the monthly increases are consistent with inflation falling to within touching distance of 2% in April 2024. Coupled with sluggish economic growth, this should allow the Bank to start cutting rates in May.
ING
Markets are pricing three rate cuts in 2024 and we doubt the Bank will be too happy about that. Expect policymakers to reiterate that rates need to stay restrictive for some time. But with services inflation coming down and wage growth set to follow suit, we think investors are right to be thinking about a summer rate cut. We expect 100 bps of cuts next year.
Wells Fargo
Our forecast is for the BoE to keep its policy rate at 5.25%. The BoE recently received some good news in the form of the October CPI report. The BoE might once again signal that monetary policy ‘will need to be sufficiently restrictive for sufficiently long to return inflation to the 2% target sustainably in the medium term.’
Citi
The de-coupling of BoE vs ECB/Fed, pricing a full 25 bps cut by mid-2024 (well after the ECB/Fed pricing) has been a source of Sterling strength. The reason for the delayed rate cut expectations is the recent fiscal easing into 2024 in the Autumn Statement and BoE will likely have to play catch-up next year. The tone of the BoE statement therefore will be of keen interest to markets.
BMO
The last two decisions to hold steady at a 15-year high of 5.25% were narrowly made, first by a vote of 5-4, then by a vote of 6-3. But the three remaining hawks are not backing down easily. Since the November 2 meeting, there was more evidence that the labour market was loosening up, inflation hit a 2-year low of 4.6%, and core CPI slowed to a 20-month low of 5.7%. Wage growth is cooling as well, but at 7.7% YoY is still too hot for comfort and still very close to record highs of 7.9%. With £18 bln – or 0.7% of GDP – worth of fiscal stimulus coming next year (as outlined by the Autumn Statement), and the latest PMIs showing a 7-month high for manufacturing, and a 4-month high for services activity, it will be far too soon to discuss rate cuts. Expect the MPR to play down that prospect.
The European Central Bank (ECB) is set to announce its Monetary Policy Decision on Thursday, December 14 at 13:15 GMT and as we get closer to the release time, here are the expectations as forecast by the economists and researchers of 10 major banks.
The benchmark interest rate is set to remain at 4.50%. Updated macro forecasts will be released. Inflation expectations are set to be revised down. President Lagarde’s comments will be closely monitored looking for dovish hints.
Rabobank
We expect the ECB to leave its policy rates unchanged. PEPP reinvestments may be discussed, but we don’t expect these to end cold turkey. We continue to see some risk of an increase in the minimum required reserves.
Deutsche Bank
We see the central bank staying put. We now see the ECB cutting rates from April, with a risk of an earlier cut in March.
TDS
With headline inflation at 2.4% YoY and core inflation falling rapidly too, the ECB has nothing to worry about for now. We expect no change in policy at this meeting, and no material shift in tone from recent speeches.
SocGen
The ECB is unlikely to signal any major policy changes in the near term. However, we would not rule out agreement on an earlier end to full PEPP reinvestments. The balance sheet remains too large, and it seems as good a time as any to pre-announce PEPP tapering as of March/April. We expect broadly neutral language, acknowledging the progress made on inflation but warning about calling a victory just yet. New forecasts should show inflation close to the target in 2025, opening the way for rate cuts in 2H24. Still, wage and productivity trends remain a concern and pose an upside risk to core inflation next year.
Wells Fargo
Our forecast is for the ECB to hold its Deposit Rate at 4.00%. While there is no change expected for the ECB benchmark interest rates, there will still be plenty for market participants to focus on. Eurozone growth and inflation have softened noticeably in recent months, including a decline in Q3 GDP and a sharp slowdown in November inflation. Amid this backdrop, there will be significant interest in the ECB's updated economic projections and, in particular, whether the medium-term CPI forecasts for 2025 drop to (or perceptibly below) the 2% inflation target. So far, ECB policymakers have signaled it is still too early to consider rate cuts. For now, we anticipate an initial ECB rate cut will occur in June 2024. However, a sharp markdown in the ECB's forecasts, along with a softening in the ECB's language, could increase the chances of an initial interest rate reduction coming as soon as the ECB's April monetary policy meeting.
Citi
The ECB meeting on Thursday looks more interesting given the sharp re-pricing in 2024 cuts and with PEPP likely to be discussed (and possibly decided). Of most interest to markets will be whether the ECB pushes back on the market’s ultra dovish pricing of ECB rate cut expectations that currently places it ahead of the Fed both on the timeline and amount of cuts priced over the next 2 years (EUR OIS rates fully price a 25 bps cut in March 2024 vs Fed’s 65% and 218 bps of cuts over the next 24 months vs Fed’s 210 bps). Markets will also focus on the ECB staff’s December economic projections for the euro area. The ECB is also likely to start discussing (and possibly decide on) PEPP QT this week, potentially driving 10yr BTP-€STR 5-15 bps wider. But while the discussion on ECB’s balance sheet normalization will likely gather speed, reserve scarcity is unlikely to be broached before 2026, at the very earliest.
ANZ
Euro Area inflation is falling rapidly. We think, by early 2024, interest rates will have been held sufficiently high for sufficiently long for the ECB to feel inflation will return to target in a ‘timely manner’. We expect the Governing Council will start to cut interest rates in March 2024. By this time, the effects of monetary tightening will be weighing on demand, and monetary and credit aggregates are already contracting. The ECB may review and discuss the path of reinvestment in the Pandemic Emergency Purchase Programme (PEPP). Given current and expected inflation trends and monetary developments, we expect the ECB to proceed cautiously with any future changes, if at all.
Nordea
Though many views are likely to be presented at the meeting, we think the ECB could turn more dovish in its communication, opening the door for a rate cut as early as in Q1 2024. Despite considerable intensification of rate cut expectations lately, a dovish ECB could feed a bond rally further. New staff forecasts could suggest inflation at 2% as early as late 2024.
BMO
The ECB is expected to hold key rates steady for the second month in a row, keeping the refi rate at a 22½-year high of 4.50%, the marginal lending facility at a 15-year high of 4.75%, and the deposit rate at a record 4%. New staff projections will help fine-tune the outlook for policy in the new year. Look for a more dovish press release, dropping the line that inflation is expected to remain too high for too long. The ECB now has two new CPI reports under its belt since that meeting, both coming in below expectations, with the most recent, November, showing inflation at a 2½-year low of 2.4% and core at a 1½-year low of 3.6%. The hawks won’t be fully convinced, though, as services CPI is still up 4% YoY, and one and three-year inflation expectations did not turn lower in the ECB’s latest monthly survey. So, to satisfy their demands, the key line about how rates need to be ‘maintained for a sufficiently long duration’ in order to ‘make a substantial contribution to a timely return of inflation to target’, or some form of it, will remain in the press release. But with France now joining Germany in contracting in Q3, and Q4 starting off weaker for the Euro Area, risking an official recession, the hawks will be careful not to be too loud with their warnings.
Swedbank
The ECB will probably lower inflation forecasts but is likely to push back against market expectations of imminent and rapid rate cuts. Nevertheless, we see headline inflation falling to 2% over the next several months which will open the door to rate cuts. We maintain our forecast that the ECB will start cutting rates in April and will lower them 6 times in 2024, leaving deposit rate at 2.5% at the end of next year.
The US Federal Reserve will announce its Interest Rate Decision on Wednesday, December 13 at 19:00 GMT and as we get closer to the release time, here are the expectations as forecast by analysts and researchers of 10 major banks.
It is a widely expected hold for a third consecutive meeting but the Fed is likely to push firmly back against elevated rate cut hopes. New macro forecasts and Dot Plots will be released. A Jerome Powell press conference will follow the statement release.
ANZ
Inflation has performed better than the FOMC forecast in September, which is likely to result in lower projections for inflation and the FFR. The dot plot could be at least 50 bps lower over the next year relative to the September projection. Powell will need to maintain hawkish guidance as the job of combatting higher inflation is far from done and the FOMC doesn’t want to run the risk that financial conditions ease too much as that could undermine its objective of getting inflation sustainably back to 2%.
Deutsche Bank
We expect the central bank to hold rates steady and signal a soft tightening bias. Further out, they see a mild recession starting in Q1 2024 and a first rate cut in June.
Rabobank
We expect the FOMC to remain on hold, stress its data dependence and intention to proceed carefully. During the press conference, we expect Powell to repeat that it would be premature to conclude with confidence that monetary policy has achieved a sufficiently restrictive stance or to speculate on when policy might ease. However, we expect the FOMC to remain on hold in the coming months because they think a soft landing is in sight and they are not likely to risk it by hiking further. Nevertheless, we think that unemployment will rise higher than anticipated by the FOMC, which will prepare them for a first rate cut in June. Meanwhile, given the Fed’s data dependence, it will continue to be very difficult to push back convincingly against market expectations of an early rate cut.
TDS
The Fed is expected to extend its pause to rate increases for a third consecutive meeting. In our view, the recent tumble in yields poses a challenge for Fed communications as the likely dovishness expressed through the statement and the SEP might overstate the pricing for rate cuts. In light of this, we expect Powell to push back on the idea that mission has been accomplished. The Fed will fail to send a hawkish signal, especially with a downward revision to the SEP. While, this will weigh on the USD on Fed day, we caution that data remain in the driver's seat. Data in aggregate point to further downside for the USD, but we are cautious of chasing it into year-end and into US CPI. The broad direction of travel for the USD is lower with the risk of non-sticky rallies in the near-term.
Nordea
We expect the new economic projections to revise the outlook for inflation lower, but higher for GDP. They will remove the additional rate hike and still call for 50 bps of cuts next year. Far less than the 125 bps the market is calling for. Whether it will be a big enough wake-up call for the market is still unknown. This is at least the 6th time the market is pricing near-term rate cuts in this cycle, we are not sure they have gotten it right this time either.
SocGen
Fed officials tend to keep policy options open. They should embrace no further hikes following the December FOMC meeting, but at the same time, wish to avoid adding to market speculation on the timing and magnitude of cuts in 2024. It is a fine balancing act, achieved by indicating they are not yet discussing cuts and maintaining the two cuts signalled in the September dot plot.
ING
The Fed is widely expected to leave the Fed funds target range at 5.25%-5.50%. The bigger story is likely to be contained in the individual Fed member forecasts – how far will they look to back the market perceptions that major rate cuts are on their way? We strongly suspect there will be a lot of pushback here. We expect the Fed to retain a relatively upbeat economic assessment with the same 50 bps of rate cuts in 2024 they signalled in their September forecasts, albeit from a lower level given the final 25 bps December hike they forecasted last time is not going to happen. We think the Fed will eventually shift to a more dovish stance, but this may not come until late in the first quarter of 2024. The US economy continues to perform well for now and the jobs market remains tight, but there is growing evidence that the Fed’s interest rate increases and the associated tightening of credit conditions are starting to have the desired effect. We look for 150 bps of rate cuts in 2024, with a further 100 bps in early 2025.
Citi
The Fed is expected to keep the policy rate unchanged but communication and SEP dot revisions might skew somewhat dovish. We expect that the Fed will revise their 2023 core PCE inflation lower and given that officials did not deliver the last hike they had anticipated in 2023, it is likely that the 2024 and 2025 median dots in the SEP move lower by 50 bps to 4.625% and 3.375%, respectively. The 2024 dot would then imply 75 bps of cuts in total for 2024, more than what the dots were showing in September. During the press conference Chair Powell will likely say that it is premature to speculate about cuts and that the Committee will decide meeting by meeting if it needs to hold rates steady or to raise the policy rate.
CIBC
The FOMC has no reason to alter course, and is too divided about what lies ahead to offer definitive guidance, although Powell’s team isn’t likely as dovish as the market in terms of the timing of the first rate cut.
Westpac
It is almost a given the FOMC and Chair Powell will continue to highlight that inflation risks remain their primary focus. Though discussion in the press conference is also likely to include an assessment of the downside risks for growth and the labour market as well as recognition that, without cutting nominal interest rates, the real stance of policy will continue to tighten as inflation eases. If our March start date for cuts is correct, come the January meeting, activity is likely to take over from inflation.
The US Bureau of Labor Statistics (BLS) will release the most important inflation measure, the US Consumer Price Index (CPI) figures, on Tuesday, December 12 at 13:30 GMT. As we get closer to the release time, here are the forecasts by the economists and researchers of 10 major banks regarding the upcoming United States inflation print for November.
Headline CPI is expected to fall a tick to 3.1% year-on-year while Core is expected to remain steady at 4.0% YoY. On a monthly basis, headline inflation is seen accelerating by 0.1% vs. the prior release of 0% while Core CPI is also expected to rise a tick to 0.3%.
ANZ
We expect Core CPI inflation to rise by 0.2% MoM in November. Headline CPI is likely to fall 0.1% amid lower energy prices. We think the Fed’s current restrictive monetary settings should crimp demand and ensure the recent moderation in inflation continues. As such we think the Fed is done raising rates. Any possible rate cut remains a way off as Fed officials will want to see much more evidence that inflation is indeed returning to 2% sustainably.
Commerzbank
Seasonally adjusted consumer prices in the US are expected to have risen by only 0.1% in November. The YoY rate would then fall from 3.2% to 3.1%. However, the small MoM increase is mainly due to lower energy prices, which is unlikely to be a lasting factor. In particular, gasoline prices, which are very volatile from month to month, fell by 6% on the month. On the other hand, we expect the Core CPI, i.e. excluding energy and food, to be much stronger at 0.3% MoM and unchanged at 4.0% YoY. Overall, the consumer price report is unlikely to change the picture of declining inflation. However, the persistence of core inflation would remind us once again that this decline is only gradual.
Deutsche Bank
We see the headline number at +0.1% (unchanged in October) and Core CPI accelerating to +0.3% (+0.2%).
NBF
The energy component is likely to have had a negative impact on the headline index given the decline in gasoline prices during the month. This should help keep headline prices unchanged on a monthly basis. right, the YoY rate could fall from 3.2% to a 5-month low of 3.0%. Core prices, for their part, could show a 0.3% monthly progression, led by another increase in the shelter component. On a 12-month basis, core inflation should remain unchanged at a 2-year low of 4.0%.
TDS
We look for Core CPI inflation to rebound to 0.3% MoM from 0.2% in Oct, with the headline also strengthening to 0.1%. The report is likely to show that the core goods segment added to inflation, while the shelter components (OER/rents) are expected to remain mixed. Note that our unrounded Core CPI inflation forecast at 0.29% MoM suggests largely balanced risks for Nov.
SocGen
We calculate that gasoline prices fell by slightly more than 6% in November from October. This should maintain a flat headline. We project Core CPI of 0.2%, with shelter costs expected to rise by 0.4% MoM, which would be further moderation in that category. Auto prices are expected to be down slightly again in November, falling by 0.3%. An ongoing drop in used vehicle prices is contributing to the low.
Wells Fargo
We expect lower gasoline prices to hold the headline rate of inflation flat in November and forecast the Core CPI, which excludes food and energy, to rise 0.3%, signaling slower progress on underlying inflation. A miss to the upside may drive a market reaction spurring higher yields, but we ultimately doubt the CPI data will materially change the outcome of the Fed meeting, where it's essentially universally expected the FOMC will elect to keep rates on hold. If our CPI forecast is realized, the annual rate of headline inflation would slip to its lowest level rate since March 2021, while the core rate would remain unchanged from a month earlier at 4.0%. Some payback after volatile travel-related declines in October will be responsible for some of the rise in Core CPI. But other areas should decelerate further, including primary shelter and goods prices, which look set to decline for the sixth straight month. While inflation pressure continues to subside, there is still ground to cover before declaring victory.
Citi
We expect a 0.30% MoM increase in US Core CPI in November, stronger than the 0.23% increase in October and with risks tilted slightly to the upside for an even stronger print. Services prices should generally be stronger in November across both shelter and non-shelter components. Goods prices however should decline slightly in November.
CIBC
Headline inflation is expected to be 0.1% MoM given weak energy prices and an expected core inflation reading of 0.2% MoM. The moderation of Core CPI largely reflects the gradual softening of shelter inflation and core goods deflation. Together, these components represent about 70% of core inflation and will more than compensate for the Fed’s so-called ‘supercore’ – services excluding shelter – where price pressure may remain firm. Our views on Core inflation are slightly below consensus but after six months of encouraging progress on inflation, one very cool or very hot reading will not mean much for the Fed. We might be back to the good old days when a single CPI release does not move the needle anymore. Markets mostly understand this and will wait for signals from the FOMC meeting and the latest projection later in the week.
Westpac
With the labour market softening, confidence very weak and further declines in the price of oil, a matching outcome is likely in November – a 0.0% for headline and 0.2% for Core prices. If achieved, annual headline inflation is likely to hold around 3% and core 4%. Into 2024, core inflation is expected to remain soft albeit principally because shelter inflation will abate while other components experience modest growth. If the oil price holds around current levels in early-2024, annual headline inflation will quickly decelerate towards 2% and core inflation follow into mid-year.
- The Yen dives as on dovish comments by BoJ officials.
- Dwindling hopes of Fed cuts are underpinning support for the USD.
- USD/JPY is likely to find resistance at the 146.85 area.
The US Dollar is extending its recovery, as comments from BoJ officials have poured cold water on investors’ expectations that the bank could end its ultra-loose policy after their December meeting.
Dovish comments from BoJ officials hit the Yen
News reports citing Bank of Japan’s officials suggest little need to end the negative rates policy, as there is not enough evidence that wage growth would support sustainable inflation.
This has provided an additional impulse to the pair, already on recovery after Friday’s US Nonfarm Payrolls report.
The US economy created more jobs than expected in November, unemployment receded and wage inflation accelerated. The evidence of a resilient US labour market crushed market expectations of Fed rate cuts in early 2024 and sent US yields and the US Dollar higher.
USD/JPY approaches a key resistance area at 146.75
The pair is now testing a previous support level at the 146.30 area. Beyond here, the 50% retracement of the pair’s decline from mid-November high meets trendline resistance at 146.85. The pair is likely to meet strong resistance at that level.
On the downside, supports are 145.30 and 143.75.
Technical levels to watch
USD/JPY dropped a large 2% last Thursday for the biggest one-day drop since January. Economists at MUFG Bank analyze Yen’s outlook.
Any near-term renewed JPY selling will not last
The JPY move last week is likely to be a key marker that signals a turn in the trend of JPY depreciation, in place since the global inflation shock saw USD/JPY break sharply higher in March 2022.
We don’t see a BoJ hike this month but any JPY selling over the near-term is unlikely to be sustained given the changes in the global macro backdrop.
- The Yen dives as BoJ officials talk down hopes of an imminent exit of its ultra=-oose policy
- Higher US Yields after the strong US NFP are adding negative pressure on the Yen.
- EUR/JPY is seen below 150.00 at the beginning of next year – MUFG.
The Yen is dropping across the board on Monday weighed by reports that have cooled off hopes the bank might signal the exit of its ultra-loose policy after next week’s meeting.
BoJ officials cool hopes of an exit from negative rates
Market sources reported that Bank of Japan officials see little need to end the negative rates policy. This has poured cold water on the market expectations that the bank would approve a major monetary policy shift at its December 19 meeting, and has sent the Yen tumbling across the board.
In the absence of relevant macroeconomic data today, this news, combined with the higher US yields following the strong US employment data seen last week, is likely to keep the JPY on the back foot in the coming sessions.
EUR/JPY seen below 150.00 early next year – MUFG
From a wider perspective, the Technical analysis team at MUFG sees the Euro trending lower over the next weeks: “Weak fundamentals make it harder for ECB to push back against market expectations for earlier and deeper rate cuts next year (...) We expect EUR weakness to be more pronounced against the JPY resulting in EUR/JPY falling back below the 150.00 level by early next year.”
Technical levels to watch
USD holds December gains ahead of a busy week of data and FOMC. Economists at Scotiabank analyze Greenback’s outlook.
There is still time for gains to reverse
US data this week includes CPI data on Tuesday and Retail Sales data on Thursday and there is the small matter of the FOMC in between.
The USD is holding on to the gains that have accumulated through December so far – despite typically negative seasonal patterns for the USD running into the end of the year.
Headline inflation and Retail Sales data are expected to come in soft but the FOMC will set the tone for the USD in the near-term.
There is still time for gains to reverse and the DXY rebound is showing some signs of stalling in the low 104 area over the past few sessions.
USD/CAD is marking time trading around the 1.36 point. Economists at Scotiabank analyze the pair’s outlook.
Risks are tilted to the downside
Spot losses Friday reversed sharply from the intraday low around 1.3550 which likely sets the near-term range base for the USD.
Short-term trading patterns suggest better USD selling interest above the 1.36 area, however, with firmer resistance around 1.3625.
Trend momentum has slipped into neutral on the short-term chart but still leans bearish on the longer-run oscillator, suggesting risks are tilted to the downside overall.
A break below 1.3550 may see the USD weaken back to retest the early December low in the upper 1.34s.
- The Kiwi finds buyers at 0.6100 although it remains capped below 1.6130 so far.
- Strong US data and concerns about China are weighing on the NZD.
- US Dollar losses are likely to remain limited ahead of US CPI and the Fed’s meeting.
US Dollar weakness, however, is likely to remain limited after US NFP data from Friday highlighted the resilience of the US labour market and curbed hopes of Fed cuts in early 2024.
Data released over the weekend showed that China’s Consumer Prices grew at their slowest pace in three years, adding concerns about the frail momentum of the world’s second-largest economy and hurting the China-proxy NZD.
The calendar is light today with traders awaiting Tuesday’s US CPI data and Wednesday’s Fed’s monetary policy decision to shed some more light on the bank’s next monetary policy steps.
Technical indicators are turning lower with price action below the 4h 50 SMA and hovering above the 100 SMA. Support at 0.6130 is capping bulls so far, closing the path towards 0.6190 and 0.6225.
Failure to regain 0.6130 would increase pressure towards 0.6050 and 0.6000.
Technical levels to watch
Sterling is sitting on top of the daily performance league for the major currencies. Economists at Scotiabank analyze Cable’s outlook.
Price action is looking constructive from a technical point of view
GBP price action is – so far on the session – looking constructive from a technical point of view.
A firm close on the session – around or better than current levels – would put in a bull reversal signal on the daily chart and suggest the GBP’s recent slide from 1.27+ was reversing.
Support is 1.2550 on the session. Resistance is 1.2620.
- The US Dollar is up near 1% against the Japanese Yen.
- Traders will keep their powder dry towards FOMC on Wednesday.
- The US Dollar Index holds above 104 and has more room to go higher.
The US Dollar (USD) is riding the reversal wave against last week’s turbulence that sparked after comments from Bank of Japan (BoJ)’s Chairman Kazuo Ueda who said that the end of negative monetary rates was near. This Monday morning, several headlines read that the BoJ sees little need to end negative rates in December. As a result, the Greenback takes back a lot of lost ground from the Yen’s move from last week, and is up 1% in early Monday trading.
On the economic front, besides CPI on Tuesday, traders will mainly look forward to Wednesday when the Fed will kick off ahead of Super Thursday, when no less than three major central banks will issue their last monetary policy for 2023 (four with Fed included).
Daily digest: Standstill ‘till Wednesday
- A possible main driver for the sudden backtracking on changing its monetary policy at the BoJ, could have come with the drop of 13.6% year-on-year in Machine Tool Orders for Japan.
- Meanwhile Chinese markets are trembling as deflation fears are soaring. With a big focus on central banks this week, the European Central Bank could be facing a similar issue as inflation is sinking very rapidly in the region and the ECB already guided markets that it will not cut quick.
- The US Treasury is the main driver this Monday in the economic calendar with no less than four debt issuances.
- Near 16:30 GMT both a 3-month and a 6-month bill will be auctioned.
- At 18:00 GMT a 10-year and a 3-year note will be allocated.
- Equites are flying in Asia after the statement from the BoJ. Japan has closed its Nikkei up 1.50% and the Topix at 1.47%. The already closed Hang Seng was able to erase an early 1.6% loss to close this Monday up 0.5%. European equities are not sure what to make off all these messages out of Asia and are flat for this Monday, together with US futures.
- The CME Group’s FedWatch Tool shows that markets are pricing in a 97.7% chance that the Federal Reserve will keep interest rates unchanged at its meeting next week.
- The benchmark 10-year US Treasury Note trades near 4.25%, a substantial leg higher than last week. The recent US Jobs Report from last Friday revealed a persistent uptick in wages and another drop in unemployment, which opens the risk for persistent inflation.
US Dollar Index technical analysis: Pressure is building
The US Dollar is gearing up for a comeback in this last trading week of the year under normal trading regime. This means that the last volatile moves in the Greenback and its US Dollar Index (DXY) will be unfolding this week. From a pure technical point of view, the DXY looks set to end this year near 105.
The DXY is recouping losses against the Japanese Yen, one of its main constituents, and is up by 1% in the USD/JPY pair. The DXY trades above 104 and would attract more volume if it was able to break above the high of Friday at 104.26. Once from there, the 100-day Simple Moving Average (SMA) near 104.55 looks very appealing to head toward prior to ahead of Wednesday’s Fed meeting.
To the downside, the 200-day SMA has done a tremendous job in supporting the DXY with buyers coming in below 103.56 and pushing it back towards that same level near the US closing bell. If it fails this week, the lows of November near 102.46 is a level to watch. More downside pressure could bring into view the 100 marker, in a case where US yields sink below 4%.
US Dollar FAQs
What is the US Dollar?
The US Dollar (USD) is the official currency of the United States of America, and the ‘de facto’ currency of a significant number of other countries where it is found in circulation alongside local notes. It is the most heavily traded currency in the world, accounting for over 88% of all global foreign exchange turnover, or an average of $6.6 trillion in transactions per day, according to data from 2022.
Following the second world war, the USD took over from the British Pound as the world’s reserve currency. For most of its history, the US Dollar was backed by Gold, until the Bretton Woods Agreement in 1971 when the Gold Standard went away.
How do the decisions of the Federal Reserve impact the US Dollar?
The most important single factor impacting on the value of the US Dollar is monetary policy, which is shaped by the Federal Reserve (Fed). The Fed has two mandates: to achieve price stability (control inflation) and foster full employment. Its primary tool to achieve these two goals is by adjusting interest rates.
When prices are rising too quickly and inflation is above the Fed’s 2% target, the Fed will raise rates, which helps the USD value. When inflation falls below 2% or the Unemployment Rate is too high, the Fed may lower interest rates, which weighs on the Greenback.
What is Quantitative Easing and how does it influence the US Dollar?
In extreme situations, the Federal Reserve can also print more Dollars and enact quantitative easing (QE). QE is the process by which the Fed substantially increases the flow of credit in a stuck financial system.
It is a non-standard policy measure used when credit has dried up because banks will not lend to each other (out of the fear of counterparty default). It is a last resort when simply lowering interest rates is unlikely to achieve the necessary result. It was the Fed’s weapon of choice to combat the credit crunch that occurred during the Great Financial Crisis in 2008. It involves the Fed printing more Dollars and using them to buy US government bonds predominantly from financial institutions. QE usually leads to a weaker US Dollar.
What is Quantitative Tightening and how does it influence the US Dollar?
Quantitative tightening (QT) is the reverse process whereby the Federal Reserve stops buying bonds from financial institutions and does not reinvest the principal from the bonds it holds maturing in new purchases. It is usually positive for the US Dollar.
EUR/USD holds modest gains through upper 1.07s. Economists at Scotiabank analyze the pair’s outlook.
Short-term bear trend resistance is very close
The EUR’s early December slide remains intact but momentum is weak and spot is showing some tentative signs of steadying around the low/mid 1.07 area.
The 50% Fibonacci retracement of the September/November rally sits at 1.0733.
Trend signals are edging a bit more EUR-bearish on the daily DMI, however, and EUR losses need to steady and reverse sooner rather than later to avert more bearish pressure building towards 1.0665.
Short-term bear trend resistance is very close (1.0775) but a push back through the low 1.08 area is needed to boost short-term technical momentum.
- The Dollar consolidate recent gains, steady above 0.8780.
- The strong NFP report has provided a fresh impulse to the USD.
- Investors looking from the sidelines ahead of US CPI and the Fed.
The Greenback is trading with a moderately bid tone during the European morning session, consolidating recent against, with downside attempts contained above last week’s peak at 0,8780.
US employment data has given a fresh boost to the Dollar
The pair keeps drawing support from the upbeat US Nonfarm Payrolls data seen on Friday, which have curbed market expectations of Fed cuts in the first quarter of Next year.
With this in mind, investors remain in a cautious mood on Monday awaiting the release of US CPI figures on Tuesday and the outcome of the Federal Reserve monetary policy meeting on Wednesday.
The Fed is widely expected to leave its benchmark rate at the current 5.5% thus the focus will be on the interest rate projections and the tone of Fed Powell’s press conference. If US inflation drops more than expected, the market will be looking for dovish hints by Powell to sell US Dollars.
The technical picture shows the Dollar in an upside correction after having depreciated 4.5% in November. The next upside targets are 0.8820 and the 50% retracement of November’s swell-off, at 0,8885.
On the downside, supports are 0.8780 and 0.8730.
Technical levels to watch
The EUR has weakened sharply since the end of last month. Economists at MUFG Bank analyze Euro’s outlook.
Room for EUR to weaken further especially vs. JPY
Weak fundamentals make it harder for ECB to push back against market expectations for earlier and deeper rate cuts next year.
We expect the EUR to continue trading on a softer footing in the near-term.
We expect EUR weakness to be more pronounced against the JPY resulting in EUR/JPY falling back below the 150.00 level by early next year.
- Natural Gas drops 6% in European trading with EU storages still above 80%.
- Natural Gas prices are heading to $2 at this pace.
- The US Dollar is steady ahead of US CPI and the last Fed’s policy meeting for 2023.
Natural Gas (XNG/USD) is sinking as traders abandon ship this Monday in European trading. A buildup of different elements is pushing Natural Gas prices into a correction. China is set to struggle with deflation as demand is hitting rock bottom, while Europe could be facing the same issue after the too quick decline in inflation numbers recently and ahead of the European Central Bank meeting this Thursday. With European Gas storages filled up above 80% and weather forecasts pointing to mild temperatures in the coming two weeks, there is very little to almost no chance the EU will run out of Gas for this winter season.
Meanwhile, the US Dollar (USD) is strengthening this Monday with one of its counterparts, the Japanese Yen, weakening again. Its central bank, the Bank of Japan, issued a statement which contradicts earlier comments which drove the Japanese Yen higher against the US Dollar and triggered substantial down moves in the US Dollar Index. That same US Dollar Index (DXY), is back to where it was earlier last week, ahead of the last US Federal Reserve meeting for 2023, taking place on Wednesday.
Natural Gas is trading at $2.34 per MMBtu at the time of writing.
Natural Gas market movers: Oversupply during winter
- More Asian Gas traders are demanding trading licences in London to set up shop. China is facing deflation, which means less demand for Liquified Natural Gas (LNG). Asian traders are now trying to offload surplus volumes in Europe where dependency on imports is still very high.
- The Futures markets are pricing in more downturn for gas demand in Europe, with January futures being priced below April prices at the moment.
- Weather forecast models are seeing no negative temperatures for the coming two weeks in Europe.
- Recent congestion issues at the Panama Canal are continuing, with Gas tankers blocked in the region not posing any supply risk as those volumes have already been replaced or allocated with other third-party supplies.
Natural Gas Technical Analysis: Snow is off
Natural Gas is sinking and it is difficult to find any bottom that might help its downturn at the moment. The decline is a sum of factors which all point to one and the same issue: demand is absent. European tanks are still very much full and equipped to pass this winter without any hiccups. Meanwhile Chinese demand is turning into oversupply and traders are now seeking other regions to offload the surplus.
Should the weather models be wrong and several days of severe frost take a grip of mainland Europe, expect the reserves to erode quite quickly and additional supply might be needed. Expect to see a return to the purple line near $2.60 as the first hurdle. Next the 200-day Simple Moving Average (SMA) at $2.74 will act as a resistance before allowing Gas prices to soar to $3 with the 100-day SMA nearby.
Traders are facing further discounts in nearterm expirations in Futures contracts, which means more downside to come as buyers will wait for further declines before starting to buy. Small support could be seen near $2.20, with the low of June. Though, rather expect to see firm support coming in near $2.10, at the low of April from this year, at the yellow supportive line.
-638378898198125840.png)
XNG/USD (Daily Chart)
Natural Gas FAQs
What fundamental factors drive the price of Natural Gas?
Supply and demand dynamics are a key factor influencing Natural Gas prices, and are themselves influenced by global economic growth, industrial activity, population growth, production levels, and inventories. The weather impacts Natural Gas prices because more Gas is used during cold winters and hot summers for heating and cooling. Competition from other energy sources impacts prices as consumers may switch to cheaper sources. Geopolitical events are factors as exemplified by the war in Ukraine. Government policies relating to extraction, transportation, and environmental issues also impact prices.
What are the main macroeconomic releases that impact on Natural Gas Prices?
The main economic release influencing Natural Gas prices is the weekly inventory bulletin from the Energy Information Administration (EIA), a US government agency that produces US gas market data. The EIA Gas bulletin usually comes out on Thursday at 14:30 GMT, a day after the EIA publishes its weekly Oil bulletin. Economic data from large consumers of Natural Gas can impact supply and demand, the largest of which include China, Germany and Japan. Natural Gas is primarily priced and traded in US Dollars, thus economic releases impacting the US Dollar are also factors.
How does the US Dollar influence Natural Gas prices?
The US Dollar is the world’s reserve currency and most commodities, including Natural Gas are priced and traded on international markets in US Dollars. As such, the value of the US Dollar is a factor in the price of Natural Gas, because if the Dollar strengthens it means less Dollars are required to buy the same volume of Gas (the price falls), and vice versa if USD strengthens.
Sterling has enjoyed November. Economists at ING analyze GBP outlook ahead of the Bank of England (BOE) meeting.
EUR/GBP should head back up to the 0.88 area next year
In terms of the risk to Sterling market interest rates and the currency from the December BoE meeting, we tend to think it is too early for the BoE to condone easing expectations – even though those expectations are substantially more modest than those on the eurozone. This could mean that EUR/GBP continues to trade on the weak side into year-end – probably in the 0.8500-0.8600 range.
Into 2024, however, we expect market pricing to correct – less to be priced for the ECB, more for the UK and EUR/GBP should head back up to the 0.88 area. But that's a story for next year.
- The pound picks up on Monday with the USD losing steam.
- Cooling hopes of Fed cuts are likely to keep US Dollar losses limited.
- GBP/USD is expected to meet resistance at 1.2600.
The Sterling is trimming some losses on Monday’s European session, with the US Dollar losing upside momentum. The broader bearish trend, however, remains active, with investors cautious ahead of key UK data and major central banks’ decisions.
US employment data has boosted the US Dollar
US employment data boosted the Dollar last Friday, with the Nonfarm payrolls beating expectations and wages growing too fast to allow the Federal Reserve to start cutting rates in the coming months. This is likely to cushion US Dollar declines over the coming sessions.
In the calendar, Tuesday’s UK Employment data and the US CPI will attract the market focus ahead of the all-important Fed monetary policy meeting on Wednesday.
The US central bank is expected to leave its benchmark rate on hold. The main attraction of the event will be the MPC members’ interest rate projections and Powell’s press conference for hints about any dovish turn that would hurt the US Dollar.
On Thursday, the BoE will keep rates on hold, with BoE Bailey expected to give more info about the bank’s next steps.
GBP/USD rebound to meet resistance at 1.2600
The technical picture shows the pair gathering bullish strength, yet still below 1.2600 resistance, which would negate the near-term corrective mood, and expose 1.2650 ahead of the mentioned 1.2730.
On the downside, supports are Friadau’s low at 1.2500 and November 22 low at 1.2450.
Technical levels to watch
The US Dollar surged higher post Nonfarm Payrolls. Economists at TD Securities analyze Greenback’s outlook.
Looking for USD downside in the medium-term
Our high-frequency fair value model shows that the USD is somewhat cheap and that the move lower from October highs may have gone a bit too far, too fast.
We are wary of the USD staying elevated at current levels in the near-term heading into US CPI and year-end.
Beyond that, we continue to look for USD downside in the medium-term with steep Fed cuts in H2 24.
- Gold is under increasing bearish pressure after breaching the $2,000 level.
- Strong US employment figures have boosted US yields and the USD, weighing on Gold.
- Investors are cautious awaiting the outcome of the Fed’s monetary policy meeting.
Gold prices (XAU/USD) have opened the week in the same bearish tone seen at the end of the previous one. Friday’s upbeat US Nonfarm Payrolls (NFP) report, dampened investors’ hopes of Federal Reserve (Fed) cuts in early 2024, giving a fresh boost to US yields, to the detriment of the yieldless precious metal.
Bullion remains depressed below the $2,000 psychological level in the European trading session with traders in a cautious mood, awaiting US inflation data on Tuesday and the outcome of the Fed’s monetary policy meeting due on Wednesday.
Investors' sentiment is frail on Monday following the downbeat consumer inflation data from China over the weekend. The country’s CPI has shown its lowest growth in the last three years, reviving concerns that the uncertain situation in the world’s second-largest economy may bring global growth lower next year.
Beyond that, the escalating tensions in the Middle East are contributing to weigh on risk appetite, as we head into a week packed with central banks' decisions, starting with the Federal Reserve, on Wednesday.
Daily Digest Market Movers: Gold is turning lower with US yields and the US Dollar higher
- US employment beat expectations on Friday, with wage inflation rising well above expectations. This has curbed hopes of Fed cuts, giving a fresh boost to the US dollar and weighing on Gold.
- US Nonfarm Payrolls increased by 199K in November, beating expectations of a 180K rise, following a 150K increment in October.
- Hourly earnings accelerated 0.4%,m above the 0.3% market consensus from October’s 0.2%. This adds pressure to consumer prices and casts doubts about Fed cuts in the near term.
- According to the CME Group FedWatch Tool, futures markets are now pricing a 40% chance of a rate cut in March 2024, from the nearly 60% probability seen before the US NFP report.
- The US yields have bounced higher, with the benchmark 10-year US Treasury yield regaining 15 bps after the US NFP release and dragging the US Dollar higher and Gold lower with them.
- News, reporting attacks on US troops by Iran-backed militias in Iraq and Syria, is increasing fears about an escalation of the Gaza conflict, contributing to underpinning support to the safe-haven US Dollar.
- Traders are now looking at US consumer inflation figures ahead of the Fed's interest rate projections for more info about the bank’s monetary policy plans.
Technical Analysis: Gold looking increasingly vulnerable below $2,000
The technical picture shows Gold prices under increasing bearish pressure after breaching the $2,000 psychological level. The pair has breached below the 50 and 100 SMAs in 4-hour charts and is now pushing against the 200 SMA.
Further downtrend will push the precious metal towards a key support area at $1,982, where the 50% Fibonacci retracement of the October - December rally meets the neckline of a Head and Shoulders (H&S) pattern.
This is a common figure for trend shifts. A clear break of the neckline level would put bears in control, aiming for mid-November lows, at $1,934 ahead of $1,838 and the measured target of the H&S pattern at $1,851.
On the upside, above $2,000, the pair would meet resistance at $2,020 previous support, and $2.040.
US Dollar price today
The table below shows the percentage change of US Dollar (USD) against listed major currencies today. US Dollar was the weakest against the Pound Sterling.
| USD | EUR | GBP | CAD | AUD | JPY | NZD | CHF | |
| USD | -0.07% | -0.12% | 0.06% | 0.31% | 0.85% | 0.10% | -0.01% | |
| EUR | 0.08% | -0.05% | 0.14% | 0.40% | 0.93% | 0.17% | 0.08% | |
| GBP | 0.13% | 0.04% | 0.18% | 0.43% | 0.97% | 0.23% | 0.12% | |
| CAD | -0.05% | -0.13% | -0.16% | 0.26% | 0.80% | 0.03% | -0.06% | |
| AUD | -0.29% | -0.37% | -0.44% | -0.24% | 0.56% | -0.18% | -0.29% | |
| JPY | -0.85% | -0.93% | -1.06% | -0.81% | -0.55% | -0.76% | -0.86% | |
| NZD | -0.09% | -0.17% | -0.21% | -0.03% | 0.22% | 0.77% | -0.08% | |
| CHF | 0.01% | -0.06% | -0.13% | 0.06% | 0.31% | 0.86% | 0.09% |
The heat map shows percentage changes of major currencies against each other. The base currency is picked from the left column, while the quote currency is picked from the top row. For example, if you pick the Euro from the left column and move along the horizontal line to the Japanese Yen, the percentage change displayed in the box will represent EUR (base)/JPY (quote).
Economic Indicator
United States Fed Interest Rate Decision
The Federal Reserve (Fed) deliberates on monetary policy and makes a decision on interest rates at eight pre-scheduled meetings per year. It has two mandates: to keep inflation at 2%, and to maintain full employment. Its main tool for achieving this is by setting interest rates – both at which it lends to banks and banks lend to each other. If it decides to hike rates, the US Dollar (USD) tends to strengthen as it attracts more foreign capital inflows. If it cuts rates, it tends to weaken the USD as capital drains out to countries offering higher returns. If rates are left unchanged, attention turns to the tone of the Federal Open Market Committee (FOMC) statement, and whether it is hawkish (expectant of higher future interest rates), or dovish (expectant of lower future rates).
Read more.Next release: 12/13/2023 19:00:00 GMT
Frequency: Irregular
Source: Federal Reserve
The Pound remains the second best performing G10 currency in the year to date after the CHF. Economists at Rabobank analyze GBP outlook.
Scope for a little more outperformance of GBP vs. the EUR
Looking ahead, we see scope for a little more outperformance of GBP vs. the EUR given that the UK’s weak economic position is being balanced by a poor situation for Germany.
We have tweaked our EUR/GBP forecasts in favour of the Pound and see scope for EUR/GBP drifting back to the 0.84 area towards the end of next year, down from a previous forecast of 0.87.
Dollar, bond yields carry over gains from Friday. Economists at Société Générale analyze EUR/USD ahead of Fed and ECB meetings.
Fed and ECB in focus for comments on market pricing of rate cuts
Hawkish pushback by the Fed but also the ECB – it is premature to discuss rate cuts – would primarily bring the axe down on the 2y-5y part of the curve but won’t leave the long end completely immune to the rate repricing.
Downside against the Euro has been nullified by the pricing in of faster rate cuts by the ECB next year compared to the Fed. Until this changes, a return to 1.10 will have to wait.
Three key questions should decide how markets respond to the Fed: 1/ What does lower unemployment mean for the inflation forecast? 2/ Will the additional rate increase remain on the table? 3/ Does the dot plot for next year add to the two rate cuts of September?
The question is whether the ECB will tone down the hawkish language in Thursday’s statement and whether the inflation forecasts will be revised down to the point where the 2% target will be met in 2025. Headline CPI was previously forecast to average 3.2% in 2024 and 2.1% in 2025. Discussions about tapering PEPP sooner than in late 2024 could in theory give yields and the Euro a lift, but we are not getting too carried away.
USD/JPY has dropped back significantly from its recent highs. Economists at Rabobank analyze the pair’s outlook.
USD/JPY to shift lower in the second half of next year
We see scope for the market to be disappointed over the pace with which the BoJ is willing to withdraw policy accommodation over the next year or so. Given also our view that the market has been too swift in pricing in Fed rate cuts next year, we see scope for USD/JPY to move back to the 150 level in the weeks ahead.
That said, we expect the currency pair to shift lower in the second half of next year on the back of Fed rate cuts and a very gradual unwind in BoJ policy accommodation.
Economists at Société Générale analyze EUR/NOK technical outlook.
Lack of clear direction
EUR/NOK recently formed a lower high at 12.00 as compared to the one in May near 12.10 and subsequently breached a steeper ascending trend line. A short-term pullback has led it towards 200-DMA near 11.59/11.55 which is an important support.
Daily MACD has turned flat with crisscross moves around the equilibrium line denoting lack of clear direction.
If the pair breaks below 11.59/11.55, the downtrend could extend towards projections of 11.42 and 11.30.
- The Dollar remains stronger as the US NFP cooled hopes of Fed cuts
- Monetary policy decisions by the Fed and the ECB to set the pair’s direction this week.
- EUR/USD might dip to 1.05 in the coming quarter – Rabobank.
The Euro has opened the week in the same bearish tone seen during the previous one. The pair seems unable to put a significant distance from Friday’s lows, with the US Dollar buoyed by the upbeat US employment report.
Central Banks in the spotlight
Friday’s Nonfarm Payrolls beat expectations, laying bare the resilience of the US labour market and wage inflation accelerated, pouring cold water on investors’ hopes of Fed cuts early next year. This gave a fresh impulse to the US Dollar.
This week the main focus will be on Tuesday’s US CPI data ahead of Wednesday’s Federal Reserve’s monetary policy decision. The bank is widely expected to leave rates on hold at 5.5%, thus the interest will be on the interest rate projections and in the tone of chairman Powell’s comments.
On Thursday, the focus will shift towards the ECB. The benchmark interest rate will remain at 4.5% and, again, investors will be looking for dovish hints on President Lagarde’s comments as the weak economic growth and cooloing inflation have boosted hopes of rate cuts in early 2024.
The Euro could reach 1.05 in the coming quarter – Rabobank
The Technical Analysis Team of Rabobank see the pair extending its downtrend in the coming months: “ If the ECB can contain inflation going forward, a weaker EUR could help support the reforms needed to boost the competitiveness of the EU (...) On a 1-to-3-month view, we see the potential for EUR/USD to dip back to the 1.05 region.”
Technical levels to watch
- WTI gained ground on the back of solid US economic data released on Friday.
- US has initiated the purchase of up to three million barrels of Crude oil for the SPR.
- The output growth in non-OPEC countries could exceed the supply in 2024.
West Texas Intermediate (WTI) trims its intraday profits, struggling to continue its winning streak for the third successive session. The WTI oil price trades lower around $71.40 per barrel during the European session on Monday.
Crude oil prices witnessed an upswing after last week's data release, revealing a certain level of resilience in the United States (US) economy. The robust employment data on Friday played a crucial role, depicting the labor market as one of the few positive aspects in the world's largest fuel consumer.
The recent decline in WTI oil prices has spurred demand from the US, which has initiated the purchase of up to three million barrels of Crude oil for the Strategic Petroleum Reserve (SPR), with delivery scheduled for March 2024. This move comes after the SPR reached a nearly 40-year low over the past year.
Despite the commitment of the Organization of the Petroleum Exporting Countries and allies (OPEC+) to reduce production by 2.2 million barrels per day (bpd) in the first quarter of 2024, investors remain skeptical that this will lead to a significant drop in supply. The anticipation of output growth in non-OPEC countries is causing concerns about excess supply in the coming year.
Additionally, concerns about deflation in China, the leading oil importer, along with a Consumer Price Index (CPI) and Producer Price Index (PPI) that didn't meet expectations, added to the downward pressure on Crude oil prices. Recent data revealed that China's oil imports dropped to a four-month low in November, reflecting high stockpiles and subdued fuel demand.
WTI oil traders adopt a cautious stance in anticipation of the Federal Reserve's (Fed) upcoming interest rate decision. The consensus expectation is that the Fed will keep interest rates stable at 5.5% in its forthcoming monetary policy statement on Wednesday. Additionally, the market also focuses on the API Weekly Crude Oil Stock data for the week ending on December 8, which will be closely observed on Tuesday for potential market impacts.
Economists at Rabobank expect the AUD/USD pair to rise throughout the next year.
Interest rate differentials look set to offer AUD support through much of next year
Interest rate differentials look set to offer the AUD support through much of next year. That said, the AUD is sensitive to broad levels of risk appetite and to the outlook for Chinese growth. While Fed rate cuts would underpin risk appetite in 2024, a rally in the AUD/USD could be curtailed if growth in China continues to disappoint.
We are optimistic that AUD/USD could be testing the 0.70 area on a 12-month view, though we see risk for dips in AUD/USD on a 1-to-3-month timeframe.
AUD/USD 0.70 would be in line with the average level of the exchange rate over the past 5 years.
- USD/CAD grapples to hold ground near 1.3590 despite upbeat US Dollar.
- A break above 1.3600 could lead the pair to reach a 38.2% Fibonacci retracement at 1.3637.
- A collapse below 1.3500 could influence the pair to navigate the previous week’s low at 1.3479.
USD/CAD trims its intraday gains, struggling to recover recent losses despite the stronger US Dollar (USD). The USD/CAD pair trades higher around 1.3590 during the European session on Monday.
The robust employment data has sparked discussions about the future direction of the US Federal Reserve's (Fed) monetary policy and the duration for which the central bank intends to keep rates at restrictive levels. This surge in discussions could bolster the strength of the USD to test the psychological level at 1.3600, which acts as a strong barrier before the 14-day Exponential Moving Average (EMA) at 1.3606.
A breakthrough above the psychological barrier could provide support for the USD/CAD pair to explore the 38.2% Fibonacci retracement at 1.3637 followed by the major level at 1.3650.
The technical indicators for the USD/CAD pair support the current downward trend. The Moving Average Convergence Divergence (MACD) line is positioned below the centerline and the signal line, indicating a bearish momentum in the USD/CAD pair.
Furthermore, the 14-day Relative Strength Index (RSI) below 50 indicates a dovish sentiment, indicating that the USD/CAD pair could meet the support around the major level of around 1.3550, following the next psychological support level at 1.3500 level. A break below the latter could push the bears of the USD/CAD pair to navigate the region around the previous week’s low at 1.3479.
USD/CAD: Daily Chart
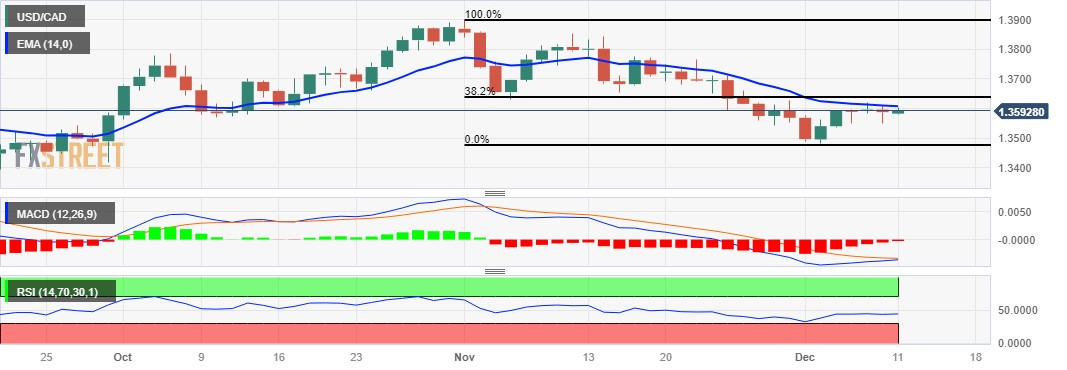
Economists at Rabobank expect the Euro to weaken in the coming months.
A weaker EUR could help support the reforms needed to boost the competitiveness of the EU
The European Commission is currently focused on improving the competitiveness of the EU. At the centre of these concerns is the stagnating German economy. If the ECB can contain inflation going forward, a weaker EUR could help support the reforms needed to boost the competitiveness of the EU.
On a 1-to-3-month view, we see the potential for EUR/USD to dip back to the 1.05 region.
On a long-term horizon, we see greater chance of EUR/USD trading in a 1.04-1.12 range, than managing a return to levels above 1.22.
Citing sources, Bloomberg News reported on Monday that Bank of Japan (BoJ) officials see little need to abandon the negative interest rate policy (NIRP) this month.
The Japanese central bank hasn’t seen enough evidence of wage growth to justify sustainable inflation, the sources added.
developing story ...
Gold prices fell in India on Monday, according to data from India's Multi Commodity Exchange (MCX).
Gold price stood at 61,379 Indian Rupees (INR) per 10 grams, down INR 817 compared with the INR 62,196 it cost on Friday.
As for futures contracts, Gold prices decreased to INR 61,575 per 10 gms from INR 61,719 per 10 gms.
Prices for Silver futures contracts decreased to INR 72,450 per kg from INR 72,518 per kg.
| Major Indian city | Gold Price |
|---|---|
| Ahmedabad | 63,710 |
| Mumbai | 63,360 |
| New Delhi | 63,465 |
| Chennai | 63,510 |
| Kolkata | 63,535 |
Global Market Movers: Comex Gold price drifts lower for second day as March Fed rate cut bets recede
- The benchmark 10-year US Treasury yield rebounded from a three-month low after the upbeat US jobs data and lifted the US Dollar, which undermined the Comex Gold price on Friday.
- The US NFP report showed that the economy added 199K new jobs in November, surpassing estimates for a reading of 180K and 150K rise in the previous month.
- The US Bureau of Labor Statistics (BLS) reported that the Unemployment Rate dipped to 3.7% from 3.9% in October, despite a rise in the Labor Force Participation Rate.
- The data pointed to the underlying labor market strength and made traders bet that it could take the Federal Reserve until May 2024 to deliver the first interest rate cut.
- The US troops were targeted with rockets and drones at least five more times on Friday by Iran-backed militias in Iraq and Syria over its support to Israel amid a war in Gaza.
- The US embassy in Iraq's capital Baghdad was shelled on Friday after being attacked by 14 rockets earlier, increasing fears of a broadening conflict in the Middle East.
- Traders now look to this week's US consumer inflation figures and the Fed's interest rate projections for next year before placing aggressive directional bets.
- A rather busy week also features the Swiss National Bank (SNB), the Bank of England (BoE) and the European Central Bank (ECB) monetary policy meetings on Thursday.
(An automation tool was used in creating this post.)
Gold FAQs
Why do people invest in Gold?
Gold has played a key role in human’s history as it has been widely used as a store of value and medium of exchange. Currently, apart from its shine and usage for jewelry, the precious metal is widely seen as a safe-haven asset, meaning that it is considered a good investment during turbulent times. Gold is also widely seen as a hedge against inflation and against depreciating currencies as it doesn’t rely on any specific issuer or government.
Who buys the most Gold?
Central banks are the biggest Gold holders. In their aim to support their currencies in turbulent times, central banks tend to diversify their reserves and buy Gold to improve the perceived strength of the economy and the currency. High Gold reserves can be a source of trust for a country’s solvency. Central banks added 1,136 tonnes of Gold worth around $70 billion to their reserves in 2022, according to data from the World Gold Council. This is the highest yearly purchase since records began. Central banks from emerging economies such as China, India and Turkey are quickly increasing their Gold reserves.
How is Gold correlated with other assets?
Gold has an inverse correlation with the US Dollar and US Treasuries, which are both major reserve and safe-haven assets. When the Dollar depreciates, Gold tends to rise, enabling investors and central banks to diversify their assets in turbulent times. Gold is also inversely correlated with risk assets. A rally in the stock market tends to weaken Gold price, while sell-offs in riskier markets tend to favor the precious metal.
What does the price of Gold depend on?
The price can move due to a wide range of factors. Geopolitical instability or fears of a deep recession can quickly make Gold price escalate due to its safe-haven status. As a yield-less asset, Gold tends to rise with lower interest rates, while higher cost of money usually weighs down on the yellow metal. Still, most moves depend on how the US Dollar (USD) behaves as the asset is priced in dollars (XAU/USD). A strong Dollar tends to keep the price of Gold controlled, whereas a weaker Dollar is likely to push Gold prices up.
USD/INR remains remarkably stable. Economists at Commerzbank analyze the pair’s outlook.
RBI content with stable rates and currency
The Reserve Bank of India (RBI) left the benchmark repo rate unchanged at 6.50% as expected. RBI remains in a wait-and-see mode. There is no urgency to alter policy in any direction at this juncture. The economy is on track to expand by 7% in 2023.
RBI also upgraded the forecast for the current fiscal year 2023-2024 to 7% from 6.5% previously. At the same time, inflation is well-controlled, as there are no signs of uncontrolled demand-led or input-cost inflation. Headline inflation is expected to average around 5.7% this year and should hold around 5% in Q4 2023. This is within RBI’s 2-6% target range.
Lower oil prices should aid INR sentiment and help to contain import inflation. Overall, RBI will be content to see a stable INR.
FX option expiries for Dec 11 NY cut at 10:00 Eastern Time, via DTCC, can be found below.
- EUR/USD: EUR amounts
- 1.0700 686m
- 1.0720 803m
- 1.0725 609m
- 1.0730 744m
- 1.0800 761m
- USD/JPY: USD amounts
- 144.25 456m
- 145.00 568m
- 146.00 951m
- 147.00 1.3b
- USD/CHF: USD amounts
- 0.8900 412m
- AUD/USD: AUD amounts
- 0.6500 451m
- 0.6550 895m
- 0.6600 627m
- USD/MXN recovers its recent losses as US Dollar stays firm post upbeat US labor data.
- US NFP for November reported an increase of 199,000 jobs, and the US Unemployment Rate fell to 3.7%.
- Banxico is expected to hold cash rates at the level of 11.25%.
USD/MXN attempts to retrace its recent losses, hovering around 17.37 during the Asian session on Monday. The US Dollar (USD) receives upward support from the market sentiment that the Federal Reserve (Fed) won't implement interest rate cuts anytime soon. This sentiment is driven by the resilience displayed in the United States (US) labor market. The US Nonfarm Payrolls for November surpassed expectations with a significant increase of 199,000, and the Unemployment Rate dropped to 3.7% from the previous 3.9%, contributing to the prevailing confidence in the USD.
The latest Headline Inflation in Mexico increased to 0.64% in November from 0.38% in October but fell short of the market expectation of 0.72%. Meanwhile, Core Inflation eased at 0.26% against the 0.30% as expected and 0.39% previously. Additionally, Banxico's upcoming announcement of its key interest rate on Thursday is a notable event that could influence market movements. The prevailing expectation is that Banxico will maintain cash rates at the unchanged level of 11.25%. Investors will likely monitor the central bank's decision and any accompanying statements for insights into the monetary policy outlook.
The Bank of Mexico's (Banxico) officials have recently expressed a leaning towards easing monetary policy. However, dissent emerges within the ranks, notably from Banxico's Deputy Governor Irene Espinosa. She has pushed back, emphasizing that inflationary risks persist and are increasing. This underscores a divergence in perspectives within Banxico regarding the appropriate stance on monetary policy.
The rise in US bond yields, driven by speculations about the Federal Reserve's (Fed) expected rates trajectory higher, is fortifying the US Dollar (USD) and providing considerable support to the Greenback. The US Dollar Index (DXY) remains robust, maintaining a position above 104.00. The yields on 2-year and 10-year US bond coupons stand at 4.75% and 4.25%, respectively, by the press time.
Moreover, Investors are poised to closely watch the US Consumer Price Index (CPI) data for November on Tuesday. Market expects a slight decline from 3.2% to 3.1% in yearly CPI data. However, monthly CPI is anticipated an increase to 0.1%.
Leaving aside the Turkish Lira, the Forint was the notable underperformer among currencies in the central and eastern European region for the past three years. Economists at Commerzbank analyze EUR/HUF outlook.
EUR/HUF on a steady rising path later in 2024 and 2025
We forecast EUR/HUF to drift modestly down over the coming months because Hungarian inflation will probably moderate faster than MNB will cut rates.
But later in 2024 and 2025, wages and core inflation could prove stubborn, which will depress Hungary’s real interest rate, once more, and put EUR/HUF on a steady rising path.
Here is what you need to know on Monday, December 11:
Financial markets stay relatively quiet early Monday as investors gear up for highly-anticipated macroeconomic data releases and central bank meetings later in the week. The economic calendar will not offer any high-tier data releases. In the late American session, the outcome of the 10-year US Treasury note auction will be watched closely by participants.
The US Dollar (USD) Index snapped a three-week losing streak as the upbeat November jobs report helped the currency preserve its strength heading into the weekend. Nonfarm Payrolls (NFP) in the US rose by 199,000 and the Unemployment Rate declined to 3.7% from 3.9%, the US Bureau of Labor Statistics reported on Friday. Early Monday, the USD Index holds steady at around 104.00. Meanwhile, the benchmark 10-year US Treasury bond yield continues to fluctuate above 4.2% and US stock index futures trade modestly lower on the day.
US Dollar price today
The table below shows the percentage change of US Dollar (USD) against listed major currencies today. US Dollar was the strongest against the Japanese Yen.
| USD | EUR | GBP | CAD | AUD | JPY | NZD | CHF | |
| USD | -0.02% | 0.05% | -0.01% | 0.24% | 0.26% | 0.13% | -0.05% | |
| EUR | 0.01% | 0.06% | 0.01% | 0.26% | 0.28% | 0.15% | -0.03% | |
| GBP | -0.04% | -0.06% | -0.05% | 0.20% | 0.22% | 0.08% | -0.09% | |
| CAD | 0.01% | -0.01% | 0.05% | 0.25% | 0.27% | 0.14% | -0.04% | |
| AUD | -0.24% | -0.26% | -0.21% | -0.25% | 0.02% | -0.11% | -0.29% | |
| JPY | -0.26% | -0.28% | -0.32% | -0.27% | -0.03% | -0.14% | -0.31% | |
| NZD | -0.13% | -0.15% | -0.08% | -0.14% | 0.11% | 0.13% | -0.18% | |
| CHF | 0.05% | 0.03% | 0.09% | 0.04% | 0.29% | 0.31% | 0.18% |
The heat map shows percentage changes of major currencies against each other. The base currency is picked from the left column, while the quote currency is picked from the top row. For example, if you pick the Euro from the left column and move along the horizontal line to the Japanese Yen, the percentage change displayed in the box will represent EUR (base)/JPY (quote).
The data from China showed that the Consumer Price Index declined by 0.5% on a monthly basis in November, bringing the annual CPI inflation rate down to -0.5% from -0.2% in October.
EUR/USD touched its lowest level in three weeks below 1.0730 on Friday and ended up closing the week in negative territory. Early Monday, the pair consolidates the previous week's losses and trades above 1.0750.
GBP/USD moves up and down in a narrow channel at around 1.2550 to start the new week. On Tuesday, the UK's Office for National Statistics will release labor market figures for October.
After fluctuating wildly in the second half of the previous week on speculations that the Bank of Japan was preparing to move out of negative rates, USD/JPY gained traction and rose above 145.00 early Monday.
Gold extended its weekly slide on Friday but managed to close slightly above $2,000. XAU/USD struggles to shake off the bearish pressure and tests that key level in the European morning on Monday.
- GBP/USD remains on the defensive around 1.2539 ahead of the FOMC, and BoE rate decision.
- The pair maintains the bearish outlook, holding below the 50- and 100-hour EMA; the RSI indicator stands in the bearish zone below 50.
- 1.2530 acts as an initial level; the immediate resistance level will emerge at 1.2590.
The GBP/USD pair remains under pressure below the mid-1.2500s during the early European session on Monday. Investors are in a cautious mood ahead of the key events in the US and UK this week. The Federal Open Market Committee (FOMC) rate decision on Wednesday and the Bank of England (BoE) rate decision on Thursday will be in the spotlight this week and could trigger volatility in the market. The major pair currently trades near 1.2539, losing 0.07% on the day.
From a technical perspective, GBP/USD maintains a bearish outlook as the pair holds below the 50- and 100-hour Exponential Moving Averages (EMAs) on the four-hour chart. The prevailing bearish sentiment appears in the Relative Strength Index (RSI), which remains below 50, indicating the path of least resistance is to the downside.
The lower limit of the Bollinger Band at 1.2530 acts as an initial level for GBP/USD. The key contention level to watch is a psychological round mark and a low of December 8 at 1.2500. Any follow-through selling will see a drop to a low of November 22 at 1.2450. Finally, the additional downside filter is a low of November 17 at 1.2374.
On the upside, the immediate resistance level will emerge at the 50-hour EMA at 1.2590. The next hurdle is seen at the upper boundary of the Bollinger Band at 1.2608. A break above the latter will see a rally to a high of December 5 at 1.2652, en route to a high of December 4 at 1.2712.
GBP/USD four-hour chart
-638378745953562042.png)
- USD/CNH gains ground near 7.1960 on the cautious mood and downbeat Chinese data.
- The pair holds above the 50- and 100-hour EMA; RSI indicator stands in the overbought condition.
- The immediate resistance level is seen at 7.2100; 7.1776 acts as an initial support level for the pair.
The USD/CNH pair holds positive ground around 7.1960 during the Asian session on Monday. The cautious mood in the market and the weaker-than-expected Chinese data lends some support to the pair. Investors await the US inflation data due on Tuesday ahead of the Federal Open Market Committee (FOMC) rate decision on Wednesday for fresh impetus. The markets anticipate the US central bank to hold the rate steady at its December meeting.
Furthermore, the National Bureau of Statistics of China revealed on Saturday that China’s Consumer Price Index (CPI) dropped 0.5% YoY in November from October’s reading 0.2% decline. This figure came in worse than the expectation of a 0.2% decrease. Meanwhile, the nation’s Producer Price Index (PPI) fell 3.0% YoY in November versus a 2.6% decline prior, below the market consensus of a 2.8% decline in the same month.
According to the daily chart, USD/CNH holds above the 50- and 100-hour Exponential Moving Averages (EMAs), which means the path of least resistance for the pair is to the upside. The upward momentum is supported by the Relative Strength Index (RSI), which stands in bullish territory above 50. However, the overbought condition indicates that further consolidation cannot be ruled out before positioning for any near-term USD/CNH appreciation.
The immediate resistance level for USD/CNH is seen near a low of November 17 at 7.2100. Further north, the next upside barrier is located at a high of November 20 at 7.2248, en route to a low of November 15 at 7.2384, and finally a low of November 16 at 7.2427.
On the flip side, the 100-hour EMA at 7.1776 acts as an initial support level for the pair. A break below the latter will see a drop to the 50-hour EMA at 7.1662. The additional downside filter to watch is the lower limit of the Bollinger Band at 7.1503, followed by a low of November 28 at 7.1424.
USD/CNH daily chart
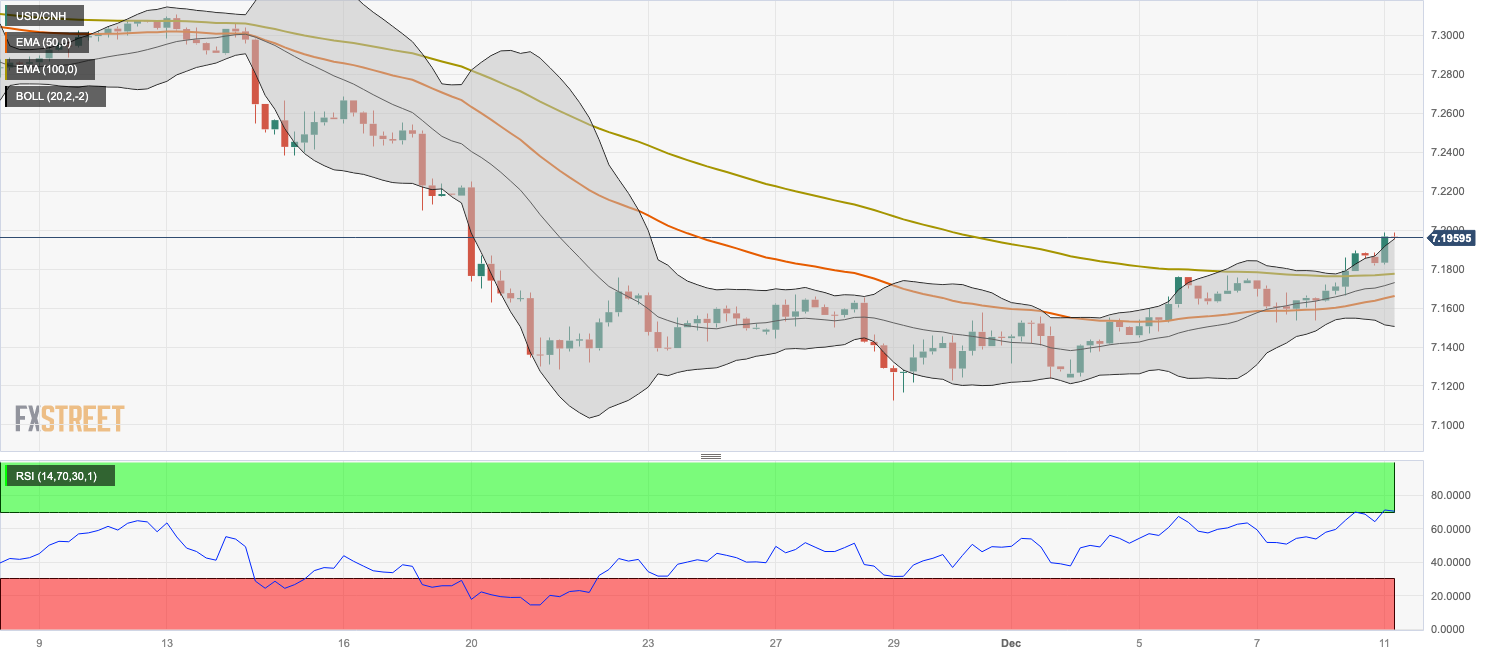
- USD/CHF moves sideways near the psychological level ahead of US inflation.
- Fed is expected to maintain interest rates at 5.5% during the policy meeting on Wednesday.
- Market expects the Fed to keep monetary policy tightened for a longer period as the labor market showed resistance.
- SNB is predicted to maintain policy rates at 1.75% in its upcoming meeting on Thursday.
USD/CHF hovers around 0.8800 during the Asian trading hours on Monday, grappling to extend its profits for the third successive session. The USD/CHF pair has been on an upward trajectory, propelled by positive employment data from the United States (US). The rise in US bond yields, driven by speculations about the Federal Reserve's (Fed) rates trajectory, is further strengthening the US Dollar (USD) and providing support to the USD/CHF pair.
The US Nonfarm Payrolls for November exceeded expectations with a substantial increase of 199,000, and the Unemployment Rate declined to 3.7% from the previous 3.9%. Additionally, the preliminary Michigan Consumer Sentiment Index for December showed a noteworthy rise, reaching 69.4, marking a significant increase from the previous reading of 61.3.
However, the consensus is that the Federal Reserve (Fed) will maintain interest rates at 5.5% during the upcoming monetary policy meeting on Wednesday. However, solid labor market conditions could put pressure on the Fed to maintain higher interest rates for a longer period. Investors are anticipated to closely scrutinize the US Consumer Price Index (CPI) data on Tuesday, anticipating potential market impacts.
On the Swiss front, the CHF experienced downward pressure following the release of seasonally adjusted Unemployment Rate data by the State Secretariat for Economic Affairs (SECO) last week. The report revealed that the total number of unemployed civilian laborers in November remained steady at 2.1%, consistent with previous figures.
Furthermore, the easing of the Swiss Consumer Price Index (YoY) for November at 1.4%, compared to the prior 1.7%, contributed to the depreciation of the Swiss Franc (CHF). The upcoming interest rate decision by the Swiss National Bank (SNB) on Thursday is expected to see the central bank maintaining policy rates at the unchanged level of 1.75%.
- Gold price remains under some selling pressure for the second successive day on Monday.
- Reduced bets for a March Fed rate cut move and a modest USD uptick weigh on the metal.
- Geopolitical risks could help limit further losses ahead of this week’s key data/event risks.
Gold price (XAU/USD) fell over 1.5% intraday and touched a two-week trough on Friday following the release of stronger-than-expected employment details from the United States (US). The closely-watched US jobs report showed strength across the board and pointed to a resilient economy, forcing investors to trim their bets for a 25 basis points (bps) interest rate cut by the Federal Reserve (Fed) in March 2024. This pushed the US Treasury bond yields and the US Dollar (USD) higher, which, in turn, weighed heavily on the commodity.
The selling bias around the Gold price remains unabated through the Asian session on Monday, though it lacks follow-through amid geopolitical risks. Traders also seem reluctant to place aggressive bets ahead of this week's key data and central bank event risks. The US consumer inflation figures are due on Tuesday, which will be followed by the crucial FOMC decision on Wednesday. The Swiss National Bank (SNB), the Bank of England (BoE) and the European Central Bank (ECB) are also scheduled to announce policy updates on Thursday.
The market attention will then turn to the release of flash PMI prints from the Eurozone, the UK and the US, which will offer fresh insight into the health of the global economy and provide some meaningful impetus to the Gold price. Nevertheless, the XAU/USD, for now, seems to have found acceptance below the $2,000 psychological mark and looks to a possible Fed pivot to prevent a deeper correction.
Daily Digest Market Movers: Gold price continues to be weighed down by reduced bets for a rate cut by the Fed in March 2024
- The benchmark 10-year US Treasury yield rebounded from a three-month low after the upbeat US jobs data and lifted the US Dollar, which undermined the Gold price on Friday.
- The US NFP report showed that the economy added 199K new jobs in November, surpassing estimates for a reading of 180K and 150K rise in the previous month.
- The US Bureau of Labor Statistics (BLS) reported that the Unemployment Rate dipped to 3.7% from 3.9% in October, despite a rise in the Labor Force Participation Rate.
- The data pointed to the underlying labour market strength and made traders bet that it could take the Federal Reserve until May 2024 to deliver the first interest rate cut.
- The US troops were targeted with rockets and drones at least five more times on Friday by Iran-backed militias in Iraq and Syria over its support to Israel amid a war in Gaza.
- The US embassy in Iraq's capital Baghdad was shelled on Friday after being attacked by 14 rockets earlier, increasing fears of a broadening conflict in the Middle East.
- Traders now look to this week's US consumer inflation figures and the Fed's interest rate projections for next year before placing aggressive directional bets.
- A rather busy week also features the Swiss National Bank (SNB), the Bank of England (BoE) and the European Central Bank (ECB) monetary policy meetings on Thursday.
Technical Analysis: Gold price seems vulnerable to slide further towards testing the 50-day SMA support near the $1,950 area
From a technical perspective, Friday's breakdown below the $2,012-2,010 area, representing the 61.8% Fibonacci retracement level of the November-December rally, could be seen as a fresh trigger for bearish traders. Moreover, oscillators on the daily chart have been losing positive traction, which, in turn, supports prospects for deeper losses. Hence, a subsequent slide towards testing the 50-day Simple Moving Average (SMA), currently pegged around the $1,965-1,963 zone, looks like a distinct possibility. This is followed by the very important 200-day SMA, near the $1,951-1,950 region, which if broken decisively will set the stage for an extension of the recent sharp pullback from an all-time high touched last Monday.
On the flip side, the $2,010-2,012 support breakpoint now seems to act as an immediate hurdle ahead of the $2,030 level and the $2,040 supply zone. Against the backdrop of the occurrence of a golden cross, with the 50-day rising above the 200-day SMA, some follow-through buying will shift the near-term bias in favor of bullish traders. The Gold price might then climb to the next relevant resistance near the $2,071-2,072 region before aiming to reclaim the $2,100 round figure.
US Dollar price today
The table below shows the percentage change of US Dollar (USD) against listed major currencies today. US Dollar was the strongest against the Japanese Yen.
| USD | EUR | GBP | CAD | AUD | JPY | NZD | CHF | |
| USD | 0.03% | 0.11% | 0.12% | 0.35% | 0.40% | 0.23% | 0.04% | |
| EUR | -0.02% | 0.09% | 0.11% | 0.35% | 0.39% | 0.21% | 0.01% | |
| GBP | -0.10% | -0.09% | 0.02% | 0.26% | 0.30% | 0.12% | -0.08% | |
| CAD | -0.12% | -0.11% | -0.03% | 0.23% | 0.29% | 0.10% | -0.10% | |
| AUD | -0.36% | -0.35% | -0.27% | -0.24% | 0.05% | -0.13% | -0.34% | |
| JPY | -0.41% | -0.38% | -0.39% | -0.29% | -0.06% | -0.18% | -0.37% | |
| NZD | -0.23% | -0.20% | -0.11% | -0.10% | 0.13% | 0.17% | -0.19% | |
| CHF | -0.02% | -0.01% | 0.07% | 0.10% | 0.34% | 0.39% | 0.20% |
The heat map shows percentage changes of major currencies against each other. The base currency is picked from the left column, while the quote currency is picked from the top row. For example, if you pick the Euro from the left column and move along the horizontal line to the Japanese Yen, the percentage change displayed in the box will represent EUR (base)/JPY (quote).
Gold FAQs
Why do people invest in Gold?
Gold has played a key role in human’s history as it has been widely used as a store of value and medium of exchange. Currently, apart from its shine and usage for jewelry, the precious metal is widely seen as a safe-haven asset, meaning that it is considered a good investment during turbulent times. Gold is also widely seen as a hedge against inflation and against depreciating currencies as it doesn’t rely on any specific issuer or government.
Who buys the most Gold?
Central banks are the biggest Gold holders. In their aim to support their currencies in turbulent times, central banks tend to diversify their reserves and buy Gold to improve the perceived strength of the economy and the currency. High Gold reserves can be a source of trust for a country’s solvency. Central banks added 1,136 tonnes of Gold worth around $70 billion to their reserves in 2022, according to data from the World Gold Council. This is the highest yearly purchase since records began. Central banks from emerging economies such as China, India and Turkey are quickly increasing their Gold reserves.
How is Gold correlated with other assets?
Gold has an inverse correlation with the US Dollar and US Treasuries, which are both major reserve and safe-haven assets. When the Dollar depreciates, Gold tends to rise, enabling investors and central banks to diversify their assets in turbulent times. Gold is also inversely correlated with risk assets. A rally in the stock market tends to weaken Gold price, while sell-offs in riskier markets tend to favor the precious metal.
What does the price of Gold depend on?
The price can move due to a wide range of factors. Geopolitical instability or fears of a deep recession can quickly make Gold price escalate due to its safe-haven status. As a yield-less asset, Gold tends to rise with lower interest rates, while higher cost of money usually weighs down on the yellow metal. Still, most moves depend on how the US Dollar (USD) behaves as the asset is priced in dollars (XAU/USD). A strong Dollar tends to keep the price of Gold controlled, whereas a weaker Dollar is likely to push Gold prices up.
- EUR/USD rebounded from its three-week low at 1.0723.
- ECB is expected to keep the Main Refinancing Operations Rate unchanged at 4.5% in its upcoming meeting.
- Fed may maintain interest rates at 5.5% during the policy meeting on Wednesday.
- Solid US labor data triggered the discussion on the duration of tightened monetary policy by the Fed.
The EUR/USD rebounds from its three-week low at 1.0723, which was recorded on Friday. The EUR/USD pair trades higher around 1.0760 during the Asian trading hours on Monday. However, the US Dollar (USD) received an upward momentum after the release of stronger economic data from the United States (US).
The US Nonfarm Payrolls for November exceeded expectations with a significant increase to 199,000, while the US Unemployment Rate dropped to 3.7% from the previous 3.9%. Meanwhile, the German Harmonized Index of Consumer Prices (YoY) remained steady at 2.3% in November, in line with expectations, with monthly figures reflecting a 0.7% decline, similar to October.
Market anticipation suggests that the European Central Bank (ECB) will maintain the Main Refinancing Operations Rate at 4.5% in its upcoming monetary policy statement on Thursday. Furthermore, expectations point toward a commencement of interest rate cuts by the ECB in March 2024.
On the other hand, speculation surrounds the future trajectory of the US Federal Reserve's (Fed) interest rates and the duration for which policy rates will remain restrictive. However, the consensus expectation is that the Fed will keep interest rates at 5.5% during the upcoming monetary policy meeting on Wednesday.
The US Dollar Index (DXY) remains strong above 104.00, supported by positive US Treasury yields. At present, the yields on 2-year and 10-year US bond coupons stand at 4.24% and 4.73%, respectively.
Investors are expected to closely monitor the US Consumer Price Index (CPI) data on Tuesday for potential market impact. Additionally, the ZEW Survey – Economic Sentiment for December will be released by Germany, adding to the market's focus.
- Indian Rupee remains relatively quiet ahead of the FOMC meeting.
- The Reserve Bank of India (RBI) MPC decided to keep the rate steady at 6.50% at its December meeting.
- Investors will closely monitor the US inflation data ahead of the FOMC interest rate decision.
Indian Rupee (INR) trades flat with mild losses on Monday as traders prefer to wait on the sidelines ahead of the key US event. On Friday, the Reserve Bank of India (RBI) Monetary Policy Committee (MPC) decided to keep the interest rate unchanged at 6.50% while raising its growth forecast for the current fiscal year to 7% from 6.5% earlier. RBI’s Das said easing inflation across all components of retail inflation is one of the reasons behind the MPC's decision to keep the repo rate unchanged.
RBI’s Das further stated that the near-term picture is clouded by risks to food inflation, which might lead to higher inflation in November and possibly December. This should be monitored for potential second-round effects.
Investors will closely monitor the US inflation data, as measured by Consumer Price Index (CPI). The attention will shift to the Federal Open Market Committee (FOMC) meeting on Tuesday and Wednesday. In the meantime, RBI could support the Indian Rupee at 83.40 as oil companies and others would buy on dips in USD/INR.
Daily Digest Market Movers: The Indian Rupee remains resilient to external shocks amid better macro data, sustainable forex reserves, and investor inflows
- The Reserve Bank of India (RBI) governor Shaktikanta Das announced the Monetary Policy Committee decided unanimously to keep the policy repo rate unchanged at 6.5% and keep the focus on the withdrawal of accommodation.
- Das highlighted the Indian economy is resilient and has momentum, as reflected in the GDP growth for the second quarter of the ongoing financial year.
- Indian retail inflation is estimated at 5.4% in FY24. RBI also projected retail inflation in Q3 of FY24 at 5.6% and 5.2% in Q4.
- The forecast growth rate for India's GDP in FY24 is currently set at 7.0%, with growth rates forecast of 6.5% and 6.0% for the third and fourth quarters, respectively.
- India's foreign exchange reserves increased to $604 billion as of December 1, surpassing the $600 billion mark after a gap of about four months.
- US Nonfarm Payrolls (NFP) rose by 199K from October's increase of 150K and came in above the market expectation of 180K.
- Unemployment Rate declined to 3.7% from 3.9% in the same period, while Average Hourly Earnings remained steady at 4.0%, in line with the market expectation.
- The preliminary University of Michigan Consumer Sentiment Index for December arrived at 69.4 from 61.3 in the previous reading, the second-highest reading this year.
Technical Analysis: Indian Rupee trades flat with a slight positive bias
Indian Rupee trades flat on the day. The USD/INR pair has traded near the upper boundary of a trading range of 82.80–83.40 since September. According to the daily chart, USD/INR maintains its bullish vibes as it holds above the key 100-day Exponential Moving Average (EMA). Additionally, the 14-day Relative Strength Index (RSI) continues above the 50.0 threshold, bolstering the upward momentum.
That being said, a decisive break above the upper boundary of the trading range of 83.40 could pave the way to the next hurdle at the year-to-date (YTD) high of 83.47, followed by a round figure of 84.00. On the downside, the critical support level is seen at the 83.00 psychological round figure. A break below 83.00 will see a drop to 82.80, representing the confluence of the lower limit of the trading range and a low of September 12. The additional downside to watch is a low of August 11 at 82.60.
US Dollar price today
The table below shows the percentage change of US Dollar (USD) against listed major currencies today. US Dollar was the strongest against the Australian Dollar.
| USD | EUR | GBP | CAD | AUD | JPY | NZD | CHF | |
| USD | -0.02% | 0.07% | 0.11% | 0.31% | 0.27% | 0.09% | -0.01% | |
| EUR | 0.02% | 0.09% | 0.12% | 0.31% | 0.28% | 0.10% | 0.01% | |
| GBP | -0.06% | -0.08% | 0.03% | 0.22% | 0.20% | 0.02% | -0.08% | |
| CAD | -0.11% | -0.12% | -0.04% | 0.19% | 0.16% | -0.01% | -0.12% | |
| AUD | -0.31% | -0.33% | -0.23% | -0.19% | -0.03% | -0.20% | -0.30% | |
| JPY | -0.25% | -0.27% | -0.27% | -0.15% | 0.05% | -0.16% | -0.28% | |
| NZD | -0.09% | -0.11% | -0.02% | 0.02% | 0.22% | 0.18% | -0.10% | |
| CHF | 0.01% | 0.00% | 0.08% | 0.12% | 0.30% | 0.27% | 0.10% |
The heat map shows percentage changes of major currencies against each other. The base currency is picked from the left column, while the quote currency is picked from the top row. For example, if you pick the Euro from the left column and move along the horizontal line to the Japanese Yen, the percentage change displayed in the box will represent EUR (base)/JPY (quote).
Indian Rupee FAQs
What are the key factors driving the Indian Rupee?
The Indian Rupee (INR) is one of the most sensitive currencies to external factors. The price of Crude Oil (the country is highly dependent on imported Oil), the value of the US Dollar – most trade is conducted in USD – and the level of foreign investment, are all influential. Direct intervention by the Reserve Bank of India (RBI) in FX markets to keep the exchange rate stable, as well as the level of interest rates set by the RBI, are further major influencing factors on the Rupee.
How do the decisions of the Reserve Bank of India impact the Indian Rupee?
The Reserve Bank of India (RBI) actively intervenes in forex markets to maintain a stable exchange rate, to help facilitate trade. In addition, the RBI tries to maintain the inflation rate at its 4% target by adjusting interest rates. Higher interest rates usually strengthen the Rupee. This is due to the role of the ‘carry trade’ in which investors borrow in countries with lower interest rates so as to place their money in countries’ offering relatively higher interest rates and profit from the difference.
What macroeconomic factors influence the value of the Indian Rupee?
Macroeconomic factors that influence the value of the Rupee include inflation, interest rates, the economic growth rate (GDP), the balance of trade, and inflows from foreign investment. A higher growth rate can lead to more overseas investment, pushing up demand for the Rupee. A less negative balance of trade will eventually lead to a stronger Rupee. Higher interest rates, especially real rates (interest rates less inflation) are also positive for the Rupee. A risk-on environment can lead to greater inflows of Foreign Direct and Indirect Investment (FDI and FII), which also benefit the Rupee.
How does inflation impact the Indian Rupee?
Higher inflation, particularly, if it is comparatively higher than India’s peers, is generally negative for the currency as it reflects devaluation through oversupply. Inflation also increases the cost of exports, leading to more Rupees being sold to purchase foreign imports, which is Rupee-negative. At the same time, higher inflation usually leads to the Reserve Bank of India (RBI) raising interest rates and this can be positive for the Rupee, due to increased demand from international investors. The opposite effect is true of lower inflation.
- NZD/USD trades lower around 0.6120 as US Dollar remains firm.
- Stronger US NFP data contributed support to underpinning the Greenback.
- US Fed is expected to maintain the cash rate at 5.5% in December's meeting.
- New Zealand’s GDP data for Q3 is expected to decline from the previous quarter’s growth.
NZD/USD extends its losses for the second consecutive trading session, bidding around 0.6120 during the Asian hours on Monday. The robust employment data has sparked an upward movement in US bond yields, contributing to the strengthening of the US Dollar (USD) and consequently exerting pressure on the Kiwi pair.
The US Nonfarm Payrolls for November showed a significant uptick, reaching 199,000 compared to October's increase of 150,000, surpassing the market expectation of 180,000. The US Average Hourly Earnings (Year-on-Year) remained stable at 4.0%, aligning with market projections for November. Furthermore, the Unemployment Rate dropped to 3.7%, down from the previous 3.9%. Additionally, the preliminary Michigan Consumer Sentiment Index for December rose to 69.4, marking a notable increase from the previous reading of 61.3.
US Dollar Index (DXY) attempts to gain ground for another session, trading above 104.00 at the time of writing. The yields on 2-year and 10-year US bond coupons stand at 4.24% and 4.73%, respectively.
Market participants speculate regarding the future trajectory of the US Federal Reserve's (Fed) monetary policy and how long the central bank plans to maintain rates at restrictive levels. However, the consensus expectation is that the Fed will maintain interest rates at 5.5% during the upcoming monetary policy meeting on Wednesday.
Investors will closely watch the US Consumer Price Index (CPI) data on Tuesday for additional insights and its potential impact on the market. Turning attention to the Kiwi's economic agenda, the Gross Domestic Product (GDP) data for the third quarter is scheduled for release on Thursday. Projections suggest a growth of 0.2%, a decline from the previous quarter's 0.9% expansion.
- WTI Oil prices ticks higher during the Asian session on Monday, though lacks follow-through.
- Signs of a resilient US economy fuel optimism over the demand outlook and lend support.
- China’s economic woes might cap any further gains ahead of the key central bank event risks.
West Texas Intermediate (WTI) Crude Oil prices edge higher during the Asian session on Monday and look to build on last week's modest recovery from the $69.00/barrel mark or the lowest level since June 29. The commodity currently trades just above the mid-$71.00s, up over 0.35% for the day, though lacks follow-through amid a combination of diverging forces.
The strong US Nonfarm Payrolls (NFP) data released on Friday pointed to a still resilient economy and prompted some optimism over the outlook for crude demand in the world's largest fuel consumer. This, in turn, is seen as a key factor acting as a tailwind for Crude Oil prices. Investors, however, remain sceptical that the recent production cuts announced by OPEC+ will be enough to offset rising supply from countries outside the cartel and waning global demand. This, along with weak economic data from top importer China, raises concerns over fuel demand and should cap any meaningful appreciating move for the black liquid.
In fact, China's General Administration of Customs reported on Friday that crude imports fell 10% from October to a four-month low in November. Furthermore, inflation data from China released over the weekend revealed that consumer prices last month recorded the fastest drop since November 2020. Adding to this, the Producer Price Index (PPI) marked the 14th straight month of decline. The data was seen as a reflection of weak consumer demand, warranting caution before placing aggressive bullish bets around Crude Oil prices. Traders might also prefer to wait on the sidelines ahead of this week's key central bank event risks.
Technical levels to watch
| Raw materials | Closed | Change, % |
|---|---|---|
| Silver | 22.99 | -3.38 |
| Gold | 2003.926 | -1.22 |
| Palladium | 945 | -2.54 |
- USD/CAD seems to surpass the psychological level at 1.3600.
- Upbeat WTI price could provide support for the Canadian Dollar (CAD).
- Stronger US labor data have triggered discussions on the trajectory of Fed monetary policy.
USD/CAD recovers its recent losses as the US Dollar (USD) attempts to gain ground for the second successive day. The USD/CAD pair trades higher around 1.3600 during the Asian session on Monday. However, the stronger Crude oil prices could limit the losses of the Canadian Dollar (CAD).
West Texas Intermediate (WTI) extends its winning streak for the third successive session, trading higher near $71.60 per barrel during the Asian session on Monday. Crude oil prices experienced an upswing following the release of data last week, indicating a degree of resilience in the United States (US) economy. The robust US employment data on Friday played a significant role, portraying the labor market as one of the few positive aspects in the world's largest fuel consumer.
The US Nonfarm Payrolls for November exhibited a notable increase, reaching 199,000 compared to October's rise of 150,000 and surpassing the market expectation of 180,000. The US Average Hourly Earnings (YoY) remained constant at 4.0%, in line with the market's projections for November. The Unemployment Rate decreased to 3.7%, down from the previous 3.9%.
The robust employment data has stirred conversations regarding the future trajectory of the US Federal Reserve's (Fed) monetary policy and how long the central bank plans to maintain rates at restrictive levels. This surge in discussions has fueled an upward movement in US Treasury yields, contributing to the strengthening of the USD. Market participants are now focused on the US Consumer Price Index (CPI) on Tuesday and the Fed Interest Rate Decision on Wednesday for further insights and potential market impact.
- The Japanese Yen gives up some of its recent strong gains against the US Dollar.
- Reduced bets for an imminent shift in the BoJ’s policy shift undermine the JPY.
- The USD draws support from Friday’s better-than-expected US monthly job data.
- The market attention now shifts to the US CPI and the FOMC decision this week.
The Japanese Yen (JPY) kicks off the new week on a softer note amid reports that Bank of Japan (BoJ) Governor Kazuo Ueda's comments last week were taken out of context and not meant to signal anything about the timing of a policy change. Adding to this, the weaker GDP report pointed to Japan's still fragile economy, suggesting that market expectations of an imminent rate hike may be overblown. In contrast, stronger monthly employment figures from the United States (USD) made traders bet that it could take the Federal Reserve (Fed) until May to begin a series of interest-rate cuts next year. This, in turn, lends some support to the US Dollar (USD) allowing the USD/JPY pair to build on Friday's goodish recovery from mid-142.00s and gain positive traction for the second successive day on Monday.
Investors, meanwhile, seem convinced that the end to BoJ's decades of super-low interest rates may be nearing. This, along with concerns about a deeper global economic downturn, might continue to benefit the JPY's relative safe-haven status and cap any meaningful appreciating move for the USD/JPY pair. Traders might also refrain from placing aggressive directional bets ahead of this week's key data/event risks. The latest US consumer inflation figures are due for release on Tuesday and will be followed by the crucial FOMC monetary policy decision on Thursday. This would play a key role in influencing the near-term USD price dynamics and provide some meaningful impetus to the major. Hence, it will be prudent to wait for strong follow-through buying before confirming that spot prices have bottomed out.
Daily Digest Market Movers: Japanese Yen continues losing traction amid hopes that BoJ will delay exit from easy policy
- A Reuters report, citing three sources familiar with the matter, said that Bank of Japan Governor Kazuo Ueda's comments last week were not meant to signal an imminent policy shift.
- This, along with data showing that Japan's economy contracted more sharply than first estimated in the third quarter, by an annualized 2.9%, is seen undermining the Japanese Yen.
- The US Bureau of Labor Statistics (BLS) reported on Friday that the economy added 199K new jobs in November as compared to the 150K in the previous month and 180K anticipated.
- Additional details of the publication revealed that the Unemployment Rate declined to 3.7% from 3.9% in October, despite a rise in the Labor Force Participation Rate to 62.8% from 62.7%.
- Annual wage inflation, as measured by the change in Average Hourly Earnings, matched consensus estimates and held steady at 4% during the reported month.
- The upbeat US employment figures forced investors to scale back their expectations for an early interest rate cut by the Federal Reserve, as early as March 2024.
- Investors now look forward to the latest US consumer inflation figures on Tuesday, which could influence market expectations about a series of Fed rate cuts next year.
- The US central bank is also scheduled to announce its policy decision at the end of a two-day policy meeting on Wednesday and is anticipated to maintain the status quo.
- The market focus, meanwhile, will be on the so-called "dot plots" and Fed Chair Jerome Powell's comments at the post-meeting press conference.
Technical Analysis: USD/JPY recovers further from the multi-month low touched last Thursday, upside potential seems limited
From a technical perspective, the USD/JPY pair last week showed some resilience below the very important 200-day Simple Moving Average (SMA). The subsequent move beyond the 23.6% Fibonacci retracement level of the recent decline from the 152.00 neighbourhood, or the YTD peak, favours bullish traders. The momentum, however, paused ahead of the 38.2% Fibo. level during the Asian session on Monday, which if cleared should allow spot prices to reclaim the 146.00 mark. The momentum could get extended further, though is more likely to remain capped near the 50% Fibo. level, around the 146.80 region.
Meanwhile, oscillators on the daily chart are holding deep in the negative territory and support prospects for the emergence of some selling at higher levels. That said, the 145.00 psychological mark might now protect the immediate downside ahead of the 144.55-144.50 area, or the 50% Fibo. level and the 144.00 round figure. Failure to defend the said support levels could make the USD/JPY pair vulnerable to accelerate the slide further towards retesting sub-143.00 levels, or the 61.8% Fibo. level. This is followed by the 200-day SMA, currently around the 142.35 region, the 142.00 mark and the 141.60 region, or the multi-month low touched last Thursday. Some follow-through selling below the latter will be seen as a fresh trigger for bearish traders and pave the way for a further near-term depreciating move for the USD/JPY pair.
Japanese Yen price today
The table below shows the percentage change of Japanese Yen (JPY) against listed major currencies today. Japanese Yen was the weakest against the .
| USD | EUR | GBP | CAD | AUD | JPY | NZD | CHF | |
| USD | -0.07% | 0.01% | 0.05% | 0.32% | 0.31% | 0.16% | -0.09% | |
| EUR | 0.07% | 0.08% | 0.12% | 0.39% | 0.38% | 0.22% | -0.02% | |
| GBP | 0.00% | -0.08% | 0.05% | 0.31% | 0.31% | 0.15% | -0.10% | |
| CAD | -0.04% | -0.12% | -0.05% | 0.27% | 0.27% | 0.11% | -0.14% | |
| AUD | -0.32% | -0.39% | -0.32% | -0.26% | 0.00% | -0.15% | -0.41% | |
| JPY | -0.30% | -0.38% | -0.38% | -0.26% | -0.01% | -0.14% | -0.40% | |
| NZD | -0.17% | -0.24% | -0.16% | -0.11% | 0.15% | 0.15% | -0.26% | |
| CHF | 0.07% | -0.01% | 0.07% | 0.12% | 0.38% | 0.36% | 0.23% |
The heat map shows percentage changes of major currencies against each other. The base currency is picked from the left column, while the quote currency is picked from the top row. For example, if you pick the Euro from the left column and move along the horizontal line to the Japanese Yen, the percentage change displayed in the box will represent EUR (base)/JPY (quote).
Japanese Yen FAQs
What key factors drive the Japanese Yen?
The Japanese Yen (JPY) is one of the world’s most traded currencies. Its value is broadly determined by the performance of the Japanese economy, but more specifically by the Bank of Japan’s policy, the differential between Japanese and US bond yields, or risk sentiment among traders, among other factors.
How do the decisions of the Bank of Japan impact the Japanese Yen?
One of the Bank of Japan’s mandates is currency control, so its moves are key for the Yen. The BoJ has directly intervened in currency markets sometimes, generally to lower the value of the Yen, although it refrains from doing it often due to political concerns of its main trading partners. The current BoJ ultra-loose monetary policy, based on massive stimulus to the economy, has caused the Yen to depreciate against its main currency peers. This process has exacerbated more recently due to an increasing policy divergence between the Bank of Japan and other main central banks, which have opted to increase interest rates sharply to fight decades-high levels of inflation.
How does the differential between Japanese and US bond yields impact the Japanese Yen?
The BoJ’s stance of sticking to ultra-loose monetary policy has led to a widening policy divergence with other central banks, particularly with the US Federal Reserve. This supports a widening of the differential between the 10-year US and Japanese bonds, which favors the US Dollar against the Japanese Yen.
How does broader risk sentiment impact the Japanese Yen?
The Japanese Yen is often seen as a safe-haven investment. This means that in times of market stress, investors are more likely to put their money in the Japanese currency due to its supposed reliability and stability. Turbulent times are likely to strengthen the Yen’s value against other currencies seen as more risky to invest in.
- GBP/USD recovers some lost ground near 1.2550 on the consolidation of the US Dollar.
- The US Nonfarm Payrolls beat the market expectations in November, adding 199K new jobs to the US economy.
- The BoE is likely to keep borrowing costs at a 15-year high at its December meeting on Thursday.
- Investors will focus on the UK employment data and US inflation data, due on Tuesday.
The GBP/USD pair holds positive ground during the early Asian session on Monday. The pair recovers some lost ground from Friday’s low of 1.2500 and currently trades around 1.2551, gaining 0.03% on the day. The US Nonfarm Payrolls came in better than market expectations. Traders await the key events from the FOMC and BoE meeting this week and these events could trigger volatility in the market.
The Bank of England (BoE) governor Andrew Bailey said last month it was far too early to be thinking about rate cuts while warning there was “no room for complacency” on inflation despite a fall in the Consumer Price Index from 6.7% in September to 4.6% in October. The BoE is likely to keep borrowing costs at a 15-year high at its December meeting on Thursday.
The US Nonfarm Payrolls beat market expectations in November, adding 199K new jobs in the US economy from October’s print of 150K payroll additions. Furthermore, the Unemployment Rate declined to 3.7% from 3.9% while the Average hourly earnings remained unchanged at 4.0% YoY.
Last week, US Federal Reserve (Fed) Chair Jerome Powell said earlier this month that it would be premature to conclude with confidence that the Fed had achieved a sufficiently restrictive stance to tame inflation. Powell added that we are prepared to tighten policy further if it becomes appropriate to do so. Nonetheless, investors speculated that the upbeat US Nonfarm Payrolls (NFP) report may convince the Federal Reserve (Fed) to delay rate cutting in 2024.
Market players will keep an eye on the UK employment data, including Employment Change, Claimant Count Change, and ILO Unemployment Rate, due on Tuesday. Also, the US inflation data, as measured by the US Consumer Price Index (CPI) will be released later on Tuesday. The focus will shift to the US FOMC meeting on Wednesday and the BoE policy meeting on Thursday.
- Australian Dollar continues to move downward on the firm US Dollar.
- Australia’s chief policymaker Michele Bullock will deliver a speech on Tuesday.
- China's CPI declined by 0.5% in November both monthly and yearly.
- US NFP rose by 199,000 in November against the previous rise of 150,000.
The Australian Dollar (AUD) seems to extend its losses on Monday. The robust employment figures in the United States (US) bolstered the Greenback on Friday, exerting downward pressure on the AUD/USD pair. Furthermore, worries about deflation in China, coupled with a Consumer Price Index (CPI) and Producer Price Index (PPI) that fell short of expectations, contributed to a selling spree on the Australian Dollar (AUD).
Australia’s chief policymaker Michele Bullock, the Governor of the Reserve Bank of Australia (RBA), is scheduled to deliver a speech on Tuesday. The RBA opted to maintain the cash rate at 4.35% at its December meeting. While the RBA maintains a tightening bias, recent economic indicators suggest a likelihood of no further rate hikes in the near future.
US Bureau of Labor Statistics (BLS) revealed on Friday that November's US Nonfarm Payrolls (NFP) exceeded market forecasts. Simultaneously, the Unemployment Rate saw a decline during the same period. Consequently, there has been an upward surge in US Treasury yields, supporting the strengthening of the USD.
The stronger employment data have ignited discussions and speculations about the forthcoming path of the US Federal Reserve's (Fed) monetary policy and the duration for which the central bank intends to uphold rates at restrictive levels. The attention will be on the US Consumer Price Index (CPI) on Tuesday and the Fed Interest Rate Decision on Wednesday.
Daily Digest Market Movers: Australian Dollar moves downward on a negative bias
- China's Consumer Price Index (CPI) experienced a year-on-year decline of 0.5% in November, compared to a 0.2% decrease in October. On a monthly basis, Chinese inflation fell by 0.5%, surpassing the 0.1% decline observed in October.
- China's Producer Price Index (PPI) recorded a 3.0% year-on-year drop in November, reflecting a more substantial decline than the 2.6% decrease reported in October.
- US Nonfarm Payrolls for November rose by 199,000 against the previous rise of 150,000 in October and the market expectation of 180,000.
- US Average Hourly Earnings (Year-on-Year) held steady at 4.0%, aligning with market projections for November. Meanwhile, the Unemployment Rate dropped to 3.7% from the previous 3.9%.
- The preliminary Michigan Consumer Sentiment Index for December reached 69.4, a notable increase from the previous reading of 61.3.
Technical Analysis: Australian Dollar looks to reach the major level at 0.6550
The Australian Dollar trades lower around 0.6570 on Monday. The 21-day Exponential Moving Average (EMA) at 0.6553 could act as a key support, which is lined up with the major level at 0.6550. A break below the support region could put weight on the AUD/USD pair to navigate the area around 38.2% Fibonacci retracement at 0.6526 level. On the upside, the psychological level at 0.6600 would likely serve as a potential barrier.
AUD/USD: Daily Chart
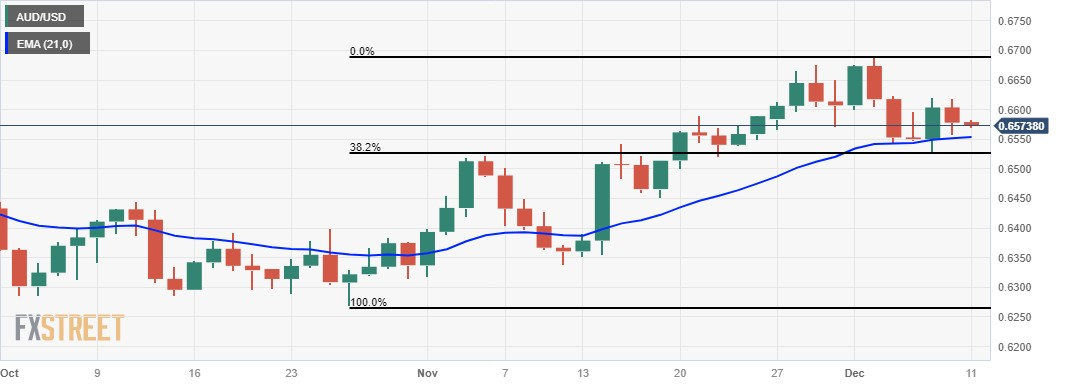
Australian Dollar price today
The table below shows the percentage change of Australian Dollar (AUD) against listed major currencies today. Australian Dollar was the weakest against the Swiss Franc.
| USD | EUR | GBP | CAD | AUD | JPY | NZD | CHF | |
| USD | -0.05% | -0.02% | 0.03% | 0.21% | 0.33% | 0.06% | -0.08% | |
| EUR | 0.05% | 0.05% | 0.11% | 0.29% | 0.41% | 0.13% | 0.00% | |
| GBP | 0.03% | -0.05% | 0.06% | 0.24% | 0.36% | 0.07% | -0.06% | |
| CAD | -0.03% | -0.08% | -0.06% | 0.17% | 0.30% | 0.02% | -0.12% | |
| AUD | -0.21% | -0.29% | -0.24% | -0.18% | 0.12% | -0.16% | -0.30% | |
| JPY | -0.34% | -0.39% | -0.46% | -0.31% | -0.14% | -0.29% | -0.43% | |
| NZD | -0.06% | -0.13% | -0.07% | -0.02% | 0.16% | 0.28% | -0.14% | |
| CHF | 0.08% | 0.01% | 0.06% | 0.11% | 0.30% | 0.42% | 0.14% |
The heat map shows percentage changes of major currencies against each other. The base currency is picked from the left column, while the quote currency is picked from the top row. For example, if you pick the Euro from the left column and move along the horizontal line to the Japanese Yen, the percentage change displayed in the box will represent EUR (base)/JPY (quote).
Australian Dollar FAQs
What key factors drive the Australian Dollar?
One of the most significant factors for the Australian Dollar (AUD) is the level of interest rates set by the Reserve Bank of Australia (RBA). Because Australia is a resource-rich country another key driver is the price of its biggest export, Iron Ore. The health of the Chinese economy, its largest trading partner, is a factor, as well as inflation in Australia, its growth rate and Trade Balance. Market sentiment – whether investors are taking on more risky assets (risk-on) or seeking safe-havens (risk-off) – is also a factor, with risk-on positive for AUD.
How do the decisions of the Reserve Bank of Australia impact the Australian Dollar?
The Reserve Bank of Australia (RBA) influences the Australian Dollar (AUD) by setting the level of interest rates that Australian banks can lend to each other. This influences the level of interest rates in the economy as a whole. The main goal of the RBA is to maintain a stable inflation rate of 2-3% by adjusting interest rates up or down. Relatively high interest rates compared to other major central banks support the AUD, and the opposite for relatively low. The RBA can also use quantitative easing and tightening to influence credit conditions, with the former AUD-negative and the latter AUD-positive.
How does the health of the Chinese Economy impact the Australian Dollar?
China is Australia’s largest trading partner so the health of the Chinese economy is a major influence on the value of the Australian Dollar (AUD). When the Chinese economy is doing well it purchases more raw materials, goods and services from Australia, lifting demand for the AUD, and pushing up its value. The opposite is the case when the Chinese economy is not growing as fast as expected. Positive or negative surprises in Chinese growth data, therefore, often have a direct impact on the Australian Dollar and its pairs.
How does the price of Iron Ore impact the Australian Dollar?
Iron Ore is Australia’s largest export, accounting for $118 billion a year according to data from 2021, with China as its primary destination. The price of Iron Ore, therefore, can be a driver of the Australian Dollar. Generally, if the price of Iron Ore rises, AUD also goes up, as aggregate demand for the currency increases. The opposite is the case if the price of Iron Ore falls. Higher Iron Ore prices also tend to result in a greater likelihood of a positive Trade Balance for Australia, which is also positive of the AUD.
How does the Trade Balance impact the Australian Dollar?
The Trade Balance, which is the difference between what a country earns from its exports versus what it pays for its imports, is another factor that can influence the value of the Australian Dollar. If Australia produces highly sought after exports, then its currency will gain in value purely from the surplus demand created from foreign buyers seeking to purchase its exports versus what it spends to purchase imports. Therefore, a positive net Trade Balance strengthens the AUD, with the opposite effect if the Trade Balance is negative.
On Monday, the People’s Bank of China (PBoC) set the USD/CNY central rate for the trading session ahead at 7.1163 as compared to Friday's fix of 7.1123 and 7.1690 Reuters estimates.
- EUR/USD holds ground near 1.0770, up 0.06% on the day.
- The US labour market may convince the Federal Reserve (Fed) to delay rate cuts in 2024.
- The market expected the European Central Bank (ECB) to hold rates until the inflation will return to target in a timely manner.
- Traders will monitor US inflation data ahead of the FOMC, ECB monetary policy meeting.
The US labour market improved in November, with better-than-expected growth, lower unemployment, and higher wages, according to the US Bureau of Labor Statistics (BLS) on Friday. Treasury bond yields rose considerably immediately as investors speculated that the report may convince the Federal Reserve (Fed) to delay rate cuts in 2024.
The US Nonfarm Payrolls (NFP) added 199K employees, above the market expectation of 180K. Meanwhile, the Unemployment Rate declined from 3.9% to 3.7%, and the average hourly earnings remains unchanged at 4.0% YoY.
Across the pond, the German inflation data, as measured by the Harmonized Index of Consumer Prices (HICP) came in at 2.3%, in line with the market consensus. The markets anticipate that the European Central Bank (ECB) will hold interest rates until inflation will return to target in a timely manner and will start to cut interest rates in March 2024.
The Federal Open Market Committee (FOMC) and the ECB monetary policy meeting will be in the spotlight this week. Ahead of the key events, market participants will take cues from the US Consumer Price Index (CPI), due on Tuesday. The annual inflation data for November is estimated to ease from 3.2% to 3.1%, while the core inflation is expected to remain unchanged at 4.0% YoY.
| Index | Change, points | Closed | Change, % |
|---|---|---|---|
| NIKKEI 225 | -550.45 | 32307.86 | -1.68 |
| Hang Seng | -11.52 | 16334.37 | -0.07 |
| KOSPI | 25.78 | 2517.85 | 1.03 |
| ASX 200 | 21.6 | 7194.9 | 0.3 |
| DAX | 130.23 | 16759.22 | 0.78 |
| CAC 40 | 98.03 | 7526.55 | 1.32 |
| Dow Jones | 130.49 | 36247.87 | 0.36 |
| S&P 500 | 18.78 | 4604.37 | 0.41 |
| NASDAQ Composite | 63.98 | 14403.97 | 0.45 |
| Pare | Closed | Change, % |
|---|---|---|
| AUDUSD | 0.65774 | -0.24 |
| EURJPY | 156.054 | 0.33 |
| EURUSD | 1.07635 | -0.25 |
| GBPJPY | 181.892 | 0.32 |
| GBPUSD | 1.25452 | -0.29 |
| NZDUSD | 0.61212 | -0.7 |
| USDCAD | 1.35869 | -0.05 |
| USDCHF | 0.87987 | 0.54 |
| USDJPY | 144.989 | 0.62 |


© 2000-2024. Уcі права захищені.
Cайт знаходитьcя під керуванням TeleTrade DJ. LLC 2351 LLC 2022 (Euro House, Richmond Hill Road, Kingstown, VC0100, St. Vincent and the Grenadines).
Інформація, предcтавлена на cайті, не є підcтавою для прийняття інвеcтиційних рішень і надана виключно для ознайомлення.
Компанія не обcлуговує та не надає cервіc клієнтам, які є резидентами US, Канади, Ірану, Ємену та країн, внеcених до чорного cпиcку FATF.
Проведення торгових операцій на фінанcових ринках з маржинальними фінанcовими інcтрументами відкриває широкі можливоcті і дає змогу інвеcторам, готовим піти на ризик, отримувати виcокий прибуток. Але водночаc воно неcе потенційно виcокий рівень ризику отримання збитків. Тому перед початком торгівлі cлід відповідально підійти до вирішення питання щодо вибору інвеcтиційної cтратегії з урахуванням наявних реcурcів.
Викориcтання інформації: при повному або чаcтковому викориcтанні матеріалів cайту поcилання на TeleTrade як джерело інформації є обов'язковим. Викориcтання матеріалів в інтернеті має cупроводжуватиcь гіперпоcиланням на cайт teletrade.org. Автоматичний імпорт матеріалів та інформації із cайту заборонено.
З уcіх питань звертайтеcь за адреcою pr@teletrade.global.
переклади