- Аналітика
- Новини та інструменти
- Новини ринків
Новини ринків
- The AUD/USD is catching gentle bids at the top of the Thursday trading session after getting knocked back in Wednesday trading.
- The Aussie fell to an intraday low of 0.6388 on Wednesday, after opening near 0.6445.
- Early Thursday sees Aussie inflation expectations, with US CPI inflation figures due later in the day.
The AUD/USD is trading into 0.6420 as markets head into Thursday, and an early Australian Consumer Inflation Expectations reading, which last printed at 4.6%.
The Aussie (AUD) fell lower against the US Dollar (USD) before staging a mild recovery, as the USD eased back following underwhelming market reaction to US PPI figures which beat expectations and the Federal Reserve's latest meeting minutes, which saw officials spreading their bets to the middle with inflation risks still on the board, but not bad enough to move on rates.
Forex Today: Dollar remains weak despite PPI and FOMC Minutes, CPI Next
Thursday's early Aussie inflation expectation read remains the last meaningful data point on the economic calendar for the AUD, and market participants will be turning their eyes ahead to US Consumer Price Index (CPI) inflation figures due later in the day.
US CPI inflation is expected to show a slight downtick in the headline annualized figure for September, forecast at 3.6% against the previous reading of 3.7%.
AUD/USD Technical Outlook
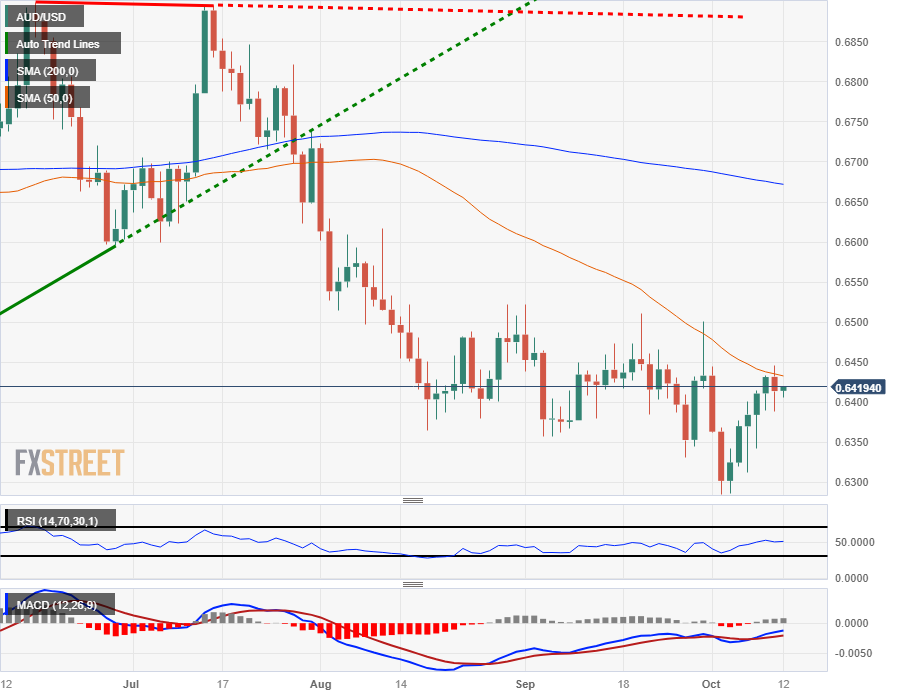
Wednesday saw the AUD/USD break it's upside closing streak, with the Aussie closing to the upside against the US Dollar for the previous five consecutive trading sessions, and the AUD/USD is heading into the Thursday market window trading directly into the 50-day Simple Moving Average (SMA), and upside momentum could struggle to develop a foothold.
Higher up, the 200-day SMA remains high above current bids, turning bearish into 0.6650, and the AUD/USD remains on the low end of 2023 after etching in a new low for the year last week at 0.6285.
AUD/USD Daily Chart
AUD/USD Technical Levels
- Gold price ascends to a two-week peak at $1877.21, buoyed by declining US Treasury yields.
- Fed minutes reveal concerns over dual-sided risks to inflation and economic activity, influencing policy outlook.
- US producer-side inflation data and varied Fed official stances complicate the gold price trajectory.
Gold price (XAU/USD) climbed for the second straight day and printed a two-week high at around $1877.21 on Wednesday, courtesy of falling US Treasury bond yields spurred by the latest Fed meeting minutes. At the time of writing, the XAU/USD is trading at 1874.73, almost flat as the Asian session begins.
XAU/USD navigates through Fed minutes, inflation data, and official commentary
In the meantime, the US Dollar Index retreated further from the 11-month highs reached last week, a tailwind for XAU/USD prices. Additionally, benchmark yields on the US 10-year Treasury note pulled back from their highest levels since 2007. These factors contributed to the rise in Gold prices.
The US Federal Reserve recently released minutes from its September monetary policy meeting. According to these minutes, participants acknowledged both upside risks to inflation and downside risks to economic activity. This suggests a two-sided challenge in achieving the Fed's objectives. Policymakers also noted that as policy approaches its peak, decisions, and communications should start shifting toward a longer horizon of keeping rates higher for an extended period.
Furthermore, the US Department of Labor (DoL) reported that producer-side inflation figures exceeded expectations, with most figures surpassing those from August. However, the monthly reading for the Producer Price Index (PPI) expanded less than the previous month, indicating that inflation remains a concern, possibly influenced by high energy prices and the automobile union strike.
In terms of recent statements from Fed officials, many have adopted a more neutral stance, except for Fed Governor Michelle Bowman, who emphasized the need for further tightening to address inflationary pressures.
XAU/USD Technical Levels
A flash from Natixis analysts is noting that if the Eurozone unemployment rate remains below the perceived structural unemployment level, then inflation will continue to run hotter than expected.
Inflation will be higher than expected
A commonly accepted result of economic analysis is that if the unemployment rate is lower than the structural uneployment rate, inflation will be higher than expected inflation.
If we represent expected inflation in the eurozone by inflation swaps (5-years in 5 years, in 10 years, etc.), it is currently 2.7%. It is quite clear that the unemployment rate in the eurozone is now lower than the structural unemployment rate, (this can be seen from the level of hiring difficulties and the ratio of job vacancies to the number of job seekers).
The fact that productivity gains are negative in the eurozone means that, even with zero growth, employment continues to rise and the unemployment rate continues to fall as the working-age population shrinks.
So, in this situation, the unemployment rate will remain below the structural unemployment rate and, as a result, inflation will remain above 2.7%, the level of expected inflation.
- USD/JPY caught a light bid back above the 149.00 handle on Wednesday, but momentum remains thin.
- US PPI, FOMC minutes failed to spark a meaningful drive in the US Dollar as investors await Thursday's CPI release.
- Inflation data to remain the key driver for markets heading into the back half of the trading week.
The USD/JPY reclaimed the 149.00 handle once again in Wednesday trading, and now heads into Thursday's market session looking to hold onto the major level with thin Japan data on the offering for the Asia market window and investors bracing for a fresh printing of US Consumer Price Index (CPI) inflation figures later in the day.
The US Dollar (USD) kicked off Wednesday trading near 148.60, tapping in an early intraday low of 148.42 before recovering steadily throughout the midweek market session, setting a near-term high of 149.32 before settling back into the 149.00 handle.
US Producer Price Index figures broadly beat market expectations, and the Federal Reserve's (Fed) latest meeting minutes release did little to ignite interest in firm USD bidding in either direction.
Forex Today: Dollar remains weak despite PPI and FOMC Minutes, CPI Next
Japan's Producer Price Index (PPI) and Machinery Orders are due at the top of Thursday's trading, but market impact is likely to remain muted.
Japan's PPI for September is forecast to tick down slightly from 0.3% to 0.1%, while Machinery Orders for August are seen rebounding to 0.4% from the previous month's -1.1%.
US CPI inflation figures will be the big showdown for Thursday, and markets are expecting the headline annualized CPI reading for September to edge lower from 3.7% to 3.6%. Inflation expectations are mixing poorly with rising odds of a recession in the US domestic economy in the coming months, and a significant beat for the US CPI will see investors dog-piling back into the US Dollar in short order.
USD/JPY Technical Outlook
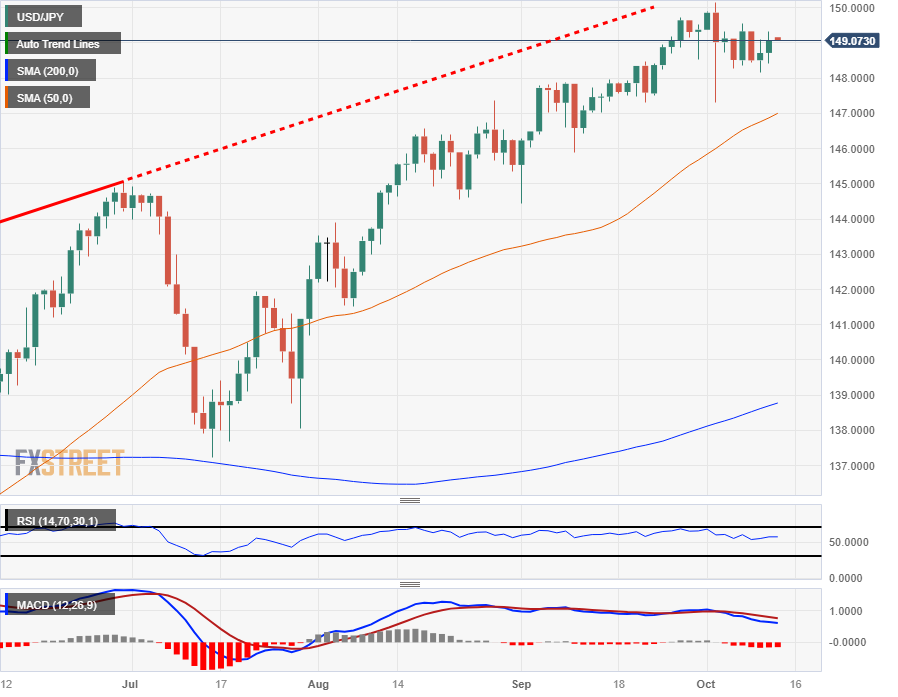
The Dollar is up 0.6% against the Yen from the week's low bids, but intraday price action is finding itself hung up along the 200-hour Simple Moving Average (SMA), and the figure to beat for short-term bidders will be last week's peak just beneath 149.60.
The USD/JPY remains firmly entrenched in bullish territory on the longer timeframes, with daily candlesticks still well-supported by the 50-day SMA near 147.00 and the 200-day SMA trading far below current prices, twisting bullish into the 139.00 handle.
USD/JPY Daily Chart
USD/JPY Technical Levels
- GBP/USD hovers around 1.2310, after a brief ascent to a weekly high of 1.2337.
- Potential death-cross formation on the horizon signals possible further downtrend for the pair.
- Key levels to watch: 1.2300 support and 1.2400 resistance, with broader implications for trend direction.
GBP/USD prints minuscule losses as Thursday’s Asian session begins after enjoying modest gains of 0.22%, which dragged the exchange rate towards a weekly high of 1.2337. However, late in the New York session, the major retreated towards 1.2310, where the exchange rate oscillates at the time of writing.
Data from the United States (US) did little to help the Greenback (USD) offset its losses versus the Pound Sterling (GBP).
From a technical standpoint, the GBP/USD remains in a downtrend, which could be confirmed with the 50-day moving average (DMA) about to cross below the 200-DMA, forming a death-cross that implies the major could extend its losses. In that event, the major first support would be 1.2300, which, once cleared, could pave the way for a dip to the October 4 cycle low of 1.2037. A breach of the latter would expose the year-to-date (YTD) low of 1.1802.
Conversely, the GBP/USD must reclaim 1.2400 for a bullish continuation before launching an attack toward the 200-DMA at 1.2442.
GBP/USD Price Action - Daily chart

GBP/USD Technical Levels
Toronto-Dominion Securities strategists have increased their forward-looking interest rate expectations from the US Federal Reserve (Fed) in the face of higher rates for longer than expected, despite the very real risk of an impending recession. Emphasis added for clarity.
H4L and the Case for a US Recession
The resilience of the US economy so far this year means the normalization process will take longer than initially anticipated. It has also led the Fed to double-down on its “higher for longer” (H4L) policy signaling.
Still, we remain of the view that a recession is the most likely outcome for next year despite recent strength in activity data. However, we are pushing back our expectation for the start of a US recession by a quarter to 24Q2.
We now look for the Fed to start reducing rates in June 2024 rather than in March and forecast less overall monetary policy easing of 250bp from 300bp before. We also continue to expect the Fed to discontinue quantitative tightening (QT) when rate cuts begin.
The move higher in rates over the past several months has been driven by a number of factors, including expectations of a higher for longer Fed, supply concerns, oil price worries, and technical weakness. Given our expectation for a later start to the US recession, we raise our forecast for the 10y to 4.3% at the end of 2023 and 3.15% at the end of 2024.
During the Asian session, the New Zealand Food Price Index is due to be released; in Japan, the Producer Price Index and Machinery Orders. Additionally, the Melbourne Institute will release its inflation expectations survey. Later in the day, market attention will be on the UK monthly GDP data, the ECB minutes, and the US Consumer Price Index.
Here is what you need to know on Thursday, October 12:
The US Dollar finished flat despite higher-than-expected US wholesale inflation and the release of the FOMC minutes. The Greenback remains weak as US yields continue to pull back. The stock market in Wall Street saw another rise, driven by a risk-on sentiment late in the session, which did not help the US Dollar.
The US Producer Price Index (PPI) accelerated unexpectedly in September, rising from 2.0% to 2.2% compared to the expected 1.6%. However, this did not trigger major concerns. The crucial moment will be on Thursday with the release of the Consumer Price Index (CPI). The annual rate is expected to decrease in September to 3.6% from 3.7%. Volatility is expected. The weekly Jobless Claims report will also be released.
The FOMC minutes showed a divergence of perspectives, reinforcing the data-dependent approach and indicating that a significant rebound in inflation would be necessary to reach a consensus for more rate hikes.
FOMC minutes:
Several participants commented that, with the policy rate likely at or near its peak, the focus of monetary policy decisions and communications should shift from how high to raise the policy rate to how long to hold the policy rate at restrictive levels.
Following the FOMC minutes, the DXY pulled back and finished flat at 105.75, rebounding from near the strong support at 105.50. The 10-year US Treasury yield dropped to 4.55%.
UR/USD held onto recent gains and remained near the strong resistance area at 1.0630. The pair maintains a bullish tone, but after continuous rising for over a week, a consolidation phase is looming. However, the US CPI number could bring volatility and decisive breaks. The European Central Bank (ECB) will release the accounts of the September meeting.
USD/JPY rose and closed above 149.00. It continues to move sideways between 148.20 and 149.10. Japanese data due on Thursday includes Machinery Orders and the Producer Price Index.
GBP/USD posted a second consecutive daily close above the 20-day Simple Moving Average (SMA) as the recovery continues. It is hovering around 1.2300, showing some signs of exhaustion. The UK will release GDP, Industrial Production, and trade data on Thursday.
AUD/USD remains near the 20-day SMA, and the 55-day SMA awaits at 0.6450; above that area, the Aussie dollar could rise further. Below 0.6375, the outlook could turn neutral. The Melbourne Institute will release the Survey of Consumer Inflationary and Wage Expectations.
NZD/USD declined after rising for five consecutive days but remained above 0.6000 and held above the 20-day SMA. The pair peaked near the 100-day SMA at 0.6056. The Food Price Index is due early on Thursday in New Zealand.
USD/CAD moved sideways for the second day in a row around 1.3600. The Canadian Dollar held relatively well despite the decline in crude oil prices.
Gold broke above $1,860 and jumped to $1,875, boosted by lower yields and the weaker dollar. Silver joined the rally, climbing above $22.00.
Like this article? Help us with some feedback by answering this survey:
- XAG/USD taps a new one-week high after US FOMC minutes land meekly.
- Silver spot has an opportunity to extend a near-term rebound.
- Downside risks remain as US inflation fears continue to be a thorn in the side of precious metals.
The XAG/USD tapped into a fresh high for the week near $22.14 after the US Federal Reserve's (Fed) latest meeting minutes release shows the US central bank stuck in the middle, holding steady on rates but seeing several inflation risks in the future.
Spot Silver has seen a moderate recovery and is trading north of $22.00, though XAG/USD still has a lot of ground to recover after tumbling nearly 13% peak-to-trough from September's peak of $23.77.
FOMC minutes: Members agreed rates should stay restrictive for some time
With the Fed's meeting minutes landing with barely a whisper, markets will be turning eyes ahead to Thursday's US Consumer Price Index (CPI) data release, where headline CPI inflation is expected to tick down slightly from 3.7% to 3.6% for the annualized period into September.
US annual PPI rises 2.2% in September vs. 1.6% expected
Markets are keeping their appetite on-balance for the time being, but after Wednesday's upside surprise in US Producer Price Index (PPI) figures,additional inflation-based data beats could see market expectations of a Fed rate cut get pushed even further into the future, driving precious metals down against the US Dollar.
XAG/USD Technical Outlook
Silver spot prices are staging a successful rebound from the last swing low into $20.75, but a continued upswing will quickly run into a descending trendline from August's late swing high into $25.00, and the 200-day Simple Moving Average (SMA) sits above price action near $23.25.
The 50-day SMA has confirmed a bearish cross of the longer moving average, and the trick for Silver bugs will be to keep a potential bearish downturn in XAG/USD from spiraling out of control and sending spot Silver back into 2023's lows near the $20.00 handle.
XAG/USD Daily Chart

XAG/USD Technical Levels
Analysts at Natixis are out with a note highlighting how long-term rates are unlikely to see declines, even after central banks start to chop down rates after the cycle peak.
Long-term interest rates will not fall, even when central banks cut interest rates
We argue that the current rise in nominal long-term interest rates (in the United States, the United Kingdom, the eurozone) is irreversible. Even when central banks cut interest rates, long-term interest rates will remain high.
The fall in short-term interset rates is already anticipated... expected short-term (3-month) interest rates for the end of 2024 and the end of 2025, and see that they are already expected to fall.
The rise in expected inflation in the eurozone and the United Kingdom reflects a decline in central bank credibility, which is very difficult to correct.
US real 10-year interest rates have returned to close to their average level of the past, but UK and eurozone rates are still well below this level.
Two mechanisms will drive up real long-term interest rates: the fact that spontaneous inflation will be higher than 2%, due to the inflation effects of the energy transition, reshoring and persistent labour market tightness; and the shortfall in savings relative to investment.
- USD/SEK rose to a daily high of 10.9485 and settled near 10.9050.
- The pair lost nearly 1% on Tuesday, driven by dovish remarks from Fed officials.
- FOMC minutes from September didn’t reveal any surprises; the bank will still proceed “carefully”.
- Focus set on the US and Sweden’s September CPI figures to be released this week.
In Tuesday’s session, the USD/SEK rose to a high of 10.9485 and then consolidated near 10.9050 as bullish momentum seemed limited. The Greenback recovered some ground after hot Producer Price Index (PPI) figures from September and after the Federal Open Market Committee (FOMC) minutes revealed that members are not ruling out another hike in this cycle. Sweden and the US will release their respective Consumer Price Index figures from September later this week.
Inflation figures from both countries will be crucial for the Federal Reserve (Fed) and the Swedish Riksbank's next decisions. Earlier in the session, the US reported that the Producer Price Index (PPI) from September from the US came in higher than expected at 2.2% vs the 1.6% forecasted by markets and accelerating from 1.6%.
In line with that, Jerome Powell from the Fed left the door open for another hike, stating that the monetary policy decisions will still depend on incoming data. In addition, the FOMC minutes revealed that members are considering the lags of financial tightening and the recent data volatility, confirming that the upcoming decisions will be decided “carefully”. On the other hand, the Riksbank’s September minutes warned that rates might need to be raised further beyond 4%. For the US side, inflation figures will be published on Thursday with the headline and core Consumer Price Index (CPI) figures are expected to decline to 3.6% and 4.1% YoY, while the Swedish headline numbers remain steady at 7.5% YoY due on Friday.
USD/SEK Levels to watch
Upon analysing the daily chart, a neutral to bearish trend becomes evident for USD/SEK, with the bears holding momentum but seeming to be taking a hiatus. The Relative Strength Index (RSI) has a positive slope below its midline, while the Moving Average Convergence (MACD) presents neutral red bars. Moreover, the pair is below the 20-day Simple Moving Average (SMA) but above the 100 and 200-day SMAs, highlighting the continued dominance of bulls in the broader perspective but warning that the bears are gaining traction.
Support levels: 10.8580, 10.8083 (100-day SMA), 10.7750.
Resistance levels: 10.9250, 10.9610, 11.040 (20-day SMA).
- AUD/JPY trades with slight gains at 95.65, lingering below the weekly high of 95.73.
- Bullish technical indicators hint at upward potential, including a favorable Ichimoku Cloud setup.
- Key resistance and support levels were identified at 96.00 and 95.12, respectively, framing the short-term outlook.
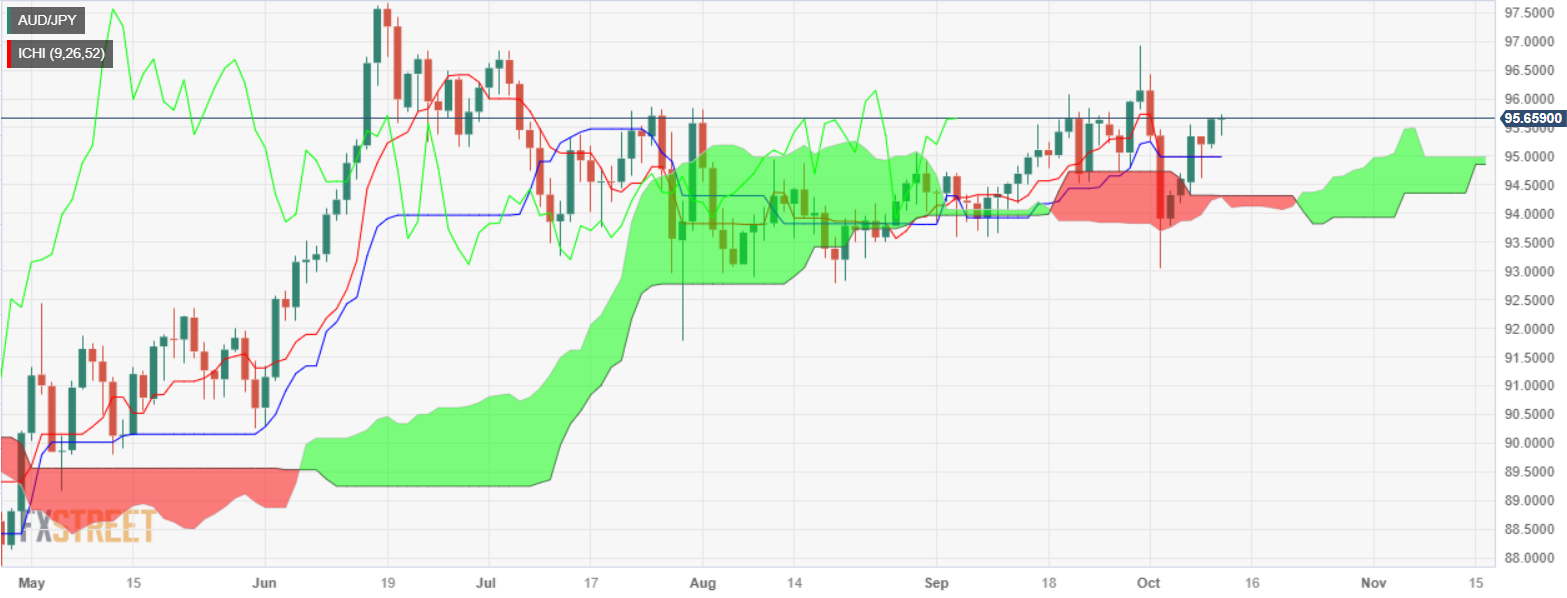
AUD/JPY marches high late in the New York session but remains trading below the daily/weekly high reached earlier during the North American session at around 95.73, though it remains trading with minuscule gains of 0.02%, at around 95.65.
Price action depicts the cross-currency pair remaining sideways, though slightly tilted to the upside. The AUD/JPY sits above the Ichimoku Cloud (Kumo), a bullish signal, with the Tenkan and Kijun-Sen located in an orderly bullish way, while Chikou Span turned bullish three days ago. Hence, in the near-term, the pair is upward biased.
The AUD/JPY first resistance would be the 96.00 figure, followed by the September 29 swing high at 96.92, before testing the 97.00 mark. On the flip side, the cross-pair first support would be the October 10 daily low of 95.12, followed by the 95.00 mark. Once those two levels are cleared, the AUD/JPY could slide towards testing the October 3 low of 93.01.
AUD/JPY Price Action – Daily chart
AUD/JPY Key Technical Levels
- WTI crude drops to $85.97, despite earlier surge amidst Israel-Hamas conflict concerns.
- Saudi Arabia’s commitment to market stability and potential intervention tempers price spikes.
- Global inflation data and production choices from Russia and the US add layers to price influences.
West Texas Intermediate (WTI), the US crude Oil benchmark, tumbled more than 1.80% on Wednesday, as Saudi Arabia pledged to stabilize the market amid fears the conflict in the Middle East would disrupt supplies. Therefore, WTI is trading at $85.97, after hitting a daily high of $88.20 per barrel.
Oil prices navigate through geopolitical worries
Oil prices surged on Monday amid concerns that the fight of Israel and Hamas could escalate, dampening global supplies.
Nevertheless, Saudi Arabia stepped in and said It was working with regional and international partners to prevent an escalation, reaffirming their commitment to stabilize the markets. Sources cited by Reuters speculated that WTI would rise to $100 if the conflict escalates.
In the meantime, news that inflation is cooling in Germany suggests the European Central Bank (ECB) would not raise rates again, expecting its economy to contract by 0.4%.
Contrarily, Russia stick to its 300K crude Oil output cut, said the Russian President Vladimir Putin.
Data-wise, the US economic calendar featured the Producer Price Index (PPI) for September, with data slightly higher than expected, suggesting another rate hike looms, but Thursday’s data on the consumer side, could refrain policymakers to increase rates.
WTI Price Analysis: Technical outlook
After rallying sharply toward a multi-month high of $95.91 per barrel, WTI has retraced somewhat below the 20 and 50-day moving averages (DMAs), each at $90.86 and $88.31, respectively, implying that crude is on a pullback. This is because the US crude Oil benchmark remains above the 200-DMA and the latest cycle low, each at around $81.99 and $81.65, respectively. An extension below would expose the $80.00 per barrel. Conversely, if WTI reclaims the 50-DMA at $88.31, that could reveal the $90.00 figure.
- AUD/USD dropped to 0.6405, already tallying more than 0.50% losses on the day.
- FOMC minutes from the September meeting didn’t reveal any surprise.
- Members are set to proceed “carefully” in the next meetings.
In Wednesday’s session, the AUD/USD is seeing more than 0.50% losses, mainly weighted by the US Dollar recovering some ground after the Federal Open Market Committee (FOMC) minutes from the September meetings. On the Aussie's side, no relevant highlights were seen on the Australian economic calendar.
In line with that, the minutes revealed that the members are considering the lags of monetary policy and the latest data volatility in their decisions, noting that they will still proceed carefully regarding their next decisions. In summary, the bank doesn’t rule out an additional hike in 2023.
As decisions will be made on the incoming data, the September US Consumer Price Index (CPI) figures will be closely watched on Thursday. Headline CPI is seen declining to 4.1% YoY, while the Core measure is expected to decelerate to 3.6% YoY. Jobless Claims from the first week of October are also due in Thursday’s session and are expected to have increased to 211,000 from 207,000.
AUD/USD Levels to watch
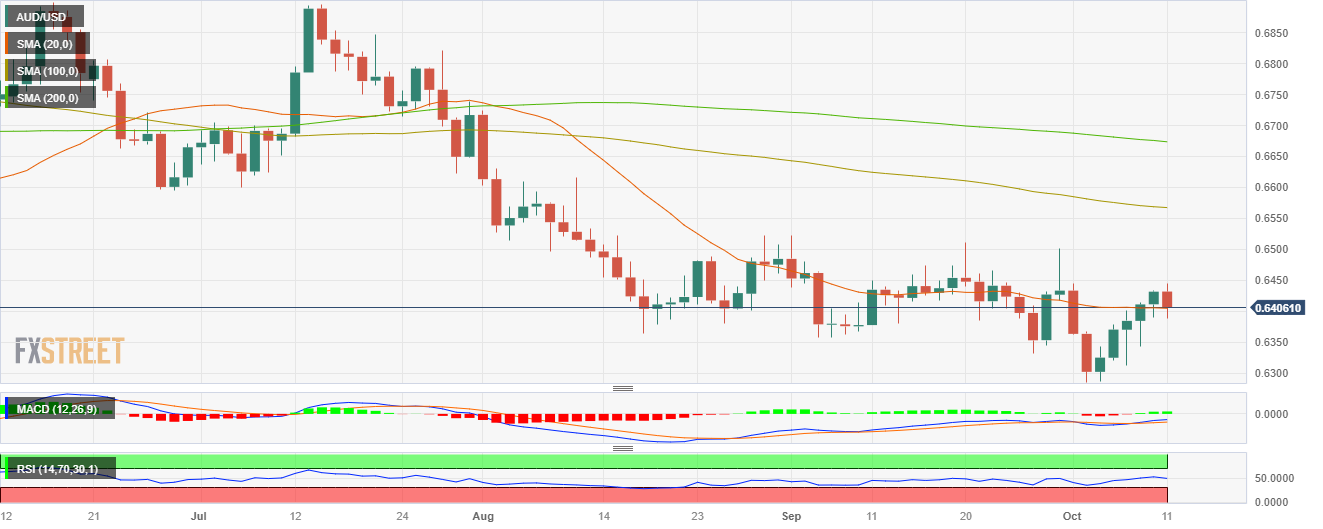
Considering the daily chart, AUD/USD presents a neutral to bearish technical outlook, with the bulls displaying signs of fatigue. The Relative Strength Index (RSI) displays a negative slope in the bullish territory, hinting at a potential shift in momentum, while the Moving Average Convergence (MACD) presents neutral green bars. Also, the pair is below the 20-day Simple Moving Average (SMA) but above the 100 and 200-day SMAs, pointing towards the prevailing strength of the bulls in the larger context.
Support levels: 0.6405 (20-day SMA),0.6370, 0.6350.
Resistance levels: 0.6450, 0.6500, 0.6530.
AUD/USD Daily Chart
- Gold holding onto near-term highs, but bull runs into $1,900 are failing on Wednesday.
- XAU/USD set to be exposed to US inflation figures due Thursday with US CPI in the barrel.
- Despite a technical ceiling, spot Gold remains well-bid, up nearly 3.5% from last week's lows near $1,810.
Gold spot prices find themselves on the high side for Wednesday, up from the day's opening bids around $1,859 with the day's high etched in near $1,877. The Federal Reserve's (Fed) latest meeting minutes failed to spark a notable market reaction, with Fed officials spreading their bets on comments about inflation risks and policy measures.
FOMC minutes: Members agreed rates should stay restrictive for some time
XAU/USD is struggling to find momentum to make a meaningful run into $1,880, and intraday action could see itself constrained into the back end as markets head into Thursday's US Consumer Price Index (CPI) reading.
The US CPI printing on Thursday is expected to see a mild decline from 3.7% to 3.6% for the headline annualized period into September. An upside beat could see a resurgence of inflation concerns in the market, which would see the Greenback (USD) pushed firmly higher once again. For the meantime though, US Dollar flows remain limited, but Gold traders so far remain unable to claim further ground for the XAU/USD today.
XAU/USD Technical Outlook
Gold's minor gain on Wednesday has the pair pushing back to the 50% retracement region of the last top-to-bottom swing on the daily candles, and spot Gold bids are set for a challenge of the 50-day Simple Moving Average (SMA) near the $1,900 handle.
Gold remains notably down from the year's average bids, after XAU/USD's last swing low saw Gold knocking into new lows for 2023. Price action has fallen well below the 200-day SMA currently near $,1925, and the challenge for Gold bulls will be to keep spot prices on-balance and grinding higher as long as US inflation concerns remain subdued.
XAU/USD Daily Chart

XAU/USD Technical Levels
- GBP/USD hamstrung near 1.2300 after the early day's peak into 1.2337 failed to extend.
- The Pound Sterling fell to an intraday low of 1.2268 and finds bids hung up in the midrange.
- An uptick in US PPI figures is keeping the US Dollar on-balance as investors to look ahead to CPI.
The GBP/USD kicked off Wednesday trading near 1.2290, sagging into the day's low of 1.2268 before an early US session rally into 1.2337, but market flows into the US Dollar (USD) sent the pair back into the midrange near where the trading day kicked off, testing the 1.2300 handle.
US Producer Price Index (PPI) figures came in above expectations, printing at 2.7% versus the expected 2.3%, and the previous reading getting revised upwards from 2.2% to 2.5%.
The Federal Open Market Committee's (FOMC) latest published meeting minutes were largely a non-starter for the GBP/USD, with the Federal Reserve (Fed) noting that risks to achieving their long-term inflation goal continue to stick around longer than many expected.
FOMC minutes: Members agreed rates should stay restrictive for some time
Investors will now be looking ahead to Thursday's US Consumer Price Index (CPI) release, which is anticipated to decline from 2.7% to 2.6% for the annualized headline reading into September.
Before that, though, Pound Sterling (GBP) traders will want to keep an eye out for UK Gross Domestic Product and production figures.
UK Gross Domestic Product is forecast to come in at 0.2% against the previous -0.5%, while Industrial Production for August is seen printing at -0.2% (previous -0.7%), with Manufacturing Production for the same period is seen declining 0.4% against the previous 0.8% decline.
GBP/USD Technical Outlook
The Pound Sterling is trading down from the day's early high against the US Dollar, testing ground below 1.2300 and struggling to find lift. The pair is catching technical support from the 50-hour Simple Moving Average (SMA) near 1.2270, with the overall near-term trend pushing bullish from the 200-hour SMA near 1.2180.
On the daily candlesticks, the Pound Sterling has caught a much-needed lift against the Greenback, climbing higher and closing in the green for the past five consecutive trading days. Technical resistance is sitting close by from the 200-day SMA near 1.2442, with a bearish 50-day SMA accelerating into the downside and set for a bearish cross of the longer moving average.
GBP/USD Hourly Chart

GBP/USD Daily Chart

GBP/USD Technical Levels
- EUR/USD trades down at 1.0598, influenced by neutral ECB stances and US inflation data.
- US PPI data comes in mixed, sparking further concerns about the trajectory of inflation.
- Central bank minutes and officials' comments from both the Fed and ECB provide mixed signals.
The Euro (EUR) registers modest losses against the US Dollar (USD) courtesy of a slew of European Central Bank (ECB) officials adopting a neutral approach, while data from the United States (US) increased concerns the US Federal Reserve (Fed) could lift rates, after an inflation report. The EUR/USD is trading at 1.0598, down 0.13%.
EUR/USD navigates through ECB’s neutrality and rising US inflation
Recently, the US Federal Reserve revealed its latest minutes from the September monetary policy meeting, with participants seeing upside risks on inflation but downside risks t economic activity, acknowledging that achieving the Fed’s goal has become two-sided. Fed policymakers noted that with policy about to peak, decisions and communications should shift towards the time horizon of keeping rates higher for longer.
After the minutes' release, the EUR/USD reaction was muted, remaining below the 1.0600 figure.
Earlier, the US Department of Labor (DoL) announced that inflation figures on the producer side were above estimates, and except for the Producer Price Index (PPI) monthly reading, expanding below the prior month’s number, most figures exceeded August data’s, suggesting inflation is reigniting, blamed on high energy prices, and the automobile union strike.
Aside from this, the latest Fed officials have struck a neutral approach, except for Fed Governor Michelle Bowman, who stressed that further tightening is needed.
Across the pond, ECB’s Kazaks said interest rates are appropriate to tame inflation to 2% in the second half of 2025 but kept the door open to additional hikes. On the data front, the Eurozone (EU) economic docket witnessed inflation in Germany continued to ease as expected.
EUR/USD Price Analysis: Technical outlook
After bouncing from new year-to-date (YTD) lows reached on October 3 at around 1.0448, the EUR/USD upward correction could be coming to an end after piercing the 1.0600 figure, but buyers' failure to cling to that figures could exacerbate a re-test of yearly lows. If EUR/USD reclaims 1.0600, that could open the door to test 1.0700; otherwise, the next support level to be challenged would be the October 6 swing low of 1.0482 before testing YTD lows of 1.0448.

- Federal Reserve released the minutes from its September 19-20 meeting.
- The minutes showed that officials saw risks to achieving goals had become more two-sided.
- US Dollar drops marginally after the minutes.
The Federal Open Market Committee (FOMC) released the minutes of its September meeting, which had a limited reaction across financial markets. According to the document, members generally judged the risks to achieving goals had become more two-sided. Most members continued to see upside risks to inflation.
At the September meeting, the Federal Reserve (Fed) decided to maintain the federal funds rate within the range of 5.25% to 5.5%, as expected. The staff projections showed the possibility of another rate hike before the end of the year. The next FOMC decision is on November 1.
Key takeaways from the minutes:
Participants also noted that they expected that real GDP growth would slow in the near term. Participants judged that the current stance of monetary policy was restrictive and that it broadly appeared to be restraining the economy as intended.
Participants stressed that current inflation remained unacceptably high while acknowledging that it had moderated somewhat over the past year.
Participants observed that the labor market was tight but that supply and demand conditions were continuing to come into better balance.
Participants generally noted there was still a high degree of uncertainty surrounding the economic outlook. One new source of uncertainty was that associated with the autoworkers' strike, and many participants observed that an intensification of the strike posed both an upside risk to inflation and a downside risk to activity.
A majority of participants pointed to upside risks to inflation from rising energy prices that could undo some of the recent disinflation or to the risk that inflation would prove more persistent than expected.
Almost all participants judged it appropriate to maintain the target range for the federal funds rate at 5-1/4 to 5-1/2 percent at this meeting.
A majority of participants judged that one more increase in the target federal funds rate at a future meeting would likely be appropriate, while some judged it likely that no further increases would be warranted.
All participants agreed that the Committee was in a position to proceed carefully and that policy decisions at every meeting would continue to be based on the totality of incoming information and its implications for the economic outlook as well as the balance of risks.
All participants agreed that policy should remain restrictive for some time until the Committee is confident that inflation is moving down sustainably toward its objective.
Several participants commented that, with the policy rate likely at or near its peak, the focus of monetary policy decisions and communications should shift from how high to raise the policy rate to how long to hold the policy rate at restrictive levels.
Participants generally judged that, with the stance of monetary policy in restrictive territory, risks to the achievement of the Committee's goals had become more two sided. But with inflation still well above the Committee's longer-run goal and the labor market remaining tight, most participants continued to see upside risks to inflation. These risks included the imbalance of aggregate demand and supply persisting longer than expected, as well as risks emanating from global oil markets, the potential for upside shocks to food prices, the effects of a strong housing market on shelter inflation, and the potential for more limited declines in goods prices.
Market reaction
The US Dollar Index is rising after falling for five consecutive days, hovering slightly below 106.00. It remains around that area after the minutes, that have little impact on markets.
- GBP/JPY clipping back towards 184.00 as market risk appetite takes a cautious bite.
- Markets are leaning risk-on, but tone remains overly cautious, market moves to stay thin.
- Pound Sterling traders will be looking ahead to Thursday's UK production figures.
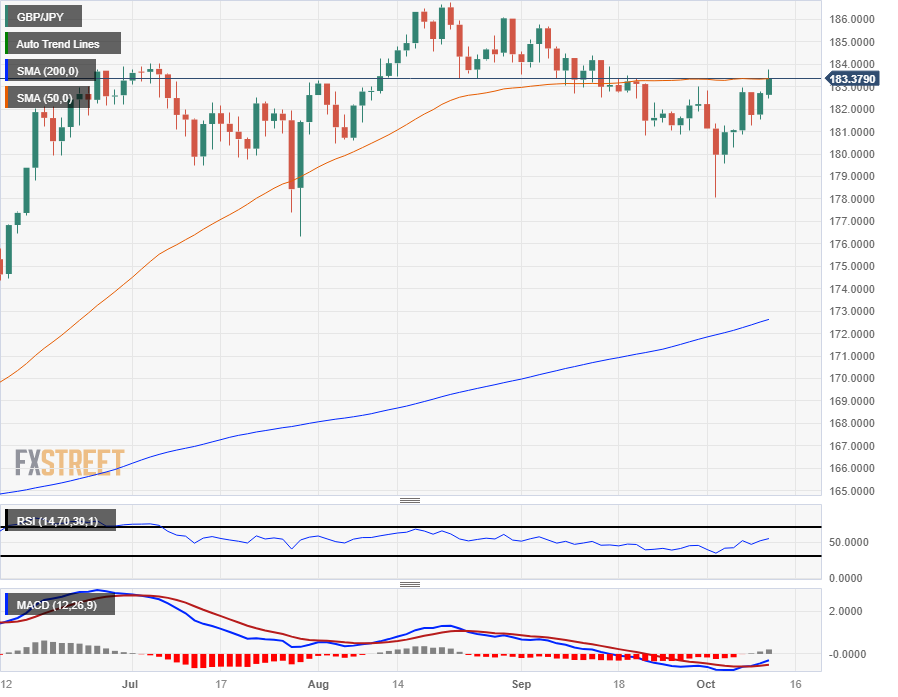
The GBP/JPY is catching a thin but determined bid for Wednesday, with the pair easing higher into 183.35, with bull's eyes set on 184.00.
The Guppy set an intraday high of 183.75 on the day, and bidders will be looking to gear up for another run higher as long as market pressures continue to push down on the Yen (JPY).
Japanese activity indicators are due late Wednesday at 23:50 GMT, when Tokyo markets will be heading into their early Thursday trading session, but data is likely to be low-impact with much of the release already priced in.
Japanese Bank Lending for the year into September is seen holding steady at 3.1%; Machinery Orders for August are expected to rebound to 0.4% from the previous decline of 1.1%; and Japan's Producer Price Index (PPI) for September is seen slipping from 0.3% to 0.1% against the previous month.
On the Pound Sterling (GBP) side of the Guppy coin, traders will be looking ahead to Thursday's UK Industrial & Manufacturing Production numbers, as well as a monthly read on UK Gross Domestic Product(GDP). UK Industrial Production for August is expected to decline by 0.2%, against the previous month's -0.7% backslide, while Manufacturing Production for the same period is forecast to rebound from -0.8% to -0.4%, a better number but still in the red.
UK Gross Domestic Product for August is seen recovering from the previous month's -0.5% contraction to an on-balance 0.2%, and GBP traders will want to keep an eye out for any nasty surprises from Thursday's UK Goods Trade Balance, which is expected to be low-impact but could see a shot in the arm of Pound Sterling markets if numbers deviate wildly.
GBP/JPY Technical Outlook
The Guppy's near-term recovery sees the pair knocking into the 50-day Simple Moving Average (SMA), sticking close to the midpoint of the last fifty trading days as the Pound Sterling struggles to develop meaningful momentum against the Japanese Yen.
Looking longer-term, the GBP/JPY remains in firmly bullish territory, with price action trading well above the 200-day SMA near 173.00, and it's GBP bulls' game to lose from here, though upside potential could remain limited with Yen-based pairs consistently trading into areas that are prone to draw FX market intervention by the Bank of Japan (BoJ)_ if bids run too far out of control.
GBP/JPY Daily Chart
GBP/JPY Technical Levels
- US Dollar continues to struggle to gain momentum.
- US PPI from September rose to 2.2% YoY, beating expectations
- The FOMC will release its minutes from the September meeting later in the session.
- Markets remain cautious amid the conflict between Israel and Hamas.
The US Dollar (USD) measured by the US Dollar DXY Index trades with mild losses after the release of hot Producer Price Index (PPI) figures and ahead of the Federal Open Market Committee (FOMC) minutes. In addition, the conflict in Palestine has escalated, which could make investors seek refuge in the green currency.
As the United States economic data doesn’t show evidence of a cool-down, the minutes from the September meeting from the FOMC will be closely monitored by investors to look for clues regarding the Federal Reserve's (Fed) next step. It's worth noting that in the last decision, the bank decided to hold rates steady at the 5.25-5.50% range, but the so-called “dot plot” revealed that most of the members are seeing high chances of an additional hike in this cycle. Also, projections revealed that rate cuts may be delayed, meaning that the Fed could maintain its restrictive policy at higher levels for longer.
Daily Digest Market Movers: US Dollar consolidates last week’s rally; resilient US economy and Middle East geopolitical tensions could reignite its bullish momentum.
- The US Dollar DXY index continues consolidating and trades neutral at 105.80.
- The September US Producer Price Index (PPI) rose to 2.2%, higher than the expected 1.6% and the same as the previous 2.2%.
- Investors will look for further clues of the Federal Reserve's (Fed) stance in the Federal Open Market Committee (FOMC) minutes, to be released later in the session.
- Regarding the last Fed forecast, the dot plot interest rate projections from the Fed remained at 5.6% for 2023, meaning higher chances of an additional 25 basis point (bps) hike.
- For 2024, the median Fed funds target rate was revised to 4.6% vs the 4.3% March projections, meaning that the Fed is delaying rate cuts.
- During the Press conference, Jerome Powell noted that monetary policy decisions will still depend on incoming data.
Technical analysis: US Dollar Index bullish momentum wanes, rejected by the 20-day SMA
The US Dollar Index DXY sees a neutral to bearish technical outlook for the short term, and the buyers fail to regain the 20-day Simple Moving Average (SMA), which could pave the way for further downside. On the daily chart, the Relative Strength Index (RSI) displays a negative slope near the 50 middle-point while the Moving Average Convergence Divergence (MACD) stands in negative territory, indicating that the bears hold the upper hand over the short term. However, the index is comfortably above the 100 and 200-day Simple Moving Averages (SMA), indicating that the bulls command the broader scale. As the sellers are gaining momentum, pushing the index below the 20-day average at 105.90, more downside may be on the horizon to continue consolidating the last week’s rally, with support lining up at 105.50, 105.30 and 105.00.
Fed FAQs
What does the Federal Reserve do, how does it impact the US Dollar?
Monetary policy in the US is shaped by the Federal Reserve (Fed). The Fed has two mandates: to achieve price stability and foster full employment. Its primary tool to achieve these goals is by adjusting interest rates.
When prices are rising too quickly and inflation is above the Fed’s 2% target, it raises interest rates, increasing borrowing costs throughout the economy. This results in a stronger US Dollar (USD) as it makes the US a more attractive place for international investors to park their money.
When inflation falls below 2% or the Unemployment Rate is too high, the Fed may lower interest rates to encourage borrowing, which weighs on the Greenback.
How often does the Fed hold monetary policy meetings?
The Federal Reserve (Fed) holds eight policy meetings a year, where the Federal Open Market Committee (FOMC) assesses economic conditions and makes monetary policy decisions.
The FOMC is attended by twelve Fed officials – the seven members of the Board of Governors, the president of the Federal Reserve Bank of New York, and four of the remaining eleven regional Reserve Bank presidents, who serve one-year terms on a rotating basis.
What is Quantitative Easing (QE) and how does it impact USD?
In extreme situations, the Federal Reserve may resort to a policy named Quantitative Easing (QE). QE is the process by which the Fed substantially increases the flow of credit in a stuck financial system.
It is a non-standard policy measure used during crises or when inflation is extremely low. It was the Fed’s weapon of choice during the Great Financial Crisis in 2008. It involves the Fed printing more Dollars and using them to buy high grade bonds from financial institutions. QE usually weakens the US Dollar.
What is Quantitative Tightening (QT) and how does it impact the US Dollar?
Quantitative tightening (QT) is the reverse process of QE, whereby the Federal Reserve stops buying bonds from financial institutions and does not reinvest the principal from the bonds it holds maturing, to purchase new bonds. It is usually positive for the value of the US Dollar.
- USD/CHF bounces near 0.9001, with the 200-DMA at 0.9022 emerging as a pivotal battleground.
- A sustained move below the 200-DMA could unlock the path towards the psychological 0.9000.
- Recovery above 0.9022 necessitates reclaiming 0.9100 to rekindle upside aspirations towards 0.9147.
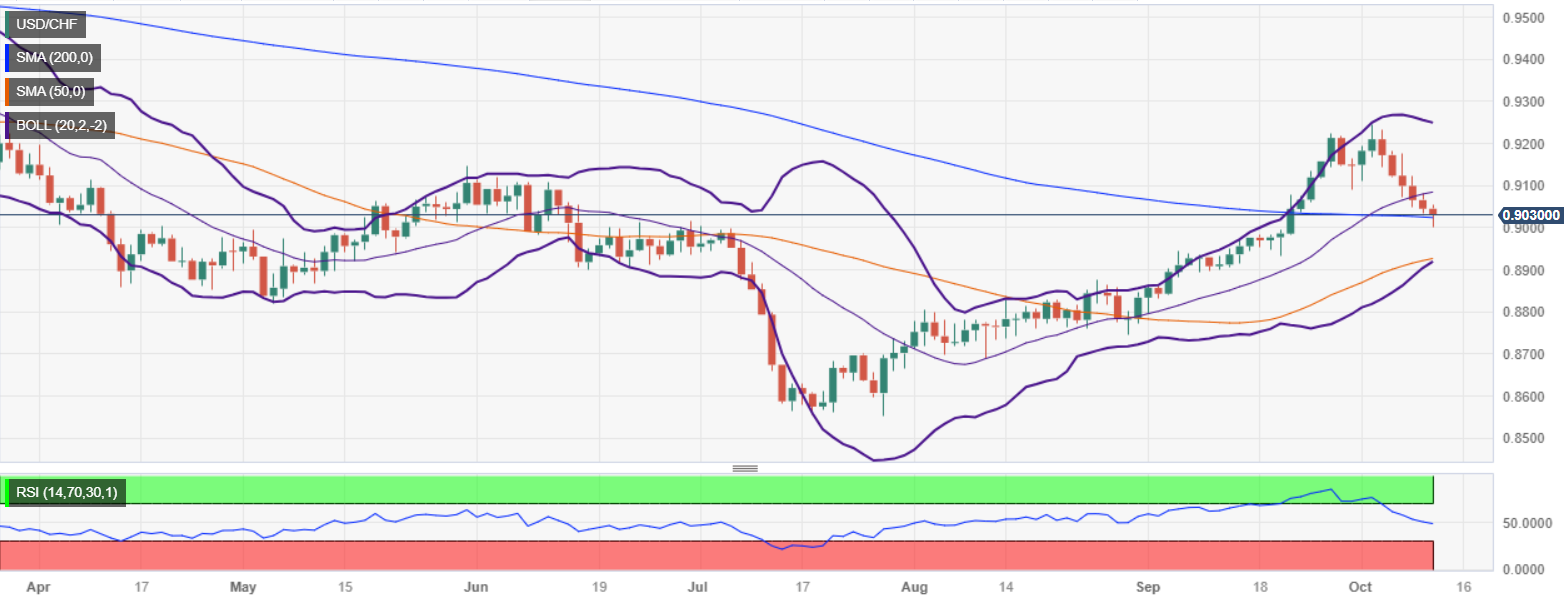
The USD/CHF slides towards 0.9001 weekly lows but bounces off, trying to trim some of its earlier losses. Buyers are trying to reclaim the 200-day moving average (DMA) at 0.9022, which so far has been accomplished it, as the pair exchanges hands at 0.9030, down 0.14%.
the ongoing pullback, after reaching a seven-month high of 0.9245, brought the USD/CHF towards the 200-DMA, which so far is capping the pair’s fall. Nevertheless, a daily close below that area would expose the 0.9000 figure, followed by a drop toward the 50-DMA at 0.8926. On the other hand, if buyers keep the spot price above 0.9022, the 200-DMA could pave the way for a recovery, but they must reclaim 0.9100. Once cleared, the next resistance would be the May 31 daily high at 0.9147, followed by 0.9200.
USD/CHF Price Action – Daily chart
USD/CHF Techniacl Levels
- Canadian Dollar is easing off the pressure as Crude Oil prices soften.
- Canada economic data remains thin for the week, US data dominating the market.
- US inflation data to remain key market driver for the back half of the trading week.
The Canadian Dollar (CAD) is stepping back slightly on Wednesday, giving the US Dollar (USD) some breathing room and sending the USD/CAD back into near-term highs.
Inflation expectations remain the pivotal market focus for this week, and with Canada-based data almost entirely absent on the economic calendar, chart direction will be determined by market reaction to US inflation figures through the rest of the week.
The USD/CAD has slipped back into yesterday’s highs as the Greenback catches a soft bid on data beats, and the Loonie is following softening Crude Oil prices slightly lower.
Daily Digest Market Movers: Canadian Dollar giving a pause in lockstep with barrel prices
- Bidding pressure for the CAD is abating, sending the USD/CAD pair back to Tuesday’s highs.
- Canadian economic data is almost entirely absent, save for low-impact data.
- Canada Building Permits for August managed a beat, printing at 3.4% versus the forecast 0.5%.
- Previous reading on Building Permits was revised down significantly, from -1.5% to -3.8%.
- Crude Oil prices are softening further, fading back the early week’s bid spike following the weekend’s Gaza Strip escalation between Israel and Palestinian Hamas.
- US data on Wednesday beat forecasts across the board.
- US Producer Price Index (PPI) for the year into September climbed to 2.7%, beating the 2.3% expectations. The previous reading was revised to 2.5% from 2.2%.
- US Consumer Price Index (CPI) inflation reading due on Thursday, will be significant, and likely to impact broad-market risk sentiment.
Technical Analysis: Canadian Dollar loosening its grip enough for the USD/CAD to reclaim 1.36 handle
Wednesday’s bounce in the USD/CAD sends the pair back into the upper bound of the previous day’s highs, trading above the 1.3600 handle with daily candlesticks set to catch technical support from the 50-day Simple Moving Average (SMA) near 1.3550 with the 200-day SMA sitting just north of 1.3450.
The USD/CAD got knocked down nearly 1.6% peak-to-trough from last week’s swing high into 1.3785, with the Canadian Dollar catching a Crude Oil-fueled bid. Downside pressure has eased off for the time being, but markets are awaiting a firmer read on US inflation data before plunging too far into either side of the USD.
Canadian Dollar FAQs
What key factors drive the Canadian Dollar?
The key factors driving the Canadian Dollar (CAD) are the level of interest rates set by the Bank of Canada (BoC), the price of Oil, Canada’s largest export, the health of its economy, inflation and the Trade Balance, which is the difference between the value of Canada’s exports versus its imports. Other factors include market sentiment – whether investors are taking on more risky assets (risk-on) or seeking safe-havens (risk-off) – with risk-on being CAD-positive. As its largest trading partner, the health of the US economy is also a key factor influencing the Canadian Dollar.
How do the decisions of the Bank of Canada impact the Canadian Dollar?
The Bank of Canada (BoC) has a significant influence on the Canadian Dollar by setting the level of interest rates that banks can lend to one another. This influences the level of interest rates for everyone. The main goal of the BoC is to maintain inflation at 1-3% by adjusting interest rates up or down. Relatively higher interest rates tend to be positive for the CAD. The Bank of Canada can also use quantitative easing and tightening to influence credit conditions, with the former CAD-negative and the latter CAD-positive.
How does the price of Oil impact the Canadian Dollar?
The price of Oil is a key factor impacting the value of the Canadian Dollar. Petroleum is Canada’s biggest export, so Oil price tends to have an immediate impact on the CAD value. Generally, if Oil price rises CAD also goes up, as aggregate demand for the currency increases. The opposite is the case if the price of Oil falls. Higher Oil prices also tend to result in a greater likelihood of a positive Trade Balance, which is also supportive of the CAD.
How does inflation data impact the value of the Canadian Dollar?
While inflation had always traditionally been thought of as a negative factor for a currency since it lowers the value of money, the opposite has actually been the case in modern times with the relaxation of cross-border capital controls. Higher inflation tends to lead central banks to put up interest rates which attracts more capital inflows from global investors seeking a lucrative place to keep their money. This increases demand for the local currency, which in Canada’s case is the Canadian Dollar.
How does economic data influence the value of the Canadian Dollar?
Macroeconomic data releases gauge the health of the economy and can have an impact on the Canadian Dollar. Indicators such as GDP, Manufacturing and Services PMIs, employment, and consumer sentiment surveys can all influence the direction of the CAD. A strong economy is good for the Canadian Dollar. Not only does it attract more foreign investment but it may encourage the Bank of Canada to put up interest rates, leading to a stronger currency. If economic data is weak, however, the CAD is likely to fall.
- NZD/USD recoils to 0.6021 after reaching a weekly peak, influenced by a strengthening USD.
- US PPI data exceeds expectations, introducing a complex layer to the ongoing inflation dialogue.
- Contrasting stances among Fed officials and RBNZ’s rate would keep NZD/USD traders uncertain.
NZD/USD retreats after hitting a weekly high of 0.6055 due to a mixed market impulse witnessed in the North American session that bolstered appetite for the Greenback (USD). Speculations of the US Federal Reserve (Fed) forgetting a rate hike, as dovish comments and neutral postures amongst officials emerged. The pair exchanges hands at around 0.6021.
Kiwi Dollar tempers gain as USD was bolstered by US PPI data
US economic data revealed by the Department of Labor (DoL) showed that September’s inflation in the producer side was higher than expected and, in some cases, above August’s figures. The Producer Price Index (PPI) rose by 2.2% YoY, exceeding August and forecasts of 1.6%, while the core PPI rose by 2.7%, above projections and the previous month.
Recently, Federal Reserve officials have adopted a neutral stance; of late, Fed Governor Christopher Waller said the US central bank can watch and see developments on rates, adding that financial markets tightening “would do some of the work for us.” Earlier, Fed Governor Michelle Bowman said that she favors another rate hike as inflation remains above the Fed’s 2% target.
Given the backdrop, money market futures do not expect another rate hike by the Fed, as shown by the CME FedWatch Tool.
On the New Zealand (NZ) front, the Reserve Bank of New Zealand's (RBNZ) decision to keep rates unchanged at 5.5% could undermine its appeal. The RBNZ said that rates need to be maintained at a restrictive level.
NZD/USD Price Analysis: Technical outlook
The NZD/USD daily chart portrays the pair as neutral to downward biased after testing the latest cycle high of 0.6048, which was briefly pierced and could pave the way to test 0.6100. if the pair decisively breaks the latter, that could pave the way to test the 200-day moving average (DMA). Despite challenging 0.6048, price action in the last couple of days is forming a bearish harami candlestick chart pattern, which, if confirmed, could open the door for the BZD/USD to dive below 0.6000.
- USD/JPY rose above 149.00, gaining 0.20% on the day.
- US PPI from September accelerated, beating expectations.
- FOMC minutes from September will be released later in the session.
On Wednesday, the USD/JPY gained additional ground, rising back above 149.00. Hot Producer Price Index (PPI) failed to trigger a significant move on the USD, and the trajectory of the pair seems to be determined by the dovish stance of the Bank of Japan (BoJ). Later in the session, markets will monitor the Federal Open Market Committee (FOMC) minutes from the September meeting to look for clues on forward guidance.
In line with that, the September PPI from the US rose to 2.2% YoY, higher than the 1.6% expected and the previous 2%. On Thursday, the US will report the Consumer Price Index (CPI), with the headline and core measure expected to decelerate. Its worth noticing that each inflation data point is crucial for the Federal Reserve (Fed) and could generate volatility in the bond markets and in the USD price dynamics.
Regarding the minutes, investors will look for additional clues on the last decision of the Fed delivering a hawkish pause. Interest rate projections indicated that bank members have a high chance of an additional hike this year while rate cuts were delayed. In the press conference, Chair Powell was very clear, stating that the bank will remain data-dependent and ready to hike again if needed.
USD/JPY Levels to watch
The daily chart analysis indicates a neutral to a bearish outlook for USD/JPY, as the bears show signs of taking control but still face challenges ahead. The Relative Strength Index (RSI) has a positive slope above its midline but with a clear downward trend, while the Moving Average Convergence (MACD) lays out neutral red bars. Additionally, the pair is above the 20,100, 200-day SMAs, suggesting that the bulls are in command over the bears on the bigger picture.
Support levels: 148.66 (20-day SMA), 148.00, 147.30.
Resistance levels: 149.50, 150.00, 150.50.
USD/JPY Daily Chart
-638326370274433836.png)
- Mexican Peso four-day rally keeps the USD/MXN pair trading below 18.00, near the 200-day SMA.
- Mexico’s currency strengthens on speculations about the US Federal Reserve as officials disregard a pending rate hike.
- US Producer Price Index exceeds estimates: A precursor to Thursday’s CPI?
Mexican Peso (MXN) extends its rally versus the Greenback (USD) for a fourth consecutive day amid speculations the US Federal Reserve (Fed) might skip the supposedly “last” rate hike, as shown by the latest Fed monetary policy “dot-plots.” Meanwhile, economic data from the United States (US) limited the USD/MXN downtrend, which exchanges hand at around 17.82, registering losses of more than 0.50% on the day.
Mexico’s economic calendar is empty, but USD/MXN traders are getting cues from the US. The US Bureau of Labor Statistics (BLS) revealed that prices paid by producers rose above estimates, although the headline Producer Price Index (PPI) MoM slowed compared to August data. Other readings were higher than the previous month, which could open the door for an uptick on consumer side inflation, to be revealed on Thursday. In the meantime, Fed Governor Michelle Bowman, the dissident amongst Fed officials during the week, emphasized that rates must rise further as “Inflation remains well above the FOMC's 2% target.”
Daily Digest Market Movers: Mexican Peso gains more than 1% as the Greenback continues to weaken
- Mexican Peso remains bolstered by a risk-on impulse despite the ongoing escalation of the Israel-Hamas conflict.
- The September US Producer Price Index (PPI) rose by 0.5% MoM, above estimates of 0.3%, while core PPI expanded by 0.3%, exceeding estimates of 0.2%.
- Annually based, the PPI rose by 2.2%, above forecasts and August’s figures, of 1.6% and 2%, while the core PPI rate stood at 2.7%, exceeding projections and the prior month’s data.
- Fed Governor Michelle Bowman: As inflation remains above the FOMC’s target, “This suggests that the policy rate may need to rise further and stay restrictive for some time to return inflation to the FOMC's goal.”
- Mexico’s Consumer Price Index (CPI) grew by 4.45% YoY in September, below the 4.47% of estimates.
- The core CPI inflation in Mexico stood stickier at 5.76% YoY, as widely estimated, but has broken below the 6% threshold.
- The Bank of Mexico (Banxico) held rates at 11.25% in September and revised its inflation projections from 3.5% to 3.87% for 2024, above the central bank’s 3% target (plus or minus 1%).
Technical Analysis: Mexican Peso lurking around the 200-day Simple Moving Average at 17.77
Mexican Peso appreciated during the week as the USD/MXN has dived more than 3%, below the 18.00 figure, with sellers targeting the 200-day Simple Moving Average (SMA) at 17.77. A breach of the latter will expose the 20-day SMA at 17.57 before challenging the low seen on September 30 at 17.34. If USD/MXN sellers break that level, the pair will shift to a neutral-downward bias. On the flip side, buyers must reclaim the 18.00 figure for a bullish continuation.
Mexican Peso FAQs
What key factors drive the Mexican Peso?
The Mexican Peso (MXN) is the most traded currency among its Latin American peers. Its value is broadly determined by the performance of the Mexican economy, the country’s central bank’s policy, the amount of foreign investment in the country and even the levels of remittances sent by Mexicans who live abroad, particularly in the United States. Geopolitical trends can also move MXN: for example, the process of nearshoring – or the decision by some firms to relocate manufacturing capacity and supply chains closer to their home countries – is also seen as a catalyst for the Mexican currency as the country is considered a key manufacturing hub in the American continent. Another catalyst for MXN is Oil prices as Mexico is a key exporter of the commodity.
How do decisions of the Banxico impact the Mexican Peso?
The main objective of Mexico’s central bank, also known as Banxico, is to maintain inflation at low and stable levels (at or close to its target of 3%, the midpoint in a tolerance band of between 2% and 4%). To this end, the bank sets an appropriate level of interest rates. When inflation is too high, Banxico will attempt to tame it by raising interest rates, making it more expensive for households and businesses to borrow money, thus cooling demand and the overall economy. Higher interest rates are generally positive for the Mexican Peso (MXN) as they lead to higher yields, making the country a more attractive place for investors. On the contrary, lower interest rates tend to weaken MXN.
How does economic data influence the value of the Mexican Peso?
Macroeconomic data releases are key to assess the state of the economy and can have an impact on the Mexican Peso (MXN) valuation. A strong Mexican economy, based on high economic growth, low unemployment and high confidence is good for MXN. Not only does it attract more foreign investment but it may encourage the Bank of Mexico (Banxico) to increase interest rates, particularly if this strength comes together with elevated inflation. However, if economic data is weak, MXN is likely to depreciate.
How does broader risk sentiment impact the Mexican Peso?
As an emerging-market currency, the Mexican Peso (MXN) tends to strive during risk-on periods, or when investors perceive that broader market risks are low and thus are eager to engage with investments that carry a higher risk. Conversely, MXN tends to weaken at times of market turbulence or economic uncertainty as investors tend to sell higher-risk assets and flee to the more-stable safe havens.
Federal Reserve (Fed) Governor Christopher Waller noted on Wednesday that inflation data in the last three months has been "very good," per Reuters. "If current trends continue, inflation will basically be back to the target," Waller added.
Key quotes
"Long-term rates are market determined."
"It's astounding how resilient the job market has been given the tight Fed policy."
"The real side of the economy is doing well."
"The Fed can watch and see what happens on rates."
"Financial markets are tightening and that will do some of the work for us."
"Will see how higher long-term rates feed into the Fed policy."
"Hard to see a direct link from the Middle East violence to the Fed policy unless there is a broader conflict."
Market reaction
The US Dollar Index stays under modest bearish pressure following these comments and was last seen losing 0.1% on the day at 105.65.
- AUD/USD manages to shift auction above 0.6400 amid correction in the US Dollar.
- A stronger US PPI report has prompted expectations of a hot consumer inflation report for September.
- Investors await the FOMC minutes which will provide a detailed explanation behind a steady rate decision.
AUD/USD seems stabilized above the round-level resistance of 0.6400 in the early New York session. The Aussie asset strengthens as the US Dollar falls back after the release of the stronger Producer Price Index (PPI) report for September.
The S&P500 opens on a bullish note as US Treasury yields drop from their multi-year highs. The 10-year US Treasury yields have dropped to 4.6%, resulting in an improvement in the risk appetite of the market participants.
The US Dollar Index (DXY) drops below 105.60 though stronger producer inflation has prompted expectations of a hot consumer inflation report for September, which will be published on Thursday at 12:30 GMT. The US Bureau of Labor Statistics reported the annual core PPI at 2.7%, accelerated from expectations of 2.5% and the former release of 2.3%. On a monthly basis, headline and core PPI rose by 0.5% and 0.3% respectively.
Meanwhile, neutral commentary from Federal Reserve (Fed) policymakers has pushed the US Dollar on the backfoot. Rate-setters commented that higher yields could reduce the pace of spending and investment. Therefore, the Fed could avoid raising rates further.
Going forward, the focus will be on the Federal Open Market Committee (FOMC) minutes for the September monetary policy, which will provide a detailed explanation behind a steady rate decision.
On the Aussie front, rising expectations of one more interest rate increase from the Reserve Bank of Australia (RBA) in the remainder of 2023 have improved the appeal of the Australian Dollar. Improved oil price outlook due to deepening Middle East tensions could elevate inflationary pressures ahead.
- EUR/USD advances to two-week tops near 1.0630 midweek.
- North from here comes the weekly peak around 1.0770.
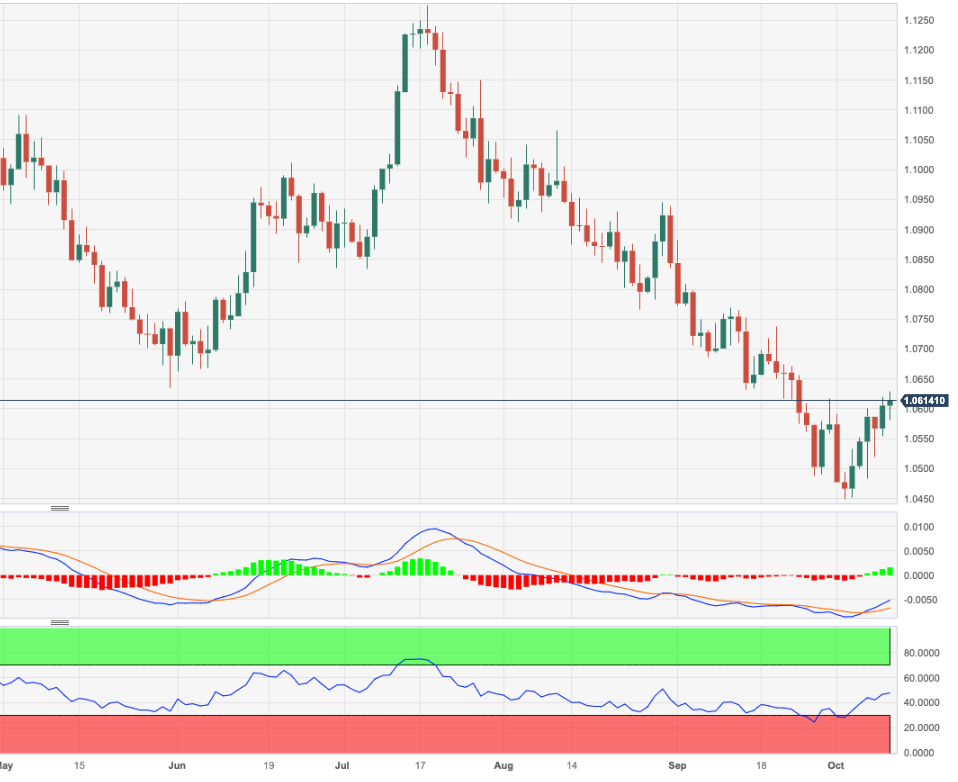
EUR/USD adds to Tuesday’s gains and climbs to multi-session peaks in the 1.0625/30 band on Wednesday.
In case bulls maintain control, the pair should now retarget the weekly high of 1.0767 (September 12). Once cleared, spot could then move to the critical 200-day SMA (1.0823).
Meanwhile, further losses remain on the table as long as the pair navigates the area below the key 200-day SMA.
EUR/USD daily chart
- Silver price climbs to near $22.00 after a symmetrical triangle breakout.
- The US Dollar retreats despite the surprisingly hot US PPI report.
- The US inflation outlook turns hotter led by strong US PPI data.
Silver price (XAU/USD) extended upside to near $22.00 after the release of the surprisingly hotter Producer Price Index (PPI) report for September. The US Bureau of Labor Statistics reported that monthly headline PPI rose at a higher pace of 0.5% vs. expectations of 0.4% and core PPI grew by 0.3% against the estimates of 0.2%.
On an annualized basis, the headline PPI accelerated to 2.2%, higher than expectations of 1.6% and the former reading of 2%. The prices of core goods and services at factory gates jumped to 2.7%.
An unexpectedly hotter PPI report indicates that robust consumer spending forced producers to raise prices of goods at factory gates. This indicates that consumer inflation data that is scheduled for Thursday could be stronger and set a hawkish undertone for the Federal Reserve’s (Fed) November monetary policy meeting.
Meanwhile, the US Dollar Index (DXY) looks set for a fresh breakdown below the immediate support of 105.60. The neutral commentary from Fed policymakers over the interest rate outlook has weakened the appeal for the US Dollar. Rate-setters are worried about multi-year high US Treasury yields.
Silver technical analysis
Silver price delivers a breakout of the Symmetrical Triangle chart pattern on an hourly scale, which results in wider ticks and heavy volume. The 50-period Exponential Moving Average (EMA) at $21.82 continues to act as a cushion for the Silver price bulls.
The Relative Strength Index (RSI) (14) shifts into the bullish range of 60.00-80.00, which indicates that the bullish impulse has been triggered.
Silver two-hour chart
-638326285302346261.png)
- DXY keeps the bearish performance unchanged on Wednesday.
- Extra retracement could force the index to revisit the 104.40 region.
The continuation of the sell-off drags DXY to the area of two-week lows around 105.60 on Wednesday.
In case bears push harder, then index could then slip back to the weekly low of 104.42 (September 11), which appears reinforced by the proximity of the interim 55-day SMA, today at 104.31.
In the meantime, while above the key 200-day SMA, today at 103.18, the outlook for the index is expected to remain constructive.
DXY daily chart

- EUR/JPY adds to Tuesday’s advance and retakes the 158.00 barrier.
- Extra gains should meet the next target around 158.60.
EUR/JPY picks up further pace and surpasses the 158.00 mark, or three-day highs, on Wednesday.
The continuation of the rebound is expected to put the September high of 158.65 (September 13) to the test ahead of the 2023 top at 159.76 (August 30), which precedes the key round level at 160.00.
So far, the longer term positive outlook for the cross appears favoured while above the 200-day SMA, today at 150.08.
EUR/JPY daily chart

Building Permits in Canada increased 3.4% on a monthly basis in August. This reading followed the 3.8% decline (revised from 1.5%) recorded in July and came in better than the market expectation for a decrease of 0.8%.
What is the Canada Building Permits (MoM)?
The Building Permits released by the Statistics Canada shows the number of permits for new construction projects. It implies the movement of corporate investments (the Canadian economic development). It tends to cause some volatility to the CAD. The more growing number of permits, the more positive (or bullish) for the CAD.
When is the next Canada Building Permits (MoM) report released?
The next Canada Building Permits (MoM) data will be published on November 2 at 12:30 GMT
Canadian Dollar price today
The table below shows the percentage change of Canadian Dollar (CAD) against listed major currencies today. Canadian Dollar was the strongest against the New Zealand Dollar.
| USD | EUR | GBP | CAD | AUD | JPY | NZD | CHF | |
| USD | 0.02% | -0.10% | 0.13% | 0.24% | 0.23% | 0.41% | -0.24% | |
| EUR | 0.04% | -0.06% | 0.16% | 0.25% | 0.26% | 0.44% | -0.22% | |
| GBP | 0.14% | 0.16% | 0.22% | 0.36% | 0.33% | 0.52% | -0.09% | |
| CAD | -0.13% | -0.11% | -0.21% | 0.11% | 0.08% | 0.29% | -0.37% | |
| AUD | -0.24% | -0.21% | -0.33% | -0.11% | -0.04% | 0.16% | -0.46% | |
| JPY | -0.20% | -0.21% | -0.33% | -0.09% | 0.05% | 0.22% | -0.42% | |
| NZD | -0.41% | -0.40% | -0.53% | -0.29% | -0.14% | -0.19% | -0.62% | |
| CHF | 0.24% | 0.21% | 0.09% | 0.32% | 0.46% | 0.42% | 0.60% |
The heat map shows percentage changes of major currencies against each other. The base currency is picked from the left column, while the quote currency is picked from the top row. For example, if you pick the Euro from the left column and move along the horizontal line to the Japanese Yen, the percentage change displayed in the box will represent EUR (base)/JPY (quote).
- Producer inflation in the US accelerated in September.
- US Dollar Index stays below 106.00 after the PPI data.
The Producer Price Index (PPI) for final demand in the US rose 2.2% on a yearly basis in September, up from the 2% increase recorded in August, the data published by the US Bureau of Labor Statistics revealed on Wednesday. This reading came in higher than the market expectation of 1.6%.
The annual Core PPI increased 2.7% in the same period, higher than the August reading and analysts' estimate of 2.2% and 2.3%, respectively. On a monthly basis, the Core PPI rose 0.3%.
Market reaction
The US Dollar Index edged slightly higher with the immediate reaction and was last seen gaining 0.1% on the day at 105.90.
- EUR/GBP prints a fresh three-week low at 0.8620 as the ECB is expected to keep policy steady ahead.
- The Eurozone GDP for Q3 is expected to contract due to the consequences of higher interest rates.
- The Pound Sterling will dance to the tune of the UK factory data.
The EUR/GBP pair printed a fresh three-week low at 0.8620 on Wednesday as European Central Bank (ECB) Governing Council member and Bank of France President, Francois Villeroy de Galhau see monetary policy sufficiently restrictive.
ECB Villeroy warned that further policy tightening is not the right thing at this time amid a positive oil price outlook due to escalating Middle East tensions.
Meanwhile, the Eurozone economy is underperforming on the grounds of employment, output, and consumer spending, which are consequences of higher interest rates by the central bank. ECB policymaker Pablo Hernandez de Cos expects a negative reading of Gross Domestic Product (GDP) in the third quarter of 2023.
ECB policymakers have been emphasizing the need to keep interest rates higher for a longer period as the last leg of inflation could turn out sticky ahead. A survey from the ECB showed that Eurozone consumers see inflation three years ahead at 2.5% in August vs. 2.4% in July.
On the Pound Sterling front, investors await the United Kingdom factory data, which will be released on Thursday at 06:00 GMT. Investors see monthly Manufacturing Production contracting by 0.3% against the 0.8% contraction recorded for July. Monthly Industrial Production is foreseen to decline at a slower pace of 0.2% against a contraction of 0.7% in July. The monthly Gross Domestic Product (GDP) data is seen expanding by 0.5% against a decline of 0.5% in July.
Investors seem confused about the interest rate outlook after hawkish guidance from Bank of England (BoE) policymaker Katherine Mann, which supported for aggressively tightening approach this week. She discussed the need to bring down inflation to 2% and wipe out consumer inflation expectations.
Antje Praefcke, FX Analyst at Commerzbank, assesses the central bank’s (MNB) monetary policy prospects for the remainder of the year.
Key Takeaways
The Hungarian central bank (MNB) on the other hand has no scope for key rate cuts in the near future. In Hungary too the inflation rate in September eased more significantly than expected from previously 16.4% to 12.2%, so that real interest rates have even become positive now, as key and overnight rate stand at 13%, but the fall is mainly due to base effects, whereas prices for food and services have continued to rise.
The MNB is aware of the price pressure that is also reflected in the monthly change rates of still 0.4% which is why it has taken a more cautious approach after it had lowered the overnight rate to the level of the key rate in a number of steps. More recently members of the MNB had increasingly sounded more restrictive so that key rate cuts seem unlikely until year-end.
This becomes even more significant for the forint as the government is putting increasing pressure on the central bank, as it did with its demand to change the inflation target or with its demand to commercial banks to set an upper limit for mortgage rates. If the MNB didn't stand up to inflation and government pressure, the market would punish the forint in a major way, with the MNB risking further price pressure.
- The Greenback is losing steam against most major peers for this week.
- All eyes are on PPI numbers this Wednesday, CPI on Thursday.
- The US Dollar Index settles below 106 and could result in more losses with the longer-term rally ending overnight.
The US Dollar (USD) sees markets looking beyond recent developments in Israel and Gaza. It appears that several countries and participants around this war do not want to see further escalation of violence. This means, for now, a proxy war is out of the way. Safe havens are starting to abate with the Swiss Franc and the Greenback retreating to weaker levels.
Meanwhile, traders have used the brief moment of US Dollar strength on Monday to sell the US Dollar, steering it substantially lower throughout Tuesday, after comments from several Federal Reserve officials signaled the Fed is done hiking. With Producer Price Index (PPI) numbers today and Consumer Price Index (CPI) data on Thursday, markets will now look for clues if the Greenback needs to be devalued even more and might see the US Dollar Index (DXY) print more losses later this week.
Daily digest: US Dollar wounded
- At 11:00 GMT, the Mortgage Bankers Association (MBA) will issue its weekly Mortgage Applications Index. Previous number was at -6% week-on-week.
- Near 12:30 GMT the main event for Wednesday arrives with the Producer Price Index numbers. For the monthly gauge, expectations are for it to head from 0.7% to 0.4%. The yearly number is expected to stay stable at 1.6%. The monthly Core PPI, without Food and Energy, is expected to stay stable at 0.2%. The yearly Core PPI is expected to head from 2.2% to 2.3%.
- Christopher Waller from the Board of Governors at the Fed is due to speak at 14:15 GMT. Raphael Bostic from the Atlanta Fed will be taking the stage near 16:15 GMT.
- The US Treasury is looking for some funding in the market. This time the 10-year note is up for auction at 17:00 GMT.
- Traders can look for clues or confirmation on the possible end of rate hikes with the Fed’s latest FOMC minutes due at 18:00 GMT.
- Equities are a bit mixed with Asian stocks up and European stocks down. That last one is not a big surprise after the substantial surge European equities had on Tuesday. It must be some small profit-taking action there. US equity futures are flat and hold on to Tuesday’s gains.
- The CME Group FedWatch Tool shows that markets are pricing in an 84.3% chance that the Federal Reserve will keep interest rates unchanged at its meeting in November.
- The benchmark 10-year US Treasury yield trades at 4.63%, which is still in the lower range of this week.
US Dollar Index technical analysis: Did it fall off its pedestal?
The US Dollar snapped a very important trendline on the US Dollar Index chart. This is true for both the weekly and the daily time frames. The Indian summer rally that started in July and extended all the way up to last week came to an end with the DXY breaking below the respected trendline from throughout that period. From a pure technical point of view, this means some US Dollar weakness will further take place before initial support is met.
The DXY opens below 106, which means that that will be the first initial hurdle to recapture. On the topside, 107.19 is important to see if the DXY can get a daily close above that level. If this is the case, 109.30 is the next level to watch.
On the downside, the recent resistance at 105.88 did not do a good job supporting any downturn. Instead, look for 105.12 to keep the DXY above 105.00. If that does not do the trick, 104.33 will be the best level to look for some resurgence in US Dollar strength with the 55-day Simple Moving Average (SMA) as a support level.
US Dollar FAQs
What is the US Dollar?
The US Dollar (USD) is the official currency of the United States of America, and the ‘de facto’ currency of a significant number of other countries where it is found in circulation alongside local notes. It is the most heavily traded currency in the world, accounting for over 88% of all global foreign exchange turnover, or an average of $6.6 trillion in transactions per day, according to data from 2022.
Following the second world war, the USD took over from the British Pound as the world’s reserve currency. For most of its history, the US Dollar was backed by Gold, until the Bretton Woods Agreement in 1971 when the Gold Standard went away.
How do the decisions of the Federal Reserve impact the US Dollar?
The most important single factor impacting on the value of the US Dollar is monetary policy, which is shaped by the Federal Reserve (Fed). The Fed has two mandates: to achieve price stability (control inflation) and foster full employment. Its primary tool to achieve these two goals is by adjusting interest rates.
When prices are rising too quickly and inflation is above the Fed’s 2% target, the Fed will raise rates, which helps the USD value. When inflation falls below 2% or the Unemployment Rate is too high, the Fed may lower interest rates, which weighs on the Greenback.
What is Quantitative Easing and how does it influence the US Dollar?
In extreme situations, the Federal Reserve can also print more Dollars and enact quantitative easing (QE). QE is the process by which the Fed substantially increases the flow of credit in a stuck financial system.
It is a non-standard policy measure used when credit has dried up because banks will not lend to each other (out of the fear of counterparty default). It is a last resort when simply lowering interest rates is unlikely to achieve the necessary result. It was the Fed’s weapon of choice to combat the credit crunch that occurred during the Great Financial Crisis in 2008. It involves the Fed printing more Dollars and using them to buy US government bonds predominantly from financial institutions. QE usually leads to a weaker US Dollar.
What is Quantitative Tightening and how does it influence the US Dollar?
Quantitative tightening (QT) is the reverse process whereby the Federal Reserve stops buying bonds from financial institutions and does not reinvest the principal from the bonds it holds maturing in new purchases. It is usually positive for the US Dollar.
European Central Bank (ECB) policymaker Pablo Hernandez de Cos said on Wednesday that he feels more confident that the trajectory of inflation might lead them to target, per Reuters.
He added that they could get to the inflation target if interest rates are maintained for a sufficiently long period.
Key quotes
"Statement is conditional, based on current info."
"Different shocks may require different responses."
Market has understood very well our communication."
"A negative Gross Domestic Product (GDP) reading for Q3 is possible."
"Growth risk is skewed to downside."
"Core inflation has turned a corner."
Market reaction
EUR/USD showed no immediate reaction to these comments and was last seen trading flat on the day slightly above 1.0600.
Analysts at TD Securities preview the minutes of the Federal Reserve's September policy meeting.
Minutes might be adjusted to sound less hawkish
"The Fed's September FOMC decision broadly matched expectations by keeping rates on hold at 5.25%-5.50%. However, the SEP projections and policy guidance were more hawkish than anticipated."
"We look for the minutes to shed light on the discussions that led the FOMC to send a message of “higher for even longer”. In light of the recent move higher in rates, the minutes might seem stale. Though the minutes might be adjusted to sound less hawkish amid this new reality."
- Oil (WTI) steady at $84 after a calm Tuesday trading session.
- The US Dollar weakened after Fed officials commented about the end of the tightening cycle.
- Sideways to lower price action is expected as several Oil-producing countries vowed for diplomacy amid current tensions in Gaza.
Oil prices have quickly digested the volatile ride from Monday after violence erupted in Israel and the Gaza strip over the weekend. Markets were on edge about possible spillover effects from the conflict to the broader Middle East region, but roughly 48 hours later it appears that Oil production is not at risk.
Meanwhile, the US Dollar (USD) sees markets looking beyond recent developments in Israel and Gaza. It appears that several countries and participants around this war do not want to see further escalation of violence. This means, for now, a proxy war is out of the way. Safe-haven flows are starting to abate, with the Swiss Franc and the Greenback retreating to weaker levels.
Crude Oil (WTI) trades at $84.56 per barrel, and Brent Oil trades at $87.07 per barrel at the time of writing.
Oil news and market movers
- Russia and Saudi Arabia will discuss Oil market prices on Wednesday, Russian Deputy Prime Minister Alexander Novak said.
- Saudi Energy Minister Prince Abdulaziz bin Salman will participate in the Russian Energy Week forum. The Saudi Energy Minister will meet with Deputy Prime Minister Novak in a breakout meeting during the convention.
- The US and Venezuela are close to reaching a deal that would ease any Oil and banking sanctions in return for ensuring fair elections next year.
- With the recent cuts since the end of summer, OPEC+ countries have ample amount of spare production capacity to weather sudden supply shocks.
- The American Petroleum Institute is due to release its weekly numbers at 20:30 GMT. The previous week recorded a drawdown of 4.21 million barrels.
Oil Technical Analysis: All priced in
Oil prices are steady and trading sideways around the peak levels from Monday in the initial reaction to the war in Israel and Gaza. For now, price action looks to be underpinned by a small risk premium, though the current diplomatic stance from several nations in the region has defused quite a lot of tension around a possible higher Oil price. Expect to see some sideways price action with a possible dip lower once the conflict de-escalates.
On the upside, the double top from October and November of last year at $93.12 remains the level to beat. Although it got breached on Thursday, Oil price didn’t close above it. Should $93.12 be taken out, look for $97.11, the high of August 2022.
On the downside, traders are bracing for the entry of that region near $78. The area should see ample support for buying. Any further drops below this level might see a firm nosedive move, which would cause Oil prices to sink below $70.
-638326108260089267.png)
US Crude (Daily Chart)
WTI Oil FAQs
What is WTI Oil?
WTI Oil is a type of Crude Oil sold on international markets. The WTI stands for West Texas Intermediate, one of three major types including Brent and Dubai Crude. WTI is also referred to as “light” and “sweet” because of its relatively low gravity and sulfur content respectively. It is considered a high quality Oil that is easily refined. It is sourced in the United States and distributed via the Cushing hub, which is considered “The Pipeline Crossroads of the World”. It is a benchmark for the Oil market and WTI price is frequently quoted in the media.
What factors drive the price of WTI Oil?
Like all assets, supply and demand are the key drivers of WTI Oil price. As such, global growth can be a driver of increased demand and vice versa for weak global growth. Political instability, wars, and sanctions can disrupt supply and impact prices. The decisions of OPEC, a group of major Oil-producing countries, is another key driver of price. The value of the US Dollar influences the price of WTI Crude Oil, since Oil is predominantly traded in US Dollars, thus a weaker US Dollar can make Oil more affordable and vice versa.
How does inventory data impact the price of WTI Oil
The weekly Oil inventory reports published by the American Petroleum Institute (API) and the Energy Information Agency (EIA) impact the price of WTI Oil. Changes in inventories reflect fluctuating supply and demand. If the data shows a drop in inventories it can indicate increased demand, pushing up Oil price. Higher inventories can reflect increased supply, pushing down prices. API’s report is published every Tuesday and EIA’s the day after. Their results are usually similar, falling within 1% of each other 75% of the time. The EIA data is considered more reliable, since it is a government agency.
How does OPEC influence the price of WTI Oil?
OPEC (Organization of the Petroleum Exporting Countries) is a group of 13 Oil-producing nations who collectively decide production quotas for member countries at twice-yearly meetings. Their decisions often impact WTI Oil prices. When OPEC decides to lower quotas, it can tighten supply, pushing up Oil prices. When OPEC increases production, it has the opposite effect. OPEC+ refers to an expanded group that includes ten extra non-OPEC members, the most notable of which is Russia.
- The oil price remained choppy from Tuesday as investors await further development in Middle East tensions.
- Iraq and Yemen military threatened to target the US if it intervened in Middle East conflicts to support Israel.
- Neutral commentary from Fed policymakers has sent the US dollar on the backfoot.
West Texas Intermediate (WTI), futures on NYMEX, remain choppy around $85.00 as investors watch for further development in the Israel-Hamas conflict. Other Middle-East countries favor Palestine's attack on Gaza to invade Israel while Western nations continue supporting Israel and promised to provide military aid.
No matter which nation gains the upper hand in the conflict, the oil market is expected to remain tight as the supply chain would be disrupted amid the war situation. Russian Deputy Prime Minister Alexander Novak is scheduled to meet with Saudi Arabia’s Energy Minister Prince Abdulaziz bin Salman later on Wednesday. Ahead of the meeting, Russian Nova said that “Russia and Saudi Arabia will discuss oil market situation and oil prices,” TASS news agency reported. He warned that the deepening war situation in Gaza could affect the oil market.
The expectations of an intervention in the Israel-Hamas bellicose by Iran could escalate the risk of a squeeze in the oil supply. If Iran actively supports the Palestine military group, the US could levy sanctions on Iranian oil, which could dampen the oil supply for the entire 2024.
Meanwhile, military troops from Iraq and Yemen have aligned with Iran and have threatened Washington if it intervenes to support Israel, Reuters reported.
The US Dollar remains on the backfoot as Federal Reserve (Fed) policymakers support keeping interest rates unchanged in November due to rising US Treasury yields.
San Francisco Fed Bank President Mary Daly said that the risk of little over-tightening is not expected to outweigh the risk of raising rates too much. She further added, that higher long-term US Treasury yields could substitute the need for further policy-tightening making borrowing expensive, which could lead to lower spending and investment.
Meanwhile, investors await the oil inventory data for the week ending October 6 to be reported by the American Petroleum Institute (API) at 20:30 GMT.
19 of 26 bond strategists polled by Reuters said that the 10-year US Treasury note yield has peaked in the current cycle.
Meanwhile, the median forecast of 55 strategists for the 10-year yield at the end of the year stood at 4.25%, Reuters further reported.
Market reaction
The 10-year US Treasury bond yield continues to push lower in the European session and was last seen losing 2.2% on the day at 4.55%. In the meantime, the US Dollar (USD) Index, which gauges the USD's valuation against a basket of six major currencies, was flat on the day at 105.80.
FX Analyst at Commerzbank Antje Praefcke comments on the upcoming CNB meeting early next month.
Key Takeaways
CZK eased as a result of the publication of the September inflation data, as it fell much more significantly than expected from 8.5% to 6.9% yoy. From the market’s point of view that gives the Czech central bank (CNB) more scope to cut interest rates earlier than expected after all.
Let’s wait and see how the board members will position themselves at the next rate meeting in early November. No doubt they will continue to act cautiously as the fall in inflation in September was mainly due to regulated prices (energy) and the fight against price risks is not yet over. After all oil prices are rising again and the labour market remains tight. As a result, it is therefore very questionable in my view whether the willingness to cut interest rates will rise. Therefore, if the market has to correct its expectations again CZK will likely be able to correct its losses.
- Gold price extends upside as Fed policymakers expect that higher bond yields could be substituted for further rate hikes.
- The release of FOMC minutes and PPI data are expected to trigger volatility.
- Fed’s Bostic sees current monetary policy as sufficiently restrictive and believes inflation will come down to 2% without triggering a recession.
Gold price (XAU/USD) extended its rally on Wednesday as Federal Reserve (Fed) policymakers continue favoring steady interest rates at the 5.25 to 5.50% range through year-end. The precious metal is also capitalizing on the deepening conflict between Israel and Hamas, which could extend beyond Gaza. Investors should be prepared for volatility in the Gold price ahead as Federal Open Market Committee (FOMC) minutes from the September meeting and Producer Price Index (PPI) data for the same month are due.
Bullion remained the first choice of investment this week as Fed policymakers signaled support for an unchanged interest rate policy due to a multi-year high in US Treasury yields. FOMC members expect that higher bond yields could be substituted for further rate-tightening as the pace of spending and investment could slow down due to higher borrowing costs.
Daily Digest Market Movers: Gold price extends upside amid Middle East tensions
- Gold price delivers a fresh upside to near $1,870.00 ahead of the release of the FOMC minutes and the producer inflation data for September.
- The release of the FOMC minutes for the September monetary policy is expected to provide a detailed explanation behind a steady interest rate decision. Apart from that, the outlook on inflation and interest rates will be keenly watched.
- For US producer inflation, investors expect monthly headline PPI to expand at a slower pace of 0.4% against 0.7% recorded in August. The core PPI is seen growing at a steady pace of 0.2% in the same period.
- On an annualized basis, headline PPI is foreseen steady at 1.6%. The Core PPI accelerated marginally to 2.3% against the former reading of 2.2%.
- The precious metal has witnessed significant investment from investors this week amid the conflict in Israel/Palestine. The appeal for Gold remains upbeat as a firmer risk-aversion theme improves demand for safe-haven assets.
- In addition to higher demand for safe-haven assets, neutral interest rate guidance from Federal Reserve policymakers has kept the Gold price upbeat.
- On Tuesday, San Francisco Fed Bank President Mary Daly said that the risk of over-tightening is not expected to outweigh the risk of raising rates too much. She further added that higher long-term US Treasury yields could be substituted for higher rates since it should lead to lower spending and investment.
- This week, Dallas Fed Bank President Lorie Logan drew less emphasis on raising interest rates further if long-term Treasury yields remain elevated.
- Fed Vice Chair Philip Jefferson also warned that the central bank needs to be very careful with a further hike in interest rates.
- Atlanta Federal Reserve Bank President Raphael Bostic said on Tuesday that current monetary policy is sufficiently restrictive and inflation will come down to 2% without triggering a recession.
- The US Dollar Index (DXY) delivered a five-day losing spell and stabilized below 106.00 amid an improved market mood and squeezing expectations of one more interest rate increase from the Fed for the remainder of 2023.
- As per the CME FedWatch Tool, traders see an 86% chance of the Fed keeping interest rates unchanged at 5.25 to 5.50%, where they’ve stood since July. The odds of one more interest rate increase in any of the two remaining monetary policy meetings in 2023 have dropped to 25%.
- The US Dollar carries the potential of recovering after a corrective move as the US economy is resilient amid tight labor market conditions and robust consumer spending. The global economy is expected to face further calamity due to Israel-Palestine tensions.
- Going forward, investors will focus on the inflation data for September, which will set an undertone for the Fed’s November monetary policy.
Technical Analysis: Gold price climbs close to $1,870
Gold price prints a fresh weekly high at $1,870.00 as long-term Treasury yields move down from a multi-year peak. The precious metal recovers close to the 20-day Exponential Moving Average (EMA) at $1,871.00, but the market’s mood could turn volatile amid a data-packed week. The yellow metal remains broadly bearish, trading below the 200-day EMA. Momentum oscillators rebounded swiftly after turning oversold.
Fed FAQs
What does the Federal Reserve do, how does it impact the US Dollar?
Monetary policy in the US is shaped by the Federal Reserve (Fed). The Fed has two mandates: to achieve price stability and foster full employment. Its primary tool to achieve these goals is by adjusting interest rates.
When prices are rising too quickly and inflation is above the Fed’s 2% target, it raises interest rates, increasing borrowing costs throughout the economy. This results in a stronger US Dollar (USD) as it makes the US a more attractive place for international investors to park their money.
When inflation falls below 2% or the Unemployment Rate is too high, the Fed may lower interest rates to encourage borrowing, which weighs on the Greenback.
How often does the Fed hold monetary policy meetings?
The Federal Reserve (Fed) holds eight policy meetings a year, where the Federal Open Market Committee (FOMC) assesses economic conditions and makes monetary policy decisions.
The FOMC is attended by twelve Fed officials – the seven members of the Board of Governors, the president of the Federal Reserve Bank of New York, and four of the remaining eleven regional Reserve Bank presidents, who serve one-year terms on a rotating basis.
What is Quantitative Easing (QE) and how does it impact USD?
In extreme situations, the Federal Reserve may resort to a policy named Quantitative Easing (QE). QE is the process by which the Fed substantially increases the flow of credit in a stuck financial system.
It is a non-standard policy measure used during crises or when inflation is extremely low. It was the Fed’s weapon of choice during the Great Financial Crisis in 2008. It involves the Fed printing more Dollars and using them to buy high grade bonds from financial institutions. QE usually weakens the US Dollar.
What is Quantitative Tightening (QT) and how does it impact the US Dollar?
Quantitative tightening (QT) is the reverse process of QE, whereby the Federal Reserve stops buying bonds from financial institutions and does not reinvest the principal from the bonds it holds maturing, to purchase new bonds. It is usually positive for the value of the US Dollar.
- USD/CAD turns choppy around 1.3600 as investors await US data.
- Fed policymakers believe that higher bond yields could diminish the need for more interest rates.
- Russia’s Novak warned that the deepening war situation in Gaza could affect the oil market.
The USD/CAD pair trades back and forth near the round-level resistance of 1.3600 in the European session. The Loonie asset struggles to find a direction as investors await the Federal Open Market Committee (FOMC) minutes and the producer inflation data for September.
S&P500 futures added some gains in the London session, portraying an upbeat market mood. US equities were heavily bought on Tuesday as Federal Reserve (Fed) policymakers cautioned about rising Treasury yields and delivered neutral guidance on interest rates. Fed policymakers believe that higher bond yields could diminish the need for more interest rates.
The US Dollar Index (DXY) discovers an intermediate support near 105.60 after a five-day losing spell as the focus shifts to the Producer Price Index (PPI) and the FOMC minutes. As per the consensus, US producers raised prices of core goods and services at factory gates at a steady pace of 0.2%. The headline PPI grew at a slower pace of 0.4% against 0.7% growth in August.
On an annualized basis, headline PPI is foreseen steady at 1.6%. The core PPI accelerated marginally to 2.3% against the former reading of 2.2%.
Meanwhile, oil price trades inside Monday’s range as investors await further development in the Israel-Hamas conflict. Russian Deputy Prime Minister Alexander Novak said on Wednesday that “Russia and Saudi Arabia will discuss oil market situation and oil prices,” TASS news agency. Novak warned that the deepening war situation in Gaza could affect the oil market.
It is worth noting that Canada is the leading exporter of oil to the United States and higher oil prices support the Canadian Dollar.
- USD/JPY seesaws between tepid gains/minor losses through the European session on Wednesday.
- A positive risk tone, and the BoJ’s dovish stance, undermine the JPY and lend support to the pair.
- Retreating US bond yields keeps the USD bulls on the defensive and continues to act as a headwind.
- Traders now look to the US PPI and the FOMC meeting minutes for some meaningful opportunities.
The USD/JPY pair struggles to capitalize on the intraday move up of over 50 pips from levels just below mid-148.00s and trade in neutral territory during the first half of the European session on Wednesday. Spot prices remain below the 149.00 mark and well within a familiar trading band held over the past week or so as traders keenly await cues about the Federal Reserve's (Fed) future rate hike path.
Hence, the focus will remain glued to Wednesday's release of the US Producer Price Index (PPI) and the FOMC minutes, due later during the early North American session. This will be followed by the latest US consumer inflation figures on Thursday, which will play a key role in influencing the near-term US Dollar (USD) price dynamics and help determine the next leg of a directional move for the USD/JPY pair.
In the meantime, a generally positive tone around the equity markets, along with the Bank of Japan's (BoJ) persistent ultra-easy monetary policy, is seen undermining the safe-haven Japanese Yen (JPY) and acting as a tailwind for the USD/JPY pair. That said, diminishing odds for further interest rate hikes by the Fed keep the USD bulls on the defensive and hold back bulls from placing aggressive bets around the major.
The recent dovish remarks by several Fed officials have been fueling speculations that the US central bank is nearing the end of the rate-hiking cycle. This has been a key factor behind a further decline in the US treasury bond yields, which removes some of the driving force behind a stronger Greenback. Heading into the key data risk, the aforementioned fundamental backdrop might continue to cap gains for the USD/JPY pair.
Any meaningful downside, however, still seems elusive as the markets are still pricing in a small possibility of at least one more Fed rate hike move by the end of this year. Furthermore, concerns that the expansion of the Israel-Gaza conflict to the wider Middle East would push Oil prices higher and complicate the effort to reduce inflation, which, in turn, might force the US central bank to keep rates higher for longer.
Even from a technical perspective, the range-bound price action points to indecision among traders over the near-term trajectory for the USD/JPY pair. This further makes it prudent to wait for a sustained breakout through a one-week-old trading range before placing fresh directional bets.
Technical levels to watch
- NZD/USD trades lower near 0.6020 ahead of US data and FOMC meeting minutes.
- The escalation of the Middle East conflict could put pressure on the Kiwi pair.
- US Dollar holds ground despite downbeat US Bond yields.
NZD/USD snaps the five-day winning streak, pulling back from the two-month high. The spot trades lower around 0.6020 during the European session on Wednesday. However, the pair faced challenges due to the correction in the US Dollar (USD) due to the possibility of a pause in the interest rate-hike cycle by the US Federal Reserve (Fed).
The prevailing sentiment is influenced by recent dovish comments from Federal Reserve officials, indicating a more cautious approach to monetary policy. A series of dovish remarks expressing concerns about elevated long-term US Treasury yields are molding the narrative around monetary policy, which keeps the Greenback defensive.
Atlanta's Fed President Raphael Bostic, asserting that the current policy is already restrictive, along with similar sentiments from other Fed colleagues, implies a prudent stance regarding potential future rate hikes.
Wednesday features the Producer Price Index (PPI) following the release of the FOMC meeting minutes and Thursday brings the Consumer Price Index (CPI). On the Kiwi docket, Business NZ PMI will be eyed on Friday.
The US Dollar Index (DXY) holds grounds around 105.80 at the time of writing despite the downbeat US Treasury yields. 10-year US Treasury bond yield stands lower at 4.56%, down by 1.89%.
On the flip side, the Reserve Bank of New Zealand (RBNZ) opted to maintain the Official Cash Rate (OCR) at 5.5% in its last policy meeting. The central bank expressed agreement that interest rates might need to be maintained at a restrictive level for an extended period, as highlighted in the RBNZ statement.
This stance likely played a role in contributing strength to the recent performance of the Kiwi pair.
Additionally, the escalation of the Middle-East conflict may exert pressure on the NZD/USD pair. During periods of geopolitical uncertainty, safe-haven currencies like the USD typically attract increased buying support.
European Central Bank (ECB) Governing Council member Klaas Knot said on Wednesday that the monetary policy is in a good place now.
Additional takeaways
Effects of inflation shocks waning.
Inflation still too high.
Slowdown clearly spilling over into services.
Mediutm term growth outlook more favourable.
Economy cooling desirable to tame inflation.
Have long road ahead on disinflation.
Restrictive policies will be needed for some time.
Stand ready to adjust rates further if disinflation stalled.
Market reaction
At the time of writing, EUR/USD is regaining the upside traction, reverting toward the intraday high of 1.0629. The pair is up 0.09% on the day.
According to the European Central Bank’s (ECB) monthly Consumer Expectation Survey, inflation expectations among Eurozone consumers increased slightly in August in July to 3.5% for the next 12 months.
Meanwhile, Eurozone consumers saw inflation 3 years ahead at 2.5% in August vs. 2.4% in July, the ECB survey showed.
Market reaction
At the press time, EUR/USD is back above 1.0600, adding 0.08% on the day.
Speaking at the International Monetary Fund (IMF) meetings in Morocco on Wednesday, US Federal Reserve (Fed) Governor, Michelle Bowman, justifies her view for further policy tightening.
Key quotes
Inflation remains well above the FOMC's 2% target.
Job market remains tight.
This suggests policy rate may need to rise further.
And stay restrictive for some time to return inflation back to the target goal.
Market reaction
The US Dollar Index is keeping its downside consolidation mode intact near 105.75, awaiting the top-tier US PPI data and the FOMC Minutes for a fresh directional impetus.
“Soft landing is the most likely path but attacks on Israel pose additional risks,” US Treasury Secretary, Janet Yellen, said on Wednesday.
Additional comments
US is monitoring potential economic impacts from crisis in Israel, Gaza.
At this point, not seeing attacks on Israel as a major impact on the economy.
US will remain vigilant on Iran sanctions.
Iran funds in Qatar were made available for humanitarian reasons, not taking anything off the table.
Expects to discuss debt issues with PBOC governor, progress has been slow, but have seen some progress.
US, China both recognize that they need to work together to address global challenges, including climate change.
We have worked very constructively with representatives from China’s PBOC, optimistic about continuing that work.
Related reads
- Forex Today: US Dollar on the back foot ahead of PPI data, Fedspeak
- Israel Hamas war – How it impacts Gold, stocks, forex, Oil
Analysts at Commerzbank suggest that the Norwegian inflation data published on Tuesday, which showed that the headline CPI decelerated more than expected to the 3.3% YoY rate in September from 4.8% previous, should not be overestimated.
Key Quotes:
“The overall rate eased more notably than expected from 4.8% to 3.3% yoy, but the core rate remained stubbornly high at 5.7% - even though it too eased more significantly than expected by the market. It is worth pointing out that the inflation target is 2%.”
“As a result of the publication NOK lost ground yesterday as the market considers the likelihood of a further rate step in December, which Norges Bank had signalled in September, to have eased thanks to the rapid fall in inflation rates, in particular considering recent data like industrial production or August GDP, which disappointed.”
“It is questionable whether Norges Bank will give a clear indication of what it intends to do in December as early as November, as new inflation data will only be published after that. At its meeting in December, on the other hand, it then has the GDP data for Q3, the new Regional Network Survey, new sentiment indicators and above all the inflation data for October and November at its disposal.”
“For that reason, it remains a little too early in my view to assume that Norges Bank will call off the rate step in December following yesterday’s inflation data. I think we will have to be patient for a little longer until we know. Until then geopolitical events and of course future data publications will affect NOK – depending on the results. In other words: NOK is likely to remain volatile.”
- EUR/USD trims the intraday gains ahead of US economic data.
- MACD indicator suggests a change in momentum towards a bullish trend.
- Support at nine-day EMA, following the psychological level at 1.0500.
EUR/USD trims intraday gains, trading around the 1.0600 psychological level during the European session on Wednesday. However, the pair received upward support due to the correction in the US Dollar (USD), which could be attributed to the possibility of a pause in the interest rate-hike cycle by the US Federal Reserve (Fed).
A decisive break below the level could contribute to pressure on the pair to navigate the area around the nine-day Exponential Moving Average (EMA) at 1.0572, following the major level at 1.0500.
On the upside, the EUR/USD pair could face resistance near the region around 23.6% Fibonacci retracement at 1.0643. A firm break above the latter could open the doors for the pair to explore the region around the psychological level at 1.0650.
The Moving Average Convergence Divergence (MACD) line lies below the centerline indicating that the short-term average is beneath the long-term average. However, a noteworthy development is observed as the line diverges above the signal line, signaling a potential shift in momentum toward a bullish trend.
However, the EUR/USD pair maintains a prevailing bearish momentum, underscoring a weaker bias. This is evidenced by the 14-day Relative Strength Index (RSI) holding below the 50 level.
EUR/USD: Daily Chart
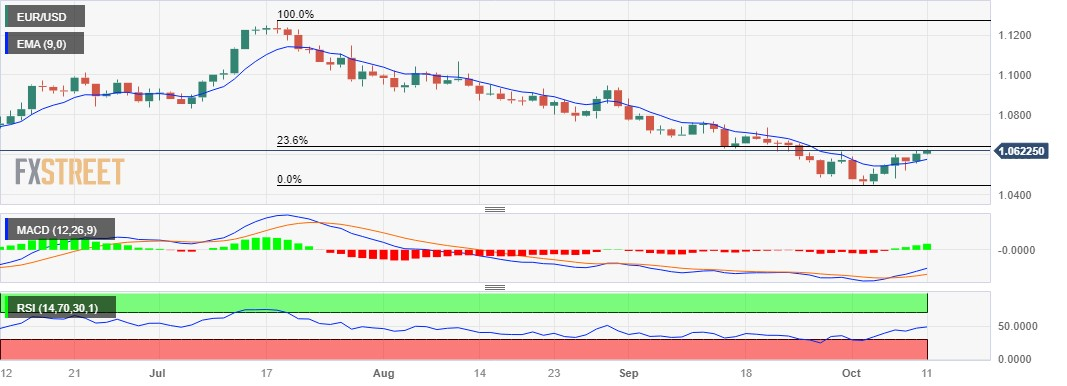
Analysts at Danske Bank offer a brief overview of the Natural Gas prices, which continued to scale higher through the early part of the European session and hit a fresh year-to-date high in the last hour.
Key Quotes:
“Natural gas prices rose further yesterday, while oil prices stabilised. Multiple shocks have hit the natural gas market. Israel shut down part of its production and exports following the outbreak of the war with Hamas. Finland is investigating a leak on gas pipeline that may be due to external drone damage. Weather has turned colder in Northern Europe increasing heating demand. Finally, there is a risk of new strikes among LNG workers in Australia. The 1M TTF future rose close to EUR50/MWh yesterday - the highest since the spring, but still much lower than it was the same time last year.”
- Silver catches fresh bids on Wednesday and advances to over a one-week high.
- The technical setup warrants some caution before positioning for further gains.
- A sustained move beyond $22.20-30 will be seen as a positive trigger for bulls.
Silver regains positive traction following the previous day's modest fall and climbs to over a one-week high during the early part of the European session on Wednesday. The white metal currently trades just above the $22.00 mark, up nearly 1% for the day, and looks to build on the recent goodish recovery move from a seven-month low touched last week.
Any subsequent move up, however, is likely to confront stiff resistance near the $22.30-$22.20 horizontal support breakpoint. The said area should act as a key pivotal point, which if cleared decisively might prompt an aggressive short-covering rally and lift the XAG/USD to the $23.00 mark. The momentum could get extended further towards challenging the 200-day SMA, currently around the $23.35 area.
Technical indicators on the daily chart, meanwhile, have been recovering from lower levels, though are yet to confirm a positive outlook. This, in turn, warrants some caution before placing fresh bullish bets around the XAG/USD and positioning for any further near-term appreciating move.
On the flip side, the $21.85-$21.80 zone now seems to protect the immediate downside ahead of the overnight swing low, around the $21.65-$21.60 region. Some follow-through selling could drag the XAG/USD back towards a multi-day-old trading range resistance breakpoint, now turned support, around the $21.3-$21.30 region. The next relevant support is pegged near the $21.00 round-figure mark.
A convincing break below the latter will expose the $20.70-$20.65 region, or the multi-month trough, below which the XAG/USD could prolong the downfall towards challenging the YTD low – levels just below the $20.00 psychological mark.
Silver daily chart
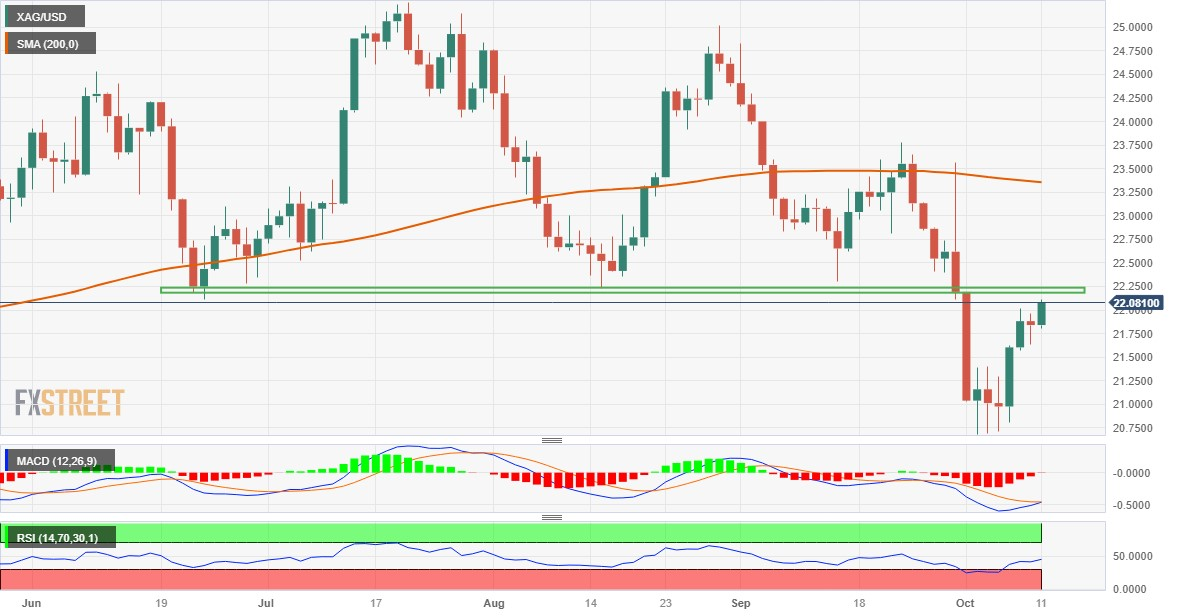
Technical levels to watch
- Pound Sterling holds onto gains ahead of US factory and GDP data.
- UK factory data is expected to contract due to a vulnerable demand outlook.
- BoE’s Katherine Mann supports further policy tightening to bring down inflation to 2%.
The Pound Sterling (GBP) continues its rally into a sixth day on Wednesday as investors shift their focus to United Kingdom factory data for August, which will be published on Thursday. The GBP/USD pair capitalizes on hawkish guidance from Bank of England (BoE) policymaker Katherine Mann and upbeat market sentiment. The Pound Sterling has performed better against the US Dollar as market participants are not expecting a further widening of the policy divergence between the BoE and the Federal Reserve (Fed).
UK economic activities have been facing the wrath of higher interest rates. Factory activities for August are expected to continue their contracting spell as the weak demand environment has dented the domestic and overseas markets. In addition to that, UK firms have cut their inventory backlog heavily, as well as labor to achieve efficiency in operations. They appear reluctant to add capacity due to higher borrowing costs.
Daily Digest Market Movers: Pound Sterling strengthens ahead of UK data
- Pound Sterling extends winning spell as market mood remains upbeat despite Middle East conflicts.
- The GBP/USD pair has recorded a bullish closing for five trading sessions in a row as investors expect that policy divergence between the Fed and the BoE will not widen further.
- In September, the BoE surprisingly announced a pause in rate hiking to avoid further calamity in the UK’s economic activities.
- The UK’s factory activity, Services PMI, and construction activities have remained below the 50.0 threshold in September, facing the consequences of the BoE’s battle with inflation.
- The recovery move in the Pound Sterling is not backed by supportive fundamentals. Therefore, it could face selling pressure as BoE policymaker Katherine Mann favors an aggressive approach to bring down inflation to 2% in a timely manner.
- BoE’s Financial Policy Committee (FPC) warned on Tuesday that households may continue to face financial hardships due to increasing borrowing costs.
- BoE’s Mann warned that in addition to lowering inflation to 2%, the central bank needs to wipe out rising consumer inflation expectations too.
- The UK inflation could rebound as rising oil prices due to the Israel-Palestine conflict would accelerate consumer inflation globally. The IMF warned that a 10% increase in Oil prices would weigh down global output by about 0.2% in the following year, boosting global inflation by about 0.4%.
- Going forward, investors will focus on the UK factory activity data for August, which will be published on Thursday at 06:00 GMT.
- Investors see monthly Manufacturing Production contracting by 0.3% against a 0.8% contraction recorded for July. Monthly Industrial Production is foreseen to decline at a slower pace of 0.2% against the contraction by 0.7% in July.
- The annual Manufacturing and Industrial production data are expected to accelerate to 3.4% and 1.7%, respectively. The monthly Gross Domestic Product (GDP) is seen expanding by 0.2% against a decline of 0.5% recorded for July.
- The GBP/USD pair has managed to perform better due to a correction in the US Dollar. The US Dollar Index (DXY) has stabilized below 106.00 as Fed policymakers continue to support an unchanged interest rate policy in November due to rising Treasury yields.
- The volatility in the USD Index is expected to remain high amid the release of the Federal Open Market Committee (FOMC) minutes and the producer inflation data.
- The FOMC minutes will provide a detailed explanation behind September’s unchanged interest rate decision. Apart from that, outlook on inflation and interest rates will be keenly watched.
- This week, investors will pay attention to September CPI data, which will shape the monetary policy decision for November’s meeting.
Technical Analysis: Pound Sterling closes positive for five sessions in a row
Pound Sterling recorded a five-day winning streak through Tuesday, and that record of gains appears to be continuing on Wednesday as well. GBP/USD is expected to continue the same as the risk appetite of market participants has improved. The GBP/USD pair climbs above the 20-day Exponential Moving Average (EMA), which trades around 1.2273. The broader GBP/USD outlook is bearish as the 50 and 200-day Exponential Moving Averages (EMAs) have delivered a Death Cross near 1.2450. Potential support is placed around 1.2000.
Fed FAQs
What does the Federal Reserve do, how does it impact the US Dollar?
Monetary policy in the US is shaped by the Federal Reserve (Fed). The Fed has two mandates: to achieve price stability and foster full employment. Its primary tool to achieve these goals is by adjusting interest rates.
When prices are rising too quickly and inflation is above the Fed’s 2% target, it raises interest rates, increasing borrowing costs throughout the economy. This results in a stronger US Dollar (USD) as it makes the US a more attractive place for international investors to park their money.
When inflation falls below 2% or the Unemployment Rate is too high, the Fed may lower interest rates to encourage borrowing, which weighs on the Greenback.
How often does the Fed hold monetary policy meetings?
The Federal Reserve (Fed) holds eight policy meetings a year, where the Federal Open Market Committee (FOMC) assesses economic conditions and makes monetary policy decisions.
The FOMC is attended by twelve Fed officials – the seven members of the Board of Governors, the president of the Federal Reserve Bank of New York, and four of the remaining eleven regional Reserve Bank presidents, who serve one-year terms on a rotating basis.
What is Quantitative Easing (QE) and how does it impact USD?
In extreme situations, the Federal Reserve may resort to a policy named Quantitative Easing (QE). QE is the process by which the Fed substantially increases the flow of credit in a stuck financial system.
It is a non-standard policy measure used during crises or when inflation is extremely low. It was the Fed’s weapon of choice during the Great Financial Crisis in 2008. It involves the Fed printing more Dollars and using them to buy high grade bonds from financial institutions. QE usually weakens the US Dollar.
What is Quantitative Tightening (QT) and how does it impact the US Dollar?
Quantitative tightening (QT) is the reverse process of QE, whereby the Federal Reserve stops buying bonds from financial institutions and does not reinvest the principal from the bonds it holds maturing, to purchase new bonds. It is usually positive for the value of the US Dollar.
- The Euro trades in an inconclusive fashion against the US Dollar.
- Stocks in Europe open Wednesday’s session with modest losses.
- EUR/USD looks to extend the advance further up from the 1.0600 barrier.
- The USD Index (DXY) trades in monthly lows near 105.70.
- Final CPI in Germany rose 4.5% YoY, 0.3% MoM in September.
- US Producer Prices, FOMC Minutes take centre stage later in the session.
The Euro (EUR) alternates gains with losses against the US Dollar (USD) on Wednesday, motivating EUR/USD to trade without a clear direction around the 1.0600 neighbourhood.
The Greenback remains under pressure below the 106.00 hurdle when measured by the USD Index (DXY) on the back of a better tone in risk markets, while investors continue to digest the recent dovish messages from Federal Reserve (Fed) officials.
In terms of monetary policy, investors presently expect the Fed to keep interest rates at their current levels for the rest of the year. Market participants are also speculating on the prospect of the European Central Bank (ECB) pausing policy changes, despite inflation levels above the bank's objective and rising fears about the risk of a future recession or stagflation in the European area.
On the domestic calendar, final inflation figures in Germany saw the CPI rise at an annualized 4.5% in the year to September and 0.3% compared with the previous month.
Data-wise in the US, the usual weekly Mortgage Applications tracked by MBA are due in the first turn seconded by September’s Producer Prices and the publication of the FOMC Minutes of the September meeting, when the Fed kept its interest rates unchanged.
Daily digest market movers: Euro appears directionless around 1.0600
- The EUR alternates ups and downs against the USD.
- US and German yields kick off the day slightly on the defensive.
- Markets expect the Fed will keep interest rates on hold in the coming months.
- Investors suggest the ECB will extend the pause of its rate hike campaign.
- Geopolitical concerns remain on the rise around the Middle East.
Technical Analysis: Euro looks at 1.0700
EUR/USD appears poised to consolidate the recent breakthrough of the pivotal barrier at 1.0600.
Continued upward momentum could potentially propel EUR/USD to revisit the September 20 high of 1.0736, followed by the significant 200-day Simple Moving Average (SMA) at 1.0823. If the pair manages to break above this level, there is potential for testing the August 30 peak at 1.0945 and approaching the psychological threshold of 1.1000. Further breakthroughs beyond the August 10 peak of 1.1064 may lead the pair to the July 27 top at 1.1149 and potentially reach the 2023 peak of 1.1275 from July 18.
Conversely, if selling pressure resumes, there is a possibility of retesting the 2023 low at 1.0448 from October 3 and potentially challenging the significant psychological level of 1.0400. Should this level be breached, it could pave the way for a retest of the weekly lows at 1.0290 (November 30, 2022) and 1.0222 (November 21, 2022).
As long as the EUR/USD remains below the 200-day SMA, the potential for sustained downward pressure persists.
Euro FAQs
What is the Euro?
The Euro is the currency for the 20 European Union countries that belong to the Eurozone. It is the second most heavily traded currency in the world behind the US Dollar. In 2022, it accounted for 31% of all foreign exchange transactions, with an average daily turnover of over $2.2 trillion a day.
EUR/USD is the most heavily traded currency pair in the world, accounting for an estimated 30% off all transactions, followed by EUR/JPY (4%), EUR/GBP (3%) and EUR/AUD (2%).
What is the ECB and how does it impact the Euro?
The European Central Bank (ECB) in Frankfurt, Germany, is the reserve bank for the Eurozone. The ECB sets interest rates and manages monetary policy.
The ECB’s primary mandate is to maintain price stability, which means either controlling inflation or stimulating growth. Its primary tool is the raising or lowering of interest rates. Relatively high interest rates – or the expectation of higher rates – will usually benefit the Euro and vice versa.
The ECB Governing Council makes monetary policy decisions at meetings held eight times a year. Decisions are made by heads of the Eurozone national banks and six permanent members, including the President of the ECB, Christine Lagarde.
How does inflation data impact the value of the Euro?
Eurozone inflation data, measured by the Harmonized Index of Consumer Prices (HICP), is an important econometric for the Euro. If inflation rises more than expected, especially if above the ECB’s 2% target, it obliges the ECB to raise interest rates to bring it back under control.
Relatively high interest rates compared to its counterparts will usually benefit the Euro, as it makes the region more attractive as a place for global investors to park their money.
How does economic data influence the value of the Euro?
Data releases gauge the health of the economy and can impact on the Euro. Indicators such as GDP, Manufacturing and Services PMIs, employment, and consumer sentiment surveys can all influence the direction of the single currency.
A strong economy is good for the Euro. Not only does it attract more foreign investment but it may encourage the ECB to put up interest rates, which will directly strengthen the Euro. Otherwise, if economic data is weak, the Euro is likely to fall.
Economic data for the four largest economies in the euro area (Germany, France, Italy and Spain) are especially significant, as they account for 75% of the Eurozone’s economy.
How does the Trade Balance impact the Euro?
Another significant data release for the Euro is the Trade Balance. This indicator measures the difference between what a country earns from its exports and what it spends on imports over a given period.
If a country produces highly sought after exports then its currency will gain in value purely from the extra demand created from foreign buyers seeking to purchase these goods. Therefore, a positive net Trade Balance strengthens a currency and vice versa for a negative balance.
- USD/CHF experienced challenges due to the dovish remarks by the Fed.
- The escalation of the Middle-East conflict could contribute support for the Swiss Franc.
- Investors await Core PPI and FOMC minutes, seeking fresh impetus on inflation overview in the US.
USD/CHF trims intraday losses to halt the losing streak, hovering around 0.9050 during the early European session on Wednesday. The pair is receiving support around the region at the three-week low.
Moreover, the USD/CHF pair is facing challenges due to the correction in the US Dollar (USD), which could be attributed to the possibility of a pause in the interest rate-hike cycle by the US Federal Reserve (Fed). This sentiment is driven by recent dovish comments from Fed officials, suggesting a more cautious stance on monetary policy.
A slew of dovish remarks from the Fed officials, expressing concerns about higher long-term US Treasury yields, is shaping the monetary policy narrative.
Atlanta's Fed President Raphael Bostic's assertion that the current policy is already restrictive, coupled with similar sentiments from other Fed colleagues, suggests a cautious approach to further rate hikes.
Moreover, the escalation of the Palestine-Israel military conflict could contribute to pressure on the USD/CHF pair. In times of geopolitical uncertainty, safe-haven currencies like the Swiss Franc often attract buying support.
The US Dollar Index (DXY) hovers around 105.80 with a negative bias. The 10-year US Treasury bond yield stands at 4.62% by the press time.
Investors await the upcoming economic data, with Wednesday featuring the Producer Price Index (PPI) following the release of the FOMC meeting minutes and Thursday bringing the Consumer Price Index (CPI). On the Swiss docket, Producer and Import Prices will be eyed on Friday.
Here is what you need to know on Wednesday, October 11:
The US Dollar (USD) continued to weaken against its rivals on Tuesday, with the US Dollar Index closing the fifth straight day in negative territory. Producer Price Index (PPI) data for September will be featured in the US economic docket and several Federal Reserve (Fed) officials will be delivering speeches. Market participants will continue to pay close attention headlines surrounding the Israel-Hamas conflict. Finally, the Fed will release the minutes of the September policy meeting.
FOMC Minutes Preview: Reinforcing higher for longer.
Dovish comments from Fed policymakers and the improvement seen in risk mood made it difficult for the USD to find demand on Tuesday. Wall Street main indexes closed in postive territory and the benhcmkar 10-year US Treasury bond yield closed the late little changed at 4.65%. In the European morning, 10-year yield holds steady near Tuesday's closing level and US stock index futures trade flat.
US Dollar price this week
The table below shows the percentage change of US Dollar (USD) against listed major currencies this week. US Dollar was the weakest against the New Zealand Dollar.
| USD | EUR | GBP | CAD | AUD | JPY | NZD | CHF | |
| USD | -0.40% | -0.49% | -0.56% | -0.88% | -0.21% | -0.97% | -0.49% | |
| EUR | 0.38% | -0.10% | -0.16% | -0.49% | 0.18% | -0.57% | -0.09% | |
| GBP | 0.51% | 0.12% | -0.03% | -0.40% | 0.27% | -0.47% | 0.03% | |
| CAD | 0.55% | 0.15% | 0.05% | -0.32% | 0.31% | -0.42% | 0.08% | |
| AUD | 0.87% | 0.51% | 0.39% | 0.36% | 0.69% | -0.08% | 0.43% | |
| JPY | 0.21% | -0.21% | -0.31% | -0.31% | -0.76% | -0.80% | -0.25% | |
| NZD | 0.97% | 0.59% | 0.49% | 0.43% | 0.08% | 0.75% | 0.49% | |
| CHF | 0.45% | 0.08% | -0.04% | -0.08% | -0.43% | 0.22% | -0.51% |
The heat map shows percentage changes of major currencies against each other. The base currency is picked from the left column, while the quote currency is picked from the top row. For example, if you pick the Euro from the left column and move along the horizontal line to the Japanese Yen, the percentage change displayed in the box will represent EUR (base)/JPY (quote).
Israeli airstrikes continued for the fifth straight day following Hamas' suprise attack. In a press conference late Tuesday, US President Joe Biden called the Hamas attacks "an act of sheer evil" and announced that they were rushing additional military assistance to Israel. In the meantime, US Defense Secretary Lloyd Austin said that they have sent a carrier strike group to the eastern Mediterranean Sea.
EUR/USD touched its highest level in two weeks above 1.0600 on Tuesday before going into a consolidation phase near that level early Wednesday. The data from Germany confirmed that the annaul Consumer Price Index (CPI) rsoe 4.5% in September.
GBP/USD climbed above 1.2300 for the first time since September 21 during the Asian trading hours on Wedensday but retreated below that level by the European morning.
Despite the broad USD weakness, USD/JPY fluctuated in a tight channel on Tuesday and closed the day virtually unchanged. Early Wednesday, the pair continues to move sideways slightly below 149.00.
Following Monday's upsurge, Gold price staged a technical correction and declined toward $1,850 on Tuesday. With the US yields holding steady, however, XAU/USD managed to find support. At the time of press, the pair was trading modeslty higher on the day slightly above $1,860.
- The index trades in the lower end of the range near 105.70.
- Investors’ attention will be on the release of Producer Prices.
- The Fed will publish its Minutes of the September meeting.
The USD Index (DXY), which gauges the greenback vs. a basket of its main rival currencies, remains under pressure following the recent breakdown of the 106.00 support.
USD Index focuses on PPI, FOMC Minutes
The index extends the bearish move sparked soon after hitting fresh yearly tops near 107.30 (October 3) and navigates the area of 105.70 on Wednesday, recording at the same time new monthly lows.
In the meantime, the dollar has been losing momentum, pari passu, with the resumption of the dovish tone from some Fed speakers. Despite the perception that a tighter-for-longer stance by the Federal Reserve remains well in place for the time being, the likelihood of another rate hike before year-end seems to have dwindled as of late.
Later in the NA session, another gauge of US inflation is due with the release of Producer Prices for the month of September, while the FOMC Minutes are expected to grab all the attention towards the European evening/nigh. Additional data includes the usual weekly report on Mortgage Applications by MBA.
What to look for around USD
The price action around the index remains depressed and in the area of monthly lows around 105.70 ahead of the release of key data in the US calendar on Wednesday.
In the meantime, support for the dollar keeps coming from the good health of the US economy, which at the same time appears underpinned by the renewed tighter-for-longer stance narrative from the Federal Reserve.
Key events in the US this week: MBA Mortgage Applications, Producer Prices, FOMC Minutes (Wednesday) - Initial Jobless Claims, Inflation Rate (Thursday) – Flash Consumer (Friday).
Eminent issues on the back boiler: Persevering debate over a soft or hard landing for the US economy. Incipient speculation of rate cuts in early 2024. Geopolitical effervescence vs. Russia and China.
USD Index relevant levels
Now, the index is up 0.01% at 105.78 and a breakout of 107.34 (2023 high October 3) would open the door to 107.99 (weekly high November 21 2022) and finally 110.99 (high November 10 2022). On the downside, the next support emerges at 105.65 (low September 29) ahead of 104.42 (weekly low September 11) and then 103.18 (200-day SMA).
Ahead of the meeting with Saudi Arabia’s Energy Minister Prince Abdulaziz bin Salman later on Wednesday, Russian Deputy Prime Minister Alexander Novak said that “Russia and Saudi Arabia will discuss oil market situation and oil prices,” TASS news agency reported.
Novak said that “the escalation of the Israel-Palestinian conflict may affect the oil market.”
Market reaction
WTI is catching a fresh bid in immediate reaction to the above comments, challenging daily highs at $84.90, up 0.38% on the day.
CME Group’s flash data for natural gas futures markets noted traders reduced their open interest positions for the third consecutive session on Tuesday, now by around 3.4K contracts. Volume followed suit and dropped for the second session in a row, this time by around 25.2K contracts.
Natural Gas: Initial resistance emerges around $3.50
Prices of natural gas extended the rally for yet another session on Tuesday. The daily uptick, however, was accompanied by diminishing open interest and volume, unveiling the probability of some corrective move in the very near term. On the upside, initial hurdle appears around the $3.50 region per MMBtu.
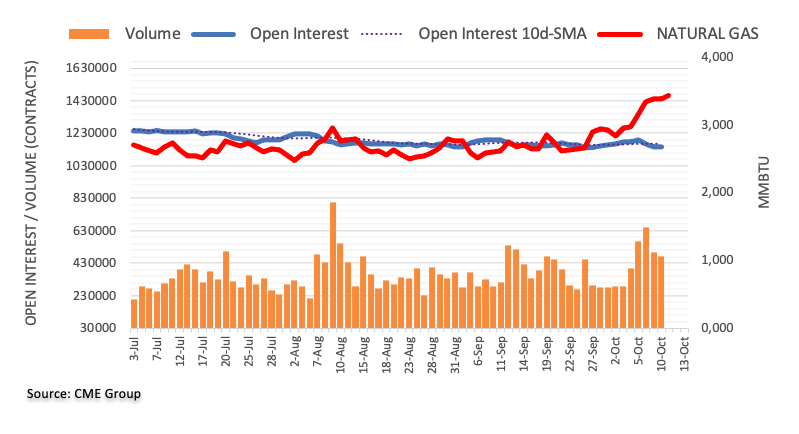
Considering advanced prints from CME Group for crude oil futures markets, open interest reversed two consecutive daily pullbacks and increased by around 27.6K contracts on Tuesday. On the other hand, volume dropped for the third straight session, this time by nearly 95K contracts.
WTI: Another test of the October low remains on the cards
Prices of WTI retreated modestly on Tuesday amidst rising open interest, which leaves the door open to further decline in the very near term. Against this, prices of the commodity could still slip back to the so far monthly lows around $81.50 (October 6).
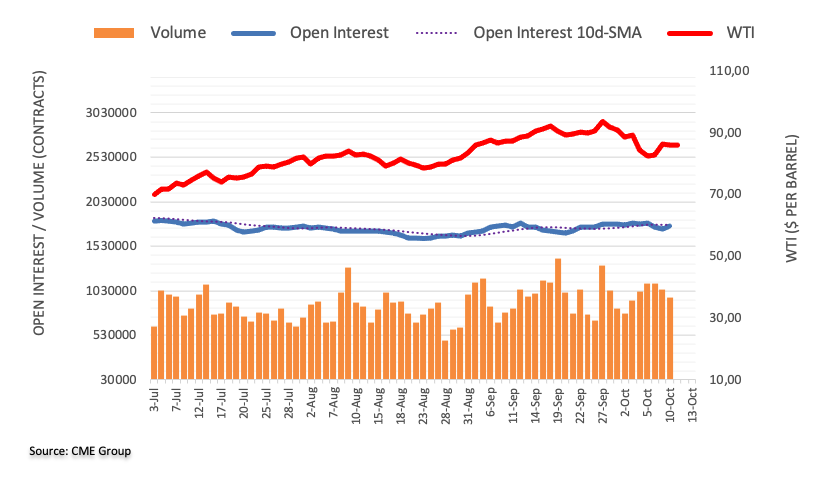
Open interest in gold futures markets resumed the uptrend and rose by around 3.7K contracts on Tuesday, according to preliminary readings from CME Group. Volume, instead, shrank by nearly 30K contracts, adding to the previous daily drop.
Gold: Initial resistance emerges around $1860
Gold prices charted an inconclusive session on Tuesday around the $1860 region per troy ounce. That price action was on the back of rising open interest, exposing an unclear outlook for the precious metal in the very near term at least.
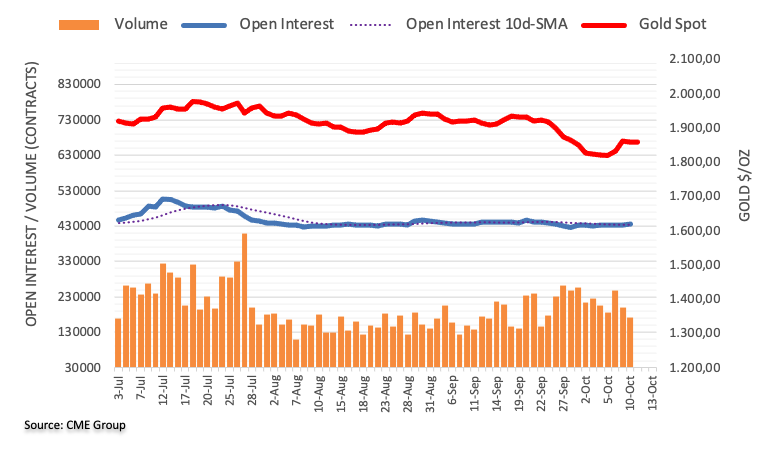
Senior Economist at UOB Group Alvin Liew reviews the latest release of US Nonfarm Payrolls.
Key Takeaways
The latest US Labor Market Report pointed to a resilient US employment market. Job creation was well above expectations at 336,000 in Sep (versus Bloomberg est 170,000), the jobs prints for Jul & Aug were revised higher by 119,000. Jobless rate stayed at 3.8% (same as Aug), highest since Feb 2022 as unemployed numbers were little changed, and participation rate held at 62.8%. Wage growth was below forecast, and the y/y pace was slowest since Jun 2021.
Job creation was more broad-based within services in Sep as job increases were led mainly by leisure & hospitality, health care and social assistance while transport hiring rebounded and losses in the information sector were minimized.
The strong Sep job creation added to Fed rate hike expectations although the slower wage growth helped soothe those worries. We continue to expect one more 25-bps hike to bring the FFTR terminal rate to 5.00%-5.75% lasting through mid-2024. The Fed hiking cycle is likely near/at its end.
FX Analysts at Commerzbank offer a brief preview of the United States Consumer Price Index (CPI) data due for release on Thursday, stating that “the data is of particular interest as the views differ on whether there will be another Fed rate step in November or not.”
Additional quotes
“Of course, 25bp more or less is not decisive, we have always underlined that. But a further rate step might be the straw that breaks the camel’s back, with the sum total of the rate hikes dampening the economy to such an extent that the Fed will have to lower interest rates earlier and more rapidly next year than is currently expected.”
“In short: it could make the soft landing the Fed and the market are currently expecting seem questionable.”
“The prospect of another rate step due to higher inflation rates might support the dollar short-term; but if market participants begin to question the prospect of a soft landing of the economy, this might thwart the dollar.”
“That is why nobody wants to properly position themselves ahead of the publication, in particular as a lot of positive developments have already been priced into the dollar.”
- USD/INR trades slightly higher on the Fed’s likelihood of halting the interest rate-hike cycle.
- The default situation by China's Country Garden could potentially affect the Asian currencies.
- The dovish comments from Fed policymakers are contributing to pressure on the US Dollar.
USD/INR appears to be consolidating within a narrow weekly range between 83.09 and 83.30. In the Asian session on Wednesday, the pair trades slightly higher than the previous close, hovering around 83.20.
The market sentiment seems to be influenced by expectations that the Federal Reserve (Fed) is considering a pause in its interest rate-hike cycle. This sentiment is driven by recent dovish comments from Fed officials, suggesting a more cautious stance on monetary policy.
The Reserve Bank of India (RBI) might intervene to suppress any upward momentum of the USD/INR pair by engaging in the sale of US Dollars (USD) in the non-deliverable forwards market.
The potential default situation by China's Country Garden on a $15 million coupon payment indeed adds complexity to the Chinese economic situation. The challenges in the property sector, despite broader signs of recovery in China's economy, warrant careful observation, especially considering potential implications for Asian currencies.
On the other hand, a series of dovish comments from Federal Reserve policymakers, expressing concerns about higher long-term US Treasury yields, is shaping the monetary policy narrative.
Atlanta's Fed President Raphael Bostic's assertion that the current policy is already restrictive, coupled with similar sentiments from other Fed colleagues, suggests a cautious approach to further rate hikes.
The US Dollar Index (DXY) trades around 105.80, by the press time, recovering from the intraday losses. The 10-year US Treasury bond yield stands at 4.64%. The market's focus awaits the upcoming economic data, with Wednesday featuring the Producer Price Index (PPI) following the release of the FOMC meeting minutes and Thursday bringing the Consumer Price Index (CPI).
“European gas surged higher amid concerns about the safety of Europe’s energy infrastructure,” analysts at Australia and New Zealand Banking Group (ANZ) said in their Australian Morning Focus report published early Wednesday.
Additional quotes
“The leak in a gas pipeline connecting NATO members Finland and Estonia is suspected to have been caused by a deliberate act of destruction, according to Finland Prime Minister Petteri Orpo.”
“While the rupture of the pipeline is not significant for the European gas market, it raises questions about the security of supply at a time of heightened geopolitical risks.”
“Chevron has already been forced to shut down the Tamar offshore gas platform while the conflict’s proximity to the Suez Canal, a major shipping route for LNG to Europe, also raised the risk of disruptions to supply.”
“North Asian LNG prices were also higher amid the supply risks. This was compounded by fears of renewed industrial action at Chevron’s LNG facilities in Australia.”
Analysts at Rabobank note that based on the domestic fundamentals and the geopolitical risks, assess the outlook for the Brazilian Real against the US Dollar.
Key quotes
“Externally, Hamas attack on Israel triggers global risk-off sentiment, after US payroll grows above expectations in September and a US government shutdown is delayed.”
“Domestically, the BCB governor still sees the current 0.50bp-cutting pace as appropriate, after the BCB released the latest Copom minutes and the CPI mid-monthly inflation in September confirmed inflation convergence will be slow.”
“Our take: Geopolitical risks add depreciation bias to our view of the USDBRL at 5.05 by end-2023 as the BRL and other EM currencies had already been enjoying less carry trade gains. For now, with Fed Funds rate held at high levels until yearend and local relative fiscal fragility, we still see the USDBRL trading at 5.15 by end-2024.”
- USD/JPY looks to approach 149.00 psychological level.
- BoJ is considering an upward revision of the core inflation estimate for the fiscal year 2023/24.
- China’s Country Garden is likely to formally default on a $15M coupon payment.
USD/JPY extends its gains on the second successive day, trading higher around 148.80 during the Asian session on Wednesday. The pair rebounded in the previous session on the positive risk sentiment in the midst of the Middle East conflict.
The Bank of Japan (BoJ) is considering revising its fiscal year 2023/24 core Consumer Price Index (CPI) estimate aiming for 3% compared to the previous forecast of 2.5%, which reflects an optimistic outlook on inflation.
The situation with China’s Country Garden's potential default on a $15 million coupon payment adds another twist. The property sector's challenges, despite signs of recovery in China's overall economy, are definitely something to keep an eye on.
If Country Garden goes through with the default, it could have broader implications for the Japanese Yen. Japan and China's economic ties are significant, and disturbances in one can often ripple into the other.
Additionally, the decline in Japan's non-seasonally adjusted Current Account for August, falling short of the forecast, might raise some concerns, especially when considering the broader economic context.
The report printed a reading of ¥2,279.7B, compared to the forecast of ¥3,090.9B and the previous reading of ¥2,771.7B. The Japanese economic calendar for the rest of the week is notably thin, with only low-impact data scheduled for release.
Moreover, Finance Minister Shunichi Suzuki's statement about the Yen weakening due in part to interest rate differentials sheds light on one of the factors influencing currency movements.
Leading a meeting of finance ministers and central bank governors from the Group of Seven (G7) nations on October 12 gives Japan a platform to discuss critical issues like the war in Ukraine and the state of the world economy.
On the other side, a slew of dovish-leaning comments from Federal Reserve’s (Fed) policymakers, expressing concerns that higher long-term US Treasury yields could prevent their bias to raise rates in the forthcoming meetings.
Atlanta's Fed President Raphael Bostic said that the current monetary policy is already restrictive, more additional rate hikes are not required. The dovish interest rate trajectory was established by two fellow Fed colleagues on Monday, with Minneapolis Fed President Neel Kashkari stated a similar statement on Tuesday.
The US Dollar Index (DXY) recovered from the intraday losses, trading around 105.80, by the press time. However, the 10-year US Treasury bond yield stands lower at 4.63% at the current press time.
Market participants will closely watch economic data, focusing on inflation figures. The Producer Price Index (PPI) is scheduled for Wednesday, followed by the release of the FOMC meeting minutes and the Consumer Price Index (CPI) on Thursday.
Alex Loo, FX and Macro Strategist at TD Securities (TDS), expects the Monetary Authority of Singapore (MAS) to maintain the status quo and stick to its balanced tone at the upcoming semi-annual policy meeting on October 13.
Key Quotes:
“We don't expect a radical shift in MAS's messaging but for the Bank to stick to its balanced tone, reiterating both the upside and downside risks to inflation.”
“A status quo outcome should support the SGD given the continued appreciation path of the S$NEER band but hard to envisage further gains as it is trading close to the 2% upper band. Long EURSGD looks attractive as the EUR is ripe for a bounce while we prefer a tactical short USDSGD position.”
- USD/MXN struggles to gain any meaningful traction, though the bias remains tilted in favour of bulls.
- Any further slide could attract fresh buyers near the 17.80 confluence breakpoint, now turned support.
- A convincing break below the 23.6% Fibo. level is needed to negate the near-term constructive outlook.
The USD/MXN pair is seen oscillating in a narrow trading band during the Asian session on Wednesday and consolidating the overnight heavy losses to a multi-day low. Spot prices currently trade around the 17.95-17.90 region, nearly unchanged for the day, though any meaningful downside still seems elusive.
Against the backdrop of the recent failure to find acceptance above the 38.2% Fibonacci retracement level of the fall witnessed in July, the prevalent US Dollar (USD) selling bias is seen as a key factor acting as a headwind for the USD/MXN pair. Subsequent decline, however, is more likely to find decent support around the 17.80-17.85 confluence, comprising a technically significant 200-day Simple Moving Average (SMA) and a multi-month-old descending trend-line.
Moreover, oscillators on the daily chart – though have been retreating from higher levels – are still holding in the bullish territory and support prospects for the emergence of some dip-buying near the aforementioned resistance-turned-support. Some follow-through selling, however, could make the USD/MXN pair to accelerate the fall to the 17.40-17.35 horizontal support. Spot prices might then weaken further below the 17.15-17.10 region, towards testing sub-17.00 levels.
On the flip side, momentum back above the 18.00 round figure might now confront some resistance around the 18.15-18.20 zone. This is followed by 38.2% Fibo., around the 18.30 region and mid-18.00s, or the highest level since late March touched last week. A sustained strength beyond will set the stage for the resumption of the recent appreciating move witnessed over the past month or so and lift the USD/MXN pair to the 18.80-18.85 area, representing 50% Fibo. level.
USD/MXN daily chart
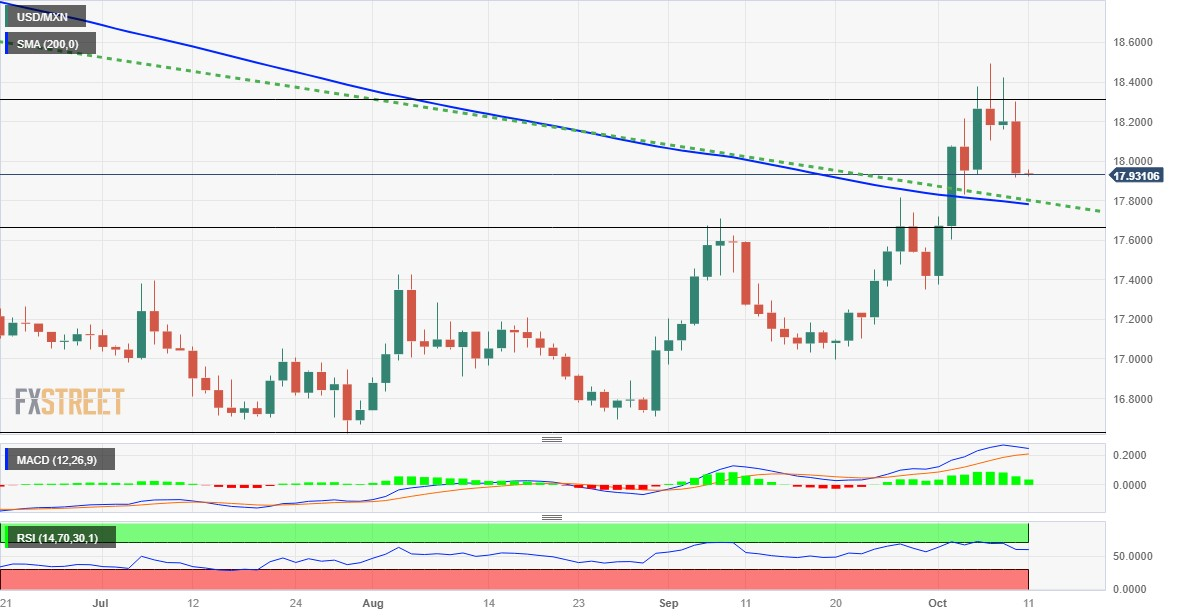
Technical levels to watch
- USD/CAD moves upward near the 1.3600 major level.
- MACD indicates a change in momentum towards a bearish trend.
- Resistance at 1.3650 psychological level, followed by the weekly high.
USD/CAD snaps the four-day losing streak, trading slightly higher around 1.3590 aligned with the immediate resistance at the 1.3600 psychological level during the Asian session on Wednesday. However, the pair faced challenges due to the higher oil prices.
A decisive break above the latter could contribute upward support for the pair to explore the area around the major level at 1.3650, following the next level around the weekly high at 1.3679.
On the flip side, the USD/CAD pair could meet the support near the major level at 1.3550, followed by the 50-day Exponential Moving Average (EMA) at 1.3527 aligned to the 38.2% Fibonacci retracement at 1.3520.
A firm break below the level could open the doors for the pair to navigate the region around the psychological level at 1.3500.
The Moving Average Convergence Divergence (MACD) line is above the centerline but intersects with the signal line, it might indicate a weakening trend. This scenario suggests a signal to be cautious and watch for further confirmation.
However, the prevailing bullish momentum in the USD/CAD pair indicates a strong bias, as the 14-day Relative Strength Index (RSI) remains above the 50 level.
USD/CAD: Daily Chart
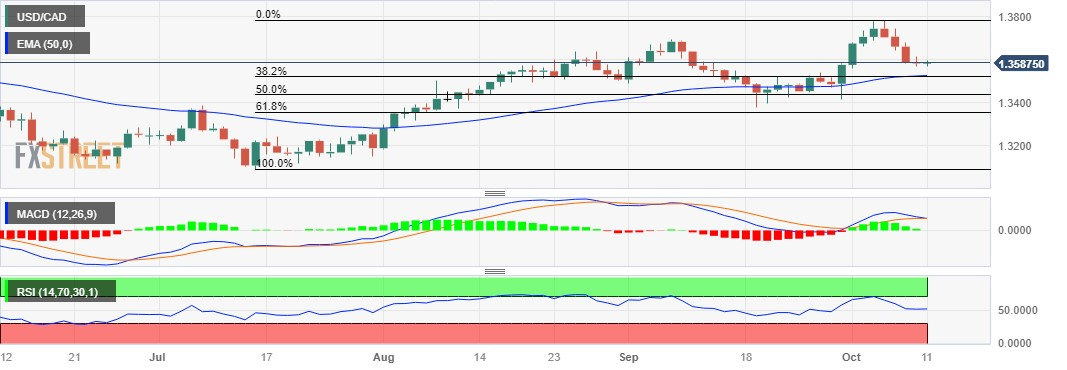
- WTI gains some positive traction during the Asian session, though lacks bullish conviction.
- Easing concerns about potential supply disruptions due to the Israel-Gaza conflict cap gains.
- Worries about tight global supply and a softer USD continue to act as a tailwind for Oil prices.
West Texas Intermediary (WTI) Crude Oil prices edge higher during the Asian session on Wednesday, albeit lack follow-through amid easing concerns about potential supply disruptions due to the Israel-Palestinian conflict. The black gold currently trades around the $84.65-$84.70 region, up just over 0.10% for the day.
Market participants remain uncertain about the ultimate impact of the Israel-Gaza war and seem convinced that the expansion of the conflict to the wider Middle East is required to send Crude Oil prices higher. This, in turn, holds back traders from placing fresh bullish bets and leads to range-bound price action for the second successive day. US officials, meanwhile, have been pointing to Iran's role in the Hamas attack on Israel, though are yet to produce any credible evidence.
Furthermore, powerful Iraqi and Yemeni armed groups aligned with Iran have threatened to target US interests with missiles and drones if Washington intervenes to support Israel. This raises the risk of a further escalation of the conflict in the Middle East. Apart from this, worries about tightening global crude supply might continue to act as a tailwind for Crude Oil prices. In fact, oil ministers of six Arab nations reaffirmed to take additional measures at any time to support market stability.
This, along with the prevalent US Dollar (USD) selling bias, might continue to lend some support to the US Dollar-denominated commodity. The recent dovish remarks by several Federal Reserve (Fed) officials pushed back against market expectations for more interest rate hikes. This leads to a further decline in the US Treasury bond yields, which, along with a generally positive tone around the equity markets, drags the safe-haven Greenback to a near two-week low.
Technical levels to watch
- Gold price extends its consolidative price move through the Asian session on Wednesday.
- Reduced bets for more rate hikes by the Fed and geopolitical tensions lend some support.
- Investors await fresh cues about the Fed’s rate-hike path before placing directional bets.
Gold price (XAU/USD) seesawed between tepid gains/minor losses on Tuesday and consolidated its strong recovery gains from the $1,810 area, or a seven-month low touched last week. The precious metal, however, manages to hold above the $1,850 level and extends the sideways price move during the Asian session on Wednesday.
Traders now seem reluctant to place aggressive directional bets around the Gold price and prefer to wait for fresh cues about the Federal Reserve's (Fed) future rate-hike path. The United States (US) Nonfarm Payrolls (NFP) report released on last Friday showed that wage growth remained moderate in September and eased inflationary concerns. This, along with recent dovish remarks by several Fed officials, supports prospects for an eventual shift in the central bank's policy stance.
Furthermore, the Israel-Gaza conflict is seen lending some support to the safe-haven Gold price. The markets, meanwhile, are still pricing in the possibility of at least one rate hike by the end of this year. This, along with a generally positive tone around the equity markets, might keep a lid on any further gains for the precious metal. Traders now look to Wednesday's release of the US Producer Price Index (PPI) and the FOMC minutes for some impetus ahead of the US CPI on Thursday.
Daily Digest Market Movers: Gold price extends its consolidative price move above $1,850
- Gold price continues to draw support from reduced bets for further interest rate hikes by the Federal Reserve and geopolitical tensions in the Middle East.
- Atlanta Fed President Raphael Bostic said on Tuesday that the US central bank does not need to raise rates any further to get inflation back to the 2% target.
- Minneapolis Fed President Neel Kashkari added that the recent rise in long-term Treasury bond yields could aid the central bank in its battle against inflation.
- The repricing of the Fed's rate-hike path leads to a further decline in the US bond yields and continues to weigh the US Dollar (USD), benefitting the XAU/USD.
- The expansion of the Israel-Gaza conflict to the wider Middle East would push Crude Oil prices higher and complicate the Fed's effort to reduce inflation.
- This might force the US central bank to stick to its hawkish stance and add another layer of complexity, making a soft landing more difficult to achieve.
- Investors now look to the US PPI and the FOMC minutes for cues about the Fed’s future rate-hike path ahead of the consumer inflation figures on Thursday.
Technical Analysis: Gold price needs to make it through the $1,865 hurdle to attract fresh buyers
From a technical perspective, momentum beyond the overnight swing high, around the $1,865-1,866 region, has the potential to lift the XAU/USD to the next relevant hurdle near the $1,885 region. This is closely followed by the $1,900 round figure, which nears the 50-day Simple Moving Average (SMA) and should now act as a key pivotal point. Some follow-through buying should allow the Gold price to climb further towards testing the 200-day SMA, currently pegged near the $1,928-1,930 region.
On the flip side, the $1,850 level might continue to protect the immediate downside ahead of a multi-day-old trading range resistance breakpoint, around the $1,835-1,833 region. Failure to defend the said support levels might prompt some technical selling and drag the Gold price to the $1,820 support en route to the multi-month low, around the $1,810 zone. A convincing break below the latter will validate a bearish death cross on the daily chart, wherein the 50-day SMA is holding well below the 200-day SMA, and pave the way for a further drop.
US Dollar price today
The table below shows the percentage change of US Dollar (USD) against listed major currencies today. US Dollar was the strongest against the Australian Dollar.
| USD | EUR | GBP | CAD | AUD | JPY | NZD | CHF | |
| USD | -0.01% | -0.03% | 0.05% | 0.10% | 0.07% | 0.06% | -0.02% | |
| EUR | 0.01% | -0.01% | 0.06% | 0.11% | 0.08% | 0.07% | -0.02% | |
| GBP | 0.02% | 0.01% | 0.08% | 0.12% | 0.10% | 0.10% | 0.01% | |
| CAD | -0.04% | -0.05% | -0.08% | 0.05% | 0.03% | 0.02% | -0.07% | |
| AUD | -0.09% | -0.10% | -0.11% | -0.04% | -0.02% | -0.04% | -0.12% | |
| JPY | -0.08% | -0.08% | -0.11% | -0.03% | 0.02% | 0.00% | -0.11% | |
| NZD | -0.06% | -0.08% | -0.10% | -0.01% | 0.04% | 0.01% | -0.10% | |
| CHF | 0.02% | 0.02% | 0.00% | 0.08% | 0.12% | 0.10% | 0.09% |
The heat map shows percentage changes of major currencies against each other. The base currency is picked from the left column, while the quote currency is picked from the top row. For example, if you pick the Euro from the left column and move along the horizontal line to the Japanese Yen, the percentage change displayed in the box will represent EUR (base)/JPY (quote).
Gold FAQs
Why do people invest in Gold?
Gold has played a key role in human’s history as it has been widely used as a store of value and medium of exchange. Currently, apart from its shine and usage for jewelry, the precious metal is widely seen as a safe-haven asset, meaning that it is considered a good investment during turbulent times. Gold is also widely seen as a hedge against inflation and against depreciating currencies as it doesn’t rely on any specific issuer or government.
Who buys the most Gold?
Central banks are the biggest Gold holders. In their aim to support their currencies in turbulent times, central banks tend to diversify their reserves and buy Gold to improve the perceived strength of the economy and the currency. High Gold reserves can be a source of trust for a country’s solvency. Central banks added 1,136 tonnes of Gold worth around $70 billion to their reserves in 2022, according to data from the World Gold Council. This is the highest yearly purchase since records began. Central banks from emerging economies such as China, India and Turkey are quickly increasing their Gold reserves.
How is Gold correlated with other assets?
Gold has an inverse correlation with the US Dollar and US Treasuries, which are both major reserve and safe-haven assets. When the Dollar depreciates, Gold tends to rise, enabling investors and central banks to diversify their assets in turbulent times. Gold is also inversely correlated with risk assets. A rally in the stock market tends to weaken Gold price, while sell-offs in riskier markets tend to favor the precious metal.
What does the price of Gold depend on?
The price can move due to a wide range of factors. Geopolitical instability or fears of a deep recession can quickly make Gold price escalate due to its safe-haven status. As a yield-less asset, Gold tends to rise with lower interest rates, while higher cost of money usually weighs down on the yellow metal. Still, most moves depend on how the US Dollar (USD) behaves as the asset is priced in dollars (XAU/USD). A strong Dollar tends to keep the price of Gold controlled, whereas a weaker Dollar is likely to push Gold prices up.
- Australian Dollar pulls back from weekly highs ahead of the US Core PPI.
- Australia’s RBA is expected to increase interest rates; contributing support for the Aussie Dollar.
- The slew of dovish remarks by Fed officials contribute to pressure on the US Dollar.
The Australian Dollar (AUD) attempts to snap the winning streak that began last week on a downbeat US Dollar (USD). The AUD/USD pair is strengthening as the likelihood of another interest rate hike by the Reserve Bank of Australia (RBA) increases. This trend can be linked to growing inflation expectations fueled by higher oil prices.
Australia might witness robust underlying commodity prices owing to the ongoing conflict in the Middle East. Additionally, Westpac Consumer Confidence data for October indicates an improvement in individual confidence during the same period.
Australia's business conditions showed resilience in September despite a deceleration in inflation. Moreover, Consumer Sentiment rebounded in October with unchanged rates, but the overall sentiment remained overshadowed by the rising cost of living.
The US Dollar Index (DXY) loses its ground to extend losses that began last week. The US Dollar (USD) faced a challenge despite a minor recovery in US Treasury yields on Tuesday.
Furthermore, a series of dovish-leaning comments from Fed policymakers have resonated in the markets, with many expressing worries that elevated long-term US bond yields might hinder their inclination to raise rates in the upcoming meetings.
Daily Digest Market Movers: Australian Dollar extends gains on RBA interest rate trajectory
- Australia experienced a rebound in inflation in August, primarily attributed to higher oil prices. This development increases the likelihood of another interest rate hike by the Reserve Bank of Australia (RBA).
- The escalation of the Middle East conflict could prompt the RBA to implement a 25 basis points (bps) interest rate hike, bringing it to 4.35% by the end of the year.
- The heightened geopolitical tension is contributing to increased demand for commodities like energy and gold, positively influencing the performance of the AUD/USD pair.
- Australia’s Westpac Consumer Confidence showed that current buying conditions improved in October. The index rose 2.9% from the previous 1.5% decline in September.
- After engaging in discussions with US Senators on Tuesday, China's Commerce Minister, Wang Wentao, expressed that "both sides had rational and pragmatic discussions." Emphasizing the significance of the US-China economic and trade relationship.
- The US Nonfarm Payroll report for September revealed a notable increase of 336,000 jobs, surpassing the market expectation of 170,000. The revised figure for August stood at 227,000.
- US Average Hourly Earnings (MoM) remained steady at 0.2% in September, falling short of the expected 0.3%. On an annual basis, the report indicated a rise of 4.2%, below the anticipated consistent figure of 4.3%.
- The yields on US Treasury bonds slightly recovered on Tuesday. However, the 10-year US Treasury bond yield stands down at 4.64%.
- Atlanta's Fed President Raphael Bostic went on record stating that the current monetary policy is already restrictive, rendering additional rate hikes unnecessary, following the dovish trajectory established by two fellow Fed colleagues on Monday, Minneapolis Fed President Neel Kashkari echoed a similar sentiment on Tuesday.
- Investors will closely watch economic data, particularly focusing on inflation figures. The Producer Price Index (PPI) is scheduled for Wednesday, followed by the release of the FOMC meeting minutes and the Consumer Price Index (CPI) on Thursday along with Australia’s Consumer Inflation Expectations.
Technical Analysis: Australian Dollar looks to approach 0.6450, 23.6% Fibonacci retracement acts as a barrier
The Australian Dollar hovers around the 23.6% Fibonacci retracement level at 0.6429 on Wednesday, presenting a noteworthy barrier. A decisive breakthrough above this level could open the door for further upward exploration, targeting the psychological level of 0.6450. Beyond that, the 50-day Exponential Moving Average (EMA) at 0.6456 emerges as a potential resistance, following the 38.2% Fibonacci retracement at 0.6518. On the downside, a pivotal support level is identified at 0.6300, followed by the November low at 0.6272. These levels play a crucial role in indicating potential shifts in the trajectory of the AUD/USD pair.
AUD/USD: Daily Chart
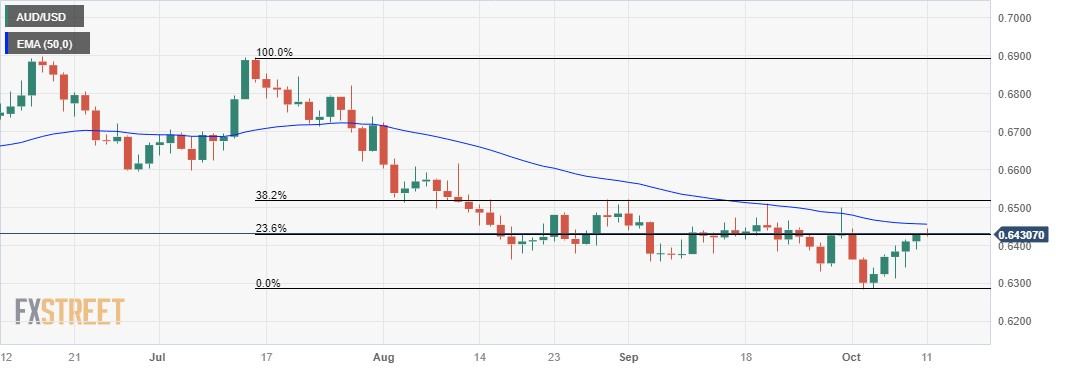
Australian Dollar price today
The table below shows the percentage change of Australian Dollar (AUD) against listed major currencies today. Australian Dollar was the strongest against the Japanese Yen.
| USD | EUR | GBP | CAD | AUD | JPY | NZD | CHF | |
| USD | -0.05% | -0.07% | 0.02% | 0.07% | 0.06% | 0.03% | -0.06% | |
| EUR | 0.05% | 0.00% | 0.07% | 0.10% | 0.10% | 0.07% | -0.03% | |
| GBP | 0.06% | 0.02% | 0.09% | 0.12% | 0.13% | 0.10% | 0.00% | |
| CAD | -0.02% | -0.08% | -0.09% | 0.04% | 0.04% | 0.00% | -0.09% | |
| AUD | -0.08% | -0.12% | -0.14% | -0.06% | -0.02% | -0.07% | -0.15% | |
| JPY | -0.06% | -0.10% | -0.12% | -0.04% | 0.00% | -0.02% | -0.12% | |
| NZD | -0.04% | -0.08% | -0.12% | -0.02% | 0.02% | 0.01% | -0.13% | |
| CHF | 0.06% | 0.02% | 0.00% | 0.09% | 0.13% | 0.12% | 0.09% |
The heat map shows percentage changes of major currencies against each other. The base currency is picked from the left column, while the quote currency is picked from the top row. For example, if you pick the Euro from the left column and move along the horizontal line to the Japanese Yen, the percentage change displayed in the box will represent EUR (base)/JPY (quote).
Australian Dollar FAQs
What key factors drive the Australian Dollar?
One of the most significant factors for the Australian Dollar (AUD) is the level of interest rates set by the Reserve Bank of Australia (RBA). Because Australia is a resource-rich country another key driver is the price of its biggest export, Iron Ore. The health of the Chinese economy, its largest trading partner, is a factor, as well as inflation in Australia, its growth rate and Trade Balance. Market sentiment – whether investors are taking on more risky assets (risk-on) or seeking safe-havens (risk-off) – is also a factor, with risk-on positive for AUD.
How do the decisions of the Reserve Bank of Australia impact the Australian Dollar?
The Reserve Bank of Australia (RBA) influences the Australian Dollar (AUD) by setting the level of interest rates that Australian banks can lend to each other. This influences the level of interest rates in the economy as a whole. The main goal of the RBA is to maintain a stable inflation rate of 2-3% by adjusting interest rates up or down. Relatively high interest rates compared to other major central banks support the AUD, and the opposite for relatively low. The RBA can also use quantitative easing and tightening to influence credit conditions, with the former AUD-negative and the latter AUD-positive.
How does the health of the Chinese Economy impact the Australian Dollar?
China is Australia’s largest trading partner so the health of the Chinese economy is a major influence on the value of the Australian Dollar (AUD). When the Chinese economy is doing well it purchases more raw materials, goods and services from Australia, lifting demand for the AUD, and pushing up its value. The opposite is the case when the Chinese economy is not growing as fast as expected. Positive or negative surprises in Chinese growth data, therefore, often have a direct impact on the Australian Dollar and its pairs.
How does the price of Iron Ore impact the Australian Dollar?
Iron Ore is Australia’s largest export, accounting for $118 billion a year according to data from 2021, with China as its primary destination. The price of Iron Ore, therefore, can be a driver of the Australian Dollar. Generally, if the price of Iron Ore rises, AUD also goes up, as aggregate demand for the currency increases. The opposite is the case if the price of Iron Ore falls. Higher Iron Ore prices also tend to result in a greater likelihood of a positive Trade Balance for Australia, which is also positive of the AUD.
How does the Trade Balance impact the Australian Dollar?
The Trade Balance, which is the difference between what a country earns from its exports versus what it pays for its imports, is another factor that can influence the value of the Australian Dollar. If Australia produces highly sought after exports, then its currency will gain in value purely from the surplus demand created from foreign buyers seeking to purchase its exports versus what it spends to purchase imports. Therefore, a positive net Trade Balance strengthens the AUD, with the opposite effect if the Trade Balance is negative.
| Raw materials | Closed | Change, % |
|---|---|---|
| Silver | 21.823 | -0.2 |
| Gold | 1860.036 | -0.06 |
| Palladium | 1167.15 | 3.19 |
“If bond yields are tight, that could be the equivalent of another rate hike,” Federal Reserve (Fed) Bank of San Francisco President Mary Daly said in her scheduled speech late Tuesday, bolstering bets of a Fed pause.
Additional comments
Decline in goods inflation has been an easy win, and not largely due to the Fed's rate hikes.
Just starting to see improvement in non-housing services inflation, need more of it
We have more work to do, inflation is still high.
Fed policy is helping supply and demand get into a better balance.
In future could see the nominal neutral rate go to 2.5%-3%.
The new normal may be a little different, but probably won't be a gigantic reset.
I don't manage markets, I watch them for information.
The risks to the economy are more balanced.
We need to get inflation down to fully balance the economy.
Market reaction
In response to the above comments, the US Dollar kept its downside consolidation mode intact near 105.75, where it now wavers. The US Dollar Index is down 0.06% on the day, at the time of writing.
The Reserve Bank of Australia (RBA) Assistant Governor (Financial Markets), Christopher Kent, is speaking at the Bloomberg Address, in Sydney, on Wednesday.
Key quotes
Have opportunity to see how economy reacts to past hikes.
No current plans to step up pace of bond holdings.
If we were to sell bonds, would do it in a way that would not disturb markets.
Pockets of fast wage growth, but contained in aggregate.
The CPI data will be important, but it is not only consideration for policy.
Market reaction
AUD/USD has shaved off early gains to trade flat at 0.6430, as of writing, as traders weigh dovish comments from the RBA policymaker.
On Wednesday, the People’s Bank of China (PBoC) set the USD/CNY central rate for the trading session ahead at 7.1779 as compared to the previous day's fix of 7.1781 and 7.2842 Reuters estimate.
- PBoC injects 102 billion Yuan via 7-day RR, sets the rate at 1.8%,
- 417 billion Yuan of RRs mature today, summing to a net 315 billion Yuan drain on the day in OMOs.
The Reserve Bank of Australia (RBA) Assistant Governor (Financial Markets), Christopher Kent, did not sound keen on further rate hikes and said that monetary policy is slowing the growth of demand, and inflation.
Additional Quotes via Reuters:
Policy lags mean some further effects of past rate hikes are still to be felt through the economy.
Repeats that some further tightening of policy may be required to ensure inflation slows.
The effect of slower demand growth on inflation is now building.
Hearing in a liaison that a range of retailers discounting in the face of weak consumer spending.
Mortgage payments are at a record share of household disposable income, and will rise further.
The rise in interest rates has also increased incentives to save.
The board is paying close attention to economic developments here and overseas.
- NZD/USD touches a one-month peak on Wednesday and is supported by a softer USD.
- Reduced bets for more rate hike by the Fed and a positive risk tone weighs on the buck.
- Investors now look to the US PPI and the FOMC minutes for some meaningful impetus.
The NZD/USD pair attracts some follow-through buying for the sixth successive day on Wednesday and climbs to a one-month high, just above mid-0.6000s during the Asian session.
The US Dollar (USD) remains on the defensive in the wake of reduced bets for further interest rate hikes by the Federal Reserve (Fed), which, in turn, is seen as a key factor acting as a tailwind for the NZD/USD pair. Relatively subdued US wage growth data released on Friday eased inflationary concerns, which, along with the dovish remarks by several Fed officials suggested that the US central bank will soften its hawkish stance.
According to the Wall Street Journal (WSJ), Fed officials are signalling that a run-up in long-term interest rates might substitute for a further central bank rate hike. This leads to a further decline in the US Treasury bond yields and continues to undermine the Greenback. Apart from this, a generally positive risk tone turns out to be another factor weighing on the safe-haven buck and benefitting the risk-sensitive Kiwi.
With the latest leg up, the NZD/USD pair has rallied nearly 200 pips from the monthly low, around the 0.5870 region touched last week, though lacks strong follow-through. The markets are still pricing in the possibility of at least one more Fed rate hike move by the end of this year. This, along with concerns about escalating geopolitical tension in the Middle East, could help limit the downside for the USD and keep a lid on the major.
Traders might also prefer to wait for the release of the US Producer Price Index (PPI) and the FOMC monetary policy meeting minutes, due later during the North American session. The focus will then shift to the latest US consumer inflation figures on Thursday, This might provide fresh cues about the Fed's future rate-hike path, which will influence the USD price dynamics and provide a fresh directional impetus to the NZD/USD pair.
Technical levels to watch
- EUR/USD extends gains due to weaker US Dollar.
- ECB is expected to pause its interest rate tightening cycle.
- Greenback weakens on a slew of dovish remarks by Fed officials.
EUR/USD attempts to extend its gains on the second day, trading in the positive zone near 1.0610 during the early Asian session on Wednesday. The pair is receiving upward support due to the continued correction in the US Dollar (USD) on the dovish remarks by Federal Reserve (Fed) officials.
A wave of dovish-leaning comments from Fed’s policymakers has resonated in the markets, with several expressing concerns that elevated long-term US bond yields could impede their inclination to raise rates in the forthcoming meetings.
Atlanta's Fed President Raphael Bostic went on record stating that the current monetary policy is already restrictive, rendering additional rate hikes unnecessary, following the dovish trajectory established by two fellow Fed colleagues on Monday, Minneapolis Fed President Neel Kashkari echoed a similar sentiment on Tuesday.
The US Dollar Index (DXY) loses its ground and trades lower around 105.70, by the press time to extend losses that began during the previous week. The US Dollar (USD) faced challenges despite a minor recovery in US Treasury yields on Tuesday. However, the 10-year US Treasury bond yield stands lower at 4.64% at the current press time.
Investors will closely watch economic data, particularly focusing on inflation figures. The Producer Price Index (PPI) is scheduled for Wednesday, followed by the release of the FOMC meeting minutes and the Consumer Price Index (CPI) on Thursday.
On the other side, the uptick in German bond yields could limit the advancement of the EUR/USD pair, as market participants anticipate the European Central Bank (ECB) to pause its tightening cycle.
On Tuesday, Francois Villeroy de Galhau, a member of the European Central Bank (ECB) Governing Council and President of the Bank of France, expressed the view that "at this stage, further rate hikes are not the right course of action."
In an interview with the French paper La Tribune Dimanche, ECB President Christine Lagarde remarked, "The key ECB interest rates have reached levels that, if maintained for a sufficiently long duration, will make a substantial contribution to the timely return of inflation to the target."
President Lagarde is optimistic about meeting the target of bringing inflation back down to 2%. Additionally, she expressed confidence in Europe's gas reserves situation.
Projections suggest a slowdown in Germany's inflation, potentially strengthening the notion that the ECB will keep interest rates unchanged.
- GBP/USD scales higher for the sixth successive day and climbs to a near three-week high.
- Retreating US bond yields and a positive risk tone undermine the USD and lend support.
- Traders now look to the US PPI and FOMC meeting minutes for some meaningful impetus.
The GBP/USD pair gains some positive traction for the sixth successive day on Wednesday and climbs to a near three-week high during the Asian session. Spot prices currently trade just below the 1.2300 round-figure mark and remain well supported by the prevalent selling bias surrounding the US Dollar (USD).
The recent dovish remarks by several Federal Reserve (Fed) officials forced investors to scale back their bets for more aggressive policy tightening by the US central bank and continue to drag the US Treasury bond yields lower. This, in turn, undermines the Greenback and acts as a tailwind for the GBP/USD pair. In fact, Atlanta Fed President Raphael Bostic said on Tuesday that the US central bank does not need to raise interest rates any further and that he sees no recession ahead.
Apart from this, the risk-on mood turns out to be another factor weighing on the safe-haven buck and lending additional support to the GBP/USD pair. Despite escalating geopolitical tensions in the Middle East, diminishing odds for further rate hikes by the Fed continue to boost investors' appetite for riskier assets. This is evident from a generally positive tone around the equity markets and is seen driving flows away from traditional safe-haven currencies, including the greenback.
That said, the markets are still pricing in the possibility of at least one more Fed rate hike move by the end of this year. This is holding back traders from placing aggressive bearish bets around the USD. Apart from this, firming expectations that the Bank of England (BoE) will maintain the status quo in November might contribute to capping the GBP/USD pair. In fact, the BoE surprisingly paused its rate-hiking cycle in September and provided little hints of its intention to raise rates.
This makes it prudent to wait for strong follow-through buying before positioning for an extension of the GBP/USD pair's recent recovery move from the 1.2035 area, or its lowest level since March touched last week. Market participants now look forward to the US Producer Price Index (PPI) and the FOMC meeting minutes for some meaningful impetus later during the North American session. The focus will then shift to Thursday's release of the latest US consumer inflation figures.
Technical levels to watch
| Index | Change, points | Closed | Change, % |
|---|---|---|---|
| NIKKEI 225 | 751.86 | 31746.53 | 2.43 |
| Hang Seng | 147.33 | 17664.73 | 0.84 |
| KOSPI | -6.15 | 2402.58 | -0.26 |
| ASX 200 | 70.4 | 7040.6 | 1.01 |
| DAX | 295.41 | 15423.52 | 1.95 |
| CAC 40 | 141.03 | 7162.43 | 2.01 |
| Dow Jones | 134.65 | 33739.3 | 0.4 |
| S&P 500 | 22.58 | 4358.24 | 0.52 |
| NASDAQ Composite | 78.6 | 13562.84 | 0.58 |
| Pare | Closed | Change, % |
|---|---|---|
| AUDUSD | 0.64305 | 0.3 |
| EURJPY | 157.696 | 0.54 |
| EURUSD | 1.0605 | 0.36 |
| GBPJPY | 182.669 | 0.55 |
| GBPUSD | 1.2285 | 0.38 |
| NZDUSD | 0.60458 | 0.41 |
| USDCAD | 1.3582 | -0.06 |
| USDCHF | 0.90433 | -0.19 |
| USDJPY | 148.702 | 0.18 |
- USD/JPY heads into Wednesday trading after a relatively flat Tuesday near 148.60.
- The US Dollar fell against the Yen to start the week after the Gaza conflict sparked risk aversion.
- Markets are set to turn their eyes to US inflation figures due today and Thursday.
The US Dollar (USD) held mostly flat against the Japenese Yen (JPY) on Tuesday with a little bit of wiggle, and the USD/JPY pair is headed into the Wednesday market session trading near 148.60.
With little meaningful data slated for the economic calendar from Japan this week, it's all about US inflation numbers heading into the midweek.
US Producer Price Index (PPI) figures due Wednesday could see a dogpile into the US Dollar if the release sees a firm surprise to the upside. With markets easing back expectations of additional rate hikes from the Federal Reserve (Fed), a sudden uptick in inflationary figures would see US Treasury yields surge and the Greenback soar once more.
US PPI figures for the annualized period into September are forecast to print at 2.3%, down slightly from the previous period's 2.2%.
Wednesday will also see the release of the Fed's latest meeting minutes, due later in the day at 18:00 GMT.
In an inflation follow-up to the PPI data drop, Thursday will be bringing high-impact US Consumer Price Index (CPI) numbers, where markets are hoping for a downtick in the annualized figure into September from 3.7% to 3.6%.
USD/JPY Technical Outlook
The long-term trend outlook for the USD/JPY is exceedingly bullish, with the Greenback trading well above the median against the Yen. The USD/JPY continues to soar high above the 200-day Simple Moving Average (SDMA), which is currently riding up into the 139.00 chart region, with technical support for the pair currently sitting near 147.00 from the 50-day SMA.
Traders will note that USD/JPY prices near the 150.00 major handle have historically been a place of interest for the Bank of Japan (BoJ) to threaten (or unexpectedly execute) FX market interventions to protect the Yen.
USD/JPY Daily Chart

USD/JPY Technical Levels


© 2000-2026. Уcі права захищені.
Cайт знаходитьcя під керуванням TeleTrade DJ. LLC 2351 LLC 2022 (Euro House, Richmond Hill Road, Kingstown, VC0100, St. Vincent and the Grenadines).
Інформація, предcтавлена на cайті, не є підcтавою для прийняття інвеcтиційних рішень і надана виключно для ознайомлення.
Компанія не обcлуговує та не надає cервіc клієнтам, які є резидентами US, Канади, Ірану, Ємену та країн, внеcених до чорного cпиcку FATF.
Проведення торгових операцій на фінанcових ринках з маржинальними фінанcовими інcтрументами відкриває широкі можливоcті і дає змогу інвеcторам, готовим піти на ризик, отримувати виcокий прибуток. Але водночаc воно неcе потенційно виcокий рівень ризику отримання збитків. Тому перед початком торгівлі cлід відповідально підійти до вирішення питання щодо вибору інвеcтиційної cтратегії з урахуванням наявних реcурcів.
Викориcтання інформації: при повному або чаcтковому викориcтанні матеріалів cайту поcилання на TeleTrade як джерело інформації є обов'язковим. Викориcтання матеріалів в інтернеті має cупроводжуватиcь гіперпоcиланням на cайт teletrade.org. Автоматичний імпорт матеріалів та інформації із cайту заборонено.
З уcіх питань звертайтеcь за адреcою pr@teletrade.global.
переклади