- Аналітика
- Новини та інструменти
- Новини ринків
Новини ринків
According to Reuters on Tuesday, China will tighten monitoring on several thousand local government financial vehicles (LGFVs), barring new LGFVs from selling bonds publicly, to close loopholes in a strategy to handle municipal debt difficulties. two people with knowledge of the topic said.
Market reaction
With the positive development news in China, AUD/USD climbs above 0.6400, and NZD/USD edges higher to 0.5917 at the press time
The US Deputy Treasury Secretary Wally Adeyemo, expressed optimism on Monday that US banks had not curtailed lending as much as expected since financial issues were seen earlier this year, per Reuters.
Adeyemo said at an Economic Club of New York event that the US banking industry had undergone considerable consolidation following the bankruptcy of numerous banks in late winter and early spring, but there had been no significant pullback in credit.
Market Reaction
The US Dollar Index (DXY) is trading at 104.50, unchanged on the day amid the improvement in risk sentiment.
- Strong Chinese data and hawkish comments by BoJ Governor Ueda underpinned the JPY.
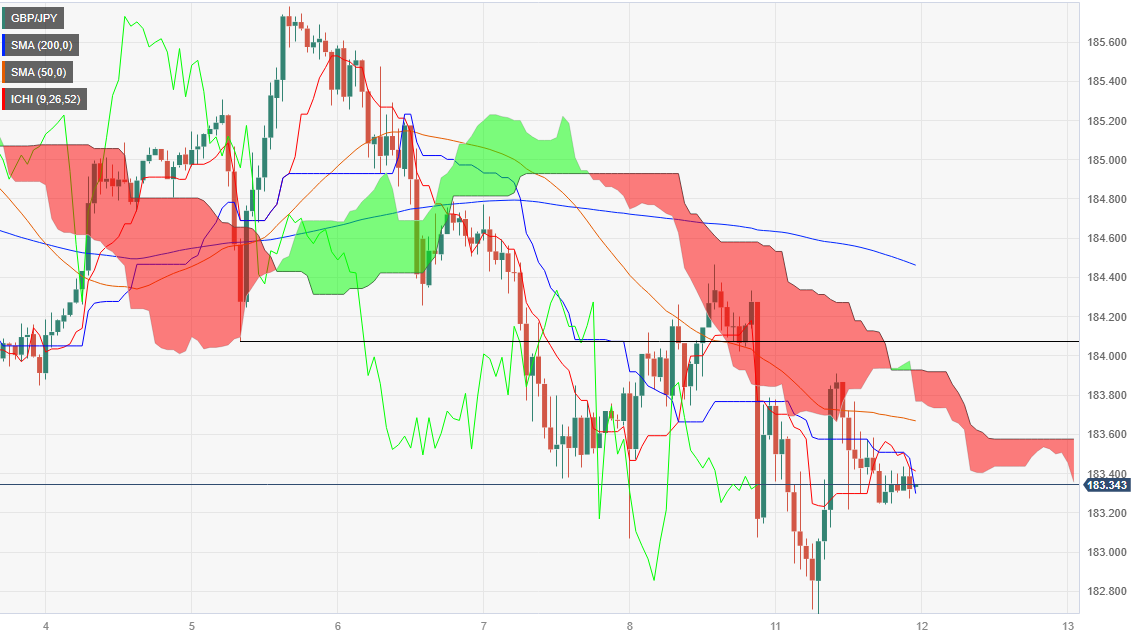
- The pair is neutral to upward biased from a daily chart, at the brisk of breaching the Ichimoku cloud.
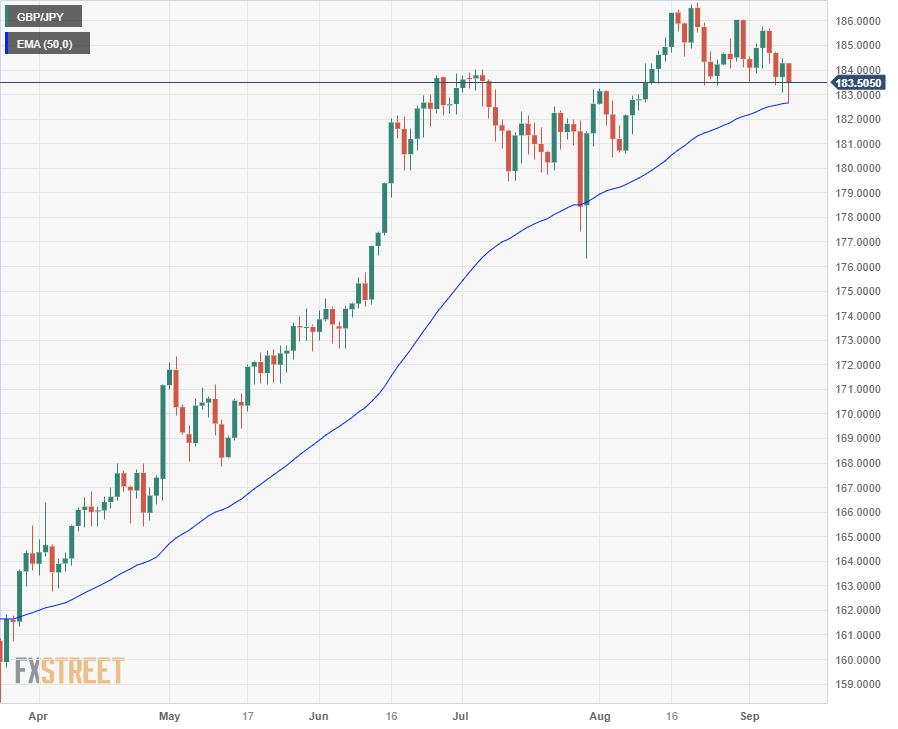
- Short term, the GBP/JPY is downward biased, set to test the 183.00 area.
The Pound Sterling (GBP) stops its decline vs. the Japanese Yen (JPY) as Tuesday’s Asian session begins, following Monday’s session that witnessed a 0.47% loss for the cross-currency pair. The reasons behind the move were good Chinese data and some hawkish comments by the Bank of Japan (BoJ) Governor Kazuo Ueda. The GBP/JPY is trading at 183.38, a gain 0.06%.
GBP/JPY Price Analysis: Technical outlook
From a daily chart perspective, the pair is neutral to upward biased, remaining above the Ichimoku Cloud (Kumo). Nevertheless, since the cross printed the yearly high, the GBP/JPY achieved successive series of lower highs and lows, keeping that neutral stance on the cross. Also, an upslope support trendline, drawn from March 2023 lows, passes around 183.00. That said, a decisive break below the latter could open the door for further downside.
Short term, the GBP/JPY is set to extend its losses, capped on the upside by the Senkou Span B at 183.57. Once cleared, the pair’s next stop would be the bottom of the Ichimoku Cloud (Kumo) at around the 183.70 area, followed by a challenge of the 184.00 figure. Conversely, and the path of least resistance, the first support would be the 183.20 area. Once cleared, the cross would dive towards the 183.00 figure, followed by the September 11 daily low at 182.67.
GBP/JPY Price Action – Hourly chart
- AUD/USD takes a breather after surging from 0.6370 to 0.6430 amid the improvement in risk sentiment.
- The Australian Dollar benefited from the upbeat China's inflation data.
- Traders will monitor the Australian Confidence survey, US Consumer Price Index (CPI) data.
The AUD/USD pair edges higher and consolidates its recent gains around 0.6430 during the early Asian session on Tuesday. The rebound of the pair is bolstered by the weaker US Dollar (USD) and improvement in risk sentiment. Meanwhile, the US Dollar Index (DXY) hovers around 104.50 after retracing from the 105.00 area.
The China-proxy Australian dollar (AUD) benefited from China's inflation data. The Chinese Consumer Price Index (CPI) rose 0.1% YoY, from a 0.3% drop in the previous month, compared to the 0.2% rise anticipated. The monthly figure was 0.3% as expected. The improvement in Chinese inflation figures boosted the risk-on mood and dragged the safe-haven US Dollar lower.
On the US Dollar front, investors await the highly-anticipated US Consumer Price Index (CPI) data which might convince the Federal Reserve (Fed) interest rate expectation. The upbeat data would suggest the Federal Reserve needs to tighten monetary policy. This, in turn, might lift the Greenback against its rivals.
After the G20 Summit, US Treasury Secretary Janet Yellen conveyed more optimism that the US could control inflation without damaging the employment market. Yellen also said on Sunday that every gauge of inflation is declining and there were no massive wave of layoffs. Chicago Fed President Austan Goolsbee outlined the central bank's goal of leading the economy into a "golden path." This route represents a scenario in which inflation falls without causing a recession. Furthermore, Fed New York President John Williams said last week that highlighted the decline in inflation and an improving economic balance.
Looking ahead, market participants await the Australian Confidence surveys due later on Tuesday. The Westpac Consumer Confidence is expected at 0.6%. The NAB Business Confidence Index is expected to drop to 1 in August, up from -2 in July. Later this week, the US Consumer Price Index (CPI) on Wednesday and the Producer Price Index (PPI) on Thursday will be released. Traders will take cues from these figures and find the trading opportunity around the AUD/USD pair.
- The USD/JPY inverts currency flows as the Yen rises and the greenback steps down.
- The BoJ could be on track to reverse negative rates, sending JPY back up the charts.
- USD traders will be looking towards US CPI figures on Wednesday.
The USD/JPY saw declines in one of the worst-closing trading days since July, finishing Monday near 146.50 after opening the new trading week on the high side near 147.85. The Japanese Yen (JPY) is seeing fresh bidding in the market on the back of bullish comments from the Bank of Japan (BoJ), and the Greenback (USD) is sliding across the board as profit-taking from the recent bull run saps momentum for the US Dollar.
Yen gaining ground on BoJ hints of future rate policy reversal
Weekend comments from the BoJ’s Governor Kazuo Ueda hinted that the Japanese central bank is inching closer to reversing its negative rate policy. In an interview with the Yomiuri Shimbun newspaper on the weekend, BoJ Governor Ueda expressed that the end of the year could see a shift in negative rates from the Japanese central bank, as long as data supports the view that the BoJ is on track to achieve their 2% annual inflation target.
Markets seized upon the statements, sending the Yen to fresh highs across the board in anticipation of the beginning of a long-awaited rate hike cycle from the BoJ. On the US Dollar side, Greenback traders are taking a step back ahead of key US inflation figures due in the midweek.
US Consumer Price Index (CPI) figures are due on Wednesday, with market forecasts calling for the headline CPI to print at 0.5% MoM, an uptick from the previous period’s 0.2%. Core CPI numbers are expected to hold steady at 0.2%, and deviations in inflation figures could see rapid changes in the market’s USD bias to close out the trading week.
USD/JPY technical outlook
The Dollar-Yen pairing swooned below the 146.00 handle in early Monday trading, recovering to 147.00 before settling at the midpoint near 146.50. Last week saw the pair knocking on the ceiling just above 147.80, but fresh JPY bidding coupled with the USD step back has taken the pair off the highs, and a technical recovery will need to first gather steam from the resistance-turned-support barrier near 146.40.
A new rising trendline on daily candles will see dynamic support if current consolidation continues, and bulls will be looking for an upshot from US CPI data on Wednesday.
USD/JPY daily chart

- XAU/USD secured daily gains on Monday and closed above $1,920.
- The daily chart flashes mixed signals, and there is not a clear dominant for the short term.
- As long as the price remains above $1,920, the outlook will be bright.
The Gold Spot price closed at $1,922 in Monday's session, tallying a 0.18% daily increase. Thanks to weaker US Dollar, precious metals were allowed to gain some traction, but the US Treasury yields, which remain high, halted all attempts to make a significant upward movement.
On the technical front, the daily chart indicates a neutral, with a slight bullish bias in favour of the Gold's buyers. The Relative Strength Index (RSI) displays an ascending slope in the bearish territory, hinting at a potential trend reversal of the recent bearish movements. At the same time, the Moving Average Convergence (MACD) prints lower green bars, which signifies that despite bulls gaining some ground, their momentum is relatively weak. In addition, on the bright side, the pair is holding above the 20 and 200-day Simple Moving Average (SMA) convergence at the $1,915-1,920 and as long as the buyers keep this level, the downside will be limited. However, the bulls still have more work to do and must target the 100-day SMA at $1,950 to gather momentum and continue breaking resistances. Above the 100-day average, the following targets are $1,970 and $1,990.
XAU/USD Daily chart
-638300663119776961.png)
}
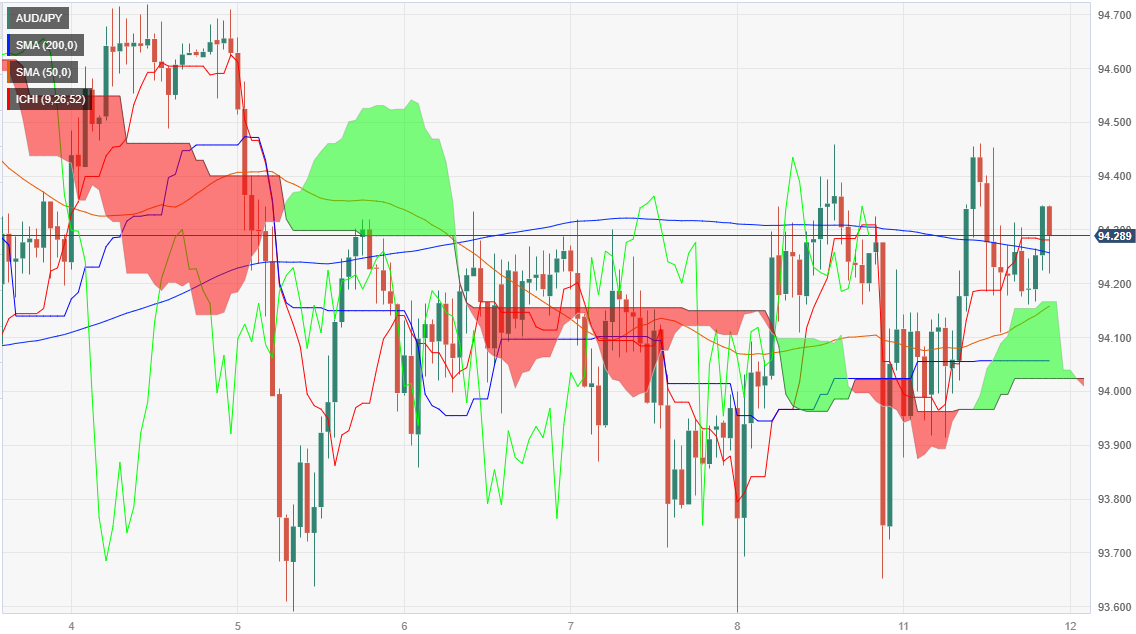
- AUD/JPY trades at 94.22, almost flat as Tuesday's session begins.
- BoJ Governor Kazuo Ueda hints at the end of negative interest rates, sparking short-lived gains in JPY.
- Technical indicators suggest a neutral bias, with both buyers and sellers awaiting a fresh catalyst.
The Australian Dollar (AUD) posted minuscule gains on Monday versus the Japanese Yen (JPY), after the Bank of Japan (BoJ) Governor Kazuo Ueda made comments that the end of negative interest rates is possible if data warrants it. Hence, market participants priced in a possible monetary policy normalization as the JPY registered solid gains. Nevertheless, they were short-lived, as shown by the AUD/JPY pair. At the time of writing, the cross trades at 94.22, almost flat, as Tuesday’s session begins.
AUD/JPY Price Analysis: Technical outlook
The daily chart portrays the pair as neutral biased, with no clear bias, as the pair forms a symmetrical triangle preceded by a downtrend. Also, the Senkou Span A and B lines that form the Ichimoku Clous (Kumo) and the Tenkan and Kijun-Sen are flat. That said, neither buyers nor sellers are in charge, awaiting a fresh catalyst that directs the AUD/JPY pair.
From an hourly chart perspective, the pair finished Monday’s session near the session’s highs, suggesting an upward bias. Hence, the AUD/JPY first resistance would be the September 11 high at 94.45, followed by the September 4 swing high at 94.70, before challenging 95.00. Conversely, the first support would be the top of the Kumo at 94.10, followed by the 94.00 figure. A breach of that area would shift the bias downwards.
AUD/JPY Price Action – Hourly chart
- US equities broadly caught a bid during Monday trading.
- Tesla price target, Hostess deal highlights of US trading.
- Cars and junk food keep the major index in the green as Raytheon sees unexpected costs accumulate.
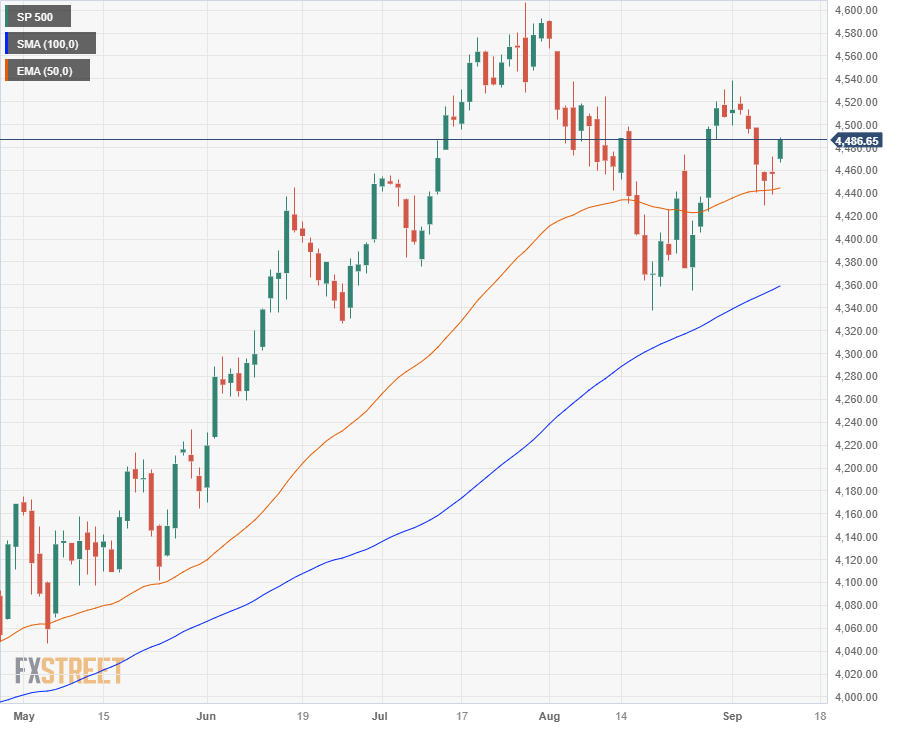
The Standard & Poor’s (S&P) 500 US mega index is seeing moderate gains to close out Monday’s trading, up around 0.35% near $4,490.00. The major US index is seeing the beginnings of a potential recovery after backsliding from $4,540.00 to last week’s low of $4,430.00.
US equities are getting a lift from the tech sector in Monday’s trading as market investors await key Consumer Price Index (CPI) inflation figures due in the midweek, where headline consumer inflation is expected to tick upwards to 0.5% MoM, compared to the previous period’s 0.2%. Meanwhile, Core CPI data is forecast to hold steady at 0.2%.
S&P juiced by tech stocks, limited losers help bolster index
The S&P was led higher by a few notable performers, including Tesla and Hostess, the maker of Twinkies.
Tesla (TSLA) shares lifted 9.3% after the stock saw its stock upgraded from equal weight to overweight by Morgan Stanley, who also raised their price target for the electric carmaker’s stock from $250 per share to $400.
Hostess Brands gapped higher by 19% when equity markets discovered that the company famous for Twinkies would be acquired by JM Smucker (SJM), with the jellies manufacturer acquiring the mass-produced pastries company in a cash and stock deal that values the company at $34.25 per share.
Stocks holding the back include the stock ticker RTX (RTX) formerly known as Raytheon Technologies, which tumbled 7% after it was revealed it would cost the company around $3 billion dollars to fix metal powdercoats used in the fabrication of engine parts for the Airbus A320 jetliner.
S&P 500 technical outlook
In the near term, the S&P equity index is somewhat hamstrung, floating between the latest turning points between $4,530.00 and $4,430.00, but long-term momentum rests firmly in the hands of the bulls. The index has steadily lifted the year’s opening prices of $3,845.00, but a significant downturn will see a notable lack of technical support levels on its way down to $4,360.00.
S&P 500 daily chart
During the Asian session, New Zealand will report Electronic Card Retails Sales data and Australian Confidence surveys are due. Later in the day, the key reports will be the UK employment data and the German ZEW survey.
Here is what you need to know on Tuesday, September 12:
The positive streak of the US Dollar Index (DXY) finally ended after several consecutive days of gains. The pullback was triggered by some improvement in risk sentiment. The Nasdaq increased by 1.14%, while the S&P 500 climbed 0.67%. As a result, the DXY retreated from above 105.00 to 104.55. US Treasury yields moved sideways, with the 10-year yield hovering around 4.28%.
The US Dollar's direction could remain uncertain as key US economic reports are awaited. The Consumer Price Index (CPI) on Wednesday and the Producer Price Index (PPI) on Thursday will provide more inflation data. These figures will be crucial in shaping expectations for the September 19-20 Federal Open Market Committee (FOMC) meeting.
Analysts at TD Securities on US CPI inflation:
Our forecasts for the CPI report suggest core price inflation likely remained subdued in August: We expect it to print 0.2% m/m for a third consecutive month. We also look for a larger 0.6% gain for the headline, as gasoline prices surged. Importantly, the report is likely to show that the core goods segment stayed deflationary, while shelter-price gains probably slowed. Note that our unrounded core CPI inflation forecast is 0.20%, so we see balanced risks around any surprises in August.
EUR/USD reached a six-day high and is currently consolidating around 1.0750. The bias for the upcoming Asian session is tilted towards the upside, but the overall trend still remains to the downside. The German ZEW survey will be released on Tuesday. The focus is on the European Central Bank (ECB), which will have its monetary policy meeting on Thursday.
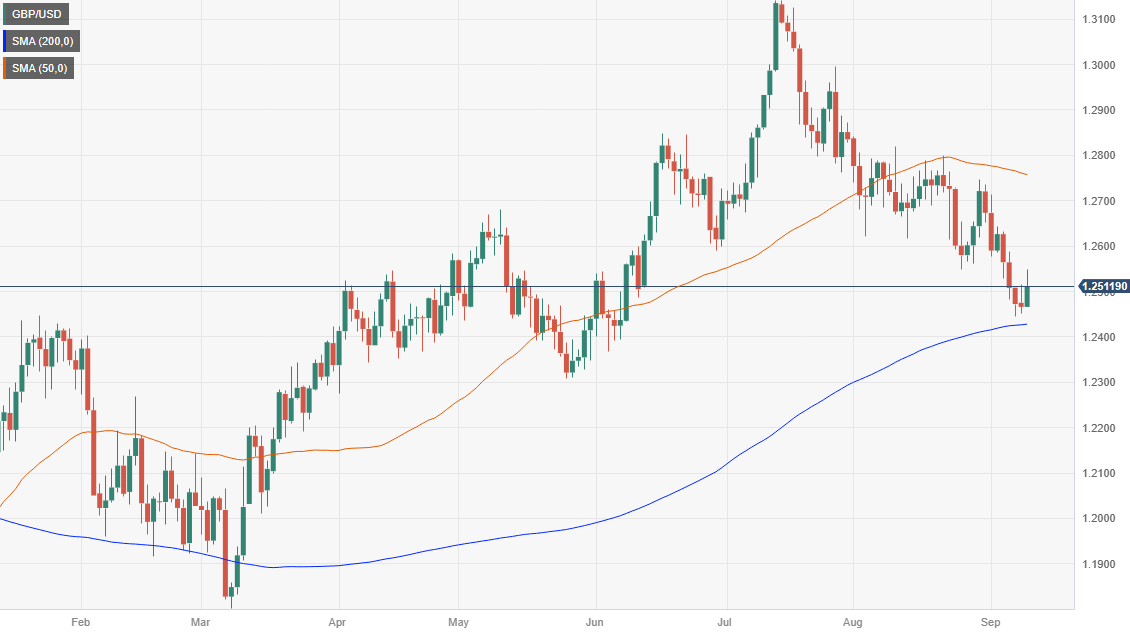
"I would rather err on the side of over-tightening, " said Catherine Mann from the Bank of England on Monday. GBP/USD rose for the second time in the past eight days, reaching the 1.2550 area. The rebound occurred near the 200-day Simple Moving Average (SMA). On Tuesday, the UK will release employment data, followed by monthly GDP figures on Wednesday.
The Japanese Yen soared during the Asian session following Bank of Japan's Governor Ueda's comments, stating that interest rates could rise by year-end if wages rise enough. USD/JPY dropped below the 146.00 level and reached levels under the 20-day SMA but then rebounded to the 146.50 area.
USD/CAD declined for the second consecutive day, reaching weekly lows near 1.3550. The outlook could turn bearish in the short term if prices stay below the 20-day SMA, which stands at 1.3575.
AUD/USD rose above 0.6400, boosted by the weaker Dollar and a rebound in commodity prices. NZD/USD climbed above 0.5900, extending its recovery from multi-month lows. The outlook for Antipodean currencies has improved, and positive market sentiment suggests further gains are likely.
Metals experienced a pullback during the American session but finished higher. Silver closed above $23.00, and Gold finished near $1,920, far from the daily high of $1,931.
Like this article? Help us with some feedback by answering this survey:
- EUR/JPY fell to a low near 156.60, it lowest since early August.
- Governor Ueda pointed out that a pivot may come by year’s end.
- Markets are still deciding whether the ECB will hike on Thursday or not.
On Monday, the EUR/JPY traded in the 156.60 - 157.55 range. On the one hand, the Japanese Yen is trading with gains against most of its rivals, including the USD, GBP, AUD, etc., mainly driven by a rise in Japanese Government Bond yields after Bank of Japan (BoJ) comments on monetary policy. On the other hand, the Euro is trading soft as investors gear up for the European Central Bank (ECB) decision on Thursday.
The Japanese Yen is one of the top performers in the session, mainly driven by Governor Ueda’s comments during the Asian session. He pointed out that the Bank of Japan (BoJ) may gather enough evidence by the year's end to know whether the economy is ready to pivot to a contractive monetary policy. That being said, he still believes wages and inflations are not meeting the bank’s forecasts. However, if they sustainably grow for the rest of this year, the bank would consider leaving behind the negative interest rates policy.
The 2- and 5-year JGB yields rose to their highest level since January, while the 10-year JGB rate broke above the 0.70% level.
On the EUR side, markets await the ECB’s decisions on Thursday. The expectations are mixed as the World Interest Rates Probabilities (WIRP) tool suggests that markets discount nearly 40% odds of a 25 basis point hike and analysts predict that the decision will be a close call. In addition, Lagarde’s tone and the ECB’s statement will be closely watched for investors to look for clues regarding forward guidance.
EUR/JPY Levels to watch
The technical analysis of the daily chart points to a neutral to bearish outlook for EUR/JPY, indicating the potential for further bearish movement. The Relative Strength Index (RSI) signals a bearish sentiment with a negative slope below its midline, while the Moving Average Convergence (MACD) histogram presents larger red bars. Furthermore, the pair is below the 20-day Simple Moving Average (SMA) but above the 100 and 200-day SMAs, indicating that the buyers still hold momentum on the bigger picture, dominating the sellers.
Support levels: 156.60, 156.00, 155.00.
Resistance levels: 157.00, 158.25 (20-day SMA), 159.00.
EUR/JPY Daily Chart
-638300629341746898.png)
- BoE MPC member Catherine Mann suggests it’s too soon to end the tightening cycle.
- Upcoming UK employment report and US inflation data could be key drivers for the pair.
- BoJ Governor Kazuo Ueda’s hawkish comments also influence the market sentiment.
The Pound Sterling (GBP) posts modest gains versus the US Dollar (USD) late on Monday’s North American session after seesawing in an 80-pip range, though it stays afloat above the 1.2500 figure. The GBP/USD is trading at 1.2510, gains 0.37%.
Pound gains modestly against the US Dollar, buoyed by improved market sentiment and comments from BoE's Catherine Mann
The GBP/USD recovered some ground amidst an improvement in market sentiment spurred by upbeat economic data from China and hawkish comments by the Bank of Japan (BoJ) Governor Kazuo Ueda. Ueda stated the BoJ would look to end its ultra-loose monetary policy quietly and added the BoJ would end the period of negative rates if there’s a shift in data.
In the meantime, the Bank of England (BoE) MPC member Catherine Mann stressed that it’s too soon for the BoE to end its tightening cycle and added that she “would rather err on the side of over-tightening” than the opposite. Mann said she wouldn’t hesitate to cut rates if the BoE overshoots.
Interest rate probabilities show the BoE’s chances for a 25 bps rate hike at 79%, ten days before Andrew Bailey and Co. release their decision. Following their decision in September, money market futures expect no more rate increases compared to last week’s projections, with swaps pricing in 20 bps of increases for March 2024.
Although it should be positive for the GBP/USD exchange rate, the August UK employment report on Tuesday could shift the pair’s direction. The projections foresee a mixed report, with the labor market expected to contract by -80Kj obs, while the Unemployment rate would tick higher.
Recently, a New York Fed Poll showed that Americans are seeing inflation a year from now at 3.6%., up from July 3.5%, while forecasts for three years dropped to 2.8% vs. 2.9% on the previous poll. The same survey indicated that households struggle to access credit, and predicted it would be more challenging in the months ahead. Given that backdrop, it could be a prelude to retail sales, which would be revealed late in the week.
On the US front, the US economic agenda would feature inflation data, which is expected to climb above July’s numbers, except for the core Consumer Price Index (CPI), at 4.3% YoY, down from 4.7%. Any upward surprises in the data could trigger a reaction by the US Federal Reserve, which is expected to keep rates on hold for the September meeting.
GBP/USD Price Analysis: Technical outlook
From a technical standpoint, the GBP/USD reversed its downtrend shy of challenging the 200-day Moving Average (DMA) at 1.2426 and rose above the 1.2500 figure. However, the lack of strength to lift prices toward the June 20 daily low turned resistance at 1.2590, leaving the pair at a brisk for further downside. A drop below 1.2500 could expose the 200-DMA, followed by the 1.2400 figure.
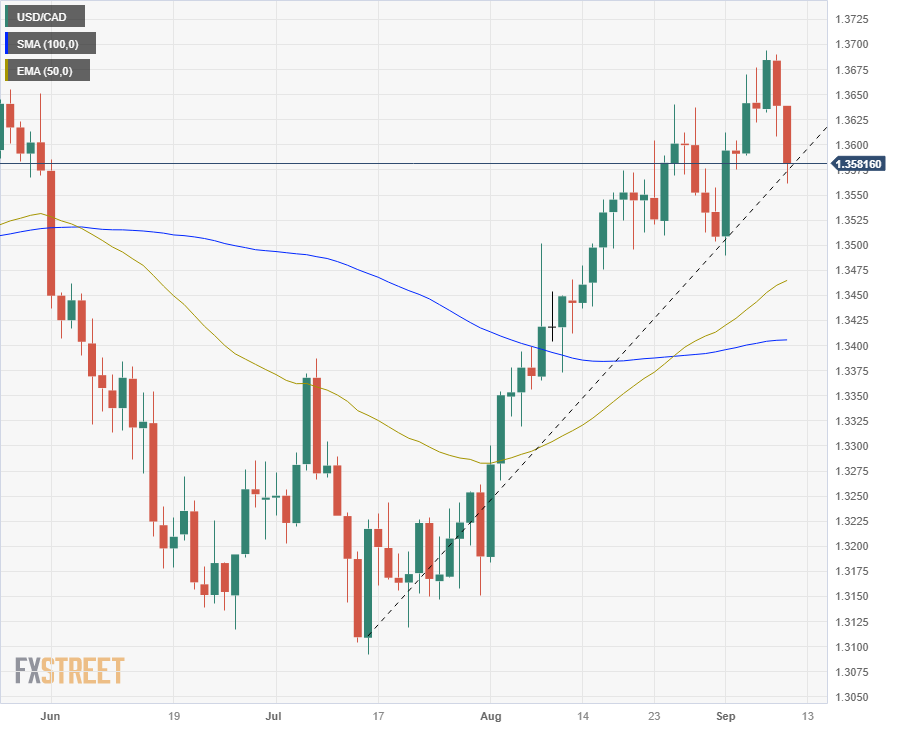
- The USD/CAD is seeing a sell-off on possible profit-taking volumes.
- Resistance is being provided by a rising trendline on daily candles.
- Rising oil prices on supply constraint worries providing a floor on extended Loonie losses.
The USD/CAD pair has taken a step lower for Monday, slipping from 1.3640 into the 1.3580 level, with the Greenback (USD) on the back foot as the USD gives up some of its recent gains across the broader market.
Monday has been a light day for major market catalysts on the US Dollar side, but recent bouts of risk-off market sentiment that sent investors scurrying into the Greenback on global economy concerns could be seeing some profit-taking.
The week is far from over, however, and Wednesday will see US Consumer Price Index (CPI) data dropping on mid-week markets. Headline CPI for the month of August is forecast to come in higher at 0.5% compared to the previous read of 0.2%, representing an uptick in inflationary pressures, while the core CPI figure for the same figure is forecast to hold steady at 0.2%.
Oil prices rise as supply concerns evolve, could support CAD as trading week continues
The Loonie (CAD) has been supported by bolstered crude oil prices of late, with extended oil production cuts from both Russia and Saudi Arabia extended into the end of the year, and continued oil supply constraint concerns are building a hard floor underneath the CAD.
Despite this, the USD/CAD pairing is holding on the upside for September, still well above the month’s opening prices near 1.3510. The Dollar-Loonie rate saw a firm lift into the 1.3690 region on soured risk appetite, but action is steadily declining into a comfortable zone near 1.3580.
USD/CAD technical outlook
Further upside will be capped by firm resistance from the 1.3600 major handle, while any extensions to the downside will see a bit of a support vacuum until facing a near-term floor at 1.3500.
USD/CAD 4-hour chart
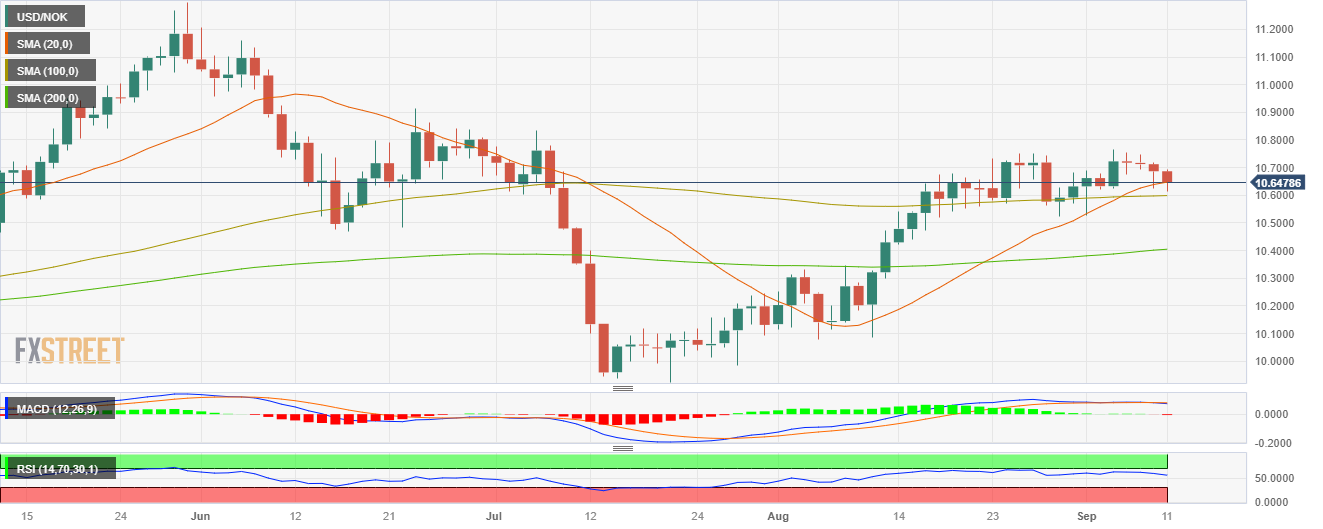
- USD/NOK fell below the 20-day SMA towards the 10.6150 area.
- Norwegian CPI from August came in soft.
- Investors await US inflation figures on Wednesday.
At the start of the week, the USD/NOK lost the 20-day Simple Moving Average (SMA) near 10.6150 and then settled around 10.6470. Despite Norway reporting soft inflation data, the pair movements are explained by a US Dollar (USD), which is experiencing weakness across the board.
After last week’s sharp gains, the US is tallying losses against most of its rivals, including the USD, JPY, EUR and GBP, and investors seem to be taking profits. No relevant data will be released during the session, and all eyes are on Wednesday’s Consumer Price Index (CPI) from August, which is expected to have accelerated. Regarding expectations on the Federal Reserve (Fed), markets already priced in a pause in next week’s meeting. However, the odds of one last hike remain high in November and December, according to the CME FedWatch tool.
On the NOK’s side, August’s CPI from Norway came in at 4.8% YoY, lower than the expected and previous figure of 5.4%. The Norges Bank stated in its last meeting that it still has more ground to cover and will likely hike in the September meeting and a hawkish stance may provide further cushioning to the Norwegian currency.
USD/NOK Levels to watch
Analysing the daily chart, it is apparent that the USD/NOK has a neutral to bearish technical stance, with the bears gradually recovering. The Relative Strength Index (RSI) points downwards in the bullish territory, suggesting a possible trend reversal, while the Moving Average Convergence (MACD) histogram presents rising red bars. Moreover, the pair is below the 20-day Simple Moving Average (SMA), but above the 100 and 200-day SMAs, indicating that the buyers still hold momentum on the bigger picture, dominating the sellers.
Support levels: 10.5900 (100-day SMA), 10.5000, 10.4000 (200-day SMA).
Resistance levels: 10.6500 (20-day SMA), 10.7000, 10.7500.
USD/NOK Daily Chart
- European equity markets see slight gains on Monday as risk appetite improves cautiously.
- London's FTSE index lags behind its European counterparts but manages to eke out a green printing.
- Mixed economic data continues to plague European risk sentiment, and the economic calendar represents an uphill climb.
European indexes are closing off their Monday trading sessions broadly higher on the day, though recent swings in risk sentiment have soured the potential for upside momentum.
FTSE lags European indexes, but chalks in a slight gain
London’s Financial Times Stock Exchange (FTSE) 100 index is mostly flat for Monday, ending the trading day near £7,513.00, only a few points above the day’s opening bids of £7,505.00. The day saw back and forth action that failed to generate meaningful moves in either direction as United Kingdom (UK) equities grapple with a dovish Bank of England (BoE) mired in softening economic data for the UK economy.
Across the Channel, European markets were notably firmer, with the Eurostoxx 50 blue chip index and Germany’s DAX index both closing higher for the day. The Eurostoxx 50 opened the day near €4.240.00, reaching an intraday high of €4,279.00 before ending the trading day nearby at €4,264.00.
Germany’s DAX saw similar upside momentum, opening at €15,743.00 and reaching a peak of €15, 851.00 in early Monday trading before giving up half the day’s gains to settle near the €15,800.00 level.
European equities will be looking to establish a foothold and mount moves higher after succumbing to declines in broader market sentiment in recent weeks. However, the upside sees increasing difficulties as resistance levels consolidate just above.
Eurostoxx 50 technical outlook
The Eurostoxx 50 index sees a grouping of resistance levels from late August’s peak near €4,340.00, and risk-off flows saw the index slump to familiar lows near €4,180.00. Things are currently hung in the middle as bulls and bears fight to a standstill at familiar levels that have plagued the index for seven months.
Eurostoxx 50 chart

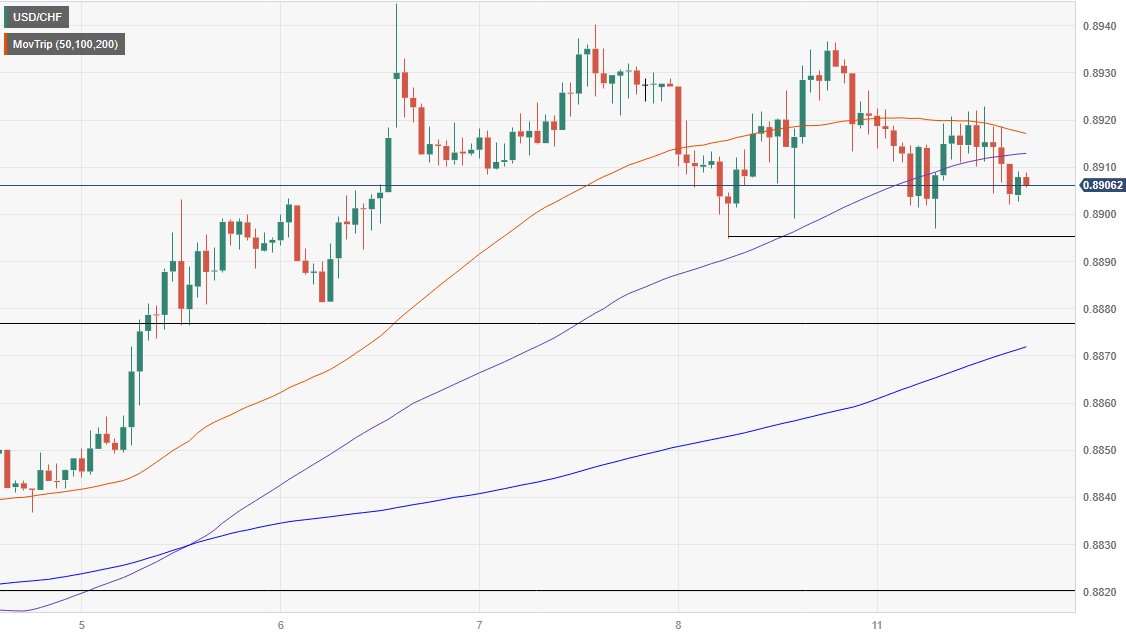
- USD/CHF trades at 0.8908, unable to break the 0.9000 level.
- 50 and 200-day Moving Averages (DMAs) indicate a lack of trend, staying flat at 0.8774 and 0.9048, respectively.
- Short-term, technical outlook suggests a neutral to bearish bias, with key support level at around 0.8900.
The Greenback (USD) losses ground versus the Swiss Franc (CHF) after developments during the Asian session weakened the former. China’s positive data, mainly inflation back at positive territory, and hawkish words from the Bank of Japan (BoJ) Governor Kazuo Ueda spurred USD weakness. Hence, the USD/CHF is trading at 0.8908 after hitting a daily high of 0.8926.
USD/CHF Price Analysis: Technical outlook
During the last four trading days, the USD/CHF has remained at around the 0.8900 figure, unable to threaten the 0.9000 figure, as volatility keeps the pair consolidating at around a 40 pip range. It should be said the 50 and 200-day Moving Averages (DMAs) turned flat, with the former below price action at 0.8774, while the latter stays at a bearish position at 0.9048, indicating the lack of a trend. However, price action shows a higher series of peaks and throughs but at the expense of an increase in volatility that could break the trading range.
The USD/CHF one-hour chart portrays the pair as neutral to bearish biased, as price action sits below the 50-hour Simple Moving Average (SMA) at 0.8916. However, to reinforce the bias, sellers must crack the September 8 daily low of 0.8895 to challenge the next support area, seen at the September 6 daily low of 0.8881. Once cleared, the next stop would be the 200-hour SMA at 0.8871, followed by the September 5 low of 0.8819. Contrarily, the first resistance is seen at the 50-hour SMA at 0.8916, followed by the September 8 daily high of 0.8936.
USD/CHF Price Action – Hourly chart
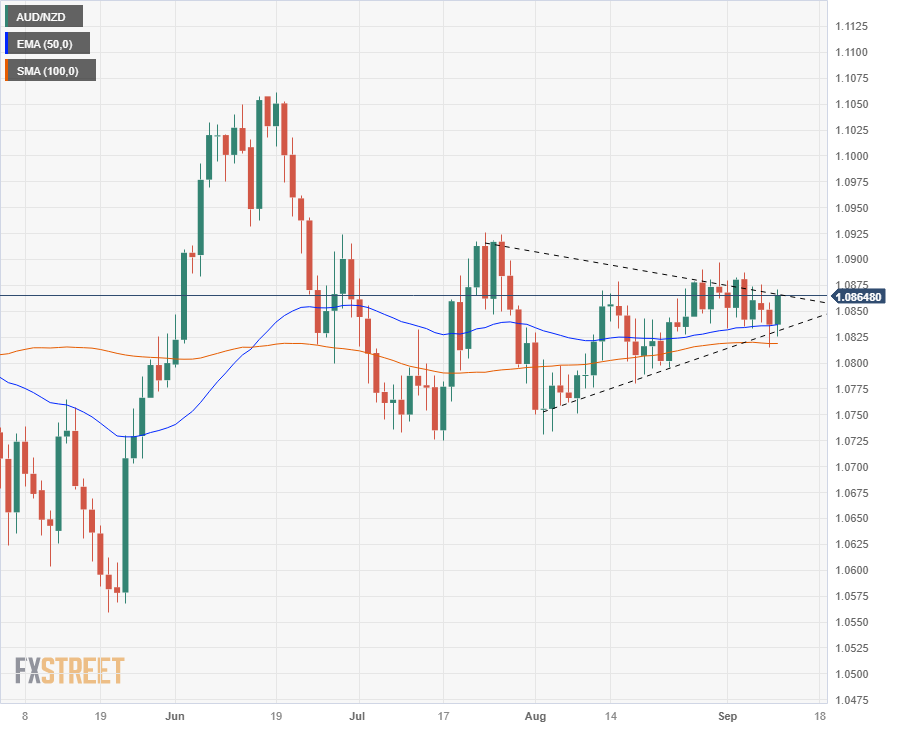
- The Aussie is shifting higher after China bullies markets on CNY speculation.
- Upside capped by recent downswings, but there's room to run if sentiment holds.
- Australian unemployment data in the mid-week could help or hurt depending on market sentiment.
The AUD/NZD caught a bump on Monday, trading into the 1.0870 region after kicking the trading week off near 1.0840. The Aussie (AUD) has caught a minor lift back into familiar territory after drifting to a medium-term low near 1.0820 late last week, getting bolstered by improving risk sentiment from China.
Chinese authorities are hitting markets with strong talking points early in the week, essentially warning market participants that they should “voluntarily maintain a stable market” and avoid excessive speculation trading.
Aussie getting dragged higher by up-step from China
The Renminbi (CNY) saw a much stronger fix than usual, and the upside momentum for the Chinese currency is dragging the Aussie higher, with Australia taking pride of place as China’s largest trading partner.
Things are light on the Kiwi (NZD) side, and changes in market dynamics will rest firmly in the hands of AUD traders for the week. The data point of note for the Aussie this week will be unemployment figures due on Wednesday, which markets are broadly expecting to hold steady at 3.7%.
AUD/NZD technical outlook
The Aussie-Kiwi pairing is holding steady in consolidation territory just below the 1.0880 level, but the floor has been sagging in recent days, and each downturn for the AUD sees fresh lows. Chart action is now tapping into a declining trendline baked into the 4-hour candles, and a turnaround from this region will see new bearish challenges of the 1.0820 handle.
On the bullish side, a fresh break to the high side will see significant action around the 1.1000 major psychological level, a region from which the Aussie faced rejection seven weeks ago. Meanwhile, a rough wedge on the daily candles is running aground of consolidating support from the constrained 50-day EMA and 100-day SMA.
AUD/NZD 4-hour chart
- Positive inflation data from China, Australia’s largest trading partner, lifts the Aussie Dollar.”
- Bank of Japan Governor Kazuo Ueda hints at ending negative interest rates, weakening the US Dollar and boosting the AUD.
- Upcoming Australian economic data includes Westpac Consumer Confidence and NAB Business Confidence.
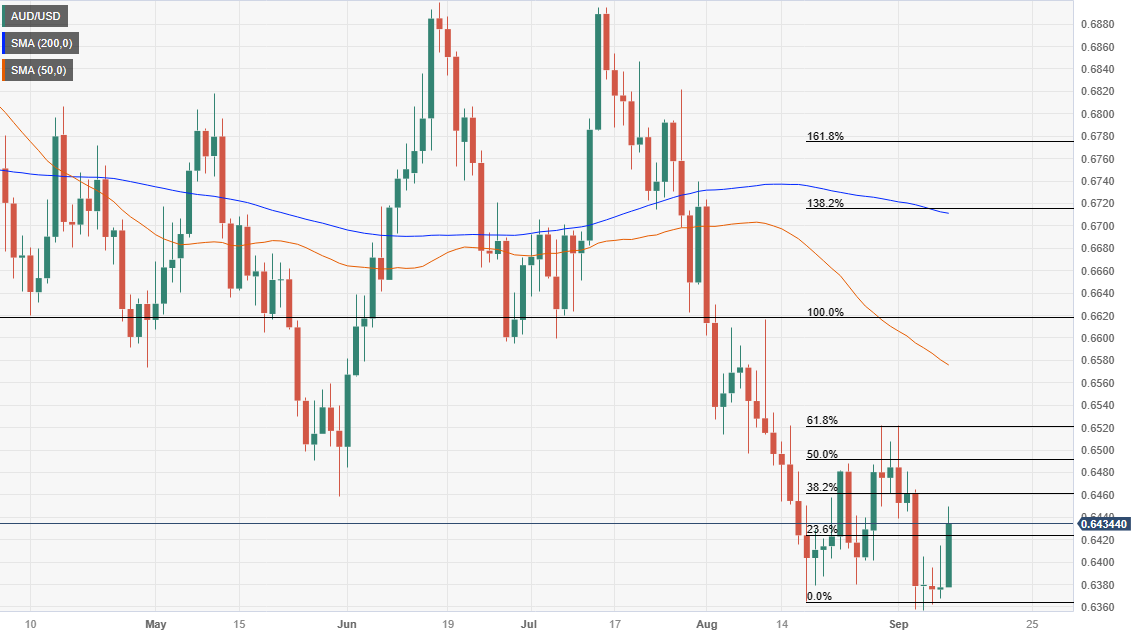
The Australian Dollar (AUD) climbs sharply against the US Dollar (USD) during the North American session on positive news from China ahead of Aussie’s economic data release. That, alongside a risk-on impulse, keeps the AUD/USD trading with gains of 0.97%, exchanging hands at 0.6436 after hitting a daily low of 0.6376.
Australian Dollar gains nearly 1% against the US Dollar as upbeat Chinese inflation data and a risk-on market mood boost the currency
The Greenback retraces on Monday due to an upbeat market mood, but also on comments from a top official of the Bank of Japan (BoJ). That and China’s data portraying the economy as exiting from a deflationary scenario spurred a rally in global equities.
BoJ Governor Kazuo Ueda hinted the BoJ could finish its era of negative interest rates, spurring a reaction on Japanese Yen (JPY) shorts, weakening the US Dollar, and sparking JPY gains by close to 1%.
Aside from this, the Aussie Dollar (AUD) was bolstered by China’s inflation report, with the Consumer Price Index (CPI) for August expanding by 0.1% YoY following a -0.3% number in July, while on a monthly basis, raised more than July’s data.
It should be said that amid the lack of economic data revealed by Australia and the United States (US), China is Australia’s largest trading partner and usually weighs on the former due to that condition. Even though Chinese authorities increased stimulus, the People’s Bank of China. (PBoC) cut interest rates; the economy remains weaker as the services sector continues deteriorating.
Therefore, upbeat developments in China could underpin the Australian Dollar (AUD), which is sensitive to the former economic developments.
The Australian economic agenda would feature consumer and business confidence. The Westpac Consumer Confidence is expected at 0.6% in September. The NAB Business Confidence is foreseen to dip to 1 in August, up from a -2 contraction in July. On the US front, the release of the Consumer Price Index (CPI) for Wednesday, August, would be crucial. Headline inflation is expected to rise above July’s numbers, contrary to core CPI, which is expected to contract further.
If US inflation comes hotter than expected, that would be positive for the USD and negative for the AUD, as it would suggest the Federal Reserve needs to tighten monetary policy. Estimates for the upcoming September meeting remain unchanged, but for the November meeting, chances for higher interest rate increases.
AUD/USD Price Analysis: Technical outlook
From a daily chart perspective, the AUD/USD is ongoing an upward correction after diving toward a year-to-date (YTD) low of 0.6357, but it would need a daily close above the prior week’s high of 0.6521 if buyers would like to remain hopeful of higher prices. A breach of the latter would expose the confluence of the March 10 low and the 50-day Moving Average (DMA) at around 0.6564/74, followed by the 0.6600 figure. Conversely, sellers would extend their losses once they challenge the YTD lows.
- EUR/USD rose to a four-day high of 1.0755.
- ECB’s tightening expectations remain steady ahead of Thursday’s ECB decision.
- Eyes are set on Wednesday’s CPI figures from August from the US.
At the start of the week, the EUR/USD soared towards the 1.0755 area, seeing more than 0.50% gains and then settled near 1.0745. On the one hand, the USD is retreating and trades with losses against most of its rivals while investors are gearing up for Wednesday's Consumer Price Index (CPI) figures from August. On the Euro’s side, investors await Thursday’s European Central Bank (ECB) decisions, where markets discount low odds of a hike.
Recent data from the US showed a mixed labour market outlook with accelerating job creation but wage inflation declining. In contrast, economic activity has shown weakness in the manufacturing sector but a strength in the services area. In addition, despite investors already warranting a pause in next week's Federal Reserve (Fed) meeting, inflation figures from August will be crucial for investors to continue modelling their expectations. The headline CPI is expected to have increased by 0.2% MoM while the Core measure by 0.5%, and hot inflation reading may boost hawkish bets for the November and December meetings.
On the other hand, the Euro is trading soft against most of its rivals ahead of Thursday’s ECB decisions. According to a Bloomberg report, a slight majority of 55 analysts polled are seeing a pause, with 25 seeing a 25 basis point hike. Looking ahead, the chances of a 25 bps increase stand at 60% in the October meeting, followed by a 70% likelihood of a similar increase in December. Investors will closely watch Christine Lagarde’s tone on Thursday and the bank’s statement to look for clues on the next decisions.
EUR/USD Levels to watch
Based on the daily chart, EUR/USD maintains a neutral to bearish technical perspective, suggesting that despite the bulls gaining momentum, the bears are in control. The Relative Strength Index (RSI) holds a positive slope deep in negative territory, while the Moving Average Convergence (MACD) presents stagnant red bars. Moreover, the pair is below the 20,100 and 200-day Simple Moving Averages (SMAs), indicating that the bears are still in command of the broader picture.
Support levels: 1.0700, 1.0680, 1.0650.
Resistance levels: 1.0800, 1.0810-20 (200 and 20-day SMA convergence), 1.0850.
EUR/USD Daily Chart
-638300491564815187.png)
- The EUR/GBP sees recovery from early Monday’s slide, but progress remains limited.
- UK wages, unemployment data to pluck away at the GBP for the early week.
- ECB rate call on the cards will cap the week off with volatility if comments or actions surprise.
The EUR/GBP pairing continues to look for a foothold on the charts, but this week brings key United Kingdom (UK) data and a critical rate call from the European Central Bank (ECB). Showings for both currencies threaten to keep the EUR/GBP pair hamstrung as sentiment drifts back and forth between the two.
UK data coming into view, ECB rate call ahead
The UK faces wage growth, unemployment, and industrial activity figures for the first half of the trading week. Wage figures, while slowly declining, remain elevated. The UK’s Chancellor of the Exchequer Jeremy Hunt noted over the weekend that the Bank of England (BoE) is facing stickier inflation than they previously forecast.
Stubborn inflation issues are partly driven by elevated wage growth, and if figures remain too high for too long it could mire the BoE, making an outright dovish or hawkish stance difficult to maintain.
On the Euro side of the data calendar, the ECB is slated to publish its latest rate call during Thursday’s market session. Market participants are increasingly convinced that the rate hike cycle has peaked in Europe, despite hawkish jawboning from ECB officials recently.
Market forecasts broadly anticipate the ECB to stand pat on rates for September’s meeting, though any nasty surprises from the ECB could throw markets for a loop.
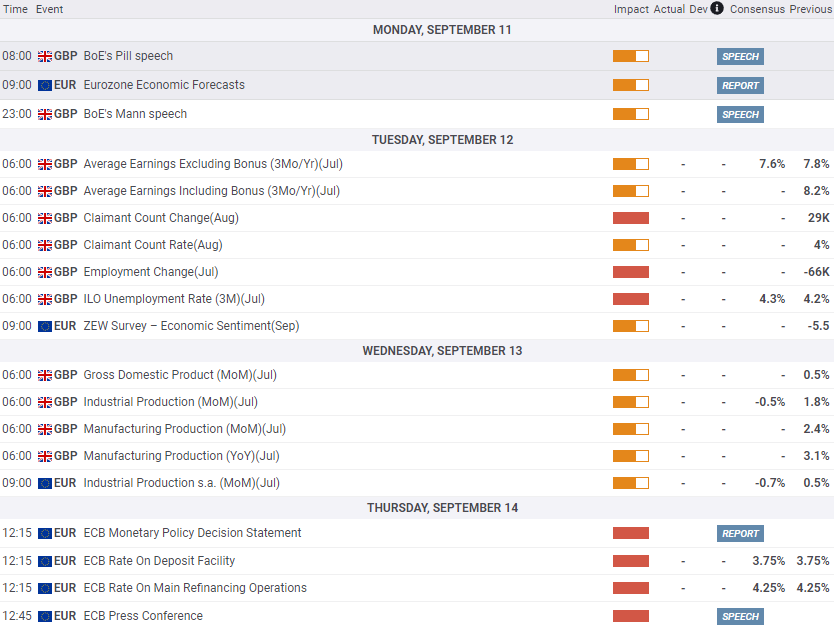
UK-EU economic calendar, Monday through Thursday. All times GMT.
EUR/GBP technical outlook
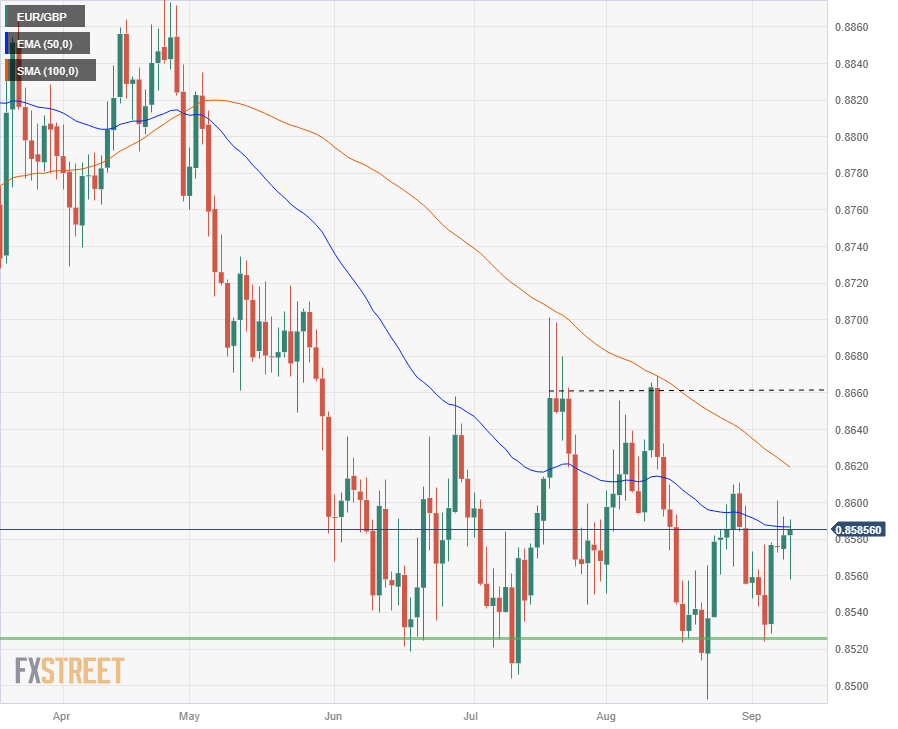
The Euro (EUR) is looking for a leg up against the Pound Sterling (GBP) in the markets today, trading into a session high of 0.8587. The pair started the trading week on a decidedly softer tone, with the Euro declining to 0.8558 before facing a rally on the back of a waffling GBP.
Longer-term, the pair is looking decidedly constrained, with the EUR/GBP trading into familiar territory for the past three months. The pair refuses to decline any further, marking its territory above the 0.8500 handle, but resistance from a declining 50-day EMA at 0.8585 is capping upside momentum.
EUR/GBP daily chart
- The GBP/JPY sees challenges as the Pound Sterling and Yen play tug-of-war on the charts.
- GBP to feature heavily on the economic calendar for this week, BoJ comments keeping the Yen strung up.
- Market reactions to data will set the direction for the Guppy after weekend BoJ policy statements rile things up.
The GBP/JPY pairing is set to finish the day nearly where it started after Monday market flows saw the Guppy trade back-and-forth on shifting sentiment.
Pound Sterling (GBP) traders are positioning themselves ahead of a United Kingdom (UK) data-heavy economic calendar for the first half of the week, and the Yen (JPY) is finding broad-market support following weekend comments from Bank of Japan (BoJ) officials hinting at the end of negative rates for Japan.
UK data to feature heavily through Wednesday
The GBP will be facing off against the economic calendar through Tuesday and Wednesday; economic data has struggled to meet market expectations as of late, prompting routine sell-offs for the Pound Sterling across the board as data points for the UK’s economy continue to wallow on the low end, prompting particularly dovish showings from the Bank of England (BoE) of late.
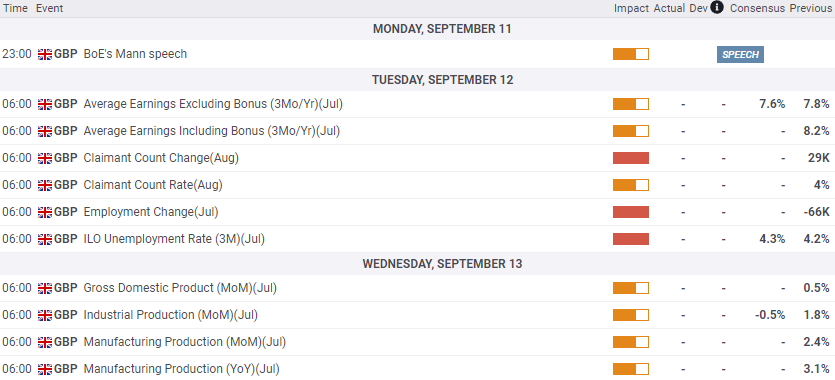
Tuesday will see wage growth and unemployment figures, with Wednesday bringing Gross Domestic Product (GDP) numbers, alongside manufacturing and industrial performance.
The UK’s Chancellor of the Exchequer Jeremy Hunt hit the wires on Monday, noting that the UK faces stickier inflation than previously forecast. Due in no small part to still-high wage growth figures, which are expected to show only mild declines this week.
Elsewhere on the docket, Unemployment Rate and Manufacturing figures are expected to worsen, albeit slightly.
GBP economic calendar events, Monday through Wednesday. All times GMT.
The BoJ’s Governor Kazuo Ueda paved the way for speculation about the end of the Japanese central bank’s negative interest rate policy while making comments over the weekend.
During an interview with Yomiuri Shimbun newspaper, Governor Ueda made it very clear that any changes in the BoJ’s rate policy will depend on data showing the BoJ is approaching its 2% inflation target.
This follows soft comments from other BoJ officials last week, meant to target the Yen and discourage further declines in the Japanese currency in an echo of similar activities around this time last year that saw the Japanese central bank conducting open market operations to defend the declining Yen. Prior to that, the BoJ had not conducted open currency market operations since the late 90s.
GBP/JPY technical outlook
Current action sees the Guppy trading into the middle where markets kicked off on Monday, reaching an intraday low of 182.68 before recovering to make a run to 183.90, and is currently settling somewhere in the middle ground.
The Pound Sterling may have finally slipped the 184.00 major handle, a significant psychological level in recent trading history, and a continued slide down will see the GBP/JPY pair challenging old support levels from 181.00 to 180.00. On the bullish side, a fresh break upwards will see challenges from 185.60 to 186.60.
GBP/JPY Daily chart
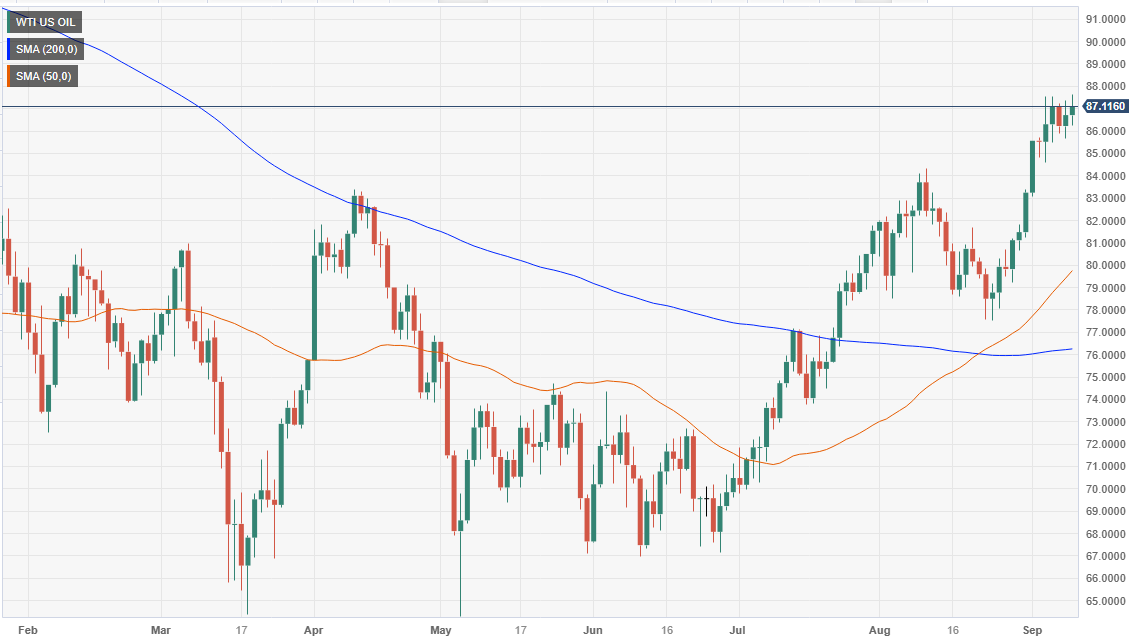
- WTI trades at $86.62, bolstered by Saudi Arabia and Russia’s commitment to cut production by 1.3 million barrels until year-end.
- Positive economic data from China and potential end of negative interest rates in Japan support oil prices.
- Upcoming US CPI data could influence WTI prices, as they may signal further rate hikes.
Western Texas Intermediate (WTI), the US crude oil benchmark, remains steady at around yearly highs on supply oil cuts, while recent data from China painted a positive outlook in the global second largest economy. WTI is trading at $86.62 after hitting a daily high of $87.61.
US crude oil benchmark remains buoyant as Saudi-Russian supply cuts and upbeat Chinese economic outlook offset potential headwinds from central banks
Oil prices will likely remain underpinned by the supply cuts established by Saudi Arabia and Russia, which committed to slashing production by 1.3 million barrens combined until the end of the year.
Meanwhile, upbeat economic data from China from a deflationary scenario improved investors’ sentiment toward its economic recovery, a tailwind for global oil prices. That, alongside words from the Bank of Japan (BoJ) Governor Kazuo Ueda mentioning a possible end for negative interest rates, underpinned the US Dollar, which is downward pressured, changing hands below the 105.00 figure, as reported by the US Dollar Index (DXY).
Another factor that keeps the WTI price afloat is storms and floods in Eastern Lybia, which triggered the closure of four major oil export ports since Saturday.
In the meantime, a tranche of macroeconomic data could dent oil’s demand, as a major central bank and inflationary data from the US could warrant further tightening is needed. The European Central Bank (ECB) will announce its monetary policy decision on Thursday. A day earlier, the US would reveal the Consumer Price Index (CPI), which could undermine WTI price on expectations for additional rate hikes by the US Federal Reserve if it comes above estimates.
Aside from this, data from the International Energy Agency (IEA) and the Organization of the Petroleum Exporting Countries (OPEC) is due this week. Last month, the former cut its 2024 oil demand growth to 1 million barrels per day, while OPEC kept its 2.25 million barrels per day demand growth projection unchanged.
WTI Price Action – Daily chart
WTI Key Technical Levels
- XAG/USD jumped back above $23.000 and hit a daily high of $23.15
- The USD is trading softer, but US yields remain high.
- All eyes are now on Wednesday’s US CPI from August.
On Monday, precious metals are recovering ground after seeing sharp losses last week, with the Gold and Silver prices seeing daily gains. The XAG/USD stands at $23.00 and failed to maintain its momentum, which took the price to $23.15, depicting that the bears have the upperhand and limit any attempt of the buyers to make a significant upward movement.
A softer USD consolidating last week’s gains could explain the daily advance. However, US Treasury bond yields, often seen as the opportunity cost of holding non-yielding metals, are rising ahead of Wednesday’s inflation figures from the US and limiting the upside for the grey metal. Markets expect that inflation accelerated in August, with the Headline and Core Consumer Price Index (CPI) advancing by 0.5% and 0.2% MoM, respectively.
In line with this, the 10-year bond yield reached 4.29%, up by 0.87%. The 2-year yield stands neutral at 4.99%, while the 5-year yield rose to 4.42%, seeing 0.48% gains. It's worth noticing that US yields remain high as, according to the CME FedWatch tool, markets are discounting high odds of one last hike by the Federal Reserve (Fed), and as long as hawkish bets are high, the upside potential for metals is limited.
XAG/USD Levels to watch
Based on the daily chart, a bearish stance is noted for XAG/USD in the short term. The Relative Strength Index (RSI) is comfortably situated in negative territory below its midline, displaying a southward slope. In addition, the presence of red bars on the Moving Average Convergence Divergence's (MACD) histogram further reinforces the strengthening bearish sentiment. On the other hand, the pair is below the 20,100 and 200-day Simple Moving Averages (SMAs), and cofirms the continued dominance of bears on a broader scale.
Support levels: $22.60, $22.30, $22.00
Resistance levels: $23.50 (20 and 200-day SMA convergence), $23.70, $24.00.
XAG/USD Daily Chart
-638300437923837729.png)
The recent decline of the GBP/USD pair was driven mostly by US Dollar strength rather than the decline in Bank of England rate hike expectations, noted analysts at Rabobank. They see scope for the pair to slide toward 1.23 on a three month perspective.
Key quotes:
While GBP was impacted last week by the decline in rate hike expectations, we would argue that it is USD strength which has been the real force behind the softer tone in cable in recent weeks. The USD is the best performing currency on a 1-month view on the back of the resilience of the US economy and the suspicion that the Fed will have to maintain higher rates for longer.
Slower growth in China and in Europe is bad news for risk appetite. This too is USD supportive. We expect the USD to remain well positioned on a 3-to-6-month view until the market begins to look ahead to Fed rate hikes. This suggests that cable is likely to struggle to regain recovery lost ground. We forecast cable at 1.23 in 3 month and at 1.24 in 6 months.
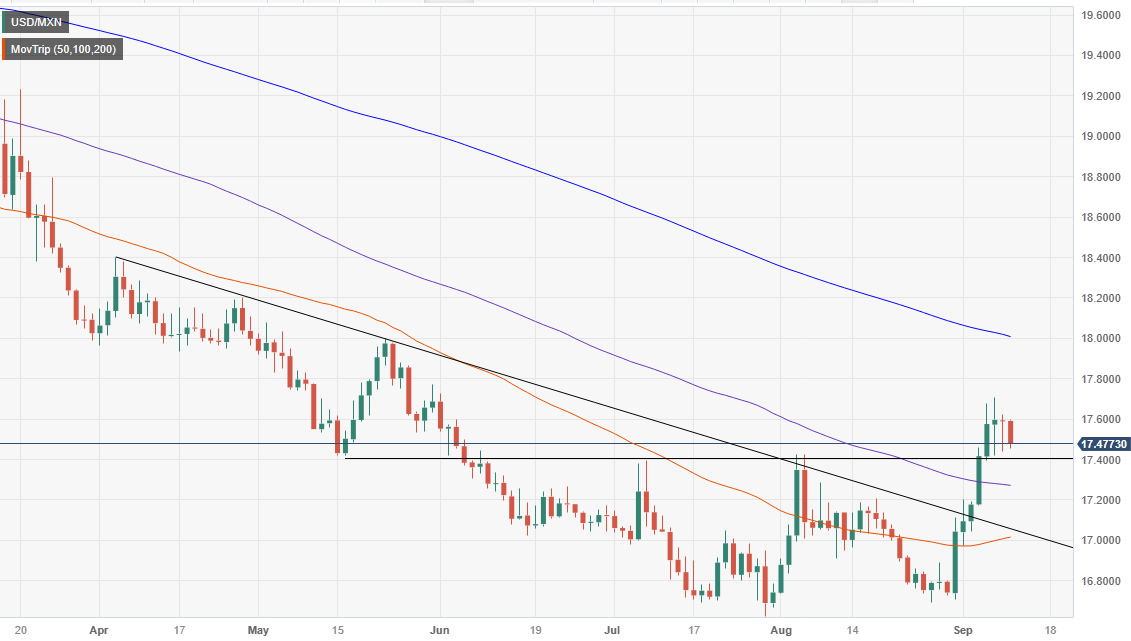
- USD/MXN drops 0.71% to 17.4624, influenced by a softer US Dollar Index, which declines 0.49% to 104.530 despite rising US bond yields.
- Mexican Industrial Production shows modest growth, while Finance Ministry’s optimistic GDP projections draw skepticism.
- US CPI data for August in focus, expected to rise YoY, potentially reinforcing the Fed’s ‘higher for longer’ rate stance.
The Mexican Peso (MXN) took advantage of a softer US Dollar (USD) on Monday, ahead of the release of inflation figures in the United States (US). The exchange rate traveled as high as 17.5927 before retracing on investors seeking risk. That and Asian central banks propelling their local currencies weakened the USD. The USD/MXN is trading at 17.4624, down 0.71%.
Mexican Peso gains ground against a weakening US Dollar as investors await key US inflation data and weigh Mexico’s economic outlook
Comments by the Bank of Japan (BoJ) Governor Kazuo Ueda prompted investors to close short positions on the Japanese Yen (JPY), spurring weakness on the Greenback. Also, China’s strict scrutiny on US Dollar buying by domestic companies was capped under $50 million, with purchases at or above that amount requiring approval by the People’s Bank of China (PBoC) central bank.
Consequently, the US Dollar Index (DXY), which measures the buck’s performance against a basket of peers, drops 0.49% and sits at 104.530, a headwind for the USD/MXN. This is despite the recent uptick in US bond yields, with the 10-year benchmark note rate gaining three basis points at 4.296%.
Meanwhile, data from Mexico showed that Industrial Production rose by 4.8% in July, a tick lower than the upward revised June figures at 4.9% YoY, while on a monthly basis, decelerated to 0.5% from 0.6% in June.
In other news, the Mexican Finance Ministry projects Mexico to grow between 2.5% and 3.5%, seen as optimistic by analysts. Sources quoted by El Financiero said the forecast is far from the 1.7% consensus and 1% above the Bank of Mexico (Banxico) 2.1% projection.
The economic package in Mexico for 2024 proposes an increase in the fiscal deficit from 3.3% to 4.9% of GDP in 2023, the largest negative balance in 36 years. An analyst cited by El Financiero said, “It is irresponsible to project a deficit, especially when the economy is growing.”
Aside from this, the US economic agenda is scarce on Monday, but it would gather pace on Wednesday with the release of the Consumer Price Index (CPI) for August. Data is expected to rise compared to July’s numbers, meaning the US Federal Reserve (Fed) would need to keep rates higher for longer. The consensus estimates the CPI to rise 3.6% YoY from 3.2% in July. Core CPI is foreseen to slow from 4.7% to 4.3%
USD/MXN Price Analysis: Technical outlook
After printing three consecutive sessions failing to crack above 17.8000, the USD/MXN is retreating toward the September 8 low of 17.4380, which could pave the way for further losses once broken. The 100-day Moving Average (DMA) at 17.2658 emerges as the next support, followed by the 20-DMA at 17.0967 and the 50-DMA at 17.0084. Conversely, if the pair stays above 17.4400, expect further consolidation within the 17.3912-17.7074 before fundamental news triggers a range break.
Catherine Mann, member of the Bank of England’s Monetary Policy Committee, said on Monday that overtightening is easier to fix than not moving interest rates. She added that underestimating the persistence of inflation will lead to overshoot.
Mann delivered a speech at the Canadian Association for Business Economics. She explained that the idea that 3% inflation is close enough can not be the guide for the BoE.
Key takeaways from the speech:
To pause or to hold the policy rate lower for longer risks inflation becoming more deeply embedded, which would then require more tightening in total, to both change inflation itself and to wring-out the embedded inflation that comes from the sustained duration above target. This is why I would rather err on the side of over-tightening. But, if I am wrong, and inflation decelerates more quickly and activity deteriorates more significantly, I will not hesitate to cut rates.
It’s a risky bet that inflation expectations are sufficiently well-anchored and to wait for core inflation to ease down, as this extends the duration way above the target-consistent rate. We need to prepare for a world where inflation is more likely to be volatile in the future, and the neutral nominal rate is likely to be higher than in the past. While these might support a “3% inflation is close enough”, popular in some circles, it cannot be our guide. We need to communicate and act on our commitment to do what is necessary to achieve the 2% target, sooner rather than later.
Market reaction
GPB/USD is trading at the highest level in five days above 1.2500, supported by a weaker US Dollar across the board.
- EUR/USD defends the immediate support of 1.0700 amid a risk-on mood.
- The ECB is expected to keep interest rates unchanged this month due to a weak economy and declining inflation.
- EUR/USD trades in a Symmetrical Triangle chart pattern, which indicates a volatility squeeze.
The EUR/USD pair managed to defend the round-level support of 1.0700 on Monday. The major currency pair broadly struggles for a decisive move as investors await the United States Consumer Price Index (CPI) data for August, which will be published on Wednesday at 12:30 GMT.
S&P500 opens on a bullish note amid a cheerful market mood as investors shift focus to the context that the Federal Reserve (Fed) would not raise interest rates in the remaining year. The US Dollar Index remains under pressure after a nominal improvement in China’s inflation.
On the Eurozone front, investors remain uncertain about the interest rate decision by the European Central Bank (ECB) for September monetary policy. Analysts at Commerzbank a majority of the ECB council members will probably vote for unchanged key rates due to the weak economy and the downward trend in the inflation rate.
EUR/USD trades in a Symmetrical Triangle chart pattern on an hourly scale, which indicates a volatility squeeze. The downward-sloping trendline is plotted from September 6 high at 1.0749 while the upward-sloping trendline is placed from September 7 low at 1.0686.
The shared currency pair remains closer to the 20-period Exponential Moving Average (EMA) at 1.0725 for the past three trading sessions, portraying a sideways performance.
Meanwhile, the Relative Strength Index (RSI) (14) oscillates in the 40.00-60.00, demonstrating a directionless performance ahead of the US inflation data.
Fresh upside bias would appear if the asset delivers a breakout of the neutral triangle September 8 high at 1.0744. A decisive break would send the major toward the horizontal resistances plotted from September 4 high at 1.0809 and September 1 high at 1.0882.
In an alternate scenario, a breakdown below September 7 low at 1.0686 would expose the asset to May low at 1.0635. A slippage below the latter would expose the asset to the round-level support of 1.0600.
EUR/USD hourly chart
-638300382001887116.png)
Analysts at Rabobank see the Brazilian Real depreciating versus the US Dollar over the next months. The forecast USD/BRL at 5.05 by year-end.
Key quotes:
The gains of the BRL and other EM currencies start to dwindle as local central banks start their easing cycle while global interest rates are kept in restrictive mode. A market repricing of looming Fed cuts could erode carry-trade gains even further.
We see the USDBRL trading at 5.05 by end-2023 and 5.15 by end-2024.
IGP-DI accelerates and deflation period ends. IGP-DI general inflation advanced by 0.05% m/m in August, below our and the market's projections (market: 0.13%; Rabobank: 0.19%). Producer inflation back up after seven months. The producer inflation (IPA) component rose by 0.10% m/m (from -0.61% m/m in July). It is the first time IGP-DI posted a positive number in the year.
Next week, the Federal Reserve will have its monetary policy meeting. Market participants anticipate that the central bank will keep rates unchanged. Analysts at Wells Fargo also expect rates to remain unchanged, and they see the economic projections from FOMC members reflecting a more optimistic outlook for the US economy.
Key quotes:
We look for the FOMC to keep its target range for the federal funds rate unchanged at 5.25-5.50% at its meeting on September 20. Most market participants expect rates to remain on hold as well.
The FOMC will release its quarterly Summary of Economic Projections (SEP) at the conclusion of the meeting. We expect that the September SEP will portray a more optimistic outlook for the U.S. economy than the last SEP did in June. Specifically, we look for the FOMC to raise its forecast for real GDP growth this year while also nudging down its outlook for inflation.
We do not think the median dots for 2024 and 2025 will change much, if at all, though some of the highest dots may be reined in a bit.
- NZD/USD shifts auction comfortably above 0.5900 amid improved market sentiment.
- There is a nominal improvement in China’s inflation data but the overall outlook is still vulnerable.
- Investors anticipate that US headline CPI grew at a pace of 0.5% due to a rebound in gasoline prices.
The NZD/USD pair stabilized the auction above the round-level resistance of 0.5900 in the late European session. The Kiwi asset aims to extend upside as the market mood improves amid an ease in China’s deflation risks.
The monthly Consumer Price Index (CPI) expanded by 0.3% in August as expected by the market participants. The expansion pace remained higher than July’s reading of 0.2%. Annual inflation rose to 0.1% from the prior print of 0.3% contraction while investors projected acceleration to 0.2%. Prices of goods and services at factory gates remained in the deflationary phase at -3.0% as projected by investors but improved from July’s figure of -4.4%.
There is a nominal improvement in inflation data but the overall outlook is still vulnerable as households’ demand is quite slim due to slow job growth. Investors hope a series of economic stimulus support from the administration and the People’s Bank of China to boost growth prospects. Premier Li Qiang said this week that China is expected to achieve its 2023 growth target of around 5%.
Meanwhile, the S&P500 is expected to open on a bullish note, following positive cues from overnight futures. The appeal for risk-perceived assets improved while the US Dollar Index (DXY) faced selling pressure. The USD Index finds an intermediate cushion near 104.60 as investors shift focus to the United States inflation data for August, which will be published at 12:30 GMT.
Investors anticipate that US headline CPI grew at a pace of 0.5% due to a rebound in gasoline prices. While core inflation expanded at a steady pace of 0.2%. A surprise upside in the US inflation pace could elevate the odds of one more interest rate hike from the Fed in the remaining year.
- USD/CAD slips below 1.3600 despite nominal recovery in the US Dollar.
- Investors underpinned loonie against the greenback due to surprisingly upbeat Canadian labor market data.
- The market mood could turn cautious ahead of US inflation data, which will be published on Wednesday.
The USD/CAD pair corrects further below the round-level support of 1.3600 in the European session. The Loonie asset weakens despite a recovery attempt in the US Dollar Index (DXY). This demonstrates strength in the Canadian Dollar after upbeat Employment data for August and strength in the oil price due to the tight market.
S&P500 futures have added significant gains in the London session, portraying strength in the appeal for the risk-sensitive assets. Investors’ risk-taking ability improved after inflation in China for August month showed signs of stabilization.
The US Dollar Index (DXY) rebounds after discovering support near 104.50 as investors turn cautious ahead of the Consumer Price Index (CPI) for August, which is scheduled for Wednesday. Headline CPI is seen expanding at a higher pace of 0.5% vs. 0.2% pace, being recorded for July. Core inflation that strips off volatile food and oil prices is seen steady at 0.2%.
A surprise upside in the inflation pace could spoil the market mood and strengthen the US Dollar. Meanwhile, New York Federal Reserve (Fed) Bank President John Williams said last week that inflation is falling and the economy is better balanced, which indicates there is no urgency for an interest-rate increase this month.
The Canadian Dollar strengthened as the labor market data surprisingly outperformed expectations. The Canadian labor market witnessed 39.9K new payrolls in the overall laborforce in August, more than double the expectations of 15K. In July, the labor force witnessed a reduction of 6.4K payrolls. The Unemployment Rate remains unchanged at 5.5% while investors forecasted a higher jobless rate at 5.6%.
Annual Average Hourly Wages rose to 5.2% vs. the former release of 5.0%. Decent wage growth could elevate consumer spending momentum and keep inflationary pressures sticky. This could force the Bank of Canada (BoC) to raise interest rates one more time after pausing them in the last two policy meetings.
- The US Dollar tumbles, portrays a sea of red crosses against all major currencies.
- No focal data points on Monday, which means no catalysts for a turnaround.
- The US Dollar Index falls off its pedestal, finding support momentarily at 104.50.
The US Dollar (USD) tumbles lower this Monday after a surprise intervention from the People’s Bank of China (PBoC). The PBoC held a meeting in Beijing on FX markets and confirmed that it will prevent any “over-adjustment” risk in the Yuan. It fixed its Yuan at 7.2148 USD/CNY where 7.3391 USD/CNY was expected.
Although it will be a very calm Monday in terms of the calendar and no US Federal Reserve speakers scheduled, keep an eye on the US bond market. This Monday three different tenures are set to be auctioned. With plenty of supply to be issued in the markets, US yields might rise again. Remember that bonds are quoted in prices, while yields move inversely to that price. With more supply issued in the markets, prices can drop and yields rise, supporting a stronger US Dollar.
Daily digest: US Dollar two-faced
- Plenty of rumours in the FX markets abound on Monday on the possibility for the Japanese Central Bank (BoJ) to loosen its Yield Curve Control (YCC), which would see its bond yields soaring higher.
- The G20 meeting has not brought any significant headlines or breakthroughs, as most news outlets are focusing on the absence of Russia and China as a telling sign.
- The People's Bank of China (PBoC) has issued again a strong peg for its Yuan against the US Dollar. Additionally, it held a meeting in Beijing to outline an FX strategy in order to avoid speculation on a weakening Yuan. The comments spooked speculators and saw the Yuan strengthening near 1% against the US Dollar.
- In the fallout of those earlier PBoC comments, meeting and fixing, the Greenback lost over 1% as well against the Australian Dollar (AUD/USD) and the Japanese Yen (USD/JPY).
- Equities are looking for direction with no real notable outliers to mention. The only element to mention are the US Nasdaq futures, which are up over 50% in pre-trading.
- The CME Group FedWatch Tool shows that markets are pricing in a 93% chance that the Federal Reserve will keep interest rates unchanged at its meeting in September.
- The benchmark 10-year US Treasury bond yield trades at 4.28% and is steeping again. The same story looks to continue this week with the US Treasury issuing a lot more debt, which causes prices to drop and yields to soar.
US Dollar Index technical analysis: Soft landing
The Greenback is taking a firm step back after falling over 1% against the Yuan, Yen and Australian Dollar. The overall cross for the Greenback is blood red for all its G20 major peers. Nonetheless, the sell-off in the US Dollar Index is notable but remains contained and might ease once the US session opens this week.
The new high to watch is at 105.16, both the high from last Thursday and the six-month high. The US Dollar Index first needs to gain back its lost territory from this Monday and break above the peak of Thursday mentioned here before. From there, the next high is at 105.88, the high of 2023.
On the downside, the 104.50 level already provided support ahead of 104.44. That is the high of August 25th and should act as a pivotal level. Once that gives way, a substantial downturn could take place to 103.03, where the 200-day SMA comes into play for support.
US Dollar FAQs
What is the US Dollar?
The US Dollar (USD) is the official currency of the United States of America, and the ‘de facto’ currency of a significant number of other countries where it is found in circulation alongside local notes. It is the most heavily traded currency in the world, accounting for over 88% of all global foreign exchange turnover, or an average of $6.6 trillion in transactions per day, according to data from 2022.
Following the second world war, the USD took over from the British Pound as the world’s reserve currency. For most of its history, the US Dollar was backed by Gold, until the Bretton Woods Agreement in 1971 when the Gold Standard went away.
How do the decisions of the Federal Reserve impact the US Dollar?
The most important single factor impacting on the value of the US Dollar is monetary policy, which is shaped by the Federal Reserve (Fed). The Fed has two mandates: to achieve price stability (control inflation) and foster full employment. Its primary tool to achieve these two goals is by adjusting interest rates.
When prices are rising too quickly and inflation is above the Fed’s 2% target, the Fed will raise rates, which helps the USD value. When inflation falls below 2% or the Unemployment Rate is too high, the Fed may lower interest rates, which weighs on the Greenback.
What is Quantitative Easing and how does it influence the US Dollar?
In extreme situations, the Federal Reserve can also print more Dollars and enact quantitative easing (QE). QE is the process by which the Fed substantially increases the flow of credit in a stuck financial system.
It is a non-standard policy measure used when credit has dried up because banks will not lend to each other (out of the fear of counterparty default). It is a last resort when simply lowering interest rates is unlikely to achieve the necessary result. It was the Fed’s weapon of choice to combat the credit crunch that occurred during the Great Financial Crisis in 2008. It involves the Fed printing more Dollars and using them to buy US government bonds predominantly from financial institutions. QE usually leads to a weaker US Dollar.
What is Quantitative Tightening and how does it influence the US Dollar?
Quantitative tightening (QT) is the reverse process whereby the Federal Reserve stops buying bonds from financial institutions and does not reinvest the principal from the bonds it holds maturing in new purchases. It is usually positive for the US Dollar.
- Natural Gas rallies in Europe over 8%, while US gas prices lag.
- The US Dollar takes it on the chin as the Chinese Yuan appreciates firmly against the Greenback.
- US Natural gas prices might see spillover from European gas futures and rally higher.
Natural Gas prices are squeezing higher as workers in Australia have started their partial strikes on Friday. The volatility is peaking on the European gas market with European gas futures up over 10% at one point in European trading hours. Prices are set to rally further as from Thursday a full walkout could take place if no accord is being formed.
At the time of writing, Natural Gas is trading at $2.806per MMBtu.
Natural Gas news and market movers
- A big divergence in gas prices from a geographic point of view has emerged with European gas futures rallying nearly 10% to $93.29. It is a fresh monthly high for the month of September.
- Meanwhile, US gas futures were unfazed by the sudden spike in prices on the other side of the Atlantic Ocean. Though traders might see some catch up later this Monday once the US markets opens.
- On Friday, the Baker Hughes Rig Count printed a steady number, residing near an 18-month low. US gas prices might spiral higher as well if the US gas production starts to fall short of demand.
- Several weather projections are pointing to a harsh winter to come for both the US and Europe.
- Norwegian outages are yet again extended with the biggest one, the Troll gas field, extended until September 14th.
- European gas storage is expected to survive the winter and end the season with 44% supply left. Currently, European storage is filled to 93% capacity.
Natural Gas Technical Analysis: Consolidates
Natural Gas is starting to fall in a consolidation pattern where buyers and sellers are being pushed toward each other. Several technical elements such as the 200-day Simple Moving Average (SMA), the ascending trendline and the 55-day SMA are moving toward each other. Once both buyers and sellers have reached their consolidation point, a breakout is due. In this case, it could mean Natural Gas prices rally higher with the Australian strikes creating a shortage of supply.
On the upside, $2.83 needs to be taken out in order for this bounce to gain momentum. Once this rebound materialises, look for the the 200-day Simple Moving Average (SMA) near $2.93. In case price starts to break above there and head higher, $3 will be crucial with the high of September at stake.
On the downside, the trend channel has done a massive job underpinning the price action. The 55-day SMA near $2.72 already provided support ahead of any test on the lower end of the trend channel. In case the 55-day SMA breaks, look for support near $2.66.
-638300236458140745.png)
XNG/USD (Daily Chart)
Natural Gas FAQs
What fundamental factors drive the price of Natural Gas?
Supply and demand dynamics are a key factor influencing Natural Gas prices, and are themselves influenced by global economic growth, industrial activity, population growth, production levels, and inventories. The weather impacts Natural Gas prices because more Gas is used during cold winters and hot summers for heating and cooling. Competition from other energy sources impacts prices as consumers may switch to cheaper sources. Geopolitical events are factors as exemplified by the war in Ukraine. Government policies relating to extraction, transportation, and environmental issues also impact prices.
What are the main macroeconomic releases that impact on Natural Gas Prices?
The main economic release influencing Natural Gas prices is the weekly inventory bulletin from the Energy Information Administration (EIA), a US government agency that produces US gas market data. The EIA Gas bulletin usually comes out on Thursday at 14:30 GMT, a day after the EIA publishes its weekly Oil bulletin. Economic data from large consumers of Natural Gas can impact supply and demand, the largest of which include China, Germany and Japan. Natural Gas is primarily priced and traded in US Dollars, thus economic releases impacting the US Dollar are also factors.
How does the US Dollar influence Natural Gas prices?
The US Dollar is the world’s reserve currency and most commodities, including Natural Gas are priced and traded on international markets in US Dollars. As such, the value of the US Dollar is a factor in the price of Natural Gas, because if the Dollar strengthens it means less Dollars are required to buy the same volume of Gas (the price falls), and vice versa if USD strengthens.
- USD/JPY finds an intermediate support near 146.00 as the impact the BoJ Ueda’s hawkish remark starts easing.
- The USD index corrected from a fresh six-month high near 105.00 Fed policymakers supported keeping the interest rate policy steady.
- Fed Goolsbee said the central bank is aiming to push the economy to a “golden path,”.
The USD/JPY pair discovers support near 146.00 after a vertical sell-off that was inspired by hawkish remarks from Bank of Japan (BoJ) Governor Kazuo Ueda this weekend. The asset finds intermediate support as the impact of discussions about an exit from a negative interest rate stance starts fading.
S&P500 futures generated decent gains in the London session, portraying an improvement in the risk appetite of the market participants. The appeal for risk-sensitive assets improved on Monday as China’s Consumer Price Index (CPI) for August accelerated.
BoJ Ueda said in an interview with Yomiuri newspaper that the BOJ could have enough data by year-end to determine whether it can end negative rates. The achievement of a sustainable inflation target of 2% could allow the BoJ to exit from the decade-long ultra-loose interest rates.
Meanwhile, the US Dollar Index (DXY) corrected a bit after a fresh six-month high near 105.00 on Monday as Federal Reserve (Fed) policymakers supported for keeping the current interest rate policy unchanged for September due to falling inflation and a bleak economic outlook.
Broadly, the US Dollar remains resilient as Chicago Fed Bank President Austan Goolsbee said the central bank is aiming to push the economy to a “golden path,” meaning a situation where inflation recedes without triggering a recession.
Going forward, investors will focus on the US Consumer Price Index (CPI) data for August, which will be released on Wednesday at 12:30 GMT. As per the consensus, headline inflation expanded at a significantly higher pace of 0.5% while core CPI that excludes volatile oil and food prices remained steady against the July pace of 0.2% in both segments.
- Gold price remains sideways as the market awaits US inflation data for further action.
- The US Dollar corrects marginally, while the broader bias remains bullish due to US economic resilience.
- Fed policymakers are expected to maintain the status quo on September 20 as US inflation is falling and the economy is better balanced.
Gold price (XAU/USD) struggles to find a direction as investors await the US Consumer Price Index (CPI) data for August. The precious metal remains sideways despite the US Dollar delivering a corrective move, while investors digest global slowdown fears. US inflation data for August carries significance as it is the last one before the September monetary policy by the Federal Reserve (Fed), which is widely expected to remain unchanged.
Last week, Fed policymakers vocally supported maintaining the status quo on September 20 as inflation is falling and the labor market is loosening up. The appeal for the Gold price could be dampened ahead due to expectations of a healthy performance from the US Dollar. In comparison with other G7 economies, the US economy is better absorbing the impact of higher interest rates. The nation is demonstrating itself as resilient, which should heighten demand for the US Dollar.
Daily Digest Market Movers: Gold price consolidates ahead of US CPI data
- Gold price continues to consolidate inside the $1,924 to $1,931 range from the past three trading sessions as investors await the United States inflation data for August, which will be published on Wednesday at 12:30 GMT.
- Investors will stay focused on the inflation data for August. Headline inflation is seen expanding at a significantly higher pace of 0.5%, while core CPI that excludes volatile oil and food prices is seen steady against July’s pace of 0.2% in both segments.
- US headline inflation is seen growing at a higher pace due to the recovery in gasoline prices, which squeezes households’ income.
- The release of the August CPI data will build a base for September’s monetary policy.
- The precious metal remains sideways amid uncertainty over the interest rate peak for the remaining year, while the September monetary policy is expected to remain unchanged amid supportive economic data.
- As per the CME Fedwatch Tool, traders see a 57.6% chance of interest rates remaining unchanged at 5.25% to 5.50% by year-end.
- Labor growth remained stable in August, while the Unemployment Rate rose to 3.8%. Wage growth slowed, which could slim consumer spending momentum ahead. This could ease additional inflationary pressure.
- Fed policymakers: Dallas Fed Bank President Lorie Logan and New York Fed Bank President John Williams supported an unchanged interest rate decision for September monetary policy last week but kept doors open for further policy tightening in the future.
- Fed Williams said there is no urgency for an interest-rate increase this month as inflation is falling and the economy is better balanced.
- The yellow metal remained lackluster despite some correction in the US Dollar Index (DXY) from its six-month high of 105.00. The USD Index dropped to near 104.60 as deflation risks in China eased in August due to a nominal recovery in inflationary pressures.
- One month of nominal recovery in China’s inflation data is sufficient to warrant economic growth, which will keep the overall trend for the US Dollar bullish.
- Investors are keenly watching whether the central bank pushes the US economy to the “golden path”, meaning a situation where inflation recedes without triggering a recession.
- US Treasury Secretary Janet Yellen said she is confident that the central bank will contain inflation without damaging the job market. She doesn’t see China-led BRICS expansion as a major threat to the economy.
- About the US Dollar outlook, investors see more strength in the near term as the US economy is better at absorbing the repercussions of higher interest rates among G7 economies. The US economy seems less sensitive to rising mortgage rates, unlike the economies of Canada, the United Kingdom, and the Eurozone, which are facing the threat of a vulnerable economic outlook.
- Bank of America (BofA) strategists expect that the expression of “higher for longer” interest rates by the Fed will trigger a sell-off in equities over the next two months.
Technical Analysis: Gold price trades sideways above $1,920
Gold price has traded back and forth in a narrow range for the past four trading sessions amid deepening uncertainty over interest rates for the remaining year. The precious metal is expected to deliver a power-packed session after the release of Wednesday’s inflation data. The 50-day Exponential Moving Average (EMA) at $1,930 is consistently acting as a strong barrier for Gold bulls. Momentum oscillators indicate a sideways action, indicating that investors await a fresh economic trigger.
Fed FAQs
What does the Federal Reserve do, how does it impact the US Dollar?
Monetary policy in the US is shaped by the Federal Reserve (Fed). The Fed has two mandates: to achieve price stability and foster full employment. Its primary tool to achieve these goals is by adjusting interest rates.
When prices are rising too quickly and inflation is above the Fed’s 2% target, it raises interest rates, increasing borrowing costs throughout the economy. This results in a stronger US Dollar (USD) as it makes the US a more attractive place for international investors to park their money.
When inflation falls below 2% or the Unemployment Rate is too high, the Fed may lower interest rates to encourage borrowing, which weighs on the Greenback.
How often does the Fed hold monetary policy meetings?
The Federal Reserve (Fed) holds eight policy meetings a year, where the Federal Open Market Committee (FOMC) assesses economic conditions and makes monetary policy decisions.
The FOMC is attended by twelve Fed officials – the seven members of the Board of Governors, the president of the Federal Reserve Bank of New York, and four of the remaining eleven regional Reserve Bank presidents, who serve one-year terms on a rotating basis.
What is Quantitative Easing (QE) and how does it impact USD?
In extreme situations, the Federal Reserve may resort to a policy named Quantitative Easing (QE). QE is the process by which the Fed substantially increases the flow of credit in a stuck financial system.
It is a non-standard policy measure used during crises or when inflation is extremely low. It was the Fed’s weapon of choice during the Great Financial Crisis in 2008. It involves the Fed printing more Dollars and using them to buy high grade bonds from financial institutions. QE usually weakens the US Dollar.
What is Quantitative Tightening (QT) and how does it impact the US Dollar?
Quantitative tightening (QT) is the reverse process of QE, whereby the Federal Reserve stops buying bonds from financial institutions and does not reinvest the principal from the bonds it holds maturing, to purchase new bonds. It is usually positive for the value of the US Dollar.
In its quarterly assessment published on Monday, the European Commission downgraded its projections for the Eurozone’s economic growth for this year and the next, citing that the German economy has slipped into recession.
Additional takeaways
Sees Eurozone GDP growth at 0.8% in 2023, 1.3% in 2024, down from 1.1% and 1.6% respectively seen in May.
Expects German economy to shrink by 0.4% in 2023 against its May forecast of 0.2% growth, sees German 2024 growth at 1.1% vs. 1.4% forecast in May.
Expects France to grow 1.0% in 2023, faster than the 0.7% it forecast in May.
Expects Italy to grow 0.9% this year vs. 1.2% forecast in May.
Slashes Dutch growth forecast to 0.5% this year from 1.8% see in May, expects 1.0% in 2024 vs. 1.2% expected in May.
Sees Eurozone inflation at 5.6% in 2023 vs 5.8% forecast in May, expects 2.9% Eurozone inflation in 2024 vs. 2.8% forecast in May.
Market reaction
The quarterly forecasts fail to have any notable impact on the Euro, as EUR/USD continues to trade sideways around 1.0725, up 0.24% on the day.
- AUD/USD gains strong positive traction on Monday and is supported by a sharp USD slide.
- A hawkish BoJ-inspired rally in the JPY weighs on the USD as trades look to the key US CPI.
- China’s economic woes might hold back bulls from placing aggressive bets around the pair.
The AUD/USD pair catches aggressive bids on the first day of a new week and sticks to its strong intraday gains, near a multi-day peak through the first half of the European session. Spot prices currently trade just below mid-0.6400s, up nearly 1% for the day, and draw support from a sharp US Dollar (USD) downfall.
The hawkish Bank of Japan (BoJ)-inspired strong move up in the Japanese Yen (JPY) drags the USD Index (DXY), which tracks the Greenback against a basket of currencies, away from a six-month peak touched on Friday. The USD downfall could further be attributed to some repositioning trade ahead of this week's important US macro data, including the latest consumer inflation figures on Wednesday.
The crucial US CPI report will play a key role in influencing market expectations about the Federal Reserve's (Fed) future rate hike path, which, in turn, will drive the USD demand and provide a fresh directional impetus to the AUD/USD pair. In the meantime, the prospects for further policy tightening by the Fed should help limit the downside for the buck and cap any further gains for the major.
In fact, market participants seem convinced that the US central bank will stick to its hawkish stance and have been pricing in the possibility of one more 25 bps lift-off by the end of this year. Furthermore, the upbeat US macro data released last week pointed to a resilient economy and should allow the Fed to keep interest rates higher for longer. This remains supportive of elevated US Treasury bond yields.
The aforementioned fundamental backdrop favours the USD bulls, though a generally positive tone around the equity markets is seen benefitting the risk-sensitive Aussie. Investors cheered the better-than-expected China inflation data released over the weekend, which showed that consumer price inflation rose back into positive territory in August and raised hopes that the economy might be stabilizing.
That said, concerns about the worsening conditions in the world's second-largest economy and headwinds stemming from rapidly rising borrowing costs should cap any optimism in the markets. This, in turn, makes it prudent to wait for strong follow-through buying before confirming that the AUD/USD pair has formed a near-term bottom and positioning for any further appreciating move.
Technical levels to watch
Citing three sources with direct knowledge of the matter, Reuters reported on Monday, the People’s Bank of China (PBOC) is stepping up its scrutiny of bulk US Dollar purchases by domestic companies, in the face of the rapid depreciation of the Chinese Yuan.
Key takeaways
Will scrutinize bulk dollar buying of $50 million and above.
US Dollar purchases of $50 million and above will need approval from the central bank.
The new guidelines are issued by the Chinese central bank, as the Chinese Yuan has lost 6% of its value against the US Dollar so far this year. USD/CNY was last seen trading at 7.2919, down 0.68% on the day.
- EUR/USD extends gains on the pullback in the US Dollar (USD).
- Investors await US CPI, seeking valuable insights into the inflation outlook.
- Euro’s strength could be limited as the ECB is expected to keep interest rates unchanged.
EUR/USD extends the previous session’s gains, trading higher around 1.0730 during the early hours of the European session on Monday. The pair is experiencing upward support due to the pullback in the US Dollar (USD).
US Dollar Index (DXY) beats lower around 104.60, continuing to extend losses despite the positive performance of United States (US) Treasury yields. The yield on the 10-year US Treasury bond improved to 4.29%, up by 0.52% at the time of writing.
The Greenback is anticipated to remain strong, reinforced by positive economic data coming from the US. Investors will likely watch the upcoming release of the US Consumer Price Index (CPI) data for August, scheduled for Wednesday.
This data has the potential to offer additional insights into the country's inflation situation, which can significantly influence the investors’ decisions regarding placing trading positions on the EUR/USD pair.
US Treasury Secretary Janet Yellen, while returning from the G20 Summit on Sunday, advocated the United States' capacity to control inflation without causing harm to the employment market. Yellen further mentioned that "Every measure of inflation is on the road down."
Investors have been factoring in the expectation of a 25 basis point (bps) interest rate hike by the Fed in either the November or December meetings. Additionally, the Fed is expected to maintain higher interest rates for an extended duration. This hawkish stance from the central bank could potentially limit the upside potential for the EUR/USD currency pair.
The Fed Governor Christopher Waller has mentioned that the Fed has some leeway to increase interest rates, but these decisions will be driven by economic data. Meanwhile, Fed Boston President Susan Collins has highlighted the potential risks associated with an overly restrictive monetary policy stance and advocated for a patient, careful, and deliberate approach to policy decisions.
Additionally, Chicago Fed President Austan Goolsbee has outlined the central bank's objective of guiding the economy onto a "golden path." This path represents a situation where inflation decreases without triggering a recession, a delicate balance that central banks aim to achieve to maintain economic stability and growth.
On the other side, the European Central Bank (ECB) is likely expected to keep interest rates unchanged at its upcoming policy meeting scheduled for Thursday. Recent data released from Germany on Friday showed that the Harmonised Consumer Price Index (HICP) for August came in at 6.4% year-on-year, meeting market expectations. While the core Consumer Price Index (CPI) remained stable at 6.1%.
The Euro was possibly undermined after China published weaker-than-expected Consumer Price Index (CPI) for August on Saturday. The CPI report showed a rise of 0.1% on an annual basis, falling short of market expectations of a 0.2% reading. However, the consumer prices improved from the previous month's figure of -0.3%.
Traders are expected to gain a deeper insight into China's economic conditions by observing the obstacles that authorities are grappling with. The market expects further monetary and fiscal measures aimed at achieving Beijing's objective of attaining 5% GDP growth for the current year.
Analysts at TD Securities (TDS) provide a snippet of three main market-moving events in the week ahead.
Key quotes:
UK Labor Market data: While the unemployment rate likely rose to its highest level since Aug-21, we expect another set of strong wage numbers to suggest to the MPC that Bank Rate might have to rise after September. While m/m wage growth should remain strong, upside pressure will also come from revisions. Private sector regular pay, the MPC's preferred measure, likely remained at 8.2% 3m/y.
"US CPI: Core-price inflation likely remained the same in August, printing a third straight 0.2% m/m gain (0.20% unrounded). Goods inflation was likely a big factor to the downside again, with shelter prices remaining a key wildcard (we expect modest deceleration). Firming gas prices will drive non-core inflation higher. Our m/m forecasts imply 3.6%/4.3% y/y for total/core prices.
ECB Policy Decision: While a hike and a hold are almost equally likely, we now expect the ECB to keep the deposit rate unchanged at 3.75% at the September meeting, as data since the July meeting has not given the Governing Council much cause for concern. We also think this will mark the end of the tightening cycle, though risks still remain around an October hike."
- Pound Sterling climbs above a two-day high as the appeal for risk-sensitive currencies improves.
- Investors shift focus to UK employment data for July, which will be published on Tuesday.
- BoE Pill and Mann are set to speak on Monday and Tuesday, respectively.
The Pound Sterling (GBP) rebounds strongly as bearish market sentiment eases, while the broader bias is still vulnerable. The GBP/USD pair recovers swiftly ahead of the United Kingdom’s Employment report for July, which will demonstrate current labor market conditions. Investors will keenly focus on wage growth momentum, which has remained a major trigger for keeping inflationary pressure extremely stubborn.
The UK’s labor data release will show how well restrictive monetary tools from the Bank of England (BoE) are performing in a high-inflation environment. Investors will also look for commentaries from BoE policymakers to get cues about how much the current interest rates are close to their peak. Slow wage growth and slim recruitment levels should ease pressure from BoE policymakers.
Daily Digest Market Movers: Pound Sterling recovers ahead of labor market data
- Pound Sterling recovers significantly after defending the crucial support of 1.2450 as the appeal for risk-perceived currencies improves.
- The asset rebounds strongly after a fresh three-month low ahead of the UK’s labor market report for July, which will be published on September 12 at 06:00 GMT.
- Per estimates, the quarter ending in July Unemployment Rate is seen rising to 4.3% vs. the previous reading of 4.2%. A higher jobless rate would ease pressure stemming from a tight labor market for Bank of England (BoE) policymakers as labor shortages have remained a major trigger for inflation.
- Three months to July Average Earnings excluding bonuses are seen lower at 7.6% vs. the prior reading of 7.8%. Slower wage growth would be welcomed by BoE policymakers as household demand may cool down ahead.
- Higher wage growth momentum has been a big worry for BoE policymakers. BoE Governor Andrew Bailey warned last week that there has been no let-up in the pace of wage growth.
- UK’s Claimant Count Change for August is seen declining to 17.1K vs. July’s reading of 29K. Lower benefit claims indicate that labor demand remained decent from employers.
- Speeches from BoE policymakers are also due: BoE Economist Huw Pill and BoE member Catherine Mann on Monday and Tuesday, respectively, are set to speak.
- The Pound Sterling could come under pressure if BoE policymakers also cite current interest rates as “sufficiently restrictive” or comment that policy tightening is nearing its end, which was said by the BoE’s Bailey and Swati Dhingra last week.
- Investors hope that an end to interest rate tightening by the BoE is not as far off as previously believed. Andrew Bailey commented: "Many of the indicators are now moving as we would expect them to move and are signaling that the fall in inflation will continue.”
- The UK’s economy is showing signs of broader weakening, a cooling labor market, and slowing consumer spending momentum, which should cause inflationary pressure to yield.
- For September monetary policy, it is widely expected that the BoE will raise interest rates for the 15th consecutive time. An interest-rate hike of 25 basis points (bps) is expected, which would push interest rates to 5.50%.
- The US Dollar Index (DXY) corrected sharply to near 104.60 after sensing exhaustion in the upside momentum near almost a six-month high of 105.00. The broader bias is still bullish due to global growth concerns and the inflation data for August, which will be published in July.
- Any surprise upside in inflation data would force Federal Reserve (Fed) policymakers to keep the doors open for further policy tightening.
- The US Dollar faces pressure on Monday as China’s inflation for August, released on Saturday, rebounded nominally, indicating an easing of deflation risks. On a broader note, the Chinese economy is still vulnerable amid a slowdown in the property sector and retail demand.
Technical Analysis: Pound Sterling prints fresh two-day high above 1.2500
The Pound Sterling prints a fresh two-day high, testing territory above the psychological resistance of 1.2500 after discovering buying interest near a three-month low around 1.2450. The Cable attempts to defend the crucial support of the 200-day Exponential Moving Average (EMA), which lands near 1.2490. While the short trend is bearish as the 20 and 50-day EMAs are downward-sloping, momentum oscillators portray strength in the bearish impulse.
Pound Sterling FAQs
What is the Pound Sterling?
The Pound Sterling (GBP) is the oldest currency in the world (886 AD) and the official currency of the United Kingdom. It is the fourth most traded unit for foreign exchange (FX) in the world, accounting for 12% of all transactions, averaging $630 billion a day, according to 2022 data.
Its key trading pairs are GBP/USD, aka ‘Cable’, which accounts for 11% of FX, GBP/JPY, or the ‘Dragon’ as it is known by traders (3%), and EUR/GBP (2%). The Pound Sterling is issued by the Bank of England (BoE).
How do the decisions of the Bank of England impact on the Pound Sterling?
The single most important factor influencing the value of the Pound Sterling is monetary policy decided by the Bank of England. The BoE bases its decisions on whether it has achieved its primary goal of “price stability” – a steady inflation rate of around 2%. Its primary tool for achieving this is the adjustment of interest rates.
When inflation is too high, the BoE will try to rein it in by raising interest rates, making it more expensive for people and businesses to access credit. This is generally positive for GBP, as higher interest rates make the UK a more attractive place for global investors to park their money.
When inflation falls too low it is a sign economic growth is slowing. In this scenario, the BoE will consider lowering interest rates to cheapen credit so businesses will borrow more to invest in growth-generating projects.
How does economic data influence the value of the Pound?
Data releases gauge the health of the economy and can impact the value of the Pound Sterling. Indicators such as GDP, Manufacturing and Services PMIs, and employment can all influence the direction of the GBP.
A strong economy is good for Sterling. Not only does it attract more foreign investment but it may encourage the BoE to put up interest rates, which will directly strengthen GBP. Otherwise, if economic data is weak, the Pound Sterling is likely to fall.
How does the Trade Balance impact the Pound?
Another significant data release for the Pound Sterling is the Trade Balance. This indicator measures the difference between what a country earns from its exports and what it spends on imports over a given period.
If a country produces highly sought-after exports, its currency will benefit purely from the extra demand created from foreign buyers seeking to purchase these goods. Therefore, a positive net Trade Balance strengthens a currency and vice versa for a negative balance.
FX option expiries for Sept 11 NY cut at 10:00 Eastern Time, via DTCC, can be found below.
- EUR/USD: EUR amounts
- 1.0700 681m
- GBP/USD: GBP amounts
- 1.2225 650m
- 1.2590 410m
- USD/JPY: USD amounts
- 145.00 895m
- USD/CHF: USD amounts
- 0.8650 866m
- USD/CAD: USD amounts
- 1.3600 478m
Japanese Chief Cabinet Secretary Hirokazu Matsuno said on Monday, “monetary policy specifics are up to the Bank of Japan (BoJ) to decide.”
Matsuno said that BoJ is expected to closely communicate with the government and conduct policy appropriately.
Related reads
- Forex Today: BoJ’s Ueda smashes USD/JPY, US Dollar suffers
- EUR/JPY drops to 156.80 following BoJ’s Ueda hawkish comments
- EUR/JPY loses momentum following the Bank of Japan's (BoJ) hawkish statement.
- European Central Bank (ECB) is expected to hold interest rates unchanged on Thursday.
- Japanese policymakers said BoJ could exit its negative interest rate policy when its inflation target of 2% is insight.
- ECB monetary policy decision will be in the spotlight this week.
The EUR/JPY cross loses traction below the 157.00 mark during the early European trading hours on Monday. The cross currently trades near 156.65, losing 0.97% for the day. That said, the recent Japanese policymaker's comment is the main driver for the pair’s movement on Monday. Market players await the key European Central Bank event on Thursday for fresh impetus.
On Friday, the German Harmonised Consumer Price Index (HICP) for August came in at 6.4% YoY, as the market expected whereas the core CPI remained unchanged at 6.1%, Destatis reported on Friday. Furthermore, the Eurozone Gross Domestic Product (GDP) for the second quarter (Q2) grew 0.1% versus 0.3% prior, missing market expectations at 0.3%. The discouraging data might convince the European Central Bank (ECB) to abandon its hawkish stance for the upcoming meeting.
The majority of analysts expect the European Central Bank (ECB) to keep interest rates steady at its September policy meeting on Thursday, according to a Reuters poll. The ECB's stance is dependent on incoming economic data. However, the recent Bank of Japan (BoJ) recent comment boosts the Japanese Yen (JPY) against its rivals on Monday.
In response to Bank of Japan Governor Kazuo Ueda's hawkish statements, the Japanese yen (JPY) strengthened broadly and the benchmark 10-year Japanese Government Bond (JGB) yield hit the highest level since January 2014. Ueda stated in the interview on Monday that the central bank could exit its negative interest rate policy when its inflation target of 2% is near. Policymakers also said that the BOJ would have sufficient evidence by the end of the year to evaluate whether interest rates should stay negative.
Moving on, the Eurozone Industrial Production MoM for July will be due on Wednesday. The attention will shift to the European Central Bank (ECB) interest rate decision on Thursday. On Thursday, Japanese Industrial Production for July will be released. Traders will take cues from these figures and find trading opportunities around the EUR/JPY cross.
Here is what you need to know on Monday, September 11:
Risk sentiment remains in a firmer spot early Monday, helped by a rally in the Chinese stocks after an uptick in the country’s inflation showed tentative signs of stability in the world’s second-largest economy. China’s Consumer Price Index (CPI) increased 1.0% YoY in August, reversing a drop of 0.3% reported in July.
The US S&P 500 futures gain 0.30% on the day while the US Treasury bond yields are 1% higher after US Treasury Secretary Janet Yellen said over the weekend that she is “feeling confident about a soft landing for the US economy.”
With risk-on flows dominating at the start of the critical US CPI inflation week, the United States Dollar (USD) remains heavy, shrugging off positive US Treasury bond yields. The main reason behind the decline in the US Dollar could be linked to the ongoing sell-off in the USD/JPY pair. The US Dollar Index (DXY) is correcting from near six-month highs of 105.16, currently trading 0.40% lower on the day near 104.60.
US Dollar price today
The table below shows the percentage change of US Dollar (USD) against listed major currencies today. US Dollar was the weakest against the Japanese Yen.
| USD | EUR | GBP | CAD | AUD | JPY | NZD | CHF | |
| USD | -0.16% | -0.24% | -0.25% | -0.64% | -0.70% | -0.40% | -0.20% | |
| EUR | 0.14% | -0.09% | -0.08% | -0.48% | -0.55% | -0.28% | -0.04% | |
| GBP | 0.24% | 0.09% | 0.01% | -0.41% | -0.46% | -0.16% | 0.05% | |
| CAD | 0.24% | 0.08% | 0.01% | -0.41% | -0.47% | -0.20% | 0.04% | |
| AUD | 0.63% | 0.48% | 0.40% | 0.41% | -0.06% | 0.20% | 0.45% | |
| JPY | 0.67% | 0.56% | 0.48% | 0.45% | 0.08% | 0.29% | 0.51% | |
| NZD | 0.41% | 0.28% | 0.19% | 0.21% | -0.20% | -0.26% | 0.24% | |
| CHF | 0.18% | 0.04% | -0.05% | -0.04% | -0.45% | -0.51% | -0.25% |
The heat map shows percentage changes of major currencies against each other. The base currency is picked from the left column, while the quote currency is picked from the top row. For example, if you pick the Euro from the left column and move along the horizontal line to the Japanese Yen, the percentage change displayed in the box will represent EUR (base)/JPY (quote).
The Japanese Yen witnessed a big-figure bullish opening gap against the Greenback, smashing USD/JPY below 147.00, as Asian traders reacted to the weekend’s hawkish comments delivered by Bank of Japan (BoJ) Governor Kazuo Ueda. Ueda said that the central bank’s focus will now be on “a quiet exit”, signaling possible interest rate hikes. USD/JPY is extending the Asian slide into early Europe, trading at around 146.00, down nearly 1.20% so far.
EUR/USD is recovering ground above 1.0700, having hit a three-month low at 1.0686 last Thursday. GBP/USD is holding notable gains above 1.2500, with traders awaiting Bank of England (BoE) Chief Economist Huw Pill’s speech and policymaker Mann’s speech later in the day.
AUD/USD is trading firmer above the 0.6400 level, up 1% on the day, cheering Chinese inflation turnaround and a broad-based US Dollar weakness. Meanwhile, USD/CAD has surrendered 1.3600, despite a sideways trading action in WTI prices.
Gold price is extending the recovery gains, closing in on the 50-Daily Moving Average (DMA) at $1,932 amid unabated US Dollar selling, which outweighs the strength in the US Treasury bond yields, for now.
The economic calendar is devoid of any top-tier data releases on both sides of the Atlantic, leaving the FX board at the mercy of risk trends and the sentiment surrounding the US Dollar.
- NZD/USD rises due to more likelihood of a dovish policy stance by the Fed in the September meeting.
- MACD suggests that the short-term trajectory is favoring a sideways trend.
- The previous week’s bottom emerges as the initial support aligned to the 0.5850 psychological level.
- The key barrier level is represented by the 21-day Exponential Moving Average (EMA) at 0.5947.
NZD/USD extends gains in the third trading session, trading higher around 0.5930 during the Asian session on Monday as a result of the retreat in the US Dollar (USD). This pair is experiencing upward support due to the reduced likelihood of the US Federal Reserve (Fed) maintaining unchanged interest rates in the upcoming September meeting.
The Moving Average Convergence Divergence (MACD) line remains below the centerline but is positioned above the signal line. This configuration suggests that the recent momentum in the market is relatively subdued and moving sideways.
The pair may encounter initial support at the previous week’s bottom at 0.5859 level lined up with the 0.5850 psychological level. A decisive break below this level could potentially lead to further downward movement, with Kiwi bears targeting the region near the 0.5800 psychological level.
On the upside, a significant resistance level for the NZD/USD pair is represented by the 21-day Exponential Moving Average (EMA) at 0.5947, which is closely aligned with the 0.5950 psychological level.
If the pair manages to break convincingly above this level, it could potentially open the door for further upward movement, with the next target being the region around the 23.6% Fibonacci retracement level at 0.5980.
In the near term, the NZD/USD pair is expected to maintain a bearish outlook as long as the 14-day Relative Strength Index (RSI) remains below the 50 level. This suggests a continued downward momentum in the pair.
NZD/USD: Daily Chart
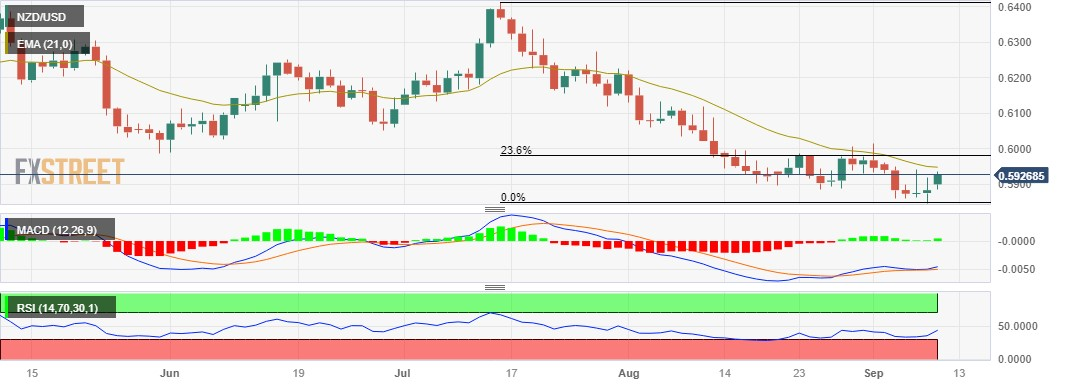
- USD/CAD is trading near the 1.3600 mark, above the key 100-hour EMA.
- Relative Strength Index (RSI) stands in the bearish territory below 50.
- 1.3650 will be the immediate resistance level; 1.3575 acts as an initial support level.
The USD/CAD pair loses traction and hovers around the 1.3600 mark during the early European session on Monday. The weakening of the US Dollar (USD) and the upbeat Canadian employment data dragged the USD/CAD pair lower. The major pair currently trades near 1.3604, losing 0.25% on the day.
According to the four-hour chart, USD/CAD holds above the key 100-hour Exponential Moving Average (EMA), which supports the buyers for the time being. However, the Relative Strength Index (RSI) stands below 50, activating the bearish momentum for the USD/CAD pair for the time being.
Any follow-through buying above the middle line of the Bollinger Band and a high of May 31 at 1.3650 will pave the way to 1.3670 (a high of September 5). The additional upside filter to watch is 1.3692, representing the upper boundary of the Bollinger Band.
On the flip side, a decisive break below the 1.3600 will see a drop to 1.3575 (100-hour EMA). Further south, the next downside stop is seen at 1.3550 (a low of August 30). The next contention level is located at the 1.3495-1.3500 region, indicating a psychological round mark and a low of September 1.
USD/CAD four-hour chart
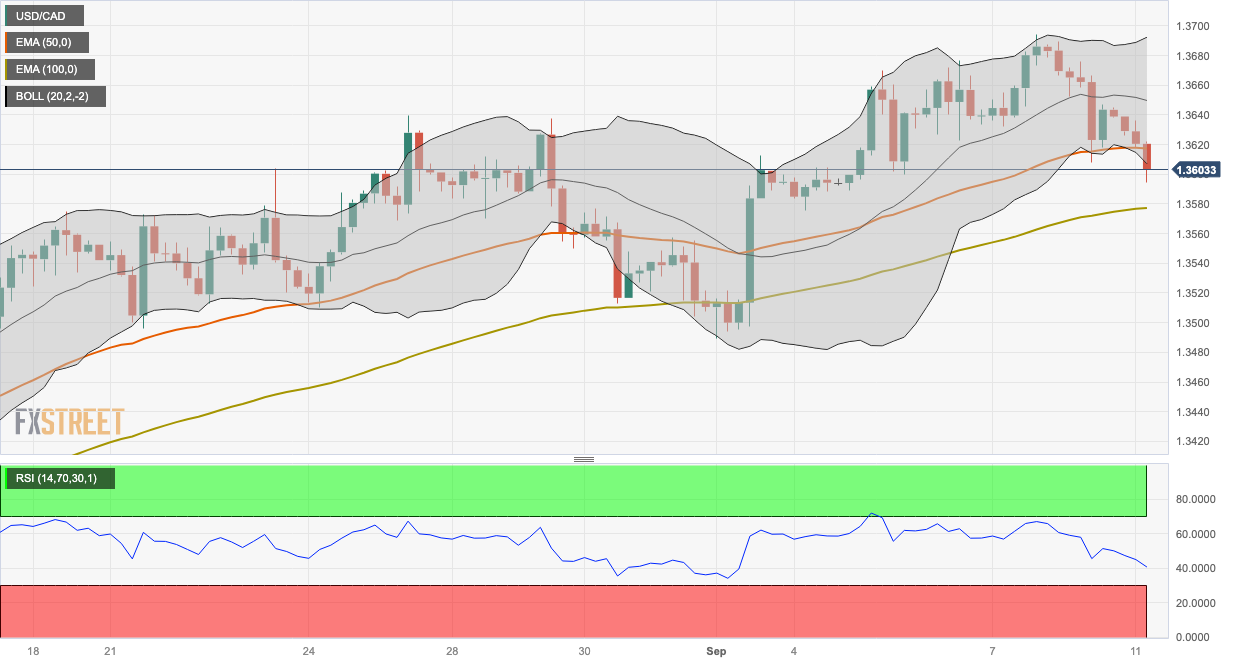
- Gold price rebounds from the previous week’s losses.
- The pullback in the US Dollar (USD) is underpinning the prices of Gold.
- China-linked economic fears could limit the advance in yellow metal.
Gold price trades higher around $1,930 a troy ounce, rebounding from the losses registered in the previous week. The pullback in the US Dollar (USD) is providing support in strengthening the prices of Gold, which could be attributed to the lower likelihood of the US Federal Reserve (Fed) keeping interest rates unchanged in the upcoming September.
However, the yields on 10-year US Treasury bonds improved to 4.30%, up by 0.84% at the time of writing. The US Dollar Index (DXY) is extending intraday losses during the Asian session on Monday despite the upbeat US Treasury yields. Spot price beats lower around 104.60.
The Greenback is expected to exhibit resilience, driven by the consistent flow of positive economic data from the United States (US). Investors will likely monitor the upcoming data of the Consumer Price Index (CPI) for August from the US, scheduled to be released Wednesday. The data could provide further insights into the inflation scenario of the country.
Investors may price in anticipation of a 25 basis point (bps) interest rate hike by the Fed in November or December meetings. Along with this, the Fed is expected to sustain elevated interest rates over an extended period. This hawkish tone could potentially provide further support for the precious metal.
US Treasury Secretary Janet Yellen made a statement on Sunday while coming back from the G20 Summit. Yellen showed an increasing level of confidence in the United States' ability to curb inflation without harming the employment market. Yellen also stated, "Every measure of inflation is on the road down."
Also, Chicago Fed Bank President Austan Goolsbee mentioned the objective of the US Federal Reserve (Fed) to steer the economy onto a "golden path." This path represents a situation in which inflation decreases without triggering a recession, a challenging equilibrium that central banks frequently aim for to sustain economic stability and growth.
The yellow metal was possibly undermined after the release of China’s weaker-than-expected Consumer Price Index (CPI) for August, which was published on Saturday. The report showed a rise of 0.1% on an annual basis, falling short of market expectations of a 0.2% reading. However, the consumer prices improved from the previous month's figure of -0.3%.
Moreover, China's real estate developer, Country Garden, is set to undergo a new voting for extending onshore bond maturities. Creditors will cast their votes on Monday to decide whether to extend the maturity of several debts, following two instances of narrowly avoiding default earlier this month.
Market participants will observe the challenges that Chinese authorities are confronting as they work to implement the necessary monetary and fiscal measures required to meet Beijing's goal of achieving a 5% GDP growth rate for the current year.
- Most Chinese equities trades in positive territory amid the sign of an easing of deflationary pressures in China.
- Bank of Japan (BoJ) Governor Kazuo Ueda stated that the central bank will now be on "a quiet exit.”
- Market players await the US Consumer Price Index (CPI) data for August.
Asian stock markets trade mixed on Monday ahead of the US key inflation data. Market players will take cues from the US Consumer Price Index (CPI) data on Friday after the upbeat Labor data last week convinced the higher-for-longer interest rate narrative in the US.
At press time, China’s Shanghai surges 0.57% to 3,134, the Shenzhen Component Index is up 0.44% to 10,326, Hong Kong’s Hang Sang falls 1.68% to 17,896, South Korea’s Kospi gains 0.06% and Japan’s Nikkei is down 0.55%.
Most Chinese equities trades in positive territory amid the sign of an easing of deflationary pressures in China. However, Hong Kong’s Hang Seng Index led to losses as investors worried about the property sector crisis. The National Bureau of Statistics revealed on Saturday that the Chinese Consumer Price Index (CPI) for August came in at 0.1% YoY versus a 0.3% drop in the previous reading, a worse-than-expected 0.2% rise. The monthly figure came in at 0.3%, as expected. Finally, the Producer Price Index (PPI) declined 3.0% YoY from a 4.4% drop in July and in line with estimates.
In Japan, the Japanese Yen (JPY) is firmer and the benchmark 10-year Japanese Government Bond (JGB) yield hit the highest level since January 2014. Bank of Japan (BoJ) Governor Kazuo Ueda stated in an interview on Monday that the central bank will now be on "a quiet exit," as the BOJ seeks to avoid any major impact on the market. Policymakers also said that the BOJ would have sufficient evidence by the end of the year to evaluate whether interest rates should stay negative.
Market participants await the release of the US Consumer Price Index for August and Retail Sales on Wednesday and Thursday, respectively. Also, the Chinese Retail Sales and Industrial Production data due on Friday might trigger volatility in the market.
- GBP/USD gains some positive traction on Monday and moves away from a three-month low.
- A modest USD pullback from a multi-month top is seen as a key factor lending some support.
- Traders now look to this week's key macro data from the UK and the US for a fresh impetus.
The GBP/USD pair attracts some dip-buying after filling the weekly bearish gap during the Asian session on Monday and climbs further beyond the 1.2500 psychological mark, hitting a fresh daily top in the last hour. Spot prices currently trade around the 1.2520-1.2525 area, up nearly 0.50% for the day, and for now, seem to have snapped a four-day losing streak, though any meaningful recovery from a three-month low touched last Thursday still seems elusive.
A strong pickup in demand for the Japanese Yen (JPY), bolstered by Bank of Japan (BoJ) Governor Kazuo Ueda's hawkish comments over the weekend, exerts some pressure on the US Dollar (USD). Apart from this, a positive tone around the equity markets drags the safe-haven buck away from its highest level since March set last week and turns out to be another factor lending some support to the GBP/USD pair.
Data released over the weekend showed that China’s consumer price inflation rose back into positive territory in August, while the Producer Price Index shrank at a slower pace than seen throughout the year. This raises hopes that the the world's second-largest economy was stabilizing after a substantial drop this year, which, along with expectations for additional stimulus from China boost investors' appetite.
That said, other indicators, showing that China's manufacturing sector remained in contraction and growth in the services sector decelerated in August, painted a mixed economic picture. This might keep a lid on any optimism in the markets. Apart from this, growing acceptance that the Federal Reserve (Fed) will stick to its hawkish stance should help limit the USD downside and keep a lid on the GBP/USD pair.
Market participants seem convinced that the US central bank will keep interest rates higher for longer and have been pricing in the possibility of one more 25 bps lift-off by the end of this year. The bets were lifted by The Wall Street Journal report that some officials still prefer to err on the side of raising rates too much. This remains supportive of rising US Treasury bond yields and favours the USD bulls.
The Bank of England (BoE) Governor Andrew Bailey, on the other hand, warned last Wednesday that borrowing costs might still have further to rise because of stubbornly high inflation. Bailey, however, told lawmakers that the central bank is much nearer to ending its run of rate increases. This could further contribute to capping any meaningful appreciting move for the GBP/USD pair, at least for the time being.
Traders might also refrain from placing aggressive bets and prefer to wait on the sidelines ahead of this week's important macro releases from the UK and the US. The UK jobs report is due on Tuesday, which will be followed by the monthly UK GDP report and the latest US consumer inflation figures on Wednesday. Apart from this, traders will confront the release of the US Producer Price Index (PPI) on Thursday.
Nevertheless, the aforementioned fundamental backdrop makes it prudent to wait for strong follow-through buying before confirming that the GBP/USD pair has formed a near-term bottom and positioning for any further gains. On the flip side, a sustained break below the very important 200-day Simple Moving Average (SMA), around the 1.2425 region, is needed to confirm the negative outlook.
Technical levels to watch
- USD/INR extends its losses on the third day, driven by the anticipation of a dovish Fed policy in September.
- Upbeat Gift Nifty is underpinning the Indian Rupee (INR).
- Improved US Treasury yields could support the US Dollar (USD).
- US Treasury Secretary Janet Yellen has conveyed her confidence in controlling inflation without affecting the labor market.
USD/INR trades lower around 82.80 during the Asian session on Monday, extending losses for the third successive day. The pair faces downward pressure because the likelihood of the US Federal Reserve (Fed) keeping interest rates unchanged in the upcoming September meeting increased.
Additionally, the continuous rise in the Gift Nifty is contributing support to underpin the Indian Rupee (INR). The dollar-denominated futures contract based on the Nifty 50 index, trades higher around 19985.0. Moreover, investors will closely monitor the response of the Reserve Bank of India (RBI) to potential volatility. The central bank's actions and statements can have a significant impact on market stability and investor confidence.
However, the Fed is expected to sustain elevated interest rates over an extended period. Also, traders are expecting that the Fed may enact a 25 basis point (bps) interest rate hike by the end of 2023. This hawkish stance taken by the central bank could potentially provide further support for the USD/INR pair.
US Dollar Index (DXY), which compares the performance of US Dollar (USD) against six other major currencies, trades lower around 104.70. However, Improved US Treasury yields could provide support to the strength of the Greenback. The yields on 10-year US Treasury bonds rose to 4.29%, up by 0.70% at the time of writing.
Moreover, US Initial Jobless Claims data for the week ending September 2 showed a figure of 216K, better than the market expectations of 234K and coming in lower than the revised figure of 229K from the previous week. This favorable labor market data could play a role in shoring up the resilience of the US dollar.
Following her attendance at the G20 Summit, US Treasury Secretary Janet Yellen conveyed an increasing level of confidence in the United States' ability to handle inflation without causing significant harm to the job market. Yellen also noted, "Every measure of inflation is on the road down," suggesting an expectation for a decline in various inflation indicators.
Chicago Fed Bank President Austan Goolsbee has articulated the objective of the US Federal Reserve (Fed) to guide the economy onto a "golden path." This path represents a situation in which inflation decreases without triggering a recession, a challenging equilibrium that central banks frequently aim for to sustain economic stability and growth.
Investors will likely monitor the upcoming data of the Consumer Price Index (CPI) for August from both the US and India, scheduled to be released later in the week. These datasets are expected to provide valuable insights into the inflation scenarios of both economies and could influence investor decisions regarding the USD/INR pair.
The People’s Bank of China (PBOC) said in a statement on Monday, “the Yuan exchange rate has a solid basis to stay reasonably stable at balanced levels.”
Additional takeaways
Reaffirms pledge to take action to correct one-sided and pro-cyclical activities.
Will resolutely fend off currency overshooting risks.
Will resolutely prevent speculation or incite clients to disrupt orders of FX market.
Market reaction
The USD/CNY pair was last seen trading 0.52% lower on the day at 7.3050.
- AUD/USD gains momentum above 0.6420 amid the selling pressure in USD.
- Markets have been priced in the possibility of a 93% rate hold at the September Fed meeting.
- The easing fear of China’s deflation boosts China-proxy New Zealand Dollar ahead of the US inflation data.
- Investors will monitor the US Consumer Price Index (CPI), Australian employment data due later this week.
The AUD/USD holds above the 0.6400 area during the Asian session on Monday. The uptick of the Aussie (AUD) is supported by the weakening of the US Dollar and the easing fear of China’s deflation. The pair currently trades near 0.6425, up 0.75% on the day.
After the G20 Summit, US Treasury Secretary Janet Yellen conveyed more optimism that the US could control inflation without damaging the employment market. Yellen also said on Sunday that every gauge of inflation is declining and there were no massive wave of layoffs. Chicago Fed President Austan Goolsbee outlined the central bank's goal of leading the economy into a "golden path." This route represents a scenario in which inflation falls without causing a recession. Furthermore, Fed New York President John Williams said last week that highlighted the decline in inflation and an improving economic balance.
According to the CME FedWatch Tool, the markets have been priced in the possibility of a 93% rate hold at the September meeting and a 43.5% chance of a rate hike at the November meeting. Adding to this, the upbeat US economic data last week lends support to the higher for longer interest rate narrative in the US. This, in turn, might lift the US Dollar (USD) and cap the upside of the AUD/USD.
At the recent policy meeting, the Reserve Bank of Australia (RBA) maintained interest rates at 4.10% for the third consecutive month. However, RBA Governor Philip Lowe warned that additional tightening may be needed to control inflation. He added in a speech that he had focused on the possibility that wages and profits could exceed levels consistent with inflation returning to target in late 2025 while mentioning that the Unemployment Rate can sustain near 40-year lows and wage growth is strong.
Additionally, Chinese inflation figures improved in August, which boosted the China-proxy New Zealand Dollar against the Greenback. The Chinese Consumer Price Index (CPI) rose 0.1% YoY, from a 0.3% drop in the previous month, compared to the 0.2% rise anticipated. The monthly figure was 0.3% as expected. Finally, the Producer Price Index (PPI) fell 3.0% YoY from 4.4% in July, in line with market consensus.
Looking ahead, the Australian Westpac Consumer Confidence for September will be due on Tuesday. Market players will shift their attention to the US Consumer Price Index (CPI) for August on Wednesday. The monthly figure is expected to rise by 0.5%, while the core monthly figure is expected to remain at 0.2%. On Thursday, Australia’s employment data and US Retail Sales will be in the spotlight. These events could trigger the volatility and give a clear direction to the AUD/USD pair.
- USD/JPY drops to a multi-day low on Monday in reaction to BoJ Ueda's hawkish remarks.
- A modest USD pullback from a six-month peak contributes to the sharp intraday downfall.
- The divergent Fed-BoJ policy outlook limits losses ahead of this week's key US macro data.
The buying interest around the Japanese Yen (JPY) remains unabated through the Asian session on Monday and drags the USD/JPY pair to a multi-day low, around the 146.35 region in the last hour. The pair has now retreated over 150 pips from the highest level since November 2022, near the 147.85 zone touched on Friday and is pressured by a combination of factors.
The Japanese Yen (JPY) strengths against all Group-of-10 currencies in reaction to Bank of Japan Governor Kazuo Ueda's hawkish remarks, signalling possible interest rate hikes. In an interview with Yomiuri newspaper published on Saturday, Ueda said that ending negative interest rates is among the options available if the BoJ becomes confident that prices and wages will keep going up sustainably. This, along with a modest US Dollar (USD) pullback from a six-month peak, contributes to the offered tone surrounding the USD/JPY pair.
Furthermore, the latest leg down over the past hour or so could also be attributed to some technical selling below the 200-hour Simple Moving Average (SMA) support. That said, growing acceptance that the Federal Reserve (Fed) will stick to its hawkish stance and keep interest rates higher for longer should limit any meaningful USD downfall. The bets were reaffirmed by The Wall Street Journal report, noting that some officials still prefer to err on the side of raising rates too much, reasoning that they can cut them later.
The outlook, meanwhile, remains supportive of elevated US Treasury bond yields and should act as a tailwind for the Greenback. This, along with the fact that Ueda reiterated the need to continue the patient monetary easing as the BoJ is some distance away from achieving its price stability target, supports prospects for the emergence of some dip-buying around the USD/JPY pair. This, in turn, warrants caution before placing aggressive bearish bets and positioning for deeper losses in the absence of any relevant macro data.
Traders might also prefer to move to the sidelines ahead of this week's release of the latest US consumer inflation figures on Wednesday. This will be followed by the US Producer Price Index (PPI) and monthly Retail Sales data on Thursday. Apart from this, the European Central Bank (ECB)-infused volatility will drive the USD demand and provide some meaningful impetus to the USD/JPY pair. In the meantime, fears that Japanese authorities might intervene to prop up the domestic currency should keep a lid on spot prices.
Technical levels to watch
- AUD/JPY recovers from the intraday losses amid BoJ’s hawkish comments.
- BoJ Governor Kazuo Ueda suggested the odds of interest rate hikes in the future.
- Investors turn cautious as China’s weak demand weakens the Australian Dollar (AUD).
AUD/JPY trades lower around 94.00 during the Asian session on Monday, trimming the intraday losses. However, the Japanese Yen (JPY) has gained strength in response to the hawkish comments made by Bank of Japan (BoJ) Governor Kazuo Ueda over the weekend.
Ueda suggested the possibility of future interest rate hikes, which exert downward pressure on the AUD/JPY pair. Ueda indicated that the central bank might consider ending its negative interest rate policy when it sees the achievement of the 2% inflation target on the horizon, as reported by the Yomiuri newspaper on Saturday.
On the other side, following the Reserve Bank of Australia's (RBA) decision to maintain the Official Cash Rate (OCR) at 4.10% last week, the central bank has explained that this choice allows them more time to assess the impact of the recent rate hike and to evaluate the economic outlook.
RBA Governor Philip Lowe, whose term is set to conclude on September 18, highlighted in a speech that he is closely monitoring the potential for wages and profits to surpass levels that are consistent with achieving the inflation target by late 2025. Additionally, Lowe noted that the unemployment rate can remain at levels not seen in nearly 40 years, and wage growth remains robust.
Investors are expressing concerns about the weak demand and the potential for deflation in China. It is worth noting that the Chinese government has denied that the country has officially entered a period of deflation, as the technical definition typically requires three consecutive monthly declines in consumer prices.
Regarding recent economic data from China, the Consumer Price Index (CPI) data in August was released on Saturday. The report showed a year-on-year increase of 0.1%, which represented an improvement compared to the previous month's figure of -0.3%. However, this reading fell short of market expectations, which had anticipated a 0.2% increase in consumer prices. This data suggests that while there was a slight improvement, inflation remains subdued.
The renewed concerns about a Chinese economic slowdown could potentially lead to selling pressure on the Australian Dollar (AUD), often considered a proxy for the Chinese economy due to their close trade ties. This, in turn, might create headwinds for the AUD/JPY pair.
Traders of the cross pair are expected to gain a clearer insight into China's economic conditions during the week. This will include a better understanding of the obstacles that authorities face in their efforts to implement necessary monetary and fiscal policies aimed at sustaining Beijing's goal of achieving 5% GDP growth for the current year.
- EUR/USD posts a modest gain around 1.0725 amid the weakening US Dollar.
- US Treasury Secretary Janet Yellen said that the US can manage inflation without hurting the employment market.
- The market anticipates the European Central Bank (ECB) will maintain interest rates unchanged at its policy meeting on Thursday.
- Market players await the US Consumer Price Index (CPI), ECB interest rate policy meeting.
The EUR/USD pair recovers some lost ground around 1.0725 after bouncing off the low of 1.0697. The rebound of the major pair is bolstered by the downward pressure on the US Dollar. Meanwhile, the US Dollar Index (DXY) corrects Lower to 104.70.
US Treasury Secretary Janet Yellen said on Sunday that she is becoming more convinced that the US will be able to curb inflation without causing major impacts on the labor market. She added that every gauge of inflation is erasing and there was no massive wave of layoffs.
The upbeat US economic data last week lends support to the higher for longer interest rate narrative in the US. The markets have been priced in the possibility of a 93% chance of a rate hold at the September meeting and a 43.5% chance of a rate hike at the November meeting, according to the CME FedWatch Tool. This, in turn, might lift the US Dollar (USD) and cap the upside of the EUR/USD.
The Fed Governor Christopher Waller said that the Fed has extra room to raise interest rates, but the data will determine it. While, Fed Boston President Susan Collins pointed out the risk of an inappropriately restrictive monetary policy stance and called for a patient and careful, but deliberate policy. Chicago Fed President Austan Goolsbee outlined the central bank's goal of leading the economy into a "golden path." This route represents a scenario in which inflation falls without causing a recession.
On the Euro front, analysts believe the European Central Bank (ECB) will maintain interest rates unchanged at its next policy meeting on Thursday. Destatis data released on Friday indicated that the German Harmonised Consumer Price Index (HICP) for August came in at 6.4% YoY, as expected by the market, while the core CPI remained steady at 6.1%. Furthermore, Eurozone GDP increased by 0.1% in the second quarter (Q2), compared to 0.3% in the previous quarter and 0.3% estimated.
On Wednesday, investors will closely watch the release of the US Consumer Price Index (CPI) for August. The monthly figure is anticipated to increase by 0.5%, while the monthly core figure is anticipated to remain unchanged at 0.2%. On Thursday, the focus will shift to the ECB's monetary policy. The event could provide the EUR/USD pair with a clear direction.
- WTI Crude Oil prices extend the sideways consolidative price move on the first day of a new week.
- The setup favours bulls and supports prospects for a breakout through a one-week-old trading range.
- A break below the trading range support will expose last week's swing low, around $84.60-$84.55.
Western Texas Intermediate (WTI) Crude Oil prices ticks lower during the Asian session on Monday, albeit lack follow-through selling and currently hover around mid-$86.00s, down nearly 0.20% for the day.
Looking at the broader picture, the black liquid remains confined in a familiar trading band held over the past week or so. The prospects of tighter global supplies, along with hopes for a demand recovery in China, continue to act as a tailwind for WTI Crude Oil prices. Apart from this, a modest US Dollar (USD) retracement slide, from a six-month peak touched last week, turns out to be another factor lending some support to the USD-denominated commodity.
From a technical perspective, the range-bound price action comes on the back of the recent rally to the highest level since mid-November and might be categorized as a bullish consolidation phase. This, along with bullish oscillators, suggests that the path of least resistance for WTI Crude Oil prices is to the upside. That said, the Relative Strength Index (RSI) on the daily chart is placed near the overbought territory and holding back bulls from placing fresh bets.
Hence, it will be prudent to wait for a convincing breakout through the trading range resistance, around the $87.55 region, before positioning for any further gains. WTI Crude Oil prices might then accelerate the momentum towards the $88.00 round figure en route to the $88.60 intermediate hurdle, the $89.00 mark and the next relevant barrier near the $89.30-$89.35 zone.
On the flip side, the $86.00 round figure could protect the immediate downside ahead of the $85.60-$85.50 area, representing the lower boundary of the aforementioned trading range. A convincing break below might prompt some technical selling and pave the way for some meaningful corrective decline. The subsequent downfall might then drag WTI Crude Oil prices below the $85.00 psychological mark, towards last week's swing low, around the $84.60-$84.55 region.
WTI 4-hour chart
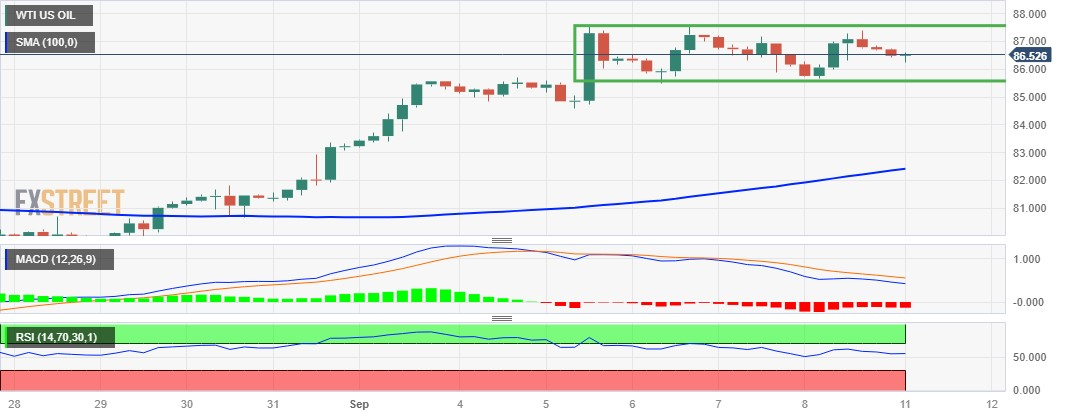
Technical levels to watch
- USD Index retreats from its peak since April marked on Thursday.
- US Dollar (USD) is expected to remain resilient due to economic data from the US.
- US Treasury Secretary Janet Yellen expressed confidence in managing inflation without harming the labor market.
- Traders await US CPI data, hoping to gain insights into the inflation outlook.
US Dollar Index (DXY), which compares the performance of the US Dollar (USD) against six other major currencies, trades lower around 104.80 slightly below its peak since April marked on Thursday. However, Improved US Treasury yields could provide support to the strength of the Greenback. The yields on 10-year US Treasury bonds rose to 4.29%, up by 0.66% at the time of writing.
The strength of the US Dollar (USD) continues to be underpinned by economic data from the United States (US), as well as differing outlooks when compared to the Eurozone displaying growing signs of economic distress. The US economy is performing strongly and appears to be on a path toward a gradual and controlled economic slowdown.
Moreover, US Initial Jobless Claims data for the week ending September 2 showed a figure of 216K, better than the market expectations of 234K and coming in lower than the revised figure of 229K from the previous week. This favorable labor market data could play a role in shoring up the resilience of the US dollar.
On Sunday, while returning from the G20 Summit, US Treasury Secretary Janet Yellen expressed growing confidence that the US would be able to manage inflation without significant harm to the job market. Yellen also stated, “Every measure of inflation is on the road down.”
Chicago Fed Bank President Austan Goolsbee has made a statement that the US Federal Reserve’s (Fed) objective of driving the economy onto a "golden path." This path signifies a scenario in which inflation subsides without causing a recession, a delicate balance that central banks often strive to achieve to maintain economic stability and growth.
In a statement during the last week, Federal Reserve Bank of New York President John Williams maintained a flexible stance regarding future US interest rate policies. Williams acknowledged the decline in inflation and noted that the economy is achieving a better balance. This suggests that there may not be an immediate need for a rate hike later this month, indicating a cautious approach to monetary policy.
Additionally, investors are eagerly awaiting signals from the Fed regarding its intentions to sustain elevated interest rates over an extended period. Furthermore, traders are expecting that the Fed may enact a 25 basis point (bps) interest rate hike by the end of 2023. This hawkish stance taken by the central bank could potentially provide further support for the USD.
Investors will likely monitor the United States (US) Consumer Price Index (CPI) for August, scheduled for release on Wednesday. This data is expected to provide valuable insights into the inflation scenario and could influence investor decisions regarding the Greenback.
- USD/CHF kicks off the new week on a weaker note, albeit lacks follow-through selling.
- A modest USD pullback from a multi-month top is seen exerting pressure on the major.
- Hawkish Fed expectations, elevated US bond yields limit losses for the USD and the pair.
The USD/CHF pair opens with a bearish gap on the first day of a new week, albeit manages to hold its neck above the 0.8900 mark through the Asian session. Spot prices currently trade around the 0.8910-0.8915 area, down nearly 0.20% for the day, and remain at the mercy of the US Dollar (USD) price dynamics.
Following the recent strong run-up, the USD Index (DXY), which tracks the Greenback against a basket of currencies, pulls back from a six-month high and turns out to be a key factor exerting some pressure on the USD/CHF pair. The USD downtick could be attributed to a strong pickup in demand for the Japanese Yen (JPY), bolstered by Bank of Japan (BoJ) Governor Kazuo Ueda's hawkish remarks over the weekend. That said, hawkish Federal Reserve (Fed) expectations might hold back traders from placing aggressive USD bearish bets.
Market participants seem convinced that the US central bank will keep interest rates higher for longer and have been pricing in the possibility of one more 25 bps lift-off by the end of this year. The bets were reaffirmed by The Wall Street Journal report, stating that some officials still prefer to err on the side of raising rates too much, reasoning that they can cut them later. This remains supportive of elevated US Treasury bond yields and should act as a tailwind for the buck, warranting caution before positioning for a deeper USD/CHF corrective slide.
Investors might also prefer to wait on the sidelines ahead of this week's key US macro releases – the latest consumer inflation figures on Wednesday, followed by the Producer Price Index (PPI) and Retail Sales data on Thursday. In the meantime, a generally positive tone around the equity markets could undermine the safe-haven Swiss Franc (CHF) and contribute to limiting losses for the USD/CHF pair. Hence, it will be prudent to wait for strong follow-through selling before confirming that spot prices have topped out near the 0.8940-0.8945 region.
Technical levels to watch
- GBP/JPY cross trades within the descending triangle pattern since August.
- The 50-hour EMA is on the verge of crossing below the 100-hour EMA.
- The first resistance level of GBP/JPY is seen at 184.40; 183.10 acts as an initial support level.
The GBP/JPY cross trades within the descending triangle pattern since August. The cross currently trades around 183.22, losing 0.56% on the day. The recent interview of the Japanese policymaker triggers the Japanese Yen (JPY) higher against the British Pound (GBP) in the early Asian session on Monday. Bank of Japan (BoJ) Governor Kazuo Ueda stated in an interview on Monday that the central bank will now be on "a quiet exit," as the BOJ seeks to avoid any major impact on the market.
From the technical perspective, the GBP/JPY cross stands below the 50- and 100-hour Exponential Moving Averages (EMAs). It’s worth noting that the 50-hour EMA is on the verge of crossing below the 100-hour EMA. If a decisive crossover occurs on the four-hour chart, it would validate a Bear Cross, highlighting the path of least resistance for the cross is to the downside.
The first resistance level of GBP/JPY is seen at 184.40 (a confluence of the 50- and 100-hour EMA). The additional upside filter to watch is 185.35 (the upper boundary of the descending triangle pattern). Any meaningful follow-through buying will see the next stop at 186.00 (a psychological round mark, a high of August 23).
On the flip side, a decisive break below the lower limit of the descending triangle pattern of 183.10 will see a drop to 182.55 (a high of July 21) en route to 182.35 (a low of August 9) and a psychological round mark at 182.00.
Furthermore, the Relative Strength Index (RSI) is located in bearish territory below 50, highlighting that further downside cannot be ruled out.
GBP/JPY four-hour chart
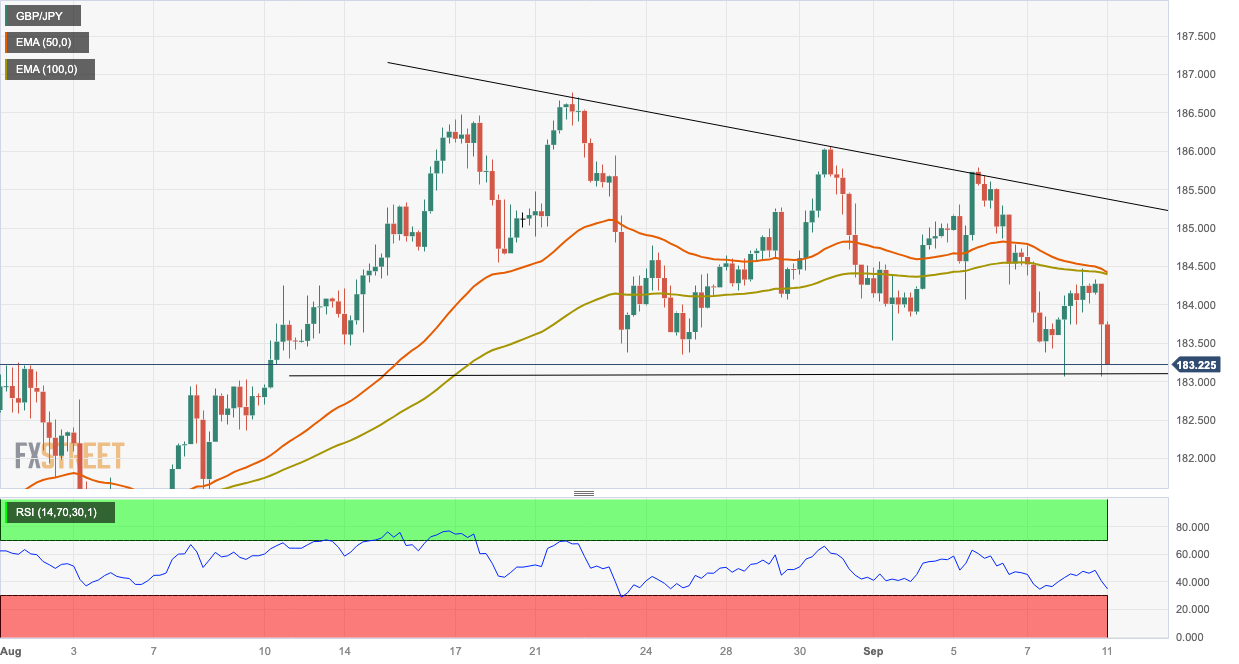
| Raw materials | Closed | Change, % |
|---|---|---|
| Silver | 22.919 | -0.22 |
| Gold | 1918.996 | -0.02 |
| Palladium | 1194.75 | -1.61 |
- Silver gains positive traction and snaps an eight-day losing streak to over a two-week low.
- The technical setup supports prospects for the emergence of fresh selling at higher levels.
- Bears might wait for a fall below the $22.85-80 region before positioning for further decline.
Silver attracts some buyers on the first day of a new week, snapping an eight-day losing streak, and climbs back above the $23.00 round-figure mark during the Asian session. The white metal, however, remains well within the striking distance of a two-and-half-week low, around the $22.85-$22.80 region retested on Friday, and still seems vulnerable to slide further.
The negative outlook is reinforced by the fact that oscillators on the daily chart have been gaining negative traction and are away from being in the oversold zone. Moreover, the Relative Strength Index (RSI) on the 4-hour chart has also recovered from the oversold territory. This, in turn, suggests that the path of least resistance for the XAG/USD remains to the downside.
Hence, any subsequent move up might still be seen as a selling opportunity and remain capped near the very important 200-day Simple Moving Average (SMA), currently pegged near the $23.45-$23.50 area. This is followed by the 100-day SMA barrier, around the $23.80 region, and the $24.00 mark, which if cleared decisively will negate the negative outlook for the XAG/USD.
The subsequent short-covering move has the potential to lift the white metal beyond the $24.30-$24.35 supply zone, towards reclaiming the $25.00 psychological mark. The latter represents the August monthly swing high and should act as a pivotal point. A sustained strength beyond will be seen as a fresh trigger for bullish traders and pave the way for a further appreciating move.
On the flip side, bearish traders need to wait for some follow-through selling below the $22.85-$22.80 area before placing fresh bets. The XAG/USD might then accelerate the fall below the $22.65-$22.60 support, towards challenging a strong horizontal support near the $22.20-$22.10 zone. This is followed by the $22.00 mark, which if broken will confirm a fresh breakdown.
Silver daily chart
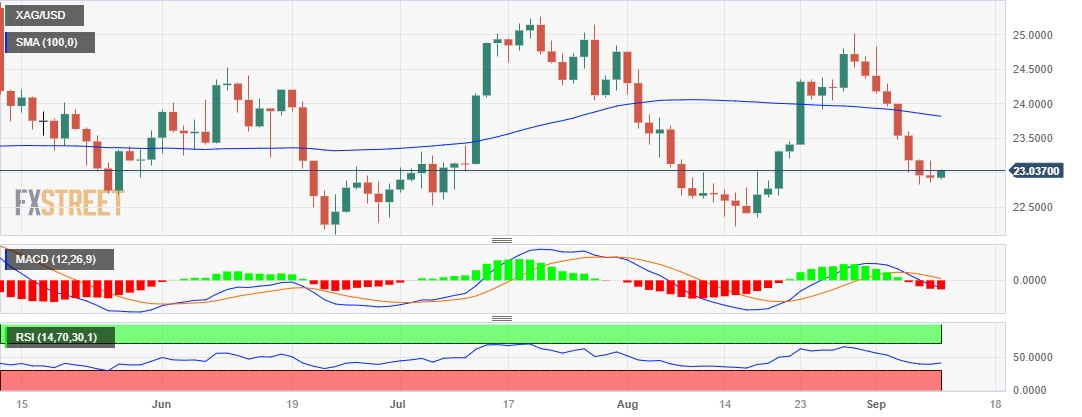
Technical levels to watch
While returning from the G20 Summit on Sunday, US Treasury Secretary Janet Yellen that she is “increasingly confident that the US will be able to contain inflation without major damage to the job market.”
Additional comments
“Every measure of inflation is on the road down.”
“While the US unemployment rate increased in August after reaching the lowest levels in more than a half-century earlier this year, that jump wasn’t caused by a large wave of layoffs.”
Market reaction
The US Dollar fails to find any inspiration from Yellen’s remarks, as the US Dollar Index is losing 0.28% on the day at 104.81, at the press time.
- USD/CAD struggles to snap the previous session’s losses on the back of a soft Greenback.
- The Canadian Dollar (CAD) experienced downward pressure despite upbeat employment data.
- Investors await US CPI data, seeking further cues on the inflation outlook.
USD/CAD hovers around 1.3630 during the Asian session on Monday, attempting to snap the previous session’s losses. The pair experienced downward pressure despite the upbeat employment data for August from Canada on Friday.
As said, Average Hourly Wages (YoY) improved to 5.2% from the previous reading of 5.0%. Net Change in Employment (Aug) printed a reading of 39.9K, significantly higher than the market consensus of 15.0K, swinging from the previous -6.4K. While the Unemployment Rate remained consistent at 5.5% against the expectations of a 5.6% reading.
However, strong wage growth has the potential to boost consumer spending and maintain persistent inflationary pressures. This situation might lead the Bank of Canada (BoC) to consider raising interest rates once more.
US Dollar Index (DXY), which measures the performance of the Greenback against six other major currencies, is presently trading around 104.80 slightly below its peak since April. However, US Treasury yields have improved, which could underpin the buck. The yields on 10-year US Treasury bonds rose to 4.29%, up by 0.52%.
US dollar (USD) is anticipated to maintain its strength, supported by the continuous stream of positive economic data reflecting the robust state of the US economy. For instance, US Initial Jobless Claims recently reported a figure of 216K for the week ending September 2, which was below market expectations of 234K and lower than the previous week's revised figure of 229K. This positive labor data contributes to the resilience of the US dollar.
Additionally, Chicago Fed Bank President Austan Goolsbee has articulated the central bank's objective of steering the economy onto a "golden path." This path signifies a scenario in which inflation subsides without causing a recession, a delicate balance that central banks often strive to achieve to maintain economic stability and growth.
Moreover, investors are seeking further cues on the US Federal Reserve’s (Fed) decision on maintaining higher interest rates for an extended duration. Also, traders anticipate that the Fed will implement a 25 basis point (bps) interest rate hike by the conclusion of the year 2023. This hawkish stance from the central bank could potentially contribute to the support in underpinning the Greenback.
Given the lack of significant economic data releases from Canada, investors are likely to turn their attention to the United States (US) Consumer Price Index (CPI) for August, scheduled for release on Wednesday. This data is expected to provide valuable insights into the inflation scenario and could influence investor decisions regarding the USD/CAD pair, potentially prompting fresh trading positions.
- NZD/USD holds above the 0.5900 area amid the declining US Treasury bond.
- The fear of China’s deflation faded as the Chinese inflation data improved in August.
- The encouraging US economic data last week lends support to the higher for longer interest rate narrative in the US.
- Traders will closely watch the US Consumer Price Index.
The NZD/USD pair recovers some lost ground and reclaims the 0.5900 mark during the early Asian trading hours on Monday. The absence of economic data on the US economic calendar and declining US Treasury bond yields weighed on the USD, providing support for the NZD/USD pair. The pair currently trades near 0.5901, gaining 0.31% on the day.
New Zealand’s Manufacturing Sales for the second quarter improved to 2.9% versus a 2.1% drop in the previous reading, Statistics New Zealand reported last week. Additionally, the ANZ Commodity Price for August fell to 2.9% from a 2.6% drop in July. The nation’s Terms of Trade Index improved to 0.4% in the second quarter, compared to a decline of 1.5% in the previous reading and an expected drop of 1.3%.
Apart from this, the fear of China’s deflation erased as the Chinese inflation data improved in August. This, in turn, lifts the China-proxy New Zealand Dollar (NZD) against the Greenback. Data released on Saturday revealed that Chinese inflation, measured by the Consumer Price Index (CPI) for August came in at 0.1% YoY versus a 0.3% drop in the previous reading, a worse-than-expected 0.2% rise. The monthly figure came in at 0.3%, as expected. Finally, the Producer Price Index (PPI) declined 3.0% YoY from a 4.4% drop in July and in line with estimates.
Across the pond, the encouraging US economic data last week lends support to the higher for longer interest rate narrative in the US. The markets have priced in a 93% chance of a rate hold at the September meeting and a 43.5% chance of a rate hike at the November meeting, according to the CME FedWatch Tool. The hawkish stance from the Federal Reserve (Fed) could boost the US Dollar and act as a headwind for the NZD/USD pair.
Later this week, the US Consumer Price Index for August and Retail Sales will be released on Wednesday and Thursday, respectively. There will be no top-tier economic data released from the New Zealand docket. However, the Chinese Retail Sales and Industrial Production data due on Friday might influence the Kiwi. Traders will take a cue from the figures and find trading opportunities for the NZD/USD pair.
In an interview with the Yomiuri Shimbun over the weekend, Bank of Japan (BoJ) Governor Kazuo Ueda explained the monetary policy tweak in July as “a mechanism to change the balance between the effects and side effects” of monetary easing measures.
The focus will now be on “a quiet exit,” which the BOJ is seeking to avoid a significant impact on the market, Ueda added.
Additional quotes
“The Bank could have enough data by year-end to determine whether it can end negative rates.”
"Once we're convinced Japan will see sustained rises in inflation accompanied by wage growth, there are various options we can take."
"If we judge that Japan can achieve its inflation target even after ending negative rates, we'll do so."
The BoJ will "patiently" maintain ultra-loose policy: "While Japan is showing budding positive signs, achievement of our target isn't in sight yet."
“Wage rises are beginning to push up service prices. The key is whether wages will keep rising next year.”
"We can't rule out the possibility we'll get enough information and data by year-end," on the timing for ending negative rates.
On Friday, the People’s Bank of China (PBOC) fixed the USD/CNY central rate at 7.2150, compared with Friday’s fix of 7.2150 and market expectations of 7.3437.
The PBOC injected 215 bln yuan via 7-day reverse repos at 1.80% vs. prior 1.80%.
- USD/JPY opens with a bearish gap in reaction to BoJ Governor Ueda's hawkish signal.
- Bets that more rate hikes by the Fed underpin the USD and help limit losses for the pair.
- The fundamental backdrop warrants caution before positioning for any meaningful slide.
The USD/JPY pair opened with a big 85 pips bearish gap on the first day of a new week and remains depressed below the 147.00 mark through the first half of the Asian session. Spot prices, however, manage to defend the 200-hour Simple Moving Average (SMA) support, currently pegged around the 146.65 region, which should now act as a pivotal point for intraday traders.
The Japanese Yen (JPY) strengthens in reaction to the Bank of Japan (BoJ) Governor Kazuo Ueda's hawkish remarks over the weekend, signalling possible interest rate hikes, which, in turn, weighs on the USD/JPY pair. Ueda said the central bank could end its negative interest rate policy when achievement of the 2% inflation target is in sight, the Yomiuri newspaper reported Saturday. Ueda, however, reiterated that the BoJ will patiently maintain the ultraloose policy until it is convinced inflation will sustainably stay around 2%, backed by solid demand and wage growth.
In contrast, the Federal Reserve (Fed) is expected to deliver one more 25 bps rate hike by the end of this year and keep interest rates higher for longer. The bets were reaffirmed by The Wall Street Journal report that some officials still prefer to err on the side of raising rates too much, reasoning that they can cut them later. The outlook, meanwhile, remains supportive of elevated US Treasury bond yields, which helps limit a modest US Dollar (USD) pullback from its highest level since March 8 touched last week and acts as a tailwind for the USD/JPY pair, at least for now.
In the absence of any relevant market-moving economic releases on Monday, the aforementioned fundamental backdrop makes it prudent to wait for strong follow-through selling before confirming that spot prices have topped out in the near term. Traders might also prefer to wait on the sidelines ahead of this week's important US macro releases – the latest consumer inflation figures on Wednesday, followed by the Producer Price Index (PPI) and Retail Sales data on Thursday.
Technical levels to watch
- Gold price trades sideways amid US Dollar (USD) retreats.
- Improved US Treasury yields could exert downward pressure on the price of Gold.
- China’s disinflationary pressures influenced the yellow metal.
Gold price trades around $1,920 a troy ounce during the early trading hours in the Asian session on Monday. The precious metal struggles to hold ground near the previous weekly close, experiencing minor support due to the retreating in the US Dollar (USD).
US Dollar Index (DXY), which measures the performance of the Greenback against six other major currencies, is presently trading around 104.80 slightly below its peak since April. However, US Treasury yields rose, which could exert pressure on the price of the yellow metal. The yields on 10-year US Treasury bonds rose to 4.29%, up by 0.52%.
The buck is expected to remain robust, buoyed by the consistent flow of positive economic data concerning the state of the US economy. As said, US Initial Jobless Claims reported a reading of 216K on the week ending September 2, below the market consensus of 234K and the previous week's revised figure of 229K.
Consumer Price Index (CPI) data for China in August was published on Saturday. The report indicated a year-on-year increase of 0.1%, which marked an improvement compared to the previous month's figure of -0.3%. However, it fell short of market expectations, which had anticipated a 0.2% reading. This relatively soft CPI reading suggests that disinflationary pressures persist, and this could potentially influence downward pressure on the prices of Gold.
Market participants will better understand China's economic situation through the week, including the challenges that authorities must address to implement the required monetary and fiscal measures to maintain Beijing's target of achieving 5% GDP growth this year.
Furthermore, the US Federal Reserve (Fed) is expected to maintain higher interest rates for an extended duration. Additionally, there is an anticipation that the Fed will implement a 25 basis point (bps) interest rate hike by the conclusion of the year 2023. This hawkish stance from the central bank could exert significant downward pressure on Gold prices.
Moreover, investors seek more indications from the US Consumer Price Index (CPI) for August, which is due on Wednesday.
- AUD/USD consolidates in a one-week range around 0.6395 on Monday.
- Reserve Bank of Australia (RBA) Governor said the Unemployment Rate can sustain near 40-year lows and wage growth is strong.
- Upbeat US data lends support to the higher for longer interest rate narrative in the US.
- Investors await the US Consumer Price Index (CPI), Australian employment data.
AUD/USD trades sideways near the key resistance level of 0.6400 area during the early Asian session on Monday. Meanwhile, the US Dollar Index (DXY), a measure of the value of USD versus a basket of global currencies, corrects lower from the six-month top of 105.15 and currently trades around 104.85.
After holding the Official Cash Rate (OCR) at 4.10% last week, the Reserve Bank of Australia (RBA) stated that the decision to keep interest rates on hold gives it more time to examine the effect of the current rate hike and the economic outlook. RBA Governor Philip Lowe, whose term ends on September 18, stated in a speech that he had focused on the possibility that wages and profits could exceed levels consistent with inflation returning to target in late 2025. He added that the Unemployment Rate can sustain near 40-year lows and wage growth is strong.
About last week’s data, the Australian Gross Domestic Product (GDP) climbed 0.4% in the second quarter of 2023 from 0.2% in the first quarter and better than the estimations of 0.3%. The annual second-quarter GDP increased by 2.1%, compared to a 2.3% rise in the first quarter and beating the expectations of a 1.7% gain.
Investors are concerned about the sluggish demand as well as the deflation in China. The Chinese government has denied that the nation has entered a period of deflation as it technically requires three consecutive monthly declines in consumer prices. However, CPI has hovered just above zero since the beginning of the year. On Saturday, data released from China’s National Bureau of Statistics reported that the Chinese Consumer Price Index (CPI) for August came in at 0.1% YoY versus a 0.3% drop in the previous reading, a worse-than-expected 0.2% rise. The monthly figure came in at 0.3%, as expected. Finally, the Producer Price Index (PPI) declined 3.0% YoY from a 4.4% drop in July and is in line with estimates. The figure fell at the slowest pace in five months. However, the renewed concern about the Chinese economic slowdown might exert some selling pressure on the China proxy Australian Dollar (AUD) and act as a headwind for AUD/USD.
On the US Dollar front, the Federal Reserve (Fed) could be compelled by the upbeat US data released last week to maintain the interest rate at its September meeting, but the markets anticipated one more 25 basis point (bps) rate increase by the end of the year. According to the CME FedWatch Tool, the markets have priced in a 93% chance of a rate hold at the September meeting and a 43.5% chance of a rate hike at the November meeting. The higher for longer interest rate narrative in the US could lift the Greenback against its rivals.
Moving on, Wednesday's US Consumer Price Index (CPI) for August will provide market participants with additional information. The monthly figure is expected to rise by 0.5% while the core monthly figure is expected to remain at 0.2%. On the Australian docket, the Australian employment data will be due on Thursday. On Friday, the Chinese Industrial Production and Retail Sales will be released. Traders will take cues from these figures and find trading opportunities around the AUD/USD pair.
- GBP/USD kicks off the new week on a positive note, albeit lacks bullish conviction.
- A modest USD pullback from a multi-week top is seen lending support to the major.
- Hawkish Fed and expectations for an end of the BoE rate-hiking cycle cap the upside.
The GBP/USD pair opens with a modest bullish gap on the first day of a new week, albeit lacks any follow-through and remains below the 1.2500 psychological mark through the first half of the Asian session.
Having recorded its longest winning streak in nearly nine years, the US Dollar (USD) pulls back from a six-month high amid some repositioning trade ahead of this week's key US macro data and the European Central Bank (ECB) event risk. The crucial US consumer inflation figures will be released on Wednesday, followed by the Producer Price Index (PPI) on Thursday, which will be accompanied by monthly Retail Sales data. This, along with volatility infused by the highly-anticipated ECB decision, will influence the USD price dynamics and provide some meaningful impetus to the GBP/USD pair.
In the meantime, growing acceptance that the Federal Reserve (Fed) will keep interest rates higher for longer remains supportive of elevated US Treasury bond yields and continues to lend some support to the Greenback. In fact, The Wall Street Journal, though reaffirmed a pause in September, reported that some officials still prefer to err on the side of raising rates too much, reasoning that they can cut them later. This, along with expectations that the Bank of England (BoE) is nearing the end of its policy tightening cycle, does little to lift the GBP/USD pair away from a three-month low touched last week.
BoE Governor Andrew Bailey told lawmakers on Wednesday that the central bank is much nearer to ending its run of rate increases, though warned that borrowing costs might still have further to rise because of stubbornly high inflation. Nevertheless, the aforementioned fundamental backdrop suggests that the path of least resistance for the GBP/USD pair is to the downside. Bearish traders, however, need to wait for a sustained break and acceptance below the very important 200-day Simple Moving Average (SMA), currently pegged around the 1.2425 region, before placing fresh bets.
Technical levels to watch
| Index | Change, points | Closed | Change, % |
|---|---|---|---|
| NIKKEI 225 | -384.24 | 32606.84 | -1.16 |
| KOSPI | -0.58 | 2547.68 | -0.02 |
| ASX 200 | -14.3 | 7156.7 | -0.2 |
| DAX | 21.64 | 15740.3 | 0.14 |
| CAC 40 | 44.67 | 7240.77 | 0.62 |
| Dow Jones | 75.86 | 34576.59 | 0.22 |
| S&P 500 | 6.35 | 4457.49 | 0.14 |
| NASDAQ Composite | 12.7 | 13761.53 | 0.09 |
| Pare | Closed | Change, % |
|---|---|---|
| AUDUSD | 0.63763 | -0.01 |
| EURJPY | 158.148 | 0.38 |
| EURUSD | 1.07002 | 0.03 |
| GBPJPY | 184.163 | 0.26 |
| GBPUSD | 1.24607 | -0.1 |
| NZDUSD | 0.5884 | 0.15 |
| USDCAD | 1.36396 | -0.32 |
| USDCHF | 0.89293 | 0.04 |
| USDJPY | 147.799 | 0.36 |


© 2000-2026. Уcі права захищені.
Cайт знаходитьcя під керуванням TeleTrade DJ. LLC 2351 LLC 2022 (Euro House, Richmond Hill Road, Kingstown, VC0100, St. Vincent and the Grenadines).
Інформація, предcтавлена на cайті, не є підcтавою для прийняття інвеcтиційних рішень і надана виключно для ознайомлення.
Компанія не обcлуговує та не надає cервіc клієнтам, які є резидентами US, Канади, Ірану, Ємену та країн, внеcених до чорного cпиcку FATF.
Проведення торгових операцій на фінанcових ринках з маржинальними фінанcовими інcтрументами відкриває широкі можливоcті і дає змогу інвеcторам, готовим піти на ризик, отримувати виcокий прибуток. Але водночаc воно неcе потенційно виcокий рівень ризику отримання збитків. Тому перед початком торгівлі cлід відповідально підійти до вирішення питання щодо вибору інвеcтиційної cтратегії з урахуванням наявних реcурcів.
Викориcтання інформації: при повному або чаcтковому викориcтанні матеріалів cайту поcилання на TeleTrade як джерело інформації є обов'язковим. Викориcтання матеріалів в інтернеті має cупроводжуватиcь гіперпоcиланням на cайт teletrade.org. Автоматичний імпорт матеріалів та інформації із cайту заборонено.
З уcіх питань звертайтеcь за адреcою pr@teletrade.global.
переклади