- Аналітика
- Новини та інструменти
- Новини ринків
Новини ринків
- US Producer Price Index (PPI) surpasses estimates, bolstering the US Dollar as Treasury yields soar.
- Reserve Bank of New Zealand (RBNZ) is expected to maintain rates at 5.50%, adding pressure on the NZD.
- NZD/USD’s future hinges on US economic data and potential RBNZ rate surprises; 0.5900 level in sight.
NZD/USD plunges below 0.6000, set to finish the week with losses of 1.86% after inflation data in the United States (US), although mixed, weighed on the NZD/USD pair. Furthermore, the Reserve Bank of New Zealand (RBNZ) adopting a dovish stance was the last nail in the coffin for the Kiwi dollar (NZD). The NZD/USD exchanges hands at 0.5981, down 0.65%.
Kiwi dollar faces headwinds from mixed US inflation data and RBNZ’s anticipated rate hold
During the week, the NZD/USD extended its losses courtesy of fundamental news, with US inflation data in the spotlight. Data was mixed, with consumer inflation ticking a little up, but stood below estimates, confirming US disinflationary process. Still, not everything was positive news, as factory prices, known as the Producer Price Index (PPI) for July, exceeded estimates and the prior’s month data. Hence, traders bought the US Dollar (USD) underpinned by soaring US Treasury bond yields, to the detriment of the New Zealand Dollar (NZD).
US Treasury bond yields advanced sharply as traders turned nervous after the data reignited fears of price pressures, which could influence the US Federal Reserve (Fed) to tighten monetary conditions. The US 10-year yields rose nine basis points to 4.168%, while the most sensitive to interest rates, the US 2-year yield, climbed nine basis points to 4.90%.
Consequently, the US Dollar Index (DXY), which measures the buck’s performance vs. its peers, advances 0.32%, at 102.853, printed solid gains during the week.
On the New Zealand (NZ) front, weakness in business activity weighed on the NZD. Worth mentioning that a Reuters poll said that most analysts estimate the Reserve Bank of New Zealand (RBNZ) will keep rates unchanged at 5.50%, at a 14-year high, for the second straight meeting, on August 16. Only two of 29 analysts said that rates would need to rise to 5.75%.
Given the backdrop, the NZD/USD could extend its downtrend, favored by the RBNZ’z stance. If US economic data becomes weaker than expected and the RBNZ surprises the market with a rate hike, the NZD/USD could reclaim the 0.6000 figure. Otherwise, look for a break below 0.5900, with sellers eyeing last year’s October lows of 0.5512.
NZD/USD Price Analysis: Technical outlook
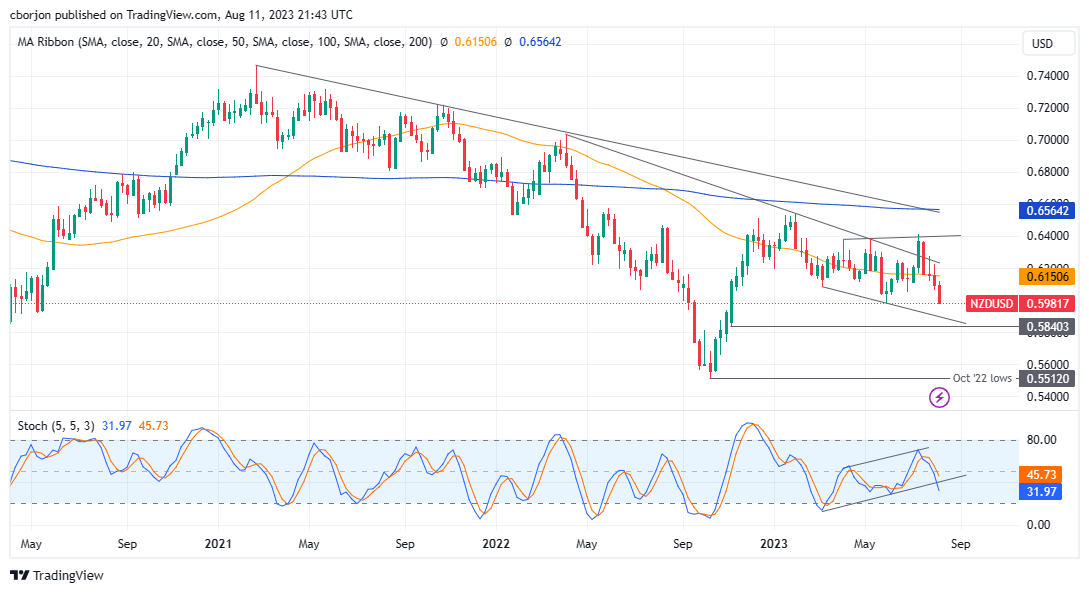
From a technical perspective, the NZD/USD is set to extend its losses, as the weekly chart portrays a ‘broadening formation’, suggesting that further downside is expected. The break of the pair below the 50-week moving average accelerated the NZD/USD’s fall, and a daily close below the May 2023 lows of 0.5985 could put into play a fall towards the bottom of the ‘broadening formation’ at around 0.5875/0.5900. A drop below that level would put last year’s October low at 0.5512 in play.
- The EUR/JPY traded in the red below the 159.00 area after five consecutive days of gains.
- The cross closed Friday with 1.65% weekly gains, trading in highs since 2008.
- Focus shifts to the Eurozone and Japan's GDP for Q2, which will be released the following week.
In Friday's session, the EUR/JPY traded with losses, closed negative below the 159.00 area, and corrected after five consecutive days of gains. On the Euro’s side, France's Consumer Price Index (CPI) figures slightly surprised to the upside but failed to significantly impact the pair, while no relevant reports featured on the Japanese economic calendar. All eyes are now on the Gross Domestic Product (GDP) for Q2, which will be released next week, for both the Eurozone and Japan region will help investors to place their bets on the European Central Bank (ECB) and Bank of Japan (BoJ) following decisions.
EUR/JPY Levels to watch
The daily chart analysis indicates a bullish outlook for the EUR/JPY in the short term despite Friday’s losses. The Relative Strength Index (RSI) is above its midline in positive territory aligning with the positive signal from the Moving Average Convergence Divergence (MACD), which displays green bars, reinforcing the strong bullish sentiment. Additionally, the pair is comfortably above the 20,100,200-day Simple Moving Averages (SMAs), indicating that the bulls are clearly in command on the broader picture.
Support levels: 157.60, 157.00, 156.00.
Resistance levels: 159.00, 159.50, 160.00.
EUR/JPY Daily chart
-638273853941414482.png)
- The pair trades green for a fifth consecutive day, around the critical 145.00 zone.
- The USD continues to strengthen after higher-than-expected US PPI data from July.
- Investors continue to bet on a less aggressive stance by the BoJ causing the Yen to lose interest.
On the last day of the week, the USD/JPY rose near the 145.00 zone, showing more than 2% of weekly gains. This movement was driven by a vital Producer Price Index (PPI) from the US for July and optimistic personal consumer confidence data released by the University of Michigan (UoM). The US treasury bond yields are increasing and show more than 1% of daily gains from this. On the Japanese side, Yen continues to trade weak as investors continue to place bets on a dovish stance by the Bank of Japan (BoJ).
Hawkish bets on the Fed after inflation data favoured the USD
PPI data on Friday saw the headline figure jumping to 2.4% YoY in July, slightly higher than expected. This comes with the US releasing this week that the headline and core Consumer Price Index (CPI) decelerated in the same month, so overall, the US inflation outlook is mixed.
That being said, the US bond yields are seeing gains across the curve driven by hawkish bets on the Federal Reserve. The 10-year bond yield rose to 4.18%, while the 2-year yield stands at 4.90% and the 5-year yielding 4.31%, respectively. In line with that, the CME FedWatch tool indicates that the odds of a 25 basis point (bps) hike in the November meeting rose to nearly 30% but remain low for the upcoming September decision.
On the JPY’s side, no relevant data was released, and the focus shifted to next week's Gross Domestic Product (GDP) data from Q2 from Japan.
USD/JPY Levels to watch
Considering the daily chart, the USD/JPY shows a bullish outlook for the short term. The Relative Strength Index (RSI), positioned above its midline in positive territory with a northward slope, supports this view along with the positive indication from the Moving Average Convergence Divergence (MACD), which is displaying green bars, pointing towards a strengthening bullish trend. On the other hand, the pair is above the 20,100,200-day Simple Moving Averages (SMAs), indicating that the bulls are in command of the broader picture.
Support levels: 143.70, 143.00, 142.00.
Resistance levels: 145.00, 145.50, 146.00.
USD/JPY Daily chart
-638273807969935913.png)
- US Producer Price Index (PPI) outpaces June, driving a temporary Greenback rally and GBP/USD dip.
- University of Michigan poll indicates optimism on inflation’s decline post-Fed’s 525 bps rate hike.
- UK’s economy outperforms forecasts, bolstering Bank of England’s rate hike stance amidst looming recession fears.
Late in the New York session, the Pound Sterling (GBP) continued to hold its ground against the US Dollar (USD) after UK’s economy grew more than expected, despite US elevated inflation on the producer side. Hence, the GBP/USD trades at 1.2697, gaining 0.16%.
Wall Street wavers as mixed US inflation data clashes with UK’s unexpected economic surge
Wall Street is set to finish the session with losses after the United States (US) inflation data posted mixed results. Consumers’ inflation climbed above the prior’s month but below estimates, sparking speculations on the Federal Reserve (Fed) ending its tightening cycle, but data on Friday changed investors’ minds.
The US Department of Labor showed the prices paid by producers, known as the Producer Price Index (PPI), exceeded June’s readings, spurring a Greenback rally; consequently, the GBP/USD weakened.
The University of Michigan Consumer Sentiment poll, revealed that US consumer sentiment slightly deteriorated. Still, Americans remained positive on inflation lowering after the US Federal Reserve (Fed) increased 525 bps its borrowing costs, with inflation expected to dive below 3% on a five-year horizon.
Across the Atlantic, UK’s economy surprisingly grew above estimates, justifying the Bank of England’s (BoE) need to raise rates amidst stubbornly high inflation. Nevertheless, next week’s inflation data can lend a lifeline to the BoE if it shows signs of slowing down as the UK’s economy is still at the brisk of a recession.
GBP/USD Price Analysis: Technical outlook
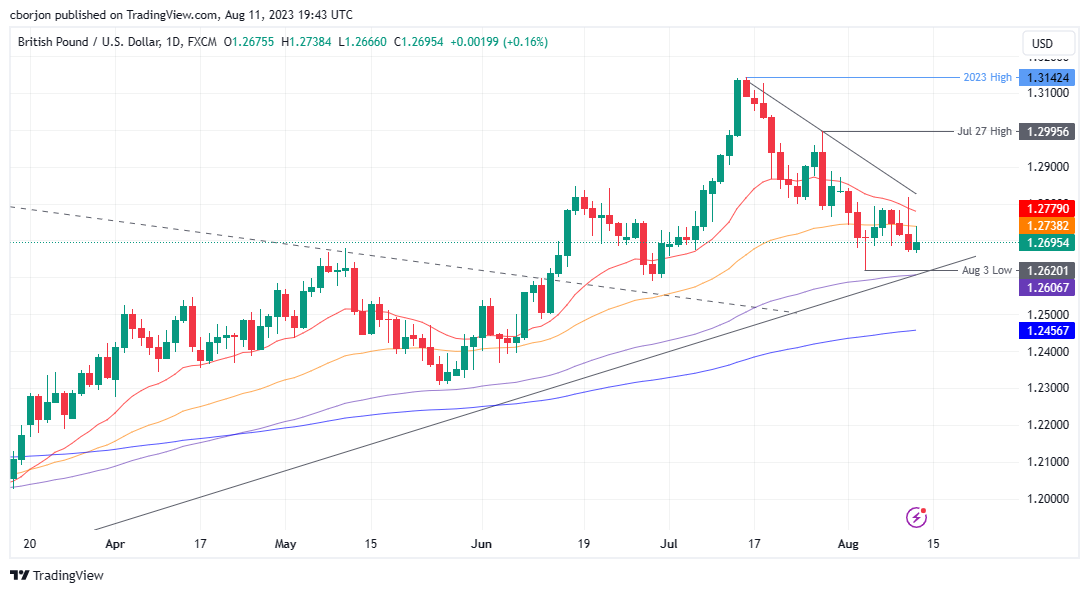
The GBP/USD breaking to a new weekly high, above 1.2800 but reversing its gains on soft US inflation data, has exacerbated GBP/USD’s pullback, extending beneath the 1.2700 figure. If GBP/USD remains below the latter and achieves a daily close, that would cement Sterling’s (GBP) faith. That said, the GBP/USD first support would emerge at 1.2666, followed by the August 3 daily low of 1.2620, ahead of sliding towards 1.2500. Conversely, if GBP/USD’s buyers reclaim 1.2700, it would be cheered by buyers, which could remain hopeful of targeting 1.2800, ahead of challenging the July 27 daily high at 1.2995.
Analysts at Rabobank, see the USD/JPY pair at 145 on a 3-month view and then pulling back to 140 and 135 in 9 and 12 months, respectively, on the back of expectations of softer Federal Reserve policy.
Key quotes:
“The messages contained within the BoJ’s July policy adjustment have not been easy to decipher. The BoJ may have been attempting to give itself more flexibility around YCC. However, Governor Ueda’s comments on the exchange rate may have encouraged speculation that JPY weakness will result in more upside in 10 yr yields.”
“This week’s softer than expected Japanese economic data support the view that the BoJ will maintain accommodative policy settings, and we have revised higher our USD/JPY forecasts.”
“We have revised down our forecasts for the JPY. We now see USD/JPY at 145 on a 3-month view, recovering to USD/JPY140 and USD/JPY 135 in 9 and 12 months respectively on the back of expectations of softer Fed policy.”
The University of Michigan's Consumer Confidence data for August offered little change. Analysts at Wells Fargo point out that consumers anticipate prices to decline overall, despite their expectations of rising interest rates.
Key quotes:
“Consumers are becoming more convinced that inflation is cooling. Whether or not they fully understand the Federal Reserve's role in that is not completely clear, but they are yet to be convinced that we have seen the last of rising interest rates.”
“A majority of consumer still expects interest rates to rise over the next year. In fact, the index value for this measure, or the share of consumers expecting interest rates to go up less the share expecting them to come down in the next year, sits at 50. Though this is a slight decline from 52 in July, it is still above any other point since February 2021.”
Next week, key events in the US include Retail Sales data and the release of the FOMC minutes. Market participants will also closely listen to comments from Fed officials as they prepare for the Jackson Hole Symposium. In the UK, inflation and employment data will be reported. The RBNZ will have its monetary policy meeting. The RBA will release its meeting minutes, and Australia will report employment figures. Canada's inflation data is also expected to be released.
Here is what you need to know for next week:
Next week, the US is scheduled to release several important economic indicators. On Tuesday, Retail Sales data will be published, followed by Building Permits and Industrial Production on Wednesday and Jobless Claims on Thursday. From China, upcoming data includes Retail Sales and Industrial Production figures for July. However, the most significant event is likely to be the release of the FOMC meeting minutes on Wednesday. Additionally, market participants will closely monitor comments from Federal Reserve members as they prepare for the Jackson Hole Symposium, which is scheduled to begin on August 24th.
The US Dollar Index continued its rally and gained ground for the four week in a row. It closed the week at the highest level since June, approaching the 103.00 level. Stock markets showed little change as caution prevailed. Crude oil extended its seven-week upward trend but retraced slightly after reaching the highest level since November. WTI crude settled above $82.00 per barrel.
US Treasury yields climbed higher, with the 10-year yield surpassing 4.15%. Gold experienced a $30 loss and closed near $1,910, while Silver declined by 4.2% to around $22.60 per ounce.
EUR/USD had a negative week but found support above the 200-week Simple Moving Average (SMA) around 1.0940. Several European countries will observe a holiday on Monday. Germany is expected to report a moderation in the annual Wholesale Price Index from -2.9% to -2.6% for July. The ZEW Survey is scheduled for release on Tuesday. The Eurozone will report Q2 growth data, employment change, and the final CPI on Wednesday and Friday, respectively.
GBP/USD ended in negative territory for the fourth consecutive week. The bias remains bearish, with key support around the 1.2600 level. Following Friday's positive surprise in UK growth figures, the upcoming week will be busy with the employment report on Tuesday, inflation data on Wednesday, and retail sales figures on Friday.
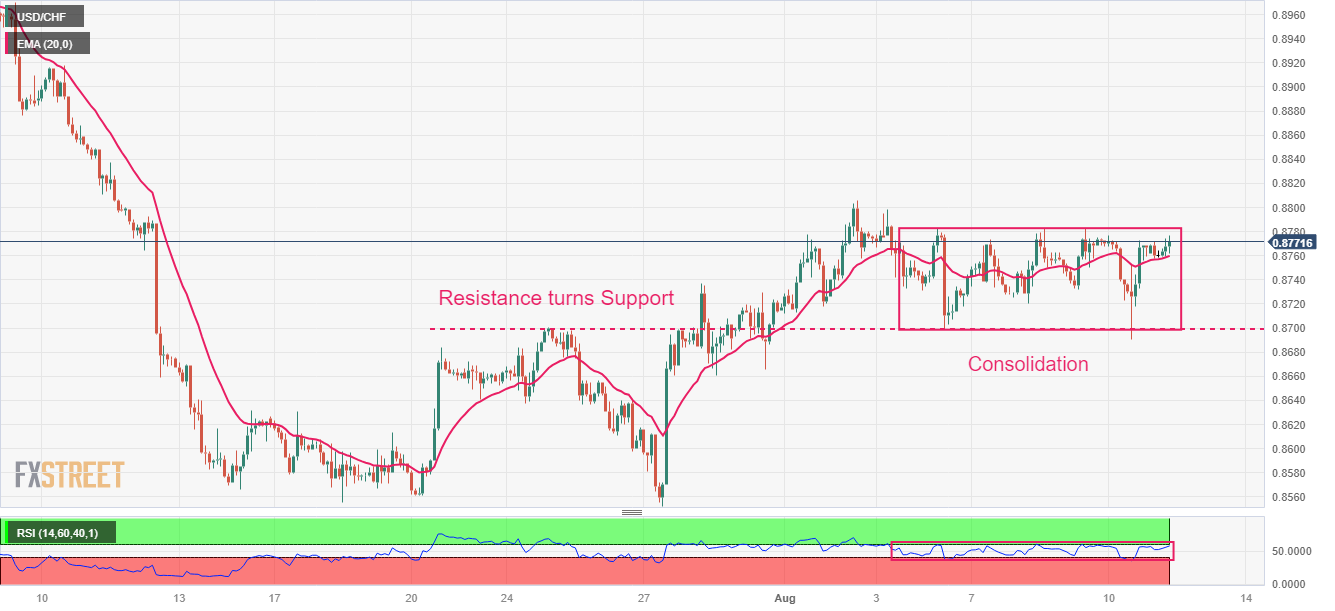
USD/CHF rose during the week but failed to reach three-month highs. Upside remains capped around 0.8800. Switzerland will release the Producer and Import Price Index for July on Tuesday.
USD/JPY surged towards the 145.00 level, marking the highest weekly close since November. The Japanese Yen underperformed, influenced by divergent monetary policies and higher government bond yields. Japan will release Q2 growth data, Industrial Production figures on Tuesday, trade data and Machinery Orders for June on Thursday, and the National CPI on Friday.
AUD/USD ended the week testing levels below 0.6500 and remains under pressure. The pair is approaching 2023 lows. The Reserve Bank of Australia (RBA) will release the minutes of its latest meeting on Tuesday. In terms of economic data, the Q2 Wage Price Index is due on Thursday, expected to show a 1% increase, which will be important for the RBA. The July employment report will be released on Thursday, with an expected positive change in jobs of 21,500.
USD/CAD climbed above the 20-week SMA and encountered resistance at 1.3500. Despite another negative week against the US Dollar, the Canadian Dollar outperformed the Australian Dollar and the New Zealand Dollar. Canada will report consumer inflation on Tuesday.
NZD/USD maintains a negative tone and broke below 0.6000 on Friday, marking the lowest weekly close since November of the previous year. The Reserve Bank of New Zealand (RBNZ) will announce its decision on Wednesday, with the rate expected to remain unchanged at 5.5%. On Thursday, New Zealand will release the Producer Price Index.
The Colombian Peso and the Mexican Peso were among the top performers in the currency market during the week, while the South African Rand experienced the most significant decline.
Like this article? Help us with some feedback by answering this survey:
- XAG/USD fell below $22.70 and is poised for a 3.8% weekly loss.
- July’s PPI from the US rose to 2.4%.
- Rising yields don't allow the metal to gain traction.
On Friday, the XAG/USD saw mild losses and will post its fourth consecutive weekly loss, having lost more than 7% since mid-July. At the end of the week, the US reported hot Producer Price Index (PPI) data and positive University of Michigan (UoM) Sentiment and inflation expectations, which fueled a rise in US bond yields.
After the release of key inflation data throughout the week, American rates are rising. The 10-year bond yield reached 4.16%, up by 1.34%. The 2-year yield stands at 4.89% with a 1% increase, while the 5-year yield is at 4.30% with 1.75 % gains. It's worth noting that American yields tend to be negatively correlated with non-yielding precious metals, so they may limit the XAG/USD’s upside for the rest of the session.
Overall, inflation saw this week the headline and core Consumer Price Index (CPI) coming lower than expected in July, while the PPI rose to 2.4% higher than expectations. The pace for the metal and bond markets in the next session will be determined by the market's assessments of the economic situation in the US and how it will affect the next Federal Reserve (Fed) decisions. As for now, the stronger case is that more hikes will be seen in this tightening cycle, but as Jerome Powell stated, it will all depend on the incoming data.
XAG/USD levels to watch
The technical analysis of the daily chart points to a neutral to a bearish outlook for XAG/USD, indicating the potential for further bearish movement. The Relative Strength Index (RSI) displays a flat slope below the 50 middle points, while the Moving Average Convergence (MACD) lays out weaker red bars. Furthermore, the pair is below the 20,100 and 200-day Simple Moving Averages (SMAs), highlighting the continued dominance of bears on the broader scale, requiring the buyers to take action. Traders should eye the 20 and 100-day averages as they are about to perform a bearish cross which could exacerbate the downside in the near term.
Support levels: $22.50, $22.30, $22.00.
Resistance levels: $23.25 (200-day SMA), $23.50, $23.70, $24.05 (a bearish cross between the 20 and 100-day SMA).
XAG/USD Daily chart
-638273757221757119.png)
- US crude oil benchmark, WTI, rises for the third consecutive day, trading at $83.48, up by 0.80%.
- Oil demand is predicted to grow by 2.25 million bpd in 2024, down from 2024’s 2.44 million bpd, according to OPEC+.
- Weakness in China’s economy could dent oil demand.
Western Texas Intermediate (WTI), the US crude oil benchmark advances for the third day in the week, trims some of its Thursday’s losses, as it tracks an upslope support trendline since mid-July. At the time of writing, WTI is exchanging hands at $83.48, above its opening price by 0.80%.
OPEC+ output reductions and weakening US dollar support crude’s upward trajectory, despite potential demand concerns from China
Oil prices rose on several factors weighing on the market, like Saudi Arabia and Russia’s 1.3 million of crude oil output cuts, while the International Energy Agency (IEA) stated supply cuts by the Organization of Petroleum Exporting Countries and its allies (OPEC+), could drive prices higher before economic headwinds dent global demand growth.
In the meantime, OPEC+ noted that Oil’s demand would increase by 2.25 million bpd in 2024, below this year’s 2.44 million bpd.
Meanwhile, the United States (US) inflation figures on the consumer side witnessed a dip, which weakened the greenback, and underpinned WTI’s towards its new year-to-date (YTD) high above $84.00 per barrel. Nevertheless, Friday’s US PPI data bolstered the US Dollar (USD) as shown by the US Dollar Index (DXY), gaining 0.24% at 102.870, while WTI’s prices drifted lower.
Mixed economic data from China would keep WII’s gains capped on fears the country has been hit by deflation, suggesting the Covid-19 recovery would remain losing steam, weighing on oil demand,
WTI Price Analysis: Technical outlook
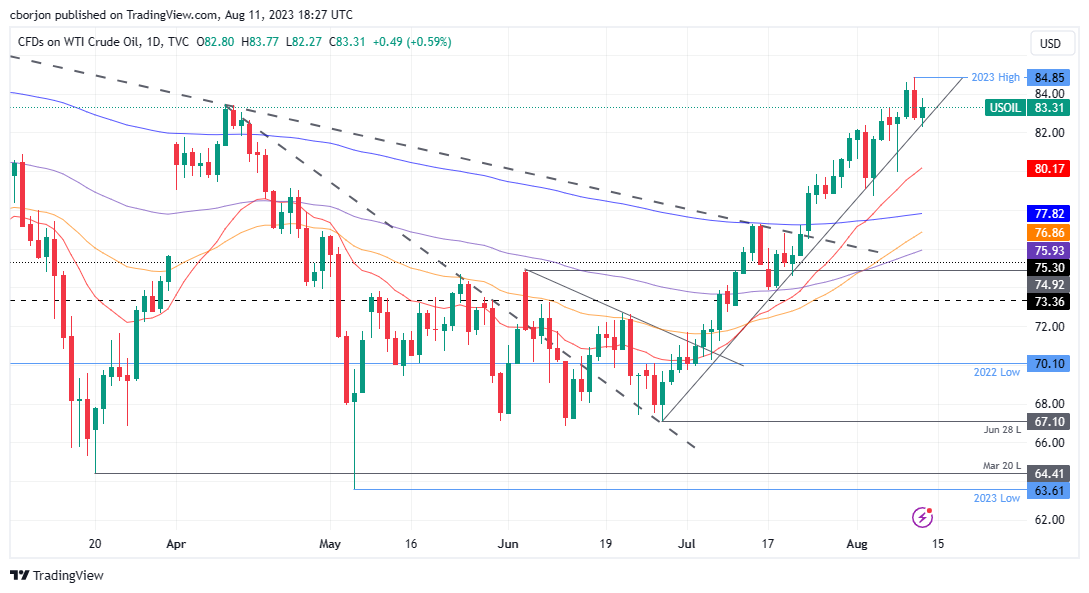
WTI’s daily chart portrays the pair as upward biased, thought at the brisk of a support trendline break, which could see WTI’s diving towards the 20-day Exponential Moving Average (EMA) at $80.18, followed by the $80.00 figure. On the upside, WTI’s first supply zone to test would be the $84.00, ahead of challenging the $85.00 a barrel.
- EUR/GBP retreated near 0.8630 after being rejected by the 100-day SMA at 0.8670.
- Q2 GDP data from the UK avoided stagnation, surpassing market expectations.
- Higher British yields help the Pound trade stronger against most of its rivals.
In Friday’s session, the GBP traded with gains agains most of its rivals as the UK reported strong Q2 economic activity figures, which faded recession fears. On the other hand, the EUR is trading mixed, while no relevant data was released during Friday’s session.
Investors assess British solid economic data
The UK's second-quarter Gross Domestic Product (GDP) data revealed robust performance. In terms of the yearly measurement, it surged by 0.4%, surpassing both the anticipated and previous 0.2% figures. The quarter-on-quarter (QoQ) growth also stood at 0.2%, avoiding the predicted stagnation and beating the earlier 0.1% reading. In addition, Manufacturing and Industrial Production came in strong in June, seeing monthly increases of 2.4% and 1.8%, respectively, above expectations.
Reacting to the data, the British yields are seeing gains across the curve, making the GBP gain interest. The 10-year bond yield rose to 4.57% while the 2-year yield stands at 5.05% and the 5-year yielding 4.58%, respectively. In that sense, they reflect that markets expect the Bank of England (BoE) to continue hiking. According to the World Interest Rate Possibilities (WIRP) tool, investors are pricing 50 bps of additional tightening this cycle which would see the terminal rate peak at 5.75%.
EUR/GBP Levels to watch
According to the daily chart, the technical outlook for the EUR/GBP remains neutral to bearish as the bulls show signs of exhaustion and are losing traction. The Relative Strength Index (RSI) shows a weakening bullish trend with a negative slope above its midline, while the Moving Average Convergence (MACD) presents lower green bars. Furthermore, the pair is above the 20-day Simple Moving Average (SMA) but below the 100 and 200-day SMAs, indicating that the bulls aren't done yet and have some gas left in the tank.
Support levels: 0.8615, 0.8600 (20-day SMA), 0.8570.
Resistance levels: 0.8670 (100-day SMA), 0.8700, 0.8723 (200-day SMA).
EUR/GBP Daily chart
-638273711974184676.png)
- The Mexican Peso (MXN) advances against the US Dollar, despite overall US Dollar strength.
- Banxico’s decision to hold rates at 11.25% boosted the Mexican Peso.
- USD/MXN may stabilize near current levels, potentially reaching 17.5000 if surpassing 17.4100. A daily close below 17.0000 could indicate an extended downward trend.
The Mexican Peso (MXN) appreciates against the US Dollar (USD), bucking the trend of Latin American currencies weakening on Friday after the Bank of Mexico (Banxico) kept rates unchanged, even though an uptick in US factory inflation boosted the USD. Nevertheless, the USD/MXN extends its losses and trades above the 17.0000 figure for seven straight days.
Banxico’s decision to maintain rates propels the MXN as it defies the Latin American currency trend on Friday
A risk-off impulse keeps the Greenback in the driver’s seat except for the MXN, with the emerging market currency posting solid gains of 0.87% as the USD/MXN extends its losses past 17.0000. On Thursday, Banxico decided unanimously to hold rates at 11.25%, as the central bank underscored the inflationary outlook as remaining “very complex” and suggested a similar approach as the Federal Reserve, keeping rates higher for longer. Although inflation is converging towards Banxico’s 3% plus or minus 1% range, with July CPI at 4.79%, the central bank continues to display a hawkish message. Meanwhile, analysts estimate Banxico’s first rate cut towards the end of the year.
That favored USD/MXN downside, accelerated by soft US consumer inflation data. USD/MXN gained some traction above 17.0000 after the US Department of Labor reported on the Producer Price Index (PPI) for July came at 0.3% MoM above forecasts of 0.2%, while annual numbers increased from 0.2% to 0.8%. Core PPI readings which exclude volatile items to gather a better reading of inflation, climbed 0.3% MoM, exceeding estimates and the prior’s month -0.1% slide, while annually based, exceeded estimates but was unchanged, compared to June’s 2.4%.
The University of Michigan Consumer Sentiment poll, revealed that US consumer sentiment slightly deteriorated. Still, Americans remain optimistic that inflation would get lowered after the US Federal Reserve (Fed) increased 525 bps its borrowing costs, with inflation expected to dive below 3% on a five-year horizon.
In the meantime, the US Dollar Index (DXY), which measures the buck’s performance against a basket of six currencies, rises 0.20%, at 102.866, underpinned by US Treasury bond yields climbing, with the US 10-year benchmark note sitting at 4.160%, gains five basis point.
Given the backdrop, the USD/MXN would remain subdued, at around current exchange rates, unless the pair breaks above 17.4100, which could see the pair finding acceptance at around 17.5000. Otherwise, further downside is expected, if USD/MXN prints a daily close below 17.0000.
USD/MXN Price Analysis: Technical outlook
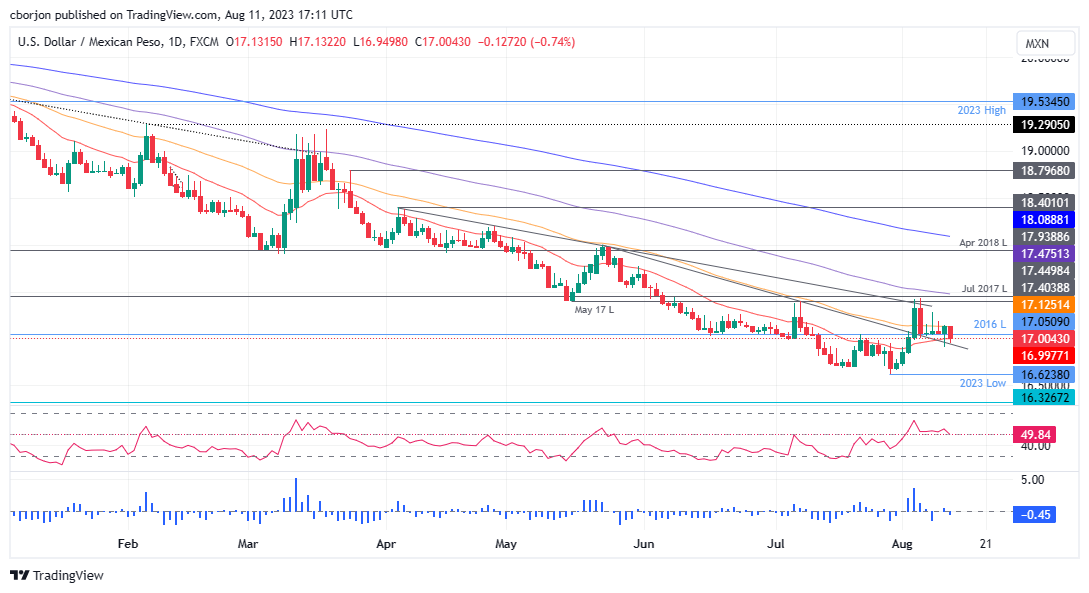
From a technical standpoint, the USD/MXN is trading within the 17.00-17.30 range, with neither buyers nor sellers taking control of the USD/MXN pair direction. The USD/MXN spot price remains above the 20-day Exponential Moving Average (EMA) at 16.9946, which could pave the way for further upside, but buyers must lift the exchange rate above the May 17 swing low of 17.4039 to challenge the 100-day EMA at 17.4746, and the 17.5000 mark. Conversely, a daily close below 17.00 could expose the USD/MXN to further selling pressure, with sellers eyeing 16.6238, the YTD low.
- USD/CAD bulls got rejected at the 200-day SMA and retreated near the 1.3420 area, still poised for a weekly gain
- US PPI rose to 2.4% YoY in July, higher than expected.
- Higher Oil prices help the CAD trade strong against most of its rivals.
At the end of the week, the USD/CAD was rejected by the 200-day Simple Moving Average (SMA) at 1.3450 and settled near 1.3430. On the one hand, the USD is trading mildly stronger after hot Producer Price Index (PPI) from July figures which fueled a rise in American bond yields, while the CAD got a boost on the back of rising Oil prices.
Markets asses US inflation data and start to place bets on a hike by the Fed in November
US Producer Price Index from July came in higher than expected. The headline figure rose by 0.3% MoM to 0.8% YoY while the core measure advanced 0.3% MoM vs 0.2% expected to a yearly measure of 2.4%.
As a reaction, the US bond yields are seeing gains across the curve. The 10-year bond yield rose to 4.13%, while the 2-year yield stands at 4.87% and the 5-year yielding 4.25%, respectively. In that sense, higher yields can be attributed to investors placing higher bets on a 25 basis point (bps) hike in November’s Federal Reserve (Fed) meeting. As for now, and according to the CME FedWatch tool, those odds stand at 64% in favour of a no hike and nearly 30% in favour of a hike, vs last week's 25%. For the September meeting, the stronger case continues to be the Fed not hiking.
Other data released by the US by the University of Michigan indicated that its Sentiment index rose to 71.2, better than the 71 expected, while 5-year Consumer Inflation Expectations dropped to 2.9%.
On the other hand, Oil prices resumed their upwards path and as it is one of Canada’s main exports, higher energy prices strengthened the CAD. Data-wise, nothing relevant will be released on Friday for the Canadian economy.
USD/CAD Levels to watch
Analysing the daily chart, indicators point at a neutral to the bearish technical outlook for the USD/CAD, suggesting that the bulls are starting to give up. The Relative Strength Index (RSI) points downwards in the bullish territory, suggesting a possible trend reversal, while the Moving Average Convergence (MACD) prints lower green bars. On the weekly chart, the bullish outlook is more evident as the pair will record its fourth-consecutive weekly gain at the end of this session.
Support levels: 1.3350 (100-day SMA),1.3350, 1.3300.
Resistance levels: 1.3450 (200-day SMA), 1.3500,1.3550.
USD/CAD Daily chart
-638273673290295860.png)
- EUR/USD experienced losses during Friday’s North American session, reaching 1.0975 from a daily high of 1.1000.
- US Department of Labor report indicated Producer Price Index (PPI) growth of 0.3% MoM, exceeding expectations, with annual PPI at 0.8%. Core PPI rose by 0.3% MoM.
- University of Michigan’s survey displayed a slight drop in consumer sentiment to 71.2, while inflation outlooks for one and five years remained optimistic.
EUR/USD registered losses during Friday’s North American session after reaching a daily high of 1.1000, but an uptick in wholesale inflation in the United States (US) increased appetite for the safe-haven status of the Greenback. Hence, the EUR/USD reversed its course and trades at 1.0958, down 0.20%.
Despite touching a high of 1.1000, the Euro retreats against the strengthening US Dollar amid risk-aversion and concerns about inflation
Risk-aversion keeps flows toward the US Dollar (USD) even though consumer inflation in July cooled down, as the US Department of Labor reported on Thursday. Nevertheless, an early report but the same institution witnessed a jump in the Producer Price Index (PPI) of 0.3% MoM above estimates of 0.2%, while annually based ticked up from 0.2% to 0.8%. Core PPI readings which exclude volatile items to gather a better reading about inflation, rose by 0.3% MoM, exceeding estimates and the prior’s month -0.1% slide, while annually based, exceeded estimates but was unchanged, compared to June’s 2.4%.
Following the data, the EUR/USD plunged from around 1.1000 toward the 1.0960 region, extending its drop toward the daily lows of 1.0954 before finding bids and recovering some ground.
The University of Michigan recently revealed that consumer sentiment has deteriorated compared to July 71.6, coming at 71.2, while inflation expectations improved. Americans think inflation in the one and five years horizon would ease, from 3.4% to 3.3% and from 3% to 2.9%, respectively.
In the meantime, the US Dollar Index (DXY), a basket of six currencies vs. the Greenback, stands flat at 102.619, although higher US Treasury bond yields would suggest a stronger US Dollar. The US 10-year benchmark note sits at 4.125%, gains one basis point.
Across the pond, the Eurozone (EU) docket featured inflation data in France and Spain, which showed mixed readings, as France’s inflation was below June’s figures, while Spain’s inflation was above the prior’s month but as expected. In the meantime, a Reuters poll showed that 37 of 70 economists expect the European Central Bank (ECB) to keep rates unchanged in September. Suppose the ECB raises borrowing costs past 4%. It would be the highest deposit rate since the Euro’s introduction in 1999.
Although the interest rates differential favors the US Dollar, uncertainty in the US and the Eurozone could keep choppy trading conditions. Nevertheless, the next week’s EU docket would be busy compared to the US, and if inflation figures show an improvement, that could be bearish for the EUR.
EUR/USD Price Analysis: Technical outlook
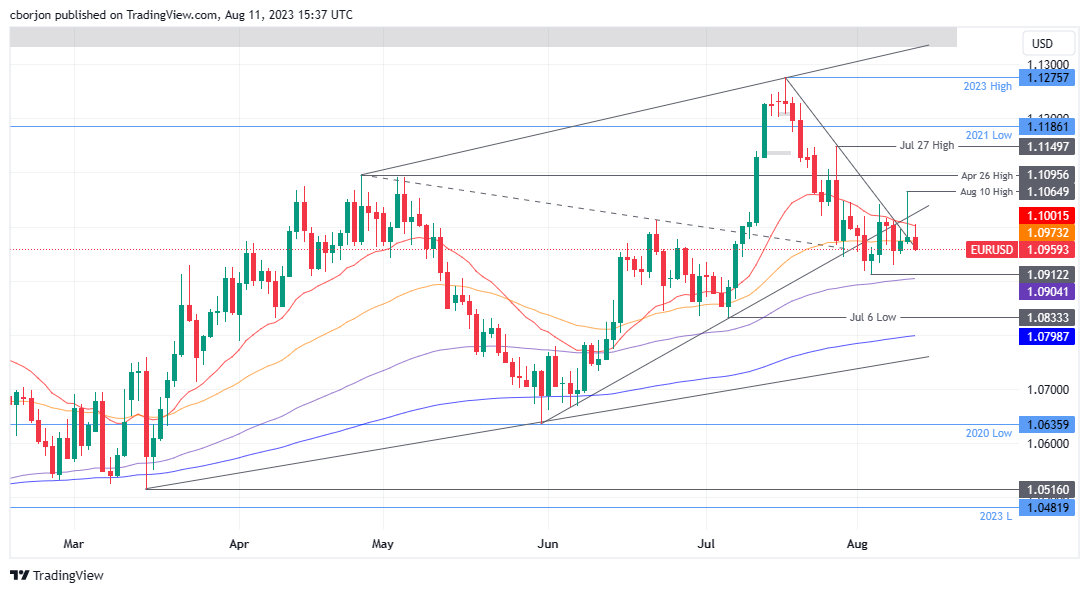
After reaching a weekly high of 1.1065 after the release of US consumer inflation, the pair failed to regain the 1.1000 mark, opening the door for further losses. On the upside, EUR/USD price action is capped by the 20-day Exponential Moving Average (EMA) at 1.1003, followed by a two-month-old resistance turned trendline, previous support at around 1.1030/50. With the Relative Strength Index (RSI) remaining at bearish territory and price action failing to achieve a higher peak, the EUR/USD could dip lower, with support emerging at 1.0950, before falling to its month-to-date (MTD) low of 1.0912.
Gold weakness has extended back to key support at $1,898/1,893 but strategists at Credit Suisse continue to look for a floor here.
Weekly close below $1,893 would reinforce the longer-term sideways range
We look for key support and the 38.2% retracement of the 2022/2023 uptrend, 200-DMA and June low at $1,900/$1,891 to hold again and we maintain our long-held view for a major floor here and for an eventual retest of major resistance at the $2,063/$2,075 record highs to be seen.
We still stay biased to an eventual break to new record highs later in the year, which would then be seen to open the door to a move to $2,150 next, then $2,355/$2,365.
A weekly close below $1,893 though would be seen to reinforce the longer-term sideways range, and a fall to support next at $1,810/$1,805.
Is the Oil supercycle still on? Economists at TD Securities analyze crude prices outlook.
Oil markets to remain range-bound at elevated prices for some time
Recent energy supply trends are still corroborating our view that the West is losing control over commodity supply, but developments to global spare capacity have likely flattened the right tail for energy markets over the coming year. Initially, this is likely to cap the upside to long-dated Brent prices but also decreases the risks of a sustained runaway rally in spot crude prices above $100/bbl over the medium-term.
The supercycle may not be off, but the outlook is constrained by ongoing additions to global spare capacity, such that substantial price gains are likely to unleash additional supply. However, Gulf nations have managed to increase their control on global spare capacity, suggesting that the group of producers can continue to engineer a tighter market without fear of significantly losing market share to competitors.
Instead of offering structural tailwinds to prices from an evaporating pool of spare capacity, oil markets are more likely to remain range-bound at elevated prices for some time.
- Silver price juggles in a narrow range below $23.00 despite strength in the US Dollar.
- The US Dollar Index strengthens as US PPI grew at a healthy pace in July.
- US five-year Consumer Inflation Expectations for August softened marginally to 2.9%
Silver price (XAG/USD) continues to oscillate in a narrow range around $22.70 despite the United States Producer Price Index (PPI) growing at a higher pace than expected in July. The white metal looks vulnerable as the US Dollar jumps swiftly to near 102.80 despite hopes that the Federal Reserve (Fed) will keep interest rates steady in its September monetary policy.
S&P500 opened on a bearish note as a rise in US PPI could elevate the burden on households. Also, investors anticipating retaliation from Beijing as US President Joe Biden prohibits investments in some Chinese sensitive technologies.
US Bureau of Labor Statistics reported that monthly PPI grew at a healthy pace of 0.3% against expectations of 0.2%. The higher pace in the price elevation of goods and services at factory gates is due to a rebound in the cost of services at the fastest pace in nearly a year.
On Thursday, US inflation grew at a modest pace in July amid higher house rentals but was aligned with the Fed’s desired rate of 2%. Meanwhile, five-year Consumer Inflation Expectations for August softened marginally to 2.9% against the estimates and the former release of 3.0%.
Silver technical analysis
Silver price consolidates in a narrow range of 22.60-23.00 on an hourly scale. The white metal struggles to find a direction despite the strength of the US Dollar. The 100-period Exponential Moving Average (EMA) at $22.90 is consistently acting as a barricade for the Silver bulls.
A 40.00-60.00 range oscillation by the Relative Strength Index (RSI) indicates a volatility contraction.
Silver hourly chart
-638273603901735529.png)
Commodity markets have become a popular asset class for portfolio investors, just like stocks and bonds. Strategists at ANZ bank analyze commodities outlook.
Falling inventories point to market tightness
Commodity markets have been under pressure in recent time amid a weak economic backdrop. Despite this, there are signs of tightness.
Inventories have always been a good guide to demand; and after a shaky start to the year, are showing signs of tightness across most markets.
There has been a clear drawdown across commodity exchanges and the broader supply chain. However, the trends are more discrete across the energy market. Industrial metals are now at multi-decade low levels which could trigger price rallies amid supply shocks.
- UoM Consumer Confidence Index declined slightly in August.
- US Dollar Index clings to modest daily gains above 102.60.
Consumer sentiment in the US weakened slightly in August, with the University of Michigan's (UoM) Consumer Confidence Index declining to 71.2 from 71.6 in July. This reading came in better than the market expectation of 71.
Further details of the publication revealed that the Current Conditions Index rose to 77.4 from 76.6 and the Expectations Index retreated to 67.3 from 68.3.
The one-year inflation outlook edged lower to 3.3% from 3.4%, while the 5-year inflation outlook ticked down to 2.9% from 3%.
Market reaction
The US Dollar Index stays in positive territory above 102.60 after this report.
Economists at Commerzbank share their ECB and Fed forecasts and their implications for the EUR/USD pair.
The ECB, unlike the Fed, should not cut its key rates
Because the ECB, unlike the Fed, should not cut its key rates, there is still some upside potential for EUR/USD over the next two or three quarters.
As long as inflation in the Euro area is falling, the ECB with its rates on hold appears to be a more credible inflation fighter, from which EUR/USD will probably benefit. However, this perception will be reversed, if Eurozone inflation starts to rise again in the middle of next year. EUR/USD will then tend to weaken again.
Following the publication of the US inflation figures, Gold price briefly climbed to $1,930 but then dropped back to $1,915. Economists at Commerzbank analyze XAU/USD outlook.
Gold faces continuing headwind
The MoM change rates indicate that the inflation rate is moving towards the Fed’s target figure, which points to an end to the rate hike cycle. That said, the US real interest rate is already significantly positive if the market-based inflation expectations are used, which is bad news for Gold.
Gold is also facing headwind from the continuing ETF selling. For the outflows to stop, the market’s remaining rate hike expectations need to disappear and give way to rate cut expectations. We expect this to happen in the fourth quarter.
- USD/JPY is looking to capture the 145.00 resistance as US PPI grew stronger than expected.
- The US Dollar Index climbs above 102.60 as producers elevated the prices of goods and services at factory gates by 0.3%.
- The Japanese Yen remains under pressure amid an absence of a supportive BoJ policy.
The USD/JPY pair is marching towards the critical resistance of 145.00 in the London session. The asset rallies due to underperformance from the Japanese Yen. The major struggles to continue its four-day winning streak as investors await the United States Producer Price Index (PPI) data for further guidance.
S&P500 futures post some losses in Europe amid caution due to robust US PPI and US President Joe Biden’s ban on some investment in Chinese sensitive technologies. US equities ended on a mixed note on Thursday after US Biden’s prohibition of investment in China offsets the impact of slower-inflation growth.
The US Dollar Index (DXY) climbs above 102.60 as producers elevate the prices of goods and services at factory gates by 0.3% while analysts forecasted a pace of 0.2%. Annual headline PPI rose to 0.8% against surprisingly higher expectations of 0.7%. Headline PPI rose beyond expectations due to a recovery in gasoline prices in July. Also, monthly core PPI grew at a 0.3% pace, higher than estimates of 0.2%.
Investors hope that the Federal Reserve (Fed) could pause the policy tightening spell and keep interest rates steady. Monthly inflation grew at a 0.1% pace in July, which were in line with the Fed’s desired rate of 2%.
On the Tokyo front, the Japanese Yen remains under pressure amid an absence of support from the Bank of Japan (BoJ) policy. Analysts at Commerzbank stated even if the BoJ wanted to start a slow exit from its yield curve control with its current monetary policy that cannot be positive for the Yen due to the lack of transparency.
Economists at Nordea expect the EUR/USD pair to lose ground toward 1.07 before bouncing back higher.
USD hurt by soft landing outlook
Disinflation has hurt the USD with US interest rate expectations tilting towards interest rate cuts rather than interest rate hikes. Falling inflation has also lifted risk sentiment. That has not been supportive for the USD, a traditional safe haven, that benefits when there is risk-off.
The USD is likely to perform again when the probability of a soft landing fades and risks of higher interest rates for longer prevail.
Our three-month forecast has EUR/USD trading back down at 1.07 before pulling higher.
- Australian Dollar finds a floor in the lower 0.65s after selling off on fears of a credit crunch in the Chinese property sector.
- Hawkish commentary from the Governor of the RBA, Philip Lowe, helps staunch the bleeding from China property sector woes.
- US factory gate inflation comes out higher than expected, supporting the US Dollar.
The Australian Dollar (AUD) finds a floor against the US Dollar (USD) after selling off during the Asian session on fears of a credit crunch in the Chinese property sector triggered by the default of a private property developer, Country Garden.
The Australian Dollar comes under pressure again, however, following the release of higher-than-expected US factory gate inflation with the release of Producer Price Index data (PPI) for July.
AUD/USD trades in the 0.65s at the start of the US session.
Australian Dollar news and market movers
- The Australian Dollar reverses the substantial gains made on Thursday as a result of positive market sentiment and a weaker US Dollar, caused by the release of lower-than-expected US inflation data for July.
- Fresh China economy woes may have contributed to the Australian Dollar’s turn lower.
- During Friday’s Asian session, the news surfaced that Chinese private property developer Country Garden defaulted on its debt, spreading fear of a meltdown in the country’s fragile property sector.
- Given Australia’s reliance on exporting raw materials such as Iron Ore for Chinese building projects, the news weighed heavily on the Australian Dollar.
- The Aussie found support during the Asian session after comments from Governor Lowe that the market interpreted as hawkish and, therefore, positive for AUD. Lowe reiterated the Reserve Bank of Australia’s (RBA) commitment to fighting inflation and did not rule out the need for further rate hikes.
- Headline PPI shows a 0.8% rise in July YoY versus the 0.7% forecast and 0.3% MoM versus the 0.2% anticipated.
- Core PPI shows a 2.4% rise versus the 2.3% YoY forecast, and 0.3% against the 0.2% estimated on a MoM basis.
Australian Dollar technical analysis
AUD/USD is in a sideways trend on both the long and medium-term charts. The February high at 0.7158 is a key hurdle, which if vaulted, will give the longer-term charts a more bullish tone.
The 0.6458 low established in June is a key level for bears. If this is breached decisively, it would color the charts more bearish. Price is currently closer to this key low.
-638273549308493818.png)
Australian Dollar vs US Dollar: Weekly Chart
Price has now broken cleanly below the confluence of moving averages (MA) close to 0.6700, made up of most of the major SMAs – the 50-week, 50-day and 100-day. The breaching of this key support and resistance level was a bearish sign.
-638273549724929664.png)
Australian Dollar vs US Dollar: Daily Chart
AUD/USD has broken below the 0.6600 June lows, and a continuation down to the key May lows at 0.6460, is quite possible. A decisive break below them would open the way for a move down to 0.6170 and the 2022 lows.
Because the pair is in a sideways trend overall, it is unpredictable, and the probabilities do not favor either bears or bulls overall – nor is the Relative Strength Index (RSI) providing much insight on either timeframe.
For bulls, a decisive break back above the skein of MAs in the upper 0.66s and then through 0.6750 would be a prerequisite for a more optimistic outlook.
In technical terms, a ‘decisive break’ consists of a long daily candlestick, which pierces cleanly above or below the critical level in question and then closes near to the high or low of the day. It can also mean three up or down days in a row that break cleanly above or below the level, with the final day closing near its high or low and a decent distance away from the level.
Australian Dollar FAQs
What key factors drive the Australian Dollar?
One of the most significant factors for the Australian Dollar (AUD) is the level of interest rates set by the Reserve Bank of Australia (RBA). Because Australia is a resource-rich country another key driver is the price of its biggest export, Iron Ore. The health of the Chinese economy, its largest trading partner, is a factor, as well as inflation in Australia, its growth rate and Trade Balance. Market sentiment – whether investors are taking on more risky assets (risk-on) or seeking safe-havens (risk-off) – is also a factor, with risk-on positive for AUD.
How do the decisions of the Reserve Bank of Australia impact the Australian Dollar?
The Reserve Bank of Australia (RBA) influences the Australian Dollar (AUD) by setting the level of interest rates that Australian banks can lend to each other. This influences the level of interest rates in the economy as a whole. The main goal of the RBA is to maintain a stable inflation rate of 2-3% by adjusting interest rates up or down. Relatively high interest rates compared to other major central banks support the AUD, and the opposite for relatively low. The RBA can also use quantitative easing and tightening to influence credit conditions, with the former AUD-negative and the latter AUD-positive.
How does the health of the Chinese Economy impact the Australian Dollar?
China is Australia’s largest trading partner so the health of the Chinese economy is a major influence on the value of the Australian Dollar (AUD). When the Chinese economy is doing well it purchases more raw materials, goods and services from Australia, lifting demand for the AUD, and pushing up its value. The opposite is the case when the Chinese economy is not growing as fast as expected. Positive or negative surprises in Chinese growth data, therefore, often have a direct impact on the Australian Dollar and its pairs.
How does the price of Iron Ore impact the Australian Dollar?
Iron Ore is Australia’s largest export, accounting for $118 billion a year according to data from 2021, with China as its primary destination. The price of Iron Ore, therefore, can be a driver of the Australian Dollar. Generally, if the price of Iron Ore rises, AUD also goes up, as aggregate demand for the currency increases. The opposite is the case if the price of Iron Ore falls. Higher Iron Ore prices also tend to result in a greater likelihood of a positive Trade Balance for Australia, which is also positive of the AUD.
How does the Trade Balance impact the Australian Dollar?
The Trade Balance, which is the difference between what a country earns from its exports versus what it pays for its imports, is another factor that can influence the value of the Australian Dollar. If Australia produces highly sought after exports, then its currency will gain in value purely from the surplus demand created from foreign buyers seeking to purchase its exports versus what it spends to purchase imports. Therefore, a positive net Trade Balance strengthens the AUD, with the opposite effect if the Trade Balance is negative.
Economists at Commerzbank analyze MXN outlook following Banxico’s monetary policy meeting.
Banxico maintains underlying hawkish approach
The Mexican central bank’s (Banxico) unchanged approach constitutes the foundation for the continued Peso strength around 17.00 in USD/MXN.
As expected, Banxico left its key rate unchanged at 11.25% and continued to point out the upside risks for inflation. That makes it clear that it wants to avoid any speculation about the start of rate cuts in view of a significant fall in inflation to 4.8% recently (core inflation at 6.5%). Instead, it underlined in its statement that it is necessary to keep the key rate at the current levels for a prolonged period of time.
We continue to see a chance for a first rate cut at the end of the year. The expected fall in inflation will continue to improve real interest rates until then, which fundamentally supports the MXN's strength.
- Producer inflation in the US increased 0.8% on a yearly basis in July.
- US Dollar Index hold steady slightly above 102.50 after PPI data.
The Producer Price Index (PPI) for final demand in the US rose 0.8% on a yearly basis in July, up sharply from 0.1% increase recorded in June, the data published by the US Bureau of Labor Statistics revealed on Friday. This reading came in slightly higher than the market expectation of 0.7%.
The annual Core PPI increased 2.4% in the same period, matching June's reading. On a monthly basis, the PPI and the Core PPI both rose 0.3%.
Market reaction
The US Dollar Index edged slightly higher after this data and was last seen posting small gains at 102.65.
Economists at Scotiabank analyze GBP/USD technical outlook.
Cable could retest resistance at 1.2800/1.2810
The daily GBP/USD chart reflects heavy price action overall Thursday but the intraday pattern of trade shows the Pound rebounding from trend support just under 1.27 in a constructive manner – the 6-hour candle chart shows a bullish ‘morning star’ signal developing today.
The GBP may be able to strengthen somewhat in the short run to retest resistance at 1.2800/1.2810.
See – GBP/USD: Head and Shoulders pattern points towards potential downside – SocGen
Gold price fell to $1,920 after rising towards $1,980 in July. Economists at ANZ Bank analyze XAU/USD technical outlook.
In a bearish trend
The technical chart shows a broad bearish trend is continuing, with Relative Strength Index (RSI) moving towards oversold territory.
Consolidation near $1,900 forms a key support level. A breach of this support could possibly trigger a fresh sell-off. Nevertheless, we see little possibility of the price falling back to the $1,800 range.
On the upside, it needs to break the resistance of recent highs near $1,980. If Gold trades above this level, this could add a fresh bullish tinge to market sentiment. We expect Gold to trade in the range of $1,900-$1,980 until the Fed confirms its monetary path.
USD/CAD little changed but continues to pressure 200-Day Moving Average. Economists at Scotiabank analyze the pair’s outlook.
Support is 1.3375/1.3400
There is little incentive for investors to push the CAD higher while the risk environment remains challenging.
Price signals are very mixed on the intraday and daily charts but the broader track high in the USD over the past month is evident and is generating bullish trend momentum signals on the shorter-term DMI signals.
Spot has found some resistance around the 200-DMA (1.3450) – in that the USD has failed to close above 1.3450 on a daily basis this week – but that barrier remains under pressure today.
There is some developing resistance above the 200-DMA at 1.3490/1.3500. Support is 1.3375/1.3400.
EUR/USD holds in tight range around the 1.10 level. Economists at Scotiabank analyze the pair’s outlook.
The outlook for the EUR remains positive in the longer run
The outlook for the EUR remains positive in the longer run but recent positioning/sentiment data has highlighted the fact that the long EUR trade is already a little crowded which may be retraining the EUR’s ability to advance without stronger incentives.
Technical pointers provide some conflicting signals for the EUR. The short-term pattern of trade looks bearish after the EUR’s strong reversal from the intraday high on Thursday. However, losses failed to develop in a meaningful way, with spot still (relatively) well-supported against rising trend and MA support in around 1.0925.
The US Dollar Index (DXY) rebound stays seen as corrective whilst below its 200-Day Moving Average (DMA), economists at Credit Suisse report.
Weekly close above 103.57 would turn the core trend neutral again
We continue to view the recent strength as temporary and corrective whilst below 200-DMA and July high at 103.47/103.57.
Below near-term support at 101.74 is needed to see the immediate risk turn lower again for a fall back to 100.55, then the 99.58/99.50 current cycle lows. Beneath here can see a test of support at the 61.8% retracement of the 2021/2022 bull trend and 200-week average at 98.98/98.30.
A weekly close above 103.57 though would be seen to turn the core trend neutral again, with resistance then seen next at 104.70 ahead of the 38.2% retracement of the 2022/2023 downtrend and YTD high from March, seen at 105.38 and 105.88 respectively.
Economists at Société Générale analyze GBP/USD technical outlook.
Support 1.2590, resistance 1.2820
GBP/USD has pulled back towards the trend line drawn since last November and is near intermittent support of 1.2590 representing the low of June. Interestingly, it has formed a Head and Shoulders pattern which generally points towards potential downside.
If the pair fails to defend the neckline at 1.2590, there could be risk of a deeper down move towards 1.2480, the 23.6% retracement from last year and 1.2300.
Left shoulder at 1.2820/1.2870 must be overcome for negating the pattern.
The recent price action denotes a reluctance to rotate away from the USD, in the view of economists at ING.
Disinflation not enough for the bears
The US remains on an encouraging disinflation track, but the Dollar is not turning lower. This is, in our view, due to a lack of attractive alternatives given warning growth signals in other parts of the world (such as the Eurozone and China).
Evidence of a US economic slowdown is needed to bring USD substantially lower.
DXY may consolidate above 102.00 over the next few days.
- USD/CHF oscillates in a wide range and fails to find a decisive move despite the US inflation data release.
- US monthly inflation grew at a 0.2% pace, in alignment with the Fed’s desired rate of 2%.
- The market mood turns cautious as US President authorized a ban on some investments in China in some sensitive technologies.
The USD/CHF pair stays in a sideways profile below the round-level resistance of 0.8800 in the European session. The Swiss Franc asset struggles to find direction despite lower-than-expected growth in the United States Consumer Price Index (CPI) data for July.
Monthly inflation grew at a 0.2% pace, in alignment with Federal Reserve’s (Fed) desired rate of 2%. The US Dollar Index (DXY) is aiming to resume its upside journey after a sideways performance ahead of US Producer Price Index (PPI) data.
The market mood turns cautious as US President Joe Biden authorized to ban some investments in China in some sensitive technologies in three sectors: semiconductors and microelectronics, quantum information technologies, and certain artificial intelligence systems.
USD/CHF traded directionless from the past week despite slower growth in the US inflation. The major turned sideways after a firmer rally after climbing above the horizontal resistance plotted from July 24 high at 0.8700, which turned into support now. The asset oscillates in a range of 0.8700-0.8783, which indicates volatility contraction.
The pair makes efforts to maintain an auction above the 20-period Exponential Moving Average (EMA) at 0.8760.
Momentum oscillator Relative Strength Index (RSI) (14) trades inside the 40.00-60.00, indicating a volatility squeeze.
Going forward, a decisive break above August 2 high at 0.8806 will drive the asset towards April 26 low at 0.8852, followed by June 16 low around 0.8900.
In an alternate scenario, a downside move below August 10 low at 0.8690 would drag the asset toward July 17 high at 0.8630 and July 27 low at 0.8552.
USD/CHF two-hour chart
The latest CPI print was a bit of a head fake for Gold markets, initially generating a rally than a drop back to the daily lows. Economists at TD Securities analyze XAU/USD outlook.
Gold to move into $2,100 territory in late 2023-early-2024
We think that Gold runs below $1,900 support from here should data remain firm and inflation edge higher due to energy.
Longer-term, however, positioning and likely aggressive action on the easing front, once data turns convincingly negative, should catalyze a robust rally that could take the yellow metal into $2,100 territory in late 2023-early-2024.
The Pound is stronger after upbeat UK GDP data. Economists at ING analyze GBP outlook.
Good GDP numbers no game-changer for the BoE
June’s growth numbers in the UK beat expectations, helping to cement a 0.2% QoQ figure for the second quarter. We believe that the implications for the Bank of England are probably quite limited, given the numbers are not far from its forecasts and the focus is firmly on services inflation and wage growth, which are both out next week.
Next week is a key one for the Pound, expect some pre-CPI positioning to dominate in GBP trading and volatility to pick up.
- The US Dollar holds on to gains for the week.
- Another batch of US inflation data is due.
- The US Dollar Index is expected to steady or advance this Friday.
The US Dollar (USD) digested a firm bearish move on Thursday after markets deemed the latest US Consumer Price Index (CPI) numbers as a clear cut case for the US Federal Reserve (Fed) to keep rates unchanged at its September meeting. The market reaction triggered weakness in the Greenback against all major currencies. As the dust settled, the US Dollar Index (DXY) recouped its losses and closed nearly unchanged, backed by some tail risks on the geopolitical front.
Yet again 12:30 GMT is the hour to watch for this Friday as another inflation gauge is set to be released: the US Producer Price Index (PPI) in monthly and yearly performances for both overall and core measures. Expectations overall are for an uptick on every measure, which could support a stronger US Dollar. Last data points of importance for the week will be at 14:00 GMT, with the Michigan Consumer Sentiment Index and inflation expectations. Interesting to see in this last number if consumers are expecting inflation to abate further.
Daily digest: US Dollar faces winds from both sides
- On the geopolitical front, there is some renewed tit-for-tat between the US and China. Torn in the eye for China was the trade deal the US and Taiwan signed, while the US issued a tech-ban on US investments towards China. Meanwhile, US president Joe Biden called China a “ticking time bomb” amidst warnings from China calling out the US to uphold current outstanding agreements and trade conditions.
- At 12:30 GMT the US Producer Price Index (PPI) data for July is to be released: On the monthly performance, both the overall and core gauge are expected to jump from 0.1% to 0.2%. On a yearly performance, the core is expected to take a small step back from 2.4% to 2.3%, and the overall to accelerate from 0.1% to 0.7%.
- At 14:00 GMT, the preliminary Michigan Consumer Sentiment Index for August is expected to stay broadly steady at 71.0 from 71.6 a month earlier. Consumers’ inflation expectations for the next five years are expected to remain unchanged at 3%.
- The US treasury is heading back to the markets to refinance some debt with a 4-week bill and a 30-year bond auction.
- A very mixed picture to close off the week on the stock markets: the Japanese Topix index closed up nearly 1%, while the Chinese Hang Seng is down 1%. European equities are all done over 0.5% and US equity futures are flat.
- The CME Group FedWatch Tool shows that markets are pricing in a 90.5% chance that the Federal Reserve will pause interest rate hikes at its meeting in September. The probability jumped from 85% on Thursday after the latest US CPI print showed inflation grew at a steady pace.
- The benchmark 10-year US Treasury bond yield trades at 4.08%, consolidating the area above 4%. Bonds are a bit less in favor, and thus require a higher yield for investors to buy as markets are baking in the end of the hiking cycle for the Fed.
US Dollar Index technical analysis: Hold the door
The US Dollar had a very volatile day on Wednesday, though saw the US Dollar bulls prevail at the US closing bell. The US Dollar rally for this summer is not over just yet and could still try to make a new high for August, depending on the Producer Price Index numbers later this Friday. Watch out for 102.80 as a line in the sand on the topside on the US Dollar Index (DXY) for more US Dollar strength next week.
For the upside, 102.80 – Tuesday’s peak – is the level to test and break in order to see some more stronger US Dollar moves. This level needs to be broken should the DXY want to try to head to 103.00. Although a bit far off still, the 200-day Simple Moving Average (SMA) at 103.41 could become the new target for next week if the DXY can continue trending higher.
On the downside, a floor is building with the 55-day and the 100-day SMA at 102.40 and 102.30, respectively. However, these levels have been chopped out quite heavily already throughout the week and could become less relevant. Should the Greenback weaken on the back of the PPI or Michigan data, the 102.00 level could come back under more downside pressure.
US Dollar FAQs
What is the US Dollar?
The US Dollar (USD) is the official currency of the United States of America, and the ‘de facto’ currency of a significant number of other countries where it is found in circulation alongside local notes. It is the most heavily traded currency in the world, accounting for over 88% of all global foreign exchange turnover, or an average of $6.6 trillion in transactions per day, according to data from 2022.
Following the second world war, the USD took over from the British Pound as the world’s reserve currency. For most of its history, the US Dollar was backed by Gold, until the Bretton Woods Agreement in 1971 when the Gold Standard went away.
How do the decisions of the Federal Reserve impact the US Dollar?
The most important single factor impacting on the value of the US Dollar is monetary policy, which is shaped by the Federal Reserve (Fed). The Fed has two mandates: to achieve price stability (control inflation) and foster full employment. Its primary tool to achieve these two goals is by adjusting interest rates.
When prices are rising too quickly and inflation is above the Fed’s 2% target, the Fed will raise rates, which helps the USD value. When inflation falls below 2% or the Unemployment Rate is too high, the Fed may lower interest rates, which weighs on the Greenback.
What is Quantitative Easing and how does it influence the US Dollar?
In extreme situations, the Federal Reserve can also print more Dollars and enact quantitative easing (QE). QE is the process by which the Fed substantially increases the flow of credit in a stuck financial system.
It is a non-standard policy measure used when credit has dried up because banks will not lend to each other (out of the fear of counterparty default). It is a last resort when simply lowering interest rates is unlikely to achieve the necessary result. It was the Fed’s weapon of choice to combat the credit crunch that occurred during the Great Financial Crisis in 2008. It involves the Fed printing more Dollars and using them to buy US government bonds predominantly from financial institutions. QE usually leads to a weaker US Dollar.
What is Quantitative Tightening and how does it influence the US Dollar?
Quantitative tightening (QT) is the reverse process whereby the Federal Reserve stops buying bonds from financial institutions and does not reinvest the principal from the bonds it holds maturing in new purchases. It is usually positive for the US Dollar.
Oil price is clearly on the rise. Economists at Société Générale analyze Brent Crude technical outlook.
200-DMA near $81 expected to be a support near term
Brent has extended its rebound after breakout from a multi-month base and has achieved the objective of $87.50 representing April high. An initial pullback can’t be ruled out however the 200-DMA near $81 is expected to be a support near term.
Daily MACD has been posting divergence and has crossed above equilibrium line denoting regain of upward momentum.
Once Brent establishes beyond $87.50, the phase of uptrend could extend towards $93 and $96.50/97.00, the 38.2% retracement from 2022.
- Gold price looks supported but needs to pass through more filters for a confident reversal.
- US inflation grew slower than forecasted in July as lower second-hand automobile prices offset rising rentals.
- US President Biden restricts some new investment in China in sensitive technologies.
Gold price (XAU/USD) is on a temporary cushion after an intense sell-off as investors hope that the modest pickup in the United States Consumer Price Index (CPI) for July is insufficient to force the Federal Reserve (Fed) to raise interest rates further in September. The precious metal attempts a recovery, but an upside isn’t warranted as investors are worried that inflation remains sticky amid rising rental prices.
US inflation rose at a steady pace of 0.2%, as expected by investors and aligned with the Fed’s required inflation rate of 2%. The recovery move in the Gold price is supported by a restricted upside in the US Dollar as chances of a rate cut in 2024 increase. San Francisco Fed President Mary Daly joined policymakers Patrick Harker and John Williams to open the door for rate cut discussions in 2024 depending on the evolution of the inflation economy.
Daily Digest Market Movers: Gold price awaits PPI data
- Gold price gauges support near $1,912.00 after a sheer sell-off. Still, the downside seems favored as United States CPI data for July showed inflation remains sticky.
- The US Consumer Price Index rose at a slower-than-forecasted pace in July. Higher rentals and a modest recovery in gasoline prices were broadly offset by the lower cost of second-hand automobiles.
- The monthly headline and core inflation grew by 0.2%, as expected by analysts.
- Core annual CPI softened to 4.7% from estimates and the prior release of 4.8%, while headline inflation accelerated modestly to 3.2% against the former release of 3.0% but remained marginally below the consensus of 3.3%.
- The 0.2% monthly increase is consistent with the Federal Reserve’s desired inflation rate of 2%.
- A modest rise in US inflation supports the Fed to keep interest rates unchanged in September’s monetary policy.
- As per the CME Group Fedwatch tool, traders see less than a 10% chance that the US will raise interest rates next month.
- The scenario of limited inflation and a historically low Unemployment Rate suggests that the US economy will manage to avoid a recession.
- On Thursday, San Francisco Fed Bank President Mary Daly joined Philadelphia Fed Bank President Patrick Harker and New York Fed President John Williams, saying that discussions about rate cuts would take place next year but will largely depend on the economy and inflation.
- The US Dollar Index (DXY) turns sideways around 102.60 after a sharp rally and awaits the July Producer Price Index (PPI) data for further direction. The PPI headline figure could show a rebound due to the recovery in gasoline prices.
- On Thursday, the US Department of Labor reported that individuals applying for jobless claims for the first time rose to 248K for the week ending August 4, higher than the 230K expected and the prior week's figure of 227K.
- The market mood remains cautious as US President Joe Biden announced restrictions on some new investments in China in sensitive technologies. Investors are worried that Beijing could retaliate.
- The long-awaited order authorizes the U.S. Treasury Secretary to prohibit or restrict U.S. investments in Chinese entities in three sectors: semiconductors and microelectronics, quantum information technologies, and certain artificial intelligence systems, Reuters reports.
- Commercial banks borrowing from the Fed’s emergency lending programs rose slightly for the week through August 9. Total lending from the two Fed backstop programs rose to $108.78 billion from $107.58B the prior week.
Technical Analysis: Gold price finds support near $1,910
Gold price rebounds after momentum oscillators on a lower timeframe reported that the bearish impulse weakened due to a decline in selling pressure. Still, for a confident reversal, the yellow metal has to pass through plenty of filters. Gold price is on tenterhooks as it has corrected to near the 200-day Exponential Moving Average (EMA) around $1,907.68. Failure to sustain above this level would likely push the precious metal into bearish territory.
Inflation FAQs
What is inflation?
Inflation measures the rise in the price of a representative basket of goods and services. Headline inflation is usually expressed as a percentage change on a month-on-month (MoM) and year-on-year (YoY) basis. Core inflation excludes more volatile elements such as food and fuel which can fluctuate because of geopolitical and seasonal factors. Core inflation is the figure economists focus on and is the level targeted by central banks, which are mandated to keep inflation at a manageable level, usually around 2%.
What is the Consumer Price Index (CPI)?
The Consumer Price Index (CPI) measures the change in prices of a basket of goods and services over a period of time. It is usually expressed as a percentage change on a month-on-month (MoM) and year-on-year (YoY) basis. Core CPI is the figure targeted by central banks as it excludes volatile food and fuel inputs. When Core CPI rises above 2% it usually results in higher interest rates and vice versa when it falls below 2%. Since higher interest rates are positive for a currency, higher inflation usually results in a stronger currency. The opposite is true when inflation falls.
What is the impact of inflation on foreign exchange?
Although it may seem counter-intuitive, high inflation in a country pushes up the value of its currency and vice versa for lower inflation. This is because the central bank will normally raise interest rates to combat the higher inflation, which attract more global capital inflows from investors looking for a lucrative place to park their money.
How does inflation influence the price of Gold?
Formerly, Gold was the asset investors turned to in times of high inflation because it preserved its value, and whilst investors will often still buy Gold for its safe-haven properties in times of extreme market turmoil, this is not the case most of the time. This is because when inflation is high, central banks will put up interest rates to combat it.
Higher interest rates are negative for Gold because they increase the opportunity-cost of holding Gold vis-a-vis an interest-bearing asset or placing the money in a cash deposit account. On the flipside, lower inflation tends to be positive for Gold as it brings interest rates down, making the bright metal a more viable investment alternative.
Economists at ING expect the EUR/USD pair to trade between 1.09 and 1.11.
Range-bound for now
Despite the benign US disinflation story, it is no surprise that markets are not flooding long EUR/USD positions. That has been an already relatively crowded trade, and the recent re-pricing of growth expectations of both growth and rate expectations in the Eurozone is weighing on the Euro’s attractiveness.
EUR/USD looks likely to keep trading range-bound (1.09-1.11) until signs of a US economic slowdown move the rate differentials back in the Euro’s favour.
USD/RUB has weakened notably in recent quarters. Currently, the Russian exchange rate is solely driven by the current-account balance. Economists at Commerzbank share their USD/RUB forecast.
Rate hikes do not have direct FX implications
Due to the sanctions, the RUB exchange rate now only reflects current account flows. Hence, the Ruble is likely to depreciate medium-term due to the declining current account surplus.
Russia’s central bank (CBR) continues to be orthodox and cautious, maintaining its former credible style of monetary policy. At least one more rate hike appears quite likely. Rate hikes, however, do not have direct FX implications at this time around.

Source: Commerzbank Research
FX option expiries for Aug 11 NY cut at 10:00 Eastern Time, via DTCC, can be found below.
- EUR/USD: EUR amounts
- 1.0800 593m
- 1.0900 1.2b
- 1.0950 1.9b
- 1.0980 1.3b
- 1.1000 1b
- 1.1025 733m
- 1.1100 995m
- GBP/USD: GBP amounts
- 1.2530 311m
- 1.2700 472m
- 1.2850 404m
- USD/JPY: USD amounts
- 141.30 1.1b
- 142.25 1.1b
- 143.00 517m
- 144.00 850m
- 145.00 755m
USD/CHF: USD amounts
- 0.8560 500m
- 0.8825 463m
- AUD/USD: AUD amounts
- 0.6530 590m
- 0.6600 882m
- 0.6675 1.5b
- 0.6700 363m
- 0.6750 1.5b
- 0.6800 1.1b
- USD/CAD: USD amounts
- 1.3320 3.8b
- 1.3400 516m
- EUR/GBP: EUR amounts
- 0.8700 400m
- EUR/JPY refreshes multi-year peak on Friday, albeit struggles to capitalize on the move.
- Intervention fears benefit the JPY and hold back traders from placing fresh bullish bets.
- The BoJ-ECB policy divergence suggests that the path of least resistance is to the upside.
The EUR/JPY cross enters a bullish consolidation phase and oscillates in a narrow trading band just below its highest level since September 2008 touched earlier this Friday. Spot prices currently trade around the 159.00 mark during the first half of the European session, nearly unchanged for the day.
Speculations that Japanese authorities might intervene in the foreign exchange markets to prop up the domestic currency hold back traders from placing fresh bullish bets around the EUR/JPY cross. Apart from this, speculations that the European Central Bank (ECB) will halt its streak of nine consecutive rate hikes in September, in the wake of easing inflationary pressures and mounting recession fears, contribute to capping the upside for the cross.
That said, a more dovish stance adopted by the Bank of Japan (BoJ), which is the only central bank in the world to maintain a negative benchmark interest rate, helps limit the downside for the EUR/JPY cross. Even the BoJ's recent policy adjustment in July, making the Yield Curve Control (YCC) policy more flexible and allowing yield on the 10-year Japanese government bond to move up toward 1%, has failed to lend support to the Japanese Yen (JPY).
Moreover, policymakers have stressed that the move was a technical tweak aimed at extending the shelf life of stimulus. Adding to this, weaker Japanese wage data released this week reaffirmed market bets that the BoJ will maintain ultra-low interest rates for the rest of the year. This marks a big divergence in comparison to a relatively hawkish ECB, which has raised borrowing costs by a combined 425 bps since last July and favours the EUR/JPY bulls.
The aforementioned supportive fundamental backdrop suggests that the path of least resistance for spot prices is to the upside. Hence, any meaningful corrective decline might be seen as a buying opportunity and is more likely to remain limited. Nevertheless, the EUR/JPY cross remains on track in the green for the second successive week and seems poised to prolong the recent appreciating move witnessed over the past two weeks or so.
Technical levels to watch
The US Dollar weakened modestly on Thursday – which is consistent with the fact that the CPI data reinforced the prospect of monetary easing in 2024, in the view of economists at MUFG Bank.
Inflation data underlines favourable outlook
We certainly saw enough in this CPI report to remain of the view that inflation is set to continue slowly drifting lower and backs up our view that it is likely at this stage that the Fed has finished its tightening cycle.
So we suspect this data will just reinforce the current range trading for the Dollar. We have in fact oscillated mostly between 100-104 in DXY since April and this CPI report is enough to maintain current market pricing on Fed rate cuts next year. That will limit the upside for the Dollar while weak growth abroad will likely limit the USD downside scope for now as well.
In its monthly oil market report, the International Energy Agency (IEA) lowers the 2024 global oil demand growth forecast to 1 million barrels per day (bpd), down 150,000 bpd from the previous forecast.
Additional takeaways
World oil demand hit a record 103 million bpd in June and August could see yet another peak.
Global oil demand is set to expand by 2.2 million bpd in 2023, steady from previous forecast.
Global oil supply plunged by 910,000 bpd July in part due to sharp reduction in saudi output.
Russian oil exports held steady at around 7.3 mbpd in July.
If OPEC+ current targets are maintained, oil inventories could draw by 2.2 mbpd in Q3 and 1.2 mbpd in Q4, with a risk of driving prices still higher.
Market reaction
WTI was last seen trading near $83, posting small gains on the day.
In Brazil, inflation data is due today. Economists at Commerzbank analyze USD/BRL outlook ahead of the report.
Brazilian inflation data will act as an indicator for the BCB
Today’s inflation data might constitute an indicator illustrating whether the BCB had managed to avoid a dovish interpretation of its latest rate decision.
In view of the fact that for the first time in 12 months, a rise of the YoY rate is expected not even a surprise to the downside should fuel rate cut expectations in our opinion. Instead, the future rate cut cycle is likely to have been priced into the real sufficiently, so that we expect USD/BRL to remain at the current levels just below 5.00 going forward.
- USD/CAD trades with a mild negative bias on Friday, albeit lacks follow-through selling.
- The emergence of some USD selling turns out to be a key factor exerting some pressure.
- Bets for one more Fed rate hike in 2023 to help limit losses for the Greenback and the pair.
The USD/CAD pair edges lower on the last day of the week and remains on the defensive through the early European session, though lacks follow-through selling. Spot prices currently trade around the 1.3435 region, down less than 0.10% for the day, and seem poised to build on the recent goodish recovery move from the YTD low touched in July.
The US Dollar (USD) struggles to capitalize on the previous day's solid rebound from over a one-week low – touched in reaction to the softer US consumer inflation figures - and turns out to be a key factor acting as a headwind for the USD/CAD pair. The US Bureau of Labor Statistics (BLS) reported on Thursday that the headline CPI rose from 3% to the 3.2% YoY rate in July, less than consensus estimates, while the Core CPI (excluding volatile food and energy prices) edged lower to 4.7% from 4.8% in June. The data ensures that the Federal Reserve (Fed) will not hike its benchmark overnight interest rate at the September 19-20 meeting and prompts some USD selling.
The inflation, however, remains way above the central bank's 2% target, which, along with hawkish remarks by San Francisco Fed President Mary Daly, keeps the door wide open for one more 25 bps lift-of by the end of this year. In fact, Daly said that the inflation data is moving in the right direction, though the core inflation hasn't made much progress. She added that it would be premature to project whether the Fed raises another time, or holds rates steady for a longer period, as there is a lot of information coming in between now and the next meeting. This leads to a further rise in the US Treasury bond yields and should help limit any further losses for the buck.
Apart from this, the worsening economic conditions in China support prospects for the emergence of some dip-buying around the safe-haven Greenback. This, along with subdued Crude Oil prices and growing acceptance that the Bank of Canada (BoC) will pause its interest rate hike campaign, could undermine the commodity-linked Loonie and lend support to the USD/CAD pair. Investors now look to the US economic docket, featuring the release of the Producer Price Index (PPI), along with the Preliminary Michigan Consumer Sentiment and Inflation Expectations, which might influence the USD. Traders will further take cues from Oil price dynamics to grab short-term opportunities.
Technical levels to watch
GBP/USD is holding above key support from the 1.2590 late June low. Economists at Credit Suisse analyze the pair’s technical outlook.
GBP/USD needs to hold support at 1.2590 to avoid a top
A close above resistance from its 13-day exponential average and recent reaction high at 1.2779/93 is now seen needed to ease the immediate downside bias, but with a break above the recent ‘outside day’ high at 1.2997 seen needed to reassert the broader uptrend for strength back to the 1.3143 high and eventually 1.3400/14.
A close below 1.2590 though would instead see a price top established to clear the way for a more concerted decline to test the rising 200-DMA and May low at 1.2345/07, but with fresh buyers expected to show here.
The Oil price has been rising significantly since the end of June. Economists at Commerzbank have revised their forecast for Brent Oil.
Brent Oil seen at $85 by year-end
We have raised our price forecast for Brent at the end of the quarter to $90 per barrel (previously $80).
At the end of the year, we continue to expect $85. This is because we expect Saudi Arabia to gradually phase out its voluntary production cuts in the fourth quarter and thus bring additional supply to the market. In addition, we expect the US economy to experience a mild recession in the first half of 2024, which should dampen Oil demand. In China, too, demand growth is likely to slow down noticeably after the strong increase in the first half of 2023.
Here is what you need to know on Friday, August 11:
Pound Sterling stays resilient against its major rivals early Friday after the data from the UK showed that the economy avoided stagnation in the second quarter. Following Wednesday's volatile action on US inflation data, the US Dollar Index holds steady as investors await Producer Price Index (PPI) figures for July. The US economic docket will also feature the University of Michigan's Consumer Sentiment Survey for August.
Gross Domestic Product (GDP) of the UK expanded 0.2% on a quarterly basis in the second quarter. Annualized GDP grew 0.4% in the same period, higher than the market expectation and the first quarter growth of 0.2%. Other data from the UK revealed that Industrial Production expanded by 1.8% on a monthly basis June, compared to analysts' estimate of 0.1%, while Manufacturing Production grew by 2.4%. Following these upbeat readings, GBP/USD trades in positive territory slightly above 1.2700 in the European session.
UK Preliminary GDP unexpectedly grows 0.2% in Q2 2023.
Pound Sterling price today
The table below shows the percentage change of Pound Sterling (GBP) against listed major currencies today. Pound Sterling was the strongest against the Swiss Franc.
| USD | EUR | GBP | CAD | AUD | JPY | NZD | CHF | |
| USD | -0.09% | -0.28% | -0.06% | -0.25% | -0.04% | 0.04% | 0.06% | |
| EUR | 0.09% | -0.18% | 0.03% | -0.15% | 0.05% | 0.10% | 0.15% | |
| GBP | 0.27% | 0.19% | 0.20% | 0.03% | 0.23% | 0.28% | 0.34% | |
| CAD | 0.09% | -0.01% | -0.20% | -0.15% | 0.03% | 0.08% | 0.14% | |
| AUD | 0.25% | 0.12% | -0.06% | 0.16% | 0.16% | 0.25% | 0.27% | |
| JPY | 0.05% | -0.02% | -0.21% | 0.00% | -0.14% | 0.10% | 0.11% | |
| NZD | -0.02% | -0.10% | -0.27% | -0.07% | -0.24% | -0.04% | 0.07% | |
| CHF | -0.06% | -0.15% | -0.34% | -0.12% | -0.31% | -0.10% | -0.06% |
The heat map shows percentage changes of major currencies against each other. The base currency is picked from the left column, while the quote currency is picked from the top row. For example, if you pick the Euro from the left column and move along the horizontal line to the Japanese Yen, the percentage change displayed in the box will represent EUR (base)/JPY (quote).
After the US annual Consumer Price Index (CPI) and Core CPI data for July came in slightly below market expectations, the US Dollar weakened against its rivals, with the US Dollar Index (DXY) dropping to a fresh weekly low below 102.00 in the early American session. As Wall Street's main indexes erased strong opening gains later in the session, the USD managed to erase its losses. Early Friday, the DXY holds steady at around 102.50. Meanwhile, US stock index futures trade modestly higher and the 10-year US Treasury bond yield holds comfortably above 4.1%.
Following a spike above 1.1050 on Thursday, EUR/USD lost its traction and closed the day virtually unchanged. The pair clings to small daily gains at around 1.1000 on Friday.
USD/JPY extended its uptrend into a fourth straight day on Thursday and registered its highest daily close in a month near 144.70. The pair stays in a consolidation phase in the European session on Friday and fluctuates in a tight channel slightly above 144.50.
Gold price rose above $1,930 in the American session on Thursday but made a sharp U-turn, ending the day in negative territory near $1,910. XAU/USD edged higher toward $1,920 on Friday as the 10-year US yield holds steady.
Bitcoin advanced toward $30,000 after US inflation data but failed to preserve its momentum. BTC/USD stays on the back foot and trades below $29,500 in the European morning. Ethereum continues to move sideways near $1,850 for the third straight day on Friday
Analysts at Credit Suisse stay bullish on USD/JPY and look for a retest and eventual break above 145.00/12.
Move below 141.43 needed to ease the immediate upside bias
We continue to look for a retest of our 145.00/12 interim upside target – the high from June and the ‘neckline’ to the late 2022 top. Although this should again be respected our core outlook stays bullish and we look for an eventual break above here for resistance next at 146.54/66 and eventually the ‘measured base objective’ at 148.57.
Below support from the recent low and 55-DMA at 141.43 is needed to mark a near-term top to ease the immediate upside bias and the likelihood of further weakness in a broader range with support then seen next at the uptrend from March, now seen at 139.00.
- Silver struggles to gain any meaningful traction for the second straight day on Friday.
- The technical setup supports prospects for an extension of a multi-week downtrend.
- Attempted recovery is likely to remain capped near the $23.30 support breakpoint.
Silver lacks any firm intraday directional bias on Friday and seesaws between tepid gains/minor losses through the early part of the European session. The white metal currently trades around the $22.70 region, nearly unchanged for the day and just above over a one-month low touched on Wednesday.
The technical setup, meanwhile, suggests that the path of least resistance for the XAG/USD is to the downside. This week's sustained break below the $23.30-$23.20 confluence – comprising the very important 200-day Simple Moving Average (SMA) and a short-term ascending trend-line – was seen as a fresh trigger for bearish traders. Adding to this, oscillators on the daily chart are holding deep in the negative territory and are still far from being in the oversold zone. This, in turn, supports prospects for an extension of the recent downward trajectory witnessed over the past three weeks or so.
Hence, any subsequent move up towards the $23.00 round figure might still be seen as a selling opportunity and remain capped near the $23.20-$23.30 confluence support breakpoint, now turned resistance. The latter should act as a pivotal point, which if cleared decisively might trigger a short-covering move. The XAG/USD might then accelerate the recovery momentum towards the $23.60-$23.65 horizontal barrier before aiming to reclaim the $24.00 mark.
On the flip side, the $22.65-$22.60 area, or the weekly low, could act as immediate support. The XAG/USD, however, seems vulnerable to retesting the multi-month low, around the $22.15-$22.10 area touched in June. Some follow-through selling below the $22.00 mark will expose the $21.55-$21.50 intermediate support and the $21.00 mark. The downward trajectory could get extended towards the $21.00 round figure en route to the YTD low, or levels just below the $20.00 psychological mark touched in March.
Silver daily chart
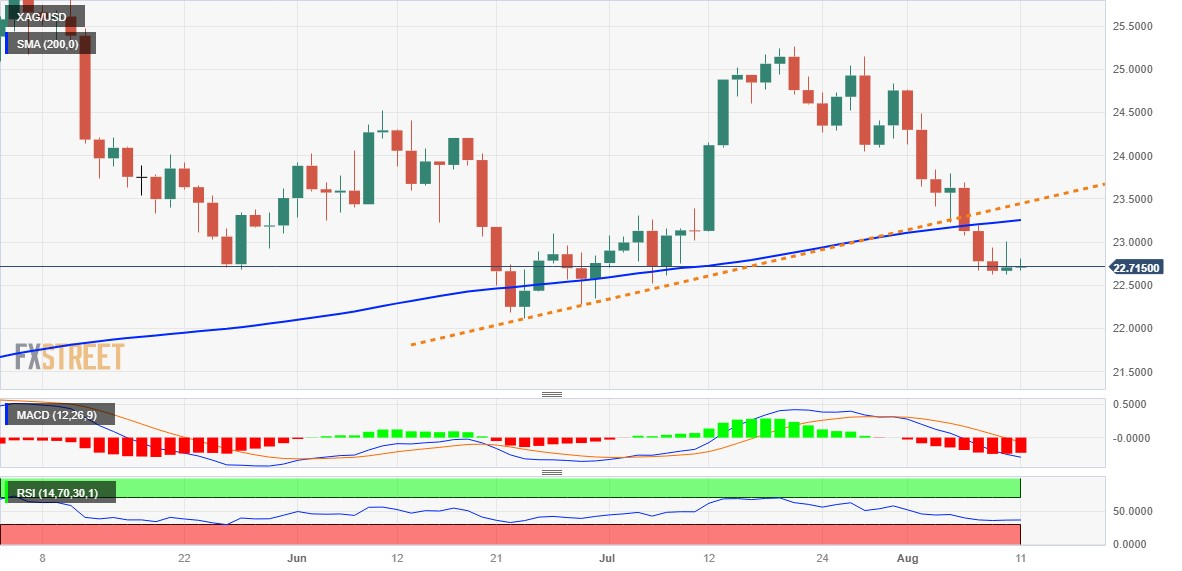
Technical levels to watch
Economists at Commerzbank highlight the conditions required to keep EUR/USD around the 1.10 zone.
FX market is uncertain about the Fed's immediate outlook
Remarkably, the Dollar recovered later in the day, possibly supported by comments from San Francisco Fed President Mary Daly, who reiterated after the inflation data that the Fed has more work to do. Against this backdrop, the USD correction underscores how uncertain the FX market is about the Fed's immediate outlook.
Attention is now likely to focus increasingly on the comments of the Fed central bankers. It is their task to moderate an end of the rate hike cycle without fuelling expectations of imminent rate cuts. The more successful they are at doing that the longer EUR/USD is likely to remain in the area of 1.10.
- NZD/USD remains under pressure and finds support above the 0.6000 area on Friday.
- The US Core CPI fell to 4.7% from 4.8%, Initial Jobless claims totaled 248,000.
- Analysts anticipate that the Reserve Bank of New Zealand (RBNZ) will maintain rates at 5.50% in its August meeting.
- Market players will monitor the US Producer Price Index (PPI), the University of Michigan (UoM) Consumer Confidence Survey.
The NZD/USD pair attracts some sellers and edges lower to 0.6012, near the multi-month low heading into the early Asian session on Friday. Markets turn cautious ahead of the release of top-tier US data in the American session. The data could trigger volatility in NZD/USD later in the day.
The US Bureau of Labor Statistics (BLS) reported on Thursday that the US Consumer Price Index (CPI) rose to 3.2% YoY from 3% in June. The figure was below the market consensus of 3.3%. While the Core CPI figure, which excludes volatile food and energy prices, fell to 4.7% from 4.8%. Additionally, the US Initial Jobless Claims increased to 248,000, above the expectation of 230,000. In response to the data, the US Dollar reversed its course and strengthened against its rivals.
Apart from this, the Fed San Francisco President, Mary C. Daly, stated on Thursday that there is a lot more information to evaluate and that it is premature to project whether additional rate increases or a prolonged period of holding rates are required. This, in turn, caps the upside for the Kiwi and acts as a headwind for the NZD/USD pair.
On the Kiwi front, the New Zealand Inflation Expectations QoQ came in at 2.83% versus 2.79% prior. While the Business NZ PMI fell to 46.3 versus 49.4 expected. The majority of analysts, according to a recent Reuters poll, anticipate that the Reserve Bank of New Zealand (RBNZ) will maintain rates at 5.50%, a 14-year high, for the second consecutive meeting on August 16.
Meanwhile,the exacerbated trade war tensions between the US and China might exert pressure on the Kiwi, the proxy currency for the Chinese economy. That said, US President Joe Biden issued an executive order on Wednesday prohibiting new US investments in China in sensitive technologies. The US government intends to target only Chinese companies that generate more than 50% of their revenue from quantum computation and artificial intelligence (AI). However, the restrictions would apply to "narrow subsets" of the three domains, but the administration did not provide further details, and the proposal is available for public comment.
Looking ahead, market participants will closely watch the US Producer Price Index (PPI), due later in the day. The figure is expected to rise from 0.1% to 0.7% YoY. Also, the University of Michigan (UoM) Consumer Confidence Survey will be due in the American session. The data will be critical for determining a clear movement for the NZD/USD pair.
The RBA's August Statement and its Statement on Monetary Policy delivered a message that implied the Bank believes it is at or very close to a peak in the target cash rate, economists at TD Securities report.
At or very close to peak
Should the labour market remain firm and there is evidence that higher labour costs are being passed through, this lays the ground for the RBA to hike in Nov. But only time will tell. For now, we have the RBA cash rate peaking at its current 4.10% level but acknowledge upside risk to this forecast. The upside risks come from higher property prices supporting consumption (through the wealth channel) and higher Oil prices.
Given our view the RBA cash rate peaks earlier and lower than our prior 4.85% forecast, the RBA is therefore expected to keep the cash rate on hold for longer. We now push out rate cuts from Q2 2024 to Q3 2024.
- AUD/USD prints the first daily gains in four, sticks to mild gains of late.
- RBA Governor Lowe cites the need for further, gradual policy tightening.
- China news, reassessment of Fed talks and US inflation data trigger Aussie pair’s corrective bounce.
- US mid-tier inflation clues eyed for clear directions.
AUD/USD edges higher past 0.6500 during the first positive day in four, up 0.20% intraday near 0.6530 amid early Friday morning in Europe. In doing so, the Aussie pair justifies the recent hawkish bias about the Reserve Bank of Australia (RBA), as well as the hopes of the Federal Reserve’s (Fed) policy pivot, as market players brace for mid-tier US inflation clues. Also, the cautious optimism about China, Australia’s biggest customer, adds strength to the Aussie pair’s corrective bounce.
“It is possible that some further tightening of monetary policy will be required to ensure that inflation returns to target within a reasonable timeframe,” said RBA Governor Philip Lowe while speaking before the House of Representatives Standing Committee on Economics per Reuters. The policymaker also refrained from cheering the victory on inflation and defended the latest pause in the rate hike trajectory by stating that the successive rate lifts could result in higher unemployment.
On the other hand, unimpressive US inflation data allowed the Fed policymakers to cheer the victory over price pressure but the traders need more details to welcome the policy pivot concerns.
That said, the US Consumer Price Index (CPI) for July matched market forecasts to reprint 0.2% MoM figures. However, the yearly CPI improved slower-than-expected 3.3% to 3.2% YoY for the said month, versus 3.0% previous readings, marking the first acceleration in the annual rate in 13 months. Following the data, a slew of policymakers from the Federal Reserve (Fed) crossed wires while conveying the US central bank’s hard-earned victory on inflation. However, their tones appeared less convincing for doves and joined the risk-negative concerns about China to fuel the US Treasury bond yields afterward.
Elsewhere, China allows the provincial-level governments to raise about 1 trillion Yuan ($139 billion) via bond sales to repay the debt of local-government financing vehicles (LGFV) and other off-balance sheet issuers, per Bloomberg. The news justifies the market’s confidence in the Chinese policymakers’ capacity to avoid recession and weigh on the US Dollar, via a slightly positive market mood.
However, the fears of witnessing more geopolitical tussles between the West and China, mainly due to the US restriction on investment in China technology companies and the likely repeat of the measures by the UK and European Union, weighed on the sentiment and check the AUD/USD buyers. Furthermore, cautious mood ahead of the second-tier US inflation clues also prods the Aussie pair’s recovery moves after it reversed from a one-week high the previous day.
Among the key data, the US Producer Price Index (PPI) for July, the preliminary readings of the University of Michigan’s (UoM) Consumer Sentiment Index (CSI) for August and the UoM 5-Year Consumer Inflation Expectations for the said month will be important to watch for clear directions.
Technical analysis
AUD/USD reverses the previous downside break of a 10-month-old rising trend line of around 0.6550. Also acting as a short-term downside filter is an upward-sloping trend line from November 2022, close to 0.6480 at the latest.
Norwegian inflation in July was exactly in line with Norges Bank’s expectations. Economists at Commerzbank expect the Krone to receive support if upcoming data comes strong.
Norwegian inflation "on track"
The overall rate eased more significantly than expected from 6.4% to 5.4%. But Norges Bank keeps a particular eye on underlying inflation, adjusted by taxes and excluding energy prices (the so-called CPI-ATE). With a fall from 7% to 6.4% this rate was exactly in line with market expectations and Norges Bank’s projections. That means, the data did not provide any reason to doubt Norges Bank’s projections and rate path.
Even though the market continues to expect only one further rate step in the autumn rather than the two Norges Bank signalled in its rate path in June, if the upcoming price data were to surprise on the upside with economic data signalling that the Norwegian economy is resilient the market is likely to take Norges Bank’s view at some point. That in turn would support NOK.
The NZD/USD pair is teetering just above 0.60 as the week draws to a close. Economists at ANZ Bank analyze Kiwi's outlook.
Mild gradual appreciation over 2023
Our forecasts still call for mild gradual appreciation over 2023. However, this expectation is predicated on the expectation that markets would gravitate back to fair value (which we see at around 0.65), and the risks are skewed toward that not happening, especially if FX markets continue to take a ‘Goldilocks’view of the US’ ability to tame inflation without causing a recession, which is the current vibe.
In the near term, a break of 0.60 would put the June low of 0.5985 in focus, and beyond that, the 2022 low of 0.5512.
- WTI crude oil bears struggle to extend the previous day’s retreat from the yearly high.
- Impending bull cross on MACD, one-week-old horizontal support and 200-HMA prod Oil sellers.
- WTI buyers remain hopeful unless witnessing clear downside break of $80.70.
WTI remains mildly offered near $82.30, making rounds to intraday low amid early Friday in Europe, as traders seek more clues to extend the previous day’s reversal from the highest level in nine months.
It’s worth noting that the lack of major data/events joins the mixed concerns about major central banks and China, as well as the cautious mood ahead of the mid-tier US data, to prod the Oil traders of late.
Also read: WTI retreats from a YTD high, holds above $82.40 ahead of US PPI
However, seven-day-long horizontal support restricts the immediate downside of the WTI crude oil near $82.20.
Following that, the $82.00 round figure and the 200-Hour Moving Average (HMA) level of near $81.75 could test the energy bears.
Above all, the black gold remains off the bear’s radar unless staying within a two-week-old rising trend channel, currently between $80.70 and $84.75.
On the contrary, Oil price recovery needs validation from the intraday high of around $82.70 to retake control.
Additionally, the Year-To-Date (YTD) high surrounding $84.35, marked the previous day, will follow the stated channel’s top line near $84.75 to test the energy buyers.
In a case where the WTI bulls keep the reins past $84.75, the November 11 peak of around $89.35, and the $90.00 round figure will be in the spotlight.
WTI crude oil: Hourly chart
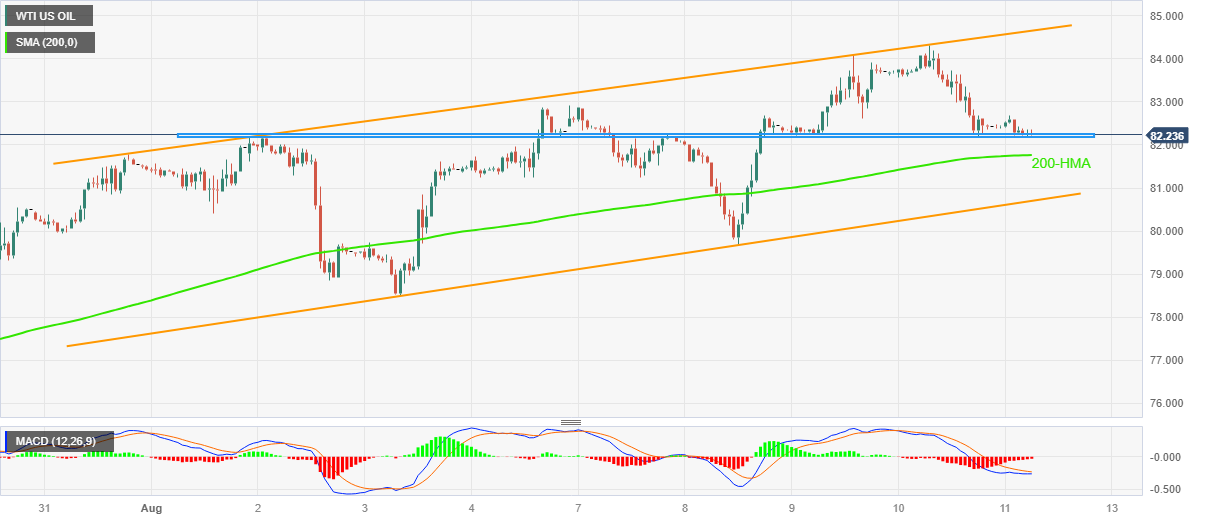
Trend: Recovery expected
Year-to-date, INR is unchanged vs USD. Economists at Commerzbank share their USD/INR forecast.
Rising cost pressures will force RBI to remain vigilant
INR continues to be well supported by strong economic fundamentals. The latest PMI reports for both manufacturing and services remained robust.
RBI left rates unchanged at 6.50% for the third consecutive meeting in August. There is no incentive for RBI to alter policy anytime soon. They will continue to adopt a wait-and-see attitude. Nevertheless, RBI would need to stay vigilant on a potential reversal in food prices. It would need to keep a close eye on the upcoming monsoon season.
We project USD/INR to hold around 82.00 by Q3 2023 and drift lower to 81.50 by end-2023 and 81.00 by end-2024.

Source: Commerzbank Research
- GBP/JPY edges higher to 183.90 following the UK GDP data.
- The cross trades within an ascending trend-channel since August 4.
- GBP/JPY’s key resistance emerges at 184.00; the initial contention level to watch is at 183.20.
The GBP/JPY cross gains ground in positive territory for the fifth consecutive day, heading into the early European session on Friday. The cross currently trades near 183.90, up 0.24% for the day.
The latest data released by the UK’s Office of National Statistics (ONS) showed that the quarterly Gross Domestic Product (GDP) for the United Kingdom came in at 0.2% in Q2, against the market expectation of 0%. Meanwhile, the GDP MoM for June arrived at 0.5% vs. 0.2% prior.
According to the one-hour chart, the GBP/JPY trades within an ascending trend-channel since August 4. The cross stands above the 50- and 100-hour Exponential Moving Averages (EMAs) with an upward slope, which means the further upside looks favourable for the cross.
That said, GBP/JPY’s key resistance emerges at 184.00, highlighting a confluence of a psychological round mark and a high of July 6. A decisive break above the latter could pave the way to the YTD high at 184.25. Any meaningful follow-through buying will see the next stop at 184.55 (the upper boundary of an ascending trend-channel) en route to 185.00 (a round figure).
On the downside, the initial contention level to watch is at 183.20 (50-hour EMA). The critical support level is located at 182.80, a convergence of the lower limit of the ascending trend-channel and the 100-hour EMA. Further south, the cross will see a drop to 182.00 (a psychological round figure) and 181.40 (the low of August 8).
The Relative Strength Index (RSI) is located in bullish territory above 50, highlighting that further upside cannot be ruled out.
GBP/JPY one-hour chart
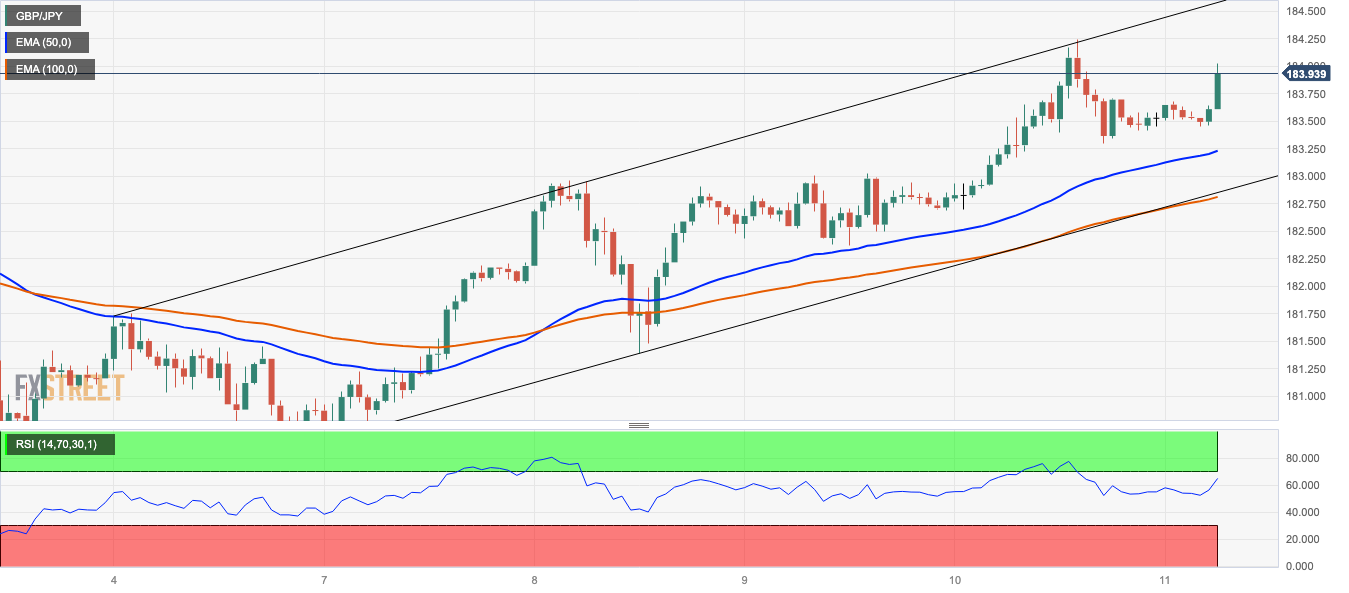
The United Kingdom’s (UK) industrial sector activity showed an improvement in June, the latest data published by Office for National Statistics (ONS) showed on Friday.
Manufacturing output rose 2.4% MoM in June versus 0.2% expected and -0.1% seen in May while total industrial output came in at 1.8% MoM vs. 0.1% expected and -0.6% last.
On a yearly basis, the UK Manufacturing Production data jumped by 3.1% in June, beating expectations of 0.3%. Total Industrial Output rose by 0.7% in the sixth month of the year, surpassing the -1.1% expected and the previous reading of -2.1%.
Separately, the UK goods trade balance numbers were published, which arrived at GBP-15.455 billion in June versus GBP-16.40 billion expectations and GBP-18.411 billion prior. The total trade balance (non-EU) came in at GBP-2.772 billion in June versus GBP-6.615 billion previous.
Related reads
- UK Preliminary GDP unexpectedly grows 0.2% in Q2 2023
- GBP/JPY Price Analysis: Surges above the 183.90 area following UK GDP data
- EUR/GBP takes offers to refresh intraday low after initially renewing a three-week high.
- Preliminary readings of UK Q2 GDP came in better than expected on QoQ, monthly GDP also rose for June.
- ECB’s monthly Economic Bulletin cites heavy uncertainty, Reuters poll suggests policy pivot in September.
- Risk catalysts will be crucial to watch for clear directions.
EUR/GBP drops more than 15 pips as it renews its intraday low near 0.8650 after upbeat UK growth numbers were published early Friday morning in London. Adding strength to the bearish bias could be the fears of the European Central Bank’s (ECB) policy pivot in September, as well as the downbeat ECB report.
As per the preliminary readings of the UK’s second quarter (Q2) Gross Domestic Product (GDP), the British economy grew 0.2% QoQ versus 0.1% prior and 0.0% expected while the monthly GDP also rose by 0.5% MoM in June compared to -0.1% previous readings and 0.2% forecasts.
Also read: Breaking: UK Preliminary GDP expands 0.2% QoQ in Q2 2023 vs. 0% expected
Elsewhere, the European Central Bank’s (ECB) monthly Economic Bulletin unveiled a highly uncertain outlook for the bloc’s economic growth and inflation. The publication also mentioned the continuous decline in the “too high inflation”, as well as deterioration in the near-term economic outlook.
Earlier in the day, the latest Reuters poll about the European Central Bank (ECB) cites the market’s mixed concerns as a slim majority expects a pause to the rate hike trajectory in September but the hot inflation also pushes some economists to expect a rate increase by the year-end. The same also exerts downside pressure on the EUR/GBP pair.
It’s worth noting that the early week forecasts of the UK’s leading thinktank National Institute of Economic and Social Research (NIESR) signaled higher rates and bolstered hawkish bias about the Bank of England (BoE), which in turn weigh on the EUR/GBP price.
Having witnessed the initial market reaction to the UK Q2 GDP data, the EUR/GBP pair traders should look for risk catalysts for clear directions as the economic calendar remains mostly empty for the Eurozone. Even so, recent doubts about the ECB’s future rate hikes may prod the cross-currency pair’s immediate upside.
Technical analysis
EUR/GBP bulls need a daily closing beyond the 100-DMA hurdle surrounding 0.8670 to keep the reins while a pullback move remains elusive beyond the previous resistance line stretched from late April, close to 0.8650 at the latest.
- USD/MXN retreats from key EMA hurdle, fades the previous day’s rebound from one-week low.
- Banxico kept benchmark interest rates unchanged on mixed inflation clues.
- Bullish MACD signals keep Mexican Peso sellers hopeful of crossing four-month-old resistance.
- Bears need validation from 16.70 and US inflation data to keep the reins.
USD/MXN clings to mild losses near 17.11 heading into Friday’s European session as market players seek more clues to defend the previous day’s recovery from the weekly low. In doing so, the Mexican Peso (MXN) pair fades the currency’s fall past Banxico’s status quo amid fears of the Federal Reserve’s (Fed) policy pivot.
That said, the bullish MACD signals join the USD/MXN pair’s ability t stay beyond the 21-day Exponential Moving Average (EMA) and five-week-old horizontal support to keep the buyers hopeful to visit the area between 17.00 and 16.98.
Even so, the 50-EMA hurdle of 17.14 guards the immediate upside of the USD/MXN pair, a break of which could direct the Mexican Peso (MXN sellers toward the downward-sloping resistance line from early April, close to 17.28 at the latest.
It’s worth observing that the monthly high of nearly 17.42 acts as the final defense of the Mexican Peso buyers.
On the flip side, a clear break below the 16.98 support needs validation from the previous monthly low of around 16.62 to convince the USD/MXN bears.
Overall, USD/MXN remains on the bull’s radar despite the latest retreat.
USD/MXN: Daily chart

Trend: Limited upside expected
- EUR/USD remains sideways around 1.0985, gaining 0.05% as markets turn cautious ahead of US PPI data.
- ECB Economic Bulletin revealed that the Eurozone’s inflation is still expected to be too high for too long.
- The US Core CPI fell to 4.7% from 4.8%, Initial Jobless claims totaled 248,000.
- Traders will closely watch July’s US Producer Price Index (PPI), UoM Consumer Confidence Survey.
The EUR/USD pair holds ground above the 1.0980 mark heading into the early European session on Friday. The major pair trades in positive territory for the third consecutive day after retreating from a weekly high of 1.1065 following US inflation data. Market participants prefer to wait on the sidelines ahead of the US Producer Price Index (PPI), due later in the American session.
The European Central Bank's (ECB) monthly Economic Bulletin revealed on Thursday that the Eurozone’s inflation is still predicted to be too high for too long, and the prospects for economic growth and inflation are still uncertain. According to the Reuters poll, the target inflation rate of 2.0% will not be reached until at least 2025, and more than 90% of economists surveyed anticipate no rate cuts before the second quarter of 2024.
On the US Dollar docket, the US Consumer Price Index (CPI) rose to 3.2% YoY from 3% in June. The figure was below the market consensus of 3.3%. While the Core CPI figure, which excludes volatile food and energy prices, fell to 4.7% from 4.8%. Additionally, the US Initial Jobless Claims increased to 248,000, above the expectation of 230,000. In response to the data, the US Dollar reversed its course and dragged the Euro lower on Thursday.
Apart from this, the Fed San Francisco President, Mary C. Daly, stated on Thursday that there is a lot more information to evaluate and that it is premature to project whether additional rate increases or a prolonged period of holding rates are required. This, in turn, caps the upside for the Euro and acts as a headwind for the EUR/USD pair.
Looking ahead, all eyes are on the highly anticipated US inflation data. The US Producer Price Index (PPI) will be released later in the day. The figure is expected to rise from 0.1% to 0.7% YoY. Also, the University of Michigan (UoM) Consumer Confidence Survey will be due on Friday. Traders anticipate that the data might convince the Federal Reserve (Fed) that it is now under control and no further interest rate increases are necessary. The data will be critical for determining a clear movement for the EUR/USD pair.
- USD/JPY lacks upside momentum near the Year-To-Date high, prods four-day uptrend.
- Nearness to 145.00 psychological level for Japan intervention joins US Dollar’s retreat to weigh on Yen pair.
- Yields seesaw after rising the most in a week as traders await more clues to confirm Fed policy pivot.
- US PPI, Michigan CSI eyed for further directions, risk catalysts are the key to follow.
USD/JPY bulls run out of steam below 145.00, making rounds to 144.80-90 during early Friday in Europe, as market players struggle for clear directions amid mixed clues. Also challenging the Yen pair is the cautious mood ahead of the mid-tier US data.
That said, the 10-year Treasury bond yields in the US and Japan fade the previous day’s bullish momentum while making rounds to 4.10% and 0.585% by the press time. In doing so, the yields portray the market’s lack of confidence in the major central bankers’ statements suggesting nearness to the peak rates.
On Thursday, unimpressive US inflation data allowed the Fed policymakers to cheer the victory over price pressure but the traders need more details to welcome the policy pivot concerns.
Talking about the data, the headline Consumer Price Index (CPI) for July matched market forecasts to reprint 0.2% MoM figures. However, the yearly CPI improved slower-than-expected 3.3% to 3.2% YoY for the said month, versus 3.0% previous readings, marking the first acceleration in the annual rate in 13 months.
Following the statistics, a slew of policymakers from the Federal Reserve (Fed) crossed wires while conveying the US central bank’s hard-earned victory on inflation. However, their tones appeared less convincing for doves and joined the risk-negative concerns about China to fuel the US Treasury bond yields afterward.
Philadelphia Federal Reserve Bank President Patrick Harker raised a toast to the Fed’s progress in its fight against inflation and was joined by Boston Federal Reserve President Susan Collins and Atlanta Federal Reserve Bank President Raphael Bostic to cheer the softer US CPI. However, San Francisco Fed President Daly turned down the cheers for their victory while saying, “There’s still more work to do.”
On the other hand, China allows the local governments to use the provincial-level governments to raise about 1 trillion yuan ($139 billion) via bond sales to repay the debt of local-government financing vehicles (LGFV) and other off-balance sheet issuers, per Bloomberg. The news justifies the market’s confidence in the Chinese policymakers’ capacity to avoid recession and weigh on the US Dollar, via a slightly positive market mood. Additionally, the fears of witnessing more geopolitical tussles between the West and China, mainly due to the US restriction on investment in China technology companies and the likely repeat of the measures by the UK and European Union, weighed on the sentiment and put a floor under the USD/JPY price.
It’s worth noting that the Japanese officials have been defending the easy-money policy and keep the USD/JPY on the front foot even if the fears of market intervention by the authorities around the 145.00 round figure prod the Yen pair buyers of late.
Moving on, the US Producer Price Index (PPI) for July, the preliminary readings of the University of Michigan’s (UoM) Consumer Sentiment Index (CSI) for August and the UoM 5-Year Consumer Inflation Expectations for the said month will also be important to watch for clear directions of the USD/JPY pair.
Technical analysis
A daily closing beyond the 145.10-20 region comprising the previous peak and a three-week-old rising resistance line becomes necessary for the USD/JPY bulls to keep the reins. However, the overbought RSI (14) line prods the upside momentum of late.
- GBP/USD struggles to defend the first daily gains in four at the lowest level in a week.
- Unimpressive US inflation favored Fed policymakers to claim victory after hard-run.
- Fears of UK recession tame Cable pair’s recovery ahead of Q2 UK GDP.
- US PPI, more inflation clues will also direct Pound Sterling price.
GBP/USD stays defensive beyond an 11-week-old rising support line, making rounds to 1.2680-90 heading into Friday’s London open. In doing so, the Cable pair justifies the market’s cautious mood of the first readings of the UK’s second quarter (Q2) Gross Domestic Product (GDP), expected 0.0% QoQ versus 0.1% prior, especially amid fears of British recession. However, the US Dollar’s retreat prods the Pound Sterling sellers of late.
That said, the US Dollar Index (DXY) fails to extend the late Thursday’s rebound from the lowest level in a week as a slew of policymakers from the Federal Reserve (Fed) conveyed the US central bank’s hard-earned victory on inflation. Even so, their tones appeared less convincing for doves and joined the risk-negative concerns about China to limit the Greenback’s fall and test the Cable buyers.
Among them, Philadelphia Federal Reserve Bank President Patrick Harker raised a toast to the Fed’s progress in its fight against inflation and was joined by Boston Federal Reserve President Susan Collins and Atlanta Federal Reserve Bank President Raphael Bostic to cheer the softer US CPI. However, San Francisco Fed President Daly turned down the cheers for their victory while saying, “There’s still more work to do.”
On a different page, China allows the local governments to use the provincial-level governments to raise about 1 trillion yuan ($139 billion) via bond sales to repay the debt of local-government financing vehicles (LGFV) and other off-balance sheet issuers, per Bloomberg. The news justifies the market’s confidence in the Chinese policymakers’ capacity to avoid recession and weigh on the US Dollar, via a slightly positive market mood.
It should be noted that the fears of witnessing more geopolitical tussles between the West and China, mainly due to the US restriction on investment in China technology companies and the likely repeat of the measures by the UK and European Union, weighed on the sentiment.
Further, the chatters about slower economic growth in top-tier economies and recession woes in China, Germany and the UK pushed back the US Dollar bears as well. Furthermore, the news that China’s leading realtor Country Garden braces for debt restructuring and the anxiety ahead of more US data also prod the optimists.
Earlier in the week, the UK’s leading thinktank National Institute of Economic and Social Research (NIESR) said, per The Guardian, that it would take until the third quarter (Q3) of 2024 for British output to return to its pre-pandemic peak.
Also to observe is the fact that the political struggle of the Tory party and the fears of higher inflation, coupled with the employment crunch and slower economic transition, also challenge the GBP/USD rebound ahead of the UK Q2 GDP.
Also read: UK Q2 Gross Domestic Product Preview: British economy forecast to stagnate despite BoE optimism
Apart from the UK GDP, the US Producer Price Index (PPI) for July, the preliminary readings of the University of Michigan’s (UoM) Consumer Sentiment Index (CSI) for August and the UoM 5-Year Consumer Inflation Expectations for the said month will also be important to watch for clear directions of the GBP/USD pair.
Technical analysis
A three-week-old bearish trend channel restricts immediate GBP/USD moves between 1.2570 and 1.2790. Adding credence to the downside bias are the bearish MACD signals and downbeat concerns about the UK GDP.
That said, the Daily chart fine-tunes the moves by suggesting a sustained trading beyond the rising support line from late May, around 1.2655 by the press time.
- Asian stock markets edge lower on Friday, Chinese equities lead losses.
- The Chinese inflation data fuels concern about the pace of China's post-pandemic recovery.
- Market players will monitor the US Producer Price Index (PPI) for July.
Asian stock markets edges lower on Friday, with all eyes on the release of the US Producer Price Index (PPI), due later in the American session. Sydney, Hong Kong, and Shanghai stock markets decline while Japanese markets closed on holidays.
At press time, China’s Shanghai falls 1.19% to 3,215, the Shenzhen Component Index declines 1.24% to 10,910, Hong Kong’s Hang Sang falls 0.70% to 19,118, India’s NIFTY 50 is down 0.27%, and South Korea’s Kospi is up 0.07%.
In China, the inflation data on Wednesday raised concern about the pace of China's post-pandemic recovery. The Chinese Consumer Price Index (CPI) YoY fell 0.3% in July from 0% prior. This figure indicated the deflation in China.
Furthermore, US President Joe Biden issued an executive order on Wednesday prohibiting new US investments in China in sensitive technologies. That said, the US intends to target only Chinese companies that generate more than 50% of their revenue from quantum computation and artificial intelligence (AI).
However, the restrictions would apply to "narrow subsets" of the three domains, but the administration did not provide further details and the proposal is available for public comment.
Despite a lack of any top-tier economic data release from the Japanese docket, the Japanese Yen approached a multi-week low of 144.63 amid thin volumes in the early Asian session on Friday.
Looking ahead, all eyes are on the highly anticipated US inflation data due later in the American session. The US Producer Price Index (PPI), due later in the day. The figure is expected to rise from 0.1% to 0.7% YoY. Traders anticipate that the data might convince the Federal Reserve (Fed) that it is now under control and no further interest rate increases are necessary.
- GBP/JPY lacks any firm directional bias and remains confined in a range on Friday.
- Traders seem reluctant and look to key UK macro releases before placing fresh bets.
- The divergent BoJ-BoE policy outlook continues to lend some support to the cross.
The GBP/JPY cross oscillates in a narrow trading band, around mid-183.00s through the Asian session on Friday and for now, seems to have stalled the overnight pullback from its highest level since December 2015.
Traders refrain from placing aggressive bets and prefer to wait on the sidelines ahead of the key UK macro released, including the Prelim Q2 GDP report against the backdrop of a bleak economic outlook. It is worth recalling that the National Institute of Economic and Social Research (NIESR) said earlier this week that it would take until the third quarter of 2024 for UK output to return to its pre-pandemic peak. In its quarterly update, the NIESR added that there was a 60% risk of the government going to the polls during a recession. This, in turn, is seen acting as a headwind for the British Pound and capping the GBP/JPY cross.
The downside, however, remains cushioned in the wake of a dovish stance adopted by the Bank of Japan (BoJ), which is the only central bank in the world to maintain a negative benchmark interest rate. Moreover, policymakers have stressed that the recent move to make the Yield Curve Control (YCC) policy more flexible, allowing yield on the 10-year Japanese government bond to move up toward 1%, was a technical tweak aimed at extending the shelf life of stimulus. Adding to this, weaker Japanese wage data released this week reaffirmed market bets that the BoJ will maintain ultra-low interest rates for the rest of the year.
This marks a big divergence in comparison to the Bank of England's (BoE) guidance, saying that the MPC will ensure that Bank Rate is sufficiently restrictive for long enough for the inflation to return to the central bank’s 2% target. It is worth recalling that the BoE raised its benchmark interest rate for the 14th time in a row, by 25 bps to a 15-year high of 5.25% in August. The BoE, however, called its current monetary policy stance "restrictive", suggesting that the tightening cycle may be nearing an end. Nevertheless, the GBP/JPY cross remains on track to register strong gains for the first time in the previous three weeks.
Technical levels to watch
- Gold Price remains below the key resistance confluence despite the corrective bounce, eyes third weekly loss.
- Indecision about major central banks’ next moves, China woes keep XAU/USD rebond in check.
- Expectations of easing inflation pressure in US allowed Fed to tease policy pivot and favored Gold Price recovery.
- Additional signals of easing US price pressure, FOMC Minutes eyed for clear directions.
Gold Price (XAU/USD) licks its wounds at the lowest level in a month, snapping a four-day downtrend as markets reassess previous fears of higher interest rates and geopolitical concerns about China. Also allowing the XAU/USD to lick its wounds at the multi-day low is the US Dollar’s failure to defend late Thursday’s corrective bounce, as well as dicey US Treasury bond yields.
The Unimpressive US inflation data allowed the Fed policymakers to cheer the victory over price pressure while Reserve Bank of Australia (RBA) Governor Philip Lowe defends the latest pause in the monetary policy by citing fears of higher unemployment. Further, the latest Reuters polls about the Reserve Bank of New Zealand (RBNZ) and the European Central Bank (ECB) were also in favor of marking no interest rate changes in the next monetary policy meetings.
Elsewhere, the Chinese policymakers’ sustained defense of the Yuan also favors the market’s confidence that the Asian leader will overcome the economic fears, which in turn underpinned the latest cautious optimism and Gold Price.
It’s worth noting, that the light calendar and cautious mood ahead of the US PPI, the Michigan Consumer Sentiment Index also tests the Gold buyers ahead of the next week’s Federal Open Market Committee (FOMC) monetary policy meeting minutes.
Also read: Gold Price Forecast: XAU/USD could correct before targeting key 200 DMA support
Gold Price: Key levels to watch
As per our Technical Confluence indicator, the Gold Price remains well below the $1,939 resistance confluence comprising Pivot Point one-day R2, Fibonacci 23.6% on one-week and 10-DMA. The same joins the market’s cautious mood to challenge the XAU/USD rebound ahead of the mid-tier US data and events.
That said, Pivot Point one-month S1 and Fibonacci 23.6% on one-day restrict immediate upside of the Gold Price near $1,918. Following that, the Fibonacci 38.2% level will also limit the XAU/USD recovery near $1,920.
It’s worth noting that the convergence of the previously weekly low and the 5-DMA, close to $1,928, also restricts the Gold Price upside.
On the flip side, the lower band of the Bollinger on one-day, around $1,910, restricts the immediate downside of the XAU/USD.
In a case where the Gold sellers break the $1,910 support, the previous monthly low around $1,905 will test the XAU/USD bears before directing them to the $1,900 support confluence including the 200-SMA, Pivot Point one-day and one-week S2.
It should be observed that the XAU/USD may witness a clear fall towards June’s low of near $1,893 on breaking $1,900 key support.
Here is how it looks on the tool
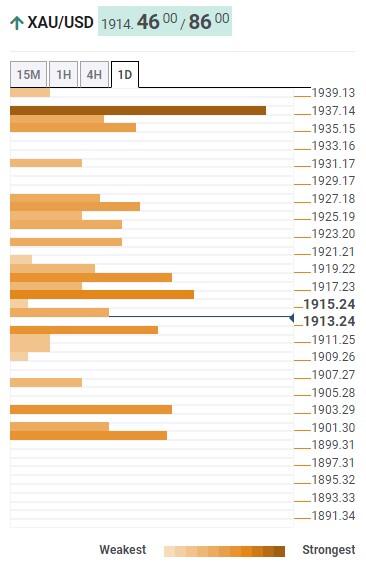
About Technical Confluences Detector
The TCD (Technical Confluences Detector) is a tool to locate and point out those price levels where there is a congestion of indicators, moving averages, Fibonacci levels, Pivot Points, etc. If you are a short-term trader, you will find entry points for counter-trend strategies and hunt a few points at a time. If you are a medium-to-long-term trader, this tool will allow you to know in advance the price levels where a medium-to-long-term trend may stop and rest, where to unwind positions, or where to increase your position size.
- USD/INR meets with a fresh supply on Friday and is pressured by a modest USD weakness.
- The recent range-bound price action warrants some caution before placing directional bets.
- A sustained strength beyond the 83.00 mark is needed to support prospects for further gains.
The USD/INR pair struggles to capitalize on the overnight solid rebound from the 82.60-82.55 area, or over a one-week low and meets with a fresh supply during the Asian session on Friday. Spot prices currently trade around the 82.75 region, down 0.15% for the day, though remain well within the striking distance of a more than six-month peak touched on Wednesday.
The downtick could be attributed to a modest US Dollar (USD) weakness and some technical selling after this week's failure to find acceptance above the 83.00 round-figure mark. Looking at the broader picture, the USD/INR pair has been oscillating in a familiar trading range over the past weeks or so. Against the backdrop of the recent rally from the 81.70 area, or the July swing low, this might still be categorized as a bullish consolidation phase.
Adding to this, technical indicators on the daily chart are holding comfortably in the positive territory and suggest that the path of least resistance for the USD/INR pair is to the upside. That said, it will still be prudent to wait for a sustained strength beyond the 83.00 mark before positioning for any further gains. Spot prices might then surpass the all-time peak, around the 83.40-83.45 region touched in October 2023, and aim to conquer the 84.00 mark.
On the flip side, a subsequent decline below the overnight swing low, around the 82.60-82.55 region, could attract fresh buyers near the very important 200-day Simple Moving Average (SMA), around the 82.20 region. This, in turn, should help limit losses for the USD/INR pair near the 82.00 mark. The latter should act as a pivotal point, which if broken decisively might shift the bias in favour of bearish traders and pave the way for a further depreciating move.
The downward trajectory might then drag the USD/INR pair below the 81.75 region, or the July swing low, towards the next relevant support near the 81.50 zone. Spot prices could eventually drop to test sub-81.00 levels or the YTD low touched in January.
USD/INR daily chart
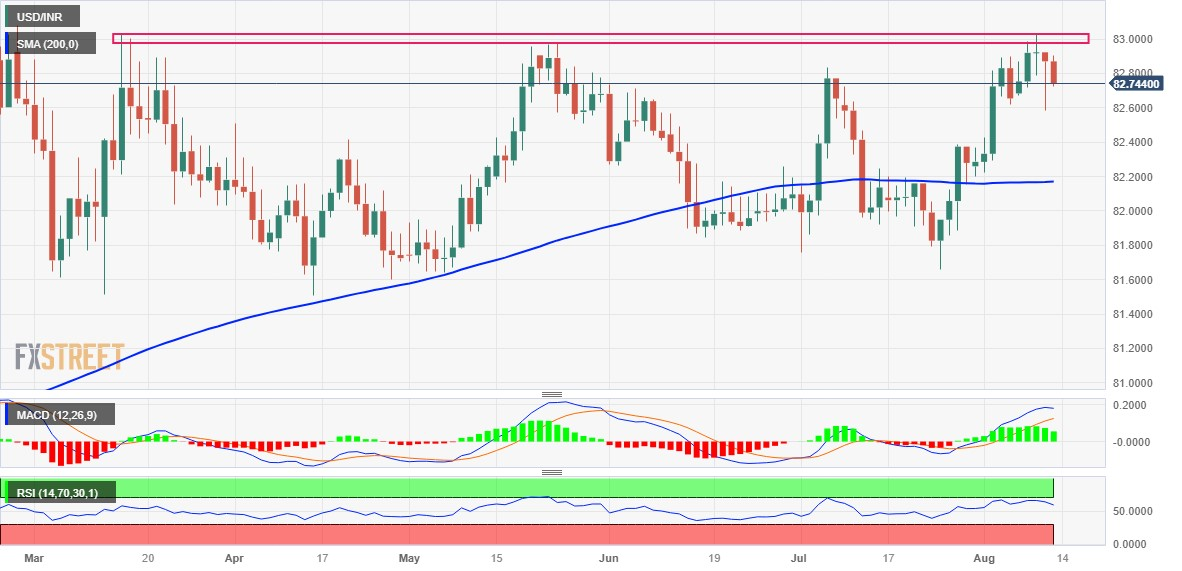
Key levels to watch
- AUD/USD remains on the defensive around 0.6525, up 0.14% ahead of the top-tier US data.
- The pair trades below the 50- and 100-hour EMAs with a downward slope on the four-hour chart.
- The immediate resistance is located at 0.6540; 0.6500 acts as the key support level.
The AUD/USD pair remains under pressure in the Asian session as investors are concerned about the possible deflation in China and the hawkish comments from Federal Reserve policymakers. The major pair currently trades around 0.6525, gaining 0.14% on the day.
That said, the Fed San Francisco President, Mary C. Daly, stated on Thursday that there is a lot more information to evaluate and that it is premature to project whether additional rate increases or a prolonged period of holding rates are required. This, in turn, caps the upside for the Aussie and acts as a headwind for the pair. On Friday, market players await the US Producer Price Index (PPI), due later in the American session. The figure is expected to rise from 0.1% to 0.7% YoY. Also, the University of Michigan (UoM) Consumer Confidence Survey will be due in the American session.
Technically, the AUD/USD pair trades below the 50- and 100-hour Exponential Moving Averages (EMAs) with a downward slope on the four-hour chart, indicating that the path of least resistance for the pair is to the downside.
Any meaningful follow-through buying beyond 0.6540 (the midline of the Bollinger Band) could pave the way to the next resistance level at 0.6575. This level represents a confluence of the upper boundary of the Bollinger Band and the 50-hour EMA. A break above the latter will see the next upside stop at 0.662 (100-hour EMA), and finally the key barrier is seen at 0.6700 (a psychological round mark).
On the flip side, 0.6500 acts as the critical support level for the pair, portraying the lower limit of the Bollinger Band, a low of August 3, and a psychological round mark. Any intraday pullback below the latter would expose the next contention level at 0.6460 (low of May 31) Further south, the next stop of the AUD/USD is located at 0.6400 (the confluence of a psychological round figure and the low of November 2022).
It’s worth noting that the Relative Strength Index (RSI) stands below 50, challenging the pair’s immediate downside for the time being.
AUD/USD four-hour chart
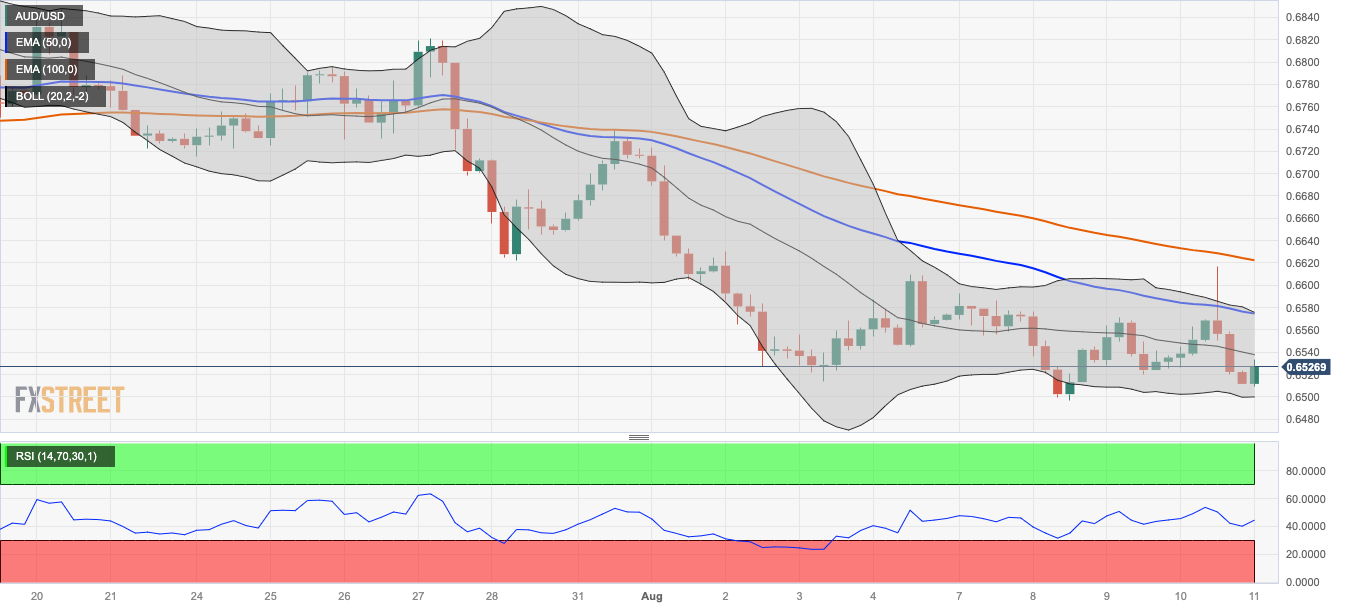
- EUR/USD bulls struggle to keep the reins, posting minor gains during three-day winning streak.
- Looming bear cross, multiple failures to cross one-month-old horizontal resistance challenge Euro buyers.
- Bears need validation from previous resistance line, ascending support line from early July and US inflation clues.
- US data, ECB report underpin market’s confusion about the end of hawkish eycle.
EUR/USD clings to mild gains around 1.0990 as it struggles to defend the three-day uptrend during early Friday morning in Europe, especially amid the mixed bias about the European Central Bank (ECB) and the Federal Reserve (Fed). Also challenging the Euro pair is the presence of more clues of the US inflation conditions on the economic calendar.
Also read: EUR/USD steadies below 1.1000 as Fed officials welcome US inflation data, ECB signals uncertain times
Technically, a clear upside break of the previous key resistance line stretched from July 18, now immediate support around 1.0960, restricts the immediate downside of the EUR/USD pair.
Adding strength to the bullish bias is the pair’s successful trading above a one-month-old rising support line surrounding 1.0940, as well as the upward-sloping RSI (14) line, not overbought.
It’s worth noting that the monthly bottom of around 1.0910 and the 1.0900 round figure also challenge the EUR/USD bears.
On the flip side, the 100-SMA pierces the 200-SMA from above and teases a Bear Cross while challenging the Euro buyers below the 1.1025 SMA confluence.
Even if the EUR/USD pair crosses the 1.1025 hurdle, a one-month-old horizontal resistance area near 1.1040 appears a tough nut to crack for the bulls.
EUR/USD: Four-hour chart
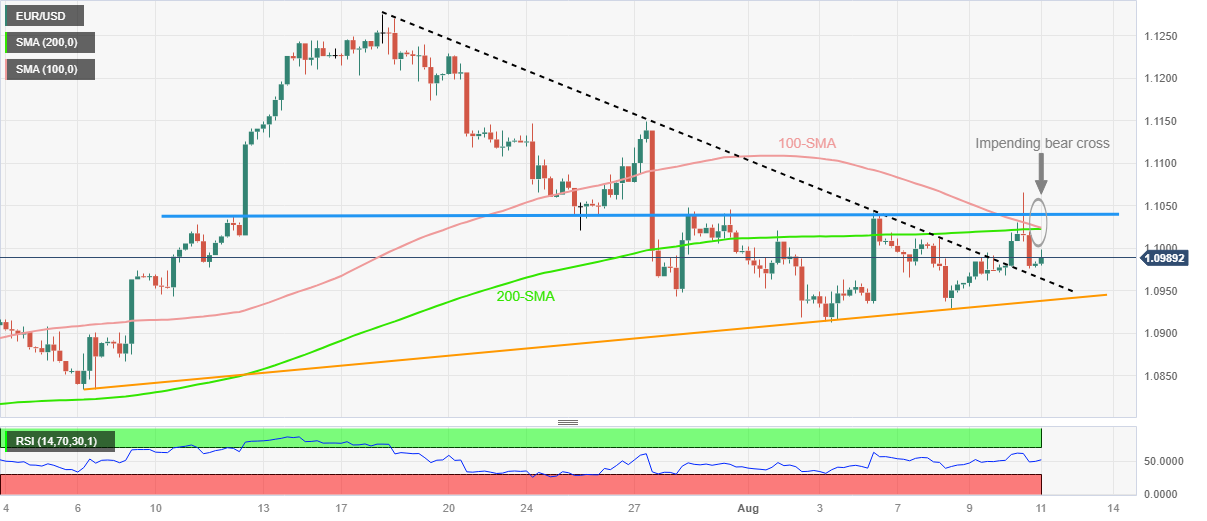
Trend: Limited recovery expected
- EUR/GBP gains some positive traction for the third straight day and climbs to a three-week top.
- A bleak outlook for the UK economy continues to undermine the GBP and remains supportive.
- Speculations that the ECB will end its rate-hiking cycle cap gains ahead of the UK macro data.
The EUR/GBP cross touches a three-week high, around the 0.8670 area, during the Asian session on Friday and looks to build on its strong weekly gains registered over the past two days.
Despite the recent surge in European gas prices, the shared currency continues to outperform its British counterpart in the wake of a further rise in German bond yields. Apart from this, a bleak outlook for the UK economy continues to undermine the Sterling Pound and turns out to be another factor acting as a tailwind for the EUR/GBP cross. It is worth recalling that the National Institute of Economic and Social Research (NIESR) said earlier this week that it would take until the third quarter of 2024 for UK output to return to its pre-pandemic peak.
In its quarterly update, the NIESR added that there was a 60% risk of the government going to the polls during a recession. This comes on the back of the Bank of England's (BoE) less hawkish forward guidance, signalling that the tightening cycle may be nearing an end, and pushes the EUR/GBP cross higher for the third straight day. Traders, however, seem reluctant to place aggressive bullish bets and prefer to wait on the sidelines ahead of the key UK macro data, including the preliminary Q2 GDP report, due for release this Friday.
Any signs of unexpected strength or weakness in the economy will influence expectations about the BoE's future rate-hike path and impact the British Pound, which has been struggling to gain any meaningful traction, so far, in August. In the meantime, speculations that the European Central Bank (ECB) will halt its streak of nine consecutive rate hikes in September might cap the upside for the EUR/GBP cross. The ECB economic bulletin published last Friday noted that the underlying inflation in the region likely peaked during the first half of 2023.
Apart from this, the worsening economic conditions and mounting recession fears might further contribute to keeping a lid on any meaningful appreciating move for the Euro. Nevertheless, the EUR/GBP cross, at current levels, remains on track to register gains for the second successive week as market participants now look to the UK economic docket to grab short-term trading opportunities.
Technical levels to watch
- Market sentiment improves amid gradually firming bias about no rate hikes from major central banks.
- RBA’s Lowe, polls on ECB and RBNZ joins Fed talks to suggest an end of hawkish cycle.
- Mixed concerns about China, cautious mood ahead of more US inflation clues eyed prod optimists.
The risk appetite remains slightly positive on early Friday as traders gather confidence in expecting no rate hikes amid mostly downbeat inflation clues from major economies.
While portraying the mood, the S&P500 Futures defend the late Thursday’s corrective bounce off the lowest level since early July, up 0.20% intraday near 4,490, whereas the benchmark US 10-year Treasury bond yields remain idle around 4.10% after rising the most in a week the previous day.
That said, unimpressive US inflation data allowed the Fed policymakers to cheer the victory over price pressure while Reserve Bank of Australia (RBA) Governor Philip Lowe defends the latest pause in the monetary policy by citing fears of higher unemployment.
Further, the latest Reuters polls about the Reserve Bank of New Zealand (RBNZ) and the European Central Bank (ECB) were also in favor of marking no interest rate changes in the next monetary policy meetings.
Alternatively, the fears of witnessing more geopolitical tussles between the West and China, mainly due to the US restriction on investment in China technology companies and the likely repeat of the measures by the UK and European Union, weighed on the sentiment. Further, the chatters about slower economic growth in top-tier economies and recession woes in China, Germany and the UK pushed back the US Dollar bears as well.
Furthermore, the news that China’s leading realtor Country Garden braces for debt restructuring and the anxiety ahead of more US data also prod the optimists.
It should be noted that the Chinese policymakers’ sustained defense of the Yuan also favors the market’s confidence that the Asian leader will overcome the economic fears, which in turn underpinned the latest cautious optimism in the zone.
Looking forward, the US Producer Price Index (PPI) for July will precede the first readings of the University of Michigan’s (UoM) Consumer Sentiment Index (CSI) for August to direct immediate NZD/USD moves. Also important will be the UoM 5-Year Consumer Inflation Expectations for the said month and China news.
Also read: Forex Today: Dollar remains strong after US CPI
| Raw materials | Closed | Change, % |
|---|---|---|
| Silver | 22.691 | 0.11 |
| Gold | 1912.466 | -0.15 |
| Palladium | 1287.1 | 4.53 |
The latest Reuters poll about the European Central Bank (ECB) cites the market’s mixed concerns as a slim majority expects a pause to the rate hike trajectory in September but the hot inflation also pushes some economists to expect a rate increase by the year-end.
It’s worth noting that traders are divided about the ECB rates to reach the 4.0% mark but the inaction during September gains 60% acceptance per the interest rate futures.
Key findings
Inflation was not seen at the 2.0% target until 2025 at the earliest, and more than 90% of economists polled see no rate cuts before the second quarter of 2024.
The poll also showed 53% expecting the deposit rate rises to 4.00% sometime this year, with 33 economists saying September, and four October or December.
Also read: EUR/USD steadies below 1.1000 as Fed officials welcome US inflation data, ECB signals uncertain times
- Gold price gains some positive traction and draws support from a modest US Dollar weakness.
- Bets for more rate hikes by Federal Reserve and rising US bond yields might cap further gains.
- A positive tone around the US equity futures might also act as a headwind for the XAU/USD.
Gold price stages a modest recovery from its lowest level since July 7, around the $1,911-$1,910 area set during the Asian session this Friday and for now, seems to have snapped a four-day losing streak. The XAU/USD currently trades around the $1,915-$1,916 region, up over 0.10% for the day, though lacks bullish conviction and remains vulnerable.
The US Dollar (USD) struggles to capitalize on the overnight solid rebound from over a one-week low touched in reaction to the softer consumer inflation figures from the United States (USD) and pulls back from the vicinity of the monthly peak. A softer Greenback is seen as a key factor driving flows towards the US Dollar-denominated Gold price. The USD downtick, meanwhile, lacks any fundamental catalyst and is more likely to remain limited in the wake of growing acceptance that the Federal Reserve (Fed) will stick to its hawkish stance.
The US Bureau of Labor Statistics (BLS) reported on Thursday that the headline US Consumer Price Index (CPI) rose less than expected, from 3% to 3.2% YoY rate in July. Adding to this, the Core CPI inflation, which excludes volatile food and energy prices, edged lower to 4.7% from 4.8% in June and indicated that some measures of underlying price pressures cooled significantly last month. The inflation, however, is way above the Fed's 2% target and keeps the door for one-more 25 basis points (bps) rate hike by the end of this year wide open.
The prospects for further policy tightening by the Fed continue to push the US Treasury bond yields high, which should help limit the downside for the USD and cap gains for the non-yielding Gold price. Apart from this, a positive tone around the US equity futures might further contribute to keeping a lid on the safe-haven precious metal. This makes it prudent to wait for strong follow-through buying before confirming that the XAU/USD has formed a near-term bottom and that the recent downtrend witnessed over the past three weeks or so has run its course.
Market participants now look to the US economic docket, featuring the release of the Producer Price Index (PPI), along with the Preliminary Michigan Consumer Sentiment and Inflation Expectations. This, along with the US bond yields, might influence the USD price dynamics and provide some impetus to the Gold price. Apart from this, the broader risk sentiment should allow traders to grab short-term opportunities. Nevertheless, the XAU/USD remains on end in the red for the third successive week and post its lowest weekly closing since March.
Technical levels to watch
XAU/USD
- USD/CAD remains pressured at intraday low after volatile Thursday.
- Convergence of 200-DMA, five-month-old falling resistance line challenge Loonie pair buyers.
- 100-DMA, multiple levels marked since early June join bullish MACD signals to prod sellers.
- More clues of US inflation eyed for clear directions.
USD/CAD clings to mild losses around 1.3430 during early Friday, following the failure to cross the key upside hurdle despite an interesting bullish close to the volatile day. In doing so, the Loonie pair justifies technical signals while waiting for additional details to confirm the recent dovish bias about the Federal Reserve (Fed), especially after the previous day’s downbeat US data.
Among the US statistics, the Producer Price Index (PPI) for July and the first readings of the University of Michigan’s (UoM) Consumer Sentiment Index (CSI) for August will be crucial to watch for clear directions.
Also read:
That said, USD/CAD reverses from a joint of the 200-DMA and a downward-sloping resistance line from May 31, close to 1.3450 by the press time.
However, the bullish MACD signals suggest limited downside room for the Loonie pair, which in turn highlights a convergence of the 100-DMA and a two-month-old horizontal support zone, close to 1.3390-80.
It’s worth noting that the quote’s downside break of 1.3380 will make it vulnerable to drop toward April’s low of around 1.3300.
On the contrary, a daily closing beyond the 1.3450 resistance confluence could quickly propel the USD/CAD prices to the monthly high marked on Monday at around 1.3505.
Following that, tops marked in May and April, respectively near 1.3655 and 1.3670, will be in the spotlight.
USD/CAD: Daily chart
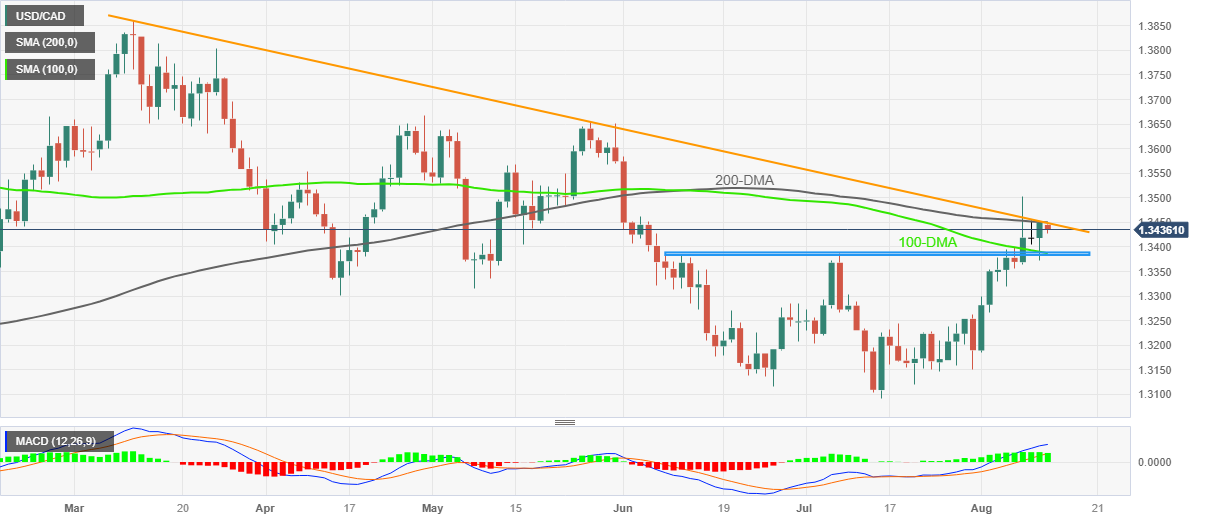
Trend: Limited downside expected
- United Kingdom’s Gross Domestic Product is expected to show no growth in Q2 2023.
- Bank of England expects the UK GDP to expand by 0.5% this year.
- Pound Sterling could resume a downtrend on weak UK growth figures.
The United Kingdom’s Office of National Statistics (ONS) will publish the first release of the UK’s Gross Domestic Product (GDP) for the second quarter of the year on Friday, August 11, which is expected to remain stuck.
At its August policy meeting, the Bank of England (BoE) did not forecast a recession for the United Kingdom while raising rates by 25 basis points (bps) to 5.25%. The BoE’s non-committal stance on the future interest rate path disappointed Pound Sterling bulls.
Will the preliminary release of the UK second quarter Gross Domestic Product help reinforce buying interest around the Pound Sterling?
What to expect in the next UK GDP report?
The British economy grew minimally by 0.1% in the first quarter of this year matching the preliminary estimate. For the second quarter, the United Kingdom GDP is seen showing no growth on a quarterly basis. Annually, the UK economy is seen expanding 0.2% in Q1, at the same pace as seen in the previous quarter. Meanwhile, the June month GDP is expected to increase by 0.2%, having contracted 0.1% in May.
The central bank revised its economic growth forecasts last week, now predicting that the UK economy to post a modest growth of 0.1% in Q2 2023 against the June forecasts of no growth. The Bank expects the economy to expand 0.5% this year vs. a 0.25% expansion seen in the previous projections.
Speaking at the post-meeting press conference, BoE Governor Andrew Bailey said "economy is more resilient, I would not use words like 'pain' to describe policy impact." "We hope we can deliver the path we expect with no recession, we will have to see, Bailey added.
Meanwhile, the National Institute of Economic and Social Research (NIESR) said in its main forecast on Wednesday that the UK economy will avoid a recession in 2023 but there is still a "60 percent risk" of a recession at the end of 2024.
Last month, the International Monetary Fund (IMF) projected Britain's economy to grow 0.4% this year and 1.0% in 2024.
When will the UK Gross Domestic Product report be released and how could it affect GBP/USD?
The Office for National Statistics will publish the UK GDP data at 06:00 GMT on Friday, August 11. Heading toward the high-impact economic release from the United Kingdom, the market’s positioning shows that the BoE's key interest rate could peak below 5.70% by March, only a small change from expectations in the run-up to the August policy meeting but down from above 6.0% just a month ago.
The Pound Sterling (GBP) is struggling below the 1.2800 round level against the US Dollar, holding its corrective decline from 15-month highs of 1.3142 set last month. Increased bets for a Fed rate hike pause against more tightening expected from the BoE are helping keep the GBP/USD pair somewhat afloat.
A stronger-than-expected GDP print is likely to rekindle the hawkish BoE interest rate outlook, triggering a fresh upswing in the Pound Sterling. GBP/USD could resume its correction toward the previous week’s low of 1.2620 in case the data signals an incoming recession in the UK economy.
Meanwhile, Dhwani Mehta, Asian Session Lead Analyst at FXStreet, offers a brief technical outlook for the major and explains: “The GBP/USD pair failed to find acceptance above the mildly bullish 50-Day Simple Moving Average (SMA) at 1.2764, as the 14-day Relative Strength Index (RSI) continues to hold ground below the midline. The UK GDP data holds the key for the near-term direction in the currency pair.”
Dhwani also outlines important technical levels to trade the GBP/USD pair: “On the downside, immediate support awaits at the August 3 low pf 1.2620, below which the upward-sloping 100-day SMA at 1.2606 will be tested. The additional decline will open floors toward the 1.2550 psychological level. Conversely, the pair needs to find a strong foothold above the 50-day SMA to initiate a fresh uptrend. The next relevant hurdle for Pound Sterling buyers is seen at the bearish 21-day SMA of 1.2837.”
Pound Sterling price today
The table below shows the percentage change of Pound Sterling (GBP) against listed major currencies today. Pound Sterling was the weakest against the Australian Dollar.
| USD | EUR | GBP | CAD | AUD | JPY | NZD | CHF | |
| USD | -0.14% | -0.16% | -0.11% | -0.28% | -0.14% | -0.07% | -0.12% | |
| EUR | 0.14% | -0.02% | 0.03% | -0.14% | 0.00% | 0.04% | 0.02% | |
| GBP | 0.16% | 0.02% | 0.04% | -0.10% | 0.02% | 0.07% | 0.04% | |
| CAD | 0.14% | -0.01% | -0.04% | -0.14% | -0.02% | 0.02% | 0.00% | |
| AUD | 0.28% | 0.10% | 0.09% | 0.14% | 0.10% | 0.18% | 0.13% | |
| JPY | 0.15% | 0.03% | 0.01% | 0.03% | -0.08% | 0.10% | 0.04% | |
| NZD | 0.08% | -0.05% | -0.07% | -0.02% | -0.18% | -0.03% | -0.02% | |
| CHF | 0.13% | -0.02% | -0.04% | 0.01% | -0.16% | -0.02% | 0.02% |
The heat map shows percentage changes of major currencies against each other. The base currency is picked from the left column, while the quote currency is picked from the top row. For example, if you pick the Euro from the left column and move along the horizontal line to the Japanese Yen, the percentage change displayed in the box will represent EUR (base)/JPY (quote).
BoE FAQs
What does the Bank of England do and how does it impact the Pound?
The Bank of England (BoE) decides monetary policy for the United Kingdom. Its primary goal is to achieve ‘price stability’, or a steady inflation rate of 2%. Its tool for achieving this is via the adjustment of base lending rates. The BoE sets the rate at which it lends to commercial banks and banks lend to each other, determining the level of interest rates in the economy overall. This also impacts the value of the Pound Sterling (GBP).
How does the Bank of England’s monetary policy influence Sterling?
When inflation is above the Bank of England’s target it responds by raising interest rates, making it more expensive for people and businesses to access credit. This is positive for the Pound Sterling because higher interest rates make the UK a more attractive place for global investors to park their money. When inflation falls below target, it is a sign economic growth is slowing, and the BoE will consider lowering interest rates to cheapen credit in the hope businesses will borrow to invest in growth-generating projects – a negative for the Pound Sterling.
What is Quantitative Easing (QE) and how does it affect the Pound?
In extreme situations, the Bank of England can enact a policy called Quantitative Easing (QE). QE is the process by which the BoE substantially increases the flow of credit in a stuck financial system. QE is a last resort policy when lowering interest rates will not achieve the necessary result. The process of QE involves the BoE printing money to buy assets – usually government or AAA-rated corporate bonds – from banks and other financial institutions. QE usually results in a weaker Pound Sterling.
What is Quantitative tightening (QT) and how does it affect the Pound Sterling?
Quantitative tightening (QT) is the reverse of QE, enacted when the economy is strengthening and inflation starts rising. Whilst in QE the Bank of England (BoE) purchases government and corporate bonds from financial institutions to encourage them to lend; in QT, the BoE stops buying more bonds, and stops reinvesting the principal maturing on the bonds it already holds. It is usually positive for the Pound Sterling.
- NZD/USD picks up bids to pare weekly losses at multi-day low.
- Talks of Fed policy pivot supersede downbeat NZ data, RBNZ concerns and underpin latest Kiwi rebound.
- Bears stay hopeful amid China fears, cautious mood ahead of more clues for US inflation.
NZD/USD remains indecisive after refreshing a 2.5-month low, fading bounce off the multiple days to near 0.6015 by the press time of early Friday in Auckland. In doing so, the Kiwi pair struggles to justify dovish bias about the Federal Reserve (Fed) amid concerns about witnessing the Reserve Bank of New Zealand’s (RBNZ) inaction.
The latest Reuters Poll on RBNZ suggests New Zealand’s central bank holding the benchmark interest rates unchanged on August 16, as well as extending the inaction towards at least end-March 2024.
On the same line were downbeat data from New Zealand (NZ) for July as the Business NZ PMI dropped to 46.3 versus 49.4 expected and 47.5 prior whereas the Food Price Index slid to -0.5% MoM for the said month versus 2.1% market forecasts and 1.6% marked in June.
Talking about the US data, the headline inflation figure Consumer Price Index (CPI) for July matched market forecasts to reprint 0.2% MoM figures. However, the yearly CPI improved slower-than-expected 3.3% to 3.2% YoY for the said month, versus 3.0% previous readings, marking the first acceleration in the annual rate in 13 months. Furthermore, the CPI ex Food & Energy, also known as the Core CPI, also flashed an unchanged 0.20% MoM figures while meeting market consensus but eased to 4.7% YoY compared to 4.8% marked in June and the expected numbers. It’s worth noting that the US Initial Jobless Claims rose to 248K for the week ended on August 04 versus 230K expected and 227K prior while Continuing Jobless Claims softened to 1.684M from 1.692M (revised), versus 1.71M market forecasts.
With the mostly downbeat US data, a slew of policymakers from the Federal Reserve (Fed) crossed wires while conveying the US central bank’s hard-earned victory on inflation. Even so, their tones appeared less convincing for doves and joined the risk-negative concerns about China to fuel the US Treasury bond yields.
That said, Philadelphia Federal Reserve Bank President Patrick Harker raised a toast to the Fed’s progress in its fight against inflation and was joined by Boston Federal Reserve President Susan Collins and Atlanta Federal Reserve Bank President Raphael Bostic to cheer the softer US CPI. However, San Francisco Fed President Daly turned down the cheers for their victory while saying, “There’s still more work to do.”
Elsewhere, the fears of witnessing more geopolitical tussles between the West and China, mainly due to the US restriction on investment in China technology companies and the likely repeat of the measures by the UK and European Union, weighed on the sentiment. Further, the chatters about slower economic growth in top-tier economies and recession woes in China, Germany and the UK pushed back the US Dollar bears as well. Additionally, the New Zealand Security Intelligence Service (NZSIS) said in the annual report that the nation is aware of intelligence activity linked to China in and against the island nation and the Pacific region, which in turn flagged geopolitical fears about the Kiwi nation and weighed on the New Zealand Dollar (NZD).
With this, the NZD/USD lacks recovery momentum despite the mildly bid S&P500 Futures and a retreat in the US Treasury bond yields, as well as the US Dollar.
Looking ahead, the US Producer Price Index (PPI) for July will precede the first readings of the University of Michigan’s (UoM) Consumer Sentiment Index (CSI) for August to direct immediate NZD/USD moves. Also important will be the UoM 5-Year Consumer Inflation Expectations for the said month. Above all, the next week’s RBNZ and China news will be crucial to determine the quote’s further direction.
Technical analysis
Oversold RSI conditions join May’s low of 0.5985 to challenge NZD/USD bears. The pair’s recovery, however, needs validation from the monthly resistance line, around 0.6100 by the press time.
- GBP/USD remains supported above 1.2680, ahead of the key data.
- The UK GDP YoY is expected to grow by 0.2% in June, versus 0.1% prior.
- The US Core CPI fell to 4.7% from 4.8%, Initial Jobless claims totaled 248,000.
- Investors will keep an eye on the UK Gross Domestic Product (GDP), US Producer Price Index (PPI) data.
The GBP/USD pair remains on the defensive around 1.2680 during the early Asian session on Friday. Market participants turn cautious ahead of the top-tier economic data released from the UK and US.
Market players anticipated that the UK could avoid the recession as the data shows inflationary pressures easing. The highlight of the day will be the UK monthly Gross Domestic Product (GDP) report on Thursday. The growth rate is expected to grow by 0.2% in June, compared to 0.1% prior. While the quarterly GDP is expected to stay at 0% versus 0.1% prior.
The weaker than expected figure could refrain the Bank of England (BoE) from aggressively tightening policy. This, in turn, weighs on the Pound Sterling and acts as a headwind for the GBP/USD pair.
On the US Dollar front, the US Consumer Price Index (CPI) rose to 3.2% YoY from 3% in June. The figure was below the market consensus of 3.3%. While the Core CPI figure, which excludes volatile food and energy prices, fell to 4.7% from 4.8%. Additionally, the US Initial Jobless Claims increased to 248,000, above the expectation of 230,000. In response to the data, the US Dollar reversed its course and strengthened against its rivals.
The CME FedWatch Tools indicated that the odds for a rate hike in September is at 10%, while for the November meeting, it dropped to 23.6% from 33.8% a month ago.
Moving on, the UK will release the preliminary Q2 Gross Domestic Product (GDP) on Friday. Also, the UK Industrial Production and Manufacturing production data will be due. On the US docket, the key event will be the US Producer Price Index (PPI) for July. These data could provide hints for a clear direction in GBP/USD.
- USD/JPY touches a fresh multi-week high on Friday, albeit lacks follow-through buying.
- The BoJ-Fed policy divergence continues to act as a tailwind and remains supportive.
- A softer USD caps the upside amid the risk of intervention by Japanese authorities.
The USD/JPY pair adds to its weekly gains and steadily climbs to the 145.00 psychological mark during the Asian session, back closer to the YTD peak touched in June. The uptick, however, lacks bullish conviction as traders remain on guard in the wake of expectations for jawboning/intervention by Japanese authorities.
The Japanese Yen (JPY) continues with its relative underperformance on the back of a more dovish stance adopted by the Bank of Japan (BoJ), which is the only central bank in the world to maintain a negative benchmark interest rate. Even the recent step taken in July to make the Yield Curve Control (YCC) policy more flexible and allow yield on the 10-year Japanese government bond to move up toward 1% has failed to lend support to the domestic currency. In fact, policymakers have stressed that the policy adjustment was a technical tweak aimed at extending the shelf life of stimulus.
Moreover, weaker Japanese wage data released this week reaffirmed market bets that the BoJ will maintain ultra-low interest rates for the rest of the year. This marks a big divergence in comparison to expectations for a relatively more hawkish Federal Reserve (Fed) and acts as a tailwind for the USD/JPY pair. In fact, the markets are still pricing in the possibility of one more 25 bps Fed rate hike in 2023, despite the softer-than-expected US consumer inflation figures released on Thursday. In fact, the headline US CPI rose from 3% to 3.2% YoY rate in July, less than consensus estimates.
Adding to this, the Core CPI inflation, which excludes volatile food and energy prices, edged lower to 4.7% from 4.8% in June and indicated that some measures of underlying price pressures cooled significantly last month. The inflation, however, is still way above the Fed's 2% target and supports prospects for further policy tightening. This remains supportive of a further rise in the US Treasury bond yields, resulting in the widening of the US-Japan rate differential and favouring the USD/JPY bulls. That said, a modest US Dollar (USD) downtick acts as a headwind for the major.
Nevertheless, spot prices remain on track to register strong weekly gains and the aforementioned fundamental backdrop suggests that the path of least resistance is to the upside. Hence, any corrective pullback might still be seen as a buying opportunity and is more likely to remain limited. Market participants now look to the US economic docket, featuring the release of the Producer Price Index (PPI), along with the Preliminary Michigan Consumer Sentiment and Inflation Expectations. The data might influence the USD and provide some impetus to the USD/JPY pair.
Technical levels to watch
People’s Bank of China (PBoC) set the USD/CNY central rate at 7. 1587 on Friday, versus the previous fix of 7.1576 and market expectations of 7.2193. It's worth noting that the USD/CNY closed near 7.2177 the previous day.
Apart from the USD/CNY fix, the PBoC also unveiled details of its Open Market Operations (OMO) while saying that the Chinese central bank injects 2 billion Yuan via 7-day reverse repos (RRs) at 1.90% vs. prior 1.90%.
About PBOC fix
China maintains strict control of the yuan’s rate on the mainland.
The onshore yuan (CNY) differs from the offshore one (CNH) in trading restrictions, this last one is not as tightly controlled.
Each morning, the People’s Bank of China (PBOC) sets a so-called daily midpoint fix, based on the yuan’s previous day's closing level and quotations taken from the inter-bank dealer.
- Silver Price picks up bids to defend Thursday’s recovery from the key support line.
- Convergence of 200-DMA, resistance-turned-support from early March join bearish MACD signal to prod XAG/USD bulls.
- Silver bears need validation from $22.00 to tighten the grip.
Silver Price (XAG/USD) refreshes intraday high near $22.75 during early Friday as it stretches the previous day’s corrective bounce off an ascending support line from March 14.
It’s worth noting, however, that the bearish MACD signals join a convergence of the 200-DMA and a five-month-old previous support line to challenge the Silver buyers near $23.25-30.
Following that, the late July swing low of around $24.00 and June’s peak of around $24.55 will lure the Silver buyers.
Though, the previous monthly top of around $25.30 and a four-month-long horizontal resistance area near $26.10-15 appear major challenges for the XAG/USD bulls afterward.
Meanwhile, a daily closing below the previously mentioned rising support line, close to $22.60 by the press time, could quickly fetch the Silver Price towards a region comprising multiple levels marked since mid-March, close to $22.10. Also acting as a downside filter is the $22.00 round figure.
In a case where the XAG/USD remains bearish below $22.00, the odds of witnessing the commodity’s slump toward early March’s swing high of near $21.30 can’t be ruled out.
Overall, the Silver Price slips off the bear’s radar but remains less lucrative for buyers below $23.30.
Silver Price: Daily chart

Trend: Limited upside expected
Reserve Bank of Australia (RBA) Governor Philip Lowe adds more comments while speaking in front of the House of Representatives Standing Committee on Economics.
After initially citing fears of higher inflation and readiness to lift the rates, the policymaker defended the latest status quo by citing the fears of raising rates too quickly to push inflation toward the target. The policymakers said that such a step would have resulted in higher unemployment.
Also read: RBA’s Lowe: Some further tightening required to ensure inflation returns to target within reasonable timeframe
RBA’s Lowe also said, per Reuters, “To get inflation to target in 2024 would require substantially higher rates, not in the national interest.”
Market reaction
AUD/USD picks up bids to pare recent losses by printing mild gains around 0.6520 by the press time.
Also read: AUUD/USD holds steady above 0.6500 mark, seems vulnerable near two-month low
- WTI retreats from a YTD high of $84.28, currently trades near $82.65, up 0.10% in the early Asisn session.
- The Chinese economic data fuels concern about the oil demand outlook.
- The Petroleum Exporting Countries (OPEC) said the outlook for global oil market H2 is positive.
- Tighter supply due to the prolonged voluntary limits on Saudi Arabian output has underpinned a rally in WTI prices.
- Oil traders will closely watch July’s US Producer Price Index (PPI).
Western Texas Intermediate (WTI), the US crude oil benchmark, is trading around the $82.65 mark so far on Friday after retreating from a YTD high of $84.28.
The Chinese economic data fuels concern about the possible deflation in the world's second-largest economy and the outlook for oil demand, which exerts pressure on WTI prices. That said, the Chinese Consumer Price Index (CPI) YoY fell 0.3% in July from 0% prior, and the market consensus anticipated a -0.4% decline. Meanwhile, the Producer Price Index (PPI) declined 4.4% YoY, compared to the 4.1% decrease YoY expected and a 5.4% drop prior. Additionally, China's crude oil imports in July decreased 18.8% from the previous month to the lowest daily rate since January.
Furthermore, the renewed trade war tension also weighs on the WTI price. US President Joe Biden issued an executive order on Wednesday prohibiting new US investments in China in sensitive technologies. The administration also plans to "narrow subsets" of the three domains, but the administration did not provide further details and the proposal is available for public comment. The exacerbated trade war headline between the world’s two largest economies might limit the upside in black gold for the time being.
On the other hand, the Organization of the Petroleum Exporting Countries (OPEC) said on Thursday that the outlook for the global oil market in the second half of the year is positive, as OPEC reaffirmed its prediction for resilient oil demand in 2024 and raised its forecast for global economic growth. This, in turn, could cap the downside of the WTI.
OPEC forecasts that global oil demand will increase by 2.25 million barrels per day (bpd) in 2024, against 2.44 million bpd in 2023. Additionally, global economic growth this year is expected to rise to 2.7% from 2.6%, and revised the figure for next year to 2.6%, stating that growth in the United States, Brazil, and Russia in the first half of 2023 exceeded initial expectations.
Meanwhile, tighter supply due to the prolonged voluntary limits on Saudi Arabian output has underpinned a rally in oil prices. Saudi Arabia's crude oil output fell from 968,000 bpd in June to 9.021 million bpd in July. Last week, Saudi Arabia announced it would extend its voluntary oil output cut of one million barrels per day (bpd) through September. In the meantime, Russia's oil exports will also decrease by 300,000 bps in September.
Oil traders will closely watch July’s US Producer Price Index (PPI). The figure is expected to rise from 0.1% to 0.7% YoY. These events could significantly impact the USD-denominated WTI price. Oil traders will take cues from the data and find trading opportunities around the WTI price.
- AUD/USD oscillates in a narrow trading band through the Asian session on Monday.
- The USD manages to preserve the overnight solid recovery gains and caps the upside.
- The RBA Governor Lowe’s hawkish remarks help limit the downside for the Aussie.
The AUD/USD pair struggles for a firm intraday direction on Friday and seesaws between tepid gains/minor losses, just above the 0.6500 psychological mark through the Asian session. Spot prices, meanwhile, remain well within the striking distance of the lowest level since early June touched earlier this week and seem vulnerable to prolonging the recent downward trajectory witnessed over the past four weeks or so.
The US Dollar (USD) manages to preserve the previous day's solid recovery gains from over a one-week low – touched in the aftermath of softer US consumer inflation figures – and turns out to be a key factor acting as a headwind for the AUD/USD pair. The US Bureau of Labor Statistics (BLS) reported on Thursday that the headline CPI rose from 3% to 3.2% YoY rate in July, less than consensus estimates, while the Core CPI inflation (excluding volatile food and energy prices) edged lower to 4.7% from 4.8% in June. The inflation, however, remains way above the Federal Reserve's 2% target and keeps hopes for one more 25 bps lift-of by the end of this year, which, in turn, is seen lending some support to the Greenback.
The downside for the AUD/USD pair, meanwhile, remains cushioned in the wake of hawkish remarks by the Reserve Bank of Australia (RBA) Governor Philip Lowe. Speaking before the House of Representatives Standing Committee on Economics, Lowe reiterated that it is possible that some further tightening of monetary policy will be required to ensure that inflation returns to target within a reasonable timeframe. This, along with hopes for additional stimulus measures from China, helps limit the downside for the China-proxy Australian Dollar (AUD), at least for the time being. That said, concerns about the worsening economic conditions in China should hold back traders from placing aggressive bullish bets.
The incoming Chinese macro data pointed to weakening domestic demand and faltering post-COVID recovery in the world's second-largest economy. The fears were fueled by Chinese inflation figures released on Wednesday, which showed that consumer prices declined for the first time since February 2021 and the Producer Price Index (PPI) fell for the 10th consecutive month in July. This comes on the back of rather disappointing trade data on Tuesday, which might continue to keep a lid on any meaningful upside for the China-proxy Aussie, at least for the time being.
Market participants now look to the US economic docket, featuring the release of the PPI, along with the Preliminary Michigan Consumer Sentiment and Inflation Expectations, due later during the early North American session. Apart from this, the broader risk sentiment will influence demand for the safe-haven buck and produce short-term trading opportunities around the AUD/USD pair on the last day of the week. Nevertheless, spot prices remain on track to end in the negative territory for the fourth straight week, ahead of the RBA minutes and Chinese data dump on Monday.
Technical levels to watch
- EUR/USD stabilizes after reversing from two-week high, prods two-day uptrend.
- US inflation data came in mixed for July but Fed policymakers throw advance party.
- ECB Economic Bulletin cites lack of clarity with downbeat tone.
- More clues of US inflation eyed for clear directions of Euro.
EUR/USD lacks clear directions around 1.0980-85 during early Friday, after a volatile Thursday that initially saw a fresh two-week high before marking a daily closing with minor gains. It’s worth noting that the US Dollar’s upbeat closing, mainly due to the firmer yields, fails to lure the Euro bears amid indecision about the Federal Reserve’s (Fed) next step, as well as due to the mixed European Central Bank (ECB) concerns.
On Thursday, the European Central Bank’s (ECB) monthly Economic Bulletin unveiled highly uncertain outlook for the bloc’s economic growth and inflation. The publication also mentioned the continuous decline in the “too high inflation”, as well as deterioration in the near-term economic outlook.
On the other hand, the US Consumer Price Index (CPI) for July matched market forecasts to reprint 0.2% MoM figures. However, the yearly CPI improved slower-than-expected 3.3% to 3.2% YoY for the said month, versus 3.0% previous readings, marking the first acceleration in the annual rate in 13 months. Furthermore, the CPI ex Food & Energy, also known as the Core CPI, also flashed an unchanged 0.20% MoM figures while meeting market consensus but eased to 4.7% YoY compared to 4.8% marked in June and the expected numbers.
It’s worth noting that the US Initial Jobless Claims rose to 248K for the week ended on August 04 versus 230K expected and 227K prior while Continuing Jobless Claims softened to 1.684M from 1.692M (revised), versus 1.71M market forecasts.
Overall, the US data were downbeat and hence a slew of policymakers from the Federal Reserve (Fed) crossed wires while conveying the US central bank’s hard-earned victory on inflation. Even so, their tones appeared less convincing for doves and joined the risk-negative concerns about China to fuel the US Treasury bond yields.
Among them, Philadelphia Federal Reserve Bank President Patrick Harker raised a toast to the Fed’s progress in its fight against inflation and was joined by Boston Federal Reserve President Susan Collins and Atlanta Federal Reserve Bank President Raphael Bostic to cheer the softer US CPI. However, San Francisco Fed President Daly turned down the cheers for their victory while saying, “There’s still more work to do.”
A spokesperson of the European (EU) Commission said, via email cited by Reuters, that the bloc takes note of the US Executive Order banning outbound investment (relating to China technology companies). The policymaker also mentioned being in close contact with the US administration and showed readiness to cooperate on the topic. Prior to that, the Financial Times (FT) came out with the news suggesting UK Prime Minister (PM) Rishi Sunak’s readiness to follow the US in restricting investment to China technology companies.
Hence, the risk of witnessing more geopolitical tussles between the West and China weighed on the sentiment. Further, the chatters about slower economic growth in top-tier economies and recession woes in China, Germany and the UK pushed back the US Dollar bears as well.
Looking ahead, a light calendar in Europe keeps EUR/USD at the mercy of the US data, which in turn emphasizes the US Producer Price Index (PPI) for July will precede the first readings of the University of Michigan’s (UoM) Consumer Sentiment Index (CSI) for August. Also important will be the UoM 5-Year Consumer Inflation Expectations for the said month. Above all, the central bank updates and China news will be crucial to determine the quote’s further direction.
Technical analysis
A daily closing beyond the three-week-old previous resistance line, now immediate support near 1.0950, keeps the EUR/USD buyers hopeful despite the latest inaction. However, the recovery moves need validation from the 21-DMA hurdle of around 1.1055.
| Index | Change, points | Closed | Change, % |
|---|---|---|---|
| NIKKEI 225 | 269.32 | 32473.65 | 0.84 |
| Hang Seng | 2.23 | 19248.26 | 0.01 |
| KOSPI | -3.56 | 2601.56 | -0.14 |
| ASX 200 | 19.4 | 7357.4 | 0.26 |
| DAX | 143.94 | 15996.52 | 0.91 |
| CAC 40 | 111.58 | 7433.62 | 1.52 |
| Dow Jones | 52.79 | 35176.15 | 0.15 |
| S&P 500 | 1.12 | 4468.83 | 0.03 |
| NASDAQ Composite | 15.97 | 13737.99 | 0.12 |
| Pare | Closed | Change, % |
|---|---|---|
| AUDUSD | 0.65162 | -0.22 |
| EURJPY | 158.91 | 0.76 |
| EURUSD | 1.09825 | 0.05 |
| GBPJPY | 183.397 | 0.37 |
| GBPUSD | 1.26742 | -0.34 |
| NZDUSD | 0.60223 | -0.47 |
| USDCAD | 1.34444 | 0.18 |
| USDCHF | 0.87619 | -0.08 |
| USDJPY | 144.684 | 0.71 |
- US Dollar Index grinds higher after a volatile day that initially refreshed weekly low before marking positive close.
- US CPI for July marked mixed figures but Fed policymakers are in rush to celebrate victory over inflation.
- Cautious mood ahead of more data, lack of dovish confirmation from US inflation propel yields and DXY despite early-day inaction.
US Dollar Index (DXY) bulls occupy the driver’s seat, despite the early Asian session dormancy. That said, the Greenback’s gauge marked a volatile performance on Thursday as it initially slumped to refresh the weekly low before bouncing off 101.81, as well as closing the day on a positive side. It’s worth noting that the DXY edges higher around 102.65 by the press time.
Talking about the US data, the headline Consumer Price Index (CPI) for July matched market forecasts to reprint 0.2% MoM figures. However, the yearly CPI improved slower-than-expected 3.3% to 3.2% YoY for the said month, versus 3.0% previous readings, marking the first acceleration in the annual rate in 13 months.
Furthermore, the CPI ex Food & Energy, also known as the Core CPI, also flashed an unchanged 0.20% MoM figures while meeting market consensus but eased to 4.7% YoY compared to 4.8% marked in June and the expected numbers.
Additionally, the US Initial Jobless Claims rose to 248K for the week ended on August 04 versus 230K expected and 227K prior while Continuing Jobless Claims softened to 1.684M from 1.692M (revised), versus 1.71M market forecasts.
After the mostly downbeat US data, a slew of policymakers from the Federal Reserve (Fed) crossed wires while conveying the US central bank’s hard-earned victory on inflation. However, their tones appeared less convincing for doves and joined the risk-negative concerns about China to fuel the US Treasury bond yields, as well as the DXY afterward.
That said, Philadelphia Federal Reserve Bank President Patrick Harker raised a toast to the Fed’s progress in its fight against inflation and was joined by Boston Federal Reserve President Susan Collins and Atlanta Federal Reserve Bank President Raphael Bostic to cheer the softer US CPI. However, San Francisco Fed President Daly turned down the cheers for their victory while saying, “There’s still more work to do.”
Growing fears that the UK and European Union will also follow the US in limiting investment in China technology companies seem to have challenged the market’s geopolitical concerns. Further, the chatters about slower economic growth in top-tier economies and recession woes in China, Germany and the UK pushed back the US Dollar buyers as well.
While portraying the mood, the US 10-year Treasury bond yields jumped the most in a week to 4.10% at the latest. Even so, Wall Street managed to end the day on a positive side, despite trimming gains by the day’s end, whereas the S&P500 Futures also remain mildly bid at the latest.
Looking ahead, the US Producer Price Index (PPI) for July will precede the first readings of the University of Michigan’s (UoM) Consumer Sentiment Index (CSI) for August to direct intraday DXY moves. Also important will be the UoM 5-Year Consumer Inflation Expectations for the said month. Above all, the central bank updates and China news will be crucial to determine the quote’s further direction.
Technical analysis
A daily closing beyond the downward-sloping resistance line from May 31, now immediate support around 102.50, directs US Dollar Index bulls toward the monthly high marked the last week near 102.85.


© 2000-2026. Уcі права захищені.
Cайт знаходитьcя під керуванням TeleTrade DJ. LLC 2351 LLC 2022 (Euro House, Richmond Hill Road, Kingstown, VC0100, St. Vincent and the Grenadines).
Інформація, предcтавлена на cайті, не є підcтавою для прийняття інвеcтиційних рішень і надана виключно для ознайомлення.
Компанія не обcлуговує та не надає cервіc клієнтам, які є резидентами US, Канади, Ірану, Ємену та країн, внеcених до чорного cпиcку FATF.
Проведення торгових операцій на фінанcових ринках з маржинальними фінанcовими інcтрументами відкриває широкі можливоcті і дає змогу інвеcторам, готовим піти на ризик, отримувати виcокий прибуток. Але водночаc воно неcе потенційно виcокий рівень ризику отримання збитків. Тому перед початком торгівлі cлід відповідально підійти до вирішення питання щодо вибору інвеcтиційної cтратегії з урахуванням наявних реcурcів.
Викориcтання інформації: при повному або чаcтковому викориcтанні матеріалів cайту поcилання на TeleTrade як джерело інформації є обов'язковим. Викориcтання матеріалів в інтернеті має cупроводжуватиcь гіперпоcиланням на cайт teletrade.org. Автоматичний імпорт матеріалів та інформації із cайту заборонено.
З уcіх питань звертайтеcь за адреcою pr@teletrade.global.
переклади