- Аналітика
- Новини та інструменти
- Новини ринків
Новини ринків
The Bank of Japan (BoJ) has reported that the Producer Price Index (PPI) dropped by 0.2% in June, which is contrary to expectations of a 0.1% increase. The annual rate stood at 4.1%, which is lower than the 5.1% registered in May and softer than the market consensus of 4.3%.
The Export Price Index fell 0.6% compared to the previous months, and the Import Price Index dropped 3.1%.
In a different report, the Cabinet Office reported that Machinery Orders tumbled 7.6% in May, against expectations of a 1% increase.
Market reaction:
The USD/JPY is falling for the fifth consecutive day and is it trading slightly above 140.00, at the lowest level since June 16. It held steady with a bearish bias after the reports as market participants await US inflation data due later on Wednesday at 12:30 GMT.
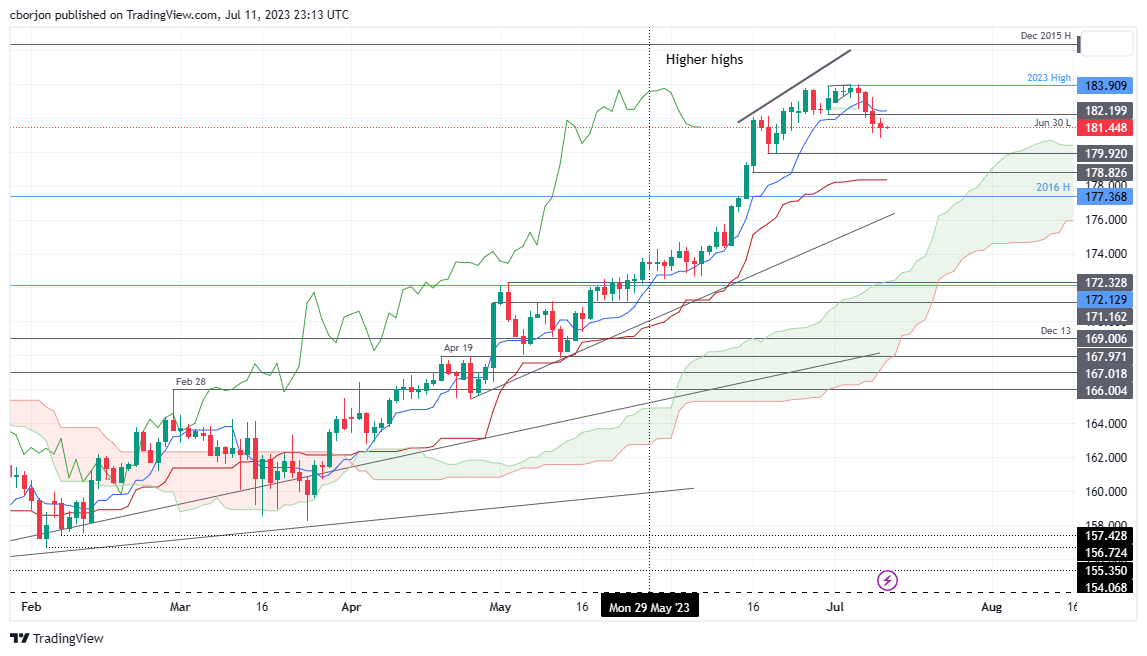
- GBP/JPY could form a bullish-engulfing pattern if it reclaims 182.00.
- The first support stands at 181.00, with a potential drop towards 180.00.
- Tenkan-Sen line at 182.40 serves as immediate resistance.
The GBP/JPY slides for the fourth straight day after data from the United Kingdom (UK) bolstered the Pound Sterlin (GBP), as the pair bounced late in the session from Tuesday’s daily lows around 180.78. At the time of writing, the GBP/JPY is trading at 181.38, registering minuscule losses of 0.04% as the Asian session starts.
GBP/JPY Price Analysis: Technical outlook
From a daily chart perspective, the GBP/JPY, after touching a weekly low of 180.78, buyers entered the market, lifting the pair back above the 181.00 mark. Tuesday’s candlestick reassembled a hammer, suggesting buying pressure outweighed sellers, which seem to have book profits, after UK’s data.
If GBP/JPY reclaims the 182.00 figure, that could form a bullish-engulfing candle pattern, suggesting further upside is expected. In that outcome, the GBP/JPY next resistance would be the Tenkan-Sen line at 182.40, followed by the 183.00 figure, ahead of the July 10 daily high at 183.22.
Conversely, GBP/JPY’s failure to crack 182.00 could exacerbate a continuation of the ongoing downtrend. That said, the first support would be 181.00. Once cleared, the next support would be the current weekly low of 180.78, followed by the Senkou Span A at 180.37, and then the 180.00 figure.
GBP/JPY Price Action – Daily chart
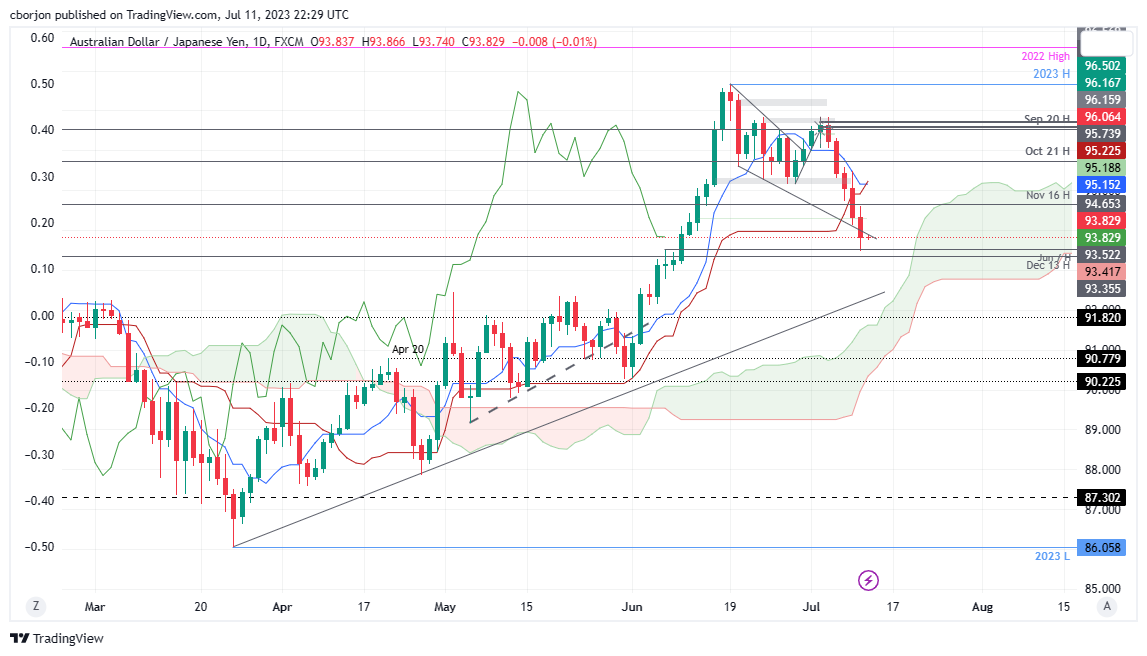
- AUD/JPY immediate support is 93.52, the June 7 daily high.
- If AUD buyers reclaim 94.00, that could ignite a rally toward 94.61.
- Downside risks are seen once the AUD/JPY breaks 93.00 and then 92.77.
The AUD/JPY trims some of Tuesday’s losses as the Asian session begins, though it remains below the 94.00 figure for the first second consecutive day. At the time of writing, the AUD/JPY exchanges hands at 93.83, barely unchanged.
AUD/JPY Price Analysis: Technical outlook
Although the cross-currency pairs have trended lower for the last five day, as long as it stays above the Ichimoku Cloud, the AUD/JPY is upward biased. Still, price action breaching technical levels like the Tenkan Sen and Kijun Sen lines suggests buyers are losing momentum.
The AUD/JPY immediate support would be the June 7 daily high at 93.52, respected by price action on Tuesday. A drop below that level could extend the AUD/JPY losses toward the June 7 daily low of 92.77, but firstly, the 93.00 mark should be broken on its way down.
Conversely, if AUD/JPY reclaims the 94.00 figure, that can exacerbate a recovery toward the July 11 daily high of 94.61. Once the pair surpasses that supply zone, the 95.00 figure would be up for grabs, followed by immediate resistance at the Tenkan Sen Line at 95.15, seven pips below the Kijun Sen.
AUD/JPY Price Action – Daily chart
- The NZD/USD has fallen near the convergence of the 20,100 and 200-day SMAs towards the 0.6170-0.6190 range.
- RBNZ is expected to hold rates at 5.5%.
- Eyes on key CPI figures from the US from June on Wednesday.
The NZD/USD trades with losses at the 0.6195 area while markets await the Reserve Bank of New Zealand (RBNZ) decision early in Wednesday’s session. In addition, all eyes will be on Consumer Price Index (CPI) data from June from the US, which is set to affect the bets on the Federal Reserve regarding its next monetary policy moves.
Eyes on RBNZ’s outlook and inflation data from the US
Wednesday’s highlight will be the Reserve Bank of New Zealand’s (RBNZ) decision, which is expected to hold rates steady at 5.5%. Despite a hawkish stance, the RBNZ has been accused of pushing the economy into a technical recession to push inflation down, so investors will closely watch the bank’s economic outlook and forecasts. In addition, in the Monetary Policy review, investors will look at the bank’s assessment of China’s situation as a weaker demand pulse from China could contribute to lowering inflation.
On the other hand, in the US, the focus is on Wednesday's Consumer Price Index (CPI) data. The headline figure is expected to drop to 3.1% in June YoY from its previous 4%, while the Core measure to 5% from it last figure of 5.3%.
As Federal Reserve’s officials sounded hawkish on Monday, markets believe a 25 basis points (bps) hike in the July meeting is a done deal. Moreover, the odds of another hike this cycle stand at 35%, but those expectations may change according to the outcome of the inflation data in Wednesday’s session.
NZD/USD Levels to watch
The daily chart suggests a neutral outlook as the convergence of the 20,100 and 200-day Simple Moving Averages (SMAs) towards the 0.6180-0.6190 range suggests that investors are waiting for a catalyst. In that sense, RBNZ’s decision and US CPI figures may determine the short-term trajectory of the pair.
Support levels: 0.6170-0.6190 (20,100 and 200-day SMA convergence)
Resistance levels: 0.6200, 0.6250,0.6270.
NZD/USD Daily chart
-638247083396817011.png)
- USD/CAD bears are looking for a break of key support.
- Bulls eye a move through resistance and a 50% mean reversion resistance area.
USD/CAD fell to a one week low on Tuesday, while oil prices climbed and investors looked forward to a likely interest rate hike by the Bank of Canada. At the time of writing, USD/CAD is at 1.3220 and is meeting resistance as the follownmg will illustrate:
USD/CAD weekly chart

The weekly chart is on the back side of the bullish long term trend. The price has rallied into old support that is now expected to act as resistance.
USD/CAD daily chart
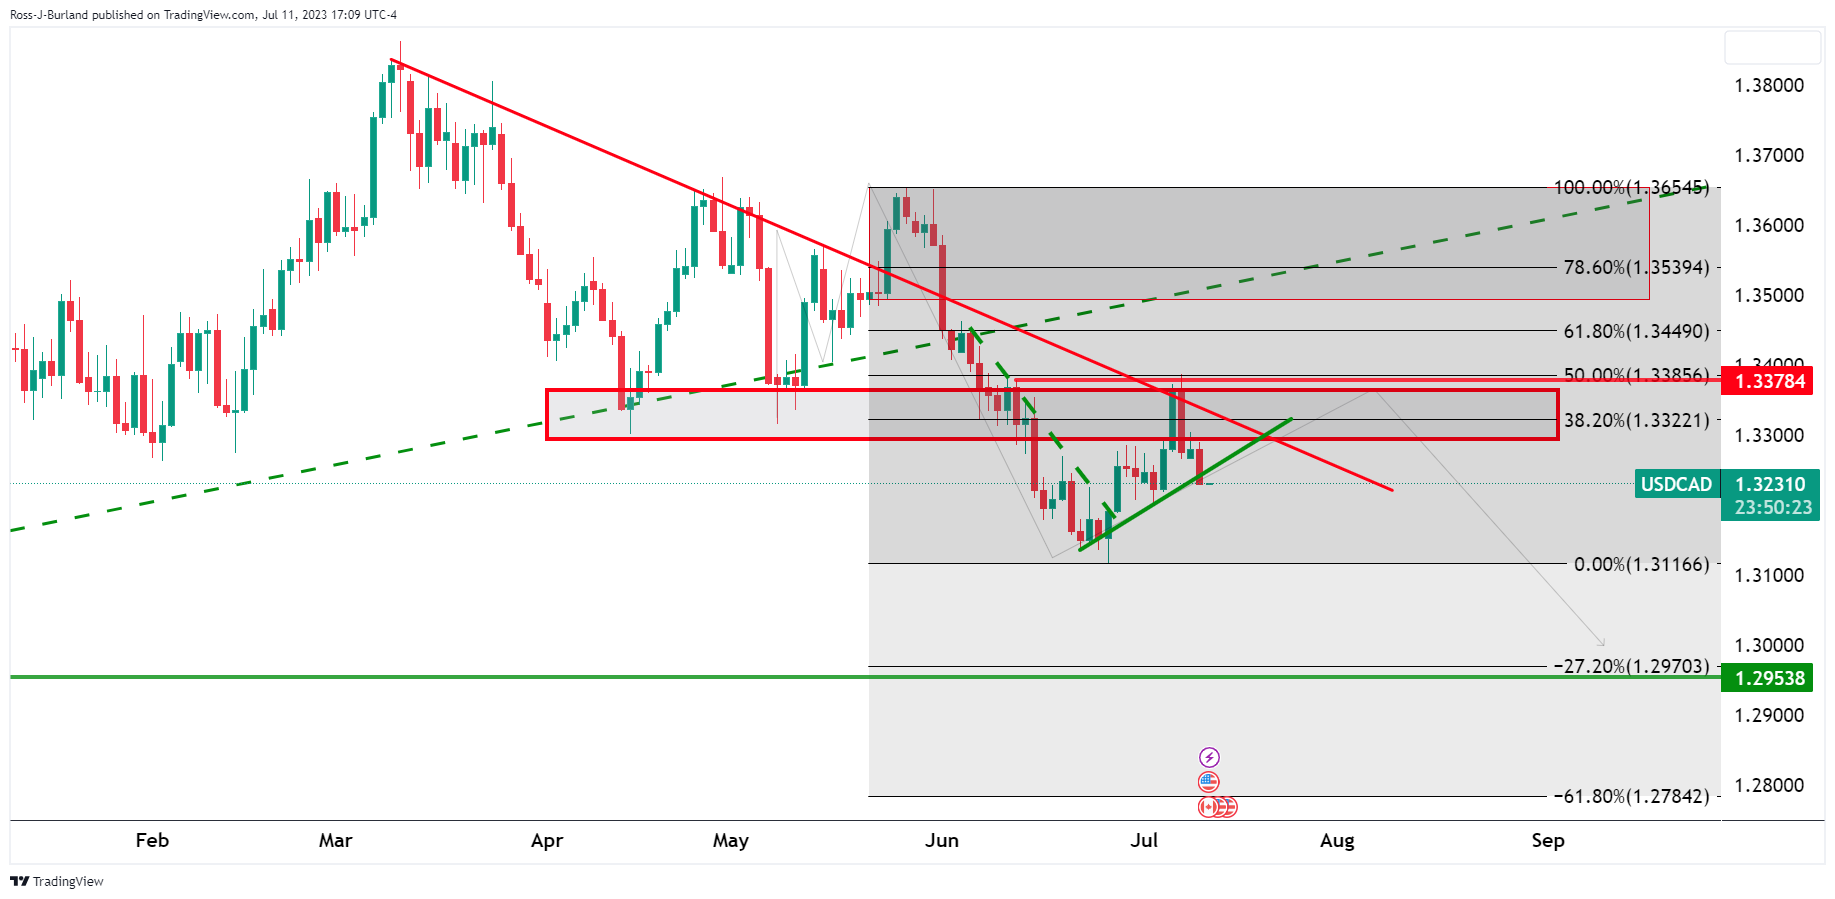
A break of the daily support trend will open risk to he key objectve for a test below 1.3000.
During the Asian session, the Reserve Bank of New Zealand will announce its monetary policy decision and RBA Governor Lowe will deliver a speech. The key event of the day, however, will be the release of the June US CPI, which is likely to trigger volatility across financial markets.
Here is what you need to know on Wednesday, July 12:
The US Dollar weakened on Tuesday ahead of key US data and amid risk appetite. On Wall Street, the Dow Jones gained 0.93% and the Nasdaq rose 0.55%. Gold rose to $1,940, while Silver finished flat around $23.10. Crude oil prices rose more than 2%.
The improvement in risk sentiment weighed on the US Dollar. The DXY dropped for the fourth consecutive day and closed at 101.65, the lowest in two months.
Price action remained limited as market participants awaited the release of crucial US data. The release of the US Consumer Price Index (CPI) for June will be the critical event. The index is expected to show a 0.3% monthly increase and a decline in the annual rate from 4% to 3.1%; and the core annual rate from 5.3% to 5%. The data will likely trigger volatility across financial markets and will be critical for Federal Reserve expectations for the July 25-26 FOMC meeting.
The EUR/USD pair hit a fresh high at 1.1025 and then pulled back modestly, ending the day above 1.1000. The key driver continues to be the weaker US Dollar.
GBP/USD reached fresh 15-month highs above 1.2900 and rose again. Labor data from the UK was mixed, with the unemployment rate rising to 4.0% in May, while wage growth rose 6.9% YoY, marking a new high.
USD/JPY slid further and approached 140.00, even as US yields remain steady and despite risk appetite. A higher-than-expected US inflation reading could boost the pair on Wednesday.
AUD/USD remained in range, moving below 0.6700 and supported by 0.6600. On Wednesday, Reserve Bank of Australia Governor Lowe will deliver a speech following the decision of the central bank to keep rates unchanged last week.
USD/CAD resumed its decline and fell below 1.3250, under the 20-day Simple Moving Average (SMA). The Bank of Canada is expected to announce its interest rate decision, and a 25 basis point hike to 5% is expected. The BoC will likely keep its forward guidance open-ended.
NZD/USD found resistance again at the 0.6220 area and pulled back, below 0.6200. The Reserve Bank of New Zealand will announce its decision on Wednesday. The central bank is expected to keep rates unchanged for the first time in more than a year.
Like this article? Help us with some feedback by answering this survey:
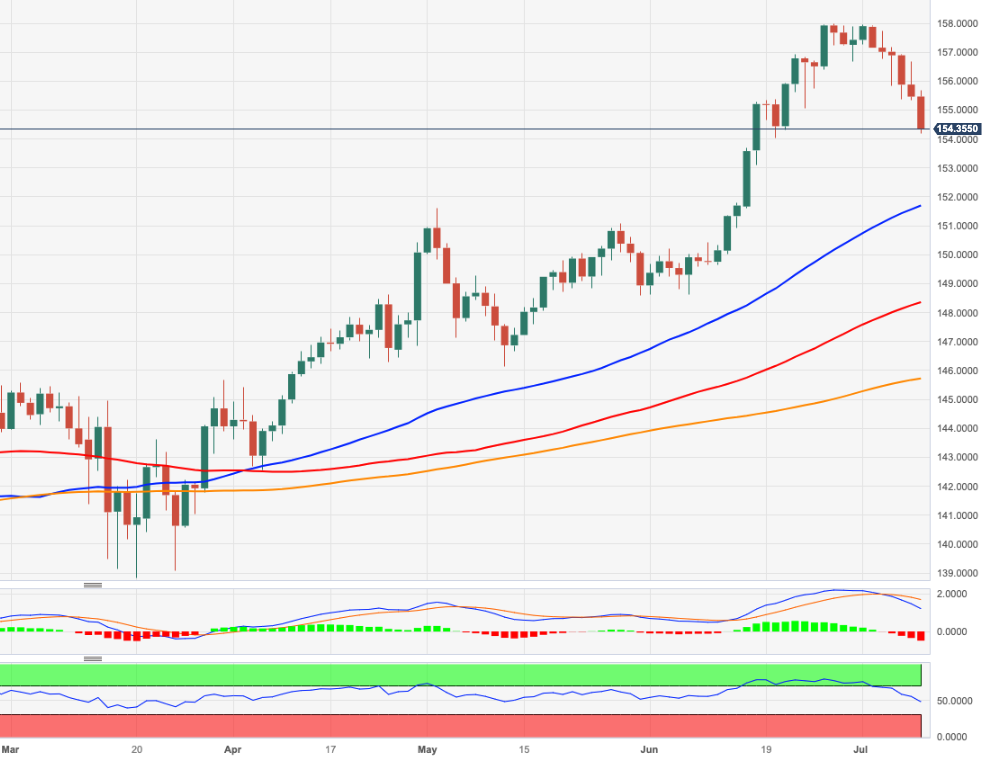
- EUR/JPY continues its downward trajectory falling below the 154.50 level as technical indicators stand in the red.
- Weak ZEW survey data from Germany from July weakened the Euro.
- BoJ’s monetary policy tweak expectations may give the JPY support.
In Tuesday’s session, the EUR/JPY cross continued its downward path as the Yen strengthened agains its major rivals. On the other hand, poor ZEW survey data seems to make the Euro difficult to find demand.
BoJ pivot expectations make the JPY gain ground. Eyes on economic data
Despite markets expecting the Bank of Japan (BoJ) to maintain its monetary policy unchanged in its July meeting, economists at Rabobank believe they will offer some signal of when the policy may be adjusted with the adjusted macroeconomic forecast. As for now, wages, which the bank closely watches, increased in May in Japan so all eyes will be on the next set of economic activity data. Also, China’s Trade Balance data on Thursdays will be the focus as it is one of Japan's main trading partners.
In that sense, on Wednesday, the May Machine orders report will be published, and analysts predict a 0.1% year-on-year growth, which is an improvement compared to April's decline of -5.9%. Additionally, the June Producer Price Index (PPI) data is expected to be released, indicating a year-on-year rate of 4.3%, lower than the previous rate of 5.1%.
On the Euro’s side, Germany reported soft ZEW July data. The Expectations Survey came in at -14.7 vs -10.6 expected, the Current Situation at -59.5, slightly above the consensus of -60.00 and overall, market sentiment is deteriorating as Germany slips into a recession.
EUR/JPY Levels to watch
The current analysis of the daily chart suggests a shift towards a bearish outlook in the short term as selling pressure escalates. The Relative Strength Index (RSI) has fallen into negative territory for the first time since March, and the Moving Average Convergence Divergence (MACD) prints growing red bars indicating the bears are in command.
Support Levels: 154.00,153.40,153.00.
Resistance Levels: 156.00 (20-day Simple Moving Average),156.50, 157.00.
EUR/JPY Daily chart
-638247054013575105.png)
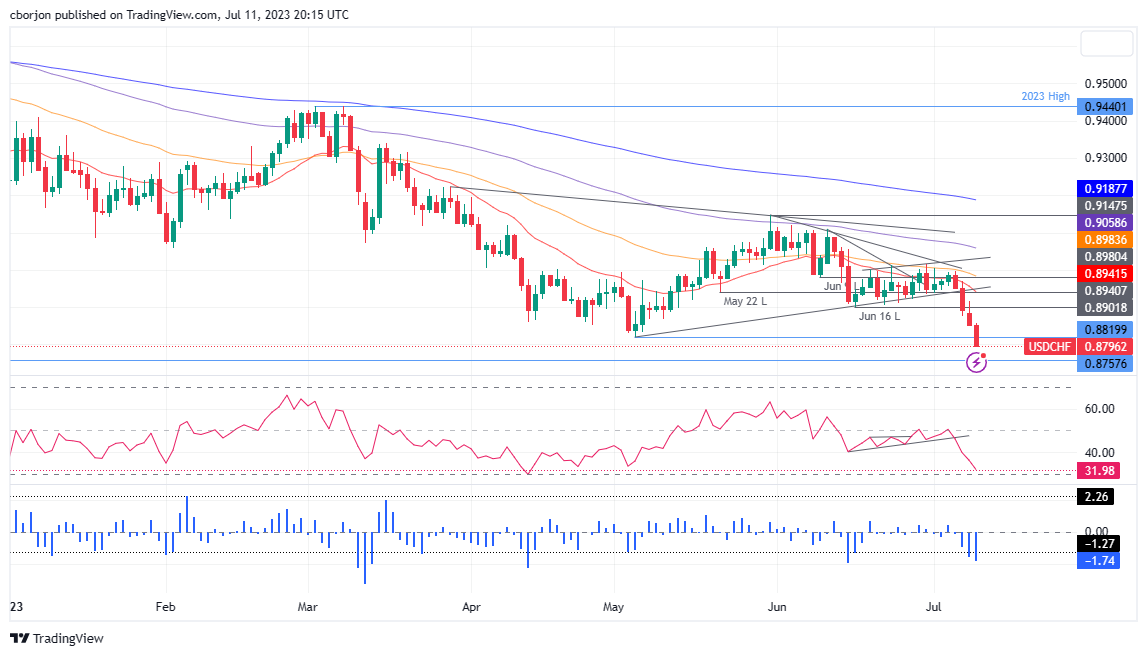
- USD/CHF eyes 2021 low at 0.8757 after the pair slid past the prior’s YTD low of 0.8819.
- RSI and RoC give mixed signals, warranting USD/CHF traders from opening fresh positions ahead of US CPI data
- Immediate resistance lies at the 0.8800 mark, while support lies at 0.8757.
USD/CHF plunges to new two-year lows as the greenback falls sharply ahead of the release of the Consumer Price Index (CPI) in the United States (US). At the time of writing, the USD/CHF is trading at 0.8799, down 1.04%, after hitting a high of 0.8918.
USD/CHF Price Analysis: Technical outlook
The USD/CHF remains downward biased and set to extend its losses to fresh multi-year lows, with the 2021 yearly low in sight at 0.8757. Notably, the USD/CHF peaked just below the 0.9000 figure, which capped the pair’s rallies since April 2023.
As the USD/CHF continues to trend lower, below 0.8800, the next support emerged at 0.8757. A breach of the latter will expose the 0.8750, followed by the 0.8700. As the pair edged lower, a divergence between the USD/CHF price action printing lower lows, the three-day Rate of Change (RoC) shows sellers are losing some momentum. Nevertheless, mixed signals between the latter and the Relative Strength Index (RSI), depicting sellers remain in charge, could refrain traders from opening fresh shorts before releasing crucial US economic data.
Contrarily, the USD/CHF first resistance would emerge at the 0.8800 mark. Once cleared, the USD/CHF could reach the June 16 swing low-turned resistance at 0.8902 before challenging the 20-day Exponential Moving Average (EMA) at 0.8942.
USD/CHF Price Action – Daily chart
- WTI is up on the day on China sentiment and testing a key resistance area.
- Bears are lurking and the dynamoic trendline support is eyed.
WTI is higher by some 2.25% at $74.82 after moving withina range of $73.03 and $74.92. Crude prices rallied Tuesday after China took steps to support the property market by extending loan relief for developers. However, there remains concern about weaker Chinese energy demand. China's National Petroleum Corp (CNPC), China's largest oil and gas producer, cut its 2023 China crude oil demand forecast on June 20 to +3.5% to 740 MMT from a March forecast of +5.1% to 756 MMT.
Elsewhere, energy supply risks are offering support to the market once more as Saudi Arabia rolled over its voluntary production cuts while Russia's decision to curtail exports, as opposed to production, helps alleviate some concern about the nation's undercompliance with the OPEC+ deal, as analysts at TD Secureities explained.
''However, the sharp deterioration in our broad commodity demand indicator, along with market expectations of continued hawkish central bank policy, dented sentiment and maintain a bearish tilt in the market psyche.''
''In this sense WTI crude and Brent crude are still prone to CTA selling below $71.15/bbl and $75.20/bbl respectively,''the analysts stated, ''whereas the bar remains higher to see supportive algorithmic flow.''
WTI techncial analysis
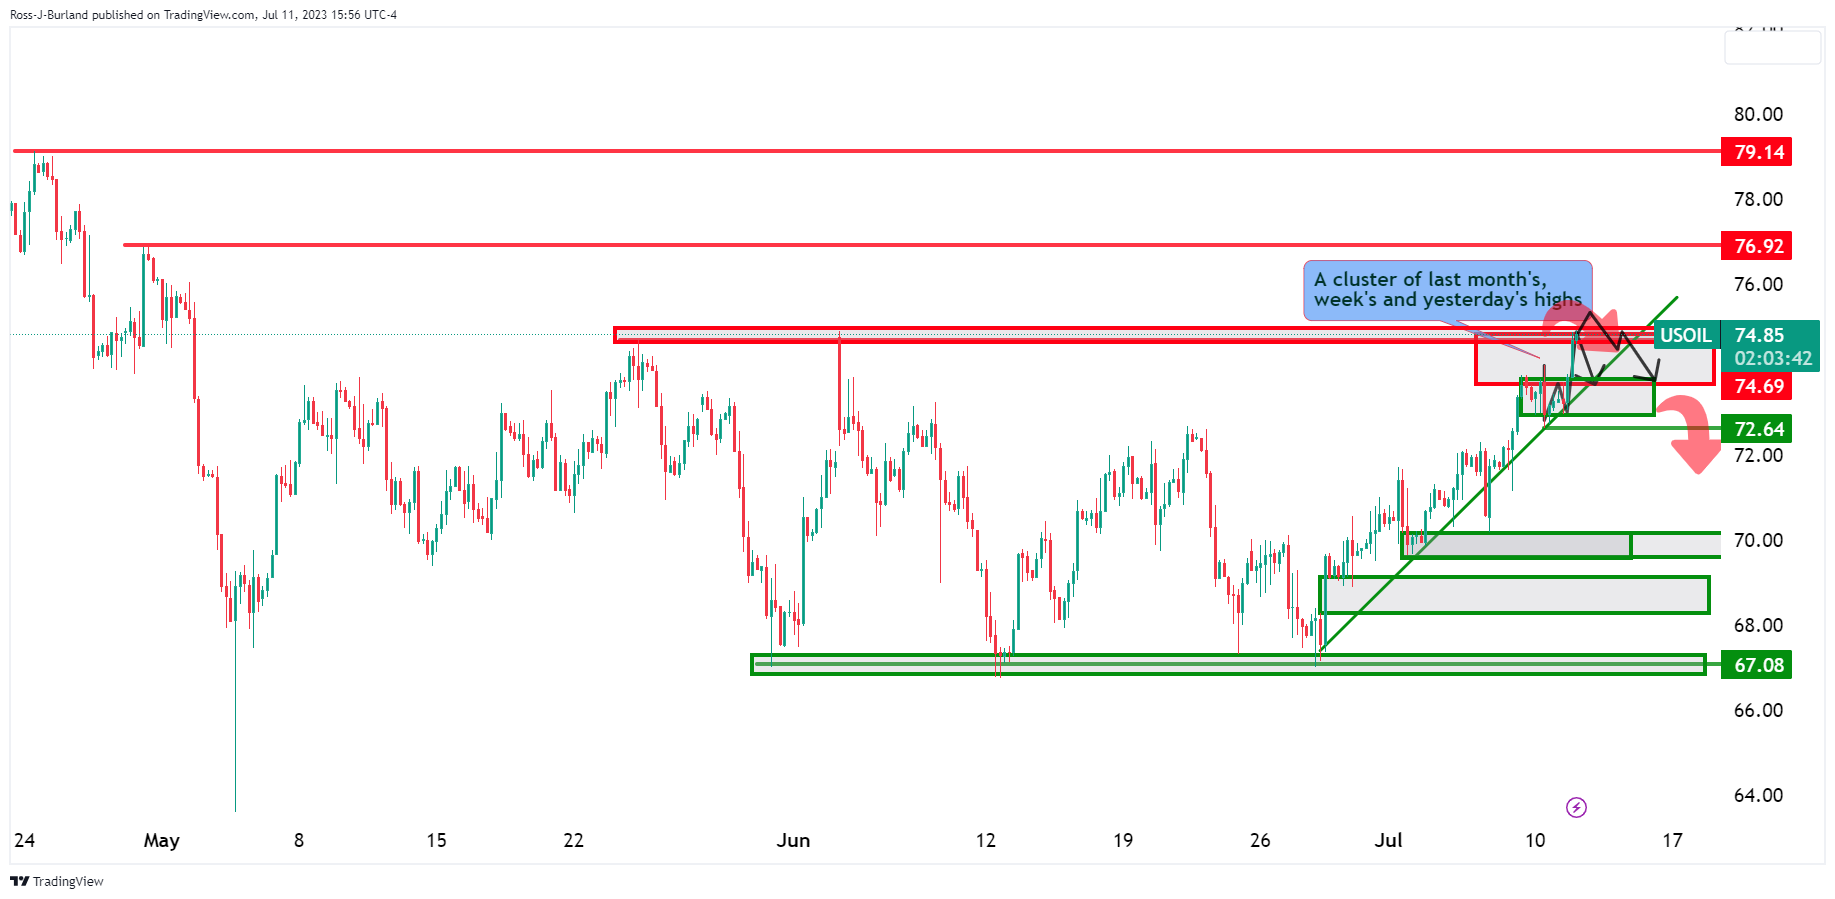

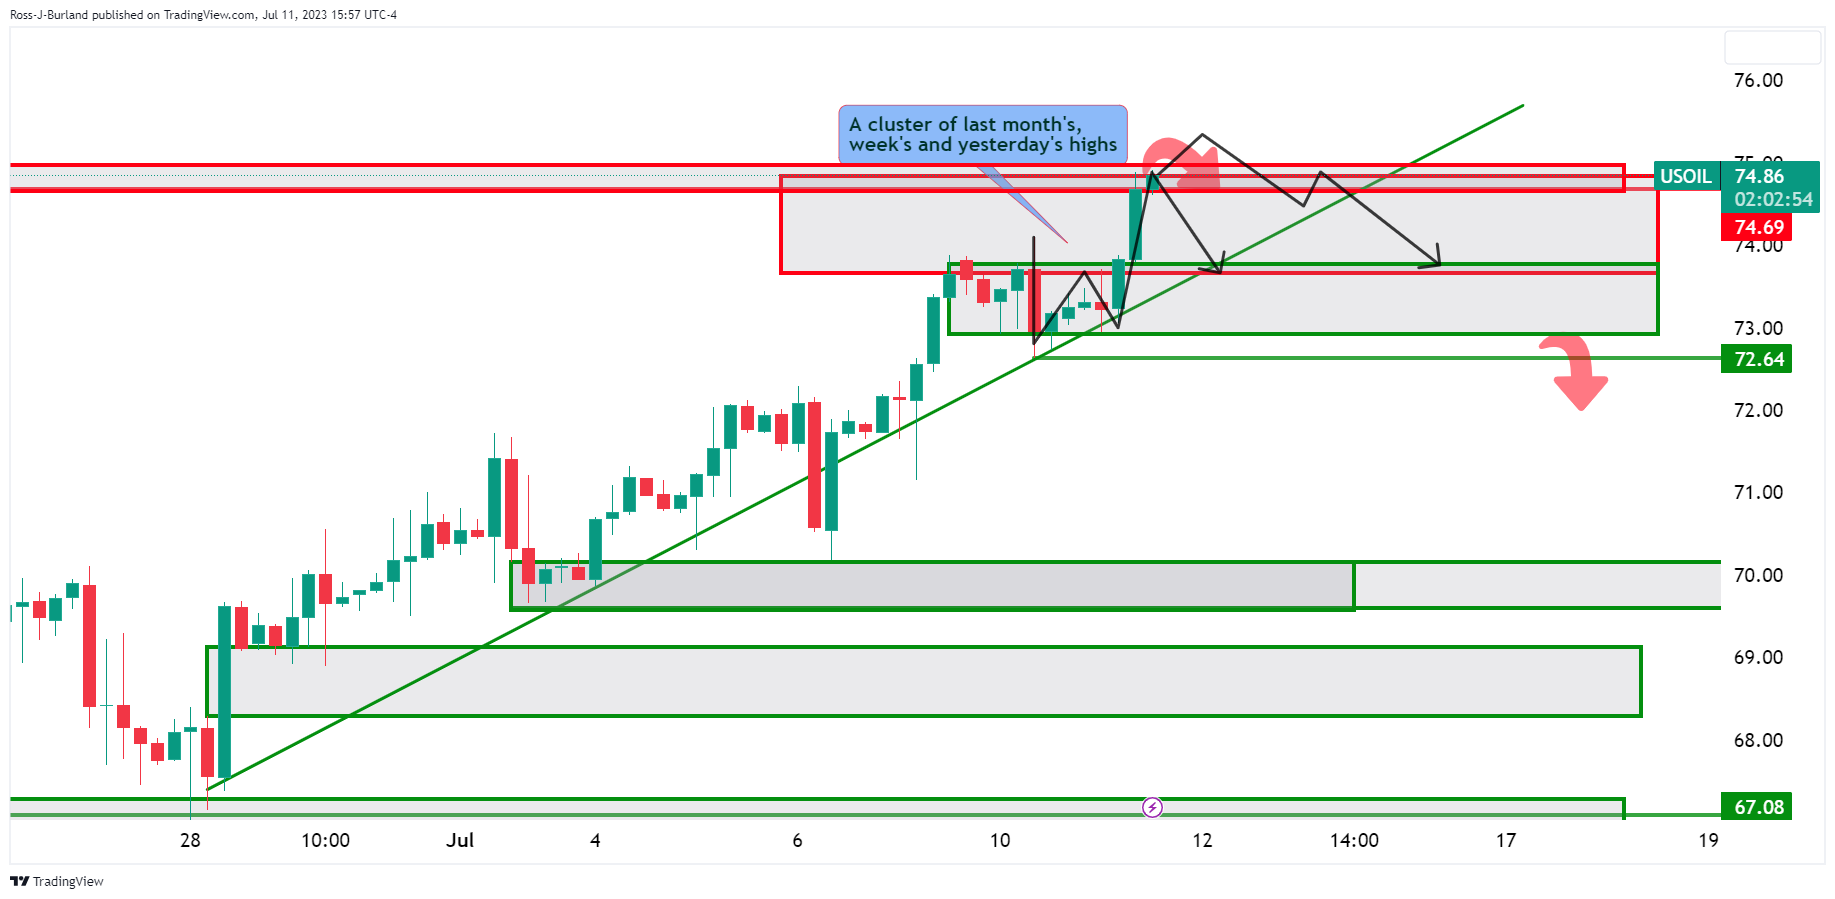
Zoomning in on the 4-hour time frame, there are prospects of a correction from the resistance area to test trendlie support.
- XAU/USD rose past the $1,930 level on Tuesday, piercing through the 20-day SMA at $1,926.
- Markets expect headline CPI to drop to 3.1% YoY in June and the Core to 5%.
- Declining US yields favour Gold prices.
On Tuesday, the Gold spot XAU/USD gained ground and consolidated above the 20-day Simple Moving Average (SMA) for the first time since May. Ahead of key US Consumer Price Index (CPI) figures on Wednesday, US yields are declining giving room to the non-yielding metal to advance.
US CPI figures to define Fed’s next steps
On Wednesday’s session, the US Bureau of Labor Statistics will release CPI data from June. The headline figure is expected to fall to 3.1% YoY from the previous 4% and the Core measure to 5% from 5.3%. Meanwhile, the US Treasury bond yields, which could be seen as the opportunity cost of holding gold, trade weak, with the 2-year standing at 4.86% and the 5 and 10-year yields falling to 4.22% and 3.96%, respectively.
That being said, hawkish bets on the Federal Reserve (Fed) remain steady. According to the FedWatch tool, investors have already priced in a 25 basis point (bps) hike in the next Fed July meeting and looking forward, they discount a 35% probability of another 25 bps in 2023. However, CPI figures may impact those expectations affecting both the US bond market and the yellow metal price dynamics.
XAU/USD Levels to watch
The daily chart suggests that the buyers have taken the lead over the sellers in the short term after conquering the 20-day SMA. However, the bulls still have some work to do to confirm the positive bias and need to retake the 100-day SMA, currently at $1,950. Meanwhile, the Relative Strength Index (RSI) points north, still below its midline, while the Moving Average Convergence Divergence (MACD) prints higher green bars.
Resistance levels: $1,940, 1,950 (100-day SMA), $1,970.
Support levels: $1,915, $1,900, $1,890.
XAU/USD Daily chart
-638247004449639299.png)
- EUR/USD bears are lurking at key resistance.
- Bears eye a run to test 1.0900 on a break of key support structures along the way.
EUR/USD is flat after its intraday breakout above June's 1.1012 peak as traders get set for the US Consumer Pricfe Index inflaiton data on Wednesday morning. The following ilustrates the market structure into the data and prospects of a correction towards 1.0900.
EUR/USD daily charts


The bullish bias persists while on the fronmt side of teh bullish trend line. However, the W-formation is a reverson pattern and with the resistance, the ficus is on a pull back.
EUR/USD H4 chart
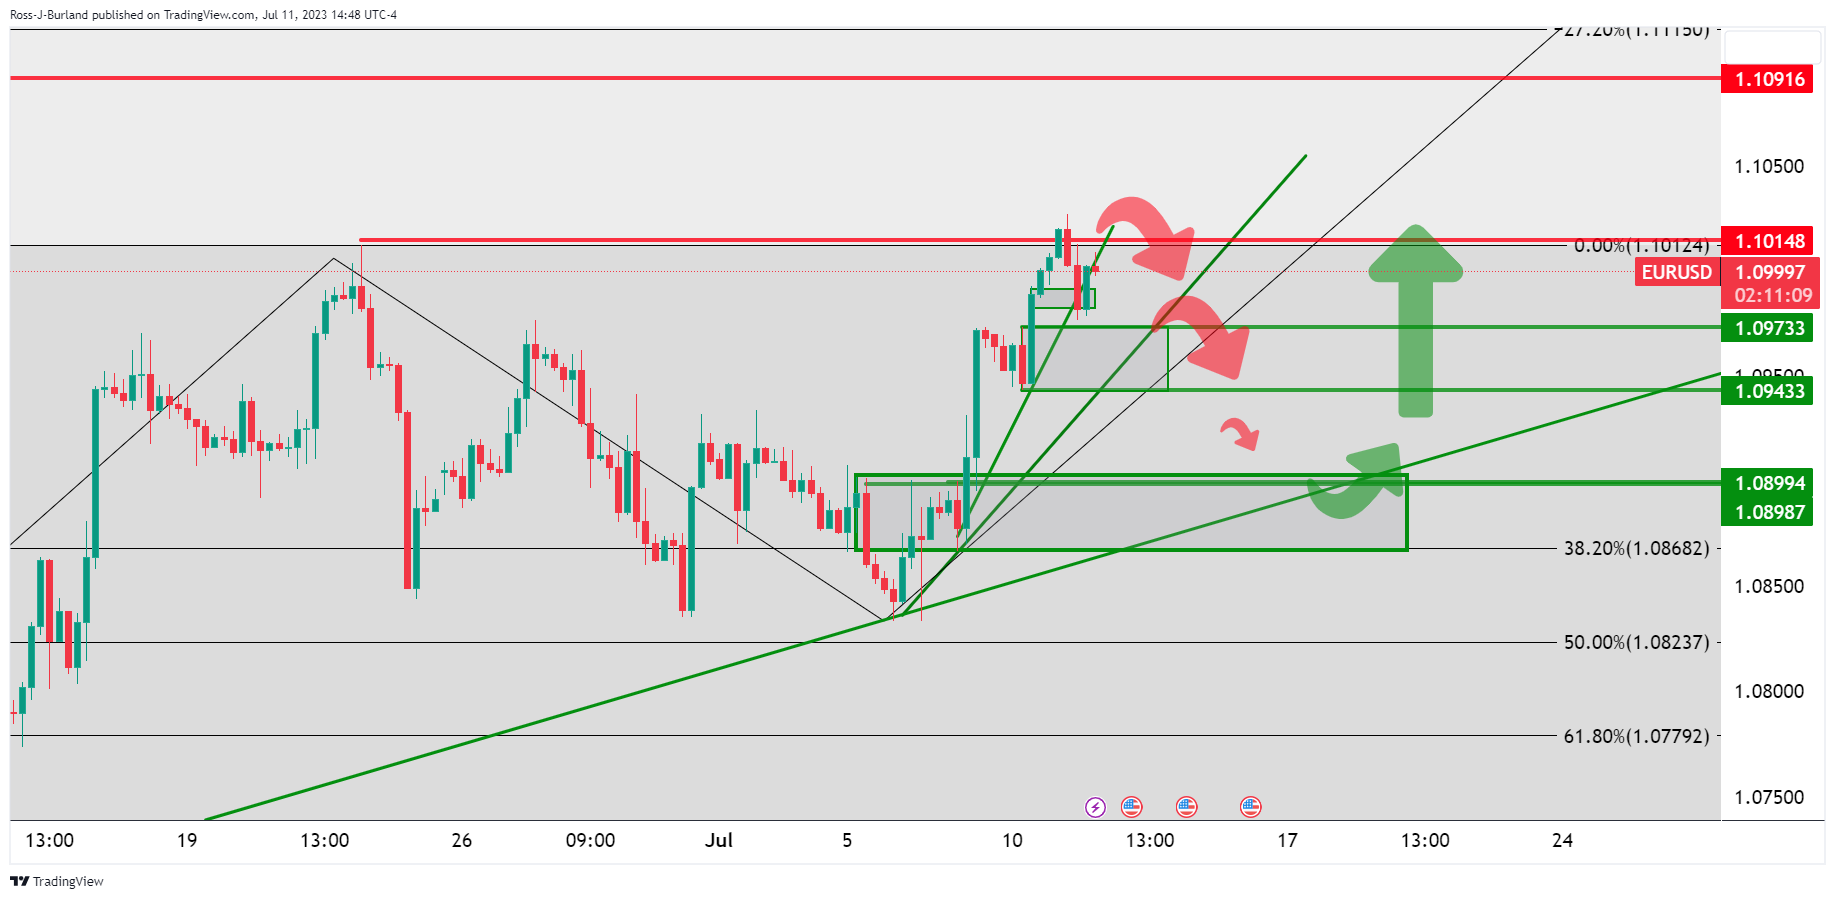
Ob the 4-hour time frame, the price is correcting into support. A break of the near term trendline will be a sign that the rally is decelerating and bears will be looking for a test of key supports on the way to the neckline of the W-formation and a test of 1.0900.
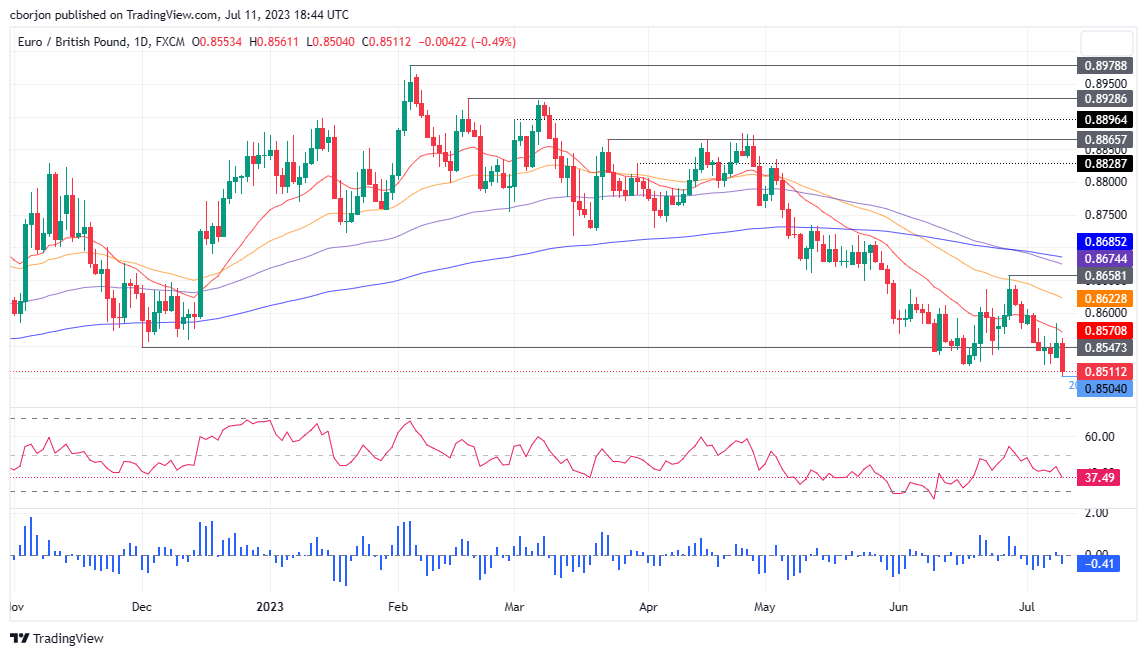
- UK employment data drive EUR/GBP lower, as BoE’s hike expectations increased.
- Following a bearish engulfing pattern, the pair could test the 0.8500 mark and below.
- Oscillators suggest seller momentum is increasing; further EUR/GBP downside is warranted.
The EUR/GBP slides to a fresh year-to-date (YTD) low of 0.8504 after a solid employment report in the United Kingdom (UK) increased the chances for a 50 basis point rate hike by the Bank of England (BoE) on August 3; hence, the EUR/GBP dropped sharply. At the time of writing, the EUR/GBP exchanges hands at 0.8511, down 0.44%.
EUR/GBP Price Analysis: Technical outlook
From a technical perspective, the EUR/GBP drop below the 20-day Exponential Moving Average (EMA) of 0.8592 on July 4 opened the door for a deeper fall. As of writing, the cross formed a bearish engulfing candle pattern after hitting a weekly high of 0.8584, suggesting that lower prices are expected near term.
If EUR/GBP achieves a daily close below the June 19 daily low of 0.8518, that could pave the way for a test of the 0.8500 mark. A breach of the latter would clear the path, with no intermediate support levels, toward the August 24 swing low of 0.8408, before sliding further down to the August 2 low of 0.8339.
Conversely, a daily close above 0.8518m could indicate a consolidation around the 0.8500-0.8580 area up next. A decisive break over the top of the range could expose 0.8600 and the 50-day EMA at 0.8623.
With both scenarios laid down, oscillators suggest that further downside is expected. The Relative Strength Index (RSI) is bearish and aiming toward oversold conditions, while the three-day Rate of Change (RoC) depicts sellers are gathering momentum. Therefore, the EUR/GBP path of least resistance is downwards.
EUR/GBP Price Action – Daily chart
- USD/JPY records its fourth consecutive day of losses, falling near 140.30.
- US headline CPI is expected to decline to 3.1% YoY.
- The USD Index, DXY, fell to its lowest level since May.
On Tuesday, the USD/JPY continued to lose ground amid the broad USD weakness. Ahead of the release of Consumer Price Index (CPI) data, investors expect inflation to decelerate while hawkish bets on the Federal Reserve remain steady. On the JPY’s side, monetary policy pivot expectations allow the Yen to advance.
Markets focus on the US’s CPI on Wednesday
In the US, the focus is on Wednesday's Consumer Price Index (CPI) data. The headline figure is expected to drop to 3.1% in June YoY from its previous 4%, while the Core measure to 5% from its last figure of 5.3%. As Federal Reserve’s officials sounded hawkish on Monday, markets believe a 25 basis points (bps) hike in the July meeting is a done deal. Moreover, the odds of another hike this cycle stand at 35%, but those expectations may change according to the outcome of the inflation data in Wednesday’s session.
On the Japanese side, while most market expectations point towards the Bank of Japan (BoJ) maintaining its current monetary policy during its July meeting, economists at Rabobank anticipate that the central bank may provide some indication regarding potential adjustments to the policy. This signal could come alongside an updated macroeconomic forecast. The recent wage increase in Japan during May has garnered significant attention from the BoJ, making it a crucial aspect to monitor in the upcoming data releases.
In that sense, Wednesday’s Core Machine Tool orders from May and Producer Price Index from June will be closely watched.
USD/JPY Levels to watch
According to the daily chart, the technical outlook for the USD/JPY suggests strong bearish momentum for the short term. However, indicators in the 4-hour chart point at oversold condition, suggesting an upwards correction may be in the horizon. Returning to the daily chart, the Relative Strength Index (RSI) shows a steep negative slope in negative territory while the Moving Average Convergence Divergence (MACD) prints rising red bars.
Support levels: 139.90,139.30,139.00.
Resistance levels: 141.25, 142.00, 142.85 (20-day Simple Moving Average).
USD/JPY Daily chart
-638246959877459596.png)
- UK wage jump increases BoE rate hike chances, with analysts expecting a 50 bps hike in August.
- GBP/USD hits year-to-date high, with buyers eyeing 1.3000.
- USD weakness continues ahead of US inflation data.
GBP/USD rallied to a 15-month high of 1.2934 after a solid employment report in the United Kingdom (UK) increased the chances the Bank of England (BoE) will need to raise rates further. That, alongside broad US Dollar (USD) weakness, underpinned the GBP/USD pair. The GBP/USD trades at 1.2923 after hitting a daily low of 1.2853.
Bank of England rate hike prospects bolster the Pound Sterling
UK’s May jobs report was mixed, as wages jumped by 7.3% YoY above estimates of 7.1% putting pressure on the Bank of England (BoE), with its Governor Andrew Bailey and Co looking forward to stirring inflation down from the 8.7% figure on May. Although wages suggest further tightening is needed, the rise in the unemployment rate to 4.0% from 3.8% in the three months to April tempered fears of a wage-price spiral.
The GBP/USD climbed towards 1.2900 on the data but failed to crack the latter on its first try. Later, the 1.29 figure gave In, exacerbating a rally to a new year-to-date (YTD) high, opening the door for a possible test of the 1.3000 figure in the near term.
Across the pond, a light economic docket in the United States (US) provided no support for the greenback, which extended its losses past the 102.000 figure per the US Dollar Index (DXY). US Treasury bond yields had reversed some of the last week’s gains, with investors bracing for US inflation data release.
The Consumer Price Index (CPI) for June is foreseen to fall to 3.1% YoY, from 4% in May, while month-over-month (MoM) is estimated at 0.3%, higher than May’s 0.1%. Excluding volatile items, the core CPI is estimated to cool down to 5% YoY from 5.3% in the last month. In comparison, MoM data is estimated at 0.3%, a downtick from the latest 0.4% readings during the previous two months.
Aside from this, words from the New York Fed President John Williams “signaled” the Fed will increase rates by a half percentage point more over the year. He added that supply and demand in the labor market are coming into better balance while adding a recession is not on his forecast.
Williams’s words, added to Monday’s comments by San Francisco’s Fed President Mary Daly suggesting that a couple of rate hikes are needed, might refrain GBP/USD traders from opening fresh bets on the pair.
GBP/USD Price Analysis: Technical outlook
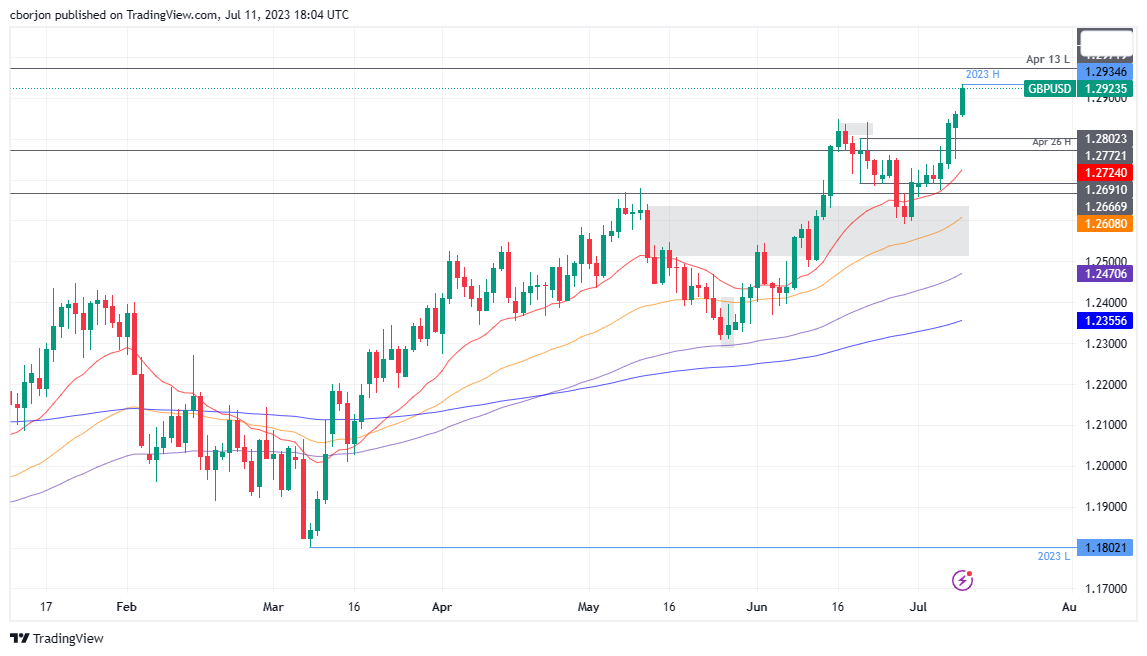
The GBP/USD price action suggests the pair would extend its gains after reclaiming 1.2900. Following key resistance levels emerge at April 13 low-turned resistance at 1.2972 before testing 1.3000. A breach of the latter will expose the April 18, 2022, daily high at 1.3089 before challenging the 2021 yearly low of 1.3160. Contrarily. If GBP/USD drops below 1.2900, that could pave the way for further downside, with first support at June 19 daily high at 1.2837. Once cleared, the GBP/USD could dive towards the 20-day EMA at 1.2724.
- USD/MXN is up 0.20% amidst a light economic docker, soft US Dollar.
- A high US inflation report can bolster the US Dollar.
- Speculations for the Bank of Mexico easing policy toward the end of the year could weaken MXN.
USD/MXN bounces off weekly lows of 17.0285 and climbs despite broad US Dollar(USD) weakness across the board on a light economic docket on both sides of the border between the United States (US) and Mexico. At the time of writing, the USD/MXN is trading at 17.0929, after hitting a daily low of 17.0330, gains 0.20%.
Greenback resilient against the Mexican Peso, despite market optimism
Investors’ mood remains positive ahead of the important inflation report in the US. The Consumer Price Index (CPI) for June is expected to decelerate from 4% to 3.1% in yearly figures, while month-over-month (MoM) is seen at 0.3%, higher than May’s 0.1%. The core CPI for the same period, which excludes volatile items like food and energy, is estimated to dip to 5% YoY from 5.3% in the last month. In comparison, MoM data is estimated at 0.3%, a downtick from the latest 0.4% readings during the previous two months.
In the meantime, Federal Reserve (Fed) speakers remain tilted hawkish, as the Vice Chairman for Supervision Michal Barr said there’s some work to do, while Cleveland’s Fed President Loretta Mester added that “rates would need to move up somewhat further.” At the same time, San Francisco’s Fed President Mary Daly stated that “a couple of more rate hikes over the course of this year” are needed while emphasizing the risks of doing too little are higher than doing too much. Contrarily, Atlanta’s Fed President Raphael Bostic leaned dovish, saying that rates are already in the restrictive territory and that inflation would reach its 2% target.
As of writing, US Treasury bond yields in the short-end of the curve are almost unchanged, while the belly and long-end are dropping, undermining the greenback. The US Dollar Index (DXY), which measures the buck’s performance against a basket of six currencies, slides 0.10%, at 101.792, falling to a new two-month low of 101.666.
On the Mexican front, an absent economic docket will leave traders adrift to US Dollar dynamics and Wednesday’s CPI data. Hot inflation in the US could be positive for the greenback and lift the USD/MXN to re-test the 17.4038 May 17 low-turned resistance. Once that level is breached, the USD/MXN could turn neutral. Factors that could undermine the Mexican Peso (MXN) is a reduction of the interest rate differential, with the Bank of Mexico (Banxico) expected to begin easing monetary policy towards the end of the year, while the Fed has signaled to keep rates “higher for longer.”
USD/MXN Price Analysis: Technical outlook
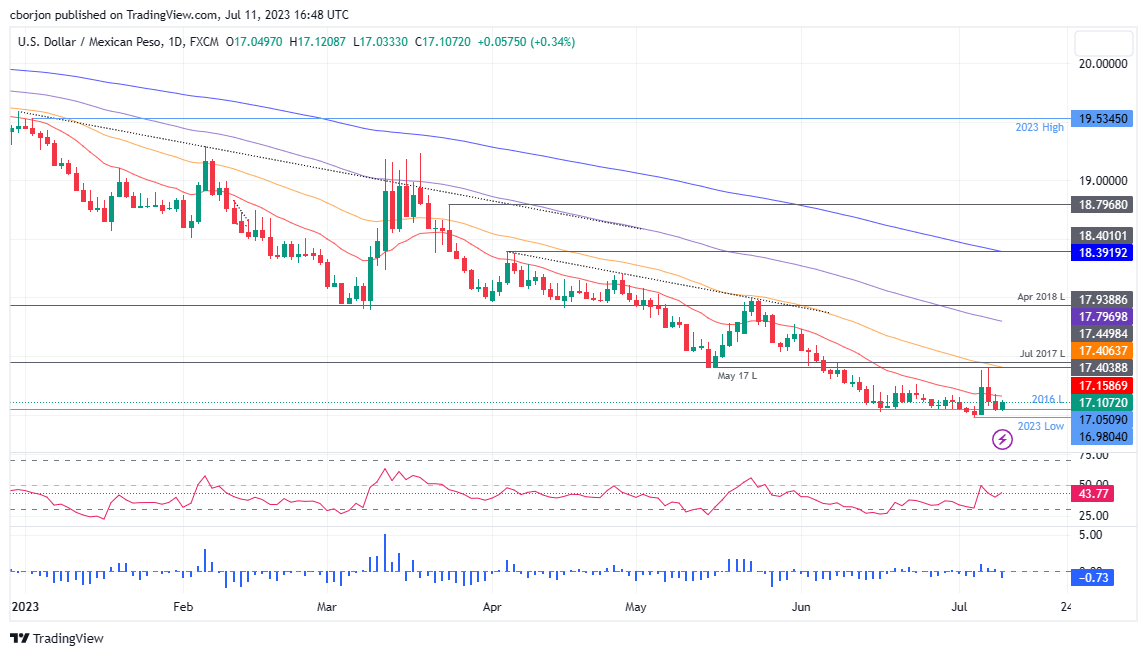
The USD/MXN daily chart stills portrays the pair as downward biased but appear to have bottomed at around 17.00 in the near term. On July 6, the USD/MXN posted a gain of 1.35%, forming a bullish engulfing candle that embraced the price action of the prior nine days, suggesting that the USD/MXN consolidation around the 16.9761-17.40 range could be seen as a sign of MXN bulls booking profits, ahead the Banxico’s shift. To the upside, USD/MXN key resistance areas are the 20-day Exponential Moving Average (EMA), at 17.1575, followed by the May 17 daily low-turned resistance at 17.4038. Conversely, support areas lie at 17.0000, followed by the year-to-date (YTD) low of 16.9761.
- The GBP/JPY cross tallied a fourth consecutive loss day and retreated near 181.00.
- The ONS from the UK reported that wages and unemployment increased in the three months leading up to May.
- Falling Japanese yields to limit the JPY gains.
On Tuesday, the GBP/JPY continued to lose ground and at the time of writing trades at 181.25. In that sense, the GBP is weakening as the Office for National Statistics (ONS) from the UK reported that unemployment picked up in May as wages increased, a red flag for the Bank of England (BoE). On the other hand, falling yields and weak economic data may limit the JPY’s advance.
Investors assess rising wages and unemployment in the UK
The National Statistics Office released mixed labour market data. The unemployment rate increased by two ticks to reach 4.0% during the three months leading up to May, its highest since January 2022, while markets expected it to remain steady at 3.8%.On the other hand, there was an improvement in wage growth. Average Weekly Earnings rose by 6.9% year-on-year, surpassing the expected 6.8%, and this figure was also revised upward from a reported 6.5% for April.
Despite the higher unemployment figures, according to the World Interest Rate Probabilities (WIRP), markets are discounting higher odds of a 50 basis points (bps) interest rate hike on August 3rd, followed by another 50 bps hike on September 21st and additional 25 bps increase in Q4, which would see the bank rate peak at 6.5%.
On the other hand, Machine Tool Orders in Japan declined by 21.7% in June YoY, compared to, a slight improvement from the 22.1% decline observed in May. In addition, falling Japanese yields from Japan due to weak data may contribute to limiting the JPY advance. On Wednesday, the May core machine orders will be released, and market expectations predict a year-on-year increase of 0.1%, an improvement from the previous month's decline of -5.9% in April. The June Producer Price Index (PPI) data will also be reported, with an anticipated year-on-year rate of 4.4%, lower than the previous 5.1%. This set of data will help markets model their expectations regarding the next Bank of Japan (BoJ) steps, affecting the JPY’s price dynamics.
GBP/JPY Levels to watch
After losing the 20-day Simple Moving Average (SMA), the short-term outlook has turned negative for the GBP/JPY cross. The Relative Strength Index (RSI) points south while the Moving Average Convergence Divergence (MACD) prints higher red bars, indicating that the bears are gaining ground.
Support Levels: 181.00, 180.50, 179.00.
Resistance Levels: 182.01 (20-day SMA), 182.50, 183.00.
GBP/JPY Daily chart
-638246888822625176.png)
The global real Gross Domestic Product (GDP) is forecast to expand at an annual rate of about 3% over the next five years, International Monetary Fund Managing (IMF) Director Kristalina Georgieva said on Tuesday. Georgieva noted that this projection is well below the historical average of 3.8%.
"Governments need to pursue fiscal tightening to create fiscal space and to help with fight against inflation," she added, per Reuters.
Market reaction
These comments don't seem to be having a noticeable impact on risk sentiment. As of writing, the S&P 500 Index was up 0.2% on a daily basis.
- Saudi Arabia and Russia reduce oil output by 1.5 million barrels.
- WTI prices rise, buoyed by a weaker US Dollar.
- IEA predicts a tight oil market through H2 2023 due to demand and supply factors.
Western Texas Intermediate (WTI), the US crude oil benchmark, advances sharply more than 1.70% or $1.30 per barrel on Tuesday, spurred by supply cuts established by Saudi Arabia and Russia, while China’s woes about a global economic slowdown, cushions WTI’s rise. At the time of writing, WTI is trading at $74.50 after hitting a daily low of $73.03.
China’s dampened demand and Saudi-Russia output cut boosted Oil prices
During the North American session, the 1.5 million barrel crude oil output cut by Saudia Arabia and Russia is one of the main reasons for Oil’s jump. That, alongside a weaker US Dollar (USD), amid a light economic calendar in the United States (US), is lifting WTI prices across the board.
However, Oil traders must be aware that on Wednesday, a hot June Consumer Price Index (CPI) report in the US could suggest that further tightening is needed to curb stickier inflation, which could pave the way for more US Federal Reserve (Fed) rate increases. Consequently, that can underpin US Treasury bond yields and the US Dollar, refraining WTI traders from opening fresh bets on the oil price rise.
Meanwhile, the International Energy Agency (IEA) stands firm that oil demand from China and developed countries, mixed with the latest supply cuts, would keep the Oil market tight during the second half of 2023.
According to Reuters, sources told that “top buyer China again requested less supply from the world’s biggest oil exporter, Saudi Aramco.”
WTI Price Analysis: Technical outlook
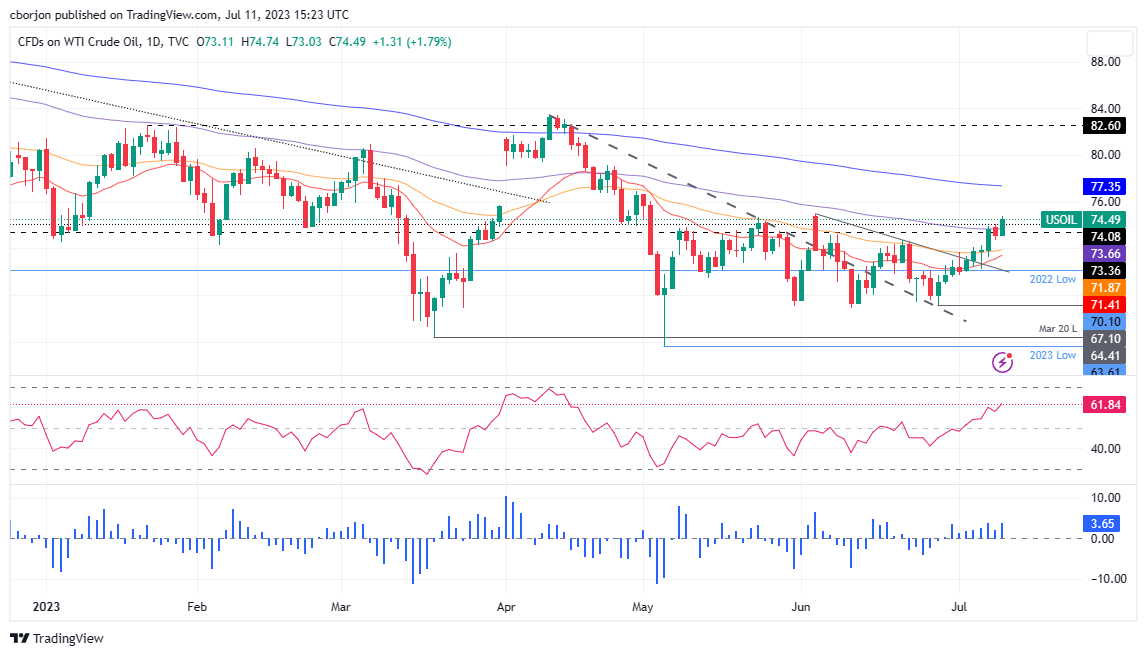
From a technical perspective, WTI buyers reclaiming the 100-day Exponential Moving Average (EMA) at $73.06 has established a floor in the near term. Still, WTI prices remain capped by the June 5 daily high of $74.92; if surpassed, that could pave the way to the psychological $76.00 figure before testing the 200-day EMA at $77.35. Conversely, if WTI does not deliver a daily close above the 100-day EMA, that could expose WTI to a fall below $73.00 and extend its losses toward the 50-day EMA at $71.87.
The Bank of Canada (BoC) is set to announce its Interest Rate Decision on Wednesday, July 12 at 14:00 GMT and as we get closer to the release time, here are the expectations as forecast by the economists and researchers of eight major banks, regarding the upcoming announcement.
The BoC is expected to hike rates by 25 basis points (bps) to 5.00%, contrary to its pause hints. Importantly, the decision will be published alongside a Monetary Policy Report, containing updated economic and inflation projections.
ING
BoC hiked interest rates 25 bps last month having left them untouched since the last hike in January. We don’t see last month’s move as a one-off. To restart the hiking process means that the BoC feels it has unfinished business, and with the jobs market looking tight and inflation running above target we expect the BoC to hike by a further 25 bps.
TDS
We look for the BoC to hike another 25 bps to 5.00% in July. Upward revisions in the July MPR will provide the main catalyst for the hike, but we do expect a more balanced statement relative to June after some further erosion of sentiment. We also look for the Bank to leave its guidance open-ended, although we believe 5.00% will mark the terminal rate for the BoC. USD/CAD should move regardless of whether the BoC hikes this week. While a hike would likely resume the recent downturn in USD/CAD, we're wary that a ‘skip’ would produce a stronger reaction.
NBF
We’re looking for the central bank to increase its overnight target by 25 bps to 5%, the second hike in as many meetings. This is not a high conviction forecast given the lack of clear guidance as well as the Bank’s history of surprise decisions. Our call for a hike reflects the BoC’s early June assessment that policy wasn’t restrictive enough. We doubt a single 25 bps rate increase last month will meaningfully change that in their minds, and they should therefore judge that another move is needed.
RBC Economics
The latest round of Canadian economic data is in – and it’s unlikely to deter the BoC from hiking rates again in July. Nothing in the data on employment, inflation, GDP or the second quarter release of the BoC’s own Business Outlook Survey (BOS) showed sufficient evidence of slowing consumer demand to convince the BoC another hike isn’t needed. The path for the overnight rate – beyond the expected 25 bps increase in July – remains very uncertain. We expect July’s increase to be the last of this cycle. But the BoC has maintained its ‘proactive’ approach when it comes to battling sticky inflation. And it wouldn’t hesitate to hike rates again in September if the economy doesn’t show more signs of cooling off. It is still our view that further deterioration in economic activity is in the pipeline, as households are increasingly challenged by rising costs of living. That should be enough to keep the Bank of Canada on the sidelines for the remainder of this year.
CIBC
While job vacancy rates have continued to fall, the latest labour force report suggests that May’s drop in employment was nothing more than a statistical anomaly related to volatility in youth employment. The rebound in jobs during June, and an unemployment rate that is still low relative to pre-pandemic norms, may have just tipped the scales towards an immediate hike. Because of that we now forecast a 25 bps hike in July, rather than at the September meeting, although we still suspect that 5.0% will be the peak for the Bank of Canada’s overnight rate.
BMO
It’s another close call for the Bank of Canada, but there’s enough momentum in the economy and labour market to tilt the scales toward another 25 bps hike.
Citi
While Canadian data has been more mixed since the June BoC meeting, we continue to expect a 25 bps rate hike from the BoC on Wednesday, taking policy rates to 5.00%. As opposed to a backward-looking June hike, where growth and inflation had not slowed as much as expected, the July hike would be forecast-driven, with higher growth and inflation projections in the July MPR likely to be convincing of at least one more rate hike to sufficiently weigh on demand, particularly in the rebounding housing sector. However, the statement is likely to be more neutral expressing continued commitment to bringing inflation back to 2%, but with an acknowledgement that there are signs of inflationary pressures easing.
Wells Fargo
Much like June, the July decision appears to be a finely balanced call. The BoC raised rates 25 bps at its June meeting, and for July, we lean toward another 25 bps rate hike, to 5.00%. Mixed recent data make the July decision a close call. While mixed, we believe recent figures have shown enough resilience in activity, and still elevated enough underlying inflation.
Economists at Commerzbank have revised their USD/RUB forecast path higher this month after the exchange rate weakened significantly and reached their end-2024 target of 90 already.
USD/RUB is currently solely driven by the current-account balance
Due to the sanctions, the RUB exchange rate now only reflects current account flows. Hence, the Ruble is likely to depreciate medium-term due to the declining current account surplus.
We now forecast 120 for end-2024.
Russia’s central bank (CBR) CBR has signalled that it is concerned about upside risk to inflation (partly a consequence of the weaker exchange rate), and will start a rate hiking cycle beginning its 21 July meeting. Rate hikes, however, do not have direct FX implications at this time.

Source: Commerzbank Research
Markets are keeping a close watch on the US CPI print on Wednesday. Economists at OCBC Bank discuss how the purport could influence the greenback.
USD can continue to slide further on a low 3% print for headline or under 5% print for core
Latest set of survey from Bloomberg pointed to expectations of 3.1% print for headline CPI (down from 4% YoY in May) and a 5% print for core (down from 5.3%).
Any disappointment (i.e. actual CPI coming in higher than expectations) would lead to USD rebound. But if we do get a low-3% print for headline or even under 5% print for core, then USD can continue to slide further.
See – US CPI Banks Preview: Inflation to step meaningfully lower in June
Gold price up slightly in wake of US labour market data. Attention will now be focused on the US consumer price data that are due to be published on Wednesday. Economists at Commerzbank analyze how XAU/USD could react to the US CPI report.
Focus now on inflation figures
The headline rate of inflation is likely to fall significantly to 3.1% on account of a base effect. The last time it was any lower was in March 2021. Though the core inflation rate, which is more relevant to monetary policy, is set to drop to 5.0%, this would still be more than two times above the target. This also underlines the need for further monetary policy tightening.
The core rate would presumably need to fall below 5% for the Gold price to gain in response to the data.
See – US CPI Banks Preview: Inflation to step meaningfully lower in June
- EUR/USD fades the initial bull run to the 1.1030 region.
- A potential test of the 2023 top emerges on the horizon.
EUR/USD retreats from earlier monthly tops north of the psychological 1.1000 mark on Tuesday.
The surpass of the July high at 1.1027 should put the pair en route to a challenge of the 2023 high at 1.1095 (April 26) just ahead of the round level at 1.1100.
Looking at the longer run, the positive view remains unchanged while above the 200-day SMA, today at 1.0630.
EUR/USD daily chart

The peak in the Fed rate cycle appears closer. Economists at Scotiabank analyze what happens when the US rate cycle peaks.
USD is liable to slide to the low point of the “USD smile”
Broader pressure on the USD is likely to develop as cyclical headwinds mount and markets begin to anticipate easier Fed policy settings. Fed rate cuts are unlikely before Q2 next year but we forecast relatively rapid (compared to the ECB) rate cuts thereafter.
The potential for more relaxed US monetary policy settings should be supportive for risk assets – a key factor in our broad outlook for further USD retrenchment. In other words, the USD is liable to slide to the low point of the ‘USD smile’ as US yield and growth premiums weaken and investors are encouraged to shift assets away from the USD to riskier, but perhaps higher-yielding investments.
On average the DXY falls nearly 5% in the first six to seven months after the last Fed hike and is down nearly 3% on average a year after the last tightening. Equity markets typically react positively to the Fed rate cycle peak, rising some 12% in the first year after the last rate increase (S&P 500).
We anticipate a moderate decline in the USD broadly in H2. Current trends, which reflect the DXY tracking index-weighted, short term spreads very closely, indicate that less supportive yield spreads (real or anticipated) will have to be part of the softer Dollar story in the coming months.
- DXY slips back to new 2-month lows near 101.70 on Tuesday.
- Extra decline appears in store as long as 103.50 caps the price action.
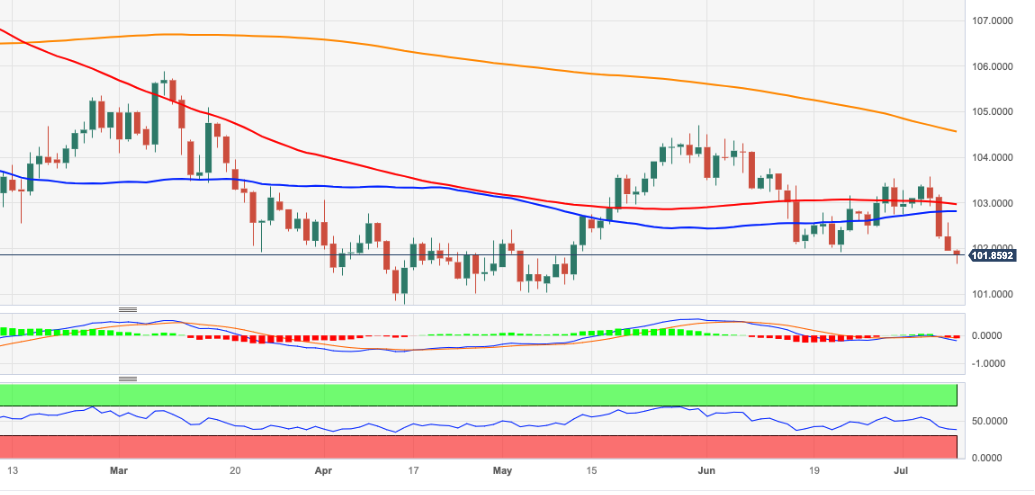
DXY extends the ongoing multi-day decline to the 101.70/65 band on Tuesday.
In light of the ongoing price action, the dollar looks poised to face further selling pressure while below the June high of 103.54 (June 30). That said, the breakdown of the July low at 101.66 (July 11) should put the May lows in the 101.00 region to the test sooner rather than later.
Looking at the broader picture, while below the 200-day SMA at 104.56, the outlook for the index is expected to remain negative.
DXY daily chart
Economists at TD Securities analyze Gold price outlook ahead of the US Consumer Price Index (CPI) report.
Fed's bark could be as bad as its bite
Gold prices are finding a footing with CPI on the radar for on Wednesday, and on that note, we are expecting a below consensus CPI print, which could help the yellow metal find further support. However, given the accumulation of broadly firmer-than-expected activity over the past few weeks and the Fed's clear inclination to hike again, we are now looking for a final 25 bps rate increase in the Fed funds at the July FOMC meeting, which suggests the precious metal is not quite ready to take off just yet.
With fears rising that the Fed's bark could be as bad as its bite, the yellow metal is likely to remain under pressure for the time being.
See – US CPI Banks Preview: Inflation to step meaningfully lower in June
- USD/CAD is marching towards 1.3300 as the USD Index has gauged an intermediate cushion.
- Wednesday’s US CPI data will provide more clarity to investors about interest rate guidance.
- BoC Macklem could raise interest rates by 25 bps for the last time to 5%.
The USD/CAD is marching towards the round-level resistance of 1.3300 in the early New York session. The Loonie asset has picked strength as investors are getting cautious ahead of the United States inflation data and the interest rate decision by the Bank of Canada (BoC).
S&P500 is expected to open on a mildly bullish note considering overnight gains. The US Dollar Index (DXY) is making efforts for extending its recovery to near 102.00. The 10-year US Treasury yields are hovering near 3.97%.
Scrutiny of the US Nonfarm Payrolls (NFP) report released last week strengthened expectations of an interest rate hike by the Federal Reserve (Fed) for its July policy decision. No doubt fresh payroll figures failed to match expectations, but labor cost was extremely upbeat and sufficient to make monetary policy more restrictive.
Going forward, Wednesday’s Consumer Price Index (CPI) data will provide more clarity to investors about interest rate guidance. As per the consensus, annualized headline CPI is expected to decelerate to 3.1% against the former release of 4.0%, and core inflation is seen softening to 5.0% vs. May’s figure of 5.3% in a similar period.
A power-pack action is expected from the Canadian Dollar ahead of the monetary policy announcement by the Bank of Canada (BoC). A poll from Reuters showed that BoC Governor Tiff Macklem could raise interest rates by 25 basis points (bps) for the last time to 5%. Canada’s inflation has softened to 3.4% in May and further policy tightening would maintain immense pressure.
-
Canadian Dollar is little changed on Tuesday as markets hold back before the key interest rate decision by the Bank of Canada.
-
Core Inflation has fallen substantially in Canada whereas it remains stubbornly high in the US, and this is bullish for USD/CAD.
-
The technical picture is mixed but slightly bullish after the break above the key 1.3270 high.
Canadian Dollar (CAD) trades at around the same level of its previous day’s open and close against the US Dollar (USD), on Tuesday, ahead of the key Bank of Canada (BoC) interest rate decision on Wednesday.
USD/CAD is trading in the upper 1.32s as the US session gets underway.
Canadian Dollar news and market movers
-
The Canadian Dollar trades flat in a calm-before-the-storm effect as traders await the BoC Interest Rate Decision scheduled for 14:00 GMT, Wednesday, July 12.
-
The Core Consumer Price Index (CPI) drives interest rate decisions, and in Canada, core inflation has fallen to 3.7% from 4.1% in the last reading, placing less pressure on the BoC to continue raising rates.
-
Since higher rates are positive for CAD as they draw more capital inflows, a decision to leave rates unchanged would be negative for CAD, and positive for USD/CAD, which would probably rise since the Federal Reserve is, in contrast, almost certain to raise rates at its July 26 meeting, given the 5.3% Core CPI inflicted on the US.
-
The BoC is prone to surprising markets, however, as FXStreet Senior Analyst Yohay Elam points out in his BoC preview, so one cannot completely discount the possibility of a hike at Wednesday’s meeting.
-
Such a move would benefit from the advantage of surprise and probably see USD/CAD sell off substantially.
Canadian Dollar Technical Analysis: Short-term trend giving mixed signals
USD/CAD is in a long-term uptrend on the weekly chart, which began after price rose following the 2021 lows. Since October 2022, the exchange rate has been in a sideways consolidation within the uptrend. Given the old saying that ‘the trend is your friend’, however, the probabilities overall an eventual continuation higher, favoring longs over shorts.-
USD/CAD appears to have completed a large measured move price pattern that began forming at the March 2023 highs. This pattern resembles a 3-wave zig-zag, much like an ABC correction in which the first and third waves are of a similar length (labeled waves A and C on the chart below).
USD/CAD’s measured move looks like it has completed given waves A and C are of a similar length. This suggests price probably bottomed at the June 27 lows and is now at the start of a new cycle higher.
-638246777771266104.png)
US Dollar vs Canadian Dollar: Weekly Chart
A confluence of support situated under the June lows in the upper 1.3000s, that is made up of several longer moving averages and a major trendline, provides a backstop to further losses. Only a decisive break below 1.3050 would indicate this thick band of weighty support has been definitively broken, bringing the uptrend into doubt.
-638246777358719341.png)
US Dollar vs Canadian Dollar: Daily Chart
The daily chart shows how price has now broken decisively above the 1.3270 key last lower high of the prior downmove, which is a bullish sign. ¡
USD/CAD subsequently rose up to just shy of the 1.3400 crossroads where the 50-day Simple Moving Average (SMA) is located, last Thursday, before reversing lower last Friday. The long green up day followed by the long red down day creates a two-bar reversal pattern which is a short-term bearish sign, however, this clashes with the other bullish indications, suggesting a balanced market.
It will take a decisive break above the 50-day SMA to keep the uptrend momentum going. Canadian Dollar bulls marginally have the upper hand with the odds slightly favoring a continuation higher.
The US Bureau of Labor Statistics (BLS) will release the most important inflation measure, the US Consumer Price Index (CPI) figures, on Wednesday, July 12 at 12:30 GMT. As we get closer to the release time, here are the forecasts by the economists and researchers of 12 major banks regarding the upcoming United States inflation print for the month of June.
Headline CPI decelerated to 4% year-on-year in May – and is expected to continue slowing down to 3.1% YoY in June. Core CPI remained stubbornly high, raising at 5.3% YoY, and expectations stand at 5% YoY for the upcoming release. In MoM terms, headline is expected at 0.3% vs. 0.1% in May and core is expected to have slowed to 0.3% vs. 0.4% in May.
ANZ
We expect both headline and core CPI inflation to rise by 0.3% MoM in June. Such an outcome would still be too hot for the Fed. Although goods price inflation should remain subdued and further reductions in rent-based inflation are likely to occur, the Fed needs to see more of a slowdown in core services ex-housing to be confident overall inflation is headed to 2% sustainably. For this to happen labour market conditions need to soften further and with it wages growth.
Commerzbank
We expect the core index to increase by 0.3% from May. Compared with the core rates of at least 0.4% recorded since November, this would be a clear step in the right direction from the Fed's perspective, even if only MoM rates of around 0.2% are compatible with its 2% inflation target. Such an outcome would probably not change the prospect of an interest rate hike at the upcoming FOMC meeting on July 25/26 as it has been indicated by Chair Powell. However, as the underlying price pressure should weaken further in the coming months, we do not expect any further rate hikes thereafter. This is also supported by the fact that the headline inflation rate has probably already weakened considerably in June. Overall consumer prices are likely to have risen by only 0.2% from Mayn. The YoY rate would then fall from 4.0% to 3.1%.
Credit Suisse
We expect core CPI inflation to step meaningfully lower in June to 0.2% MoM. The decline would be welcome for the Fed since core inflation has seemingly been stuck around a monthly run rate of 0.4% so far this year. The YoY reading of core inflation is likely to decline to 4.9%, with headline inflation coming in at 3.1% YoY, continuing its path toward target. A reading in-line with our expectations would represent the lowest run rate for core inflation in 22 months.
ING
A 0.3% MoM reading for headline and core inflation would see the annual rate of headline inflation slowing to 3.1% from 4% and core (ex-food and energy slowing to 5% from 5.3%). While this will do little to alter the likelihood of a July hike, it could at the margin provide a little relief and see longer-dated interest rate expectations tick a little lower.
TDS
Our estimates for the CPI report suggest core price inflation likely lost meaningful momentum in June: We expect it to print 0.2% MoM – the slowest monthly pace for the core since 2021. We also look for a similar 0.2% gain for the headline. Note that our unrounded core CPI inflation forecast is 0.23%, so we judge the risk of a 0.3% m/m advance to be larger than that of 0.1%. Our MoM forecasts imply 3.1%/4.9% YoY for total/core prices.
Deutsche Bank
We expect a +0.20% MoM gain for headline CPI (vs. +0.12% previously) and a +0.28% increase for core (vs. +0.44%) which would have the YoY rate for the former dropping by a full percentage point to 3.1%, while that for the latter would drop by 30 bps to 5.0%, both in line with consensus. This would leave the three (4.6% vs. 5.0%) and six-month annualised (4.8% vs. 5.1%) core rates still well above the Fed’s target.
NBF
The energy component could have had a limited impact on the headline index, as a slight rise in gasoline prices could have been more or less offset by a drop in the utility gas services segment. Expected gains for shelter could still result in a 0.3% monthly increase in headline prices. If we’re right, the year-on-year rate should come down from 4.0% to a 27-month low of 3.1%. The core index could also have advanced 0.3% on a monthly basis, something which would translate into a 5.0% annual gain.
RBC Economics
US headline inflation in June likely slowed to 3.2% on a YoY basis (0.3 MoM), with widespread moderation among food, energy, and other components. Core inflation (ex-food and energy) is expected to decelerate too (5% YoY, 0.3% MoM) as some of the key drivers of recent monthly readings, including rents and used cars, start to turn around following easing in market-posted rent indices and declines in the Manheim used car index.
SocGen
It will be the US turn on Wednesday to reveal just how quickly headline inflation is easing, with another 0.8pp decline in the annual rate. However, the core rate is likely to decline by just 0.3pp and remain high at 5.2% YoY. Indeed, easing headline inflation is likely to increase demand pressures on core inflation, which will only add to central banks’ inclination to continue tightening policy.
CIBC
Base effects will be behind a sharp drop in the pace of annual headline inflation to 3.1% in the US in June, as surging gasoline prices from a year ago drop out of the calculation. That will leave inflation at the slowest pace since March 2021. Excluding food and energy, core price pressures could have also subsided to a pace not seen since late 2021 at 5.0%, with potentially slower inflation in shelter adding to a possible drop in used car prices, in line with industry measures. But all eyes will be on the Fed’s preferred measure of underlying prices tied to demand, core services ex. housing, which will provide an indication of how the tight labor market is feeding through to inflation.
Citi
US core CPI inflation should continue to slow more noticeably in June, with Citi Research forecasting a 0.256% MoM rise, the softest core increase since September 2021. This will likely spur further optimism around easing of inflationary pressures in H2’23. The slowing in core CPI is likely to be a result of further easing in shelter prices (we forecast 0.47% owners’ equivalent rent and 0.50% primary rents) and a drop in used car prices (-0.8% MoM) – both of which should continue to imply easing core CPI over the coming months. Importantly, however, the divergence between core CPI and core PCE could be particularly noticeable this month.
Wells Fargo
We forecast the headline CPI to rise a modest 0.2% in June. Favorable base comparisons due to last year's surge in energy and food prices should set up the year-over-year rate to fall nearly a full percentage point to 3.1%. We look for the core CPI to downshift alongside a decline in core goods prices. The ongoing improvement in supply chains has helped to ease pressure on goods, and we expect vehicle prices to contract in June. At the same time, core services are likely to stay firm. Shelter inflation is only slowly cooling off, while medical care and recreational services have scope to rebound in June. The Fed will welcome the continued moderation in price growth, though the road back to 2% inflation remains long.
- Silver price has corrected to near $23.00 as the USD Index has attempted a recovery move.
- After sustained US payroll additions and higher wage pressure, investors are awaiting inflation numbers.
- Silver price is auctioning in a Rising Channel chart pattern in which each pullback is considered a buying opportunity.
Silver price (XAG/USD) has slipped to near $23.11 after failing to extend the upside above $23.40 in the European session. The white metal has faced pressure as the US Dollar Index (DXY) has recovered after building a base around 101.70. The recovery move in the USD Index is propelled by anxiety among investors ahead of the Consumer Price Index (CPI) data, which is scheduled for Wednesday at 12:30 GMT.
As per the preliminary report, monthly headline CPI delivered a higher pace of 0.3% vs. the former pace of 0.1%. Also, core inflation that excludes oil and food prices is expected to match the headline CPI pace.
S&P500 futures have posted overnight gains following positive sentiment observed in Monday’s session. The market could go through some tough phases ahead of corporate earnings. Investors are not convinced of resilience in the second-quarter result season as higher interest rates by the Federal Reserve (Fed) and tight credit conditions by commercial banks have weighed heavily on firms’ operating activities.
After sustained payroll additions and higher wage pressure, investors are awaiting inflation numbers for further guidance. In addition to United States inflation data, investors will focus on the Fed’s Beige Book, which is expected to show the current economic situation and the outlook of the economy.
Silver technical analysis
Silver price is auctioning in a Rising Channel chart pattern on a two-hour scale in which each pullback is considered a buying opportunity by the market participants. The white metal is giving a tough fight to the 50-period Exponential Moving Average (EMA) around $23.00.
Meanwhile, the Relative Strength Index (RSI) (14) has slipped back into the 40.00-60.00 range, indicating a non-directional performance.
Silver two-hour chart
-638246769523642707.png)
Economist at UOB Group Lee Sue Ann expects the RBNZ to refrain from acting on rates at its meeting later in the week.
Key Quotes
While it is important for the RBNZ to appropriately account for the lags with which monetary policy typically works, there are still significant upside risks to the domestic inflation outlook.
That said, given that the RBNZ has signaled that it has finished hiking, we are maintaining our view for the OCR to remain at 5.50% for now.
- EUR/JPY extends the decline to the vicinity of the 154.00 region.
- The loss of the latter exposes the interim 55-day SMA near 151.70.
EUR/JPY accelerates its losses and trades at shouting distance from the 154.00 neighbourhood, or nearly 4-week lows, on Tuesday.
The cross extends further its monthly retracement and threatens to revisit the weekly low at 154.04 (June 20). The breach of this level could open the door to a deeper drop to, initially, the provisional 55-day SMA at 151.66.
The daily RSI around 48 still allows for the continuation of the downward move in the very near term.
So far, the longer term positive outlook for the cross appears favoured while above the 200-day SMA, today at 145.69.
EUR/JPY daily chart
- AUD/USD has dropped to near 0.6660 as the USD Index has attempted a recovery.
- S&P500 futures have extended overnight gains as investors have digested uncertainty about corporate earnings.
- The Australian Dollar will remain on tenterhooks ahead of the speech from RBA Governor Philip Lowe.
The AUD/USD pair has corrected modestly to near 0.6660 in the European session. A mild sell-off in the Aussie asset has stemmed due to a recovery attempt by the US Dollar Index (DXY).
The USD Index has rebounded from 101.67 after a vertical sell-off. Minor recovery in the USD Index has propelled as investors are getting anxious ahead of the United States Consumer Price Index (CPI) data, which will release on Wednesday at 12:30 GMT.
S&P500 futures have extended overnight gains as investors have digested uncertainty about corporate earnings. The yields offered on 10-year US Treasury bonds have rebounded to near 3.98%.
The USD Index is consistently facing selling pressure for the past three trading sessions as investors are anticipating that interest rates by the Federal Reserve (Fed) will peak sooner. Economists at Commerzbank cited it would probably be too early though to write off the Dollar at this stage. The labor market report on Friday was not that bad after all. We assume that the labor market remains too tight for the liking of the Fed and that it will therefore hike its key rate once again at the end of July. It remains to be seen whether that will be the end of the rate hike cycle, and it is still uncertain how quickly rate cuts really will follow.
Meanwhile, the Australian Dollar will remain on tenterhooks ahead of the speech from Reserve Bank of Australia (RBA) Governor Philip Lowe. Investors would look for interest rate guidance from Philip Lowe as labor market conditions are getting tighter.
USD slide extends as markets await CPI data on Wednesday. Economists at Scotiabank analyze the greenback’s outlook.
USD sentiment may sour a little more on Wednesday
The broader trend in the USD is soft and appears poised to remain so as markets start to factor in the likely peak in the Fed tightening cycle.
USD sentiment may sour a little more on Wednesday when US CPI data for June is released. Headline inflation is expected to fall sharply, although progress on core inflation will be slower.
USD/CAD remains largely rangebound in the upper 1.32 zone. Economists at Scotiabank analyze the pair’s outlook.
Range trading may extend a little in the very short run
USD/CAD rebounded firmly from a test of the 1.3250 zone after breaking minor trend support – which should figure as initial intraday resistance at least now – at 1.3285.
Short-term trend momentum is flat, suggesting range trading may extend a little in the very short run. But last Friday’s surge in the CAD remains the salient feature of the daily chart (USD-bearish outside range rejection of major resistance in the upper 1.33s) and tilts broader USD/CAD risks to the downside and a retest of the 1.3150/1.32 area at least.
- USD/CHF has stretched its downside to near 0.8800 amid an intense sell-off in the USD Index.
- US headline inflation is expected to soften further amid a sheer decline in gasoline prices while core inflation could remain sticky.
- USD/CHF has dropped perpendicularly to near May’s low around 0.8820.
The USD/CHF pair has extended its downside to near 0.8800 in the European session as market sentiment is extremely cheerful. The Swiss Franc asset has faced an intense sell-off following negative cues from the US Dollar Index (DXY).
S&P500 futures have added decent gains in London, portraying further strength in the risk-taking ability of the market participants. The USD Index has found intermediate support near 101.70 but is insufficient to be recognized as a bullish reversal.
Meanwhile, investors are awaiting the United States Consumer Price Index (CPI) for further guidance. Headline inflation is expected to soften further amid a sheer decline in gasoline prices while core inflation could remain sticky amid higher labor costs.
USD/CHF has dropped perpendicularly to near May’s low around 0.8820 on a four-hour scale. Momentum has remained extremely solid in the recent downfall. The 20-period Exponential Moving Average (EMA) at 0.8890 is far from the Swiss Franc prices, which stems chances of a mean-reversion move
The Relative Strength Index (RSI) (14) is oscillating in the 40.00-60.00 range, indicating sheer strength in the downside momentum.
A further breakdown below the intraday low at 0.8810 would expose the asset to 07 January 2021 low at 0.8774 and 06 January 2021 low at 0.8758.
In an alternate scenario, a recovery move above April 26 low at 0.8852 would drive the asset toward the round-level resistance at 0.8900 followed by June 30 low at 0.8935.
USD/CHF four-hour chart
-638246724818333597.png)
UOB Group’s Economist Ho Woei Chen, CFA, comments on the release of Chinese inflation figures.
Key TAkeaways
Inflation is largely absent in China due to its weak domestic demand and falling factory prices. This continues to argue for stronger policy support from the central government given the increased risks from local government debt, as well as further monetary policy easing from the central bank.
However, any additional stimulus measures may disappoint given that the Chinese economy is still likely on track for the official target of “around 5.0%” this year. We maintain our expectation of stronger property support measures and our call for another cut to banks’ reserve requirement ratio (RRR) in 2H23 but do not expect further reduction in the benchmark rates this year.
Overall, both the headline and core inflation averaged 0.7% y/y while PPI averaged -3.1% y/y in 1H23. We maintain our full-year headline inflation for 2023 at 0.8% (2022: 2.0%) and PPI at -2.0% (2022: 4.1%). The risk for CPI and PPI remains to the downside.
EUR/USD regains the 1.10 area. Economists at Scotiabank analyze the pair’s outlook.
Minor dips will remain well-supported
Investors remain concerned by soft economic prospects amid rising rates and slack global demand. EUR sentiment remains well-supported by the outlook for additional ECB policy tightening later this month (and September), however.
Short-term price action suggests EUR gains through the low 1.10 zone have stalled, with spot trading off its earlier high. But solid bull trend momentum evident across a range of timeframes suggests that minor EUR dips will remain well-supported (around 1.0950/75) and that the bull run has room to extend to a retest of the 1.11 zone.
See: EUR/USD could drift closer to the year's highs near 1.1100 – ING
GBP/USD advances through low 1.29s. Economists at Scotiabank analyze the pair’s technical outlook.
Minor dips remain a buy
Solid gains on the day so far add to the recent strengthening in the GBP bull tone.
There is a clear run ahead though to the 1.33 zone (some resistance may develop around the 1.30 point).
Trend momentum is solidly bullish across a range of time frames.
Minor dips remain a buy.
See: GBP/USD looks set to extend to 1.30 in this soft Dollar environment – ING
The USD closed last week mixed. Economists at TD Securities analyze the greenback’s outlook.
Good growth news should be welcome, especially if it dovetails with continued disinflation
The setup for H2 will hinge on a few fluid narratives that have played out through H1. The major questions are about the impact of good news. Is good news good for markets or bad for markets? Put another way, should we cheer on positive data surprises or worry about them? We think the former, suggesting that good growth news should be welcome, especially if it dovetails with continued disinflation.
This week's US inflation release will set the tone. We're below consensus, looking for a 0.2% MoM print that should reinforce that disinflation plus positive growth news is bad for the USD and good for risk.
In a statement on Tuesday, the International Monetary Fund (IMF) said that its directors “welcomed the Bank Of England’s (BoE) policy response to arrest inflation pressures, including the 50 bps policy rate increase on June 22.”
“Should inflationary pressures show signs of further persistence, the BoE policy rate may have to be raised further and would need to remain higher for longer,” the IMF said.
Related reads
- Pound Sterling refreshes annual high inspired by elevated wage pressures
- UK Unemployment Rate ticks higher to 4.0%, wage growth hits record high
The USD took another battering on Monday. Economists at Commerzbank analyze the greenback’s outlook.
USD beleaguered
It would probably be too early though to write off the Dollar at this stage. The labor market report on Friday was not that bad after all. We assume that the labor market remains too tight for the liking of the Fed and that it will therefore hike its key rate once again at the end of July. It remains to be seen whether that will be the end of the rate hike cycle; and it is still uncertain how quickly rate cuts really will follow.
At present USD seems beleaguered and that might well continue for some time, but as long as the economic data paints a picture of a robust US economy, the uncertainty about when the US central bank might begin its rate cutting cycle remains high, and excessive USD weakness seems unjustified.
- US Dollar outmatched by Asian currencies on Tuesday after PBoC announces more support packages.
- Except for some second-tier data points, all eyes are on Saint Louis Fed President James Bullard.
- The US Dollar Index continues its decline for a fourth consecutive day.
The US Dollar (USD) is continuing its slide against nearly every major currency on Tuesday. The biggest descent comes on the back of the People’s Bank of China (PBoC) latest decision which is stepping up its stimulus and rescue packages for the construction sector. The support is being applauded in the region and has pushed Chinese stocks higher while Asian currencies are in demand against the Greenback.
Out of the economic data calendar no real big events that could trigger a sudden turnaround in the tone for the US Dollar. The National Federation of Independent Business (NFIB) is to issue its Optimism Index for June at 10:00 GMT, which is expected to remain elevated at 89.9. Interesting to see after the NFIB print, will be the Economic Optimism Index from the TechnoMetrica Institute of Policy and Politics (TIPP) in order to get confirmation if there really is an uptick or rather a decline in economic sentiment. That number is expected at 14:00 GMT, and comes after the speech of James Bullard, the President of the Federal Reserve Bank of St. Louis, at 13:00 GMT.
Daily digest: US Dollar loses ground in Asia
- China will accelerate the roll-out of its policy to aid the property sector, the Chinese Yuan is rallying on the back of it.
- Around 10:00 GMT, the National Federation of Independent Business (NFIB) will release its Optimism Index for June with expectations coming in at 89.9, a small jump from 89.4 previous.
- James Bullard is expected to speak at 13:00 GMT. After already a slew of hawkish comments from his fellow Fed members, it will be good to hear if Bullard is still in the hawkish camp and confirm if more hikes are needed.
- A similar index as the NFIB, but this time from the Economic Optimism Index from the TechnoMetrica Institute of Policy and Politics (TIPP), will be published at 14:00 GMT. Consensus here points to a jump as well from 41.7 previous to 45.3.
- The US Treasury is set to access the markets as well in order to allocate a 1-year and a 3-year bond auction.
- The Japanese Topix index was too late to enjoy the positive tone in Asia and closed at -0.31%, nearly flat for this Tuesday, while the Chinese Hang Seng soared higher and closed near 1% of gains. European equities fell back after another negative print from Germany’s Zentrum für Europäische Wirtschaftsforschung GmbH (ZEW) print and is near flat while US equity futures are mildly in the red.
- The CME Group FedWatch Tool shows that markets are pricing in a 92.4% chance of a 25 basis points (bps) interest-rate hike on July 26. Chances of a second hike in November are down to 26.7%. It appears that markets are pricing out again the possibility of a second rate hike and presume that the Fed will hike in July for the last time. Markets expect US Fed Chairman Jerome Powell to announce that the pivotal level has been reached at the yearly Jackson-Hole Symposium between August 24 and 26 in Kansas.
- The benchmark 10-year US Treasury bond yield trades at 3.97% and is continuing its slide lower from 4.09% last week. Traders are again doubling down on whether there will be more than one rate hike from the Fed.
US Dollar Index technical analysis: More downside looks inevitable
The US Dollar is continuing its decline for a fourth straight day in a row as this time Asian currencies are overpowering the Greenback. During European trading hours, the US Dollar was down nearly 0.50% against the Japanese Yen (USD/JPY), the South Korean Won (USD/KRW) and the Chinese Yuan (USD/CNY). The support and demand for Asian currencies comes from China, where the government will speed-up its promised support packages for the much battered construction sector. This boosted the belief for a speedy recovery in China and made the US Dollar Index (DXY) retreat for another day.
On the upside, look for 102.811 at the 55-day Simple Moving Average (SMA), that will have regained partially its importance after having been chopped up that much a few weeks ago. Only a few inches above the 55-day SMA, the 100-day SMA comes in at 102.96 and could create a firm area of resistance in between both moving averages. In case the DXY makes its way through that region, the high of July at 103.57 will be the level to watch for a further breakout.
On the downside, the only thing in the way to stop the DXY from hitting 101.00 is the psychological handle at 101.50. Once that level is breached, not many relevant levels to look for as it will become a quick decline to 101.00 and start testing the lows of May. Special notice for 100.75 as that level is a floor since February 2nd and could open the door for a slide below 100.00 one broken through it.
US Dollar FAQs
What is the US Dollar?
The US Dollar (USD) is the official currency of the United States of America, and the ‘de facto’ currency of a significant number of other countries where it is found in circulation alongside local notes. It is the most heavily traded currency in the world, accounting for over 88% of all global foreign exchange turnover, or an average of $6.6 trillion in transactions per day, according to data from 2022.
Following the second world war, the USD took over from the British Pound as the world’s reserve currency. For most of its history, the US Dollar was backed by Gold, until the Bretton Woods Agreement in 1971 when the Gold Standard went away.
How do the decisions of the Federal Reserve impact the US Dollar?
The most important single factor impacting on the value of the US Dollar is monetary policy, which is shaped by the Federal Reserve (Fed). The Fed has two mandates: to achieve price stability (control inflation) and foster full employment. Its primary tool to achieve these two goals is by adjusting interest rates.
When prices are rising too quickly and inflation is above the Fed’s 2% target, the Fed will raise rates, which helps the USD value. When inflation falls below 2% or the Unemployment Rate is too high, the Fed may lower interest rates, which weighs on the Greenback.
What is Quantitative Easing and how does it influence the US Dollar?
In extreme situations, the Federal Reserve can also print more Dollars and enact quantitative easing (QE). QE is the process by which the Fed substantially increases the flow of credit in a stuck financial system.
It is a non-standard policy measure used when credit has dried up because banks will not lend to each other (out of the fear of counterparty default). It is a last resort when simply lowering interest rates is unlikely to achieve the necessary result. It was the Fed’s weapon of choice to combat the credit crunch that occurred during the Great Financial Crisis in 2008. It involves the Fed printing more Dollars and using them to buy US government bonds predominantly from financial institutions. QE usually leads to a weaker US Dollar.
What is Quantitative Tightening and how does it influence the US Dollar?
Quantitative tightening (QT) is the reverse process whereby the Federal Reserve stops buying bonds from financial institutions and does not reinvest the principal from the bonds it holds maturing in new purchases. It is usually positive for the US Dollar.
- USD/JPY is aiming to extend the downside journey towards 140.00 amid a sell-off in the USD Index.
- US headline inflation is expected to show a significant cooldown and core CPI may deliver a moderate softening.
- Fed Mester conveyed the economy has shown more underlying strength than anticipated earlier this year.
The USD/JPY pair is declining toward the psychological support of 140.00 in the European session. The asset is facing a sheer sell-off following weak cues from the US Dollar Index (DXY). The USD Index has sharply corrected to near 101.70 as investors are anticipating that interest rates by the Federal Reserve (Fed) will sooner peak.
S&P500 futures are demonstrating choppy moves as investors are awaiting the release of the United States Consumer Price Index (CPI) data for further guidance. Also, the upcoming second-quarter result season has kept investors on tenterhooks. Investors are uncertain about corporate earnings due to higher interest rates from the Federal Reserve (Fed) and tight credit conditions by commercial banks.
Preliminary report shows that headline inflation will show a significant cooldown and core CPI will deliver a moderate softening. Core price pressures have turned out extremely critical for Fed policymakers as service inflation is not showing significant deceleration. Thanks to a strong labor market that is offering higher wages to land fresh talent and consistently propelling retail demand.
On Monday, Cleveland Fed President Loretta Mester, in a speech at the University of San Diego, cited that “The economy has shown more underlying strength than anticipated earlier this year, and inflation has remained stubbornly high, with progress on core inflation stalling,” as reported by Reuters.
On the Japanese Yen front, economists at Rabobank analyzed scenarios for the Bank of Japan’s (BoJ) July interest rate policy and cited that although steady policy appears to be the most likely outcome for the July policy meeting, it is widely expected to bring upgraded inflation forecasts and the market will continue to hope that the BoJ may offer some signal as to when YCC could be adjusted. Speculation of a possible tweak could allow the Japanese Yen some support ahead of the BoJ meeting this month.
The Reserve Bank of New Zealand (RBNZ) will announce its Interest Rate Decision on Wednesday, July 12 at 02:00 GMT and as we get closer to the release time, here are the expectations as forecast by the economists and researchers of five major banks.
The RBNZ is expected to keep the key Official Cash Rate (OCR) steady at 5.50%, marking the end of a 20-month hike cycle.
ANZ
We expect the RBNZ to keep the OCR unchanged at 5.5%. Anything else would be a massive surprise. Local data since the May MPS has been mixed, but overall supports the RBNZ’s wait-and-see stance. We continue to see the balance of risks tilted towards the RBNZ eventually having to do more, but it’s not today’s story.
Standard Chartered
We expect the RBNZ to keep the cash rate unchanged at 5.5%, with risks tilted slightly to the upside. In the May monetary policy meeting, the RBNZ alluded to the need to keep policy rates higher-for-longer to slow the economy and guide inflationary pressures back to the 1-3% target range. While this is not our base case, the non-trivial risk is that the RBNZ sees the need for further tightening in the face of inertial and more persistent inflationary dynamics that are playing out in the US.
TDS
NZ entered a mild recession in Q2 after back-to-back quarterly declines. The housing market is cooling fast with prices falling by the most in 8 months in Jun and the Q2 QSBO survey also points to business taking a more downbeat view as demand stagnates. Taken together, the RBNZ has enough reasons to leave rates on hold.
Citi
For the first time in almost two years, we expect the MPC to keep the OCR unchanged at the upper bound of the current cycle of 5.50%. It’s mission accomplished for the MPC and the path forward is for maintenance of restrictive monetary policy until inflation is closer to the mid-point of the target band and there are signs of better balance in the labor market. We expect conditions in NZ product and labor markets to be more amenable to reductions in the OCR from Q1’24 even though the technical recession has already commenced ahead of RBNZ expectations for Q323.
Wells Fargo
Overall, the indications are that demand remains subpar, which should eventually see an easing of inflationary pressures over time. Against this backdrop, we believe the RBNZ will be comfortable holding its policy rate steady at 5.50% at its July meeting. That would be the first rate hike pause since the RBNZ began tightening in late 2021.
UOB Group’s Senior Economist Julia Gogh and Economist Loke Siew Ting review the latest foreign portfolio figures in Malaysia.
Key Takeaways
Malaysia continued to garner foreign portfolio inflows for a sixth straight month in Jun (at MYR3.9bn vs May: +MYR2.3bn) and for a second consecutive quarter (2Q23: +MYR7.4bn vs 1Q23: +MYR9.5bn). This was purely driven by higher foreign purchases of Malaysian debt securities (Jun: +MYR5.2bn vs May: +MYR3.0bn; 2Q23: +MYR9.8bn vs 1Q23: +MYR11.4bn), which fully offset the persistent foreign selling of Malaysian equities (Jun: -MYR1.3bn vs May: MYR0.7bn; 2Q23: -MYR2.3bn vs 1Q23: -MYR1.9bn).
Bank Negara Malaysia (BNM)’s foreign reserves dropped for the third straight month by USD1.3bn m/m to USD111.4bn as at end-Jun (end-May: -USD1.8bn m/m to USD112.7bn) after taking into account the quarterly foreign exchange revaluation changes amid a weaker MYR against the USD. The latest reserve position is sufficient to finance 5.0 months of imports of goods & services and is 1.0 time of total short-term external debt. BNM’s net short position in FX swaps widened by USD0.1bn m/m to USD23.7bn as at end-May (end-Apr: USD3.1bn m/m to USD23.6bn).
Lingering global economic and financial challenges as well as ongoing geopolitical tensions continue to point to volatile capital flows into emerging markets (EMs) including Malaysia in the near term. Domestically, political uncertainty linger ahead of the six state elections on 12 Aug. Bank Negara Malaysia (BNM) kept a cautious view on the economic outlook as the policy rate was kept unchanged at 3.00% last week. We expect BNM to keep rates unchanged for the rest of the year. We reiterate our house view of a weakening bias for MYR this quarter (3Q23) before gradually regaining momentum from 4Q23 onwards.
The Dollar has started the week on the soft side. Economists at ING analyze the greenback’s outlook.
DXY could continue drifting toward the 101.50 area
Reports suggest that hedge funds may be rotating away from the narrow rally in US equities towards better valuations in Europe. If so, the Dollar could soften further.
Today, the best chance for this Dollar decline to extend a little further will be the release of the NFIB small business optimism data for June. A further decline in pricing intentions in this survey will add weight to the view that inflation is coming lower. (The main event, however, remains Wednesday's release of June CPI.)
We do not expect big FX moves today, but DXY could continue drifting toward the 101.50 area.
- NZD/USD has slipped below the 0.6200 support amid caution ahead of the RBNZ interest rate policy.
- S&P500 futures have surrendered their entire gains added in Asia, portraying a decline in the risk appetite.
- NZD/USD has corrected to near the upward-sloping trendline of the Ascending Triangle chart pattern.
The NZD/USD pair has displayed a steep fall after failing to extend upside above the critical resistance of 0.6220 in the London session. The Kiwi asset has sharply dropped below the round-level support of 0.6200 as investors have turned cautious ahead of the interest rate decision by the Reserve Bank of New Zealand (RBNZ).
S&P500 futures have surrendered their entire gains added in Asia, portraying a decline in the risk appetite of the market participants. The US Dollar Index (DXY) has found an intermediate support around 101.68.
The USD Index will dance to the tunes of Wednesday’s Consumer Price Index (CPI) data, which will be printed at 12:30 GMT. Inflationary pressures are expected to decelerate as gasoline prices have dropped.
NZD/USD has corrected to near the upward-sloping trendline of the Ascending Triangle chart pattern, which is plotted from July 06 low at 0.6132 while the horizontal resistance of the aforementioned chart pattern is placed from July 06 high at 0.6220. The Kiwi asset is giving a tough fight to the 100-period Exponential Moving Average (EMA) at 0.6188.
Meanwhile, the Relative Strength Index (RSI) (14) is looking for support near 40.00. A slippage below the same could trigger bearish momentum.
A downside move below July 10 low at 0.6160 will expose the asset to June 29 low at 0.6116. A slippage below the latter would drag the asset to June 05 low at 0.6041.
Alternatively, a decisive break above June 22 high around 0.6220 will drive the asset towards June 14 high at 0.6236 followed by May 17 high at 0.6274.
NZD/USD two-hour chart
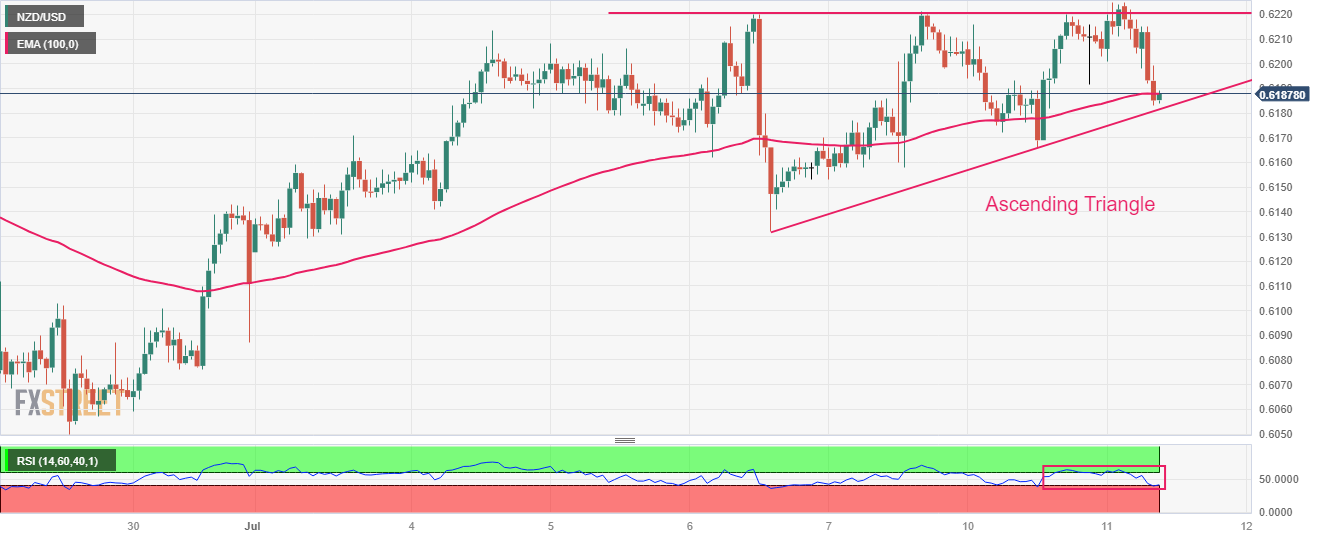
- Germany’s ZEW Economic Sentiment Index declined to -14.7 in July.
- EUR/USD is battling 1.1000 after the mixed ZEW surveys.
The German ZEW headline number showed that the Economic Sentiment Index fell further in July, arriving at-14.7 from -8.5 seen in June while missing the market expectation of -10.0.
However, the Current Situation Index improved slightly to -59.5 from -56.5 prior, beating estimates of -60.0.
During the same period, the Eurozone ZEW Economic Sentiment Index worsened to -12.2 from -10.0, compared with the estimates of -10.2.
Key points
The ZEW indicator of economic sentiment is shifting even more noticeably into negative territory.
Financial market experts predict a further deterioration in the economic situation by year-end.
Key reason for this is the expectation of rising short-term interest rates in the Eurozone and the US.
Important export markets like China are seen as relatively weak.
The industrial sectors are likely to bear the brunt of the anticipated economic downturn, with profit expectations for these export-oriented industries experiencing a substantial decline once again.
Market reaction
The EUR/USD pair is paring back gains while trading at around 1.1000 on the mixed data, modestly flat on the day.
- USD/CAD stages a modest recovery from a multi-day trough touched earlier this Tuesday.
- An uptick in Crude Oil prices could underpin the Loonie and cap gains amid a weaker USD.
- Bets that the Fed is nearing the end of its rate-hiking cycle to act as a headwind for the buck.
The USD/CAD pair comes under some renewed selling pressure on Tuesday and drops to a four-day low, around the 1.3245 region during the early European session. Spot prices, however, manage to recover a major part of the intraday losses and currently trade near the 1.3275-1.3280 region, nearly unchanged for the day.
Any meaningful upside for the USD/CAD pair, however, seems elusive in the wake of sustained US Dollar (USD) selling bias and the emergence of some buying around Crude Oil prices, which tends to underpin the commodity-linked Loonie. Speculation that the Federal Reserve (Fed) is nearing the end of its policy tightening cycle led to a further decline in the US Treasury bond yields and drag the USD to a two-month low. Apart from this, signs of stability in the equity markets drag the safe-haven buck to a two-month low.
Crude Oil prices, meanwhile, inch back closer to a multi-week high touched on Monday and remain well supported by supply cuts announced by the world's biggest oil exporters - Saudi Arabia and Russia - for August. Apart from this, hopes for a recovery in fuel demand during the second half of 2023 lend some support to the black liquid. That said, looming recession risk might keep a lid on any further gains for Oil prices. This, along with bets for a 25 bps Fed rate hike in July, could help limit losses for the USD/CAD pair.
Despite a slight miss from the headline US NFP print, the unexpected dip in the unemployment rate and persistently strong wage growth pointed to still-tight labor market conditions. Moreover, several Fed officials on Monday backed the case for further policy tightening by the US central bank. This, in turn, assists the USD/CAD pair to attract some dip-buying as traders seem reluctant to place aggressive directional bets ahead of the US consumer inflation figures on Wednesday, which will influence the USD demand in the near term.
In the meantime, the USD will take cues from the US bond yields and the broader risk sentiment in the absence of any relevant market-moving economic data. Apart from this, Oil price dynamics should provide some impetus to the USD/CAD pair and allow traders to grab short-term opportunities.
Technical levels to watch
GBP/USD moves to within touching distance of the 1.3000 level for the first time since April of last year. Economists at MUFG Bank analyze the pair’s outlook.
Pound should continue to benefit from higher UK rates in the near term
The Pound should continue to benefit from higher UK rates in the near term until evidence begins to emerge that the UK economy is slowing more in response to much higher rates.
Cable is poised to move into the low 1.3000’s.
See: GBP/USD looks set to extend to 1.30 in this soft Dollar environment – ING
Alvin Liew, Economist at UOB Group, assesses the recently released US Nonfarm Payrolls figures for the month of June.
Key Takeaways
The latest US Labor Market Report was mixed as job creation came in below expectations at 209,000 jobs added in May (versus Bloomberg est 230,000) while the jobs print for Apr & May was revised lower by 110,000. Jobless rate receded to 3.6% (May: 3.7%), as the unemployed numbers fell by 140,000 to 5.957 million and participation rate held at 62.6%. Wage growth pace was above forecast, and at the same pace as May, at 0.4% m/m, 4.4% y/y.
After the hawkish pause in the Jun FOMC, we assigned a high probability the Fed will hike once more by 25-bps in Jul. We continue to expect no rate cuts in 2023, with the FFTR terminal rate at 5.50% lasting through this year.
Admittedly, the US Jun job creation while below forecast, remained above 200k and unemployment rate and wage growth highlighted the resilience of US labor market.
USD/JPY extends its decline. Economists at OCBC Bank analyze the pair’s outlook.
Risks skewed to the downside
Softer used car prices somewhat gave markets the confidence that US CPI could come in softer on Wednesday and the markets are front-loading expectations for UST yields to come off.
Bias remains for downside play.
Support at 139.90 (50-DMA), 138.30 (38.2% fibo retracement of 2023 low to high). Resistance at 142.75 (21-DMA).
See – USD/JPY: Yen forecasts softened on anticipation that a policy tweak is likely to be delayed – Rabobank
- Euro advances for the fourth session in a row vs. the US Dollar.
- Stocks in Europe opens mostly with gains on Tuesday.
- EUR/USD pushes harder and reaches the 1.1025/30 band.
- Germany’s Final inflation figures matched the preliminary readings.
The Euro (EUR) is performing well, maintaining its rebound and extending optimism on turnaround Tuesday. This time, it has encouraged the EUR/USD to surpass the psychological barrier at 1.1000 and reach fresh 2-month highs. Meanwhile, the US Dollar (USD) is experiencing an intense sell-off and the USD Index (DXY) has fallen to multi-week lows in the 101.70 region.
The FX universe currently favors risk appetite against the backdrop of the renewed loss of momentum in US and German yields. Despite this, recent strong results from key US fundamentals indicate a resilient US economy and a tight labor market, reinforcing the likelihood of a 25 basis point rate hike by the Federal Reserve at its July 26 gathering. Similarly, a 25 bps rate raise is anticipated at the European Central Bank's (ECB) meeting later in the month.
Francois Villeroy, a Board member of the ECB, suggests that food inflation should lose traction in the second half of the year and hints that the CPI should average 2.5% in 2024. He also argues that the tightening cycle is approaching its peak, where the bank should remain for a while.
In the meantime, there are increasing concerns about an economic slowdown on both sides of the Atlantic, and discussions continue about the potential future actions of the Fed and ECB in normalizing their monetary policies.
In Germany, the final Inflation Rate for June showed the CPI rising 0.3% MoM and 6.4% over the last twelve months, matching the advanced prints. Later in the European morning, the ZEW Institute will publish its Economic Sentiment survey for both Germany and the broader euro area for the current month.
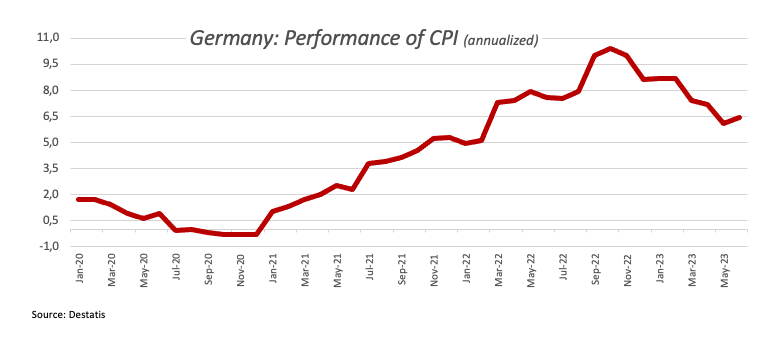
In the US, the NFIB Business Optimism Index and the IBD/TIPP Economic Optimism index are due, followed by a speech from St. Louis Fed James Bullard (2025 voter, hawk).
Daily digest market movers: Euro looks strong ahead of US CPI
- The EUR advances past the 1.1000 hurdle on Tuesday.
- Germany’s final CPI rose 6.4% in the year to June, as expected.
- UK labour market report came in short of estimates in April/May.
- Investors continue to see a 25 bps rate hike by the Fed, ECB in July.
- ECB Villeroy ruled out a wage spiral in France and the euro area.
- Fed’s Bullard will speak later in the US session.
Technical Analysis: Euro now shifts now targets the 2023 peak
The ongoing price action in EUR/USD hints at the idea that further gains might be in store in the short-term horizon.
The continuation of the uptrend now targets the 2023 high of 1.1095 (April 26), which is closely followed by the round level of 1.1100. Further up comes the weekly top of 1.1184 (March 31, 2022), which is supported by the 200-week SMA at 1.1180, just before another round level at 1.1200.
On the downside, the weekly low at 1.0833 (July 6) appears reinforced by the provisional 100-day SMA. The breakdown of this region should meet the next contention area not before the May low of 1.0635 (May 31), which remains propped up by the crucial 200-day SMA (1.0630). South from here emerges the March low of 1.0516 (March 15) prior to the 2023 low of 1.0481 (January 6).
Furthermore, the constructive view of EUR/USD appears unchanged as long as the pair trades above the key 200-day SMA, today at 1.0630.
Euro FAQs
What is the Euro?
The Euro is the currency for the 20 European Union countries that belong to the Eurozone. It is the second most heavily traded currency in the world behind the US Dollar. In 2022, it accounted for 31% of all foreign exchange transactions, with an average daily turnover of over $2.2 trillion a day.
EUR/USD is the most heavily traded currency pair in the world, accounting for an estimated 30% off all transactions, followed by EUR/JPY (4%), EUR/GBP (3%) and EUR/AUD (2%).
What is the ECB and how does it impact the Euro?
The European Central Bank (ECB) in Frankfurt, Germany, is the reserve bank for the Eurozone. The ECB sets interest rates and manages monetary policy.
The ECB’s primary mandate is to maintain price stability, which means either controlling inflation or stimulating growth. Its primary tool is the raising or lowering of interest rates. Relatively high interest rates – or the expectation of higher rates – will usually benefit the Euro and vice versa.
The ECB Governing Council makes monetary policy decisions at meetings held eight times a year. Decisions are made by heads of the Eurozone national banks and six permanent members, including the President of the ECB, Christine Lagarde.
How does inflation data impact the value of the Euro?
Eurozone inflation data, measured by the Harmonized Index of Consumer Prices (HICP), is an important econometric for the Euro. If inflation rises more than expected, especially if above the ECB’s 2% target, it obliges the ECB to raise interest rates to bring it back under control.
Relatively high interest rates compared to its counterparts will usually benefit the Euro, as it makes the region more attractive as a place for global investors to park their money.
How does economic data influence the value of the Euro?
Data releases gauge the health of the economy and can impact on the Euro. Indicators such as GDP, Manufacturing and Services PMIs, employment, and consumer sentiment surveys can all influence the direction of the single currency.
A strong economy is good for the Euro. Not only does it attract more foreign investment but it may encourage the ECB to put up interest rates, which will directly strengthen the Euro. Otherwise, if economic data is weak, the Euro is likely to fall.
Economic data for the four largest economies in the euro area (Germany, France, Italy and Spain) are especially significant, as they account for 75% of the Eurozone’s economy.
How does the Trade Balance impact the Euro?
Another significant data release for the Euro is the Trade Balance. This indicator measures the difference between what a country earns from its exports and what it spends on imports over a given period.
If a country produces highly sought after exports then its currency will gain in value purely from the extra demand created from foreign buyers seeking to purchase these goods. Therefore, a positive net Trade Balance strengthens a currency and vice versa for a negative balance.
- Gold price has recovered after a minor corrective move amid a weak appeal for the USD Index.
- Fed Daly reiterated that two more rate hikes this year will likely be needed to bring down too-high inflation.
- Gold price is on the verge of delivering a breakout of the Inverted Head and Shoulder chart pattern.
Gold price (XAU/USD) has resumed its upside journey after a marginal correction to near $1,930.00 in the London session. The precious metal has found support as the US Dollar Index (DXY) is under extreme pressure ahead of Wednesday’s Consumer Price Index (CPI) data, which will be published at 12:30 GMT.
S&P500 futures have added some gains in Europe, following positive cues observed on Monday. Market sentiment is extremely bullish as investors have shrugged-off uncertainty associated with upcoming corporate earnings for major banks this week.
The US Dollar Index (DXY) has found intermediate support near 101.68. More downside in the USD Index seems favored as tight labor market conditions are releasing heat and inflationary pressures are expected to cool down further amid a decline in gasoline prices. The 10-year US Treasury yields have further dropped to near 3.96%.
As per the preliminary report, annualized headline CPI is expected to decelerate to 3.1% against the former release of 4.0%, and core inflation is seen softening to 5.0% vs. May’s figure of 5.3% in a similar period. Meanwhile, San Francisco Fed Bank President Mary Daly reiterated on Monday that she believes two more rate hikes this year will likely be needed to bring down too-high inflation in the face of a strong labor market.
Gold technical analysis
Gold price is on the verge of delivering a breakout of the Inverted Head and Shoulder chart pattern formed on a two-hour scale. A breakout of the aforementioned chart pattern will result in a bullish reversal. The neckline of the chart pattern is plotted around June 21 high at $1,935.00.
The 50-period Exponential Moving Average (EMA) at $1,923.43 is providing a cushion to the Gold bulls.
Meanwhile, the Relative Strength Index (RSI) (14) has jumped into the bullish range of 60.00-80.00, which indicates that the bullish momentum has been triggered.
Gold two-hour chart

- AUD/USD once again fails ahead of the 200-day SMA barrier near the 0.6700 mark.
- The USD drops to a two-month low and helps limit any meaningful slide for the pair.
- A generally positive risk tone further acts as a tailwind for the risk-sensitive Aussie.
The AUD/USD pair continues with its struggle to make it through the very important 200-day Simple Moving Average (SMA) and attracts some intraday selling in the vicinity of the 0.6700 mark on Tuesday. Spot prices retreat to the lower end of the daily range, around the 0.6680-0.6675 region, though lack follow-through and remain well within a familiar trading band held over the past week or so.
The modest intraday pullback, meanwhile, lacks any obvious fundamental catalyst and is more likely to remain cushioned in the wake of the prevailing bearish sentiment surrounding the US Dollar (USD). Speculations that the Federal Reserve (Fed) has limited headroom to keep raising rates and is nearing the end of its rate-hiking cycle drag the USD Index (DXY), which tracks the Greenback against a basket of currencies, to a two-month low. This, in turn, should act as a tailwind for the AUD/USD pair and help limit any meaningful slide.
The closely-watched US employment details released on Friday showed that the economy added the fewest jobs in 2-1/2 years in June and indicated that the labor market is cooling. Furthermore. the New York Fed's monthly survey revealed on Monday that the one-year consumer inflation expectation dropped to 3.8% in June - the lowest level since April 2021. This could allow the US central bank to soften its hawkish stance, which leads to a further decline in the US Treasury bond yields and continues to undermine demand for the buck.
Apart from this, a stable performance around the equity markets further dents the Greenback's relative safe-haven status and should benefit the risk-sensitive Aussie. That said, repeated failures near a technically significant 200-day SMA make it prudent to wait for some follow-through buying before placing fresh bullish bets around the AUD/USD pair. Traders also prefer to wait on the sidelines ahead of the release of the latest US consumer inflation figures on Wednesday, which will influence the near-term USD price dynamics.
Technical levels to watch
NOK trended stronger after Norway’s inflation on Monday. Economists at Commerzbank analyze Krone's outlook.
Norges Bank expects the terminal rate to be 4.25%
In June, NB proved to be courageous and sent out another restrictive signal ahead of the summer break. It hiked the key rate by 50 bps to 3.75% and signalled a further rate step for August. It expects the terminal rate to be 4.25%. If inflation remains stubbornly high it is quite possible though that Norges Bank takes even further action and that the terminal rate will be even higher in the end.
A lot can happen until then though. But high price data in conjunction with economic data that points towards a reasonably robust economy are likely to principally support NOK in view of Norges Bank’s determined approach as this increases the likelihood of a higher terminal rate.
On Monday, Gold was little changed at $1,925. Economists at ANZ Bank analyze XAU/USD outlook.
Traders remain wary ahead of the CPI data
The weaker USD helped reverse earlier losses in the gold market. However, traders remain wary ahead of the CPI data. Even if inflation falls, the market is still expecting the US Federal Reserve to raise rates later this month.
The market is finding support from sovereign investors. A survey from Invesco indicated they still favour gold as an inflation hedge.
Here is what you need to know on Tuesday, July 11:
The US Dollar (USD) started the week on a bullish note but came under selling pressure in the American session to close in the day in negative territory on Monday. The USD continues to weaken against its rivals amid improving risk sentiment early Tuesday, with the US Dollar Index falling to its lowest level in two months below 102.00. ZEW survey for the Eurozone and Germany will be featured in the European economic docket ahead of NFIB Business Optimism and IBD/TIPP Economic Optimism data from the US. Market participants will continue to pay close attention to comments from central bankers.
Following a mixed opening on Monday, Wall Street's main indexes registered modest daily gains. In the European morning, US stock index futures are up between 0.2% and 0.3%. Meanwhile, the 10-year US Treasury bond yield is already down nearly 1% on the day below 4%.
The Federal Reserve Bank of New York's monthly Survey of Consumer Expectations showed on Monday that the US consumers' one-year inflation expectation dropped to the lowest level since April 2021 at 3.8% in June from 4.1% in May.
EUR/USD climbed to its strongest level since early May above 1.1000 on Tuesday. The data from Germany showed that the annual Consumer Price Index (CPI) rose 6.8% in June, matching the flash estimate and the market expectation.
GBP/USD rose above 1.2900 for the first time since April 2022 on Tuesday. The UK's Office for National Statistics announced on Tuesday that the annual wage inflation, as measured by Average Earnings Excluding Bonus, held steady at 7.3% in three months to May, surpassing the market expectation of 7.1%. The ILO Unemployment Rate edged higher to 4% from 3.8% in the same period.
USD/JPY continues to push lower and trades at its lowest level in three weeks at around 140.50.
Fuelled by retreating US yields, Gold price advanced toward $1,940 during the Asian trading hours and touched its highest level since June 20. In the European morning, XAU/USD stages a downward correction but manages to hold above $1,930.
NZD/USD trades in a tight channel at around 0.6200 early Tuesday. In the Asian session on Wednesday, the Reserve Bank of New Zealand (RBNZ) will announce monetary policy decisions. The RBNZ is forecast to leave the key interest rate unchanged at 5.5%.
Bitcoin registered small daily gains on Monday after having found support at $30,000. BTC/USD holds steady near $30,500 on Tuesday. Ethereum rose nearly 1% on Monday and continues to stretch higher toward $1,900 in the European morning.
- GBP/JPY has fallen back as the UK labor market report has failed to match expectations.
- Three-month Unemployment Rate has jumped to 4.0% while June’s Claimant Count Change is added with fresh 25.7K claims.
- Jeremy Hunt cited that the administration and the central bank will do whatever is necessary to tame price pressures.
The GBP/JPY pair has sensed selling pressure while attempting to hit the immediate resistance of 182.00 in the early London session. The cross has faced a sell-off as the United Kingdom labor market data has missed expectations.
Three-month Unemployment Rate has jumped to 4.0% vs. the consensus and the former release of 3.8%. June’s Claimant Count Change jumped to 25.7K vs. a decline in the number of job-seekers at 22.5K reported last month. Employment figures have missed expectations as firms preferred to dodge credit with higher interest obligations.
Meanwhile, the odds of fat rate hike announcements by the Bank of England (BoE) are still solid amid an absence of deceleration in the labor cost data. Three-month Average Earnings excluding bonuses have maintained a steady pace of 7.3% vs. expectations of 7.1%. Households with higher disposable income could step up overall purchasing ahead and eventually will fuel price pressures.
On Monday, BoE Governor Andrew Bailey conveyed that the central banks observing labor market conditions to bring down inflation to the 2% target. Also, UK FM Jeremy Hunt cited that the administration and the central bank will do whatever is necessary to tame price pressures.
The Japanese Yen has been underpinned against the Pound Sterling amid a solid Taken Survey. Manufacturing activities in the small, medium, and largest enterprises increased tremendously while service activities showed a slower pace. Going forward, Japan’s Producer Price Index (PPI) (June) will be keenly watched. Monthly PPI is expected to show an expansion of 0.1% vs. a contraction of 0.7%.
- Pound Sterling has attracted significant bets as chances of more fat rate hikes from the Bank of England solidify.
- United Kingdom firms are offering higher payroll charges to offset labor shortages.
- Britain’s jobless rate has jumped to 4% and the Claimant Count Change has added fresh 25.7K job seekers.
The Pound Sterling (GBP) has delivered a north-side vertical move marginally above the round-level resistance of 1.2900 as labor cost data has turned out more resilient than expected. The GBP/USD pair has picked immense strength as chances of a bulky interest rate hike from the Bank of England (BoE) have escalated, knowing the fact, that higher disposable income available to households will result in higher purchasing power, and eventually the overall demand will elevate further.
United Kingdom firms are offering higher wages to attract fresh talent amid labor shortages. Scrutiny of the Employment data indicates that the jobless rate has increased as firms have started avoiding credit due to higher interest rate attachment. It seems that the chances of a fat rate hike by the BoE will remain elevated as higher wage pressures are sufficient to offset the impact of a rise in the Unemployment Rate.
Daily Digest Market Movers: Pound Sterling capitalizes upbeat labor data
- Pound Sterling attempts a break above 1.2900 United Kingdom labor cost has turned out hotter than expected.
- Three-month Average Earnings excluding bonuses have remained steady at 7.3% while investors were anticipating a decline to 7.1%.
- Claimant Count Change has jumped to 25.7K while there was a decline of 22.5K claims last month. Three-month Unemployment Rate has increased to 4.0% vs. the expectations and the former release of 3.8%.
- Higher wage pressures are sufficient to offset a significant rise in the jobless rate.
- Market participants are expecting that the interest rates by the Bank of England would peak at 6.25-6.50%.
- BoE Governor Andrew Bailey conveyed on Monday that the central bank will keep the job market under observation in an attempt to bring down inflation.
- Andrew Bailey reiterated that the central bank is making efforts to provide an environment of price stability.
- United Kingdom FM Jeremy Hunt cited on Monday that the government and the central bank "will do what is necessary, for as long as necessary" to return inflation to its 2% target.
- Inflation in Britain's economy has softened from its peak of 11.1%, however, the promise made by UK PM Rishi Sunak that inflationary pressures would halve by year-end would be missed.
- A survey from British Retail Consortium (BRC) showed that higher food prices have squeezed the budgets of households, which has eased demand for big-ticket items.
- Households are facing the burden of high price pressures as the pace of inflation is higher than the velocity of labor costs.
- Last week, Andrew Bailey urged industry regulators to stop overcharging customers for fuel.
- This week, UK’s economic calendar is full of events as the labor market data will be followed by Wednesday’s Financial Policy Committee (FPC) minutes, and Thursday’s Industrial and Manufacturing data (May).
- Monthly Industrial Production and Gross Domestic Product (GDP) are expected to contract by 0.4%. And Manufacturing Production is seen contracting by 0.5%.
- Market sentiment is quite bullish amid an upbeat appeal for risk-sensitive currencies.
- The US Dollar Index (DXY) has extended its three-day losing spell as investors are hoping only one interest rate hike has left in the toolkit of the Federal Reserve (Fed).
- Cleveland Fed President Loretta Mester, in a speech at the University of San Diego, cited that “The economy has shown more underlying strength than anticipated earlier this year, and inflation has remained stubbornly high, with progress on core inflation stalling,” as reported by Reuters.
- This week, the United States Consumer Price Index (CPI) will be keenly watched. As per the preliminary report, monthly headline CPI delivered a higher pace of 0.3% vs. the former pace of 0.1%. Also, core inflation that excludes oil and food prices is expected to match the headline CPI pace.
Technical Analysis: Pound Sterling aims to sustain above 1.2900
Pound Sterling has continued its three-day winning streak after overstepping Monday’s high at 1.2868. The Cable is approaching the Rising Channel chart pattern formed on a daily period in which each pullback is considered a buying opportunity for investors. Upward-sloping 50-and 200-period daily Exponential Moving Averages (DEMAs) indicate that the overall trend is extremely bullish. Bounded oscillators are demonstrating strength in the upside momentum.
Pound Sterling FAQs
What is the Pound Sterling?
The Pound Sterling (GBP) is the oldest currency in the world (886 AD) and the official currency of the United Kingdom. It is the fourth most traded unit for foreign exchange (FX) in the world, accounting for 12% of all transactions, averaging $630 billion a day, according to 2022 data.
Its key trading pairs are GBP/USD, aka ‘Cable’, which accounts for 11% of FX, GBP/JPY, or the ‘Dragon’ as it is known by traders (3%), and EUR/GBP (2%). The Pound Sterling is issued by the Bank of England (BoE).
How do the decisions of the Bank of England impact on the Pound Sterling?
The single most important factor influencing the value of the Pound Sterling is monetary policy decided by the Bank of England. The BoE bases its decisions on whether it has achieved its primary goal of “price stability” – a steady inflation rate of around 2%. Its primary tool for achieving this is the adjustment of interest rates.
When inflation is too high, the BoE will try to rein it in by raising interest rates, making it more expensive for people and businesses to access credit. This is generally positive for GBP, as higher interest rates make the UK a more attractive place for global investors to park their money.
When inflation falls too low it is a sign economic growth is slowing. In this scenario, the BoE will consider lowering interest rates to cheapen credit so businesses will borrow more to invest in growth-generating projects.
How does economic data influence the value of the Pound?
Data releases gauge the health of the economy and can impact the value of the Pound Sterling. Indicators such as GDP, Manufacturing and Services PMIs, and employment can all influence the direction of the GBP.
A strong economy is good for Sterling. Not only does it attract more foreign investment but it may encourage the BoE to put up interest rates, which will directly strengthen GBP. Otherwise, if economic data is weak, the Pound Sterling is likely to fall.
How does the Trade Balance impact the Pound?
Another significant data release for the Pound Sterling is the Trade Balance. This indicator measures the difference between what a country earns from its exports and what it spends on imports over a given period.
If a country produces highly sought-after exports, its currency will benefit purely from the extra demand created from foreign buyers seeking to purchase these goods. Therefore, a positive net Trade Balance strengthens a currency and vice versa for a negative balance.
- Silver climbs to a three-week high during the early European session on Tuesday.
- The technical setup favours bullish traders and supports prospects for further gains.
- A convincing break below the $22.70-65 area is needed to negate the positive bias.
Silver regains positive traction following the previous day's good two-way price swings and jumps to a three-week high during the early part of the European session on Tuesday. The white metal, however, struggles to find acceptance or build on the move beyond the $23.35-$23.40 confluence - comprising the 200-period Simple Moving Average (SMA) on the 4-hour chart and the 50% Fibonacci retracement level of the downfall from the June swing high.
Looking at the broader picture, the formation of an ascending channel from the vicinity of the $22.00 mark, or the multi-month low touched in June, points to a well-established short-term bullish trend. Moreover, technical indicators on hourly charts are holding comfortably in bullish territory and have just started gaining positive traction on the daily chart. This adds credence to the constructive setup and supports prospects for a further near-term appreciating move.
Bulls, however, might still wait for a sustained strength above the $23.35-$23.40 confluence before positioning for a move towards testing the 61.8% Fibo., around the $23.60 region, en route to the $24.00 round figure. The positive momentum could get extended further towards the $24.20-$24.25 intermediate barrier en route to the June monthly swing high, around the $24.55 region. The XAG/USD might eventually aim towards reclaiming the $25.00 psychological mark.
On the flip side, the 38.2% Fibo., around the $23.00 round figure, now seems to act as immediate support. Any further slide is likely to attract some buying and remain limited near the $22.65-$22.70 area, or the 23.6% Fibo. level. A convincing break below the latter could make the XAG/USD vulnerable to sliding back towards the $22.mark. Some follow-through selling should pave the way for fall towards the $21.70-$21.65 zone en route to the $21.25 support and the $21.00 mark.
Silver 4-hour charty
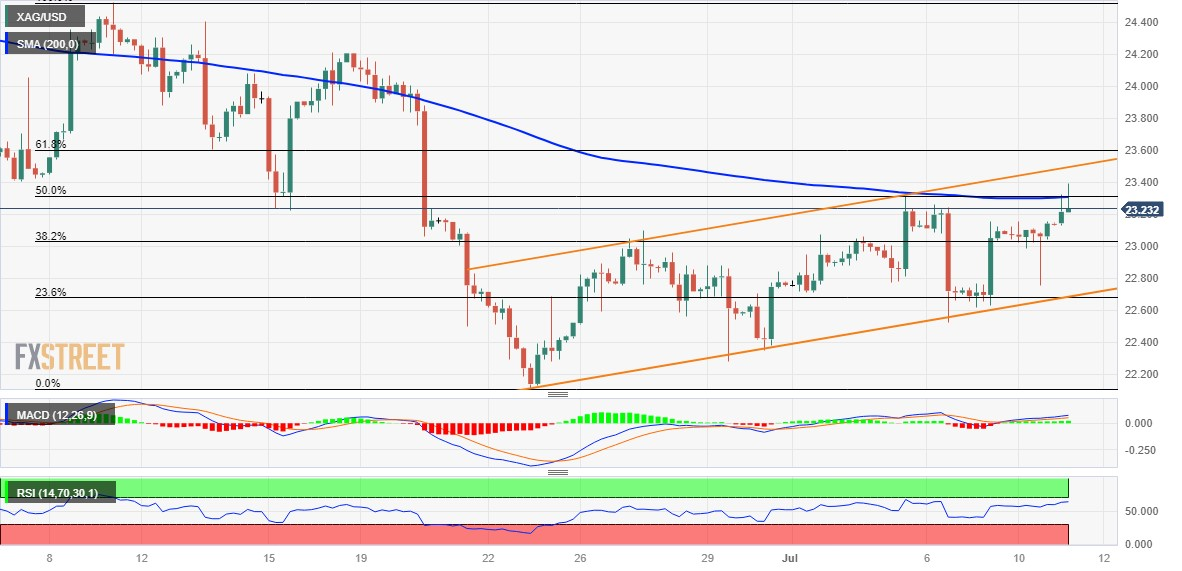
Key levels to watch
Extra weakness could see USD/CNH revisit the area below the 7.1800 level in the short-term horizon, comment UOB Group’s Economist Lee Sue Ann and Markets Strategist Quek Ser Leang.
Key Quotes
24-hour view: We expected USD to decline yesterday but we were of the view that “the major support at 7.1800 is likely out of reach.” USD weakened less than expected as after dropping to 7.2205, it rebounded and ended the day little changed at 7.2298 (-0.03%). The underlying tone still appears to be soft, and today, USD is likely to trade with a downward bias. However, 7.1800 is still likely out of reach. Resistance is at 7.2380, followed by 7.2500.
Next 1-3 weeks: Yesterday (10 Jul, spot at 7.2230), we indicated that short-term momentum is building rapidly, and the risk of USD pulling back below 7.1800 has increased. USD then traded in a range of 7.2205/7.2492 before closing little changed at 7.2298 (-0.03%). While there is no further increase in momentum, we will hold on to our view for now. Only a breach of 7.2650 (no change in ‘strong resistance’ level) would indicate that USD is not ready to head lower to 7.1800.
- The index extends the breach of the 102.00 support.
- Investors continue to favour the risk complex on Tuesday.
- NFIB Index, IBD/TIPP Index, Fed’s Bullard next on tap.
The greenback, when tracked by the USD Index (DXY), sheds further ground and breaks below the 102.00 support to print new 2-month lows on turnaround Tuesday.
USD Index looks offered ahead of key US CPI
The dollar extends the sell-off and drops for the fourth session in a row on Tuesday, this time breaching the key support at 102.00 the figure with certain conviction in a context dominated by the investors’ appetite for the risk-associated universe.
Adding to the dollar’s decline, US yields continue to correct lower from recent peaks ahead of the publication of crucial US inflation figures on Wednesday and steady bets for a 25 bps rate hike by the Federal Reserve at its July 26 meeting.
Minor releases in the US docket will see the NFIB Business Optimism Index and the IBD/TIPP Economic Optimism index along with the speech by St. Louis Fed James Bullard (2025 voter, hawk).
What to look for around USD
The index loses further ground and extends the pessimism seen at the beginning of the week, this time below the key 102.00 support.
Meanwhile, the likelihood of another 25 bps hike at the Fed's upcoming meeting in July remains high, supported by the continued strength of key US fundamentals such as employment and prices.
This view was further bolstered by comments from Fed Chief Powell at the June FOMC event, who referred to the July meeting as "live" and indicated that most of the Committee is prepared to resume the tightening campaign as early as next month.
Key events in the US this week: MBA Mortgage Applications, Inflation Rate, Fed’s Beige Book (Wednesday) – Producer Prices, Initial Jobless Claims (Thursday) – Advanced Michigan Consumer Sentiment (Friday).
Eminent issues on the back boiler: Persistent debate over a soft/hard landing of the US economy. Terminal Interest rate near the peak vs. speculation of rate cuts in late 2023/early 2024. Fed’s pivot. Geopolitical effervescence vs. Russia and China. US-China trade conflict.
USD Index relevant levels
Now, the index is down 0.16% at 101.78 and faces the next support at 101.67 (monthly low July 11) followed by 100.78 (2023 low April 14) and finally 100.00 (round level). On the other hand, the breakout of 103.54 (weekly high June 30) would open the door to 104.56 (200-day SMA) and then 104.69 (monthly high May 31).
GBP/USD has risen to the highest levels since last April on the back of some strong UK wage data for May. Economists at ING analyze the pair’s outlook.
Pay data can keep the Bank of England hawkish for longer
The upward surprise to UK wage growth is partly down to backward revisions. But that is not a huge comfort because looking at the private sector, which is what the BoE focuses on, we have seen another big MoM increase in pay. Whether that is partly because of the ongoing passthrough of the new National Living Wage (+10% in April), is not clear. But certainly, these are not figures the BoE will want to see and will maintain the market's exceptionally aggressive pricing of the Bank Rate up near 6.40% early next year.
GBP/USD looks set to extend to 1.30 in this soft Dollar environment, while EUR/GBP can retest the lows near 0.8520.
EUR/USD is nudging above 1.10 in quiet conditions. Economists at ING analyze the pair’s outlook.
Not get over-eager on a possible range break-out
The default view will be that EUR/USD is unlikely to break above 1.1100 since the Fed is still hawkish and risk assets have yet to adjust to the much more restrictive monetary policy settings around the world. It is probably dangerous to expect a range break-out, but if it were to occur this week, Wednesday's US June CPI figure would probably be the catalyst.
We have been here before and should not get over-eager on a possible range break-out, but we could see EUR/USD drifting closer to the year's highs near 1.1100.
- USD/JPY drops to the lowest level in three weeks, down for the fourth consecutive day.
- Downside break of 21-DMA, 61.8% Fibonacci retracement joins bearish MACD signals to favor Yen pair sellers.
- Multiple hurdles to challenge USD/JPY bulls within bullish megaphone pattern.
USD/JPY remains on the back foot for the fourth consecutive day as sellers attack May’s peak below 141.00, down 0.50% intraday near 140.60 heading into Tuesday’s European session.
In doing so, the Yen pair renews a three-week low while extending the previous week’s downside break of the 21-DMA and 61.8% Fibonacci retracement level of October 2022 to January 2023 downside. It’s worth noting that the bearish MACD signals add strength to the downside bias.
With this, the risk-barometer pair appears all-set to break the 140.00 psychological magnet with an aim to test the 50% Fibonacci retracement level surrounding 139.60.
However, the bottom line of a bullish megaphone trend-widening chart pattern comprising levels marked since late March, around 139.00 by the press time, appears a tough nut to crack for the USD/JPY bears.
Following that, the 200-DMA and an ascending support line from January, respectively near 137.20 and 134.90, will be in the spotlight for the Yen pair sellers.
Alternatively, the 61.8% Fibonacci retracement and the 21-DMA, close to 142.50 and 142.75 in that order, restrict the short-term upside of the USD/JPY pair.
More importantly, a horizontal area encompassing multiple levels marked since October 2022, near 145.10-15, appears a tough nut to crack for the USD/JPY bulls.
USD/JPY: Daily chart

Trend: Limited downside expected
European Central Bank (ECB) Governing Council member Francois Villeroy de Galhau said on Tuesday, “we are close to the peak of interest rates.”
Additional quotes
Livret a savings account rate must strike right balance.
We are starting having good news on inflation.
Inflation will continue to decline and will be back at 2% by 2025.
Inflation should be at 2.5% on average next year.
Once we reach this peak, we will need to stay at this level for a while.
Sees 2023 French growth at 0.7%.
France does not have the means for a new lowering of taxes.
If France was able to stabilize its expenses, the country's debt/GDP ratio could be brought under 100% in 10 years.
Extra decline could see USD/JPY revisit the 140.00 neighbourhood in the next few weeks, suggest UOB Group’s Economist Lee Sue Ann and Markets Strategist Quek Ser Leang.
Key Quotes
24-hour view: Our view for USD to consolidate in a range of 142.00/143.30 yesterday was incorrect. USD rose to a high of 143.00, plunged to 141.26 before closing on a soft note at 141.31 (-0.53%). While the strong decline over the past couple of days appears to be overdone, the weakness in USD has not stabilized. That said, the next major support at 140.05 is unlikely to come under threat today. On the upside, a breach of 142.30 (minor resistance is at 141.75) would suggest the weakness in USD has stabilized.
Next 1-3 weeks: Yesterday (10 Jul, spot at 142.50), we highlighted that “while USD could pullback further; it is worth noting that there is a solid support level at 141.60 and another at 140.95.” We did not expect USD to slice through both support levels as it plunged to a low of 141.26. Not surprisingly, conditions are severely oversold, but the weakness in USD has not stabilized. In other words, USD could weaken further. The next level to watch is 140.05. Overall, only a breach of 143.00 (‘strong support’ level was at 144.00 yesterday) would indicate that USD is not weakening further.
Considering advanced prints from CME Group for natural gas futures markets, open interest shrank by nearly 3.5K contracts on Monday, partially reversing the previous daily build. Volume, instead, went up by almost 48K contracts after two consecutive daily drops.
Natural Gas faces initial support around $2.50
Monday’s uptick in prices of natural gas was accompanied by shrinking open interest and increasing volume, which leaves the door open to a minor corrective decline amidst the prevailing consolidative phase. So far, there is decent contention around the $2.50 region per MMBtu.
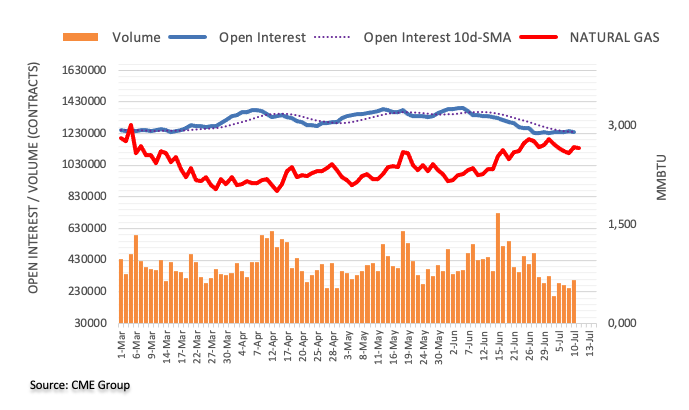
Economists at Commerzbank expect the British Pound (GBP) to weaken medium term as the Bank of England will continue to act hesitantly.
The BoE remains too hesitant
We stick to our view that Sterling is likely to struggle to record further gains.
The BoE remains too hesitant, and concerns about a hard landing for the economy are going to intensify, thus limiting Sterling’s upside potential.
We continue to see a weakening GBP medium term as we assume that the market’s rate expectations are excessive. Hence, we see potential for disappointment.
In the opinion of UOB Group’s Economist Lee Sue Ann and Markets Strategist Quek Ser Leang, NZD/USD is likely to navigate within the 0.6130-0.6250 range in the next few weeks.
Key Quotes
24-hour view: We expected NZD to trade in a range of 0.6180/0.6230 yesterday. However, after dropping to 0.6167, NZD rebounded to 0.6217 before ending the day little changed at 0.6212 (+0.05%). The price actions offer no fresh clues and today, we expect NZD to trade in a range of 0.6175/0.6230.
Next 1-3 weeks: There is not much to add to our update from yesterday (10 Jul, spot at 0.6200). As highlighted, we continue to expect NZD to trade in a range even though the slightly firmed underlying tone suggests a higher range of 0.6130/0.6250.
- Gold Price pierces short-term resistance to aim for $1,950, prints three-day uptrend.
- Softer US Dollar, market’s cautious optimism underpin XAU/USD run-up.
- US inflation numbers, Fed talks appear the key for clear directions of the Gold Price.
Gold Price (XAU/USD) renews intraday high as it keeps Friday’s run-up, despite a sluggish week-start. In doing so, the Gold Price benefits from the broad US Dollar weakness, mainly due to the softer US inflation expectations and mixed China data. However, the hawkish Fed talks and the US-China tension prod the XAU/USD bulls amid a cautious mood ahead of Wednesday’s US inflation numbers.
Additionally challenging the Gold buyers are the doubts about the latest US Treasury bond yields. It’s worth noting that the market’s fears of recession push traders toward traditional havens like bonds, Gold and the Yen. However, the same catalysts also allow the US Dollar to cheer the sour sentiment, which it has failed to off late. As a result, the market’s mixed concerns keep the Gold buyers hopeful but the upside room appears limited.
Also read: Gold Price Forecast: XAU/USD upside appears limited until 21 DMA resistance holds
Gold Price: Key levels to watch
Our Technical Confluence Indicator shows that the Gold Price edges higher after crossing the $1,930 key support comprising the Fibonacci 23.6% on one-week, 38.2% on one-month and the previous daily high.
With this, the XAU/USD upside appears well-set to claim the $1,935 hurdle comprising the upper Bollinger band on the four-hour chart.
Following that, a convergence of the 100-DMA and 61.8% on one-month, around $1,950, will be in the spotlight.
On the contrary, a downside break of $1,930 could quickly fetch the Gold price towards the $1,922 support confluence including the 5-DMA, and 38.2% on one-week and one-month.
In a case where the Gold Price drops below $1,922, the Fibonacci 61.8% on one-week and the Pivot Point One-day S1 will highlight the last defense of the XAU/USD buyers around $1,915 before directing the quote toward the $1,900 round figure.
It should be observed that the Pivot Points one-day S2 and one-week S1 highlights the $1,908 level as an extra filter toward the south.
Here is how it looks on the tool
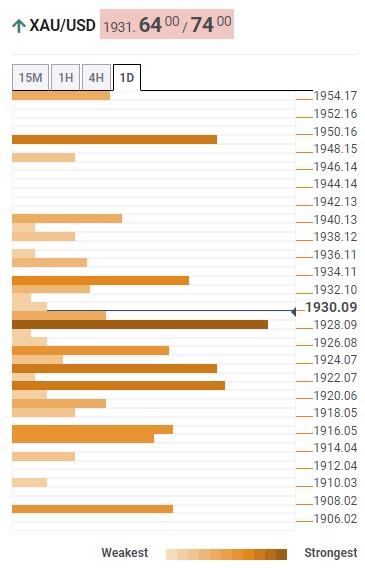
About Technical Confluences Detector
The TCD (Technical Confluences Detector) is a tool to locate and point out those price levels where there is a congestion of indicators, moving averages, Fibonacci levels, Pivot Points, etc. If you are a short-term trader, you will find entry points for counter-trend strategies and hunt a few points at a time. If you are a medium-to-long-term trader, this tool will allow you to know in advance the price levels where a medium-to-long-term trend may stop and rest, where to unwind positions, or where to increase your position size
Economists at Commerzbank analyze Hungarian Forint (HUF) outlook.
Forint to regain some ground by the end of the year
We forecast the Forint to regain some ground by the end of the year because inflation is likely to moderate faster than the pace at which MNB will cut rates, and the real interest rate will therefore become less negative – in this window, we see EUR/HUF in the 365 range.
But, we forecast a weaker forint subsequently in 2024 because: Hungary is more inflation-prone than Poland or the Czech Republic, which will depress Hungary’s real interest rate once again when inflation proves stubborn in 2024. The situation surrounding Hungary’s disputes with the European Commission on EU funds continues to be precarious. The latest government guidance suggests that such conditionalities are not about to be met soon. High risks prevail in this regard.

Source: Commerzbank Research
CME Group’s flash data for crude oil futures markets noted traders scaled back their open interest positions for the third consecutive session at the beginning of the week, now by around 11.6K contracts. In the same direction, volume shrank for the third session in a row, this time by around 208.5K contracts.
WTI re-targets the $75.00 region
WTI prices kicked off the new trading week on the back foot amidst shrinking open interest and volume. Against that backdrop, the likelihood of further weakness appears diminished and could pave the way for a potential challenge of the June high near the $75.00 mark per barrel.
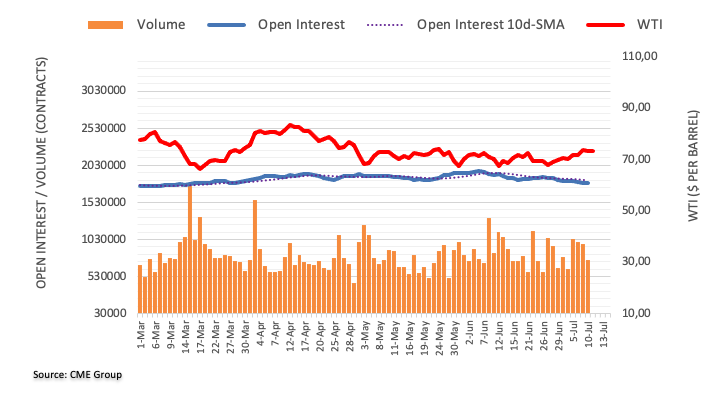
Further upside could motivate GBP/USD to challenge and even surpass the 1.2900 yardstick, according to UOB Group’s Economist Lee Sue Ann and Markets Strategist Quek Ser Leang.
Key Quotes
24-hour view: Yesterday, we held the view that GBP “could rise to 1.2865 before the current strong upward pressure might ease”. We stated, “support is at 1.2805, followed by 1.2780”. In London, GBP fell sharply but briefly to 1.2751 and then rebounded strongly to 1.2869. Despite the advance, upward momentum has not increased much. That said, there is room for GBP to rise further even though 1.2950 is unlikely to come into view (there is another resistance at 1.2900). On the downside, 1.2800 is strong support now (minor support is at 1.2835).
Next 1-3 weeks: We highlighted yesterday (10 Jul, spot at 1.2830) that “while the risk for GBP has shifted to the upside, it must break and stay above 1.2850 before an advance to 1.2900 is likely.” GBP rose to 1.2869 in NY before closing at 1.2860 (+0.15%). In view of the improved momentum, GBP is likely to break above 1.2900. Further advance above 1.2900 is not ruled out, but 1.3000 may not come into view so soon. The upside risk is intact as long as GBP stays above 1.2750 (‘strong support’ level was at 1.2735 yesterday).
- EUR/GBP reverses from daily top on firmer UK jobs report, downbeat German inflation figures.
- Final German inflation figures for June contrast with firmer British employment data to weigh on price.
- ECB policymakers appear comparatively more hawkish than their BoE counterparts, suggesting room for upside.
- German ZEW Survey data for July, central bank headlines eyed for fresh impulse.
EUR/GBP reverses from intraday high, refreshing the daily low near 0.8550 as a slew of UK/EU data released early Tuesday.
That said, the UK Claimant Count Change jumps by 25.7K for June versus -22.5K prior (revised) whereas the ILO Unemployment Rate rallies to 4.0% for three months to May compared to market expectations of witnessing no change in 3.8% prior figure.
Additionally, the final readings of Germany’s inflation for June, per the Consumer Price Index (CPI) and the Harmonized Index of Consumer Prices (HICP) measures match the initial forecasts of 6.4% and 6.8% respectively YoY figures.
Apart from the data, hawkish comments from the British policymakers, versus the mixed central bank talks and data from Eurozone also weigh on the cross-currency pair, especially after the firmer British employment figures.
On Monday, UK finance minister Jeremy Hunt spoke alongside Bank of England (BoE) Governor Andrew Bailey while showing readiness to take measures to return inflation to its 2% target. It’s worth noting that the BoE Governor Bailey tried defending the restrictive monetary policy while pushing back concerns about the UK’s economic slowdown.
On the other hand, the Eurozone Sentix Investor Confidence declined to -22.5 for July from -17 in June. Adding to the pessimism were comments from Sentix managing director Manfred Huebner who said, “There is also nothing positive to report in terms of forward-looking expectations.” Sentix’s Huebner also mentioned that the Investor Confidence Index for Germany fell 7.3 points to -28.4.
Talking about the European Central Bank (ECB) talks, Governing Council member Francois Villeroy de Galhau said, “Eurozone rates will soon reach their high point, but it will be more of a high plateau than a peak.” On the same line, Governing Council member and Bank of Portugal Governor, Mario Centeno, said that the inflation is coming down faster than the way up. The policymaker also added that they need to fuel this process and be very confident we can make it.
It should be noted that the market’s cautious mood also put a floor under the EUR/GBP prices considering the Euro’s (EUR) comparatively more market credence than the Pound Sterling (GBP).
Moving on, Germany’s ZEW sentiment survey for July and the central bankers’ comments will be eyed for clear directions.
Technical analysis
Although the 0.8520-15 region appears a tough nut to crack for the EUR/GBP bears, the pair’s recovery remains elusive unless crossing a downward-sloping resistance line from late April, close to 0.8615 as we write.
Open interest in gold futures markets extended the uptrend for yet another session on Monday, this time by around 19.8K contracts according to preliminary readings from CME Group. Volume followed suit and increased by around 31.5K contracts after two consecutive daily pullbacks.
Gold: Support remains around $1900
Gold prices charted an inconclusive session at the beginning of the week amidst rising open interest and volume, leaving the door open to the continuation of the range bound in the very near term at least. In the meantime, the $1900 region per troy ounce continues to hold the downside for the time being.
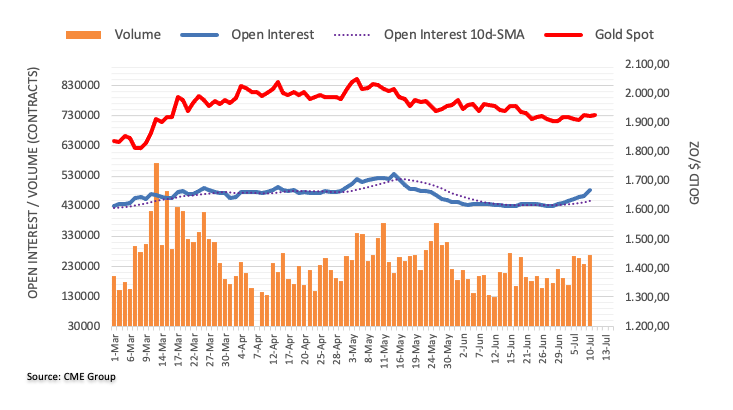
- USD/CHF is expected to extend its downside journey below 0.8840 as the market sentiment is bullish.
- The US Dollar Index has extended its three-day losing streak as only one interest rate hike has been left in the toolkit of the Fed.
- Apart from the US inflation data, investors will focus on the Fed’s Beige Book.
The USD/CHF pair has delivered a perpendicular fall to near 0.8840 in the early European session. The Swiss Franc asset is expected to deliver further breakdown as the market mood is quite upbeat and the appeal for the US Dollar Index (DXY) is extremely weak.
S&P500 futures have turned choppy after a bullish trading session, awaiting a fresh trigger for further action. c Federal Reserve (Fed), which will be announced this month. The yields offered on 10-year US treasury bonds have dropped below 4.0%.
This week, the major trigger for the USD Index will be the Consumer Price Index (CPI) data, which will release on Wednesday at 12:30 GMT. As per the preliminary report, monthly headline CPI delivered a higher pace of 0.3% vs. the former pace of 0.1%. Also, core inflation that excludes oil and food prices is expected to match the headline CPI pace.
Meanwhile, annualized headline CPI is expected to decelerate to 3.1% against the former release of 4.0%, and core inflation is seen softening to 5.0% vs. May’s figure of 5.3% in a similar period.
Apart from the US inflation data, investors will focus on the Fed’s Beige Book, which is expected to show the current economic situation and the outlook.
An absence of economic events in the Swiss Franc economy will keep the spotlight on the US Dollar. However, about the Swiss National Bank’s (SNB) interest rate guidance, analysts at MUFG believe that another 25 bps rate hike in September seems more likely than not at this stage. Another rate hike with core CPI unchanged at the current level (1.9%) or lower would take the SNB’s policy rate in real terms into positive territory – joining the RBNZ, the Fed, and the BoC.
- EUR/JPY drops to the lowest level in three weeks, down for the sixth consecutive day.
- Bearish MACD signals, RSI’s retreat from overbought territory joins 21-DMA break to favor sellers.
- Convergence of previous resistance line, short-term support line challenges the bears.
- Multiple hurdles near 158.00 stand tall to prod pair buyers.
EUR/JPY remains on the back foot for the sixth consecutive day as it flashes the 154.93 figure heading into Tuesday’s European session. In doing so, the cross-currency pair declines to the lowest levels in three weeks.
That said, a clear downside break of the 21-DMA, near 155.85 by the press time, joins the bearish MACD signals and the RSI (14) line’s U-turn from the overbought territory to suggest the quote’s further downside.
However, a convergence of the previous resistance line from late October 2022 and ascending trend line from March 24, close to the 152.00 round figure, appears a tough nut to crack for the EUR/JPY bears.
If at all the quote remains bearish past 152.00, Mays high near 151.60 and the 150.00 psychological magnet will entertain the EUR/JPY bears before directing them to the 100-DMA support of around 148.40.
Meanwhile, a daily closing beyond the 21-DMA, around 155.85 at the latest, could recall the short-term buyers of the EUR/JPY pair.
Though, a slew of resistances around the 158.00 and the 160.00 round figure will challenge the bulls afterward.
EUR/JPY: Daily chart
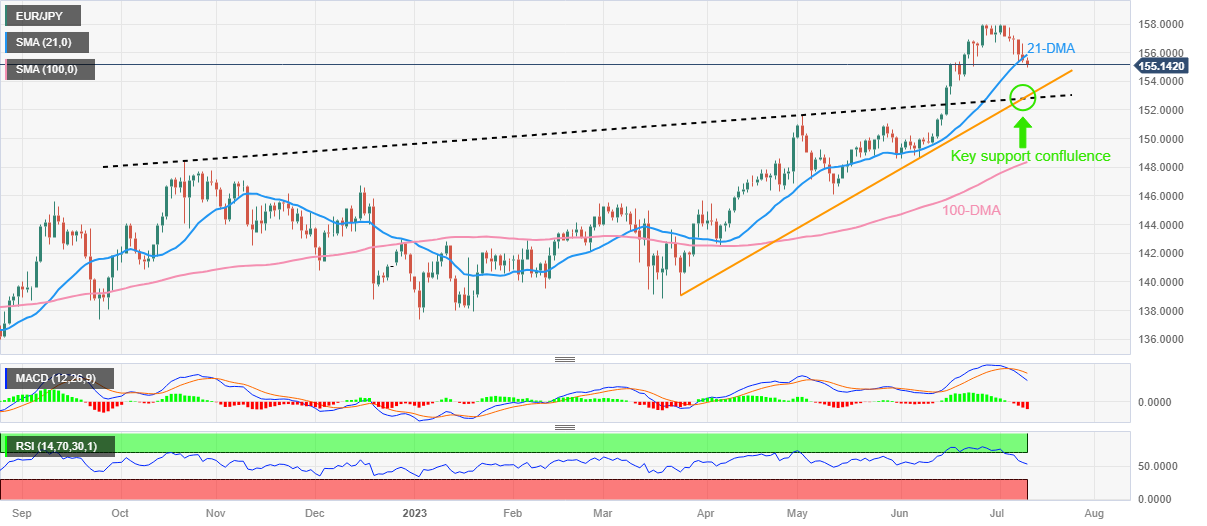
Trend: Further downside expected
UOB Group’s Economist Lee Sue Ann and Markets Strategist Quek Ser Leang note EUR/USD now targets the 1.1050 region in the near term.
Key Quotes
24-hour view: We expected EUR to strengthen yesterday but we highlighted that “in view of the overbought conditions, June’s high near 1.1010 is unlikely to come under threat today”. We added, “In order to keep the momentum going, EUR must stay above 1.0925 (minor support is at 1.0945).” Our view turned out to be correct, as EUR dipped to 1.0942 and then rose to a high of 1.1001 in late NY trade. While conditions remain overbought, the EUR strength is not showing signs of easing just yet. Today, EUR is likely to break above 1.1010, but the next resistance at 1.1050 could be just out of reach. Support is at 1.0975, followed by 1.0950.
Next 1-3 weeks: We turned positive in EUR yesterday (10 Jul, spot at 1.0965) and we noted, the level to watch is 1.1010, followed by 1.1050. EUR rose to a high of 1.1001 in NY trade, and upward momentum remains strong. Looking ahead, if EUR breaks above 1.1050, the next level to aim for is the year-to-date high of 1.1095. In order to maintain the buildup in momentum, EUR must not break below 1.0905 (‘strong support’ level was at 1.0870 yesterday).
FX option expiries for July 11 NY cut at 10:00 Eastern Time, via DTCC, can be found below.
- EUR/USD: EUR amounts
- 1.0800 762m
- 1.0890 1.6b
- 1.0925 467m
- 1.0950 994m
- 1.0980 434m
- 1.1050 308m
- 1.1200 729m
- USD/JPY: USD amounts
- 143.00 421m
- AUD/USD: AUD amounts
- 0.6600 390m
- EUR/GBP: EUR amounts
- 0.8580 303m
- NZD/USD struggles to defend three-day uptrend at monthly top, retreats from recent peak of late.
- Cautious mood ahead of top-tier data/events join pre-RBNZ anxiety to prod Kiwi bulls.
- Downbeat US inflation expectations, NFP weigh on US Dollar.
- Traders anticipate RBNZ’s inaction, softer US CPI and flag fears of heavy reaction to surprises.
NZD/USD pares intraday gains around 0.6215-10 as it reverses from the highest levels in three weeks heading into Tuesday’s European session. In doing so, the Kiwi pair struggles to defend the three-day uptrend amid the market’s cautious mood ahead of Wednesday’s Reserve Bank of New Zealand (RBNZ) Interest Rate Decision and the US inflation data for June per the Consumer Price Index (CPI) indicator.
It’s worth noting that the US Dollar renews a two-month low of around 101.75 by the press time as market players fear downbeat US inflation data and challenges for the Federal Reserve’s (Fed) further rate hikes, especially after Friday’s disappointment from the US jobs report.
The fears of softer US inflation gained momentum on Monday after the New York Federal Reserve’s (Fed) monthly inflation expectations survey suggested the US consumers' one-year inflation expectation dropped to the lowest level since April 2021 at 3.8% in June from 4.1% in May. Previously, the US Nonfarm Payrolls (NFP) marked the first below-expectations print in 15 months and drowned the US Dollar to make it post the biggest daily loss in three weeks.
On the other hand, Monday’s downbeat China inflation joined the market’s fears of the RBNZ’s inaction, after consecutive rate hikes since October 2021, to prod the NZD/USD buyers amid sluggish market sentiment.
While portraying the mood, the S&P500 Futures seesaw around 4,445, up 0.05% intraday, struggling to extend the previous day’s recovery from the lowest level since June 29. That said, the US Treasury bond yields remain pressured after reversing from the highest level since March on Monday. It should be noted that the benchmark US 10-year Treasury bond yields printed the first daily loss in July the previous day whereas the two-year counterpart declined for the second consecutive day, to respectively near 3.99% and 4.85% at the latest.
Moving on, a light calendar and chatters about the US-China tension may join the hawkish Fed talks to prod the NZD/USD bulls ahead of the key RBNZ. Should New Zealand’s central bank surprise markets with a rate hike, even of 0.25%, the Kiwi pair may rally towards the late May swing high. Even if it doesn’t, downbeat US inflation data can keep the quote firmer.
Technical analysis
Despite the latest pullback, the NZD/USD pair buyers remain hopeful unless the quote stays beyond a convergence of the 100-DMA and the previous resistance line from May 19, close to 0.6185-80 by the press time.
- EUR/USD is sustaining auction confidently above 1.1000 amid a vertical sell-off in the USD Index.
- The US Dollar Index is under severe pressure as July’s interest rate hike by the Fed could be the last nail in the coffin.
- Inflationary pressures in the German economy are significantly higher than other nations of the old continent.
The EUR/USD pair is maintaining an auction comfortably above the psychological resistance of 1.1000 in the Asian session. The major currency pair has got immense strength as the US Dollar Index (DXY) has continued its three-day losing spell.
S&P500 futures have added nominal gains in Tokyo. US equities were decently bought on Monday, portraying upbeat market sentiment. The USD Index has refreshed its two-month low at 101.74 despite the chances of one more interest rate hike from the Federal Reserve (Fed) in July being resilient. As per the CME Fedwatch tool, more than 92% chances are in favor of a 25 basis point (bp) interest rate hike, which will push rates to 5.25-5.50%.
The US Dollar Index is under severe pressure as July’s interest rate hike by Fed chair Jerome Powell could be the last nail in the coffin as tight labor market conditions are releasing heat and inflationary pressures are softening consistently.
Going forward, Wednesday’s United States Consumer Price Index (CPI) data will be keenly watched. As per the preliminary report, monthly headline CPI delivered a higher pace of 0.3% vs. the former pace of 0.1%. Also, core inflation that excludes oil and food prices is expected to match the headline CPI pace.
On the Eurozone front, investors are awaiting the final reading of German inflation data. Inflationary pressures in the German economy are significantly higher than other nations of the old continent, which will keep the odds of further policy-tightening by the European Central Bank (ECB) healthy.
ECB Governing Council member Francois Villeroy de Galhau said over the weekend, “Eurozone rates will soon reach their high point, but it will be more of a high plateau than a peak.”
- WTI picks up bids to refresh intraday high, reverses the previous day’s pullback from five-week top.
- U-turn from previous resistance, upbeat oscillators keep Oil buyers hopeful.
- 100-DMA, 50% Fibonacci retracement challenge energy bulls near multi-day top.
- Fortnight-old rising trend line acts as additional downside filter.
WTI crude oil price remains on the front foot as it renews its intraday high near $73.40 while reversing the previous day’s pullback from a multi-day high early Tuesday. In doing so, the black gold bounces off a seven-week-old previous resistance line to poke the 100-DMA hurdle.
Apart from the clear U-turn from the resistance-turned-support, the bullish MACD signals and upbeat RSI (14), not overbought, also keep the WTI crude oil buyers hopeful to overcome the immediate upside hurdle, namely the 100-DMA level of around $73.55.
However, the 50% Fibonacci retracement of the commodity’s April-May downturn and the recent peak, respectively near $73.90 and $74.10, act as the last defenses of the black gold bears.
Following that, the 61.8% Fibonacci retracement and the 200-DMA, around $76.20 and 77.20 in that order, will be in the spotlight.
On the contrary, a downside break of the previous resistance line, near the $73.00 round figure, isn’t an open invitation to the Oil bears as an upward-sloping support line from June 28, close to $71.90, holds the key for WTI seller’s entry.
Hence, the Oil price remains on the buyer’s radar even if the road toward the north appears bumpy.
WTI crude oil: Daily chart
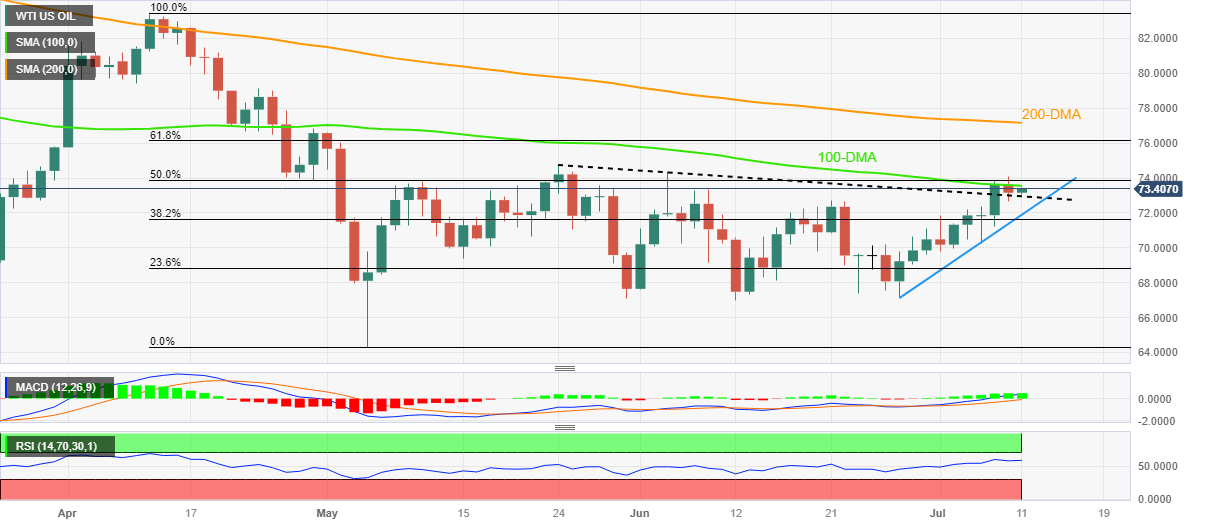
Trend: Further upside expected
- USD/CAD meets with a fresh supply on Tuesday and is weighed down by a combination of factors.
- An uptick in Oil prices underpins the Loonie and exerts some pressure amid sustained USD selling.
- The recent failure near the 50-day SMA and the subsequent fall support prospects for further losses.
The USD/CAD pair comes under some renewed selling pressure following the previous day's modest bounce and hits a four-day low, around the 1.3250 area during the Asian session on Tuesday.
Crude Oil prices regain some positive traction and reverse a part of Monday's pullback from a five-week high, which, in turn, is seen underpinning the commodity-linked Loonie. The US Dollar (USD), on the other hand, prolongs its descending trend for the fourth straight day and drops to a two-month low. This contributes to the offered tone surrounding the USD/CAD pair and supports prospects for further losses.
From a technical perspective, last week's failure near the 50-day Simple Moving Average (SMA) and the subsequent sharp pullback from the 1.3385 region, or a one-month peak, favour bearish traders. Moreover, oscillators on the daily chart have again started gaining negative traction and add credence to the negative outlook, suggesting that the path of least resistance for the USD/CAD pair is to the downside.
Hence, some follow-through decline towards testing the next relevant support near the 1.3225-1.3220 area, en route to the 1.3200 mark, or the monthly low touched last week, looks like a distinct possibility. A convincing break below the latter could make the USD/CAD pair vulnerable to weaken further below the 1.3145 intermediate support and challenge the YTD low, around the 1.3115 area touched in June.
On the flip side, the overnight swing high, around 1.3300 round figure now seems to act as an immediate hurdle. A sustained move beyond might trigger a short-covering move and lift the USD/CAD pair back towards the 50-day SMA resistance, currently around the 1.3375-1.3380 region. This is closely followed by the 1.3400 mark, which if cleared decisively will shift the near-term bias in favour of bullish traders.
USD/CAD daily chart
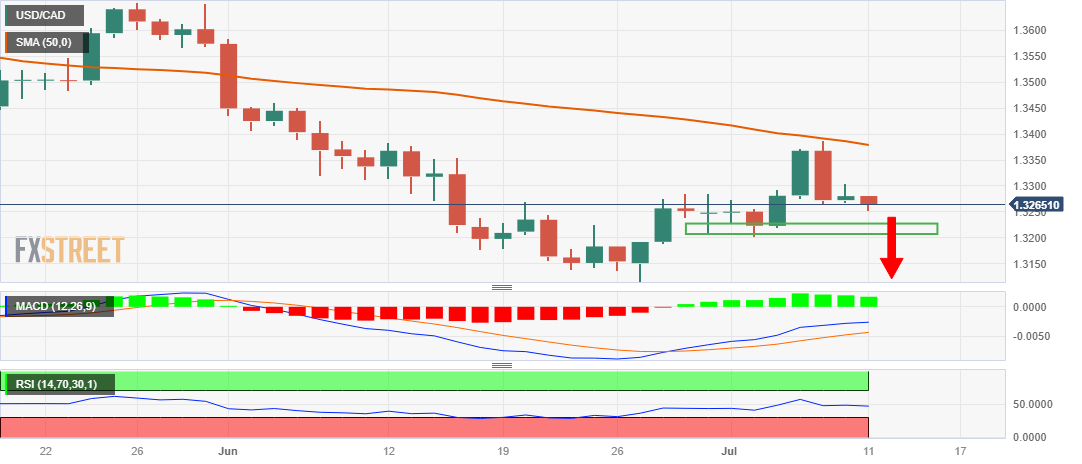
Key levels to watch
- GBP/JPY prints four-day losing streak, fades bounce off multi-day low of late.
- Yields edge lower as inflation fears recede, recession woes escalate.
- BoE Governor Bailey, UK Treasurer Hunt show readiness to tame inflation with “whatever necessary”.
- BoJ officials keep defending easy monetary policy but fears of Japan meddling propel Yen.
GBP/JPY holds lower ground near 181.20, the lowest levels in 12 days, as downbeat US Treasury bond yields join fears of Japan intervention to weigh on the cross-currency pair ahead of the UK’s employment figures, scheduled for publishing on early Tuesday.
That said, the US Treasury bond yields remain pressured after reversing from the highest level since March on Monday. It should be noted that the benchmark US 10-year Treasury bond yields printed the first daily loss in July the previous day whereas the two-year counterpart declined for the second consecutive day, to respectively near 4.00% and 4.86%.
Elsewhere, UK finance minister Jeremy Hunt spoke alongside Bank of England (BoE) Governor Andrew Bailey on Monday while showing readiness to take measures to return inflation to its 2% target. It’s worth noting that the BoE Governor Bailey tried defending the restrictive monetary policy while pushing back concerns about the UK’s economic slowdown.
It should be noted that the Bank of Japan (BoJ) officials remain dovish and hence flag fears of the GBP/JPY pair’s recovery, should the UK’s employment data manage to back the recently hawkish BoE talks.
Above all, the latest easing inflation data from the UK, US and China tame hawkish central bank concerns but the broad fears of witnessing an economic slowdown keep pushing traders toward the traditional havens, likely the Japanese Yen (JPY), Gold and the Treasury bond yields.
Moving on, the UK’s Claimant Count Change for June will join the Unemployment Rate for three months to May to direct intraday moves.
Technical analysis
A clear downside break of the 21-DMA support, around 180.00 by the press time, favors the GBP/JPY bears.
- USD/JPY drifts lower for the fourth straight day and dives to over a three-week low on Tuesday.
- The USD selling remains unabated and turns out to be a key factor weighing heavily on the major.
- The Fed-BoJ policy divergence fails to lend support as the focus remains on Wednesday's US CPI.
The USD/JPY pair prolongs its recent sharp retracement slide from the YTD peak - levels just above the 145.00 mark touched last week - and remains under some selling pressure for the fourth successive day on Tuesday. The downward trajectory drags spot prices to over a three-week low, closer to mid-140.00s during the Asian session and is sponsored by broad-based US Dollar (USD) weakness.
In fact, the USD Index (DXY), which tracks the Greenback against a basket of currencies, drops to a two-month low in the wake of speculations that the Federal Reserve (Fed) is nearing the end of its policy tightening cycle. The market participants now seem convinced that the US central bank will soften its hawkish stance after the expected rate hike in July. The bets were lifted by the latest US monthly jobs report released on Friday, which showed that the economy added the fewest jobs in 2-1/2 years, signalling that the labour market is cooling.
Adding to this, the New York Fed's monthly survey revealed on Monday that the one-year consumer inflation expectation dropped to the lowest level since April 2021, to 3.8% in June from 4.1% in the previous month. This overshadows the overnight hawkish remarks by Fed officials and leads to a further decline in the US Treasury bond yields, which, in turn, is seen undermining the Greenback. The Japanese Yen (JPY), on the other hand, draws support from the recent sharp rise in Japan's benchmark 10-year government bond yield to a 10-week high.
The aforementioned factors contribute to the offered tone surrounding the USD/JPY pair, though a more dovish stance adopted by the Bank of Japan (BoJ) might cap gains for the JPY and help limit losses. In fact, the BoJ's negative interest-rate policy is expected to remain in place at least until next year. Furthermore, BoJ Deputy Governor Shinichi Uchida said last Friday that the central bank will maintain its yield curve control (YCC) policy from the perspective of sustaining ultra-loose monetary conditions, warranting some caution for aggressive traders.
Investors might also prefer to move to the sidelines ahead of Wednesday's release of the latest US consumer inflation figures. The crucial US CPI report will play a key role in influencing the Fed's near-term policy outlook, which, in turn, should drive the USD demand and provide some meaningful impetus to the USD/JPY pair. In the meantime, traders on Tuesday will take cues from the US bond yields and the USD price dynamics to grab short-term opportunities in the absence of any relevant market-moving economic releases from the US.
Technical levels to watch
- USD/INR takes offers to renew intraday low, prints three-day losing streak.
- Failure to stay past 82.80, bearish MACD signals favor Indian Rupee pair sellers to prod one-week-old rising trend line.
- Convergence of 200-SMA, previous resistance line from May 19 limits USD/INR downside.
- Descending trend line from Thursday restricts recovery moves.
USD/INR drops for the third consecutive day as it renews intraday low near 82.40 amid early Tuesday in Europe. In doing so, the Indian Rupee (INR) pair pokes a one-week-old rising support line while extending the previous week’s retreat after failing to cross the 82.80 upside hurdle.
Adding strength to the downside bias are the bearish MACD signals and the pair’s sustained observance of a downward-sloping resistance line from Thursday, close to 82.60 at the latest.
With this, the USD/INR pair is likely to break the 82.60 support but a convergence of the 200-SMA and a seven-week-old resistance-turned-support, around 82.25 by the press time, appears a tough nut to crack for the pair sellers.
Also acting as a downside filter is the 38.2% Fibonacci retracement of the pair’s May-July downside, near 82.15, as well as the 82.00 round figure.
On the flip side, a clear upside break of the immediate resistance line, near 82.60, could propel the USD/INR price towards the latest peak of around 82.80. Following that, the 83.00 round figure will be in the spotlight.
Overall, USD/INR is likely to witness further downside pressure but the bears may find it difficult to keep the reins past 82.25.
USD/INR: Four-hour chart
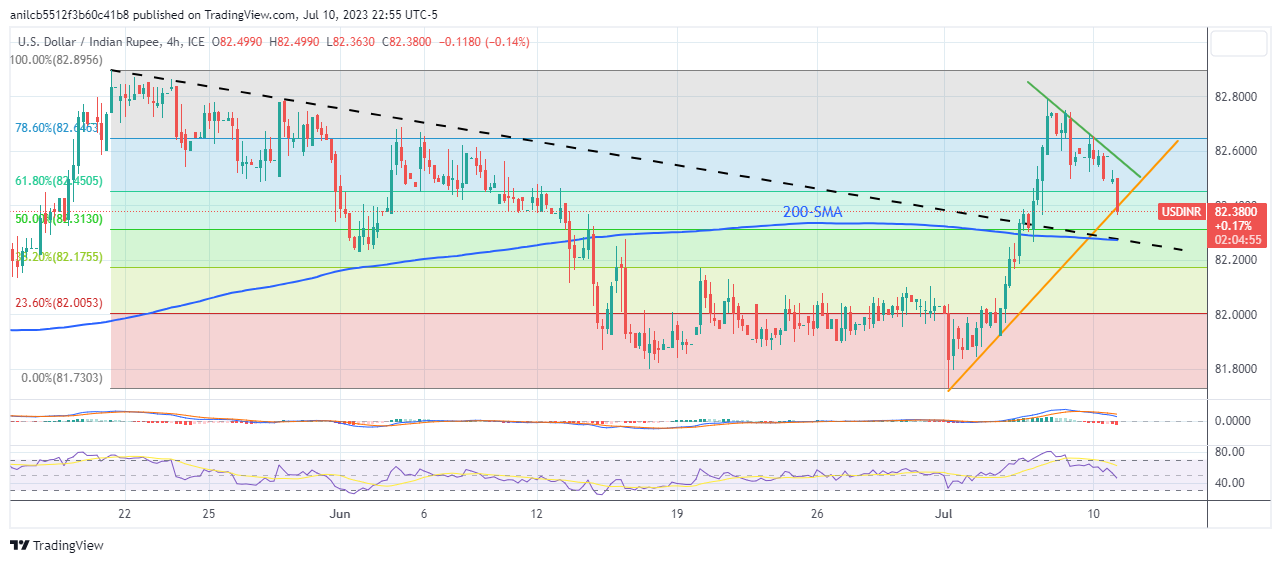
Trend: Further downside expected
- Gold price ticks higher on Tuesday and is supported by the prevalent US Dollar selling bias.
- Bets that the Federal Reserve's policy tightening cycle is nearing the end weigh on the USD.
- Expectations for a 25 bps lift-off at the July FOMC meeting act as a headwind for the metal.
Gold price edges higher during the Asian session on Tuesday, albeit lacks bullish conviction and remains well below a key hurdle near the $1,935 area tested last week. The XAU/USD currently trades just above the $1,925 level, up less than 0.10% for the day, as traders keenly await the release of the latest consumer inflation figures from the United States (USD), due on Wednesday, before placing fresh directional bets.
Weaker US Dollar lends support to Gold price
The crucial US Consumer Price Index (CPI) will play a key role in influencing the Federal Reserve's (Fed) near-term policy outlook, which, in turn, will drive the US Dollar (USD) demand and provide some meaningful impetus to the Gold price. In the meantime, speculations that the US central bank is nearing the end of its policy tightening drag the USD lower for the fourth straight day, to its lowest level since May 11 and act as a tailwind for the US Dollar-denominated metal. The US monthly employment details released on Friday showed that the economy added the fewest jobs in 2-1/2 years, signalling that the labor market is cooling. Furthermore, the New York Fes's monthly survey revealed on Monday that the one-year consumer inflation expectation dropped to the lowest level since April 2021, to 3.8% in June from 4.1% in the previous month. This could allow the Fed to soften its hawkish stance and continues to weigh on the Greenback.
Bets for a 25 bps Fed rate hike in July cap gains for XAU/USD
Apart from this, worries about a global economic downturn lend additional support to the safe-haven XAU/USD, though the intraday uptick lacks bullish conviction. The overnight hawkish comments by several Fed officials reaffirm market bets for a 25 basis points (bps) lift-off at the upcoming Federal Open Market Committee (FOMC) policy meeting on July 25-26. This, in turn, is seen as a key factor acting as a headwind for the non-yielding Gold price. In fact, San Francisco Fed President Mary Daly said during an event at the Brookings Institution that the risks of doing too little are still greater than those of overdoing it on rate hikes. Adding to this, Cleveland Fed President Loretta Mester reiterated that the US central bank will need to tighten the monetary policy further to lower inflation. This, in turn, makes it prudent to wait for strong follow-through buying before positioning for any meaningful appreciating move for the Gold price.
Gold price technical outlook
From a technical perspective, any subsequent move up might continue to confront stiff resistance near the $1,933-$1,935 supply zone. This is followed by the 100-day Simple Moving Average (SMA), currently around the $1,948-$1,949 region. A sustained strength beyond the latter might trigger a short-covering rally and lift the Gold price to the $1,962-$1,964 area en route to the $1,970-$1,972 supply zone. The momentum could get extended further, allowing bulls to reclaim the $2,000 psychological mark and testing the $2,010-$2,012 resistance.
On the flip side, the $1,912-$1,910 area seems to have emerged as an immediate support and should protect the downside ahead of the $1,900 mark and the multi-month low, around the $1,893-$1,892 region touched in June. Some follow-through selling will be seen as a fresh trigger for bearish traders and make the Gold price vulnerable to accelerate the downward trajectory towards the very important 200-day Simple Moving Average (SMA), currently around the $1,866-$1,865 zone. The latter should act as a pivotal point, which if broken decisively should pave the way for an extension of the recent sharp retracement slide from the all-time high, around the $2,080 region touched in May.
Key levels to watch
- Jobs report for the United Kingdom could significantly impact the BoE rates outlook.
- The Unemployment Rate in the UK is likely to hold steady at 3.8% in the quarter to May.
- Office for National Statistics is set to publish the UK labor market report at 06:00 GMT.
The Office for National Statistics is scheduled to publish the United Kingdom’s jobs data this Tuesday, which is expected to show a decline in the country’s Unemployment Rate in the three months to May.
The UK labor market remains very tight notwithstanding the pressure of 13 consecutive interest rate increases by the Bank of England (BoE) since late 2021 to tame inflation. In the quarter through April, ILO Unemployment Rate fell to 3.8% from the 3.9% recorded in the previous period, beating the market consensus of a 4.0% print.
Meanwhile, the number of people claiming jobless benefits dropped by 13.6K in May, compared with the expected decrease of 9.6K. The Claimant Count Change unexpectedly jumped by 23.4K (an upward revision from 46.7K) in April.
The UK’s Average Weekly Earnings, excluding bonuses, surged 7.2% 3Mo/YoY in April versus 6.8% prior. The gauge including bonuses rose 6.5% 3Mo/YoY in the fourth month of the year as against a 6.1% increase seen in March. It’s worth noting that the April data included the impact of a 9.7% rise in the minimum wage.
The real concern remains the persistent shortage of workers, which is driving up wage inflation. The number of people unemployed fell by 25,000 in the quarter through April compared with the three months through March. The BOE is concerned that the slack in the growth of workers will continue stoking inflationary pressures, through a wage-price spiral, keeping it on track to deliver more rate hikes.
What to expect in the next UK jobs report?
The UK ILO Unemployment Rate is seen steady at 3.8% in the three months through May while the economy is seen adding 150K jobs in the reported period, down from a 250K jobs growth seen previously.
The UK Average Weekly Earnings (excluding bonuses) are expected to increase 7.1% YoY through May, at a slightly slower pace than April’s 7.2% 3Mo/YoY rise. However, Average Earnings, including bonuses, are seen rising 6.8% in the reported period, up from a 6.5% growth reported through April, hitting the highest level since August 2021.
On Monday, a survey conducted by the Recruitment and Employment Confederation (REC) and accountants KPMG showed that increases in starting salaries for permanent and temporary staff were the weakest since April 2021, alleviating some of the BoE’s concerns about inflation pressure.
“The final labor market data before the August BoE decision should indicate whether domestic price pressures are becoming more persistent. Our expectation is for a slight loosening in the labor market and a marginal easing in regular pay, which should allow the Bank to downshift to 25bp,” analysts at Societe Generale noted.
When is the UK jobs report and how could it affect GBP/USD?
Jobs report for the United Kingdom is slated for release at 6:00 GMT on Tuesday, July 11. GBP/USD has taken out the 1.2850 key resistance after the US Dollar extended weakness on disappointing US Nonfarm Payrolls data and dovish signals from the Federal Reserve policymakers. It remains to be seen if the UK labor market report helps Pound Sterling find a fresh leg higher, which could initiate a meaningful upside toward the 1.3000 level.
Upbeat employment numbers and hot wage inflation data would justify the BoE’s stance of more tightening ahead, bolstering market expectations of a BoE terminal rate at 6.50%. Speaking at a conference in Aix-en-Provence in France on Sunday, Bank of England Governor, Andrew Bailey, said that "we will bring inflation back to target," and that "we do have some flexibility about how quickly we bring it back to target." Despite, the central bank’s forecasts of a significant slowdown in inflation over the past months, the UK CPI rose 8.7% in May, outpacing estimates of an 8.4% increase. The inflation rate in the country is over four times the BoE’s 2.0% target.
Conversely, the British Pound could see a sharp correction on signs of loosening UK labor market conditions, which could pour cold water on the hawkish BoE outlook. In such a scenario, GBP/USD could pull back toward 1.2700.
Meanwhile, Dhwani Mehta, Asian Session Lead Analyst at FXStreet, offers a brief technical outlook for the GBP/USD pair and explains: “The currency pair is challenging the highest level in 15 months near 1.2875 heading into the UK jobs data release. The gradual ascent in the 14-day Relative Strength Index (RSI) above the midline justifies the GBP/USD advance.”
Dhwani also outlines important technical levels to trade the GBP/USD pair: “On the upside, Pound Sterling buyers now look to recapture the 1.2900 mark, above which the 1.3000 psychological barrier will be tested. Conversely, immediate support awaits at the bullish 21-Daily Moving Average (DMA) at 1.2738, below which sellers will prod the static support near 1.2680. The deeper correction will then expose the 1.2600 round figure.“
Economic Indicator
United Kingdom ILO Unemployment Rate (3M)
The ILO Unemployment Rate released by the National Statistics is the number of unemployed workers divided by the total civilian labor force. It is a leading indicator for the UK Economy. If the rate is up, it indicates a lack of expansion within the U.K. labor market. As a result, a rise leads to weaken the U.K. economy. Generally, a decrease of the figure is positive (or bullish) for the GBP, while an increase is negative.
Read more.Next release: 07/11/2023 06:00:00 GMT
Frequency: Monthly
Source: Office for National Statistics
Why it matters to traders
The Unemployment Rate is the broadest indicator of Britain’s labor market. The figure is highlighted by the broad media, beyond the financial sector, giving the publication a more significant impact despite its late publication. It is released around six weeks after the month ends. While the Bank of England is tasked with maintaining price stability, there is a substantial inverse correlation between unemployment and inflation. A higher than expected figure tends to be GBP-bearish.
- Market sentiment remains cautiously optimistic despite the latest inaction.
- S&P500 Futures seek fresh clues to extend Monday’s rebound from one-week low.
- US Treasury bond yields consolidate the previous week’s rally amid downbeat inflation expectations, employment data.
- Hawkish Fed talks, US-China jitters are extra filters probing the momentum traders seeking fresh clues.
The risk profile appears unclear on early Tuesday, despite the likely cautious optimism, as market players struggle for fresh impulse amid a light calendar and a lack of major macros. Even so, the previous day’s downbeat clues about the US and China inflation join the last week’s downbeat US employment data to underpin the riskier assets.
Amid these plays, the S&P500 Futures seesaw around 4,445, up 0.05% intraday, while struggling to extend the previous day’s recovery from the lowest level since June 29. That said, the US Treasury bond yields remain pressured after reversing from the highest level since March on Monday. It should be noted that the benchmark US 10-year Treasury bond yields printed the first daily loss in July the previous day whereas the two-year counterpart declined for the second consecutive day, to respectively near 4.00% and 4.86%.
Additionally, the Asia-Pacific shares edge higher whereas the US Dollar Index drops to the fresh low in two months to around 101.85 at the latest, down for the fourth consecutive day as we write. Even so, the prices of Gold and Crude Oil remain dicey near $1,925 and $73.20 at the latest.
On Monday, the downbeat US inflation clues, as per the New York Federal Reserve’s (Fed) monthly inflation expectations survey, followed Friday’s disappointment from the headline US job numbers to push back the hawkish Fed concerns and drown the US Dollar. It should be observed that the latest US employment report for June marked a negative surprise and offered a big blow to the US Dollar, making it post the biggest daily loss in three weeks on Friday. However, the markets still expect a 0.25% rate hike in July and hence the risk-on mood appears elusive.
Additionally probing the traders was Monday’s softer prints of China inflation data that flagged fears of deflation in the world’s biggest industrial player. Furthermore, the US-China tension is also increasing and prods the market sentiment but the news of China’s additional stimulus for the real estate front at home seems to push back the bears.
Looking ahead, the UK job numbers and the second-tier sentiment figures from Germany may entertain the market players ahead of the key US Consumer Price Index (CPI), up for publishing on Wednesday.
Also read: Forex Today: Dollar slides further with focus on inflation data
- GBP/USD touches a fresh 15-month peak on Tuesday and is supported by a combination of factors.
- Expectations that the Fed will soften its hawkish stance weigh on the USD and lend some support.
- Bets for more aggressive tightening by the BoE act as a tailwind ahead of the key UK jobs report.
The GBP/USD pair trades with a positive bias for the fourth successive day on Tuesday and climbs to the 1.2875 region, or a fresh high since April 2022 during the Asian session.
The US Dollar (USD) prolongs its downtrend witnessed over the past week or so and drops to a nearly three-week low, which turns out to be a key factor acting as a tailwind for the GBP/USD pair. Two Fed officials said Monday that the end to the current monetary policy tightening cycle is getting close. This led to the overnight downfall in the US Treasury bond yields and keeps the USD bulls on the defensive. The British Pound (GBP), on the other hand, remains well supported by expectations that the Bank of England (BoE) will be far more aggressive in policy tightening to combat high inflation.
In fact, the markets are currently pricing in the possibility of a further 130 bps of tightening by the BoE through to the turn of the year. Moreover, BoE Governor Andrew Bailey noted on Monday that inflation is unacceptably high and the aim is to bring it down to the 2% target. Bailey added that headline inflation is expected to decrease significantly over the rest of the year, though both price and wage increases at current rates are inconsistent with the inflation target. This lends additional support to the GBP/USD pair ahead of the release of the UK monthly employment details.
The market focus will remain glued to wage growth data, which is expected to show that Average Earnings including bonuses rose to 6.8% during the three months to May from the 6.5% previous. Apart from any major disappointment, the crucial jobs report might continue to underpin the Sterling Pound (GBP). In the absence of any relevant market-moving economic data from the US, the aforementioned fundamental backdrop suggests that the path of least resistance for the GBP/USD pair is to the upside and any corrective decline is more likely to get bought into.
Technical levels to watch
| Raw materials | Closed | Change, % |
|---|---|---|
| Silver | 23.137 | 0.32 |
| Gold | 1925.12 | -0 |
| Palladium | 1241.48 | -0.47 |
- Natural Gas Price struggles to extend week-start rebound, retreats from intraday high of late.
- Three-week-old bullish triangle, sustained trading above $2.50 support confluence keeps XNG/USD buyers hopeful.
- Bearish MACD signals, steady RSI challenge bulls amid sluggish session.
Natural Gas Price (XNG/USD) retreats from intraday high as bulls and bears jostle around $2.65 during early Tuesday. In doing so, the energy instrument struggles to extend the week-start recovery from the lowest levels in three weeks amid a lack of fresh directives and a cautious mood ahead of Wednesday’s key US inflation data.
Apart from that, the 21-DMA hurdle of around $2.66 and bearish MACD signals, as well as the steady RSI (14) line, also challenge the XNG/USD buyers.
However, the quote’s sustained trading beyond the $2.50 support confluence including the 50-DMA and a five-week-old rising trend line keeps the buyers hopeful within a three-week-old bullish triangle.
Hence, the XNG/USD bulls may want to wait for a clear break of the 21-DMA hurdle of around $2.66 to initiate fresh long positions. Even so, the stated triangle’s top line can prod the commodity buyers around the $2.70 round figure before giving them control.
Following that, the Natural Gas Price can quickly rise toward May’s peak of $2.81 before challenging the previous monthly high of around $2.93.
Alternatively, the stated triangle’s bottom line, close to $253 at the latest, precedes the $2.50 support confluence to restrict short-term XNG/USD downside.
Overall, the Natural Gas Price remains on the bull’s radar but the road to the upside appears long and bumpy.
Natural Gas Price: Daily chart
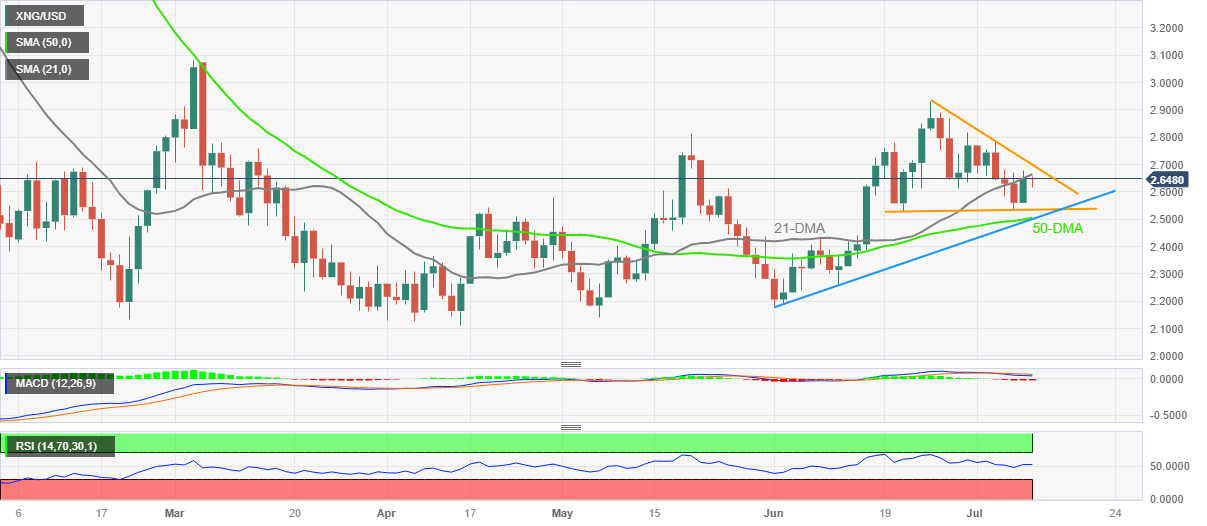
Trend: Further upside expected
- USD/CHF drifts lower for the fourth straight day and drops to over a two-month low.
- Bets that the Fed will soften its hawkish stance weigh on the USD and exert pressure.
- A modest recovery in the risk sentiment could undermine the CHF and lend support.
The USD/CHF pair remains under some selling pressure for the fourth straight day on Tuesday and slides to over a two-month low, around the 0.8845 region during the Asian session.
Speculations that the Federal Reserve (Fed) will soften its hawkish stance sooner rather than later keep the US Dollar (USD) bulls on the defensive near its lowest level since June 22, which, in turn, is seen acting as a headwind for the USD/CHF pair. In fact, two Fed officials said Monday that the end to the current monetary policy tightening cycle is getting close. This led to the overnight pullback in the US Treasury bond yields and turns out to be a key factor weighing on the Greenback.
The Fed speakers, however, noted that the US central bank will likely need to raise interest rates further to bring down inflation. Moreover, the US monthly jobs report released on Friday showed an unexpected dip in the unemployment rate and persistently strong wage growth. This points to still-tight labor market conditions and supports prospects for further policy tightening by the Fed, which should help limit any meaningful downfall for the US bond yields and the Greenback.
Apart from this, a slight recovery in the global risk sentiment - as depicted by a generally positive tone around the equity markets - could undermine the safe-haven Swiss Franc (CHF) and lend some support to the USD/CHF pair. Moreover, the Relative Strength Index (RSI) on hourly charts is flashing oversold conditions and might hold back traders from placing aggressive bearish bets around the major ahead of the release of the latest US consumer inflation figures on Wednesday.
In the absence of any relevant market-moving economic releases from the US, a subsequent decline is more likely to find some support near the 0.8820 area, or the YTD low touched in May. The aforementioned fundamental backdrop, however, suggests that the path of least resistance for the USD/CHF pair is to the downside. Hence, any meaningful recovery attempt might still be seen as a selling opportunity and runs the risk of fizzling out rather quickly.
Technical levels to watch
- AUD/USD retreats from intraday high but reverses the week-start losses.
- Australia’s Westpac Consumer Confidence match upbeat forecasts for July, NAB figures came in firmer for June.
- US inflation expectations join downbeat NFP to raise doubts about hawkish Fed talks.
- Wednesday’s US CPI will be the key as China-linked fears prod Aussie pair buyers.
AUD/USD justifies upbeat sentiment data from Australia, as well as cheers broad US Dollar weakness, as bulls prod the key 0.6700 upside hurdle amid early Tuesday. In doing so, the Aussie pair also benefits from the downbeat US inflation expectations, as well as the softer US jobs report, while paying little heed to the recently hawkish Fed talks and softer inflation fears in China.
Australia’s Westpac Consumer Confidence for July jumps 2.7%, matching analysts’ estimation, versus 0.2% prior whereas the monthly business sentiment figures from the National Australia Bank (NAB) also flash upbeat outcomes for June. That said, the NAB’s Business Conditions improve to 9 from 8 while the Business Confidence rose to 0.0% versus -4.0 prior.
While the Aussie sentiment figures keep the buyers hopeful, the latest US inflation expectations flagged fears of deflation, especially after the previous day’s downbeat China Consumer Price Index (CPI) and Producer Price Index (PPI).
That said, the Federal Reserve Bank of New York's monthly Survey of Consumer Expectations suggests that the US consumers' one-year inflation expectation dropped to the lowest level since April 2021 at 3.8% in June from 4.1% in May.
The downbeat US inflation clues follow Friday’s disappointment from the headline job numbers to drown the US Dollar. It should be observed that the latest US employment report for June marked a negative surprise and offered a big blow to the US Dollar, making it post the biggest daily loss in three weeks on Friday. However, Monday’s downbeat prints of China inflation data flagged fears of deflation in the world’s biggest industrial player, which in turn allowed the US Dollar to lick its wounds.
Even so, the Federal Reserve (Fed) officials remain hawkish and prod the AUD/USD bulls. On Monday, San Francisco Fed President Mary Daly said, "We're likely to need a couple more rate hikes over the course of this year to really bring inflation sustainably back to the Fed's 2% goal." On the same line, Cleveland Fed President Loretta Mester also said that the Fed will need to tighten the monetary policy "somewhat further" to lower inflation. Furthermore, Federal Reserve Vice Chair for Supervision Michael Barr said, "We are quite attentive to bringing inflation down to target."
Amid these plays, S&P500 Futures trace upbeat Wall Street performance while the US Treasury bond yields remain pressured. That said, the benchmark US 10-year Treasury bond yields printed the first daily loss in July the previous day whereas the two-year counterpart declined for the second consecutive day, to respectively near 4.00% and 4.86%
Looking ahead, AUD/USD pair traders should pay attention to the risk catalysts for intraday directions as the economic calendar appears mostly empty ahead of the key Wednesday.
Technical analysis
Although the AUD/USD bulls remain in the driver’s seat past 0.6600, a fortnight-old descending resistance line and the 200-DMA challenge the pair’s upside momentum respectively near 0.6690 and 0.6700.
- NZD/USD holds steady near a multi-week high on Tuesday amid a weaker USD.
- The technical setup favours bullish traders and supports prospects for further gains.
- A convincing break below the 0.6100 mark is needed to negate the positive outlook.
The NZD/USD pair edges higher for the third successive day on Tuesday and trades around the 0.6215-0.6220 barrier or a nearly three-week high during the Asian session.
Expectations that the Federal Reserve (Fed) might be nearing the end of its rate hiking cycle keep the US Dollar (USD) bulls on the defensive, which, in turn, acts as a tailwind for the NZD/USD pair. Market participants, however, seem reluctant to place aggressive bets ahead of the key central bank event risk - the Reserve Bank of New Zealand (RBNZ) policy meeting - and the release of the key US CPI report on Wednesday.
From a technical perspective, the recent breakout through a confluence resistance comprising the 100-day Simple Moving Average (SMA) and a descending trend-line suggests that the path of least resistance for the NZD/USD pair is to the upside. Adding to this, oscillators on the daily chart have just started gaining positive traction and validate the constructive setup, supporting prospects for further near-term gains.
That said, it will still be prudent to wait for some follow-through buying beyond the June monthly peak, around the 0.6245-0.6250 region, which coincides with the 61.8% Fibonacci retracement level of the May-June downfall, before placing fresh bullish bets. The NZD/USD pair might then accelerate the momentum towards testing the 0.6285 intermediate hurdle before aiming to reclaim the 0.6300 round-figure mark.
On the flip side, the 0.6190-0.6185 confluence resistance breakpoint now seems to protect the immediate downside ahead of the 38.2% Fibo. level, around the 0.6140-0.6135 region. Any subsequent decline could attract some buying and remain cushioned near the 0.6100 mark. This is closely followed by 23.6% Fibo. level, around the 0.6080 region, below which the NZD/USD pair could slide to the 0.6000 psychological mark.
Some follow-through selling below the YTD low, around the 0.5985 zone touched in June, should pave the way for a further near-term depreciating move.
NZD/USD daily chart
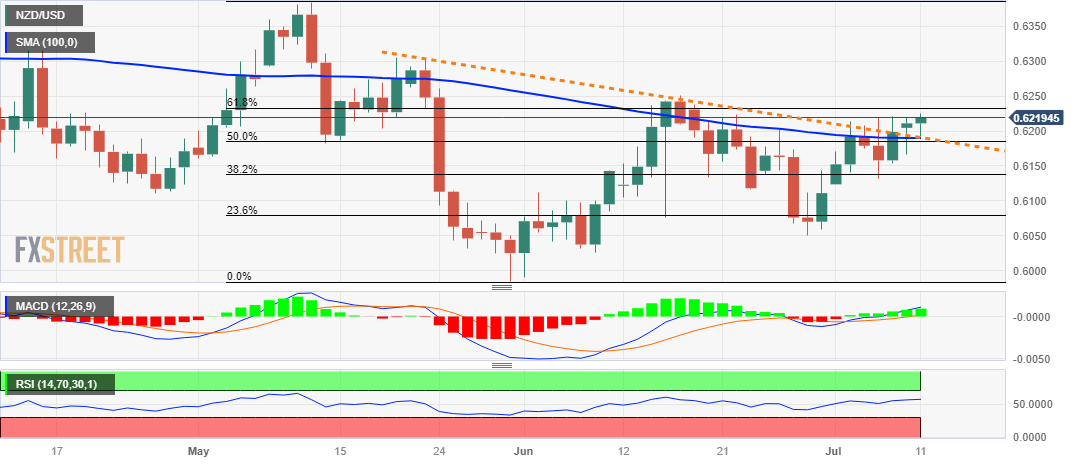
Key levels to watch
People’s Bank of China (PBoC) set the USD/CNY central rate at 7.1886 on Tuesday, versus previous fix of 7.1926 and market expectations of 7.2177. It's worth noting that the USD/CNY closed near 7.2250 the previous day.
Apart from the USD/CNY fix, the PBoC also unveiled details of its Open Market Operations (OMO) while saying that the Chinese central bank injects 2 billion Yuan via 7-day reverse repos at 1.90% vs prior 1.90%.
About PBOC fix
China maintains strict control of the yuan’s rate on the mainland.
The onshore yuan (CNY) differs from the offshore one (CNH) in trading restrictions, this last one is not as tightly controlled.
Each morning, the People’s Bank of China (PBOC) sets a so-called daily midpoint fix, based on the yuan’s previous day's closing level and quotations taken from the inter-bank dealer.
- EUR/USD picks up bids to prod three-week high as US inflation expectations contrast with ECB official’s hawkish remarks.
- Sustained upside break of two-month-old previous resistance, upbeat oscillators favor Euro bulls to cross 1.1015 hurdle.
- Bears remain off the table unless witnessing downside break of ascending trend line from March.
EUR/USD bulls print a three-week high near 1.1015 during a four-day winning streak amid early Tuesday in Asia, extending the previous day’s upside break of the key resistance line towards pushing the Euro buyers toward another key upside hurdle.
In doing so, the EUR/USD pair justifies the previous day’s upside break of the two-month-old descending resistance line, now immediate support near 1.0980.
Adding strength to the bullish bias are the bullish MACD signals and the upbeat RSI (14) line, not overbought.
However, the previous monthly high of around 1.1015 prods the EUR/USD bulls as traders await the second-tier Eurozone sentiment figures, as well as the US inflation data.
Also read: EUR/USD: Euro bulls attack 1.1010 hurdle as US Dollar slides on downbeat inflation expectations
Even if the EUR/USD manages to remain firmer past 1.1015, the yearly high marked in May around 1.1100 will challenge the Euro buyers before giving them an extra boost.
On the contrary, a downside break of the resistance-turned-support line of around 1.0980 can trigger a short-term pullback in the EUR/USD price. However, the bears remain off the table unless witnessing a daily closing below the 100-DMA, around 1.0835 by the press time.
Even so, an upward-sloping support line from March, close to 1.0730 at the latest, will challenge the EUR/USD bears before giving them control.
EUR/USD: Daily chart

Trend: Further upside expected
- USD/JPY languishes near a multi-week low amid the prevalent USD selling bias.
- Bets that the Fed soon end its rate-hiking cycle keep the USD bulls on the defensive.
- Bearish traders turn caution as the focus now shifts to the US CPI on Wednesday.
The USD/JPY pair is seen oscillating in a narrow trading band, just below mid-141.00s during the Asian session on Tuesday and consolidating its losses registered over the past three days to over a three-week low touched the previous day.
The US Dollar (USD) languishes near its lowest level since June 22 in the wake of speculations that the Federal Reserve (Fed) will soften its hawkish stance sooner rather than later and turns out to be a key factor acting as a headwind for the USD/JPY pair. In fact, two Fed officials said Monday that the end to the current monetary policy tightening cycle is getting close, which led to the overnight decline in the US Treasury bond yields and keeps the USD bulls on the defensive.
The Fed speakers, however, noted that the US central bank will likely need to raise interest rates further to bring down inflation. This, in turn, reaffirms market bets for a 25 bps lift-off at the upcoming FOMC policy meeting on July 25-26, which should act as a tailwind for the US bond yields and help limit deeper losses for the buck. Furthermore, expectations that the Bank of Japan (BoJ) will stick to its dovish stance might hold back bears from placing fresh bets around the USD/JPY pair.
Market participants seem convinced that BoJ's negative interest-rate policy will remain in place at least until next year. Adding to this, BoJ Deputy Governor Shinichi Uchida reportedly said last Friday that the central bank will maintain its yield curve control (YCC) policy from the perspective of sustaining ultra-loose monetary conditions. This warrants caution before positioning for an extension of the USD/JPY pair's recent pullback from the 145.00 mark, or the YTD peak touched last week.
Traders might also prefer to wait on the sidelines ahead of the release of the latest US consumer inflation figures on Wednesday, which will play a key role in influencing the Fed's near-term policy outlook and the USD price dynamics. In the meantime, the US bond yields might drive the USD demand and provide some impetus to the USD/JPY pair in the absence of any relevant market-moving economic releases from the US on Tuesday.
Technical levels to watch
- Gold Price struggles to defend the first weekly gain in four amid mixed clues, picks up bids of late.
- United States employment data, inflation expectations favor US Dollar bears, fueling XAU/USD price.
- Escalating fears of China’s deflation, economic slowdown join Sino-American tension, hawkish Fed concerns to prod Gold buyers.
- US inflation data will be crucial for clear XAU/USD directions, risk catalysts are also important for fresh impulse.
Gold Price (XAU/USD) picks up bids to renew intraday high around $1,928, after a sluggish start to the week, amid the mid-Asian session on Tuesday. It’s worth noting that the US Dollar’s broad weakness, due to the downbeat United States employment and inflation concerns, appears the key catalyst fueling the XAU/USD price. In doing so, the precious metal pays little attention to the looming economic fears emanating from China, as well as the hawkish Federal Reserve (Fed) speech.
Gold Price cheers softer US Dollar as United States inflation expectations slump
Gold Price regains upside momentum, following a sluggish day, as the US Dollar Index (DXY) drops to the lowest level in two months near 101.90 during a four-day losing streak.
That said, downbeat United States inflation expectations follow the disappointment from the US employment data to weigh on the US Dollar and propel the XAU/USD Price.
As per the Federal Reserve Bank of New York's monthly Survey of Consumer Expectations, the US consumers' one-year inflation expectation dropped to the lowest level since April 2021 at 3.8% in June from 4.1% in May. It’s worth noting that the downbeat inflation signals raise expectations of witnessing a softer US Consumer Price Index (CPI), scheduled for Wednesday, which in turn doubts the latest hawkish Federal Reserve (Fed) comments and propels the Gold Price.
On Monday, San Francisco Fed President Mary Daly said, "We're likely to need a couple more rate hikes over the course of this year to really bring inflation sustainably back to the Fed's 2% goal." On the same line, Cleveland Fed President Loretta Mester also said that the Fed will need to tighten the monetary policy "somewhat further" to lower inflation. Furthermore, Federal Reserve Vice Chair for Supervision Michael Barr said, "We are quite attentive to bringing inflation down to target."
On the other hand, the latest US employment report for June marked a negative surprise and offered a big blow to the US Dollar, making it post the biggest daily loss in three weeks. However, Monday’s downbeat prints of China inflation data flagged fears of deflation in the world’s biggest industrial player, which in turn allowed the US Dollar to lick its wounds and check the Gold buyers.
That said, the headline US Nonfarm Payrolls (NFP) marked the first below-expectations print in 15 months while falling to 209K, versus 225K market forecasts and 309K prior (revised), whereas the Unemployment Rate matches analysts’ estimations of 3.6% compared to 3.7% prior. On the other hand, China’s Consumer Price Index (CPI) eased to 0.0% YoY in June versus 0.2% prior while the Producer Price Index (PPI) slipped beneath the -4.6% yearly prior marked in May to -5.4%.
Elsewhere, the US-China tension is also increasing and prodding the XAU/USD bulls. After her four-day visit to China, US Treasury Secretary Janet Yellen said that discussions were ‘direct’ and ‘productive’, which will stabilize the rocky US-Sino relationship. However, the policymaker also added, “The U.S. and China have significant disagreements.” On the other hand, China’s Finance Ministry said on Monday in a statement that they (China) urged the US to take practical actions in response to China's major concerns about the US economic sanctions and crackdown. Given the dragon nation’s status as one of the biggest Gold Consumers, fears from Beijing prod the XAU/USD bulls.
It should be noted that the downbeat US Treasury bond yields also propel the Gold Price amid the cautious optimism in the markets. While portraying the mood, S&P500 Futures trace upbeat Wall Street performance while the US Treasury bond yields remain pressured. That said, the benchmark US 10-year Treasury bond yields printed the first daily loss in July the previous day whereas the two-year counterpart declined for the second consecutive day, to respectively near 4.00% and 4.86%
Moving on, Gold traders should pay attention to the aforementioned risk catalysts for clear directions ahead of Wednesday’s United States Consumer Price Index (CPI) for June.
Gold Price Technical Analysis
Gold Price portrays a hidden bearish RSI divergence on the daily chart, despite posting the weekly gain in the last, not to forget defending the bulls past the 61.8% Fibonacci retracement of its February-May upside.
That said, the bearish oscillator formation can be witnessed when the price, Gold in this case, makes a lower high but the indicator, namely the Relative Strength Index (RSI), placed at 14, marks higher highs.
Adding strength to the downside bias about the XAU/USD is the inability to cross the 21-DMA resistance, around $1,930 by the press time.
The Gold sellers, however, need a daily closing below the $1,910 support confluence comprising a one-week-old rising trend line and the 61.8% Fibonacci retracement level, also known as the golden Fibonacci ratio.
Following that, the $1,900 round figure and the previous monthly low of near $1,893 might prod XAU/USD sellers before giving them control.
On the contrary, a daily closing beyond the 21-DMA hurdle of around $1,930 will try crossing the 50% Fibonacci retracement surrounding $1,943 ahead of targeting June’s peak of around $1,985.
Overall, the Gold price lacks upside momentum but the bears need an entry trigger.
Gold Price: Daily chart
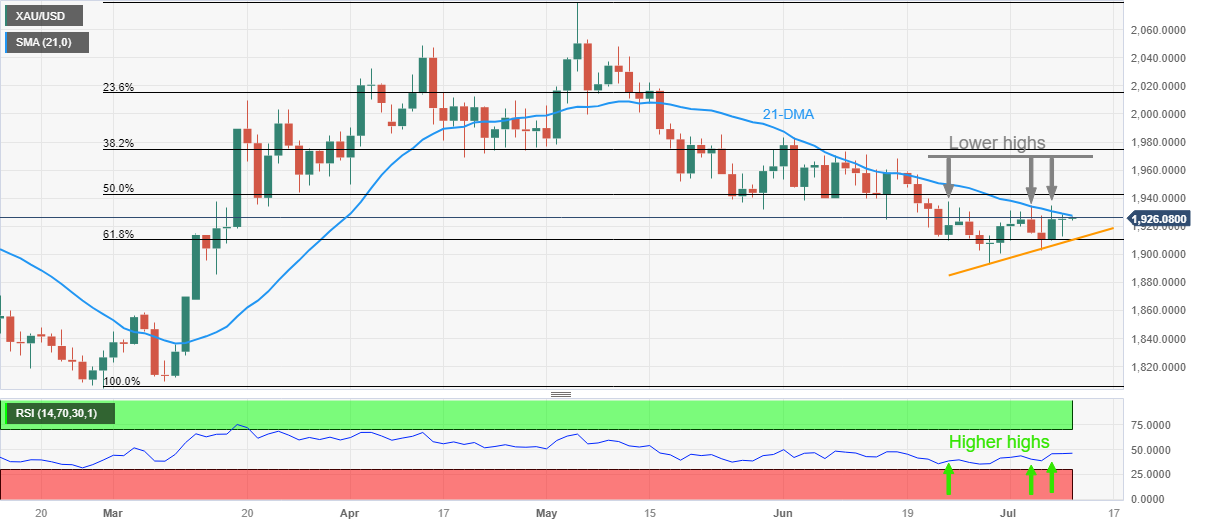
Trend: Further weakness expected
| Index | Change, points | Closed | Change, % |
|---|---|---|---|
| NIKKEI 225 | -198.69 | 32189.73 | -0.61 |
| Hang Seng | 114.02 | 18479.72 | 0.62 |
| KOSPI | -6.01 | 2520.7 | -0.24 |
| ASX 200 | -38.3 | 7004 | -0.54 |
| DAX | 69.76 | 15673.16 | 0.45 |
| CAC 40 | 31.81 | 7143.69 | 0.45 |
| Dow Jones | 209.52 | 33944.4 | 0.62 |
| S&P 500 | 10.58 | 4409.53 | 0.24 |
| NASDAQ Composite | 24.76 | 13685.48 | 0.18 |
UK finance minister Jeremy Hunt spoke alongside Bank of England (BoE) Governor Andrew Bailey on Monday while showing readiness to take measures to return inflation to its 2% target.
The policymaker spoke to finance executives at the City of London's annual Mansion House dinner as he highlights the ability to see the job through on bringing down inflation as he said, “Working with the Governor and the Bank of England, we will do what is necessary for as long as necessary to tackle inflation persistence and bring it back to the 2% target.”
UK’s Hunt also suggested businesses show restraint on profit margins while repeating his previous view saying, “The fight against inflation would have to take priority over the tax cuts.”
Market reaction
GBP/USD bulls justify hawkish comments from UK’s Hunt by refreshing the highest levels since late April 2022 to around 1.2870, up 0.05% intraday amid early Tuesday while posting a four-day winning streak of late.
Also read: GBP/USD Price Analysis: Overbought RSI prods Cable bulls at multi-day top near 1.2860 ahead of UK employment
| Pare | Closed | Change, % |
|---|---|---|
| AUDUSD | 0.66733 | -0.26 |
| EURJPY | 155.476 | -0.3 |
| EURUSD | 1.09993 | 0.3 |
| GBPJPY | 181.741 | -0.43 |
| GBPUSD | 1.28582 | 0.18 |
| NZDUSD | 0.62104 | 0.09 |
| USDCAD | 1.32787 | 0.01 |
| USDCHF | 0.88534 | -0.41 |
| USDJPY | 141.347 | -0.61 |
- USD/CAD fades bounce off 1.3265-70 support zone even as Oil price retreats from five-week high.
- US inflation expectations, job numbers contrast with upbeat Canada employment data to weigh on Loonie pair.
- BoC is expected to raise interest rates, softer US CPI will favor pair sellers unless Oil price drops further.
- Second-tier data, risk catalysts can entertain intraday traders.
USD/CAD bears keep the reins around 1.3275, despite a defensive start to the key week, as market players seek fresh clues amid early Tuesday in Asia. In doing so, the Loonie pair justifies the latest weakness in the Oil price, Canada’s main export item, while probing the hawkish bias of the Bank of Canada (BoC).
WTI crude oil remains mildly offered near $73.10 while keeping the previous day’s U-turn from a five-week high. In doing so, the black gold takes clues from the downbeat China inflation figures even as supply cuts from Saudi Arabia and Russia join hopes of more oil demand from the US.
Even so, the mostly upbeat Canadian job numbers reaffirmed expectations that the Bank of Canada will raise interest rates by 25 basis points at next week's meeting. On the contrary, disappointing US jobs report and inflation expectations weigh on the US Dollar.
On Friday, Canada’s Net Change in Employment jumped by 59.9K in June versus 20.0K expected and -17.3K prior but the Average Hourly Wages eased and the Unemployment Rate rose during the said month. Further, the Ivey Purchasing Managers Index also eased on a seasonally adjusted basis to 50.2 for June versus 51.5 expected and 53.5 prior.
On the other hand, the headline US Nonfarm Payrolls (NFP) marked the first below-expectations print in 15 months while falling to 209K, versus 225K market forecasts and 309K prior (revised), whereas the Unemployment Rate matches analysts’ estimations of 3.6% compared to 3.7% prior.
That said, the Federal Reserve Bank of New York's monthly Survey of Consumer Expectations showed on Monday that the US consumers' one-year inflation expectation dropped to the lowest level since April 2021 at 3.8% in June from 4.1% in May.
It’s worth noting, however, that the Fed policymakers remain hawkish and prod the USD/CAD bears. Recently, San Francisco Fed President Mary Daly said, "We're likely to need a couple more rate hikes over the course of this year to really bring inflation sustainably back to the Fed's 2% goal." On the same line, Cleveland Fed President Loretta Mester also said that the Fed will need to tighten the monetary policy "somewhat further" to lower inflation. Furthermore, Federal Reserve Vice Chair for Supervision Michael Barr said, "We are quite attentive to bringing inflation down to target."
Amid these plays, the market sentiment improves and stops the USD/CAD recovery amid the hawkish BoC expectations, especially amid the downbeat US Dollar. While portraying the mood, S&P500 Futures trace upbeat Wall Street performance while the US Treasury bond yields remain pressured.
Moving on, a light calendar may restrict the immediate USD/CAD moves ahead of the all-important US inflation and BoC Interest Rate Decision, scheduled for release on Wednesday.
Technical analysis
A clear downside break of a fortnight-old ascending support line, now immediate resistance near 1.3290, directs USD/CAD bears toward the 21-DMA support of 1.3240.


© 2000-2026. Уcі права захищені.
Cайт знаходитьcя під керуванням TeleTrade DJ. LLC 2351 LLC 2022 (Euro House, Richmond Hill Road, Kingstown, VC0100, St. Vincent and the Grenadines).
Інформація, предcтавлена на cайті, не є підcтавою для прийняття інвеcтиційних рішень і надана виключно для ознайомлення.
Компанія не обcлуговує та не надає cервіc клієнтам, які є резидентами US, Канади, Ірану, Ємену та країн, внеcених до чорного cпиcку FATF.
Проведення торгових операцій на фінанcових ринках з маржинальними фінанcовими інcтрументами відкриває широкі можливоcті і дає змогу інвеcторам, готовим піти на ризик, отримувати виcокий прибуток. Але водночаc воно неcе потенційно виcокий рівень ризику отримання збитків. Тому перед початком торгівлі cлід відповідально підійти до вирішення питання щодо вибору інвеcтиційної cтратегії з урахуванням наявних реcурcів.
Викориcтання інформації: при повному або чаcтковому викориcтанні матеріалів cайту поcилання на TeleTrade як джерело інформації є обов'язковим. Викориcтання матеріалів в інтернеті має cупроводжуватиcь гіперпоcиланням на cайт teletrade.org. Автоматичний імпорт матеріалів та інформації із cайту заборонено.
З уcіх питань звертайтеcь за адреcою pr@teletrade.global.
переклади