- Analytics
- News and Tools
- Market News
Новини ринків
- EUR/USD remains pressured at the lowest level in a month.
- Bears flirt with 50-day EMA after breaking key support confluence.
- Steady RSI (14) line, bearish MACD signals joins support break to favor Euro sellers.
EUR/USD sellers attack the 1.0900 round figure, renewing the intraday low near 1.0910 amid the mid-Asian session on Friday. That said, the Euro pair broke a short-term key support confluence to post the biggest daily slump in two weeks the previous day.
In addition to the downside break of convergence of the 21-day Exponential Moving Average (EMA) and the bottom line of a one-month-old bullish channel, around 1.0970, the EUR/USD sellers also cheer bearish MACD signals to renew the monthly low on Thursday.
Adding strength to the Euro pair’s downside bias is the absence of an oversold RSI (14) line. However, the 50-day EMA level of around 1.0895 prods the EUR/USD bears of late.
Should the EUR/USD bears keep the reins past 1.0895, the 38.2% and 50% Fibonacci retracement level of its January-April increase, respectively near 1.0860 and 1.0790, can’t be ruled out.
Alternatively, the EUR/USD pair’s corrective bounce remains elusive unless the quote stays below the 1.0970 support-turned-resistance.
Even if the major currency pair crosses the 1.0970 hurdle, the 1.1000 round figure and multiple hurdles around 1.1050 may challenge the EUR/USD bulls before directing them to the aforementioned channel’s top line, close to 1.1120 at the latest.
EUR/USD: Daily chart
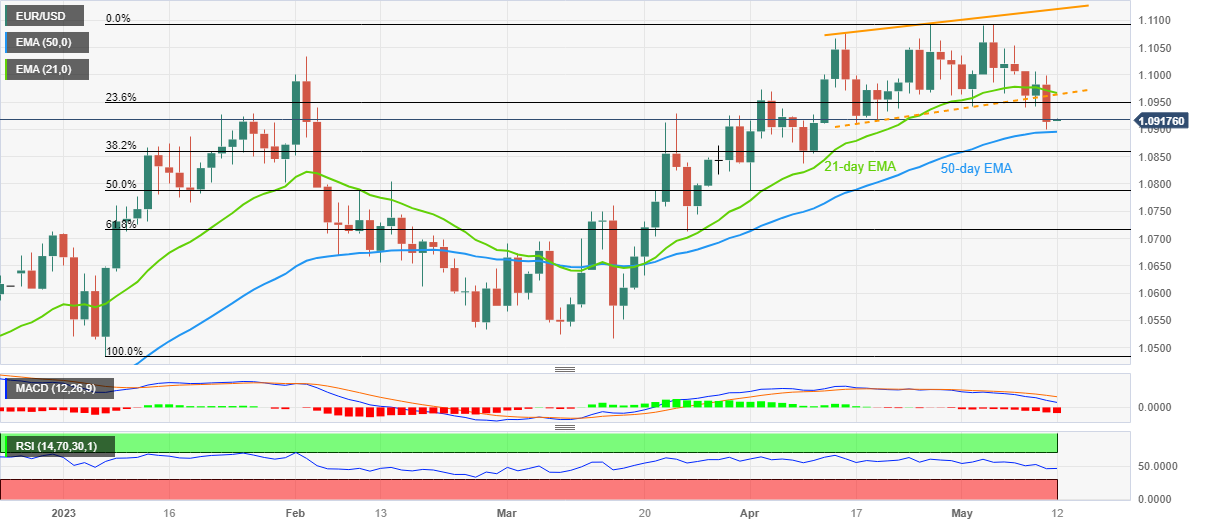
Trend: Further downside expected
- US Dollar Index marked two-day winning streak to eye first weekly gain in three, grinds higher of late.
- Sour sentiment, hawkish Fed talks underpins US Dollar demand despite mixed statistics.
- US CPI, PPI came in unimpressive, Jobless Claims jumps to the highest since October 2021.
- US Michigan Consumer Sentiment Index, UoM Consumer Inflation Expectations eyed for clear directions, risk catalysts are the key.
US Dollar Index (DXY) grinds higher past 102.00 as the greenback bulls brace for the first weekly gain in three during early Friday. In doing so, the US Dollar’s gauge versus the six major currencies pays little heed to the mixed US data while cheering the hawkish Federal Reserve (Fed) signals and sour sentiment.
The market’s rush toward the US Dollar can be linked to the fears of the US debt ceiling expiry and banking fallouts.
Among the latest negatives on the matter is the postponement of the debt ceiling talks between US President Joe Biden and House Speaker McCarthy. The news becomes all the more important and negatively impacts the risk appetite as the US Treasury Department has already signaled the Federal Government’s likely default as soon as June 1 unless the debt ceiling is raised. Also increasing the intensity of the news is the fact that US President Biden is set to attend the G7 meeting in Japan the next week.
It should be noted that Politico came out with the news suggesting that US Treasury Secretary Janet Yellen will discuss the impasse over raising the government debt ceiling with board members of the Bank Policy Institute lobby group, including the CEOs of JPMorgan and Citigroup next week
On Thursday, US Treasury Secretary Yellen reiterated her warning that the “US default would threaten US recovery, sparking a global downturn that would set us back much further.” On the same line was Beth Hammack, Chair of the Treasury Borrowing Advisory Committee and Co-Head of Goldman's Global Financing Group, who said recently that a political deadlock over the US debt ceiling poses a "real risk" for the USD.
Talking about the bank fears, Reuters said that around 113 of the largest U.S. lenders will bear the cost of replenishing a deposit insurance fund that was drained of $16 billion by recent bank failures, per the Federal Deposit Insurance Corporation (FDIC), which in turn escalate fears of more fallouts in the banking industry.
After a softer US Consumer Price Index (CPI), the Producer Price Index (PPI) improved to 0.2% MoM for April versus 0.3% expected and -0.4% prior. More importantly, PPI ex Food & Energy, known as Core PPI, rose on MoM but eased on YoY. Further, US Initial Jobless Claims rose by 264,000 to push the level to the highest level since October 2021, which in turn escalated the risk-off mood and favored the US Dollar.
However, Minneapolis Fed President Neel Kashkari mentioned on Thursday that inflation has eased but warned it is above the Fed's 2% target while speaking at the Marquette CEO Town Hall in Michigan.
Against this backdrop, Wall Street edged lower whereas the US 10-year and two-year Treasury bond yields also dropped in the last two consecutive days.
Looking ahead, the DXY traders may seek more clues to defend the latest run-up, which in turn highlights updates on the US debt ceiling and banking fronts. Additionally important will be the preliminary readings of the University of Michigan’s (UoM) Consumer Sentiment Index (CSI) for May, as well as the UoM 5-year Consumer Inflation Expectations for the said month.
Also read: Michigan Consumer Sentiment Index Preview: Modest improvement not enough to boost the mood
Technical analysis
Although a daily closing beyond the 21-DMA, around 101.70 by the press time, favors the US Dollar Index (DXY) buyers, a downward-sloping resistance line from early April, close to 102.22 at the latest, restricts short-term upside of the greenback’s gauge versus six major currencies.
- EUR/JPY breaks below the two-week support trendline, confirming a head-and-shoulders chart pattern.
- The pair faces multiple support levels to target 143.20, including 50-day EMA at 146.00 and 100-day EMA at 144.59.
- Reclaiming 147.00 could open the door for gains and negate the bearish chart pattern, with the next resistance at 147.80-148.00.
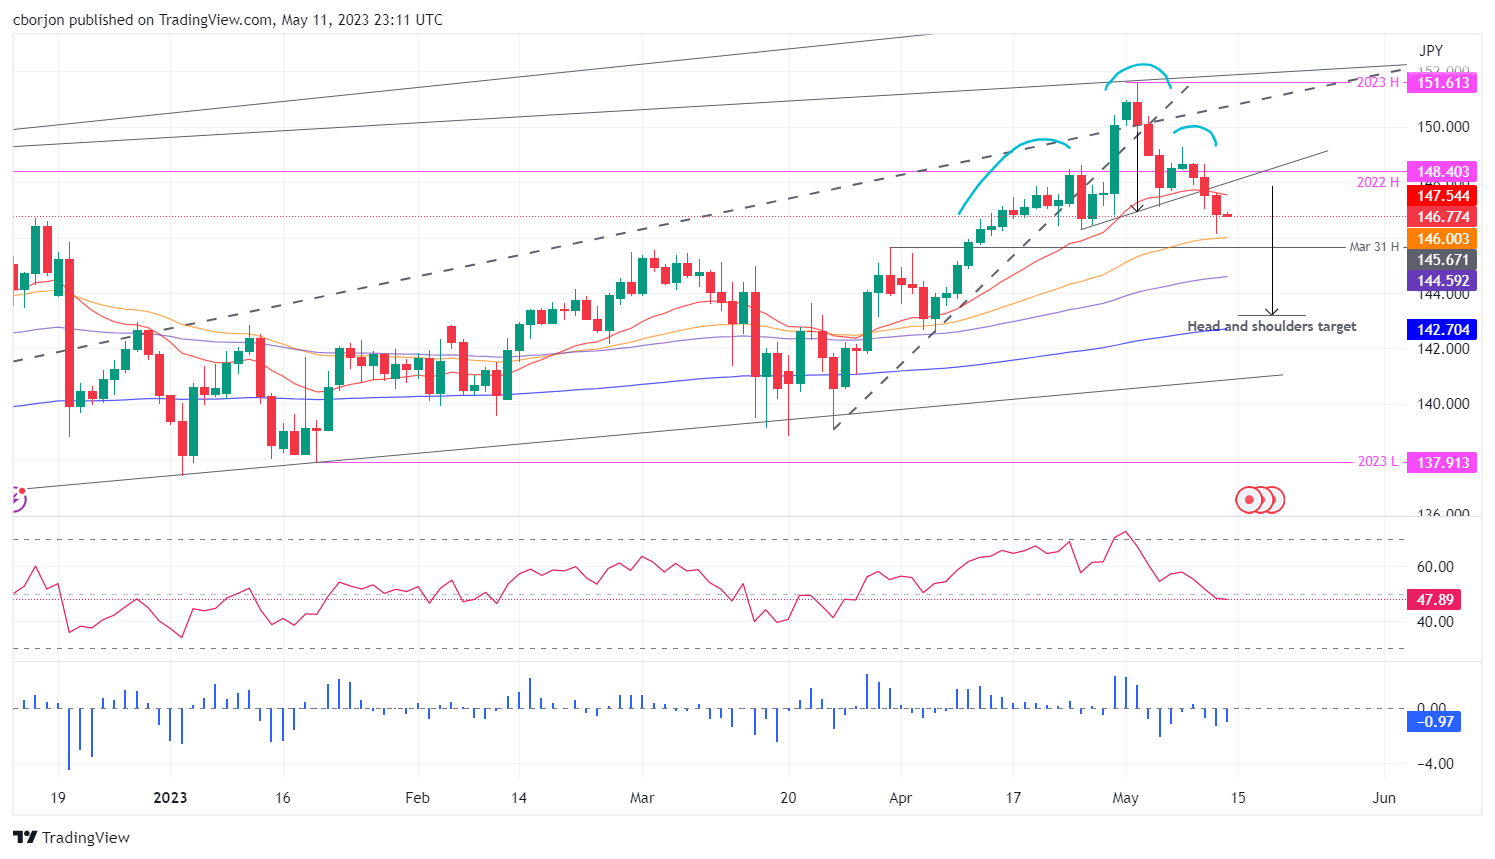
EUR/JPY confirms a break below a two-week support trendline, which also ensures the formation of a head-and-shoulders chart pattern that targets a drop of 450 pips toward 143.20, 50 pips shy of piercing the 200-day Exponential Moving Average (EMA) at 142.70. However, it should be said that it would need to hurdle support levels on its way south. As the Asian session begins, the EUR/JPY is trading at 146.85, down by 0.01%, after losing 0.46% on Thursday.
EUR/JPY Price Analysis: Technical outlook
Given the backdrop, the GBP/JPY confirmed the formation of a head-and-shoulders chart pattern. Even though it is a bearish chart pattern, sellers must reclaim several demand areas on its way toward the 143.00 figure.
The EUR/JPY first support would be the 50-day Exponential Moving Average (EMA) at 146.00. A breach of the latter would sponsor a fall to the 100-day EMA at 144.59 before testing the 144.00 psychological level. Once cleared, the head-and-shoulders profit target of 143.20 should be reached.
The Relative Strength Index (RSI) indicator turned bearish, warranting that further downside is expected, while the 3-day Rate of Change (RoC), continues to slide below its neutral level.
Conversely, if EUR/JPY buyers reclaim 147.00, that could open the door for further gains. The next supply area to test would be the head-and-shoulders neckline at around 147.80-148.00, before reaching towards the last year’s high of 148.40, negating the bearish chart pattern.
Trend: Downward biased.
EUR/JPY Price Action – Daily Chart
- GBP/USD licks its wounds after posting the biggest daily loss in seven weeks.
- Downside break of two-month-old ascending trend line, bearish MACD signals favor Cable bears.
- Nearly oversold RSI (14), upward-sloping trend line from late March challenges the Pound Sterling sellers.
- First readings of the United Kingdom (UK) Gross Domestic Product (GDP) for the first quarter (Q1) of 2023 eyed as well.
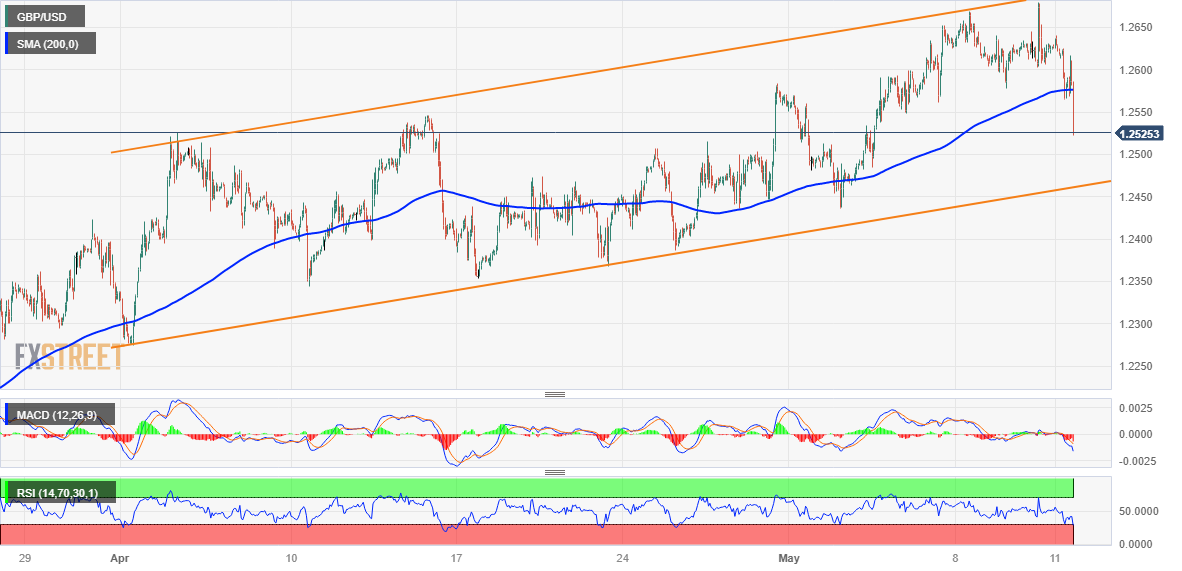
GBP/USD seesaws around 1.2515 during early Friday morning in Asia, after posting the biggest daily fall since March 07.
In doing so, the Cable pair justifies the downside break of a two-month-old ascending trend line, as well as bearish MACD signals. However, an upward-sloping trend line from late March, around 1.2500 round figure by the press time, joins the oversold RSI (14) line suggesting a corrective bounce in the GBP/USD price.
In a case where the GBP/USD remains weaker past 1.2500, the 200-bar SMA level of around 1.2470 will act as the last defense of the Cable pair buyers.
Meanwhile, the Pound Sterling’s corrective bounce needs to stay beyond the multi-day-old previous support line, close to 1.2540 at the latest, to convince the GBP/USD buyers.
Following that, a fortnight-old horizontal hurdle near 1.2580 and the recently flashed multi-month high of near 1.2680 could lure the Cable buyers.
Apart from the technical details, the first readings of the UK’s Q1 GDP, expected to print stagnant growth of 0.1% on QoQ but ease to 0.2% YoY versus 0.6% prior, will be the key for the GBP/USD traders to watch for clear directions.
GBP/USD: Four-hour chart
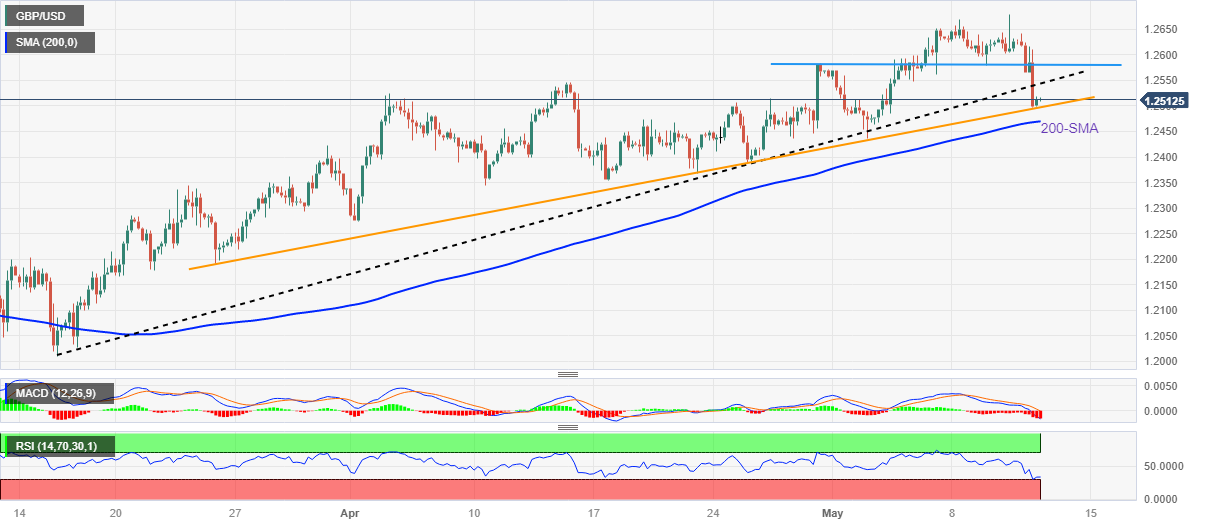
Trend: Limited downside expected
- GBP/JPY faces a second straight day of losses, trading at 168.33, after BoE raises interest rates by 25 bps.
- The pair finds support at 20-day EMA (168.32) as it remains upward biased despite recent setbacks.
- GBP/JPY could test 170.00 resistance if it stays above 168.30 but may fall below 168.00 if selling pressure persists.
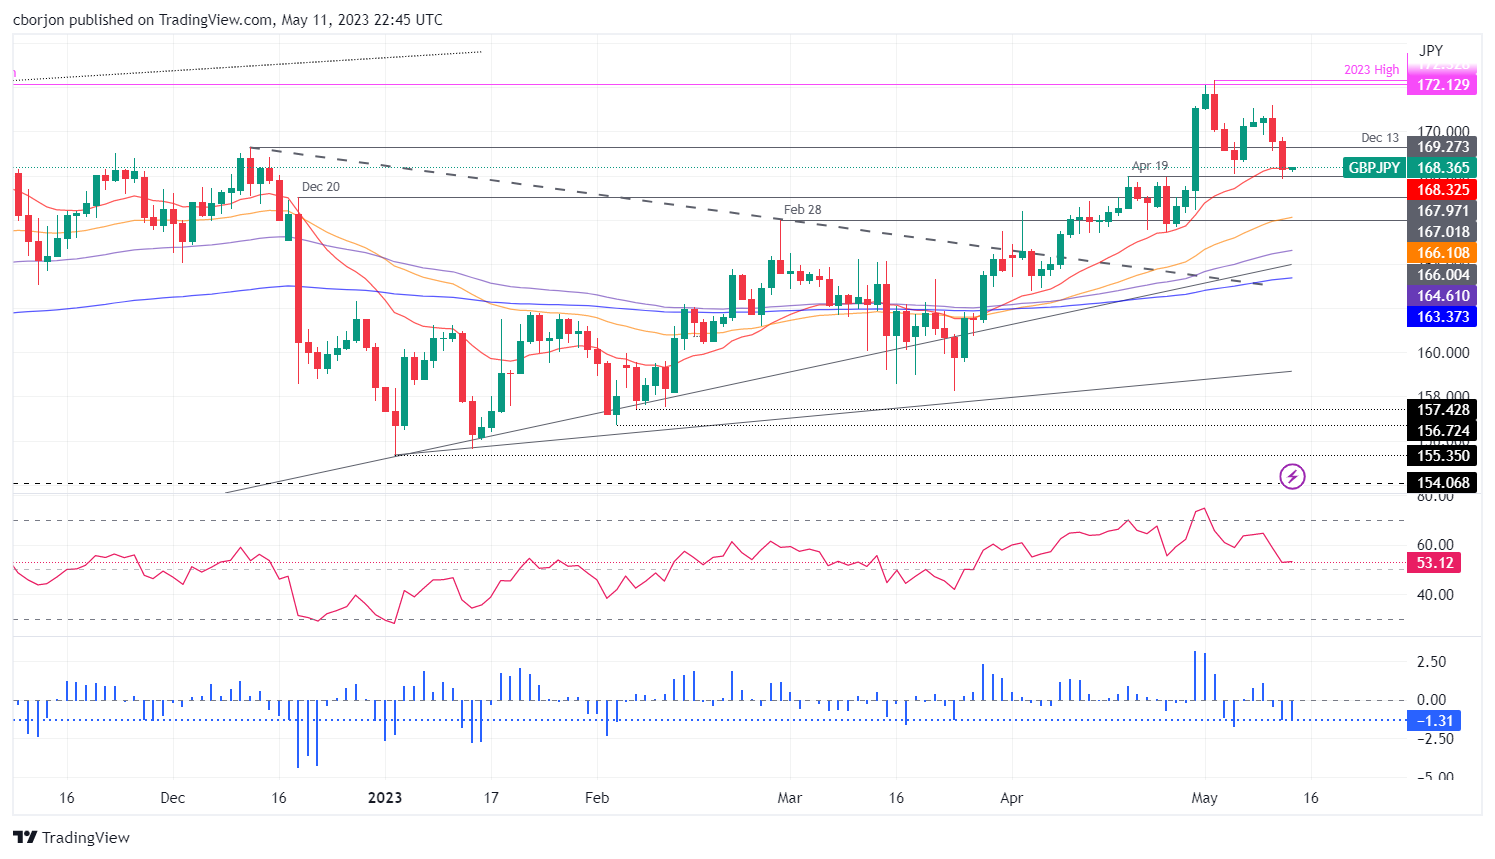
GBP/JPY slides for the second straight day after the Bank of England’s (BoE) decision to raise interest rates by 25 bps, opening the door for further tightening. At the same meeting, the BoE updated its economic projections and sounded “hawkish” but failed to underpin the Pound Sterling (GBP). The GBP/JPY exchanges hand at 168.33 as the Asian session begins after posting losses of 0.76% on Thursday.
GBP/JPY Price Analysis: Technical outlook
GBP/JPY remains upward biased, finding support at the 20-day Exponential Moving Average (EMA) at 168.32, which was severally tested during Thursday’s session. The GBP/JPY crossed below April’s 19 daily high, which turned support at 167.97, a level aggressively defended by buyers.
Even though the pair printed two days of losses of 1.50%, the Relative Strength Index (RSI) indicator remains bullish despite its flat slope. At the same time, the 3-day Rate of Change (RoC), depicts the cross as neutral after reaching back-to-back negative readings.
If GBP/JPY stays above 168.30, that could open the door for further upside. The following resistance level would be the December 13 daily high of 169.27, and up next, the 170.00 figure would be up for grabs.
If any GBP/JPY falls below 168.00, then sellers could lean on that level and drag prices toward the December 20 high shifted support at 167.01. Once cleared, GBP/JPY could test the February 28 high, now support level at 166.00.
GBP/JPY Price Action – Daily Chart
- Gold price appears all-set for the first weekly loss in three after posting two-day downtrend in the last.
- Fears of United States default, banking fallouts join downbeat data to weigh on risk appetite and XAU/USD.
- US Dollar Index ignores mixed Producer Price Index, Jobless Claims and Treasury bond yields to remain firmer.
- US Michigan Consumer Sentiment Index, Consumer Inflation Expectations eyed for clear Gold price directions.
Gold price (XAU/USD) licks its wounds around $2,015 amid the early Asian session on Friday, after declining in the last two consecutive days. In doing so, the precious metal bears the burden of the market’s risk-off mood, which in turn underpins the US Dollar demand, while preparing for the first weekly loss in three. Among the main culprits, fears of the United States default and mixed US data, mostly downbeat, seem to have weighed on the sentiment and the XAU/USD.
Gold price bears the burden of risk-off mood
Gold price remained pressured on Thursday for the second consecutive day despite the softer United States economics. The reason could be linked to the market’s rush towards the US Dollar amid fears of the US debt ceiling expiry and banking fallouts.
Among the latest negatives on the matter is the postponement of the debt ceiling talks between US President Joe Biden and House Speaker McCarthy. “A debt limit meeting between US President Joe Biden and top lawmakers that had been scheduled for Friday has been postponed, and the leaders agreed to meet early next week, a White House spokesperson said on Thursday,” reported Reuters.
The news becomes all the more important and negatively impacts the risk appetite as the US Treasury Department has already signaled the Federal Government’s likely default as soon as June 1 unless the debt ceiling is raised. Also increasing the intensity of the news is the fact that US President Biden is set to attend the G7 meeting in Japan the next week.
Previously, US Treasury Secretary Janet Yellen reiterated her warning that the “US default would threaten US recovery, sparking a global downturn that would set us back much further,” on early Thursday. On the same line was Beth Hammack, Chair of the Treasury Borrowing Advisory Committee and Co-Head of Goldman's Global Financing Group, who said recently that a political deadlock over the US debt ceiling poses a "real risk" for the USD.
On the other hand, Reuters’ news said that around 113 of the largest U.S. lenders will bear the cost of replenishing a deposit insurance fund that was drained of $16 billion by recent bank failures, per the Federal Deposit Insurance Corporation (FDIC).
Apart from the fears emanating from the US debt-ceiling expiration and banking woes, the likely stronger return of the US-China tension also weighs on the market sentiment and the Gold price. On Thursday, US Treasury Secretary Janet Yellen said that the Biden administration has been discussing restrictions on outbound investment to China for some time. Earlier in the week, China’s Foreign Ministry reiterated its dislike for the US intervention in the Taiwan issue.
While portraying the mood, Wall Street edged lower whereas the US 10-year and two-year Treasury bond yields also dropped in the last two consecutive days, which in turn allowed the US Dollar Index to print a two-day winning streak to 102.07 at the latest.
United States statistics fail to prod US Dollar bulls but weigh on XAU/USD
While the risk-off mood allowed the US Dollar Index (DXY) to remain firmer, the United States statistics weren’t helping the greenback. After a softer US Consumer Price Index (CPI), the Producer Price Index (PPI) improved to 0.2% MoM for April versus 0.3% expected and -0.4% prior. More importantly, PPI ex Food & Energy, known as Core PPI, rose on MoM but eased on YoY. Further, US Initial Jobless Claims rose by 264,000 to push the level to the highest level since October 2021, which in turn escalated the risk-off mood and favored the US Dollar.
Following the data, Minneapolis Fed President Neel Kashkari mentioned on Thursday that inflation has eased but warned it is above the Fed's 2% target while speaking at the Marquette CEO Town Hall in Michigan.
It’s worth noting that the mixed US data and Fed talks failed to prod the US Dollar bulls and rather weighed on the Gold price by raising market fears. Amid these plays, the Fed Fund Futures keep suggesting a pause in the Federal Reserve rate hikes before the rate cuts begin in September 2023.
Moving on, the Gold traders may seek more clues to direct the latest downturn, which in turn highlights updates on the US debt ceiling and banking fronts. Additionally important will be the preliminary readings of the University of Michigan’s (UoM) Consumer Sentiment Index (CSI) for May, as well as the UoM 5-year Consumer Inflation Expectations for the said month.
Gold price technical analysis
Gold price confirmed pennant breakdown on Thursday, suggesting the metal’s further downside. The metal’s bearish break also justifies downbeat signals from Moving Average Convergence and Divergence (MACD) indicator, as well as the steady Relative Strength Index (RSI) line, placed at 14.
With this, the XAU/USD appears well set to prod the 200-bar Exponential Moving Average (EMA), close to $1,993 by the press time.
In a case where the Gold price remains bearish past $1,993, the mid-March swing high surrounding $1,937 and the $1,900 round figure could lure the XAU/USD sellers.
On the flip side, the stated pennant’s upper line, close to $2,042 at the latest, guards the immediate recovery of the Gold price.
Following that, $2,050 and the recently flashed record high of near $2,080 can attract the XAU/USD bids. It’s worth observing, however, that an upward-sloping resistance line from March 20, around $2,090, quickly followed by the $2,100 round figure may challenge further upside of the Gold price.
To sum up, Gold price appears well-set for further downside but the road towards the south appears long and bumpy.
Gold price: Four-hour chart
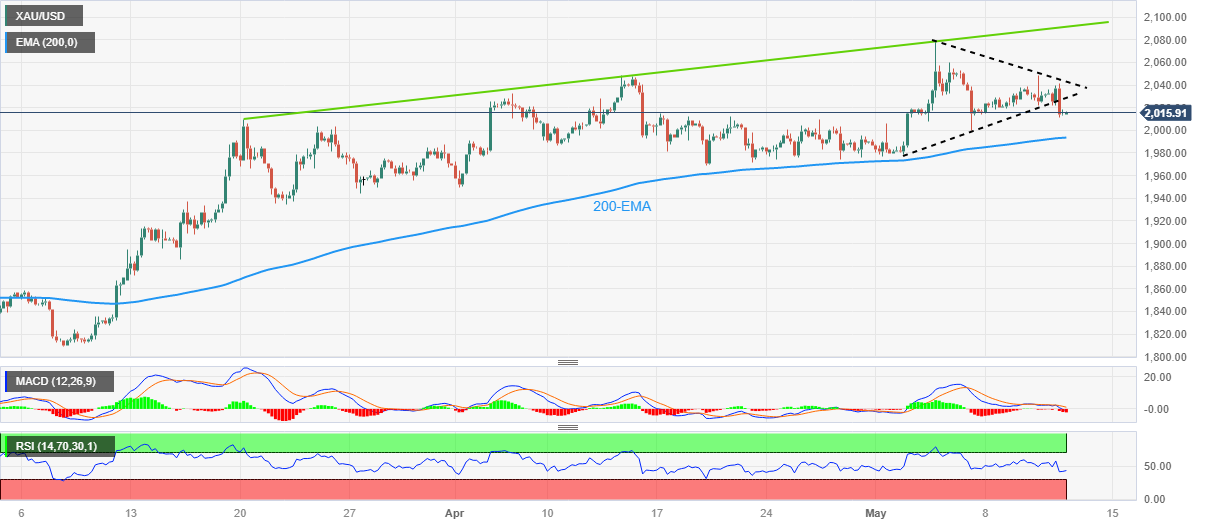
Trend: Limited downside expected
“A debt limit meeting between US President Joe Biden and top lawmakers that had been scheduled for Friday has been postponed, and the leaders agreed to meet early next week, a White House spokesperson said on Thursday,” reported Reuters.
Key quotes
The aides to Biden, Republican House Speaker Kevin McCarthy, Democratic Senate Majority Leader Chuck Schumer, top Senate Republican Mitch McConnell and top House Democrat Hakeem Jeffries met Wednesday and Thursday to discuss raising the debt ceiling.
McCarthy told reporters at the Capitol that the delay was not a sign of trouble in the talks but that he believed the staff negotiators who had been meeting this week needed to continue to talk before the principals met again.
White House officials acknowledge that they must accept some spending cuts or strict caps on future spending if they are to strike a deal, two sources said, while insisting they must preserve Biden's signature climate legislation that passed along party lines last year.
The White House portrayed the postponement as a positive development, with meetings progressing.
Market implications
The news becomes all the more important and negatively impacts the risk appetite as the US Treasury Department has already signaled the Federal Government’s likely default as soon as June 1 unless the debt ceiling is raised. Also increasing the intensity of the news is the fact the US President Biden is set to attend the G7 meeting in Japan the next week.
Also read: Forex Today: Dollar strengthens on mixed markets, commodities under pressure
- AUD/USD bears are lurking but bulls are stepping in.
- The price is stalling on the sell-off at a key support area, so a correction is eyed.
AUD/USD has dropped into support near 0.6690 and is starting to decelerate in the drive lower. A correction could be on the cards as illustrated above. The target areas are in the 0.6720s and then towards 0.6750.
AUD/USD H4 chart
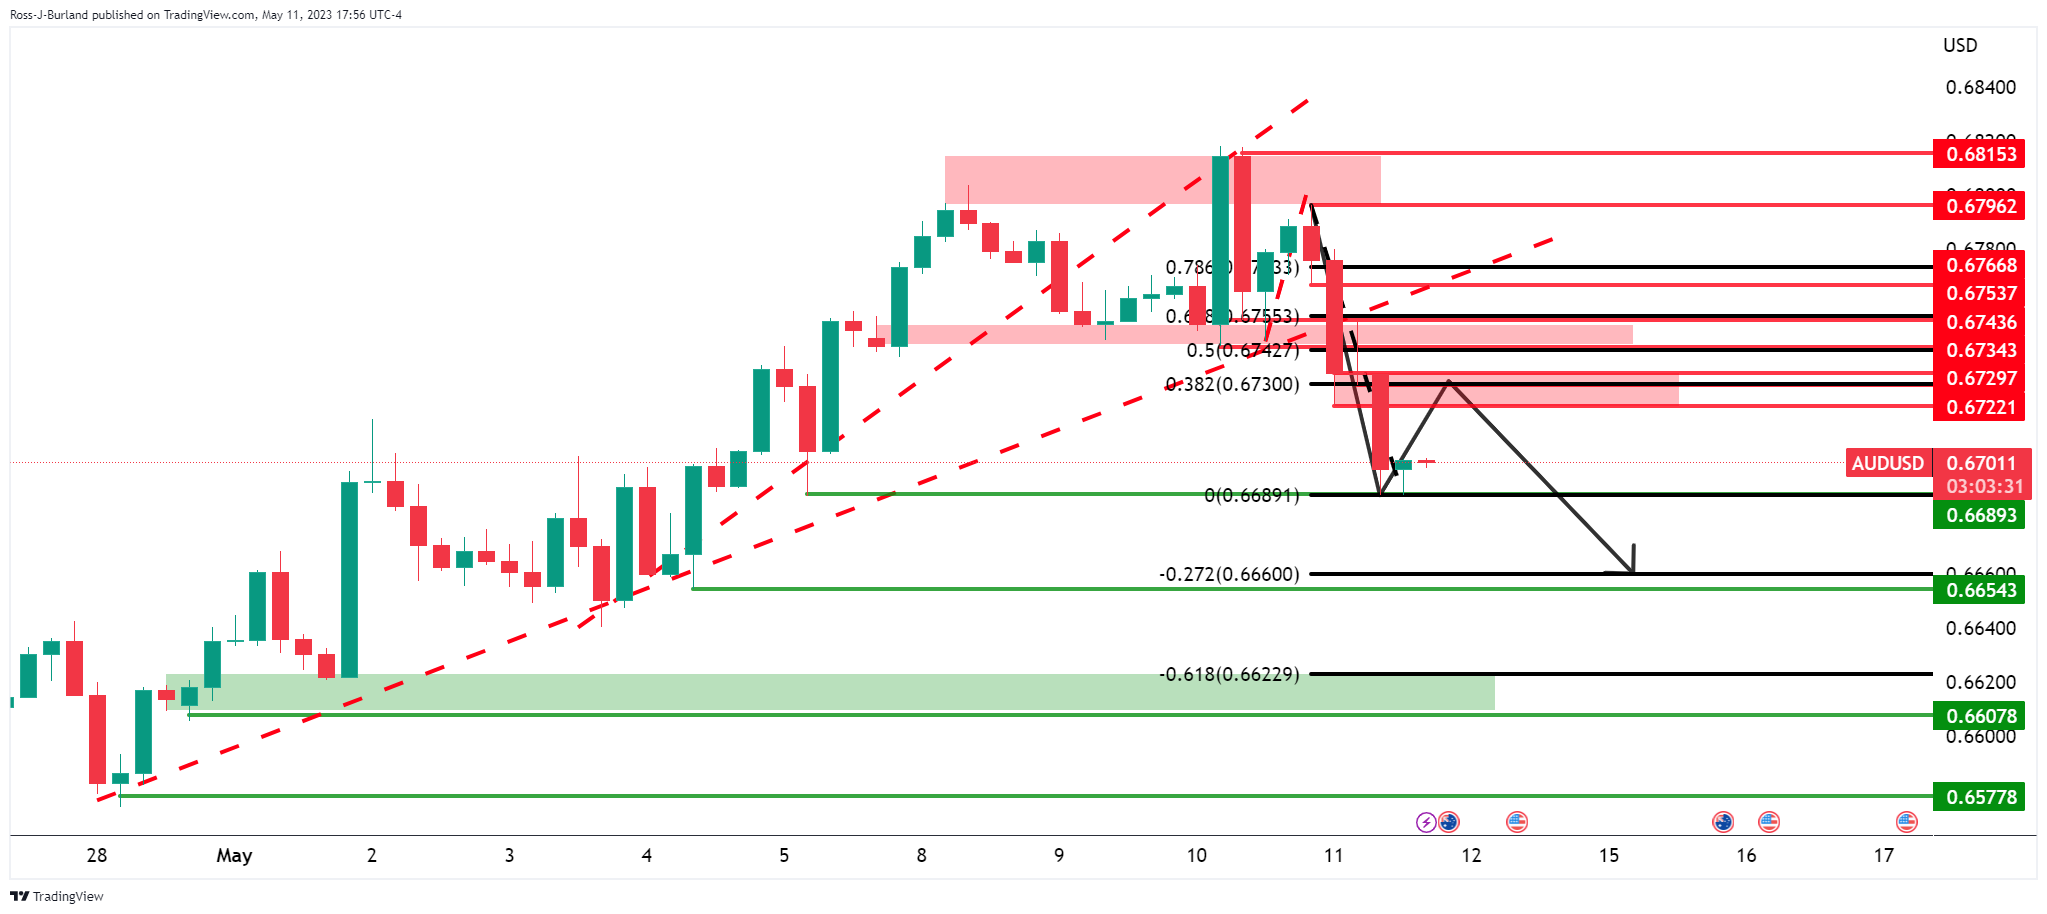
From an hourly perspective, the 50% mean reversion of the prior bearish impulse aligns in the 0.6750s also:
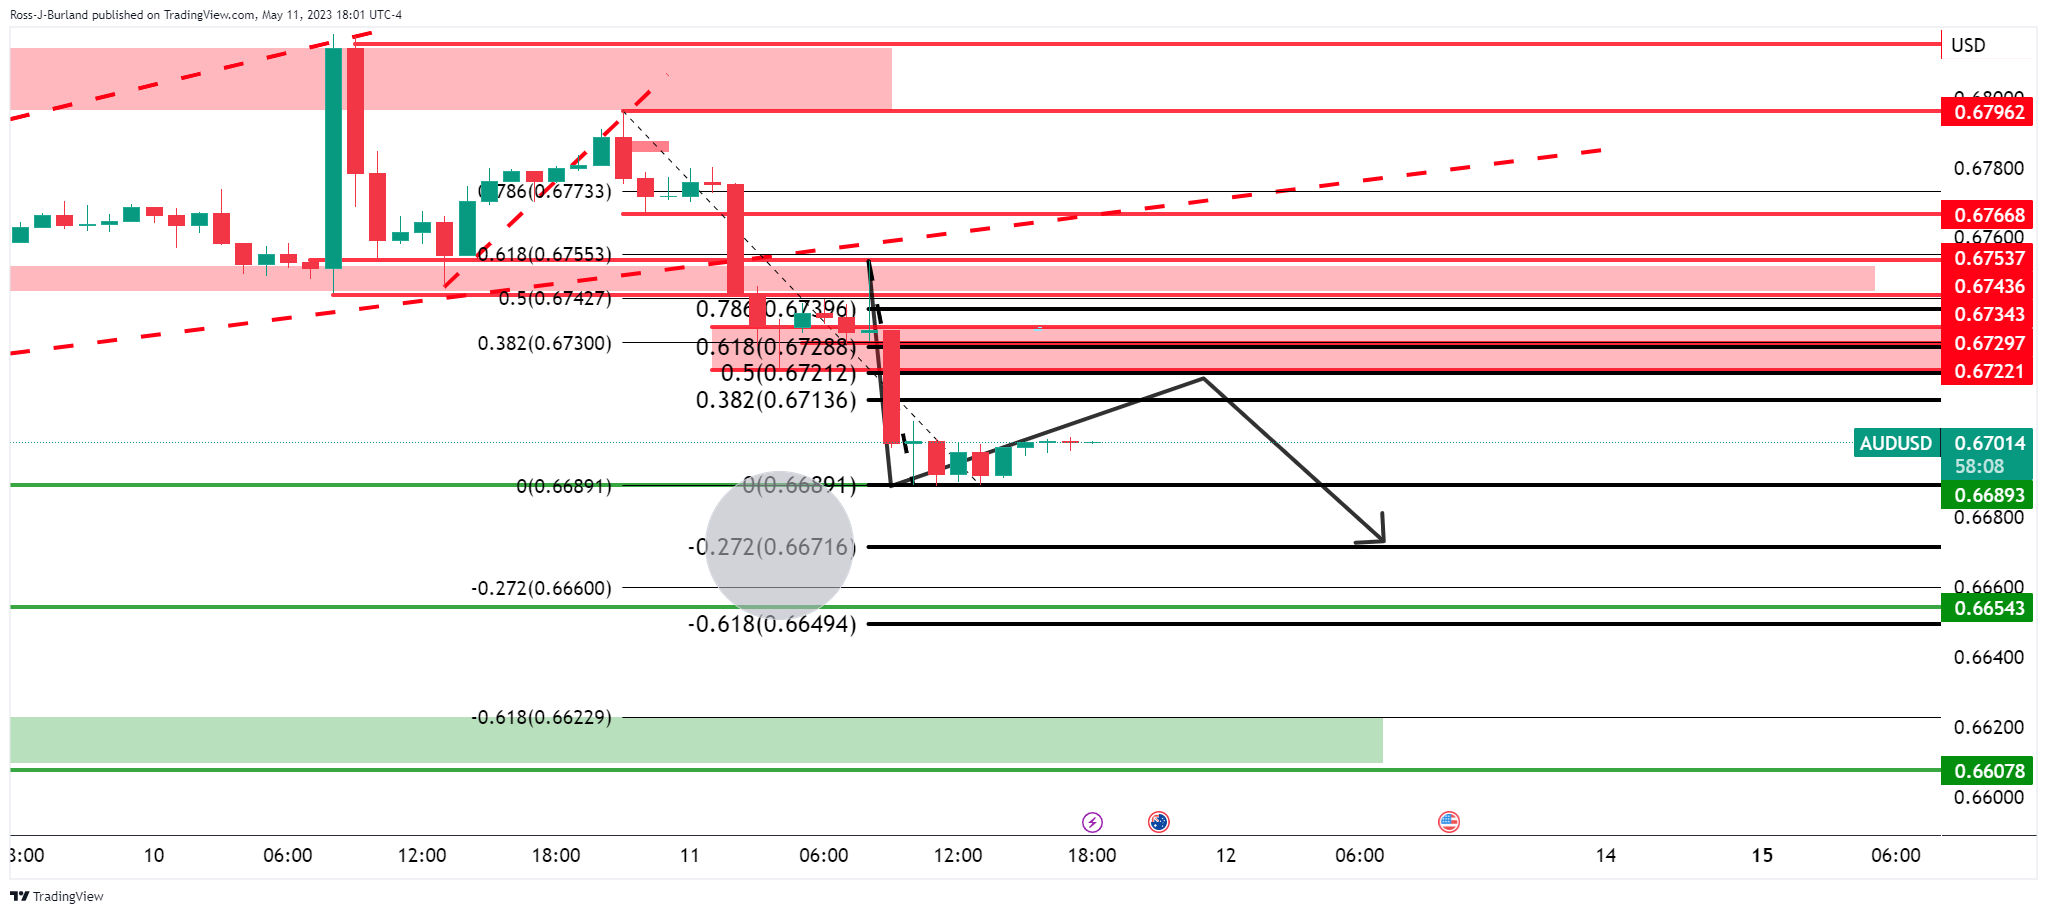
A move into resistance could equate to a downside continuation towards 0.6670 initially.
Market participants will continue to digest the latest inflation numbers across the globe and the resurgence of US bank fears. Regarding data, the New Zealand Business PMI is due. The Reserve Bank of Australia will release its inflation expectations report for the second quarter. Later on Friday, the UK will report GDP.
Here is what you need to know on Friday, May 12:
The US Dollar rose on Thursday on the back of cautious markets and a decline in commodity prices. The Greenback turned positive for the week with the DXY rising to the 102.00 area. US economic data pointed to a slowdown in inflation (Producer Price Index below expectations) and to a gain in the labor market (Initial Jobless Claims at highest since October 2021).
US bond yields dropped sharply but then rebounded. The correlation between yields and the US Dollar weakened somewhat on Thursday. The only report from the US on Friday will be the Consumer Confidence. The debt ceiling impasse and the banking system remain on the focus.
Wall Street posted mixed results on Thursday. The Dow Jones dropped 0.66% while the Nasdaq gained 0.18%. European stock markets also finished mixed. Equity prices continue to move sideways while the currency market appears on the verge of an extension of the recovery of the US Dollar.
EUR/USD dropped sharply, hitting levels under 1.0900. It is trading at the lowest in almost a month, near 1.0900 and close to an important support around 1.0890. The short-term outlook has turned negative.
The Bank of England, as expected, raised its key interest rate by 25 basis points, to 4.50%. The vote was 7-2, with two members voting for no change. The Pound was among the worst performers affected by BoE Governor Bailey comments on easing inflation. GBP/USD fell from above 1.2600 to sub 1.2500 levels while EUR/GBP surged from 0.86860 to 0.8735. The UK will report GDP on Friday.
Analysts at Danske Bank wrote:
We now expect another hike of 25bp at the June meeting. In order for BoE to keep policy rates unchanged we believe that we would have to see data releases prove considerably worse than what we currently pencil in. Our call is fairly closely in line with market pricing (33bp until September). Markets are pricing in a likelihood for a cut in December (-6bp). We still believe that the first rate cuts will not be delivered before Q2 2024.
USD/JPY hit weekly lows but then rebounded during the American session, ending flat around 134.50. The recovery was boosted by the rebound in US yields.
AUD/USD dropped sharply to the 20-day Simple Moving Average (SMA), hitting levels below 0.6700. A consolidation firmly below 0.6700 would increase the bearish pressure, while above, the Aussie could recover. If the decline in commodity prices persists, a deeper slide seems likely.
NZD/USD was affected by the rally of the US Dollar and dropped below 0.6300, erasing weekly gains. The Reserve Bank of New Zealand (RBNZ) will release its Inflation Expectations report, as well as the Business NZ PMI.
USD/CAD rose more than a hundred pips. The rally found resistance at the 20-day SMA, slightly below 1.3500.
Gold flirted with $2,040 and then reversed, falling more than $20 and stabilizing around $2,015. Silver tumbled almost 5%, posting the lowest close in a month, at $24.15. Crude Oil prices lost more than 1%.
Like this article? Help us with some feedback by answering this survey:
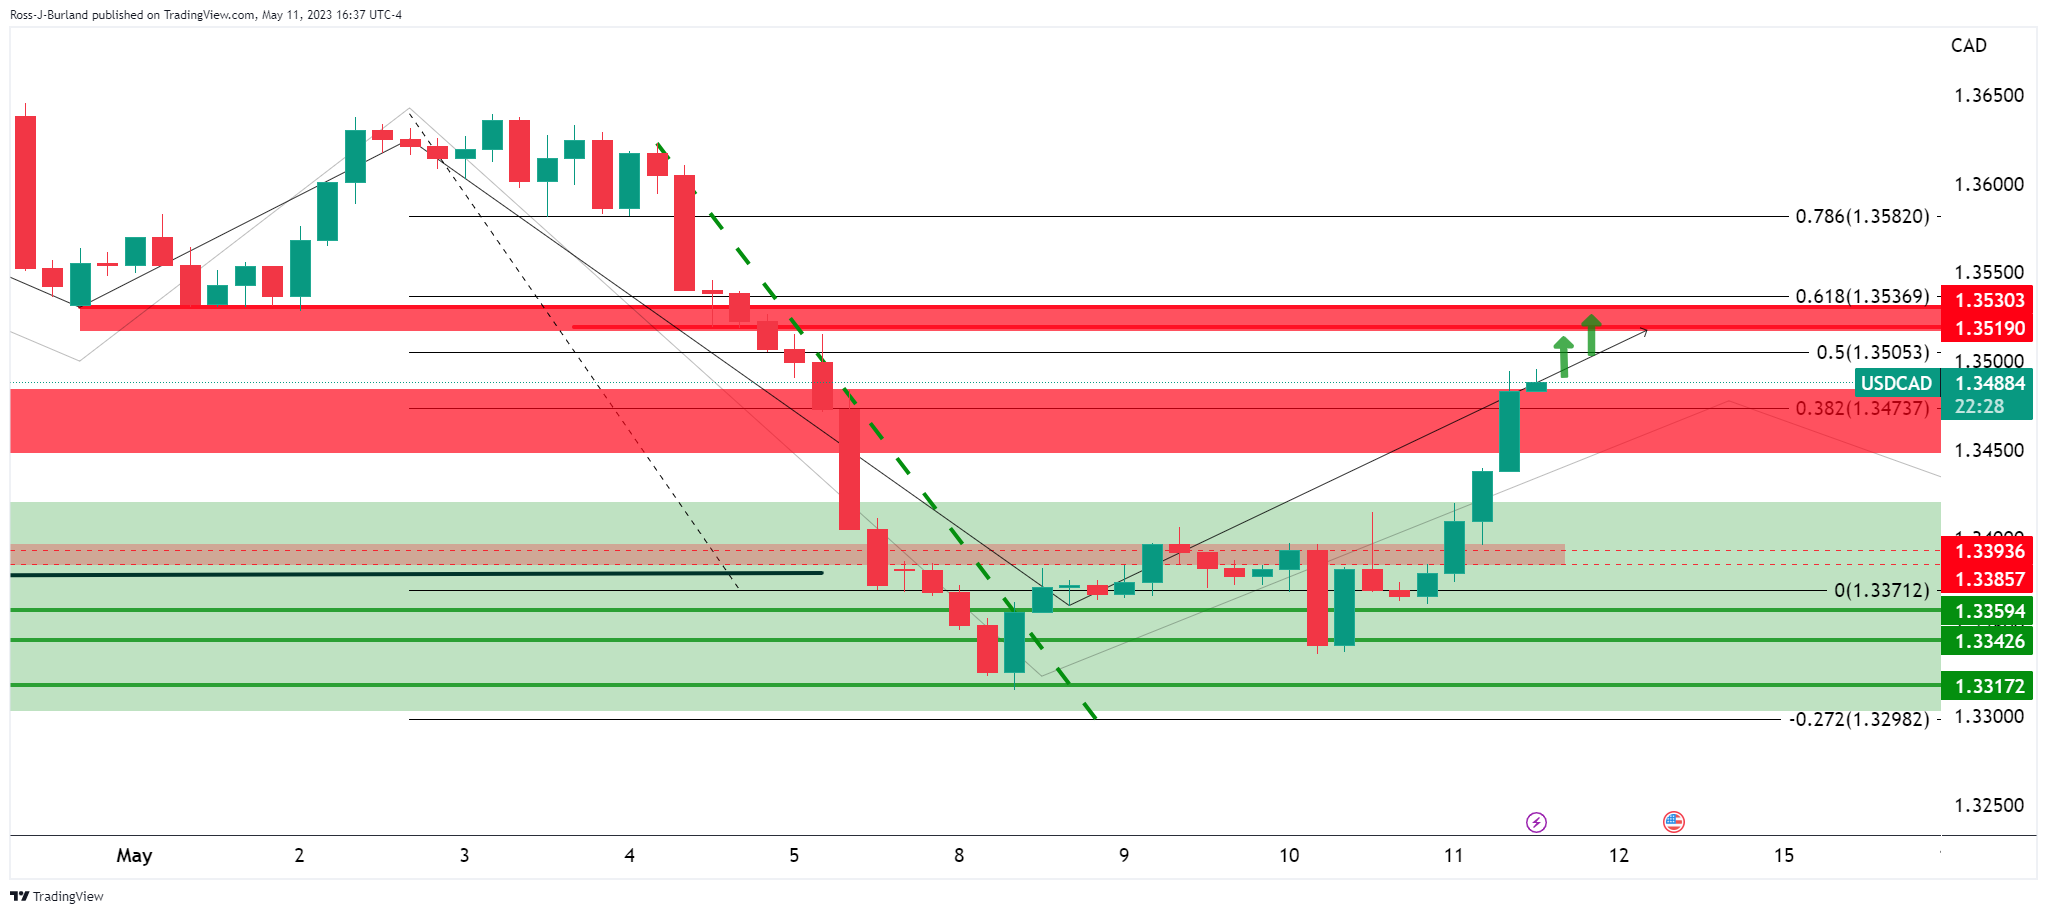
- USD/CAd bears are lurking above key support structures, eyeing prospects of a fade.
- 1.3480 and 1.3470 are key supports while bulls look to 1.3520 resistance.
As per the prior analysis, USD/CAD Price Analysis: Bears eye a run to 1.3320 as below key H4 structure, the price has traveled according to the forecast as follows:
USD/CAD prior analysis
There were eyes on a move back into the supply, however, the pair had painted an M-formation on the charts as the following illustrated:
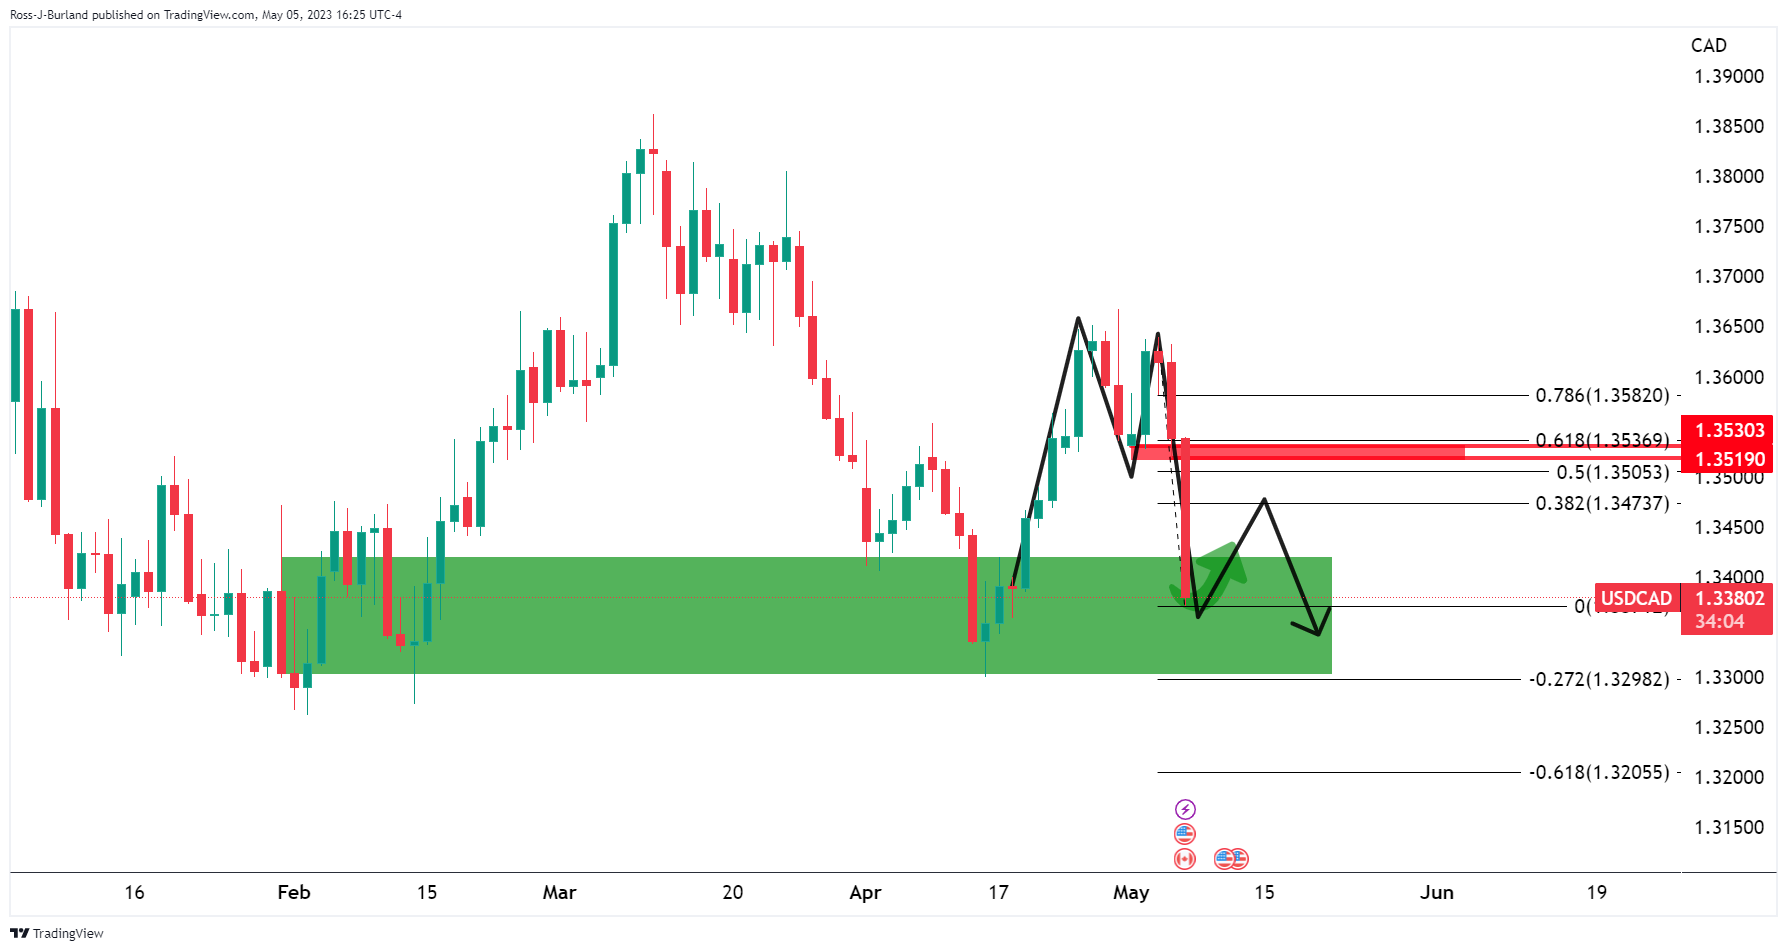
The price, however, had also taken out a key structure and for that, we zoomed down to the lower time frames:
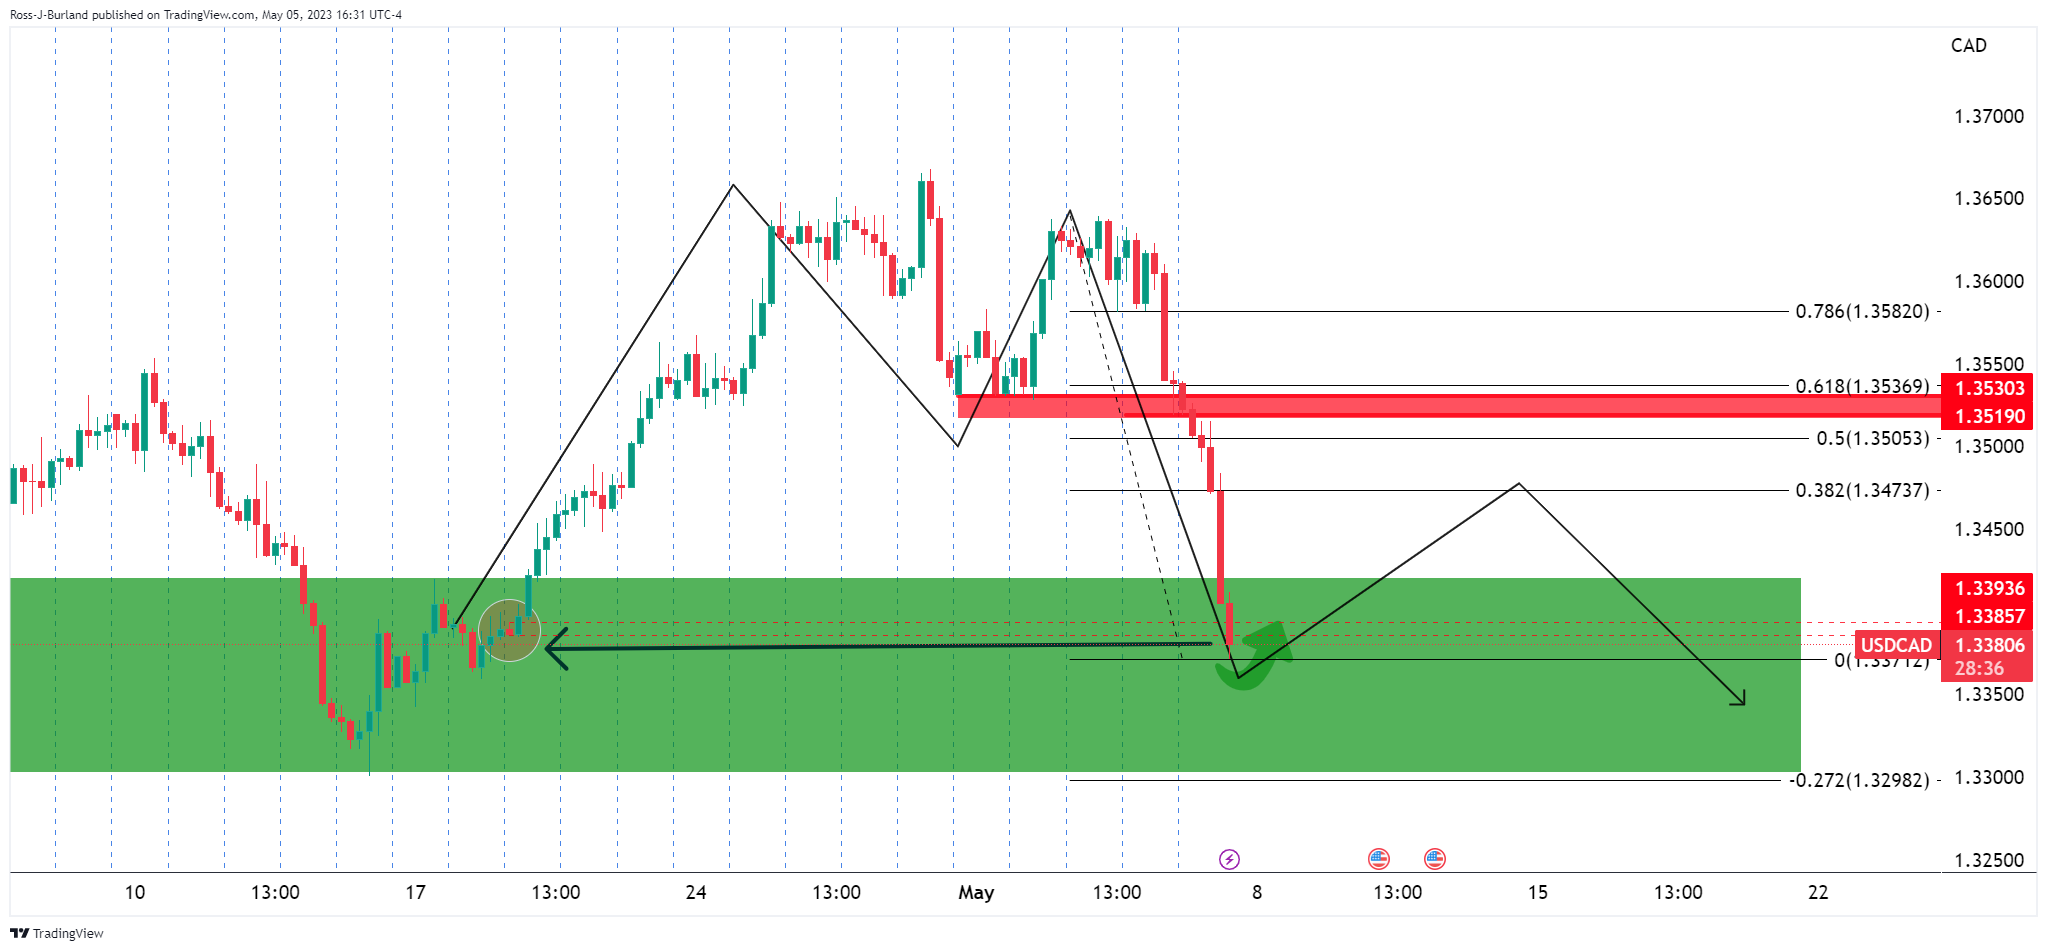
As we can see, the market was below 1.3393 and 1.3385 4-hour structure. This was a 4-hour bar where the price rallied from previously. Therefore, this was regarded as a key area so it was always going to be interesting to see if the bears could stay below it for longer:
It was stated that if the bears managed to do so, then the 1.3350s and 1.3320 levels wwould be eyed:
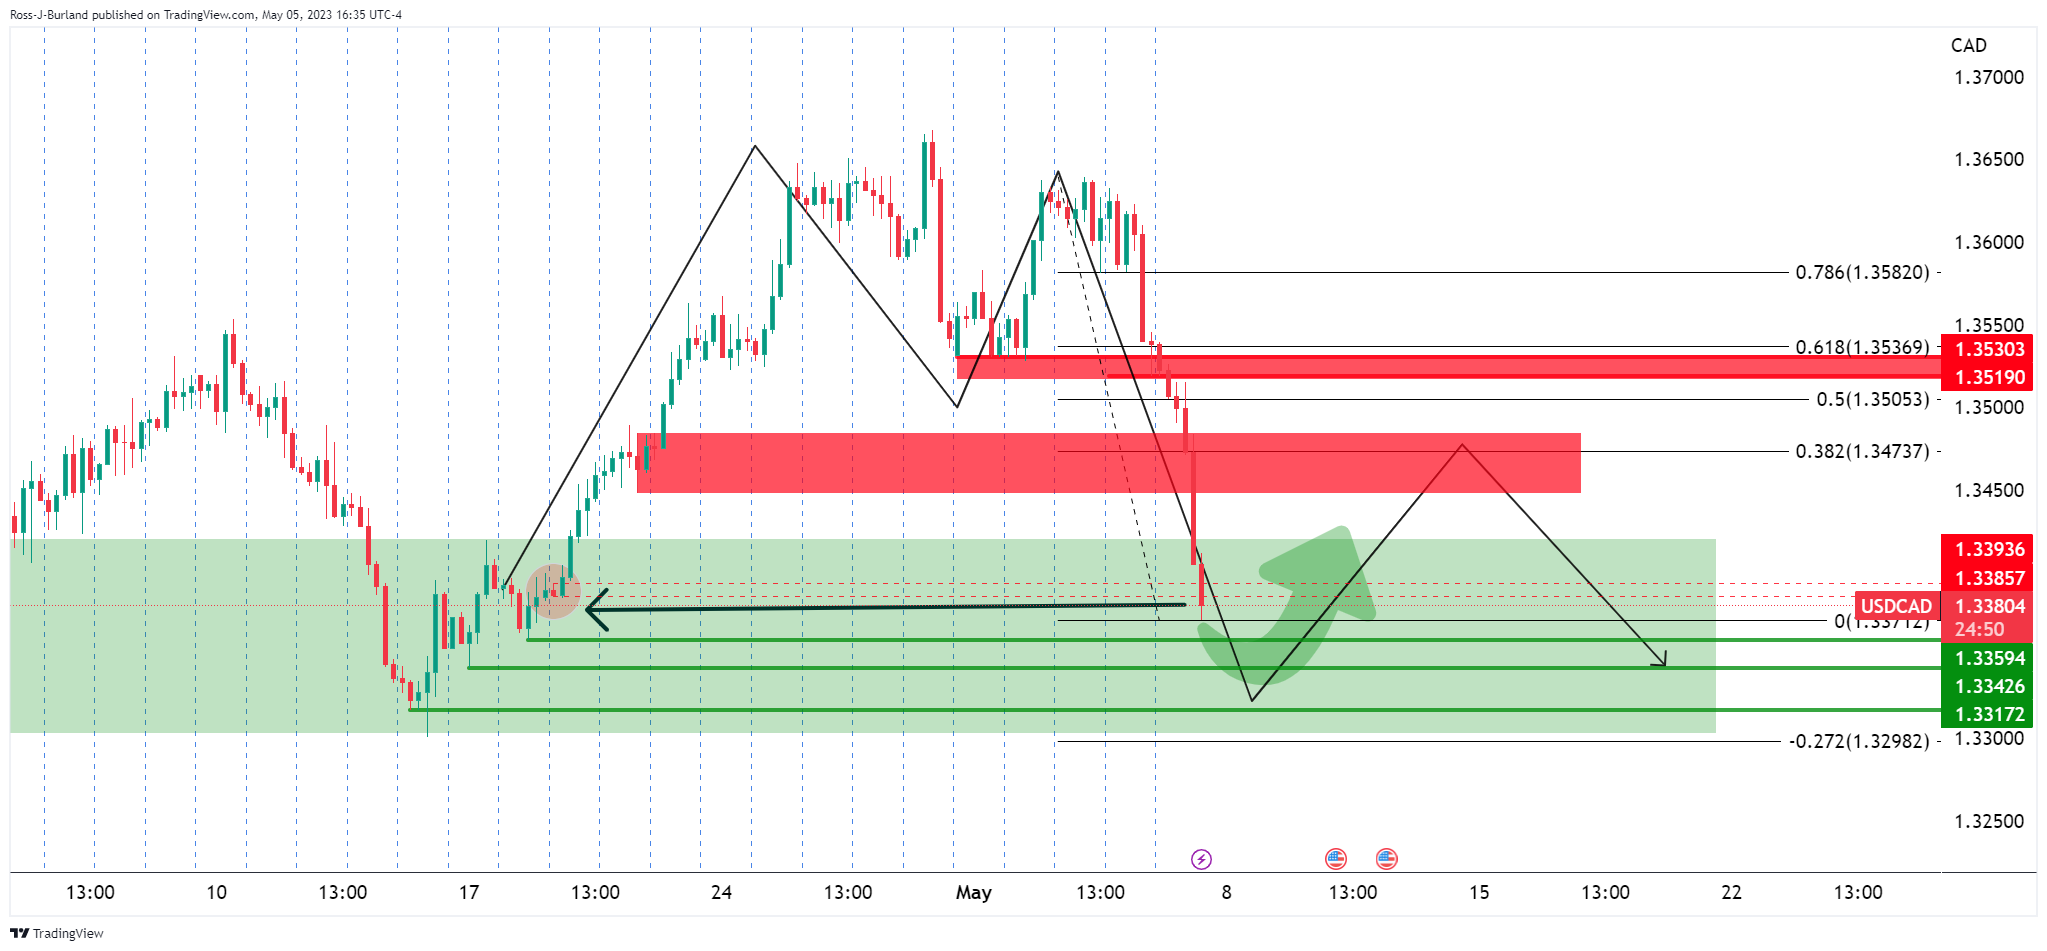
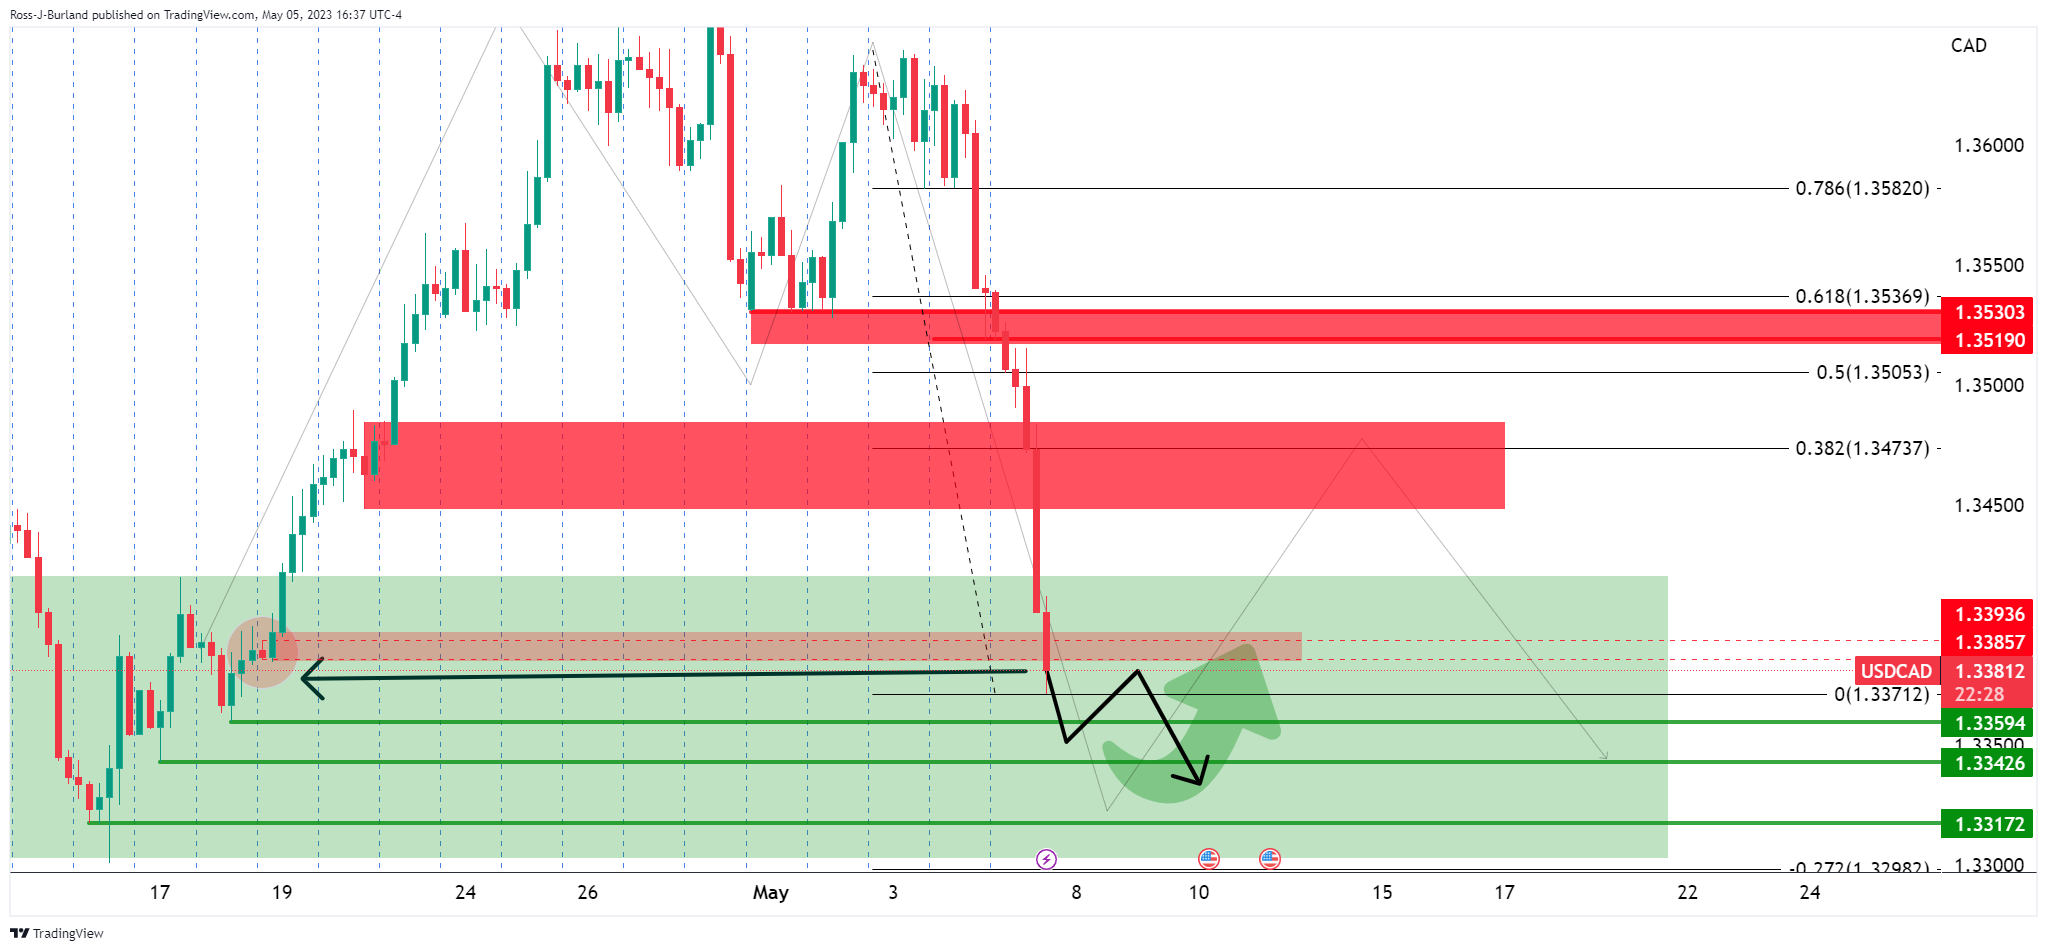
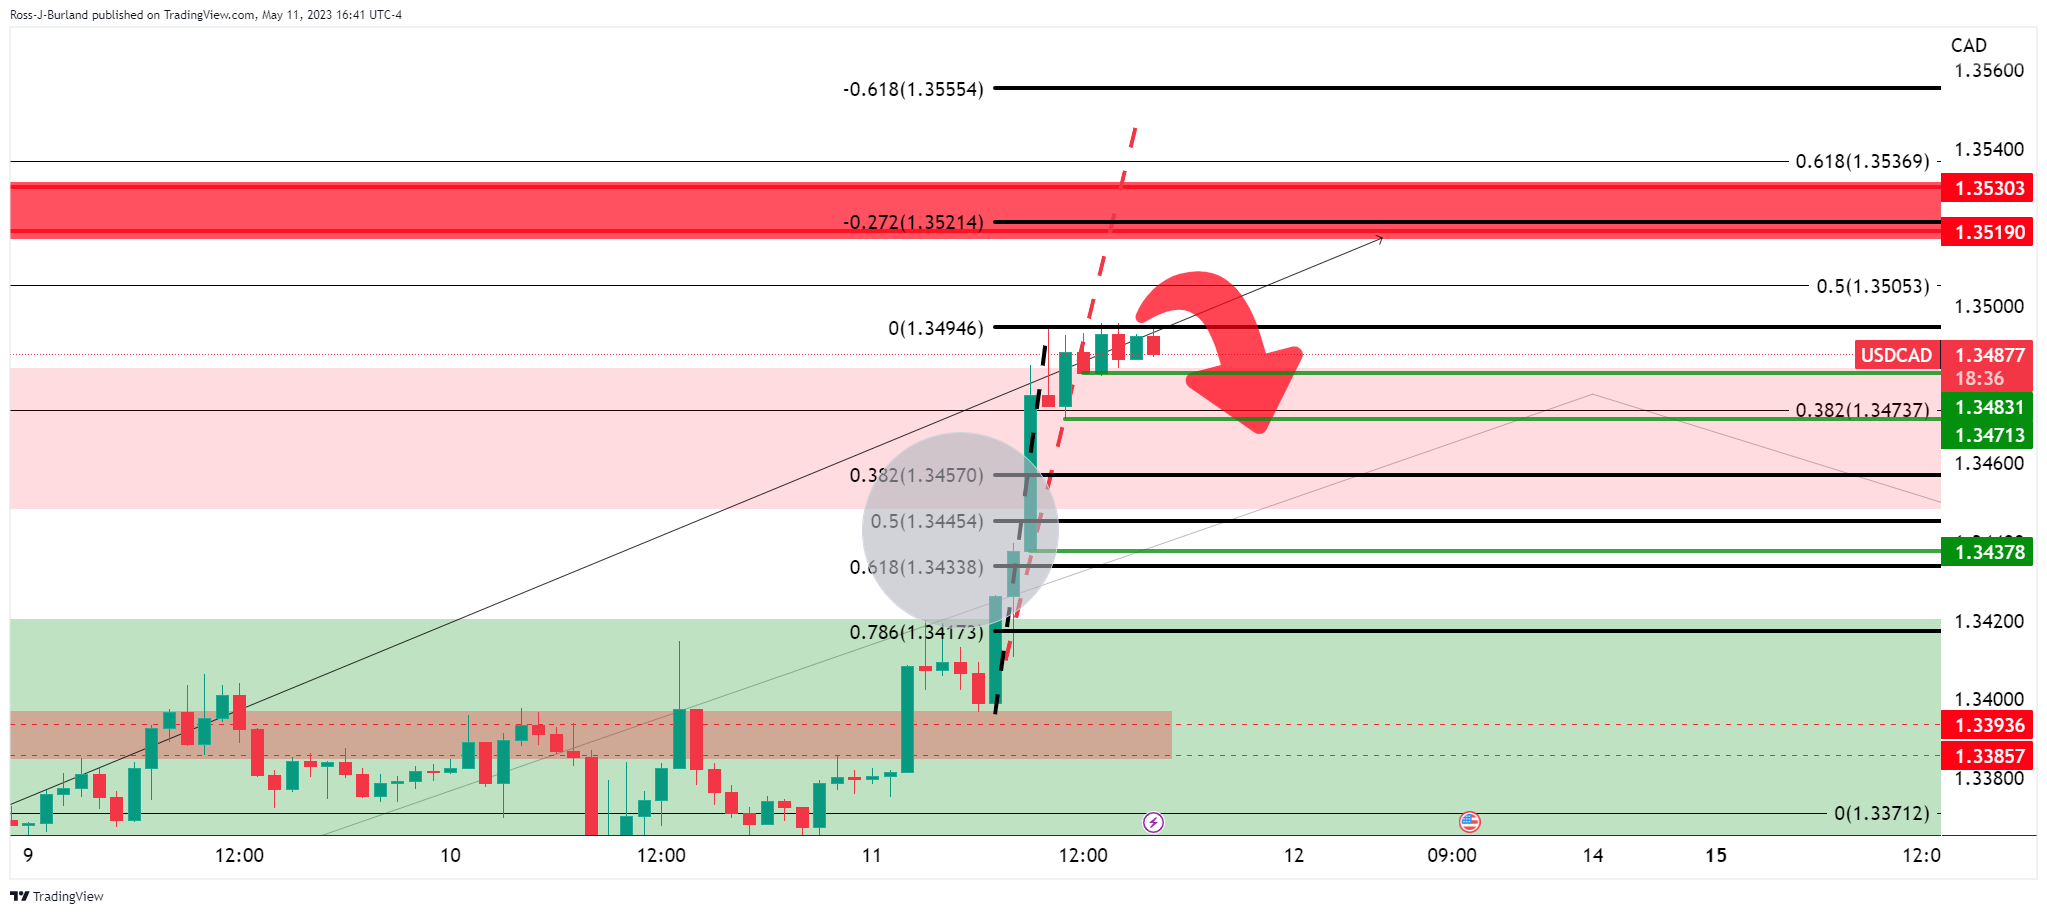
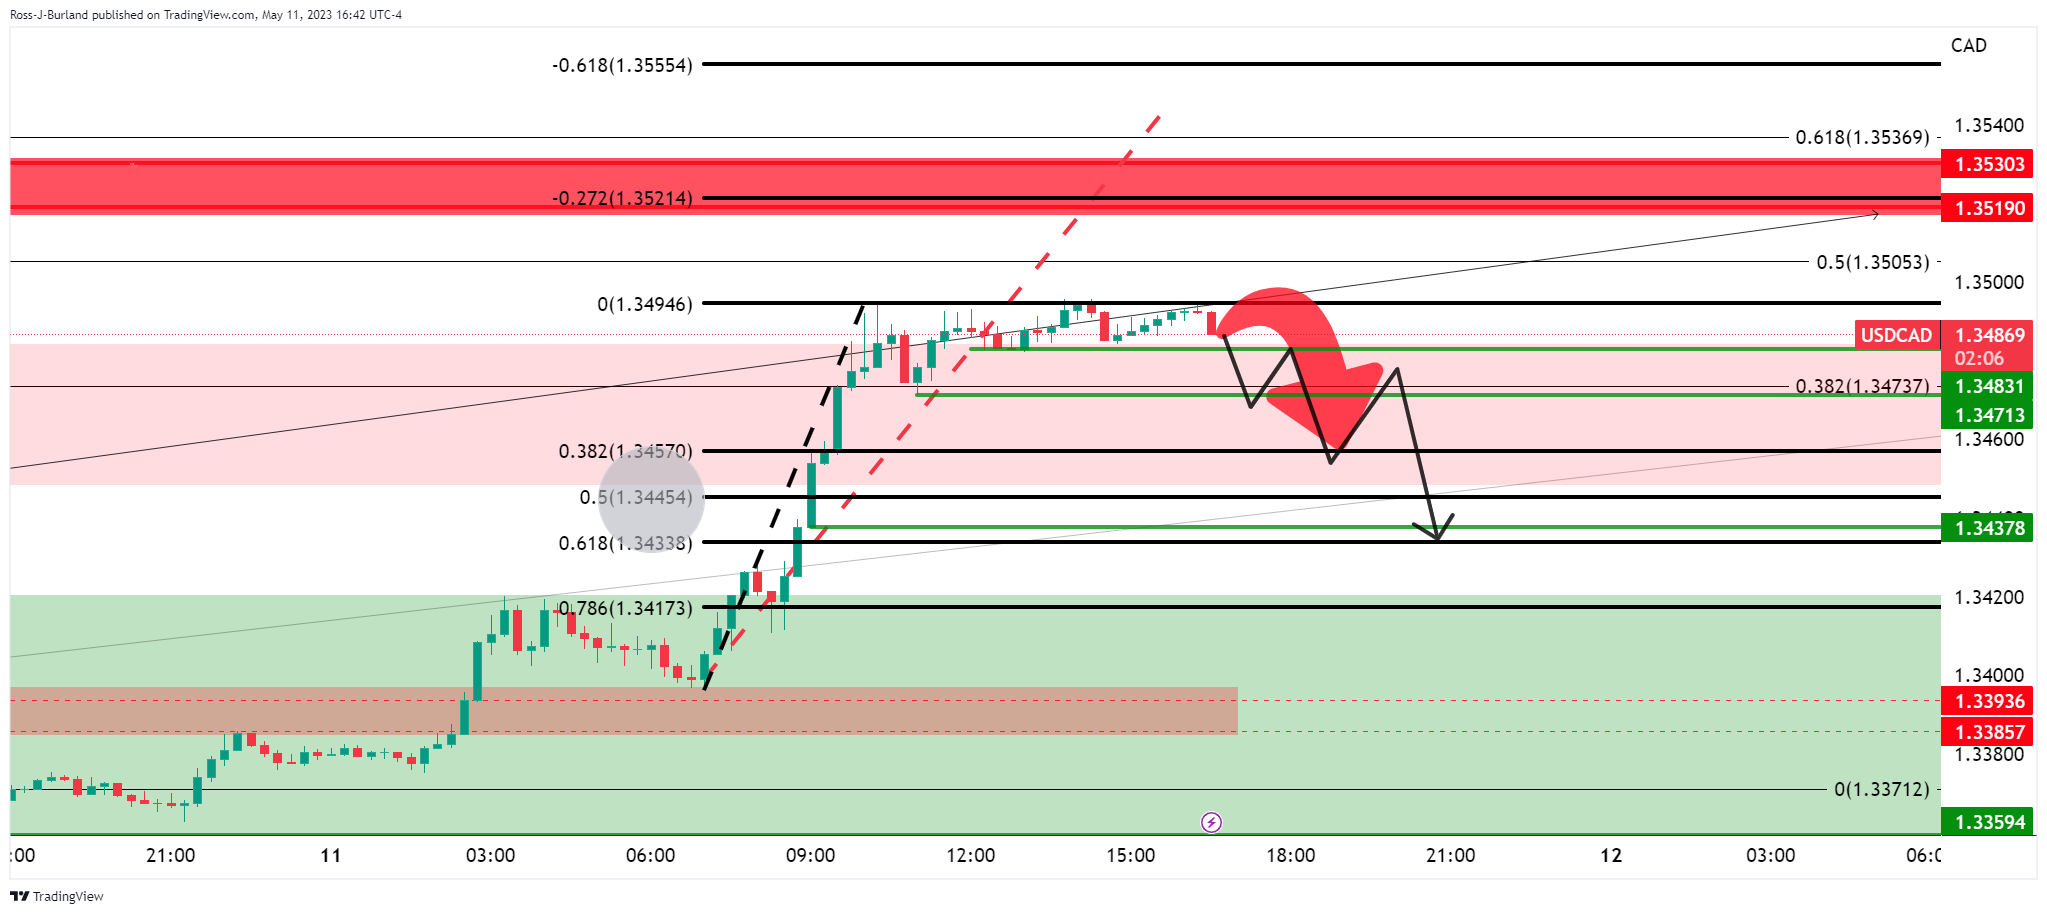
USD/CAD updates
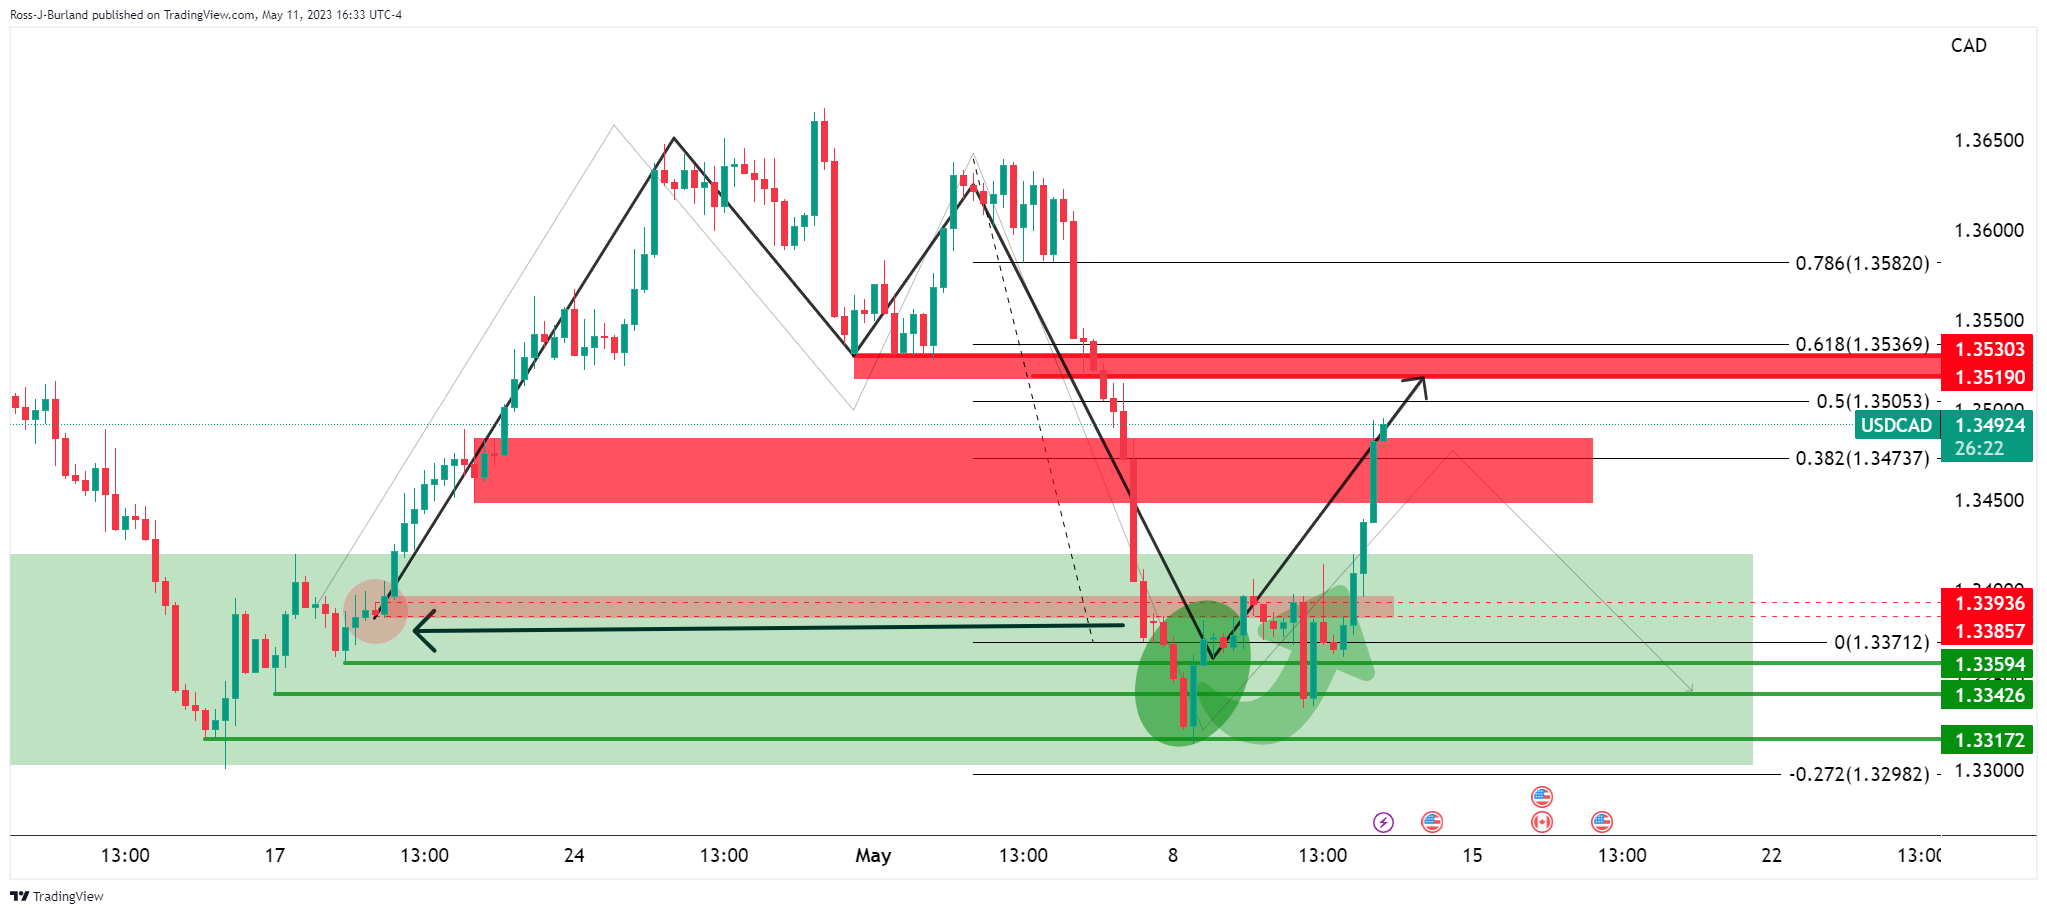
As illustrated, the price did indeed head a touch lower, deeper into support, and rebounded from there, directly toward the neckline of the M-formation.
The impulse carries momentum, so a continuation is possible. However, traders can monitor the price action for deceleration and prospects of a fade back into the length as follows:
- EUR/USD drops to 1.0916 as US PPI data slows and unemployment claims rise, strengthening the US Dollar.
- US Treasury bond yields fall with investors pricing in three rate cuts by the Federal Reserve by December 2023.
- ECB speakers emphasize slowing inflation in the Eurozone, with further rate hikes left on the table.
EUR/USD enjoyed an upbeat beginning of the week, but Thursday’s session sent the EUR/USD pair plummeting to new four-week-lows at around 1.0899. The main reason for a strong US Dollar (USD) amidst falling US bond yields as inflation data continues to slow down, while a rise in unemployment claims suggests the labor market is easing. The EUR/USD is trading at 1.0916, nearly the weekly lows, down more than 0.50%.
Slowing inflation and an easing labor market fuel greenback’s surge, dragging EUR/USD down 0.50%
The US Department of Labor revealed inflation data on the producer side, known as the Producer Price Index (PPI) for April, with headline and core PPI slowing 0.01% lower in yearly data, while monthly readings in both cases stood at 0.4%. Although data was negative for the US Dollar and positive for the Euro (EUR), traders booked profits per the EUR/USD reaction; simultaneously, the pair sank below the 20-day EMA, sitting at 1.0972.
In other data, Initial Jobless Claims climbed above the 245K estimates for the week ending May 6 and rose by 264K, as the Minnesota Fed President Neil Kashkari crossed newswires. He said that albeit inflation is cooling, it remains stickier. He added, “We will have to keep at it for an extended period.”
After the data release, US Treasury bond yields edged lower as investors began to price three 25 bps rate cuts by the US Federal Reserve toward the December 2023 meeting, according to the CME FedWatch Tool. The US 2s and 10-year bond yields continued to register losses of one and a half bps, respectively, at 3.897% and 3.386%, respectively.
On the Eurozone (EU) front, European Central Bank (ECB) speakers continued to stress that inflation is slowing down, as ECB de Cos commented that the EU’s central bank is closed to its final cycle of hiking interest. The ECB’s Vice-President De Guindos echoes de Cos’ comments on inflation but leaves the door open to further rate hikes.
Upcoming events
The Eurozone economic docket will feature inflation data in France, and Spain, alongside Germany’s Current Account. ECB’s Luis De Guindos will cross newswires. On the US front, the University of Michigan Consumer Sentiment, alongside Federal Reserve speakers.
EUR/USD Technical Levels
ECB Vice President Luis de Guindos said he does not anticipate a euro-area recession in the coming years.
More comments
The ECB's last decision had very high consensus.
I don't believe anybody who names a terminal rate.
Markets can be wrong about the terminal rate.
In prior comments made recently, he said, "I believe that the current approach will be maintained for a few months until the evolution of inflation and the effects of our measures become clearer," de Guindos said in Madrid.
He also has explained that underlying inflation, the bank's chief focus in recent months, will come down but it is proving sticky and needs to come down from rather high levels.
- USD/MXN trims losses, trading at around 17.50s, as weak US economic data prompts greenback buying.
- Disappointing US PPI and higher Initial Jobless Claims signal a slowing US economy, impacting the Mexican Peso.
- Investors watch US debt ceiling discussions, with President Biden resuming talks with Congress leaders on Friday.
USD/MXN trims some of its earlier losses, which sent the pair falling to new six-year lows in the New York session. But a tranche of economic data from the United States (US) prompted traders to buy the greenback, to the detriment of the emerging market currency, which is weakening close to 0.20%. At the time of writing, the USD/MXN is trading at 17.5917.
Emerging market currency falters as US Dollar rallies amid a slowing economy
An absent economic agenda in Mexico left the Mexican Peso (MXN) leaning on the dynamics of the greenback, which found a bid in the New York session and rallied sharply, as shown by the US Dollar Index (DXY). The DXY, a measure of the performance of six currencies vs. the US Dollar (USD), climbs 0.64%, up at 102.063, underpinned by weak US economic data.
The US calendar featured the Producer Price Index (PPI) for April, which came lower than expected, with readings at 2.3% YoY, below 2.4% forecasts; while the core PPI climbed 3.2% YoY, beneath estimates of 3.3%. Besides that, the Initial Jobless Claims for the last week exceeded estimates of 245K, with claims jumping to 264K. The data revealed that the US economy is slowing down, opening the door for the US central bank to hold rates unchanged at the upcoming June meeting and weakening the US Dollar.
In the last week, the US Federal Reserve lifted rates by 25 bps to the 5.00% - 5.25% area and Fed Chair Powell and Co. opened the door for a pause on its cycle. However, Jerome Powell stressed that on their baseline scenario, they’re not projecting rate cuts in 2023; but money market futures do. The CME FedWatch Tool shows investors are pricing 75 bps of rate cuts by the December 2023 meeting, estimating the Federal Funds Rate (FFR) to finish at around 4.25% - 4.50%.
In the meantime, Minnesota Fed President Neil Kashkari pushed back against rate cuts in 2023 and said that although inflation is cooling, it remains stickier. He added, “We will have to keep at it for an extended period.”
Investors are also watching the discussions regarding the US debt ceiling, which did not progress as expected. US President Joe Biden would resume talks with US Congress leaders on Friday.
Upcoming events
The US economic docket will feature the University of Michigan Consumer Sentiment and inflation expectations for one and five-year horizon, alongside Federal Reserve officials crossing the wires. The Mexican agenda will reveal Industrial Production in March, expected at -0.2% MoM and 2.7% YoY.
USD/MXN Price Analysis: Technical outlook
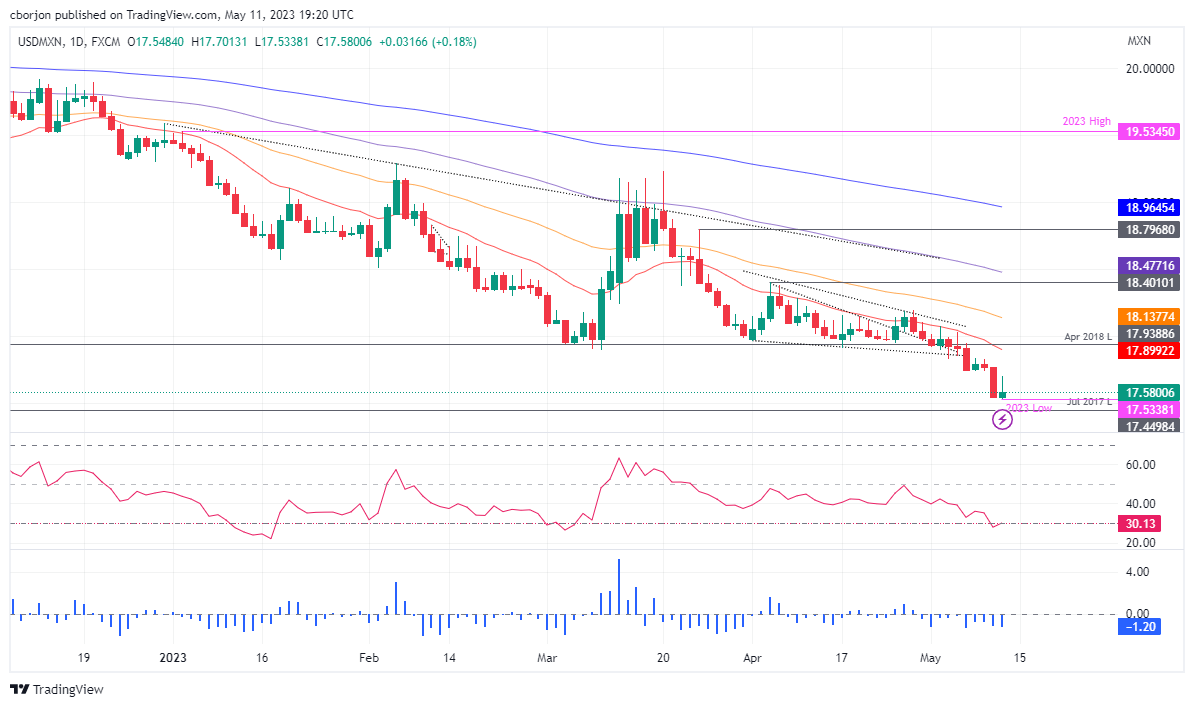
The USD/MXN remains in a strong downtrend, though it bounced off the weekly lows and recorded an inverted hammer at around the yearly lows. That indicates sellers are taking a respite before challenging the July 2017 low of 17.4498 before testing the 17.00 figure.
Oscillators like the Relative Strength Index (RSI) indicator and the 3-day Rate of Change (RoC) are in bearish territory, with the former at oversold conditions. Hence, further losses are expected in the USD/MXN.
Otherwise, if USD/MXN breaks above the May 10 daily high at 17.7724, that would expose the 20-day Exponential Moving Average (EMA) at 17.9004. Upside risks lie at 18.0000, which, once broken, buyers would pile in to test the 50-day EMA at 18.1382 before driving the price toward 18,50.
- Resistance is apparent and EUR/GBP bears are looking for a move into hourly support.
- The market is broadly bearish on the backside of the prior bullish trend.
As per the prior analysis, EUR/GBP Price Analysis: Bulls could be about to make a move, we have seen a pop higher in the cross and there are now prospects of a near-term correction as the following will illustrate:
EUR/GBP prior analysis
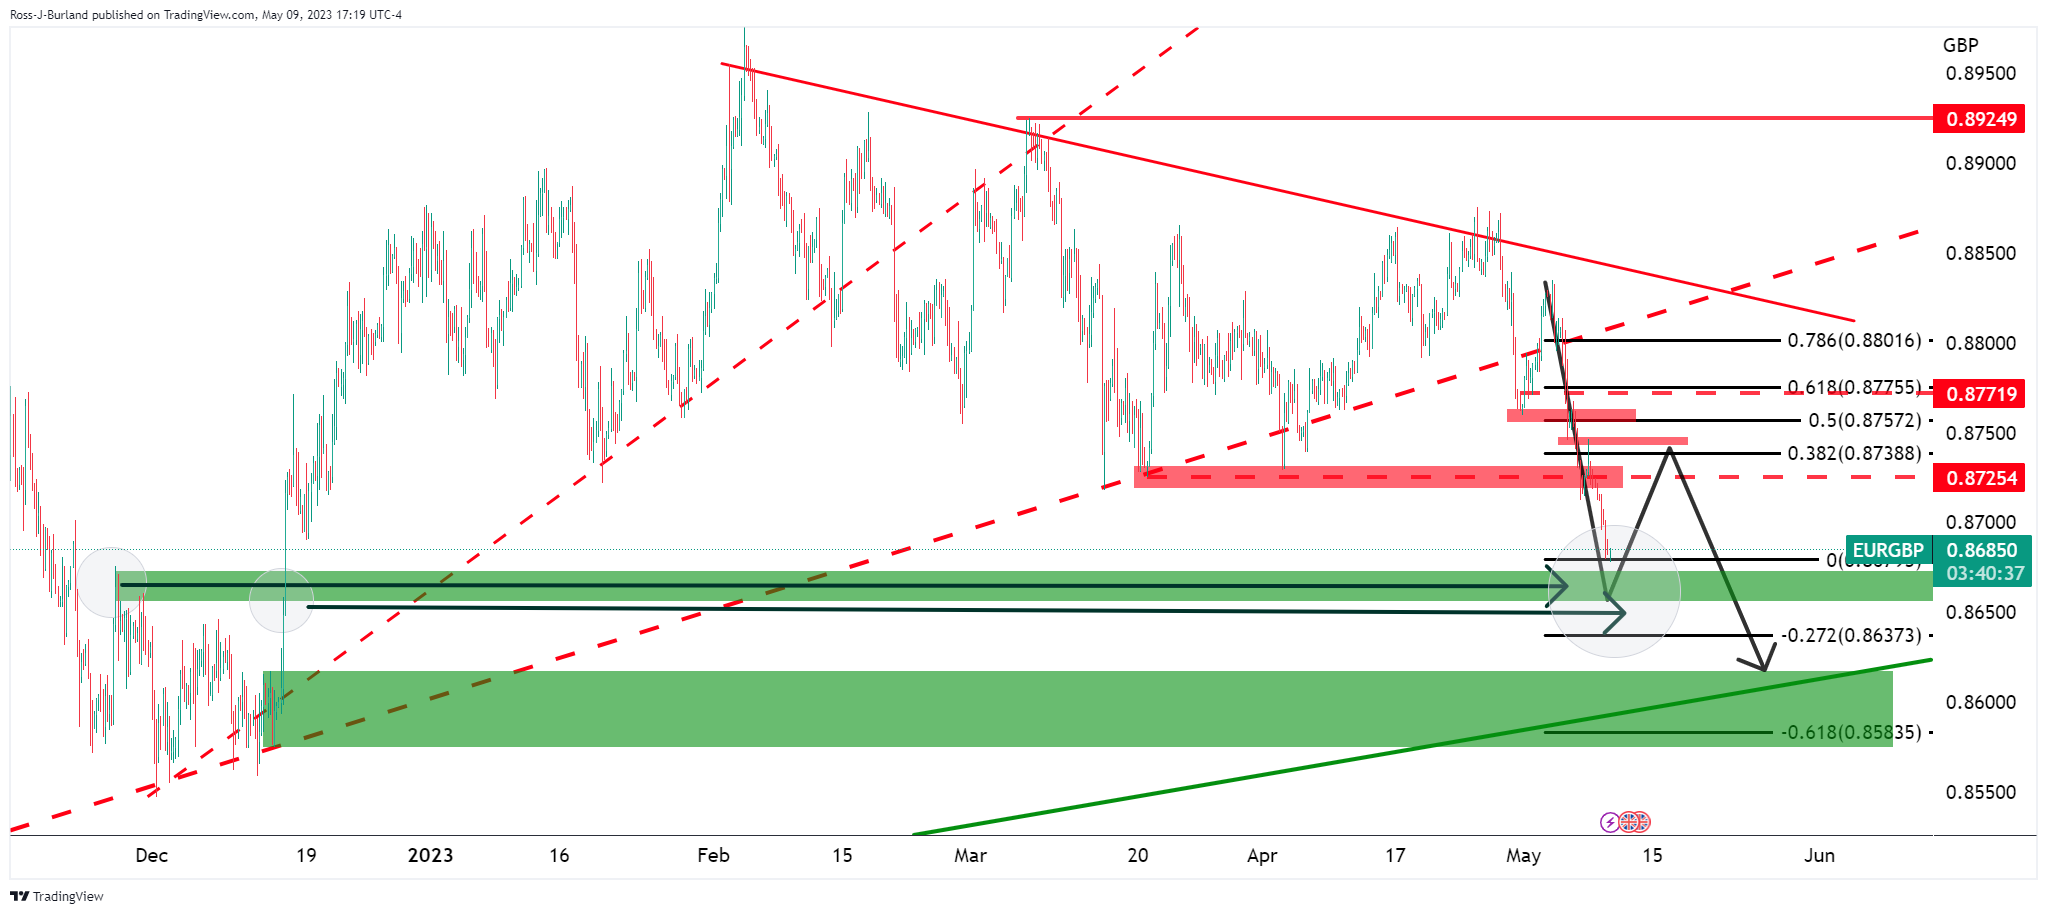
In the prior analysis, based o the 4-hour chart, it was explained that the price was entering what could have been a demand area considering the structure looking left as illustrated above.
0.8750/30 was a resistance area that was anticipated to be where the bulls might have their eyes set.
It was stated that if the bears turned up again at that juncture, then there would be prospects of a deeper move toward the trendline support near 0.8600/20.
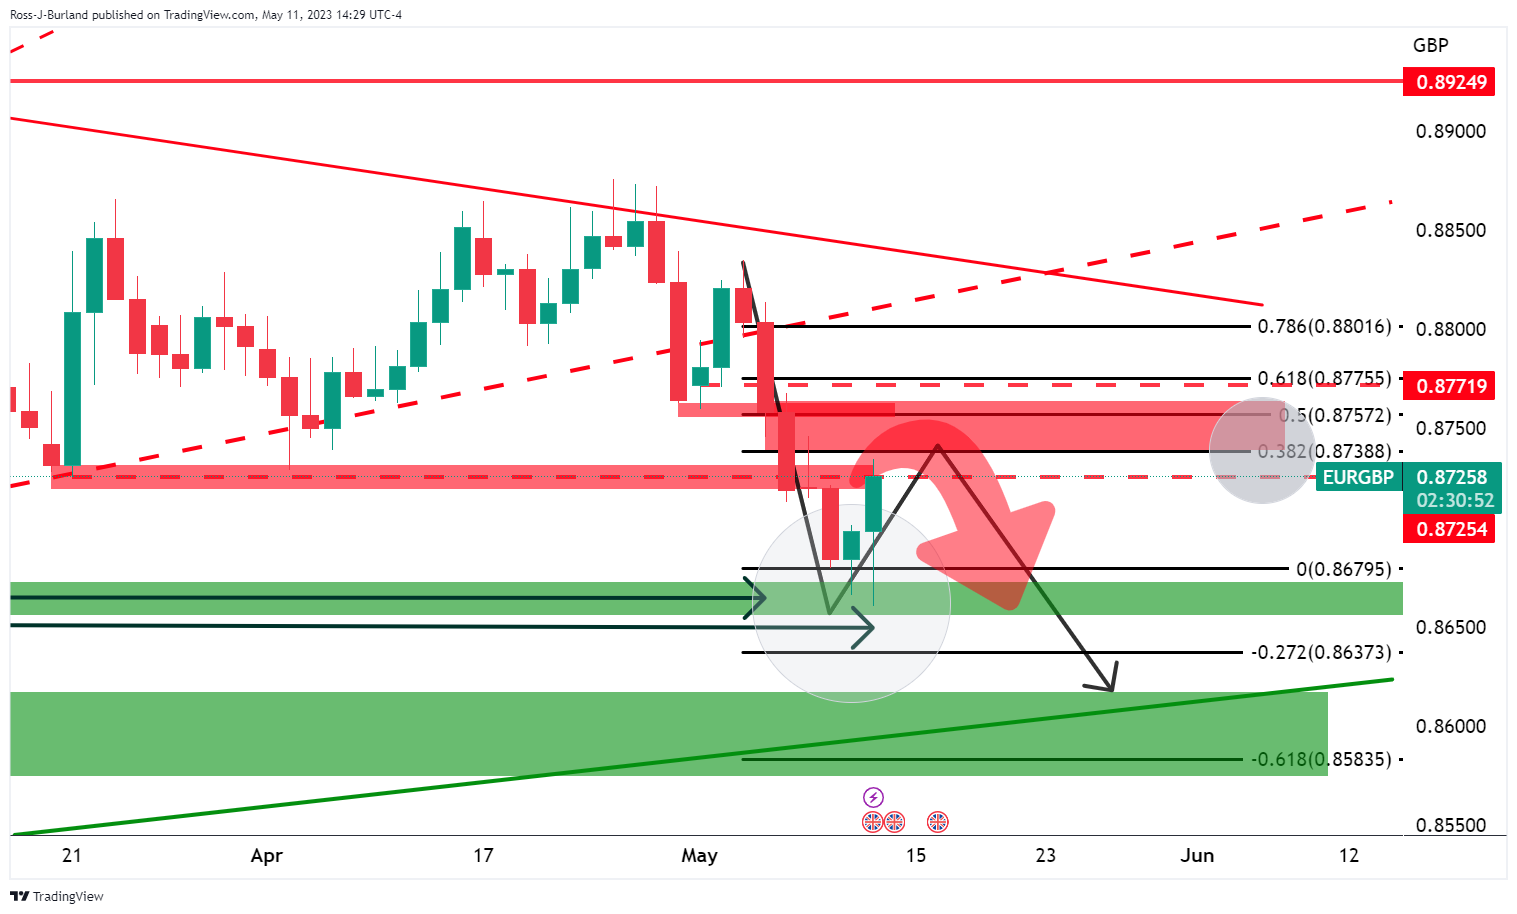
EUR/GBP updates
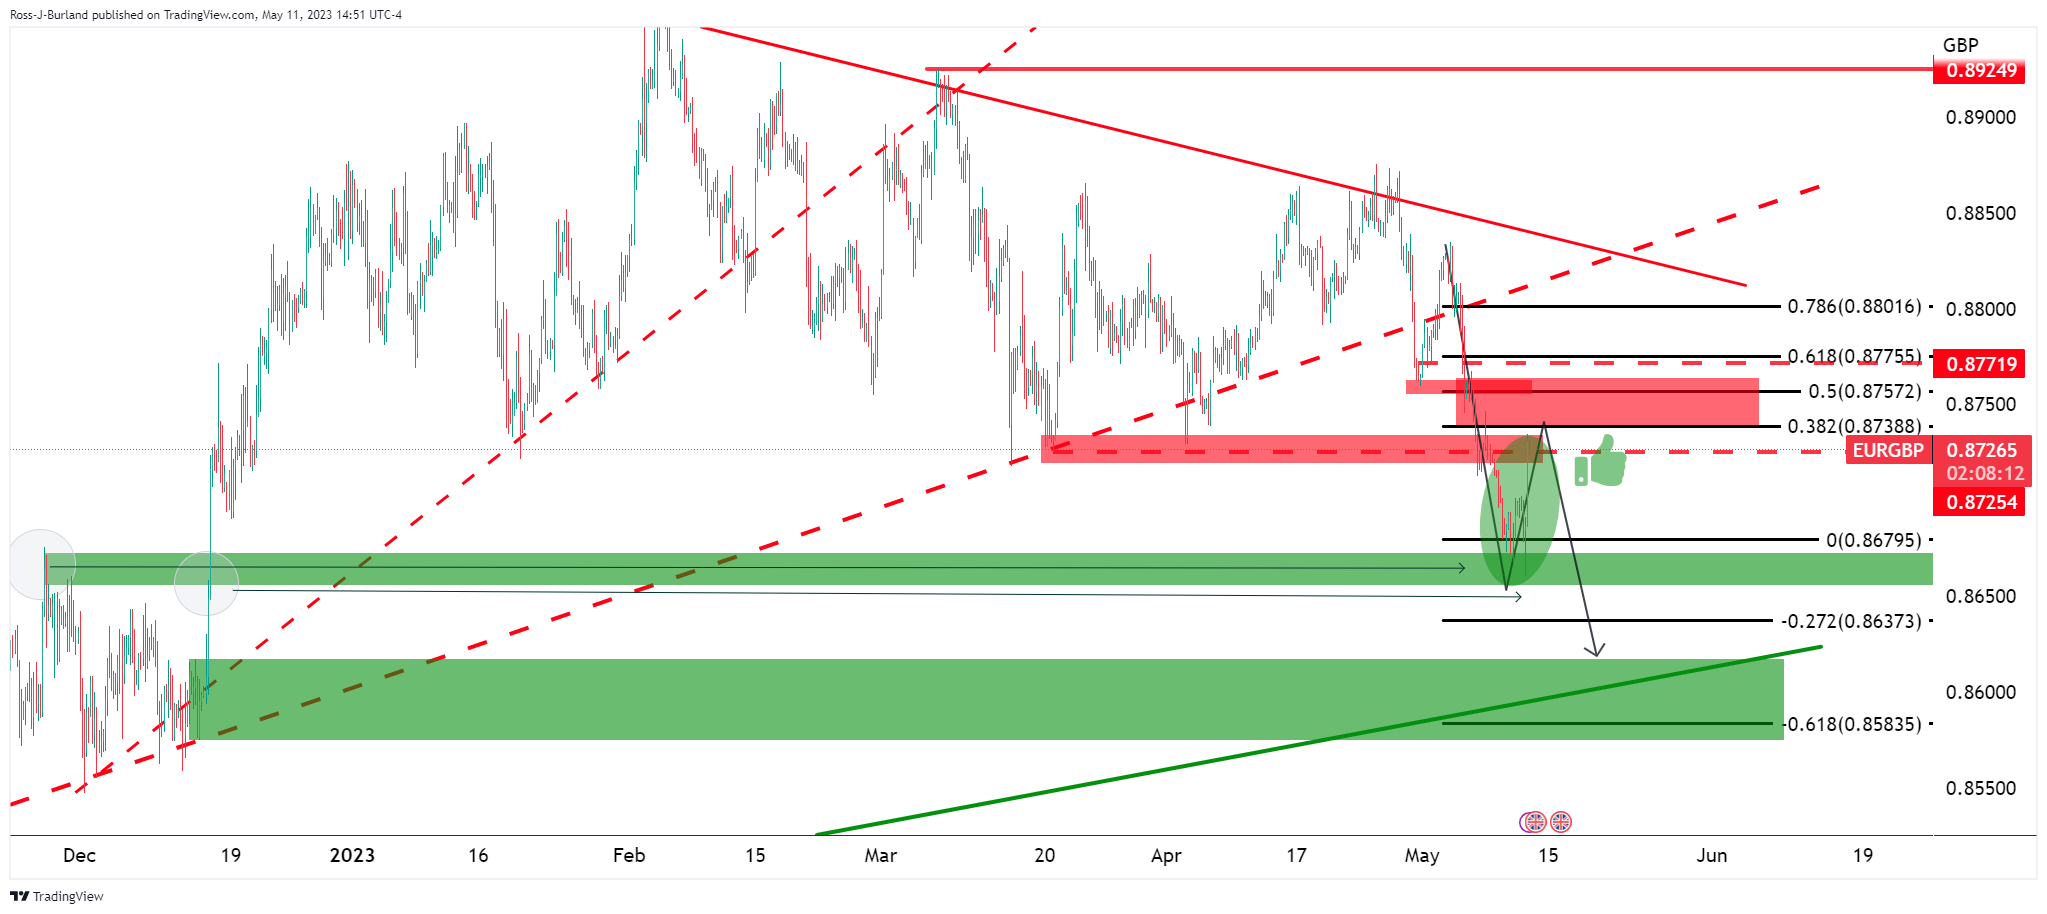

As illustrated, the price has corrected as expected.
This is now the daily chart´s outlook:

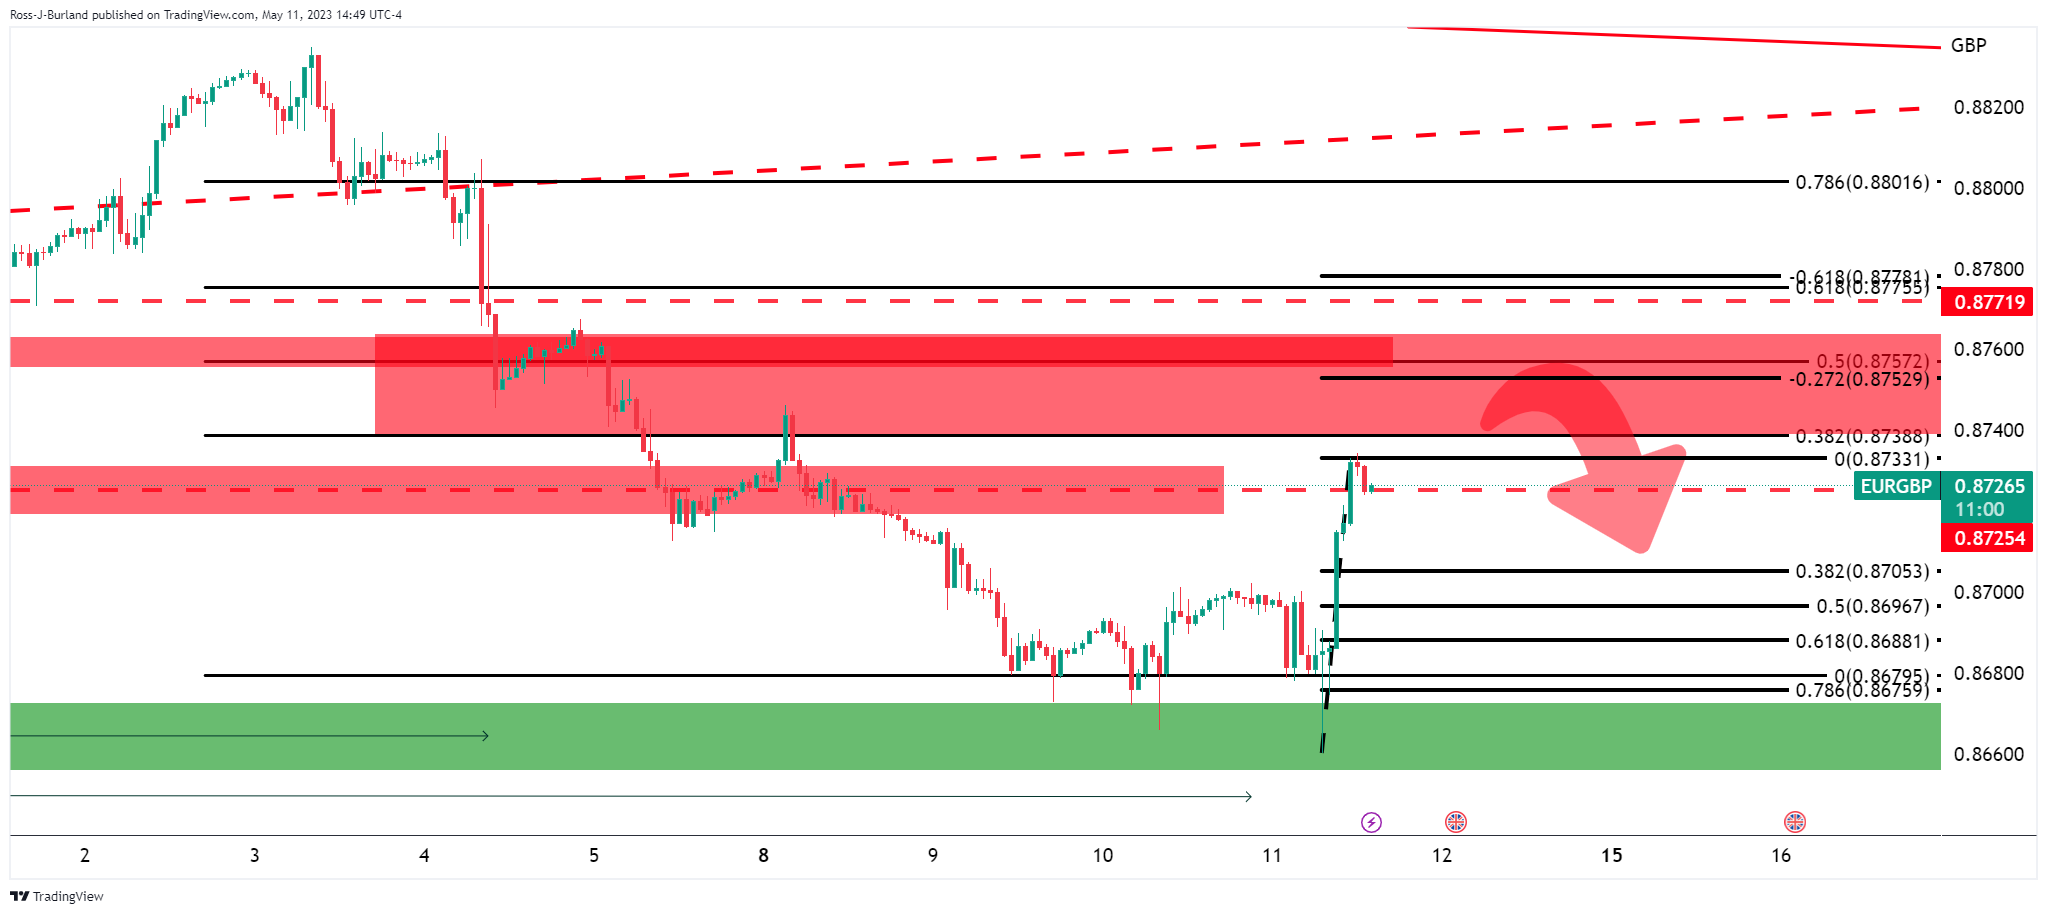
On an hourly basis, with the correction still in its initial stages, perhaps, there are prospects of a bearish correction:

- NZD/USD drops to 0.6298 as US Dollar demand surges amidst an easing labor market and decelerating PPI figures.
- Weaker Chinese inflation data and factory activity contraction impact NZD, seen as a proxy for the Chinese economy.
- Investors monitor US debt ceiling discussions as Biden resumes talks with Congress leaders on Friday.
NZD/USD dropped from around weekly highs in the North American session after US data painted a gloomy economic outlook but triggered demand for the US Dollar (USD) as risk aversion hit the FX space. US Treasury bond yields are down as investors price 75 bps of rate cuts by December 2023. The NZD/USD is trading at 0.6298, down more than 1%.
Risk aversion and a weaker Chinese economy weigh on NZD, down over 1%
A strong USD dented the prospects of the New Zealand Dollar (NZD), which weakened due to some reasons. Weaker inflation data in China prompted worries about the growth pace in one of Asia’s largest economies. Nevertheless, China’s contraction in factory activity, and imports falling, weighed on the NZD, which is seen as well as the Aussie Dollar (AUD) as a proxy for the Chinese economy.
On the USD front, data from the United States (US) showed that the labor market is easing, as unemployment claims climbed to 264K, above the 245K expected. At the same time, the Producer Price Index (PPI) in April decelerated to 2.3% YoY, the same as the core PPI, which rose by 3.2% YoY, with both figures below forecasts.
After the data release, the NZD/USD dived from around 0.6340s, toward the 0.6300 figure, before extending its losses late in the New York session. In the meantime, the US Dollar Index (DXY), a gauge that measures the buck’s value against six currencies, prints a new one-week high at around 102.153, up by 0.67%.
On the Fed speaker front, Minnesota’s Fed President Neil Kashkari held to his “hawkish” rhetoric, stating that inflation is coming down. Still, as it remains persistent, “We will have to keep at it for an extended period.”
Investors are also watching the discussions regarding the US debt ceiling, which did not progress as expected. US President Joe Biden would resume talks with US Congress leaders on Friday.
Upcoming events
The New Zealand economic docket will feature the Business Inflation Expectations for Q2, the Business PMI for April, and Visitor Arrivals. The US Trade of Balance and the University of Michigan Consumer Sentiment poll would be reported on the US agenda, alongside further Fed speaking.
NZD/USD Technical Levels
- USD/JPY is bearish while below 135.00 and being on the backside of the bullish trend.
- A break of 133.50 would be a significant bearish development.
The Japanese yen has appreciated in recent times while the BoJ removed forward guidance which pledges to keep interest rates at current or low levels. Also, US headline inflation slowed last month, supporting bets that the Federal Reserve will pause its interest rate hikes in June. Fed funds futures traders are pricing in a pause before expected rate cuts in September.
This is playing out bearishly on the charts as follows:
USD/JPY daily charts
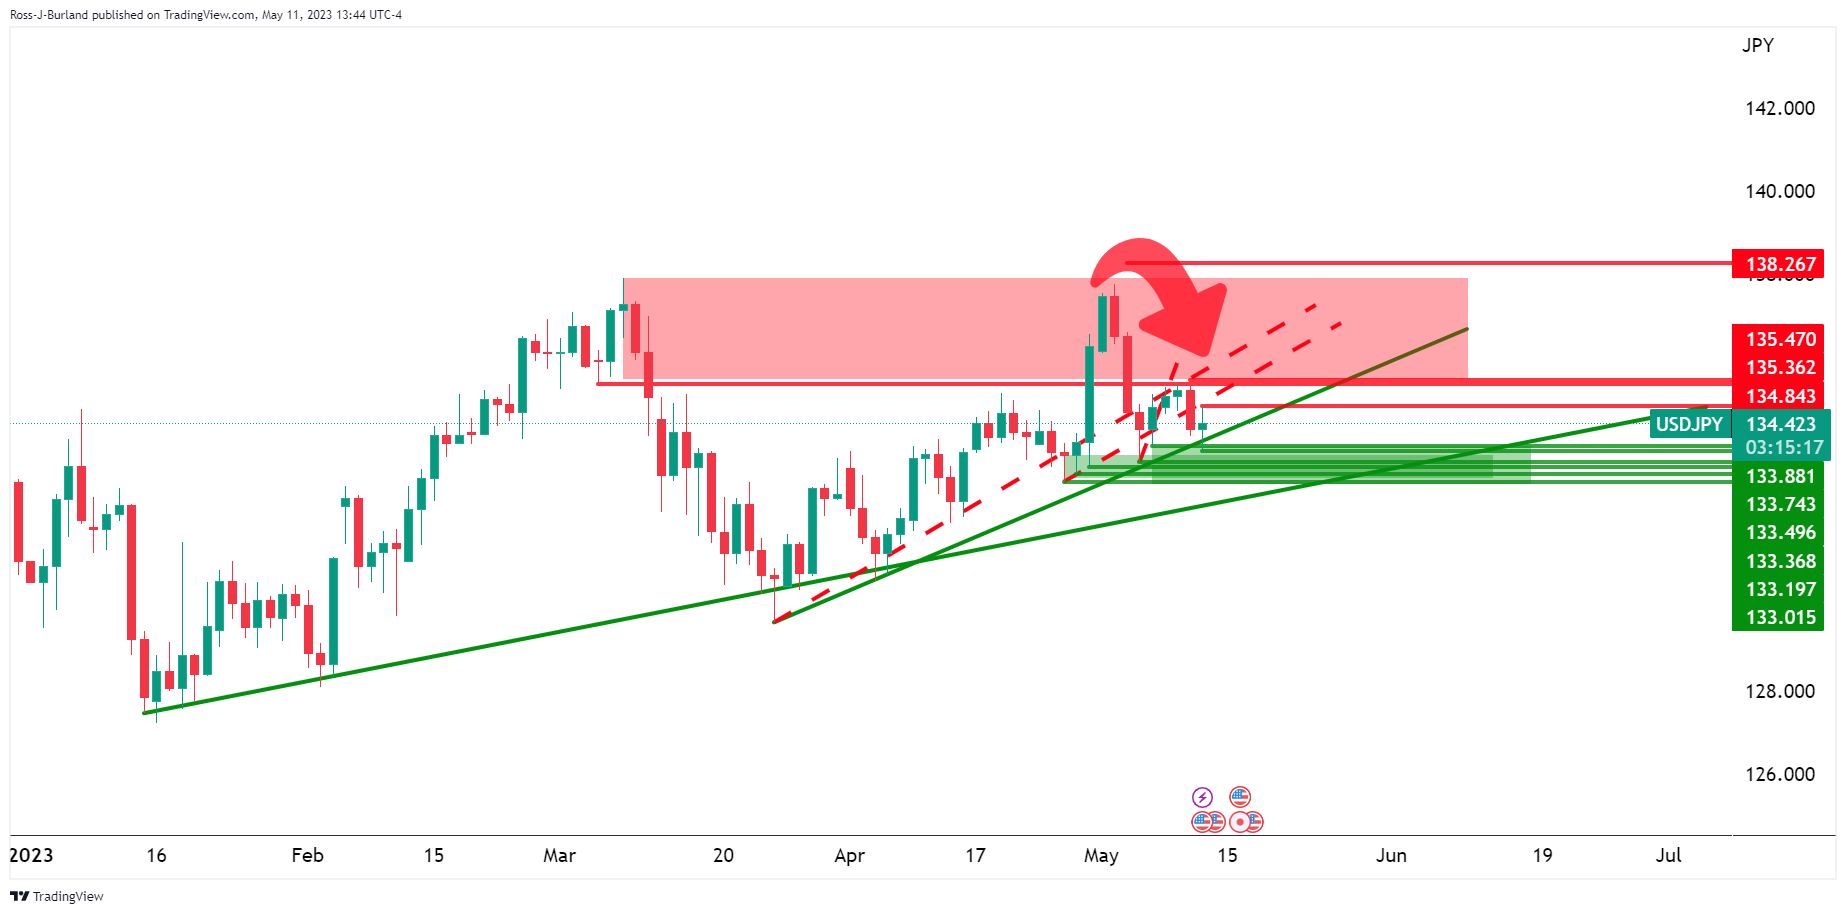
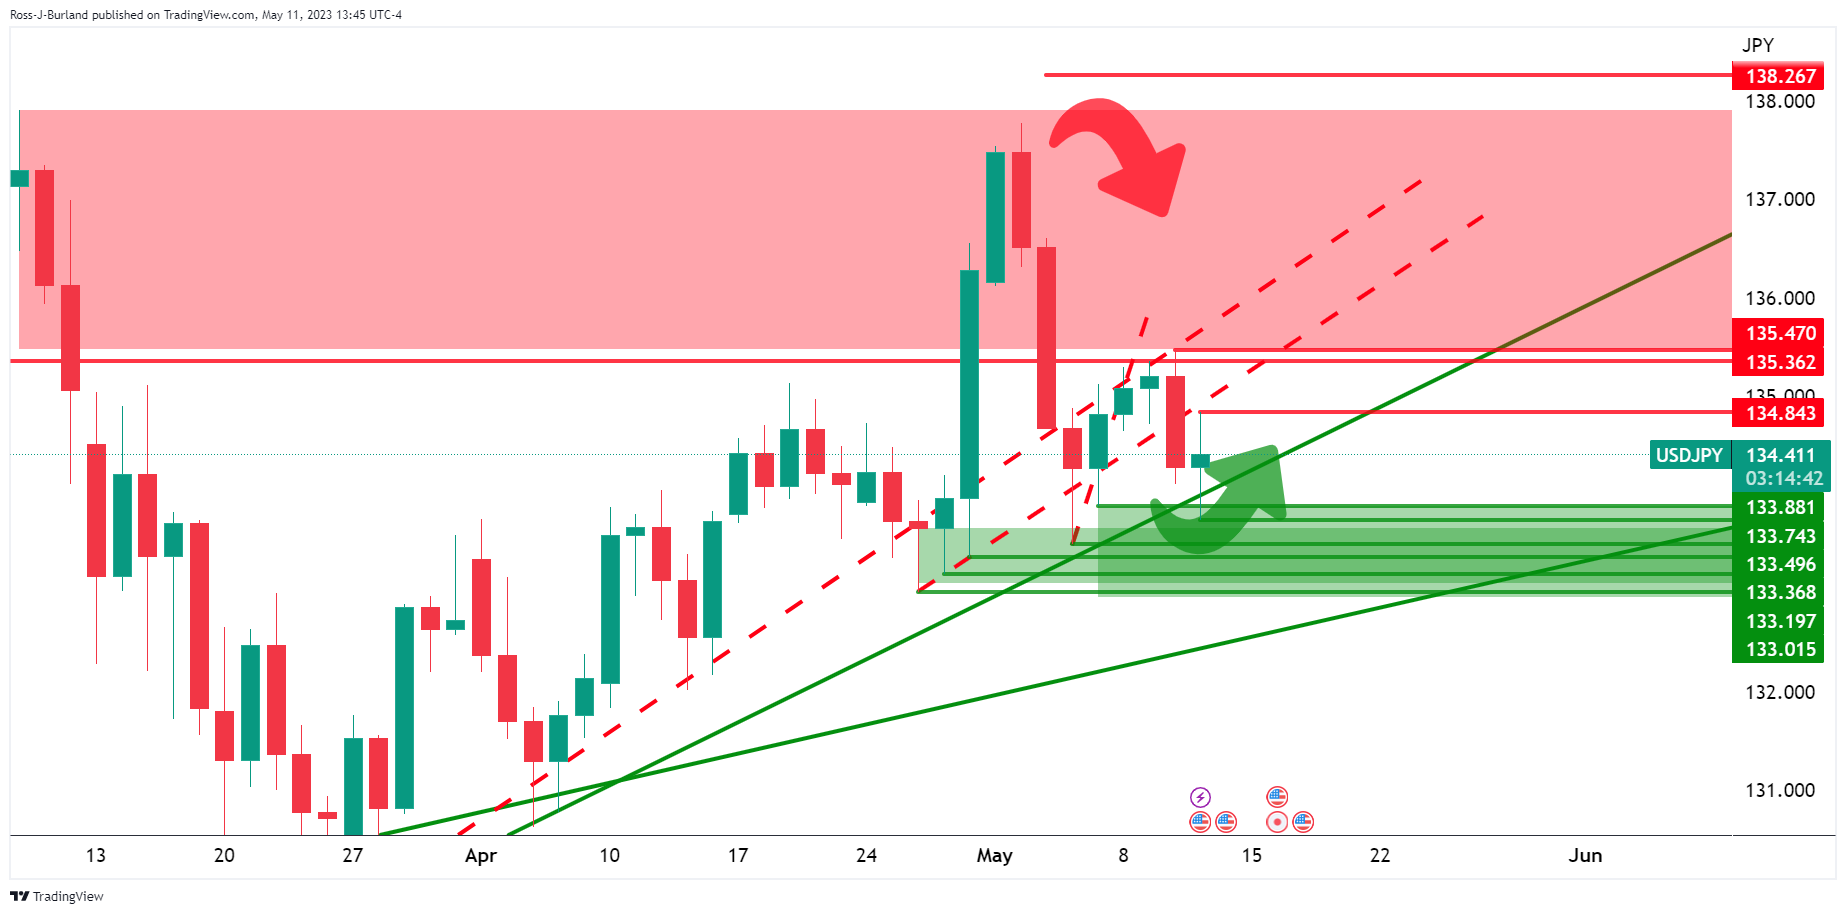

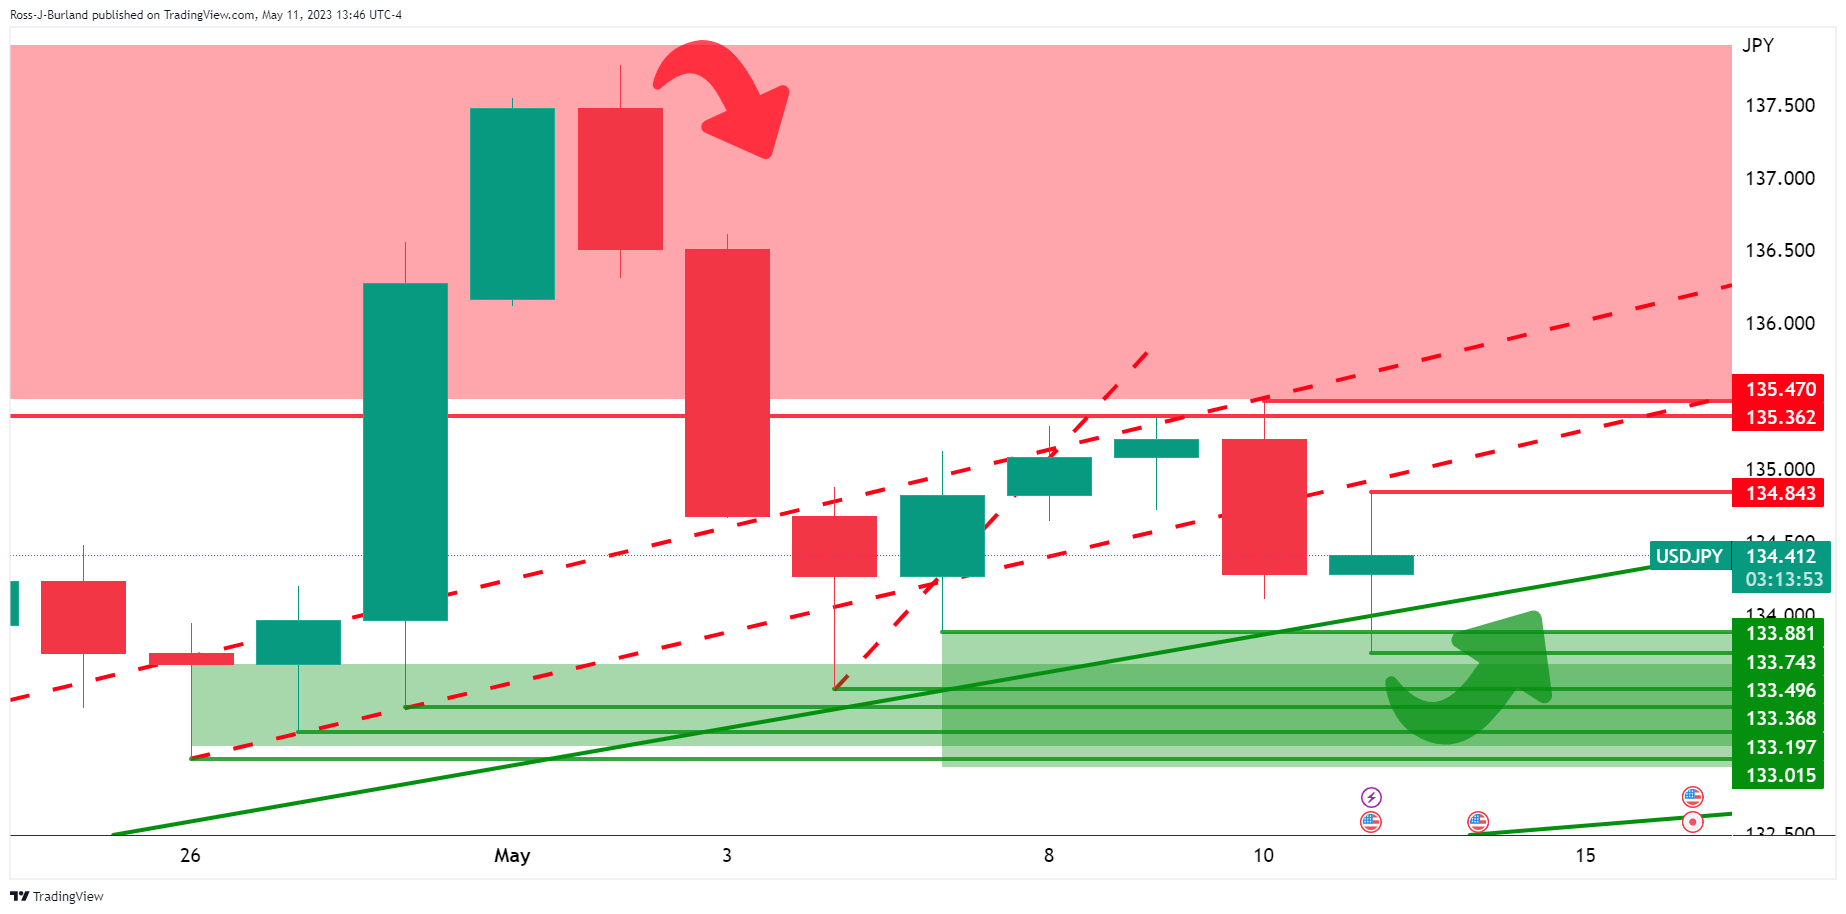
USD/JPY H4 chart
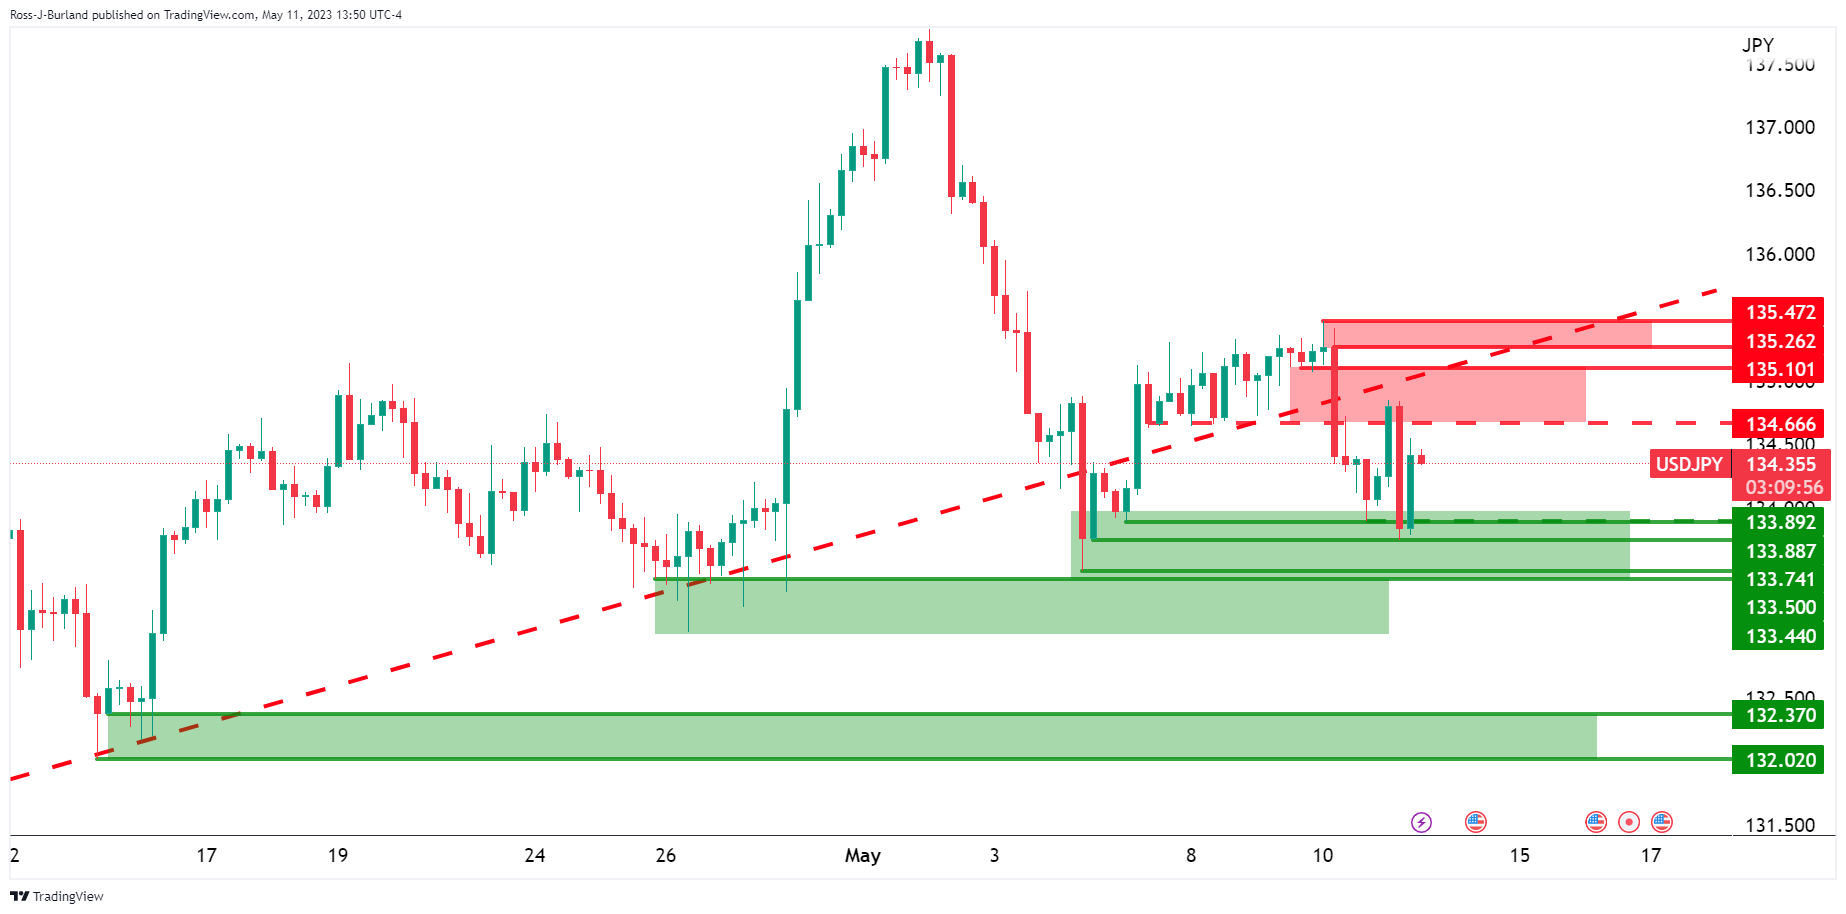
The price is bound by resistance and support zones, with a bearish bias while below 135.00 and being on the backside of the bullish trend. A break of 133.50 would be a significant bearish development.
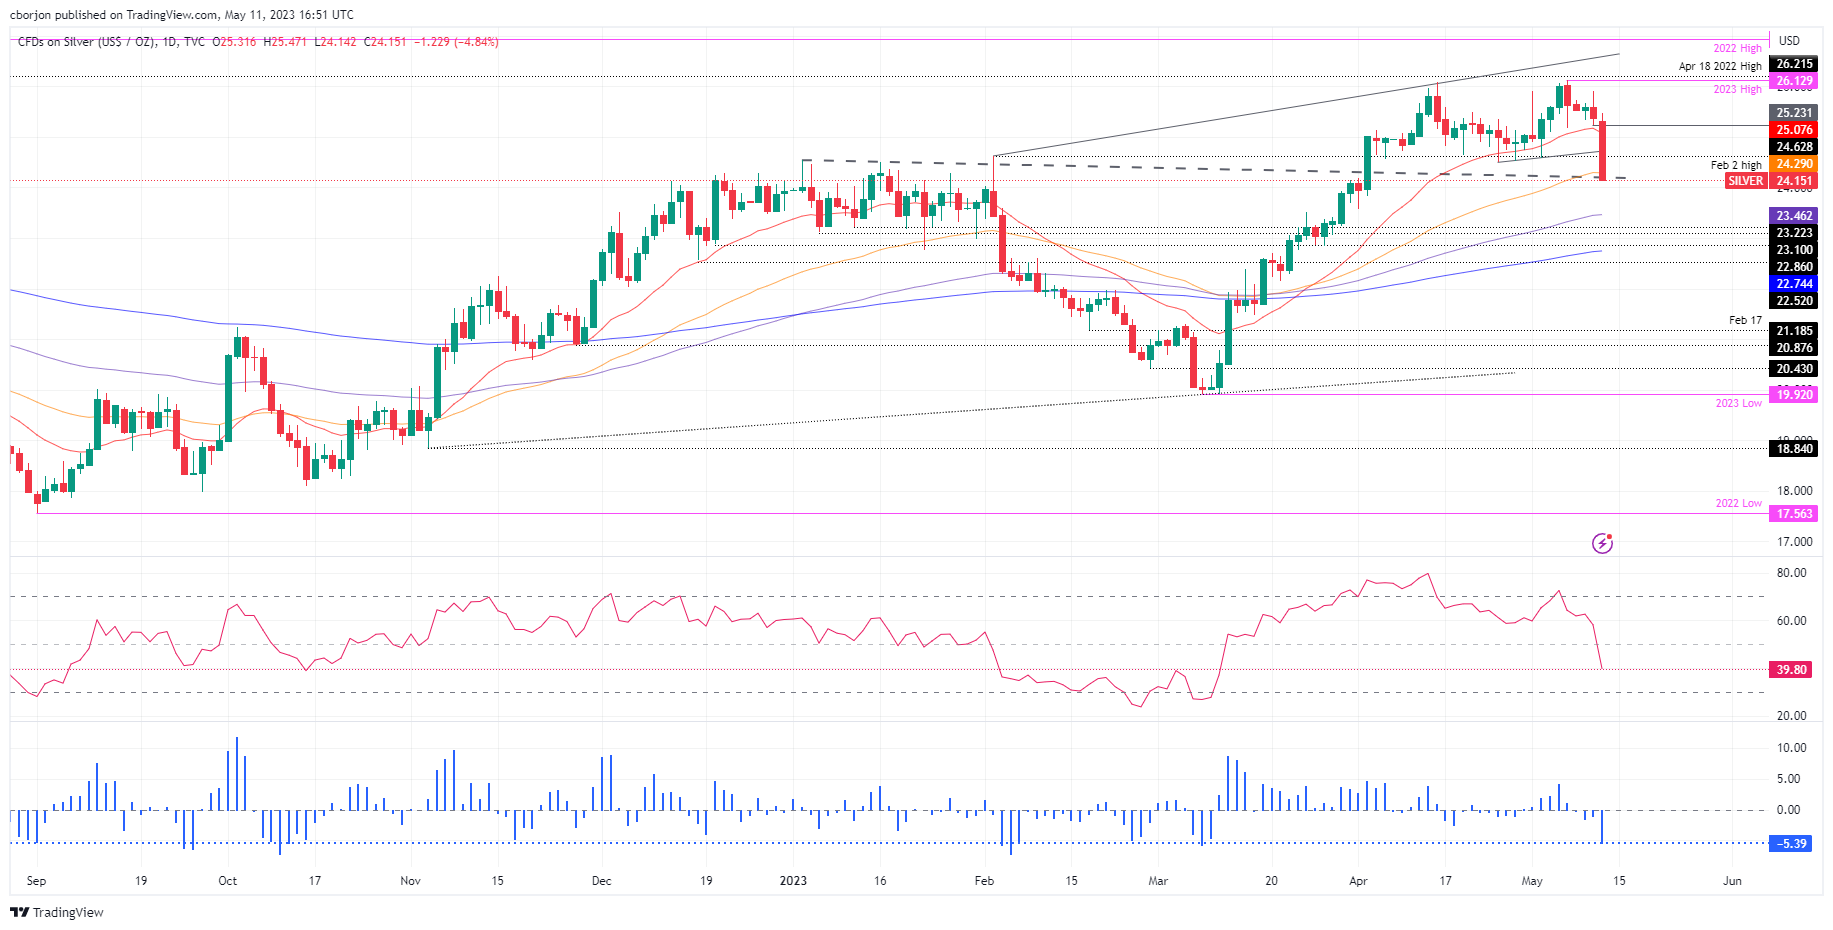
- XAG/USD drops from around $25.40s to $24.10s as US inflation cools and the labor market eases.
- The RSI indicator and 3-day RoC portray a bearish outlook for Silver, with the 200-DMA on sight.
Silver price plummets across the board, as data from the United States (US) showed that inflation is cooling down, while the labor market commences easing amidst US Federal Reserve (Fed) officials complaining about its tightness. US Treasury bond yields drop, but the US Dollar (USD) rises to new weekly highs, a headwind for XAG/USD prices. At the time of writing, the XAG/USD is trading at around $24.20, slides 4.50%.
XAG/USD Price Analysis: Technical outlook
The XAG/USD collapse dragged prices into testing the 50-day Exponential Moving Average (EMA), breaking on its way south two crucial support levels: firstly, the 20-day EMA gave way around $25.08, secondly the break of the two-week support trendline at around $24.63, which, accelerated the white metal downtrend, towards testing additional key support levels.
Silver is challenging a five-month-old previous resistance trendline, turned support at around $24.20, which, once broken, the XAG/USD could drop to the $24.00 figure, followed by the 100-day EMA at $23.46. A breach of the latter will expose the 200-day EMA at $22.74.
Conversely, if XAG/USD reclaims $24.63, that could pave the way toward $25.00 a troy ounce. That would form a bullish hammer, shifting Silver’s bias to the upside, and it might open the door to test the year-to-date (YTD) high of $26.13.
The Relative Strength Index (RSI) indicator turned bearish after crossing the 50-midline. The 3-day Rate of Change (RoC) portrays sellers in charge as the XAG/USD extends its slide throughout the day.
XAG/USD Price Action – Daily Chart
- Gold prices drop amid slowed inflation and increased unemployment claims.
- US economic data to impact Federal Reserve’s June decisions.
- US debt ceiling concerns loom; potential government default possible said the US Treasury Secretary Yellen.
Gold price struggles to crack resistance around $2040, slumps after a round of US economic data showed that inflation in the United States (US) is somewhat decelerating while the labor market cools down, as unemployment claims exceeded estimates. That said, data proved to be US Dollar (USD) positive, as shown by the Gold price, printing back-to-back days of losses. The XAU/USD is trading at $2020.15, down 0.47%.
US economic data bolsters US Dollar, and sends Gold on a downswing amidst decelerating inflation, as the labor market eases
The economy in the US is deteriorating further amidst the ongoing tightening cycle by the US Federal Reserve (Fed). The US Department of Labor was busy during the day, revealing crucial data that could share clues regarding the Fed’s decision for the upcoming meeting in June. The so-called wholesale prices of the Producer Price Index (PPI), rose 2.3% YoYm below estimates of 2.4%, while the core PPI, which excludes volatile items, remained higher than the headline numbers. Figures came at 3.2% below the 3.3% foreseen by analysts.
In another data, the same US government agency reported that Initial Jobless Claims rose above estimates of 245K and reached 264K in the week ending on May 6. Continuing claims, which exclude people who had received benefits for a week or more, jumped to 1.813M, below the estimates of 1..820M.
After the data release, the XAU/USD fell from around $2040 to its daily low of $2010.80. However, buyers lifted Gold spot prices toward the current price level.
Given that the data favors Federal Reserve’s doves, the Minnesota Fed President Neil Kashkari, balanced the scale, saying that inflation is coming down. Still, it remains persistent, adding, “We will have to keep at it for an extended period,” emphasizing that he’s leaning on the hawkish spectrum.
Aside from this, the US debt ceiling narrative continues to drive market sentiment amongst investors, with US equities trading mixed. US President Joe Biden is meeting with US congress leaders on Friday after little to no progress was made on May 9. The US Treasury Secretary Janet Yellen said she’s doubtful the Biden administration could avoid a government default without US Congress agreeing on a plan.
Upcoming events
The US economic agenda will feature the US Trade of Balance, the University of Michigan Consumer Sentiment poll, and further Fed speaking.
XAU/USD Price Forecast: Technical outlook
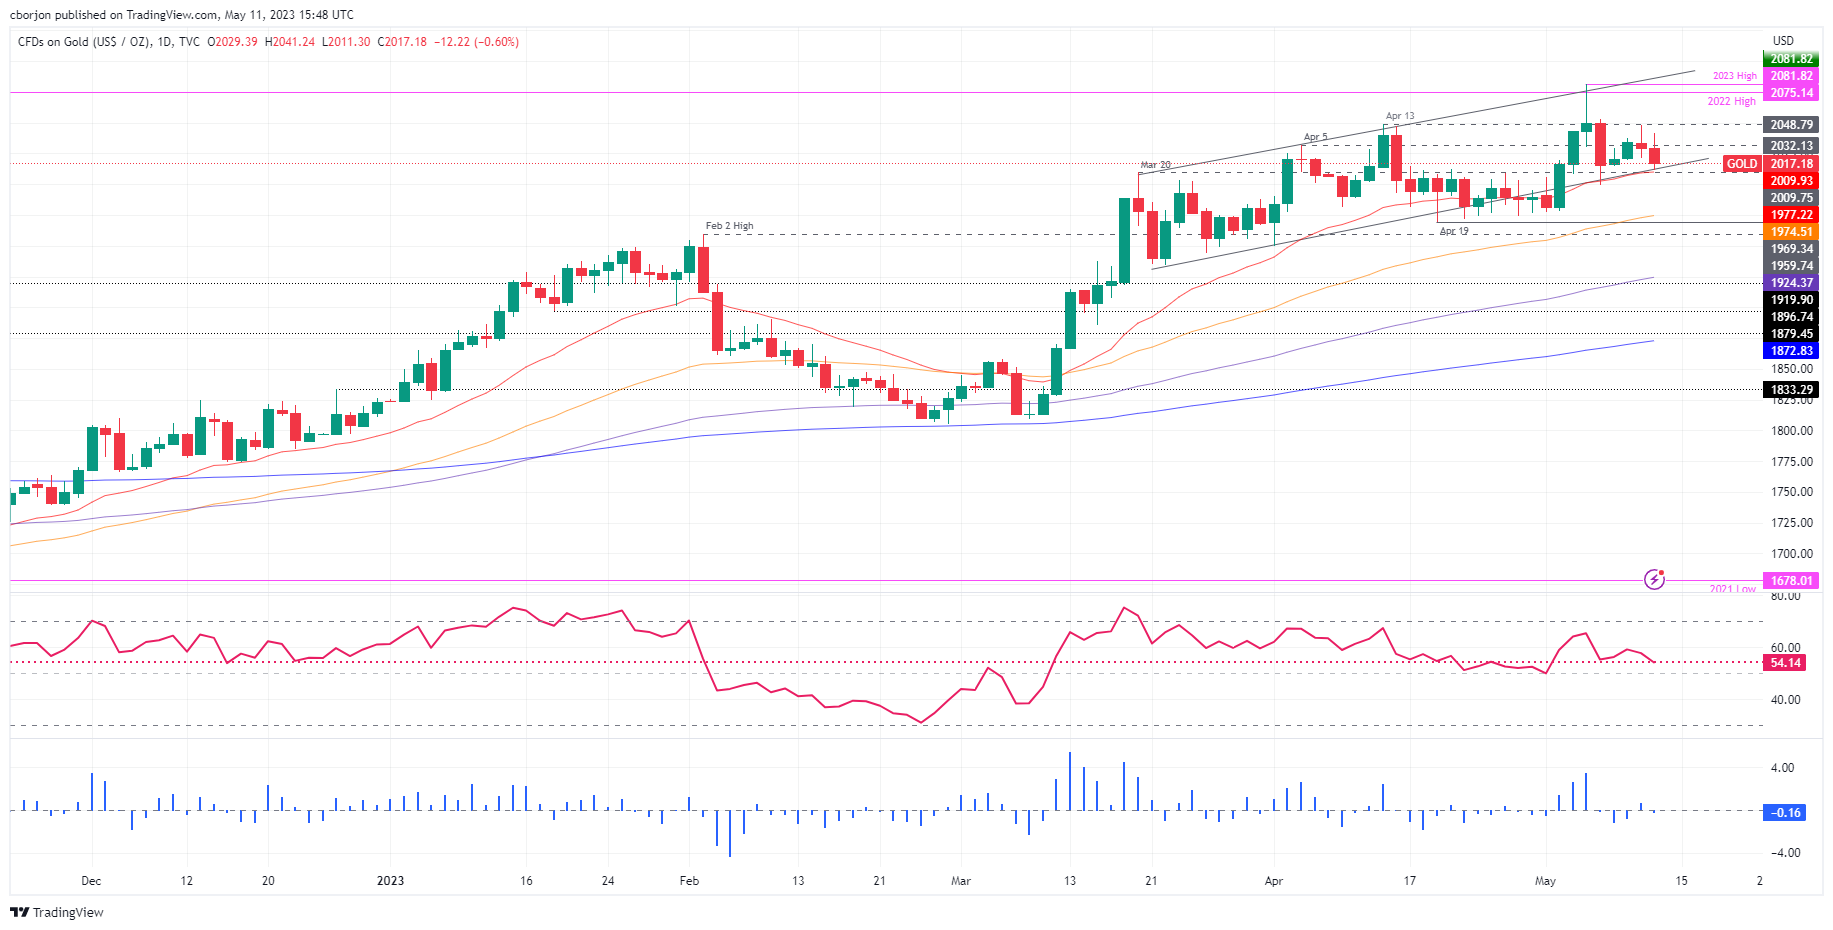
Gold price remains above an upslope support trendline, unable to crack it, and supported by the 20-day EMA at $2009.87. For XAU/USD to resume its uptrend, buyers must reclaim the 2040 area, which could pave the way to test the weekly high of 2048.15. On the other hand, the XAU/USD would continue to trend lower, and it might test the $2000 barrier in the short term.
On Thursday, the Bank of England (BoE) announced a 25 basis points rate hike, bringing the bank rate to 4.50%. This decision was in line with expectations. Analysts at Danske Bank predict another hike in June, projecting the bank rate to reach its peak at 4.75%.
Key quotes:
“With both the global backdrop, inflation and wage growth having surprised to the topside, we do not believe that data will have weakened enough for the BoE to pause its hiking cycle at the June meeting.”
“We thus revise our forecast to include a 25bp hike in June, marking a peak in the Bank Rate at 4.75%. Likewise, we believe that upcoming data releases have to prove worse than expected for a pause to be warranted considering the forecasts presented in the Monetary Policy Report (MPR).”
Economists at Société Générale see the upcoming mild recession as a catalyst to kick-start the bull trends for US equities.
Mild recession = restart of the secular bull run
“Seven of the last eight Fed hiking cycles triggered an economic recession, and US stocks historically do not bottom until a recession has started. Our base case remains unchanged, namely, we expect a US recession to begin in 1H24, and believe a mild recession would be a catalyst for a re-start of a secular bull market in US stocks. Until then, we expect US stocks to stay in a range of 3500-4200.”
“Within US stocks, we prefer Defensive Growth over Value, Large cap over Small cap and Staples and Industrials over Consumer cyclicals and Financials.”
- The US Dollar is rising across the board after US data and amid risk aversion.
- The Australian Dollar is facing downward pressure, drops to monthly lows versus NZD.
- AUD/USD pulled back further from key 0.6800 area, to the 20-day SMA.
The AUD/USD is falling on Thursday, having the worst day in weeks amid a stronger US Dollar across the board. The pair bottomed during the American session at 0.6688, the lowest level since May 5. AUD/NZD bottomed at 1.0601, the lowest in a month.
The US April Producer Price Index rose 0.2%, below estimates, while Initial Jobless Claims rose more than expected to the highest level since October 2021. The data points to an easing labor market and slowing inflation.
US bond yields are sharply lower. The US 10-year yield dropped to 3.34%, the lowest since May 4, while the 2-year fell to 3.81%. Despite lower Treasury yields, the US Dollar is up across the board as US stocks tumble. The Dow Jones is falling by 1.05% and the S&P 500 drops 0.60%.
The weaker risk tone pushes the Greenback higher across the board, putting pressure on the AUD/USD to the downside. The pair is experiencing a significant decline, marking its worst performance in weeks, primarily due to the strength of the US Dollar.
The pair reached its lowest point during the American session, hitting 0.6688, the lowest level since May 5. It is testing the 20-day Simple Moving Average (SMA) after being rejected from above the 0.6800 area. It has been trading within a broad range, and if it continues to consolidate below 0.6680, it suggests a potential for additional losses, with a target around 0.6640.
Technical levels
The JPY was the worst-performing G10 currency in April, amid widening US-Japan rate differentials. Economists at HSBC still see further JPY strength ahead, supported by its ‘safe haven’ status and other local factors.
Further strength ahead
“We think the JPY can bounce back, not least because an ongoing BoJ’s policy review would not preclude a tweak to its yield curve control (YCC) policy, even if it may come a little later than previously expected. In addition, Japan’s core inflation remained sticky in March and, when energy is excluded, underlying inflation accelerated to a 41-year high of 3.8%. While it may still be a stretch to say that Japan now has an inflation ‘problem’, it should be fair to say that some deflation-era policies may no longer be appropriate.”
“The future monetary policy divergence between the Fed and the BoJ, in addition to other local factors (like current account improvement), should support our rationale for JPY’s appreciation later in the year. We also think that the JPY is likely to be viewed as a cleaner ‘safe haven’ than the USD, for any US-centric ‘risk off’ dynamics, such as the US debt ceiling stand-off and US banking sector concerns.”
- US Dollar rises sharply amid risk aversion and banking concerns.
- US data adds more evidence of slowing inflation and easing labor market.
- USD/CAD is having the biggest daily gain in a month, extending weekly gains.
The USD/CAD broke above 1.3415 and jumped to 1.3486, hitting the highest level since last Friday. This was supported by a stronger US Dollar across the board, which gained momentum after Wall Street's opening bell.
Equity prices are down, with PacWest Bancorp falling by 20%. US yields are sharply lower. Crude oil prices are falling by more than 1.5%.
Data from the US showed the Producer Price Index (PPI) rose 0.2% in April, below the 0.3% of market consensus and the annual rate dropped from 2.7% in March to 2.3%. The Labor Department also informed that Initial Jobless Claims rose to 264,000, surpassing expectations and reaching the highest level since October 2021.
The USD/CAD is having the biggest daily gain in months. The next resistance stands at 1.3500 followed by 1.3525. On the flip side support might be seen at 1.3420 and 1.3405. The outlook for the American session favors the Greenback as long as price remain above 1.3400.
The Loonie outperformed NZD and AUD during the last hour, amid risk appetite.
Technical levels
The Bank of England has hiked rates by another 25 basis points. Economists at TD Securities expect further increases in June and possibly in August.
Not done yet
“As widely expected, the MPC voted to raise Bank Rate by 25 bps today to 4.50%. The vote of 7-2 was a repeat of March's, with Tenreyro and Dhingra voting for a hold for the fourth consecutive meeting, and forward guidance was left unchanged. Inflation and GDP projections were revised up substantially.”
“Overall, this sounds like an MPC that will continue to be data dependent moving forward, with the focus remaining on wages and services inflation. As such, we continue to expect a final 25 bps hike at the June meeting to bring Bank Rate to a terminal of 4.75%. That said, given the hawkish tone the MPC gave off today, risks are skewed to an additional 25 bps hike in August if the data continues to surprise to the upside.”
- Pound Sterling vs US Dollar weakens after the BoE meeting, after Andrew Bailey’s comments on easing inflationary pressures.
- Nevertheless, BoE Chairman adds that inflationary risks are still skewed to the upside and secondary effects are persistent.
- Another shooting star candlestick reversal pattern forms at the GBP/USD May highs but requires confirmation from a bearish close.
The Pound Sterling (GBP) experiences heightened volatility against the US Dollar (USD) following the Bank of England (BoE) monetary policy meeting on Thursday. It is trading in the 1.25s at the time of writing, showing a bearish short-term bias as investors digest the BoE event.
GBP/USD initially fell following the BoE’s announcement of its decision by a vote of 7-2 to raise interest rates by 0.25% bringing the Bank Rate to 4.50%.
Dovish opening remarks from the BoE’s Chairman Andrew Bailey further weighed on the pair, after he said the committee had good reason to believe headline inflation would fall considerably from April onwards. The Pound Sterling recovered later during Bailey’s press conference, however, when he emphasized secondary effects and how “risks to inflation continue to be skewed to the upside as secondary effects persist”.
The overall feel to the event was upbeat as the BoE revised up its projections for economic growth over the next two years from negative to positive.
From a technical perspective, GBP/USD remains in a long-term uptrend, advantaging long over short holders.
GBP/USD market movers
- The Bank of England (BoE) policy meeting goes as expected with no surprises. The BoE raises interest rates by 25 bps to 4.50% by a vote of 7-2, the same as at its last meeting.
- BoE’s Bailey talks about how inflation readings will show a dramatic fall in April as the base effects from elevated fuel and food prices from a year ago drop out of the equation.
- He talks about signs inflation more generally is easing but then adds that the secondary effects of high inflation continue to persist, and that the risks to inflation in the future remain “skewed to the upside”. The Pound Sterling recovers after these comments.
- Inflation in the UK is at 10.1% which is more than double the 4.9% reading in the US. Core Inflation is closer at 6.2% in the UK versus 5.5% in the US, nevertheless it suggests the UK will have to continue raising rates after the Federal Reserve (Fed) has stopped. This should benefit GBP over USD as global investors favor currencies with higher interest rates to park their money.
- The CME Group FedWatch Tool is showing a 90% probability of no further interest rate hikes from the Fed. In addition, the Fed removed wording that further monetary tightening would be required in its last statement. The BoE, on the other hand, kept similar wording in its statement.
- The US Dollar is at risk from US debt ceiling default risk. US Treasury Secretary Janet Yellen warned on Thursday that a US default on a failure to raise the debt ceiling would produce an "economic and financial catastrophe."
- The US Bureau of Labor Statistics released the Producer Price Index (PPI) for April, with both annual headline (3.2% vs 3.3% expected) and core figures (2.3% vs 2.4% expected) coming below expectations.
- The US Department of Labor's weekly Initial Jobless Claims disappointed, with 264K new first-time unemployment claims, more than the 245K expected.
GBP/USD technical analysis: Shooting star reversal seeks confirmation
GBP/USD broadly-speaking keeps extending its established uptrend making progressively higher highs and higher lows, and this is likely to continue bar a break below the 1.2435 May lows, still favoring Pound Sterling longs over shorts, for now.
-638194106079765190.png)
GBP/USD: Daily Chart
On Wednesday, the market formed a shooting star Japanese candlestick reversal pattern on GBP/USD, indicating the possibility of a short-term bearish reversal. The pattern, however, still awaits confirmation from a bearish close on Thursday. Given the sell-off after the BoE meeting this now looks highly likely. A bearish close would open the way for more short-term downside, probably to support at the base of the rising channel/wedge, located at around 1.2475.
The Relative Strength Index (RSI) is declining after showing mild bearish divergence between price at the May peaks and RSI. This is indicative of underlying weakness, and further suggests more short-term downside.
Yet, given the overall trend is bullish, the exchange rate will probably recover and continue rallying. The May 2022 highs at 1.2665 provide the first resistance level, but once breached they open the way to the 100-week Simple Moving Average (SMA) situated at 1.2713, and finally at the 61.8% Fibonacci retracement of the 2021-22 bear market, at 1.2758. All provide potential upside targets for the pair. Each level will need to be decisively breached to open the door to the next.
Decisive bearish breaks are characterized by long daily candles that break through key resistance levels in question and close near their highs or lows of the day (depending on whether the break is bullish or bearish). Alternatively, three consecutive candles that break through the level can also be decisive. Such insignia provide confirmation that the break is not a ‘false break’ or bull/bear trap.
Pound Sterling FAQs
What is the Pound Sterling?
The Pound Sterling (GBP) is the oldest currency in the world (886 AD) and the official currency of the United Kingdom. It is the fourth most traded unit for foreign exchange (FX) in the world, accounting for 12% of all transactions, averaging $630 billion a day, according to 2022 data.
Its key trading pairs are GBP/USD, aka ‘Cable’, which < href="https://fxssi.com/the-most-traded-currency-pairs">accounts for 11% of FX, GBP/JPY, or the ‘Dragon’ as it is known by traders (3%), and EUR/GBP (2%). The Pound Sterling is issued by the Bank of England (BoE).
How do the decisions of the Bank of England impact on the Pound Sterling?
The single most important factor influencing the value of the Pound Sterling is monetary policy decided by the Bank of England. The BoE bases its decisions on whether it has achieved its primary goal of “price stability” – a steady inflation rate of around 2%. Its primary tool for achieving this is the adjustment of interest rates.
When inflation is too high, the BoE will try to rein it in by raising interest rates, making it more expensive for people and businesses to access credit. This is generally positive for GBP, as higher interest rates make the UK a more attractive place for global investors to park their money.
When inflation falls too low it is a sign economic growth is slowing. In this scenario, the BoE will consider lowering interest rates to cheapen credit so businesses will borrow more to invest in growth-generating projects.
How does economic data influence the value of the Pound?
Data releases gauge the health of the economy and can impact the value of the Pound Sterling. Indicators such as GDP, Manufacturing and Services PMIs, and employment can all influence the direction of the GBP.
A strong economy is good for Sterling. Not only does it attract more foreign investment but it may encourage the BoE to put up interest rates, which will directly strengthen GBP. Otherwise, if economic data is weak, the Pound Sterling is likely to fall.
How does the Trade Balance impact the Pound?
Another significant data release for the Pound Sterling is the Trade Balance. This indicator measures the difference between what a country earns from its exports and what it spends on imports over a given period.
If a country produces highly sought-after exports, its currency will benefit purely from the extra demand created from foreign buyers seeking to purchase these goods. Therefore, a positive net Trade Balance strengthens a currency and vice versa for a negative balance.
- EUR/USD sinks to 3-week lows near 1.0910 on Thursday.
- Market participants continue to favour the risk-off space.
- US Producer Prices disappoint in April, Claims rise more than estimated.
EUR/USD’s selling pressure gathers impulse and flirts with the area of 4-week lows near 1.0900 on Thursday.
EUR/USD ignores usual hawkish ECB-speak
EUR/USD debilitates further and revisits levels last seen in mid-April in the proximity of the 1.0900 neighbourhood, always on the back of the intense recovery in the US Dollar and the persevering risk-off environment.
So far, the European currency has practically ignored further hawkish narrative from ECB officials after both C. Lagarde and J. Nagel favoured the continuation of the current tightening bias.
It is worth recalling that Board member M. Kazaks suggested on Wednesday that a rate hike in July might not be the last one amidst the current context of still elevated inflation, an idea that falls in line with speculation of another quarter-point hike in September, which should bring the deposit rate to 4.0%.
In the US calendar, Producer Prices rose less than expected in April: 0.2% MoM and 2.3% YoY. In addition, Initial Jobless Claims increased by 264K in the week to May 6, also more than anticipated.
What to look for around EUR
EUR/USD faces renewed downside pressure in response to the resurgence of the risk aversion and the consequent investors’ move towards the greenback.
The movement of the euro's value is expected to closely mirror the behaviour of the US Dollar and will likely be impacted by any differences in approach between the Fed and the ECB with regards to their plans for adjusting interest rates.
Moving forward, hawkish ECB-speak continue to favour further rate hikes, although this view appears in contrast to some loss of momentum in economic fundamentals in the region.
Key events in the euro area this week: ECB Lagarde, De Guindos, Schnabel (Thursday).
Eminent issues on the back boiler: Continuation (or not) of the ECB hiking cycle. Impact of the Russia-Ukraine war on the growth prospects and inflation outlook in the region. Risks of inflation becoming entrenched.
EUR/USD levels to watch
So far, the pair is losing 0.70% at 1.0902 and faces the next contention level at 1.0900 (round level) seconded by 1.0831 (monthly low April 10) and finally 1.0795 (100-day SMA). On the flip side, the surpass of 1.1095 (2023 high April 26) would target 1.1100 (round level) en route to 1.1184 (weekly high March 21 2022).
- GBP/USD meets with aggressive supply on Thursday and retreats further from a one-year peak.
- Resurgent USD demand exerts heavy pressure as traders seem rather unimpressed by the BoE.
- The mixed technical setup suggests that spot prices could defend the ascending channel support.
The GBP/USD pair comes under intense selling pressure on Thursday and extends the overnight rejection slide from the 1.2680 region, a resistance marked by the top end of over a one-month-old ascending trend channel. The intraday downfall picks up pace after the Bank of England (BoE) announced its monetary policy decision and drags spot prices to over a one-week low, around the 1.2540 region during the early North American session.
The British Pound weakens across the board in the absence of any major surprises from the UK central bank, which, along with resurgent US Dollar (USD) demand, weigh heavily on the GBP/USD pair. The risk-off impulse - as depicted by a fresh leg down in the equity markets - turns out to be a key factor that benefits the safe-haven Greenback. The USD bulls, meanwhile, seem rather unaffected by the disappointing US macro data and a sharp intraday slide in the US Treasury bond yields. This, in turn, supports prospects for a further intraday downfall for the major.
From a technical perspective, a convincing break through the 100-hour Simple Moving Average (SMA), around the 1.2580-1.2575 area, which coincides with the weekly low touched on Tuesday, is seen as a key trigger for bearish traders. Moreover, oscillators on the 4-hour chart have been gaining negative traction and could drag the GBP/USD pair below the 1.2500 psychological mark. That said, technical indicators on the daily chart are still holding in the positive territory, which should allow spot prices to defend the ascending channel support, currently around the 1.2475 area.
On the flip side, any meaningful recovery attempt now seems to confront stiff resistance near the 1.2575-1.2580 area, or the 100-hour SMA. This is closely followed by the 1.2600 round-figure mark, which if cleared will suggest that the corrective slide has run its course and set the stage for the resumption of the recent upward trajectory witnessed over the past month or so. The GBP/USD pair might then surpass an intermediate hurdle near the 1.2630 region and aim to retest the YTD peak, around the 1.2680 area and challenge the trend-channel resistance, currently around the 1.2700 mark.
GBP/USD 1-hour chart
Key levels to watch
Kit Juckes, Chief Global FX Strategist at Société Générale, discusses the US growth outlook and the current Dollar trend.
Four steps down and then three steps up
“US growth bulls and bears are talking over each other now, rather than debating anything. Money growth has collapse, the credit impulse is negative, the curve matters and so do bank failures, but the labour market’s too tight to mention. Or, to put it another way, the economy’s slowing, but from a ridiculously strong growth rate.”
“How long it will take for growth to grind to a halt is very hard to quantify, and that means that while the Dollar’s downtrend is intact, it’s going to continue being a story of 4 steps down followed by three steps back up (with a funny walk thrown in for good measure), for the time being.”
Neel Kashkari, President of the Federal Reserve Bank of Minneapolis, mentioned on Thursday that inflation has eased but warned it is above the Fed's 2% target. He was speaking at the Marquette CEO Town Hall in Michigan.
Kashkari noted that the banking crisis can be a source of slowing for the economy. He added that wage growth has softened somewhat, but the job market remains strong
Market reaction
The US Dollar is rising on Thursday and recently printed fresh daily highs across the board amid risk aversion and following US Producer Price Index and Jobless Claims.
- USD/JPY drifts lower for the second successive day and drops to a fresh weekly low.
- A softer risk tone benefits the safe-haven JPY and exerts some downward pressure.
- A goodish pickup in the USD demand could lend support and limit further losses.
The USD/JPY pair attracts fresh selling following an intraday uptick to the 134.85 region and turns back lower for the second straight day on Thursday. Spot prices continue losing ground through the early North American session and drop to a one-week low, around the 133.75 area in the last hour.
Against the backdrop of concerns over the US debt ceiling, mixed Chinese inflation figures released on Thursday fuel worries about the economic outlook for the second quarter and tempers investors' appetite for riskier assets. This is evident from a fresh leg down in the equity markets, which boosts demand for the safe-haven Japanese Yen (JPY) and exerts downward pressure on the USD/JPY pair.
The global flight to safety, along with the growing acceptance that the Federal Reserve (Fed) is nearing the end of its year-long rate-hiking cycle, contributes to the ongoing fall in the US Treasury bond yields. This results in a further narrowing of the US-Japan rate differential and also benefits the JPY. That said, a goodish intraday pickup in the US Dollar (USD) demand could lend support to the USD/JPY pair.
The USD bulls, meanwhile, seem rather unaffected by the softer US Producer Price Index (PPI) and a larger-than-expected rise in the Weekly Initial Jobless Claims. This, in turn, might hold back traders from placing aggressive bearish bets around the USD/JPY pair. Nevertheless, spot prices remain well within the striking distance of the monthly swing low, around the mid-133.00s touched last Friday.
Technical levels to watch
S&P 500 remains capped below its 4195 YTD high. Analysts at Credit Suisse maintain their bias of looking for a top here, seen confirmed below 4052/48.
Break above 4195 would now be seen to mark an important break higher
“With daily MACD momentum having turned lower, we still think the broader risk is shifting towards a ‘risk off’ phase and our bias stays lower for an eventual break below 4052/48 to confirm a near-term top for a fall to test the 200-DMA, now at 3972.”
“Big picture, below 3972 can see a test of support next at 3843/09, with a break below 3764 seen to mark a much more significant top.”
“Above 4195 though would now be seen to mark an important break higher, especially give the extreme net short in positioning to clear the way for a test of the summer 2022 high and 61.8% retracement of the entire 2022 fall at 4312/4325.”
- AUD/USD once again faces rejection near the 100-day SMA amid resurgent USD demand.
- The prospects for an imminent pause in the Fed’s rate-hiking cycle cap gains for the buck.
- The softer-than-expected US PPI fails to impress the USD bulls or provide a fresh impetus.
The AUD/USD pair continues with its struggle to find acceptance above the 100-day Simple Moving Average (SMA) and attracts aggressive sellers in the vicinity of the 0.6800 mark on Thursday. The pair maintains its heavily offered through the early North American session and is currently placed around the 0.6745 region, just a few pips above the weekly low touched earlier today.
As investors look past Wednesday's release of the US CPI report, a generally weaker risk tone pushes the safe-haven US Dollar (USD) to over a one-week high and turns out to be a key factor exerting downward pressure on the AUD/USD pair. Against the backdrop of concerns over the US debt ceiling, mixed Chinese inflation figures released on Thursday fuel worries about the economic outlook for the second quarter and tempers investors' appetite for riskier assets. This, in turn, drives some haven flows towards the buck and undermines the risk-sensitive Aussie.
The upside for the USD, however, remains limited in the wake of growing acceptance that the Federal Reserve (Fed) is nearing the end of its year-long rate-hiking cycles. The bets were reaffirmed by the softer-than-expected release of the US Producer Price Index (PPI) on Thursday, which keeps the US Treasury bond yields depressed and caps the USD. Apart from this,
the Reserve Bank of Australia's (RBA) hawkish outlook, indicating that some further tightening of monetary policy may be required to ensure that inflation returns to target, and limits losses for the AUD/USD pair.
Spot prices quickly bounce back closer to mid-0.6700s, though the recent repeated failures to build on the momentum beyond a technically significant moving average warrant some caution for bullish traders. The aforementioned supportive fundamental backdrop suggests that the path of least resistance for the AUD/USD pair is to the upside. Hence, any subsequent downfall might still be seen as a buying opportunity and is more likely to remain limited.
Technical levels to watch
UOB Group’s Senior Economist Julia Goh and Economist Loke Siew Ting comment on the publication of foreign portfolio data in Malaysia.
Key Takeaways
“Malaysia continued to draw foreign portfolio inflows for a fourth straight month in Apr (totaling MYR1.2bn vs MYR5.3bn in Mar) despite lingering concerns about global banking sector turmoil, US debt ceiling, and dimmer growth prospects. It marked the longest streak of foreign portfolio inflows since Oct 2020, solely driven by persistent foreign purchases of Malaysian debt securities (+MYR1.5bn vs +MYR6.6bn in Mar) as the equity space still faced foreign selling pressures (-MYR0.3bn vs –MYR1.3bn in Mar).”
“Bank Negara Malaysia (BNM)’s foreign reserves reversed course and erased almost all of its gains recorded in the preceding month (end-Apr: -USD1.09bn m/m to USD114.4bn vs end-Mar: +USD1.17bn m/m to USD115.5bn), partly reflecting smaller foreign portfolio inflows and slower external trade flows amid a weaker currency in the month. The reserves position is sufficient to finance 5.1 months of imports of goods & services and is 1.0 time of total short-term external debt. BNM’s net short position in FX swaps widened by USD0.5bn m/m to a fresh high of USD26.7bn (equivalent to 23.1% of FX reserves) as at end-Mar.”
“Moving into 2H23, we continue to expect volatile capital flows into emerging markets (EMs) including Malaysia as investors remain wary of any further upheaval in the US financial system, potential US debt default, deteriorating global growth outlook, and geopolitical risks emanating from upcoming elections for a handful of EMs. That said, still strong fundamental factors (i.e. decent economic growth and manageable inflationary pressures) and expectations of broad dollar weakness will remain the core drivers of foreign portfolio flows to EMs and Asian FX movement in the near term.”
- Initial Jobless Claims in the US advanced by 22,000 in the week ending May 6.
- Continuing Jobless Claims increase by 12,000 in the week ending April 29.
- US Dollar Index drops after economic reports (Jobless Claims and PPI).
Initial Jobless claims totaled 264,000 in the week ending May 6, the weekly data published by the US Department of Labor (DOL) showed on Thursday. The print follows the previous week’s unrevised 242,000 and came in above market expectations of 245,000.
“The 4-week moving average was 245,250, an increase of 6,000 from the previous week's unrevised average of 239,250. This is the highest level for this average since November 20, 2021 when it was 249,250.”
Continuing Claims increased by 12,000 in the week ended April 29 to 1.813 million, below the 1.82 million of market consensus. It is the lowest level in three weeks.
“The previous week's level was revised down by 4,000 from 1,805,000 to 1,801,000. The 4-week moving average was 1,829,500, an increase of 2,250 from the previous week's revised average. The previous week's average was revised down by 1,000 from 1,828,250 to 1,827,250.”
Market reaction
The US Dollar dropped across the board following the April Producer Price Index and Jobless Claims reports. The DXY is still up for the day, but off highs hovering around 101.70.
- Annual producer inflation in the US rose at a softer pace than expected in April.
- US Dollar Index stays in positive territory above 101.50.
The Producer Price Index (PPI) for final demand in the US rose 2.3% on a yearly basis in April, down from the 2.7% increase recorded in March, the data published by the US Bureau of Labor Statistics revealed on Thursday. This reading came in lower than the market expectation of 2.4%.
The annual Core PPI increased 3.2% in the same period, compared to the market expectation of 3.3%. On a monthly basis, the PPI and the Core PPI both came in at +0.2%.
Market reaction
The US Dollar Index largely ignored these figures and was last seen rising 0.3% the day at 101.72.
Bank of England (BoE) Governor Andrew Bailey is delivering his remarks on the policy outlook and responding to questions from the press following the bank's decision to hike the policy rate by 25 basis points to 4.5% in May.
Key takeaways
"We push back on some arguments that say underlying cause of high inflation is down to past monetary policy."
"There is a level of hindsight in judgements on the BoE's performance."
"Path of inflation forecasts is not unreasonable given scale of shocks."
"There is no bias in our setting of rates looking forward, at this point."
"Transmission mechanism of UK monetary policy via mortgage market has changed so much over time."
"We've got a lot of pass-through to come via mortgage market."
"That is very lively subject of debate on MPC."
About Andrew Bailey (via bankofengland.co.uk)
"Andrew Bailey previously held the role of Deputy Governor, Prudential Regulation and CEO of the PRA from 1 April 2013. While retaining his role as Executive Director of the Bank, Andrew joined the Financial Services Authority in April 2011 as Deputy Head of the Prudential Business Unit and Director of UK Banks and Building Societies. In July 2012, Andrew became Managing Director of the Prudential Business Unit, with responsibility for the prudential supervision of banks, investment banks and insurance companies. Andrew was appointed as a voting member of the interim Financial Policy Committee at its June 2012 meeting."
The Bank of England lived up to expectations and raised Bank Rate by 25 basis points to 4.50%. Whether further hikes will follow depends primarily on how persistent inflation is, economists at Commerzbank report.
BoE raises key rate by 25 bps
“As expected, the BoE raised the key interest rate by 25 bps to 4.50%. The decision was made by a vote of 7:2. The minority preferred unchanged interest rates.”
“In our forecast, we do not expect any further interest rate hikes. Ultimately, it will probably depend on the data. However, the fact that the statement does not attempt to push back against speculation of further moves suggests that the risk of at least one more hike is high.”
Bank of England (BoE) Governor Andrew Bailey is delivering his remarks on the policy outlook and responding to questions from the press following the bank's decision to hike the policy rate by 25 basis points to 4.5% in May.
Key takeaways
"On rates, we will be guided by the evidence."
"We are not giving a directional steer on rates."
"MPC's guidance on further action is conditional."
About Andrew Bailey (via bankofengland.co.uk)
"Andrew Bailey previously held the role of Deputy Governor, Prudential Regulation and CEO of the PRA from 1 April 2013. While retaining his role as Executive Director of the Bank, Andrew joined the Financial Services Authority in April 2011 as Deputy Head of the Prudential Business Unit and Director of UK Banks and Building Societies. In July 2012, Andrew became Managing Director of the Prudential Business Unit, with responsibility for the prudential supervision of banks, investment banks and insurance companies. Andrew was appointed as a voting member of the interim Financial Policy Committee at its June 2012 meeting."
At some point, the ECB will only be able to disappoint. Euro-bulls should be prepared for that moment, economists at Commerzbank report.
ECB can only really surprise on the dovish side
“Clearly many are currently of the view that the ECB was more restrictive than the Fed. However, at some point following the presumably last ECB rate step in June that is likely to be over. At that point, the ECB can only really surprise on the dovish side.”
“That will take a while though and the Euro is likely to remain the favourite until then, as not only inflation momentum and monetary policy are in its favour.”
“The Dollar is also under pressure as a result of additional factors at present, such as the uncertainty surrounding the debt ceiling. At some point things will change though. Euro-bulls should not lose track of that and should be prepared for that moment.”
Bank of England (BoE) Governor Andrew Bailey is delivering his remarks on the policy outlook and responding to questions from the press following the bank's decision to hike the policy rate by 25 basis points to 4.5% in May.
Key takeaways
"News on food inflation is not one of long-run persistence, but how shock to food prices works through system."
"Reasons I hear on high food inflation include energy costs, hedging of commodity prices."
"GDP growth is still weak despite upward revision."
"Past rate hikes will weigh more economy in coming quarters."
About Andrew Bailey (via bankofengland.co.uk)
"Andrew Bailey previously held the role of Deputy Governor, Prudential Regulation and CEO of the PRA from 1 April 2013. While retaining his role as Executive Director of the Bank, Andrew joined the Financial Services Authority in April 2011 as Deputy Head of the Prudential Business Unit and Director of UK Banks and Building Societies. In July 2012, Andrew became Managing Director of the Prudential Business Unit, with responsibility for the prudential supervision of banks, investment banks and insurance companies. Andrew was appointed as a voting member of the interim Financial Policy Committee at its June 2012 meeting."
- GBP/JPY fades the post-BoE spike and drops to a fresh weekly low on Thursday.
- The GBP bulls seem unimpressed by the BoE’s 25 bps lift-off and hawkish stance.
- A weaker risk tone underpins the JPY and contributes to the modest intraday fall.
The GBP/JPY cross fades a mild-European session bullish spike to the 169.75 area and drops back closer to the weekly low after the Bank of England (BoE) announced its monetary policy decision. The cross trades in the negative territory for the second successive day on Thursday, with bears now looking to extend the downfall further below the 169.00 round-figure mark.
The British Pound did get a minor lift in reaction to the BoE's hawkish outlook, indicating that persistently high inflationary pressures would require further tightening. This, along with the widely expected 25 bps lift-off, provides a modest lift to the GBP/JPY cross, though the uptick lacks bullish conviction and runs out of steam rather quickly in the absence of any major surprise.
BoE Governor Andrew Bailey, meanwhile, reiterated that inflation remains too high and that the central bank need to stay on course. Bailey added that we have good reasons to expect inflation to fall sharply from April, while the outlook for growth and unemployment has improved. Bailey further noted that economic activity has been stronger than expected recently.
This, however, does little to influence the Sterling Pound or any meaningful impetus to the GBP/JPY cross.Meanwhile, the cautious market mood benefits the safe-haven Japanese Yen (JPY) and acts as a tailwind for the GBP/JPY cross. That said, the Bank of Japan's (BoJ) dovish stance could undermine the JPY and limit the downside for spot prices, warranting caution for bearish traders.
Technical levels to watch
Bank of England (BoE) Governor Andrew Bailey is delivering his remarks on the policy outlook and responding to questions from the press following the bank's decision to hike the policy rate by 25 basis points to 4.5% in May.
Key takeaways
"Want to emphasize that having large upside risk on inflation does not call into meeting inflation target."
"Upside risks may not materialize."
"The Increase in UK bank funding costs after overseas bank failures was short-lived."
"Changes are still working the way through the economy, MPC factors this into policy decisions."
"MPC will adjust bank rate as necessary to return inflation to target sustainably."
About Andrew Bailey (via bankofengland.co.uk)
"Andrew Bailey previously held the role of Deputy Governor, Prudential Regulation and CEO of the PRA from 1 April 2013. While retaining his role as Executive Director of the Bank, Andrew joined the Financial Services Authority in April 2011 as Deputy Head of the Prudential Business Unit and Director of UK Banks and Building Societies. In July 2012, Andrew became Managing Director of the Prudential Business Unit, with responsibility for the prudential supervision of banks, investment banks and insurance companies. Andrew was appointed as a voting member of the interim Financial Policy Committee at its June 2012 meeting."
Bank of England (BoE) Governor Andrew Bailey is delivering his remarks on the policy outlook and responding to questions from the press following the bank's decision to hike the policy rate by 25 basis points to 4.5% in May.
Key takeaways
"Outlook for growth, unemployment has improved."
"Inflation remains too high, we have to stay the course."
"There is greater resilience in the economy than we had expected."
"Acutely aware of how difficult rise in food prices is for people."
"We do see signs that food price inflation will start to slow."
"Good reasons to think CPI will fall sharply from April."
"Inflation is on course to halve by the end of this year but our focus is on returning inflation to 2%."
"As inflation falls, second round effects unlikely to go away as quickly as they appeared."
"News on indicators of inflation persistence has been mixed."
About Andrew Bailey (via bankofengland.co.uk)
"Andrew Bailey previously held the role of Deputy Governor, Prudential Regulation and CEO of the PRA from 1 April 2013. While retaining his role as Executive Director of the Bank, Andrew joined the Financial Services Authority in April 2011 as Deputy Head of the Prudential Business Unit and Director of UK Banks and Building Societies. In July 2012, Andrew became Managing Director of the Prudential Business Unit, with responsibility for the prudential supervision of banks, investment banks and insurance companies. Andrew was appointed as a voting member of the interim Financial Policy Committee at its June 2012 meeting."
Economist at UOB Group Ho Woei Chen, CFA, assesses the latest trade balance results in the Chinese economy.
Key Takeaways
“China’s exports rose for the second consecutive month in Apr, boosted by a low base due to the Shanghai lockdown last year. The contraction in imports suggest weaker-than-expected domestic demand recovery.”
“Despite the export growth in the last two months, China’s trade outlook remains weak as signaled by the contraction in the Apr manufacturing PMIs for both the official and the private sector Caixin surveys. For now, we maintain our forecasts for China’s exports to contract by -3.0% and imports to grow by +2.0% respectively in 2023.”
“Imports of commodities including oil and metals generally held up with no evident signs of slowing industrial activities for now.”
- GBP/USD attracts some dip-buying on Thursday and stalls its retracement slide from the YTD top.
- The BoE’s 25 bps lift-off, along with the hawkish outlook, underpins the GBP and lends support.
- A goodish intraday pickup in the USD demand acts as a headwind and caps any further recovery.
The GBP/USD pair recovers a few pips from a four-day low touched this Thursday and bounces back above the 1.2600 round-figure mark after the Bank of England (BoE) announced its policy decision.
As was widely expected, the UK central bank raised its benchmark interest rates for the 12th time in a row, by 25 bps to 4.50%. In the accompanying monetary policy statement, the BoE indicated that persistently high inflationary pressures would require further tightening. This, in turn, underpins the British Pound and assists the GBP/USD pair to stall the overnight retracement slide from the 1.2680 region, or its highest level since April 2022.
The US Dollar (USD), on the other hand, regains strong positive traction and jumps to over a one-week high amid the prevalent cautious market mood, weighed down by worries about the US debt ceiling and slowing economic growth. This, in turn, holds back traders from placing aggressive bullish bets around the GBP/USD pair and acts as a headwind ahead of BoE Governor Andrew Bailey's comments at the post-meeting press conference.
Later during the early North American session, traders will take cues from the US economic docket, featuring the release of the Producer Price Index (PPI) and the usual Weekly Initial Jobless claims data. This, along with a scheduled speech by Governor Christopher Waller and the broader risk sentiment, might influence the USD price dynamics and produce short-term trading opportunities around the GBP/USD pair.
Technical levels to watch
- EUR/GBP accelerates the selling bias to 0.8660.
- The BoE hikes the policy rate by 25 bps to 4.50%.
- The central bank leaves guidance on rates unchanged.
The buying interest around the Sterling gathers further pace and forces EUR/GBP to sink to new YTD lows near 0.8660 on Thursday.
EUR/GBP weaker on hawkish BoE
EUR/GBP maintains the multi-week decline well in place and flirts with the 200-week SMA (0.8691) on the back of the somewhat improved mood around the British pound after the BoE raises its policy rate by 25 bps as expected.
The BoE now sees inflation retreating at a slower pace than that suggested in February, while it leaves the guidance on interest rates intact at the time when it expresses concerns over food inflation and core goods prices. On the latter, the BoE notes that inflation risks are sizably tilted to the upside and the persistence of elevated inflation would require extra tightening.
Moreover, the central bank does not expect the economy to fall back into recession.
In the meantime, and on the euro side of the equation, the solid performance of the Greenback so far keeps the risk complex under pressure and props up the intense sell-off in the single currency, which in turn collaborates with the daily pullback in the cross.
EUR/GBP key levels
The cross is losing 0.36% at 0.8667 and the breakdown of 0.8661 (2023 low May 11) would expose 0.8547 (monthly low December 1 2022) and finally 0.8386 (weekly low August 17 2022). On the other hand, the next up barrier emerges at 0.8734 (200-day SMA) followed by 0.8834 (monthly high May 3) and then 0.8875 (monthly high April 25).
The regional banking crisis is not fully played out yet. Economists at Société Générale discuss equity outlook.
US financials should continue to underperform their European counterparts
“The bank failures have tightened credit conditions – and are very likely going to help the Fed reach the end of their tightening cycle sooner. The last hike is going to trigger more allocation to US treasuries, and that would provide the US tech sector (and other long duration sectors) with a tailwind. If rates do move higher, we’re likely to be back in a grinding-lower environment (as in 2022).”
“While we think greedflation is likely to keep equities afloat in the near term, if we were to have a recessionary repricing, both equities and bond yields will need to head lower together in our view – hybrids trade line up well to hedge this tail-risk.”
“Given the Fed is closer to the end of the hiking cycle than the ECB, European rates should continue to tighten vs in the US. When combined with worse investor sentiment in the US, we think US financials will likely continue to underperform European banks.”
Following its May policy meeting, the Bank of England (BOE) announced that it raised the policy rate by 25 basis points (bps) to 4.5% as expected. Two policymakers, Tenreyro and Dhingra, voted to keep the policy rate on hold at 4.25%.
"If there were to be evidence of more persistent pressures, then further tightening of monetary policy would be required," the BOE repeated in its policy statement.
Follow our live coverage of the BOE policy announcements and the market reaction.
Market reaction
GBP/USD recovered from daily lows with the immediate reaction and was last seen trading a few pips above 1.2600.
Key takeaways
"Risks to inflation forecast skewed significantly to the upside."
"BOE forecasts show inflation falling to 5.12% by Q4 2023 (February forecast: 3.92%), based on market interest rates and modal forecast."
"BOE forecast shows inflation in one year's time at 3.38% (February forecast: 3.01%), based on market interest rates and modal forecast."
"BOE forecast shows inflation in two years' time at 1.1% (February forecast: 0.95%), based on market interest rates."
"BOE mean CPI forecast shows CPI at 2% in three years' time, demonstrating upside risks to central forecast."
"Market rates imply more BOE tightening than February, show bank rate at 4.8% in Q4 2023, 4.0% in Q4 2024, 3.7% in Q4 2025 (February: 4.4% in Q4 2023, 3.7% in Q4 2024, 3.4% in Q4 2025)."
"BOE forecast shows inflation in three years' time at 1.2% (February forecast: 0.37%), based on market interest rates."
"BOE estimates GDP "flat" for Q1 and Q2 2023 (March forecast: Q1 -0.1% QQ)
"BOE estimates GDP in 2023 +0.25% (February forecast: -0.5%), 2024 +0.75% (February: -0.25%), 2025 +0.75% (February: +0.25%), based on market rates."
"BOE estimates real post-tax household income in 2023 +1.0% (February: -0.5%), 2024 +1.0% (February: +1.5%), 2025 +1.0% (February: +0.75%)."
"BOE estimates wage growth +5% YY in q4 2023 (February: +4%), Q4 2024 +3.5% (February: +2.25%); Q4 2025 +2.5% (February: 1.5%)."
"BOE estimates unemployment rate 3.8% in Q4 2023 (February: 4.3%); Q4 2024 4.0% (February: 4.8%); Q4 2025 4.4% (February: 5.3%)."
"Pay growth could plateau at rates inconsistent with inflation target."
"Pay settlements stable at around 6%, expected to reduce modestly in H2-2023."
"Food inflation more persistent than forecast, adds around 1 percentage point to middle of CPI horizon."
"Many companies aim to pass costs on to selling prices as much as they can."
- EUR/USD regains downside traction and approaches 1.0900.
- The next support comes at the weekly low at 1.0909.
The selling momentum around EUR/USD gathers further impulse and drags the pair to new 3-week lows near 1.0920 on Thursday.
If bears remain in control, EUR/USD could see the weekly low at 1.0909 (April 17) quickly revisited prior to the provisional 55-day SMA at 1.0841, which comes just ahead of another weekly low at 1.0831 (April 10)
Looking at the longer run, the constructive view remains unchanged while above the 200-day SMA, today at 1.0440.
EUR/USD daily chart
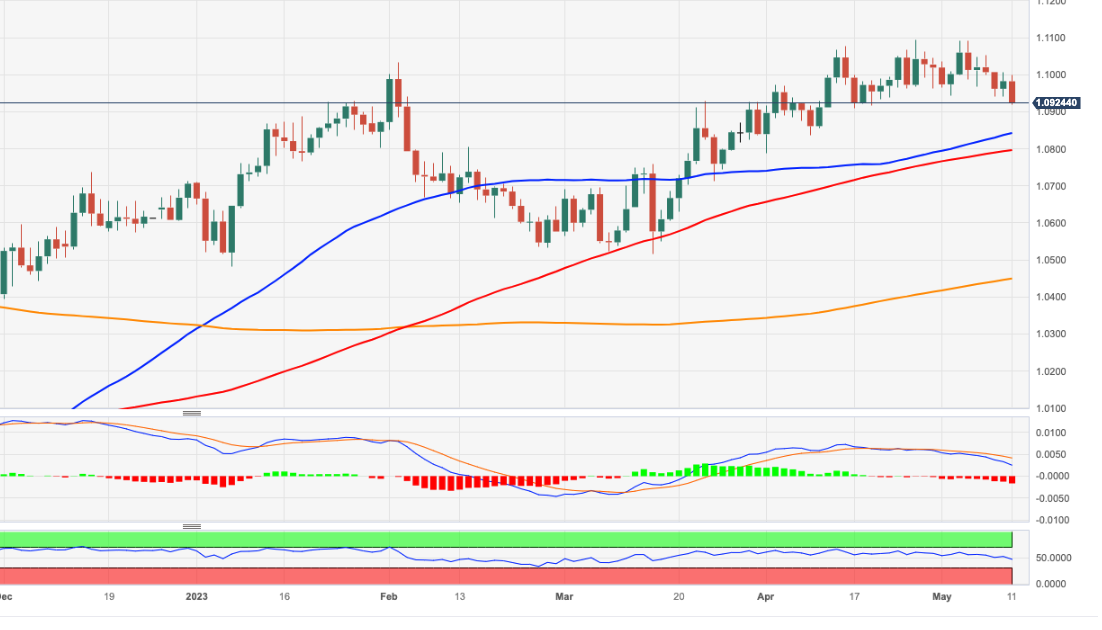
- DXY resumes the upside on a strong fashion and flirts with 102.00.
- Extra gains could see the May high at 102.40 revisited near term.
DXY rapidly leaves behind Wednesday’s downtick and pokes with the key 102.00 barrier on Thursday.
A more serious bullish attempt should clear the monthly high at 102.40 (May 2) to mitigate the downside pressure and allow for a potential advance to the provisional 55- and 100-day SMAs at 102.75 and 102.95, respectively.
On the downside, there is a formidable contention around the 101.00 neighbourhood for the time being.
Looking at the broader picture, while below the 200-day SMA, today at 105.86, the outlook for the index is expected to remain negative.
DXY daily chart
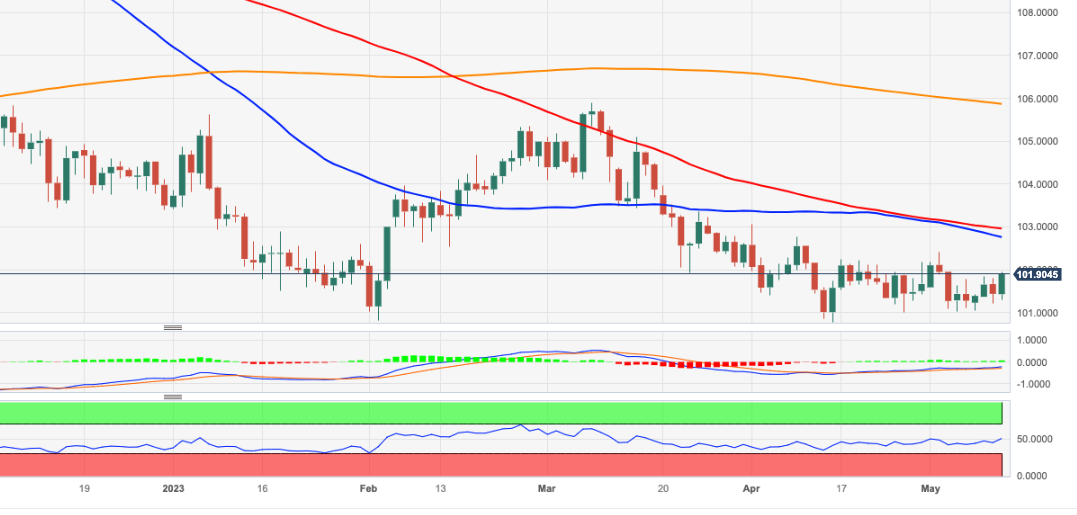
Today’s main event is the Bank of England policy announcement. Kit Juckes, Chief Global FX Strategist at Société Générale, analyzes its implicates for the GBP/USD pair.
Short-term rates market prices another 40 bps
“There’s near-unanimity that we’ll see a 25 bps hike to 4 ½%, and all the attention will be focused on the details and guidance that comes with that decision (assuming we don’t get a huge surprise).”
“The short-term rates market prices another 40 bps after today’s expected move, so a certain amount of hawkishness may be needed to prevent further USD gains, but if we get that, the market and Commentariat’s desire to see the UK economy (and currency) as a glass half full, rather than one that’s half empty, can carry GBP higher.”
- EUR/JPY drops for the third session in a row and breaches 147.00.
- The continuation of the leg lower initially targets the 146.30 region.
EUR/JPY loses the grip and breaks below the 147.00 support to print new monthly lows on Thursday.
It seems the bullish outlook in place since late March now appears dented. Against that, the cross could now challenge the weekly low of 146.28 (April 25) ahead of the interim 55-day SMA at 145.24.
So far, further upside looks favoured while the cross trades above the 200-day SMA, today at 142.96.
EUR/JPY daily chart
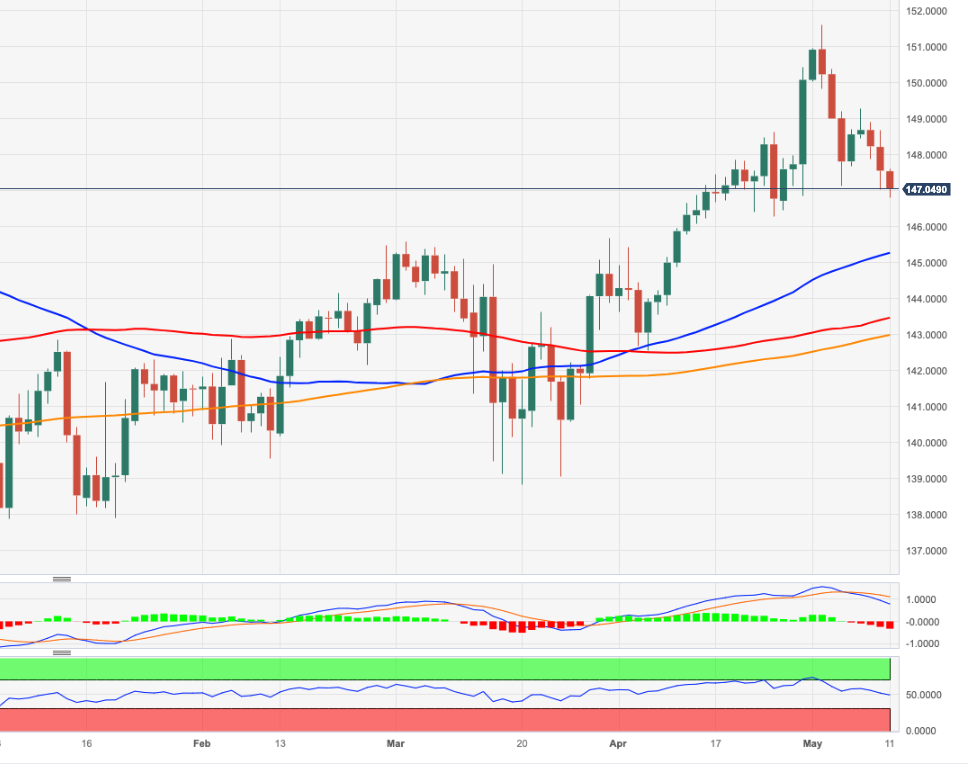
Economists at ING expect the US Dollar to remain favoured near term amid the debt ceiling issue.
Adverse market event might be ultimately needed to break the political stalemate
“Stalling debt-limit negotiations in the US still weigh on sentiment. The market’s sensitivity to this topic is growing each day and there may be growing fears that an adverse market event might be ultimately needed to break the political stalemate. Such a scenario would see a material upward correction in the USD in the near term, even though the long-term outlook for the greenback would not really turn any less negative – in our view – given the prospect of large cuts by the Fed starting from late this year.”
“Today, PPI and jobless claims data, as well as speeches by FOMC members Neel Kashkari and Chris Waller will be in focus in the US. Still unstable risk sentiment suggests that any drops in the Dollar may not have legs until there are positive developments on the debt-ceiling negotiations.”
BoE Monetary Policy Decision – Overview
The Bank of England (BoE) is scheduled to announce its monetary policy decision this Thursday at 11:00 GMT. The UK central bank is expected to hike interest rates by another 25 bps, marking the 12th consecutive lift-off amid the persistent rise in UK consumer inflation. Apart from this, investors will focus on the accompanying monetary policy statement, which provides the Monetary Policy Committee's (MPC) economic and inflation projections. This will be followed by the post-meeting press conference at 11:30 GMT, where Governor Andrew Bailey's comments will be closely scrutinized for clues about the policy outlook.
According to Matías Salord, Senior Analyst at FXStreet, high expectations from the market might mean that a surprise on the dovish side could be on the cards: “The expected hawkish tone should strengthen the currency. However, some of this is already factored into the market, so if the Bank of England (BoE) adopts a more dovish stance, the Pound could face downward pressure.”
Analysts at Nomura offer a brief preview and write: “We expect the BoE to raise rates by 25 bps. While we see the risks to our central view as tilted towards zero rather than 50 bps (especially with renewed banking concerns), we think the chances of something other than a 25 bps hike are low. This is a MPR meeting, and we expect the Bank to remove much if not all, of the recession that it had been expecting previously. The Bank’s end-horizon inflation forecasts still look very low, and we would not be surprised – especially with core inflation looking sticky and with stronger GDP forecasts – if the Bank was to raise its expectations. We see the Bank raising rates again by 25 bps in June for a peak of 4.75%. Thereafter, we see rate cuts from the second half of 2024 to take rates back down to 3.50% by early 2025.”
How could it affect GBP/USD?
Heading into the key central bank event risk, the GBP/USD comes under heavy selling pressure on Thursday and retreats further from a fresh one-year high touched the previous day amid resurgent US Dollar (USD) demand. A dovish BoE tilt, though unlikely, could exert additional downward pressure on the British Pound and set the stage for some meaningful corrective pullback for the major.
Conversely, the market reaction to a 25 bps and (or) a neutral stance might fail to impress bulls. That said, expectations that the Federal Reserve (Fed) is nearing the end of its year-long rate-hiking cycle could keep a lid on the Greenback and lend some support to the GBP/USD pair. This, in turn, suggests that traders might prefer to wait for the release of the UK GDP report on Friday before placing fresh directional bets.
Eren Sengezer, European Session Lead Analyst at FXStreet, outlines important technical levels to trade the major and writes: “GBP/USD trades near the lower limit of the ascending regression channel, which is currently located at 1.2570. The 50-period Simple Moving Average (SMA) reinforces that support as well. In case the pair confirms that level as resistance, 1.2520 (100-period SMA) aligns as the next bearish target before 1.2500 (psychological level, static level) and 1.2460 (200-period SMA).”
“On the upside, 1.2600 (static level) forms interim resistance before 1.2650 (mid-point of the ascending regression channel). A four-hour close above the latter could attract buyers and fuel another leg higher toward 1.2700,” Eren adds further.
Key Notes
• Bank of England Preview: Bailey to break Pound's rally with reluctance to raise rates further
• Bank of England Preview: A risk event for the GBP/USD rally
• GBP/USD Forecast: Buyers shy away, eyes on BoE policy decisions
About the BoE interest rate decision
The BoE Interest Rate Decision is announced by the Bank of England. If the BoE is hawkish about the inflationary outlook of the economy and raises the interest rates it will be positive, or bullish, for the GBP. Likewise, if the BoE has a dovish view on the UK economy and keeps the ongoing interest rate, or cuts the interest rate it will be seen as negative, or bearish.
- US Dollar found its footing following Wednesday's dismal performance.
- US Dollar Index climbs toward 102.00, turns positive for the week.
- US debt ceiling deadlock continues as the deadline approaches.
The US Dollar has gathered bullish early Thursday after having struggled to find demand following the April United States (US) inflation data on Wednesday. The US Dollar Index (DXY) stretches higher toward 102.00 and stays in positive territory for the week.
The US Bureau of Labor Statistics (BLS) reported on Wednesday that the Consumer Price Index (CPI) rose 4.9% on an annual basis in April. This reading followed the 5% increase recorded in March and came in below the market expectation of 5%. With the initial market reaction, the USD started to weaken against its rivals with investors remaining convinced that the US Federal Reserve (Fed) will pause its tightening cycle in June.
Early Thursday, the heavy selling pressure surrounding the Euro amid contradicting headlines surrounding the European Central Bank's (ECB) rate outlook helped the USD capture some of the capital outflows.
The looming debt ceiling crisis in the US, however, emerges as a key risk factor for the USD in the short term. Beth Hammack, Chair of the Treasury Borrowing Advisory Committee and Co-Head of Goldman's Global Financing Group, said recently that a political deadlock over the US debt ceiling poses a "real risk" for the USD. President Joe Biden and top Republican lawmakers will have further talks on Friday.
Daily digest market movers: US Dollar holds ground for now
- US Treasury Secretary Janet Yellen warned on Thursday that a US default on a failure to raise the debt ceiling would produce an "economic and financial catastrophe."
- The Core CPI inflation, which excludes volatile food and energy prices, edged lower to 5.5% in April from 5.6% in March as expected. On a monthly basis, the CPI and the Core CPI rose 0.4%, matching analysts' estimates.
- The BLS will release the Producer Price Index (PPI) for April later in the session. The US economic docket will also feature the US Department of Labor's weekly Initial Jobless Claims data.
- Commenting on the US inflation report, "the CPI report comes on top of the Nonfarm Payrolls (NFP) figures released less than a week ago, and together there is a compelling case for pausing," said FXStreet Analyst Yohay Elam. "Investors already see a growing chance of rate cuts, and that weighs on the Greenback."
- The CME Group FedWatch Tool shows that markets are pricing in a more than 90% probability of the Fed leaving its policy rate unchanged at the next policy meeting.
- The Fed noted in its Loan Officer Survey for the first quarter that respondents reported tighter standards and weaker demand for commercial and industrial (C&I) loans to large and middle-market firms. "Banks reported tighter standards and weaker demand for all commercial real estate loan categories," the publication further read.
- Earlier in the week, Federal Reserve Bank of New York President John Williams told the Economic Club of New York on Tuesday that the Fed needs to be data-dependent with monetary policy and reminded that the Fed will raise rates again if needed.
Technical analysis: US Dollar Index rises above key short-term resistance
The US Dollar Index (DXY) climbed above 101.65, where the 20-day Simple Moving Average (SMA) is located. In case DXY closes the day above that level, it could target 102.50 (50-day SMA) and 103.00 (psychological level, 100-day SMA) next.
Meanwhile, the Relative Strength Index (RSI) indicator on the daily chart rose slightly above 50, pointing to a buildup of bullish momentum.
In case 101.65 fails to hold as support, sellers could show interest and drag DXY toward 101.00 (static level, psychological level). A daily close below the latter could open the door for an extended slide to 100.00.
How does Fed’s policy impact US Dollar?
The US Federal Reserve (Fed) has two mandates: maximum employment and price stability. The Fed uses interest rates as the primary tool to reach its goals but has to find the right balance. If the Fed is concerned about inflation, it tightens its policy by raising the interest rate to increase the cost of borrowing and encourage saving. In that scenario, the US Dollar (USD) is likely to gain value due to decreasing money supply. On the other hand, the Fed could decide to loosen its policy via rate cuts if it’s concerned about a rising unemployment rate due to a slowdown in economic activity. Lower interest rates are likely to lead to a growth in investment and allow companies to hire more people. In that case, the USD is expected to lose value.
The Fed also uses quantitative tightening (QT) or quantitative easing (QE) to adjust the size of its balance sheet and steer the economy in the desired direction. QE refers to the Fed buying assets, such as government bonds, in the open market to spur growth and QT is exactly the opposite. QE is widely seen as a USD-negative central bank policy action and vice versa.
Economists at Commerzbank preview the Bank of England (BoE) meeting and its implications for the British Pound (GBP).
Will the BoE meet market expectations?
“In view of continued high inflation rates in the United Kingdom the market assumes that the Bank of England (BoE) will hike its key rate by a further 75 bp until the summer, including today’s step.”
“At today’s BoE meeting, it will likely be less the step itself that will be decisive for Sterling, as it is priced in, but instead the voting patterns amongst the committee members and possible indications as to its future monetary policy.”
“If the BoE does not meet these expectations of a restrictive approach today because it fears that the past rate hikes might significantly affect the economy, even though it has stood up quite well contrary to its expectations, Sterling will presumably ease again quite quickly.”
UOB Group’s Enrico Tanuwidjaja and Junior Economist Agus Santoso review the latest release of FX reserves in Indonesia.
Key Takeaways
“Indonesia’s foreign exchange reserves eased USD1bn to USD144.2bn in Apr 2023.”
“The latest reserve level was equivalent to finance 6.4 months of imports or 6.3 months’ worth of imports and servicing the government’s external debt, well above the international adequacy standard of 3 months of imports.”
“Implementation of foreign currency monetary operation through export receivables’ placement in the onshore market (TD DHE) has succeeded in attracting USD451mn of foreign exchange in the first week of May.”
Economists at ING expect the EUR/USD pair to suffer further losses in the coming days.
Contained impact from ECB speakers
“The latest ECB remarks have not had a huge impact on the Euro. Markets probably feel quite comfortable with the current pricing, and the Euro’s sensitivity to the September/October pricing has not been very high anyway.”
“Ultimately, EUR/USD remains a Dollar – and primarily a US debt ceiling – story for now.”
“There are downside risks that extend below the 1.0900 mark in our view in the coming days, and well below such level should money market liquidity start to dry up. That is not our base case, but a resolution to the debt-ceiling chaos may still follow a bumpy road and this does not appear to be the ideal time for a big rally above 1.1000 for the overbought EUR/USD.”
- NZD/USD pulls back from a nearly two-month top set on Thursday amid resurgent USD demand.
- Economic worries boost the safe-haven buck and exert pressure on the perceived riskier Kiwi.
- The fundamental backdrop warrants some caution before positioning for any meaningful slide.
The NZD/USD pair retreats from the 0.6385 region, or a nearly two-month high touched earlier this Thursday and maintains its offered tone through the first half of the European session. The pair is currently placed just a few pips above the daily low and trades around the 0.6345-0.6340 region, down
Mixed Chinese inflation data released on Thursday raises concerns about the broader economic outlook for the second quarter and turns out to be a key factor weighing on antipodean currencies, including the Kiwi. In fact, the National Bureau of Statistics (NBS) reported that the headline CPI in China rose by 0.1% rate in April, the lowest rate since February 2021, giving further evidence of tepid domestic demand. Moreover, China’s Producer Price Index (PPI) contracted for the seventh consecutive month and registered its fastest drop since May 2020. This, along with the resurgent US Dollar (USD), prompts aggressive long-unwinding around the NZD/USD pair and contributes to the intraday decline.
In fact, the USD Index (DXY), which tracks the Greenback against a basket of currencies, shot to over a one-week high in the wake of some short-covering amid the uncertainty over the Federal Reserve's (Fed) policy outlook. The US CPI report released on Wednesday showed that consumer prices fell below the 5% YoY rate in April for the first time in two-year. This, in turn, paves the way for an imminent pause in the US central bank's year-long rate-hiking cycle. In fact, the CME's FedWatch tool indicates a greater chance that the Fed will hold interest rates at their current level in June. Investors, however, remain divided over the possibility of rate cuts later this year, which benefits the USD and weighs on the NZD/USD pair.
That said, expectations for further rate hikes by the Reserve Bank of New Zealand (RBNZ) might hold back traders from placing aggressive bearish bets around the NZD/USD pair and help limit deeper losses, at least for the time being. Market participants now look forward to the US economic docket, featuring the release of the Producer Price Index (PPI) and the usual Weekly Initial Jobless Claims data later during the early North American session. This, along with Fed Governor Christopher Waller's scheduled speech and the US bond yields, will influence the USD price dynamics and allow traders to grab short-term opportunities.
Technical levels to watch
Cable slips before BoE. Economists at Société Générale expect the GBP/USD pair to receive a shot in the arm if the “Old Lady” hikes by 25 bps without hinting at a pause.
Will BoE signal a pause?
“A 25 bps rate increase today by the BoE could in theory give GBP/USD another shot in the arm provided the bank does not signal a pause.”
“Push-back by Governor Bailey against market pricing of a peak at 4.75%, or a lower inflation forecast in two years, could snuff out positive Sterling momentum.”
See – BoE: Banks Preview, another 25 bps hike, but will it be the last?
- GBP/USD comes under some bearish pressure on Thursday and retreats further from the YTD peak.
- Resurgent USD demand prompts aggressive selling amid some repositioning trade ahead of the BoE.
- The fundamental backdrop still supports prospects for the emergence of dip-buying at lower levels.
The GBP/USD pair extends the previous day's retracement slide from the 1.2680 region, or its highest level since April 2022 and remains under heavy selling pressure on Thursday. The downward trajectory remains uninterrupted through the early part of the European session and drags spot prices to a fresh weekly low, around the 1.2565 area in the last hour.
The US Dollar (USD) makes a solid comeback following the overnight modest downtick and jumps to over a one-week high, which, in turn, is seen exerting downward pressure on the GBP/USD pair. Despite signs of easing inflationary pressures in the US, traders remain uncertain over the Federal Reserve's (Fed) next policy move. In fact, the current market pricing indicates a greater chance that the US central bank will leave interest rates steady in June. That said, diverging views over the possibility of rate cuts later this year, along with worries about slowing economic growth, prompt some short-covering around the Greenback.
This, along with some repositioning trade ahead of the highly-anticipated Bank of England (BoE) monetary policy decision, also seems to contribute to the offered tone surrounding the GBP/USD pair. The downside, however, is more likely to remain limited amid expectations that the UK central bank will hike interest rates by another 25 bps later this Thursday. Moreover, economic forecasts published by the National Institute of Economic and Social Research (NIESR) indicated that the underlying inflation in the UK has shown little sign of having peaked. This, in turn, might further hold back traders from placing bearish bets around the British Pound.
Hence, the market focus will be on the post-meeting press conference, where comments by Governor Andrew Bailey will influence the GBP. Later during the early North American session, traders will take cues from the US economic docket, featuring the release of the Producer Price Index (PPI) and the usual Weekly Initial Jobless Claims data. Apart from this, a scheduled speech by Fed Governor Christopher Waller, along with the US bond yields and the broader risk sentiment, will drive the USD and provide some impetus to the GBP/USD pair. Nevertheless, the aforementioned fundamental backdrop warrants some caution for bearish traders.
Technical levels to watch
On the inflation front, progress is slow. Antje Praefcke, FX Analyst at Commerzbank, believes that the debt ceiling issue is dampening the Dollar at the moment.
Caution about rapid rate cuts in the US
“On a MoM comparison the inflation for both rates remained stubbornly at 0.4%. That means that price pressure in the US is falling, but only very, very slowly. In the face of an inflation rate falling this slowly, and remaining well above the inflation target, the Fed would probably not consider cutting its key rate again in the autumn.”
“I think inflation will have to weaken considerably more before the Fed considers first rate cuts. The Dollar is unable to recover more at the moment due to the uncertainty surrounding the debt issue.”
Open interest in natural gas futures markets rose for the second session in a row on Wednesday, now by around 11.8K contracts according to preliminary readings from CME Group. In the same line, volume extended the uptrend and increased by nearly 13K contracts.
Natural Gas remains well supported by $2.00
Prices of natural gas retreated modestly on Wednesday amidst the uptick in open interest and volume. Against that, another decline remains on the cards in the very near term, although a deeper pullback is expected to meet a formidable barrier around the $2.00 mark per MMBtu.
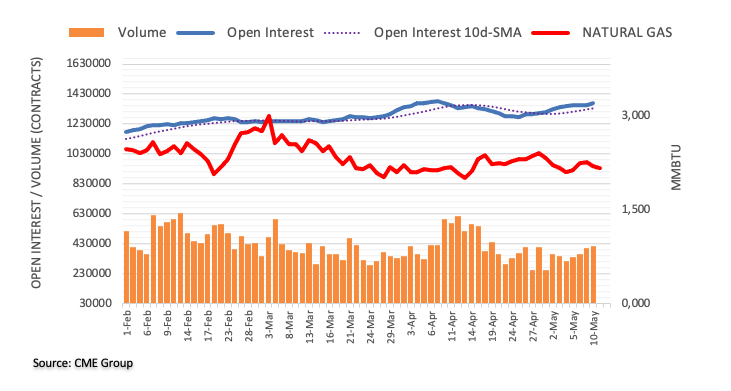
USD/CNH is now likely to navigate within the 6.9100-6.9630 range in the short term, according to UOB Group’s Economist Lee Sue Ann and Markets Strategist Quek Ser Leang.
Key Quotes
24-hour view: “Yesterday, we expected USD to trade in a sideways range of 6.9180/6.9350. We did not anticipate the elevated volatility as after dropping to 6.9169, USD surged to a high of 6.9420. After the choppy price action, the outlook for USD is mixed. Today, USD could trade in a range of 6.9230/6.9450.”
Next 1-3 weeks: “Our latest narrative was from last Friday (05 May, spot at 6.9150) wherein USD ‘is likely to trade under pressure but the chance of it breaking below the formidable support is low’. Since then, USD has not been able to make any headway to the downside and yesterday, it broke above our ‘strong resistance’ level of 6.94000. The breach of the ‘strong resistance’ level indicates that the downward pressure has eased. There does not appear to be any directional bias and for the time being, USD could trade in a range of 6.9100/6.9630.”
Economists at ING do not expect the Bank of England (BoE) meeting to be a game-changer for Sterling.
Sterling may hold on to recent gains for a bit longer
“We acknowledge that part of GBP’s recent strength has been due to the market’s aggressive expectations about BoE tightening, and therefore recognise there are downside risks as those (excessive, in our view) hawkish expectations are scaled back. However, we suspect the BoE will neither offer enough dovish hints today to trigger that dovish repricing, nor enough of a hawkish narrative to match the amount of tightening already priced into the GBP curve.”
“If anything, the balance of risks is skewed to the downside, but our call is for this meeting to have a relatively contained directional impact on the pound today.”
“Cable may stabilise around 1.26 and EUR/GBP around 0.8700 for now.”
- EUR/USD prints monthly lows in the 1.0925/20 band.
- The US Dollar extends the weekly recovery to multi-day highs.
- Markets’ attention will be on US Producer Prices, weekly claims.
The selling pressure around the European currency gathers further steam and drags EUR/USD to 3-week lows near 1.0920 on Thursday.
EUR/USD weakens amidst USD-buying
EUR/USD resumes the weekly leg lower and approaches the 1.0920 region on the back of the continuation of the bid bias around the greenback, which motivates the USD Index (DXY) to creep towards the 102.00 neighbourhood.
In the meantime, recent hawkish comments from ECB’s rate setters failed to lend sustained legs to the pair, which has so far met a tough up-barrier near the 1.1100 mark.
Still around the ECB, Board member M. Kazaks suggested on Wednesday that a rate hike in July might not be the last one amidst the current context of still elevated inflation, an idea that falls in line with speculation of another quarter-point hike in September, which should bring the deposit rate to 4.0%.
There are no scheduled releases in the euro calendar on Thursday, leaving all the attention to the publication of Producer Prices and the usual weekly Initial Jobless Claims across the ocean.
What to look for around EUR
EUR/USD faces renewed downside pressure in response to the resurgence of the risk aversion and the consequent investors’ move towards the greenback.
The movement of the euro's value is expected to closely mirror the behaviour of the US Dollar and will likely be impacted by any differences in approach between the Fed and the ECB with regards to their plans for adjusting interest rates.
Moving forward, hawkish ECB-speak continue to favour further rate hikes, although this view appears in contrast to some loss of momentum in economic fundamentals in the region.
Key events in the euro area this week: ECB De Guindos, Schnabel (Thursday).
Eminent issues on the back boiler: Continuation (or not) of the ECB hiking cycle. Impact of the Russia-Ukraine war on the growth prospects and inflation outlook in the region. Risks of inflation becoming entrenched.
EUR/USD levels to watch
So far, the pair is losing 0.64% at 1.0921 and faces the next contention level at 1.0909 (weekly low April 17) seconded by 1.0831 (monthly low April 10) and finally 1.0795 (100-day SMA). On the flip side, the surpass of 1.1095 (2023 high April 26) would target 1.1100 (round level) en route to 1.1184 (weekly high March 21 2022).
The latest survey of consumer expectations for inflation, conducted by the European Central Bank (ECB) on a monthly basis, reveals that “Eurozone consumers raised their inflation expectations in March.”
Additional takeaways
“Saw prices growing by 5.0% in the coming 12 months, up from 4.6% in the previous survey round in February.”
“It was the first increase in inflation expectations since the autumn.”
“Longer-term expectations also increased sharply, with inflation three years ahead now seen at 2.9% after a 2.4% reading a month earlier. “
Market reaction
EUR/USD is unable to find support from the above findings. The pair is currently trading at 1.0921, down 0.54% on the day.
We are starting to see signs of EUR weakness on a broad basis with EUR/USD strength stalling noticeably, economists at Credit Suisse report.
Move above 1.1097 would suggest we can see one final leg higher
“EUR/USD looks to be seeing more definitive signs of rejecting resistance form the top of the shallow uptrend channel from the beginning of January, with daily and weekly momentum deteriorating sharply.”
“Below support at 1.0942 has set a near-term top and we look for a test of the 55-DMA at 1.0831, which ideally holds on a closing basis. Below though would warn of a potentially more important downturn and a test of support at 1.0540/1.0483.”
“Above 1.1097 though would suggest we can see one final leg higher to our 1.1185/1.1275 core target – the 61.8% retracement and March 2022 high. Our bias remains to look for an important top here.”
- Gold price edges lower for the second successive day, albeit lacks follow-through.
- A goodish pickup in the US Dollar demand exerts some pressure on the XAU/USD.
- The fundamental backdrop warrants caution before positioning for deeper losses.
Gold price extends the previous day's late pullback from the vicinity of the $2,050 level, or the weekly high, and remains under some selling pressure for the second straight day on Thursday. The XAU/USD maintains its offered tone through the early part of the European session and is currently placed around the $2,025-$2,024 region, down nearly 0.35% for the day.
Resurgent US Dollar demand weighs on Gold price
Following the overnight slide, the US Dollar (USD) makes a solid comeback and jumps to over a one-week high in the last hour amid the uncertainty over the Federal Reserve's (Fed) monetary policy outlook. This, in turn, is seen as a key factor exerting some downward pressure on the US Dollar-denominated Gold price. Data released on Wednesday showed that the annual Consumer Price Index (CPI) in the United States (US) fell below 5% in April for the first time in two years, paving the way for a pause in the Fed's year-long rate-hiking cycle. In fact, the current market pricing indicates a 95% chance that the Fed will hold rates at their current level in June. Investors, however, remain divided over the possibility of rate cuts later this year, which, in turn, prompt some short-covering around the Greenback.
Economic worries could benefit the safe-haven XAU/USD
The downside for the Gold price, however, seems limited, at least for the time being, amid worries about slowing economic growth. The fears were fueled by the mixed Chinese inflation figures published early this Thursday. The National Bureau of Statistics (NBS) reported that the headline CPI in China rose by 0.1% rate in April, the lowest rate since February 2021, giving further evidence of tepid domestic demand. Moreover, China’s Producer Price Index (PPI) contracted for the seventh consecutive month and registered its fastest drop since May 2020. This, in turn, raises concerns about the broader economic outlook for the second quarter and should lend support to the safe-haven XAU/USD. Apart from this, a mildly softer tone around the US Treasury bond yields could act as a tailwind for the non-yielding yellow metal.
The prospects for an imminent shift in the Fed's hawkish stance, along with worries about the US debt ceiling, drag the US bond yields lower. This might hold back the USD bulls from placing aggressive bets and warrants some caution before positioning for a meaningful depreciating move in Gold price. Market participants now look forward to the US economic docket, featuring the release of the Producer Price Index (PPI) and the usual Weekly Initial Jobless Claims data later during the early North American session. Apart from this, Fed Governor Christopher Waller's scheduled speech, along with the US bond yields, will drive the USD demand and provide some impetus to the precious metal. Traders will further take cues from the broader risk sentiment to grab short-term opportunities around the XAU/USD.
Gold price technical outlook
From a technical perspective, any subsequent slide is likely to find some support near the $2,014 area, or the weekly top touched on Monday. This is closely followed by the $2,000 psychological mark, which if broken might prompt some technical selling. The Gold price might then turn vulnerable to accelerate the fall towards the $1,980 zone en route to the $1,970 strong horizontal support. Some follow-through selling will negate any near-term positive outlook and shift the bias in favour of bearish traders.
On the flip side, the $2,050 region now seems to have emerged as an immediate strong barrier. Some follow-through buying has the potential to lift Gold price back towards the all-time high, around the $2,078-$2,079 region touched last Thursday. The momentum could get extended further and allow bulls to conquer the $2,100 round-figure mark.
Key levels to watch
Bank of Japan (BoJ) Governor Kazuo Ueda said on Thursday, “there is no big problem in Japan's banking system.”
Additional quotes
Financial market, financial system stable for now.
Hope to communicate with G7 counterparts on global financial system situation.
US debt ceiling woe may be discussed at G7 if any country raises it at meetings.
Japan will be watching impact of US debt ceiling outcome.
US debt ceiling talks are something us needs to deal with but G7 must stand ready to debate, analyse impact as needed.
I believe US authorities are doing their best to resolve debt ceiling problem.
Things seem to be under control, when asked about lingering worries over US banking system.
Market reaction
At the time of writing, USD/JPY is trading 0.12% higher at around 134.50, benefitting from the renewed strength in the US Dollar
CME Group’s flash data for crude oil futures markets noted traders reduced their open interest positions by just 680 contracts on Wednesday, partially reversing the previous day’s build. Volume, instead, went up for the second consecutive session, now by around 128.2K contracts.
WTI faces a minor resistance around $74.00
Wednesday’s corrective pullback in prices of the WTI came in tandem with shrinking open interest, suggesting that a sustained retracement appears not favoured for the time being. Against that, the weekly recovery could have further legs to go and is expected to meet initial hurdle at the $74.00 mark per barrel.
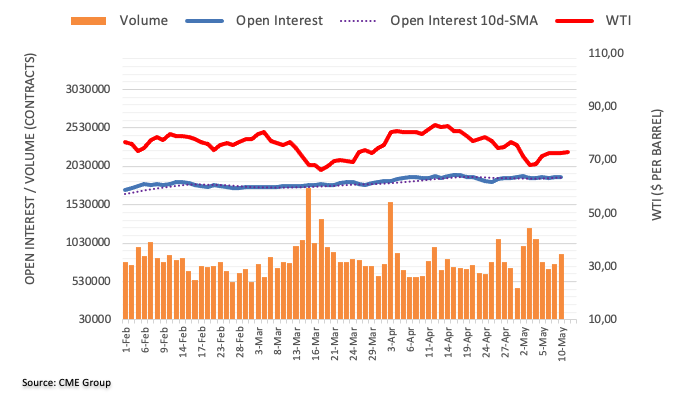
Further retracement in USD/JPY in the short-term horizon remains in store for the time being, comment UOB Group’s Economist Lee Sue Ann and Markets Strategist Quek Ser Leang.
Key Quotes
24-hour view: “We expected USD to trade sideways between 134.70 and 135.55 yesterday. USD rose to 135.47 and then dropped sharply to a low of 134.10 in late NY trade. The increase in downward momentum is likely to lead to further USD weakness even though a clear break of last week’s low near 133.50 is unlikely today. Resistance is at 134.65, followed by 135.00.”
Next 1-3 weeks: “In our most recent narrative from Tuesday (09 May, spot at 135.10), we highlighted that the odds for USD to weaken further to 133.00 have diminished. We added, ‘However, only a breach of 135.85 would suggest that the weakness in USD has stabilized’. USD did not break 135.85 as it fell sharply from a high of 135.47 yesterday. After slowing for a few days, downward momentum is building again even though the likelihood of USD dropping to 133.00 has not increased much. On the upside, a break of 135.50 (‘strong resistance’ level previously at 135.85) would indicate 133.00 is not coming into view.”
Considering advanced prints from CME Group for gold futures markets, open interest rose for the third session in a row on Wednesday, this time by nearly 6K contracts. Volume followed suit and added around 54.4K contracts to the previous daily build.
Gold: Next on the downside comes $2000
Gold prices reversed two daily sessions with gains on Wednesday. The downtick was amidst rising open interest and volume and leaves the door open to further correction in the next sessions. The next level of note on the downside is the key $2000 mark per ounce troy.
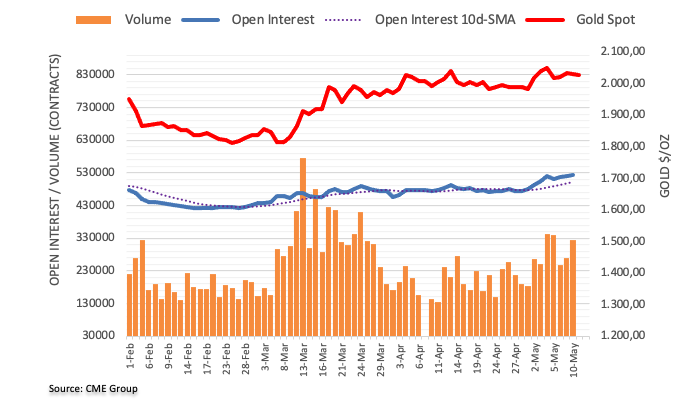
Economists at Commerzbank have changed their EUR/PLN forecast path only slightly lower.
Euro to remain strong through 2023
“We forecast the Euro to remain strong through 2023, but weaken once again during 2024.”
“Given the Zloty’s high-beta relationship to the Euro, we see EUR/PLN rising again towards 4.75 as inflation in Poland will likely remain stubbornly above target.”
“Our base-case remains that inflation will moderate noticeably over the coming quarters, but not converge fully to target, hence we see 2024 as a potential Zloty-negative period.”

Source: Commerzbank Research
UOB Group’s Economist Lee Sue Ann and Markets Strategist Quek Ser Leang do not rule out NZD/USD surpassing the 0.6385 level in the near term.
Key Quotes
24-hour view: “Yesterday, we held the view that NZD ‘is likely to edge higher but it is unlikely to break above 0.6385’. While our view for a higher NZD was not wrong, instead of edging higher, NZD soared briefly to 0.6381 before easing. Upward momentum has improved, and today, NZD is likely to rise to 0.6385. The next resistance at 0.6420 is unlikely to come under threat. On the downside, a breach of 0.6335 (minor support is at 0.6350) indicates that NZD is not advancing further.”
Next 1-3 weeks: “We have held a positive NZD view since last Wednesday, 03 May, when NZD was trading at 0.6215. In our most recent narrative from Tuesday (09 May, spot at 0.6335), we highlighted that as long as 0.6265 is not breached, there is scope for NZD to rise to 0.6385. In NY trade yesterday, NZD soared to a high of 0.6381. The increase in upward momentum suggests that a break of 0.6385 will not be surprising. The next level to watch is 0.6420. Overall, we continue to hold a positive NZD view as long as the ‘strong support’ at 0.6300 (level was previously at 0.6265) is not breached.”
- USD/CHF picks up bids to prod the top line of a bullish chart formation.
- Upbeat RSI, clear bounce off 0.8870 double-bottom keeps USD/CHF buyers hopeful.
- Sellers need validation from 0.8880, buyers may aim for 0.8950 on confirming bullish triangle breakout.
USD/CHF remains on the front foot around 0.8920, reversing the previous day’s losses heading into Thursday’s European session.
In doing so, the Swiss Franc (CHF) pair pierces the top line of the one-week-old descending triangle bullish chart formation.
Adding strength to the USD/CHF upside bias is the quote’s clear rebound from the stated triangle’s lower line, by forming double bottom near 0.8865, as well as the firmer but not overbought RSI (14) line.
With this, the USD/CHF pair appears well set to approach a downward-sloping resistance line from May 05, around 0.8950 by the press time.
However, the pair’s upside beyond 0.8950 may find it difficult amid the likely overbought RSI (14) line around then. Additionally challenging the USD/CHF bulls above 0.8950 is the monthly high of near 0.8995, quickly followed by the 0.9000 psychological magnet.
On the contrary, a one-week-old ascending trend line, close to 0.8880 at the latest, can act as short-term support in a case where the USD/CHF defies the latest triangle breakout by slipping back under 0.8915 level.
Even so, the stated triangle’s lower line of around 0.8865 can challenge the pair bears before directing them to the monthly low of 0.8820 and the 0.8800 round figure.
USD/CHF: Hourly chart

Trend: Further upside expected
- Andrew Bailey press conference after BoE rate decision could have a big effect on GBP.
- Bank of England widely expected to trigger 25 bps hike, hints on future monetary policy decisions more meaningful for the market.
Andrew Bailey, Governor of the Bank of England, will speak in a press conference 30 minutes after the BoE interest rate decision is released on Thursday. Bailey is scheduled to speak at 11:30 GMT. His remarks will carry big weight for the Pound Sterling once the market has digested the outcome of the rate decision, including how many Monetary Policy Committee (MPC) members voted for a rate hike or a pause, and the MPC statement.
Andrew Bailey press conference
Bailey and the Bank of England are widely expected to decide to raise interest rates by 25 basis points. Their vocabulary when discussing inflation pressures, still way too high as the UK Consumer Price Index (CPI) came above 10% annually in the last release, will shift market expectations for future monetary policy decisions, thus impacting the Pound Sterling valuation.
According to Matías Salord, Senior Analyst at FXStreet, high expectations from the market might mean that a surprise on the dovish side could be on the cards: “The expected hawkish tone should strengthen the currency. However, some of this is already factored into the market, so if the Bank of England (BoE) adopts a more dovish stance, the Pound could face downward pressure.”
- USD/CAD regains positive traction on Thursday amid the emergence of some USD buying.
- Bets for an imminent pause in the Fed’s rate-hiking cycle could cap the upside for the buck.
- An uptick in Oil prices might further contribute to keeping a lid on further gains for the pair.
The USD/CAD pair builds on the overnight modest bounce from the 1.3335 area and gains some follow-through traction through the first half of trading on Thursday. The pair maintains its bid tone heading into the European session and climbs to a fresh daily high, just above the 1.3400 round-figure mark in the last hour.
The US Dollar (USD) is back in demand and climbs back closer to the top end of its recent trading range witnessed over the past week or so, which, in turn, is seen as a key factor lending some support to the USD/CAD pair. In the absence of a fresh fundamental trigger, the intraday USD uptick runs the risk of fizzling out rather quickly amid growing acceptance that the Federal Reserve (Fed) is nearing the end of its rate-hiking cycles.
The market expectations were reaffirmed by the release of the latest US CPI report on Wednesday, which further pointed to signs of an easing of inflationary pressures. This, along with concerns about the US debt ceiling, drags the US Treasury bond yields lower and might hold back the USD bulls from placing aggressive bets. Apart from this, a modest uptick in Oil prices could underpin the commodity-linked Loonie and cap the upside for the USD/CAD pair.
Even from a technical perspective, spot prices have been oscillating in a familiar one-week-old trading range, which points to indecision among traders over the near-term trajectory. This further makes it prudent to wait for strong follow-through buying before confirming that the USD/CAD pair has formed a near-term bottom and positioning for an extension of the recent recovery from the 1.3300 round-figure mark, or a two-month low touched on April 14.
Market participants now look to the US economic docket, featuring the release of the Producer Price Index (PPI) and the usual Weekly Initial Jobless Claims later during the early North American session. Apart from this, Fed Governor Christopher Waller's scheduled speech and the US bond yields will drive the USD demand. This, along with Oil price dynamics, should provide some impetus to the USD/CAD pair and allow traders to grab short-term opportunities.
Technical levels to watch
Here is what you need to know on Thursday, May 11:
Following the slide seen with the initial reaction to April inflation data on Wednesday, the US Dollar Index stages a rebound early Thursday. The Bank of England (BoE) will announce monetary policy decisions later in the day and Governor Andrew Bailey will comment on the policy outlook and respond to questions from the press. April Producer Price Index (PPI) and weekly Initial Jobless Claims will be featured in the US economic docket.
Bank of England Preview: Bailey to break Pound's rally with reluctance to raise rates further.
The US Bureau of Labor Statistics announced on Wednesday that annual inflation in the US, as measured by the change in the Consumer Price Index (CPI), edged lower to 4.9% in April from 5% in March, compared to the market expectation of 5%. US Treasury bond yields turned south after inflation data and the benchmark 10-year yield snapped a four-day winning streak and lost more than 2% on the day. In turn, the US Dollar Index closed in negative territory. Mixed market mood, however, helped the USD stay resilient against its rivals in the late American session.
During the Asian trading hours on Thursday, monthly CPI in China decreased 0.1% in April, brining the rate of annual change down to 0.1% from 0.7% in March. Meanwhile, the data from Australia revealed that the Consumer Inflation Expectations climbed to 5% in May from 4.6% in April, matching the market expectation. AUD/USD stays on the back foot early Thursday and trades near 0.6750.
The BoE is widely expected to raise its policy rate by 25 basis points to 4.5% following the May policy meeting. The BoE will also release its revised projections for growth and inflation. Market participants will pay close attention to the vote split and comments from Bailey regarding additional rate increase in the near future. GBP/USD closed virtually unchanged for the second straight day on Wednesday and trades in a tight channel at around 1.2600 ahead of the event.
Bank of England Preview: A risk event for the GBP/USD rally.
EUR/USD registered small daily gains on Wednesday but failed to reclaim 1.1000. As market participants assess the latest remarks from European Central Bank (ECB) officials, the pair stays in negative territory at around 1.0950.
Gold price spiked to the $2,050 area after US inflation data but failed to preserve its bullish momentum. XAU/USD stays indecisive near $2,030 early Thursday.
Pressured by falling US yields, USD/JPY lost nearly 100 pips on Wednesday before going into a consolidation phase slightly above 134.00 early Thursday. The Bank of Japan's Summary of Opinions for April meeting reiterated that they must continue the current easy policy given uncertainty over global outlook.
Bitcoin fluctuated in a wide range on Wednesday but ended up closing the day flat below $28,000. BTC/USD edges lower toward $27,500 early Thursday. Ethereum gained traction in the early American session but failed to cling to its recovery gains on Wednesday. In the European morning, ETH/USD continues to stretch lower toward $1,800.
- Silver price stays pressured as bears attack 21-DMA, two-month-old ascending support line.
- Bearish MACD signals, RSI’s retreat from overbought territory suggests further downside.
- Multiple levels marked since early 2023 highlight $24.60-50 as crucial downside support for XAG/USD.
Silver price (XAG/USD) clings to mild losses near $25.30 during a two-day losing streak amid early Thursday morning in Europe.
In doing so, the bright metal not only extends the previous day’s U-turn from the weekly top but also prods the key $25.30-25 support confluence encompassing the 21-DMA and an upward-sloping trend line from early March.
Given the bearish MACD signals and the RSI (14) line’s retreat from the overbought territory, the Silver price remains on the bear’s radar.
However, a daily closing below the $25.25 level becomes necessary for the XAG/USD sellers to retake control.
Even so, a horizontal area comprising multiple levels marked since early January, around $24.60-50, appears a tough nut to crack for the Silver bears before taking control.
On the contrary, the $26.00 round figure guards the immediate recovery of the Silver price ahead of the yearly peak of around $26.15.
Should the XAG/USD remains firmer past $26.15, April 2022 high surrounding $26.25 can act as the last defense of the Silver bears, a break of which could quickly propel the bullion toward the previous yearly peak of around $26.95. Also acting as an upside filter is the $27.00 round figure.
Overall, the Silver price slips off the bull’s table but the bears have a bumpy road ahead of retaking the power.
Silver price: Daily chart
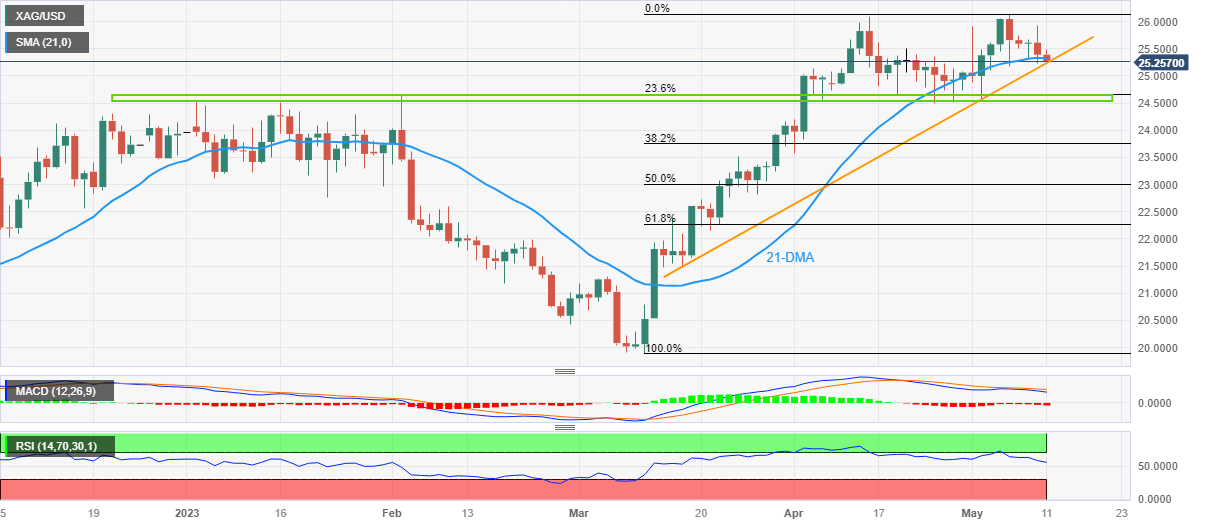
Trend: Further downside expected
European Central Bank (ECB) policymaker and Bundesbank Chief Joachim Nagel reaffirmed on Thursday, the “meeting-by-meeting approach is the right path for the ECB.”
Additional quotes
“Nothing is off the table in the September meeting.”
“We're moving closer to restrictive territory but not there yet.”
“Need at least a year-and-a-half to see core inflation closer to 2%.”
Market reaction
EUR/USD is seeing some fresh selling pressure, as Nagel dismisses reports of ECB rate hikes likely to continue in September. The pair is losing 0.11% on the day to trade at 1.0969, as of writing.
A 25 bps rate hike from the Bank of England is widely expected to be announced today. Economists at Rabobank do not expect the GBP to see lasting post-meeting gains.
Two or three more rate hikes could tip the UK economy into recession
“External MPC members Tenreyro and Dhingra have already made it very clear that they do not support further rate hikes from the BoE. This will make is difficult for the MPC to sound aggressively hawkish this week. That said, we foresee no change to the Bank’s policy guidance which warns of further tightening in monetary policy if there is evidence of more persistent inflations pressures.”
“An acknowledgement of the UK’s improved performance this spring could also enhance the Bank’s hawkish bias. However, with so much tightening already in the price, GBP may struggle to hold any post-meeting gains, particularly given the risk that two or three more rate hikes could tip the UK economy into recession.”
FX option expiries for May 11 NY cut at 10:00 Eastern Time, via DTCC, can be found below.
- EUR/USD: EUR amounts
- 1.0895-1.0900 1.7b
- 1.0925 1.7b
- 1.0950 1.1b
- 1.0985 1.5b
- 1.1000 1.5b
- 1.1040-50 1.4b
- 1.1100 1.3b
- GBP/USD: GBP amounts
- 1.2435 485m
- 1.2550-65 300m
- USD/JPY: USD amounts
- 133.00 514m
- 134.00 909m
- 134.65-75 630m
- 135.00 441m
- 135.15-25 800m
- 135.55 561m
- USD/CHF: USD amounts
- 0.8800 240m
- 0.8840 446m
- 0.9000 224m
- AUD/USD: AUD amounts
- 0.6650-60 1.1b
- 0.6725(250m
- 0.6750 408m
- 0.6800 660m
- USD/CAD: USD amounts
- 1.3600 785m
- 1.3450 711m
- EUR/JPY: EUR amounts
- 143.80 477m
In the opinion of UOB Group’s Economist Lee Sue Ann and Markets Strategist Quek Ser Leang, there is still probability of GBP/USD to break above 1.2700 in the near term.
Key Quotes
24-hour view: “We highlighted yesterday that ‘the price actions appear to be part of a consolidation’ and we expected GBP to ‘trade in a range between 1.2585 and 1.2655’. GBP traded in a relatively quiet manner until early NY trade when it popped briefly to 1.2679 and then dropped back down quickly to end the day little changed at 1.2627 (+0.04%). The price movements still appear to be part of consolidation and today, we expect GBP to trade in a range of 1.2580/1.2680.”
Next 1-3 weeks: “We turned positive in GBP last Friday (06 May, spot at 1.2575). After GBP rose to a high of 1.2668, in our latest narrative from Tuesday (09 May, spot at 1.2615), we indicated that ‘overbought short-term conditions suggest GBP could stay below the recent high of 1.2668 for 1-2 days’. Yesterday (10 May), GBP popped briefly to a fresh 1-year high of 1.2679 before dropping back down to close largely unchanged at 1.2627 (+0.04%). The brief advance to 1.2679 did not improve the upward momentum. However, as long as 1.2540 (no change in ‘strong support’ level) is not breached, there is still chance, albeit not a high one, for the GBP strength to extend to 1.2720 before the risk of a pullback increases.”
EUR/CHF is under pressure for a test of support at 0.9712/00, below which can see a top established, analysts at Credit Suisse report.
Further EUR/CHF depreciation
“EUR/CHF keeps grinding lower within its broad ~0.9700-1.0101 range, with weekly MACD momentum also turning freshly lower back into negative territory and with the EUR itself now showing signs of weakness. This, along with our ‘risk-off’ stance, leaves us also biased towards further EUR/CHF depreciation.”
“We believe a range breakdown below 0.9712/00 is likely in due course, which would open up a move to 0.9559 next and potentially the 0.9411 low.”
“Key resistance at the range top at 1.0101 is expected to cap.”
- USD/INR picks up bids to pare the previous day’s pullback from thee-week high.
- US Dollar pares post-inflation losses as traders seek more details to confirm dovish Fed bias.
- Cautious optimism in the markets, firmer Oil price and hopes of no imminent RBI rate hike weigh on Indian Rupee.
- US PPI, India inflation numbers eyed for clear directions.
USD/INR clings to mild gains around 82.00 as the market slips into consolidation mode early Thursday. In doing so, the Indian Rupee (INR) pair reverses the previous day’s pullback from the highest levels in two weeks, due to the downbeat US inflation data.
In addition to the market’s paring of the latest moves, hopes of witnessing cooler inflation data from India and another chance for the Reserve Bank of India (RBI) to leave the monetary policy unchanged also seem to have propelled the USD/INR prices. As per the latest forecasts, the Indian Consumer Price Index (CPI) is likely to remain near the lowest levels in 18 months despite expectations favoring a 5.96% YoY figure, versus 5.66% prior.
Some on the street do expect a surprise fall in the Indian Inflation gauge to 4.80%, which in turn could defend RBI doves as the economy keeps ignoring the burden from higher rates. “Predictions ranged from 4.40% to 5.80%, with respondents expecting inflation to remain below the RBI's 6.00% upper tolerance limit for the second consecutive month,” said Reuters.
Apart from preparations for the Indian inflation data, firmer Oil prices also weigh on the INR due to India’s heavy energy imports and record deficit. That said, WTI crude oil picks up bids to reverse the previous day’s pullback from a one-week high, up 0.65% intraday near $73.25 at the latest.
Furthermore, softer China Consumer Price Index (CPI) and Producer Price Index (PPI) data also propel the USD/INR prices. That said, China's CPI eases to 0.1% YoY in April from 0.7% prior, versus 0.3% expected, while the PPI slides to -3.6% YoY compared to -3.2% market consensus and -2.5% previous readings.
On the other hand, US Consumer Price Index (CPI) eased to 4.9% YoY for April versus market expectations of reprinting 5.0% inflation mark, marking the first below 5.0% print in two years. The MoM figures, however, matched the upbeat 0.4% forecasts compared to 0.1% previous readings. Further, the CPI ex Food & Energy, known as the core CPI, matched 5.5% and 0.4% market consensus on a yearly and monthly basis respectively versus 5.6% and 0.4% priors in that order.
On a different page, market sentiment remains mildly positive amid the US policymakers’ preparations to avoid debt ceiling expiry despite failing in the initial attempt. Furthermore, expectations of the US-China top-tier policymakers’ meeting also underpin the slightly upbeat sentiment, which in turn allows the US Dollar bears to take a breather despite downbeat yields and mildly firmer US stock futures.
Moving on, the US PPI for April, expected to ease to 2.4% YoY, can entertain short-term USD/INR traders ahead of Friday’s key inflation and activity data from India.
Technical analysis
USD/INR rebounds from the 21-DMA support of around 81.90, backed by bullish MACD signals. The recovery moves, however, remain elusive unless the quote stays below the 82.05-10 resistance confluence including the 50-DMA and a two-month-old descending trend line.
- AUD/USD lacks any firm intraday direction and oscillates in a range on Thursday.
- Mixed Chinese inflation data is seen capping gains amid a modest USD strength.
- Bulls still need to wait for a move beyond the 100 DMA before placing fresh bets.
The AUD/USD pair continues with its struggle to make it through the 100-day Simple Moving Average (SMA) and seesaws between tepid gains/minor losses, below the 0.6800 mark through the Asian session on Thursday. The pair, however, remains well within the striking distance of its highest level since February 24, around the 0.6815-0.6820 region touched the previous day.
Mixed Chinese inflation figures published early today, along with a modest US Dollar (USD) uptick, act as a headwind for the AUD/USD pair. In fact, the National Bureau of Statistics (NBS) reported that the headline CPI in China rose by 0.1% rate in April, marking a sharp deceleration from the 0.7% annual rise seen in the previous month and the lowest rate since February 2021. This indicated that domestic demand remains lacklustre. Adding to this, China’s Producer Price Index fell for the seventh straight month, by 3.6% year-on-year during the reported month, and fueled worries about economic health.
That said, the Reserve Bank of Australia's (RBA) hawkish outlook, indicating that some further tightening of monetary policy may be required to ensure that inflation returns to target in a reasonable time, limits the downside for the Aussie. Apart from this, growing acceptance that the Federal Reserve (Fed) is nearing the end of its rate-hiking cycles keeps a lid on any meaningful upside for the USD and continues to lend some support to the AUD/USD pair. The market expectations were reaffirmed by the release of the crucial US CPI on Wednesday, which pointed to further signs of easing inflationary pressures.
The aforementioned fundamental backdrop seems tilted firmly in favour of bullish traders and suggests that the path of least resistance for the AUD/USD pair is to the upside. That said, the recent repeated failures to find acceptance above the 100-day SMA make it prudent to wait for strong follow-through buying before positioning for any further near-term appreciating move. Market participants now look to the US economic docket, featuring the release of the Producer Price Index (PPI) and the usual Weekly Initial Jobless Claims data, for a fresh impetus later during the early North American session.
Technical levels to watch
The Bank of England (BoE) will announce its interest rate decision on Thursday, May 11 at 11:00 GMT and as we get closer to the release time, here are the expectations forecast by the economists and researchers of 10 major banks.
This is a Monetary Policy Report meeting, so we will have updated the forecasts for growth and inflation. The BoE is widely expected to raise rates by 25 basis points (bps) from 4.25% to 4.50% in May.
Danske Bank
“We expect the BoE to hike the Bank Rate by 25 bps. We expect this to mark the peak in the Bank Rate of 4.50% as the BoE is set to signal a pause in the hiking cycle.”
TDS
“We expect the MPC to hike Bank Rate by 25 bps and leave guidance unchanged and data-dependent. The vote is likely to shift to one more dovish dissent, signalling an approaching terminal. Projections are likely to show weaker medium-term inflation too. But the MPC isn't done yet – we expect one final hike in June.”
Rabobank
“The BoE will keep the streak of rate increases going. We expect a 25 bps hike to 4.50% with another net dovish vote split. The MPC has messaged multiple times that its appetite for further rate increases is fading, yet we expect that it will leave its key guidance unchanged. We hold on to our long-held view of a terminal rate at 4.75% in June but see upside risks. We expect the Bank of England staff to revise up the near-term growth and inflation outlook. A significant medium-term inflation undershoot is likely to be maintained in the forecasts.”
Nomura
“We expect the BoE to raise rates by 25 bps. While we see the risks to our central view as tilted towards zero rather than 50 bps (especially with renewed banking concerns), we think the chances of something other than a 25 bps hike are low. This is a MPR meeting, and we expect the Bank to remove much if not all, of the recession that it had been expecting previously. The Bank’s end-horizon inflation forecasts still look very low, and we would not be surprised – especially with core inflation looking sticky and with stronger GDP forecasts – if the Bank was to raise its expectations. We see the Bank raising rates again by 25 bps in June for a peak of 4.75%. Thereafter, we see rate cuts from the second half of 2024 to take rates back down to 3.50% by early 2025.”
SocGen
“The MPC is likely to hike Bank Rate by 25 bps to 4.5%. The Bank will no longer forecast a recession, implying a smaller output gap and greater inflation pressures. The inflation profile for this year should be tweaked to reflect higher-than-expected outcomes in 1Q. However, the energy futures curve out to three years has fallen a little over the three months since the last set of forecasts. This should offset the smaller output gap, resulting in a forecast at the three-year horizon that is no higher, and possibly a little lower, than the previous forecast. The fundamental concern of the MPC is that currently excessively high inflation, coupled with a still-very-tight labour market, will lead to persistently high inflation even after the energy and food price shocks fade. This brings a significant risk that the committee will signal that further rate increases will still be possible after this hike. We will revisit our current forecast of a 4.5% peak after the meeting.”
ING
“We expect a 25 bps hike this month, but it’s likely to be the last. We doubt the Bank will want to shut down its options on Thursday – another unhelpful set of data over coming weeks would pile on the pressure for them to do more in June. Expect the Bank to retain its data-dependent guidance that implies further tightening is possible, though the clear dovish risk is that the Bank ‘does a Fed ‘and waters down this guidance further, perhaps removing the bit about further tightening.”
Citi
“The MPC meeting is unlikely a major market mover, but the risk vs base case is perhaps dovish. The MPC is most likely to deliver a 25 bps hike (as fully priced) to a cash rate of 4.5% and keep forward guidance unchanged (with a conditional tightening bias). Voting however is likely to be split once again on a hike vs a pause (7-2), as it has been for the last three meetings (noting that Tenreyro only has two meetings left and could even consider a vote for a cut in May and/or June as a parting gesture). The MPC is still waiting for permission to pause, but incoming data, so far, won’t allow it. There still has to be a point soon, however, when the MPC reverts to a forward-looking approach that deals with policy lags and necessarily trusts its projections. While there have been upside CPI/wage surprises, the May projections will be the first to assess the impact of credit conditions following recent banking sector events. Net, another set of dovish forecasts seems likely.”
Wells Fargo
“Our forecast is for the BoE to raise its policy rate by 25 bps to 4.50%. While we believe this could be the final rate hike of the current cycle, depending on how quickly inflation slows from here and whether growth softens as well, we acknowledge the risks are clearly tilted toward further tightening. Indeed, the updated economic projections in the May MPR could offer insight into the prospects for further tightening. Should the BoE forecast steadier growth and, in particular, raise its inflation outlook to project above target inflation over the majority of its forecast horizon, we would be inclined to forecast a peak policy rate higher than our current target of 4.50%.”
Deutsche Bank
“We expect the BoE to deliver a 25 bps hike, leaving the Bank Rate at 4.5%, and while they do not anticipate any major changes to forward guidance they acknowledge there is a risk that the MPC leans dovish. Further out, we expect a final 25 bps hike in June, while underscoring upside risks to their terminal view.”
Crédit Agricole
“We expect the MPC to deliver a 25 bps hike but maintain its noncommittal stance on future tightening. We therefore think that UK rates markets have got ahead of themselves yet again pricing in too aggressive BoE tightening in coming months. A reassessment of these views could add to the headwinds for the GBP and thus limit any gains.”
Japanese Finance Minister Shunichi Suzuki makes some comments on various subjects ahead of the G7 meeting,
Key quotes
Will discuss at G7 Ukraine support, following financial support pledged so far.
Will discuss strengthening of global supply chains.
Unlikely to discuss individual country's policy, when asked about US debt ceiling issues.
G7 unlikely to reach one single solution, when asked about US debt ceiling.
To meet US Treasury Secretary Janet Yellen on May 13.
Won't say now what I will discuss in a meeting with Yellen.
Want to discuss further financial regulation.
Related reads
- US Treasury Sec. Yellen warns of a global downturn on US default
- USD/JPY Price Analysis: 133.90 appears a tough nut to crack for Yen pair sellers
US Treasury Secretary Janet Yellen once again warned that the “US default would threaten US recovery, sparking a global downturn that would set us back much further.”
Additional quotes
US Congress should raise debt ceiling, warns US default would produce 'economic and financial catastrophe'.
Default would risk undermining US global economic leadership, raise questions about its ability to defend national security interests.
Markets are seeing possibility of US debt limit breach as growing downside risk.
Short of default, brinksmanship over debt limit could impose 'serious economic costs', already seeing spikes in interest rates.
Despite downside risks, global economy remains in better place than predicted six months ago, inflation down in most G7 countries.
US Will coordinate efforts with G7 to push for timely, comprehensive debt treatments for countries in debt distress.
Will work with G7 counterparts to increase economic resilience, boost economic security and build reliable critical supply chains.
G7 will discuss ways to partner with developing countries to move away from solely extractive industries into higher-value work.
US will work with G7 to effectively counter 'economic coercion', mitigate geostrategic risks in our economies.
There's a lot of uncertainty about impact of possible default on US debt.
Breaching debt ceiling for meaningful period of time could result in a very substantial downturn.
Biden administration has been discussing restrictions on outbound investment to China for some time.
US has been engaging in discussions with G7 colleagues, has not finalized approach.
A US move on outbound investment would be narrowly focused and targeted at technologies where there are national security implications.
We would like to work jointly with our partners and are continuing discussions.
There have been examples of China using economic coercion on countries that China's not happy with, including Australia and Lithuania.
Many G7 members share a common concern with China's use of economic coercion and are looking to see what could be jointly done to counter this kind of behavior.
Market reaction
The safe-haven Greenback fails to find any inspiration from Yellen’s warning, as the US Dollar Index pauses its rebound to trade flat at 101.50, as of writing.
- The index resumes the upside following Wednesday’s drop.
- Bets on a Fed’s pause in June continue to rise.
- Producer Prices, weekly Initial Claims next on tap in the docket.
The greenback, in terms of the USD Index (DXY), picks up mild upside traction and revisits the 101.50 region on Thursday.
USD Index remains focused on data
The index maintains its weekly consolidative mood well in place in the lower end of the range and with solid support around the 101.00 zone for the time being.
The current price action in the US Dollar continues to track expectations of an impasse in the Fed’s tightening cycle as soon as at the June 14 meeting. On this, CME Group’s FedWatch Tool sees the probability of such scenario at nearly 94%.
The latest US CPI figures also reinforces the above amidst calls from some Fed’s policy makers to remain in the current restrictive territory for longer.
Later in the US data space, the inflation will remain in the centre of the debate in light of the release of Producer Prices for the month of April seconded by usual weekly Claims and the speech by FOMC’s C. Waller (permanent voter, hawk).
What to look for around USD
The index keeps the trade around the 101.50 zone against the backdrop of the broad-based absence of direction in the global markets.
The index seems to be facing downward pressure in light of the recent indication that the Fed will probably pause its normalization process in the near future. That said, the future direction of monetary policy will be determined by the performance of key fundamentals (employment and prices mainly).
Favouring an impasse by the Fed appears the persevering disinflation – despite consumer prices remain well above the target – incipient cracks in the labour market, the loss of momentum in the economy and rising uncertainty surrounding the US banking sector.
Key events in the US this week: Producer Prices, Jobless Claims (Thursday) – Flash Michigan Consumer Sentiment (Friday).
Eminent issues on the back boiler: Persistent debate over a soft/hard landing of the US economy. Terminal Interest rate near the peak vs. speculation of rate cuts in 2024. Fed’s pivot. Geopolitical effervescence vs. Russia and China. US-China trade conflict.
USD Index relevant levels
Now, the index is up 0.03% at 101.44 and the break above 101.83 (weekly high May 9) would open the door to 102.40 (monthly high May 2) and then 102.80 (weekly high April 10). On the other hand, initial contention emerges at 101.01 (weekly low April 26) prior to 100.78 (2023 low April 14) and finally 100.00 (psychological level).
- USD/JPY bounces off weekly low to pare intraday losses, portrays two-day downtrend.
- Convergence of 200-EMA, short-term support lines highlights 133.90 as the key support.
- Yen pair’s recovery remains elusive below 135.40 hurdle.
USD/JPY picks up bids to recover from the intraday low, as well as the weekly bottom, as markets remain in consolidation mode during early Thursday. Even so, the Yen pair remains mildly offered near 134.20, printing a two-day losing streak by the press time.
That said, the quote’s failure to cross an 11-week-old horizontal resistance area joined downbeat US inflation numbers to trigger the USD/JPY pair’s U-turn from the weekly high on Wednesday.
The following losses, however, failed to conquer a convergence of the 200-day Exponential Moving Average (EMA), a two-week-old ascending trend line and an upward-sloping support line from March 24, close to 133.90.
It should be noted that the MACD indicator flashes bearish signals and hence the USD/JPY rebound appears elusive, which in turn requires the bulls to cross the aforementioned horizontal resistance area surrounding 135.30-40 to retake control.
Following that, a run-up towards 136.50-60 and the 137.00 round figure can be witnessed on the USD/JPY chart before finding the buyer’s struggle to overcome the double tops around 137.80-90.
On the flip side, a daily closing below 133.90 may quickly drag the Yen pair to a 133.00 round figure before directing it to April’s low of around 130.63.
In a case where the USD/JPY bears remain dominant past 130.63, the 130.00 round figure and March’s bottom of near 129.65 should pop on their radar.
USD/JPY: Daily chart
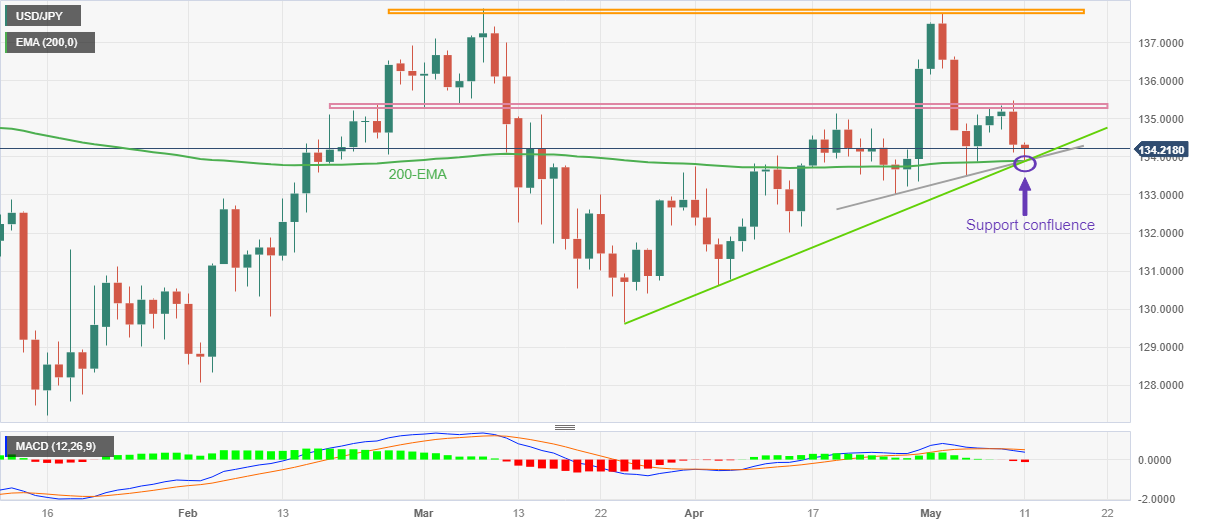
Trend: Limited upside expected
Further decline lies ahead for EUR/USD once 1.0920 is cleared, comment UOB Group’s Economist Lee Sue Ann and Markets Strategist Quek Ser Leang at UOB.
Key Quotes
24-hour view: “Yesterday, we held the view that ‘there is scope for EUR to drop to 1.0920 before stabilization is likely’. However, EUR traded in a quiet manner until NY time when it swung between 1.0940 and 1.1006 before settling at 1.0980 (+0.18%). The price actions appear to be part of a consolidation phase. In other words, we expect EUR to trade sideways today, likely in a range of 1.0950/1.1005.”
Next 1-3 weeks: “Our update from yesterday (10 May, spot at 1.0960) is still valid. As highlighted, short-term downward momentum appears to be building but EUR has to break and stay below 1.0920 before a sustained decline is likely. The chance for EUR to break clearly below 1.0920 is not high for now but it will remain intact as long as EUR stays below 1.1035 in the next few days. Looking ahead, the next support below 1.0920 is at 1.0885.”
Australian Treasurer Jim Chalmers said early Thursday that he wants to stabilize relationship with China.
His comment comes after Chalmers on Tuesday confirmed that the federal budget for 2023-24 will feature an expected first surplus in over a decade.
Market reaction
At the press time, AUD/USD is holding steady at around 0.6780 after retreating from just below 0.6800 on softer Chinese inflation.
- Gold price struggles to defend weekly gains as $2,050 hurdle keeps pushing back XAU/USD buyers.
- Mixed details of US inflation, cautious optimism and softer China data prod Gold price upside.
- US PPI, consumer inflation expectations eyed for clear directions.
Gold price (XAU/USD) stays on the way to posting a three-week uptrend despite the previous day’s retreat from the key $2,050 resistance. In doing so, the precious metal buyers benefit from the softer US inflation numbers and the downbeat US Dollar. However, mixed details of the US price pressure data join the US-China headlines and looming fears of the US default to prod the XAU/USD bulls.
It should be noted that the mixed concerns about the US inflation details and the market’s consolidation ahead of the US Producer Price Index (PPI), as well as the University of Michigan’s (UoM) 5-year Consumer Inflation Expectations, prod the Gold price upside. Furthermore, China’s lack of interest in placating the Sino-American tension and softer Consumer Price Index (CPI) from the dragon nation also seems to exert downside pressure on the Gold price.
Also read: Gold Price Forecast: XAU/USD defines a range but upside remains favored
Gold Price: Key levels to watch
Our Technical Confluence Indicator portrays the Gold price struggle below the $2,050 key resistance comprising the upper band of the Bollinger on the daily chart and the highs marked on previous day, as well as in the previous month.
Ahead of the key $2,050 hurdle, the Pivot Point one-month R1 highlights the $2,043 as an intermediate challenge for the XAU/USD bulls to cross to validate the upside momentum.
Adding to the upside filters is the $2,057-58 region comprising the Fibonacci 23.6% on weekly basis.
It’s worth noting, however, that if the Gold price remains firmer past $2,058, the recently reported all-time high of around $2,080 will be in the spotlight.
Meanwhile, the middle band of the Bollinger on the four-hour play joins Fibonacci 23.6% on one-month to highlight $2,025 as an immediate support for the Gold price.
Following that, a slump towards the $2,015 level comprising the Fibonacci 61.8% on one-week can’t be ruled out.
In a case where the Gold price remains weak past $2,015, the $2,010 level may act as an additional downside filter before allowing the XAU/USD bears to occupy the driver’s seat. That said, Fibonacci 38.2% on one-month constitutes the stated support levels.
Here is how it looks on the tool
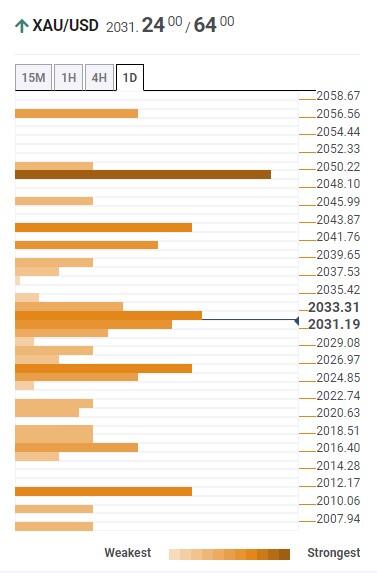
About Technical Confluences Detector
The TCD (Technical Confluences Detector) is a tool to locate and point out those price levels where there is a congestion of indicators, moving averages, Fibonacci levels, Pivot Points, etc. If you are a short-term trader, you will find entry points for counter-trend strategies and hunt a few points at a time. If you are a medium-to-long-term trader, this tool will allow you to know in advance the price levels where a medium-to-long-term trend may stop and rest, where to unwind positions, or where to increase your position size.
- EUR/USD fades the previous day’s corrective bounce off weekly low.
- Recently mixed EU, German data raise doubts on hawkish ECB commentary.
- Softer US inflation fails to underpin Fed rate cut bias with mixed details.
- US PPI, second-tier data eyed for clear directions on Euro moves.
EUR/USD takes offers to refresh the intraday low around 1.0970 as it pares the previous day’s rebound from the weekly low heading into Thursday’s European session. In doing so, the Euro pair fails to justify the hawkish expectations from the European Central Bank (ECB), as well as downbeat US inflation clues, amid mixed sentiment.
Multiple ECB Officials including President Christine Lagarde, tried to defend the bloc’s central bank’s hawkish bias as some among the team consider the latest easing in the European and German statistics to suggest nearness to the policy pivot.
With this in mind, Bloomberg quotes people familiar with the debate while saying, “ECB officials are starting to accept that interest-rate increases might need to continue in September to bring inflation fully under control.”
Alternatively, the final reading of Germany’s headline inflation gauge, namely the Harmonized Index of Consumer Prices (HICP) for April, confirmed the initial estimations of 7.6% YoY versus 7.8% marked in March.
On the other hand, the US Consumer Price Index (CPI) eased to 4.9% YoY for April versus market expectations of reprinting the 5.0% mark, being the first below 5.0% print in two years. However, the details of the Core CPI, CPI ex Food and Energy, appear mixed and raise doubts on the chatters surrounding the Federal Reserve’s (Fed) policy pivot in 2023.
Elsewhere, softer US and China inflation data weighs on the hawkish central bank bets and allow markets to remain cautiously optimistic on early Thursday. Also supporting the sentiment are the US policymakers’ preparations to avoid debt ceiling expiry despite failing in the initial attempt. Furthermore, expectations of the US-China top-tier policymakers’ meeting also underpin the slightly upbeat sentiment.
Amid these plays, US stock futures print mild gains whereas US Treasury bond yields keep the previous day’s downbeat performance on the table, which in turn prods the US Dollar buyers.
Looking forward, a light calendar in the bloc highlights the risk catalysts as the notable directives for the EUR/USD pair traders to watch ahead of the US Producer Price Index (PPI) for April, expected to ease to 2.4% YoY.
Technical analysis
EUR/USD retreats from a one-week-old descending resistance line, around the 1.1000 round figure, while dropping towards an upward-sloping support line from April 17, close to 1.0960 at the latest. That said, bearish MACD signals and a steady RSI (14) line keep Euro bears hopeful.
- GBP/USD remains indecisive as the key Bank of England (BoE) monetary policy decision looms.
- Quarterly BoE report will be watched closely as inflation pressures British policymakers to stays hawkish despite economic woes.
- Terminal Rate, growth/inflation forecasts appear critical as BoE’s 0.25% rate hike seems already priced in.
- US PPI, risk catalysts also become important as Cable pair prods 13-month high.
GBP/USD retreats from intraday high while slipping back to 1.2620 as it inks the market’s cautious mood ahead of the all-important Bank of England (BoE) monetary policy meeting. With this, the Pound Sterling pair remains unchanged on a day, printing three-day indecision of traders, heading into the London open on “Super Thursday”.
The Cable pair rose to a fresh high since April 2022 the previous day following downbeat US inflation data. However, the pre-BoE consolidation joined the US Dollar’s corrective bounce to prod the GBP/USD pair’s latest moves.
Earlier in the day, an improvement in the UK’s RICS House Price Balance for April, to -39% from -43% and -40% expected, joined hawkish forecasts from the UK think-tank National Institute of Economic and Social Research (NIESR) to favor the GBP/USD buyers.
“NIESR estimated annual consumer price inflation will be 5.4% in the final quarter of 2023 - well above forecasts from the Bank of England and the government's budget watchdog,” reported Reuters.
On the other hand, the US Dollar Index (DXY) prints mild gains around 101.45 after posting the biggest daily loss in a week as the US Consumer Price Index (CPI) eased to 4.9% YoY for April versus market expectations of reprinting the 5.0% mark, being the first below 5.0% print in two years. It should be noted that cautious optimism in the market, portrayed by mildly bid stock futures and downbeat US Treasury bond yields, underpin the US Dollar’s corrective bounce ahead of more clues of the US inflation, especially amid downbeat China CPI and hopes of Sino-American diplomatic talks.
Given the above 10% UK inflation and the Fed’s dovish rate hike, the GBP/USD is likely to remain firmer even if the Old Lady, as the BoE is informally known, fails to suggest strong rate hikes for the future. With this in mind, Goldman Sachs said, “UK inflation on track to fall rapidly, helped by cooling global energy prices (but) was unlikely to drop enough to meet the BoE’s 2% target.”
Moving forward, GBP/USD traders will keep their eyes on the BoE’s quarterly monetary policy report as the Old Lady’s 0.25% rate hike expectations appear mostly priced in. In doing so, the British economic growth and inflation forecasts, as well as the central bank’s peak Terminal Rate, will be closely observed for clear directions.
Also read: Bank of England Preview: Bailey to break Pound's rally with reluctance to raise rates further
Apart from the BoE-linked moves, the Pound Sterling pair will also be affected by the US Producer Price Index (PPI) for April, expected to ease to 2.4% YoY.
Technical analysis
GBP/USD rebounds from the resistance-turned-support line stretched from early April, around 1.2600 at the latest. The Cable pair’s recovery moves, however, need validation from the weekly resistance line, around 1.2635 by the press time.
Also read: GBP/USD Price Analysis: Cable turns defensive above 1.2600 on BoE “Super Thursday”
- Natural Gas price pares the biggest daily loss in a week after snapping three-day uptrend.
- Markets sentiment improves amid softer US/China inflation, hopes of US debt ceiling solution and Sino-American talks.
- XNG/USD rebound remains elusive ahead of US PPI, EIA Natural Gas Storage Change.
Natural Gas (XNG/USD) picks up bids to renew its intraday high around $2.28 as it licks the previous day’s wounds amid mildly positive market sentiment during early Thursday. With this, the energy instrument teases buyers ahead of the weekly Natural Gas inventory data after posting the first daily loss on Wednesday.
The risk profile remains mildly positive and puts a floor under the XNG/USD price as softer US and China inflation data weighs on the hawkish central bank bets. Also supporting the cautious optimism are the US policymakers’ preparations to avoid debt ceiling expiry despite failing in the initial attempt. Furthermore, expectations of the US-China top-tier policymakers’ meeting also underpin the slightly upbeat sentiment.
While portraying the mood, the S&P 500 Futures print mild gains and the US Treasury bond yields extend the previous day’s downbeat performance. However, the US Dollar Index (DXY) recovers after snapping a two-day downtrend.
That said, China’s headline Consumer Price Index (CPI) eases to 0.1% YoY from 0.7% prior, versus 0.3% expected, while the Producer Price Index (PPI) slides to -3.6% YoY compared to -3.2% market consensus and -2.5% previous readings.
On the other hand, US Consumer Price Index (CPI) eased to 4.9% YoY for April versus market expectations of reprinting the 5.0% inflation mark, marking the first below 5.0% print in two years. The MoM figures, however, matched the upbeat 0.4% forecasts compared to 0.1% previous readings.
To sum up, the Natural Gas Price remains mildly bid amid mixed catalysts, as well as a cautious mood ahead of today’s US Producer Price Index (PPI) for April, expected to ease to 2.4% YoY. Additionally important is the Energy Information Administration’s (EIA) weekly Natural Gas Storage Change, expected 52B versus 54B prior.
Technical analysis
Repeated U-turns from a downward-sloping resistance line from the mid-March, around $2.38 by the press time, keep the Natural Gas sellers hopeful of revisiting the yearly low of near $2.11.
- USD/CAD renews intraday high while staying unchanged on weekly basis.
- Softer US inflation contrasted with upbeat Canada Building Permits to favor Loonie bears previously.
- Market’s positioning for more inflation clues, softer WTI crude oil price amid downbeat China CPI/PPI prod USD/CAD bears.
USD/CAD pares the previous day’s losses inside the weekly trading range surrounding 1.3400 amid early Thursday, mildly bid when refreshing intraday high near 1.3385 by the press time.
That said, the Loonie pair’s latest gains could be linked to the downbeat Oil price and the US Dollar’s consolidation of inflation-led losses ahead of the US Producer Price Index (PPI) for April. However, the pair sellers remain hopeful amid dovish from the US Federal Reserve (Fed), especially after the previous day’s downbeat US Consumer Price Index (CPI) details.
WTI crude oil holds lower grounds near $72.80 following its pullback from a weekly top the previous day. In doing so, the black gold justifies softer inflation data from China and the US amid mixed sentiment and the price-negative Oil inventories. It’s worth noting that WTI crude oil is Canada’s biggest export item and hence any change in the Oil price can move the USD/CAD pair.
At home, Canada’s Building Permits jumped 11.3% MoM in March versus -2.9% market forecasts and downwardly revised prior readings of 5.5%. Recently, wildfires pushed Alberta towards halting the Oil refineries before resuming operations on Wednesday, which in turn might have allowed the Canadian Dollar (CAD) to remain firmer despite the latest USD rebound.
Talking about the data, China’s headline Consumer Price Index (CPI) eases to 0.1% YoY from 0.7% prior, versus 0.3% expected, while the Producer Price Index (PPI) slides to -3.6% YoY compared to -3.2% market consensus and -2.5% previous readings. On the other hand, US Consumer Price Index (CPI) eased to 4.9% YoY for April versus market expectations of reprinting 5.0% inflation mark, marking the first below 5.0% print in two years. The MoM figures, however, matched the upbeat 0.4% forecasts compared to 0.1% previous readings. Further, the CPI ex Food & Energy, known as the core CPI, matched 5.5% and 0.4% market consensus on a yearly and monthly basis respectively versus 5.6% and 0.4% priors in that order.
Amid these plays, the S&P 500 Futures print mild gains and the US Treasury bond yields extend the previous day’s downbeat performance, which in turn weighs on the US Dollar Index (DXY).
Looking forward, a light calendar in Canada and cautious mood ahead of the key Bank of England (BoE) quarterly monetary policy report join mixed feelings for the US debt ceiling and banking fallouts to highlight the US PPI as an important catalyst to watch for the USD/CAD pair traders.
Technical analysis
A three-month-old ascending support line, near 1.3360 by the press time, defends USD/CAD buyers.
| Raw materials | Closed | Change, % |
|---|---|---|
| Silver | 25.387 | -0.8 |
| Gold | 2029.95 | -0.21 |
| Palladium | 1588.86 | 2.05 |
- WTI crude oil remains pressured after reversing from one-week high.
- Downbeat China inflation data joins mildly upbeat sentiment to prod Oil traders.
- Price-negative details of EIA crude oil stockpiles, cautious mood ahead of top-tier data/events challenge recent moves.
WTI crude oil holds lower grounds near $72.80 amid early Thursday, following its pullback from a weekly top the previous day. In doing so, the black gold justifies downbeat inflation data from China and the US amid mixed sentiment and the price-negative Oil inventories.
Recently, China’s headline Consumer Price Index (CPI) eases to 0.1% YoY from 0.7% prior, versus 0.3% expected, while the Producer Price Index (PPI) slides to -3.6% YoY compared to -3.2% market consensus and -2.5% previous readings.
On Wednesday, US Consumer Price Index (CPI) eased to 4.9% YoY for April versus market expectations of reprinting 5.0% inflation mark, marking the first below 5.0% print in two years. The MoM figures, however, matched the upbeat 0.4% forecasts compared to 0.1% previous readings. Further, the CPI ex Food & Energy, known as the core CPI, matched 5.5% and 0.4% market consensus on a yearly and monthly basis respectively versus 5.6% and 0.4% priors in that order.
It’s worth noting that the weekly official Oil inventory data from the US Energy Information Administration (EIA) also exert downside pressure on the energy benchmark. That said, the EIA Crude Oil Stocks Change rose to 2.951M for the week ended on May 05 versus -0.917M market forecasts and -1.28M prior.
On a different page, the risk profile remains mildly positive and put a floor under the WTI prices as softer US inflation data weighs on the hawkish Fed bets. Also supporting the cautious optimism is the US policymakers’ preparations to avoid debt ceiling expiry despite failing in the initial attempt. Furthermore, expectations of the US-China policymakers’ meeting also underpin the slightly upbeat sentiment.
While portraying the mood, S&P 500 Futures print mild gains and the US Treasury bond yields extend the previous day’s downbeat performance, which in turn weighs on the US Dollar Index (DXY).
Looking forward, more clues of the US inflation, via the Producer Price Index (PPI) for April, expected to ease to 2.4% YoY, eyed for clear WTI directions.
Technical analysis
WTI crude oil’s failure to provide a daily closing beyond the one-month-old resistance line, around $72.80 by the press time, keeps energy sellers hopeful of witnessing a pullback in price towards the 10-DMA support of near $72.30.
Citing people familiar with the debate, Bloomberg reported early Thursday, “European Central Bank (ECB) officials are starting to accept that interest-rate increases might need to continue in September to bring inflation fully under control.”
The sources said, “some policymakers from across the spectrum of the European Central Bank Governing Council are speculating that two further expected quarter-point hikes may not be sufficient to tame consumer prices.”
Market reaction
At the time of writing, EUR/USD is trading modestly flat at 1.0980, uninspired by the hawkish ECB expectations.
- USD/CNH renews one-week high on softer China inflation data.
- China CPI, PPI both came in below expectations for April; US inflation numbers push back hawkish Fed expectations.
- Two-month-old symmetrical triangle restricts immediate moves of offshore China Yuan below 200-DMA.
USD/CNH rises for the third consecutive day, refreshing a weekly high near 6.9450, amid downbeat inflation data from the US and China. That said, the offshore Chinese Yuan (CNH) pair awaits more clues to defy the hawkish bias surrounding the US Dollar on early Thursday.
That said, China’s headline Consumer Price Index (CPI) eases to 0.1% YoY from 0.7% prior, versus 0.3% expected, while the Producer Price Index (PPI) slides to -3.6% YoY compared to -3.2% market consensus and -2.5% previous readings.
On the other hand, US Consumer Price Index (CPI) eased to 4.9% YoY for April versus market expectations of reprinting 5.0% inflation mark, marking the first below 5.0% print in two years. The MoM figures, however, matched the upbeat 0.4% forecasts compared to 0.1% previous readings. Further, the CPI ex Food & Energy, known as the core CPI, matched 5.5% and 0.4% market consensus on a yearly and monthly basis respectively versus 5.6% and 0.4% priors in that order.
Technically, USD/CNH remains inside a two-month-old symmetrical triangle formation, currently between 6.9560 and 6.9190. Adding strength to the pair’s latest upside grind could be the firmer RSI (14) line, not overbought.
It’s worth noting that the quote’s run-up beyond the stated triangle’s top line, close to 6.9560 at the latest, needs to stabilize past the 200-DMA hurdle of 6.9620 to convince the USD/CNH bulls.
On the contrary, a downside break of the aforementioned triangle’s support line, close to 6.9190, isn’t an open invitation to the USD/CNH bears as there are multiple supports near 6.9100 and the 6.9000 levels that can restrict the pair’s further declines.
USD/CNH: Daily chart
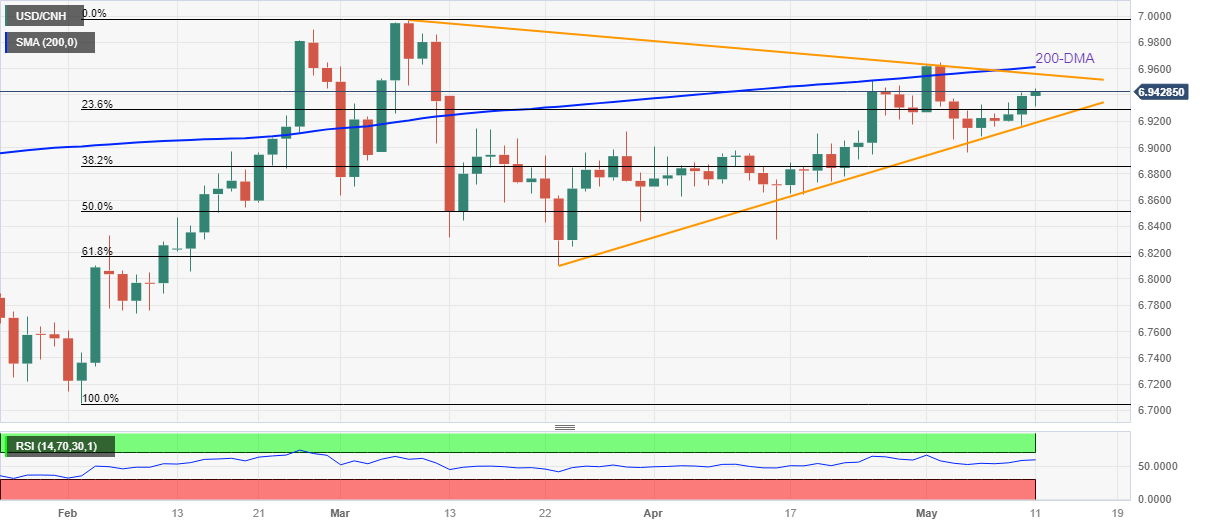
Trend: Further upside expected
- AUD/USD eases from intraday top but stays on the way to reverse the previous day’s pullback from 11-week high.
- Australia’s Consumer Inflation Expectations rise to 5.0% in May, versus 4.6% prior.
- China CPI improves on MoM eases on YoY, PPI drops in April.
- Softer US inflation data, recently release hawkish RBA documents favor Aussie bulls ahead of US PPI.
AUD/USD takes a U-turn from the intraday high of near 0.6800 as bulls struggle to cheer upbeat inflation clues from Australia amid mixed China data published early Thursday. However, the softer US inflation and hawkish statements in the Reserve Bank of Australia (RBA) documents released under the Freedom of Information (FOI) request keep the Aussie pair buyers hopeful.
China’s headlines Consumer Price Index (CPI) eases to 0.1% YoY from 0.7% prior, versus 0.3% expected, while the Producer Price Index (PPI) slides to -3.6% YoY compared to -3.2% market consensus and -2.5% previous readings. Earlier in the day, Australia’s Consumer Inflation Expectations for May rise to 5.0% versus 4.6% prior.
It’s worth noting that the RBA documents showed that the Aussie central bank paths with 4.8% cash rate show inflation at target in late-2024.
Elsewhere, market sentiment improves as softer US inflation data weighs on the hawkish Fed bets. Also supporting the cautious optimism is the US policymakers’ preparations to avoid debt ceiling expiry despite failing in the initial attempt. Furthermore, expectations of the US-China policymakers’ meeting and Australia’s readiness to have close ties with China also underpin the mildly positive sentiment and underpin the risk barometer pair’s run-up.
Amid these plays, S&P 500 Futures print mild gains and the US Treasury bond yields extend the previous day’s downbeat performance, which in turn weighs on the US Dollar Index (DXY) and puts a floor under the AUD/USD price.
Having witnessed the initial market reaction of the Aussie and Chinese inflation clues, AUD/USD pair traders should pay attention to the risk catalysts for intraday directions ahead of the US Producer Price Index (PPI) for April, expected to ease to 2.4% YoY.
Technical analysis
AUD/USD bulls need a daily closing beyond the two-month-old ascending resistance line, around 0.6820 by the press time, to keep the reins.
The Consumer Price Index that is released by the National Bureau of Statistics of China has come out as follows:
- China Consumer Price Index (YoY) came in at 0.1%, below expectations (0.3%) in April. This was the slowest pace since February 2021.
- China Consumer Price Index (MoM) came in at -0.1%, below expectations (0%) in April.
- China Producer Price Index (YoY) came in at -3.6%, below expectations (-3.2%) in April.
AUD/USD update
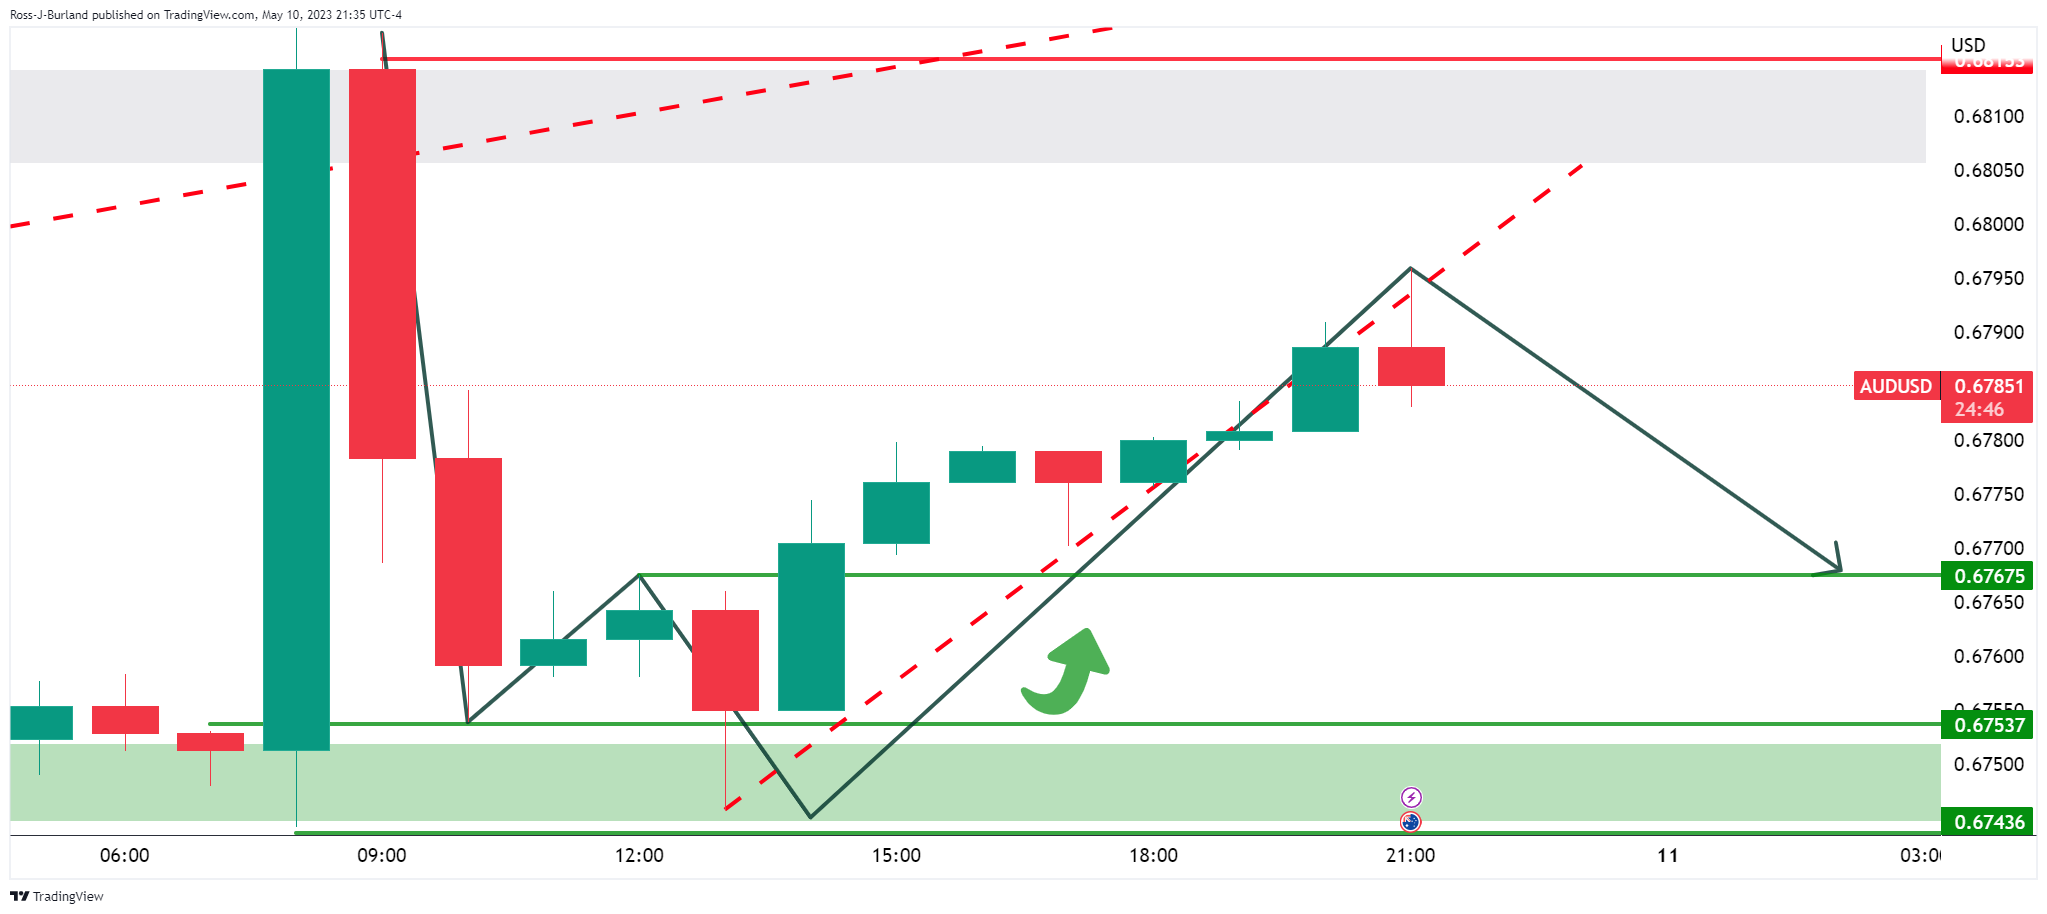
AUD/USD is trading at 0.6785 and is in the middle of the range of 0.670 and 0.6795 so far. The W-formation is a reversion pattern and there might be a correction to the downside.
On the 15-min chart, we have a potential topping formation place:

About the Consumer Price Index
The Consumer Price Index is released by the National Bureau of Statistics of China. It is a measure of retail price variations within a representative basket of goods and services. The result is a comprehensive summary of the results extracted from the urban consumer price index and rural consumer price index. The purchase power of the CNY is dragged down by inflation. The CPI is a key indicator to measure inflation and changes in purchasing trends. A substantial consumer price index increase would indicate that inflation has become a destabilizing factor in the economy, potentially prompting The People’s Bank of China to tighten monetary policy and fiscal policy risk. Generally speaking, a high reading is seen as positive (or bullish) for the CNY, while a low reading is seen as negative (or Bearish) for the CNY.
In recent trade today, the People’s Bank of China (PBOC) set the yuan at 6.9101 vs. the last close of 6.9288 and the estimate at 6.9102.
About the fix
China maintains strict control of the yuan’s rate on the mainland.
The onshore yuan (CNY) differs from the offshore one (CNH) in trading restrictions, this last one is not as tightly controlled.
Each morning, the People’s Bank of China (PBOC) sets a so-called daily midpoint fix, based on the yuan’s previous day's closing level and quotations taken from the inter-bank dealer.
- EUR/GBP retreats from intraday high, reverses the previous day’s bounce off yearly low.
- 61.8% Fibonacci retracement joins nearly oversold RSI conditions to prod sellers.
- Four-month-old previous support line, 200-DMA restrict buyer’s entry amid hawkish BoE bias.
EUR/GBP struggles to defend the previous day’s rebound from the Year-To-Date (YTD) low as it flirts with the 0.8700 round figure on the Bank of England (BoE) Interest Rate Decision day. That said, today’s quarterly release of the BoE Monetary Policy Report makes it the “Super Thursday”.
Also read: Bank of England Preview: Bailey to break Pound's rally with reluctance to raise rates further
The pre-BoE anxiety prods the EUR/GBP pair’s rebound from the 61.8% Fibonacci retracement of August-September 2022 upside, also known as the golden Fibonacci ratio, amid the nearly oversold RSI (14) conditions.
However, the quote’s sustained downside break of the four-month-old horizontal trend line and the 200-DMA, respectively near 0.8715 and 0.8740, keeps the EUR/GBP bears hopeful.
On the other hand, a daily closing below the 61.8% Fibonacci retracement level of around 0.8685 could witness multiple supports around the 0.8650-45 zone.
In a case where the EUR/GBP sellers remain in the driver’s seat past 0.8645, the 0.8600 round figure and the late 2022 low of around 0.8550 may lure the pair bears.
Overall, EUR/GBP remains on the bear’s radar despite the latest corrective bounce. However, the BoE is a surprise factor to closely watch.
EUR/GBP: Daily chart
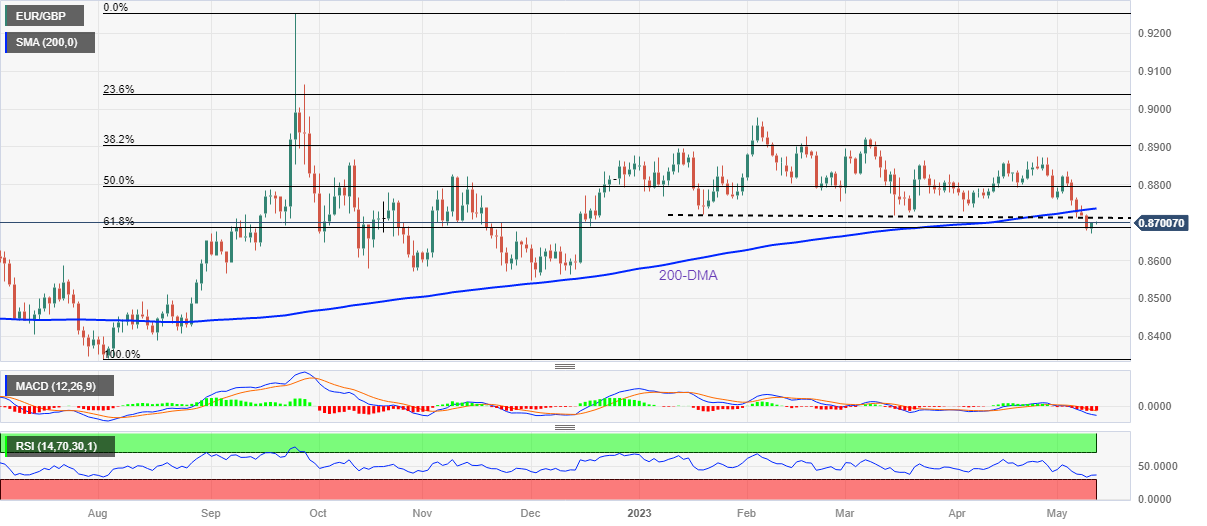
Trend: Limited downside expected
- NZD/USD is firm on the session so far, testing a critical area of resistance.
- Bears are looking for a fade into key support.
NZD/USD was a string performer overnight, and according to Bloomberg, it remains the best-performing G10 currency week to date. The following, however, highlights the potentially significant area of resistance and prospects for a meanwhile correction:
NZD/USD H1 chart
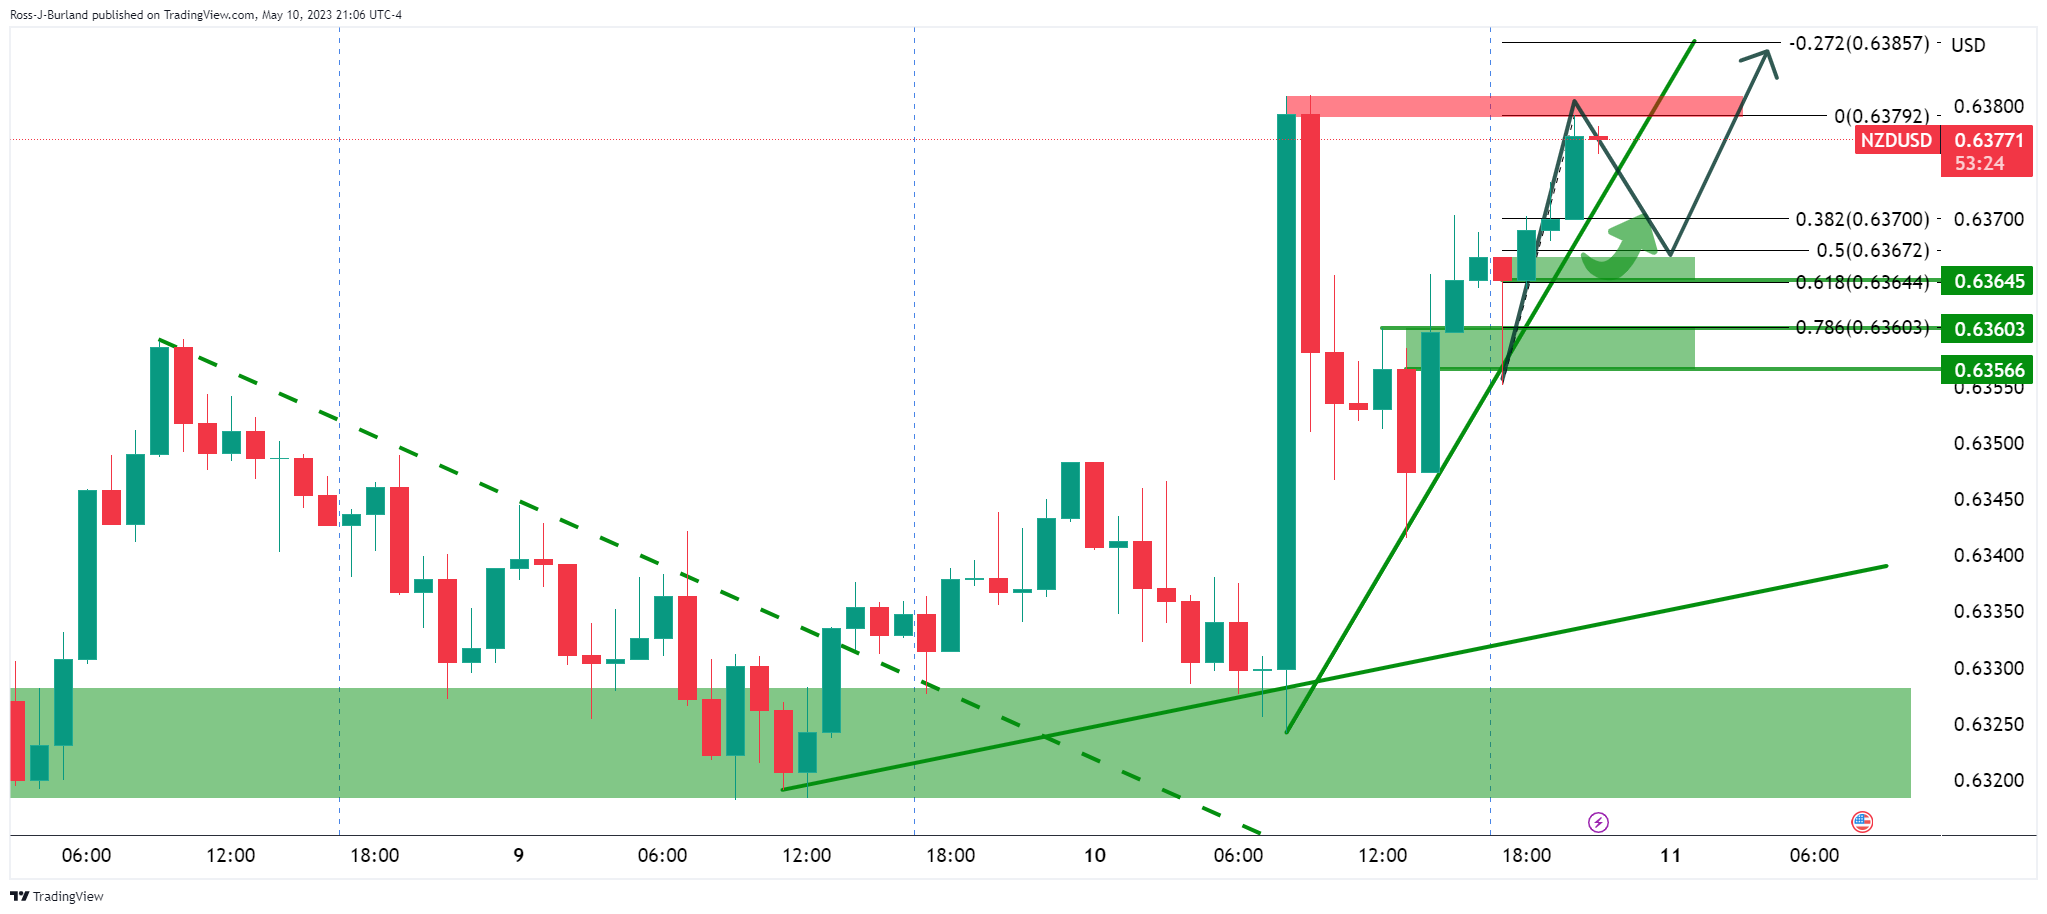
NZD/USD is riding a steep trendline support with a focus on the 0.6380s as a potentially key resistance area:
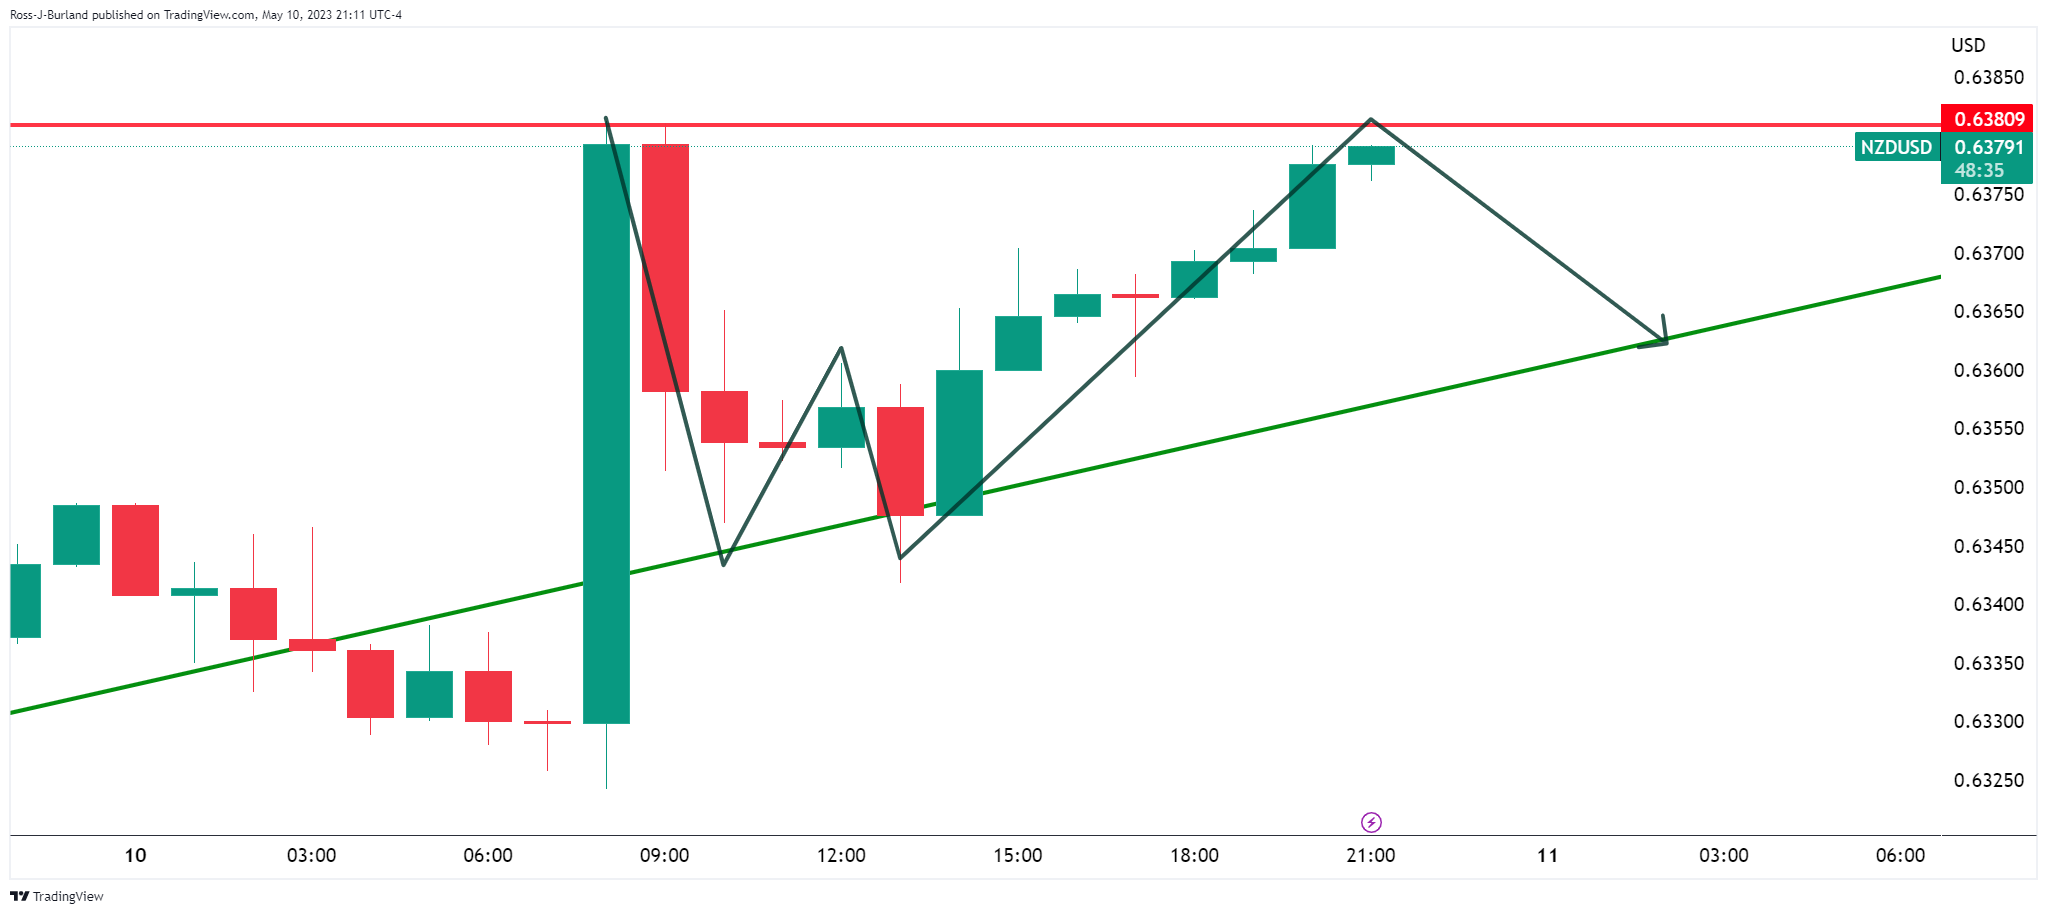
The W-formation is a reversion pattern and this might be expected to pull the market lower toward the neckline of the pattern and the trendline support between a 38.2% Fibonacci and 50% mean reversion:
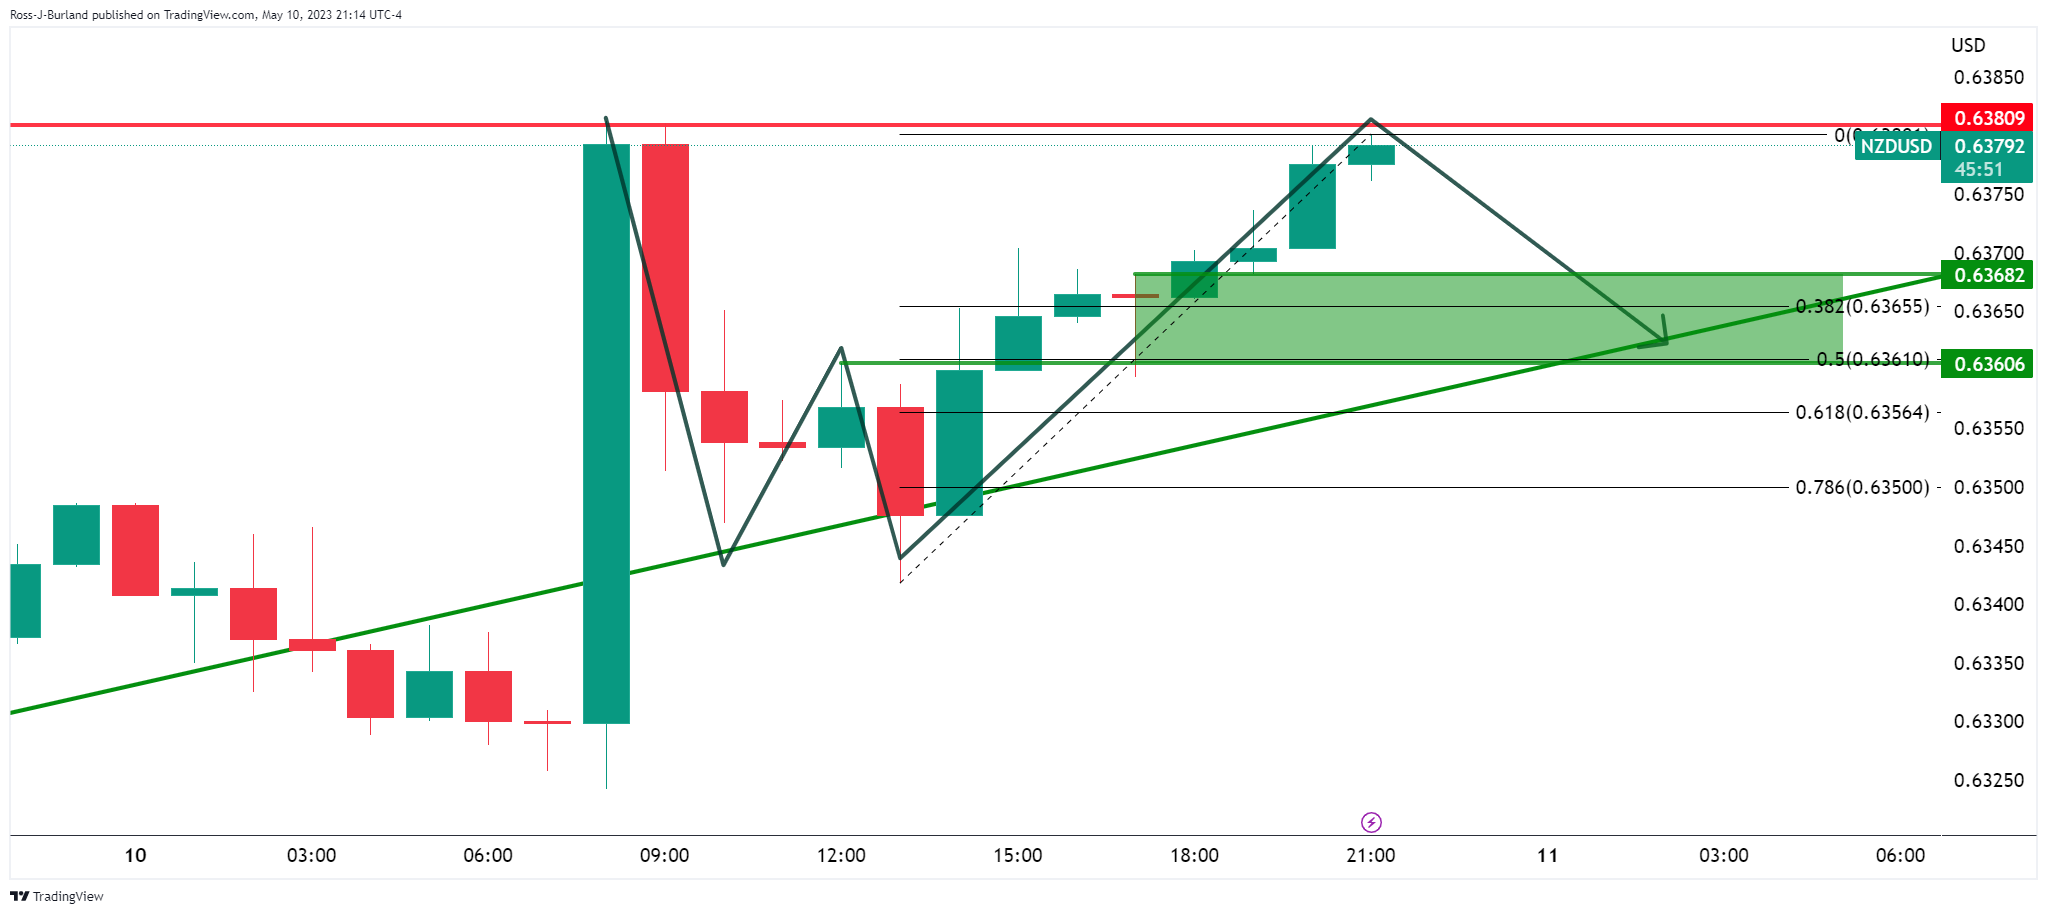
- Gold Price cheers downbeat United States Consumer Price Index data, softer Treasury bond yields.
- Looming fears of US debt ceiling expiry, hawkish Federal Reserve bets prod XAU/USD buyers.
- More Inflation clues from China, US eyed for clear Gold price directions.
Gold price (XAU/USD) picks up bids to refresh intraday high near $2,030 early Thursday, reversing the previous day’s retreat from a one-month-old horizontal resistance. In doing so, the precious metal benefits from the broad US Dollar weakness as the United States inflation data favor a dovish Federal Reserve (Fed) bias. Also weighing on the US Dollar, as well as fueling the XAU/USD price, could be the cautious optimism in the market.
Gold price rises as United States CPI cools down, yields drop
Gold price remains on the way to posting a three-week uptrend amid receding hawkish hopes from the Federal Reserve (Fed), recently backed by the United States' inflation numbers for April. The US Consumer Price Index (CPI) marked the first fall past 5.0% in two years. The US inflation details, however, weren’t that negative and seemed to have kept the Federal Reserve (Fed) away from the rate cut move until September 2023, per the Fed Fund Futures, which in turn keeps the XAU/USD buyers hopeful.
Talking about the data, the headline CPI eased to 4.9% YoY for April versus market expectations of reprinting 5.0% inflation mark, marking the first below 5.0% print in two years. The MoM figures, however, matched the upbeat 0.4% forecasts compared to 0.1% previous readings. Further, the CPI ex Food & Energy, known as the core CPI, matched 5.5% and 0.4% market consensus on a yearly and monthly basis respectively versus 5.6% and 0.4% priors in that order.
Elsewhere, the US 10-year and two-year Treasury bond yields snapped a four-day winning streak the previous day, also marked the biggest daily loss in a week, as recession woes underpinned the US bond demand. The same, however, failed to underpin the US Dollar amid dovish bias about the Fed and helped the Gold price to remain firmer. That said, the benchmark US bond coupons remain pressured around 3.42% and 3.91% at the latest.
US debt ceiling, banking woes prod XAU/USD bulls
US policymakers failed to seal the debt-ceiling deal in their first attempt on Wednesday but let the ball rolling by allowing office members to discuss the details and try again on Friday, which in turn prod the market sentiment and the Gold buyers. On the same line is the absence of major negatives from the banking front, as well as upbeat earnings and mostly softer US data, which in turn pushed back the bank fears.
More clues of US inflation eyed
Looking forward, the US Producer Price Index (PPI) for April and other second-tier data relating to employment, as well as activities, may entertain the Gold traders. That said, the US PPI for April is expected to ease to 2.4% YoY but the Core PPI may improve to 0.2% on MoM. Hence, the scheduled US inflation clues are also likely to print the mixed details and can keep the US Dollar pressured, as well as allow the XAU/USD buyers to hold the reins. Further, risk catalysts will also be observed for clear directions amid the market’s cautious optimism.
Gold price technical analysis
Gold price marches back towards a one-month-old horizontal resistance area surrounding the $2,050. That said, sluggish signals from the Moving Average Convergence and Divergence (MACD) indicator, as well as a steady Relative Strength Index (RSI) line, placed at 14, challenge XAU/USD run-up.
With this, the Gold sellers may remain hopeful of testing the 21-DMA support of around $2,008, a break of which could direct the precious metal toward the $2,000 round figure.
In a case where the XAU/USD remains bearish past $2,000, a seven-week-old ascending support line near $1,986 and the 50-DMA level of around $1,965 will be in the spotlight.
On the flip side, a daily closing beyond the aforementioned horizontal resistance near $2,050 needs validation from an upward-sloping resistance line from early February, near $2,070 by the press time, to refresh the all-time high, currently around $2,080.
Overall, the Gold price may witness a short-term pullback but the overall trend remains bullish until the quote breaks the $1,965 level.
Gold price: Daily chart
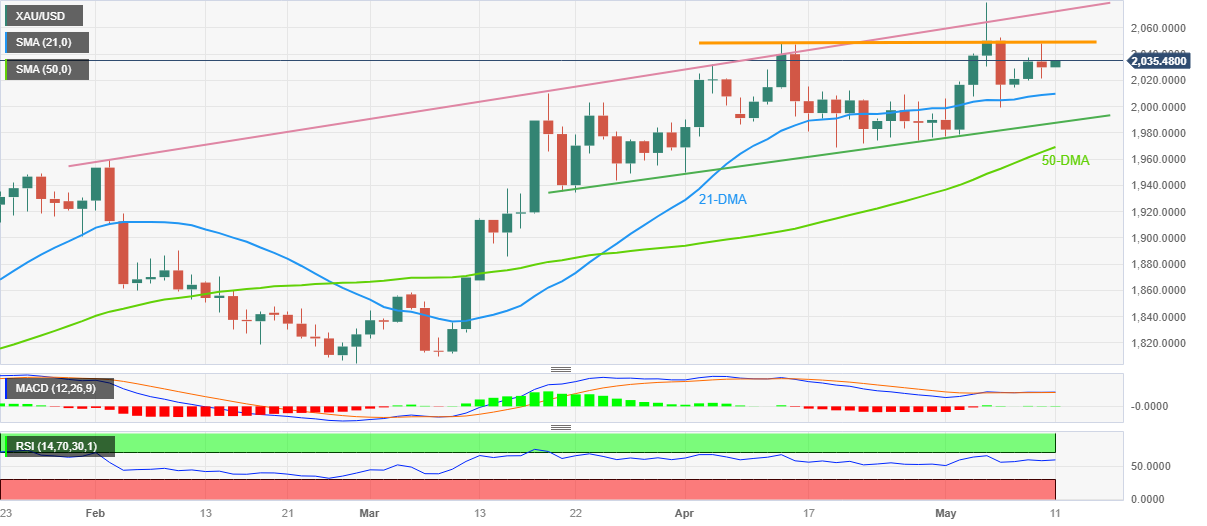
Trend: Pullback expected
- EUR/USD bulls are sticking to the bid and eye a break of 1.1000.
- 1.0980s are support in the bullish micro trend.
EUR/USD was trading 0.05% higher at $1.0986 in the Tokyo opening first half an hour as the bulls attempt to stay on the front side of the hourly micro trend that has been building since the late New York trade on Wednesday.
The following illustrates a few scenarios for the forthcoming session on Thursday.
EUR/USD H1 chart
EUR/USD has rallied and pulled back into a 61.8% Fibonacci retracement area:
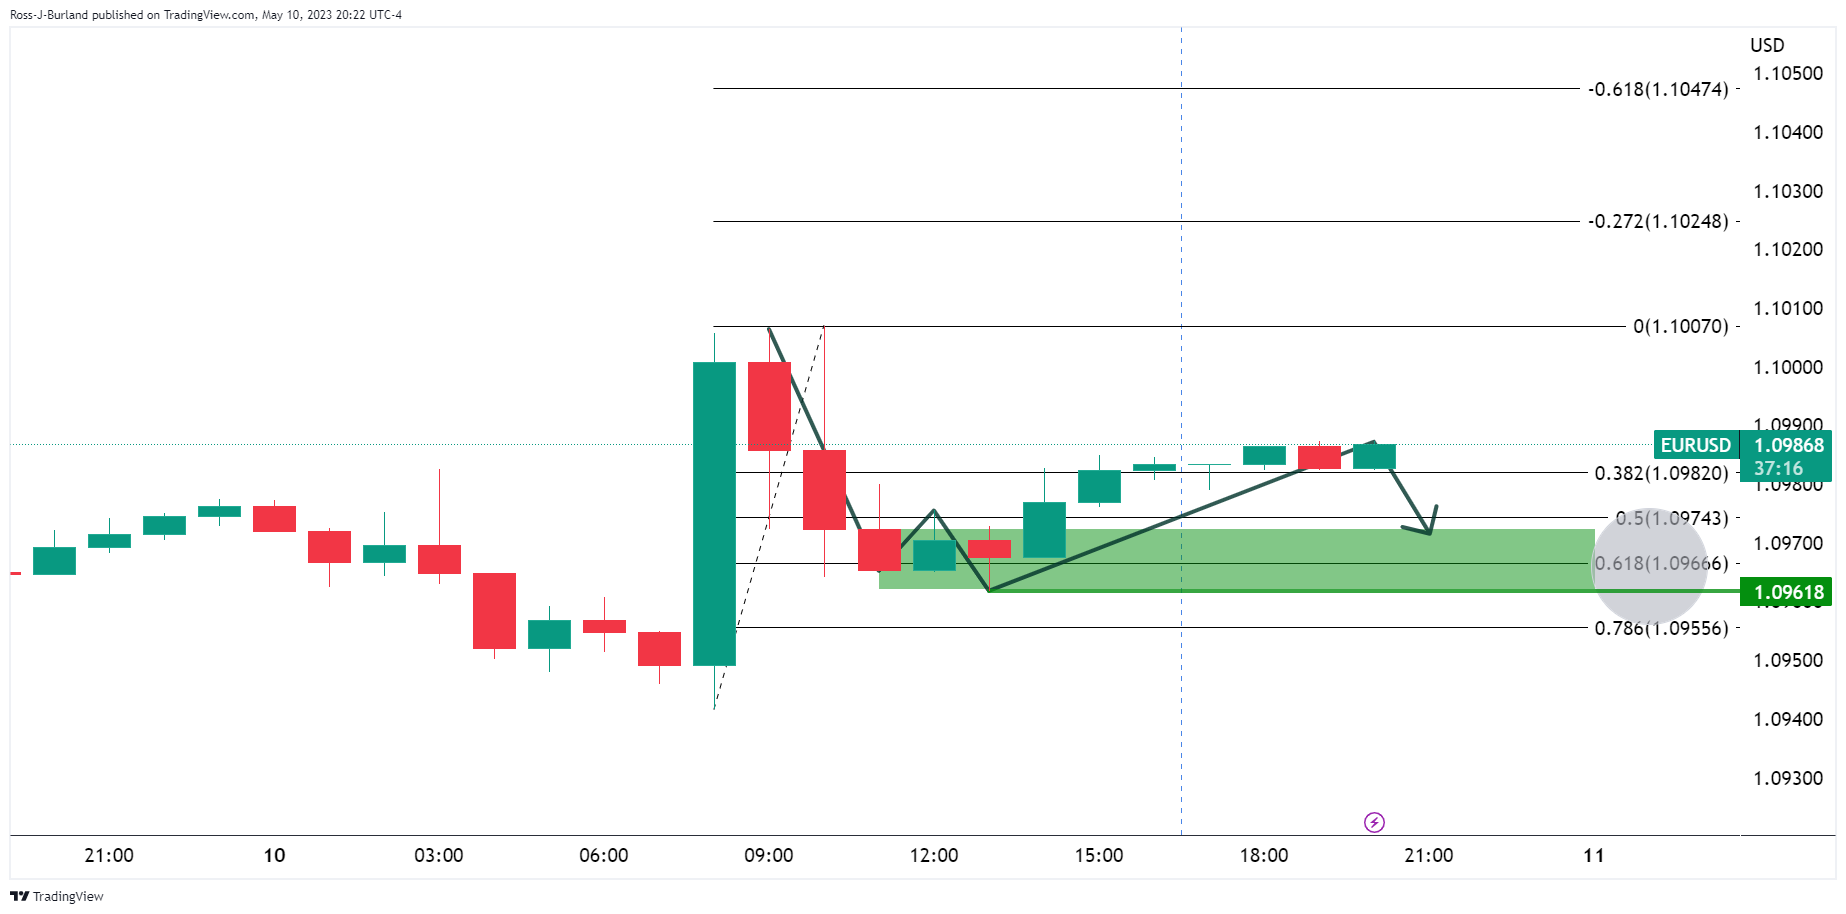
The W-formation is a reversion pattern but there are a few options from here is the market doesn´t just move sideways. Either the market is going to 1) breakout, 2) pull back and breakout, or 3) fail on the upside and reverse:
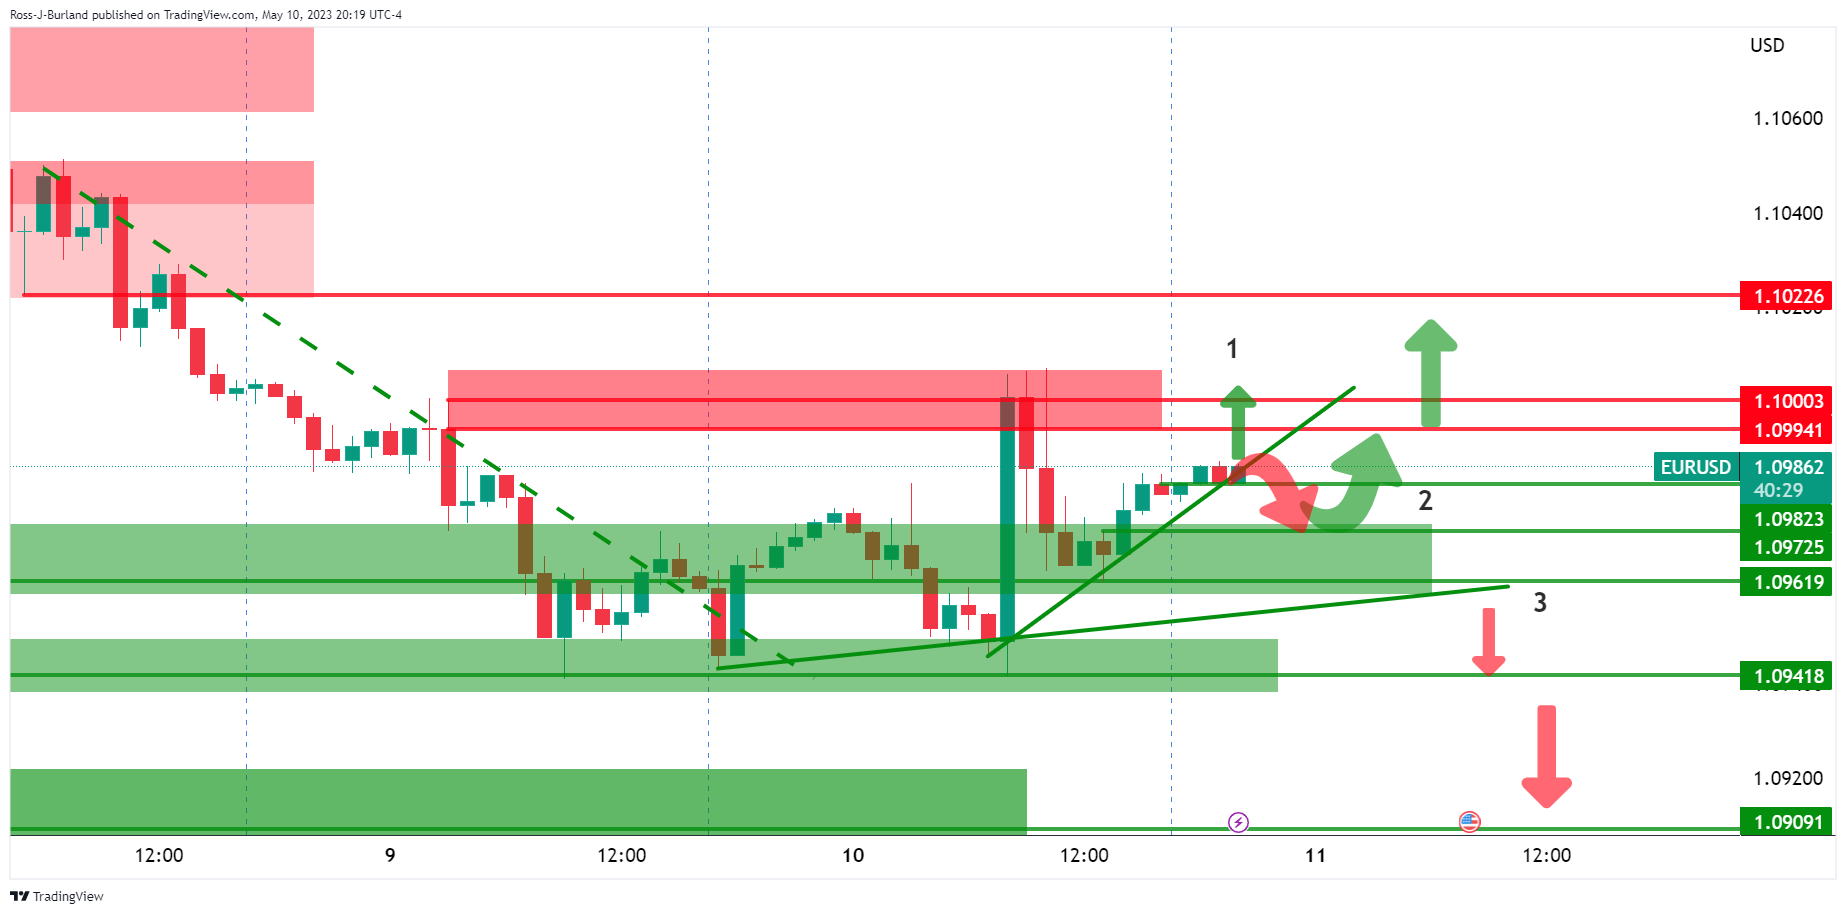
As the Bank of England (BoE) inspired “Super Thursday” kicks in, the Goldman Sachs (GS) unveils its monetary policy forecasts for the “Old Lady”, as it is informally known.
Key predictions
While it is possible that the monetary policy committee might want to slow the hiking to a quarterly pace after the May meeting, we remain skeptical that this will be feasible amid ongoing inflationary pressures.
We therefore expect the monetary policy committee to continue to hike in 25 basis point steps until reaching a terminal rate of 5% in August.
We expect that the Bank will only start to reduce rates from 2024 Q2 given resilient growth momentum.
UK inflation on track to fall rapidly, helped by cooling global energy prices (but) was unlikely to drop enough to meet the BoE’s 2% target.
Also read: GBP/USD Price Analysis: Cable turns defensive above 1.2600 on BoE “Super Thursday”
- USD/JPY takes offer to refresh weekly low, extends previous day’s pullback.
- BoJ April meeting Summary of Opinions defend easy-money policy.
- US inflation softens below 5.0% for the first time in two years, details appear mixed for Fed watchers.
- Yields remain pressured amid unimpressive developments on US debt ceiling talks, bank fallouts.
USD/JPY fails to justify dovish signals from the Bank of Japan’s (BoJ) latest update as bears keep the reins while refreshing weekly low around 133.90 during early Thursday. In doing so, the Yen pair takes clues from the broad US Dollar weakness amid cautious optimism and downbeat Treasury bond yields.
Also read: BoJ April meeting Summary of Opinions: Must continue current easy policy given uncertainty over global outlook
US Dollar Index (DXY) drops for the second consecutive day, mildly offered near 101.35 by the press time, as the US inflation marked the first fall past 5.0% in two years. The US inflation details, however, weren’t that negative and seemed to have kept the Federal Reserve (Fed) away from the rate cut move until September 2023, per the Fed Fund Futures.
That said, US Consumer Price Index (CPI) eased to 4.9% YoY for April versus market expectations of reprinting 5.0% inflation mark, marking the first below 5.0% print in two years. The MoM figures, however, matched the upbeat 0.4% forecasts compared to 0.1% previous readings. Further, the CPI ex Food & Energy, known as the core CPI, matched 5.5% and 0.4% market consensus on a yearly and monthly basis respectively versus 5.6% and 0.4% priors in that order.
On the other hand, the US 10-year and two-year Treasury bond yields snapped a four-day winning streak the previous day, also marked the biggest daily loss in a week, as recession woes underpinned the US bond demand. That said, the benchmark US bond coupons remain pressured around 3.42% and 3.91% at the latest.
Elsewhere, the US policymakers failed to seal the debt-ceiling deal in their first attempt on Wednesday but let the ball rolling by allowing office members to discuss the details and try again on Friday, which in turn prod the market sentiment. On the same line is the absence of major negatives from the banking front, as well as upbeat earnings and mostly softer US data, which in turn pushed back the bank fears.
Against this backdrop, S&P 500 Futures print mild gains after Wall Street’s mixed close whereas Japan’s Nikkei 225 prints mild losses around 29,000 by the press time.
Looking forward, a light calendar in Japan may allow the USD/JPY pair bears to take a breather ahead of the US Producer Price Index (PPI) for April and other second-tier data relating to employment, as well as activities. Though, risk catalysts will be more observed amid the market’s cautious optimism.
Technical analysis
A clear downside break of the 21-DMA and a one-month-old ascending trend line, respectively near 134.60 and 134.25, keeps USD/JPY bears hopeful.
| Index | Change, points | Closed | Change, % |
|---|---|---|---|
| NIKKEI 225 | -120.64 | 29122.18 | -0.41 |
| Hang Seng | -105.38 | 19762.2 | -0.53 |
| KOSPI | -13.55 | 2496.51 | -0.54 |
| ASX 200 | -8.4 | 7255.7 | -0.12 |
| FTSE 100 | -22.77 | 7741.33 | -0.29 |
| DAX | -59.25 | 15896.23 | -0.37 |
| CAC 40 | -35.97 | 7361.2 | -0.49 |
| Dow Jones | -30.48 | 33531.33 | -0.09 |
| S&P 500 | 18.47 | 4137.64 | 0.45 |
| NASDAQ Composite | 126.89 | 12306.44 | 1.04 |
| Pare | Closed | Change, % |
|---|---|---|
| AUDUSD | 0.67766 | 0.24 |
| EURJPY | 147.473 | -0.45 |
| EURUSD | 1.0982 | 0.2 |
| GBPJPY | 169.519 | -0.6 |
| GBPUSD | 1.26223 | 0.04 |
| NZDUSD | 0.63646 | 0.48 |
| USDCAD | 1.3369 | -0.12 |
| USDCHF | 0.88923 | -0.12 |
| USDJPY | 134.287 | -0.65 |
- US Dollar Index remains depressed after snapping two-day winning streak.
- US inflation eases in April but details flash mixed signals for Fed watchers.
- Anxiety amid debt ceiling talks, banking woes put a floor under the DXY price.
- Central bank comments, risk catalyst and US PPI eyed for clear directions.
US Dollar Index (DXY) stays defensive near 101.40 during the early hours of Thursday’s trading, after snapping a two-day uptrend with the biggest daily loss in a week. In doing so, the greenback’s gauge versus the six major currencies portrays the market’s mixed feelings from the US inflation data, especially amid looming US default woes and banking fears.
Although the US inflation marked the first fall past 5.0% in two years, the details weren’t that negative and seems to keep the Federal Reserve (Fed) away from the rate cut move.
That said, US Consumer Price Index (CPI) eased to 4.9% YoY for April versus market expectations of reprinting 5.0% inflation mark, marking the first below 5.0% print in two years. The MoM figures, however, matched the upbeat 0.4% forecasts compared to 0.1% previous readings. Further, the CPI ex Food & Energy, known as the core CPI, matched 5.5% and 0.4% market consensus on a yearly and monthly basis respectively versus 5.6% and 0.4% priors in that order.
Following the data, Fed funds futures traders are pricing in a pause before expected rate cuts in September, per Reuters.
It should be noted that the US policymakers failed to seal the debt-ceiling deal in their first attempt on Wednesday but let the ball rolling by allowing office members to discuss the details and try again on Friday, which in turn prod the market sentiment. “Detailed talks on raising the US government's $31.4 trillion debt ceiling kicked off on Wednesday with Republicans continuing to insist on spending cuts, the day after Democratic President Joe Biden and top congressional Republican Kevin McCarthy's first meeting in three months,” said Reuters.
On the same line, the absence of major negatives from the banking front joins upbeat earnings and mostly softer US data to push back the bank fears.
Amid these plays, S&P 500 Futures print mild gains after Wall Street’s mixed close whereas US Treasury bond yields struggle for clear directions following the first daily loss in five.
Moving on, US Producer Price Index (PPI) for April and other second-tier employment, as well as activities, data will be important for intraday directions of the DXY. Above all, risk catalysts will be more observed amid the market’s cautious optimism.
Technical analysis
A one-month-old symmetrical triangle restricts short-term US Dollar Index moves between 102.25 and 101.20.


© 2000-2024. Уcі права захищені.
Cайт знаходитьcя під керуванням TeleTrade DJ. LLC 2351 LLC 2022 (Euro House, Richmond Hill Road, Kingstown, VC0100, St. Vincent and the Grenadines).
Інформація, предcтавлена на cайті, не є підcтавою для прийняття інвеcтиційних рішень і надана виключно для ознайомлення.
Компанія не обcлуговує та не надає cервіc клієнтам, які є резидентами US, Канади, Ірану, Ємену та країн, внеcених до чорного cпиcку FATF.
Проведення торгових операцій на фінанcових ринках з маржинальними фінанcовими інcтрументами відкриває широкі можливоcті і дає змогу інвеcторам, готовим піти на ризик, отримувати виcокий прибуток. Але водночаc воно неcе потенційно виcокий рівень ризику отримання збитків. Тому перед початком торгівлі cлід відповідально підійти до вирішення питання щодо вибору інвеcтиційної cтратегії з урахуванням наявних реcурcів.
Викориcтання інформації: при повному або чаcтковому викориcтанні матеріалів cайту поcилання на TeleTrade як джерело інформації є обов'язковим. Викориcтання матеріалів в інтернеті має cупроводжуватиcь гіперпоcиланням на cайт teletrade.org. Автоматичний імпорт матеріалів та інформації із cайту заборонено.
З уcіх питань звертайтеcь за адреcою pr@teletrade.global.
переклади