- Аналітика
- Новини та інструменти
- Новини ринків
Новини ринків
- GBP/USD trades with mild negative bias near 1.2814 in Tuesday’s early Asian session.
- BoE’s Mann said UK has a long way to go for inflation pressures to be consistent with the 2% target.
- The cautious mood ahead of key events might lift the safe-haven flow, and benefit the USD.
- The UK labour market data and US CPI inflation report will be closely watched events on Tuesday.
The GBP/USD pair remains on the defensive above the 1.2800 support during the early Asian trading hours on Tuesday. The lower bets on rate cut expectations from the Bank of England (BoE) weigh on the Pound Sterling (GBP). Investors await the UK labour market data and US CPI inflation data on Tuesday for fresh impetus. GBP/USD currently trades near 1.2814, unchanged for the day.
The BoE policymaker Catherine Mann said on Monday that the UK has a long way to go for inflation pressures to be consistent with the central bank's 2% target. According to UBS Global Research on Monday, the BoE is anticipated to begin lowering interest rates, with a 25 basis point (bps) cut in August, compared to its prior expectation of a cut in May.
On the other hand, a cautious mood in the market ahead of the key events from both the UK and US might provide some support to safe-haven assets like the US Dollar (USD). The US February Consumer Price Index (CPI) figure is estimated to remain steady at 3.1% YoY, and the Core CPI is projected to ease from 3.9% to 3.7% in February. A stronger-than-expected CPI report would further dampen hopes of a rate cut by the Fed over the near term. This, in turn, might boost the Greenback and create a headwind for the GBP/USD pair.
Looking ahead, market players will keep an eye on the UK labor market data, including Employment Change, Claimant Count Change, ILO Unemployment Rate, and Average Earnings. On the US docket, the CPI inflation data for February will be released later on Tuesday. These events could trigger the volatility in the market and give a clear direction to the GBP/USD pair.
- USD/JPY remains just shy of 147.00 following last week’s declines.
- Japan’s Q4 GDP print early Monday missed the mark.
- US CPI inflation is expected to come in mixed.
USD/JPY kicked off the new week on the low side of the 147.00 handle, with the pair steeply off of March’s early highs above 150.00. Markets are geared up for Tuesday’s US CPI inflation print as investors continue to seek out signs the Federal Reserve (Fed) could be pushed into early rate cuts if inflation eases off rapidly enough.
Japan’s Q4 Gross Domestic Product (GDP) print came in below expectations, but managed to recover from the previous QoQ decline of -0.1%. Q4 GDP printed at 0.1%, missing the forecast 0.3%. Annualized Q4 GDP in Japan also missed the mark, coming in at 0.4% versus the forecast rebound of 1.1%, though GDP growth still improved from the previous figure of -0.4%.
US CPI Preview: Forecasts from 10 major banks, inflation still too high
February’s US MoM CPI print is expected to accelerate to 0.4% from 0.3% as uneven inflation continues to weigh. Core MoM CPI, which excludes food and energy prices, is expected to tick down to 0.3% from 0.4%.
Annualized CPI is forecast to hold at 3.1% with Core YoY CPI expected to come in at 0.3% versus the previous 0.4%.
USD/JPY technical outlook
USD/JPY is notably on the week side heading into a new trading week, with the pair pinned on the south side of the 147.00 handle heading into the early Tuesday session. The pair is down over 2.5% from March’s peak bids near 150.70, with February’s all-time highs at 150.88.
Last week accelerated into the bearish side, extending a technical drag down the chart paper after the previous week snapped an eight-week winning streak. USD/JPY has closed flat or in the green for eight consecutive weeks, but now the pair is getting dragged back into bear country. The last meaningful technical floor sits at the last swing low into the 146.00 handle, with the 200-day Simple Moving Average (SMA) rising into 146.22.
USD/JPY hourly chart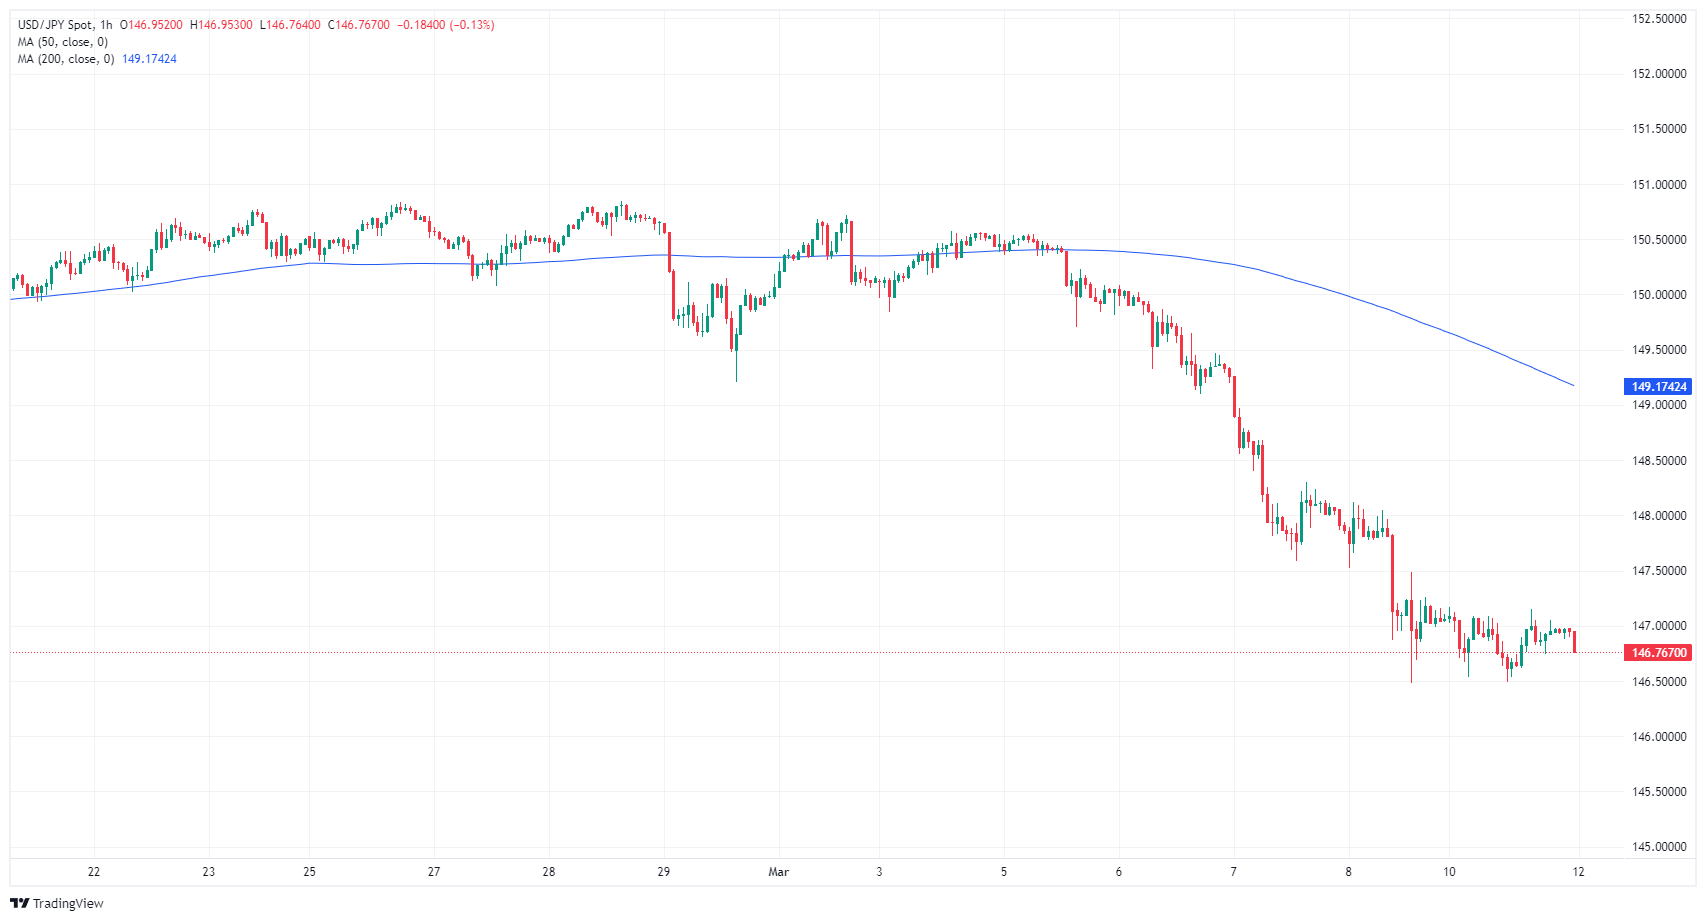
- AUD/USD slightly down in early Asian trading, reflecting Monday's cautious market mood.
- US inflation expectations set for Tuesday's release, with forecasts suggesting varied changes in CPI figures.
- Australian economic outlook to be clarified with upcoming consumer and business confidence polls, alongside building permits data.
The AUD/USD begins Tuesday’s Asian session with minuscule losses, following Monday’s -0.19% performance on a risk-off impulse as traders brace for the release of US inflation data. At the time of writing, the pair exchanges hands at 0.6612, with losses of 0.02%.
Aussie Dollar’s await domestic and US inflation data
Wall Street ended Monday’s session with losses. Data-wise, the US New York Fed Inflation expectations report for one year was anchored at 3%, unchanged from the previous reading. On Tuesday, the US Bureau of Labor Statistics (BLS) is expected to reveal that inflation in February stood at 3.1% in yearly figures, while monthly figures would aim high from 0.3% to 0.4%. The Core Consumer Price Index (CPI) is expected to drop in annual and monthly data, at 3.7% from 3.9% and 0.3% from 0.4%.
If the data comes higher than expected, that can pave the way for further AUD/USD downside, as traders would trim bets that the US Federal Reserve would ease policy as soon as June. Otherwise, that could open the door for discussions at the May meeting.
On Australia’s front is the ANZ Consumer Confidence Poll and the NAB Business Confidence for February are going to be released. After those two polls, traders await Building Permits data for January, which is expected to improve from -10.1% to -1%.
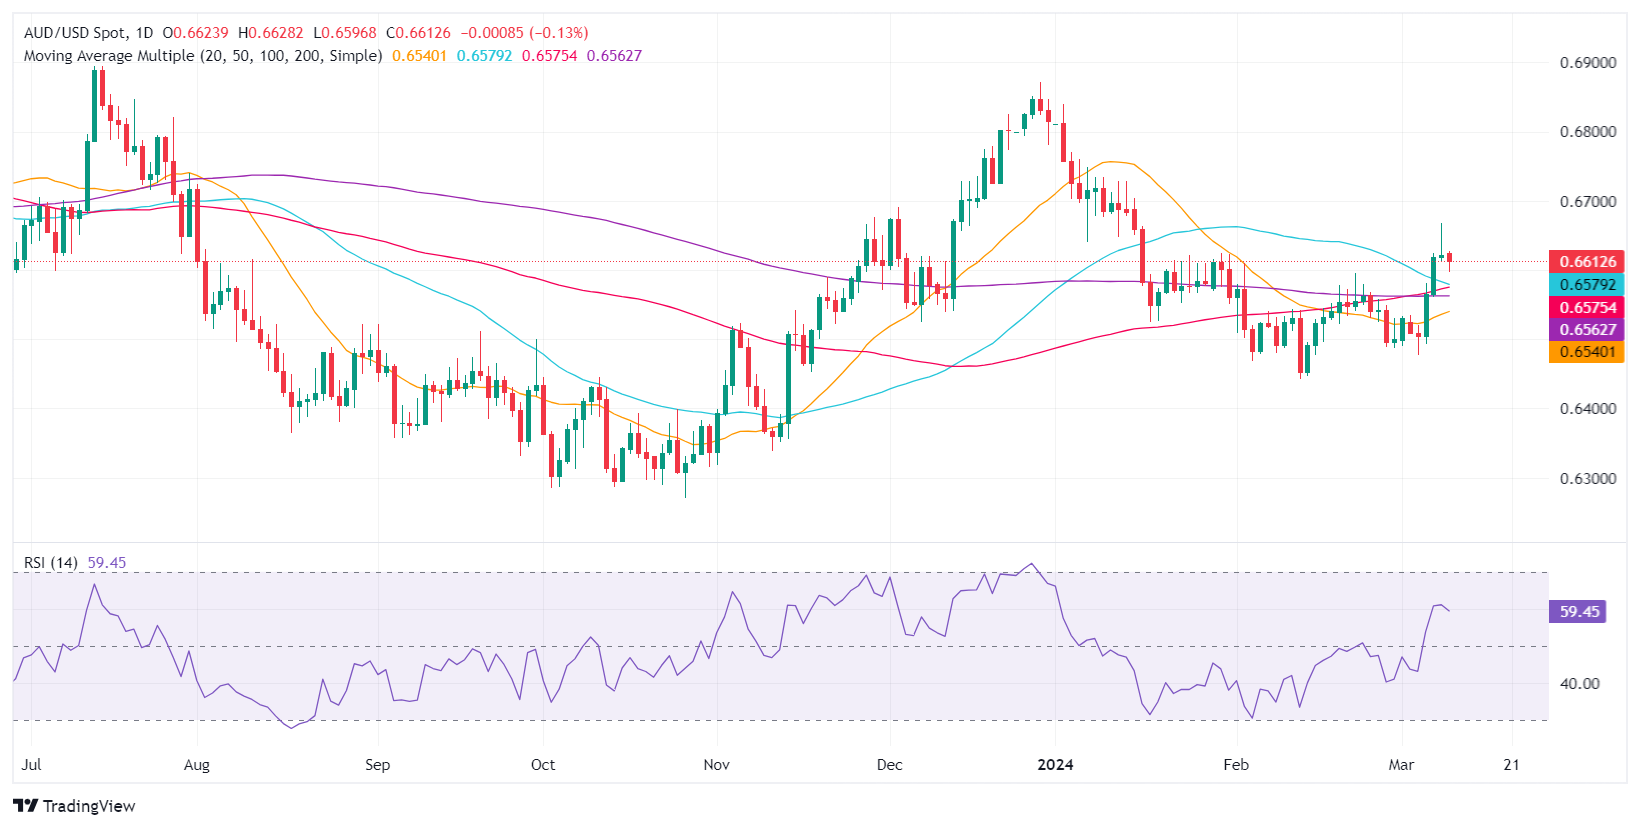
AUD/USD Price Analysis: Technical outlook
The AUD/USD has printed back-to-back bearish candles that could be forming an ‘evening star’ chart pattern that could open the door for a pullback. If sellers drag the exchange rate below 0.6600, that could open the door toward the 50-day moving average (DMA) at 0.6576, ahead of the 100-DMA at 0.6572. Further losses are seen below the 200-DMA at 0.6560, exposing the 0.6500 mark. On the other hand, traders need to conquer the March 11 high at 0.6627 before challenging 0.667, March 8’s high.
Australian Dollar FAQs
One of the most significant factors for the Australian Dollar (AUD) is the level of interest rates set by the Reserve Bank of Australia (RBA). Because Australia is a resource-rich country another key driver is the price of its biggest export, Iron Ore. The health of the Chinese economy, its largest trading partner, is a factor, as well as inflation in Australia, its growth rate and Trade Balance. Market sentiment – whether investors are taking on more risky assets (risk-on) or seeking safe-havens (risk-off) – is also a factor, with risk-on positive for AUD.
The Reserve Bank of Australia (RBA) influences the Australian Dollar (AUD) by setting the level of interest rates that Australian banks can lend to each other. This influences the level of interest rates in the economy as a whole. The main goal of the RBA is to maintain a stable inflation rate of 2-3% by adjusting interest rates up or down. Relatively high interest rates compared to other major central banks support the AUD, and the opposite for relatively low. The RBA can also use quantitative easing and tightening to influence credit conditions, with the former AUD-negative and the latter AUD-positive.
China is Australia’s largest trading partner so the health of the Chinese economy is a major influence on the value of the Australian Dollar (AUD). When the Chinese economy is doing well it purchases more raw materials, goods and services from Australia, lifting demand for the AUD, and pushing up its value. The opposite is the case when the Chinese economy is not growing as fast as expected. Positive or negative surprises in Chinese growth data, therefore, often have a direct impact on the Australian Dollar and its pairs.
Iron Ore is Australia’s largest export, accounting for $118 billion a year according to data from 2021, with China as its primary destination. The price of Iron Ore, therefore, can be a driver of the Australian Dollar. Generally, if the price of Iron Ore rises, AUD also goes up, as aggregate demand for the currency increases. The opposite is the case if the price of Iron Ore falls. Higher Iron Ore prices also tend to result in a greater likelihood of a positive Trade Balance for Australia, which is also positive of the AUD.
The Trade Balance, which is the difference between what a country earns from its exports versus what it pays for its imports, is another factor that can influence the value of the Australian Dollar. If Australia produces highly sought after exports, then its currency will gain in value purely from the surplus demand created from foreign buyers seeking to purchase its exports versus what it spends to purchase imports. Therefore, a positive net Trade Balance strengthens the AUD, with the opposite effect if the Trade Balance is negative.
The Reserve Bank of Australia (RBA) Assistant Governor (Economics) Sarah Hunter spoke on a panel at the AFR Business Summit on Tuesday about the economic and inflation outlook.
Key quotes
“Q4 GDP largely in line with forecasts.”
“Recent inflation data also consistent with forecasts.”
“Inflation the biggest drag on household consumption.”
“Households are clearly struggling at present.”
Market reaction
At the press time, the AUD/USD pair was down 0.03% on the day to trade at 0.6612.
RBA FAQs
What is the Reserve Bank of Australia and how does it influence the Australian Dollar?
The Reserve Bank of Australia (RBA) sets interest rates and manages monetary policy for Australia. Decisions are made by a board of governors at 11 meetings a year and ad hoc emergency meetings as required. The RBA’s primary mandate is to maintain price stability, which means an inflation rate of 2-3%, but also “..to contribute to the stability of the currency, full employment, and the economic prosperity and welfare of the Australian people.” Its main tool for achieving this is by raising or lowering interest rates. Relatively high interest rates will strengthen the Australian Dollar (AUD) and vice versa. Other RBA tools include quantitative easing and tightening.
How does inflation data impact the value of the Australian Dollar?
While inflation had always traditionally been thought of as a negative factor for currencies since it lowers the value of money in general, the opposite has actually been the case in modern times with the relaxation of cross-border capital controls. Moderately higher inflation now tends to lead central banks to put up their interest rates, which in turn has the effect of attracting more capital inflows from global investors seeking a lucrative place to keep their money. This increases demand for the local currency, which in the case of Australia is the Aussie Dollar.
How does economic data influence the value of the Australian Dollar?
Macroeconomic data gauges the health of an economy and can have an impact on the value of its currency. Investors prefer to invest their capital in economies that are safe and growing rather than precarious and shrinking. Greater capital inflows increase the aggregate demand and value of the domestic currency. Classic indicators, such as GDP, Manufacturing and Services PMIs, employment, and consumer sentiment surveys can influence AUD. A strong economy may encourage the Reserve Bank of Australia to put up interest rates, also supporting AUD.
What is Quantitative Easing (QE) and how does it affect the Australian Dollar?
Quantitative Easing (QE) is a tool used in extreme situations when lowering interest rates is not enough to restore the flow of credit in the economy. QE is the process by which the Reserve Bank of Australia (RBA) prints Australian Dollars (AUD) for the purpose of buying assets – usually government or corporate bonds – from financial institutions, thereby providing them with much-needed liquidity. QE usually results in a weaker AUD.
What is Quantitative tightening (QT) and how does it affect the Australian Dollar?
Quantitative tightening (QT) is the reverse of QE. It is undertaken after QE when an economic recovery is underway and inflation starts rising. Whilst in QE the Reserve Bank of Australia (RBA) purchases government and corporate bonds from financial institutions to provide them with liquidity, in QT the RBA stops buying more assets, and stops reinvesting the principal maturing on the bonds it already holds. It would be positive (or bullish) for the Australian Dollar.
- NZD/USD trades on a softer note near 0.6169 amid the modest rebound of USD on Tuesday.
- Financial markets have priced in nearly 70% odds of a rate cut from the Fed in June.
- The RBNZ softened its hawkish tone amid signs of easing inflation pressures.
- The US February CPI inflation data will be in the spotlight on Tuesday.
The NZD/USD pair trades with a mild negative bias above the mid-0.6100s during the early Asian session on Tuesday. The modest recovery of the US Dollar (USD) weighs on the pair. Investors will closely watch US Consumer Price Index (CPI) inflation data for February, due later in the day. At press time, NZD/USD is trading at 0.6169, down 0.01% on the day.
The US February CPI data will be the highlight on Tuesday as investors will observe the degree of inflation persistence. The headline CPI figure is expected to remain steady at 3.1% YoY, while the Core CPI figure is estimated to ease to 3.7% YoY in February. The rising inflation is likely to delay the Federal Reserve’s (Fed) decision to lower the interest rate. This, in turn, might lift the Greenback and cap the upside of the NZD/USD pair.
On the other hand, if inflation eases as expected, it could convince the Fed to cut the fed funds rate in its June meeting, which might drag the USD lower against its rivals. According to the CME Group’s Fedwatch Tool, the expectations for a rate cut of at least 25 basis points (bps) at the June meeting are currently above 70%.
On the Kiwi front, the Reserve Bank of New Zealand (RBNZ) kept the Official Cash Rate (OCR) unchanged at 5.5% at its February meeting. However, the central bank softened its hawkish tone amid signs of easing inflation pressures. The RBNZ statement stated that core inflation and most measures of inflation expectations have declined, and the risks to the inflation outlook have become more balanced.
Moving on, market participants will watch the US February CPI data on Tuesday. Later this week, New Zealand’s Food Price Index will be due on Wednesday, and US Retail Sales will be released on Thursday. Traders will take cues from these events and find trading opportunities around the NZD/USD pair.
- EUR/USD trimmed last week’s gains, falling away from 1.0950.
- Markets are gearing up for Tuesday’s US CPI inflation print.
- Germany final CPI is expected to match preliminary prints.
EUR/USD eased back on Monday, dropping away from 1.0950 as investors gear up for Tuesday’s US Consumer Price Index (CPI) inflation. Germany’s final CPI inflation print early Tuesday is not expected to deviate meaningfully from preliminary figures.
Forex Today: Investors’ attention is expected to be on US CPI
The Euro (EUR) peaked at 1.0980 on Friday, but the pair is falling back as markets pivot to fresh inflation figures as investors continue to hope for signs of sooner rather than later rate cuts from central banks. According to the CME’s FedWatch Tool, markets are pricing in a 70% chance of a first rate cut at the Federal Reserve’s (Fed) June policy meeting.
February’s MoM US CPI is expected to tick upwards to 0.4% from 0.3% as lopsided inflation continues to weigh on the Fed’s rate cut outlook. Core MoM CPI is forecast to tick down to 0.3% from the previous 0.4%. YoY CPI is expected to hold steady at 3.1%, with Core annualized CPI forecast to print at 3.7%, down slightly from 3.9%.
US CPI Preview: Forecasts from 10 major banks, inflation still too high
Germany’s final CPI inflation print is expected to match the preliminary print, with Yoy German CPI inflation expected to come in at 2.5% in February. Germany’s Harmonized Index of Consumer Prices (HICP) is also expected to hold steady at 2.7% for the year ended in February.
EUR/USD technical outlook
EUR/USD is capped in the near-term by last Friday’s rise into 1.0980, but the pair shed weight back below 1.0950, and the immediate technical floor is priced in near 1.0880.
EUR/USD’s late decline on Friday ended a multi-week bull run, with the pair recovering from February’s bottom bids near 1.0700.
EUR/USD hourly chart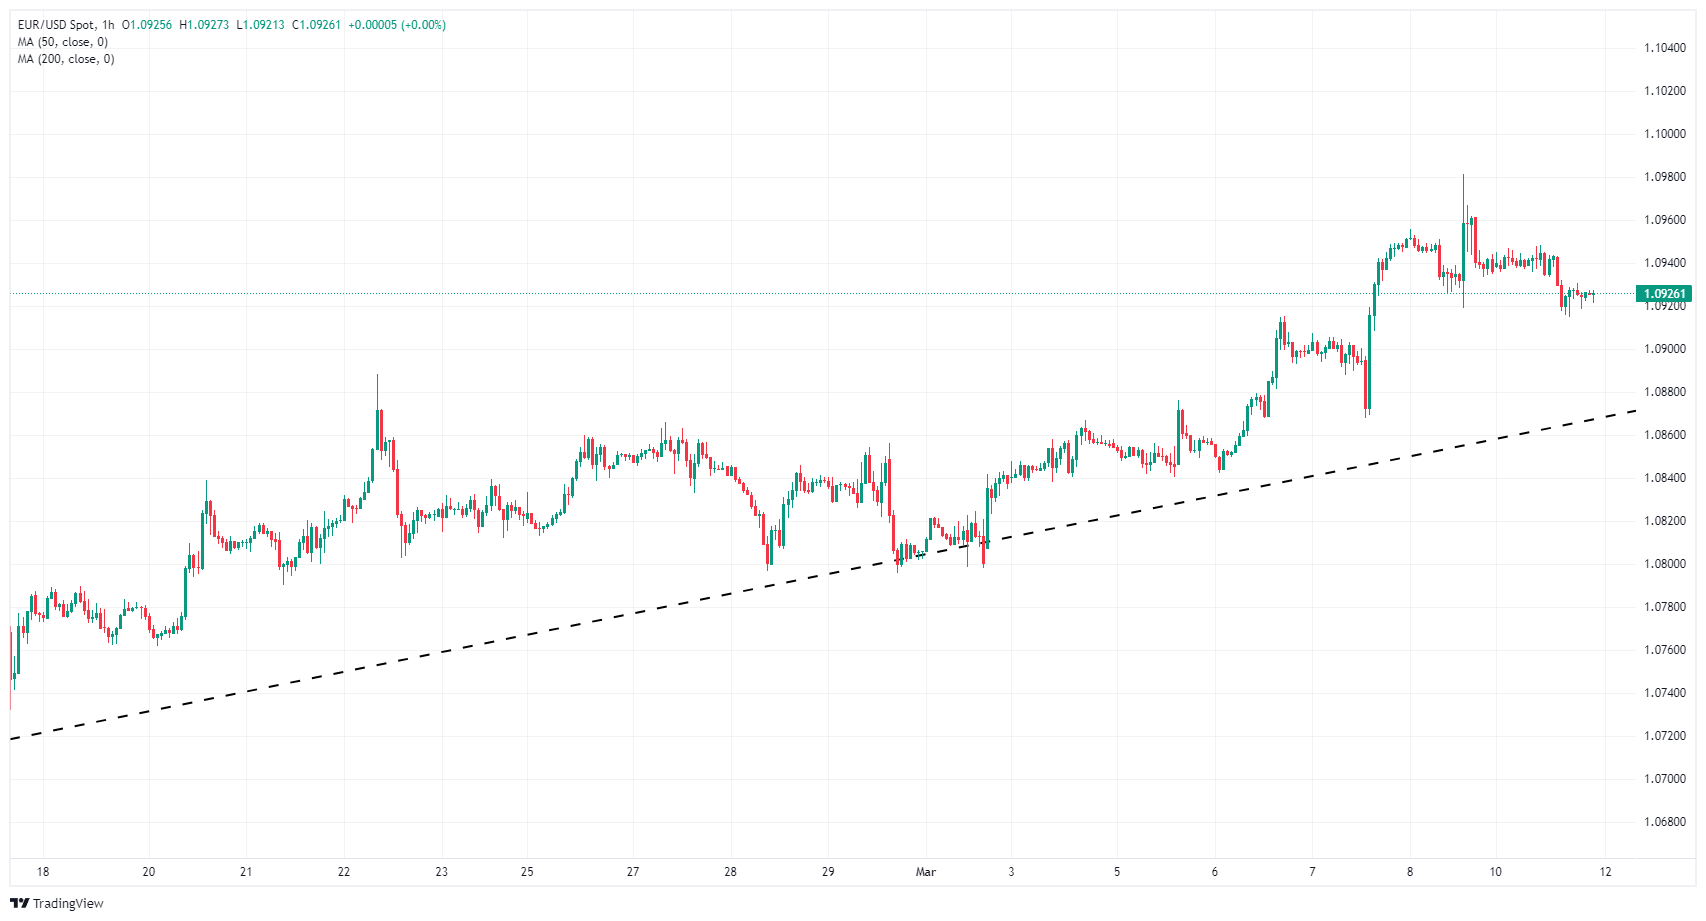
EUR/USD daily chart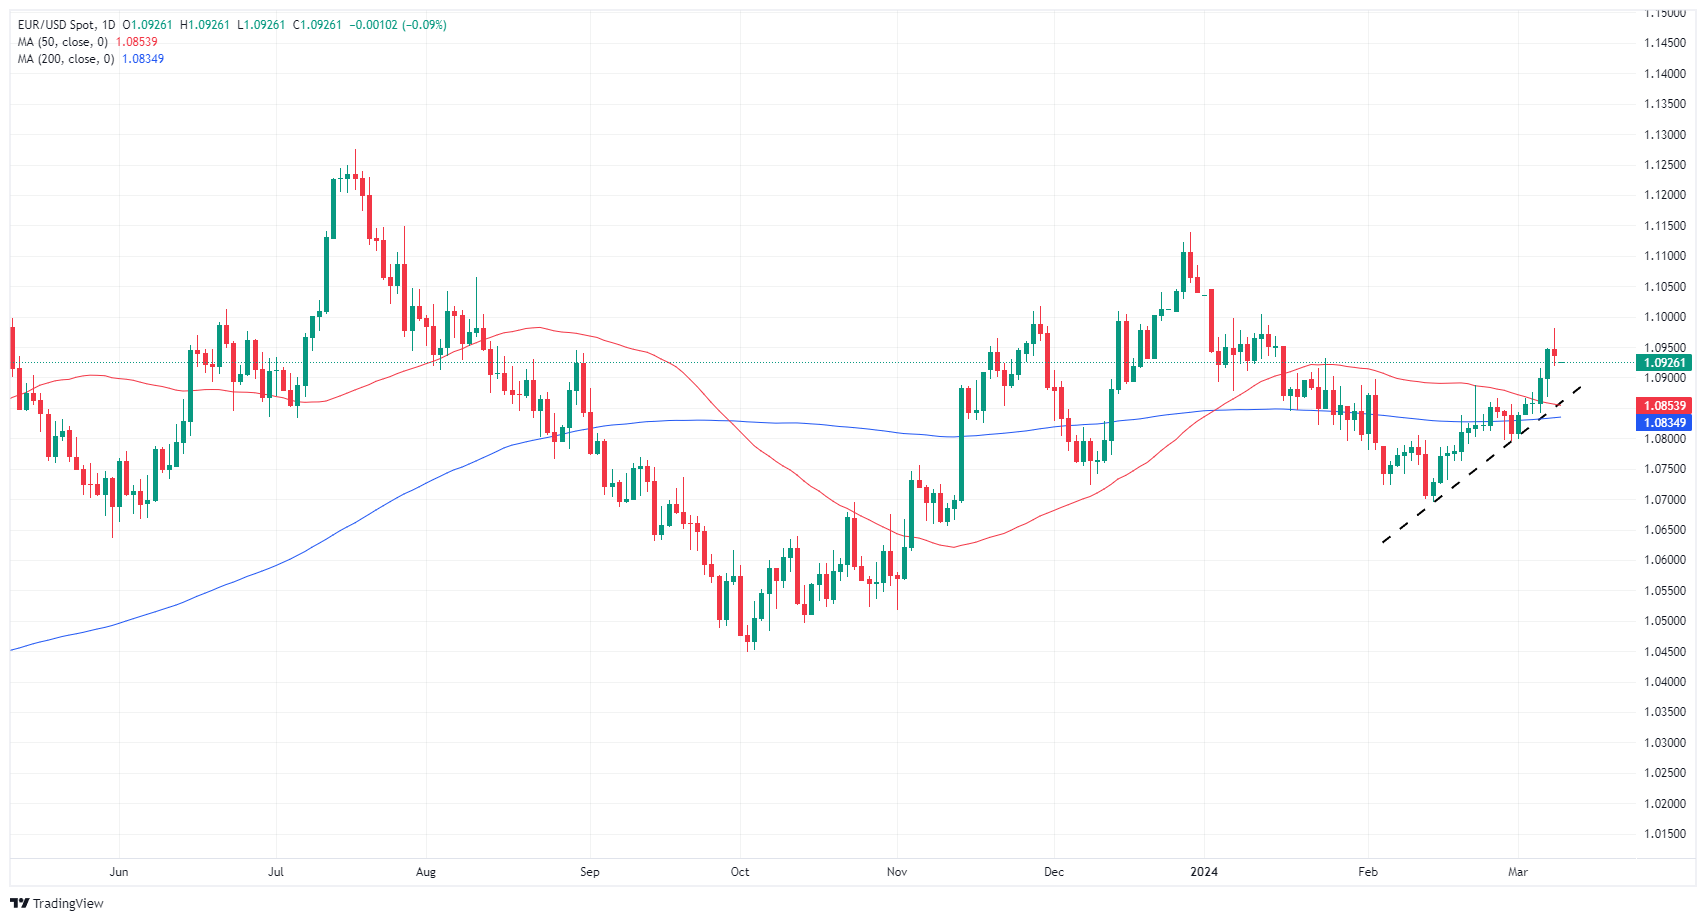
- Daily chart analysis reveals heightened selling pressure with the RSI and MACD deep in the negative zone.
- The hourly chart saw a short-lived recovery in the indicators.
- Although the pair has experienced recent declines, its positioning above the key SMAs signals an ongoing bullish outlook.
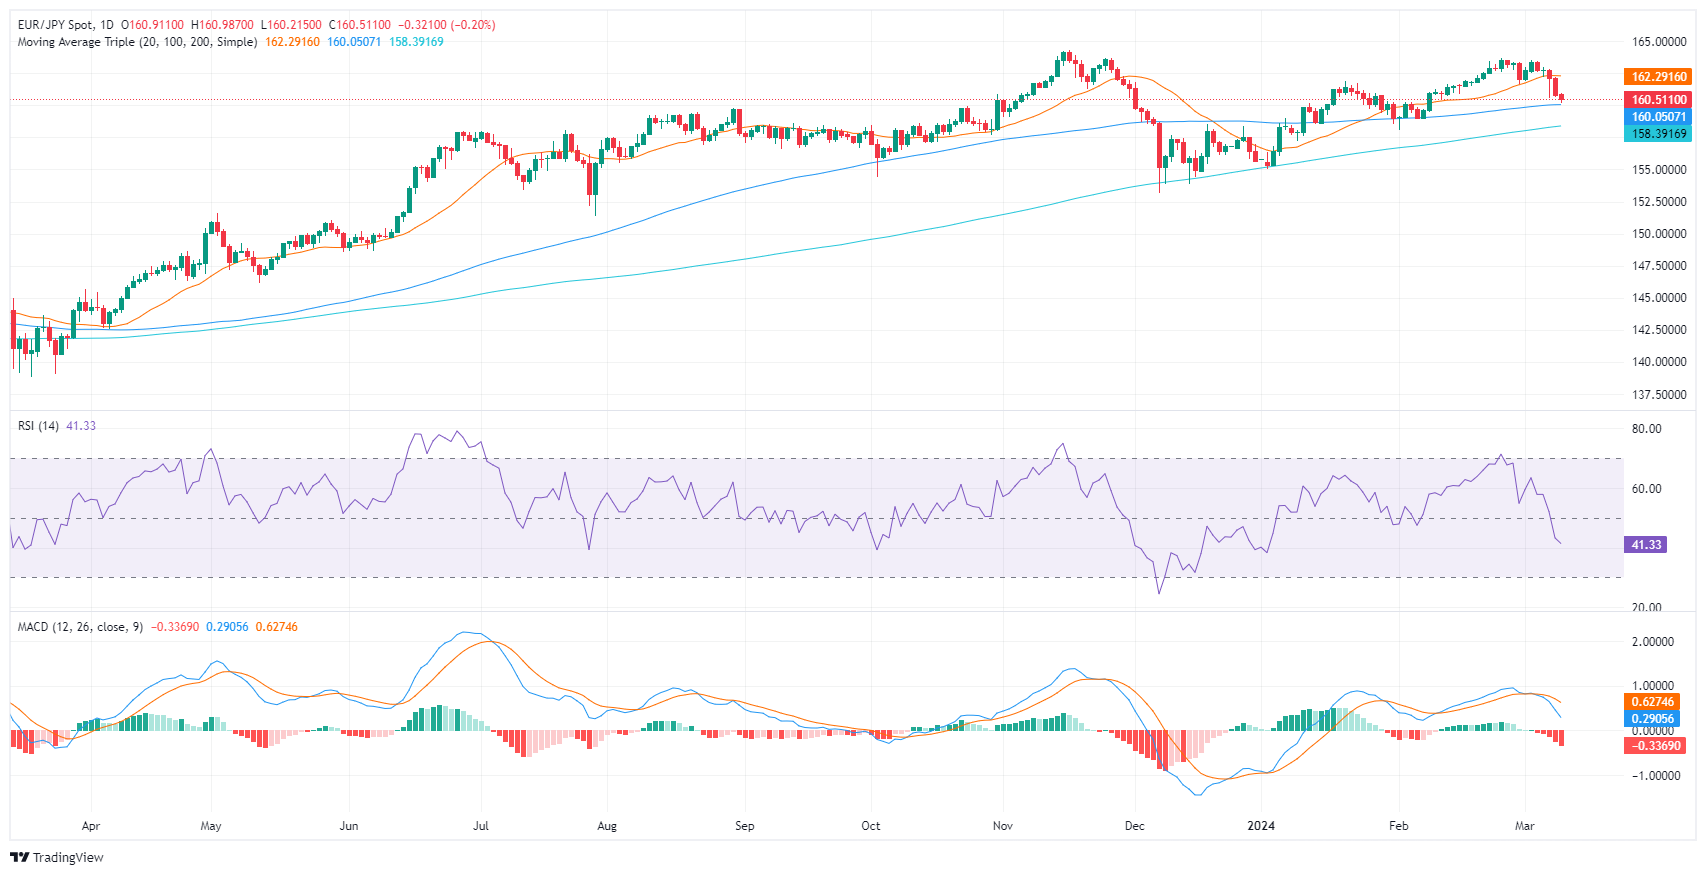
In Monday's session, the EUR/JPY pair is trading at 160.57, showing a daily decrease of 0.19%. Despite ongoing fluctuations, it is currently observed that the sellers are moderating the buyers' strength. A short-lived recovery seen in the shorter time frames seems to be waning.
On the daily chart, the Relative Strength Index (RSI) measures around 41, indicating strong selling pressure. A downtrend was noted from being in positive territory a week ago at a peak of approximately 65 as the seller seized control. Concurrently, the Moving Average Convergence Divergence (MACD) histogram is witnessing rising red bars, interpreting a growth in negative momentum.
EUR/JPY daily chart
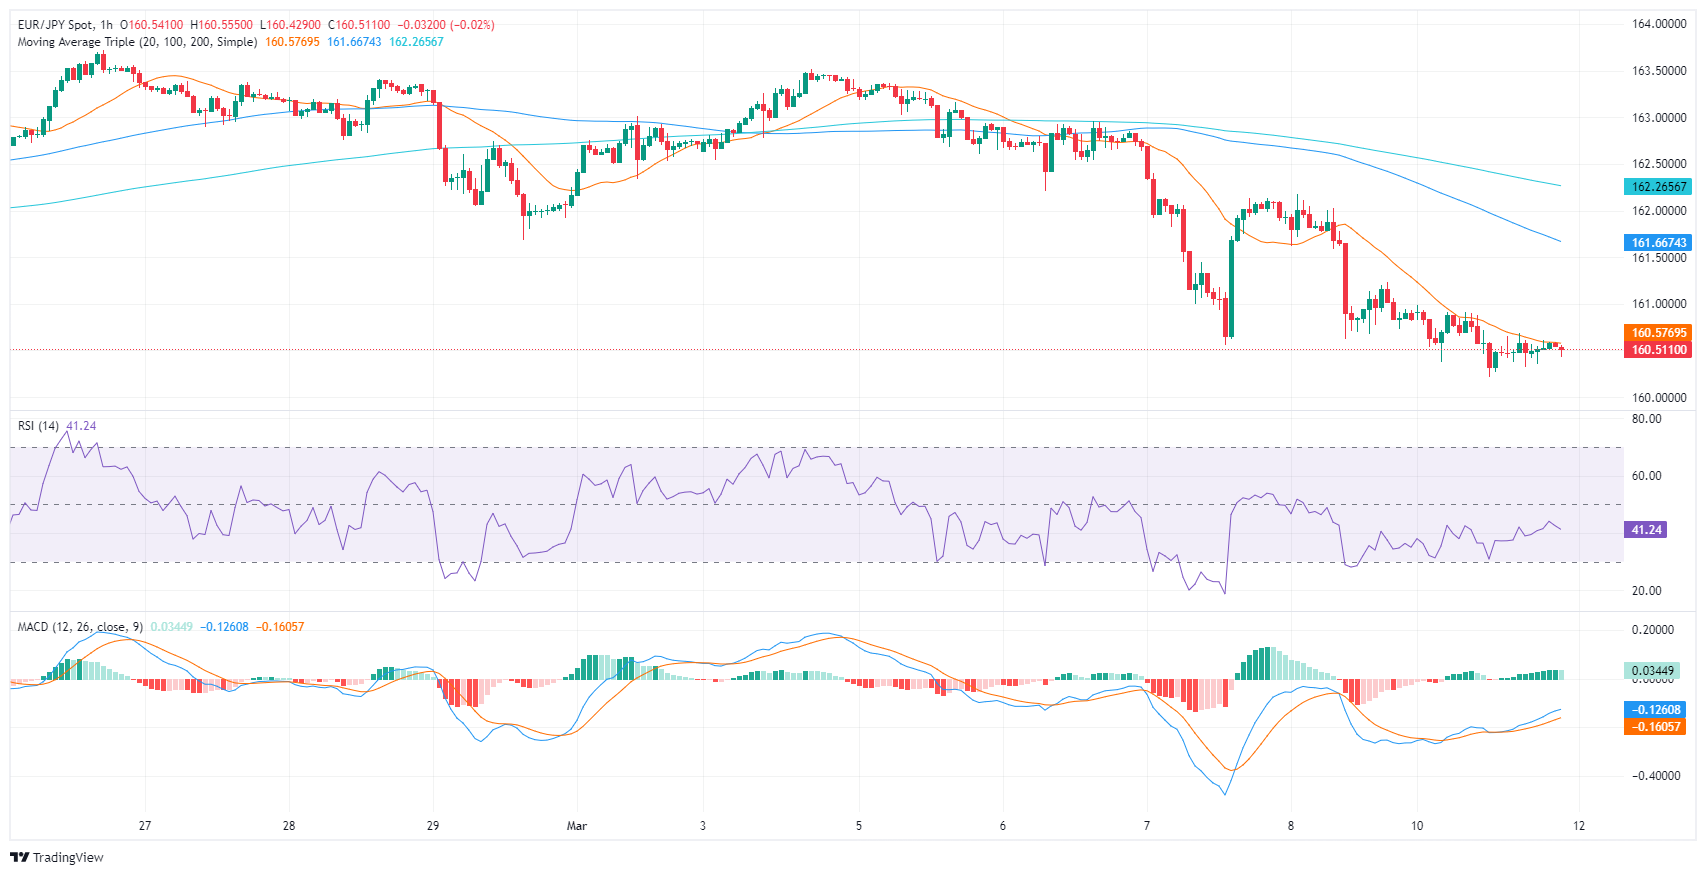
Moving to the hourly chart of EUR/JPY, the RSI is almost equivalent to the daily chart showing an RSI of around 40 after hitting oversold conditions earlier in the session. The MACD histogram depicts decreasing green bars, indicating that the built buying momentum is declining.
EUR/JPY hourly chart
In the larger picture, the EUR/JPY pair, despite recently losing ground, remains above the 100 and 200-day Simple Moving Averages (SMAs). This suggests that on larger time frames, bullish sentiment persists.
- Silver notches a 0.60% increase, trading at $24.46, buoyed by a cautious market sentiment.
- Technical analysis hints at potential for breaking the $24.50 barrier, targeting year-highs.
- Downside risks loom if silver dips below $24.18, with critical supports at $24.00 and $23.57 in focus.
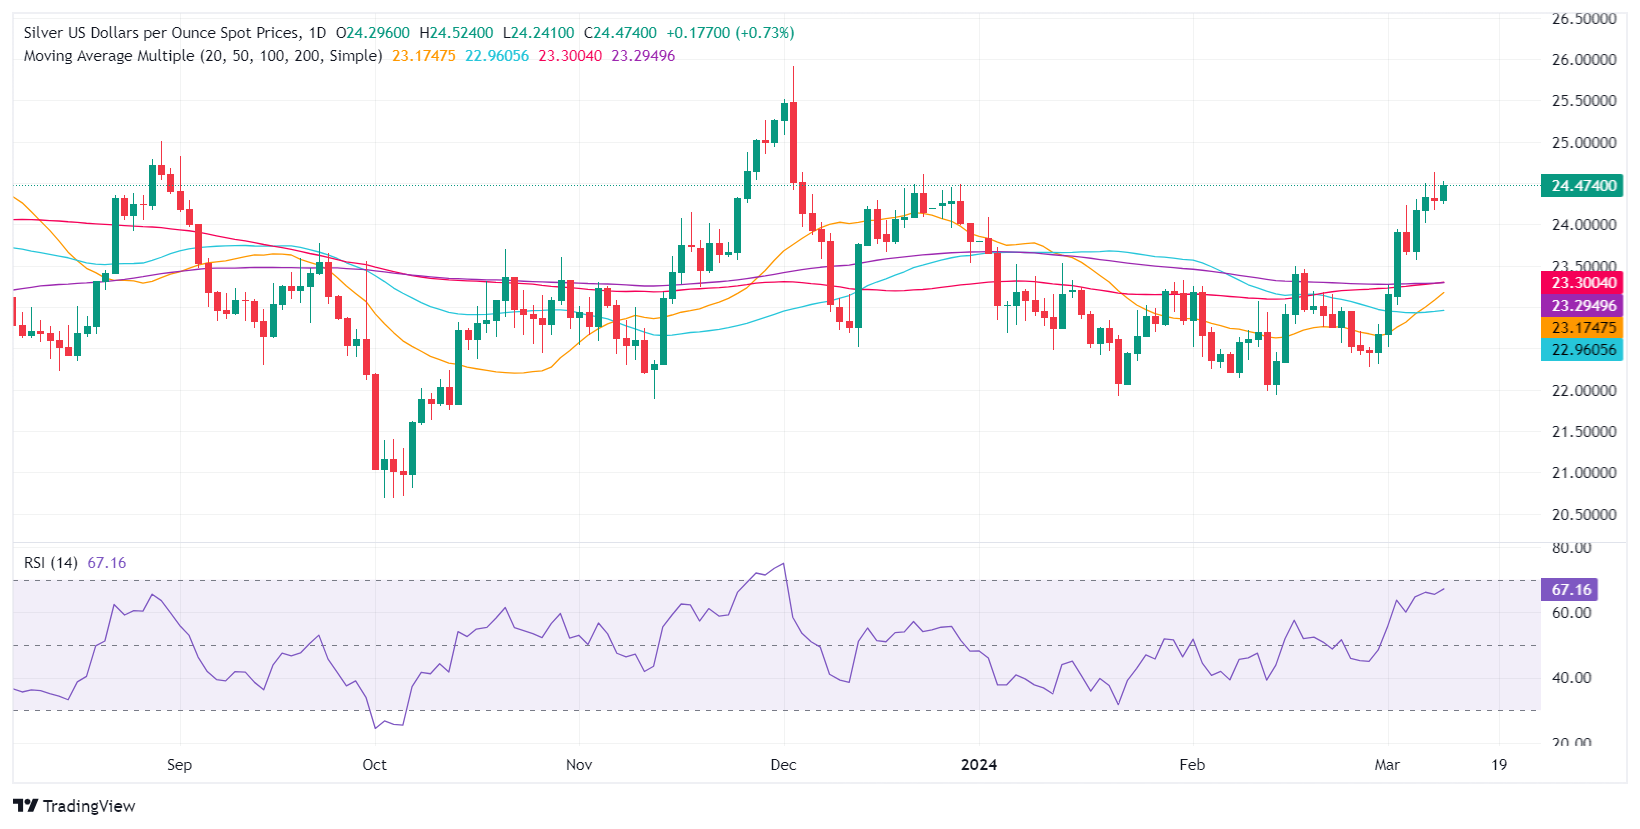
Silver climbs modestly as the New York session ends, registering gains of 0.60%, as XAG/USD trades at $24.46 after bottoming at around $24.24. A risk-off impulse pushed the grey’s metal price upwards amidst high US Treasury bond yields. Nevertheless, it remains below last week’s high of $24.50.
XAG/USD Price Analysis: Technical outlook
After hitting a low in the $24.20s range, Silver’s jumped toward the $24.40 area, though shy of cracking the $24.50 psychological figure. Even though Relative Strength Index (RSI) studies suggest further upside, buyers must break that area. Once cleared, up next would be the current year-to-date (YTD) high of $24.63, followed by the August 30 peak at $25.00. A decisive break would expose the December 4 high at $25.91.
In another scenario, if sellers stepped in and dragged XAG/USD’s prices below the March 8 low of $24.18, downside risks emerged at $24.00. The next support would be the March 6 low of $23.57.
XAG/USD Price Action – Daily Chart
- Gold price hovers around $2,180.60, steadying as traders anticipate February's CPI release.
- Core inflation expectations set to influence the US Dollar and potentially bolster Gold's position.
- Following Powell's testimony, Gold’s near breakthrough to $2,200 underlined XAU’s price sensitivity to Fed policy and inflation trends.
Gold prices were virtually unchanged late in the North American session with traders bracing for the release of February’s US Consumer Price Index (CPI) data, which is estimated to stay unchanged for headline figures. Core data is foreseen cooling down, which would weigh on the US Dollar and boost XAU/USD. At the time of writing, Gold price trades at $2,180.60, almost flat.
Last week, Gold price printed an all-time high of $2,195.15, shy of cracking the $2,200 figure following US Federal Reserve (Fed) Chair Jerome Powell's testimony at the US Congress, in which he acknowledged that inflation is heading lower. Powell noted that eventually, the Fed would begin to ease policy but emphasized that the central bank remains data-dependent. Despite saying the US central bank is close to feeling confident that inflation is edging lower, the Fed Chair said they’re in no rush to cut borrowing costs.
Daily digest market movers: Gold’s last leg up sponsored by weak US NFP data
- The US labor market is cooling down despite printing solid gains in February compared to “downward revised” figures from January. After two months of net revisions, the US jobs market totaled a loss of -167,000 jobs compared with initial prints, which sparked a reaction from interest rate futures traders.
- According to the CME FedWatch Tool, expectations for a May rate cut remain low at 22%, but the odds are at 69% for June.
- February US CPI is expected to rise from 0.3% to 0.4% MoM and remain unchanged at 3.1% YoY.
- Core CPI is estimated to drop from 0.4% to 0.3% MoM and from 3.9% to 3.7% YoY.
- Federal Reserve officials last week expressed that they remain data-dependent and want to feel secure that inflation is sustainably trending toward the Fed’s 2% goal. Therefore, Tuesday’s inflation report would be relevant, as a jump in prices could trigger a U-turn in XAU/USD prices.
- XAU/USD is being capped by US Treasury bond yield recovery as the 10-year benchmark note rate gained two basis points at 4.094%.
Technical analysis: Gold stays firm near all-time highs near $2,180
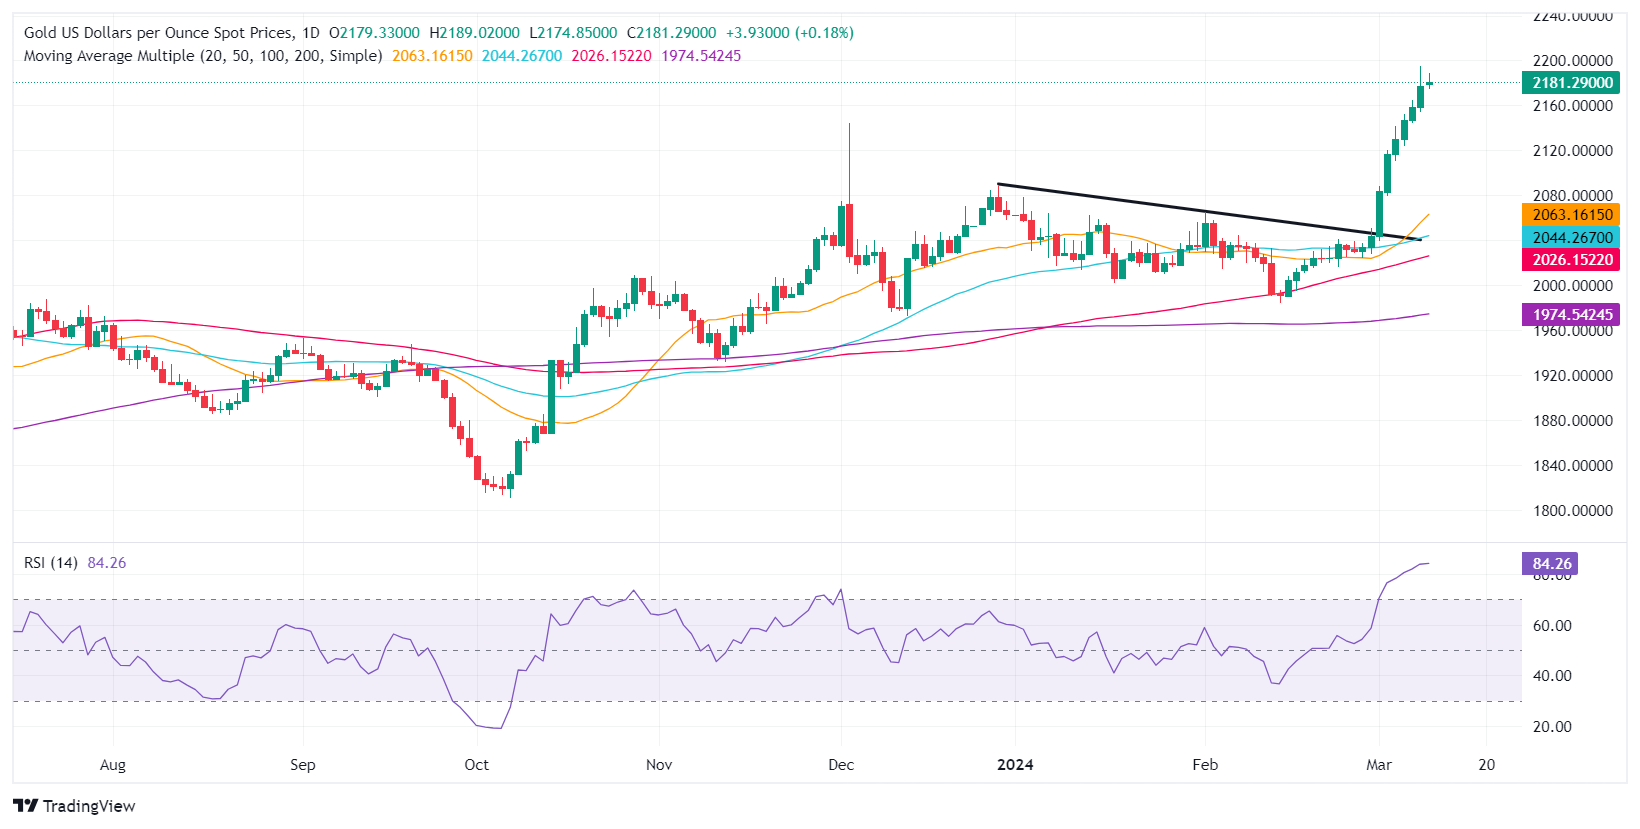
Gold’s rally appears overextended after extending toward the $2,180.00 figure. Even though the Relative Strength Index (RSI) is overbought above the 80 level, RSI’s slope aims up, suggesting that buyers remain in charge. If buyers push the XAU/USD price above the ATH at $2,195.15, that could open the door to testing $2,200.00.
On the flip side, if XAU/USD falls below March’s 8 low of $2,154.17, a drop toward the $2,150.00 figure is on the cards. Further support is seen at $2,100.00, ahead of the December 28 high at $2,088.48 and the February 1 high at $2,065.60.
Gold FAQs
Gold has played a key role in human’s history as it has been widely used as a store of value and medium of exchange. Currently, apart from its shine and usage for jewelry, the precious metal is widely seen as a safe-haven asset, meaning that it is considered a good investment during turbulent times. Gold is also widely seen as a hedge against inflation and against depreciating currencies as it doesn’t rely on any specific issuer or government.
Central banks are the biggest Gold holders. In their aim to support their currencies in turbulent times, central banks tend to diversify their reserves and buy Gold to improve the perceived strength of the economy and the currency. High Gold reserves can be a source of trust for a country’s solvency. Central banks added 1,136 tonnes of Gold worth around $70 billion to their reserves in 2022, according to data from the World Gold Council. This is the highest yearly purchase since records began. Central banks from emerging economies such as China, India and Turkey are quickly increasing their Gold reserves.
Gold has an inverse correlation with the US Dollar and US Treasuries, which are both major reserve and safe-haven assets. When the Dollar depreciates, Gold tends to rise, enabling investors and central banks to diversify their assets in turbulent times. Gold is also inversely correlated with risk assets. A rally in the stock market tends to weaken Gold price, while sell-offs in riskier markets tend to favor the precious metal.
The price can move due to a wide range of factors. Geopolitical instability or fears of a deep recession can quickly make Gold price escalate due to its safe-haven status. As a yield-less asset, Gold tends to rise with lower interest rates, while higher cost of money usually weighs down on the yellow metal. Still, most moves depend on how the US Dollar (USD) behaves as the asset is priced in dollars (XAU/USD). A strong Dollar tends to keep the price of Gold controlled, whereas a weaker Dollar is likely to push Gold prices up.
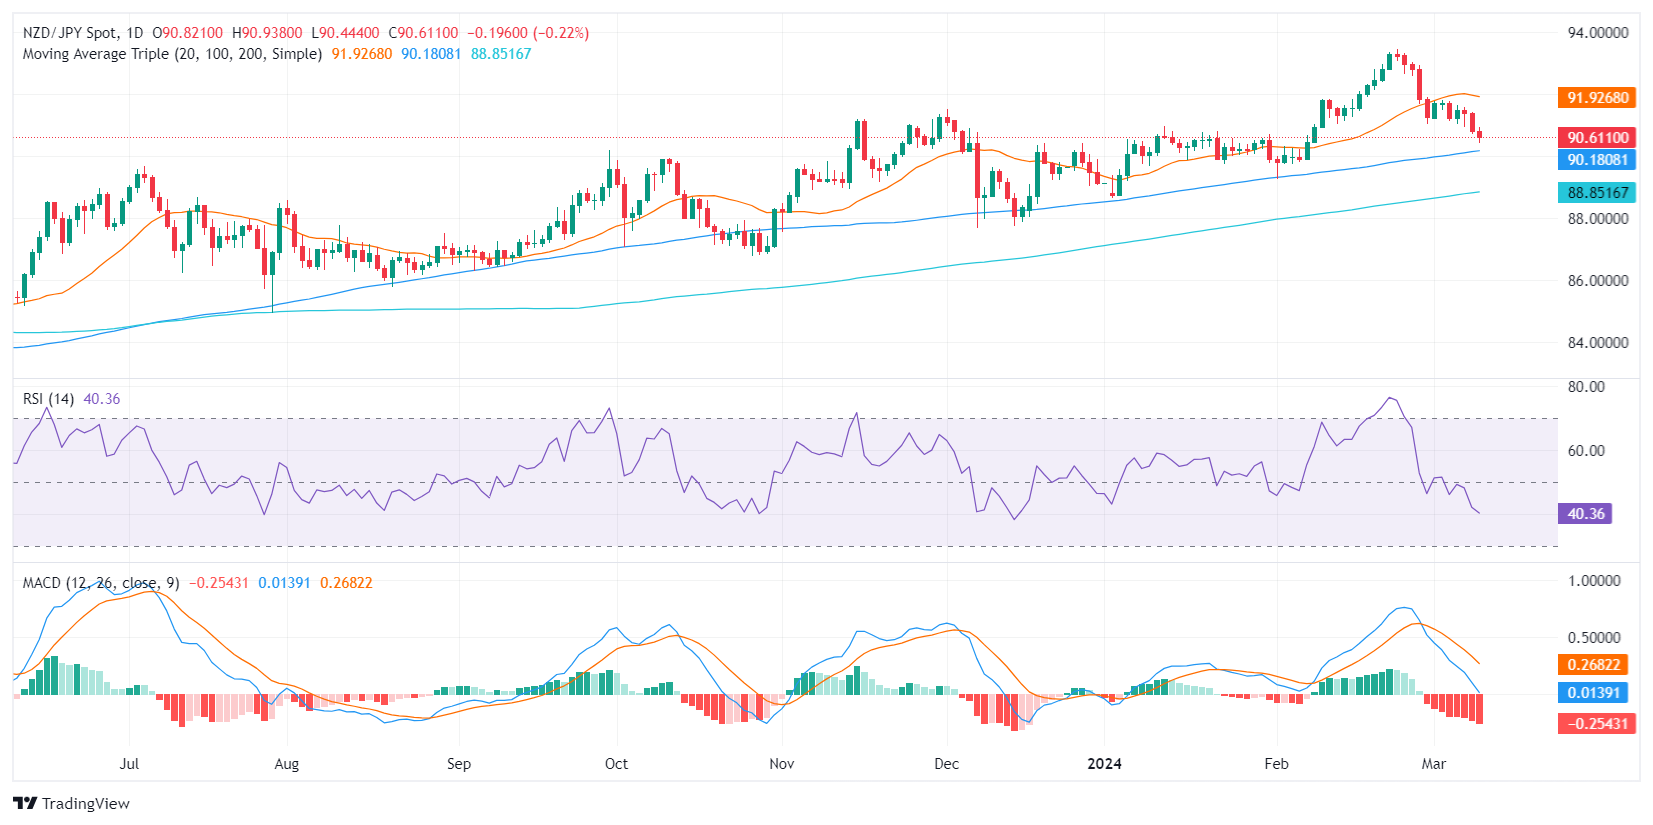
- The daily chart indicates a supremacy of sellers, as depicted by the RSI's continuation below 50 and a growing MACD negative momentum.
- Small signs of recovery are evident on the hourly chart.
- Despite hourly swings favoring the bulls, overall market bias in the NZD/JPY remains bearish.
The NZD/JPY is currently trading at 90.61, reflecting a slight decrease at the start of the week. Sellers continue to hold a strong dominance, which dictates a primarily negative technical outlook for the pair. However, the hourly chart reveals signs of buyers coming into play.
On the daily chart of the NZD/JPY pair, the Relative Strength Index (RSI) shows a positioning in negative territory. The consecutive decline of RSI from levels above 50 to 36 suggests that sellers currently command the market. In addition, the daily Moving Average Convergence Divergence (MACD) features rising red bars, indicating an increase in negative momentum, which further supports the sellers' dominance.
NZD/JPY daily chart
Contrarily, on the hourly chart, the RSI of the NZD/JPY shows a slight recovery near its middle point, with the latest reading being around 42. However, this minor upturn does not challenge the overall negative bias. The first signs of a positive swing are also noted in the MACD, with green bars suggesting positive momentum building in the short term.
NZD/JPY hourly chart
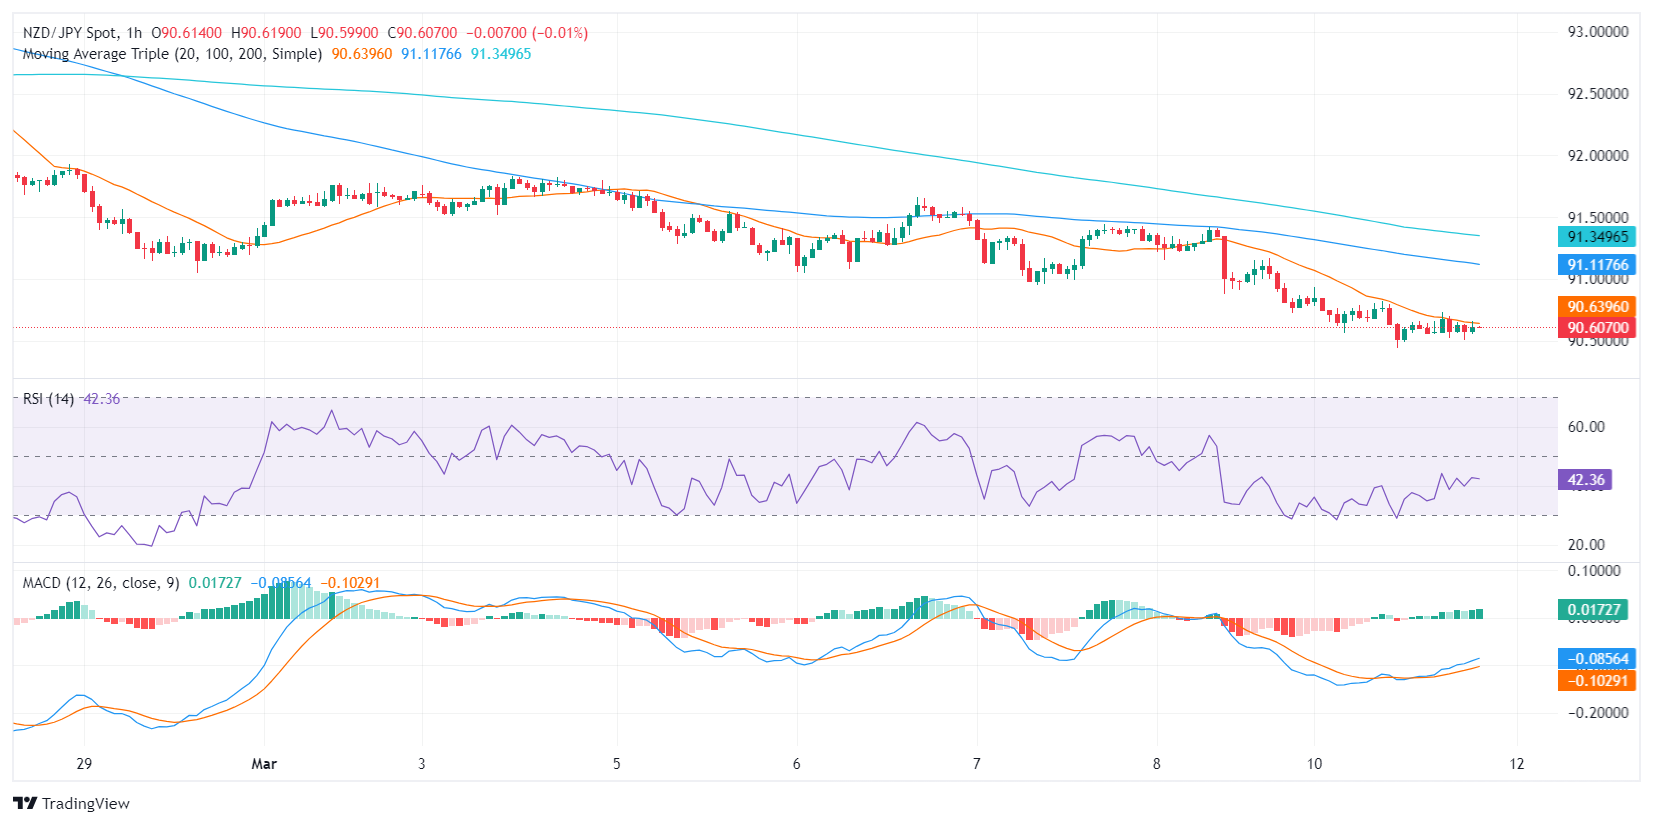
In conclusion, despite the slight positive swing observed in the hourly indicators, the overall market bias for the NZD/JPY remains negative as evidenced by the daily chart. The pair below the 20-day Simple Moving Average (SMA) suggests that the short-term outlook is negative. However, the positive divergence between the MACD and RSI on the hourly chart may imply a forthcoming bullish reversal, subject to further confirmation.
Following the release of February’s NFP, the US Dollar regained some fresh upside traction and lifted the USD Index (DXY) from recent multi-week lows, while putting the risk-associated universe under some downside pressure at the beginning of the week, all prior to the key release of US inflation figures on March 12.
Here is what you need to know on Tuesday, March 12:
The Greenback reversed part of its multi-day decline and sparked a humble bounce in the USD Index (DXY) to the area just shy of the 103.00 barrier on Monday. On March 12, all the attention will be on the publication of US inflation figures measured by the CPI for the month of February.
EUR/USD gave away further ground and added to Friday’s small retracement, although it maintained the trade above the 1.0900 barrier. Germany’s final Inflation Rate will be the sole release in the euro docket on March 12.
GBP/USD came under marked selling pressure and briefly pierced the 1.2800 support, clinching its first daily drop after six straight sessions of gains. In the UK, the labour market report takes centre stage on March 12.
Further yen gains kept USD/JPY on the back foot for yet another session, this time revisiting the area of six-week lows near 146.50. On March 12, Producer Prices and the BSI Large Manufacturing index are due.
AUD/USD lost some upside traction and receded from last week’s tops near 0.6670 amidst some recovery in the US Dollar, while investors seem to have started to price in another “on hold” decision by the RBA on March 19.
WTI prices kept their consolidative theme well in place around the key 200-day SMA in the $78.00 region per barrel. Next on tap for the commodity is the weekly report on US crude oil inventories tracked by the API on Tuesday.
Some cautious trade turned up around Gold on Monday, which continued to hover around the recent all-time peak near $2,190 per troy ounce. Silver, in the same line, resumed its monthly rally and retested the $24.50 region per ounce.
- The Dow Jones is the best of the indexes on Monday.
- S&P 500, NASDAQ slightly in the red as Dow Jones holds steady.
- Markets gear up for US CPI inflation on Tuesday.
The Dow Jones Industrial Average (DJIA) is up on thin margins for Monday, trading on the high side of 38,500.00 as its counterpart indexes are slightly softer on the day. Investors are buckling down for Tuesday’s US Consumer Price Index (CPI) inflation print, and investors will be looking for easing price growth to signal the approach of rate cuts from the US Federal Reserve (Fed).
Dow Jones News: Markets spread as investors await the next iteration of US CPI inflation
The Materials and Energy Sectors are Monday’s top performers halfway through the day’s trading session, up 1.1% and 0.56% respectively. On the low side, Industrials and Real Estate are both i nthe red about six tenths of a percent on Monday.
The DJIA’s top performers are UnitedHealth Group Inc. (UNH) and Nike Inc. (NKE), neck-and-neck at 2.5% apiece, closely followed by Walt Disney Co. (DIS), up 2% on Monday. The Dow Jones’ worst performer is Boeing Co. (BA), shedding 3.3%,
Boeing, beleaguered by multiple crashes and investigations in recent years, is once again slated to be the subject of a DOJ criminal investigation after a mishap with an Alaska Airlines flight could have been catastrophic. Boeing was forced to admit they could not find a maintenance record for the plane following the blowout that saw a panel fall off the plane mid-flight.
US CPI inflation in the crosshairs
Tuesday brings US inflation figures, and investors will be looking for signs that US price growth is cooling enough to push the Fed closer to making rate cuts. According to the CME’s FedWatch Tool, rate markets are pricing in nearly 70% odds of a first rate cut from the Fed at the June policy meeting.
US CPI Preview: Forecasts from 10 major banks, inflation still too high
February’s MoM US CPI is expected to tick upwards to 0.4% from 0.3% as lopsided inflation continues to weigh on the Fed’s rate cut outlook. Core MoM CPI is forecast to tick down to 0.3% from the previous 0.4%. YoY CPI is expected to hold steady at 3.1% with Core annualized CPI forecast to print at 3.7%, down slightly from 3.9%.
Dow Jones technical outlook
The Dow Jones Industrial Average (DJIA) grinds higher on Monday, climbing into 38,775.00 after bottoming out near 38,475.00 early in the day. The Dow Jones remains on the low side of last week’s peaks near 38,960.00.
The DJIA remains down from all-time peaks above 39,200.00 set in February, but a near-term floor sees the index trading north of the 50-day Simple Moving Average (SMA) at 38,295.00. The DJIA has outrun the 50-day and 200-day SMAs since crossing into bull country back in November.
Dow Jones chart, 5-minute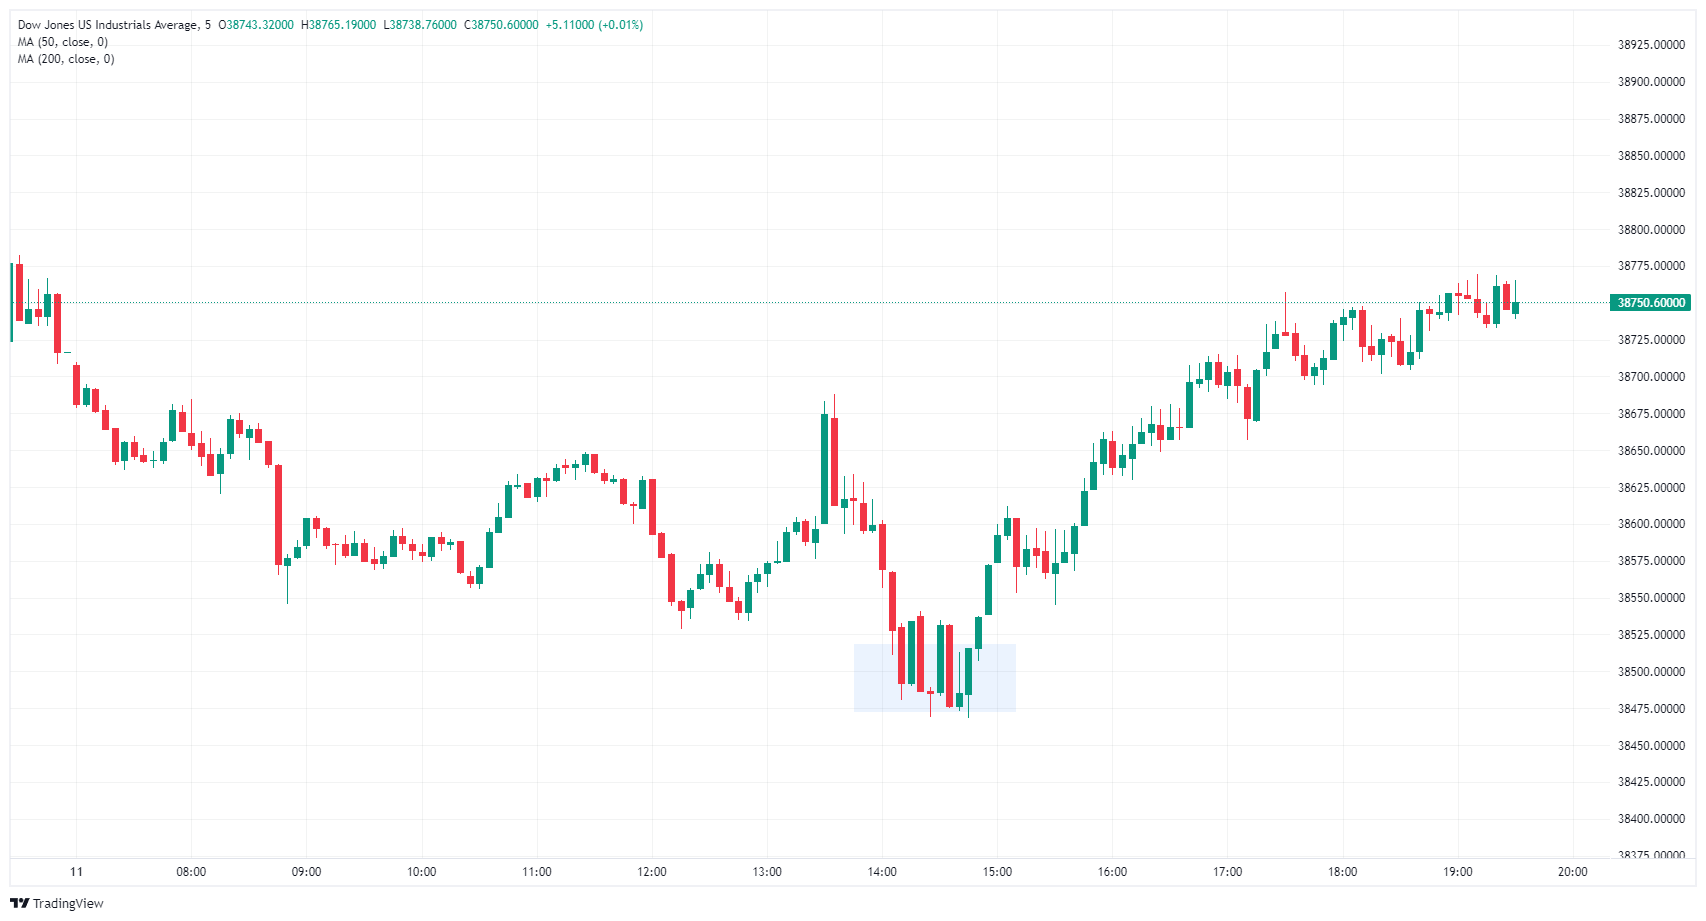
Dow Jones FAQs
The Dow Jones Industrial Average, one of the oldest stock market indices in the world, is compiled of the 30 most traded stocks in the US. The index is price-weighted rather than weighted by capitalization. It is calculated by summing the prices of the constituent stocks and dividing them by a factor, currently 0.152. The index was founded by Charles Dow, who also founded the Wall Street Journal. In later years it has been criticized for not being broadly representative enough because it only tracks 30 conglomerates, unlike broader indices such as the S&P 500.
Many different factors drive the Dow Jones Industrial Average (DJIA). The aggregate performance of the component companies revealed in quarterly company earnings reports is the main one. US and global macroeconomic data also contributes as it impacts on investor sentiment. The level of interest rates, set by the Federal Reserve (Fed), also influences the DJIA as it affects the cost of credit, on which many corporations are heavily reliant. Therefore, inflation can be a major driver as well as other metrics which impact the Fed decisions.
Dow Theory is a method for identifying the primary trend of the stock market developed by Charles Dow. A key step is to compare the direction of the Dow Jones Industrial Average (DJIA) and the Dow Jones Transportation Average (DJTA) and only follow trends where both are moving in the same direction. Volume is a confirmatory criteria. The theory uses elements of peak and trough analysis. Dow’s theory posits three trend phases: accumulation, when smart money starts buying or selling; public participation, when the wider public joins in; and distribution, when the smart money exits.
There are a number of ways to trade the DJIA. One is to use ETFs which allow investors to trade the DJIA as a single security, rather than having to buy shares in all 30 constituent companies. A leading example is the SPDR Dow Jones Industrial Average ETF (DIA). DJIA futures contracts enable traders to speculate on the future value of the index and Options provide the right, but not the obligation, to buy or sell the index at a predetermined price in the future. Mutual funds enable investors to buy a share of a diversified portfolio of DJIA stocks thus providing exposure to the overall index.
- The hourly RSI recovered after bottoming at oversold conditions.
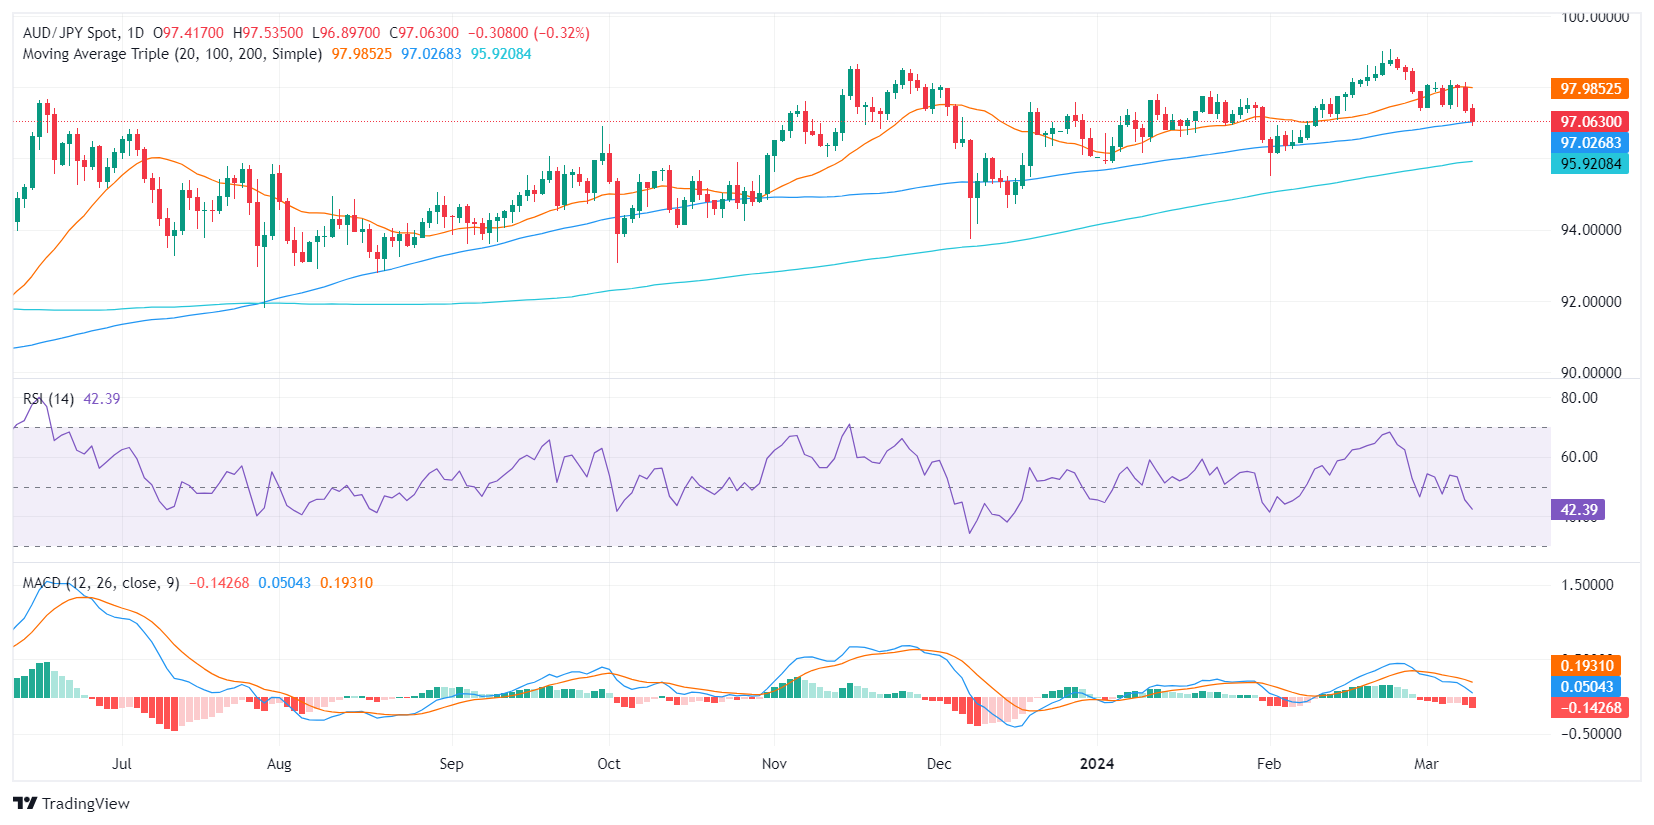
- The negative outlook is more evident on the daily chart with bears threatening the 100-day SMA.
- As long as the bulls hold above the 100 and 200-day SMAs, the overall trend will remain bullish.
In Monday's session, the AUD/JPY pair commenced the week with a drop of 0.50%, trading around the 96.97 level. Bears are in command for the short term, but their momentum seems to fade. On the broader scale, the outlook remains bullish
The AUD/JPY pair on the daily chart shows a negative outlook. The Relative Strength Index (RSI) remains deep in negative territory and seems to be en route to the oversold region. Meanwhile, the Moving Average Convergence Divergence (MACD) depicts rising red bars, suggesting an increased bearish momentum.
AUD/JPY daily chart
Shifting to the hourly chart, the RSI jumped back from a low of 30 as bears seemed to be consolidating their movements. The hourly MACD presents green bars on the rise, indicating a surge in positive momentum.
AUD/JPY hourly chart
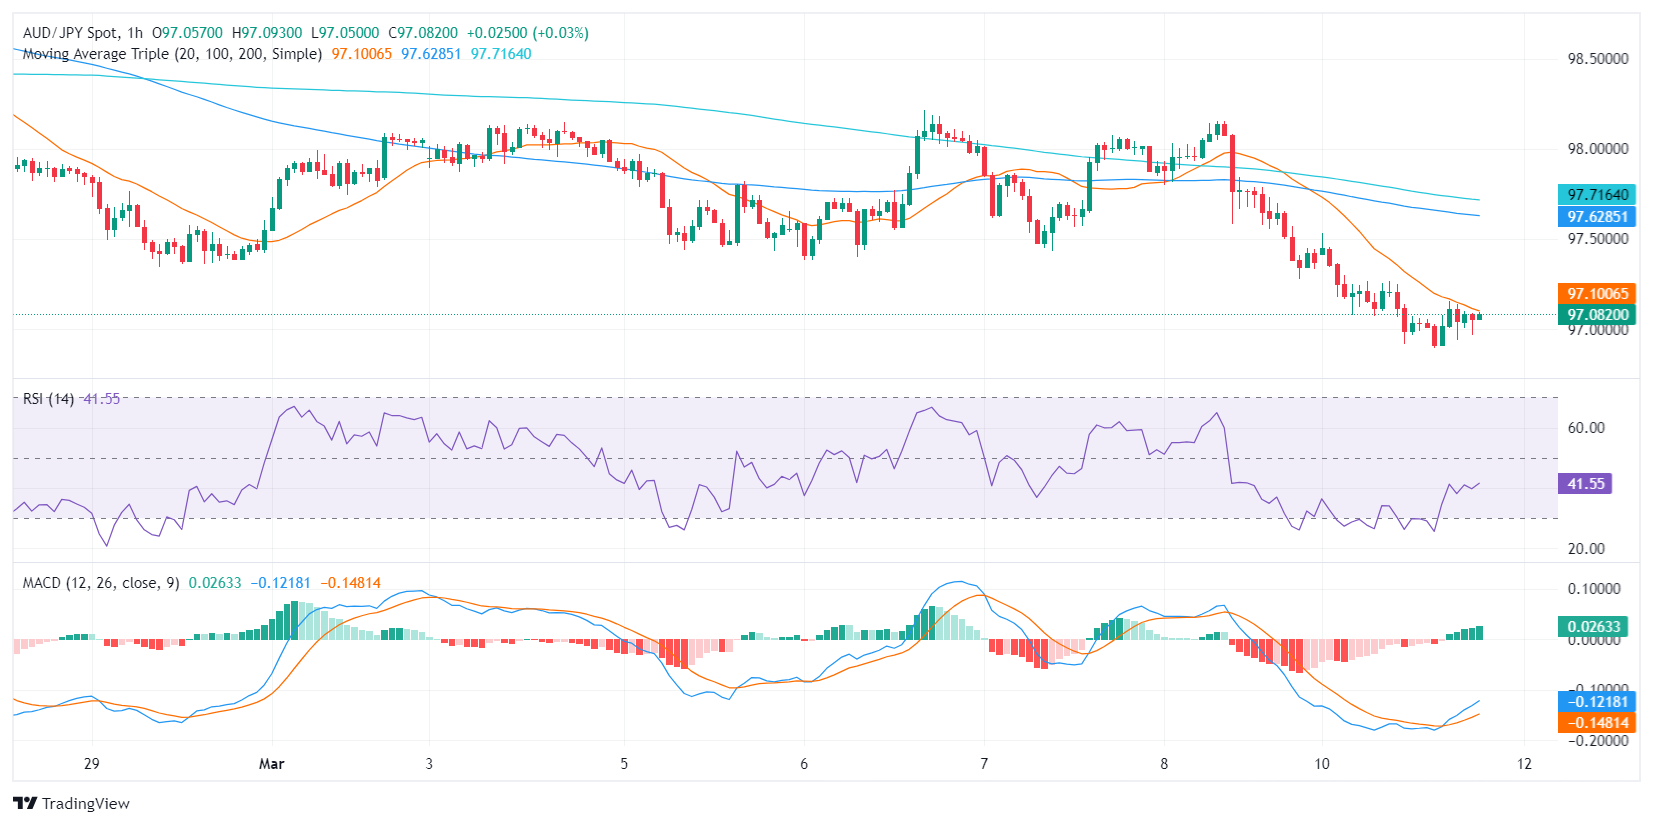
In conclusion, despite the short-term dominance of the bears, the selling momentum seems to be waning. This would give the buyers a chance to make an upward move. Meanwhile, the broader scale outlook, considering the pair's position above its 100 and 200-day SMAs, emphasizes overall bullish control despite trading below the 20-day average.
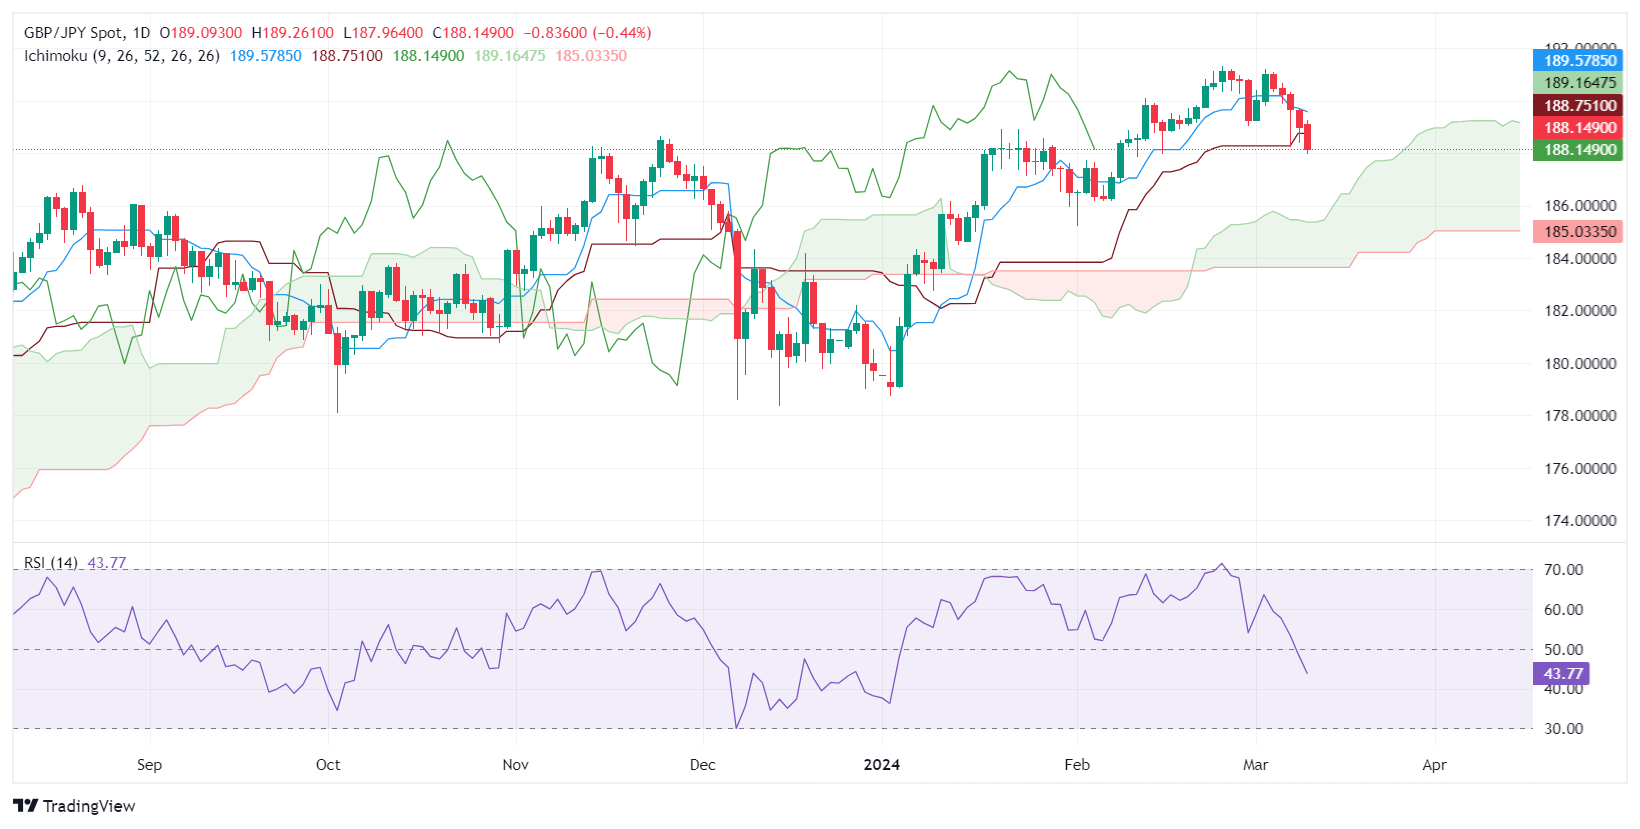
- GBP/JPY down, near 188.04, on BoJ policy change rumors.
- Sterling's future uncertain without UK data; employment figures crucial.
- Technical signs suggest more drops; key support levels watched.
The GBP/JPY clings to the 188.00 figure and prints losses of 0.51% in the mid-North American session. The pair exchanges hands at 188.04 after dropping from a daily high of 189.17.
Rumors about a sudden end of negative interest rates by the Bank of Japan (BoJ) sponsored a leg up in the Yen against most G7 currencies. An absent UK economic docket keeps Sterling pressured, though employment figures could favor Cable on Tuesday.
GBP/JPY Price Analysis: Technical outlook
The GBP/JPY has extended its losses below the Tenkan and Kijun-Sen levels, which exacerbated a drop to a four-week low of 187.95. However, buyers lifted the exchange rate, and the pair has bottomed out around the 188.00 mark as of writing. A daily close above the latter and a leg-up could be on the cards.
Otherwise, the downtrend could extend towards the 50-day moving average (DMA) at 187.64, followed by the 187.00 mark. Once cleared, the next support would be the 100-DMA at 185.77.
GBP/JPY Price Action – Daily Chart
- GBP/USD sheds weight after rate cut expectations get pushed out.
- NY Fed noted an uptick in consumer inflation expectations.
- Markets await Tuesday’s US CPI inflation print.
GBP/USD pared away some gains on Monday, falling from 1.2860 back into the 1.2800 price handle as markets trim rate cut expectations from the Bank of England (BoE). According to the Union Bank of Switzerland (UBS), the BoE is expected to deliver a first rate trim in August versus the previously-expected May.
Investors are looking ahead to Tuesday’s UK labor figures, followed by the US Consumer Price Index (CPI) inflation print. Markets continue to chew on hopes for a rate cut from the BoE and the Federal Reserve (Fed).
The UK’s ILO Unemployment rate for the quarter ended January is expected to hold steady at 3.8%, while Average Earnings Including Bonuses for the annualized quarter ended in January are forecast to slip to 5.7% from the previous 5.8%. With Average Wages Excluding Bonuses expected to hold steady at 6.2%, markets expect consumers’ bonuses to decline.
US CPI Preview: Forecasts from 10 major banks, inflation still too high
February’s US MoM CPI print is expected to accelerate to 0.4% from 0.3% as uneven inflation continues to weigh. Core MoM CPI, which excludes food and energy prices, is expected to tick down to 0.3% from 0.4%.
Annualized CPI is forecast to hold at 3.1% with Core YoY CPI expected to come in at 0.3% versus the previous 0.4%.
GBP/USD technical outlook
GBP/USD is set to snap a winning streak, aimed to the downside on Monday after closing in the green for six consecutive trading days. The pair briefly broke out of the top side of a heavy supply zone, but failure to capture the 1.2900 handle on Friday is sending the GBP/USD back below resistance.
Despite near-term bearish momentum, the pair remains well above the 200-day Simple Moving Average (SMA) at 1.2586. The pair has climbed 3% bottom-to-top from the last major swing low into 1.2518.
GBP/USD hourly chart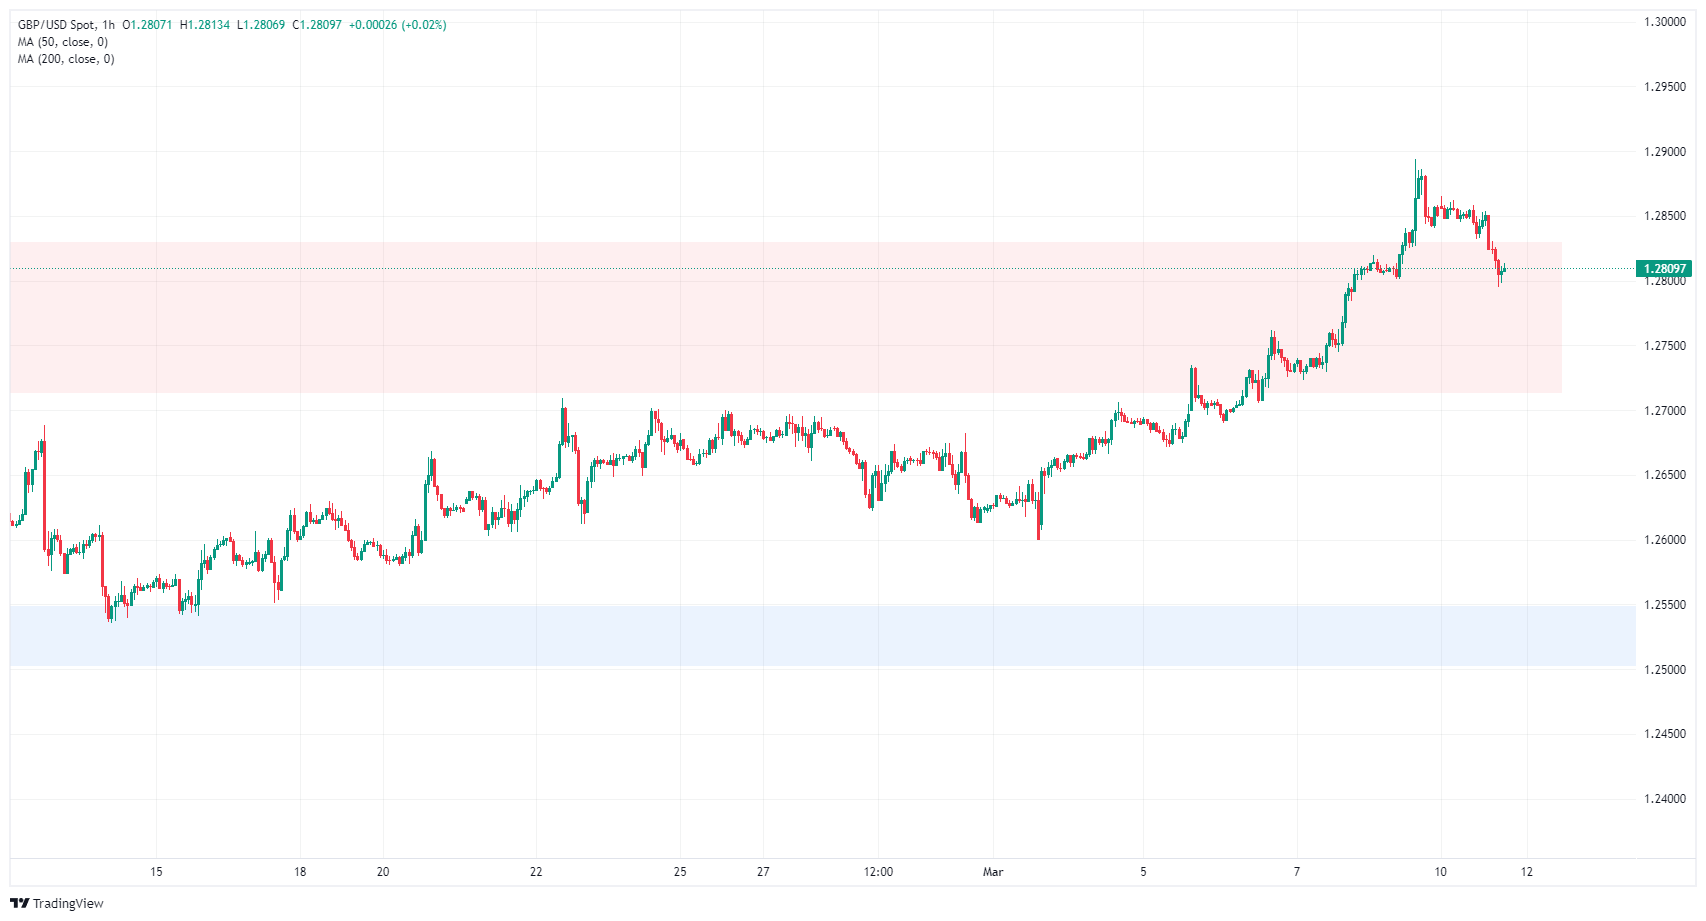
GBP/USD daily chart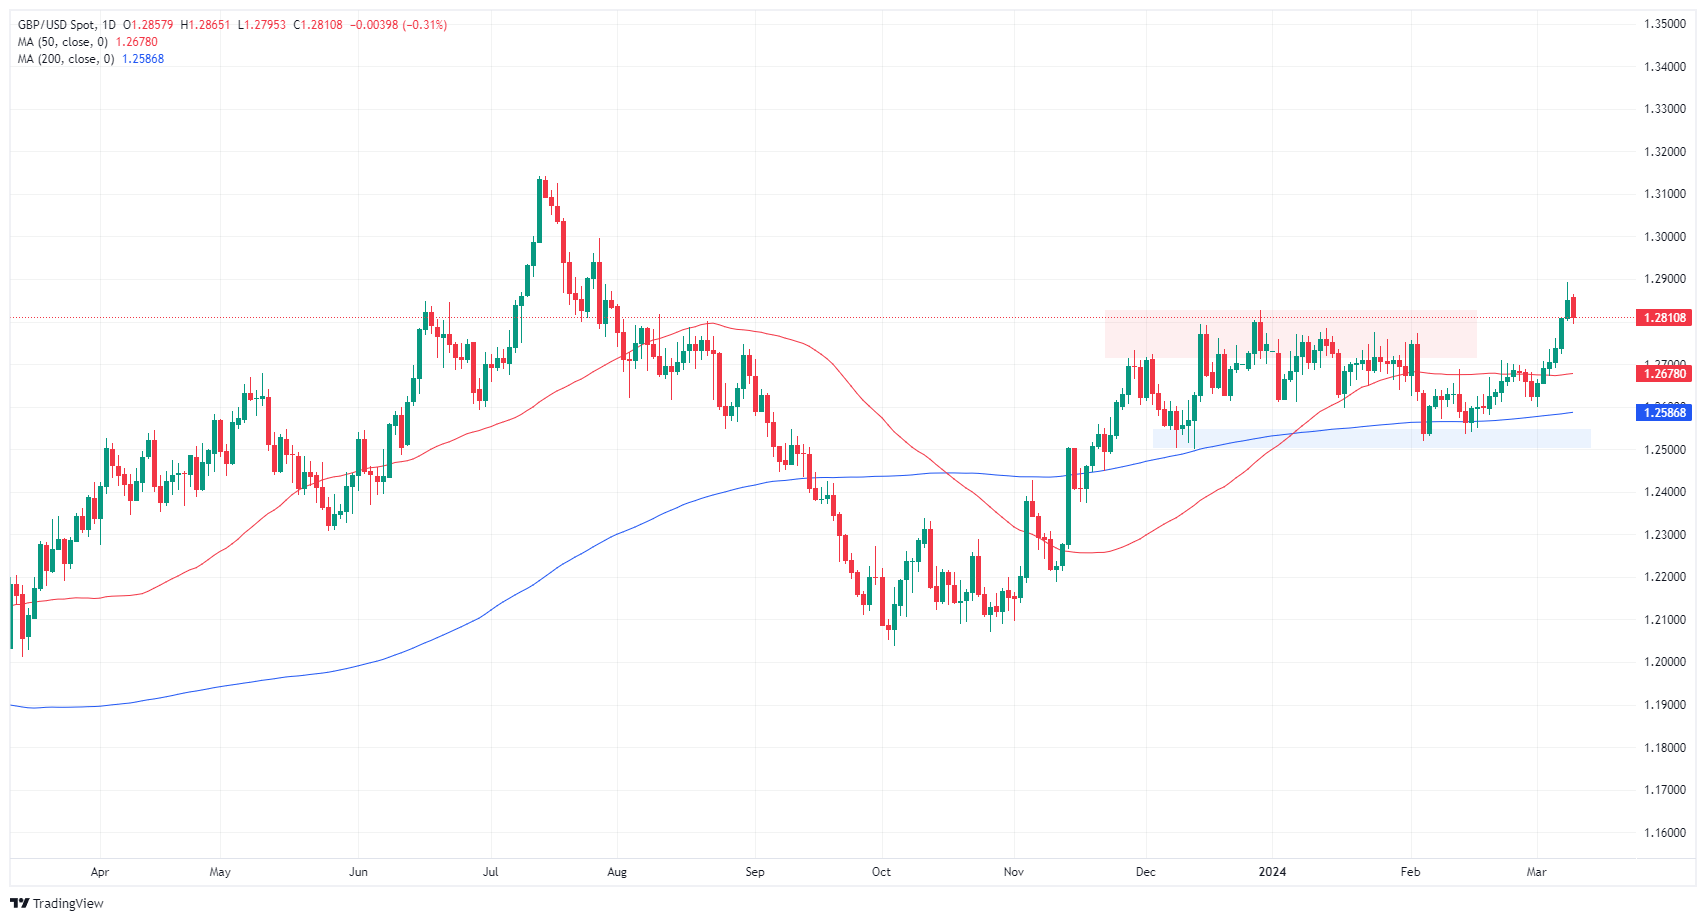
- Mexican Peso slips modestly against the US Dollar, reflecting cautious sentiment before US CPI release.
- US Dollar finds footing after last week's drop, bolstered by adjustments in Treasury yields.
- Industrial Production data looms for Mexico with forecasts pointing to a monthly decline alongside annual growth.
The Mexican Peso posts minimal losses against the US Dollar on Monday amid a risk-off impulse ahead of the release of the latest inflation report in the United States. The Greenback is rebounding off last week's losses, while US Treasury yields recovered some ground. The USD/MXN trades at 16.82, up 0.17%.
Mexico’s economic docket would feature Industrial Production on Tuesday, which is expected to drop -0.7% monthly and is estimated to grow by 2.2%. Across the border, the New York Fed revealed that inflation expectations for one year stood at 3% and for three years dropped from 2.7% to 2.4%. On Tuesday, the US Bureau of Labor Statistics (BLS) is expected to reveal February's Consumer Price Index (CPI).
Daily digest market movers: Mexican Peso buyers wait for US CPI; Fed rate cuts eyed in June
- Last week, Federal Reserve Chair Jerome Powell reiterated the Fed is not ready to cut rates until they (the Fed) are convinced that inflation is cooling down toward the 2% target.
- Data-wise, business activity in the sector segment in the US remained mixed, while Factory Orders plummeted. According to the ADP Employment Change report, the labor market cooled further, even though private hiring remained solid. January’s Nonfarm Payrolls report was revised downward, which triggered a reaction in the swaps market.
- A Reuters poll showed investors estimate the Fed to be the first central bank to cut rates in June.
- Meanwhile, 52 of 108 economists expect the Fed to cut rates by 75 basis points in 2024, with 26 saying 100 bps.
- A Reuters poll sees the Mexican Peso depreciating 7% to 18.24 in 12 months from 16.96 on Monday, according to the median of 20 FX strategists polled between March 1-4. The forecast ranged from 15.50 to 19.00.
- A Reuters poll shows 15 analysts estimate that inflation will slow down in February, corroborating bets that the Bank of Mexico (Banxico) could cut rates as soon as the March 21 meeting.
- Banxico’s private analysts' poll projections for February were revealed. They expect inflation at 4.10%, core CPI at 4.06%, and the economy to grow by 2.40%, unchanged from January. Regarding monetary policy, they see Banxico lowering rates to 9.50% and the USD/MXN exchange rate at 18.31, down from 18.50.
- During Banxico’s quarterly report, policymakers acknowledged the progress on inflation and urged caution against premature interest rate cuts. Governor Victoria Rodriguez Ceja said adjustments would be gradual, while Deputy Governors Galia Borja and Jonathan Heath called for prudence. The latter specifically warned against the risks of an early rate cut.
- Banxico updated its economic growth projections for 2024 from 3.0% to 2.8% YoY and maintained 1.5% for 2025. The slowdown is blamed on higher interest rates at 11.25%, which sparked a shift in three of the five governors of the Mexican Central Bank, who are eyeing the first rate cut at the March 21 meeting.
- The CME FedWatch Tool shows traders increased their bets for a 25-basis-point rate cut in June to 72%.
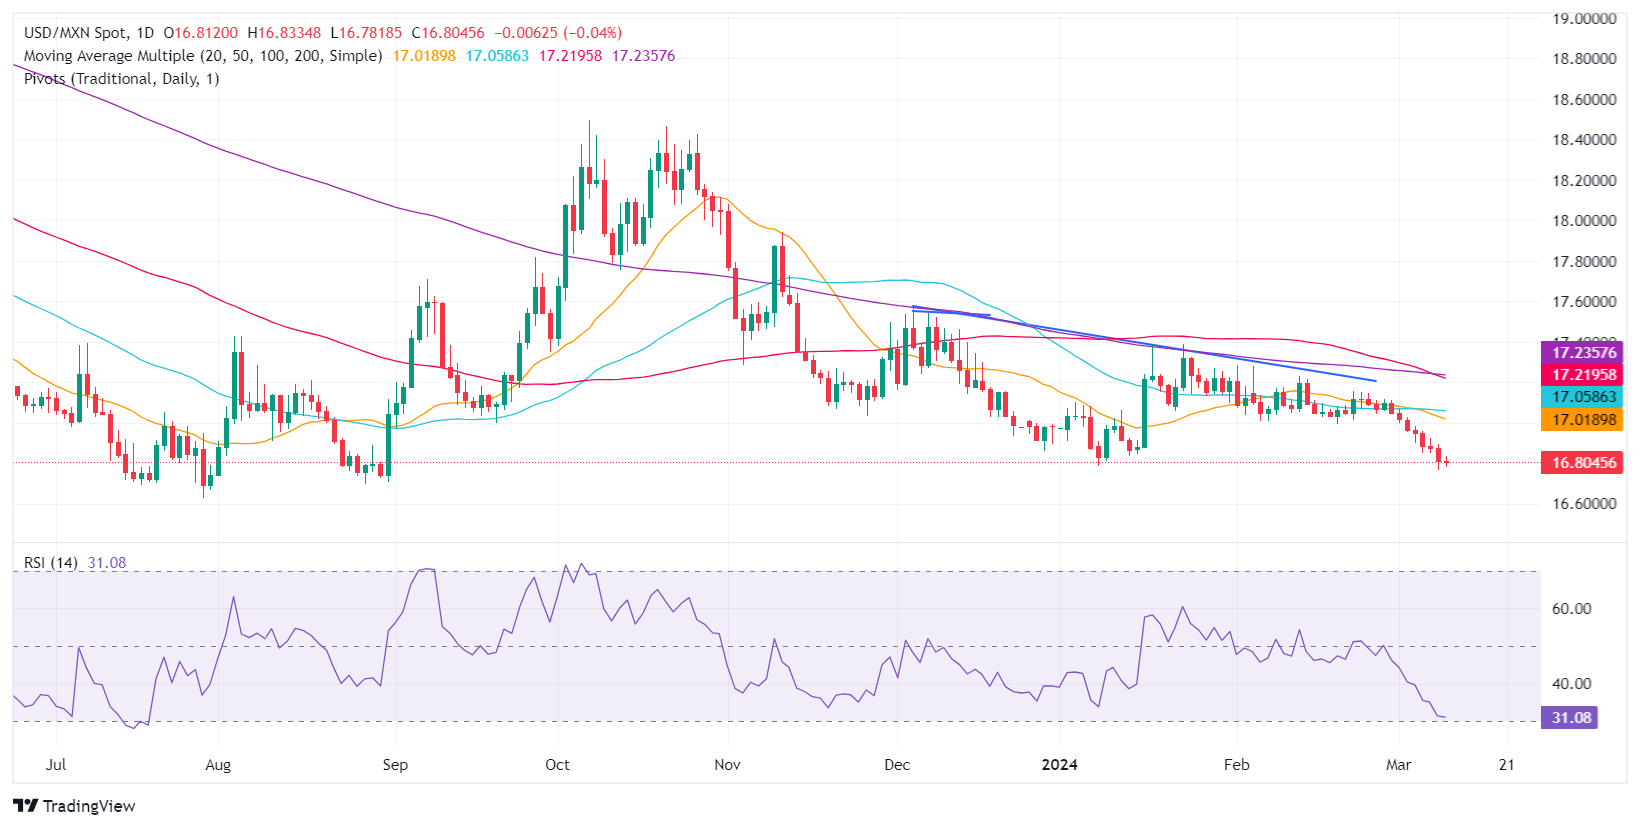
Technical analysis: Mexican Peso stays almost flat as USD/MXN hovers around 16.80
The USD/MXN is downwardly biased, though it appears to have bottomed out near 17.80. The Relative Strength Index (RSI) has edged up, but downside risks remain. If sellers push the prices below the current year-to-date (YTD) low of 16.76, that could pave the way for challenging last year’s low of 16.62.
On the other hand, if buyers reclaim the 17.00 figure, that could open the door to testing the 50-day Simple Moving Average (SMA) at 17.05, followed by the 200-day SMA at 17.23 and the 100-SMA at 17.24.
USD/MXN Price Action – Daily Chart
Mexican Peso FAQs
The Mexican Peso (MXN) is the most traded currency among its Latin American peers. Its value is broadly determined by the performance of the Mexican economy, the country’s central bank’s policy, the amount of foreign investment in the country and even the levels of remittances sent by Mexicans who live abroad, particularly in the United States. Geopolitical trends can also move MXN: for example, the process of nearshoring – or the decision by some firms to relocate manufacturing capacity and supply chains closer to their home countries – is also seen as a catalyst for the Mexican currency as the country is considered a key manufacturing hub in the American continent. Another catalyst for MXN is Oil prices as Mexico is a key exporter of the commodity.
The main objective of Mexico’s central bank, also known as Banxico, is to maintain inflation at low and stable levels (at or close to its target of 3%, the midpoint in a tolerance band of between 2% and 4%). To this end, the bank sets an appropriate level of interest rates. When inflation is too high, Banxico will attempt to tame it by raising interest rates, making it more expensive for households and businesses to borrow money, thus cooling demand and the overall economy. Higher interest rates are generally positive for the Mexican Peso (MXN) as they lead to higher yields, making the country a more attractive place for investors. On the contrary, lower interest rates tend to weaken MXN.
Macroeconomic data releases are key to assess the state of the economy and can have an impact on the Mexican Peso (MXN) valuation. A strong Mexican economy, based on high economic growth, low unemployment and high confidence is good for MXN. Not only does it attract more foreign investment but it may encourage the Bank of Mexico (Banxico) to increase interest rates, particularly if this strength comes together with elevated inflation. However, if economic data is weak, MXN is likely to depreciate.
As an emerging-market currency, the Mexican Peso (MXN) tends to strive during risk-on periods, or when investors perceive that broader market risks are low and thus are eager to engage with investments that carry a higher risk. Conversely, MXN tends to weaken at times of market turbulence or economic uncertainty as investors tend to sell higher-risk assets and flee to the more-stable safe havens.
- Markets are trading on the thin side as investors await key inflation print.
- Canada has a lean schedule on the economic calendar this week.
- CAD is softly higher across the board on quiet Monday but stuck on USD.
The Canadian Dollar (CAD) had a mild recovery on a quiet Monday, trading into the green against most of its major currency peers as broader markets hunkered down and waited for a push from US Consumer Price Index (CPI) inflation figures slated for Tuesday. Despite moderating into the high side overall, the CAD is stuck close to the day’s opening bids against the US Dollar (USD).
Canada is underrepresented on the economic calendar this week and sees strictly low-tier data releases in the back half of the trading week with Thursday’s January Manufacturing Sales and Friday’s Housing Starts for February. This week’s key data prints will be US CPI inflation for February, which is expected to ease slightly. Thursday will also bring US Retail Sales and a Producer Price Index update.
Daily digest market movers: Markets huddle ahead of another go around the US CPI inflation wheel
- On Monday, the New York Federal Reserve (Fed) noted that US 3-year inflation expectations rose to 2.7% in February, up from the previous 2.4%.
- US 5-year inflation expectations also rose, jumping to 2.9% from 2.5% as consumers turned less optimistic about the future. Near-term inflation expectations held at 3% in the aggregate.
- According to a poll of economists, the Fed is going to be the first of the major central banks to cut rates, with 72 of 108 responding economists saying a first cut will happen in June.
- 52 of 108 economists expect the Fed to cut rates by 75 basis points in 2024, with 26 saying 100 bps.
- Tuesday’s US CPI print is expected to be mixed. The headline MoM CPI is forecast to increase, while Core CPI figures are forecast to decline.
- February’s MoM CPI is expected to print at 0.4% versus the previous 0.3%.
- Core MoM CPI is forecast to tick lower to 0.3% from 0.4%.
- YoY CPI for the year ended February is expected to hold steady at 3.1%.
- MoM Core CPI (headline less volatile food and energy prices) is expected to ease slightly to 0.3% from the previous 0.4%.
Canadian Dollar price today
The table below shows the percentage change of Canadian Dollar (CAD) against listed major currencies today. Canadian Dollar was the strongest against the Pound Sterling.
| USD | EUR | GBP | CAD | AUD | JPY | NZD | CHF | |
| USD | 0.13% | 0.35% | -0.03% | 0.19% | 0.05% | 0.15% | 0.07% | |
| EUR | -0.14% | 0.21% | -0.18% | 0.06% | -0.09% | 0.01% | -0.07% | |
| GBP | -0.35% | -0.21% | -0.38% | -0.15% | -0.30% | -0.19% | -0.27% | |
| CAD | 0.02% | 0.14% | 0.36% | 0.20% | 0.04% | 0.13% | 0.08% | |
| AUD | -0.21% | -0.08% | 0.13% | -0.25% | -0.16% | -0.06% | -0.14% | |
| JPY | -0.05% | 0.06% | 0.52% | -0.10% | 0.16% | 0.09% | 0.00% | |
| NZD | -0.12% | 0.00% | 0.21% | -0.17% | 0.06% | -0.09% | -0.07% | |
| CHF | -0.09% | 0.07% | 0.28% | -0.09% | 0.13% | -0.04% | 0.06% |
The heat map shows percentage changes of major currencies against each other. The base currency is picked from the left column, while the quote currency is picked from the top row. For example, if you pick the Euro from the left column and move along the horizontal line to the Japanese Yen, the percentage change displayed in the box will represent EUR (base)/JPY (quote).
Technical analysis: USD/CAD propped up by supply zone, but 1.3500 remains a tricky barrier
The Canadian Dollar (CAD) was broadly higher on Monday, climbing four-tenths of a percent against the Pound Sterling (GBP) and about a third of a percent against the Australian Dollar (AUD). However, the CAD remains close to flat against the USD and the Japanese Yen (JPY).
USD/CAD caught a late bounce last Friday from a familiar supply zone near 1.3440, but 1.3500 remains a tricky handle for the pair, halting a technical recovery into last week’s highs near 1.3600. Despite a steady grind of higher highs, USD/CAD continues to struggle with rough congestion in the midrange as the pair cycles a wide rising range.
Monday’s rise and fall has USD/CAD hung up on the 200-day Simple Moving Average (SMA) at 1.3477. The pair continues to trade into the middle of a rough range since rising into the 1.3500 region in January. A downside break into 1.3400 opens the Loonie to further declines toward late 2023’s lows near 1.3200, while the immediate near-term ceiling sits at the 1.3600 handle.
USD/CAD hourly chart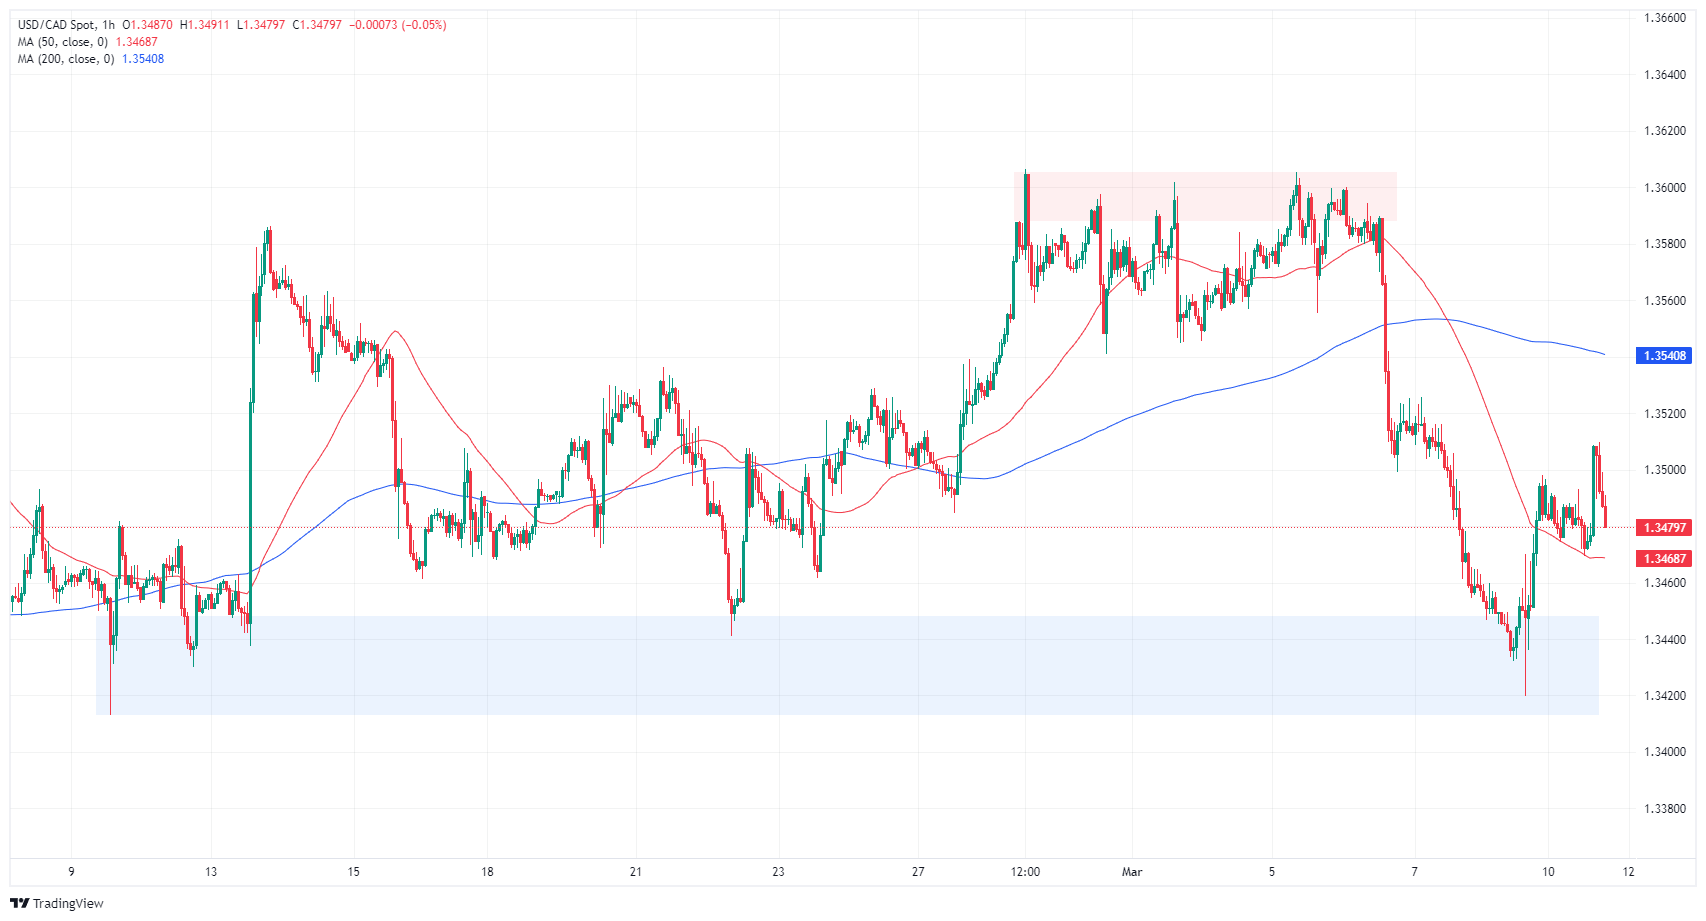
USD/CAD daily chart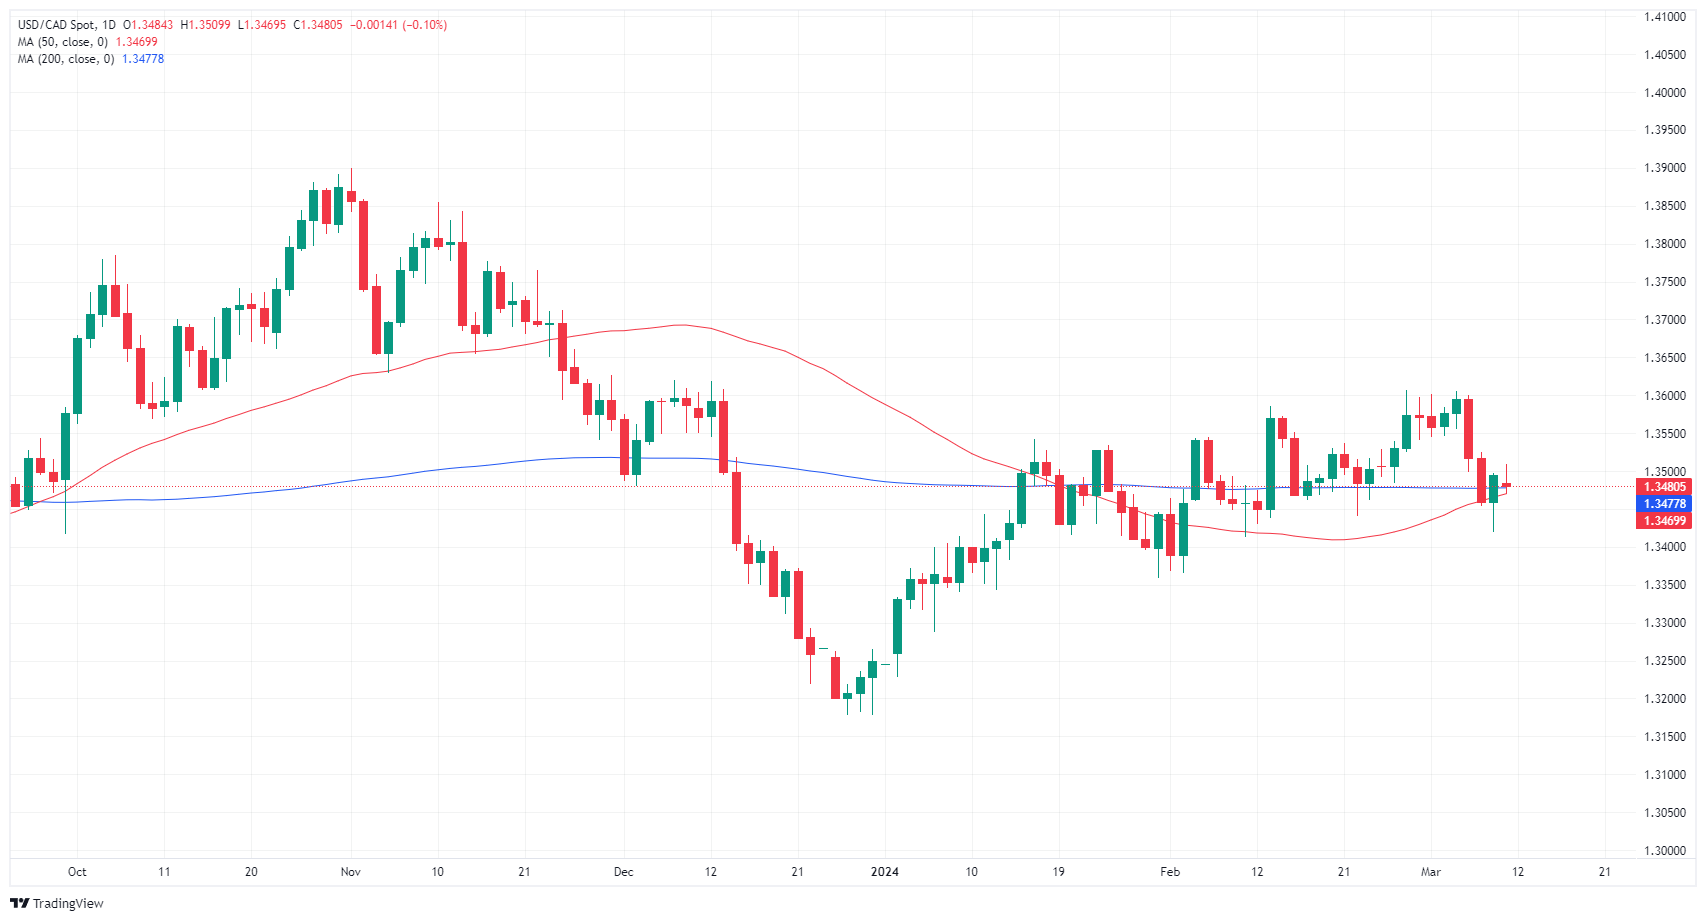
Canadian Dollar FAQs
The key factors driving the Canadian Dollar (CAD) are the level of interest rates set by the Bank of Canada (BoC), the price of Oil, Canada’s largest export, the health of its economy, inflation and the Trade Balance, which is the difference between the value of Canada’s exports versus its imports. Other factors include market sentiment – whether investors are taking on more risky assets (risk-on) or seeking safe-havens (risk-off) – with risk-on being CAD-positive. As its largest trading partner, the health of the US economy is also a key factor influencing the Canadian Dollar.
The Bank of Canada (BoC) has a significant influence on the Canadian Dollar by setting the level of interest rates that banks can lend to one another. This influences the level of interest rates for everyone. The main goal of the BoC is to maintain inflation at 1-3% by adjusting interest rates up or down. Relatively higher interest rates tend to be positive for the CAD. The Bank of Canada can also use quantitative easing and tightening to influence credit conditions, with the former CAD-negative and the latter CAD-positive.
The price of Oil is a key factor impacting the value of the Canadian Dollar. Petroleum is Canada’s biggest export, so Oil price tends to have an immediate impact on the CAD value. Generally, if Oil price rises CAD also goes up, as aggregate demand for the currency increases. The opposite is the case if the price of Oil falls. Higher Oil prices also tend to result in a greater likelihood of a positive Trade Balance, which is also supportive of the CAD.
While inflation had always traditionally been thought of as a negative factor for a currency since it lowers the value of money, the opposite has actually been the case in modern times with the relaxation of cross-border capital controls. Higher inflation tends to lead central banks to put up interest rates which attracts more capital inflows from global investors seeking a lucrative place to keep their money. This increases demand for the local currency, which in Canada’s case is the Canadian Dollar.
Macroeconomic data releases gauge the health of the economy and can have an impact on the Canadian Dollar. Indicators such as GDP, Manufacturing and Services PMIs, employment, and consumer sentiment surveys can all influence the direction of the CAD. A strong economy is good for the Canadian Dollar. Not only does it attract more foreign investment but it may encourage the Bank of Canada to put up interest rates, leading to a stronger currency. If economic data is weak, however, the CAD is likely to fall.
- Investors await US inflation data to shape their expectation of easing cycle pace.
- The consensus sees the easing cycle initiation from June after mixed NFP data on Friday.
- The US won’t release any relevant reports in Monday's session.
The US Dollar Index (DXY) is trading at 102.80 with mild gains in Monday’s session. Despite Powell's dovish tone and mixed employment figures, the Federal Reserve's (Fed) future stance on easing interest rates is expected to be influenced largely by US inflation data scheduled for release on Tuesday.
The US labor market saw a mixed performance in February. Despite the Unemployment Rate increasing, earnings figures mildly eased, while the job creation pace accelerated. Easing expectations didn’t see major changes, and the consensus still expects the first cut from the Fed in June.
Daily digest market movers: DXY sees some upside as markets brace for CPI
- The dual effect of Powell's speech coupled with mixed employment data seems to cap any upward movement of the USD.
- Investors keep their expectations steady for a June interest rate cut by the Fed, predicting a total easing of 100 basis points for this year.
- This week's data poses a lopsided risk for the Greenback as weakened inflation or Retail Sales data from February will further support the argument for a June rate cut.
- US Treasury bond yields are on the rise, trading at 4.51%, 4.07%, and 4.09% for the 2-year, 5-year and 10-year bonds, respectively.
DXY technical analysis: DXY displays a hint of bullish resurgence, bears still in charge
The indicators on the daily chart reflect a mixed sentiment in the market. The Relative Strength Index (RSI) remains in negative territory, but the positive slope posits a hint of bullish resurgence, indicating that the selling momentum could be weakening.
While the Moving Average Convergence Divergence (MACD) is in an area of flat red bars, this too implies that bears are losing their selling edge, possibly paving the way for a minor bullish correction.
The Simple Moving Averages (SMAs) scenario further emphasizes the bearish trend, with DXY charting beneath the 20, 100 and 200-day Simple Moving Averages. This underpins the dominant bearish market structure, but simultaneous signs of a bullish reversal cannot be utterly discounted.
Still, after losing 1% last week, the short-term outlook for the DXY remains more inclined to the bearish side. However, bears seem to be taking a breather, and if the bullish indications strengthen, buyers might attempt to seize control in the near future.
US Dollar FAQs
What is the US Dollar?
The US Dollar (USD) is the official currency of the United States of America, and the ‘de facto’ currency of a significant number of other countries where it is found in circulation alongside local notes. It is the most heavily traded currency in the world, accounting for over 88% of all global foreign exchange turnover, or an average of $6.6 trillion in transactions per day, according to data from 2022.
Following the second world war, the USD took over from the British Pound as the world’s reserve currency. For most of its history, the US Dollar was backed by Gold, until the Bretton Woods Agreement in 1971 when the Gold Standard went away.
How do the decisions of the Federal Reserve impact the US Dollar?
The most important single factor impacting on the value of the US Dollar is monetary policy, which is shaped by the Federal Reserve (Fed). The Fed has two mandates: to achieve price stability (control inflation) and foster full employment. Its primary tool to achieve these two goals is by adjusting interest rates.
When prices are rising too quickly and inflation is above the Fed’s 2% target, the Fed will raise rates, which helps the USD value. When inflation falls below 2% or the Unemployment Rate is too high, the Fed may lower interest rates, which weighs on the Greenback.
What is Quantitative Easing and how does it influence the US Dollar?
In extreme situations, the Federal Reserve can also print more Dollars and enact quantitative easing (QE). QE is the process by which the Fed substantially increases the flow of credit in a stuck financial system.
It is a non-standard policy measure used when credit has dried up because banks will not lend to each other (out of the fear of counterparty default). It is a last resort when simply lowering interest rates is unlikely to achieve the necessary result. It was the Fed’s weapon of choice to combat the credit crunch that occurred during the Great Financial Crisis in 2008. It involves the Fed printing more Dollars and using them to buy US government bonds predominantly from financial institutions. QE usually leads to a weaker US Dollar.
What is Quantitative Tightening and how does it influence the US Dollar?
Quantitative tightening (QT) is the reverse process whereby the Federal Reserve stops buying bonds from financial institutions and does not reinvest the principal from the bonds it holds maturing in new purchases. It is usually positive for the US Dollar.
EUR/USD has been pushing higher since mid-February. Economists at Rabobank analyze the pair’s outlook.
Similar policy responses between both the Fed and the ECB to limit volatility in the months ahead
The Greenback is still significantly weaker than the levels traded at the start of last week. This raises the question as to whether the USD has further ground to give or whether USD buyers will be tempted to re-enter the fray. Today’s better tone suggests that the latter may be more likely.
The next technical resistance is at last week’s high in the 1.9070/1.0980 area ahead of the psychologically important 1.1000 level.
The potential for similar policy responses between both the Fed and the ECB this year has the potential to limit volatility in EUR/USD in the months ahead. That said, as we move into H2, the market is likely to be increasingly focused on the US election and on the outlook for growth and interest rate differentials into 2025.
- EUR/USD is in a short-term uptrend since rising up from the February lows in the 1.06s.
- The pair is currently undergoing a pullback within that uptrend.
- If it finds a floor, it will likely consolidate and then resume rallying.
EUR/USD has corrected back from its 1.0981 peak, established on Friday, to trade in the 1.0920s at the time of publication.
Despite the correction, the pair remains in a short-term uptrend with peaks and troughs making consistently higher highs and higher lows on the 4-hour chart. This overall still favors bullish bets.
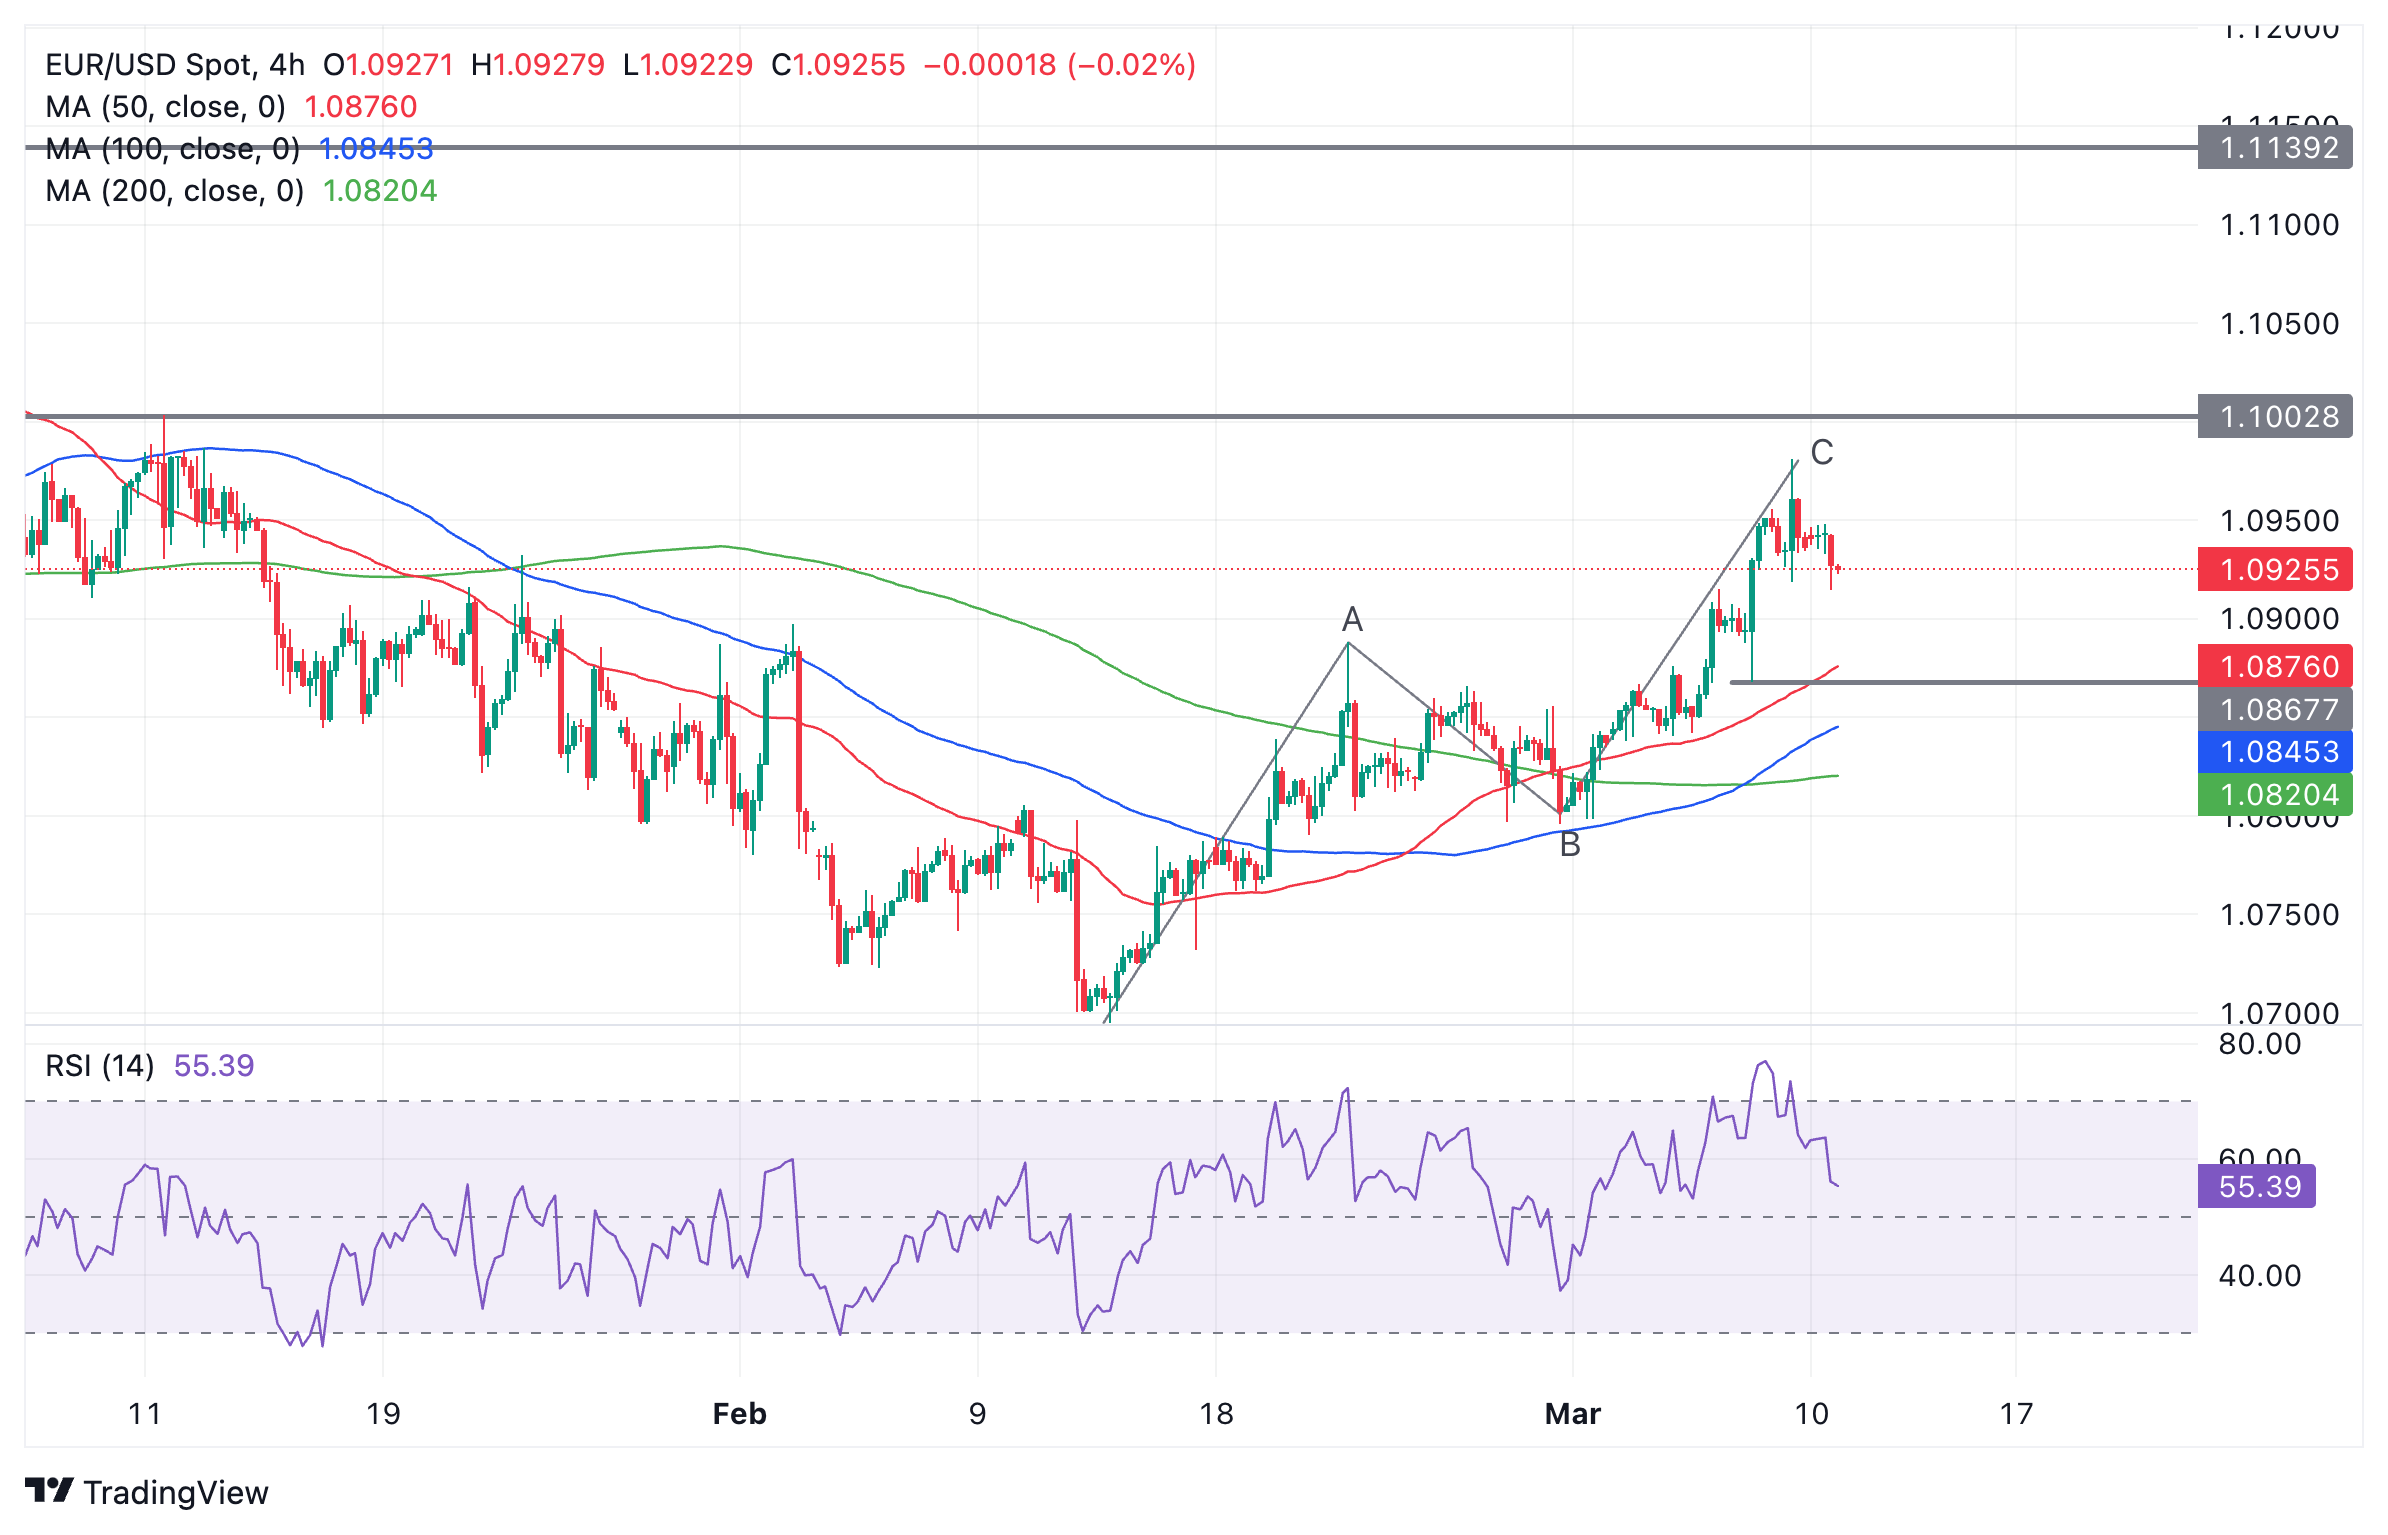
Euro vs US Dollar: 4-hour chart
The EUR/USD pair completed what is probably a three-wave ABC pattern or “Measured Move” at Friday’s highs and this, combined with the exit from overbought seen on the Relative Strength Index (RSI) suggests a pullback was underway.
It is not yet clear whether this pullback has completed. It is still possible it could correct further, perhaps, to as low as support in the 1.0860s. However, given the uptrend bias, price will probably eventually find a floor, recover and resume climbing.
A short-term reversal pattern such as a bullish candlestick reversal pattern would provide a clue the uptrend was restarting.
A break above the 1.0981 high of March 8 would provide a strong signal the bull trend was evolving into a new wave of buying. The tough resistance expected at 1.1000, however, could see such an up move short-lived unless supported by compelling fundamentals. At 1.1000 a battle is likely to ensue between bulls and bears, with more volatility.
A clear and decisive break above 1.1000, however, would open the gates to further gains towards the next key resistance level at 1.1139, the December 2023 high. Such a decisive break would be characterized by a long green bar breaking clearly above the level and closing near its high or three green bars in a row, breaking through the level.
Alternatively, a break below 1.0850, would indicate the short-term trend had reversed and momentum was now moving south, favoring bears instead.
The US Bureau of Labor Statistics (BLS) will release the most important inflation measure, the US Consumer Price Index (CPI) figures, on Tuesday, March 12 at 12:30 GMT. As we get closer to the release time, here are the forecasts by the economists and researchers of 10 major banks regarding the upcoming United States inflation print for February.
Headline prices are expected to have risen 0.4% month-on-month vs. the prior release of 0.3% and to remain steady at 3.1% year-on-year. Core CPI, which excludes volatile energy and food data, is set to show an increase of 0.3% MoM in February, slower than 0.4% in January. Yearly, a deceleration of two ticks from 3.9% to 3.7% is expected.
Wells Fargo
We expect the data to show that while inflation remains frustratingly high, the underlying trend is not strengthening. Headline CPI likely rose 0.4% in February, fueled in part by a jump in gasoline prices, which would keep the year-over-year rate at 3.1%. Core CPI, however, likely moderated in February; we look for a 0.3% monthly gain and for the YoY rate to edge down to 3.7%. While goods deflation was likely less pronounced in February, we expect to see a smaller increase in core services relative to January. Owners' equivalent rent growth should continue to trend lower despite January's pop, while we see less chance of residual seasonality boosting services in February. Nevertheless, with the core CPI likely to be running at a 3.9% annualized pace in the three months through February, the Fed is likely to be searching for more confidence that inflation is on course to return to target on a sustained basis for a little while longer.
ANZ
We expect core CPI inflation to have risen 0.3% MoM in February, with higher energy prices pushing headline up by 0.5% MoM. Supercore and rent inflation surprised to the upside in January. Some reversal is expected in February, though lingering seasonality in supercore suggests it may be modest. There remains a sizable net excess demand for labour despite an easing over the past year thanks largely to increased labour supply Further closure of the gap between demand and supply will probably need to come from weaker demand. Although Fed officials are encouraged by the easing in inflation over the past year, it remains too high and progress has been uneven across different inflation components. FOMC officials need more confidence that inflation is returning to 2% before considering rate cuts.
TDS
Our forecasts for the February CPI report suggest core inflation slowed to a 0.3% MoM pace after posting an acceleration to 0.4% in the last report. In terms of the headline, we expect CPI prices to print a firmer 0.4% MoM increase as energy inflation rebounded in February. on a YoY basis we look for headline CPI to stay unchanged at 3.1% YoY, but to decelerate for the core to 3.7% from 3.9% YoY in January.
Commerzbank
We expect the core rate in February to be lower than in the previous month at 0.3%, but still relatively high. Across all goods and services, however, prices are likely to have risen by as much as 0.4%, which is more than in January. This is because while gasoline prices fell at the beginning of the year, they have recently risen again. Within the US Federal Reserve, these figures would certainly give a boost to those who want to see more convincing evidence that inflation is easing before cutting interest rates. We continue to believe that the markets have priced in excessive rate cuts.
Deutsche Bank
We expect headline CPI at 0.41% to grow faster than core at +0.30%. This would bring YoY core CPI two-tenths lower to 3.7%, with headline flat at 3.1%. Of some concern would be the three-month annualised rate 'only' ticking down a tenth to 3.9% while the six-month annualised rate would rise a tenth to 3.7%.
NBF
The energy component is likely to have had a positive impact on the headline index given the rise in gasoline prices during the month. This, combined with a decent gain in shelter costs, should result in a 0.4% increase in headline prices. YoY rate could remain unchanged at 3.1%. The advance in core prices could have been slightly more subdued (+0.3% MoM) thanks in part to another weak print in the core goods segment. This monthly gain should allow the annual rate to come down two ticks to 3.7%, its lowest level in nearly three years.
RBC Economics
We look for a softer price report for February with consumer price index growth holding at 3.1% on higher energy prices, but slower ‘core’ (excluding food and energy) price growth. Gasoline prices jumped 4.4% by our count in February and food prices should continue to edge higher from last month, albeit at a slower rate. Core inflation is expected to slow to 3.7% from a year ago on a 0.3% increase from January. Shelter costs still account for a disproportionate share of the price growth and that is expected to continue slowing as moderation in home rent growth passes through to lease renewals.
SocGen
This month’s CPI release, for February, is more likely to show a jump of 0.4% in the headline reading, mostly due to energy. Our precise calculation is between 0.3%-0.4% with a round up. Markets might be willing to look past the headline figure if the core and recent core readings were tame. Unfortunately, January's core CPI was up 0.4%, and there is a reasonable risk that core CPI for February will be as high as 0.3%. Rents remain the biggest challenge to falling CPI inflation. We anticipate a 0.4% owners’ equivalent rent increase for February after a 0.6% increase in January.
Citi
Following a surprisingly strong 0.39% MoM increase in core CPI in January, we expect another solid 0.33% increase in February although with slightly different details – a more modest 0.1% decline in core goods prices in February but with strong services prices overall, although with a more modest 0.45% increase in core non-shelter services after a very strong 0.85% increase last month. Shelter inflation should also remain strong, although we expect a more modest 0.50% increase in owners’ equivalent rent in February and a 0.38% increase in primary rents. Headline CPI should rise 0.5% MoM (0.46% unrounded) and remain at 3.1% YoY with strength in energy prices.
CIBC
Are we on the cusp of a second inflation surge? We don’t think so. Our expectation for the February CPI print is a headline and core reading of 0.3% MoM. Underpinning this assumption is that the January wage and price resetting that occurred throughout the economy – which may have been juiced by the strength of the economy and residual seasonality – is done. That should mean a cooler non-housing services print in the month. Shelter could remain hot but goods prices will stay in deflationary territory. That’s not the composition Chair Powell would love, but with the economy humming along and the overall level of core inflation in a reasonable range, the Fed has time on the clock to get a more sustainable composition of inflation.
- USD/JPY enters oversold territory suggesting the chance of a pullback.
- The pair has fallen rapidly over recent weeks due to expectations the BoJ will raise interest rates,
- The pair is now probably in a short-term downtrend, favoring bears.
USD/JPY is trending lower since peaking in mid February. It has fallen about $4.00 since Valentine’s Day and is currently trading in the upper 146.00s.
Expectations that the Bank of Japan (BoJ) will raise its base interest rates from negative levels are fueling a rally in the Yen. The country could even be exiting the moribund growth trend of the last 30 years, analysts at Rabobank hypothesize.
Combined with a weaker US Dollar, which has been falling on the expectation the Federal Reserve (Fed) is moving closer to cutting interest rates – made more certain by a string of dismal employment data – has led USD/JPY’s charge down.
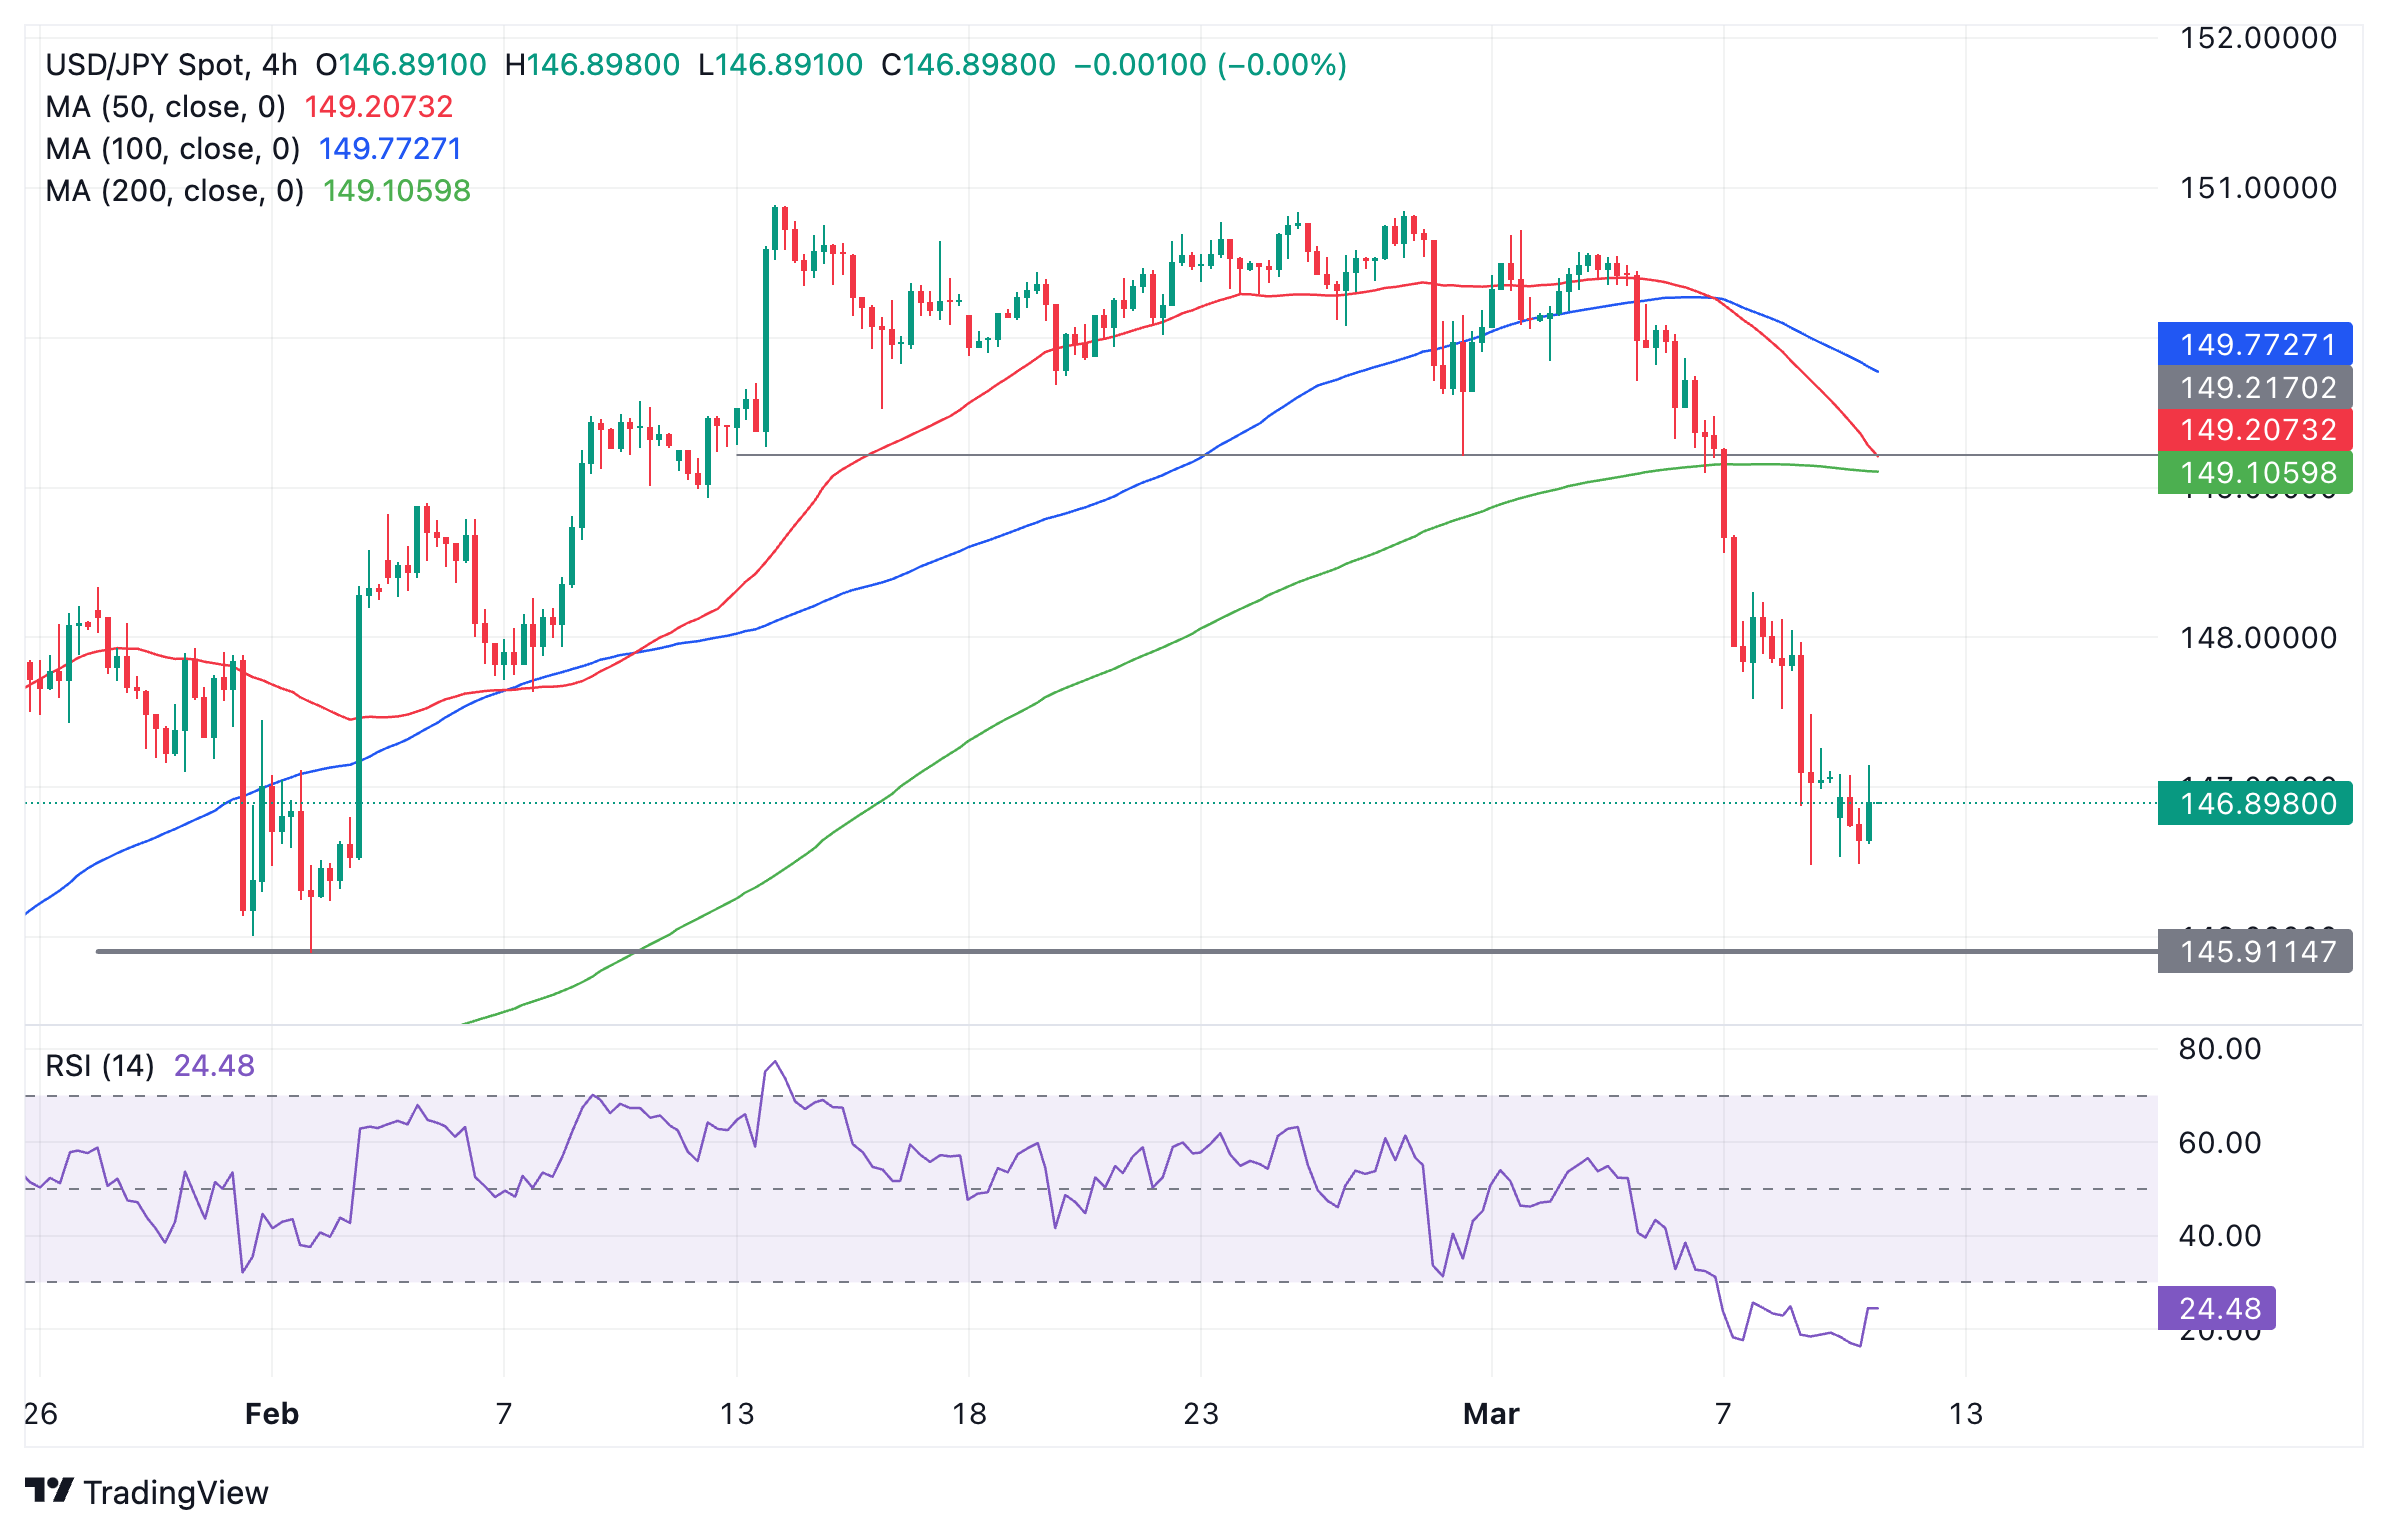
US Dollar vs Japanese Yen: 4-hour chart
The pair has fallen so swiftly and deeply that it is now probably in a short-term downtrend, which overall favors bearish bets.
There are some caveats, however, to the bearish outlook.
The pair has declined so much in recent sessions it has now entered the oversold zone on the Relative Strength Index (RSI), on the 4-hour chart. This suggests the risk of a pullback evolving.
When RSI enters oversold the advice is for traders not to add any new bearish bets to their positions, however, neither should they close their existing shorts.
They should only close existing shorts and open longs when the RSI exits oversold and starts rising again.
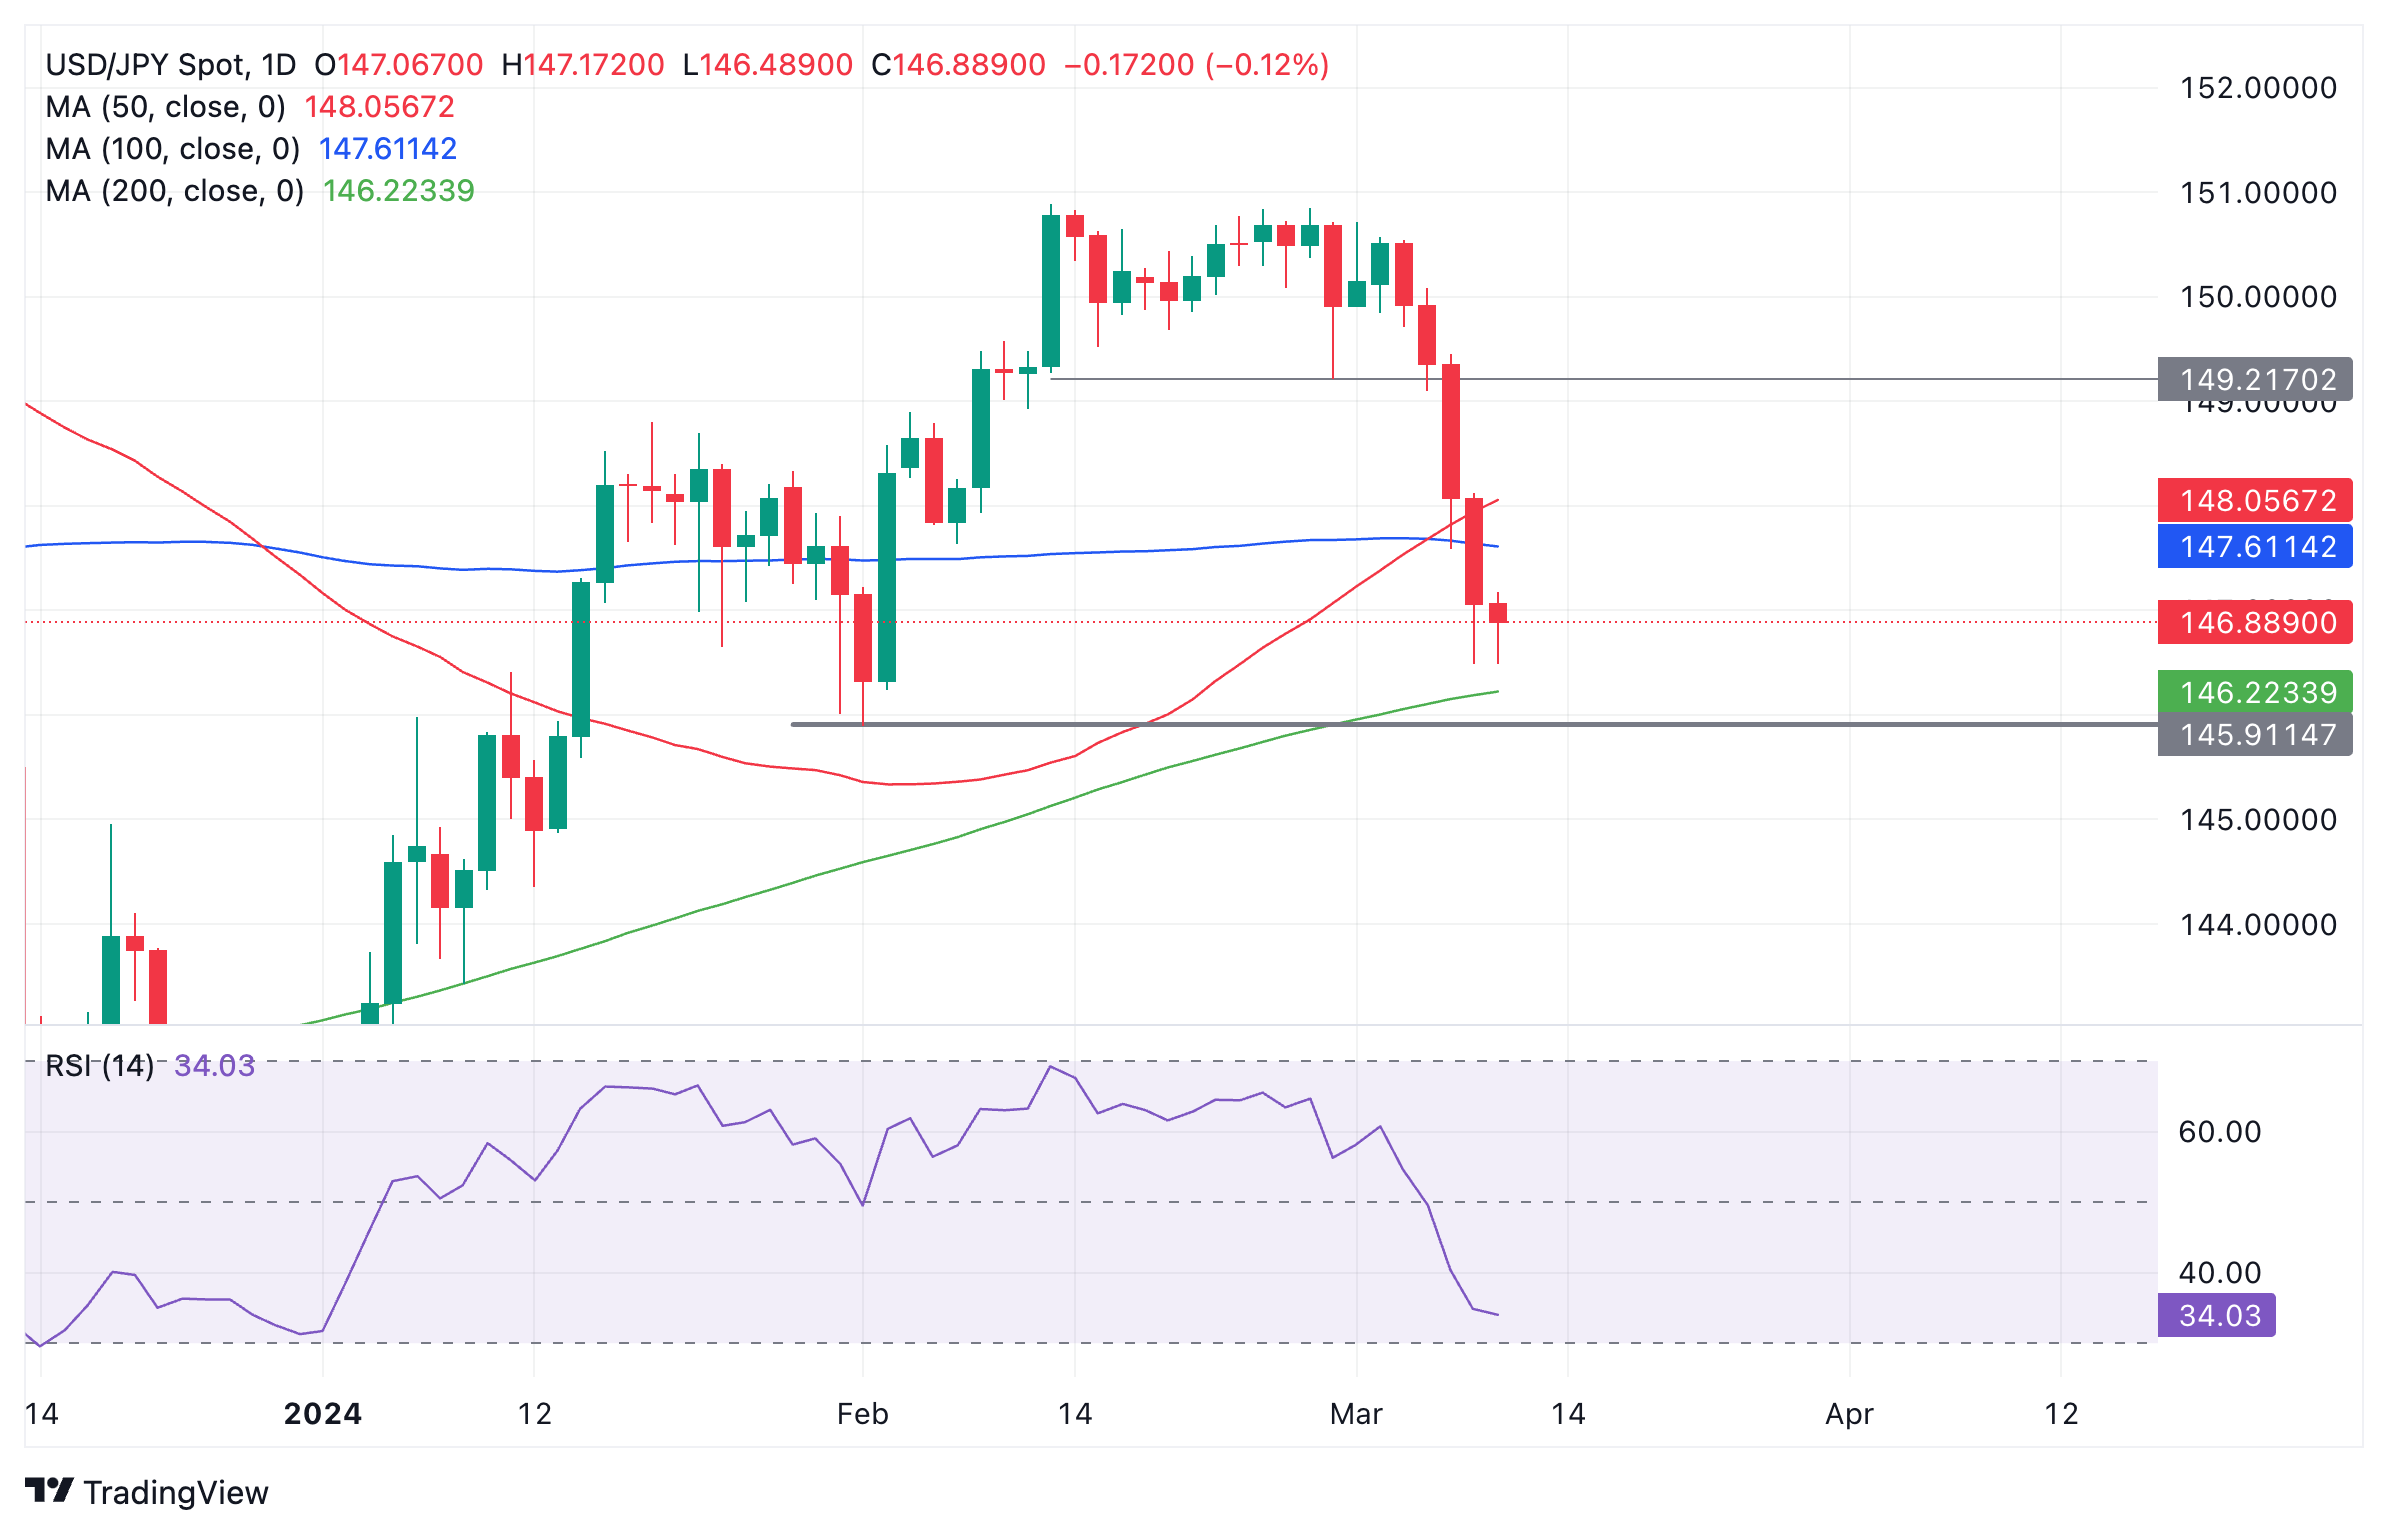
US Dollar vs Japanese Yen: Daily chart
A move higher would probably soon encounter resistance in the region of 147.60-148.00 where the 100 and 50-day Simple Moving Averages (SMA) are situated.
Given the pair is now in a short-term downtrend, however, it will probably eventually rollover and start falling again, back down to the 146.48 March 8 lows.
If the pair breaks below the 146.48 lows it will probably fall to support at the 146.22 and the 200-day SMA, followed by 145.89, the February 1 low.
Gold closed at a new record-high of $2,178 on Friday after trading above $2,200 briefly. Scope for additional gains will increasingly rely on macro trends, economists at TD Securities say.
Gold prices can still firm further, but additional gains will now rely more heavily on macro tailwinds
The risk-reward in Gold markets has deteriorated following the sharp rally.
Macro traders still appear somewhat underpositioned for a Fed cutting cycle, but the striking dislocation in their positioning relative to rates market pricing has now largely dissipated with markets expecting fewer cuts and as discretionary traders were forced to cover a large chunk of their net short.
The extreme buying activity from Shanghai traders also appears to be running out of steam.
Gold prices can still firm further, but the additional gains will now rely more heavily on macro tailwinds, which dampens the risk-reward from current levels.
Domestic macro developments may see downside risks to the Euro (EUR), but upside risks for the Canadian Dollar (CAD), in the view of economists at HSBC.
EUR likely to weaken modestly against the USD in the months ahead
The USD/CAD seems to have started tracking its rate differentials again. We still expect the pair to grind lower over the course of the year, as the domestic growth-inflation mix and the possibility of more fiscal stimulus in Canada over the next three years would add cyclical support to the CAD.
The EUR is likely to weaken modestly against the USD in the months ahead, amid slowing improvement in the Eurozone’s external balances, and alongside continued economic disappointments in the region.
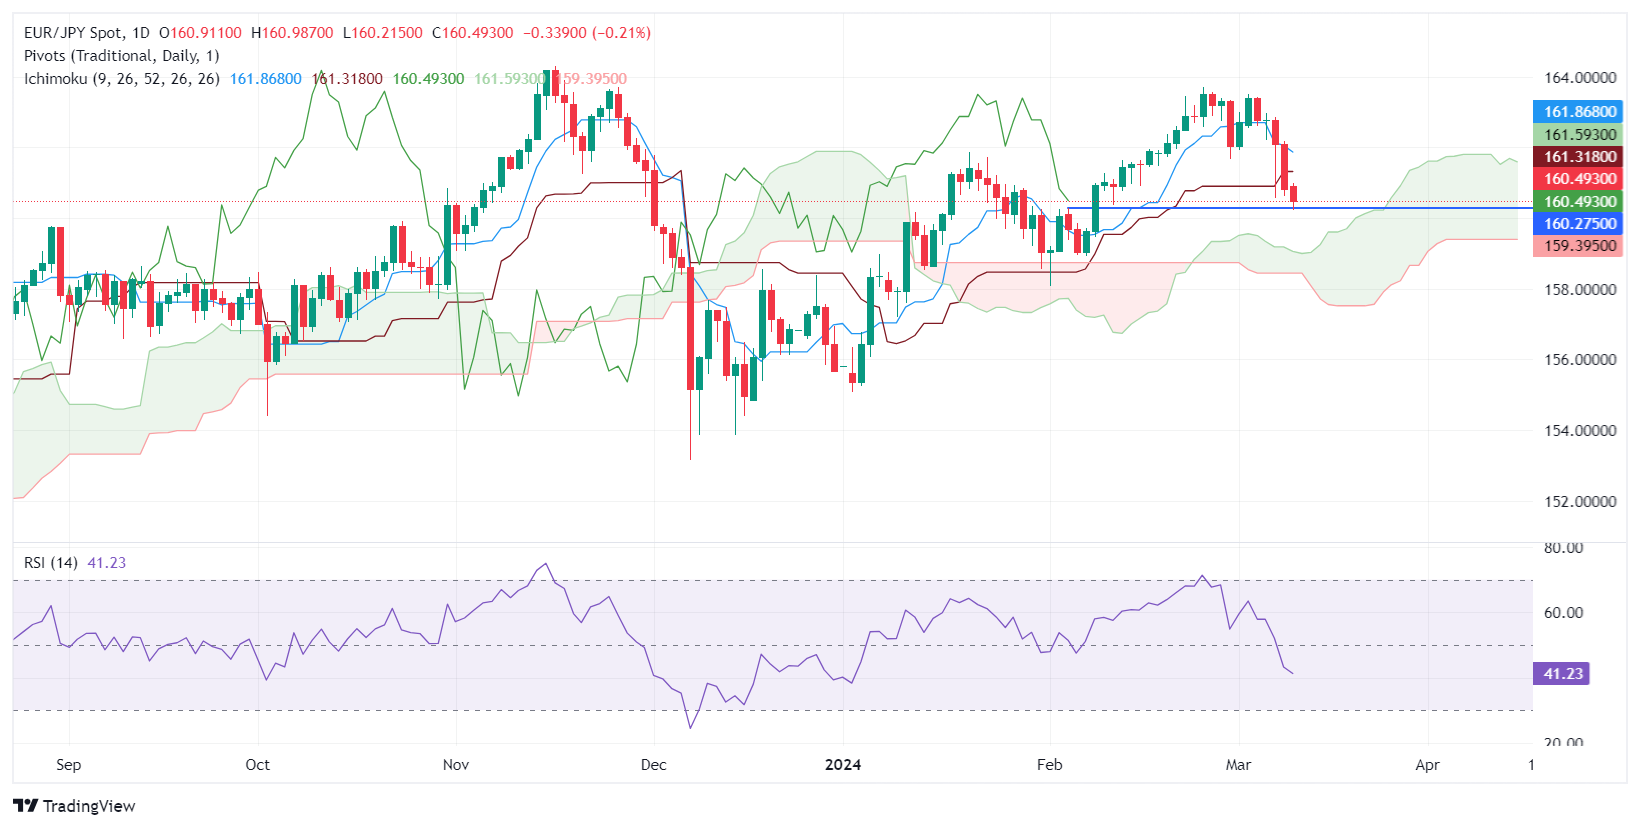
- EUR/JPY retreats, influenced by potential changes in BoJ's monetary policy and wage negotiation outcomes.
- Japan's GDP outperforms expectations, stoking anticipations for a BoJ rate adjustment in the near future.
- ECB's hawkish tone tempers immediate easing expectations, with policy shifts eyed for June amidst inflation concerns.
The Euro registered losses against the Japanese Yen in the morning of the North American session. It was down 0.13% and traded at 160.55 after hitting a daily high below the 161.00 mark. Rumors that the Bank of Japan (BoJ) could end negative rates sponsored a neg-down in the EUR/JPY pair.
Euro dips against Yen on growing speculations over BoJ rate hikes
According to sources cited by Reuters, some BoJ policymakers are considering ending the negative rate. Officials are eyeing wage negotiations between big companies and unions on March 13. A significant increase in salaries could increase the odds of a rate hike by the BoJ as soon as the March 18-19 meeting.
Data-wise, the Gross Domestic Product (GDP) in Japan for the last quarter of 2023 indicated the economy dodged a recession, coming at 0.1% QoQ, exceeding estimates and the prior’s reading at -0.1%. Annually based, GDP was 0.4%, less than expected, above the previous estimate of -0.4%.
In the Euro area (EU), the European Central Bank (ECB) held rates unchanged at last Thursday's meeting, though ECB President Christine Lagarde opened the door to easing policy in June. Initially, the EUR/JPY paired its losses, but it resumed its downtrend last Friday and carried onto Monday’s session.
During the European session, ECB’s Kazimir delivered hawkish remarks, pushing the first rate cut until June. He acknowledged that risks of inflation are “alive and kicking.” He added that discussions should already start and favor a “smooth and steady” cycle of policy easing.
EUR/JPY Price Analysis: Technical outlook
Since last week, the EUR/JPY has extended its losses to more than 1.70%, breaking key support levels like the Tenkan and Kijun Sen, and the psychological 161.00 level. If sellers remain in charge, the pair could aim towards the top of the Ichimoku Cloud (Kumo) at 158.90/159.00, though firstly a break of the 160.00 mark is a must. On the other hand, if buyers move in and push the exchange rate above 161.00, look for a test of the Kijun-Sen at 161.31.
For the week ahead, investors chasing a rally in EUR/USD above 1.1000 will brace for US Consumer Price Index (CPI) report and US Retail Sales, economists at Société Générale say
Path to 1.1000 for EUR/USD?
For EUR/USD, an acceleration to 1.1000 will most likely depend on US CPI, if not Retail Sales.
For GBP/USD, the break of 1.2865 is technically relevant and brings 1.3000 into play. United Kingdom wage data on Tuesday will be a crucial input for the Bank of England (BoE).
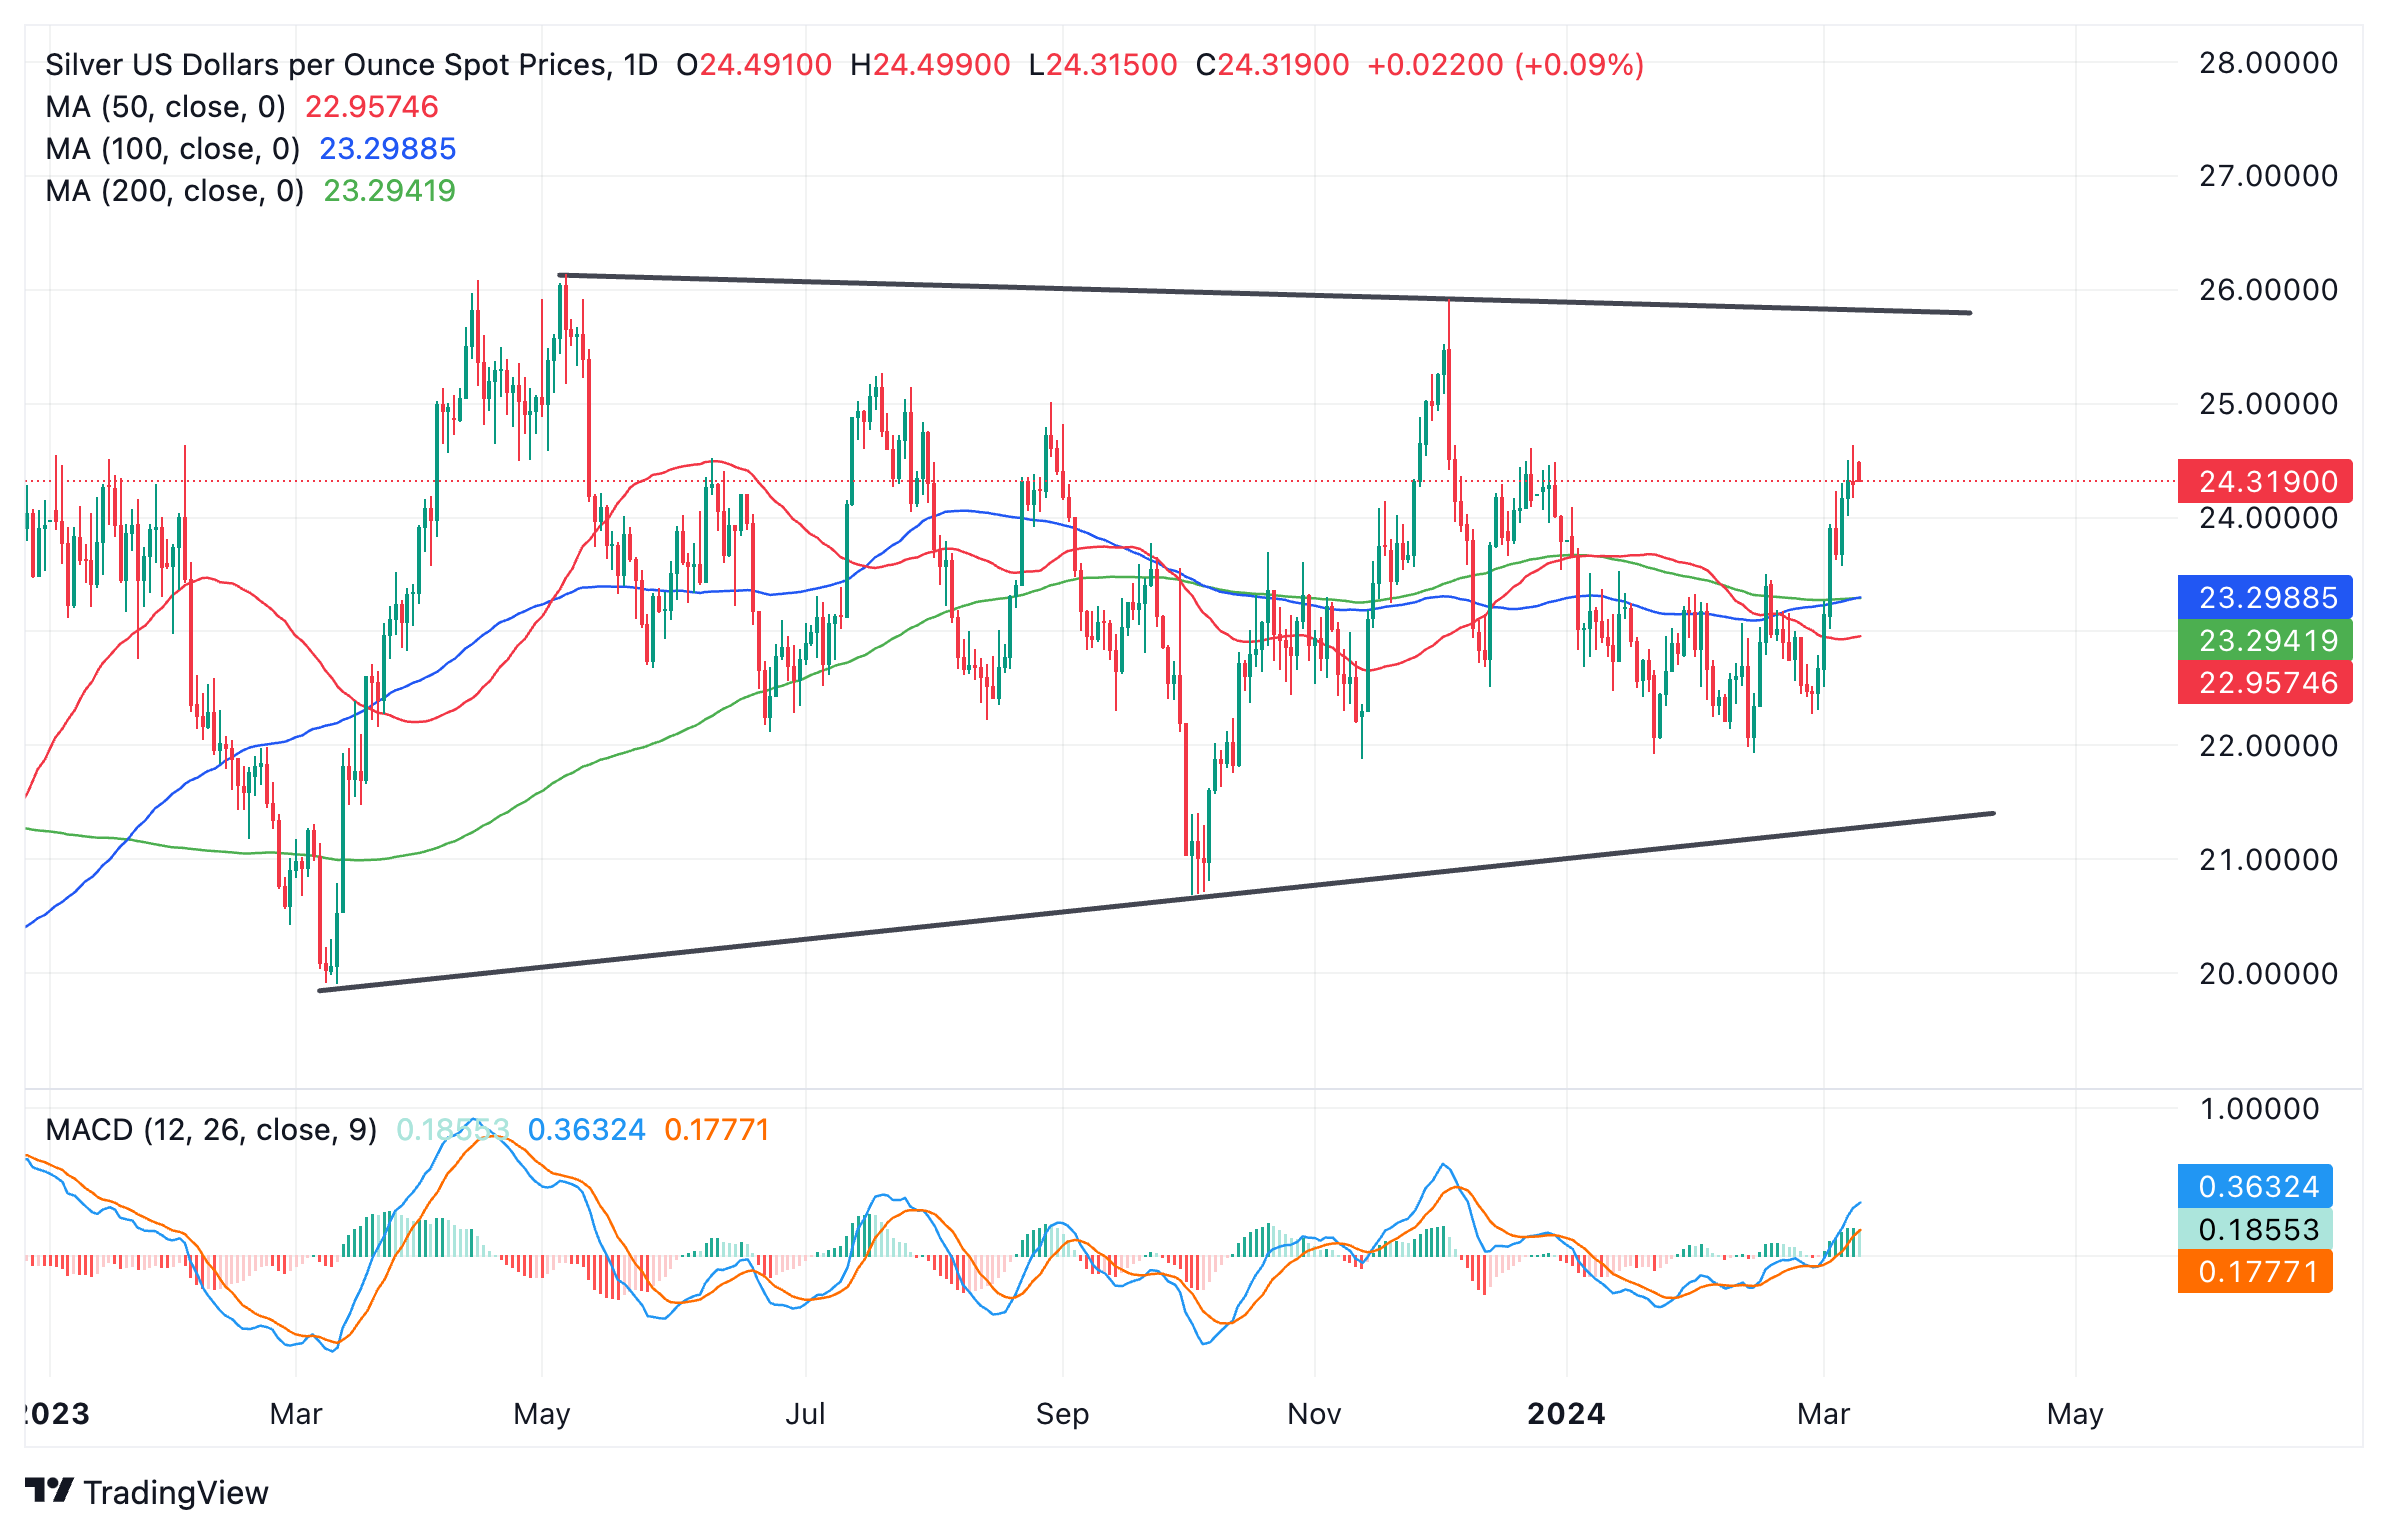
- Silver has been trapped in a range since the start of 2023.
- A list of bullish fundamental factors are gathering, however, suggesting more upside for Silver.
- A decisive break above $26.00 would provide confirmation of a bullish turn.
Silver (XAG/USD) has been trapped in a range between $20 and $26 over the last year, but the precious metal’s fundamentals look bright for 2024, suggesting it could break out, according to experts.
Silver versus US Dollar: daily chart
Silver is both a precious metal, bought because it retains its value like Gold, but also because it is used in a wide variety of industrial processes, including the manufacture of automobiles, solar panels and electronics. It is, therefore, sensitive to both global growth prospects and to changes in interest rates and inflation. This special combination of influences suggests Silver could be in a sweet spot from a fundamental perspective.
Silver to rise on global growth prospects
XAG/USD should push higher in the third and fourth quarters of 2024 because rising growth will see increased demand for the metal from industry, according to Marcus Garvey, a commodities analyst at Macquarie Group.
“As a dual precious and industrial metal, if we start to see global growth pick up a bit more over the course of this year — which is very much our base case — then I would expect Silver to go from a relative underperformer to Gold to being a relative outperformer to gold over really the third and fourth quarter of this year.” Garvey said in an Interview with CNBC news.
Riding on the coat-tails of Gold
Silver’s traditional role as a store of value, however, also means it should benefit from expectations that the Federal Reserve (Fed) will start to cut interest rates this year.
Lower interest rates mean precious metals and non-yielding assets in general – such as Bitcoin – gain in value. This is because the opportunity cost of owning them falls, which means holders stand to lose less money compared to parking their money as cash or in yielding assets such as bonds or dividend stocks.
This is the main reason behind Gold’s recent ascent to an all-time high in the $2,190s.
It could mean Silver is about to start its own surge, according to some experts who hold that Silver usually follows Gold, only after a lag.
In addition, because Silver is primarily priced in US Dollars, a weaker USD tends to propel Silver higher. Lower interest rates tend to negatively impact the Dollar as they lead to less foreign capital inflows, and this could further support Silver prices going forward.
Heightened demand
Demand for Silver is likely to hit record levels in 2024, according to the Silver Institute, a not-for-profit association, further acting as a bullish driver on prices.
In a report published earlier in the year, the Institute said global Silver demand was forecast to reach 1.2 billion ounces in 2024, hitting its second-highest level on record.
When to buy?
What sort of technical confirmation can investors expect before pressing the “buy” button on Silver? To answer this question we return to the chart, which shows the top of Silver’s long-term range located at $26.00 an ounce. It would, therefore, take a decisive break above this level to confirm a breakout from the precious metal’s current straight jacket and see it rally higher.
The usual technical method for predicting the extent of breakouts from ranges is to take the height of the range and extrapolate it higher from the breakout point. Such a method would indicate a target for Silver at just shy of $32.00, however, a more conservative estimate would indicate a target in the $29.50s, the 61.8% Fibonacci extrapolation of the range.
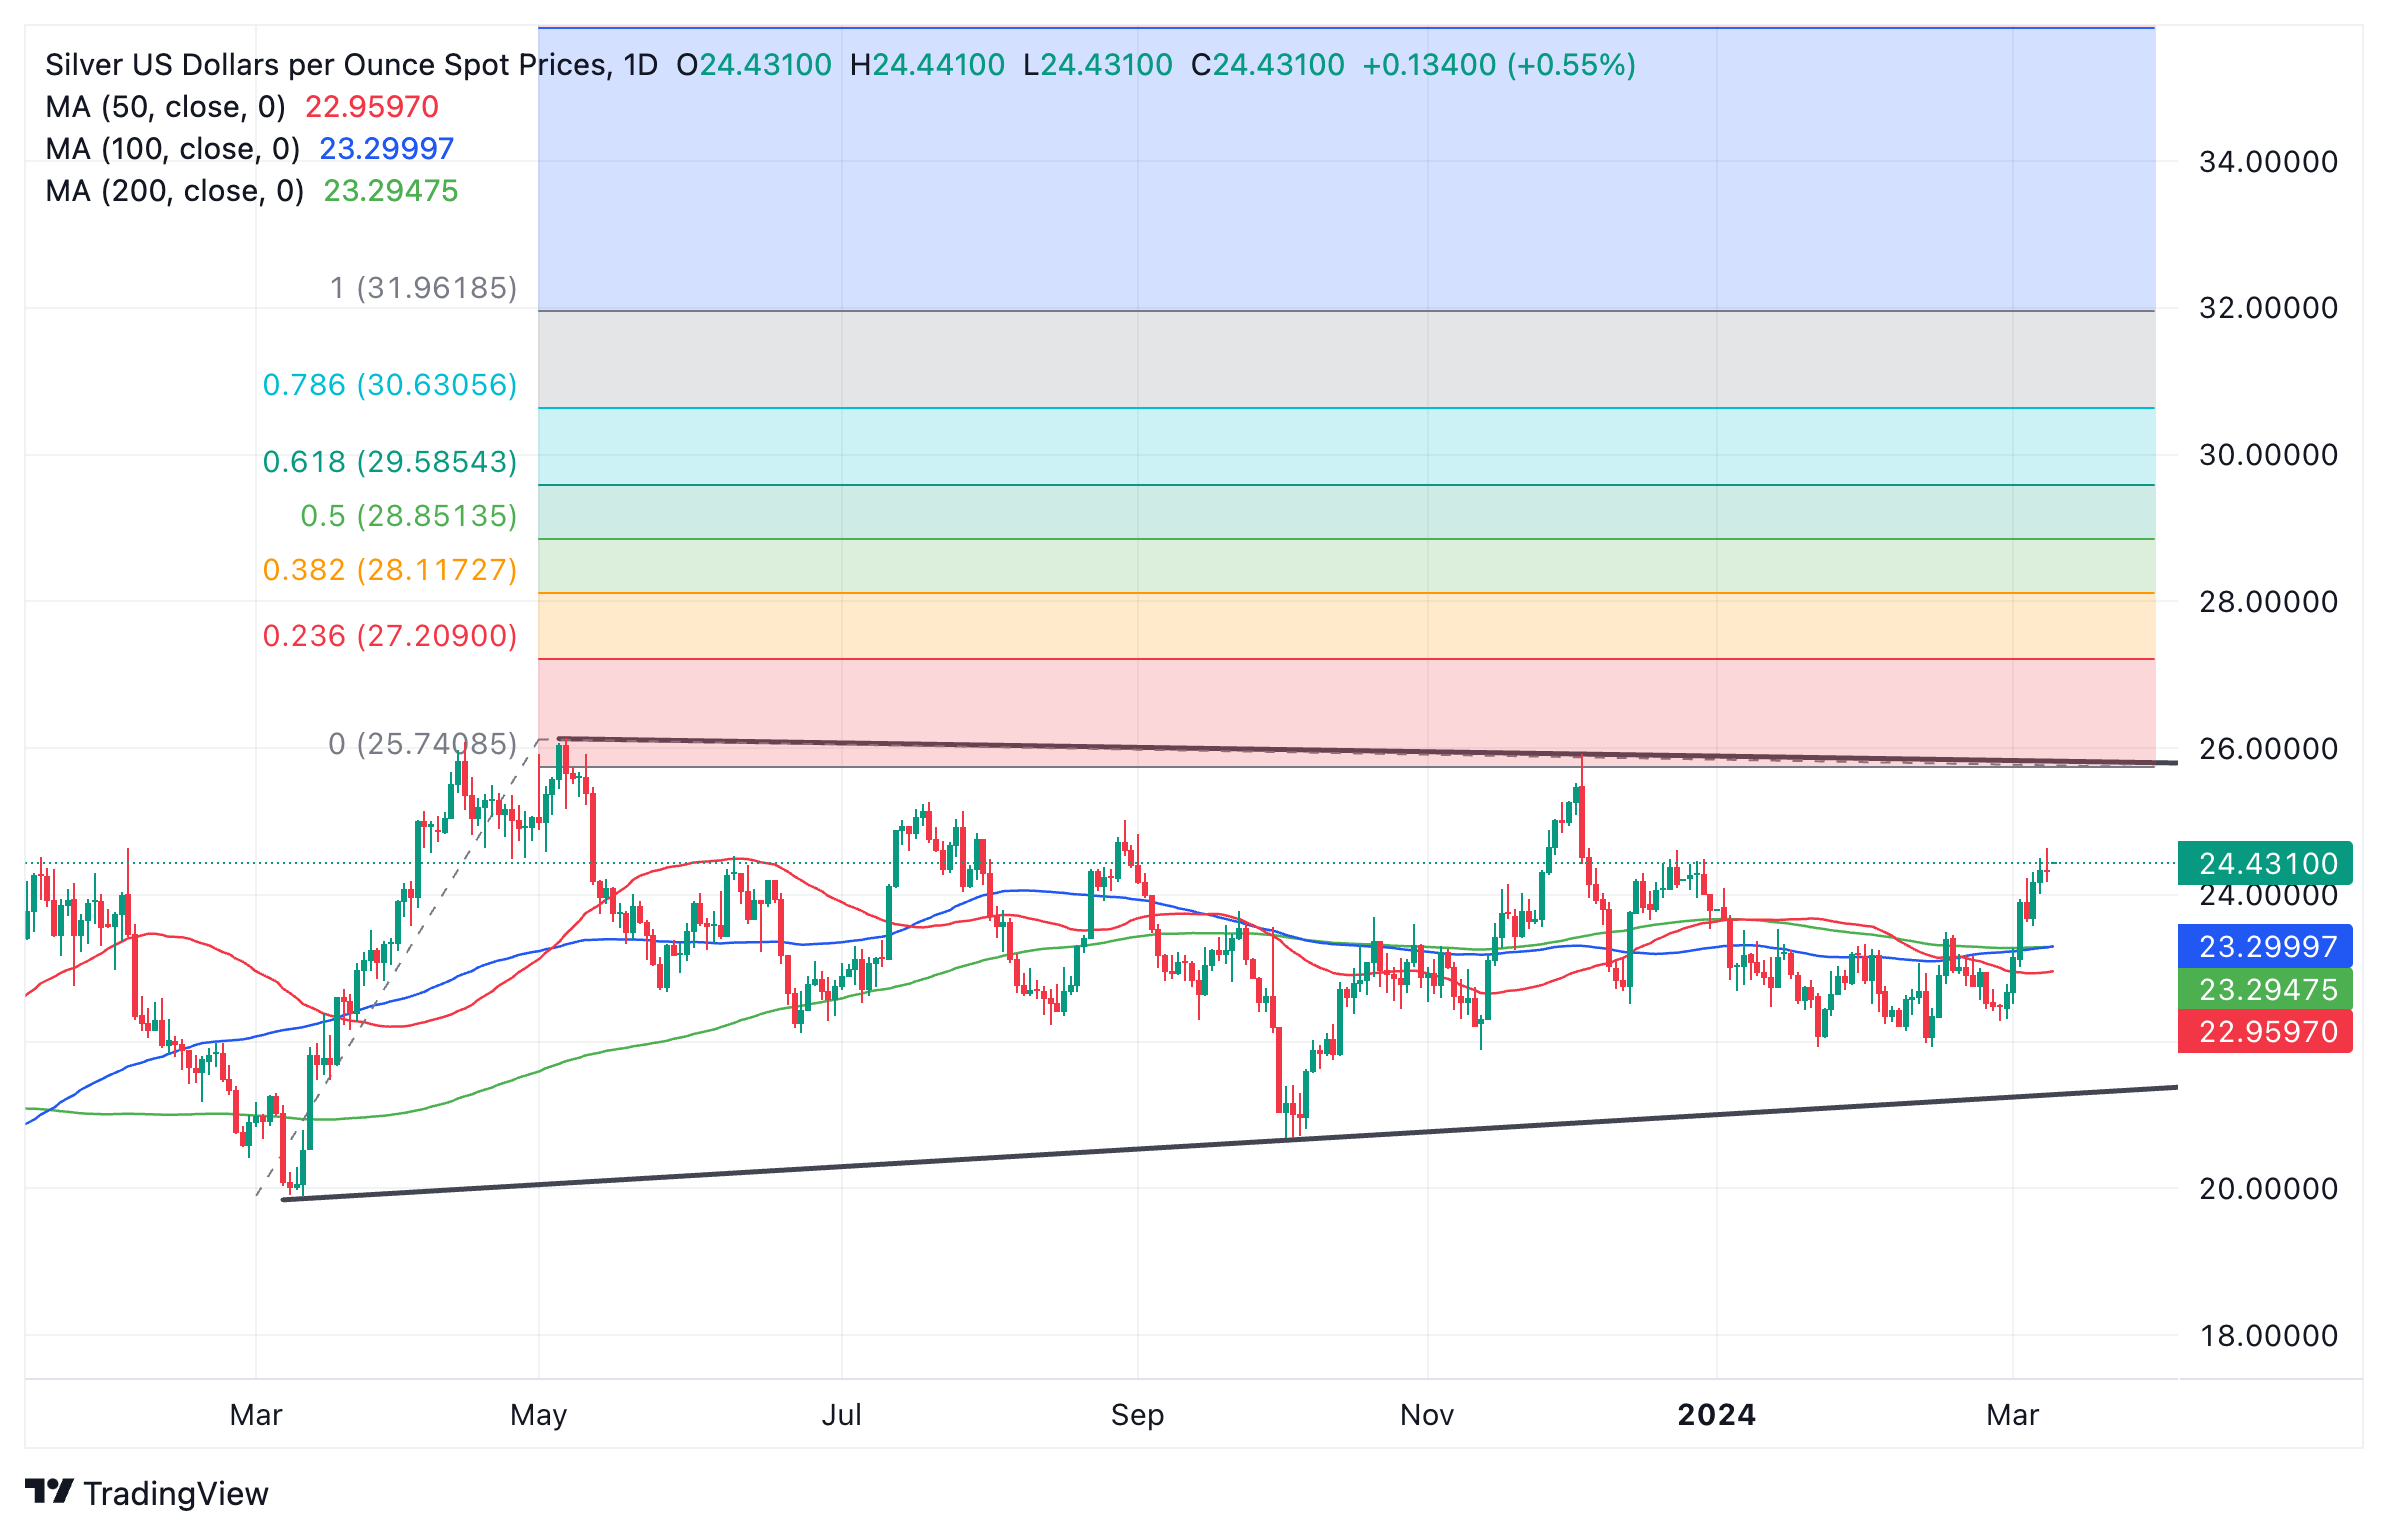
Silver versus US Dollar: daily chart
In order to avoid being caught in a “fake out”, investors should make sure the break above $26.00 is decisive before diving in. This means it should be accompanied by a longer-than-average daily bullish bar which closes near its high, or three up days that pierce cleanly above the resistance level.
- AUD/USD falls sharply to 0.6600 as safe-haven appeal improves ahead of US Inflation data.
- The USD Index rebounds to 102.90 even though the Fed rate-cut expectations remain firm.
- RBA Hunter is expected to provide GDP projections at Australia’s Financial Review's Business Summit on Tuesday.
The AUD/USD pair faces a sharp sell-off and drops to the round-level support of 0.6600 in the early New York session on Monday. The Aussie asset tumbles as uncertainty ahead of the United States Consumer Price Index (CPI) data for February has dented risk appetite of the market participants.
The monthly headline inflation is forecasted to have risen by 0.4% against a 0.3% increase in January. The core CPI that excludes volatile food and energy prices is expected to have grown at a slower pace of 0.3% from 0.4%. For annual figures, economists expect that the headline CPI remains sticky at 3.1% and the core inflation decelerates to 3.7% from 3.9% in January.
Considering negative overnight futures, the S&P 500 is expected to open on a negative note. The US Dollar Index (DXY) rebounds to 102.90 though market expectations for the Federal Reserve (Fed) reducing interest rates in the June policy meeting remain firm. The CME FedWatch tool shows a 72% chance for a rate-cut decision in June.
Meanwhile, the next move in the Australian Dollar will be guided by the Australia’s Financial Review's Business Summit, scheduled for Tuesday. Reserve Bank of Australia’s (RBA) recently appointed chief economist, Sarah Hunter, is expected to deliver Gross Domestic Product (GDP) projections and the economic risks.
AUD/USD drops after failing to deliver a decisive break above the horizontal resistance of the Ascending Triangle pattern formed on a daily timeframe, which is plotted from the January 24 high at 0.6621. The upward-sloping border of the chart pattern is placed from the February 13 low at 0.6319.
The triangle could break out in either direction. However, the odds marginally favor a move in the direction of the trend before the formation of the triangle – in this case, up. A decisive break above or below the triangle boundary lines would indicate a breakout is underway.
The 14-period Relative Strength Index (RSI) falls back into the 40.00-60.00 region, which indicates persistent indecisiveness among investors.
Shorts buildups for the Aussie asset may swell if it breaks below February 20 high at 0.6579. This would drag the asset towards February 26 low at 0.6530, followed by the psychological support of 0.6500.
On the contrary, the Australian Dollar will strengthen if the asset climbs above December 4 high at 0.6688. This would drive the pair towards January 11 high at 0.6728 and January 4 high at 0.6760.
AUD/USD daily chart
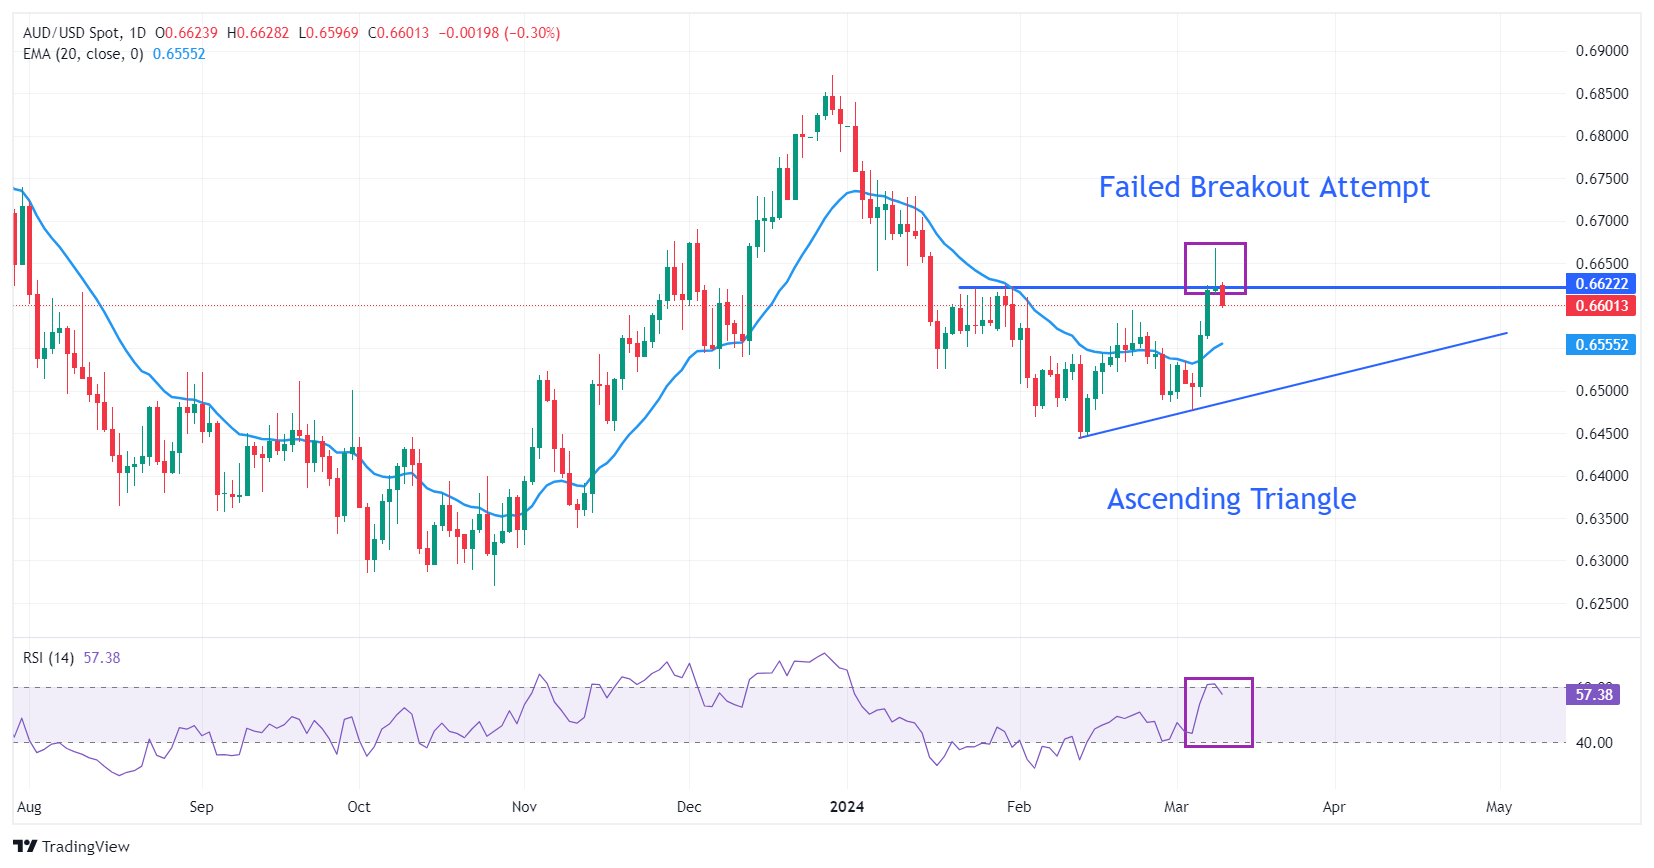
Gold (XAU/USD) has now gained close to 19% since a recent low in October and almost 7% over the past month alone. Strategists at UBS analyze the yellow metal’s outlook.
Potential for a pullback in Gold in the near term
Part of the recent rally may reflect technical factors, as prices crossed key resistance levels. But while we see potential for a pullback in Gold in the near term, this does not mean the rally can’t go further over the coming year.
We see Gold being supported by several trends: The Fed appears on track to cut rates. Central bank and investor buying of Gold should be supportive. Heightened geopolitical risk should also support Gold.
The US Dollar (USD) retains a soft undertone overall but trade is on the quiet side to start the week. Economists at Scotiabank analyze Greenback’s outlook.
Tuesday’s inflation report may go some way to determining which way the USD will move in the short run
The broader USD slide over the past week may have stabilized in the short run, however, with Friday’s price action suggesting some consolidation in the weak tone after an extended run lower from the middle of last month.
The DXY closed well off the intraday low Friday and was little changed from the opening level for the index. The ‘pause’ signal in the DXY sell-off developed on the charts a little ahead of key support for the index defined by the 61.8% retracement of the December/February rally at 102.28.
The low 102.00 area may now develop into a key pivot point for the USD – losses could extend quite a bit further below here or the area could provide the base for a more significant rebound.
Tuesday’s inflation report may go some way to determining which way the USD will move in the short run. The street is looking for a 0.4% MoM rise in February CPI, leaving the headline pace of inflation steady at 3.1%; core prices are expected to rise 0.3% MoM, allowing a slowing in the pace of core inflation to 3.7%.
USD/CAD has steadied below 1.3500. Economists at Scotiabank analyze the pair’s outlook.
Potential bull flag pattern
The domestic data run is relatively light this week – just Manufacturing Sales, Housing Starts and Wholesale Sales, which are all out later in the week. This likely means the CAD will trade more off of external developments – the USD, asset markets – and technical factors in the next day or so.
Spot’s losses last week stalled in the low 1.3400s and price action leaves the door open for a little more corrective USD strength in the short run, potentially.
USD gains are consolidating just under 1.3500 in what could be a bull flag pattern (more gains above 1.3495/1.3500 intraday towards firmer resistance at 1.3540/1.3550.
USD support is 1.3420/1.3440.
Cable’s gains are holding comfortably in the mid-1.2800s, the highest for the pound since last July. Economists at Scotiabank analyze GBP/USD outlook.
Cable consolidates solid gains through recent range ceiling
Sterling’s gains through the low 1.2800s last week take Cable out of its long-standing trading range and target additional gains to 1.3000+ in the next few weeks, potentially.
Short-term price action looks more consolidative, however, with spot holding well within Friday’s range.
Support is 1.2790/1.2800. Resistance is 1.2880/1.2890.
See – EUR/GBP: Break below 0.8490 can extend the decline towards next projections at 0.8455/0.8440 – SocGen
- The US Dollar steadies at the opening on Monday.
- All eyes this week will be on the US CPI numbers ahead of the Fed interest-rate decision next week.
- The US Dollar Index trades just below 103.00, with technical risk of more downside to come.
The US Dollar (USD) is starting the week at a slow pace, not really making any waves on Monday. However, the Greenback is set for a very firm data-driven regime this week as there will be no US Federal Reserve (Fed) officials speaking. This is because the Fed’s blackout period has started ahead of the rate decision and Chairman Jerome Powell’s speech next week.
Looking ahead on the economic calendar front, focal points this week are Tuesday, Thursday and Friday.. On the top of the board there is the US Consumer Price Index (CPI), to be released on Tuesday. Any decline in inflation will be enough for markets to bring back forward those heavily anticipated rate cuts from the Fed. Add to that the US Producer Price Index (PPI) numbers and Retail Sales for Thursday, and the Greenback could be trading in a whole other ballpark by Friday.
Daily digest market movers: All will be quiet on the Fed front
- No ceasefire deal was reached over the weekend, which means Muslims in Gaza are entering the Ramadan fasting with little supply.
- Portuguese elections were a surprise with a swing to the right, though a coalition remains unclear. With more European countries facing an election year, a swing to the right could mean more protectionism on the trade front.
- Japanese equity markets took it on the chin on Monday after a revision of Gross Domestic Product (GDP) numbers showed that Japan made it just barely out of recession, casting doubts over an upcoming interest-rate hike..
- The US Treasury Department is having its hands full this Monday with no less than three auctions: Near 15:30 GMT both a 3-month and a 6-month bill will be auctioned. At 17:00 GMT, a longer 3-year note will be placed in the markets.
- Equities are painting a very mixed picture this Monday at the start of the week. All Japanese indices are closing by over 2% in the red, while Chinese equity indices are up over 1%. Europe is not taking over the tone from China, and is trading by a near 0.50% in the red for both the German Dax and the overall Stoxx 50. The US equity futures are near flat or very mild in the red ahead of the US session.
- According to the CME Group’s FedWatch Tool, expectations for a Fed pause in the March 20 meeting are at 96%, while chances of a rate cut stand at 4%.
- The benchmark 10-year US Treasury Note trades around 4.05%, the lowest level in over a week.
US Dollar Index Technical Analysis: Markets to move from one point to the next
The US Dollar Index (DXY) is entering a period when it can trade as the Fed says it acts: data-driven. With Fed speakers silent for over a week, markets will need to settle with data points being released throughout the week. This increases the possibility of whipsaw moves should several data points fall in line with a certain bias, with the DXY pricing already the outcome of the Fed meeting next week. Traders will also look for technical levels to break or hold to assess the situation, making the charts this week even more important.
On the upside, the first reclaiming ground is at 103.29, the 55-day Simple Moving Average (SMA), and at the 200-day SMA near 103.71. Once broken through, the 100-day SMA is popping up at 103.76, so a bit of a double cap in that region. Depending on the catalyst that pushes the DXY upwards, 104.96 remains the key level on the topside.
The DXY is trading a bit in nomad's land, with not really any significant support levels nearby. More downside looks inevitable with 102.00 up next, which bears some pivotal relevance. Once through there, the road is open for another leg lower to 100.61, the low of 2023.
US Dollar FAQs
The US Dollar (USD) is the official currency of the United States of America, and the ‘de facto’ currency of a significant number of other countries where it is found in circulation alongside local notes. It is the most heavily traded currency in the world, accounting for over 88% of all global foreign exchange turnover, or an average of $6.6 trillion in transactions per day, according to data from 2022. Following the second world war, the USD took over from the British Pound as the world’s reserve currency. For most of its history, the US Dollar was backed by Gold, until the Bretton Woods Agreement in 1971 when the Gold Standard went away.
The most important single factor impacting on the value of the US Dollar is monetary policy, which is shaped by the Federal Reserve (Fed). The Fed has two mandates: to achieve price stability (control inflation) and foster full employment. Its primary tool to achieve these two goals is by adjusting interest rates. When prices are rising too quickly and inflation is above the Fed’s 2% target, the Fed will raise rates, which helps the USD value. When inflation falls below 2% or the Unemployment Rate is too high, the Fed may lower interest rates, which weighs on the Greenback.
In extreme situations, the Federal Reserve can also print more Dollars and enact quantitative easing (QE). QE is the process by which the Fed substantially increases the flow of credit in a stuck financial system. It is a non-standard policy measure used when credit has dried up because banks will not lend to each other (out of the fear of counterparty default). It is a last resort when simply lowering interest rates is unlikely to achieve the necessary result. It was the Fed’s weapon of choice to combat the credit crunch that occurred during the Great Financial Crisis in 2008. It involves the Fed printing more Dollars and using them to buy US government bonds predominantly from financial institutions. QE usually leads to a weaker US Dollar.
Quantitative tightening (QT) is the reverse process whereby the Federal Reserve stops buying bonds from financial institutions and does not reinvest the principal from the bonds it holds maturing in new purchases. It is usually positive for the US Dollar.
EUR/USD’s gains have slowed after peaking near 1.0980 last week. Economists at Scotiabank analyze the pair’s outlook.
Net losses today could tilt risks towards a little more weakness in the near term
With both the Fed and ECB appearing to be headed for a June ease, EUR gains may struggle to extend through to 1.1000 for now.
There is nothing obviously bearish about price action on the short-term chart but net losses today for the EUR could tilt risks towards a little more weakness in the near term.
Support is 1.0900/1.0910. Resistance is 1.0970/1.0980.
- NZD/USD rotates after touching the top of a month-long range on Friday.
- The MACD has given a sell signal at the same time, indicating the chance of a move lower.
- A move down to the floor of the range is possible subject to fundamentals.
The New Zealand Dollar trades flat against the US Dollar on Monday, after touching the top of a multi-week range, as traders bide their time ahead of the release of US Consumer Price Index (CPI) data on Tuesday.
The release could impact expectations of when the Federal Reserve (Fed) is expected to cut interest rates. Since lower interest rates or the expectation of lower rates is negative, the data is likely to impact US Dollar pairs, including NZD/USD.
NZD/USD rotates after touching range ceiling
The NZD/USD pair rose up to a peak of 0.6218 on Friday hitting the top of a range that unfolded during February. The price then withdrew and fell back down as technical traders shorted the pair, forming a bearish Shooting Star Japanese candlestick pattern on the 4-hour chart (circled).
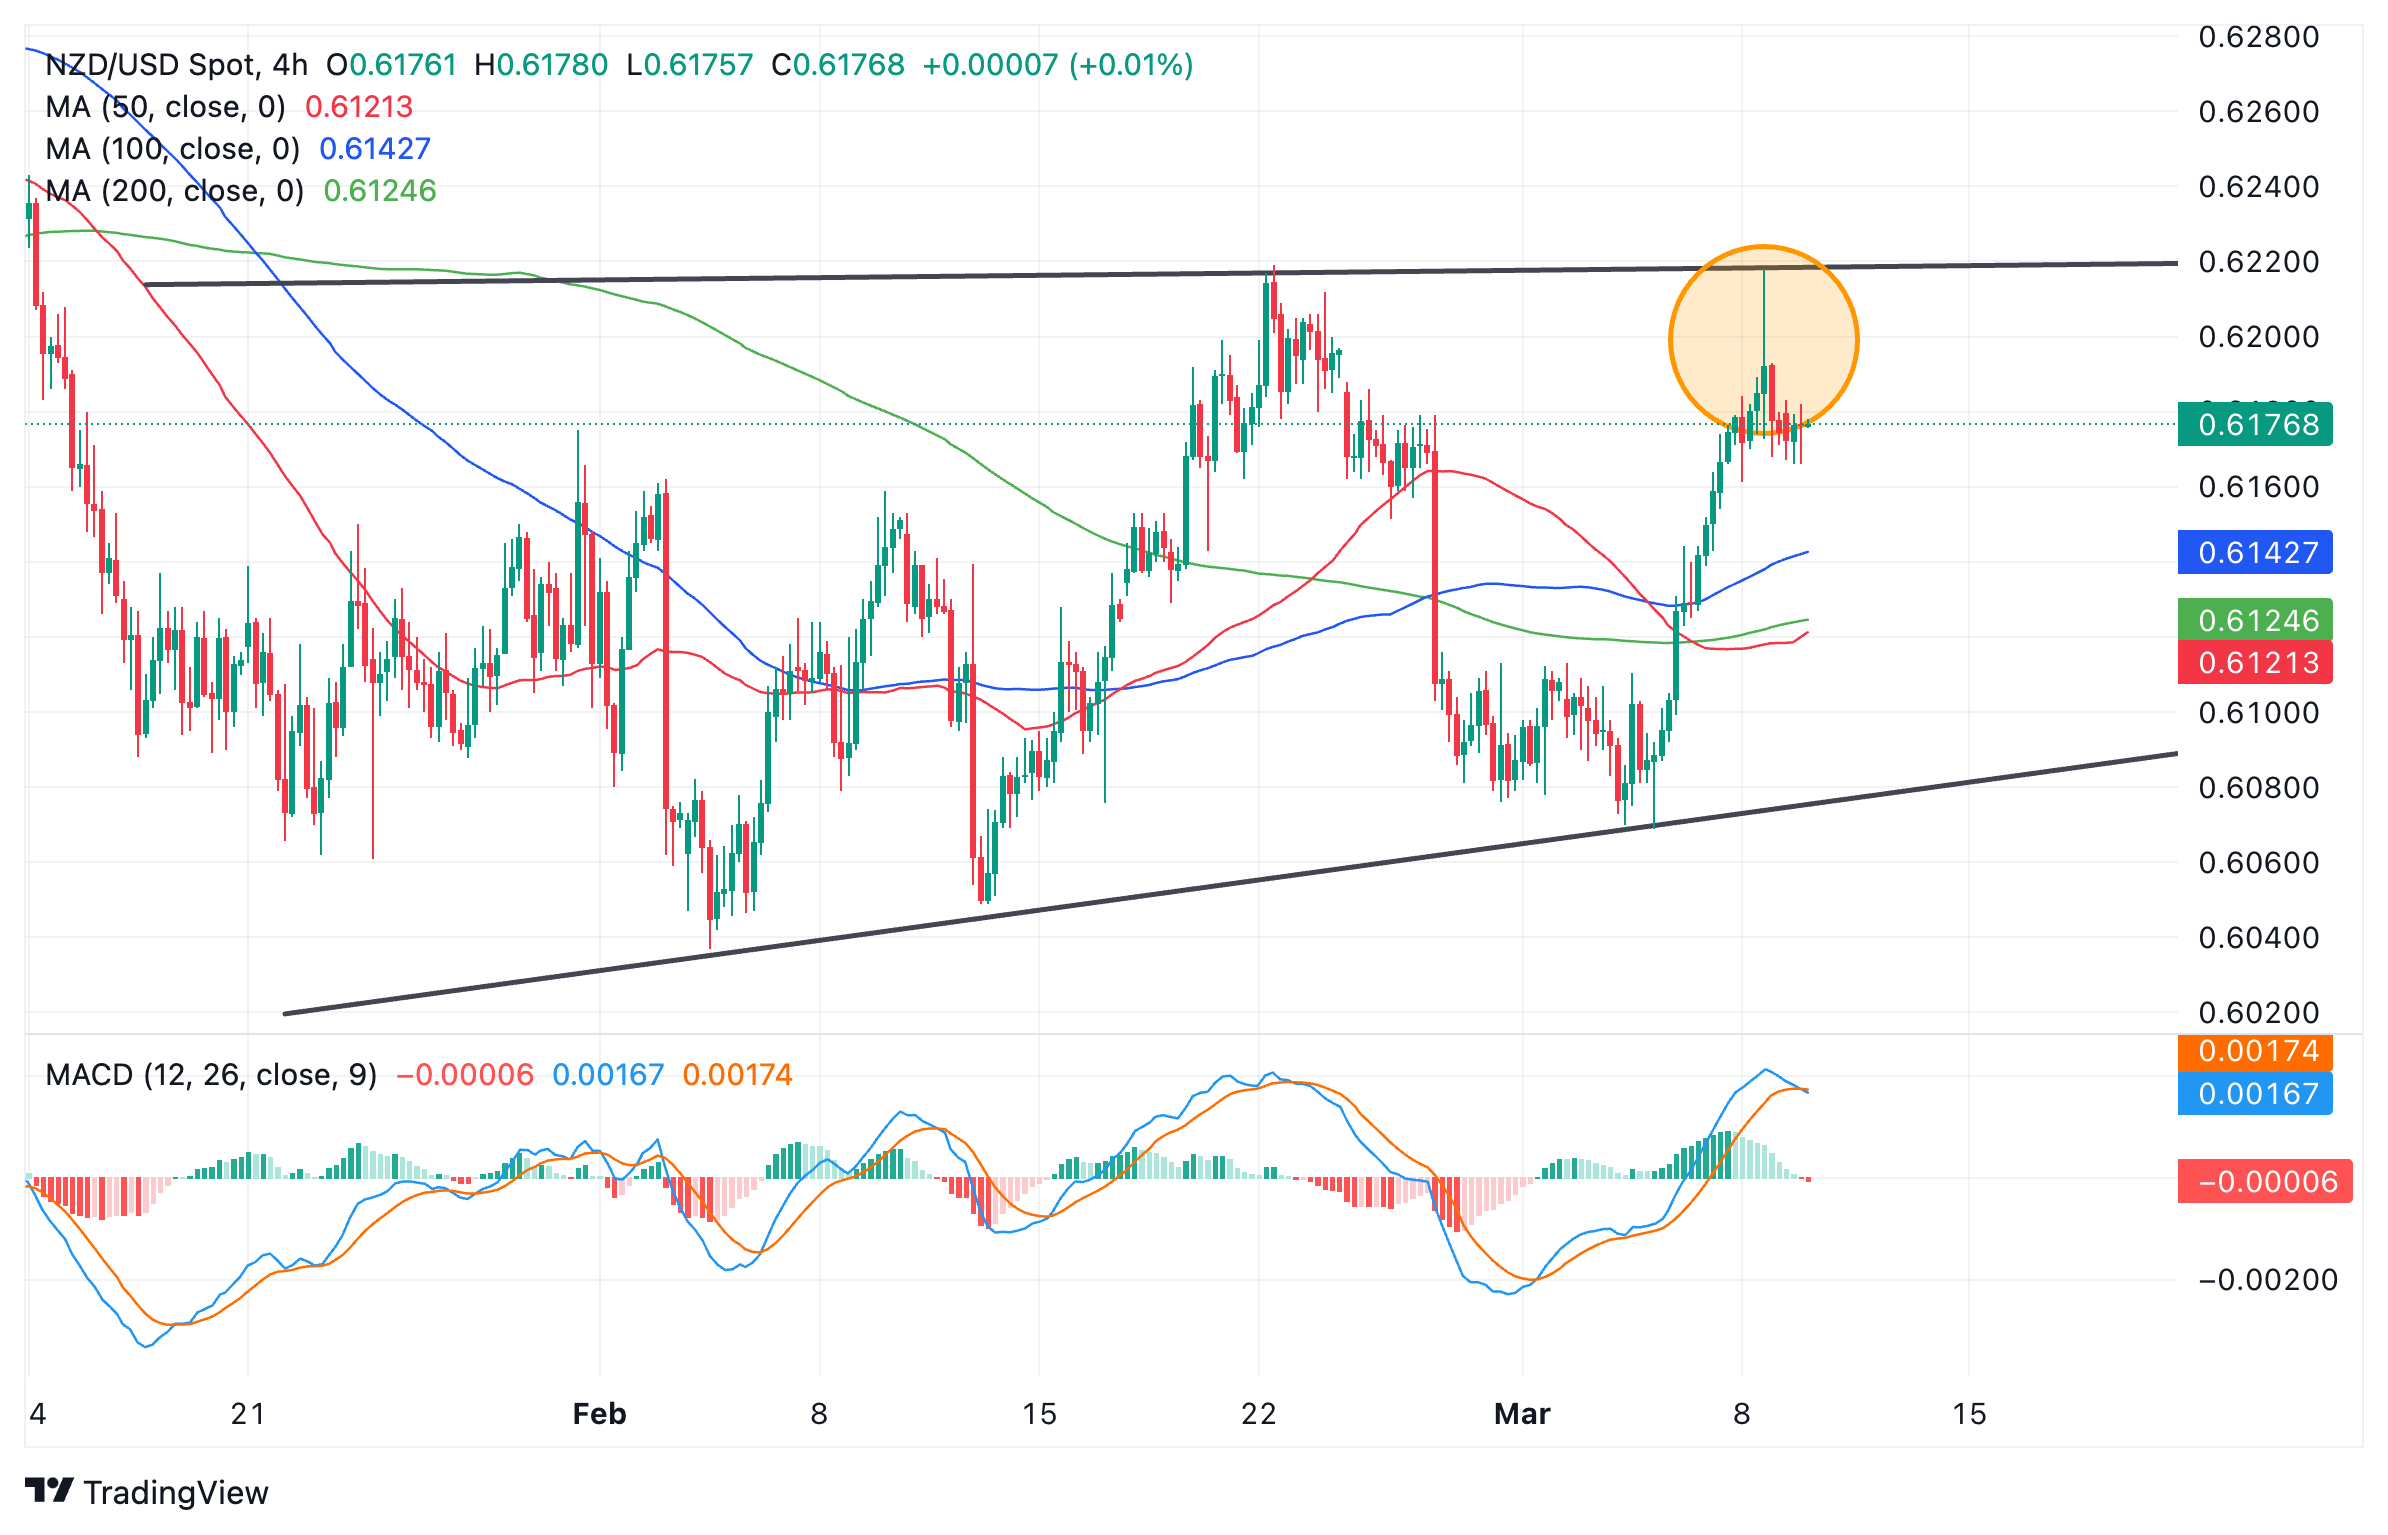
New Zealand Dollar vs US Dollar: 4-hour chart
The combination of the Shooting Star with the range high – a formidable resistance ceiling – suggests a possibility the short-term trend could be changing, and the pair will start to descend back down towards the range lows at around 0.6090 – subject to fundamental developments.
The Moving Average Convergence/ Divergence (MACD) indicator has just crossed below its signal line whilst in positive territory, giving a sell-signal and adding credence to the bearish outlook.
The MACD is a particularly useful indicator for timing the turns in a sideways market such as this, as can be seen from the chart where the crosses in the MACD closely synchronize with the turning points in the price as it oscillates within the range.
A breakout above the range high and the high of the Shooting Star would suggest the market was going higher, however, and possibly breaking out of the range, in which case it would expected to run higher to a target at 0.6309, the 61.8% Fibonacci extrapolation of the range higher.
USD/JPY has dropped as the market adjusts to the prospect of a new era for the Bank of Japan (BoJ). Economists at Rabobank analyze the pair’s outlook.
BoJ to retain a cautious pace on policy normalisation, curtailing upside potential for the Yen
Bets that the BoJ may pull the plug on its negative interest rate policy on March 19 have surged. Hopes that the Japanese industry may also have turned a corner and finally shrugged off the trauma and behaviours which followed the bursting of the economic bubble more than 30 years ago have also risen.
BoJ policymakers have indicated that they are prepared to exit the negative rate policy this spring. But BoJ policy moves this year are likely to be modest in total and this will likely cap upside potential for the JPY.
We expect a move to USD/JPY 140.00 on a 12-month view.
- The Swiss Franc edges higher as risk aversion sets in, hitting global stocks.
- The Swiss Franc is the go-to safe haven when investors become fearful.
- USD/CHF has turned lower after touching a key resistance level on the weekly charts.
The Swiss Franc (CHF) edges higher against the US Dollar (USD) on Monday as it capitalises on its safe-haven status. Global equity markets, a key barometer of risk appetite, are falling on uncertainty over the economic outlook, news of another China property bailout and over-valuation concerns. Most European equities are down by over half a percentage point and US futures are also deep in the red ahead of Wall Street's open.
Swiss Franc vulnerable, HSBC says
Swiss Franc upside could be limited, according to analysts at HSBC, who see the Swiss National Bank’s (SNB) reluctance to implement policies to strengthen the Franc as well as an environment of overall uptrending equity markets as key headwinds.
In an interview with Bloomberg in February, SNB Chairman Thomas Jordan said the Swiss Franc might now be too strong. The CHF, he said, had been rising in nominal terms for several years, and that this had been “helpful” as it had “shielded us from inflationary pressures from abroad.” Jordan added, however, that at the end of 2023 the Franc had started to rise in real terms, and that this could be a problem for Swiss businesses.
Recent lower-than-expected core inflation data in Switzerland, which fell to 1.1% in February – lower than the 1.2% previous – further suggests the SNB will not need to raise interest rates.
On the Horizon
The next key event for the USD/CHF is likely to be the US Consumer Price Index (CPI) data for February, published on Tuesday at 12:30 GMT.
The Consumer Price Index ex Food and Energy is forecast to moderate to 3.7% YoY – from 3.9% previously, and 0.3% MoM from 0.4% previously.
The headline CPI figure is forecast to come in at 3.1% YoY, unchanged from the previous month, and at 0.4% MoM from 0.3% in the previous month.
The result of the CPI data will be key in factoring into when the Federal Reserve (Fed) is expected to start cutting interest rates. A lower-than-expected result could lead to earlier rate cuts from the Fed, which would have a negative impact on USD as it reduces foreign capital inflows.
According to the CME FedWatch Tool, which calculates a market-based expectation of when the Fed will begin reducing its Fed Funds Rate, the probability of a first cut in March is 4%, in May 31.5%, and the chances of a cut by June are 73.8%.
Technical Analysis: Swiss Franc vs US Dollar turns lower after touching key resistance level
The USD/CHF – the number of Swiss Francs one US Dollar can buy – is bumping up against several key technical levels on the charts which could point to the start of a reversal back down in line with the long-term downtrend.
The weekly chart shows the price currently butting up against the falling trendline of a descending channel, as well as the key 50-week Simple Moving Average (SMA). It is possible this could mark the inflection point of a reversal where the pair starts moving down again within the falling channel.
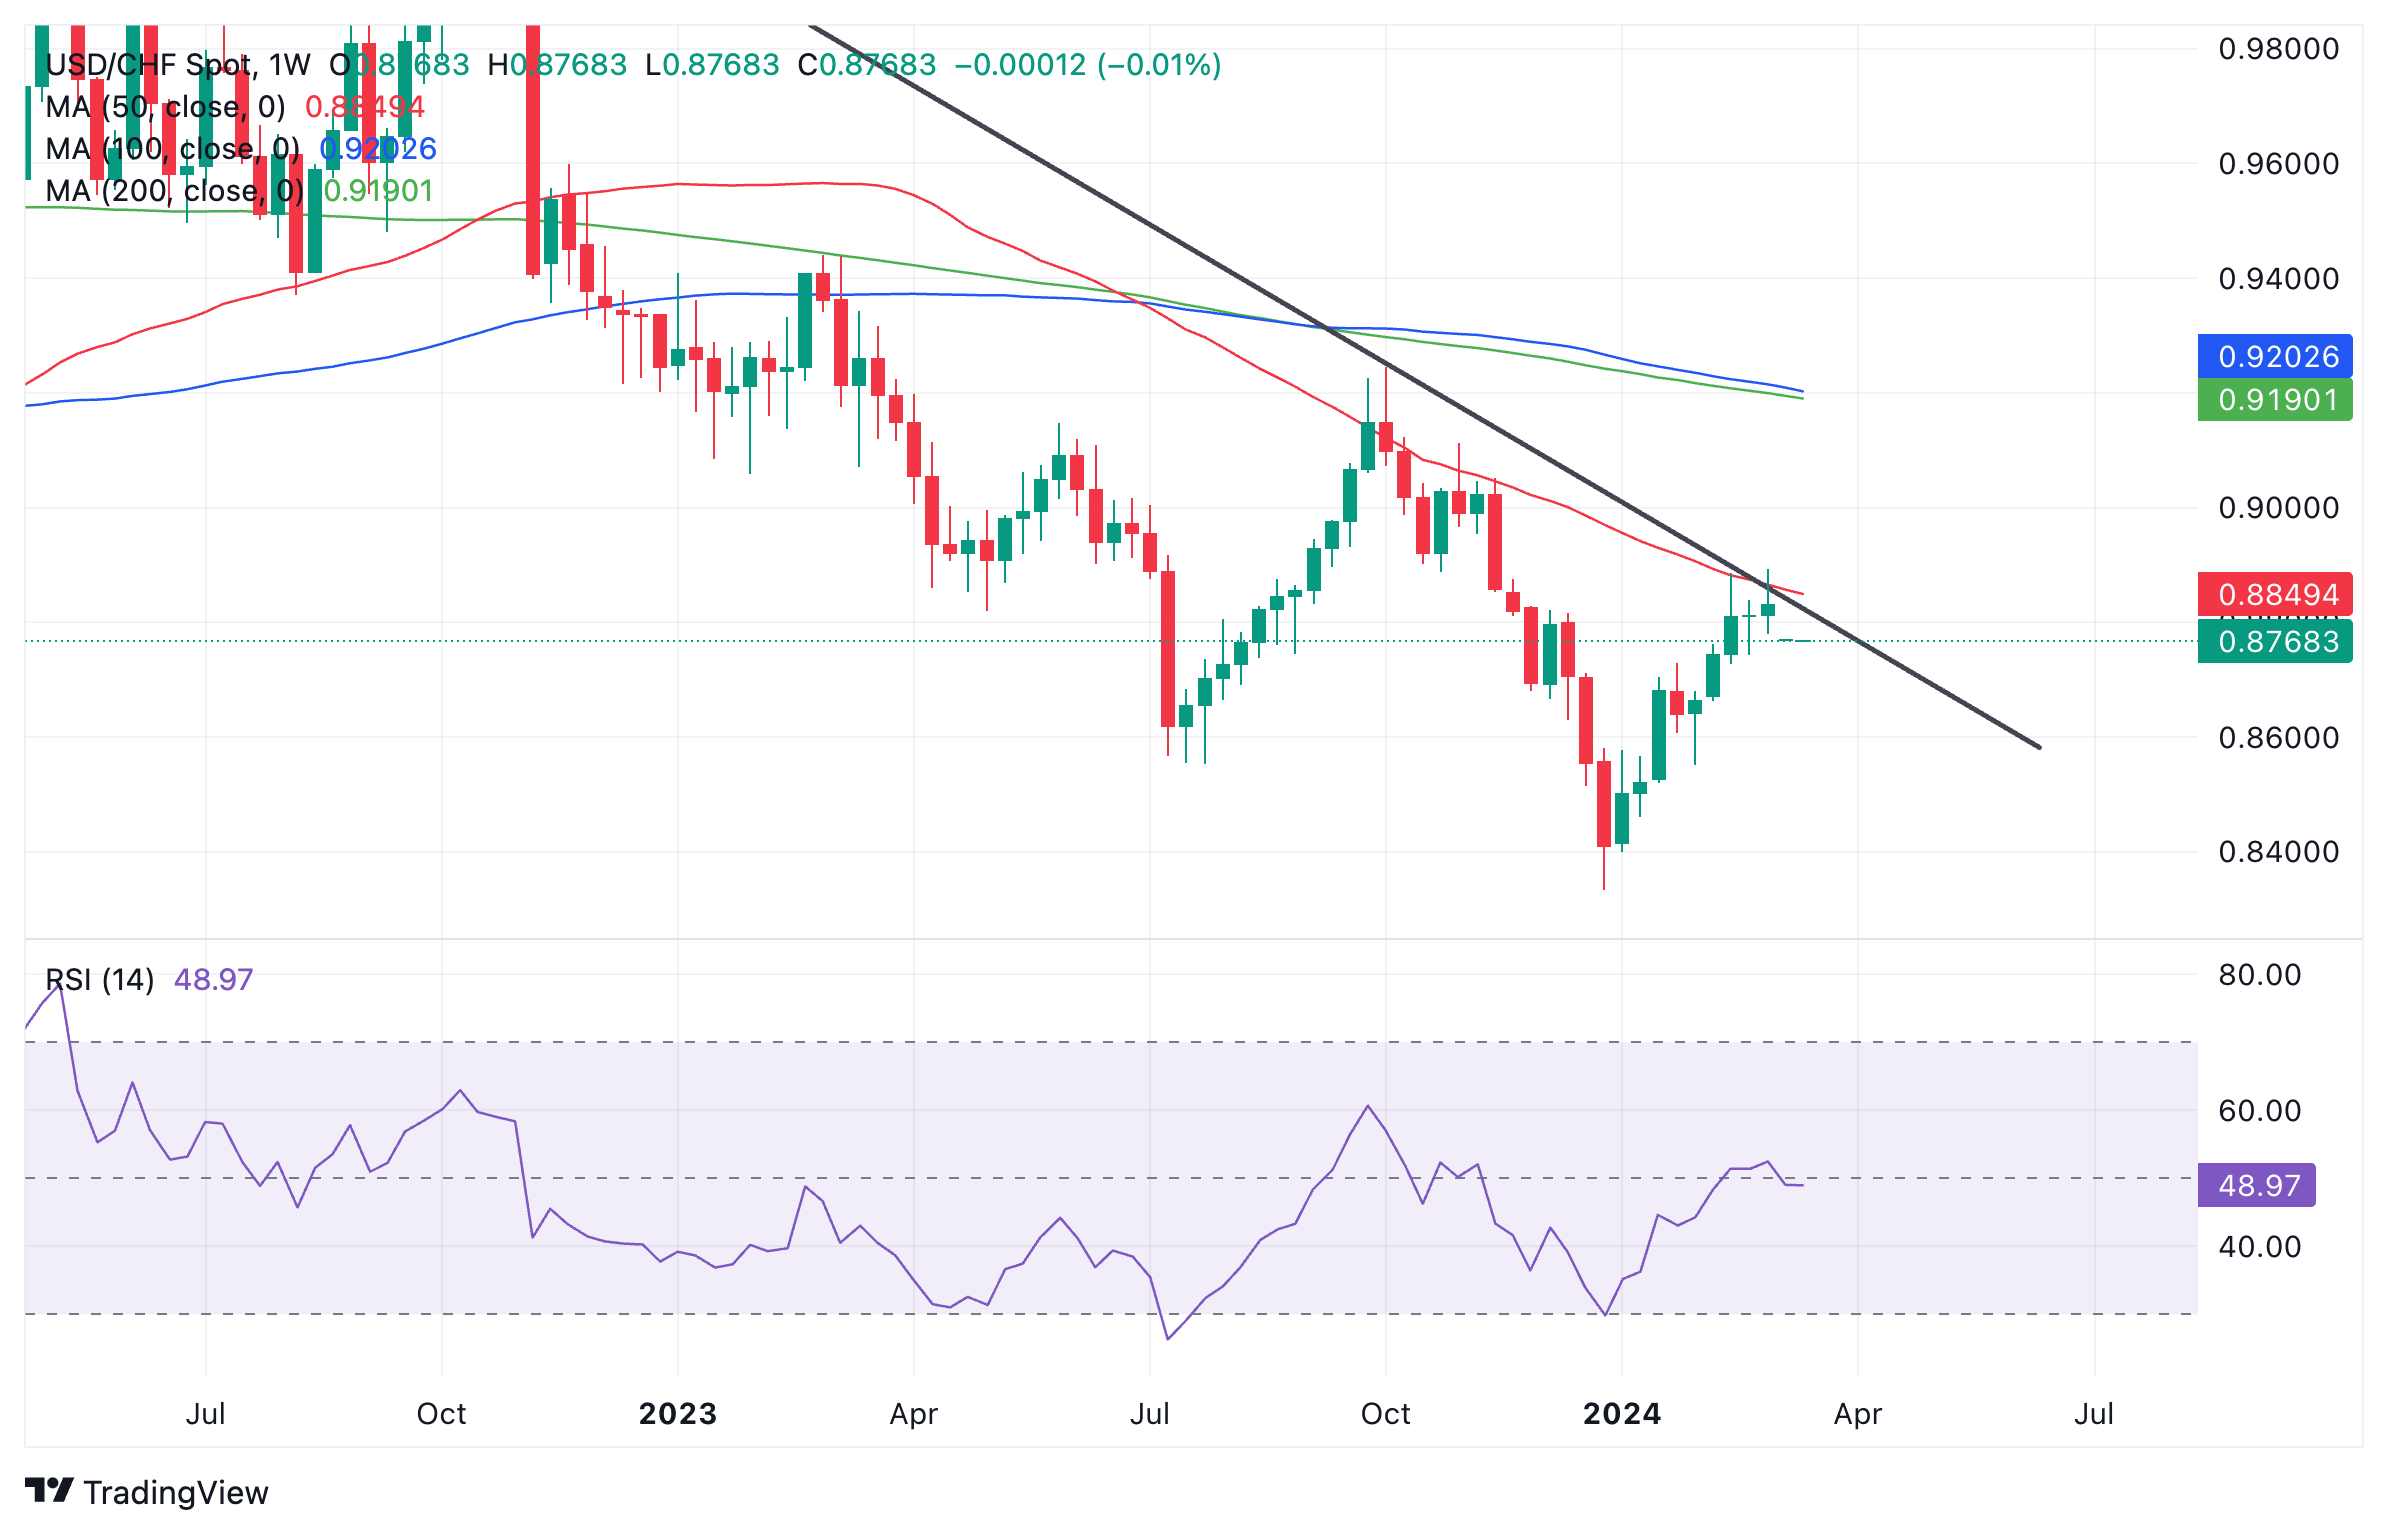
US Dollar vs Swiss Franc: weekly chart
The daily chart shows the battle at the resistance levels highlighted above, in more detail. The pair has pulled back from the channel line and weekly MA. It has also pierced below the February 22 low of 0.8742 on an intraday basis, suggesting the possibility of a deeper decline to 0.8645. A break below that level would solidify a reversal in the short-term trend and a bearish bias. The next target down if 0.8645 is breached would be the support level at January 31 lows of 0.8551.
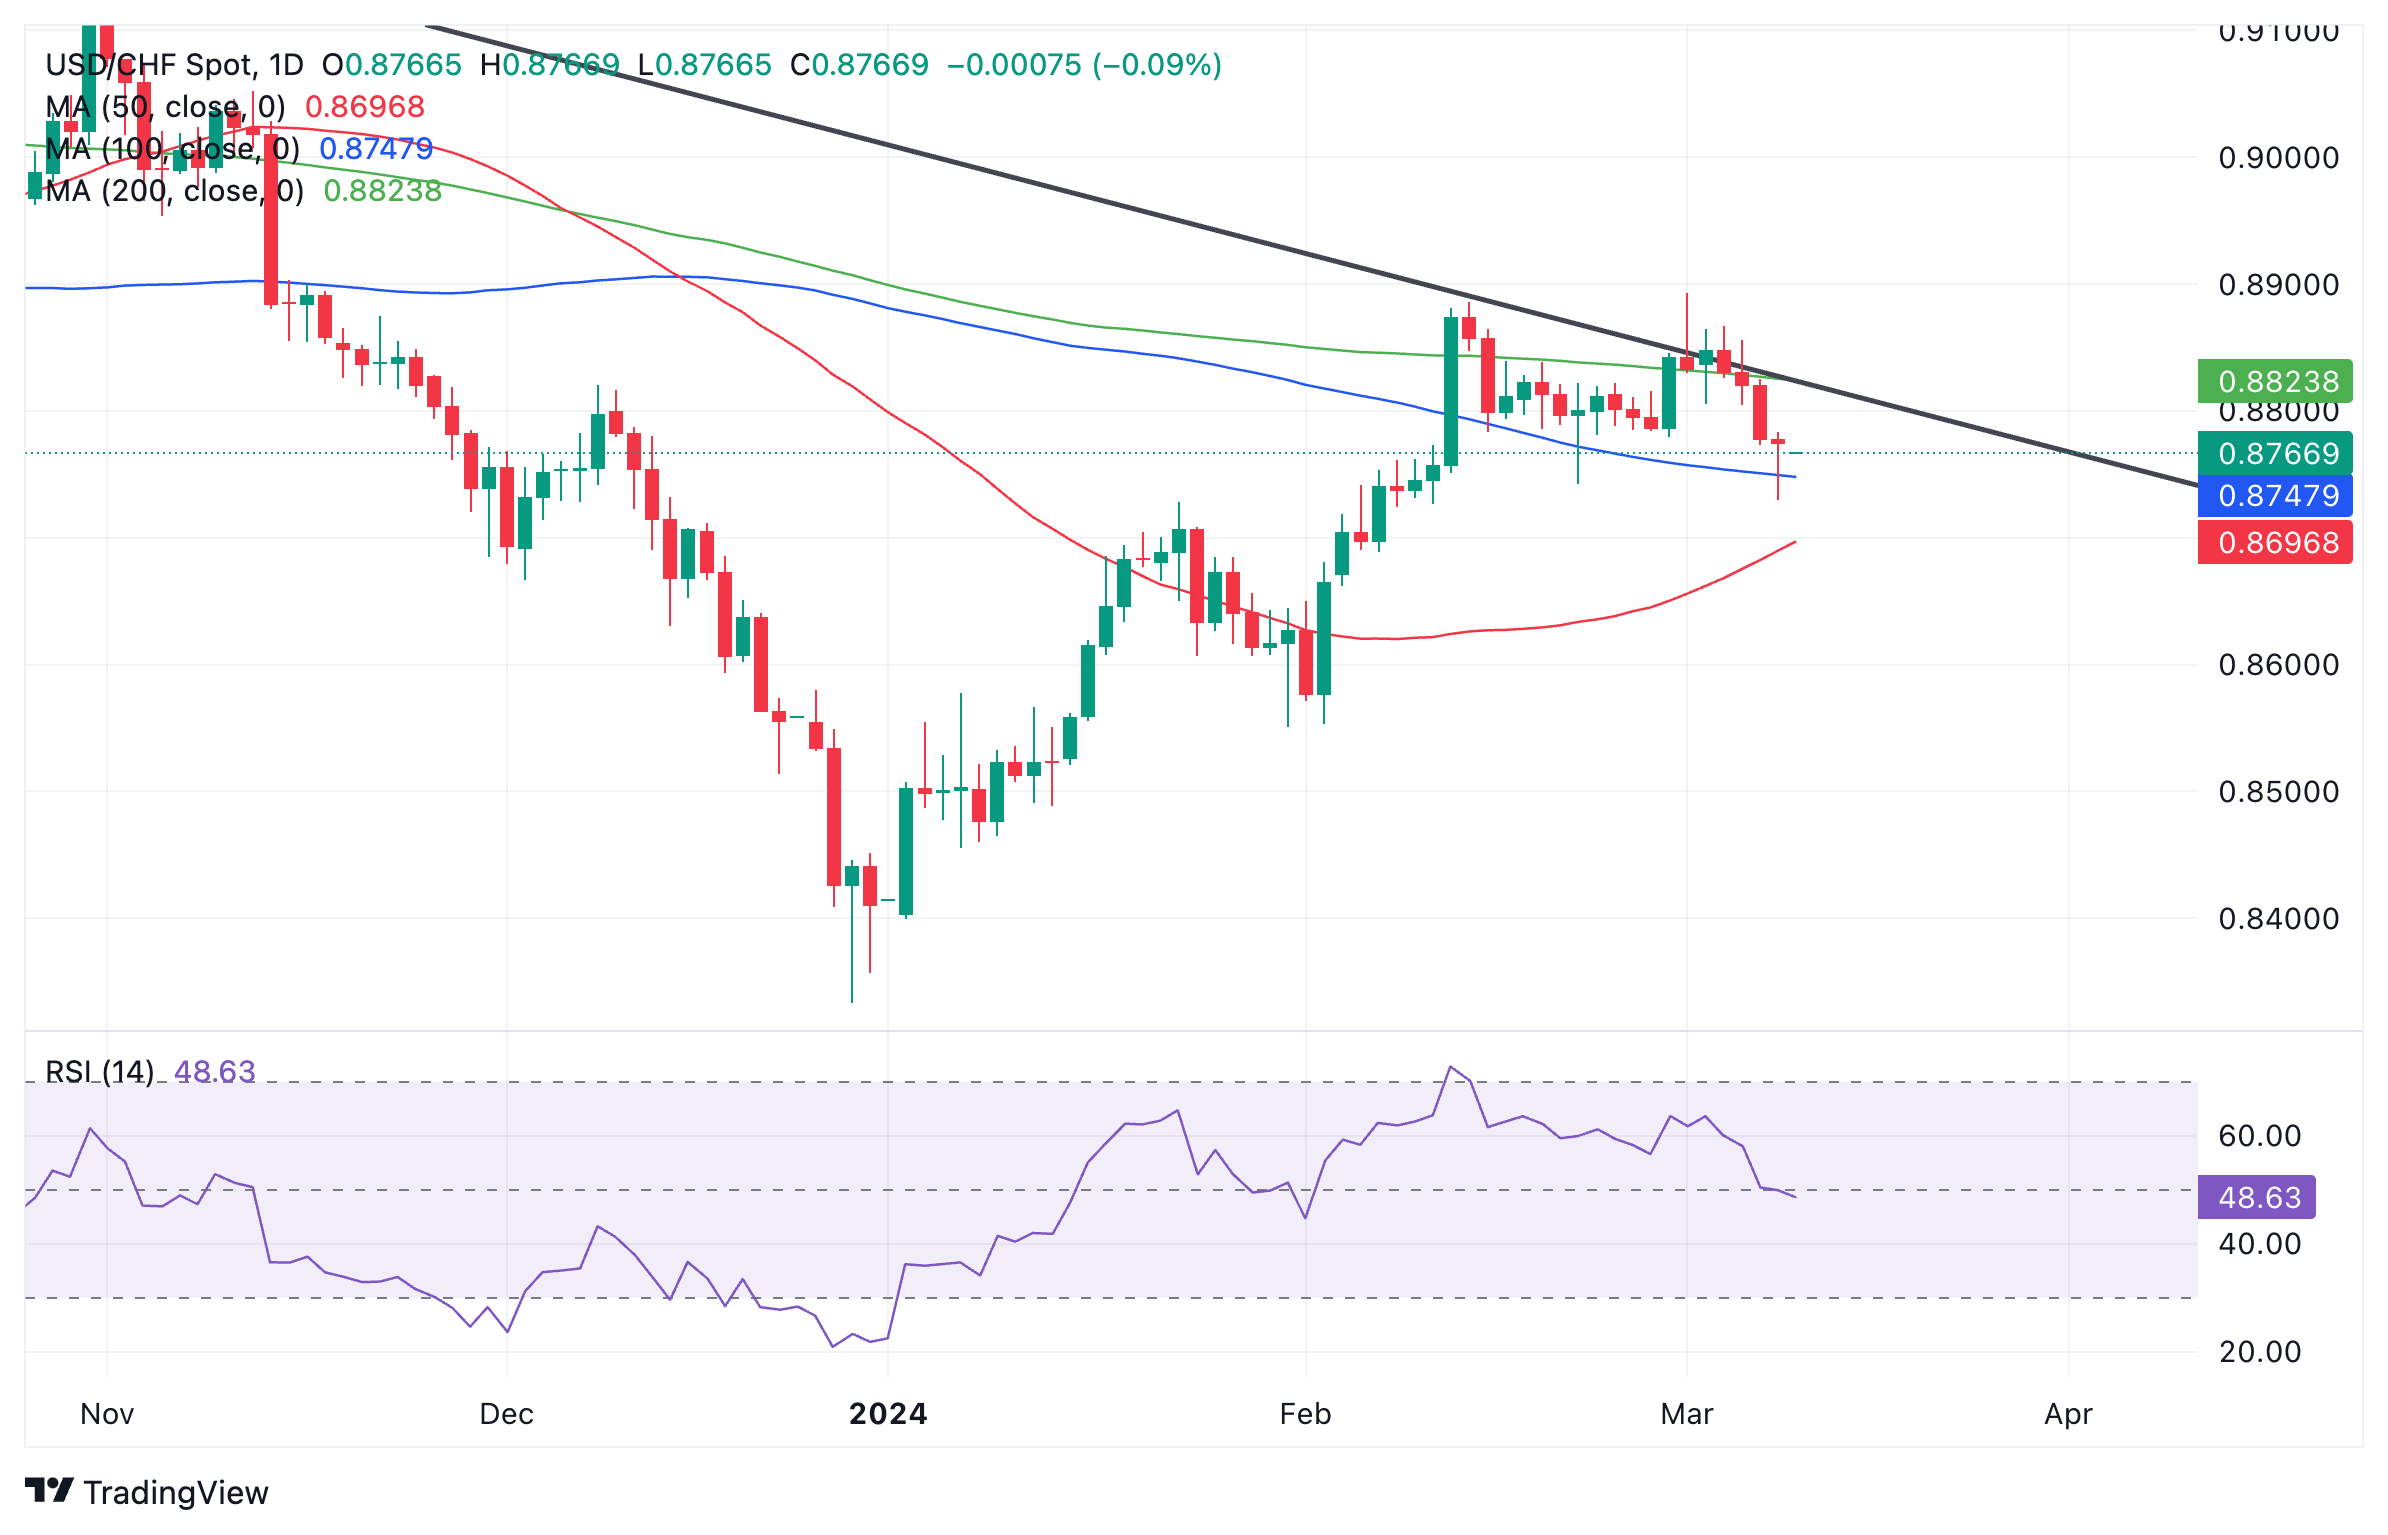
US Dollar vs Swiss Franc: daily chart
There is now a good chance that price has reversed its uptrend. However, there is still also a fairly strong possibility it could recover and resume its trend higher. A break above the 0.8892 high would indicate a continuation of the short-term uptrend to a possible target at 0.9056.
Swiss Franc FAQs
The Swiss Franc (CHF) is Switzerland’s official currency. It is among the top ten most traded currencies globally, reaching volumes that well exceed the size of the Swiss economy. Its value is determined by the broad market sentiment, the country’s economic health or action taken by the Swiss National Bank (SNB), among other factors. Between 2011 and 2015, the Swiss Franc was pegged to the Euro (EUR). The peg was abruptly removed, resulting in a more than 20% increase in the Franc’s value, causing a turmoil in markets. Even though the peg isn’t in force anymore, CHF fortunes tend to be highly correlated with the Euro ones due to the high dependency of the Swiss economy on the neighboring Eurozone.
The Swiss Franc (CHF) is considered a safe-haven asset, or a currency that investors tend to buy in times of market stress. This is due to the perceived status of Switzerland in the world: a stable economy, a strong export sector, big central bank reserves or a longstanding political stance towards neutrality in global conflicts make the country’s currency a good choice for investors fleeing from risks. Turbulent times are likely to strengthen CHF value against other currencies that are seen as more risky to invest in.
The Swiss National Bank (SNB) meets four times a year – once every quarter, less than other major central banks – to decide on monetary policy. The bank aims for an annual inflation rate of less than 2%. When inflation is above target or forecasted to be above target in the foreseeable future, the bank will attempt to tame price growth by raising its policy rate. Higher interest rates are generally positive for the Swiss Franc (CHF) as they lead to higher yields, making the country a more attractive place for investors. On the contrary, lower interest rates tend to weaken CHF.
Macroeconomic data releases in Switzerland are key to assessing the state of the economy and can impact the Swiss Franc’s (CHF) valuation. The Swiss economy is broadly stable, but any sudden change in economic growth, inflation, current account or the central bank’s currency reserves have the potential to trigger moves in CHF. Generally, high economic growth, low unemployment and high confidence are good for CHF. Conversely, if economic data points to weakening momentum, CHF is likely to depreciate.
As a small and open economy, Switzerland is heavily dependent on the health of the neighboring Eurozone economies. The broader European Union is Switzerland’s main economic partner and a key political ally, so macroeconomic and monetary policy stability in the Eurozone is essential for Switzerland and, thus, for the Swiss Franc (CHF). With such dependency, some models suggest that the correlation between the fortunes of the Euro (EUR) and the CHF is more than 90%, or close to perfect.
- WTI Oil enters in range trade after Aramco scrubs production boost.
- Oil traders are still positioned for more upside potential with bullish option market positioning.
- The US Dollar Index steady below 103.00, with data-driven week ahead while Fed enters blackout period.
Oil prices are trading sideways this Monday with some slim gains on the back of headlines that Saudi Arabia’s Aramco has postponed plans to boost its production from 12 to 13 million barrels per day by 2027. Still, the news only moves the price by a touch because the actual production was never close at these levels, and thus is not being taken away from markets. All in all, nothing changed much and this puts the Crude in a bit of a range between $75 and $80.
The US Dollar is entering a week in which it will move from one data point to the next. The glue or guidance that markets normally get from US Federal Reserve members’ speeches will not be taking place this week as the Fed has entered its blackout period ahead of the rate decision and Chairman Jerome Powell’s speech next week. Expect thus a very whipsaw week for the US Dollar, facing scenarios such as when one data point contradicts the next, or an accelerated move in one direction when all data falls in line with one bias.
Crude Oil (WTI) trades at $77.47 per barrel, and Brent Oil trades at $81.74 per barrel at the time of writing.
Oil news and market movers: Aramco retreats
- The situation in Gaza remains in a stalemate with no ceasefire deal reached over the weekend. With Ramadam having started, the people in Gaza remain in search of food and basic supplies.
- Saudi Aramco has halted its plans to boost its oil-production capacity. The reasoning behind it is the robust non-OPEC supply growth in recent months, which could create a severe supply glut in the market.
- Furthermore, Saudi Aramco is set to boost its dividend payments as elevated benchmark Oil prices are boosting revenue and cash flow for the company.
- An Oil tanker in India has hit a crude import terminal at Sikka port. The timing of possible delays in Crude deliveries is still unclear.
Oil Technical Analysis: Can the US keep this up?
Oil prices are starting to give shape to a bandwidth between $75 and $80 as a healthy equilibrium between buyers and sellers appears to be in place. The fact that Saudi Aramco did not go ahead with its production boost shows that it sees no urgency to do so, although these plans are ready in a drawer to be pulled out one day. With the US Dollar tilted to more weakness, more upside in Oil could still be on the horizon.
Oil bulls still clearly see more upside potential. The break above $80 though does not seem to be taking place that quickly, and $86 is appearing as the next cap. Further up, $86.90 follows suit before targeting $89.64 and $93.98 as top levels.
On the downside, the 100-day and the 55-day Simple Moving Averages (SMA) are near $75.71 and $75.31, respectively. Add the pivotal level near $75.27, and it looks like the downside is very limited and well-equipped to resist the selling pressure.
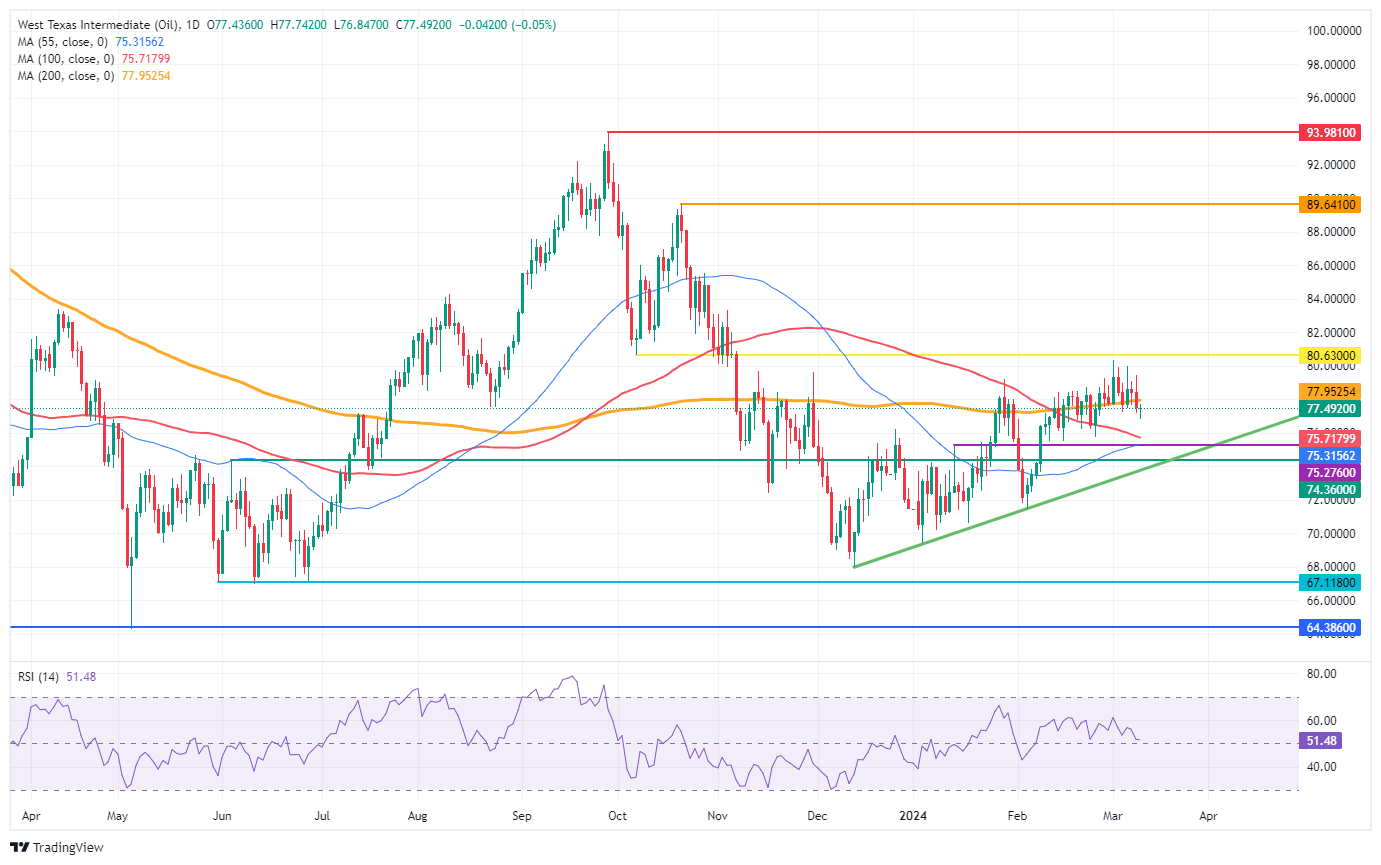
US WTI Crude Oil: Daily Chart
WTI Oil FAQs
WTI Oil is a type of Crude Oil sold on international markets. The WTI stands for West Texas Intermediate, one of three major types including Brent and Dubai Crude. WTI is also referred to as “light” and “sweet” because of its relatively low gravity and sulfur content respectively. It is considered a high quality Oil that is easily refined. It is sourced in the United States and distributed via the Cushing hub, which is considered “The Pipeline Crossroads of the World”. It is a benchmark for the Oil market and WTI price is frequently quoted in the media.
Like all assets, supply and demand are the key drivers of WTI Oil price. As such, global growth can be a driver of increased demand and vice versa for weak global growth. Political instability, wars, and sanctions can disrupt supply and impact prices. The decisions of OPEC, a group of major Oil-producing countries, is another key driver of price. The value of the US Dollar influences the price of WTI Crude Oil, since Oil is predominantly traded in US Dollars, thus a weaker US Dollar can make Oil more affordable and vice versa.
The weekly Oil inventory reports published by the American Petroleum Institute (API) and the Energy Information Agency (EIA) impact the price of WTI Oil. Changes in inventories reflect fluctuating supply and demand. If the data shows a drop in inventories it can indicate increased demand, pushing up Oil price. Higher inventories can reflect increased supply, pushing down prices. API’s report is published every Tuesday and EIA’s the day after. Their results are usually similar, falling within 1% of each other 75% of the time. The EIA data is considered more reliable, since it is a government agency.
OPEC (Organization of the Petroleum Exporting Countries) is a group of 13 Oil-producing nations who collectively decide production quotas for member countries at twice-yearly meetings. Their decisions often impact WTI Oil prices. When OPEC decides to lower quotas, it can tighten supply, pushing up Oil prices. When OPEC increases production, it has the opposite effect. OPEC+ refers to an expanded group that includes ten extra non-OPEC members, the most notable of which is Russia.
- USD/JPY extends losing streak on firm BoJ rate hike bets.
- The revised estimate shows that the Japanese economy accelerated meager by 0.1% in the last quarter of 2023.
- The US Dollar will dance to the tunes of the US Inflation data.
The USD/JPY extends its losing spell for the fifth trading session on Monday. The asset drops 146.70 on broader weakness in the US Dollar and rising expectations for the Bank of Japan (BoJ) exiting its expansionary interest rate stance in the March monetary policy meeting.
BoJ policymakers have indicated that a positive wage cycle will continue for a substantial period that will keep inflation sustainably above the desired target of 2%. Investors hope that the BoJ will scrap its Yield Curve Control (YCC) and will shift to policy normalization.
Meanwhile, expectations for the BoJ raising interest rates have also been prompted, as the revised estimate for Japan’s Q4 Gross Domestic Product (GDP) shows that the economy was not in a technical recession in the second half of 2023. The revised estimates show that the economy grew by 0.1% against a degrowth of 0.1% indicated by the preliminary estimates.
On the US Dollar front, the expectations for the Federal Reserve (Fed) reducing interest rates from the June policy meeting remain firm as labor market conditions have cooled down despite upbeat job growth. The United States employers recruited 275K jobs, against expectations of 200K and the prior reading of 229K, downwardly revised from 353K. The Unemployment Rate rose to 3.9% from 3.7%.
Firm expectations for the Fed unwinding its restrictive policy stance for June have built pressure on the US Dollar. The US Dollar Index (DXY), which gauges Greenabck’s value against six major currencies, drops to 102.70.
For further guidance, investors await the US Consumer Price Index (CPI) data for February, which will be published on Tuesday. Investors should note that the soft Average Hourly Earnings data for February, released on Friday, indicates cooling inflation expectations.
EUR/GBP dived on Friday and is trading close to the 0.8500 lows. Economists at ING analyze the Pound Sterling (GBP) outlook.
Key data tests for the strong Pound
The Pound’s strong momentum is set to face a key challenge on Tuesday as the UK releases its jobs report. Wage growth figures – especially in the private sector – will be watched very closely as they now represent the second most important input for the Bank of England after services inflation.
Later in the week, we’ll also see the UK’s January GDP report, February’s Retail Sales and the BoE's inflation attitude survey.
Back in February, EUR/GBP’s exploration of the 0.8500 area was very short-lived and followed by a sharp rebound. Unless UK data surprises on the strong side, we doubt EUR/GBP can fall much further from these levels.
- Gold price clings to all-time highs and awaits US Inflation data for further action.
- The US CPI data will indicate whether the Fed gets confident that price stability is ensured.
- The US NFP report keeps hopes of a Fed rate cut in June alive.
Gold price (XAU/USD) rally hit a pause in Monday’s European session as investors await the United States Consumer Price Index (CPI) data for February, which will be published on Tuesday. The precious metal takes a breather as the inflation data will provide cues about the US interest rate outlook.
The Gold price remains near all-time highs as yields on interest-bearing government bonds were hit hard after the Nonfarm Payrolls (NFP) report indicated that the labor market conditions are cooling. The 10-year US Treasury yields drop to 4.07%. The US Dollar Index (DXY) also exhibits a subdued performance, trading at around 102.73. On Friday, the USD Index recovered after printing a fresh seven-week low near 102.35.
The near-term outlook for Gold remains bullish. The NFP report for February, released on Friday, and last week’s Federal Reserve (Fed) Chair Jerome Powell’s Congressional testimony kept hopes alive for the central bank reducing interest rates in the June policy meeting. Fed Powell said the central bank is not far from gaining confidence that inflation will return to the 2% target. He recognized the need to dial back the restrictive monetary policy stance to avoid the economy falling into a recession.
Daily digest market movers: Gold price oscillates inside Friday’s trading range
- Gold price turns sideways around $2,180 after refreshing all-time highs ahead of the United States CPI data for February. The inflation data will provide fresh guidance on interest rates and influence investors’ expectations for rate cuts by the Federal Reserve (Fed) in the June policy meeting.
- Monthly headline inflation is forecasted to have risen by 0.4% from 0.3% in January. In the same period, core inflation, which strips off volatile food and oil prices, is anticipated to have grown at a slower pace of 0.3% against the prior reading of 0.4%. For annual figures, economists expect that the headline CPI will remain sticky at 3.1% and the core inflation will decelerate to 3.7% from 3.9% in January.
- Federal Reserve policymakers want to confirm that inflation will sustainably come down to the 2% target before rolling back the restrictive monetary policy stance. A sticky inflation report would allow the Fed to not rush towards interest-rate cuts and may dampen hopes of the Fed reducing interest rates in June.
- Currently, the CME FedWatch tool shows that expectations for the Fed pivoting to rate cuts in June by 25 basis points (bps) are firm at 57%. Traders may not have elevated bets for a rate cut in June as the impact of a higher Unemployment Rate and soft Average Hourly Earnings was offset by higher Nonfarm Payrolls.
- The jobless rate rose to 3.9% from expectations and the prior reading of 3.7%. The monthly Average Hourly Earnings increased by a meager 0.1% on month while investors projected a growth by 0.3%. In January, wages grew by 0.5%, downwardly revised from 0.6%. Fresh payrolls were at 275K, against expectations of 200K and the prior reading of 229K, downwardly revised from 353K.
Technical Analysis: Gold hovers near all-time highs around $2,195
Gold price extends its winning spell for the ninth trading session on Monday. The precious metal refreshes its all-time high around $2,195 and is expected to capture the round-level resistance of $2,200. On the downside, December 4 high near $2,145 and December 28 high at $2,088 will act as major support levels.
The 14-period Relative Strength Index (RSI) reaches overbought territory at 84.00, pointing to the chances of some correction ahead.
Gold FAQs
Gold has played a key role in human’s history as it has been widely used as a store of value and medium of exchange. Currently, apart from its shine and usage for jewelry, the precious metal is widely seen as a safe-haven asset, meaning that it is considered a good investment during turbulent times. Gold is also widely seen as a hedge against inflation and against depreciating currencies as it doesn’t rely on any specific issuer or government.
Central banks are the biggest Gold holders. In their aim to support their currencies in turbulent times, central banks tend to diversify their reserves and buy Gold to improve the perceived strength of the economy and the currency. High Gold reserves can be a source of trust for a country’s solvency. Central banks added 1,136 tonnes of Gold worth around $70 billion to their reserves in 2022, according to data from the World Gold Council. This is the highest yearly purchase since records began. Central banks from emerging economies such as China, India and Turkey are quickly increasing their Gold reserves.
Gold has an inverse correlation with the US Dollar and US Treasuries, which are both major reserve and safe-haven assets. When the Dollar depreciates, Gold tends to rise, enabling investors and central banks to diversify their assets in turbulent times. Gold is also inversely correlated with risk assets. A rally in the stock market tends to weaken Gold price, while sell-offs in riskier markets tend to favor the precious metal.
The price can move due to a wide range of factors. Geopolitical instability or fears of a deep recession can quickly make Gold price escalate due to its safe-haven status. As a yield-less asset, Gold tends to rise with lower interest rates, while higher cost of money usually weighs down on the yellow metal. Still, most moves depend on how the US Dollar (USD) behaves as the asset is priced in dollars (XAU/USD). A strong Dollar tends to keep the price of Gold controlled, whereas a weaker Dollar is likely to push Gold prices up.
The US Dollar (USD) had its worst week since December losing out versus the rest of G10. Economists at ING analyze Greenback’s outlook ahead of the US Consumer Price Index (CPI) report.
CPI report can offer the US Dollar some support
We expect inflation figures to put a stop to the Dollar decline this week. The shifts in FX positioning last week no longer justify an exacerbation in USD downward pressure unless key data starts to turn in favour of Fed easing.
There is a non-negligible risk that part of the USD losses driven by Fed Chair Powell’s testimony will be unwound this week.
EUR/GBP dip buyers emerge ahead of psychological support of 0.8500. Economists at Société Générale analyze the pair’s technical outlook.
Failure to overcome 0.8580 can denote risk of one more down leg
EUR/GBP recently defended last August low near 0.8490. The rebound has so far remained contained near 50-DMA at 0.8580.
Daily MACD has posted positive divergence denoting receding downward momentum but a break beyond 0.8580 would be crucial for confirming short-term upside. Failure to overcome this can denote risk of one more down leg.
Break below 0.8490 can extend the decline towards next projections at 0.8455/0.8440 which is also the trend line connecting lows of December 2022 and July 2023.
- EUR/USD is trading quietly prior to the major key US inflation data release on Tuesday.
- US CPI data is likely to shape expectations of when the Federal Reserve will start to cut interest rates – a US Dollar driver.
- There are technical signs the pair may be about to correct further, although the short-term trend remains bullish.
EUR/USD is trading in the 1.0940s on Monday during the early European session as traders await the next big data release for the pair, US Consumer Price Index (CPI) inflation data out on Tuesday, at 13:30 GMT.
The CPI report is seen as a key factor in deciding when the US Federal Reserve (Fed) will decide to start cutting interest rates. If inflation falls lower than expected, then it could bring forward the moment when the Fed pivots. Lower interest rates would be negative for the US Dollar (USD) all other things being equal, as they attract lower inflows of foreign capital.
Daily digest market movers: EUR/USD awaits inflation data
- EUR/USD is trading in the mid 1.0900s as traders await the release of US CPI data for February.
- The Consumer Price Index ex Food and Energy is forecast to moderate to 3.7% YoY – from 3.9% previously, and 0.3% MoM from 0.4% previously.
- The headline CPI figure is forecast to come in at 3.1% YoY, unchanged from the previous month, and at 0.4% MoM from 0.3% in the previous month.
- According to the CME FedWatch Tool, which calculates a market-based expectation of when the Federal Reserve will begin reducing its Fed Funds Rate, the probability of a first cut in March is 4%, in May 31.5%, and the chances of a cut by June are 73.8%.
- EUR/USD saw a volatile end to last week after US Nonfarm Payrolls (NFP) data painted a mixed picture of the US labor market.
- Although the headline NFP figure beat estimates, the previous figure was revised down from 353K to 229K, Average Hourly Earnings – a key factor in inflation – came out lower than expected, and the Unemployment Rate rose from 3.7% to 3.9% when economists had forecast no-change.
- The result weighed on the US Dollar (USD) as it suggested an increased chance the Fed might reduce interest rates to avert a hard landing. This resulted in an upswing for EUR/USD to the 1.0970s.
- The pair failed to sustain the highs, however, as the Euro also weakened on reports that two key figures in the European Central Bank (ECB) had suggested the ECB might need to cut interest rates as soon as April.
- Banque de France President François Villeroy de Galhau and Bundesbank President Dr. Joachim Nagel, both said that a rate cut in the spring might now be warranted.
- This contrasted with the official line delivered by ECB President Christine Lagarde at her press conference after the meeting on Thursday, where she had earmarked June as the month when the ECB would review its policy on interest rates.
Technical Analysis: Euro overbought and pulling back
Turning to the charts, the overall short-term picture for EUR/USD is that the pair has been rising since February in an uptrend that continues to slightly favor bulls, but there are increasing signs a correction may be about to unfold.
The Relative Strength Indicator (RSI) has exited the overbought zone on the 4-hour chart, providing a sell signal. The RSI has also formed a pattern at the highs (circled), which resembles a Head and Shoulders reversal pattern. This reinforces the sell signal.
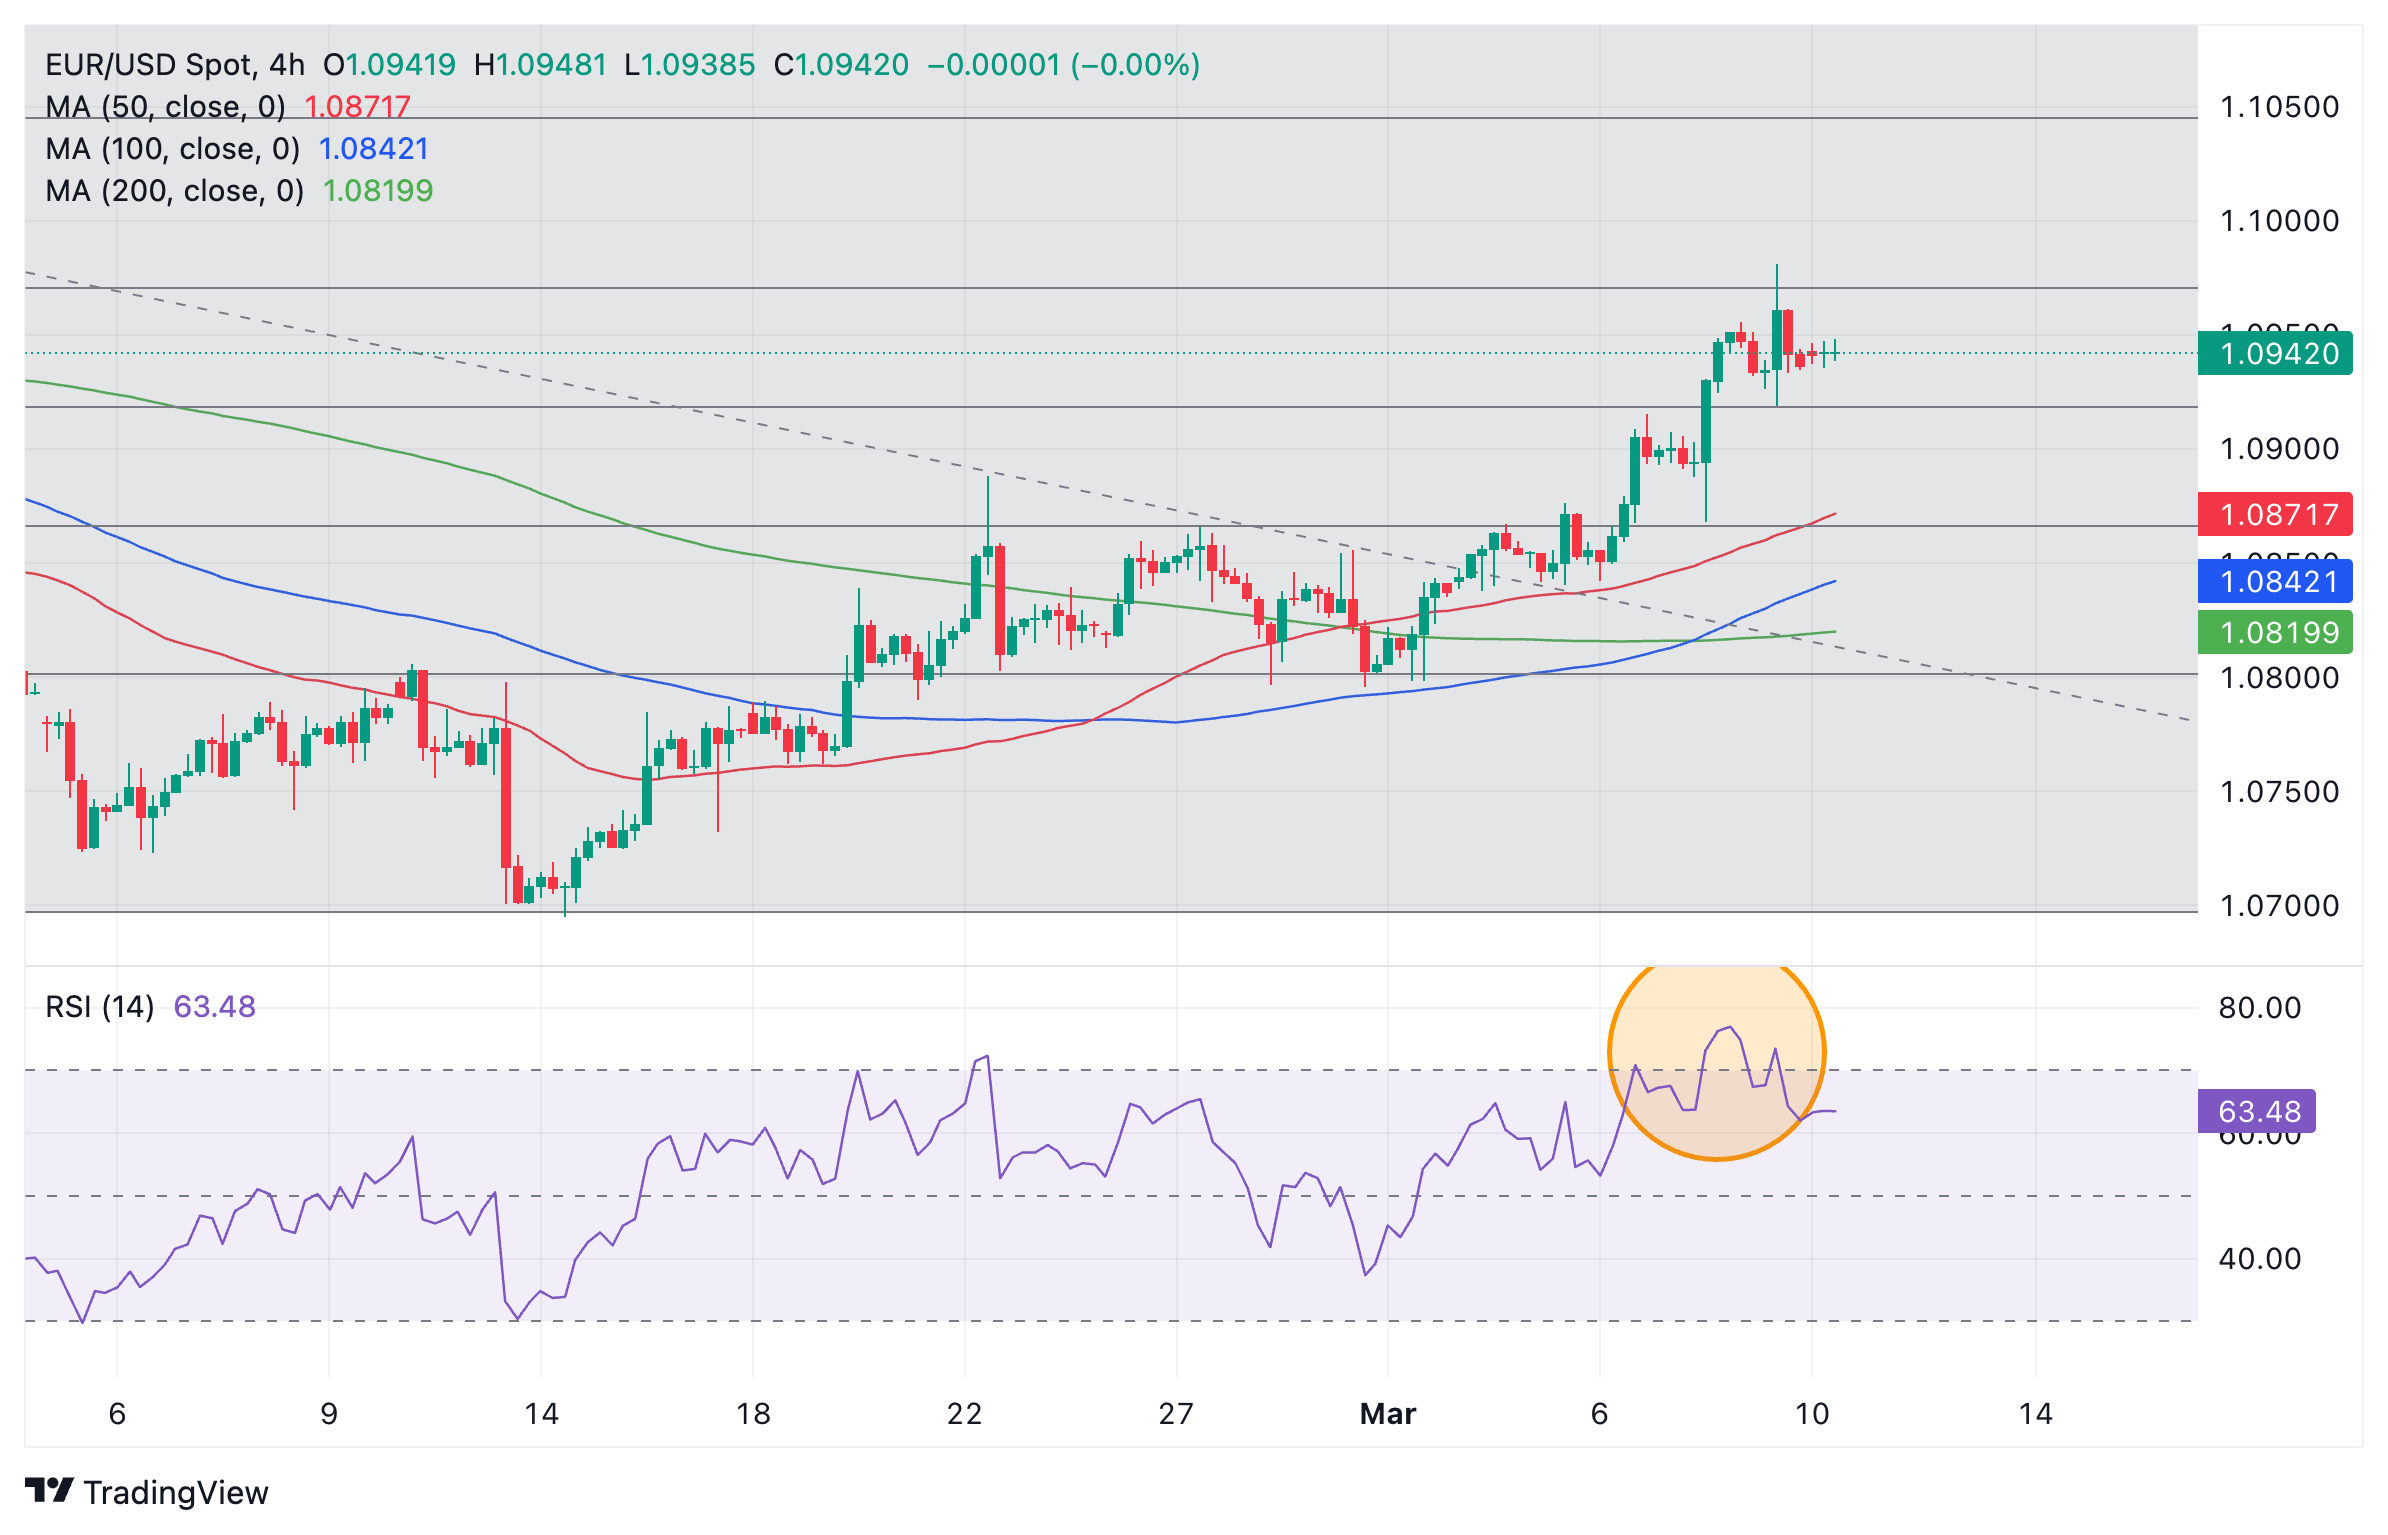
Euro vs US Dollar: 4-hour chart
The pair also seems to have completed a three-wave ABC measured move pattern, further suggesting a deeper correction is about to unfold.
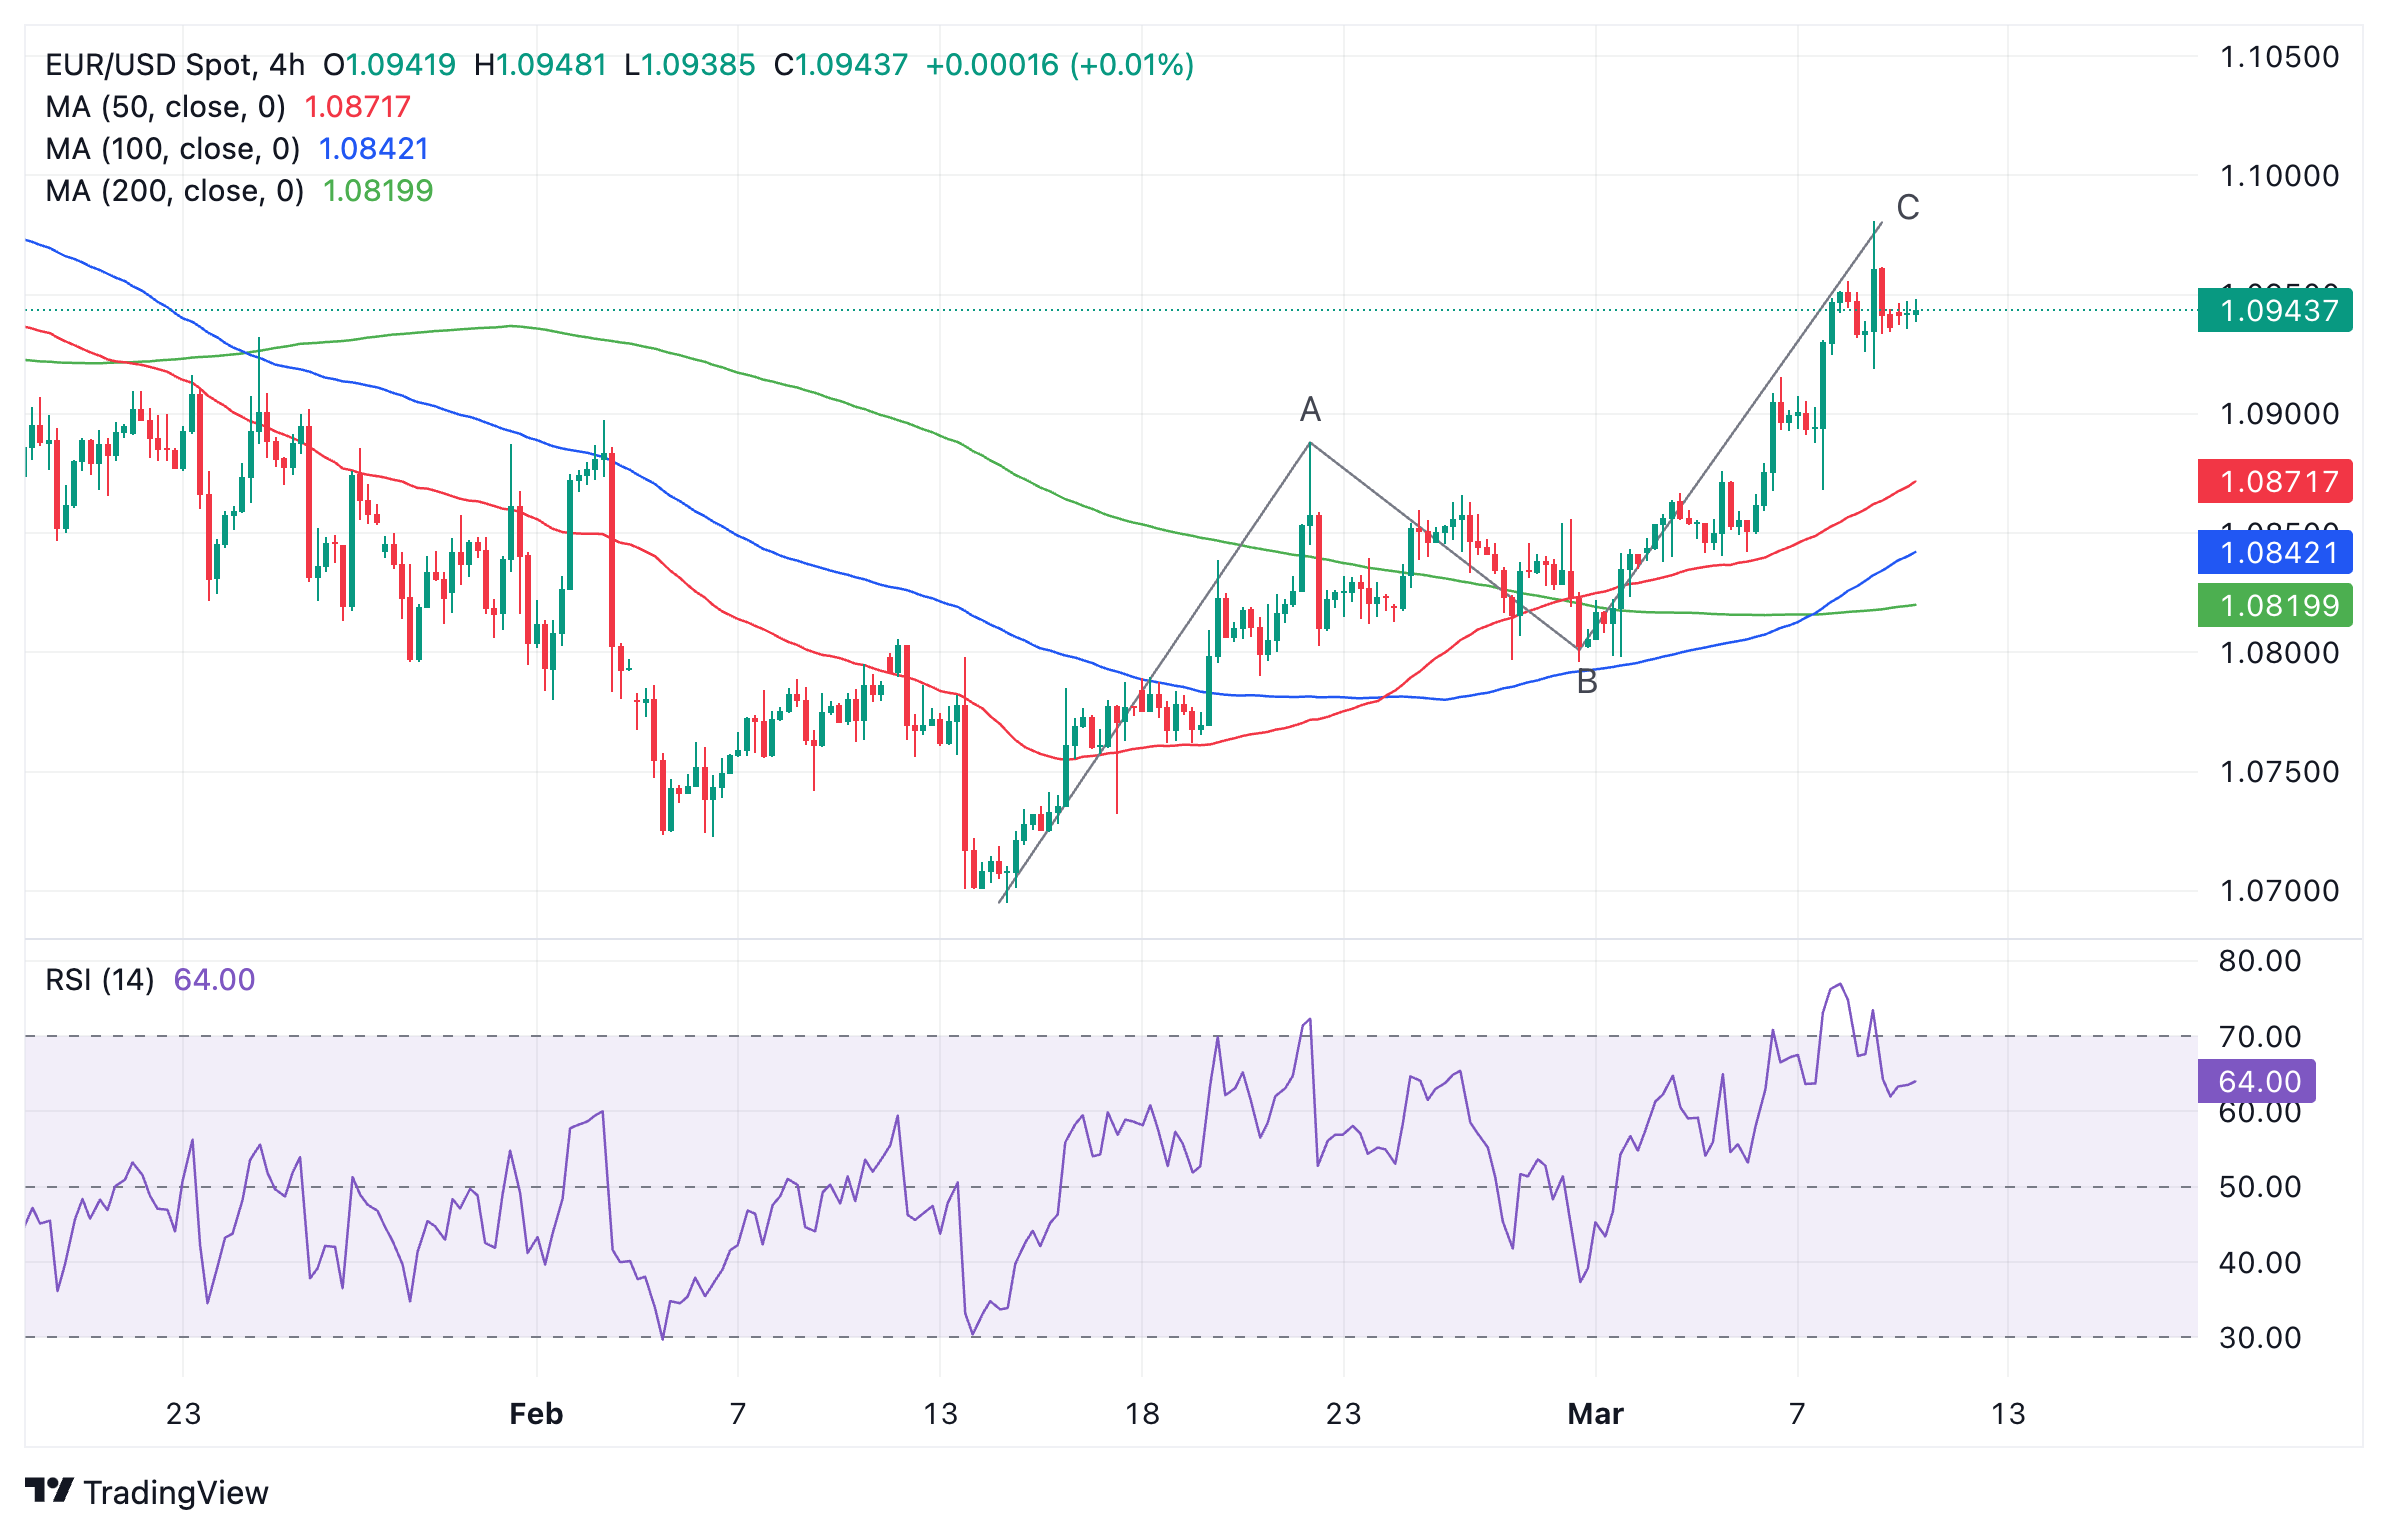
Euro vs US Dollar: 4-hour chart
One possible zone where the correction could find support is between the 1.0898 February 2 high and the top of the A wave at 1.0888.
The daily chart shows a bearish Shooting Star Japanese candlestick pattern (circled) has formed on Friday, March 8, after the NFP release. If this is followed up by another bearish day it will provide confirmation for a bearish short-term reversal signal.
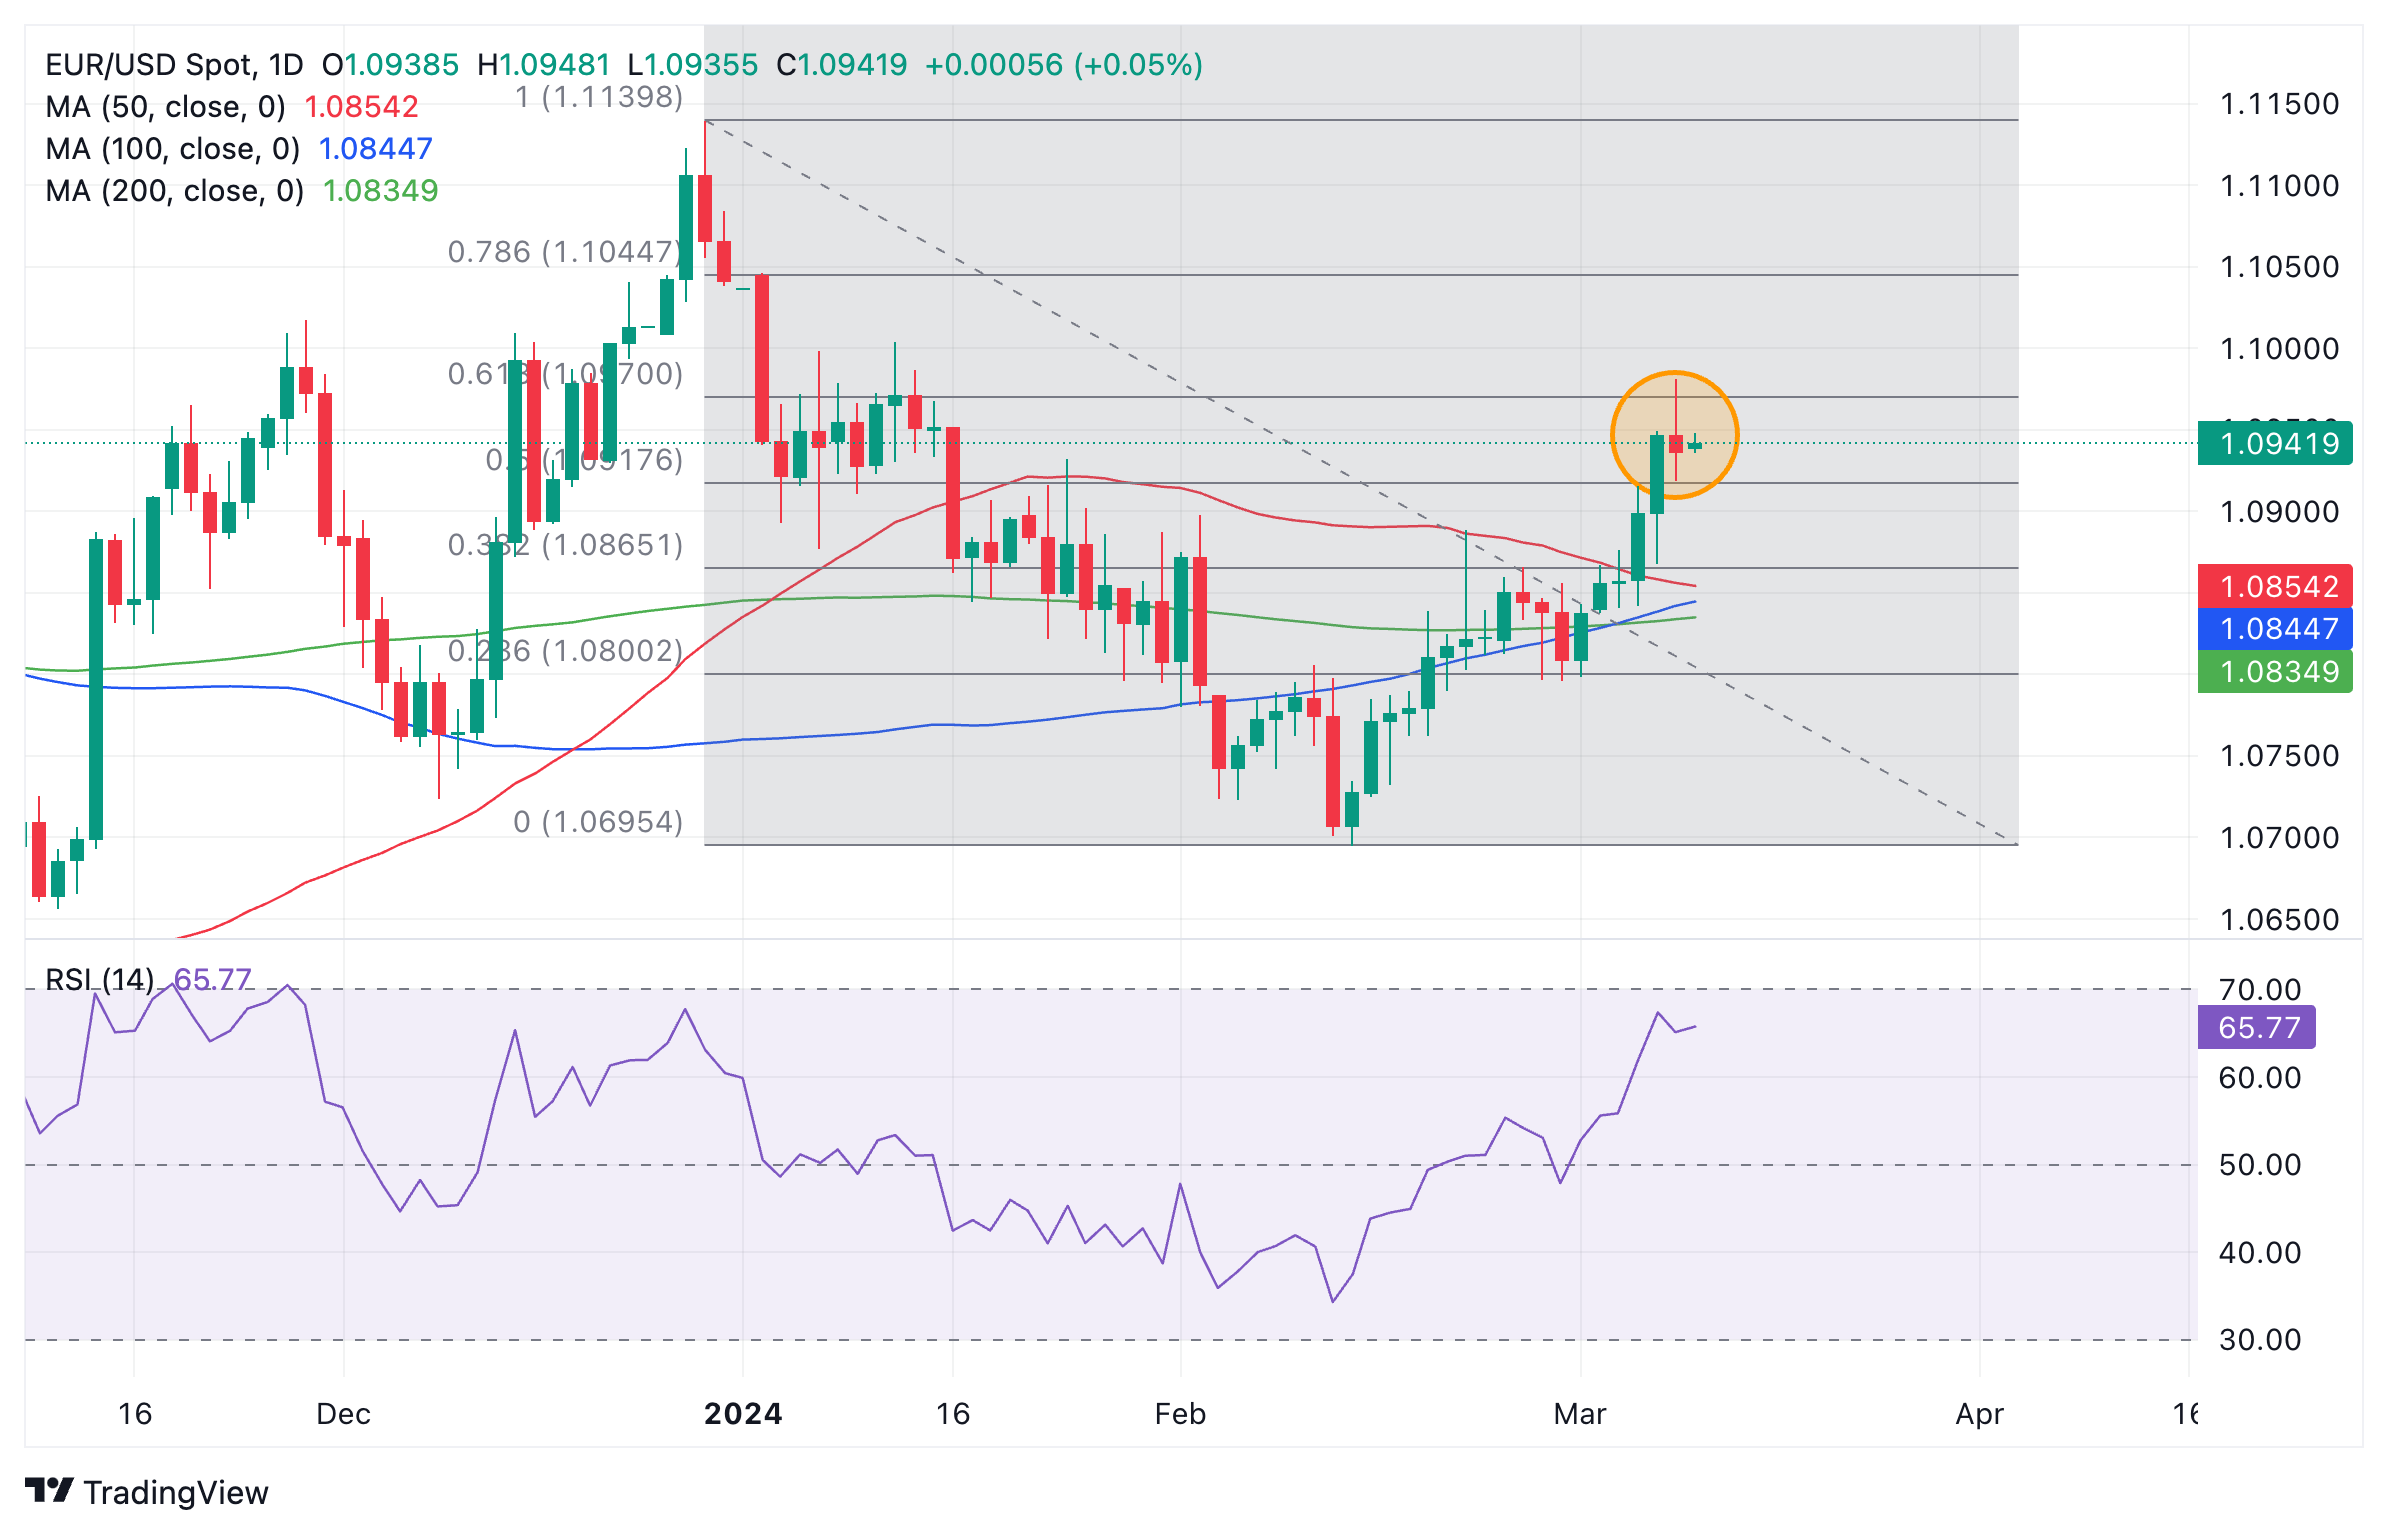
Euro vs US Dollar: 1-day chart
The completion of the Shooting Star also coincides with the key 0.618 Fibonacci retracement of the early 2024 decline, at 1.0972.
Despite all these bad omens, price itself stubbornly remains in the 1.0940s and it is still possible it could recover and run up to the next major target at 1.1000, simply extending the short-term trend higher. After that, 1.1043 comes into view, at the 0.786 Fibonacci retracement.
A break beneath the 1.0795 lows would indicate a vulnerability to a reversal of the short-term trend.
The overall long-term trend is sideways and difficult to forecast.
European Central Bank (ECB) Governing Council member Peter Kazimir said on Monday that the central bank “should wait until June for the first rate cut.”
Additional comments
Rushing the move is not smart nor beneficial.
Upside risks to inflation are "alive and kicking".
Need more hard evidence on inflation outlook.
Only in June will we reach the confidence threshold on that.
But discussions on easing should ready start.
We will use the weeks ahead for that.
Market reaction
The Euro was little affected by Kazimir’s comments, keeping EUR/USD unperturbed near 1.0940.
ECB FAQs
The European Central Bank (ECB) in Frankfurt, Germany, is the reserve bank for the Eurozone. The ECB sets interest rates and manages monetary policy for the region. The ECB primary mandate is to maintain price stability, which means keeping inflation at around 2%. Its primary tool for achieving this is by raising or lowering interest rates. Relatively high interest rates will usually result in a stronger Euro and vice versa. The ECB Governing Council makes monetary policy decisions at meetings held eight times a year. Decisions are made by heads of the Eurozone national banks and six permanent members, including the President of the ECB, Christine Lagarde.
In extreme situations, the European Central Bank can enact a policy tool called Quantitative Easing. QE is the process by which the ECB prints Euros and uses them to buy assets – usually government or corporate bonds – from banks and other financial institutions. QE usually results in a weaker Euro. QE is a last resort when simply lowering interest rates is unlikely to achieve the objective of price stability. The ECB used it during the Great Financial Crisis in 2009-11, in 2015 when inflation remained stubbornly low, as well as during the covid pandemic.
Quantitative tightening (QT) is the reverse of QE. It is undertaken after QE when an economic recovery is underway and inflation starts rising. Whilst in QE the European Central Bank (ECB) purchases government and corporate bonds from financial institutions to provide them with liquidity, in QT the ECB stops buying more bonds, and stops reinvesting the principal maturing on the bonds it already holds. It is usually positive (or bullish) for the Euro.
EUR/USD kicks off the new week positively. Economists at ING analyze the pair’s outlook.
A correction could take EUR/USD back to the 1.0850/1.0900 area
We must reiterate that EUR/USD is trading around the top of the range, consistent with a still depressed short-term rate differential. The EUR:USD 2-year swap rate gap has not moved much since the start of March, staying around 125 bps, and we need to see a clearer convergence of USD and EUR rates to justify continued support beyond 1.1000.
We see some downside risks this week for EUR/USD, and a correction could take it back to the 1.0850/1.0900 area. However, our call for a first rate cut in June by both the ECB and the Fed can still argue for a higher EUR/USD, as the Fed should ultimately deliver a larger easing package.
In view of the Riksbank's recent dovish stance, the Swedish Krona (SEK) is likely to have little more upside potential, economists at Commerzbank say.
Riksbank turns dovish
In February, the Riksbank surprised with the statement that the key interest rate could be cut significantly earlier, possibly as early as the first half of 2024. It did not want to completely rule out March either, although the hurdles for this are probably high. Although inflationary pressure is actually still too high for this, the Riksbank has become a dove, which we believe was hasty. It could have waited until March when it had more data on inflation and growth.
Given the Riksbank's recent dovish stance, the Krona is likely to have little upside potential. If the Riksbank gives the impression in March that it is not sufficiently combating inflation risks, this would be fatal for the Krona.
- USD/CAD struggles to extend recovery above 1.3500 amid weak US Dollar.
- Cooling US labor market conditions indicate that Fed rate cut bets for June remain on the table.
- Slower Canada’s wage growth indicates that the inflation outlook is softening.
The USD/CAD pair faces pressure while attempting to extend recovery above the psychological resistance of 1.3500 in the European session on Monday. The Loonie asset is expected to resume its downside journey as the broader appeal for the US Dollar remains weak due to firm market expectations for the Federal Reserve (Fed) reducing interest rates in the June policy meeting.
The United States Nonfarm Payrolls (NFP) report for February, released on Friday, indicated that the Unemployment Rate rose to 3.9%, highest in two years, though in a comfortable range and monthly wage growth was significantly slower. On the contrary, labor demand remains robust as employers hired 275K workers against expectations of 200K.
Going forward, the US Dollar will be guided by the Consumer Price Index (CPI) data for February, which will be published on Tuesday and will provide fresh insights into the interest rate outlook.
On the Canadian Dollar front, slower wage growth has softened the inflation outlook. Annual Average Hourly Earnings grew at a significantly slower pace of 4.9% in February from a 5.3% increase in January. This could allow Bank of Canada (BoC) policymakers to consider reducing interest rates ahead.
USD/CAD trades in a Rising Channel chart pattern on a daily timeframe. The chart formation exhibits an upside bias with moderate strength, and market participants consider each pullback a buying opportunity. Near-term demand remains downbeat as the Loonie asset is trading below the 20-day Exponential Moving Average (EMA), which trades around 1.3510.
The 14-period Relative Strength Index (RSI) oscillates inside the 40.00-60.00 range, indicating indecisiveness among market participants.
Fresh upside would appear if the asset breaks above January 17 high at 1.3542, which will drive the asset towards February 13 high at 1.3586, followed by the round-level resistance of 1.3600.
On the flip side, a downside move below February 22 low at 1.3441 would expose the asset to February 9 low at 1.3413. A breakdown below the latter would extend downside towards January 15 low at 1.3382.
USD/CAD daily chart
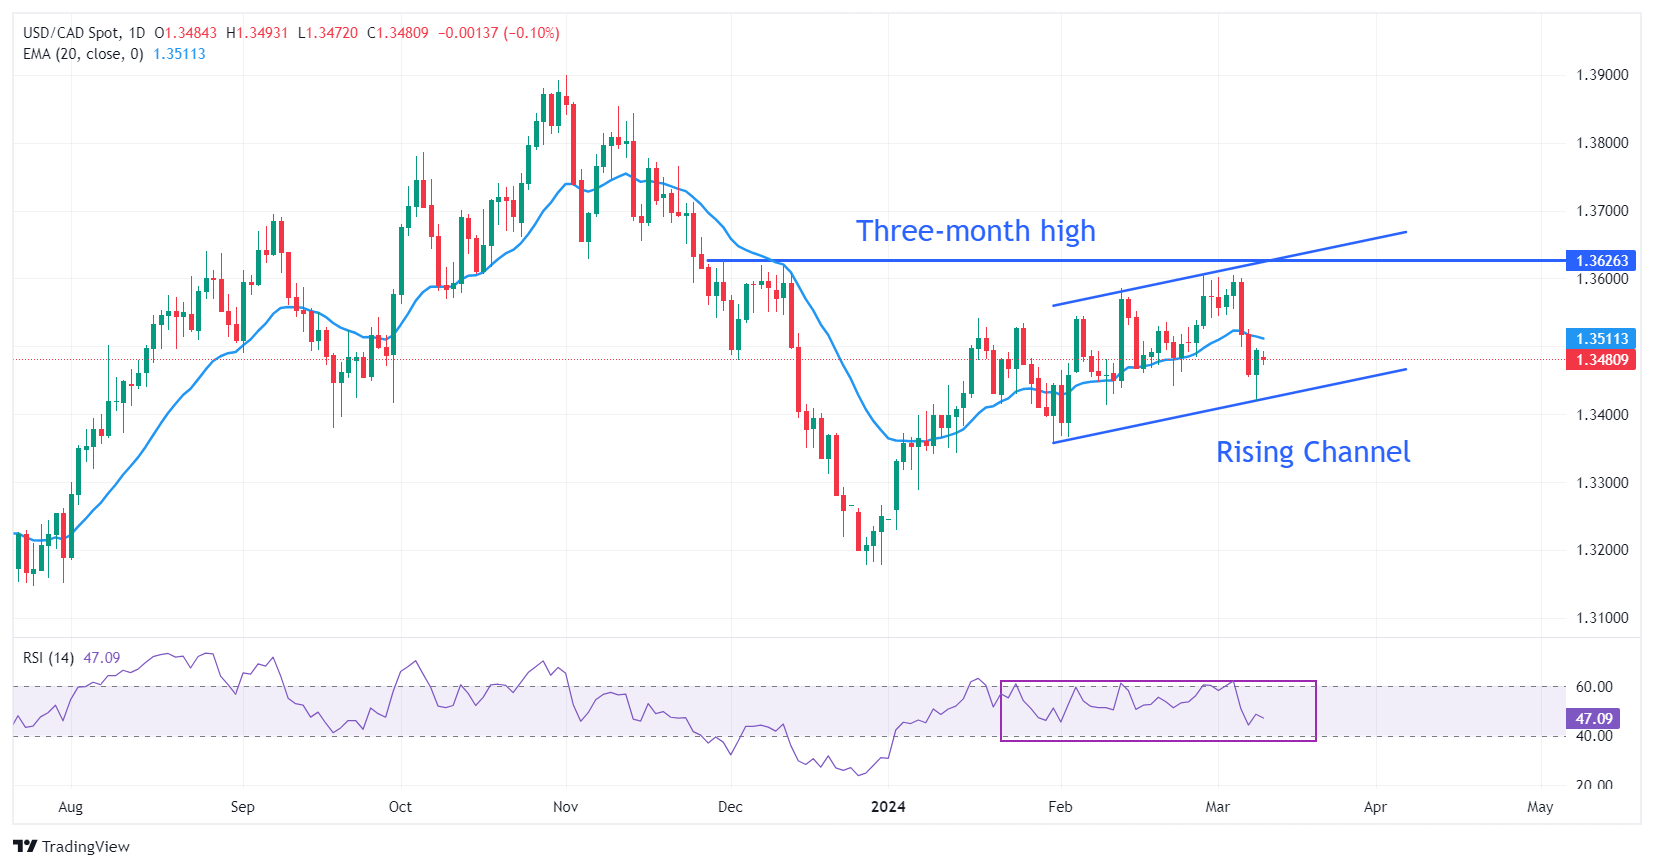
- AUD/USD kicks off the new week on a weaker note in reaction to mixed Chinese inflation figures.
- A softer risk tone also undermines the Aussie, though subdued USD demand lends some support.
- Traders might also prefer to wait on the sidelines ahead of the crucial US CPI report on Tuesday.
The AUD/USD pair extends Friday's retracement slide from the 0.6665-0.6670 region, or its highest level since mid-January and remains under some selling pressure on the first day of a new week. Spot prices remain on the defensive through the first half of the European session and currently trade just above the 0.6600 round-figure mark, though any meaningful corrective slide seems elusive.
Mixed Chinese inflation figures released over the weekend failed to ease concerns about deflation, which, along with US-Sino trade tensions, turn out to be key factors undermining the China-proxy Australian Dollar (AUD). In fact, China’s Consumer Price Index (CPI) rose for the first time in four months, while the Producer Price Index slipped by the 2.7% YoY rate during the reported month. Adding to this, Bloomberg reported that Washington is weighing sanctions on several Chinese tech companies, which, along with a generally weaker tone around the equity markets, undermines the risk-sensitive Aussie.
The US Dollar (USD), on the other hand, struggles to attract any meaningful buyers or build on Friday's recovery from its lowest level since mid-February amid bets for an imminent shift in the Federal Reserve's (Fed) policy stance. Market participants now seem convinced that the US central bank will start cutting interest rates in June and the expectations were reaffirmed by a spike in the US jobless rate. This keeps the yield on the benchmark 10-year US government bond depressed near a more than one-month low, which keeps the USD bulls on the defensive and should lend some support to the AUD/USD pair.
Traders might also refrain from placing aggressive directional bets and prefer to wait on the sidelines ahead of the latest US consumer inflation figures, due for release on Tuesday. The crucial US CPI report will play a key role in influencing expectations about the Fed's rate-cut path, which, in turn, will drive the USD demand and provide some meaningful impetus to the AUD/USD pair. In the meantime, spot prices remain at the mercy of the USD price dynamics and the broader risk sentiment in the absence of any relevant market-moving economic releases from the US on Monday.
- USD/MXN extends its losing streak ahead of US CPI data scheduled for Tuesday.
- CME FedWatch Tool suggests a 73.8% probability of a rate cut in June.
- US Dollar suffered losses following the mixed employment data from the United States.
USD/MXN continues its downward trend following mixed employment data from the United States (US). The pair inches lower to around 16.80 during the European session on Monday. Negative sentiment surrounding the US Dollar Index (DXY) weakens the USD/MXN pair amid growing expectations of a Federal Reserve (Fed) rate cut in June.
According to the CME FedWatch Tool, there is a 73.8% probability of a rate cut in June. Furthermore, Federal Reserve (Fed) Chair Jerome Powell hinted at potential cuts in borrowing costs sometime this year, emphasizing that such actions would depend on the inflation trajectory aligning with the Fed's 2% target.
In February, US Nonfarm Payrolls added new jobs by 275K, exceeding January's figure of 229K and market expectations of 200K. However, US Average Hourly Earnings (YoY) increased by 4.3%, slightly below both the estimated and previous reading of 4.4%. Investors will likely observe the Consumer Price Index data from the United States (US) scheduled for Tuesday, along with Retail Sales and Producer Price Index data expected on Thursday.
On the Mexican side, the 12-Month Inflation rate increased by 4.40% in February. This figure represented a decline from a seven-month high of a 4.88% rise in January and was slightly lower than the forecasted increase of 4.42%. Core Inflation increased by 0.49%, higher than the previous 0.40% rise. However, Headline Inflation rose by 0.9%, which was lower than the expected 0.11% and the previous 0.89% increase. Market participants are eagerly awaiting the upcoming policy meeting of the Bank of Mexico (Banxico) on March 21.
- The Pound Sterling is stuck in a tight range ahead of the UK labor market, US CPI data.
- The UK wage growth data will provide fresh cues about the inflation outlook.
- The broader market sentiment remains upbeat as hopes for Fed rate cuts in June remain firm.
The Pound Sterling (GBP) consolidates in a tight range around 1.2850 in Monday’s European session as investors stay on the sidelines in a data-packed week. The GBP/USD pair trades sideways ahead of the United Kingdom Employment and monthly Gross Domestic Product (GDP), which will be published on Tuesday and Wednesday, respectively.
UK labor market data for the three months ending in January will give clues about job growth and wage growth momentum, which has been a major driving factor in stubborn inflationary pressures. Persistent wage growth could push back market expectations for Bank of England (BoE) rate cuts to the August meeting. BoE policymakers said that inflation is expected to come down to the 2% target by summer, but that it could flare up again afterwards.
Outside the UK, the Pound Sterling will be impacted by the market sentiment, which will be guided by the United States Consumer Price Index (CPI) data for February, to be released on Tuesday. Hot inflation data could dent firm expectations for the Federal Reserve (Fed) reducing interest rates in June. Prospects for a Fed rate cut in June remain firm as the US Nonfarm Payrolls (NFP) report for February indicated that labor market conditions are cooling. The data showed that, while hiring by US employers remained strong, the Unemployment Rate rose and wage growth softened.
Daily digest market movers: Pound Sterling consolidates ahead of busy UK economic calendar
- The Pound Sterling trades back and forth in a confined range around 1.2850 after a strong rally as investors await fresh guidance on Bank of England interest rates.
- The BoE is expected to reduce interest rates in the August meeting after tightening its policy stance for more than two years. However, the wage growth data for the three months ending in January, to be released on Tuesday, could influence market expectations for rate cuts.
- Investors anticipate that wage growth excluding bonuses was steady at 6.2%. In the same period, Average Earnings including bonuses are forecast to have grown at a slightly slower pace of 5.7% against the former reading of 5.8%. Sticky wage growth would dampen hopes of early rate cuts by the BoE.
- BoE policymakers have been warning that wage growth remains a major barrier to progress in consumer price inflation declining towards the 2% target. Wage growth remains almost double what is required to be consistent for inflation to return to target. Strong wage growth momentum has been feeding inflation particularly in the services sector, where prices accelerated in the November-January period.
- Apart from the labor cost growth data, investors will also focus on the broader labor market data, as the BoE needs to achieve full employment and price stability to achieve the dual mandate. The Unemployment Rate for the three months ending January is expected to remain unchanged at 3.8%.
- Meanwhile, the broader market sentiment is upbeat as expectations for the Federal Reserve rate cut in the June policy meeting persist after the release of the US Employment report on Friday, which showed softening wage growth and a higher Unemployment Rate. The CME Fedwatch tool shows that there is a 57% chance that a rate-cut decision of 25 basis points (bps) will be announced in June.
Technical Analysis: Pound Sterling struggles to extend six-day winning streak
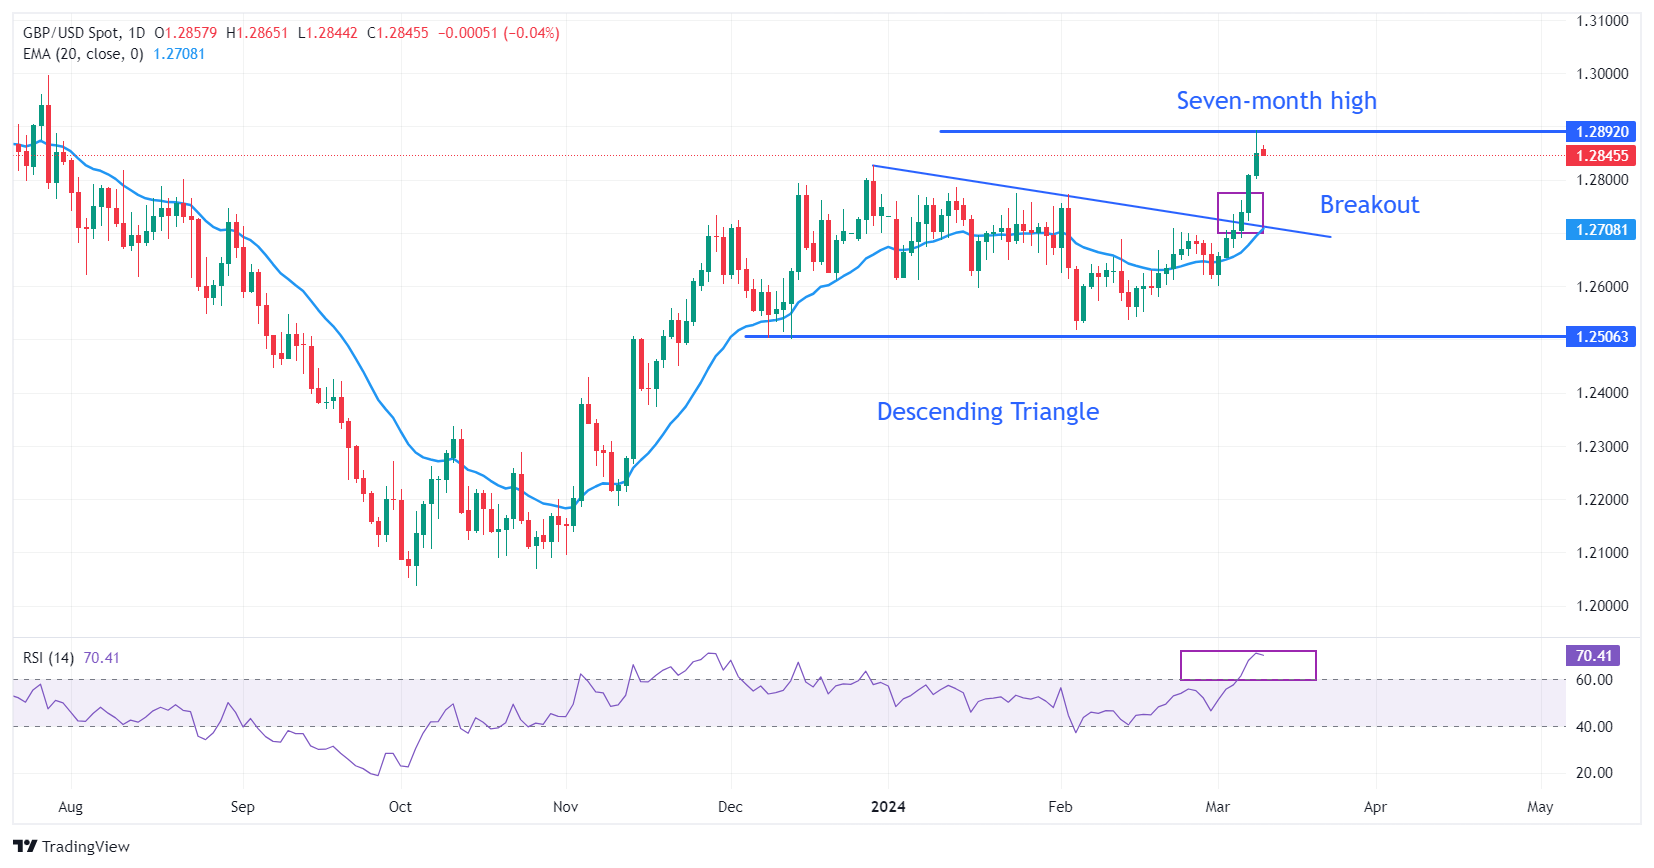
The Pound Sterling trades close to a seven-month high against the US Dollar near the round-level resistance of 1.2900. The pair struggles to extend its six-day winning spell on Monday as investors await fresh guidance on interest rates. The GBP/USD pair posted a strong upside move after breaking out from the Descending Triangle formation on the daily time frame. The near-term appeal is upbeat, and the 20-day Exponential Moving Average (EMA) at 1.2710 should act as a major cushion for the Pound Sterling bulls.
The 14-period Relative Strength Index reaches 70.00, exhibiting momentum towards the upside. No signs of overbought and divergence keep doors open for more upside.
Pound Sterling FAQs
The Pound Sterling (GBP) is the oldest currency in the world (886 AD) and the official currency of the United Kingdom. It is the fourth most traded unit for foreign exchange (FX) in the world, accounting for 12% of all transactions, averaging $630 billion a day, according to 2022 data. Its key trading pairs are GBP/USD, aka ‘Cable’, which accounts for 11% of FX, GBP/JPY, or the ‘Dragon’ as it is known by traders (3%), and EUR/GBP (2%). The Pound Sterling is issued by the Bank of England (BoE).
The single most important factor influencing the value of the Pound Sterling is monetary policy decided by the Bank of England. The BoE bases its decisions on whether it has achieved its primary goal of “price stability” – a steady inflation rate of around 2%. Its primary tool for achieving this is the adjustment of interest rates. When inflation is too high, the BoE will try to rein it in by raising interest rates, making it more expensive for people and businesses to access credit. This is generally positive for GBP, as higher interest rates make the UK a more attractive place for global investors to park their money. When inflation falls too low it is a sign economic growth is slowing. In this scenario, the BoE will consider lowering interest rates to cheapen credit so businesses will borrow more to invest in growth-generating projects.
Data releases gauge the health of the economy and can impact the value of the Pound Sterling. Indicators such as GDP, Manufacturing and Services PMIs, and employment can all influence the direction of the GBP. A strong economy is good for Sterling. Not only does it attract more foreign investment but it may encourage the BoE to put up interest rates, which will directly strengthen GBP. Otherwise, if economic data is weak, the Pound Sterling is likely to fall.
Another significant data release for the Pound Sterling is the Trade Balance. This indicator measures the difference between what a country earns from its exports and what it spends on imports over a given period. If a country produces highly sought-after exports, its currency will benefit purely from the extra demand created from foreign buyers seeking to purchase these goods. Therefore, a positive net Trade Balance strengthens a currency and vice versa for a negative balance.
- EUR/JPY could gain ground on growing speculation of BoJ lifting negative rates.
- Japan’s GDP QoQ increased by 0.1% in the fourth quarter of 2023, against the previous decline of 0.1%.
- Traders will observe ECB Lagarde’s remarks during the Eurogroup Meeting on Monday.
EUR/JPY recovers its intraday losses as the Japanese Yen (JPY) strengthened following Japan’s Gross Domestic Product (GDP) data showing Japan's economy returned to growth in the last quarter of 2023, thus turning away from a technical recession. The EUR/JPY cross attempts to rebound from weekly lows, trading around 160.60 during the early European trading hours on Monday.
Japan’s GDP quarter-on-quarter expanded by 0.1% in the fourth quarter of 2023, reversing the previous decline of 0.1% but falling short of the expected 0.3% growth. Meanwhile, the GDP Annualized figure showed a reading of 0.4% growth, below the market expectation of 1.1% and the previous decline of 0.4%. Consequently, Japan’s 2-year yield surged towards 0.20%, marking the highest level since 2011. Additionally, the 10-year government bond yield rose to near 0.75%.
These GDP figures have strengthened speculations that the Bank of Japan (BoJ) could commence raising interest rates soon. BoJ policymakers are reportedly inclined towards the notion of ending negative interest rates this month, driven by expectations of substantial pay hikes in the year's annual wage negotiations.
Last week, BoJ Governor Kazuo Ueda stated that it is "fully possible to seek an exit from stimulus while striving to achieve the 2% inflation target." Additionally, BoJ board member Junko Nakagawa recently commented that “prospects for the economy to achieve a positive cycle of inflation and wages are in sight."
On the other side, the European Central Bank (ECB) maintained borrowing costs at record levels last week, in line with expectations. ECB President Christine Lagarde adopted a cautious stance, stressing the need for further evidence before considering rate cuts. Market participants will closely watch Lagarde's remarks during the Eurogroup Meeting scheduled for Monday. Additionally, Consumer Price Index (CPI) data from Germany on Tuesday will likely attract attention from investors.
Here is what you need to know on Monday, March 11:
The US Dollar (USD) stays quiet early Monday after having suffered large losses against its major rivals in the previous week. The USD Index, which lost more than 1% last week, fluctuates slightly below 103.00, while the benchmark 10-year US Treasury bond yield holds above 4%. The economic calendar will not offer any high-tier data releases to start the week.
The US Bureau of Labor Statistics (BLS) reported on Friday that Nonfarm Payrolls (NFP) rose by 275,000 in February. This reading surpassed the market expectation of 200,000 but failed to provide a boost to the USD because the BLS also announced that it revised the January increase of 353,000 lower to 229,000. Other details of the jobs report showed that the annual wage inflation edged lower to 4.3% and the Unemployment Rate rose to 3.9% from 3.7% while the Labor Force Participation held steady at 62.5%.
US Dollar price today
The table below shows the percentage change of US Dollar (USD) against listed major currencies today. US Dollar was the strongest against the Japanese Yen.
| USD | EUR | GBP | CAD | AUD | JPY | NZD | CHF | |
| USD | -0.02% | -0.01% | -0.03% | 0.11% | 0.14% | 0.01% | -0.08% | |
| EUR | 0.02% | 0.00% | -0.02% | 0.13% | 0.17% | 0.03% | -0.06% | |
| GBP | 0.01% | -0.02% | -0.02% | 0.15% | 0.15% | 0.05% | -0.06% | |
| CAD | 0.02% | 0.00% | 0.02% | 0.16% | 0.15% | 0.06% | -0.05% | |
| AUD | -0.15% | -0.13% | -0.17% | -0.17% | 0.03% | -0.09% | -0.18% | |
| JPY | -0.14% | -0.16% | 0.11% | -0.17% | -0.04% | -0.11% | -0.22% | |
| NZD | -0.01% | -0.03% | -0.02% | -0.05% | 0.09% | 0.13% | -0.09% | |
| CHF | 0.06% | 0.04% | 0.05% | 0.04% | 0.17% | 0.20% | 0.11% |
The heat map shows percentage changes of major currencies against each other. The base currency is picked from the left column, while the quote currency is picked from the top row. For example, if you pick the Euro from the left column and move along the horizontal line to the Japanese Yen, the percentage change displayed in the box will represent EUR (base)/JPY (quote).
Over the weekend, the data from China showed that the annual inflation, as measured by the change in the Consumer Price Index (CPI), jumped to 0.7% in February from -0.8% in January, surpassing analysts' estimate of 0.3% by a wide margin. AUD/USD largely ignored this data at the weekly opening and the pair was last seen consolidating the previous week's gains at around 0.6600.
Australian Dollar pulls back from weekly highs on lower commodities' prices.
USD/JPY declined nearly 2% last week and touched its lowest level in over a month below 147.00 on Friday. The pair stays relatively calm slightly below 147.00 in the European morning on Monday. Gross Domestic Product in Japan expanded at an annual rate of 0.4% in the fourth quarter, following the 0.4% contraction recorded in the previous quarter.
Japanese Yen seems poised to appreciate further against USD amid BoJ rate hike bets.
EUR/USD touched its highest level in nearly two months at 1.0981 after the US data on Friday but profit taking caused it to erase its daily gains. The pair fluctuates in a tight channel slightly below 1.0950 in the early European session.
EUR/USD Price Analysis: Treads water below the major resistance of 1.0950.
Gold extended its impressive uptrend and reached a new record-high of $2,195 during the American trading hours on Friday. XAU/USD moves up and down in a narrow range at around $2,180 in the European morning.
FX option expiries for Mar 11 NY cut at 10:00 Eastern Time, via DTCC, can be found below.
- EUR/USD: EUR amounts
- 1.0800 1.6b
- 1.0840 1b
- 1.0900 1.2b
- 1.0930 1.2b
- 1.1000 738m
- USD/JPY: USD amounts
- 148.50 1.3b
- 150.00 1.3b
- USD/CHF holds positive ground near 0.8777 in Monday’s early European session.
- The US economy added 275,000 jobs in February vs. 229,000 prior, better than expected.
- The rising Middle East geopolitical and economic uncertainties might lift safe-haven assets like the Swiss Franc (CHF).
- The US February CPI and Retail Sales data will be closely watched this week.
The USD/CHF pair posts modest gains below the 0.8800 psychological barrier during the early European session on Monday. The prospect that the Federal Reserve (Fed) will cut the interest rate this year exerts some selling pressure on the US Dollar (USD) and creates a headwind for the pair. Investors will closely watch the US CPI inflation on Tuesday for fresh impetus. At press time, USD/CHF is trading at 0.8777, up 0.04% on the day.
The Federal Reserve (Fed) Chair, Jerome Powell, said during his semi-annual testimony last week that the US economy is robust and that the Fed is close to having enough confidence in inflation's downward track to begin lowering rates. According to the CME FedWatch Tools, futures markets have priced in around a 70% chance that the Fed will begin cutting interest rates by mid-June, with a full percentage point of rate reductions expected by year-end.
The US Labor Department reported on Friday that the US economy added 275,000 jobs in February, up from 229,000 in January, better than the estimation of 200,000. Furthermore, the Unemployment Rate in the US climbed to 3.9% in the same month from 3.7% in January. The figure registered its highest level in two years. The US wage growth, as measured by Average Hourly Earnings, rose by 4.3% YoY in February versus 4.4% prior, below the market consensus of 4.4%.
On the Swiss front, the ongoing geopolitical tensions in the Middle East and the economic uncertainties in major countries might boost safe-haven demand and benefit the Swiss Franc (CHF). In the Middle East, Hamas leader Ismail Haniyeh blamed Israel on Sunday for impeding cease-fire talks and rejecting Hamas' desire to stop the bloodshed in Gaza. Meanwhile, tensions are rising in Russia and its neighboring territories, raising fears about a possible war escalation beyond Ukraine.
Traders will monitor the US February CPI and Retail Sales, due on Tuesday and Thursday, respectively. The headline CPI figure is forecast to remain steady at 3.1% YoY in February, while Retail Sales are estimated to improve to 0.7%. Traders will take cues from the data and find trading opportunities around the USD/CHF pair.
- EUR/USD could test the immediate resistance of the 1.0950 level.
- A break above the eight-week high of 1.0981 could lead the pair to test the psychological barrier of 1.1000.
- The key support area appears around the 23.6% Fibonacci retracement of 1.0913 and the psychological level of 1.0900.
EUR/USD exhibits sideways movement amid a stable US Dollar (USD) following the upbeat US Nonfarm Payrolls released on Friday. The pair hovers around 1.0940 during the Asian trading hours on Monday, with an immediate resistance barrier at 1.0950 level followed by the eight-week high of 1.0981, marked in the previous session.
Technical analysis indicates a bullish sentiment for the EUR/USD pair. The 14-day Relative Strength Index (RSI) is positioned above the 50 mark. Moreover, the Moving Average Convergence Divergence (MACD) exhibits a divergence above the signal line and lies above the centerline. While a lagging indicator, this suggests a confirmation of the bullish momentum for the EUR/USD pair.
If there is a breakthrough above the recent highs, the EUR/USD pair may receive upward support, potentially testing the psychological barrier of 1.1000. Further exploration could lead to the area around January’s high of 1.1038 if surpassed.
On the downside, the EUR/USD pair could find the key support at 23.6% Fibonacci retracement of 1.0913 followed by the psychological level of 1.0900. A break below the latter could push the pair to test the nine-day Exponential Moving Average (EMA) at 1.0892 before the 38.2% Fibonacci retracement level of 1.0871 and the major support of 1.0850 level.
EUR/USD: Daily Chart
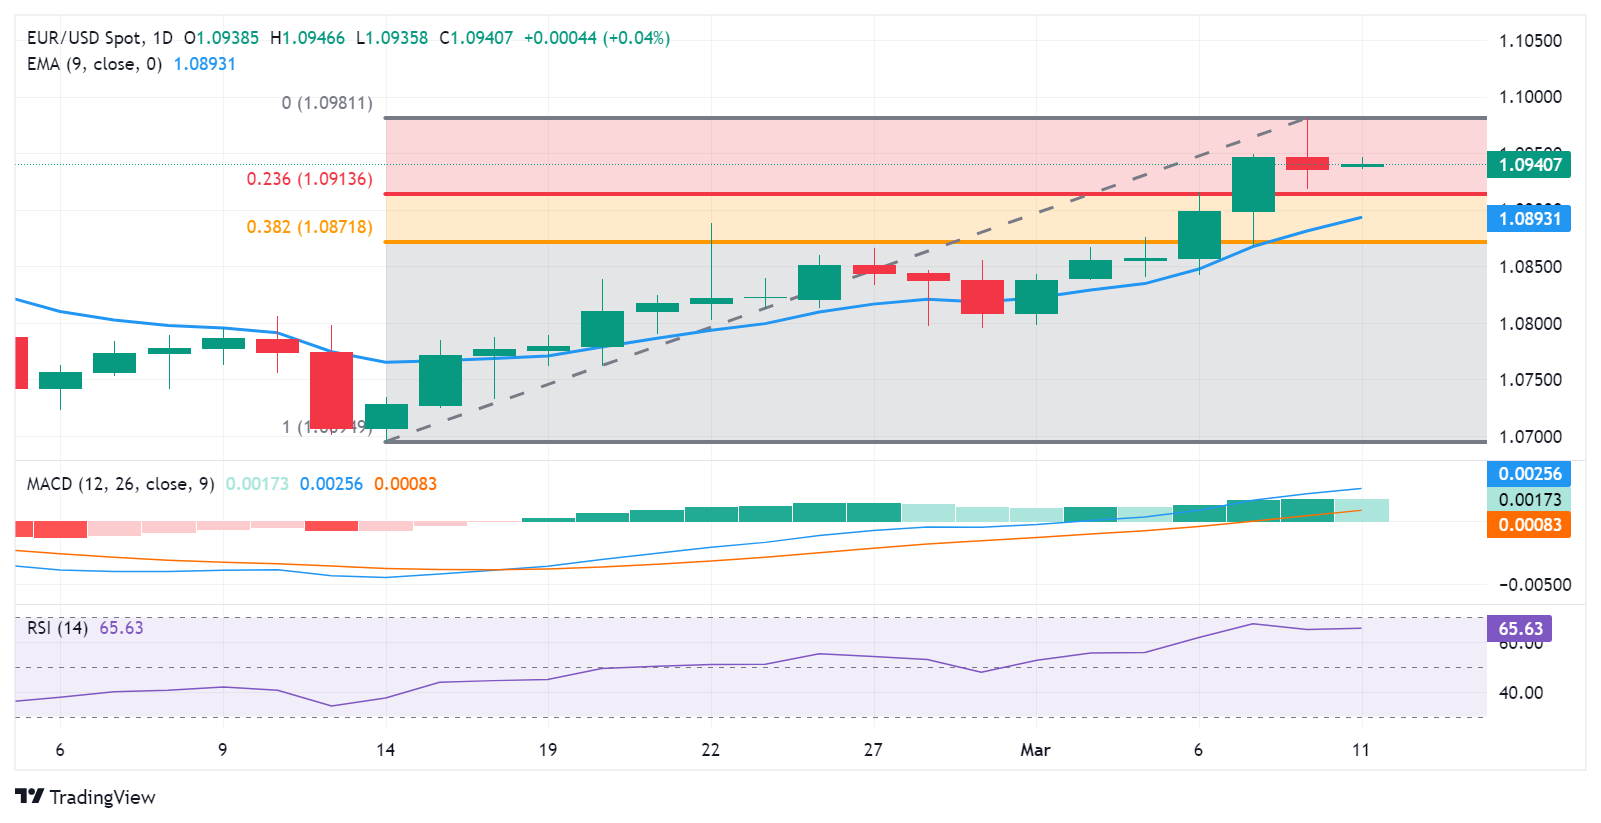
- NZD/USD weakens near 0.6172 despite the softer USD in Monday’s Asian session.
- The mixed US February labour market data and dovish remarks from Fed’s Powell triggered the expectation for rate cuts in June.
- The upbeat China’s CPI inflation data lifts the Kiwi against the USD.
- The highlight of this week will be the US February CPI, due on Tuesday.
The NZD/USD pair remains capped under the 0.6200 barrier during the Asian session on Monday. The downtick of the pair might be limited as the US Dollar (USD) is likely to remain on its back foot after the dovish comments from Federal Reserve (Fed) Chair Jerome Powell and the mixed jobs data last week. At press time, NZD/USD is trading at 0.6172, down 0.03% on the day.
Last week, Fed’s Powell suggested that the path for easing policy may not be far off as the US central bank isn’t far from getting the evidence needed to be confident inflation is returning sustainably to the 2% target. The dovish remarks from Powell triggered the expectation for rate cuts in June, with the market now pricing in 100 basis points (bps) of total easing this year. This, in turn, exerts some selling pressure on the Greenback and acts as a tailwind for the NZD/USD pair.
On the other hand, the signal of an upward trend in China's main gauge of inflation provides some support to the China-proxy New Zealand Dollar (NZD). The Chinese Consumer Price Index (CPI) rose by 0.7% YoY in February from a 0.8% fall in January, stronger than the estimation of a 0.3% rise.
The US February CPI will be due on Tuesday. The headline CPI figure is expected to remain steady at 3.1% YoY, while the Core CPI is estimated to ease to 3.7% YoY. Additionally, US Retail Sales will be reported on Thursday, which is projected to improve to 0.7%. The better-than-expected data might lift the USD and cap the upside of the NZD/USD pair.
- USD/CAD struggles to attract any meaningful buyers amid a mixed fundamental cue.
- Sliding Crude Oil prices and Friday’s mixed Canadian jobs data undermine the Loonie.
- Bets for a June Fed rate cut keep the USD bulls on the defensive and act as a headwind.
The USD/CAD pair struggles to capitalize on Friday's goodish rebound from the 1.3420 region, or a nearly one-month low and oscillates in range on the first day of a new week. The pair trades around the 1.3480 area, nearly unchanged for the day during the Asian session, and is influenced by a combination of diverging forces.
Crude Oil prices drift lower for the second straight day and retreat further from over a four-month peak set earlier this March amid concern about slowing demand in China, exacerbated by underwhelming import data for the first two months of 2024. Furthermore, mixed Chinese inflation data add to market worries and overshadow a tighter supply outlook. This continues to weigh on the black liquid, which is seen undermining the commodity-linked Loonie and acting as a tailwind for the USD/CAD pair.
The Canadian Dollar (CAD) is further pressured by slowing domestic wage growth in February, to its lowest level since June, and an uptick in the unemployment rate. Meanwhile, the simultaneous release of the US jobs report pointed to a spike in the jobless rate to the highest level in two years reaffirmed bets that the Federal Reserve (Fed) will start cutting interest rates in June. This fails to assist the US Dollar (USD) to build on its recovery from a nearly one-month low and caps the upside for the USD/CAD pair.
The mixed fundamental backdrop warrants some caution for bullish traders and before positioning for any meaningful appreciating move for the currency pair. Market participants might also prefer to move to the sidelines ahead of the release of the latest US consumer inflation figures on Tuesday, which might influence the Fed's rate-cut path and drive the USD demand in the near term. This, along with Oil price dynamics, should help determine the next leg of a directional move for the USD/CAD pair.
- WTI price extends its losing streak on demand concern following Chinese oil import data.
- China's oil imports fell to 10.8 million bpd in the first two months of the year, compared to 11.44 million bpd in December.
- Crude oil prices could find support from a weakening US Dollar amid growing expectations of a Fed rate cut in June.
The West Texas Intermediate (WTI) oil price has continued to decline for the third consecutive session, driven by data indicating a decrease in oil imports in China. Imports fell around 5.7% to 10.8 million barrels per day (bpd) in the first two months of the year, compared to 11.44 million bpd in December. The WTI price trades around $77.00 per barrel during the Asian hours on Monday.
Furthermore, the market is adopting a cautious stance ahead of the release of the Consumer Price Index data from the United States (US) scheduled for Tuesday. Investors will also closely monitor Retail Sales and Producer Price Index data expected on Thursday, which could provide fresh insights into the US economic situation amidst growing expectations of a Federal Reserve (Fed) interest rate cut in June.
The WTI price could find support from a weakening US Dollar (USD) following Federal Reserve (Fed) Chair Jerome Powell's testimony before the US Congress last week. Powell reiterated the central bank's stance and hinted at potential cuts in borrowing costs sometime this year, emphasizing that such actions would depend on the inflation trajectory aligning with the Fed's 2% target.
According to the CME FedWatch Tool, the probability of a rate cut in March and May has slightly decreased, with chances at 3.0% and 24.5%, respectively. However, the likelihood of a 25 basis points rate cut has increased to 57.2% for June.
Crude oil prices faced downward pressure due to concerns about demand, offsetting several factors. These include lower US oil stockpiles than expected for the week ending on March 1 and positive sentiment surrounding the Chinese economy, as highlighted by Trade Balance data.
Additionally, Saudi Arabia's unexpected decision to raise prices of its primary grade for buyers in Asia. Furthermore, market participants are closely monitoring ceasefire talks between Israel and Hamas, which have shown little progress.
- Gold price struggles to capitalize on last week’s blowout rally to a fresh record peak.
- Extremely overbought conditions cap gains for the metal amid a modest USD uptick.
- Bets for a Fed rate cut in June act as a headwind for the USD and should limit losses.
Gold price (XAU/USD) shot to a fresh record high on Friday after the US jobs report showed a spike in the unemployment rate and bolstered expectations that the Federal Reserve (Fed) will start cutting rates in June. The momentum, however, stalled ahead of the $2,200 round-figure mark amid a late US Dollar (USD) bounce from its lowest level since mid-January, which tends to undermine the USD-denominated commodity. The precious metal remains below the said handle and attracts some intraday sellers near the $2,189 region during the Asian session on Monday.
Bullish traders opt to lighten their positions amid extremely overbought conditions on the daily chart and ahead of the release of the latest US consumer inflation figures on Tuesday. The crucial US CPI report will influence market expectations about the Fed's rate-cut path, which, in turn, will drive the USD demand and provide a fresh impetus to the non-yielding yellow metal. In the meantime, bets that the Fed will begin easing its monetary policy soon keep the US Treasury bond yields depressed and should help limit any meaningful corrective decline for the XAU/USD.
Daily Digest Market Movers: Gold price continues to benefit from rising bets for an imminent Fed rate cut move in June
- Data released on Friday revealed that the US unemployment rate rose to its highest level in two years, lifting bets for a June rate cut by the Federal Reserve and pushing the Gold price to a fresh record high.
- The headline NFP showed that the US economy added 275 new jobs in February as compared to the 200K estimated, though the previous month's reading was revised down to 229K from the 353K reported.
- Adding to this, wage inflation, as measured by the change in the Average Hourly Earnings, rose by 4.3% on a yearly basis, also falling short of market expectations and January's growth of 4.4%.
- The possibility of a May interest rate cut by the Fed climbed to around 30% after the crucial jobs report, though the June policy meeting is still the most likely expected timing for any such move.
- The yield on the 10-year US government bond dived to a more than one-month trough, dragging the US Dollar to its lowest level since mid-January and benefitting the non-yielding metal.
- A modest USD uptick prompts some intraday sellers during the Asian session on Monday, albeit firming expectations for an imminent shift in the Fed's policy stance should help limit losses.
- Furthermore, geopolitical tensions, along with expectations that the global economy could weaken in 2024, might continue to drive flows towards the safe-haven XAU/USD and act as a tailwind.
- Investors now look forward to the release of the latest US consumer inflation figures on Tuesday for fresh cues about the Fed's rate-cut path and before positioning for the next leg of a directional move.
Technical Analysis: Gold price needs to consolidate before the next leg up amid extremely overbought RSI on the daily chart
From a technical perspective, last week's breakout through the previous record high, around the $2,144 area, favours bullish traders and supports prospects for additional gains. That said, the Relative Strength Index (RSI) on the daily chart is flashing extremely overbought conditions and makes it prudent to wait for some near-term consolidation or a modest pullback before placing fresh bullish bets.
Any meaningful corrective slide, however, is more likely to find decent support near Friday's swing low, around the $2,154 region, which should now act as a key pivotal point for intraday traders. A convincing break below might prompt some technical selling and drag the Gold price further towards the $2,125 intermediate support en route to the $2,100 round figure. On the flip side, bulls might now wait for a move beyond the $2,200 mark, above which the XAU/USD will enter uncharted territory and build on its recent strong gains registered over the past month or so.
US Dollar price today
The table below shows the percentage change of US Dollar (USD) against listed major currencies today. US Dollar was the strongest against the Australian Dollar.
| USD | EUR | GBP | CAD | AUD | JPY | NZD | CHF | |
| USD | 0.01% | 0.02% | -0.01% | 0.15% | 0.14% | 0.09% | 0.00% | |
| EUR | -0.01% | 0.03% | -0.04% | 0.15% | 0.13% | 0.08% | -0.01% | |
| GBP | -0.02% | -0.01% | -0.04% | 0.13% | 0.12% | 0.07% | -0.01% | |
| CAD | 0.02% | 0.03% | 0.04% | 0.16% | 0.14% | 0.11% | 0.01% | |
| AUD | -0.15% | -0.15% | -0.14% | -0.17% | -0.02% | -0.06% | -0.15% | |
| JPY | -0.12% | -0.13% | 0.13% | -0.16% | 0.03% | -0.03% | -0.14% | |
| NZD | -0.09% | -0.09% | -0.07% | -0.11% | 0.06% | 0.04% | -0.09% | |
| CHF | 0.00% | 0.02% | 0.03% | -0.01% | 0.16% | 0.12% | 0.10% |
The heat map shows percentage changes of major currencies against each other. The base currency is picked from the left column, while the quote currency is picked from the top row. For example, if you pick the Euro from the left column and move along the horizontal line to the Japanese Yen, the percentage change displayed in the box will represent EUR (base)/JPY (quote).
Gold FAQs
Why do people invest in Gold?
Gold has played a key role in human’s history as it has been widely used as a store of value and medium of exchange. Currently, apart from its shine and usage for jewelry, the precious metal is widely seen as a safe-haven asset, meaning that it is considered a good investment during turbulent times. Gold is also widely seen as a hedge against inflation and against depreciating currencies as it doesn’t rely on any specific issuer or government.
Who buys the most Gold?
Central banks are the biggest Gold holders. In their aim to support their currencies in turbulent times, central banks tend to diversify their reserves and buy Gold to improve the perceived strength of the economy and the currency. High Gold reserves can be a source of trust for a country’s solvency. Central banks added 1,136 tonnes of Gold worth around $70 billion to their reserves in 2022, according to data from the World Gold Council. This is the highest yearly purchase since records began. Central banks from emerging economies such as China, India and Turkey are quickly increasing their Gold reserves.
How is Gold correlated with other assets?
Gold has an inverse correlation with the US Dollar and US Treasuries, which are both major reserve and safe-haven assets. When the Dollar depreciates, Gold tends to rise, enabling investors and central banks to diversify their assets in turbulent times. Gold is also inversely correlated with risk assets. A rally in the stock market tends to weaken Gold price, while sell-offs in riskier markets tend to favor the precious metal.
What does the price of Gold depend on?
The price can move due to a wide range of factors. Geopolitical instability or fears of a deep recession can quickly make Gold price escalate due to its safe-haven status. As a yield-less asset, Gold tends to rise with lower interest rates, while higher cost of money usually weighs down on the yellow metal. Still, most moves depend on how the US Dollar (USD) behaves as the asset is priced in dollars (XAU/USD). A strong Dollar tends to keep the price of Gold controlled, whereas a weaker Dollar is likely to push Gold prices up.
- The Indian Rupee (INR) edges lower on Monday despite the softer USD.
- The RBI is likely to maintain its monetary policy stance as the upside risks to food inflation remain.
- Market players will closely watch the Indian and US CPI inflation data for February, due on Tuesday.
The Indian Rupee (INR) trades on a weaker note on Monday, despite the decline of the US dollar (USD). The mixed US February labor market data on Friday has exerted some selling pressure on the Greenback as it has triggered the possibility of a rate cut in June.
The markets estimate the Indian Consumer Price Index (CPI) inflation for February to ease to 5.02% from 5.10% in January. Analysts believe that the upside risks to food inflation remain, and it should keep the RBI on the sidelines for longer with no urgency to cut rates. This, in turn, might boost the Indian Rupee and act as a headwind for the USD/INR pair.
Investors will keep an eye on India’s CPI inflation and Industrial Production on Tuesday. On Wednesday, the attention will shift to the Wholesale Price Index (WPI) of Food, Fuel and Inflation. On the US docket, the February CPI and Retail Sales will be released on Tuesday and Thursday, respectively.
Daily Digest Market Movers: Indian Rupee remains sensitive to high inflation, geopolitical risks
- The INR has climbed 0.5% this year, making it Asia's top-performing currency in 2024, as foreign investors continued to purchase local bonds ahead of the country's entry into global debt indexes.
- Traders will monitor the maturity of the Reserve Bank of India’s $5 billion USD/INR sell-buy swap on Monday, which might impact the overnight USD/INR swap rate and forward premiums.
- The US Nonfarm Payrolls rose by 275K in February from 229K in January, stronger than the market expectation of 200K, according to the US Bureau of Labor Statistics (BLS) on Friday.
- The Unemployment Rate in the US rose to 3.9% in February from 3.7% in January, the highest level in two years.
- The US wage growth, as measured by the Average Hourly Earnings, rose by 4.3% YoY in February versus 4.4% prior, below the market consensus of 4.4%.
- Fed Chair Powell said last week during his semiannual testimony that more confidence is needed before the central bank is ready to lower the rate, but they’re not far from it.
Technical Analysis: Indian Rupee remains capped within a longer range of 82.60-83.15
Indian Rupee weakens on the day. USD/INR remains confined within a multi-month-old descending trend channel since December 8, 2023 around 82.60-83.15.
In the near term, the bearish outlook of USD/INR remains intact as the pair is the 100-day Exponential Moving Average (EMA) on the daily chart. Additionally, the 14-day Relative Strength Index (RSI) lies in bearish territory below the 50.0 midlines, indicating that further decline looks favorable.
The potential support level will emerge near the lower limit of the descending trend channel at 82.60. A breach of this level could draw in more bears and put a move back to a low of August 23 at 82.45 and finally a low of June 1 at 82.25.
On the bright side, the confluence of the 100-day EMA and a psychological round figure of 83.00 act as an immediate resistance level. Further north, the pair could open up a move to the upper boundary of the descending trend channel at 83.15. An upside breakout above 83.15 will see a rally to a high of January 2 at 83.35, en route to 84.00.
US Dollar price today
The table below shows the percentage change of US Dollar (USD) against listed major currencies today. US Dollar was the strongest against the Australian Dollar.
| USD | EUR | GBP | CAD | AUD | JPY | NZD | CHF | |
| USD | 0.03% | 0.05% | 0.01% | 0.22% | 0.21% | 0.14% | -0.01% | |
| EUR | -0.03% | 0.02% | -0.03% | 0.18% | 0.19% | 0.12% | -0.02% | |
| GBP | -0.05% | -0.02% | -0.05% | 0.17% | 0.16% | 0.09% | -0.05% | |
| CAD | 0.00% | 0.02% | 0.04% | 0.19% | 0.19% | 0.13% | 0.00% | |
| AUD | -0.22% | -0.19% | -0.17% | -0.23% | 0.00% | -0.07% | -0.21% | |
| JPY | -0.19% | -0.18% | 0.09% | -0.21% | 0.02% | -0.06% | -0.22% | |
| NZD | -0.14% | -0.12% | -0.10% | -0.15% | 0.07% | 0.06% | -0.15% | |
| CHF | 0.00% | 0.03% | 0.05% | -0.01% | 0.19% | 0.19% | 0.14% |
The heat map shows percentage changes of major currencies against each other. The base currency is picked from the left column, while the quote currency is picked from the top row. For example, if you pick the Euro from the left column and move along the horizontal line to the Japanese Yen, the percentage change displayed in the box will represent EUR (base)/JPY (quote).
Indian Rupee FAQs
What are the key factors driving the Indian Rupee?
The Indian Rupee (INR) is one of the most sensitive currencies to external factors. The price of Crude Oil (the country is highly dependent on imported Oil), the value of the US Dollar – most trade is conducted in USD – and the level of foreign investment, are all influential. Direct intervention by the Reserve Bank of India (RBI) in FX markets to keep the exchange rate stable, as well as the level of interest rates set by the RBI, are further major influencing factors on the Rupee.
How do the decisions of the Reserve Bank of India impact the Indian Rupee?
The Reserve Bank of India (RBI) actively intervenes in forex markets to maintain a stable exchange rate, to help facilitate trade. In addition, the RBI tries to maintain the inflation rate at its 4% target by adjusting interest rates. Higher interest rates usually strengthen the Rupee. This is due to the role of the ‘carry trade’ in which investors borrow in countries with lower interest rates so as to place their money in countries’ offering relatively higher interest rates and profit from the difference.
What macroeconomic factors influence the value of the Indian Rupee?
Macroeconomic factors that influence the value of the Rupee include inflation, interest rates, the economic growth rate (GDP), the balance of trade, and inflows from foreign investment. A higher growth rate can lead to more overseas investment, pushing up demand for the Rupee. A less negative balance of trade will eventually lead to a stronger Rupee. Higher interest rates, especially real rates (interest rates less inflation) are also positive for the Rupee. A risk-on environment can lead to greater inflows of Foreign Direct and Indirect Investment (FDI and FII), which also benefit the Rupee.
How does inflation impact the Indian Rupee?
Higher inflation, particularly, if it is comparatively higher than India’s peers, is generally negative for the currency as it reflects devaluation through oversupply. Inflation also increases the cost of exports, leading to more Rupees being sold to purchase foreign imports, which is Rupee-negative. At the same time, higher inflation usually leads to the Reserve Bank of India (RBI) raising interest rates and this can be positive for the Rupee, due to increased demand from international investors. The opposite effect is true of lower inflation.
- GBP/USD consolidates amid a muted US Dollar on Monday.
- US Nonfarm Payrolls increased by 275K in February, against the expected 200K.
- Traders await employment data to gain fresh impetus on the United Kingdom’s labor market.
GBP/USD hovers around 1.2850 during the Asian session on Monday, maintaining a positive sentiment to potentially extend its winning streak that commenced on March 1. However, the US Dollar (USD) has received upward strength and recovered from intraday losses on Friday following the release of upbeat US Nonfarm Payrolls data.
In February, US Nonfarm Payrolls increased by 275K, surpassing January's figure of 229K and beating expectations of 200K. However, US Average Hourly Earnings (YoY) grew by 4.3%, slightly below both the estimated and previous reading of 4.4%. Monthly, there was an increase of 0.1%, which was lower than the anticipated 0.3% and the previous month's 0.5%.
The GBP/USD pair continues to maintain a positive tone as markets widely anticipate the Federal Reserve (Fed) to cut interest rates before the Bank of England (BoE), potentially narrowing the policy divergence between the two central banks for a period. Federal Reserve (Fed) Chair Jerome Powell, during his testimony before the US Congress last week, reiterated the central bank's stance. Powell hinted at potential cuts in borrowing costs sometime this year, emphasizing that such actions would be contingent upon the inflation trajectory aligning with the Fed's target of 2%.
Last week, UK Chancellor of the Exchequer Jeremy Hunt delivered the Spring Budget to Parliament. This boosted positive sentiment surrounding the United Kingdom’s (UK) budget, particularly as the Office for Budget Responsibility (OBR) forecasted stronger economic growth.
Market participants eagerly anticipate employment data from the United Kingdom (UK), including the ILO Unemployment Rate (3M) and Employment Change figures, scheduled for release on Tuesday. Additionally, the Consumer Price Index data for February is also on the radar for investors and analysts alike.
- India’s Sensex eyes a subdued opening, as Asian stocks trade mixed while Gift Nifty futures drop.
- Sensex hit fresh record highs above 74,000 last week but finished flat on Thursday.
- Markets stay cautious ahead of the US and Indian CPI inflation data on Tuesday.
The Sensex 30, one of India’s key benchmark indices, is set to open on the wrong side on Monday, having closed Thursday modestly flat after the correction from fresh record highs of 74,245.17.
The Indian index could take the negative lead from the mixed Asian stock markets and small losses in the Gift Nifty futures. Traders are in a risk-averse position, refraining from placing any fresh bets on risky assets ahead of Tuesday’s Consumer Price Index (CPI) inflation data from India and the US.
The Bombay Stock Exchange (BSE) Sensex 30 ended almost unchanged on Thursday at 74,115. The index was closed on Friday on account of Mahashivratri.
Stock market news
- The top gainers on Sensex on Thursday were JSW Steel, Tata Steel, Bajaj Finance, Bajaj FinServ and Tata Motors. Meanwhile, the top losers were Mahindra & Mahindra, ICICI Bank, Axis Bank, Power Grid and Reliance Industries.
- Among the Tata Group stocks, Tata Chemicals, Tata Consumer Products, Tata Investment Corporation and Tata Steel clinched their respective record highs in intra-day trade.
- Tata Motors is set to increase commercial vehicle prices by up to 2% from April.
- Tata Power announced that it became an Indian Integrated Power entity with validated science-based targets.
- Larsen and Toubro Ltd’s (L&T) hydrocarbon vertical secured an offshore order from ONGC for a project.
- SingTel sold 0.8% stake in Bharti Airtel for $711 mn to GQG Partners.
- Bajaj Auto hit a new high and rallied 12% in one week after robust February sales.
- The US stock markets ended in the red on Friday, as investors resorted to profit-taking amid high valuations and gearing up for the critical US inflation report.
- On Friday, the headline NFP rose by 275K in February, compared to market forecasts of 200K while the January figure of 353K was revised down to 229K, a difference of 124K.
- Markets are currently pricing in about a 75% chance that the Fed could begin easing rates in June, higher than a 63% probability seen last Thursday, according to the CME FedWatch Tool.
- The main event risks for markets this week will be the inflation data releases from India and the US.
Sensex FAQs
What is the Sensex?
The Sensex is a name for one of India’s most closely monitored stock indexes. The term was coined in the 1980s by analyst Deepak Mohoni by mashing the words sensitive and index together. The index plots a weighted average of the share price of 30 of the most established stocks on the Bombay Stock Exchange. Each corporation's weighting is based on its “free-float capitalization”, or the value of all its shares readily available for trading.
What factors drive the Sensex?
Given it is a composite, the value of the Sensex is first and foremost dependent on the performance of its constituent companies as revealed in their quarterly and annual results. Government policies are another factor. In 2016 the government decided to phase out high value currency notes, for example, and certain companies saw their share price fall as a result. When the government decided to cut corporation tax in 2019, meanwhile, the Sensex gained a boost. Other factors include the level of interest rates set by the Reserve Bank of India, since that dictates the cost of borrowing, climate change, pandemics and natural disasters
What are the key milestones for the Sensex?
The Sensex started life on April 1 1979 at a base level of 100. It reached its highest recorded level so far, at 73,328, on Monday, January 15, 2024 (this is being written in Feb 2024). The Index closed above the 10,000 mark for the first time on February 7, 2006. On March 13, 2014 the Sensex closed higher than Hong Kong’s Hang Seng index to become the major Asian stock index with the highest value. The index’s biggest gain in a single day occurred on April 7, 2020, when it rose 2,476 points; its deepest single-day loss occurred on January 21, 2008, when it plunged 1,408 points due the US subprime crisis.
What major corporations are in the Sensex?
Major companies within the Sensex include Reliance Industries Ltd, HDFC Bank, Axis Bank, ITC Ltd, Bharti Airtel Ltd, Tata Steel, HCL Technologies, Infosys, State Bank of India, Sun Pharma, Tata Consultancy Services and Tech Mahindra.
| Raw materials | Closed | Change, % |
|---|---|---|
| Silver | 24.311 | 0.04 |
| Gold | 2178.596 | 0.91 |
| Palladium | 1021.32 | -1.3 |
- The Japanese Yen continues to draw support from expectations for a hawkish BoJ pivot.
- Bets for a June Fed rate cut undermine the USD and further exert pressure on USD/JPY.
- An upward revision of Japan’s Q4 GDP print contributes to the offered tone on Monday.
The Japanese Yen (JPY) rallied to the highest level since early February against its American counterpart on Friday amid bets for an imminent shift in the Bank of Japan's (BoJ) policy stance. Moreover, investors seem convinced that another substantial pay hike in Japan will fuel demand-driven inflationary pressure and allow the BoJ to end the negative interest rates as early as the March 18-19 meeting. This, along with an upward revision of Japan's fourth-quarter GDP print, underpins the JPY and keeps the USD/JPY pair depressed through the Asian session on Monday.
Meanwhile, the US employment report for February reaffirmed expectations that the Federal Reserve (Fed) will start cutting interest rates in June and continues to weigh on the US Dollar (USD). This turns out to be another factor that contributes to the offered tone surrounding the USD/JPY pair for the sixth straight day and supports prospects for a further depreciating move. The market focus now shifts to the US consumer inflation figures, due for release on Tuesday. Nevertheless, the fundamental backdrop suggests that the path of least resistance for spot prices is to the downside.
Daily Digest Market Movers: Japanese Yen remains well supported by bets for an imminent shift in the BoJ’s policy stance
- The Japanese Yen remains on the front foot against its American counterpart for the sixth successive day on Monday amid bets that the Bank of Japan (BoJ) will end its negative rate policy in March.
- Jiji News Agency reported over the weekend that the BoJ is considering scrapping its yield curve control program and indicating in advance the amount of government bonds it plans to purchase.
- Furthermore, data released last week showed that wage growth in Japan marked the highest rise since last June and reaffirmed market bets for an imminent shift in the BoJ's monetary policy stance.
- A revised GDP report showed on Monday that Japan's economy expanded by 0.1% during the fourth quarter as against a 0.1% contraction reported previously and avoided a technical recession.
- This gives the BoJ more headroom to pivot away from its ultra-loose monetary policy settings, which continue to underpin the JPY and keep the USD/JPY pair depressed near a one-month low.
- A spike in the US unemployment rate to its highest level in two years lifted bets for a June rate cut by the Federal Reserve and dragged the US Dollar to its lowest level since mid-January on Friday.
- The headline NFP showed that the US economy added 275K jobs in February vs. 200K estimated, through was offset by a downward revision of the previous month's reading to 229K from 353 K.
- Investors now look forward to the release of the latest US consumer inflation figures on Tuesday for a fresh impetus, though the near-term bias seems tilted firmly in favour of the JPY bulls.
Technical Analysis: USD/JPY continues to show hows some resilience below 38.2% Fibo. level, remains vulnerable to sliding further
From a technical perspective, Friday's breakdown below the 100-day Simple Moving Average (SMA) was seen as a fresh trigger for bearish traders. This comes on top of the recent repeated failures ahead of the 152.00 mark, which constituted the formation of a double-top pattern on the daily chart. Moreover, oscillators on the said chart are holding deep in the negative territory and validate the bearish outlook for the USD/JPY pair. That said, it will still be prudent to wait for acceptance below the 38.2% Fibonacci retracement level of the December-February rally before positioning for further losses. Some follow-through selling below the 200-day SMA, currently pegged near the 146.30-146.25 region, will reaffirm the negative bias and drag spot prices below the 146.00 round figure, towards the 50% Fibo. level, around the 145.60 zone.
On the flip side, any meaningful recovery attempt beyond the 147.00 round figure is more likely to attract fresh sellers and remain capped near the 100-day SMA support breakpoint, now turned resistance near mid-147.00s. A sustained strength beyond, however, could trigger a short-covering rally and lift the USD/JPY pair beyond the 148.00 mark, towards testing the next relevant hurdle near the 148.65-148.70 region. The momentum could extend further towards reclaiming the 149.00 round figure en route to the 149.25 horizontal support-turned-resistance.
Japanese Yen price today
The table below shows the percentage change of Japanese Yen (JPY) against listed major currencies today. Japanese Yen was the strongest against the Pound Sterling.
| USD | EUR | GBP | CAD | AUD | JPY | NZD | CHF | |
| USD | 0.01% | 0.01% | -0.03% | 0.15% | 0.14% | 0.09% | -0.01% | |
| EUR | -0.01% | -0.02% | -0.05% | 0.14% | 0.12% | 0.06% | -0.02% | |
| GBP | 0.00% | 0.01% | -0.03% | 0.14% | 0.15% | 0.10% | 0.00% | |
| CAD | 0.04% | 0.04% | 0.04% | 0.18% | 0.15% | 0.10% | 0.02% | |
| AUD | -0.15% | -0.14% | -0.14% | -0.19% | -0.01% | -0.06% | -0.16% | |
| JPY | -0.12% | -0.14% | 0.11% | -0.19% | 0.03% | -0.04% | -0.14% | |
| NZD | -0.09% | -0.06% | -0.09% | -0.13% | 0.06% | 0.05% | -0.11% | |
| CHF | 0.03% | 0.04% | 0.02% | -0.01% | 0.18% | 0.13% | 0.09% |
The heat map shows percentage changes of major currencies against each other. The base currency is picked from the left column, while the quote currency is picked from the top row. For example, if you pick the Euro from the left column and move along the horizontal line to the Japanese Yen, the percentage change displayed in the box will represent EUR (base)/JPY (quote).
Japanese Yen FAQs
What key factors drive the Japanese Yen?
The Japanese Yen (JPY) is one of the world’s most traded currencies. Its value is broadly determined by the performance of the Japanese economy, but more specifically by the Bank of Japan’s policy, the differential between Japanese and US bond yields, or risk sentiment among traders, among other factors.
How do the decisions of the Bank of Japan impact the Japanese Yen?
One of the Bank of Japan’s mandates is currency control, so its moves are key for the Yen. The BoJ has directly intervened in currency markets sometimes, generally to lower the value of the Yen, although it refrains from doing it often due to political concerns of its main trading partners. The current BoJ ultra-loose monetary policy, based on massive stimulus to the economy, has caused the Yen to depreciate against its main currency peers. This process has exacerbated more recently due to an increasing policy divergence between the Bank of Japan and other main central banks, which have opted to increase interest rates sharply to fight decades-high levels of inflation.
How does the differential between Japanese and US bond yields impact the Japanese Yen?
The BoJ’s stance of sticking to ultra-loose monetary policy has led to a widening policy divergence with other central banks, particularly with the US Federal Reserve. This supports a widening of the differential between the 10-year US and Japanese bonds, which favors the US Dollar against the Japanese Yen.
How does broader risk sentiment impact the Japanese Yen?
The Japanese Yen is often seen as a safe-haven investment. This means that in times of market stress, investors are more likely to put their money in the Japanese currency due to its supposed reliability and stability. Turbulent times are likely to strengthen the Yen’s value against other currencies seen as more risky to invest in.
- Australian Dollar could extend its winning streak on the tepid US Dollar.
- Australia’s S&P/ASX 200 Index retreats from all-time highs as investors booked profits.
- China's CPI YoY and MoM increased by 0.7% and 1.0%, respectively, in February.
- US Nonfarm Payrolls rose by 275K in February, surpassing the expected 200K and 229K prior.
The Australian Dollar (AUD) moves sideways with a positive bias to extend its winning streak for the fourth consecutive session on Monday, supported by a weaker US Dollar (USD). However, the benchmark S&P/ASX 200 Index witnessed a decline at the beginning of the week, retreating notably from all-time highs as investors booked profits. The drop was particularly pronounced in the materials and healthcare sectors. Additionally, Australian shares followed a decline in technology stocks on Wall Street on Friday, which has tempered the strength of the AUD/USD pair.
Australian Dollar experienced a 1.60% gain against the US Dollar last week, driven by increasing expectations that the US Federal Reserve (Fed) will initiate interest rate cuts earlier than other major central banks. However, the Australian economy expanded less than anticipated in the fourth quarter, and the Trade Balance surplus fell short of expectations. These economic indicators highlight the argument for the Reserve Bank of Australia (RBA) to potentially consider rate cuts in the near future.
Investors will be closely monitoring a panel discussion at the AFR Business Summit in Sydney on Tuesday, where Sarah Hunter, Assistant Governor (Economics) at the Reserve Bank of Australia, may provide insights on domestic inflation trends. Additionally, attention will be on the release of the Australian Westpac Consumer Confidence for March and the US Consumer Price Index data for February, both scheduled for Tuesday.
Daily Digest Market Movers: Australian Dollar strives to extend gains on weaker US Dollar
- Australian Trade Balance (MoM) showed that the surplus increased to 11,027M in February, from 10,743M prior. The market expectation was an increase to 11,500M.
- Australian Gross Domestic Product (GDP) grew by 0.2% QoQ in the fourth quarter of 2023, slightly below market expectations of no change at 0.3%. GDP (YoY) expanded by 1.5%, surpassing the expected 1.4%, but falling short of the previous growth of 2.1%.
- Australia's Treasurer, Jim Chalmers, has announced that the government will abolish nearly 500 import tariffs on a wide range of goods starting from July 1, 2024. This initiative aims to reduce compliance costs for businesses. By removing these tariffs, approximately A$8.5 billion worth of annual trade will be streamlined, leading to savings of over A$30 million in compliance costs for businesses each year.
- In February, China's Consumer Price Index (CPI) increased by 0.7% year-over-year, rebounding from a 0.8% decline in January and surpassing market expectations of a 0.3% rise. CPI inflation (MoM) rose by 1.0%, up from a 0.3% increase seen in January and exceeding the market consensus of 0.7%.
- Chinese Producer Price Index (PPI) dropped by 2.7% YoY in February, compared to a 2.5% decline in January. This data came in weaker than market expectations, which anticipated a 2.5% decline.
- Federal Reserve (Fed) Chair Jerome Powell, in his s testimony before the US Congress last week, reaffirmed the central bank's position. Powell hinted at potential cuts in borrowing costs sometime this year. However, he emphasized that such actions would hinge on the inflation trajectory aligning with the Fed's target of 2%.
- Cleveland Fed President Loretta Mester addressed the Virtual European Economics and Financial Center, expressing concerns about the potential persistence of inflation throughout the year. She indicated that if the economy aligns with forecasts, there could be a likelihood of rate cuts later in the year.
- According to the CME FedWatch Tool, there has been a slight decrease in the probability of a rate cut in March and May, with chances at 3.0% and 24.5%, respectively. However, the likelihood of a 25 basis points rate cut has increased to 57.2% for June.
- US Nonfarm Payrolls increased by 275K in February, surpassing January's figure of 229K and beating expectations of 200K.
- US Average Hourly Earnings (YoY) grew by 4.3%, falling slightly below both February’s estimated and previous reading of 4.4%. On a monthly basis, there was an increase of 0.1%, which was lower than the anticipated 0.3% and the previous month's 0.5%.
- US Initial Jobless Claims were unchanged at 217K for the week ending on March 1, against the expected 215K.
- US Nonfarm Productivity remained consistent at the growth of 3.2% in the fourth quarter of 2023, exceeding the market expectation of 3.1%.
- February’s US ADP Employment Change came in at 140K against the expected 150K, increasing from 111K prior.
Technical Analysis: Australian Dollar hovers around 0.6620 followed by the previous week’s high
The Australian Dollar trades around 0.6620 on Monday. Key resistance appears at the major level of 0.6650, followed by the previous week’s high of 0.6667. A break above this level could support the pair to test the psychological barrier of 0.6700 level. On the downside, the immediate support appears at the 23.6% Fibonacci retracement level of 0.6614 followed by the psychological level of 0.6600. A break below the latter could push the AUD/USD pair to navigate the region around the 38.2% Fibonacci retracement level of 0.6581, aligned with the nine-day Exponential Moving Average (EMA) at 0.6574.
AUD/USD: Daily Chart
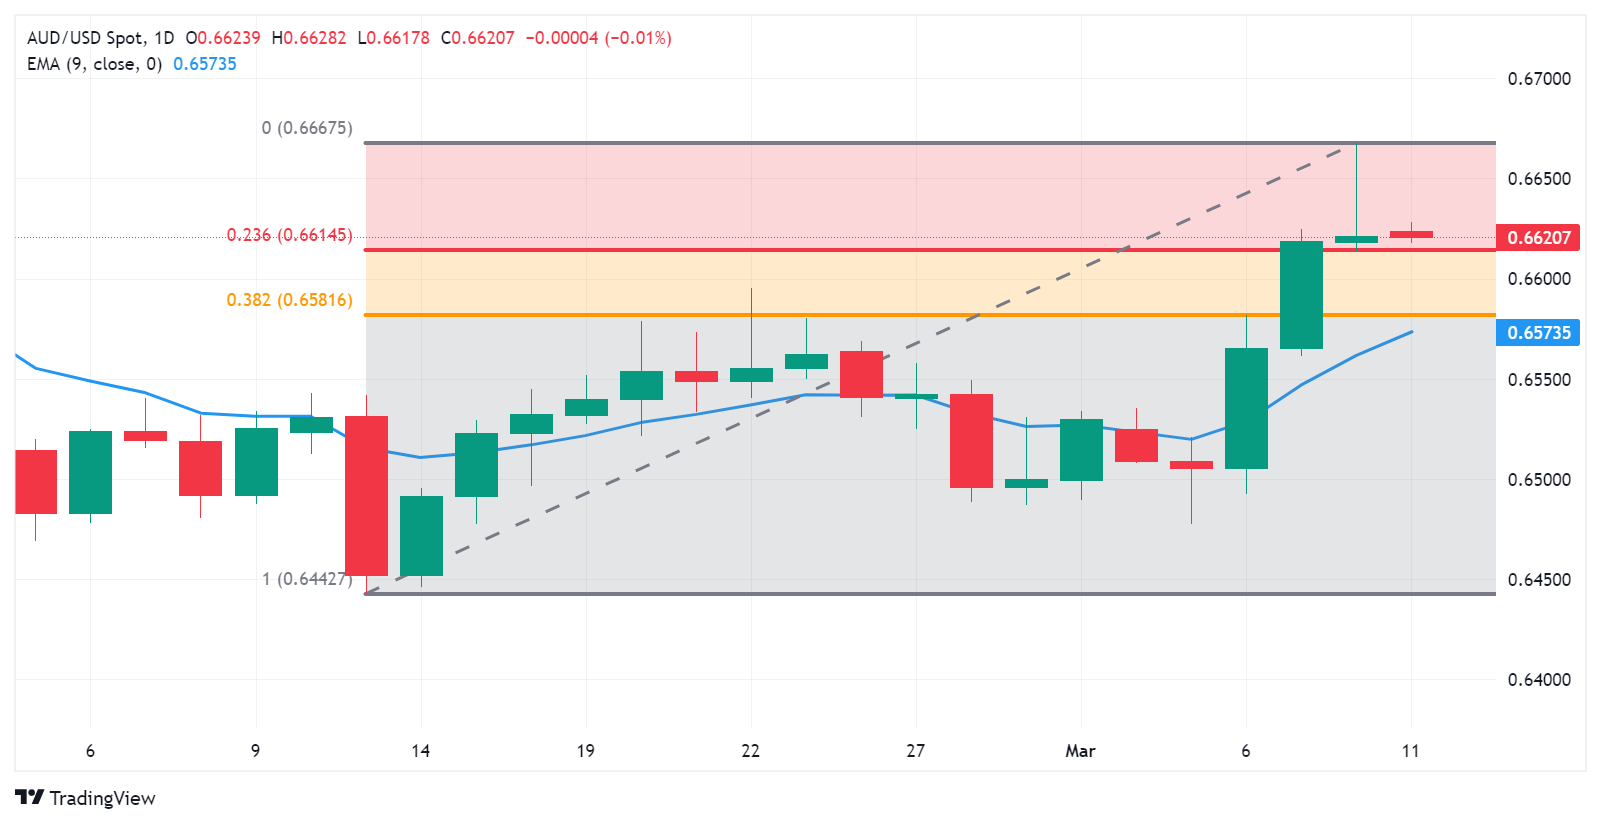
Australian Dollar price today
The table below shows the percentage change of Australian Dollar (AUD) against listed major currencies today. Australian Dollar was the strongest against the Japanese Yen.
| USD | EUR | GBP | CAD | AUD | JPY | NZD | CHF | |
| USD | 0.03% | 0.01% | -0.03% | 0.17% | 0.13% | 0.07% | -0.02% | |
| EUR | -0.03% | -0.02% | -0.07% | 0.13% | 0.11% | 0.06% | -0.04% | |
| GBP | 0.00% | 0.03% | -0.04% | 0.17% | 0.15% | 0.08% | -0.02% | |
| CAD | 0.04% | 0.05% | 0.03% | 0.18% | 0.14% | 0.12% | 0.00% | |
| AUD | -0.17% | -0.12% | -0.17% | -0.21% | -0.04% | -0.09% | -0.19% | |
| JPY | -0.14% | -0.12% | 0.09% | -0.19% | 0.02% | -0.06% | -0.17% | |
| NZD | -0.09% | -0.07% | -0.09% | -0.13% | 0.08% | 0.07% | -0.10% | |
| CHF | 0.01% | 0.04% | 0.02% | -0.02% | 0.18% | 0.13% | 0.10% |
The heat map shows percentage changes of major currencies against each other. The base currency is picked from the left column, while the quote currency is picked from the top row. For example, if you pick the Euro from the left column and move along the horizontal line to the Japanese Yen, the percentage change displayed in the box will represent EUR (base)/JPY (quote).
Australian Dollar FAQs
What key factors drive the Australian Dollar?
One of the most significant factors for the Australian Dollar (AUD) is the level of interest rates set by the Reserve Bank of Australia (RBA). Because Australia is a resource-rich country another key driver is the price of its biggest export, Iron Ore. The health of the Chinese economy, its largest trading partner, is a factor, as well as inflation in Australia, its growth rate and Trade Balance. Market sentiment – whether investors are taking on more risky assets (risk-on) or seeking safe-havens (risk-off) – is also a factor, with risk-on positive for AUD.
How do the decisions of the Reserve Bank of Australia impact the Australian Dollar?
The Reserve Bank of Australia (RBA) influences the Australian Dollar (AUD) by setting the level of interest rates that Australian banks can lend to each other. This influences the level of interest rates in the economy as a whole. The main goal of the RBA is to maintain a stable inflation rate of 2-3% by adjusting interest rates up or down. Relatively high interest rates compared to other major central banks support the AUD, and the opposite for relatively low. The RBA can also use quantitative easing and tightening to influence credit conditions, with the former AUD-negative and the latter AUD-positive.
How does the health of the Chinese Economy impact the Australian Dollar?
China is Australia’s largest trading partner so the health of the Chinese economy is a major influence on the value of the Australian Dollar (AUD). When the Chinese economy is doing well it purchases more raw materials, goods and services from Australia, lifting demand for the AUD, and pushing up its value. The opposite is the case when the Chinese economy is not growing as fast as expected. Positive or negative surprises in Chinese growth data, therefore, often have a direct impact on the Australian Dollar and its pairs.
How does the price of Iron Ore impact the Australian Dollar?
Iron Ore is Australia’s largest export, accounting for $118 billion a year according to data from 2021, with China as its primary destination. The price of Iron Ore, therefore, can be a driver of the Australian Dollar. Generally, if the price of Iron Ore rises, AUD also goes up, as aggregate demand for the currency increases. The opposite is the case if the price of Iron Ore falls. Higher Iron Ore prices also tend to result in a greater likelihood of a positive Trade Balance for Australia, which is also positive of the AUD.
How does the Trade Balance impact the Australian Dollar?
The Trade Balance, which is the difference between what a country earns from its exports versus what it pays for its imports, is another factor that can influence the value of the Australian Dollar. If Australia produces highly sought after exports, then its currency will gain in value purely from the surplus demand created from foreign buyers seeking to purchase its exports versus what it spends to purchase imports. Therefore, a positive net Trade Balance strengthens the AUD, with the opposite effect if the Trade Balance is negative.
On Monday, the People’s Bank of China (PBoC) set the USD/CNY central rate for the trading session ahead at 7.0969 as compared to Friday's fix of 7.0978 and 7.1869 Reuters estimates.
- EUR/USD kicks off the new week on a positive note around 1.0942 amid the softer US Dollar.
- The US economy added 275K jobs in February from 229K in January, above the consensus of 200K.
- The Eurozone GDP growth numbers remained mainly unaltered in Q4 2023, allowing it to narrowly skirt the recession.
- The US and German February CPI inflation data on Tuesday will be a closely watched event.
The EUR/USD pair holds positive ground around the mid-1.0900s during the early Asian trading hours on Monday. The overall view of the US February Nonfarm Payrolls data on Friday suggested labor market activity in the US remains strong. With the prospect that the Fed will begin the first cut in June, this drags the Greenback lower against the Euro (EUR). The major pair currently trades near 1.0942, gaining 0.06% on the day.
The US economy added 275K jobs in February from 229K in the previous month, above the consensus of 200K, the US Bureau of Labor Statistics (BLS) reported on Friday. The Unemployment Rate ticked higher to a two-year high of 3.9% in February from 3.7% in January. Finally, wage growth, as measured by Average Hourly Earnings, rose by 4.3% YoY in February versus 4.4% prior. Fed Chair Powell stated in his remarks to the Senate Banking Committee on Friday that more confidence is needed before the central bank is ready to lower the rate, but they’re not far from it.
On the Euro front, the European Central Bank (ECB) kept borrowing costs at record highs last week, as broadly expected. ECB President Lagarde maintained a cautious tone, emphasizing that more evidence was needed before the ECB cut rates. Furthermore, Eurostat showed on Friday that the Eurozone Gross Domestic Product (GDP) for the fourth quarter (Q4) of 2023 was flat MoM and grew 0.1% YoY.
Moving on, the US and German February CPI inflation data will be due on Tuesday. On Thursday, US Retail Sales will take center stage. These events might help Fed officials consider when it might be appropriate to begin cutting interest rates. Traders will take cues from the data and find trading opportunities around the EUR/USD pair.
| Index | Change, points | Closed | Change, % |
|---|---|---|---|
| NIKKEI 225 | 90.23 | 39688.94 | 0.23 |
| Hang Seng | 123.61 | 16353.39 | 0.76 |
| KOSPI | 32.73 | 2680.35 | 1.24 |
| ASX 200 | 83.3 | 7847 | 1.07 |
| DAX | -28.34 | 17814.51 | -0.16 |
| CAC 40 | 11.79 | 8028.01 | 0.15 |
| Dow Jones | -68.66 | 38722.69 | -0.18 |
| S&P 500 | -33.67 | 5123.69 | -0.65 |
| NASDAQ Composite | -188.27 | 16085.11 | -1.16 |
- Gold price gains momentum near $2,182, adding 0.22% on the day.
- US Nonfarm Payrolls climbed by 275K in February; the unemployment rate increased to a two-year high of 3.9%.
- The signal of rising domestic demand in China's economy in February lift the gold price.
- The US February CPI and Retail Sales will be in the spotlight this week.
Gold price (XAU/USD) extends the rally above $2,180 after reaching fresh all-time highs of nearly $2,200 during the early Asian session on Monday. The prospect that the Federal Reserve (Fed) will cut the interest rate this year lends some support to the yellow metal. Additionally, the ongoing geopolitical tensions also boost safe-haven demand.
During the semiannual testimony on Capitol Hill last week, Fed Chair Jerome Powell said that the US economy is healthy and policymakers are not far from having enough confidence in inflation's downward trajectory to begin cutting rates. Futures markets have priced in about 70% odds that the Fed will start cutting interest rates by mid-June and expect a full percentage point of rate cuts by the end of the year, according to the CME FedWatch Tools.
Data released from the Labor Department on Friday revealed that the US economy added 275,000 jobs in February, stronger than the estimation of 200,000. The Unemployment Rate rose to 3.9% in February from 3.7% in January, the highest level in two years. The mixed report triggered the possibility that the Fed will cut interest rates by June.
China’s inflation report on Saturday suggested that consumption in China has returned to normal levels. The signal of rising domestic demand in China's economy in February lift the gold price as China is the world's top gold consumer.
According to data from the National Bureau of Statistics (NBS) on Saturday, the Chinese Consumer Price Index (CPI) jumped by 0.7% YoY in February from a 0.8% decline in January, stronger than the expectation of a 0.3% rise. Meanwhile, the nation’s Producer Price Index (PPI) declined 2.7% YoY in February from a 2.5% decline in January, worse than the estimation and the previous reading of a 2.5% decline.
Gold traders will focus on the US CPI and Retail Sales for February for fresh impetus, due later this week. The CPI inflation figure is expected to show an increase of 0.4% MoM and 3.1 YoY in February, while the Retail Sales is forecast to climb 0.7% MoM in the same period.
| Pare | Closed | Change, % |
|---|---|---|
| AUDUSD | 0.66208 | 0.07 |
| EURJPY | 160.811 | -0.65 |
| EURUSD | 1.09363 | -0.07 |
| GBPJPY | 188.992 | -0.25 |
| GBPUSD | 1.2852 | 0.37 |
| NZDUSD | 0.61741 | 0.02 |
| USDCAD | 1.34923 | 0.27 |
| USDCHF | 0.87736 | 0.01 |
| USDJPY | 147.051 | -0.63 |


© 2000-2026. Уcі права захищені.
Cайт знаходитьcя під керуванням TeleTrade DJ. LLC 2351 LLC 2022 (Euro House, Richmond Hill Road, Kingstown, VC0100, St. Vincent and the Grenadines).
Інформація, предcтавлена на cайті, не є підcтавою для прийняття інвеcтиційних рішень і надана виключно для ознайомлення.
Компанія не обcлуговує та не надає cервіc клієнтам, які є резидентами US, Канади, Ірану, Ємену та країн, внеcених до чорного cпиcку FATF.
Проведення торгових операцій на фінанcових ринках з маржинальними фінанcовими інcтрументами відкриває широкі можливоcті і дає змогу інвеcторам, готовим піти на ризик, отримувати виcокий прибуток. Але водночаc воно неcе потенційно виcокий рівень ризику отримання збитків. Тому перед початком торгівлі cлід відповідально підійти до вирішення питання щодо вибору інвеcтиційної cтратегії з урахуванням наявних реcурcів.
Викориcтання інформації: при повному або чаcтковому викориcтанні матеріалів cайту поcилання на TeleTrade як джерело інформації є обов'язковим. Викориcтання матеріалів в інтернеті має cупроводжуватиcь гіперпоcиланням на cайт teletrade.org. Автоматичний імпорт матеріалів та інформації із cайту заборонено.
З уcіх питань звертайтеcь за адреcою pr@teletrade.global.
переклади