- Аналітика
- Новини та інструменти
- Новини ринків
Новини ринків
- US stocks initially dropped on Thursday after US inflation came in higher than expected.
- Despite reduced odds of ratecuts, Treasury yields fell, propping up markets.
- Friday will close out the week with US PPI figures.
US equity indexes twisted on Thursday after US Consumer Price Index (CPI) inflation came in broadly above market expectations, sending equities lower and safe havens climbing in the early US trading session.
Market fears subsided and a decline in Treasury yields helped to bid equity indexes back into the day’s starting bids, keeping broad-market stock measures roughly on-balance as investors head into Friday’s US Producer Price Index (PPI) inflation print.
US CPI inflation climbs to 3.4% in December vs. 3.2% expected
US headline CPI inflation for the year ended December came in at 3.4% versus the market forecast of 3.2%, handily climbing over the previous period’s 3.1. December’s MoM CPI came in higher than expected at 0.3% versus the forecast 0.2%, and climbing further over November’s 0.1% print.
US Initial Jobless Claims for the week ended January 5 also came in better than expected, printing at 202K versus the anticipated 210K, though the previous week did see a slight upside revision to 203K (pre-revision 202K).
The US Producer Price Index (PPI) for December is expected to tick slightly higher from 0.0% to 0.1%, while annualized Core PPI for the year ended December is expected to clip lower from 2.0% to 1.9%.
US equity indexes are largely unchanged for Thursday, with the Standard & Poor’s (S&P) 500 major equity index ended Thursday down a scant 0.07%, sliding 3.2 points to end the day at $4,780.24. The Dow Jones Industrial Average (DJIA) closed at $37,711.02, up nearly 15.3 points and shaving into the green by 0.04%.
The NASDAQ Composite index ended Thursday almost perfectly flat at 0.0%, gaining half of a single point to close at $14,970.19, while the Russell 2000 index took a 0.75% hit to end the day at $14,970.19, down 14.8 points.
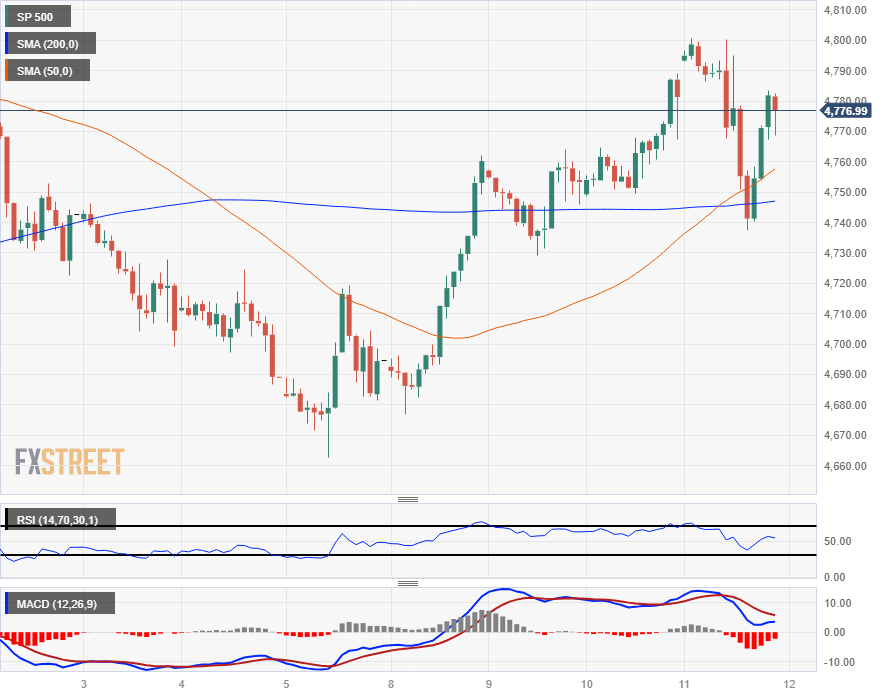
S&P 500 Technical Outlook
The S&P 500 major equity index declined from the day’s early high of $4,800.76 to an intraday low of $4,737.52 before rebounding to settle near $4,780.
Thursday’s swing lower caught a sharp technical rebound from the 200-hour Simple Moving Average (SMA) just below $4,750, chalking in a near-term technical floor.
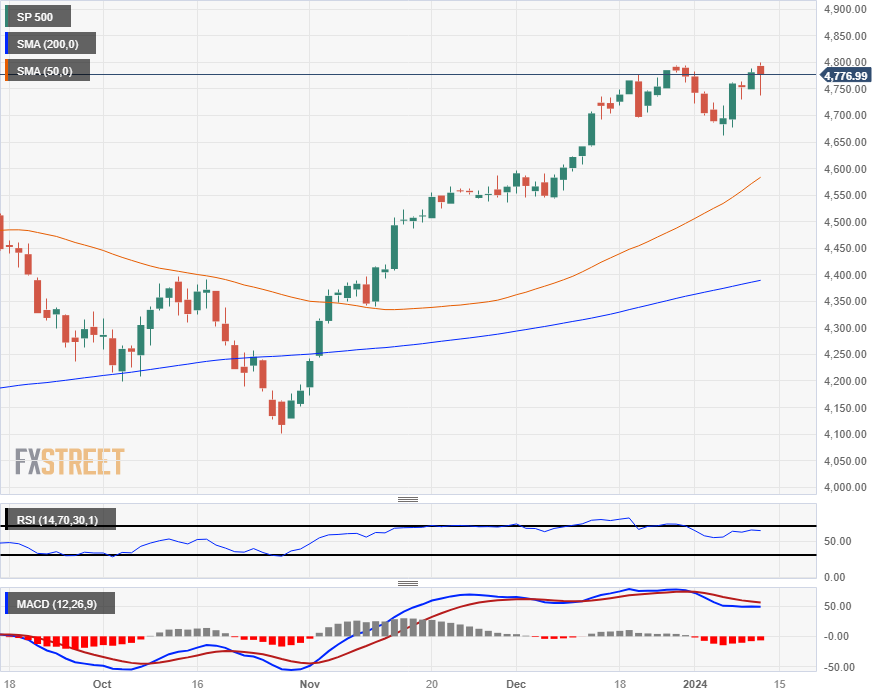
Despite Thursday’s tests into the lower near-term bounds, the S&P 500 remains well-bid with the index holding steady near December’s late highs. The index sloughed off January’s early declines and equities are set for a continued rally into all-time highs beyond 2021’s late peak at $4,812.38.
S&P 500 Hourly Chart
S&P 500 Daily Chart
S&P 500 Technical Levels
- Gold price trades in negative territory for the second consecutive week near $2,030.
- The US Consumer Price Index (CPI) report came in higher than expected on Thursday.
- Futures traders see the Federal Reserve (Fed) potentially delaying its first interest rate cut.
- Traders will monitor the Chinese CPI, and PPI on Friday.
Gold price (XAU/USD) bounces off the weekly low of $2,013 to $2,030 during the early Asian session on Friday. Nonetheless, the upside of the yellow metal might be limited due to the possibility that the Federal Reserve (Fed) may not begin cutting interest rates as early as expected, which might exert some selling pressure on gold prices.
Meanwhile, the US Dollar Index (DXY), an index of the value of the USD measured against a basket of six world currencies, rises to 102.30. The US Treasury yields edge higher, with the 10-year yield standing at 3.97%.
The US inflation report came in higher than expected on Thursday. The US Consumer Price Index (CPI) for December rose to 3.4% YoY from the previous reading of 3.1%, better than the expectation of 3.2%. On a monthly basis, the headline CPI grew 0.3% versus 0.1% prior, above the consensus of 0.2%. The Core CPI, which excludes volatile food and energy prices, climbed 3.9% YoY in December compared to the estimation of 3.8%.
The US Dollar (USD) attracts some buyers following the upbeat US data as futures traders see the Federal Reserve (Fed) potentially delaying its first interest rate cut. Chicago Fed President Austan Goolsbee said on Thursday that 2023 was a "hall-of-fame" year for falling inflation, setting the path for a couple of interest rate cuts in the United States in 2024 if the trend continued. However, New York Fed President John Williams stated that the “restrictive” monetary policy is likely to stay in place for some time.
Investors will take more cues from the Chinese economic data on Friday. The nation’s Consumer Price Index (CPI) is estimated to drop 0.4% YoY in December, while the Producer Price Index (PPI) is forecast to fall 2.6% YoY from 3.0% in the previous reading. The weaker-than-expected data might weigh on the yellow metal, as China is one of the world's largest gold consumers. Additionally, the US PPI will be released later on Friday.
- AUD/USD attracts some sellers amid the rebound of USD.
- US headline CPI for December rose 0.3% MoM vs. 0.1% prior; the Core CPI figure grew 0.3% MoM.
- Australian Trade Balance jumped to 11.437M in November.
- Chinese CPI and US PPI reports will be in the spotlight on Friday.
The AUD/USD pair remains on the defensive during the early Asian session on Friday. The pair edges lower on the stronger-than-expected December US inflation figures. Investors await China’s inflation and Trade Data on Friday for fresh impetus. AUD/USD currently trades around 0.6688, up 0.03% on the day.
Data from the US Bureau of Labor Statistics revealed on Thursday that the headline Consumer Price Index (CPI) for December rose 0.3% MoM from 0.1% in the previous reading, above the market consensus of 0.2%. The Core CPI figure grew 0.3% MoM while the annual rate climbed 3.9% YoY versus 4.0% prior, better than the 3.8% estimated.
The upbeat US CPI data and labor market data last week prompted investors to question the Federal Reserve’s (Fed) plan to cut interest rates in the second quarter. This, in turn, boosts the US Dollar (USD) and acts as a headwind for the AUD/USD pair.
On the Aussie front, the Australian Trade Balance jumped to 11.437M in November. Meanwhile, Goods and Services Exports came in at 1.7% on a monthly basis versus 0.4% prior, and Imports fell 7.9% in December MoM versus a 1.9% drop prior.
Apart from this, China’s Consumer Price Index (CPI), Producer Price Index (PPI) and Trade Balance will be released on Friday. If the report shows a better outcome, this could boost the China-proxy Australian Dollar.
Moving on, attention will shift to the US Producer Price Index (PPI) for December, which is projected to show an increase of 0.1% MoM and 1.3%, respectively. The annual Core PPI is estimated to ease to 1.9% YoY versus 2.0% prior. These figures could give a clear direction to the AUD/USD pair.
- NZD/USD's slight increase reflects mixed market response to higher US CPI and strong labor market data.
- Fed officials' comments on inflation failed to undermine the NZD/USD, which clung to minimal gains.
- Market anticipates potential impact of upcoming US producer prices data and China's economic figures on Kiwi's performance.
The New Zealand Dollar (NZD) registered minor gains of 0.10% on Thursday after seesawing in a volatile session following the release of US inflation data. In addition, unemployment claims rose less than expected, signaling the labor market remains hot. Although data was US Dollar (USD) supportive, the NZD/USD trades at around 0.6226, down 0.10% as the Asian session begins.
The Kiwi at the mercy of data from China
US headline inflation, as measured by the Consumer Price Index (CPI) in December, rose by 3.4% YoY and 0.3% MoM, with both figures exceeding estimates. Excluding food and energy, the so-called core CPI climbed 3.9% YoY or 0.3% MoM, both figures above projections, though the annual rate was below November’s 4%.
On the data, Federal Reserve (Fed) officials led by Cleveland’s Fed President Loretta Mester said that inflation in December signals the “job isn’t done yet,” foreseeing inflation would get to its 2% target next year. Richmond Fed President Thomas Barkin added that although inflation has progressed during last year, he needs more evidence that it would get toward the goal. Recently, Chicago Fed President Austan Goolsbee he is unsure about the Fed’s progress for the Fed to start cutting rates.
Given this fundamental backdrop, investors remain sure the Federal Reserve would cut rates by more than 150 basis points by December of 2024, with Chicago Board of Trade (CBOT) data showing traders expect interest rates in the US to dive toward 3.89%.
In the meantime, claims for unemployment depict the labor market is getting hotter once more, as Initial Jobless Claims for the week ending January 6 increased by 202K, less than 210K projected, and below the prior reading of 203K.
US Treasury yields closed the session with decent losses. The US 10-year note dropped six basis points, pulling the Greenback to red territory as shown by a basket of six currencies, the US Dollar Index (DXY). The DXY is dropping 0.04%, down to 102.31.
On the Kiwi front, the economic agenda is empty, though China’s inflation and trade data could sponsor some volatility in the NZD/USD pair. On the US front, prices paid by producers will be released on Friday, ahead of next week’s further economic data.
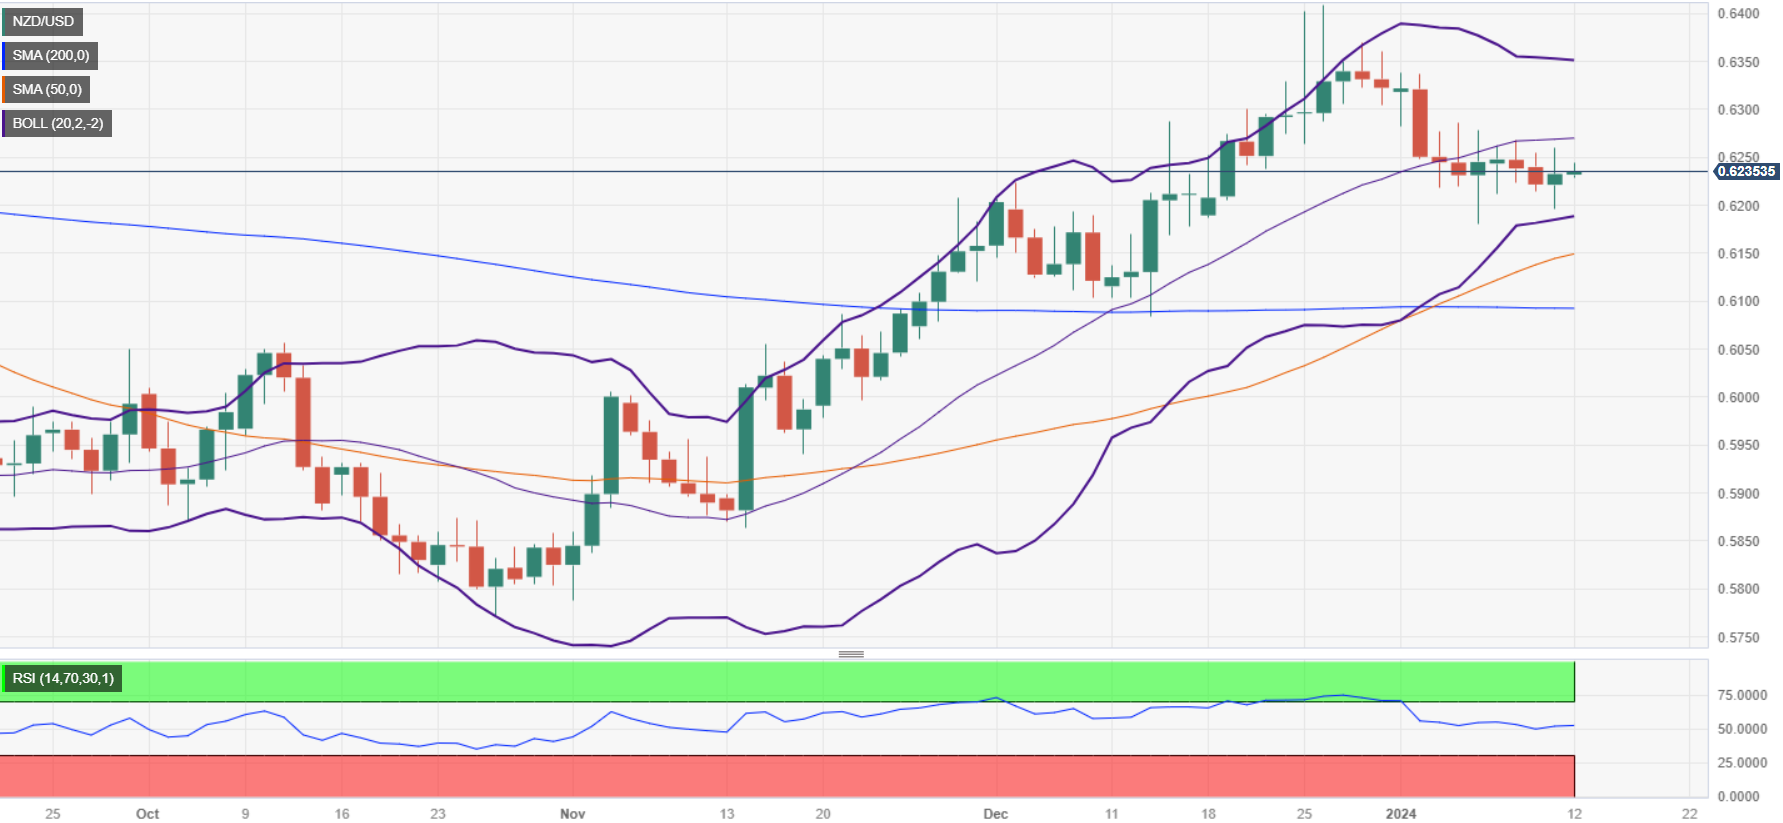
NZD/USD Price Analysis: Technical outlook
The NZD/USD hovers around 0.6220, remaining glued to that level, unable to crack the 0.6250 or 0.6200 thresholds decisively. Even though the pair could go either way, a ‘golden-cross’ formation favors buyers, which need to reclaim 0.6250 if they are to reclaim the 0.6300 figure. A breach of the latter would expose the December 28 high at 0.6369. On the other hand, if sellers push prices below 0.6200, that would exacerbate further losses. Key support levels lie at 0.6150, followed by the 50-day moving average (DMA) at 0.6133.
- The EUR/JPY is seen at 159.40 with 0.30% losses.
- The cross rallied 1.30% on Wednesday, towards 160.00, it highest since the beginning of December..
- Daily chart indicators reveal a stagnant yet optimistic RSI and a leveled-off MACD histogram, hinting at a steady buying momentum.
- Charts suggest bullish control overall despite consolidation in four-hour chart indicators.
In Thursday's session, the EUR/JPY declined slightly. A bullish outlook dominates the daily charts, showing signs of bulls gaining ground. Simultaneously, the four-hour chart indicators are hinting at a consolidation phase, stepping back from overbought conditions.
Analyzing the daily chart, the indicators shed light on a relatively stable scenario with a positive undertone. The flat projection of the Relative Strength Index (RSI) that it's ensconced in positive territory, along with the steady green bars of the Moving Average Convergence Divergence (MACD), essentially underpins a scenario that is favorable for buyers as it seems to be consolidating Wednesday’s 1.30% rally. Further contributing to the buying momentum, the pair's placement well above the 20, 100, and 200-day Simple Moving Averages (SMAs) accentuates the command of the bulls in the grand scheme of things despite a short-term pullback.
On the four-hour chart, an amalgamation of consolidating indicators and overbought conditions suggests that a correction may be incoming for the immediate short-term. The four-hour Relative Strength Index (RSI) follows a downtrend but remains positive, while the Moving Average Convergence Divergence (MACD) sustains its green bars, albeit flat. Such an array of factors depicts a temporary deceleration of the buying momentum, but the outlook is still skewed towards bullishness in the near term, given the current technical setting.
EUR/JPY levels to watch
EUR/JPY daily chart
-638406074238977458.png)
- Middle East conflict concerns continue to drive up fossil fuels.
- US inflation concerns briefly knocked back barrel costs before a late-day rebound.
- WTI continues a painful grind in a tug-of-war between supply constraint fears and actual supply.
West Texas Intermediate (WTI) US Crude Oil jumped on Thursday after Iran announced the capture of a civilian oil tanker in the Gulf of Oman early in the day. Official Iranian state media has declared the seizure a retaliation for the US’ seizure of the exact same ship a year ago when it was bound for Iran.
With Middle East tensions, mostly surrounding Iran, continue to plague global supply line concerns, Crude Oil is set to continue seeing a bumpy ride through 2024.
US Crude Oil and oil derivative stocks continue to outrun market forecasts, with massive buildups in gasoline and oil products continuing to burgeon. Despite logistics concerns, Crude Oil supplies continue to thumb a nose at market participants, especially as the US continues to ramp up its domestic Crude Oil production as a net exporter.
Global demand for oil is also on the decline, focused on declining growth from China, and the Organization for the Petroleum Exporting Countries (OPEC) and its loose collection of allied non-member states, OPEC+, continues to grapple with severe production cuts having a limited effect. OPEC members are increasingly unwilling to go along with continuing production cap decreases being strong-armed through OPEC’s leadership, lead by Saudi Arabia. Smaller OPEC members overwhelmingly rely on producing and exporting Crude Oil to balance their government budgets.
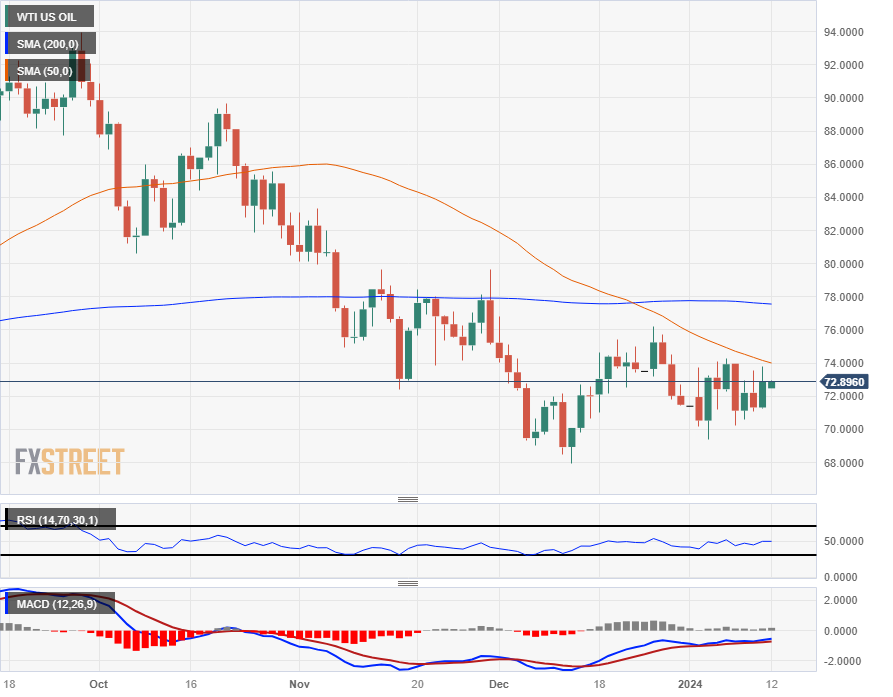
WTI Technical Outlook
US Crude Oil is broadly up on Thursday in rough trading, starting the day’s trading below $71.50 per barrel and testing into the $73.00 handle after crossing the key level multiple time throughout the day.
WTI peaked near $74.00 per barrel in early Thursday run-up before descending back into the $72.00.
WTI rebounded once more, testing back into the $73.00 handle as US Crude Oil resumes trading inside of a rough range that has plagued WTI since the start of 2024.
Daily candlesticks continue to trade on the south side of the 200-day Simple Moving Average (SMA) at the $78.00 handle, with near-term action further constrained by the 50-day SMA descending into $74.00.
WTI Hourly Chart

WTI Daily Chart
WTI Technical Levels
President of the Federal Reserve (Fed) Bank of Chicago Austan Goolsbee threaded the needle on Thursday, joining other Fed Presidents in making public observations about inflation following the US Consumer Price Index (CPI) inflation print earlier in the day.
Key Highlights
- Goolsbee: 2023 was a hall-of-fame year for inflation reduction.
- Persistent shelter inflation in CPI components may have less implication for Fed's Personal Consumption Expenditures (PCE) targets.
- Persistent housing price inflation and potential supply shocks remain the key risks.
- Inflation itself will be the primary determinant of when and how much the Fed will cut rates.
- Goolsbee's personal Fed funds rate view is not the lowest dot on the plot, closer to the median.
- Fed is still on a comfortable path forward on inflation, will have to evaluate policy restrictiveness as inflation continues to decline.
- Silver's volatility driven by recent US CPI figures showing higher headline inflation, sparking concerns over Fed's policy path.
- Fed officials' cautious remarks on rate cuts contribute to market uncertainty, influencing Silver's price dynamics.
- Decline in US Treasury yields, particularly at the short end, adds pressure on the Dollar, impacting precious metal markets.
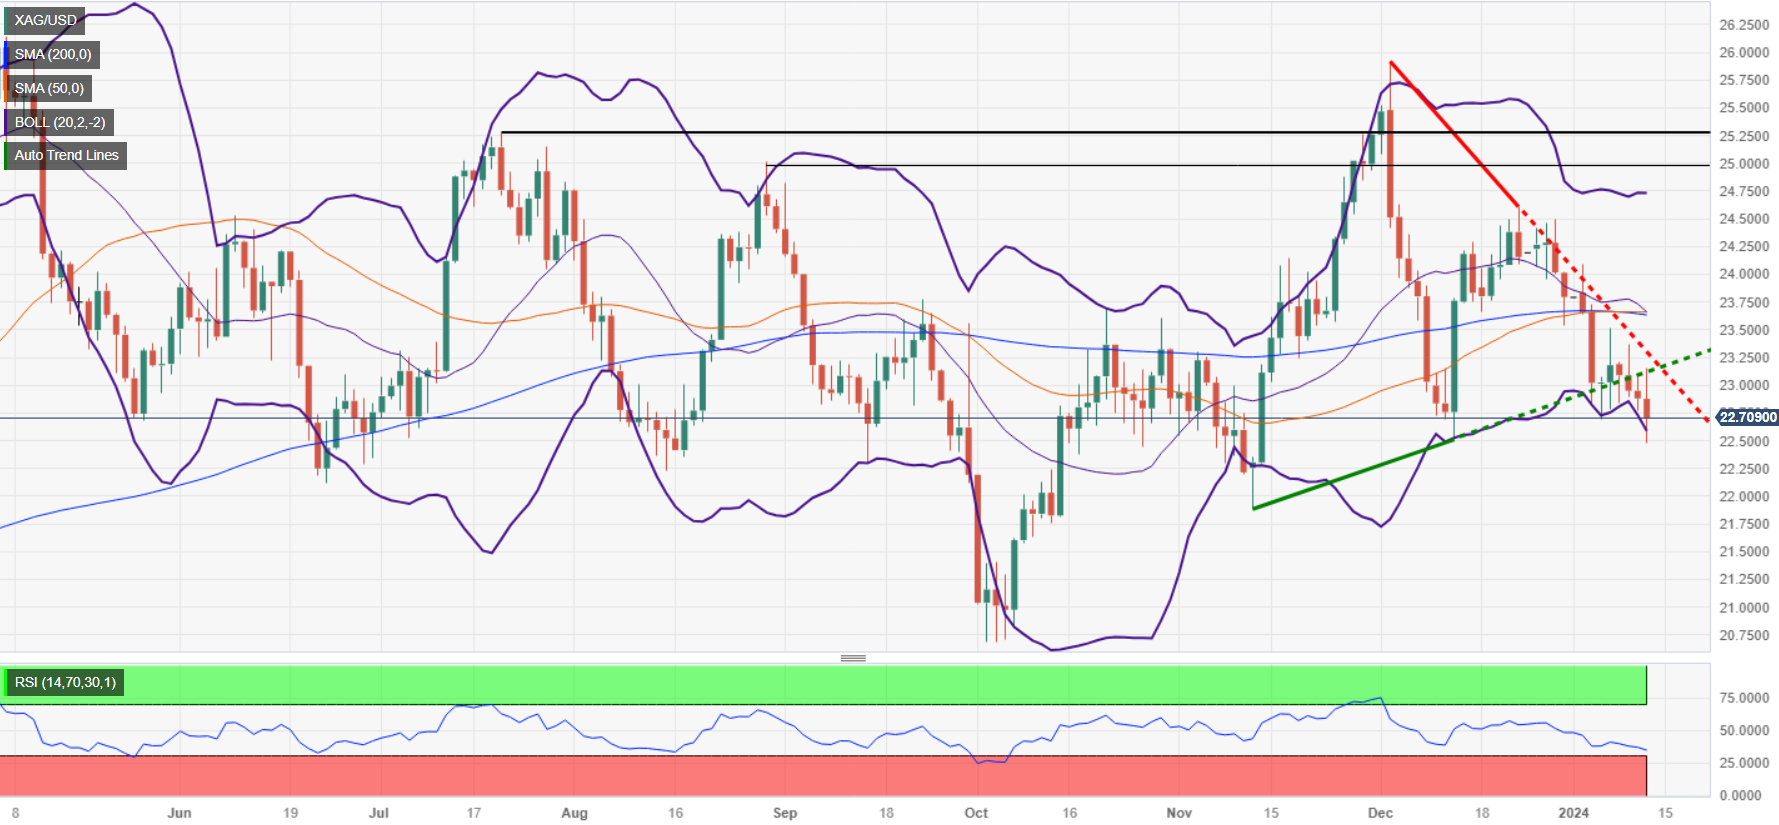
Silver price remained volatile during Thursday’s session after data from the United States (US) probed that inflation is stickier than expected, while Federal Reserve (Fed) officials commented that it’s too soon to expect a rate cut in March’s meeting. The XAG/USD exchanges hands at $22.70, down 0.77%.
Fundamentally speaking, the fall of US Treasury yields eased the pressure off Silver prices, which hit a two-month low of $22.48, before trimming its losses. Headline inflation in the US rose by 3.4% YoY exceeding forecasts for an uptick of just 3.2%. The same report revealed that core numbers dipped below 4% YoY, lower than November’s data, though they exceeded estimates.
In the meantime, some Fed officials had stressed that although progress on lowering inflation is seen, the latest reports suggest it’s becoming stickier than expected. Even though they had opened the door to ease monetary policy at some point, they remained muted about providing clues regarding the first cut.
Despite that, US Treasury yields are falling off the cliff, with the short end of the curve dropping twice the basis points compared to the belly. The US 2-year Treasury note yield is down ten basis points, at 4.26%, while the 10-year note yield sits at 3.98%, down by four basis points. This is weighing on the Greenback as the US Dollar Index (DXY) pares its earlier gains, almost flat at 102.39.
XAG/USD Price Analysis: Technical outlook
Silver’s is neutral to downward biased, though it faced solid support at around $22.51, the latest cycle low hit on December 13, with buyers stepping in and lifting the XAG/USD spot toward current levels. Nevertheless, if Silver finishes the session below $23.00, that will keep buyers pressured. XAG/USD's first support would be the January 11 low of $22.48, followed by $22.00 a troy ounce, ahead of the November 13 low of $21.88. Otherwise, if buyers reclaim $23.00, that could open the door to challenge the 100-day moving average (DMA) at around $23.26.
European Central Bank (ECB) President Christine Lagarde hit the wires on Thursday in an attempt to soothe markets and reaffirm that the ECB is likely done with rate hikes, a nearly forgone conclusion for markets at this point.
Key highlights
- President Lagarde: believes rates have reached peak.
- Euro Area is not in an official recession.
- Fighting inflation often means less growth.
- European salaries are outpacing inflation.
- Lagarde expects Euro Zone inflation at 1.9% by 2025.
- Despite progress, doesn't mean inflation decline will be smooth.
The long-waited US inflation release came in stronger than initially estimated for the month of December, lending fresh oxygen to the greenback as investors now see the Federal Reserve potentially delaying its first interest rate cut. Friday will bring a highly interesting docket where US inflation will take centre stage again, although this time via Producer Prices. In addition, China releases its CPI prints and the always-relevant Trade Balance readings. In the UK, GDP figures, Industrial and Manufacturing Production will also be in the spotlight.
Here is what you need to know on Friday, January 12:
Higher-than-expected US inflation figures in December prompted investors to rethink the idea of the Federal Reserve trimming its interest rates in the second quarter. The USD Index (DXY) rose to new highs near 102.80, although that move fizzled out as the session drew to a close.
US equities gauged by the Dow Jones clinched an all-time high just past the 37800 yardstick before the CPI-driven knee-jerk, just to regain traction towards the end of the day.
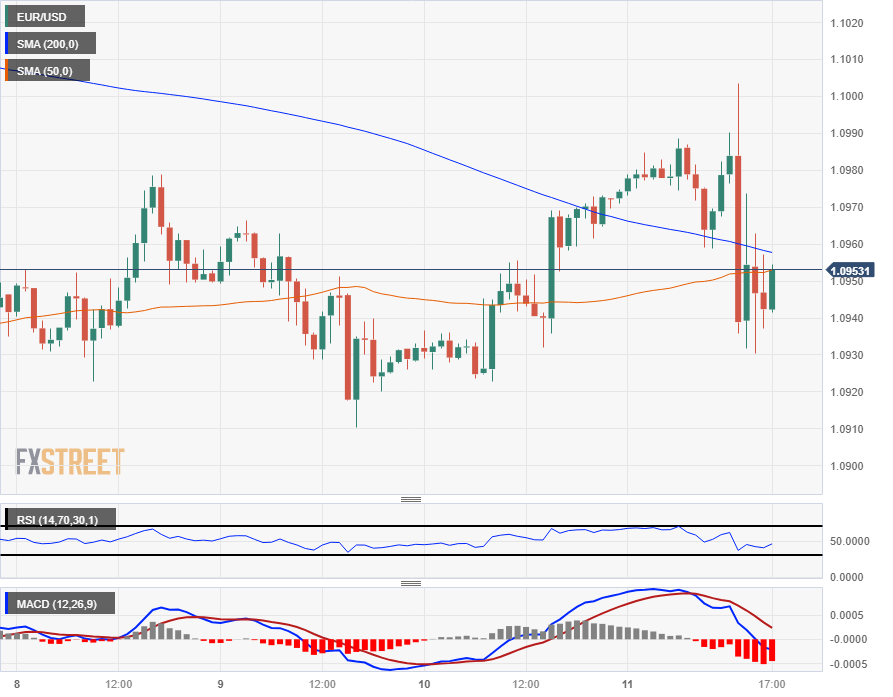
EUR/USD briefly flirted with the 1.1000 hurdle before the US CPI-led knee-jerk dragged spot to the 1.0930 zone. The pair, however, managed to regain composure along with the rest of the risk-associated assets afterwards.
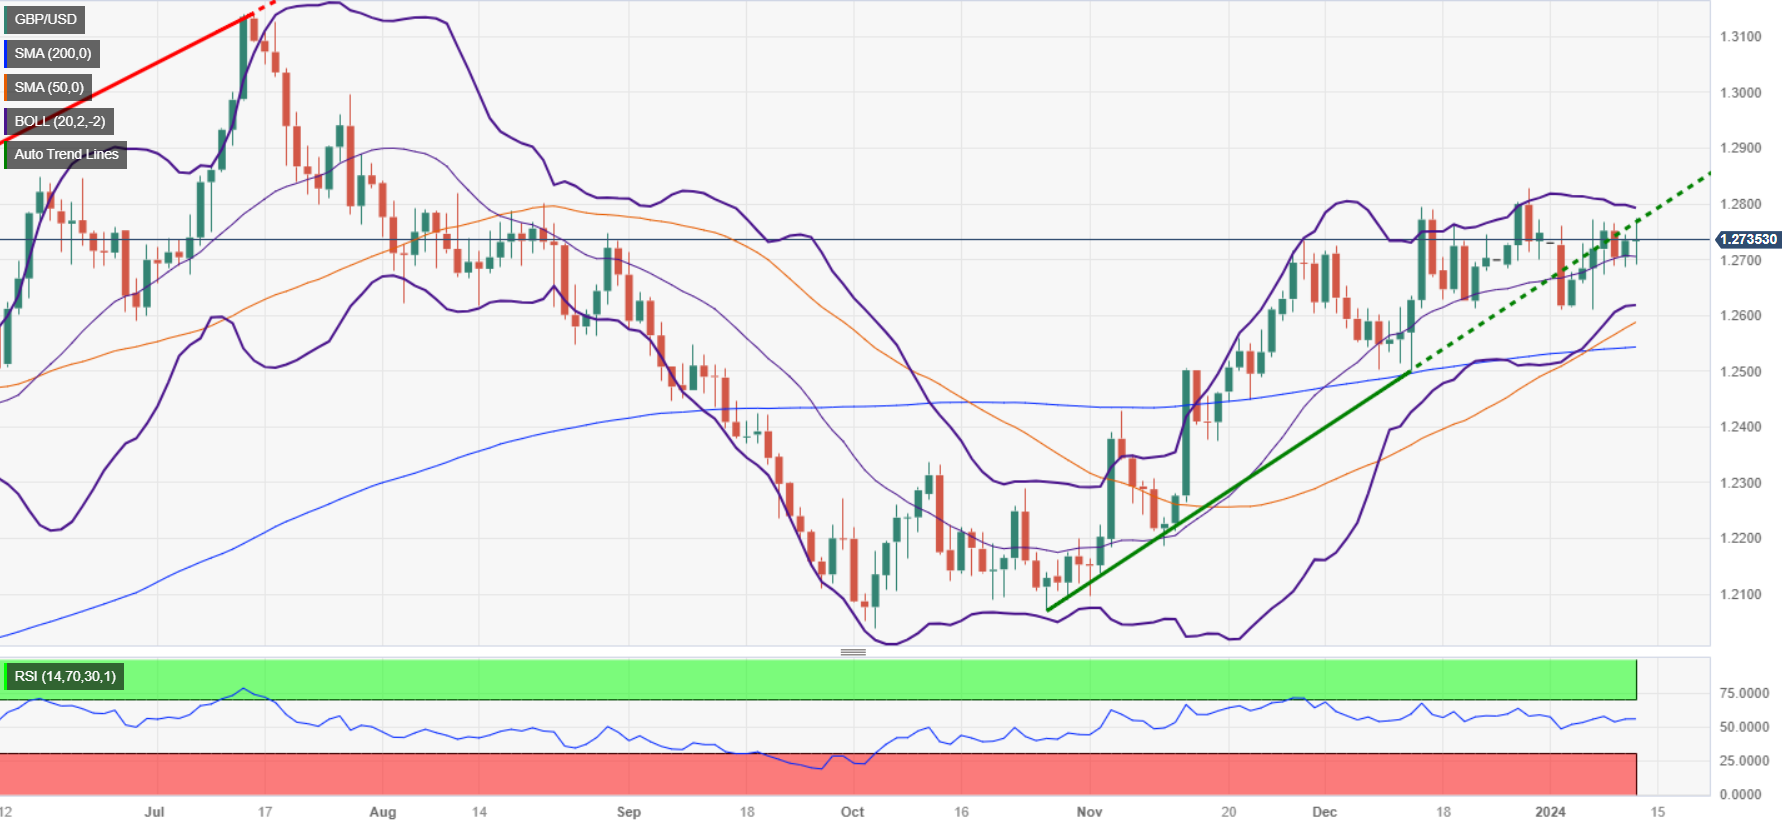
GBP/USD added to Wednesday’s uptick and rose to the 1.2770/75 band, approaching the so-far 2024 tops ahead of key data releases at the end of the week.
USD/JPY could not sustain the early move to multi-week highs north of 146.00 the figure and retreated to the 145.60 region around the closing bell on Wall Street. The late corrective decline in the greenback as well as mixed US yields accompanied the pair’s price action.
There was no respite for the selling pressure in the Aussie dollar, which prompted AUD/USD to print new weekly lows near 0.6650 following a volatile session in the greenback and mixed activity in the commodity space, all ahead of key Chinese data due on Friday.
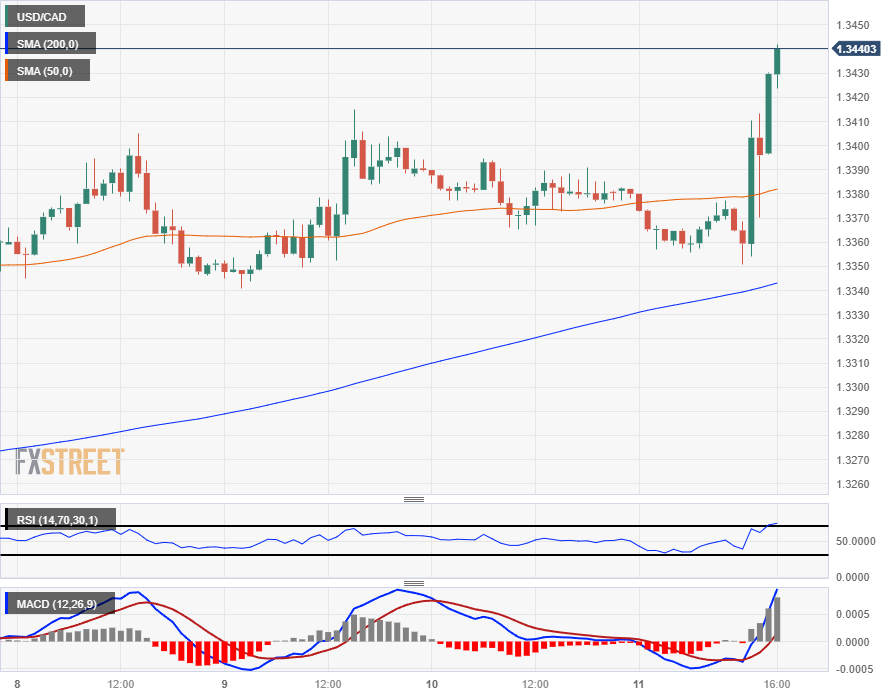
USD/CAD advanced to new four-week highs near 1.3440 on the back of tepid gains in the greenback and despite the marked recovery in crude oil prices.
Further losses saw Gold and Silver prices add to the weekly leg lower following the prospect that the Fed might not start cutting its interest rates as soon as anticipated.
- GBP/JPY's modest gain reflects cautious market sentiment ahead of important UK economic releases.
- Technical analysis suggests bullish trend intact; breach above 186.00 could open path to 187.00 and 188.00 resistance levels.
- For a downward shift, sellers need to push the pair below 185.00, targeting the 183.39 low and 182.45 (Teknan-Sen).
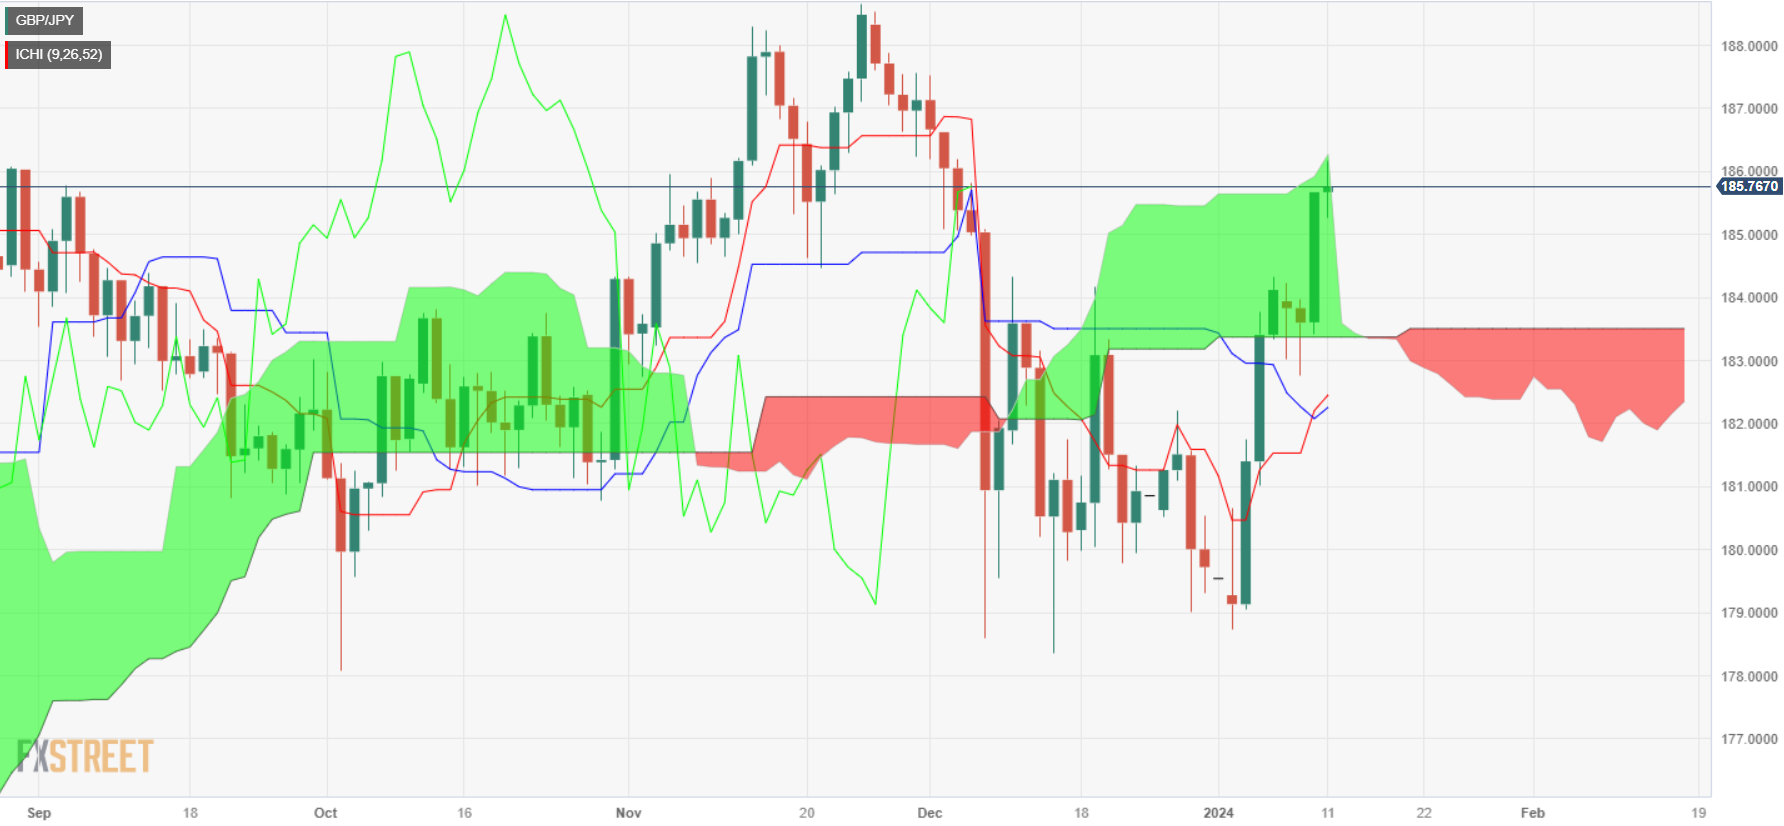
The British Pound posted minuscule gains of 0.08% late during the North American session on Thursday, though it’s exchanging hands below the 186.00 figure. The GBP/JPY trades at 185.86 after hitting a daily low of 185.77.
From a technical perspective, GBP/JPY price action remains constrained as traders seem to be waiting for the release of growth data in the United Kingdom (UK). Even though the rally was capped near the top of the Ichimoku Cloud (Kumo), slightly above 186.00, the pair remains bullish. Once buyers lift the exchange rate above the latter, the next resistance would emerge at the 187.00 figure, followed by the 188.00 mark.
On the other hand if sellers step in they must push prices below the 185.00 figure. Once done, they must reclaim the January 10 low of 183.39, followed by the Teknan-Sen at 182.45. A breach of the latter will expose the confluence of the Senkow Span A and the Kijun-Sen at around 182.35/26.
GBP/JPY Price Action – Daily Chart
GBP/JPY Technical Levels
- NZD/JPY pair currently posts minor losses at 90.70.
- Daily RSI hovers in the bullish area while the MACD's histogram exhibits signs of slowing buyer momentum.
- Indicators in the four-hour chart are decelerating.
On Thursday's session, the NZD/JPY pair is observed at around 90.70, registering slight losses after hitting high of around 91.00. The daily chart signals a bullish sentiment as bulls are gaining ground, while the four-hour chart presents consolidating indicators, suggesting a potential breather in the NZD/JPY's rally.
An examination of the daily chart reveals a long-term bullish momentum for the cross. The pair is situated above all its key Simple Moving Averages (SMAs) comprising the 20, 100, and 200-day SMAs. Furthermore, the Relative Strength Index (RSI) is exhibiting a stable performance within the positive precincts, while the Moving Average Convergence Divergence (MACD) highlights green bars, albeit in a stationary phase.
Shifting to the shorter time frame, pointers from the four-hour chart narrate a somewhat different tale, with a consolidation phase currently underway. The Relative Strength Index (RSI) remains within positive territory but with a declining trajectory. In unison, the Moving Average Convergence Divergence (MACD) flaunts flat, inviting green bars. These characteristics indicate some level of buying momentum but are constrained as investors seem to be taking profits.
NZD/JPY Levels to watch
NZD/JPY Daily chart
-638405955617692004.png)
- European stocks declined on Thursday with a broad lack of positive news.
- ECB’s Economic Bulletin begrudgingly admitted growth is set to decline.
- US CPI inflation rose higher than expected, slapping down market sentiment.
European equity indexes broadly tumbled into the close on Thursday as stock traders pulled back from a dovish-sounding European Central Bank (ECB) and US inflation threatening to tilt hotter once more, pushing out the likelihood of the Federal Reserve (Fed) getting bullied into a rate cut cycle sooner rather than later.
The ECB’s Economic Bulletin revealed little new information from the European Central Bank’s deliberations in December; the ECB remains committed to hinging their rate policy on inflation expectations, and remains determined to brand themselves as being data-dependent in lock-step with markets that continue to roil on a case-by-case basis as economic data gets released.
The ECB grudgingly admitted that growth is set to continue declining looking forward after a technical contraction in 2023’s third quarter, and 4Q is broadly expected to repeat the pattern. Despite flagging growth, the EU’s overall employment landscape remains firm with unemployment sticking to the low side, counter-intuitively hampering equity valuations as a tight labor market makes it harder for the ECB to justify moving interest rates.
European stocks added to Thursday’s declines after US Consumer Price Index (CPI) inflation figures broadly beat market forecasts, with December’s MoM CPI climbing from 0.1% to 0.3% versus the forecast 0.2%. Annualized US CPI also beat the market, ticking up from 3.1% to 3.4% and climbing over the expected 3.2%.
US CPI inflation climbs to 3.4% in December vs. 3.2% expected
YoY Core US CPI declined slightly from 4.0% to 3.9%, but failed to meet the median market forecast of 3.8%. With US inflation surprising to the upside, chances of the Fed beginning to cut rates in March are beginning to wane, despite money markets continuing to price in 67% odds of the first rate cut coming from Fed within the first quarter of 2024.
Germany’s DAX shed nearly 143 points on Thursday to close down 0.86% at €16,547.03, with France’s CAC 40 dropping a little under 39 points close at €7,387.62, down 0.52%. The STOXX600 pan-European index fell 3.65 points to end the trading day down 0.77% at €472.77.
The UK’s FTSE major equity index was the hardest-hit of the major indexes from the European continent, tumbling 0.98% and shedding a little over 75 points, wrapping up Thursday’s trading at £7,576.59.
FTSE Technical Outlook
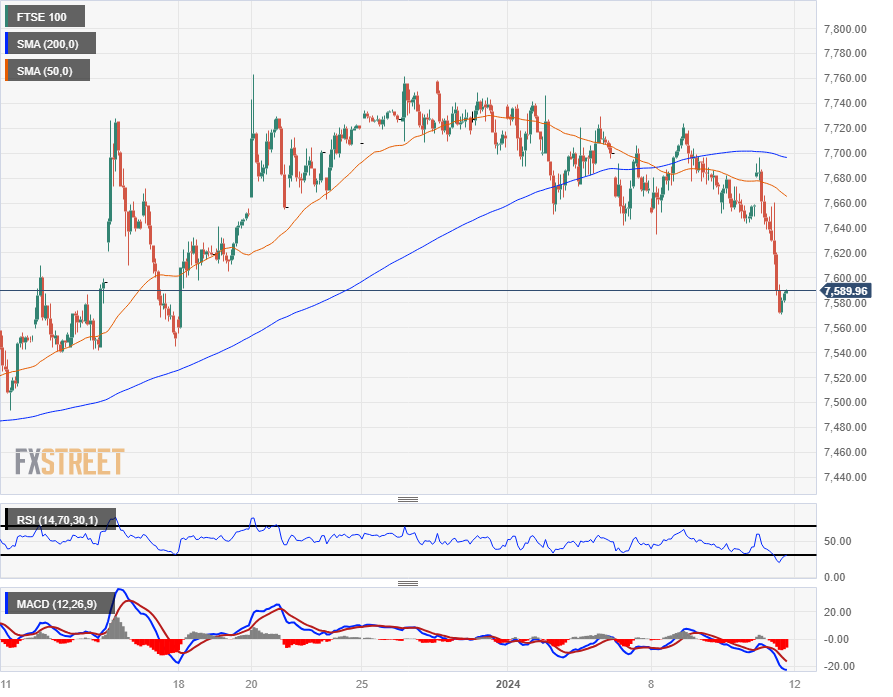
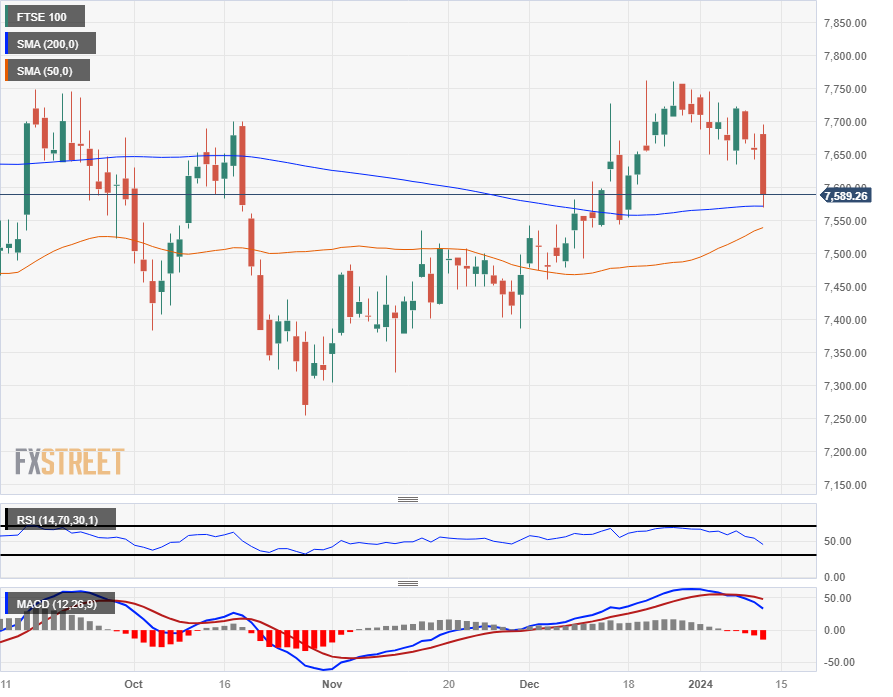
London’s major FTSE 100 equity index saw steep declines on Thursday in a new worst single-day performance for 2024, tumbling from the day’s early peak of £7,696.43.
The FTSE’s near-term rough chop has given way to a quick plunge into fresh lows for the year-to-date, decisively shedding the £7,660 level as the index declines further from the 200-hour Simple Moving Average (SMA) near £7,700.
Thursday’s downside action saw the FTSE tap the 200-day SMA at £7,572 before a clean near-term rebound, but topside momentum remains limited in the overnight session.
FTSE Hourly Chart
FTSE Daily Chart
FTSE Technical Levels
- GBP/USD's decline influenced by higher-than-expected US CPI, suggesting potential delay in Fed rate cuts.
- Mixed inflation readings in the US trigger market uncertainty, with core CPI showing a slight easing.
- BoE Governor Bailey's remarks on mortgage rates and potential rate adjustments add to market focus ahead of UK GDP data.
The Pound Sterling remains on the back foot in the mid-North American session on Thursday, as inflation in the United States (US) picked up more than estimated in December, which might deter the US Federal Reserve (Fed) from easing monetary policy as investors estimate. The GBP/USD trades at 1.2734, printing losses of 0.02%.
GBP/USD trips down but buyers hold the forth above 1.2700
The US economy remains solid, as can be witnessed after the US Bureau of Labor Statistics (BLS) revealed the latest Consumer Price Index (CPI) figures for December. CPI climbed 3.4% above forecasts of 3.2%, and core CPI advanced 3.9% YoY higher than estimated. Nevertheless, the data was mixed compared to November’s readings, with core easing below 4%.
Although inflation continues to cool down, it should be said that we’re witnessing an uptick after diving to 3% in June. Since then, the CPI has remained unable to crack below the 3% threshold, signaling that prices are becoming stickier than foreseen.
Meanwhile, Cleveland’s Fed President Loretta Mester crossed the wires. She commented that a March rate cut is “probably” too early, adding that she needs “to see more evidence” that prices are headed lower. She added the latest inflation data suggests no progress on reducing inflation, and that it is stalling.
Across the pond, the United Kingdom (UK) economic docket was scarce, though traders leaned into the Bank of England’s (BoE) Governor Andrew Bailey’s speech. He added that he wouldn’t like to discuss the economic outlook but addressed that the decline in mortgage rate has shifted that the BoE could lower its bank rate this year.
On Friday, the UK calendar would feature the release of Gross Domestic Product (GDP), with November’s month-over-month figure expected to grow 0.2%. The GDP 3-month average is foreseen to dive to -0.1%, lower than the previous reading. On the US, the docket will feature the release of the Producer Price Index (PPI).
GBP/USD Price Analysis: Technical outlook
On Thursday, the GBP/USD hit an eight-day high at around 1.2774, but it was quickly rejected around those levels as data underpinned the US Dollar. Although the pair is neutral to upward biased, a daily close below the 1.2700 figure could open the door to challenge the January 5 swing low at 1.2611 before breaking toward 1.2600. On the other hand if buyers keep the spot price above 1.2700, that could pave the way for further upside. Key resistance levels lie at 1.2774, followed by 1.2800, ahead of reaching December’s high at 1.2827.
Pound Sterling price today
The table below shows the percentage change of Pound Sterling (GBP) against listed major currencies today. Pound Sterling was the weakest against the US Dollar.
| USD | EUR | GBP | CAD | AUD | JPY | NZD | CHF | |
| USD | 0.16% | 0.08% | 0.30% | 0.57% | 0.10% | 0.17% | 0.51% | |
| EUR | -0.16% | -0.09% | 0.13% | 0.42% | -0.06% | -0.01% | 0.37% | |
| GBP | -0.09% | 0.08% | 0.21% | 0.50% | 0.02% | 0.07% | 0.45% | |
| CAD | -0.30% | -0.13% | -0.22% | 0.28% | -0.19% | -0.13% | 0.24% | |
| AUD | -0.57% | -0.40% | -0.49% | -0.27% | -0.46% | -0.42% | -0.05% | |
| JPY | -0.10% | 0.05% | -0.04% | 0.18% | 0.46% | 0.04% | 0.42% | |
| NZD | -0.17% | 0.03% | -0.07% | 0.13% | 0.42% | -0.06% | 0.39% | |
| CHF | -0.53% | -0.37% | -0.45% | -0.23% | 0.05% | -0.43% | -0.36% |
The heat map shows percentage changes of major currencies against each other. The base currency is picked from the left column, while the quote currency is picked from the top row. For example, if you pick the Euro from the left column and move along the horizontal line to the Japanese Yen, the percentage change displayed in the box will represent EUR (base)/JPY (quote).
- The DXY Index is witnessing an uptick toward 102.60.
- Headline and core CPI from December came in higher than expected.
- Investors are still confident that the Fed will cut in March.
The US Dollar (USD) Index has climbed to 102.60 as financial markets continue to grapple with the release of a hot US Consumer Price Index (CPI) report from December, which came in higher than expected. Dovish bets eased somewhat, but markets are still betting on the Federal Reserve (Fed) easing cycle to begin in March.
The Fed's dovish stance, based on welcoming the cooling inflation and projecting no rate hikes in 2024, has recently weakened the USD and seems to be offsetting the resilience of the US economy while other economic blocks are weakening. Despite higher CPI numbers, the market remains stubborn and expects the Fed to initiate its easing cycle sooner rather than later. As long as this rhetoric predominates, the index's upward potential is limited.
Daily digest market movers: US Dollar climbs with hot CPI figures, dovish bets still high
- The US Bureau of Labor Statistics revealed that the Consumer Price Index (CPI) escalated to 3.4% YoY in December, surpassing November's 3.1% and the predicted 3.2% consensus figure.
- The core CPI dropped to 3.9%, lower than November’s 4%, but higher than the expected 3.8%.
- Yield rates for US bonds display mixed trends: 2-year bond yield at 4.33%, 5-year at 3.96%, and the 10-year bond yield is 4.01%.
- The CME FedWatch Tool reveals no rate hike predictions for the January meeting. Instead, March and May 2024 meeting expectations indicate increased probabilities for rate cut-offs despite hot inflation readings.
Technical Analysis: DXY index bulls make another stride as momentum gathers
Despite the index's location below both the 100 and 200-day Simple Moving Averages (SMAs), which suggests sustained pressure from the bears, the position of the index above the 20-day SMA is evidence that the bulls are gaining ground in this battle. This is clear from the uptick in buying momentum and indicates the potential for further short-term upside movements.
Secondly, the positive slope in the Relative Strength Index (RSI) corroborates this view. This signals that despite the recent bearish backdrop, buying momentum may be growing in strength, illustrating an increasing pressure from the bulls.
Lastly, the flat green bars on the Moving Average Convergence Divergence (MACD) provide further validation of this mixed sentiment. While the bars indicate a stillness in momentum, their green shade suggests a column of buying forces vying to tip the scale.
Taken altogether, the bulls appear to be gaining ground momentarily. However, the dominant bearish forces, given away by the positioning below the 100 and 200-day SMAs, must not be overlooked.
Support levels: 102.30, 102.00 (20-day SMA), 101.80.
Resistance levels: 102.70, 102.90, 103.00.
US Dollar FAQs
What is the US Dollar?
The US Dollar (USD) is the official currency of the United States of America, and the ‘de facto’ currency of a significant number of other countries where it is found in circulation alongside local notes. It is the most heavily traded currency in the world, accounting for over 88% of all global foreign exchange turnover, or an average of $6.6 trillion in transactions per day, according to data from 2022.
Following the second world war, the USD took over from the British Pound as the world’s reserve currency. For most of its history, the US Dollar was backed by Gold, until the Bretton Woods Agreement in 1971 when the Gold Standard went away.
How do the decisions of the Federal Reserve impact the US Dollar?
The most important single factor impacting on the value of the US Dollar is monetary policy, which is shaped by the Federal Reserve (Fed). The Fed has two mandates: to achieve price stability (control inflation) and foster full employment. Its primary tool to achieve these two goals is by adjusting interest rates.
When prices are rising too quickly and inflation is above the Fed’s 2% target, the Fed will raise rates, which helps the USD value. When inflation falls below 2% or the Unemployment Rate is too high, the Fed may lower interest rates, which weighs on the Greenback.
What is Quantitative Easing and how does it influence the US Dollar?
In extreme situations, the Federal Reserve can also print more Dollars and enact quantitative easing (QE). QE is the process by which the Fed substantially increases the flow of credit in a stuck financial system.
It is a non-standard policy measure used when credit has dried up because banks will not lend to each other (out of the fear of counterparty default). It is a last resort when simply lowering interest rates is unlikely to achieve the necessary result. It was the Fed’s weapon of choice to combat the credit crunch that occurred during the Great Financial Crisis in 2008. It involves the Fed printing more Dollars and using them to buy US government bonds predominantly from financial institutions. QE usually leads to a weaker US Dollar.
What is Quantitative Tightening and how does it influence the US Dollar?
Quantitative tightening (QT) is the reverse process whereby the Federal Reserve stops buying bonds from financial institutions and does not reinvest the principal from the bonds it holds maturing in new purchases. It is usually positive for the US Dollar.
- The Euro chipped lower against the US Dollar on Thursday despite broadly rising.
- European Economic Bulletin highlighted the ECB’s data-dependency on inflation outlook.
- US PPI inflation due Friday, EU Industrial Production next Monday.
The Euro (EUR) fell back against the US Dollar (USD) in the US market session after US Consumer Price Index (CPI) inflation figures broadly arrived higher than market forecasts, taking a chunk out of the Euro’s overall positive lean to the day. The Euro stepped higher against most of the major currencies on Thursday but fell flat against the safe havens of the Greenback and the Japanese Yen (JPY).
The European Central Bank’s (ECB) latest Economic Bulletin mostly towed the line earlier Thursday, reaffirming the ECB’s data-dependency as the ECB continues to focus on inflation expectations for the European economy.
Daily digest market movers: Euro loses some ground against safe havens
- The Euro saw firm gains early Thursday before a slight knockback following the US CPI release.
- US CPI inflation climbed higher than expected in December, with headline inflation rising 0.3% MoM versus the forecast of 0.2% and November’s 0.1%.
- Annualized core US CPI ticked down from 4.0% to 3.9%, less than the market’s expected decline to 3.8%.
- YoY December headline CPI stepped higher to 3.4% from 3.1%, beating the forecast of 3.2%.
- Rising inflation will make it tougher for the Federal Reserve (Fed) to justify rate cuts as soon as markets hope.
- See more: US CPI inflation climbs to 3.4% in December vs. 3.2% expected
- Cleveland Fed President Loretta Mester says Fed is not “there yet” on rate cuts
- European Economic Bulletin noted that the ECB remains firmly focused on data releases, rate cuts hinge on forward-looking inflation expectations.
- Economic Bulletin also highlighted slight contraction in euro area economy in 3Q 2023, blames decline in inventories.
- ECB expects growth to continue to weaken heading forward but noted that employment remains firm.
Euro price today
The table below shows the percentage change of Euro (EUR) against listed major currencies today. Euro was the weakest against the US Dollar.
| USD | EUR | GBP | CAD | AUD | JPY | NZD | CHF | |
| USD | 0.19% | 0.18% | 0.34% | 0.68% | 0.13% | 0.22% | 0.55% | |
| EUR | -0.19% | -0.02% | 0.13% | 0.48% | -0.07% | 0.01% | 0.38% | |
| GBP | -0.19% | 0.01% | 0.16% | 0.50% | -0.06% | 0.03% | 0.38% | |
| CAD | -0.34% | -0.14% | -0.16% | 0.33% | -0.20% | -0.12% | 0.22% | |
| AUD | -0.68% | -0.47% | -0.48% | -0.33% | -0.53% | -0.45% | -0.12% | |
| JPY | -0.13% | 0.07% | 0.06% | 0.18% | 0.54% | 0.07% | 0.42% | |
| NZD | -0.23% | 0.01% | -0.03% | 0.12% | 0.46% | -0.10% | 0.36% | |
| CHF | -0.56% | -0.36% | -0.38% | -0.22% | 0.13% | -0.43% | -0.33% |
The heat map shows percentage changes of major currencies against each other. The base currency is picked from the left column, while the quote currency is picked from the top row. For example, if you pick the Euro from the left column and move along the horizontal line to the Japanese Yen, the percentage change displayed in the box will represent EUR (base)/JPY (quote).
Technical Analysis: Euro holds steady against other risk assets but sheds weight against Greenback and Yen
The Euro (EUR) was broadly firmer in early Thursday trading, climbing half a percent against the Australian Dollar (AUD) and a third of a percent against the Swiss Franc (CHF). However, the Euro has lost a fifth of a percent against the US Dollar (USD) and around a tenth of a percent against the Japanese Yen (JPY) as safe havens climb broadly higher on the day.
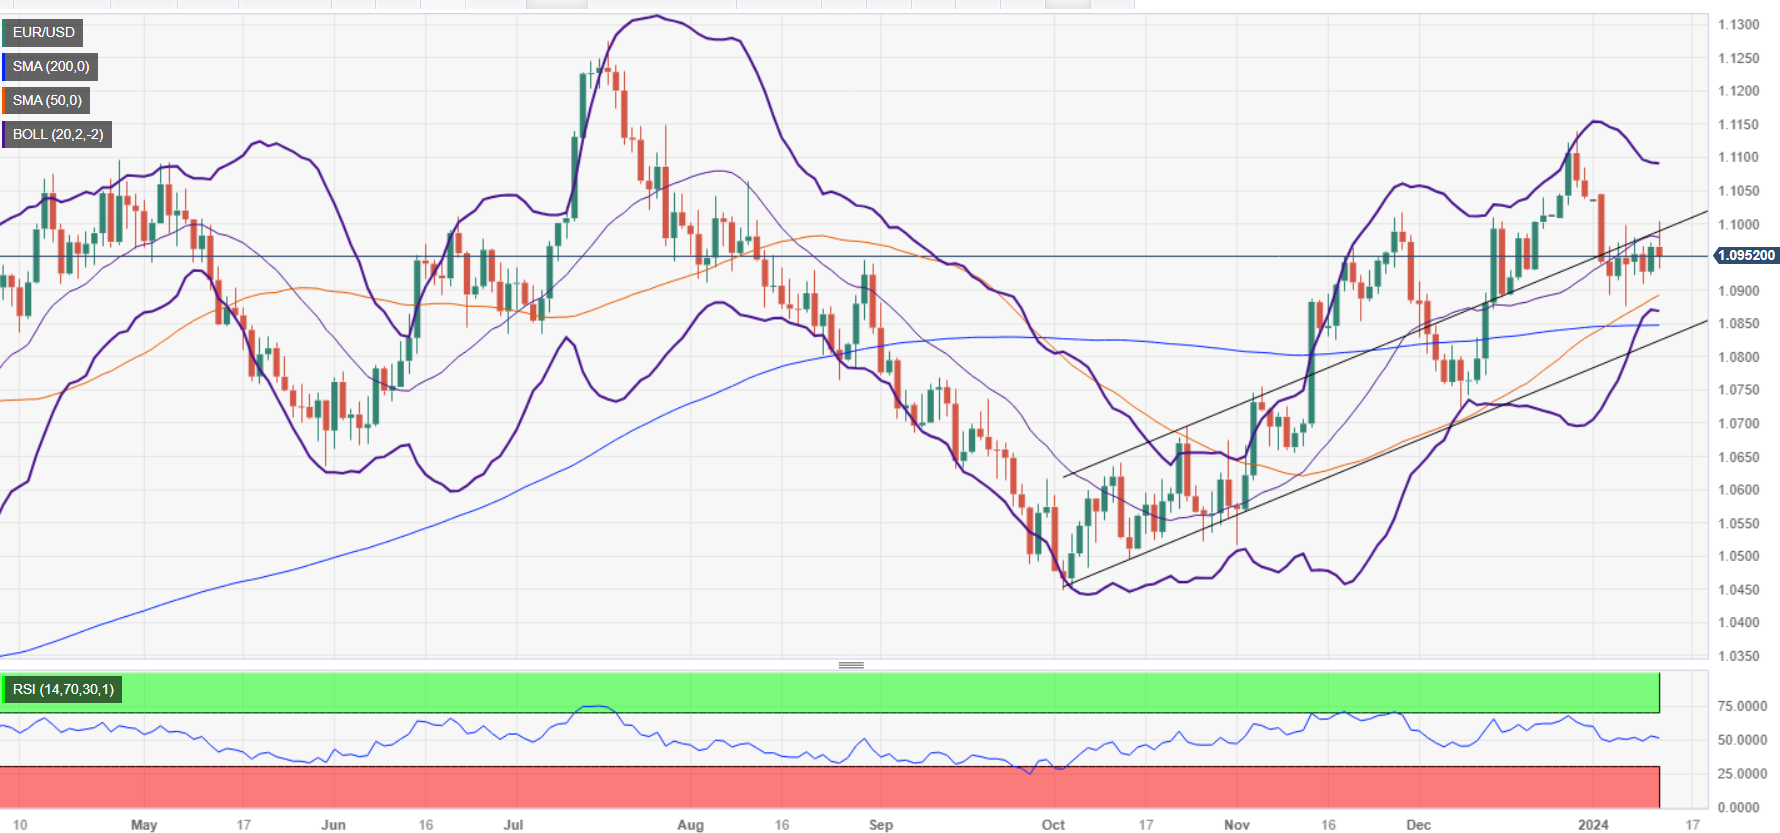
The EUR/USD hoisted itself into the 1.1000 handle early Thursday, setting a new 2024 high of 1.1004 before getting slapped down to trade back into 1.0950. The pair has slid back into near-term congestion at the 200-hour Simple Moving Average (SMA) near 1.0960.
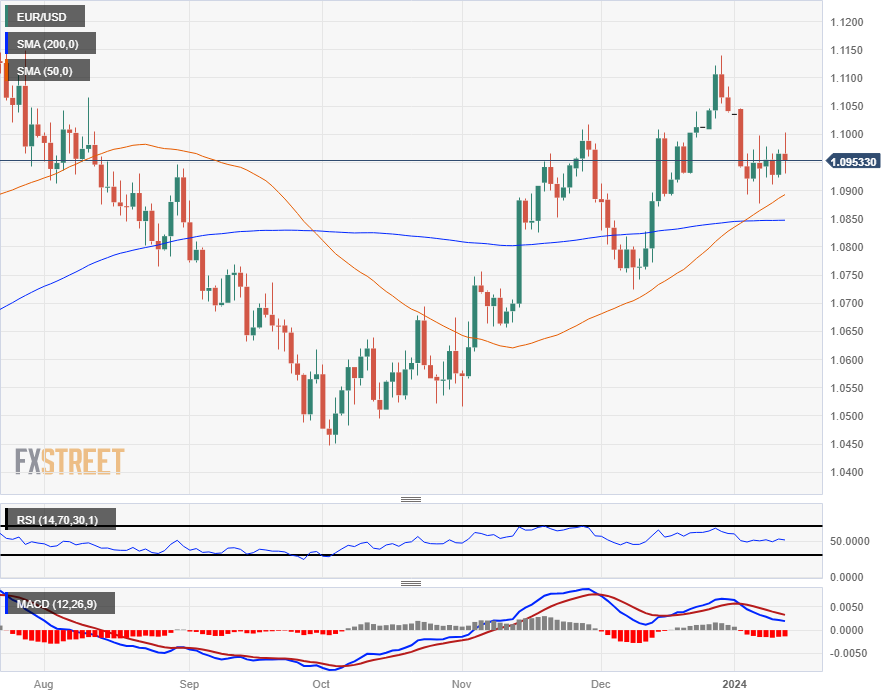
Despite exploring a fresh high on Thursday, the EUR/USD remains trapped in a minor sideways pattern, with daily candles coiling just north of a bullish crossover of the 50-day and 200-day SMAs near 1.0850. The 50-day SMA is rising into 1.0900, building out a technical floor beneath bids as bulls gear up for another challenge.
The EUR/USD remains down around 1.6% from December’s late peak near 1.1140, but the pair is still fairly well-bid, up a little under 5% from last September’s bottom bids near 1.0450.
EUR/USD Hourly Chart
EUR/USD Daily Chart
Euro FAQs
What is the Euro?
The Euro is the currency for the 20 European Union countries that belong to the Eurozone. It is the second most heavily traded currency in the world behind the US Dollar. In 2022, it accounted for 31% of all foreign exchange transactions, with an average daily turnover of over $2.2 trillion a day.
EUR/USD is the most heavily traded currency pair in the world, accounting for an estimated 30% off all transactions, followed by EUR/JPY (4%), EUR/GBP (3%) and EUR/AUD (2%).
What is the ECB and how does it impact the Euro?
The European Central Bank (ECB) in Frankfurt, Germany, is the reserve bank for the Eurozone. The ECB sets interest rates and manages monetary policy.
The ECB’s primary mandate is to maintain price stability, which means either controlling inflation or stimulating growth. Its primary tool is the raising or lowering of interest rates. Relatively high interest rates – or the expectation of higher rates – will usually benefit the Euro and vice versa.
The ECB Governing Council makes monetary policy decisions at meetings held eight times a year. Decisions are made by heads of the Eurozone national banks and six permanent members, including the President of the ECB, Christine Lagarde.
How does inflation data impact the value of the Euro?
Eurozone inflation data, measured by the Harmonized Index of Consumer Prices (HICP), is an important econometric for the Euro. If inflation rises more than expected, especially if above the ECB’s 2% target, it obliges the ECB to raise interest rates to bring it back under control.
Relatively high interest rates compared to its counterparts will usually benefit the Euro, as it makes the region more attractive as a place for global investors to park their money.
How does economic data influence the value of the Euro?
Data releases gauge the health of the economy and can impact on the Euro. Indicators such as GDP, Manufacturing and Services PMIs, employment, and consumer sentiment surveys can all influence the direction of the single currency.
A strong economy is good for the Euro. Not only does it attract more foreign investment but it may encourage the ECB to put up interest rates, which will directly strengthen the Euro. Otherwise, if economic data is weak, the Euro is likely to fall.
Economic data for the four largest economies in the euro area (Germany, France, Italy and Spain) are especially significant, as they account for 75% of the Eurozone’s economy.
How does the Trade Balance impact the Euro?
Another significant data release for the Euro is the Trade Balance. This indicator measures the difference between what a country earns from its exports and what it spends on imports over a given period.
If a country produces highly sought after exports then its currency will gain in value purely from the extra demand created from foreign buyers seeking to purchase these goods. Therefore, a positive net Trade Balance strengthens a currency and vice versa for a negative balance.
- Canadian Dollar falls back as US CPI inflation kicks higher.
- Canada economic data remains absent until next week.
- Rising inflation makes rate cuts difficult.
The Canadian Dollar (CAD) is mostly lower on Thursday as broader markets pivot into safe haven currencies after US inflation from the Consumer Price Index (CPI) ticked broadly higher than markets were expecting, widening the gap between market hopes of a March rate cut and the Federal Reserve’s (Fed) current stance.
Economic data from Canada remains absent from the data docket for the rest of the week, leaving CAD traders waiting for next week’s Canada CPI print as well as Canadian Retail Sales figures from November, due next Tuesday and Friday, respectively.
Daily digest market movers: Canadian Dollar follows broader market lower as markets pile into the safe haven Greenback
- Canadian Dollar sees declines as markets bid up the US Dollar post-CPI.
- US inflation is driving markets into safe havens after US CPI broadly thumped market forecasts.
- CAD is getting little support from Crude Oil despite a near-term rise in barrel bids, WTI clips back over $73.50.
- Headline monthly US CPI inflation ticked higher in December to 0.3% versus the forecast of 0.2%, climbing over November’s 0.1%.
- Annualized CPI inflation rose to 3.4% in December, climbing over the median market forecast of 3.2% and extending from November’s annualized 3.1% print.
- Core annualized CPI through December fell from the previous 4.0% to 3.9%, but less than the market’s 3.8% forecast.
- Despite the upside surprise in US CPI inflation, bond markets remain stubbornly resilient even as safe havens climb and equities decline.
- Policy-sensitive 2-year US Treasury yield staunchly continues to bet on rate cuts sooner rather than later as yield slips a scant 0.2%.
- Up next: US Producer Price Index (PPI) inflation on Friday, where markets will be hoping for further price declines on the front end of the supply chain.
- Core PPI (headline PPI less volatile food and energy prices) is expected to decline from 2.0% to 1.9% for the year ending in December.
Canadian Dollar price today
The table below shows the percentage change of Canadian Dollar (CAD) against listed major currencies today. Canadian Dollar was the weakest against the US Dollar.
| USD | EUR | GBP | CAD | AUD | JPY | NZD | CHF | |
| USD | 0.27% | 0.30% | 0.46% | 0.75% | 0.26% | 0.39% | 0.59% | |
| EUR | -0.27% | 0.03% | 0.18% | 0.49% | -0.01% | 0.08% | 0.34% | |
| GBP | -0.31% | -0.02% | 0.16% | 0.47% | -0.04% | 0.07% | 0.31% | |
| CAD | -0.47% | -0.19% | -0.15% | 0.30% | -0.20% | -0.09% | 0.17% | |
| AUD | -0.76% | -0.47% | -0.43% | -0.29% | -0.48% | -0.39% | -0.13% | |
| JPY | -0.27% | 0.00% | 0.04% | 0.17% | 0.47% | 0.07% | 0.33% | |
| NZD | -0.39% | -0.07% | -0.05% | 0.10% | 0.39% | -0.10% | 0.27% | |
| CHF | -0.60% | -0.33% | -0.30% | -0.13% | 0.16% | -0.34% | -0.22% |
The heat map shows percentage changes of major currencies against each other. The base currency is picked from the left column, while the quote currency is picked from the top row. For example, if you pick the Euro from the left column and move along the horizontal line to the Japanese Yen, the percentage change displayed in the box will represent EUR (base)/JPY (quote).
Technical Analysis: Canadian Dollar backslides in broad-market US Dollar bid
The Canadian Dollar (CAD) is broadly lower on Thursday, gaining a quarter of a percent against the Australian Dollar (AUD) and a scant tenth of a percent against the Swiss Franc (CHF). The Loonie has shed a fifth of a percent against both the Japanese Yen (JPY) and the Euro (EUR), and the CAD has also slumped around half a percent against the US Dollar heading into the tail end of the trading week.
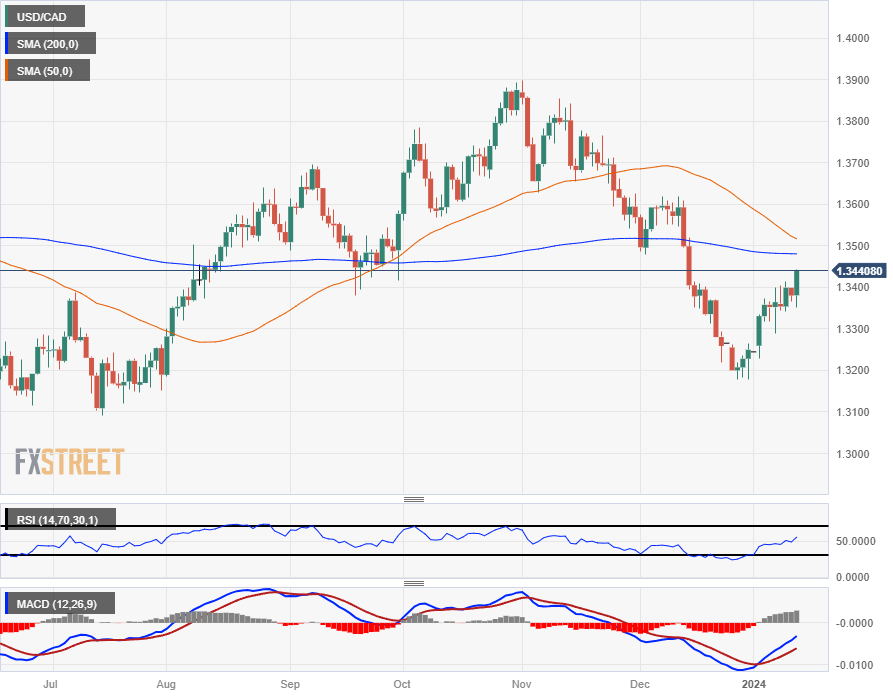
The Canadian Dollar tumbled against the US Dollar post-CPI, sending the USD/CAD pair toward 1.3450 after hitting a near-term low of 1.3350 in the run-up to US inflation prints.
Intraday, USD/CAD bids continue to be buoyed above the 200-hour Simple Moving Average (SMA) near 1.3340. Prices continue to run above the near-term median since crossing the moving average at the outset of 2024’s trading.
Thursday’s bump in the USD/CAD drags the pair within reach of the 200-day SMA near the 1.3500 handle, but continued bullish momentum faces near-term technical resistance as the 50-day SMA declines, heading into a bearish crossover of the long-term moving average. The USD/CAD has closed flat or bullish for nine of the last ten consecutive trading days and is on pace to make it a tenth green day.
The USD/CAD is now up 2% from late December’s bottom bids near 1.3177 but remains down around 3.3% from October’s peak near the 1.3900 handle.
USD/CAD Hourly Chart
USD/CAD Daily Chart
Canadian Dollar FAQs
What key factors drive the Canadian Dollar?
The key factors driving the Canadian Dollar (CAD) are the level of interest rates set by the Bank of Canada (BoC), the price of Oil, Canada’s largest export, the health of its economy, inflation and the Trade Balance, which is the difference between the value of Canada’s exports versus its imports. Other factors include market sentiment – whether investors are taking on more risky assets (risk-on) or seeking safe-havens (risk-off) – with risk-on being CAD-positive. As its largest trading partner, the health of the US economy is also a key factor influencing the Canadian Dollar.
How do the decisions of the Bank of Canada impact the Canadian Dollar?
The Bank of Canada (BoC) has a significant influence on the Canadian Dollar by setting the level of interest rates that banks can lend to one another. This influences the level of interest rates for everyone. The main goal of the BoC is to maintain inflation at 1-3% by adjusting interest rates up or down. Relatively higher interest rates tend to be positive for the CAD. The Bank of Canada can also use quantitative easing and tightening to influence credit conditions, with the former CAD-negative and the latter CAD-positive.
How does the price of Oil impact the Canadian Dollar?
The price of Oil is a key factor impacting the value of the Canadian Dollar. Petroleum is Canada’s biggest export, so Oil price tends to have an immediate impact on the CAD value. Generally, if Oil price rises CAD also goes up, as aggregate demand for the currency increases. The opposite is the case if the price of Oil falls. Higher Oil prices also tend to result in a greater likelihood of a positive Trade Balance, which is also supportive of the CAD.
How does inflation data impact the value of the Canadian Dollar?
While inflation had always traditionally been thought of as a negative factor for a currency since it lowers the value of money, the opposite has actually been the case in modern times with the relaxation of cross-border capital controls. Higher inflation tends to lead central banks to put up interest rates which attracts more capital inflows from global investors seeking a lucrative place to keep their money. This increases demand for the local currency, which in Canada’s case is the Canadian Dollar.
How does economic data influence the value of the Canadian Dollar?
Macroeconomic data releases gauge the health of the economy and can have an impact on the Canadian Dollar. Indicators such as GDP, Manufacturing and Services PMIs, employment, and consumer sentiment surveys can all influence the direction of the CAD. A strong economy is good for the Canadian Dollar. Not only does it attract more foreign investment but it may encourage the Bank of Canada to put up interest rates, leading to a stronger currency. If economic data is weak, however, the CAD is likely to fall.
- Mexican Peso remains on the defensive after Mexico’s Industrial Production figures disappointed investors.
- US inflation exceeds forecasts, impacting speculation of dovish US Federal Reserve.
- USD/MXN is volatile in the session as traders digest recent economic data released on both sides of the border.
The Mexican Peso (MXN) extended its losses for a third consecutive day against the US Dollar (USD) on Thursday following a hotter-than-expected inflation report in the United States. Bets that the US Federal would cut rates in March remained largely unchanged at around 61.4%, though the Mexican currency failed to gain traction in early trading on Thursday. The USD/MXN posts minuscule gains of 0.03% and trades at 16.97 after hitting a four-day high.
Mexico’s economic docket featured Industrial Production that missed the mark set by economists, a headwind for the Peso. The US Bureau of Labor Statistics (BLS) revealed that US inflation in December rose above the mark, which could prevent the Fed from easing policy. At the same time, unemployment claims for the last week were lower than expected, indicating the labor market is softening.
Daily digest market movers: Mexican Peso took a toll on weak Mexican data and strong US inflation
- Industrial Production in Mexico plunged -1.5% MoM in November, worse than the -0.2% estimated. The annual figure slumped -3.1%, its lowest reading since August.
- The December US Consumer Price Index (CPI) rose b y 3.4% YoY, above forecasts and November’s 3.1%. Core CPI climbed 3.9% YoY, lower than the 4% achieved in the previous reading but higher than the 3.8% projected by the consensus.
- Initial Jobless Claims for the week ending January 6 rose by 202K, less the previous week's 203K and forecasts of 210K.
- Given the fact that Industrial Production plunged in Mexico, the scenario of the country is becoming uncertain, which could weigh on the Mexican Peso. Even though Gross Fixed Investment climbed, other key economic indicators like inflation edging up and an economic slowdown pose challenges that could prevent the economic growth foreseen by analysts.
- On Wednesday, the World Bank revised its economic projections for Mexico in 2024. The updated forecast anticipates that Mexico's Gross Domestic Product (GDP) will grow by 2.6%, an increase from the bank’s initial prediction of 1.9%. Analysts at the bank attribute this expected growth to the rise in near-shoring activities, which they believe will positively impact the Mexican economy.
- Although the recent meeting minutes from Banxico (the Central Bank of Mexico) suggest that the central bank might contemplate easing its monetary policy, the inflation report for December could hinder any move toward policy relaxation.
- On Tuesday, Mexico's Consumer Price Index (CPI) recorded a YoY increase of 4.66% in December, surpassing the expected 4.55%. This is a significant jump from November's figure of 4.32%.
- Core inflation figures, which exclude volatile items like food and energy, showed a YoY increase of 5.09%, which was slightly lower than the consensus and the previous month's figures of 5.15% and 5.30%, respectively.
- On January 5, a Reuters Poll suggested the Mexican Peso could weaken 5.4% to 18.00 per US Dollar in the 12 months following December.
- Last week’s Federal Reserve officials expressed that interest rates should remain at current levels. Fed’s Bostic emphasized that policy needs to stay tight, while Fed’s Bowman added that policy is sufficiently restrictive.
- The US economy continues to paint a mixed economic outlook as the latest US jobs data was mixed, while business activity in manufacturing contracted and the service sector deteriorated. Although a soft-landing scenario looms, the chance of a mild recession has increased, so caution is warranted.
Technical analysis: Mexican Peso trims some of its losses as USD/MXN slides below 17.00
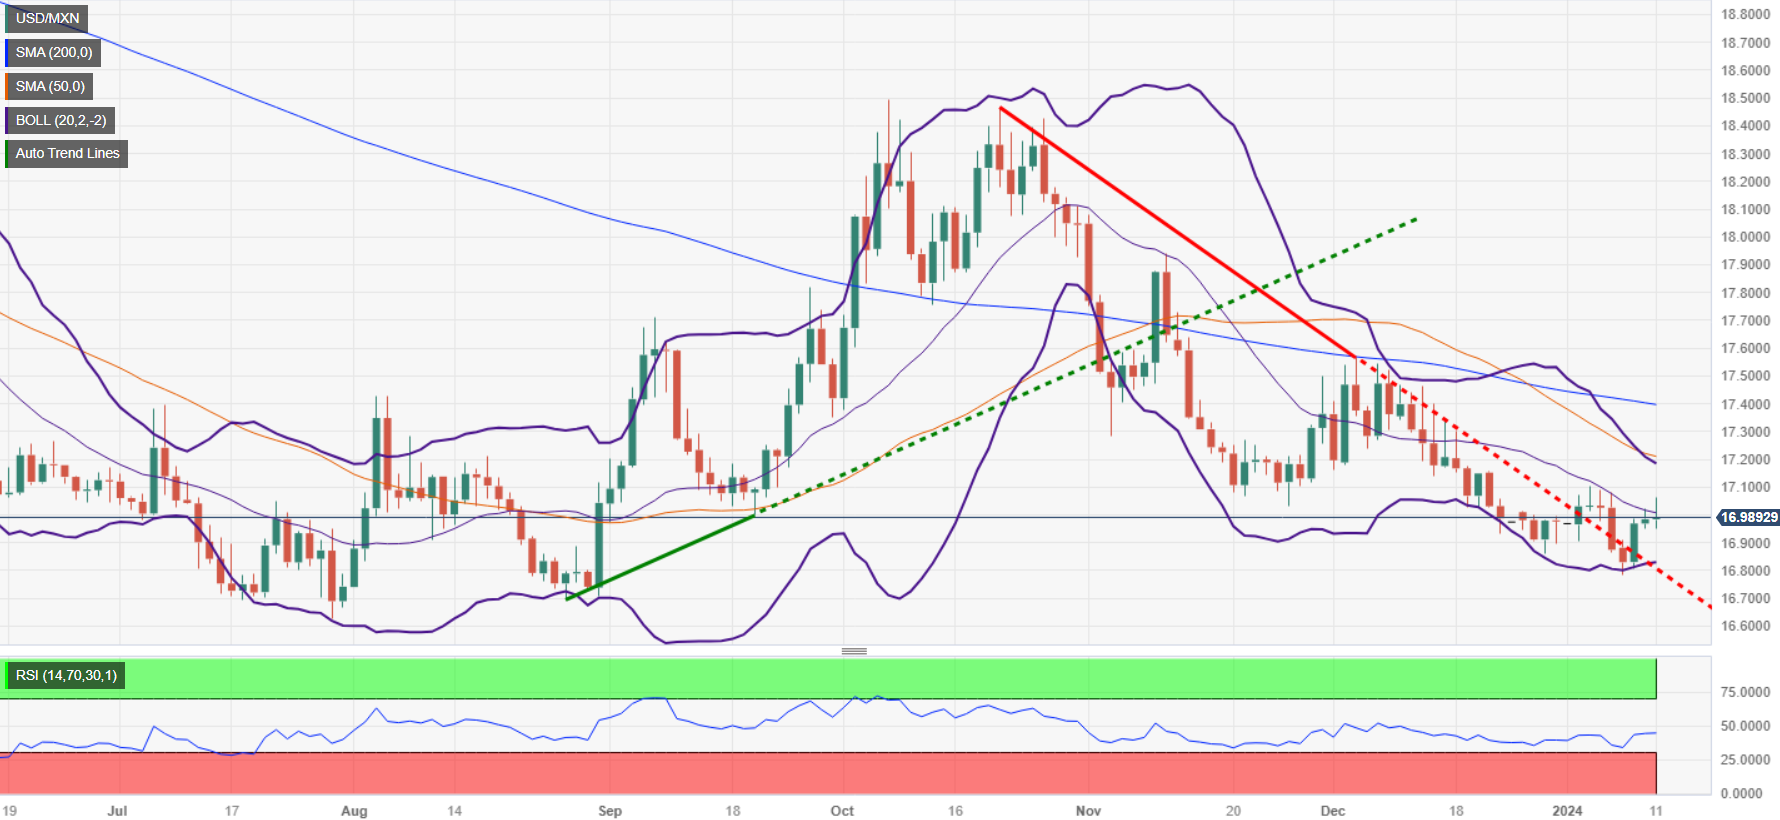
The USD/MXN is bearishly biased even though it hit a new weekly high of 17.04, but the exchange rate has fallen below the 17.00 figure even though the Greenback continues to trade higher as shown by the US Dollar Index (DXY).
If buyers fail to lift the exotic pair above the 17.00 figure and achieve a daily close, that would pave the way for further losses. The first key support level would be the January 10 daily low of 16.92, followed by the latest cycle low of 16.78. Further downside is seen at last year’s low of 16.62.
Conversely, if buyers keep the USD/MXN exchange rate above 17.00, that could pave the way to test the 17.20 mark, followed by the 50-day Simple Moving Average (SMA) at 17.22, ahead of challenging the confluence of the 100 and 200-day SMAs at around 17.40.
USD/MXN Price Action – Daily Chart
Mexican Peso FAQs
What key factors drive the Mexican Peso?
The Mexican Peso (MXN) is the most traded currency among its Latin American peers. Its value is broadly determined by the performance of the Mexican economy, the country’s central bank’s policy, the amount of foreign investment in the country and even the levels of remittances sent by Mexicans who live abroad, particularly in the United States. Geopolitical trends can also move MXN: for example, the process of nearshoring – or the decision by some firms to relocate manufacturing capacity and supply chains closer to their home countries – is also seen as a catalyst for the Mexican currency as the country is considered a key manufacturing hub in the American continent. Another catalyst for MXN is Oil prices as Mexico is a key exporter of the commodity.
How do decisions of the Banxico impact the Mexican Peso?
The main objective of Mexico’s central bank, also known as Banxico, is to maintain inflation at low and stable levels (at or close to its target of 3%, the midpoint in a tolerance band of between 2% and 4%). To this end, the bank sets an appropriate level of interest rates. When inflation is too high, Banxico will attempt to tame it by raising interest rates, making it more expensive for households and businesses to borrow money, thus cooling demand and the overall economy. Higher interest rates are generally positive for the Mexican Peso (MXN) as they lead to higher yields, making the country a more attractive place for investors. On the contrary, lower interest rates tend to weaken MXN.
How does economic data influence the value of the Mexican Peso?
Macroeconomic data releases are key to assess the state of the economy and can have an impact on the Mexican Peso (MXN) valuation. A strong Mexican economy, based on high economic growth, low unemployment and high confidence is good for MXN. Not only does it attract more foreign investment but it may encourage the Bank of Mexico (Banxico) to increase interest rates, particularly if this strength comes together with elevated inflation. However, if economic data is weak, MXN is likely to depreciate.
How does broader risk sentiment impact the Mexican Peso?
As an emerging-market currency, the Mexican Peso (MXN) tends to strive during risk-on periods, or when investors perceive that broader market risks are low and thus are eager to engage with investments that carry a higher risk. Conversely, MXN tends to weaken at times of market turbulence or economic uncertainty as investors tend to sell higher-risk assets and flee to the more-stable safe havens.
Federal Reserve (Fed) of Cleveland President Loretta Mester gave her perspective on the Fed rate outlook during a televised interview with Bloomberg.
Key highlights
- Fed is not "there" yet on rate cuts, want more evidence that economy is progressing as expected.
- Fed's current evaluation is for how much longer rates to be kept high, policy kept restrictive.
- Inflation has to be coming down on a "sustainable basis" before rate cut conversation can happen.
- Fed needs to calibrate policy to achieve a soft landing.
- The AUD/USD fell below the 0.6700 level after posting 0.30% losses.
- Surging US CPI in December made dovish bets on the Fed ease.
- The downside for the pair is limited as the odds of a cut in March from the Fed are high.
The Australian Dollar (AUD) softened on Thursday, tallying losses against the US dollar (USD), with the pair reaching near the 0.6685 mark. Major contributors to this downturn movement are the surprisingly higher than-anticipated Consumer Price Index (CPI) data from the United States, which made dovish bets on the Federal Reserve (Fed) ease.
On Thursday, the US Bureau of Labor Statistics revealed that the Consumer Price Index (CPI) escalated to 3.4% YoY in December, surpassing November's 3.1% and the predicted 3.2% market figure. Moreover, December's monthly CPI growth experienced a 0.3% rise, besting the estimated projection of 0.2% as predicted by market analysts. The Core CPI came in at 3.9%, down from 4% in November.
Following the release, dovish bets on the Federal Reserve (Fed) eased somewhat, but according to the CME FedWatch Tool, they are still high. In that sense, investors remain stubborn and are betting on higher than 50% odds of a cut in March and May, which would leave the target rate at 450-475 bps by June. As long as the markets strengthen the dovish rhetoric, the upside for the Greenback will be limited.
AUD/USD levels to watch
The daily chart indicates that there is a mixed stance towards the pair. The negative slope in the Relative Strength Index (RSI) and its position in negative territory communicate an underlying selling momentum. This implies that sellers have recently had the upper hand and suggests a possible downtrend continuation. This aligns with the rising red bars of the the Moving Average Convergence Divergence (MACD)
Bringing in the perspective of the Simple Moving Averages (SMAs), the pair is positioned below the 20-day SMA, suggesting a shorter-term bearish bias. Yet, since it's standing above the 100 and 200-day SMAs, the longer-term trend appears to be bullish. This points to the fact that the bulls are still in control in the larger time frames despite the recent bearish developments.
AUD/USD daily chart
-638405855377348162.png)
Economists at TD Securities expect the US Dollar to struggle through the first half of 2024.
Value could steal some of carry's performance
Terms of trade and carry proved dominant FX themes again over the past year. With rate cuts on the way this year, value could steal some of carry's performance. Still, that could take some time to play out through the course of the year.
We also note the divergence between G10 growth/inflation factors, where G10 housing could shape performance this year.
Broad USD forecasts call for further weakness through H1.
- The US Dollar broadly climbed on Thursday after US CPI inflation broadly beat the street.
- US Initial Jobless Claims also improved, US labor market looking stubbornly firm.
- Japan Current Account, US PPI still due for Friday.
The USD/JPY climbed early in Thursday’s US market session after US Consumer Price Index (CPI) inflation numbers broadly beat market forecasts, with inflation stepping higher in December and completely swamping out market hopes for signs that rate cuts would be impending soon.
US CPI inflation climbs to 3.4% in December vs. 3.2% expected
US headline CPI inflation for the year ended December came in at 3.4% versus the market forecast of 3.2%, handily climbing over the previous period’s 3.1. December’s MoM CPI came in higher than expected at 0.3% versus the forecast 0.2%, and climbing further over November’s 0.1% print.
US Initial Jobless Claims for the week ended January 5 also came in better than expected, printing at 202K versus the anticipated 210K, though the previous week did see a slight upside revision to 203K (pre-revision 202K).
The US Dollar (USD) caught a broad-market bid after the CPI inflation print as market hopes of impending rate cuts from the Federal Reserve dashed on the rocks of rising inflation metrics. Many investors were hoping for inflation to cool at least enough to keep the dream of a March rate cut alive, with money markets pricing in a 60% chance of a March rate cut as recently as yesterday.
The week isn’t over yet, and the USD/JPY still has to grapple with Japanese Trade Balance and Current Account figures due early Friday, while US producer-facing inflation will be printing tomorrow. The US Producer Price Index (PPI) for December is expected to tick slightly higher from 0.0% to 0.1%, while annualized Core PPI for the year ended December is expected to clip lower from 2.0% to 1.9%.
USD/JPY Technical Outlook
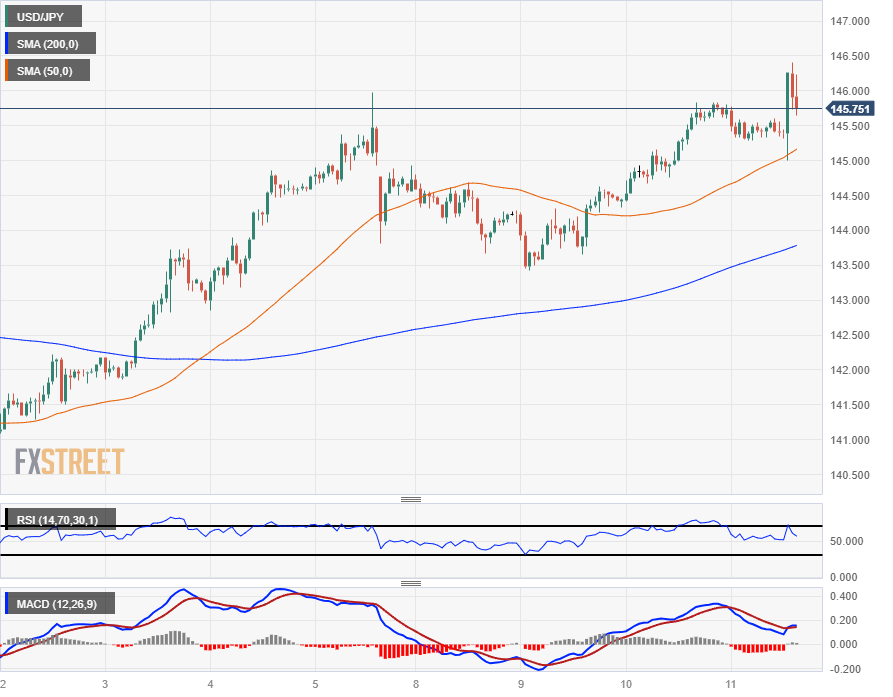
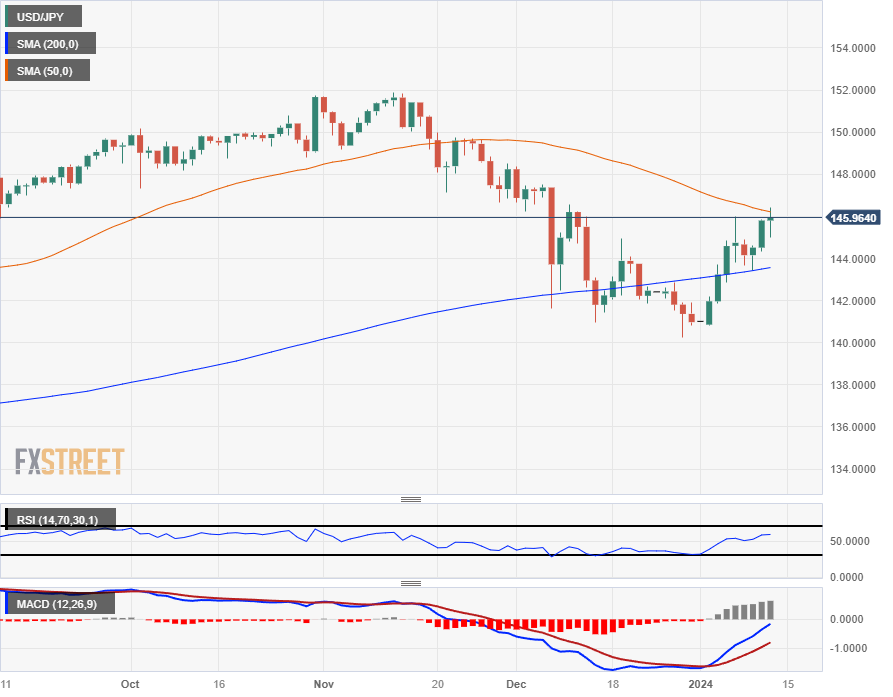
The USD/JPY rose to a near-term high of 146.41 before falling back into Thursday’s intraday levels with the US Dollar getting driven higher against the already-softening Japanese Yen (JPY). With the USD/JPY continuing to test higher, the 200-hour Simple Moving Average (SMA) is set to continue climbing through the 144.00 handle, building out an intraday technical floor.
Daily candlesticks have the USD/JPY running into near-term technical resistance at the 50-day SMA descending into 146.00, and prices are caught on the topside of the 200-day SMA approaching 144.00, with USD/JPY caught in the congestion zone of the two moving averages.
USD/JPY Hourly Chart
USD/JPY Daily Chart
USD/JPY Technical Levels
- The Swiss Franc weakens marginally against the US Dollar on Thursday after the release of US inflation data.
- The data shows headline inflation coming out at 3.4%, beating estimates and previous results.
- Core inflation, however, shows less upside pressure and moderates down YoY.
The Swiss Franc (CHF) falls marginally against the US Dollar (USD) on Thursday after the release of mostly higher-than-expected US inflation data. The data suggests the Federal Reserve (Fed) may delay cutting interest rates in order to keep up its war against inflation. Since higher interest rates attract more foreign capital inflows, the news is bullish for the US Dollar.
Daily digest market movers: Swiss Franc adjusts lower after USD gets inflation-data pump
- The Swiss Franc edges down against the US Dollar after US inflation data for the month of December shows continued price pressures.
- The Consumer Price Index (CPI) for December showed a 3.4% rise YoY in December, which was above the 3.2% forecast and the 3.1% registered in November.
- CPI on a monthly basis, came out at 0.3% compared to analysts’ estimates of 0.2%.
- Annual Core CPI came out slightly lower at 3.9%, compared to the 4.0% of November, but this was still more than the 3.8% expected.
- With a rise of 0.3%, Core CPI on a monthly basis came out in line with expectations and the same as the 0.3% in November.
- The release of the CPI data led to a slight fall in the market-gauged probabilities of the Federal Reserve cutting interest rates at its meeting in March 2024, from the upper 60s% to the lower 60s%.
- That the odds still favor a Fed rate cut in March, however, still stands in contrast to the Swiss National Bank (SNB), which remains silent on the subject of bringing down interest rates.
- At the SNB’s last monetary policy meeting in December, the SNB Chairperson Thomas Jordan, avoided committing to cutting rate cuts, giving vague reasons relating to geopolitical risks.
Swiss Franc technical analysis: USD/CHF in long-term downtrend
USD/CHF – the number of Swiss Francs (CHF) that one US Dollar (USD) can buy – rises on Thursday, extending the pair’s short-term recovery rally.
The USD/CHF pair is in a long-term downtrend, however, suggesting the pair is at risk of recapitulating and continuing lower.
-638405845748990229.png)
US Dollar vs Swiss Franc: 4-hour Chart
The four-hour chart shows the pair pulling back after bottoming at the late November lows. The short-term trend is indeterminate, and given the broader bearish bias ultimately at risk of resuming its downtrend.
The recovery since the November lows has stalled and appears trapped in a range. The speed of ascent of the recovery is slower than the down move that preceded it – a further sign of weakness.
A break below the December consolidation range lows at 0.8465 would probably indicate a resumption of the downtrend back down to the November lows at 0.8332.
It would take a break above the major trendline for the downmove at around 0.8600 to confirm a change in the short-term trend and more upside. But the next target after that would be the 200-four-hour Simple Moving Average (SMA) not much higher at circa 0.8630.
Swiss Franc FAQs
What key factors drive the Swiss Franc?
The Swiss Franc (CHF) is Switzerland’s official currency. It is among the top ten most traded currencies globally, reaching volumes that well exceed the size of the Swiss economy. Its value is determined by the broad market sentiment, the country’s economic health or action taken by the Swiss National Bank (SNB), among other factors. Between 2011 and 2015, the Swiss Franc was pegged to the Euro (EUR). The peg was abruptly removed, resulting in a more than 20% increase in the Franc’s value, causing a turmoil in markets. Even though the peg isn’t in force anymore, CHF fortunes tend to be highly correlated with the Euro ones due to the high dependency of the Swiss economy on the neighboring Eurozone.
Why is the Swiss Franc considered a safe-haven currency?
The Swiss Franc (CHF) is considered a safe-haven asset, or a currency that investors tend to buy in times of market stress. This is due to the perceived status of Switzerland in the world: a stable economy, a strong export sector, big central bank reserves or a longstanding political stance towards neutrality in global conflicts make the country’s currency a good choice for investors fleeing from risks. Turbulent times are likely to strengthen CHF value against other currencies that are seen as more risky to invest in.
How do decisions of the Swiss National Bank impact the Swiss Franc?
The Swiss National Bank (SNB) meets four times a year – once every quarter, less than other major central banks – to decide on monetary policy. The bank aims for an annual inflation rate of less than 2%. When inflation is above target or forecasted to be above target in the foreseeable future, the bank will attempt to tame price growth by raising its policy rate. Higher interest rates are generally positive for the Swiss Franc (CHF) as they lead to higher yields, making the country a more attractive place for investors. On the contrary, lower interest rates tend to weaken CHF.
How does economic data influence the value of the Swiss Franc?
Macroeconomic data releases in Switzerland are key to assessing the state of the economy and can impact the Swiss Franc’s (CHF) valuation. The Swiss economy is broadly stable, but any sudden change in economic growth, inflation, current account or the central bank’s currency reserves have the potential to trigger moves in CHF. Generally, high economic growth, low unemployment and high confidence are good for CHF. Conversely, if economic data points to weakening momentum, CHF is likely to depreciate.
How does the Eurozone monetary policy affect the Swiss Franc?
As a small and open economy, Switzerland is heavily dependent on the health of the neighboring Eurozone economies. The broader European Union is Switzerland’s main economic partner and a key political ally, so macroeconomic and monetary policy stability in the Eurozone is essential for Switzerland and, thus, for the Swiss Franc (CHF). With such dependency, some models suggest that the correlation between the fortunes of the Euro (EUR) and the CHF is more than 90%, or close to perfect.
The Dollar is recovering some of its late 2023 losses. Economists at ING analyze Greenback’s outlook for 2024.
EUR/USD to embark on its rally to 1.15 in the second half of the year
Our preference is that the next major leg of the Dollar decline probably comes through late in the second quarter as the Fed launches into its easing cycle.
Rate spreads should eventually prove positive for EUR/USD – especially as European Central Bank (ECB) easing expectations seem far too aggressive – but again, it should be in the second half that the currency pair embarks on its rally to 1.15. Until then, we expect choppy conditions for the major currencies and also expect investors to continue their search for yield.
- Euro drops following US CPI figures exceeding estimates, suggesting less likelihood of an early Fed rate reduction.
- Lower-than-expected US unemployment claims and rising Treasury yields add to the Dollar's strength against the Euro.
- Mixed European industrial production data and ECB officials' comments on inflation and rate decisions also influence EUR/USD dynamics.
The Euro (EUR) plunged in early trading on Thursday during the North American session after an inflation report from the United States (US) was higher than foreseen, which could deter the US Federal Reserve (Fed) from cutting rates soon. The EUR/USD trades at 1.0952, down 0.23%.
US economic data was mixed, but the jump in inflation refrained traders from speculating that rate cuts would come soon
The US Bureau of Labor Statistics (BLS) revealed that inflation in December exceeded estimates as the Consumer Price Index (CPI) rose by 3.4% YoY, above forecasts and November’s 3.1%. Excluding volatile items like food and energy, advanced 3.9% YoY, lower than the 4% achieved in the previous reading but higher than the 3.8% projected by the consensus.
At the same time, the BLS revealed that unemployment claims for the week ending January 6 increased by 202K, less than the previous week's 203K and forecasts of 210K.
Following the data release, money market futures trimmed some of the chances for a quarter of a percentage rate cut by the Fed at the March meeting, with odds standing at 69%. The US 10-year Treasury note is yielding 4.045%, gaining two basis points, while the Greenback, as portrayed by the US Dollar Index (DXY), advances toward 102.52, gaining 0.20%.
Across the pond, the economic docket revealed that Industrial Production in Spain slowed while in Italy plummeted sharply, painting a gloomy economic outlook in the Eurozone (EU). Meanwhile, European Central Bank (ECB) officials continued to cross the newswires, with Vujcic saying that risks for inflation look balanced. He added that if prices fall faster than expected, the ECB could move earlier on rates, on 25 basis points decrements.
Ahead of the week, the US economic docket will feature inflation on the producer side on Friday. In the EU, France inflation in December is expected to rise to 3.7% YoY.
EUR/USD Price Analysis: Technical outlook
The daily chart portrays the major as neutral to upward biased, but if sellers push prices toward the 1.0900 figure, that could pave the way for further losses. Earlier, EUR/USD buyers failed to crack the 1.1000 figure, exacerbating a retracement towards a daily low of 1.0931, but the pair has recovered some ground toward current exchange rates. Key resistance levels on the upside lie at 1.0998, 1.1000 and the January 2 daily high at 1.1038. Contrarily, the first support level is seen at 1.0950, followed by 1.0931 and the 1.0900 mark.
Euro price today
The table below shows the percentage change of Euro (EUR) against listed major currencies today. Euro was the strongest against the Australian Dollar.
| USD | EUR | GBP | CAD | AUD | JPY | NZD | CHF | |
| USD | 0.23% | 0.14% | 0.07% | 0.41% | 0.23% | 0.16% | 0.29% | |
| EUR | -0.23% | -0.08% | -0.18% | 0.18% | -0.05% | -0.08% | 0.07% | |
| GBP | -0.16% | 0.12% | -0.07% | 0.26% | 0.06% | -0.02% | 0.14% | |
| CAD | -0.08% | 0.15% | 0.06% | 0.33% | 0.15% | 0.08% | 0.23% | |
| AUD | -0.41% | -0.16% | -0.25% | -0.33% | -0.16% | -0.25% | -0.09% | |
| JPY | -0.22% | 0.01% | -0.06% | -0.17% | 0.22% | -0.08% | 0.07% | |
| NZD | -0.17% | 0.10% | -0.01% | -0.12% | 0.24% | 0.02% | 0.16% | |
| CHF | -0.31% | -0.06% | -0.14% | -0.23% | 0.11% | -0.08% | -0.09% |
The heat map shows percentage changes of major currencies against each other. The base currency is picked from the left column, while the quote currency is picked from the top row. For example, if you pick the Euro from the left column and move along the horizontal line to the Japanese Yen, the percentage change displayed in the box will represent EUR (base)/JPY (quote).
Economists at Rabobank expect the AUD/USD pair to slide toward 0.65 over the coming quarter before moving back higher to 0.70 on a 12-month horizon.
AUD/USD to dip back to 0.65 on a 3-month view
Rabobank is not expecting an RBA policy adjustment until late in the year. This should lend support to AUD/USD and we see scope for the currency pair to climb back to 0.70 on a 12-month view.
That said, on the expectation that the market has priced in too many Fed rate cuts too soon, we see scope for the USD to pull back some ground on a 1-to-3-month view and see scope for AUD/USD to dip back to 0.65 on a 3-month view. This has been revised up from a previous forecast of 0.64.
- Silver price skids below $23.00 as US Inflation remains stubbornly higher-than-projected.
- Monthly headline and core inflation grew by 0.3%.
- The argue in favour of keeping a restrictive policy stance would get strengthen ahead.
Silver price (XAG/USD) drops sharply as the United States Bureau of Labor Statistics (BLS) has reported a hotter-than-projected inflation report for December. The monthly highly inflation was up by 0.3% against the consensus of 0.2% and the former reading of 0.1%. Annually, inflation rose strongly by 3.4% versus. the expectations of 3.2% and the prior release of 3.1%.
The monthly core Consumer Price Index (CPI) grew at a steady pace of 0.3% as anticipated. On an annual basis, the underlying inflation decelerated slightly to 3.9% against 4.0% in November while investors projected a sharp deceleration to 3.8%.
A stubbornly higher US inflation indicates that Federal Reserve (Fed) should not rush for cutting interest rates and would allow them to maintain a restrictive policy stance atleast for the first-half.
On Wednesday, New York President John Williams supported for interest rates remaining higher as more work is needed to get inflation back to 2% target. John Williams said it will only be appropriate to unwind restrictive monetary policy stance only when the Fed is confident that inflation is moving toward 2% on a sustained basis.
Meanwhile, the US Dollar Index (DXY) rises to 102.70 as bets supporting rate cuts by the Fed in March have dropped. The 10-year US Treasury yields have climbed to near 4.05%.
Silver technical analysis
Silver price demonstrates a back-and-forth move around $23.00 on a two-hour scale. The white metal is expected to get direction as investors reconsider bets supporting rate cuts in March. Horizontal support plotted from December 13 low at $22.51 will act as a major cushion for Silver bulls. The broader appeal seems bearish as the asset is trading below the 200-day Exponential Moving Average (EMA).
The Relative Strength Index (RSI) (14) oscillates in the 40.00-60.00 range, which indicates a lacklustre performance.
Silver two-hour
-638405808463227292.png)
US December inflation data surprised slightly on the upside overall. Still, economists at Commerzbank are sticking to their forecast that the Fed will cut its key interest rates only in May and not – as the market has priced in – in March.
US inflation slightly above expectations
US consumer prices rose by 0.3% in December compared to November, both overall and excluding the volatile prices for energy and food. This was slightly more than expected but does little to change the gradual downward trend in inflation.
What is important for the Federal Reserve is that the last mile in bringing inflation back to target appears to be more difficult. We, therefore, feel confirmed in our assessment that the Fed will not cut interest rates in March, as the market expects, but only in May.
- Initial Jobless Claims rose by 202K in the first week of the year.
- The US labour market keeps signalling a tight stance.
US citizens that applied for unemployment insurance benefits increased by 202K in the week ending January 6, showed the US Department of Labor (DOL) on Thursday. The reading came in short of market consensus and follows a 203K gain in the previous week.
Further details of the publication revealed that the advance seasonally adjusted insured unemployment rate was 1.2% and the 4-week moving average stood at 207.75K, a decrease of 250 from the previous week's revised average.
In addition, Continuing Claims dropped by 34K to 1.834M in the week ended December 30.
Market reaction
The US Dollar Index rose to a new intraday high past 102.60 soon in the wake of higher-than-expected US inflation figures measured by the CPI for the month of December (+3.4% YoY).
USD/CAD establishes below 1.34. Economists at Scotiabank analyze the pair’s outlook.
Intraday and daily trend strength oscillators are neutral
USD/CAD has edged ever so slightly lower since Tuesday’s test of the 1.34 area, without really looking that well offered, USD losses have eased below minor support at 1.3375 today but there has been little follow through selling pressure.
Intraday and daily trend strength oscillators are neutral, reflecting the lack of dynamism in funds now. Longer-term risks remain geared towards some corrective USD gains after the late December (weekly) bull reversal in the USD, however.
Look for USD support on dips to the 1.3325/1.3350 area.
GBP/USD trades sideways between 1.26/1.28. Economists at Scotiabank analyze Cable’s outlook.
Lack of progress through the 1.28 area may be starting to wear a bit
The Pound retains some bullish underlying trend momentum and remains relatively comfortable towards the upper end of its recent trading range. But the lack of progress through the 1.28 area may be starting to wear a bit and price action over the past month is still shaping up to be potentially bearish (Head & Shoulders top/reversal, with the neckline trigger at 1.2600).
Sterling needs to push on through resistance at 1.2800/1.2820 to progress.
- EUR/GBP consolidates slightly above 0.8600 ahead of UK factory data.
- UK’s monthly GDP is seen expanding by 0.2% after a contraction in October.
- The ECB is expected to remain hawkish for longer than the BoE.
The EUR/GBP pair trades back-and-forth slightly above 0.8600 in the late London session. The cross struggles for a direction as investors await the United Kingdom factory data for November, which will be published on Friday.
The UK factory data will be keenly watched as it will provide cues about scale of industrial activities. Fears of a technical recession in the UK economy deepened after the Office for National Statistics (ONS) reported a shrinkage by 0.1% in the third quarter of 2023. The chances of further contraction in the UK economy would deepen if the factory report remains subdued.
As per the consensus, UK’s monthly Industrial and Manufacturing Production rose by 0.3%. The annual Industrial Production rose by 0.7% against 0.4% in October. In the same period, the Manufacturing Production grew strongly by 1.7% versus. the former reading of 0.8%. The monthly Gross Domestic Product (GDP) expanded by 0.2% after shrinking 0.3% earlier.
Meanwhile, Bank of England (BoE) policymakers struggle between vulnerable economic outlook and high price pressures. BoE Governor Andrew Bailey reiterate in his testimony before UK Treasury Select Committee on Wednesday that bringing inflation to the 2% target is very important.
On the Eurozone front, higher preliminary inflation in December as anticipated has strengthened European Central Bank (ECB) policymakers to remain hawkish longer than the BoE. ECB Governing Council member and Bank of France President, Francois Villeroy de Galhau, said on Thursday that he “commits to an inflation back at 2.0% by 2025.”
USD edges marginally lower ahead of the December Consumer Price Index (CPI) report. Shaun Osborne, Chief FX Strategist at Scotiabank, analyzes how US inflation data could impact the Dollar.
Markets are looking for soft inflation data
Price action suggests that markets are looking for soft inflation data – a decent bet as recent US inflation data reports have tended to surprise more on the downside relative to market expectations. The first move (in response to data) is not always the right move, as we saw with Friday’s NFP, however.
Beyond the CPI data, I still rather think broader risks are geared toward some strengthening in the USD in the next few weeks.
Markets are pricing in around 18 bps of Fed easing in March now. Swaps and yield moves will drive the USD’s reaction to the inflation print.
- The US Dollar traders are in a very tight range ahead of Thursday’s main event.
- Traders face volatility near 13:30 GMT in a massive data dump.
- The US Dollar Index remains above 102.00, though bets are on for substantial weakness.
The US Dollar (USD) is holding its head above 102 for now, though traders and markets are shouting that it will sink lower this Thursday. The long-awaited US inflation report will be released in the form of the Consumer Price Index (CPI) numbers. Expectations are overall that it will come out lower, with several analysts pointing to the contraction in Purchase Managers Indices in recent weeks and Crude Oil prices trading in a lower range as factors.
Additionally, traders will need to pluck their way through the other data points that will be released near 13:30 GMT. The weekly Jobless Claims numbers are due to be released, and could either counterweigh or accelerate any moves on the back of the US inflation outcome. Expect a volatile ride from 13:30 into the start of the US opening bell.
Daily digest market movers: CPI talk of the town
- Fireworks expected near 13:30 GMT:
- US Consumer Price Index:
- Monthly Headline CPI is expected to head from 0.1% to 0.2%. Economists' estimates range from 0.1% to 0.4%.
- Yearly Headline CPI is foreseen to head from 3.1% to 3.2%. Economists' estimates range from 3.1% to 3.6%.
- Monthly Core CPI is to stay steady at 0.3%. Economists' estimates range from 0.1% to 0.3%.
- Yearly Core CPI is foreseen to head from 4% to 3.8%. Economists' estimates range from 3.7% to 4.0%.
- Any print below the lowest estimates will trigger substantial US Dollar weakness, while any surprise beat above the highest estimate will trigger US Dollar strength.
- Jobless Claims release:
- Initial Jobless Claims is expected to pick up from 202,000 to 210,000.
- Continuing Claims are seen heading from 1,855 million to 1,871 million.
- US Consumer Price Index:
- Equity markets are roaring ahead of the US CPI print. With market expectations going all-in on a further decline of inflation numbers, triggering a call for a quicker US Federal Reserve rate cut, investors are forecasting a goldilocks scenario for the stock markets. Asian indices are all up over 1%. Europe is following suit with gains near 0.50%.
- The CME Group’s FedWatch Tool shows that markets are pricing in a 97.4% chance that the Federal Reserve will keep interest rates unchanged at its January 31 meeting. Around 2.6% expect the first cut already to take place.
- The benchmark 10-year US Treasury Note holds near 3.99%, and could sink lower if this Thursday’s CPI report points to further disinflation.
US Dollar Index Technical Analysis: Expectations are high
The US Dollar is expected to sink lower according to market participants. Proof is in the pudding with the US Fed futures pointing to rate cuts from the Fed as soon as May. Confirmation of this projection wil come with the US inflation numbers this Thursday. If they decline lower, that rate cut timing might even be moved forward to March, which would mean substantial US Dollar weakness ahead.
The first level on the upside to watch is 103.00, which falls nearly in line with the trend line from the top of October 3 and December 8. If broken and closed above, the 200-day Simple Moving Average (SMA) at 103.43 comes into play. The 104.00 level might be too far off, with 103.78 (55-day SMA) coming in as the next resistance.
To the downside, a rejection by the descending trendline will give fuel to Greenback bears leading to a further downturn. The line in the sand here is 101.74, the floor which held halfway through December before breaking down in the last two weeks. In case the DXY snaps this level, expect to see a test at the low near 100.80.
US Dollar FAQs
What is the US Dollar?
The US Dollar (USD) is the official currency of the United States of America, and the ‘de facto’ currency of a significant number of other countries where it is found in circulation alongside local notes. It is the most heavily traded currency in the world, accounting for over 88% of all global foreign exchange turnover, or an average of $6.6 trillion in transactions per day, according to data from 2022.
Following the second world war, the USD took over from the British Pound as the world’s reserve currency. For most of its history, the US Dollar was backed by Gold, until the Bretton Woods Agreement in 1971 when the Gold Standard went away.
How do the decisions of the Federal Reserve impact the US Dollar?
The most important single factor impacting on the value of the US Dollar is monetary policy, which is shaped by the Federal Reserve (Fed). The Fed has two mandates: to achieve price stability (control inflation) and foster full employment. Its primary tool to achieve these two goals is by adjusting interest rates.
When prices are rising too quickly and inflation is above the Fed’s 2% target, the Fed will raise rates, which helps the USD value. When inflation falls below 2% or the Unemployment Rate is too high, the Fed may lower interest rates, which weighs on the Greenback.
What is Quantitative Easing and how does it influence the US Dollar?
In extreme situations, the Federal Reserve can also print more Dollars and enact quantitative easing (QE). QE is the process by which the Fed substantially increases the flow of credit in a stuck financial system.
It is a non-standard policy measure used when credit has dried up because banks will not lend to each other (out of the fear of counterparty default). It is a last resort when simply lowering interest rates is unlikely to achieve the necessary result. It was the Fed’s weapon of choice to combat the credit crunch that occurred during the Great Financial Crisis in 2008. It involves the Fed printing more Dollars and using them to buy US government bonds predominantly from financial institutions. QE usually leads to a weaker US Dollar.
What is Quantitative Tightening and how does it influence the US Dollar?
Quantitative tightening (QT) is the reverse process whereby the Federal Reserve stops buying bonds from financial institutions and does not reinvest the principal from the bonds it holds maturing in new purchases. It is usually positive for the US Dollar.
EUR/USD tests 1.10 area. Economists at Scotiabank analyze the pair’s outlook.
EUR/USD support is 1.0955/60
Spot has retained a firm undertone in Thursday’s trade but the intraday chart does reveal a fairly strong rejection of the upper 1.09 area through Asian trade (bearish outside range on the six-hour chart). That should strengthen resistance to EUR gains in the 1.0990/1.1000 area this morning (but would also imply scope for more gains on a sustained push above the figure).
EUR/USD support is 1.0955/60 ahead of major trend support at 1.0920.
Gold hit a new high in December 2023 and has remained well above $2,000 per ounce so far this year. Economists at HSBC analyze the yellow metal’s outlook.
Pitfalls lie ahead
While market sentiment is bullish, we think that the price of Gold is overstretched and may decline over the near term in the absence of notable economic or political news. The high price of Gold is also limiting demand for jewellery, coins, and bars, mainly in price-sensitive emerging markets, but also in less price-sensitive Western markets.
Gold is historically sensitive to US real rates, and while there has been a significant disconnect in this relationship, we think that positive real rates could be a headwind for XAU/USD this year.
Should the USD rebound, Gold prices may face downward pressure, but a sustained USD weakness should be Gold-positive.
Several bedrock factors will sustain the price of Gold at what would still be a historically high level. For example, geopolitical and trade risks are elevated and may stay high in 2024, as 75 nations hold elections, lending underlying support to gold prices. And central bank demand remains historically strong, triggered by geopolitical risks and portfolio diversification needs, but may not be fully sustained at price levels above $2,000.
- Natural Gas trades near $2.67, continuing a steep decline from Wednesday.
- Traders see ample amounts of supply, despite frost temperatures in Europe and China.
- The US Dollar steady above 102 ahead of US CPI numbers.
Natural Gas (XNG/USD) is unable to bank on the current elevated geopolitical tensions and winter in the Northern Hemisphere. While Israel is facing tribunal repercussions from a possible genocide accusation out of South Africa, negative temperateres across Europe, China and other parts of the Northern hemisphere are eating into Gas reserves. Supply is flowing, however, and ships are still making ports, despite longer routes to circumvent the Red Sea passage.
Meanwhile, the US Dollar (USD) is gearing up for a spike in volatility with the US inflation report due to be released this Thursday. Markets are positioned for quick rate cuts from the US Federal Reserve with expectations that the US Consumer Price Index (CPI) will continue its disinflationary path. Substantial US Dollar weakness is expected on the back of all this, which could support Natural Gas prices.
Natural Gas is trading at $2.67 per MMBtu at the time of writing.
Natural Gas Market Movers: Not cold enough
- European Gas prices are sinking with industrial demand not picking up at all and stockpiles still very much equipped to face a longer period of low temperatures on the continent.
- Several Norwegian Oil and Gas companies have launched projects for mining. Expectations are that nearly 40 to 50 wells will come online this year, from the 34 last year.
- German Gas storages drop to 88% while European Gas storage is still near 82%.
- This Tuesday the first hearings started in the United Nations Tribunal for Genocide against Israel after South Africa launched a formal complait with the tribunal.
Natural Gas Technical Analysis: Close but no cigar
Natural Gas was on a tear earlier this week, nearing $3 finally. The price action plunged back to $2.70, however, after markets saw no supply issues and lacklustre demand from the industry for the commodity. Expect to see still fairly muted reactions to the upside, unless a supply hiccup could emerge at one point out of the Middle East.
On the upside, Natural Gas is facing all the important Simple Moving Averages (SMA) as resistance levels to the upside. First up, nearby is the 200-day SMA near $2.75. Next up is the 55-day SMA at $2.85. Last but not least is the 100-day SMA at $2.95, near $3.
One big element that is always returning when it comes to Natural Gas, is that there is always an ample amount of supply. Each initial bullish reaction is being backtracked thereafter with the realisation that more supply is present. In that case, expect to see a continuing drop lower to $2.60 with a test at the low of December near $2.20 as not unthinkable.
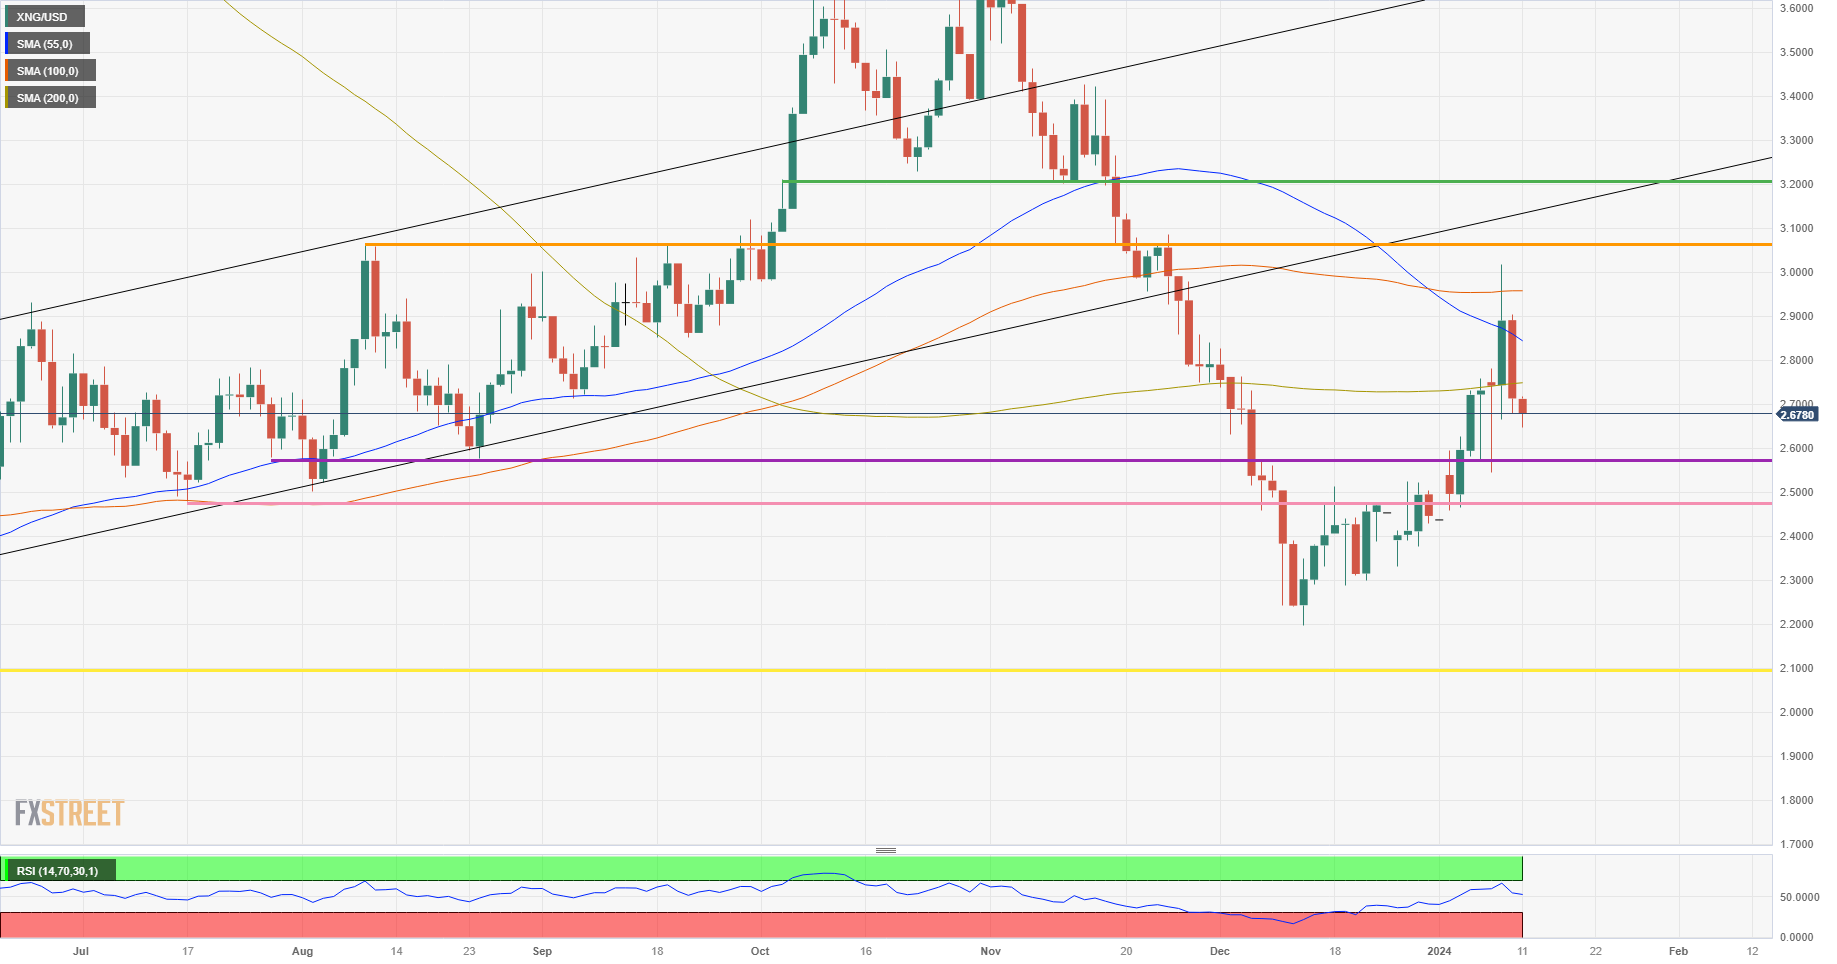
XNG/USD (Daily Chart)
Natural Gas FAQs
What fundamental factors drive the price of Natural Gas?
Supply and demand dynamics are a key factor influencing Natural Gas prices, and are themselves influenced by global economic growth, industrial activity, population growth, production levels, and inventories. The weather impacts Natural Gas prices because more Gas is used during cold winters and hot summers for heating and cooling. Competition from other energy sources impacts prices as consumers may switch to cheaper sources. Geopolitical events are factors as exemplified by the war in Ukraine. Government policies relating to extraction, transportation, and environmental issues also impact prices.
What are the main macroeconomic releases that impact on Natural Gas Prices?
The main economic release influencing Natural Gas prices is the weekly inventory bulletin from the Energy Information Administration (EIA), a US government agency that produces US gas market data. The EIA Gas bulletin usually comes out on Thursday at 14:30 GMT, a day after the EIA publishes its weekly Oil bulletin. Economic data from large consumers of Natural Gas can impact supply and demand, the largest of which include China, Germany and Japan. Natural Gas is primarily priced and traded in US Dollars, thus economic releases impacting the US Dollar are also factors.
How does the US Dollar influence Natural Gas prices?
The US Dollar is the world’s reserve currency and most commodities, including Natural Gas are priced and traded on international markets in US Dollars. As such, the value of the US Dollar is a factor in the price of Natural Gas, because if the Dollar strengthens it means less Dollars are required to buy the same volume of Gas (the price falls), and vice versa if USD strengthens.
The Bank of Japan is considering lowering its inflation outlook for the fiscal year of 2024 to the mid-2% range in its upcoming quarterly report, which will be published on January 23, Jiji news agency reported on Thursday, per Reuters.
Market reaction
This headline doesn't seem to be having a noticeable impact on the Japanese Yen's performance against its major rivals. Ahead of the highly-anticipated Consumer Price Index (CPI) data from the US, USD/JPY was seen trading modestly lower on the day at around 145.50.
The FX market is looking for the next big input to Dollar/risk sentiment in the US Consumer Price Index (CPI) report. But in the view of economists at ING, US inflation data will not be a game-changer in FX.
US CPI release unlikely to leave very long-lasting marks on FX
Our US economist agrees that rate cuts in March and April are too optimistic, but that conclusion could be reached even with a consensus CPI reading today. Core inflation is expected to come in at 0.3% MoM, and while supply chain bottlenecks continue to ease and energy prices fall, overall pricing pressures remain relatively strong.
While we may not see a big jump in the Dollar on a consensus CPI print (actually there are some downside risks given part of the market is possibly positioned for a strong number), we suspect the combination of only modest core inflation declines and lingering labour tightness will prompt the Fed to push back on rate cuts more forcefully. That is a Dollar-positive development, on paper, but a market seemingly anxious not to miss out on the next big USD lower may impatiently sell USD rallies. That is one of the reasons why our expectations for a short-term Dollar rebound are modest: a clearer narrative that rate cuts before May are unlikely needs to take over before Dollar bears can be discouraged.
EUR/NOK continues to trade around the 11.30 mark. Antje Praefcke, FX Analyst at Commerzbank, analyzes Krone’s outlook.
Norges Bank unlikely to consider cutting rates
The upcoming figures on economic activity and inflation will be crucial. As long as the economy is robust and inflation remains high, Norges Bank is unlikely to consider cutting rates.
The big question for the market will be which central bank – the ECB or Norges Bank – might cut rates first and to what extent. Overall, however, Norges Bank has shown, most recently in December in impressive fashion, that it is taking decisive action against the threat of inflation, which has catapulted the krone upwards accordingly. I am therefore comfortable with my forecast of further moderate Krone appreciation in 2024 and 2025.
- EUR/USD drops to near 1.0960 amid firm recovery in the US Dollar ahead of US CPI data.
- Fed policymakers denies favoring for early interest rate cuts.
- The Euro performs strongly as ECB policymakers have not discussed rate cuts at all.
The EUR/USD pair faces selling pressure while attempting to sustain above the crucial resistance of 1.0980 in the London session. The major currency pair corrects as the US Dollar Index (DXY) has recovered its entire losses generated in the Asian session. The USD Index has rebounded to near 102.40.
S&P500 futures have generated decent gains in the European session, portraying further improvement in the risk-appetite of the market participants. The 10-year US Treasury yields are hovering below 4%.
Investors are expected to face sheer volatility after the release of the United States Consumer Price Index (CPI) data for December, which will be published at 13:30 GMT. The headline inflation is expected to increase slightly while the core CPI is seen decelerating due to fall in prices of used cars.
Meanwhile, Fed policymakers continue to stay with a restrictive monetary policy stance until gets confidence that inflation will return to 2% in a sustainable manner. New York Fed Bank President Raphael Bostic said on Wednesday that more work is needed to achieve the 2% inflation target and it is still too early to discuss rate cuts.
On the Euro front, the broader performance from the old continent’s currency continues to remain upbeat as a rebound in preliminary Eurozone inflation has provided an argument to European Central Bank (ECB) policymakers to maintain the ‘higher for longer’ interest rates narrative.
ECB Governing Council member and Bank of France President, Francois Villeroy de Galhau, said on Thursday that he “commits to an inflation back at 2.0% by 2025.” He added that the French economy is expected to grow by 0.9% in 2024.
USD softens ahead of release of latest US Consumer Price Index (CPI) report. Economists at MUFG Bank analyze how the Dollar could react to inflation data.
Will US CPI report support expectations for imminent rate cut?
Unless there is a significant upside surprise in today’s CPI report today, the slowing inflation trend should encourage the Fed to begin cutting rates giving it more confidence that inflation is falling back towards their target.
Even though inflation has been slowing during the 2H of last year, USD performance immediately following the release of CPI reports has been mixed recently. The US Dollar Index (DXY) strengthened by +0.3% in the first hour after the last US CPI report was released on 12th December and has strengthened three times in the first hour following the release of the last six US CPI reports.
The clearer trend is that the USD has moved more in percentage terms in response to the last three US CPI reports highlighting that inflation readings are becoming more important with Fed policy at a pivot point.
With the US interest rate market still pricing in around 18 bps of Fed cuts by March, another softer inflation reading will be required today to meet expectations for an early rate cut otherwise the Dollar will attempt to stage a relief rally.
The Polish Zloty (PLN) has suffered in recent days. Economists at ING analyze PLN outlook.
PLN is now the only currency in the CEE region supported by higher rates
PLN is now the only currency in the CEE region supported by higher rates. On the other hand, heavy long positioning in the FX market will be a problem for bigger gains.
For now, we expect EUR/PLN to settle below 4.34 and we'll see how much the market takes back the dovish bets built in the last few days.
- Gold price recovers while the US Dollar faces pressure ahead of US CPI data.
- Investors seem confident about the Fed reducing interest rates in March.
- Fed policymakers continue to favor a restrictive policy stance.
Gold price (XAU/USD) advances on Thursday as safe-haven assets face a sharp sell-off despite uncertainty ahead of the United States Consumer Price Index (CPI) data, which will be published at 13:30 GMT. Bullions enjoy significant demand as investors remain confident over the Federal Reserve (Fed) reducing interest rates in March to avoid the consequences of over-tightening.
The headline inflation is expected to increase modestly, while the core CPI is seen softening further due to a decline in the prices of used cars. The ISM Price Paid Index for the Manufacturing sector, a key leading indicator of price pressures, contracted significantly in December. Investors seem to ignore that Fed policymakers continue to lean towards keeping a restrictive stance for a longer period, denying the likelihood of early rate cuts.
Atlanta Fed Bank President Raphael Bostic and New York Fed President John Williams supported the idea of keeping interest rates higher as they said more work is needed to get inflation back to the 2% target. John Williams said it would only be appropriate to unwind the current restrictive monetary policy stance when the Fed is confident that inflation is moving toward 2% on a sustained basis.
Daily digest market movers: Gold price recovers as US Dollar, yields fall
- Gold price climbs swiftly to near $2,030 as safe-haven assets have come under pressure ahead of the United States inflation data for December.
- The correction in the US Dollar Index (DXY) has extended to near 102.20, and the 10-year US Treasury yields have stabilized below 4.0%.
- The release of the US inflation data will provide cues about the likely monetary policy action for January’s meeting.
- Investors see headline inflation rising 3.2% annually, up from 3.1% in November. Core inflation, which excludes volatile food and energy prices, is forecasted to decline tof 3.8% against the former reading of 4.0%.
- Economists are anticipating that monthly headline and core inflation grew by 0.2% and 0.3%, respectively.
- The Federal Reserve (Fed) is highly expected to keep interest rates unchanged in the range of 5.25%-5.50% in January’s monetary policy meeting for the fourth time in a row. Guidance about upcoming interest rate cuts will be of utmost importance.
- In the latest projections, Fed policymakers said interest rates could come down by 75 basis points (bps) this year.
- As per the CME Fedwatch tool, chances in favour of a 25 bp rate cut in March have rebounded to 67%.
- Bets supporting an interest rate cut by the Fed in March could decline sharply if the US inflation report comes in hotter than projected. Also, projections for the first cut in interest rates could shift to May’s monetary policy meeting.
- A sticky or higher inflation data will offer an argument to Fed policymakers to keep interest rates high for the entire first half of this year.
- After the release of the US Inflation data, investors will shift focus towards the Producer Price Index (PPI) data for December, which will be published on Friday.
- On US-China relations, US Treasury Secretary Janet Yellen said former Republican President Donald Trump’s plan to levy universal 10% tariffs on all imports would escalate costs for consumers. She added that a review of tariffs on Chinese imports is highly needed.
Technical Analysis: Gold price struggles to climb above 20-EMA
Gold price rebounds strongly after a decent correction on Wednesday as investors seem certain about an interest rate cut from the Fed in March. The precious metal manages to attain a firm footing, but struggles to extend its recovery above the 20-day Exponential Moving Average (EMA) at $2,037. The 14-period Relative Strength Index (RSI) oscillates around 50.00, which indicates that investors await a potential trigger for further action.
Gold FAQs
Why do people invest in Gold?
Gold has played a key role in human’s history as it has been widely used as a store of value and medium of exchange. Currently, apart from its shine and usage for jewelry, the precious metal is widely seen as a safe-haven asset, meaning that it is considered a good investment during turbulent times. Gold is also widely seen as a hedge against inflation and against depreciating currencies as it doesn’t rely on any specific issuer or government.
Who buys the most Gold?
Central banks are the biggest Gold holders. In their aim to support their currencies in turbulent times, central banks tend to diversify their reserves and buy Gold to improve the perceived strength of the economy and the currency. High Gold reserves can be a source of trust for a country’s solvency. Central banks added 1,136 tonnes of Gold worth around $70 billion to their reserves in 2022, according to data from the World Gold Council. This is the highest yearly purchase since records began. Central banks from emerging economies such as China, India and Turkey are quickly increasing their Gold reserves.
How is Gold correlated with other assets?
Gold has an inverse correlation with the US Dollar and US Treasuries, which are both major reserve and safe-haven assets. When the Dollar depreciates, Gold tends to rise, enabling investors and central banks to diversify their assets in turbulent times. Gold is also inversely correlated with risk assets. A rally in the stock market tends to weaken Gold price, while sell-offs in riskier markets tend to favor the precious metal.
What does the price of Gold depend on?
The price can move due to a wide range of factors. Geopolitical instability or fears of a deep recession can quickly make Gold price escalate due to its safe-haven status. As a yield-less asset, Gold tends to rise with lower interest rates, while higher cost of money usually weighs down on the yellow metal. Still, most moves depend on how the US Dollar (USD) behaves as the asset is priced in dollars (XAU/USD). A strong Dollar tends to keep the price of Gold controlled, whereas a weaker Dollar is likely to push Gold prices up.
After a poor performance last year for the currency, the Norges Bank will likely be satisfied that the NOK appreciated vs. the EUR following its decision to hike rates by 25 bps to 4.5% on December 13. Economists at Rabobank analyze Krone’s outlook.
NOK to find some support as the market adjusts to a more cautious Norges Bank
Given its focus on the exchange rate, we would expect the Norges Bank to follow the ECB in cutting rates this year. That said, the combination of the decline in core inflation and the stronger value of the NOK in recent weeks has allowed the market to re-price the start of the Norges Bank rate cutting schedule.
Last month the Norges Bank indicated that the policy rate would remain at 4.5% until the autumn before gradually moving lower. Currently, the market is priced for rates around 35 bps lower on a six-month view. We see this as overdone and look for the NOK to find some support as the market adjusts to a more cautious Norges Bank.
We expect EUR/NOK to edge lower to 11.20 on a three-month view.
Gold prices rose in India on Thursday, according to data from India's Multi Commodity Exchange (MCX).
Gold price stood at 62,050 Indian Rupees (INR) per 10 grams, up INR 83 compared with the INR 61,967 it cost on Wednesday.
As for futures contracts, Gold prices increased to INR 62,178 per 10 gms from INR 61,996 per 10 gms.
Prices for Silver futures contracts decreased to INR 72,138 per kg from INR 71,969 per kg.
| Major Indian city | Gold Price |
|---|---|
| Ahmedabad | 64,210 |
| Mumbai | 64,015 |
| New Delhi | 64,170 |
| Chennai | 64,210 |
| Kolkata | 64,210 |
Global Market Movers: Comex Gold price awaits US CPI inflation data for a fresh direction
- The uncertainty over the Federal Reserve's rate-cut path keeps the US Dollar bulls on the defensive and assists the Comex Gold price in gaining some positive traction amid some repositioning trade ahead of the US consumer inflation figures.
- The markets were quick to react to the Fed's surprising dovish tilt at the December policy meeting and are now pricing in five interest rate cuts by the end of 2024, summing up to a cumulative of around 140 basis points (bps) of easing.
- The incoming US macro data underscored the fundamental resilience of the American economy, which, along with mixed signals from Fed officials, forced investors to scale back their expectations for more aggressive policy easing.
- New York Fed President John Williams said on Wednesday that the US central bank is in a ‘good place’ and has time to think about what’s next for rates, though would eventually need to get policy back to more neutral levels.
- US Treasury Secretary Janat Yellen spoke from Boston on Wednesday, saying that said more work is required to get inflation under control and pledging to use “all tools at our disposal” to bring costs down.
- The yield on the benchmark 10-year US government bond holds steady above the 4.0% threshold and should help limit deeper losses for the USD, capping any further gains for the non-yielding yellow metal ahead of the US data.
- The headline US CPI is expected to rise by 0.2% in December, lifting the yearly rate to 3.2% from 3.1%, while the core gauge (excluding food and energy prices) is anticipated to ease to 3.8% YoY from 4.0% in the previous month.
- Cooler-than-expected inflation data will give the Fed more reason to cut interest rates this year and turn out to be a negative trigger for the Greenback, which, in turn, should lead to a fresh leg up for the precious metal.
- Conversely, a stronger US CPI print should provide the US central bank headroom to keep interest rates higher for longer and boost the buck, forcing the XAU/USD to break through a multi-week low touched on Monday.
(An automation tool was used in creating this post.)
Gold FAQs
Why do people invest in Gold?
Gold has played a key role in human’s history as it has been widely used as a store of value and medium of exchange. Currently, apart from its shine and usage for jewelry, the precious metal is widely seen as a safe-haven asset, meaning that it is considered a good investment during turbulent times. Gold is also widely seen as a hedge against inflation and against depreciating currencies as it doesn’t rely on any specific issuer or government.
Who buys the most Gold?
Central banks are the biggest Gold holders. In their aim to support their currencies in turbulent times, central banks tend to diversify their reserves and buy Gold to improve the perceived strength of the economy and the currency. High Gold reserves can be a source of trust for a country’s solvency. Central banks added 1,136 tonnes of Gold worth around $70 billion to their reserves in 2022, according to data from the World Gold Council. This is the highest yearly purchase since records began. Central banks from emerging economies such as China, India and Turkey are quickly increasing their Gold reserves.
How is Gold correlated with other assets?
Gold has an inverse correlation with the US Dollar and US Treasuries, which are both major reserve and safe-haven assets. When the Dollar depreciates, Gold tends to rise, enabling investors and central banks to diversify their assets in turbulent times. Gold is also inversely correlated with risk assets. A rally in the stock market tends to weaken Gold price, while sell-offs in riskier markets tend to favor the precious metal.
What does the price of Gold depend on?
The price can move due to a wide range of factors. Geopolitical instability or fears of a deep recession can quickly make Gold price escalate due to its safe-haven status. As a yield-less asset, Gold tends to rise with lower interest rates, while higher cost of money usually weighs down on the yellow metal. Still, most moves depend on how the US Dollar (USD) behaves as the asset is priced in dollars (XAU/USD). A strong Dollar tends to keep the price of Gold controlled, whereas a weaker Dollar is likely to push Gold prices up.
The fact that the Australian inflation figures surprised to the downside on Wednesday went somewhat under the radar. Economists at Commerzbank analyze Aussie’s outlook after the Monthly Consumer Price Index (CPI) report.
RBA likely to have reached its interest rate peak in November
The RBA is likely to have reached its interest rate peak in November. It is unlikely to follow up with another hike when inflation is falling so much and people are suffering from higher mortgage rates. The market has therefore correctly priced out the remaining probability of another hike since the beginning of November. On the other hand, Wednesday's data also shows that rate cuts are unlikely to start any time soon.
If the RBA takes a similar view of the figures, it is likely to continue to emphasize its determination for the time being and to be skeptical about rate cuts in the near future. Only if inflation continues to fall significantly from February will rate cuts, as currently priced in by the market, look more realistic. Until then, the Aussie is likely to remain supported by the global inflation gap.
- NZD/USD snaps its two-day losing streak ahead of US inflation data.
- Market expects an increase in both monthly and yearly US CPI figures.
- New Zealand Building Permits declined by 10.6%, marking a 15-month low.
NZD/USD advances to near 0.6250 during the European session on Thursday. The NZD/USD pair receives upward support due to the improved market sentiment ahead of the inflation data from the United States (US).
Later in the North American session, the Consumer Price Index (CPI) data for December in the United States will be revealed. Forecasts suggest an increase in both the monthly and yearly CPI, with expectations of a 0.2% rise in the monthly figure and a 3.2% increase in the yearly figure. Concurrently, Core inflation on a year-over-year basis is anticipated to ease at 3.8%, while the month-over-month change is projected to remain steady at 0.3%.
Moreover, market participants price in the five rate cuts by the US Federal Reserve (Fed) in the year 2024, which puts pressure on the Greenback. The US Dollar Index (DXY) remains subdued, influenced by softer US Treasury yields.
New Zealand's primary housing market indicator revealed a decrease in the issuance of permits for new construction projects in the country. In November 2023, the seasonally adjusted Building Permits (MoM) witnessed a substantial decline, plummeting by 10.6%, marking a 15-month low compared to the previous reading, which showed an 8.5% increase.
However, the positive Consumer Confidence and Business Confidence data in November have improved the market sentiment that the Reserve Bank of New Zealand (RBNZ) will uphold a hawkish stance by abstaining from any rate cuts in the upcoming meeting. This has been contributing to a favorable outlook for the New Zealand Dollar.
EUR/USD remains below the 1.10 figure. Economists at ING analyze the pair’s outlook.
Schnabel helps the Euro
European Central Bank member Isabel Schnabel delivered a hawkish counteroffensive on Wednesday after a slew of dovish comments from other ECB members.
The Euro traded on the strong side after Schnabel’s comments, probably since her December remarks had suggested she might have turned more dovish. Any impact on the Euro shouldn’t be very last longing, especially considering the polarising US CPI risk event today.
EUR/USD may stabilise around current levels unless US CPI surprises on the upside (not our base case), although the near-term view for the pair is for rangebound trading.
- Silver attracts buyers on Thursday and snaps a three-day losing streak to the weekly low.
- The technical setup supports prospects for the emergence of fresh selling at higher levels.
- Bears might wait for a break below $22.70 or the monthly low before placing fresh bets.
Silver (XAG/USD) gains some positive traction on Thursday and for now, seems to have snapped a three-day losing streak to the weekly low, around the $22.80-$22.75 region touched the previous day. The white metal sticks to its intraday gains through the first half of the European session and currently trades around the $23.00 round figure, up 0.60% for the day.
From a technical perspective, any subsequent move up is likely to confront resistance near the 100-day Simple Moving Average (SMA), currently pegged near the $23.30 region. This is followed by a multi-month-old ascending trend-line support breakpoint, around the $23.60 region, which now coincides with the 200-day SMA and should act as a key pivotal point. A sustained strength beyond the latter might trigger a short-covering rally and lift the XAG/USD to the $23.80 horizontal resistance en route to the $24.00 round-figure mark.
Some follow-through buying will suggest that the recent corrective downfall since late December has run its course and shift the bias in favour of bullish traders. The XAG/USD might then accelerate the positive momentum towards the $24.60 area, or the December 22 high, before aiming back towards reclaiming the $25.00 psychological mark. That said, oscillators on the daily chart are holding deep in the negative territory and support prospects for the emergence of fresh selling at higher levels. This, in turn, favours bearish traders and suggests that the path of least resistance for the white metal remains to the downside.
That said, it will still be prudent to wait for weakness below a multi-week low, around the $22.70 region touched last Thursday before positioning for the resumption of the recent depreciating move witnessed over the past two weeks or so. The XAG/USD might then turn vulnerable to weaken further below the December monthly swing low, around the mid-$22.00s and test the next relevant support near the $22.25 region before eventually dropping further towards the $22.00 round-figure mark.
Silver daily chart
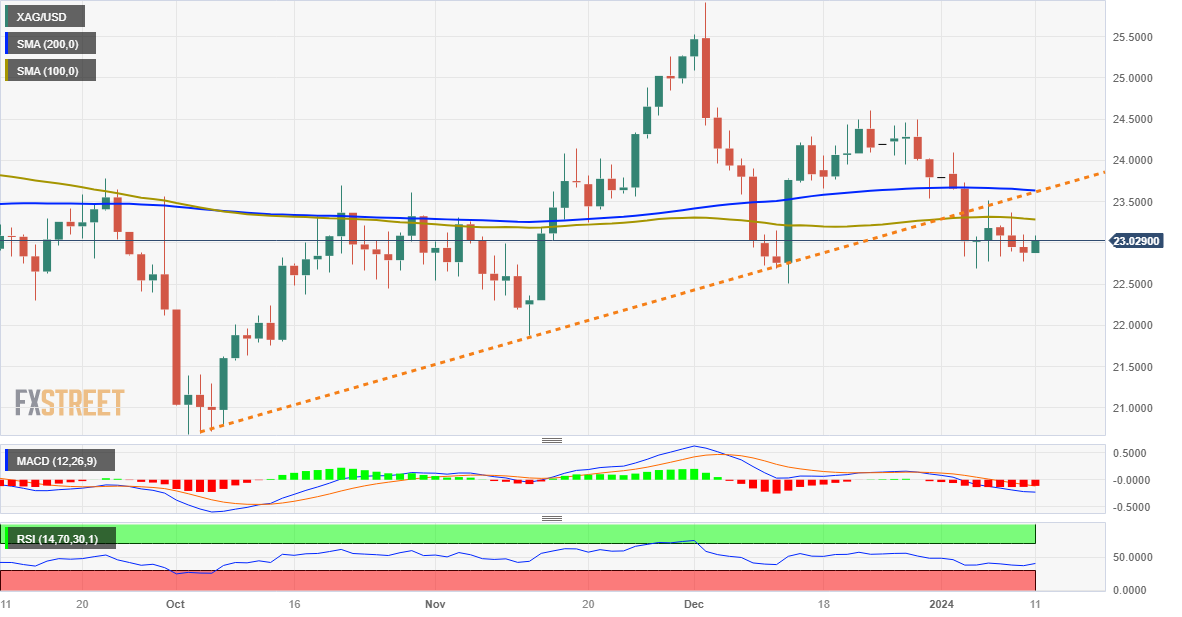
Technical levels to watch
USD/KRW defends the 200-Day Moving Average (DMA) at 1,316. Economists at Société Générale analyze the pair’s outlook.
November/December trough near 1,283 is important support
USD/KRW revisited low of November at 1,283 recently and has staged an initial rebound.
It is worth noting that the pair has experienced crisscross moves around the 200-DMA which highlights lack of clear direction.
A break above last month’s high of 1,327/1,330 is essential to confirm a larger up move. Holding below this resistance, a short-term pullback is likely towards recent up gap at 1,303.
November/December trough near 1,283 would be an important support.
- USD/CHF faces challenges as investors price in the Fed rate cuts.
- MACD indicator suggests the subdued momentum in the pair.
- A fall below the 0.8500 level could lead the pair to revisit the weekly low at 0.8460.
USD/CHF moves on a downward trajectory for the second successive day, trading near 0.8510 during the European hours on Thursday. The USD/CHF pair encounters difficulties as investors shift their focus away from the US Dollar (USD), possibly due to speculation about five interest rate cuts by the Federal Reserve (Fed) in 2024.
The technical indicator 14-day Relative Strength Index (RSI) suggests a bearish market sentiment for the USD/CHF pair as it is positioned below 50. Moreover, the Moving Average Convergence Divergence (MACD) line, though positioned below the centreline lies above the signal line. This suggests a subdued momentum in the EUR/USD pair. Market participants would likely exercise caution and await confirmation from the lagging indicator.
The USD/CHF pair could break below the psychological support at 0.8500 followed by the weekly low at 0.8460 and a major support level at 0.8450. A break below the latter could push the USD/CHF pair to navigate the region around the key level at 0.8400.
On the upside, the 23.6% Fibonacci retracement level at 0.8547 aligned with the 21-exponential Moving Average (EMA) at 0.8549 could act as the immediate resistance zone. A breakthrough above the zone could lead the USD/CHF pair to explore the psychological region around the 0.8600 level.
USD/CHF: Daily Chart
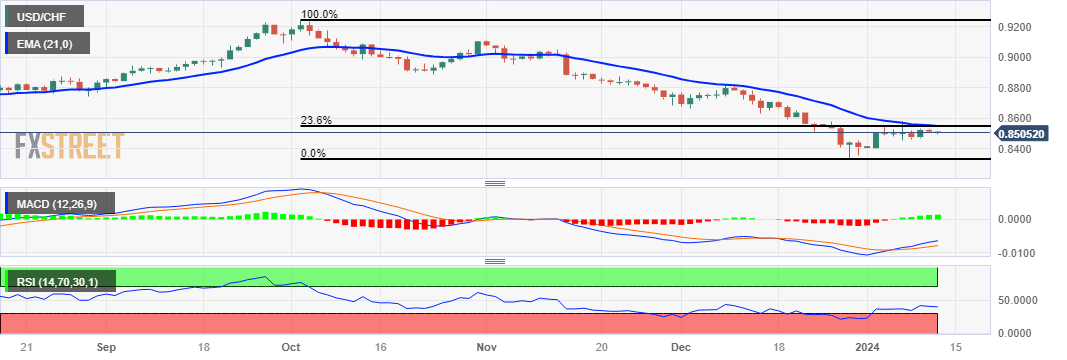
- USD/CAD drops to near 1.3360 on upbeat market sentiment.
- A quite action is anticipated ahead of the US Inflation data.
- Oil prices recover amid uncertainty over commercial shipment from Red Sea.
The USD/CAD pair drops to near 1.3360 after failing to sustain above the crucial resistance of 1.3400. The Loonie asset continues to struggle as demand for safe-haven assets has dampened due to improved risk-appetite of the market participants.
S&P500 futures extended rally in the Asian session, portraying improved appeal for risk-sensitive assets. The US Dollar Index (DXY) has corrected to near 102.20 as bets in favour of first rate-cut by the Federal Reserve (Fed) in March after a historically tight rate-hiking campaign remains intact ahead of the United States Consumer Price Index (CPI) data for December, which will be published at 13:30 GMT.
The annual headline inflation data is forecasted to grow by 3.2%, slightly higher than November’s reading of 3.1%. In the same period, the core CPI that excludes volatile food and oil prices is seen rising at a slower pace of 3.8% against 4.0%.
On the oil front, oil prices deliver a moderate recovery to near $72.00 as tensions in Middle East region deepens. Attacks on commercial oil tankers passing through Red Sea are delaying shipment and resulting in supply shortage. It is worth noting that Canada is the leading exporter of oil to the United States and higher oil prices support the Canadian Dollar.
USD/CAD continues to consolidate in a range of 1.3340-1.3400 on an hourly scale. The Loonie asset struggles for a direction as investors await the US data. Horizontal resistance plotted from December 15 high around 1.3405 continues to act as barricade for US Dollar bulls.
The 200-period Exponential Moving Average (EMA) around 1.3350 will act as a major cushion to the US Dollar.
The Relative Strength Index (RSI) (14) oscillates in a 40.00-60.00 range as investors await a potential economic trigger.
Fresh upside would appear if the Loonie asset breaks above January 9 high of 1.3415. This would open upside towards December 3 low at 1.3480, followed by December 5 low at 1.3540.
On the flip side, a downside move below January 5 low at 1.3288 would expose the asset to December 22 low at 1.3220. Breach of the latter would build more pressure on the asset and will drag it towards December 27 low at 1.3177.
USD/CAD hourly chart
-638405573711088735.png)
The highlight of the week, the US inflation figures for December, is finally on the agenda today. Economists at Commerzbank analyze USD outlook ahead of the Consumer Price Index (CPI) report.
The second decimal point could become important for the USD in the medium-term
The economists surveyed by Bloomberg expect the headline rate to rise stronger again month-on-month compared to last month (to 0.2%) and the MoM change of the core rate at least not to fall further (still +0.3%). However, the consensus for the latter was still at 0.2% on Wednesday morning. Our economists take a similarly narrow view of the data, expecting +0.25% in each case. Nuances will likely determine the rounding. This makes it almost impossible to predict the (short-term) reaction of the USD. Accordingly, I will refrain from doing so at this point.
As long as core inflation continues to stabilise at a level between 0.2% and 0.3% MoM, it is still a tad too high. Probably not high enough to justify the current level of interest rates forever, but also too high to justify more than 150 bps of rate cuts this year. And this is where the second decimal point is likely to become relevant again in the medium-term.
For stronger rate cuts and, above all, an even stronger turnaround on the part of Fed officials, we would probably need to see figures that are a little bit below 0.2% MoM. Although this is not expected today, the second decimal point could become important for the USD in the medium-term.
- Pound Sterling has stabilized above 1.2700 on upbeat market sentiment.
- The release of UK factory data, if upbeat, would ease fears of a technical recession.
- The US Dollar faces intense selling pressure ahead of US Inflation data.
The Pound Sterling (GBP) has extended its upside, capitalizing on improved market sentiment and an absence of commentary hinting at interest rate cuts from any Bank of England (BoE) policymakers.
GBP/USD has printed a fresh weekly high as investors have ignored uncertainty associated with United States Consumer Price Index (CPI) data, which will be published at 13:30 GMT. Deepening confidence of investors toward rate cuts by the Federal Reserve (Fed) from March is maintaining a cheerful market mood.
Further action in the Pound Sterling will be guided by the UK factory data, which is due to be released on Friday. Last month, UK Finance Minister Jeremy Hunt commented that the economy is not as bad as revised Gross Domestic Product (GDP) numbers for the third quarter would suggest. The economic data is expected to remain upbeat but risks of a technical recession are still high as the BoE forecasted a stagnant performance in the last quarter of 2023.
Daily Digest Market Movers: Pound Sterling capitalizes on risk-on mood
- Pound Sterling prints a fresh weekly high at 1.2770. Risk-perceived assets have gained traction as the market mood is quite upbeat ahead of the United States inflation data for December.
- The headline inflation figure is expected to show an annual rise of 3.2%, slightly higher than the former reading of 3.1%. Meanwhile, the core inflation that strips off volatile food and Oil prices is seen softening to 3.8% from the prior reading of 4.0% in the same period.
- Monthly headline CPI is estimated to have grown by 0.2% from 0.1% in November while the core inflation rate is estimated to have risen at a steady pace of 0.3%.
- Market participants will keenly watch the inflation result as it will provide the basis for policy guidance on interest rates provided by Federal Reserve (Fed) policymakers in their monetary policy meeting on January 31.
- The Fed is widely anticipated to keep interest rates unchanged at 5.25-5.50%. However, investors will be looking for cues about a possible reduction in interest rates from March.
- A sticky inflation report would dial down bets in favour of rate cuts from March.
- On the domestic front, the Pound Sterling will be guided by the factory and Gross Domestic Product (GDP) data for November, which will be published on Friday.
- Annual Manufacturing and Industrial Production data are forecasted to grow by 1.7% and 0.7% respectively. The monthly data is projected to rise by 0.3%. Monthly GDP is seen expanding by 0.2% after shrinking by 0.3% in November.
- Upbeat factory data may trim fears of a technical recession in the UK economy.
- The Bank of England continues to struggle, caught between high price pressures and deepening recession fears.
- On Wednesday, BoE Governor Andrew Bailey emphasized on bringing inflation back to the 2% target. While comparing the current scenario with the global financial crisis, Bailey said UK households with mortgages are nowhere near as stretched as during the subprime crisis. He added that incomes of households have risen in recent months.
- The US Dollar Index (DXY) declines toward 102.20 as investors seem confident about steep rate cuts this year despite steady labor market conditions.
Technical Analysis: Pound Sterling aims stability above 61.8% Fibo retracement
-638405552754174782.png)
Pound Sterling refreshes weekly high near 1.2770 as the risk-appetite of the market participants has improved ahead of US inflation data. The GBP/USD pair aims at stability above the 61.8% Fibonacci retracement at 1.2710 (of the move from 13 July 2023 high at 1.3142 to 4 October 2023 low at 1.2037). The overall trend is quite bullish as all short-to-long term Exponential Moving Averages (EMAs) are sloping higher.
The 14-period Relative Strength Index (RSI) is hovering around 60.00. A decisive break above the same will trigger a bullish momentum.
Pound Sterling FAQs
What is the Pound Sterling?
The Pound Sterling (GBP) is the oldest currency in the world (886 AD) and the official currency of the United Kingdom. It is the fourth most traded unit for foreign exchange (FX) in the world, accounting for 12% of all transactions, averaging $630 billion a day, according to 2022 data.
Its key trading pairs are GBP/USD, aka ‘Cable’, which accounts for 11% of FX, GBP/JPY, or the ‘Dragon’ as it is known by traders (3%), and EUR/GBP (2%). The Pound Sterling is issued by the Bank of England (BoE).
How do the decisions of the Bank of England impact on the Pound Sterling?
The single most important factor influencing the value of the Pound Sterling is monetary policy decided by the Bank of England. The BoE bases its decisions on whether it has achieved its primary goal of “price stability” – a steady inflation rate of around 2%. Its primary tool for achieving this is the adjustment of interest rates.
When inflation is too high, the BoE will try to rein it in by raising interest rates, making it more expensive for people and businesses to access credit. This is generally positive for GBP, as higher interest rates make the UK a more attractive place for global investors to park their money.
When inflation falls too low it is a sign economic growth is slowing. In this scenario, the BoE will consider lowering interest rates to cheapen credit so businesses will borrow more to invest in growth-generating projects.
How does economic data influence the value of the Pound?
Data releases gauge the health of the economy and can impact the value of the Pound Sterling. Indicators such as GDP, Manufacturing and Services PMIs, and employment can all influence the direction of the GBP.
A strong economy is good for Sterling. Not only does it attract more foreign investment but it may encourage the BoE to put up interest rates, which will directly strengthen GBP. Otherwise, if economic data is weak, the Pound Sterling is likely to fall.
How does the Trade Balance impact the Pound?
Another significant data release for the Pound Sterling is the Trade Balance. This indicator measures the difference between what a country earns from its exports and what it spends on imports over a given period.
If a country produces highly sought-after exports, its currency will benefit purely from the extra demand created from foreign buyers seeking to purchase these goods. Therefore, a positive net Trade Balance strengthens a currency and vice versa for a negative balance.
- USD/MXN loses ground as market sentiment improves.
- Traders factor in the possibility of five rate cuts in 2024.
- Banxico is expected to avoid easing policy in February’s meeting on the mixed inflation scenario.
USD/MXN halts its two-day winning streak, which could be attributed to the improved risk appetite as traders price in the possibility of five rate cuts in 2024. The US Dollar (USD) loses ground on downbeat US Treasury yields. The USD/MXN pair trades lower near 16.95 during the early European session on Thursday.
The World Bank has revised its economic projections for Mexico in 2024. The updated forecast anticipates a growth in the Gross Domestic Product (GDP) to reach 2.6%, surpassing the initially projected 1.9%. In October, Mexico's Gross Fixed Income experienced a month-on-month increase of 1.9%, rebounding from the 1.5% decline observed in September.
In December, Mexico's inflation data revealed a mixed scenario, with an increase noted in 12-month inflation and Headline inflation. However, Core inflation grew slightly lower than the market expectations. Market participants are anticipated to closely monitor Thursday's Industrial Output data, with expectations pointing toward a potential slowdown in the production activities of Mexican industries.
The US Dollar Index (DXY) extends its losses on the second successive session, hovering near 102.20 with the 2-year and 10-year yields standing lower at 4.35% and 4.00%, respectively, at the time of writing.
The Consumer Price Index (CPI) data for December in the United States is set to be unveiled later in the North American session. The monthly and yearly CPI are expected to exceed the previous figures rising by 0.2% and 3.2%, respectively. Meanwhile, the Core inflation year-over-year could ease at 3.8% and month-over-month may remain consistent at 0.3%. These economic indicators hold considerable significance in assessing inflationary pressures and have the potential to significantly shape market expectations concerning the monetary policy stance of the US Federal Reserve.
Economists at ANZ Bank analyze Fed and ECB outlook in a year of transition.
ECB will start cutting rates this European spring
Our core view is there will be sufficient progress on inflation towards target in both the US and Euro Area this year for the Fed and ECB to start cutting interest rates.
We think the conditions for ECB rate cuts will be in place from the European spring. In the US, we acknowledge recent low inflation prints but still think it will be the northern hemisphere summer before the FOMC will feel sufficiently confident to cut rates.
We forecast the FOMC will cut the target for fed funds by 100 bps taking the fed funds ceiling to 4.50% by year-end. We forecast the ECB will cut key policy rates by 150 bps by year-end.
Here is what you need to know on Thursday, January 11:
The US Dollar (USD) stays on the back foot early Thursday, with the USD Index retreating toward 102.00 after closing in negative territory on Wednesday. Weekly Initial Jobless Claims data and Consumer Price Index (CPI) figures for December will be featured in the US economic docket later in the day.
US Inflation Preview: Stocks set to surge if reality fails to meet high Core CPI expectations.
In the absence of high-tier macroeconomic data releases, improving risk mood made it difficult for the USD to stay resilient against its rivals during the American trading hours on Wednesday. US stock index futures were last seen rising between 0.2% and 0.4%, suggesting that the sentiment remains upbeat. Meanwhile, the high-yield at the 10-year US Treasury note auction came in at 4.02%, down from 4.29% in December and put additional weight on the currency.
US Dollar price this week
The table below shows the percentage change of US Dollar (USD) against listed major currencies this week. US Dollar was the weakest against the Pound Sterling.
| USD | EUR | GBP | CAD | AUD | JPY | NZD | CHF | |
| USD | -0.39% | -0.43% | -0.02% | -0.04% | 0.47% | -0.06% | -0.18% | |
| EUR | 0.40% | -0.03% | 0.39% | 0.37% | 0.88% | 0.35% | 0.22% | |
| GBP | 0.42% | 0.03% | 0.42% | 0.40% | 0.90% | 0.38% | 0.24% | |
| CAD | 0.02% | -0.37% | -0.41% | -0.02% | 0.51% | -0.04% | -0.16% | |
| AUD | 0.04% | -0.34% | -0.38% | 0.03% | 0.54% | -0.02% | -0.15% | |
| JPY | -0.50% | -0.86% | -0.92% | -0.48% | -0.50% | -0.54% | -0.66% | |
| NZD | 0.06% | -0.35% | -0.38% | 0.04% | 0.02% | 0.53% | -0.13% | |
| CHF | 0.17% | -0.23% | -0.26% | 0.16% | 0.14% | 0.65% | 0.12% |
The heat map shows percentage changes of major currencies against each other. The base currency is picked from the left column, while the quote currency is picked from the top row. For example, if you pick the Euro from the left column and move along the horizontal line to the Japanese Yen, the percentage change displayed in the box will represent EUR (base)/JPY (quote).
CPI inflation in the US is forecast to tick up to 3.2% on a yearly basis from 3.1% in November. The Core CPI, which excludes volatile food and energy prices, is expected to rise 0.3% on a monthly basis.
US CPI Data Preview: Declining core inflation could reinforce expectations of Fed rate cuts.
Earlier in the day, the data from Australia showed that Imports declined by 7.9% on a monthly basis in December, while Exports increased by 1.7%. After posting small gains on Wednesday, AUD/USD continued to edge higher in the Asian trading hours and the pair was last seen trading in positive territory above 0.6700.
EUR/USD gained traction in the second half of the day on Wednesday and closed above 1.0950. The pair was last seen inching higher toward 1.1000.
GBP/USD reclaimed 1.2700 during the American session on Wednesday and extended its rebound in the Asian trading hours on Thursday. The pair was last seen trading at its highest level in nearly two weeks at around 1.2770.
Despite the renewed USD weakness, USD/JPY rose toward 146.00 and posted strong gains on Wednesday. The pair staged a technical correction early Thursday and was last seen trading in negative territory below 145.50.
Gold closed marginally lower on Wednesday as the benchmark 10-year US Treasury bond yield managed to stabilize near 4%. XAU/USD clings to modest recovery gains slightly above $2,030.
(This story was corrected at 07:28 GMT to say CPI inflation in the US is forecast to tick up to 3.2% on a yearly basis from 3.1% in November, not 2.1%.)
European Central Bank (ECB) Governing Council member and Bank of France President, Francois Villeroy de Galhau, said on Thursday that he “commits to an inflation back at 2.0% by 2025.”
Further comments
French economy is slowing but more robust than feared.
Confirm the 2024 growth estimate for French economy of 0.9%.
Market reaction
EUR/USD is unfazed by the above comments, holding higher ground near 1.0985, up 0.13% on the day.
Euro price today
The table below shows the percentage change of Euro (EUR) against listed major currencies today. Euro was the strongest against the US Dollar.
| USD | EUR | GBP | CAD | AUD | JPY | NZD | CHF | |
| USD | -0.11% | -0.22% | -0.15% | -0.32% | -0.26% | -0.44% | -0.18% | |
| EUR | 0.11% | -0.11% | -0.04% | -0.21% | -0.16% | -0.34% | -0.03% | |
| GBP | 0.20% | 0.11% | 0.07% | -0.09% | -0.03% | -0.24% | 0.08% | |
| CAD | 0.15% | 0.04% | -0.07% | -0.16% | -0.10% | -0.28% | 0.01% | |
| AUD | 0.32% | 0.20% | 0.11% | 0.18% | 0.05% | -0.12% | 0.16% | |
| JPY | 0.25% | 0.15% | 0.03% | 0.08% | -0.07% | -0.20% | 0.08% | |
| NZD | 0.43% | 0.36% | 0.23% | 0.28% | 0.12% | 0.19% | 0.32% | |
| CHF | 0.12% | 0.02% | -0.10% | -0.03% | -0.19% | -0.14% | -0.31% |
The heat map shows percentage changes of major currencies against each other. The base currency is picked from the left column, while the quote currency is picked from the top row. For example, if you pick the Euro from the left column and move along the horizontal line to the Japanese Yen, the percentage change displayed in the box will represent EUR (base)/JPY (quote).
FX option expiries for Jan 11 NY cut at 10:00 Eastern Time, via DTCC, can be found below.
- EUR/USD: EUR amounts
- 1.0900 559m
- 1.0950 431m
- 1.1000 530m
- 1.1020 731m
- 1.1050 1.7b
- GBP/USD: GBP amounts
- 1.2790 430m
- USD/JPY: USD amounts
- 144.00 1.1b
- 145.50 437m
- NZD/USD: NZD amounts
- 0.6000 800m
- EUR/GBP edges lower to 0.8601 on Thursday.
- ECB’s de Guindos said the eurozone may have been in recession last quarter and prospects in the near term remain weak.
- Bank of England (BoE) Governor Bailey highlighted that it’s important to curb inflation towards its 2% target.
The EUR/GBP cross snaps the two-day winning streak during the early European trading hours on Thursday. The cross hovers around the 0.8600 mark after retreating from the weekly high of 0.8620.
The eurozone may have been in recession last quarter, and prospects in the near term remain weak, ECB Vice President Luis de Guindos said on Wednesday. Additionally, ECB’s member Isabel Schnabel said the central bank is on the right track to curb inflation while mentioning geopolitical tensions as one of the upside risks to inflation. ECB policymaker Mario Centeno said that the central bank will cut its key interest rates sooner than it recently thought and should not wait until May to make a decision.
The markets anticipate that the ECB will cut rates this year, with the first move beginning in March or April. That being said, the pricing of aggressive future rate cuts by the ECB compared to the Bank of England's (BoE) should cap the EUR/GBP’s upside.
On the British Pound front, the Bank of England (BoE) Governor Andrew Bailey said on Wednesday that it’s important to curb inflation towards its 2% target and further stated that the UK hasn’t witnessed a rise in unemployment. Bailey claimed that household income has lately increased, which has helped to ease the effect of higher interest rates.
The Industrial Output from Spain and Italy and Economic Bulletin will be due on Thursday. On Friday, traders will monitor UK Manufacturing Production, Industrial Production, and monthly Gross Domestic Product (GBP) for November. ECB Philip Lane is set to speak on Friday. Market players will take cues from the data and find trading opportunities around the EUR/GBP cross.
- GBP/USD gains ground near 1.2765, up 0.25% on the day.
- The bullish outlook of the pair remains intact above the key EMA; the RSI indicator stands in bullish territory above 50.
- The key resistance level is seen at the 1.2800–1.2805 zone; 1.2715 acts as an initial support level for GBP/USD.
The GBP/USD pair holds positive ground around 1.2765 during the early European session on Thursday. The uptick of the pair is supported by the weaker US Dollar (USD) and improved risk-on sentiment. Traders await the December US Consumer Price Index (CPI) for fresh impetus. The Core CPI is projected to grow 3.8% YoY, while headline inflation is estimated to rise 3.2% YoY versus 3.1% prior.
According to the four-hour chart, the bullish outlook of GBP/USD remains intact as the major pair holds above the 50- and 100-hour Exponential Moving Averages (EMA). Furthermore, the Relative Strength Index (RSI) stands in bullish territory above 50, suggesting the path of least resistance level is to the upside.
A decisive break above the upper boundary of the Bollinger Band at 1.2778 will pave the way to a psychological round mark and a high of December 27 at the 1.2800–1.2805 region. Further north, the next hurdle is seen near a high of December 28 at 1.2828 and a high of July 28 at 1.2888.
On the flip side, the 50-hour EMA at 1.2715 acts as an initial support level for the pair. Any follow-through selling below the latter will expose the 100-hour EMA at 1.2696, followed by the lower limit of the Bollinger Band at 1.2680.
GBP/USD four-hour chart
-638405487689087916.png)
- EUR/JPY loses ground amid the positive remarks on BoJ from the OECD.
- OECD Secretary-General Cormann expressed confidence that inflation will more persistently align with BoJ’s target.
- ECB Vice President Luis de Guindos mentioned that ECB’s future policy decisions will be data-dependent.
EUR/JPY pulls back from its six-week high at 160.00, retracing its recent profits registered on Wednesday. The EUR/JPY pair trades lower near 159.60 during the Asian session on Thursday. The remarks from Organisation for Economic Co-operation and Development (OECD) Secretary-General Mathias Cormann regarding the Bank of Japan's (BoJ) monetary policy could offer some support to the Japanese Yen (JPY).
Secretary-General Cormann conveyed a relatively optimistic outlook, suggesting confidence that inflation will more persistently align with the Bank of Japan’s (BoJ) target. He expressed the view that Japan's monetary policy can gradually and modestly initiate tightening. Although inflation is anticipated to decelerate throughout the year, wage pressures are expected to sustain it close to the BoJ target. Considering the prolonged period of very low inflation or deflation over several decades, Cormann acknowledged the BoJ's diligence in gathering all relevant data to assess the appropriate level of monetary policy tightening.
On the other side, European Central Bank (ECB) Vice President Luis de Guindos, speaking as scheduled on Wednesday, noted that the rapid pace of disinflation witnessed in 2023 is expected to decelerate in the current year. He mentioned the growth outlook is less favorable, with disappointing developments. De Guindos highlighted the uncertainty in the future and pointed to the possibility of a technical recession in the second half of 2023 as indicators pointed to an economic contraction in December. De Guindos emphasized that future decisions by the ECB will continue to be dependent on data.
On Thursday, the Japanese Cabinet Office revealed the preliminary Coincident Index for November. The index showed a contracted reading of 114.5 from the October’s figure of 115.9. ECB will publish its Economic Bulletin later in the day. Traders will likely observe German Current Account data as well.
In its quarterly review of the Japanese regional economies, the Bank of Japan (BoJ) raises the assessment for two of the country's nine regions.
Additional takeaways
BoJ cuts assessment for 1 of Japan’s 9 regions in quarterly report.
BoJ maintains assessment for 6 of Japan’s 9 regions in quarterly report.
Many regions reported on tightening job market, labor shortages among firms.
Some big firms have announced plans of wage hikes at or above last year's pace.
There are momentum for firms in regional areas to hike wages, with announcement of plans made somewhat earlier than last year.
Many firms in regional areas have yet to reach decision on rate of wage hike.
Quite a number of smaller firms in regional areas remain cautious of hiking wages due to concern over profits.
Many regions reported that there was high uncertainty on how much wage hikes will broaden.
Many firms continued to pass on higher raw material costs but pace slowing.
Market reaction
At the press time, USD/JPY is losing 0.25% on the day to trade at 145.40, unperturbed by the above BoJ findings.
Japanese Yen price today
The table below shows the percentage change of Japanese Yen (JPY) against listed major currencies today. Japanese Yen was the strongest against the US Dollar.
| USD | EUR | GBP | CAD | AUD | JPY | NZD | CHF | |
| USD | -0.07% | -0.19% | -0.14% | -0.31% | -0.24% | -0.37% | -0.14% | |
| EUR | 0.06% | -0.13% | -0.08% | -0.25% | -0.18% | -0.32% | -0.06% | |
| GBP | 0.18% | 0.12% | 0.05% | -0.12% | -0.05% | -0.19% | 0.07% | |
| CAD | 0.13% | 0.08% | -0.05% | -0.17% | -0.10% | -0.23% | 0.01% | |
| AUD | 0.30% | 0.26% | 0.13% | 0.18% | 0.08% | -0.06% | 0.19% | |
| JPY | 0.24% | 0.19% | 0.06% | 0.11% | -0.08% | -0.14% | 0.13% | |
| NZD | 0.37% | 0.34% | 0.19% | 0.23% | 0.06% | 0.13% | 0.27% | |
| CHF | 0.13% | 0.06% | -0.07% | -0.01% | -0.18% | -0.12% | -0.25% |
The heat map shows percentage changes of major currencies against each other. The base currency is picked from the left column, while the quote currency is picked from the top row. For example, if you pick the Euro from the left column and move along the horizontal line to the Japanese Yen, the percentage change displayed in the box will represent EUR (base)/JPY (quote).
Commenting on the Bank of Japan’s (BoJ) monetary policy on Thursday, OECD Secretary-General Mathias Cormann said that “there is scope for the BoJ to consequently consider the level of tightening in monetary policy.”
Additional quotes
Inflation is expected to slow over course of this year but wage pressure will keep it around the BoJ's target
In the context of several decades of very low inflation or deflation, I understand why BoJ is very keen to ensure it has all of data necessary to judge level of tightening of monetary policy
We are perhaps more optimistic that inflation will more durably settle around BoJ’s target.
Related reads
- Japanese Yen sticks to intraday gains against USD, dovish BoJ expectations to cap upside
- Ex-BOJ’s Sakurai: Bank of Japan is fully prepared to end negative rates in April 2024
- USD/CHF trades with a negative bias for the second straight day amid a softer USD.
- The Fed rate-cut uncertainty might hold back traders from placing directional bets.
- A positive risk tone could undermine the CHF and limit losses ahead of the US CPI.
The USD/CHF pair drifts lower for the second straight day on Thursday and slips below the 0.8500 psychological mark during the Asian session. Spot prices, however, remain confined in a familiar trading band held over the past two weeks or so as traders keenly await the release of the latest US consumer inflation figures before placing fresh directional bets.
Heading into the key US data risks, the US Dollar (USD) remains depressed in a one-week-old range amid the uncertainty over the Federal Reserve's (Fed) rate-cut path and is seen exerting some pressure on the USD/CHF pair. That said, the incoming US macro data underscored the fundamental resilience of the American economy. This, along with mixed signals from several Fed officials, forced investors to scale back expectations for a more aggressive policy easing in 2024.
In fact, New York Fed President John Williams said on Wednesday that the US central bank is in a ‘good place’ and has time to think about what’s next for rates, though would eventually need to get policy back to more neutral levels. In contrast, Atlanta Fed President Raphael Bostic earlier this week noted that the central bank still needs to give tight policy time to work on cooling off inflation, which has declined more than expected, and sees two 25 bps cuts by the year-end.
Nevertheless, diminishing odds for an imminent Fed rate cut in March allow the yield on the benchmark 10-year US government bond to hold steady above the 4.0% threshold and support prospects for the emergence of some USD dip-buying. Apart from this, a generally positive tone around the equity markets is likely to undermine the safe-haven Swiss Franc (CHF) and help limit deeper losses for the USD/CHF pair, warranting caution for aggressive bearish traders.
Investors might also prefer to wait for the release of the latest US consumer inflation figures, due later during the early North American session, which will influence the Fed's future rate decisions. This, in turn, will play a key role in driving the USD demand and determining the next leg of a directional move for the USD/CHF pair.
Technical levels to watch
- EUR/USD gains upward traction as the US Dollar declines on improved risk appetite.
- The breakthrough above the barrier at 1.1000 could lead the pair to revisit the previous week's high at 1.1038.
- The major support at 1.0950 could be retested as MACD suggests tepid momentum.
EUR/USD extends its gains on the second consecutive day, trading around 1.0980 during the Asian session on Thursday. The EUR/USD pair receives upward support as US Dollar (USD) faces challenges on risk-on market mood ahead of the US Consumer Price Index (CPI data.
The EUR/USD pair may encounter resistance at the psychological level of 1.1000. If there is a breakthrough above this level, it could potentially support the pair to revisit the previous week's high at 1.1038. Notably, the 14-day Relative Strength Index (RSI) for the EUR/USD pair has moved back above the 50 mark, indicating a bullish momentum in the market.
However, the Moving Average Convergence Divergence (MACD) line, though positioned above the centerline, is still below the signal line. This suggests a subdued momentum in the EUR/USD pair. Traders may exercise caution and await confirmation before making decisions in the pair, considering the mixed signals provided by the lagging indicator.
On the downside, the EUR/USD pair might revisit the immediate support at the major level of 1.0950, subsequent to testing the psychological level of 1.0900. A decisive breach of the latter could intensify downward pressure on the pair, potentially directing it towards the 50-day Exponential Moving Average (EMA) at 1.0888 and the 38.2% Fibonacci retracement level at 1.0867. A further downside could lead to a significant support level at 1.0850.
EUR/USD: Daily Chart
-638405432441102012.png)
- Gold price catches fresh bids on Thursday, although it remains well within a familiar trading range.
- A softer USD, geopolitical risks and China’s economic woes act as a tailwind for the XAU/USD.
- The Fed rate-cut uncertainty should cap any meaningful gains ahead of the crucial US CPI report.
Gold price (XAU/USD) attracts fresh buyers during the Asian session on Thursday and stalls the previous day's retracement slide from the $2,040-2,042 supply zone. The precious metal, however, remains confined in a multi-day-old trading range and within the striking distance of a multi-week low touched on Monday as traders seek clarity about the Federal Reserve's (Fed) rate-cut path before placing directional bets. Hence, the market focus will remain glued to the release of the latest consumer inflation figures from the United States (US).
Heading into the key data risk, the US Dollar (USD) is seen extending its consolidative price move in a familiar range amid the uncertainty over the timing of when the Fed will start cutting interest rates. This, along with geopolitical risks and China's economic woes, keeps a floor on the safe-haven Gold price. However, investors have been scaling back their bets for a more aggressive policy easing by the Fed in the wake of the US economic resilience. This remains supportive of elevated US Treasury bond yields and should cap the non-yielding yellow metal.
Daily Digest Market Movers: Gold price benefits from softer US Dollar as traders await US CPI
- The uncertainty over the Federal Reserve's rate-cut path keeps the US Dollar bulls on the defensive and assists the Gold price in gaining some positive traction amid some repositioning trade ahead of the US consumer inflation figures.
- The markets were quick to react to the Fed's surprising dovish tilt at the December policy meeting and are now pricing in five interest rate cuts by the end of 2024, summing up to a cumulative of around 150 basis points (bps) of easing.
- The incoming US macro data underscored the fundamental resilience of the American economy, which, along with mixed signals from Fed officials, forced investors to scale back their expectations for more aggressive policy easing.
- New York Fed President John Williams said on Wednesday that the US central bank is in a ‘good place’ and has time to think about what’s next for rates, though would eventually need to get policy back to more neutral levels.
- The yield on the benchmark 10-year US government bond holds steady above the 4.0% threshold and should cap any further gains for the non-yielding yellow metal ahead of the crucial US CPI report, due for release later today.
- The headline US CPI is expected to rise by 0.2% in December, lifting the yearly rate to 3.2% from 3.1%, while the core gauge (excluding food and energy prices) is anticipated to ease to 3.8% YoY from 4.0% in the previous month.
- Cooler-than-expected inflation data will give the Fed more reason to cut interest rates this year and turn out to be a negative trigger for the Greenback, which, in turn, should lead to a fresh leg up for the precious metal.
- Conversely, a stronger US CPI print should provide the US central bank more headroom to keep interest rates higher for longer and boost the buck, forcing the XAU/USD to break through a multi-week low touched on Monday.
Technical Analysis: Gold price needs to break through $2,040-2,042 hurdle to attract buyers
From a technical perspective, any subsequent move up might continue to confront stiff resistance near the $2,040-2,042 region. A sustained strength beyond has the potential to lift the Gold price further towards last Friday's swing high, around the $2,064 area en route to the $2,077 area. Some follow-through buying will negate any near-term negative outlook and set the stage for a move towards reclaiming the $2,100 round figure.
On the flip side, the $2,020 level, followed by the multi-week low around the $2,017-2,016 area and the 50-day Simple Moving Average (SMA), currently near the $2,013 region should protect any meaningful slide. A convincing break below the latter will be seen as a fresh trigger for bearish traders and drag the Gold price to the $2,000 psychological mark. Given that oscillators on the daily chart have just started gaining negative traction, the downward trajectory could extend further towards the December swing low, around the $1,973 region. The XAU/USD might eventually drop to the $1,965-1,963 confluence, comprising the 100- and 200-day SMAs.
US Dollar price today
The table below shows the percentage change of US Dollar (USD) against listed major currencies today. US Dollar was the weakest against the New Zealand Dollar.
| USD | EUR | GBP | CAD | AUD | JPY | NZD | CHF | |
| USD | -0.05% | -0.17% | -0.13% | -0.29% | -0.21% | -0.30% | -0.13% | |
| EUR | 0.05% | -0.12% | -0.08% | -0.25% | -0.17% | -0.26% | -0.07% | |
| GBP | 0.16% | 0.12% | 0.04% | -0.14% | -0.05% | -0.16% | 0.04% | |
| CAD | 0.14% | 0.09% | -0.03% | -0.15% | -0.08% | -0.16% | 0.02% | |
| AUD | 0.29% | 0.26% | 0.14% | 0.17% | 0.10% | -0.01% | 0.18% | |
| JPY | 0.21% | 0.16% | 0.04% | 0.06% | -0.09% | -0.11% | 0.08% | |
| NZD | 0.30% | 0.29% | 0.15% | 0.18% | 0.00% | 0.09% | 0.21% | |
| CHF | 0.11% | 0.08% | -0.04% | -0.01% | -0.18% | -0.09% | -0.19% |
The heat map shows percentage changes of major currencies against each other. The base currency is picked from the left column, while the quote currency is picked from the top row. For example, if you pick the Euro from the left column and move along the horizontal line to the Japanese Yen, the percentage change displayed in the box will represent EUR (base)/JPY (quote).
Gold FAQs
Why do people invest in Gold?
Gold has played a key role in human’s history as it has been widely used as a store of value and medium of exchange. Currently, apart from its shine and usage for jewelry, the precious metal is widely seen as a safe-haven asset, meaning that it is considered a good investment during turbulent times. Gold is also widely seen as a hedge against inflation and against depreciating currencies as it doesn’t rely on any specific issuer or government.
Who buys the most Gold?
Central banks are the biggest Gold holders. In their aim to support their currencies in turbulent times, central banks tend to diversify their reserves and buy Gold to improve the perceived strength of the economy and the currency. High Gold reserves can be a source of trust for a country’s solvency. Central banks added 1,136 tonnes of Gold worth around $70 billion to their reserves in 2022, according to data from the World Gold Council. This is the highest yearly purchase since records began. Central banks from emerging economies such as China, India and Turkey are quickly increasing their Gold reserves.
How is Gold correlated with other assets?
Gold has an inverse correlation with the US Dollar and US Treasuries, which are both major reserve and safe-haven assets. When the Dollar depreciates, Gold tends to rise, enabling investors and central banks to diversify their assets in turbulent times. Gold is also inversely correlated with risk assets. A rally in the stock market tends to weaken Gold price, while sell-offs in riskier markets tend to favor the precious metal.
What does the price of Gold depend on?
The price can move due to a wide range of factors. Geopolitical instability or fears of a deep recession can quickly make Gold price escalate due to its safe-haven status. As a yield-less asset, Gold tends to rise with lower interest rates, while higher cost of money usually weighs down on the yellow metal. Still, most moves depend on how the US Dollar (USD) behaves as the asset is priced in dollars (XAU/USD). A strong Dollar tends to keep the price of Gold controlled, whereas a weaker Dollar is likely to push Gold prices up.
- Indian Rupee attracts some buyers on the weaker USD and robust foreign inflows.
- India is on track to become one of the top three global economies, Indian Prime Minister Modi said.
- The US Consumer Price Index (CPI) for December will be a closely watched event on Thursday.
Indian Rupee (INR) trades on a positive note on Thursday, supported by robust foreign inflows. On Wednesday, India’s Prime Minister Narendra Modi stated that India is set to become one of the top three global economies. Modi acknowledged India's economic development as a decade of structural reforms that improved the country's capacity and competitiveness amid global headwinds.
The highlight on Thursday will be the US inflation report, as measured by the Consumer Price Index (CPI). The stronger-than-expected inflation data could lift the US Dollar and potentially delay a rate cut from the Federal Reserve (Fed). On Friday, attention will shift to the December Indian CPI, Industrial Production, and Manufacturing Output.
Daily Digest Market Movers: Indian Rupee remains strong amid challenges from external factors
- The World Bank kept its FY25 economic growth projection for India unchanged at 6.4%, owing to strong domestic demand, rising public infrastructure spending, and strong private-sector credit growth.
- Bloomberg Index Services proposed including eligible Indian bonds in its emerging market local currency index from September.
- Finance Minister Nirmala Sitharaman said on Wednesday that India is estimated to be a $5 trillion economy by 2027–28 and become the third largest economy.
- New York Federal Reserve (Fed) President John Williams said that interest rates in the US will likely need to stay high “for some time” until the central bank is confident that inflation is returning to 2%.
- Atlanta Fed Bank President Raphael Bostic emphasized that monetary policy needs to stay tight while inflation remains above the 2% target. Fed’s Bowman stated that the policy is sufficiently restrictive.
- The US Consumer Price Index (CPI) data for December will be due on Thursday at 13:30 GMT. The Core CPI is estimated to show an increase of 3.8% YoY, while headline inflation is projected to grow 3.2% YoY versus 3.1% prior.
Technical Analysis: Indian Rupee could see a downleg in the shorter term
Indian Rupee trades strongly on the day. The USD/INR pair remains stuck within a multi-month trading range between 82.80 and 83.40. According to the daily chart, USD/INR resumes a bearish outlook in the shorter timeframe as the pair holds below the key 100-period Exponential Moving Average (EMA). Additionally, the downward momentum is supported by the 14-day Relative Strength Index (RSI) that stands below the 50.0 midpoint.
A breach below the 83.00 psychological level will see a drop to the critical contention level at 82.80, portraying the confluence of the lower limit of the trading range and a low of September 12. Further south, the next downside target is located at a low of August 11 at 82.60. On the other hand, the immediate resistance level for USD/INR will emerge near the upper boundary of the trading range at 83.40. A break above 83.40 will expose a 2023 high of 83.47, followed by the psychological figure at 84.00.
US Dollar price today
The table below shows the percentage change of US Dollar (USD) against listed major currencies today. US Dollar was the weakest against the Australian Dollar.
| USD | EUR | GBP | CAD | AUD | JPY | NZD | CHF | |
| USD | -0.06% | -0.17% | -0.13% | -0.30% | -0.22% | -0.29% | -0.15% | |
| EUR | 0.06% | -0.12% | -0.08% | -0.25% | -0.17% | -0.25% | -0.07% | |
| GBP | 0.16% | 0.12% | 0.05% | -0.12% | -0.04% | -0.13% | 0.06% | |
| CAD | 0.13% | 0.07% | -0.05% | -0.18% | -0.10% | -0.16% | 0.00% | |
| AUD | 0.29% | 0.25% | 0.14% | 0.17% | 0.09% | 0.00% | 0.17% | |
| JPY | 0.21% | 0.16% | 0.04% | 0.07% | -0.08% | -0.06% | 0.08% | |
| NZD | 0.29% | 0.26% | 0.12% | 0.15% | -0.01% | 0.07% | 0.15% | |
| CHF | 0.13% | 0.06% | -0.06% | -0.01% | -0.17% | -0.10% | -0.16% |
The heat map shows percentage changes of major currencies against each other. The base currency is picked from the left column, while the quote currency is picked from the top row. For example, if you pick the Euro from the left column and move along the horizontal line to the Japanese Yen, the percentage change displayed in the box will represent EUR (base)/JPY (quote).
Indian Rupee FAQs
What are the key factors driving the Indian Rupee?
The Indian Rupee (INR) is one of the most sensitive currencies to external factors. The price of Crude Oil (the country is highly dependent on imported Oil), the value of the US Dollar – most trade is conducted in USD – and the level of foreign investment, are all influential. Direct intervention by the Reserve Bank of India (RBI) in FX markets to keep the exchange rate stable, as well as the level of interest rates set by the RBI, are further major influencing factors on the Rupee.
How do the decisions of the Reserve Bank of India impact the Indian Rupee?
The Reserve Bank of India (RBI) actively intervenes in forex markets to maintain a stable exchange rate, to help facilitate trade. In addition, the RBI tries to maintain the inflation rate at its 4% target by adjusting interest rates. Higher interest rates usually strengthen the Rupee. This is due to the role of the ‘carry trade’ in which investors borrow in countries with lower interest rates so as to place their money in countries’ offering relatively higher interest rates and profit from the difference.
What macroeconomic factors influence the value of the Indian Rupee?
Macroeconomic factors that influence the value of the Rupee include inflation, interest rates, the economic growth rate (GDP), the balance of trade, and inflows from foreign investment. A higher growth rate can lead to more overseas investment, pushing up demand for the Rupee. A less negative balance of trade will eventually lead to a stronger Rupee. Higher interest rates, especially real rates (interest rates less inflation) are also positive for the Rupee. A risk-on environment can lead to greater inflows of Foreign Direct and Indirect Investment (FDI and FII), which also benefit the Rupee.
How does inflation impact the Indian Rupee?
Higher inflation, particularly, if it is comparatively higher than India’s peers, is generally negative for the currency as it reflects devaluation through oversupply. Inflation also increases the cost of exports, leading to more Rupees being sold to purchase foreign imports, which is Rupee-negative. At the same time, higher inflation usually leads to the Reserve Bank of India (RBI) raising interest rates and this can be positive for the Rupee, due to increased demand from international investors. The opposite effect is true of lower inflation.
- NZD/USD retraces its recent losses on risk-on market mood.
- New Zealand's Building Permits MoM fell by 10.6% versus the previous increase of 8.5%.
- Downbeat US Treasury yields contributed to undermining the US Dollar.
NZD/USD snaps a two-day losing streak on Thursday, improving to near 0.6240 during the Asian session. The New Zealand Dollar (NZD) moves on an upward trajectory despite a leading housing market indicator showing a decline in the number of permits for new construction projects in the country.
New Zealand's seasonally adjusted Building Permits (MoM) experienced a significant decline in November 2023, falling by 10.6%, a 15-month low against the previous reading of an 8.5% increase. The new permits for the month registered a 24% decrease. The annualized number of new home consents is on a continued decline from the all-time peak of 51,015 recorded for the year ending May 2022.
The US Dollar Index (DXY) moves on a downward trend, influenced by softer US Treasury yields. The DXY trades lower near 102.30, with 2-year and 10-year yields on US bond coupons standing at 4.36% and 4.02%, respectively, by the press time.
Additionally, traders are displaying an enhanced risk appetite, speculating on the likelihood of five rate cuts in 2024. Furthermore, New York Federal Reserve (Fed) President John Williams noted on Wednesday that financial markets continue to be highly reactive to new data. Williams conveyed assurance in the Fed's present stance and proposed that it is an appropriate time to deliberate on the future path of interest rates.
The December's Consumer Price Index (CPI) data from the United States (US) is scheduled to be released later in the North American session. This economic indicator carries substantial importance in evaluating inflationary pressures and holds the potential to significantly influence market expectations regarding the monetary policy stance of the US Federal Reserve.
- The US Consumer Price Index is set to rise 3.2% YoY in December, up from November’s 3.1% increase.
- Annual Core CPI inflation is expected to edge lower to 3.8% in December.
- The US Dollar’s fate hinges on the CPI data amid dovish Fed expectations.
The high-impact US Consumer Price Index (CPI) inflation data for December will be published by the Bureau of Labor Statistics (BLS) on Thursday at 13:30 GMT. Inflation data could alter the market’s pricing of the Federal Reserve (Fed) interest rate cuts later this year, fuelling extreme volatility around the US Dollar (USD).
What to expect in the next CPI data report?
The US Consumer Price Index is forecast to rise at an annual pace of 3.2% in December, a tad quicker than the 3.1% increase reported in November. The Core CPI inflation, which excludes volatile food and energy prices, is set to fall to 3.8% in the same period, compared with the previous growth of 4.0%.
The monthly CPI and the Core CPI are seen increasing 0.2% and 0.3%, respectively.
In November, the US CPI numbers came in line with the market expectations, but the details of the report showed an uptick in the shelter index and used car and trucks index, which helped push back against the market’s pricing of Fed rate cuts next year.
Used car prices dropped 0.5% in December, dragging the Manheim Used Vehicle Index down 7.0% year-over-year (YoY), the monthly market report published by the auction house Manheim showed Tuesday.
Previewing the US December inflation report, “our forecasts for the December CPI report suggest core inflation slowed notably: we are projecting a “strong” 0.1% increase, notably down from 0.3% m/m in the last report,” said TD Securities analysts.
“Despite that, we look for strengthening in the headline to 0.2% m/m, as inflation won't be aided by falling energy prices this time around. In the details, the report is likely to show that the goods segment remained an important drag on core inflation, while the shelter components are expected to remain sticky,” the analysts added.
Meanwhile, the Prices Paid Index of the ISM Services PMI survey edged slightly lower to 57.4 in December from 58.3 a month earlier. The Prices Paid Index of the Manufacturing PMI dropped to 45.2 in December from 49.9 in November. These readings portrayed the continued softening of price pressures in the services sector, and signaled sharper price declines in the manufacturing industry.
As Fed officials maintained their data-dependent stance on monetary policy, the US CPI inflation data holds the key to gauging the timing and the pace of the Fed rate cuts, which could significantly influence the value of the US Dollar. The details of the report could also highlight the sticky parts of inflation.
Heading into the US CPI showdown, the CME Group FedWatch Tool shows that markets are pricing in a 66% probability of the Fed announcing rate cuts as early as March. “The Bloomberg's World Interest Rate Probability (WIRP) function suggests 5% odds of a cut on January 31 and rising to nearly 75% for the March 20 meeting after being nearly priced in at the start of last week. Five rate cuts are priced in vs. six at the start of last week, though there are still 50% odds of a sixth cut,” analysts at BBH noted.
How could the US Consumer Price Index report affect EUR/USD?
Although the annual CPI and Core CPI figures are widely cited by the media, the monthly inflation data, especially the Core CPI, is likely to stir markets.
A monthly core inflation reading of 0.3% or higher could prompt investors to dial down their bets on March Fed rate cuts, offering a fresh boost to the US Dollar. On the other hand, a softer-than-expected Core CPI print could trigger a broad USD sell-off, as it would reverberate Fed rate cut expectations in the first quarter of 2024.
Dhwani Mehta, Asian Session Lead Analyst at FXStreet, offers a brief technical outlook for EUR/USD and explains: “The pair is consolidating Friday’s volatile trading action at around the 1.0900 level heading into the inflation data release on Thursday. The 14-day Relative Strength Index (RSI) indicator is trading listlessly at the midline, suggesting a lack of clear directional bias at the time of writing.”
On the upside, stiff resistance aligns at the 21-day Simple Moving Average (SMA) at 1.0975, above which the EUR/USD pair needs to find acceptance at the 1.1000 round level. The next relevant topside barrier is seen at the January 2 high of 1.1046.
Alternatively, a sustained move below the 50-day SMA of 1.0885 will threaten the horizontal 200-day SMA at 1.0847. A test of the 100-day SMA at 1.0764 cannot be ruled out if the above healthy support levels give way.”
Economic Indicator
United States Consumer Price Index (YoY)
Inflationary or deflationary tendencies are measured by periodically summing the prices of a basket of representative goods and services and presenting the data as The Consumer Price Index (CPI). CPI data is compiled on a monthly basis and released by the US Department of Labor Statistics. The YoY reading compares the prices of goods in the reference month to the same month a year earlier.The CPI is a key indicator to measure inflation and changes in purchasing trends. Generally speaking, a high reading is seen as bullish for the US Dollar (USD), while a low reading is seen as bearish.
Read more.Next release: 01/11/2024 13:30:00 GMT
Frequency: Monthly
Source: US Bureau of Labor Statistics
Why it matters to traders
The US Federal Reserve has a dual mandate of maintaining price stability and maximum employment. According to such mandate, inflation should be at around 2% YoY and has become the weakest pillar of the central bank’s directive ever since the world suffered a pandemic, which extends to these days. Price pressures keep rising amid supply-chain issues and bottlenecks, with the Consumer Price Index (CPI) hanging at multi-decade highs. The Fed has already taken measures to tame inflation and is expected to maintain an aggressive stance in the foreseeable future.
Inflation FAQs
What is inflation?
Inflation measures the rise in the price of a representative basket of goods and services. Headline inflation is usually expressed as a percentage change on a month-on-month (MoM) and year-on-year (YoY) basis. Core inflation excludes more volatile elements such as food and fuel which can fluctuate because of geopolitical and seasonal factors. Core inflation is the figure economists focus on and is the level targeted by central banks, which are mandated to keep inflation at a manageable level, usually around 2%.
What is the Consumer Price Index (CPI)?
The Consumer Price Index (CPI) measures the change in prices of a basket of goods and services over a period of time. It is usually expressed as a percentage change on a month-on-month (MoM) and year-on-year (YoY) basis. Core CPI is the figure targeted by central banks as it excludes volatile food and fuel inputs. When Core CPI rises above 2% it usually results in higher interest rates and vice versa when it falls below 2%. Since higher interest rates are positive for a currency, higher inflation usually results in a stronger currency. The opposite is true when inflation falls.
What is the impact of inflation on foreign exchange?
Although it may seem counter-intuitive, high inflation in a country pushes up the value of its currency and vice versa for lower inflation. This is because the central bank will normally raise interest rates to combat the higher inflation, which attract more global capital inflows from investors looking for a lucrative place to park their money.
How does inflation influence the price of Gold?
Formerly, Gold was the asset investors turned to in times of high inflation because it preserved its value, and whilst investors will often still buy Gold for its safe-haven properties in times of extreme market turmoil, this is not the case most of the time. This is because when inflation is high, central banks will put up interest rates to combat it.
Higher interest rates are negative for Gold because they increase the opportunity-cost of holding Gold vis-a-vis an interest-bearing asset or placing the money in a cash deposit account. On the flipside, lower inflation tends to be positive for Gold as it brings interest rates down, making the bright metal a more viable investment alternative.
- WTI price gains upward traction on concerns about supply disruptions in the Red Sea.
- UN Security Council passed a resolution demanding Yemen's Houthis end attacks on ships in the Red Sea.
- Houthis expressed criticism of the United Nations resolution regarding Red Sea navigation.
- EIA Crude Oil Stocks Change rose by 1.338M barrels versus an expected decline of 0.675M.
West Texas Intermediate (WTI) price retraces its recent losses, trading higher near $71.70 per barrel during the Asian session on Thursday. Crude oil prices are gaining upward momentum due to concerns about potential supply disruptions following recent developments where Yemen's Houthis criticized the United Nations (UN) resolution on Red Sea navigation.
The UN Security Council has adopted a resolution calling on Yemen's Houthis to halt attacks on ships in the Red Sea and release the Japanese-operated vessel, Galaxy Leader, seized in November. Eleven council members voted for the measure on Wednesday, urging the Iran-aligned Houthis to "immediately cease all attacks, which impede global commerce and navigational rights and freedoms as well as regional peace." The resolution implicitly supported a United States (US)-led task force that has been defending vessels, while also urging caution to prevent an escalation of tensions.
In response, Mohammed Ali al-Houthi, the head of Yemen's Houthi supreme revolutionary committee, expressed a different perspective in a post on the media platform X (formerly known as Twitter) on Thursday. He dismissed the UN resolution on Red Sea navigation as a "political game" and accused the United States of violating international law.
On Wednesday, the Energy Information Administration (EIA) released the updated data on US Crude Oil Stocks Change for the week ending on January 5. The report revealed a notable increase in Crude oil stock, exerting downward pressure on the WTI price. The Crude oil stocks climbed by 1.338 million barrels, contrary to the expected decline of 0.675 million barrels, offsetting the previous week's decrease of 5.503 million barrels.
However, Crude oil prices saw an uptick following the release of US crude stock data on Tuesday, indicating a reduction. The American Petroleum Institute (API) published its Weekly Crude Oil Stock report, revealing a decline of 5.215 million barrels, surpassing the anticipated drop of 1.2 million barrels. This contrasts with the previous reading, which showed a substantial decline of 7.418 million barrels.
| Raw materials | Closed | Change, % |
|---|---|---|
| Silver | 22.883 | -0.41 |
| Gold | 2024.266 | -0.32 |
| Palladium | 998.2 | 1.46 |
- USD/CAD drifts lower for the second straight day and is pressured by a combination of factors.
- An uptick in Oil prices underpins the Loonie and weighs on the pair amid subdued USD demand.
- The downside potential seems limited as traders keenly await the release of the US CPI report.
The USD/CAD pair remains under some selling pressure for the second straight day on Thursday and moves further away from a nearly four-week high, around the 1.3415 region touched on Tuesday. Spot prices currently trade around the 1.3365-1.3360 area, down just over 0.10% for the day, as traders now look to the latest US consumer inflation figures for a fresh impetus.
The crucial US CPI report will influence the Federal Reserve's (Fed) future policy decisions, which, in turn, should drive the US Dollar (USD) demand and provide a fresh directional impetus to the USD/CAD pair. Heading into the key US data risk, the buck extends its consolidative price move and remains confined in a one-week-old trading range amid the uncertainty over the timing of when the US central bank will start cutting interest rates. Apart from this, a positive risk tone is seen as another factor denting the Greenback's relative safe-haven status and exerting some pressure on the currency pair.
Meanwhile, an uptick in Crude Oil prices is seen underpinning the commodity-linked Loonie and contributing to the offered tone surrounding the USD/CAD pair. That said, any meaningful upside for the black liquid, however, seems elusive in the wake of the bearish fundamental backdrop. The Energy Information Administration (EIA) report on Wednesday showed an unexpected weekly build in US inventories added to fears that global oil consumption will slow in 2024. This, to a larger extent, offsets worries about potential disruptions in Middle Eastern supplies and should act as a headwind for Oil prices.
Apart from this, diminishing odds for a more aggressive policy easing by the Fed, which remains supportive of elevated US Treasury bond yields, favours the USD bulls and contributes to limiting losses for the USD/CAD pair. Hence, it will be prudent to wait for strong follow-through selling before confirming that the recent strong recovery move from the 1.3175 region, or a multi-month low touched in late December has run its course and positioning for any further losses.
Technical levels to watch
- GBP/USD extends the rally to 1.2760 amid the risk-on mood.
- New York Federal Reserve (Fed) President Williams speaks on the 2024 economic outlook.
- BoE Governor Andrew Bailey said that he hoped that the recent fall in the cost of mortgages would continue.
- Traders will closely focus on the December US Consumer Price Index (CPI) on Thursday.
The GBP/USD pair gains momentum above the mid-1.2700s during the early Asian session on Thursday. The US Dollar (USD) weakness and risk-on environment lend some support to the major pair ahead of the key US inflation data, due later on Thursday. GBP/USD currently trades around 1.2760, up 0.21% on the day.
Late Wednesday, New York Federal Reserve (Fed) President Williams spoke on the 2024 economic outlook. Williams said that US interest rates will need to remain high "for some time" until central bank authorities are sure that inflation will return to the 2% target. According to the WIRP, the markets have priced in 5% odds of a rate cut on January 31 and nearly 70% possibility of rate cuts on March 20. This, in turn, might exert some selling pressure on the Greenback and act as a tailwind for the GBP/USD pair.
The Bank of England (BoE) Governor Andrew Bailey said on Wednesday that he hoped that the recent fall in the cost of mortgages would continue. However, the BoE Governor has given no hints regarding the path of interest rates, as he reaffirmed the need to bring inflation down. Meanwhile, an external member of the BOE’s Financial Policy Committee, Jonathan Hall stated on Wednesday that exuberance as interest rates fall and growth recovers is one of the biggest risks to financial stability this year.
Market players will focus on the December US inflation data, as measured by the Consumer Price Index (CPI), due later on Thursday. On Friday, the UK Manufacturing Production, Industrial Production, and monthly Gross Domestic Product for November will be released. These figures could give a clear direction to the GBP/USD pair.
- The Japanese Yen gains positive traction on Thursday and snaps a two-day losing streak.
- The Fed rate-cut uncertainty keeps the USD bulls on the defensive and benefits the JPY.
- Traders might refrain from placing fresh directional bets ahead of the key US CPI report.
The Japanese Yen (JPY) edges higher during the Asian session on Thursday and recovers a part of the previous day's heavy losses back closer to the monthly low against the US Dollar (USD). The uptick lacked any obvious fundamental catalyst and could be attributed to some repositioning trade ahead of the latest consumer inflation figures from the United States (USD), due later today. The crucial US Consumer Price Index (CPI) report could determine the Federal Reserve's (Fed) monetary policy path, which, in turn, will drive the USD demand and provide a fresh directional impetus to the USD/JPY pair.
Heading into the key data risk, the uncertainty over the likely speed and magnitude of the interest rate cuts by the Fed holds back traders from placing aggressive USD directional bets. Meanwhile, the recent devastating earthquake in central Japan, falling rates of inflation in Tokyo – Japan’s capital city – and weak wage data might have already delayed the Bank of Japan's (BoJ) plan to pivot away from its ultra-dovish monetary policy settings. This, along with the upbeat market mood, should contribute to capping any further gains for the safe-haven JPY and limiting the downside for the USD/JPY pair.
Daily Digest Market Movers: Japanese Yen might struggle to build on intraday gains amid dovish BoJ expectations
- The Japanese Yen attracts some buyers on Thursday as traders opt to lighten their bearish bets and prefer to wait for the release of the latest US consumer inflation figures later during the North American session.
- The headline US CPI is expected to rise by 0.2% in December, lifting the yearly rate to 3.2% from 3.1%, while the core gauge (excluding food and energy prices) is anticipated to ease to 3.8% YoY from 4.0% previous.
- The crucial inflation data will play a key role in influencing the Fed's future policy decisions amid the uncertainty over the timing of the first interest rate cut and drive the US Dollar demand in the near term.
- Japan's Labour Ministry reported on Wednesday that inflation-adjusted real wages fell by 3.0% in November from a year earlier and nominal pay grew by 0.2% in November – the slowest in nearly two years.
- Data released on Tuesday showed that Tokyo's core CPI decelerated to the 2.1% YoY rate in December and matched a low hit in June 2022, dampening hopes for a hawkish pivot by the Bank of Japan.
- The BoJ regards wage trends and inflation outlooks as key factors in considering the dismantling of its negative rate policy.
- A generally positive tone around the equity markets could further undermine the JPY's relative safe-haven status and help limit any meaningful downside for the USD/JPY pair ahead of the key US data risk.
Technical Analysis: USD/JPY bulls need to wait for a sustained move beyond 146.00 before placing fresh bets
From a technical perspective, the recent repeated failures ahead of the 146.00 mark make it prudent to wait for a sustained strength beyond the said handle before positioning for any further gains. Given that oscillators on the daily chart have just started gaining positive traction, the USD/JPY pair might then climb to the 146.55-146.60 hurdle. The momentum could extend further towards the 147.00 mark, above which bulls might aim to challenge the 100-day Simple Moving Average (SMA), currently around the 147.45-147.50 region.
On the flip side, any further decline might now attract fresh buyers and remain limited near the 145.00 psychological mark. That said, a convincing break below will expose the next relevant support near the 144.65 horizontal zone. This is followed by the 144.20 area and the 144.00 round-figure mark, below which the USD/JPY pair could slide to the 200-day SMA, currently near the 143.45-143.40 region. Some follow-through selling will shift the near-term bias back in favour of bearish traders and drag spot prices below the 143.00 mark, towards the 142.45 support.
Japanese Yen price today
The table below shows the percentage change of Japanese Yen (JPY) against listed major currencies today. Japanese Yen was the strongest against the US Dollar.
| USD | EUR | GBP | CAD | AUD | JPY | NZD | CHF | |
| USD | -0.02% | -0.10% | -0.08% | -0.17% | -0.17% | -0.17% | -0.09% | |
| EUR | 0.02% | -0.09% | -0.07% | -0.15% | -0.15% | -0.16% | -0.06% | |
| GBP | 0.08% | 0.08% | 0.01% | -0.07% | -0.07% | -0.09% | 0.02% | |
| CAD | 0.08% | 0.06% | -0.02% | -0.09% | -0.08% | -0.09% | 0.00% | |
| AUD | 0.17% | 0.16% | 0.09% | 0.10% | 0.02% | 0.00% | 0.09% | |
| JPY | 0.17% | 0.15% | 0.06% | 0.07% | -0.01% | -0.02% | 0.07% | |
| NZD | 0.17% | 0.18% | 0.08% | 0.09% | 0.00% | 0.00% | 0.11% | |
| CHF | 0.08% | 0.06% | -0.02% | 0.00% | -0.09% | -0.09% | -0.09% |
The heat map shows percentage changes of major currencies against each other. The base currency is picked from the left column, while the quote currency is picked from the top row. For example, if you pick the Euro from the left column and move along the horizontal line to the Japanese Yen, the percentage change displayed in the box will represent EUR (base)/JPY (quote).
Japanese Yen FAQs
What key factors drive the Japanese Yen?
The Japanese Yen (JPY) is one of the world’s most traded currencies. Its value is broadly determined by the performance of the Japanese economy, but more specifically by the Bank of Japan’s policy, the differential between Japanese and US bond yields, or risk sentiment among traders, among other factors.
How do the decisions of the Bank of Japan impact the Japanese Yen?
One of the Bank of Japan’s mandates is currency control, so its moves are key for the Yen. The BoJ has directly intervened in currency markets sometimes, generally to lower the value of the Yen, although it refrains from doing it often due to political concerns of its main trading partners. The current BoJ ultra-loose monetary policy, based on massive stimulus to the economy, has caused the Yen to depreciate against its main currency peers. This process has exacerbated more recently due to an increasing policy divergence between the Bank of Japan and other main central banks, which have opted to increase interest rates sharply to fight decades-high levels of inflation.
How does the differential between Japanese and US bond yields impact the Japanese Yen?
The BoJ’s stance of sticking to ultra-loose monetary policy has led to a widening policy divergence with other central banks, particularly with the US Federal Reserve. This supports a widening of the differential between the 10-year US and Japanese bonds, which favors the US Dollar against the Japanese Yen.
How does broader risk sentiment impact the Japanese Yen?
The Japanese Yen is often seen as a safe-haven investment. This means that in times of market stress, investors are more likely to put their money in the Japanese currency due to its supposed reliability and stability. Turbulent times are likely to strengthen the Yen’s value against other currencies seen as more risky to invest in.
- Australian Dollar gains ground on improved risk-on sentiment.
- Australian Trade Balance rose to 11,437M against the market expectation of 7,500M.
- US Dollar faces downward pressure as traders price in the possibility of five rate cuts in 2024.
The Australian Dollar (AUD) gains upward traction for the second successive day on Thursday. The improved risk-on sentiment puts pressure on the US Dollar (USD), which in turn, supports the AUD/USD pair. Additionally, the upbeat Aussie Trade Balance data could also provide support to underpinning the Aussie Dollar (AUD).
Australia's trade surplus widened to 11,437 million month-on-month in December, surpassing the market expectation of 7,500 million and exceeding the previous reading of 7,129 million, according to the latest report from the Bureau of Statistics. While the economic signals in Australia offer a diverse perspective, with the Monthly Consumer Price Index for November showing a slight decrease and Retail Sales indicating an increase, lower-than-expected inflation figures in Australia also contribute to the perception of a potential pause by the RBA at its next February meeting.
The US Dollar Index (DXY) experiences a decline, attributed to weaker US Treasury yields. Additionally, an improved risk appetite among traders is evident as they speculate on the possibility of five rate cuts in 2024. New York Federal Reserve (Fed) President John Williams remarked on Wednesday that financial markets remain highly responsive to new data. Williams expressed confidence in the Fed's current position and suggested that it is now opportune to contemplate the future trajectory of interest rates.
Market participants await the release of December's Consumer Price Index (CPI) data from the United States (US) on Thursday. This economic data holds significant importance for assessing inflationary pressures and has the potential to significantly impact market expectations regarding the monetary policy stance of the US Federal Reserve.
Daily Digest Market Movers: Australian Dollar gains on improved risk appetite
- Australian Monthly Consumer Price Index (YoY) for November showed a slight reduction to 4.3%, falling slightly short of the market expectation of 4.4% from the previous figure of 4.9%.
- Australia’s Bureau of Statistics revealed the seasonally adjusted Retail Sales (MoM) for November, which rose by 2.0% instead of the expected 1.2%, swinging from the previous 0.2% decline.
- Aussie Building Permits (MoM) came to 1.6% from 7.5% prior against the expected decline of 2.0%.
- Chinese Defense Ministry has urged the United States to cease providing support to provocations by certain countries. China is calling on the US to adhere to the "One China Principle" and to halt the arming of Taiwan. Furthermore, the ministry is urging the US to strictly restrain front-line forces and refrain from hyping up security issues.
- Atlanta Fed President Raphael W. Bostic mentioned on Monday that inflation has declined more than initially anticipated and expressed the view of expecting two quarter-point cuts by the end of 2024. Bostic conveyed comfort with the current rate level and emphasized the importance of allowing the Fed's tight policy time to work on cooling off inflation.
- US Fed Governor Michelle W. Bowman expressed that inflation could fall further with the policy rate held steady for some time. Bowman said that the current policy stance appears sufficiently restrictive, but it might eventually become appropriate to lower the Fed's policy rate if inflation falls closer to the 2% target.
- US Nonfarm Payrolls rose to 216K in December, showing an improvement from the 173K reported in November. This figure surpassed the market expectation, which anticipated a rise of 170K.
- US Average Hourly Earnings (YoY) improved to 4.1% from 4.0% prior. Meanwhile, the monthly index remained consistent at 0.4% against the expected decline of 0.3%.
- US ISM Services Purchasing Managers Index (PMI) came in at 50.6 against the expected 52.6 and 52.7 prior. While the Services Employment Index reduced to 43.3 from the previous reading of 50.7.
Technical Analysis: Australian Dollar maintains position above 0.6700 psychological level
The Australian Dollar trades near 0.6710 on Thursday situated above a significant psychological resistance level of 0.6700 and the nine-day Exponential Moving Average (EMA) at 0.6724. A potential breakthrough above the latter could bring the AUD/USD pair closer to the key level at 0.6750. Conversely, on the downside, the 0.6650 level holds importance as a major support, followed by the 38.2% Fibonacci retracement level at 0.6637. If the price drops below this level, it may lead the AUD/USD pair to explore the territory around the psychological level of 0.6600.
AUD/USD: Daily Chart
-638405334489798376.png)
Australian Dollar price today
The table below shows the percentage change of Australian Dollar (AUD) against listed major currencies today. Australian Dollar was the strongest against the Euro.
| USD | EUR | GBP | CAD | AUD | JPY | NZD | CHF | |
| USD | -0.01% | -0.07% | -0.07% | -0.15% | -0.17% | -0.14% | -0.08% | |
| EUR | 0.01% | -0.06% | -0.06% | -0.14% | -0.16% | -0.14% | -0.06% | |
| GBP | 0.06% | 0.06% | 0.01% | -0.07% | -0.10% | -0.09% | 0.01% | |
| CAD | 0.06% | 0.05% | -0.01% | -0.08% | -0.11% | -0.08% | 0.00% | |
| AUD | 0.14% | 0.15% | 0.09% | 0.10% | -0.01% | 0.01% | 0.10% | |
| JPY | 0.17% | 0.14% | 0.09% | 0.10% | 0.03% | -0.02% | 0.09% | |
| NZD | 0.14% | 0.16% | 0.08% | 0.08% | -0.01% | -0.04% | 0.09% | |
| CHF | 0.07% | 0.06% | 0.00% | 0.00% | -0.08% | -0.10% | -0.07% |
The heat map shows percentage changes of major currencies against each other. The base currency is picked from the left column, while the quote currency is picked from the top row. For example, if you pick the Euro from the left column and move along the horizontal line to the Japanese Yen, the percentage change displayed in the box will represent EUR (base)/JPY (quote).
Australian Dollar FAQs
What key factors drive the Australian Dollar?
One of the most significant factors for the Australian Dollar (AUD) is the level of interest rates set by the Reserve Bank of Australia (RBA). Because Australia is a resource-rich country another key driver is the price of its biggest export, Iron Ore. The health of the Chinese economy, its largest trading partner, is a factor, as well as inflation in Australia, its growth rate and Trade Balance. Market sentiment – whether investors are taking on more risky assets (risk-on) or seeking safe-havens (risk-off) – is also a factor, with risk-on positive for AUD.
How do the decisions of the Reserve Bank of Australia impact the Australian Dollar?
The Reserve Bank of Australia (RBA) influences the Australian Dollar (AUD) by setting the level of interest rates that Australian banks can lend to each other. This influences the level of interest rates in the economy as a whole. The main goal of the RBA is to maintain a stable inflation rate of 2-3% by adjusting interest rates up or down. Relatively high interest rates compared to other major central banks support the AUD, and the opposite for relatively low. The RBA can also use quantitative easing and tightening to influence credit conditions, with the former AUD-negative and the latter AUD-positive.
How does the health of the Chinese Economy impact the Australian Dollar?
China is Australia’s largest trading partner so the health of the Chinese economy is a major influence on the value of the Australian Dollar (AUD). When the Chinese economy is doing well it purchases more raw materials, goods and services from Australia, lifting demand for the AUD, and pushing up its value. The opposite is the case when the Chinese economy is not growing as fast as expected. Positive or negative surprises in Chinese growth data, therefore, often have a direct impact on the Australian Dollar and its pairs.
How does the price of Iron Ore impact the Australian Dollar?
Iron Ore is Australia’s largest export, accounting for $118 billion a year according to data from 2021, with China as its primary destination. The price of Iron Ore, therefore, can be a driver of the Australian Dollar. Generally, if the price of Iron Ore rises, AUD also goes up, as aggregate demand for the currency increases. The opposite is the case if the price of Iron Ore falls. Higher Iron Ore prices also tend to result in a greater likelihood of a positive Trade Balance for Australia, which is also positive of the AUD.
How does the Trade Balance impact the Australian Dollar?
The Trade Balance, which is the difference between what a country earns from its exports versus what it pays for its imports, is another factor that can influence the value of the Australian Dollar. If Australia produces highly sought after exports, then its currency will gain in value purely from the surplus demand created from foreign buyers seeking to purchase its exports versus what it spends to purchase imports. Therefore, a positive net Trade Balance strengthens the AUD, with the opposite effect if the Trade Balance is negative.
On Thursday, the People’s Bank of China (PBoC) sets the USD/CNY central rate for the trading session ahead at 7.1087 as compared to the previous day's fix of 7.1055 and 7.1667 Reuters estimates.
- EUR/USD attracts some buyers amid the USD softness.
- ECB’s de Cos said risks to economic growth remain skewed to the downside.
- The markets anticipate the Fed to begin cutting rates as early as March, but the Fed’s Williams pushed back against the expectation.
- The US Consumer Price Index (CPI) for December will be a closely watched event on Thursday.
The EUR/USD pair edges higher for the second consecutive day during the early Asian trading hours on Thursday. The rebound of the major pair is bolstered by the softer US Dollar (USD) broadly. Traders await the release of the US Consumer Price Index (CPI) for fresh impetus on Thursday, which is estimated to show an increase of 0.2% MoM and 0.3% YoY in December. At press time, EUR/USD is trading at 1.0977, up 0.11% on the day.
Late Wednesday, the European Central Bank (ECB) Governing Council member Pablo Hernandez de Cos said that the euro area probably failed to grow in the final three months of 2023 and the central bank will pay attention in the coming months to different developments that may condition the trajectory of inflation and its monetary policy action
ECB Vice President Luis de Guindos stated that the Eurozone's economy may have entered a recession last quarter, and its prospects are gloomy. He also supports the current level of interest rates. Meanwhile, the ECB’s member, Isabel Schnabel emphasized that the central bank is on the right track to curb inflation. She also mentioned geopolitical tensions as one of the upside risks to inflation.
Across the pond, the financial markets anticipate the Federal Reserve (Fed) to begin cutting rates as early as March, but New York Fed President John Williams and other officials have been pushing back against the idea. Williams said that interest rates in the US will likely need to stay high “for some time” until the central bank is confident that inflation is returning to 2%.
The Industrial Output from Spain and Italy, and the Economic Bulletin will be due on Thursday. Nonetheless, the December US CPI report in the American session will be the highlight. Traders will take cues from this data and find trading opportunities around the EUR/USD pair.
Australia’s trade surplus widened to 11,437M MoM in December versus 7,500M expected and 7,129M in the previous reading, according to the latest Aussie foreign trade data published by the Australian Bureau of Statistics on Thursday.
Further details reveal that Australia's December Goods/Services Exports reprint 1.7% figures on a monthly basis versus 0.4% prior. The nation’s Goods/Services Imports fell 7.9% in December MoM versus 1.9% drop prior.
Market reaction
At the press time, the AUD/USD pair is up 0.15% on the day to trade at 0.6707.
About Australia Trade Balance
The trade balance released by the Australian Bureau of Statistics is the difference in the value of its imports and exports of Australian goods. Export data can give an important reflection of Australian growth, while imports provide an indication of domestic demand. Trade Balance gives an early indication of the net export performance. If a steady demand in exchange for Australian exports is seen, that would turn into a positive growth in the trade balance, and that should be positive for the AUD.
Australian Dollar FAQs
What key factors drive the Australian Dollar?
One of the most significant factors for the Australian Dollar (AUD) is the level of interest rates set by the Reserve Bank of Australia (RBA). Because Australia is a resource-rich country another key driver is the price of its biggest export, Iron Ore. The health of the Chinese economy, its largest trading partner, is a factor, as well as inflation in Australia, its growth rate and Trade Balance. Market sentiment – whether investors are taking on more risky assets (risk-on) or seeking safe-havens (risk-off) – is also a factor, with risk-on positive for AUD.
How do the decisions of the Reserve Bank of Australia impact the Australian Dollar?
The Reserve Bank of Australia (RBA) influences the Australian Dollar (AUD) by setting the level of interest rates that Australian banks can lend to each other. This influences the level of interest rates in the economy as a whole. The main goal of the RBA is to maintain a stable inflation rate of 2-3% by adjusting interest rates up or down. Relatively high interest rates compared to other major central banks support the AUD, and the opposite for relatively low. The RBA can also use quantitative easing and tightening to influence credit conditions, with the former AUD-negative and the latter AUD-positive.
How does the health of the Chinese Economy impact the Australian Dollar?
China is Australia’s largest trading partner so the health of the Chinese economy is a major influence on the value of the Australian Dollar (AUD). When the Chinese economy is doing well it purchases more raw materials, goods and services from Australia, lifting demand for the AUD, and pushing up its value. The opposite is the case when the Chinese economy is not growing as fast as expected. Positive or negative surprises in Chinese growth data, therefore, often have a direct impact on the Australian Dollar and its pairs.
How does the price of Iron Ore impact the Australian Dollar?
Iron Ore is Australia’s largest export, accounting for $118 billion a year according to data from 2021, with China as its primary destination. The price of Iron Ore, therefore, can be a driver of the Australian Dollar. Generally, if the price of Iron Ore rises, AUD also goes up, as aggregate demand for the currency increases. The opposite is the case if the price of Iron Ore falls. Higher Iron Ore prices also tend to result in a greater likelihood of a positive Trade Balance for Australia, which is also positive of the AUD.
How does the Trade Balance impact the Australian Dollar?
The Trade Balance, which is the difference between what a country earns from its exports versus what it pays for its imports, is another factor that can influence the value of the Australian Dollar. If Australia produces highly sought after exports, then its currency will gain in value purely from the surplus demand created from foreign buyers seeking to purchase its exports versus what it spends to purchase imports. Therefore, a positive net Trade Balance strengthens the AUD, with the opposite effect if the Trade Balance is negative.
| Index | Change, points | Closed | Change, % |
|---|---|---|---|
| NIKKEI 225 | 678.54 | 34441.72 | 2.01 |
| Hang Seng | -92.74 | 16097.28 | -0.57 |
| KOSPI | -19.26 | 2541.98 | -0.75 |
| ASX 200 | -52 | 7468.5 | -0.69 |
| DAX | 1.45 | 16689.81 | 0.01 |
| CAC 40 | -0.54 | 7426.08 | -0.01 |
| Dow Jones | 170.57 | 37695.73 | 0.45 |
| S&P 500 | 26.95 | 4783.45 | 0.57 |
| NASDAQ Composite | 111.94 | 14969.65 | 0.75 |
The European Central Bank (ECB) Governing Council member Pablo Hernandez de Cos said on Wednesday that the euro area probably failed to grow in the final three months of 2023, per Bloomberg.
Key quotes
"Economic activity has continued to show clear weakness and is only expected to increase its degree of dynamism gradually.”
“In the third quarter, GDP decreased by 0.1% and available indicators suggest stagnation in the fourth.”
“Risks to economic growth remain skewed to the downside.”
“Slowdown in prices is expected to continue in the coming quarters.”
“Although in 2024 the decline will be slower due to upward base effects and the gradual withdrawal of fiscal measures adopted during the energy crisis.”
“In addition to geopolitical developments, the transmission of monetary policy has been surprising us for its strength, which, if extended in the coming years, would translate into lower growth.”
“We’ll have to pay attention in the coming months to different developments that may condition the trajectory of inflation and, therefore, our monetary policy action.”
“The high level of uncertainty means that we must remain very vigilant to avoid both insufficient tightening, which would prevent the achievement of our inflation target, and excessive tightening, which would unnecessarily harm activity and employment.”
Market reaction
The EUR/USD pair is trading higher at 1.0975, up 0.09% on the day.
ECB FAQs
What is the ECB and how does it influence the Euro?
The European Central Bank (ECB) in Frankfurt, Germany, is the reserve bank for the Eurozone. The ECB sets interest rates and manages monetary policy for the region.
The ECB primary mandate is to maintain price stability, which means keeping inflation at around 2%. Its primary tool for achieving this is by raising or lowering interest rates. Relatively high interest rates will usually result in a stronger Euro and vice versa.
The ECB Governing Council makes monetary policy decisions at meetings held eight times a year. Decisions are made by heads of the Eurozone national banks and six permanent members, including the President of the ECB, Christine Lagarde.
What is Quantitative Easing (QE) and how does it affect the Euro?
In extreme situations, the European Central Bank can enact a policy tool called Quantitative Easing. QE is the process by which the ECB prints Euros and uses them to buy assets – usually government or corporate bonds – from banks and other financial institutions. QE usually results in a weaker Euro.
QE is a last resort when simply lowering interest rates is unlikely to achieve the objective of price stability. The ECB used it during the Great Financial Crisis in 2009-11, in 2015 when inflation remained stubbornly low, as well as during the covid pandemic.
What is Quantitative tightening (QT) and how does it affect the Euro?
Quantitative tightening (QT) is the reverse of QE. It is undertaken after QE when an economic recovery is underway and inflation starts rising. Whilst in QE the European Central Bank (ECB) purchases government and corporate bonds from financial institutions to provide them with liquidity, in QT the ECB stops buying more bonds, and stops reinvesting the principal maturing on the bonds it already holds. It is usually positive (or bullish) for the Euro.
| Pare | Closed | Change, % |
|---|---|---|
| AUDUSD | 0.6699 | 0.23 |
| EURJPY | 159.914 | 1.39 |
| EURUSD | 1.09721 | 0.4 |
| GBPJPY | 185.703 | 1.22 |
| GBPUSD | 1.27407 | 0.29 |
| NZDUSD | 0.62268 | -0.11 |
| USDCAD | 1.33782 | -0.03 |
| USDCHF | 0.85084 | -0.17 |
| USDJPY | 145.755 | 0.9 |
- Gold price gains ground around $2,026 on the softer USD.
- Fed’s Williams said it is premature to call for rate cuts
- Market players will closely monitor the US Consumer Price Index (CPI), due on Thursday.
Gold price (XAU/USD) drifted higher during the early Asian trading hours on Thursday. The softer US Dollar (USD) lends some support to the yellow metal ahead of the key US CPI report on Thursday. At press time, the gold price is trading at $2,026, gaining 0.15% on the day.
Meanwhile, the US Dollar Index (DXY), a measure of the value of the USD against a weighted basket of currencies used by US trade partners, drops to 102.35. The US Treasury yields edge lower, with the 10-year yield standing at 4.03%.
Federal Reserve (Fed) Bank of New York President John Williams said on Wednesday that it is premature to call for rate cuts as the Fed still faces challenges in bringing inflation to its target level of 2%. Williams further stated that the Fed will need to maintain a restrictive policy posture for some time to fully achieve its goals, and monetary policy decisions will be made at each meeting, taking into account the incoming data, the evolving outlook, and the balance of risks.
Fed maintained the interest rate unchanged at its December meeting and penciled in three quarter-percentage-point rate cuts by the end of 2024. Minutes from that meeting released last week did not indicate any discussion about a timetable for the rate cuts. However, traders will keep an eye on the US inflation report on Thursday for fresh impetus. Economists estimate inflation to rise in December, casting doubt on the market's keen expectation that the Fed would cut interest rates this year.
Moving on, the US Consumer Price Index (CPI) is due later on Thursday. The headline inflation is estimated to rise 0.2% MoM, and the core CPI is expected to rise 0.3% MoM in December. Also, the weekly Initial Jobless Claims will be released on the same day. On Friday, attention will shift to the Chinese CPI, Producer Price Index (PPI), and Trade Balance data.


© 2000-2026. Уcі права захищені.
Cайт знаходитьcя під керуванням TeleTrade DJ. LLC 2351 LLC 2022 (Euro House, Richmond Hill Road, Kingstown, VC0100, St. Vincent and the Grenadines).
Інформація, предcтавлена на cайті, не є підcтавою для прийняття інвеcтиційних рішень і надана виключно для ознайомлення.
Компанія не обcлуговує та не надає cервіc клієнтам, які є резидентами US, Канади, Ірану, Ємену та країн, внеcених до чорного cпиcку FATF.
Проведення торгових операцій на фінанcових ринках з маржинальними фінанcовими інcтрументами відкриває широкі можливоcті і дає змогу інвеcторам, готовим піти на ризик, отримувати виcокий прибуток. Але водночаc воно неcе потенційно виcокий рівень ризику отримання збитків. Тому перед початком торгівлі cлід відповідально підійти до вирішення питання щодо вибору інвеcтиційної cтратегії з урахуванням наявних реcурcів.
Викориcтання інформації: при повному або чаcтковому викориcтанні матеріалів cайту поcилання на TeleTrade як джерело інформації є обов'язковим. Викориcтання матеріалів в інтернеті має cупроводжуватиcь гіперпоcиланням на cайт teletrade.org. Автоматичний імпорт матеріалів та інформації із cайту заборонено.
З уcіх питань звертайтеcь за адреcою pr@teletrade.global.
переклади