- Аналітика
- Новини та інструменти
- Новини ринків
Новини ринків
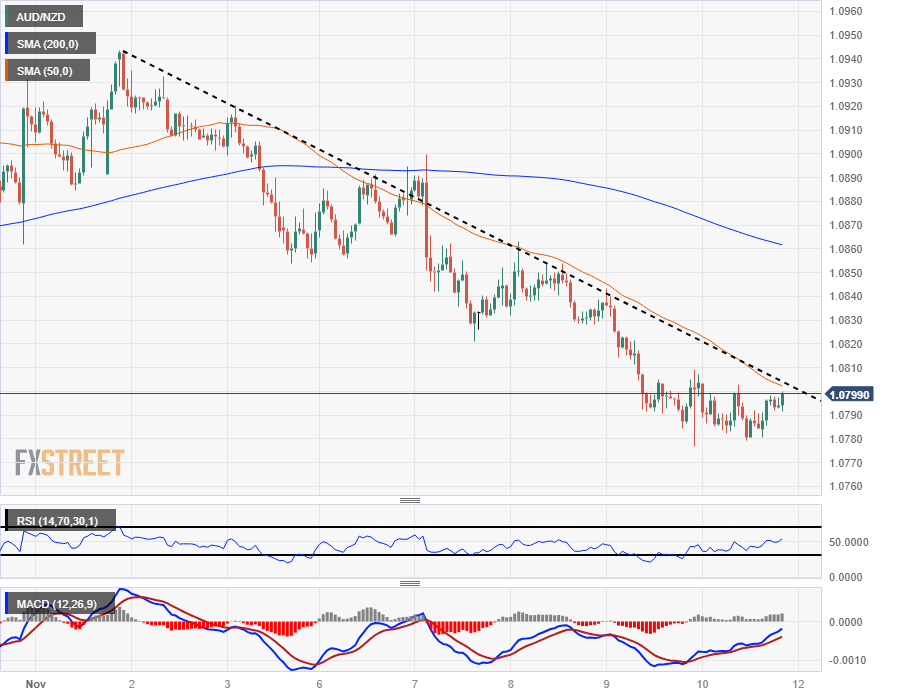
- The AUD/NZD has etched in a new weekly low at 1.0780 after a week of declines.
- The Aussie's backslide comes after reaching a technical ceiling at 1.0940.
- Buyers to be pushed to the back end for next week if they can't grab ahold of moving average barriers.
The AUD/NZD has managed to hold on for Friday, closing out the trading week close to flat on the last day after declining over 1.1% peak-to-trough from Monday's peak near 1.0900.
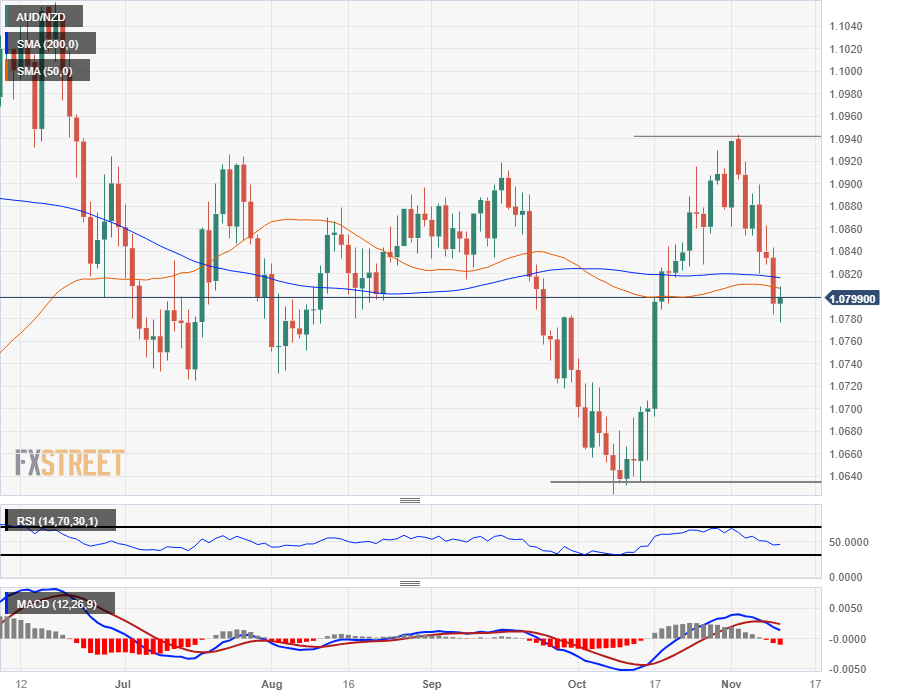
The pair still remains down almost 1.4% from the last meaningful swing high into 1.0945 and Aussie bidders are beginning to run out of track as the AUD/NZD rotates into a bearish technical pattern, slipping below the 200-day Simple Moving Average (SMA) and on pace to extend declines back into the last low set in October near 1.0640.
The Moving Average Convergence-Divergence (MACD) on the daily candles is confirming a bearish signal following a slow and fast moving average crossover, and a Relative Strength Index (RSI) still near the midrange but declining slowly is implying there's still room to run on the down side before hitting oversold conditions.
AUD/NZD Hourly Chart
AUD/NZD Daily Chart
AUD/NZD Technical Levels
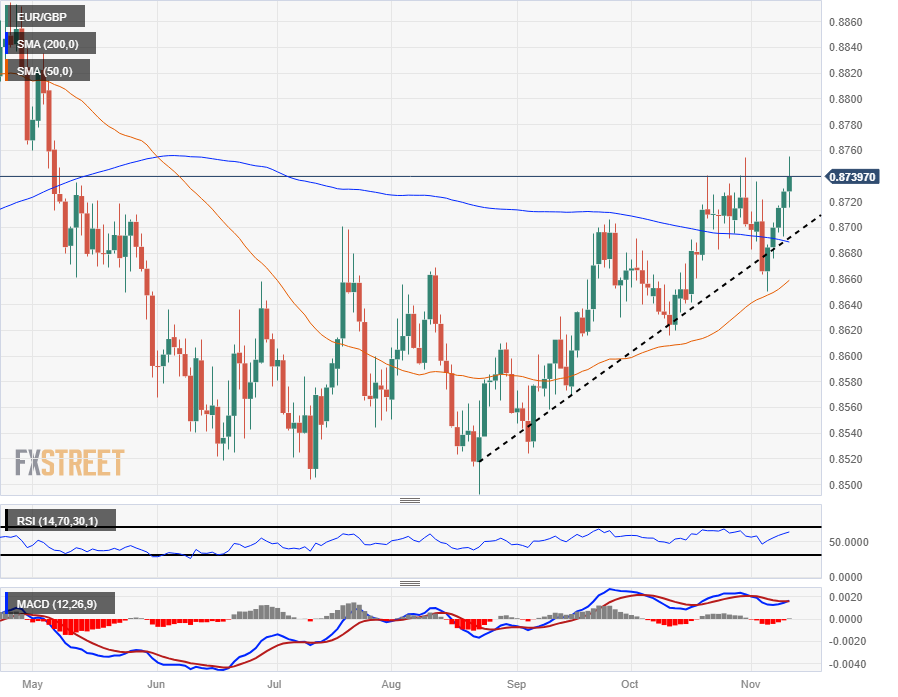
- The Euro has stepped higher against the Pound Sterling for five straight trading days.
- The EUR/GBP briefly saw a fresh six-month high on Friday.
- Economic data has mixed for both the EU and the UK, but the market's hat tip goes to the Euro.
The EUR/GBP wraps up another trading week just shy of 0.8750 after seeing five straight days of gains with the Pound Sterling (GBP) waffling against the Euro (EUR) for the entire week.
EU and UK economic data mixed on forecasts across the board this week, but it's getting difficult for investors to ignore the fact that UK data beats, even when they clear forecasts, still leaves economic indicators middling at best.
UK Gross Domestic Product (GDP) figures held steady for the year into September at 1.5% instead of declining to 1.1% as markets had expected, and UK Manufacturing Production for the same period held flat at 3% versus the expected growth to 3.1%, and the previous figure being revised from 28% to 3.0%.
Next Up: hectic data schedule for EU & UK
Next Tuesday sees UK labor and wage figures, while the EU will be releasing their own GDP figures for the third quarter.
Wednesday delivers UK Consumer Price Index (CPI) inflation data, paired with EU Industrial production.
Next week will close out high-impact data with UK Retail Sales and EU Harmonized Index of Consumer Prices (HICP) on Friday.
EUR/GBP Technical Outlook
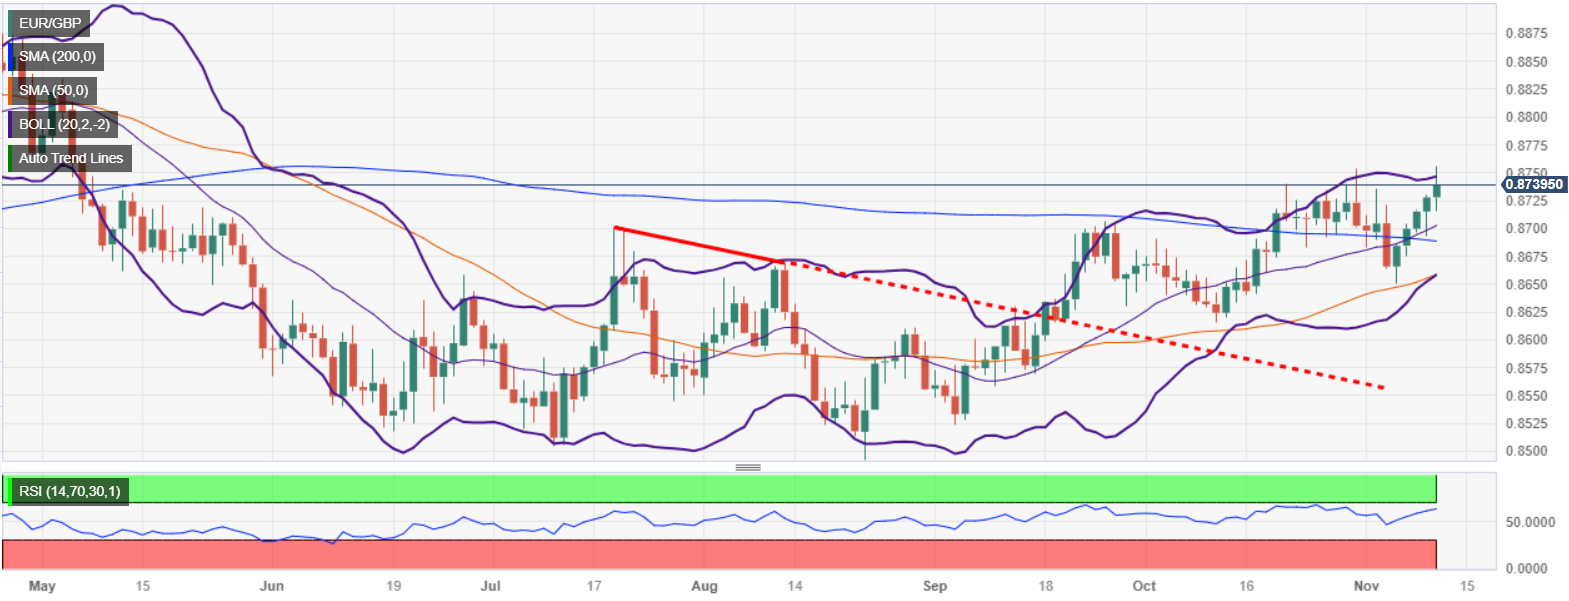
The EUR/GBP chalked in five straight green bars, climbing back over the 200-day Simple Moving Average (SMA) and pushing back into near-term high bids as the Euro rallies against the Pound Sterling.
The pair has continued to etch in higher lows along a rising trendline from August's low closes near 0.8520, and the 50-day SMA is accelerating from 0.8660 towards a bullish cross of the 200-day SMA, which is currently parked near 0.8690.
EUR/GBP Daily Chart
EUR/GBP Technical Levels
- NZD/JPY rose nearly 0.10% towards the 89.245 area
- The cross continues to side-ways trades, slightly tilted to the downside.
- Bulls seem to be taking a breather after last week’s 3% gains.
The NZD/JPY will close a 0.30% losing week around the 89.245 area, as investors are taking profits from the early month's sharp gains.
Observing the daily chart, the NZD/JPY displays signs of bullish exhaustion after the cross gained more than 3% at the beginning of November. The Relative Strength Index (RSI) has turned flat above its midline, while the Moving Average Convergence (MACD) prints neutral green bars. On the four-hour chart, the indicators have also flattened but are also slightly lilted to the upside, suggesting that buyers are consolidating gains.
Additionally, the cross is above the 20,100,200-day Simple Moving Average (SMA), suggesting that the outlook also favours the bulls in the larger time frames. Furthermore, there could be a bullish confirmation as the 100-day SMA is converging towards the 20-day average to perform a bullish cross, which could reignite the momentum for the buyers in the short term.
Support levels: 89.000, 88.700, 88.500.
Resistance levels: 89.5000, 89.850,90.000.
NZD/JPY Daily Chart
-638352489705454998.png)
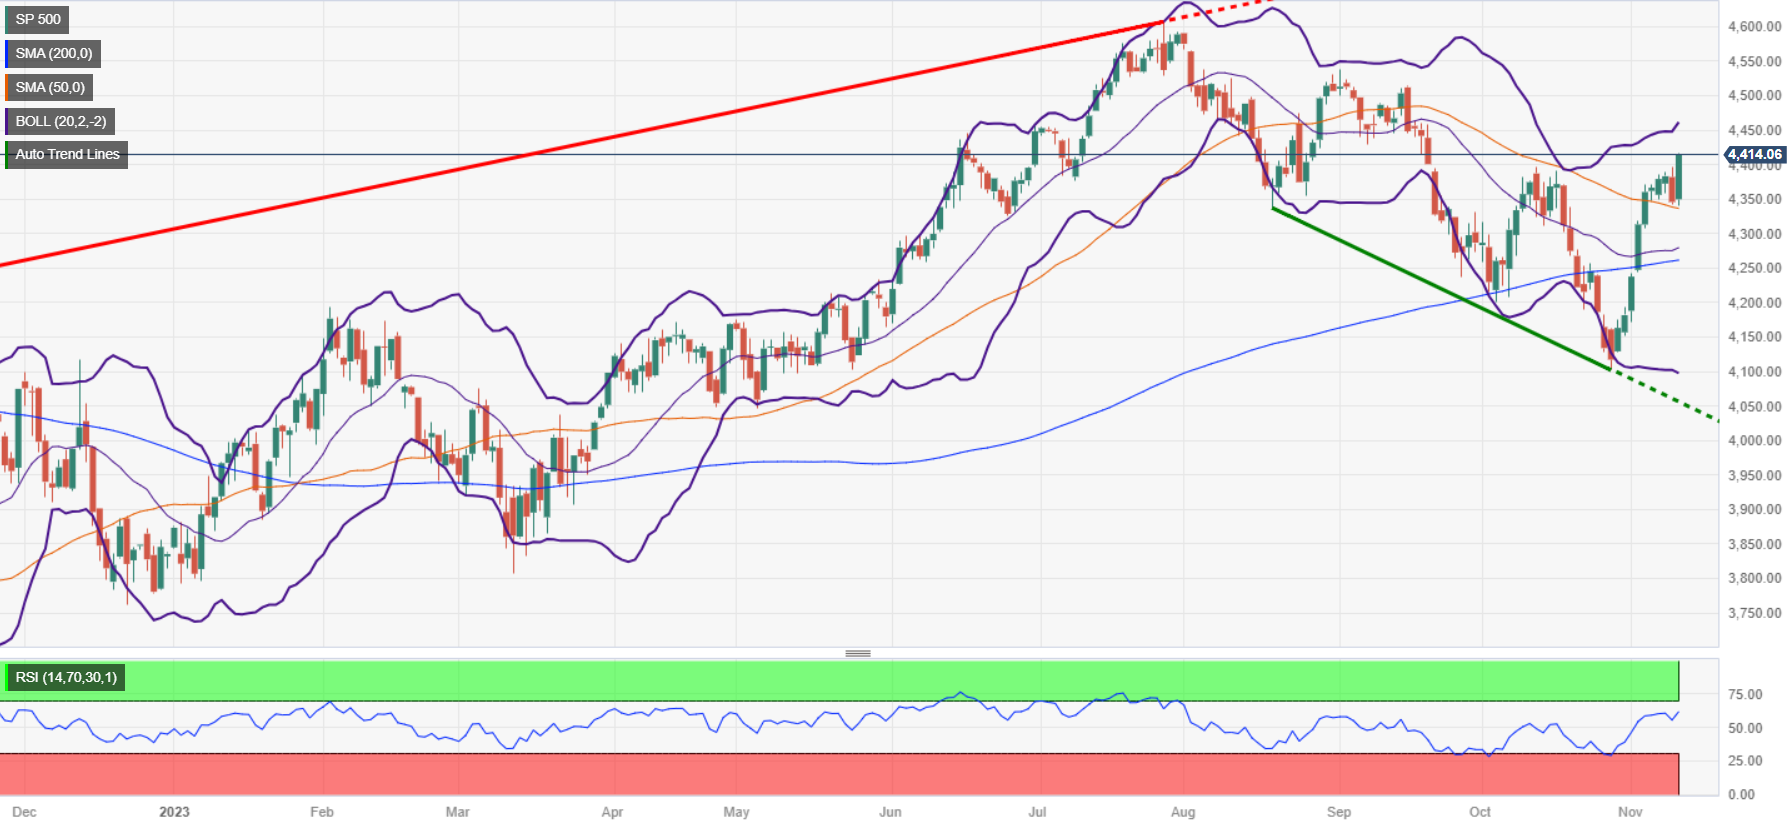
- S&P 500 rises 1.54%, closing at 4,414.57, marking its seventh consecutive week of gains.
- Nasdaq 100 and Dow Jones Industrial also post gains, with technology and consumer sectors leading.
- Market players overlook Fed Chair Jerome Powell's hawkish comments, focusing instead on mixed economic data.
- Upcoming week to focus on US inflation data, unemployment claims, and further commentary from Federal Reserve officials.
Wall Street is set to finish the week with gains, as the S&P 500 prints solid gains above the 4,400 figure, shrugging off a deteriorated consumer sentiment, while US Treasury bond yields stabilized after climbing more than 10 bps along the whole yield curve on Thursday.
Wall Street ends week on a high note as S&P 500 surpasses 4,400, despite mixed economic signals and Fed's hawkish stance
At the time of writing, the S&P 500 is gaining 1.54% late Friday, staying at 4,414.57, on track for seven-week gains, while the Nasdaq 100 rises 2.05%, at 13,798.56. The laggard was the Dow Jones Industrial, which ended up 1.20%, at 34298.
On Thursday, hawkish remarks by the US Federal Reserve (Fed) Chair Jerome Powell were brushed aside by traders, who remain reluctant to accept additional rate hikes by the US central bank. In the meantime, a poll of the University of Michigan (UoM) revealed that Consumer Sentiment deteriorated, while American households upward revised inflation expectations from now to a one-year horizon at 4.4%, while for five years, at 3.2%.
Given the backdrop, the 10-year US Treasury bond yields failed to gain traction and finished almost flat at 4.618%, while the Greenback dropped 0.09%, as measured by a basket of six currencies, namely the US Dollar Index at 105.79.
Sector-wise, the leaders were Technology, Communication Services, and Consumer Discretionary, each added 2.69%, 1.67%, and 1.66%, respectively. The laggards were Utilities, Health, and Consumer Staples, gaining 0.52%, 0.60% and 0.66%, each.
Investors remained focused on the Federal Reserve, as Atlanta Fed President Raphael Bostic stated that policymakers can bring inflation to its goal with the current level of the fed funds rate. Meanwhile, San Francisco Fed President Mary Daly pushed against dovish postures, adding the Fed could need to hike again if progress on inflation stalls.
Next week's economic docket will feature US inflation data, unemployment claims, and Fed speaking will provide some clues regarding the US economy's status.
S&P 500 Price Analysis – Daily Chart
S&P 500 Technical Levels
- Spot Gold prices are seeing further downside on Friday as investors pivot on Fed remarks.
- Fed looking more hawkish than market participants believed last week.
- US Dollar, US Treasury yields seeing gains for the week, Gold swoons.
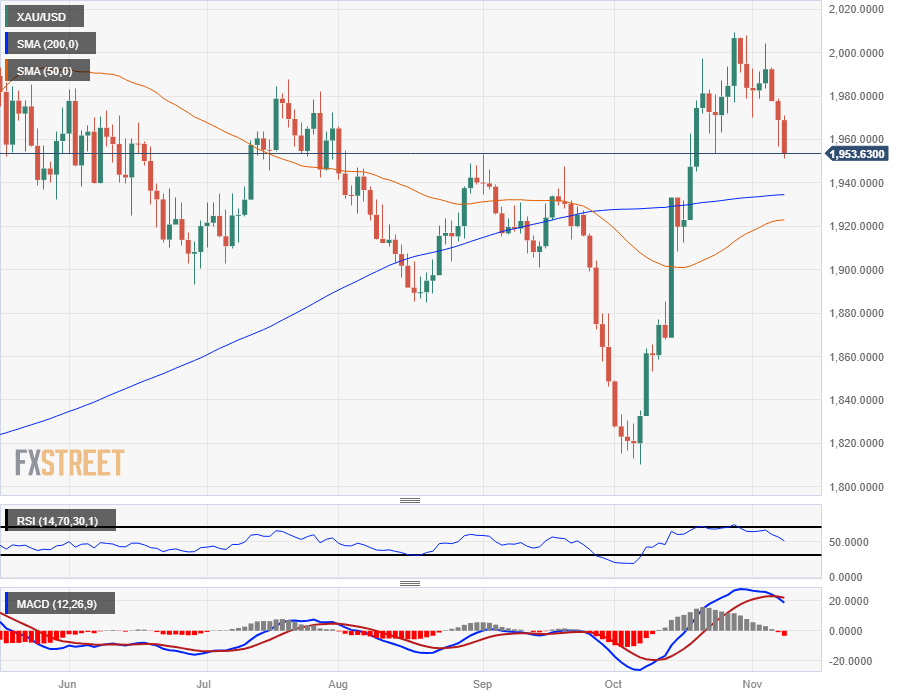
XAU/USD prices are testing towards the downside on Friday, edging towards $1,930 after yesterday's hawkish comments from Federal Reserve (Fed) Chairman Jerome Powell, who suggested that the Fed may not have achieved suitably restrictive monetary policy to contain inflation.
Alongside Fed head Powell, several Fed policymakers hit newswires this week suggesting that rates may not be high enough to sufficiently cap inflation towards the Fed's 2% target looking forward. The hawkish stance completely eviscerated the broad-market narrative that the Fed was not only done with rate hikes, but would be heading into a rate-cut cycle soon.
Investors last week heralded the end of the Fed's rate hike cycle following a worse-than-expected US Nonfarm Payrolls (NFP) print last Friday, but Fed officials have spent the week warning that a single bad labor data reading is not enough to shift the dot plot.
Up Next: US CPI inflation data to balance Fed statements
Next week's US Consumer Price Index (CPI) inflation reading will carry extra weight on Tuesday as investors peel back the layers to see if inflation will cool enough for investors to resume hoping for future rate cuts to ease borrowing costs.
US CPI inflation figures are expected to soften month-on-month, with the headline October print forecast to decline from 0.4% to 0.1%, while the annualized Core CPI for the year into October is expected to hold steady at 4.1%.
A meet-or-beat print for annualized Core CPI would mean US inflation is still running over twice as hot as the Fed's target of 2% annually.
XAU/USD Technical Outlook
Spot Gold's declines on Friday accelerate price action into bear country, seeing a rejection from the 50-hour Simple Moving Average (SMA) from $1,965.
XAU/USD has closed entirely bearish for the week with little relief bidding, seeing a rejection from the 200-hour SMA early Monday and declining nearly 3% on the week.
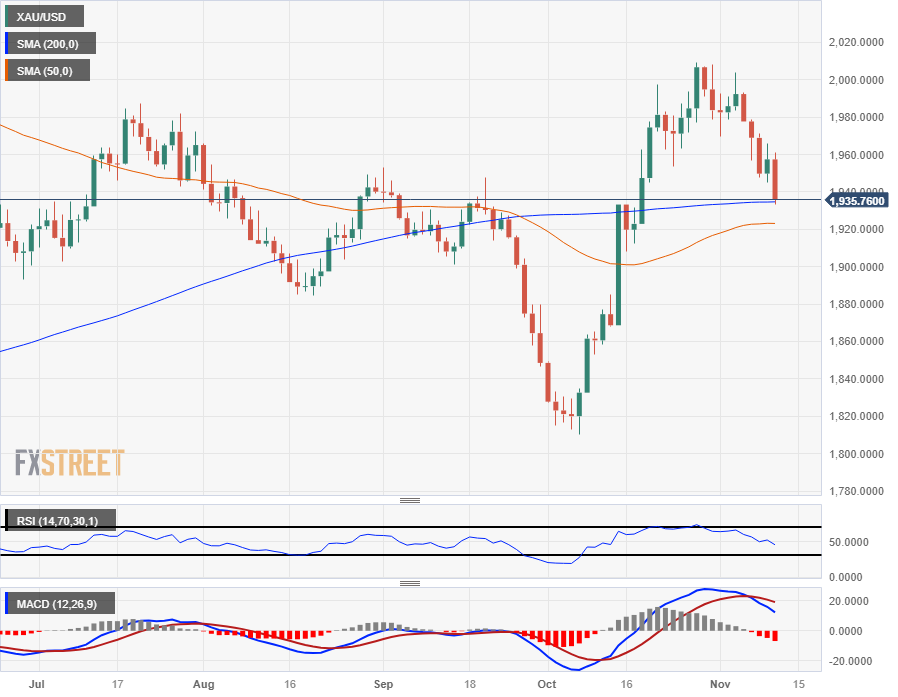
On the daily candlesticks, XAU/USD has slumped back into the 200-day SMA as Gold bids back into long-term median prices, and a constraining 50-day SMA on the bearish side of the longer moving average implies further downside could be on the cards.
XAU/USD Hourly Chart
XAU/USD Daily Chart
XAU/USD Technical Levels
- AUD/USD declined 0.12% for the day, marking a significant weekly drop from 0.6522 to 0.6338.
- The RBA's 25 bps rate hike under new Governor Michele Bullock's leadership fails to provide a bullish impetus for the Aussie.
- Jerome Powell's hawkish tone on US monetary policy adds to the AUD's woes, with China's economic slowdown posing additional risks.
The AUD/USD dropped 0.12% daily and extended its substantial losses during the week, which has witnessed the pair traveling from a weekly high of 0.6522 toward a low of 0.6338. At the time of writing, the pair trades at 0.6358.
Australian Dollar struggles as RBA rate hike fails to inspire, while Fed Chair's remarks bolster the US Dollar
Some reasons behind the AUD/USD price action are linked to central banks, with the Reserve Bank of Australia (RBA) hiking rates 25 bps from 4.10% to 4.35%. However, it failed to deliver a hawkish stance, which was the first monetary policy decision headed by Governor Michele Bullock. On Tuesday, that sent the pair into a tailspin, plunging more than 50 pips or 0.81%.
Despite that, dovish remarks by several Federal Reserve members kept the AUD/USD afloat until Thursday, when Fed Chair Jerome Powell was more hawkish than expected. He commented that US central bank policymakers are unsure whether the current monetary policy stance is sufficiently restrictive, emphasizing that they would raise rates if needed. In his speech, he acknowledged that inflation is slowing down but remains above the 2% target.
Given the backdrop, the AUD/USD failed to extend last week's uptrend, hampered by fundamentals and market sentiment. In addition to that, a deflationary scenario in China, hurts the prospects of the Aussie (AUD), due to Australia’s dependence on its largest trading partner. A further deterioration of China’s economy would dampen Australia’s prospects, suggesting that further AUD/USD weakness lies ahead.
The following week, the Aussie’s economic docket would feature NAB Consumer Confidence and jobs data. On the US side, inflation data, unemployment claims, and Fed speaking would provide some clues regarding the US economy's status.
AUD/USD Price Analysis: Technical outlook
AUD/USD price action portrays the pair reversing most of its losses during November, with bears remaining in charge. An initial ‘evening star’ chart pattern opened the door for consolidation, but a drop below the November 7 low of 0.6403 exacerbated the plunge below the 0.6350 mark.
The formation of an ongoing hammer could pave the way to consolidate the AUD/USD at around current exchange rates, but if sellers push prices below 0.6300, that could pave the way to test the year-to-date (YTD) low of 0.6270. On the other hand, if buyers lift the AUD/USD past the 50-day moving average (DMA) at 0.6387, that could open the door to reclaim 0.6400, ahead of retesting 0.6500.
- The USD/SEK is seen at 10.908 with 0.10% loses
- US Treasury yields retreated after sharply rising on Thursday.
- All eyes are on next week's CPI data from October from the US.
The USD/SEK showed minimal downward movements around the 10.908 area on Friday. The pair declined as the Greenback consolidated the week’s gains while falling US yields and negative consumer sentiment data from the University of Michigan are making the US Dollar struggle to gain interest.
On the data front, the University of Michigan revealed that its Consumer Sentiment index from November came in lower than expected at 60.4 vs the consensus of 63.7 and fell from its previous reading of 63.8. That being said, no other high-tier reports were published during the week as the focus is set on next week’s Consumer Price Index (CPI) figures from the US from October, which are expected to show a slight deceleration.
It's worth noticing that the Federal Reserve (Fed) hawks and Chair Powell claimed during the week that they left the door open for further tightening so the outcome of inflation or labor market data may shape the expectations of the next decisions of the bank. As for now, the odds of a 25 bps hike for the December meeting are low, around 10%.
Elsewhere, the Fed’s hawkish rhetoric revived US yields, and the 2-year Treasury yield rose back to 5%, while the 5 and 10-year rates increased to 4.59% and 4.60%, which allowed the USD to gain interest, pushing the pair upwards.
USD/SEK Levels to watch
According to the daily chart, the technical outlook for the USD/SEK remains neutral to bearish as the bears are raking a breather after bringing down the pair by more than 2%. The Relative Strength Index (RSI) has turned flat below its midline, while the Moving Average Convergence (MACD) prints flat red bars.
In the larger context, the pair is below the 20-day Simple Moving Average (SMA) but above the 100 and 200-day SMAs, indicating a favourable position for the bulls in the bigger picture.
Supports: 10.861 (100-day SMA), 10.822, 10.811.
Resistances: 10.950, 10.973, 11.000 (20-day SMA).
USD/SEK Daily chart
-638352410560701299.png)
- The Euro is seeing a thin rebound on Friday after declining steadily through the week.
- Concerns are mounting that the ECB may have to move more to cap inflation.
- Up Next: Tuesday sees EU GDP, US CPI inflation readings.
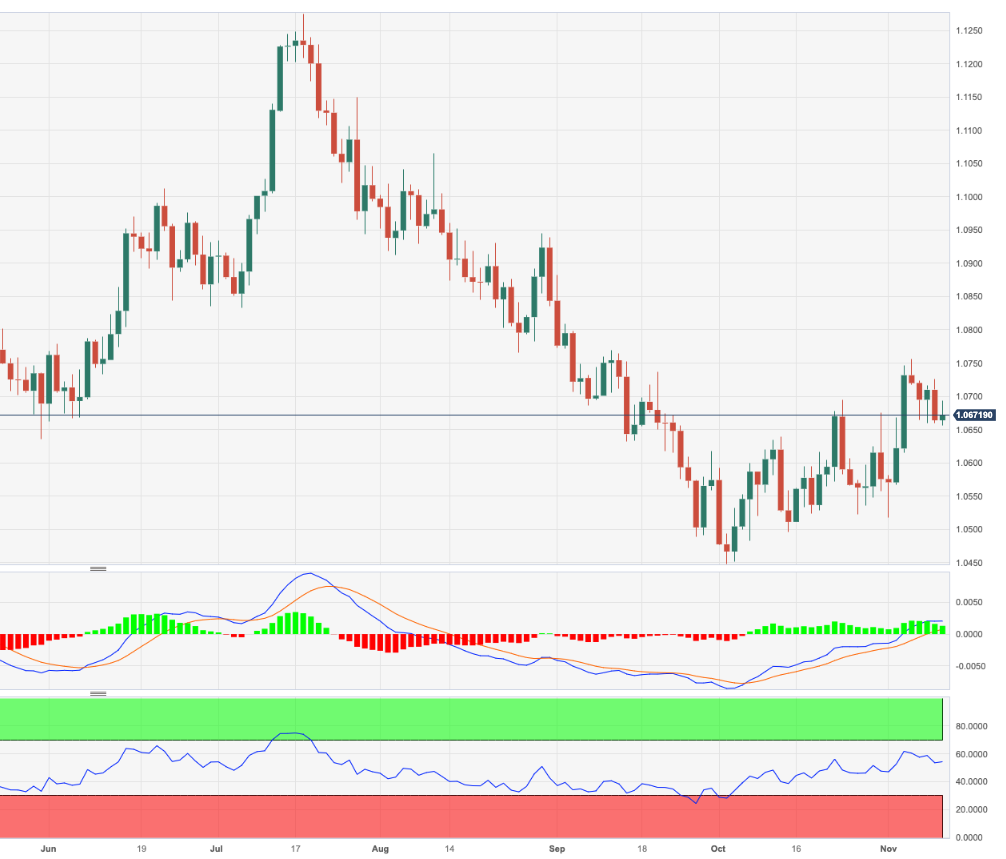
The EUR/USD is seeing a minor rebound on Friday as the US Dollar (USD) cools its heels following a week of steady gains that sent the Euro (EUR) down almost a full percent top-to-bottom from Monday's peak of 1.0756.
EU data was relatively thin this week with much of the market focus going to central bank figures. European Central Bank (ECB) President Christine Lagarde avoided making any waves on Friday during a public appearance, and markets are still chewing developments after Federal Reserve (Fed) Chairman Jerome Powell came out with unexpectedly hawkish comments on Thursday.
Fed Chair Powell noted that the Fed isn't entirely confident that they have done enough to reign in inflation, and market corkscrewed on the statements.
EU GDP, US CPI in the pipe for next week
Next week sees EU Gross Domestic Product (GDP) figures on Tuesday, to be followed by US Consumer Price Index (CPI) inflation figures.
The EU's third quarter GDP is expected to hold steady for both the monthly and annualized figures, forecast at -0.1% and 0.1% respectively.
On the US side, headline CPI for October is expected to fall back from 0.4% to 0.1%, while Core CPI for the year into October is expected to hold steady at 4.1%.
With the Fed's hawkish stance and renewed market focus on central bank statements, next week's growth and inflation figures are set to have an increased impact if figures deviate from forecasts.
EUR/USD Technical Outlook
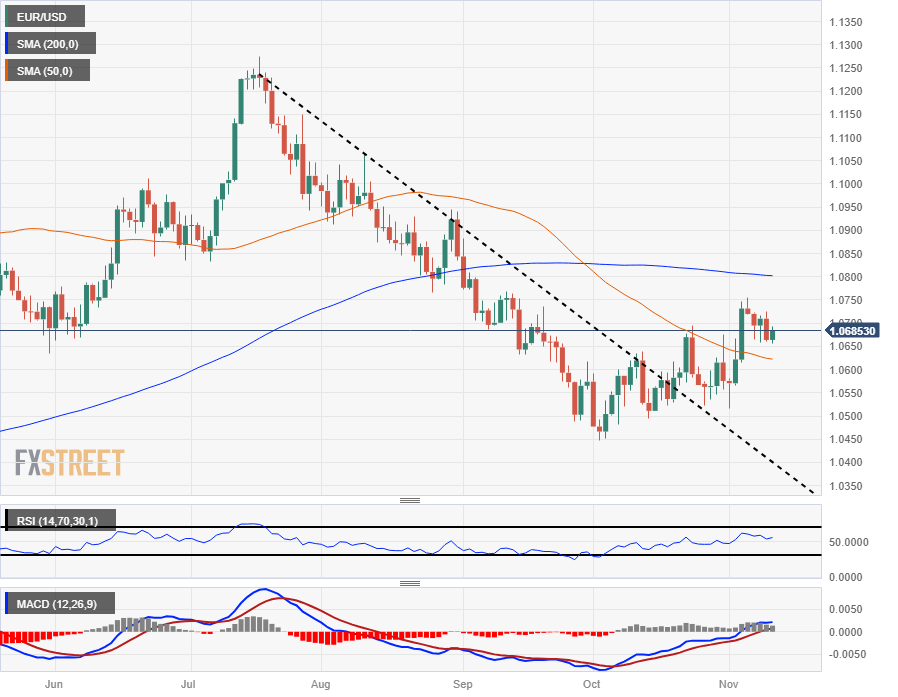
The Euro has spent most of the week hung up on the 1.0700 price level after Monday's clean rejection from 1.0750.
The EUR/USD has been capped off by the 200-day Simple Moving Average (SMA) near 1.0800, with a bearish 50-day SMA putting a floor underneath prices, leaving the pair strung in the middle as prices consolidate between the moving averages.
Despite still being down over 5% from July's peaks near 1.1275, the EUR/USD pair has been steadily grinding higher from early October's swing low into 1.0450.
EUR/USD Daily Chart
EUR/USD Technical Levels
- EUR/GBP maintains its upward momentum, trading at 0.8731, as it solidifies the 0.8700 level as a crucial support.
- The pair shows a bullish bias, but a failure to surpass the 0.8755 high could invite bearish activity.
- Key levels to watch include resistance at 0.8800 and 0.8834, with support at the 200-DMA of 0.8688 and the 50-DMA at 0.8657.
EUR/GBP climbed during Friday’s session, extending its rally to five consecutive days, gaining so far 0.89% in the week, cementing the 0.8700 psychological level as solid support for the next week. At the time of writing, the cross-pair trades at 0.8731, up a decent 0.13%.
The EUR/GBP pair is bullish biased but downside risks remain. Unless buyers reclaim today’s high at 0.8755, bears are lurking. In the event of a bullish resumption, the cross’s first resistance would be the 0.8800 mark, followed by the May 3 high at 0.8834, followed by April’s 25 high at 0.8875.
Conversely, if EUR/GBP drops below 0.8700, the first support would be the 200-day moving average (DMA) previously broken at 0.8688 followed by the 50-DMA at 0.8657, before diving to the latest cycle low of 0.8649.
EUR/GBP Price Analysis – Daily Chart
EUR/GBP Technical Levels
The key report for the week will be on Tuesday with the US Consumer Price Index. Additionally, more US inflation data is scheduled for Wednesday with the Producer Price Index. The Eurozone will report GDP growth, and the UK will release employment and inflation data. Australia will also release jobs data. The bond market and geopolitics will continue to be important factors influencing the market.
Here is what you need to know for next week:
The US Dollar Index (DXY) rose during the five days of the week, but it was not enough to completely erase last week's losses. A correction and Powell's comments helped the Greenback, which was not affected by signs of gradual loosening in the labor market. With the US economy outperforming the Euro area, the slide of the US Dollar is poised to be limited. The DXY climbed from six-week lows under 105.00 towards 106.00.
Next week, the US Consumer Price Index (CPI) on Tuesday and the Producer Price Index (PPI) on Wednesday will be closely watched. A surprise here has the potential to be a game changer.
The bond market will remain in focus. A weak 30-year Treasury auction triggered sharp moves, as did Federal Reserve Chair Powell's comments. The rebound in yields could signal the end of the bond rally that started in October.
European Central Bank (ECB) officials offered different perspectives on the future. In the near term, the ECB is not expected to raise rates further, and the debate is about when they will start cutting rates amid a negative economic outlook. Eurostat will release employment and growth data on Tuesday.
EUR/USD failed to hold above 1.0700 and pulled back, finding support above 1.0650. The pair offers mixed signals. The upside faces a strong barrier around 1.0800, which includes the 20-week Simple Moving Average (SMA).
The Pound was affected by dovish comments from Bank of England (BoE) officials. Growth data from the third quarter came in above expectations, but only to shows the economy stagnating. Next week, the UK will report employment on Tuesday and inflation on Wednesday. These numbers will be critical ahead of the next BoE meeting on December 14. GBP/USD retreated to the 20-day SMA around the 1.2200 area, which is a crucial support. A break lower would clear the way for more losses. EUR/GBP posted the highest weekly close since April, around 0.8735.
USD/JPY rose above 151.50 and posted the highest weekly close since 1990. The pair trades at levels compatible with intervention from Japanese authorities.
The Reserve Bank of Australia (RBA) hiked interest rates by 25 basis points, but it was a dovish hike as it signaled that the tightening cycle is over and weighed on the Australian Dollar. Australian yields dropped during the week based on guidance offered by the central bank. On Wednesday, the Q3 Wage Price Index will be released, followed by the employment report on Thursday. The Aussie was the worst performer among majors. AUD/USD erased most of last week's gains, retreating from the 20-week SMA after being unable to hold above the 0.6500 zone.
NZD/USD pulled back from the 20-week SMA to levels below 0.5900. Consolidation under 0.5850 would expose 2023 lows. The New Zealand Q3 Producer Price Index is due on Friday.
The Chilean Peso was among the biggest losers during the week, with USD/CLP rising from 880.00 to 920.00 after the annual inflation rate in Chile dropped to 5%, increasing expectations of more monetary policy easing.
Crude oil prices fell for the third week in a row due to demand concerns. WTI dropped from above $80.00 and bottomed slightly under $75.00, settling around $77.50.
Gold experienced a significant decline, losing over $50 during the week and dropping to $1,934. This drop can be attributed to higher yields and a stronger Dollar. Similarly, Silver faced resistance around the $23.00 level and subsequently fell to $22.20, marking its lowest close since early October.
Like this article? Help us with some feedback by answering this survey:
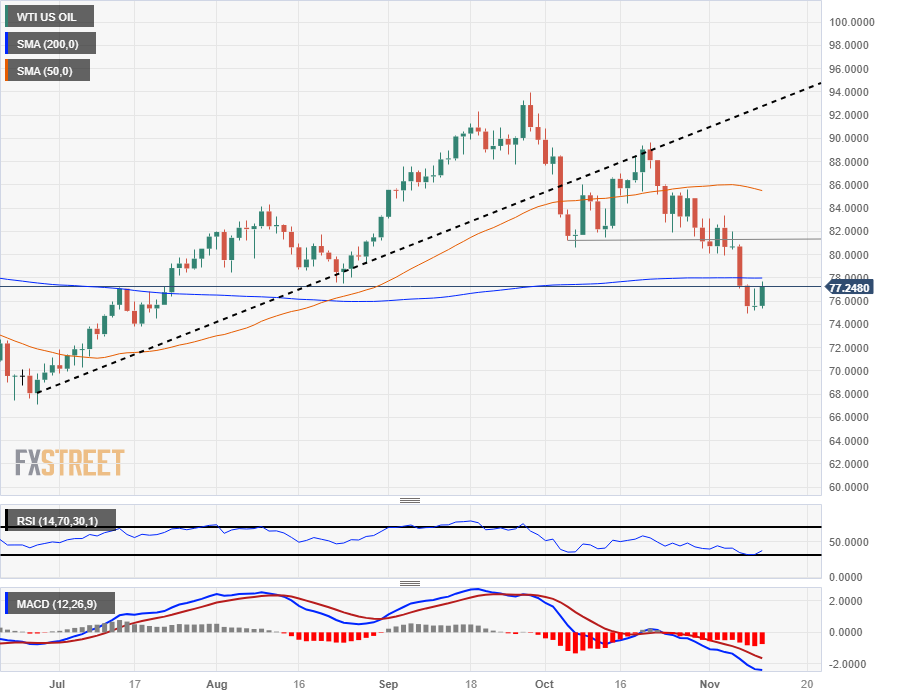
- WTI prices are up for Friday, but Crude Oil remains significantly down from recent highs.
- Market fears about declining demand have replaced fears of spill-over from Gaza Strip conflict.
- Friday bidding likely a spot of profit-taking rather than outright reversal.
West Texas Intermediate (WTI) Crude Oil prices have rebounded 2.8% on Friday, climbing from a daily low of $75.35 and testing into $77.50 heading towards the close after a rough week that has seen WTI shed 8.61% peak-to-trough.
Broad-market concerns about further escalations and a spillover in geopolitical conflict from the Gaza Strip conflict have eroded out of markets and replaced with newfound investor fears that global Crude Oil demand is failing to grow as fast as many had predicted. The long-running assumption that global oil production would undershoot demand, which initially sent WTI climbing into year-long highs near $94.00 per barrel.
Crude Oil chronic undersupply proving nonexistent
Despite significant production cuts from key member states of the Organization of the Petroleum Exporting Countries (OPEC), global oil demand has failed to materialize in a meaningful way, specifically weighed down by a notable lack of Crude Oil demand from China.
US Crude Oil stocks declined sharply last month, but the drawdown is larger a result of oil refiners capitalizing on soaring oil prices, and Crude Oil stocks continue to rebound almost as quickly as they declined.
WTI Technical Outlook
WTI is down 14% from the last swing high into $89.65 in October, declining into a near-term low of $74.95.
Crude Oil declined into the 200-day Simple Moving Average (SMA) this week, tumbling through the technical barrier and Friday's bids are sending WTI back into the moving average as prices pin to the median.
The last technical swing low in early October that saw congestion mear the $82.00 handle has marked out a potential inflection point that could pivot into technical resistance for any topside challenges next week.
WTI Daily Chart
WTI Technical Levels
- GBP/USD continues its downward trend, dropping 0.16% despite the UK GDP narrowly avoiding a contraction in Q3.
- The Bank of England's cautious stance mirrors the Fed's, as both central banks adopt a meeting-by-meeting approach to monetary policy.
- Upcoming economic releases from the UK and US, including jobs, inflation, and retail data, are set to influence the pair's trajectory next week.
GBP/USD failed to gain traction on Friday, extended its losses to five consecutive days, is down 0.16% or 20 pips from its opening price after hitting a daily high of 1.2237. At the time of writing, the pair exchanges hands at 1.2205.
Sterling dips to 1.2205, extending its losing streak amid mixed UK economic signals and a robust US Dollar
The UK's Gross Domestic Product (GDP) for the third quarter failed to grow every month but exceeded estimates for a 0.1% contraction. On an annual basis, GDP grew by 0.6%, missing forecasts of 0.5%. Even though data portrays British dodged a recession in 2023, remains at the brisk of a stagflationary scenario, as inflation remains at higher levels, despite the Bank of England’s (BoE) efforts to curb higher prices, after more than 500 basis points of tightening.
Meantime, BoE officials delivered hawkish remarks, though adopted a meeting-by-meeting approach like the US Federal Reserve.
Across the pond, hawkish comments from Jay Powell sparked a jump in US Treasury bond yields, which underpinned the Greenback. Friday´s data revealed that Consumer Sentiment among American households deteriorated further, easing from 63.8 to 60.4. Inflation expectations rose, for one year to 4.4%, and five-year inflation is seen at 3.2%.
Meanwhile, GBP/USD traders brace for next week´s UK economic docket that will feature jobs data, inflation, and retail sales. On the US front, besides further Fed speakers, consumer, and producer inflation, along with unemployment claims and retail sales.
GBP/USD Technical Levels
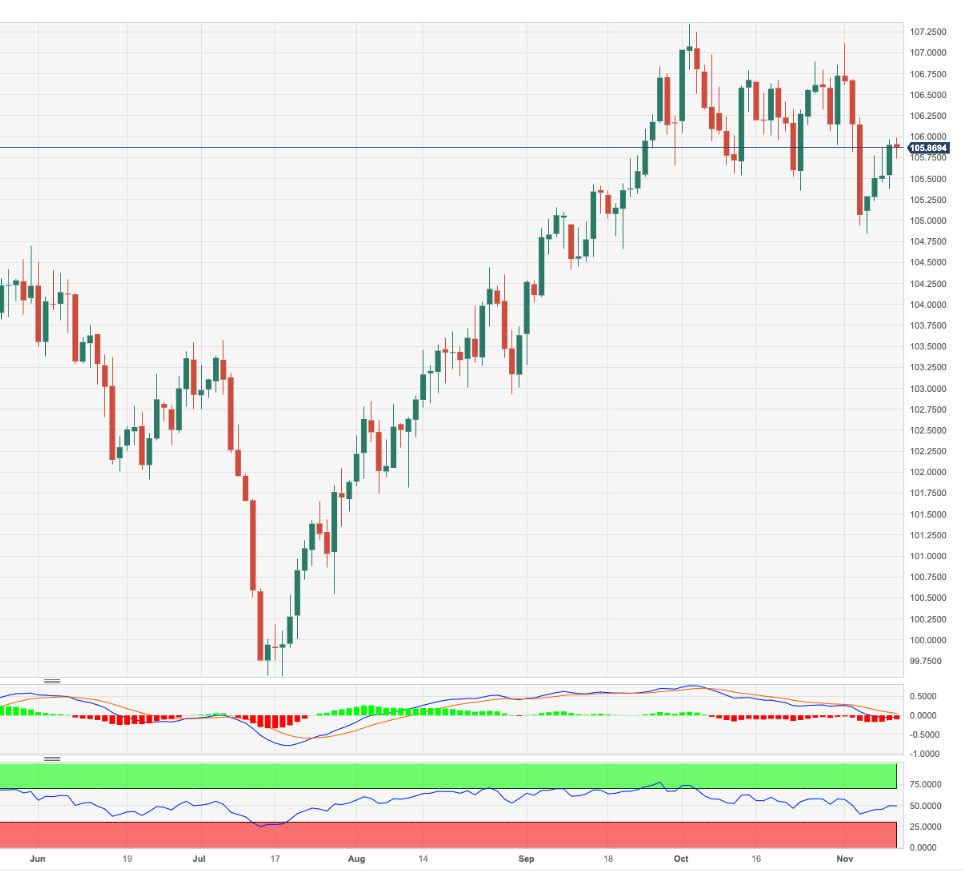
- The DXY index trades neutral at 105.90, closing a 0.80% weekly gain.
- Fed hawks revived USD strength during the week.
- UoM consumer sentiment data come in lower than expected.
- The focus shifts to next week’s inflation figure from the US from October.
The US Dollar (USD) showed minimal movement on Friday. The DXY index, which measures the value of the US Dollar versus a basket of global currencies, stood flat at 105.90 as bulls seem to be taking a hiatus. The Greenback strengthened after Federal Reserve (Fed) hawks hinted that there may be further tightening, which revived the US Treasury, allowing the Dollar to gain interest.
Despite the United States’ labor market showing signs of cooling down last week, several officials, including Chair Powell, seemed unsatisfied with the progress made on inflation. They spoke with cautious tones, welcoming the recent data but leaving the door open for further tightening in case it is needed. The focus seems to have turned to next week’s October inflation figures from the US.
Daily Digest Market Movers: US Dollar flattens, consolidating weekly gains
- The US Dollar Index is mildly neutral at 105.90 after rising in three out of the last four sessions.
- The University of Michigan revealed that the Michigan Consumer Sentiment index from November came in lower than expected at 60.4 vs the consensus of 63.7, declining from its previous reading of 63.8.
- Markets await next week’s Consumer Price Index (CPI) figures from October from the US.
- The Initial Jobless Claims from the week ending November 3 came in at 217,000, lower than the expected 218,000 and fell in relation to its last reading of 220,000.
- After sharply declining last week, US Treasury yields recovered throughout the week. The 2-year Treasury yield rose back to 5%, while the longer-term 5 and 10-year rates increased to 4.59% and 4.60%, which seems to be limiting downside for the USD.
- Investors continue to be on the sidelines, awaiting high-tier reports to continue placing their bets on the next Fed decision.
- According to the CME FedWatch Tool, the odds of a 25-basis-point hike in December are extremely low, below 10%.
Technical Analysis: US Dollar Index approaches 20-day SMA, bulls must step in
Analysing the daily chart, a neutral outlook is evident for the DXY Index. What gives the outlook neutrality is the index staying below the 20-day Simple Moving Average (SMA) but above the 100 and 200-day SMAs. Bulls are striving to regain the short-term 20-day SMA. As long as the bears hold the index below this level, the DXY will be prone to further downside.
In the meantime, the Relative Strength Index (RSI) turned flat over its midpoint, while the Moving Average Convergence (MACD) displays flat red bars suggesting that the bears momentum has flattened contributing to the neutral outlook.
Support levels: 105.80, 105.50,105.30.
Resistance levels: 106.00, 106.10 (20-day SMA), 106.30.
US Dollar FAQs
What is the US Dollar?
The US Dollar (USD) is the official currency of the United States of America, and the ‘de facto’ currency of a significant number of other countries where it is found in circulation alongside local notes. It is the most heavily traded currency in the world, accounting for over 88% of all global foreign exchange turnover, or an average of $6.6 trillion in transactions per day, according to data from 2022.
Following the second world war, the USD took over from the British Pound as the world’s reserve currency. For most of its history, the US Dollar was backed by Gold, until the Bretton Woods Agreement in 1971 when the Gold Standard went away.
How do the decisions of the Federal Reserve impact the US Dollar?
The most important single factor impacting on the value of the US Dollar is monetary policy, which is shaped by the Federal Reserve (Fed). The Fed has two mandates: to achieve price stability (control inflation) and foster full employment. Its primary tool to achieve these two goals is by adjusting interest rates.
When prices are rising too quickly and inflation is above the Fed’s 2% target, the Fed will raise rates, which helps the USD value. When inflation falls below 2% or the Unemployment Rate is too high, the Fed may lower interest rates, which weighs on the Greenback.
What is Quantitative Easing and how does it influence the US Dollar?
In extreme situations, the Federal Reserve can also print more Dollars and enact quantitative easing (QE). QE is the process by which the Fed substantially increases the flow of credit in a stuck financial system.
It is a non-standard policy measure used when credit has dried up because banks will not lend to each other (out of the fear of counterparty default). It is a last resort when simply lowering interest rates is unlikely to achieve the necessary result. It was the Fed’s weapon of choice to combat the credit crunch that occurred during the Great Financial Crisis in 2008. It involves the Fed printing more Dollars and using them to buy US government bonds predominantly from financial institutions. QE usually leads to a weaker US Dollar.
What is Quantitative Tightening and how does it influence the US Dollar?
Quantitative tightening (QT) is the reverse process whereby the Federal Reserve stops buying bonds from financial institutions and does not reinvest the principal from the bonds it holds maturing in new purchases. It is usually positive for the US Dollar.
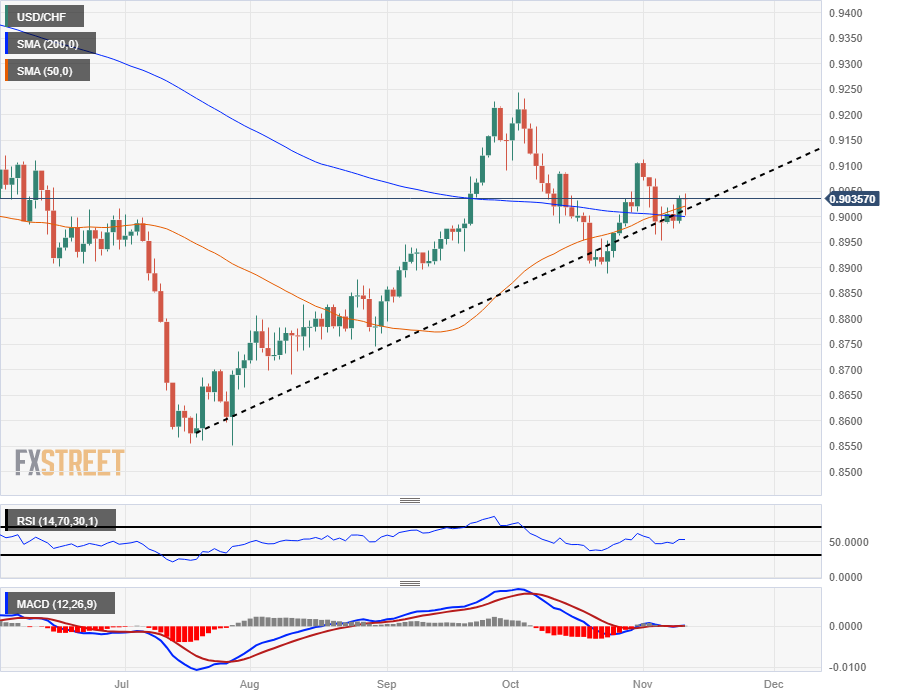
- The USD/CHF is seeing a thin bounce for Friday, churning towards 0.9050.
- The pair is holding steady after falling into the median range near major moving averages.
- Up Next: On Tuesday, an appearance from SNB Chair Thomas Jordan, US CPI inflation.
The USD/CHF is on the high side for the week after Federal Reserve (Fed) Chairman Jerome Powell propped up the US Dollar (USD) with hawkish comments, sending broader market sentiment into a tailspin.
The USD has seen some weakness against the Swiss Franc (CHF) through October and November, and remains down 2.25% from October's peak near 0.9245.
Coming up next week, early Tuesday sees Swiss National Bank (SNB) Chairman Thomas Jordan will be delivering the opening remarks at the Third High-Level Conference on Global Risk, Uncertainty, and Volatility, in Zurich.
Later that same day will be US Consumer Price Index (CPI) inflation, and investors will be drawing additional focus to the headline figures after the Fed's hawkish showing this week.
USD/CHF Technical Outlook
The USD/CHF has been cycling around the 200-day Simple Moving Average (SMA) since September, drawing out a constraining range from 0.9100 to 0.8900, but the pair's long-term bullish momentum from July's bottom near 0.8550 sees the 50-day SMA confirming a bullish cross of the longer moving average.
This week saw a decline into 0.8950 on Monday before the USD recovered into the week's midrange, seeing a bullish push on Thursday and holding steady at the top end for Friday.
USD/CHF Daily Chart
USD/CHF Technical Levels
- The Canadian Dollar has seen little but downside this week.
- A pivot to market Fed expectations is sending investors into the US Dollar.
- Crude Oil bids try to recover, limiting Loonie losses for Friday.
The Canadian Dollar (CAD) is in the red again this week, set to close down for the fifth trading day in a row, its worst day-on-day performance since April.
Canada has seen a thin showing on the economic calendar all week, and next week is set for more of the same as broader markets focus on the US Dollar (USD) and investors get pushed around by central bank expectations.
Daily Digest Market Movers: Canadian Dollar recedes as traders pick the Greenback
The CAD is down for a fifth consecutive trading session, shedding 1.5% against the USD.
Risk aversion appears to be the general tone to overall market themes, sending the USD higher across the board.
US Michigan Consumer Sentiment Index for November dropped back to 60.4 from 63.8.
UoM 5-Year Consumer Inflation Expectations ticked up from 3% to 3.2%.
Federal Reserve Chairman Jerome Powell’s hawkish showing yesterday continues to bleed through markets as investors prove jittery around inflation.
Crude Oil is seeing soft gains for Friday, helping to support the Loonie and limit CAD losses.
Next Tuesday sees US Consumer Price Index (CPI) inflation figures that should electrify Greenback traders.
Technical Analysis: Canadian Dollar drops to 1.3850 against US Dollar
The USD/CAD has climbed 1.65% bottom-to-top this week, sending the Loonie-Greenback pair into familiar highs and etching in a Friday peak of 1.3850.
The pair kicked off the week’s trading with a clean bounce from the 50-day Simple Moving Average (SMA) near 1.3630, and the week’s price action has been notably one-sided the entire way through.
Monday’s low-side rebound also saw a rejection from a rising trendline from July’s swing low into the 1.3100 region.
The near-term ceiling for USD/CAD bulls to beat will be the 1.3900 handle, a technical barrier that rejected the pair at the beginning of the month.
USD/CAD Daily Chart

Canadian Dollar FAQs
What key factors drive the Canadian Dollar?
The key factors driving the Canadian Dollar (CAD) are the level of interest rates set by the Bank of Canada (BoC), the price of Oil, Canada’s largest export, the health of its economy, inflation and the Trade Balance, which is the difference between the value of Canada’s exports versus its imports. Other factors include market sentiment – whether investors are taking on more risky assets (risk-on) or seeking safe-havens (risk-off) – with risk-on being CAD-positive. As its largest trading partner, the health of the US economy is also a key factor influencing the Canadian Dollar.
How do the decisions of the Bank of Canada impact the Canadian Dollar?
The Bank of Canada (BoC) has a significant influence on the Canadian Dollar by setting the level of interest rates that banks can lend to one another. This influences the level of interest rates for everyone. The main goal of the BoC is to maintain inflation at 1-3% by adjusting interest rates up or down. Relatively higher interest rates tend to be positive for the CAD. The Bank of Canada can also use quantitative easing and tightening to influence credit conditions, with the former CAD-negative and the latter CAD-positive.
How does the price of Oil impact the Canadian Dollar?
The price of Oil is a key factor impacting the value of the Canadian Dollar. Petroleum is Canada’s biggest export, so Oil price tends to have an immediate impact on the CAD value. Generally, if Oil price rises CAD also goes up, as aggregate demand for the currency increases. The opposite is the case if the price of Oil falls. Higher Oil prices also tend to result in a greater likelihood of a positive Trade Balance, which is also supportive of the CAD.
How does inflation data impact the value of the Canadian Dollar?
While inflation had always traditionally been thought of as a negative factor for a currency since it lowers the value of money, the opposite has actually been the case in modern times with the relaxation of cross-border capital controls. Higher inflation tends to lead central banks to put up interest rates which attracts more capital inflows from global investors seeking a lucrative place to keep their money. This increases demand for the local currency, which in Canada’s case is the Canadian Dollar.
How does economic data influence the value of the Canadian Dollar?
Macroeconomic data releases gauge the health of the economy and can have an impact on the Canadian Dollar. Indicators such as GDP, Manufacturing and Services PMIs, employment, and consumer sentiment surveys can all influence the direction of the CAD. A strong economy is good for the Canadian Dollar. Not only does it attract more foreign investment but it may encourage the Bank of Canada to put up interest rates, leading to a stronger currency. If economic data is weak, however, the CAD is likely to fall.
- USD/JPY extends its rally for the fifth day, flirting with the 151.00 level, driven by rising US Treasury yields and Fed Chair Powell's inflation concerns.
- Market sentiment shifts following the University of Michigan data, indicating lower confidence in the economic outlook and persistent inflation fears.
- Japanese Yen's further decline is tempered by intervention warnings from the Ministry of Finance, as officials emphasize the need for Forex movements to align with economic fundamentals.
The USD/JPY prolongs its rally to five consecutive days, exchanging hands above the 151.00 figure, shy of challenging the 15-year high reached on October 31 at 151.72. a jump in the 10-year US Treasury bond yield after a weak 30-year US bond auction and Federal Reserve (Fed) Chair Jerome Powell's hawkish pullback are tailwinds for the major. At the time of writing, the pair trades at 151.50’, posting minimal gains of 0.11%:
Yen struggles as USD/JPY approaches October peak, with US bond yields and Fed policy in focus
Marker participants continued to digest Powell{s words, which signaled the US central bank remains worried about inflation, and that it would raise rates if needed. Growing concerns that the policy is not sufficiently restrictive remain. That spurred a leg-up in the USD/JPY, along with the rise of US bond yields.
Meanwhile, a sudden improvement in market sentiment has witnessed US bond yields retreating some after data from the University of Michigan (UoM), suggests Americans are less confident regarding the economic outlook, as the index eased from 63.8 to 60.4. Regarding inflation expectations, upside risks are lingering, as households see prices climbing 4.4% in a year from now, and 3.2% in five years.
On the Japanese front, the USD/JPY remains capped due to intervention threats by authorities namely the Ministry of Finance (MoF). Officials had been jawboning that volatility and further Yen depreciation could suggest action from authorities. They remain saying that the Forex movement should reflect fundamentals.
Next week, the USD/JPY pair would get some cues of US Retail Sales, and inflation data in the United States (US). In Japan, the calendar would feature the release of GDP, Industrial Production, and the Trade Balance.
USD/JPY Price Analysis: Technical outlook
Price action is about to test the year-to-date (YTD) high, which, if broken, could expose the USD/JPY for further upside, with buyers targeting 152.00. On the flip side, a failed breakout of the YTD high could form a ‘double top’ chart pattern which implies the exchange rate would fall further. In that outcome, the USD/JPY first support would be the Tenkan-Sen at 150.36, followed by Senkou-Span A at 150.15, ahead of testing the Kijun-Sen at 149.94.
- The Silver’s spot price XAG/USD is down by more than 1%, around $22.30.
- Jerome Powell from the Fed was seen as hawkish on Thursday, fuelling US bond yields.
- Markets are pricing in rates at restrictive levels for a more extended period.
- UoM Consumer Sentiment data from the US came in lower than expected.
At the end of the week, the XAG/USD plunged toward $22.30 and will close a 3% weekly loss, mainly driven by the US Dollar and yields recovering through the week, which pushed the metal’s price downwards.
After the Greenback weakened following the Federal Reserve (Fed) held rates steady last week, which markets interpreted as the bank reaching the end of its cycle and the release of a weak jobs report from October, the USD recovered in the last sessions. This was due to Fed hawks stepping in and Chair Powell claiming that the bank’s job wasn’t done, which fueled a rise in the US bond yields.
In line with that, the Treasury rates, often seen as the cost of holding non-yielding metals, recovered after reaching multi-week lows last week, and on Thursday, they jumped back towards to their highest levels in November, which made holding Silver lose interest.
On the data front, the University of Michigan revealed that the Michigan Consumer Sentiment index from November from the US came in lower than expected at 60.4, vs the consensus of 63.7 and declined from its previous reading of 63.8. As a reaction, the negative figures seem to be limiting the upside for the USD, whose DXY index trades neutral at 105.90.
XAG/USD Levels to watch
From a technical standpoint, the XAG/USD maintains a bearish outlook for the short term, as observed on the daily chart. The Relative Strength Index (RSI) is comfortably positioned in the negative territory below its midline and has a southward slope, complemented by a negative signal from the Moving Average Convergence Divergence (MACD), which is showing red bars, signalling a growing bearish momentum. On the other hand, the pair is below the 20,100,200-day Simple Moving Average (SMA), implying that the bears retain control on a broader scale.
Resistance levels: $22.90 (20-day SMA), $23.00,$23.30 (100 and 200-day SMA convergence).
Support levels: $22.30, $22.15,$22.00.
XAG/USD Daily Chart
-638352294371282454.png)
RMB has gained significant market share in global payments. Economists at ANZ Bank analyze RMB internationalisation.
New internationalisation opportunity for RMB
As of Q3 2023, RMB has surpassed USD to become the top currency in China’s cross-border payments. It has also replaced the Euro to become the second-largest currency in the global trade financing market.
RMB debt financing is the biggest driver behind the rising use of RMB. Many borrowers, including sovereigns and corporates, have started replacing their USD debt with RMB.
Chinese authorities are happy to export RMB despite concerns related to capital outflow. Looking forward, we expect RMB to gain market share amid the global dedollarisation.
- Mexican Peso will remain soft after Banxico’s dovish hold.
- Mexico’s Industrial Production uptrend halted after two months of continuous improvement.
- Federal Reserve Chair Jerome Powell commented that the Fed would not hesitate to adjust monetary policy tighter.
Mexican Peso (MXN) remains on the defensive against the US Dollar (USD), hitting a weekly low of 17.93 as shown by the USD/MXN due to hawkish comments by US Federal Reserve (Fed) Chair Jerome Powell. Additionally, the Bank of Mexico (Banxico) adopting a “less hawkish” stance weighed on the emerging market currency. The exotic pair is trading at 17.79, gaining 0.06% on the day.
Mexico’s economic docket on Thursday witnessed Banxico holding interest rates at 11.25%, justifying that inflation remains high and stating that for “some time” rates would need to stay at current levels. The Mexican central bank language was less hawkish as they said, “In order to achieve an orderly and sustained convergence of headline inflation to the 3% target, the reference rate must be maintained at its current level for some time.” This rephrasing removed the past statement that it would maintain rates “for an extended period.”
Meanwhile, Fed Chair Jerome Powell was hawkish, saying that officials “are not confident” that monetary policy is sufficiently restrictive while adding, "If it becomes appropriate to tighten policy further, we will not hesitate to do so.”
Aside from this, Mexico’s economic docket featured Industrial Production, which surprisingly slowed more than estimates and was poised to remain above the 4% threshold. On the US front, Consumer Sentiment deteriorated, while inflation expectations ticked to the upside.
Daily digest movers: Mexican Peso drops further as Mexico’s Industrial Production eases
- Industrial Production in Mexico cooled down, revealed the National Statistics Agency (INEGI). The print was 3.9% YoY in September, below the 4.4% forecast and trailing August’s 5.2%.
- The University of Michigan's Consumer Sentiment Index in October decelerated to 60.4, missing forecasts and the previous month’s readings of 63.7 and 63.8, respectively.
- Americans expect inflation to remain higher, as they see prices a year from now up 4.4%, higher than August’s 4.2% and the five-year average at 3.2%, up from 3%.
- On Thursday, Mexico’s inflation expanded by 4.26% YoY in October, below forecasts of 4.28%, and the previous reading was 4.45%. On a monthly basis, inflation rose 0.39%, slightly above the 0.38% consensus and September’s 0.44%.
- Initial Jobless Claims in the United States for the week ending November 4 rose by 217K, below estimates of 218K and last week’s 220K.
- Fed officials continued to strike mixed signals, as the Philadelphia Fed’s Patrick Harker emphasized that rates must remain higher for longer. On the contrary, Chicago’s Fed Goolsbee turned dovish as he saw risks of overshooting rates.
- Money market futures have priced in a 25 bps rate cut by the Federal Reserve in July 2024.
- Mexico´s economy remains resilient after October’s S&P Global Manufacturing PMI improved to 52.1 from 49.8, and the Gross Domestic Product (GDP) expanded by 3.3% YoY in the third quarter.
- Banxico revised its inflation projections from 3.50% to 3.87% for 2024, which remains above the central bank’s 3.00% target (plus or minus 1%).
Technical Analysis: Mexican Peso is set to plunge further as Golden Cross emerges, USD/MXN extends its gains
The USD/MXN shifted from neutrally biased to neutrally upward biased as buyers emerged from below the 200-day Simple Moving Average (SMA) at 17.67 and lifted the pair more than 1.60% since Thursday's opening. It should be said that the 50-day SMA is above the 200-day SMA, suggesting that a Golden Cross formed a bullish signal. Hence, the pair might gain some steam as buyers have the upper hand, but they must first breach the 20-day SMA at 17.93, putting the psychological 18.00 threshold into play.
Conversely, key support levels lie at the 50 and 200-day SMAs, each at 17.00 and 17.67, respectively, followed by Monday's low of 17.40 and the 100-day Simple Moving Average (SMA) at 17.33. A breach of the latter will expose the 17.00 figure before the pair aims to test the year-to-date (YTD) low of 16.62.
Mexican Peso FAQs
What key factors drive the Mexican Peso?
The Mexican Peso (MXN) is the most traded currency among its Latin American peers. Its value is broadly determined by the performance of the Mexican economy, the country’s central bank’s policy, the amount of foreign investment in the country and even the levels of remittances sent by Mexicans who live abroad, particularly in the United States. Geopolitical trends can also move MXN: for example, the process of nearshoring – or the decision by some firms to relocate manufacturing capacity and supply chains closer to their home countries – is also seen as a catalyst for the Mexican currency as the country is considered a key manufacturing hub in the American continent. Another catalyst for MXN is Oil prices as Mexico is a key exporter of the commodity.
How do decisions of the Banxico impact the Mexican Peso?
The main objective of Mexico’s central bank, also known as Banxico, is to maintain inflation at low and stable levels (at or close to its target of 3%, the midpoint in a tolerance band of between 2% and 4%). To this end, the bank sets an appropriate level of interest rates. When inflation is too high, Banxico will attempt to tame it by raising interest rates, making it more expensive for households and businesses to borrow money, thus cooling demand and the overall economy. Higher interest rates are generally positive for the Mexican Peso (MXN) as they lead to higher yields, making the country a more attractive place for investors. On the contrary, lower interest rates tend to weaken MXN.
How does economic data influence the value of the Mexican Peso?
Macroeconomic data releases are key to assess the state of the economy and can have an impact on the Mexican Peso (MXN) valuation. A strong Mexican economy, based on high economic growth, low unemployment and high confidence is good for MXN. Not only does it attract more foreign investment but it may encourage the Bank of Mexico (Banxico) to increase interest rates, particularly if this strength comes together with elevated inflation. However, if economic data is weak, MXN is likely to depreciate.
How does broader risk sentiment impact the Mexican Peso?
As an emerging-market currency, the Mexican Peso (MXN) tends to strive during risk-on periods, or when investors perceive that broader market risks are low and thus are eager to engage with investments that carry a higher risk. Conversely, MXN tends to weaken at times of market turbulence or economic uncertainty as investors tend to sell higher-risk assets and flee to the more-stable safe havens.
The ECB's mandate is clear: to ensure price stability in the Eurozone. Economists at Commerzbank do not believe that the ECB's current interest rate is sufficient to push inflation down.
ECB strategy with pitfalls
Fighting inflation without stifling the economy. The ECB is pursuing this goal with a strategy of not raising interest rates too much, but keeping them at this level for a longer period of time (‘lower high for longer’).
However, in doing so, it risks inflation settling at a higher level. This would leave the central bankers with no room for manoeuvre for significant rate cuts for years to come and the economy would have to drive with the handbrake on.
The Oil price is already high. Economists at Natixis analyze the maximum price Brent could reach.
How high could Oil prices go?
If the conflict in the Middle East were to spread and last, either as a result of a retaliatory movement triggered by Middle Eastern Oil producing countries against Western countries or as a result of a more severe embargo imposed by the Americans on Iranian oil production, it is possible that the Oil price will rise above its current level (around $90 for Brent).
But there is an upper limit to the Oil price, which is the price level that would trigger additional exploration and production of US shale Oil and Canadian Oil shale.
In view of the past reaction of these Oil producers to Oil price rises, the maximum price that Oil could reach before triggering a major production surge in North America is probably around $120 (Brent).
Economists at CIBC Capital Markets expect the USD/BRL pair to move back higher in the coming months.
BCB to maintain the current pace of rate cuts in December
Given President Lula’s comments suggesting expenditures will not be cut to meet the new 2024 fiscal target, we expect USD/BRL to resume its upward path towards 5.10, and on a break above that level, retest the 5.20 mark in line with our year-end forecast.
As for the Selic rate, we expect the BCB to maintain the current pace of rate cuts in December, bringing it to 11.75% by the end of 2023 and another 50 bps rate cut in the first meeting of 2024, after which we expect the BCB to adjust its forward guidance (likely a slower pace of rate cuts as fiscal risks materialize/persist).
- UoM Consumer Confidence Index declined further in November.
- US Dollar Index stays in daily range bear 106.00 after the data.
Consumer sentiment in the US continued to weaken in November, with the University of Michigan's (UoM) Consumer Confidence Index declining to 60.4 from 63.8 in October. This reading fell short of the market expectation of 63.7.
Further details of the publication revealed that the Current Conditions Index fell to 65.7 from 70.6 and the Expectations Index retreated to 56.9 from 59.3.
The one-year inflation outlook jumped rose to 4.4% from 4.2%, while the 5-year inflation outlook climbed to 3.2% from 3%.
Market reaction
The US Dollar Index showed no immediate reaction to these data and was last seen posting small daily gains at 106.00.
- EUR/USD keeps the trade below the 1.0700 hurdle so far on Friday.
- Bullish attempts are expected to meet the next hurdle near 1.0750.
EUR/USD prints humble gains in the 1.0670/80 band at the end of the week.
In case the upward bias picks up extra pace, there is an initial barrier at the round level of 1.0700 ahead of the monthly top of 1.0756 (November 6).
In the meantime, while below the 200-day SMA at 1.0801, the pair’s outlook should remain negative.
EUR/USD daily chart
Silver has underperformed Gold, both during the course of the year so far and during the latest price rally in October. Economists at Commerzbank analyze the precious metal’s outlook.
Silver suffering from weaker physical demand
One factor putting the brakes on Silver is presumably the weaker physical demand than last year. This at least is what the Silver Institute, together with Metals Focus, had predicted for this year back in April.
Having said that, industrial demand should continue to grow to reach a record level. Next week, the institute present its interim report for the Silver market in 2023. If this confirms the forecast of a declining supply deficit in response to weaker demand, we do not expect any significant reaction from the price.
We certainly anticipate higher prices in the medium term, however, given that Silver should profit from ‘green’ industrial demand.
- DXY trades in a vacillating fashion just below 106.00.
- The surpass of 106.00 should refocus the attention to 107.00.
DXY trades within a narrow range near the 106.00 region at the end of the week.
In case the buying interest gathers extra pace, the index is expected to challenge the 106.00 barrier. Once cleared, it could open the door to a rapid visit to the November top at 107.11 (November 1) prior to the 2023 peak of 107.34 (October 3).
In the meantime, while above the key 200-day SMA, today at 103.59, the outlook for the index is expected to remain constructive.
DXY daily chart
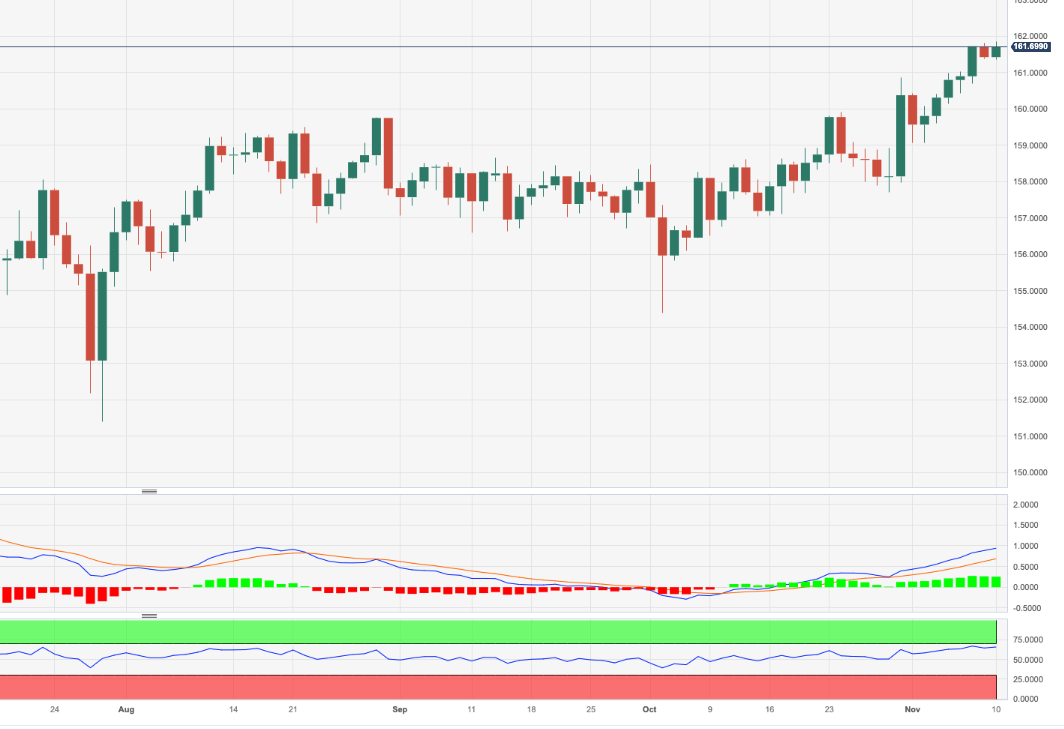
- EUR/JPY advances to new 2023 highs near 162.00.
- Further upside could lift the cross to the 2008 high near 170.00.
EUR/JPY resumes the upside and prints new yearly highs in the vicinity of the 162.00 yardstick on Friday.
Further upside appears well on the cards for the cross in the short-term horizon. Against that, the surpass of the 2023 high of 161.85 (November 10) is expected to face the next significant resistance level not before the 2008 peak of 169.96 (July 23)
So far, the longer term positive outlook for the cross appears favoured while above the 200-day SMA, today at 152.13.
EUR/JPY daily chart
After an extended period of US Dollar strength in 2022, it has been a back-and-forth year for Greenback in 2023. Economists at Wells Fargo analyze USD outlook.
Dollar should be a safe place during economic storm
Given an uncertain backdrop as we head into 2024, we believe the US Dollar will remain a safe place to be for at least the next several months.
We forecast further US Dollar appreciation through at least Q1-2024 and perhaps longer. We expect USD strength could be particularly noticeable against the Euro and British Pound, where sharply slower growth along with central banks that have probably reached the end of their tightening cycles are factors likely to weigh on those currencies. Some Latin American currencies could also come under pressure.
We expect the trend of US Dollar strength will eventually wane and turn to USD weakness later in 2024, as our view remains for a mild US recession, and for the Fed to ease monetary policy by more than expected by financial market participants. That said, the outlook is shifting toward less USD weakness and less foreign currency strength, with the risks tilted toward a softer landing for the US economy and more gradual Fed easing.
We still believe the Japanese Yen could be an outperformer among the G10 currencies in 2024 as central banks eventually turn to easing.
The risk and commodity sensitive currencies of Australia, Canada and New Zealand may experience moderate gains during 2024, while the Pound and Euro might continue to underwhelm.
Economists at Commerzbank expect the EUR/USD pair to regain some ground next year.
ECB likely to cut interest rates less than the markets expect
We expect the EUR/USD exchange rate to recover moderately in 2024 (year-end forecast 2024: 1.09). This is likely to be driven primarily by the US Dollar, which is likely to suffer from the expected US interest rate cuts, just as it had previously benefited from the interest rate hikes.
EUR/USD should also receive some support from the fact that the ECB is likely to cut interest rates less than the markets expect.
- AUD/USD refreshes weekly low near 0.6560 as the broader market mood is risk-off.
- Fed Powell considered current monetary policy as inadequate to bring down inflation to 2%.
- The RBA MPS report indicated that further tightening would be largely dependent on incoming data.
The AUD/USD pair continues its losing streak for the fifth trading session as fears of a global slowdown have deepened after hawkish commentary from Federal Reserve (Fed) Chair Jerome Powell in his commentary at the International Monetary Fund (IMF) on Thursday.
The S&P500 opens on a bullish note as fears of widening Middle East tensions have started fading. Investors see conflicts remaining contained between Israel and Palestine and may Iran would not intervene. The US Dollar Index (DXY) consolidates near 105.80, struggling to extend recovery, as investors shift focus to US inflation data for October, which will be published next week.
Jerome Powell, in his commentary, showed no confidence in the current monetary policy, considering it inadequate to bring down inflation to 2% in a timely manner.
The expectations that the Fed may not be able to achieve price stability with current interest rates are prompted by a resilient US economy. The world’s largest economy is performing stronger on the grounds of consumer spending and the labor market, which could slow the progress in inflation returning towards 2%.
On the Australian Dollar front, the Reserve Bank of Australia (RBA) released its Monetary Policy Statement (MPS) on early Friday. The report indicated that further tightening would be largely dependent on incoming data. The RBA warned that inflation has turned out persistent more than expected. As per the forecasts, inflation is seen easing to 4.5% by 2023, 3.5% by 2024, and 3.0% by the end of 2025.
The USD jumped on Thursday as US yields rose strongly. Economists at Scotiabank analyze Greenack’s outlook.
Trends may steady ahead of next week’s key data
Rising yields which reflect rising risks for holding US Treasury debt rather than the underlying strength of US economic data are not necessarily going to support the USD moving forward.
The squeeze higher in the DXY averted rising technical pressure for more losses below support in the mid-105 area and gains appear to be stalling, if not reversing from 106.
There is still some underlying softness evident in the broader USD performance but trends may steady ahead of next week’s key (CPI, Retail Sales) data.
- The New Zealand Dollar declines across the board on Friday.
- Kiwi weakness comes from a combination of a negative global growth outlook and US Dollar outperformance.
- Hawkish commentary from Fed Chair Powell set the US Dollar trending higher against the Kiwi, NZD/USD resumes decline.
The New Zealand Dollar (NZD) weakens across the board on Friday as concerns about global growth continue to fester following a run of weak data from China, New Zealand’s biggest trading partner.
NZD/USD, in particular, falls as the US Dollar (USD) outperforms the Kiwi, following a speech by Federal Reserve Chairman Jerome Powell, on Thursday. Powell surprised markets by saying further rate hikes might be necessary to curb inflation. The USD rose on his remarks as higher interest rates could attract more foreign capital inflows, boosting demand for the buck.
Daily digest market movers: New Zealand Dollar falls on China data, Fedspeak
- The New Zealand Dollar trades lower against the US Dollar on Friday, reversing the previous day’s short-lived gains after a bounce off the 50-day Simple Moving Average (SMA).
- The pair fell after comments from Chairman Powell put interest rate hikes back on the table.
- The market had been lulled into expecting the Federal Reserve (Fed) to maintain the current level of the fed funds rate (5.25%-5-50%), but after Powell – and several other Fed officials – voiced dissatisfaction with the current level of tightening, the market view is shifting to potentially seeing further hikes.
- Downbeat Chinese inflation data has dampened the outlook for global growth. This weighs directly on NZD, as it is a major commodity exporter – especially of dairy products – to China.
- The Kiwi itself weakened midweek on the back of an inflation report from the RBNZ that showed both one-year-out and two-years-out inflation expectations for New Zealand falling in Q3 compared to the previous quarter.
- The lower inflation expectations imply the RBNZ is less likely to raise interest rates.
New Zealand Dollar technical analysis: NZD/USD threatens more downside
NZD/USD – the number of US Dollars one New Zealand Dollar can buy – reversed its bounce and then broke below the 50-day SMA on Friday. Previous to that it had used the SMA as a springboard for intraday gains.
-638352184562674719.png)
New Zealand Dollar vs US Dollar: Daily Chart
The bullish short-term trend is now seriously at risk of reversing. The pair trades at 0.5890 at the time of writing, only a few pips above the last major lower high of the previous uptrend, at 0.5874, made on November 2. A break below would probably indicate a reversal and deeper losses.
The next target to the downside would probably be at 0.5862, where the 61.8% Fibonacci retracement of the recovery from the year-to-date lows in late October and early November. The main target, however, sits at 0.5790.
A recovery and decisive break above the November 3 high at 0.6001, however, would reconfirm this bullish bias, with a likely target thereafter at the 0.6055 October high.
The medium and long-term trends are still bearish, suggesting the potential for more downside is strong.
-638352185024744687.png)
New Zealand Dollar vs US Dollar: Weekly Chart
Bulls would have to push above the 0.6055 October high to change the outlook in the medium term and suggest the possibility of the birth of a new uptrend.
New Zealand Dollar FAQs
What key factors drive the New Zealand Dollar?
The New Zealand Dollar (NZD), also known as the Kiwi, is a well-known traded currency among investors. Its value is broadly determined by the health of the New Zealand economy and the country’s central bank policy. Still, there are some unique particularities that also can make NZD move. The performance of the Chinese economy tends to move the Kiwi because China is New Zealand’s biggest trading partner. Bad news for the Chinese economy likely means less New Zealand exports to the country, hitting the economy and thus its currency. Another factor moving NZD is dairy prices as the dairy industry is New Zealand’s main export. High dairy prices boost export income, contributing positively to the economy and thus to the NZD.
How do decisions of the RBNZ impact the New Zealand Dollar?
The Reserve Bank of New Zealand (RBNZ) aims to achieve and maintain an inflation rate between 1% and 3% over the medium term, with a focus to keep it near the 2% mid-point. To this end, the bank sets an appropriate level of interest rates. When inflation is too high, the RBNZ will increase interest rates to cool the economy, but the move will also make bond yields higher, increasing investors’ appeal to invest in the country and thus boosting NZD. On the contrary, lower interest rates tend to weaken NZD. The so-called rate differential, or how rates in New Zealand are or are expected to be compared to the ones set by the US Federal Reserve, can also play a key role in moving the NZD/USD pair.
How does economic data influence the value of the New Zealand Dollar?
Macroeconomic data releases in New Zealand are key to assess the state of the economy and can impact the New Zealand Dollar’s (NZD) valuation. A strong economy, based on high economic growth, low unemployment and high confidence is good for NZD. High economic growth attracts foreign investment and may encourage the Reserve Bank of New Zealand to increase interest rates, if this economic strength comes together with elevated inflation. Conversely, if economic data is weak, NZD is likely to depreciate.
How does broader risk sentiment impact the New Zealand Dollar?
The New Zealand Dollar (NZD) tends to strengthen during risk-on periods, or when investors perceive that broader market risks are low and are optimistic about growth. This tends to lead to a more favorable outlook for commodities and so-called ‘commodity currencies’ such as the Kiwi. Conversely, NZD tends to weaken at times of market turbulence or economic uncertainty as investors tend to sell higher-risk assets and flee to the more-stable safe havens.
Sterling is finding some support on dips to the 1.22 area against the USD for now but appears set for a weak close on the week against the EUR, economists at Scotiabank.
EUR/GBP advance may extend
Steady losses through the course of the week have pushed Cable back to near last Friday’s low, just under 1.22. Short-term trends look soft and losses over the week suggest the soft tone may extend. The 1.22 point may be a short-term pivot, with weakness below here pointing to the risk of losses extending to retest the 1.20/1.21 area.
EUR/GBP’s high close on the week should solidify the break out from the recent trading range and target additional gains in the weeks ahead towards 0.89.
European Central Bank (ECB) President Christine Lagarde said at a Financial Times event on Friday that the interest rate level, if sustained long enough, will contribute to returning inflation to target, per Reuters.
Lagarde noted that there might be some upticks in inflation in the months ahead and added that they were uncomfortable that the EU fiscal framework has not been agreed upon yet.
Market reaction
These comments failed to trigger a reaction in the Euro. As of writing, EUR/USD was up 0.15% on the day at 1.0682.
USD/CAD holds around 1.38. Economists at Scotiabank analyze the pair’s outlook.
The rebound looks no more than a consolidation
With no domestic data ahead, external drivers will remain key influences on the direction of the market in the short run but downside potential for the CAD from here still looks limited.
There are no clear signs from short-term price action that the USD rebound cannot extend a bit more but intraday price action has stalled in the low 1.38 area, with some minor congestion resistance doing enough to slow the USD recovery so far today.
The USD has put in a solid gain over the week so far but the rebound looks no more than a consolidation after last week’s big, bearish reversal from 1.39 – which should still mark very stiff resistance for funds.
Support intraday is 1.3790 and 1.3750.
- Silver price falls after a short-lived pullback to near $23.00 as Fed Powell leans toward further policy tightening.
- Fed Barkin is less optimistic about progress in inflation easing towards 2%.
- Silver price trades in a Descending Triangle pattern, which indicates a sharp contraction in volatility.
Silver price (XAG/USD) fell sharply after facing selling pressure near the crucial resistance of $23.00. The appeal for bullions has dented significantly as investors see Middle East tensions remaining contained between Israel and Palestine.
S&P500 futures remain subdued in the European session, portraying a cautious market mood as Fed Powell is not confident that current interest rates are sufficiently high to bring down inflation to 2%. More interest rate hikes from the Fed would dampen business investment and household spending.
Richmond Fed Bank President Thomas Barkin is less optimistic about progress in inflation easing towards 2%, he remained unsure about raising rates further. Fed Barkin sees some slowdown as higher interest rates have started hitting the economy.
The US Dollar Index (DXY) gathers strength to climb above the immediate resistance of 106.00 as expectations that the Fed is done with hiking interest rates are peaking now. 10-year US Treasury yields hover around 4.6%.
Going forward, investors will focus on the inflation data for October, which will be released next week. The inflation data will set an undertone for the Fed’s monetary policy in December.
Silver technical analysis
Silver price trades in a Descending Triangle chart pattern on a two-hour timeframe, which indicates a sharp contraction in volatility. The white metal remains cushioned near $22.40 while the downward-sloping trendline from October 30 high at $23.60 continues to act as a barricade for them.
The Relative Strength Index (RSI) (14) oscillates in the 40.00-60.00 range, which indicates a consolidation ahead.
Silver two-hour chart
-638352164245793106.png)
EUR/USD consolidates in the mid-1.06 area. Economists at Scotiabank analyze the pair’s outlook.
Bullish reversal pattern developing
Intraday price signals indicate the EUR may have based, with a bullish reversal pattern developing on the six-hour chart around the daily low just under 1.0660. This is near where spot picked up support earlier this week.
Broader patterns suggest a potential bull consolidation ahead of another push higher in the EUR after the early November recovery from the low 1.05s.
Intraday EUR support is 1.0655. Resistance (bull trigger) is 1.0715.
- The Greenback traded substantially higher overnight.
- Traders got caught by surprise as Powell delivered surprisingly hawkish remarks.
- The US Dollar Index nearly broke above 106.00, but softened a bit in European trading.
The US Dollar (USD) eases mildly on Friday’s European morning after surging overnight due to Federal Reserve Chairman Jerome Powell’s hawkish comments, which caught traders by surprise. The Fed’s Chairman signalled that policymakers are not scared of increasing interest rates further if needed, which goes against market consensus that the Fed is done hiking and cuts will be soon at hand. The surprise was even more bigger as earlier Atlanta Fed President Raphael Bostic and Richmond Fed President Thomas Barkin delivered very dovish comments.
On the economic data front, traders will need to assess the words of Powell before heading into the weekend. With only one Fed speaker still to come, the focal point on Friday will be the preliminary Michigan Consumer Sentiment Index and the Consumer Inflation Expectations. Should those decline further, the US Dollar Index (DXY) could be seen squaring back its gains from late Thursday evening and close this week off flat or with a small profit.
Daily digest: US Dollar has Powell to thank for
- These are the main takeaways from US Fed Chairman Powell speech on Thursday evening:
- “We are not confident that we have achieved the right stance for inflation.”
- “Continued inflation progress is not assured.”
- “[The] Fed will not hesitate to tighten more if appropriate. We are not confident that we have done enough to achieve the stance to hit 2% inflation.”
- Dallas Fed President Lorie Logan is due to make some comments at 12:30 GMT.
- The only important data point on Friday will be the preliminary report from the University of Michigan for November:
- The Consumer Sentiment Index is expected to fall marginally, from 63.8 to 63.7.
- The 5-year Consumer Inflation Expectation came in at 3% in October.
- Equities are not digesting Powell's speech well: The Chinese Hang Seng is down over 1% and European equities are in the red over 0.50%. US equity futures are trading marginally in the green in pre-market opening.
- The CME Group’s FedWatch Tool shows that markets are pricing in a 90.7% chance that the Federal Reserve will keep interest rates unchanged at its meeting in December.
- The benchmark 10-year US Treasury yield trades at 4.60%, after Powell reiterated that more hikes might be needed to battle inflation.
US Dollar Index technical analysis: US Dollar gets brief kick-start
The US Dollar got a boost from the hawkish comments from Fed’s Powell. However, the boost starts to fade quite quickly on Friday’s European trading. It looks like that King Dollar, tracked by the DXY Index, is not able to make a comeback, which means more downside could be in the cards.
The DXY was looking for support near 105.00, and has been able to bounce ahead of it earlier this week. Any shock events in global markets could spark a sudden turnaround and favour safe-haven flows into the US Dollar. A rebound first to 105.85 would make sense, a pivotal level from March 2023. A break above could mean a revisit to near 107.00 and recent peaks printed there.
On the downside, 105.10 is still acting as a line in the sand. Once the DXY slides back below that, a big air pocket is opening up with only 104.00 as the first big level, where the 100-day Simple Moving Average (SMA) can bring some support. Just beneath that, near 103.50, the 200-day SMA should provide similar underpinning.
US Dollar FAQs
What is the US Dollar?
The US Dollar (USD) is the official currency of the United States of America, and the ‘de facto’ currency of a significant number of other countries where it is found in circulation alongside local notes. It is the most heavily traded currency in the world, accounting for over 88% of all global foreign exchange turnover, or an average of $6.6 trillion in transactions per day, according to data from 2022.
Following the second world war, the USD took over from the British Pound as the world’s reserve currency. For most of its history, the US Dollar was backed by Gold, until the Bretton Woods Agreement in 1971 when the Gold Standard went away.
How do the decisions of the Federal Reserve impact the US Dollar?
The most important single factor impacting on the value of the US Dollar is monetary policy, which is shaped by the Federal Reserve (Fed). The Fed has two mandates: to achieve price stability (control inflation) and foster full employment. Its primary tool to achieve these two goals is by adjusting interest rates.
When prices are rising too quickly and inflation is above the Fed’s 2% target, the Fed will raise rates, which helps the USD value. When inflation falls below 2% or the Unemployment Rate is too high, the Fed may lower interest rates, which weighs on the Greenback.
What is Quantitative Easing and how does it influence the US Dollar?
In extreme situations, the Federal Reserve can also print more Dollars and enact quantitative easing (QE). QE is the process by which the Fed substantially increases the flow of credit in a stuck financial system.
It is a non-standard policy measure used when credit has dried up because banks will not lend to each other (out of the fear of counterparty default). It is a last resort when simply lowering interest rates is unlikely to achieve the necessary result. It was the Fed’s weapon of choice to combat the credit crunch that occurred during the Great Financial Crisis in 2008. It involves the Fed printing more Dollars and using them to buy US government bonds predominantly from financial institutions. QE usually leads to a weaker US Dollar.
What is Quantitative Tightening and how does it influence the US Dollar?
Quantitative tightening (QT) is the reverse process whereby the Federal Reserve stops buying bonds from financial institutions and does not reinvest the principal from the bonds it holds maturing in new purchases. It is usually positive for the US Dollar.
USD/JPY at just a whisper below 151.50. Economists at Rabobank analyze the pair’s outlook.
Potential for USD/JPY to move back below 145 in H2 2024
As yet, no fresh verbal intervention from the MoF has been reported, though there is a heightened chance of this. Given the risk that verbal intervention may be followed up with JPY purchases by the authorities, the market will likely be very reluctant to push USD/JPY above 152.00.
The slow progress of policy normalisation suggests that USD/JPY may continue to trade above the 150 level in the weeks ahead.
Any step-up in speculation of a rate hike would allow USD/JPY to move lower next year. The spring wage rounds are likely to be a crucial determinant in policy decisions in 2024. We see the potential for USD/JPY to move back below 145 in H2 2024.
Gold market has run out of steam. Strategists at Commerzbank analyze the yellow metal’s outlook.
Mid-term outlook is positive for Gold
The latest speeches given by Fed officials including Chairman Jerome Powell have dampened any hopes of rate cuts in the near future.
If US inflation figures were to surprise to the upside, the Gold price could fall further in the short term. In principle, however, we are convinced that the US rate cycle has peaked and that the mid-term outlook is positive for Gold.
UOB Group’s Senior Economist Julia Goh and Economist Loke Siew Ting comment on the latest set of GDP figures in the Philippines.
Key Takeaways
The Philippine economy expanded at a stronger-than-expected pace of 5.9% y/y in 3Q23 (from +4.3% in 2Q23), which was well above our estimate (+4.5%) and Bloomberg consensus (+4.7%). It was primarily driven by higher government spending, investments and a persistent positive net trade contribution, which offset softening household consumption and stock withdrawals. All major economic sectors pencilled in a bigger gain with the services sector remaining the key growth driver, followed by construction, utilities and manufacturing sectors.
Taking the latest upbeat GDP growth reading and year-end festive demand into consideration, we raise our 2023 full-year real GDP growth forecast to 5.7% (from 5.0% previously, official est: 6.0%-7.0%). We also upgrade the country’s growth outlook for next year to 6.5% (from 6.0% previously, official est: 6.5%8.0%), mainly backed by the passage of a larger national budget for 2024 (on 27 Sep), softer inflationary pressures with less restrictive monetary policy stance, as well as an expected upturn in global tech cycle.
As investors see value in high-yielding ZAR assets, economists at CIBC Capital Markets expect the USD/ZAR pair to decline towards the 18.40 mark.
Ongoing appetite for high-yielding paper
While the market remains mindful of ongoing capacity pressures, potentially risking a final rate hike (although, we assume that we are already at terminal), signs of a graduated upturn in leading indicators, allied to still elevated real yields and elevated spreads versus UST provide potential appetite for international investors.
Ongoing appetite for high-yielding paper, albeit that remains on the proviso that inflationary pressures remain contained, provides scope for USD/ZAR to correct towards August lows around 18.40 in Q1.
USD/ZAR – Q4 2023: 19.15 | Q1 2024: 18.40
- Natural Gas prices sink over 10% for the week.
- The US Dollar briefly surges on the back of hawkish Powell comments.
- Natural Gas prices could sink lower as temperatures in Europe remain on the high end of the range.
Natural Gas prices have fallen more than 10% since the opening on Monday as concerns over supply following the Middle-East war fade and demand in Europe weakens on higher-than-usual temperatures. Markets have been following the narrative that the longer the tensions linger in the Middle East, the less probable it becomes that a proxy war would get underway.
Meanwhile, the US Dollar (USD) is weaker on Friday after its overnight stronger performance on the back of comments from US Federal Reserve Chairman Jerome Powell. Powell went against earlier comments from a few Fed members that the central bank has reached the end of its hiking cycle. Although the US Dollar Index (DXY) trades in the green, this week's gains are far from enough to erase losses from the prior one.
Natural Gas is trading at $3.23 per MMBtu at the time of writing.
Natural Gas market movers: Stalemate blocks Gas upticks
- Uganda Energy Minister Ruth Nankabirwa said the country signed a bilateral agreement with Tanzania for the construction of a natural gas import pipeline.
- The Pentagon has issued a statement on its military personnel in Syria and Iraq that came under attack four times since an overnight US airstrike on an arms depot.
- Turkey’s President Recep Tayyip Erdogan has urged Israel to free detained Palestinians in order to secure the release of civilian hostages held by Hamas.
- Around 18:00 GMT, the weekly Baker Hughes Gas Rig count will come out. Previous was at 118, posting a small uptick from the week before.
Natural Gas Technical Analysis: risk fading by the day
Natural Gas price has given back a substantial part of its uprising since the start of the Israeli-Palestinian war a few weeks ago. The risk premium has been all but erased by now. While Europe is facing elevated temperatures and with gas storages still fully filled up for the winter, more downturn should be priced into Natural Gas prices.
Only one big catalyst could break the price ceiling near $3.64, and that is a proxy war in the Middle East. A risk premium would be priced in if Iran, Saudi Arabia and other countries in the region started mobilising forces. In such a case, a quick sprint to $4.33, the high of 2023, would be expected.
On the downside, the 55-day Simple Moving Average (SMA) is doing its work near $3.15 as the downturn appears to be losing traction near $3.20. In case it is unable to hold the recent sell-off, expect to sell the orange line, from the double top in August, to try and salvage the situation near $3.06. That will be the last line of defence before gas prices retreat below $3.
-638352077594712475.png)
XNG/USD (Daily Chart)
Natural Gas FAQs
What fundamental factors drive the price of Natural Gas?
Supply and demand dynamics are a key factor influencing Natural Gas prices, and are themselves influenced by global economic growth, industrial activity, population growth, production levels, and inventories. The weather impacts Natural Gas prices because more Gas is used during cold winters and hot summers for heating and cooling. Competition from other energy sources impacts prices as consumers may switch to cheaper sources. Geopolitical events are factors as exemplified by the war in Ukraine. Government policies relating to extraction, transportation, and environmental issues also impact prices.
What are the main macroeconomic releases that impact on Natural Gas Prices?
The main economic release influencing Natural Gas prices is the weekly inventory bulletin from the Energy Information Administration (EIA), a US government agency that produces US gas market data. The EIA Gas bulletin usually comes out on Thursday at 14:30 GMT, a day after the EIA publishes its weekly Oil bulletin. Economic data from large consumers of Natural Gas can impact supply and demand, the largest of which include China, Germany and Japan. Natural Gas is primarily priced and traded in US Dollars, thus economic releases impacting the US Dollar are also factors.
How does the US Dollar influence Natural Gas prices?
The US Dollar is the world’s reserve currency and most commodities, including Natural Gas are priced and traded on international markets in US Dollars. As such, the value of the US Dollar is a factor in the price of Natural Gas, because if the Dollar strengthens it means less Dollars are required to buy the same volume of Gas (the price falls), and vice versa if USD strengthens.
Economist at UOB Group Ho Woei Chen, CFA, reviews the latest release of inflation figures in China.
Key Takeaways
China’s CPI fell back to deflation at -0.2% y/y in Oct due to a larger decline in food prices. Core inflation (excluding food & energy) and services inflation were both lower at 0.6% y/y (Sep: 0.8%) and 1.2% y/y (Sep: 1.3%) respectively in Oct.
The weaker price pressures reflected generally sufficient supply of agricultural products while consumer demand fell after the holidays. Furthermore, the decline in travel demand after the holidays also led to lower air ticket and tourism prices which kept non-food prices flat on a m/m basis.
We maintain our forecast for headline inflation at 0.4% in 2023 before strengthening to 1.7% in 2024. We expect the PPI to decline by -2.9% in 2023 and turn positive to 0.6% in 2024.
The weak inflation and growth backdrop lends support to the case for further monetary policy easing. We keep our call for a further 10 bps cut to the 1Y LPR and 20 bps cut to the 5Y LPR in 4Q23 to bring the rates to 3.35% and 4.00% respectively by year-end. A further cut to banks’ reserve requirement ratio is also possible to provide additional liquidity.
Economists at Société Générale analyze EUR/NOK outlook.
11.82 is first support near term
EUR/NOK successfully defended the 200-Day Moving Average (DMA) last month and subsequently broke above the range since August. This has resulted in extension of rebound.
The pair is gradually inching higher towards the peak achieved in May near 12.10. This could be an intermittent resistance. In case the pair fails to reclaim 12.10, a short-term pullback is likely.
11.82, the 23.6% retracement from October is the first support near term.
The Dollar chased the spike in US yields following a big tailing in the 30-year Treasury auction and hawkish comments by Fed Chair Jerome Powell. Economists at ING analyze USD outlook.
Some reassurances from the data side needed for another big jump in the USD
Dynamics across the US yield curve will have a big say in whether the Dollar can hold on to its new gains. Anyway, we had called for a recovery in DXY to 106.00 as the Fed would have likely pushed back against the dovish repricing.
The rebound in yields should put a floor under the Dollar, but we suspect some reassurances from the data side will be needed for another big jump in the USD.
- The oil price struggles for a direction as investors seek fresh developments in the Israel-Hamas war.
- A hawkish guidance from Fed Powell on interest rates has dampened the oil demand outlook.
- WTI trades sideways due to a Symmetrical Triangle chart formation.
West Texas Intermediate (WTI), futures on NYMEX, trade directionless in a narrow range above the crucial support of $75.00 in the European session. The oil price struggles for a direction as investors seek fresh developments in the Israel-Hamas war.
The oil price is hovering near the three-month low and is expected to extend downside as the war situation between Israel and Palestine is seen remaining contained between them. This would not disrupt the oil supply chain significantly.
Meanwhile, hawkish guidance from Federal Reserve (Fed) Chair Jerome Powell on interest rates has dampened the oil demand outlook. Jerome Powell doesn’t consider current interest rates adequate to tame price pressures.
WTI trades sideways due to a Symmetrical Triangle chart formation on an hourly scale. The aforementioned chart pattern indicates a sharp compression in volatility. This indicates that investors await a potential trigger for a strong action.
The 20-period Exponential Moving Average (EMA) at $76.00 remains close to oil prices, indicating a lackluster performance.
The Relative Strength Index (RSI) (14) oscillates in the 40.00-60.00, portraying a sideways trend.
More offers would appeal if the oil price drops below November 8 low near $75.00. The oil price would fall further towards July 18 low at $73.85, followed by psychological support of $70.00.
In an alternate scenario, a decisive break above November 8 high at $77.42 would drive the asset toward November 3 low near $80.00. A breach of the latter would expose the asset to November 6 high at $82.00.
WTI hourly chart
-638352082772259271.png)
Further range bound trade appears in store for USD/CNH in the next few weeks, argue UOB Group’s Markets Strategist Quek Ser Leang and Senior FX Strategist Peter Chia.
Key Quotes
24-hour view: Yesterday, we expected USD to trade in a range between 7.2770 and 7.2950. Instead of trading in a range, USD rose to a high of 7.3021. Upward momentum is beginning to improve, and the bias for USD is tilted to the upside. As upward momentum is only beginning to build, any advance is unlikely to reach the major resistance at 7.3320. Note that there is another resistance at 7.3200. On the downside, a breach of 7.2880 (minor support is at 7.2960) would indicate that the upward bias has faded.
Next 1-3 weeks: Our latest narrative was from Monday (06 Nov, spot at 7.2880), wherein, after the sharp drop last Friday, downward momentum is beginning to build, but USD must break clearly below 7.2700 before further decline is unlikely. Yesterday, USD rebounded to a high of 7.3021. While our ‘strong resistance’ level at 7.3200 has not been breached yet, downward momentum has more or less faded. The current price action is likely part of a sideways trading phase, likely between 7.2700 and 7.3320.
In Norway, CPI figures for the month of October have just been released. Economists at ING analyze EUR/NOK outlook ahead of the 14 December Norges Bank meeting.
Inflation surprised to the upside
Headline inflation accelerated from 3.3% to 4.0%, more than the market expected. Underlying inflation also increased from 5.7% to 6.0%. In addition to sticky inflation, the recent weakness in NOK has been a rather hawkish signal ahead of the 14 December Norges Bank meeting.
Brief spikes above 12.00 in EUR/NOK are a tangible risk before the NB meeting, also considering the recent acceleration in NB’s daily FX purchases.
- Gold price struggles for a sustained recovery as Fed Powell endorsed tightening policy further.
- Middle East tensions ease as investors see the war between Israel and Palestine remaining contained.
- Next week, the release of the US inflation data will guide further action in the US Dollar and bond markets.
Gold price (XAU/USD) is highly likely to deliver a second straight bearish weekly closing as several Federal Reserve (Fed) policymakers voice support for further tightening. Federal Reserve Chairman Jerome Powell is not confident that the current interest rate policy is sufficiently restrictive to ensure the return of inflation to 2% in a timely manner.
Jerome Powell cited that the Fed is committed to bringing down inflation to 2% and the central bank will not hesitate in tightening policy further if required. Fed policymakers are not confident of achieving price stability through the current level of monetary policy as the United States economy is resilient on the grounds of consumer spending, labor market, and economic performance. Therefore, the majority of policymakers are leaning towards tightening monetary policy further.
Daily Digest Market Movers: Gold price remains under pressure on Powell’s hawkish remarks
- Gold price attempts a recovery after buying interest near $1,950 as fears over Israel-Palestine war escalate. The hopes of a truce between the Middle East nations deteriorate as US President Joe Biden says that he doesn’t see any possibility of a ceasefire in Gaza.
- The attacks from the Israeli army on Palestine’s military forces have intensified while a four-hour humanitarian pause each day continues to allow civilians to flee to the southern region of Gaza.
- Meanwhile, hopes are high that the war situation in the Middle East will remain contained between Israel and Palestine. If so, safe-haven demand for Gold will diminish.
- Gold price is set to decline for the second week in a row as Federal Reserve policymakers lean towards raising interest rates further.
- Fed Chair Jerome Powell said that he is unsure whether current interest rates are adequate in the battle against stubborn inflation.
- Jerome Powell, in his statement at the International Monetary Fund (IMF), said that the Fed may need to do a little more to tame price pressures prompted by an improvement in the supply of goods, services, and labor.
- Powell added that the central bank has kept financial conditions tight, aided by higher bond yields and whilst it doesn’t endorse policy over-tightening, a failure in getting inflation under control would be the biggest mistake.
- The commentary from Jerome Powell was surprising as market participants were hoping that he would emphasize on the ‘higher for longer’ interest rates narrative but will keep doors open for further policy-tightening due to the resilience of the US economy.
- Interim St. Louis Fed President Kathleen O’Neill Paese supported hawkish remarks from Jerome Powell, and said "It would be unwise to suggest that further rate hikes are off the table". Paese emphasized waiting for additional economic and inflation figures before contemplating an interest rate increase.
- While Richmond Federal Reserve Bank President Thomas Barkin is less optimistic on progress in inflation easing towards 2%, he remained unsure about raising rates further. Barkin saw some slowdown as likely as higher interest rates have started hitting the economy.
- The US Dollar Index (DXY) struggles to extend the upside above 106.00 despite hawkish commentary from Fed Powell. This week, a light economic calendar kept commentaries from Fed policymakers in the spotlight. Next week, the release of the inflation figures for October will be keenly watched.
Technical Analysis: Gold price struggles to hold minor recovery near $1,955
Gold price rebounds after sensing buying interest near $1,950. The downside bias is still strong as Fed policymakers are more in favor of tightening monetary policy further.
On a daily time frame, the precious metal has corrected below the 20-day Exponential Moving Average (EMA). The near-term trend is seen consolidating as the 50 and 200-day EMAs have turned sideways.
Gold FAQs
Why do people invest in Gold?
Gold has played a key role in human’s history as it has been widely used as a store of value and medium of exchange. Currently, apart from its shine and usage for jewelry, the precious metal is widely seen as a safe-haven asset, meaning that it is considered a good investment during turbulent times. Gold is also widely seen as a hedge against inflation and against depreciating currencies as it doesn’t rely on any specific issuer or government.
Who buys the most Gold?
Central banks are the biggest Gold holders. In their aim to support their currencies in turbulent times, central banks tend to diversify their reserves and buy Gold to improve the perceived strength of the economy and the currency. High Gold reserves can be a source of trust for a country’s solvency. Central banks added 1,136 tonnes of Gold worth around $70 billion to their reserves in 2022, according to data from the World Gold Council. This is the highest yearly purchase since records began. Central banks from emerging economies such as China, India and Turkey are quickly increasing their Gold reserves.
How is Gold correlated with other assets?
Gold has an inverse correlation with the US Dollar and US Treasuries, which are both major reserve and safe-haven assets. When the Dollar depreciates, Gold tends to rise, enabling investors and central banks to diversify their assets in turbulent times. Gold is also inversely correlated with risk assets. A rally in the stock market tends to weaken Gold price, while sell-offs in riskier markets tend to favor the precious metal.
What does the price of Gold depend on?
The price can move due to a wide range of factors. Geopolitical instability or fears of a deep recession can quickly make Gold price escalate due to its safe-haven status. As a yield-less asset, Gold tends to rise with lower interest rates, while higher cost of money usually weighs down on the yellow metal. Still, most moves depend on how the US Dollar (USD) behaves as the asset is priced in dollars (XAU/USD). A strong Dollar tends to keep the price of Gold controlled, whereas a weaker Dollar is likely to push Gold prices up.
Economists at Société Générale analyze EUR/GBP technical outlook.
Defence of 0.8650 could mean persistence in up move
EUR/GBP recently broke out above a multi-month trend line and attempted cross above the upper band of a base. It has gradually established itself above both 50-DMA and 200-DMA denoting regain of upward momentum. This is also highlighted by daily MACD which remains anchored within positive territory.
Defence of recent pivot low near 0.8650 could mean persistence in up move.
Next potential hurdles are located at 0.8785 and projections at 0.8830/0.8875.
- The Euro trades without a clear direction against the US Dollar.
- European equities open on the defensive on Friday.
- ECB President Christine Lagarde speaks later in the session.
The Euro (EUR) keeps trading in a tight range against the US Dollar (USD) on Friday, prompting EUR/USD to gyrate around the 1.0670 level at the end of the week.
The Greenback appears slightly bid, flirting with the key barrier at 106.00, when measured by the USD Index (DXY). Investors continue to digest Federal Reserve (Fed) Chair Jerome Powell’s comments on Thursday, while US yields advance marginally across the curve.
Back to Powell, he confirmed that the Fed is not enthusiastic about raising its benchmark interest rate any further at a time when there is evidence of a gradual reduction in inflationary pressures. He also refrained from ruling out the possibility of another rate hike to help bring inflation closer to the target of 2% and expressed doubts about the effectiveness of the current benchmark rate in consistently achieving the inflation goal.
Later in the session, market participants are expected to closely follow comments from the European Central Bank’s (ECB) President Christine Lagarde in what will be the salient event in the Eurozone on Friday. Lagarde’s speech will come amidst the recent pickup in the hawkish narrative from some rate setters, who seem to favour further tightening in light of current upside risks for inflation in the region.
In the US economic calendar, the advanced print of the Michigan Consumer Sentiment for November will take the centre stage. Dallas Fed President Lorie Logan (voter, hawk) and Atlanta Fed President Raphael Bostic (2024 voter, centrist) are also set to speak.
Daily digest market movers: Euro remains cautious prior to Lagarde remarks
- The EUR trades below 1.0700 against the USD.
- US and German yields advance marginally on Friday.
- Markets anticipate that the Fed will keep its monetary policy unchanged in December.
- The ECB appears to be considering a long-term pause until H2 2024.
- Geopolitical tensions in the Middle East remain high.
- The RBA’s SoMP leaves the door open to further tightening.
- UK GDP figures surprised to the upside.
Technical Analysis: Euro remains supported by 55-day SMA
EUR/USD maintains the cautious trade in the sub-1.0700 region at the end of the week.
If the selling pressure continues, EUR/USD might initially confront the interim 55-day Simple Moving Average (SMA) at 1.0642 prior to the weekly low of 1.0495 (October 13), and the 2023 low of 1.0448 (October 15).
On the plus side, the November high of 1.0754 (November 6) stands in the way of the 200-day SMA at 1.0801 and another weekly top of 1.0945 (August 30). The psychological level of 1.1000 is oriented north of here, before to the August peak of 1.1064 (August 10) and the weekly high of 1.1149 from July 27. The surpass of the later could pave the way for a move to the 2023 top of 1.1275 seen on July 18.
The pair's outlook remains bearish as long as it trades below the 200-day SMA.
Euro FAQs
What is the Euro?
The Euro is the currency for the 20 European Union countries that belong to the Eurozone. It is the second most heavily traded currency in the world behind the US Dollar. In 2022, it accounted for 31% of all foreign exchange transactions, with an average daily turnover of over $2.2 trillion a day.
EUR/USD is the most heavily traded currency pair in the world, accounting for an estimated 30% off all transactions, followed by EUR/JPY (4%), EUR/GBP (3%) and EUR/AUD (2%).
What is the ECB and how does it impact the Euro?
The European Central Bank (ECB) in Frankfurt, Germany, is the reserve bank for the Eurozone. The ECB sets interest rates and manages monetary policy.
The ECB’s primary mandate is to maintain price stability, which means either controlling inflation or stimulating growth. Its primary tool is the raising or lowering of interest rates. Relatively high interest rates – or the expectation of higher rates – will usually benefit the Euro and vice versa.
The ECB Governing Council makes monetary policy decisions at meetings held eight times a year. Decisions are made by heads of the Eurozone national banks and six permanent members, including the President of the ECB, Christine Lagarde.
How does inflation data impact the value of the Euro?
Eurozone inflation data, measured by the Harmonized Index of Consumer Prices (HICP), is an important econometric for the Euro. If inflation rises more than expected, especially if above the ECB’s 2% target, it obliges the ECB to raise interest rates to bring it back under control.
Relatively high interest rates compared to its counterparts will usually benefit the Euro, as it makes the region more attractive as a place for global investors to park their money.
How does economic data influence the value of the Euro?
Data releases gauge the health of the economy and can impact on the Euro. Indicators such as GDP, Manufacturing and Services PMIs, employment, and consumer sentiment surveys can all influence the direction of the single currency.
A strong economy is good for the Euro. Not only does it attract more foreign investment but it may encourage the ECB to put up interest rates, which will directly strengthen the Euro. Otherwise, if economic data is weak, the Euro is likely to fall.
Economic data for the four largest economies in the euro area (Germany, France, Italy and Spain) are especially significant, as they account for 75% of the Eurozone’s economy.
How does the Trade Balance impact the Euro?
Another significant data release for the Euro is the Trade Balance. This indicator measures the difference between what a country earns from its exports and what it spends on imports over a given period.
If a country produces highly sought after exports then its currency will gain in value purely from the extra demand created from foreign buyers seeking to purchase these goods. Therefore, a positive net Trade Balance strengthens a currency and vice versa for a negative balance.
USD firmed, alongside a rise in UST yields on weak 30-year auction while Fed Chair Powell’s comments at the IMF conference aided momentum. Economists at OCBC analyze Greenback’s outlook.
Sell rallies
We remain biased to adopt a ‘sell-on-rally’ for USD as the Fed is likely done with tightening for current cycle. But any USD sell-off may require patience and could only come when market narrative shifts into trading the expectations for ‘more rate cuts in 2024’ and this would be highly dependent on how data pans out.
A more entrenched disinflation trend and more material easing of labour market tightness, activity data in the US should bring about the shift and for the USD to trade softer.
That said, USD still retains a significant yield advantage and is a safe haven proxy to some extent. As such, USD may still find intermittent support on dips especially if global, China growth momentum sputters and/or geopolitical tensions escalate or the ‘higher for longer’ narrative persists.
- EUR/GBP trims intraday losses and continues the winning streak.
- UK GDP showed a consistent increase of 0.6% in Q3, surpassing the 0.5% expectations.
- Pound Sterling weakens due to the concerns that the BoE might discuss rate cuts.
EUR/GBP recovers intraday losses and continues the winning streak that began on Monday. The cross spot trades around 0.8730 during the European session on Friday. However, the EUR/GBP cross faced a challenge after the upbeat economic data from the United Kingdom (UK) on Friday.
The UK Office for National Statistics released the preliminary Gross Domestic Product (GDP) for Q3, showing a consistent annual increase of 0.6%, surpassing the 0.5% expectations. However, the quarter-on-quarter GDP remains neutral, with a reading of 0.0%, contrary to the anticipated decline of 0.1%.
Pound Sterling (GBP) has exhibited weakness this week, driven by concerns that the Bank of England (BoE) might discuss rate cuts earlier than other central banks. BoE Chief Economist Huw Pill cautioned about the potential adverse effects of maintaining higher interest rates for an extended period, warning of an excessive slowdown in the economy. Discussing rate cuts, Pill indicated an expectation of such cuts in mid-2024.
The EUR/GBP cross could encounter challenges amid uncertainties surrounding the European Central Bank's (ECB) future policy actions. Market pricing indicates a 30% chance of a cut in March 2023. However, ECB Vice President Luis de Guindos stated on Thursday that it is too early to start discussing interest rate cuts.
Furthermore, China's inflation data for October indicated a decline compared to previous growth, signaling deteriorating economic conditions. This has contributed to a decrease in investor enthusiasm for riskier currencies, including the Euro.
Investors are focusing on ECB President Christine Lagarde's participation in an event in London on Friday. Lagarde's remarks and insights during the event can potentially provide valuable information and influence market sentiment, particularly regarding the ECB's perspective on economic and monetary scenarios.
The Dollar’s bounce sent EUR/USD back close to the 1.0660 mark. Economists at ING analyze the pair’s outlook.
Lagarde to speak today
We cannot exclude a bit more pressure as the impact of Thursday’s US bond sell-off might be felt across European markets today. The EUR/USD 2-year swap rate differential has rewidened after Thursday’s events and is now close to the 136 bps pre-FOMC low.
Today's focus will be on a speech by European Central Bank (ECB) President Christine Lagarde in London. A slow shift from trying to convince markets another hike is a possibility to pushing back more directly against rate expectations may start to appear more clearly in ECB members’ remarks. The impact on the EUR from ECB speakers has been, however, quite modest and we doubt that would change in a very short time.
USD/JPY seems to be continually moving towards the recent high. Economists at Commerzbank analyze the pair’s outlook.
Few positive prospects for the Yen
It is hardly surprising that USD/JPY is trending upwards. The only question is why the BoJ and the Japanese Ministry of Finance (MoF) seem to think that the exchange rate does not reflect the ‘economic fundamentals’. At current rate differentials, JPY investments simply are not particularly attractive for foreign (and domestic) investors.
Until the Japanese monetary policy changes fundamentally, USD/JPY is likely to test another high again soon. The MoF will probably react again with a threat of interventions. But if the BoJ does not refrain from dovish comments and the MoF actually intervenes notably that is only going to prevent higher exchange rates temporarily.
- Silver trades with a positive bias for the second straight day, though lacks follow-through.
- The technical setup favours bears and warrants caution before positioning for further gains.
- A sustained move beyond the $23.60-70 supply zone is needed to negate the negative bias.
Silver (XAG/USD) attracts some dip-buying on Friday and for now, seems to have stalled the overnight rejection slide from the $23.00 round-figure mark. The white metal trades with a mild positive bias for the second successive day and is currently placed around the $22.65-$22.70 region, up over 0.30% for the day.
The intraday uptick, meanwhile, lacks bullish conviction, warranting some caution before positioning for a further appreciating move. Moreover, the recent decline from the $23.60-$23.70 supply zone constituted the formation of multiple tops, warranting caution for bulls. Adding to this, the repeated failures to find acceptance above the very important 200-day Simple Moving Average (SMA) suggest that the path of least resistance for the XAG/USD is to the downside.
The bearish outlook is reinforced by the fact that technical indicators on the daily chart have just started drifting into negative territory. Hence, any subsequent move-up might continue to attract fresh sellers and run the risk of fizzling out rather quickly. From current levels, the overnight swing high, around the $23.00 mark, might confront an immediate hurdle ahead of the $23.25 area (200-day SMA) and the $23.60-$23.70 region. The latter should now act as a key pivotal point.
A sustained strength beyond the aforementioned barriers, however, will negate the bearish outlook and prompt an aggressive short-covering rally. The XAG/USD might then climb further beyond the $24.00 mark, towards the $24.20-$24.25 intermediate hurdle, before making a fresh attempt to conquer the $25.00 psychological mark.
On the flip side, the $22.35-$22.30 area, or a three-week low touched on Wednesday, is likely to protect the immediate downside. This is followed by the $22.00 mark and the next relevant support near the $21.70 zone. Some follow-through selling will be seen as a fresh trigger for bearish traders and drag the XAG/USD further towards the $21.35-$21.30 support en route to the $21.00 round figure and a multi-month low, around the $20.70-$20.65 area touched in October.
Silver daily chart
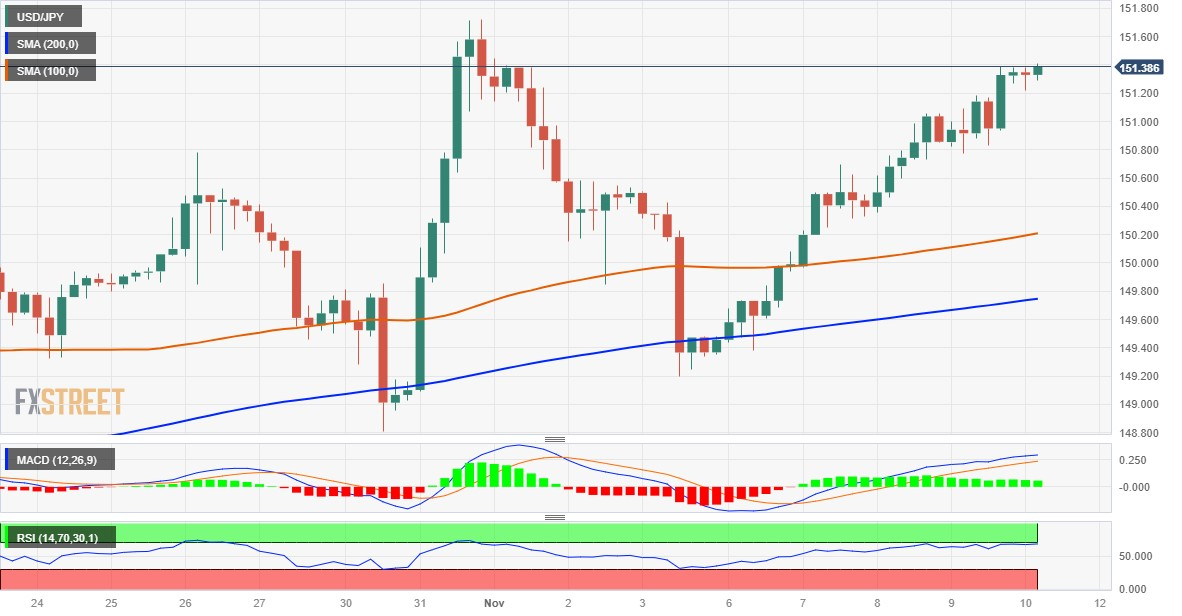
Technical levels to watch
- NZD/USD struggles to halt the losing streak amid improved US Dollar.
- MACD suggests tepid momentum, monitoring for potential shifts in market dynamics.
- The pair could revisit the 1.0750 major level aligned to the weekly high at 1.0756.
NZD/USD continues the losing streak for the fifth successive day, trading around the 14-day Exponential Moving Average (EMA) at 0.5898 during the European trading hours on Friday, lined up with the immediate resistance at 0.5900. Fed Chair Jerome Powell's endorsement of further interest rate hikes has exerted downward pressure on the Kiwi pair.
The 23.6% Fibonacci retracement level at 0.5923 is identified as a crucial resistance point in the event of the NZD/USD pair making further advances. If the pair manages to firmly break above this level, it could provide support for bullish momentum, allowing traders to explore the region around the previous week's high at the psychological level of 0.6000.
The 14-day Relative Strength Index (RSI) lies below the 50 level, indicating downward pressure. This suggests a bearish momentum and reflects a weaker market sentiment for the NZD/USD pair. As a result, the pair may be pushed toward major support at the 0.5800 psychological level, with the next potential level of support being the previous week's low at 0.5789.
However, the Moving Average Convergence Divergence (MACD) line is positioned below the centerline but above the signal line in the NZD/USD pair. This configuration suggests a subdued momentum, reflecting a state of uncertainty in the market. Traders may monitor this situation closely for potential shifts in market dynamics.
NZD/USD: Daily Chart
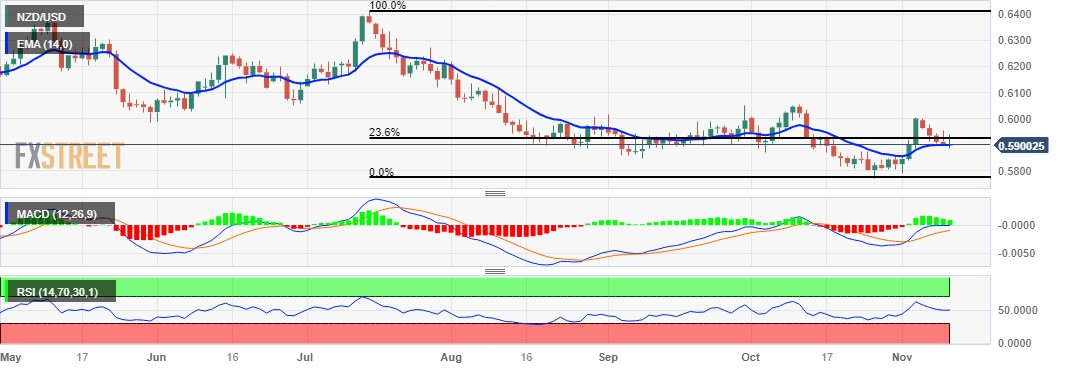
The Swedish Krona has been the best-performing G10 currency after the Dollar this week. Economists at ING analyze SEK outlook.
Riksbank’s FX sales in focus
We observed the rather distinctive SEK-bullish price action in European mornings (around 10:00 am GMT) that points to Riksbank’s activity in the FX market.
Like every Friday, FX hedging data will be released by the Riksbank – this time for the week of 23-27 October. The threshold is around $500-600 and €100 worth of sales weekly, and the weekly pace is consistent with the hedging programme ending in four months (the shortest possible window). Higher figures should be negative for SEK, even though the immediate impact may not be too significant.
- The index alternates gains with losses near 106.00.
- Chief Powell remained cautious at his speech on Thursday.
- The flash Consumer Sentiment gauge takes centre stage later.
The greenback looks to extend its strong weekly recovery and already flirts with the key barrier at 106.00 the figure when measured by the USD Index (DXY) on Friday.
USD Index retargets 106.00 near term
The index keeps pushing harder and extends its weekly bounce to the boundaries of the 106.00 hurdle.
In fact, the upbeat mood in the dollar appears bolstered by Thursday’s prudent tone from Chief Powell at his Q&A session.
Indeed, Chair Powell indicated that the Federal Reserve is not eager to raise its benchmark interest rate further, citing evidence of a gradual easing of inflation pressures. While participating in a panel discussion, he refrained from dismissing the possibility of another rate hike to aid in bringing inflation down to the Fed's target level of 2%. In addition, Powell asserted that there is a lack of confidence in the belief that the Fed’s benchmark rate is sufficiently elevated to consistently bring inflation down to 2%.
Later in the US docket, the release of the preliminary Michigan Consumer Sentiment for the month of November will take centre stage along with speeches by Dallas Fed L. Logan (voter, hawk) and Atlanta Fed R. Bostic (2024 voter, centrist).
What to look for around USD
The index seems to be struggling to surpass the 106.00 barrier so far at the end of the week, all amidst the multi-session recovery sparked following lows in the sub-105.00 region (November 6).
In the meantime, the dollar loses some composure despite the broad-based good health of the US economy and the inflation still running above the Fed’s target, while further cooling of the US labour market now appear to underpin a protracted impasse in the Fed’s current restrictive stance.
Key events in the US this week: Flash Michigan Consumer Sentiment (Friday).
Eminent issues on the back boiler: Persistent debate over a soft or hard landing for the US economy. Speculation of rate cuts in early 2024. Geopolitical effervescence vs. Russia and China. Potential spread of the Middle East crisis to other regions.
USD Index relevant levels
Now, the index is up 0.01% at 105.90 and the breakout of 106.88 (weekly high October 26) could expose 107.34 (2023 high October 3) and finally 107.99 (weekly high November 21 2022). On the other hand, initial support is seen at 104.84 (monthly low November 6) ahead of 104.42 (weekly low September 11) and then 103.59 (200-day SMA).
- Pound Sterling faces pressure due to multiple headwinds.
- The UK economy remained stagnant in Q3 while economists forecasted a 0.1% contraction.
- Business investment by UK firms fell sharply in Q3 due to higher borrowing costs.
The Pound Sterling (GBP) is expected to continue its losing streak for the fifth trading session as the market participants anticipate a sharp slowdown in the United Kingdom economy. The British economy managed to avoid de-growth in the third quarter of 2023 but remained stagnant as firms were reluctant to hire job-seekers on a permanent basis and plans for capacity expansion were scrapped due to poor demand outlook. Higher interest rates by the Bank of England (BoE) and stubborn price pressure have squeezed the budgets of households.
Apart from the economic turmoil, dovish expectations for the interest rate outlook from BoE policymakers and dismal market sentiment are weighing on the Pound Sterling. BoE Chief Economist Huw Pill said the possibility of rate cuts in mid-2024 “doesn’t seem totally unreasonable” due to fears of an excessive slowdown. The market mood turned downbeat after Federal Reserve (Fed) Chair Jerome Powell said the current level of interest rates is not adequate to bring down inflation to 2%.
Daily Digest Market Movers: Pound Sterling remains vulnerable on mixed UK data
- Pound Sterling faces pressure as the UK GDP in the third quarter remained stagnant while investors forecasted a contraction by 0.1%. In the second quarter, the economy grew by 0.2%.
- Preliminary GDP grew at a steady pace of 0.6% YoY in Q3, marginally higher than expectations of 0.5%. The monthly growth rate in September was similar to August's GDP of 0.2%. Investors had anticipated a decline of 0.1%.
- In addition to Q3 GDP data, the Office for National Statistics (ONS) has reported factory data for September.
- Monthly Manufacturing Production grew at a slower pace of 0.1% in September against expectations of 0.3%. In August, output from manufacturing activities contracted by 0.7%. The annual Manufacturing Production rose by 3.0% versus. expectations of 3.1%.
- Industrial Production remained stagnant in September, on a monthly basis, against a 0.5% contraction in August. Economists forecasted a growth rate of 0.1%. The annual data rose by 1.5%, outperforming expectations of 1.1%.
- Preliminary Total Business Investment contracted significantly by 4.2% in Q3 against expectations of a 3.5% decline. In the second quarter, business investment grew by 4.1%. Investment by firms in capacity expansion fell after a two-quarter increase as higher borrowing costs have forced them to postpone their expansion plans.
- Though the UK economy managed to avoid a decline in growth in the July-September quarter, chances of an excessive slowdown in the UK economy are high as firms hesitate to widen the scale of operations and hire permanent payrolls due to a sharp decline in consumer spending.
- The Pound Sterling remains under pressure as dovish expectations for interest rates by the Bank of England (BoE) grew sharply after commentary from Chief Economist Huw Pill.
- Huw Pill warned that higher interest rates for a sufficiently longer period to tame inflationary pressures could result in an excessive slowdown in the economy. While discussing cutting rates, Pill said that he expects rate cuts in mid-2024.
- In the latest forecasts, the BoE said that the economy will be stagnant in the next two years and a mere 0.1% growth will be seen in 2026.
- After factory data, investors will shift focus to the labor market and inflation data, which will be published next week.
- Meanwhile, the US Dollar Index (DXY) aims to extend recovery above the immediate resistance of 106.00, supported by hawkish remarks on interest rate guidance by Federal Reserve (Fed) Chair Jerome Powell.
- Jerome Powell leaned towards raising interest rates further, claiming the battle against stubborn inflation was far from over.
- Apart from Jerome Powell, interim Bank of St. Louis Federal Reserve President Kathleen O’Neill Paese said "It would be unwise to suggest that further rate hikes are off the table".
- This week, commentaries from Fed policymakers remained in the spotlight due to the light economic calendar. Next week, the US inflation data will be keenly watched.
Technical Analysis: Pound Sterling trades at a make or a break near 1.2200
Pound Sterling trades at a make-or-break level near the breakout region of the symmetrical triangle chart pattern formed on the daily timeframe. The GBP/USD pair hovers around the 20-day Exponential Moving Average (EMA), which trades around 1.2230. The broader appeal for the Cable is bearish as the 200-day EMA has started sloping south.
Pound Sterling FAQs
What is the Pound Sterling?
The Pound Sterling (GBP) is the oldest currency in the world (886 AD) and the official currency of the United Kingdom. It is the fourth most traded unit for foreign exchange (FX) in the world, accounting for 12% of all transactions, averaging $630 billion a day, according to 2022 data.
Its key trading pairs are GBP/USD, aka ‘Cable’, which accounts for 11% of FX, GBP/JPY, or the ‘Dragon’ as it is known by traders (3%), and EUR/GBP (2%). The Pound Sterling is issued by the Bank of England (BoE).
How do the decisions of the Bank of England impact on the Pound Sterling?
The single most important factor influencing the value of the Pound Sterling is monetary policy decided by the Bank of England. The BoE bases its decisions on whether it has achieved its primary goal of “price stability” – a steady inflation rate of around 2%. Its primary tool for achieving this is the adjustment of interest rates.
When inflation is too high, the BoE will try to rein it in by raising interest rates, making it more expensive for people and businesses to access credit. This is generally positive for GBP, as higher interest rates make the UK a more attractive place for global investors to park their money.
When inflation falls too low it is a sign economic growth is slowing. In this scenario, the BoE will consider lowering interest rates to cheapen credit so businesses will borrow more to invest in growth-generating projects.
How does economic data influence the value of the Pound?
Data releases gauge the health of the economy and can impact the value of the Pound Sterling. Indicators such as GDP, Manufacturing and Services PMIs, and employment can all influence the direction of the GBP.
A strong economy is good for Sterling. Not only does it attract more foreign investment but it may encourage the BoE to put up interest rates, which will directly strengthen GBP. Otherwise, if economic data is weak, the Pound Sterling is likely to fall.
How does the Trade Balance impact the Pound?
Another significant data release for the Pound Sterling is the Trade Balance. This indicator measures the difference between what a country earns from its exports and what it spends on imports over a given period.
If a country produces highly sought-after exports, its currency will benefit purely from the extra demand created from foreign buyers seeking to purchase these goods. Therefore, a positive net Trade Balance strengthens a currency and vice versa for a negative balance.
Norwegian core inflation came in at 6.0% year-on-year – spot on to Norges Bank’s view. Economists at Nordea now expect Norges Bank to hike in December.
December hike is on
Norwegian core inflation came in at 6.0 % YoY in October from 5.7% YoY in September. Norges Bank expected core inflation at 6.0% y/y while consensus was at 5.6%. We expected 5.3% YoY as we believed food prices would continue to fall. We were wrong.
Looking at headline inflation, it rose to 4.0% YoY from 3.3% YoY in September. Norges Bank expected 4.4% YoY.
Given the latest CPI print, Norges Bank will likely disregard the fall we saw in September. This means that a December hike is fully on with the NOK now around 4.5% weaker than expected. We therefore now expect Norges Bank to hike in December.
- GBP/JPY regains positive traction on Friday and reverses a part of the overnight slide.
- The BoJ’s dovish stance is seen undermining the JPY and lending support to the cross.
- The better-than-expected UK GDP print also contributes to the modest intraday uptick.
The GBP/JPY cross attracts some dip-buying near the 184.80 region on Friday and for now, seems to have stalled the overnight retracement slide from the vicinity of the weekly top. Spot prices stick to modest intraday gains through the first half of the European session and currently trade around the 185.20 region, up 0.15% for the day.
The Japanese Yen (JPY) continues with its relative underperformance in the wake of the Bank of Japan's (BoJ) dovish stance and turns out to be a key factor acting as a tailwind for the GBP/JPY cross. The British Pound (GBP), on the other hand, gets a minor lift from a slightly better than UK GDP print, though expectations that the Bank of England (BoE) will soon start cutting interest rates keep a lid on any meaningful appreciating move.
The UK Office for National Statistics reported that the economy stagnated in the third quarter of 2023. The reading, however, was slightly better than the 0.1% contraction anticipated. Adding to this, the yearly growth rate stood at 0.6% as compared to 0.5% expected. This helps ease worries about a looming recession and to a larger extent, overshadows the disappointing release of UK Manufacturing and Industrial Production figures.
Bulls, however, seem reluctant to place aggressive bets around the GBP/USD pair in the wake of mixed signals about the BoE's future rate-hike path. BoE's Chief Economist Huw Pill said earlier this week that the current market pricing for a first-rate cut in August 2024 does not seem totally unreasonable. In contrast, BoE Governor Andrew Bailey said on Thursday that it is too soon to discuss easing policy on the back of high inflation.
Furthermore, speculations about a potential intervention in FX markets by Japanese authorities contribute to capping the upside for the GBP/JPY cross. Hence, it will be prudent to wait for strong follow-through buying before positioning for an extension of the move-up witnessed over the past two weeks or so. Even from a technical perspective, the recent repeated failures ahead of the 186.00 mark warrant caution for bullish traders.
Technical levels to watch
Fed Chairman Jerome Powell's comments at the IMF panel gave the Dollar a further boost. Economists at Commerzbank analyze EUR/USD outlook.
Final round of central bank commentaries
It all depends on the data. For example, if US inflation comes in lower than expected next week, the tide could turn quickly. It's unlikely to happen today, however, as there is little meaningful data on the calendar.
There are still a few central bank speeches to come, with ECB President Christine Lagarde's remarks at 13:30 GMT likely to attract renewed attention, although Lagarde is unlikely to have much to add to the market after a large number of speeches. Nevertheless, Powell's comments show that EUR/USD can still see significant market movement in the absence of major data points.
The continuation of the upward bias could lift USD/JPY to the next up-barrier at 152.50 in the short-term horizon, comment UOB Group’s Markets Strategist Quek Ser Leang and Senior FX Strategist Peter Chia.
Key Quotes
24-hour view: We highlighted yesterday that USD “could edge higher to 151.15 before the risk of a more sustained pullback increases.” We also highlighted that “151.30 is unlikely to come into view.” The anticipated USD strength exceeded our expectations as it rose to a high of 151.38. Further USD strength is not ruled out, but upward momentum is not exactly strong, and it remains to be seen if USD can break above last week’s high near 151.80. Support is at 151.10; a breach of 150.90 would indicate that the current upward pressure has eased.
Next 1-3 weeks: Yesterday (09 Nov, spot at 150.80), we indicated “upward momentum has increased just a tad.” We added, USD “has to break clearly above 151.30 before a sustained advance is likely.” USD then rose to a high of 151.38. While we prefer a more ‘impulsive’ break off 151.30, the price action suggests that the risk of USD breaking above last week’s high near 151.80 has increased. Note that this level is not far below last year’s peak near 151.95. If USD can break above this solid resistance zone, it is likely to rise further to 152.50. In order to keep the momentum going, USD must stay above 150.40 in the next few days.
Considering advanced prints from CME Group for natural gas futures markets, open interest extended the uptrend on Thursday, increasing by around 18.4K contracts. On the flip side, volume shrank by more than 100K contracts after three consecutive daily builds.
Natural Gas faces the next contention at $3.00
Prices of natural gas declined further on Thursday. The daily drop followed another uptick in open interest, which leaves the commodity vulnerable to further losses in the very near term. Against that, there is an important support zone around the $3.00 mark per MMBtu for the time being.
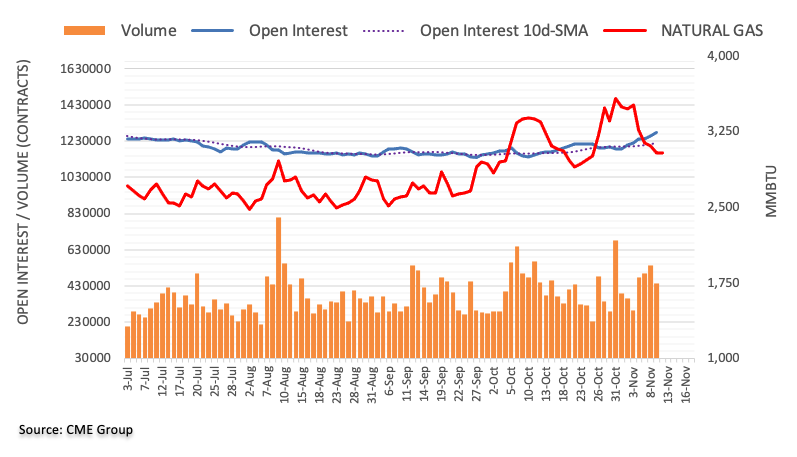
- USD/JPY receives upward support on hawkish remarks by the Fed Powell.
- Japanese authorities may intervene in the FX market to provide support for the JPY.
- BoJ Governor Ueda mentioned that the central bank will approach the exit from ultra-loose monetary policy.
USD/JPY continues the winning streak for the fifth consecutive day, trading higher around 151.40 during the early European session on Friday. Federal Reserve (Fed) Chair Jerome Powell’s unexpected hawkish remarks had a notable impact, boosting US Treasury yields and strengthening the US Dollar (USD) against the Japanese Yen (JPY). However, Japanese authorities may consider intervention to curb the advance of the USD/JPY pair in response to these developments.
Fed Chair Powell's statement at the International Monetary Fund (IMF) event on Thursday, expressed concern that current policies may not be sufficient to curb inflation. This sentiment resulted in a surge in the US Dollar Index (DXY), hovering around 106.00, with the 10-year US bond yield standing at 4.62% by the press time.
Despite the aggressive tightening policies from major central banks, the Bank of Japan (BoJ) is maintaining its dovish stance. BoJ Governor Kazuo Ueda stated on Thursday that the central bank will approach the exit from ultra-loose monetary policy cautiously to prevent substantial volatility in the bond market.
However, the Japanese Yen continues to face pressure as plans to exit the ultra-loose policy stance may be delayed due to lower wage growth. Decent wage growth is seen as a crucial factor for the Japanese central bank to consider exiting from the prolonged easy monetary policy.
Market participants keep a close eye on the Fed's Logan speech and the preliminary Michigan Consumer Sentiment Index for November, as traders seek cues to identify trading opportunities within the USD/JPY pair.
Further weakness could drag AUD/USD to the 0.6300 region in the near term, suggest UOB Group’s Markets Strategist Quek Ser Leang and Senior FX Strategist Peter Chia.
Key Quotes
24-hour view: Yesterday, we highlighted that “mild downward pressure could lead to AUD edging lower.” We also highlighted that “any decline is highly unlikely to reach the major support at 0.6350.” In NY trade, AUD dropped sharply to a low of 0.6364 before ending the day on a soft note at 0.6366 (-0.56%). While the sharp decline is approaching oversold levels, there is no sign of stabilisation just yet. Today, AUD is likely to break below 0.6350, but it is unlikely to reach the major support at 0.6300. In order to keep the momentum going, AUD must stay below 0.6400 (minor resistance is at 0.6385).
Next 1-3 weeks: Our most recent narrative was from two days ago (08 Nov, spot at 0.6435), wherein the recent buildup in upward momentum has faded and AUD is likely to trade in a range between 0.6350 and 0.6525. Yesterday, AUD dropped sharply to 0.6364. Downward momentum is beginning to build, and AUD is likely to trade with a downward bias to 0.6300. The downward bias is intact as long as AUD stays below 0.6440.
CME Group’s flash data for crude oil futures markets noted traders scaled back their open interest positions for the four session in a row on Thursday, this time by around 14.7K contracts. In the same line, volume reversed two daily builds in a row and shrank by nearly 252K contracts.
WTI appears supported around $75.00
Prices of WTI dropped marginally on Thursday amidst the steep weekly decline. The daily losses were on the back of declining open interest and volume and open the door to a potential rebound in the very near term. In light of the recent price action, the commodity appears underpinned by the $75.00 region per barrel for the time being.
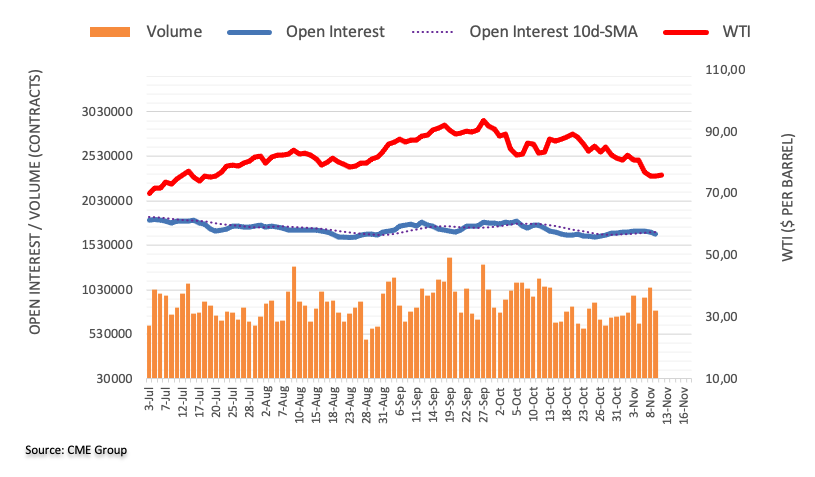
Here is what you need to know on Friday, November 10:
The US Dollar went into a consolidation phase early Friday after outperforming its major rivals on Federal Reserve (Fed) Chairman Jerome Powell's hawkish remarks late Thursday. Ahead of the weekend, the University of Michigan will release the preliminary Consumer Sentiment Index data for November.
While discussing monetary policy challenges in a global economy at an International Monetary Fund (IMF) panel late Thursday, Fed Chairman Jerome Powell said that they are not confident that they have achieved a 'sufficiently restrictive' policy stance to bring inflation down to 2% over time. "We are making decisions meeting by meeting, based on the totality of the incoming data and their implications for the outlook for economic activity and inflation," Powell added. Following these comments, the benchmark 10-year US Treasury bond yield rose nearly 3% and climbed above 4.6%, providing a boost to the USD. In the meantime, Wall Street's main indexes came under bearish pressure and closed the day deep in negative territory.
US Dollar price this week
The table below shows the percentage change of US Dollar (USD) against listed major currencies this week. US Dollar was the strongest against the Australian Dollar.
| USD | EUR | GBP | CAD | AUD | JPY | NZD | CHF | |
| USD | 0.63% | 1.21% | 1.01% | 2.39% | 1.28% | 1.67% | 0.53% | |
| EUR | -0.64% | 0.58% | 0.39% | 1.76% | 0.66% | 1.02% | -0.10% | |
| GBP | -1.23% | -0.58% | -0.19% | 1.19% | 0.08% | 0.45% | -0.69% | |
| CAD | -1.02% | -0.38% | 0.21% | 1.39% | 0.27% | 0.66% | -0.49% | |
| AUD | -2.46% | -1.80% | -1.21% | -1.41% | -1.12% | -0.76% | -1.90% | |
| JPY | -1.30% | -0.67% | -0.30% | -0.25% | 1.14% | 0.37% | -0.77% | |
| NZD | -1.68% | -1.03% | -0.43% | -0.63% | 0.76% | -0.37% | -1.14% | |
| CHF | -0.53% | 0.10% | 0.68% | 0.49% | 1.87% | 0.76% | 1.13% |
The heat map shows percentage changes of major currencies against each other. The base currency is picked from the left column, while the quote currency is picked from the top row. For example, if you pick the Euro from the left column and move along the horizontal line to the Japanese Yen, the percentage change displayed in the box will represent EUR (base)/JPY (quote).
The UK economy expanded at an annual rate of 0.6% in the third quarter, the UK's Office for National Statistics (ONS) reported on Friday. This reading matched the second quarter's growth rate and came in better than the market expectation of 0.5%. Other data from the UK showed that Total Business Investment contracted by 4.2% on a quarterly basis in the third quarter. Finally, Industrial Production and Manufacturing Production increased by 1.5% and 3%, respectively, on a yearly basis in September. GBP/USD showed no immediate reaction to these data and extended its sideways grind above 1.2200.
EUR/USD climbed above 1.0720 in the early American session on Thursday before turning south and retreating below 1.0700 toward the end of the day. In the European morning on Friday, the pair trades up and down in a tight channel slightly above 1.0650.
USD/JPY spent the Asian session fluctuating below 151.50 on Friday after closing the fourth consecutive day higher on Thursday.
In the Monetary Policy Statement published early Friday, the Reserve Bank of Australia (RBA) noted that inflation has passed its peak but said "whether further tightening of monetary policy is required to ensure that inflation returns to target in a reasonable timeframe will depend upon the data and the evolving assessment of risks." AUD/USD showed no reaction to this publication and was last seen moving sideways near 0.6350.
After falling to a fresh multi-week low below $1,950 early Thursday, Gold staged a rebound and climbed above $1,960 in the American trading hours. Rising US yields, however, made it difficult for XAU/USD to preserve its recovery momentum and caused it to return below $1,960.
Economists at CIBC Capital Markets expect the Swiss Franc to soften as the SNB is set to moderate FX activity.
Moderating SNB intervention to ease CHF overvaluation
The SNB shifted towards actively encouraging a stronger CHF in Q2 2022. However, we would expect the SNB to moderate FX activity as inflationary pressures remain contained and export competitiveness remains challenged, the OECD estimates that the CHF is the most overvalued major versus the EUR.
The prospect of reduced SNB activism, allied to an eventual easing in CHF safe haven demand points towards a graduated reduction in Swiss valuations.
EUR/CHF – Q4 2023: 0.96 | Q1 2024: 0.97
In the view of UOB Group’s Markets Strategist Quek Ser Leang and Senior FX Strategist Peter Chia, GBP/USD is seen navigating within the 1.2180-1.2400 range in the short-term horizon.
Key Quotes
24-hour view: We did not anticipate the sharp drop in GBP that reached a low of 1.2213 (we were expecting it to trade sideways). While the sharp drop appears to be overdone, there is room for GBP to weaken further. In view of the oversold conditions, a sustained drop below 1.2180 appears unlikely (next support is at 1.2140). Resistance is at 1.2245, followed by 1.2270.
Next 1-3 weeks: We continue to hold the same view as yesterday (09 Nov, spot at 1.2285). As highlighted, GBP is likely to trade in a range of 1.2180/1.2400 for now. However, short-term downward momentum has improved somewhat, and the risk of GBP breaking below 1.2180 has increased. That said, it is worth noting that there is another strong support level at 1.2140. To put it another way, a sustained decline in GBP appears unlikely.
- EUR/JPY is prolonging the consolidative note below the mid-161.00s on Friday.
- The cross holds above the 50- and 100-hour EMAs; RSI indicator is located in the bullish territory above 50.
- The critical resistance level will emerge at 161.80; 160.85 acts as an initial support level.
The EUR/JPY cross trades flat around 161.45 during the early European session on Friday. In the absence of top-tier economic data released from both Japan and the Eurozone, investors await the sidelined ahead of the European Central Bank (ECB) President Christine Lagarde's speech later on Friday.
From a technical perspective, EUR/JPY holds above the 50- and 100-hour Exponential Moving Averages (EMAs) on the four-hour chart, which supports the buyers for the time being. It’s worth noting that the Relative Strength Index (RSI) is located in the bullish territory above 50, indicating that further upside looks favorable.
The key resistance level for the cross is located near the year-to-date (YTD) highs and the upper boundary of the Bollinger Band at 161.80. A break above the latter will see the next barrier near the psychological round figure at 162.00. Further north, the additional upside filter to watch is 161.76 (high of August 25, 2008)
On the downside, a high of October 31 at 160.85 acts as an initial support level. The next downside stop is seen near the lower limit of the Bollinger Band at 160.51. The key contention level will emerge at 159.80 (50-hour EMA). Any follow-through selling below the latter will see a drop to 159.07 (low of November 2).
EUR/JPY four-hour chart
-638351966511204890.png)
Open interest in gold futures markets rose by more than 1K contracts after two consecutive daily drops on Thursday according to preliminary readings from CME Group. Volume followed suit and went up by around 12.2K contracts amidst the broad-based erratic performance.
Gold: Further rebound targets $2000 and beyond
Thursday’s decent uptick in gold prices was in tandem with increasing open interest and volume and is indicative that further gains appear likely in the very near term. That said, there are no resistance levels of note until the critical $2000 mark per troy ounce.
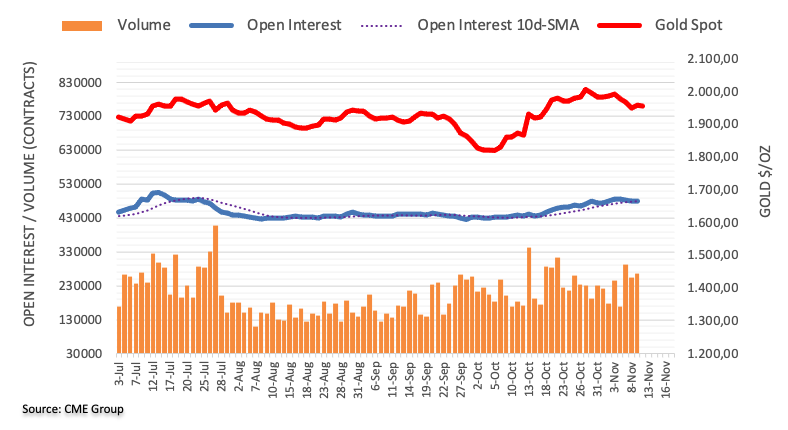
UOB Group’s Markets Strategist Quek Ser Leang and Senior FX Strategist Peter Chia expect EUR/USD to maintain a consolidative mood in the next few weeks.
Key Quotes
24-hour view: We highlighted yesterday that EUR “is likely to edge higher but is unlikely to break above 1.0755.” However, after rising to 1.0725, EUR fell sharply to a low of 1.0658. The decline has scope to dip below 1.0640, but the next support at 1.0620 is unlikely to come under threat. On the upside, if EUR breaks above 1.0705 (minor resistance is at 1.0690), it would indicate that the current downward pressure has eased.
Next 1-3 weeks: We turned positive in EUR late last week (see annotations in the chart below). After EUR rose to a high of 1.0756 and pulled back, we indicated two days ago (08 Nov, spot at 1.0700) that “while upward momentum has waned somewhat, only a breach of 1.0640 would indicate that 1.0770 is out of reach.” Yesterday, EUR fell to a low of 1.0658. While our ‘strong support’ level at 1.0640 has not been breached, upward momentum has more or less fizzled out. In other words, the outlook for EUR has turned neutral. For the time being, EUR could trade sideways in a relatively broad range of 1.0580/1.0750.
- USD/CAD trades close to 1.3800 after a sharp recovery.
- The USD Index struggles to climb above 106.00.
- USD/CAD continues to move higher in a Rising Channel chart pattern.
The USD/CAD pair hovers near the round-level resistance of 1.3800 after a sharp recovery, which was prompted by hawkish guidance on interest rates from Federal Reserve (Fed) Chair Jerome Powell. The Loonie asset aims for stabilization above 1.3800 as the market mood has turned risk-averse amid caution that the Fed could raise interest rates further.
USD/CAD continues to move higher in a Rising Channel chart pattern in which each pullback is considered as a buying opportunity by the market participants. The 50-day Exponential Moving Average (EMA) at 1.3660 continues to provide support to the US Dollar bulls. Horizontal resistance is plotted from March 10 high at 1.3682.
The Relative Strength Index (RSI) (14) struggles to shift into the bullish range of 60.00-80.00. If the RSI (14) manages to do so, a bullish momentum would get triggered.
Going forward, a decisive break above October 27 high at 1.3880 would expose the round-level resistance at 1.3900, followed by 13 October 2022 high at 1.3978.
In an alternate scenario, a breakdown below October 24 low around 1.3660 would drag the asset to the round-level support of 1.3600. A further breakdown could expose the asset to October 7 low at 1.3570.
USD/CAD daily chart
-638351954005762904.png)
- EUR/USD oscillates around the 1.0663-1.0675 region in a narrow trading band.
- The pair holds above the key 100-hour Exponential Moving Averages (EMA), but the RSI indicator is located in bearish territory.
- The first immediate resistance level will emerge at 1.0725; 1.0659 acts as an initial support level.
The EUR/USD pair consolidates its losses during the early European session on Friday. The hawkish comments from the Federal Reserve (Fed) Chairman Jerome Powell lift the US Dollar (USD) broadly and weigh on the pair. The major pair currently trades around 1.0669, up 0.05% on the day.
Technically, the EUR/USD pair holds above the key 100-hour Exponential Moving Averages (EMA), suggesting the path of least resistance is to the upside. However, the Relative Strength Index (RSI) is located in bearish territory under 50, which indicates the sellers are likely to retain control in the near term.
The first upside barrier for the major pair will emerge at 1.0725, representing the confluence of the upper boundary of Bollinger Band and a high of November 9. Any decisive break above the latter will pave the way to a high of November 6 at 1.0756. Further north, the next upside stop is located near the psychological round mark at 1.0800.
On the downside, the lower limit of the Bollinger Band at 1.0659 acts as an initial support level for EUR/USD. The next contention level is seen at 1.0638 (the 100-hour EMA). The additional downside filter to watch is 1.0600, portraying a round figure and a high of October 27. A breach of the latter will see a drop to 1.0535 (a low of October 27), followed by 1.0517 (a low of November 1).
EUR/USD four-hour chart
-638351935106570554.png)
- EUR/GBP faces an intermediate resistance near 0.8730, more upside remains likely.
- BoE Pill warned that higher interest rates for a sufficiently longer period could result in an excessive slowdown.
- Economists expected that the UK economy contracted by 0.1% in the third quarter of 2023.
The EUR/GBP pair faces some sell-off while extending a rally above 0.8730 as investors turn cautious ahead of the United Kingdom Gross Domestic Product (GDP) data for the third quarter of 2023. The cross has shown a sharp rally this week on hopes that the Bank of England (BoE) could discuss cutting rates sooner than other central banks.
BoE Chief Economist Huw Pill warned this week that higher interest rates for a sufficiently longer period could result in an excessive slowdown in the economy. While discussing rate cuts, Pill said that he expects rate cuts in mid-2024.
The UK economy is going through a vulnerable phase as labor demand has slowed significantly and Manufacturing and Services PMI have been contracting due to poor consumer spending. Meanwhile, investors await the UK factory data for September and Q3 GDP data.
As per the consensus, the UK economy contracted by 0.1% against 0.2% growth in the April-June quarter. Economists are expecting a weak performance as higher interest rates have forced home buyers to postpone investment in housing while firms have delayed expansion plans.
For the monthly UK factory data, the Manufacturing Production rose by 0.3% versus. de-growth of 0.8% in August. Industrial Production rose nominally by 0.1% against a 0.7% decline in a similar period.
On the Eurozone front, investors await the speech from European Central Bank (ECB) President Christine Lagarde at 12:30 GMT. ECB Lagarde is expected to guide interest rates and outlook on economic performance. The inflation in the shared continent is consistently easing due to higher interest rates but rates are needed to remain higher to ensure price stability.
- NZD/USD hovers near a five-day low around 0.5900 on hawkish commentary from Fed Powell.
- Fed Powell said that current interest rates don’t seem sufficiently restrictive to ensure price stability.
- The Chinese economy shifts into deflation due to poor consumer spending.
The NZD/USD pair printed a fresh five-day low marginally below 0.5900 as Federal Reserve (Fed) Chair Jerome Powell supported for raising interest rates further. The Kiwi asst fell sharply as more interest rate hikes from the Fed would widen policy divergence between the latter and the Reserve Bank of New Zealand (RBNZ).
S&P500 futures added nominal gains in Tokyo. US equities were heavily sold on Thursday after Fed Powell said that current interest rates don’t seem sufficiently restrictive to ensure price stability. The US Dollar Index (DXY) consolidates near the crucial resistance of 106.00. More upside in the USD Index is highly likely as the market mood has turned risk-averse after hawkish remarks from Jerome Powell. 10-year US Treasury yields correct to near 4.61%.
Last week, the Fed kept interest rates unchanged in the range of 5.25-5.50% and emphasized keeping interest rates higher for a longer period to bring down inflation to 2%. Therefore, hawkish commentary from Fed Powell was a surprise for market participants.
Apart from Jerome Powell, interim St. Louis Fed President Kathleen O’Neill Paese said "It would be unwise to suggest that further rate hikes are off the table".
Meanwhile, global slowdown fears due to Middle East tensions and deflationary pressures in China have impacted the appeal of the New Zealand Dollar. Weak consumer spending due to lower employment has pushed the Chinese economy into a deflation. Chinese producers continue to cut prices of goods and services at their factory gates due to a poor demand environment.
It is worth noting that New Zealand is one of the leading trading partners to China and an economic slowdown in China impacts the New Zealand Dollar.
- USD/MXN retreats after the recent surge as Banxico kept rates at 11.25%.
- Mexico’s central bank has committed to achieving its 3% target in 2025.
- US Dollar receives upward support after Fed Chair Powell’s hawkish comments.
USD/MXN retreats from a weekly high, bidding near 17.7600 during the Asian trading hours on Friday. The pair received upward support after US Federal Reserve (Fed) Chair Jerome Powell mentioned at the International Monetary Fund (IMF) event on Thursday that current policies may not be enough to control inflation.
This sentiment resulted in a surge in US Treasury yields, offering support for the US Dollar (USD). The US Dollar Index (DXY) hovers around 105.90, with the 10-year US bond yield standing at 4.61% by the press time.
Additionally, the US weekly Initial Jobless Claims for the week ending November 4, coming in at 217K, slightly below both the market forecast of 218K and the previous week's figure of 220K, likely added further support to the Greenback.
On Thursday, the Bank of Mexico (Banxico) opted to maintain interest rates at 11.25%. In addition, the central bank has committed to working towards achieving its 3% target for headline inflation in the year 2025.
Economists at ING believe that Banxico is likely content to maintain the 600 basis points policy rate premium over Fed rates. This stance has contributed to the relative stability of USD/MXN, reduced implied volatility, and enhanced the Peso's appeal for carry trade strategies.
- GBP/JPY gains momentum around 185.08 ahead of the UK key data.
- BoE Chief Economist Huw Pill said the rates must remain at their current level to curb inflation.
- BoJ Governor Ueda stated they will exit the ultra-loose monetary policy with prudence to avoid volatility in the bond market.
- The UK Gross Domestic Product will be closely watched by traders.
The GBP/JPY cross edges higher above the 185.00 psychological mark during the Asian session on Friday. Traders await the preliminary UK Gross Domestic Product (GDP) for the third quarter (Q3). The cross is trading at 185.08 at the time of writing, gaining 0.07% on the day.
The Bank of England (BoE) Chief Economist Huw Pill said on Thursday that interest rates must remain at their current level to curb inflation, in a shift in tone from earlier in the week when he addressed probable cuts next year. However, the events in the Middle East are the main focus at the moment.
The UK Gross Domestic Product for Q3 is expected to contract 0.1% QoQ from 0.2% expansion in the previous reading. The annual growth number is expected to grow 0.5% versus 0.6% prior. If the GDP reports come in worse than expected, this might exert some selling pressure on the British Pound (GBP) and act as a headwind for the GBP/JPY cross.
Japan’s government plans to increase its fiscal loan and investment program in a proposed second extra budget to build up supply chains and other long-term investments, said Reuters on Friday.
Furthermore, BoJ Governor Kazuo Ueda said on Thursday that the BoJ will exit the ultra-loose monetary policy with prudence to avoid significant volatility in the bond market. Ueda further stated that Japan was making moves towards the central bank's 2% inflation target, with a cycle of rising wages and domestic demand-driven inflation picking up pace. Apart from this, the rising geopolitical tension in the Middle East might trigger the safe-haven flows and benefit the Japanese Yen (JPY) against the GBP.
Market participants will closely watch the UK growth numbers for fresh impetus. Also, the UK Industrial Production, Manufacturing Production, and Trade Balance for September will be released. Traders will take cues from these data and find a trading opportunity around the GBP/JPY cross.
- `USD/JPY approaches 152.00 after hawkish remarks from Fed Powell.
- Fed Powell expects that current interest rates are not sufficiently restrictive.
- The likelihood of Japan’s intervention has escalated after Powell’s hawkish remarks.
The USD/JPY pair has closed positive for straight four sessions in a row and is expected to continue its upbeat performance further, prompted by hawkish remarks from Federal Reserve (Fed) Chair Jerome Powell in his commentary on Thursday.
S&P500 futures added nominal gains in the Asian session, portraying a marginal improvement in the risk appetite of the market participants. The near-term market mood is still risk-averse as Fed Powell sees that current interest rates are not sufficiently restrictive to ensure the return of consumer inflation to 2%.
Jerome Powell commented that the Fed would not hesitate to raise rates further if it turned out appropriate to achieve price stability. The comments from Powell were surprising for markets as last week the Fed kept interest rates unchanged in the range of 5.25-5.50% and emphasized the narrative of keeping interest rates ‘higher for longer’.
The expectations for one more interest rate increase rose nominally after Powell's commentary. As per the CME Fedwatch tool, traders see a 15% chance for the Fed raising interest rates by 25 basis points (bps) in the December monetary policy meeting.
This week, a light economic calendar kept the spotlight on commentaries from Fed policymakers. Next week, investors will focus on the inflation data for October, which will guide further action in the US Dollar and bond markets.
Meanwhile, the Japanese Yen remains on the back foot against the US Dollar as plans of an exit from the ultra-loose policy stance by the Bank of Japan (BoJ) could be delayed due to lower wage growth. Higher price pressures due to external forces have dampened the real income of households and consumer spending.
Decent wage growth is a prerequisite for the BoJ to exit from the decade-long easy policy. The likelihood of a stealth intervention by Japan’s authority is high as Powell’s hawkish commentary on interest rates has worsened the appeal for the Japanese Yen.
- USD/CHF continues to gain ground on the likelihood of another rate hike by the Fed.
- Fed Chair Powell’s hawkish sentiment led to a surge in US Treasury yields.
- US weekly Initial Jobless Claims eased at 217K compared to the previous week's figure of 220K.
USD/CHF extends its gains for the second consecutive session, which could be attributed to the hawkish comments from US Federal Reserve (Fed) Chair Jerome Powell at the International Monetary Fund (IMF) event on Thursday. The USD/CHF trades higher near 0.9030 during the Asian trading hours on Friday.
Switzerland's inflation rate held steady at 1.7% in October, and the seasonally adjusted unemployment rate remained at 2.1%. Market participants will likely observe upcoming data, including the ZEW Survey – Expectations and Real Retail Sales, to gauge whether the Swiss National Bank (SNB) will consider increasing interest rates in the December meeting, with expectations leaning towards a 25 basis points hike.
Fed Chair Powell's recognition that current policies may not be adequately restrictive to control inflation strengthens the likelihood of at least one more rate hike. This sentiment led to a surge in US Treasury yields, providing support for the US Dollar (USD). Furthermore, the US weekly Initial Jobless Claims stood at 217K, slightly below both the market forecast of 218K and the previous week's figure of 220K, which may have contributed additional support to the Greenback.
In the absence of economic data from Switzerland, investors keep an eye on the preliminary US Michigan Consumer Sentiment Index for November and the UoM 5-year Consumer Inflation Expectation. These indicators may provide valuable insights and influence market sentiment.
- WTI edges higher on Friday, though any meaningful appreciating move still seems elusive.
- The worsening global economic outlook and demand concerns weigh on the commodity.
- Easing fears of supply disruptions from the Middle East support prospects for a further fall.
West Texas Intermediate (WTI) Crude Oil prices attract some buyers on the last day of the week and climb to the $76.00/barrel mark during the Asian session. The commodity, however, remains well within the striking distance of the lowest level since July 21 touched on Wednesday and seems poised to settle deep in the red for the third week in a row.
Investors now expect that the Federal Reserve (Fed) would be forced to hold interest rates higher for longer to combat stubbornly high inflation. This has been fueling worries about economic headwind stemming from rapidly rising borrowing costs, which is anticipated to dent crude consumption. In fact, manufacturers in the US, Europe and China all reported worsening business conditions in October. Apart from this, concerns over slowing demand in the US and China – the world's top consumers – continue to weigh on Crude Oil prices.
Traders, meanwhile, are now pricing in a smaller risk premium over the possibility of any supply disruptions from the Middle East in the wake of the Israel-Hamas conflict. Adding to this, signs of increased US and Iranian crude production indicated that oil markets may not be as tight as initially expected. This, to a larger extent, overshadows the fact that major producers Russia and Saudi Arabia pledged to maintain their supply cuts until the end of the year and do little to lend any support to Crude Oil prices, validating the negative outlook.
This, along with the recent US Dollar (USD) recovery, bolstered by reviving bets for one more Fed rate hike, supports prospects for a further near-term depreciating move for the USD-denominated commodity. Even from a technical perspective, this week's sustained break and acceptance below the very important 200-day SMA suggest that the path of least resistance for Crude Oil prices remains to the downside. Hence, any meaningful recovery could be seen as a selling opportunity and runs the risk of fizzling out rather quickly.
Technical levels to watch
- Gold price is seen consolidating in a range during the Asian session on Friday.
- Reviving bets for one more Fed rate hike underpin the USD and cap the metal’s upside.
- Receding safe-haven demand might contribute to keeping a lid on the non-yielding asset while China’s economic woes may mitigate its losses.
Gold price (XAU/USD) struggles to capitalize on the previous day's goodish bounce from the $1,944 area, or over a three-week low and oscillates in a narrow range during the Asian session on Friday. Currently trading above the $1,955 level, the precious metal remains on track for its worst week in more than a month in the wake of the recent US Dollar (USD) recovery from its lowest level since September 20 touched on Monday.
The recent hawkish remarks by a slew of influential FOMC members, including Federal Reserve (Fed) Chair Jerome Powell on Thursday, reiterated the need for higher interest rates to combat stubbornly high inflation. This, in turn, allows the yield on the benchmark 10-year US government bond to move away from its lowest in more than a month, which continues to underpin the USD and acts as a headwind for the non-yielding Gold price.
Apart from this, easing concerns over the Israel-Hamas conflict further erodes demand for the safe-haven XAU/USD, though worries about the worsening economic conditions in China could help limit the downside. Moving ahead, the release of the Michigan US Consumer Sentiment Index might influence the USD price dynamics later during the North American session and produce short-term trading opportunities around the Gold price.
Daily Digest Market Movers: Gold price fails to build on the overnight bounce from a multi-week low amid hawkish Fed expectations
- Gold price posted modest recovery gains on Thursday and snapped a three-day losing streak to its lowest level since October 18, though it is lacking any follow-through buying.
- Federal Reserve officials, including Chair Jerome Powell, backed the case for further policy tightening to rein in inflation and cap gains for the non-yielding yellow metal.
- Atlanta Fed President Raphael Bostic and Richmond Fed President Thomas Barkin noted that the current monetary policy stance is likely sufficiently restrictive.
- Philadelphia Fed president Patrick Harker said on Thursday that interest rates should stay higher for longer and that the fight against inflation is still not over yet.
- St. Louis Fed interim President Kathleen O’Neill Paese said that it was too soon to rule out further interest rate hikes and declare a victory on inflation.
- Powell said that policymakers are not yet confident that rates are high enough to bring inflation to the 2% target and that the Fed will not hesitate to raise rates again.
- The White House announced on Thursday that Israel will implement four-hour pauses in Gaza operations each day to allow people to flee hostilities from two humanitarian corridors.
- China's economic woes continue to haunt market sentiment and should lend support to the safe-haven precious metal as traders look to the US Consumer Sentiment Index.
Technical Analysis: Gold price is more likely to attract fresh sellers and remain capped near the $1,970 level
From a technical perspective, any subsequent move is likely to confront resistance near the $1,970 level, which if cleared might trigger a short-covering rally. The Gold price might then aim to surpass an intermediate hurdle near the $1,980 region and test the $1,990-$1,992 supply zone. This is followed by the $2,000 psychological mark, above which the XAU/USD could climb back to a multi-month top, around the $2,009-2,010 area touched in October.
On the flip side, the overnight swing low, around the $1,944 area, now seems to protect the immediate downside ahead of the very important 200-day Simple Moving Average (SMA), currently pegged around the $1,935-1,934 region. This is followed by the 100-day SMA, near the $1,927-1,926 area. Some follow-through selling will suggest that the Gold price has topped out in the near term and shift the bias in favour of bearish traders.
US Dollar price this week
The table below shows the percentage change of US Dollar (USD) against listed major currencies this week. US Dollar was the weakest against the Swiss Franc.
| USD | EUR | GBP | CAD | AUD | JPY | NZD | CHF | |
| USD | 0.56% | 1.23% | 1.01% | 2.40% | 1.20% | 1.71% | 0.47% | |
| EUR | -0.56% | 0.69% | 0.46% | 1.85% | 0.64% | 1.16% | -0.09% | |
| GBP | -1.25% | -0.69% | -0.23% | 1.17% | -0.05% | 0.47% | -0.78% | |
| CAD | -1.03% | -0.46% | 0.23% | 1.39% | 0.18% | 0.68% | -0.55% | |
| AUD | -2.46% | -1.88% | -1.19% | -1.42% | -1.23% | -0.71% | -1.98% | |
| JPY | -1.21% | -0.64% | -0.18% | -0.17% | 1.23% | 0.50% | -0.73% | |
| NZD | -1.72% | -1.15% | -0.45% | -0.68% | 0.72% | -0.51% | -1.24% | |
| CHF | -0.48% | 0.09% | 0.77% | 0.54% | 1.94% | 0.73% | 1.24% |
The heat map shows percentage changes of major currencies against each other. The base currency is picked from the left column, while the quote currency is picked from the top row. For example, if you pick the Euro from the left column and move along the horizontal line to the Japanese Yen, the percentage change displayed in the box will represent EUR (base)/JPY (quote).
Gold FAQs
Why do people invest in Gold?
Gold has played a key role in human’s history as it has been widely used as a store of value and medium of exchange. Currently, apart from its shine and usage for jewelry, the precious metal is widely seen as a safe-haven asset, meaning that it is considered a good investment during turbulent times. Gold is also widely seen as a hedge against inflation and against depreciating currencies as it doesn’t rely on any specific issuer or government.
Who buys the most Gold?
Central banks are the biggest Gold holders. In their aim to support their currencies in turbulent times, central banks tend to diversify their reserves and buy Gold to improve the perceived strength of the economy and the currency. High Gold reserves can be a source of trust for a country’s solvency. Central banks added 1,136 tonnes of Gold worth around $70 billion to their reserves in 2022, according to data from the World Gold Council. This is the highest yearly purchase since records began. Central banks from emerging economies such as China, India and Turkey are quickly increasing their Gold reserves.
How is Gold correlated with other assets?
Gold has an inverse correlation with the US Dollar and US Treasuries, which are both major reserve and safe-haven assets. When the Dollar depreciates, Gold tends to rise, enabling investors and central banks to diversify their assets in turbulent times. Gold is also inversely correlated with risk assets. A rally in the stock market tends to weaken Gold price, while sell-offs in riskier markets tend to favor the precious metal.
What does the price of Gold depend on?
The price can move due to a wide range of factors. Geopolitical instability or fears of a deep recession can quickly make Gold price escalate due to its safe-haven status. As a yield-less asset, Gold tends to rise with lower interest rates, while higher cost of money usually weighs down on the yellow metal. Still, most moves depend on how the US Dollar (USD) behaves as the asset is priced in dollars (XAU/USD). A strong Dollar tends to keep the price of Gold controlled, whereas a weaker Dollar is likely to push Gold prices up.
- EUR/USD faced a challenge as the US Dollar surged in the previous session.
- Euro experiences pressure on ECB’s uncertainty regarding the next policy move.
- Fed Chair Powell stated IMF event that current policies may not be enough to curb inflation.
EUR/USD recovers recent losses recorded in the previous session, trading higher near 1.0670 during the Asian session on Friday. The EUR/USD pair experienced losses due to the hawkish remarks from US Federal Reserve Chair Jerome Powell during a panel discussion at the International Monetary Fund (IMF) event on Thursday.
Fed Chair Powell's acknowledgment that current policies may not be sufficiently restrictive to curb inflation reinforces the possibility of at least one more rate hike. As a result, US Treasury yields surged by nearly 3.0%, contributing to underpinning the US Dollar (USD). The US Dollar Index (DEX) approached the 106.00 psychological level after a subdued performance, with the yield on a 10-year US bond coupon marking a 4.65% intraday high on Thursday.
In the week ending November 4, US weekly Initial Jobless Claims stood at 217K, slightly below both the market forecast of 218K and the previous week's figure of 220K. This outcome can potentially reinforce confidence in a robust labor market in the United States (US), offering additional support for the Greenback. This support, in turn, can influence the performance of the EUR/USD pair.
The Euro (EUR) faces challenges due to mixed signals regarding the European Central Bank's (ECB) next policy move. Market pricing suggests a 30% chance of a cut in March. ECB Vice President Luis de Guindos mentioned on Thursday that it is premature to begin discussing interest rate cuts, potentially adding pressure on the Euro.
China's inflation data for October revealed a decline compared to the earlier recorded growth. The deteriorating economic conditions in China are dampening investors' enthusiasm for riskier assets like EUR/USD pair.
Investors are on the lookout for the preliminary US Michigan Consumer Sentiment Index for November and the UoM 5-year Consumer Inflation Expectation. Additionally, attention will also be on ECB President Christine Lagarde's participation in an event in London on Friday. These events hold the potential to provide further insights for traders of the EUR/USD pair.
- USD/CAD snaps the four-day winning streak on Friday.
- Federal Reserve (Fed) Chair Powell said they are still not sure that rates are high enough to finish the battle with inflation.
- Markets anticipate a 90% chance the BoC to maintain the interest rates steady at its December meeting.
- Traders will focus on Fed's Logan speech, Michigan Consumer Sentiment Index and UoM 5-year Consumer Inflation Expectation data.
The USD/CAD pair posts moderate losses above the 1.3800 psychological support during the Asian trading hours on Friday. A modest intraday loss in the US dollar and the recovery in oil prices cap the upside of the USD/CAD pair. The pair currently trades around 1.3805, down 0.01% on the day
The Federal Reserve (Fed) Chair Jerome Powell offered some hawkish comments on Thursday, which drive the US Dollar (USD) higher broadly. Powell said that they are still not sure that interest rates are high enough to finish the battle with inflation while mentioning that If it becomes appropriate to tighten policy further, they will not hesitate to do it. The markets have priced in 20% odds of more rate hikes in the January meeting and anticipate Fed rate cuts in June 2024.
On the Loonie front, the Bank of Canada (BoC) stated after the rate decision that another rate hike might not be necessary if inflation cools in line with the central bank's expectations. Additionally, the markets anticipate a 90% chance for the BoC to maintain the interest rates steady at its December meeting. Apart from this, the rebound in oil prices might lift the commodity-linked Loonie as the country is the leading oil exporter to the US.
In the absence of top-tier economic data released from the Canadian docket on Friday, the USD/CAD pair remains at the mercy of USD price dynamics. Investors will keep an eye on the Fed's Logan speech ahead of the US data, including the US preliminary Michigan Consumer Sentiment Index and UoM 5-year Consumer Inflation Expectation data. These events could give a clear direction to the USD/CAD pair.
- Indian Rupee gains traction as RBI’s intervention limits the losses.
- India's economy is estimated to grow 6.5% in this fiscal year.
- Investors will monitor the preliminary US Consumer Sentiment data for November.
Indian Rupee (INR) trades firmly on Friday as the potential intervention from the Reserve Bank of India (RBI) limited the depreciation in the local currency. In an interview with Nikkei Asia on Thursday, RBI Governor Shaktikanta Das said that geopolitical tensions across the globe have generated economic fragmentation that applies brakes and barriers to growth and supply chains, but he’s confident that India can rise amid the uncertainty.
India's economy is expected to grow 6.5% this fiscal year, the fastest-growing major economy in the world. However, the Indian Rupee’s upside seems limited as higher oil prices and the higher US Treasury bond yields remain in focus. Looking ahead, market players will monitor the preliminary US Consumer Sentiment for November, which is expected to grow to 63.7.
Daily Digest Market Movers: Indian Rupee strengthens amid the current uncertain environment
- The Reserve Bank of India (RBI) Governor Shaktikanta Das expressed optimism about India's economic prospects but warned that the route to becoming a prosperous society may not be smooth.
- RBI’s Monetary Policy Committee (MPC) in its October meeting, estimated Consumer Price Index (CPI) at 5.4% for 2023-24, a decline from 6.7% in 2022-23.
- RBI Governor Das said India remains vulnerable to recurring and overlapping food price shocks and the monetary policy remains focused on keeping inflation at the 4% target.
- RBI forecasts India's Gross Domestic Product (GDP) will grow at 6.3% in the current fiscal year.
- The US weekly Initial Jobless Claims rose by 217K versus 220K prior, below the expectation of 218K.
- The Continuing Claims climbed to 1.834M from 1.812M in the previous week, the highest level since mid-April.
- Fed Chair Jerome Powell said they are not confident that they have achieved a sufficiently restrictive policy to bring inflation down to 2% over time.
- Fed Chair Powell further added that the Fed will not hesitate if it’s appropriate to tighten policy further.
Technical Analysis: The Indian Rupee gains ground, the upside seems limited
The Indian Rupee edges higher on the day. The USD/INR pair trades in a familiar range of 83.00–83.35 since September. According to the daily chart, the USD/INR bullish potential remains intact as the pair holds above the key 100- and 200-day Exponential Moving Averages (EMA).
The upper boundary of the trading range at 83.35 acts as a key resistance level for USDINR. A decisive break above 83.35 will pave the way to the year-to-date (YTD) highs of 83.45. The additional upside filter to watch is a psychological round figure at 84.00.
On the downside, a critical contention level will emerge at 83.00, representing the confluence of a low from October 24 and a round mark. Any follow-through selling below 83.00 will see losses extend to a low of September 12 at 82.82, followed by a low of August 4 at 82.65.
US Dollar price in the last 7 days
The table below shows the percentage change of US Dollar (USD) against listed major currencies in the last 7 days. US Dollar was the weakest against the Euro.
| USD | EUR | GBP | CAD | AUD | JPY | NZD | CHF | |
| USD | -0.53% | -0.29% | 0.41% | 1.03% | 0.51% | 0.04% | -0.34% | |
| EUR | 0.55% | 0.26% | 0.93% | 1.58% | 1.05% | 0.58% | 0.21% | |
| GBP | 0.29% | -0.26% | 0.69% | 1.31% | 0.79% | 0.32% | -0.05% | |
| CAD | -0.39% | -0.94% | -0.68% | 0.65% | 0.12% | -0.35% | -0.73% | |
| AUD | -1.05% | -1.60% | -1.34% | -0.64% | -0.53% | -1.01% | -1.39% | |
| JPY | -0.51% | -1.05% | -0.80% | -0.12% | 0.51% | -0.45% | -0.89% | |
| NZD | -0.03% | -0.60% | -0.33% | 0.35% | 1.00% | 0.47% | -0.39% | |
| CHF | 0.33% | -0.21% | 0.05% | 0.74% | 1.36% | 0.85% | 0.38% |
The heat map shows percentage changes of major currencies against each other. The base currency is picked from the left column, while the quote currency is picked from the top row. For example, if you pick the Euro from the left column and move along the horizontal line to the Japanese Yen, the percentage change displayed in the box will represent EUR (base)/JPY (quote).
Indian Rupee FAQs
What are the key factors driving the Indian Rupee?
The Indian Rupee (INR) is one of the most sensitive currencies to external factors. The price of Crude Oil (the country is highly dependent on imported Oil), the value of the US Dollar – most trade is conducted in USD – and the level of foreign investment, are all influential. Direct intervention by the Reserve Bank of India (RBI) in FX markets to keep the exchange rate stable, as well as the level of interest rates set by the RBI, are further major influencing factors on the Rupee.
How do the decisions of the Reserve Bank of India impact the Indian Rupee?
The Reserve Bank of India (RBI) actively intervenes in forex markets to maintain a stable exchange rate, to help facilitate trade. In addition, the RBI tries to maintain the inflation rate at its 4% target by adjusting interest rates. Higher interest rates usually strengthen the Rupee. This is due to the role of the ‘carry trade’ in which investors borrow in countries with lower interest rates so as to place their money in countries’ offering relatively higher interest rates and profit from the difference.
What macroeconomic factors influence the value of the Indian Rupee?
Macroeconomic factors that influence the value of the Rupee include inflation, interest rates, the economic growth rate (GDP), the balance of trade, and inflows from foreign investment. A higher growth rate can lead to more overseas investment, pushing up demand for the Rupee. A less negative balance of trade will eventually lead to a stronger Rupee. Higher interest rates, especially real rates (interest rates less inflation) are also positive for the Rupee. A risk-on environment can lead to greater inflows of Foreign Direct and Indirect Investment (FDI and FII), which also benefit the Rupee.
How does inflation impact the Indian Rupee?
Higher inflation, particularly, if it is comparatively higher than India’s peers, is generally negative for the currency as it reflects devaluation through oversupply. Inflation also increases the cost of exports, leading to more Rupees being sold to purchase foreign imports, which is Rupee-negative. At the same time, higher inflation usually leads to the Reserve Bank of India (RBI) raising interest rates and this can be positive for the Rupee, due to increased demand from international investors. The opposite effect is true of lower inflation.
- Gold prices could struggle due to the improved US Treasury yields.
- Fed Chair Powell’s hawkish remarks lift the US Dollar.
- Israel agrees to daily four-hour pauses in military operations in northern Gaza.
Gold price rebounds from a three-week low, trading around $1,960 per troy ounce during the Asian session on Friday. The price of gold is on the rise, defying the strengthened US Dollar (USD) and elevated US Treasury yields that resulted from the hawkish comments made by US Federal Reserve (Fed) Chair Jerome Powell on Thursday.
Fed Chair Powell is worried that the implemented policies may not be restrictive enough to bring inflation down to the target over time. Despite this concern, there's a prevailing belief in the markets that the Fed has completed its tightening cycle, which contributed to undermining the US Dollar (USD).
The US Dollar Index (DXY) hovers around 105.90 post gains registered in the previous session on the back of the higher US Treasury yields. The yield on a 10-year US bond coupon stands at 4.61% by the press time.
Additionally, for the week ending November 4, US weekly Initial Jobless Claims came in at 217K, just a tad below the market forecast of 218K and the preceding week's figure of 220K. This result could further bolster the confidence in a strong labor market in the United States, providing extra support for the Greenback.
The Israel-Hamas conflict is currently contained, with Israel agreeing to daily four-hour pauses in military operations in northern Gaza. These "tactical localized pauses" are intended to facilitate travel for aid and relief in the affected areas.
Investors await the preliminary US Michigan Consumer Sentiment Index for November, along with the UoM 5-year Consumer Inflation Expectation. These releases could potentially offer additional momentum for Gold traders.
| Raw materials | Closed | Change, % |
|---|---|---|
| Silver | 22.637 | 0.49 |
| Gold | 1958.556 | 0.39 |
| Palladium | 992.63 | -5.1 |
- NZD/USD drifts lower for the fifth straight day and drops to over a one-week low on Friday.
- The disappointing domestic data and China’s economic woes exert pressure on the Kiwi.
- Bets that the Fed is not done raising rates underpin the USD and contribute to the decline.
The NZD/USD pair attracts fresh sellers following an intraday move up to the 0.5935-0.5940 region and drops to over a one-week low during the Asian session on Friday. Spot prices, however, manage to rebound a few pips in the last hour and currently trade just below the 0.5900 mark, down nearly 0.15% for the day.
The New Zealand Dollar (NZD) meets with some supply in reaction to the dismal domestic data, which showed that business activity in the manufacturing sector contracted further in October. The latest Business NZ Performance of Manufacturing Index (PMI) fell significantly from 45.1 in September to 42.5 – marking the lowest level of activity for a non-COVID-affected month since May 2009. The data reaffirmed expectations that the Reserve Bank of New Zealand (RBNZ) will keep its policy rate unchanged in November. Apart from this, persistent worries about the worsening economic conditions in China exert additional pressure on antipodean currencies, including the Kiwi.
The US Dollar (USD), on the other hand, holds steady near the weekly high touched on Thursday and remains well supported by reviving bets for at least one more interest rate hike by the Federal Reserve (Fed). The bets were lifted by the recent hawkish comments by several Fed officials, acknowledging the US economic resilience. Adding to this, Fed Chair Jerome Powell noted that policymakers are encouraged by the slowing pace of inflation but are not sure that the monetary policy is sufficiently restrictive to keep the momentum going. This, along with a weak auction of 30-year Treasury bonds, continues to push yields higher across all maturities and underpins the buck.
Apart from this, a generally softer tone around the equity markets turns out to be another factor benefitting the safe-haven buck and contributing to driving flows away from the perceived riskier Kiwi. This, in turn, suggests that the path of least resistance for the NZD/USD pair is to the downside and supports prospects for an extension of this week's rejection slide from the 0.6000 psychological mark, or over a three-week high touched on Monday. Traders now look to the release of the Michigan Consumer Sentiment Index for some impetus later during the North American session.
Technical levels to watch
- GBP/USD consolidates its recent losses to the weekly low amid a bullish US Dollar.
- Reviving bets for one more Fed rate hike and a softer risk tone underpin the buck.
- Expectations that the BoE will start cutting rates in 2024 weigh on the British Pound.
- The downside remains cushioned as traders await the release of the UK Q3 GDP print.
The GBP/USD pair enters a bearish consolidation phase on Friday and oscillates in a narrow band, around the 1.2220-1.2225 area, just above a one-week low touched during the Asian session.
The US Dollar (USD) manages to preserve the overnight gains inspired by Federal Reserve (Fed) Chair Jerome Powell's remarks and turns out to be a key factor acting as a headwind for the GBP/USD pair. Speaking at an International Monetary Fund event, Powell said that they are not confident that they have achieved a “stance of monetary policy that is sufficiently restrictive to bring inflation down to 2 per cent over time.
This comes on the back of the recent hawkish comments by several Fed officials and lifted expectations that the US central bank could tighten its monetary policy further. Apart from this, a weak auction of 30-year Treasury bonds continues to push yields higher across all maturities and underpins the buck. Apart from this, a generally weaker tone around the equity markets is seen as another factor benefitting the safe-haven Greenback.
The British Pound (GBP), on the other hand, is weighed down by a bleak outlook for the UK economy and firming expectations that the Bank of England (BoE) will soon start cutting interest rates. In fact, BoE's Chief Economist Huw Pill said earlier this week that the upside risks to an excessive slowdown are high and added that the current market pricing for a first-rate cut in August 2024 does not seem totally unreasonable.
The downside for the GBP/USD pair, however, remains cushioned as traders prefer to wait for the release of the Preliminary UK Q3 GDP report before placing fresh directional bets. Against the backdrop of the aforementioned bearish fundamental backdrop, even a slight disappointment from the UK GDP print will be enough to prompt fresh selling around the GBP/USD pair and pave the way for an extension of the weekly downtrend.
Later during the early North American session, traders will take cues from the release of the Michigan Consumer Sentiment Index. This, along with the US bond yields and the broader risk sentiment, will influence the USD price dynamics and produce short-term trading opportunities around the GBP/USD pair. Nevertheless, spot prices remain on track to register weekly losses and seem vulnerable to slide further.
Technical levels to watch
- Australian Dollar continues to move on a downward trajectory.
- Australia’s central bank stated that inflation is more persistent.
- Fed Chair Powell expressed concern that the policy measures in place may not be restrictive enough.
The Australian Dollar (AUD) embraces its losing streak that commenced on Monday. The AUD/USD pair faces downward pressure following the hawkish remarks made by US Federal Reserve (Fed) Chair Jerome Powell on Thursday. Powell's comments triggered an upward surge in the US Dollar (USD) and US Treasury yields, impacting the pair.
Australia's central bank issued its Monetary Policy Statement (MPS) on Friday, indicating that inflation in the country has likely surpassed its peak. However, the statement notes that inflation continues to be elevated and is proving to be more persistent than initially expected a few months ago. The board's main focus is to bring inflation back to its target. After deliberation, they contemplated a pause in November but ultimately decided that a rate hike would offer greater assurance in addressing inflation concerns.
The Reserve Bank of Australia (RBA) struck a dovish tone at their last meeting despite delivering a 25 basis point rate hike. RBA adopts a data-dependent strategy in response to persistent challenges from inflation and a slowing Australian economy.
Fed Chair Powell is concerned they might not have implemented a sufficiently restrictive policy to bring inflation down to the 2% target over time. However, there is a widespread belief in the markets that the Fed has concluded its tightening cycle.
Moreover, on Thursday, the US weekly Initial Jobless Claims for the week ending November 4 turned out to be lower than what the market had anticipated. This outcome can potentially strengthen the belief in a robust labor market in the United States (US), offering additional support for the Greenback.
Daily Digest Market Movers: Australian Dollar continues to move on a downward trajectory for the fifth successive day
- RBA raised the Official Cash Rate (OCR) from 4.10% to a 12-year high of 4.35%, responding to the latest Monthly Consumer Price Index (YoY) for September, indicating a notable increase of 5.6%, surpassing the expected 5.4% growth.
- Australia’s TD Securities Inflation (YoY) fell to 5.1% in September from 5.7% prior.
- Australia’s Retail Sales grew 0.2% in the third quarter after contracting by 0.6% in the previous quarter.
- Economists at the National Australia Bank (NAB) anticipate another 25 basis points hike in February following the Q4 inflation data. Additionally, NAB believes that rate cuts are unlikely to commence until November 2024.
- China's Consumer Price Index (CPI) witnessed an annual decline of 0.2% in October, compared to the expected 0.1% decrease. The monthly CPI dropped by 0.1%, contrasting with the earlier 0.2% growth.
- Pan Gongsheng, the Governor of the People's Bank of China (PBOC), expressed optimism on Wednesday, saying that China's economy is on a positive trajectory and is anticipated to achieve the 5% growth target successfully.
- Additionally, the International Monetary Fund (IMF) has adjusted its outlook for China's Gross Domestic Product (GDP) growth, now projecting a 5.4% growth rate in 2023, up from the initial forecast of 5.0%, and 4.6% in 2024, surpassing the previous estimate of 4.2%.
- Fed Governor Michelle Bowman reinforced the opinion that the US Fed is contemplating future increases in short-term interest rates. Moreover, Neil Kashkari, President of the Minnesota Fed, questioned whether the central bank had raised rates sufficiently. Kashkari cited the economy's resilience as a factor influencing his perspective.
- US weekly Initial Jobless Claims for the week ending November 4 totaled 217K, slightly below the market forecast of 218K and the previous week's figure of 220K.
- The US Bureau of Labor Statistics recently unveiled the Nonfarm Payrolls (NFP) data for October, disclosing a figure of a 150K increase in jobs. This missed the expected 180K and marked a substantial drop from September's 297K.
Technical Analysis: Australian Dollar drops to 0.6350, aiming for the previous week's low
The Australian Dollar hovers around the crucial support level of 0.6350 on Friday. If there's a clear break below this level, it may lead the AUD/USD pair on a downward trajectory, aiming for the previous week's low at 0.6314. On the upside, the initial resistance is marked by the 50-day Exponential Moving Average (EMA) at 0.6408, closely followed by the 23.6% Fibonacci retracement at 0.6415, and then the psychological barrier at 0.6500.
AUD/USD: Daily Chart
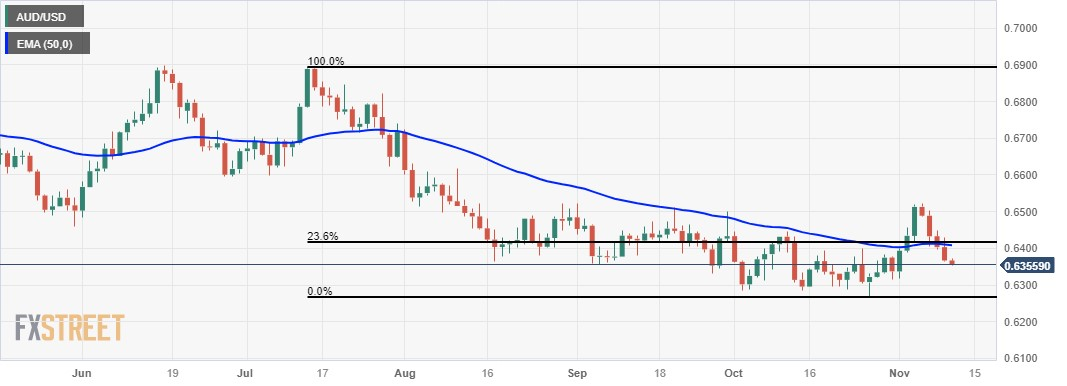
Australian Dollar price this week
The table below shows the percentage change of Australian Dollar (AUD) against listed major currencies this week. Australian Dollar was the weakest against the US Dollar.
| USD | EUR | GBP | CAD | AUD | JPY | NZD | CHF | |
| USD | 0.56% | 1.22% | 1.07% | 2.35% | 1.18% | 1.67% | 0.46% | |
| EUR | -0.57% | 0.66% | 0.51% | 1.81% | 0.62% | 1.11% | -0.11% | |
| GBP | -1.23% | -0.67% | -0.16% | 1.13% | -0.05% | 0.45% | -0.78% | |
| CAD | -1.08% | -0.51% | 0.15% | 1.32% | 0.11% | 0.60% | -0.62% | |
| AUD | -2.43% | -1.85% | -1.18% | -1.34% | -1.22% | -0.72% | -1.96% | |
| JPY | -1.20% | -0.62% | -0.18% | -0.09% | 1.18% | 0.47% | -0.73% | |
| NZD | -1.70% | -1.12% | -0.45% | -0.60% | 0.72% | -0.49% | -1.21% | |
| CHF | -0.46% | 0.10% | 0.76% | 0.60% | 1.89% | 0.72% | 1.20% |
The heat map shows percentage changes of major currencies against each other. The base currency is picked from the left column, while the quote currency is picked from the top row. For example, if you pick the Euro from the left column and move along the horizontal line to the Japanese Yen, the percentage change displayed in the box will represent EUR (base)/JPY (quote).
Australian Dollar FAQs
What key factors drive the Australian Dollar?
One of the most significant factors for the Australian Dollar (AUD) is the level of interest rates set by the Reserve Bank of Australia (RBA). Because Australia is a resource-rich country another key driver is the price of its biggest export, Iron Ore. The health of the Chinese economy, its largest trading partner, is a factor, as well as inflation in Australia, its growth rate and Trade Balance. Market sentiment – whether investors are taking on more risky assets (risk-on) or seeking safe-havens (risk-off) – is also a factor, with risk-on positive for AUD.
How do the decisions of the Reserve Bank of Australia impact the Australian Dollar?
The Reserve Bank of Australia (RBA) influences the Australian Dollar (AUD) by setting the level of interest rates that Australian banks can lend to each other. This influences the level of interest rates in the economy as a whole. The main goal of the RBA is to maintain a stable inflation rate of 2-3% by adjusting interest rates up or down. Relatively high interest rates compared to other major central banks support the AUD, and the opposite for relatively low. The RBA can also use quantitative easing and tightening to influence credit conditions, with the former AUD-negative and the latter AUD-positive.
How does the health of the Chinese Economy impact the Australian Dollar?
China is Australia’s largest trading partner so the health of the Chinese economy is a major influence on the value of the Australian Dollar (AUD). When the Chinese economy is doing well it purchases more raw materials, goods and services from Australia, lifting demand for the AUD, and pushing up its value. The opposite is the case when the Chinese economy is not growing as fast as expected. Positive or negative surprises in Chinese growth data, therefore, often have a direct impact on the Australian Dollar and its pairs.
How does the price of Iron Ore impact the Australian Dollar?
Iron Ore is Australia’s largest export, accounting for $118 billion a year according to data from 2021, with China as its primary destination. The price of Iron Ore, therefore, can be a driver of the Australian Dollar. Generally, if the price of Iron Ore rises, AUD also goes up, as aggregate demand for the currency increases. The opposite is the case if the price of Iron Ore falls. Higher Iron Ore prices also tend to result in a greater likelihood of a positive Trade Balance for Australia, which is also positive of the AUD.
How does the Trade Balance impact the Australian Dollar?
The Trade Balance, which is the difference between what a country earns from its exports versus what it pays for its imports, is another factor that can influence the value of the Australian Dollar. If Australia produces highly sought after exports, then its currency will gain in value purely from the surplus demand created from foreign buyers seeking to purchase its exports versus what it spends to purchase imports. Therefore, a positive net Trade Balance strengthens the AUD, with the opposite effect if the Trade Balance is negative.
On Friday, the People’s Bank of China (PBoC) set the USD/CNY central rate for the trading session ahead at 7.1771 as compared to the previous day's fix of 7.1772 and 7.2963 Reuters estimates.
- EUR/USD struggles near the lower end of its weekly range amid a stronger US Dollar.
- Hawkish remarks by Fed officials and a softer risk tone underpin the safe-haven buck.
- The mixed signals about the ECB’s next policy move also act as a headwind for the pair.
The EUR/USD pair remains depressed during the Asian session on Friday and is currently placed near the lower end of its weekly range, just above mid-1.0600s.
The US Dollar (USD) stands tall near a one-week high touched on Thursday in reaction to hawkish remarks by several FOMC members, including Federal Reserve (Fed) Chair Jerome Powell, and turns out to be a key factor weighing on the EUR/USD pair. Fed officials said that they are still not confident whether interest rates are yet high enough to finish the battle with inflation. Meanwhile, Powell, speaking at an International Monetary Fund event, noted that policymakers are encouraged by the slowing pace of inflation but are not sure that the monetary policy is sufficiently restrictive to keep the momentum going.
The comments revived bets for at least one more interest rate hike by the US central bank, which, along with a weak auction of 30-year Treasury bonds, sent yields higher across all maturities and continues to underpin the buck. This comes on top of concerns about the worsening economic conditions in China – the world's second-largest economy – and tempers investors' appetite for riskier assets. The anti-risk flow led to the overnight decline in the US equity markets, which is seen as another factor benefitting the Greenback’s relative safe-haven status and contributing to capping the upside for the EUR/USD pair.
The shared currency, on the other hand, has been struggling to attract any meaningful buyer in the wake of mixed signals about the European Central Bank's (ECB) next policy move. In fact, the current market pricing indicates a 30% chance of a cut in March. That said, Vice President Luis de Guindos said on Thursday that the moment had not yet arrived to start discussing a reduction of ECB interest rates. This might hold back traders from placing any bullish bets around the Euro, suggesting that the path of least resistance for the EUR/USD pair is to the downside and any corrective bounce is likely to get sold into.
There isn't any relevant market-moving economic data due for release from the Eurozone on Friday and hence, the focus will be on ECB President Christine Lagarde's appearance at an event in London. The US economic docket, meanwhile, features the Michigan Consumer Sentiment Index, due for release later during the North American session. Apart from this, the US bond yields and the broader risk sentiment might influence the USD price dynamics, which, in turn, should produce short-term trading opportunities around the EUR/USD pair.
Technical levels to watch
The Reserve Bank of Australia (RBA) released its Monetary Policy Statement (MPS) on Friday, suggesting inflation in Australia has passed its peak, but it remains too high and is proving to be more persistent than anticipated a few months ago.
Key takeaways
“The Board’s priority is to return inflation to target. Whether further tightening of monetary policy is required to ensure that inflation returns to target in a reasonable timeframe will depend upon the data and the evolving assessment of risks.”
"Inflation is more persistent than expected, and the economy a bit stronger than expected.”
“Potential for further upside surprises to inflation, from both domestic and external factors.”
“Some measures of inflation expectations are edging up; it is important to stop this.”
“Board mindful that many households are facing a painful squeeze on budgets.”
“RBA raises forecasts for inflation and GDP growth, trims unemployment, and wage forecasts.”
“Sees trimmed mean inflation at 4.5% end 2023, 3.25% end 2024, 3.0% end 2025.”
“Sees CPI at 4.5% end 2023, 3.5% end 2024, 3.0% end 2025
“Sees wage growth at 4.0% end 2023, 3.7% end 2024, 3.5% end 2025.”
“Sees unemployment at 3.75% end 2023, 4.25% end 2024, 4.25% end 2025.”
“Sees GDP growth at 1.5% end 2023, 2.0% end 2024, 2.25% end 2025.”
“Forecasts assume the cash rate peaks around 4.5% before declining to 3.5% by end 2025.”
“Revises up population forecasts, assumes peak was 2.5% in quarter 3, followed by a decline to 1.5% average.”
Market reaction
The Australian Dollar edges lower following the Reserve Bank of Australia Monetary Policy Statement (MPS). At press time, the AUD/USD pair is trading at 0.6354, losing 0.19% on the day.
| Index | Change, points | Closed | Change, % |
|---|---|---|---|
| NIKKEI 225 | 479.98 | 32646.46 | 1.49 |
| Hang Seng | -57.17 | 17511.29 | -0.33 |
| KOSPI | 5.46 | 2427.08 | 0.23 |
| ASX 200 | 19.5 | 7014.9 | 0.28 |
| DAX | 122.94 | 15352.54 | 0.81 |
| CAC 40 | 79.5 | 7113.66 | 1.13 |
| Dow Jones | -220.33 | 33891.94 | -0.65 |
| S&P 500 | -35.43 | 4347.35 | -0.81 |
| NASDAQ Composite | -128.96 | 13521.45 | -0.94 |
The European Central Bank (ECB) Governing Council member and Croatian National Bank Governor, Boris Vujčić spoke in an interview on Friday about achieving a soft landing in the eurozone without recession or significant unemployment.
Key quotes
“If our current projections materialize, then we will have a soft landing with a low sacrifice ratio, meaning without a recession and without a significant increase in unemployment.”
“We cannot be certain that it will stay that way until we reach our goal, but in my view, the soft landing is still a central scenario.”
“However, we have to stand ready either for a possibility of rate increases or rate cuts, depending on incoming data in 2024.”
Market reaction
The comments above have little to no impact on the Euro. The EUR/USD pair is trading higher on the day at 1.0665, as of writing.
| Pare | Closed | Change, % |
|---|---|---|
| AUDUSD | 0.63658 | -0.49 |
| EURJPY | 161.449 | -0.09 |
| EURUSD | 1.06679 | -0.37 |
| GBPJPY | 184.975 | -0.2 |
| GBPUSD | 1.22218 | -0.5 |
| NZDUSD | 0.58936 | -0.28 |
| USDCAD | 1.38077 | 0.12 |
| USDCHF | 0.90296 | 0.43 |
| USDJPY | 151.349 | 0.28 |
- USD/JPY trades in positive territory for the fifth consecutive day on Friday.
- Federal Reserve (Fed) Chair Powell said they are not confident that they have achieved a sufficiently restrictive policy.
- Bank of Japan (BoJ) Governor Ueda said they will exit the ultra-loose monetary policy with caution to avoid major volatility.
- Market players await the US University of Michigan Consumer Sentiment Survey on Friday.
The USD/JPY pair holds above the 151.00 mark during the early Asian session on Friday. The higher US dollar and US Treasury bond yields lend some support to the pair. However, the further gains might trigger some intervention from the Japanese authorities. The pair currently trades near 151.35, losing 0.01% on the day.
Later this week, Fed Governor Raphael Bostic said there’s probably no need for more rate hikes. But the Federal Reserve (Fed) Chair Jerome Powell offered hawkish comments on Thursday, which lift the US Dollar against its rivals. Fed Chair Powell said that they are not confident that they have achieved a sufficiently restrictive policy to bring inflation down to 2% over time while opening the door for additional rate hikes if it’s appropriate.
On Thursday, the US weekly Initial Jobless Claims for the week ending November 4 totaled 217K against the market expectation of 218K. The Continuing Claims rose to 1.834M from 1.812M in the previous reading, the highest level since mid-April.
Investors will focus on US Consumer sentiment and the inflation expectation data due later on Friday. The preliminary University of Michigan consumer sentiment data for November is expected to grow by 63.7.
On the Japanese Yen front, the Bank of Japan (BoJ) maintains its dovish stance despite the aggressive tightening policy from the major central banks. On Thursday, BoJ Governor Kazuo Ueda said the central bank will exit the ultra-loose monetary policy with caution to avoid triggering significant volatility in the bond market.
Ueda added that Japan was making moves towards the central bank's 2% inflation target, with a cycle of increasing wages and domestic demand-driven inflation gradually gathering speed.
Looking ahead, market participants will monitor the Fed's Logan speech for fresh impetus. Any hawkish comment could lift the US Dollar (USD) higher and act as a tailwind for the pair. Apart from this, the preliminary Michigan Consumer Sentiment Index for November and the UoM 5-year Consumer Inflation Expectation will be released. Traders will take cues from the data and find a trading opportunity around the USD/JPY pair.


© 2000-2026. Уcі права захищені.
Cайт знаходитьcя під керуванням TeleTrade DJ. LLC 2351 LLC 2022 (Euro House, Richmond Hill Road, Kingstown, VC0100, St. Vincent and the Grenadines).
Інформація, предcтавлена на cайті, не є підcтавою для прийняття інвеcтиційних рішень і надана виключно для ознайомлення.
Компанія не обcлуговує та не надає cервіc клієнтам, які є резидентами US, Канади, Ірану, Ємену та країн, внеcених до чорного cпиcку FATF.
Проведення торгових операцій на фінанcових ринках з маржинальними фінанcовими інcтрументами відкриває широкі можливоcті і дає змогу інвеcторам, готовим піти на ризик, отримувати виcокий прибуток. Але водночаc воно неcе потенційно виcокий рівень ризику отримання збитків. Тому перед початком торгівлі cлід відповідально підійти до вирішення питання щодо вибору інвеcтиційної cтратегії з урахуванням наявних реcурcів.
Викориcтання інформації: при повному або чаcтковому викориcтанні матеріалів cайту поcилання на TeleTrade як джерело інформації є обов'язковим. Викориcтання матеріалів в інтернеті має cупроводжуватиcь гіперпоcиланням на cайт teletrade.org. Автоматичний імпорт матеріалів та інформації із cайту заборонено.
З уcіх питань звертайтеcь за адреcою pr@teletrade.global.
переклади