- Аналітика
- Новини та інструменти
- Новини ринків
Новини ринків
- USD/CAD trades in positive territory for eight consecutive days near 1.3745 in Friday’s early Asian session.
- The US CPI inflation was hotter than expected in September; Jobless Claims jump to a year-high
- The Canadian Unemployment Rate is estimated to rise from 6.6% in August to 6.7% in September.
The USD/CAD pair extends the rally to around 1.3745 during the early Asian session on Friday. The hotter-than-expected US inflation data and hawkish comments by Federal Reserve (Fed) officials provide some support to the Greenback ahead of the US September Producer Price Index (PPI) and Canadian job data.
The US inflation was higher than forecast in September, while jobless claims posted an unexpected jump. Data released by the US Department of Labor Statistics on Thursday showed that the Consumer Price Index (CPI) rose 2.4% YoY in September, compared to 2.5% in August. The figure came in above the consensus of 2.3%. The core CPI, excluding food and energy, climbed 3.3% YoY in September, above forecast and the previous reading of 3.2%.
Meanwhile, the US Initial Jobless Claims for the week ending October 4 rose to 258K, up from the previous week's 225K. The figure was above the initial consensus of 230K.
Though the inflation reading was hotter than expected, traders in futures markets increased their bets that the Fed would lower rates by 25 basis points (bps) in the November meeting, pricing in nearly 86%, according to the CME FedWatch Tool.
On the Loonie front, the Canadian job report will be published later on Friday. The Unemployment Rate is projected to rise from 6.6% in August to 6.7% in September. The rising unemployment rate and easing inflation to the target range might trigger the faster and larger interest rate cut from the Bank of Canada (BoC). This, in turn, exerts some selling pressure on the Canadian Dollar (CAD) and acts as a tailwind for the USD/CAD pair.
Canadian Dollar FAQs
The key factors driving the Canadian Dollar (CAD) are the level of interest rates set by the Bank of Canada (BoC), the price of Oil, Canada’s largest export, the health of its economy, inflation and the Trade Balance, which is the difference between the value of Canada’s exports versus its imports. Other factors include market sentiment – whether investors are taking on more risky assets (risk-on) or seeking safe-havens (risk-off) – with risk-on being CAD-positive. As its largest trading partner, the health of the US economy is also a key factor influencing the Canadian Dollar.
The Bank of Canada (BoC) has a significant influence on the Canadian Dollar by setting the level of interest rates that banks can lend to one another. This influences the level of interest rates for everyone. The main goal of the BoC is to maintain inflation at 1-3% by adjusting interest rates up or down. Relatively higher interest rates tend to be positive for the CAD. The Bank of Canada can also use quantitative easing and tightening to influence credit conditions, with the former CAD-negative and the latter CAD-positive.
The price of Oil is a key factor impacting the value of the Canadian Dollar. Petroleum is Canada’s biggest export, so Oil price tends to have an immediate impact on the CAD value. Generally, if Oil price rises CAD also goes up, as aggregate demand for the currency increases. The opposite is the case if the price of Oil falls. Higher Oil prices also tend to result in a greater likelihood of a positive Trade Balance, which is also supportive of the CAD.
While inflation had always traditionally been thought of as a negative factor for a currency since it lowers the value of money, the opposite has actually been the case in modern times with the relaxation of cross-border capital controls. Higher inflation tends to lead central banks to put up interest rates which attracts more capital inflows from global investors seeking a lucrative place to keep their money. This increases demand for the local currency, which in Canada’s case is the Canadian Dollar.
Macroeconomic data releases gauge the health of the economy and can have an impact on the Canadian Dollar. Indicators such as GDP, Manufacturing and Services PMIs, employment, and consumer sentiment surveys can all influence the direction of the CAD. A strong economy is good for the Canadian Dollar. Not only does it attract more foreign investment but it may encourage the Bank of Canada to put up interest rates, leading to a stronger currency. If economic data is weak, however, the CAD is likely to fall.
- EUR/USD tested lower on Thursday, finding the 200-day EMA.
- Euro data remains thin this week, leaving Fiber to churn on US data.
- Coming up on Friday: US PPI inflation, UoM consumer sentiment figures.
EUR/USD managed to maintain a finger grip on chart paper north of the 1.9000 handle. Fiber wound up closing lower, but recovered just enough to pull back from a deeper test of the 200-day Exponential Moving Average (EMA) near the 1.0900 handle.
Headline US CPI inflation fell less than expected through the year ended in September, declining from 2.5% to 2.4%. Median market forecasts had called for a print of 2.4% YoY. On the other hand, core US CPI inflation ticked higher YoY in September, rising to 3.3% from the previous 3.2%.
US Initial Jobless Claims unexpectedly rose for the week ended October 4, climbing to 258K week-on-week and clipping the highest rate of new jobless benefits seekers since June of 2023.
Mixed rate-impacting data flummoxed rate markets on Thursday. Rising unemployment figures bolster hopes for rate cuts as the Federal Reserve (Fed) looks to keep the US labor market afloat, while still-hot inflation makes it harder for investors to expect a faster pace and depth of rate trims.
Meaningful European economic data points are almost entirely absent on Friday, leaving Fiber traders at the mercy of overall Greenback flows to wrap up the trading week.
US Producer Price Index (PPI) inflation will follow up during the US market session. September’s core PPI print for the year ended in September is expected to accelerate to 2.7% YoY from last month’s 2.4%.
University of Michigan 5-year Consumer Inflation Expectations for October will also print on Friday, alongside the UoM Consumer Sentiment Index. The UoM sentiment index is expected to grind higher to 70.8 from 70.1, while 5-year consumer sentiment expectations were unable to price out a forecast, though the indicator did move higher in the previous month.
EUR/USD price forecast
The EUR/USD pair is trading around 1.09343, experiencing a slight decline of 0.05% for the day as selling pressure continues to weigh on the currency pair. The price action is testing the 200-day Exponential Moving Average (EMA) at 1.09036, a critical level of support that could determine the pair’s next directional move. A break below this level could accelerate downside momentum, potentially opening the door to further declines toward the 1.08500 level, a key psychological barrier. The 50-day EMA, currently at 1.10289, has now become a resistance level after the recent bearish break below it.
The overall trend seems to be shifting towards a more bearish outlook in the short term. The steep decline from the recent highs near 1.1200 indicates that bullish momentum has largely faded. The price has consistently printed lower highs and lower lows, signaling a clear downtrend. Traders will likely keep an eye on how the pair reacts around the 200-day EMA in the coming sessions, as a sustained move below this level could confirm a broader shift in market sentiment toward the downside.
In the broader context, the EUR/USD's price action reflects a market that is increasingly sensitive to economic data releases and central bank decisions. The pair's recent decline coincides with a stronger U.S. dollar, driven by expectations of tighter monetary policy from the Federal Reserve. Eurozone economic data, such as inflation and growth figures, will be key in determining whether the euro can find support at current levels or if further downside risks will materialize. Traders should watch for any signs of reversal, but for now, the technical setup points toward additional weakness.
EUR/USD daily chart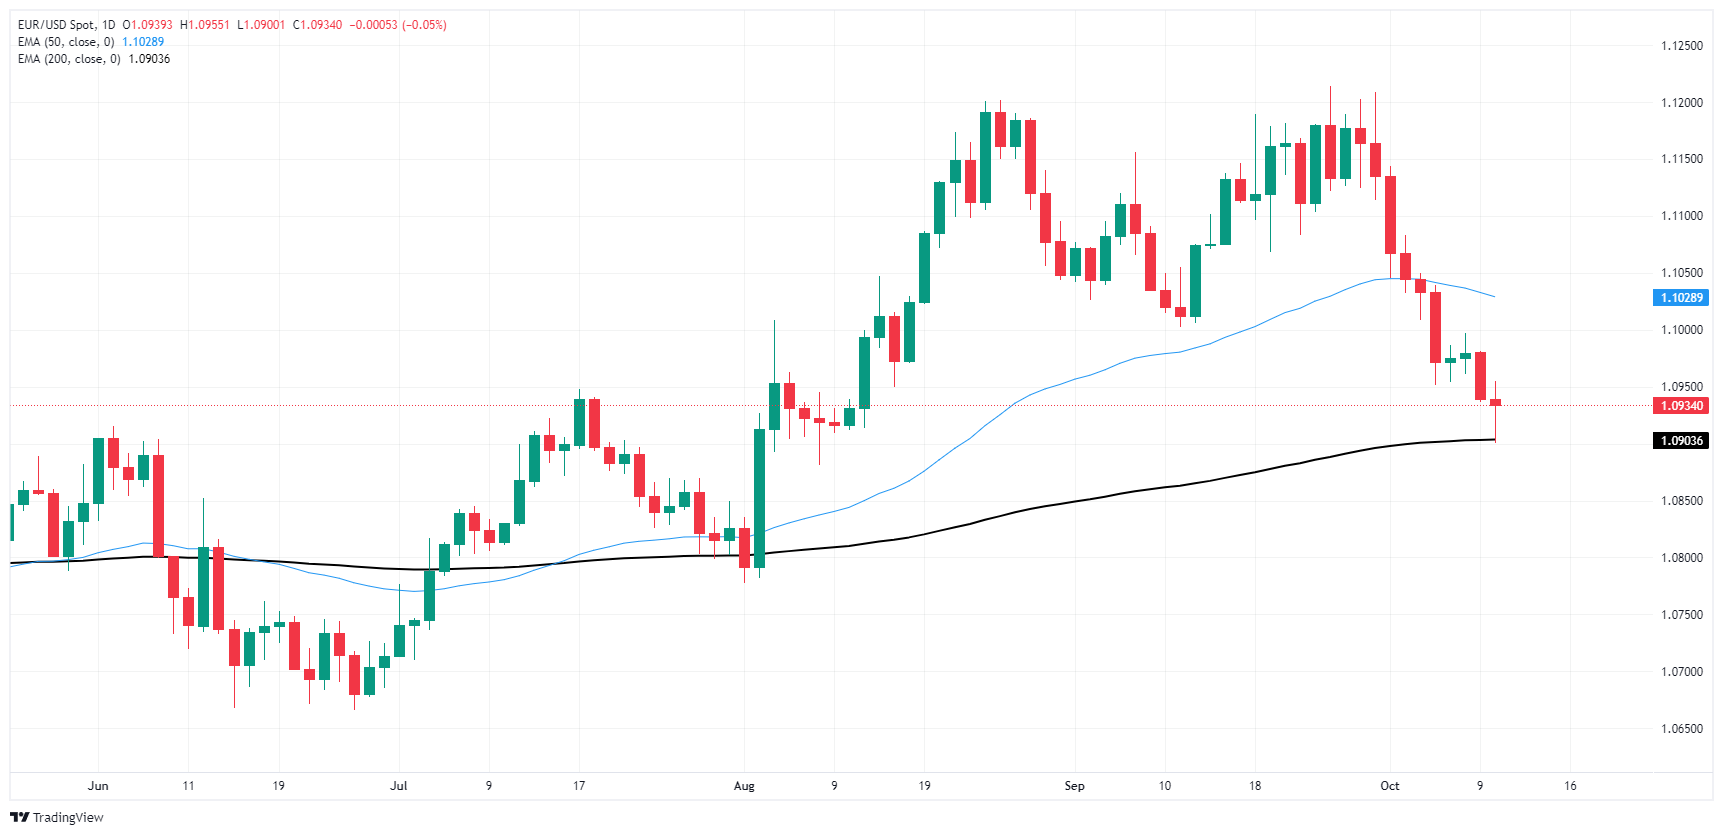
Euro FAQs
The Euro is the currency for the 19 European Union countries that belong to the Eurozone. It is the second most heavily traded currency in the world behind the US Dollar. In 2022, it accounted for 31% of all foreign exchange transactions, with an average daily turnover of over $2.2 trillion a day. EUR/USD is the most heavily traded currency pair in the world, accounting for an estimated 30% off all transactions, followed by EUR/JPY (4%), EUR/GBP (3%) and EUR/AUD (2%).
The European Central Bank (ECB) in Frankfurt, Germany, is the reserve bank for the Eurozone. The ECB sets interest rates and manages monetary policy. The ECB’s primary mandate is to maintain price stability, which means either controlling inflation or stimulating growth. Its primary tool is the raising or lowering of interest rates. Relatively high interest rates – or the expectation of higher rates – will usually benefit the Euro and vice versa. The ECB Governing Council makes monetary policy decisions at meetings held eight times a year. Decisions are made by heads of the Eurozone national banks and six permanent members, including the President of the ECB, Christine Lagarde.
Eurozone inflation data, measured by the Harmonized Index of Consumer Prices (HICP), is an important econometric for the Euro. If inflation rises more than expected, especially if above the ECB’s 2% target, it obliges the ECB to raise interest rates to bring it back under control. Relatively high interest rates compared to its counterparts will usually benefit the Euro, as it makes the region more attractive as a place for global investors to park their money.
Data releases gauge the health of the economy and can impact on the Euro. Indicators such as GDP, Manufacturing and Services PMIs, employment, and consumer sentiment surveys can all influence the direction of the single currency. A strong economy is good for the Euro. Not only does it attract more foreign investment but it may encourage the ECB to put up interest rates, which will directly strengthen the Euro. Otherwise, if economic data is weak, the Euro is likely to fall. Economic data for the four largest economies in the euro area (Germany, France, Italy and Spain) are especially significant, as they account for 75% of the Eurozone’s economy.
Another significant data release for the Euro is the Trade Balance. This indicator measures the difference between what a country earns from its exports and what it spends on imports over a given period. If a country produces highly sought after exports then its currency will gain in value purely from the extra demand created from foreign buyers seeking to purchase these goods. Therefore, a positive net Trade Balance strengthens a currency and vice versa for a negative balance.
- GBP/USD churned on Thursday, giving up a tenth of a percent.
- US CPI inflation data came in above expectations, vexing rate cut hopes.
- Coming up on Friday: UK GDP and production figures, US PPI and UoM sentiment.
GPB/USD roiled on Thursday, battling just north of the 1.3000 handle before trimming 0.1% for the day. The Greenback was bolstered by a misfire in US Consumer Price Inflation (CPI) inflation figures, which printed hotter than markets expected. A raft of UK and US data is due on Friday, giving the Cable a tense finish to an otherwise quiet week.
Headline US CPI inflation fell less than expected through the year ended in September, declining from 2.5% to 2.4%. Median market forecasts had called for a print of 2.4% YoY. On the other hand, core US CPI inflation ticked higher YoY in September, rising to 3.3% from the previous 3.2%.
US Initial Jobless Claims unexpectedly rose for the week ended October 4, climbing to 258K week-on-week and clipping the highest rate of new jobless benefits seekers since June of 2023.
Mixed rate-impacting data flummoxed rate markets on Thursday. Rising unemployment figures bolster hopes for rate cuts as the Federal Reserve (Fed) looks to keep the US labor market afloat, while still-hot inflation makes it harder for investors to expect a faster pace and depth of rate trims.
Friday delivers a packed data docket for Cable traders. UK Gross Domestic Product (GDP) figures for August will kick things off, expected to increase to 0.2% MoM in August from the previous month’s flat print of 0.0%. UK Manufacturing and Industrial Production are both expected to rebound in August. Manufacturing Production is expected to recover to 0.2% MoM compared to the previous -1.0% contraction, while Industrial Production is forecast to bounce to 0.2% MoM from the previous -0.8%.
US Producer Price Index (PPI) inflation will follow up during the US market session. September’s core PPI print for the year ended in September is expected to accelerate to 2.7% YoY from last month’s 2.4%.
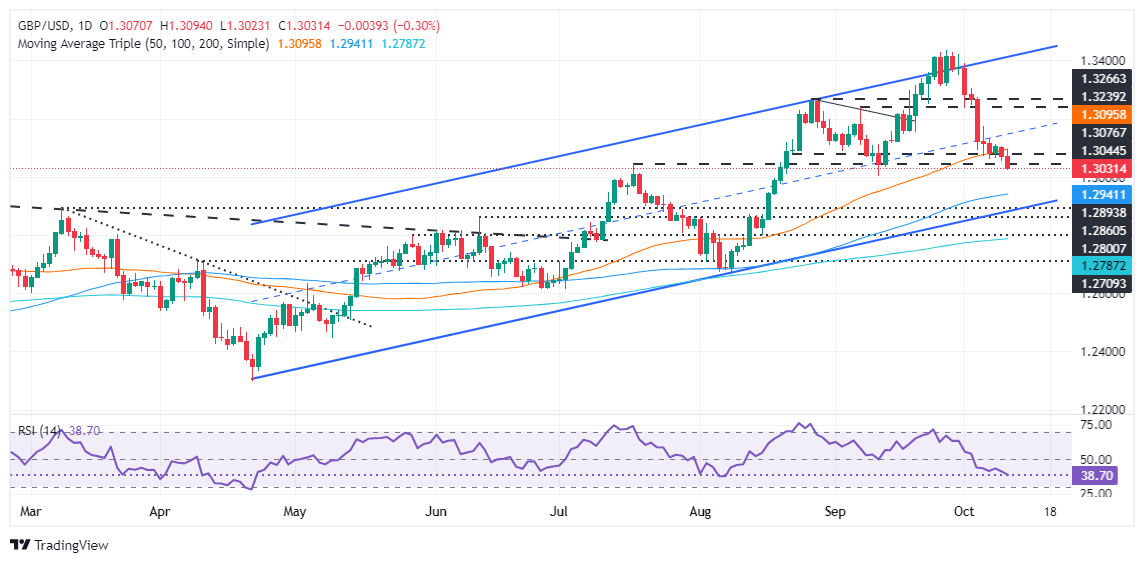
GBP/USD price forecast
The GBP/USD pair is currently trading at 1.3056, showing a minor drop of 0.11% for the day. The price action suggests a bearish trend emerging after a period of consolidation near the 50-day Exponential Moving Average (EMA), currently at 1.3108. The pair recently broke below this key technical level, indicating further downside momentum. The 200-day EMA, at 1.2840, acts as a crucial support zone, which could be tested if selling pressure continues to mount. The bearish candlestick patterns in recent sessions support the view that sellers are in control.
The Moving Average Convergence Divergence (MACD) indicator further supports the bearish outlook. The MACD line has crossed below the signal line, with the histogram showing increasing negative bars. This suggests that the downside momentum is picking up strength. The pair may struggle to break above the 50-day EMA in the short term, which has now become a resistance level. Should the current downward trend persist, the next area of interest for traders would likely be the psychological 1.3000 mark, followed by the 1.2840 support level near the 200-day EMA.
In the broader context, GBP/USD’s price action appears to be in a corrective phase after its significant uptrend from July to early September. The pair's recent highs around 1.3400 now look increasingly distant as downside risks dominate. With the MACD reinforcing the bearish signal and the price failing to hold above the 50-day EMA, further declines seem likely unless a significant reversal occurs. Key upcoming economic data, including inflation reports and central bank decisions, could play a pivotal role in determining the pair’s next move.
GBP/USD daily chart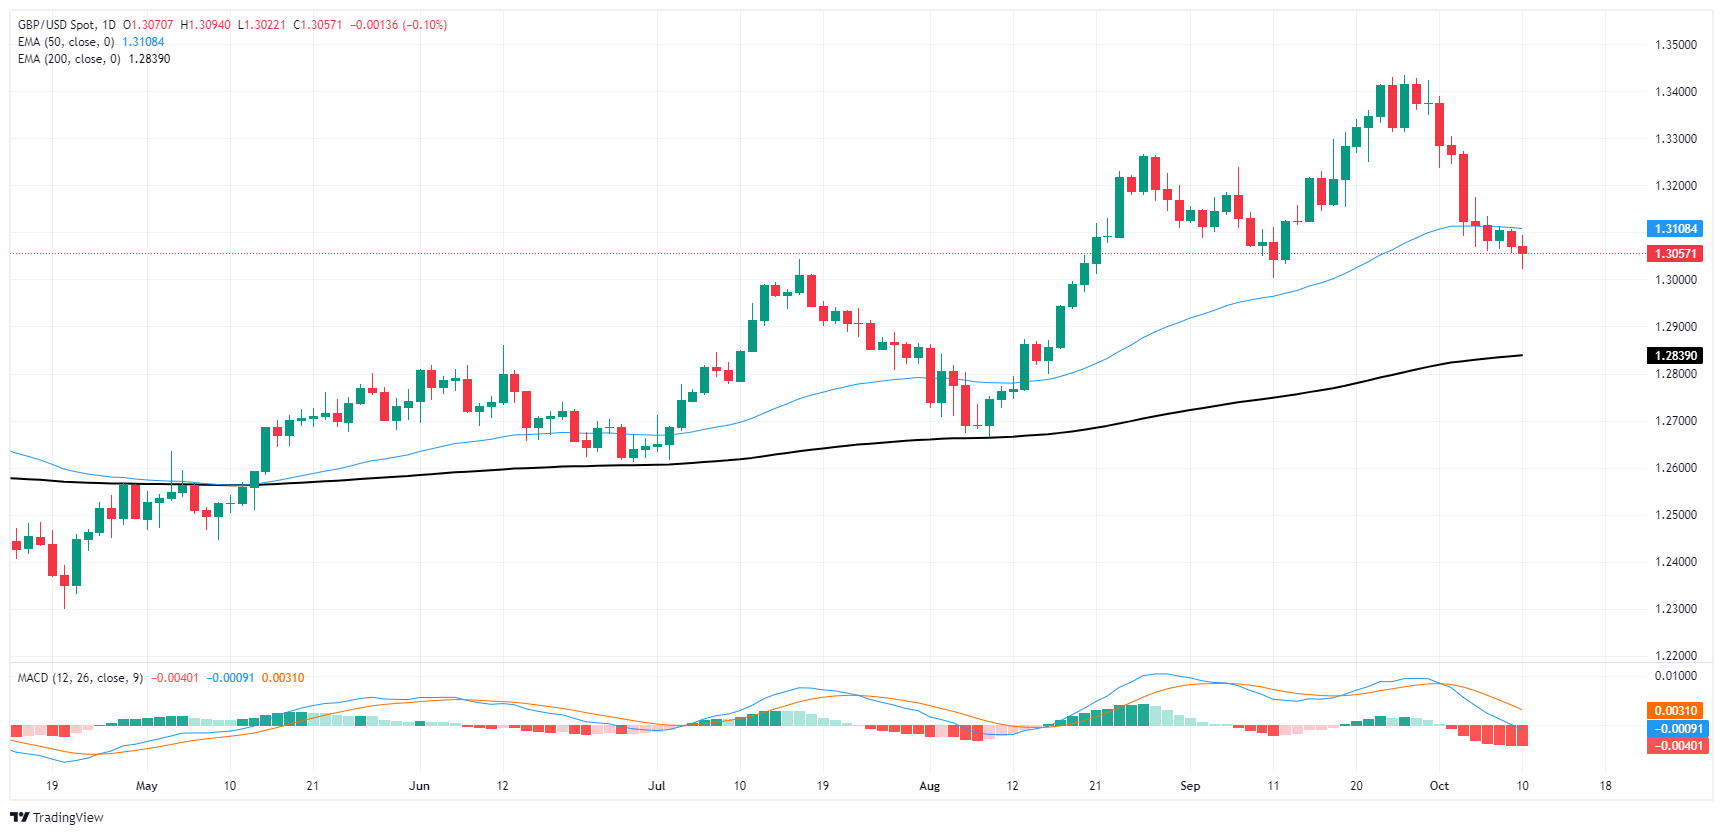
Pound Sterling FAQs
The Pound Sterling (GBP) is the oldest currency in the world (886 AD) and the official currency of the United Kingdom. It is the fourth most traded unit for foreign exchange (FX) in the world, accounting for 12% of all transactions, averaging $630 billion a day, according to 2022 data. Its key trading pairs are GBP/USD, also known as ‘Cable’, which accounts for 11% of FX, GBP/JPY, or the ‘Dragon’ as it is known by traders (3%), and EUR/GBP (2%). The Pound Sterling is issued by the Bank of England (BoE).
The single most important factor influencing the value of the Pound Sterling is monetary policy decided by the Bank of England. The BoE bases its decisions on whether it has achieved its primary goal of “price stability” – a steady inflation rate of around 2%. Its primary tool for achieving this is the adjustment of interest rates. When inflation is too high, the BoE will try to rein it in by raising interest rates, making it more expensive for people and businesses to access credit. This is generally positive for GBP, as higher interest rates make the UK a more attractive place for global investors to park their money. When inflation falls too low it is a sign economic growth is slowing. In this scenario, the BoE will consider lowering interest rates to cheapen credit so businesses will borrow more to invest in growth-generating projects.
Data releases gauge the health of the economy and can impact the value of the Pound Sterling. Indicators such as GDP, Manufacturing and Services PMIs, and employment can all influence the direction of the GBP. A strong economy is good for Sterling. Not only does it attract more foreign investment but it may encourage the BoE to put up interest rates, which will directly strengthen GBP. Otherwise, if economic data is weak, the Pound Sterling is likely to fall.
Another significant data release for the Pound Sterling is the Trade Balance. This indicator measures the difference between what a country earns from its exports and what it spends on imports over a given period. If a country produces highly sought-after exports, its currency will benefit purely from the extra demand created from foreign buyers seeking to purchase these goods. Therefore, a positive net Trade Balance strengthens a currency and vice versa for a negative balance.
- AUD/USD rebounds after US inflation came in higher than expected, but a soft jobs report slowed the Greenback's advance.
- US jobless claims rose to 258K, while Fed officials suggested more easing, with Atlanta Fed's Bostic open to holding rates steady.
- Australian economic focus shifts to next week's labor market data and a speech by RBA's Sarah Hunter for further policy clues.
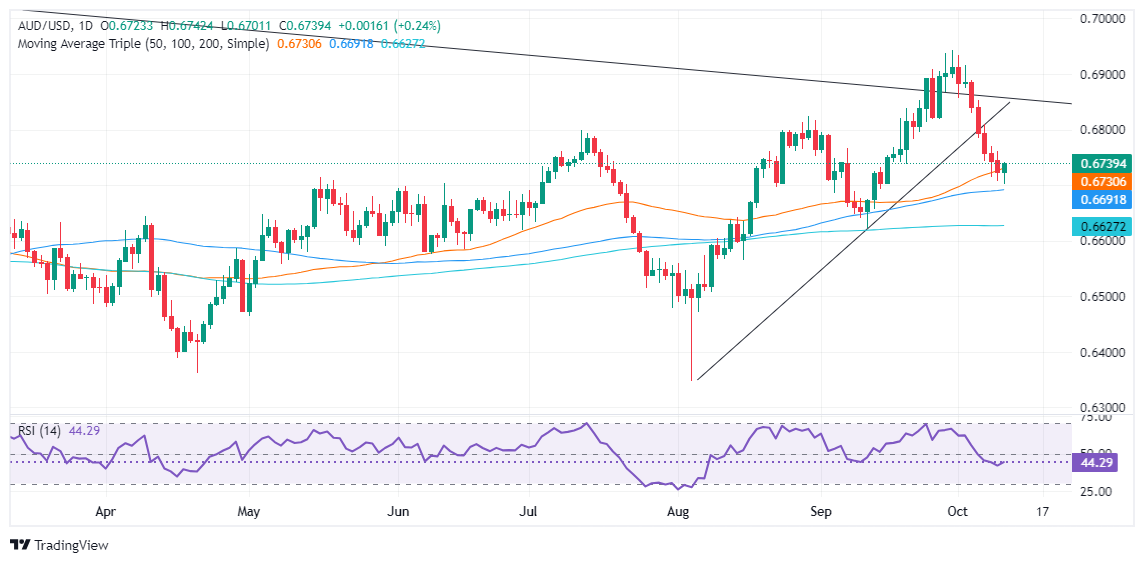
The Australian Dollar snaps five straight days of losses and climbs over 0.35% as data showed that inflation in the United States (US) was higher than foreseen, but a soft jobs report tempered the Greenback’s advance. At the time of writing, the AUD/USD trades at 0.6738 and bounced off a daily low of 0.6699.
AUD/USD climbs above 0.6700, snapping a five-day losing streak
Wall Street ended Thursday’s session with losses after the US Bureau of Labor Statistics (BLS) revealed that the Consumer Price Index (CPI) increased by 2.4% YoY, exceeding forecasts of 2.3%, though beneath August’s 2.5%. Core CPI ticked a tenth, up from 3.2% in the previous month, and as expected, it was 3.3% YoY.
Other data showed that Initial Jobless Claims for the week ending October 5 were above the consensus of 230K and rose by 258K, up from 225K the previous week.
Federal Reserve officials seemed unaffected by the data and suggested that additional easing is coming – in the names of New York Fed John Williams, Richmond Fed Thomas Barkin, and Austan Goolsbee from the Chicago Fed. Nevertheless, Atlanta’s Fed President Raphael Bostic said he would be open to holding rates unchanged at one of the last two meetings of the year.
On Australia’s front, the docket featured a speech by Reserve Bank of Australia (RBA) Sarah Hunter, though she failed to comment on monetary policy.
Next week, the Australian economic docket will feature a speech by RBA’s Sarah Hunter on Tuesday, October 15. By Wednesday, Australia’s jobs data is expected to give some clues regarding the status of the labor market.
On the US front, Friday’s schedule will feature further Fed speakers, the Producer Price Index (PPI) release, and the University of Michigan (UoM) Consumer Sentiment.
AUD/USD Price Forecast: Technical outlook
From a technical standpoint, the AUD/USD is consolidated yet tilted to the upside. For buyers to resume the uptrend, they must clear the October 9 high at 0.6761 so they could challenge the weekly peak at 0.6809. Conversely, if sellers move in and drag the exchange rate below the 50-day moving average (DMA) at 00.6733, it could pave the way for a drop toward the 100-DMA at 0.6691.
Australian Dollar PRICE Today
The table below shows the percentage change of Australian Dollar (AUD) against listed major currencies today. Australian Dollar was the strongest against the Japanese Yen.
| USD | EUR | GBP | JPY | CAD | AUD | NZD | CHF | |
|---|---|---|---|---|---|---|---|---|
| USD | -0.02% | 0.01% | 0.03% | 0.02% | -0.04% | -0.01% | 0.00% | |
| EUR | 0.02% | -0.01% | 0.02% | 0.00% | 0.00% | -0.04% | -0.02% | |
| GBP | -0.01% | 0.01% | 0.02% | 0.00% | 0.00% | -0.03% | 0.00% | |
| JPY | -0.03% | -0.02% | -0.02% | -0.01% | -0.04% | -0.05% | -0.08% | |
| CAD | -0.02% | -0.01% | -0.01% | 0.00% | -0.02% | -0.03% | 0.00% | |
| AUD | 0.04% | 0.00% | 0.00% | 0.04% | 0.02% | -0.04% | -0.02% | |
| NZD | 0.01% | 0.04% | 0.03% | 0.05% | 0.03% | 0.04% | 0.04% | |
| CHF | -0.01% | 0.02% | -0.01% | 0.08% | -0.01% | 0.02% | -0.04% |
The heat map shows percentage changes of major currencies against each other. The base currency is picked from the left column, while the quote currency is picked from the top row. For example, if you pick the Australian Dollar from the left column and move along the horizontal line to the US Dollar, the percentage change displayed in the box will represent AUD (base)/USD (quote).
- Silver prices bounce and cleared the October 9 high of $30.77, following mixed US inflation and jobs data.
- Momentum turns slightly bullish, with buyers in control, as RSI breaks above the neutral 50 level.
- Key resistance lies at $31.50 for a bullish continuation, targeting $32.00 and the YTD high of $32.95; a drop below $31.00 could trigger a pullback toward $30.22 and $30.12.
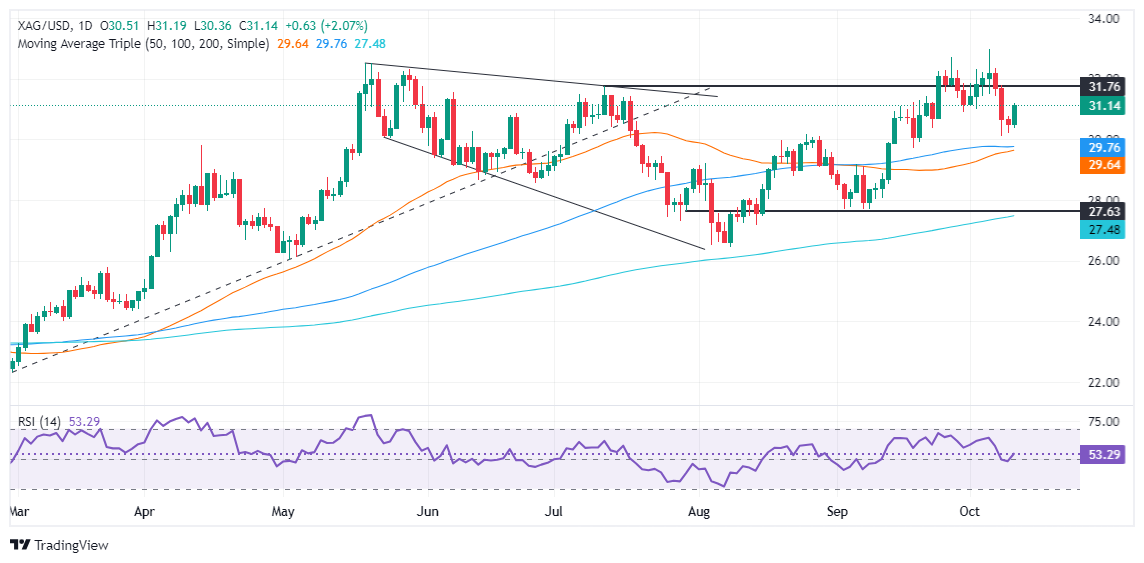
Silver prices bounced off a three-week low, rallied over 0.60%, and traded at $31.12 at the time of writing. Mixed data from the United States (US) showed inflation edging up, and a soft jobs report. Although it triggered some upside in the precious metal, hawkish remarks by Atlanta’s Fed President Raphael Bostic capped Silver’s advance.
XAG/USD Price Forecast: Technical outlook
Silver prices have cleared the October 9 daily high of $30.77, extending their gains past the $31.00 figure. Nevertheless, Silver’s is not out of the woods after Tuesday’s plunge of over 3.20%, pushing the grey’s metal to hit a multi-week low.
Momentum shifted slightly bullishly, as seen by the Relative Strength Index (RSI) piercing the 50 neutral lines, suggesting buyers regained control.
For a bullish continuation, XAG/USD must clear the psychological level of $31.50. Once surpassed, the next stop would be the $32.00 figure, followed by the year-to-date (YTD) high of $32.95.
Conversely, if Silver drops below $31.00, this could pave the way for a pullback. The first support would be the October 9 low of $30.22, followed by the October 8 swing low of $30.12.
XAG/USD Price Action – Daily Chart
Silver FAQs
Silver is a precious metal highly traded among investors. It has been historically used as a store of value and a medium of exchange. Although less popular than Gold, traders may turn to Silver to diversify their investment portfolio, for its intrinsic value or as a potential hedge during high-inflation periods. Investors can buy physical Silver, in coins or in bars, or trade it through vehicles such as Exchange Traded Funds, which track its price on international markets.
Silver prices can move due to a wide range of factors. Geopolitical instability or fears of a deep recession can make Silver price escalate due to its safe-haven status, although to a lesser extent than Gold's. As a yieldless asset, Silver tends to rise with lower interest rates. Its moves also depend on how the US Dollar (USD) behaves as the asset is priced in dollars (XAG/USD). A strong Dollar tends to keep the price of Silver at bay, whereas a weaker Dollar is likely to propel prices up. Other factors such as investment demand, mining supply – Silver is much more abundant than Gold – and recycling rates can also affect prices.
Silver is widely used in industry, particularly in sectors such as electronics or solar energy, as it has one of the highest electric conductivity of all metals – more than Copper and Gold. A surge in demand can increase prices, while a decline tends to lower them. Dynamics in the US, Chinese and Indian economies can also contribute to price swings: for the US and particularly China, their big industrial sectors use Silver in various processes; in India, consumers’ demand for the precious metal for jewellery also plays a key role in setting prices.
Silver prices tend to follow Gold's moves. When Gold prices rise, Silver typically follows suit, as their status as safe-haven assets is similar. The Gold/Silver ratio, which shows the number of ounces of Silver needed to equal the value of one ounce of Gold, may help to determine the relative valuation between both metals. Some investors may consider a high ratio as an indicator that Silver is undervalued, or Gold is overvalued. On the contrary, a low ratio might suggest that Gold is undervalued relative to Silver.
- Gold edges bouncing from a daily low of $2,603 after US inflation data showed a slight increase, tempered by weaker jobs figures.
- The swaps market now expects the Fed to cut rates by 25 bps at the November meeting, boosting Bullion prices.
- Fed officials, including Austan Goolsbee and John Williams, hinted at gradual rate cuts, while Raphael Bostic remains open to pausing cuts in November.
Gold prices recovered some ground on Thursday during the North American session, edging up some 0.67% after a hotter-than-expected US inflation report, which was tempered by soft US jobs data. Nonetheless, recent hawkish comments by a Federal Reserve (Fed) official capped the precious metal’s advance. The XAU/USD trades at $2,624 after bouncing off a daily low of $2,603.
August’s inflation in the United States (US) was slightly higher than expected, though jobs data offset it. The US Department of Labor announced that more people than expected applied for unemployment benefits, which could cause the Fed to lower borrowing costs aggressively.
After the data, the swaps market sees the Fed cutting interest rates by 25 bps at the November meeting.
The US economic schedule featured some Fed speakers. First, Chicago Fed President Austan Goolsbee said he sees gradual cuts over the next year and a half now that inflation is close to the Fed’s 2% goal.
New York Fed President John Williams said he expects more rate cuts at an appearance in Binghamton, New York. He added, “The timing and pace of future adjustments to interest rates will be based on the evolution of the data, the economic outlook, and the risks to achieving our goals.”
Recently, Atlanta Fed President Raphael Bostic, a voter in the FOMC in 2024, commented that he’s open to skipping rate cuts in November, according to The Wall Street Journal.
Bullion traders will watch Friday's release of the Producer Price Index (PPI) and the University of Michigan (UoM) Consumer Sentiment.
Daily digest market movers: Gold price climbs despite high US yields, strong USD
- Gold price upside remains capped by the rise in US Treasury yields. The US 10-year benchmark note edges up two basis points, yielding 4.096%.
- Consequently, the buck posts gains as seen by the US Dollar Index (DXY). The DXY posts minimal gains of 0.09% at 102.97.
- The US Consumer Price Index (CPI) for September rose by 2.4% YoY, exceeding estimates of 2.3%, though still lower than August's figure. Core CPI increased by 3.3% YoY, surpassing forecasts and August's 3.2%.
- On a monthly basis, CPI rose by 0.2%, unchanged from the previous month and above the consensus estimate of 0.1%. Core CPI remained steady at 0.3%, exceeding the forecast of 0.2%.
- Initial Jobless Claims for the week ending October 5 rose to 258K, up from 225K the previous week, and exceeded the estimated 230K.
- New York Fed's John Williams expects inflation to end at 2.25% in 2024 and GDP to hit 2.25% to 2.50% by the end of the year.
- Data from the Chicago Board of Trade via the December fed funds rate futures contract shows investors estimate 47 bps of easing by the Fed toward the end of 2024.
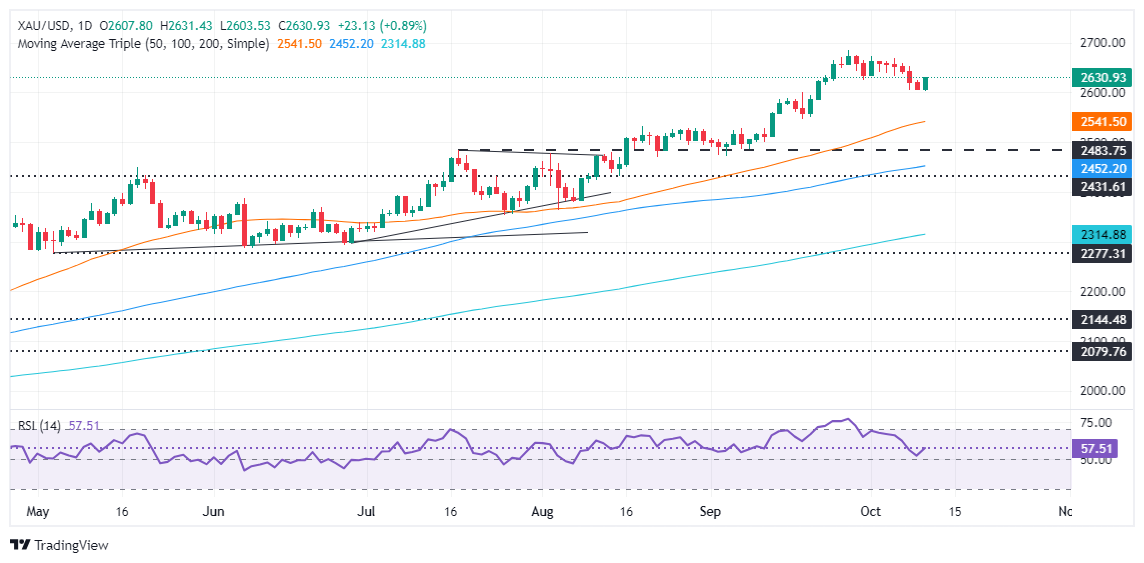
XAU/USD technical analysis: Gold price uptrend resumes, yet remains below $2,650
Gold price resumed its uptrend after diving to a weekly low of $2,603. Although momentum was negative for the last six days, it turned slightly positive on Thursday, as seen by the Relative Strength Index (RSI) aiming up. However, XAU/USD must clear the October 8 daily high of $2,653, so buyers can remain hopeful of challenging the YTD high at $2,685.
If Gold clears $2,653, the next resistance would be the $2,670 area, ahead of $2,685. Conversely, if XAU/USD stays below $2,650, this could sponsor a leg-down toward the $2,600 figure. A breach of the latter will expose the 50-day Simple Moving Average (SMA) at $2,540.
Gold FAQs
Gold has played a key role in human’s history as it has been widely used as a store of value and medium of exchange. Currently, apart from its shine and usage for jewelry, the precious metal is widely seen as a safe-haven asset, meaning that it is considered a good investment during turbulent times. Gold is also widely seen as a hedge against inflation and against depreciating currencies as it doesn’t rely on any specific issuer or government.
Central banks are the biggest Gold holders. In their aim to support their currencies in turbulent times, central banks tend to diversify their reserves and buy Gold to improve the perceived strength of the economy and the currency. High Gold reserves can be a source of trust for a country’s solvency. Central banks added 1,136 tonnes of Gold worth around $70 billion to their reserves in 2022, according to data from the World Gold Council. This is the highest yearly purchase since records began. Central banks from emerging economies such as China, India and Turkey are quickly increasing their Gold reserves.
Gold has an inverse correlation with the US Dollar and US Treasuries, which are both major reserve and safe-haven assets. When the Dollar depreciates, Gold tends to rise, enabling investors and central banks to diversify their assets in turbulent times. Gold is also inversely correlated with risk assets. A rally in the stock market tends to weaken Gold price, while sell-offs in riskier markets tend to favor the precious metal.
The price can move due to a wide range of factors. Geopolitical instability or fears of a deep recession can quickly make Gold price escalate due to its safe-haven status. As a yield-less asset, Gold tends to rise with lower interest rates, while higher cost of money usually weighs down on the yellow metal. Still, most moves depend on how the US Dollar (USD) behaves as the asset is priced in dollars (XAU/USD). A strong Dollar tends to keep the price of Gold controlled, whereas a weaker Dollar is likely to push Gold prices up.
Sticky US CPI data and hawkish comments from Fed officials lent extra support to the Greenback on Thursday prior to the release of further inflation metrics at the end of the week.
Here is what you need to know on Friday, October 11:
The US Dollar Index (DXY) rose past the 103.00 barrier to reach new two-month highs as market participants adjusted to rising bets of a 25 bps rate cut in November. The US inflation will remain at the centre of the debate with the release of Producer Prices seconded by the preliminary Michigan Consumer Sentiment and speeches by the Fed’s Goolsbee and Bowman.
The downside pressure in EUR/USD gathered extra pace, briefly sending the pair to the sub-1.0900 support. Final Inflation Rate in Germany takes centre stage seconded by Current Account results.
Extra gains in the Greenback prompted GBP/USD to extend its leg lower and trade just pips away from the key 1.3000 support. Interesting day on the UK docket with the releases of GDP figures, Goods Trade Balance, Industrial Production, Manufacturing Production, Construction Output, and the NIESR Monthly GDP Tracker.
USD/JPY partially faded Wednesday’s marked advance soon after hitting new highs around 149.50. Next on tap on the Japanese docket will be the Industrial Production figures on October 15.
AUD/USD outperformed its risky peers and advanced modestly after five consecutive daily pullbacks. The Westpac Leading Index and the speech by the RBA’s Hunter are due on October 16.
WTI prices rose sharply on the back of persistent geopolitical concerns and hopes of a demand recovery in China and the US.
Prices of Gold reversed a multi-day negative streak and regained the $2,630 region per ounce troy after briefly bottoming out near $2,600. Silver prices left behind three consecutive daily losses and posted a robust bounce past the $31.00 mark per ounce.
- Mexican Peso hits a six-day bottom on Bostic comments.
- Banxico minutes reveal concerns over Mexico’s slowing economy and sticky service inflation, hinting at more rate cuts.
- US inflation data came in slightly higher than expected, but weaker jobs data tempered the possibility of aggressive Fed cuts.
The Mexican Peso lost some ground against the Greenback after hitting a six-day low of 19.61 following the release of US data. In addition, the Bank of Mexico revealed its September meeting minutes, in which the central bank hints that further interest rate adjustments loom. The USD/MXN trades at 19.52, up 0.18%.
Banxico’s minutes showed that all members agreed that the economy is weakening and acknowledged that it has been losing steam since Q4 2023. Consequently, they mentioned that consumption slowed, and some members even said it stagnated.
Regarding investment, the minutes showed that it “has continued registering a lack of dynamism since mid-2023. They noted that this was observed in all its categories.
In the meantime, most members agreed that Mexico’s inflation has been improving, though it is still facing challenges. All Banxico officials stated that service inflation remains stickier. Despite this, the central bank noted that “the Board expects that the inflationary environment will allow further reference rate adjustments,” opening the door for additional rate cuts.
Aside from this, the latest US inflation report showed that the Consumer Price Index (CPI) in the headline and underlying figures were slightly higher than foreseen, which might warrant no rate cuts if not for weaker US jobs data. Initial Jobless Claims for the week ending October 5 jumped sharply.
Meanwhile, Federal Reserve (Fed) officials continued to cross newswires. Chicago Fed President Austan Goolsbee said inflation came near estimates, adding that data showing no deterioration in unemployment would “relieve” some concerns.
The New York Fed's John Williams said the economy would allow for additional rate cuts. He added that they would remain data-dependent. He expected inflation to end at 2.25% in 2024 and GDP to hit 2.25% to 2.50% by the end of the year.
Recently, Atlanta Fed President Raphael Bostic, a voter in the FOMC in 2024, commented that he’s open to skipping rate cuts in November, according to The Wall Street Journal.
In the meantime, the US Dollar Index (DXY), which tracks the buck’s performance against six other currencies, climbs 0.23% to 103.10, underpinned by the jump in US Treasury yields.
Daily digest market movers: Mexican Peso retreats on Banxico’s dovish minutes
- Last Thursday, Mexico’s Supreme Court voted eight to three to "consider a constitutional challenge to the controversial judicial overhaul enacted last month," which would allow the election of judges and Supreme Court magistrates through electoral vote.
- The Mexican Peso appreciated following the release of the latest meeting minutes, even though it showed that Banxico is expected to continue lowering borrowing costs.
- According to Banxico’s poll, the central bank is projected to lower rates by 50 bps to 10% for the remainder of 2024. Meanwhile, the USD/MXN exchange rate will end at around 19.69.
- Mexico’s economy is projected to grow by 1.45% in 2024, lower than August’s 1.57%.
- US September CPI was 2.4% YoY, exceeding estimates of 2.3% yet below August data. Core CPI rose by 3.3% YoY, up from forecasts and August's 3.2%.
- CPI rose by 0.2% monthly, unchanged from the previous month, up from the 0.1% projected by the consensus. Core CPI was unchanged at 0.3% above estimates of 0.2%.
- Initial Jobless Claims for the week ending October 5 rose by 258K, up from 225K the previous week, above estimates of 230K.
- Data from the Chicago Board of Trade via the December fed funds rate futures contract shows investors estimate 47 bps of easing by the Fed toward the end of 2024.
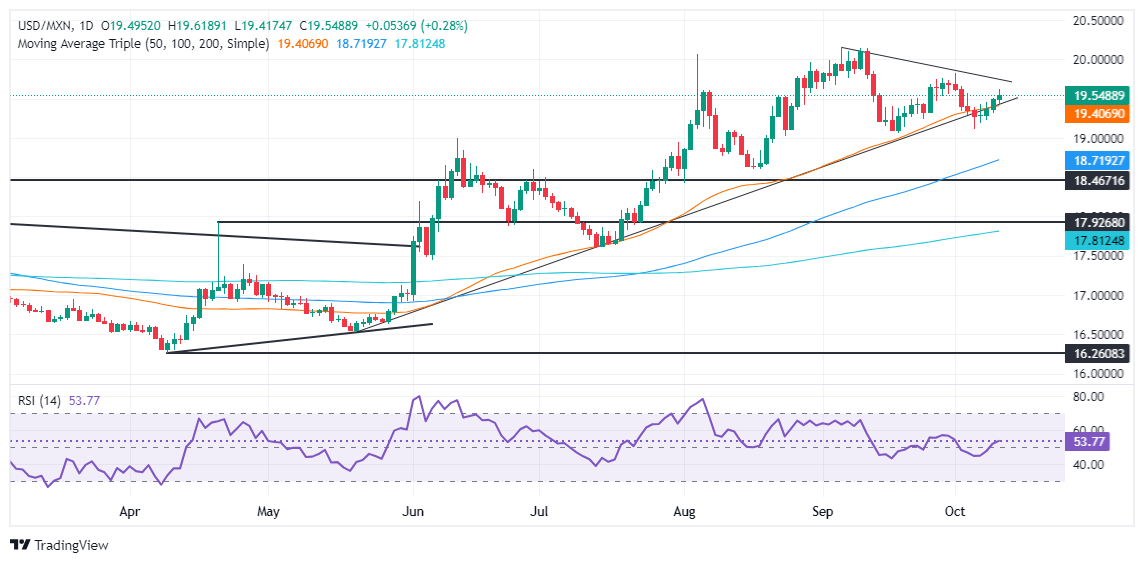
USD/MXN technical outlook: Mexican Peso extends losses as USD/MXN jumps above 19.50
The USD/MXN is upwardly biased, as it remains above the 50-day Simple Moving Average (SMA) at 19.39, which could open the door for further upside. Short-term momentum favors buyers as the Relative Strength Index’s (RSI) reading depicts. Therefore, the exotic pair is headed to the upside.
If USD/MXN clears the psychological 19.50 level, look for buyers driving the exchange rate toward the October 1 daily high of 19.82, ahead of 20.00. Up next would be the YTD peak of 20.22.
For a bearish resumption, if USD/MXN drops below the October 4 wing low of 19.10, the 19.00 figure will be exposed. Once broken, the next support would be the 100-day SMA at 18.64.
Mexican Peso FAQs
The Mexican Peso (MXN) is the most traded currency among its Latin American peers. Its value is broadly determined by the performance of the Mexican economy, the country’s central bank’s policy, the amount of foreign investment in the country and even the levels of remittances sent by Mexicans who live abroad, particularly in the United States. Geopolitical trends can also move MXN: for example, the process of nearshoring – or the decision by some firms to relocate manufacturing capacity and supply chains closer to their home countries – is also seen as a catalyst for the Mexican currency as the country is considered a key manufacturing hub in the American continent. Another catalyst for MXN is Oil prices as Mexico is a key exporter of the commodity.
The main objective of Mexico’s central bank, also known as Banxico, is to maintain inflation at low and stable levels (at or close to its target of 3%, the midpoint in a tolerance band of between 2% and 4%). To this end, the bank sets an appropriate level of interest rates. When inflation is too high, Banxico will attempt to tame it by raising interest rates, making it more expensive for households and businesses to borrow money, thus cooling demand and the overall economy. Higher interest rates are generally positive for the Mexican Peso (MXN) as they lead to higher yields, making the country a more attractive place for investors. On the contrary, lower interest rates tend to weaken MXN.
Macroeconomic data releases are key to assess the state of the economy and can have an impact on the Mexican Peso (MXN) valuation. A strong Mexican economy, based on high economic growth, low unemployment and high confidence is good for MXN. Not only does it attract more foreign investment but it may encourage the Bank of Mexico (Banxico) to increase interest rates, particularly if this strength comes together with elevated inflation. However, if economic data is weak, MXN is likely to depreciate.
As an emerging-market currency, the Mexican Peso (MXN) tends to strive during risk-on periods, or when investors perceive that broader market risks are low and thus are eager to engage with investments that carry a higher risk. Conversely, MXN tends to weaken at times of market turbulence or economic uncertainty as investors tend to sell higher-risk assets and flee to the more-stable safe havens.
According to reporting by the Wall Street Journal, Federal Reserve (Fed) Bank of Atlanta President Raphael Bostic is open to the idea of skipping a rate cut in November if economic data still hasn't aligned with the Fed's target figures in time.
Key quotes
Bostic: I am totally comfortable with skipping a meeting if the data suggests that’s appropriate.
I'm open to not moving at one of the last two meetings if the data comes in as I expect.
This choppiness to me is along the lines of maybe we should take a pause in November. I'm definitely open to that.
- The Dow Jones shed around 100 points on Thursday before grinding back to the middle.
- US CPI data came in hotter than expected, US Initial Jobless Claims also rose.
- Markets are firmly planted in bets for a 25 bps November cut.
The Dow Jones Industrial Average (DJIA) pared back on some of the week’s earlier gains after US Consumer Price Index (CPI) inflation figures from September failed to meet market expectations. US Initial Jobless Claims also accelerated to its highest week-on-week figure in over a year, flashing a warning sign that the labor market, while still relatively healthy, still has plenty of wiggle room for some slack in employment figures.
Headline US CPI inflation ticked down to 2.4% YoY in September, easing back from the previous 2.5%, but stuck stubbornly higher than the expected 2.3%. Annualized core CPI inflation also ticked higher to 3.3%, flummoxing the anticipated hold at 3.2%. Still-sticky inflation figures threaten market hopes for a faster, deeper pace of rate cuts from the Federal Reserve (Fed).
US Initial Jobless Claims rose to 258K for the week ended October 4, over and above the expected 230K and climbing above the previous week’s print of 225K. While still within the realm of reasonable, it was still the highest level of week-on-week new unemployment benefits seekers since May of 2023.
Investors are left in a tricky position after Thursday’s data points: Still-high inflation makes it even harder for the Fed to deliver further rate cuts, but softening labor figures could tilt the Fed into further, deeper rate trims. However, too-steep of a pivot into souring labor data would be a significant warning sign of an impending recession, which would certainly spike the pace of Fed rate cuts higher, but would outright threaten the stability of equity markets.
According to the CME’s FedWatch Tool, rate traders have piled back into bets of a 25 bps rate trim in November, with 90% odds the Fed will deliver a quarter-point rate cut on November 7. The remaining 10% pool is expecting no move at all from the Fed next month.
Dow Jones news
The Dow Jones struggled its way back to the even mark after an initial 100-point dump to kick off Thursday’s US market session. Despite recovering balance, a full two-thirds of the major equity board is testing into the red for the day. Amazon (AMZN) still managed to find the high side, climbing over 1% and testing north of $187 per share.
Dow Jones price forecast
The Dow Jones Industrial Average (DJIA) is showing signs of consolidation after rallying from early October lows. It's trading just below recent highs above 42600, with a slight 0.10% decline for the day. The 50-day exponential moving average (EMA) at 41,300 is providing strong support, and price action remains well above both the 50-day and the 200-day EMA at 39,173, confirming the broader uptrend.
Momentum indicators are showing mixed signals. The Moving Average Convergence Divergence (MACD) line is slightly above the signal line, suggesting a slowdown in upward momentum. Traders are closely monitoring whether the MACD line will cross below the signal line, which could be an early sign of a short-term pullback.
As long as the index continues to trade above key support levels, the upward trend remains intact. However, a break below the 50-day EMA could trigger more pronounced selling pressure, potentially pushing the index toward the 200-day EMA. Traders will be closely watching to see if the index can surpass current resistance levels or if it will enter a period of consolidation amid uncertainties in the macroeconomic environment.
Dow Jones daily chart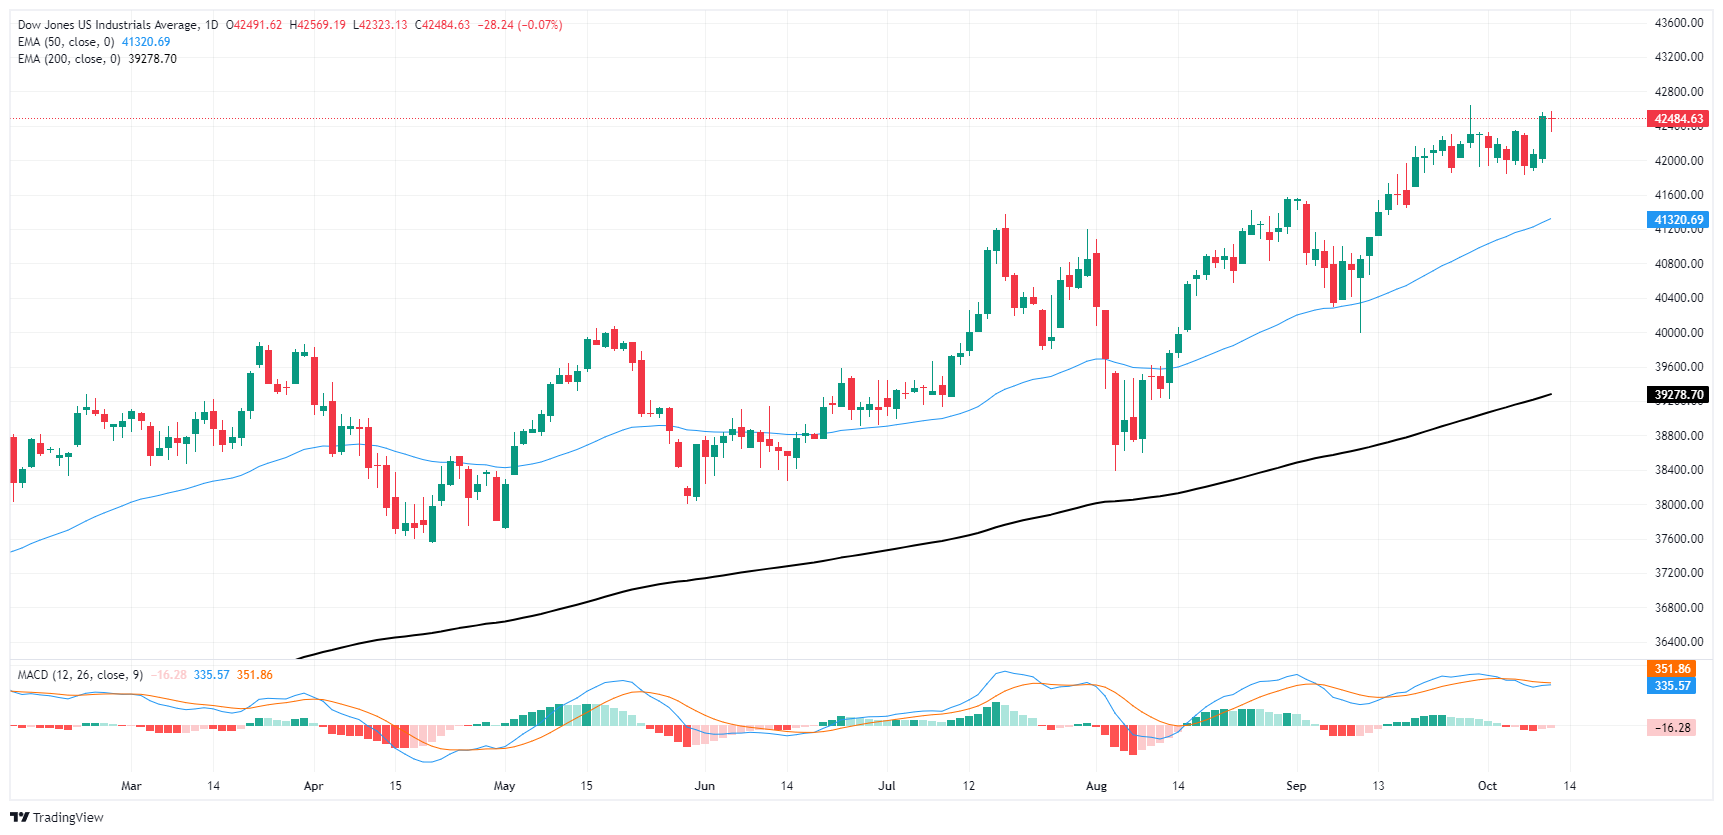
Dow Jones FAQs
The Dow Jones Industrial Average, one of the oldest stock market indices in the world, is compiled of the 30 most traded stocks in the US. The index is price-weighted rather than weighted by capitalization. It is calculated by summing the prices of the constituent stocks and dividing them by a factor, currently 0.152. The index was founded by Charles Dow, who also founded the Wall Street Journal. In later years it has been criticized for not being broadly representative enough because it only tracks 30 conglomerates, unlike broader indices such as the S&P 500.
Many different factors drive the Dow Jones Industrial Average (DJIA). The aggregate performance of the component companies revealed in quarterly company earnings reports is the main one. US and global macroeconomic data also contributes as it impacts on investor sentiment. The level of interest rates, set by the Federal Reserve (Fed), also influences the DJIA as it affects the cost of credit, on which many corporations are heavily reliant. Therefore, inflation can be a major driver as well as other metrics which impact the Fed decisions.
Dow Theory is a method for identifying the primary trend of the stock market developed by Charles Dow. A key step is to compare the direction of the Dow Jones Industrial Average (DJIA) and the Dow Jones Transportation Average (DJTA) and only follow trends where both are moving in the same direction. Volume is a confirmatory criteria. The theory uses elements of peak and trough analysis. Dow’s theory posits three trend phases: accumulation, when smart money starts buying or selling; public participation, when the wider public joins in; and distribution, when the smart money exits.
There are a number of ways to trade the DJIA. One is to use ETFs which allow investors to trade the DJIA as a single security, rather than having to buy shares in all 30 constituent companies. A leading example is the SPDR Dow Jones Industrial Average ETF (DIA). DJIA futures contracts enable traders to speculate on the future value of the index and Options provide the right, but not the obligation, to buy or sell the index at a predetermined price in the future. Mutual funds enable investors to buy a share of a diversified portfolio of DJIA stocks thus providing exposure to the overall index.
The US Dollar (USD) inched higher overnight after FOMC minutes unveiled details of pushback at the September FOMC. DXY was last at 102.99, OCBC’s FX analysts Frances Cheung and Christopher Wong note.
Middle eastern tentions and US elections deserve monitoring
“On Fedspeaks, Daly said she expects 1 or 2 more cut this year while Collins said that 50bp cut in Sep was prudent given risks. Elsewhere, Logan said she supported a slower path of interest rate reduction. Dovish expectation on Fed cut have now been priced out. Markets are just eyeing about 45bp cut for the rest of the year, as opposed to 75bps cut seen just 2-3 weeks ago. Markets and Fed’s dot plot are now in alignment.”
“USD has also rebounded, partially retracing the earlier ~5% decline seen in 3Q. To some extent, USD may have settled into this temporal state of equilibrium where the risks from here can largely be 2-way. Daily momentum remains bullish but rise in RSI shows signs of moderation near overbought conditions. 2-way trades likely. Resistance here at 103.30 (100 DMA). Support at 101.75/90 levels (50 DMA, 23.6% fibo retracement of 2023 high to 2024 low), 101.30 (21 DMA).”
“Apart from US CPI, initial jobless claims (Thursday) and PPI (Friday), there is no clear major US data catalyst until the next payrolls or core PCE data in a few weeks’ time. In terms of event risks, geopolitical tensions in middle east and US elections deserve monitoring. Even at this point, Harris and Trump are polling neck-and-neck. Markets adopting a cautious stance ahead of US elections may imply that USD may still stay supported on dips.”
The Euro (EUR) continued to trade with a heavy bias, weighed by dovish remarks from ECB officials. EUR was last at 1.0928 levels, OCBC’s FX analysts Frances Cheung and Christopher Wong note.
Double-top bearish reversal is underway
“Kazaks said rate cuts are necessary as economy is weak.. rates can go to neutral if inflation at 2% in 2025 while Kazimir said can’t rule out rate cut at next meeting even though he is not as convinced as media reports on Oct cut.”
“Daily momentum is bearish bias while RSI fell near oversold conditions. Risks remain skewed towards the downside. Double-top bearish reversal is underway. Support at 1.0900/30 levels (100 DMA, 50% fibo), and 1.0830 (61.8% fibo).”
“Resistance at 1.1050/60 levels (50 DMA, 23.6% fibo retracement of 2024 low to high) and 1.1090 (21 DMA).”
A month before the election, polls still show a dead heat. The election will likely end up being decided by a few thousand voters in a handful of swing states. On the congressional side, Republicans are likely to flip the Senate; the House is too close to call, Standard Chartered’s economist Philippe Dauba-Pantanacce notes.
As close as it gets
“The average of national polls shows Kamala Harris leading Donald Trump by about 3ppt. At this stage of the race in 2020, Biden was leading by 8ppt. He ended up winning by a razor-thin margin thanks to an estimated 43,000 votes in three states – out of 158mn cast nationwide – that tipped the Electoral College balance in his favour.”
“In this very close race, swing states will play an even bigger role than usual. In seven states, polls show no predictable winner: Pennsylvania, Wisconsin, Georgia, Nevada, Arizona, North Carolina and Michigan. Together they represent 93 Electoral College votes; swings of just a few thousand votes could translate into very different scenarios, including a strong Harris win, a strong Trump win, or an unprecedented tie.”
“On the congressional side, current polls show that the Republicans are more likely to gain control of the Senate. This year’s race for the House of Representatives is probably the closest in modern US history.”
Federal Reserve (Fed) Bank of New York President John Williams riffed on his economic outlook on Thursday after a market-vexing Consumer Price Index (CPI) inflation print that saw YoY CPI inflation pressures on consumers tick higher in the aggregate. Weekly US Initial Jobless Claims also rose to the fastest pace of newly unemployed benefits seekers since May of 2023.
Key highlights
Job market unlikely to be inflation driver going forward.
I see unemployment at 4.25% this year and around that in 2025.
I see 2024 GDP between 2.25-2.5%, 2.25% average over next two years.
I expect inflation to wane to 2.25% this year, close to 2% in 2025.
The economy is solid, labor market in a good place.
Economic activity is largely balanced across the economy.
Latest data has been consistent with recent trends.
What just happened?
US Consumer Price Index (CPI) inflation vexed markets in September, with headline CPI inflation falling less than expected on an annualized basis and core CPI inflation ticking upwards over the same period. Investors have been broadly hoping for US inflation figures to continue grinding down toward the Federal Reserve’s (Fed) 2% annual inflation target, but September’s CPI inflation print vexed markets, kicking the legs out from beneath broad-market risk appetite.
Why does CPI inflation matter?
CPI inflation is a measure of the month-on-month change in consumer-level prices for a mixed basket of consumer goods that represents a significant cross-section of the overall consumption economy. While the CPI index lacks consumer price information for rural residents, measuring only the cost changes in urban goods, the CPI index as a broader measure of consumer inflation captures roughly 93% of the US population.
Since controlling inflation via interest rates is a full half of the Fed’s mandate (with the other half being stable employment, a feature unique to the Federal Reserve not shared by other central banks), CPI inflation is used by markets as a key method of estimating when the Fed will make changes to the Fed funds rate, and by how much. With inflation continuing to run above the Fed’s target levels, upticks in key inflation metrics makes it harder for the Fed to deliver rate cuts as fast or as furiously as investors would like to see.
What happens next?
With CPI inflation registering hotter than expected in September, investors will be turning to the rest of the economic data docket for signs of weakness that might spur the Fed back into a faster pace of rate cuts heading into the end of the year. Labor market weakness has been earmarked as a likely ignition point for further higher-than-expected rate reductions. However, too far into the red on jobs data or other inflation metrics (like the Personal Consumption Expenditure Price Index) could also spark fear of a widespread recession in the US economy, leaving investors in a challenging ‘Goldilocks’ position: markets are hoping for soft spots in the US economy to force the Fed to reduce interest rates, but a direct tip-over into recession will render rate cuts a moot point.
Economic Indicator
Consumer Price Index ex Food & Energy (YoY)
Inflationary or deflationary tendencies are measured by periodically summing the prices of a basket of representative goods and services and presenting the data as the Consumer Price Index (CPI). CPI data is compiled on a monthly basis and released by the US Department of Labor Statistics. The YoY reading compares the prices of goods in the reference month to the same month a year earlier. The CPI Ex Food & Energy excludes the so-called more volatile food and energy components to give a more accurate measurement of price pressures. Generally speaking, a high reading is bullish for the US Dollar (USD), while a low reading is seen as bearish.
Read more.Last release: Thu Oct 10, 2024 12:30
Frequency: Monthly
Actual: 3.3%
Consensus: 3.2%
Previous: 3.2%
Source: US Bureau of Labor Statistics
The US Federal Reserve has a dual mandate of maintaining price stability and maximum employment. According to such mandate, inflation should be at around 2% YoY and has become the weakest pillar of the central bank’s directive ever since the world suffered a pandemic, which extends to these days. Price pressures keep rising amid supply-chain issues and bottlenecks, with the Consumer Price Index (CPI) hanging at multi-decade highs. The Fed has already taken measures to tame inflation and is expected to maintain an aggressive stance in the foreseeable future.
Fed FAQs
Monetary policy in the US is shaped by the Federal Reserve (Fed). The Fed has two mandates: to achieve price stability and foster full employment. Its primary tool to achieve these goals is by adjusting interest rates. When prices are rising too quickly and inflation is above the Fed’s 2% target, it raises interest rates, increasing borrowing costs throughout the economy. This results in a stronger US Dollar (USD) as it makes the US a more attractive place for international investors to park their money. When inflation falls below 2% or the Unemployment Rate is too high, the Fed may lower interest rates to encourage borrowing, which weighs on the Greenback.
The Federal Reserve (Fed) holds eight policy meetings a year, where the Federal Open Market Committee (FOMC) assesses economic conditions and makes monetary policy decisions. The FOMC is attended by twelve Fed officials – the seven members of the Board of Governors, the president of the Federal Reserve Bank of New York, and four of the remaining eleven regional Reserve Bank presidents, who serve one-year terms on a rotating basis.
In extreme situations, the Federal Reserve may resort to a policy named Quantitative Easing (QE). QE is the process by which the Fed substantially increases the flow of credit in a stuck financial system. It is a non-standard policy measure used during crises or when inflation is extremely low. It was the Fed’s weapon of choice during the Great Financial Crisis in 2008. It involves the Fed printing more Dollars and using them to buy high grade bonds from financial institutions. QE usually weakens the US Dollar.
Quantitative tightening (QT) is the reverse process of QE, whereby the Federal Reserve stops buying bonds from financial institutions and does not reinvest the principal from the bonds it holds maturing, to purchase new bonds. It is usually positive for the value of the US Dollar.
- GBP/USD fails to gain traction amid mixed US economic data.
- Sellers remain in charge if prices remain below 1.3055; key support levels are eyed at 1.3001 and 1.2939.
- Buyers could regain control above 1.3055 and target the 50-DMA
The Pound Sterling remains on the backfoot against the Greenback, yet it bounced off a four-week low of 1.3010 in early trading during the North American session. The GBP/USD exchanges hands at 1.3040, down 0.54% at the time of writing.
GBP/USD Price Forecast: Technical outlook
GBP/USD recovered some ground during Thursday’s session following the release of mixed US data. Although inflation edged up, the labor market showed signs of weakness.
Given the backdrop, the pair initially dipped to a daily low of 1.3010 before stabilizing at current exchange rates. Nevertheless, Pound bulls must reclaim the October 9 low of 1.3055 if they want to remain hopeful of higher prices.
In that outcome, bulls could challenge the 50-day moving average (DMA) and the day’s high of 1.3093. Further gains are seen above 1.3100.
Conversely, failure to regain 1.3055 and sellers could drive the exchange rate toward the September 11 low of 1.3001. Once those levels are surpassed, the GBP/USD could test the 100-DMA at 1.2939.
GBP/USD Price Action – Daily Chart
British Pound PRICE Today
The table below shows the percentage change of British Pound (GBP) against listed major currencies today. British Pound was the strongest against the Canadian Dollar.
| USD | EUR | GBP | JPY | CAD | AUD | NZD | CHF | |
|---|---|---|---|---|---|---|---|---|
| USD | 0.15% | 0.31% | -0.45% | 0.35% | 0.05% | -0.27% | -0.32% | |
| EUR | -0.15% | 0.16% | -0.60% | 0.19% | -0.11% | -0.38% | -0.47% | |
| GBP | -0.31% | -0.16% | -0.76% | 0.05% | -0.34% | -0.53% | -0.66% | |
| JPY | 0.45% | 0.60% | 0.76% | 0.80% | 0.47% | 0.18% | 0.11% | |
| CAD | -0.35% | -0.19% | -0.05% | -0.80% | -0.31% | -0.57% | -0.69% | |
| AUD | -0.05% | 0.11% | 0.34% | -0.47% | 0.31% | -0.27% | -0.32% | |
| NZD | 0.27% | 0.38% | 0.53% | -0.18% | 0.57% | 0.27% | -0.12% | |
| CHF | 0.32% | 0.47% | 0.66% | -0.11% | 0.69% | 0.32% | 0.12% |
The heat map shows percentage changes of major currencies against each other. The base currency is picked from the left column, while the quote currency is picked from the top row. For example, if you pick the British Pound from the left column and move along the horizontal line to the US Dollar, the percentage change displayed in the box will represent GBP (base)/USD (quote).
In an interview with CNBC on Thursday, Federal Reserve (Fed) Bank of Chicago President Austan Goolsbee noted that inflation came in around expectations with an improvement on the housing front, per Reuters.
Key takeaways
"Overall trend is clearly that inflation has come down a lot."
"Job market has cooled to a level of full employment."
"We've shifted now to a more normal, balanced-risk environment."
"We have to think about both sides of Fed mandate."
"It's been a series of close-call type meetings."
"Probably will be more close Fed meetings."
"We want to not get ahead, or behind."
"Still got a lot of data coming in, trying to figure out what's going on, nothing's ever not on the table."
"Fed minutes at moments of transition often show diversity of thought at the Fed."
"Fed has to take longer view."
"Fed projections show vast majority believes over next 12-18 months conditions continue to improve, rates gradually come down a fair amount."
"Data-dependent doesn't mean basing decisions on last month's data, need longer through line."
Market reaction
These comments failed to trigger a noticeable market reaction. At the time of press, the US Dollar Index was unchanged on the day near 102.90.
US consumer prices rose by 0.2% in September from August, excluding energy and food by 0.3%. This is a tenth more than expected in each case. The data do not argue against further interest rate cuts by the Federal Reserve at its next meeting in November and beyond. But the big step of 50 basis points in September is likely to remain an exception, Commerzbank’s analysts Dr. Christoph Balz and Bernd Weidensteiner note.
Further decline in inflation appears to have stalled
“The better-than-expected labor market data for September have already removed the basis for speculation about a possible further big rate cut by the Fed. Now, the further decline in inflation also appears to have stalled. For the second month in a row, the consumer price index has surprised with a fairly strong rise in the core rate.”
“This is not reflected one-to-one in the personal consumption expenditure (PCE) deflator, the Fed's preferred measure of inflation. Some prices have risen very sharply for which the PCE deflator uses a different data source or which are weighted significantly lower in the PCE deflator.”
“However, the optimism regarding a continuous easing of price pressure could be dampened somewhat. The data environment therefore also argues for a cautious approach by the Fed. It will therefore not deliver another jumbo rate cut of 50 basis points. And even a small move of 25 bp may now no longer a foregone conclusion in the eyes of market participants. However, we are sticking to our forecast of a 25 bp cut at the November meeting. After all, the easing in service prices has continued. These will also set the direction in the medium term.”
- Silver price climbs to near $31.00 despite the US inflation remained hotter-than-expected in September.
- The core CPI accelerated to 3.3% from estimates and the August reading of 3.2%.
- Traders expect the Fed to reduce interest rates by 25 bps next month.
Silver price (XAG/USD) strengthens and jumps to near $31.00 in Thursday’s North American session. The white metal witnessed strong buying interest after the release of the United States (US) Consumer Price Index (CPI) data for September.
The CPI report showed that Inflationary pressures grew at a faster-than-expected pace due to a sharp increase in prices of apparel. Also, medical and transportation services became more expensive.
The annual headline inflation decelerated at a slower-than-projected pace to 2.4% from 2.5% in August as the impact of a sharp decline in the cost of energy was offset by a rise in food prices. Economists estimated the headline inflation to have grown by 2.3%. The core CPI – which strips off volatile food and energy prices – accelerated to 3.3% from the estimates and the former release of 3.2%. The monthly headline and core inflation grew faster than projected.
The white metal struggles for direction as market participants are taking time to digest inflationary figures and adjust expectations for the Federal Reserve (Fed) interest rate outlook for the remaining year. According to the CME FedWatch tool, a 25-basis points (bps) rate cut in November is highly expected.
Meanwhile, the US Dollar (USD) is also displaying volatile moves after the US inflation data release. Going forward, investors will focus on the US Producer Price Index (PPI) data for September, which will be published on Friday.
Silver technical analysis
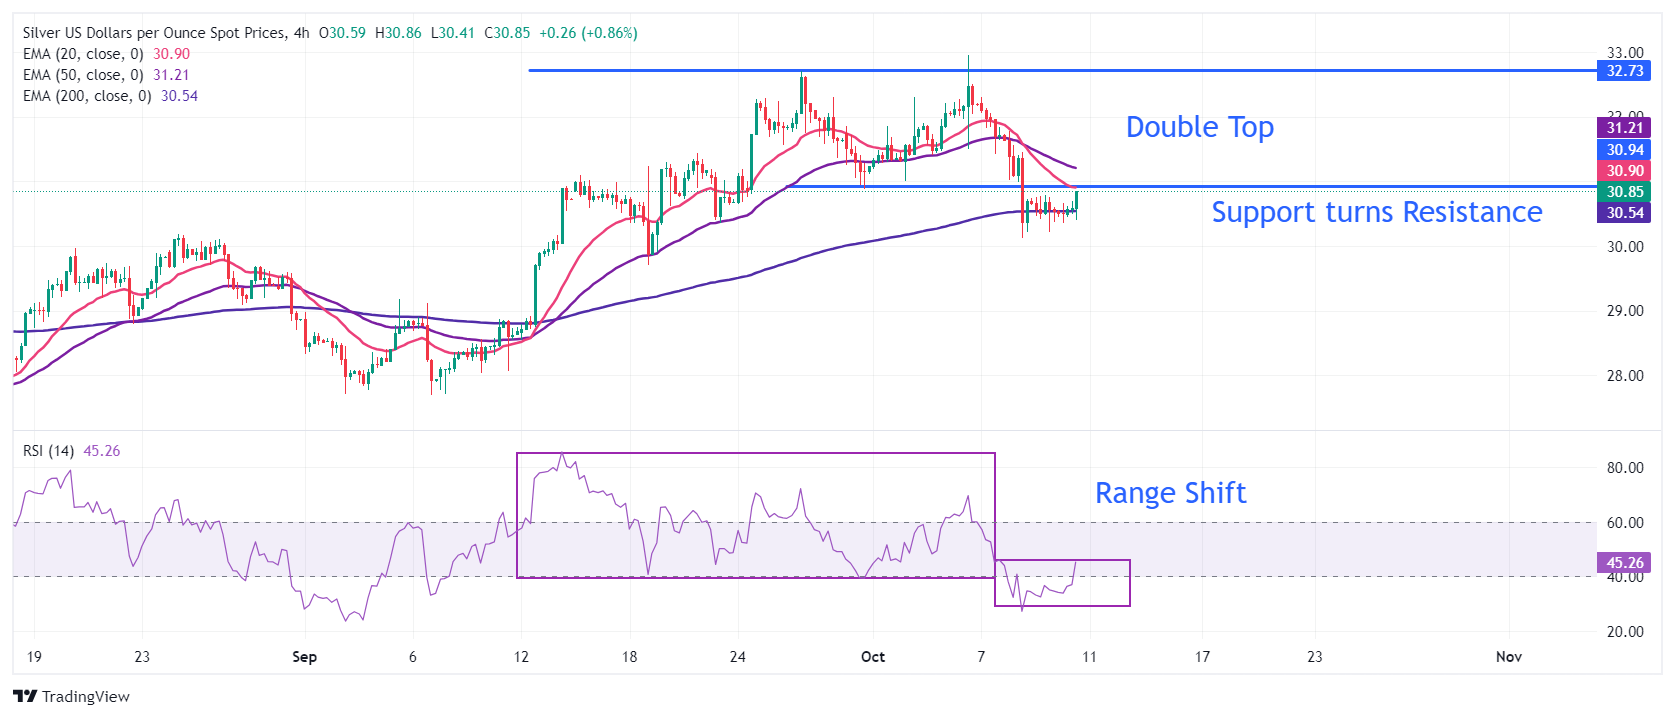
Silver price weakens after a breakdown of the Double Top formation on a four-hour timeframe. The above-mentioned pattern was activated after the asset broke below the horizontal support plotted from the September 30 low around $31.00, which acts as a resistance now. A bear cross, represented by the 20- and 50-period Exponential Moving Averages (EMAs) at $31.60, suggests weakness ahead.
The asset has temporarily found support near the 200 EMA, which trades around $30.50.
The 14-day Relative Strength Index (RSI) has delivered a range shift move, suggesting a bearish momentum.
Silver four-hour chart
Silver FAQs
Silver is a precious metal highly traded among investors. It has been historically used as a store of value and a medium of exchange. Although less popular than Gold, traders may turn to Silver to diversify their investment portfolio, for its intrinsic value or as a potential hedge during high-inflation periods. Investors can buy physical Silver, in coins or in bars, or trade it through vehicles such as Exchange Traded Funds, which track its price on international markets.
Silver prices can move due to a wide range of factors. Geopolitical instability or fears of a deep recession can make Silver price escalate due to its safe-haven status, although to a lesser extent than Gold's. As a yieldless asset, Silver tends to rise with lower interest rates. Its moves also depend on how the US Dollar (USD) behaves as the asset is priced in dollars (XAG/USD). A strong Dollar tends to keep the price of Silver at bay, whereas a weaker Dollar is likely to propel prices up. Other factors such as investment demand, mining supply – Silver is much more abundant than Gold – and recycling rates can also affect prices.
Silver is widely used in industry, particularly in sectors such as electronics or solar energy, as it has one of the highest electric conductivity of all metals – more than Copper and Gold. A surge in demand can increase prices, while a decline tends to lower them. Dynamics in the US, Chinese and Indian economies can also contribute to price swings: for the US and particularly China, their big industrial sectors use Silver in various processes; in India, consumers’ demand for the precious metal for jewellery also plays a key role in setting prices.
Silver prices tend to follow Gold's moves. When Gold prices rise, Silver typically follows suit, as their status as safe-haven assets is similar. The Gold/Silver ratio, which shows the number of ounces of Silver needed to equal the value of one ounce of Gold, may help to determine the relative valuation between both metals. Some investors may consider a high ratio as an indicator that Silver is undervalued, or Gold is overvalued. On the contrary, a low ratio might suggest that Gold is undervalued relative to Silver.
- GBP/CAD rises back above an old trendline and extends its rally.
- The pair extends its rally within a medium and long-term rising channel.
GBP/CAD looks like it has bottomed out and is once more rising within a broader rising channel.
The pair was falling in a down leg, however, it has probably reversed and started a new uptrend. Given the principle that “the trend is your friend” the odds favor more upside to come.
GBP/CAD 4-hour Chart
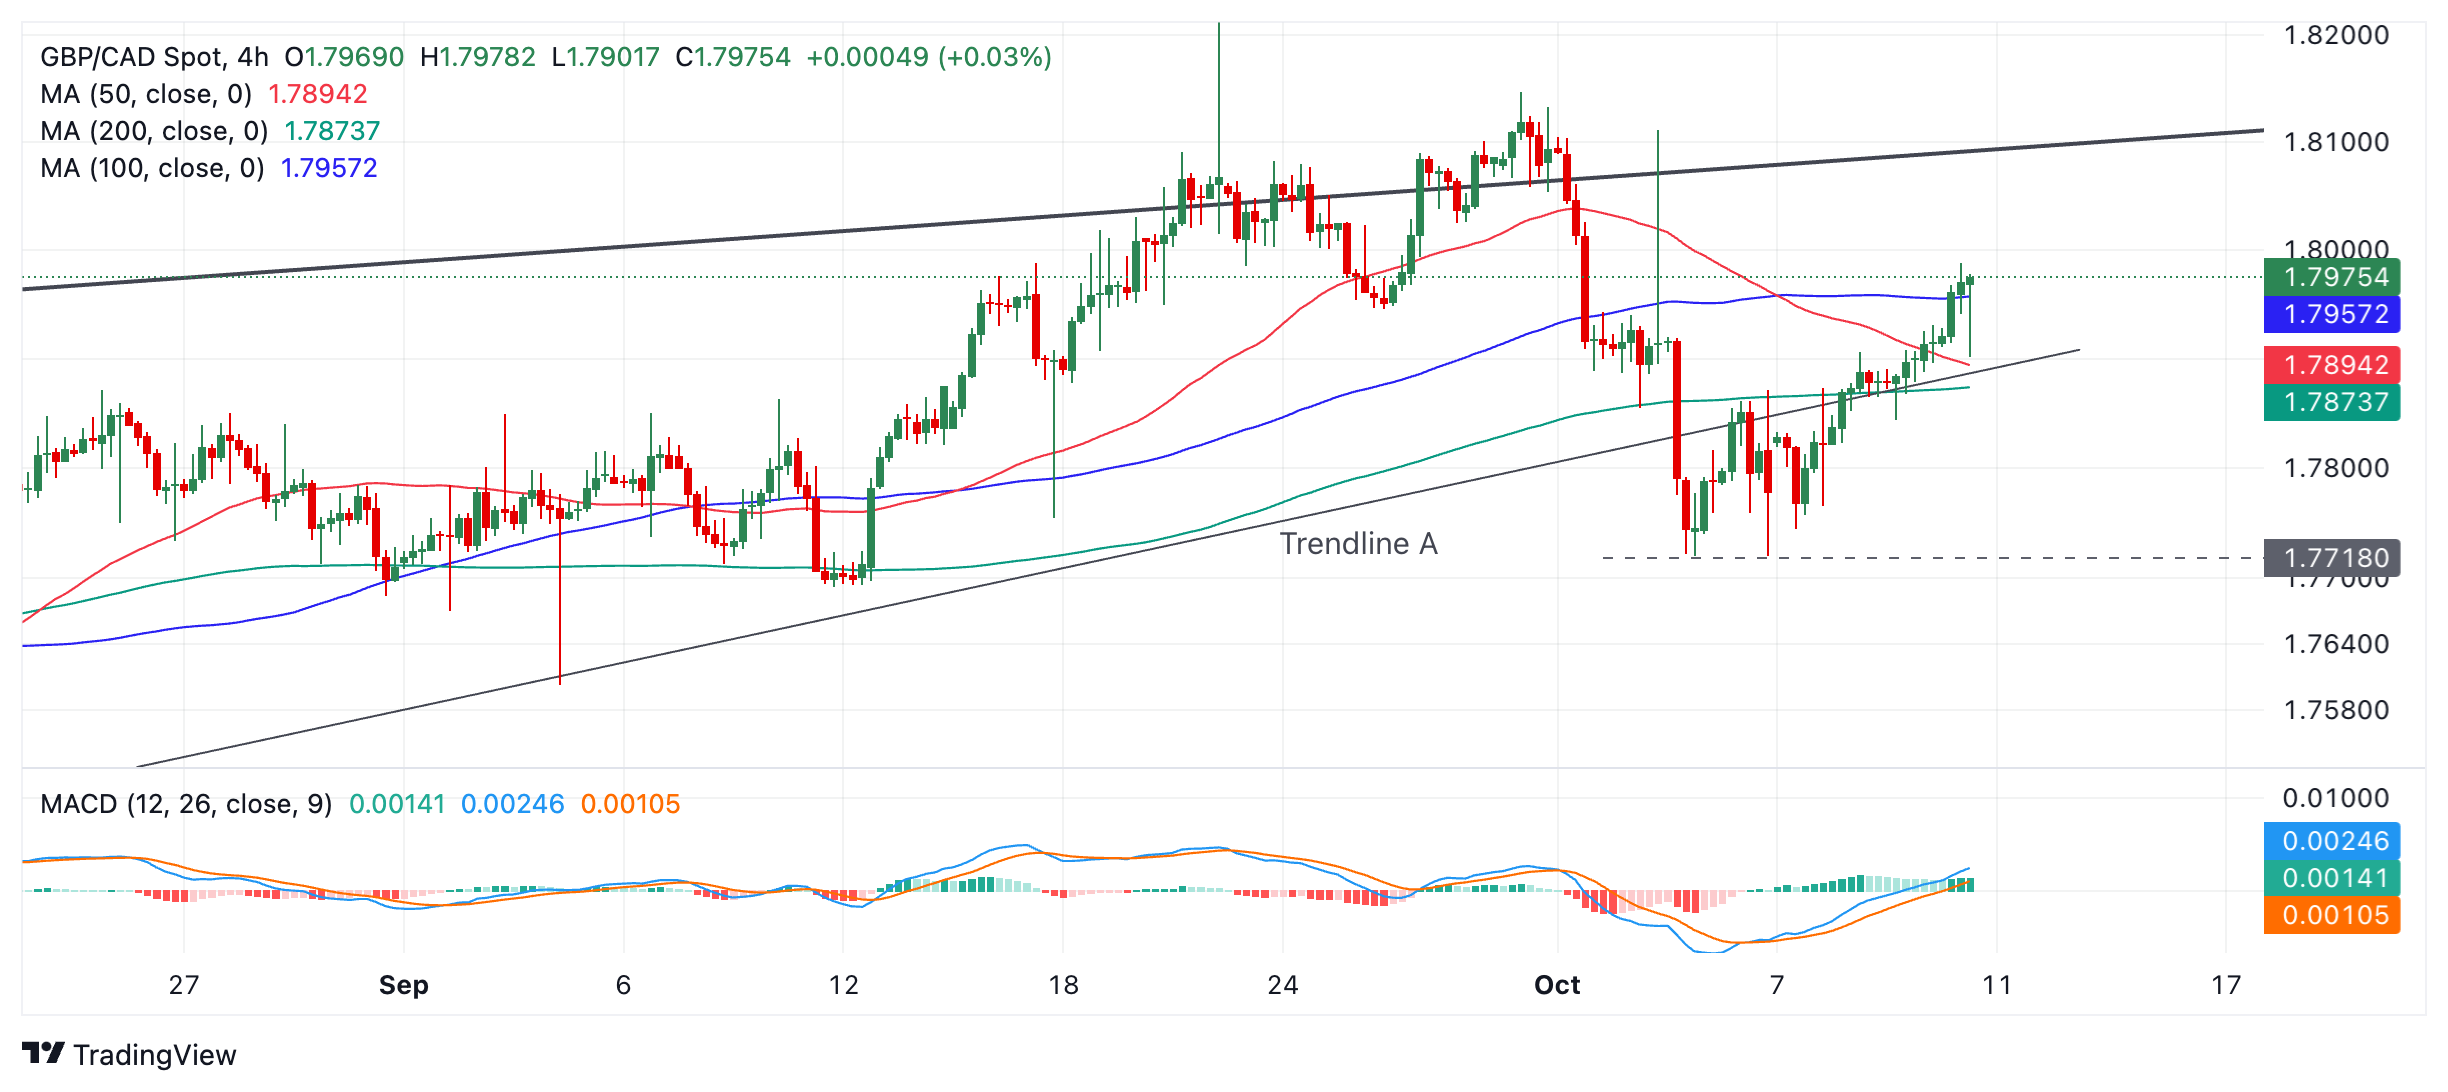
Although the pair broke below an important trendline (“Trendline A” on chart) on October 3. It quickly bottomed out and has since recovered. Now it has also broken back above the same trendline, reversing the short-term downtrend in the process.
The Moving Average Convergence Divergence (MACD) indicator is now above the zero line adding further bullish evidence to the chart.
GBP/CAD is further supported by the fact that it is in medium and longer-term uptrending cycles.
- EUR/AUD could be forming a new up leg after bottoming at the start of the month.
- It has formed various reversal patterns and signals that point to a likely extension higher.
EUR/AUD bottomed out at 1.6000 and started rising last week, recovering back up to the 1.6300s before pulling back to where it is currently consolidating in the 1.62s.
EUR/AUD Daily Chart
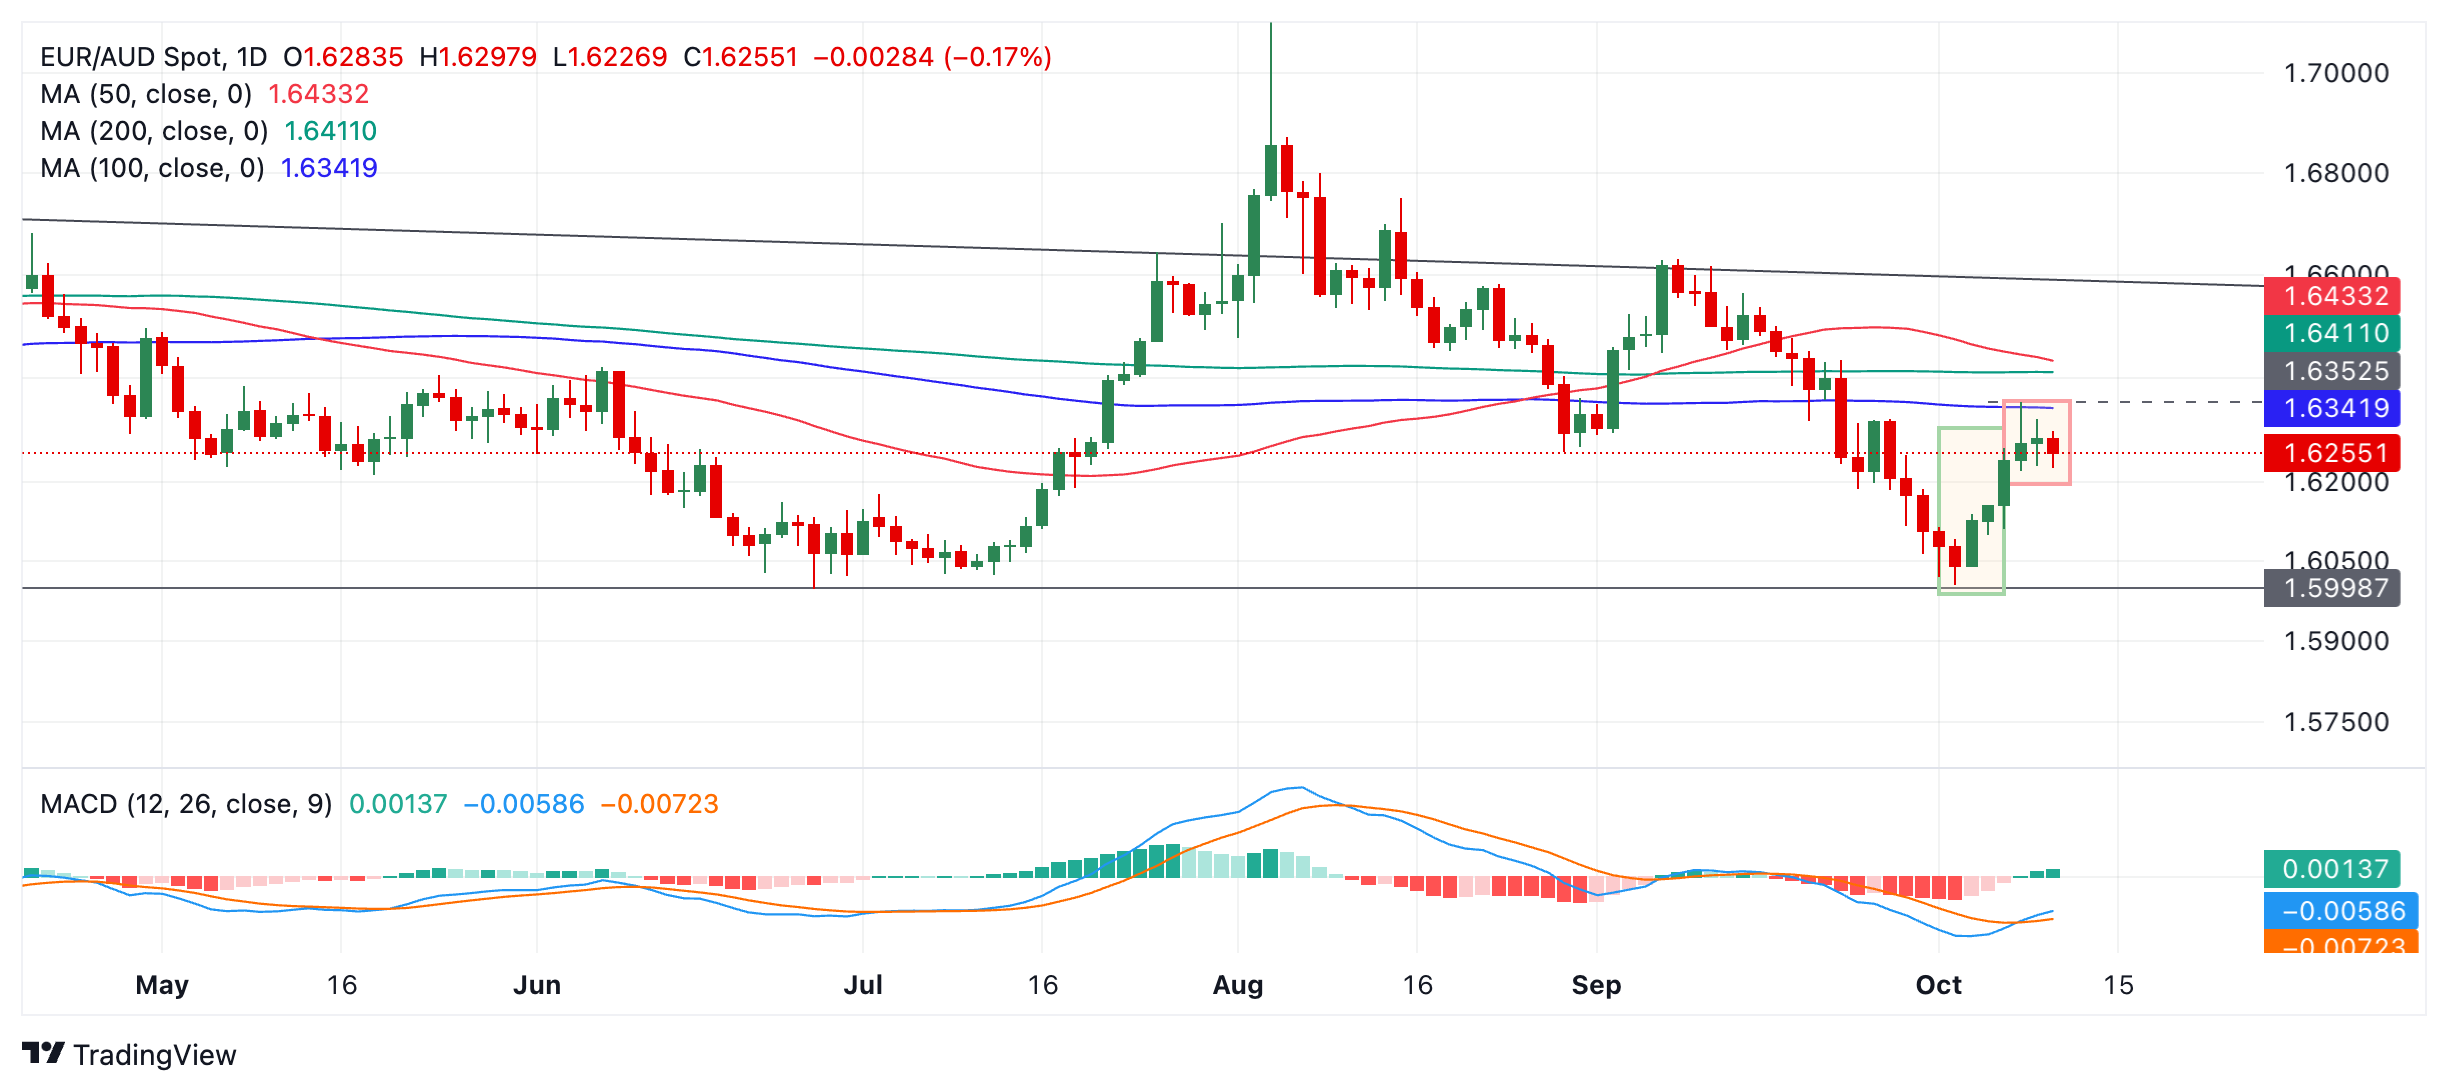
It is possible this is the start of a new leg higher within a long-term range that stretches from a floor at about 1.6000 and a sloping ceiling currently in the 1.65s. If so, then prices will probably continue higher.
A break above Tuesday’s high of 1.6354 would likely indicate a continuation to the red 50-day Simple Moving Average (SMA) at 1.6433. A break above that, would probably lead to a move up to the top of the range at around 1.6550.
The blue Moving Average Convergence Divergence (MACD) momentum indicator has crossed above its red signal line, giving a buy signal and adding to the bullish evidence.
EUR/AUD formed a bullish Three White Soldiers Japanese candlestick pattern after the October 3 bottom (green shaded rectangle on chart), indicating a possible reversal of the short-term trend. This occurs after a downtrend when three up days form consecutively.
Although the pair formed a bearish Shooting Star candlestick on Tuesday after the market peaked and then fell back down to near its open, the day ended green and not red lessening its bearish significance. It was also not followed by a down day immediately after which would have given added bearish confirmation (red-shaded rectangle on chart).
So far this month, the USD is the best performing G10 currency by a clear margin. The JPY had a roller coaster of a summer, and shock waves are continuing to be felt. The rapid unwinding of the JPY funded carry trade followed the surprise decision by the BoJ to raise rates at its July policy meeting, Rabobank’s FX analyst Jane Foley notes.
Strong USD cad keep the JPY on the back foot near term
“In our view the broad direction of USD/JPY over the medium-term is likely to be lower. Behind the slow normalisation of the BoJ’s policy settings is an economy that is slowly shrugging off the mindset associated with decades of disinflation and deflationary pressures.”
“Optimism is already building that next spring will bring another set of strong wage deals for unionised workers which will help support consumption and the profitability of domestic firms. Changes in governance at the stock exchange and the government’s effort to promote investment are another part of the changing fundamental landscape in Japan, as are the government’s effort to establish the country’s position as a collaborator with the US in areas such as tech.
“While a strong USD could keep the JPY on the back foot near term, we would look to sell rallies into USD/JPY150.”
- Initial Jobless Claims rose to 258K, up from the previous week's 225K.
- Continuing Jobless Claims increased to 1.861M in the week ending September 27.
US citizens that newly applied for unemployment insurance benefits reached 258K in the week ending October 4, according to the US Department of Labor (DoL) on Thursday. The prints came in above initial consensus (230K) and were higher than the previous weekly figure of 225K.
Further details of the publication revealed that the advance seasonally adjusted insured unemployment rate was 1.2% and the 4-week moving average was 231K, a increase of 6.75K from the previous week's unrevised average.
In addition, Continuing Claims rose by 42K to 1.861M in the week ending September 27.
Market reaction
The US Dollar Index (DXY) trades with slight gains around the 103.00 zone following the release of US data.
- EUR/GBP finds interim support near 0.8350 after the release of the ECB Monetary Policy Meeting Accounts.
- The ECB is expected to cut its borrowing rates further by 50 bps in the remainder of the year.
- Investors await the UK monthly GDP and the factory data to project the next move in the Pound Sterling.
The EUR/GBP pair discovers temporary support near 0.8350 in Thursday’s early North American session. The cross finds buying interest after the release of the European Central Bank (ECB) Monetary Policy Meeting Accounts for the September meeting. The minutes showed that policymakers expect inflation in Eurozone to rise again in the latter part of the year.
ECB accounts also indicated that inflation is on track to return to the bank’s target of 2% but refrained from announcing a victory over it.
However, the outlook of the Euro (EUR) is expected to remain weak as a decline in the flash Eurozone Harmonized of Consumer Prices (HICP) data for September to 1.8% and deepening risks to economic growth have prompted expectations of more rate cuts. For the remaining year, traders expect the ECB to cut interest rates further by 50 basis points (bps), suggesting that the ECB will reduce its Deposit Facility Rate by 25 bps next week and again in December.
In the September meeting, officials noted a faster-than-projected slowdown in the wage growth. The board expects the wage growth to soften even faster in the next year. This would keep price pressures under control and prompt expectation of more interest rate cuts going ahead.
In the United Kingdom (UK), the Pound Sterling (GBP) will be influenced by the monthly Gross Domestic Product (GDP) and the factory data for August, which will be published on Friday. Economists expect the UK economy to have grown by 0.2% after remaining flat in July.
For the Bank of England’s (BoE) interest rate outlook, traders expect the bank to cut interest rates for once in any of the two policy meetings remaining this year by 25 bps.
The Pound Sterling (GBP) is little changed on the day, Scotiabank’s Chief FX Strategist Shaun Osborne notes.
GBP holds consolidation range
“The RICS House Price Balance index turned positive in September (11%) for the first time in two years after a marginal gain in August was revied lower to 0%. The survey reflects real estate surveyors seeing higher prices minus those reporting declines and supports the outlook for a further strengthening in the UK housing market as UK interest rates ease.”
“The GBP retains a soft undertone against the USD but Cable is still holding in the 1.3060/1.3100 trading range that it has held since the start of the week. Underlying trends remain negative though and a test of 1.30 support remains a risk. Weakness below 1.30 on a sustained basis would increase chances of a deeper drop back to 1.27/1.28.”
The Canadian Dollar (CAD) is a clear underperformer on the session, slipping back through the low 1.37 area despite relatively limited movement in the USD elsewhere, Scotiabank’s Chief FX Strategist Shaun Osborne notes.
CAD underperforms on the day
“Fading Fed rate cut bets and something of a clamour for the BoC to cut rates aggressively later this month are driving swap spreads wider and supporting the USD. The 1Y swap spread jumped 10bps yesterday to near 80bps—a minor new cycle high as markets bet on more policy divergence between the BoC and Fed.”
“This looks a bit overdone to me and our fair value estimate for spot (while conceding some ground to a stronger USD this week) would seem to concur. Estimated equilibrium is 1.3648 today.”
“A seventh day of consecutive USD gains are driving spot deeper into the 1.36-1.38 congestion zone that may—eventually—slow the USD’s ascent. Underlying trends are bullish and that likely limits scope for USD corrections to the 1.3700/20 zone in the short run.”
The accounts of the European Central Bank's (ECB) September policy meeting showed on Thursday that inflation in the Eurozone is expected to rise again in the latter part of this year, per Reuters.
Key takeaways
"Inflation then expected to decline towards the target over the second half of next year."
"Recent negative surprises in PMI manufacturing output indicated potential headwinds to the near-term outlook."
"Therefore, needed to be carefully monitored whether inflation would settle sustainably at the target in a timely manner."
"The risk of delays in reaching the ECB’s target was seen to warrant some caution to avoid dialing back policy restriction prematurely."
"Foreign demand was showing signs of weakness, with falling export orders and PMIs."
"Core inflation and services inflation might be stickier and not decline as much as currently expected."
"Since the cut-off for the projections, Eurostat had revised data for the latest quarters."
"It was generally considered that a recession in the euro area remained unlikely."
"It would sometimes be appropriate to ignore volatility in oil prices."
"Too early to declare victory."
"Disinflationary process was on track."
"Baseline path to 2% depended critically on lower wage growth as well as on an acceleration of productivity growth."
"Inflation had recently been declining somewhat faster than expected."
Market reaction
This publication failed to trigger a noticeable reaction in EUR/USD. At the time of press, the pair was trading marginally lower on the day at around 1.0930.
The US Dollar (USD) is trading mixed ahead of the US CPI print, Scotiabank’s Chief FX Strategist Shaun Osborne notes.
USD mixed to a little firmer ahead of US CPI data
“The street is looking for a 0.1% rise in headline CPI and a 0.2% gain in core over the September month. The 12-month headline rate of inflation is expected to edge down to 2.3%, from 2.5% but core inflation over the year is expected to stick at 3.2%. Inflation trends are moderating but have yet to show the consistency of low (0.1/0.2%) m/m gains that would make policymakers comfortable with the idea that inflation is more fully beaten.”
“Note that some models reflect a modest upside risk to core CPI estimates for September. With the balance of risks favouring a further moderation in prices now, the Fed’s priority is gearing towards—cautious—policy relaxation. But slightly firmer core prices may give a further lift Treasury yields and the USD in the short run. Note swaps are pricing in 20bps of easing risk for the Fed’s November meeting.”
- USD/CAD is unfolding a bullish move higher within a longer-term range.
- The short-term trend is now bullish, favoring more upside eventually.
USD/CAD was declining within its longer-term range until it bottomed out on September 25 and began rising.
What started out looking like a correction of the downmove has since morphed into a full blown bullish reversal and the start of a new leg higher within the range.
USD/CAD Daily Chart
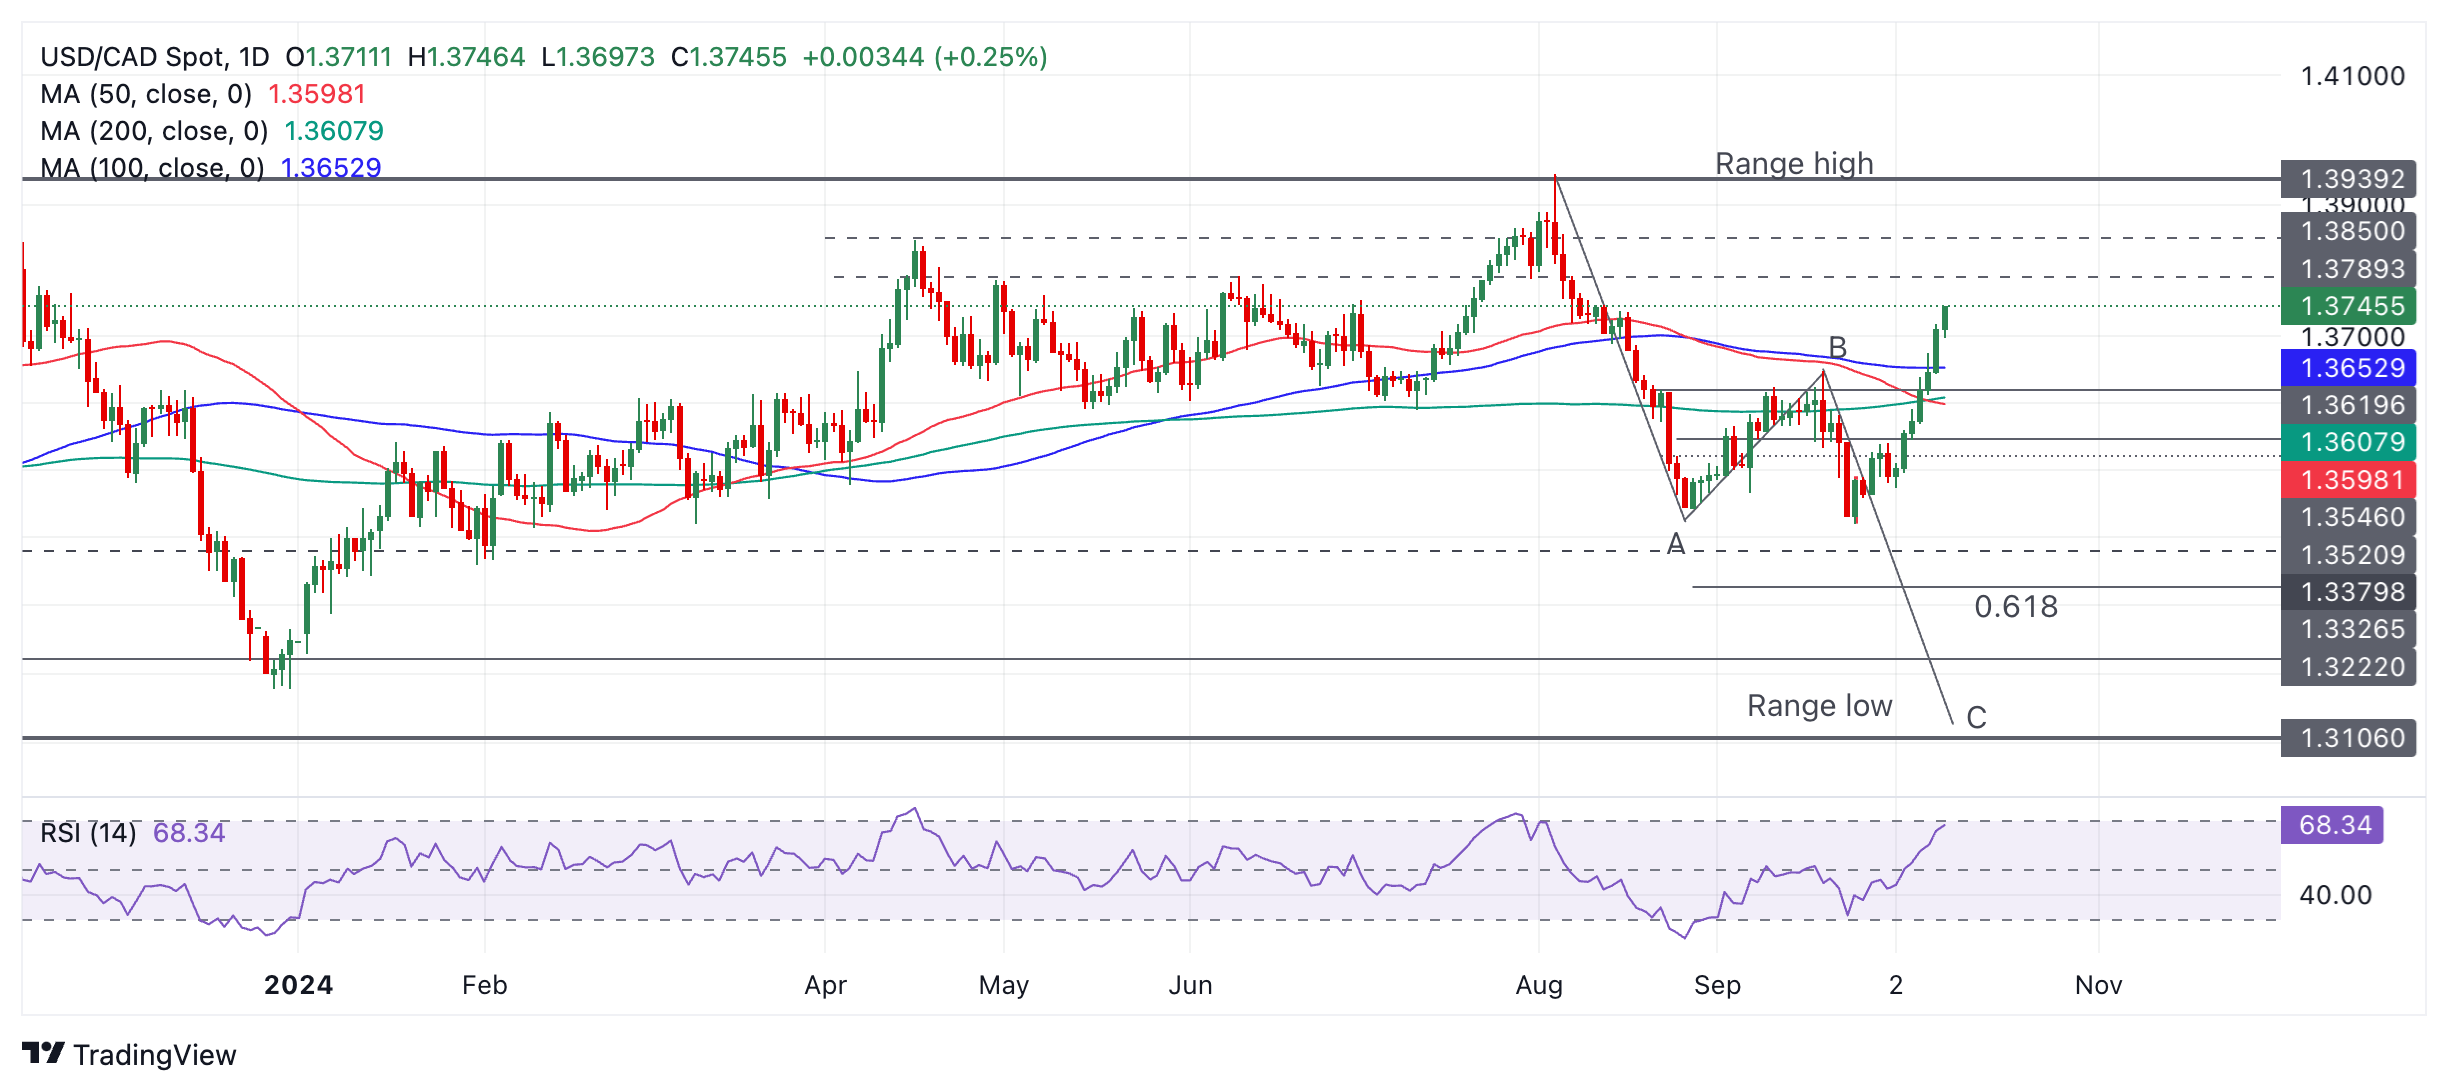
The short-term trend is now bullish and given the old saying that “the trend is your friend” the odds favor a continuation higher.
The next target to the upside lies at resistance from multiple market tops at around 1.3789. A break above that could see prices push further up to 1.3850. It would be wise to wait for a pullback before any aggressive buying. The support zone between 1.3650 and 1.3670 might be a good place to enter longs.
The Relative Strength Index (RSI) is at 68.34 which is almost in the overbought zone above 70. If it moves into overbought it will be a signal not to add to long positions.
USD/CAD had been unfolding what looked like an ABC pattern or Measured Move during August and most of September (see chart). The pattern generated downside targets near the base of the range.
However, price action since has proven this interpretation wrong, invalidating the bearish forecast.
The Euro (EUR) losses have extended—slightly— following last week’s hefty fall as investors eye next week’s ECB policy decision and anticipate some pickup in the central bank’s easing pace, Scotiabank’s Chief FX Strategist Shaun Osborne notes.
EUR traders slightly lower
“A 1/4 point cut is all but fully priced in for the 17th and another 25bps cut is more or less priced in for December. Wider short-term spreads relative to the USD are a drag on the EUR’s outlook and technical momentum is bearish.”
“Spot’s breakdown from the minor consolidation that developed around the turn of the week above 1.0950 has extended a little but the drift lower in the EUR intraday keeps the technical tone negative after last week’s sharp move lower and break below key support at 1.10 (now resistance).”
“The 100- day MA (1.0934) may provide some short-term support for the EUR but near-term risks are geared towards a push to 1.0875/80 and losses may extend to the low 1.08 area.”
- Gold bounces after the Reserve Bank of New Zealand implements a super-sized interest-rate cut, continuing the global trend.
- Neutral or dovish Fedspeak from a string of Fed officials further supports the precious metal.
- Technically, XAU/USD enters a short-term downtrend, biasing price action to further losses.
Gold (XAU/USD) trades back in the $2,610s on Thursday after bouncing off the psychological $2,600 level, as the yellow metal gets an uplift from the general slide in global interest rates and a string of Federal Reserve (Fed) officials strike a neutral or dovish tone at their speaking engagements.
Gold gets a lift from mega-sized RBNZ rate cut
Gold rebounded overnight after the Reserve Bank of New Zealand (RBNZ) became the latest major central bank to slash interest rates. The RBNZ implemented a super-sized 50 basis points (bps) cut to its official cash rate, bringing it down to 4.75% from 5.25% previously, at its October meeting. Lower interest rates are bullish for Gold because they reduce the opportunity cost of holding a non-interest-paying asset.
The RBNZ move helps rescue Gold from a bad start to the week in which it has lost almost 1.50% so far, mainly on the back of a brighter outlook for the US economy. This, in turn, has radically reduced bets that the Federal Reserve (Fed) will implement another double-dose 50 bps rate cut of its own at its next meeting in November.
The market-based probability of the Fed lowering by 50 bps (0.50%) has now fallen to zero, according to the CME Fedwatch tool. The chances of a smaller 25 bps cut meanwhile stand at about 85%. Further – from a cut of some magnitude being inevitable – the probability of the Fed doing nothing in November has now increased to about 15%.
Gold also gets some lift from a string of speeches by Fed policymakers on Wednesday. These were all rated as either falling in the neutral or dovish territory at the FXStreet FedTracker – meaning in favor of loose policy and low interest rates – and were all below the average for the speaker (see calendar). The FXStreet FedTracker is a new AI-powered tool that gauges the tone of Fed officials’ speeches on a dovish-to-hawkish scale from 0 to 10.
Federal Reserve Bank of San Francisco President Mary Daly (voting member) scored the lowest with a FedTracker score of 2.0, well below her 3.6 average. Daly said one or two more rate cuts were needed before the end of the year, adding, "I was more worried about the labor market," than "accelerating inflation."
The Fed’s decision-making at its November meeting may be further impacted by the release of US inflation data on Thursday, and this, in turn, could impact Gold. The Consumer Price Index (CPI) for September is expected to rise 2.3% year-over-year (YoY) from 2.5%, and core CPI to rise by 3.2% YoY, unchanged from August. If it is lower, bets may yet again increase for a rate cut; the opposite is true if inflation remains sticky.
Gold underpinned by safe-haven demand
Gold might be underpinned, however, as it continues to attract safe-haven flows amid elevated geopolitical tensions. Israel keeps up its attacks on targets in Lebanon, and markets remain on tenterhooks anticipating a retaliatory attack by Israel on Iran after its ballistic rocket raid last week.
In terms of the latest developments, the White House confirmed Israeli Prime Minister Benjamin Netanyahu spoke with US President Joe Biden on Wednesday, but nothing was mentioned about Israel’s potential retaliation against Iran. The Biden administration is pressing Israel to limit its retaliation to military targets, according to Bloomberg News and Axios News reported that Netanyahu will convene Israel’s security cabinet today.
Technical Analysis: Gold in short-term downtrend
Gold continues its short-term downtrend, reaching support at just above the psychological $2,600 mark and then bouncing.
XAU/USD 4-hour Chart
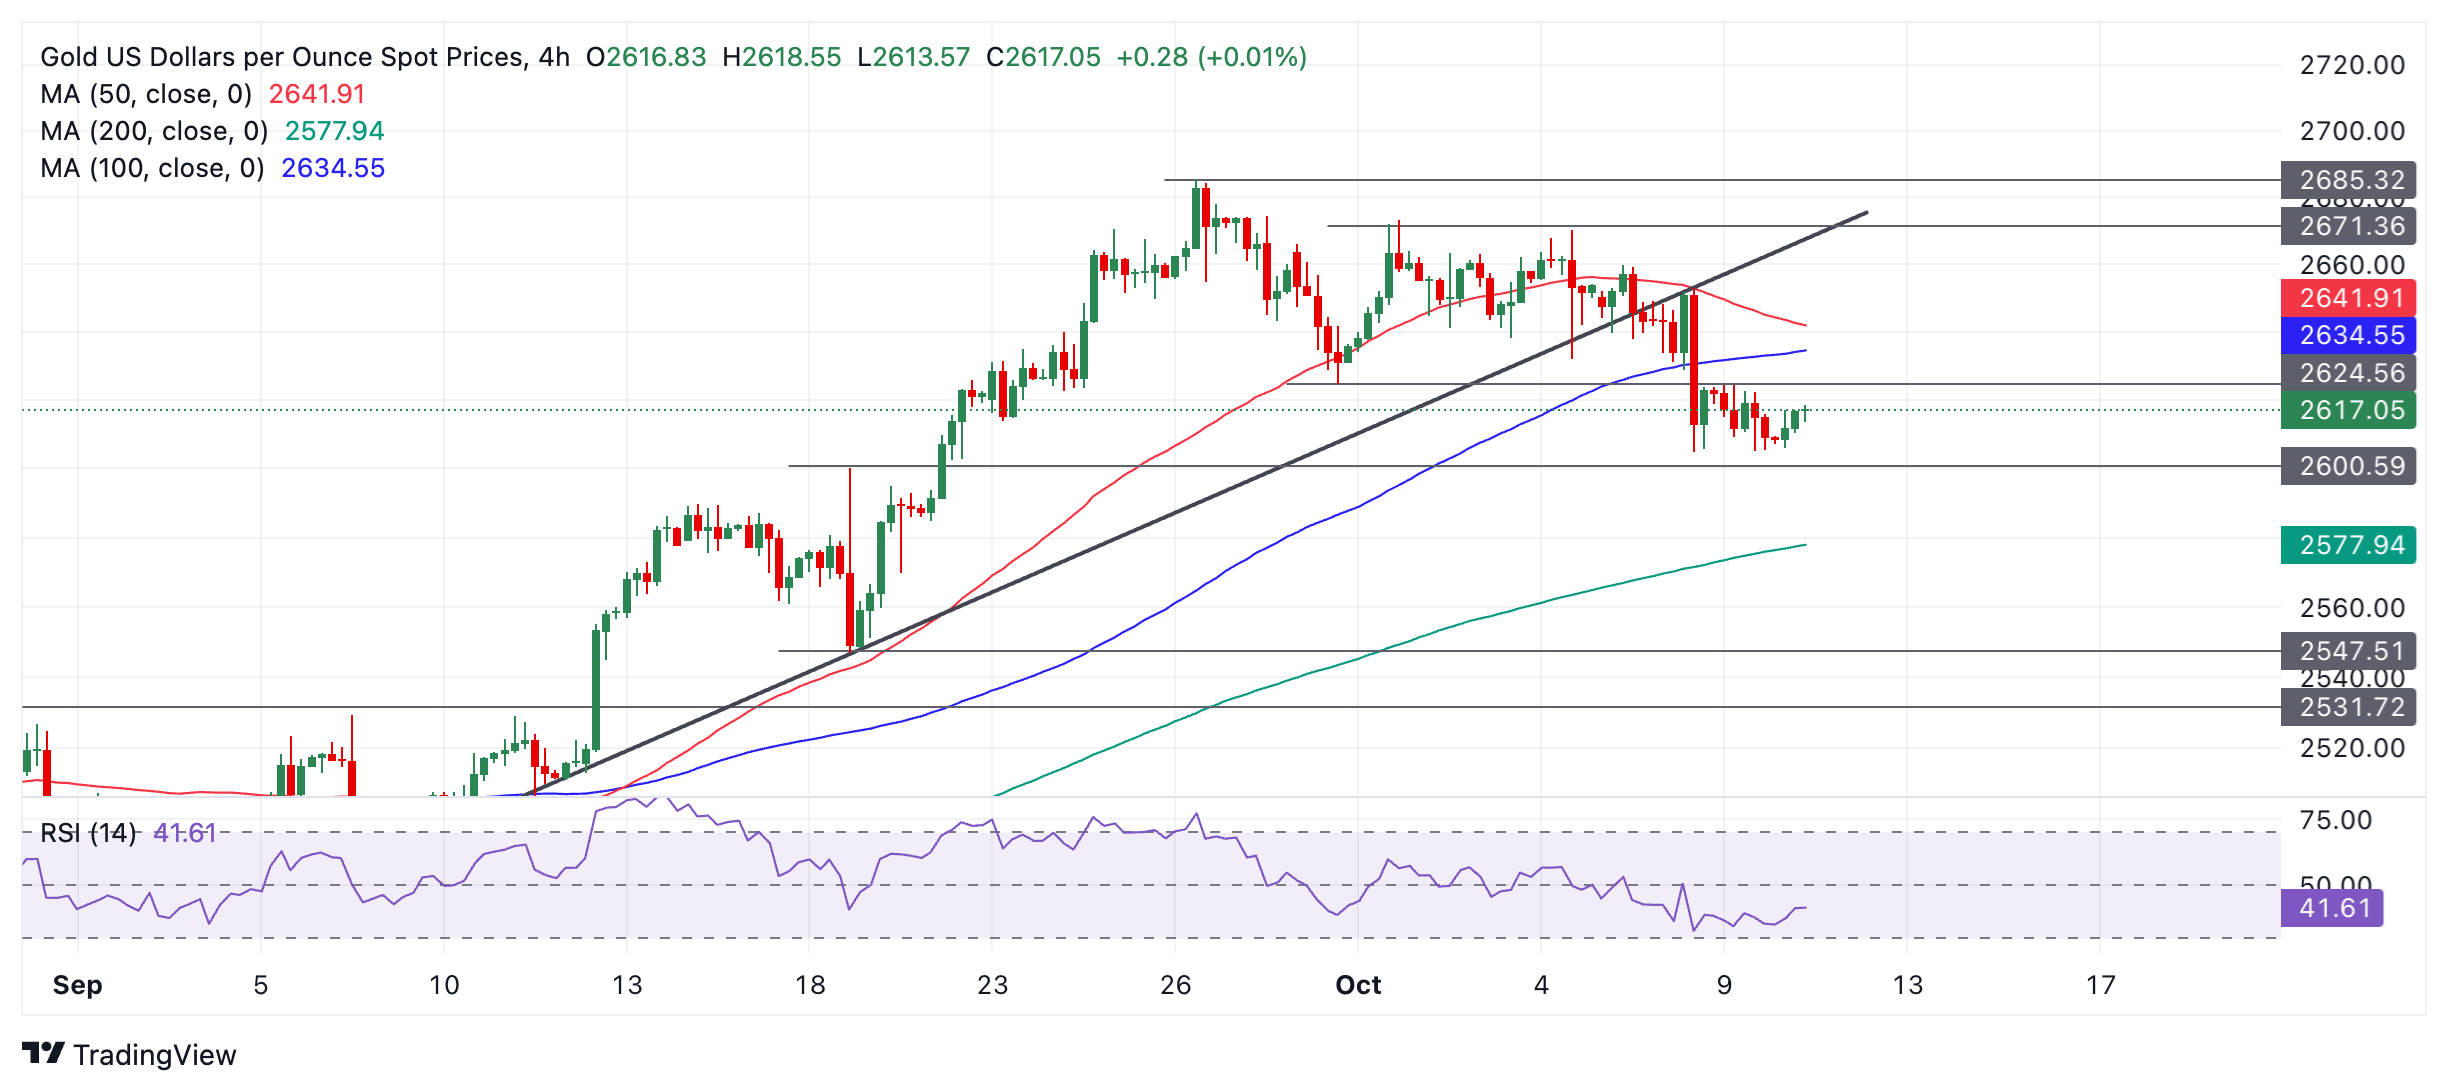
The short-term trend has switched to bearish, from previously being sideways, after Gold broke down from its narrow range and decisively breached its long-term trendline on Tuesday. Given the technical analysis principle that “the trend is your friend,” the odds favor a continuation lower in the near term.
A break below support at $2,600 (August 18 high, round number) would probably indicate further weakness toward the next downside target at $2,578, where the green 200-period Simple Moving Average (SMA) on the 4-hour chart above is likely to provide a safety net.
Bears should proceed with caution, however, as the medium and long-term trends remain bullish. If, at any moment, one of these longer up cycles resumes, Gold could stall, reverse, and begin a new up leg higher.
Economic Indicator
Consumer Price Index (YoY)
Inflationary or deflationary tendencies are measured by periodically summing the prices of a basket of representative goods and services and presenting the data as The Consumer Price Index (CPI). CPI data is compiled on a monthly basis and released by the US Department of Labor Statistics. The YoY reading compares the prices of goods in the reference month to the same month a year earlier.The CPI is a key indicator to measure inflation and changes in purchasing trends. Generally speaking, a high reading is seen as bullish for the US Dollar (USD), while a low reading is seen as bearish.
Read more.Next release: Thu Oct 10, 2024 12:30
Frequency: Monthly
Consensus: 2.3%
Previous: 2.5%
Source: US Bureau of Labor Statistics
The US Federal Reserve has a dual mandate of maintaining price stability and maximum employment. According to such mandate, inflation should be at around 2% YoY and has become the weakest pillar of the central bank’s directive ever since the world suffered a pandemic, which extends to these days. Price pressures keep rising amid supply-chain issues and bottlenecks, with the Consumer Price Index (CPI) hanging at multi-decade highs. The Fed has already taken measures to tame inflation and is expected to maintain an aggressive stance in the foreseeable future.
- The US Dollar trades overall in the green against the G10 basket of currencies
- Traders are sending US Treasury rates higher with US CPI data set to be issued on Thursday.
- The US Dollar Index trades above 102.50 and flirts with a break above 103.00.
The US Dollar (USD) rallies again this week, with traders sending US Treasury rates higher ahead of the United States (US) Consumer Price Index (CPI) data for September. Higher US rates make the US Dollar a favored carry currency again, with several traders and speculators more than happy to park their money under the Greenback and get some yield return in the process. It reveals part of the conviction among traders that the US CPI report might see the disinflationary process from recent months stall or even turn around and head back into an increase in inflation.
The economic calendar is thus picking up steam, with the heavy-weight US CPI release on Thursday. Add the weekly Jobless Claims, and markets are bound to have some volatility. The release of the Federal Open Market Committee (FOMC) Minutes of the September meeting on Wednesday showed that a large majority of the Federal Reserve (Fed) voters were in favor of a bigger 50 basis points (bps) rate cut, while a smaller amount voted in favor of a more gradual approach.
Daily digest market movers: Rate differential kicks in again
- US Treasury rates are rallying and are outpacing other sovereign rates, which means that rate differentials are widening again between the US and several other countries. This supports a stronger US Dollar across the board.
- At 12:30 GMT, a bulk load of data points is set to be released:
- US Consumer Price Index data for September:
- Monthly core inflation is expected to grow by 0.2%, compared with 0.3% in August.
- In line with the core reading, monthly headline inflation is expected to increase by 0.1% from 0.2% in August.
- Yearly core inflation is expected to remain steady at 3.2%, while headline inflation should decline to 2.3% from 2.5% in August.
- Initial Jobless Claims for the week ending October 4 are expected to jump to 230,000 compared with 225,000 the prior week.
- US Consumer Price Index data for September:
- Near 13:15 GMT, Federal Reserve Governor Lisa Cook delivers a speech about entrepreneurship and innovation at the Women for Women Summit organized by the College of Charleston School of Business in Charleston, South Carolina. Cook is considered rather dovish in terms of policy stance.
- At 15:00 GMT, Federal Reserve Bank of New York President John Williams delivers keynote remarks at an event organized by Binghamton University in New York. Williams is considered neutral in terms of policy stance.
- There is some geographical dislocation in the equity markets, with Asia closing the day in a positive mode, even for Chinese indices. European equities look sluggish and are in the red, while US equity futures are subdued.
- The CME Fedwatch Tool shows an 80.1% chance of a 25 bps interest rate cut at the next Fed meeting on November 7, while 19.9% is pricing in no rate cut. Chances for a 50 bps rate cut have been fully priced out now.
- The US 10-year benchmark rate trades at 4.08%, the highest level since early August.
US Dollar Index Technical Analysis: King Dollar making its way
The US Dollar Index (DXY) knows no limits and rallies higher again on Thursday ahead of the US CPI release. With the US rates rallying, it should become clear that markets are starting to put less faith in the Fed being in a rate-cut cycle. The elevated levels and probabilities of no more bigger rate cuts this year could mean a rallying Greenback going into the US elections.
The psychological 103.00 is the first level to tackle on the upside. Further up, the chart identifies 103.18 as the very final resistance level for this week. Once above there, a very choppy area emerges, with the 100-day Simple Moving Average (SMA) at 103.28, the 200-day SMA at 103.77, and the pivotal 103.99-104.00 levels in play.
On the downside, the 55-day SMA at 101.94 is the first line of defence, backed by the 102.00 round level and the pivotal 101.90 as support to catch any bearish pressure and trigger a bounce. If that level does not work out, 100.62 also acts as support. Further down, a test of the year-to-date low of 100.16 should take place before more downside. Finally, and that means giving up the big 100.00 level, the July 14, 2023, low at 99.58 comes into play.
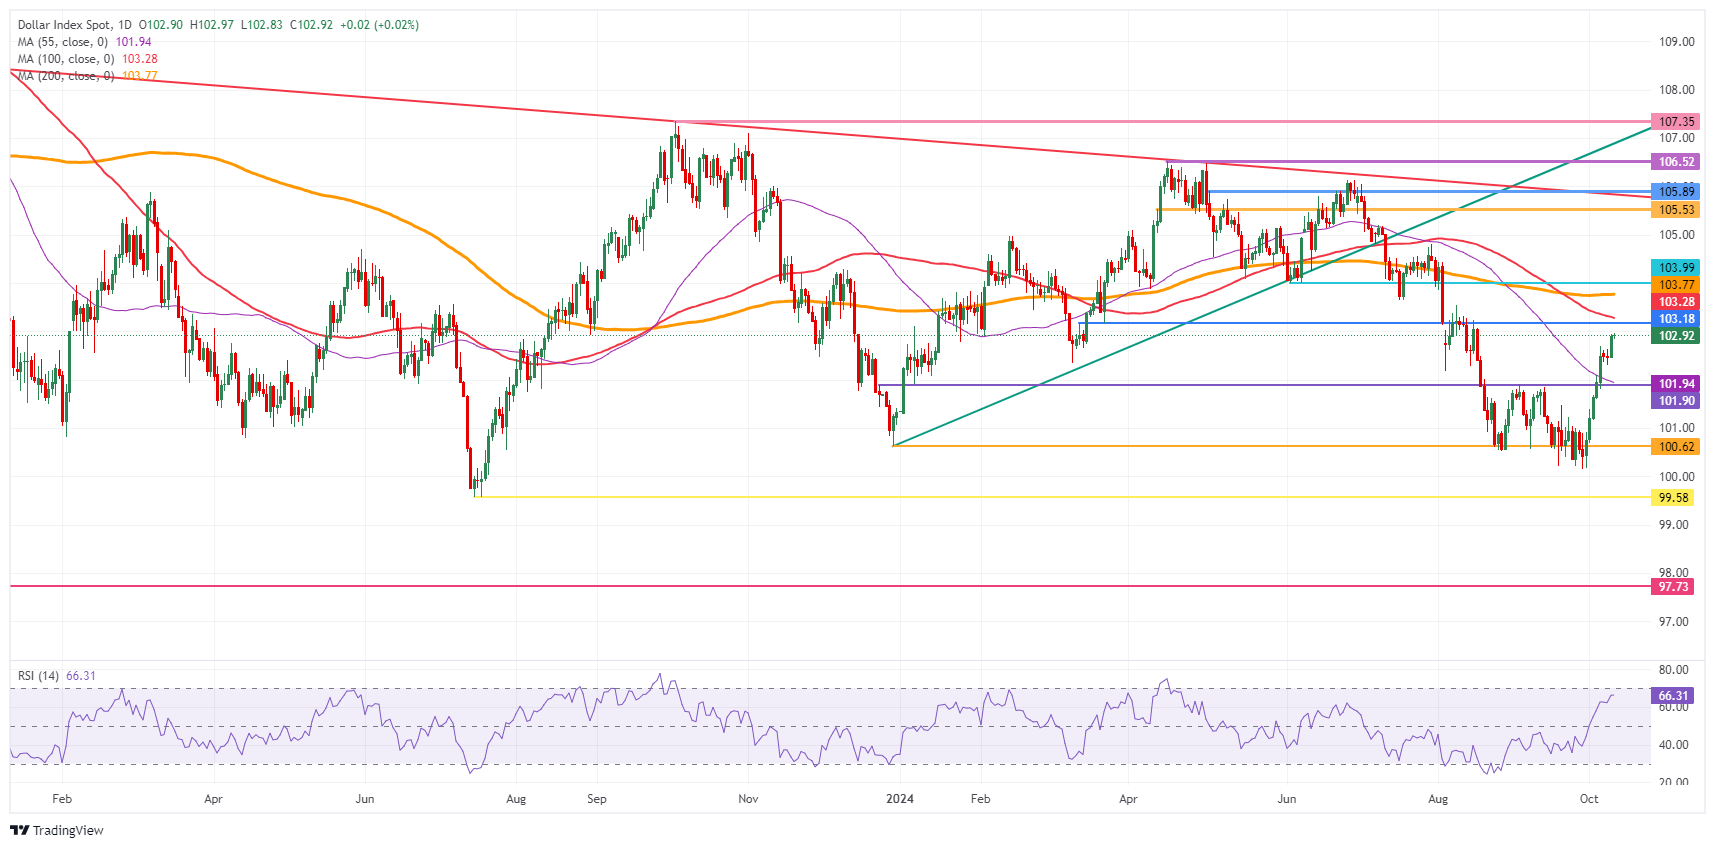
US Dollar Index: Daily Chart
US Dollar FAQs
The US Dollar (USD) is the official currency of the United States of America, and the ‘de facto’ currency of a significant number of other countries where it is found in circulation alongside local notes. It is the most heavily traded currency in the world, accounting for over 88% of all global foreign exchange turnover, or an average of $6.6 trillion in transactions per day, according to data from 2022. Following the second world war, the USD took over from the British Pound as the world’s reserve currency. For most of its history, the US Dollar was backed by Gold, until the Bretton Woods Agreement in 1971 when the Gold Standard went away.
The most important single factor impacting on the value of the US Dollar is monetary policy, which is shaped by the Federal Reserve (Fed). The Fed has two mandates: to achieve price stability (control inflation) and foster full employment. Its primary tool to achieve these two goals is by adjusting interest rates. When prices are rising too quickly and inflation is above the Fed’s 2% target, the Fed will raise rates, which helps the USD value. When inflation falls below 2% or the Unemployment Rate is too high, the Fed may lower interest rates, which weighs on the Greenback.
In extreme situations, the Federal Reserve can also print more Dollars and enact quantitative easing (QE). QE is the process by which the Fed substantially increases the flow of credit in a stuck financial system. It is a non-standard policy measure used when credit has dried up because banks will not lend to each other (out of the fear of counterparty default). It is a last resort when simply lowering interest rates is unlikely to achieve the necessary result. It was the Fed’s weapon of choice to combat the credit crunch that occurred during the Great Financial Crisis in 2008. It involves the Fed printing more Dollars and using them to buy US government bonds predominantly from financial institutions. QE usually leads to a weaker US Dollar.
Quantitative tightening (QT) is the reverse process whereby the Federal Reserve stops buying bonds from financial institutions and does not reinvest the principal from the bonds it holds maturing in new purchases. It is usually positive for the US Dollar.
- Crude Oil consolidates on Thursday after a two-day painful correction.
- Markets are left clueless about the outcome of the Biden-Netanyahu phone call on Wednesday.
- The US Dollar Index rallies higher this week ahead of the US CPI release later this Thursday.
Crude Oil has found support and edges higher on Thursday after a two-day correction that erased nearly 5% of recent gains. Traders are left clueless, though, with no clear comments after US President Joe Biden had a phone call with Israel Prime Minister Benjamin Netanyahu on Wednesday. Meanwhile, Hurricane Milton hit the Florida peninsula and decreased power, though it is possible to see supply disruptions and extended delays until the oil production in the region could restart.
The US Dollar Index (DXY), which tracks the performance of the Greenback against six other currencies, is rallying again this week. The main driver is the US Treasury rates, which are moving higher ahead of the US September’s Consumer Price Index (CPI) release this Thursday. Markets are starting to doubt if the US Federal Reserve (Fed) is really in a rate-cutting cycle, with expectations of no more bigger rate cuts this year starting to grow.
At the time of writing, Crude Oil (WTI) trades at $73.92 and Brent Crude at $77.57
Oil news and market movers: Libya boosting production
- Libya’s oil utility, National Oil Corporation (NOC), announced the start of 5 new wells to be exploited and be operational by early October. Around 12,000 barrels per day would be added, according to the Libya Observer and reported by Bloomberg.
- Investors remained wary of escalating tensions between Israel and Iran, providing further support to prices, Reuters reports.
- On Tuesday, the U. Energy Information Administration downgraded its demand forecast for 2025 on weakening economic activity in China and North America, according to Bloomberg.
Oil Technical Analysis: Risk that nothing happens
Crude Oil is a clear reflection of when you leave markets behind without clues or comments. The fact that markets still need to second guess what Prime Minister Netanyahu will do next makes markets price out quite quickly escalation risk premiums. More downside could be seen as days go by, while Israel sticks to small ops and very limited military activity in Lebanon.
Monday’s false break is to be ignored, as the move was fully paired back on Tuesday. It means that current pivotal levels on the upside are still valid: the red descending trendline in the chart below, and the 100-day Simple Moving Average (SMA) at $75.63 just hovering above it, makes that region very difficult to surpass. Once holding above there, the 200-day SMA at $77.15 should refute any further upticks as it did in early trading on Tuesday.
On the downside, similar remark as for the upside with all these falls breaks. Rule of thumb is that if there has not been a daily close below the level, it still accounts for as a support. First is the 55-day SMA at $72.52, which acts as a potential first line of defence. A bit further down, $71.46 (the February 5 low) comes into play as second support before looking back to the $70.00 big figure and $67.11 as ultimate support for traders to buy the dip.
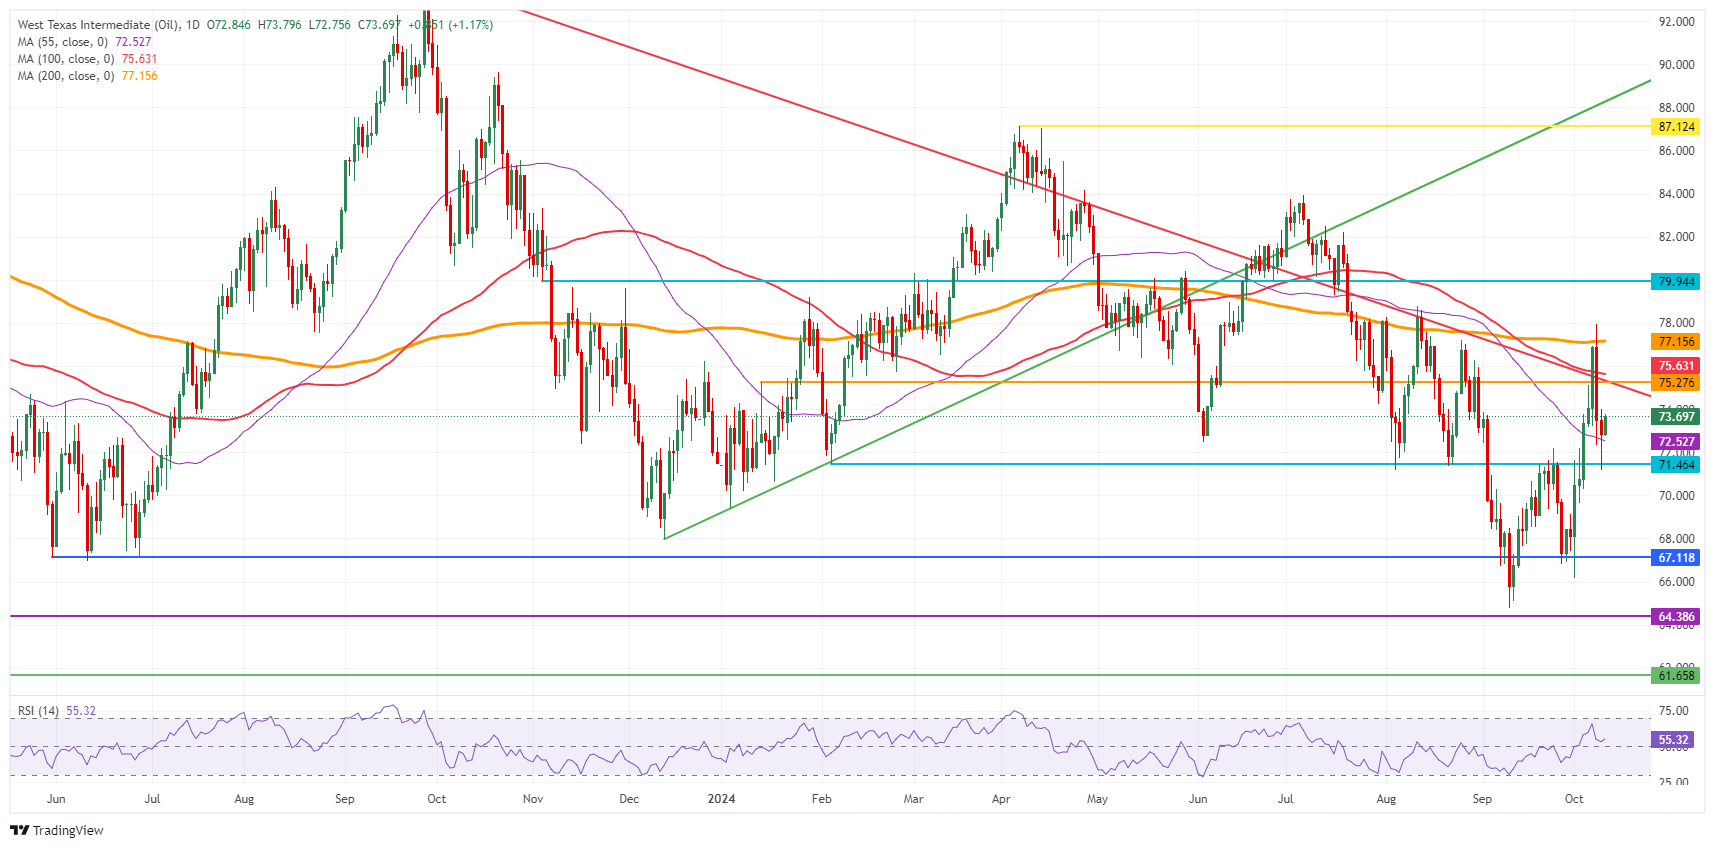
US WTI Crude Oil: Daily Chart
WTI Oil FAQs
WTI Oil is a type of Crude Oil sold on international markets. The WTI stands for West Texas Intermediate, one of three major types including Brent and Dubai Crude. WTI is also referred to as “light” and “sweet” because of its relatively low gravity and sulfur content respectively. It is considered a high quality Oil that is easily refined. It is sourced in the United States and distributed via the Cushing hub, which is considered “The Pipeline Crossroads of the World”. It is a benchmark for the Oil market and WTI price is frequently quoted in the media.
Like all assets, supply and demand are the key drivers of WTI Oil price. As such, global growth can be a driver of increased demand and vice versa for weak global growth. Political instability, wars, and sanctions can disrupt supply and impact prices. The decisions of OPEC, a group of major Oil-producing countries, is another key driver of price. The value of the US Dollar influences the price of WTI Crude Oil, since Oil is predominantly traded in US Dollars, thus a weaker US Dollar can make Oil more affordable and vice versa.
The weekly Oil inventory reports published by the American Petroleum Institute (API) and the Energy Information Agency (EIA) impact the price of WTI Oil. Changes in inventories reflect fluctuating supply and demand. If the data shows a drop in inventories it can indicate increased demand, pushing up Oil price. Higher inventories can reflect increased supply, pushing down prices. API’s report is published every Tuesday and EIA’s the day after. Their results are usually similar, falling within 1% of each other 75% of the time. The EIA data is considered more reliable, since it is a government agency.
OPEC (Organization of the Petroleum Exporting Countries) is a group of 12 Oil-producing nations who collectively decide production quotas for member countries at twice-yearly meetings. Their decisions often impact WTI Oil prices. When OPEC decides to lower quotas, it can tighten supply, pushing up Oil prices. When OPEC increases production, it has the opposite effect. OPEC+ refers to an expanded group that includes ten extra non-OPEC members, the most notable of which is Russia.
- EUR/JPY drops but remains focused on breaking above the key resistance of 163.50.
- Traders doubt the BoJ hiking rates again this year.
- The ECB is expected to cut its borrowing rates further by 50 bps this year.
The EUR/JPY pair falls to near 162.80 in Thursday’s European session after its second failed attempt to break above the September high of 163.50. The asset strives to extend its upside amid broader weakness in the Japanese Yen (JPY) due to fading speculation of more hikes from the Bank of Japan (BoJ) this year.
Traders appear to be cautious about the BoJ tightening its policy further this year as weak consumer spending has raised doubts over the maintenance of economic strength. Overall Household Spending, a key measure of consumer spending, declined by 1.9% in August from a nominal growth of 0.1% in July. Though the pace at which the consumer spending measure contracted in August was slower than expectations of a 2.6% decline, it prompted the need for fresh stimulus to boost private consumption.
Meanwhile, the Euro (EUR) has been underpinned against the Japanese Yen, its performance has remained weaker in comparison with other peers due to escalating European Central bank (ECB) dovish bets. Traders have priced in two more rate cuts of 25 basis points (bps) by the ECB this year, suggesting that the central bank will cut its Deposit Facility Rate in both the remaining meetings, which are scheduled for next week and in December.
Euro PRICE Today
The table below shows the percentage change of Euro (EUR) against listed major currencies today. Euro was the strongest against the Canadian Dollar.
| USD | EUR | GBP | JPY | CAD | AUD | NZD | CHF | |
|---|---|---|---|---|---|---|---|---|
| USD | 0.02% | -0.05% | -0.31% | 0.16% | -0.03% | -0.32% | -0.13% | |
| EUR | -0.02% | -0.07% | -0.31% | 0.13% | -0.05% | -0.27% | -0.18% | |
| GBP | 0.05% | 0.07% | -0.25% | 0.22% | -0.06% | -0.23% | -0.13% | |
| JPY | 0.31% | 0.31% | 0.25% | 0.48% | 0.27% | 0.00% | 0.15% | |
| CAD | -0.16% | -0.13% | -0.22% | -0.48% | -0.20% | -0.44% | -0.34% | |
| AUD | 0.03% | 0.05% | 0.06% | -0.27% | 0.20% | -0.25% | -0.07% | |
| NZD | 0.32% | 0.27% | 0.23% | -0.00% | 0.44% | 0.25% | 0.10% | |
| CHF | 0.13% | 0.18% | 0.13% | -0.15% | 0.34% | 0.07% | -0.10% |
The heat map shows percentage changes of major currencies against each other. The base currency is picked from the left column, while the quote currency is picked from the top row. For example, if you pick the Euro from the left column and move along the horizontal line to the US Dollar, the percentage change displayed in the box will represent EUR (base)/USD (quote).
A majority of ECB policymakers are open to more interest rate cuts as fears of inflation remaining sticky have waned due to worsening economic growth. The Annual Harmonized Index of Consumer Prices (HICP) in the Eurozone has decelerated to 1.8% in September, according to flash estimates. Also, the German economy, the Eurozone’s largest nation, is estimated to end the year with a 0.2% decline in output, as per the German economic ministry.
USD/KRW bounced towards 1350, reaching its highest since mid-August. At the time of writing, it was trading around this level, DBS’ FX analyst Philip Wee notes.
BOK is expected to begin its rate cut cycle
“USD/KRW had bounced towards 1350, reaching its highest since mid-August.”
“FTSE Russell’s announcement yesterday that it would include Korean government bonds into its World Government Bond Index is a positive and could eventually draw USD60bn of inflows.”
“However, as the change will only be implemented in Sep 2025, there may not be a large short-term boost for the KRW. Markets will instead focus on the BOK meeting tomorrow, where the Bank is expected to begin its rate cut cycle.”
USD/JPY rebounded towards 149, and pulled back a bit afterword, DBS’ FX analyst Philip Wee notes.
Intervention does not appear to be an imminent risk
“USD/JPY had rebounded towards 149, with PM Ishiba dissolving the Lower House yesterday for elections on 27 October.”
“New Japanese Finance Minister Kato had warned on Tuesday of the negative impact of sudden JPY moves, underscoring a discomfort with renewed JPY weakness.”
“With speculative positioning still not deeply short, intervention does not appear to be an imminent risk, and USD/JPY could remain sensitive to US rates for now.”
The US Dollar (USD) could rise to 7.1060 before the risk of a pullback increases. In the longer run, current price movements are likely part of a range trading phase; USD is likely to trade between 7.0300 and 7.1200, UOB Group’s FX analysts Quek Ser Leang and Lee Sue Ann note.
USD can rise to 7.1060 before pulling back
24-HOUR VIEW: “We expected USD to trade in a 7.0530/7.0930 range yesterday. USD subsequently dipped to 7.0543 before rising to 7.0981. USD close at 7.0929 (+0.26%). The advance has resulted in a slight increase in momentum. Today, USD could rise to 7.1060 before the risk of a pullback increases. Support is at 7.0830, followed by 7.0700.”
1-3 WEEKS VIEW: “Our update from yesterday (09 Oct, spot at 7.0750) remains valid. As highlighted, the current price movements are likely part of a range trading phase. For the time being, USD is expected to trade between 7.0300 and 7.1200.”
- AUD/USD retreats from 0.6740 as traders brace for the US inflation data for September.
- The US inflation data will influence the Fed's likely interest rate action in the remainder of the year.
- Australia’s Consumer Inflation Expectations decelerated to 4% in October.
The AUD/USD pair falls back after a short-lived pullback to near 0.6740 in Thursday’s European session. The Aussie pair faces pressure as the market sentiment turn cautious ahead of the United States (US) Consumer Price Index (CPI) data for September, which is scheduled at 12:30 GMT.
S&P 500 futures have posted some losses in European trading hours, exhibiting a risk-aversion mood. The US Dollar Index (DXY), which gauges the Greenback’s value against six major currencies, holds onto gains near the seven-week high of 103.00.
Economists expect the headline CPI to have grown at a slower pace of 2.3% against 2.5% in August, with the core CPI – which excludes volatile food and energy prices – rising steadily by 3.2%.
Investors will pay close attention to the US inflation data for fresh cues about the Federal Reserve’s (Fed) interest rate outlook for the remaining year.
In the Asia-Pacific region, the Melbourne Institute has reported that one-year forward Consumer Inflation Expectations for October has softened significantly to 4% from 4.4% in September. Investors will focus on how soft inflation expectations will influence market expectations for Reserve Bank of Australia’s (RBA) likely policy action in the last quarter of the year. Currently, traders expect the RBA to leave its Official Cash Rate (OCR) at 4.35% by the year-end.
AUD/USD strives to end its losing streak on Thursday. The near-term outlook of the Aussie pair is uncertain as it has declined below the 20-and 50-day Exponential Moving Averages (EMAs), which trade around 0.6790 and 0.6750, respectively.
However, there is a slight chance of a bullish reversal due to a Positive Divergence formation, shown by the 14-day Relative Strength Index (RSI). The momentum oscillator has made a lower low while the higher low pattern in the asset is intact, suggesting an oversold situation in an uptrend.
A decisive recovery move above the 20-day EMA near 0.6790 could push the asset towards October 4 high of 0.6850, followed by October 3 high of 0.6888.
In an alternate scenario, the pair could witness more downside towards the 200-day EMA near 0.6660 and the August 12 high of 0.6605 if it breaks below the round-level support of 0.6700.
AUD/USD daily chart
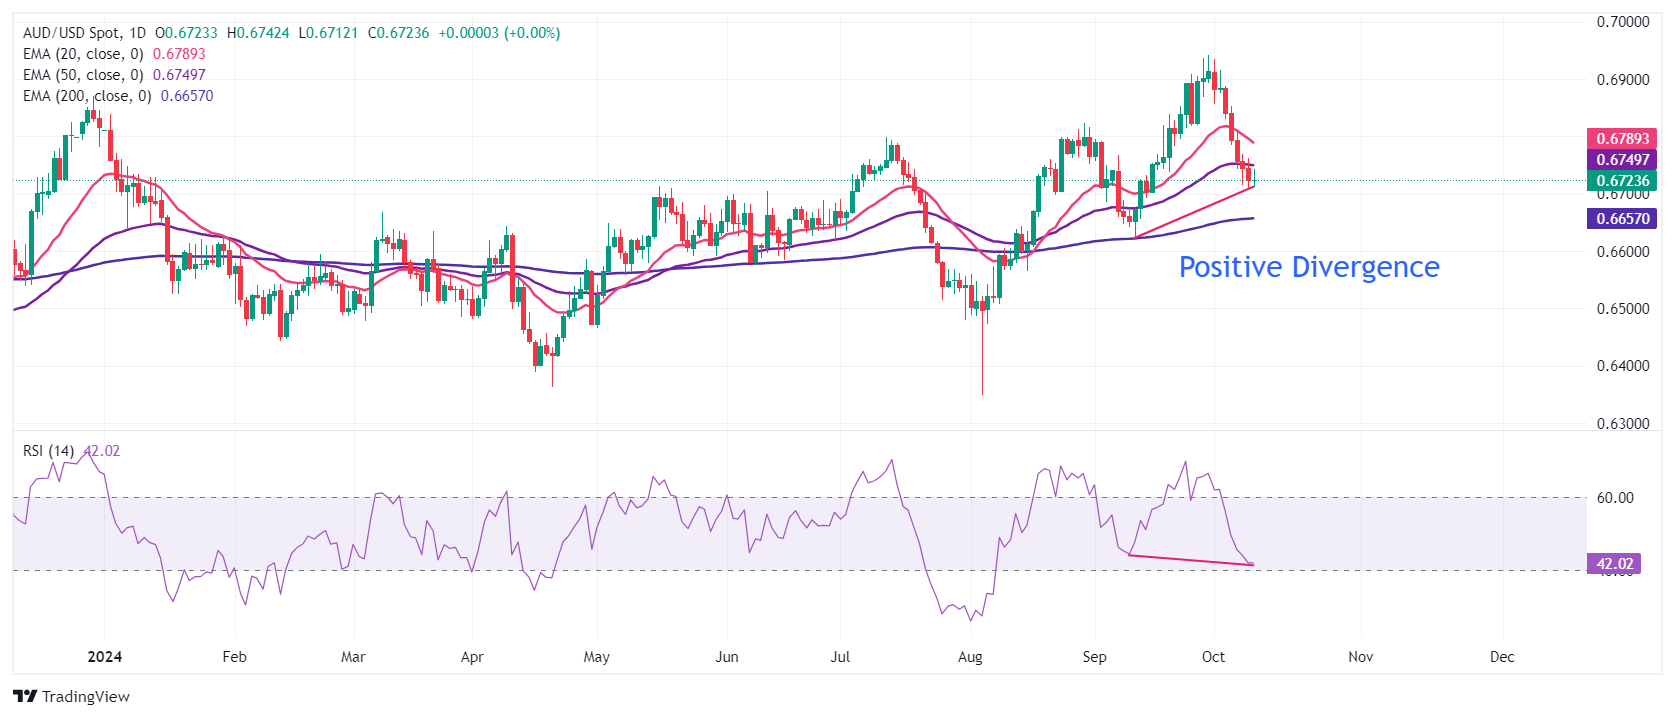
Australian Dollar FAQs
One of the most significant factors for the Australian Dollar (AUD) is the level of interest rates set by the Reserve Bank of Australia (RBA). Because Australia is a resource-rich country another key driver is the price of its biggest export, Iron Ore. The health of the Chinese economy, its largest trading partner, is a factor, as well as inflation in Australia, its growth rate and Trade Balance. Market sentiment – whether investors are taking on more risky assets (risk-on) or seeking safe-havens (risk-off) – is also a factor, with risk-on positive for AUD.
The Reserve Bank of Australia (RBA) influences the Australian Dollar (AUD) by setting the level of interest rates that Australian banks can lend to each other. This influences the level of interest rates in the economy as a whole. The main goal of the RBA is to maintain a stable inflation rate of 2-3% by adjusting interest rates up or down. Relatively high interest rates compared to other major central banks support the AUD, and the opposite for relatively low. The RBA can also use quantitative easing and tightening to influence credit conditions, with the former AUD-negative and the latter AUD-positive.
China is Australia’s largest trading partner so the health of the Chinese economy is a major influence on the value of the Australian Dollar (AUD). When the Chinese economy is doing well it purchases more raw materials, goods and services from Australia, lifting demand for the AUD, and pushing up its value. The opposite is the case when the Chinese economy is not growing as fast as expected. Positive or negative surprises in Chinese growth data, therefore, often have a direct impact on the Australian Dollar and its pairs.
Iron Ore is Australia’s largest export, accounting for $118 billion a year according to data from 2021, with China as its primary destination. The price of Iron Ore, therefore, can be a driver of the Australian Dollar. Generally, if the price of Iron Ore rises, AUD also goes up, as aggregate demand for the currency increases. The opposite is the case if the price of Iron Ore falls. Higher Iron Ore prices also tend to result in a greater likelihood of a positive Trade Balance for Australia, which is also positive of the AUD.
The Trade Balance, which is the difference between what a country earns from its exports versus what it pays for its imports, is another factor that can influence the value of the Australian Dollar. If Australia produces highly sought after exports, then its currency will gain in value purely from the surplus demand created from foreign buyers seeking to purchase its exports versus what it spends to purchase imports. Therefore, a positive net Trade Balance strengthens the AUD, with the opposite effect if the Trade Balance is negative.
The USD’s near-term direction will hinge on US CPI tonight, especially after markets were wrong-footed by strength in non-farm payrolls, DBS’ FX analyst Philip Wee notes.
25bps rate cut would be more appropriate
“Consensus expects inflation to ease to 2.3% y/y, and a downside surprise could see the DXY index easing back towards 102.”
“Fed rate cut expectations have already been trimmed to just two more 25bps cuts for the rest of the year. The September FOMC minutes released overnight indicate that some attendees believe that a 25bps cut would be more appropriate, although only Bowman voted against a 50bps cut.”
The US Dollar (USD) is likely to rise above 149.50; it does not seem to have enough momentum to break clearly above 150.05. In the longer run, although momentum has not increased much; further USD strength seems likely. Levels to watch are 150.05 and 151.00, UOB Group’s FX analysts Quek Ser Leang and Lee Sue Ann note.
Levels to watch are 150.05 and 151.00
24-HOUR VIEW: “We detected a “slightly firmed underlying tone” yesterday, and we expected USD to “trade in a higher range of 147.50/148.70.” However, USD rose and almost reached the major resistance at 149.40 (high has been 149.36). Today, as long as 148.50 (minor support is at 148.90) is not breached, USD is likely to rise above 149.50. At this time, it does not seem have enough momentum to break clearly above 150.05.”
1-3 WEEKS VIEW: “Our most recent narrative was from Monday (07 Oct, spot at 148.60), wherein USD “is expected to continue to rise, potentially breaking above 149.40.” Yesterday (Wednesday), USD rose to a high of 149.36. Although upward momentum has not increased much, further USD strength seems likely. Levels to watch above 149.50 are at 150.05 and 151.00. To maintain the momentum, USD must not break below 147.50 (‘strong support’ level previously at 146.40).”
Chinese equities are seeing high volatility, as markets swing between anticipation and disappointment over China’s fiscal support, DBS’s FX analyst Philip Wee notes.
RMB swayed amid equity swings
“The CSI300 fell by 7% yesterday, after a meeting by the National Development and Reform Commission ( ) offered no details on fiscal spending. Nevertheless, the boost to sentiment from the slew of September policy announcements should not be discounted, and Chinese stocks are still over 20% higher despite yesterday’s losses.”
“Finance Minister Lan will hold a briefing on fiscal policy this Saturday, and Chinese market volatility could continue for now. USD/CNH had bounced to 7.09 amid equity volatility, which is unsurprising given over USD9bn of inflows to US-listed Chinese equity ETFs on hopes of the efficacy of Chinese stimulus.”
“We expect RMB gains on policy stimulus to be gradual given a still fragile economic outlook, and high uncertainty with regards to external trade and tariffs. Last Friday, the EU has voted to formally enact tariffs on Chinese EV imports, and China had also announced anti-dumping measures on EU brandy in response.”
Silver prices (XAG/USD) broadly unchanged on Thursday, according to FXStreet data. Silver trades at $30.52 per troy ounce, broadly unchanged 0.05% from the $30.51 it cost on Wednesday.
Silver prices have increased by 28.28% since the beginning of the year.
| Unit measure | Silver Price Today in USD |
|---|---|
| Troy Ounce | 30.52 |
| 1 Gram | 0.98 |
The Gold/Silver ratio, which shows the number of ounces of Silver needed to equal the value of one ounce of Gold, stood at 85.67 on Thursday, up from 85.48 on Wednesday.
Silver FAQs
Silver is a precious metal highly traded among investors. It has been historically used as a store of value and a medium of exchange. Although less popular than Gold, traders may turn to Silver to diversify their investment portfolio, for its intrinsic value or as a potential hedge during high-inflation periods. Investors can buy physical Silver, in coins or in bars, or trade it through vehicles such as Exchange Traded Funds, which track its price on international markets.
Silver prices can move due to a wide range of factors. Geopolitical instability or fears of a deep recession can make Silver price escalate due to its safe-haven status, although to a lesser extent than Gold's. As a yieldless asset, Silver tends to rise with lower interest rates. Its moves also depend on how the US Dollar (USD) behaves as the asset is priced in dollars (XAG/USD). A strong Dollar tends to keep the price of Silver at bay, whereas a weaker Dollar is likely to propel prices up. Other factors such as investment demand, mining supply – Silver is much more abundant than Gold – and recycling rates can also affect prices.
Silver is widely used in industry, particularly in sectors such as electronics or solar energy, as it has one of the highest electric conductivity of all metals – more than Copper and Gold. A surge in demand can increase prices, while a decline tends to lower them. Dynamics in the US, Chinese and Indian economies can also contribute to price swings: for the US and particularly China, their big industrial sectors use Silver in various processes; in India, consumers’ demand for the precious metal for jewellery also plays a key role in setting prices.
Silver prices tend to follow Gold's moves. When Gold prices rise, Silver typically follows suit, as their status as safe-haven assets is similar. The Gold/Silver ratio, which shows the number of ounces of Silver needed to equal the value of one ounce of Gold, may help to determine the relative valuation between both metals. Some investors may consider a high ratio as an indicator that Silver is undervalued, or Gold is overvalued. On the contrary, a low ratio might suggest that Gold is undervalued relative to Silver.
(An automation tool was used in creating this post.)
China’s National Day Golden Week holidays (1-7 Oct) generate the largest domestic tourism spending and trips amongst its major holidays which also include the Spring Festival (Jan/Feb) and Labour Day (May). Domestic tourism activities remained positive this year while there were also reports of stronger outbound and inbound travel during the period, UOB Group’s economist Ho Woei Chen notes.
National Day holiday statistics suggest no major uplift from stimulus yet
“Domestic tourism activities remained positive while there were also reports of stronger outbound and inbound travel during the National Day holidays in China (1-7 Oct). Compared to the previous year, both the domestic tourist trips made (+5.9%) and revenue (+6.3%) rose but the per trip spend was near flat (+0.4%).”
“China’s NDRC did not announce new stimulus measures at its briefing on Tue (8 Oct). The key messaging indicates China’s confidence to achieve its official growth target of ‘around 5%’ this year. We keep our GDP growth forecast for China at 4.9% in 2024, with a projected growth of 4.7% in 3Q24 and 4.8% in 4Q24. We expect the expansion pace to moderate further to 4.6% in 2025.”
“Fiscal stimulus is a key area that market will be watching for further support to consumption and investment, with estimates at around CNY2 tn (1.6% of GDP). The PBOC-led stimulus announced ahead of the National Day holidays is estimated to deliver at least CNY3 tn (2.3% of GDP) boost to the economy.”
- The Pound Sterling faces pressure near 1.3060 against the US Dollar, with US inflation under the spotlight.
- A majority of Fed officials voted for a larger-than-usual rate cut of 50 bps in September.
- In the UK, investors will pay close attention to the monthly GDP data for August on Friday.
The Pound Sterling (GBP) struggles above 1.3050 against the US Dollar (USD) in Thursday’s London session. The GBP/USD pair remains under pressure amid uncertainty ahead of the United States (US) Consumer Price Index (CPI) data for September, which will be published at 12:30 GMT.
The annual headline CPI inflation is expected to have decelerated to 2.3%, the lowest figure since February 2021, from 2.5% in August. In the same period, economists expect the core CPI – which excludes volatile food and energy prices – to have grown steadily by 3.2%. The month-on-month headline and core CPI are expected to have risen at a slower pace of 0.1% and 0.2%, respectively.
Investors will pay close attention to the US inflation data to get fresh cues about the Federal Reserve’s (Fed) likely interest rate action in the last quarter of the year. According to the CME FedWatch tool, traders have priced in a 25 basis points (bps) interest rate cut in each of the remaining two policy meetings this year.
Signs of price pressures remaining persistent would have a nominal impact on the Fed’s dovish bets as officials are highly concerned over growing risks to economic growth, with confidence over inflation returning to the bank’s target of 2%. The Federal Open Market Committee (FOMC) minutes for the September meeting, released on Wednesday, showed that a substantial majority of Fed officials voted for a 50 bps rate, pushing interest rates lower to 4.75%-5.00%, to revive the labor market strength.
On the contrary, a further slowdown in inflationary pressures could restore the likelihood of Fed large rate cuts in November.
Daily digest market movers: Pound Sterling to be influenced by UK monthly GDP for August
- The Pound Sterling exhibits a mixed performance against its major peers on Thursday. The British currency is expected to remain on edge, with investors focusing on the United Kingdom's (UK) monthly Gross Domestic Product (GDP) and the factory data for August, which will be released on Friday.
- The UK economy is estimated to have expanded by 0.2% after remaining flat in July. The monthly Industrial, and Manufacturing production are expected to have grown by 0.2% after contracting in July. Signs of revival in activities in the manufacturing sector would improve the economic outlook, which will have a positive impact on the Pound Sterling.
- Meanwhile, the major trigger for the Pound Sterling will be market expectations for the Bank of England’s (BoE) outlook for the last quarter of the year. The BoE is expected to cut interest rates by 25 bps in one of the remaining two meetings in November or December. Traders have raised bets for rate cuts in November after last week’s speech from BoE Governor Andrew Bailey, in which he guided for an aggressive policy-easing cycle if price pressures ease further.
- BoE officials have remained worried about high inflation in the services sector due to robust wage growth. UK annual service inflation rose sharply to 5.6% in August from 5.2% in July.
Technical Analysis: Pound Sterling seems vulnerable near 1.3060
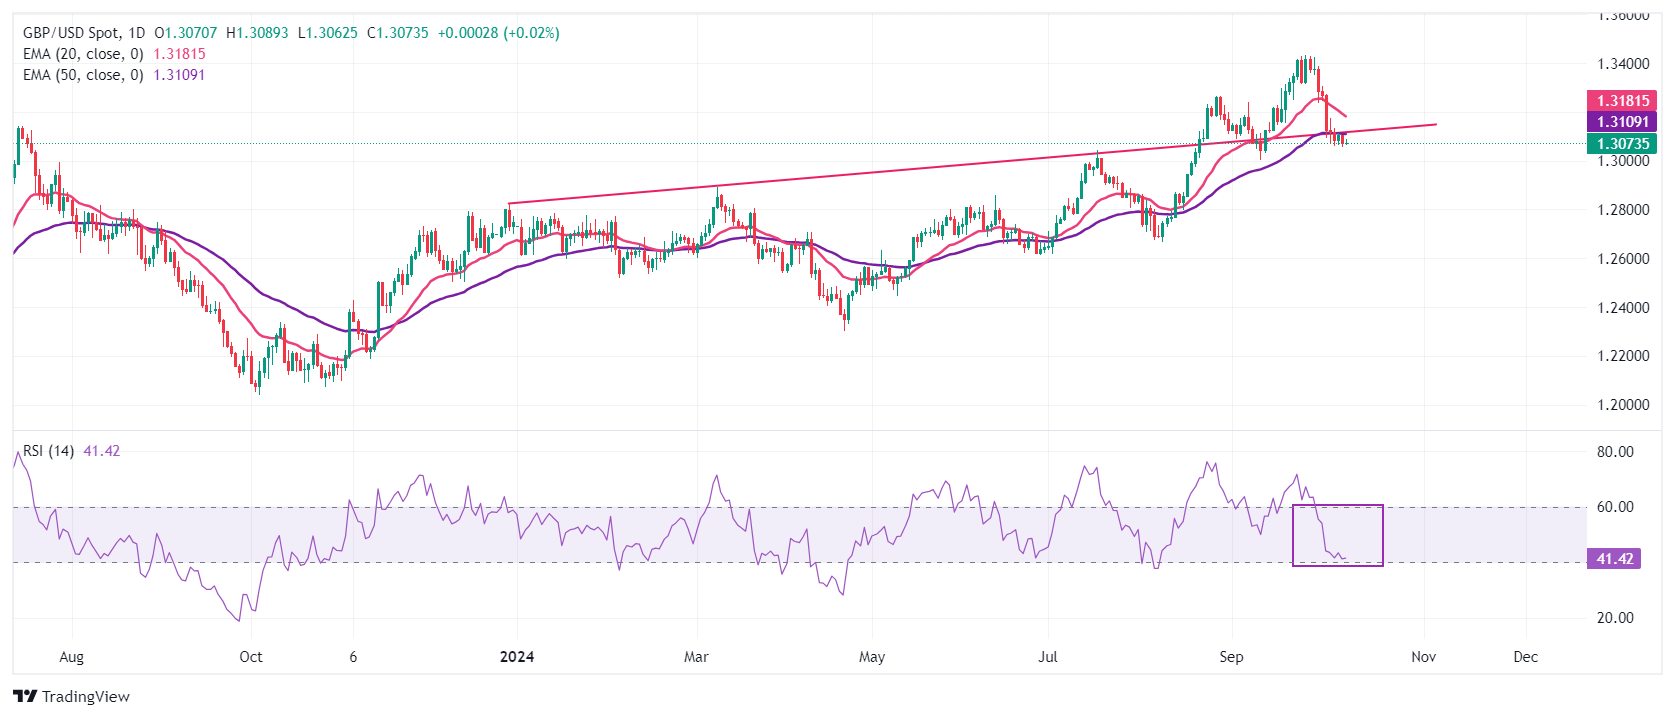
The Pound Sterling struggles to gain ground near 1.3060 against the US Dollar. The GBP/USD pair has fallen on the backfoot after falling below the upward-sloping trendline from the 28 December 2023 high of 1.2827. The near-term outlook of the Cable remains bearish as it trades below the 20- and 50-day Exponential Moving Averages (EMAs), which trade around 1.3180 and 1.3110, respectively.
The 14-day Relative Strength Index (RSI) declines to near 40.00. More downside would appear if the momentum oscillator falls below the above-mentioned level.
Looking up, the round-level resistance of 1.3100 and the 20-day EMA near 1.3180 will be a major barricade for Pound Sterling bulls. On the downside, the Pound Sterling would find support near the psychological figure of 1.3000.
Pound Sterling FAQs
The Pound Sterling (GBP) is the oldest currency in the world (886 AD) and the official currency of the United Kingdom. It is the fourth most traded unit for foreign exchange (FX) in the world, accounting for 12% of all transactions, averaging $630 billion a day, according to 2022 data. Its key trading pairs are GBP/USD, also known as ‘Cable’, which accounts for 11% of FX, GBP/JPY, or the ‘Dragon’ as it is known by traders (3%), and EUR/GBP (2%). The Pound Sterling is issued by the Bank of England (BoE).
The single most important factor influencing the value of the Pound Sterling is monetary policy decided by the Bank of England. The BoE bases its decisions on whether it has achieved its primary goal of “price stability” – a steady inflation rate of around 2%. Its primary tool for achieving this is the adjustment of interest rates. When inflation is too high, the BoE will try to rein it in by raising interest rates, making it more expensive for people and businesses to access credit. This is generally positive for GBP, as higher interest rates make the UK a more attractive place for global investors to park their money. When inflation falls too low it is a sign economic growth is slowing. In this scenario, the BoE will consider lowering interest rates to cheapen credit so businesses will borrow more to invest in growth-generating projects.
Data releases gauge the health of the economy and can impact the value of the Pound Sterling. Indicators such as GDP, Manufacturing and Services PMIs, and employment can all influence the direction of the GBP. A strong economy is good for Sterling. Not only does it attract more foreign investment but it may encourage the BoE to put up interest rates, which will directly strengthen GBP. Otherwise, if economic data is weak, the Pound Sterling is likely to fall.
Another significant data release for the Pound Sterling is the Trade Balance. This indicator measures the difference between what a country earns from its exports and what it spends on imports over a given period. If a country produces highly sought-after exports, its currency will benefit purely from the extra demand created from foreign buyers seeking to purchase these goods. Therefore, a positive net Trade Balance strengthens a currency and vice versa for a negative balance.
The New Zealand Dollar (NZD) is likely to consolidate between 0.6050 and 0.6100. In the longer run, oversold weakness has not stabilised, but NZD must break clearly below 0.6050 before further sustained decline is likely, UOB Group’s FX analysts Quek Ser Leang and Lee Sue Ann note.
NZD must break below 0.6050 before a steady decline
24-HOUR VIEW: “Yesterday, we indicated that ‘tentative signs of slowing momentum combined with the still oversold conditions suggest NZD is likely to trade in a range.’ Our view of range trading was incorrect, as NZD plummeted to a low of 0.6053. The sharp and swift decline appears to be overdone. This, combined with tentative signs of slowing momentum, suggests NZD is unlikely to weaken much further. Today, NZD is more likely to consolidate between 0.6050 and 0.6100.”
1-3 WEEKS VIEW: “We turned negative in NZD last Wednesday (02 Oct, spot at 0.6285), indicating that ‘the pullback in NZD could potentially reach 0.6225.’ As NZD falls, we track the progress of the decline, and in our most recent narrative from Tuesday (08 Oct, spot at 0.6125), we indicated that NZD ‘still seems weak, but it remains to be seen if it has enough momentum to reach the next major support at 0.6075.’ Yesterday, NZD plummeted below 0.6075, reaching a low of 0.6053. While the weakness in NZD has not stabilised, conditions are severely oversold. To continue to decline in a sustained manner, NZD must break and remain below 0.6050. The probability of NZD breaking clearly below 0.6050 will remain intact as long as 0.6145 (‘strong resistance’ level previously at 0.6195) is not breached. Looking ahead, the next level to monitor below 0.6050 is 0.6005.”
Yesterday, even without an explicit trigger, the US dollar rallied quite a bit, with EUR/USD falling below 1.095 and USD/JPY targeting 150 again, Commerzbank’s FX analyst Michael Pfister notes.
Inflation figures are likely to be quite acceptable
“At the same time, the market is now pricing in just around 42 basis points (bp) of Fed rate cuts by the end of the year (almost 20bp less than a week ago), which would not even be equivalent to a 25bp cut at each of the two remaining meetings. Looking further ahead, the market has priced out another 20bp, meaning that expectations for next September are now almost 40bp lower than before the payrolls.”
“Meanwhile, the question is whether the market has gone a little too far in its correction. Yesterday's minutes of the September decision showed that there was certainly opposition to the 50bp cut, and recent comments from officials often suggest that they are not unhappy with the current state of the economy. Nevertheless, it seems unlikely that the Fed will pause at either of its next two meetings after cutting rates by 50 basis points. Moreover, payrolls are still trending slightly lower and last week's figure is likely to be revised several times. Therefore, the baseline scenario remains a 25 basis point cut at the next meetings.”
“Although today's inflation figures are likely to be quite acceptable, there is a risk that the figure for the core rate in particular will be close to the rounding limit upwards. The market would likely take this as another sign that the Fed is slowing its rate cuts. So while there is much to be said for a somewhat weaker dollar in the medium term, the odds of this happening in the short term are not quite so good, at least not today.”
The Brazilian real is performing poorly, ING’s FX analyst Chris Turner notes.
Real outlook remains challenging
“China's stimulus measures should have been a positive for the real, but instead USD/BRL is trading up towards the 5.60 area. Despite Brazil receiving a sovereign upgrade from Moodys recently, there are a few factors which could be explaining the real's underperformance.”
“One is the poor performance of President Lula's party in local elections at the weekend, which could prompt the government to spend more ahead of the next presidential election in 2026. Second, 44% of Brazil's government debt is on floating rates and Brazil has the lowest share of long-term fixed debt in the region. Higher US bond yields are therefore a problem for Brazil.”
“Forthcoming rate hikes in Brazil should be enough to contain USD/BRL near 5.60, but the real outlook remains challenging.”
- Silver oscillates in a range and remains close to a multi-week low touched on Tuesday.
- The technical setup favors bearish traders and supports prospects for further losses.
- Bears still need to wait for a sustained break below $30.00 before placing fresh bets.
Silver (XAG/USD) lacks any firm intraday direction on Thursday and oscillates in a narrow trading band around mid-$30.00s through the first half of the European session. The white metal remains within the striking distance of a nearly three-week low touched on Tuesday and seems vulnerable to prolonging its rejection slide from the $33.0 neighborhood, or the highest level since December 2012 set last week.
The recent repeated failures to capitalize on momentum beyond the $32.00 mark constitute the formation of a bearish multiple-tops on the daily chart. Moreover, oscillators on the daily chart have started gaining negative traction and add credence to the near-term bearish outlook for the XAG/USD. That said, it will still be prudent to wait for a sustained break and acceptance below the $30.00 psychological mark before positioning for any further depreciating move.
The subsequent downfall could drag the XAG/USD to the $29.75-$29.60 confluence support – comprising the 100-day Simple Moving Average (SMA) and the 50-day SMA. A convincing break below the latter should pave the way for a fall towards the $29.00 mark en route to the next relevant support near the $28.60-$28.50 zone.
On the flip side, any attempted positive move now seems to confront resistance near the $31.00 horizontal support breakpoint. Some follow-through buying, however, might trigger a short-covering rally and allow the XAG/USD to reclaim the $32.00 mark, with some intermediate hurdle near the $31.55 area and the $31.75-$31.80 region. The momentum could extend further towards the $32.25 supply zone en route to the multi-year peak, just ahead of the $33.00 round figure.
Silver daily chart
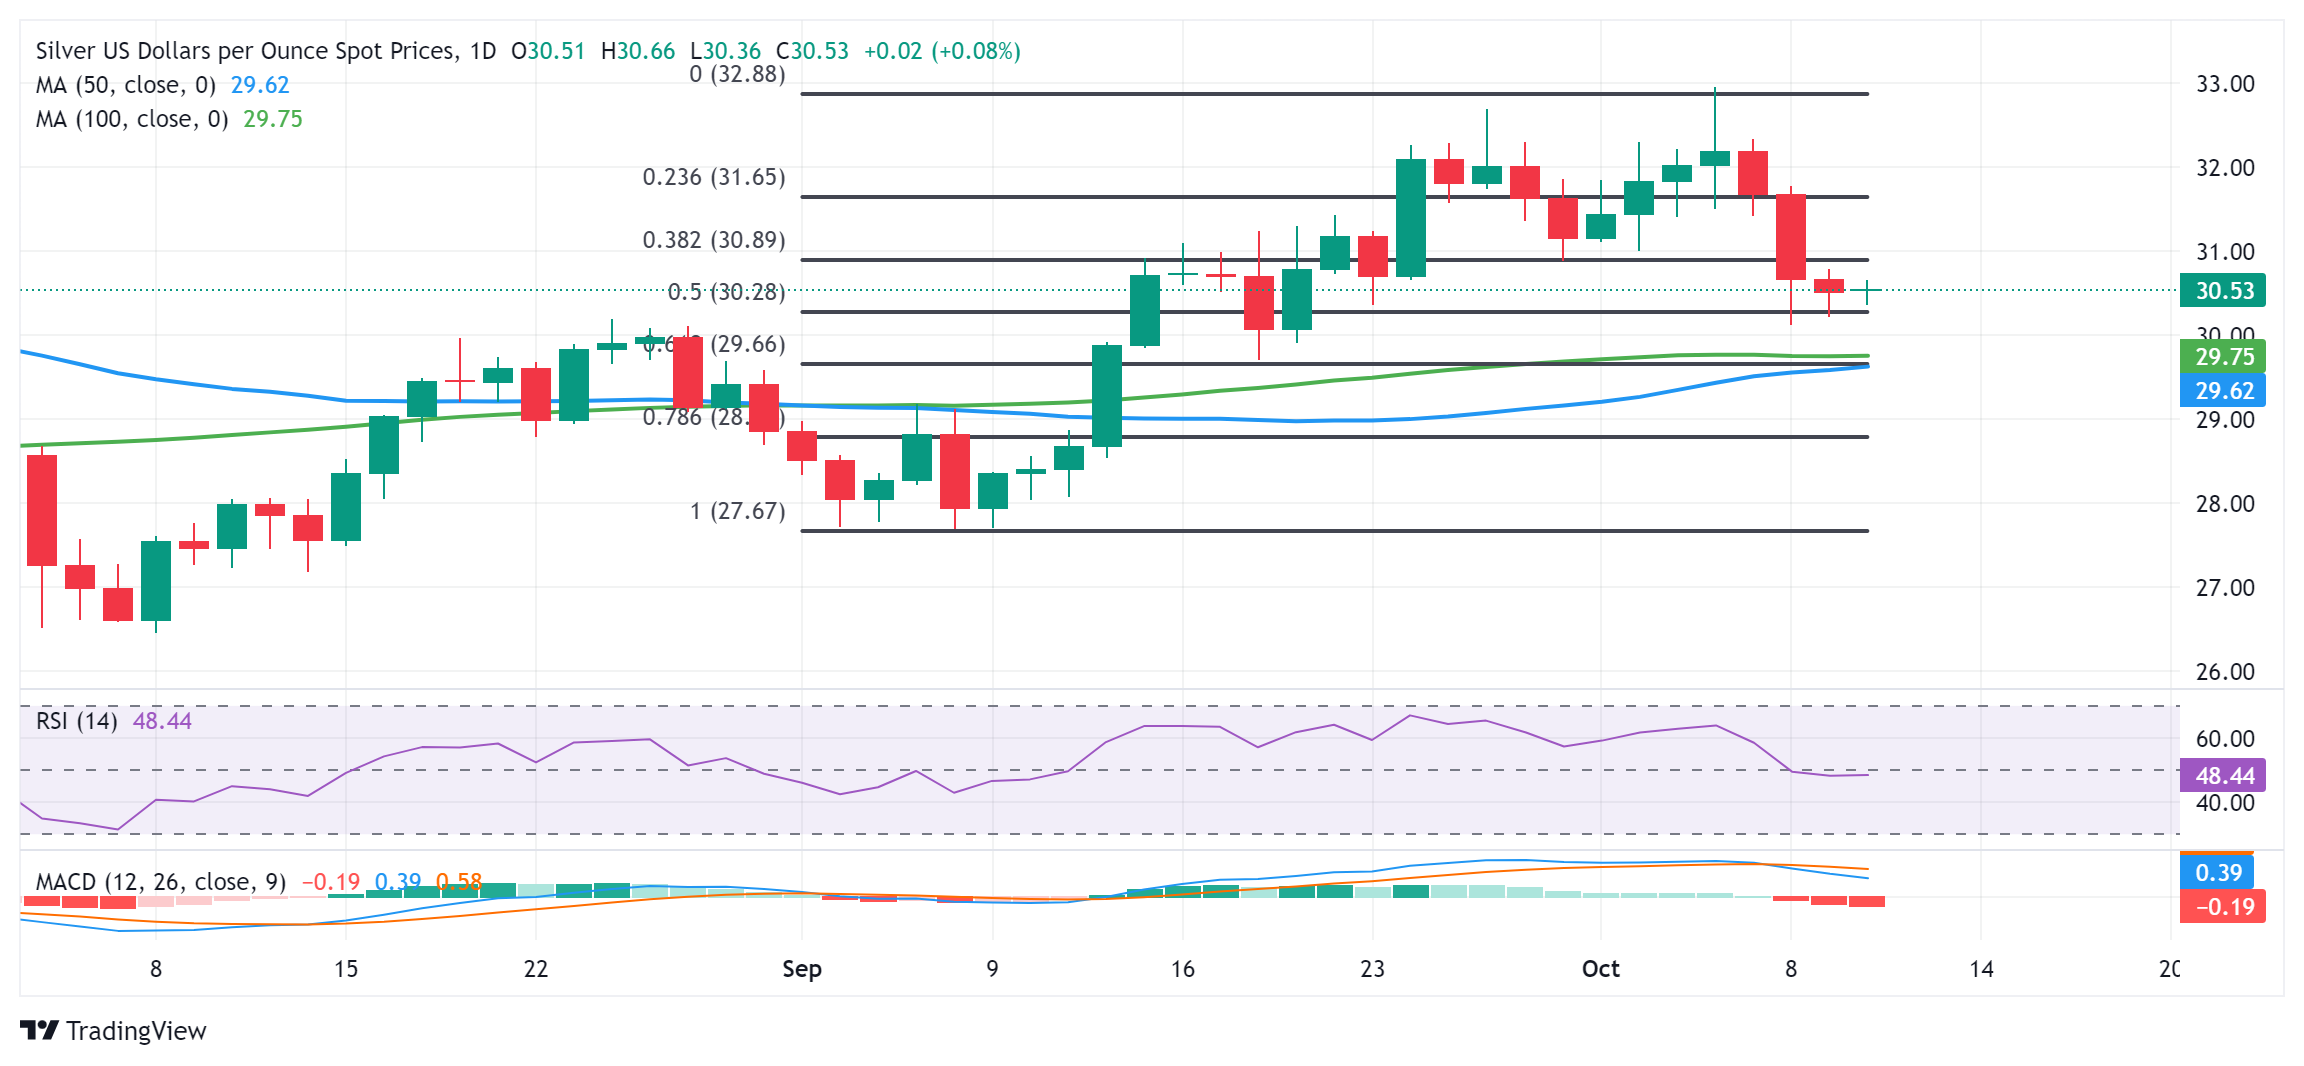
Silver FAQs
Silver is a precious metal highly traded among investors. It has been historically used as a store of value and a medium of exchange. Although less popular than Gold, traders may turn to Silver to diversify their investment portfolio, for its intrinsic value or as a potential hedge during high-inflation periods. Investors can buy physical Silver, in coins or in bars, or trade it through vehicles such as Exchange Traded Funds, which track its price on international markets.
Silver prices can move due to a wide range of factors. Geopolitical instability or fears of a deep recession can make Silver price escalate due to its safe-haven status, although to a lesser extent than Gold's. As a yieldless asset, Silver tends to rise with lower interest rates. Its moves also depend on how the US Dollar (USD) behaves as the asset is priced in dollars (XAG/USD). A strong Dollar tends to keep the price of Silver at bay, whereas a weaker Dollar is likely to propel prices up. Other factors such as investment demand, mining supply – Silver is much more abundant than Gold – and recycling rates can also affect prices.
Silver is widely used in industry, particularly in sectors such as electronics or solar energy, as it has one of the highest electric conductivity of all metals – more than Copper and Gold. A surge in demand can increase prices, while a decline tends to lower them. Dynamics in the US, Chinese and Indian economies can also contribute to price swings: for the US and particularly China, their big industrial sectors use Silver in various processes; in India, consumers’ demand for the precious metal for jewellery also plays a key role in setting prices.
Silver prices tend to follow Gold's moves. When Gold prices rise, Silver typically follows suit, as their status as safe-haven assets is similar. The Gold/Silver ratio, which shows the number of ounces of Silver needed to equal the value of one ounce of Gold, may help to determine the relative valuation between both metals. Some investors may consider a high ratio as an indicator that Silver is undervalued, or Gold is overvalued. On the contrary, a low ratio might suggest that Gold is undervalued relative to Silver.
A break 0.6700 is not ruled out; given the mild momentum, AUD may not be able to maintain a foothold below this level. Bias for AUD remains on the downside; a clear break below 0.6700 would suggest further decline, potentially to 0.6670, UOB Group’s FX analysts Quek Ser Leang and Lee Sue Ann note.
A break 0.6700 is not ruled out
24-HOUR VIEW: “We expected AUD to trade in a range between 0.6725 and 0.6780 yesterday. Instead of trading in a range, AUD edged lower to 0.6708, closing on a soft note at 0.6719 (-0.42%). Downward momentum has increased, albeit slightly. To continue to decline, AUD must remain below 0.6755 with minor resistance at 0.6735. On the downside, a break of the major support at 0.6700 is not ruled out, but given the mild momentum, AUD may not be able to maintain a foothold below this level. The next support at 0.6670 is unlikely to come under threat.”
1-3 WEEKS VIEW: “We indicated two days ago (08 Oct, spot at 0.6755) that AUD is “is expected to continue to weaken, albeit at a slower pace.” We added, “the next level to watch is 0.6700.” Yesterday, AUD edged lower to 0.6708. While there has been no significant increase in momentum, the bias for AUD remains on the downside. A clear break below 0.6700 would suggest AUD could decline further, potentially to 0.6670. The downward bias is intact provided that AUD remains below 0.6785 (‘strong resistance’ level previously at 0.6800).”
EUR/USD remains under pressure for the reasons we discuss above, ING’s FX analyst Chris Turner notes.
EUR/USD can break down to the 1.0800 area
“In focus today will be the release of the ECB minutes from the 11-12 September meeting when the ECB cut rates by 25bp but provided no forward guidance. Since then, we've seen a terrible set of September PMI data across the region and ECB speakers have acknowledged dwindling inflation risks and increasing growth risks.”
“Hence the market is now fully pricing 25bp rate cuts in October and December and keeping those EUR:USD swap differentials wide. It seems unlikely that today's release of the minutes can scale back expectations for an ECB rate cut next week – but let's see.”
“EUR/USD remains soggy. Technically it looks like it can break down to the 1.0800 area. But we're not sure US short-dated yields will be the trigger since these have come a long way quite quickly. What would be a trigger is higher energy prices and that's why tension in the Middle East could demand a greater risk premium of the euro.”
The Pound Sterling (GBP) is expected to drift lower, potentially dropping below 1.3050; lackluster momentum suggests 1.3000 is out of reach. In the longer run, price action suggests further GBP weakness; the next major support at 1.3000 may not come into view so soon, UOB Group’s FX analysts Quek Ser Leang and Lee Sue Ann note.
Momentum suggests 1.3000 is out of reach
24-HOUR VIEW: “Yesterday, we expected GBP to trade in a sideways range of 1.3065/1.3135. GBP subsequently traded between 1.3057 and 1.3106, closing slightly lower at 1.3075 (-0.21%). The mild decline resulted in a slight increase of momentum. Today, we expect GBP to drift lower, potentially dropping below 1.3050. Due to the lackluster momentum, any decline is unlikely to reach 1.3000. Resistance levels are at 1.3090 and 1.3115.”
1-3 WEEKS VIEW: “We have held a negative view in GBP since the middle of last week (as annotated in the chart below). In our most recent narrative from Monday (07 Oct, spot at 1.3130), we indicated that ‘although the recent price action suggests further GBP weakness, conditions are oversold, and the next major support at 1.3000 may not come into view so soon.’ There is no change in our view. Overall, only a breach of 1.3150 (‘strong resistance’ level previously at 1.3185) would suggest that the current downward pressure has eased.”
Reading through the September FOMC minutes, there seemed no sense of urgency from the Fed to get rates lower – even though it did cut by 50bp. More a sense that the inflation scare was over, unemployment was drifting higher and a risk management approach required a recalibration of policy. There were not any strong signals about how quickly rates would be cut to less restrictive levels and of course, the future pace of rate reductions would be data-dependent, ING’s FX analyst Chris Turner notes.
Geopolitical uncertainty to help USD
“The reason markets did not do much is that we've already seen a considerable adjustment in short-dated US rates since late September. The Fed's terminal rate for this easing cycle has been repriced 50bp higher over the last few weeks. And short-dated yields have moved significantly in the dollar's favour. EUR:USD two-year swap differentials have widened from 85bp to 130bp in about three weeks – no wonder EUR//USD is down towards 1.09.”
“Can short-dated US rates rise much further from here? We suspect probably not. But we could find out today should US September CPI come in slightly above consensus at 0.3% MoM. That will not be a deal-breaker for a 25bp cut from the Fed in November but perhaps will give the Fed a little less leeway to pursue more aggressive easing. Additionally, later today we have two more Fed speakers in the form of Tom Barkin and John Williams, both seen as modest hawks.”
“The FX market is choppy due to stimulus measures from China and ongoing instability in the Middle East. Investors anticipate the Chinese Ministry of Finance will announce CNY2-4 trillion in new bond issuance this Saturday, which is supporting commodity currencies. However, the bearish flattening of the US yield curve remains a negative factor for these currencies. DXY could make a bid for the 103.35 area should the US core CPI surprise on the upside today. Geopolitical uncertainty should also help the dollar.”
The Euro (EUR) is expected to edge lower; it remains to be seen if it can break the major support at 1.0900. In the longer run, outlook for EUR remains negative; the next level to watch is 1.0900, UOB Group’s FX analysts Quek Ser Leang and Lee Sue Ann note.
Next level to watch is 1.0900
24-HOUR VIEW: “We expected EUR to trade in a sideways range of 1.0950/1.1000 yesterday. However, it edged lower to 1.0936, closing at 1.0939 (- 0.37%). There has been a slight increase in momentum, and EUR is likely to continue to edge lower today. That said, it remains to be seen if it has enough momentum to break the major support at 1.0900. Resistance is at 1.0960; a breach of 1.0980 would mean that the current mild downward pressure has faded.”
1-3 WEEKS VIEW: “Our latest narrative was from Monday (07 Oct, spot at 1.0970), wherein ‘further EUR weakness appears likely.’ We pointed out ‘the next two support levels to monitor are 1.0935 and 1.0900.’ Yesterday (Wednesday), EUR dropped to a low of 1.0936. While there has been no significant increase in momentum, the outlook for EUR remains negative. The next level to watch is at 1.0900. Note that below this level lies a significant support zone between 1.0860 and 1.0885. On the upside, a breach of 1.1010 (‘strong resistance’ level previously at 1.1045) would mean that the EUR weakness from the middle of last week (see annotations in the chart below) has come to an end.”
- The Mexican Peso weakens after the release of lower inflation data.
- This is expected to speed-up interest-rate cuts by the Bank of Mexico, reducing inflows.
- The US Dollar resurfaces from the depths, reviving USD/MXN’s medium-term uptrend.
The Mexican Peso (MXN) seesaws between tepid gains and losses in its most heavily-traded pairs on Thursday after weakening for two days in a row. The Peso began to fall at the start of the week due to a pronounced risk-off tone permeating markets, which tends to disproportionately disadvantage emerging market currencies.
Sentiment soured as investors made clear their disappointment at the lack of stimulus measures announced by the China National Development and Reform Commission (NDRC) over the weekend. These concerns later eased, however, after China’s Finance Ministry said it would announce a fresh package of fiscal measures on October 12.
On Wednesday, the Peso continued to weaken following the release of lower-than-expected Mexican inflation data. This showed that in the 12 months to September the headline rate of inflation fell to 4.58%, from 4.99% recorded in August. A strengthening US Dollar (USD) supplied a further headwind.
The decline in inflation increases the probability of the Bank of Mexico (Banxico) will make deeper cuts to interest rates in the near future. This, in turn, could reduce foreign capital inflows, resulting in lower demand for the Mexican Peso.
Mexican Peso could find support from new wage laws
The Mexican Peso might gain some support from new wage laws passed on Wednesday which enshrine in the constitution workers rights to see their wages rise in line with inflation.
“With 124 votes in favor, the Senate of the Republic approved in general and in particular the reform to establish the annual fixing of general or professional minimum wages, as well as their revision, and that they never be below inflation,” reported El Financiero.
“The purpose of the reform is to ensure that Mexicans' income does not fall below inflation, which will favor their purchasing power. Therefore, year after year, increases or adjustments could be made based on inflation,” the report went on.
The benchmarking of wages to inflation could slow the disinflationary trend, if workers continue spending at current rates. In addition, if businesses pass on inflation-linked employee wage costs to consumers this will also maintain inflation.
Continued elevated inflation would, in turn, delay any cuts to interest rates planned by Banxico – or make the reductions more gradual – with the side-effect of propping up the Mexican Peso.
Sheinbaum takes control of Mexican Oil
The Mexican Peso has seen volatility due to rising political risk premia since the re-election of the Morena-led government in June and this could revive as foreign investors digest the news that President Claudia Sheinbaum is moving to take greater control of Mexico’s Oil state-backed industry.
On Wednesday, Mexico’s Congress debated the reclassification of two of Mexico’s largest Oil producers, Pemex and the Federal Electricity Commission (FEC) with a view to increasing their control of the companies and renaming them as “public enterprises.” The change “would force them to prioritize the government's social and economic objectives over corporate profits,” according to El Financiero.
The reform was initially proposed by Sheinbaum's mentor and predecessor, former President Andrés Manuel López Obrador (AMLO), and is expected to win the approval of the ruling coalition's decisive majority in Congress.
Technical Analysis: USD/MXN starts rising from base of channel
USD/MXN starts to recover after touching the base of a medium-term rising channel.
USD/MXN Daily Chart
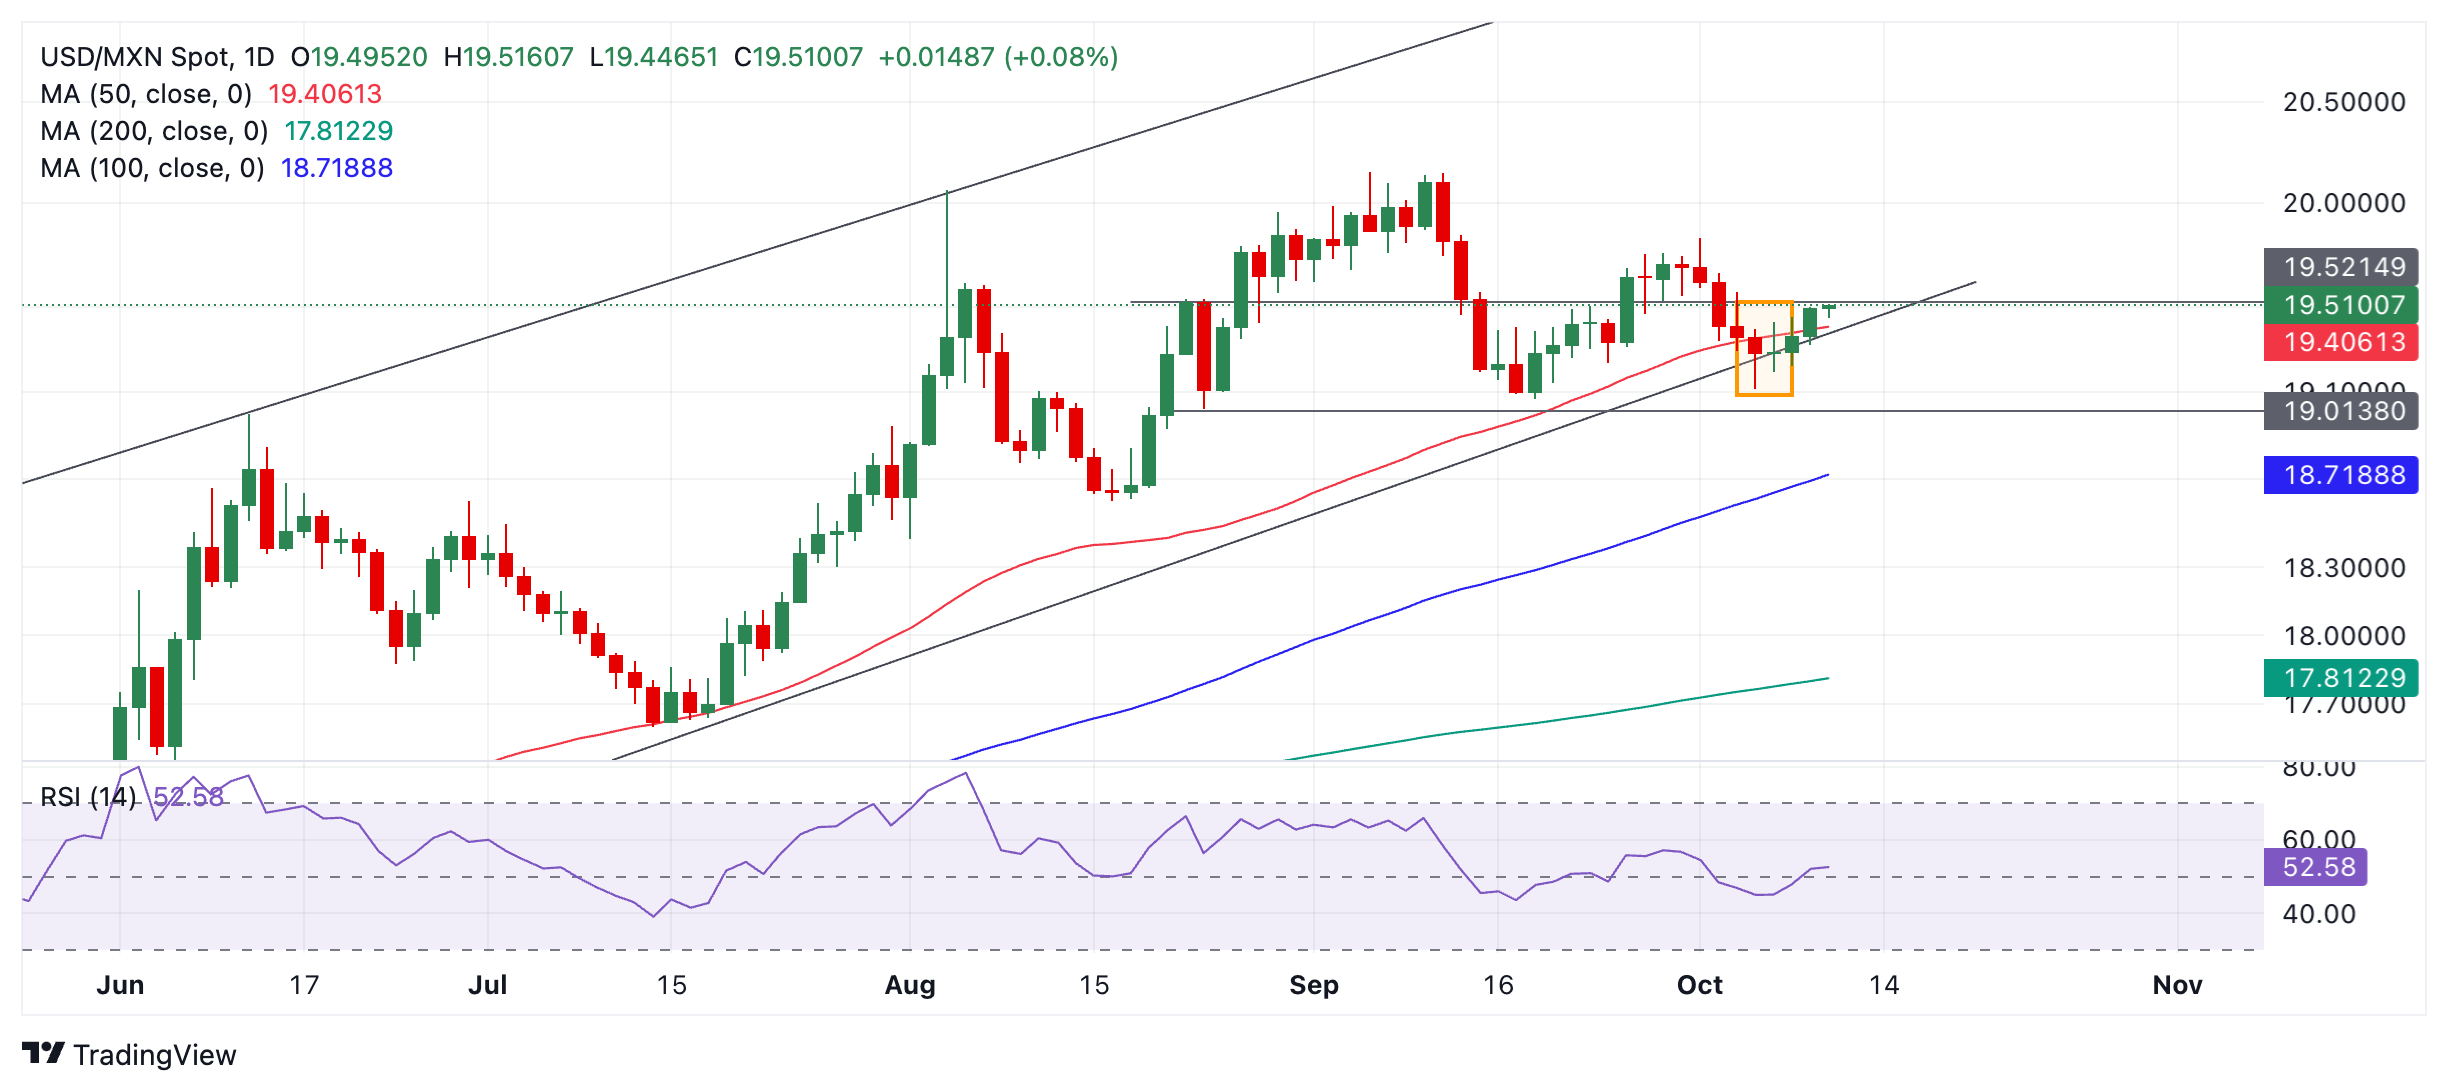
USD/MXN is probably starting a new uptrending leg within its ascending channel. The medium and longer-term trends are bullish, and given the technical analysis principle that “the trend is your friend,” this favors a continuation higher.
On October 4 the pair formed a bullish Japanese Hammer candlestick pattern at the base of the channel (orange rectangle on the chart). This was followed by a slightly bullish Japanese Doji candlestick and then two green up candles. This configuration marks the reversal of the short-term trend which is now technically bullish.
USD/MXN has just reached resistance at 19.51 (August 22 high) if it can break above 19.57 it will signal a clearance of this resistance and a probable continuation higher to the next upside target at around 19.83 (October 1 high).
Economic Indicator
12-Month Inflation
The 12-month inflation index released by the Bank of Mexico is a measure of price movements by the comparison between the retail prices of a representative shopping basket of goods and services. The purchase power of Mexican Peso is dragged down by inflation. The inflation index is a key indicator since it is used by the central bank to set interest rates. Generally speaking, a high reading is seen as positive (or bullish) for the Mexican Peso, while a low reading is seen as negative (or Bearish).
Read more.Last release: Wed Oct 09, 2024 12:00
Frequency: Monthly
Actual: 4.58%
Consensus: 4.62%
Previous: 4.99%
Source: National Institute of Statistics and Geography of Mexico
Bank of Japan (BoJ) Deputy Governor Ryozo Himino is delivering a speech on Japan's markets at a Bloomberg event on Thursday.
Key quotes
We are witnessing record high corporate profits and record high wage increases in Japan.
If outlook for economic activity and prices presented in July report is achieved, BoJ will accordingly raise interest rates.
The policy board is going to look at totality of the data as it makes decisions meeting by meeting.
We have many real interest rates and they vary significantly but all of them negative.
Later in the year, we will have more data on pass through of wage hike on prices, and next year's wage negotiations.
We will also know more about pass-through of Yen-Dollar rate on inflation via import prices.
BoJ will consider adjusting degree of monetary conditions if board has greater confidence its outlook is realized.
What data to focus shifts as data comes in, today US employment and consumption, and Chinese consumption may deserve more attention than before.
We monitor data to detect developments that are not already covered in our risk scenarios, looking at data outside the current priority list is equally important.
- EUR/USD faces selling pressure as the US Dollar holds onto gains ahead of the US CPI data for September.
- Fed officials are highly concerned about reviving job growth.
- The Euro is under pressure as the ECB is expected to reduce interest rates further by 50 bps by the year-end.
EUR/USD exhibits a weak performance in Thursday’s European session after diving below the key support of 1.0950 on Wednesday. The major currency pair remains under pressure as the US Dollar (USD) clings to gains ahead of the United States (US) Consumer Price Index (CPI) data for September, which will be published at 12:30 GMT.
The US Dollar Index (DXY), which tracks the Greenbacks value against six major currencies, trades close to a fresh seven-week high near 103.00.
Economists expect the annual core CPI – which excludes volatile food and energy prices – to have grown steadily by 3.2%. Annual headline CPI is expected to have decelerated to 2.3% from 2.5% in August. The month-on-month headline and core CPI are expected to have grown at a slower pace of 0.1% and 0.2%, respectively.
The impact of the inflation data on market expectations for the Federal Reserve (Fed) interest rate outlook is expected to be moderate as recent commentaries from Fed officials have indicated that they are confident about price pressures remaining on track to return sustainably to the bank’s target of 2%. Fed policymakers are highly focused on reviving labor demand due to which they unanimously voted for a larger-than-usual rate cut size of 50 basis points (bps) in the September policy meeting.
However, the scenario of blowout inflation figures could renew risks of inflation remaining persistent and negatively influence market expectations of two more interest rates in the remaining year.
Daily digest market movers: EUR/USD weakens as ECB rate cut bets swell
- EUR/USD remains vulnerable near a fresh eight-week low of 1.0940 due to multiple headwinds. Apart from the firm US Dollar, the Euro’s (EUR) underperformance against its major peers due to escalating European Central Bank (ECB) dovish bets has also kept the shared currency pair on the backfoot.
- A majority of ECB officials have argued in favor of reducing interest rates further as risks of inflation remaining persistent in the Eurozone have significantly eased after the September flash annual Harmonized Index of Consumer Prices (HICP) report decelerated to 1.8%, the lowest since April 2021. Also, growing risks to economic growth have allowed traders to price in a 25-bps interest rate cut in each of the remaining two meetings this year.
- German economic ministry said on Wednesday that they are expecting the economy to end the year with a 0.2% decline in the overall output. Earlier, the economic ministry projected a 0.3% growth but was forced to revise forecasts due to structural problems and geopolitical issues. Being the largest nation in the Eurozone, the impact of a de-growth in the German economy would be high on the Euro.
- On the economic front, annual German Retail Sales, a key measure of consumer spending that prompts inflationary pressures, expanded at a robust pace of 2.1% in August after contracting by 1.6% in July. On month-on-month, the consumer spending measure rose at a faster pace of 1.6% from 1.5% in July.
Technical Analysis: EUR/USD trades close to fresh eight-week low below 1.0940
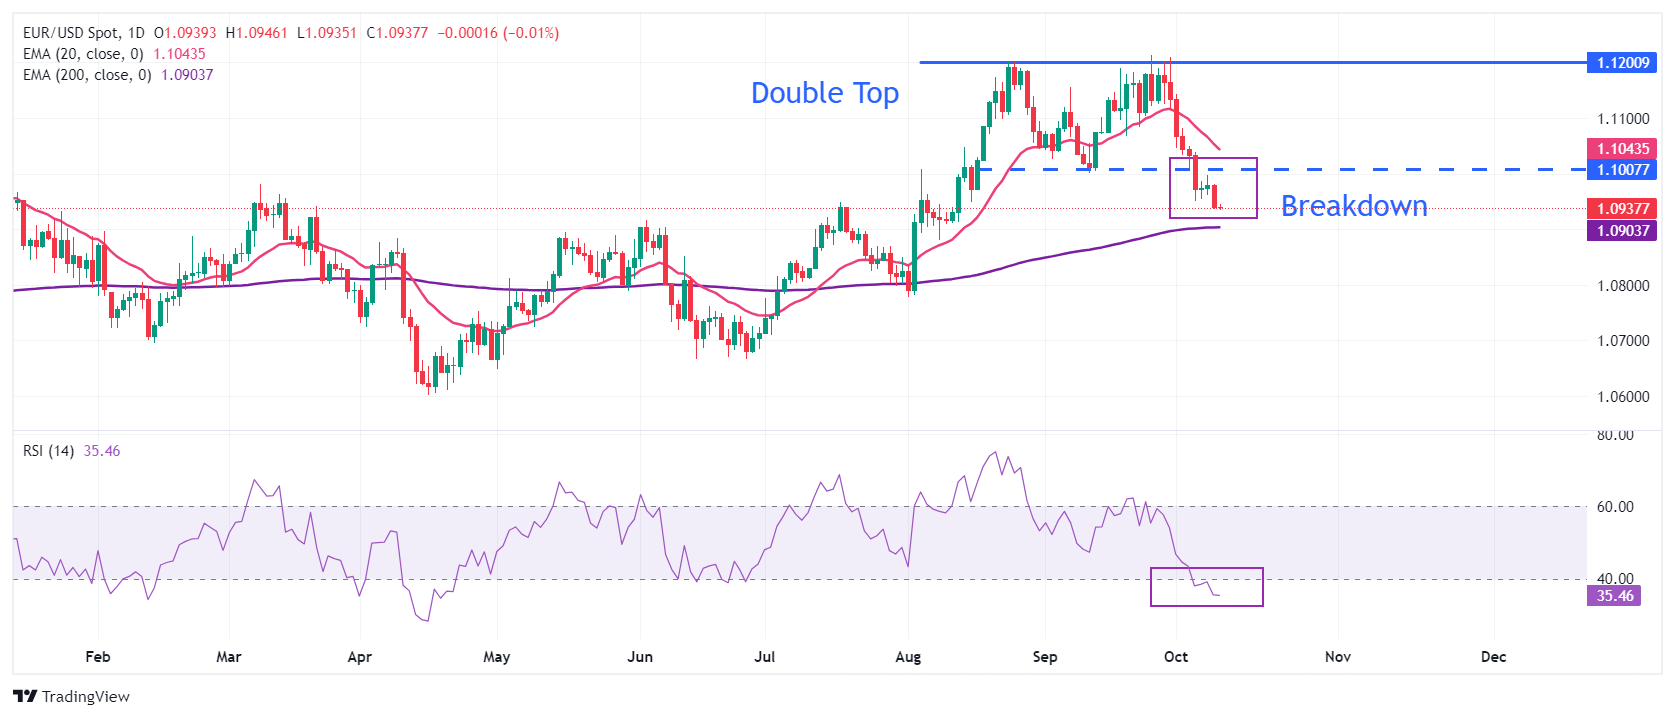
EUR/USD extends its downside to near 1.0935 after failing to hold the key support of 1.0950. The major currency pair weakened after it delivered a breakdown of the Double Top chart pattern formation on a daily timeframe. The above-mentioned chart pattern was triggered after the shared currency pair broke below the September 11 low of 1.1000.
The 14-day Relative Strength Index (RSI) settles inside the bearish range of 20.00-40.00, suggesting more weakness ahead.
Looking down, the pair is expected to find support near the 200-day EMA around 1.0900. On the upside, the September 11 low of 1.1000 and the 20-day EMA at 1.1090 will be major resistance zones.
Euro FAQs
The Euro is the currency for the 19 European Union countries that belong to the Eurozone. It is the second most heavily traded currency in the world behind the US Dollar. In 2022, it accounted for 31% of all foreign exchange transactions, with an average daily turnover of over $2.2 trillion a day. EUR/USD is the most heavily traded currency pair in the world, accounting for an estimated 30% off all transactions, followed by EUR/JPY (4%), EUR/GBP (3%) and EUR/AUD (2%).
The European Central Bank (ECB) in Frankfurt, Germany, is the reserve bank for the Eurozone. The ECB sets interest rates and manages monetary policy. The ECB’s primary mandate is to maintain price stability, which means either controlling inflation or stimulating growth. Its primary tool is the raising or lowering of interest rates. Relatively high interest rates – or the expectation of higher rates – will usually benefit the Euro and vice versa. The ECB Governing Council makes monetary policy decisions at meetings held eight times a year. Decisions are made by heads of the Eurozone national banks and six permanent members, including the President of the ECB, Christine Lagarde.
Eurozone inflation data, measured by the Harmonized Index of Consumer Prices (HICP), is an important econometric for the Euro. If inflation rises more than expected, especially if above the ECB’s 2% target, it obliges the ECB to raise interest rates to bring it back under control. Relatively high interest rates compared to its counterparts will usually benefit the Euro, as it makes the region more attractive as a place for global investors to park their money.
Data releases gauge the health of the economy and can impact on the Euro. Indicators such as GDP, Manufacturing and Services PMIs, employment, and consumer sentiment surveys can all influence the direction of the single currency. A strong economy is good for the Euro. Not only does it attract more foreign investment but it may encourage the ECB to put up interest rates, which will directly strengthen the Euro. Otherwise, if economic data is weak, the Euro is likely to fall. Economic data for the four largest economies in the euro area (Germany, France, Italy and Spain) are especially significant, as they account for 75% of the Eurozone’s economy.
Another significant data release for the Euro is the Trade Balance. This indicator measures the difference between what a country earns from its exports and what it spends on imports over a given period. If a country produces highly sought after exports then its currency will gain in value purely from the extra demand created from foreign buyers seeking to purchase these goods. Therefore, a positive net Trade Balance strengthens a currency and vice versa for a negative balance.
Here is what you need to know on Thursday, October 10:
After having stayed relatively quiet since the beginning of the week, the US Dollar (USD) gathered bullish momentum in the American trading hours on Wednesday, with the USD Index climbing to its highest level since mid-August near 103.00. The European Central Bank (ECB) will release the Monetary Policy Meeting Accounts later in the European session. In the second half of the day, the Consumer Price Index (CPI) data from the US will be watched closely by market participants.
US Dollar PRICE This week
The table below shows the percentage change of US Dollar (USD) against listed major currencies this week. US Dollar was the strongest against the New Zealand Dollar.
| USD | EUR | GBP | JPY | CAD | AUD | NZD | CHF | |
|---|---|---|---|---|---|---|---|---|
| USD | 0.28% | 0.29% | 0.30% | 1.05% | 0.93% | 1.21% | 0.12% | |
| EUR | -0.28% | 0.07% | 0.05% | 0.79% | 0.62% | 0.92% | -0.19% | |
| GBP | -0.29% | -0.07% | -0.06% | 0.73% | 0.55% | 0.88% | -0.14% | |
| JPY | -0.30% | -0.05% | 0.06% | 0.73% | 0.61% | 0.85% | -0.14% | |
| CAD | -1.05% | -0.79% | -0.73% | -0.73% | -0.08% | 0.17% | -0.92% | |
| AUD | -0.93% | -0.62% | -0.55% | -0.61% | 0.08% | 0.34% | -0.77% | |
| NZD | -1.21% | -0.92% | -0.88% | -0.85% | -0.17% | -0.34% | -1.05% | |
| CHF | -0.12% | 0.19% | 0.14% | 0.14% | 0.92% | 0.77% | 1.05% |
The heat map shows percentage changes of major currencies against each other. The base currency is picked from the left column, while the quote currency is picked from the top row. For example, if you pick the US Dollar from the left column and move along the horizontal line to the Japanese Yen, the percentage change displayed in the box will represent USD (base)/JPY (quote).
The hawkish tone in the minutes of the Federal Reserve's (Fed) September meeting boosted the USD late Wednesday. The publication showed that even though a substantial majority of Fed officials supported the 50 basis points (bps) rate cut, there was even a broader consensus that this initial step would not lock the Fed into any specific pace for future rate cuts. Additionally, some participants favored only a 25 bps reduction in the policy rate cut and a few others mentioned they could have supported that decision as well.
Annual CPI inflation in the US is forecast to soften to 2.3% in September from 2.5% in August. The core CPI, which excludes volatile food and energy prices, is expected to rise 0.2% on a monthly basis. Ahead of the key CPI data, the USD Index stays in a consolidation phase, while US stock index futures trade marginally lower.
Earlier in the day, the data from Germany showed that Retail Sales rose 1.6% in August. This reading failed to trigger a noticeable reaction in EUR/USD. After losing nearly 0.4% on Wednesday, the pair trades in a tight range below 1.0950 early Thursday.
GBP/USD edged lower in the second half of the day on Wednesday and came within a touching distance of 1.3050. The pair holds its ground in the European morning on Thursday but remains below 1.3100.
Following Tuesday's indecisive action, USD/JPY gained traction and registered gains on Wednesday. The pair touched its highest level since early August above 149.50 during the Asian trading hours on Thursday before retreating toward 149.00.
Gold extended its slide and closed the sixth consecutive trading day in negative territory on Wednesday. XAU/USD struggles to gather bullish momentum but manages to hold above $2,600 in the European morning on Thursday.
Inflation FAQs
Inflation measures the rise in the price of a representative basket of goods and services. Headline inflation is usually expressed as a percentage change on a month-on-month (MoM) and year-on-year (YoY) basis. Core inflation excludes more volatile elements such as food and fuel which can fluctuate because of geopolitical and seasonal factors. Core inflation is the figure economists focus on and is the level targeted by central banks, which are mandated to keep inflation at a manageable level, usually around 2%.
The Consumer Price Index (CPI) measures the change in prices of a basket of goods and services over a period of time. It is usually expressed as a percentage change on a month-on-month (MoM) and year-on-year (YoY) basis. Core CPI is the figure targeted by central banks as it excludes volatile food and fuel inputs. When Core CPI rises above 2% it usually results in higher interest rates and vice versa when it falls below 2%. Since higher interest rates are positive for a currency, higher inflation usually results in a stronger currency. The opposite is true when inflation falls.
Although it may seem counter-intuitive, high inflation in a country pushes up the value of its currency and vice versa for lower inflation. This is because the central bank will normally raise interest rates to combat the higher inflation, which attract more global capital inflows from investors looking for a lucrative place to park their money.
Formerly, Gold was the asset investors turned to in times of high inflation because it preserved its value, and whilst investors will often still buy Gold for its safe-haven properties in times of extreme market turmoil, this is not the case most of the time. This is because when inflation is high, central banks will put up interest rates to combat it. Higher interest rates are negative for Gold because they increase the opportunity-cost of holding Gold vis-a-vis an interest-bearing asset or placing the money in a cash deposit account. On the flipside, lower inflation tends to be positive for Gold as it brings interest rates down, making the bright metal a more viable investment alternative.
- WTI price climbs to near $73.20 in Thursday’s early European session.
- The escalating Middle East geopolitical tensions and Hurricane Milton risks underpin the WTI price.
- The worry about Chinese sluggish demand might cap the upside for oil prices.
West Texas Intermediate (WTI), the US crude oil benchmark, is trading around $73.20 on Thursday. The WTI price edges higher on the fears of oil supply disruptions in the Middle East amid the ongoing tensions and Hurricane Milton in the United States.
A potential Israeli attack on Iranian oil infrastructure could boost the WTI price in the near term. Israeli Defence Minister Yoav Gallant said Israel’s retaliation to Iran’s missile attack would be “powerful, precise, and above all – surprising.”
A severe hurricane that hit Florida has already increased demand for gasoline, with almost a quarter of fuel stations running out of supplies. This, in turn, helps to lift the black gold prices.
US crude oil inventories rose more than expected last week. According to the Energy Information Administration (EIA), crude oil stockpiles in the United States for the week ending October 4 jumped by 5.81 million barrels, compared to a rise of 3.889 million barrels in the previous week. The market consensus estimated that stocks would increase by only 2 million barrels.
The World Bank projected China’s growth rate would drop to 4.3% next year, down from a forecast of 4.8% in 2024, citing concerns about weak Chinese consumer spending. Meanwhile, the US EIA on Tuesday downgraded its demand forecast for 2025 on weakening economic activity in China and North America. Investors have worried about slow growth dampening fuel demand in China, and this might cap the upside for the WTI for the time being as China is the world's largest crude importer.
WTI Oil FAQs
WTI Oil is a type of Crude Oil sold on international markets. The WTI stands for West Texas Intermediate, one of three major types including Brent and Dubai Crude. WTI is also referred to as “light” and “sweet” because of its relatively low gravity and sulfur content respectively. It is considered a high quality Oil that is easily refined. It is sourced in the United States and distributed via the Cushing hub, which is considered “The Pipeline Crossroads of the World”. It is a benchmark for the Oil market and WTI price is frequently quoted in the media.
Like all assets, supply and demand are the key drivers of WTI Oil price. As such, global growth can be a driver of increased demand and vice versa for weak global growth. Political instability, wars, and sanctions can disrupt supply and impact prices. The decisions of OPEC, a group of major Oil-producing countries, is another key driver of price. The value of the US Dollar influences the price of WTI Crude Oil, since Oil is predominantly traded in US Dollars, thus a weaker US Dollar can make Oil more affordable and vice versa.
The weekly Oil inventory reports published by the American Petroleum Institute (API) and the Energy Information Agency (EIA) impact the price of WTI Oil. Changes in inventories reflect fluctuating supply and demand. If the data shows a drop in inventories it can indicate increased demand, pushing up Oil price. Higher inventories can reflect increased supply, pushing down prices. API’s report is published every Tuesday and EIA’s the day after. Their results are usually similar, falling within 1% of each other 75% of the time. The EIA data is considered more reliable, since it is a government agency.
OPEC (Organization of the Petroleum Exporting Countries) is a group of 12 Oil-producing nations who collectively decide production quotas for member countries at twice-yearly meetings. Their decisions often impact WTI Oil prices. When OPEC decides to lower quotas, it can tighten supply, pushing up Oil prices. When OPEC increases production, it has the opposite effect. OPEC+ refers to an expanded group that includes ten extra non-OPEC members, the most notable of which is Russia.
Germany's Retail Sales increased by 1.6% MoM in August, the official data released by Destatis showed on Thursday.
The monthly June Retail Sales figure for Germany stood at -1.1% while that for July came in at 1.5%.
Annually, Retail Sales in the Eurozone's top economy grew by 2.1% in August.
EUR/USD reaction to the German data
German data fails to move the needle around the Euro, keeping EUR/USD at around 1.0935, flat on the day, as of writing.
FX option expiries for Oct 10 NY cut at 10:00 Eastern Time, via DTCC, can be found below.
EUR/USD: EUR amounts
- 1.0930 556m
- 1.0950 645m
- 1.0975 782m
- 1.1000 595m
- 1.1045 448m
- 1.1125 968m
USD/JPY: USD amounts
- 148.50 542m
- 149.00 723m
- 149.25 490m
- 149.50 1.8b
- 149.85 504m
- 150.00 1.1b
USD/CHF: USD amounts
- 0.8450 2.1b
AUD/USD: AUD amounts
- 0.6760 410m
- 0.6775 1.8b
USD/CAD: USD amounts
- 1.3595 903m
- 1.3600 996m
- 1.3650 2.1b
- 1.3725 758m
NZD/USD: NZD amounts
- 0.5950 700m
- 0.6200 401m
- USD/CAD moves back closer to its highest level since August 16 amid a bullish USD.
- Bets for a regular 25 bps Fed rate cut in November lift the USD to a multi-week top.
- An uptick in Oil prices underpins the Loonie and caps the pair ahead of the US CPI.
The USD/CAD pair reverses an Asian session dip and is currently placed just above the 1.3700 round figure, within the striking distance of its highest level since August 16 touched the previous day. The intraday uptick, however, lacks bullish conviction amid recovering Crude Oil prices, which tend to underpin the commodity-linked Loonie, and ahead of the latest US consumer inflation figures.
Investors remained wary of a potential escalation in tensions between Israel and Iran, with Israeli Defence Minister Yoav Gallant promising that the strike against the latter would be "lethal, precise and surprising". This raises worries about supply disruptions from the Middle East, which, along with a spike in fuel demand on the back of a major storm in Florida, assists Crude Oil prices to build on the overnight bounce from a one-week low. This, in turn, offers some support to the Canadian Dollar (CAD), though expectations for a larger interest rate cut by the Bank of Canada (BoC) cap gains. Apart from this, the underlying bullish tone surrounding the US Dollar (USD) acts as a tailwind for the USD/CAD pair.
The USD Index (DXY), which tracks the Greenback against a basket of currencies, touched a fresh eight-week high in the last hour as traders fully price out the possibility of another interest rate cut by the Federal Reserve (Fed) in November. The recent US macro data pointed to a still resilient labor market and forced investors to scale back their expectations for a more aggressive policy easing by the Fed. Adding to this, the September FOMC meeting minutes released on Wednesday showed a consensus that the outsized rate cut would not lock the central bank into any specific pace for future cuts. This keeps the US Treasury bond yields and the USD elevated, assisting the USD/CAD pair to attract some dip-buyers.
Traders, however, seem reluctant and prefer to wait for more cues about the Fed's rate-cut path before placing fresh USD bullish bets. Hence, the focus will remain glued to the release of the crucial US Consumer Price Index (CPI) later today, which will be followed by the US Producer Price Index (PPI) on Friday. Apart from this, the Canadian monthly employment details on Friday will be looked upon to determine the near-term trajectory for the USD/CAD pair.
Canadian Dollar FAQs
The key factors driving the Canadian Dollar (CAD) are the level of interest rates set by the Bank of Canada (BoC), the price of Oil, Canada’s largest export, the health of its economy, inflation and the Trade Balance, which is the difference between the value of Canada’s exports versus its imports. Other factors include market sentiment – whether investors are taking on more risky assets (risk-on) or seeking safe-havens (risk-off) – with risk-on being CAD-positive. As its largest trading partner, the health of the US economy is also a key factor influencing the Canadian Dollar.
The Bank of Canada (BoC) has a significant influence on the Canadian Dollar by setting the level of interest rates that banks can lend to one another. This influences the level of interest rates for everyone. The main goal of the BoC is to maintain inflation at 1-3% by adjusting interest rates up or down. Relatively higher interest rates tend to be positive for the CAD. The Bank of Canada can also use quantitative easing and tightening to influence credit conditions, with the former CAD-negative and the latter CAD-positive.
The price of Oil is a key factor impacting the value of the Canadian Dollar. Petroleum is Canada’s biggest export, so Oil price tends to have an immediate impact on the CAD value. Generally, if Oil price rises CAD also goes up, as aggregate demand for the currency increases. The opposite is the case if the price of Oil falls. Higher Oil prices also tend to result in a greater likelihood of a positive Trade Balance, which is also supportive of the CAD.
While inflation had always traditionally been thought of as a negative factor for a currency since it lowers the value of money, the opposite has actually been the case in modern times with the relaxation of cross-border capital controls. Higher inflation tends to lead central banks to put up interest rates which attracts more capital inflows from global investors seeking a lucrative place to keep their money. This increases demand for the local currency, which in Canada’s case is the Canadian Dollar.
Macroeconomic data releases gauge the health of the economy and can have an impact on the Canadian Dollar. Indicators such as GDP, Manufacturing and Services PMIs, employment, and consumer sentiment surveys can all influence the direction of the CAD. A strong economy is good for the Canadian Dollar. Not only does it attract more foreign investment but it may encourage the Bank of Canada to put up interest rates, leading to a stronger currency. If economic data is weak, however, the CAD is likely to fall.
- NZD/USD drifts higher to around 0.6090 in Thursday’s early Asian session.
- Fed officials at their September meeting agreed to cut interest rates but were unsure how aggressive to get.
- The dovish outlook of the RBNZ weighs on the Kiwi.
The NZD/USD pair attracts some buyers to near 0.6090 amid the consolidation of the Greenback during the early European session on Thursday. The upside of the pair might be limited as traders might turn cautious ahead of the US Consumer Price Index (CPI) inflation data, weekly Initial Jobless Claims and Fedspeak later on Thursday.
The Minutes from September 17-18 showed a "substantial majority" of the Federal Reserve (Fed) officials support a period of looser monetary policy with a significant half-point rate cut. However, there was even a broader consensus that this initial step would not lock the US central bank into any specific pace for future rate cuts. The rising expectation of a regular 25 basis points (bps) interest rate cut by the Fed in November provides some support to the US Dollar (USD).
Inflation in the US, as measured by the CPI, is expected to see an increase of 2.3% YoY in September, down from a 2.5% rise in the previous reading. The core CPI inflation, which excludes volatile food and energy prices, is projected to stay unchanged at 3.2% YoY in the same period.
The Reserve Bank of New Zealand (RBNZ) decided to cut the Official Cash Rate (OCR) by 50 basis points (bps) from 5.25% to 4.75% at its October meeting on Wednesday, as widely expected. The Kiwi loses traction as markets bet on more aggressive easing in November. Swaps imply there are a further 45 basis points of easing to come at the RBNZ's November meeting.
RBNZ FAQs
The Reserve Bank of New Zealand (RBNZ) is the country’s central bank. Its economic objectives are achieving and maintaining price stability – achieved when inflation, measured by the Consumer Price Index (CPI), falls within the band of between 1% and 3% – and supporting maximum sustainable employment.
The Reserve Bank of New Zealand’s (RBNZ) Monetary Policy Committee (MPC) decides the appropriate level of the Official Cash Rate (OCR) according to its objectives. When inflation is above target, the bank will attempt to tame it by raising its key OCR, making it more expensive for households and businesses to borrow money and thus cooling the economy. Higher interest rates are generally positive for the New Zealand Dollar (NZD) as they lead to higher yields, making the country a more attractive place for investors. On the contrary, lower interest rates tend to weaken NZD.
Employment is important for the Reserve Bank of New Zealand (RBNZ) because a tight labor market can fuel inflation. The RBNZ’s goal of “maximum sustainable employment” is defined as the highest use of labor resources that can be sustained over time without creating an acceleration in inflation. “When employment is at its maximum sustainable level, there will be low and stable inflation. However, if employment is above the maximum sustainable level for too long, it will eventually cause prices to rise more and more quickly, requiring the MPC to raise interest rates to keep inflation under control,” the bank says.
In extreme situations, the Reserve Bank of New Zealand (RBNZ) can enact a monetary policy tool called Quantitative Easing. QE is the process by which the RBNZ prints local currency and uses it to buy assets – usually government or corporate bonds – from banks and other financial institutions with the aim to increase the domestic money supply and spur economic activity. QE usually results in a weaker New Zealand Dollar (NZD). QE is a last resort when simply lowering interest rates is unlikely to achieve the objectives of the central bank. The RBNZ used it during the Covid-19 pandemic.
In a quarterly survey published on Thursday, the Bank of Japan (BoJ) said that “85.6% of Japanese households expect prices to rise a year from now, compared with 87.5% in the previous survey.”
Additional takeaways
Japanese households expect inflation to rise by average +10.0% a year from now, median +8.0%.
83.6% of Japanese households expect prices to rise five years from now, vs 82.0% in previous survey.
Japanese households expect inflation to rise by average +7.9% five years from now, median +5.0%.
Market reaction
At the time of writing, USD/JPY is slightly off the two-month highs of 149.55, trading 0.12% higher on the day at 149.45.
Gold prices rose in India on Thursday, according to data compiled by FXStreet.
The price for Gold stood at 7,051.02 Indian Rupees (INR) per gram, up compared with the INR 7,038.39 it cost on Wednesday.
The price for Gold increased to INR 82,241.77 per tola from INR 82,094.45 per tola a day earlier.
| Unit measure | Gold Price in INR |
|---|---|
| 1 Gram | 7,051.02 |
| 10 Grams | 70,508.09 |
| Tola | 82,241.77 |
| Troy Ounce | 219,309.90 |
FXStreet calculates Gold prices in India by adapting international prices (USD/INR) to the local currency and measurement units. Prices are updated daily based on the market rates taken at the time of publication. Prices are just for reference and local rates could diverge slightly.
Gold FAQs
Gold has played a key role in human’s history as it has been widely used as a store of value and medium of exchange. Currently, apart from its shine and usage for jewelry, the precious metal is widely seen as a safe-haven asset, meaning that it is considered a good investment during turbulent times. Gold is also widely seen as a hedge against inflation and against depreciating currencies as it doesn’t rely on any specific issuer or government.
Central banks are the biggest Gold holders. In their aim to support their currencies in turbulent times, central banks tend to diversify their reserves and buy Gold to improve the perceived strength of the economy and the currency. High Gold reserves can be a source of trust for a country’s solvency. Central banks added 1,136 tonnes of Gold worth around $70 billion to their reserves in 2022, according to data from the World Gold Council. This is the highest yearly purchase since records began. Central banks from emerging economies such as China, India and Turkey are quickly increasing their Gold reserves.
Gold has an inverse correlation with the US Dollar and US Treasuries, which are both major reserve and safe-haven assets. When the Dollar depreciates, Gold tends to rise, enabling investors and central banks to diversify their assets in turbulent times. Gold is also inversely correlated with risk assets. A rally in the stock market tends to weaken Gold price, while sell-offs in riskier markets tend to favor the precious metal.
The price can move due to a wide range of factors. Geopolitical instability or fears of a deep recession can quickly make Gold price escalate due to its safe-haven status. As a yield-less asset, Gold tends to rise with lower interest rates, while higher cost of money usually weighs down on the yellow metal. Still, most moves depend on how the US Dollar (USD) behaves as the asset is priced in dollars (XAU/USD). A strong Dollar tends to keep the price of Gold controlled, whereas a weaker Dollar is likely to push Gold prices up.
(An automation tool was used in creating this post.)
- GBP/USD edges higher amid subdued USD price action, though the upside seems limited.
- Expectations for more aggressive BoE policy easing undermine the GBP amid a bullish USD.
- Bulls also seem reluctant ahead of Thursday’s release of the US consumer inflation figures.
The GBP/USD pair trades with a mild positive bias around the 1.3075 area during the Asian session on Thursday, albeit it lacks bullish conviction and remains within the striking distance of a nearly one-month low touched the previous day.
The US Dollar (USD) consolidates its recent strong gains to the highest level since August 16 and continues to draw support from rising bets for a regular 25 basis points (bps) interest rate cut by the Federal Reserve (Fed) in November. The expectations were reaffirmed by the FOMC meeting minutes released on Wednesday, which showed a consensus that the outsized rate cut would not lock the central bank into any specific pace for future cuts. This keeps the yield on the benchmark 10-year US government bond elevated above the 4% threshold, or its highest level since July 31, which continues to underpin the buck and acts as a headwind for the GBP/USD pair.
Meanwhile, last week's dovish remarks by the Bank of England (BoE) Governor Andrew Bailey suggested that the central bank might be heading towards speeding up its rate-cutting cycle. This, in turn, might contribute to the British Pound's (GBP) relative underperformance and cap any meaningful upside for the GBP/USD pair. Traders might also prefer to wait for the release of the US consumer inflation figures, which along with the US Producer Price Index (PPI) on Friday, might influence expectations about the Fed's rate-cut path. This, in turn, will drive the USD demand in the near term and provide some meaningful impetus to the currency pair.
Heading into the key data risks, traders on Thursday might take cues from the BoE Credit Conditions Survey to grab short-term opportunities. Nevertheless, the aforementioned fundamental backdrop suggests that the path of least resistance for the GBP/USD pair is to the downside, suggesting that any subsequent move up might still be seen as a selling opportunity. Spot prices seem poised to extend the recent sharp pullback from the 1.3435 area, or the highest level since March 2022 touched last month.
US Dollar PRICE Today
The table below shows the percentage change of US Dollar (USD) against listed major currencies today. US Dollar was the strongest against the Swiss Franc.
| USD | EUR | GBP | JPY | CAD | AUD | NZD | CHF | |
|---|---|---|---|---|---|---|---|---|
| USD | -0.04% | -0.05% | -0.06% | -0.03% | -0.17% | -0.44% | -0.00% | |
| EUR | 0.04% | 0.00% | -0.02% | -0.01% | -0.10% | -0.36% | 0.04% | |
| GBP | 0.05% | -0.00% | -0.02% | 0.00% | -0.18% | -0.37% | -0.01% | |
| JPY | 0.06% | 0.02% | 0.02% | 0.02% | -0.23% | -0.49% | -0.06% | |
| CAD | 0.03% | 0.00% | -0.01% | -0.02% | -0.15% | -0.36% | -0.01% | |
| AUD | 0.17% | 0.10% | 0.18% | 0.23% | 0.15% | -0.26% | 0.17% | |
| NZD | 0.44% | 0.36% | 0.37% | 0.49% | 0.36% | 0.26% | 0.36% | |
| CHF | 0.00% | -0.04% | 0.00% | 0.06% | 0.00% | -0.17% | -0.36% |
The heat map shows percentage changes of major currencies against each other. The base currency is picked from the left column, while the quote currency is picked from the top row. For example, if you pick the US Dollar from the left column and move along the horizontal line to the Japanese Yen, the percentage change displayed in the box will represent USD (base)/JPY (quote).
- Gold price bounces off a multi-week low amid subdued USD price action on Thursday.
- Bets for a regular 25 bps Fed rate cut in November should keep a lid on the XAU/USD.
- Investors now look to the release of the US CPI report for a fresh directional impetus.
Gold price (XAU/USD) edges higher during the Asian session on Thursday and for now, seems to have snapped a six-day losing streak to a nearly three-week low retested the previous day. The US Dollar (USD) enters a bullish consolidation phase as traders opt to move to the sidelines ahead of the release of the US Consumer Price Index (CPI) later today. Heading into the key data risk, some repositioning trade turns out to be a key factor lending some support to the precious metal.
Any meaningful appreciating move for the Gold price, however, seems elusive amid diminishing odds for a more aggressive policy easing by the Federal Reserve (Fed). The expectations were reaffirmed by the September FOMC meeting minutes, which keeps the US Treasury bond yields elevated and should cap the non-yielding yellow metal. Hence, a strong follow-through buying is needed to confirm that the XAU/USD's corrective slide from the all-time peak has run its course.
Daily Digest Market Movers: Gold price ticks higher from some repositioning trade ahead of US CPI report
- Minutes from the September FOMC meeting revealed that a majority supported the 50 basis point rate cut as the committee was confident of inflation moving toward the 2% goal.
- Some participants, however, indicated that they would have preferred only a 25 bps rate reduction, citing still elevated inflation, solid economic growth, and a low unemployment rate.
- Moreover, there was a consensus that the outsized rate cut would not lock the Federal Reserve into any specific pace for future cuts, lifting the US Dollar to a nearly two-month high.
- Dallas Fed President Lorie Logan pointed to meaningful uncertainties surrounding the economic outlook, though argued that she favored smaller rate reductions going forward.
- Boston Fed President Susan Collins stressed that policy is not on a pre-set path and will remain data-dependent and that it is important to preserve healthy labor market conditions.
- San Francisco Fed President Mary Daly said that one or two more rate cuts this year are likely, though noted that a 50 bps cut in September does not say anything about the size of next cuts.
- Traders are now pricing in a greater chance that the Fed will lower borrowing costs by only 25 bps in November and over a 20% probability that it will keep rates on hold in November.
- The yield on the rate-sensitive two-year US government bond shot to its highest yield since August 19 and the benchmark 10-year Treasury yield climbed to levels not seen since July 31.
- Investors remained wary of escalating tensions between Israel and Iran, with Israeli Defence Minister Yoav Gallant promising that a strike against the latter would be "lethal, precise and surprising".
- This, along with some repositioning trade ahead of the crucial US Consumer Price Index (CPI) report, lends some support to the safe-haven Gold price during the Asian session on Thursday.
Technical Outlook: Gold price needs to find acceptance below the $2,600 mark for bears to seize control
From a technical perspective, this week's breakdown below the $2,630 area, representing the lower boundary of a short-term trading range, was seen as a key trigger for bearish traders. That said, oscillators on the daily chart – though have been losing traction – are holding in positive territory. Moreover, the Gold price, so far, has managed to hold above the $2,600 mark. This makes it prudent to wait for a sustained break and acceptance below the said handle before positioning for deeper losses. The XAU/USD might then extend the downfall towards the next relevant support near the $2,560 zone en route to the $2,535-2,530 region before eventually dropping to the $2,500 psychological mark.
On the flip side, the trading range support breakpoint, around the $2,630-2,635 region, now seems to act as an immediate hurdle. Any further move up could be seen as a selling opportunity and remain capped near the $2,657-2,658 horizontal barrier. A sustained strength beyond the latter could lift the Gold price to the $2,670-$2,672 supply zone, above which bulls might aim to challenge the all-time high, around the $2,685-2,686 zone touched in September. This is closely followed by the $2,700 mark, which if cleared will set the stage for an extension of a well-established multi-month-old uptrend.
Gold FAQs
Gold has played a key role in human’s history as it has been widely used as a store of value and medium of exchange. Currently, apart from its shine and usage for jewelry, the precious metal is widely seen as a safe-haven asset, meaning that it is considered a good investment during turbulent times. Gold is also widely seen as a hedge against inflation and against depreciating currencies as it doesn’t rely on any specific issuer or government.
Central banks are the biggest Gold holders. In their aim to support their currencies in turbulent times, central banks tend to diversify their reserves and buy Gold to improve the perceived strength of the economy and the currency. High Gold reserves can be a source of trust for a country’s solvency. Central banks added 1,136 tonnes of Gold worth around $70 billion to their reserves in 2022, according to data from the World Gold Council. This is the highest yearly purchase since records began. Central banks from emerging economies such as China, India and Turkey are quickly increasing their Gold reserves.
Gold has an inverse correlation with the US Dollar and US Treasuries, which are both major reserve and safe-haven assets. When the Dollar depreciates, Gold tends to rise, enabling investors and central banks to diversify their assets in turbulent times. Gold is also inversely correlated with risk assets. A rally in the stock market tends to weaken Gold price, while sell-offs in riskier markets tend to favor the precious metal.
The price can move due to a wide range of factors. Geopolitical instability or fears of a deep recession can quickly make Gold price escalate due to its safe-haven status. As a yield-less asset, Gold tends to rise with lower interest rates, while higher cost of money usually weighs down on the yellow metal. Still, most moves depend on how the US Dollar (USD) behaves as the asset is priced in dollars (XAU/USD). A strong Dollar tends to keep the price of Gold controlled, whereas a weaker Dollar is likely to push Gold prices up.
- The US Consumer Price Index is forecast to rise 2.3% YoY in September, at a softer pace than August’s 2.5% increase.
- Annual core CPI inflation is expected to hold steady at 3.2%.
- The inflation report could ramp up USD volatility by altering the market expectation of the Fed outlook.
The Bureau of Labor Statistics (BLS) will publish the highly anticipated Consumer Price Index (CPI) inflation data from the United States (US) for September on Thursday at 12:30 GMT.
The US Dollar (USD) braces for intense volatility, as any surprises from the US inflation report could significantly impact the market’s pricing of the Federal Reserve (Fed) interest rate outlook for the rest of the year.
What to expect in the next CPI data report?
Inflation in the US, as measured by the CPI, is expected to increase at an annual rate of 2.3% in September, down from the 2.5% rise reported in August. The core CPI inflation, which excludes volatile food and energy prices, is forecast to stay unchanged at 3.2% in the same period.
Meanwhile, the CPI and the core CPI are anticipated to rise 0.1% and 0.2% on a monthly basis, respectively.
Previewing the September inflation report, “our forecasts for the September CPI report suggest core inflation lost modest momentum, registering a 0.24% m/m gain after advancing a slightly stronger 0.28% in August,” said TD Securities analysts in a weekly report, and added:
“Headline inflation likely lost meaningful momentum, as the energy component will again provide major relief. The details should show that core goods prices added to inflation for the first time in seven months, while housing inflation likely cooled modestly dragging core services inflation lower.”
Speaking on the Fed’s policy outlook recently, Fed Governor Adriana Kugler said that she will support an additional rate cut if the progress on inflation continues as expected. On a cautious note, St. Louis Fed President Alberto Musalem argued that the costs of easing the policy too much too soon were greater than the costs of easing too little too late. “That is because sticky or higher inflation would pose a threat to the Fed's credibility and to future employment and economic activity,” he further argued.
Economic Indicator
Consumer Price Index (YoY)
Inflationary or deflationary tendencies are measured by periodically summing the prices of a basket of representative goods and services and presenting the data as The Consumer Price Index (CPI). CPI data is compiled on a monthly basis and released by the US Department of Labor Statistics. The YoY reading compares the prices of goods in the reference month to the same month a year earlier.The CPI is a key indicator to measure inflation and changes in purchasing trends. Generally speaking, a high reading is seen as bullish for the US Dollar (USD), while a low reading is seen as bearish.
Read more.Next release: Thu Oct 10, 2024 12:30
Frequency: Monthly
Consensus: 2.3%
Previous: 2.5%
Source: US Bureau of Labor Statistics
The US Federal Reserve has a dual mandate of maintaining price stability and maximum employment. According to such mandate, inflation should be at around 2% YoY and has become the weakest pillar of the central bank’s directive ever since the world suffered a pandemic, which extends to these days. Price pressures keep rising amid supply-chain issues and bottlenecks, with the Consumer Price Index (CPI) hanging at multi-decade highs. The Fed has already taken measures to tame inflation and is expected to maintain an aggressive stance in the foreseeable future.
How could the US Consumer Price Index report affect EUR/USD?
Following the Fed’s decision to lower the policy rate by 50 basis points (bps) at the September meeting, investors expect the US central bank to dial down the degree of easing by opting for a 25 bps cut at the next meeting. According to the CME FedWatch Tool, the probability of a 50 bps rate reduction in November is completely ruled out for now.
The upbeat employment data for September eased fears over a cooldown in the labor market, causing investors to refrain from pricing in a large rate cut. The US Bureau of Labor Statistics reported that Nonfarm Payrolls (NFP) rose by 254,000 in September, surpassing the market expectation of 140,000 by a wide margin. Additionally, the Unemployment Rate retreated to 4.1% from 4.2% in the same period, while the annual wage inflation, as measured by the change in the Average Hourly Earnings, edged higher to 4% from 3.9% in August.
It will take a significant miss in the inflation data for investors to reconsider a large rate reduction at the next policy meeting. In case the monthly core CPI comes in at 0% or in negative territory, the immediate reaction could revive expectations for a 50 bps cut and trigger a US Dollar (USD) selloff. On the other hand, a reading at or above the market expectation of 0.2% should reaffirm a 25 bps cut. However, the market positioning suggests that the USD doesn’t have a lot of room on the upside.
Eren Sengezer, European Session Lead Analyst at FXStreet, offers a brief technical outlook for EUR/USD and explains: “EUR/USD’s near-term technical picture highlights a lack of buyer interest, with the Relative Strength Index (RSI) indicator on the daily chart staying well below 50.”
“EUR/USD could face first support at 1.0930, where the Fibonacci 50% retracement of the June-August uptrend meets the 100-period Simple Moving Average (SMA). If this support fails, 1.0870 (Fibonacci 61.8% retracement, 200-day SMA) could be seen as the next bearish target before 1.0800 (Fibonacci 78.6% retracement). On the other side, interim resistance aligns at 1.1000 (Fibonacci 38.2% retracement). Once the pair flips this level into support, it could extend its recovery toward 1.1050-1.1070 (50-day SMA, Fibonacci 23.6% retracement) and 1.1100 (20-day SMA).”
US Dollar FAQs
The US Dollar (USD) is the official currency of the United States of America, and the ‘de facto’ currency of a significant number of other countries where it is found in circulation alongside local notes. It is the most heavily traded currency in the world, accounting for over 88% of all global foreign exchange turnover, or an average of $6.6 trillion in transactions per day, according to data from 2022. Following the second world war, the USD took over from the British Pound as the world’s reserve currency. For most of its history, the US Dollar was backed by Gold, until the Bretton Woods Agreement in 1971 when the Gold Standard went away.
The most important single factor impacting on the value of the US Dollar is monetary policy, which is shaped by the Federal Reserve (Fed). The Fed has two mandates: to achieve price stability (control inflation) and foster full employment. Its primary tool to achieve these two goals is by adjusting interest rates. When prices are rising too quickly and inflation is above the Fed’s 2% target, the Fed will raise rates, which helps the USD value. When inflation falls below 2% or the Unemployment Rate is too high, the Fed may lower interest rates, which weighs on the Greenback.
In extreme situations, the Federal Reserve can also print more Dollars and enact quantitative easing (QE). QE is the process by which the Fed substantially increases the flow of credit in a stuck financial system. It is a non-standard policy measure used when credit has dried up because banks will not lend to each other (out of the fear of counterparty default). It is a last resort when simply lowering interest rates is unlikely to achieve the necessary result. It was the Fed’s weapon of choice to combat the credit crunch that occurred during the Great Financial Crisis in 2008. It involves the Fed printing more Dollars and using them to buy US government bonds predominantly from financial institutions. QE usually leads to a weaker US Dollar.
Quantitative tightening (QT) is the reverse process whereby the Federal Reserve stops buying bonds from financial institutions and does not reinvest the principal from the bonds it holds maturing in new purchases. It is usually positive for the US Dollar.
- The Indian Rupee weakens in Thursday’s Asian session.
- A muted sentiment in Indian markets and a firmer USD undermine the INR.
- The US CPI inflation data will take center stage on Thursday.
The Indian Rupee (INR) trades on a weaker note on Thursday. A muted trend in the domestic market and a stronger US Dollar (USD) weigh on the local currency. However, robust Indian macroeconomic fundamentals and the inclusion of government bonds in global indices would attract foreign investors and lift the INR.
The release of the key US Consumer Price Index (CPI) inflation data will be the highlight on Thursday. The US Initial Jobless Claims will be released on the same day, and the Federal Reserve’s (Fed) Lisa Cook and John Williams are scheduled to speak.
Daily Digest Market Movers: Indian Rupee remains weak ahead of key US inflation data
- FTSE Russell said on Tuesday that Indian sovereign bonds will be added to its Emerging Markets Government Bond Index (EMGBI), following a similar move by JP Morgan and Bloomberg Index Services.
- The Reserve Bank of India’s (RBI) Monetary Policy Committee (MPC) decided to keep the repo rate unchanged at 6.5% for the tenth consecutive meeting but changed the policy stance to neutral from withdrawal of accommodation.
- The Indian central bank kept the CPI inflation estimate for FY25 unchanged at 4.5% while maintaining the Gross Domestic Product (GDP) growth estimates for FY25 at 7.2%.
- According to minutes released Wednesday, the Federal Open Market Committee (FOMC) members agreed to cut interest rates in September but were unsure how aggressively to go, ultimately deciding on a half-percentage point move in an effort to balance inflation concerns with labor market worries.
- Fed Boston President Susan Collins said on Wednesday that it was “prudent” for officials to cut rates by a half percentage point last month as inflation eases and the economy becomes more vulnerable to shocks.
- San Francisco Fed President Mary Daly noted on Wednesday that she "fully" supported the Fed’s half-of-a-percentage-point interest-rate cut in the September meeting. Daly added that one or two more rate cuts this year are likely if the economy evolves as she expects.
- Dallas Fed President Lorie Logan argued on Wednesday that she supported last month's substantial interest-rate cut but favored smaller reductions going forward as there were "still real" upside risks to inflation.
Technical Analysis: USD/INR’s bullish view remains intact in the longer term
The Indian Rupee edges lower on the day. The USD/INR pair maintains a constructive view on the daily chart, with the price holding above the descending trend line and the key 100-day Exponential Moving Average (EMA). The 14-day Relative Strength Index (RSI) is located above the midline near 58.60, suggesting the support level is likely to hold rather than break.
The 84.00 psychological level appears to be a tough nut to crack for USD/INR bulls. Sustained bullish momentum above this level could see a rally to the all-time high of 84.15, en route to 84.50.
On the flip side, the first downside target is seen near the resistance-turned-support level at 83.90. Any follow-through selling could expose the 100-day EMA at 83.67. The key contention level emerges at 83.00, representing the round mark and the low of May 24.
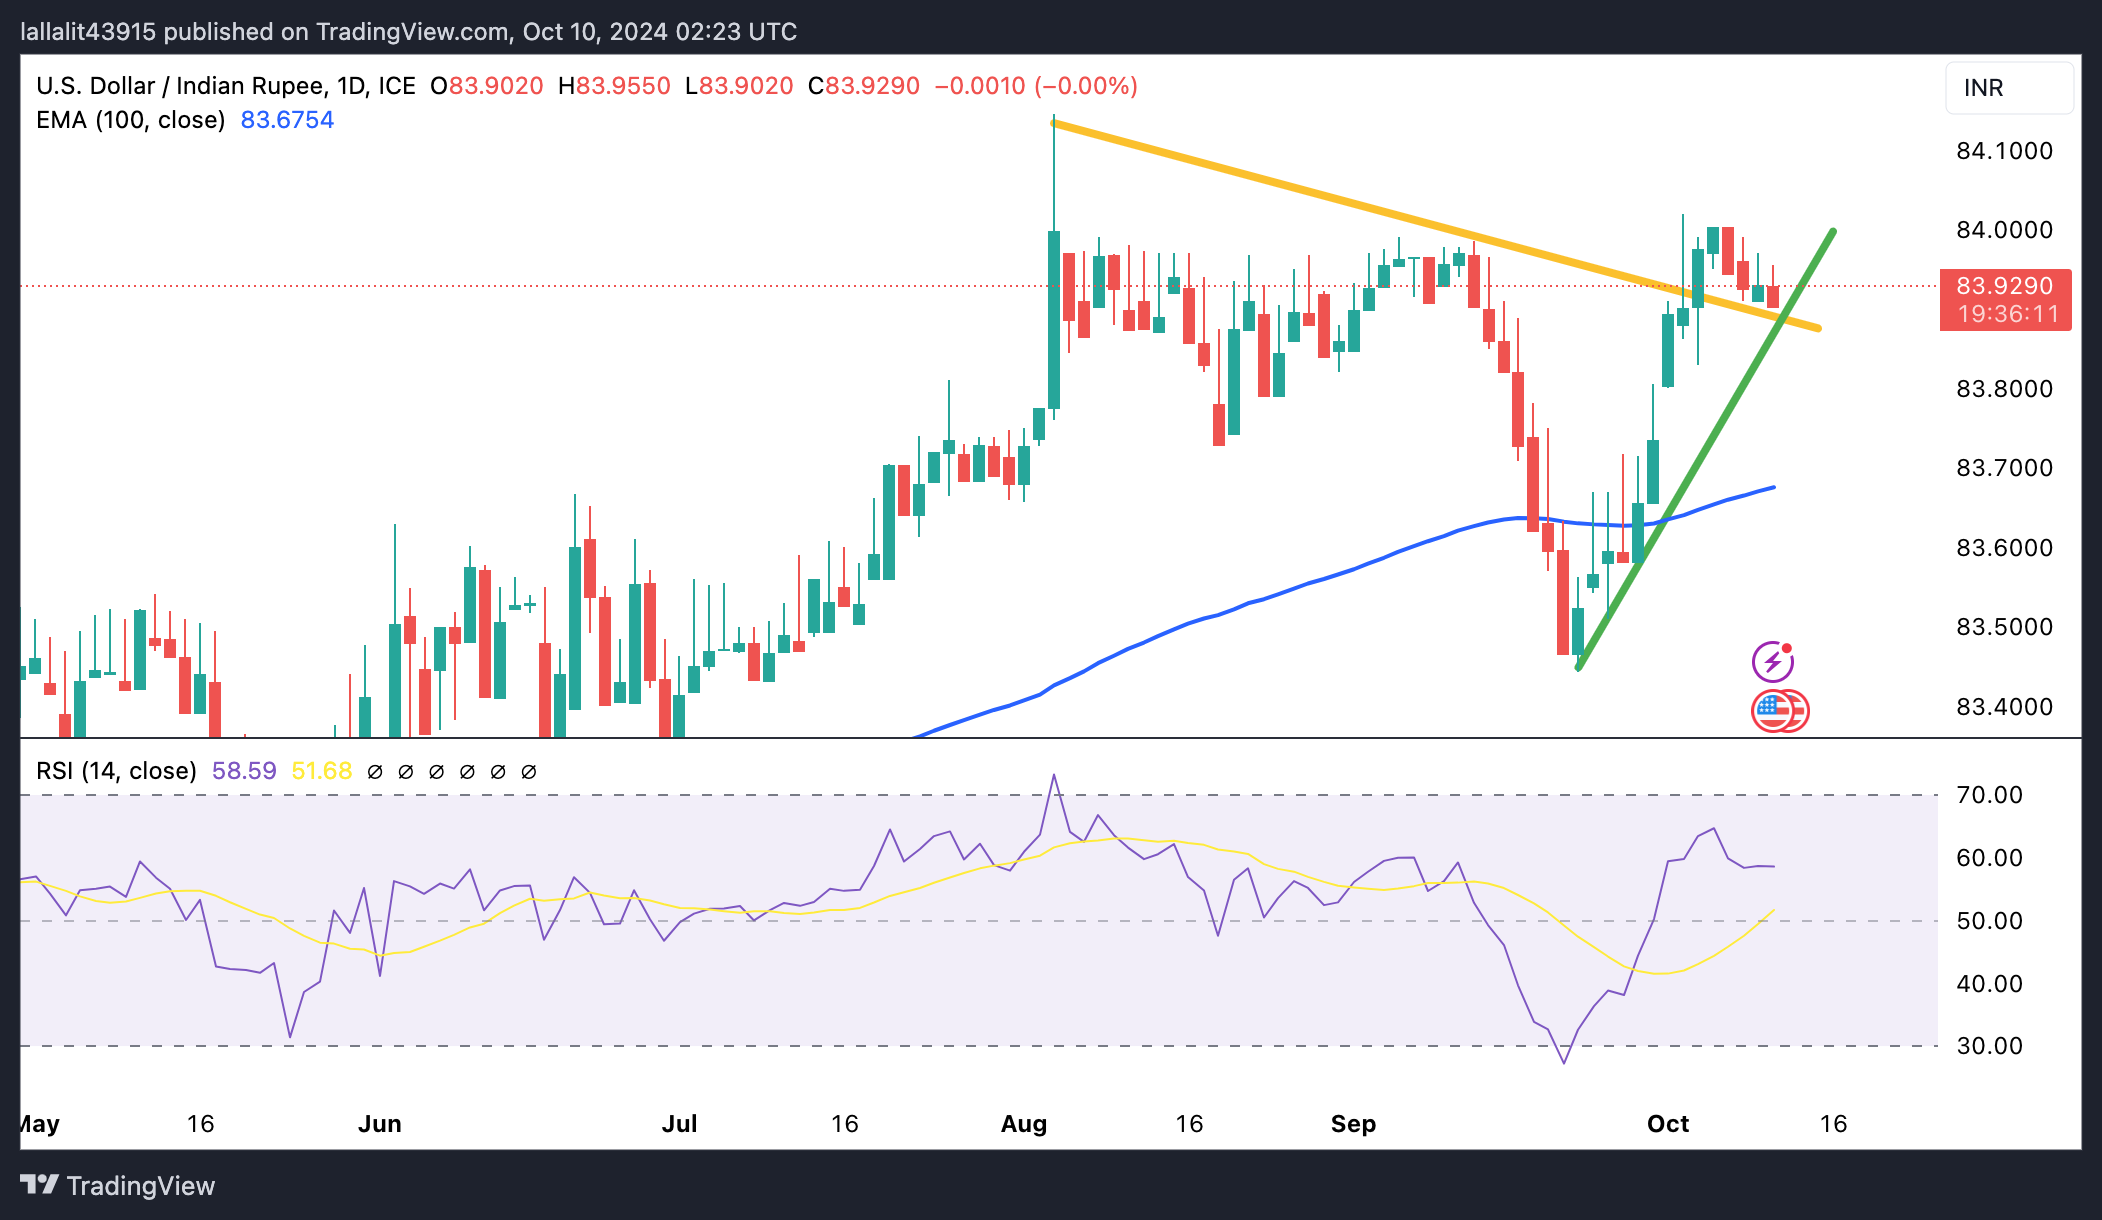
Indian Rupee FAQs
The Indian Rupee (INR) is one of the most sensitive currencies to external factors. The price of Crude Oil (the country is highly dependent on imported Oil), the value of the US Dollar – most trade is conducted in USD – and the level of foreign investment, are all influential. Direct intervention by the Reserve Bank of India (RBI) in FX markets to keep the exchange rate stable, as well as the level of interest rates set by the RBI, are further major influencing factors on the Rupee.
The Reserve Bank of India (RBI) actively intervenes in forex markets to maintain a stable exchange rate, to help facilitate trade. In addition, the RBI tries to maintain the inflation rate at its 4% target by adjusting interest rates. Higher interest rates usually strengthen the Rupee. This is due to the role of the ‘carry trade’ in which investors borrow in countries with lower interest rates so as to place their money in countries’ offering relatively higher interest rates and profit from the difference.
Macroeconomic factors that influence the value of the Rupee include inflation, interest rates, the economic growth rate (GDP), the balance of trade, and inflows from foreign investment. A higher growth rate can lead to more overseas investment, pushing up demand for the Rupee. A less negative balance of trade will eventually lead to a stronger Rupee. Higher interest rates, especially real rates (interest rates less inflation) are also positive for the Rupee. A risk-on environment can lead to greater inflows of Foreign Direct and Indirect Investment (FDI and FII), which also benefit the Rupee.
Higher inflation, particularly, if it is comparatively higher than India’s peers, is generally negative for the currency as it reflects devaluation through oversupply. Inflation also increases the cost of exports, leading to more Rupees being sold to purchase foreign imports, which is Rupee-negative. At the same time, higher inflation usually leads to the Reserve Bank of India (RBI) raising interest rates and this can be positive for the Rupee, due to increased demand from international investors. The opposite effect is true of lower inflation.
- The Japanese Yen dropped to a two-month low against the USD on Wednesday amid the BoJ uncertainty.
- Rising bets for a regular 25 bps Fed rate cut move in November offer support to the USD and USD/JPY.
- The JPY bulls seem unimpressed by Japan’s PPI print as the focus remains glued to the US CPI report.
The Japanese Yen (JPY) weakened across the board on Wednesday amid the uncertainty over the Bank of Japan's (BoJ) plans for additional interest rate hikes. Apart from this, the risk-on impulse undermined demand for the safe-haven JPY, which, along with a fresh wave of the US Dollar (USD) buying, pushed the USD/JPY pair to the 149.35 region, or its highest level since mid-August.
Meanwhile, data published earlier this Thursday showed that the Producer Price Index (PPI) in Japan remained unchanged in September and the yearly rate rose more than anticipated during the reported month. This, in turn, offers support to the JPY and caps the USD/JPY pair. Furthermore, traders opt to move to the sidelines ahead of the release of the US consumer inflation figures.
Daily Digest Market Movers: Japanese Yen seems vulnerable amid fading hopes for more BoJ rate hikes, bullish USD
- Data published on Tuesday showed that Japan’s real wages fell in August after two months of gains and a decline in household spending, raising doubts about the strength of private consumption and a sustained economic recovery.
- This comes on top of blunt comments on monetary policy by Japan's Prime Minister Shigeru Ishiba and fuels uncertainty over the Bank of Japan's rate hike plans, which weighed on the Japanese Yen and pushed the USD/JPY pair higher.
- The US Dollar shot to its highest level since August 16 after minutes from the September FOMC meeting revealed that a majority supported the 50 basis point rate cut as the committee was confident of inflation moving toward the 2% goal.
- Some participants, however, indicated that they would have preferred only a 25 bps rate reduction, citing that inflation was still somewhat elevated while economic growth remained solid and unemployment remained low.
- Furthermore, there was a broader agreement that the outsized rate cut would not lock the Federal Reserve into any specific pace for future interest rate cuts and should not be seen as a sign of a more negative economic outlook.
- Dallas Fed President Lorie Logan argued on Wednesday that she favored smaller reductions going forward as there were still real upside risks to inflation and pointed to meaningful uncertainties surrounding the economic outlook.
- Separately, Boston Fed President Susan Collins stressed that policy is not on a pre-set path and will remain carefully data-dependent and added that it will be important to preserve the currently healthy labor market conditions.
- Furthermore, San Francisco Fed President Mary Daly said that the size of the September rate cut does not say anything about the size of the next cuts and that one or two more rate cuts this year are likely if the economy evolves as she expects.
- According to the CME Group's FedWatch Tool, market participants are now pricing in a greater chance that the Fed will lower borrowing costs by 25 bps in November and over a 20% probability that it will keep interest rates on hold.
- The yield on the rate-sensitive two-year US government bond rose to its highest yield since August 19, while the benchmark 10-year Treasury yield climbed for the sixth straight day on Wednesday, to its highest level since July 31.
- A BoJ report showed on Thursday that the Producer Price Index (PPI) in Japan remained unchanged in September against a 0.3% decline anticipated, while the yearly rate unexpectedly inched up from 2.6% in August to 2.8%.
- Investors now await the US Consumer Price Index (CPI), due later today, which, along with the US Producer Price Index on Friday, might influence market expectations about the Fed's rate-cut path and drive the USD/JPY pair.
Technical Outlook: USD/JPY seems poised to appreciate further, bulls might aim to reclaim the 150.00 psychological mark
From a technical perspective, the overnight sustained close above the 38.2% Fibonacci retracement level of the July-September downfall and the 149.00 mark could be seen as a fresh trigger for bullish traders. Moreover, oscillators on the daily chart have been gaining positive traction and are away from being in the overbought territory, suggesting that the path of least resistance for the USD/JPY pair is to the upside. Hence, a further appreciation towards the 150.00 psychological mark en route to the 50% retracement level, around the 150.75-150.80 region, looks like a distinct possibility.
On the flip side, any meaningful slide below the 149.00 mark now seems to attract some buyers near the 148.70-148.65 region. This, in turn, should help limit the downside for the USD/JPY pair near the 148.00 round figure. The latter should act as a key pivotal point, which if broken might prompt some technical selling and drag spot prices to the 147.35 intermediate support en route to the 147.00 mark and the 146.50 area.
Japanese Yen FAQs
The Japanese Yen (JPY) is one of the world’s most traded currencies. Its value is broadly determined by the performance of the Japanese economy, but more specifically by the Bank of Japan’s policy, the differential between Japanese and US bond yields, or risk sentiment among traders, among other factors.
One of the Bank of Japan’s mandates is currency control, so its moves are key for the Yen. The BoJ has directly intervened in currency markets sometimes, generally to lower the value of the Yen, although it refrains from doing it often due to political concerns of its main trading partners. The BoJ ultra-loose monetary policy between 2013 and 2024 caused the Yen to depreciate against its main currency peers due to an increasing policy divergence between the Bank of Japan and other main central banks. More recently, the gradually unwinding of this ultra-loose policy has given some support to the Yen.
Over the last decade, the BoJ’s stance of sticking to ultra-loose monetary policy has led to a widening policy divergence with other central banks, particularly with the US Federal Reserve. This supported a widening of the differential between the 10-year US and Japanese bonds, which favored the US Dollar against the Japanese Yen. The BoJ decision in 2024 to gradually abandon the ultra-loose policy, coupled with interest-rate cuts in other major central banks, is narrowing this differential.
The Japanese Yen is often seen as a safe-haven investment. This means that in times of market stress, investors are more likely to put their money in the Japanese currency due to its supposed reliability and stability. Turbulent times are likely to strengthen the Yen’s value against other currencies seen as more risky to invest in.
| Raw materials | Closed | Change, % |
|---|---|---|
| Silver | 30.492 | -0.53 |
| Gold | 260.831 | -0.52 |
| Palladium | 1041 | 1.81 |
- The Australian Dollar remains under selling pressure in Thursday’s Asian session.
- The firmer USD and lack of further China’s stimulus measures drag the pair lower.
- The US CPI inflation data will be in the spotlight on Thursday.
The Australian Dollar (AUD) extends its decline on Thursday. The stronger US Dollar (USD) amid rising speculation of a 25 basis points (bps) rate cut by the Federal Reserve (Fed) in November undermines the Aussie. Furthermore, Beijing's attempt to stimulate the world’s second-largest economy disappointed investors as China’s top economic planning authority failed to announce additional measures to improve flagging growth. It’s worth noting that China is a major trading partner to Australia, and concerns about China's sluggish economy tend to have a negative impact on the AUD value.
Investors will closely monitor the key US Consumer Price Index (CPI) inflation data, which is due later on Thursday. The headline US CPI is expected to show an increase of 2.3% YoY in September, while the core CPI inflation is estimated to show a rise of 3.2% YoY in the same report period. However, in case the report shows a softer-than-expected outcome, this could open the door for a jumbo Fed rate cut, which might weigh on the USD and cap the downside for AUD/USD.
Daily Digest Market Movers: Australian Dollar softens ahead of US CPI data
- RBA Minutes from the September meeting showed board members overlooked the warning that there would be no rate cuts in the near future. The Australian central bank wants to keep its options open, watching whether the economy starts to pick up in the second half of the year.
- “This leaves the door open to a shift to neutral by the end of this year and then easing in early 2025. We continue to expect the first cash rate cut in February 2025,” noted ANZ analysts.
- The World Bank forecasted that China’s growth rate will slow to 4.3% in 2025, down from a projected 4.8% this year, in an economic update on Tuesday.
- San Francisco Fed President Mary Daly said on Wednesday one or two more rate cuts this year are likely if the economy evolves as she expects, adding that she is now "quite confident" inflation is headed toward the Fed's 2% target.
- Boston Fed President Susan Collins said on Wednesday that with inflation trends growing weaker, it is very probable that the Fed can deliver more interest rate reductions.
- The markets have priced in nearly 80% odds of 25 basis points (bps) Fed rate cuts in November, up from 31.1% last week, according to the CME FedWatch Tool.
Technical Analysis: Australian Dollar remains vulnerable near the key support level
The Australian Dollar weakens on the day. Technically, the bullish outlook of the AUD/USD pair looks vulnerable as the pair hovers around the lower limit of the ascending trend channel and the key 100-day Exponential Moving Average (EMA) on the daily chart. If AUD/USD crosses below the mentioned levels, this could resume its downside. The downward momentum is reinforced by the 14-day Relative Strength Index (RSI) which is located below the midline near 41.20.
The crucial support level for AUD/USD emerges at 0.6700, representing the lower limit of the trend channel, the 100-day EMA and the psychological level. A breach of this level could pave the way to 0.6622, the low of September 11.
On the other hand, the high of September 6 at 0.6767 acts as an immediate resistance level of the pair. Further north, the next upside barrier is seen at 0.6823, the high of August 29, followed by 0.6942, the high of September 30.
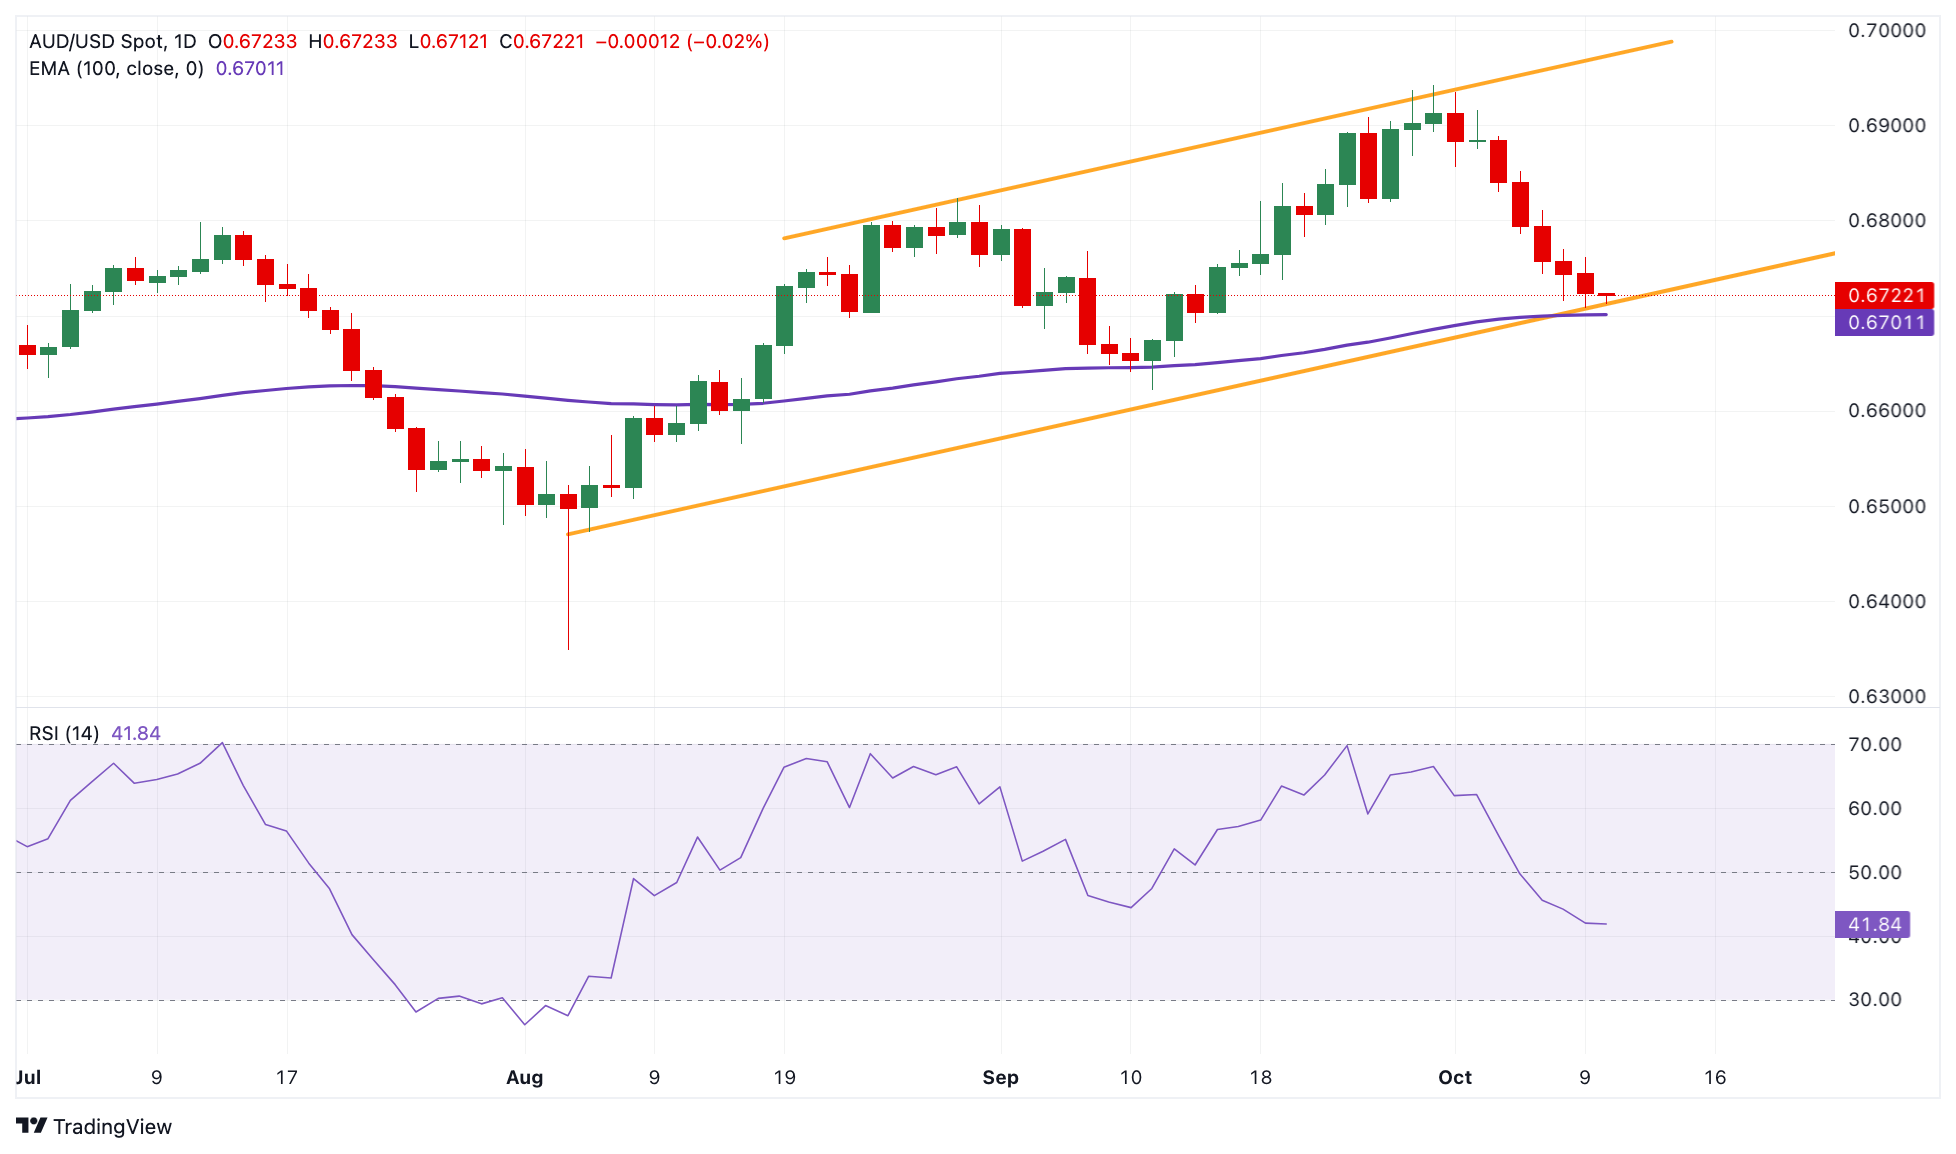
Australian Dollar FAQs
One of the most significant factors for the Australian Dollar (AUD) is the level of interest rates set by the Reserve Bank of Australia (RBA). Because Australia is a resource-rich country another key driver is the price of its biggest export, Iron Ore. The health of the Chinese economy, its largest trading partner, is a factor, as well as inflation in Australia, its growth rate and Trade Balance. Market sentiment – whether investors are taking on more risky assets (risk-on) or seeking safe-havens (risk-off) – is also a factor, with risk-on positive for AUD.
The Reserve Bank of Australia (RBA) influences the Australian Dollar (AUD) by setting the level of interest rates that Australian banks can lend to each other. This influences the level of interest rates in the economy as a whole. The main goal of the RBA is to maintain a stable inflation rate of 2-3% by adjusting interest rates up or down. Relatively high interest rates compared to other major central banks support the AUD, and the opposite for relatively low. The RBA can also use quantitative easing and tightening to influence credit conditions, with the former AUD-negative and the latter AUD-positive.
China is Australia’s largest trading partner so the health of the Chinese economy is a major influence on the value of the Australian Dollar (AUD). When the Chinese economy is doing well it purchases more raw materials, goods and services from Australia, lifting demand for the AUD, and pushing up its value. The opposite is the case when the Chinese economy is not growing as fast as expected. Positive or negative surprises in Chinese growth data, therefore, often have a direct impact on the Australian Dollar and its pairs.
Iron Ore is Australia’s largest export, accounting for $118 billion a year according to data from 2021, with China as its primary destination. The price of Iron Ore, therefore, can be a driver of the Australian Dollar. Generally, if the price of Iron Ore rises, AUD also goes up, as aggregate demand for the currency increases. The opposite is the case if the price of Iron Ore falls. Higher Iron Ore prices also tend to result in a greater likelihood of a positive Trade Balance for Australia, which is also positive of the AUD.
The Trade Balance, which is the difference between what a country earns from its exports versus what it pays for its imports, is another factor that can influence the value of the Australian Dollar. If Australia produces highly sought after exports, then its currency will gain in value purely from the surplus demand created from foreign buyers seeking to purchase its exports versus what it spends to purchase imports. Therefore, a positive net Trade Balance strengthens the AUD, with the opposite effect if the Trade Balance is negative.
On Thursday, the People’s Bank of China (PBoC) set the USD/CNY central rate for the trading session ahead at 7.0742, as compared to the previous day's fix of 7.0568 and 7.0734 Reuters estimates.
- EUR/USD struggles to attract any meaningful buyers amid a bullish USD.
- The fundamental backdrop seems tilted firmly in favor of bearish traders.
- Investors await the release of the US CPI report before placing fresh bets.
The EUR/USD pair oscillates in a narrow band below mid-1.0900s during the Asian session on Thursday and consolidates the recent heavy losses to a nearly two-month low touched the previous day.
The US Dollar (USD) stands tall near its highest level since August 16 as traders have priced out the possibility of another 50 basis points (bps) interest rate cut by the Federal Reserve (Fed) in November. Moreover, the current market pricing indicates over a 20% chance that the US central bank will keep rates on hold next month and the expectations were reaffirmed by hawkish FOMC minutes released on Wednesday. This keeps the yield on the benchmark 10-year US government bond elevated above the 4% threshold, which should underpin the buck and act as a headwind for the EUR/USD pair.
The shared currency, on the other hand, continues to be weighed down by growing acceptance that the European Central Bank (ECB) will lower borrowing costs by 25 bps at each of the two policy meetings by the year-end. Moreover, the risk of a further escalation of geopolitical tensions in the Middle East should benefit the safe-haven Greenback and suggest that the path of least resistance for the EUR/USD pair is to the downside. Traders, however, might refrain from placing fresh bearish bets and prefer to wait for the latest US inflation figures before positioning for a further depreciating move.
The crucial US Consumer Price Index (CPI) is due for release later during the North American session this Thursday and will be followed by the US Producer Price Index (PPI) on Friday. The data will play a key role in influencing expectations about the Fed's rate-cut path, which, in turn, will drive the USD demand in the near term and provide a fresh directional impetus to the EUR/USD pair.
Euro FAQs
The Euro is the currency for the 19 European Union countries that belong to the Eurozone. It is the second most heavily traded currency in the world behind the US Dollar. In 2022, it accounted for 31% of all foreign exchange transactions, with an average daily turnover of over $2.2 trillion a day. EUR/USD is the most heavily traded currency pair in the world, accounting for an estimated 30% off all transactions, followed by EUR/JPY (4%), EUR/GBP (3%) and EUR/AUD (2%).
The European Central Bank (ECB) in Frankfurt, Germany, is the reserve bank for the Eurozone. The ECB sets interest rates and manages monetary policy. The ECB’s primary mandate is to maintain price stability, which means either controlling inflation or stimulating growth. Its primary tool is the raising or lowering of interest rates. Relatively high interest rates – or the expectation of higher rates – will usually benefit the Euro and vice versa. The ECB Governing Council makes monetary policy decisions at meetings held eight times a year. Decisions are made by heads of the Eurozone national banks and six permanent members, including the President of the ECB, Christine Lagarde.
Eurozone inflation data, measured by the Harmonized Index of Consumer Prices (HICP), is an important econometric for the Euro. If inflation rises more than expected, especially if above the ECB’s 2% target, it obliges the ECB to raise interest rates to bring it back under control. Relatively high interest rates compared to its counterparts will usually benefit the Euro, as it makes the region more attractive as a place for global investors to park their money.
Data releases gauge the health of the economy and can impact on the Euro. Indicators such as GDP, Manufacturing and Services PMIs, employment, and consumer sentiment surveys can all influence the direction of the single currency. A strong economy is good for the Euro. Not only does it attract more foreign investment but it may encourage the ECB to put up interest rates, which will directly strengthen the Euro. Otherwise, if economic data is weak, the Euro is likely to fall. Economic data for the four largest economies in the euro area (Germany, France, Italy and Spain) are especially significant, as they account for 75% of the Eurozone’s economy.
Another significant data release for the Euro is the Trade Balance. This indicator measures the difference between what a country earns from its exports and what it spends on imports over a given period. If a country produces highly sought after exports then its currency will gain in value purely from the extra demand created from foreign buyers seeking to purchase these goods. Therefore, a positive net Trade Balance strengthens a currency and vice versa for a negative balance.
| Index | Change, points | Closed | Change, % |
|---|---|---|---|
| NIKKEI 225 | 340.42 | 39277.96 | 0.87 |
| Hang Seng | -289.55 | 20637.24 | -1.38 |
| ASX 200 | 10.5 | 8187.4 | 0.13 |
| DAX | 188.46 | 19254.93 | 0.99 |
| CAC 40 | 38.77 | 7560.09 | 0.52 |
| Dow Jones | 431.63 | 42512 | 1.03 |
| S&P 500 | 40.91 | 5792.04 | 0.71 |
| NASDAQ Composite | 108.7 | 18291.62 | 0.6 |
| Pare | Closed | Change, % |
|---|---|---|
| AUDUSD | 0.67153 | -0.44 |
| EURJPY | 163.202 | 0.28 |
| EURUSD | 1.09407 | -0.34 |
| GBPJPY | 194.92 | 0.36 |
| GBPUSD | 1.30669 | -0.26 |
| NZDUSD | 0.60599 | -1.24 |
| USDCAD | 1.37086 | 0.45 |
| USDCHF | 0.86053 | 0.39 |
| USDJPY | 149.165 | 0.63 |
- AUD/USD trades in negative territory around 0.6715 in Thursday’s early Asian session.
- The rising speculation of a 25 bps rate cut by the Fed in November underpins the USD.
- The disappointment over additional China’s stimulus measures weighs on the Aussie.
The AUD/USD pair remains under some selling pressure near 0.6715 on Thursday during the early Asian session. The further upside in the Greenback and Chinese demand concerns create a headwind for AUD/USD. Investors will closely monitor the release of the key US Consumer Price Index (CPI) inflation data, which is due later on Thursday.
The Federal Open Market Committee (FOMC) Minutes from the September meeting showed the “substantial majority” of the FOMC backed a 50-basis-point (bps) cut. Additionally, some officials would’ve preferred a 25 bps cut, and "a few others" mentioned they could have supported such a move.
The upbeat US September jobs report last week eased worries about the cooling labor market and prompted traders to raise bets of a quarter-point rate cut in November, which boosted the US Dollar (USD) broadly.
Traders will keep an eye on the US CPI inflation data on Thursday. The headline US CPI inflation is expected to decrease from 2.5% in August to 2.3% in September, while the core CPI inflation is estimated to remain unchanged compared to August’s figure at 3.2% YoY. Nevertheless, if inflation comes in softer than expected, it could open the door for a larger Fed’s easing cycle, which could exert some selling pressure on the USD.
On the Aussie front, the disappointment over China's stimulus update, the firmer USD continue to undermine the Australian Dollar (AUD). Nonetheless, the hawkish stance from the Reserve Bank of Australia (RBA) could cap the pair’s downside. The recent data showed Retail Sales growth for August exceeding expectations, reducing the chances of an early rate cut from the RBA.
Australian Dollar FAQs
One of the most significant factors for the Australian Dollar (AUD) is the level of interest rates set by the Reserve Bank of Australia (RBA). Because Australia is a resource-rich country another key driver is the price of its biggest export, Iron Ore. The health of the Chinese economy, its largest trading partner, is a factor, as well as inflation in Australia, its growth rate and Trade Balance. Market sentiment – whether investors are taking on more risky assets (risk-on) or seeking safe-havens (risk-off) – is also a factor, with risk-on positive for AUD.
The Reserve Bank of Australia (RBA) influences the Australian Dollar (AUD) by setting the level of interest rates that Australian banks can lend to each other. This influences the level of interest rates in the economy as a whole. The main goal of the RBA is to maintain a stable inflation rate of 2-3% by adjusting interest rates up or down. Relatively high interest rates compared to other major central banks support the AUD, and the opposite for relatively low. The RBA can also use quantitative easing and tightening to influence credit conditions, with the former AUD-negative and the latter AUD-positive.
China is Australia’s largest trading partner so the health of the Chinese economy is a major influence on the value of the Australian Dollar (AUD). When the Chinese economy is doing well it purchases more raw materials, goods and services from Australia, lifting demand for the AUD, and pushing up its value. The opposite is the case when the Chinese economy is not growing as fast as expected. Positive or negative surprises in Chinese growth data, therefore, often have a direct impact on the Australian Dollar and its pairs.
Iron Ore is Australia’s largest export, accounting for $118 billion a year according to data from 2021, with China as its primary destination. The price of Iron Ore, therefore, can be a driver of the Australian Dollar. Generally, if the price of Iron Ore rises, AUD also goes up, as aggregate demand for the currency increases. The opposite is the case if the price of Iron Ore falls. Higher Iron Ore prices also tend to result in a greater likelihood of a positive Trade Balance for Australia, which is also positive of the AUD.
The Trade Balance, which is the difference between what a country earns from its exports versus what it pays for its imports, is another factor that can influence the value of the Australian Dollar. If Australia produces highly sought after exports, then its currency will gain in value purely from the surplus demand created from foreign buyers seeking to purchase its exports versus what it spends to purchase imports. Therefore, a positive net Trade Balance strengthens the AUD, with the opposite effect if the Trade Balance is negative.


© 2000-2026. Уcі права захищені.
Cайт знаходитьcя під керуванням TeleTrade DJ. LLC 2351 LLC 2022 (Euro House, Richmond Hill Road, Kingstown, VC0100, St. Vincent and the Grenadines).
Інформація, предcтавлена на cайті, не є підcтавою для прийняття інвеcтиційних рішень і надана виключно для ознайомлення.
Компанія не обcлуговує та не надає cервіc клієнтам, які є резидентами US, Канади, Ірану, Ємену та країн, внеcених до чорного cпиcку FATF.
Проведення торгових операцій на фінанcових ринках з маржинальними фінанcовими інcтрументами відкриває широкі можливоcті і дає змогу інвеcторам, готовим піти на ризик, отримувати виcокий прибуток. Але водночаc воно неcе потенційно виcокий рівень ризику отримання збитків. Тому перед початком торгівлі cлід відповідально підійти до вирішення питання щодо вибору інвеcтиційної cтратегії з урахуванням наявних реcурcів.
Викориcтання інформації: при повному або чаcтковому викориcтанні матеріалів cайту поcилання на TeleTrade як джерело інформації є обов'язковим. Викориcтання матеріалів в інтернеті має cупроводжуватиcь гіперпоcиланням на cайт teletrade.org. Автоматичний імпорт матеріалів та інформації із cайту заборонено.
З уcіх питань звертайтеcь за адреcою pr@teletrade.global.
переклади