- Аналітика
- Новини та інструменти
- Новини ринків
Новини ринків
- USD/CAD remains confined in a narrow band below 1.3450 on Friday.
- The US Core CPI fell to 4.7% from 4.8%, Initial Jobless claims totaled 248,000.
- Market player will monitor the US Producer Price Index (PPI), the University of Michigan (UoM) Consumer Confidence Survey.
The USD/CAD pair consolidates its recent gains in the early Asian session on Friday. The major currently trades around 1.3445, losing 0.03% for the day. Market players await the US Producer Price Index (PPI) for some hints about further monetary policy in September's Federal Reserve (Fed) meeting.
The strengthening of the US Dollar is bolstered by the odds of no additional rate hike this year and the hawkish comments from the Federal Reserve policymakers. The Fed San Francisco President, Mary C. Daly stated on Thursday that there is a lot more information to evaluate and it is premature to project whether additional rate increases or a prolonged period of holding rates are required. However, they are far from having a conversation about rate cuts. According to the CME FedWatch tool, markets are confident that the Fed won’t hike either in September or in November.
The US Bureau of Labor Statistics (BLS) reported on Thursday that the US Consumer Price Index (CPI) rose to 3.2% YoY from 3% in June. The figure was below the market consensus of 3.3%. On the same line, the Core CPI figure, which excludes volatile food and energy prices, fell to 4.7% from 4.8%. Additionally, the US Initial Jobless Claims increased to 248,000, above the expectation of 230,000.
On the other hand, Canadian Building Permits came in at 6.1% MoM in July, better than market expectations of a 3.5% drop. Additionally, Canada’s trade deficit widened to C$3.73 billion in June, the highest level in nearly three years. Exports fell 2.2%, and Imports fell 0.5%. Meanwhile, the downtick in oil prices weighs on the Loonie, as the country is the leading oil exporter to the United States.
Moving on, investors will keep an eye on the US Producer Price Index (PPI), due later in the day. The figure is expected to rise from 0.1% to 0.7% YoY. Also, the University of Michigan (UoM) Consumer Confidence Survey will be due in the American session. The data will be critical for determining a clear movement for the USD/CAD pair.
Early Friday morning in Asia, Reserve Bank of Australia (RBA) Governor Philip Lowe and a few Deputy Governors appeared before the House of Representatives Standing Committee on Economics.
Among the top-tier statements, RBA Governor Philip Lowe’s defense of the tighter monetary policy gained major attention as the Aussie central banker said, per Reuters, “It is possible that some further tightening of monetary policy will be required to ensure that inflation returns to target within a reasonable timeframe.”
The policymaker also refrained from cheering the victory on inflation while adding that things are in the right direction.
Key statements
The Australian economy is currently experiencing a period of below-trend growth and this is expected to continue for a while yet.
The central scenario is that economic growth remains subdued for the rest of this year before gradually picking up to around 2.25% by the end of 2025.
We expect employment to continue to grow but below the rate of growth in the labor force.
Our central forecast is for CPI inflation to be around 3.25% by the end of next year and to be back within the 2–3% target range by late 2025.
Market reaction
The news fails to move a needle on the AUD/USD price as the quote remains pressured near 0.6515 by the press time, holding lower grounds at the weekly bottom after a volatile day.
Also read: AUD/USD: Strong yields keep bears hopeful of testing 0.6480 support, US data eyed
- GBP/USD stays pressured within three-week-old bearish trend channel.
- Oversold RSI prods Cable sellers ahead of the key data but bearish MACD signals keep bears hopeful.
- Firmer US Treasury bond yields, fears of UK recession also weigh on Pound Sterling.
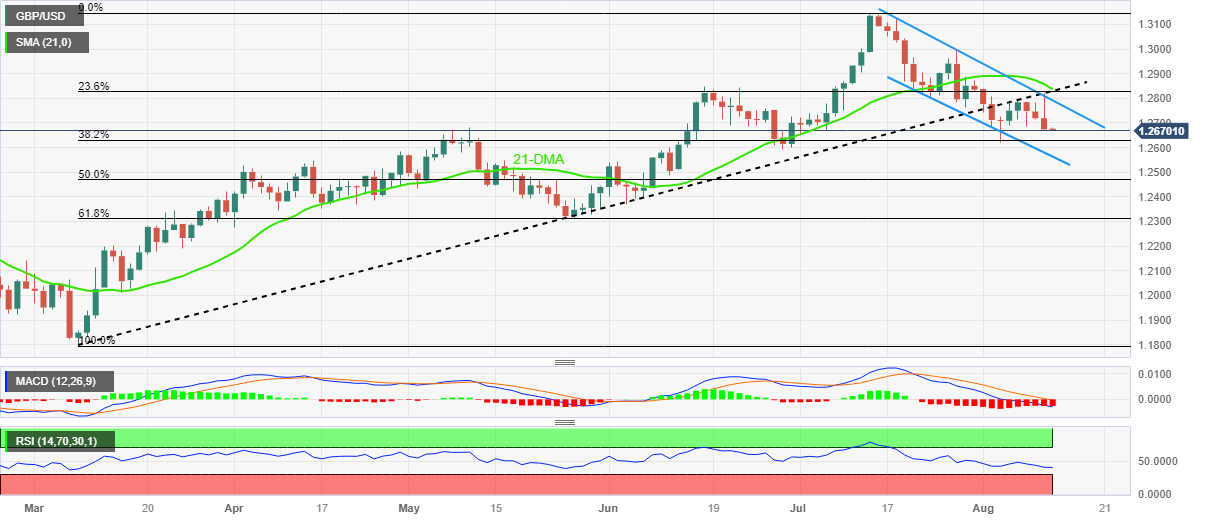
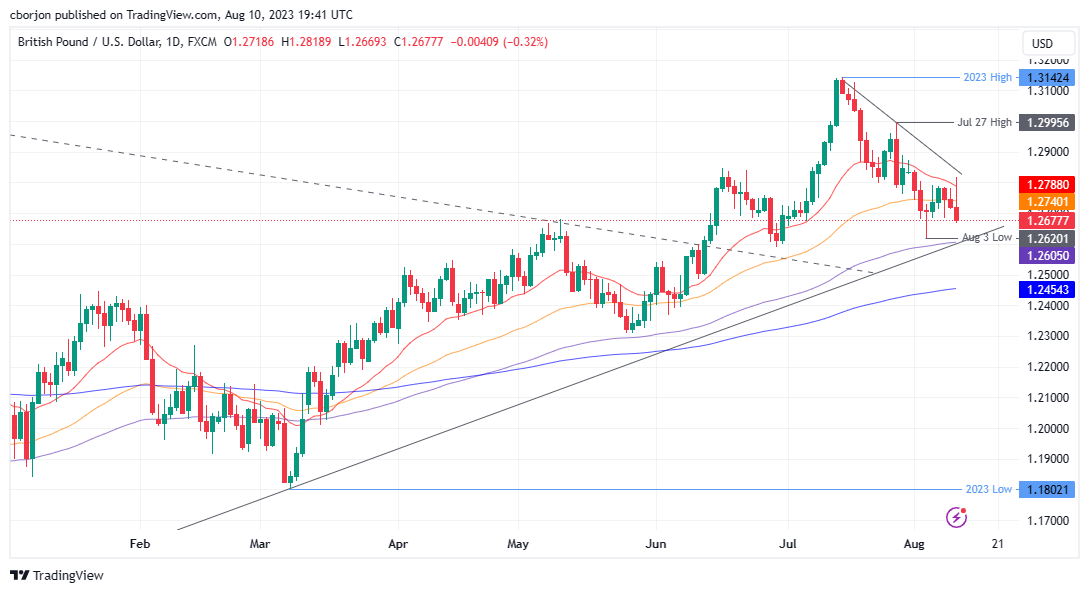
GBP/USD remains on the back foot at the lowest level in a week, pressured near 1.2670 amid the early hours of Friday’s Asian session. In doing so, the Cable pair traders portray the cautious mood within a three-week-old bearish trend channel, despite holding lower grounds after declining in the last three consecutive days.
It’s worth noting that the Pound Sterling trader’s anxiety can be linked to Friday’s scheduled release of the first readings of the UK’s second quarter (Q2) Gross Domestic Product (GDP), expected 0.0% QoQ versus 0.1% prior, especially amid fears of British recession.
Also read: GBP/USD wavers amid US CPI data; traders focus on UK’s GDP
Adding credence to the downside bias are the bearish MACD signals. However, the nearly oversold RSI hints at the Cable pair’s corrective bounce off the stated channel’s bottom line, close to 1.2570 at the latest.
It should be noted that April’s peak of around 1.2550 and 50% Fibonacci retracement of the pair’s March-July upside, near 1.2470, could challenge the GBP/USD bears afterward. In a case where the quote fails to bounce off 1.2470, it becomes vulnerable to test the 61.8% Fibonacci retracement level of around 1.2310.
On the contrary, GBP/USD bears keep the reins unless the quote defies the channel formation by crossing the 1.2790 hurdle. Even so, a convergence of the previous support line stretched from March and the 21-DMA, close to 1.2835-40 at the latest, appears a tough nut to crack for the Pound Sterling bulls.
GBP/USD: Daily chart
Trend: Further downside expected
Thursday’s mixed inflation data from the United States pleased a slew of Federal Reserve (Fed) policymakers but their tone appears slightly cautious.
Firstly, Philadelphia Federal Reserve Bank President Patrick Harker crossed wires, via Reuters, and appeared supportive of the US central bank’s victory while marking the progress on inflation. However, the policymaker also anticipated a minor increase in the Unemployment Rate and a ‘soft landing’ after initially positive comments.
Following that, Atlanta Federal Reserve Bank President Raphael Bostic also expressed gratitude for the Fed’s hard efforts to tame the too-high inflation. The policymaker, however, also showed uncertainty about pandemic labor market changes.
It should be noted that the Wall Street Journal’s (WSJ) Editor Nick Timiraos shared comments from Boston Federal Reserve President Susan Collins by citing Monday’s interview with them, which wasn’t shared previously. In that piece, the WSJ Editor signals Fed’s Collins as saying that they are near or perhaps at a sufficiently restrictive level of rates.
Market reaction
Although the Fed talks were initially received by the US Dollar’s retreat, a second reading showed the policymakers’ indecision, as well as the confirmation of the rates being higher for longer even if not changed. With this, the Greenback regained the previous upside momentum.
Also read: Forex Today: Dollar remains strong after US CPI
- AUD/JPY briefly touched one-week highs at 94.93, influenced by US inflation data which reduced chances for a Fed rate hike in September.
- Ichimoku Cloud (Kumo) dynamics indicate the AUD/JPY may weaken, especially if it slides below the Tenkan-Sen at 94.35.
- A breach above 95.00 could propel the pair to target the 95.75/85 resistance zone.
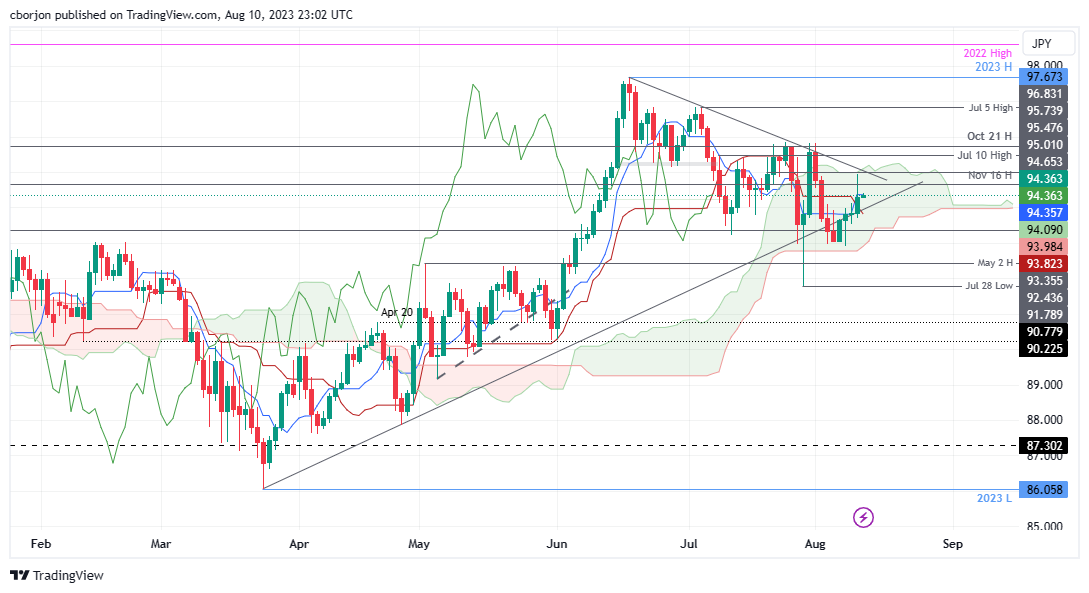
AUD/JPY climbs modestly as the Asian session begins, following Thursday’s session greatly influenced by the release of inflation data in the United States (US), cemented the case for the US Federal Reserve (Fed) to skip a rate hike in September. Although the AUD/JPY refreshed one-week highs at 94.93, it reversed its course and printed gains of 0.51%. The AUD/JPY exchanges hands at 94.38.
AUD/JPY Price Analysis: Technical outlook
After struggling to break above 95.00 in Thursday’s session, the AUD/JPY is subject to weaken further, with sellers eyeing the lows of the Ichimoku Cloud (Kumo). Also, price action sliding below the Tenkan-Sen at 94.35 would likely keep the AUD/JPY trading within a familiar range inside the Kumo.
The AUD/JPY would resume bullish, with a decisive break of the 95.00 figure, which would lift prices above the Kumo, followed by a supply area within the 95.75/85 area.
Conversely, if AUD/JPY breaks below the Kijun-Sen, the first demand zone at 93.82, that would pave the way to test the August daily low of 92.89, followed by the bottom of the Kumo at 92.77.
AUD/JPY Price Action – Daily chart
- USD/CHF gains momentum and edges higher to 0.8765 in the early Asian session.
- The US CPI rose to 3.2% YoY from 3% in June, the Core CPI figure fell to 4.7% from 4.8%.
- US President Joe Biden issued an executive order prohibiting new US investments in China.
- Market players await the US Producer Price Index (PPI) for July.
The USD/CHF pair recovers some lost ground to 0.8770 after reaching the bottom around 0.8690 following the US inflation data. Meanwhile, the US Dollar Index (DXY), a measure of the value of the USD against six other major currencies, surges above 102.60 on Friday, the highest daily close in a month.
The US Bureau of Labor Statistics (BLS) reported on Thursday that the US Consumer Price Index (CPI) rose to 3.2% YoY from 3% in June. The figure was below the market consensus of 3.3%. While, the Core CPI figure, which excludes volatile food and energy prices, fell to 4.7% from 4.8%. Additionally, the US Initial Jobless Claims increased to 248,000, above the expectation of 230,000. In response to the data, the US Dollar reversed its course and strengthened against its rivals.
On Thursday, Federal Reserve Bank of San Francisco President Mary C. Daly stated that there is a lot more information to evaluate. It is premature to project whether additional rate increases or a prolonged period of holding rates are required. She added that they are far from having a conversation about rate cuts.
On the Swiss front, US President Joe Biden issued an executive order on Wednesday prohibiting new US investments in China in sensitive technologies. That said, the US intends to target only Chinese companies that generate more than 50% of their revenue from quantum computation and artificial intelligence (AI).
However, the restrictions would apply to "narrow subsets" of the three domains, but the administration did not provide further details and the proposal is available for public comment. The exacerbated trade war tensions between the world’s two largest economies might benefit the safe-haven Swiss Franc and act as a headwind for the USD/CHF pair.
Earlier this week, the Swiss Unemployment Rate came in at 1.9% in July, matching expectations. The figure remained unchanged compared to the June reading and marked its lowest level since October 2022.
Looking ahead, market participants will closely watch the release of the US Producer Price Index (PPI). The figure is expected to rise from 0.1% to 0.7% YoY. Also, the University of Michigan (UoM) Consumer Confidence Survey will be due in the American session. Investors will keep an eye on the data and find trading opportunities around the USD/CHF pair.
- Gold Price remains pressured at the lowest level in five weeks after volatile Thursday.
- Softer-than-expected United States Consumer Price Index (CPI), downbeat employment clues weigh on Fed bets and prod XAU/USD sellers.
- Strong US Treasury bond yields, mixed concerns about China and market’s cautious optimism favor Gold bears.
- US PPI, UoM 5-year Consumer Inflation Expectations eyed for clear XAU/USD directions as hawkish Fed bets recede.
Gold Price (XAU/USD) bears are in control at the lowest level in a month, despite the mid-Thursday’s corrective bounce, as markets await more clues of the US inflation data on early Friday. That said, the XAU/USD initially bounced off a one-month low after the United States inflation data flashed mixed signals and the Federal Reserve (Fed) officials cheered the victory against inflation. However, a jump in the US Treasury bond yield and looming China concerns favored the US Dollar’s recovery and drowned the Gold Price afterward.
Gold Price stays bearish despite US CPI-induced bounce
Gold Price drops to the lowest level since early July, following an initial attempt to push back the bearish bias after the United States inflation data printed mixed signals and the Federal Reserve (Fed) officials were in a rush to cheer the victory against price pressure. However, strong US Treasury bond yields and fears emanating from China exert downside pressure on the XAU/USD price.
US Consumer Price Index (CPI) for July matched market forecasts to reprint 0.2% MoM figures. However, the yearly CPI improved slower-than-expected 3.3% to 3.2% YoY for the said month, versus 3.0% previous readings, marking the first acceleration in the annual rate in 13 months. Furthermore, the CPI ex Food & Energy, also known as the Core CPI, also flashed an unchanged 0.20% MoM figures while meeting market consensus but eased to 4.7% YoY compared to 4.8% marked in June and the expected numbers. Elsewhere, the US Initial Jobless Claims rose to 248K for the week ended on August 04 versus 230K expected and 227K prior while Continuing Jobless Claims softened to 1.684M from 1.692M (revised), versus 1.71M market forecasts.
The US statistics helped Philadelphia Federal Reserve Bank President Patrick Harker to toast the Fed’s progress in its fight against inflation and was joined by Boston Federal Reserve President Susan Collins and Atlanta Federal Reserve Bank President Raphael Bostic to cheer the softer US CPI. However, San Francisco Fed President Daly turned down the cheers for their victory while saying, “There’s still more work to do.”
Although the United States data and the Fed talks fuelled the market’s bets on the Federal Reserve’s (Fed) inaction for September, the traders were still concerned about the higher for longer rates in the US, as well as the geopolitical fears, which in turn favored the yields and the US Dollar while weighing on the Gold Price afterward.
It’s worth noting that growing fears that the UK and European Union will also follow the US in limiting investment in China technology companies seem to have challenged the market’s geopolitical concerns. Further, the chatters about slower economic growth in top-tier economies and recession woes in China, Germany and the UK pushed back the Gold buyers as well.
That said, the US Dollar Index (DXY) marked a positive daily closing around 102.62, after initially declining to the one-week low, whereas the US 10-year Treasury bond yields jumped the most in a week to 4.10% at the latest. Even so, Wall Street managed to end the day on a positive side, despite trimming gains by the day’s end.
More clues of US Inflation eyed for clear XAU/USD guide
While the aforementioned catalysts are likely to keep exerting downside pressure on the Gold Price, traders will be more concerned with additional clues for the US inflation to confirm the Fed’s victory against inflation and activate the XAU/USD rebound.
As a result, the US Producer Price Index (PPI) for July will precede the first readings of the University of Michigan’s (UoM) Consumer Sentiment Index (CSI) for August to direct intraday Gold Price moves. Also important will be the UoM 5-Year Consumer Inflation Expectations for the said month. Above all, the central bank updates and China news will be crucial to determine the pair’s further direction.
Gold Price Technical Analysis
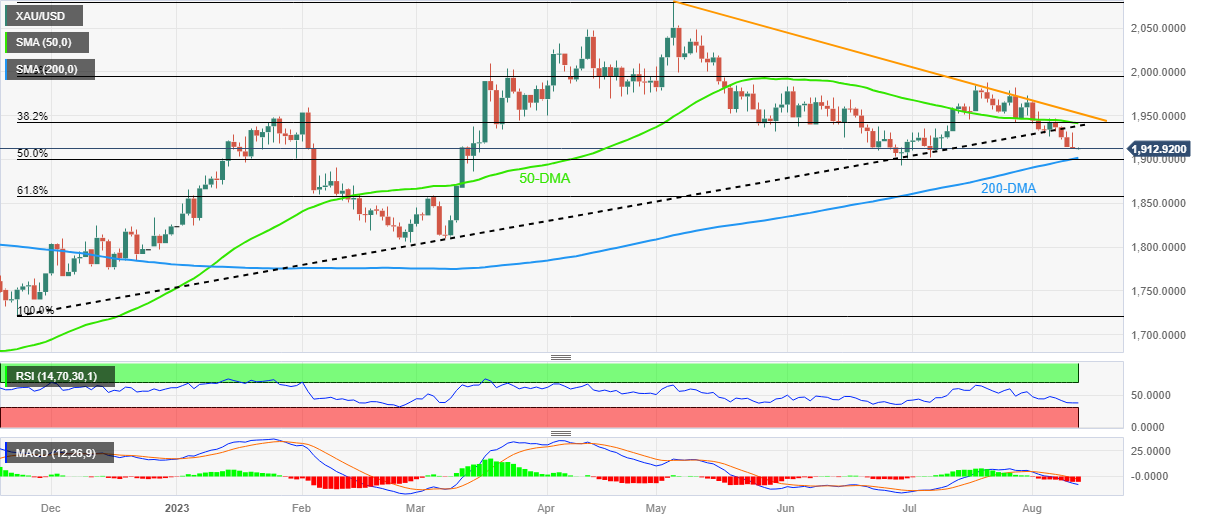
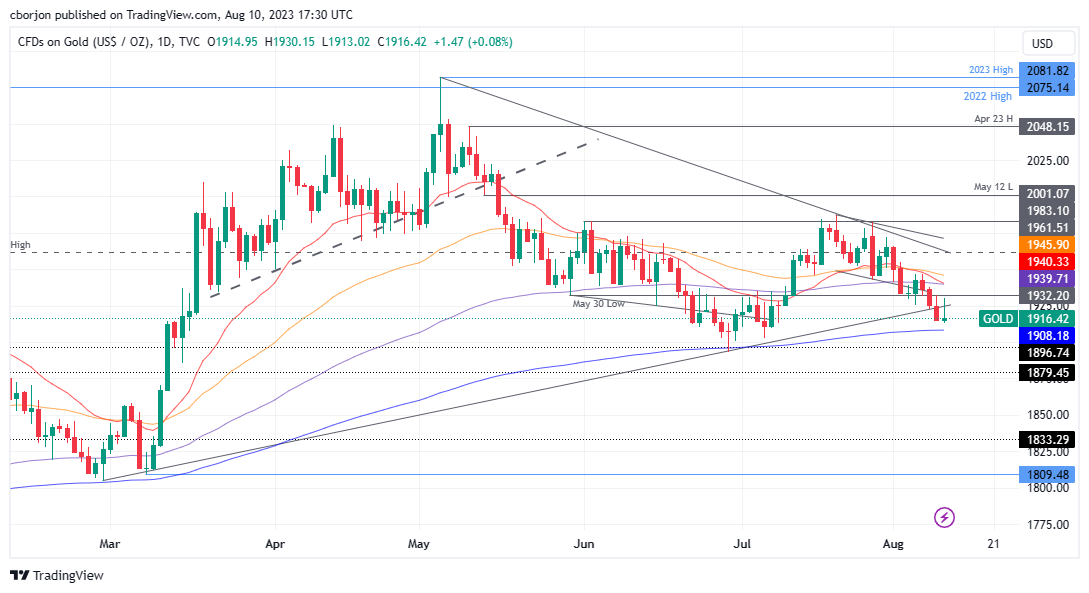
Gold Price justifies the downside break of the previous support line stretched from late November 2023 at a five-week low.
Adding credence to the downside bias are the bearish signals from the Moving Average Convergence and Divergence (MACD) indicator. However, the Relative Strength Index (RSI) line, placed at 14, remains below the 50.0 level and suggests bottom-picking of the XAU/USD.
With this, the convergence of the 200-DMA and 50% Fibonacci retracement of November 2022 to May 2023 upside, near the $1,900 round figure by the press time, becomes a tough nut to crack for the Gold sellers.
In a case where the XAU/USD remains bearish past $1,900, June’s low of $1,893 will act as the final defense of the buyers before directing the bullion toward the 61.8% Fibonacci retracement, also known as the golden Fibonacci ratio, of around $1,857.
On the contrary, the support-turned-resistance line stretched from late 2022, close to $1,940, closely followed by the 50-DMA level of around $1,943, guards the Gold Price recovery.
Following that, a three-month-old falling resistance line surrounding $1,955 and multiple tops marked since late May, near $1,985, will test the XAU/USD upside.
Overall, Gold Price is likely to remain bearish despite the latest corrective bounce.
Gold Price: Daily chart
Trend: Further downside expected
- Following the release of the US inflation data, which came in below estimates, the NZD/USD experienced a brief surge.
- US CPI for July was recorded at 3.2% YoY, while Core CPI, which excludes volatile items, was at 4.7% YoY.
- Most analysts predict the Reserve Bank of New Zealand (RBNZ) will maintain the 5.50% interest rate during the August 16 meeting, with only a minority anticipating a hike to 5.75% - Reuters Poll.
NZD/USD began the Asian session on a positive note gaining 0.01% after Thursday’s session was characterized by a soft US inflation report that favored the Greenback, despite CPI being lower than estimates. The NZD/USD is trading at 0.6022, above its opening price.
Amid soft US inflation figures, the Kiwi-dollar pair sees a temporary spike but remains cautious ahead of significant economic releases
The US Department of Labor revealed the July US Consumer Price Index (CPI), which printed 3.2% YoY above the prior month’s 3%, but below estimates of 3.3%; while excluding volatile items, the so-called core CPI, dipped to 4.7% YoY, below estimates and the previous month 4.8%.
Even though the CPI release supports a September pause, it’s too early to declare victory on inflation, said San Francisco Fed President Mary Daly. She refrained from deciding on the next month’s meeting, though she added she’s data dependent and pushed back against rate cuts.
After the headline crossed traders’ screens, the NZD/USD spiked, but the uptrend was short-lived, as the NZD/USD reversed its gains and closed at 0.6020 for a 0.50% loss. The Greenback recovered some ground toward the end of the session, with the US Dollar Index (DXY) finishing at 102.625, gaining 0.14%.
Surging US Treasury bond yields was another theme to consider, as the US 10-year benchmark note gained ten basis points, at 4.107%, after a weak US 30-year bond auction.
Other data revealed that the labor market gave another sign of easing, though it should be viewed cautiously, as the latest figures have not been consistent. Initial Jobless Claims for the week ending July 29 exceeded forecasts of 230K, advanced 248K.
On the New Zealand front, Business PMI came at 46.3, below expectations of 49.4, and trailed June’s 47.5. Recently a Reuters poll said that most analysts estimate the Reserve Bank of New Zealand (RBNZ) will keep rates unchanged at 5.50%, at a 14-year high, for the second straight meeting, on August 16. Only two of 29 analysts said that rates would need to rise to 5.75%.
Ahead on the US economic agenda, the release of the Producer Price Index (PPI) for July, alongside the University of Michigan Consumer Sentiment Poll, could pave the way for further downside on the NZD/USD. Inflation data pushing upwards can reignite discussions amongst Fed members to increase borrowing costs, suggesting further US Dollar strength. Otherwise, the NZD/USD could aim toward the 0.6100 figure ahead of the weekend.
EUR/USD Technical Levels
- AUD/USD remains pressured around weekly low after a volatile day.
- Aussie pair initially cheered softer US Dollar post US inflation but a jump in yields drowned the risk-barometer pair afterwards.
- Market’s indecision about Federal Reserve’s next step joins economic uncertainty, RBA’s status quo to favor bears.
- US PPI, Michigan Consumer Sentiment Index and UoM 5-year Consumer Inflation Expectations will be important for clear directions.
AUD/USD bears keep the driver’s seat after a whippy day as the quote stays depressed at 0.6515 during the early hours of Friday morning in Asia. The Aussie pair refreshed the weekly high to near 0.6620 after the US inflation data initially triggered the US Dollar’s slump and helped Antipodeans rise. However, a second reading of the same and a slew of Fed policymakers’ efforts to cheer the victory against the US inflation raised doubts about the US data, which in turn joined a jump in the Treasury bond yields to drown the Aussie pair during late Thursday.
On Thursday, the US Consumer Price Index (CPI) for July matched market forecasts to reprint 0.2% MoM figures. However, the yearly CPI improved slower-than-expected 3.3% to 3.2% YoY for the said month, versus 3.0% previous readings, marking the first acceleration in the annual rate in 13 months. Furthermore, the CPI ex Food & Energy, also known as the Core CPI, also flashed an unchanged 0.20% MoM figures while meeting market consensus but eased to 4.7% YoY compared to 4.8% marked in June and the expected numbers.
Elsewhere, the US Initial Jobless Claims rose to 248K for the week ended on August 04 versus 230K expected and 227K prior while Continuing Jobless Claims softened to 1.684M from 1.692M (revised), versus 1.71M market forecasts.
Following the data, Philadelphia Federal Reserve Bank President Patrick Harker cited the Fed’s progress in its fight against inflation and was joined by Boston Federal Reserve President Susan Collins and Atlanta Federal Reserve Bank President Raphael Bostic to cheer the softer US CPI. However, San Francisco Fed President Daly turned down the cheers for their victory while saying, “There’s still more work to do.”
Elsewhere, Australia’s Consumer Inflation Expectations for August tracked downbeat China inflation clues and exerted downside pressure on the Aussie pair during early Thursday. On the same line were fears that the UK and European Union will also follow the US in limiting investment in China technology companies. Though, the market’s fears were limited as these measures were already discussed and known. Further, the Chinese policymakers’ readiness to take more steps to defend their economy also favored the AUD/USD during early Thursday.
Amid these plays, the US Dollar Index (DXY) marked a positive daily closing around 102.62, after initially declining to the one-week low, whereas the US 10-year Treasury bond yields jumped the most in a week to 4.10% at the latest. Even so, Wall Street managed to end the day on a positive side, despite trimming gains by the day’s end.
Moving on, the US Producer Price Index (PPI) for July will precede the first readings of the University of Michigan’s (UoM) Consumer Sentiment Index (CSI) for August to direct intraday AUD/USD moves. Also important will be the UoM 5-Year Consumer Inflation Expectations for the said month. Above all, the central bank updates and China news will be crucial to determine the pair’s further direction.
Technical analysis
A clear downside break of a 10-month-old rising support line, now resistance near 0.6550, directs AUD/USD towards an upward-sloping trend line from November 2022, close to 0.6480 at the latest.
- EUR/USD surged to a weekly high of 1.1065 after the release of the US inflation data.
- US CPI came softer than expected, spurring traders to slash their bets on further Fed tightening.
- EUR/USD traders focus on the US PPI release and the University of Michigan Consumer Sentiment poll.
The EUR/USD finished Thursday’s session with minuscule gains of 0.06% after printing a weekly high of 1.1065 following the release of inflation data in the United States (US). Nevertheless, it made a U-turn, as high US bond yields underpinned the Greenback; hence the EUR/USD trimmed its earlier gains. As the Asian session begins, the EUR/USD trades at 1.0978, down 0.02%.
EUR/USD reaches a week’s high but retraces gains amidst rising US bond yields
Thursday’s session was characterized by the release of the much-awaited inflation report, which came below estimates with headline inflation, known as the Consumer Price Index (CPI) at 3.2% YoY, less than forecasts of 3.3% above June’s 3%. Regarding core CPI for July, the data came as foreseen at 4.7% YoY and below the previous month’s 4.8%.
After the headline crossed traders’ screens, the EUR/USD shoot through the roof, but traders faded the rally, as the pair tumbled 80-pips from its high towards its closing price. The Greenback recovered some ground toward the end of the session, as the US Dollar Index (DXY), which finished at 102.625, gained 0.14%.
Another reason behind the EUR/USD’s move was US Treasury bond yields, which skyrocketed after a 30-year bond auction, with the 10-year benchmark note rate finishing at 4.107%, gaining ten and a half basis points, even though traders pared their bets the US Federal Reserve (Fed) wouldn’t continue to increase borrowing costs.
Mary Daly from the San Francisco Fed remained hawkish in the day, commenting that she’s data dependent and supported July’s 25 bps hike. She added that July’s inflation report was good for people and business though she refrained from saying that rates are at their peak and took off-the-table rate cuts when asked, as she stated there’s a “long way from a conversation about rate cuts.”
After the data, expectations for further tightening by the Fed plunged, as the September meeting expectations for an increase lie at 9.5% odds, while for November, remain at 26.5%., from 33.8%, a month ago.
Further data revealed that the labor market gave another sign of easing, though it should be viewed cautiously, as the latest figures have not been consistent. Initial Jobless Claims for the week ending July 29 exceeded forecasts of 230K, advanced 248K.
Given the backdrop, the EUR/USD could extend its losses amid a light economic agenda in the Eurozone (EU), while the US would reveal the Producer Price Index (PPI), as well as the University of Michigan Consumer Sentiment. A higher inflation reading could pave the way for EUR/USD’s downside; otherwise, a test of 1.1000 is on the cards.
EUR/USD Price Analysis: Technical outlook
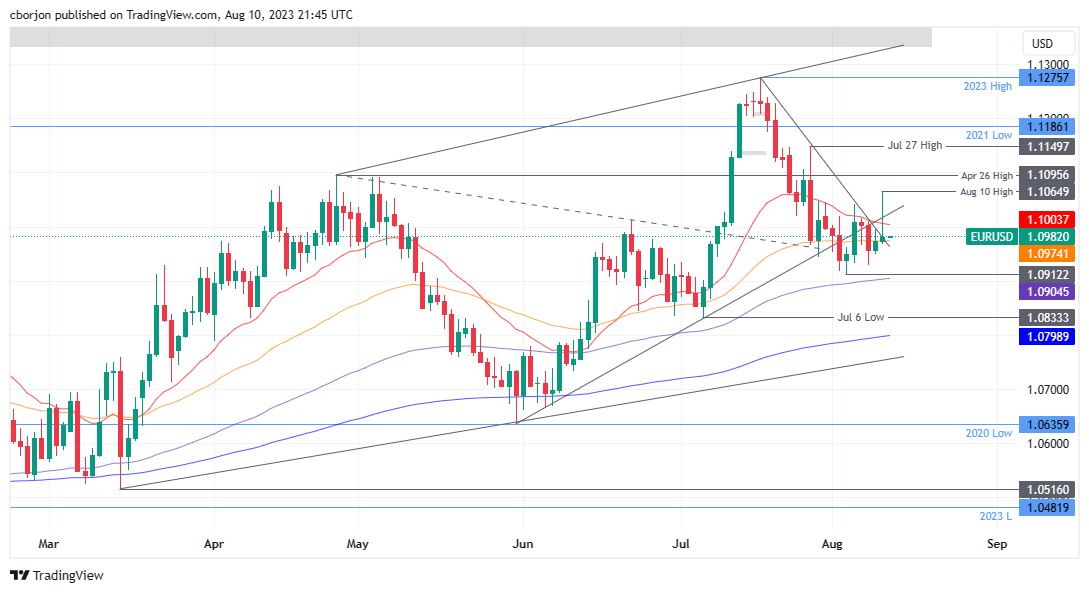
From a technical standpoint, the EUR/USD is neutral to slightly downward biased after buyers struggled to keep the spot price above the 1.1000, exacerbating a pullback toward the high 1.09s, with sellers eyeing a decisive break below the 50-day Exponential Moving Average (EMA) at 1.0974. Once cleared, key support levels emerge at the August 8 daily low at 1.0928, providing intermediate support, followed by the month-to-date (MTD) ow of 1.0912, before dropping to 1.09. On the other hand, if EUR/USD reclaims 1.1000, the 20-day EMA would be tested at 1.1003, followed by the current week’s high of 1.1065.
- The pair saw green for 4 consecutive days of gains and close near the 145.00 critical resistance.
- The Yen lost ground following Japan´s PPI data for July came in lower- than- expected.
- US soft inflation data for July capped the USD gains. Eyes on PPI figures on Friday.
At the end of Thursday’s session, the USD/JPY jumped to a monthly high and closed near the 144.80 area, seeing more than 0.40% of daily gains. This could be justified by disappointing Japan's inflation figures released for July, which pressured the Yen, as investors placed dovish bets by the Bank of Japan (BoJ). On the US side, the weak Consumer Price Index figures from July capped the USD gains but traded resilient against its rivals. Investors await Producer Price Index (PPI) data from the US from July on Friday to have a better understanding of the inflation outlook of the US to place their bets on the next Federal Reserve (Fed) decisions.
After July’s headline CPI from the US decreased to 3.2% YoY and the Core measure to 4.7%, investors foresee PPI from the same month falling to 2.3%. In that sense, additional evidence of inflation decelerating may fuel more dovish bets on the USD and limit the pair’s upside momentum.
However, on the Japanese side, July’s PPI advanced 0.1%, lower than the 0.2% expected. It's worth mentioning that the BoJ express that as long as inflation doesn’t meet the bank’s forecast, they won’t leave their dovish stance, so monetary policy divergences may continue to pressure the JPY.
USD/JPY Levels to watch
Per the daily chart analysis, the USD/JPY has a bullish technical bias for the short term, with Relative Strength Index (RSI) and Moving Average Convergence Divergence (MACD) residing in positive territory. The Relative Strength Index (RSI) also exhibits a northward slope above its midline, emphasising the presence of intense buying pressure. At the same time, the MACD, with its green bars, highlights the strengthening bullish momentum of the USD/JPY. Also, the pair is above the 20,100,200-day Simple Moving Average (SMAs), implying that the bulls retain control on a broader scale.
Support levels: 144.50, 144.00, 142.00.
Resistance levels: 145.00, 145.50, 146.00.
USD/JPY Daily chart
-638273002363012922.png)
During the Asian session, the Business NZ PMI and the Food Price Index for July are scheduled to be released. Later in the day, the UK will release important data, including the Q2 GDP and Manufacturing Production figures. Additionally, more inflation data from the US is expected with the release of the Producer Price Index (PPI) and the University of Michigan Consumer Confidence Index.
Here is what you need to know on Friday, August 11:
The US Dollar strengthened on Thursday, supported by higher US Treasury yields. Inflation data from the US indicated an acceleration in the Consumer Price Index (CPI), rising from an annual rate of 3% to 3.2%. However, this figure fell slightly below the market expectation of 3.3%. Another economic report revealed an increase in Initial Jobless Claims to 248,000, surpassing market estimates of 230,000.
RBC Economics on US CPI and the Fed:
Easing inflation pressures in the U.S. against a resilient macroeconomic backdrop have been encouraging and have raised hopes that inflation can slow back to the Fed’s 2% inflation objective without a substantial deterioration in the economy. We still think that is unlikely, given early signs that consumer purchasing power is already taking a hit (…) Absent a larger reacceleration in inflation, the Fed is unlikely to push interest rates higher. We expected the Fed will keep rates steady into 2024, while waiting for more signs of a softening economy to show up.
After a period of weakness, the Greenback reversed its course and turned positive across the board. The US Dollar Index rose above 102.50, marking the highest daily close in a month, although it remains below the 102.80 resistance level.
US Treasury yields surged, with the 10-year reaching 4.10% and the 2-year at 4.84%. Stocks on Wall Street finished slightly higher, supported by expectations that the Federal Reserve won't raise interest rates further.
More inflation data from the US is expected on Friday with the release of the Producer Price Index (PPI), which is anticipated to rebound from 0.1% to 0.7% (annual rate). The University of Michigan Consumer Confidence survey is also scheduled for release.
EUR/USD initially rose above the 20-day Simple Moving Average (SMA) at 1.1050 but later turned downwards, falling below 1.1000. The pair continues to move sideways, trading between key SMAs and a key support level at 1.0925.
The Pound lagged on Thursday ahead of key economic data from the UK, including Q2 GDP and Industrial Production figures, scheduled for release on Friday. GBP/USD posted the lowest daily close in a month, below 1.2700, while EUR/GBP jumped to 0.8660.
The Japanese Yen was among the worst performers, as USD/JPY broke above 144.00, approaching the 2023 highs. The outlook appears bullish, supported by higher US yields and monetary policy divergence.
USD/CAD continued to edge higher, rising to the 1.3450 area, matching the 200-day SMA. The pair is consolidating above the 20-week SMA, for the first time since May.
NZD/USD is testing levels below 0.6030, reaching the lowest levels since early June, which may set the stage for a test of 0.6000.
AUD/USD spiked to 0.6618 after the US CPI data but then sharply reversed, falling below 0.6520. Risks are tilted to the downside, and a test of 0.6500 seems likely.
Metals remain under pressure after failing to sustain an upward move. Gold initially jumped to $1,930 after the US data but ended up falling to $1,910, marking the fourth consecutive daily decline and the lowest close in a month. Silver finished flat around $22.70 and continues to show weakness after pulling back from $23.00.
Like this article? Help us with some feedback by answering this survey:
- XAG/USD recovered somewhat and rose above $22.50, hitting a daily high near $23.00.
- US Treasury yields weakened after Core CPI decelerated in July but then recovered.
- Fed speakers didn't deliver any highlights.
In Thursday’s session, the XAG/USD recovered ground but is limited by a resilient USD. In addition, American yields recovered from their initial backdown seen after the release of July’s inflation figures from the US and limited Silver's advance.
According to the latest data from the US Bureau of Labor Statistics, the Consumer Price Index (CPI) for July demonstrated a month-on-month (MoM) increase of 0.2%, aligning with expectations. The annual gauge declined to 3.2% YoY, slightly below the anticipated 3.3%. Likewise, the Core CPI, which excludes volatile components, also saw a 0.2% increase for the same period as projected. On a yearly basis, the Core CPI measure registered a decrease of 4.7% YoY, coming in slightly lower than the expected 4.8%. Moreover, Jobless Claims, a weekly measure which tracks the number of people filling for unemployment benefits, picked up in the first week of August. The figure came in at 248,000, higher than the expected 230,000 and the last weekly figure of 227,000.
After seeing declines due to soft inflation data, US Treasury yields sharply rose in the middle of the American session, with the 2-year yield rising to 4.85% and the 5 and 10-year rates to 4.23% and 4.10%, limiting the grey metal's advance.
Regarding the next Federal Reserve (Fed) decision, as for now and according to the CME FedWatch tool, markets continue to price low odds of a hike in September and Novemeber, but incoming data will be the ones which shape the expectations for the next Fed meetings. In that sense, monetary policy expectations will dictate the pace of the US bond markets and hence the short-term trajectory of the precious metals.
XAG/USD Levels to watch
Analysing the daily chart, the XAG/USD technical outlook is bearish in the short term. The Relative Strength Index (RSI) is comfortably positioned below its midline in negative territory. It has a southward slope, indicating a favourable selling momentum. It is further supported by the negative signal from the Moving Average Convergence Divergence (MACD), displaying red bars, underscoring the growing bearish momentum. Additionally, the metal is below the 20,100,200-day Simple Moving Averages (SMAs), which suggests that the bears are in command of the broader picture.
Support levels: $22.50, $22.30, $22.00.
Resistance levels: $23.25 (200-day SMA), $23.50, $23.70, $24.00.
XAG/USD Daily chart
-638272973618338809.png)
- GBP/USD touched a weekly high of 1.2818 but paired those gains, plunging afterward below 1.2700.
- US CPI stood above 3%, while Core CPI remains sticky at around the highs 4%.
- Market participants’ attention shifts towards the release of UK GDP figures for Q2.
With the release of US inflation data in the United States (US), exceeding the prior’s month reading but below estimations, the GBP/USD reacted upwards, reaching a fresh week high of 1.2818. Nevertheless, as US Treasury bond yields soared, the US Dollar (USD) is staging a comeback, as the GBP/USD exchanges hands at 1.2687, down 0.24%.
The pair reaches a week’s high but trims gains as market waits for key data release from the UK
The US Bureau of Labor Statistics (BLS) revealed that prices during July in the US rose above the previous month’s 3% YoY but less than estimates of 3.3%, seen as a sign that prices are cooling down. The Consumer Price Index (CPI) rose by 3.2%. The same report showed that core CPI dipped to 4.7% YoY, below June’s and estimates of 4.8%, portraying the stickiness of the report.
Although the data is encouraging, the Federal Reserve (Fed) would remain data dependent, as the San Francisco Fed President Mary Daly commented that it’s too early to declare victory, stressing she remains data dependent, and backed July’s 25 bps rate hike. When asked about easing monetary conditions, she added it’s a “long way from a conversation about rate cuts.”
Further data revealed that the labor market gave another sign of easing, though it should be viewed cautiously, as the latest figures have not been consistent. Initial Jobless Claims for the week ending July 29 exceeded forecasts of 230K, advanced 248K.
After the data, traders slashed bets the Fed would raise rates again, as shown by money market futures. The CME FedWatch Tools portrays the chances for a rate hike in September below 10%, while for the November meeting, it dropped to 23.6% from 33.8% a month ago.
Given the backdrop, the GBP/USD rallied sharply. Still, market participants faded the move, as data from the United Kingdom is expected to show the country’s exit from the recessionary territory, as the Gross Domestic Product (GDP) for the last Quarter would be released. If the UK posts solid numbers, the GBP/USD might gain traction and retest the 1.2800 mark. Otherwise, the GBP/USD would resume its downtrend and extend its losses past the 100-day EMA, with traders eyeing the 200-day EMA.
GBP/USD Price Analysis: Technical outlook
GBP/USD’s failure to hold to its gains above 1.2800 offered sellers a better entry price as traders faded the uptick, exerting downward pressure on the pair. In addition, the GBP/USD printed a new weekly low, opening the door for a test of the August 3 daily low of 1.2620. A breach of the latter will expose the 100-day Exponential Moving Average (EMA) at 1.2605, followed by the 1.2600 psychological figure. On the other hand, the GBP/USD could retest 1.2800 if the buyers reclaim 1.2700.
- GBP/JPY reached a new YTD high above 184.00.
- A favorable technical setup, including the Ichimoku Cloud (Kumo) position and a Tenkan-Sen/Kijun-Sen crossover, supports a bullish outlook.
- If the GBP/JPY retraces below 183.00, it might witness an accelerated pullback towards technical support at 182.32 and 182.00, with Kumo’s top and the Kijun-Sen providing subsequent support levels.
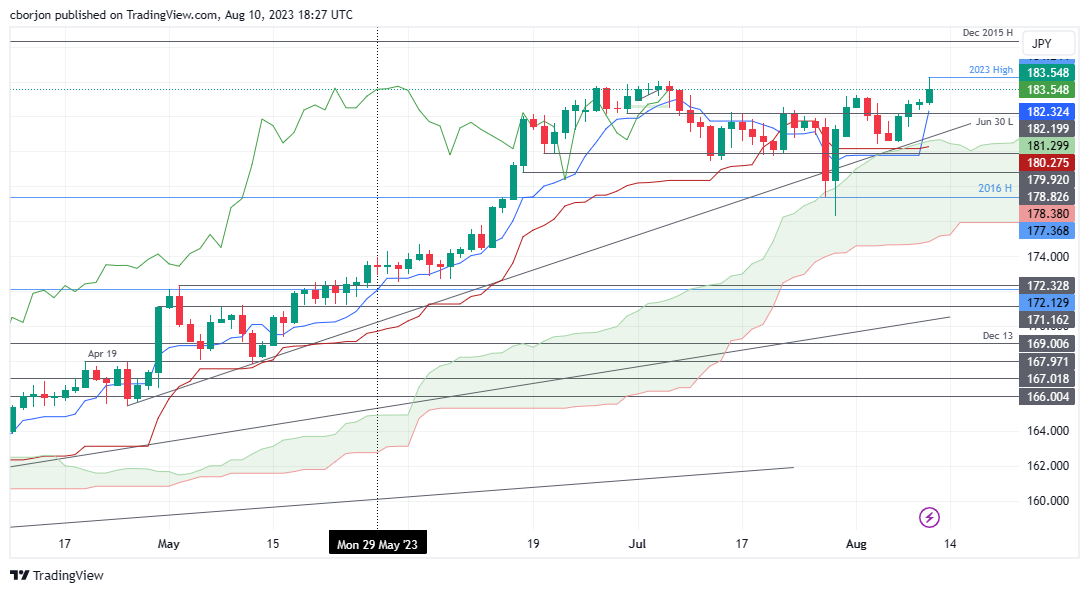
Pound Sterling (GBP) extended its gains against the Japanese Yen (JPY) on Thursdays, as the latter weakened as inflation in the United States (US) decelerated, though it triggered a rally in the USD/JPY pair. Consequently, the GBP/JPY printed a new year-to-date (YTD) high of 184.24. At the time of writing, the GBP/JPY exchanges hands at 183.44, up 0.34%.
GBP/JPY Price Analysis: Technical outlook
The GBP/JPY resumed its uptrend, despite dipping towards the 183.40s area as of writing, sponsored by several factors. The Ichimoku Cloud (Kumo) remains below the price action, while the crossover of the Tenkan-Sen above the Kijun-Sen, opened the door for further upside, as seen during Thursday’s session.
For the GBP/JPY to extend its uptrend toward the 185.00 figure, buyers must reclaim 184.00, followed by the YTD high of 184.24. Conversely, if GBP/JPY continues to edge lower and breaks below 183.00, that could exacerbate the pullback. Hence, the GBP/JPY first support would be the Tenkan-Sen at 182.32, followed by a support trendline at around 182.00. Break below will expose the Kumo’s top at 180.60/75, followed by the Kijun-Sen at 180.27.
GBP/JPY Price Action – Daily chart
- EUR/GBP gained more than 0.70% between Wednesday and Thursday, standing at 0.8660.
- German yields are rising despite soft inflation figures from Italy.
- Tightening cycles are pressuring up mortgages in the UK.
On Thursday, the EUR continued to trade strong against most of its rivals despite rising German yields, while the GBP continued to trade weak. On one side, Italy reported soft inflation figures while the UK reported a worrying in the housing sector suggestion that the Bank of England’s (BoE) tightening cycle is pressuring up mortgages.
Italy reported soft inflation figures from July, with the headline Consumer Price Index (CPI) remaining steady vs the 0.1% increase expected, and the YoY measure dropped to 5.9%.
That being said, the German yields are rising. The 10-year bond yield stands at 2.54%, while the 2-year yield is at 3.17% and the 5-year yielding 2.59%, showing more than 1% advances. The European Central Bank (ECB) expectations remain steady, but markets continue to bet on low odds of a hike in September. It will all come down to the incoming data the bank receives.
On the British side, it was reported that the BoE’s tightening cycle is significantly straining household budgets, as evidenced by a nearly 30% increase in arrears for UK buy-to-let mortgages in Q2, along with a more moderate 7% rise in primary homeowner mortgage arrears. However, the BoE will continue hiking, and markets are pricing an additional 50 bps of tightening for this cycle. In the meantime, the Pound may see further downside if the economy continues to show weakness.
EUR/GBP Levels to watch
According to the daily chart, the technical outlook for the EUR/GBP remains neutral to bullish as the bulls are recovering ground. The Relative Strength Index (RSI) shows an upward trend above its midline, while the Moving Average Convergence (MACD) histogram presents larger green bars. On the other hand, the pair is above the 20-day Simple Moving Average (SMA) but below the 100 and 200-day SMAs, suggesting that despite the recent bearish sentiment, the bulls are still resilient, holding some momentum.
Support levels: 0.8640, 0.8600 (20-day SMA), 0.8570.
Resistance levels: 0.8670 (100-day SMA), 0.8700, 0.8722 (200-day SMA).
EUR/GBP Daily Chart
-638272882247670201.png)
The US government recorded a $221 billion budget deficit in July. The Treasury Department informed that total receipts in July totalled $276 billion and outlays $496 billion. It compares to a deficit of $211 billion last year.
With two months remaining in FY 2023, the deficit currently stands at $1.6 trillion, which is higher than the $1.3 trillion deficit recorded in FY 2022. It is worth noting that August and September of the previous year experienced the highest deficit.
- Gold price surged from its lows of around $1913.02 after US inflation data.
- The July inflation report revealed a 3.2% YoY rise in CPI, below forecasts and June’s 3%.
- Core CPI, which strips out volatile items, climbed by 4.7% YoY – a tad below expectations and 4.8% from the prior month.
Gold price advances more than 0.20% following an inflation report from the United States (US) showing that prices are getting lower, easing pressure on the US Federal Reserve (Fed), which has been increasing rates to bring inflation towards its 2% target. Hence, XAU/USD jumped from its daily lows of $1,913.02, exchanging hands at $1,920.00 a troy ounce.
XAU/USD reacts positively as US inflation data eases, prompting speculation on the Fed’s forward monetary policy
Gold extended its gains early in the day but is trimming some of those after the greenback recovers some ground as US Treasury bond yields advance. The latest inflation report for July in the US showed the Consumer Price Index (CPI) jumping by 3.2% YoY, below estimates and exceeded June’s 3% dip. Core CPI for the same period rose by 4.7% YoY, less than estimates, and the prior month by 4.8%.
Initially, the data bolstered XAU/USD towards the $1930 area; since then, XAU/USD has extended its losses, as the 10-year benchmark note peaks at 4.047%, gaining one and a half basis points (bps).
Other data revealed by the US Bureau of Labor Statistics (BLS), portrayed the labor market easing after Initial Jobless Claims for the week ending July 29 exceeded forecasts of 230K, advanced 248K.
After the data, traders slashed bets the Fed would raise rates again, as shown by money market futures. The CME FedWatch Tools portrays the chances for a rate hike in September below 10%, while for the November meeting, it dropped to 23.6% from 33.8% a month ago.
The San Francisco Fed President Mary Daly recently stated that CPI data was good news. Still, the July report did not imply Fed’s victory n inflation, while stressing she’s data dependent and supported the last month’s Fed rate hike. She pushed back against easing monetary conditions, saying there’s a “long way from a conversation about rate cuts.”
XAU/USD Price Analysis: Technical outlook
From a technical standpoint, the XAU/USD remains neutrally biased but set to extend its losses toward the $1900 psychological figure. Still, first, it would need to crack the 200-day Exponential Moving Average (EMA) at $1908.19. A breach of the daily low of $1913.02 would expose the latter, followed by the former. At that point, XAU/USD would shift bearish, and it might extend its losses to test June’s low of $1893.12, ahead o diving toward the March 6 high turned support at $1858.33. Conversely, XAU/USD’s reclaiming $1932.36 could open the door to test the confluence of the 100 and 20-day EMAs, each at $1939.75 and $1940.49.
- WTI retreated below the $83.00 area, still trading in highs since mid-April correcting overbought conditions.
- Soft inflation figures from the US and weaker USD limit losses. Eyes on the Fed speaker later in the session
- WTI’s outlook remains positive amid tighter global supplies.
On Thursday’s session, the West Texas Intermediate (WTI) saw more than 1% losses as investors seem to be taking profits after jumping to a high since November 2022. However, a weaker USD may limit the session’s downside as well as tighter global supplies which cushion Oil prices.
The Consumer Price Index (CPI) for the US rose by 0.2% MoM in July, as predicted, according to the US Bureau of Labor Statistics. However, the annual measure fell to 3.2% YoY, below the 3.3% forecast. In line with expectations, the Core measure increased by 0.2% in the same month, while the YoY measure declined by 4.7% rather than the 4.8% anticipated. As a reaction, US Treasury yields reacted rapidly to the downside as investors are betting on a dovish Federal Reserve, which applied selling pressure to the USD. Higher rates tend to be negatively correlated with Oil prices as they cool down the economy bringing down energy demand and prices.
On the upside, the prospects of further voluntary by the Saudis will contribute to further upside. In addition, a sluggish Chinese economy may push the local government to carry on more aggressive stimulus, which would bolster the economy of the world's biggest oil importer, meaning a higher energy demand.
WTI Levels to watch
Analyzing the daily chart, the WTI technical outlook is bullish in the short term despite the price correction. The barrel stands well above the 20,100,200-day Simple Moving Averages (SMAs) indicating that the bulls have the upperhand but further correction shouldn’t be taken off the table for the near term as the Moving Average Convergence Divergence (MACD) is flashing signs of bullish exhaustion.
Support levels: $83.00, $80.00, $79.50 (20-day SMA).
Resistance levels: $84.70, $85.00, $86.00.
WTI Daily chart
-638272838165288640.png)
- USD/CAD trades with losses near 1.3400 as bulls battle to defend the 100-day SMA at 1.3390.
- Core CPI from the US dropped to 4.7% in July, and Jobless Claims picked up in August.
- Lower yields and dovish bets weakened the USD. Eyes on Fed speakers.
On Thursday, the USD/CAD retreated towards the 1.3400 area but still holds above the critical support of the 100-day Simple Moving Average (SMA) of 1.3390. On the USD side, soft inflation data made the Greenback retreat while the CAD suffered Oil prices correction overbought conditions.
The US Bureau of Labor Statistics revealed that the Consumer Price Index (CPI) from the US from July advanced by 0.2% MoM, just as expected, and the yearly measure dropped to 3.2% YoY vs the 3.3% expected. The Core measure also advanced 0.2% in the same month as scheduled, with the YoY measure dropping by 4.7%, lower than the 4.8% expected. In addition, Jobless Claims for the first week of August increased to 248,000, higher than the expected 230,000 and the previous figure of 227,000 and gave another signal of the labour market cooling off.
As a reaction, the US bond yields have weakened across the curve. The 10-year bond yield fell to 4.01%, while the 2-year yield sits at 4.77% and the 5-year yielding 4.12%. Downward movements reflect dovish bets on the Federal Reserve (Fed), and according to the CME FedWatch tool, markets are confident that the Fed won’t hike either in September or in November. However, incoming data will be the ones which shape the next monetary policy decisions.
USD/CAD Levels to watch
The daily chart shows exhaustion for the USD/CAD’s bulls. The Relative Strength Index (RSI) displays a negative slope but stands above its midline, while the Moving Average Convergence (MACD) prints decreasing green bars. On the bigger picture, the pair is above the 20 and 100-day Simple Moving Averages (SMA) but below the 200-day SMA, highlighting the continued dominance of bulls in the broader perspective. However, buyers must soon overcome the 200-day SMA to confirm an upward trajectory.
Support levels: 1.3380 (100-day SMA),1.3350, 1.3300.
Resistance levels: 1.3450, 1.3500 (200-day SMA), 1.3550.
USD/CAD Daily chart
-638272808220736004.png)
- USD/CHF pulls back from weekly highs, shedding 0.43% after US data points to continued disinflation and a cooling labor market.
- Key upside barriers for the pair include the 0.8782 level, the psychological 0.8800, and the 50-day EMA at 0.8815.
- A potential downturn could see the pair targeting the significant 0.8700 level, possibly extending losses to the YTD low at 0.8554 if that support breaks.
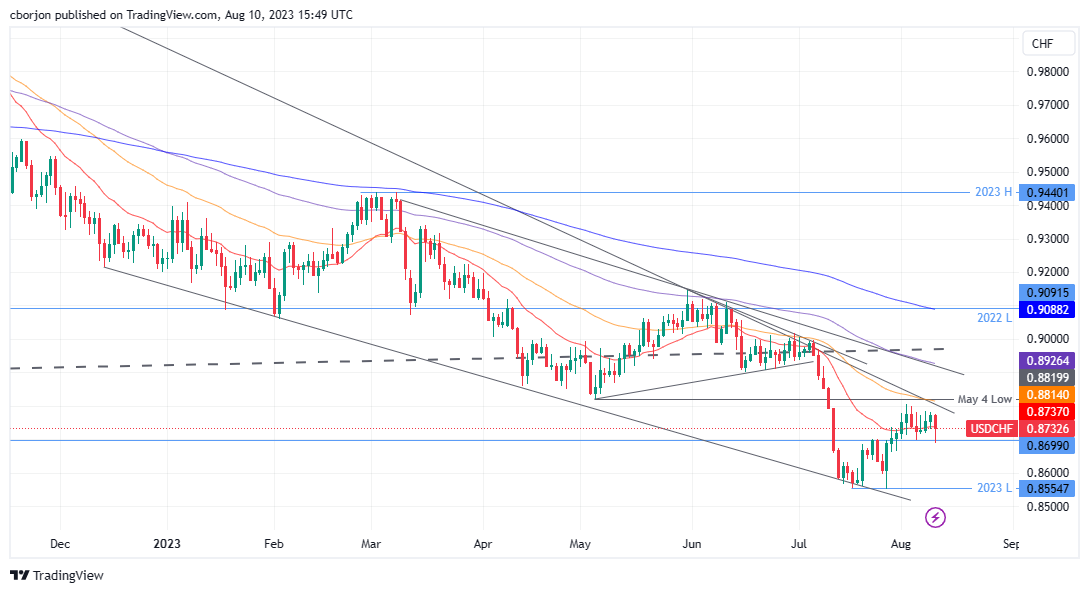
USD/CHF retraces from weekly highs but remains trading sideways within a narrow 40-pip range after a tranche of US economic data indicates the disinflationary process continues while the labor market flashes signs of easing. Hence, the USD/CHF drops 0.43% and changes hands at around 0.8733.
USD/CHF Price Analysis: Technical outlook
Even though the USD/CHF registers losses, it remains neutrally biased, slightly tilted upwards, as the pair remains trading off the year’s lows of 0.8554. As of writing, after printing a daily low of 0.8689, it reversed its course, with buyers reclaiming the 20-day Exponential Moving Average (EMA) at 0.8737 after testing the last week’s low of 0.8699.
If USD/CHF resumes its uptrend above 0.8782 and conquers 0.8800, that could exacerbate a test of the 50-day EMA at 0.8815. A breach of the latter would expose the 0.8900 mark, followed by the 100-day EMA at 0.8926.
Conversely, a daily close below 0.8700 and the USD/CHF could test the year-to-date (YTD) low of 0.8554.
USD/CHF Price Action – Daily chart
Federal Reserve Bank of San Francisco President Mary C. Daly said on Thursday that today’s Consumer Price Index report was “good news” for families and businesses in an interview with Yahoo! Finance. She mentioned that they are committed to getting core inflation down.
“We're going to be watching supercore carefully, that's a big component of spending and it hasn't made much progress so far, we need to see it come back to pre-pandemic levels,” argued Daly.
Regarding the next FOMC meeting, Daly mentioned that there is a lot more information to assess before. “It’s premature to project” if what is needed is more rate hikes or to hold them steady for a longer period. “We are a long way from a conversation about rate cuts".
“It’s still hard to find workers,” said Daly. According to the the economy is not yet in balance.
Market reaction:
The US Dollar Index is falling on Thursday but is off lows. The DXY bottomed after the US CPI report at 101.79 and then rebounded to 102.25.
- Soft US CPI readings suggesting no more Fed hikes needed sent the USD/MXN plunging.
- After the data, bets for additional Fed tightening dived below 30% for November and less than 10% in September.
- USD/MXN traders’ attention turns to Banxico’s decision at around 19:00 GMT.
USD/MXN plummets below 17.0000 after the Department of Labor in the United States (US) revealed that inflation rose above the prior month’s data but below estimates, seen as a sign that the US Federal Reserve (Fed) tightening cycle has ended. Hence, the USD/MXN exchanges hands at 16.9280, losses 0.74%, ahead of the Bank of Mexico (Banxico) monetary policy decision.
US inflation data underwhelms expectations, weighing on the USD, while traders await Banxico's monetary policy direction
The US Dollar (USD) cemented its faith in expectations for an inflation report that can spur speculations for further tightening by the Fed but failed to crystalize. The Consumer Price Index (CPI) rose 3.2% YoY, above June’s 3% but beneath forecasts, while core CPI, which strips volatile items, advanced 4.7% YoY, lower than the previous reading of 4.8% in June.
After the data, traders slashed bets the Fed would raise rates again, as shown by money market futures. The CME FedWatch Tools shows the chances for a rate hike in September below 10%, while for the November meeting, it dropped to 23.6% from 33.8% a month ago.
At the same time, another report from the Labor Department showed that Initial Jobless Claims for the week ending July 29 rose by 248K exceeding estimates of 230K.
Of late, the San Francisco Fed President Mary Daly stated that CPI data was good news. Still, the July report did not imply Fed’s victory n inflation, while stressing she’s data dependent and supported the last month’s Fed rate hike. She pushed back against easing monetary conditions, saying there’s a “long way from a conversation about rate cuts.”
Later in the day, Banxico is expected to hold rates unchanged at 11.25%, with traders eyeing signals about the forward path of the Mexican central bank. Dovish signs could weaken the Mexican Peso, and the USD/MXN could erase its earlier losses following US economic data releases.
USD/MXN Price Analysis: Technical outlook
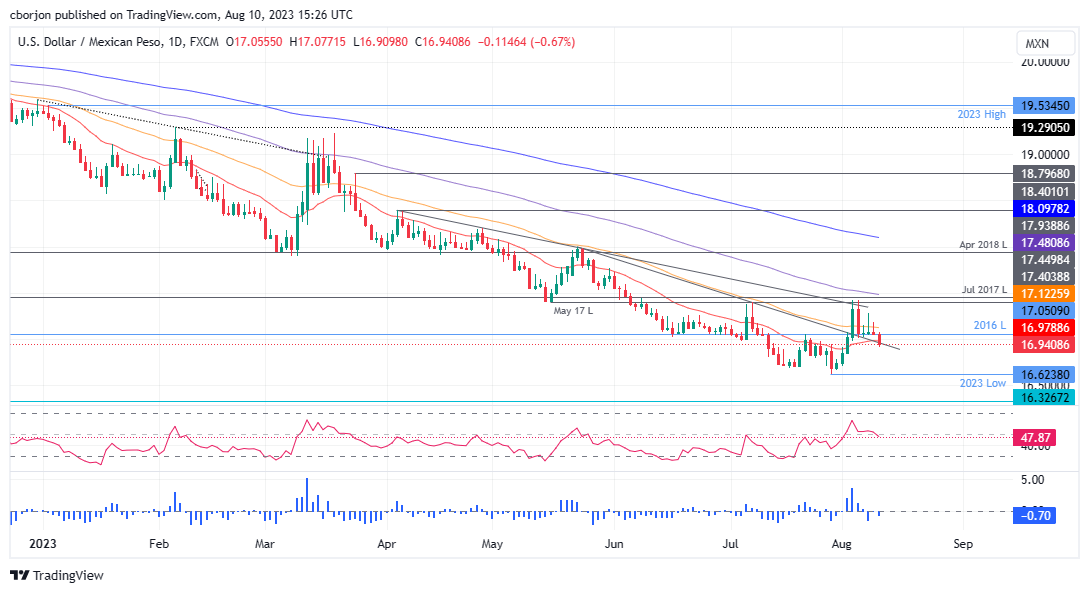
With the USD/MXN breaking support at 17.0000, the pair is testing a previously broken resistance trendline that turned support, which is cushioning USD/MXN’s fall. The USD/MXN break below the 20-day Exponential Moving Average (EMA) at 16.9771 gave another leg-down to the pair. Nevertheless, traders should be aware that Banxico’s decision late in the day could trigger a fade move in the pair’s recent fall. Key support levels lie at a year-to-date (YTD) low of 16.6238, followed by the October 2015 swing low at 16.3267. Contrarily, USD/MXN’s resistance areas emerge at the 20-day EMA at 16.9771, followed by the 17.0000 psychological level and the 50-day EMA at 17.1222.
At the beginning of August, the CAD again suffered in the wake of subdued market sentiment. Economists at Commerzbank analyze Loonie’s outlook.
CAD well supported from the BoC side
Despite recent weaker economic data and mixed signals from the labor market in recent months, we continue to expect a soft landing for the economy. Moreover, persistent wage pressures and stubbornly high core inflation argue for a continued active BoC.
We continue to see moderate CAD recovery potential against the USD in the medium term. The CAD should benefit if the interest rate differential between the Fed and the BoC narrows or turns positive in the medium term.
EUR/CAD should reflect the interim EUR strength we expect.

Source: Commerzbank Research
Economists at RBC Economics do not expect the Federal Reserve to deliver more rate hikes.
Monetary policy at its current level is already very restrictive
Easing inflation pressures in the US against a resilient macroeconomic backdrop have been encouraging and have raised hopes that inflation can slow back to the Fed’s 2% inflation objective without a substantial deterioration in the economy. We still think that is unlikely, given early signs that consumer purchasing power is already taking a hit.
Household financial cushions are thinning, and delinquencies are already on the rise. Elevated interest rates will continue to suppress credit demand, making it more challenging to borrow to support spending. Indeed, monetary policy at its current level is already very restrictive.
Absent a larger reacceleration in inflation, the Fed is unlikely to push interest rates higher. We expected the Fed will keep rates steady into 2024 while waiting for more signs of a softening economy to show up.
Brent Crude Oil has finally seen a concerted move higher. Economists at Credit Suisse analyze the technical outlook.
Trend can remain seen sideways whilst $87.49/$89.37 caps
Whilst capped at $87.49/$89.37, the core trend can remain seen sideways, with a break of support at $83.32/$82.36 seen needed to add weight to this view to mark a top at the upper end of this range.
A weekly close above $89.37 would see an important base established to suggest the core trend has turned bullish. We would then see resistance initially at the 38.2% retracement of the 2022/2023 downtrend at $96.48. Whilst we would look for this to cap at first, the ‘measured objective’ from the base would be seen set significantly higher and we would thus be alert to a break in due course for resistance next at $99.56, then the 50% retracement at $104.63.
- USD/JPY jumps swiftly above 144.00 as US inflation grew slower than expected.
- The risk profile remains positive as a nominal growth in US CPI won’t be sufficient to force the Fed to tighten monetary policy further.
- The Japanese Yen remains under pressure amid an absence of support from BoJ policy.
The USD/JPY pair prints a fresh monthly high at 144.28 in the New York session after the release of United States inflation data for July. US Consumer Price Index (CPI) grew at a 0.2% pace in July, similar to the market expectations.
Annual Consumer Price Index (CPI) softened to 4.7% while investors were anticipating a steady figure at 4.8% while headline inflation grew modestly to 3.2% from the prior release of 3.0% but remained marginally below than the consensus of 3.3%.
S&P500 opens on a bullish note as a nominal growth in US inflation won’t be sufficient to force the Federal Reserve (Fed) to tighten monetary policy further. Also, investors digested Moody’s downgrade to small and medium-sized US banks. The credit-rating firm warned that it can downgrade some of the biggest lends ahead. Moody’s delivered reasoning behind its downgrade that higher borrowing costs have impacted banks’ funding potential and their profitability sharply.
The US Dollar Index (DXY) gyrates wildly around 102.00 as investors assess the inflation data for further guidance. Slower-than-expected rebound in the US inflation and hiring slowdown could allow the Federal Reserve (Fed) to keep interest rates steady.
On the Tokyo front, the Japanese Yen remains under pressure amid an absence of support from the Bank of Japan (BoJ) policy. Analysts at Commerzbank stated even if the BoJ wanted to start a slow exit from its yield curve control with its current monetary policy that cannot be positive for the Yen due to the lack of transparency.
Mexico's still attractive real interest rate outlook supports continued peso strength. Next year, however, the weakening US economy and political risks are likely to weigh on the Peso. Economists at Commerzbank have adjusted their forecast to reflect these risks.
Continued support from attractive real interest rates
Banxico expects inflation to return to the 3% inflation target towards the end of 2024. Given the decline in inflation, we see room for interest rate cuts towards the end of this year. However, the central bank continues to emphasize the upside risks to inflation, which is why we expect it to maintain an attractive real interest rate even after rate cuts begin. This argues for continued strong MXN levels for the time being.
Developments in the US remain an important risk factor for the Peso. A slowdown in the US economy next year is also likely to weigh on the Mexican outlook and limit upside risks to inflation. In addition, Mexico's ongoing structural problems are likely to come under increasing scrutiny as the country prepares for new elections in July 2024. As a result, we now expect the Peso to weaken slightly next year.

Source: Commerzbank Research
Economist Ho Woei Chen, CFA, at UOB Group, comments on the recently published trade balance results in China.
Key Takeaways
The contraction in China’s exports and imports (both USD and CNY terms) deepened in Jul. Weakening external demand further dims the prospects of China’s recovery in 2H23.
Domestically, the property market stress, poor consumer sentiment and severe floods are also keeping economic risks to the downside as markets continue to watch for stronger policy response with the annual Beidaihe retreat of senior Chinese government officials reported to be in session.
Taking into account of the sharper than expected contractions to-date, we revise our forecast for exports and imports decline this year to -6.0% (from 3.0%) and -7.0% (from -2.0%) respectively. For both, the monthly contractions trend may be extended to the end of 2023, though the magnitude would likely ease as the base effect turns more favourable.
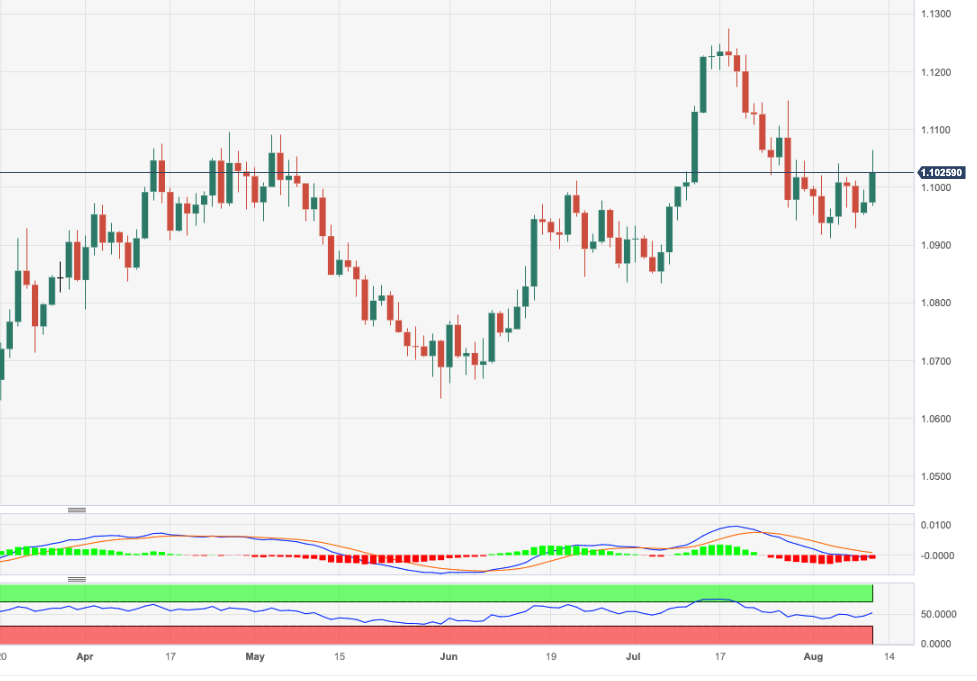
- EUR/USD adds to Wednesday’s gains north of 1.1000.
- The continuation of the uptrend should target 1.1150.
EUR/USD picks up further pace and surpasses the key barrier at 1.1000 the figure on Thursday.
Further gains now need to quickly clear the August high at 1.1064 (August 10) to allow for a rapid challenge of the weekly peak at 1.1149 (July 27). Once the latter is cleared, the pair’s downside pressure is expected to mitigate.
Looking at the longer run, the positive view remains unchanged while above the 200-day SMA, today at 1.0766.
EUR/USD daily chart
This week’s volatility in LNG is itself a sign that sensitivities around energy in Europe remain heightened. Thus, economists at Rabobank expect the Euro to move downward.
EUR/USD seen at 1.08 on a three-month view
While expectations of higher interest rate differentials are the textbook example of a currency supportive factor, in reality, higher rates may not be currency supportive if growth fears are compounded.
Given that higher energy prices would stoke long term growth concerns for the Eurozone, we would be wary about seeing volatility in LNG prices as a reason to add to long EUR positions. Since the ECB may have already reached the peak in its policy rates and given the economic headwinds facing the Eurozone, we view the market as being too long EUR.
We see EUR/USD at 1.08 on a three-month view.
- DXY breaches the 102.00 support in the wake of US CPI.
- Bullish attempts remain limited by the 102.80 region, or monthly highs.
DXY comes under intense selling pressure and breaks below the 102.00 support to rebound soon afterwards on Thursday.
The index appears to have embarked on a consolidative phase for the time being. Next on the upside emerges the so far monthly top of 102.84 (August 3), while the breakout of this level exposes a probable move to the key 200-day SMA at 103.37 prior to the July high of 103.57 (July 3).
Looking at the broader picture, while below the 200-day SMA the outlook for the index is expected to remain negative.
DXY daily chart

- Silver price seems well supported above $22.60 after US inflation expands slower than expected.
- The US Dollar Index tests territory below 102.00 as the Fed is expected to keep interest rates steady ahead.
- Fed Powell commented in July’s policy meeting that the central bank will remain dependent on incoming data.
Silver price (XAG/USD) turns volatile as the United States Bureau of Labor Statistics reports that inflation grew at a steady pace in July. Headline and core inflation expanded at a 0.2% pace. The economic data remained in line with forecasts.
Annual Consumer Price Index (CPI) softened to 4.7% while investors were anticipating a steady figure at 4.8% while headline inflation grew modestly to 3.2% from the prior release of 3.0% but remained marginally below than the consensus of 3.3%. Sticky inflationary pressures might allow the Federal Reserve (Fed) policymakers to keep interest rates steady.
Fed chair Jerome Powell commented in July’s policy meeting that the central bank will remain dependent on incoming data. US hiring slows down in July and inflation maintains a steady pace of 0.2%, which is mostly in line with the Fed’s desired rate of 2%. However, sustained wage growth with a historically low jobless rate could be a concern for policymakers.
After the inflation hangover, investors will focus on the US Producer Price Index (PPI) data for July, which will be published on Friday at 12:30 GMT. Headline PPI data is expected to deliver a decent recovery as gasoline prices rebounded last month.
Silver technical analysis
Silver price looks well-supported near the crucial support around $22.66 on an hourly scale. The white metal climbs above the 20-period Exponential Moving Average (EMA) at $22.75, which indicates that the short-term trend turns bullish. Horizontal resistance is plotted from August 03 low at $23.40.
The Relative Strength Index (RSI) (14) climbs into the 40.00-60.00 range after witnessing a fade in bearish momentum.
Silver hourly chart
-638272671609317021.png)
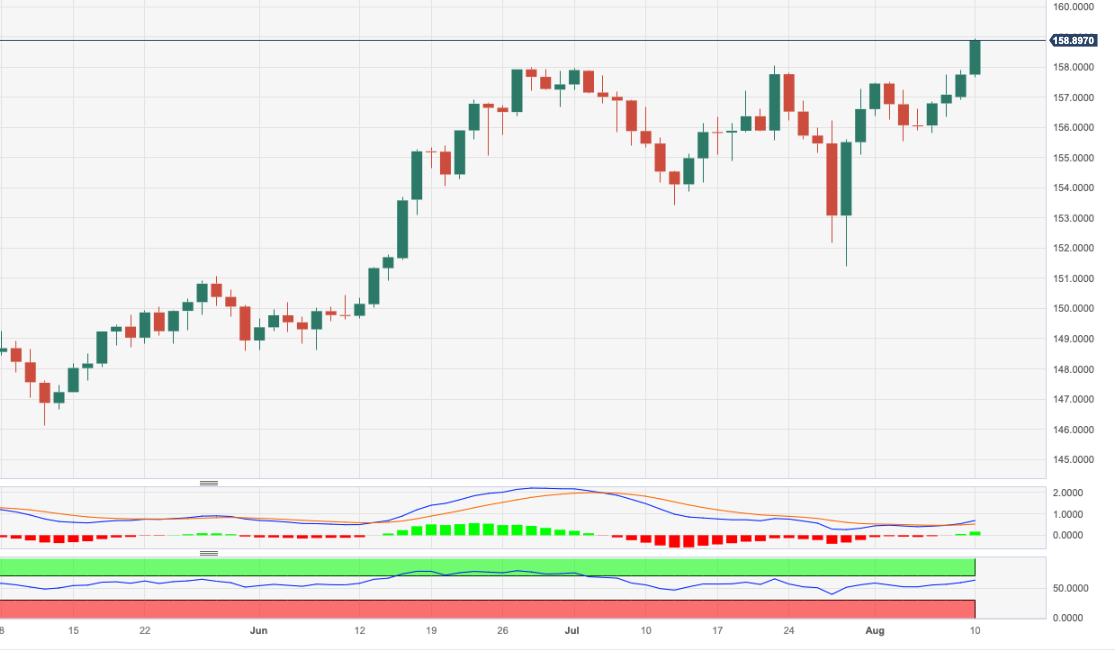
- EUR/JPY climbs to fresh highs well past 158.00 on Thursday.
- Further upside could now see 160.00 revisited in the near term.
EUR/JPY extends the advance for the fifth consecutive session and finally surpasses the key 158.00 hurdle to print new peaks in levels last seen in September 2008 around 158.90.
So far, the continuation of the upside momentum appears likely with an immediate target emerging at he round level of 160.00 in the short-term horizon. The breakout of the latter should not see any resistance level of note until the 2008 high at 169.96 (July 23)
So far, the longer term positive outlook for the cross appears favoured while above the 200-day SMA, today at 146.92.
EUR/JPY daily chart
US consumer prices rose only slightly in July. The data support Commerzbank’s assessment that the Federal Reserve will not raise interest rates further.
US inflationary pressure is easing further
In the US, July data confirmed that underlying inflationary pressure is easing. As expected, consumer prices rose by only 0.2% MoM, as in June. The core rate (excluding energy and food), which is important as an indicator of the trend, was also only 0.2%, also as in June.
We expect only a core rate of 0.2% for August as well, as there are signs of an even stronger decline in prices for used cars. Due to the significant increase in the price of gasoline, the headline rate could then be 0.5% to 0.6%, but that would probably just be an outlier.
The data that have been released since the last meeting support a standstill on the part of the US central bank: the labor market has lost further momentum, even if there is by no means any weakness here. Today's inflation figures speak the same language; underlying inflation has eased further. We, therefore, see ourselves confirmed in the view that the Fed has peaked with the rate hike on July 25/26 and that no further rate hikes are to be expected.
The lack of transparency by the Bank of Japan (BoJ) puts another dampener on the Yen, Antje Praefcke, FX Analyst at Commerzbank, reports.
Another aspect of the BoJ’s policy is Yen negative
I would like to add another aspect that is negative for the Yen in my view: the fact that the BoJ’s monetary policy is getting increasingly intransparent.
Even if the BoJ wanted to start a slow exit from its yield curve control with its current monetary policy, which I don’t know and cannot judge, that cannot be positive for the Yen in my view due to the lack of transparency.
I have always made clear that the Yen is a currency that I do not really understand. Perhaps that was always due to the BoJ’s monetary policy. However, one thing has become clear for me over the past months, when all central banks with the exception of the BoJ hiked their key rates: the BoJ’s monetary policy is not going to become positive for the JPY for the foreseeable future.
- US Dollar tumbles after US inflation data but then trims losses.
- USD/JPY falls to daily lows near 143.30 and climbs back to 143.80.
- US annual rate rebounds to 3.2%, below the 3.3% of market consensus.
The USD/JPY is currently hovering around the same level it was before the release of the US inflation and jobless claims data, around 143.80. Immediately after the reports, the pair tumbled to 143.27, but as time passed, it managed to recover all the lost ground.
Disinflation in the US, but still above target
The US Consumer Price Index (CPI) for July increased by 0.2%, which was in line with expectations. The annual rate rebounded from 3% to 3.2%, slightly below the market consensus of 3.3%. The Core CPI also rose by 0.2%, matching estimates, while the annual rate slowed from 4.8% to 4.7%.
In a separate report, the Labor Department informed that Initial Jobless Claims rose from 227,000 to 248,000, surpassing market estimates and reaching the highest level in five weeks.
Following these numbers, US yields experienced a sharp drop, and the US Dollar Index (DXY) fell to 101.77, reaching its lowest level since last Friday. However, the US Dollar recovered most of its CPI-driven losses, with the DXY rising back above 102.00.
No clear direction for USD/JPY
After the report, the pair reached a low point at 143.27, slightly above the 20-period Simple Moving Average on the 4-hour chart. The initial weakness after the data has turned into a potential reversal.
The pair now faces immediate resistance at 143.90, and if it consolidates above that level, it could potentially reach the five-week high of 144.10 (Aug 10 high). On the other hand, if the pair falls below 143.50, the bearish momentum is likely to intensify.
Technical levels
- Initial Jobless Claims increased by 21,000 in the week ending August 5.
- Continuing Jobless Claims declined by 8,000 in the week ending July 29.
- US Dollar Index tumbles after US July Consumer Price Index.
Initial Jobless claims totaled 248,000 in the week ending August 5, the weekly data published by the US Department of Labor (DOL) showed on Thursday. The highest level in five weeks. The print follows the previous week's 227,000 (unrevised) and came in above market expectations of 230,000. Further details showed that “The 4-week moving average was 231,000, an increase of 2,750 from the previous week's unrevised average of 228,250.”
Continuing Claims decline by 8,000 in the week ended July 29 to 1.68 million, a reading better than market estimates of 1.71 million. The four-week moving average was 1,701,000, a decrease of 9,250 from the previous week's revised average.
Market reaction:
Along with the Jobless Claims, the July Consumer Price Index was released. The US Dollar Index dropped from 102.10 to 101.80, extending its daily losses. US yields slide following US economic reports.
- Australian Dollar rises after the market adopts a risk-on vibe following positive Disney earnings.
- AUD/USD could see volatility from soon-to-be-released US CPI data.
- Embattled Aussie Dollar pushes back up towards 0.66 at the start of the US session.
The Australian Dollar (AUD) gets lifted up by the helium balloon of positive sentiment on Thursday after Disney announces feel-good earnings and the major Wall Street indices rise on the back of its coat-tails.
The US Dollar (USD), meanwhile, takes a turn lower as safe-haven demand diminishes and traders await key inflation data out at 12:30 GMT.
AUD/USD trades in the upper 0.65s at the start of the US session.
Australian Dollar news and market movers
- The Australian Dollar recovers on the back of a positive change in market sentiment after entertainment megalith Disney announces decent earnings.
- The news helps mitigate the negative impact of recent lower-than-expected trade and inflation data from China, which stoked fears the country may be slowing down.
- Australian data out on Thursday morning showed a moderation lower in Inflation Expectations in August to 4.9% from 5.2% previously.
- Longer- term influences include the fact that China is trying to diversify away from relying too heavily on Australian raw materials, according to Clifford Bennet, Chief Economist at ACY Securities – a negative for AUD.
- AUD/USD could fall to as low as 0.40, according to David Llewellyn-Smith, Chief Strategist at the MB Fund and MB Super.
- He likens the current market conditions to those in the 1990s, comparing China to Japan, which similarly underwent an economic boom before peaking in the 90s when the Japanese property bubble burst, bringing the good times to an end. Llewellyn-Smith foresees the same fate for China.
- He further expects the US Dollar to maintain its value as the AI revolution creates a tech boom in the US, just as the dot-com bubble did in the 90s.
- The US Dollar is likely to be impacted by US Consumer Price Index (CPI) data for July, out on Thursday at 12:30 GMT. Expectations are for CPI to rise by 3.3% YoY and 0.2% MoM, and for Core CPI to rise by 4.8% YoY and also 0.2% MoM.
- An undershoot is likely to weigh on the US Dollar (bullish for AUD/USD) because it reduces the chances of the Federal Reserve (Fed) raising interest rates. The opposite is true of an overshoot.
Australian Dollar technical analysis
AUD/USD is in a sideways trend on both the long and medium-term charts. The February high at 0.7158 is a key hurdle, which if vaulted, will give the longer-term charts a more bullish tone.
The 0.6458 low established in June is a key level for bears. If this is breached decisively, it would color the charts more bearish. Price is currently closer to this key low.
-638272670680070573.png)
Australian Dollar vs US Dollar: Weekly Chart
Price has now broken cleanly below the confluence of moving averages (MA) close to 0.6700, made up of most of the major SMAs – the 50-week, 50-day and 100-day. The breaching of this key support and resistance level is a bearish sign.
-638272671202172705.png)
Australian Dollar vs US Dollar: Daily Chart
AUD/USD has broken below the 0.6600 June lows, and a continuation down to the key May lows at 0.6460, is quite possible. A decisive break below them would open the way for a move down to 0.6170 and the 2022 lows.
Because the pair is in a sideways trend overall, it is unpredictable, and the probabilities do not favor either bears or bulls overall – nor is the Relative Strength Index (RSI) providing much insight on either timeframe.
For bulls, a decisive break back above the skein of MAs in the upper 0.66s and then through 0.6750 would be a prerequisite for a more optimistic outlook.
In technical terms, a ‘decisive break’ consists of a long daily candlestick, which pierces cleanly above or below the critical level in question and then closes near to the high or low of the day. It can also mean three up or down days in a row that break cleanly above or below the level, with the final day closing near its high or low and a decent distance away from the level.
Australian Dollar FAQs
What key factors drive the Australian Dollar?
One of the most significant factors for the Australian Dollar (AUD) is the level of interest rates set by the Reserve Bank of Australia (RBA). Because Australia is a resource-rich country another key driver is the price of its biggest export, Iron Ore. The health of the Chinese economy, its largest trading partner, is a factor, as well as inflation in Australia, its growth rate and Trade Balance. Market sentiment – whether investors are taking on more risky assets (risk-on) or seeking safe-havens (risk-off) – is also a factor, with risk-on positive for AUD.
How do the decisions of the Reserve Bank of Australia impact the Australian Dollar?
The Reserve Bank of Australia (RBA) influences the Australian Dollar (AUD) by setting the level of interest rates that Australian banks can lend to each other. This influences the level of interest rates in the economy as a whole. The main goal of the RBA is to maintain a stable inflation rate of 2-3% by adjusting interest rates up or down. Relatively high interest rates compared to other major central banks support the AUD, and the opposite for relatively low. The RBA can also use quantitative easing and tightening to influence credit conditions, with the former AUD-negative and the latter AUD-positive.
How does the health of the Chinese Economy impact the Australian Dollar?
China is Australia’s largest trading partner so the health of the Chinese economy is a major influence on the value of the Australian Dollar (AUD). When the Chinese economy is doing well it purchases more raw materials, goods and services from Australia, lifting demand for the AUD, and pushing up its value. The opposite is the case when the Chinese economy is not growing as fast as expected. Positive or negative surprises in Chinese growth data, therefore, often have a direct impact on the Australian Dollar and its pairs.
How does the price of Iron Ore impact the Australian Dollar?
Iron Ore is Australia’s largest export, accounting for $118 billion a year according to data from 2021, with China as its primary destination. The price of Iron Ore, therefore, can be a driver of the Australian Dollar. Generally, if the price of Iron Ore rises, AUD also goes up, as aggregate demand for the currency increases. The opposite is the case if the price of Iron Ore falls. Higher Iron Ore prices also tend to result in a greater likelihood of a positive Trade Balance for Australia, which is also positive of the AUD.
How does the Trade Balance impact the Australian Dollar?
The Trade Balance, which is the difference between what a country earns from its exports versus what it pays for its imports, is another factor that can influence the value of the Australian Dollar. If Australia produces highly sought after exports, then its currency will gain in value purely from the surplus demand created from foreign buyers seeking to purchase its exports versus what it spends to purchase imports. Therefore, a positive net Trade Balance strengthens the AUD, with the opposite effect if the Trade Balance is negative.
CAD holds little changed. Economists at Scotiabank analyze Loonie’s outlook.
CAD strays further from fair value
Weak risk appetite seems to be the biggest headwind for the CAD at the moment (although broader stock gains today are not providing the CAD with any obvious support), with firmer crude oil in recent weeks largely washing over the CAD and short-term spreads holding little changed.
The situation leaves the CAD straying even further from fair value (1.3108), with little sign that negative CAD sentiment will improve any time soon.
Sterling shrugs off more weak housing data. Economists at Scotiabank analyze GBP outlook.
Further weakening in the UK housing market
The RICS House Price data survey weakened to its lowest level since 2009 in July as higher rates and tighter credit conditions weighed on activity.
Cable is trading a little firmer on the day but remains within its recent trading range.
Support is 1.2695/1.2700. Resistance is 1.2785/1.2795, with the 40-Day Moving Average just above at 1.2815.
See: EUR/GBP seems happy to trace out an 0.8600-0.8650 range for the time being – ING
UOB Group’s Head of Research Suan Teck Kin, CFA, and Economist Ho Woei Chen, CFA, assess the recent stimulus measures in China.
Key Takeaways
The lukewarm stimulus measures may have contributed to the lack of economic recovery in China, but there are concerns that the economy could well be facing a liquidity trap or balance sheet recession risks that undermine monetary policy’s effectiveness.
However, our view is that the underlying issue is the weak consumer and business confidence which continues to hold back consumption and investment despite the various forms of stimulus measures. As such, this calls for stronger fiscal policy and specifically, measures that target the property demand and local government debt resolution.
We also believe that there is further room for monetary policy easing as real interest rate in China has remained high due to the current disinflation trend. Furthermore, we note that there remains significant scope for private consumption to grow given its dual circulation strategy and planned loosening of China’s hukou household registration system.
USD edges lower ahead of expected uptick in headline inflation. Economists at Scotiabank analyze Greenback’s outlook.
Moderating core prices should soften the impact on the USD
The monthly rise in inflation is expected to be moderate, 0.2% MoM, but the pace of headline inflation is expected to push higher from June’s 3.0% to 3.3%. Core prices are also seen up 0.2% in the month but should slow to 4.7% (from 4.8%) in the year.
Assuming 0.2% MoM gains between now and the end of the year, core CPI should still slow further by December (to around 3.5%). With policy settings restrictive, the Fed will be cautious about overtightening from here.
Markets may find the jump in July headline prices difficult to digest but the risk of an uptick in the next few months has been well signaled and should not be too surprising for market participants. Moderating core prices should soften the impact on the USD.
The DXY still looks to be reflecting broader selling pressure on the USD building in the 102.50/102.75 area and developing losses today leave support around 101.75 potentially exposed. Expect more USD weakness to accumulate below here.
See – US CPI Preview: Forecasts from 10 major banks, monthly pace should hold at 0.2%
USD/CAD is little changed on the session so far. Economists at Scotiabank analyze the pair’s outlook.
Evidence of firm support on dips below the 1.34 area
There is a modest, downside bias in spot trends on the intraday chart but there is also evidence of firm support on dips below the 1.34 area.
The 1.3385/1.3390 level looks pivotal in the short run; spot losses may pick up a little more on a clear move below here for 1.3340/1.3345 but holding above this point intraday could mean a retest of major resistance in the mid/upper 1.34 area.
EUR/USD regains 1.10. Economists at Scotiabank analyze the pair’s outlook.
Intraday trend momentum is bullish
Solid gains have established a foothold for spot above the 1.10 area.
Intraday trend momentum is bullish and sets the market up for a test of key resistance – and potential bull trigger – at 1.1040. Gains through here target a rise to 1.1140/1.1150 in the coming days.
Support is 1.0990/1.1000.
See – EUR/USD: US CPI may not be enough to trigger a sustained break of the 1.1040 area – ING
Banxico meets today. Economists at ING analyze Peso outlook ahead of the Interest Rate Decision.
No change is expected
Today, look out for a Banxico policy meeting. This follows larger-than-expected cuts in Brazil and Chile over recent weeks. No change is expected, but investors are on the lookout for any hints of easing later this year.
November is seen as a popular month for the first cut, but market pricing for the Banxico easing cycle is already fairly aggressive at 300 bps+ for the next two years. The Peso should continue to perform well, however.
UOB Group’s Senior Economist Alvin Liew reviews the latest publication of the US jobs report for the month of July.
Key Takeaways
The latest US Labor Market Report showed job creation still positive but below expectations at 187,000 in Jul (versus Bloomberg est 200,000) while the jobs prints for Jun & May was revised lower by 49,000. Jobless rate receded again to 3.5% (Jun: 3.6%), as unemployed numbers fell further by 116,000 to 5.8 million and participation rate held at 62.6%. For the fifth month in a row wage growth was above forecast, and at the same pace as Jun, at 0.4% m/m, 4.4% y/y.
While robust wage growth added to inflation concerns, disparity in job creation was surprisingly stark within services in Jul as job increases were led mainly by health care and social assistance that dwarfed other service segments.
After the 25-bps hike in Jul FOMC, we assigned a high probability the Fed will hold rates unchanged in Sep and rest of the year. We continue to expect no rate cuts in 2023, with the FFTR terminal rate at 5.50% lasting through this year. Data to watch ahead: Jul headline and core CPI (10 Aug).
Economists at Société Générale sums up the importance of today’s July inflation data for markets.
One small step for CPI, a big leap for the Fed?
We forecast a rise in core of 0.3% MoM, an acceleration from +0.2% in June. Not a disaster, but not ideal, and not what a data-dependent Fed would have in mind. This could help yields to make up ground lost during the flurry of risk aversion earlier this week.
An increase of +0.4% or more could potentially mean chaos, potentially including hawkish repricing of the Fed, Treasuries (and Bunds) selling off, paying in swaps, risk-off in stocks/credit/high beta FX, and a stronger Dollar.
An increase of 0.2% or less would be the Goldilocks scenario: risk on in stocks and FX, and bull flattening in 2s/10s.
See – US CPI Preview: Forecasts from 10 major banks, monthly pace should hold at 0.2%
USD/JPY scales 144 for first time since 7th July. Economists at Société Générale analyze the pair’s technical outlook.
50-DMA near 141.50 is crucial support
USD/JPY has embarked on a steady rebound after defending the upper part of previous consolidation zone near 138/137. It is approaching the peak of June near 144.50/145.00 which could be a potential resistance.
Daily MACD has entered within positive territory denoting prevalence of upward momentum.
In case the pair establishes above 144.50/145.00, the phase of bounce could extend towards 146.10, the 76.4% retracement from last October and 147.90.
The 50-DMA near 141.50 is crucial support.
- AUD/USD oscillates after a solid recovery around 0.6560 as investors await US inflation data.
- Expectations of fresh fiscal stimulus by the Chinese authority provided support to the Australian Dollar.
- AUD/USD rebounded strongly after the momentum oscillator showed a weak impulse in the bearish trend.
The AUD/USD pair consolidates around 0.6560 after rebounding from the psychological support of 0.6500 in the European session. The Aussie asset extended recovery but caution seems intact as the United States inflation data will be published at 12:30 GMT.
A sticky performance is expected from US Consumer Price Index (CPI) as gasoline prices rebounded modestly last month. This would propel chances of further policy-tightening by the Federal Reserve (Fed).
Meanwhile, expectations of fresh fiscal stimulus by the Chinese authority to stimulate economic demand provide support to the Australian Dollar. The Chinese economy falls into deflation due to bleak demand and falling exports, therefore fiscal and monetary stimulus seem warranted.
It is worth noting that Australia is the leading trading partner of China and fresh stimulus in China is supportive of the Australian Dollar.
AUD/USD rebounded strongly after the momentum oscillator, Relative Strength Index (RSI) (14) showed a weak impulse in the bearish trend. The Aussie asset climbs above the 50-period Exponential Moving Average (EMA) around 0.6545, which indicates that the mid-term trend turns bullish.
The RSI (14) climbs into the bullish range of 60.00-80.00, which indicates that an upside momentum triggers.
A decisive break above the horizontal resistance plotted from August 04 high around 0.6609 would break the series of lower highs and lower lows. This would drive the asset toward June 29 high at 0.6640, followed by the round-level resistance at 0.6700.
On the flip side, a breakdown below the psychological support of 0.6500 would expose the asset to May’s low around 0.6458. Breakdown of the latter would send the major to a fresh none-month low at 0.6414, which is 09 November 2022 low.
AUD/USD hourly chart
-638272599300914658.png)
The Franc continued to strengthen against the Euro in July. The unchanged hawkish stance of the SNB is likely to have helped. Economists at Commerzbank analyze CHF outlook.
SNB should increasingly tolerate a weaker Franc
As long as the SNB sees inflation risks, it is likely to favour a strong Franc and intervene in the foreign exchange market if necessary.
As we also assume that recession concerns for the Eurozone will weigh on the Euro, we have adjusted our EUR/CHF forecast slightly downwards, but maintain the view that the Franc should weaken moderately medium-term.
Price pressures and the risk of second-round effects should continue to ease in the coming months so that the SNB could tolerate a weakening of the Franc to some extent. And with the ECB likely to remain quite hawkish and, contrary to the market expectations unlikely to cut interest rates next year, the EUR should be supported from that side.

Source: Commerzbank Research
- The US Dollar holds on to gains for the week.
- Big data dump expected later today with US July Consumer Price Index.
- The US Dollar Index is expected to have a very binary outcome on the inflation data.
The US Dollar (USD) is a touch softer this Thursday in a calm start of the trading days as traders will focus on the batch of important US data due later in the session. Meanwhile, the Greenback is trading very mixed on the quote board, though overall it is holding on to weekly gains. The data numbers later this Thursday are expected to fuel a substantial move in any direction.
The focal point today is at 12:30 GMT, when all metrics of the US Consumer Price Index (CPI) are about to be released to the markets. At that same time, we will see the weekly jobless statistics. The cherry on the cake is right at the end at 19:00 GMT when Federal Reserve (Fed) speakers Raphael Bostic from Atlanta and Patrick Harker from Philadelphia are due to speak and comment on Thursday’s inflation numbers and what they could mean for the central bank’s September policy meeting.
Daily digest: US Dollar expected to cover some ground
- At 12:30 GMT, all hell will break loose in global markets as the US CPI is due to come out. Expectations on the monthly index are for the headline and core inflation to remain steady at 0.2%. On the yearly time frame, headline CPI is expected to jump from 3% to 3.3% and the core reading to remain steady at 4.8%.
- In all the noise of the US CPI publication, the US Labor department will issue the weekly jobless claims: Initial jobless claims are expected to tick up from 227K to 230K. The continuing claims are expected to remain quite steady with a minor uptick from 1.7M to 1.71M.
- The US treasury is heading back to the markets to refinance some debt with a 4-week bill and a 30-year bond auction.
- Markets could quickly see the Fed stepping in and put a lid on any undesired move in the markets on the back of the CPI numbers. Fed speakers Bostic and Harker are due to speak at 19:00 GMT and could deliver some guidance on what the recent US CPI numbers could or could not mean for the Fed’s decision in September and beyond.
- Stocks are currently ignoring the possible event risk at hand later this Thursday with green numbers across the board and across the regions. The Japanese Topix index nearly closed up 1%, while the Chinese Hang Seng is up near 0.5%. European equities are more than happy to take over the positive sentiment with the German DAX and European Stoxx 50 trading nearly 1% in the green. US equity futures are no different and point to a green opening for Wall Street.
- The CME Group FedWatch Tool shows that markets are pricing in an 86.5% chance that the Federal Reserve will pause interest rate hikes at its meeting in September. In case the US CPI numbers point to a further inflation decline, that chance might increase to a 90% probability or more.
- The benchmark 10-year US Treasury bond yield trades at 4.02% and is very steady since Wednesday. Expectations are with this decline in volatility, that a breakout is due. That breakout could come this Thursday on the back of the US inflation numbers.
US Dollar Index technical analysis: consolidation point reached
The US Dollar is giving US Dollar bulls a hard time after a good start of the week, while gains are starting to evaporate since Wednesday. Meanwhile, the US Dollar Index (DXY) is back at the lower support level that will be crucial on where the DXY will close this week. Expect the US CPI numbers to act as catalyst for any move and look for technical levels to confirm if the breakout is substantial or short-lived.
For the upside, 102.42 – where the 55-day Simple Moving Average (SMA) is located – is again in play on the upside. This level needs to be broken yet again and needs to see a full daily close above before starting to think about 103. To do so, the double peak near 102.80 needs to be broken as well and print a new monthly high.
On the downside, bears have already breached the defence line of the US Dollar bulls at 102.31 - at the 100-day SMA - earlier this Thursday. Should the US CPI numbers support a weaker Greenback, expect to see some sharp losses in a few specific pairs or crosses against the USD. Expect 102 to come under pressure, and once the low of last week at 101.75 gets breached, expect this to be the end of the DXY rally for now.
US Dollar FAQs
What is the US Dollar?
The US Dollar (USD) is the official currency of the United States of America, and the ‘de facto’ currency of a significant number of other countries where it is found in circulation alongside local notes. It is the most heavily traded currency in the world, accounting for over 88% of all global foreign exchange turnover, or an average of $6.6 trillion in transactions per day, according to data from 2022.
Following the second world war, the USD took over from the British Pound as the world’s reserve currency. For most of its history, the US Dollar was backed by Gold, until the Bretton Woods Agreement in 1971 when the Gold Standard went away.
How do the decisions of the Federal Reserve impact the US Dollar?
The most important single factor impacting on the value of the US Dollar is monetary policy, which is shaped by the Federal Reserve (Fed). The Fed has two mandates: to achieve price stability (control inflation) and foster full employment. Its primary tool to achieve these two goals is by adjusting interest rates.
When prices are rising too quickly and inflation is above the Fed’s 2% target, the Fed will raise rates, which helps the USD value. When inflation falls below 2% or the Unemployment Rate is too high, the Fed may lower interest rates, which weighs on the Greenback.
What is Quantitative Easing and how does it influence the US Dollar?
In extreme situations, the Federal Reserve can also print more Dollars and enact quantitative easing (QE). QE is the process by which the Fed substantially increases the flow of credit in a stuck financial system.
It is a non-standard policy measure used when credit has dried up because banks will not lend to each other (out of the fear of counterparty default). It is a last resort when simply lowering interest rates is unlikely to achieve the necessary result. It was the Fed’s weapon of choice to combat the credit crunch that occurred during the Great Financial Crisis in 2008. It involves the Fed printing more Dollars and using them to buy US government bonds predominantly from financial institutions. QE usually leads to a weaker US Dollar.
What is Quantitative Tightening and how does it influence the US Dollar?
Quantitative tightening (QT) is the reverse process whereby the Federal Reserve stops buying bonds from financial institutions and does not reinvest the principal from the bonds it holds maturing in new purchases. It is usually positive for the US Dollar.
Economists at MUFG Bank expect no further widening of the 10-year US yield spread over the 10-year German bund, which should cushion EUR/USD downside.
A strong CPI print could see 10-year yield quickly becoming more comfortable at levels over 4.00%
The 10-year yield is oscillating around the 4.00% level but has corrected lower from the recent high of 4.20% which technically is looking like another rejection by the market of levels over 4.00%. Of course, a strong CPI print could see the market quickly becoming more comfortable with consolidating at levels over 4.00%.
The spread over the 10-year German bund is currently at around 150 bps having been as narrow as close to 100 bps in April. The current spread is consistent with the level (150-175 bps) that prevailed in 2015-2016 when EUR/USD was around trading around 1.1000. Our forecasts assume there is no further widening from these levels favouring the US which should limit the downside for EUR/USD over the medium-term.
- Gold price struggles to sustain as investors await US inflation data.
- United States inflation data for July is expected to provide meaningful cues.
- US credit card spending remained the highest ever in Q2, and delinquencies rise.
Gold price (XAU/USD) discovered an intermediate cushion after printing a fresh monthly low on Thursday. The precious metal remains on tenterhooks as forward action will be guided by the pace of inflation in the July US Consumer Price Index (CPI) data on inflation. Gold price doesn’t find meaningful support despite a decline in the US Dollar. It seems that the impact of falling demand from central banks is intact.
United States inflation data for July is expected to provide meaningful cues about September’s monetary policy by the Federal Reserve (Fed). Signs of persistence in inflation data would elevate hopes of a hawkish interest rate decision by the Fed. Meanwhile, consumer sentiment could come under pressure as mortgage rates rose to a fresh high at 7.09% this week.
Daily Digest Market Movers: Gold price delivers modest rebound ahead of US Inflation
- Gold price finds buying interest after printing a fresh monthly low around $1,915.00 ahead of the US CPI data for July, which will be released at 12:30 GMT.
- July’s inflation data might set a base for September’s monetary policy from the Federal Reserve (Fed) as the economic data could turn out persistent after a long softening spell.
- Gasoline prices saw a modest recovery last month, which could influence a rebound in headline inflation. Apart from that, Q2 Gross Domestic Product (GDP) and June’s Consumer Spending outperformed expectations. They may be sufficient to keep core inflation sticky.
- Per estimates, monthly headline and core CPI should expand at a steady pace of 0.2%. Annual headline inflation is forecast to rebound to 3.3%, and core CPI is expected to remain stubborn at 4.8%.
- Persistent inflation data might force Fed policymakers’ hand: Philadelphia Fed Bank President Patrick Harker and New York Fed President John Williams to change their neutral stance for September monetary policy.
- On the contrary, Fed Governor Michelle Bowman remained hawkish over interest rate guidance amid tight labor market conditions.
- After inflation data, investors would shift their focus on the Producer Price Index (PPI) for July, which will be published on Friday at 12:30 GMT.
- This week, global markets reacted strongly to the US government’s long-term debt rating downgrade by Fitch.
- Chicago Fed President Austan D. Goolsbee commented that Fitch’s downgrade won’t make any difference. However, the US 30-year mortgage rate jumped to a nine-month peak at 7.09%.
- Joel Kan, the Mortgage Bankers Association's vice president, and deputy chief economist, pointed to Fitch's recent downgrading of U.S. government debt, which affected all types of loans on the weekly survey, Reuters reported.
- The US Dollar Index (DXY) faces a severe sell-off after retreating from 102.50 as investors believe that a 0.2% monthly expansion pace in inflation is in line with the Fed’s desired core rate of 2%.
- On Wednesday, Moody’s downgraded the credit rating of several small and mid-sized banks as higher borrowing costs could impact their funding strength and profitability. The credit-rating firm also warned that it might also downgrade some of the biggest lenders ahead.
- New York Fed said in its latest quarterly household debt and credit report that households increased their borrowing to its highest-ever level of $45 billion in the second quarter at $1.03 trillion. Credit card delinquencies rose to an 11-year high.
Technical Analysis: Gold price prints fresh monthly low
Gold price finds temporary support near the fresh monthly low of $1,916. The precious metal looks vulnerable and is expected to continue its downside move. After remaining consistently below the 20 and 50-day Exponential Moving Averages (EMAs), the yellow metal is declining toward the 200-day EMA around $1,907.00. Momentum oscillators are near the support region and a further downside would trigger a bearish impulse.
Inflation FAQs
What is inflation?
Inflation measures the rise in the price of a representative basket of goods and services. Headline inflation is usually expressed as a percentage change on a month-on-month (MoM) and year-on-year (YoY) basis. Core inflation excludes more volatile elements such as food and fuel which can fluctuate because of geopolitical and seasonal factors. Core inflation is the figure economists focus on and is the level targeted by central banks, which are mandated to keep inflation at a manageable level, usually around 2%.
What is the Consumer Price Index (CPI)?
The Consumer Price Index (CPI) measures the change in prices of a basket of goods and services over a period of time. It is usually expressed as a percentage change on a month-on-month (MoM) and year-on-year (YoY) basis. Core CPI is the figure targeted by central banks as it excludes volatile food and fuel inputs. When Core CPI rises above 2% it usually results in higher interest rates and vice versa when it falls below 2%. Since higher interest rates are positive for a currency, higher inflation usually results in a stronger currency. The opposite is true when inflation falls.
What is the impact of inflation on foreign exchange?
Although it may seem counter-intuitive, high inflation in a country pushes up the value of its currency and vice versa for lower inflation. This is because the central bank will normally raise interest rates to combat the higher inflation, which attract more global capital inflows from investors looking for a lucrative place to park their money.
How does inflation influence the price of Gold?
Formerly, Gold was the asset investors turned to in times of high inflation because it preserved its value, and whilst investors will often still buy Gold for its safe-haven properties in times of extreme market turmoil, this is not the case most of the time. This is because when inflation is high, central banks will put up interest rates to combat it.
Higher interest rates are negative for Gold because they increase the opportunity-cost of holding Gold vis-a-vis an interest-bearing asset or placing the money in a cash deposit account. On the flipside, lower inflation tends to be positive for Gold as it brings interest rates down, making the bright metal a more viable investment alternative.
In an email on Thursday, a spokesperson of the European (EU) Commission said that "We take note of the Executive Order on outbound investment released by the U.S. on 9 August. We will be analyzing the Executive Order closely.”
"We are in close contact with the US administration and look forward to continued cooperation on this topic,” the official said.
Market reaction
The above headlines have little to no market impact, with the EUR/USD pair trading 0.35% higher on the day at 1.1019, at the time of writing.
UOB Group’s Economist Enrico Tanuwidjaja and Junior Economist Agus Santoso comment on the latest release of GDP figures in Indonesia.
Key Takeaways
Indonesia’s 2Q23 GDP growth came in higher than expectation at 5.17% y/y or 3.86% q/q. The figure beat consensus forecast of 4.93% y/y and our forecast of just 4.8%, marking a back-to-back better-than-expected growth for the year and continuing optimism since the final quarter of last year.
Positive contribution from all expenditure components continued to underpin the growth momentum. For the past quarter, all expenditure components grew at a faster pace than previous quarter, except for exports and imports. Sectorwise, most grew faster in 2Q23, most notably transportation and accommodation which continued to accelerate in the last 6 quarters, consistent with the reopening that has undone all the pandemic mobility and activity restrictions. Robust growth in these two sectors were also in line with fast recovering tourism sectors that drove occupancy rate higher.
Indonesian economy continues to prove itself to be resilient amid rising global uncertainty, as it registered stronger than forecasted growth for two quarters in a row. Strong domestic consumption and earlier than expected rebound in government spending, as well as sustained expansion in investment expenditure in light of down-streaming efforts by the current government is likely to underpin another year of above-5% growth, yet again. We revise our GDP growth higher to 5.1% for 2023 from 4.9% previously on account of stronger-than-expected 1H23 GDP growth.
Today's release of US July CPI data will be the highlight of a quiet week. Is disinflation enough to get the Dollar lower? Economists at ING analyze USD outlook.
DXY to continue to trade within a 101.80-102.80 range
Consensus expects 0.2% MoM readings for both headline and core today – consistent with inflation running closer to the Fed's 2% target. Normally we would say that this outcome would be a Dollar negative – questioning whether the Fed needs to keep rates at these restrictive 5%+ levels for an extended period after all.
However, US activity data – especially the labour market and consumption data – have been stronger than expected and are likely to keep the Fed on guard for longer. And FX price action after the recent soft 2Q23 Employment Cost Index release hinted that disinflation may not be enough to take the Dollar lower on a sustained basis. For that to happen it looks like we will need to see both softer US activity data (look out for jobless claims today) and a much more attractive overseas investment environment than currently on offer in China or Europe today.
Expect DXY to continue to trade within a 101.80-102.80 range.
See – US CPI Preview: Forecasts from 10 major banks, monthly pace should hold at 0.2%
New Zealand Dollar forecast to appreciate but risks skewed towards that not happening, economists at ANZ Bank report.
NZD/USD seen at 0.65 by end-2024
Our currency forecasts assume a further gradual appreciation of the Kiwi over coming quarters, taking it to 0.63 by year-end, and 0.65 by the end of 2024.
The forecast is based on our expectation of USD weakness as the US tightening cycle comes to an end and the USD reverts to our analytical estimate of fair value. We see fair value at around 91.50 DXY terms.
Although we like to anchor our forecasts to measures of fair value, we are mindful that the market has been unwilling to embrace the idea of a substantially weaker US Dollar yet. That likely reflects broad economic resilience there (which is somewhat surprising, given how aggressively the Fed has tightened policy) and a sense that fragilities elsewhere (especially in China) add to the appeal of the US Dollar.
- Euro manages to surpass the 1.1000 hurdle vs. the US Dollar.
- Stocks in Europe kickstart the session in a positive tone.
- EUR/USD rises to multi-day tops near 1.1030.
- The USD Index (DXY) puts the 102.00 support to the test.
- Final CPI in Italy rose 5.9% YoY in July.
The Euro (EUR) remains on a path of recovery against the US Dollar (USD), and this is currently prompting optimism for EUR/USD to surpass the significant psychological level of 1.1000 and go even higher. This positive momentum started with the opening of the trading session in the euro area on Thursday.
The increased positive sentiment in terms of risk appetite is causing downward pressure on the Greenback, leading to further weakening of the USD Index (DXY), which is approaching the critical level of 102.00.
The pair's upward movement can also be attributed to the ongoing positive performance of German 10-year bund yields. Meanwhile, the direction in the US money market is still uncertain, with no clear trend emerging so far. This uncertainty prevails just before the important release of the US inflation data for July, as measured by the Consumer Price Index (CPI).
Looking at the bigger picture in terms of monetary policy, there haven't been any significant changes. Investors continue to expect that the Federal Reserve will keep its current interest rates unchanged for the remainder of the year. On the other hand, the European Central Bank (ECB) is currently grappling with internal disagreements within its Council regarding the continuation of its tightening measures post-summer.
Apart from the upcoming CPI results in the US economic calendar, there are also regular weekly events such as the Initial Jobless Claims data, as well as speeches by important figures including Philly Fed's Patrick Harker, who holds a voting position and is considered a hawkish voice, and Atlanta Fed's Raphael Bostic, another voting member for 2024 who also leans hawkish.
Daily digest market movers: Euro extends the optimism above 1.1000
- The EUR advances to weekly tops past 1.1000 vs. the USD.
- The USD Index (DXY) comes closer to the 102.00 zone on Thursday.
- The appetite for the riskier assets prevails so far.
- Italian inflation figures showed the CPI rising 5.9% YoY in July
- Investors remain of the view that the Fed could remain on hold in H2 2023.
- The US CPI for the month of July takes centre stage later in the session.
Technical Analysis: Euro now looks to clear 1.1040
EUR/USD accelerates the recovery and leaves behind the key barrier at 1.1000 the figure amidst further weakness surrounding the US Dollar.
The continuation of the ongoing bullish move could motivate the pair to challenge the August top at 1.1041 (August 4) prior to the weekly high at 1.1149 (July 27). If the pair surpasses this level, it could alleviate some of the downward pressure and potentially test the 2023 peak of 1.1275 (July 18). Once this region is breached, significant resistance levels become less prominent until the 2022 high at 1.1495 (February 10), closely followed by the round level of 1.1500.
On the other hand, If EUR/USD breaks below the August low of 1.0912 (August 3), it could indicate a potential downward movement towards the July low of 1.0833 (July 6) ahead of the significant 200-day SMA at 1.0766, and eventually the May low of 1.0635 (May 31). Deeper down, there are additional support levels at the March low of 1.0516 (March 15) and the 2023 low at 1.0481 (January 6).
Furthermore, the positive outlook for the EUR/USD pair remains valid as long as it remains above the important 200-day SMA.
Euro FAQs
What is the Euro?
The Euro is the currency for the 20 European Union countries that belong to the Eurozone. It is the second most heavily traded currency in the world behind the US Dollar. In 2022, it accounted for 31% of all foreign exchange transactions, with an average daily turnover of over $2.2 trillion a day.
EUR/USD is the most heavily traded currency pair in the world, accounting for an estimated 30% off all transactions, followed by EUR/JPY (4%), EUR/GBP (3%) and EUR/AUD (2%).
What is the ECB and how does it impact the Euro?
The European Central Bank (ECB) in Frankfurt, Germany, is the reserve bank for the Eurozone. The ECB sets interest rates and manages monetary policy.
The ECB’s primary mandate is to maintain price stability, which means either controlling inflation or stimulating growth. Its primary tool is the raising or lowering of interest rates. Relatively high interest rates – or the expectation of higher rates – will usually benefit the Euro and vice versa.
The ECB Governing Council makes monetary policy decisions at meetings held eight times a year. Decisions are made by heads of the Eurozone national banks and six permanent members, including the President of the ECB, Christine Lagarde.
How does inflation data impact the value of the Euro?
Eurozone inflation data, measured by the Harmonized Index of Consumer Prices (HICP), is an important econometric for the Euro. If inflation rises more than expected, especially if above the ECB’s 2% target, it obliges the ECB to raise interest rates to bring it back under control.
Relatively high interest rates compared to its counterparts will usually benefit the Euro, as it makes the region more attractive as a place for global investors to park their money.
How does economic data influence the value of the Euro?
Data releases gauge the health of the economy and can impact on the Euro. Indicators such as GDP, Manufacturing and Services PMIs, employment, and consumer sentiment surveys can all influence the direction of the single currency.
A strong economy is good for the Euro. Not only does it attract more foreign investment but it may encourage the ECB to put up interest rates, which will directly strengthen the Euro. Otherwise, if economic data is weak, the Euro is likely to fall.
Economic data for the four largest economies in the euro area (Germany, France, Italy and Spain) are especially significant, as they account for 75% of the Eurozone’s economy.
How does the Trade Balance impact the Euro?
Another significant data release for the Euro is the Trade Balance. This indicator measures the difference between what a country earns from its exports and what it spends on imports over a given period.
If a country produces highly sought after exports then its currency will gain in value purely from the extra demand created from foreign buyers seeking to purchase these goods. Therefore, a positive net Trade Balance strengthens a currency and vice versa for a negative balance.
- GBP/JPY gains strong follow-through traction on Thursday and climbs to over a one-month top.
- The BoJ’s dovish stance, along with a positive risk tone, weigh on the JPY and remain supportive.
- The BoE’s hawkish guidance offset a bleak economic outlook and underpins the British Pound.
The GBP/JPY cross prolongs its upward trajectory witnessed since the beginning of the current week and climbs to over a one-month top during the early part of the European session on Thursday. Spot prices currently trade just above mid-183.00s and might now aim to retest the highest level since December 2015 touched last month.
A positive turnaround in the global risk sentiment – as depicted by a generally positive tone around the equity markets - is seen undermining the safe-haven Japanese Yen (JPY). Apart from this, a dovish stance adopted by the Bank of Japan (BoJ) continues to weigh on the JPY. This, along with a pickup in demand for the British Pound (GBP), provides a goodish lift to the GBP/JPY cross, taking along short-term trading stops near the 183.00 mark.
It is worth recalling that the BoJ decided in July to make its Yield Curve Control (YCC) policy flexible, though policymakers have stressed that the change was a technical tweak aimed at extending the accommodative policy. Furthermore, weaker Japanese wage data released earlier this week reaffirmed market expectations that the Japanese central bank will maintain its ultra-low/negative interest rates over the rest of the year.
Furthermore, the BoJ, in the Summary of Opinions from the July 28 meeting, said that it still has a significantly long way to go before revising its stance on the negative rate policy. This marks a big divergence in comparison to the Bank of England's (BoE) relatively more hawkish guidance, saying that the MPC will ensure that Bank Rate is sufficiently restrictive for long enough for the inflation to return to the central bank’s 2% target.
The aforementioned supportive factors help offset a bleak outlook for the UK economy and continue to push the GBP/JPY cross higher. In fact, the National Institute of Economic and Social Research (NIESR) said earlier this week that it would take until the third quarter of 2024 for UK output to return to its pre-pandemic peak. The NIESR further added that there was a 60% risk of the government going to the polls during a recession.
Hence, the market focus will remain glued to the preliminary release of the UK Q2 GDP report, which will be accompanied by other key macro releases on Friday. The data will play a key role in influencing the British Pound (GBP) and determine the next leg of a directional move for the GBP/JPY cross. The fundamental backdrop, meanwhile, favours bulls and suggests that the path of least resistance for spot prices remains to the upside.
Technical levels to watch
The Turkish Lira still appears to be kept stable by policymakers. But, rate hikes have lagged market expectations and inflation has begun to re-accelerate. Subsequently, economists at Commerzbank have revised up their USD/TRY forecast.
Inflation-FX spiral may have restarted
The current set of policies cannot be viewed to have resolved longstanding problems or restored central bank credibility.
As inflation re-accelerates, the outlook for the real interest rate will deteriorate, which will further intensify exchange rate depreciation – this is the familiar inflation-FX spiral – the reason why we significantly weakened our lira forecasts in the election aftermath.
We revised up our USD/TRY forecast path significantly, with a target of 27.00 for September 2023 and 30.00 for end-2023.


Source: Commerzbank Research
Wednesday was a day of consolidation with no major market moves in FX and rates as market participants await the key US CPI data. Economists at MUFG Bank analyze how inflation figures could impact the US Dollar.
A big upside surprise is required for a big rates/FX reaction
We suspect a divergence from consensus of 0.2ppt or more on MoM changes will be required for a big move in short-term rates and the Dollar.
We do have another CPI report before the September FOMC which dilutes the importance of today’s report somewhat.
With the likes of Fed President Harker this week mentioning possible rate cuts in 2024 as plausible, a big upside surprise is probably required for a big rates/FX reaction.
See – US CPI Preview: Forecasts from 10 major banks, monthly pace should hold at 0.2%
In its Economic Bulletin article on Thursday, the European Central Bank (ECB) unveils details on the economic, financial and monetary developments in the Euro area.
Key highlights
Inflation continues to decline but is still expected to remain too high for too long.
The near-term economic outlook for the euro area has deteriorated, owing largely to weaker domestic demand. High inflation and tighter financing conditions are dampening spending.
Euro area output is expected to rise moderately in the third quarter, mainly supported by the services sector.
The labour market remains robust. The unemployment rate stayed at its historical low of 6.5% in May and many new jobs are being created, especially in the services sector.
The outlook for economic growth and inflation remains highly uncertain.
Upside risks to inflation include potential renewed upward pressures on the costs of energy and food, also related to Russia’s unilateral withdrawal from the Black Sea Grain Initiative.
Global activity remained resilient in the second quarter, but incoming survey data have started to show signs of a loss of momentum.
The global divergence between the services and manufacturing sectors widened further in June.
The near-term global trade outlook is clouded by weak merchandise trade, while services trade continues to improve.
Related reads
- EUR/USD: US CPI may not be enough to trigger a sustained break of the 1.1040 area – ING
- US CPI Data Forecast: Price pressures expected to stay high in July
Further range bound theme appears on the table for USD/CNH in the next few weeks, note Economist Lee Sue Ann and Markets Strategist Quek Ser Leang at UOB Group.
Key Quotes
24-hour view: Yesterday, USD rose briefly to 7.2442, dropped to 7.2075 and then closed at 7.2281 (-0.12%). There is no clear directional bias for now. Today, we expect USD to trade sideways between 7.2000 and 7.2400.
Next 1-3 weeks: Our most recent narrative was from last Wednesday (02 Aug, spot at 7.1800), wherein USD is likely to trade in a range of 7.1300/7.2450 for the time being. We continue to hold the same view for now.
- Silver attracts some buying on Thursday and snaps a three-day losing streak to a one-month low.
- The technical setup still seems tilted in favour of bears and supports prospects for further losses.
- A move beyond the $23.20-$23.30 confluence support breakpoint might negate the bearish bias.
Silver gains some positive traction on Thursday and for now, seems to have snapped a three-day losing streak to over a one-month low, around the $22.60 region touched the previous day. The white metal sticks to the recovery gains through the early part of the European session and currently trades around the $22.80 area, up over 0.60% for the day, though the technical setup remains tilted in favour of bearish traders.
This week's sustained breakdown below the $23.30-$23.20 confluence – comprising the very important 200-day Simple Moving Average (SMA) and a short-term ascending trend-line – adds credence to the negative outlook for the XAG/USD. Moreover, oscillators on the daily chart are holdign deep in the negative territory and are still far from being in the oversold zone. This, in turn, suggests that the path of least resistance for Silver is to the downside and supports prospects for an extension of the recent .downward trajectory witnessed over the past three weeks or so.
Hence, a subsequent slide back towards retesting the multi-month low, around the $22.15-$22.10 area touched in June, looks like a distinct possibility. Some follow-through selling below the $22.00 round-figure mark will be seen as a fresh trigger for bearish traders and drag the XAG/USD to the $21.55-$21.50 intermediate support en route to the $21.00 mark. The downward trajectory could get extended further towards the $21.00 level before Silver eventually aim to challenge the YTD low, or levels just below the $20.00 psychological mark touched in March.
On the flip side, any further recovery beyond the $23.00 round figure is likely to attract fresh sellers and remain capped near the $23.20-$23.30 confluence support breakpoint, now turned resistance. The latter should act as a pivotal point, which if cleared decisively might trigger a short-covering move. The XAG/USD might then climb further towards the $23.60-$23.65 horizontal barrier before aiming to reclaim the $24.00 mark.
Silver daily chart
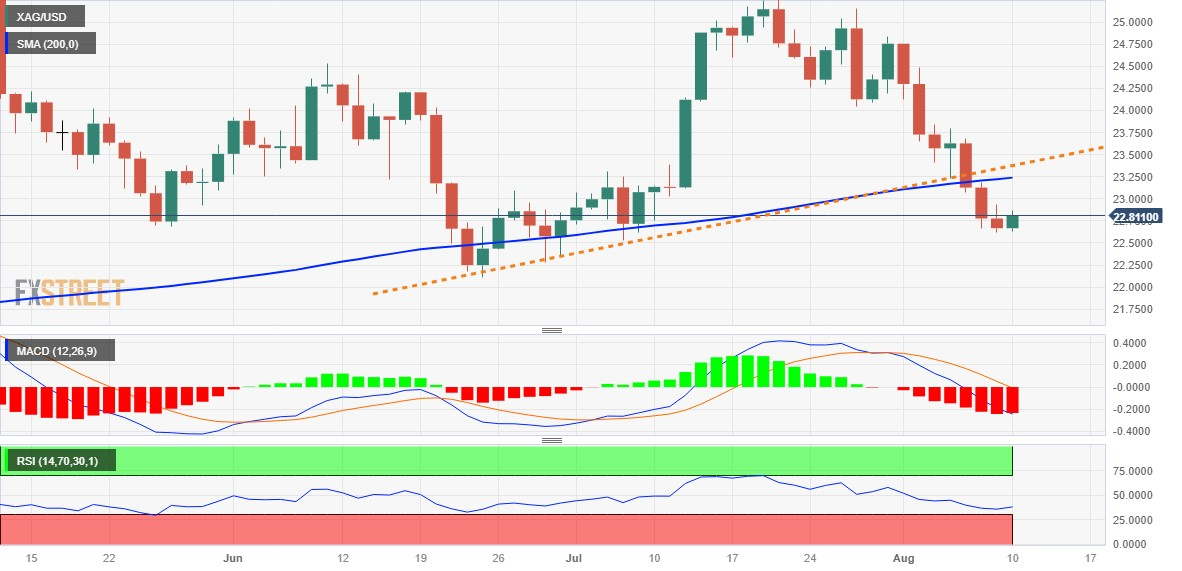
Technical levels to watch
Economists at ING analyze EUR/USD outlook ahead of the release of the US July CPI.
Short-term range clearly defined between 1.0925 and 1.1040
EUR/USD today will largely be determined by the US July CPI release.
The short-term range is now clearly defined between 1.0925 (the 100-Day Moving Average) and the recent high at 1.1040.
Our thesis is that today's consensus CPI number may not be enough to trigger a sustained break of the 1.1040 area.
See – US CPI Preview: Forecasts from 10 major banks, monthly pace should hold at 0.2%
Considering advanced prints from CME Group for natural gas futures markets, open interest extended the downtrend for yet another session on Wednesday, this time by around 1.4K contracts. Volume, on the other hand, kept the erratic performance and advanced sharply by around 269.1K contracts.
Natural Gas meets resistance near $3.00
Prices of natural gas rose markedly and briefly surpassed the key $3.00 mark per MMBtu on Wednesday. The pronounced uptick, however, was amidst shrinking open interest, which also imposes a pause in the recent acute rebound, although the strong build in volume does not exclude another spike above the key $3.00 hurdle in the very near term.
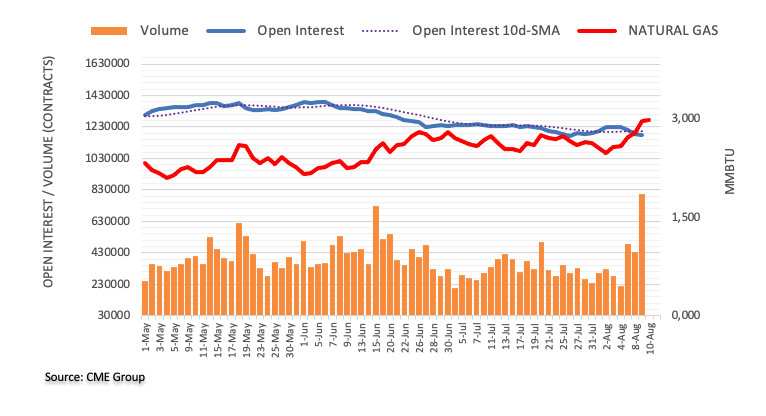
- Pound Sterling finds support amid quiet market mood, UK factory data eyed.
- It is expected that the United Kingdom economy could avoid recession.
- UK’s GDP is seen growing in Q2 despite the aggressively restrictive monetary policy.
The Pound Sterling (GBP) finds support despite sheer silence in the market ahead of crucial economic data. The GBP/USD pair looks well-supported for now as investors hope that the British economy could avoid recession due to easing inflationary pressures and declining consumer spending. Domestically, Friday’s factory data and Q2 Gross Domestic Product (GDP) figures will be in focus.
Investors would be eager to know how effectively firms are handling the impact of higher interest rates by the Bank of England (BoE). Market participants anticipate that United Kingdom’s GDP grew in the April-June quarter despite aggressively tight monetary policy. Also, production activities remained on a recovery path, demonstrating resilience in the economy.
Daily Digest Market Movers: Pound Sterling awaits UK factory data
- Pound Sterling manages to sustain above 1.2700 as investors await factory data for June and Q2 GDP data, which will be published on Friday at 06:00 GMT.
- Per estimates, monthly GDP expanded by 0.2% in June against a contraction of 0.1%. Preliminary GDP data for the April-June quarter is seen as stagnant versus a nominal expansion of 0.1% recorded for Q1. Annual GDP is forecast to be expanding at a steady pace of 0.2%.
- According to consensus, Monthly Industrial Production expanded by 0.1% against a steep contraction of 0.6% recorded for May. Annually, the economic data is seen at -1.1%, against the former release of -2.3%.
- Meanwhile, Manufacturing Production grew at 0.2% in June versus a contraction by a similar figure in May. Annual data expanded by 0.3% against -1.2%.
- Preliminary consensus for United Kingdom factory data indicates a recovery despite aggressive policy tightening by the Bank of England.
- A recovery in the UK Manufacturing sector would ease recession fears but more interest rate hikes from the central bank will remain warranted.
- BoE policymakers cannot announce victory over inflation as the current UK Consumer Price Index (CPI) is almost four times the required rate of 2%. Therefore, further policy tightening cannot be ruled out.
- About the interest rate outlook, MUFG said that softening in the labor market and recent retail sales data showing slower consumer spending is “certainly strengthening the case for the BoE to possibly pause its tightening cycle,”
- It is expected that the promise made by UK PM Rishi Sunak of halving inflation by year-end when inflation was a little above 10% would be fulfilled as consumer spending loses resilience and hiring slows down.
- After UK factory data, investors will shift their focus toward the labor market data for July, which will be released on Tuesday.
- The risk profile seems quiet as investors await the United States Consumer Price Index (CPI) data for July, which will be published at 12:30 GMT.
- On Wednesday, the market mood remained sour after Moody’s downgraded small and mid-sized US banks. The credit-rating firm warned that it could downgrade America’s biggest lenders ahead.
- Analysts at Commerzbank expect the core rate to expand at just 0.2% in July. The headline inflation rate is also likely to be 0.2%. As this would be largely in line with the Federal Reserve (Fed)'s inflation target of 2%, such a result would support the broader view that the central bank is unlikely to raise rates again.
- Annual headline CPI is expected to rebound to 3.3% from 3.0% in the former release due to a modest recovery in gasoline prices. Core inflation is expected to remain sticky at 4.8% YoY.
- The US Dollar Index (DXY) drops after a sluggish performance ahead of the inflation data. July’s inflation data is going to build a base for September’s monetary policy.
- US 30-year mortgage rates rose sharply to 7.09% this week, the second-highest since 2001, demonstrating the impact of the US government downgrade.
Technical Analysis: Pound Sterling maintains auction above 1.2700
Pound Sterling continues to remain well-supported above the round-level support of 1.2700. A power-pack action is anticipated from Cable as the US economy will report its inflation data. The asset continues to trade below the 20 and 50-period Exponential Moving Averages (EMAs), which keeps the short and medium-term trend bearish. A downside move below the four-day low around 1.2680 would elevate the downside pressure.
Pound Sterling FAQs
What is the Pound Sterling?
The Pound Sterling (GBP) is the oldest currency in the world (886 AD) and the official currency of the United Kingdom. It is the fourth most traded unit for foreign exchange (FX) in the world, accounting for 12% of all transactions, averaging $630 billion a day, according to 2022 data.
Its key trading pairs are GBP/USD, aka ‘Cable’, which accounts for 11% of FX, GBP/JPY, or the ‘Dragon’ as it is known by traders (3%), and EUR/GBP (2%). The Pound Sterling is issued by the Bank of England (BoE).
How do the decisions of the Bank of England impact on the Pound Sterling?
The single most important factor influencing the value of the Pound Sterling is monetary policy decided by the Bank of England. The BoE bases its decisions on whether it has achieved its primary goal of “price stability” – a steady inflation rate of around 2%. Its primary tool for achieving this is the adjustment of interest rates.
When inflation is too high, the BoE will try to rein it in by raising interest rates, making it more expensive for people and businesses to access credit. This is generally positive for GBP, as higher interest rates make the UK a more attractive place for global investors to park their money.
When inflation falls too low it is a sign economic growth is slowing. In this scenario, the BoE will consider lowering interest rates to cheapen credit so businesses will borrow more to invest in growth-generating projects.
How does economic data influence the value of the Pound?
Data releases gauge the health of the economy and can impact the value of the Pound Sterling. Indicators such as GDP, Manufacturing and Services PMIs, and employment can all influence the direction of the GBP.
A strong economy is good for Sterling. Not only does it attract more foreign investment but it may encourage the BoE to put up interest rates, which will directly strengthen GBP. Otherwise, if economic data is weak, the Pound Sterling is likely to fall.
How does the Trade Balance impact the Pound?
Another significant data release for the Pound Sterling is the Trade Balance. This indicator measures the difference between what a country earns from its exports and what it spends on imports over a given period.
If a country produces highly sought-after exports, its currency will benefit purely from the extra demand created from foreign buyers seeking to purchase these goods. Therefore, a positive net Trade Balance strengthens a currency and vice versa for a negative balance.
Further upside could motivate USD/JPY to surpass the 145.00 hurdle in the short-term horizon, suggest Economist Lee Sue Ann and Markets Strategist Quek Ser Leang at UOB Group.
Key Quotes
24-hour view: Yesterday, USD rose to high of 143.77. Upward momentum is building, and USD is likely to rise further. A break of 144.00 is not ruled out, but the major resistance at 145.05 is unlikely to come into view today. There is another resistance at 144.40. Support is at 143.40, followed by 143.00.
Next 1-3 weeks: Our view from Monday (07 Aug, spot at 141.60) wherein USD “could trade in a range of 140.00/141.30” was invalidated when USD broke clearly above 143.30. Upward momentum is building again, and USD is likely to trade with an upward bias towards the major resistance level at 145.05. However, if USD breaks below 142.50 (‘strong support’ level), it would suggest that the buildup in upward pressure has faded.
- The index comes under pressure near 102.20.
- US yields advance marginally across the curve so far.
- US inflation is expected to rise 3.3% YoY in July.
The greenback adds to Wednesday’s pullback and revisits the 102.20 region when tracked by the USD Index (DXY) on Thursday.
USD Index looks at US data
The index loses ground for the second session in a row and navigates in the low-102.00s on Thursday amidst rising expectation ahead of the release of US inflation figures for the month of July.
According to market consensus, US consumer prices are seen rising 3.3% in the year to July, a tad above June’s readings and the first uptick since June 2022.
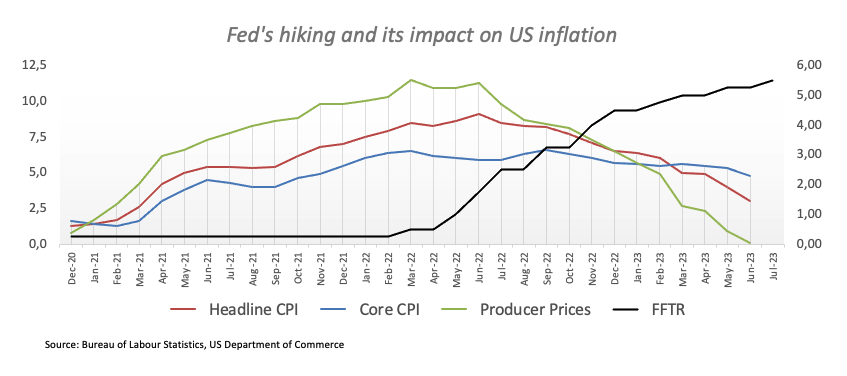
In the meantime, US yields appear slightly bid following the recent weakness against the backdrop of steady bets that the Federal Reserve could have ended its tightening campaign with July’s interest rate hike.
Other than the release of inflation figures, weekly Jobless Claims are due and Philly Fed P. Harker (voter, hawk) and Atlanta Fed R. Bostic (2024 voter, hawk) are also scheduled to speak later in the NA session.
What to look for around USD
The index remains offered on Thursday, although it manages well to keep the trade north of 102.00 for the time being.
Other than risk appetite trends, the dollar could face extra headwinds in response to the data-dependent stance from the Fed against the current backdrop of persistent disinflation and cooling of the labour market.
Furthermore, speculation that the July hike might have been the last of the current hiking cycle is also expected to keep the buck under some pressure for the time being.
Key events in the US this week: Inflation Rate, Initial Jobless Claims (Thursday) – Producer Prices, Flash Michigan Consumer Sentiment (Friday).
Eminent issues on the back boiler: Persistent debate over a soft or hard landing for the US economy. Terminal Interest rate near the peak vs. speculation of rate cuts in late 2023 or early 2024. Geopolitical effervescence vs. Russia and China. US-China trade conflict.
USD Index relevant levels
Now, the index is losing 0.23% at 102.24 and faces initial support at 101.74 (monthly low August 4) seconded by 100.55 (weekly low July 27) and then 100.00 (psychological level). On the other hand, the breakout of 102.84 (weekly high August 3) would open the door to 103.37 (200-day SMA) and finally 103.57 (weekly high June 30).
Economists at Commerzbank analyze how Chinese policies could impact the Yuan.
Most policy measures will focus on the supply side
Markets and businesses should get used to the ‘new normal’ in which the Chinese government will avoid rolling out big stimulus. Instead, targeted stimulus will be implemented and most policy measures will focus on the supply side.
We will likely only see a rather moderate boost from policy stimulus in the coming months. As such, the Yuan will remain under pressure for longer.
Economists at ING analyze GBP outlook after the release of the RICS UK house price data survey.
Housing market pessimism starting to show
RICS UK house price data survey showed the most pessimism over UK house prices since early 2009. It will be interesting to see whether this starts to feed more heavily into UK consumer confidence and spending. We also expect it will pressure the pricing of the BoE cycle, where another 50 bps of tightening is still seen.
EUR/GBP seems happy to trace out an 0.8600-0.8650 range for the time being. But we are happy with our upside bias towards the 0.88 area for later in the year.
- EUR/JPY marches to the highest level since September 2008.
- Clear upside break of five-week-old falling resistance, absence of overbought RSI and bullish MACD signal together favor bulls.
- Ascending trend line from March, 21-DMA restrict short-term downside.
EUR/JPY refreshes multi-year high to 158.30 heading into Thursday’s European session after crossing the key upside hurdle earlier in the day. That said, the cross-currency pair’s run-up in the last four consecutive days also takes clues from the firmer MACD signals, as well as the upbeat but not overbought RSI (14) line.
With this, the quote is well set for reaching the 159.00 round figure ahead of poking the 160.00 psychological magnet.
However, the RSI may turn overbought around those levels and can challenge the EUR/JPY buyers.
Apart from that, the February 2007 peak of around 159.65 also acts as an extra filter towards the north.
Meanwhile, EUR/JPY pullback needs to provide a daily closing beneath the previous resistance line stretched from late June, close to 157.80 by the press time.
Following that, an ascending support line from late March, close to 156.60, and the 21-DMA level of 156.30 may prod the EUR/JPY bears.
Above all, the pair remains on the buyer’s radar unless breaking a three-month-old horizontal support zone surrounding 151.70-40.
To sum up, EUR/JPY pair's upside break of 157.70 opened the door for the pair's rally towards 160.00 but the futher advances appear doubtful.
EUR/JPY: Daily chart
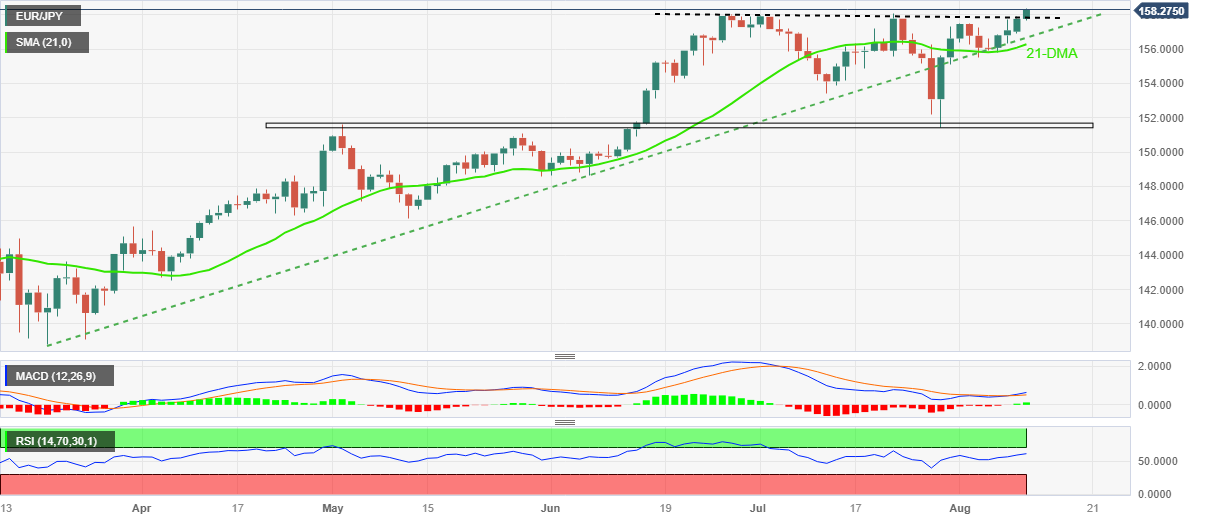
Trend: Further upside expected
The near-term outlook for NZD/USD remains negative, according to Economist Lee Sue Ann and Markets Strategist Quek Ser Leang at UOB Group.
Key Quotes
24-hour view: NZD traded in a range of 0.6046/0.6095 yesterday before closing slightly lower at 0.6052 (-0.20%). The price actions appear to be consolidative. Today, we expect NZD to trade between 0.6035/0.6085.
Next 1-3 weeks:We turned negative in NZD about a week ago. In our most recent narrative from Monday (07 Aug, spot at 0.6105), we indicated that “the likelihood of NZD weakening further has decreased.” On Tuesday, NZD dropped to a low of 0.6035. Downward pressure has increased, albeit not much. We will continue to hold a negative NZD view for now, as long as it stays below 0.6100 (‘strong resistance’ level previously at 0.6145). That said, it remains to be seen if there is enough momentum for NZD to break below 0.6020. Looking ahead, the next support is at 0.5985
- USD/JPY gains momentum for the fourth consecutive day, just below the 144.00 barrier.
- The pair stands above the 50- and 100-hour EMAs with an upward slope.
- The immediate resistance level is seen at 144.65; the initial support level is located at 143.10.
The USD/JPY pair extends its upside for the fourth consecutive day, heading into an early European session on Thursday. The major pair currently trades around 143.95, gaining 0.15% for the day. Market participants await the US Consumer Price Index (CPI) for July for fresh impetus. The US inflation figure is expected to rise from 3% to 3.3%, and the core figure is expected to remain unchanged at 4.8%.
According to the four-hour chart, the USD/JPY pair stands above the 50- and 100-hour Exponential Moving Averages (EMAs) with an upward slope, which means the path of least resistance is to the upside for the major pair.
Any meaningful follow-through buying beyond 144.25 (the upper boundary of the Bollinger Band) could pave the way to the next hurdle at 144.65 (High July 6). The 144.90–145.00 zone will be a tough nut to crack for the USD/JPY pair. The mentioned level is the confluence of a high of June 30 and a psychological round mark.
On the downside, the immediate support level for USD/JPY is located at 143.10, representing the midline of the Bollinger Band en route to 142.65 (50-hour EMA). The additional downside filter is seen at 142.00 (100-hour EMA and the lower limit of the Bollinger Band), and finally at 141.50 (Low of August 7).
It’s worth noting that the Relative Strength Index (RSI) stands around 70 and Moving Average Convergence/Divergence (MACD) stays in bullish territory, which indicates that the upside momentum has been activated for the time being.
USD/JPY four-hour chart
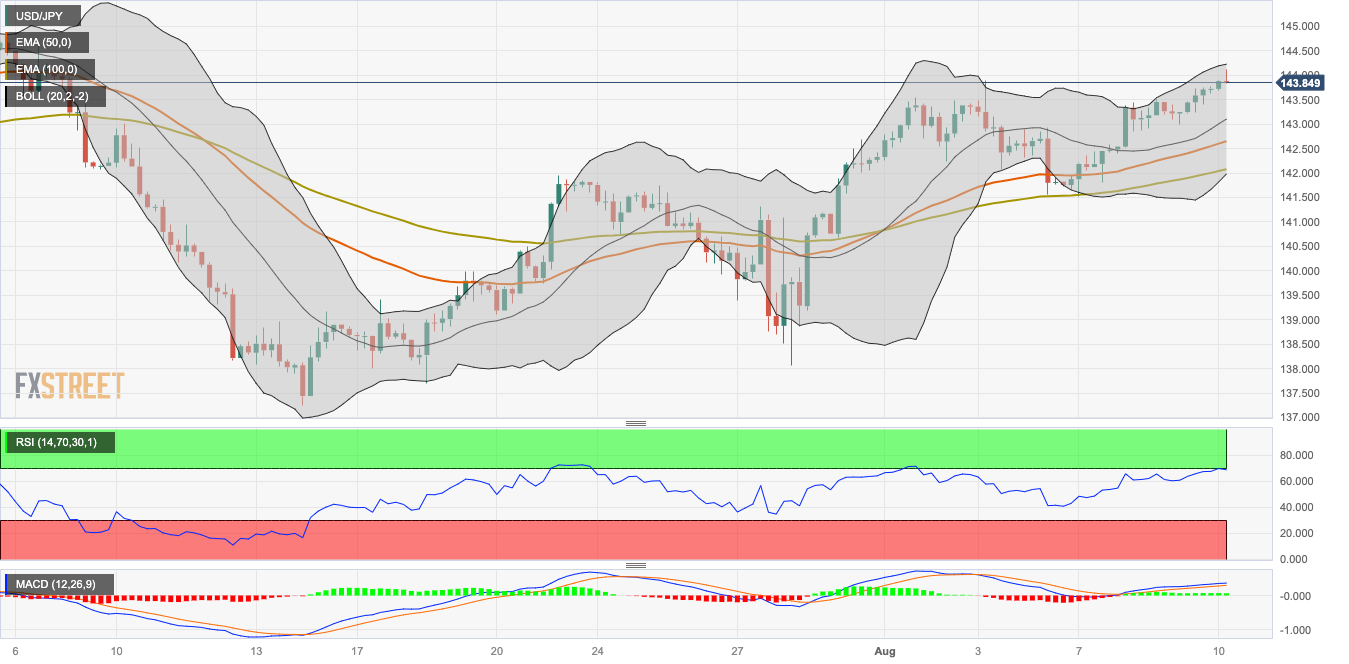
EUR/CZK has been surprisingly stable since last week's CNB meeting. Economists at ING analyze the pair’s outlook.
Zero CNB activity
One may wonder if the CNB is not active in the market again. The available central bank balance sheet data only shows us last week. However, these numbers imply zero CNB activity as expected.
We think today's inflation numbers may open the way for the market to test higher EUR/CZK above 24.30 and confirm that the central bank is fine with a weaker Koruna.
Here is what you need to know on Thursday, August 10:
The US Dollar struggles to find demand early Thursday as investors remain on the sidelines while waiting for the all-important Consumer Price Index (CPI) data from the US. The US Dollar Index stays in negative territory below 102.50 after posting small daily losses on Wednesday. The US economic docket will also feature the weekly Initial Jobless Claims report and several Federal Reserve (Fed) policymakers will be speaking later in the day.
US CPI Data Preview: Core inflation expected to stick close to 5%.
The annual CPI in the US is forecast to rise 3.3% in July, at a slightly stronger pace than the 3% increase recorded in June. Ahead of the inflation data, the CME Group FedWatch Tool shows that markets are pricing in a more than 25% probability of the Fed raising the policy rate one more time this year.
US Dollar price today
The table below shows the percentage change of US Dollar (USD) against listed major currencies today. US Dollar was the weakest against the Australian Dollar.
| USD | EUR | GBP | CAD | AUD | JPY | NZD | CHF | |
| USD | -0.14% | -0.07% | -0.13% | -0.25% | 0.16% | -0.17% | -0.08% | |
| EUR | 0.15% | 0.07% | 0.04% | -0.08% | 0.30% | -0.01% | 0.07% | |
| GBP | 0.07% | -0.08% | -0.03% | -0.14% | 0.27% | -0.08% | 0.00% | |
| CAD | 0.11% | -0.05% | 0.03% | -0.12% | 0.26% | -0.05% | 0.03% | |
| AUD | 0.26% | 0.12% | 0.19% | 0.13% | 0.41% | 0.09% | 0.17% | |
| JPY | -0.16% | -0.35% | -0.26% | -0.30% | -0.42% | -0.34% | -0.27% | |
| NZD | 0.17% | 0.02% | 0.10% | 0.04% | -0.07% | 0.32% | 0.08% | |
| CHF | 0.11% | -0.07% | 0.00% | -0.03% | -0.15% | 0.27% | -0.08% |
The heat map shows percentage changes of major currencies against each other. The base currency is picked from the left column, while the quote currency is picked from the top row. For example, if you pick the Euro from the left column and move along the horizontal line to the Japanese Yen, the percentage change displayed in the box will represent EUR (base)/JPY (quote).
Meanwhile, the benchmark 10-year US Treasury bond yield holds steady at around 4% and US stock index futures trade in positive territory despite concerns over escalating US-China tensions. US President Joe Biden signed the bill late Wednesday that will restrict US investments in certain Chinese entities. In response, "we hope that the US side will respect the laws of market economy and the principle of fair competition, refrain from artificially impeding global economic and trade exchanges and cooperation, as well as setting obstacles for the recovery of world economic growth," said a spokesperson for China's Commerce Ministry.
EUR/USD continues to inch higher toward 1.1000 after registering small daily gains on Wednesday. The European Central Bank's (ECB) monthly Economic Bulletin is expected to be released later in the day.
GBP/USD closed in the red for the second straight day on Wednesday but managed to hold above 1.2800. The pair trades in a narrow channel early Thursday. The UK's Office for National Statistics will release second-quarter Gross Domestic Product (GDP) figures on Friday.
USD/JPY continued to stretch higher and touched its strongest level in a month near 144.00 on Thursday. The data from Japan showed earlier in the day that the Producer Price Index (PPI) rose 3.6% on a yearly basis in July, down from 4.1% in June but slightly higher than the market expectation of 3.5%.
Gold price extended its weekly slide and dropped below $1,920 for the first time since July 11 on Wednesday. XAU/USD stays relatively quiet early Thursday and fluctuates slightly below that level.
Following Tuesday's failed attempt to break above $30,000, Bitcoin edged lower on Wednesday. At the time of press, BTC/USD was moving sideways at around $29,500. Ethereum holds steady at around $1,850 after closing the day virtually unchanged on Wednesday.
Open interest in gold futures markets reversed three consecutive daily pullbacks and rose by around 2.4K contracts on Wednesday according to preliminary readings from CME Group. Volume followed suit and increased for the third session in a row, this time by around 280.4K contracts.
WTI now looks at $90.00 and beyond
Prices of WTI continued its march north on Wednesday and reached new yearly highs past the $84.00 mark per barrel. The uptick was on the back of increasing open interest and volume, which is indicative that further gains appear in store in the very near term. Against that, the next target for the commodity emerges at the key $90.00 per barrel ahead of the November 2022 high of $93.73 (November 7).
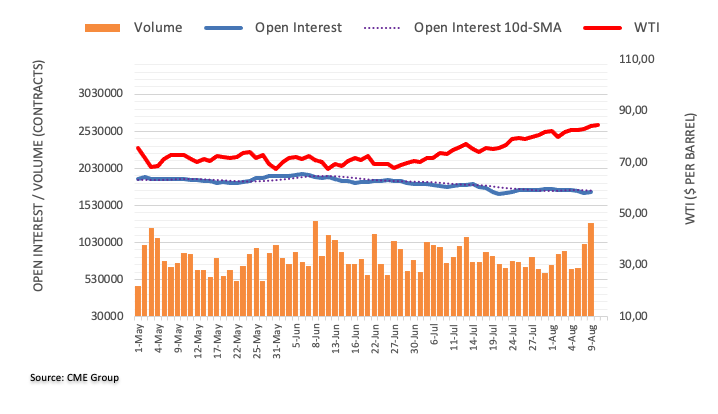
The US inflation data for July is due for publication today. Antje Praefcke, FX Analyst at Commerzbank, analyzes how CPI report could impact the US Dollar.
US Dollar should not be able to benefit from inflation data
According to our experts, the data will suggest that the Fed rate has peaked. That means the US Dollar should not be able to benefit from the data as the publication will not call the rate pause in September into question while at the same time cementing the view that there will be no further step in November either.
Perhaps the market will be quite happy that it can stay in the summer ranges for now, rather than having to trade backward and forwards manically because of the inflation data. Of course, the data might cause the odd pip here or there, above all if the data were to deviate significantly from the expectations, but I think everyone is quite happy with EUR/USD levels around 1.10.
See – US CPI Preview: Forecasts from 10 major banks, monthly pace should hold at 0.2%
In the view of Economist Lee Sue Ann and Markets Strategist Quek Ser Leang at UOB Group, prospects for extra downside in GBP/USD appears diminished for the time being.
Key Quotes
24-hour view: GBP closed slightly lower at 1.2721 yesterday (-0.22%). There is a slight increase in momentum, and GBP is likely to edge lower today. In view of the mild downward pressure, any decline is unlikely to break clearly below 1.2665. The major support at 1.2620 is unlikely to come under threat. On the upside, if GBP breaks above 1.2765 (minor resistance is at 1.2740), it would suggest that the current mild downward pressure has eased.
Next 1-3 weeks: We have held a negative GBP view for more than a week now. In our most recent update from two days ago (08 Aug, spot at 1.2780), we noted that “downward momentum has eased further.” We held the view that “the chance for GBP to drop to 1.2580 has diminished.” We continue to hold the same view for now. Overall, only a breach of 1.2805 (‘strong resistance’ level previously at 1.2830) would indicate that the GBP weakness has stabilised.
CME Group’s flash data for gold futures markets noted traders added around 2.3K contracts to their open interest positions after four consecutive daily pullbacks on Wednesday. Volume, instead, remained choppy and went down by around 3.5K contracts, partially trimming the previous daily build.
Gold: Next on the downside emerges $1900
Gold prices dropped to new four-week lows near $1915 on Wednesday. The downtick was on the back of rising open interest, which suggests the likelihood of further decline in the very near term. That said, the $1900 region per troy ounce emerges as the next contention area for the yellow metal.
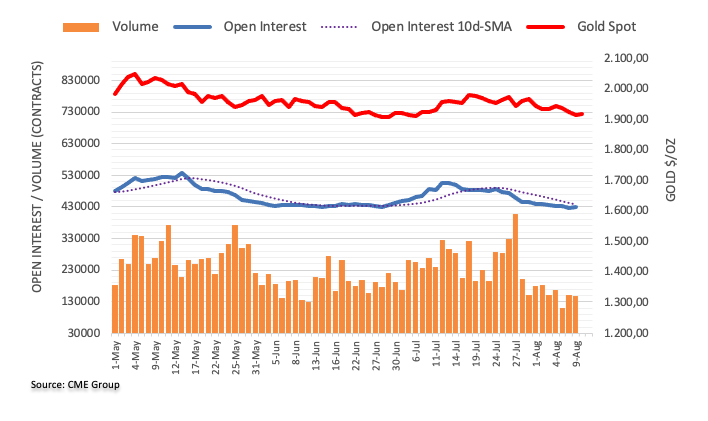
- Gold Price fades bounce off one-month low as US CPI looms.
- Cautious optimism, sluggish US Dollar joins pre-data anxiety to prod XAU/USD traders.
- Mixed feelings about China underpin XAU/USD consolidation despite impending trade war, economic fears.
- Softer US inflation can extend the Gold Price recovery as downbeat US NFP flagged Fed policy pivot concerns.
Gold Price (XAU/USD) struggles to defend the first daily gains at the lowest level in a month as the market braces for the US inflation data, namely the Consumer Price Index (CPI) for July. Adding strength to the XAU/USD rebound is the slightly positive market sentiment as the US-China trade war and looming Sino-UK tension fail to spoil the market’s mood as China policymakers show confidence in taming the economic fears.
Further, the Gold Price rebound could also be linked to the mildly bid stock futures and the Asia-Pacific shares, not to forget the Reserve Bank of India’s (RBI) inaction. However, the corrective bounce in the yields and fears that the US CPI will offer a positive surprise and defy the concerns about the Fed policy pivot, especially backed by the previous week’s downbeat US jobs report and early signals of inflation, could recall the XAU/USD sellers.
Also read: Gold Price Forecast: XAU/USD could test 200 DMA on hot US Consumer Price Index data
Gold Price: Key levels to watch
Our Technical Confluence indicator suggests that the Gold Price struggles to overcome the immediate upside hurdle surrounding $1,918-20 comprising the lower band of the Bollinger and Fibonacci 23.6% on one-day.
It’s worth noting that the XAU/USD downside needs validation from the Pivot Point one-month S1, around $1,915.
Following that, the Gold bears will have a space before hitting the $1,905 support confluence including the previous monthly low. However, the Pivot Point one-week S2, around the $1,900 round figure, can challenge the XAU/USD bears past $1,905.
In a case where the Gold Price drops below the $1,900 threshold, June’s low of $1,893 will be in the spotlight.
Alternatively, a clear upside break of the aforementioned $1,918-20 resistance confluence could quickly fuel the Gold Price towards the previous weekly low and the Pivot Point one-day R1, close to $1,930.
If the Gold buyers manage to stay keep the reins past $1,930, Fibonacci 61.8% in one-month, near $1,938, may test the buyers before directing them to the multi-day resistance area surrounding $1,955.
Here is how it looks on the tool
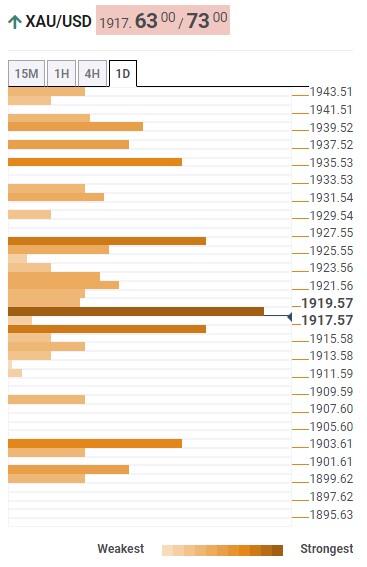
About Technical Confluences Detector
The TCD (Technical Confluences Detector) is a tool to locate and point out those price levels where there is a congestion of indicators, moving averages, Fibonacci levels, Pivot Points, etc. If you are a short-term trader, you will find entry points for counter-trend strategies and hunt a few points at a time. If you are a medium-to-long-term trader, this tool will allow you to know in advance the price levels where a medium-to-long-term trend may stop and rest, where to unwind positions, or where to increase your position size.
Economists at CIBC Capital Markets expect to see a rally in the Norwegian Krone.
Resilient domestic fundamentals sit alongside positive terms of trade dynamics
While the uptick in price pressures remains a cause for concern, we’d also note a positive fundamental bias that validates underlying NOK resilience.
Resilient domestic fundamentals sit alongside positive terms of trade dynamics.
Positive NOK dynamics leave us mindful of EUR/NOK retreating back toward levels last seen in late February, at around 10.85/90 over time.
- EUR/USD holds positive ground near 1.0986, gaining 0.12% for the day.
- The announcement of Italy's bank tax, the fear of recession exert pressure on the Euro.
- Market anticipated that the Fed's stance would shift from additional rate hikes to holding rates steady.
- Market players will monitor the US Consumer Price Index (CPI) for July for fresh impetus.
The EUR/USD pair gains momentum and holds above 1.0980 heading into the early European session on Thursday. The major pair trades in positive territory for two consecutive days. EUR/USD currently trades around 1.0986, up 0.12% for the day.
In the Eurozone, Italy’s surprise tax on the windfall profits of banks and the possible recession in Germany exert pressure on the Euro against its rivals. Additionally, the odds of an interest rate pause by the ECB in its September meeting amid easing inflationary pressures and recession fear might cap the upside in the Euro and act as a headwind in the EUR/USD pair.
Earlier this week, the German Harmonized Index of Consumer Price (HICP) came in at 6.5%, matching the market consensus. The Eurozone Sentix Investor Confidence improved from -22.5 in July to -18.9 in August, versus the market consensus of -23.4. Later in the day, the European Central Bank will release the Economic Bulletin. This report could offer hints about the further monetary policy of the ECB for the entire year.
On the US dollar front, the recent commentary from Federal Reserve (Fed) speakers indicated that the Fed stance has shifted from additional rate hikes to holding rates steady. The Philadelphia Fed president, Patrick Harker, stated that the central bank can leave interest rates where they are. Meanwhile, Atlanta Fed president Raphael Bostic states that no further rate hikes are necessary. However, investors will take more cues from the US inflation figures. The weaker US inflation data might limit the Greenback and lift EUR/USD.
Looking ahead, the US Consumer Price Index (CPI) report will be released on Thursday. The data will have a significant impact on the Federal Reserve's (Fed) future rate hike path and help investors determine the direction of EUR/USD. The US inflation figure is expected to rise from 3% to 3.3%, and the core figure is expected to remain unchanged at 4.8%. Also, the US Producer Price Index for July will be released on Friday.
- USD/CAD takes offers to refresh intraday low, printing the biggest daily loss, so far, in more than a week.
- Oil price cheers cautious optimism, softer US Dollar and technical breakout to stay firmer around YTD top.
- US Dollar fails to justify trade war fears as markets brace for US CPI with eyes on Fed policy pivot.
USD/CAD justifies bearish technical signals while refreshing intraday low to around 1.3400 amid the early hours of Thursday morning in Europe. Apart from the technical details, mentioned below, the Loonie pair’s latest weakness could also be linked to the firmer price of Canada’s main export item WTI crude oil, as well as the US Dollar’s retreat.
US Dollar Index (DXY) remains depressed near 102.45 after snapping a two-day uptrend the previous day. In doing so, the Greenback’s gauge versus the six major currencies justifies the market’s cautious mood ahead of the US inflation data, namely the Consumer Price Index (CPI) for July. Additionally weighing on the DXY is the market’s cautious optimism.
It should be noted that the US-China trade war and looming Sino-UK tension fail to spoil the market’s mood as China policymakers show confidence in taming the economic fears.
That said, Financial Times (FT) came out with the news suggesting that UK Prime Minister Rishi Sunak is weighing whether to follow US President Joe Biden in restricting outbound investment into the Chinese tech sector, including artificial intelligence, chips and quantum computing. Before that, US President Joe Biden signed the much-awaited bill that allows the US Treasury Department to prohibit or restrict certain US investments in Chinese entities, per Reuters. In a reaction, China's Commerce Ministry cited “grave concerns” and marked the right to take measures against the US ban on technology investment. However, such an issue was long discussed and the announced steps are slightly lenient than originally planned, which in turn allowed the markets to remain cautiously optimistic.
Elsewhere, the firmer sentiment and likely improvement in demand from China join the looming supply crunch from Saudi Arabia and Russia to propel the WTI crude oil. Additionally, a clear upside break of an eight-month-old horizontal resistance, now immediate support around $83.50, as well as the softer DXY also allowed WTI to remain firmer around the yearly top, up 0.40% intraday near $84.05 by the press time.
Amid these plays, S&P500 Futures print mild gains despite Wall Street’s downbeat closing whereas the US Treasury bond yields also pare weekly losses.
Looking ahead, the early signals for the US inflation data and the downbeat prints of the US Nonfarm Payrolls (NFP) underpin the dovish Fed bias, which in turn seeks confirmation from today's US CPI.
Technical analysis
Wednesday’s Doji candlestick below the convergence of a five-month-old descending trend line and the 200-DMA, around 1.3450, directs the USD/CAD pair towards 1.3390-85 support area including July’s peak and the 100-DMA.
Economist Lee Sue Ann and Markets Strategist Quek Ser Leang at UOB Group see EUR/USD navigating in a consolidative fashion in the near term.
Key Quotes
24-hour view: Yesterday, EUR traded in a relatively narrow range between 1.0950 and 1.0995 before settling at 1.0973 (+0.17%). The price movements appear to be part of a consolidation. Today, EUR could continue to consolidate, likely in a range of 1.0945/1.1000.
Next 1-3 weeks: Our latest narrative was from Monday (07 Aug, spot at 1.1000), wherein EUR is likely to trade in a range between 1.0920 and 1.1100 for the time being. While we continue to expect EUR to trade in a range, the relatively low volatility over the past couple of days suggests a 1.0920/1.1080 range could contain the price actions in EUR for now. Looking ahead, if EUR breaks clearly below 1.0920, it will mean the start of a fresh leg lower.
- Consumer Price Index in the US is forecast to rise 3.3% YoY in July, up from the 3% increase recorded in June.
- Core CPI inflation is expected to hold steady at 4.8% YoY in July.
- US CPI inflation report could significantly impact the US Dollar’s valuation by altering the Fed’s rate outlook.
The highly-anticipated Consumer Price Index (CPI) inflation data for July will be published by the US Bureau of Labor Statistics (BLS) on Thursday, August 10, at 12:30 GMT.
The US Dollar (USD) has been gathering strength against its rivals since mid-July, with macroeconomic data releases highlighting the relatively upbeat performance of the US economy and tight labor market conditions. Following the July policy meeting, Federal Reserve (Fed) Chairman Jerome Powell refrained from committing to one more rate hike before the end of the year but investors are yet to decide whether the Fed has already reached the terminal rate.
The US CPI inflation data could alter the way markets price the Fed’s rate outlook and significantly influence the USD’s valuation. Investors will pay close attention to the details of the report to see if there is progress in the sticky parts of inflation.
What to expect in the next CPI data report?
The US Consumer Price Index data, on a yearly basis, is expected rise 3.3% in July, at a modestly stronger pace than the 3% increase recorded in June. The Core CPI figure, which excludes volatile food and energy prices, is forecast to remain unchanged at 4.8% in the same period.
The monthly CPI and the Core CPI are both seen rising 0.2% in July. Because annual CPI readings are subject to base effects, markets are likely to react to changes in monthly figures.
In July, the Prices Paid Index – the inflation component – of the ISM Manufacturing PMI edged higher to 42.6 from 41.8 in July, showing that input prices declined at a softer pace than in June. More importantly, the Prices Paid Index of the ISM Services PMI survey rose to its highest level since April at 56.8, unveiling an acceleration in the service sector’s input inflation.
Speaking on the policy outlook, Fed Governor Michelle Bowman said that additional rate increases will likely be needed if data show that progress on inflation has stalled. Meanwhile, “we are making progress against inflation. It has been slow progress, and I am watchful of any reemerging price pressures,” said Philadelphia Fed President Patrick Harker and added: “We remain unwavering in our commitment to bring inflation back to target.”
Analysts at TD Securities provide a brief preview of the key macro data and explain:
“Our forecasts for the CPI report suggest core price inflation likely stayed subdued in July: We expect it to print 0.2% m/m — a June repeat. We also look for a 0.2% gain for the headline. Importantly, we expect the report to show that core goods prices shifted more decidedly into deflation, while shelter-price gains accelerated modestly. Note that our unrounded core CPI inflation forecast is 0.23%, so we judge the risk of a 0.3% m/m advance to be larger than that of 0.1%.”
When will the Consumer Price Index report be released and how could it affect EUR/USD?
The Consumer Price Index (CPI) inflation data for July will be published at 12:30 GMT on August 10. The US Dollar started the week on a bullish note. The US Dollar Index, which gauges the USD’s valuation against a basket of six major currencies, is up nearly 1% in August after posting losses in June and July. According to the CME Group FedWatch Tool, markets are currently pricing in a more than 20% probability of the Fed opting for one more rate increase in 2023. The market positioning suggests that the USD faces significant upside risk in case inflation readings come in hotter than expected. On the flip side, the USD could weaken on a downside surprise to the CPI prints but the currency’s losses could remain limited, at least in the near term, with markets already forecasting a more than 70% probability of a no change in the Fed interest rate.
Eren Sengezer, European Session Lead Analyst at FXStreet, offers a brief technical outlook for EUR/USD and explains:
“Heading into the US inflation data, the near-term technical outlook for EUR/USD fails to provide a directional clue. The pair has been fluctuating between the 20-day and the 50-day Simple Moving Averages (SMA) since late July and the Relative Strength Index (RSI) indicator on the daily chart has been moving sideways at around 50 during that period.”
Eren also outlines key technical levels to watch for:
“On the upside, 1.1060 (20-day SMA) aligns as the first resistance. A daily close above that level could open the door for an extended uptrend toward 1.1150 (static level, July 28 high) and 1.1250 (end-point of the latest uptrend).”
“Looking south, critical support is located at 1.0920 (100-day SMA). If the pair drops below that level and starts using it as resistance on a hot inflation report, additional losses toward 1.0850 (static level) and 1.0760 (200-day SMA) could be witnessed.”
Inflation FAQs
What is inflation?
Inflation measures the rise in the price of a representative basket of goods and services. Headline inflation is usually expressed as a percentage change on a month-on-month (MoM) and year-on-year (YoY) basis. Core inflation excludes more volatile elements such as food and fuel which can fluctuate because of geopolitical and seasonal factors. Core inflation is the figure economists focus on and is the level targeted by central banks, which are mandated to keep inflation at a manageable level, usually around 2%.
What is the Consumer Price Index (CPI)?
The Consumer Price Index (CPI) measures the change in prices of a basket of goods and services over a period of time. It is usually expressed as a percentage change on a month-on-month (MoM) and year-on-year (YoY) basis. Core CPI is the figure targeted by central banks as it excludes volatile food and fuel inputs. When Core CPI rises above 2% it usually results in higher interest rates and vice versa when it falls below 2%. Since higher interest rates are positive for a currency, higher inflation usually results in a stronger currency. The opposite is true when inflation falls.
What is the impact of inflation on foreign exchange?
Although it may seem counter-intuitive, high inflation in a country pushes up the value of its currency and vice versa for lower inflation. This is because the central bank will normally raise interest rates to combat the higher inflation, which attract more global capital inflows from investors looking for a lucrative place to park their money.
How does inflation influence the price of Gold?
Formerly, Gold was the asset investors turned to in times of high inflation because it preserved its value, and whilst investors will often still buy Gold for its safe-haven properties in times of extreme market turmoil, this is not the case most of the time. This is because when inflation is high, central banks will put up interest rates to combat it.
Higher interest rates are negative for Gold because they increase the opportunity-cost of holding Gold vis-a-vis an interest-bearing asset or placing the money in a cash deposit account. On the flipside, lower inflation tends to be positive for Gold as it brings interest rates down, making the bright metal a more viable investment alternative.
- NZD/USD clings to mild gains as Kiwi traders brace for US CPI after RBNZ inflation expectations favored buyers.
- Cautious optimism, US Dollar inaction allow Kiwi pair to consolidate recent losses.
- Downbeat US inflation can confirm Fed policy pivot and weigh on NZD/USD ahead of next week’s RBNZ.
NZD/USD remains sidelined near 0.6065-70 during the first positive day in three amid early Thursday morning in Europe. In doing so, the Kiwi pair justifies the previous day’s upbeat inflation signals from the Reserve Bank of New Zealand (RBNZ) survey while preparing for the US Consumer Price Index (CPI) for July, up for publishing at 12:30 GMT.
The Reserve Bank of New Zealand’s (RBNZ) Inflation Expectations for the third quarter (Q3) of 2023 flashed mixed results as the two-year inflation expectations, seen as the time frame when RBNZ policy action will filter through to prices, rose slightly to 2.83% in Q3 from 2.79% prior. However, New Zealand’s 2023 average one-year inflation expectations fell further to 4.17% for Q3 vs. 4.28% prior.
On the other hand, hopes of witnessing softer US inflation data, based on the early signals flashed the last week, join the market’s preparations for the likely hawkish surprise from the RBNZ during next week’s monetary policy announcements to propel the NZD/USD prices.
Further, the recently downbeat MBA Mortgage Applications, falling for the third consecutive week of late, also test the DXY bulls, especially amid the growing chatters of the Federal Reserve’s (Fed) policy pivot, which in turn puts a floor under the Kiwi prices. It should be noted that the CME Group FedWatch Tool shows that markets are pricing in an 86.0% chance that the Federal Reserve will pause interest rate hikes at its meeting in September.
With this, the Kiwi pair also justifies cautious optimism in the Asia-Pacific zone despite the US-China and the Sino-UK tension. That said, Financial Times (FT) came out with the news suggesting that UK Prime Minister Rishi Sunak is weighing whether to follow US President Joe Biden in restricting outbound investment into the Chinese tech sector, including artificial intelligence, chips and quantum computing. Before that, US President Joe Biden signed the much-awaited bill that allows the US Treasury Department to prohibit or restrict certain US investments in Chinese entities, per Reuters.
Against this backdrop, S&P500 Futures print mild gains despite Wall Street’s downbeat closing whereas the US Treasury bond yields also pare weekly losses.
Looking ahead, today’s US CPI becomes crucial due to the recently downbeat US employment data and disappointing early signals for the price pressure. Hence, an upbeat outcome can defy concerns that the Fed is near its peak rate and may recall the pair bears.
Technical analysis
Failure to provide daily closing beneath June’s bottom of 0.6050 joins an oversold RSI (14) line to trigger the NZD/USD pair’s corrective bounce. However, the Kiwi buyers remain off guard unless crossing a one-month-old falling resistance line, close to 0.6135 at the latest.
- Asian stock markets trade in negative territory on Thursday ahead of the key event.
- The fears of possible deflation in China exert pressure on Chinese equities.
- US President Joe Biden issued an executive order about the restriction on China.
- The Indian central bank decides to hold the key interest rate unchanged at 6.50%.
- All eyes are on the US Consumer Price Index (CPI), due on Thursday.
Asian stock markets trade lower on Thursday. Markets turn cautious amid concern over the possible deflation in China and the renewed trade war tension between the US-China. Market players prefer to wait on the sidelines ahead of the highly anticipated US inflation data.
At press time, China’s Shanghai drops 0.26%, the Shenzhen Component Index falls 0.54%, Hong Kong’s Hang Sang falls 0.95%, India’s NIFTY 50 is down 0.25%, South Korea’s Kospi dips 0.40%, and Japan’s Nikkei rises 0.66%.
The fears of possible deflation in China join the trade war tension headlines, which exert pressure on Chinese equities. Earlier on Thursday, US President Joe Biden issued an executive order about the restriction on China. That said, the US intends to target only Chinese companies that generate more than 50% of their revenue from quantum computation and artificial intelligence (AI).
China's Commerce Ministry expressed severe worries in response to the US executive order restricting some investments in Chinese technology businesses, according to Reuters. The Chinese authorities added that they hope the US will respect market laws and the principle of fair competition.
In India, the Reserve Bank of India (RBI) decides to maintain the status quo and holds the key interest rate unchanged at 6.50% for the third consecutive time. RBI Governor Shaktikanta Das said the central bank is expected to see inflation drop to 5.2% in Q1 of the fiscal year 2025.
In Japan, the Bank of Japan (BoJ) revealed on Thursday that the Producer Price Index (PPI) for July fell to 3.6% from 4.1% prior and was above the expectation of 3.5%. On a monthly basis, the figure increased to 0.1% MoM from -0.2% in the previous month and was worse than expected at -0.2%. The data suggests that inflationary pressures in Japan are currently increasing.
All eyes are on the highly anticipated US inflation data due later in the American session. The US Consumer Price Index (CPI) is expected to rise from 3% to 3.3%, and the core CPI is expected to remain unchanged at 4.8%. The economic data could give direction to riskier assets like gold, crude oil, equities, the AUD/USD, etc.
FX option expiries for Aug 10 NY cut at 10:00 Eastern Time, via DTCC, can be found below.
- EUR/USD: EUR amounts
- 1.0800 735m
- 1.0825 1.4b
- 1.0850 909m
- 1.0890 2.3b
- 1.0925 827m
- 1.0965 390m
- 1.1000 2.2b
- 1.1020 2b
- 1.1100 668m
- GBP/USD: GBP amounts
- 1.2485 357m
- 1.2560 420m
- 1.2600 431m
- 1.2740 513m
- 1.3095 1b
- USD/JPY: USD amounts
- 142.00 349m
- USD/CHF: USD amounts
- 0.8550 500m
- 0.8615 500m
- 0.8660 865m
- 0.8795 500m
- AUD/USD: AUD amounts
- 0.6565 1.1b
- 0.6640 400m
- 0.6675 1.1b
- EUR/GBP: EUR amounts
- 0.8625 380m
- WTI crude oil lacks upside momentum after refreshing yearly high the previous day.
- Overbought RSI, seven-week-old rising resistance line challenge Oil buyers.
- 10-DMA, wedge formation prod energy sellers as markets await US inflation.
WTI crude oil treads water around $83.80 amid cautious markets heading into Thursday’s European session. In doing so, the black gold also justifies the overbought RSI (14) line as energy traders await the key US Consumer Price Index (CPI) data for July.
It’s worth noting that the energy benchmark rose to the highest level since late November 2022 the previous day after crossing an eight-month-old horizontal resistance, now immediate support around $83.50.
However, the commodity’s failure to cross an upward-sloping resistance line from June 21 joined the overbought RSI and the market’s cautious mood ahead of the US data to restrict the further upside.
That said, the MACD signals also fade bullish bias and suggest a pullback in the WTI crude oil price. Though, a clear downside break of the previous resistance surrounding $83.50 needs to gain back-up of the firmer US inflation data to recall the sellers.
Even so, the 10-DMA and an ascending support line from June 28, close to $81.90 and $80.65 in that order, will challenge the WTI bears afterward.
In a case where the black gold drops beneath $80.65, it confirms the rising wedge bearish chart formation suggesting a theoretical target of around $63.50.
On the flip side, the stated wedge’s top line restricts the WTI crude oil’s immediate upside near $84.60.
Following that, the $90.00 round figure and the November 2022 high of near $92.95 will be in the spotlight.
WTI crude oil: Daily chart
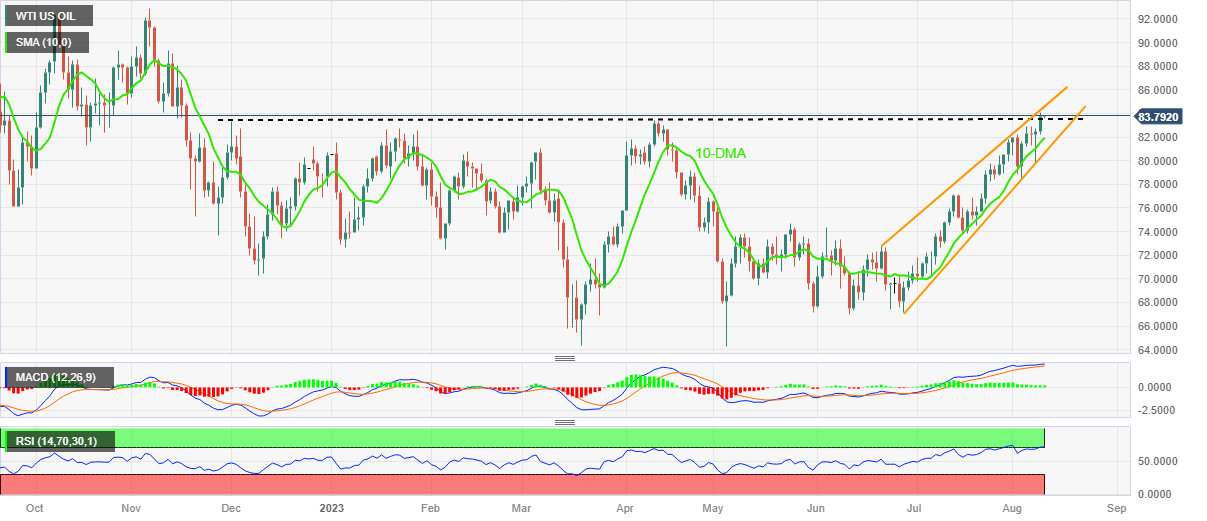
Trend: Pullback expected
- USD/INR meets with a fresh supply on Thursday, though lacks follow-through.
- The RBI’s decision to maintain the status quo do little to provide any impetus.
- Traders keenly await the release of the latest US consumer inflation figures.
The USD/INR pair comes under some selling pressure during the Asian session on Thursday and move away from a more than six-month top, levels just above the 83.00 mark touched the previous day. Spot prices remain depressed around the 82.80-82.85 region and move little after the Reserve Bank of India (RBI) announced its policy decision.
As was widely anticipated, the Indian central bank decides to maintain the status quo and leave its key policy rate (repo rate) unchanged at 6.50% for the third time in a row. The Indian Rupee (INR), meanwhile, draws some support from an increase in the RBI’s average inflation forecast for the financial year (FY) 2024 to 5.40% from the 5.1% estimated previously.
Adding to this, RBI Governor Shaktikanta Das said that the economy is showing enhanced strength and has made significant progress towards controlling inflation. Das, however, raises concerns about the recent spike in vegetable price inflation, though expects it to reverse quickly and sees inflation easing back to 5.2% in Q1 of FY25.
This, along with subdued US Dollar (USD) price action, exerts some pressure on the USD/INR pair. That said, the downside remains cushioned as traders seem reluctant to place aggressive bets ahead of the US consumer inflation figures, due for release later during the early North American session. The crucial US CPI report will influence expectations about the Fed's future rate-hike path, which, in turn, will drive the USD demand and provide a fresh directional impetus to the pair.
Technical levels to watch
- USD/CHF seesaws around weekly top amid pre-CPI inaction, prints the first daily loss in four.
- US Dollar pares weekly gains as market sentiment improves despite mixed updates from US, China.
- US inflation eyed for clear directions as market players heavily bet on Fed policy pivot.
USD/CHF bears lack momentum as the Swiss Franc (CHF) pair fails to extend the first daily loss in four near 0.8665-70 heading into Thursday’s European session. That said, the quote’s latest pullback can be linked to the US Dollar’s retreat ahead of the all-important inflation data, as well as a shift in the market’s sentiment despite the risk-negative headlines surrounding China.
That said, US Dollar Index (DXY) remains depressed near 102.45 after snapping a two-day uptrend the previous day. In doing so, the Greenback’s gauge versus the six major currencies justifies the market’s cautious mood ahead of the US inflation data, as well as a light calendar.
It’s worth noting that the mildly bid S&P500 Futures and the Treasury bond yields suggest the market’s cautious optimism despite headlines suggesting trade wars between the US and China, as well as looming concerns of Sino-UK geopolitical tension.
Recently, Financial Times (FT) came out with the news suggesting that UK Prime Minister Rishi Sunak is weighing whether to follow US President Joe Biden in restricting outbound investment into the Chinese tech sector, including artificial intelligence, chips and quantum computing. Before that, US President Joe Biden signed the much-awaited bill that allows the US Treasury Department to prohibit or restrict certain US investments in Chinese entities, per Reuters.
China's Commerce Ministry showed grave concerns and marked the right to take measures against the US ban on technology investment. However, such an issue was long discussed and the announced steps are slightly lenient than originally planned, which in turn allowed the markets to remain cautiously optimistic.
On a broader scale, hopes of witnessing an end to hawkish monetary policy in the US, mainly due to the recently downbeat US employment data and downbeat early signals for today’s Consumer Price Index (CPI) for July, seem to underpin the USD/CHF fall. That said, the US CPI is expected to improve to 3.3% YoY versus 3.0% prior and an upbeat outcome can defy concerns that the Fed is near its peak rate, which in turn may recall the pair buyers.
Also read: US CPI Preview: Forecasts from 10 major banks, monthly pace should hold at 0.2%
Technical analysis
Unless providing a daily closing below the two-week-long horizontal support around 0.8700, the USD/CHF bulls stay on the way to challenge a downward-sloping resistance line from November 2022, close to 0.8825 by the press time.
- GBP/USD holds lower ground at weekly bottom during three-day losing streak, lacks momentum of late.
- UK PM Sunak braces for US-like technology ban on China.
- Market sentiment dwindles as Sino-American tussles were mostly priced in.
- US CPI for July appears the key but UK recession woes prod Cable buyers ahead of British GDP.
GBP/USD stays defensive around 1.2715-20 heading into Thursday’s London open as market players remain cautious ahead of the US inflation data for July. Also acting as the barrier for the Pound Sterling traders is the news suggesting the UK’s step to ban on China technology investments. Furthermore, fears of the British recession and likely higher rates in London seem to also challenge the Cable pair.
Financial Times (FT) came out with the news suggesting that UK Prime Minister Rishi Sunak is weighing whether to follow US president Joe Biden in restricting outbound investment into the Chinese tech sector, including artificial intelligence, chips and quantum computing. The news gains popularity as UK PM Sunak seeks acceptance among the political fraternity after witnessing the latest disappointment in the by-elections.
Elsewhere, the UK's leading thinktank, the National Institute of Economic and Social Research (NIESR), said late Tuesday, per The Guardian, that it would take until the third quarter (Q3) of 2024 for British output to return to its pre-pandemic peak. “There was a 60% risk of the government going to the polls during a recession,” adds the NIESR per The Guardian. On the positive side, the NIESR also expects the UK inflation to stay beyond the Bank of England’s (BoE) 2.0% target for the next four years and push the “Old Lady”, as the BoE is sometimes called informally, toward hawkish moves and defend the British Pound (GBP) bulls.
On a broad front, the market’s risk appetite remains dicey as traders’ want for the US Consumer Price Index (CPI) and the preliminary readings of the UK’s second quarter (Q2) Gross Domestic Product (GDP) contrast with the US-China tension.
Earlier in the day, US President Joe Biden signed the much-awaited bill that allows the US Treasury Department to prohibit or restrict certain US investments in Chinese entities, per Reuters. In a retaliation, China's Commerce Ministry showed grave concerns and marked the right to take measures, per Reuters. However, such issue was long discussed and the announced steps are slightly lenient than originally planned, which in turn allowed the markets to remain cautiously optimistic.
That said, the looming economic fears from China, Europe and the UK join the global rating agencies’ crackdown on banks to weigh on the sentiment. On the same line are fears of deflation in China and the market’s doubts about future moves of the major central banks. However, the recent consolidation in the market ahead of the key US data allows the US stock futures and yields to improve, which in turn exert downside pressure on the US Dollar.
Even so, the US Consumer Price Index (CPI) for July, expected 3.3% YoY versus 3.0% prior, needs to print upbeat outcome to defy concerns that the Fed is near its peak rate, especially after the latest disappointment from the Nonfarm Payrolls (NFP) for the said month.
Technical analysis
GBP/USD portrays a sustained trading below the 50-DMA hurdle of around 1.2760, which in turn joins the bearish MACD signals to direct sellers toward an ascending support line stretched from early November 2022, close to 1.2650 by the press time.
- Gold price stalls its decline and rebounds to $1,918, gaining 0.22% for the day.
- The prospects of the end of the tightening policy by the Fed might boost the gold price.
- The concern about the economic slowdown in China might exert pressure on XAU/USD.
- Investors will closely watch the US Consumer Price Index (CPI) report due later in the day.
The gold price recovers its recent losses and snaps a three-day losing streak during the Asian session on Thursday. XAU/USD currently trades around $1,918, up 0.22% on the day. Gold traders will keep an eye on the US Consumer Price Index (CPI) due later in the American session. The inflation figure is expected to rise from 3% to 3.3%, and the core inflation figure is expected to stay at 4.8%.
The US Dollar Index, a measure of the value of USD against six other major currencies, trades sideways above 102.40. Meanwhile, US 10-year Treasury bond yield stands at 4.02%, which acts as a headwind for the gold price.
The recent commentary from Federal Reserve (Fed) speakers indicated that the Fed's stance has shifted from additional rate hikes to holding rates steady. The Philadelphia Fed president, Patrick Harker, stated that the central bank can leave interest rates where they are. Meanwhile, Atlanta Fed president Raphael Bostic states that no further rate hikes are necessary. Market players anticipated that the Fed would be less hawkish in the September meeting. The prospects of the end of the tightening policy by the Fed might cap the upside in the USD and could act as a tailwind for the XAU/USD.
That said, the concern about the economic slowdown in China exerts pressure on the gold price as China is the major gold consumer in the world. The Chinese inflation data on Wednesday showed the Consumer Price Index (CPI) YoY fell 0.3% in July from 0% prior, and the market consensus anticipated a -0.4% decline. Meanwhile, the Producer Price Index (PPI) declined 4.4% YoY, compared to the 4.1% drop expected and a 5.4% decline prior.
Looking ahead, the US Consumer Price Index (CPI) report will have a significant impact on the Federal Reserve's (Fed) future rate hike path and help investors determine the direction of XAU/USD. Also, the US Producer Price Index for July will be released on Friday.
- AUD/USD regains some positive traction on Thursday, albeit lacks follow-through.
- China’s economic woes hold back bulls from placing fresh bets around the major.
- Bets for more Fed rate hikes underpin the USD and contribute to capping the upside.
- Traders might also prefer to wait on the sidelines ahead of the crucial US CPI report.
The AUD/USD pair attracts fresh buying during the Asian session on Thursday and for now, seems to have snapped a two-day losing streak. Spot prices currently trade around the 0.6540 region, up over 0.20% for the day, though remain well within the striking distance of the lowest level since early June touched on Tuesday.
Hopes for additional stimulus measures from China turn out to be a key factor benefiting antipodean currencies, including the Australian Dollar (AUD). The US Dollar (USD), on the other hand, struggles to gain any meaningful traction as traders seem reluctant to place aggressive bets ahead of the crucial US consumer inflation figures, due later today. This, in turn, acts as a tailwind for the AUD/USD pair and remains supportive of the intraday uptick.
That said, concerns about the worsening economic conditions in China, fueled by the incoming weaker macro data, might keep a lid on the China-proxy Aussie. It is worth recalling that Chinese inflation figures released on Wednesday showed that consumer prices declined for the first time since February 2021, while the Producer Price Index (PPI) fell for the 10th consecutive month in July. This was seen as another sign that domestic demand is weakening.
Apart from this, weaker Chinese trade data on Tuesday raised questions about the pace of post-pandemic recovery in the world's second-largest economy. Furthermore, expectations that the Federal Reserve (Fed) will stick to its hawkish stance and keep interest rates higher for longer should act as a tailwind for the USD, which might contribute to capping the AUD/USD pair. This warrants caution before positioning for any further appreciating move.
Hence, the focus will remain glued to the US CPI report, which might offer fresh cues about the Fed's future rate hike path. The outlook, in turn, will play a key role in influencing the USD price dynamics and help determine the next leg of a directional move for the AUD/USD pair. Meanwhile, the recent slide below the 0.6600 mark confirmed a bearish double-top breakdown and suggests that the path of least resistance for spot prices is to the downside.
Technical levels to watch
- GBP/JPY extends it upside below the 183.00 area on Thursday ahead of the UK top-tier data.
- The softer Gross Domestic Product (GDP) data could refrain the Bank of England (BoE) from aggressively tightening policy.
- The Bank of Japan (BoJ) is likely to maintain ultra-low interest rates.
- The UK preliminary Q2 GDP will be a crucial event to watch.
The GBP/JPY cross trades in positive territory for four consecutive days. The cross currently trades around 182.90 during the Asian session on Thursday. Investors await the top-tier economic data from the UK for fresh impetus.
In its August policy meeting, the Bank of England (BoE) raised interest rates by 25 basis points (bps) to a 15-year high of 5.25% from 5%. Last week, BoE chief economist Huw Pill stated that interest rates would remain high for a longer period. However, the central bank will respond as the economy and data evolve.
Markets anticipated that the BoE would likely hike two additional rates by the end of the year as inflation remains high. Investors will take cues from the UK Gross Domestic Product (GDP) on Thursday. The annual growth rate is expected to remain at 0.2%. The softer growth number could refrain the Bank of England (BoE) from aggressively tightening policy. This, in turn, might cap the upside in the Pound Sterling.
On the Japanese Yen front, the latest data from the Bank of Japan (BoJ) showed that the Producer Price Index (PPI) for July fell to 3.6% from 4.1% prior and above the expectation of 3.5%. On a monthly basis, the figure increased to 0.1% MoM from -0.2% in the previous month, and worse than expected of -0.2%.
Apart from the data, policymakers stated in the Summary of Opinions of the BoJ that the central bank supports maintaining ultra-low interest rates until robust domestic demand and higher wages replace cost-push factors as the primary drivers of price increases. That said, the monetary policy divergences between the easy-money policy by the BoJ and the tightening by the BoE lead to the weakening of the Japanese Yen (JPY) against the Pound Sterling (GBP).
Looking ahead, the UK preliminary Q2 Gross Domestic Product (GDP) will be released later in the day. The UK Industrial Production and Manufacturing production data will be due on Friday. In the absence of top-tier economic data releases from Japan later this week, the GBP price dynamic will be the main driver for the GBP/JPY cross.
- USD/CAD lacks any firm intraday direction on Thursday and remains confined in a narrow range.
- Bullish Oil prices underpin the Loonie and caps gains, though a modest USD uptick lends support.
- The technical setup favours bullish traders and supports prospects for a further appreciating move.
The USD/CAD pair struggles to gain any meaningful traction on Thursday and oscillates in a narrow trading band, above the 1.3400 round-figure mark through the Asian session. The technical setup, meanwhile, seems tilted in favour of bullish traders and warrants some caution before positioning for an extension of the corrective decline from the 1.3500 psychological mark, or over a two-month high touched on Tuesday.
Crude Oil prices consolidate the previous day's rise to a fresh YTD peak, which underpins the commodity-linked Loonie and acts as a headwind for the USD/CAD pair. That said, expectations that the Bank of Canada (BoC) will pause its rate hike campaign cap gains for the Canadian Dollar (CAD). The US Dollar (USD), on the other hand, continues to draw support from the prospects for further policy tightening by the Federal Reserve (Fed) and contribute to limiting the downside for the major.
From a technical perspective, this week's sustained breakout through the 1.3390-1.3400 confluence hurdle – comprising the 50% Fibonacci retracement level of the May-July downfall and the 100-day Simple Moving Average (SMA) – was seen as a fresh trigger for bullish traders. Moreover, oscillators on the daily chart are holding in the positive territory and are still far from being in the overbought zone. This, in turn, suggests that the path of least resistance for the USD/CAD pair is to the upside.
That said, repeated failures to find acceptance above the 61.8% Fibo. level warrants some caution and makes it prudent to wait for some follow-through buying beyond the mid-1.3400s before placing fresh bullish bets. The USD/CAD pair might then make a fresh attempt to conquer the 1.3500 mark and accelerate the momentum further towards testing the next relevant hurdle near the 1.3555-1.3560 region. The subsequent move-up could lift spot prices further towards the 1.3600 round figure.
On the flip side, any meaningful slide below the 1.3400-1.3390 confluence resistance breakpoint, now turned support, might attract some buyers near the weekly low, around the 1.3355 region. This should help limit the downside for the USD/CAD pair near the 1.3315-1.3310 zone, or the 38.2% Fibo. level. This is closely followed by the 1.3300 mark, which if broken might prompt some technical selling and drag spot prices to the 1.3250 support en route to the 23.6% Fibo. level, around the 1.3225 region.
A convincing break below the latter, leading to a subsequent fall below the 1.3200 mark, will negate the positive outlook and shift the near-term bias back in favour of bearish traders. The USD/CAD pair might then accelerate the slide towards the 1.3160-1.3150 intermediate support before eventually dropping to test sub-1.3100 levels, or the YTD low touched on July 14.
USD/CAD daily chart
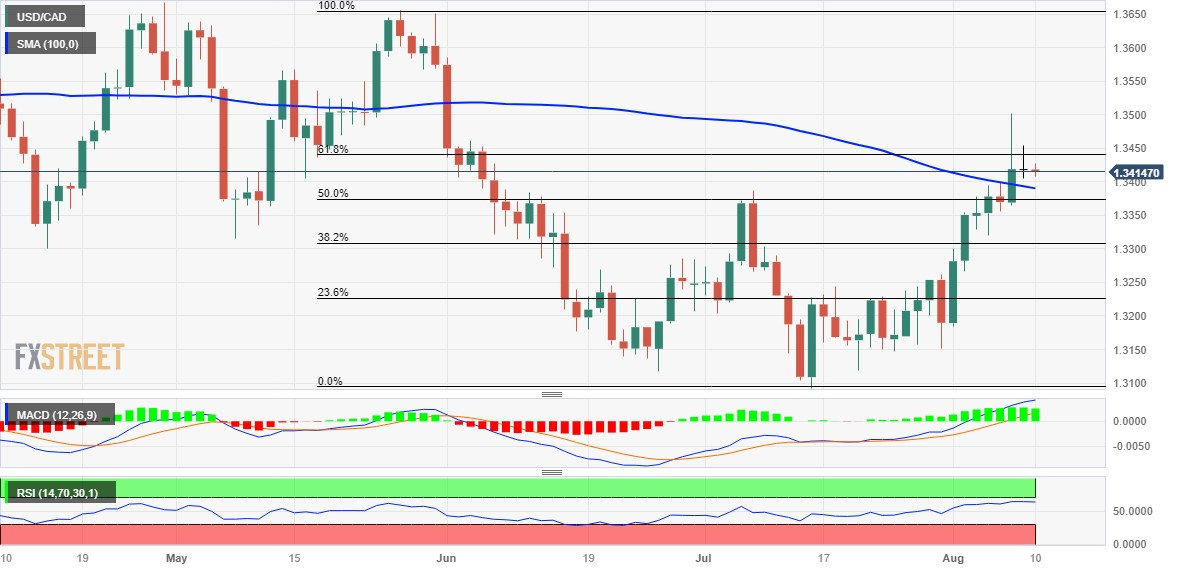
Technical levels to watch
- USD/JPY clings to mild gains as bulls print monthly peak during four-day winning streak.
- Yields pare weekly losses ahead of US inflation data amid mixed sentiment.
- Japan PPI for July defends dovish BoJ concerns.
- US CPI needs strong positive figures to defy Fed policy pivot.
USD/JPY picks up bids to refresh the monthly high near 143.90 as it ignores the US Dollar inaction ahead of the key data during early Thursday. In doing so, the Yen pair justifies the recently firmer US Treasury bond yields, as well as the dovish concerns about the Bank of Japan (BoJ) after Japan inflation clues.
That said, the 10-year Treasury bond yields in the US and Japan both print the first daily gains in three around 4.02% and 0.585% respectively as markets brace for the US inflation data amid cautious optimism after witnessing no major shock from China price pressure clues.
On the other hand, Japan’s Producer Price Index (PPI) for July eased to 3.6% YoY from 4.1% prior and 3.5% market forecasts while the monthly figures improved to 0.1% Mom versus 0.2% expected and -0.2% previous readings for the said month.
With this, the BoJ doves are likely to keep defending the ultra-easy monetary policy, especially amid the growing concerns that the major central banks–which previously announced rate hikes–are likely to pause the hawkish trajectory soon.
Elsewhere, mildly bid S&P500 Futures and firmer Nikkei 225 also underpins the USD/JPY run-up due to the pair’s risk-barometer status. It’s worth noting that the US-China headlines have been against the mood but seemed mostly ignored of late.
That said, China's Commerce Ministry showed grave concerns and marked the right to take measures in retaliation early Thursday in Asia, per Reuters. The news also quotes China Commerce Ministry as saying, “Hopes that the US will respect laws of market economy and the principle of fair competition.” Earlier in the day, US President Joe Biden signed the much-awaited bill that allows the US Treasury Department to prohibit or restrict certain US investments in Chinese entities, per Reuters.
Previously, the looming economic fears from China, Europe and the UK join the global rating agencies’ crackdown on banks to weigh on the sentiment. On the same line are fears of deflation in China and the market’s doubts about future moves of the major central banks. However, the US Dollar struggled to cheer the risk-off mood amid downbeat yields.
Moving on, inflation data, per the Consumer Price Index (CPI) for July, will be crucial for USD/JPY traders to watch for clear direction. Market forecasts suggest an improvement in the headline CPI to 3.3% YoY versus 3.0% prior while the Core CPI, namely the CPI ex Food & Energy, may remain unchanged at 4.8%. The statistics become all the more important after the latest disappointment from the Nonfarm Payrolls (NFP) for the said month and the concerns that the Fed is near its peak rate.
Also read: US CPI Preview: Forecasts from 10 major banks, monthly pace should hold at 0.2%
Technical analysis
A daily closing beyond the downward-sloping resistance line from late October 2022, close to 143.80 by the press time, becomes necessary for the USD/JPY buyers to keep the reins.
- Natural Gas Price retreats from five-month high, prints the first daily loss in six.
- Overbought RSI prods XNG/USD bulls as multi-day-old horizontal resistance area joins rising trend line from May.
- Energy sellers need validation from previous resistance line stretched from March 14.
Natural Gas Price (XNG/USD) prints mild losses around $3.00 during early Thursday as it braces for the US inflation data at the highest level in five months.
In doing so, the XNG/USD not only justifies the pre-data consolidation but also portrays the failure to cross a convergence of the five-month-old horizontal resistance area and an ascending trend line from May, close to $3.08.
Also challenging the bullish bias about the Natural Gas Price is the overbought RSI (14) line.
It’s worth noting, however, that the XNG/USD sellers must offer a daily closing beneath a rising strength from Mach 14, close to $3.00 at the latest, to retake control.
Even so, June’s peak of $2.93 and May’s high surrounding $2.81 can test the Natural Gas bears before giving them control.
On the contrary, a daily closing beyond the $3.08 resistance confluence could quickly direct the XNG/USD buyers toward the 200-DMA hurdle of around $3.37.
Should the Natural Gas buyers occupy the driver’s seat past $3.37, the $4.00 round figure and the yearly high of near $4.17 will be in the spotlight.
Overall, Natural Gas seeks a pullback in prices before resuming a fresh upside toward crossing the immediate key resistance confluence.
Natural Gas Price: Daily chart

Trend: Pullback expected
- EUR/JPY steadily advances closer to a multi-year peak during the Asian session on Thursday.
- The divergent BoJ-ECB policy stance continues to act as a tailwind and remains supportive.
- Speculations that the ECB will end its rate-hiking cycle soon could cap any meaningful gains.
The EUR/JPY cross trades with a positive bias during the Asian session on Thursday and climbs back closer to the multi-year peak touched in July, with bulls now awaiting a sustained strength beyond the 158.00 mark before placing fresh bets.
Data released earlier this week showed that real wages in Japan fell for a 15th straight month, while nominal pay growth also slowed in June. This, in turn, reaffirmed market expectations that the Bank of Japan (BoJ) will stick to its ultra-easy monetary policy settings, which continue to undermine the Japanese Yen (JPY) and acts as a tailwind for the EUR/JPY cross. It is worth recalling that the BoJ has emphasised that a sustainable pay hike is a prerequisite to consider dismantling its massive monetary stimulus.
Furthermore, the Japanese central bank, in the Summary of Opinions from the July 28 meeting, said it still has a significantly long way to go before revising its stance on the negative interest rate policy. This marks a big divergence in comparison to a hawkish stance adopted by other major central banks, including the European Central Bank (ECB), which has raised borrowing costs by a combined 425 bps since last July. This, along with the overnight bounce in European bond yields lends support to the Euro and the EUR/JPY cross.
That said, rising bets that the ECB will pause in September, in the wake of easing inflationary pressures and mounting recession fears, hold back traders from placing aggressive bullish bets around the shared currency. Apart from this, concerns about the worsening economic conditions in China benefit the JPY's relative safe-haven status and contributes to keeping a lid on the EUR/JPY cross. This makes it prudent to wait for some follow-through buying beyond the 158.00 mark before positioning for any further gains.
Technical levels to watch
- Market sentiment improves despite looming US-China tussles, economic shocks.
- S&P500 Futures rebound from one-month low, yields also recover amid lackluster session.
- Increasing bets on Fed policy pivot highlights today’s US inflation data, especially after downbeat US NFP.
- Risk catalysts, ECB updates eyed ahead of US CPI for July.
Traders seek solace in the pre-data consolidation as the riskier assets pare recent losses during early Thursday despite challenging news about the US-China trade war. The reason could be linked to the policymakers’ optimism about the use of tools to defend respective currencies ahead of the US inflation data, per the Consumer Price Index (CPI), for July. Also important to watch is the European Central Bank’s (ECB) monthly Economic Bulletin.
While portraying the mood, the S&P500 Futures print mild gains as it snaps a two-day losing streak at the lowest level in a month, up 0.20% intraday near 4,500 by the press time. On the same line, the US 10-year Treasury bond yields dropped in the last two consecutive days to signal the first weekly loss in four, around 4.01% by the press time.
Be it the People’s Bank of China’s (PBoC) sturdy defense of the Yuan or the Bank of Japan’s (BoJ) confidence in the easy-money policy, not to forget the optimism at the Federal Reserve (Fed) and the ECB, policymakers at the major central banks defy the fears of the global recession. The same joins the recently mixed reaction to China’s downbeat inflation data and US President Joe Biden’s slightly easy ban on the technology investment in Beijing to allow the traders to better brace for today’s top-tier data/events.
On the contrary, China's Commerce Ministry showed grave concerns and marked the right to take measures in retaliation early Thursday in Asia, per Reuters. The news also quotes China Commerce Ministry as saying, “Hopes that the US will respect laws of market economy and the principle of fair competition.” It’s worth observing that China's Commerce Ministry showed grave concerns and marked the rights to take measures in retaliation early Thursday in Asia, per Reuters. The news also quotes China Commerce Ministry as saying, “Hopes that the US will respect laws of market economy and the principle of fair competition.”
Furthermore, the looming economic fears from China, Europe and the UK join the global rating agencies’ crackdown on banks to weigh on the sentiment. On the same line are fears of deflation in China and the market’s doubts about future moves of the major central banks.
Moving on, US inflation numbers for July become all the more important after the latest disappointment from the Nonfarm Payrolls (NFP) for the said month. Further, the recently downbeat MBA Mortgage Applications, falling for the third consecutive week of late, also test the DXY bulls, especially amid the growing chatters of the Federal Reserve’s (Fed) policy pivot. With this, the CME Group FedWatch Tool shows that markets are pricing in an 86.0% chance that the Federal Reserve will pause interest rate hikes at its meeting in September.
Also read: US CPI Preview: Forecasts from 10 major banks, monthly pace should hold at 0.2%
| Raw materials | Closed | Change, % |
|---|---|---|
| Silver | 22.661 | -0.46 |
| Gold | 1914.496 | -0.54 |
| Palladium | 1235 | 0.73 |
- USD/CNH drops for the second consecutive day despite looming economic hardships for China.
- Biden Administration limits US investment in China technology companies, Beijing marks grave concerns.
- China inflation drops but decision-makers sound optimistic about the right usage of policy, tools as PBoC defends Yuan.
- US CPI bears upbeat forecasts but can derail US Dollar on softer outcomes amid softer NFP, downbeat Fed bias.
USD/CNH remains on the back foot for the second consecutive day, mildly offered near 7.2220 amid early Thursday morning. In doing so, the offshore Chinese Yuan (CNH) justifies the People’s Bank of China’s (PBoC) sustained efforts to defend the domestic currency while paying little heed to the latest blow from the inflation data and the US policies.
China Securities Journal (CSJ) cites multiple Chinese analysts while praising the PBoC’s sturdy efforts to keep the Yuan afloat despite the US Dollar’s latest strength. That said, the Chinese central bank has been actively participating in the open markets and keeps the USD/CNY Fix in a lower range despite the market’s expectations of witnessing a strong outcome.
That said, the PBoC set the USD/CNY fix to around 7.1576 on Thursday while posting a heavy difference between the PBoC fix and the market forecasts.
On the other hand, US Dollar Index (DXY) remains sidelined near 102.50 after snapping a two-day uptrend the previous day. In doing so, the greenback’s gauge versus the six major currencies justifies the market’s cautious mood ahead of the US inflation data, as well as a light calendar.
On Wednesday, improvement in China’s Producer Price Index (PPI) for July superseded negative readings of the Consumer Price Index (CPI) for the said month, which in turn allowed the CNH to push back the bears. That said, CPI declines to -0.3% YoY versus -0.4% YoY expected and 0.0% prior whereas the PPI improves to -4.4% YoY compared to -4.1% YoY market forecasts and -5.4% previous readings.
However, China's Commerce Ministry showed grave concerns and marked the rights to take measures in retaliation early Thursday in Asia, per Reuters. The news also quotes China Commerce Ministry as saying, “Hopes that the US will respect laws of market economy and the principle of fair competition.”
Earlier in the day, US President Joe Biden signed the much-awaited bill that allows the US Treasury Department to prohibit or restrict certain US investments in Chinese entities, per Reuters.
Furthermore, the looming economic fears from China, Europe and the UK join the global rating agencies’ crackdown on banks to weigh on the sentiment and the AUD/USD price. On the same line are fears of deflation in China and the market’s doubts about future moves of the major central banks.
Against this backdrop, Wall Street closed in the red and the US Treasury bond yields were down while the S&P500 Futures printed mild gains by the press time.
Looking ahead, US CPI and Core CPI for July will be crucial to watch amid looming dovish Fed concerns, which if confirmed can extend the AUD/USD pair’s downside towards the key 0.6480 support.
Technical analysis
Although the failure to cross a one-month-old horizontal hurdle surrounding 7.2370-80 favors the USD/CNH bears, a fortnight-long support line, close to 7.2090 by the press time, restricts the downside of the Yuan pair.
- NZD/USD gains some positive traction on Thursday, though the upside potential seems limited.
- Bets for more rate hikes by the Fed continue to underpin the USD and cap any meaningful gains.
- Traders keenly await the latest US consumer inflation figures before placing fresh directional bets.
The NZD/USD pair attracts some buying near the 0.6040 area during the Asian session on Thursday and for now, seems to have snapped a two-day losing streak. Spot prices currently trade around the 0.6060-0.6065 zone, up nearly 0.20% for the day, though remain well within the striking distance of a two-month low touched on Tuesday.
A subdued US Dollar (USD) demand turns out to be a key factor lending support to the NZD/USD pair amid some repositioning trade ahead of the latest US consumer inflation figures, due later today. Apart from this, hopes for additional stimulus measures from China further benefit antipodean currencies, including the New Zealand Dollar (NZD). That said, growing concerns about the worsening economic conditions in China, fueled by the incoming weaker macro data, might keep a lid on any meaningful upside.
In fact, Chinese inflation figures released on Wednesday showed that the headline CPI turned negative for the first time since February 2021 and the Producer Price Index (PPI) fell for the 10th consecutive month in July. This comes on the back of rather disappointing trade data on Tuesday and suggested that the post-COVID economy recovery is losing steam. Adding to this, the prospects for further policy tightening by the Federal Reserve (Fed) limit the USD downside and might contribute to capping the NZD/USD pair.
Market participants now seem convinced that the US central bank will stick to its hawkish stance and keep interest rates higher for longer amid expectations of a soft landing for the resilient domestic economy. This, in turn, remains supportive of elevated US Treasury bond yields and favours the USD bulls. Traders, however, seem reluctant to place aggressive bets and look to the US CPI report for clues about the Fed's rate-hike path. This, in turn, will drive the USD demand and provide a fresh impetus to the NZD/USD pair.
Technical levels to watch
- GBP/USD lacks firm intraday direction, holds above 1.2715 ahead of US key data.
- The softer UK GDP data could refrain the Bank of England (BoE) from aggressively tightening policy.
- Market anticipates an 86.0% chance that the Federal Reserve will pause rate hikes at its September meeting.
- The Q2 UK GDP, US CPI will be in the spotlight this week.
The GBP/USD pair moves sideways above the 1.2700 area during the early Asian session on Thursday. Market participants prefer to wait on the sidelines and await key data from the US and UK. The US inflation figure could trigger volatility in the market later in the American trading hours.
The Bank of England (BoE) chief economist, Huw Pill, stated last week that interest rates were expected to remain high for a longer period. He added that the central bank will be more data-dependent, and policymakers will respond as the economy and the data evolve. It's worth noting that the Bank of England (BoE) raised interest rates by 25 basis points (bps) to a 15-year high of 5.25% from 5% in its August policy meeting.
Investors will focus on the Gross Domestic Product (GDP) report on Thursday for fresh impetus. The weaker than expected figure could refrain the Bank of England (BoE) from aggressively tightening policy. This, in turn, weighs on the Pound Sterling.
On the US Dollar front, the recent commentary from Federal Reserve (Fed) speakers indicated that the Fed stance has shifted from additional rate hikes to holding rates steady. The Philadelphia Fed president, Patrick Harker, stated that the central bank can leave interest rates where they are. Meanwhile, Atlanta Fed president Raphael Bostic states that no further rate hikes are necessary.
Furthermore, money market futures do not anticipate higher borrowing rates. According to the CME FedWatch tool, the market anticipates an 86.0% chance that the Federal Reserve will pause interest rate hikes at its meeting in September. However, the US inflation data will offer hints about further monetary policy from the Fed in the next meeting. The dovish stance from the central bank might cap the upside in the Greenback and act as a tailwind for the GBP/USD pair.
Moving on, the UK will release the preliminary Q2 Gross Domestic Product (GDP) on Friday. The annual growth rate is expected to remain at 0.2%. Also, the UK Industrial Production and Manufacturing production data will be due. On the US docket, the key events will be the US Consumer Price Index (CPI) and the Producer Price Index (PPI) for July. These data could provide hints for a clear direction in GBP/USD.
- EUR/USD treads water within key technical envelope, edges higher of late.
- Three-week-old falling resistance line restricts immediate upside; 50-DMA, 100-DMA limit Euro pair’s fall.
- ECB Economic Bulletin needs to defy recession woes, US CPI should print softer data to defend EUR/USD buyers.
EUR/USD portrays the tug-of-war between the bulls and the bears as the quote remains tightly gripped around the 1.0980 resistance amid early Thursday. In doing so, the Euro pair justifies the market’s cautious mood ahead of the European Central Bank’s (ECB) monthly Economic Bulletin and the US States inflation data, per the Consumer Price Index (CPI) for July.
Also read: EUR/USD remains defensive above 1.0950, ECB Economic Bulletin, US inflation eyed
Technically, the Euro pair stays between a three-week-old descending resistance line and the 50-DMA support. However, the bearish MACD signals keep sellers hopeful ahead of the key data/events.
Though, the quote’s downside break of the 50-DMA support of 1.0955 won’t give a full hand to the bears as the 100-DMA level of around 1.0930 will act as the final defense of the buyers.
In a case where the EUR/USD drops below 1.0930, the odds of witnessing a slump towards the five-month-old rising support line, close to 1.0790 by the press time, can’t be ruled out.
On the flip side, a daily closing beyond the 1.0980 resistance can challenge the monthly high of 1.1042 before targeting the tops marked in April and May surrounding 1.1100.
Following that, the 1.1150 and 1.1200 round figures may test the EUR/USD bulls before directing them to the yearly high marked late in July near 1.1275.
EUR/USD: Daily chart
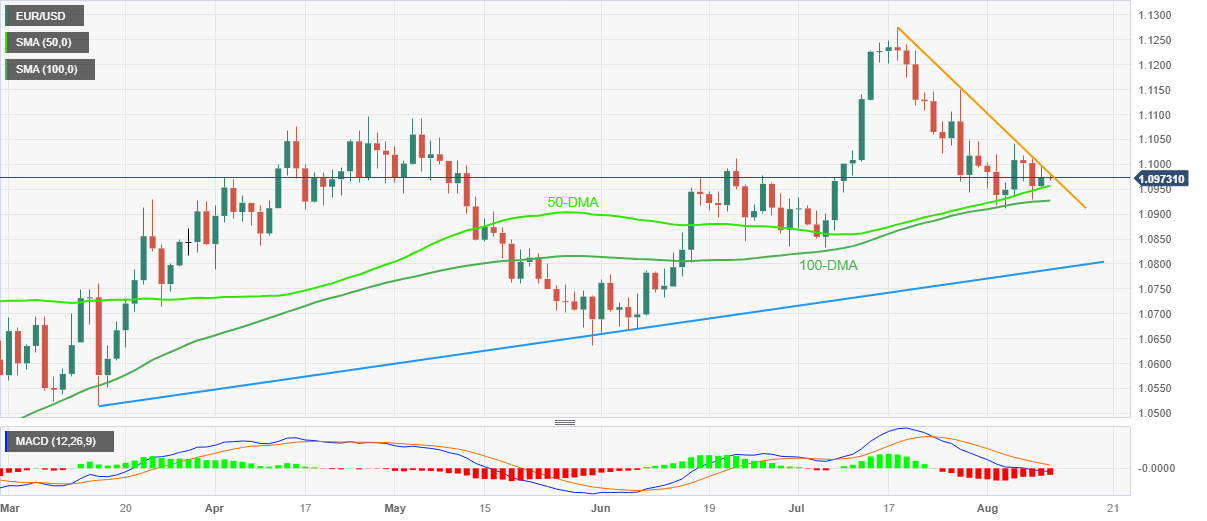
Trend: Limited upside expected
- Gold price edges higher during the Asian session on Thursday, albeit lacks follow-through.
- Bets for more rate hikes by the Federal Reserve underpin the US Dollar and cap the upside.
- China’s economic woes could lend support to the safe-haven XAU/USD and help limit losses.
Gold price attracts some buyers during the Asian session on Thursday and for now, seems to have snapped a three-day losing streak to a one-month low, around the $1,913 area touched the previous day. The XAU/USD, however, lacks follow-through or bullish conviction and currently trades around the $1,916-$1,917 region, up just over 0.10% for the day.
The intraday uptick, meanwhile, could be attributed to some repositioning trade ahead of the latest consumer inflation figures from the United States (US), due for release later today. The crucial Consumer Price Index (CPI) report will play a key role in influencing the Federal Reserve's (Fed) future rate hike path and help investors to determine the next leg of a directional move for the non-yielding Gold price. In the meantime, the prospects for further policy tightening by the US central bank could act as a headwind for the XAU/USD.
In fact, market participants now seem convinced that the US central bank will stick to its hawkish stance and keep interest rates higher for longer amid hopes of a soft landing for the resilient domestic economy. This, in turn, remains supportive of elevated US Treasury bond yields and continues to act as a tailwind for the US Dollar (USD). A stronger Greenback might also contribute to capping the US Dollar-denominated commodity and warrants some caution before confirming that the Gold price has already formed a near-term bottom.
Heading into the key data risk, worries about the worsening economic conditions in China, fueled by this week's weaker macro data, could lend support to the safe-haven precious metal. In fact, Chinese inflation figures released on Wednesday showed that the headline CPI turned negative for the first time since February 2021 and the Producer Price Index (PPI) fell for the 10th consecutive month in July. This comes on the back of rather disappointing trade data on Tuesday and suggested that the post-COVID economy recovery is losing steam.
Nevertheless, the aforementioned fundamental backdrop still seems tilted in favour of bearish traders and suggests that the path of least resistance for the Gold price is to the downside. Hence, any subsequent move up might still be seen as a selling opportunity and runs the risk of fizzling out rather quickly.
Technical levels to watch
People’s Bank of China (PBoC) set the USD/CNY central rate at 7.1576 on Thursday, versus the previous fix of 7.1588 and market expectations of 7.2023. It's worth noting that the USD/CNY closed near 7.2114 the previous day.
Apart from the USD/CNY fix, the PBoC also unveiled details of its Open Market Operations (OMO) while saying that the Chinese central bank injects 2 billion Yuan via 7-day reverse repos (RRs) at 1.90% vs. prior 1.90%.
About PBOC fix
China maintains strict control of the yuan’s rate on the mainland.
The onshore yuan (CNY) differs from the offshore one (CNH) in trading restrictions, this last one is not as tightly controlled.
Each morning, the People’s Bank of China (PBOC) sets a so-called daily midpoint fix, based on the yuan’s previous day's closing level and quotations taken from the inter-bank dealer.
- AUD/USD eases from intraday high during a lackluster day after two-day losing streak.
- Australia Inflation Expectations for August eased to 4.9% from 5.2% prior.
- US President Biden signs executive order to ban certain China technology investment, Beijing appears ‘gravely’ concerned.
- US CPI will be closely examined for clear directions, risk catalysts may entertain Aussie traders ahead of the release.
AUD/USD steps back from intraday high while keeping the early-day sluggish momentum around 0.6530 after Australia inflation clues print a softer outcome for August. In doing so, the Aussie pair also fails to react to the likely US-China tension on the White House order restricting technology investments to Beijing. The reason could be linked to the market’s cautious mood ahead of the US inflation data, per the Consumer Price Index (CPI), for July.
That said, Australia Consumer Inflation Expectations eased to 4.9% from 5.2% prior, which in turn backs the Reserve Bank of Australia’s (RBA) recent pause to the tightening cycle. However, the S&P Global appears a bit hawkish on the RBA and puts a floor under the Aussie pair price. “The key risk is that inflation in Australia is more sticky than expected and the RBA has to hike interest rates more strongly,” said the global rating and research house on Wednesday.
Elsewhere, China's Commerce Ministry showed grave concerns and marked the rights to take measures in retaliation early Thursday in Asia, per Reuters. The news also quotes China Commerce Ministry as saying, “Hopes that the US will respect laws of market economy and the principle of fair competition.”
Late Wednesday, US President Joe Biden signed the much-awaited bill that allows the US Treasury Department to prohibit or restrict certain US investments in Chinese entities, per Reuters.
It should be noted that the looming economic fears from China, Europe and the UK join the global rating agencies’ crackdown on banks to weigh on the sentiment and the AUD/USD price. On the same line are fears of deflation in China and the market’s doubts about future moves of the major central banks.
Amid these plays, Wall Street closed in the red and the US Treasury bond yields were down while the S&P500 Futures printed mild gains by the press time.
Also read: US CPI Preview: Forecasts from 10 major banks, monthly pace should hold at 0.2%
Technical analysis
Although a nine-month-old rising support line, around 0.6480 by the press time, challenges the AUD/USD bears amid the nearly oversold RSI conditions, a clear downside break of the rising support line from October 2022, now immediate support near 0.6545, favors the pair sellers.
USD/MXN remains sidelined near 17.06 amid early Thursday in Asia, struggling to extend the previous day’s losses amid the market’s indecision ahead of the US inflation figures.
That said, the Mexican Peso (MXN) pair dropped 0.15% on Wednesday even as Mexico’s inflation data for July came in softer than expected but were mixed when compared to the previous readings.
Also read: USD/MXN drops as inflation cools down in Mexico, traders eye Banxico’s monetary policy decision
It should be noted, however, that the options market appears the most bullish in a month and might have exerted downside pressure on the USD/MXN price of late.
While portraying the options market bias, the one-month Risk Reversal (RR) of the USD/MXN pair, a measure of the spread between call and put prices, dropped the most in a month to -0.065 by the end of Wednesday’s North American trading session.
However, the weekly RR still remains positive for the fourth consecutive time, to 0.325 by the press time, which in turn prods the USD/MXN bears of late.
Elsewhere, the US Dollar Index (DXY) lacks clear directions near 102.50 after snapping a two-day losing streak as markets await the US inflation data, per the Consumer Price Index (CPI) for July. Analysts’ expectations suggest an improvement in the headline CPI to 3.3% YoY versus 3.0% prior while the Core CPI, namely the CPI ex Food & Energy, may remain unchanged at 4.8%.
- USD/CAD moves sideways near the 1.3420 mark in the early Asian session.
- US President Joe Biden issued an executive order about the restriction on China.
- The Canadian Building Permits came in at 6.1% MoM in July, better than market expectation of 3.5%.
- Investors will monitor the US Consumer Price Index (CPI) for July, due later in the American session.
The USD/CAD pair struggles to gain any meaningful traction during the early Asian session on Thursday. The major pair currently trades near 1.3421, up 0.01% for the day. Market participants prefer to wait on the sidelines ahead of the US top-tier data release. Meanwhile, the US Dollar Index (DXY) trades sideways near 102.50 amid the cautious mood in the market.
On Wednesday, US President Joe Biden issued an executive order about the restriction on China. That said, the US intends to target only Chinese companies that generate more than 50% of their revenue from quantum computation and artificial intelligence (AI).
China's Commerce Ministry expressed severe worries in response to the US executive order restricting some investments in Chinese technology businesses, according to Reuters. The Chinese authorities added that they hope the US will respect market economic laws and the principle of fair competition. Market players will keep an eye on the developments surrounding the world’s two largest economies.
Furthermore, money market futures do not anticipate higher borrowing rates. According to the CME FedWatch Tool, the markets anticipate an 86.0% chance that the Federal Reserve will pause interest rate hikes at its meeting in September. This, in turn, might cap the upside in the US Dollar and acts as a headwind for the USD/CAD pair
On the other hand, Canadian Building Permits came in at 6.1% MoM in July, better than market expectations of a 3.5% drop. Meanwhile, the uptick in oil prices has supported the Loonie. That said, WTI prices hit a new yearly high on Wednesday, above $84.00. Higher crude prices strengthen the Canadian Dollar, as the country is the leading oil exporter to the United States.
Looking ahead, investors will keep an eye on the US inflation data due later this week. The US Consumer Price Index (CPI) for July will be released on Thursday in the American session. The inflation figure is expected to rise from 3% to 3.3%, and the core inflation figure is expected to stay at 4.8%. Also, the Producer Price Index (PPI) will be due on Friday. The data will be critical for determining a clear movement for the USD/CAD pair.
- USD/JPY trades with a positive bias for the fourth successive day on Thursday.
- The divergent BoJ-Fed policy outlook continues to lend support to the major.
- Bulls, however, seem reluctant and prefer to wait for the crucial US CPI report.
The USD/JPY pair climbs back closer to the monthly peak during the Asian session on Thursday and currently trades around the 143.80 region, up for the fourth successive day.
The Japanese Yen (JPY) continues to be undermined by the growing acceptance that the Bank of Japan (BoJ) will stick to its dovish stance and turns out to be a key factor acting as a tailwind for the USD/JPY pair. In fact, the BoJ, in its Summary of Opinions for the July 28 meeting, said it still has a significantly long way to go before revising its stance on the negative interest rate policy. This marks a big divergence in comparison to a relatively more hawkish stance adopted by other major central banks, including the Federal Reserve (Fed), which, along with a modest US Dollar (USD) uptick, lends support to the major.
In fact, the markets now seem convinced that the US central bank will keep interest rates higher for longer in the wake of an extremely resilient economy. The expectations were reaffirmed by the latest US jobs report last Friday, which indicated the continued tightness in the labour market and raised the odds of a soft economic landing. This, in turn, keeps the door for one more 25 bps lift-off in September or November wide open and allows the yield on the benchmark 10-year US government bond to hold steady above the 4.0% threshold. Elevated US bond yields lend support to the buck and the USD/JPY pair.
The USD bulls, however, seem reluctant to place aggressive bets and prefer to wait for the release of the latest US consumer inflation figures, due later during the early North American session. The crucial US CPI report will influence expectations about the Fed's future rate-hike path, which, in turn, should drive the USD demand and provide a fresh directional impetus to the USD/JPY pair. In the meantime, a generally weaker risk tone could benefit the JPY's relative safe-haven status and keep a lid on any meaningful upside or spot prices, warranting some caution before positioning for further intraday gains.
Technical levels to watch
- Silver Price remains pressured at one-month low after three-day losing streak.
- Bearish MACD signals, clear downside break of previous support line, 200-DMA favors XAG/USD sellers.
- Nine-month-old horizontal support area appears a tough nut to crack for Silver sellers.
- XAG/USD recovery needs validation from $23.30 and US CPI for July.
Silver Price (XAG/USD) holds lower grounds near $22.70 as bears await the US inflation data on early Thursday. In doing so, the XAG/USD stays depressed at the lowest level in a month after declining in the last three consecutive days.
It’s worth noting that the bearish MACD signals keep the Silver sellers hopeful as the commodity defends the early-week break of the 200-DMA and an upward-sloping support line from early March, now immediate resistance near $23.10.
However, the RSI (14) line is near the oversold territory, suggesting limited downside room for the XAG/USD, which in turn highlights a horizontal area comprising multiple levels marked since November 2022 around $22.20–10. Also acting as a downside filter is the $22.00 round figure.
In a case where the Silver Price drops below $22.00, the early March swing high of around $21.30 will be in the spotlight.
Alternatively, an upside break of the support-turned-resistance line of around $23.10 isn’t an open invitation to the Silver buyers as the 200-DMA hurdle surrounding $23.30 also challenges the bright metal’s upside momentum.
Following that, the tops marked in June and July, respectively around $24.55 and $25.25 should lure the XAG/USD bulls.
Silver Price: Daily chart
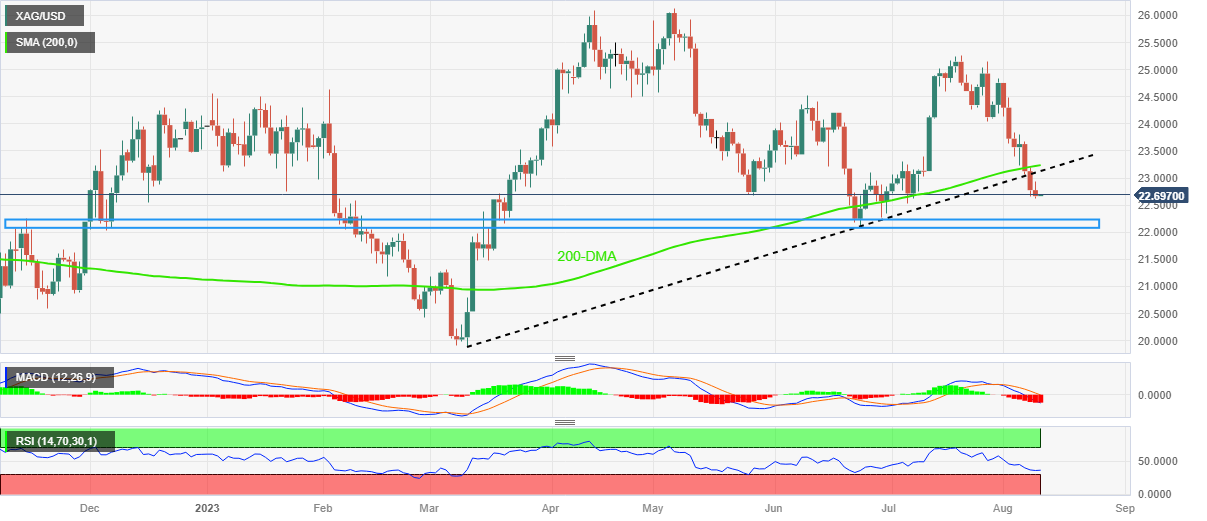
Trend: Further downside expected
| Index | Change, points | Closed | Change, % |
|---|---|---|---|
| NIKKEI 225 | -172.96 | 32204.33 | -0.53 |
| Hang Seng | 61.86 | 19246.03 | 0.32 |
| KOSPI | 31.14 | 2605.12 | 1.21 |
| ASX 200 | 26.9 | 7338 | 0.37 |
| DAX | 77.65 | 15852.58 | 0.49 |
| CAC 40 | 52.57 | 7322.04 | 0.72 |
| Dow Jones | -191.13 | 35123.36 | -0.54 |
| S&P 500 | -31.67 | 4467.71 | -0.7 |
| NASDAQ Composite | -162.3 | 13722.02 | -1.17 |
In a reaction to the US executive order banning certain investments in Chinese technology companies, China's Commerce Ministry showed grave concerns and marked the rights to take measures in retaliation early Thursday in Asia, per Reuters.
The news also quotes China Commerce Ministry as saying, “Hopes that the US will respect laws of market economy and the principle of fair competition.”
Market reaction
The news dragged AUD/USD from an intraday high to 0.6530 but lacks a major reaction from the market.
It’s worth noting that the market’s recent lack of reaction to the news could also be linked to the cautious mood ahead of the US inflation, as well as the fact that the US order to limit foreign investments in China is a softer version of the previously announced harsh measures.
Also read: AUD/USD stays depressed below 0.6550 ahead of Australia/US inflation clues
| Pare | Closed | Change, % |
|---|---|---|
| AUDUSD | 0.65287 | -0.21 |
| EURJPY | 157.678 | 0.4 |
| EURUSD | 1.09745 | 0.18 |
| GBPJPY | 182.739 | 0.02 |
| GBPUSD | 1.27176 | -0.23 |
| NZDUSD | 0.60524 | -0.17 |
| USDCAD | 1.34201 | 0.02 |
| USDCHF | 0.87678 | 0.15 |
| USDJPY | 143.669 | 0.22 |
- US Dollar Index treads water after snapping two-day winning streak.
- Bond market fears contrast with geopolitical woes surrounding China to also prod DXY.
- US President Biden approved limited ban on investments in China technology companies.
- US CPI for July becomes more important due to softer NFP, Fed policy pivot concerns.
US Dollar Index (DXY) remains sidelined near 102.45 during Thursday’s Asian session, after posting the first daily loss in three. In doing so, the Greenback’s gauge versus the six major currencies portrays the market’s cautious mood ahead of today’s United States inflation data, per the Consumer Price Index (CPI) for July.
Today’s US inflation numbers become all the more important after the latest disappointment from the Nonfarm Payrolls (NFP) for the said month. Further, the recently downbeat MBA Mortgage Applications, falling for the third consecutive week of late, also test the DXY bulls, especially amid the growing chatters of the Federal Reserve’s (Fed) policy pivot. With this, the CME Group FedWatch Tool shows that markets are pricing in an 86.0% chance that the Federal Reserve will pause interest rate hikes at its meeting in September.
Apart from the Fed concerns, the recently easy US Treasury bond yields also flag economic woes about the US and weigh on the DXY. That said, the US 10-year Treasury bond yields dropped in the last two consecutive days to signal the first weekly loss in four, around 4.01% by the press time.
Even so, the looming economic fears from China, Europe and the UK join the global rating agencies’ crackdown on banks to weigh on the sentiment and puts a floor under the US Dollar Index. On the same line are fears of deflation in China and the market’s doubts about future moves of the major central banks.
Late Wednesday, US President Joe Biden signed the much-awaited bill that allows the US Treasury Department to prohibit or restrict certain US investments in Chinese entities, per Reuters.
Amid these plays, Wall Street closed in the red and the US Treasury bond yields were down while the S&P500 Futures printed mild gains by the press time.
Moving on, US CPI and Core CPI for July will be crucial to watch amid looming dovish Fed concerns, which if confirmed can extend the DXY’s latest retreat from the key resistance line. That said, market forecasts suggest an improvement in the headline CPI to 3.3% YoY versus 3.0% prior while the Core CPI, namely the CPI ex Food & Energy, may remain unchanged at 4.8%.
Technical analysis
US Dollar Index retreats from a five-week-old descending resistance line, around 102.55 by the press time, but the 100-DMA and a three-week-old rising support line, close to 102.30 and 102.00 round figure, challenge DXY bears.


© 2000-2026. Уcі права захищені.
Cайт знаходитьcя під керуванням TeleTrade DJ. LLC 2351 LLC 2022 (Euro House, Richmond Hill Road, Kingstown, VC0100, St. Vincent and the Grenadines).
Інформація, предcтавлена на cайті, не є підcтавою для прийняття інвеcтиційних рішень і надана виключно для ознайомлення.
Компанія не обcлуговує та не надає cервіc клієнтам, які є резидентами US, Канади, Ірану, Ємену та країн, внеcених до чорного cпиcку FATF.
Проведення торгових операцій на фінанcових ринках з маржинальними фінанcовими інcтрументами відкриває широкі можливоcті і дає змогу інвеcторам, готовим піти на ризик, отримувати виcокий прибуток. Але водночаc воно неcе потенційно виcокий рівень ризику отримання збитків. Тому перед початком торгівлі cлід відповідально підійти до вирішення питання щодо вибору інвеcтиційної cтратегії з урахуванням наявних реcурcів.
Викориcтання інформації: при повному або чаcтковому викориcтанні матеріалів cайту поcилання на TeleTrade як джерело інформації є обов'язковим. Викориcтання матеріалів в інтернеті має cупроводжуватиcь гіперпоcиланням на cайт teletrade.org. Автоматичний імпорт матеріалів та інформації із cайту заборонено.
З уcіх питань звертайтеcь за адреcою pr@teletrade.global.
переклади