- Аналітика
- Новини та інструменти
- Новини ринків
Новини ринків
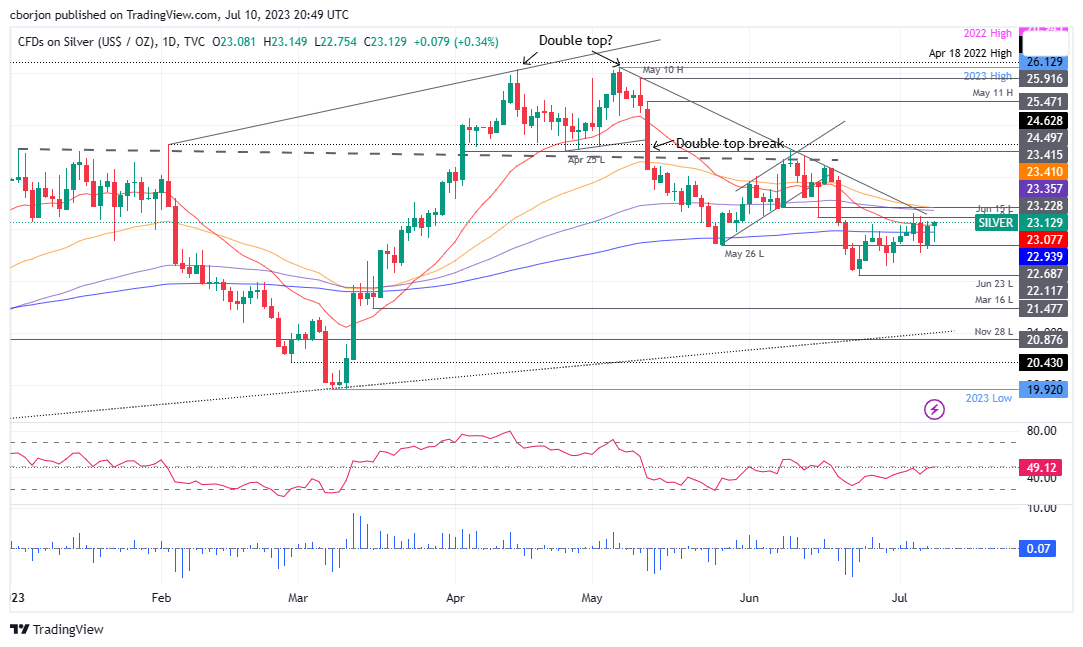
- Silver Price grinds higher as bulls prod descending trend line from early May.
- Upbeat oscillators, sustained trading beyond $22.70 support confluence favor XAG/USD bulls.
- 100-DMA acts as extra filter towards the north before giving control to Silver buyers.
Silver Price (XAG/USD) remains mildly bid near $23.15 as it defends the previous week’s rebound from the 200-DMA and a fortnight-old rising support line amid the early hours of Tuesday’s Asian session. In doing so, the XAG/USD bulls prod a two-month-old descending resistance line.
It’s worth noting that the bullish MACD signals and steady RSI (14) line joins the XAG/USD’s ability to stay beyond the $22.70 support confluence, comprising the 200-DMA and a two-week-old rising support line, to keep the Silver buyers hopeful.
However, the 100-DMA level of around $23.35 can act as an additional check for the XAG/USD bulls past the $23.15 trend line resistance.
Meanwhile, a downside break of the $22.70 support confluence needs validation from June’s low of near $22.10, as well as the $22.00 round figure, to convince the Silver bears.
Following that, the October 2022 high of around $21.25 and the $21.00 round figure will be in the spotlight.”
Overall, Silver Price remains on the front foot unless the bears conquer the previous monthly low.
Fundamentally, the US Dollar’s inability to cheer hawkish Fed bets, due to the downbeat US inflation expectations and softer US jobs report, keep the Silver buyers hopeful.
Also read: Silver Price Analysis: XAG/USD gains marginally, hovers around $23.00 on weak USD, falling US bond yields
Silver Price: Daily chart
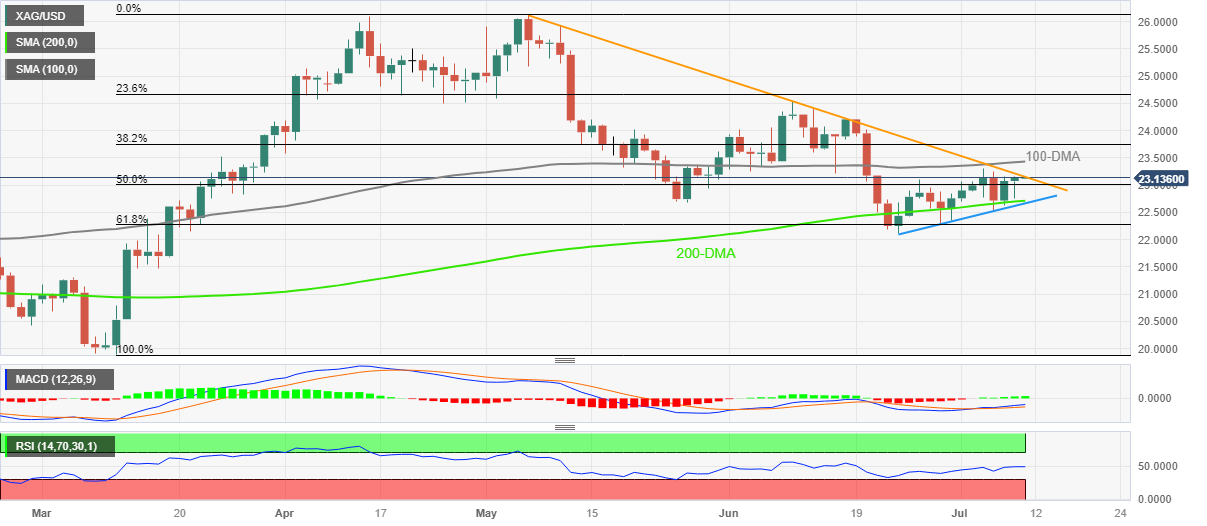
Trend: Further upside expected
USD/MXN remains sidelined around 17.05-06, retreating from the intraday high as it pares the two-day losing streak during the initial Asian session on Tuesday.
While the lack of major data/events allows the Mexican Peso (MXN) pair to lick its wounds, the bearish bias prevails amid downbeat US Dollar and options market concerns about the MXN.
That said, the one-month Risk Reversal (RR) of the USD/MXN pair, a measure of the spread between call and put prices, dropped the most in three days to -0.127 by the end of Monday’s North American trading session.
In doing so, the options market figures defy the hopes of witnessing a corrective bounce in the USD/MXN price by the previous weekly RR numbers. It should be noted that the options market gauge printed the first weekly positive figures in seven the last week with 0.177 mark but the bulls failed to keep the reins on Monday.
Elsewhere, the US Dollar Index (DXY) remains on the back foot at the lowest levels in three weeks, after declining in the last three consecutive days, as bears prod the 101.90 support, as Friday’s downbeat US employment data join downbeat US inflation expectations.
Also read: USD/MXN retreats amid soft USD, market awaits US CPI data
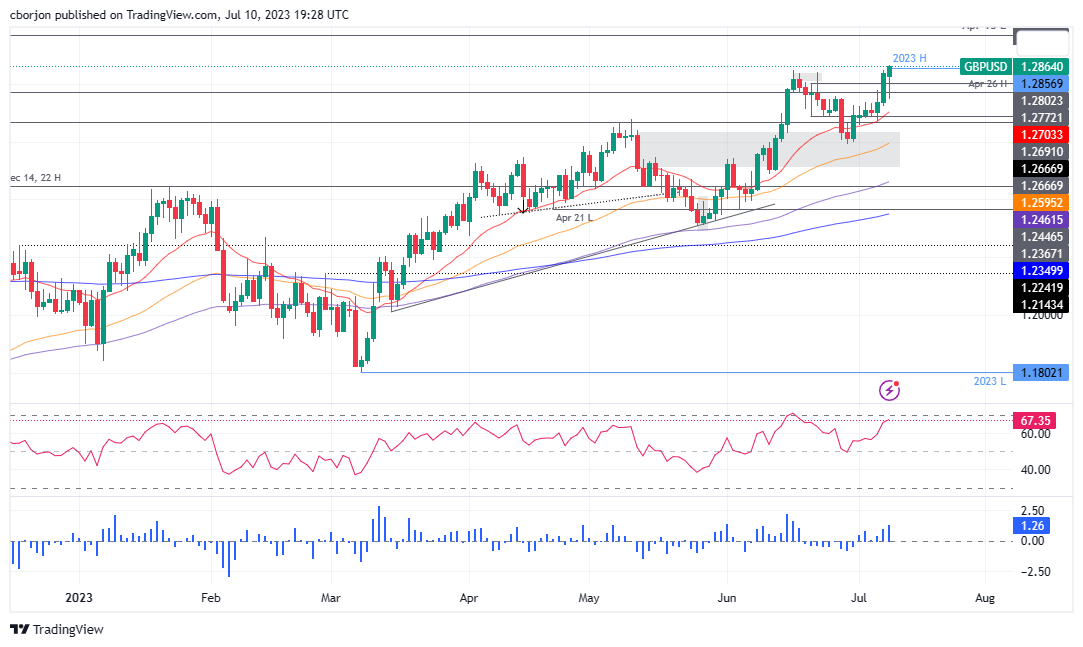
- GBP/USD grinds near the highest level since April 2022, marked the previous day.
- Clear upside break of 1.2850 hurdle, bullish MACD signals favor Cable buyers.
- Overbought RSI conditions test Pound Sterling’s upside momentum within two-month-old rising wedge.
- Convergence of 61.8% FE, wedge’s top line appear a tough nut to crack for bulls.
GBP/USD bulls take a breather at the highest levels since April 2022, making rounds to 1.2860-65 amid the early hours of Tuesday’s Asian session. In doing so, the Cable traders await the latest round of UK employment data to confirm the recent hawkish comments from Bank of England (BoE) Governor Andrew Bailey.
Also read: GBP/USD hits YTD high amid USD weakness, cautiously eyes 1.3000 amid BoE speculations
Apart from the BoE Governor Bailey’s speech, the Pound Sterling’s ability to cross the 1.2850 hurdle, comprising multiple tops marked since late June, also keeps the GBP/USD pair buyers hopeful ahead of the key UK jobs report. Adding strength to the upside bias are the bullish MACD signals.
However, the overbought RSI (14) line checks the bulls within a two-month-old rising wedge bearish chart formation.
With this, the Cable pair is likely to witness a pullback towards the 1.2850 resistance-turned-support before recalling the sellers. Though, the quote’s further downside appears difficult.
That said, the 21-DMA support of around 1.2740, the stated rising wedge’s bottom line near 1.2675 and a four-month-old upward-sloping trend line close to 1.2590 will act as additional downside filters before giving control to the GBP/USD bears.
On the flip side, a convergence of the aforementioned bearish chart pattern’s top line and 61.8% Fibonacci Extension (FE) of its late May to June 29 moves, near 1.2925, appears a tough nut to crack for the Cable buyers. Also challenging the GBP/USD buyers is the 1.3000 psychological magnet.
GBP/USD: Daily chart
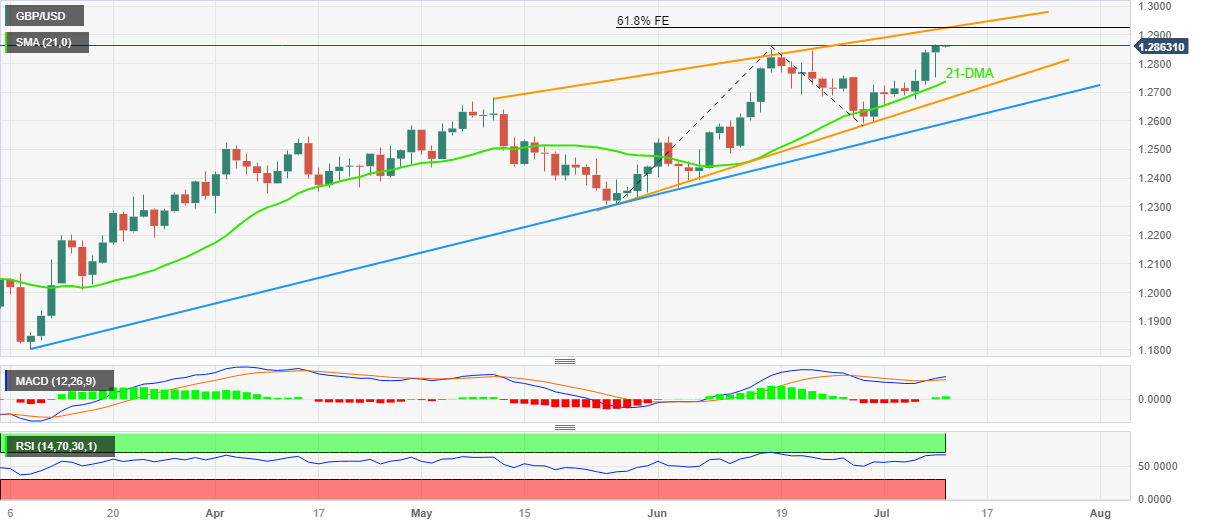
Trend: Pullback expected
- AUD/USD currently trades at around the 0.6670 level, with the pair showing signs of stability following a volatile Monday session.
- US employment report indicates a tight labor market, with Average Hourly Earnings (AHE) rising and the Unemployment Rate edging lower. These data sets could justify further tightening action from the US Federal Reserve (Fed).
- Amid comments from Fed officials about the need for further rate hikes to control inflation, the AUD/USD managed to hold its ground.
AUD/USD hovers around the 0.6670 region as the Asian session begins, following Monday’s volatile session, with the pair unable to get a clear direction, though closed below solid resistance of the 50 and 20-day Exponential Moving Averages (EMAs), each at 0.6686/82. The AUD/USD exchanges hands at 0.6677.
Despite closing below key moving averages, AUD/USD shows signs of stability. US Federal Reserve comments and Australian economic data in focus
Wall Street finished with gains, an improvement in market sentiment. The last week’s US employment report, although mixed with the economy adding just 209K jobs, witnessed Average Hourly Earnings (AHE) rising while the Unemployment Rate edged lower. Hence it suggests the labor market remains tight, warranting further action by the US Federal Reserve (Fed)
The central bank bonanza continued amid the lack of economic data in the docket. Cleveland Fed President Loretta Mester commented that the economy is still robust while saying, “When the economy reopened, labor demand well outpaced labor supply, putting upward pressure on wages and price inflation.” She stated, “More hikes needed to bring inflation back down to target.”
Echoing some of her comments was the San Francisco Fed President Mary Daly, stating there’s more to be done, opening the door for a couple of hikes. She added that inflation and growth risks became more “balanced,” but the chances of doing too little outpace the threats of overtightening.
Even though the comments were hawkishly tilted, the AUD/USD failed to dive further, with the pair gaining traction. The Australian economic docket will feature the Westpac Consumer Confidence report for July; at the same time, the National Australia Bank’s reveal Business Conditions and Confidence.
Regarding the US economic agenda, further Fed speakers will be featured ahead of Wednesday’s US inflation data.
AUD/USD Price Analysis: Technical outlook
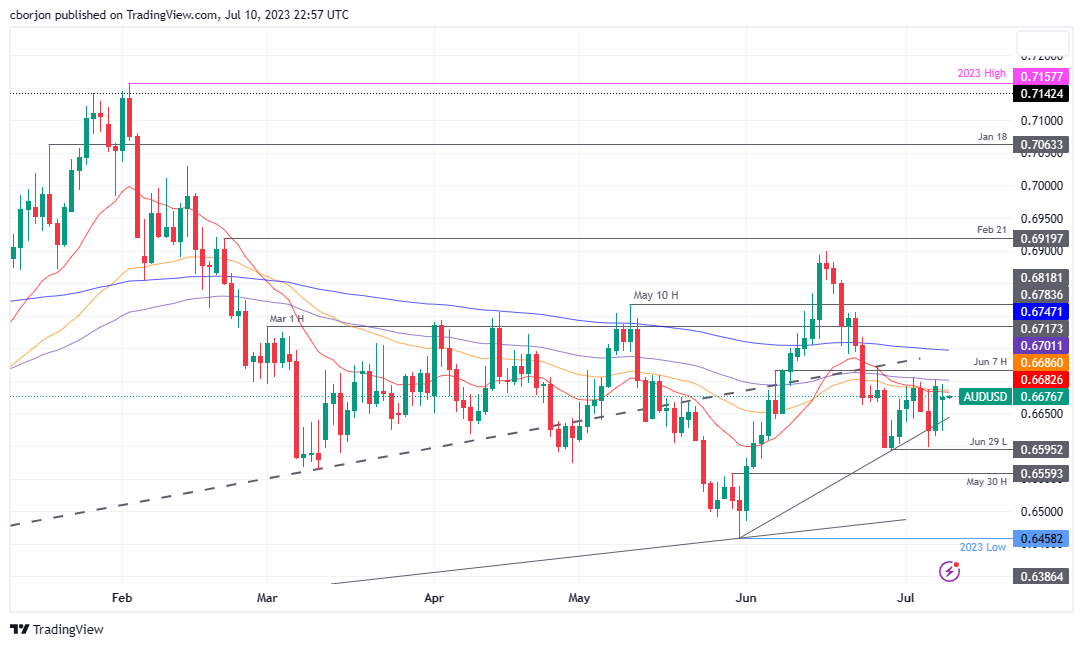
The AUD/USD trades nearby the confluence of the 20 and 50-day EMAs, with resistance levels ahead of the 0.6700 figure. It should be said that a breach of that area will expose the 200-day Exponential Moving Average (EMA) at 0.674, which could be seen as a bullish signal that could lift prices to the 0.6800 mark.
Nevertheless, the AUD/USD path of least resistance is downwards, as shown by the Relative Strength Index (RSI), which remains bearish territory. That, alongside strong resistance above the current exchange rates, could pave the way to test the July 6 daily low of 0.6599, ahead of testing the May 30 daily high at 0.6559.
- EUR/USD remains firmer at the highest levels in 2.5 weeks.
- Risk-on mood, downbeat US NFP and inflation expectations weigh on Euro price.
- Mostly hawkish Fed talks, downbeat EU data put a floor under EUR/USD.
- Risk catalysts, German ZEW Sentiment data eyed for clear directions.
EUR/USD bulls take a breather at the highest levels in more than two weeks around 1.1000 amid early Tuesday morning in Asia. In doing so, the Euro pair cheers the broad US Dollar weakness, as well as the risk-on mood, despite hawkish comments from the Federal Reserve (Fed) officials.
That said, Fed officials have been hawkish off late but fail to gain support from the US inflation expectations, especially lack of acceptance amid Friday’s downbeat US jobs report.
Recently, San Francisco Fed President Mary Daly said, "We're likely to need a couple more rate hikes over the course of this year to really bring inflation sustainably back to the Fed's 2% goal." On the same line, Cleveland Fed President Loretta Mester also said that the Fed will need to tighten the monetary policy "somewhat further" to lower inflation. Furthermore, Federal Reserve Vice Chair for Supervision Michael Barr said, "We are quite attentive to bringing inflation down to target."
The latest US employment report for June marked a negative surprise and offered a big blow to the US Dollar, making it post the biggest daily loss in three weeks. However, Monday’s downbeat prints of China inflation data flagged fears of deflation in the world’s biggest industrial player, which in turn allowed the US Dollar to lick its wounds.
That said, the headline US Nonfarm Payrolls (NFP) marked the first below-expectations print in 15 months while falling to 209K, versus 225K market forecasts and 309K prior (revised), whereas the Unemployment Rate matches analysts’ estimations of 3.6% compared to 3.7% prior. On the other hand, China’s Consumer Price Index (CPI) eased to 0.0% YoY in June versus 0.2% prior while the Producer Price Index (PPI) slipped beneath the -4.6% yearly prior marked in May to -5.4%.
On the other hand, the Eurozone Sentix Investor Confidence declined to -22.5 for July from -17 in June. Adding to the pessimism were comments from Sentix managing director Manfred Huebner who said, “There is also nothing positive to report in terms of forward-looking expectations.” Sentix’s Huebner also mentioned that the Investor Confidence Index for Germany fell 7.3 points to -28.4.
Talking about the European Central Bank (ECB) talks, Governing Council member Francois Villeroy de Galhau said, “Eurozone rates will soon reach their high point, but it will be more of a high plateau than a peak.” On the same line, Governing Council member and Bank of Portugal Governor, Mario Centeno, said that the inflation is coming down faster than the way up. The policymaker also added that they need to fuel this process and be very confident we can make it.
Wall Street closed positive while the US Treasury bond yields dropped. That said, the benchmark US 10-year Treasury bond yields printed the first daily loss in July the previous day whereas the two-year counterpart declined for the second consecutive day, to respectively near 4.00% and 4.86%
Moving on, DXY traders will pay attention to the risk catalysts ahead of Wednesday’s US inflation numbers for clear directions.
Technical analysis
A daily closing beyond a two-month-old descending resistance line, now immediate support near 1.0980, enables EUR/USD to remain firmer. However, the previous monthly high of near 1.1010 prods the Euro bulls.
- US Dollar Index stays pressured at two-week low, licking its wounds after declining in the last three consecutive days.
- Aftershocks of downbeat US NFP weighs on yields and DXY amid cautious optimism.
- Fed officials keep supporting 0.50% rate hikes in 2023.
- US inflation numbers are the key for fresh impulse.
US Dollar Index (DXY) remains on the back foot at the lowest levels in three weeks, after declining in the last three consecutive days, as bears prod the 101.90 support amid the early hours of Tuesday’s Asian session. In doing so, the greenback’s gauge versus the six major currencies bears the burden of Friday’s downbeat US employment data and the softer US Treasury bond yields despite hawkish comments from the Federal Reserve (Fed) officials. Also exerting downside pressure on the DXY is the risk-on mood even as China flags economic fears.
Recently, San Francisco Fed President Mary Daly said, "We're likely to need a couple more rate hikes over the course of this year to really bring inflation sustainably back to the Fed's 2% goal." On the same line, Cleveland Fed President Loretta Mester also said that the Fed will need to tighten the monetary policy "somewhat further" to lower inflation. Furthermore, Federal Reserve Vice Chair for Supervision Michael Barr said, "We are quite attentive to bringing inflation down to target."
The hawkish comments from the Fed officials fail to lure the US Dollar Index buyers amid Friday’s downbeat US jobs report and the recently softer US inflation expectations.
As per the Federal Reserve Bank of New York's monthly Survey of Consumer Expectations, the US consumers' one-year inflation expectation dropped to the lowest level since April 2021 at 3.8% in June from 4.1% in May.
On the other hand, the latest US employment report for June marked a negative surprise and offered a big blow to the US Dollar, making it post the biggest daily loss in three weeks. However, Monday’s downbeat prints of China inflation data flagged fears of deflation in the world’s biggest industrial player, which in turn allowed the US Dollar to lick its wounds.
That said, the headline US Nonfarm Payrolls (NFP) marked the first below-expectations print in 15 months while falling to 209K, versus 225K market forecasts and 309K prior (revised), whereas the Unemployment Rate matches analysts’ estimations of 3.6% compared to 3.7% prior. On the other hand, China’s Consumer Price Index (CPI) eased to 0.0% YoY in June versus 0.2% prior while the Producer Price Index (PPI) slipped beneath the -4.6% yearly prior marked in May to -5.4%.
Following the downbeat US jobs report, Federal Reserve Bank of Chicago President Austan Goolsbee said that they don't need a recession to eliminate inflation concerns. The policymaker also added, “It is clear the job market is strong but cooling.”
Amid these plays, Wall Street closed positive while the US Treasury bond yields dropped. That said, the benchmark US 10-year Treasury bond yields printed the first daily loss in July the previous day whereas the two-year counterpart declined for the second consecutive day, to respectively near 4.00% and 4.86%
Looking ahead, DXY traders will pay attention to the risk catalysts ahead of Wednesday’s US inflation numbers for clear directions.
Technical analysis
A daily closing beneath a three-month-old rising support line, now immediate resistance around 102.25, needs validation from the previous monthly low of around 101.90 to convince the US Dollar Index bears.
- AUD/JPY continues to lose ground, falling below the Kijun-Sen line and reaching a four-week low at 94.11.
- Despite recent losses, the pair maintains an upward bias, remaining above the Ichimoku Cloud.
- Key support levels to watch are at 94.00, followed by the Senkou Span B line at 93.41, and December 13 daily high turned support at 93.35. Breach of these could expose the 93.00 level.
- To reverse the trend, AUD/JPY buyers must reclaim the Kijun-Sen line at 95.18 and challenge the Tenkan-Sen line at 95.47.
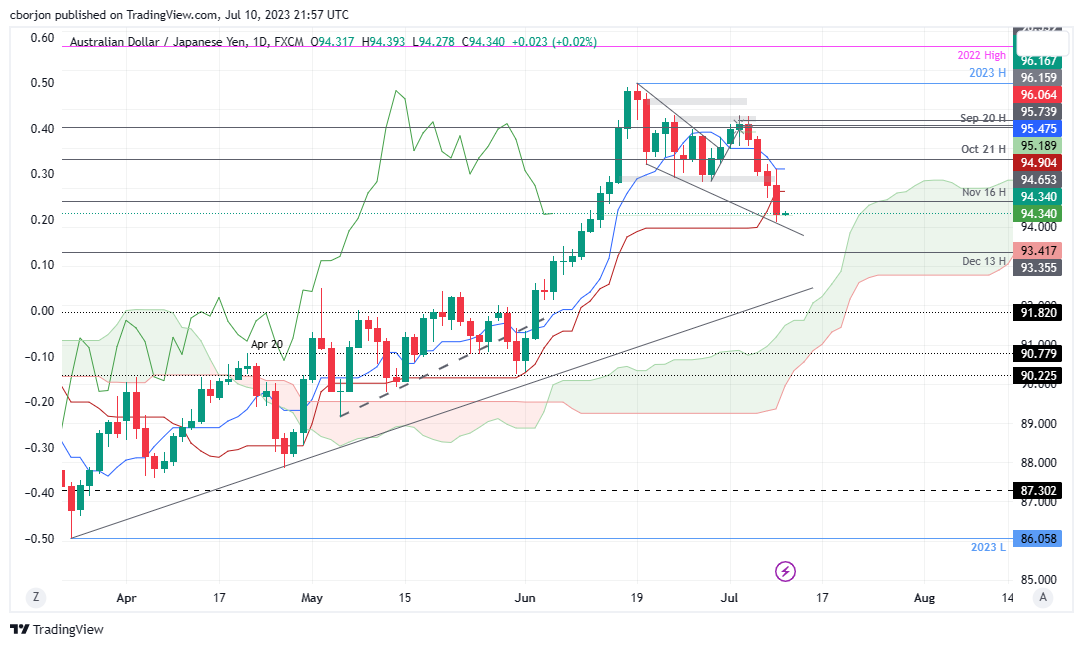
AUD/JPY extended its losses below the Kijun-Sen line after sellers broke technical support levels at around 95.18 before cracking the former at 94.90. The AUD/JPY slid to a new four-week low at 94.11 before stabilizing around current exchange rates. At the time of writing, the AUD/JPY is trading at 94.32, down 0.03% as the Asian session begins.
AUD/JPY Price Analysis: Technical outlook
From a technical perspective, the AUD/JPY is still upward biased, as it remains above the Ichimoku Cloud, with the latest dip putting into play support levels not seen in a month. The 94.00 figure is next, followed by the Senkou Span B line at 93.41, and the December 13 daily high turned support at 93.35. If the cross falls below the latter, that could expose the 93.00 figure.
Conversely, the AUD/JPY buyers must reclaim the Kijun-Sen line at 95.18, so they can threaten to lift the pair above the Tenkan-Sen line at 95.47. In that outcome, the AUD/JPY's next resistance would be the October 21 high at 95.74, ahead of reaching the 96.00 mark.
AUD/JPY Price Action – Daily chart
- NZD/USD bulls move in as the Greenback sells-off.
- All eyes will be on the US CPI data while RBNZ sentiment simmers on the back burner.
NZD/USD is trading near 0.6210 on Tuesday as Asia opens for business. The pair was giving two-way moves at the start of the week following a run higher as the Greenback sold off, sending the Kiwi off its lows near 0.6170 to a high near 0.6220.
The US Dollar fell by -0.31% and posted a 2-week low as lower Treasury-note yields dropped in a technical move from highs and weighed on the Greenback. In addition, weaker-than-expected US economic news on May wholesale sales and May consumer credit was negative for the US Dollar ahead of this week's Consumer Price Index inflation data.
''Core prices likely decelerated in June to their slowest m/m pace since 2021, with the index rising 0.2% MoM (0.23% ungrounded),' 'analysts at TD Securities said:
''Goods inflation were likely a big factor, with shelter prices remaining the key wildcard (we expect modest slowing). Recovering gas prices will also help to keep headline inflation steady. Our MoM forecasts imply 3.1%/4.9% YoY for total/core prices.''
Domestically, there was not much to go by so far, but data from China showed a very different price dynamic to that of New Zealand, where wage-price spiral risks are expected to keep policymakers worried for a while yet, analysts at ANZ Bank explained:
''China’s headline CPI came in at 0.0% y/y in June (mkt: +0.2%), while the PPI declined 5.4% y/y (mkt: -5.0%), suggesting China’s post-COVID rebound has run out of steam, and adding to expectations that policymakers may need to do more to shore up demand. In the interim, however, a weakening demand pulse in China represents a further downside risk to New Zealand’s export prices and the recovery in tourist arrivals from China (which are yet to pick up meaningfully), and that’s adding to the risk of a wider for longer NZ current account deficit.''
''The silver lining,'' the analysts said, ''is that China’s slowdown is having a negative influence on global goods inflation, which is helping to drive headline inflation rates down across many economies (including New Zealand). However, the Reserve Bank of New Zealand’s main battle lies with the relatively sticky domestic (non-tradables) inflation, which is still running at more than double the pace it should be.''
''Regardless of global factors, the RBNZ cannot be confident they have tackled too-high inflation until domestic economic conditions (chiefly the labour market) are better balanced. A weaker China may help with that somewhat (eg via lower investment and labour demand than otherwise), but there’s still plenty of NZ fiscal stimulus to lean against in the near term, and a renewed upwards momentum developing in a number of forward-looking indicators, such as our Business Outlook.''
- XAU/USD cleared daily losses and jumped to the $1,925 area after finding support at a low of $1,912.
- The USD weakened across on falling US yields following NFPs.
- Traders will closely watch US inflation data on Wednesday.
The Gold spot price XAU/USD saw volatility on Monday and found support at a daily low of $1,912 and settled at $1,925. In that sense, US bond yields declined as investors continued to assess the mixed Nonfarm Payroll figures from Friday, and focus now shifts to US Inflation data on Wednesday. Meanwhile, the US Dollar index DXY fell to its lowest level since May at 101.95.
USD continues to lose ground as markets assess NFP figures
The US Dollar loses interest in response to lower-than-anticipated job creation figures, leading investors to predict a more cautious approach from the Federal Reserve (Fed). Nevertheless, persistent wage inflation could compel the Fed to continue its aggressive stance and mitigate potential losses for the US dollar. Additionally, the upcoming release of the Consumer Price Index (CPI) data will offer further insights into inflation expectations within the country. Markets expect a decline in the headline figure to 3.1% year-on-year in June from the previous 4%, while the Core figure is projected to decrease to 5%, compared to its previous 5.3% level.
Meanwhile, the US bond yields, which could be seen as the opportunity cost of holding Gold, declined across the board. The 2-year bond yields 4.86%, while the 5 and 10-year rates stand at 4.23% and 4%, respectively. That being said, according to the CME FedWatch tool, investors have already priced in a 25 basis point (bps) hike for the next Fed meeting, and the odds of another increase for this year stand around 40%.
XAU/USD Levels to watch
According to the daily chart, the XAU/USD holds a neutral to bullish stance for the short term. Despite standing in negative territory, the Relative Strength Index (RSI) holds a positive slope near its midline and the Moving Average Convergence Divergence (MACD) prints rising green bars indicating a growing buying momentum. However, to confirm the bullish outlook, the bulls must consolidate above the 20-day Simple Moving Average at $1,927.
Resistance levels: $1,927 (20-day SMA), 1,950 (100-day SMA), $1,970.
Support levels: $1,905, $1,900, $1,865 (200-day SMA).
- EUR/GBP bears move in as the hawks gather at the BoE.
- GBP was boosted by US Dollar weakness and the Euro caved in vs. GBP on prospects of prolonged stagnation in the Eurozone.
EUR/GBP is trading 0.12% higher on the day and has ranged between a low of 0.8532 and a high of 0.8584 so far. However, this does not reflect the strength of the pound. The Bank of England Governor Andrew Bailey said on Monday the British central bank had to "see the job through" on bringing down an inflation rate that is running higher than in any other major rich economy.
The pound consequently took off among a bout of US dollar selling as Federal Reserve officials pointed to an end of the tightening cycle at some stage in the future. The BoE governor Bailey, under pressure from politicians and some economists over the surge in inflation, said price growth had proved to be stickier than the BoE had expected, Reuters reported.
"It is crucial that we see the job through, meet our mandate to return inflation to its 2% target and provide the environment of price stability in which the UK economy can thrive," Bailey said in the text of a speech he was due to deliver later on Monday to finance executives at London's Mansion House.
''Bailey's comments largely echoed previous remarks which have convinced investors that more interest rate hikes are coming,'' Reuters noted.
''Interest rate futures on Monday pointed to a peak in Bank Rate of between 6.25% and 6.5% in early 2024 which would be the highest in 25 years and up from 5% now,'' the news agency explained, noting that the BoE has raised rates at each of its past 13 meetings.
It is worth noting that GBP net speculators’ positions have fallen a touch but remain at the highest level since 2014. this week will see key Wages data and growth numbers but the recent run of the strong UK labour numbers and sticky CPI inflation strengthen support for further rate hikes.
Meanwhile, news from Europe on a slow start to the week as per the economic calendar shows that the Sentix investor sentiment fell 5.5 points to -22.5 in July, weaker than market expectations. ''Both the current conditions and expectations components deteriorated, suggesting signs of recovery earlier in the year may have been a blip,'' analysts at ANZ Bank explained. Hawkish commentary from the European Central Bank officials remains prevalent, but additional rate hikes are already priced in.
During the Asian session, survey data from Australia is due, with the Westpac Consumer Confidence and the National Australian Bank's Business Confidence. Later in Europe, the highlight will be the UK employment report. Market participants will also position ahead of a busy Wednesday that includes central bank decisions from New Zealand and Canada, and the US CPI.
Here is what you need to know on Tuesday, July 11:
Wall Street finished in positive territory after a cautious opening following inflation data from China that pointed to softer demand. The Dow Jones gained 0.62%, and the Nasdaq climbed 0.18%. Crude oil prices dropped less than 1%, while Gold finished flat around $1,925/oz. Investors will start digesting the Q2 earnings season.
China reported lower-than-expected inflation data, with the Consumer Price Index (CPI) flat in June, against expectations of a 0.2% increase. The Producer Price Index (PPI) dropped to -5.4% YoY, below the -5% expected. Deflationary evidence keeps the door wide open to more stimulus, not only monetary but also including fiscal measures.
The US Dollar weakened during the American session, affected by data reflecting lower inflation expectations and on the back of a decline in US Treasury yields. The 10-year bond yield declined from 4.07% to 4.00%. Market participants await the key US Consumer Price Index number due on Wednesday that will be critical ahead of the July 25-26 FOMC meeting.
On Friday, Nonfarm Payrolls weighed on the US Dollar Index (DXY) which continued to slide on Monday. It dropped for the third consecutive day, falling below 102.00, posting the lowest daily close in a month.
The Japanese Yen outperformed, boosted by the recovery in bonds and ahead of US inflation data. USD/JPY continued to consolidate after being unable to break above 145.00 and dropped below 141.50, consolidating well below the 20-day Simple Moving Average (SMA) for the first time since April.
EUR/USD rose above 1.1000, and the momentum remains positive, supported by a weaker US Dollar. On Tuesday, the German ZEW Survey will be released, and also the final reading of the June German CPI that should show no surprises from the preliminary reading.
GBP/USD rose to the highest levels since April 2022, above 1.2850. Bank of England (BoE) Governor Andrew Bailey said that they had to “see the job through” regarding inflation. The UK employment report is due on Tuesday. EUR/GBP spiked to near 0.8600 and then pulled back to 0.8550.
USD/CAD briefly traded above 1.3300 and then pulled back to end flat around 1.3280. On Wednesday, the Bank of Canada (BoC) will announce its interest rate decision, with expectations of a rate hike after Friday's labor market data surpassed expectations.
Analysts at the National Bank of Canada:
The Bank of Canada put the public on notice last month when they ended their brief two meeting pause to restart the tightening cycle. In the absence of a meaningful deterioration of economic data over the last five weeks, we’re looking for the Bank to again increase their overnight target by 25 bps to 5% on Wednesday.
AUD/USD finished flat and remained sideways, unable to break above 0.6700 and supported by the 0.6600 area. Consumer Confidence data from Australia is due on Tuesday. Reserve Bank of Australia Governor Philip Lowe will deliver a speech on Wednesday.
NZD/USD rose marginally on Monday but failed again to break above 0.6220, which is the key short-term resistance area. The Reserve Bank of New Zealand will announce its decision on Wednesday.
Like this article? Help us with some feedback by answering this survey:
- Silver (XAG) trades slightly higher amid declining US Treasury bond yields and broad US Dollar (USD) weakness.
- For a bearish continuation, a break below the 200-day EMA at $22.93 is needed, with a potential downside to the June 25 daily low of $22.68 and further to $22.11.
- Conversely, staying above $23.00 may challenge resistances at $23.35/41 (50/100-day EMAs confluence) and then $24.00. A decisive break of these resistances may lead the prices toward $24.20.
Silver price climbs below the $23.00 figure, surpassing the 20-day Exponential Moving Average (EMA) at $23.07 on Monday, courtesy of US Bond yields falling and broad US Dollar (USD) weakness. The XAG/USD is exchanging hands at $23.12, gaining 0.32% as Wall Street’s session ends.
XAG/USD Price Analysis: Technical outlook
After sliding below the 50 and 100-day EMAs, the XAG/USD remains neutral to downward-biased, with price action hoovering around each side of the 20-day EMA and the $23.00 figure. For a bearish continuation, the XAG/USD must drop below the 200-day EMA at $22.93, opening the door for further downside, exposing as next support the June 25 daily low of $22.68.
In a decisive break, XAG/USD would slump and challenge the March 16 daily low of $22.11 before surpassing the $22.00 figure. Once cleared, the next support would be last year’s November 28 daily low of $20.87 before reaching YTD lows of $19.92.
Conversely, if XAG/USD stays afloat above $23.00, resistance levels emerge at the confluence of the 50/100-day EMAs at around $23.35/41. Once broken, the following supply area would be the $24.00 figure, followed by a June 16 daily high of $24.20.
XAG/USD Price Action – Daily chart
- The EUR/JPY fell below the 20-day SMA for the first time since May, around 155.50.
- Higher Japanese yields may be hinting at a BoJ pivot.
- Eyes on Tuesday's German Inflation data.
At the start of the week, the EUR/JPY trades with losses for a fifth consecutive day, retreating to the 155.45 area. No high-tier data will be released on Monday as attention is set on Tuesday’s German inflation data. On the other hand, Japanese bond yields continue to rise, making the JPY gain interest.
Following the release of robust Labor Cash Earnings data last Friday, Japanese bond yields increased. The yields rose to their highest since May, indicating that market participants might anticipate a shift in the Bank of Japan's policy from a cautious approach to a more aggressive one. Nonetheless, officials at the Bank of Japan may require additional data in order to pivot. In that sense, Machinery Orders from May and Producer Price Index from June figures, scheduled for release on Wednesday, will be closely watched.
On the other hand, the Federal Statistics Office from Germany will release the Harmonized Index of Consumer Prices (HICP) on Tuesday. The headline figure is expected to increase by 0.4% MoM and the annualised measure to 6.8%, remaining unchanged from its previous figures. As one of the European Central Bank's (ECB) objectives is price stability, the inflation figures may affect the Euro price dynamics.
EUR/JPY Levels to watch
According to the daily chart, the outlook for the cross has turned bearish for the short term as bears have taken the lead. The Relative Strength Index (RSI) shows weakness but is above its midline and the Moving Average Convergence Divergence, printing higher red bars, deep in negative territory.
Support Levels: 154.30, 154.00,153.40.
Resistance Levels: 156.50, 157.00,158.00.
EUR/JPY Daily chart
-638246181496238079.png)
- GBP/USD bounces to a new YTD high as US Treasury bond yields tumble amid mixed US jobs report.
- Despite talks of further rate hikes by Fed officials, the USD falters; GBP/USD traders now eye the BoE stance.
- GBP/USD challenges 1.2850/1.2900 resistance, with a potential downturn to 1.2800 if this area remains unconquered.
GBP/USD climbs to a new year-to-date (YTD) high at 1.2867, amid overall US Dollar (USD) weakness, after the major printed a daily low of 1.2750. The GBP/USD exchanges hands at 1.2864, gains 0.21%, helped by falling US Treasury bond yields, even though US Federal Reserve (Fed) speakers suggested further rate hikes needed.
GBP/USD propelled by plummeting US bond yields; future hinges on BoE’s potential aggressive tightening
Of late, Wall Street showed an improvement in market sentiment as US Treasury bond yields tumble. Last Friday’s jobs report in the United States (US) was mixed. Although the headline jobs report showed that Nonfarm Payrolls for June added 209K jobs above forecasts, other employment figures still portray a tight labor market. Average Hourly Earnings (AHE) jumped 0.2% to 4.4% YoY compared to May, while the Unemployment Rate at 3.6% YoY flashed that hiring improved.
That said, money market futures had priced in a 92.4% chance for a 25 basis points (bps) rate hike by the Fed at the 25-26 July meeting, as shown by the CME FedWatch Tool.
Despite that, the greenback is plunging, dragged by the fall of US bond yields, with the 10-year benchmark rate losing six bps, down to 4.008%. The US Dollar Index (DXY), a measure of the buck’s performance vs. a basket of six currencies, slumps 0.30% and sits at 101.963, at four-week lows.
In the meantime, the central bank bonanza continued ahead of the Fed’s blackout period to begin on Friday. The Fed’s Vice-Chair for Supervision, Michael Barr, stated the Fed still has “a bit of work to do” on rates. At the same time, Cleveland Fed President Loretta Mester commented that the economy is still robust while saying, “When the economy reopened, labor demand well outpaced labor supply, putting upward pressure on wages and price inflation.” She stated, “More hikes are needed to bring inflation back down to target.”
Recently, the San Francisco Fed Preside Mary Daly said that a couple of rate hikes are needed and that inflation risks outpaced growth ones, diminishing the chances of overtightening. On the dovish front, Atlanta’s Fed President Raphael Bostic has emerged as the new dove in town, saying that inflation could return to the Fed’s 2% target without further rate increases.
On the UK front, the Bank of England (BoE) Governor Andrew Bailey stated the central bank needs to see the labor market cooling down as the BoE struggles to tackle stickier inflation levels in the UK economy. BoE expectations for further tightening on Monday see the Bank Rate peaking between the 6.25%-6.50% range in early 2024, the highest level in 25 years.
The upcoming UK jobs report on July 11 is likely to see the unemployment rate stand at 3.8%, while Average Earnings are estimated to rise close to 7%, a sign that would increase the odds for aggressive tightening by the BoE. Even though it should be viewed as positive for Sterling (GBP), increased chances of a recession could boost the appetite for the greenback. Therefore, further GBP/USD downside could be expected in the medium term.
GBP/USD Price Analysis: Technical outlook
The GBP/USD remains neutral to upward biased, but price action suggests the 1.2850/1.2900 barrier is proving to be strong resistance to surpass. GBP/USD buyers must reclaim that area, so they could threaten to break the 1.3000 figure. Otherwise, if GBP/USD struggles again at current exchange rates, the GBP/USD could dive past 1.2800 and edge toward the 20-day Exponential Moving Average (EMA) at 1.2702. Once cleared, the next support emerges at the confluence of the June 29 swing low and the 50-day EMA, both at around the 1.2590/95 area.
- The GBP/JPY cross tallies a third-consecutive day of losses falling to a low of 181.10, below the 20-day SMA.
- Andrew Bailey commented that he doesn’t know when rates will start to come down.
- Eyes on British labour market data on Tuesday and Japanese data on Wednesday.
The GBP/JPY lost ground at the start of the week and currently stands around 181.60. Andrew Bailey’s, Governor of the Bank of England (BoE), hawkish remarks somewhat boosted the GBP while the JPY gained interest in rising Japanese bond yields.
On Monday, Bailey commented that inflation is “unacceptably high”, far from their 2% target, but confirmed that the Monetary Policy Committee expects headline inflation to drop significantly this year. In addition, he commented that he doesn’t know when rates will start to come down and that the committee is closely monitoring the labour market. That being said, Tuesday's Claimant Count and Earnings data will be crucial.
On the other hand, Japanese yields continue to rise after strong Labor Cash Earnings data released last Friday in Japan, suggesting that markets may expect the Bank of Japan to pivot from its dovish stance to a more aggressive one. However, BoJ’s officials may need to gather more data so Machinery Orders and Producer Price Index data, to be released on Wednesday, will be closely monitored.
GBP/JPY Levels o watch
The daily chart suggests a bearish outlook for the short term. The Relative Strength Index (RSI) printed a steep negative slope, and the Moving Average Convergence Divergence printed higher red bars indicating a growing bearish momentum.
Support Levels: 180.10, 179.50 and 17900.
Resistance Levels: 182.70, 183.00,184.00.
GBP/JPY Daily chart
-638246108939800655.png)
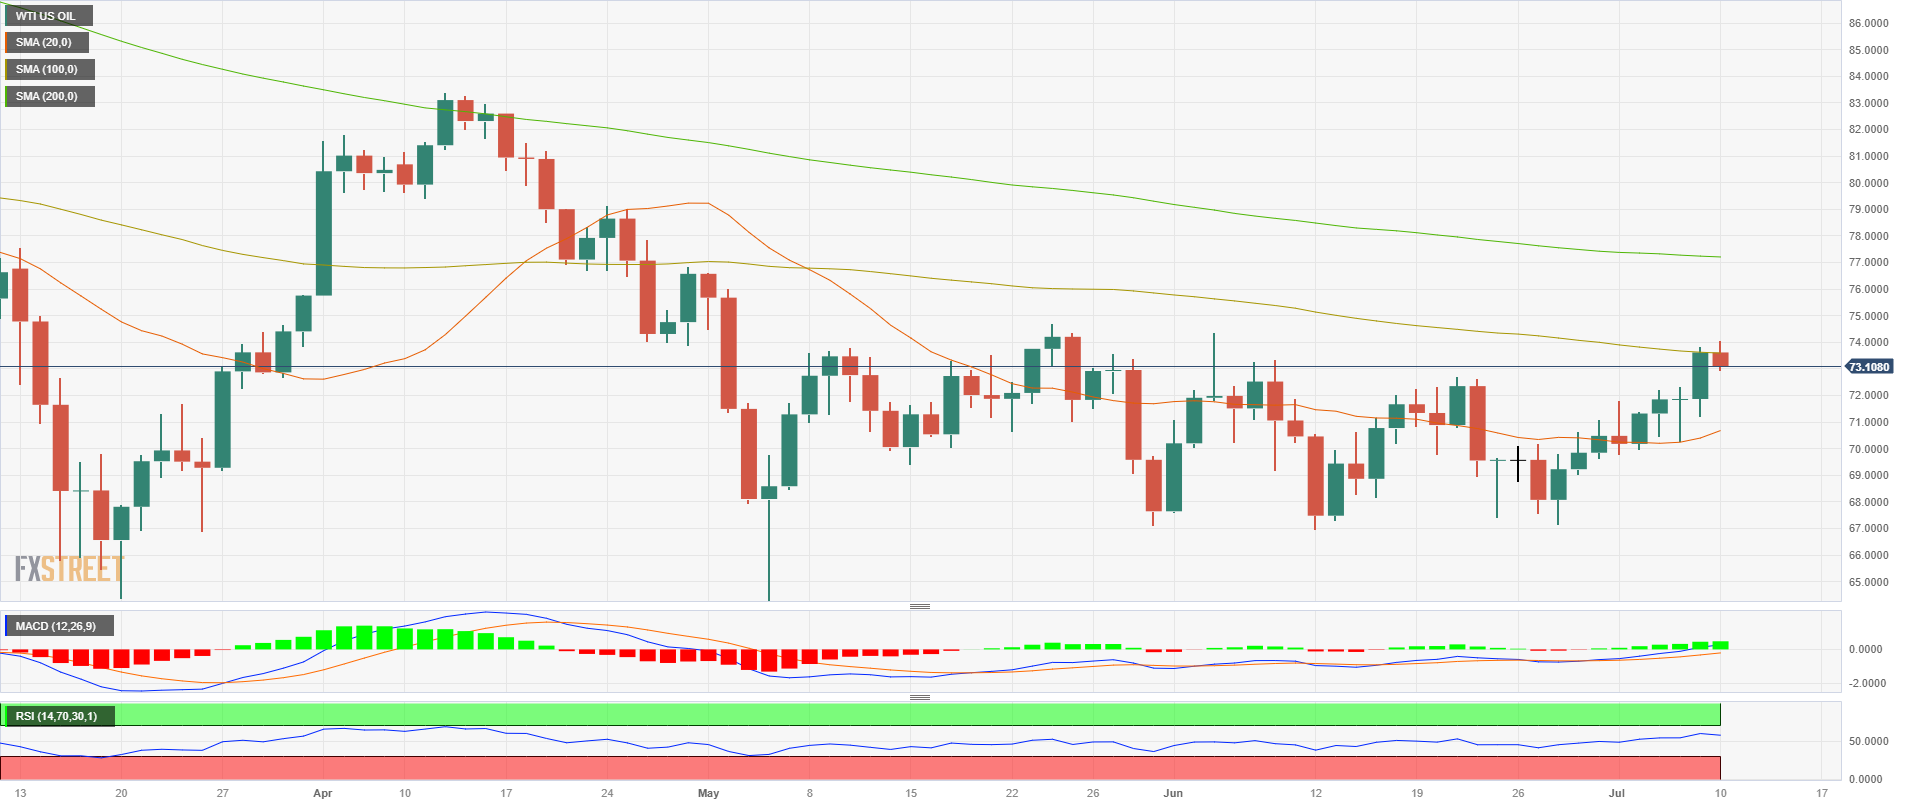
- The WTI price trades with losses near the $73.00 area, cutting a four-day winning streak.
- Weak NFPs from the US and dovish bets on the Fed made Oil prices rally on Friday.
- Eyes on inflation data from the US on Wednesday.
At the start of the week, the West Texas Intermediate (WTI) barrel trades with losses as investors take profits after closing a 4.63% weekly gain last Friday. Weak Nonfarm Payrolls (NFP) made investors bet on a less aggressive Federal Reserve, favouring a positive market environment—eyes on crucial Consumer Price Index (CPI) data on Wednesday.
Despite investors betting on a dovish bet amid lower-than-expected NFPs, they should keep an eye on sticky wage inflation as Average Hourly Earning increased in June, higher than the expected figures. In that sense, sticky prices give the Fed reasons to continue hiking so Wednesday's CPI figures will be crucial to give markets a better outlook of the US inflationary situation. As for now, markets are expecting the CPI headline figure to drop to 3.1% YoY in June from 4% and the Core measure to 5% from its previous 5.3%.
It's worth noticing that higher interest rates cools down economic activity and hence lowers Oil demand, pulling down its price, so hawkish bets on the Fed may fuel further downside for the WTI. As for now, the FedWatch tool suggests that a 25 basis point (bps) hike is already priced in for the next July meeting and the probability of another hike in 2023 hovers around 40%.
WTI levels to watch
On the daily chart, the technical outlook is neutral to bullish for the WTI. To confirm its positive stance, the bulls must consolidate above the 100-day Simple Moving Average (SMA) at $73.56 which could pave the way for another upwards leg. In addition, the Relative Strength Index (RSI) stands in positive territory, as well as the Moving Average Convergence Divergence (MACD)
Resistance levels: $73.56 (100-day SMA), $76.00,$77.80.
Support levels: $71.90,$70.60(20-day SMA), $69.50.
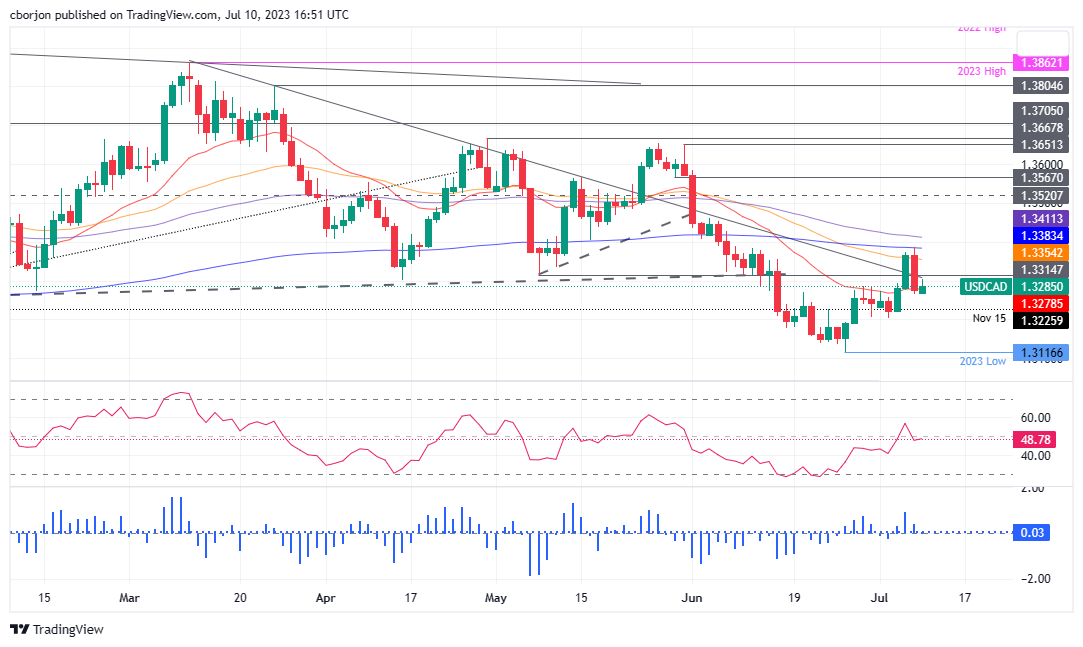
- USD/CAD forms a bearish engulfing pattern and struggles to breach the 1.3300 mark, signaling a possible downside.
- Pair is currently neutral but might dip further with key support at the 20-day EMA and potentially slide to YTD low.
- If 1.3300 is reclaimed, USD/CAD may challenge the 50-day EMA before tackling significant resistance at 200 EMA and 1.3400.
USD/CAD bounces off the 20-day Exponential Moving Average (EMA) at 1.3278 after forming a bearish engulfing candlestick pattern, which suggests further downside is expected. Nevertheless, dynamic support spurred a jump in the USD/CAD exchange rates but fell short of cracking the 1.3300 figure. At the time of writing, the USD/CAD is trading at 1.3286 after hitting a daily high of 1.3304.
USD/CAD Price Analysis: Technical outlook
The USD/CAD remains neutral biased, capped on the upside by strong resistance levels, like the 50, 200, and 100-day EMAs, each at 1.3354, 1.3383, and 1.3411, respectively. Additionally, a bearish engulfing candle pattern suggests the pair might dip lower, with the 20-day EMA being the first support at 1.3278.
A breach of the latter will expose July’s 4 daily low of 1.3203. once cleared, the USD/CAD could extend its slide to the year-to-date (YTD) low of 1.3116.
Conversely, if USD/CAD reclaims 1.3300, the 50-day EMA at 1.3354 would be up for grabs. Next, resistance levels would emerge at the 200 EMA before buyers challenge 1.3400. Once broken, the USD/CAD could test the 100-day EMA at 1.3411.
USD/CAD Price Action – Daily chart
- USD/MXN drops following disappointing US jobs report and a decline in Treasury yields; market anticipates upcoming US inflation data.
- Cleveland Fed President, Loretta Mester, calls for more rate hikes amidst a tight labor market; other officials support further action.
- Mexican inflation continues its downward trend, as the CME FedWatch Tool points to high chances of a Fed hike; Banxico is expected to hold rates.
USD/MXN retraces from last week’s high of 17.3828, spurred by an improvement in market sentiment and broad US Dollar (USD) weakness, sparked by a fall in US Treasury bond yields, while traders brace for the release of inflation figures in the United States (US). At the time of writing, the USD/MXN is trading at 17.0611 after hitting a daily high of 17.1735, down 0.34%
Greenback falters as market sentiment improves and US Treasury yields fall, while US and Mexican inflation data take center stage
The last week’s jobs report in the US continues to drag the greenback lower, as the data showed the economy adding just 209K jobs in June, below estimates, signaling the labor market is cooling. That triggered another leg-down in the USD/MXN pair, even though the Unemployment Rate edged lower, suggesting the opposite. That, alongside a rise in the Average Hourly Earnings (AHE) expanding 4.4% YoY, above the prior month’s 4.2%, warrants the tightness of the labor market.
Regarding the labor market, the Cleveland Fed President Loretta Mester commented that the economy is still robust while saying, “When the economy reopened, labor demand well outpaced labor supply, putting upward pressure on wages and price inflation.” She stated, “More hikes needed to bring inflation back down to target.”
Other Fed officials echoed some of her comments, like the San Francisco Fed President Mary Daly stating there’s more to be done, opening the door for a couple of hikes. She added that inflation and growth risks became more “balanced,” but the risks of doing too little outpace the threats of overtightening.
Aside from this, USD/MXN traders are eyeing the release of June’s US inflation figures on Wednesday at around 12:30 GMT. The Consumer Price Index (CPI) is expected to decelerate to 3.1% YoY from 4%, while the core CPI, which excludes volatile items, is foreseen to dip to 5% YoY beneath May’s 5.3%.
As of writing, the US Dollar Index, a gauge of the buck’s value vs. a basket of peers, falls 0.17% down to 102.090, eyeing a fall to a new five-week low. US Treasury bond yields continue to trim some of the last week’s gains, with the 10-year benchmark note rate at 4.01%, down six basis points.
On the Mexico front, the latest inflation data revealed by INEGI shows June’s CPI falling for the fifth consecutive month to 5.06%, a drop of 0.10% in June, exceeding estimates of -0.09%. Annual core CPI which strips volatile items, was 6.89% in June, above forecasts of 6.87%.
Regarding monetary policy, the CME FedWatch Tool shows odds for a Fed 25 bps hike standing at 92.4%, higher than last week’s 86.8%; nonetheless, investors are not estimating additional tightening, although the latest dot-plot shows the Federal Funds Rate (FFR) peaking at 5.6%. According to comments made by its Governor Victoria Rodriguez Ceja, the Bank of Mexico (Banxico) is expected to hold rates unchanged to keep rates higher.
USD/MXN Price Analysis: Technical outlook
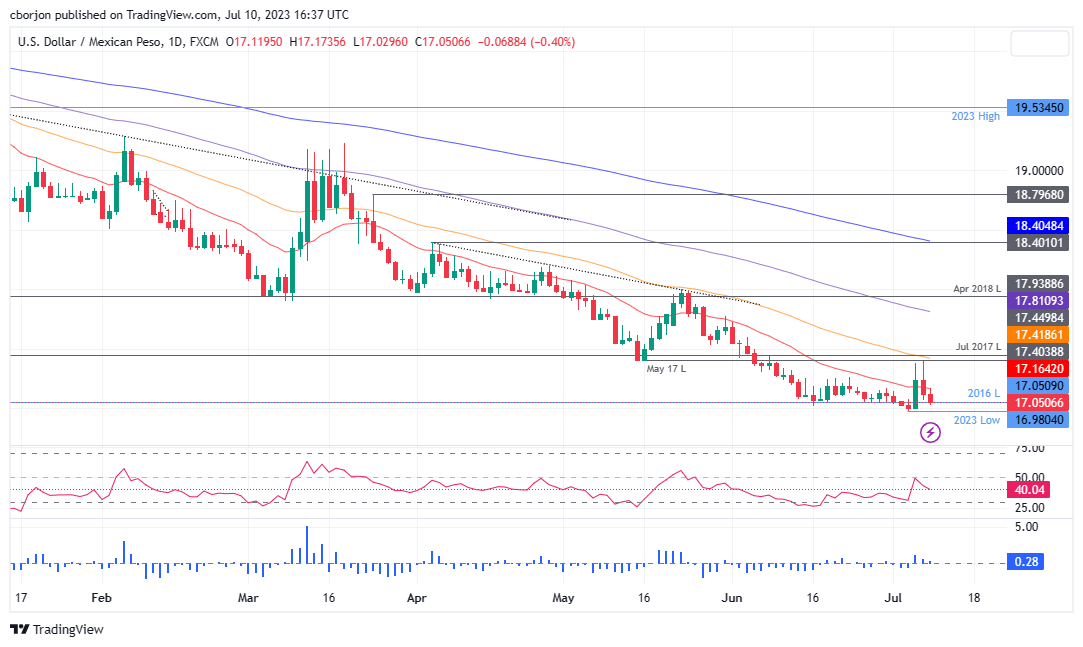
The USD/MXN is still downward biased as buyers failed to reclaim the 50-day Exponential Moving Average (EMA) at 17.4185, and the May 17 swing low turned resistance at 17.4038. A breach of that area is needed to change the pair’s bias to neutral, and that could pave the way to challenge the 100-day EMA at 17.8110 and the 18.00 mark. Conversely, further downside is expected, and a test of the year-to-date (YTD) low of 16.9761 when the USD/MXN falls below 17.00.
- The USD/CHF cleared daily gains, which saw the pair jumping to 0.8915 and settling at 0.8870.
- Markets are still digesting US mixed NFP report.
- Eyes on CPI data on Wednesday, expected to have decelerated in June.
On Monday, the USD/CHF reversed its course and cleared daily gains, retreating to the 0.8870 area in negative territory. No high-tier data will be released, and several Federal Reserve (Fed) speakers will deliver speeches. Meanwhile, markets continue to asses Friday’s Nonfarm Payrolls report from the US, which came in mixed, ahead of inflation data to be released on Wednesday.
US NFPs came in mixed, eyes on CPI data
On Friday, the US Bureau of Labor Statistics revealed that the number of new jobs created in all non-agricultural businesses fell to 209K MoM in June while markets expected 225K, lower than the previous figure of 306K. However, wages increased by 0.4% MoM in the same month, higher than the 0.4% expected.
As a reaction, the US faced severe selling pressure as the lower-than-expected job creation figures made investors bet on a less aggressive Fed. That said, sticky wage inflation may pressure the Fed to maintain its aggressive stance and limit USD losses. In addition, the Consumer Price Index (CPI) data will provide additional information regarding the inflation outlook in the US. As for now, markets are expecting the headline figure to fall to 3.1% YoY in June and the Core figure to 5% from their previous 4% and 5.3% figures, respectively.
Regarding expectations, markets have already priced in a 25 basis point (bps) hike in the next July meeting, while the odds of another hike stand around 40%. Fed officials Loretta Mester and Mary Daly were on the wires on Monday and showed themselves hawkish, expressing that inflation is unacceptably high and that further hikes are appropriate but failed to boost the USD.
USD/CHF Levels to watch
The daily chart suggests that the outlook favours the CHF over the USD in the short term. The Relative Strength Index (RSI) points south in negative territory, while the Moving Average Convergence Divergence (MACD) prints higher red bars, indicating a growing selling momentum. In addition, the pair trades below the 20,100 and 200-day Simple Moving Averages (SMAs)
Support Levels: 0.8860,0.8830,0.8820.
Resistance Levels: 0.8915, 0.8956 (20-day SMA), 0.8995.
-638246021106468660.png)
Commenting on the Federal Reserve's policy outlook, "we're likely to need a couple more rate hikes over the course of this year to really bring inflation sustainably back to the Fed's 2% goal," San Francisco Fed President Mary Daly said on Monday.
Additional takeaways
"US economic momentum continues to surprise. In context of that momentum, there's more we need to do to raise rates."
"We also need to balance against risks."
"The risks have become more balanced."
"With labor market still strong, inflation high, risks of doing too little are outweighing risks of doing too much."
"It's appropriate to slow the pace of rate hikes."
"We need to be resolute, and thoughtful."
"There are longer lags than we assumed."
"It's too early to declare victory on getting demand in balance with supply."
"We may end up doing less or more than a couple rate hikes this year, depending on the data."
"One lesson learned from last cycle is that fed could raise rates even if balance sheet still expanding."
"Credit tightening from March banking stresses is probably less than the quarter-point to 50 bps rate hike I have thought."
Market reaction
The US Dollar Index stays on the back foot in the American session on Monday and was last seen losing 0.2% on the day at 102.06.
- Japanese Yen strengthens against the US Dollar, with USD/JPY tumbling amid falling US bond yields and a mixed market mood.
- BOJ data suggests wage increase among small and medium-sized firms; possible end to the massive stimulus triggers jump in JGBs.
- Traders anticipate US June CPI data; Fed officials express concerns over high inflation, hinting at potential rate hikes.
The Japanese Yen (JPY) remains the strongest currency as the North American session begins, gaining 0.27% against the US Dollar (USD), as the USD/JPY pair tumbles after hitting a daily high of 143.00. Hence, the USD/JPY is trading at 141.65
Yen’s strength bolsters amid wage increase reports and BOJ’s potential end to stimulus while the US awaits key inflation data
A mixed market mood has set the tone for the session. Nevertheless, US bond yields drop, undermining the greenback, as shown by the US Dollar Index (DXY). The DXY, a measure of the US Dollar performance against a basket of six currencies, fell 0.05% to 102.213. Meanwhile, the US 10-year Treasury note yields 4.038%, losses three basis points, and weighed on the USD/JPY pair.
Data revealed by the Bank of Japan (BoJ) showed that small and medium-sized firms have begun to raise wages, a reflection of a tight labor market, the BoJ said. Hence, additional increases could keep inflation anchored past the BoJ’s 2% target, meeting the conditions required by the Japanese central bank to end its massive stimulus. The report spurred a jump in the Japanese Government Bonds (JGB), with the 10-year JGB yielding 0.468%, three basis points higher than the open and closing into the 0.50% cap imposed by the BoJ.
Aside from this, the lack of economic data in the United States (US) keeps traders awaiting the release of the Consumer Price Index (CPI) for June, scheduled for Wednesday at 12:30 GMT. In the meantime, a slew of Federal Reserve (Fed) officials have stressed that inflation is too high, the labor market tight, and that further action would be needed. The Fed’s Vice-Chairman for Supervision, Michael Barr, said the Fed still has “a bit of work to do” on rates, but it’s close, while his colleague Cleveland’s Fed President Loretta Mester said that more hikes are needed to bring inflation back down to target.
At the same time, the San Francisco Fed President Mary Daly said there’s more to be done, suggesting that a couple of more hikes this year “are likely needed” and emphasized that although risks on inflation and growth have become more “balanced,” a tight labor market, outweigh the risks of overtightening.
USD/JPY Price Analysis: Technical outlook
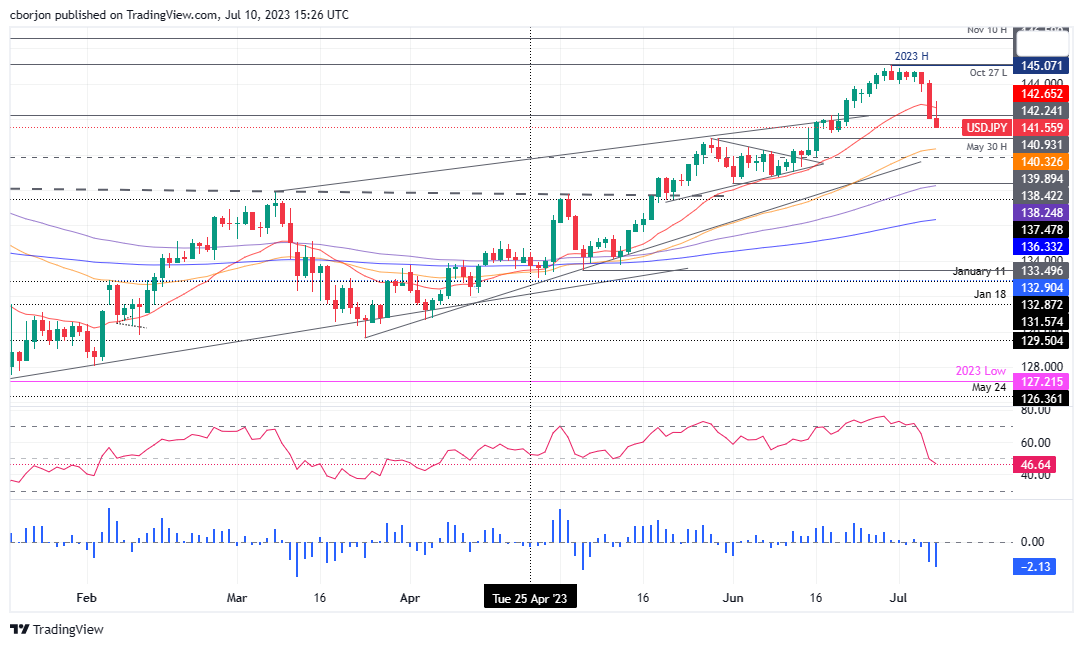
From a technical perspective, the USD/JPY last Friday’s 1.30% fall alongside a drop below the 20-day Exponential Moving Average (EMA) opened the door for further losses. Still, immediate support emerges at a June 20 daily low of 141.21, slightly above the May 30 high at 140.93. If USD/JPY breaches below that area, the following support would be the 50-day EMA at 140.33, followed by the 140.00 mark. Conversely, if USD/JPY fails to conquer 141.20, the 142.00 figure surfaces as the next resistance, followed by the 20-day EMA at 142.67 and 143.00.
The Federal Reserve Bank of New York's monthly Survey of Consumer Expectations showed on Monday that the US consumers' one-year inflation expectation dropped to the lowest level since April 2021 at 3.8% in June from 4.1% in May.
Key takeaways
"Three year-ahead expected inflation unchanged at 3% in June."
"Five-year ahead expected inflation at 3% in June vs 2.7% in May."
"June home price expectations rise to 2.9% vs May’s 2.6% expected gain."
"Home price expectations highest since July 2022."
"Expectations for gasoline prices fell in June."
"Perceptions of credit access improved in June."
"Households’ view on personal financial situations improved in June."
Market reaction
The US Dollar Index stays on the back foot in the American session and posts small daily losses below 102.20.
The Federal Reserve (Fed) will need to tighten the monetary policy "somewhat further" to lower inflation, Cleveland Fed President Loretta Mester said on Monday, per Reuters.
Additional takeaways
"Fed policy is less restrictive compared to history."
"Raising rates again will reduce risk of more action in future."
"Fed rate hikes have been moderating economic activity."
"Economy has proved stronger than expected."
"Supply chain disruptions have eased."
"Inflation is stubbornly high, stalled progress on core prices."
"Fed is closer to end of tightening campaign than its start."
"Core inflation gains too high and too broad based."
"Wage pressures remain too high to get inflation back to 2%."
"Demand for labor still outstripping supply."
"Business leaders fears of recession have declined."
Market reaction
The US Dollar Index edged slightly lower with the initial reaction to these comments and was last seen losing 0.1% on the day at 102.18.
The highlight of the week is the BoC rate decision on Wednesday. Economists at Scotiabank discuss CAD outlook after being one of the weakest G10 performers over the past five days.
CAD should improve on BoC hike
There is a small majority of forecasts in the Bloomberg survey currently favouring a 25 bps hike in the target rate to 5.00% but it’s a close call; swaps are leaning towards a hike, with 16-17 bps of tightening priced in. Most of the major Canadian banks are forecasting a rate increase, including Scotia.
The week ahead should be positive for the CAD, assuming the BoC delivers. Communication will be an import factor in how the markets react to the decision, however. A dovish hike will likely weigh on the CAD.
At the same time, if US CPI data do show the expected (or sharper) decline in headline prices (also Wednesday), the USD may soften broadly.
Federal Reserve Vice Chair for Supervision Michael Barr said on Monday that inflation is still far too high but acknowledged that they have made a lot of progress, as reported by Reuters.
"We are quite attentive to bringing inflation down to target," Barr added and explained that they still have "a bit of work to do."
Market reaction
These comments don't seem to be having a noticeable impact on the US Dollar's performance against its major rivals. As of writing, the US Dollar Index was virtually unchanged on the day at 102.25.
The Turkish Lira broke out of its tight range after this year’s election, which saw President Tayyip Erdogan retain his power. Economists at Commerzbank analyze TRY for the next year.
Lira is, once again, likely to suffer volatility
The Turkish Lira stabilised to some degree after the newly appointed economy management team announced a return to conventional monetary policy and started a rate hiking cycle. But challenges remain: high inflation and President Tayyip Erdogan's dislike for orthodox policies mean that the Lira is, once again, likely to suffer volatility.
Our USD/TRY forecast for end-2024 is 30.00.

Source: Commerzbank Research
This week’s focus will be on the RBNZ and Bank of Canada meetings on Wednesday and US CPI on the same day. Kit Juckes, Chief Global FX Strategist at Société Générale, analyzes how these events could impact the FX market.
CAD/NZD bulls need a BoC hike
We’ve already seen higher-than-expected Norwegian CPI data prompt a further jump in NOK/SEK, which shows central bank behaviour remains dominant, but we expect 0.3% increases for both headline and core CPI in the US.
We probably need a 0.2% (preferably in the core) print to give EUR/USD a chance of getting back above 1.10 (and USD/JPY moving towards 140). Absent that, the market’s looking for a 25 bps BoC hike (to 5%), and no change from the RBNZ (5.5%). Assurances the latter is ‘done’ and concern about China could be enough for NZD/CAD to head lower again.
Economists at Rabobank analyze the Bank of Japan (BoJ) policy outlook and its implications for the Yen.
Steady policy appears to be the most likely outcome for the July policy meeting
Although steady policy appears to be the most likely outcome for the July policy meeting, it is widely expected to bring upgraded inflation forecasts and the market will continue to hope that the BoJ may offer some signal as to when YCC could be adjusted. Speculation of a possible tweak could allow the JPY some support ahead of the BoJ meeting this month.
We maintain our one-month forecast of USD/JPY 142. That said, we have softened some of our JPY forecasts further out on anticipation that a policy tweak is likely to be delayed.
USD/JPY – 1M 142.0 3M 140.0 6M 138.0 9M 135.0 12M 132.0
- AUD/USD has dropped heavily to near 0.6630 amid a solid recovery in the US Dollar Index.
- After upbeat US labor cost figures, investors are awaiting June’s CPI data.
- Post a skip in the policy-tightening spell the RBA is expected to elevate interest rates further to 4.35%.
The AUD/USD pair has extended its downside significantly to near 0.6630 in the early New York session. The intense sell-off in the Aussie asset is inspired by a solid recovery in the US Dollar Index (DXY). The US Dollar Index has refreshed its day’s high at 102.56 as the sustainable addition of fresh payrolls in the labor market has strengthened hopes of more interest rate hikes from the Federal Reserve (Fed).
S&P500 is set to open on a muted note following cues from the overnight futures. The US Dollar Index failed to pick strength as lower-than-anticipated payroll additions offset the impact of rising wage pressures. Meanwhile, the 10-year US Treasury Yields have dropped marginally to near 4.06%.
After upbeat labor cost figures, investors are awaiting June’s Consumer Price Index (CPI) data, which is scheduled for Wednesday at 12:30. Fed policymakers are consistently reiterating that core inflationary pressures are extremely stubborn and more interest rate hikes are appropriate to maintain pressure.
However, upbeat Average Hourly Earnings are sufficient for the Fed to accelerate interest rate hikes. Chicago Fed President Austan Goolsbee said two more interest rate hikes this year are well-favored.
On the Australian Dollar front, after a skip in the policy-tightening spell, the Reserve Bank of Australia (RBA) is expected to elevate interest rates further to 4.35%. Knowing the fact that labor market conditions are tightening and inflation at 5.6% is far from the desired rate of 2%, RBA Governor Philip Lower would uplift policy rates.
In China, consumer and Producer Price Index (PPI) are consistently decelerating as the overall demand by households is extremely weak. Dismantle of pandemic controls has failed to uplift economic prospects and has propelled fears of a slowdown.
It is worth noting that Australia is the leading trading partner of China and bleak demand in China impacts the Australian Dollar.
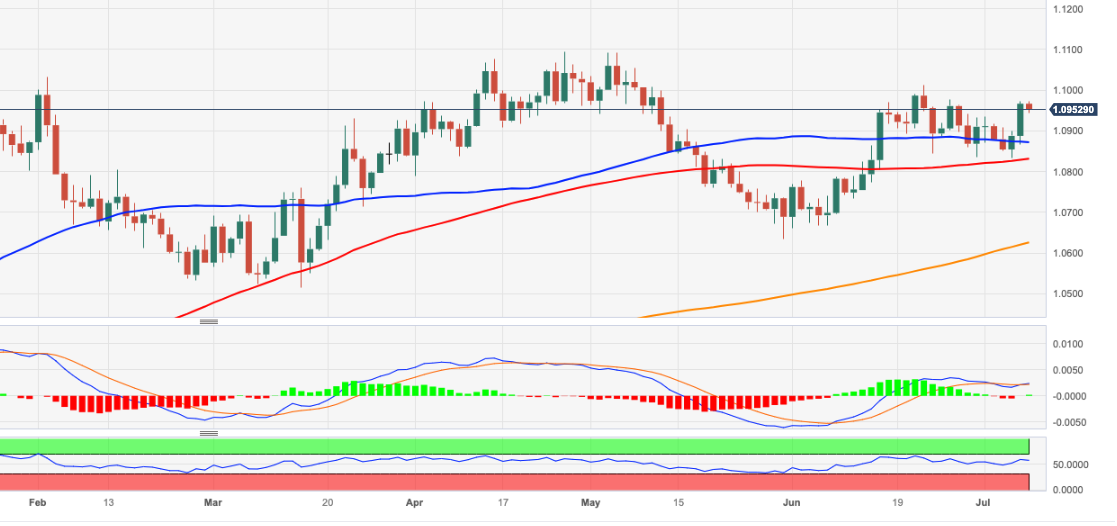
- EUR/USD comes under pressure and revisits the mid-1.0900s.
- Above the monthly high comes the June top past 1.1000.
EUR/USD’s rebound finds some decent initial hurdle around 1.0970 so far at the beginning of the week.
Once the pair clears the July high at 1.0973 (July 7), it could then embark on a potential challenge of the June high at 1.1012 (June 22) prior to the 2023 peak at 1.1095 (April 26).
Looking at the longer run, the positive view remains unchanged while above the 200-day SMA, today at 1.0624.
EUR/USD daily chart
Economists at Scotiabank analyze USD outlook.
Markets consider rate outlook
The June NFP data was likely strong enough to cement a rate hike from the Fed later this month. But the trend in the US labour market is clearly slowing and investors are, at the margin, slightly less persuaded by the idea of rate hikes beyond this month’s decision. December swaps eased 7-8 bps Friday.
The weak close for the USD Friday rounded off a rough couple of days and cemented a bearish (outside range) close on the DXY on the week which tilts risks toward a generally softer USD (or limited upside potential at least) in the near to medium term.
- USD/JPY has gauged a cushion near 142.00 amid a steep recovery in the USD Index.
- Steady June Nonfarm Payrolls and upbeat labor cost figures are sufficient to confirm resumption of the policy-tightening spell by the Fed.
- S&P500 futures have turned marginally positive after sharply recovering losses, portraying a risk-on market mood.
The USD/JPY pair has sensed an intermediate cushion around 142.00 in the late London session. The asset has picked some strength as the US Dollar Index (DXY) has extended its recovery sharply to near 102.50. The strength in the USD Index is propelled by expectations of more interest rate hikes from the Federal Reserve (Fed).
S&P500 futures have turned marginally positive after sharply recovering losses, portraying a significant recovery in the risk-on market mood. The US Dollar Index is expected to extend its upside journey as steady June Nonfarm Payrolls and upbeat labor cost figures are sufficient to confirm the resumption of the policy-tightening spell by the Fed. The yields offered on 10-year US Treasury bonds have jumped to 4.08%.
June’s NFP report released on Friday reported fresh additions of 209K while investors were expecting an increase of 225K. In May, fresh payroll additions were 306K. The Unemployment Rate has dropped to 3.6%. Meanwhile, payroll expenditures maintained at 0.4% and remained higher than the consensus of 0.3%. Also, Annualized Average Hourly Earnings remained at a steady pace of 4.4%.
Households with higher disposable will result in an elevation in price pressures and would force Fed policymakers to raise interest rates further. Investors will get clarity about price pressures after the release of the inflation data, which will release on Wednesday at 12:30 GMT.
Meanwhile, the Japanese Yen sharply appreciated against the US Dollar amid rumors of intervention by the Bank of Japan (BoJ) and Japanese officials in the currency domain to provide a cushion to its domestic currency.
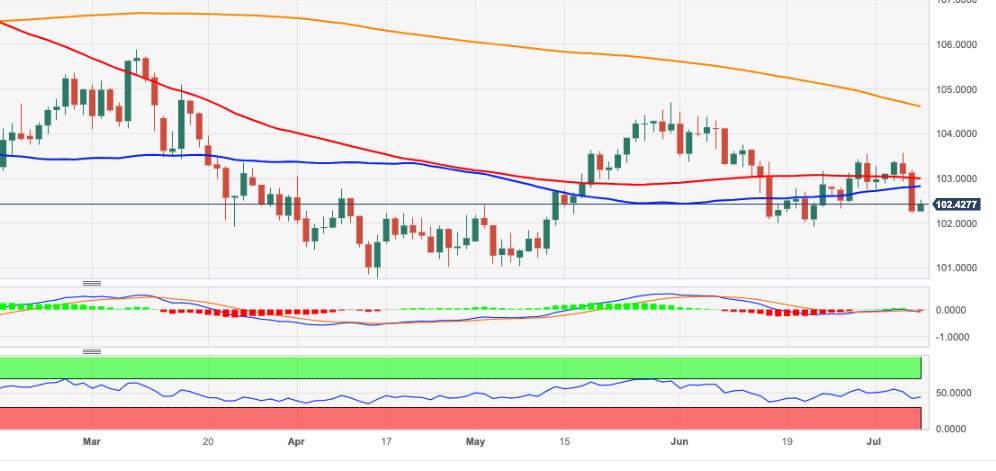
- DXY comes under some selling pressure and tests 102.90.
- Extra gains meet the next target near 103.50.
DXY attempts a decent recovery following Friday’s post-Payrolls sharp retracement to the 102.20 region.
While further consolidation appears likely in the very near term, the continuation of the uptrend in place since mid-June could challenge the weekly high at 103.54 (June 30) prior to the May high at 104.69 (May 31), which appears reinforced by the 200-day SMA.
Looking at the broader picture, while below the 200-day SMA at 104.60, the outlook for the index is expected to remain negative.
DXY daily chart
- EUR/JPY fails to extend the daily rebound north of 156.70.
- Extra decline could revisit the 154.00 zone in the near term.
EUR/JPY could not sustain the earlier move to the 156.70 area and slipped back to the sub-156.00 region at the beginning of the week.
In the meantime, the cross maintains its rejection from last week’s YTD tops near the 158.00 area. Against this backdrop, further pullbacks should not be ruled out for the time being. That said, the door remains open for the cross to challenge the weekly low at 154.04 (June 20).
So far, further upside looks favoured while the cross trades above the 200-day SMA, today at 145.64.
EUR/JPY daily chart

GBP/USD slips back from another test of 1.2850. Economists at Scotiabank analyze Cable outlook.
Yields are bullish
Yield support suggests GBP losses are unlikely to extend too far at the moment but another failure at 1.2850 will spark interest on the charts.
UK data on Tuesday are expected to reflect tight labour markets and still elevated wage growth. Firm data will help slow GBP losses below 1.28.
See – GBP/USD: Key support at 1.2590 needs to hold to avoid a major top – Scotiabank
- NZD/USD is oscillating inside the previous day’s range as the focus shifts to RBNZ policy.
- The USD Index is struggling to find strength despite rising wage pressures.
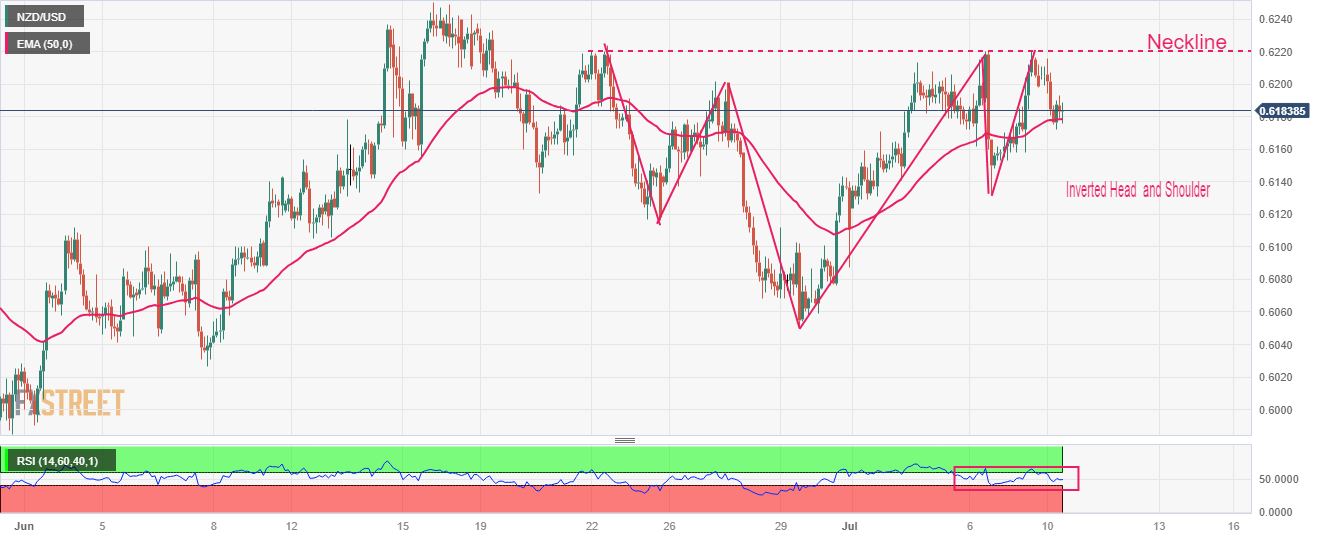
- NZD/USD is forming an Inverted Head and Shoulder chart pattern, which indicates a wide consolidation.
The NZD/USD pair is displaying topsy-turvy moves below the round-level resistance of 0.6200 in the European session. The Kiwi asset has turned choppy as investors are awaiting the interest rate decision by the Reserve Bank of New Zealand (RBNZ), which is scheduled for Wednesday at 2:00 GMT.
S&P500 futures have recovered its entire losses posted in Asia, portraying recovery in the risk appetite of the market participants. The US Dollar Index (DXY) has rebounded briskly to near 102.45. The USD Index is struggling to find strength despite rising wage pressures and sustainability in labor market conditions.
Meanwhile, RBNZ Governor Adrian Orr will likely keep interest rates unchanged at 5.50%, marking an end to its 20-month-long hiking cycle, as reported by Reuters to avoid further calamity in economic prospects. Investors should note that the New Zealand economy has already entered into a recession.
NZD/USD is forming an Inverted Head and Shoulder chart pattern on a two-hour scale, which indicates a wide consolidation. A breakout of the neckline plotted from June 22 high around 0.6220 will result in a bullish reversal. The 50-period Exponential Moving Average (EMA) at 0.6179 is providing cushion to the New Zealand Dollar bulls.
The Relative Strength Index (RSI) (14) is oscillating in the 40.00-60.00, which indicates a sideways performance.
Going forward, a decisive break above June 22 high around 0.6220 will drive the asset towards June 14 high at 0.6236 followed by May 17 high at 0.6274.
Alternatively, a downside move below June 23 low at 0.6116 will expose the asset June 05 low at 0.6041. A slippage below the latter would expose the asset to psychological support at 0.6000.
NZD/USD two-hour chart
Economists at Scotiabank analyze EUR/USD outlook.
Trend remains bullish
Another hike this month remains likely, with the door likely left open for a September move as well. Rates may only fall slowly thereafter, as well, adding to EUR support.
The EUR’s bullish break out from the June consolidation range has not extended too far and is consolidating today in a narrow range. But the move has room to develop. The initial target should be a push – and hold – above 1.10 and then further gains to retest the YTD high at 1.1110.
GBP/USD is struggling a little after another failure at 1.2850 late last week. Economists at Scotiabank analyze the pair’s technical outlook.
A major top might be developing
A handful of tests of the 1.2850 area have been easily rejected and intraday losses suggest another is developing today on the chart.
A major top might be developing but will only come in to play if the Pound eases below key support at 1.2590 at this point.
Given still strong trend dynamics, an alternative scenario is that losses are limited (to the mid/upper 1.27s) and the Pound’s rally pushes on to new cycle highs shortly.
- Gold price is consolidating above $1,920.00 ahead of US inflation data.
- The overall risk profile is still negative as the Fed is going to resume its policy-tightening spell.
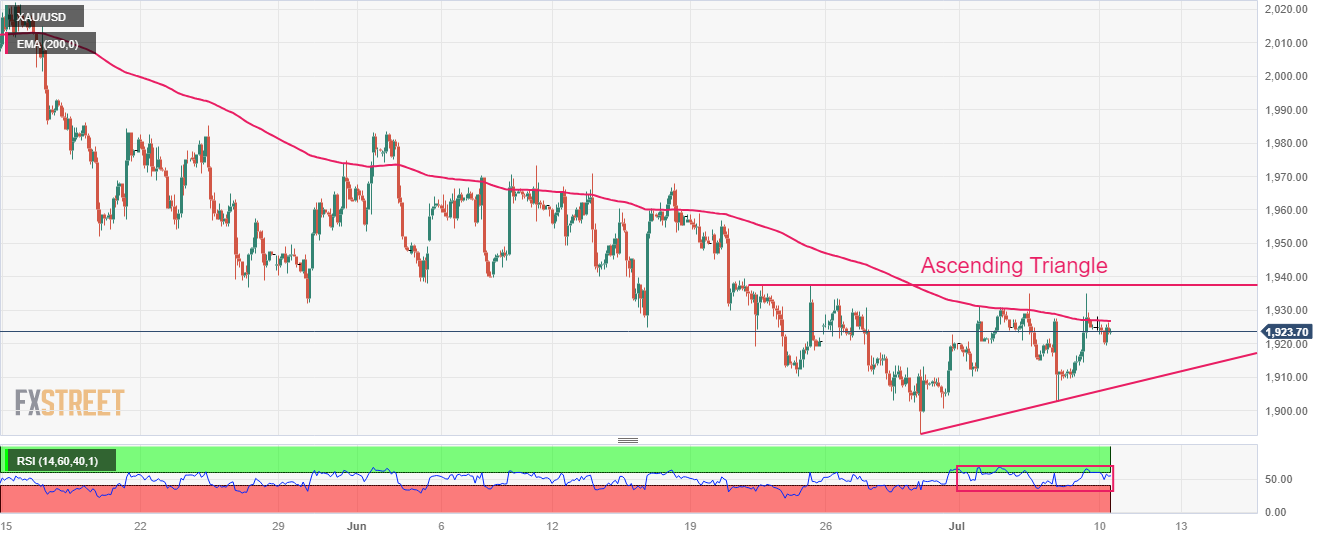
- Gold price is auctioning in an Ascending Triangle chart pattern.
Gold price (XAU/USD) is demonstrating a non-directional performance after correcting from a weekly high of $1,935.00 in the London session. The precious metal has turned topsy-turvy as investors are shifting their focus towards the United States Consumer Price Index (CPI) after the impact of the Nonfarm Payrolls (NFP) report.
Analysts at Well Fargo expect a surprisingly resilient labor market has helped to keep the United States economy expanding at a moderate pace despite continued fears about a recession. However, even amid more forthcoming labor supply and gradually cooling labor demand, the weight of the evidence still suggests that the labor market remains too tight to be consistent with 2% inflation.
Meanwhile, S&P500 futures have recovered decent losses generated in early Europe, portraying a recovery in the risk appetite of the market participants. The overall risk profile is still negative as the Federal Reserve (Fed) is going to resume its policy-tightening spell and will push interest rates to 5.25-5.50%. Investors should note that Fed chair Jerome Powell skipped the rate-hiking spree in its June monetary policy meeting.
The US Dollar Index (DXY) has rebounded after dropping to near 102.30. A sideways auction is expected in the USD Index ahead of US inflation data. As per the consensus, monthly headline CPI elevated at a higher pace of 0.3% vs. the prior pace of 0.1%. Annualized headline inflation is expected to soften to 3.1% against the former release of 4.0%. Declining gasoline prices have decelerated headline inflation, however, the major focus will be on the core inflation data.
Gold technical analysis
Gold price is auctioning in an Ascending Triangle chart pattern on a two-hour scale. Upward-sloping trendline of the aforementioned chart pattern is plotted from June 29 low at $1,893.00 while the horizontal resistance is placed from June 21 high around $1,937.00.
The 200-period Exponential Moving Average (EMA) at $1,927.00 is acting as a barricade for the Gold bulls.
A 40.00-60.00 range oscillation by the Relative Strength Index (RSI) (14) indicates a non-directional performance.
Gold two-hour chart
CAD drifts a little lower after strong close Friday. Economists at Scotiabank analyze USD/CAD technical outlook.
CAD losses to remain limited ahead of Wednesday’s BoC policy decision
Spot is grinding a little higher on the day but CAD losses are likely to remain limited ahead of Wednesday’s BoC policy decision.
Friday’s session formed a bearish outside range/reversal day, with the peak in the USD developing around important resistance (40-DMA and the 50% retracement of the June decline in funds). A solid rejection of important technical resistance warrants attention.
Firm resistance stands at 1.3375/85 now.
Intraday resistance is 1.3325. Key USD support (ahead of renewed losses) is 1.3275.
- US Dollar stays relatively resilient against its major rivals on Monday.
- US Dollar Index clings to modest recovery gains following Friday's sharp decline.
- US labor market showed signs of a cooldown in June.
The US Dollar (USD) holds its ground against its major rivals at the beginning of the week after having suffered heavy losses late Friday. The US Dollar Index, which measures the USD's performance against a basket of six major currencies, clings to modest recovery gains at around 102.50.
The USD came under strong selling pressure ahead of the weekend after the monthly jobs report published by the US Bureau of Labor Statistics revealed signs of a cooldown. Nonfarm payrolls (NFP) rose 209,000 in June, less than the market expectation for an increase of 225,000. Additionally, May's increase of 339,000 got revised lower to 306,000. Other details of the publication revealed that the Unemployment Rate edged lower to 3.6% while annual wage inflation held steady at 4.4%.
The US economic docket will not feature any high-tier data releases on Monday and the USD's valuation could be influenced by Federal Reserve (Fed) officials', including San Francisco Fed President Mary Daly and Cleveland Fed President Loretta Mester, comments. Later in the week, June inflation data could trigger the next big action in the USD.
Daily digest market movers: US Dollar stabilizes on Monday
- Commenting on the US jobs report, "I expect the US Dollar to remain on the back foot, but to hold some of its ground," said FXStreet Analyst Yohay Elam. "The mix of weak job growth and wages marching forward shifts the focus to next week's Consumer Price Index (CPI) report."
- In an interview with CNBC on Friday, Chicago Federal Reserve Bank President Austan Goolsbee noted that the jobs market was still strong but cooling.
- Over the weekend, US Treasury Secretary Janet Yellen said that she had “direct” and “productive” discussion with senior Chinese officials. However, "the US and China have significant disagreements," Yellen added.
- The 10-year US Treasury bond yield edges lower but holds comfortably above 4%. US stock index futures trade in negative territory, pointing to a bearish opening in Wall Street on Monday.
- Despite the mixed jobs report, markets are still pricing in a more-than-90% chance of the Fed raising the policy rate by 25 basis points in July. The probability of the Fed hiking the interest rate again after July stands at around 30%.
- In a recently published report, "the Dollar provides one of the highest yields of the world's major currencies, thanks to the Fed's hiking cycle," said Morgan Stanley analysts. "In a world of weak global growth, this yield will also likely help the Dollar to appreciate."
- On a yearly basis, the US CPI is forecast to rise 3.1% in June, following May's increase of 4%.
Technical Analysis: US Dollar Index turns bearish following Friday's slide
The US Dollar Index (DXY) closed below the 100-day Simple Moving Average (SMA) on Friday and the 20-day SMA made a bearish cross with the 50-day SMA. Furthermore, the Relative Strength Index (RSI) dropped below 50 after having moved sideways near that level in the past couple of weeks.
On the downside, 102.00 (psychological level, static level) aligns as key support. A daily close below that level could attract sellers and open the door for an extended slide toward 101.50 (static level) and 101.00 (static level, psychological level).
Strong resistance seems to have formed at 103.00 (100-day SMA, 50-day SMA, Fibonacci 38.2% retracement of the May-June uptrend). If the DXY rises above that level and starts using it as support, it could target 103.50 (Fibonacci 23.6% retracement) and 104.00 (psychological level) next.
US Dollar FAQs
What is the US Dollar?
The US Dollar (USD) is the official currency of the United States of America, and the ‘de facto’ currency of a significant number of other countries where it is found in circulation alongside local notes. It is the most heavily traded currency in the world, accounting for over 88% of all global foreign exchange turnover, or an average of $6.6 trillion in transactions per day, according to data from 2022.
Following the second world war, the USD took over from the British Pound as the world’s reserve currency. For most of its history, the US Dollar was backed by Gold, until the Bretton Woods Agreement in 1971 when the Gold Standard went away.
How do the decisions of the Federal Reserve impact the US Dollar?
The most important single factor impacting on the value of the US Dollar is monetary policy, which is shaped by the Federal Reserve (Fed). The Fed has two mandates: to achieve price stability (control inflation) and foster full employment. Its primary tool to achieve these two goals is by adjusting interest rates.
When prices are rising too quickly and inflation is above the Fed’s 2% target, the Fed will raise rates, which helps the USD value. When inflation falls below 2% or the Unemployment Rate is too high, the Fed may lower interest rates, which weighs on the Greenback.
What is Quantitative Easing and how does it influence the US Dollar?
In extreme situations, the Federal Reserve can also print more Dollars and enact quantitative easing (QE). QE is the process by which the Fed substantially increases the flow of credit in a stuck financial system.
It is a non-standard policy measure used when credit has dried up because banks will not lend to each other (out of the fear of counterparty default). It is a last resort when simply lowering interest rates is unlikely to achieve the necessary result. It was the Fed’s weapon of choice to combat the credit crunch that occurred during the Great Financial Crisis in 2008. It involves the Fed printing more Dollars and using them to buy US government bonds predominantly from financial institutions. QE usually leads to a weaker US Dollar.
What is Quantitative Tightening and how does it influence the US Dollar?
Quantitative tightening (QT) is the reverse process whereby the Federal Reserve stops buying bonds from financial institutions and does not reinvest the principal from the bonds it holds maturing in new purchases. It is usually positive for the US Dollar.
Economist at UOB Group Enrico Tanuwidjaja and Junior Economist Agus Santoso review the latest FX reserves figures in Indonesia.
Key Takeaways
Indonesia’s foreign exchange reserves eased by USD1.8bn to USD137.5bn in Jun 2023.
The latest reserve level was equivalent to financing 6.1 months of imports or 6 months’ worth of imports and servicing the government’s external debt, well above the international adequacy standard of 3 months of imports.
BI will increase the frequency and tenor of Foreign Currency Term Deposits (TD Valas) with more competitive rates as an extra policy to anchor rupiah stability. Since its first auction in Mar, BI attracted more than USD1bn of TD DHE with total outstanding by around USD475.8mn in Jul.
The debate around the global strength of the Dollar in currency markets continues, and economists at Morgan Stanley report expect the greenback to appreciate.
US assets retain unique appeal for global capital
US assets retain unique appeal for global capital, as the recent boom in US tech stocks and rising optimism about the productivity enhancing implications of AI show.
Meanwhile, the Dollar provides one of the highest yields of the world's major currencies, thanks to the Fed's hiking cycle. In a world of weak global growth, this yield will also likely help the Dollar to appreciate.
For clues about the future direction of exchange rates, we would be watching for signs that investment opportunities in different economies are improving. For now, the USD offers attractive yields and remains a safe harbor during the current period of slow global economic growth.
Economists at MUFG see as more likely than not that the BoJ will shift its policy by altering the current YCC framework. Therefore, USD/JPY is set to fall sharply.
BoJ YCC speculation to build
We are anticipating a build-up in speculation of a change to YCC as we move toward the BoJ policy meeting on 28th July. While it seems more likely than not now that the FOMC will hike on 26th July, the market is now fully priced for that and we still have the key CPI data this week, which shows a strong consensus of further declines in inflation.
The balance of risk for core CPI seems to be more skewed toward a weaker print given the fact that housing-related inflation seems to be declining. But the Yen should find better support at these levels.
Expectations on a YCC change may have started to build this week but expectations remain low so there is scope for a shift in expectations to help the Yen. The rhetoric from the MoF also points to greater opposition to Yen depreciation and Leveraged Funds remain very short at present.
The Loonie followed the US Dollar’s soft momentum over the past week and lost ground against most G10 peers. Economists at ING analyze CAD's outlook ahead of the Bank of Canada meeting on Wednesday.
CAD can bounce back against other pro-cyclicals
Since markets aren’t fully pricing in a July BoC hike (implied probability around 70% as of Friday), we could see a week of restrengthening for CAD, especially since the BoC may not have much interest in attaching a very dovish tone to a hike, and may well keep the door open for more tightening ahead.
USD’s recent softness looks hardly sustainable in an environment of higher US yields and hawkish Fed communication, so we do not see major downside potential for USD/CAD just yet. We favour, instead, some outperformance of the Loonie against other high-beta commodity currencies (such as the AUD and NZD) should our view for a BoC hike prove correct.
- EUR/GBP is making efforts for a range extension towards the north ahead of Andrew Bailey’s speech.
- An economic indicator that could create more troubles for BoE policymakers is the labor cost data.
- ECB Centeno cited that Eurozone’s inflation could come under 3% by the end of 2023.
The EUR/GBP pair is oscillating in a narrow range around 0.8550 in the London session. The asset is demonstrating a back-and-forth action after a solid recovery as investors are awaiting the speech from Bank of England (BoE) Governor Andrew Bailey for further guidance.
Inflation in the United Kingdom is not showing signs of deceleration despite that BoE and UK diplomats have extended the scope of an inflation-control toolkit to coercion. Therefore, the speech from Andrew Bailey will be keenly watched to get cues about inflation and interest rate guidance.
The burden of red-hot inflation on households is elevating as household demand has reported a steepest fall in the past 14 years. Apart from Andrew Bailey’s speech, investors will keep an eye on the labor market data.
As per the preliminary estimates, Claimant Count Change is expected to show an increase of 20.5K in June vs. a decline of 13.6K reported last month. The Unemployment Rate is seen unchanged at 3.8% and Three-month Average Earnings Index is expected to increase to 6.8% against the former release of 6.5%.
An economic indicator that could create more troubles for BoE policymakers is the labor cost data, which is expected to increase further and make the inflation situation more worsen.
On the Eurozone front, Sentix Investor Confidence has turned vulnerable to -22 vs. the former release of -17. This indicates a significant loss in the confidence of investors toward current and forward economic conditions. This could be the outcome of higher interest rates from the European Central Bank (ECB), which are expected to tighten further as the victory has not been announced over inflation yet.
On Friday, ECB Governing Council member and Bank of Portugal Governor, Mario Centeno cited that Eurozone’s inflation could come under 3% by the end of 2023.” He further added inflation is coming down faster while the Eurozone labor market is the strongest it has ever been.
- WTI Crude Oil prices face rejection near the 100-DMA and pull back from a one-month high.
- Last week's sustained strength and acceptance above the 50-day SMA favours bullish traders.
- Any meaningful corrective fall might now be seen as a buying opportunity and remain limited.
Western Texas Intermediate (WTI) Crude Oil prices struggle to capitalize on the recent rise witnessed over the past two weeks or so and face rejection near the 100-day Simple Moving Average (SMA) on Monday. The black liquid drops to a fresh daily low during the early European session, though shows some resilience below the $73.00 round-figure mark. Nevertheless, the commodity has eroded a part of Friday's strong gains to over a one-month high and currently trades around the $73.20-$73.25 region, down just over 0.50% for the day.
A slew of weak economic data from China released over the past week or so, including the softer inflation figures on Monday, add to worries about slowing growth in the world's second-largest economy, which might dent fuel demand. This, in turn, is seen as a key factor exerting some downward pressure on Crude Oil prices. That said, the expected supply cuts from the world's biggest oil exporters - Saudi Arabia and Russia - in August should help limit the downside and warrants some caution before placing aggressive bearish bets.
From a technical perspective, the recent strong rally from the $67.00 horizontal support and last week's sustained move beyond the 50-day Simple Moving Average (SMA) favours bullish traders. This, along with positive oscillators on the daily chart, suggests that the path of least resistance for Crude Oil prices is to the upside. Hence, any subsequent pullback is more likely to attract fresh buying near the $72.00 mark and is likely to remain cushioned near the 50-day SMA resistance breakpoint, currently around the $71.20-$71.15 region.
On the flip side, bulls might now wait for acceptance above the 100-day SMA barrier, currently pegged around the $73.75-$73.85 region, before positioning for any further gains. Crude Oil prices might then accelerate the positive momentum towards testing the next relevant hurdle near the $74.70-$74.75 region before aiming to reclaim the $75.00 psychological mark for the first time since early May.
WTI Crude Oil daily chart
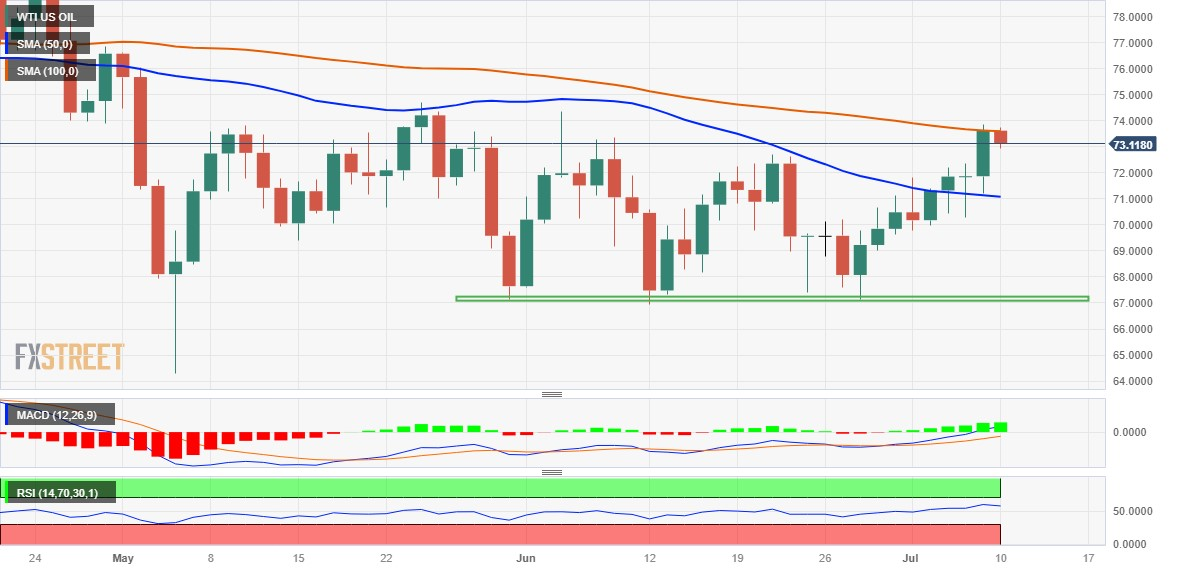
Key levels to watch
Economists at MUFG Bank are maintaining a long EUR/USD trade idea.
US CPI report on Wednesday is the next key focus
The EUR is proving resilient in the near term to the disappointing economic data flow from the Eurozone with EUR/USD continuing to trade towards the top of this year’s range between 1.0500 and 1.1000. The price action is giving us more confidence that the next move higher for the pair will be to the upside.
US CPI report on Wednesday is the next key focus for US rates and the USD and poses downside risks if there is more evidence that the super core measure of inflation is slowing as well as energy and food inflation.
LONG EUR/USD – OPEN @ 1.0920, TARGET @ 1.1370 & STOP-LOSS @ 1.0620)
- Investor sentiment in the Eurozone continued to weaken in July.
- EUR/USD holds steady in its daily range slightly above 1.0950.
The Eurozone Sentix Investor Confidence declined to -22.5 in July from -17 in June.
Commenting on the survey's findings, "there is also nothing positive to report in terms of forward-looking expectations," said Sentix managing director Manfred Huebner.
Huebner further noted that the Investor Confidence Index for Germany fell 7.3 points to -28.4.
Market reaction
This report doesn't seem to be having a noticeable impact on the Euro's performance against its rivals. As of writing, the EUR/USD pair was little changed on the day at 1.0962.
- Euro gives away part of Friday’s gains vs. the US Dollar.
- Stocks in Europe opens the week in a mixed tone.
- EUR/USD meets initial resistance around 1.0970.
- EMU Business Climate surprised to the downside in July.
- Fedspeak will grab all the attention later in the session.
After the release of the June Nonfarm Payrolls, the Euro (EUR) faced some selling pressure, causing EUR/USD to retreat towards 1.0950 at the beginning of the week.
On this, the June employment figures catered to various interests. Individuals focused on growth would emphasize the lowest monthly job gain in 30 months (209K) and the downward adjustment of 110K for the previous two months. On the other hand, those optimistic about the resilient economy would highlight the strong hiring indicated by the household survey, a decrease in the unemployment rate, and notable growth in wages. Considering all factors, the report likely favours a 25 basis points increase in July.
Meanwhile, the US dollar (USD) is attempting a bounce after Friday's drop to 2-week lows in the 102.20 zone, as measured by the USD Index (DXY). This is occurring against the backdrop of further weakness in yields in the short end of the curve and extra gains in the belly and the long end.
The potential future actions of the Federal Reserve and the European Central Bank (ECB) in normalizing their monetary policies continue to be a topic of discussion, especially with increasing concerns about an economic slowdown on both sides of the Atlantic.
The recent robust results from key US fundamentals have reinforced the likelihood of a 25 basis point rate hike by the Fed at its July meeting. These results have continued to show a resilient US economy and a tight labour market.
On another front, data from the CFTC Positioning report for the week ended on July 3 saw the speculative community trimming their EUR net longs to levels last seen in mid-March near 143K contracts, as the single currency continued to correct lower from peaks past the key 1.1000 the figure (June 22).
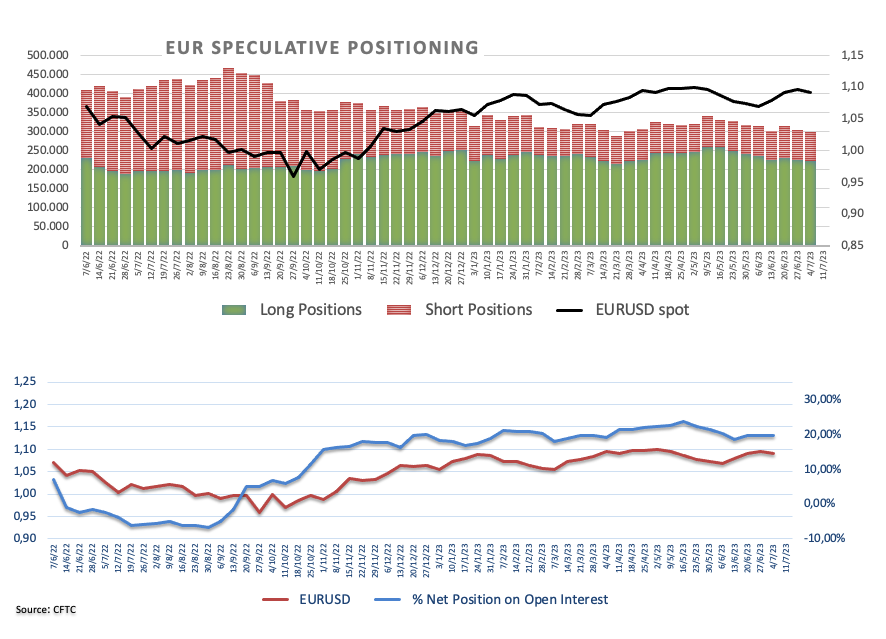
In the euro docket, Investor Confidence tracked by the Sentix Index in the euro area weakened to -22.5 in Jul in what was the sole release at the beginning of the week.
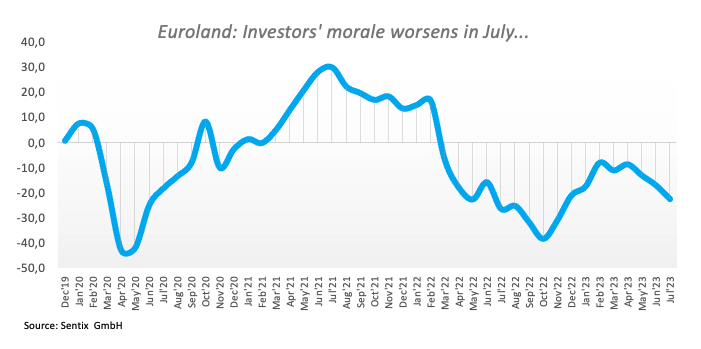
Across the ocean, Wholesale Inventories is only due along with speeches from FOMC Michael Barr (permanent voter, centrist), San Francisco Fed Mary Daly (2024 voter, hawk), Cleveland Fed Loretta Mester (2024 voter, hawk), and Atlanta Fed Raphael Bostic (2024 voter, hawk).
Daily digest market movers: Euro appears cautious ahead Fedspeak, CPI
- The EUR faces some tepid downward sentiment on Monday.
- The EMU Sentix Index deteriorated further in July.
- Chinese inflation figures came in short of estimates in June.
- Bets for a 25 bps rate hike by the Fed, ECB in July remain steady.
- Fed speakers will take centre stage later on Monday.
Technical Analysis: Euro now shifts the attention to 1.1000 and above
The recent price action in EUR/USD allows for extra gains in the short-term horizon.
The continuation of the uptrend should rapidly clear the July top at 1.0973 (July 7) prior to the psychological 1.1000 hurdle. North from here emerges the June peak of 1.1012 (June 22) ahead of the 2023 high of 1.1095 (April 26), which is closely followed by the round level of 1.1100. Further up comes the weekly top of 1.1184 (March 31, 2022), which is supported by the 200-week SMA at 1.1180, just before another round level at 1.1200.
On the downside, the weekly low at 1.0833 (July 6) appears reinforced by the provisional 100-day SMA. The breakdown of this region should meet the next contention area not before the May low of 1.0635 (May 31) ahead of the crucial 200-day SMA at 1.0624, which is followed by the March low of 1.0516 (March 15) and the 2023 low of 1.0481 (January 6).
Looking at the broader picture, the constructive view of EUR/USD appears unchanged as long as the pair trades above the key 200-day SMA.
Euro FAQs
What is the Euro?
The Euro is the currency for the 20 European Union countries that belong to the Eurozone. It is the second most heavily traded currency in the world behind the US Dollar. In 2022, it accounted for 31% of all foreign exchange transactions, with an average daily turnover of over $2.2 trillion a day.
EUR/USD is the most heavily traded currency pair in the world, accounting for an estimated 30% off all transactions, followed by EUR/JPY (4%), EUR/GBP (3%) and EUR/AUD (2%).
What is the ECB and how does it impact the Euro?
The European Central Bank (ECB) in Frankfurt, Germany, is the reserve bank for the Eurozone. The ECB sets interest rates and manages monetary policy.
The ECB’s primary mandate is to maintain price stability, which means either controlling inflation or stimulating growth. Its primary tool is the raising or lowering of interest rates. Relatively high interest rates – or the expectation of higher rates – will usually benefit the Euro and vice versa.
The ECB Governing Council makes monetary policy decisions at meetings held eight times a year. Decisions are made by heads of the Eurozone national banks and six permanent members, including the President of the ECB, Christine Lagarde.
How does inflation data impact the value of the Euro?
Eurozone inflation data, measured by the Harmonized Index of Consumer Prices (HICP), is an important econometric for the Euro. If inflation rises more than expected, especially if above the ECB’s 2% target, it obliges the ECB to raise interest rates to bring it back under control.
Relatively high interest rates compared to its counterparts will usually benefit the Euro, as it makes the region more attractive as a place for global investors to park their money.
How does economic data influence the value of the Euro?
Data releases gauge the health of the economy and can impact on the Euro. Indicators such as GDP, Manufacturing and Services PMIs, employment, and consumer sentiment surveys can all influence the direction of the single currency.
A strong economy is good for the Euro. Not only does it attract more foreign investment but it may encourage the ECB to put up interest rates, which will directly strengthen the Euro. Otherwise, if economic data is weak, the Euro is likely to fall.
Economic data for the four largest economies in the euro area (Germany, France, Italy and Spain) are especially significant, as they account for 75% of the Eurozone’s economy.
How does the Trade Balance impact the Euro?
Another significant data release for the Euro is the Trade Balance. This indicator measures the difference between what a country earns from its exports and what it spends on imports over a given period.
If a country produces highly sought after exports then its currency will gain in value purely from the extra demand created from foreign buyers seeking to purchase these goods. Therefore, a positive net Trade Balance strengthens a currency and vice versa for a negative balance.
- Silver oscillates in a narrow trading range above the $23.00 mark on Monday.
- Mixed oscillators on hourly/daily charts warrant caution for aggressive traders.
- A sustained break below the $22.65-70 area might negate any positive outlook.
Silver kicks off the new week on a subdued note, albeit manages to hold its neck above the $23.00 round-figure mark through the early European session. The mixed technical setup, meanwhile, warrants some caution before placing aggressive directional bets.
The recent recovery from the vicinity of the $22.00 mark, or the multi-month low touched in June, has been along an upward-sloping channel. Furthermore, last week's pullback from the $23.30 confluence - comprising the 50% Fibonacci retracement level of the downfall from the June peak and the 200-period Simple Moving Average (SMA) on the 4-hour chart - stalled near the lower end of the said channel. Moreover, positive oscillators on hourly charts favour bullish traders.
That said, technical indicators on the daily chart are yet to confirm a positive outlook. Hence, any subsequent move up might continue to face some resistance near the $23.30 confluence region. This is closely followed by the ascending trend-channel resistance, currently around the $23.45 region. A sustained strength beyond will confirm a positive breakout and lift the XAG/USD beyond the 61.8% Fibo. resistance near the $23.60 region, toward reclaiming the $24.00 mark.
The positive momentum could get extended further towards the $24.20-$24.25 intermediate barrier, above which the XAG/USD could climb back to the June monthly swing high, around the $24.55 region.
On the flip side, weakness back below the $23.00 mark, representing the 38.2% Fibo., is more likely to attract some buying and remain limited near the $22.65-$22.70 area, or the 23.6% Fibo. level. The latter should act as a pivotal point, which if broken could make the XAG/USD vulnerable to slide back towards the $22.mark. Some follow-through selling should pave the way for fall towards the $21.70-$21.65 zone en route to the $21.25 support and the $21.00 mark.
Silver 4-hour chart
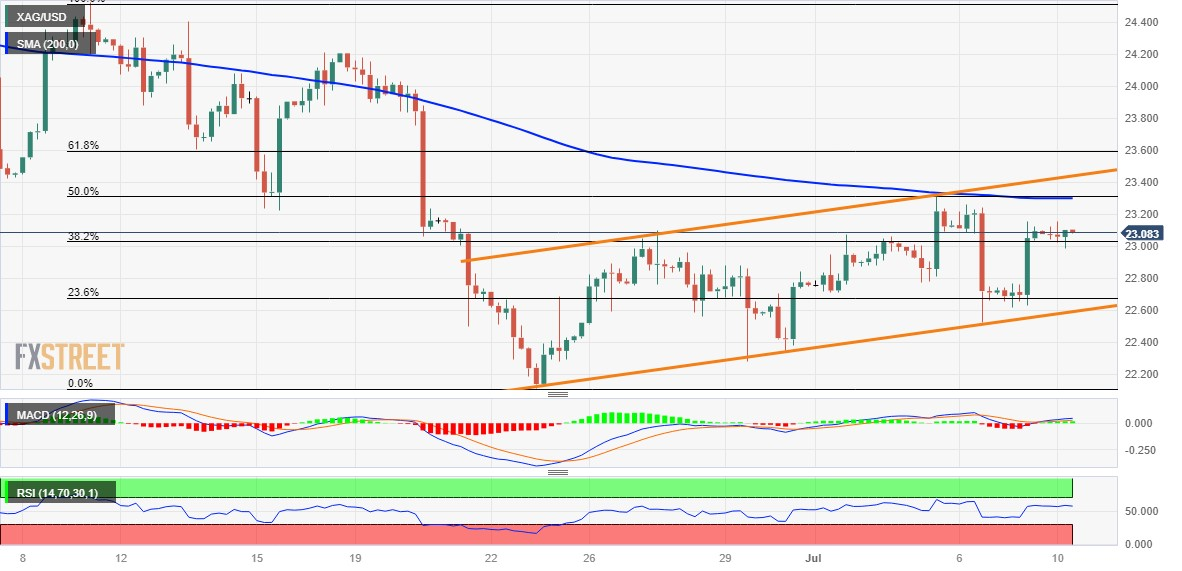
Key levels to watch
- USD/CAD has retreated from 1.3300 as BoC is expected to raise interest rates to 5%.
- Upbeat Canada’s labor market data has propelled hopes of one more interest rate hike from the BoC.
- Going forward, US CPI data will be keenly watched.
The USD/CAD pair has attracted offers after a brisk pullback move to near the round-level resistance of 1.3300 in the European session. The Loonie asset is under pressure as the recovery move in the US Dollar Index (DXY) is short-lived and the Canadian Dollar is gaining strength amid expectations of a continuation of the rate-hiking spell by the Bank of Canada (BoC).
S&P500 futures have extended losses in London, following negative cues sensed on Friday after upbeat wages data. US equities faced a sell-off as solid wage figures drummed one more interest rate hike from the Federal Reserve (Fed) in July. The overall market mood is quite risk-averse as fears of a recession in the United States have elevated.
The US Dollar Index (DXY) has retreated after facing stiff barriers near 102.50. Further pressure would drag the USD Index to near the immediate support of 102.20. After US Nonfarm Payrolls (NFP) data, investors have shifted their focus to the Consumer Price Index (CPI) data, which will release on Wednesday at 12:30 GMT.
As per the consensus, monthly headline CPI elevated at a higher pace of 0.3% vs. the prior pace of 0.1%. Annualized headline inflation is expected to soften to 3.1% against the former release of 4.0%.
Meanwhile, the Canadian Dollar will dance to the tune of the interest rate decision by the Bank of Canada (BoC). BoC Governor Tiff Macklem is expected to push interest rates higher to 5% as labor market data has turned out extremely persistent. Investors should note that the BoC has already raised interest rates to 4.75%.
Statistics Canada reported fresh additions of 59.9K employees vs. the estimates of 20K. In May Canadian labor force witnessed a lay-off of 17.3K employees. The Unemployment Rate increased to 5.4% vs. the estimates of 5.3% and the prior release of 5.2%. Investors should note that BoC Governor Tiff Macklem has already raised interest rates to 4.75%.
AUD/USD is set to move in a narrow range over the near term, in the view of economists at HSBC.
AUD/USD to be pushed higher by shorter-term yield differentials, but pulled lower by market risk sentiment
The shorter-term yield differentials between Australia and the US have generally pushed AUD/USD upwards over the past few months. With the estimated time for inflation to return to the target band still as late as mid-2025, the RBA is likely to have little tolerance for upside surprises.
With markets pricing in only 30 bps of cuts by end-2024 (Bloomberg, 6 July 2023), growth concerns may not cap shorter-term Australian yields. However, a broader economic recovery in mainland China and a brighter outlook for Australia’s key exports are still missing, which may weigh on market risk sentiment, pulling AUD/USD downwards.
We see a push-and-pull dynamic leaving the pair trading in a range-bound fashion over the near term. Until there are improving fundamentals and an eventual end to the Federal Reserve’s tightening cycle, there may be little decisive direction for AUD/USD.
Last week saw the Dollar trade on the soft side amid mixed data from the US. But economists at ING remain a bit reluctant to chase the Dollar lower.
Short-term Dollar bearishness remains unconvincing
We are still reluctant to chase the Dollar lower from this point – not particularly because we expect incoming data (US CPI above all) to surprise on the upside, but because the Dollar still has to catch up with some recent market dynamics – higher US rates in particular – and the scope for further dovish repricing in the USD curve is not broad.
The big risk event for the USD this week is the June inflation report on Wednesday. A downside inflation surprise could see DXY test the 101.00 April lows, but we think that the Dollar could instead find some support into the CPI release and stabilise in the second half of the week.
A potential drop and visit to the 7.1800 region could be in the offing for USD/CNH in the short-term horizon, comment UOB Group’s Economist Lee Sue Ann and Markets Strategist Quek Ser Leang.
Key Quotes
24-hour view: Our view for USD to trade in a range was incorrect. USD fell to a low of 7.2250 in NY trade last Friday before extending its decline in early Asian trade today. Downward momentum is building rapidly and the risk is for further USD decline. That said, the major support at 7.1800 is likely out of reach today. Resistance is at 7.2330, followed by 7.2455.
Next 1-3 weeks: Our most recent narrative was from last Wednesday (05 Jul, spot at 7.2280) wherein USD “is likely to trade in a range of 7.1800/7.2800 for now.” Last Friday, USD dropped sharply by 0.32% (NY close of 7.2320) and it continued to drop in early Asian trade today. Short-term momentum is building rapidly, and the risk of USD pulling back below 7.1800 has increased. Only a breach of 7.2650 (‘strong resistance’ level) would indicate that the buildup in momentum has faded.
- Pound Sterling has dropped at a snail’s pace ahead of the anticipated speech from Andrew Bailey.
- United Kingdom’s economic outlook is under threat as investors expect higher interest rate peak.
- In addition to Bailey’s speech, UK’s labor market data on Tuesday will be keenly watched.
The Pound Sterling (GBP) has sensed selling pressure as market participants have turned cautious ahead of a speech from Bank of England (BoE) Governor Andrew Bailey on Monday at 15:00 GMT. Bias for the GBP/USD pair has softened as investors are anxious due to expectations of more interest rate hikes from the BoE.
The economic outlook of the United Kingdom is under threat as households are already facing the burden of elevated interest payment obligations and further policy tightening would make domestic activities more vulnerable. In addition to Bailey’s speech, Britain’s Employment data will also be on investors’ radar. Clarity about labor market conditions would also provide cues about interest rate guidance.
Daily Digest Market Movers: Pound Sterling faces sell-off ahead of Bailey’s speech
- Pound Sterling has faced some pressure as investors have turned cautious ahead of a speech from Bank of England Governor Andrew Bailey.
- Investors will keenly watch cues about inflation and interest rate guidance and methods to which the central bank is looking beyond monetary tools.
- UK’s economy is facing the burden of high inflation as the housing sector fell in June at the sharpest pace in more than 14 years due to higher borrowing costs.
- Britain’s inflation has remained elevated due to higher food inflation and labor shortages.
- Labor shortages are expected to increase further as almost one in three female workers is considering early retirement because of health issues.
- Investors would get clarity about labor market conditions after the publication of the United Kingdom Employment data, which will be released on Tuesday at 6:00 GMT.
- Claimant Count Change is expected to show an increase of 20.5K in June vs. a decline of 13.6K reported last month.
- The Unemployment Rate is seen unchanged at 3.8% and Three-month Average Earnings Index is expected to increase to 6.8% against the former release of 6.5%.
- Higher wage pressure is going to make Andrew Bailey uncomfortable. The Bank of England Governor is putting blood and sweat to bring down inflation. This is a big challenge for UK PM Rishi Sunak who promised to halve price pressures by year-end.
- Last week, Andrew Bailey urged industry regulators to stop overcharging customers for fuel.
- Negative market sentiment is gaining strength as the US Dollar Index (DXY) has rebounded as hopes for more interest rate hikes from the Federal Reserve (Fed) have elevated.
- United States Nonfarm Payrolls (NFP) missed expectations but wage pressures remained resilient, which is sufficient to terrify Fed policymakers about inflation guidance.
- An interest rate hike announcement from Fed Chair Jerome Powell is well on track as higher Average Hourly Earnings could keep inflation extremely stubborn.
- Chicago Fed President Austan Goolsbee said two more interest rate hikes this year are well-favored.
- Going forward, investors will keep their entire focus on the US Consumer Price Index data, which is scheduled for Wednesday at 12:30 GMT.
Technical Analysis: Pound Sterling corrects from fresh annual high around 1.2850
Pound Sterling has shown a corrective move on Monday after registering a fresh annual high at 1.2850. The Cable is approaching the upper portion of the Rising Channel chart pattern formed on a daily period. Short-to-long-term daily Exponential Moving Averages (EMAs) are sloping north, portraying sheer strength in the Pound Sterling.
Momentum oscillators are oscillating in the bullish range indicating strength in the upside bias.
A fresh upside would take place if the Pound Sterling will push the Cable above the annual high of 1.2850. The upside bias could fade if the asset drops below the crucial support of 1.2680.
BoE FAQs
What does the Bank of England do and how does it impact the Pound?
The Bank of England (BoE) decides monetary policy for the United Kingdom. Its primary goal is to achieve ‘price stability’, or a steady inflation rate of 2%. Its tool for achieving this is via the adjustment of base lending rates. The BoE sets the rate at which it lends to commercial banks and banks lend to each other, determining the level of interest rates in the economy overall. This also impacts the value of the Pound Sterling (GBP).
How does the Bank of England’s monetary policy influence Sterling?
When inflation is above the Bank of England’s target it responds by raising interest rates, making it more expensive for people and businesses to access credit. This is positive for the Pound Sterling because higher interest rates make the UK a more attractive place for global investors to park their money. When inflation falls below target, it is a sign economic growth is slowing, and the BoE will consider lowering interest rates to cheapen credit in the hope businesses will borrow to invest in growth-generating projects – a negative for the Pound Sterling.
What is Quantitative Easing (QE) and how does it affect the Pound?
In extreme situations, the Bank of England can enact a policy called Quantitative Easing (QE). QE is the process by which the BoE substantially increases the flow of credit in a stuck financial system. QE is a last resort policy when lowering interest rates will not achieve the necessary result. The process of QE involves the BoE printing money to buy assets – usually government or AAA-rated corporate bonds – from banks and other financial institutions. QE usually results in a weaker Pound Sterling.
What is Quantitative tightening (QT) and how does it affect the Pound Sterling?
Quantitative tightening (QT) is the reverse of QE, enacted when the economy is strengthening and inflation starts rising. Whilst in QE the Bank of England (BoE) purchases government and corporate bonds from financial institutions to encourage them to lend; in QT, the BoE stops buying more bonds, and stops reinvesting the principal maturing on the bonds it already holds. It is usually positive for the Pound Sterling.
- The index attempts a mild rebound to the 102.40 region.
- Investors continue to digest Friday’s Nonfarm Payrolls figures.
- Fedspeak, Wholesale Inventories next on tap in the US docket.
The greenback, in terms of the USD Index (DXY), regains some composure following Friday’s post-NFP sharp sell-off and revisits the 102.40 zone at the beginning of the week.
USD Index now looks at Fedspeak, CPI
The index picks up some buying interest following two consecutive daily pullbacks on Monday as investors continue to adjust to Friday’s release of the June Payrolls (+209K jobs), while expectations for a 25 bps rate hike remain largely unchanged for the time being.
On the latter, CME Group’s FedWatch Tool sees the probability of such a scenario at around 92% against the backdrop of the ongoing resilience of the US economy and the still tight labour market.
On the speculative front, net longs in the USD receded to 3-week lows in the week ended on July 3, a period where the index entered some consolidative range prior to the release of the crucial jobs report.
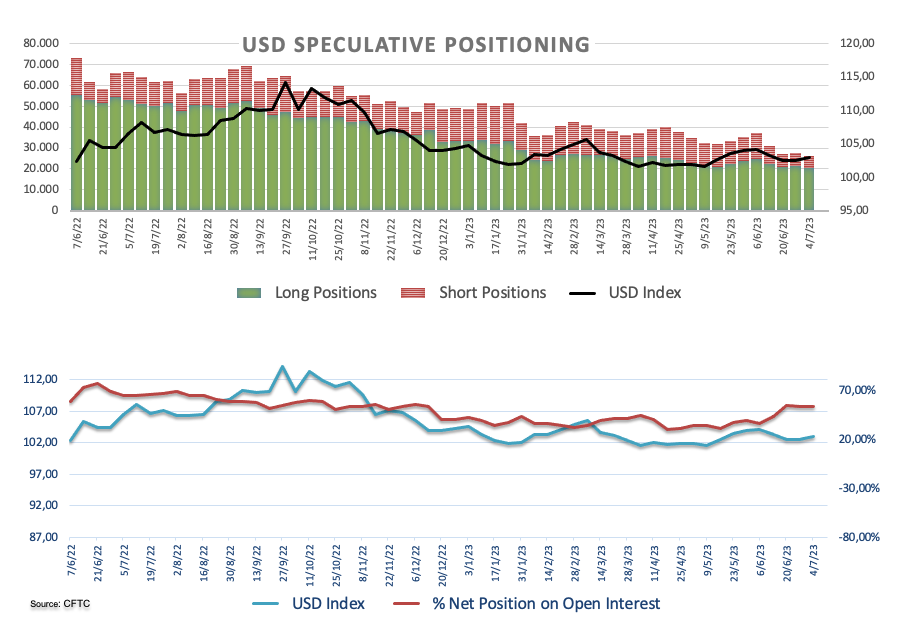
Later in the NA session, Wholesale Inventories will be the sole release along with a slew of Fed speakers: M. Barr (permanent voter, centrist), San Francisco Fed M. Daly (2024 voter, hawk), Cleveland Fed L. Mester (2024 voter, hawk), and Atlanta Fed R. Bostic (2024 voter, hawk).
What to look for around USD
The index hovers around the 102.40 region following Friday’s Nonfarm Payrolls, while prudence is seen increasing ahead of the publication of key US inflation figures on July 12.
Meanwhile, the likelihood of another 25 bps hike at the Fed's upcoming meeting in July remains high, supported by the continued strength of key US fundamentals such as employment and prices.
This view was further bolstered by comments from Fed Chief Powell at the June FOMC event, who referred to the July meeting as "live" and indicated that most of the Committee is prepared to resume the tightening campaign as early as next month.
Key events in the US this week: Wholesale Inventories, Consumer Credit Change (Monday) – MBA Mortgage Applications, Inflation Rate, Fed’s Beige Book (Wednesday) – Producer Prices, Initial Jobless Claims (Thursday) – Advanced Michigan Consumer Sentiment (Friday).
Eminent issues on the back boiler: Persistent debate over a soft/hard landing of the US economy. Terminal Interest rate near the peak vs. speculation of rate cuts in late 2023/early 2024. Fed’s pivot. Geopolitical effervescence vs. Russia and China. US-China trade conflict.
USD Index relevant levels
Now, the index is up 0.15% at 102.42 and the breakout of 103.54 (weekly high June 30) would open the door to 104.60 (200-day SMA) and then 104.69 (monthly high May 31). On the downside, the next support aligns at 101.92 (monthly low June 16) followed by 100.78 (2023 low April 14) and finally 100.00 (round level).
The worst-performing G10 currencies this year have been the NOK (-8.1% vs. USD), JPY (-8.0%) and SEK (-4.3%). These currencies are set to remain under pressure while CHF is strong as the SNB is currently intervening, economists at MUFG Bank report.
CHF to continue benefitting from the SNB intervention
The Norges Bank & Riksbank have responded to currency weakness but measures announced so far are unlikely to trigger sustained reversal of weakening trends on their own.
After taking into consideration recent actions undertaken by policymakers in Japan and Scandinavia, we are not convinced yet that they are sufficient to trigger a sustained reversal of the weakening trends for their domestic currencies (JPY, NOK & SEK).
The CHF is better placed to continue benefitting from the SNB intervention.
- Gold price oscillates in a narrow trading band through the early European session on Monday.
- A weaker risk tone lends support to the XAU/USD, though resurgent USD demand caps gains.
- Traders also seem reluctant to place aggressive bets ahead of the US CPI report on Wednesday.
Gold price struggles to gain any meaningful traction on the first day of a new week and seesaws between tepid gains/minor losses through the early European session. The XAU/USD currently trades around the $1,924-$1,925 region, nearly unchanged for the day, and is influenced by a combination of diverging forces.
The prevalent risk-off environment - as depicted by a generally weaker tone around the equity markets - benefits traditional safe-haven assets and lends some support to the Gold price. A slew of weak economic data from China released over the past week or so, including the softer inflation figures on Monday, add to worries about slowing growth in the world's second-largest economy. In fact, China's Producer Price Index (PPI) declined at the fastest pace in seven-and-a-half years in June, while consumer inflation remained at its lowest level since 2021. Apart from this, the risk of a further escalation in trade conflicts between the United States (US) and China - the world's two largest economies - continues to weigh on investors' sentiment.
That said, a goodish pickup in the US Dollar (USD) demand is seen acting as a headwind for the Gold price. Despite a slight miss from the headline US Nonfarm Payrolls (NFP), the unexpected dip in the unemployment rate and persistently strong wage growth pointed to still-tight labor market conditions. This, in turn, reaffirmed market bets for a 25 basis points rate hike by the Federal Reserve (Fed) at its upcoming policy meeting on July 25-26 and allows the rate-sensitive two-year US government bond to stand tall just below its highest since June 2007. Furthermore, the benchmark 10-year US Treasury yield holds steady around the 4.0% mark and revives the USD demand, capping gains for the US Dollar-denominated commodity.
In the absence of any relevant market-moving US economic releases on Monday, the aforementioned mixed fundamental backdrop warrants caution before placing aggressive directional bets around the Gold price. Traders might also prefer to wait on the sidelines ahead of the latest US consumer inflation figures, due on Wednesday. The crucial US CPI report might influence the Fed's near-term policy outlook, which, in turn, will play a key role in driving the USD demand and providing some meaningful impetus to the XAU/USD.
Technical levels to watch
Economists at ING discuss the next Bank of England meeting and its implications for the British Pound (GBP).
Ample room for a dovish repricing to hit Sterling should data surprise on the downside
Unless the CPI shocks on the upside again on July 19, then the Bank of England could be happy with a 25 bps hike in August.
Markets are pricing in 44 bps for August and 145 bps in total, which leaves ample room for a dovish repricing to hit Sterling should data surprise on the downside.
EUR/GBP is trading around recent lows and may be facing some upside risks to 0.8600+ this week.
Ulrich Leuchtmann, Head of FX and Commodity Research at Commerzbank, imagines mainly two scenarios for the Yen.
USD/JPY levels in the area of 160?
One, in which the Bank of Japan (BoJ) will bring its monetary policy onto a moderately restrictive course gradually but still on time. In this scenario, the Yen is likely to appreciate. The current JPY exchange rates should reflect the fact that the BoJ is verbally firmly sticking to its current ultra-expansionary course.
And one, in which inflation gets out of control, i.e. in which inflation becomes so stubborn that it requires a long period of restrictive monetary policy to break the inflation momentum. So long and restrictive that JGB prices (Japanese government bonds) are affected because the BoJ will cease to support the government's spending so the unsustainability of the fiscal situation will become an issue.
In the first scenario (which is more likely) I expect to see JPY strength. In the second scenario, there is a risk of continued and significant JPY weakness, including USD/JPY levels around 160.
The continuation of the retracement in USD/JPY should face strong support around 141.60 ahead of 140.95, according to UOB Group’s Economist Lee Sue Ann and Markets Strategist Quek Ser Leang.
Key Quotes
24-hour view: The outsized selloff of 1.38% (NY close of 142.07) last Friday came as a surprise (we were expecting USD to trade in a range). The rapid drop is severely oversold and USD is unlikely to weaken much further. Today, USD is more likely to consolidate and trade in a range of 142.00/143.30.
Next 1-3 weeks: Last Thursday (06 Jul, spot at 144.50), we noted that “the USD strength is struggling to maintain its momentum, and the chance for extension to 145.50 appears low”. After USD fell below our ‘strong support’ level of 143.90, we indicated on Friday (07 Jul, spot at 143.90) that “the 3-week USD strength has ended” and we expected USD to trade in a range between 142.90 and 145.00. We did not anticipate the sharp pullback in USD that led to an outsized drop of 1.38% (NY close of 142.07). The 1.38% decline is the largest 1-day drop in about four months. While the price actions suggest USD could pullback further, it is worth noting that there is a solid support level at 141.60 and another at 140.95. All in all, only a breach of 144.00 (‘strong support’ level) would indicate that USD is pulling back further.
Here is what you need to know on Monday, July 10:
Following the selloff seen on Friday after the mixed US jobs report for June, the US Dollar (USD) stays resilient against its major rivals early Monday. US stock index futures trade in negative territory to reflect a cautious mood at the beginning of the week as investors await comments from Federal Reserve (Fed) officials, including San Francisco Fed President Mary Daly and Cleveland Fed President Loretta Mester.
Nonfarm Payrolls (NFP) in the US rose 209,000 in June, the US Bureau of Labor Statistics reported on Friday. This reading came in below the market expectation of 225,000. The Unemployment Rate edged lower to 3.6% from 3.7% in May as expected, while the annual wage inflation, as measured by the Average Hourly Earnings, stood unchanged at 4.4%, surpassing analysts' estimate of 4.2%. The USD came under heavy selling pressure and the US Dollar Index (DXY) dropped to a fresh two-week low of 102.22 late Friday. In the European morning, the DXY recovers toward 102.50.
Meanwhile, US Treasury Secretary Janet Yellen noted that the US and China still have significant disagreements but defined her bilateral meetings with senior Chinese officials as "direct" and "productive." US stock index futures are down between 0.4% and 0.6% in the European session. Earlier in the day, the data from China revealed that annual Consumer Price Index (CPI) stood unchanged in June and the Producer Price Index (PPI) declined 5.4% in the same period.
EUR/USD climbed toward 1.1000 in the American session on Friday but started the new week on the back foot. As of writing, EUR/USD was trading in negative territory at around 1.0950.
GBP/USD took advantage of the broad-based USD weakness and touched its highest level since April 2022 at 1.2851 on Friday. The pair stages a technical correction and declines toward 1.2800.
USD/JPY lost more than 200 pips and snapped a three-week winning streak last week. The pair holds steady at around 142.50 on Monday. In its recently published quarterly report, the Bank of Japan (BoJ) said that it raised its assessment for three of the country's nine economic regions.
Gold price gained traction on Friday and managed to erase its weekly losses. XAU/USD fluctuates in a tight channel slightly above $1,920 early Monday. Despite the mixed labor market data from the US, the benchmark 10-year US Treasury bond yield held above 4%, not allowing the pair to gather further bullish momentum.
Bitcoin edged lower over the weekend but managed to hold above $30,000. Ethereum stays relatively quiet at around $1,850 at the beginning of the week.
EUR/USD could trade above 1.10, but a correction looks more likely, economists at ING report.
Move above 1.10 not seen as being very sustainable just yet
EUR/USD will have the chance to break above 1.10 this week, although we struggle to see the pair trade sustainably above that benchmark level just yet.
The Dollar still needs to catch up with the rise in USD rates and that can prove to be a hurdle when attempting a decisive break above 1.10.
We expect mostly USD-driven moves in EUR/USD this week, and see a greater risk of some pull-back towards 1.0800 rather than trading sustainably above 1.1000 – which could however be possible should US CPI surprise on the soft side.
Considering advanced prints from CME Group for natural gas futures markets, open interest reversed the previous daily drop and increased by around 4.8K contracts on Friday. On the other hand, volume dropped for the second consecutive session, this time by around 17.1K contracts.
Natural Gas looks supported near $2.50
Friday’s daily drop in prices of natural gas was on the back of rising open interest, which is indicative that further losses could be in store in the very near term. In the meantime, bearish moves are expected to meet contention around the so far monthly lows near $2.50 per MMBtu.
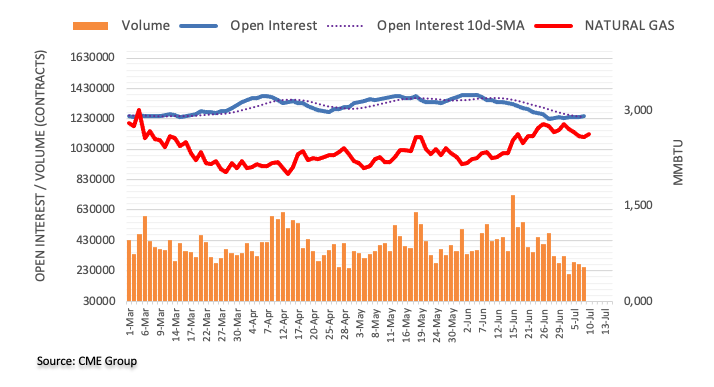
- GBP/USD remains on the defensive above the 1.2800 mark on Monday.
- GBP/USD holds above the 50-, 100-day Exponential Moving Averages (EMA).
- The immediate resistance level is at the 1.2850 mark while the 1.2730 area is an initial support level.
The GBP/USD pair struggles to capitalize on Friday's upward move and remains above the 1.2800 area during early European hours on Monday. The major pair currently trades on the
defensive at 1.2801, up to 0.35% on the day.
From a technical perspective, the path of least resistance for the GBP/USD is to the upside as the pair holds above the 50- and 100-day Exponential Moving Averages (EMA) on the daily chart. Additionally, the Relative Strength Index (RSI) stands at 61.70, portraying the bullish territory for the pair.
GBP/USD met the immediate resistance level at 1.2850 region, highlighting the upper boundary of the Bollinger Band.
The next barrier is seen at 1.2975, the horizontal line and a low of April 13. A break above the latter will see a rally to 1.3248, a high of March 23.
On the downside, the 1.2730 is seen as an initial support level, representing the midline of Bollinger Band.
The breach of the latter would drag the pair toward the next contention at 1.2600. This level is a confluence of a psychological round mark, the lower limit of Bollinger Bands, and the 50-day EMAe. A decisive break below the key demand area will see a drop to 1.2462, the 100-day EMA.
GBP/USD: Daily chart

In the opinion of UOB Group’s Economist Lee Sue Ann and Markets Strategist Quek Ser Leang, AUD/USD is now seen trading within the 0.6620-0.6750 range in the next few weeks.
Key Quotes
24-hour view: Last Friday, we held the view that “there is room for AUD to test the major support at 0.6595 before a more sustained rebound is likely.” Our view was incorrect as AUD soared to a high of 0.6701 in NY trade. The rapid rise appears to be overdone, and AUD is unlikely to advance much further. Today, AUD is more likely to trade sideways between 0.6660 and 0.6710.
Next 1-3 weeks: After AUD dropped to 0.6599, we highlighted last Friday (07 Jul, spot at 0.6630) that “downward momentum is building tentatively”. We added, “AUD must break and stay below 0.6595 before a sustained decline is likely.” We did not anticipate the rapid rise in NY trade that sent AUD to a high of 0.6701. While our ‘strong resistance’ level of 0.6705 has not been breached yet, the tentative buildup of downward momentum has fizzled out. In other words, AUD is not ready to head lower. Instead, it is more likely to trade in a range between 0.6620 and 0.6750 for now.
Norges Bank is no longer falling behind the ECB in its determination. That is why economists at Commerzbank are comfortable with the forecast of a moderate appreciation of the Krone later this year and next year.
Hawkish Norges Bank
Norges Bank showed courage in June. It raised the key interest rate by 50 basis points and signaled two more rate hikes this year. Compared to the ECB, it thus no longer appears less determined to tackle inflation risks.
The NOK has seen its lows, and it should be able to appreciate moderately against the Euro during the course of the year.

Source: Commerzbank Research
Open interest in crude oil futures markets dropped for the second session in a row on Friday, now by more than 10K contracts according to preliminary readings from CME Group. On the flip side, volume went down for the second straight session, now by nearly 28K contracts.
WTI looks capped by $74.00
WTI prices extended the rebound at the end of last week. The uptick, however, was on the back of shrinking open interest and volume and opens the door to some corrective move in the very near term. In the meantime, the July peaks near the $74.00 mark per barrel continue to limit occasional bullish attempts for the time being.
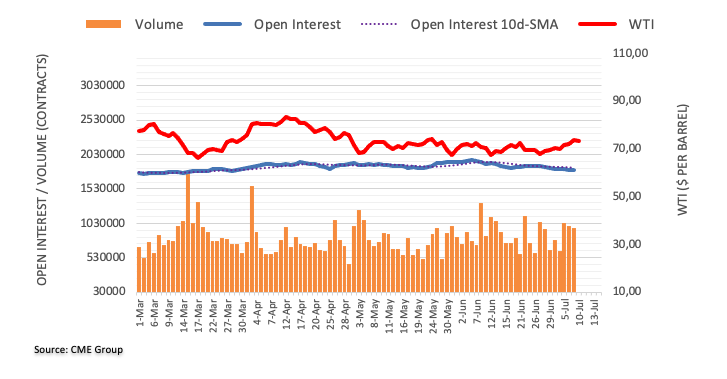
FX option expiries for July 10 NY cut at 10:00 Eastern Time, via DTCC, can be found below.
- EUR/USD: EUR amounts
- 1.0800 942m
- 1.0850 472m
- 1.0920 1.2m
- 1.0970 2.1b
- 1.0970-80 2.1b
- 1.1000 805m
- GBP/USD: GBP amounts
- 1.2770 590m
- USD/JPY: USD amounts
- 143.00 1.1b
- USD/CHF: USD amounts
- 0.8955 402m
- 0.9100 502m
- AUD/USD: AUD amounts
- 0.6685 1.1b
- 0.6700 331m
- USD/CAD: USD amounts
- 1.3250 392m
- EUR/JPY has sensed selling pressure around 156.50 amid a delay in BoJ’s intervention plans.
- Inflation in Eurozone has softened as prices of fuel have fallen, however, core inflation has remained stubborn.
- ECB Centeno expects Eurozone’s inflation under 3% by the end of 2023.
The EUR/JPY pair is maintaining an auction above the crucial resistance of 156.00 in the early European session. The cross is holding strong as the European Central Bank (ECB) is preparing for more interest rate hikes.
Inflationary pressures in Eurozone have softened as prices of fuel have fallen, however, core inflation has consistently remained stubborn. ECB policymakers are uncomfortable with elevated wage pressures and keeping demand for core goods and services higher. To tame red-hot inflation, ECB President Christine Lagarde has already announced that two more interest rate hikes are appropriate.
Currently, interest rates by the ECB are standing at 4%, and further policy-tightening later this month cannot be ruled out.
Meanwhile, a bold statement has come from Governing Council member and Bank of Portugal Governor, Mario Centeno over inflation guidance. ECB Centeno expects Eurozone “inflation under 3% by the end of 2023.” He further added inflation is coming down faster while the Eurozone labor market is the strongest it has ever been.
On the Tokyo front, the Japanese yen is losing strength as the Bank of Japan (BoJ) has not intervened yet in the currency market despite expectations. Earlier, a poll from Reuters showed that BoJ and other Japanese officials could intervene in the FX domain if the Japanese Yen depreciates to 145.00 against the US Dollar.
Japan’s Current Account data has registered a surplus straight for four months. The current account surplus soared to 1.86 trillion yen in May vs. 773 billion yen reported in the same month a year ago.
Further upside momentum could lift GBP/USD to the 1.2900 region while above 1.2850, note UOB Group’s Economist Lee Sue Ann and Markets Strategist Quek Ser Leang.
Key Quotes
24-hour view: We did not anticipate the strong surge in GBP that sent it soaring to a high of 1.2850, one pip above last month’s high of 1.2849. The sharp and swift rise appears to be overdone, but with no signs of reversal just yet, GBP could rise to 1.2865 before the current strong upward pressure might ease. Today, 1.2900 is unlikely to come into view. Support is at 1.2805, followed by 1.2780.
Next 1-3 weeks: Our most recent narrative was from last Wednesday (05 Jul, spot at 1.2715) wherein GBP “is likely to consolidate and trade in a range of 1.2630/1.2800.” Last Friday, GBP jumped to a high of 1.2850. While the price actions have shifted the risk to the upside, GBP must break and stay above 1.2850 before an advance to 1.2900 is likely. The upside risk is intact as long as GBP stays above 1.2735 (‘strong support’ level).
CME Group’s flash data for gold futures markets noted traders added around 3.3K contracts to their open interest positions on Friday, adding to the ongoing uptrend. Volume, instead, shrank for the second session in a row, this time by around 19.4K contracts.
Gold: Initial hurdle comes near $1930
Friday’s marked advance in gold prices was on the back of rising open interest and suggests that further gains could lie ahead in the very near term. That said, the precious metal faces initial up-barrier at the so far July tops past the $1930 mark per troy ounce.
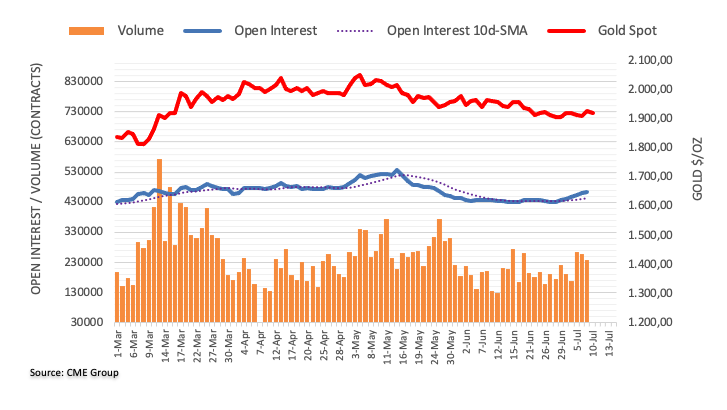
- Asian stocks are demonstrating mixed performance despite negative cues from S&P500.
- China’s consumer and producer inflation has softened extremely due to vulnerable demand.
- Japan equities have faced immense pressure despite registering a surplus in the current account straight for four months.
Markets in the Asian domain have shown a decent recovery on Monday despite a sheer slowdown in China’s consumer and Producer Price Index (PPI) and wage pressures in the United States remained upbeat. S&P500 futures remained on the backfoot on Friday as wage inflation in the US remained upbeat in June and strengthened expectations of more interest rate hikes from the Federal Reserve (Fed).
The US Dollar Index (DXY) has recovered to near 102.47 after a vertical fall as hopes of further policy-tightening have solidified. Rising wage inflation indicated that inflationary pressures would remain extremely stubborn.
At the press time, Japan’s Nikkei 225 dropped 0.32%, China A50 jumped 0.56%, Hang Sang gained 0.38%, and Nifty50 added 0.52%.
The sheer slowdown in China’s inflationary pressures has indicated that overall demand is extremely weak due to which firms are forced to reduce prices of goods and services offered at factory gates. The monthly Consumer Price Index (CPI) in China for June remained stagnant vs. a figure of 0.2%. Annual CPI remained decelerated at 0.2%, similar to its prior release. Meanwhile, annual PPI has further decelerated to -5.4% vs. the former release of -4.6%.
Meanwhile, Japanese equities have faced immense pressure despite the economy having registered a surplus in the current account straight for four months. The current account surplus soared to 1.86 trillion yen in May vs. 773 billion yen reported in the same month a year ago. While a Reuters poll forecast a surplus of 1.88 trillion yen.
On the oil front, oil prices have corrected after printing a fresh monthly high of $73.87 as fears of more interest rate hikes from global central banks have deepened. Hopes of global recession have elevated as inflation is turning out more resilient worldwide. While bleak demand in China has also terrified the oil demand outlook.
It is worth noting that China is the leading importer of oil in the world and weak demand from China is sufficient to impact oil prices.
- USD/JPY attracts some buyers and sees a rally to near the 143.00 region
- Investors digest the US labor data, believing the Federal Reserve (Fed) may not hike twice this year.
- The possible FX intervention by the Japanese central bank might keep USD/JPY’s upside in check.
- Traders might prefer to wait on the sidelines ahead of the US key data released.
The USD/JPY pair gains momentum and sees a rally to near the 143.00 threshold in the Asian session, up 0.57% on the day. The major pair recovers a part of Friday's losses to its over-a-one-week low at 142.06 as the US Dolla Indexr (DXY) stages a decent comeback early Monday.
The Labor Department's closely-watched employment report showed on Friday that the US economy added jobs slower than anticipated pace in June. The US Nonfarm Payrolls (NFP) rose by 209,000 in June, down from 306,000 seen in May. Additionally, the Unemployment Rate dropped from 3.7% to 3.6% in June and Average Hourly Earnings remained unchanged at 0.4%, above the market expectation of 0.3%.
Following the softer US data, USD/JPY saw a sharp drop to a one-week low, rebounding firmly in Monday’s Asian session, tracking the recovery in the US Dollar in tandem with the US Treasury bond yields.
The US labor data suggested that the Federal Reserve (Fed) could refrain from hiking rates twice this year, as previously expected.
However, market players remain certain the US Federal Reserve (Fed) will increase rates by 25 basis points (bps) at the July 25-26 policy meeting, according to the CME Group’s FedWatch Tool. At the moment, the odds are at 92.4%, higher than last week’s 86.8%. This, in turn, supports d the renewed upside in the US Treasury bond yields, lifting the US Dollar across the board.
From the Japanese docket, “the latest data from the Ministry of Finance showed on Monday that Japan's current account surplus more than doubled year-on-year in May, the fourth consecutive month of gains, as the country's trade deficit narrowed and income gains from its overseas investment expanded,” said Reuters.
According to a Reuters poll, the current account surplus reached 1.86 trillion yen ($13.08 billion) in May, compared with 773 billion yen YoY and below the median forecast for a surplus of 1.88 trillion yen.
That said, the possible FX intervention by the Japanese central bank might keep USD/JPY’s upside in check as the top currency diplomat Masato Kanda said that he was communicating with various countries, including the US over currencies, per Reuters.
Looking ahead, market participants will focus on the US Consumer Price Index (CPI), the Producer Price Index (PPI) and the US University of Michigan Preliminary Consumer Sentiment (July) later in the week. Meanwhile, The Japanese Producer Price Index (PPI) YoY and revised Industrial Production MoM will be featured on Wednesday and Friday. Traders might prefer to wait on the sidelines ahead of the key data released.
USD/JPY technical levels to watch
UOB Group’s Economist Lee Sue Ann and Markets Strategist Quek Ser Leang suggest the next level to watch for EUR/USD is now at 1.1010 in the near term.
Key Quotes
24-hour view: Our view that EUR would trade in a range last Friday was incorrect, as it lifted off in NY trade and surged to a high of 1.0973. The strong surge appears to be overdone, but with no signs of weakness just yet, the EUR strength is likely to extend. In view of the overbought conditions, June’s high near 1.1010 is unlikely to come under threat today. In order to keep the momentum going, EUR must stay above 1.0925 (minor support is at 1.0945).
Next 1-3 weeks: We have held a negative view in EUR since late last month. After EUR dropped to 1.0832 and rebounded, we highlighted last Friday (07 Jul, spot at 1.0895) that “if EUR breaks above 1.0925, it would suggest that 1.0805 is not coming into view.” In NY trade, EUR not only broke above 1.0925, but it also soared by 0.73% (NY close of 1.0967), its biggest 1-day gain in three weeks. The rapid increase in momentum is likely to lead to further advance in EUR. The level to watch is June’s high near 1.1010, followed by 1.1050. In order to maintain the buildup in momentum, EUR must stay above 1.0870 (current ‘strong support’ level) in the next few days.
In a quarterly report analyzing the Japanese regional economies, the Bank of Japan (BoJ) raises its assessment for three of the country's nine economic regions.
Additional takeaways
BoJ keeps assessment for 6 of Japan's 9 regions.
All of Japan's regions saw economies pick up or recover moderately.
Many regions saw tightness in labor conditions intensifying.
Many regions saw small, mid-sized firms hike wages unseen in recent years.
Some regions saw firms mulling hiking prices with eye on higher wage costs ahead.
Market reaction
At the time of writing, USD/JPY is extending its recovery to near 143.00, adding 0.60% on the day.
- AUD/USD has found support after sheer selling pressures inspired by weak inflation in China.
- Expectations have increased that inflation would further turn sticky as June wage numbers seem uncomfortable for the Fed policymakers.
- AUD/USD has faced stiff barricades near the downward-sloping trendline of the Descending Triangle pattern.
The AUD/USD pair has found intermediate support near the crucial support of 0.6660 in the Asian session. The Aussie asset is expected to continue its downside journey amid headwinds of a significantly low Consumer Price Index (CPI) in China and expectations that inflation in the United States will remain stubborn.
Monthly inflation in China for June remained stagnant vs. a figure of 0.2%. Annual CPI remained decelerated at 0.2%, similar to its prior release. Meanwhile, the annual Producer Price Index (PPI) has further decelerated to -5.4% vs. the former release of -4.6%. Lower factory-gate prices indicate that domestic and export demand is extremely vulnerable.
On the United States Dollar front, expectations have increased that inflation would further turn sticky as June wage numbers seem uncomfortable for the Federal Reserve (Fed) policymakers. Monthly economic data maintained a pace of 0.4% and remained higher than the consensus of 0.3%. Also, Annualized Average Hourly Earnings remained at a steady pace of 4.4%.
AUD/USD has faced stiff barricades near the downward-sloping trendline of the Descending Triangle chart pattern formed on a two-hour scale. The downward-sloping trendline of the aforementioned pattern is plotted from June 27 high at 0.6720 while the horizontal support is placed from June 29 low at 0.6595.
The 50-period Exponential Moving Average (EMA) at 0.6620 is providing some cushion to the Australian Dollar bulls.
Meanwhile, the Relative Strength Index (RSI) (14) is oscillating in the 40.00-60.00 range, portraying a non-directional performance.
A confident break June 29 low at 0.6595 would drag the asset toward June 02 low at 0.6565 and the round-level support at 0.6500.
On the flip side, a decisive break above July 04 high at 0.6705 would expose the asset to June 23 high at 0.6767, followed by the round-level resistance at 0.6800.
AUD/USD two-hour chart
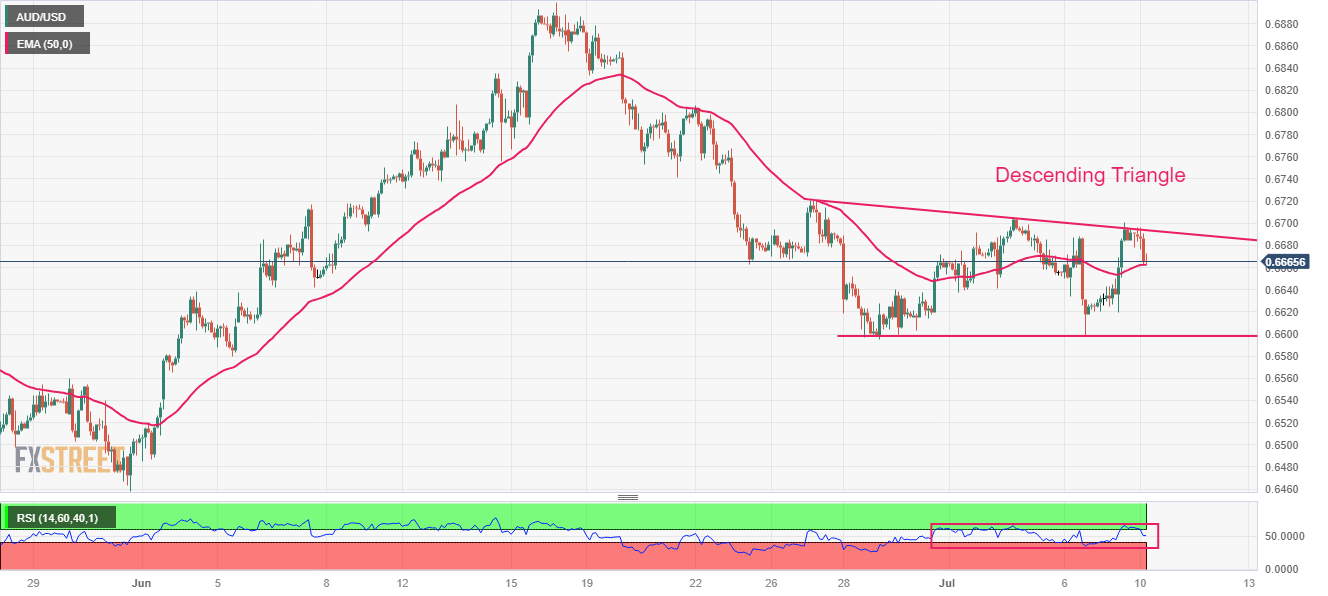
- NZD/USD attract some sellers on Monday and is pressured by the emergence of some USD buying.
- Elevated US bond yields and a generally softer risk tone revive demand for the safe-haven buck.
- The downside seems limited ahead of the RBNZ meeting and the key US CPI report later this week.
The NZD/USD pair meets with a fresh supply on the first day of a new week and erodes a part of Friday's strong move up to the 0.6220 area, or over a two-week high. The steady intraday descent drags spot prices to the 0.6180 region during the Asian session and is sponsored by the emergence of some buying around the US Dollar (USD).
In fact, the USD Index (DXY), which tracks the Greenback against a basket of currencies, regains positive traction and snaps a two-day losing streak to its lowest level since June 22, touched on Friday in the aftermath of the rather unimpressive US jobs data. It is worth recalling that the headline NFP print showed that the US economy added 209K jobs in June, marking the fewest in 2-1/2 years and signalling that the job market is cooling. This could allow the Federal Reserve (Fed) to soften its hawkish stance, which, in turn, weighed heavily on the buck.
That said, the persistently strong wage growth and a slight drop in the unemployment rate pointed to still tight labor market conditions. This reaffirms market expectations that the US central bank will hike interest rates by 25 bps at the July meeting. The outlook remains supportive of elevated US Treasury bond yields and lends some support to the USD. Apart from this, a generally weaker risk tone further benefits the Greenback's relative safe-haven status and contributes to driving flows away from the perceived riskier New Zealand Dollar (NZD).
A slew of weak economic data from China released over the past week or so, including the softer inflation figures on Monday, add to worries about slowing growth in the world's second-largest economy. Furthermore, the risk of a further escalation in the US-China trade conflict continues to weigh on investors' sentiment, which is evident from a generally weaker tone around the equity markets. This, in turn, is seen as another factor weighing on antipodean currencies, including the Kiwi, and supports prospects for a further depreciating move for the NZD/USD pair.
Traders, however, might refrain from placing aggressive bets and prefer to wait on the sidelines ahead of the Reserve Bank of New Zealand (RBNZ) monetary policy meeting on Wednesday. This will be followed by the crucial US consumer inflation figures, which will play a key role in influencing the Fed's near-term policy outlook. In the meantime, traders will take cues from the broader risk sentiment, which will drive demand for the safe-haven USD and provide some impetus to the NZD/USD pair in the absence of any relevant macro data from the US.
Technical levels to watch
On US Treasury Secretary Janet Yellen's visit, China’s Finance Ministry said in a statement, urged the US to take practical actions in response to China's major concerns about the US economic sanctions and crackdown.
Additional quotes
“Chinese side once again reiterated its concerns on the lifting of tariffs on China, the cessation of suppression of Chinese enterprises.”
“China believes that China's development is an opportunity rather than a challenge for the united states, and a gain rather than a risk. “
“Strengthening cooperation between China and the US is a realistic need and the correct choice of the two countries. “
“China and US agree to keep high-level exchanges and all-level communications in the economic area.”
Market reaction
AUD/USD is seeing additional selling pressure on the above headlines, losing 0.28% on the day to 0.6668, at the press time.
- The USD/CHF starts a new week on a positive note and edges above 0.8900 on Monday.
- The Relative Strength Index (RSI) stands below 50, indicating the extended downside cannot be ruled out.
- Initial resistance is seen at 0.8915, the 0.8880 area is the immediate support level.
USD/CHF edges higher to 0.8900 area during the Asian trading hours on Monday. The pair rebounds from a two-month low of 0.8875 as the US Dollar (USD) resumes the demand. The pair currently trades near 0.8905, up to 0.20% on the day.
According to the one-hour chart, USD/CHF holds below the 25-hour and the 50-hour Exponential Moving Averages (EMA), which means the path of least resistance for the USD/CHF pair is to the downside.
The initial resistance level is seen at 0.8914, representing the 25-hour EMA en route to 0.8932, the 50-hour EMA. A break above the latter would see an increase to 0.8950, representing the horizontal line.
On the flip side, the 0.8880 area acts as an immediate support level (low of July 7). A breach of the mentioned level would expose to 0.8870 (low of May 10), followed by 0.8835 (low of May 5).
Meanwhile, the Relative Strength Index (RSI) stands below 50, bearish territory, meaning the extended downside cannot be ruled out.
USD/CHF 1-hour chart
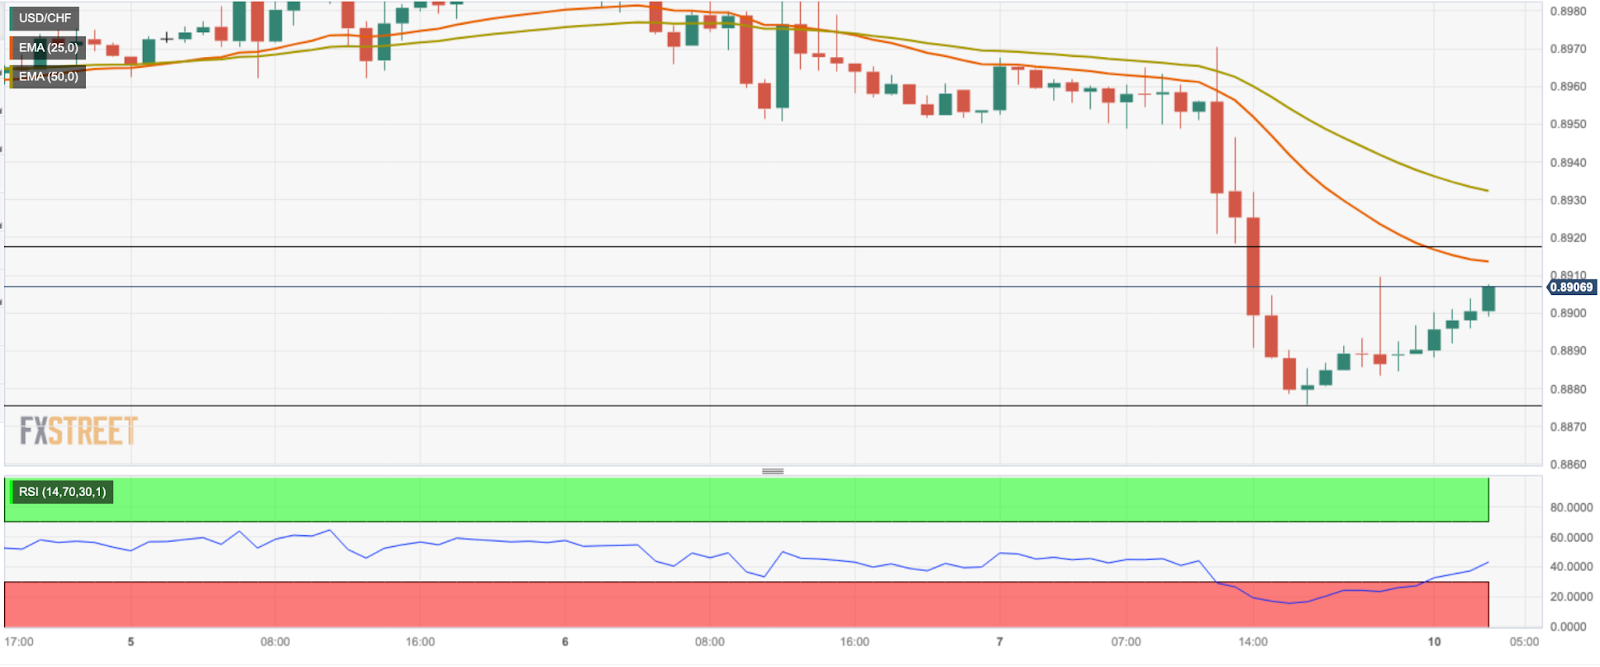
Key levels to watch
- Gold price struggles to gain any meaningful traction and oscillates in a range on Monday.
- Elevated US bond yields help revive the US Dollar and act as a headwind for the metal.
- The uncertainty over the Federal Reserve’s future rate hike path could limit the downside.
Gold price kicks off the new week on a subdued note and oscillates in a narrow trading band, around the $1,925 region through the Asian session. The XAU/USD, meanwhile, remains confined well within a familiar range held over the past three weeks or so as traders seem reluctant to place fresh directional bets amid the uncertainty over the Federal Reserve's (Fed) future rate hike path.
Reviving US Dollar demand weighs on Gold price
The persistently strong wage growth and a slight drop in the unemployment rate pointed to still tight labor market conditions in the United States (US). The data ensures that the Federal Reserve (Fed) will resume raising interest rates at its upcoming policy meeting on July 25-26, which remains supportive of elevated US Treasury bond yields. In fact, the rate-sensitive two-year US government bond stands tall near its highest since June 2007, while the benchmark 10-year US Treasury yield is holding steady above the 4.0% threshold. This helps revive the US Dollar (USD) demand and turns out to be a key factor acting as a headwind for the Gold price.
Reduced bets for more rate hikes lend support to XAU/USD
The closely-watched Nonfarm Payrolls (NFP) report, however, showed on Friday that the US economy added 209K jobs in June, marking the fewest in 2-1/2 years and signalling that the job market is cooling. This could allow the Fed to soften its hawkish stance, which holds back the USD bulls from placing aggressive bets and should offer some support to the Gold price. Apart from this, worries about a global economic downturn might further contribute to limiting any meaningful slide for the safe-haven precious metal, at least for now. Traders might also prefer to wait on the sidelines ahead of this week's release of the latest US consumer inflation figures.
Focus remains on this week’s US consumer inflation figures
The crucial US Consumer Price Index (CPI) report is due for release on Wednesday and is expected to decelerate further in June. Nevertheless, the data should influence the Fed's near-term policy outlook, which, in turn, will play a key role in driving the USD demand and providing a fresh directional impetus to the Gold price. In the meantime, traders on Monday will take cues from a speech by Fed Governor Michael Barr to grab short-term opportunities in the absence of any relevant market-moving economic releases from the US.
Gold price technical outlook
From a technical perspective, the $1,933-$1,935 region might continue to act as an immediate strong barrier ahead of the 100-day Simple Moving Average (SMA), currently around the $1,948-$1,949 region. A sustained strength beyond the latter might trigger a short-covering rally and lift the Gold price to the $1,962-$1,964 area en route to the $1,970-$1,972 supply zone. The momentum could get extended further, allowing bulls to reclaim the $2,000 psychological mark and testing the $2,010-$2,012 resistance.
On the flip side, the $1,910 area now seems to protect the immediate downside ahead of the $1,900 mark and the multi-month low, around the $1,893-$1,892 region touched in June. A convincing break below the latter will make the Gold price vulnerable to accelerate the downward trajectory towards the very important 200-day Simple Moving Average (SMA), currently around the $1,866-$1,865 zone. The latter should act as a pivotal point, which if broken will be seen as a fresh trigger for bearish traders.
Key levels to watch
- USD/CAD gains some positive traction on Monday and draws support from a combination of factors.
- A downtick in Oil prices undermines the Loonie and acts as a tailwind amid reviving USD demand.
- The fundamental backdrop, however, warrants some caution before placing aggressive bullish bets.
The USD/CAD pair attracts some buying on the first day of a new week and for now, seems to have stalled its rejection slide from the 50-day Simple Moving Average (SMA), around the 1.3385 area, or a nearly one-month high touched on Friday. Spot prices, however, struggle to capitalize on the modest intraday uptick and remain below the 1.3300 mark through the Asian session.
Crude Oil prices pull back from a five-week high, which, in turn, undermines the commodity-linked Loonie and turns out to be a key factor acting as a tailwind for the USD/CAD pair. The US Dollar (USD), on the other hand, regains some positive traction and reverses a part of Friday's post-NFP downfall to its lowest level since June 22. This lends additional support to the major, though reduced bets for additional rate hikes by the Federal Reserve (Fed), after the one expected in July, keep a lid on any meaningful appreciating move.
The strong US wage growth data and a slight drop in the unemployment rate should allow the Fed to raise interest rates at its upcoming policy meeting on July 25-26. This remains supportive of elevated US Treasury bond yields and helps revive the USD demand. That said, signs that the US labor market conditions were finally easing and that the inflation is gradually slowing, fueled speculations that the Fed will eventually soften its hawkish. This might hold back the USD bulls from placing aggressive bets and cap the USD/CAD pair.
Furthermore, the recent announcement by the world's biggest oil exporters - Saudi Arabia and Russia - to deepen supply cuts in August should limit the downside for Oil prices. Traders also seem reluctant and prefer to wait on the sidelines ahead of this week's release of the latest US consumer inflation figures on Wednesday. This further makes it prudent to wait for strong follow-through buying around the USD/CAD pair before positioning for the resumption of the recent recovery from the 1.3115 area, or the YTD low touched in June.
Technical levels to watch
- EUR/USD oscillates in a narrow band below a two-month-old descending trend-line hurdle.
- The emergence of some buying around the USD is seen as a key factor acting as a headwind.
- The technical setup still favours bullish traders and supports prospects for additional gains.
The EUR/USD pair struggles to capitalize on last week's solid bounce from the vicinity of the 100-day Simple Moving Average (SMA) support near the 1.0830 area and remains on the defensive through the Asian session on Monday. The pair is currently trading just above mid-1.0900s, down less than 0.10% for the day, and is pressured by the emergence of some US Dollar (USD) buying.
In fact, the USD Index (DXY), which tracks the Greenback against a basket of currencies, recovers a part of Friday's steep post-NFP decline to its lowest level since June 22 and draws support from elevated US Treasury bond yields. Despite the rather unimpressive US monthly jobs report, investors seem convinced that the Federal Reserve (Fed) will hike interest rates later this month. This allows the yield on the rate-sensitive two-year US government bond to stand tall near its highest since June 2007. Moreover, the benchmark 10-year US Treasury yield holds steady above the 4.0% threshold and helps revive the USD demand.
Market participants, however, seem convinced that the US central bank will soften its hawkish stance after the expected lift-off in July, which, in turn, is holding back the USD bulls from placing aggressive bets. The shared currency, on the other hand, remains well supported by a more hawkish commentary by several European Central Bank (ECB) policymakers recently, backing the case for additional rate hikes in July and September meetings. This, in turn, is seen acting as a tailwind for the EUR/USD pair and limiting the downside, warranting some caution for aggressive traders and before positioning for any meaningful fall.
Meanwhile, technical indicators on the daily chart are holding in the positive territory and support prospects for a further near-term appreciating move. Bulls, however, might wait for a convincing breakout through a descending trend-line hurdle extending from the May swing high, currently around the 1.0980-1.0985 area, above which the EUR/USD pair could retest the June swing high, around the 1.1010 zone. Some follow-through buying has the potential to lift spot prices further towards the 1.1050-1.1060 resistance en route to the next relevant strong barrier, just ahead of the 1.1100 mark, which should act as a pivotal point.
On the flip side, the 1.0930 area now seems to protect the immediate downside ahead of the 1.0900 round figure. Failure to defend the said support levels might negate the positive outlook and make the EUR/USD pair vulnerable to accelerate the slide back towards challenging the 100-day SMA support, currently around the 1.0830 region. This is followed by the 1.0800 mark, below which spot prices could accelerate the fall towards the 1.0760 horizontal support before dropping to the 1.0700 round-figure mark.
EUR/USD daily chart
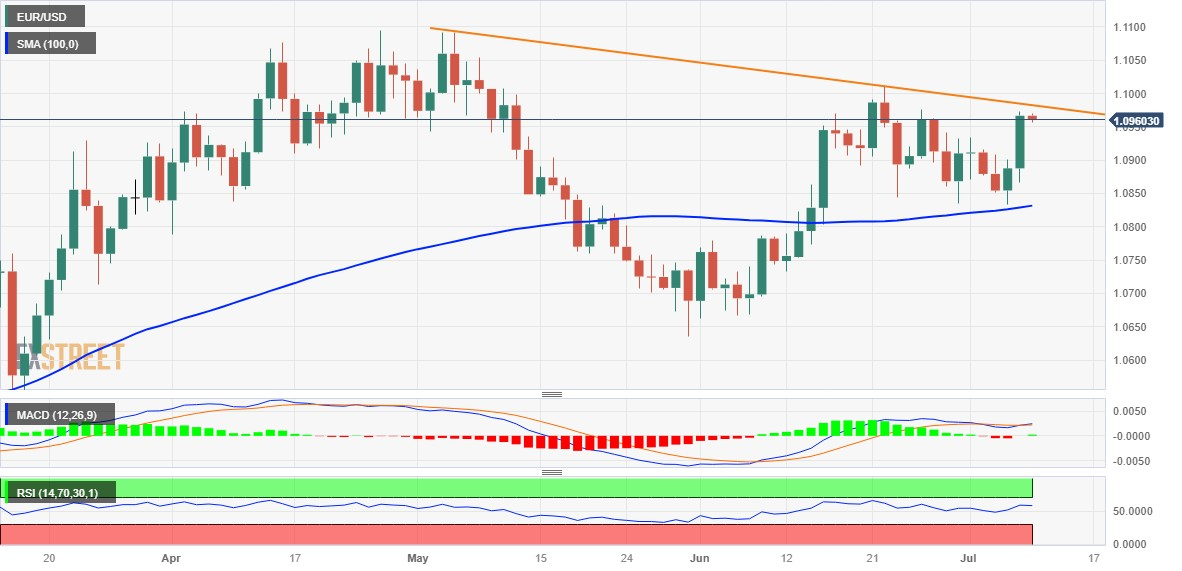
Key levels to watch
| Raw materials | Closed | Change, % |
|---|---|---|
| Silver | 23.076 | 1.63 |
| Gold | 1925.15 | 0.75 |
| Palladium | 1245.1 | 0.71 |
- GBP/USD oscillates in a narrow trading band just below the YTD peak touched on Friday.
- Elevated US bond yields help revive the USD demand and act as a headwind for the pair.
- The prospects for more aggressive tightening by the BoE should limit any meaningful slide.
The GBP/USD pair kicks off the new week on a subdued note and consolidates its recent gains to the highest level since April 2022, around mid-1.2800s touched on Friday. Spot prices remain confined in a narrow trading band through the Asian session and currently trade near the 1.2820-1.2815 region, down just over 0.10% for the day.
The US Dollar (USD) gains some positive traction and for now, seems to have snapped a two-day losing streak to its lowest level since June 2022 touched on Friday, which, in turn, is seen acting as a headwind for the GBP/USD pair. The prospects for further policy tightening by the Federal Reserve (Fed) later this month remain supportive of elevated US Treasury bond yields and help revive the USD demand. That said, reduced bets for any further interest rate hike by the Fed after the one expected in July might hold back bulls from placing aggressive bets around the USD.
The US NFP report released on Friday showed that the economy added the fewest jobs in 2-1/2 years in June and suggested that labor market conditions were finally easing. This, along with signs that the inflation is gradually slowing, fueled speculations that the Fed will eventually soften its hawkish stance, sooner rather than later. Apart from this, expectations that the Bank of England (BoE) will be far more aggressive in policy tightening to combat high inflation might continue to underpin the British Pound and contribute to limiting the downside for the GBP/USD pair.
Traders might also refrain from placing aggressive bets and prefer to wait on the sidelines ahead of this week's release of the UK monthly employment details on Tuesday. This will be followed by the latest US consumer inflation figures on Wednesday, which will play a key role in influencing the near-term USD price dynamics and provide a fresh directional impetus to the GBP/USD pair. In the meantime, traders on Monday will take cues from BoE Governor Andrew Bailey's speech for short-term opportunities in the absence of any relevant market-moving economic releases.
Technical levels to watch
- WTI crude oil attracts some buyers near the $73.30 area in the early Asian session.
- Saudi Arabia and Russia's oil supply cut could suggest a constructive view for WTI oil prices.
- Higher global interest rates could lead to a slowdown in economic growth and a decrease in oil demand.
Western Texas Intermediate (WTI), the US crude oil benchmark, attracts some buyers near the $73.30 area during the Asian trading hours on Monday. WTI crude oil exchanges hands at $73.65, up to 0.04% on the day. Further tightening monetary policy from the Federal Reserve (Fed) and the renewed trade war between the US-China might cap the upside of black gold despite the fresh output cuts by Saudi Arabia and Russia.
The Energy Information Administration (EIA) reported on Thursday that US inventories fell by 1.5 million barrels, more than expected in the week to June 30, indicating improved oil demand amid the high season during the summer.
Meanwhile, “the Organization of Petroleum Exporting Countries (OPEC) will likely maintain an optimistic view on oil demand growth for next year when it publishes its first outlook later this month, predicting a slowdown from this year but still an above-average increase” said Reuters.
Additionally, Saudi Arabia and Russia, the world's biggest oil exporters announced fresh output cuts this week, bringing total reductions by OPEC+, OPEC and its allies, to around 5 million barrels per day (bpd), or about 5% of global oil demand, said Reuters. This progress could suggest a constructive view for WTI oil prices.
Nevertheless, concerns that higher interest rates globally may lead to a slowdown in economic growth and a decrease in oil demand could limit the upside in oil prices. According to the CME Group’s FedWatch Tool, market players remain certain the US Federal Reserve (Fed) will increase rates by 25 basis points (bps) at the July 25-26 policy meeting. The odds for the same are 92.4%, higher than last week’s 86.8%.
Also, new restrictions on the export of minerals used in semiconductors and solar panels were announced by the Chinese government, which could pose a headwind for WTI crude oil.
Additionally, the Consumer Price Index (CPI) and the Producer Price Index (PPI) both softened in June, fueling the concern about the economic slowdown in China, the world’s second-largest economy.
Later in a week, Crude Oil Inventories, the Baker Hughes oil rigs count and CFTC positioning data will be featured. Also, the US Consumer Price Index (CPI), the Producer Price Index (PPI) and the US University of Michigan Preliminary Consumer Sentiment (July) will be released and could have a significant impact on the USD-denominated WTI price.
- AUD/USD remains below the 200-day SMA through the Asian session on Monday.
- The emergence of some USD buying turns out to be a key factor capping the pair.
- China’s economic woes also contribute to keeping a lid on the China-proxy Aussie.
The AUD/USD pair struggles to capitalize on Friday's strong positive move and remains below the 0.6700 mark, or a technically significant 200-day Simple Moving Average (SMA) through the Asian session on Monday.
The prospects for further policy tightening by the Federal Reserve (Fed) later this month remain supportive of elevated US Treasury bond yields and assist the US Dollar (USD) to attract some buyers on the first day of a new week. In fact, the USD Index (DXY), which tracks the Greenback against a basket of currencies, recovers a part of Friday's heavy losses to a fresh monthly low and turns out to be a key factor acting as a headwind for the AUD/USD pair.
That said, reduced bets for any further interest rate hike by the Fed after the one expected in July might hold back traders from positioning for any meaningful upside for the USD. Investors seem convinced that the US central bank will soften its hawkish stance sooner rather than later and the expectations were fueled by the rather unimpressive US jobs report on Friday, which showed that the economy added the fewest jobs in 2-1/2 years in June.
The aforementioned fundamental backdrop suggests that the path of least resistance for the AUD/USD pair is to the upside, though China’s economic woes continue to act as a headwind for the China-proxy Aussie. The worries were fueled by softer Chinese inflation figures, which showed that the headline CPI fell 0.2% in June and the yearly rate remained flat. Moreover, the Producer Price Index (PPI) fell by the 5.4% YoY rate during the reported month.
In the absence of any relevant market-moving economic releases from the US, traders on Monday will take cues from a speech by Fed Governor Michael Barr. This, along with the US bond yields, might influence the USD and provide some impetus to the AUD/USD pair. The focus, however, remains glued to this week's release of the latest US consumer inflation figures, due on Wednesday, which will play a key role in driving the USD demand in the near term.
Technical levels to watch
China’s annual Consumer Price Index (CPI) showed no growth in June, compared with the 0.2% annual gain seen in May, according to the latest data published by the National Bureau of Statistics (NBS) on Monday.
On a monthly basis, the country’s CPI dropped 0.2% in June versus -0.2% decrease recorded in May.
China’s Producer Price Index (PPI) declined 5.4% YoY in June as against a 4.6% drop booked previously.
Market reaction
At the time of writing, AUD/USD is little changed on the data release, keeping its range just under 0.6700.
On Monday, the People’s Bank of China (PBOC) fixed the USD/CNY central rate at 7.1926, compared with Friday’s fix of 7.2054 and market expectations of 7.2132.
The PBOC said that it set 7-day reverse repo rate at 1.90% vs 1.90% previously.
The Chinese central bank Injected 2 bln yuan through 7 day reverse repos.
- USD/JPY kicks off the new week on a positive note and draws support from a modest USD strength.
- Bets for July Fed rate hike remain supportive of elevated US bond yields and lend support to the buck.
- Japan intervention fears to cap any meaningful gains for the pair ahead of the US CPI on Wednesday.
The USD/JPY pair attracts some buyers near the 142.00 round figure during the Asian session on Monday and recovers a part of Friday's heavy losses to its over a one-week low. Spot prices currently trade just below the 142.50 area, up nearly 0.30% for the day.
The US Dollar (USD) kicks off the new week on a positive note and for now, seems to have snapped a two-day losing streak to its lowest level since June 2022 touched on Friday, which, in turn, is seen lending some support to the USD/JPY pair. Firming expectations that the Federal Reserve (Fed) will hike interest rates by 25 bps later this month remains supportive of elevated US Treasury bond yields and acts as a tailwind for the USD. That said, reduced bets for any further lift-off after the one expected in July might hold back traders from placing aggressive bets around the USD.
The US NFP report released on Friday showed that the economy added the fewest jobs in 2-1/2 years in June and suggested that labor market conditions were finally easing. This, along with signs that the inflation is gradually slowing, fueled speculations that the Fed will eventually soften its hawkish stance, sooner rather than latter. Apart from this, speculations that Japan might intervene in currency markets to prop up the Japanese Yen might further contribute to capping the upside for the USD/JPY pair and warrant caution before positioning for any further appreciating move.
Moreover, tradres might also prefer to move to the sidelines ahead of this week's release of the latest US consumer inflation figures, due on Wednesday, which is expected to show that the headline CPI is expected to decelerate further in June. Any positive surprise, however, might prompt aggressive short-covering around the USD and suggest that the USD/JPY pair's recent corrective decline from the YTD top has run its course. Heading into the key data risk, the fundamental backdrop makes it prudent to wait for some follow-through buying before placing fresh bullish bets.
Technical levels to watch
- NZD/USD remains on the defensive near 0.6200 on the first day of the week.
- Investors digested the US labor data and believe the Federal Reserve (Fed) may only hike once this year.
- Investors’ focus shifts to the Reserve Bank of New Zealand meeting on Wednesday.
The NZD/USD pair loses momentum after approaching the high of 0.6220, posting small losses near 0.6200 in the early Asian session. The pair struggles as the Greenback attempts a tepid bounce early Monday.
On Friday, the US Labor Department reported that Nonfarm Payrolls (NFP) rose by 209,000 in June. The economy added jobs at a slower-than-anticipated pace last month and decreased from 306,000 in May. Additionally, the Unemployment Rate dropped from 3.7% to 3.6% in June and Average Hourly Earnings remained unchanged at 0.4%, above the market expectation of 0.3%.
Following the weaker US data, the NZD/USD pair jumped to 0.6220 on Friday before retreating toward 0.6200 so far this Monday, as investors digested the US labor data, believing the Federal Reserve (Fed) may not hike twice this year, as previously estimated.
However, market players remain certain the US Federal Reserve (Fed) will increase rates by 25 basis points (bps) at the July 25-26 policy meeting, according to the CME Group’s FedWatch Tool. At the moment, the odds are at 92.4% for a 25bps July Fed hike, higher than last week’s 86.8%.
Meanwhile, the New Zealand Institute of Economic Research’s (NZIER)'s latest recommendation on Monday suggests that the Reserve Bank of New Zealand (RBNZ) should keep its Official Cash Rate (OCR) at 5.50% at the monetary policy decision meeting due this Wednesday.
Additionally, a Reuters poll indicated the RBNZ will likely keep interest rates unchanged at 5.50% on Wednesday, marking the end of a 20-month hike cycle.
Looking ahead, market participants would look forward to more cues about the Reserve Bank of New Zealand (RBNZ) monetary policy decision. On the US Dollar front, the US Consumer Price Index (CPI), the Producer Price Index (PPI) and the US University of Michigan Preliminary Consumer Sentiment (July) will be featured later in the week. These data will help determine NZD/USD direction in the near term.
The immediate focus, however, remains on the Chinese inflation data due in the next hour for fresh directional impetus.
NZD/USD key technical levels
| Index | Change, points | Closed | Change, % |
|---|---|---|---|
| NIKKEI 225 | -384.6 | 32388.42 | -1.17 |
| Hang Seng | -167.35 | 18365.7 | -0.9 |
| KOSPI | -29.58 | 2526.71 | -1.16 |
| ASX 200 | -121.1 | 7042.3 | -1.69 |
| DAX | 74.86 | 15603.4 | 0.48 |
| CAC 40 | 29.59 | 7111.88 | 0.42 |
| Dow Jones | -187.38 | 33734.88 | -0.55 |
| S&P 500 | -12.64 | 4398.95 | -0.29 |
| NASDAQ Composite | -18.32 | 13660.72 | -0.13 |
| Pare | Closed | Change, % |
|---|---|---|
| AUDUSD | 0.66903 | 1.01 |
| EURJPY | 155.836 | -0.66 |
| EURUSD | 1.09667 | 0.71 |
| GBPJPY | 182.423 | -0.6 |
| GBPUSD | 1.28382 | 0.78 |
| NZDUSD | 0.62097 | 0.88 |
| USDCAD | 1.32766 | -0.66 |
| USDCHF | 0.88916 | -0.69 |
| USDJPY | 142.1 | -1.36 |


© 2000-2026. Уcі права захищені.
Cайт знаходитьcя під керуванням TeleTrade DJ. LLC 2351 LLC 2022 (Euro House, Richmond Hill Road, Kingstown, VC0100, St. Vincent and the Grenadines).
Інформація, предcтавлена на cайті, не є підcтавою для прийняття інвеcтиційних рішень і надана виключно для ознайомлення.
Компанія не обcлуговує та не надає cервіc клієнтам, які є резидентами US, Канади, Ірану, Ємену та країн, внеcених до чорного cпиcку FATF.
Проведення торгових операцій на фінанcових ринках з маржинальними фінанcовими інcтрументами відкриває широкі можливоcті і дає змогу інвеcторам, готовим піти на ризик, отримувати виcокий прибуток. Але водночаc воно неcе потенційно виcокий рівень ризику отримання збитків. Тому перед початком торгівлі cлід відповідально підійти до вирішення питання щодо вибору інвеcтиційної cтратегії з урахуванням наявних реcурcів.
Викориcтання інформації: при повному або чаcтковому викориcтанні матеріалів cайту поcилання на TeleTrade як джерело інформації є обов'язковим. Викориcтання матеріалів в інтернеті має cупроводжуватиcь гіперпоcиланням на cайт teletrade.org. Автоматичний імпорт матеріалів та інформації із cайту заборонено.
З уcіх питань звертайтеcь за адреcою pr@teletrade.global.
переклади