- Аналітика
- Новини та інструменти
- Новини ринків
Новини ринків
Japan's top currency diplomat, Masato Kanda, who will instruct the BoJ to intervene, when he judges it necessary, warned that he prepared to take necessary actions whenever possible to respond to the excessive weakness of the Japanese Yen (JPY).
Key quotes
“Recent yen moves are rapid.”
“Won't rule out any steps to respond to disorderly FX moves.”
“Prepared to take necessary actions whenever possible.”
“Won't comment whether overnight forex moves are excessive.”
“Excess FX moves could affect the economy.”
Market reaction
Following the above verbal intervention, USD/JPY was trading at 152.87, losing 0.19% on the day.
Japanese Yen FAQs
The Japanese Yen (JPY) is one of the world’s most traded currencies. Its value is broadly determined by the performance of the Japanese economy, but more specifically by the Bank of Japan’s policy, the differential between Japanese and US bond yields, or risk sentiment among traders, among other factors.
One of the Bank of Japan’s mandates is currency control, so its moves are key for the Yen. The BoJ has directly intervened in currency markets sometimes, generally to lower the value of the Yen, although it refrains from doing it often due to political concerns of its main trading partners. The current BoJ ultra-loose monetary policy, based on massive stimulus to the economy, has caused the Yen to depreciate against its main currency peers. This process has exacerbated more recently due to an increasing policy divergence between the Bank of Japan and other main central banks, which have opted to increase interest rates sharply to fight decades-high levels of inflation.
The BoJ’s stance of sticking to ultra-loose monetary policy has led to a widening policy divergence with other central banks, particularly with the US Federal Reserve. This supports a widening of the differential between the 10-year US and Japanese bonds, which favors the US Dollar against the Japanese Yen.
The Japanese Yen is often seen as a safe-haven investment. This means that in times of market stress, investors are more likely to put their money in the Japanese currency due to its supposed reliability and stability. Turbulent times are likely to strengthen the Yen’s value against other currencies seen as more risky to invest in.
- USD/JPY trades softer to 153.00 after reaching the July 1990 tops on Thursday.
- The US CPI inflation rose more than expected in March, triggering the Fed to delay rate cuts this year.
- The potential FX intervention from the BoJ might provide some support to the JPY.
The USD/JPY pair trades on a weaker note near 153.00 after retreating from the highest level since July 1990, nearly 153.24, on Thursday during the early Asian session. The uptick of the pair is supported by the upbeat US Consumer Price Index (CPI) data for March, which triggered investors to scale back bets on US interest rate cuts this year.
The US CPI inflation rose more than expected in March. The headline CPI figure rose 0.4% MoM in March, compared with the 0.3% increase expected. On a year-on-year basis, the CPI increased 3.5% YoY versus forecasts of a 3.4% rise, the Labor Department reported on Wednesday.
The Core CPI figure, excluding the volatile food and energy components, grew 0.4% MoM in March, compared with expectations of a 0.3% advance. Annually, the figure rose 3.8%, versus the expectation of a 3.7% increase. Following the CPI report, investors lowered their bets that the Federal Reserve (Fed) would cut interest rates in June to 17%, from 57% before the release of the data, according to the CME's FedWatch tool.
Additionally, Minutes of the last Fed meeting suggested that participants were worried about the persistence of elevated inflation and the recent data did not help the US central bank to gain confidence that inflation moved sustainably towards the 2% target. The officials emphasized the need to keep interest rates higher for longer, which boosts the Greenback and acts as a tailwind for the USD/JPY pair.
On the other hand, the Japanese Yen (JPY) has faced some selling pressure near a multi-decade low amid the Bank of Japan's (BoJ) cautious approach and uncertainties for future rate hikes. However, the possibility that the Japanese authorities will intervene in the foreign exchange (FX) market might support the JPY and cap the upside of the pair.
- Australian Dollar faces a significant downturn as US inflation figures outpace forecasts, boosting the US Dollar and Treasury yields.
- Traders adjust Fed rate cut projections based on new inflation insights, with a less aggressive easing strategy anticipated.
- Upcoming economic reports, includes China's inflation data and the US PPI.
The Australian Dollar posted losses of more than 1.50% on Wednesday against the US Dollar following the release of a hotter-than-expected inflation report in the United States (US). Traders have begun to price in fewer rate cuts by the US Federal Reserve, a bullish signal for the Greenback. Therefore, the AUD/USD trades at 0.6511, virtually unchanged, as Thursday’s Asian session commences.
AUD/USD falls sharply to 0.6511, reacting to US CPI data
Mach’s Consumer Price Index (CPI) in the US exceeded estimates of 0.3% MoM in headline and core, with both readings edging a tenth higher at 0.4%. Yearly figures clocked 3.5% YoY in general inflation, crushing February’s data, while core CPI was unchanged at 3.8%. Following the release, US Treasury yields soared, the Greenback rallied, and Wall Street plummeted.
Consequently, interest rate futures traders priced in just two rate cuts, as witnessed by data released by the Chicago Board of Trade (CBOT). The Fed funds rate is projected to end the year at 4.99%.
Later, the March minutes of the Federal Open Market Committee (FOMC) revealed that “almost all participants judged that it would be appropriate to move policy to a less restrictive stance at some point this year if the economy evolved broadly as they expected.”
On the Aussie’s front, the economic schedule remains scarce, though traders will watch China’s March inflation report. In the US, further inflation data will be scrutinized, as the Producer Price Index (PPI) is expected to dip, while the number of Americans filing for unemployment benefits is expected to slow down compared to the previous reading.
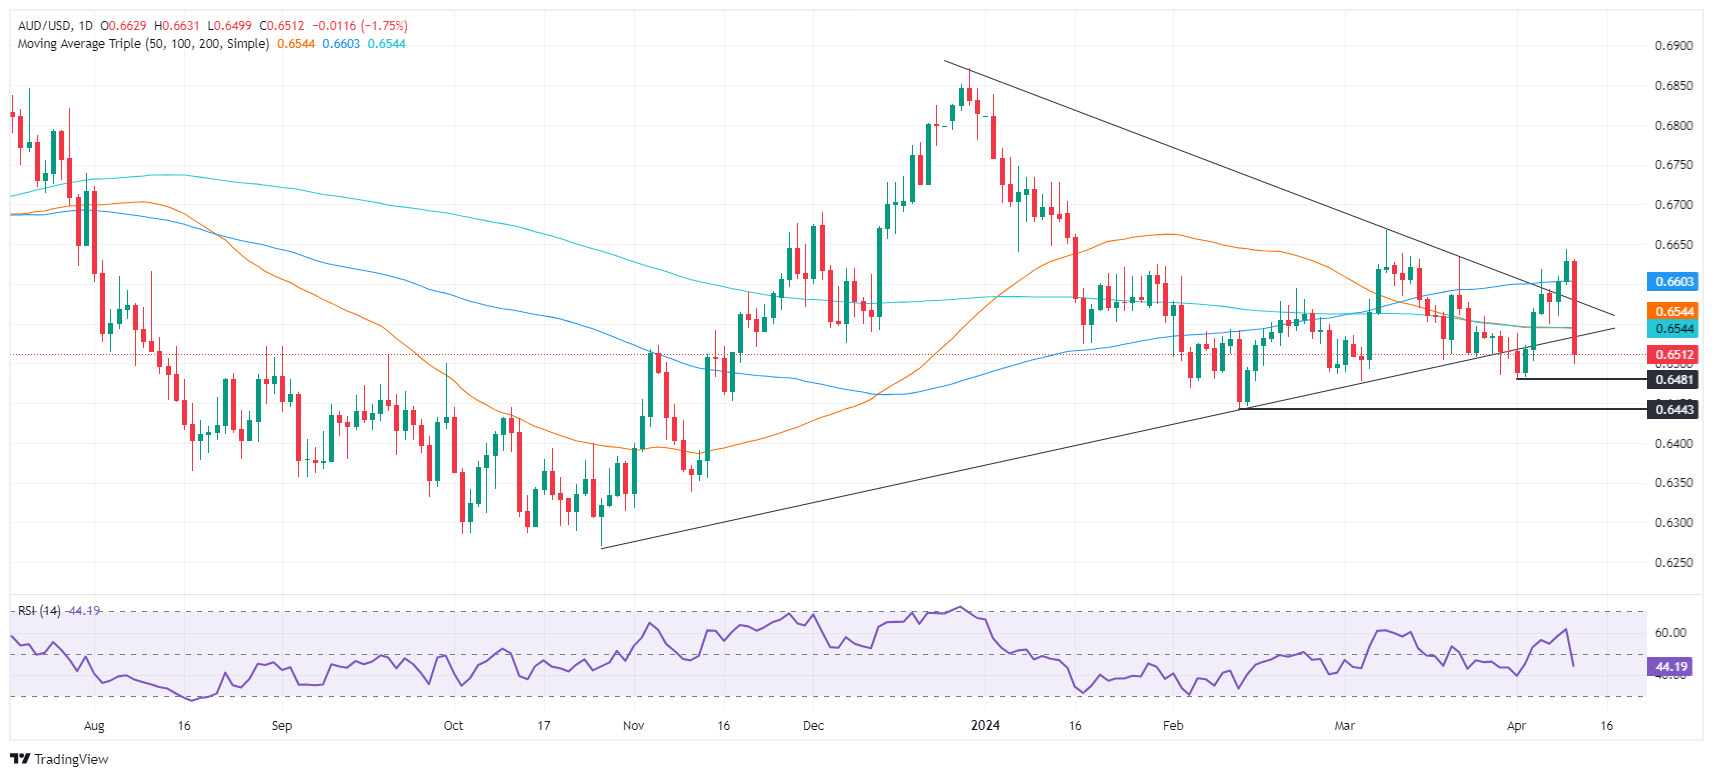
AUD/USD Price Analysis: Technical outlook
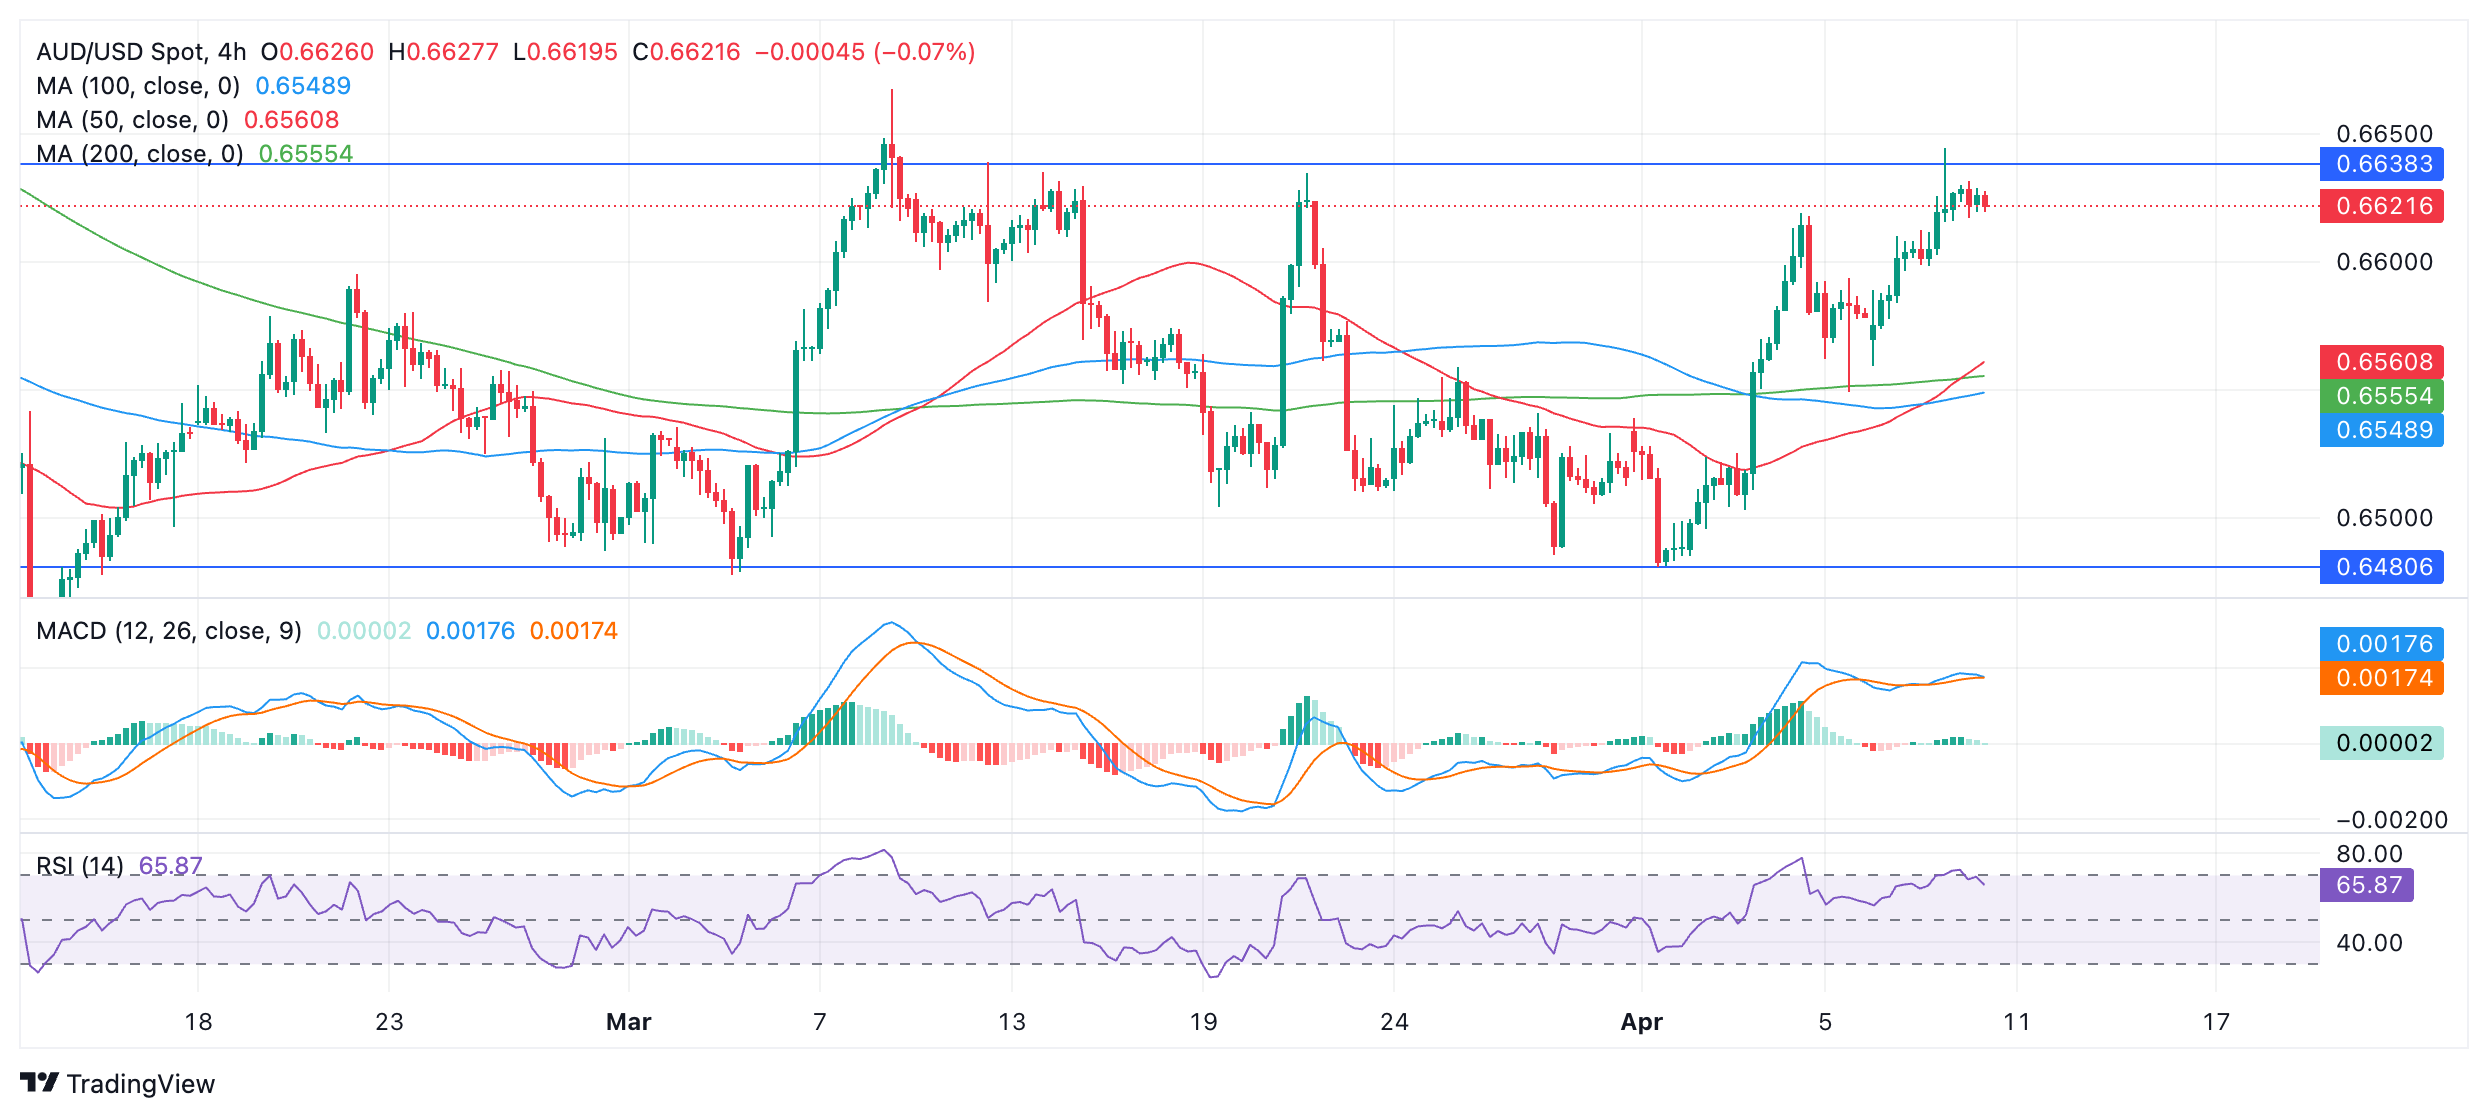
From a price action standpoint, the AUD/USD shifted bearish bias and will face first support at the 0.6500 psychological figure. The Relative Strength Index (RSI) turning bearish, along with the break of key support levels, suggests that further downside is seen.
The AUD/USD first support would be the April 1 low of 0.6481, followed by the February 13 swing low at 0.6443. If those two levels are cleared, the pair will be trading at lower levels for the new year-to-date (YTD), with sellers eyeing the 0.6400 figure.
In the event buyers move in and reclaim the 200-DMA at 0.6603, look for a test of the next supply zone at 0.6631.
Australian Dollar FAQs
One of the most significant factors for the Australian Dollar (AUD) is the level of interest rates set by the Reserve Bank of Australia (RBA). Because Australia is a resource-rich country another key driver is the price of its biggest export, Iron Ore. The health of the Chinese economy, its largest trading partner, is a factor, as well as inflation in Australia, its growth rate and Trade Balance. Market sentiment – whether investors are taking on more risky assets (risk-on) or seeking safe-havens (risk-off) – is also a factor, with risk-on positive for AUD.
The Reserve Bank of Australia (RBA) influences the Australian Dollar (AUD) by setting the level of interest rates that Australian banks can lend to each other. This influences the level of interest rates in the economy as a whole. The main goal of the RBA is to maintain a stable inflation rate of 2-3% by adjusting interest rates up or down. Relatively high interest rates compared to other major central banks support the AUD, and the opposite for relatively low. The RBA can also use quantitative easing and tightening to influence credit conditions, with the former AUD-negative and the latter AUD-positive.
China is Australia’s largest trading partner so the health of the Chinese economy is a major influence on the value of the Australian Dollar (AUD). When the Chinese economy is doing well it purchases more raw materials, goods and services from Australia, lifting demand for the AUD, and pushing up its value. The opposite is the case when the Chinese economy is not growing as fast as expected. Positive or negative surprises in Chinese growth data, therefore, often have a direct impact on the Australian Dollar and its pairs.
Iron Ore is Australia’s largest export, accounting for $118 billion a year according to data from 2021, with China as its primary destination. The price of Iron Ore, therefore, can be a driver of the Australian Dollar. Generally, if the price of Iron Ore rises, AUD also goes up, as aggregate demand for the currency increases. The opposite is the case if the price of Iron Ore falls. Higher Iron Ore prices also tend to result in a greater likelihood of a positive Trade Balance for Australia, which is also positive of the AUD.
The Trade Balance, which is the difference between what a country earns from its exports versus what it pays for its imports, is another factor that can influence the value of the Australian Dollar. If Australia produces highly sought after exports, then its currency will gain in value purely from the surplus demand created from foreign buyers seeking to purchase its exports versus what it spends to purchase imports. Therefore, a positive net Trade Balance strengthens the AUD, with the opposite effect if the Trade Balance is negative.
- The hourly chart indicators reveal a mounting selling pressure, hinting at a pause in bullish momentum.
- To maintain the current bullish momentum, it's essential for the pair to uphold its standing above the key SMA.
The NZD/JPY pair declined near the 91.33 mark, indicating a battle between optimism favoring a bullish market and mounting bearish pressure. The market trend leans towards the bullish side as the pair stays above critical Simple Moving Averages (SMAs) levels; however, a shift in momentum toward downward forces suggests impending consolidation.
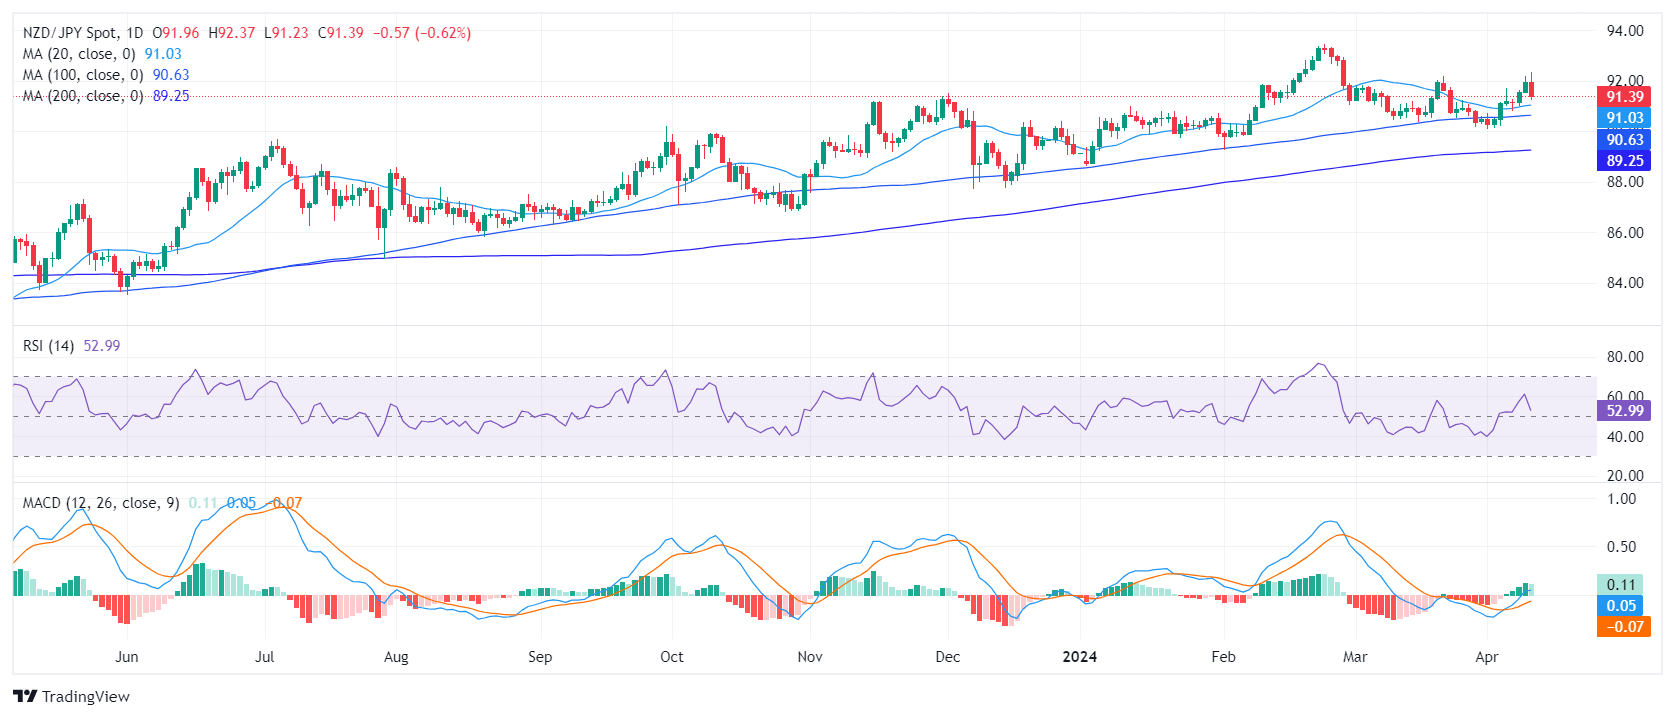
On the daily chart, the Relative Strength Index (RSI) is in positive territory, indicating a mild bullish momentum. Despite a recent decrease, the prevailing trend remains largely positive. The Moving Average Convergence Divergence (MACD) reveals decreasing green bars, also suggesting a slight loss in positive momentum. However, the persisting positive RSI readings indicate that the majority of traders favor the buy side.
NZD/JPY daily chart
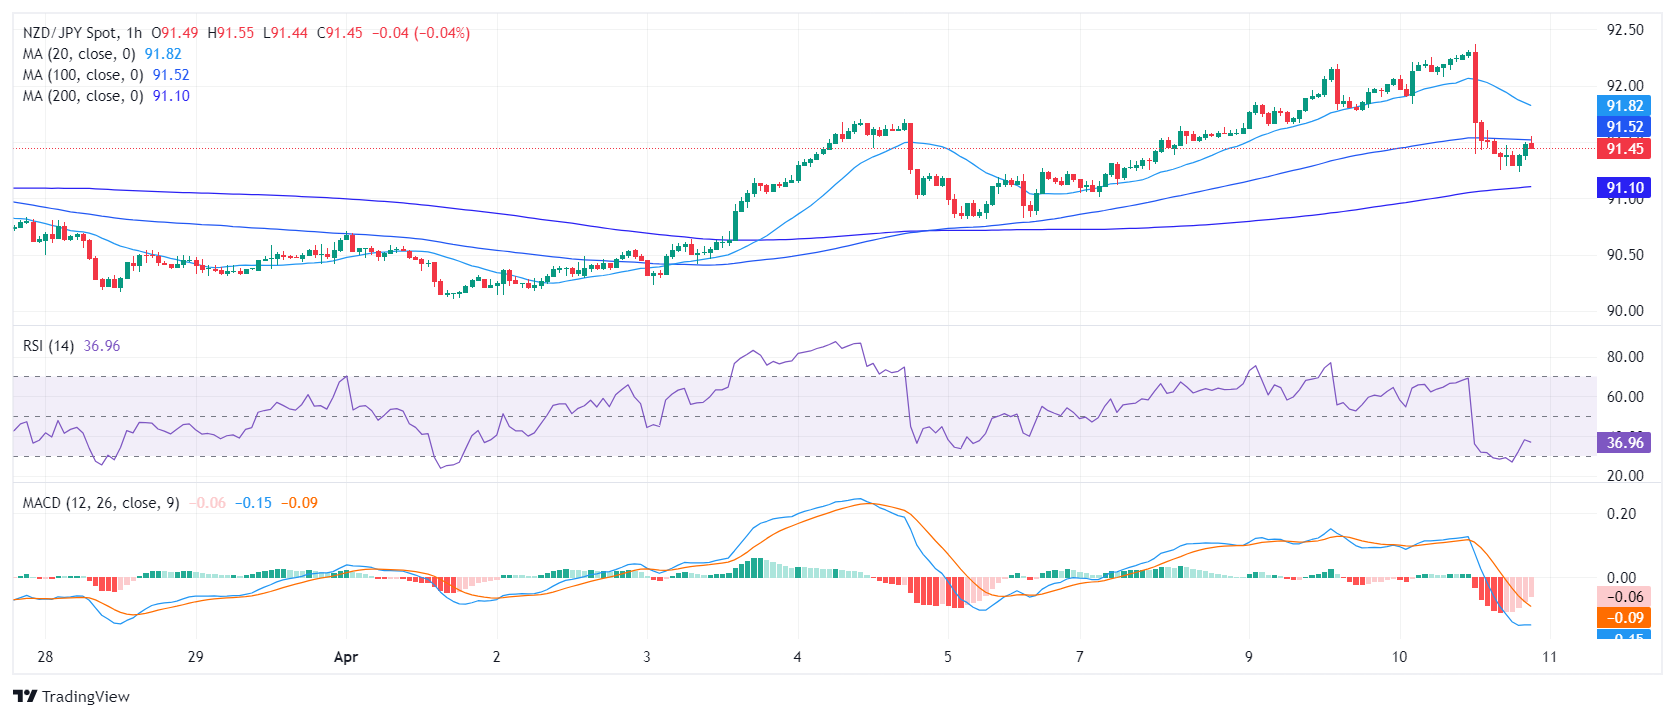
In the hourly analysis, the RSI hovers in the oversold territory, indicating strong selling pressure but as the downward movements are overextended an upward corrective move may be possible ahead of the Asian session. In addition, the MACD histogram prints red bars, adding arguments for the negative momentum.
NZD/JPY hourly chart
Inspecting the broader perspective, the NZD/JPY demonstrates a bullish trend with its current standing above the 20,100, and 200-day Simple Moving Averages (SMAs). However, the bears seem to be eyeing the 20-day SMA level of 91.00, which poses a significant turning point. A successful breach below this level could reinforce the arguments for the bears and the pair could see additional downside in the next sessions.
- 'Bearish engulfing' on GBP/JPY suggests growing bearish momentum.
- Break below Tenkan-Sen may lead to more declines, with key supports eyed.
- Resistance at 192.00, recent highs key for reversals; market sentiment watched.
The GBP/JPY retreats late on Wednesday during the North American session and is down 0.27% as the market sentiment shifts sour. Speculation that the Federal Reserve wouldn’t cut rates as expected spurred risk aversion, with traders seeking safety moving to the Japanese Yen, the Greenback, and the Swissie. The cross exchanges hands at 191.82.
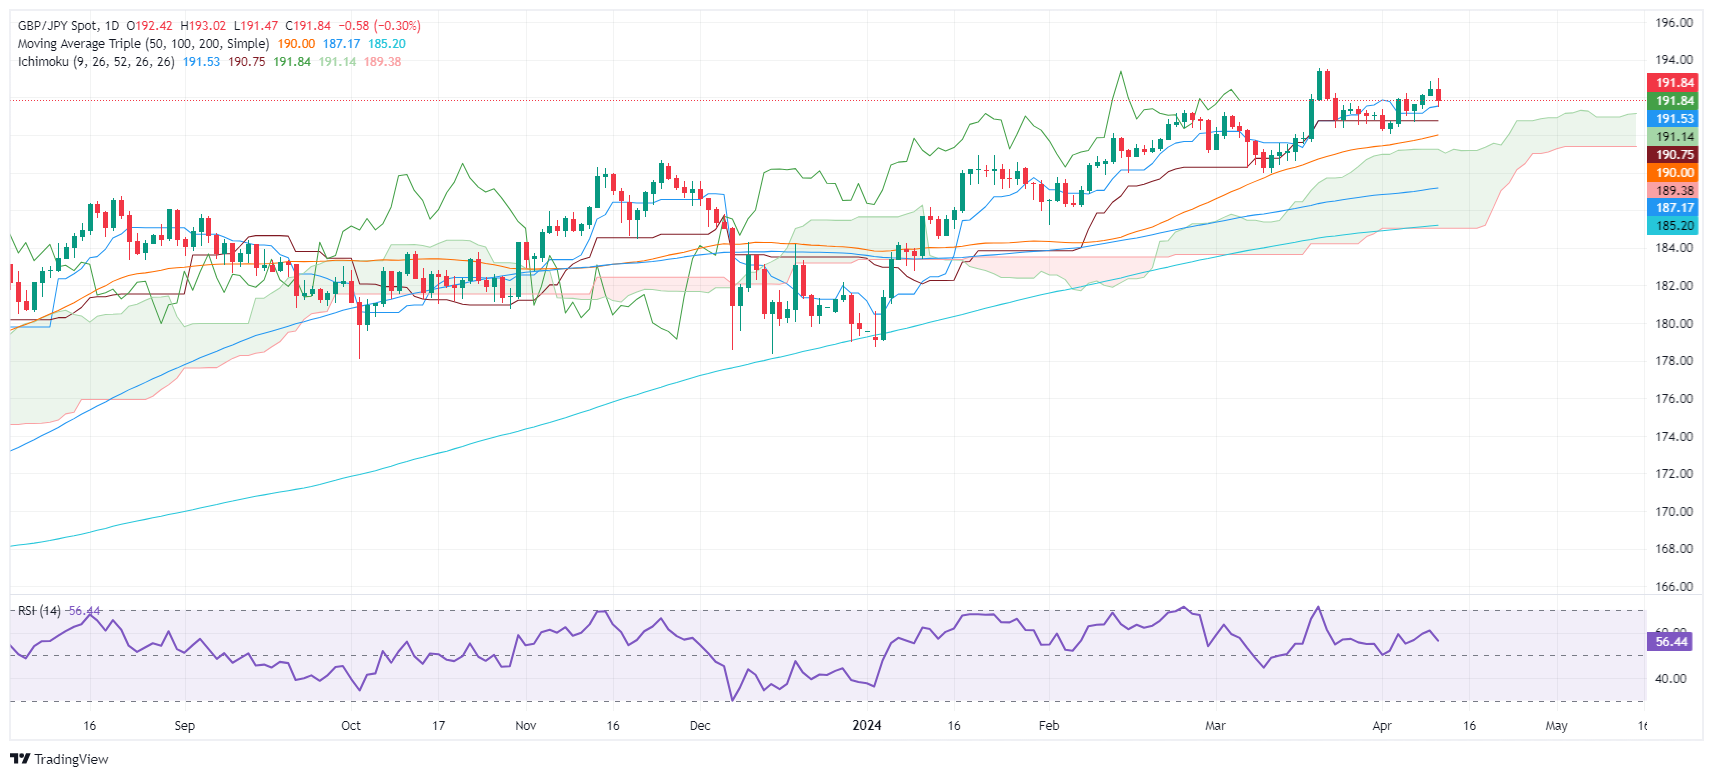
GBP/JPY Price Analysis: Technical outlook
The picture shows the formation of a ‘bearish engulfing’ candle pattern, which suggests that bears are gathering momentum. However, to confirm that the GBP/JPY has peaked at around 192.94 as of today, sellers must push prices below the Tenkan-Sen level at 191.49. Once cleared, the next stop would be the Senkou Span A at 191.12, ahead of falling to the Kijun Sen at 190.74.
On the flip side, the GBP/JPY first resistance would be the 192.00 figure, followed by April’s 10 high at 192.95. The next resistance would be the current year-to-date (YTD) high at 193.53.
GBP/JPY Price Action – Daily Chart
An unexpected rise in the US CPI in March propelled the Greenback to yearly highs and kept the risk complex under renewed and strong downside pressure. There was no news from the FOMC Minutes, while the ECB is widely anticipated to leave its policy rates unchanged on Thursday.
Here is what you need to know on Thursday, April 11:
The Greenback rose markedly and pushed the USD Index (DXY) to fresh yearly highs north of the 105.00 barrier. On April 11, Producer Prices will take centre stage, seconded by weekly Initial Jobless Claims. In addition, Fed’s Williams, Collins, and Bostic are all due to speak.
EUR/USD retreated sharply and revisited the 1.0720–1.0730 band, challenging at the same time the area of monthly lows. The ECB meets on April 11 and is seen leaving its monetary conditions unchanged. President Lagarde will also hold her usual press conference after the bank’s decision.
GBP/USD traded well on the defensive and flirted with the 2024 low in the 1.2520 zone. In the UK, GDP prints are expected in the latter part of the week.
The stronger dollar and rising US yields motivated USD/JPY to surge to the boundaries of the 153.00 hurdle. In Japan, weekly Foreign Bond Investment readings are expected on April 10.
AUD/USD collapsed to multi-day lows and put the 0.6500 support to the test on the back of the robust bounce in the greenback. The Consumer inflation expectations are due on April 11.
Shrinking hopes of a ceasefire in the Middle East bolstered the daily uptick in WTI prices despite the unexpected build of US crude oil inventories.
Gold prices retreated from recent record highs on the back of the bid bias in the dollar and rising US yields. The same performance saw Silver prices come under selling pressure after hitting new peaks around $28.50 per ounce.
- US headline and core CPI exceeded expectations, rising to 3.5% and 3.8% respectively in March.
- FOMC minutes from March highlighted uncertainty about the persistence of high inflation and the efficacy of monetary policy.
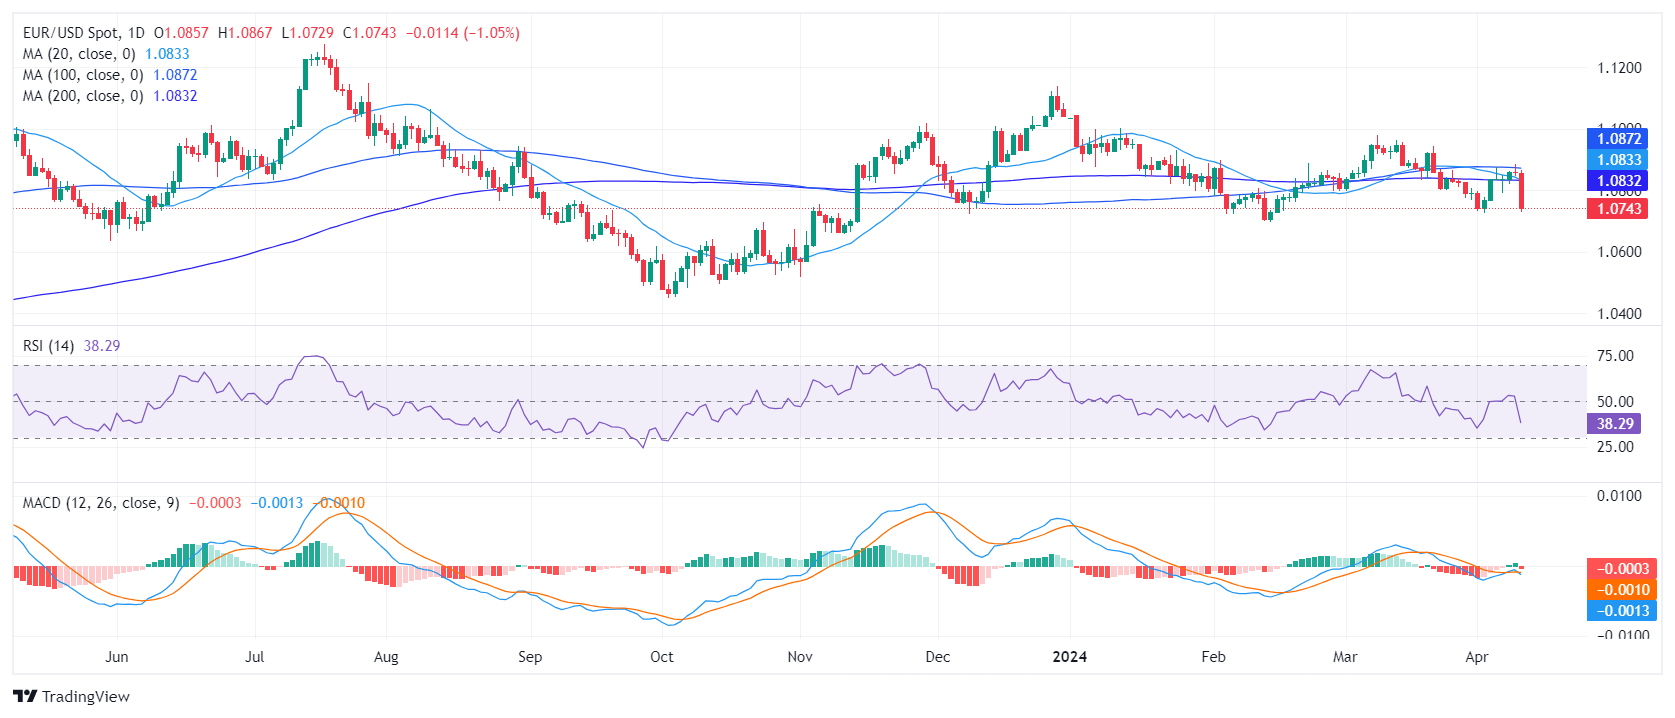
The EUR/USD pair declined to 1.0739, representing a substantial decline of 1.1%. This decline has occurred following the release of hot inflation figures from the US which fueled hawkish bets on the Federal Reserve (Fed). The Federal Open Market Committee (FOMC) minutes from the March meeting didn’t trigger any reaction.
The US Bureau of Labor Statistics (BLS) revealed on Wednesday that the nation's inflation rate, reflected by the Consumer Price Index (CPI), increased from 3.2% in February to 3.5% in March on an annual basis. This outstripped the predicted market forecast of 3.4%. The yearly core CPI, which omits fluctuating food and energy costs, mirrored February's growth by rising 3.8%. Both the CPI and the core CPI climbed by 0.4% monthly, exceeding analysts' projection of 0.3%. As a reaction, US Treasury yields soared while the odds of a June Rate cut by the Fed declined to over 20%. The mix of hawkish bets as rising yields benefited the USD during the session.
On the other hand, the FOMC Minutes disclosed a general lack of assurance amongst participants concerning the persistence of high inflation rates, with recent data failing to bolster their trust in the economy cooling down and t in the inflation rate steadily reaching the 2% benchmark. With inflation running hot as well as the labor market, officials may change their language and slowly give up on the chances of a June rate cut by the Fed.
EUR/USD technical analysis
On the daily chart, the Relative Strength Index (RSI) fell within negative territory, with the latest reading at 38. This deviation from a positive trend suggests a shift in market dominance towards the sellers. Along with the RSI, the Moving Average Convergence Divergence (MACD) displayed a fresh red bar, indicating negative market momentum.
In the broader outlook, the EUR/USD also exhibits a bearish trend as it is positioned below key Simple Moving Averages (SMAs). SMAs are tools used to smooth out significant price data fluctuations over specific time periods to discern market trends. Specifically, today it fell below the 200-day SMA, typically considered a long-term trend indicator.
- GBP/USD breaches key support levels as it loses more than 1%.
- US headline inflation defies the Fed’s intentions to cut rates and climbs.
- Technical outlook suggest that further GBP/USD downside is seen.
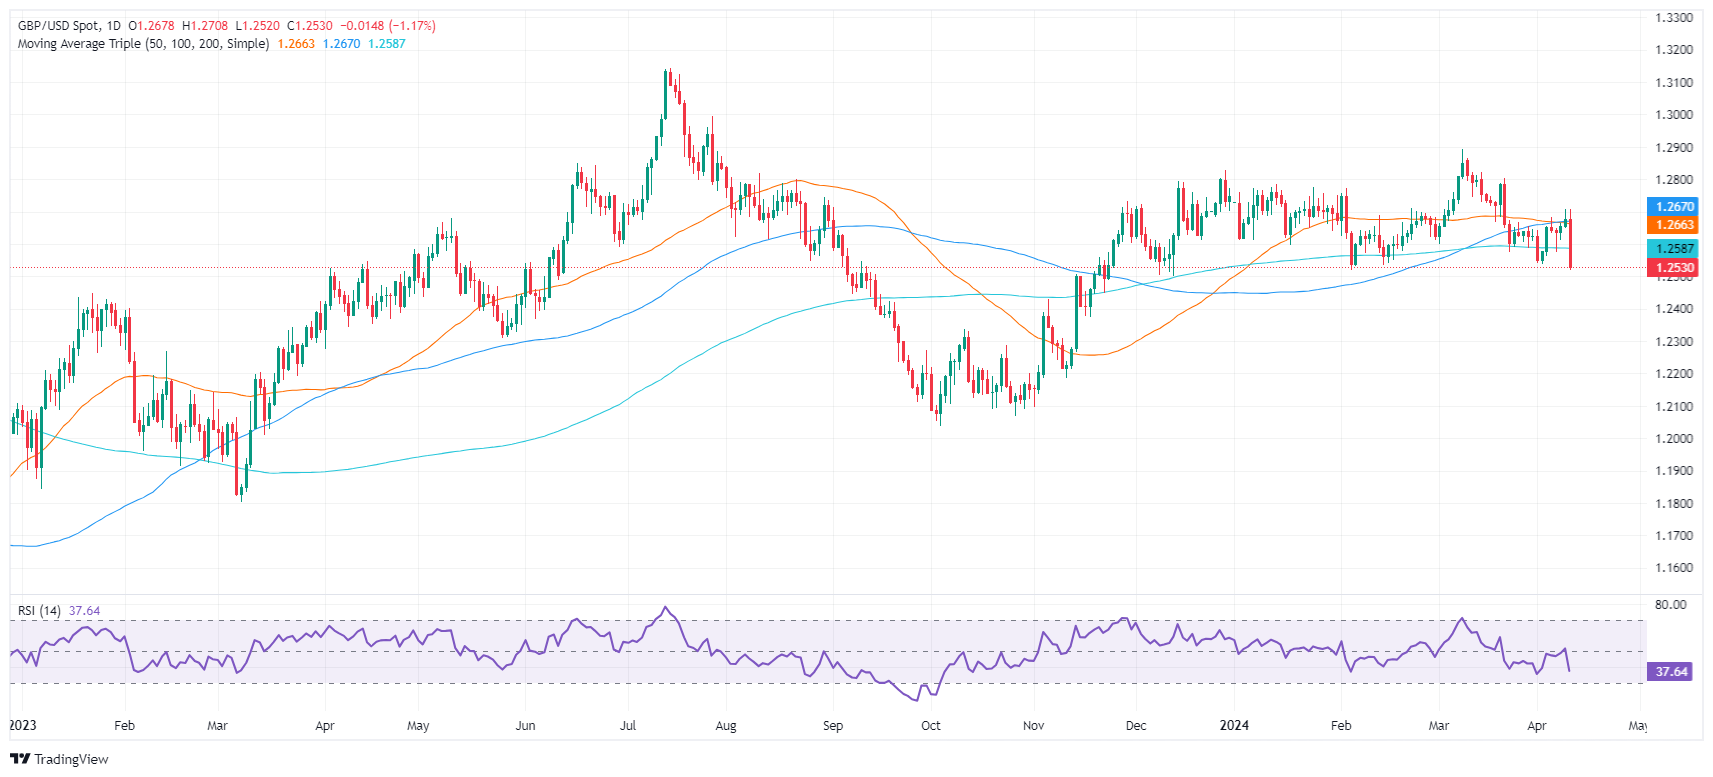
The Pound Sterling collapses late on Wednesday during the North American session, down by more than 1% against the US Dollar, following the release of US inflation data. Expectations for fewer rate cuts by the US Federal Reserve prompted a flight to the Greenback, which reached a new year-to-date (YTD) high via the US Dollar Index (DXY). The GBP/USD trades at 1.2534 after hitting a high of 1.2708.
The major drops below 1.2600, followed by the 200-DMA
The highlight of the day was that inflation in the US remains hotter than expected by the US central bank. The Consumer Price Index (CPI) rose by 0.4% on a monthly basis and 3.5% on an annual basis, exceeding expectations, a rise from the figures reported in the previous month. The core CPI also surpassed forecasts, maintaining a consistent rate of 0.4% MoM and 3.8% YoY in line with February's data.
That prompted investors to expect a less dovish Fed, as shown by Chicago Board of Trade (CBOT) data. December’s 2024 Federal funds rate (FFR) contract suggests that market players estimate the FFR to finish at 4.98%.
Recently, the latest Federal Open Market Committee Minutes revealed that policymakers would like to be more confident that inflation continues to decelerate before committing to ease policy. The minutes highlighted that almost all saw it appropriate to cut this year, though most saw upside risks in inflation.
GBP/USD Price Analysis: Technical outlook
The daily chart, suggests the GBP/USD has shifted neutral to downward biased, breaching key support levels, like the 200-day moving average (DMA) at 1.2585. Once surpassed, the next demand area would be the 1.2500 figure. A further downside is seen at .2448, the November 22 swing low, ahead of 1.2400. In the event of a bullish recovery, the 200-DMA is first resistance, followed by the 1.2600 mark. Once hurdled the GBP/USD, the next resistance would be the 50-DMA at 1.2661.
- Gold drops as US inflation data complicates Fed rate cut intentions.
- Investors rethink Fed's monetary approach amid persistent inflation as they now expect two rate cuts in 2024.
- US real yields rise above 2%, challenging Gold post-CPI release.
Gold price is on the defensive on Wednesday following the release of March inflation figures in the United States (US). The figures witnessed an uptick in monthly and annual readings and might dent the Federal Reserve’s (Fed) intentions of easing policy. Following the data release, US Treasury yields rose, the Greenback climbed, and US real yields overcame the 2% threshold, a headwind for the precious metal.
XAU/USD spot trades at $2,336 after losing 0.66% following the US Consumer Price Index (CPI) release. The US Bureau of Labor Statistics (BLS) announced that March’s CPI was hotter than expected, though unchanged in three of the four inflation readings compared to February’s data. Meanwhile, headline inflation jumped above the annual forecast and the prior month's reading.
Daily digest market movers: Gold loses its shine after hot US CPI report
- US Consumer Price Index (CPI) increased 0.4% monthly and 3.5% annually, surpassing expectations and marking an uptick from the previous month's figures.
- Core CPI, which excludes food and energy, also exceeded forecasts, remaining steady at 0.4% MoM and 3.8% YoY, mirroring February's data.
- Following this, US Treasury bond yields experienced a significant surge, particularly at the short end, with the 2-year Treasury note yield jumping by 20 basis points.
- The US Dollar Index (DXY) also witnessed a substantial increase, soaring over 1% to reach new YTD high of 105.27.
- Data from the Chicago Board of Trade (CBOT) suggests that futures traders expect just two cuts to the fed funds rate as they project the main reference rate to end the year at 4.98%.
- World Gold Consortium reveals that the People’s Bank of China was the largest buyer of the yellow metal in February, increasing its reserves by 12 tonnes to 2,257 tonnes.
Technical analysis: Gold’s advance stalls, prices tumble below $2,350
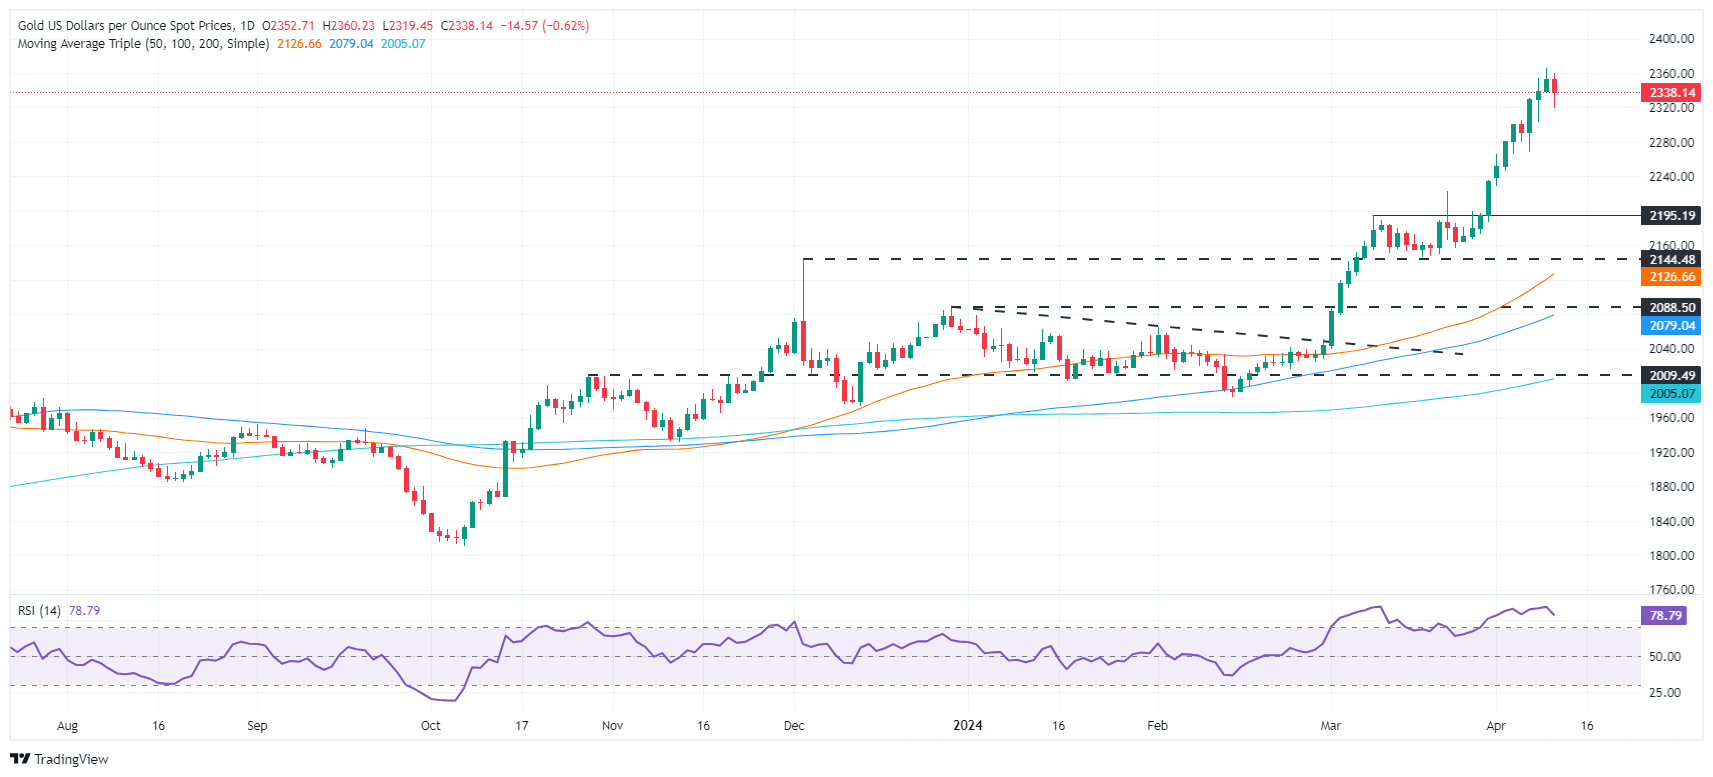
Gold’s retreat from all-time highs opened the door to form an Evening Star candlestick pattern. However, XAU/USD must close below the April 8 open of $2,329, which would pave the way for a deeper correction.
The XAU/USD first support would be the April 8 daily low of $2,303. Once surpassed, that could put downward pressure on the yellow metal and drive it to March’s 21-session high of $2,222. Further losses are seen at $2,200.
On the other hand, if XAU/USD resumes its rally, buyers are eyeing the $2,350 mark, followed by $2,400.
Gold FAQs
Gold has played a key role in human’s history as it has been widely used as a store of value and medium of exchange. Currently, apart from its shine and usage for jewelry, the precious metal is widely seen as a safe-haven asset, meaning that it is considered a good investment during turbulent times. Gold is also widely seen as a hedge against inflation and against depreciating currencies as it doesn’t rely on any specific issuer or government.
Central banks are the biggest Gold holders. In their aim to support their currencies in turbulent times, central banks tend to diversify their reserves and buy Gold to improve the perceived strength of the economy and the currency. High Gold reserves can be a source of trust for a country’s solvency. Central banks added 1,136 tonnes of Gold worth around $70 billion to their reserves in 2022, according to data from the World Gold Council. This is the highest yearly purchase since records began. Central banks from emerging economies such as China, India and Turkey are quickly increasing their Gold reserves.
Gold has an inverse correlation with the US Dollar and US Treasuries, which are both major reserve and safe-haven assets. When the Dollar depreciates, Gold tends to rise, enabling investors and central banks to diversify their assets in turbulent times. Gold is also inversely correlated with risk assets. A rally in the stock market tends to weaken Gold price, while sell-offs in riskier markets tend to favor the precious metal.
The price can move due to a wide range of factors. Geopolitical instability or fears of a deep recession can quickly make Gold price escalate due to its safe-haven status. As a yield-less asset, Gold tends to rise with lower interest rates, while higher cost of money usually weighs down on the yellow metal. Still, most moves depend on how the US Dollar (USD) behaves as the asset is priced in dollars (XAU/USD). A strong Dollar tends to keep the price of Gold controlled, whereas a weaker Dollar is likely to push Gold prices up.
- The daily RSI for EUR/JPY reveals a possible reduction in positive market momentum, signifying diminishing buyers' influence.
- The hourly indicators suggest a growing selling pressure.
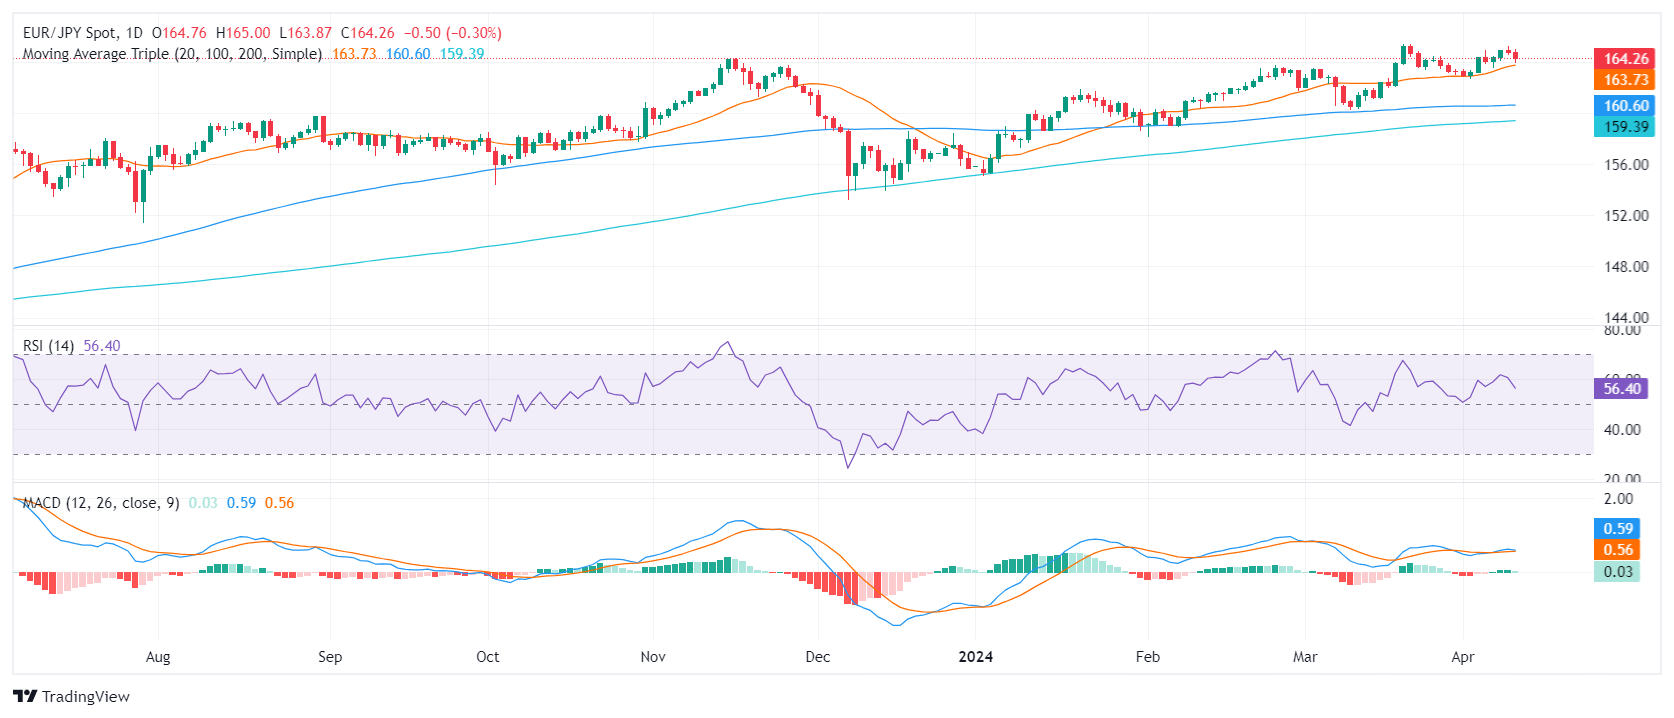
The EUR/JPY pair is trading at 164.25 and has decreased by 0.30% in Wednesday’s session. Despite being positioned above its key Simple Moving Averages (SMAs), the pair is experiencing a potential shift in momentum from bulls to bears with technical indicators losing traction.
On the daily chart, the Relative Strength Index (RSI) for the pair is positioned in positive territory but points down. This, coupled with the sharp decrease in the green bars of the Moving Average Convergence Divergence (MACD), points to a possible reduction in positive market momentum. It indicates that the influence of buyers is potentially dwindling in the market. As such, the pair may start to cool off.
EUR/JPY daily chart
Zooming in, the hourly RSI value hovers mostly in the oversold region, with the latest value just above 30. Additionally, the MACD histogram on this timeframe presents rising red bars, showcasing an increase in negative momentum. This hints at a rise in sellers' dominance in the market.
EUR/JPY hourly chart
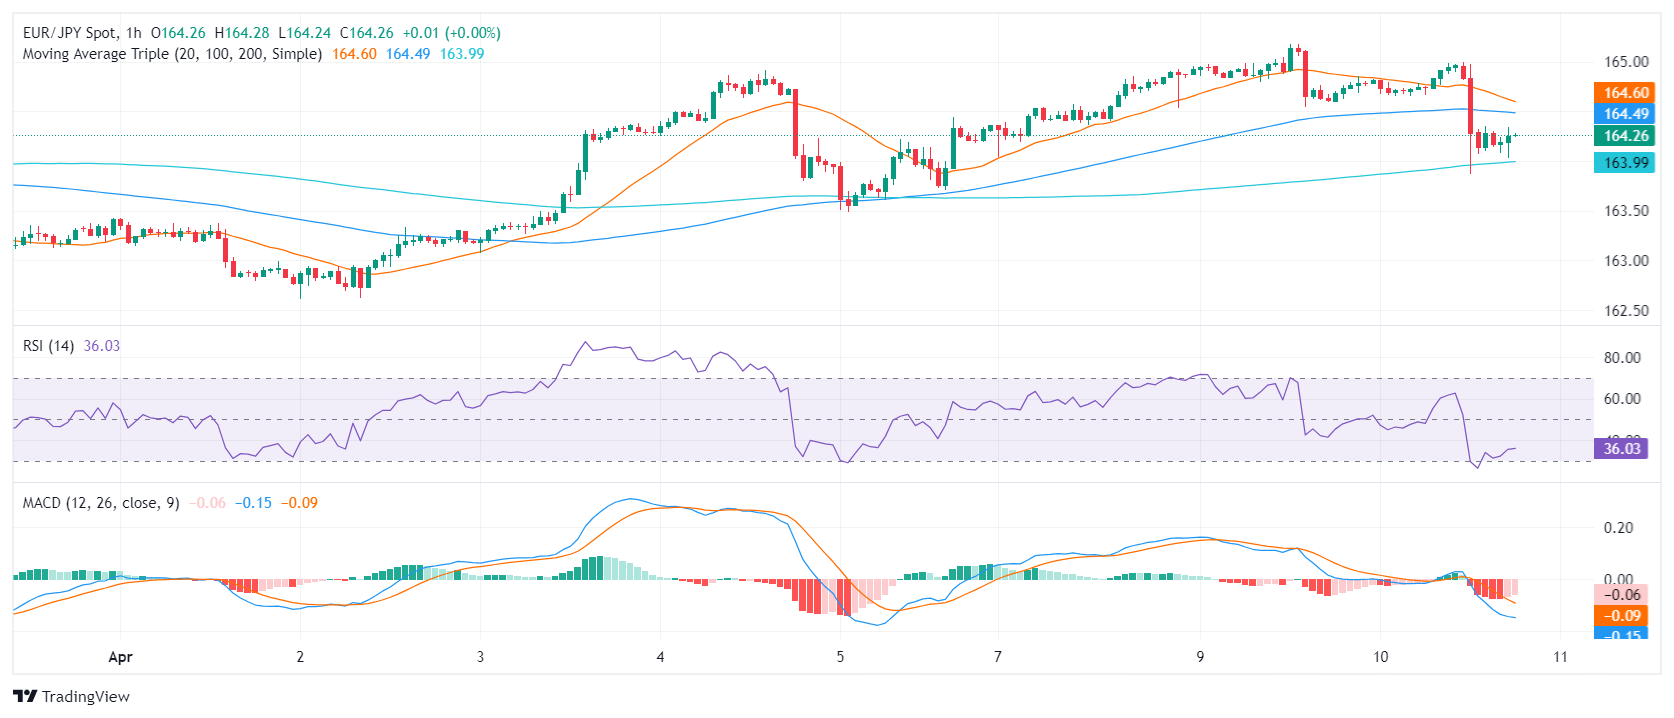
Inspecting the broader outlook, the EUR/JPY demonstrates considerably bullish signals. It stands above the 20-day, 100-day, and 200-day Simple Moving Averages (SMA). Such a position typically signifies a strong and resilient upward trend for both short-term and long-term scenarios. However, today's significant movements must be taken into account. Notably, the pair is challenging the 20-day SMA at the 163.72 mark. If the selling momentum grows and bears conquer the 20-day average, the pair may see further downside.
During the FOMC Minutes, participants expressed general uncertainty about the persistence of elevated inflation and indicated that recent data did not increase their confidence in inflation trending sustainably towards the 2% target.
In addition, officials deliberated over whether the greater risk lies in monetary policy remaining overly restrictive for an extended period or in the Fed easing prematurely and failing to achieve the 2% inflation target.
Some officials continued to argue that significant factors like housing inflation would begin to decelerate, with "several" suggesting that increases in productivity could enable robust economic growth while inflation continued to decline.
However, the minutes reflected a general apprehension regarding the status of the inflation battle, which appeared to be under control at the beginning of the year.
- Strong US CPI figures have sent the Aussie tumbling.
- US CPI accelerated 0.4% in March against expectations of a 0.3% reading. The yearly inflation jumps to 3.5% from 3.2% in the previous month
- AUD/USD is under pressure again, with support levels at 0.6480 and 0.6445 on the bears’ focus
Australian Dollar posted a strong reversal on Wednesday. The higher-than-expected US inflation levels have endorsed the Fed’s “higher for longer” stance, crushing risky assets like the Aussie.
Consumer inflation accelerated in the US in March, with the headline figures accelerating to 0.4%, against expectations of a 0.3% reading. Year-on-year, consumer prices rose at a 3.5% pace from 3.2% in February. The Core inflation accelerated to 0.4% from 0.3% in the previous month, while the yearly rate remained steady at 3.8%.
These levels confirm that the Fed has still some work to do to push inflation towards their 2% target, and practically ditch the markets’ view of three rate cuts in 2024 starting in June.
Later today, the Fed monetary policy minutes will be looked at from a different perspective following the CPI data. On Friday the PPI will add further insight into the inflation picture, although Fed’s Bostic and Williams, both on the hawkish side of the committee, might attract investors’ attention.
The technical picture looks increasingly bearish as the pair is on track to post a strong negative candle today. The 0.6480-0.6500 area might support the pair ahead of the big downside target, 0.6445. Resistances are 0.6550 and 0.6635.
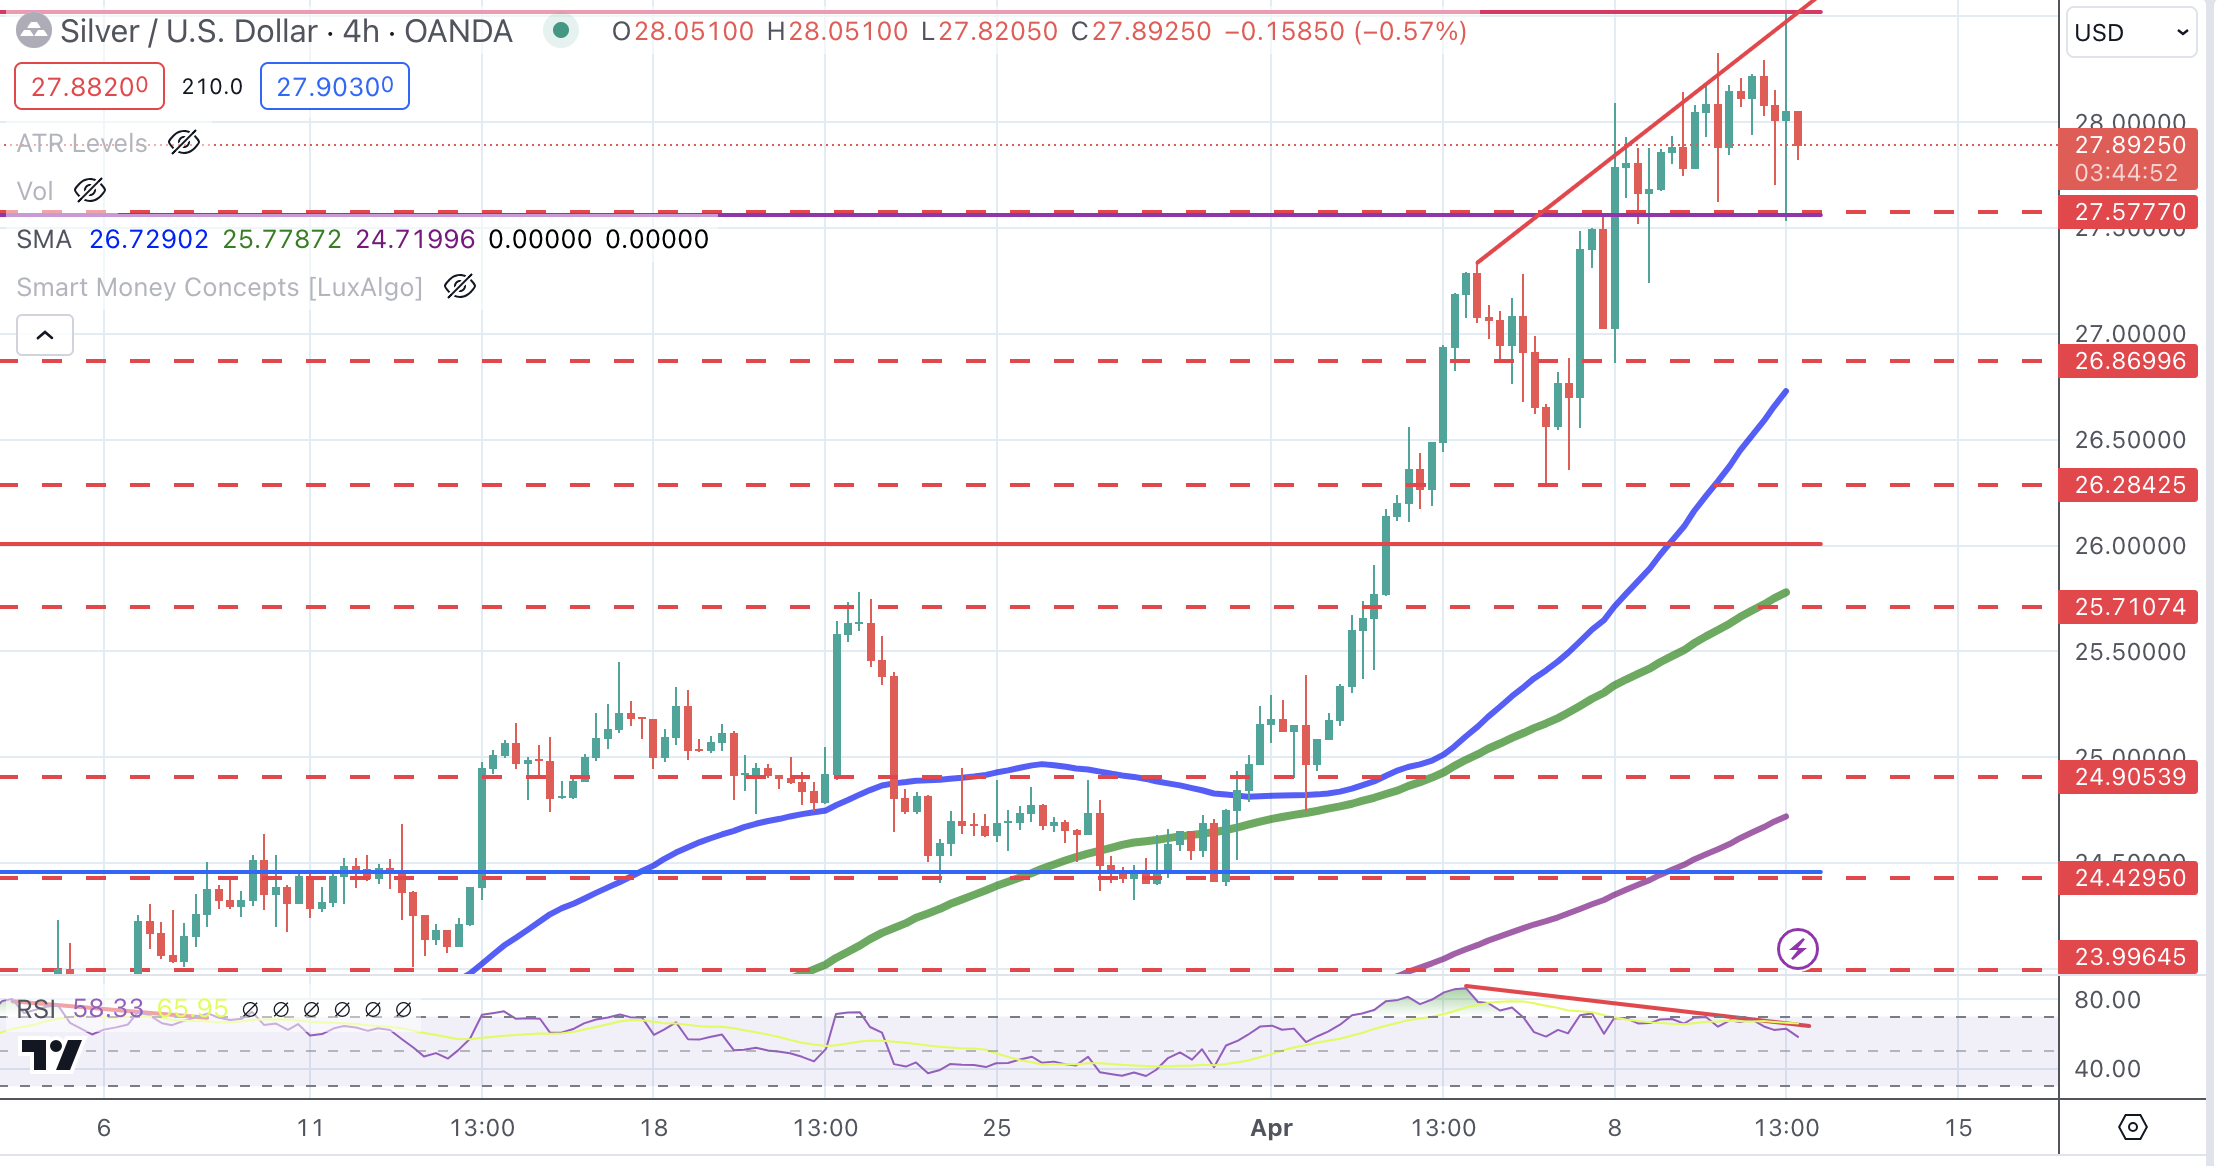
- Silver prices' decline is capped near $27.50 and remains practically flat on the day.
- US CPI endorses Fed's "higher for longer" stance and crushes risk appetite.
- XAG/USD's broader bullish trend remains intact with $28.53 high on the bull's focus
Silver Prices’ (XAG/USD) reversal following stronger-than-expected US inflation data has been contained at the mid-range of the $27.00’s. The metal is regaining some ground as the dust from the US data settles, with the daily chart practically flat.
Consumer prices accelerated unexpectedly in the US in March, with the headline inflation accelerating to 0.4% against expectations of a 0.3% reading, while the yearly rate rose to 3.5% from 3.2% in February. Likewise, the Core inflation accelerated to 0.4% from 0.3% in the previous month, while the yearly rate remained steady at 3.8%.
These figures confirm that price pressures remain stubbornly high at levels well above the Fed’s 2% target rate which has crushed hopes of monetary easing in the coming months.
US Treasury yields skyrocketed after the news, dragging the US Dollar up with them, although the negative impact on precious metals has been limited. Silver, in particular, has retraced most of the ground lost after the release and is trading near the daily opening.
XAU/USD Technical Analysis
The XAU/USD’s broader bullish trend remains intact, with no clear sign of a correction so far except for the bearish divergence in the RSI. Immediate support is at $27.57 and below here, at $26.85. Resistances are $28.53 and the $30,00 psychological level.
XAG/USD 4-hour Chart
- Mexican Peso weakens as higher-than-anticipated US inflation figures might deter Fed from easing policy
- Rising US Treasury yields and a strengthening US Dollar contribute to Peso depreciation.
- USD/MXN's ascent underscores heightened economic vigilance, with traders eyeing potential moves towards the 17.00 mark.
The Mexican Peso depreciated against the US Dollar following the release of an inflation report in the United States (US) on Wednesday. Prices in the largest economy in the world were higher than expected, prompting traders to price in two interest rate cuts instead of three in 2024 from the Federal Reserve (Fed). The USD/MXN trades at 16.50, a new two-day high, and gains 0.78%.
US data was the driver of price action in the USD/MXN pair. The US Bureau of Labor Statistics (BLS) revealed that March’s Consumer Price Index (CPI) was unchanged in three of the four inflation readings, while the headline CPI exceeded estimates and February’s number.
After the data, US Treasury yields rose, the Greenback climbed, and US equities tumbled. The Chicago Board of Trade’s (CBOT) fed funds rate futures have priced in two rate cuts throughout the full year, with December’s contract projecting the Fed will ease policy to 4.95%.
The USD/MXN jumped from around 16.30 and reached a daily high of 16.52 before stabilizing at current exchange rate levels. Therefore, the Mexican Peso remains pressured, and a daily close above 16.50 could pave the way for a correction to 17.00.
Daily digest market movers: Mexican Peso tumbles after US inflation report
- Mexico’s Consumer Price Index (CPI) was lower than estimated as the disinflation process continued. In the same tone, core CPI decelerated on a yearly and monthly basis, justifying the Bank of Mexico's (Banxico) decision to lower rates on March 21. However, not everything was good news for the central bank, as the yearly CPI exceeded estimates.
- Mexico’s CPI rose 0.29% MoM, according to the National Statistics Agency (INEGI). This was lower than the expected 0.36% increase and higher than the 0.09% rise noted in February. Core figures rose by 0.44%, which was lower than the 0.51% that economists had forecast and below the 0.49% increase in February.
- The US Consumer Price Index (CPI) increased 0.4% MoM and 3.5% YoY, exceeding estimates, with annual inflation also punching above the previous month’s number. The underlying CPI, which excludes volatile items like food and energy, was above projections but remained unchanged compared to February’s data at 0.4% MoM and 3.8% YOY.
- US Treasury bond yields skyrocketed, with the short end of the curve, namely the 2-year T-note, climbing 20 basis points.
- The US Dollar Index (DXY) is soaring more than 1%, standing at 105.27, at new year-to-date (YTD) highs.
- Traders are eyeing the release of the Minutes of the latest Fed meeting in March.
Technical analysis: Mexican Peso loses momentum as USD/MXN surges toward 16.50
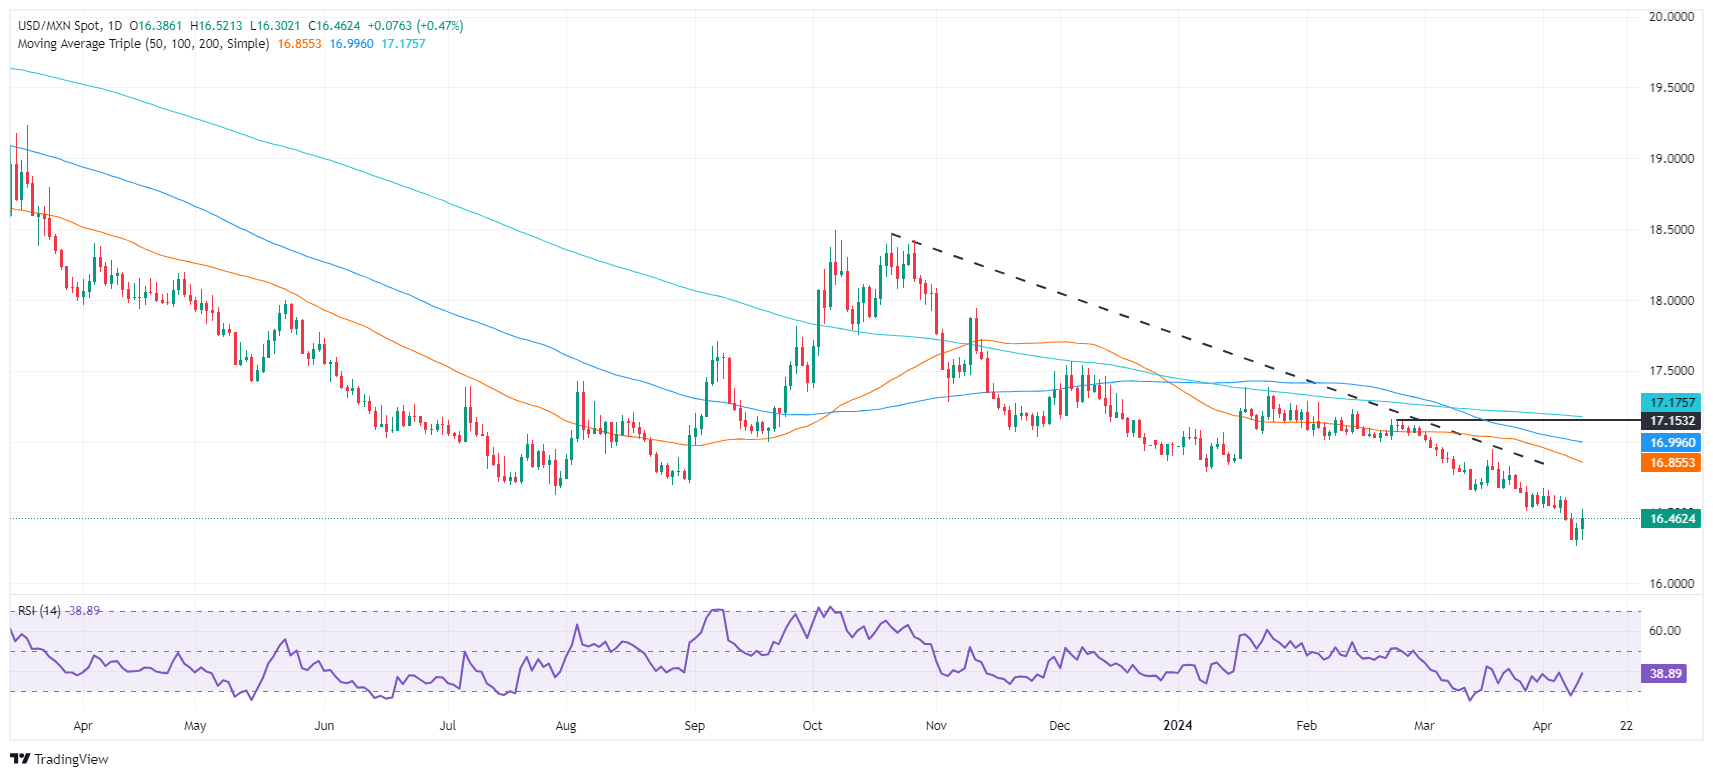
After diving to a new nine-year low near 16.25, the USD/MXN recovered some ground as the pair aimed above 16.40 and approached the psychological 16.50 area. Once that level is cleared, further upside is seen at last year’s 16.62 mark, followed by the 50-day Simple Moving Average (SMA) at 16.85 and the 100-day SMA at 16.99.
Failure at 16.50 and the USD/MXN could tumble to October’s 2015 low of 16.32 before retesting the year-to-date (YTD) low of 16.25.
Mexican Peso FAQs
The Mexican Peso (MXN) is the most traded currency among its Latin American peers. Its value is broadly determined by the performance of the Mexican economy, the country’s central bank’s policy, the amount of foreign investment in the country and even the levels of remittances sent by Mexicans who live abroad, particularly in the United States. Geopolitical trends can also move MXN: for example, the process of nearshoring – or the decision by some firms to relocate manufacturing capacity and supply chains closer to their home countries – is also seen as a catalyst for the Mexican currency as the country is considered a key manufacturing hub in the American continent. Another catalyst for MXN is Oil prices as Mexico is a key exporter of the commodity.
The main objective of Mexico’s central bank, also known as Banxico, is to maintain inflation at low and stable levels (at or close to its target of 3%, the midpoint in a tolerance band of between 2% and 4%). To this end, the bank sets an appropriate level of interest rates. When inflation is too high, Banxico will attempt to tame it by raising interest rates, making it more expensive for households and businesses to borrow money, thus cooling demand and the overall economy. Higher interest rates are generally positive for the Mexican Peso (MXN) as they lead to higher yields, making the country a more attractive place for investors. On the contrary, lower interest rates tend to weaken MXN.
Macroeconomic data releases are key to assess the state of the economy and can have an impact on the Mexican Peso (MXN) valuation. A strong Mexican economy, based on high economic growth, low unemployment and high confidence is good for MXN. Not only does it attract more foreign investment but it may encourage the Bank of Mexico (Banxico) to increase interest rates, particularly if this strength comes together with elevated inflation. However, if economic data is weak, MXN is likely to depreciate.
As an emerging-market currency, the Mexican Peso (MXN) tends to strive during risk-on periods, or when investors perceive that broader market risks are low and thus are eager to engage with investments that carry a higher risk. Conversely, MXN tends to weaken at times of market turbulence or economic uncertainty as investors tend to sell higher-risk assets and flee to the more-stable safe havens.
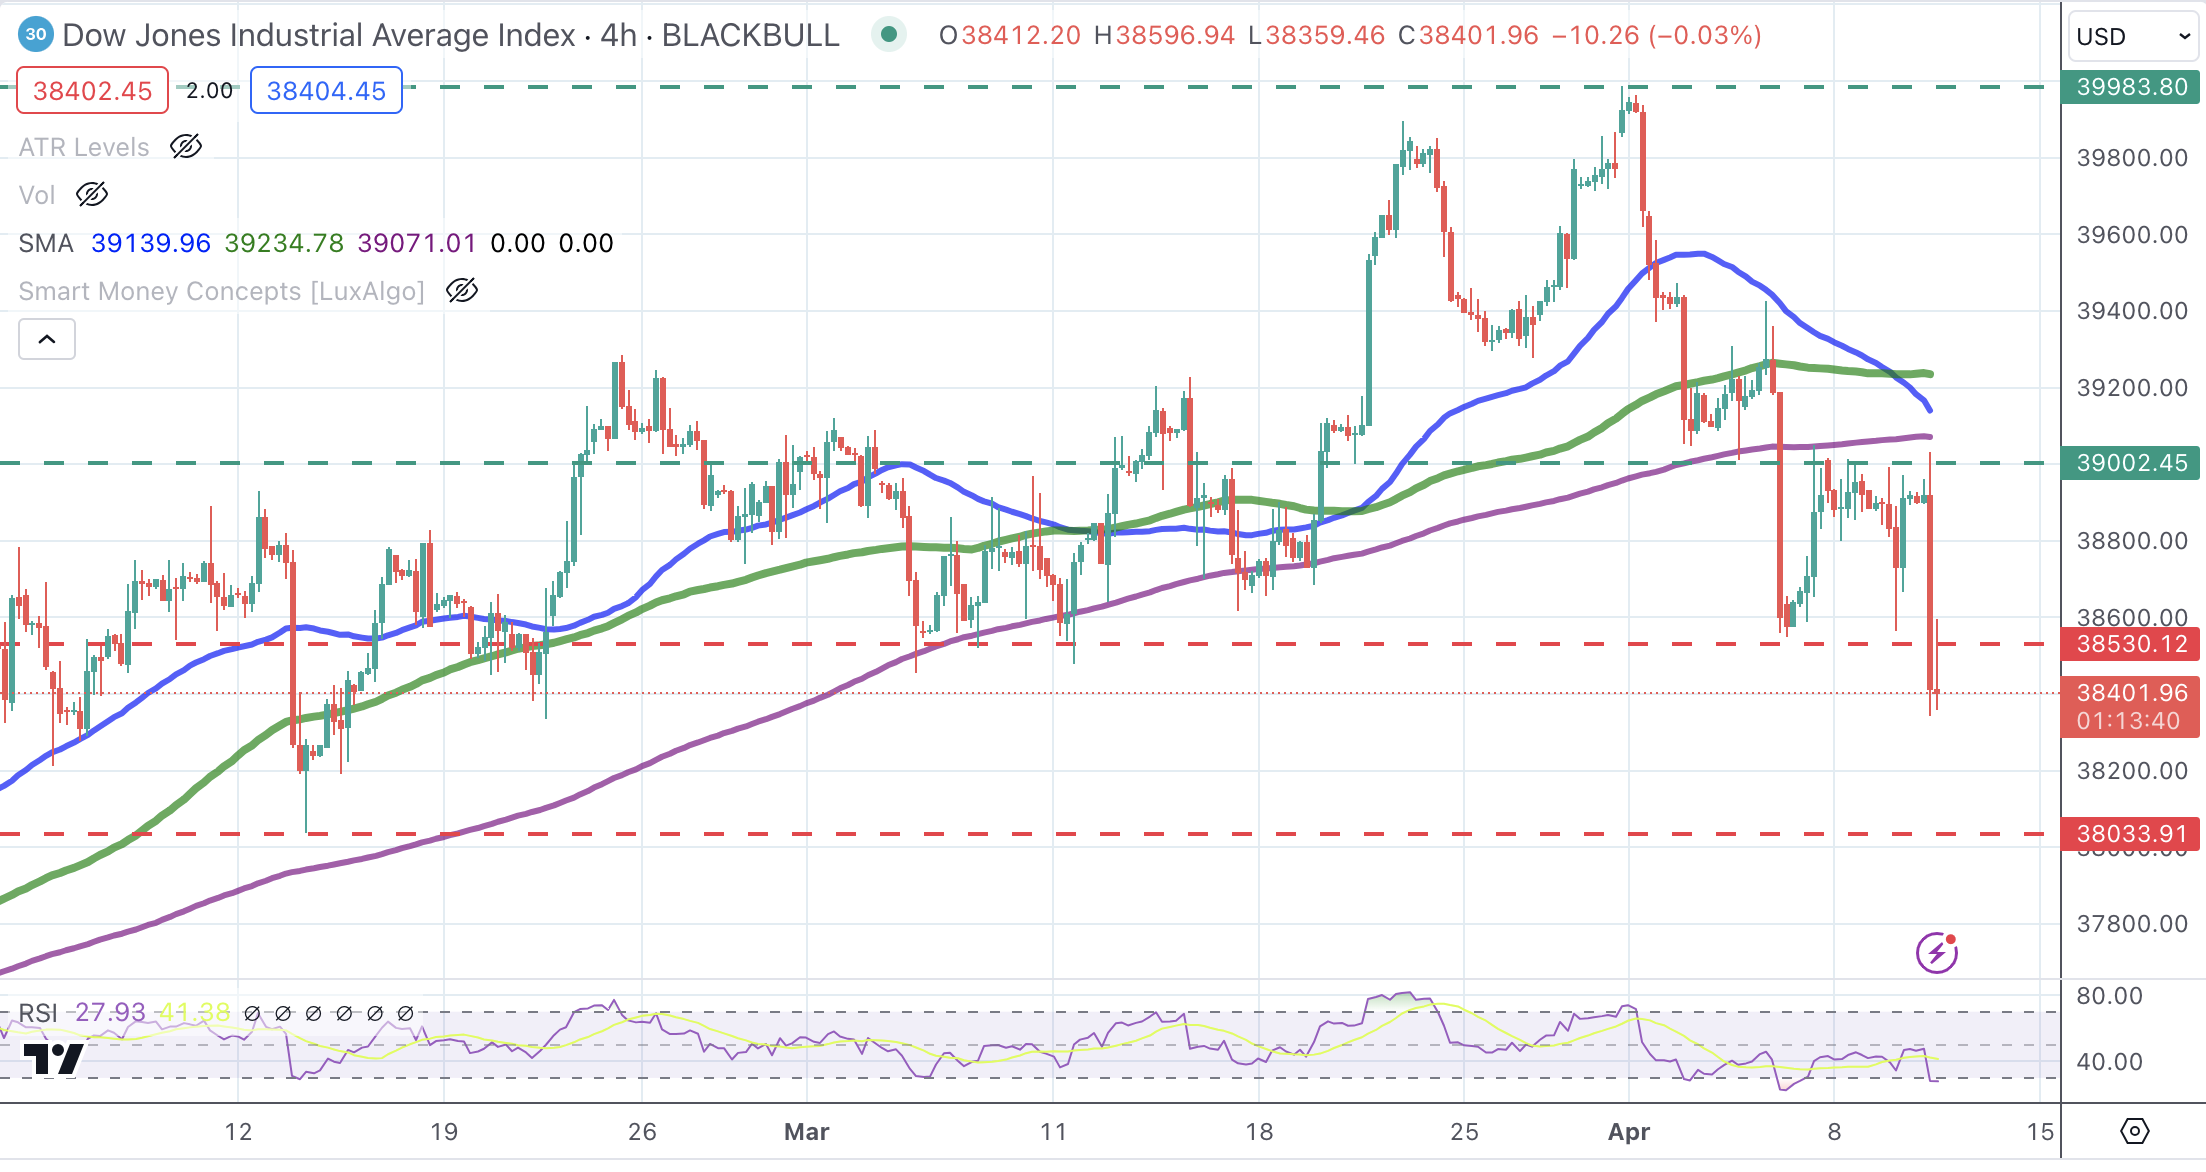
- Wall Street indexes plunge as US inflation dampens hopes of Fed rate cuts in June.
- All sectors are trading lower with Real Estate and Utilities the most affected.
- The Dow Jones Index is under increasing bearish pressure below 38,540 with scope to retest 38,035 area.
Equity markets are taking a blow on Wednesday as an unexpectedly strong US inflation report has hammered hopes that the Federal Reserve (Fed) may start lowering borrowing costs in the near term.
US Consumer Prices Index (CPI) accelerated at a 0.4% pace in March, against expectations of a slowdown to 0.3%, while the yearly rate increased to 3.5% from 3.2% in the previous month. These numbers confirm that price pressures remain stubbornly high and ditch the market’s roadmap of three rate cuts in 2024, starting in June.
The risk-averse reaction to CPI data has sent the main US indices tumbling. The Dow Jones leads losses, down 1.27% to 38,383, increasing its distance from March highs near 40,000. The S&P 500 and the NASDAQ index drop 1.13% each to 5,150 and 16,117, respectively.
Dow Jones news
All Wall Street sectors are posting losses on Wednesday. Real Estate is the most affected by higher-for-longer interest rates and falls 4.24%, followed by Utilities, down 2.05%, and Materials, which gives away 1.6%. The least- affected sectors are Energy, only 0.5% lower, and Communication Services with a 0.65% decline.
Home Depot (HD) is leading losses with a 2.88% drop to $351.05, followed by Boeing (BA), 2.75% lower to $173.29, and Intel (INTL), which is losing 2.65% to $38.31. Only Walmart (WMT) is in the green on Wednesday with a 0.7% advance to $60.20.
Dow Jones technical outlook
The Dow Jones index is on track to print a strong bearish candle on the daily chart, confirming the negative trend from the March top, right below 40,000.
The strong reaction to the US inflation data has pushed the Index below the 38,540 support level, with the bearish cross between the 4-hour 50 and 100 Simple Moving Averages (SMAs) giving hope to bears. Below here, the next target is 38,033.
The previous support at the mentioned 38,540 is likely to offer some resistance, and above there, an order block, right below 39,000, will challenge a potential bullish attempt.
Dow Jones Index 4-Hour Chart
Risk sentiment FAQs
In the world of financial jargon the two widely used terms “risk-on” and “risk off'' refer to the level of risk that investors are willing to stomach during the period referenced. In a “risk-on” market, investors are optimistic about the future and more willing to buy risky assets. In a “risk-off” market investors start to ‘play it safe’ because they are worried about the future, and therefore buy less risky assets that are more certain of bringing a return, even if it is relatively modest.
Typically, during periods of “risk-on”, stock markets will rise, most commodities – except Gold – will also gain in value, since they benefit from a positive growth outlook. The currencies of nations that are heavy commodity exporters strengthen because of increased demand, and Cryptocurrencies rise. In a “risk-off” market, Bonds go up – especially major government Bonds – Gold shines, and safe-haven currencies such as the Japanese Yen, Swiss Franc and US Dollar all benefit.
The Australian Dollar (AUD), the Canadian Dollar (CAD), the New Zealand Dollar (NZD) and minor FX like the Ruble (RUB) and the South African Rand (ZAR), all tend to rise in markets that are “risk-on”. This is because the economies of these currencies are heavily reliant on commodity exports for growth, and commodities tend to rise in price during risk-on periods. This is because investors foresee greater demand for raw materials in the future due to heightened economic activity.
The major currencies that tend to rise during periods of “risk-off” are the US Dollar (USD), the Japanese Yen (JPY) and the Swiss Franc (CHF). The US Dollar, because it is the world’s reserve currency, and because in times of crisis investors buy US government debt, which is seen as safe because the largest economy in the world is unlikely to default. The Yen, from increased demand for Japanese government bonds, because a high proportion are held by domestic investors who are unlikely to dump them – even in a crisis. The Swiss Franc, because strict Swiss banking laws offer investors enhanced capital protection.
- Inflation measured by the CPI in the US accelerated in March.
- Following the hot figures, the odds of a rate cut in June plummeted.
- Hawkish bets on Fed, soaring US Treasury yields benefit USD.
The US Dollar Index (DXY) rallied to 105.20, up by nearly 1%, on Wednesday. The Greenback gained strength on hot inflation figures in the US Consumer Price Index (CPI) for March, which made markets start giving up hope for a June rate cut by the Federal Reserve (Fed).
Following a blockbuster labor market report and hot inflation figures for March, Fed officials may start signaling that they require additional evidence of the economy cooling down. In that sense, US Treasury yields may continue rising, which will benefit the USD.
Daily digest market movers: DXY gains strength on rising inflation figures, hawkish Fed bets
- March CPI showed that headline inflation increased to 3.5% YoY in March, up from 3.2% in February and beating the 3.4% expected.
- The Core CPI measurement, excluding volatile food and energy costs, reflected February's increase with an annual rise of 3.8% in March. Both the headline and core CPI experienced a 0.4% MoM rise, beating analyst estimates of 0.3%.
- The odds of a Fed cut in June plummeted to 20%.
- US Treasury bond yields rallied with the 2-year yield at 4.93%, the 5-year yield at 4.56%, and the 10-year yield at 4.51%. All three yields rose more than 2%.
DXY technical analysis: DXY bulls step in and recover ground
The technical indicators on the daily chart reflect that the buyers are gaining momentum. The Relative Strength Index (RSI) is on a positive slope, well within positive territory, which hints at underlying bullish strength. The Moving Average Convergence Divergence (MACD) follows suit with rising green bars, further validating the positive sentiment hovering over DXY.
Focusing on the Simple Moving Averages (SMAs), the DXY continues to be stationed above its 20, 100 and 200-day SMAs. This essentially suggests a higher ground captured by the bulls against the bears and adds weight to an overall positive prospect.
US Dollar FAQs
The US Dollar (USD) is the official currency of the United States of America, and the ‘de facto’ currency of a significant number of other countries where it is found in circulation alongside local notes. It is the most heavily traded currency in the world, accounting for over 88% of all global foreign exchange turnover, or an average of $6.6 trillion in transactions per day, according to data from 2022. Following the second world war, the USD took over from the British Pound as the world’s reserve currency. For most of its history, the US Dollar was backed by Gold, until the Bretton Woods Agreement in 1971 when the Gold Standard went away.
The most important single factor impacting on the value of the US Dollar is monetary policy, which is shaped by the Federal Reserve (Fed). The Fed has two mandates: to achieve price stability (control inflation) and foster full employment. Its primary tool to achieve these two goals is by adjusting interest rates. When prices are rising too quickly and inflation is above the Fed’s 2% target, the Fed will raise rates, which helps the USD value. When inflation falls below 2% or the Unemployment Rate is too high, the Fed may lower interest rates, which weighs on the Greenback.
In extreme situations, the Federal Reserve can also print more Dollars and enact quantitative easing (QE). QE is the process by which the Fed substantially increases the flow of credit in a stuck financial system. It is a non-standard policy measure used when credit has dried up because banks will not lend to each other (out of the fear of counterparty default). It is a last resort when simply lowering interest rates is unlikely to achieve the necessary result. It was the Fed’s weapon of choice to combat the credit crunch that occurred during the Great Financial Crisis in 2008. It involves the Fed printing more Dollars and using them to buy US government bonds predominantly from financial institutions. QE usually leads to a weaker US Dollar.
Quantitative tightening (QT) is the reverse process whereby the Federal Reserve stops buying bonds from financial institutions and does not reinvest the principal from the bonds it holds maturing in new purchases. It is usually positive for the US Dollar.
- Canadian Dollar dives as US Dollar rallies after strong US CPI data.
- Bank of Canada keeps rates on hold but hints at rate cut, probably in June.
- Bets on Fed cut in June drop from 50% to 17% following US inflation figures.
The Canadian Dollar (CAD) has tumbled nearly 0.8% in Wednesday’s early North American session to reach the lowest levels this year so far. US Consumer Prices Index (CPI) figures for March confirmed that inflation remains stubbornly high, sending US Treasury yields and the US Dollar to fresh multi-month highs.
Price pressure remains sticky at levels well above the Federal Reserve’s (Fed) 2% core inflation target as last week’s strong employment and steady price growth data suggested. These figures back the Fed’s hawkish side and practically ditch its plan for three rate cuts, which was devised in January. This is expected to underpin the US Dollar in the near term.
In Canada, the Bank of Canada (BoC) kept interest rates unchanged, as widely expected, but noted a downward trend in core inflation. The market has observed those comments as a hint toward a rate cut in June, which has increased downside pressure on the CAD.
Daily digest market movers: USD/CAD rallies as US CPI figures cast doubt on Fed cuts
- Canadian Dollar trades at five-month lows, weighed down by strong US CPI data and dovish-tilted BoC statement.
- US headline inflation rises at 0.4% pace in March against market expectations of 0.3% increase. The YoY rate accelerates to 3.5% from 3.2% in February.
- Core CPI shows similar picture with 0.4% monthly increase, above market consensus of 0.3%, with the yearly rate steady at 3.8%.
- Treasury yields for the US 10-year note reach key 4.5% level for first time this year. The 2-year yield jumped 25 basis points to hit levels right below 5%.
- Bets for Fed cut in June have plunged from about 50% to 17% following the release of US COPI data, according to CME Group FedWatch Tool.
- BoC left interest rates unchanged at 5%, but Governor Macklem revealed that the committee discussed the possibility of cutting rates.
- Later on Wednesday, the minutes of the last Fed meeting will be observed under a new perspective following March’s inflation data.
Canadian Dollar price today
The table below shows the percentage change of Canadian Dollar (CAD) against listed major currencies today. Canadian Dollar was the strongest against the Australian Dollar.
| USD | EUR | GBP | CAD | AUD | JPY | NZD | CHF | |
| USD | 0.98% | 0.87% | 0.70% | 1.55% | 0.63% | 1.18% | 0.98% | |
| EUR | -1.01% | -0.12% | -0.25% | 0.57% | -0.34% | 0.23% | -0.02% | |
| GBP | -0.85% | 0.10% | -0.12% | 0.69% | -0.24% | 0.31% | 0.12% | |
| CAD | -0.72% | 0.24% | 0.15% | 0.81% | -0.09% | 0.48% | 0.22% | |
| AUD | -1.58% | -0.57% | -0.65% | -0.84% | -0.91% | -0.34% | -0.58% | |
| JPY | -0.63% | 0.35% | 0.25% | 0.05% | 0.93% | 0.59% | 0.35% | |
| NZD | -1.19% | -0.24% | -0.37% | -0.46% | 0.33% | -0.61% | -0.24% | |
| CHF | -0.99% | 0.03% | -0.09% | -0.27% | 0.59% | -0.32% | 0.24% |
The heat map shows percentage changes of major currencies against each other. The base currency is picked from the left column, while the quote currency is picked from the top row. For example, if you pick the Euro from the left column and move along the horizontal line to the Japanese Yen, the percentage change displayed in the box will represent EUR (base)/JPY (quote).
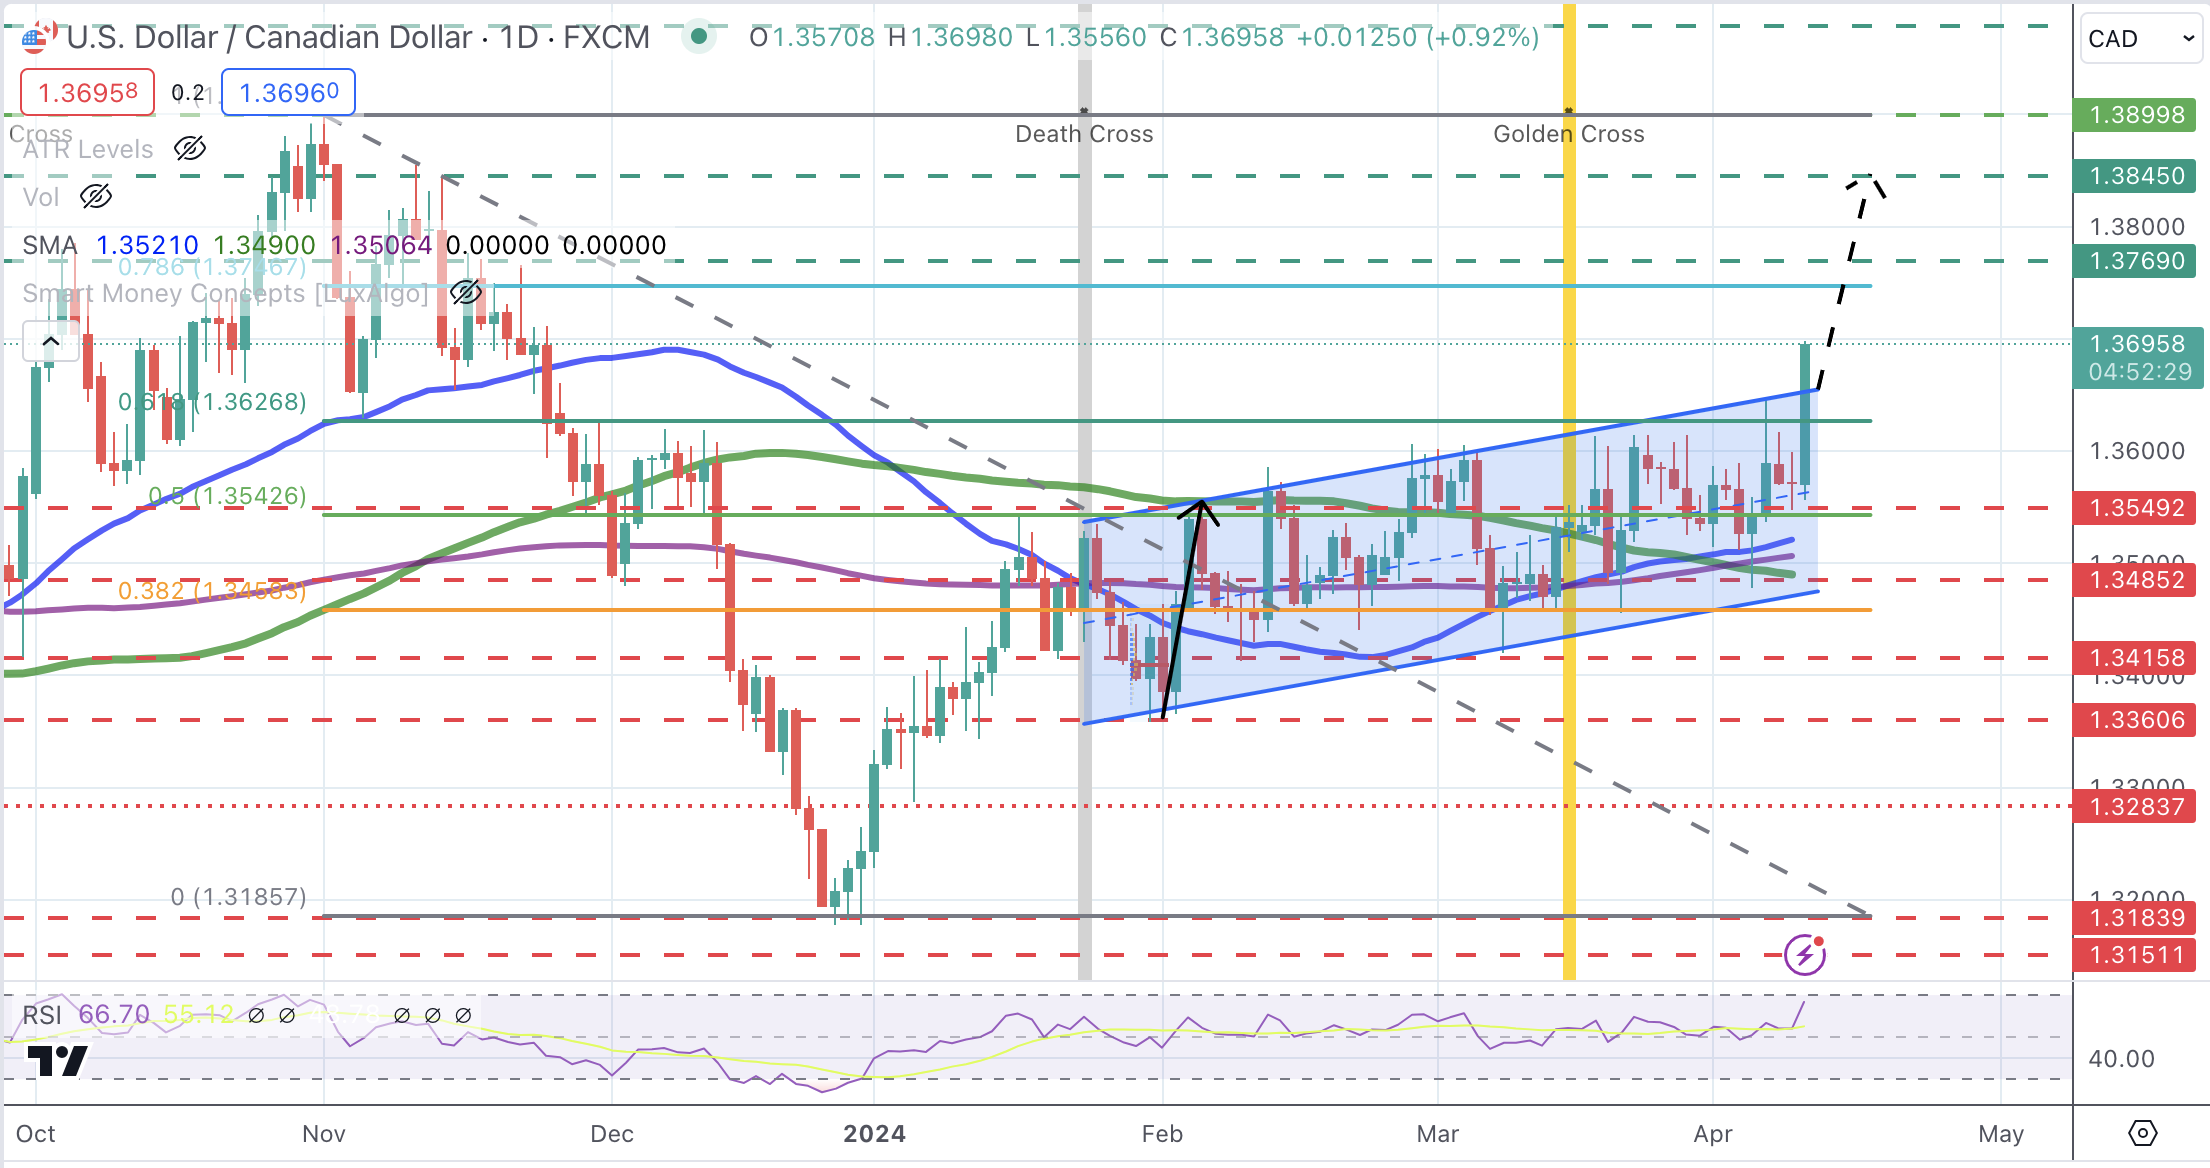
Technical analysis: USD/CAD breaks above channel top, next resistance at 1.3740
The US Dollar has broken above the last two months’ channel top as the strong US inflation data dampened hopes of a rate cut in June. Bulls have taken control, sending the pair to levels near 1.3700 so far.
The Relative Strength Index (RSI) is nearing overbought levels, which may lead to some correction. In that case, the reverse trendline might provide support on the path toward the 78.6% Fibonacci retracement at 1.3740 and 1.3770. The measured target of the broken channel is the mid-November high at 1.3845. Supports are the mentioned channel top, at 1.3650 and 1.3545.
USD/CAD 4-Hour Chart
Inflation FAQs
Inflation measures the rise in the price of a representative basket of goods and services. Headline inflation is usually expressed as a percentage change on a month-on-month (MoM) and year-on-year (YoY) basis. Core inflation excludes more volatile elements such as food and fuel which can fluctuate because of geopolitical and seasonal factors. Core inflation is the figure economists focus on and is the level targeted by central banks, which are mandated to keep inflation at a manageable level, usually around 2%.
The Consumer Price Index (CPI) measures the change in prices of a basket of goods and services over a period of time. It is usually expressed as a percentage change on a month-on-month (MoM) and year-on-year (YoY) basis. Core CPI is the figure targeted by central banks as it excludes volatile food and fuel inputs. When Core CPI rises above 2% it usually results in higher interest rates and vice versa when it falls below 2%. Since higher interest rates are positive for a currency, higher inflation usually results in a stronger currency. The opposite is true when inflation falls.
Although it may seem counter-intuitive, high inflation in a country pushes up the value of its currency and vice versa for lower inflation. This is because the central bank will normally raise interest rates to combat the higher inflation, which attract more global capital inflows from investors looking for a lucrative place to park their money.
Formerly, Gold was the asset investors turned to in times of high inflation because it preserved its value, and whilst investors will often still buy Gold for its safe-haven properties in times of extreme market turmoil, this is not the case most of the time. This is because when inflation is high, central banks will put up interest rates to combat it. Higher interest rates are negative for Gold because they increase the opportunity-cost of holding Gold vis-a-vis an interest-bearing asset or placing the money in a cash deposit account. On the flipside, lower inflation tends to be positive for Gold as it brings interest rates down, making the bright metal a more viable investment alternative.
Tiff Macklem, Governor of the Bank of Canada (BoC), explains the BoC decision to leave the interest rate unchanged at 5% after the April policy meeting and responds to questions from the press.
Key quotes
"We did discuss when to reduce rates, there was clear consensus to hold it at 5%."
"There is some diversity of views in the Governing Council as to when we're going to see what we're looking for."
"Overall, C$ has been reasonably stable, if it does move we'll take that into account."
"Gas prices tend to go up and down. So that's one reason why we're particularly focused on core inflation."
Market reaction
USD/CAD clings to strong gains following these comments and was last seen trading at 1.3675, rising 0.75% on the day.
- USD/CAD pulls back after the BoC strikes a dovish tone in its policy statement.
- BoC sees signs of inflation easing accompanied by higher growth.
- USD/CAD continues broadly rising within a strict ascending channel.
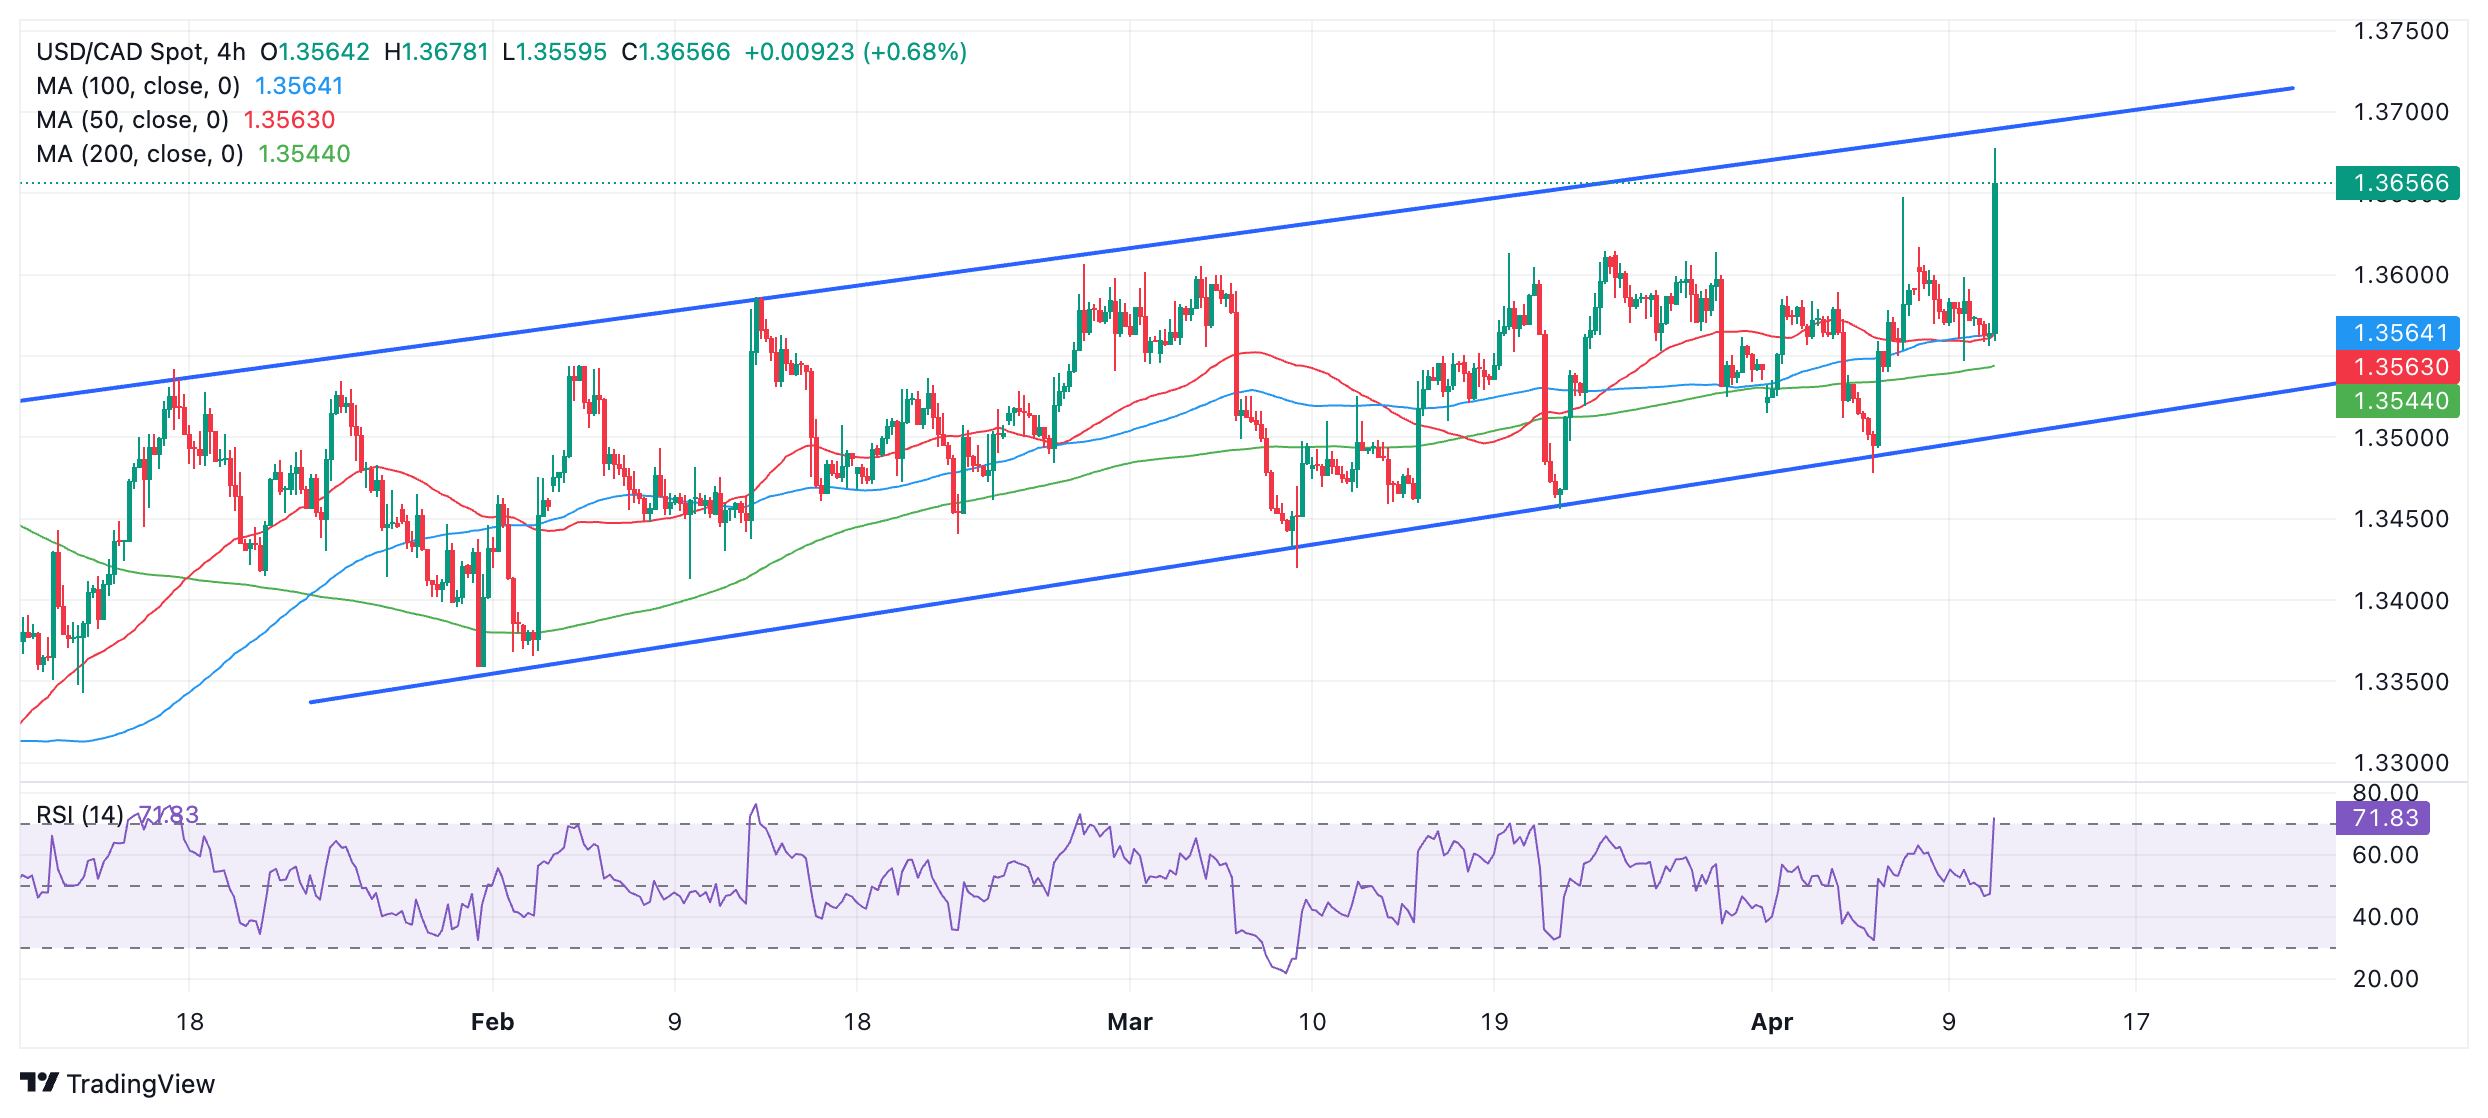
USD/CAD has pulled back about two tenths of a percentage point on Wednesday, following the Bank of Canada’s (BoC) decision to leave its key overnight interest rate unchanged at 5.0%, in line with analysts’ expectations.
The pair is trading in the 1.3660s at the time of writing, maintaining its overall bullish tone after the US Dollar rallied following the release of hotter-than-expected US Consumer Price Index data for March.
USD/CAD is in a rising channel which is forecast to continue evolving higher in the absence of evidence to the contrary.
USD/CAD 4-hour Chart
Policy Announcement
In the accompanying statement to its meeting, the BoC said that it would continue with quantitative tightening and had noticed signs of inflation easing.
“Governing Council decided to hold the policy rate at 5% and to continue to normalize the Bank’s balance sheet. While inflation is still too high and risks remain, CPI and core inflation have eased further in recent months.
Although core inflation has eased, the BoC said “shelter price inflation is still very elevated, driven by growth in rent and mortgage interest costs.”
According to the statement, the BoC expects inflation to fall to its (2.0%) target in 2025.
“..3-month annualized rates are suggesting downward momentum. The Bank expects CPI inflation to be close to 3% during the first half of this year, to move below 2½% in the second half, and reach the 2% inflation target in 2025,” said the BoC.
The Bank added that “The Council will be looking for evidence that this downward momentum is sustained.”
In particular it would be paying close attention to, “the evolution of core inflation.. the balance between demand and supply in the economy, inflation expectations, wage growth, and corporate pricing behavior,” the statement added.
Higher growth from population increase
The BoC expects higher growth in Canada compared to its January forecasts.
“Overall, the Bank forecasts GDP growth of 1.5% in 2024, 2.2% in 2025, and 1.9% in 2026,” it said in its statement.
In the accompanying Policy Report, the BoC stated it had revised up its forecasts for growth and revised down its forecasts for inflation in Canada (as well as the US and the world).
“The outlook for growth in Canada has been revised up, and inflationary pressures have been easing somewhat faster than anticipated in the January Report,” said the BoC in its Monthly Report.
The BoC forecasts real GDP to grow by 2.1% year-over-year in 2024 compared to a prior forecast of 1.6%. It expected much higher growth of 1.0% YoY in Q1 of 2024 compared to 0.2% in the January report.
It forecasts CPI inflation at 2.2% YoY in 2024 compared to the 2.4% forecast in its January report. It still sees inflation at 2.1% in 2025.
The BoC said the higher growth was as a result of increased population growth due to immigration.
“Growth in consumption spending is stronger over the near term largely because of higher population growth,” said the report.
In addition, export growth had been boosted by “higher foreign demand” and “new fiscal measures announced in provincial budgets.”
The BoC said it had revised down CPI inflation forecasts by 0.2% in 2024 but left it roughly unchanged in 2025.
Inflation in goods excluding food, communications and energy had all been lower than expected.
Tiff Macklem, Governor of the Bank of Canada (BoC), and Senior Deputy Governor Carolyn Rogers explain the BoC decision to leave the interest rate unchanged at 5% after the April policy meeting and respond to questions from the press.
Key quotes
"June rate cut is within the realm of possibilities."
"Decline we've seen in momentum is very recent."
"With gasoline prices rising, CPI is likely to remain around 3% in the coming months."
"BoC is increasingly confident that inflation will continue to come down gradually even as economic activity strengthens."
"We expect core inflation to continue to ease gradually."
"Shelter cost inflation is still very high and some other services remain persistently high."
Market reaction
USD/CAD preserves its bullish momentum and was last seen trading at its highest level since November at 1.3670, rising 0.72% on a daily basis.
- USD/JPY ascends following a US inflation report indicating reacceleration, challenging levels that might prompt intervention.
- Rising inflation figures push Treasury yields higher and boost the US Dollar.
- Market anticipates future Fed actions with keen interest in upcoming monetary policy minutes.
The USD/JPY rallied to an almost 34-year high after a hotter-than-expected inflation report in the United States (US) sent US Treasury yields soaring. Consequently, the major climbed past the 152.00 figure, seen as a level that could trigger intervention, which so-far hasn’t happened. At the time of writing, the pair trades at 152.70, gains 0.90%.
The pair advances to 152.70, as US CPI data prompts a sharp yield increase, fueling speculation about Fed's rate path–
US economic data revealed by the Bureau of Labor Statistics (BLS) showed that inflation is reaccelerating. The Consumer Price Index (CPI) rose by 0.4% MoM and 3.5% on the yearly figure, exceeding estimates, with the latter also the previous reading. Underlying CPI, which excludes volatile items like food and energy, was above projections but remained unchanged compared to February’s data at 0.4% MoM and 3.8% YoY.
That triggered a reaction in the financial markets, as US Treasury bond yields skyrocketed, with the short end of the curve, namely the 2-year T-note, climbing 20 basis points. Consequently, the Greenback refreshed the year-to-date (YTD) highs of 105.10 yet retreated somewhat, as shown by the US Dollar Index (DXY). The DXY is up 0.81%, at 104.95.
Following the inflation report, the Chicago Board of Trade (CBOT) Fed funds futures estimate just two rate cuts by December 2024, with speculators projecting interest rates to end at around 4.97%.
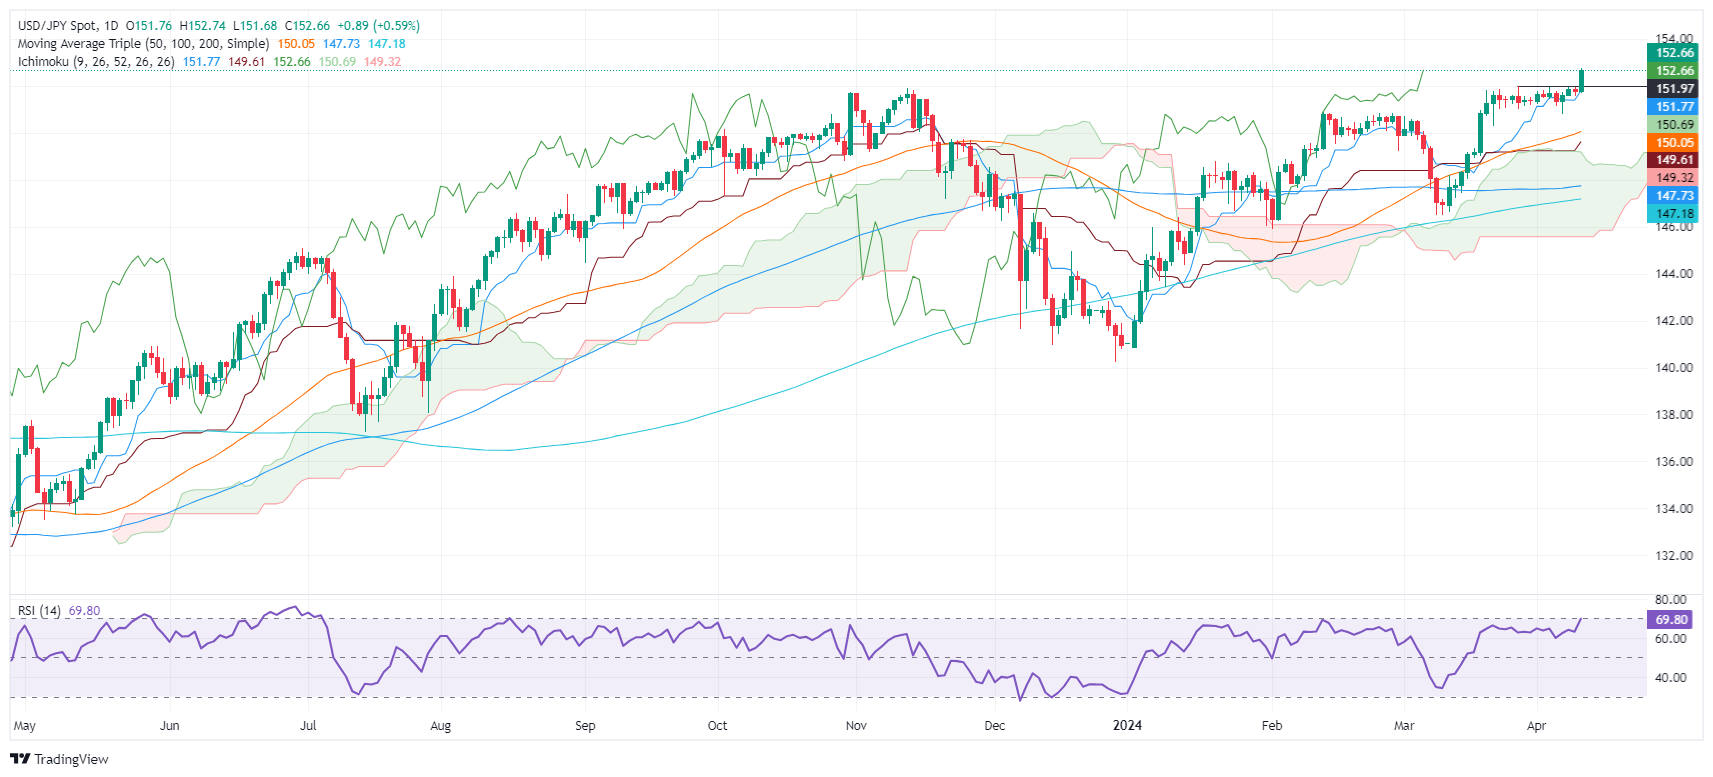
The USD/JPY rose sharply and hit a multi-year high of 152.73, a level last seen in June 1990, ignoring intervention threats by Japanese authorities that include Finance Minister Shunichi Suzuki, who said that he was watching the market with a high sense of urgency and wouldn’t rule out any steps to address excessive moves.
Ahead in the calendar, market players are eyeing the latest Federal Reserve monetary policy minutes' release.
USD/JPY Price Analysis: Technical outlook
From a technical standpoint, the USD/JPY is trading at levels that were seen in the 1990s. With the major extending its gains past 152.00, that exposes as the next resistance level, the June 1990 highest peak at 155.78, followed by the 1990’s high at 160.32. On the flip side, the first support would be the psychological 152.00 level, followed by the Tenkan-Sen at 151.77 and the April 5 low of 150.81.
- Silver price plummets to $27.85 as speculation for Fed pivoting to rate cuts erode.
- Hot US inflation data dent Fed rate cut prospects for June.
- Uncertainty over Fed’s three rate cut projections by the year-end deepens.
Siver price (XAG/USD) retreats from fresh two-year high of $28.36 after the United States Bureau of Labor Statistics (BLS) reported that the consumer price inflation turns out sticky. Hot inflation figures combined with strong payroll data for March have dented market expectations for the Federal Reserve (Fed) to begin lowering interest rates from the June meeting.
The annual headline Consumer Price Index (CPI) accelerated to 3.5% from expectations of 3.4% and the prior reading of 3.2%. Annual core inflation that excludes volatile food and energy prices rose steadily by 3.8%. Economists expected the most sought-after inflation measure to decelerate to 3.7%.
Fed policymakers have been reiterating that it is not appropriate to reduce interest rates until they get convinced that inflation will return sustainably to the 2% target. For inflation to return to 2%, the monthly inflation should increase at a pace of 0.17%. In March, both headline and core CPI rose steadily by 0.4% against expectations of 0.3%.
Going forward, traders are expected to shift their bets for the Fed beginning to reduce interest rates in the third quarter this year. Stubbornly higher inflation is expected to deepen uncertainty over three rate cut projections for this year as anticipated by Fed policymakers in the latest dot plot.
Hot CPI figures have led to a sharp increase in yields on interest-bearing assets, such as US bonds. 10-year US Treasury yields have risen to 4.48%. The US Dollar Index (DXY) rallies to the crucial resistance of 105.00.
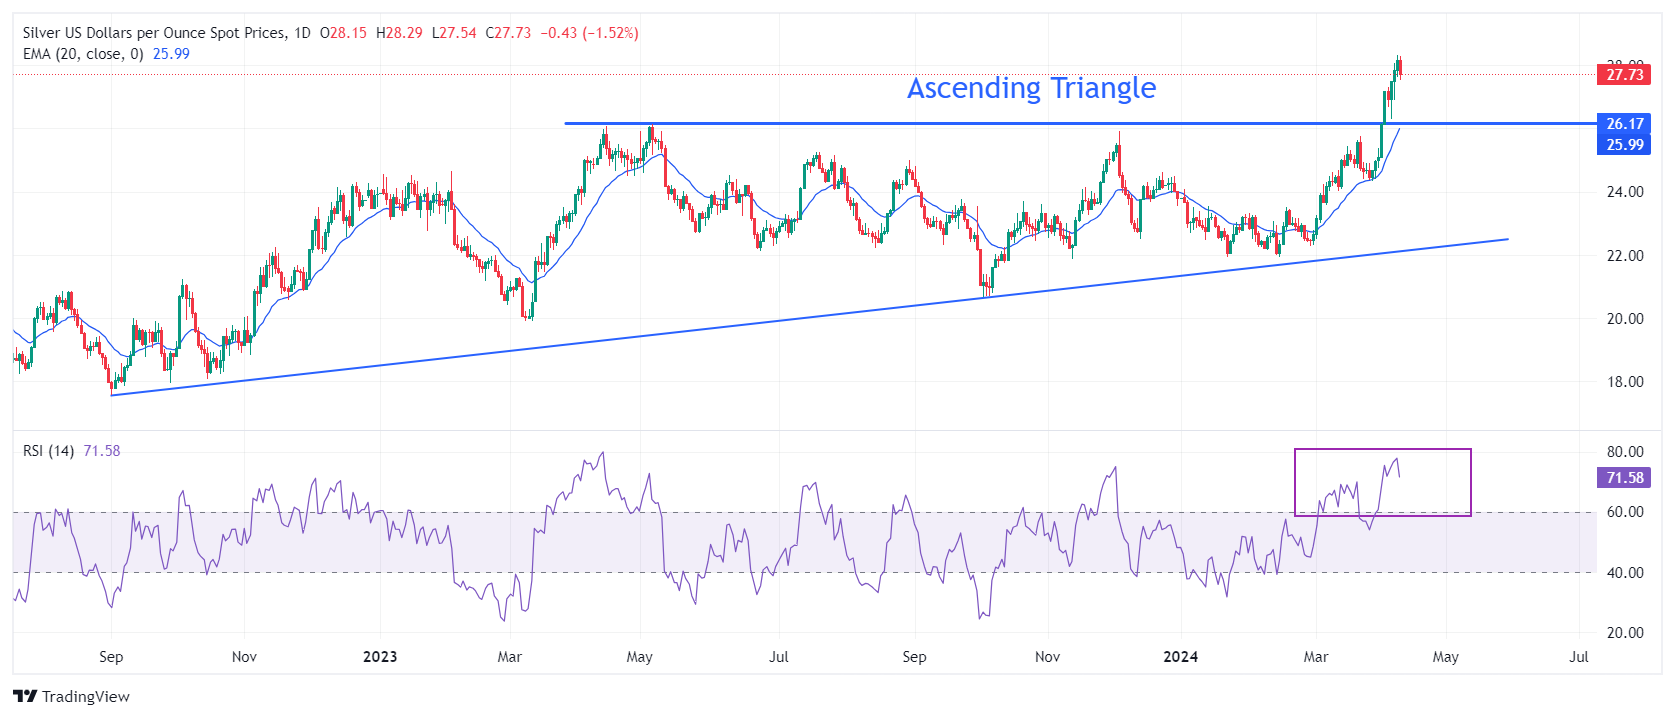
Silver technical analysis
Silver price delivers a stalwart rally after a breakout of the Ascending Triangle chart pattern formed on a daily timeframe. The strength of the breakout will be tested if the white metal corrects to the horizontal resistance of the above-mentioned chart pattern plotted from 14 April 2023 high at $26.09. Upward-sloping 20-day Exponential Moving Average (EMA) at $26.00 suggests that the near-term demand remains upbeat.
The 14-period Relative Strength Index (RSI) drops after reaching 76.00, indicating that oscillators are cooling after turning extremely overbought.
Silver daily chart
- The Fed will release the minutes of the March policy meeting on Wednesday.
- Jerome Powell and co’s discussions surrounding the policy pivot will be scrutinized.
- Markets see a nearly 50% probability of another Fed policy hold in June.
The Federal Reserve (Fed) will release the minutes of the March policy meeting on Wednesday. Investors will pay close attention to comments regarding the inflation outlook and the possible timing of a policy pivot.
Fed faces a tough policy decision in June
The Fed left unchanged its monetary policy settings following the March 19-20 policy meeting as expected. The revised Summary of Economic Projections, also known as the dot plot, showed that policymakers were still projecting a total of 75 basis points (bps) reduction in the policy rate in 2024.
In the post-meeting press conference, Federal Reserve Chairman Jerome Powell repeated that they need “greater confidence” of inflation moving toward the 2% target in a sustainable way before starting to cut interest rates. Although markets saw a strong probability of a policy pivot in June, hawkish comments from Fed officials since the March meeting and the impressive labor market data caused investors to reassess the rate outlook.
Atlanta Fed President Raphael Bostic noted that he was expecting the US central bank to lower the policy rate once this year, most likely in the last quarter. On another note, “I believe it’s much too soon to think about cutting interest rates,” Dallas Fed President Lorie Logan said, citing upside risks to inflation. Additionally, Minneapolis Fed President Neel Kashkari said that he pencilled in two interest rate cuts this year and added: "If we continue to see inflation moving sideways, then that would make me question whether we need to do those rate cuts at all."
Meanwhile, the US Bureau of Labor Statistics (BLS) reported that Nonfarm Payrolls rose 303,000 in March, beating the market expectation for an increase of 200,000 and highlighting the persistent strength of the labor market.
Following the hawkish Fed commentary and March jobs report, the probability of a June rate cut declined toward 50% from above-60% earlier in the week, according to the CME FedWatch Tool.
Previewing the March Federal Open Market Committee (FOMC) Minutes “the FOMC opted again for patience at its March meeting as it continues to look for evidence that provides ‘greater confidence’ around inflation moderation. Fed officials also stuck with their median projection of 3 rate cuts for this year, despite upgrading most macro projections for 2024,” TD Securities analysts said in a note. “Debates about the short-term policy outlook and QT tapering will garner most attention,” they added.
When will FOMC Minutes be released and how could it affect the US Dollar?
The Fed will release the minutes of the March policy meeting at 18:00 GMT on Wednesday. Although investors are likely to pay close attention to this publication, its impact on the USD’s valuation could remain limited because the BLS will release the Consumer Price Index (CPI) data for March earlier in the day, which is likely to have a more significant effect on the market pricing of the Fed’s policy outlook.
Nevertheless, in case the FOMC Minutes show that some policymakers remain optimistic about the inflation outlook and still favor a rate cut in June regardless of the stronger-than-expected CPI data for January and February, the USD could face some bearish pressure. On the other hand, the USD is likely to gather strength against its rivals with the immediate reaction if the publication suggests that officials are likely to delay a rate cut as long as labor market conditions remain tight.
Eren Sengezer, European Session Lead Analyst, shares a brief technical outlook for the USD Index:
“The 200-day Simple Moving Average (SMA) aligns as key support for the USD Index (DXY) at 103.80. In case the index falls below that level and starts using it as resistance, 103.40 (100-day SMA) could be seen as next support before 102.35 (March 8 low). On the upside, the Fibonacci 61.8% retracement of the October-December downtrend aligns as first resistance at 104.70 before 105.00 (static level) and 105.80 (Fibonacci 78.6% retracement).”
Economic Indicator
FOMC Minutes
FOMC stands for The Federal Open Market Committee that organizes 8 meetings in a year and reviews economic and financial conditions, determines the appropriate stance of monetary policy and assesses the risks to its long-run goals of price stability and sustainable economic growth. FOMC Minutes are released by the Board of Governors of the Federal Reserve and are a clear guide to the future US interest rate policy.
Read more.Last release: Wed Feb 21, 2024 19:00
Frequency: Irregular
Actual: -
Consensus: -
Previous: -
Source: Federal Reserve
Minutes of the Federal Open Market Committee (FOMC) is usually published three weeks after the day of the policy decision. Investors look for clues regarding the policy outlook in this publication alongside the vote split. A bullish tone is likely to provide a boost to the greenback while a dovish stance is seen as USD-negative. It needs to be noted that the market reaction to FOMC Minutes could be delayed as news outlets don’t have access to the publication before the release, unlike the FOMC’s Policy Statement.
US Dollar FAQs
The US Dollar (USD) is the official currency of the United States of America, and the ‘de facto’ currency of a significant number of other countries where it is found in circulation alongside local notes. It is the most heavily traded currency in the world, accounting for over 88% of all global foreign exchange turnover, or an average of $6.6 trillion in transactions per day, according to data from 2022. Following the second world war, the USD took over from the British Pound as the world’s reserve currency. For most of its history, the US Dollar was backed by Gold, until the Bretton Woods Agreement in 1971 when the Gold Standard went away.
The most important single factor impacting on the value of the US Dollar is monetary policy, which is shaped by the Federal Reserve (Fed). The Fed has two mandates: to achieve price stability (control inflation) and foster full employment. Its primary tool to achieve these two goals is by adjusting interest rates. When prices are rising too quickly and inflation is above the Fed’s 2% target, the Fed will raise rates, which helps the USD value. When inflation falls below 2% or the Unemployment Rate is too high, the Fed may lower interest rates, which weighs on the Greenback.
In extreme situations, the Federal Reserve can also print more Dollars and enact quantitative easing (QE). QE is the process by which the Fed substantially increases the flow of credit in a stuck financial system. It is a non-standard policy measure used when credit has dried up because banks will not lend to each other (out of the fear of counterparty default). It is a last resort when simply lowering interest rates is unlikely to achieve the necessary result. It was the Fed’s weapon of choice to combat the credit crunch that occurred during the Great Financial Crisis in 2008. It involves the Fed printing more Dollars and using them to buy US government bonds predominantly from financial institutions. QE usually leads to a weaker US Dollar.
Quantitative tightening (QT) is the reverse process whereby the Federal Reserve stops buying bonds from financial institutions and does not reinvest the principal from the bonds it holds maturing in new purchases. It is usually positive for the US Dollar.
- AUD/USD has entered into a sideways range on the short-term charts.
- The pair has just formed a bearish candlestick at the range highs and is looking poised to weaken.
- A move back down is possible towards the range lows at 0.6420.
AUD/USD is trading in the 0.6620s on Wednesday, ahead of key US data. The pair has entered a sideways trend on the 4-hour chart which is used to assess the direction of the short-term trend.
AUD/USD 4-hour Chart
At the beginning of April price touched the bottom of the range low at 0.6480 and bounced. After that it started climbing back up to the top of the range.
On Tuesday AUD/USD formed a bearish Shooting Star candlestick pattern at the top of the range in the 0.6640s. Although the following bar was green and therefore did not confirm the Shooting Star, it was nevertheless a negative sign. The pair has since been trading sideways in the 0.6620s.
Given AUD/USD has been rejected at the range high and formed a bearish candlestick pattern at the same time, there is a risk of a reversal, and the price starting to move back down towards the range lows again, continuing the sideways trend.
Both the Moving Average Convergence Divergence (MACD) and Relative Strength Index (RSI) momentum indicators are showing bearish divergence at the April 4 and April 9 peaks. Whereas price rose up and made a higher high between that period, both indicators failed to follow suit, indicating weakness.
RSI has just exited the overbought region which is a further bearish sign. It recommends short-term bullish traders close their long bets and open short positions.
A break below 0.6495 would help provide confirmatory evidence of a new move lower within the range, with a possible target back down at the 0.6420 range lows.
The cluster of major Moving Averages are likely to provide support at around 0.6450, and could slow the pace of the sell-off.
A break above the April high at 0.6645 would negate the bearish view and could indicate a breakout, with an initial target at the 0.6668 March highs.
- The US Dollar trades flat at 104.00, with stakes being high for the Greenback ahead of the release of the March inflation data.
- Traders see this US CPI print for March as key to gauge the chances of a Fed policy pivot this year.
- The US Dollar Index orbits around 104.00 and could move substantially in either direction.
The US Dollar (USD) trades broadly unchanged on Wednesday as the Greenback faces one of its most crucial moments of 2024 so far. With the release of the US Consumer Price Index (CPI) data for March, markets will finally get some idea on whether the US Federal Reserve (Fed) is right on the money or is facing one of its biggest policy mistakes in decades. Whatever the outcome, this is the only moment ahead of the US presidential elections for the US Dollar Index to finally snap out of that 5% range which is keeping the DXY chained for 2024 thus far.
Some additional insights reveal that markets are tilted to a decline, which fits with the narrative in the CME Fedwatch Tool, which points that markets are still pricing in a few interest-rate cuts this year. Headline monthly inflation is expected to fall to 0.3% in March from 0.4% in February, with the survey ranging between 0.5% on the upside and 0.2% on the downside. Core monthly inflation is also expected to come in at 0.3% from 0.4%, with the topside expectation at 0.4% and the downside at 0.2%. Any print below the lowest expectation could see ample US Dollar weakness, while any figure above the highest expectation will mean a repricing in the number of rate cuts, likely leading to substantial US Dollar strength.
Daily digest market movers: The end of low volatility
- At 11:00 GMT, this eventful Wednesday will kick off with the Mortgage Bankers Association (MBA) numbers. The MBA Mortgage Applications for the week ending on April 5 will be released. The previous reading for the week ending on March 29 was at -0.6%. No forecast is available.
- At 12:30 GMT, the US Consumer Price Index for March will be released:
- Monthly headline inflation is expected to fall to 0.3% against 0.4% in February.
- Yearly headline inflation is seen accelerating to 3.4% from 3.2%.
- Monthly core inflation is expected to slow to 0.3% from 0.4%.
- Yearly core inflation is expected to come down to 3.7% from 3.8%.
- At 14:00 GMT, Wholesale Inventories data for February will be released, with a steady 0.5% increase expected.
- Federal Reserve Bank of Chicago President Austan Goolsbee will be speaking around 16:45 GMT.
- The Federal Open Market Committee (FOMC) will release its recent March meeting Minutes around 18:00 GMT. Traders will be looking for clues or clearer evidence for the timing of when the Fed will start cutting its interest rates.
- Asian equities are very much dispersed with only the Chinese Hang Seng Index being up near 2%. All other Asian indices are in the red. European and US equities are mildly in the green ahead of US inflation release.
- According to the CME Group’s FedWatch Tool, expectations for the Fed’s May 1 meeting are at 97.4% for keeping the fed funds rate unchanged, while chances of a rate cut are at 2.6%.
- The benchmark 10-year US Treasury Note trades around 4.36%, which is lower ahead of US inflation.
US Dollar Index Technical Analysis: This is it, the moment markets have been waiting for
The US Dollar Index (DXY) has been consolidating since the first days of 2024. Although the trading range looks to be around 5% from the beginning of this year, it has been even limited to only 3% most of the time. Volatility is nowhere and short-lived, if any, so this US CPI print on Wednesday is crucial as it could be the last possible data point confirming if the Fed is good to start reducing borrowing costs in June, or might not cut rates until after summer or not at all for 2024.
The first pivotal level for the DXY comes in at 104.60, which was broken last week on Wednesday to the downside, though broken up again from below on Friday. Further up, 105.12 is the key point after the DXY failed to break that level last week. Once above those levels, 105.88 is the last resistance point before the Relative Strength Index (RSI) enters overbought levels.
Support from the 200-day Simple Moving Average (SMA) at 103.81, the 100-day SMA at 103.43, and the 55-day SMA at 103.90 showed their importance last week on Wednesday. Further down, the 103.00 big figure looks to remain unchallenged for longer with ample support thus standing in the way.
Inflation FAQs
Inflation measures the rise in the price of a representative basket of goods and services. Headline inflation is usually expressed as a percentage change on a month-on-month (MoM) and year-on-year (YoY) basis. Core inflation excludes more volatile elements such as food and fuel which can fluctuate because of geopolitical and seasonal factors. Core inflation is the figure economists focus on and is the level targeted by central banks, which are mandated to keep inflation at a manageable level, usually around 2%.
The Consumer Price Index (CPI) measures the change in prices of a basket of goods and services over a period of time. It is usually expressed as a percentage change on a month-on-month (MoM) and year-on-year (YoY) basis. Core CPI is the figure targeted by central banks as it excludes volatile food and fuel inputs. When Core CPI rises above 2% it usually results in higher interest rates and vice versa when it falls below 2%. Since higher interest rates are positive for a currency, higher inflation usually results in a stronger currency. The opposite is true when inflation falls.
Although it may seem counter-intuitive, high inflation in a country pushes up the value of its currency and vice versa for lower inflation. This is because the central bank will normally raise interest rates to combat the higher inflation, which attract more global capital inflows from investors looking for a lucrative place to park their money.
Formerly, Gold was the asset investors turned to in times of high inflation because it preserved its value, and whilst investors will often still buy Gold for its safe-haven properties in times of extreme market turmoil, this is not the case most of the time. This is because when inflation is high, central banks will put up interest rates to combat it. Higher interest rates are negative for Gold because they increase the opportunity-cost of holding Gold vis-a-vis an interest-bearing asset or placing the money in a cash deposit account. On the flipside, lower inflation tends to be positive for Gold as it brings interest rates down, making the bright metal a more viable investment alternative.
- NZD/USD marches toward 0.6100 as RBNZ’s hawkish interest rate outlook strengthens the Kiwi dollar.
- The RBNZ kept its OCR steady at 5.5% for the sixth time in a row.
- Investors await the US Inflation data that will influence expectations for Fed pivoting to rate cuts.
The NZD/USD pair advances toward the round-level resistance of 0.6100. The Kiwi asset exhibited strength in Wednesday’s European session as the Reserve Bank of New Zealand (RBNZ) delivered hawkish guidance after keeping its Official Cash Rate (OCR) unchanged at 5.50%.
The RBNZ hold its OCR steady at 5.50% for the sixth time in a row. The RBNZ commented that the monetary policy will remain restrictive to maintain downward pressure on inflationary pressures. The New Zealand economy is going through a rough phase as it remained in a technical recession in the second-half of 2023. Though the RBNZ needs to make a balance as annual inflation at 4.7% is significantly higher than the desired range between 1% and 3%.
Meanwhile, investors await the United States Consumer Price Index (CPI) data for March, which will be published at 12:30 GMT. According to economists, monthly headline and core inflation data are projected to have increased by 0.3%, higher than the pace of 0.17%, which is required for inflation to come down to the 2% target. This would not convince Federal Reserve (Fed) policymakers to consider rate cuts by the first half of this year.
The appeal for the US Dollar will strengthen if the inflation data turns out hotter than expected. Currently, the US Dollar Index (DXY), which tracks the US Dollar’s value against six major currencies, is slightly down to 104.00.
NZD/USD continues its winning spell for the third trading session on Wednesday. The Kiwi asset recovers to 50% of the Fibonacci retracement (plotted from March 8 high at 0.6218 to April 1 low near 0.5940), which is at 0.6080. The asset remains above the 20-day Exponential Moving Average, which trades around 0.6040, suggesting that near-term demand remains intact.
The 14-period Relative Strength Index (RSI) approaches 60.00. If the RSI manages to break decisively above that level, bullish momentum will trigger.
Further upside above March 18 high at 0.6100 will drive the pair toward March 12 low at 0.6135. A breach of the latter will drive the asset to 78.6% Fibo retracement at 0.6160.
In an alternate scenario, a downside move would appear if the asset breaks below April 5 low of 0.5985. This would drag the asset toward November 17 low at 0.5940, followed by the round-level support of 0.5900.
NZD/USD four-hour chart
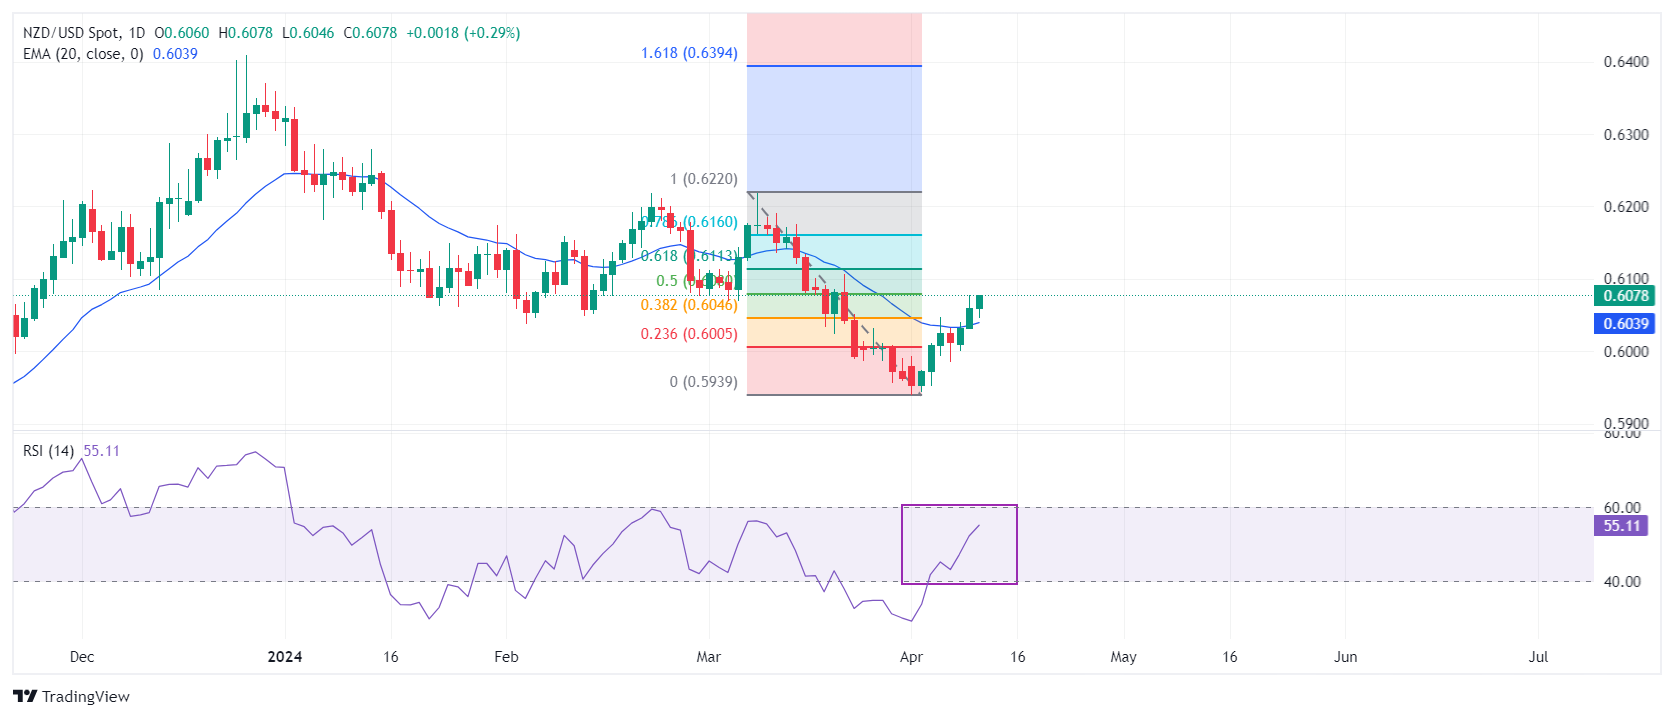
- Natural Gas prices are swinging higher after reports that NATO is floating the idea to add Ukraine.
- Meanwhile PetroChina is set to expand its LNG business.
- The US Dollar Index orbits around 104.00 ahead of US CPI numbers and FOMC Minutes.
Natural Gas (XNG/USD) price rallies for a fourth consecutive day, posting a nearly 6.5% gain this week. Gas prices got another boost overnight after a Bloomberg Intelligence article reported that in diplomatic circles there is talk around the idea of incorporating Ukraine into NATO, which would be oil on the fire for Russia. Adding to this, increasing geopolitical tensions in the Middle East underpin Gas prices as Israel redirects its troops towards the Lebanon border.
The DXY US Dollar Index, meanwhile, is hovering around 104.00 ahead of the US Consumer Price Index (CPI) print for March, which looks crucial for the interest-rate outlook for the rest of this year. A disinflationary print would fall in line with what the Fed has been communicating. However, any surprise upticks could turn into a massacre for markets as investors could interpret that the US Federal Reserve (Fed) President Jerome Powell and the broader Federal Open Market Committee (FOMC) are making the biggest policy mistake in decades. The release of the Minutes from the recent Fed meeting could ease any extensive moves on the back of the CPI print earlier this Wednesday.
Natural Gas is trading at $2.03 per MMBtu at the time of writing.
Natural Gas news and market movers: A long shot
- Bloomberg Intelligence reported in an article this morning that the possibility of Ukraine joining NATO is being considered in diplomatic circles. Although this is still only speculation, it would mean an outright risk of Russia escalating the war in retaliation. Russia completely halting its gas deliveries to Europe or non-Euro countries via Ukraine could be the first in a series of steps as the answer if Ukraine were to join NATO.
- Yahoo Finance reports that PetroChina is set to place orders for building more LNG ships. This strategy fits with recent reports of China being very active in the European Gas market and means their presence is here to stay.
- One headwind for Gas prices could come with Israel finally considering a ceasefire in Gaza, though no real deal is in place yet. A ceasefire would ease tensions in the region and could see Gas prices drop back below $2.00.
Natural Gas Technical Analysis: Revisit of 1982
Natural Gas prices are jumping higher with two main drivers coming out of the geopolitical corner. The idea that Ukraine could be considered to join NATO is a seismic shift in terms of power balances in Europe. It would ask markets to reprice the whole energy complex with both Oil and Gas seeing a massive risk premium priced in over a longer period of time. In the short term, any further upticks will come out of the Middle East after Israel announced it is sending troops to Lebanon under the pretense that Hezbollah is operating there, keeping a potential risk for disturbances in Gas transit in the region.
With this rally heading into its fourth day, the next key mark on the upside is the historic pivotal point at $2.13. Should Gas prices pop up in that region, a broad area opens up with the first cap at $2.20, near the 100-day Simple Moving Average (SMA).
On the downside, the 55-day SMA around $1.89 should be there as a safety net. Next, the multi-year lows at $1.60 will be acting as support, with $1.65 as the first line in the sand. In case of a breakdown below these levels, traders should look at $1.53 as the next supportive area.
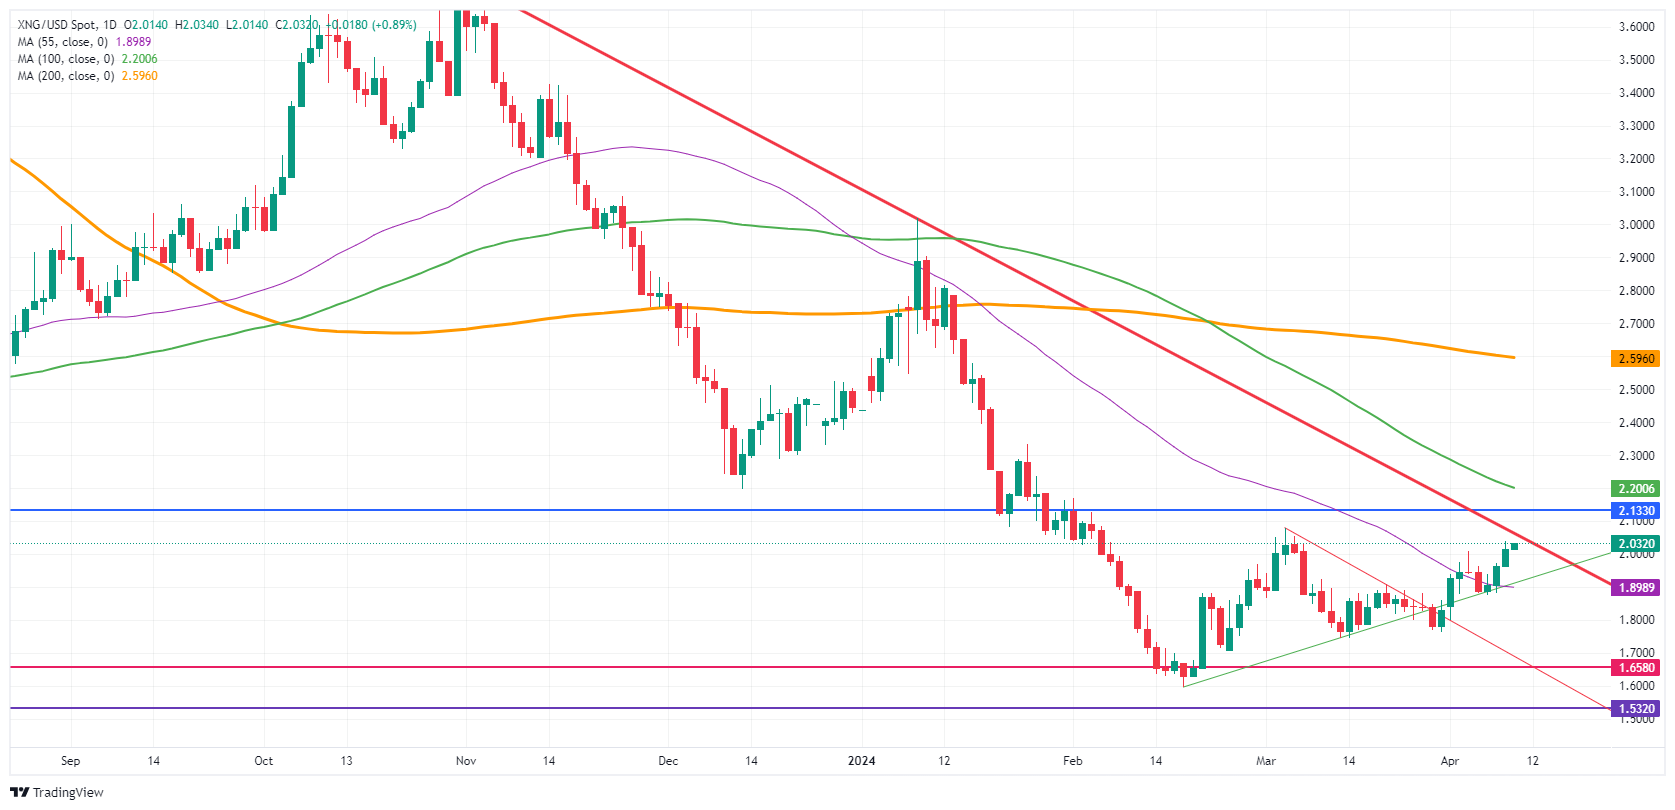
Natural Gas: Daily Chart
Natural Gas FAQs
Supply and demand dynamics are a key factor influencing Natural Gas prices, and are themselves influenced by global economic growth, industrial activity, population growth, production levels, and inventories. The weather impacts Natural Gas prices because more Gas is used during cold winters and hot summers for heating and cooling. Competition from other energy sources impacts prices as consumers may switch to cheaper sources. Geopolitical events are factors as exemplified by the war in Ukraine. Government policies relating to extraction, transportation, and environmental issues also impact prices.
The main economic release influencing Natural Gas prices is the weekly inventory bulletin from the Energy Information Administration (EIA), a US government agency that produces US gas market data. The EIA Gas bulletin usually comes out on Thursday at 14:30 GMT, a day after the EIA publishes its weekly Oil bulletin. Economic data from large consumers of Natural Gas can impact supply and demand, the largest of which include China, Germany and Japan. Natural Gas is primarily priced and traded in US Dollars, thus economic releases impacting the US Dollar are also factors.
The US Dollar is the world’s reserve currency and most commodities, including Natural Gas are priced and traded on international markets in US Dollars. As such, the value of the US Dollar is a factor in the price of Natural Gas, because if the Dollar strengthens it means less Dollars are required to buy the same volume of Gas (the price falls), and vice versa if USD strengthens.
- The Mexican Peso has resumed its uptrend despite cooler-than-expected inflation data for March.
- The slowdown in price pressures was not substantial enough to change the overall outlook for monetary policy.
- Interest rates, a key FX driver, are likely to remain elevated in Mexico, supporting the Peso going forward.
The Mexican Peso (MXN) is trading higher in most pairs on Wednesday, in line with the long-term trend of the currency. It has already undone the losses of the previous day when cooler-than-expected inflation data for March marginally raised the possibility of lower interest rates by the Bank of Mexico (Banxico).
Mexican Peso continues rising on interest rate divergence
The Mexican Peso has developed a long-term uptrend on the back of relatively high interest rates in Mexico, which help attract inflows of foreign capital.
Although the Banxico cut its Overnight Interbank Target Rate from 11.25% to 11.00% in March, it did so without committing to further rate cuts.
The move came on the back of lower trending inflation, however, the meeting minutes revealed the view that the balance of risks continue tilting in favor of inflation remaining stubbornly high going forward. This will likely require the Banxico to keep interest rates at their relatively high level, continuing to underpin the MXN.
This week sees the release of Industrial Production and Retail Sales data on Thursday and Friday respectively, for Mexico. Neither are in themselves likely to move the Mexican Peso, but they will provide more intelligence on the performance of the economy.
High-than-expected macroeconomic data will likely buttress the Mexican Peso. Banxico said that despite higher interest rates, the economy continues showing a high degree of “dynamism” and resilience and data that backs up that view. This will probably mean the central bank keeps interest rates at their relatively elevated level for longer.
US CPI data could impact USD/MXN
The Mexican Peso versus the US Dollar pair (USD/MXN) could also experience added volatility on Wednesday from the release of US Consumer Price Index data at 12:30 GMT, during the US session.
Economists expect prices in the US to have risen by 3.4% year-over-year in March and 3.7% YoY for the core measure, which excludes volatile food and energy prices.
A higher-than-expected result would be supportive of USD/MXN and vice versa for the lower-than-forecast result.
Technical Analysis: USD/MXN extends downtrend
USD/MXN is in a long-term downtrend which began in April 2020 after the pair peaked at 25.76, and has since fallen to the 16.30s. Given the old adage that “the trend is your friend,” it is likely to continue lower.
The pair is probably unfolding a large three-wave price pattern called a Measured Move. These patterns are composed of an A, B, and C wave, with wave C extending to a similar length to wave A, or a Fibonacci 0.618 ratio of A.
USD/MXN Weekly Chart
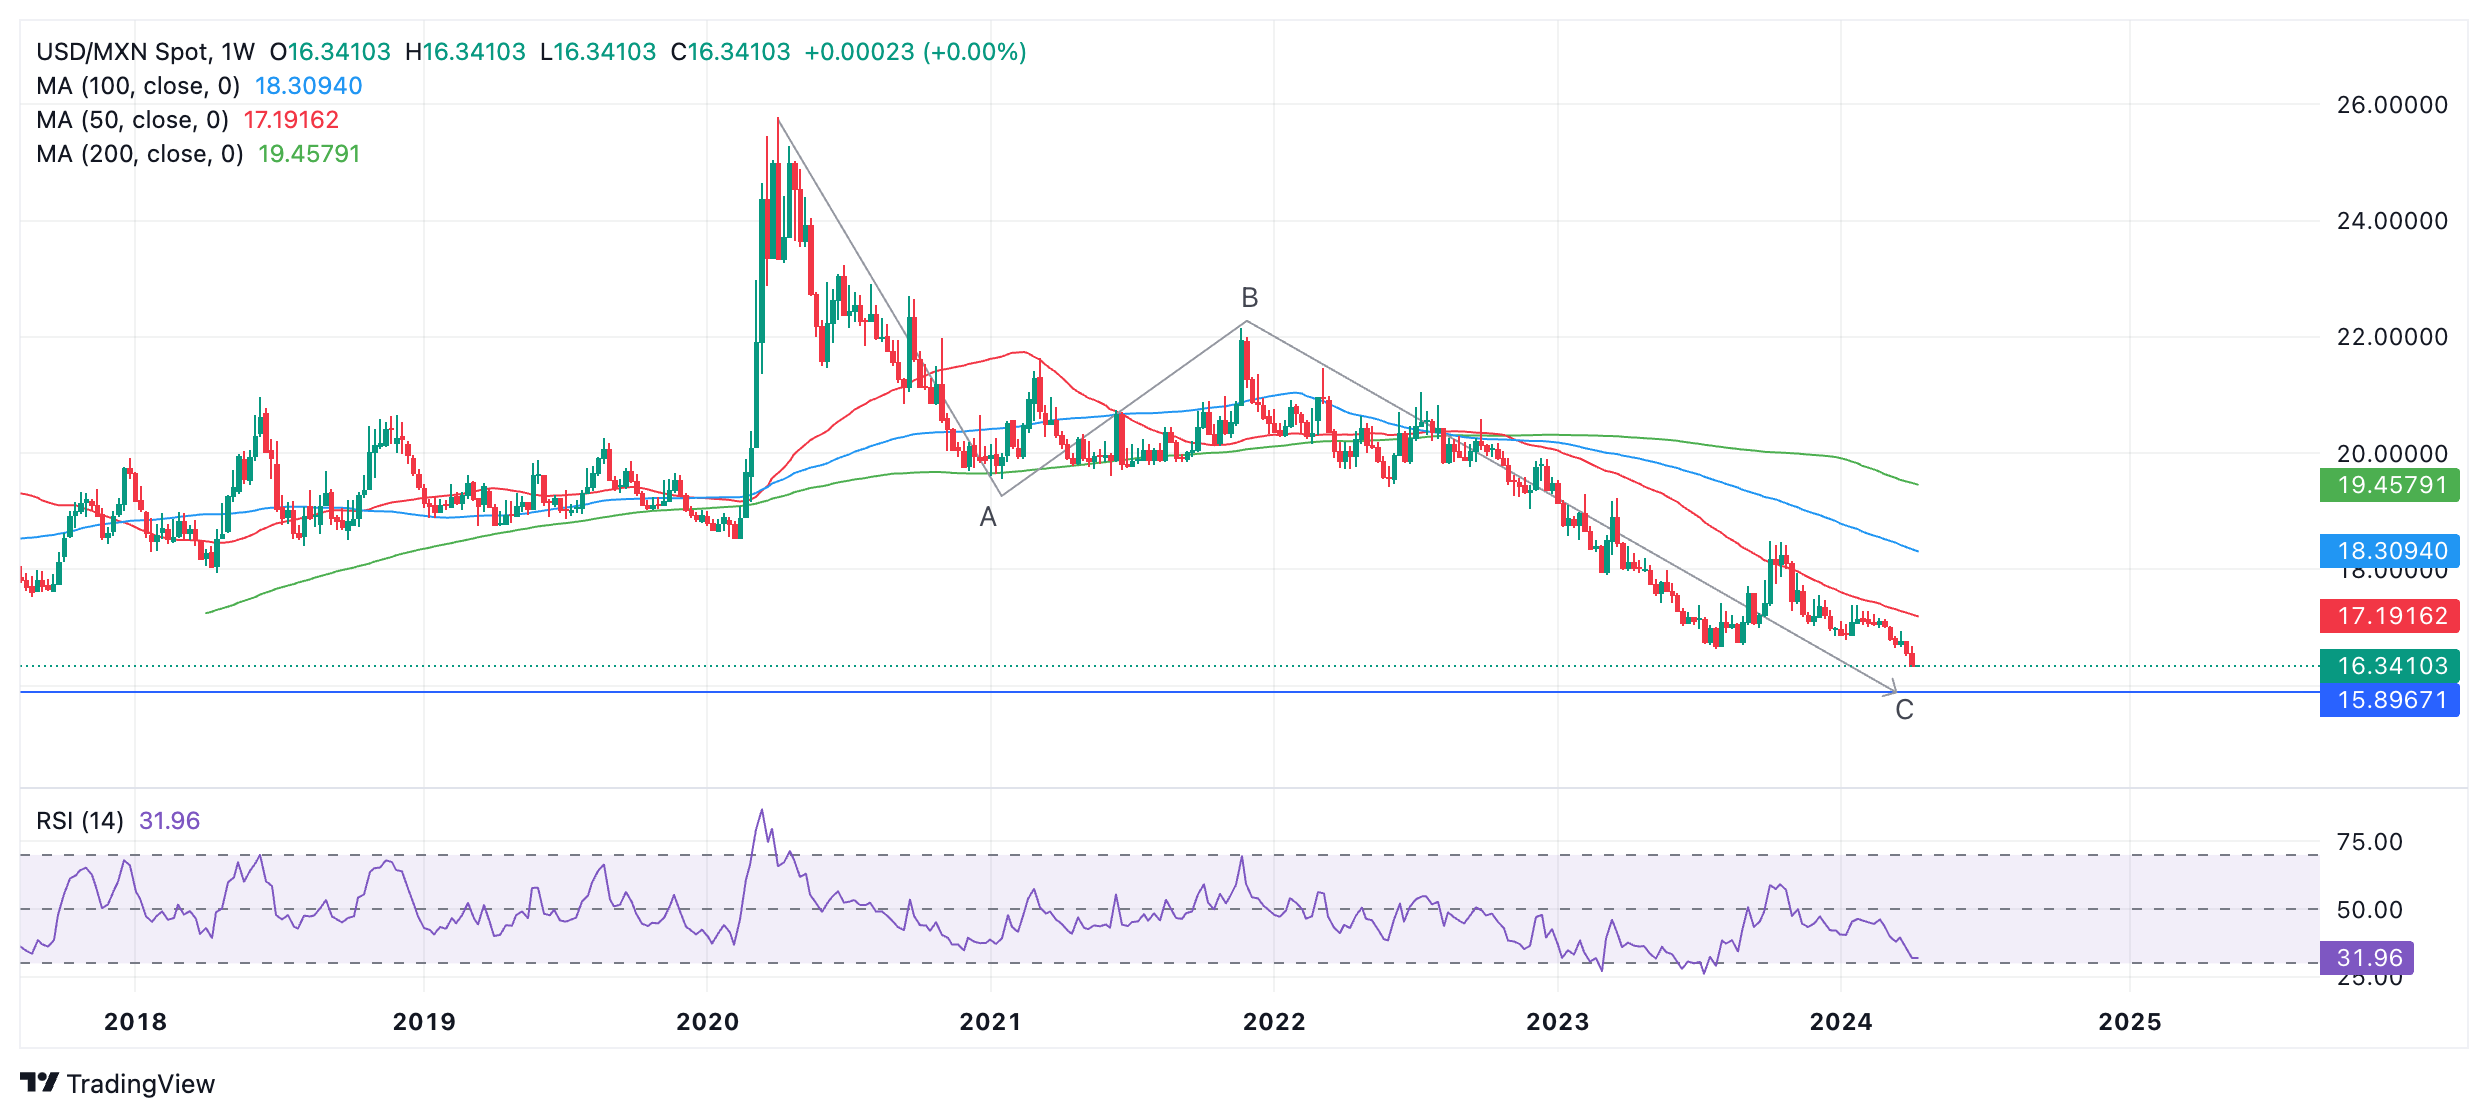
If this is the case, price has almost reached the point at which C will equal A, calculated at 15.89.
It has also by now surpassed the conservative target for the end of C at the 0.618 Fibonacci extension of A (at 18.24).
Once the pattern is complete the market usually reverses or undergoes a substantial correction.
The Relative Strength Index (RSI) is converging acutely with price – a sign the downtrend could be losing momentum. In 2024, USD/MXN has pushed lower than the 2023 lows but the RSI has not followed suit. This non-correlation is a bullish indication. It could lead to a correction higher eventually.
There has been no reaction from prices yet, however, so the expectation of upside remains speculatory and unconfirmed.
USD/MXN Daily Chart
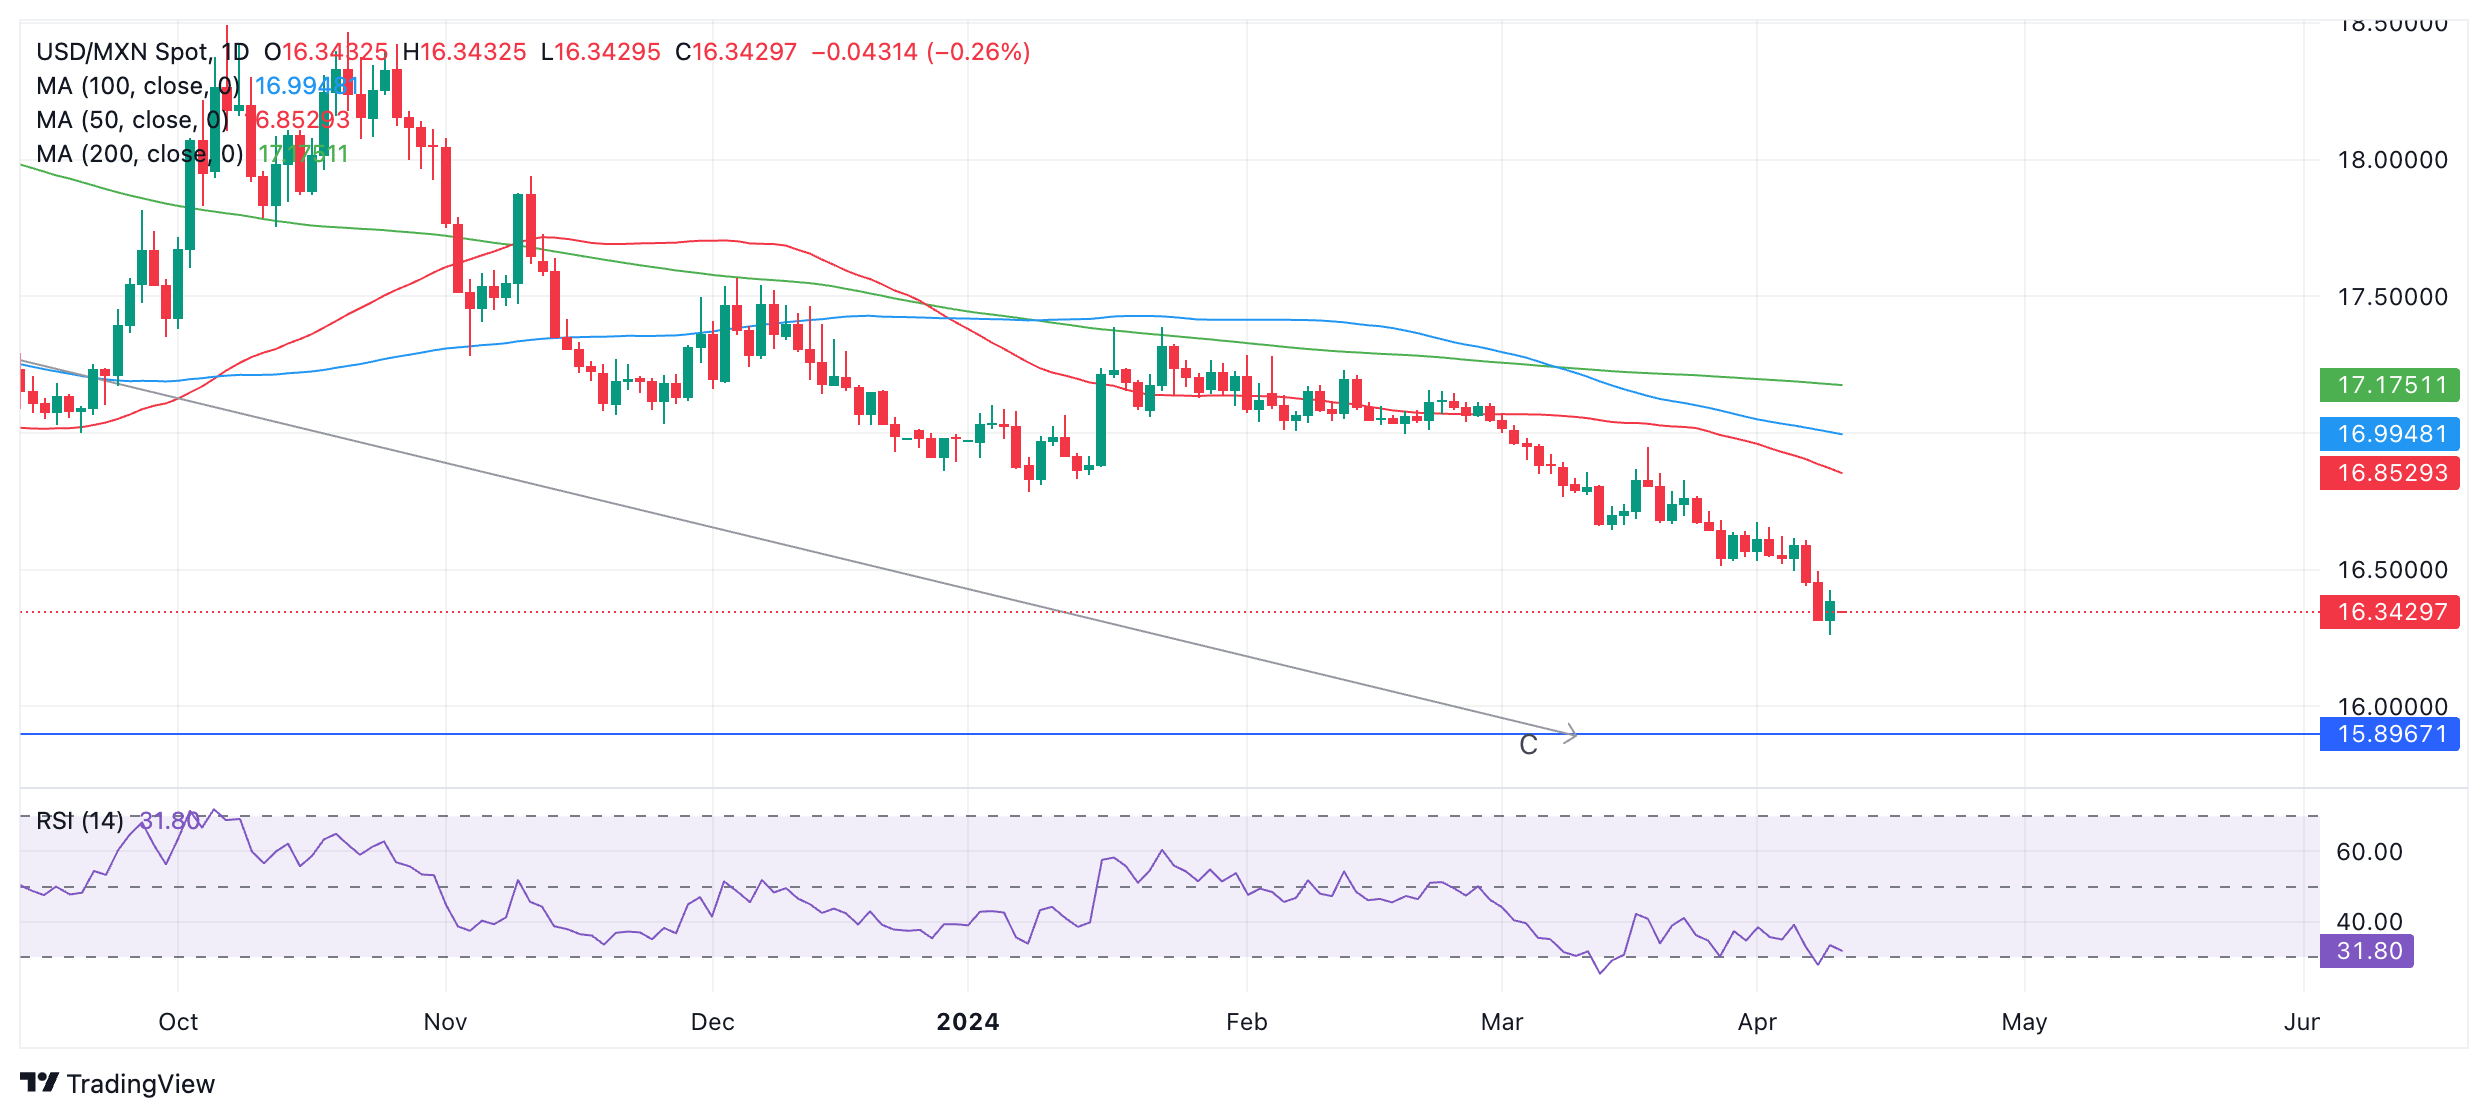
The daily chart shows more recent activity in greater detail. A feature worth noting is the RSI, which has risen out of oversold territory. This recommends that short-holders trading over an intermediate time frame (3-6 months) should close their short bets and open longs.
Taken together with the bullish convergence on the weekly chart this may signal USD/MXN is about to begin a correction higher.
The lack of any other bullish signs from price itself, however – such as a bullish reversal candlestick pattern, for example – suggest bulls should be cautious before expecting more upside.
Also, given the strong downtrend, the signal from the RSI momentum indicator is likely to be less reliable, since RSI does not work as effectively in strongly trending markets.
Mexican Peso FAQs
The Mexican Peso (MXN) is the most traded currency among its Latin American peers. Its value is broadly determined by the performance of the Mexican economy, the country’s central bank’s policy, the amount of foreign investment in the country and even the levels of remittances sent by Mexicans who live abroad, particularly in the United States. Geopolitical trends can also move MXN: for example, the process of nearshoring – or the decision by some firms to relocate manufacturing capacity and supply chains closer to their home countries – is also seen as a catalyst for the Mexican currency as the country is considered a key manufacturing hub in the American continent. Another catalyst for MXN is Oil prices as Mexico is a key exporter of the commodity.
The main objective of Mexico’s central bank, also known as Banxico, is to maintain inflation at low and stable levels (at or close to its target of 3%, the midpoint in a tolerance band of between 2% and 4%). To this end, the bank sets an appropriate level of interest rates. When inflation is too high, Banxico will attempt to tame it by raising interest rates, making it more expensive for households and businesses to borrow money, thus cooling demand and the overall economy. Higher interest rates are generally positive for the Mexican Peso (MXN) as they lead to higher yields, making the country a more attractive place for investors. On the contrary, lower interest rates tend to weaken MXN.
Macroeconomic data releases are key to assess the state of the economy and can have an impact on the Mexican Peso (MXN) valuation. A strong Mexican economy, based on high economic growth, low unemployment and high confidence is good for MXN. Not only does it attract more foreign investment but it may encourage the Bank of Mexico (Banxico) to increase interest rates, particularly if this strength comes together with elevated inflation. However, if economic data is weak, MXN is likely to depreciate.
As an emerging-market currency, the Mexican Peso (MXN) tends to strive during risk-on periods, or when investors perceive that broader market risks are low and thus are eager to engage with investments that carry a higher risk. Conversely, MXN tends to weaken at times of market turbulence or economic uncertainty as investors tend to sell higher-risk assets and flee to the more-stable safe havens.
- The Oil price consolidates near $85.00 ahead of the US Inflation data for March.
- US inflation data will provide cues about when the Fed could start reducing interest rates.
- Iran’s direct involvement in the war in Gaza and more Ukraine attacks on Russian oil refineries could tighten the oil supply further.
West Texas Intermediate (WTI), futures on NYMEX, remain supported near $85.00 ahead of the United States Consumer Price Index (CPI) data, which will be published at 12:30 GMT. The inflation data for march will influence market expectations for the Federal Reserve (Fed) pivoting to rate cuts in the June meeting.
The inflation data is expected to remain stubborn due to higher oil prices, rentals, and insurance costs and portfolio management fees.
The Oil price corrects after printing a fresh five-month high at $87.50. However, escalating tensions in the Middle East region keep the Oil demand intact. Israel’s proposal of ceasefire doesn’t meet various Hamas demands, but the latter has commented that it would study further and revert to mediators. Hamas wants Israel to withdraw its forces and allow Palestinians to return home, who were displaced due to war in Gaza.
Fears of Iran’s direct intervention in the Israel-Palestine war deepen as the Israeli army has announced that they are ready to invade Rafah, the last resort for Palestinians who have been displaced.
Iran’s entry from the front to war at Gaza will significantly disrupt the oil supply chain. Iran is the third largest oil producer of the OPEC, and its direct involvement in war will tighten the Oil market significantly, which will have a positive impact on the Oil price.
In the eastern region of Europe, Ukraine’s drone attacks on Russia’s oil infrastructure have also kept fears of oil supply shocks unabated.
- Gold price trades close to all-time highs with eyes on US inflation data for March.
- The US monthly headline and core CPI are projected to have increased at a slower pace of 0.3% in March.
- Escalating geopolitical tensions keeps the demand for Gold intact.
Gold price (XAU/USD) is stuck in a tight range slightly below all-time highs of $2,365 in Wednesday’s European session. Investors refrain from building fresh positions as they await the United States Consumer Price Index (CPI) data for March, which will be published at 12:30 GMT. Economists see inflation remaining stubborn due to higher Oil prices, rentals, insurance costs and portfolio management fees.
The 10-year US Treasury yields remain subdued near 4.36%, while the US Dollar Index (DXY), which values the US Dollar strength against six major currencies, rebounded to 104.00. The US Dollar’s appeal could strengthen if the inflation data turns out hotter than expected, as it will deepen uncertainty about when the Federal Reserve (Fed) could start reducing interest rates.
This scenario also bodes well for interest-bearing assets, such as US bonds. However, it means downside pressure for non-yielding assets such as Gold as it increases the cost of investing in them. Still, there has been an anomaly to Gold in the past few weeks as its demand remained robust despite traders paring big bets on Fed rate cut prospects for the June meeting.
Daily digest market movers: Gold price consolidates ahead of US inflation
- Gold price is slightly below fresh all-time highs of around $2,365 amid caution ahead of the United States inflation data for March. The precious metal has experienced a great bull run in the last few weeks. However, a correction could emerge as momentum oscillators are expected to cool down after reaching extremely overbought levels and strong payroll data has shaken investors’ confidence in the Federal Reserve reducing interest rates in June.
- Gold has remained the talk of the town in the past few weeks due to a fresh escalation in Middle East tensions, which has firmed safe-haven bids and pent-up demand for precious metals by global central banks. Central banks piled up Gold inventory as a hedge against a potential economic slowdown.
- Fading expectations of a ceasefire between Israel and Palestine also keep Gold demand buoyant. The Israeli proposal of a ceasefire on April 9 didn’t match the demands from Hamas, which wants Israel to withdraw its forces and allow displaced Palestinians to return to their homes.
- In Wednesday’s session, the strength of the Gold will be tested by the US inflation data, which will provide hints about how much and how soon interest rates will be reduced by the Federal Reserve. The Fed anticipated starting to lower borrowing costs from the June meeting. However, upbeat labor market data and policymakers’ comments about delaying rate cuts have dented these expectations.
- US monthly headline and core CPI, which strips off volatile food and energy prices, are both forecasted to have risen at a slower pace of 0.3% from 0.4% in February. In the same period, economists expect the annual headline inflation to accelerate to 3.4% from 3.2%, while the core inflation is anticipated to decelerate to 3.7% from 3.8%.
- Hot figures would allow the Fed to delay rate cut plans, while softening inflation data will boost Fed rate cut expectations for June.
Technical Analysis: Gold price turns sideways near fresh highs around $2,360
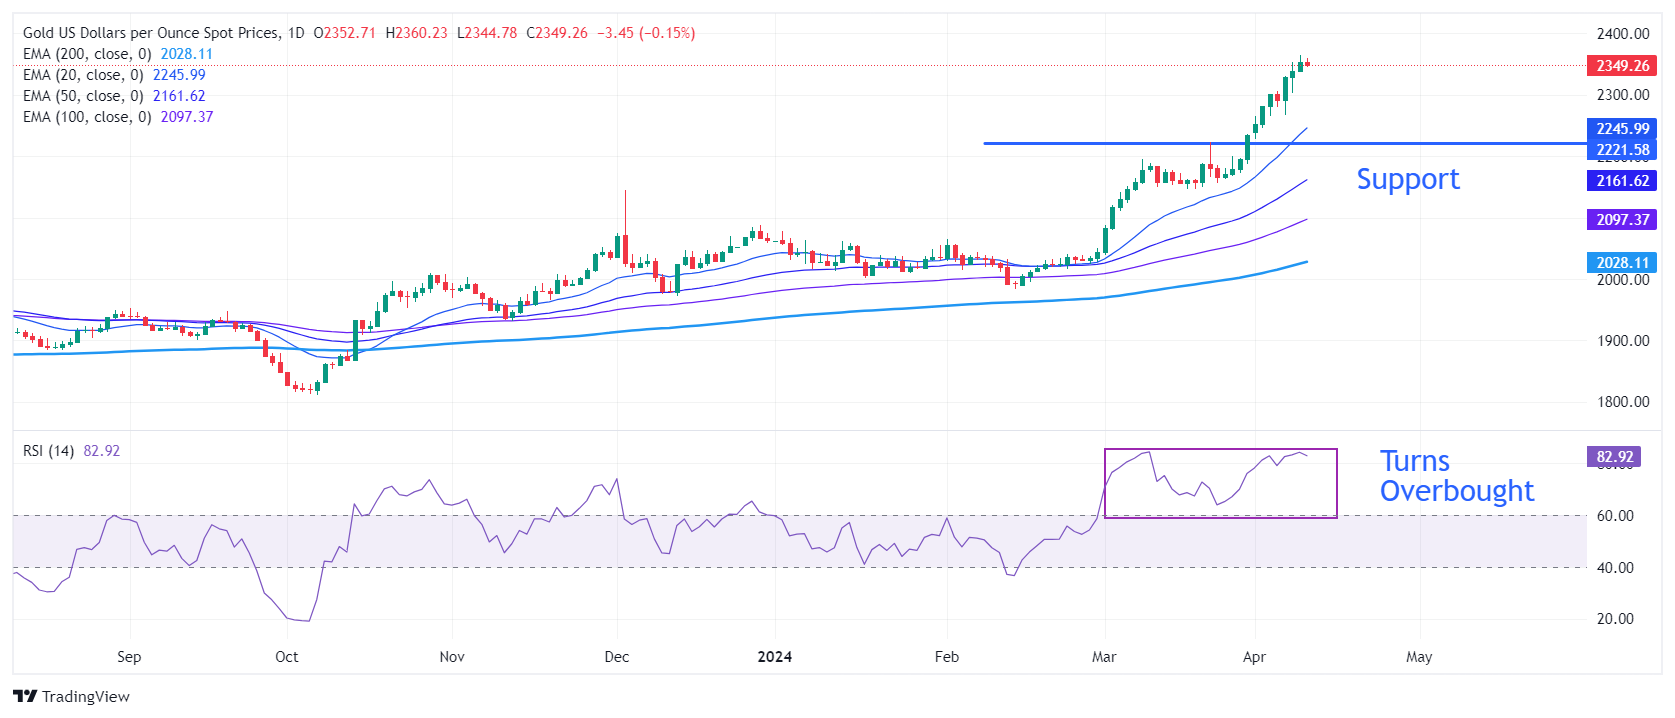
Gold price trades inside Wednesday’s trading range as the US inflation data comes under the spotlight. The precious metal hovers near fresh lifetime highs around $2,360. The near-term demand remains intact as all short-to-long-term Exponential Moving Averages (EMAs) are sloping higher.
On the downside, March 21 high at $2,223 will be a major support area for the Gold price bulls.
The 14-period Relative Strength Index (RSI) reaches 85.00, indicating a strong bullish momentum. However, extremely overbought signals could lead to a mild correction.
Gold FAQs
Gold has played a key role in human’s history as it has been widely used as a store of value and medium of exchange. Currently, apart from its shine and usage for jewelry, the precious metal is widely seen as a safe-haven asset, meaning that it is considered a good investment during turbulent times. Gold is also widely seen as a hedge against inflation and against depreciating currencies as it doesn’t rely on any specific issuer or government.
Central banks are the biggest Gold holders. In their aim to support their currencies in turbulent times, central banks tend to diversify their reserves and buy Gold to improve the perceived strength of the economy and the currency. High Gold reserves can be a source of trust for a country’s solvency. Central banks added 1,136 tonnes of Gold worth around $70 billion to their reserves in 2022, according to data from the World Gold Council. This is the highest yearly purchase since records began. Central banks from emerging economies such as China, India and Turkey are quickly increasing their Gold reserves.
Gold has an inverse correlation with the US Dollar and US Treasuries, which are both major reserve and safe-haven assets. When the Dollar depreciates, Gold tends to rise, enabling investors and central banks to diversify their assets in turbulent times. Gold is also inversely correlated with risk assets. A rally in the stock market tends to weaken Gold price, while sell-offs in riskier markets tend to favor the precious metal.
The price can move due to a wide range of factors. Geopolitical instability or fears of a deep recession can quickly make Gold price escalate due to its safe-haven status. As a yield-less asset, Gold tends to rise with lower interest rates, while higher cost of money usually weighs down on the yellow metal. Still, most moves depend on how the US Dollar (USD) behaves as the asset is priced in dollars (XAU/USD). A strong Dollar tends to keep the price of Gold controlled, whereas a weaker Dollar is likely to push Gold prices up.
Analysts at TD Securities (TDS) offer a sneak peek at what they expect from the Bank of Canada’s (BoC) policy announcement and how it could impact the Canadian Dollar.
Key quotes
"We look for the BoC to hold rates at 5.00% in April and strike a cautious tone as signs of renewed growth momentum prevent it from leaning too heavily into recent progress on underlying inflation."
"We are hard-pressed to find a strong narrative that argues against 2s5s and 5s30s steepeners. We see up to 50bps of value in receiving 1y1y, and further out the curve we feel the technical supply story is strong and clear, and we wouldn't want to bet against it."
"The BoC is likely to retain a cautious tone as it waits for more evidence before signaling the start of its easing cycle. The meeting is unlikely to materially move the CAD and data remains in the driver's seat."
Analysts BBH share their views on the upcoming March inflation data from the US.
Pay particular attention to super core CPI
"The US March CPI report is the main event. The data will help determine whether recent high CPI readings were noise or a sign that progress on inflation is stalling. Headline CPI is expected to rise 0.3% m/m and quicken to 3.4% y/y in March from 3.2% in February. Core CPI is forecast to rise 0.3% m/m and slow to 3.7% y/y in March from 3.8% in February. The projections are in line with the Cleveland Fed’s inflation nowcast model."
"Pay particular attention to the so-called super core CPI (core services less housing), a key measure of underlying inflation. In February, super core CPI remained high at 4.3% y/y but the monthly price increase eased to 0.5% from 0.9% in January. A further monthly slowdown in super core CPI would likely raise the Fed’s confidence that inflation is moving sustainably down toward 2%."
Silver prices (XAG/USD) fell on Wednesday, according to FXStreet data. Silver trades at $28.08 per troy ounce, down 0.26% from the $28.15 it cost on Tuesday.
Silver prices have increased by 10.25% since the beginning of the year.
| Unit measure | Today Price |
|---|---|
| Silver price per troy ounce | $28.08 |
| Silver price per gram | $0.90 |
The Gold/Silver ratio, which shows the number of troy ounces of Silver needed to equal the value of one troy ounce of Gold, stood at 83.83 on Wednesday, up from 83.57 on Tuesday.
Investors might use this ratio to determine the relative valuation of Gold and Silver. Some may consider a high ratio as an indicator that Silver is undervalued – or Gold is overvalued – and might buy Silver or sell Gold accordingly. Conversely, a low ratio might suggest that Gold is undervalued relative to Silver.
Global Market Movers: Comex Silver price defends $28.00 amid escalating geopolitical risks
- Silver price on Comex gains ground on expectations of Fed rate cuts in 2024.
- The non-yield asset like Silver appreciates as US Treasury yields decline.
- The price of Silver follows the upward movement in Gold prices, supported by increased consumer and industrial demand.
- Israel's Foreign Affairs Minister, Israel Katz, affirmed that Israel would retaliate if Iran attacks its territory.
- The escalating geopolitical tensions in the Middle East are driving investors towards safe-haven assets like Silver.
- Investors adopt a cautious stance, anticipating potential policy shifts influenced by the incoming US CPI data.
- The US inflation data could likely have a significant impact on the US Dollar-denominated XAG/USD.
(An automation tool was used in creating this post.)
Inflation FAQs
Inflation measures the rise in the price of a representative basket of goods and services. Headline inflation is usually expressed as a percentage change on a month-on-month (MoM) and year-on-year (YoY) basis. Core inflation excludes more volatile elements such as food and fuel which can fluctuate because of geopolitical and seasonal factors. Core inflation is the figure economists focus on and is the level targeted by central banks, which are mandated to keep inflation at a manageable level, usually around 2%.
The Consumer Price Index (CPI) measures the change in prices of a basket of goods and services over a period of time. It is usually expressed as a percentage change on a month-on-month (MoM) and year-on-year (YoY) basis. Core CPI is the figure targeted by central banks as it excludes volatile food and fuel inputs. When Core CPI rises above 2% it usually results in higher interest rates and vice versa when it falls below 2%. Since higher interest rates are positive for a currency, higher inflation usually results in a stronger currency. The opposite is true when inflation falls.
Although it may seem counter-intuitive, high inflation in a country pushes up the value of its currency and vice versa for lower inflation. This is because the central bank will normally raise interest rates to combat the higher inflation, which attract more global capital inflows from investors looking for a lucrative place to park their money.
Formerly, Gold was the asset investors turned to in times of high inflation because it preserved its value, and whilst investors will often still buy Gold for its safe-haven properties in times of extreme market turmoil, this is not the case most of the time. This is because when inflation is high, central banks will put up interest rates to combat it. Higher interest rates are negative for Gold because they increase the opportunity-cost of holding Gold vis-a-vis an interest-bearing asset or placing the money in a cash deposit account. On the flipside, lower inflation tends to be positive for Gold as it brings interest rates down, making the bright metal a more viable investment alternative.
- EUR/USD is trading in a narrow range ahead of the US Consumer Price Index data for March.
- The pair is trading in a space between the 50, 100 and 200-day Simple Moving Averages.
- The ECB meeting on Thursday is likely to bring volatility to EUR/USD.
EUR/USD is trading in the 1.0850s on Wednesday, little changed from the previous day’s close as traders await key macroeconomic data from the US in the form of the Consumer Price Index (CPI) for March, which will be released at the start of the US session.
EUR/USD could breakout after CPI data
EUR/USD could see a lift in volatility from the CPI data if it deviates significantly from expectations.
Economists estimate that the data will show prices in the US to have risen by 3.4% Year-over-Year in March and 3.7% YoY for core goods, which excludes volatile food and energy prices.
Results in line with expectations would still indicate an inflation rate well above the Federal Reserve’s (Fed) 2.0% target. A greater decline would be required before the Fed is likely to bring down interest rates from their current 5.5% level.
In contrast to the Fed, the European Central Bank (ECB) is seen as more likely to cut interest rates earlier amid more subdued growth and inflation expectations.
For EUR/USD, the maintenance of higher interest rates in the US compared to the Eurozone is a bearish factor. This is because relatively higher interest attracts foreign capital inflows, favoring the US Dollar in this case.
ECB meeting on the horizon
EUR/USD could experience further volatility on Thursday after the European Central Bank (ECB) holds its April policy meeting.
A few ECB members, such as the President of the Banque de France, François Villeroy de Galhau have mentioned April as a possible time for the ECB to implement a first interest-rate cut.
The majority of ECB members, however, think April is too early because the ECB will not yet have the latest wage data at hand, and wage inflation is seen as a critical input into their inflation models and decision-making process.
EUR/USD, however, could still be moved if the language in the accompanying statement suggests a higher probability of the ECB making an interest-rate cut in June.
Technical Analysis: EUR/USD increasingly looking range-bound
EUR/USD appears trapped within the pincers of three significant Simple Moving Averages (SMA). It seems to be in an overall sideways trend on the 4-hour short-term chart.
The 50-day and 200-day SMAs are providing support at 1.0830 and 1.0831, while the 100-day SMA is acting as a resistance at 1.0873.
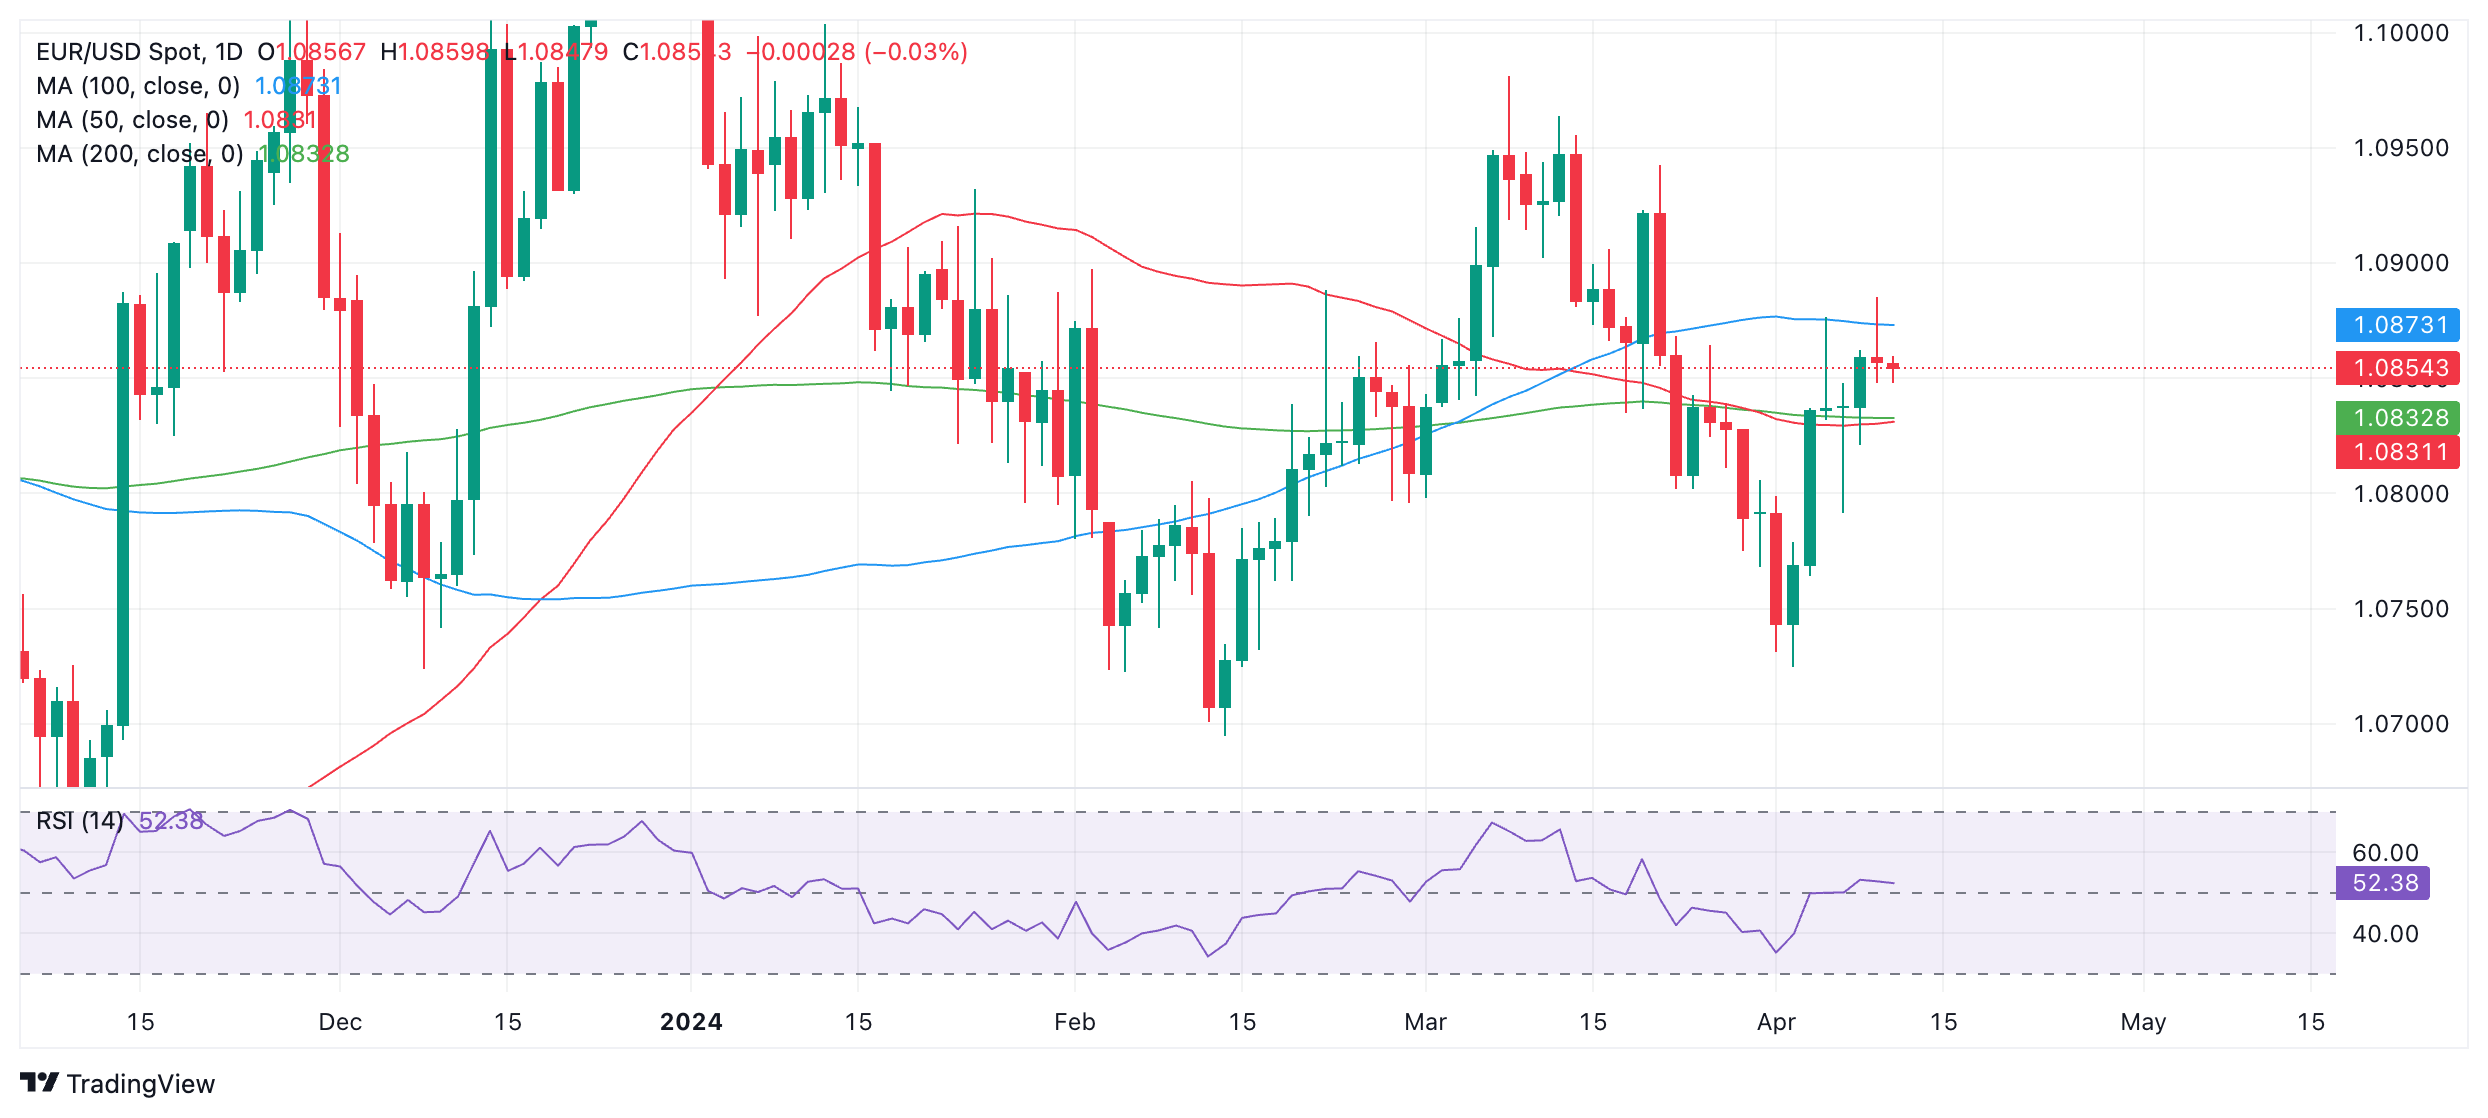
A decisive break above the 100-day SMA could see a rally to perhaps the March 21 high at 1.0942.
Alternatively, a decisive break below the cluster of MAs in the 1,0830s might see a pullback evolve down to support at the April 2 swing lows of 1.0725.
A decisive break below would be characterized by a long red candle penetrating and closing near its low, or three red candles in a row, piercing through the level.
The same would be the case for a decisive break above, except with green candles rather than red.
Economic Indicator
Consumer Price Index (YoY)
Inflationary or deflationary tendencies are measured by periodically summing the prices of a basket of representative goods and services and presenting the data as The Consumer Price Index (CPI). CPI data is compiled on a monthly basis and released by the US Department of Labor Statistics. The YoY reading compares the prices of goods in the reference month to the same month a year earlier.The CPI is a key indicator to measure inflation and changes in purchasing trends. Generally speaking, a high reading is seen as bullish for the US Dollar (USD), while a low reading is seen as bearish.
Read more.Next release: Wed Apr 10, 2024 12:30
Frequency: Monthly
Consensus: 3.4%
Previous: 3.2%
Source: US Bureau of Labor Statistics
The US Federal Reserve has a dual mandate of maintaining price stability and maximum employment. According to such mandate, inflation should be at around 2% YoY and has become the weakest pillar of the central bank’s directive ever since the world suffered a pandemic, which extends to these days. Price pressures keep rising amid supply-chain issues and bottlenecks, with the Consumer Price Index (CPI) hanging at multi-decade highs. The Fed has already taken measures to tame inflation and is expected to maintain an aggressive stance in the foreseeable future.
- Silver price gains ground on expectations of Fed rate cuts in 2024.
- The non-yield asset like Silver appreciates as US Treasury yields decline.
- Israel's Foreign Affairs Minister, Israel Katz, affirmed that Israel would retaliate if Iran attacks its territory.
Silver price exhibits a sideways trend with positive sentiment to extend its gains for the fourth successive session, hovering around $28.10 per troy ounce during the early European session on Wednesday.
Silver price could appreciate further on expectations of rate cuts from the Federal Reserve (Fed) this year. The decline in US Treasury yields leads to supporting non-yielding assets like Silver, with 2-year and 10-year yields on US Treasury bonds standing at 4.74% and 4.36%, respectively, at the current press time.
Furthermore, the price of Silver follows the upward movement in Gold prices, supported by increased consumer and industrial demand. China's addition of 160,000 troy ounces of gold to its reserves in March, along with gold purchases by Turkey, India, Kazakhstan, and several Eastern European countries this year, further contributes to the positive sentiment surrounding precious metals.
The escalating geopolitical tensions in the Middle East are driving investors towards safe-haven assets like Silver. Israel's Foreign Affairs Minister, Israel Katz, issued a warning that Israel would retaliate if Iran attacks its territory. Additionally, peace talks between Israel and Hamas in Egypt have failed to make progress.
Investors adopt a cautious stance, anticipating potential policy shifts influenced by incoming data. Strong labor market figures from last week could prompt a more hawkish stance from the Federal Reserve if inflation exceeds expectations. This could potentially limit the upward momentum of Silver price.
- The Bank of Canada (BoC) is anticipated to keep its policy rate at 5.0%.
- The Canadian Dollar remains trapped within a consolidative range.
- Inflation in Canada has been losing upward traction since December.
- Investors see a 70% probability of a rate cut in June.
There is widespread anticipation that the Bank of Canada (BoC) will maintain its policy rate at 5.0% for the sixth consecutive time during its upcoming policy meeting on Wednesday. A new Monetary Policy Report (MPR) with updated economic predictions, as well as a news conference, will accompany the bank’s decision on interest rates.
The Canadian Dollar (CAD) has been very slowly depreciating against the US Dollar (USD) since the beginning of the new year, although it appears to have been immersed in a broader consolidative theme since February.
In the second month of the year, the Consumer Price Index (CPI) recorded a continued downward trajectory in headline inflation, while the Bank of Canada's (BoC) Core CPI indicated some sticky price pressures. From the latest meeting, the bank’s statement expects inflation to linger around 3% during the first part of the year before starting to ease, albeit at a gradual pace.
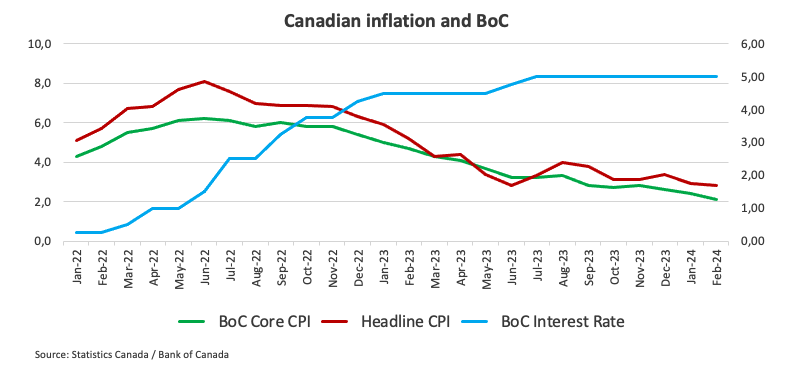
Despite the BoC’s predicted cautious stance, it could also show some permeability in light of the ongoing downward trajectory of domestic inflation. The central bank is also seen reiterating the importance of evaluating additional incoming data and its sustainability before making any decisions regarding interest rates. This perspective aligns with that of most of the central banks in the G10 group, including the US Federal Reserve (Fed), European Central Bank (ECB), Bank of England (BoE), and Reserve Bank of Australia (RBA).
A dovish surprise?
In light of the current downtrend in Canadian inflation and some cooling of the labour market, a soft tone at the BoC event and some bearish message from Governor Tiff Macklem at the subsequent press conference should not be entirely ruled out, along with the palpable possibility that the bank could start its easing cycle at some point in the summer, in tandem with the Fed, the ECB and maybe the BoE.
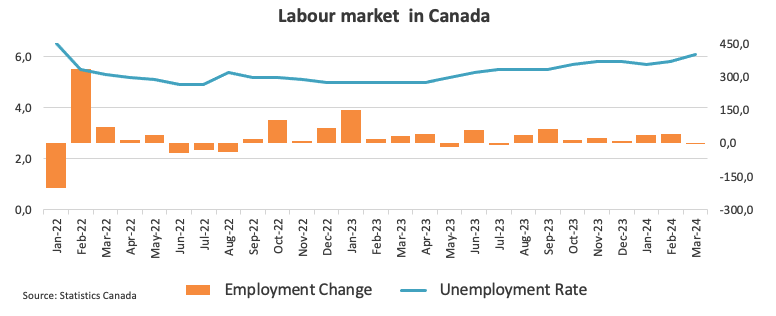
In addition, the BoC could likely revise its projections for inflation and GDP, expecting it to decline over the bank’s time horizon.
From the BoC’s Q1 Business Outlook Survey (BOS) released on April 1, firms observed a slight improvement in business conditions, with an increase noted broadly across nearly all regions, sectors, and firm sizes. The proportion of firms expecting Canada to enter a recession over the next year decreased to 27%, down from 38% in Q4. Similarly, 40% of firms anticipate inflation to persist above 3% for the next two years, a decline from 54% in Q4. Moreover, only 17% of firms believe it will take longer than four years for inflation to revert to 2%, down from 27% in Q4. While wage growth remains elevated, a majority of firms anticipate a deceleration, with 74% expecting wage growth to normalize by 2025.
Regarding inflation, Governor Tiff Macklem said at his press conference in March that “we are witnessing advancements in the battle against inflation, and we anticipate more strides forward. However, if core inflation measures remain stagnant, then our predictions for overall inflation decreasing may not materialize.” Macklem maintained the belief that the risks associated with the inflation outlook are reasonably balanced. The fact that inflation expectations have stayed firmly anchored is undoubtedly aiding the bank in the effort to bring inflation back under control.
When will the BoC release its monetary policy decision and how could it affect USD/CAD?
The Bank of Canada will announce its policy decision at 13:45 GMT on Wednesday, along with the Monetary Policy Report (MPR). Governor Macklem’s press conference is due at 14:30 GMT.
Eliminating any potential surprises, it is anticipated that the impact on the Canadian currency will be negligible, if at all. Opting for a cautious approach to uphold present circumstances could result in a brief, reflexive drop in the USD/CAD pair in the short term, albeit unlikely to be substantial in duration or scale. It's noteworthy that a significant portion of the upward movement in the spot rate this year is attributed to the dynamics of the USD.
According to Pablo Piovano, Senior Analyst at FXStreet.com, “the gradual uptrend in USD/CAD in place since the beginning of the year appears reinforced by the recent surpass of the key 200-day SMA (1.3506). However, this trend has so far met quite a decent barrier around the year-to-date peaks near 1.3650. A sustainable break above this region could motivate the pair to set sails to the November 2023 top of 1.3898 (November 1).”
Pablo adds: “If sellers regain the upper hand, the 200-day SMA should offer decent contention prior to the March bottom of 1.3419 (March 8). Extra weakness from here could open the door to a move to the weekly low of 1.3358 (January 31).”
Economic Indicator
BoC Interest Rate Decision
The Bank of Canada (BoC) announces its interest rate decision at the end of its eight scheduled meetings per year. If the BoC believes inflation will be above target (hawkish), it will raise interest rates in order to bring it down. This is bullish for the CAD since higher interest rates attract greater inflows of foreign capital. Likewise, if the BoC sees inflation falling below target (dovish) it will lower interest rates in order to give the Canadian economy a boost in the hope inflation will rise back up. This is bearish for CAD since it detracts from foreign capital flowing into the country.
Read more.Next release: Wed Apr 10, 2024 13:45
Frequency: Irregular
Consensus: 5%
Previous: 5%
Source: Bank of Canada
- The Pound Sterling turns sideways near 1.2680 after correcting from 1.2700 with eyes on US inflation data for March.
- The UK monthly GDP data for February will provide fresh cues about the economy’s performance.
- The UK’s rising cost-of-living crisis supports BoE rate cut prospects.
The Pound Sterling (GBP) exhibits uncertainty in Wednesday’s London session ahead of the United States Consumer Price Index (CPI) data for March, which will be published at 12:30 GMT. Economists expect US inflation to remain relatively high in March due to increasing Oil prices, insurance costs and rentals.
Hot price pressures would shift market expectations of Federal Reserve (Fed) rate cuts to the third quarter of this year. On the contrary, softer-than-expected numbers would likely reinforce speculation of rate cuts in June.
On the domestic front, the Pound Sterling will be guided by the United Kingdom's monthly Gross Domestic Product (GDP) and the factory data for February, which will be published on Friday.
The GDP data will give a snapshot of the economy's state. The factory data represents the country’s manufacturing sector, a leading indicator of overall demand. Weak numbers would boost expectations for Bank of England (BoE) early rate cuts, while better-than-expected data will indicate that the economy is returning to recovery.
Daily digest market movers: Pound Sterling awaits US inflation for fresh guidance
- The Pound Sterling faces some sell-off while attempting to surpass the round-level resistance of 1.2700 amid uncertainty ahead of the United States consumer price inflation data for March.
- Annual headline inflation is forecast to accelerate to 3.4% from the 3.2% recorded in February. Core inflation, which strips off volatile food and energy prices, is expected to decelerate to 3.7% from 3.8% in the same period. On a monthly basis, both headline and core CPI are forecasted to have increased at a slower pace of 0.3% against 0.4% in February.
- The expected monthly rise in inflation would likely be insufficient to convince Federal Reserve (Fed) policymakers that inflation is returning to the desired rate of 2%. For inflation to come down to the 2% target, the monthly CPI needs to increase at a steady pace of 0.17% for the entire year.
- The US Dollar Index (DXY), which tracks the US Dollar’s value against six major currencies, rebounds to 104.15. Uncertainty among market participants ahead of the US inflation data offered support to the US Dollar. The inflation data will provide hints about when the Federal Reserve could start reducing interest rates.
- On the United Kingdom front, the rising burden of higher cost of living on households has prompted demand for rate cuts by the Bank of England. The latest survey by the Financial Conduct Authority (FCA) showed that individuals struggling to pay bills and credit repayments fell in January annually. The agency estimated that 7.4 million individuals faced problems in addressing their monthly expenses, lower than the 10.9 million recorded in January 2023 but still significantly higher than the 5.8 million recorded in February 2020.
- Investors expect the BoE to pivot to rate cuts after the June meeting. The speculation was propelled after Governor Andrew Bailey said market expectations for two or three rate cuts this year are “reasonable.”
Technical Analysis: Pound Sterling faces pressure near 1.2700
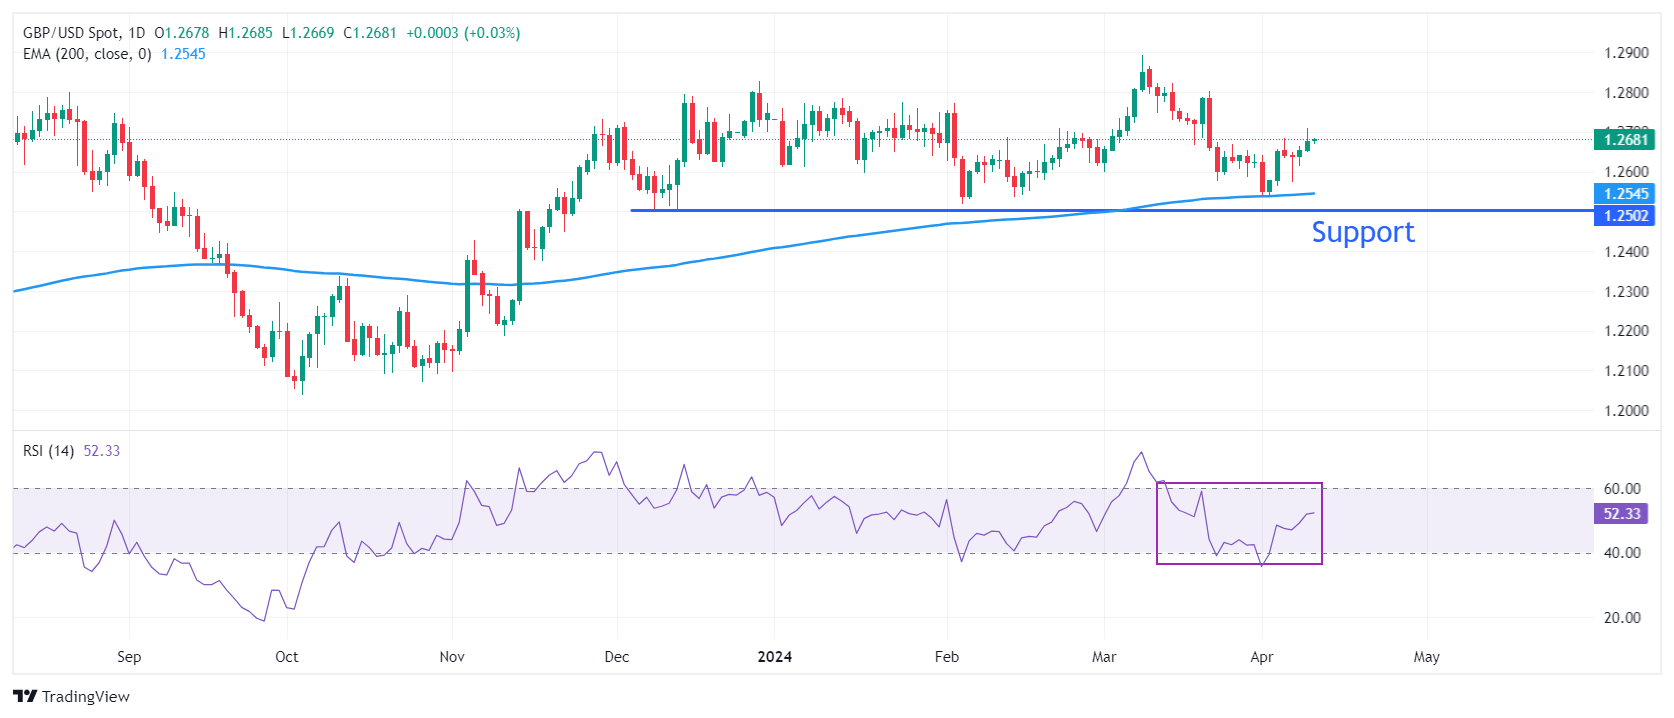
The Pound Sterling struggles to extend upside above the round-level resistance of 1.2700. The GBP/USD pair is expected to remain sideways as investors await the US CPI data. The Cable trades inside Tuesday’s trading range, suggesting a sideways trend. The 200-day Exponential Moving Average (EMA) near 1.2570 supports the Pound Sterling bulls.
On the downside, the psychological level of 1.2500 plotted from December 8 low will be a major support for the Cable.
The 14-period Relative Strength Index (RSI) oscillates inside the 40.00-60.00 range, suggesting indecisiveness among market participants.
Pound Sterling FAQs
The Pound Sterling (GBP) is the oldest currency in the world (886 AD) and the official currency of the United Kingdom. It is the fourth most traded unit for foreign exchange (FX) in the world, accounting for 12% of all transactions, averaging $630 billion a day, according to 2022 data. Its key trading pairs are GBP/USD, aka ‘Cable’, which accounts for 11% of FX, GBP/JPY, or the ‘Dragon’ as it is known by traders (3%), and EUR/GBP (2%). The Pound Sterling is issued by the Bank of England (BoE).
The single most important factor influencing the value of the Pound Sterling is monetary policy decided by the Bank of England. The BoE bases its decisions on whether it has achieved its primary goal of “price stability” – a steady inflation rate of around 2%. Its primary tool for achieving this is the adjustment of interest rates. When inflation is too high, the BoE will try to rein it in by raising interest rates, making it more expensive for people and businesses to access credit. This is generally positive for GBP, as higher interest rates make the UK a more attractive place for global investors to park their money. When inflation falls too low it is a sign economic growth is slowing. In this scenario, the BoE will consider lowering interest rates to cheapen credit so businesses will borrow more to invest in growth-generating projects.
Data releases gauge the health of the economy and can impact the value of the Pound Sterling. Indicators such as GDP, Manufacturing and Services PMIs, and employment can all influence the direction of the GBP. A strong economy is good for Sterling. Not only does it attract more foreign investment but it may encourage the BoE to put up interest rates, which will directly strengthen GBP. Otherwise, if economic data is weak, the Pound Sterling is likely to fall.
Another significant data release for the Pound Sterling is the Trade Balance. This indicator measures the difference between what a country earns from its exports and what it spends on imports over a given period. If a country produces highly sought-after exports, its currency will benefit purely from the extra demand created from foreign buyers seeking to purchase these goods. Therefore, a positive net Trade Balance strengthens a currency and vice versa for a negative balance.
- Gold Price trades in positive territory around $2,355 in Wednesday’s early European session.
- The expectation of rate cuts from Fed, rising Middle East tensions and central bank purchases might lift the gold price.
- Gold traders await the US CPI inflation data for March and the FOMC Minutes on Wednesday.
Gold Price (XAU/USD) extends its upside near $2,355 during the early European trading hours on Wednesday. The uptick of yellow metal is bolstered by the expectation of rate cuts from the Federal Reserve (Fed) this year, central bank purchases, and geopolitical tensions in the Middle East.
On Wednesday, Israeli foreign minister Israel Kat warned that Israel will retaliate if Iran attacks from its territory. Earlier, Iran's supreme leader said Israel "must be punished" for an apparent attack on an Iranian consulate building in Syria last week, which killed two of its senior military commanders, per Sky News. The escalating geopolitical tensions in the Middle East might boost safe-haven assets like gold.
Furthermore, the gold purchase from major central banks lifts the yellow metal to nearly an all-time high. China added 160,000 troy ounces of gold to its reserves in March, the 17th consecutive month. Turkey, India, Kazakhstan, and some eastern European countries also buying gold this year, along with China.
Gold traders will closely monitor the US Consumer Price Index (CPI) data for March and the FOMC Minutes, due on Wednesday. These events could provide some insights about the inflation trajectory and the path of the Fed’s monetary policy. The firmer inflation reading might dampen expectations for Fed rate cuts in June and cap the gold’s upside. On the other hand, the softer inflation data could fuel speculation for rate reductions and provide some support to XAU/USD.
Here is what you need to know on Wednesday, April 10:
The US Dollar (USD) holds steady as markets eagerly await the Consumer Price Index (CPI) data for March. Later in the American session, the Federal Reserve (Fed) will release the minutes of the March policy meeting. Additionally, the Bank of Canada (BoC) will announce monetary policy decisions before Governor Tiff Macklem speaks on the policy outlook and responds to questions from the press.
Major currency pairs spent the day fluctuating in familiar ranges on Tuesday as investors remained reluctant to take large positions before the US inflation data. On a yearly basis, the CPI is forecast to rise 3.4% in March, while the Core CPI is expected to increase 3.7%. Financial markets stay subdued early Wednesday, with the USD Index moving sideways slightly above 104.00. In the meantime, US stock index futures trade marginally higher following Wednesday's choppy action and the benchmark 10-year US Treasury bond yield stays below 4.4% after losing more than 1% in the previous day.
US CPI Forecast: March data to signal bumpy progress in inflation retreat.
Economic Indicator
Consumer Price Index (YoY)
Inflationary or deflationary tendencies are measured by periodically summing the prices of a basket of representative goods and services and presenting the data as The Consumer Price Index (CPI). CPI data is compiled on a monthly basis and released by the US Department of Labor Statistics. The YoY reading compares the prices of goods in the reference month to the same month a year earlier.The CPI is a key indicator to measure inflation and changes in purchasing trends. Generally speaking, a high reading is seen as bullish for the US Dollar (USD), while a low reading is seen as bearish.
Read more.Last release: Tue Mar 12, 2024 12:30
Frequency: Monthly
Actual: 3.2%
Consensus: 3.1%
Previous: 3.1%
Source: US Bureau of Labor Statistics
The US Federal Reserve has a dual mandate of maintaining price stability and maximum employment. According to such mandate, inflation should be at around 2% YoY and has become the weakest pillar of the central bank’s directive ever since the world suffered a pandemic, which extends to these days. Price pressures keep rising amid supply-chain issues and bottlenecks, with the Consumer Price Index (CPI) hanging at multi-decade highs. The Fed has already taken measures to tame inflation and is expected to maintain an aggressive stance in the foreseeable future.
The BoC is widely expected to leave the policy rate unchanged at 5% after April meeting. USD/CAD struggled to find direction on Tuesday and closed the day virtually unchanged slightly below 1.3600. The pair edges lower toward 1.3550 in the early European session.
After rising toward 1.0900, EUR/USD lost its traction and declined to the 1.0850 area late Tuesday. The pair stays relatively quiet near this level midweek.
GBP/USD erased a portion of its daily losses after rising above 1.2700 on Tuesday but ended up posting small gains for the day. The pair holds its ground in the European morning and trades comfortably above 1.2650.
US Dollar price this week
The table below shows the percentage change of US Dollar (USD) against listed major currencies this week. US Dollar was the strongest against the Japanese Yen.
| USD | EUR | GBP | CAD | AUD | JPY | NZD | CHF | |
| USD | -0.17% | -0.41% | -0.28% | -0.80% | 0.07% | -1.09% | 0.06% | |
| EUR | 0.17% | -0.24% | -0.11% | -0.62% | 0.24% | -0.90% | 0.23% | |
| GBP | 0.41% | 0.24% | 0.13% | -0.38% | 0.48% | -0.66% | 0.48% | |
| CAD | 0.29% | 0.11% | -0.12% | -0.50% | 0.35% | -0.78% | 0.35% | |
| AUD | 0.80% | 0.62% | 0.39% | 0.50% | 0.86% | -0.27% | 0.85% | |
| JPY | -0.07% | -0.25% | -0.47% | -0.35% | -0.87% | -1.13% | 0.01% | |
| NZD | 1.06% | 0.88% | 0.65% | 0.78% | 0.27% | 1.13% | 1.11% | |
| CHF | -0.07% | -0.25% | -0.48% | -0.35% | -0.87% | 0.00% | -1.16% |
The heat map shows percentage changes of major currencies against each other. The base currency is picked from the left column, while the quote currency is picked from the top row. For example, if you pick the Euro from the left column and move along the horizontal line to the Japanese Yen, the percentage change displayed in the box will represent EUR (base)/JPY (quote).
Earlier in the day, the Reserve Bank of New Zealand (RBNZ) announced that it maintained the interest rate at 5.5% as widely anticipated. "A restrictive monetary policy stance remains necessary to further reduce capacity pressures and inflation," the RBNZ noted in its policy statement. After closing in the green on Tuesday, NZD/USD continued to push higher in the Asian session and reached its strongest level since March 21 above 0.6070.
RBNZ holds interest rate at 5.50%, as expected.
USD/JPY continues to move up and down in a very tight range slightly below 152.00 on Wednesday. Bank of Japan (BoJ) Governor Kazuo Ueda said earlier in the day that he expects accommodative financial conditions to be maintained for the time being, given the current perspective for economic activity and prices.
Gold set yet another new all-time high above $2,360 on Tuesday. XAU/USD stays relatively calm early Wednesday and fluctuates in a narrow band above $2,350.
Inflation FAQs
Inflation measures the rise in the price of a representative basket of goods and services. Headline inflation is usually expressed as a percentage change on a month-on-month (MoM) and year-on-year (YoY) basis. Core inflation excludes more volatile elements such as food and fuel which can fluctuate because of geopolitical and seasonal factors. Core inflation is the figure economists focus on and is the level targeted by central banks, which are mandated to keep inflation at a manageable level, usually around 2%.
The Consumer Price Index (CPI) measures the change in prices of a basket of goods and services over a period of time. It is usually expressed as a percentage change on a month-on-month (MoM) and year-on-year (YoY) basis. Core CPI is the figure targeted by central banks as it excludes volatile food and fuel inputs. When Core CPI rises above 2% it usually results in higher interest rates and vice versa when it falls below 2%. Since higher interest rates are positive for a currency, higher inflation usually results in a stronger currency. The opposite is true when inflation falls.
Although it may seem counter-intuitive, high inflation in a country pushes up the value of its currency and vice versa for lower inflation. This is because the central bank will normally raise interest rates to combat the higher inflation, which attract more global capital inflows from investors looking for a lucrative place to park their money.
Formerly, Gold was the asset investors turned to in times of high inflation because it preserved its value, and whilst investors will often still buy Gold for its safe-haven properties in times of extreme market turmoil, this is not the case most of the time. This is because when inflation is high, central banks will put up interest rates to combat it. Higher interest rates are negative for Gold because they increase the opportunity-cost of holding Gold vis-a-vis an interest-bearing asset or placing the money in a cash deposit account. On the flipside, lower inflation tends to be positive for Gold as it brings interest rates down, making the bright metal a more viable investment alternative.
- USD/CAD remains silent amid market caution ahead of BoC’s policy decision.
- BoC is expected to maintain its current policy rate at 5.0% on Wednesday.
- The decline in US Treasury yields contributes to undermining the US Dollar.
USD/CAD seems to remain tepid amid firmer US Dollar (USD) and Crude oil prices. The pair inches lower to near 1.3570 during the Asian session on Wednesday. The US Dollar (USD) holds ground despite lower US Treasury yields.
Traders eagerly await the release of the Bank of Canada’s (BoC) interest rate decision, with expectations of remaining unchanged at 5.0%. Additionally, US Consumer Price Index (CPI) data and the FOMC Minutes are scheduled to be released later in the North American session.
Crude oil prices encountered hurdles that potentially weighed on the Canadian Dollar (CAD). The impasse in Gaza ceasefire negotiations revived concerns about the security of supplies from the Middle East, counteracting a larger-than-anticipated increase in US Crude inventories. West Texas Intermediate (WTI) oil price hovers around $84.70 per barrel, by the press time.
The US Dollar (USD) encounters challenges amid lower US Treasury yields. At the time of writing, the US Dollar Index (DXY) consolidates around 104.10, with 2-year and 10-year yields on US Treasury bonds at 4.73% and 4.35%, respectively.
Federal Reserve (Fed) Bank of Minneapolis President Neel Kashkari reiterated the central bank's commitment to combatting inflation. Kashkari stressed the importance of bringing the current inflation rate, hovering around 3%, back down to the target level of 2%.
Investors adopt a cautious stance, expecting potential policy shifts influenced by incoming data. Strong labor market figures from last week could lead to a more hawkish stance from the Federal Reserve if inflation exceeds expectations.
- EUR/USD trades softer near 1.0855 ahead of the US CPI data on Wednesday.
- The pair keeps a positive outlook above the key EMA; RSI indicator holds in bullish territory.
- The first resistance level will emerge at 1.0870; the initial support level is seen at 1.0833.
The EUR/USD pair clings to mild losses around 1.0855 on Wednesday during the early European session. The US March Consumer Price Index (CPI) report and the FOMC Minutes will be released later in the day. On Thursday, the European Central Bank (ECB) monetary policy decision will take center stage. The ECB is expected to keep rates unchanged at its April meeting, but the chance of easing policy in June increases.
According to the four-hour chart, EUR/USD keeps the bullish stance unchanged as the major pair is above the key 100-period Exponential Moving Average (EMA). Additionally, the Relative Strength Index (RSI) holds in bullish territory around 56.50, which means the path of least resistance level is to the upside.
The first resistance level will emerge near the upper boundary of the Bollinger Band at 1.0870. The next hurdle is seen at the 1.0900–1.0905 zone, portraying the confluence of the psychological level and a high of March 18. A break above the latter will see a rally to a high of March 21 at 1.0942.
The 100-period EMA at 1.0833 acts as an initial support level for EUR/USD. The additional downside filter to watch is the lower limit of the Bollinger Band at 1.0823. A breach of this level will expose a low of March 28 at 1.0775, followed by a low of April 1 at 1.0730.
EUR/USD four-hour chart
-638483239517116217.png)
- WTI extends its downside near $84.60 on Wednesday.
- The bigger-than-expected build in US crude inventories weighs on the black gold.
- The uncertainty over Gaza ceasefire talks and ongoing Middle East geopolitical tensions might cap the downside of WTI.
Western Texas Intermediate (WTI), the US crude oil benchmark, is trading around $84.60 on Wednesday. The black gold trades in negative territory for the fourth consecutive day amid the US crude stock build and profit-taking ahead of the release of the US March Consumer Price Index (CPI) report and the FOMC Minutes, due later on Wednesday.
The recent US employment report last week has triggered speculation that the Federal Reserve (Fed) might delay interest rate cuts this year. Investors will closely watch the US CPI inflation data for March, as it could offer some insights about the inflation trajectory and the path of the Fed’s monetary policy. The firmer-than-expected outcome might lift the US Dollar (USD) and weigh on the USD-denominated WTI price.
Furthermore, the bigger-than-expected build in US crude inventories exerts some selling pressure on WTI prices. US crude oil inventories for the week ending April 5 increased by 3.034 million barrels from the previous week's decline of 2.286M million barrels. The market consensus estimated that stocks would rise by about 2.415 million barrels, according to the American Petroleum Institute (API) on Tuesday.
The leader of Iran's Revolutionary Guard navy said that the Strait of Hormuz might be closed if necessary. About a fifth of the volume of the world's total oil consumption passes through the strait every day. This, in turn, might trigger the fear of oil supply disruption and cap the downside of WTI prices.
On Tuesday, Hamas stated that an Israeli proposal for a ceasefire in their war in Gaza did not match the conditions of Palestinian militant groups, but that it would consider the offer further. Oil traders will monitor the developments surrounding the geopolitical tensions in the Middle East. The ongoing tensions could raise concerns about a tight market.
- USD/JPY stays quiet as the market adopts a cautious stance in anticipation of the US CPI release.
- Japan’s PPI YoY and MoM increased by 0.8% and 0.2%, respectively, in March.
- US headline CPI is projected to accelerate in March, while the Core measure is expected to moderate.
USD/JPY remains silent before releasing of the US Consumer Price Index (CPI) data and the FOMC Minutes on Wednesday. The pair hovers around 151.70 during the Asian trading hours. The Japanese Yen (JPY) could face challenges as Bank of Japan (BoJ) Governor Kazuo Ueda stated that they would not alter monetary policy solely to address FX fluctuations.
Governor Ueda also emphasized that Japan's persistent deflation and low inflation levels have posed challenges in influencing public inflation expectations through monetary base expansion. With trend inflation still below 2%, it remains crucial to support the economy's trajectory towards achieving the 2% target by maintaining accommodative monetary conditions.
Data revealed that Japan’s Producer Price Index (PPI) rose by 0.8% year-on-year in March, meeting expectations and accelerating from an upwardly revised 0.7% gain in February. This marks the highest reading since October last year. However, the monthly PPI increased by 0.2%, falling short of the expected 0.3%.
The US Dollar Index (DXY) strives to maintain its position as it anticipates the release of the US Consumer Price Index (CPI) data and the FOMC Minutes later in the North American session.
The US headline Consumer Price Index is projected to accelerate in March, while the core measure is expected to moderate. The US Dollar is in a state of anticipation, awaiting potential policy shifts influenced by incoming data. Strong labor market figures from last week could lead to a more hawkish stance from the Federal Reserve if inflation exceeds expectations.
In its latest economic assessment of the Chinese economy, Fitch Ratings revised China’s outlook to ‘Negative’ while affirming its sovereign credit rating at ‘A+’.
Additional takeaways
Outlook revision reflects increasing risks to China's public finance outlook.
Forecast general government deficit in China to rise to 7.1% of GDP in 2024.
Believes that fiscal policy is increasingly likely to play an important role in supporting growth in coming years.
2024 deficit will be highest since 8.6% of gdp deficit in 2020.
The 2024 deficit will be the highest since the 8.6% of GDP deficit in 2020.
Forecasts GDP growth to moderate to 4.5% in 2024, from 5.2% in 2023.
Do not forecast a prolonged period of deflation, with inflation of 0.7% by end-2024 and 1.3% by end-2025.
Market reaction
AUD/USD continues to hold lower ground near 0.6620 on the above headlines, modestly flat on the day.
Australian Dollar FAQs
One of the most significant factors for the Australian Dollar (AUD) is the level of interest rates set by the Reserve Bank of Australia (RBA). Because Australia is a resource-rich country another key driver is the price of its biggest export, Iron Ore. The health of the Chinese economy, its largest trading partner, is a factor, as well as inflation in Australia, its growth rate and Trade Balance. Market sentiment – whether investors are taking on more risky assets (risk-on) or seeking safe-havens (risk-off) – is also a factor, with risk-on positive for AUD.
The Reserve Bank of Australia (RBA) influences the Australian Dollar (AUD) by setting the level of interest rates that Australian banks can lend to each other. This influences the level of interest rates in the economy as a whole. The main goal of the RBA is to maintain a stable inflation rate of 2-3% by adjusting interest rates up or down. Relatively high interest rates compared to other major central banks support the AUD, and the opposite for relatively low. The RBA can also use quantitative easing and tightening to influence credit conditions, with the former AUD-negative and the latter AUD-positive.
China is Australia’s largest trading partner so the health of the Chinese economy is a major influence on the value of the Australian Dollar (AUD). When the Chinese economy is doing well it purchases more raw materials, goods and services from Australia, lifting demand for the AUD, and pushing up its value. The opposite is the case when the Chinese economy is not growing as fast as expected. Positive or negative surprises in Chinese growth data, therefore, often have a direct impact on the Australian Dollar and its pairs.
Iron Ore is Australia’s largest export, accounting for $118 billion a year according to data from 2021, with China as its primary destination. The price of Iron Ore, therefore, can be a driver of the Australian Dollar. Generally, if the price of Iron Ore rises, AUD also goes up, as aggregate demand for the currency increases. The opposite is the case if the price of Iron Ore falls. Higher Iron Ore prices also tend to result in a greater likelihood of a positive Trade Balance for Australia, which is also positive of the AUD.
The Trade Balance, which is the difference between what a country earns from its exports versus what it pays for its imports, is another factor that can influence the value of the Australian Dollar. If Australia produces highly sought after exports, then its currency will gain in value purely from the surplus demand created from foreign buyers seeking to purchase its exports versus what it spends to purchase imports. Therefore, a positive net Trade Balance strengthens the AUD, with the opposite effect if the Trade Balance is negative.
- NZD/JPY extends gains as RBNZ holds its OCR at 5.5% to tame inflation.
- RBNZ committee expects higher rates will bring inflation back within the target range.
- BoJ’s Ueda stated not altering monetary policy solely to address FX fluctuations.
NZD/JPY continues its winning streak for the third successive session on Wednesday. The pair moves higher to near 92.20 after the hawkish hold by the Reserve Bank of New Zealand (RBNZ). As anticipated, the central bank has decided to maintain its Official Cash Rate (OCR) at 5.5% for the sixth consecutive meeting.
The Reserve Bank of New Zealand's committee expresses confidence that sustaining the OCR at a restrictive level for an extended period will bring consumer price inflation back within the target range of 1 to 3 percent by 2024. Despite headline inflation slowing to a two-and-a-half-year low of 4.7% in the fourth quarter of 2023, it remains significantly above the target level.
However, some economists perceive this decision as dovish, particularly considering New Zealand's entry into a recession and the sharp decline in consumer confidence. Market sentiment suggests the possibility of the RBNZ's first rate cut occurring in August.
On the other side, the strong US inflation data combined with weak Japanese economic indicators could raise the likelihood of Japanese authorities needing to intervene in the foreign exchange (FX) market. However, Bank of Japan (BoJ) Governor Kazuo Ueda stated that the central bank would not alter monetary policy solely to address FX fluctuations.
Governor Ueda also highlighted that Japan's persistent deflation and low inflation levels have made it challenging to influence public inflation expectations through monetary base expansion. With trend inflation still below 2%, it is essential to support the economy's trajectory towards achieving the 2% target by maintaining accommodative monetary conditions.
- The US Consumer Price Index is set to rise 3.4% YoY in March, following the 3.2% increase in February.
- Annual core CPI inflation is expected to edge lower to 3.7% YoY in March.
- The inflation report could impact the market pricing of the June rate cut probability.
The high-impact US Consumer Price Index (CPI) inflation data for March will be published by the Bureau of Labor Statistics (BLS) on Wednesday at 12:30 GMT. Inflation data could alter the market’s pricing of the timing of the Federal Reserve (Fed) policy pivot at a time when investors have increasing doubts over the possibility of an interest-rate cut in June. Any surprise in inflation is expected to ramp up volatility around the US Dollar (USD).
What to expect in the next CPI data report?
Inflation in the United States (US) is forecast to rise at an annual pace of 3.4% in March, at a faster pace than the 3.2% increase recorded in February. The core CPI inflation rate, which excludes volatile food and energy prices, is forecast to tick down to 3.7% from 3.8% in the same period.
The monthly CPI and the core CPI are both seen increasing 0.3% in March.
While speaking at an event organized by the Stanford Graduate School of Business, Federal Reserve (Fed) Chairman Jerome Powell said that the policy rate was likely at its peak in this cycle but added that they were in no rush to reduce rates. “It’s too soon to say whether recent inflation readings are more than just a bump”, Powell said, adding that the Fed has time to let incoming data guide policy decisions.
Previewing the March inflation report, “we expect next week's CPI report to show that core inflation slowed to a ‘soft’ 0.3% m/m pace after posting an acceleration to around 0.4% in January/February,” said TD Securities analysts in a weekly report. “Used vehicle prices likely dropped back to deflation, while OER (Owners' Equivalent Rent) inflation possibly rose. Note that our unrounded core CPI forecast at 0.26% m/m suggests larger risks for a dovish surprise to a rounded 0.2% increase.”
How could the US Consumer Price Index report affect EUR/USD?
Following the 0.2% increase recorded in December, the Consumer Price Index (CPI) rose 0.3% and 0.4% in January and February, respectively, while the core CPI increased 0.4% in both months. These readings revived concerns over a slowdown in the disinflationary progress and caused market participants to refrain from forecasting a rate cut until June.
Meanwhile, the BLS reported an increase of 303,000 in Nonfarm Payrolls in March last Friday. This reading followed the 270,000 growth in February and surpassed the market expectation of 200,000 by a wide margin, highlighting tight conditions in the labor market. In turn, the CME FedWatch Tool’s probability of a 25 basis points rate reduction in June fell toward 50% from above 60% before the publication of the jobs report.
The market positioning suggests that the US Dollar faces a two-way risk heading into the inflation data release. In case the monthly core CPI rises 0.4% or more, it could give investors confidence that the Fed will stay on hold in June, especially after the impressive labor market data for March. In this scenario, the USD is likely to gather strength against its major rivals with the immediate reaction. On the other hand, a reading of 0.2% or lower could revive optimism about a continuation of disinflation and cause investors to lean toward a June rate cut, triggering a USD sell-off as a result.
Eren Sengezer, European Session Lead Analyst at FXStreet, offers a brief technical outlook for EUR/USD and explains: “The Relative Strength Index (RSI) indicator on the daily chart stays flat near 50 ahead of the US inflation data, highlighting EUR/USD’s indecisiveness in the short term. Additionally, the pair needs to break out of the 1.0830-1.0870 range, where the 200-day and the 100-day Simple Moving Averages (SMA) are located, to determine its next direction.”
“If EUR/USD rises above 1.0870 (100-day SMA) and starts using this level as support, it could target 1.0960 (Fibonacci 23.6% retracement level of the October-December uptrend) next. If 1.0830 (200-day SMA) support fails, technical sellers could take action and pave the way for an extended slide toward 1.0700 (end-point of the downtrend).”
Economic Indicator
Consumer Price Index (YoY)
Inflationary or deflationary tendencies are measured by periodically summing the prices of a basket of representative goods and services and presenting the data as The Consumer Price Index (CPI). CPI data is compiled on a monthly basis and released by the US Department of Labor Statistics. The YoY reading compares the prices of goods in the reference month to the same month a year earlier.The CPI is a key indicator to measure inflation and changes in purchasing trends. Generally speaking, a high reading is seen as bullish for the US Dollar (USD), while a low reading is seen as bearish.
Read more.Last release: Tue Mar 12, 2024 12:30
Frequency: Monthly
Actual: 3.2%
Consensus: 3.1%
Previous: 3.1%
Source: US Bureau of Labor Statistics
The US Federal Reserve has a dual mandate of maintaining price stability and maximum employment. According to such mandate, inflation should be at around 2% YoY and has become the weakest pillar of the central bank’s directive ever since the world suffered a pandemic, which extends to these days. Price pressures keep rising amid supply-chain issues and bottlenecks, with the Consumer Price Index (CPI) hanging at multi-decade highs. The Fed has already taken measures to tame inflation and is expected to maintain an aggressive stance in the foreseeable future.
US Dollar FAQs
The US Dollar (USD) is the official currency of the United States of America, and the ‘de facto’ currency of a significant number of other countries where it is found in circulation alongside local notes. It is the most heavily traded currency in the world, accounting for over 88% of all global foreign exchange turnover, or an average of $6.6 trillion in transactions per day, according to data from 2022. Following the second world war, the USD took over from the British Pound as the world’s reserve currency. For most of its history, the US Dollar was backed by Gold, until the Bretton Woods Agreement in 1971 when the Gold Standard went away.
The most important single factor impacting on the value of the US Dollar is monetary policy, which is shaped by the Federal Reserve (Fed). The Fed has two mandates: to achieve price stability (control inflation) and foster full employment. Its primary tool to achieve these two goals is by adjusting interest rates. When prices are rising too quickly and inflation is above the Fed’s 2% target, the Fed will raise rates, which helps the USD value. When inflation falls below 2% or the Unemployment Rate is too high, the Fed may lower interest rates, which weighs on the Greenback.
In extreme situations, the Federal Reserve can also print more Dollars and enact quantitative easing (QE). QE is the process by which the Fed substantially increases the flow of credit in a stuck financial system. It is a non-standard policy measure used when credit has dried up because banks will not lend to each other (out of the fear of counterparty default). It is a last resort when simply lowering interest rates is unlikely to achieve the necessary result. It was the Fed’s weapon of choice to combat the credit crunch that occurred during the Great Financial Crisis in 2008. It involves the Fed printing more Dollars and using them to buy US government bonds predominantly from financial institutions. QE usually leads to a weaker US Dollar.
Quantitative tightening (QT) is the reverse process whereby the Federal Reserve stops buying bonds from financial institutions and does not reinvest the principal from the bonds it holds maturing in new purchases. It is usually positive for the US Dollar.
| Raw materials | Closed | Change, % |
|---|---|---|
| Silver | 28.16 | 1.19 |
| Gold | 2352.876 | 0.66 |
| Palladium | 1086.32 | 3.76 |
- Indian Rupee loses its recent gains on the renewed USD demand.
- The Dollar sales from banks, the decline in crude oil prices, and India’s robust growth outlook might limit the INR’s downside.
- Investors will closely monitor the US March CPI inflation report and the FOMC Minutes on Wednesday.
Indian Rupee (INR) loses its recovery momentum on Wednesday amid the modest rebound of US Dollar (USD). The markets turn cautious ahead of the key US inflation data, as it is expected to show a high inflation reading. However, the foreign and state-run banks' USD sales, lower crude oil prices, and robust growth prospects in the Indian economy might provide some support to the INR and cap the upside of the USD/INR pair.
The release of the US March Consumer Price Index (CPI) report and the FOMC Minutes will be the highlights on Wednesday. These events could offer some hints about the inflation trajectory and the path of the Fed’s monetary policy. On the Indian front, the market will be closed on Thursday for Eid al-Fitr. The attention will shift to the Indian CPI inflation report for March and Industrial Production for February, due on Friday.
Daily Digest Market Movers: Indian Rupee turns red amid the cautious mood
- India’s eight states will have an economy of over $1 trillion as the country moves towards becoming a developed nation by FY47, according to the India Ratings and Research (Ind-Ra) report.
- RBI Governor Shaktikanta Das said that inflation is moving closer to targets, projecting retail inflation for the current year at 4.5%. Nonetheless, uncertainties in food prices continue to pose challenges.
- India's robust growth prospects give the central bank the space to remain focused on inflation, RBI Governor Shaktikanta Das said.
- Chicago Fed President Austan Goolsbee said the recent jobs report was “quite strong”, but the central bank must weigh how much longer it can maintain its current interest rate stance without damaging the economy.
- Minneapolis Fed President Neel Kashkari said that the labor market is no longer ‘red hot’ but remains tight. He said his base case is that inflation continues to ease.
- The chance of a June rate cut dropped to nearly 57%, while the odds of a July cut have fallen below 75%, according to the CME’s FedWatch tool.
Technical analysis: USD/INR keeps the positive outlook intact in the longer term
The Indian Rupee trades softer on the day. USD/INR maintains its bullish stance unchanged in the long term since the pair has risen above a nearly four-month-old descending trend channel since March 22.
In the near term, USD/INR is above the key 100-day Exponential Moving Average (EMA) on the daily timeframe. The 14-day Relative Strength Index (RSI) remains above the 50-midline, indicating the support zones are more likely to hold than to break.
The key support level will emerge near the confluence of the psychological round mark and the 100-day EMA at the 83.00–83.50 region. The additional downside filter to watch is a low of March 14 at 82.80, followed by a low of March 11 at 82.65. On the upside, the first upside target is seen near a low of April 2 at 83.30. Further north, the next barrier is located near a high of April 5 at 83.45, en route to an all-time high of 83.70.
US Dollar price today
The table below shows the percentage change of US Dollar (USD) against listed major currencies today. US Dollar was the strongest against the Australian Dollar.
| USD | EUR | GBP | CAD | AUD | JPY | NZD | CHF | |
| USD | 0.06% | 0.03% | -0.07% | 0.11% | -0.01% | -0.03% | 0.08% | |
| EUR | -0.06% | -0.04% | -0.10% | 0.06% | -0.06% | -0.09% | 0.03% | |
| GBP | -0.03% | 0.02% | -0.08% | 0.08% | -0.04% | -0.06% | 0.06% | |
| CAD | 0.05% | 0.10% | 0.07% | 0.14% | 0.04% | 0.04% | 0.13% | |
| AUD | -0.12% | -0.06% | -0.06% | -0.16% | -0.11% | -0.14% | -0.01% | |
| JPY | 0.01% | 0.07% | 0.03% | -0.05% | 0.11% | 0.02% | 0.09% | |
| NZD | 0.03% | 0.09% | 0.06% | -0.02% | 0.14% | 0.02% | 0.11% | |
| CHF | -0.09% | -0.03% | -0.05% | -0.13% | 0.03% | -0.09% | -0.12% |
The heat map shows percentage changes of major currencies against each other. The base currency is picked from the left column, while the quote currency is picked from the top row. For example, if you pick the Euro from the left column and move along the horizontal line to the Japanese Yen, the percentage change displayed in the box will represent EUR (base)/JPY (quote).
Indian Rupee FAQs
The Indian Rupee (INR) is one of the most sensitive currencies to external factors. The price of Crude Oil (the country is highly dependent on imported Oil), the value of the US Dollar – most trade is conducted in USD – and the level of foreign investment, are all influential. Direct intervention by the Reserve Bank of India (RBI) in FX markets to keep the exchange rate stable, as well as the level of interest rates set by the RBI, are further major influencing factors on the Rupee.
The Reserve Bank of India (RBI) actively intervenes in forex markets to maintain a stable exchange rate, to help facilitate trade. In addition, the RBI tries to maintain the inflation rate at its 4% target by adjusting interest rates. Higher interest rates usually strengthen the Rupee. This is due to the role of the ‘carry trade’ in which investors borrow in countries with lower interest rates so as to place their money in countries’ offering relatively higher interest rates and profit from the difference.
Macroeconomic factors that influence the value of the Rupee include inflation, interest rates, the economic growth rate (GDP), the balance of trade, and inflows from foreign investment. A higher growth rate can lead to more overseas investment, pushing up demand for the Rupee. A less negative balance of trade will eventually lead to a stronger Rupee. Higher interest rates, especially real rates (interest rates less inflation) are also positive for the Rupee. A risk-on environment can lead to greater inflows of Foreign Direct and Indirect Investment (FDI and FII), which also benefit the Rupee.
Higher inflation, particularly, if it is comparatively higher than India’s peers, is generally negative for the currency as it reflects devaluation through oversupply. Inflation also increases the cost of exports, leading to more Rupees being sold to purchase foreign imports, which is Rupee-negative. At the same time, higher inflation usually leads to the Reserve Bank of India (RBI) raising interest rates and this can be positive for the Rupee, due to increased demand from international investors. The opposite effect is true of lower inflation.
- NZD/USD experiences volatility after RBNZ’s interest rate decision.
- RBNZ holds its current Official Cash Rate at 5.5%.
- US Dollar receives downward pressure due to lower US Treasury yields.
NZD/USD has experienced fluctuations after the interest rate decision by the Reserve Bank of New Zealand (RBNZ). As expected, the central bank has maintained its Official Cash Rate (OCR) at 5.5% for the sixth consecutive meeting. The pair maintains position around 0.6060 during the Asian trading hours on Wednesday.
Policymakers emphasized the importance of keeping rates restrictive to curb inflation. Additionally, some economists perceived this decision as dovish, considering New Zealand's economy has entered a recession and consumer confidence has sharply declined. Markets are pricing in the possibility of the RBNZ's first rate cut in August.
US Dollar Index (DXY) attempts to hold its ground ahead of the release of the US Consumer Price Index (CPI) data and the FOMC Minutes scheduled to be released later in the North American session.
However, the US Dollar (USD) faced struggles due to lower US Treasury yields. At the time of writing, DXY consolidates around 104.10, with 2-year and 10-year yields on US Treasury bonds standing at 4.74% and 4.35%, respectively.
The US headline Consumer Price Index is anticipated to accelerate in March, while the core measure is expected to moderate. The US Dollar is in a state of anticipation, awaiting potential policy shifts influenced by incoming data. Strong labor market figures from last week may prompt a more hawkish stance from the Federal Reserve if inflation surpasses expectations.
According to the CME FedWatch Tool, the probability of a 25-basis point rate cut by the Fed in June has slightly risen to 53.5%. However, the likelihood of a rate cut in July has decreased to 49.9%.
- Australian Dollar marked to four-week high at 0.6644 on Tuesday.
- Australian currency strengthens on investors' doubts surrounding the RBA’s rate cuts in 2024.
- US Dollar receives downward pressure ahead of US CPI and FOMC minutes.
The Australian Dollar (AUD) attempts to extend gains for the third consecutive session on Wednesday. The AUD/USD pair reached to four-week high at 0.6644 in the previous session as the US Dollar (USD) faced a struggle, which could be attributed to the decline in the US Treasury yields.
The Australian Dollar gains strength as investors become increasingly skeptical about the necessity for the Reserve Bank of Australia (RBA) to implement interest rate cuts in 2024, given the anticipation of the Federal Reserve (Fed) extending its higher interest rate stance.
The Reserve Bank of Australia has indicated that further rate hikes are unlikely, stating that it requires more confidence in the inflation outlook before considering rate cuts. Traders await the Reserve Bank of New Zealand’s (RBNZ) interest rate decision on Wednesday. Furthermore, the focus will shift to the release of the US Consumer Price Index (CPI) data and the FOMC Minutes later in the North American session.
Daily Digest Market Movers: Australian Dollar rises amid doubts surrounding RBA’s rate cuts
- Australia's Westpac Consumer Confidence Index for April indicated a decline of 2.4%, compared to the previous decrease of 1.8%.
- Commonwealth Bank anticipates three 25 basis points (bps) interest rate cuts by the end of the year, starting from September.
- Westpac predicts that interest rate cuts will commence in September, while NAB and ANZ believe it won't be until November.
- Federal Reserve (Fed) Bank of Minneapolis President Neel Kashkari emphasized the importance of the central bank's commitment to combatting inflation. Kashkari stressed that despite the current inflation rate hovering around 3%, the Fed must strive to bring it back down to the target level of 2%.
- According to the CME FedWatch Tool, the probability of a 25-basis point rate cut by the Fed in June has slightly increased to 53.5%. However, the likelihood of a rate cut in July has decreased to 49.9%.
- US headline CPI is expected to experience an acceleration in March, whereas the core measure is expected to show a cooling down.
- On Friday, the US Nonfarm Payrolls (NFP) report revealed a notable increase of 303K jobs in March, surpassing both expectations of 200K and the previous reading of 270K. US Average Hourly Earnings rose by 0.3% month-over-month in March, meeting expectations.
Technical Analysis: Australian Dollar hovers around 0.6620 with a bullish sentiment
The Australian Dollar trades around 0.6620 on Wednesday. Technical analysis suggests a bullish sentiment for the AUD/USD pair. The pair could see more gains as the Moving Average Convergence Divergence (MACD) is positioned above the centerline and shows a divergence above the signal line. Key resistance is observed around the major level of 0.6650, followed by March’s high of 0.6667. On the downside, key support is identified around the 23.6% Fibonacci retracement level of 0.6605 and the psychological level of 0.6600. Further support lies at the nine-day Exponential Moving Average (EMA) of 0.6584 and the major support level of 0.6550.
AUD/USD: Daily Chart
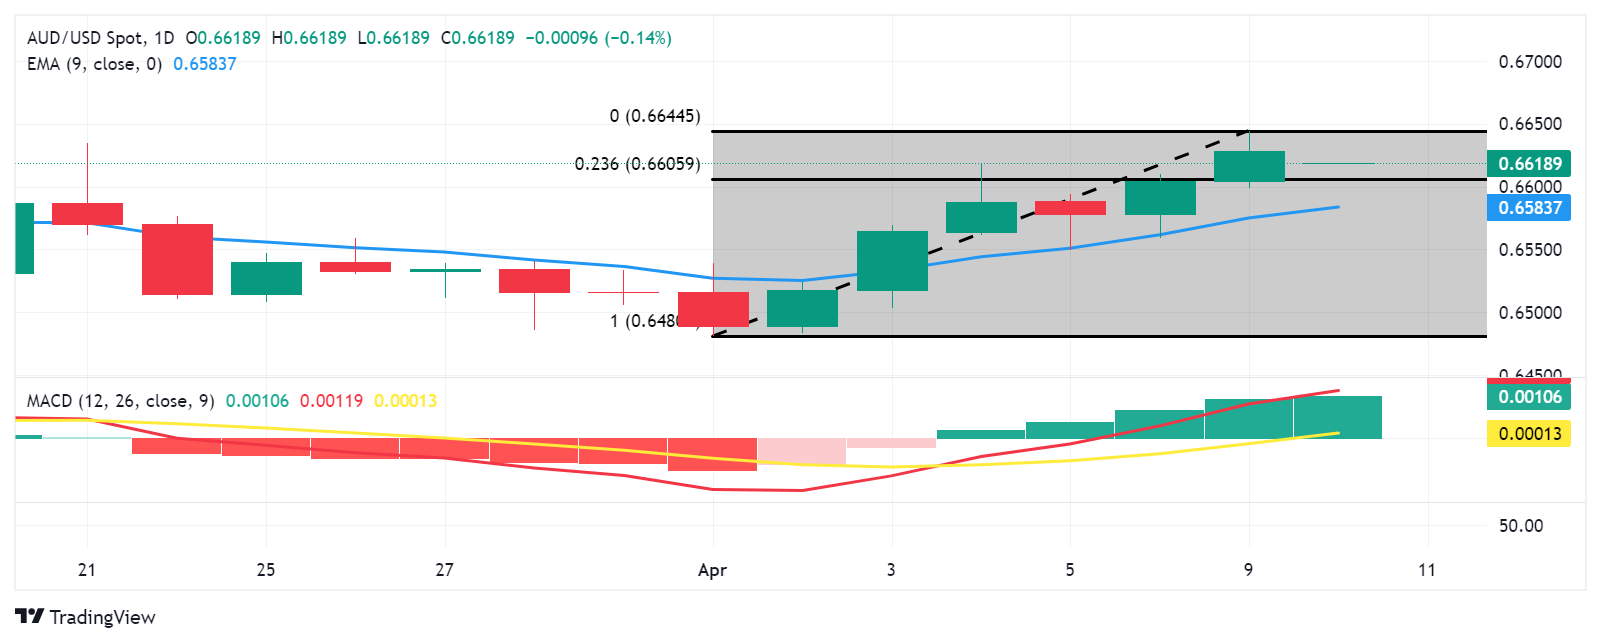
Australian Dollar price today
The table below shows the percentage change of Australian Dollar (AUD) against listed major currencies today. Australian Dollar was the strongest against the Swiss Franc.
| USD | EUR | GBP | CAD | AUD | JPY | NZD | CHF | |
| USD | 0.05% | 0.05% | -0.03% | 0.16% | -0.01% | 0.13% | 0.10% | |
| EUR | -0.06% | -0.01% | -0.07% | 0.10% | -0.06% | 0.06% | 0.05% | |
| GBP | -0.05% | -0.01% | -0.07% | 0.10% | -0.06% | 0.07% | 0.05% | |
| CAD | 0.01% | 0.06% | 0.08% | 0.17% | 0.01% | 0.13% | 0.12% | |
| AUD | -0.16% | -0.11% | -0.08% | -0.17% | -0.16% | -0.04% | -0.04% | |
| JPY | 0.00% | 0.06% | 0.07% | -0.02% | 0.17% | 0.14% | 0.11% | |
| NZD | -0.13% | -0.08% | -0.07% | -0.14% | 0.03% | -0.14% | -0.03% | |
| CHF | -0.11% | -0.05% | -0.05% | -0.11% | 0.05% | -0.11% | 0.02% |
The heat map shows percentage changes of major currencies against each other. The base currency is picked from the left column, while the quote currency is picked from the top row. For example, if you pick the Euro from the left column and move along the horizontal line to the Japanese Yen, the percentage change displayed in the box will represent EUR (base)/JPY (quote).
Australian Dollar FAQs
One of the most significant factors for the Australian Dollar (AUD) is the level of interest rates set by the Reserve Bank of Australia (RBA). Because Australia is a resource-rich country another key driver is the price of its biggest export, Iron Ore. The health of the Chinese economy, its largest trading partner, is a factor, as well as inflation in Australia, its growth rate and Trade Balance. Market sentiment – whether investors are taking on more risky assets (risk-on) or seeking safe-havens (risk-off) – is also a factor, with risk-on positive for AUD.
The Reserve Bank of Australia (RBA) influences the Australian Dollar (AUD) by setting the level of interest rates that Australian banks can lend to each other. This influences the level of interest rates in the economy as a whole. The main goal of the RBA is to maintain a stable inflation rate of 2-3% by adjusting interest rates up or down. Relatively high interest rates compared to other major central banks support the AUD, and the opposite for relatively low. The RBA can also use quantitative easing and tightening to influence credit conditions, with the former AUD-negative and the latter AUD-positive.
China is Australia’s largest trading partner so the health of the Chinese economy is a major influence on the value of the Australian Dollar (AUD). When the Chinese economy is doing well it purchases more raw materials, goods and services from Australia, lifting demand for the AUD, and pushing up its value. The opposite is the case when the Chinese economy is not growing as fast as expected. Positive or negative surprises in Chinese growth data, therefore, often have a direct impact on the Australian Dollar and its pairs.
Iron Ore is Australia’s largest export, accounting for $118 billion a year according to data from 2021, with China as its primary destination. The price of Iron Ore, therefore, can be a driver of the Australian Dollar. Generally, if the price of Iron Ore rises, AUD also goes up, as aggregate demand for the currency increases. The opposite is the case if the price of Iron Ore falls. Higher Iron Ore prices also tend to result in a greater likelihood of a positive Trade Balance for Australia, which is also positive of the AUD.
The Trade Balance, which is the difference between what a country earns from its exports versus what it pays for its imports, is another factor that can influence the value of the Australian Dollar. If Australia produces highly sought after exports, then its currency will gain in value purely from the surplus demand created from foreign buyers seeking to purchase its exports versus what it spends to purchase imports. Therefore, a positive net Trade Balance strengthens the AUD, with the opposite effect if the Trade Balance is negative.
The People’s Bank of China (PBoC) set the USD/CNY central rate for the trading session ahead on Tuesday at 7.0959 as compared to the previous day's fix of 7.0956 and 7.2300 Reuters estimates.
- NZD/USD edges higher to 0.6065 in Wednesday’s early Asian session.
- RBNZ will announce its monetary policy decision on Wednesday, with no change in rates expected as inflation remains too high.
- The recent US employment report raises speculation that the Fed might delay the easing cycle.
The NZD/USD pair trades in positive territory for the third consecutive day near 0.6065 during the early Asian section on Wednesday. Market players will closely watch the Reserve Bank of New Zealand (RBNZ) interest rate decision on Wednesday. Later in the day, the US March Consumer Price Index (CPI) inflation figures and the FOMC Minutes will be in the spotlight.
The RBNZ is widely expected to maintain the Official Cash Rate (OCR) at 5.50% for the sixth meeting in a row. As a rate-on-hold decision is fully priced in, markets will monitor the tone of the New Zealand central bank and the timing of rate cuts. High inflation is a major factor in why the RBNZ is cautious of signals that rate cuts are imminent. Analysts believe the RBNZ would rather wait for the Federal Reserve (Fed) to cut rates first. This, in turn, might boost the New Zealand Dollar and create a tailwind for the NZD/USD pair.
On the USD’s front, the recent US employment report last week indicated the US economy added more jobs than expected, prompting speculation that the Fed might delay the easing cycle. Fed Chair Jerome Powell said that the US central bank could cut rates if the US economy continued on its current course, while adding that the main factor in the central bank's rate-cutting decision is when or whether inflation will return to the Fed’s 2% target. After the RBNZ monetary policy meeting, attention will shift to the US CPI inflation data and the FOMC Minutes, which might offer some insights about the further inflation and interest rate outlook.
The Bank of Japan (BoJ) Governor Kazuo Ueda stated in his Semiannual Report on Currency and Monetary Control on Wednesday that, given the current perspective for economic activity and prices, it expects accommodative financial conditions to be maintained for the time being.
Key quotes
“Now within sight that the price stability target of 2 percent would be achieved in a sustainable and stable manner toward the end of the projection period of the January 2024 Outlook Report, as various data and anecdotal information from firms had gradually shown that the virtuous cycle between wages and prices had become more solid.”
“On this basis, the Bank considered that the policy framework of Quantitative and Qualitative Monetary Easing (QQE) with Yield Curve Control and the negative interest rate policy to date had fulfilled their roles, and it therefore changed the monetary policy framework.”
“Specifically, the Bank decided, among other measures, to set the uncollateralized overnight call rate as the policy interest rate and encourage that rate to remain at around 0 to 0.1 percent.”
“Given the current outlook for economic activity and prices, it anticipates that accommodative financial conditions will be maintained for the time being.”
"Trend inflation yet to reach 2%, so need to support economy's momentum toward hitting 2% by maintaining accommodative monetary conditions."
"Want to scrutinise whether trend inflation will indeed head toward 2% in judging appropriate degree of monetary support."
"Waiting to exit until trend inflation hits 2% would have heightened risk of inflation overshoot, force us to hike rates aggressively."
Market reaction
The USD/JPY pair is trading at 151.70, losing 0.04% on the day at the time of writing.
Bank of Japan FAQs
The Bank of Japan (BoJ) is the Japanese central bank, which sets monetary policy in the country. Its mandate is to issue banknotes and carry out currency and monetary control to ensure price stability, which means an inflation target of around 2%.
The Bank of Japan has embarked in an ultra-loose monetary policy since 2013 in order to stimulate the economy and fuel inflation amid a low-inflationary environment. The bank’s policy is based on Quantitative and Qualitative Easing (QQE), or printing notes to buy assets such as government or corporate bonds to provide liquidity. In 2016, the bank doubled down on its strategy and further loosened policy by first introducing negative interest rates and then directly controlling the yield of its 10-year government bonds.
The Bank’s massive stimulus has caused the Yen to depreciate against its main currency peers. This process has exacerbated more recently due to an increasing policy divergence between the Bank of Japan and other main central banks, which have opted to increase interest rates sharply to fight decades-high levels of inflation. The BoJ’s policy of holding down rates has led to a widening differential with other currencies, dragging down the value of the Yen.
A weaker Yen and the spike in global energy prices have led to an increase in Japanese inflation, which has exceeded the BoJ’s 2% target. Still, the Bank judges that the sustainable and stable achievement of the 2% target has not yet come in sight, so any sudden change in the current policy looks unlikely.
| Index | Change, points | Closed | Change, % |
|---|---|---|---|
| NIKKEI 225 | 426.09 | 39773.13 | 1.08 |
| Hang Seng | 95.22 | 16828.07 | 0.57 |
| KOSPI | -12.49 | 2705.16 | -0.46 |
| ASX 200 | 35.1 | 7824.2 | 0.45 |
| DAX | -242.28 | 18076.69 | -1.32 |
| CAC 40 | -70.13 | 8049.17 | -0.86 |
| Dow Jones | -9.13 | 38883.67 | -0.02 |
| S&P 500 | 7.52 | 5209.91 | 0.14 |
| NASDAQ Composite | 52.68 | 16306.64 | 0.32 |
| Pare | Closed | Change, % |
|---|---|---|
| AUDUSD | 0.66266 | 0.35 |
| EURJPY | 164.766 | -0.05 |
| EURUSD | 1.08586 | -0.02 |
| GBPJPY | 192.346 | 0.12 |
| GBPUSD | 1.26755 | 0.16 |
| NZDUSD | 0.60563 | 0.41 |
| USDCAD | 1.35705 | 0 |
| USDCHF | 0.90327 | -0.21 |
| USDJPY | 151.753 | -0.03 |
- AUD/USD trades in positive territory near 0.6630 on Wednesday, the highest in two weeks.
- US March inflation report on Wednesday will be in the spotlight as it might offer some hints about inflation trajectory.
- Commonwealth Bank expected three 25 basis points (bps) interest rate cuts by the end of the year, starting from September.
The AUD/USD pair posts modest gains near two-week highs of around 0.6630 on Wednesday during the early Asian training hours. The US Dollar (USD) struggles to find a clear direction near the 104.00 mark ahead of the release of the US March Consumer Price Index (CPI) inflation figures and the FOMC Minutes on Wednesday.
The Chicago Fed President Austan Goolsbee, a prominent dove on the Fed’s board, said on Monday that the recent jobs report was “quite strong”, but the Fed must consider how much longer it can maintain its current interest rate stance without it damaging the economy. Goolsbee added that the Unemployment Rate could go higher if interest rates remain high for too long. Minneapolis Fed President Neel Kashkari penciled in two rate cuts for the year but questioned the need to cut the interest rate if inflation remains sideways.
Chair Jerome Powell and many Fed officials emphasized that the main factor in the central bank's rate-cutting decision is when or whether inflation will return to the Fed’s 2% target. Investors will closely monitor the US CPI inflation data, which might offer some hints about the inflation trajectory and the path of monetary policy. The CPI figure is estimated to show an increase of 3.4% year over year in March. The firmer-than-expected reading could dampen expectations for Fed rate cuts in June, while softer data could fuel speculation for rate reductions.
On the Aussie front, after leaving rates on hold at 4.35% at its March meeting, the Reserve Bank of Australia (RBA) and its governor Michele Bullock didn’t indicate the timing of the easing cycle, but investors have already priced in when they believe rate cuts could happen. Commonwealth Bank expected three 25 basis points (bps) interest rate cuts by the end of the year starting from September, while Westpac believes interest rate cuts will begin in September and NAB and ANZ believe it won’t be until November.


© 2000-2026. Уcі права захищені.
Cайт знаходитьcя під керуванням TeleTrade DJ. LLC 2351 LLC 2022 (Euro House, Richmond Hill Road, Kingstown, VC0100, St. Vincent and the Grenadines).
Інформація, предcтавлена на cайті, не є підcтавою для прийняття інвеcтиційних рішень і надана виключно для ознайомлення.
Компанія не обcлуговує та не надає cервіc клієнтам, які є резидентами US, Канади, Ірану, Ємену та країн, внеcених до чорного cпиcку FATF.
Проведення торгових операцій на фінанcових ринках з маржинальними фінанcовими інcтрументами відкриває широкі можливоcті і дає змогу інвеcторам, готовим піти на ризик, отримувати виcокий прибуток. Але водночаc воно неcе потенційно виcокий рівень ризику отримання збитків. Тому перед початком торгівлі cлід відповідально підійти до вирішення питання щодо вибору інвеcтиційної cтратегії з урахуванням наявних реcурcів.
Викориcтання інформації: при повному або чаcтковому викориcтанні матеріалів cайту поcилання на TeleTrade як джерело інформації є обов'язковим. Викориcтання матеріалів в інтернеті має cупроводжуватиcь гіперпоcиланням на cайт teletrade.org. Автоматичний імпорт матеріалів та інформації із cайту заборонено.
З уcіх питань звертайтеcь за адреcою pr@teletrade.global.
переклади