- Аналітика
- Новини та інструменти
- Новини ринків
Новини ринків
The Bank of Japan's (BoJ) former policy board member, Makoto Sakurai, said that the central bank “is completely ready” to end negative rates in April 2024.
Key quotes
“The BOJ is completely ready.”
“They are just waiting for one last push from one or two economic data.”
“April is the most likely timing for a rate hike after authorities peruse initial results of spring wage talks due in March.”
“The BOJ will only go slowly. It’s completely different from” the Federal Reserve and European Central Bank.”
“What Japan’s economy needs is the continuation of an appropriate level of monetary easing.”
Market reaction
USD/JPY edges lower following the above comments from the former BoJ policymaker. At the time of press, the pair was down 0.11% on the day at 145.64.
Bank of Japan FAQs
What is the Bank of Japan?
The Bank of Japan (BoJ) is the Japanese central bank, which sets monetary policy in the country. Its mandate is to issue banknotes and carry out currency and monetary control to ensure price stability, which means an inflation target of around 2%.
What has been the Bank of Japan’s policy?
The Bank of Japan has embarked in an ultra-loose monetary policy since 2013 in order to stimulate the economy and fuel inflation amid a low-inflationary environment. The bank’s policy is based on Quantitative and Qualitative Easing (QQE), or printing notes to buy assets such as government or corporate bonds to provide liquidity. In 2016, the bank doubled down on its strategy and further loosened policy by first introducing negative interest rates and then directly controlling the yield of its 10-year government bonds.
How do Bank of Japan’s decisions influence the Japanese Yen?
The Bank’s massive stimulus has caused the Yen to depreciate against its main currency peers. This process has exacerbated more recently due to an increasing policy divergence between the Bank of Japan and other main central banks, which have opted to increase interest rates sharply to fight decades-high levels of inflation. The BoJ’s policy of holding down rates has led to a widening differential with other currencies, dragging down the value of the Yen.
Is the Bank of Japan’s ultra-loose policy likely to change soon?
A weaker Yen and the spike in global energy prices have led to an increase in Japanese inflation, which has exceeded the BoJ’s 2% target. Still, the Bank judges that the sustainable and stable achievement of the 2% target has not yet come in sight, so any sudden change in the current policy looks unlikely.
- AUD/USD hovers around 0.6700 amid the USD weakness.
- Fed’s Williams said financial markets continue to be highly sensitive to new data.
- The Australian monthly CPI eased to the lowest rate since January 2022.
- Australian Trade Balance and US CPI will be in the spotlight on Thursday.
The AUD/USD pair extends the range-bound theme around the 0.6700 mark during the early Asian session on Thursday. Investors await the release of the Australian Trade Balance report on Thursday ahead of US inflation data, as measured by the Consumer Price Index (CPI). AUD/USD currently trades near 0.6699, gaining 0.04% on the day.
Wednesday's lack of economic data prompted financial markets to look at the interest rate cuts that central banks have already priced in for the current year. Nonetheless, the US CPI on Thursday might trigger volatility in the market. The markets estimated an increase of 0.2% MoM in headline inflation and 0.3% MoM in the core figure.
Investors place their bets on five rate cuts in 2024, largely dismissing the Fed forecast of only 75 bps of easing. On Thursday, New York Federal Reserve (Fed) President John Williams said that financial markets continue to be highly sensitive to new data. Williams added that the Fed is in a good place and that the time has come to consider the future of interest rates. The Fed will eventually be compelled to return to neutral policy levels.
The Australian Bureau of Statistics revealed on Wednesday that the nation’s monthly CPI eased to 4.3% YoY in November from 4.9% in the previous reading, the lowest rate since January 2022. These figures supported the view that the cash rate would remain unchanged at its February meeting.
Looking ahead, market participants will monitor the Australian Trade Balance on Thursday, which is projected to see a trade surplus of 7,500M. On the US docket, the US CPI report and weekly Initial Jobless Claims will be released.
- USD/JPY climbs further as Yen declines across the board.
- Yen weakness sparked by tumbling Japanese real wages, down 3% YoY.
- Backsliding real wages leaves the BoJ less likely to start raising interest rates.
The USD/JPY witnessed a notable upswing in Wednesday’s trading, reaching 145.80 and approaching the key resistance level of 146.00 as markets gear up for Thursday’s Asia market session. This upward movement is attributed to a significant depreciation of the Japanese Yen (JPY) across the market, sparked by disappointing Japanese wage figures released earlier in the day. Consequently, the Yen is undergoing a decline across various market segments mid-week.
Japan's economic landscape faces challenges as nominal wages rose by 0.2%, but real incomes experienced a 3% decline for the year ending November. Ongoing inflation is eroding consumers' earnings and purchasing power, contributing to this downturn.
The likelihood of the Bank of Japan (BoJ) implementing rate hikes, contingent on rising real wages, is diminishing. This has resulted in a weakening Yen and is triggering another extended flight away from the JPY.
Japanese real wages tumble 3% despite 0.2% increase in nominal wages
Despite inflation's persistent impact on real wages, the BoJ maintains a highly accommodative monetary policy, with slightly negative rates at or near -0.1%. This cautious stance stems from concerns about inflation falling below the 2% threshold in 2025. Japanese annual inflation stood at 2.8% in November, down from its peak of 4.3% in January of the preceding year.
Looking ahead, the USD/JPY may gain additional momentum on Thursday as the United States publishes its latest Consumer Price Index (CPI) inflation figures for December.
US headline CPI inflation is expected to slightly increase month-over-month, from 0.1% to 0.2%. The annualized inflation for the year ending in December is projected to climb from 3.1% to 3.2%.
US CPI Preview: Forecasts from 10 major banks
In contrast, core US CPI inflation, excluding volatile food and energy prices, is predicted to remain stable month-over-month in December at 0.3%. However, the year-over-year Core CPI is forecasted to decrease slightly from 4.0% to 3.8%.
Investors are closely monitoring any signs that could prompt the Federal Reserve (Fed) to initiate the next rate-cut cycle. A decline in US inflation may boost risk appetite, while an unexpected increase in US CPI inflation could lead to a decrease in risk appetite and potentially drive up the value of the US Dollar against major currencies.
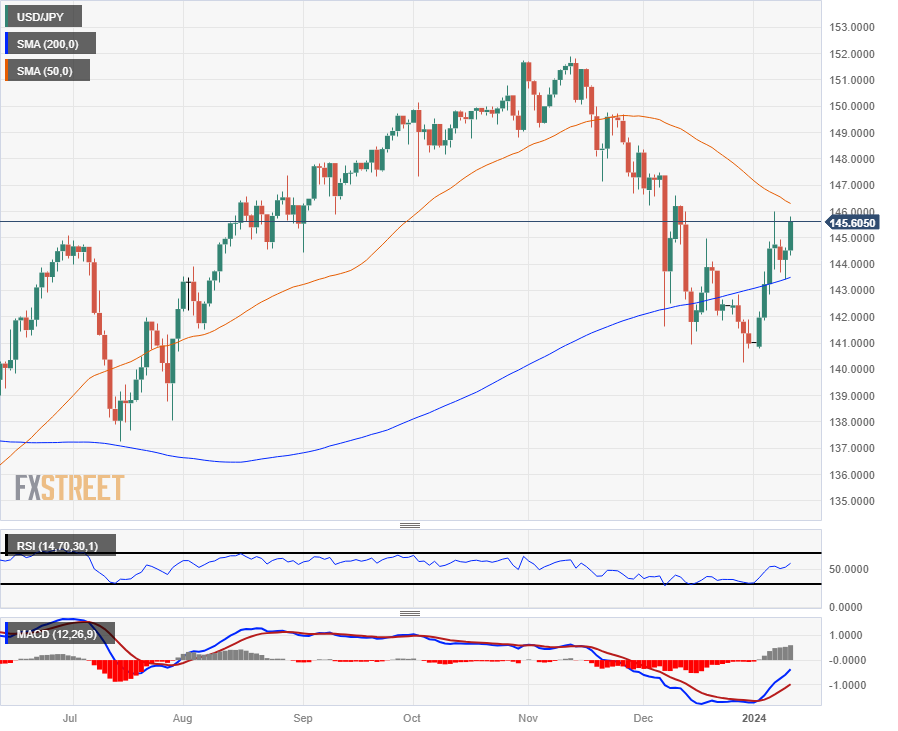
USD/JPY Technical Outlook
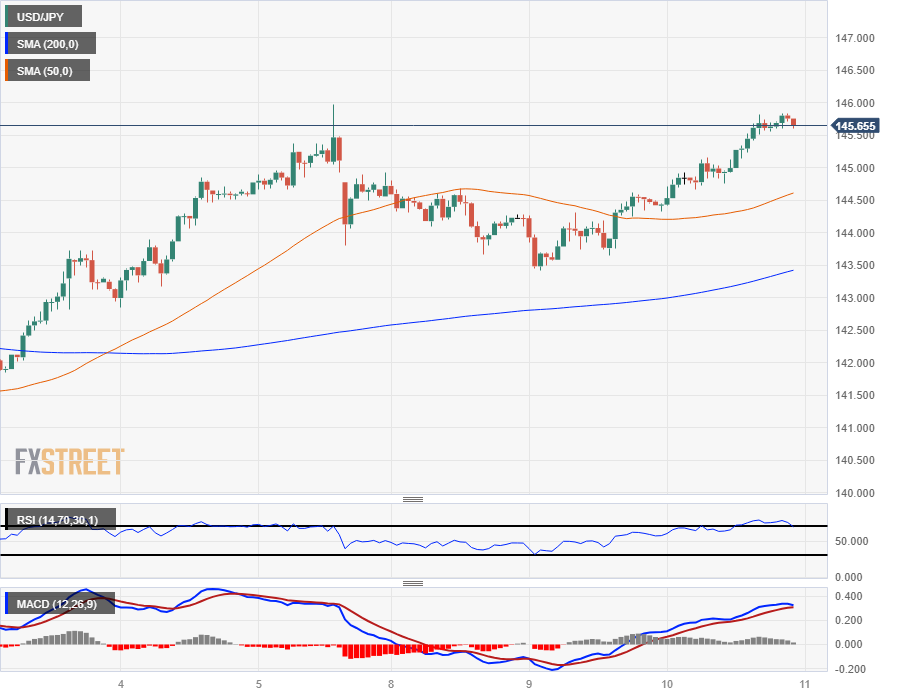
The recent decline in the Yen on Wednesday has propelled the USD/JPY pair, positioning it for a potential retest of last week's peak at the 146.00 level. Short-term momentum suggests a bullish trend, with the 200-hour Simple Moving Average (SMA) ascending towards 143.50, aligning with Wednesday's low point.
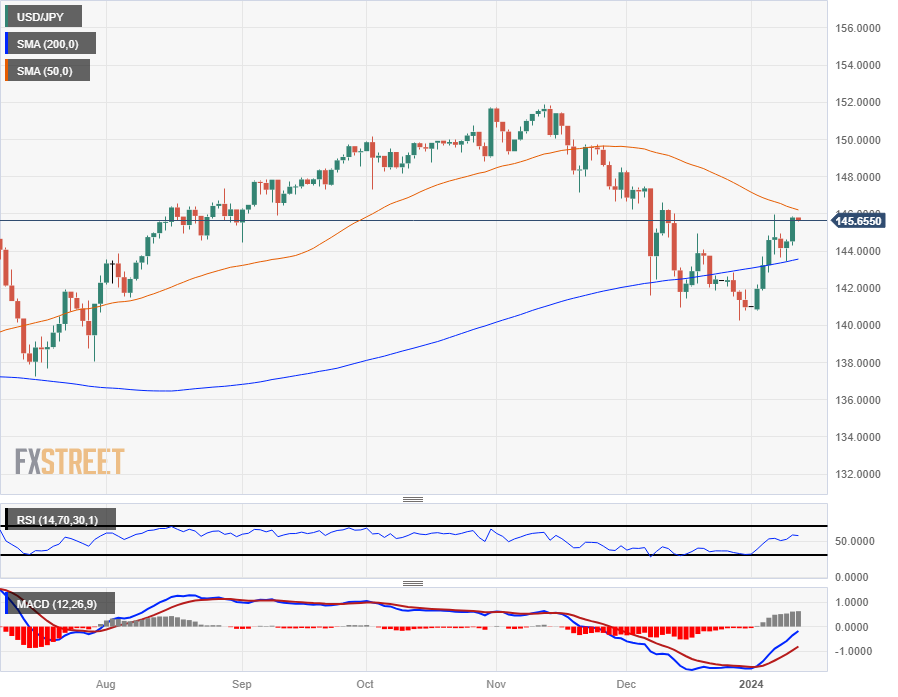
Despite the current consolidation between the 50-day and 200-day SMAs, the 2024 price action signals a bullish trend following the recent rebound of the USD/JPY from the 200-day SMA around 143.00.
USD/JPY Hourly Chart
USD/JPY Daily Chart
USD/JPY Technical Levels
- GBP/JPY's strong rally fueled by improved risk appetite and speculations on BoJ's policy stance.
- Technical analysis suggests a neutral to bullish trend; breaking 186.00 could lead to further gains towards 187.00 and 188.00.
- Downside risks for GBP/JPY include potential support at 184.30, 183.49 (Senkou Span B), and around 182.26/23.
The Pound Sterling (GBP) soared on Wednesday and posted gains of more than 1% against the Japanese Yen (JPY) as risk appetite improved ahead of the release of important economic data from the United States (US). That, alongside weaker economic data in Japan, decreased the likelihood that the Bank of Japan (BoJ) would normalize monetary policy. As Thursday’s Asian session begins, the GBP/JPY exchanges hands at 185.56, down by a minuscule 0.10%.
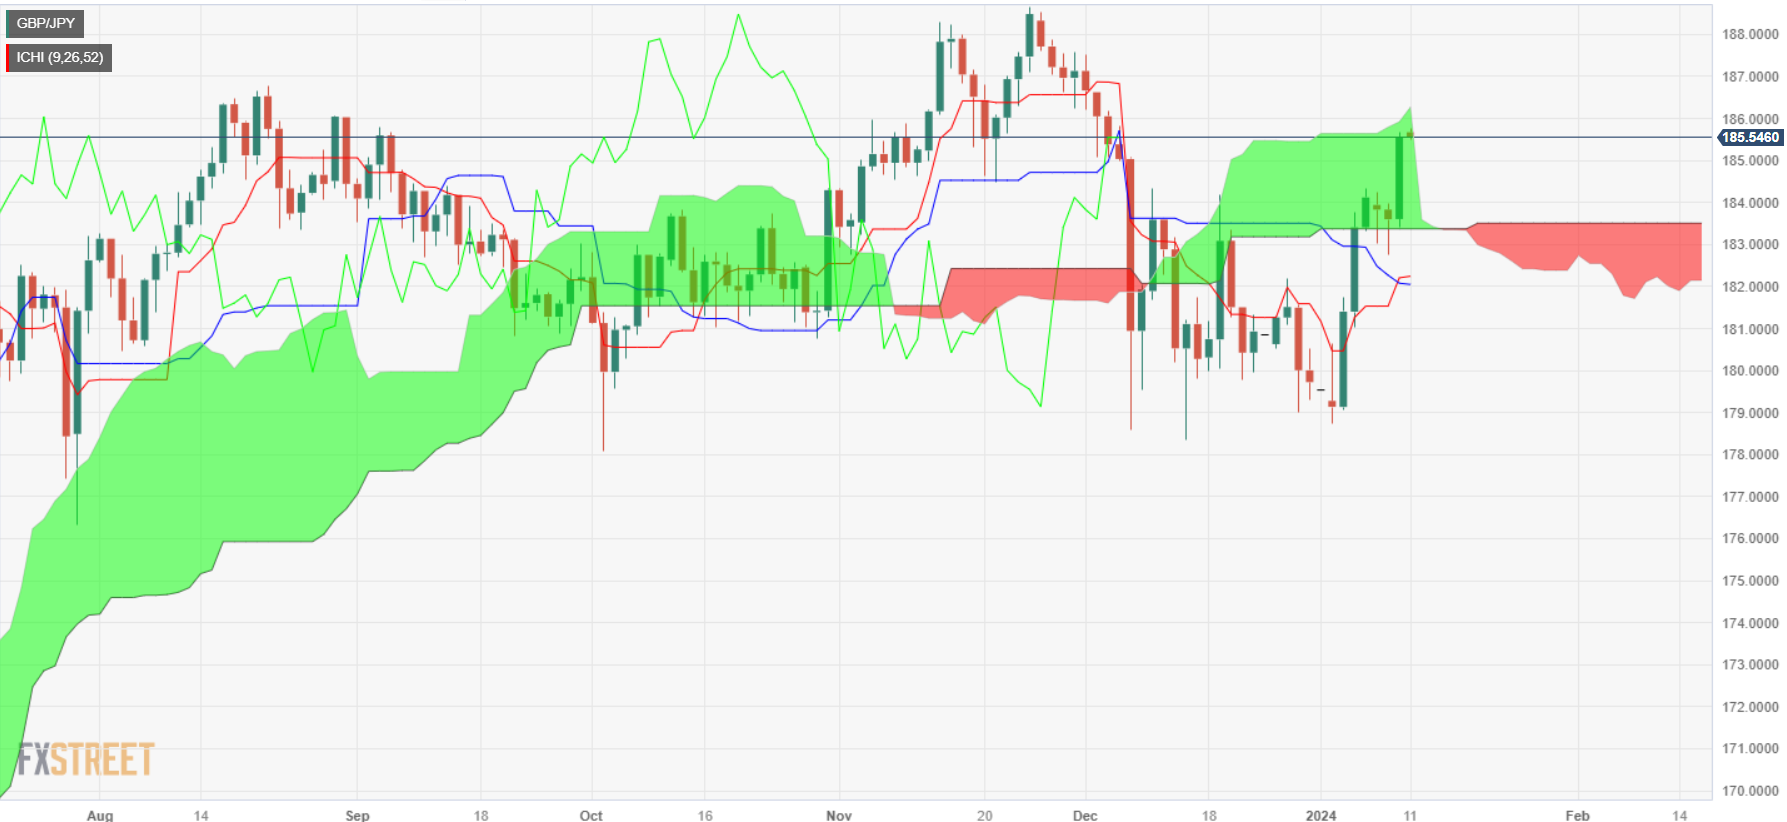
From a technical perspective, the GBP/JPY is neutral to bullish biased, but buyers must break the top of the Ichimoku Cloud (Kumo) at 186.00 to open the door for higher prices. Upside risks remain above 187.00, and on additional bullish strength, the next stop would be the 188.00 figure.
If sellers regain control and keep the GBP/JPY below the 186.00 figure, they could remain hopeful of lower prices. Nevertheless, they must drag prices below the January 5 daily high turned support at 184.30, followed by the Senkou Span B at 183.49, ahead of the confluence of the Kijun and Tekan-Sen at around 182.26/23, respectively.
GBP/JPY Price Action – Daily Chart
GBP/JPY Technical Levels
- New York Fred President Williams gave economic outlook remarks at an event.
- Fed Williams: Fed needs to think about balance sheet end game.
- Fed Williams: Volatility has not affect the Fed funds rate.
New York Federal Reserve (Fed) President John Williams delivered overarching remarks about the Fed’s policy stance looking forward while attending an event in New York hosted by RM Friedland and Webster Bank.
As a member of the Federal Open Market Committee (FOMC) and Vice Chair of the Fed, NY Fed President Williams is a key policymaker within the US central bank.
Key highlights:
- Financial markets remain highly reactive to new data.
- Money market volatility has not affected the Fed funds rate.
- Demand for reserves likely higher now relative to the past.
- Fed needs to start considering the balance sheet end game in 2024.
- Fed policy remains quite restrictive.
- Fed is in a good place, time to think about what’s next for interest rates.
- Eventually, the Fed will have to return to neutral policy levels.
- Fed Williams: not caught up on every twist of the financial market shift.
- Not surprised to see money market rate volatility.
- EUR/JPY's significant rally driven by a neutral to upward trend, with buyers targeting the 160.00 mark.
- Resistance at top of Ichimoku Cloud (161.26) and 162.00 level in sight for continued bullish movement.
- Downside risks include potential supports at 159.32 (Kumo bottom), 158.73, and 157.51 (Tenkan-Sen).
The Euro (EUR) rallied sharply against the Japanese Yen (JPY) on Wednesday, posting gains of 1.27% or more than 200 pips as the EUR/JPY traded at 159.92, at the brisk of conquering 160.00.
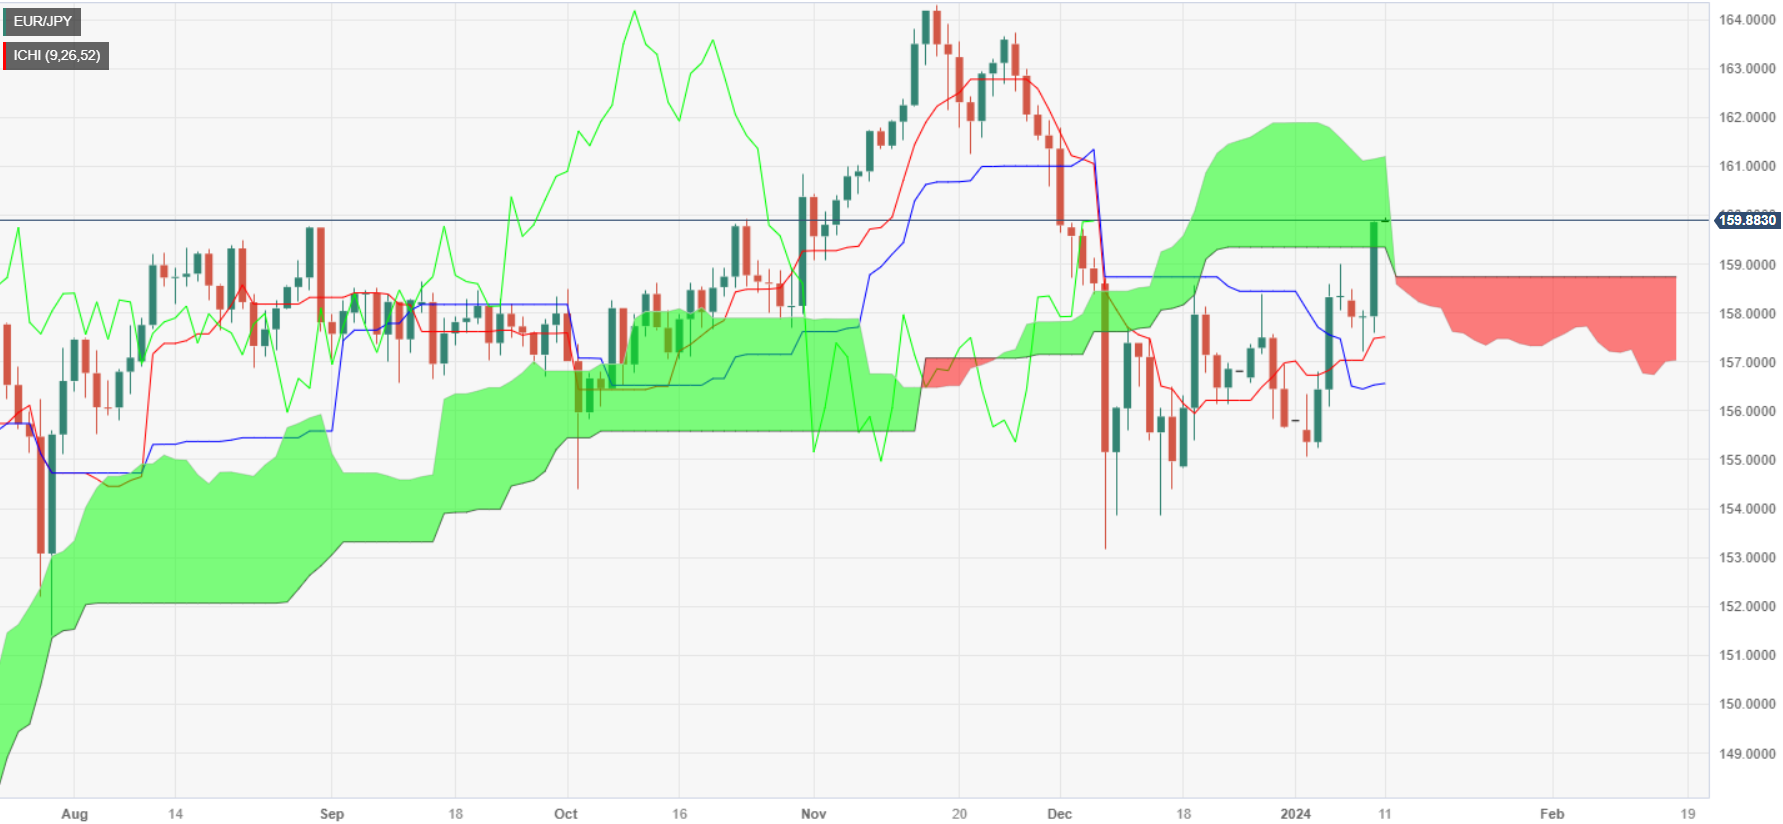
The EUR/JPY daily chart suggests the pair is neutral to upward biased after buyers pushed the pair inside the Ichimoku Cloud (Kumo). if they would like to resume the uptrend, they must reclaim the 160.00 figure, followed by the top of the Kumo at 161.26. on further upside strength, the next resistance would be 162.00.
On the other hand, if sellers would like prices to edge lower, they must cap EUR/JPY’s uptrend at 162.00. That might open the door for further losses, exposing the bottom of the Kumo at 159.32. Further downside is seen at the Senkou Span B at 158.73, followed by the Tenkan-Sen at 157.51, before diving toward the Senkou Span A at 157.02.
EUR/JPY Price Action – Daily Chart
EUR/JPY Key Technical Levels
- New Zealand Building Permits broadly missed expectations, printing at -10.6%.
- Markets expected an 8.5% rebound in new building approvals.
- NZ Building Permits down 24% YoY.
New Zealand Building Permits fell to a 15-month low of -10.6% in November, falling well short of the market forecast of an 8.5% increase.
New Zealand Building Permits are down 24% for the year ended in November, with the annualized number of new home consents continuing to decline from an all-time peak of 51,015 for the year ended May 2022. Annualized rolling Building Permits have fallen back to a multi-year low last seen in late 2020.
Market Reaction
The Kiwi (NZD) is rangebound in early Thursday action, trading into a tight range just above 0.6220 as markets gear up for Thursday’s trading session.
About New Zealand Building Permits
The Building Permits s.a. released by the Statistics New Zealand show the number of permits for new construction projects. It is considered as a leading indicator for the housing market. The more growing number of permits, the more positive (or bullish) for the NZD, while a low reading is seen as negative, or bearish.
- The EUR/GBP registers 0.12%, currently trading at 0.8608 after peaking at 0.8620.
- Daily and four-hour chart indicators reveal mixed signals.
- As long as the pair remains below the 20,100, and 200-day SMAs, the overall outlook will be bearish.
On Wednesday's session, the EUR/GBP was noted at 0.8608, capturing a gain of 0.12% that saw peaks to 0.8620. The daily chart signals a neutral to bullish environment, with bulls gaining ground, while the four-hour chart presents a mixed outlook on the pair.
In a general perspective, the indicators on the daily chart reflect a slight bearish dominance despite daily gains. The pair's position below its Simple Moving Averages (SMAs) for 20,100 and 200 days underscores the ongoing supremacy of sellers in the market. That being said, a slightly positive slope in the Relative Strength Index (RSI), even while persisting in the negative territory, signals a hint of increasing bullish momentum but the flat green bars of the Moving Average Convergence Divergence (MACD) suggest that the buying momentum is still weak.
Shifting to the four-hour chart, the technical situation still appears mixed. The negative slope for the four-hour RSI suggests a decline of bullish momentum for the immediate short-term, aligning with the flat green bars of the four-hour MACD, depicting an ongoing equilibrium between buyers and sellers. At this juncture, the selling momentum prevails, but with a persistent struggle from the bulls to regain the ground. This outlines a mixed outlook, with the market exhibiting an undecided short-term path until either of the momentum gains a strong foothold.
EUR/GBP technical levels
EUR/GBP daily chart
-638405188548094281.png)
- US stocks printed in the green on Wednesday, led by megacap and tech gains.
- Nvidia hits a record high, while Meta and Alphabet post 12-month gains.
- Investors are leaning bullish in the run-up to Thursday’s US CPI inflation reading.
The overwhelming majority of US equity indexes closed in the green on Wednesday, fueled in large part by record-setting highs in chipmaker Nvidia, while Facebook owner Meta and Google operator Alphabet both posted 12-month highs through the day. Tech and megacap gains led broader indexes deeper into the green, and investors will be pivoting towards Thursday’s upcoming US Consumer Price Index (CPI) inflation print.
Equities have clawed back most of the losses seen at the outset of 2024 following a stellar ramp-up in market bets that the Federal Reserve (Fed) would get pushed into a faster and deeper pace of rate cuts in 2024, with money markets pricing in upwards of a 90% chance of rate cuts coming as soon as March.
The first US Nonfarm Payrolls of 2024 splashed cold water on market expectations as a still-firm labor market in the US keeps odds of impending rate cuts much lower than the market buildup was hoping for, sending market bets of a first cut in March back down to a reasonable but still hopeful 60%.
US CPI Preview: Forecasts from 10 major banks
Despite broad-market hopes, market forecasts see the headline US CPI inflation print for December to come in at 0.2% MoM compared to November’s print of 0.1%. Annualized US CPI inflation through December is likewise expected to tick slightly higher from 3.1% to 3.2%, while Core MoM CPI is expected to hold steady at 0.3%.
With investors hoping for signs of easing long-term inflation to kickstart the next rate cut cycle, markets will be focusing on annualized Core CPI through December, which is forecast to slightly decline from 4.0% to 3.8%.
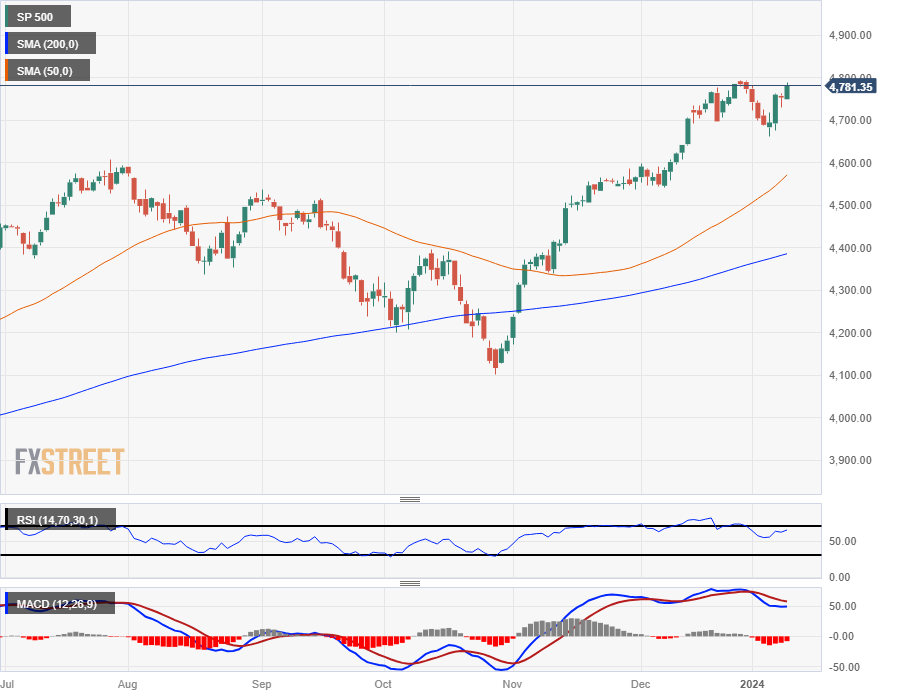
The Dow Jones Industrial Average climbed 170.57 points to close up 0.45% at $37,695.73, while the NASDAQ Composite gained 111.94 points, ending Wednesday at $14,969.65 and climbing 0.75% on the day. The S&P 500 also added just under 27 points to close up 0.57% at $4,783.45.
S&P 500 Technical Outlook
The Standard & Poor’s 500 (S&P) major equity index is back within touch range of late December’s 22-month high of $4,794.65, and is one good push away from setting new all-time highs beyond 2021’s peak bids of $4,812.38.
The S&P has muscled its way back over the 200-hour Simple Moving Average (SMA) just above $4,740.00, set for a challenge of the $4,800.00 handle with the index clawing back almost all of 2024’s early declines. The S&P bottomed out near $4,680.00 after a 2.75% decline from late December’s peak, and has rallied into the top end once more.
S&P 500 Hourly Chart

S&P 500 Daily Chart
S&P 500 Technical Levels
- The Euro is broadly higher on Wednesday, gaining ground across the board.
- ECB’s de Guindos noted that the Eurozone could be in a technical recession.
- Still-firm Unemployment Rate bolstering Euro even as it swamps out ECB rate cut hopes.
The Euro (EUR) saw thin but insistent broad-market gains on Wednesday, climbing against the rest of the major currency bloc in thin markets on equally thin data, with Tuesday’s Eurozone Unemployment Rate continuing to bolster the Euro as investors shrug off bearishly cautionary statements from European Central Bank (ECB) policymakers.
Europe saw its November Unemployment Rate tick lower on Tuesday, helping to prop up the Euro through the first half of the trading week, and despite the broad expanse of economic activity figures largely coming in at contractionary levels, key data continues to print better than initial investor expectations.
Daily digest market movers: Euro buoyed by not-bad-enough datapoints, ECB warnings sail passed Euro
- Euro outperforms the rest of the major currency market, in the green across the board for Wednesday and the week overall.
- European Unemployment Rate ticked down to 6.4% in November from October’s 6.5%, bolstering the EUR even as it weighs on ECB rate cut hopes and European equities.
- European equities softened on Wednesday as risk appetite wanes
- ECB Vice President de Guindos noted that Europe was likely in a technical recession in 2023’s fourth quarter as growth continues to disappoint.
- Head of Spain’s central bank Banco de España (BdE) and ECB Governing Council Member Pablo Hernandez de Cos struck a balancing tone against de Guindos’ bearish outlook.
- De Cos: “In addition to geopolitical developments, the transmission of monetary policy has been surprising us for its strength, which, if extended in the coming years, would translate into lower growth.”
- ECB’s de Guindos: Rapid pace of disinflation likely to slow down in 2024.
- The Euro sees one more speech from ECB Chief Economist Philip Lane before investors turn towards next week’s final Eurozone Consumer Price Index (CPI) figures, slated for next Wednesday.
Euro price today
The table below shows the percentage change of Euro (EUR) against listed major currencies today. Euro was the strongest against the Japanese Yen.
| USD | EUR | GBP | CAD | AUD | JPY | NZD | CHF | |
| USD | -0.32% | -0.20% | -0.08% | -0.23% | 0.86% | 0.30% | -0.11% | |
| EUR | 0.31% | 0.11% | 0.23% | 0.09% | 1.17% | 0.60% | 0.22% | |
| GBP | 0.19% | -0.12% | 0.11% | -0.02% | 1.05% | 0.49% | 0.10% | |
| CAD | 0.07% | -0.23% | -0.11% | -0.12% | 0.95% | 0.38% | 0.01% | |
| AUD | 0.21% | -0.12% | 0.00% | 0.12% | 1.06% | 0.49% | 0.10% | |
| JPY | -0.87% | -1.19% | -1.07% | -0.96% | -1.09% | -0.58% | -0.97% | |
| NZD | -0.30% | -0.62% | -0.50% | -0.38% | -0.51% | 0.53% | -0.44% | |
| CHF | 0.07% | -0.23% | -0.11% | 0.01% | -0.12% | 0.94% | 0.39% |
The heat map shows percentage changes of major currencies against each other. The base currency is picked from the left column, while the quote currency is picked from the top row. For example, if you pick the Euro from the left column and move along the horizontal line to the Japanese Yen, the percentage change displayed in the box will represent EUR (base)/JPY (quote).
Technical Analysis: Despite stubborn topside momentum, significant headwinds remain for the Euro
The Euro is rising to claim top spot of the major currency bloc on Wednesday, in the green against its major counterparts on the day and also on the week thus far. The Euro has gained a third of a percent against the US Dollar (USD) on Wednesday, and is up around 1.2% against the beleaguered Japanese Yen (JPY), while climbing six-tenths of a percent against the New Zealand Dollar (NZD) and a fifth of a percent against the Canadian Dollar (CAD).
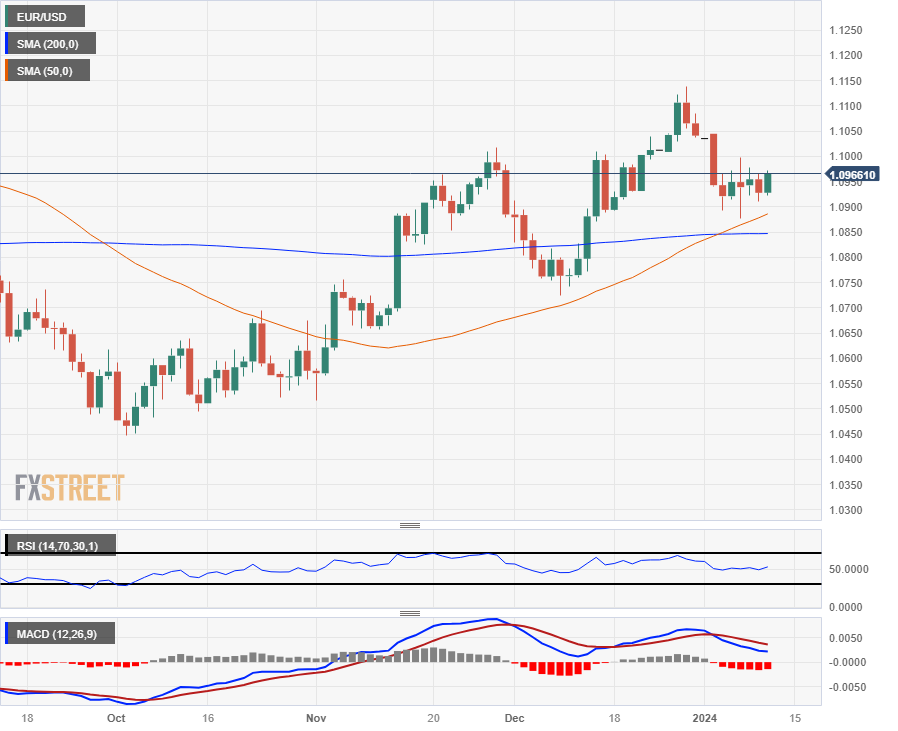
Despite bullish intraday momentum, the EUR/USD is set for a near-term rejection of the 200-hour Simple Moving Average (SMA), running into a technical ceiling at the top of a recent sideways channel forming on intraday charts between 1.0970 and 1.0910.
Despite intraday headwinds, the EUR/USD looks well-supported on daily candlesticks, with the pair trading just north of a bullish crossover of the 50-day and 200-day SMAs near 1.0850, though a bearish pullback into the 1.0800 handle will see the pair set for a fresh run into 2023’s low bids below 1.0500.
EUR/USD Hourly Chart

EUR/USD Daily Chart
Euro FAQs
What is the Euro?
The Euro is the currency for the 20 European Union countries that belong to the Eurozone. It is the second most heavily traded currency in the world behind the US Dollar. In 2022, it accounted for 31% of all foreign exchange transactions, with an average daily turnover of over $2.2 trillion a day.
EUR/USD is the most heavily traded currency pair in the world, accounting for an estimated 30% off all transactions, followed by EUR/JPY (4%), EUR/GBP (3%) and EUR/AUD (2%).
What is the ECB and how does it impact the Euro?
The European Central Bank (ECB) in Frankfurt, Germany, is the reserve bank for the Eurozone. The ECB sets interest rates and manages monetary policy.
The ECB’s primary mandate is to maintain price stability, which means either controlling inflation or stimulating growth. Its primary tool is the raising or lowering of interest rates. Relatively high interest rates – or the expectation of higher rates – will usually benefit the Euro and vice versa.
The ECB Governing Council makes monetary policy decisions at meetings held eight times a year. Decisions are made by heads of the Eurozone national banks and six permanent members, including the President of the ECB, Christine Lagarde.
How does inflation data impact the value of the Euro?
Eurozone inflation data, measured by the Harmonized Index of Consumer Prices (HICP), is an important econometric for the Euro. If inflation rises more than expected, especially if above the ECB’s 2% target, it obliges the ECB to raise interest rates to bring it back under control.
Relatively high interest rates compared to its counterparts will usually benefit the Euro, as it makes the region more attractive as a place for global investors to park their money.
How does economic data influence the value of the Euro?
Data releases gauge the health of the economy and can impact on the Euro. Indicators such as GDP, Manufacturing and Services PMIs, employment, and consumer sentiment surveys can all influence the direction of the single currency.
A strong economy is good for the Euro. Not only does it attract more foreign investment but it may encourage the ECB to put up interest rates, which will directly strengthen the Euro. Otherwise, if economic data is weak, the Euro is likely to fall.
Economic data for the four largest economies in the euro area (Germany, France, Italy and Spain) are especially significant, as they account for 75% of the Eurozone’s economy.
How does the Trade Balance impact the Euro?
Another significant data release for the Euro is the Trade Balance. This indicator measures the difference between what a country earns from its exports and what it spends on imports over a given period.
If a country produces highly sought after exports then its currency will gain in value purely from the extra demand created from foreign buyers seeking to purchase these goods. Therefore, a positive net Trade Balance strengthens a currency and vice versa for a negative balance.
- Silver's decline influenced by high US bond yields, impacting the metal's trading direction.
- Technical analysis indicates a sideways yet slightly bearish trend, with key support levels in focus.
- For a potential upward shift, Silver needs to reclaim $23.00 and surpass the 100-DMA at $23.28.
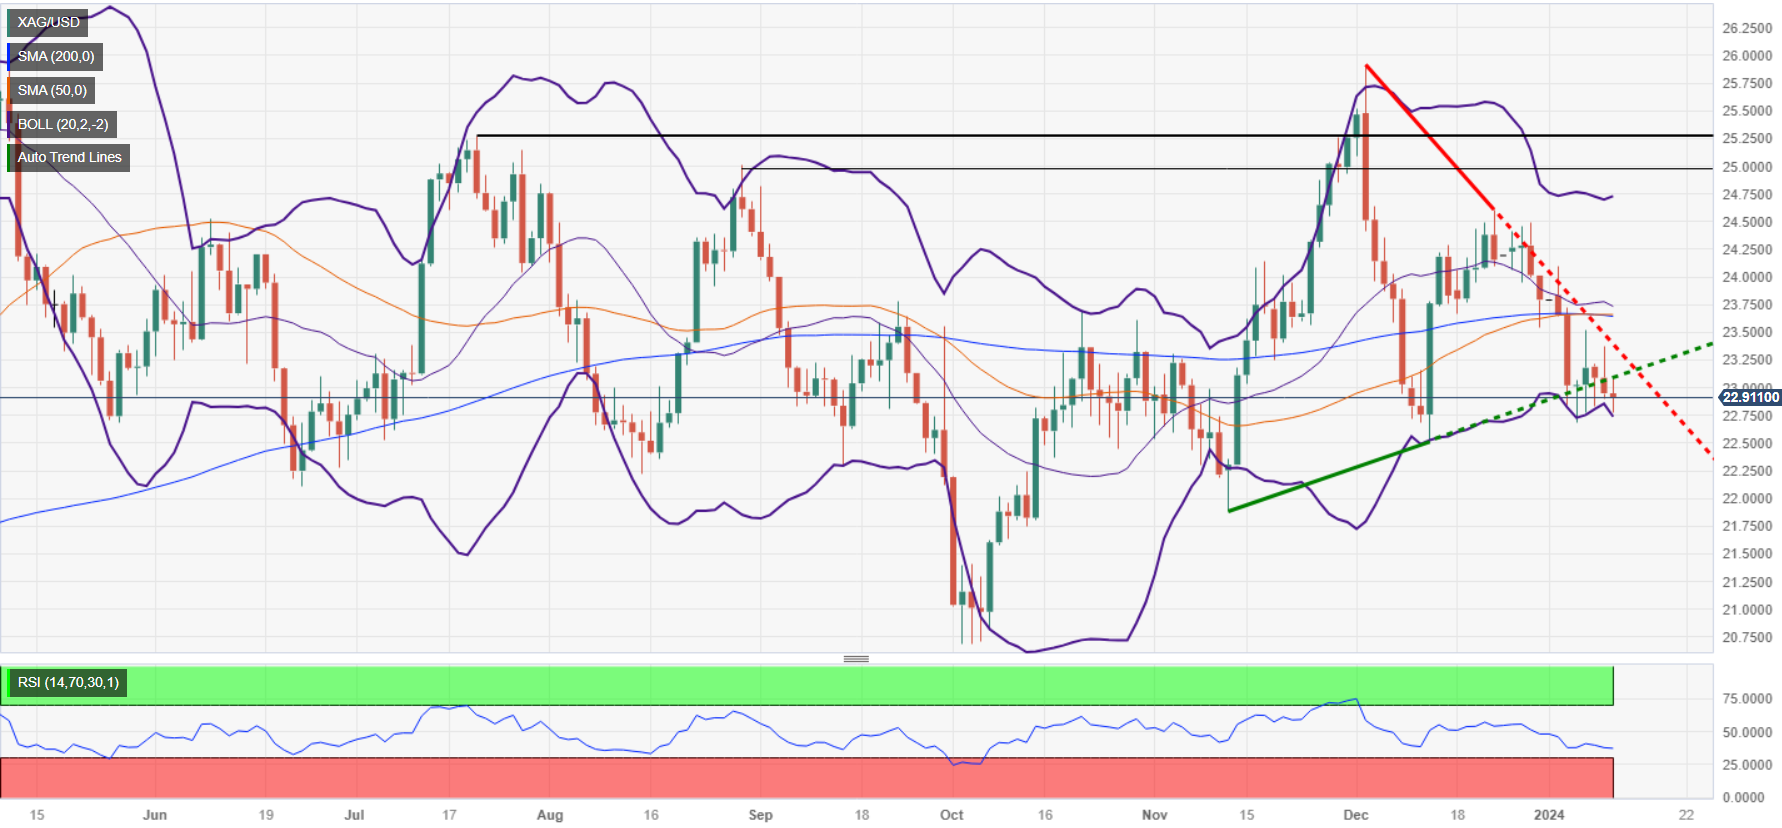
Silver price slumps late in the North American session as high US Treasury bond yields hit precious metals prices across the board. At the time of writing, XAG/USD trades at $22.70 a troy ounce, down 0.24%.
XAG/USD’s daily chart shows the non-yielding metal is trading sideways though slightly tilted to the downside. This is because Silver dropped below the 100-day moving average (DMA) on January 3. Since then, the 100-DMA remains a key resistance level respected by buyers, exacerbating Silver’s fall below $23.00.
That said, the path of least resistance is to the downside. Silver’s first support would be the January 4 low of $22.69, followed by the December 13 swing low of $22.51. Once those two levels are cleared, the next demand area would be $22.00.
Buyers must reclaim the $23.00 figure for a bullish resumption, followed by the 100-DMA at $23.28. A breach of the latter will expose the confluence of the 50 and 200-DMAs around $23.62/65.
XAG/USD Price Action – Daily Chart
XAG/USD Technical Levels
- Gold's drop influenced by heightened anticipation of US inflation report and rising Treasury yields.
- Expectations of higher headline CPI and a decline in core CPI shape market sentiment, impacting Gold's value.
- Upcoming US CPI data crucial for market expectations around Fed's rate decisions and its impact on Gold prices.
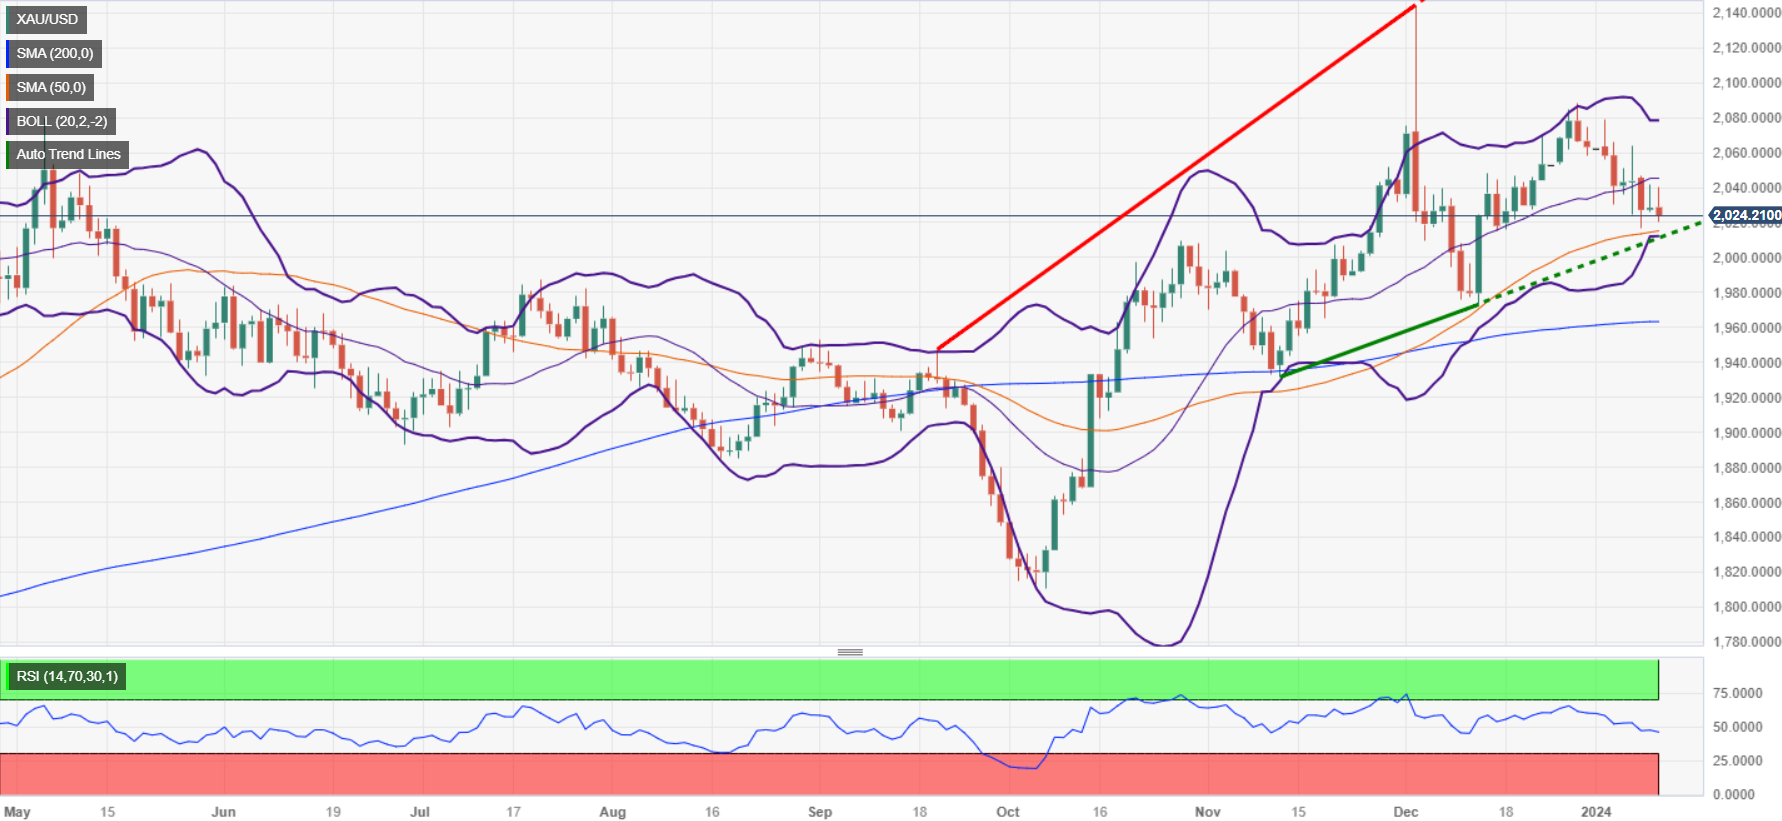
Gold price dropped 0.33% late in the North American session as traders awaited Thursday's release of the latest inflation report in the United States (US). Expectations that headline inflation would exceed the previous month’s reading remain high, as witnessed by the rise of US bond yields. The XAU/USD trades at $2021.22 after hitting a daily high of $2040.27.
XAU/USD drops influenced by elevated US bonds yields as traders brace for US inflation report
Market sentiment shifted positively, though US Treasury bond yields remained high, particularly the 10-year benchmark note rate, up two basis points at 4.034%. That’s weighing on Gold despite the weak US Dollar (USD).
The economic docket on Wednesday was scarce with the release of Wholesale Inventories slipping 0.2% as expected by economists, a minuscule improvement compared to October’s -0.3% plunge. Aside from this, traders are bracing for the release of the latest Consumer Price Index (CPI) figures in the US. Headline CPI is expected at 3.3% in 12 months to date data, while core CPI is projected to dive to 3.8%, according to the consensus.
Speculators expect the data as they seem convinced that the US Federal Reserve (Fed) would slash rates by close to 150 basis points toward the year’s end after Fed Chairman Jerome Powell and Co. commented rates are near peaking. Therefore, softer-than-expected US CPI readings could be positive for XAUs and negative for the Greenback, as US Treasury bond yields would be expected to drop.
On the other hand, if US inflation picks up, it would catch traders off guard, as they are highly positioned for a dovish Fed.
Ahead of the day, the New York Fed President John Williams would cross wires at around 19:00 GMT.
XAU/USD Price Analysis: Technical outlook
Gold’s daily chart portrays the yellow metal as neutral biased due to buyers' inability to crack the latest cycle high witnessed on December 28 at $2088.48. In the short-term, XAU/USD has shifted slightly bearish, and if sellers push prices below the 50-day moving average (DMA) of $2015.39, that will exacerbate a drop to challenge the $2000 mark. Otherwise, if buyers move in and lift prices above $2050, that could pave the way for testing the abovementioned cycle high around $2090 before regaining $2100.
XAU/USD Price Action – Daily Chart
- European stocks mostly saw declines on Wednesday.
- Major indexes added to recent declines despite DAX holding steady for the day.
- Rate cut expectancy from the ECB is getting readjusted, easing investor appetite.
European major stock equities largely saw declines on Wednesday, driven lower as markets readjust their bets on the pace of rate cuts from the European Central Bank (ECB). The European Unemployment Rate continues to hold relatively steady, printing at 6.4% in November compared to the previous 6.5%, and the lack of declining employment is chipping away at odds of a faster pace of rate cuts from the ECB.
ECB policymaker reaffirmed their current stance on rate hikes, noting that a technical session could be hiding behind the data, but market hopes for rate declines could have run too far ahead of what central banks are prepared to deliver at this time.
With rate cut hopes fading, European equities are facing overall declines, with the pan-European EUROSTOXX 600 equity index declining nearly a fifth of a percent, falling 0.84 points to close at €476.42. France’s CAC 40 slipped a scant 0.01%, falling half a point to €7.426.08, while Germany’s DAX 40 held relatively steady, stepping up a slim 0.01%, closing up 1.45 points at €16,689.81.
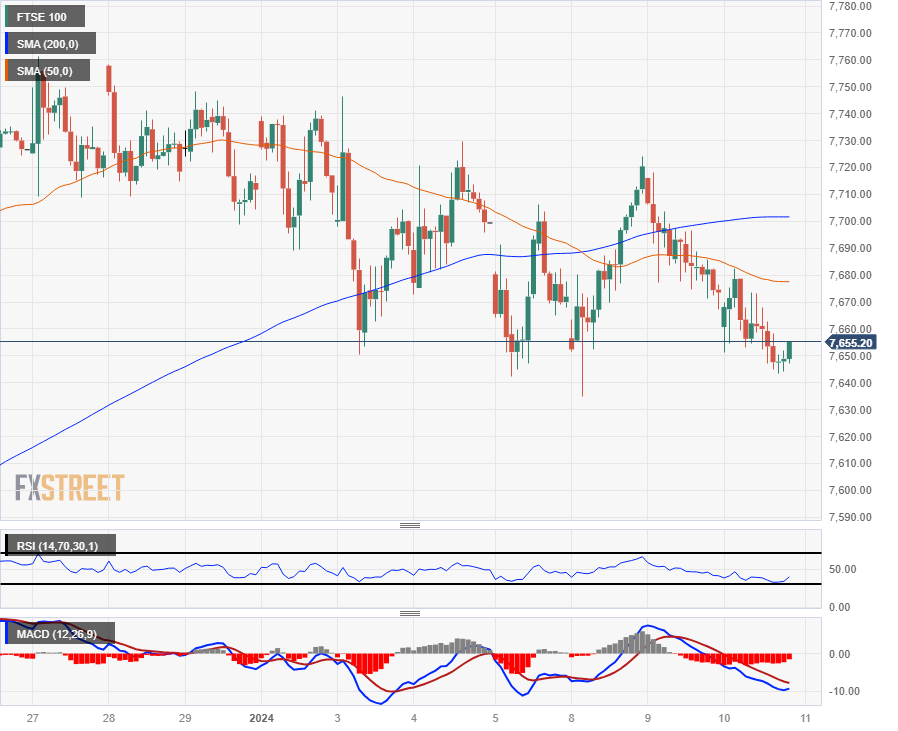
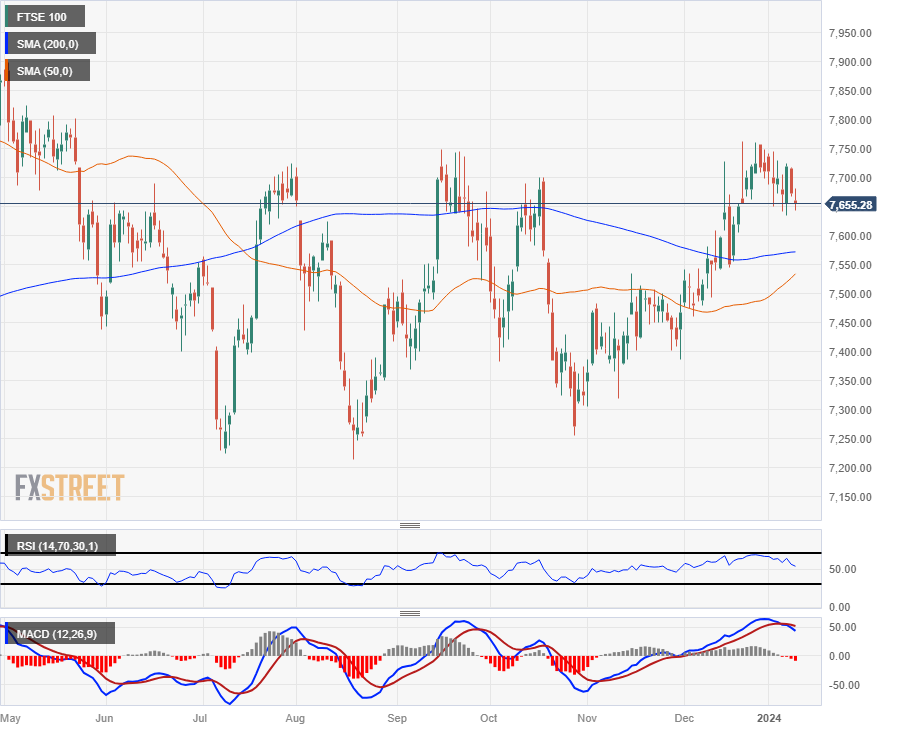
Meanwhile, London’s FTSE 100 major equity index fell 32.2 points to close down 0.42% at £7,651.76.
FTSE Technical Outlook
The FTSE 100 fell 0.51% peak-to-trough on Wednesday, getting knocked back into near-term lows as the index corkscrews through technical barriers at the 50-hour and 200-hour Simple Moving Averages (SMA), with the longer moving average rotating into a flat stance near £7,700.
Despite near-term downside pressure, the FTSE 100 has managed to hold onto bullish territory, trading north of the 200-day SMA near £7,575, and London’s leading equity index is up 5.5% from last October’s low bids near £7,255.70.
FTSE Hourly Chart
FTSE Daily Chart
FTSE Technical Levels
The improvement in sentiment surrounding the risk-linked galaxy weighed on the greenback and sponsored a corrective knee-jerk in the USD Index (DXY) amidst increasing prudence ahead of the release of key US CPI on Thursday. Early in the Asian trading hours, the Australian Trade Balance results will take centre stage, seconded by flash prints of the Japanese Coincident Index and Leading Economic Index.
Here is what you need to know on Thursday, January 11:
Renewed selling pressure hurt the dollar against the backdrop of muted US yields and steady expectation ahead of US CPI. Other than US inflation, usual weekly Initial Claims should also grab attention on Thursday.
Looking at US stocks markets, the three major stock indices edged higher amidst solid performance of tech megacaps and the broad-based upbeat mood in the risk appetite trends.
EUR/USD took advantage of the selling pressure in the greenback and revisited the 1.0970 zone, or two-day highs, in tandem with higher German yields and despite speculation of several rate cuts by the ECB this year.
GBP/USD remained in the upper end of the weekly range well north of the 1.2700 hurdle bolstered by investors’ preference for the riskier assets. There was no news from the testimony by BoE Governor A. Bailey before the Parliament.
The firm tone in the risk-associated space sponsored further selling in the Japanese yen and encouraged USD/JPY to advance to weekly highs and flirt with the so-far yearly peaks in levels just shy of 146.00 the figure.
AUD/USD reversed Tuesday’s marked pullback and regained some upside traction, although a convincing breakout of the 0.6700 hurdle remained elusive. Lower-than-expected inflation figures in Oz also seems to have propped up the view of a pause by the RBA at its next event in February.
The modest sell-off in the dollar weighed on USD/CAD, prompting the pair to partially reverse the weekly advance, leaving a decent resistance around the 1.3400 region.
Both Gold and Silver grinded lower and revisited the lower end of the so-far yearly range prior to the release of US inflation on Thursday.
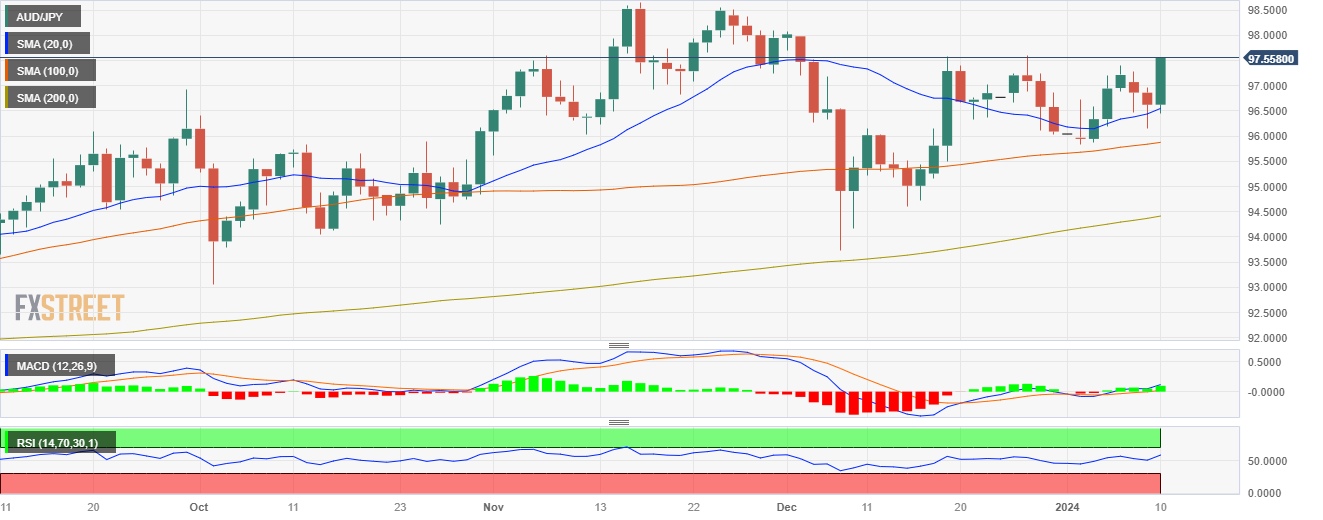
- The AUD/JPY sees a promising rally, standing at 97.50, its highest since December 4.
- Indicators are riding towards overbought conditions on the four-hour chart.
- A healthy consolidation may be on the papers to correct the rally..
On Wednesday, the AUD/JPY rallied to a high of 97.60, with bulls increasing their dominance on the daily chart. However, further upside may be limited as the four-hour indicators proceed towards overbought conditions.
In consideration of the positioning of the key indicators on the daily chart, it is discernible that the bulls are in command. The Relative Strength Index (RSI) demonstrates a positive inclination within bullish territory, which indicates increasing buying power. Moreover, the Moving Average Convergence Divergence (MACD) continues its ascent, marked by swelling green bars that reinforce the ongoing bullish momentum. In addition, the overall trend also appears optimistic as the pair navigates above the 20,100,200-day Simple Moving Averages (SMAs).
Zooming into the four-hour chart, the short-term market momentum is leaning towards a possible overbought state. The stairway to overbought conditions is becoming increasingly visible, with the four-hour Relative Strength Index (RSI) demonstrating a strong surge. Concurrently, the four-hour Moving Average Convergence Divergence (MACD) underscores this buying momentum with its progressively burgeoned green bars. Yet, traders should tread carefully as these overbought conditions can often precede reversals, suggesting a possible moderation of the bullish drive in the near term.
AUD/JPY technical levels
AUD/JPY daily chart
- USD/JPY climbs further on Wednesday in a broad-market Yen selloff.
- Japanese wages plummeted in real terms, sparking a Yen weakening.
- With real wages declining, the BoJ is less likely to begin hiking rates.
The USD/JPY rose on Wednesday, tapping 145.80 as the pair grinds towards the 146.00 handle. A broad-market Japanese Yen (JPY) sell-off, sparked by a wide miss in Japanese wage figures published early Wednesday, is dragging the Yen down across the board in mid-week market action.
Japanese real wages tumble 3% despite 0.2% increase in nominal wages
Despite a 0.2% rise in nominal wages, Japanese real incomes tumbled 3% for the year ended November as inflation continues to eat away at Japanese consumers’ earnings and purchasing power.
With the Bank of Japan (BoJ) hinging rate hikes on rising real wages, odds of a tightening cycle from the Japanese central bank are evaporating, sending the Yen skidding across the floorboards and is set to spark another long-run flight out of the JPY. Despite high inflation continuing to erode real wages, the BoJ is stubbornly entrenched in a hyper easy monetary policy stance, with Japanese central planners keeping rates pinned in slightly negative territory at or near -0.1% as the BoJ fearfully looks ahead to the possibility of inflation declining too far past the 2% barrier sometime in 2025. Japanese annual inflation currently stands at 2.8% through last November, declining from a peak of 4.3% in January of last year.
Markets could see further momentum added to the USD/JPY from the Greenback side on Thursday, when the US will publish its latest Consumer Price Index (CPI) inflation figures for December.
US CPI Preview: Forecasts from 10 major banks
US headline CPI inflation is expected to tick slightly higher MoM in December, forecast to rise from 0.1% to 0.2%, while annualized inflation for the year ended December is seen rising from 3.1% to 3.2%.
Core US CPI inflation (headline inflation less volatile food and energy prices) is expected to hold steady MoM in December at 0.3%, but YoY Core CPI is forecast to tick down slightly from 4.0% to 3.8%.
With global markets keen for the Federal Reserve (Fed) to kick off the next rate cut cycle, investors will be scrambling for any signs that US inflation is continuing to recede, while an upside beat to US CPI inflation prints will see risk appetite slumping, and could drive the US Dollar (USD) even higher against the major currency bloc.
Japanese Yen price today
The table below shows the percentage change of Japanese Yen (JPY) against listed major currencies today. Japanese Yen was the weakest against the Euro.
| USD | EUR | GBP | CAD | AUD | JPY | NZD | CHF | |
| USD | -0.33% | -0.23% | -0.07% | -0.20% | 0.80% | 0.18% | -0.08% | |
| EUR | 0.33% | 0.09% | 0.26% | 0.14% | 1.13% | 0.51% | 0.24% | |
| GBP | 0.23% | -0.09% | 0.16% | 0.04% | 1.03% | 0.40% | 0.17% | |
| CAD | 0.06% | -0.26% | -0.16% | -0.12% | 0.87% | 0.24% | 0.01% | |
| AUD | 0.19% | -0.14% | -0.04% | 0.12% | 0.98% | 0.37% | 0.08% | |
| JPY | -0.81% | -1.13% | -1.06% | -0.88% | -1.01% | -0.63% | -0.89% | |
| NZD | -0.17% | -0.50% | -0.41% | -0.24% | -0.36% | 0.63% | -0.28% | |
| CHF | 0.07% | -0.23% | -0.13% | 0.03% | -0.08% | 0.90% | 0.28% |
The heat map shows percentage changes of major currencies against each other. The base currency is picked from the left column, while the quote currency is picked from the top row. For example, if you pick the Euro from the left column and move along the horizontal line to the Japanese Yen, the percentage change displayed in the box will represent EUR (base)/JPY (quote).
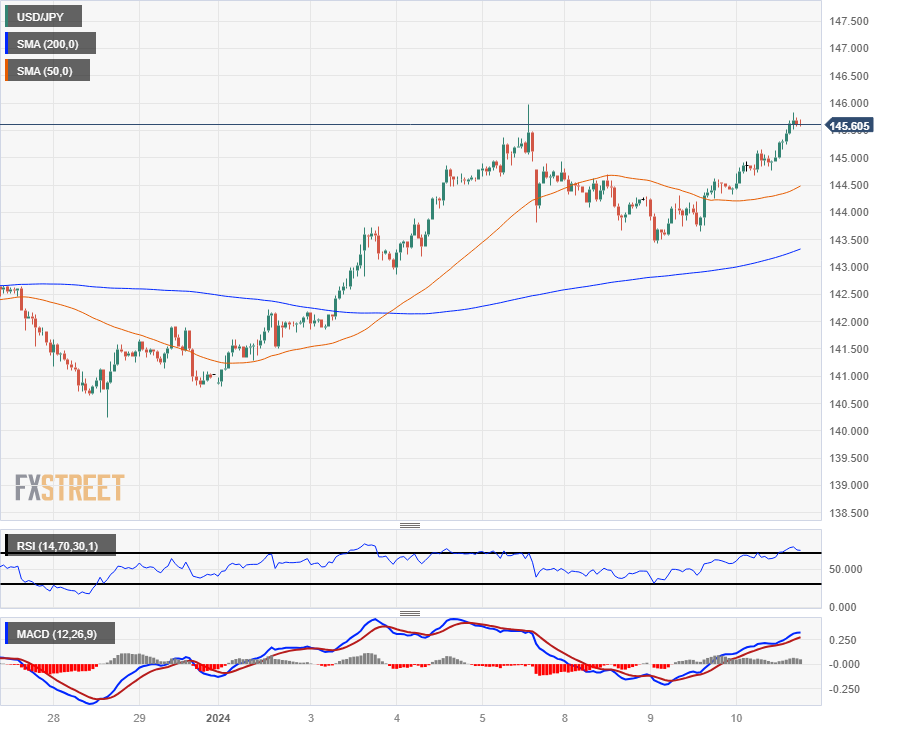
USD/JPY Technical Outlook
Wednesday’s broad-market Yen backslide has the USD/JPY pair surging, set to rechallenge last week’s peak bids at the 146.00 handle as near-term momentum tilts bullish with the 200-hour Simple Moving Average (SMA) rising into 143.50, a confluence level with Wednesday’s swing low.
Despite a bullish lean in the USD/JPY, the pair remains constrained between the 50-day and 200-day SMAs as the two moving averages push into the middle, but 2024’s price action looks decidedly bullish after the USD/JPY’s recent bounce from the 200-day SMA near 143.00.
USD/JPY Hourly Chart
USD/JPY Daily Chart
USD/JPY Technical Levels
- AUD/USD slumped back toward Wednesday’s opening bids after a CPI-fueled run.
- The Aussie couldn’t hold onto territory above 0.6710.
- US CPI inflation expectations are weighing down risk appetite for the midweek.
The AUD/USD initially rose on Wednesday after Australian Consumer Price Index (CPI) inflation figures showed inflation cooling faster than market forecasts predicted. The pair climbed over the 0.6700 handle to hit an intraday high of 0.6713, but the pair is waffling back into the low side of 0.6700 as markets gear up for Thursday’s US CPI inflation print.
Australia’s November CPI comes in at 4.3% YoY vs. 4.4% expected
Australian CPI inflation for the year ended November slipped to 4.3% versus the median market forecast of 4.4% and fell even further from October’s YoY print of 4.9%. With inflation pressures easing, Aussie bulls found a reason to bid, but buying pressure proved short-lived as markets turn broad-face to look towards Thursday’s US CPI inflation print.
US CPI Preview: Forecasts from 10 major banks
Market participants are hoping for signs that the Federal Reserve (Fed) will get pushed into the next rate-cutting cycle sooner rather than later, and major investors are looking for easing inflation to be the spark the Fed needs to begin slashing its main reference rate. Despite broad-market hopes, market forecasts see the headline US CPI inflation print for December to come in at 0.2% MoM compared to November’s print of 0.1%.
Annualized US CPI inflation through December is likewise expected to tick slightly higher from 3.1% to 3.2%, while Core MoM CPI is expected to hold steady at 0.3%.
With investors hoping for signs of easing long-term inflation to kickstart the next rate cut cycle, markets will be focusing on annualized Core CPI through December, which is forecast to slightly decline from 4.0% to 3.8%.
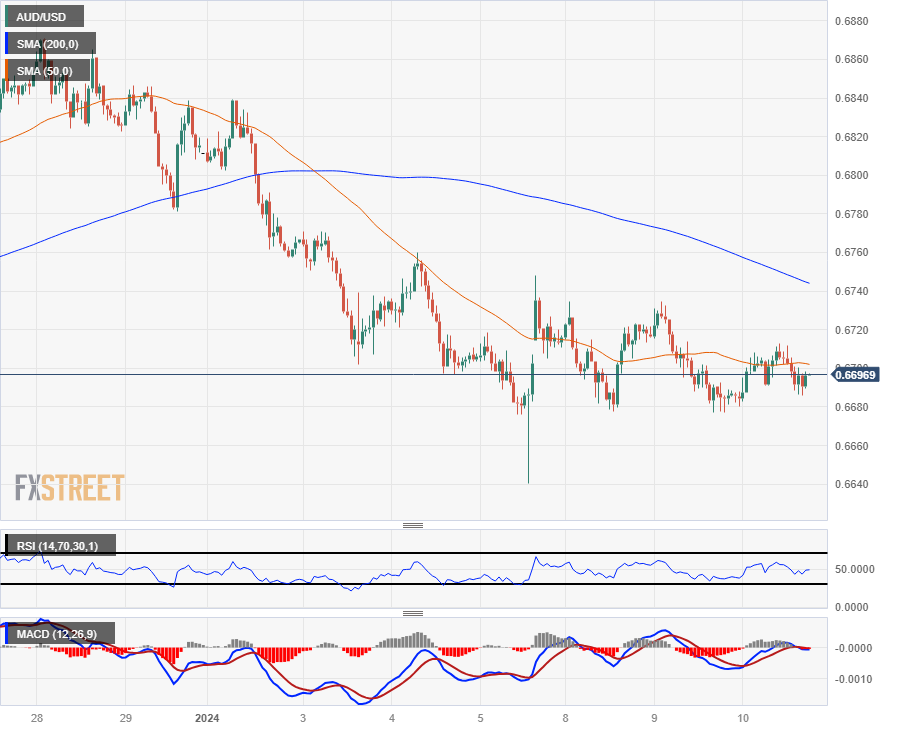
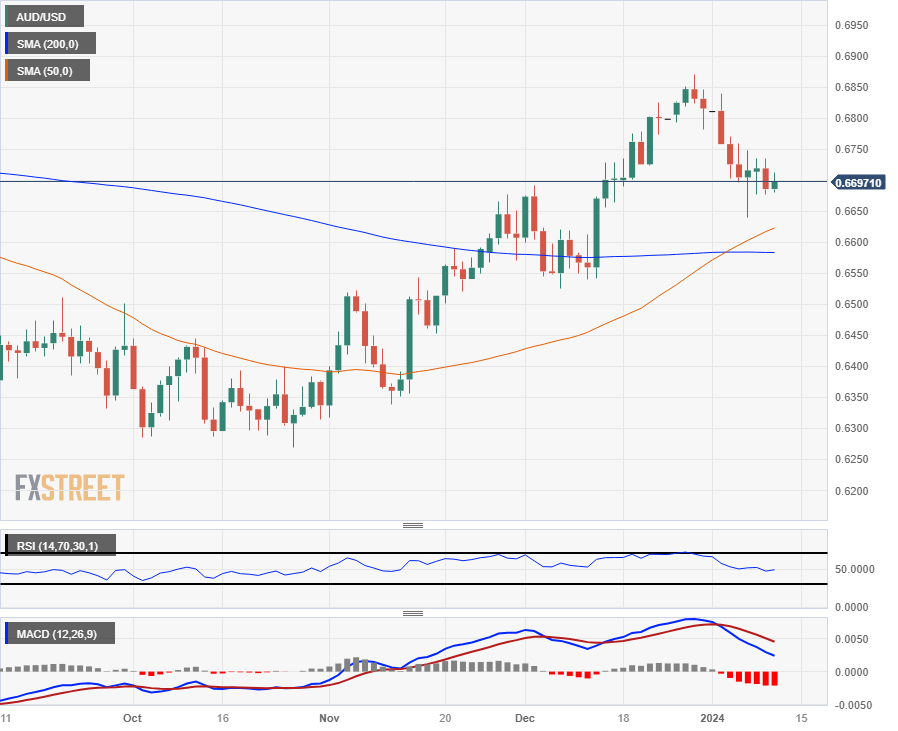
AUD/USD Technical Outlook
The AUD/USD is cycling the 50-hour Simple Moving Average (SMA), hitting the price median for a fifth consecutive day as momentum drains out of the pair. The AUD/USD sees descending resistance from a declining 200-hour SMA falling into 0.6740.
The AUD/USD has fallen around 2.5% from late December’s swing high into 0.68711, but near-term technical support is priced in from a 50-day and 200-day SMA crossover near the 0.6600 handle.
AUD/USD Hourly Chart
AUD/USD Daily Chart
AUD/USD Technical Levels
- The NZD/USD is suffering losses, moving downwards towards the 0.6220 level.
- The market mood remains cautious, as no significant highlight was seen on Wednesday’s economic docket.
- US Core CPI is seen easing, which may boost the pair.
In Wednesday's trading session, the NZD/USD pair decreased, landing around 0.6226. The drop, which tallied a 0.25% loss, comes on a quiet Wednesday while market players brace themselves for upcoming Consumer Price Index (CPI) data on Thursday. In addition, the pair faced rejection at the 20-day Simple Moving Average (SMA), which contributed to the downside.
The Consumer Price Index for December is anticipated to be 3.2% YoY, a slight progression from the preceding 3.1%. The Core measure figure is projected to soften at 3.8%, a dip from November’s 4%.
Recent data shows that the US economy is still going strong thanks to favorable financial conditions, helping the USD hold its ground. However, the Dollar remains vulnerable due to persistent dovish bets on the Federal Reserve easing, which has yet to materialize. Investors look upon watching remarks from Fed's Williams at the end of the American session for any potential clues on the bank’s next steps. As for now, investors re seeing rate cuts anticipated in March and May and a total of five in 2024, contradicting the Fed’s protected three. However, those bets may change on the outcome of December’s CPI.
NZD/USD levels to watch
The daily chart suggests that the pair has a tinge of selling momentum building in the immediate term. This is reflected by the declining position of the Relative Strength Index (RSI) within negative territory, indicating the potential strengthening of selling pressure. Moreover, this bearish sentiment is echoed by the rising red bars on the Moving Average Convergence Divergence (MACD), with sellers potentially gaining momentum.
Meanwhile, the pair's position across multiple Simple Moving Averages (SMAs) puts a different spin on the picture. It's positioned below the 20-day SMA, a signal that might usually indicate bearishness. However, with the pair above both the 100-day and 200-day SMAs, it suggests that buyers still hold the reins in a broader perspective.
In spite of the near-term neutral to bearish sentiment, the pair's position above longer-term SMAs indicates a dominant buying momentum, at least on a broader horizon. This hints that while sellers may seek to push the pair lower in the immediate future the buyers still have strength to limit any downside.
NZD/USD daily chart
-638405058553206867.png)
- GBP/USD's uptick influenced by Governor Bailey's comments on inflation control and stable UK employment levels.
- Expectations of BoE rate cuts and upcoming US inflation report keep the pair's movements within known ranges.
- Investors to closely monitor US CPI data and unemployment claims for further insights into economic trends.
The Pound Sterling (GBP) registers decent gains of 0.13% against the US Dollar (USD) during the North American session after reaching a daily low of 1.2670. Investors bracing for the Bank of England’s (BoE) Governor Andrew Bailey’s speech, along with the release of US inflation data on Thursday, keeps price action within familiar levels. The GBP/USD trades at 1.2724.
Pound Sterling in the driver’s seat as traders brace of US CPI report on Thursday
The BoE Governor Baley recently testified before the Treasury Select Committee during the day. He expressed that it’s important to curb inflation towards its 2% target and added that the UK hasn’t witnessed a rise in unemployment. He states household incomes have risen recently, and those factors helped ease the impact of higher rates.
Meanwhile, sources cited by Reuters expressed they expect three 25 basis points rate cuts instead of two, stating that inflation most likely fall to around 1.5% in the third quarter.
In the United States, the economic docket is relatively light, with market participants eagerly anticipating the upcoming inflation report set to be released on Thursday. The Consumer Price Index (CPI) for December is projected to increase to 3.2% year-over-year, up from 3.1% in November. In contrast, the Core CPI, which excludes volatile food and energy prices, is expected to decelerate from 4% to 3.8% year-over-year. Concurrently, the US Bureau of Labor Statistics (BLS) is scheduled to release the latest unemployment claims data for the week ending January 6.
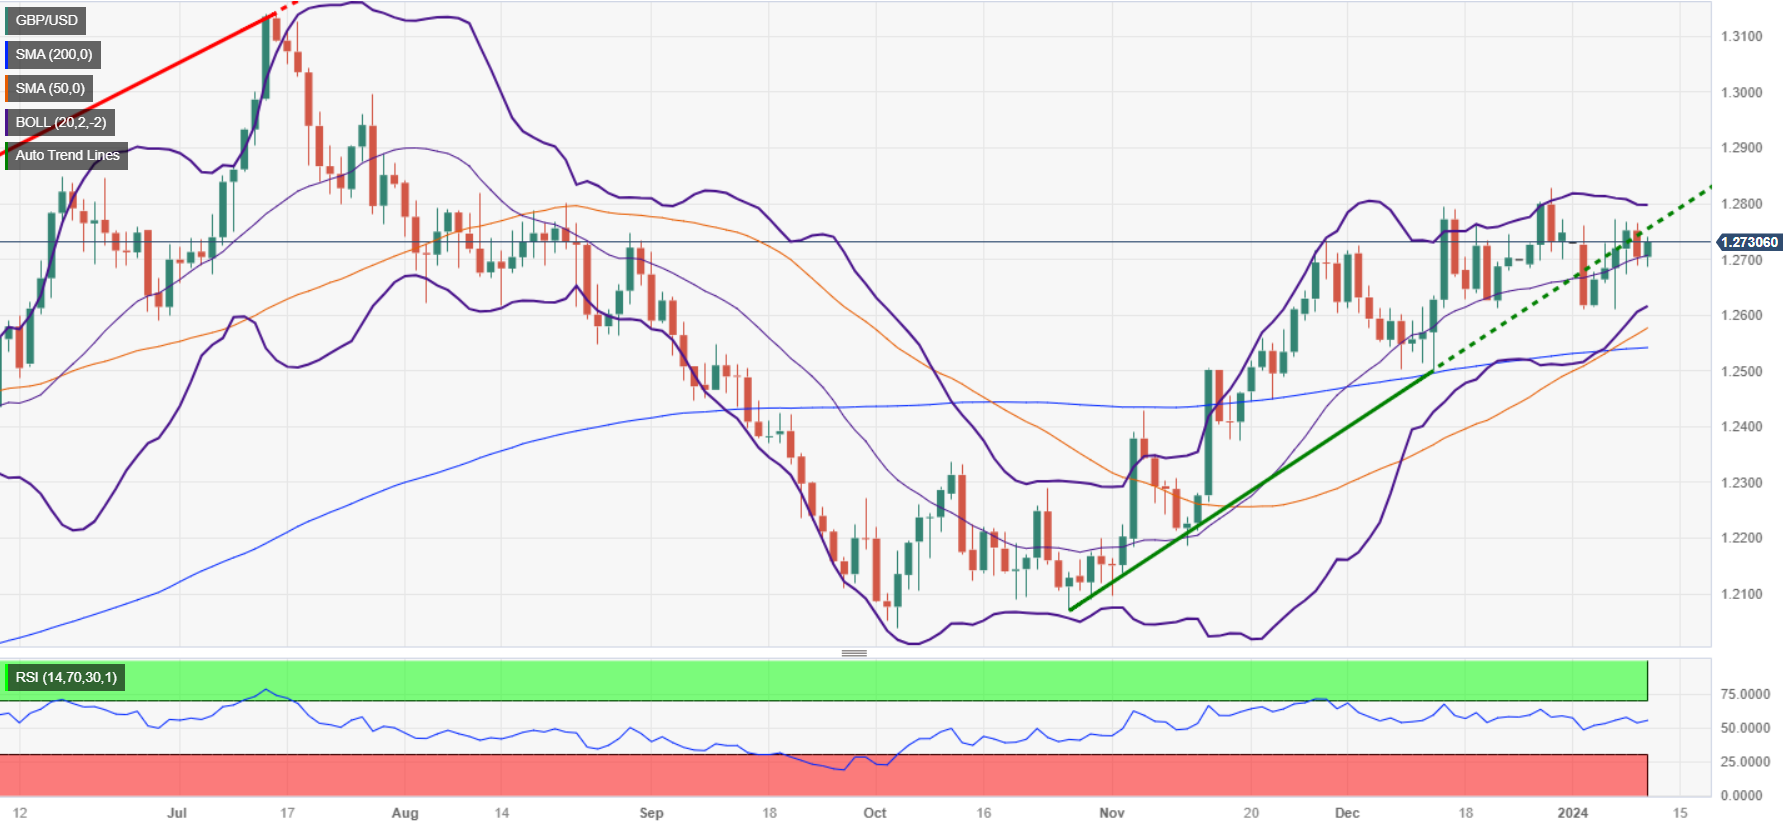
GBP/USD Price Analysis: Technical outlook
From a technical standpoint, the pair is neutral to upward biased, with buyers unable to lift spot prices above the 1.2800 figure. In that event, the GBP/USD could aim toward the December 28 high of 1.2827, followed by the July 27 high at 1.2995. On the other hand, if bears step in and drag prices below the 1.2700 mark, that could pave the way for testing January’s 5 swing low of 1.2611, ahead of 1.2600.
- Crude Oil took a hit on Wednesday after EIA crude stocks climbed again.
- Downstream oil products also rose significantly.
- Middle East complications continue to prop up Crude Oil on supply concerns.
West Texas Intermediate (WTI) US Crude Oil slipped from a fresh daily high after the Energy Information Administration (EIA) released their updated US Crude Oil stocks numbers, revealing another buildup of Crude Oil barrels, as well as burgeoning numbers of oil derivative products in supply lines.
Crude Oil prices popped early Wednesday after it was reported that Iran-backed Houthi rebels in Iran launched their largest wave of attacks to-date on civilian cargo ships in the waterways leading towards the Suez Canal. Houthis launched a combination of 21 drones and missiles at shipping vessels in the key waterway that connects supply lines between Europe and Asia.
No damage was reported and coalition naval forces from the US and the UK reported 100% destruction of all Houthi weapons that were in transit at the time. According to reporting by the BBC, citing US military sources, Houthi rebels in Yemen have carried out 26 attacks on commercial shipping vessels since November 19.
Despite the successful fending off of further rebel attacks, Crude Oil caught a fear-based bid as energy markets continue to fret about the possibility of conflicts hampering global trade in oil barrels. WTI climbed to $73.55 before getting knocked back once again after the EIA released their Crude Oil barrel counts for the week ended January 5, showing another buildup in both Crude Oil barrels and downstream oil derivatives.
According to the EIA, US Crude Oil Stocks climbed 1.338 million barrels versus the forecast 675K decline, taking a bite out of the previous week’s 5.5 million barrel decline.
Gasoline reserves also climbed well above expectations, adding a further 8.29 million barrels vs the expected 2.489 million. Oil Distillates also climbed 6.528 million versus the forecast 2.382 million uptick. The EIA also estimates that US Crude Oil production remained above 13 million barrels per day.
WTI Technical Outlook
WTI US Crude Oil stumbled back from Wednesday’s peak bids near $73.60 to retest the $72.00 handle as bids continue to get hampered by the 200-hour Simple Moving Average (SMA). Rough chop on the intraday level continues to be the name of the game, with WTI prices whipsawing in a rough range in the early weeks of 2024.
Daily candlesticks have WTI pressured into the low side, with near-term price action capped by a declining 50-day SMA with a technical ceiling priced in at the 200-day SMA near $78.00.
Technical momentum has drained out of the WTI chart as technical indicators drift into the midrange, and US Crude Oil remains down nearly 24% from last September’s top bids near $94.00.
WTI Hourly Chart
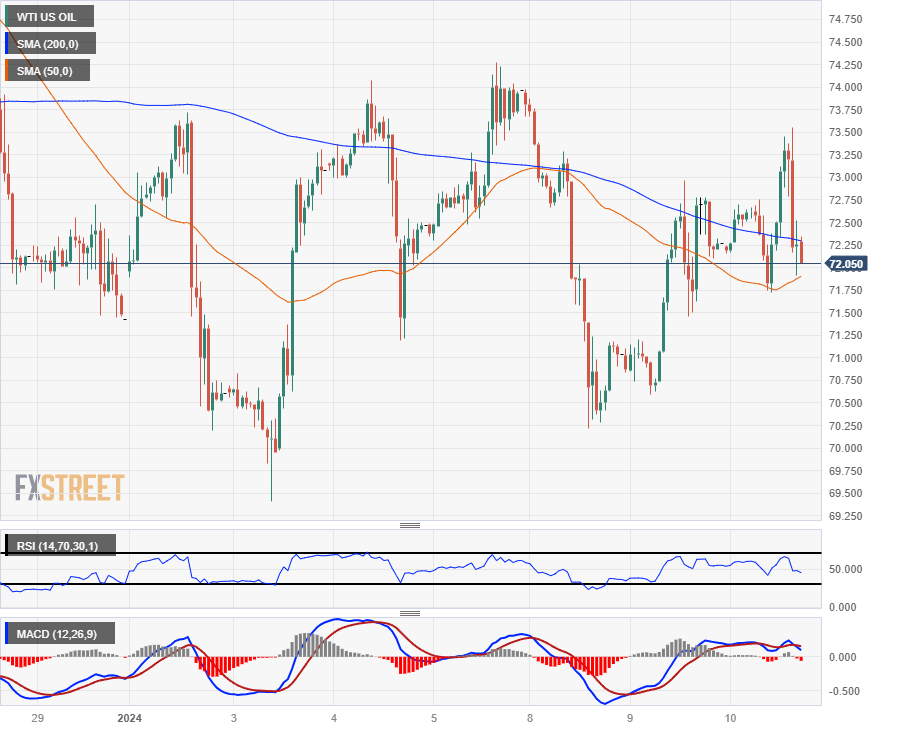
WTI Daily Chart
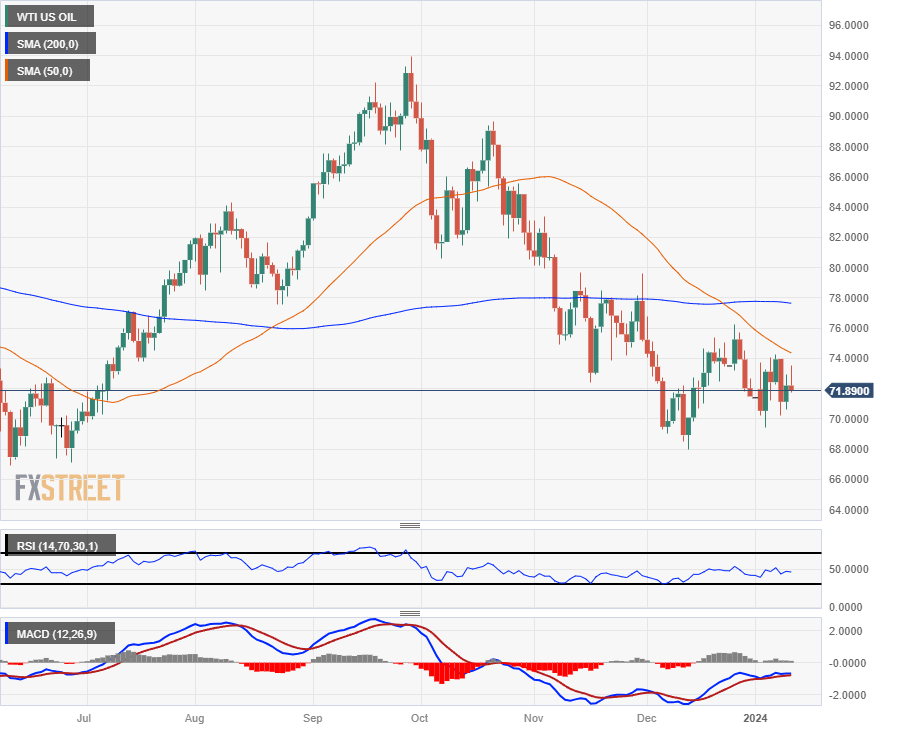
WTI Technical Levels
- Mexican Peso registers loss of more than 0.20% on Wednesday amid risk-off impulse.
- Banxico’s potential rate cut for Q1 2024 in danger as Mexican inflation rises.
- USD/MXN traders prepare for Thursday’s US inflation data.
The Mexican Peso (MXN) extended its losses for two straight days against the US Dollar (USD) during the North American session as USD/MXN buyers stepped in and lifted the exchange rate past 17.00 to reach a daily high of 17.02. At the time of writing, the exotic pair is trading at 16.99, gaining 0.32%.
Mexico’s economic docket remains scarce, though it revealed that Gross Fixed Investment improved in October. The latest inflation report in Mexico was mixed as core inflation cooled while headline inflation advanced. Given the fact that two Bank of Mexico (Banxico) officials expressed their intentions of easing policy toward the end of Q1 2024, prices remain elevated, which might deter Banxico from cutting rates.
Daily digest market movers: Mexican Peso gives way against US Dollar amid mixed Mexican data
- Mexico’s Gross Fixed Income rose 1.9% MoM in October, exceeding September’s -1.5% plunge, while annually-based figures exceeded forecasts of 22.8%, coming at 25.5%.
- The economy in Mexico is facing several challenges as inflation data was mixed alongside consumer confidence showing signs of deterioration. Elevated prices and a deceleration in economic growth could weigh on the Mexican Peso and cause its depreciation.
- Even though the latest Banxico meeting minutes indicate the central bank might consider easing policy, December’s inflation report might prevent the central bank from relaxing policy.
- On Tuesday, Mexico’s Consumer Price Index (CPI) rose by 4.66% YoY in December, exceeding forecasts of 4.55%.November’s print was 4.32%. Core figures came at 5.09% YoY, less than the consensus, and the previous month’s 5.15% and 5.30%, respectively.
- Consumer Confidence in Mexico deteriorated in December as households remained concerned about the future economic outlook.
- On January 5, a Reuters Poll suggested the Mexican Peso could weaken 5.4% to 18.00 per US Dollar in 12 months from December.
- Federal Reserve officials expressed that interest rates should remain at current levels. Fed’s Bostic emphasized that policy needs to stay tight, while Fed’s Bowman added that policy is sufficiently restrictive.
- The US economy continues to paint a mixed economic outlook as the latest US jobs data was mixed, while business activity in manufacturing contracted and the service sector deteriorated. Although a soft-landing scenario looms, the chance of a mild recession has increased, so caution is warranted.
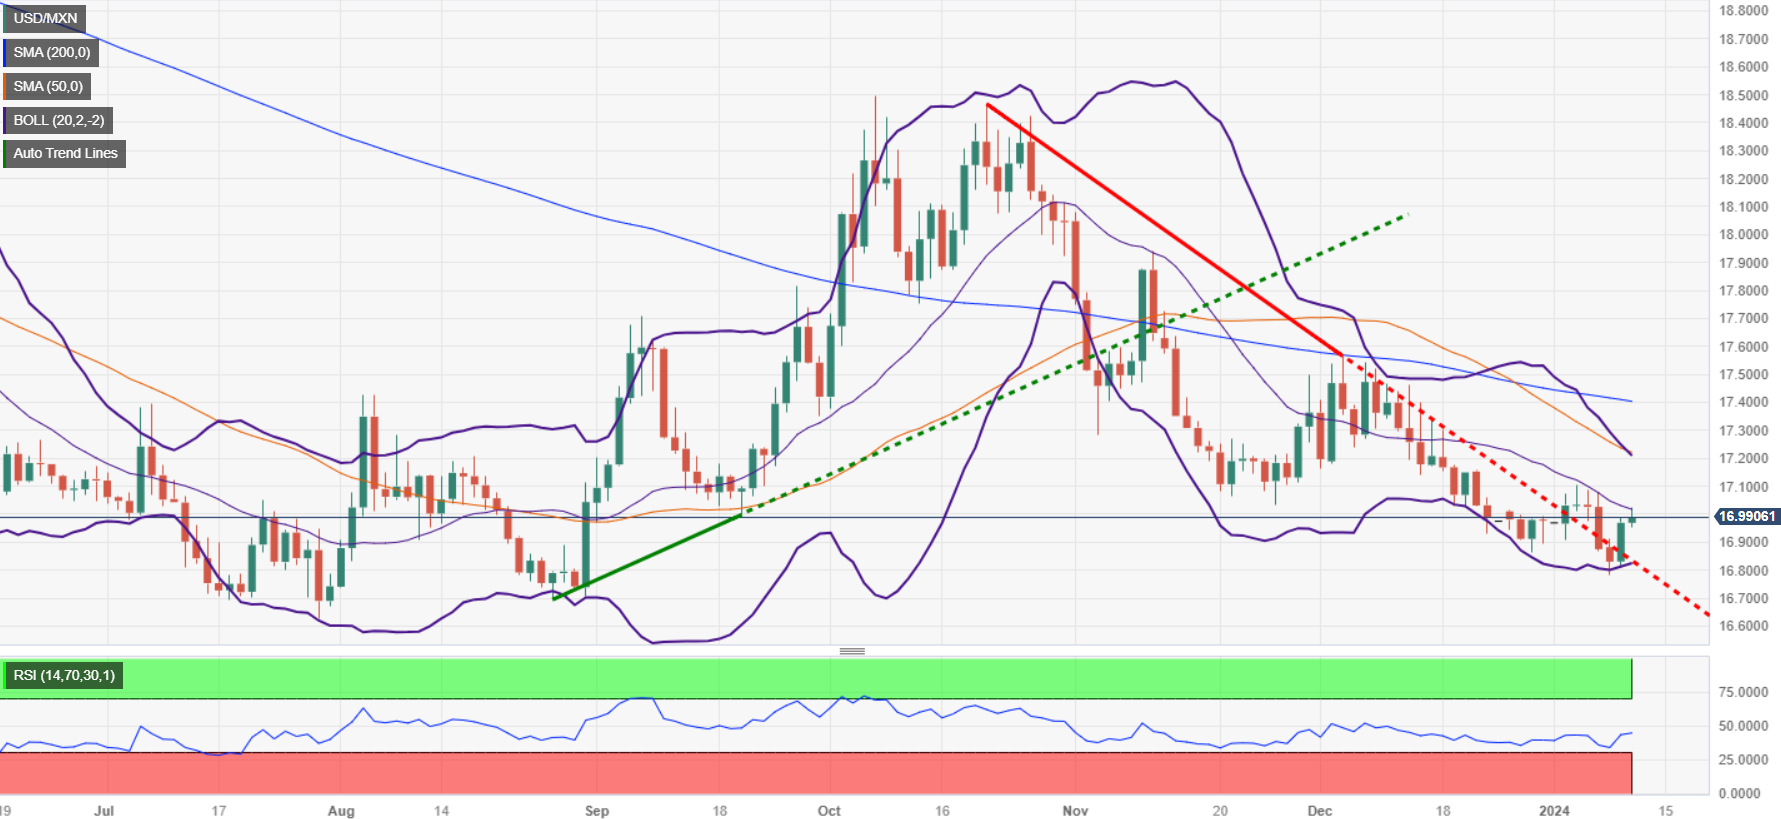
Technical analysis: Mexican Peso is on the backfoot after reaching a three-day high above 17.00
The USD/MXN remains bearishly biased, though it briefly tested the 17.00 figure but was quickly rejected. The spot price is aimed toward the 16.97 area. If buyers achieve a daily close above the latest cycle low seen on November 27 at around 17.03, that could open the door for further gains. On further strength, the pair could test the 17.20 mark, followed by the 50-day Simple Moving Average (SMA) at 17.24, ahead of challenging the confluence of the 100 and 200-day SMAs at around 17.40
On the other hand, If sellers prevent the exotic pair from piercing the 17.00 figure, a test of last year’s low is on the cards. But sellers must conquer the 16.80 area, followed by the August 28 swing low of 16.69 ahead of the 2023 low of 16.62.
USD/MXN Price Action – Daily Chart
Mexican Peso FAQs
What key factors drive the Mexican Peso?
The Mexican Peso (MXN) is the most traded currency among its Latin American peers. Its value is broadly determined by the performance of the Mexican economy, the country’s central bank’s policy, the amount of foreign investment in the country and even the levels of remittances sent by Mexicans who live abroad, particularly in the United States. Geopolitical trends can also move MXN: for example, the process of nearshoring – or the decision by some firms to relocate manufacturing capacity and supply chains closer to their home countries – is also seen as a catalyst for the Mexican currency as the country is considered a key manufacturing hub in the American continent. Another catalyst for MXN is Oil prices as Mexico is a key exporter of the commodity.
How do decisions of the Banxico impact the Mexican Peso?
The main objective of Mexico’s central bank, also known as Banxico, is to maintain inflation at low and stable levels (at or close to its target of 3%, the midpoint in a tolerance band of between 2% and 4%). To this end, the bank sets an appropriate level of interest rates. When inflation is too high, Banxico will attempt to tame it by raising interest rates, making it more expensive for households and businesses to borrow money, thus cooling demand and the overall economy. Higher interest rates are generally positive for the Mexican Peso (MXN) as they lead to higher yields, making the country a more attractive place for investors. On the contrary, lower interest rates tend to weaken MXN.
How does economic data influence the value of the Mexican Peso?
Macroeconomic data releases are key to assess the state of the economy and can have an impact on the Mexican Peso (MXN) valuation. A strong Mexican economy, based on high economic growth, low unemployment and high confidence is good for MXN. Not only does it attract more foreign investment but it may encourage the Bank of Mexico (Banxico) to increase interest rates, particularly if this strength comes together with elevated inflation. However, if economic data is weak, MXN is likely to depreciate.
How does broader risk sentiment impact the Mexican Peso?
As an emerging-market currency, the Mexican Peso (MXN) tends to strive during risk-on periods, or when investors perceive that broader market risks are low and thus are eager to engage with investments that carry a higher risk. Conversely, MXN tends to weaken at times of market turbulence or economic uncertainty as investors tend to sell higher-risk assets and flee to the more-stable safe havens.
- Canadian Dollar sees little momentum in tight Wednesday trading.
- Markets await the next update on US CPI inflation due Thursday.
- CAD finds little support from struggling Crude Oil bids.
The Canadian Dollar (CAD) is stuck within a tight intraday range on Wednesday as broader markets pivot to focus on Thursday’s upcoming US Consumer Price Index (CPI) inflation print for December. Rate-cut-hungry markets will be looking for continued easing in price growth pressures from the US, but market forecast models are currently expecting a slight uptick in headline inflation figures.
Crude Oil caught a short-lived bounce on Wednesday, fueled by ongoing Middle East tensions and a fresh round of attacks on cargo ships by Houthi rebels. West Texas Intermediate (WTI) US Crude Oil fell back on the day after the Energy Information Administration (EIA) showed another surprise buildup in US Crude Oil stockpiles. The Canadian Dollar is getting less support from rising but choppy Crude Oil prices than usual as currency markets hunker down ahead ofUS CPI inflation.
Daily digest market movers: Canadian Dollar hamstrung in the midrange
- A quiet Wednesday for the Loonie with no further Canadian data releases on the economic calendar docket for the week.
- Canadian Dollar traders will be looking out for Canadian CPI inflation and Retail Sales next week, on Tuesday and Friday, respectively.
- US CPI inflation will dominate headlines and price action this week and is slated for release on Thursday.
- Broader markets are keeping an eye out for any data that will help tilt the Federal Reserve (Fed) into a rate-cutting cycle sooner rather than later.
- Thursday’s MoM US CPI from December is forecast to tick upward slightly from 0.1% to 0.2%.
- Annualized December CPI is also expected to shift from 3.1% to 3.2%.
- December’s MoM Core US CPI is forecast to hold steady at 0.3%, while the annualized Core CPI is seen ticking down from 4.0% to 3.8%.
- An upside beat to inflation data bodes poorly for the market’s rate-cutting hopes, could sever risk appetite if inflation continues to run above expectations.
- US CPI Preview: Forecasts from 10 major banks
- Crude Oil continues to struggle, rising and falling back as supply concerns centered around Middle East tensions play tug-of-war with downside pressure from rising US barrel counts.
- EIA US Crude Stocks climbed by 1.338 million barrels for the week ended January 5 versus the expected drawdown of 675K barrels, taking a chunk out of the previous week’s 5.5 million barrel drawdown.
Canadian Dollar price today
The table below shows the percentage change of Canadian Dollar (CAD) against listed major currencies today. Canadian Dollar was the weakest against the Euro.
| USD | EUR | GBP | CAD | AUD | JPY | NZD | CHF | |
| USD | -0.20% | -0.09% | -0.06% | -0.07% | 0.94% | 0.29% | -0.05% | |
| EUR | 0.20% | 0.11% | 0.13% | 0.14% | 1.14% | 0.48% | 0.17% | |
| GBP | 0.08% | -0.11% | 0.02% | 0.03% | 1.03% | 0.37% | 0.03% | |
| CAD | 0.06% | -0.13% | -0.03% | 0.01% | 1.01% | 0.35% | 0.03% | |
| AUD | 0.06% | -0.15% | -0.04% | -0.02% | 0.99% | 0.33% | 0.00% | |
| JPY | -0.93% | -1.13% | -1.03% | -1.01% | -1.01% | -0.68% | -0.97% | |
| NZD | -0.28% | -0.49% | -0.38% | -0.35% | -0.34% | 0.65% | -0.34% | |
| CHF | 0.03% | -0.15% | -0.05% | -0.02% | 0.01% | 0.98% | 0.34% |
The heat map shows percentage changes of major currencies against each other. The base currency is picked from the left column, while the quote currency is picked from the top row. For example, if you pick the Euro from the left column and move along the horizontal line to the Japanese Yen, the percentage change displayed in the box will represent EUR (base)/JPY (quote).
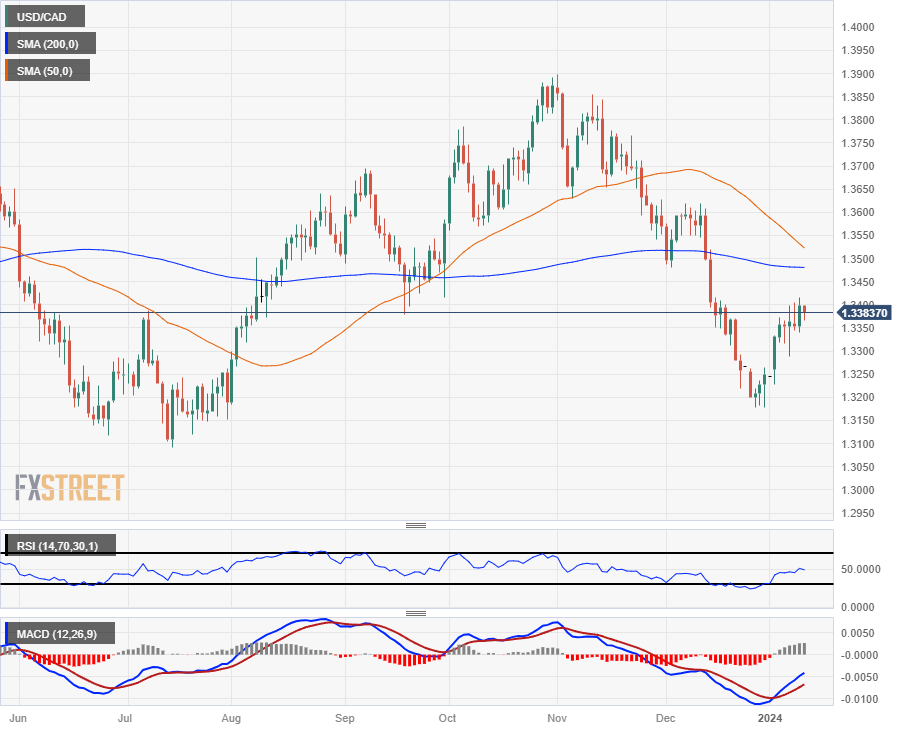
Technical Analysis: Canadian Dollar skews sideways as markets mix in US CPI run-up
The Canadian Dollar (CAD) is mixed against the major currencies cadre on Wednesday, shedding a little less than a fifth of a percent against the Euro (EUR) but gaining about three-tenths of one percent against the New Zealand Dollar (NZD). The CAD has also climbed around a full percent against the battered Japanese Yen (JPY) thanks to a broad-market sell-off in the Yen.
The USD/CAD pair is swamped just below 1.3400, with intraday pressure skewing to the downside as the Loonie-Greenback pairing middles. Near-term price action remains buoyed by the 200-hour Simple Moving Average (SMA) near 1.3325, and bidders will be looking for continued support from a pattern of intraday higher lows driving the pair into the top end in early 2024 trading.
Daily candlesticks have the USD/CAD bid facing a slowdown of bullish momentum from the 1.3400 handle, and a technical ceiling is forming up near 1.3500 as the 50-day SMA heads for a bearish cross of the 200-day SMA. With topside action capped, a pullback could see the pair heading back into December’s lows near the 1.3200 handle.
USD/CAD Hourly Chart
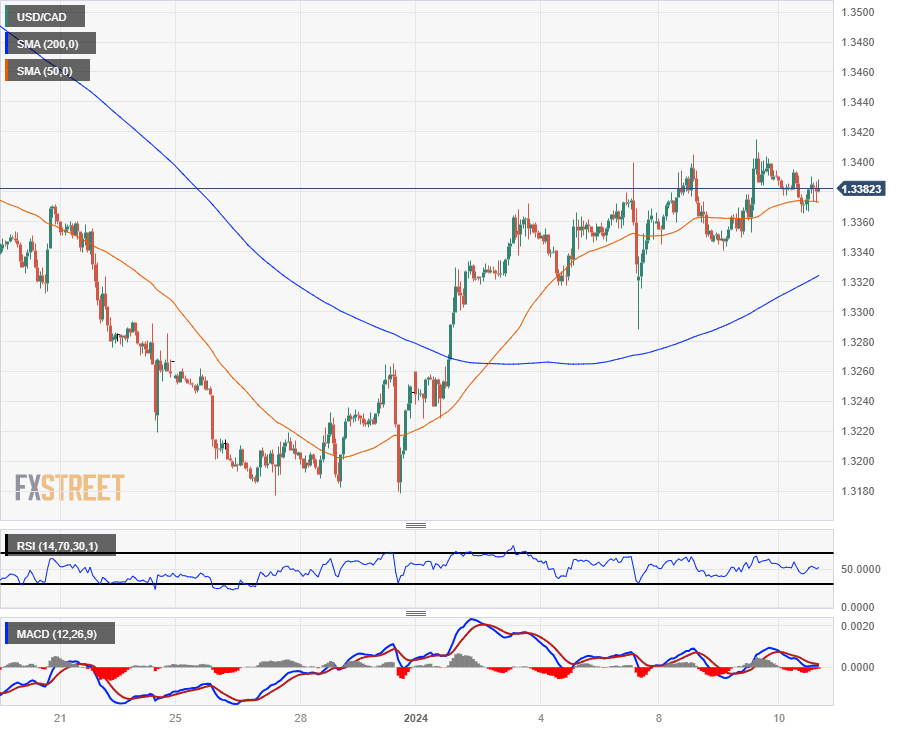
USD/CAD Daily Chart
Canadian Dollar FAQs
What key factors drive the Canadian Dollar?
The key factors driving the Canadian Dollar (CAD) are the level of interest rates set by the Bank of Canada (BoC), the price of Oil, Canada’s largest export, the health of its economy, inflation and the Trade Balance, which is the difference between the value of Canada’s exports versus its imports. Other factors include market sentiment – whether investors are taking on more risky assets (risk-on) or seeking safe-havens (risk-off) – with risk-on being CAD-positive. As its largest trading partner, the health of the US economy is also a key factor influencing the Canadian Dollar.
How do the decisions of the Bank of Canada impact the Canadian Dollar?
The Bank of Canada (BoC) has a significant influence on the Canadian Dollar by setting the level of interest rates that banks can lend to one another. This influences the level of interest rates for everyone. The main goal of the BoC is to maintain inflation at 1-3% by adjusting interest rates up or down. Relatively higher interest rates tend to be positive for the CAD. The Bank of Canada can also use quantitative easing and tightening to influence credit conditions, with the former CAD-negative and the latter CAD-positive.
How does the price of Oil impact the Canadian Dollar?
The price of Oil is a key factor impacting the value of the Canadian Dollar. Petroleum is Canada’s biggest export, so Oil price tends to have an immediate impact on the CAD value. Generally, if Oil price rises CAD also goes up, as aggregate demand for the currency increases. The opposite is the case if the price of Oil falls. Higher Oil prices also tend to result in a greater likelihood of a positive Trade Balance, which is also supportive of the CAD.
How does inflation data impact the value of the Canadian Dollar?
While inflation had always traditionally been thought of as a negative factor for a currency since it lowers the value of money, the opposite has actually been the case in modern times with the relaxation of cross-border capital controls. Higher inflation tends to lead central banks to put up interest rates which attracts more capital inflows from global investors seeking a lucrative place to keep their money. This increases demand for the local currency, which in Canada’s case is the Canadian Dollar.
How does economic data influence the value of the Canadian Dollar?
Macroeconomic data releases gauge the health of the economy and can have an impact on the Canadian Dollar. Indicators such as GDP, Manufacturing and Services PMIs, employment, and consumer sentiment surveys can all influence the direction of the CAD. A strong economy is good for the Canadian Dollar. Not only does it attract more foreign investment but it may encourage the Bank of Canada to put up interest rates, leading to a stronger currency. If economic data is weak, however, the CAD is likely to fall.
- DXY Index registers minor losses, trading around 102.40.
- Investors are on standby awaiting CPI figures to be released on Thursday.
- Lower US yields limit the US Dollar advance.
The US Dollar (USD) observed modest losses on Wednesday, trailing at 102.4 in the US Dollar Index, as market participants stick to the sidelines awaiting drivers. The trading floors were relatively quiet with no significant reports fuelling reactions during the session. The focus is set on the release of the US Consumer Price Index (CPI) from December, due on Thursday.
For now, markets are betting on five rate cuts in 2024, largely dismissing the Federal Reserve (Fed) forecast of only 75 bps of easing. Strong labor market data from the US economy was largely offset by a weak US ISM PMI print, so December’s CPI reading will play a big role in shaping expectations of the central bank’s easing calendar.
Daily digest market movers: US Dollar edges lower on quiet Tuesday, Fed Williams will be on the wires
- The US economy demonstrates continued expansion above trend with Q4 and possibly Q1 growth, bolstered by loose financial conditions.
- The US Dollar remains vulnerable as market easing expectations for the Federal Reserve remain high yet unmet. Fed’s Williams will be on the wires by the end of the American session, which may move markets.
- For Thursday, the December Consumer Price Index is projected to come in at 3.2% YoY, above the previous 3.1%. The core annual reading, however, is expected at 3.8%, easing from 4% in November.
- US bond yields, specifically for the 2, 5 and 10-year bonds, are on a downward trajectory. The yields are seen at 4.35%, 3.96% and 4.02%, which should limit upside for the USD.
- Market anticipations gauged through the CME FedWatch Tool suggest a hold on rates in the upcoming January meeting is priced in. Cuts in interest rates are, however, expected around March and May 2024.
Technical Analysis: DXY bulls are undecided as sellers sit just around the corner
The indicators on the daily chart reflect a decrease in buying momentum and increase in selling pressure. The Relative Strength Index (RSI), which is on a negative slope and in negative territory, suggests that bears are around the corner.
In addition, a decreasing histogram of green bars in the Moving Average Convergence Divergence (MACD) indicator confirms the growing bearish sentiment, indicative of a decrease in bullish momentum. Despite bulls taking a breather, they still are struggling to make a decisive upward move.
This lack of bullish momentum is also confirmed by the position of the index in relation to the Simple Moving Averages (SMAs). While it remains above the 20-day SMA, it is under the broader 100 and 200-day SMAs, suggesting bears are maintaining a bullish grip on the larger time horizon.
Support levels: 102.30, 102.00 (20-day SMA), 101.80.
Resistance levels: 102.70, 102.90, 103.00.
US Dollar FAQs
What is the US Dollar?
The US Dollar (USD) is the official currency of the United States of America, and the ‘de facto’ currency of a significant number of other countries where it is found in circulation alongside local notes. It is the most heavily traded currency in the world, accounting for over 88% of all global foreign exchange turnover, or an average of $6.6 trillion in transactions per day, according to data from 2022.
Following the second world war, the USD took over from the British Pound as the world’s reserve currency. For most of its history, the US Dollar was backed by Gold, until the Bretton Woods Agreement in 1971 when the Gold Standard went away.
How do the decisions of the Federal Reserve impact the US Dollar?
The most important single factor impacting on the value of the US Dollar is monetary policy, which is shaped by the Federal Reserve (Fed). The Fed has two mandates: to achieve price stability (control inflation) and foster full employment. Its primary tool to achieve these two goals is by adjusting interest rates.
When prices are rising too quickly and inflation is above the Fed’s 2% target, the Fed will raise rates, which helps the USD value. When inflation falls below 2% or the Unemployment Rate is too high, the Fed may lower interest rates, which weighs on the Greenback.
What is Quantitative Easing and how does it influence the US Dollar?
In extreme situations, the Federal Reserve can also print more Dollars and enact quantitative easing (QE). QE is the process by which the Fed substantially increases the flow of credit in a stuck financial system.
It is a non-standard policy measure used when credit has dried up because banks will not lend to each other (out of the fear of counterparty default). It is a last resort when simply lowering interest rates is unlikely to achieve the necessary result. It was the Fed’s weapon of choice to combat the credit crunch that occurred during the Great Financial Crisis in 2008. It involves the Fed printing more Dollars and using them to buy US government bonds predominantly from financial institutions. QE usually leads to a weaker US Dollar.
What is Quantitative Tightening and how does it influence the US Dollar?
Quantitative tightening (QT) is the reverse process whereby the Federal Reserve stops buying bonds from financial institutions and does not reinvest the principal from the bonds it holds maturing in new purchases. It is usually positive for the US Dollar.
- The Swiss Franc declines versus the Pound Sterling after BoE governor Bailey insists on significance of lowering inflation.
- Bailey said households were coping better than expected and wages were rising.
- The GBP/CHF gains for seventh consecutive day, extending its recovery.
The Swiss Franc (CHF) weakens against the Pound Sterling (GBP) for the seventh day in a row on Wednesday as the Governor of the Bank of England (BoE), Andrew Bailey, testifies before members of Parliament at the UK Treasury Select Committee.
Overall market sentiment is positive, with the Dow Jones Industrial Average and S&P 500 both edging higher at the time of writing. This marginally aids the Pound more than the safe-haven Swiss Franc.
Daily digest market movers: Swiss Franc trades lower versus the Pound Sterling as Bailey emphasizes inflation prerogative
- The Swiss Franc loses ground against the Pound as BoE’s Bailey reiterates the importance of returning inflation to target at a Treasury Select Committee meeting.
- UK households with mortgages are nowhere near as stretched as during the global financial crisis and household incomes in the UK have risen in recent months, says Bailey.
- This suggests the BoE is unlikely to cut interest rates anytime soon, a stance that contrasts with most other central banks, including the Federal Reserve, which is eyeing cuts in 2024.
- The Chairperson of the Swiss National Bank (SNB), Thomas Jordan, however, sidestepped questions from journalists about when and whether the SNB was considering cutting interest rates in Switzerland at the December meeting of the bank.
- The two central banks have similar stances at the moment, although inflation is higher in the UK, perhaps indicating the Pound could strengthen longer term.
Swiss Franc technical analysis: GBP/CHF short-term recovery extends
GBP/CHF – the number of Swiss Francs (CHF) that one Pound Sterling (GBP) can buy – rises for the seventh consecutive day, extending the short-term recovery rally.
The pair is in no clear trend on any time frame, however, and despite the recovery rally entering its seventh day, even the short-term trend is debatable.
-638405001148583533.png)
Pound Sterling vs Swiss Franc: 4-hour Chart
Analyzing GBP/CHF’s short-term trend using the 4-hour chart gives a mixed picture. Whilst the peaks and troughs are rising in a month-long series of higher highs and lows ever since the late November lows, the pair still has not broken above the critical 1.0900 level (last key lower high of the prior downtrend), which would provide more confidence that the trend had flipped from down to up.
The Relative Strength Index (RSI) is rising in line with price, suggesting the uptrend retains underlying strength. It has not entered the overbought region, which would indicate a growing risk of a pullback.
A further indication of strength is that it has broken above the 50 and 100 four-hour Simple Moving Averages (SMA).
That said, the speed of the move higher since the November lows has been rather slow when compared to the down move that preceded it – a sign this recovery could merely be a pullback within a broader downtrend.
A break below 1.0794 would suggest a recapitulation and the beginning of a new leg lower. A break above the day’s highs would suggest a continuation higher to just below the key 1.0900 level. A break above that would confirm a change in trend and more upside.
Swiss Franc FAQs
What key factors drive the Swiss Franc?
The Swiss Franc (CHF) is Switzerland’s official currency. It is among the top ten most traded currencies globally, reaching volumes that well exceed the size of the Swiss economy. Its value is determined by the broad market sentiment, the country’s economic health or action taken by the Swiss National Bank (SNB), among other factors. Between 2011 and 2015, the Swiss Franc was pegged to the Euro (EUR). The peg was abruptly removed, resulting in a more than 20% increase in the Franc’s value, causing a turmoil in markets. Even though the peg isn’t in force anymore, CHF fortunes tend to be highly correlated with the Euro ones due to the high dependency of the Swiss economy on the neighboring Eurozone.
Why is the Swiss Franc considered a safe-haven currency?
The Swiss Franc (CHF) is considered a safe-haven asset, or a currency that investors tend to buy in times of market stress. This is due to the perceived status of Switzerland in the world: a stable economy, a strong export sector, big central bank reserves or a longstanding political stance towards neutrality in global conflicts make the country’s currency a good choice for investors fleeing from risks. Turbulent times are likely to strengthen CHF value against other currencies that are seen as more risky to invest in.
How do decisions of the Swiss National Bank impact the Swiss Franc?
The Swiss National Bank (SNB) meets four times a year – once every quarter, less than other major central banks – to decide on monetary policy. The bank aims for an annual inflation rate of less than 2%. When inflation is above target or forecasted to be above target in the foreseeable future, the bank will attempt to tame price growth by raising its policy rate. Higher interest rates are generally positive for the Swiss Franc (CHF) as they lead to higher yields, making the country a more attractive place for investors. On the contrary, lower interest rates tend to weaken CHF.
How does economic data influence the value of the Swiss Franc?
Macroeconomic data releases in Switzerland are key to assessing the state of the economy and can impact the Swiss Franc’s (CHF) valuation. The Swiss economy is broadly stable, but any sudden change in economic growth, inflation, current account or the central bank’s currency reserves have the potential to trigger moves in CHF. Generally, high economic growth, low unemployment and high confidence are good for CHF. Conversely, if economic data points to weakening momentum, CHF is likely to depreciate.
How does the Eurozone monetary policy affect the Swiss Franc?
As a small and open economy, Switzerland is heavily dependent on the health of the neighboring Eurozone economies. The broader European Union is Switzerland’s main economic partner and a key political ally, so macroeconomic and monetary policy stability in the Eurozone is essential for Switzerland and, thus, for the Swiss Franc (CHF). With such dependency, some models suggest that the correlation between the fortunes of the Euro (EUR) and the CHF is more than 90%, or close to perfect.
With the potential for Fed rate cuts, the Canadian Dollar (CAD) is set to extend its gains, economists at Société Générale report.
Scandies are due for rehabilitation
The most interest rate sensitive developed-economy currencies are the ones sensitive to housing.
Lower Fed rates will help CAD extend recent modest gains and should also help SEK and NOK recover after a dire performance as rates rose.
The Scandinavian currencies will over-react to every twist and turn in risk sentiment, and NOK will remain sensitive to oil prices, but over time, both are due rehabilitation. If nothing else, they have gone very expensive tourist destinations to much more affordable ones, which will further help already sizeable current account surpluses, especially when Northern Hemisphere evenings start to lengthen on the fjords.
Dollar has started 2024 on the front foot. Economists at Rabobank analyze EUR/USD outlook for the coming months.
EUR to perform poorly in the months ahead
Despite this year’s adjustment in market pricing, in our view, investors are still too optimistically positioned for Fed rate cuts. The market currently sees scope for a 64 bps reduction in the Fed funds target on a 6-month view. We expect further correction in this outlook and consequently expect the USD to see some support on a 1-to-3-month view.
Additionally, we expect the EUR to perform poorly in the months ahead largely on the back of weakness in the German economy.
We see scope for EUR/USD to dip to 1.05 on a 3-month view before the impact of Fed rate cuts boosts risk appetite and weakens the USD in the second half of the year.
The US Bureau of Labor Statistics (BLS) will release the most important inflation measure, the US Consumer Price Index (CPI) figures, on Thursday, January 11 at 13:30 GMT. As we get closer to the release time, here are the forecasts by the economists and researchers of 10 major banks regarding the upcoming United States inflation print for December.
Headline CPI is expected to pick up a tick to 3.2% year-on-year while core is expected to fall two ticks to 3.8% YoY. On a monthly basis, headline inflation is seen at 0.2% while core CPI is expected at 0.3% for the second consecutive month.
TDS
We look for core inflation to slow down to 0.1% MoM from 0.3% in Nov, with the headline likely strengthening a tenth to 0.2%. Our unrounded core CPI forecast at 0.14% MoM suggests it will be a close call between a 0.1% and a 0.2% gain. The report is likely to show that used vehicle prices were a large drag on inflation, while OER/rents are expected to head modestly lower.
Deutsche Bank
We expect headline CPI (0.26%) to come in roughly in line with core (0.28%). This would equate to 3.9% and 3.3% YoY, a tenth ahead of consensus. We were at 4.0% and 3.1% last month. So core is not yet breaking through 3% on the downside and the 3 and 6m annualised rates are also likely to stay slightly above this mark.
ANZ
We expect core CPI inflation to have risen 0.2% MoM in December. A similar increase is expected for headline, although energy price volatility pose downside risks.
NBF
Food and shelter prices are expected to rise again, while a drop in gasoline prices should translate into a decline in the energy component. All of this could result in a 0.2% increase in prices on a monthly basis. If we're right, the YoY rate could rise from 3.1% to 3.2%. Core prices, for their part, could show a 0.3% monthly progression. On a 12-month basis, core inflation should still decline a tick from 4.0% to 3.9%.
SocGen
We expect a 0.2% headline increase and a 0.3% core CPI increase for December. Our more precise forecasts are for a 0.23% increase for the headline rounding down and a 0.28% increase on core rounding up. Energy prices help to suppress the headline increase but are not the drag they have been in the previous two months. We expect energy to be up 0.2%, while food-at-home prices are likely to climb 0.15%.
RBC Economics
We look for US CPI growth to show further signs of moderation in December, notwithstanding a likely tick higher in the YoY rate of headline price growth to 3.2% from 3.1% a month earlier. That small increase should be entirely explained by a smaller YoY decline in energy prices. We expect YoY price growth in core (excluding food and energy) products to slow to 3.8% from 4.0% on a more ‘normal’ looking 0.2% monthly (seasonally adjusted) increase from November. With price growth trending in the right direction and signs that economic growth is slowing, the Fed is widely expected to pivot to interest rate cuts in the first half of this year. Our own forecast assuming the first decrease comes in Q2.
Wells Fargo
We look for Thursday’s CPI report to show that inflation continues to slow on trend in a way that positions the FOMC to start cutting rates in June. We expect a 0.2% increase in headline CPI and a 0.3% increase in the core. Energy prices were more stable last month and are unlikely to repeat the major declines that occurred in October and November. We expect the disinflation in core goods to continue amid demand normalization, healthier supply chains and the fall in commodity prices from their peak. Core services inflation should also slow modestly relative to November, led by softer price increases for primary shelter.
Commerzbank
The information available to us on individual goods and services points to a change in consumer prices of around 0.25% compared to the previous month, both for the headline rate and for the core rate, which excludes energy and food. Whether the figure published by the statisticians, rounded to one digit, will be 0.2% or 0.3% cannot be clearly assessed on this basis. In terms of YoY rates, headline inflation could even increase slightly from 3.1% to 3.2%. In any case, we expect the core rate to fall, this time from 4.0% to 3.8%.
ING
We think the CPI report will show a soft print this month, given falling gasoline prices and more benign housing rent data. Core CPI is set to break below 4% YoY for the first time since May 2021, and this will give the Federal Reserve added confidence that inflation is on the path to sustainability reaching the 2% target by mid-2024.
CIBC
We expect headline and core prices both to rise by 0.3% MoM in the month. Core goods prices should show a somewhat weaker disinflationary impulse but services inflation will edge down to keep core inflation very close to the Fed’s target on a monthly basis. Our views on core inflation are slightly above consensus but it’s getting harder to get excited about CPI surprises given the progress observed on inflation over the past six months. We are now out of the territory where one report could change the FOMC’s thinking about near-term policy choices and markets understand this.
- EUR/USD recovers slightly in anticipation of US CPI release, with ECB members' statements weighing on the Euro.
- ECB Vice-President de Guindos hints at possible Eurozone recession, while Schnabel affirms stance on inflation control.
- EUR/USD traders focus on upcoming US inflation figures and unemployment claims.
The Euro (EUR) pares some of its Tuesday’s losses and gains ground versus the US Dollar (USD) on Wednesday in muted trading due to investors expecting the release of the latest inflation figures in the United States (US). Nevertheless, some European Central Bank (ECB) members had crossed the wires, weighing on the shared currency. The EUR/USD is trading at 1.0937, posting minuscule gains of 0.06%.
The shared currency capped by ECB’s officials turning less hawkish, open the door for rate cuts
ECB Vice-President Luis de Guindos commented that the Eurozone’s (EU) economy might have been in recession last quarter, and its prospects look weak. He added, “Soft indicators point to an economic contraction in December, too, confirming the possibility of a technical recession in the second half of 2023 and weak prospects for the near term.” Regarding monetary policy, he supports the current level of interest rates.
Recently, ECB’s member Isabel Schnabel agreed with de Guindo's position about a weaker economic outlook for the EU and emphasized the central bank Is on the right path to curb inflation. She added that geopolitical tensions are one of the upside risks to inflation.
Meanwhile, on the dovish side of the spectrum lies ECB’s Centeno stated the central bank should not wait until May to make policy decisions, while Villeroy added the ECB would cut rates in 2024.
Across the pond, the US economic docket is scarce, with investors awaiting the release of the latest inflation report on Thursday. The Consumer Price Index (CPI) for December is expected to rise to 3.2% YoY, from 3.1% in November, while the Core CPI is foreseen to slow from 4% to 3.8% YoY. At the same time, the US Bureau of Labor Statistics (BLS) would announce the latest unemployment claims report for the week ending January 6.
EUR/USD Price Analysis: Technical outlook
The daily chart portrays the pair in consolidation, capped by the boundaries of last Friday’s high and low each at 1.0998/1.0876, with neither buyers nor sellers able to crack the range. For a bullish resumption, EUR/USD buyers must reclaim the January 9 high of 1.0966, followed by January 8 at 1.0978, ahead of challenging 1.1000. On the other hand, if sellers push prices below the January 9 low of 1.0910, that could open the door to breaching the 1.0900 figure, followed by the 50-day moving average at 1.0885.
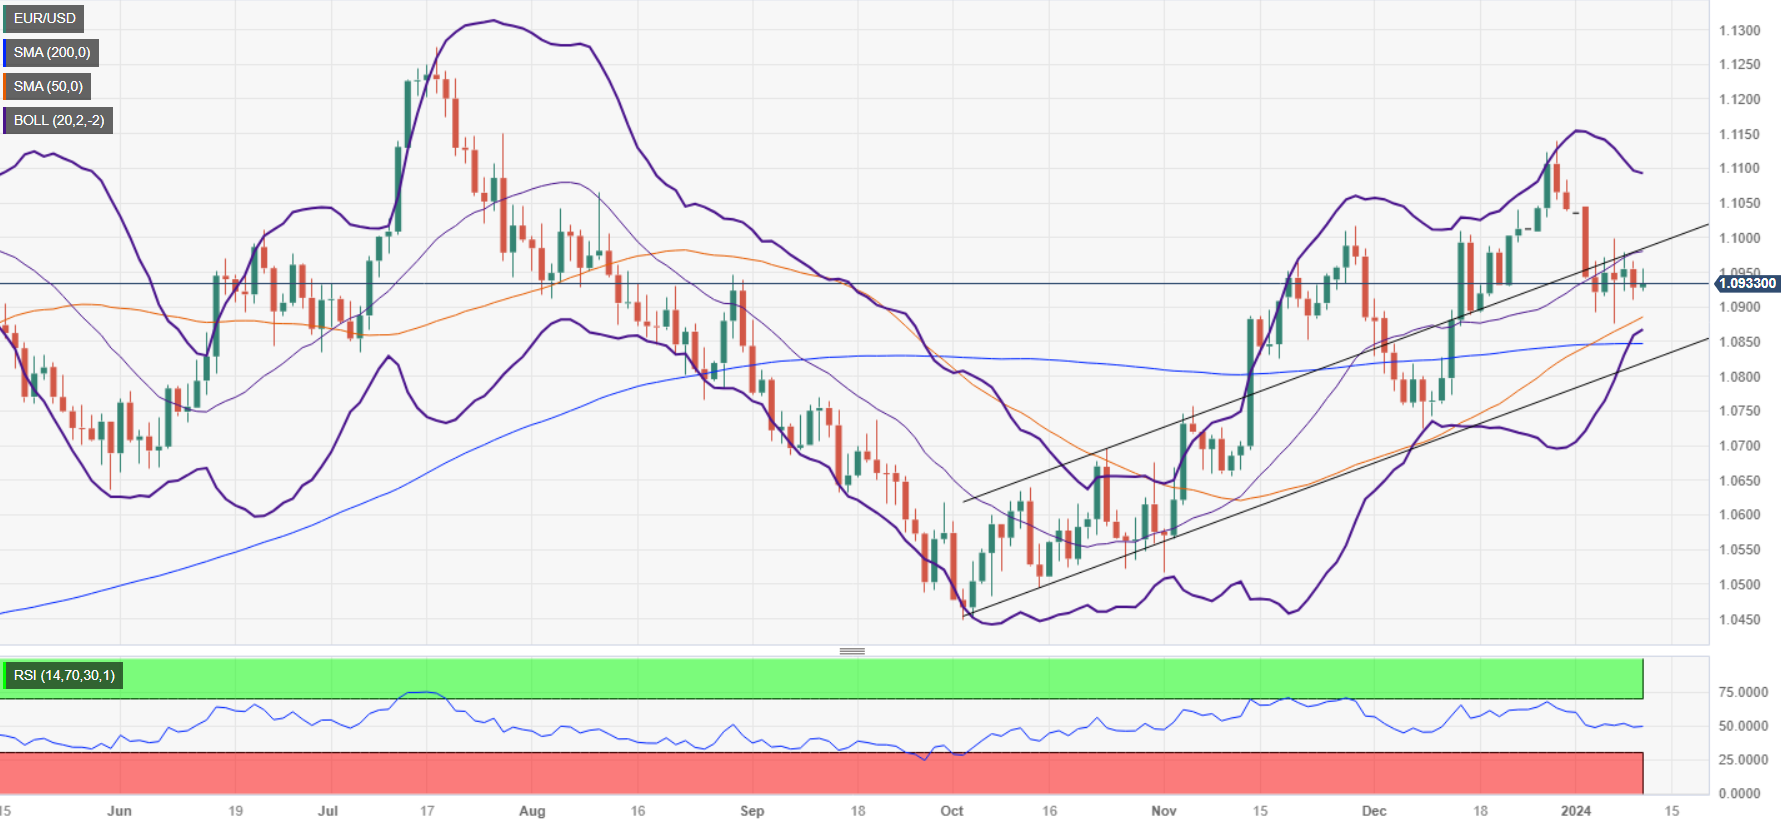
Euro FAQs
What is the Euro?
The Euro is the currency for the 20 European Union countries that belong to the Eurozone. It is the second most heavily traded currency in the world behind the US Dollar. In 2022, it accounted for 31% of all foreign exchange transactions, with an average daily turnover of over $2.2 trillion a day.
EUR/USD is the most heavily traded currency pair in the world, accounting for an estimated 30% off all transactions, followed by EUR/JPY (4%), EUR/GBP (3%) and EUR/AUD (2%).
What is the ECB and how does it impact the Euro?
The European Central Bank (ECB) in Frankfurt, Germany, is the reserve bank for the Eurozone. The ECB sets interest rates and manages monetary policy.
The ECB’s primary mandate is to maintain price stability, which means either controlling inflation or stimulating growth. Its primary tool is the raising or lowering of interest rates. Relatively high interest rates – or the expectation of higher rates – will usually benefit the Euro and vice versa.
The ECB Governing Council makes monetary policy decisions at meetings held eight times a year. Decisions are made by heads of the Eurozone national banks and six permanent members, including the President of the ECB, Christine Lagarde.
How does inflation data impact the value of the Euro?
Eurozone inflation data, measured by the Harmonized Index of Consumer Prices (HICP), is an important econometric for the Euro. If inflation rises more than expected, especially if above the ECB’s 2% target, it obliges the ECB to raise interest rates to bring it back under control.
Relatively high interest rates compared to its counterparts will usually benefit the Euro, as it makes the region more attractive as a place for global investors to park their money.
How does economic data influence the value of the Euro?
Data releases gauge the health of the economy and can impact on the Euro. Indicators such as GDP, Manufacturing and Services PMIs, employment, and consumer sentiment surveys can all influence the direction of the single currency.
A strong economy is good for the Euro. Not only does it attract more foreign investment but it may encourage the ECB to put up interest rates, which will directly strengthen the Euro. Otherwise, if economic data is weak, the Euro is likely to fall.
Economic data for the four largest economies in the euro area (Germany, France, Italy and Spain) are especially significant, as they account for 75% of the Eurozone’s economy.
How does the Trade Balance impact the Euro?
Another significant data release for the Euro is the Trade Balance. This indicator measures the difference between what a country earns from its exports and what it spends on imports over a given period.
If a country produces highly sought after exports then its currency will gain in value purely from the extra demand created from foreign buyers seeking to purchase these goods. Therefore, a positive net Trade Balance strengthens a currency and vice versa for a negative balance.
Gold recorded strong gains in 2023. Strategists at Société Générale analyze the yellow metal’s outlook.
Gold had its moment in the spotlight late last year
Gold had its moment in the spotlight late last year, hitting a new all-time high in December as the Federal Reserve signalled an inflection point in its tightening cycle.
As the saying goes ‘it is better to travel well than to arrive’, and it is hard for us to see the immediate catalyst to a further leg-up.
See – Gold Price Forecast: Slightly weaker XAU/USD is justified in the short term – Commerzbank
While testifying before the UK Treasury Select Committee, Bank of England (BoE) Governor Andrew Bailey reiterated that it's important to return the UK to the inflation target.
Bailey added that UK households with mortgages are nowhere near as stretched as during the global financial crisis, adding that household incomes have risen in recent months.
He noted that the tragic event in the Middle East haven't yet had a big economic impact but added that they were watching them closely.
Market reaction
These comments don't seem to have triggered a noticeable reaction in GBP/USD. As of writing, the pair was up 0.13% on the day at 1.2720.
"The drop in unemployment to a historical low confirms continued strong resilience in labour markets, which is broadly in line with the December 2023 staff projections," European Central Bank (ECB) executive board member Isabel Schnabel said on social media Platform X on Monday.
"As inflation falls, we continue to expect a gradual decline in wage growth in 2024," Schnabel added in response to a question about wage inflation.
Market reaction
EUR/USD showed no immediate reaction to these comments and was last seen gaining 0.06% on the day at 1.0938.
- AUD/USD aims stability above 0.6700 ahead of us Inflation data.
- A sharp decline in the Australian monthly CPI indicates that the RBA’s ‘rate-tightening’ campaign has come to an end.
- Investors await the speech from Fed Williams for further guidance on interest rates.
The AUD/USD pair struggles to sustain above the round-level support of 0.6700 in the late European session. The Aussie asset holds majority of intraday gains as the US Dollar Index (DXY) has come under pressure ahead of the United States Consumer Price Index (CPI) data for December.
The S&P500 is expected to open on a subdued note, considering overnight futures. The market mood could turn cautious as investors await the US CPI data, which will guide further action in the FX domain. The USD Index is slightly lower around 102.50 and 10-year US Treasury yields have dropped to 3.99%.
Investors will keenly focus on the US inflation data as it will guide whether the Fed will discuss about cutting interest rates from March. As per the preliminary consensus, the monthly and core headline inflation rose by 0.2% and 3.2% respectively. Monthly core CPI grew at a steady pace of 0.3% while the annual data decelerated to 3.8% from the former reading of 4.0%.
If the inflation report turns out hotter-than-projected, bets in favour of rate cuts from March would ease further. As per the CME Fedwatch tool, the chances for first rate cut in March are at 66% from 90% a week ago.
Meanwhile, investors await the speech from New York Fed Bank President John Williams, which is expected at 20:15 GMT. Investors will keenly watch whether Fed Williams will maintain a restrictive interest rate stance or shift to endorsing early rate cuts.
On the Australian Dollar front, a sharp fall in monthly Consumer Price Index (CPI) has strengthened hopes that the Reserve Bank of Australia (RBA) has reached to an endgame. The monthly CPI data softened to 4.3% against expectations of 4.4% and the prior reading of 4.9%.
The USD is a little softer overall on the session so far. Economists at Scotiabank analyze Dollar’s outlook.
Markets lack motivation ahead of US CPI
There is little to suggest FX markets are doing anything different from the trading patterns seen so far this week – idling ahead of Thursday’s US CPI data.
Short-term DXY technical trading patterns suggest a softer USD undertone overall on the day so far which may mean more USD drift in the short run and some slippage in the DXY to the lower end of its post-NFP trading range (near 101.90/102.00).
EUR/USD edges higher but consolidation range trade persists, economists at Scotiabank report.
The broader corrective undertone is clear on the weekly chart
Flat range trading in spot is extending further after Friday’s intraday volatility.
Short-term patterns lean somewhat bearish, however, and the broader corrective (negative) undertone in the EUR is clear on the weekly chart after the turn lower in spot from the late December high.
EUR resistance is 1.0975/1.1000. Support is 1.0900/1.0910.
- USD/CAD consolidates below 1.3400 as investors await the US Inflation data.
- Bets in favour of rate cuts from the Fed in March may deepen if the US CPI report turns out sticky.
- USD/CAD reflects a volatility contraction pattern formation.
The USD/CAD pair falls slightly to near 1.370 after failing to sustain above the round-level resistance of 1.3400. The Loonie asset demonstrates a sheer consolidation as investors shift focus towards the United States inflation data for December, which will be published on Thursday.
S&P500 futures struggle to hold gains as market mood remains cautious. The US Dollar Index (DXY) drops to near 102.44 despite persistent uncertainty over rate cuts by the Federal Reserve (Fed). 10-year US Treasury yields have slipped slightly below 4.0%.
Investors will keenly watch the US inflation data as it will provide fresh cues about likely rate cuts by the Federal reserve (Fed) in March. According to the estimates, the headline inflation rose by 0.2% against 0.1% growth in November. The annual headline Consumer Price Index (CPI) grew by 3.2% from 3.1% increase a month ago.
Meanwhile, core inflation grew steadily on a monthly basis. The annual core CPI data decelerated to 3.8% against the former reading of 4.0%.
USD/CAD struggles for a direction amid formation of a volatility contraction pattern on an hourly scale near 1.3400. A sharp decline in volatility indicates indecisiveness among market participants amid absence of a potential trigger. Horizontal resistance plotted from December 15 high around 1.3405 continues to act as barricade for US Dollar bulls.
The 50-period Exponential Moving Average (EMA) around 1.3380 continues to provide support to the US Dollar.
The Relative Strength Index (RSI) (14) oscillates in a 40.00-60.00 range, which indicates a consolidation ahead.
Fresh upside would appear if the Loonie asset breaks above January 9 high of 1.3415. This would open upside towards December 3 low at 1.3480, followed by December 5 low at 1.3540.
On the flip side, a downside move below January 5 low at 1.3288 would expose the asset to December 22 low at 1.3220. Breach of the latter would build more pressure on the asset and will drag it towards December 27 low at 1.3177.
USD/CAD hourly chart
-638404889666400456.png)
USD/CAD edges slightly lower after 1.34+ rebuff. Economists at Scotiabank analyze the pair’s outlook.
Underlying uptrend in place since the turn of the year remains intact
Momentum is weak and the underlying uptrend in place since the turn of the year remains intact. That should mean USD support around 1.3350/1.3360.
A firm close on the week through last Friday continues to tilt broader risks to the topside and should also help limit scope for USD/CAD losses in the short run.
Corrective potential may extend to the 1.3450/1.3550 range in the next few weeks.
GBP/USD recovers its early losses but may struggle to extend, economists at Scotiabank report
1.2600 is key support
Solid Sterling gains from the daily low just under 1.27 cast a positive light on near-term price action but there has been little follow through demand through the low 1.27s and broader trading patterns still lean somewhat bearish for the Pound’s outlook.
A flat trading range that developed over the past month above 1.26 might yet develop into a bearish Head & Shoulders reversal (bearish on a break under 1.2600 for a drop back to 1.2370/1.2380).
Intraday resistance is 1.2760/1.2770. Support is 1.2690.
- The US Dollar comes at a halt with some minor gains for this week’s performance.
- Traders are on the lookout for any guidance from Fed’s Williams.
- The US Dollar Index remains above 102.00, clinging on to weekly gains.
The US Dollar (USD) trades steady with markets easing a touch. Traders will want to stay out of the market ahead of the main event on Thursday when the US inflation will be printed in the form of the Consumer Price Index (CPI) numbers. Expectations have never been higher as another slowdown in the numbers will make the Federal Reserve (Fed) more likely to cut interest rates sooner, rather than later, and vice versa.
On the economic front, rather a light calendar with the only notable point the upcoming speech from New York Federal Reserve President John Williams. Known to be a very neutral person, in regards to his stance at the Federal Open Market Committee (FOMC), any hawkish or dovish comments could trigger a market reaction. He is due to speak near 20:15 GMT this Wednesday.
Daily digest market movers: Fed to guide
- At 12:00 GMT, the Mortgage Bankers Association (MBA) has released its weekly Mortgage Applications number. The last week of December registered -10.7% with a positive 9.9% for the first week of January.
- Near 15:00 US Wholesale Inventories are due to be released. Expectation is a steady -0.2% for November.
- The US Treasury is heading to markets yet again, for a 10-Year Note Auction near 18:00 GMT.
- Main event for this Wednesday will take place around 20:15 GMT with a speech from New York Fed member John Williams.
- Equity markets are mixed again on Wednesday, with Japan soaring further while its Nikkei prints new all-time highs. China is coming off worse with negative results while traders await further stimulus packages from the Chinese government before buying into Chinese equities. European and US equities are in the green, overall near 0.50%.
- The CME Group’s FedWatch Tool shows that markets are pricing in a 95.3% chance that the Federal Reserve will keep interest rates unchanged at its January 31 meeting. Around 4.7% expect the first cut already to take place.
- The benchmark 10-year US Treasury Note holds near 4%, with pressure building for rates to decline. This could mean that the US Dollar is set to weaken soon.
US Dollar Index Technical Analysis: Dead calm
The US Dollar is coming to a halt after printing a nice profit on Tuesday, according to the US Dollar Index (DXY). While those gains are reversing again this Wednesday, it is becoming clear that the DXY will go nowhere until the main event of this week, the US CPI print on Thursday. No big waves are expected this Wednesday, unless a catalyst pops up and shakes the tree by surprise.
The first level to watch on the upside is 103.00, which falls nearly in line with the trend line from the top of October 3 and December 8. If broken and closed above, the 200-day Simple Moving Average (SMA) at 103.43 comes into play. The 104.00 level might be too far off, with 103.78 (55-day SMA) coming in as the next resistance.
To the downside, a rejection by the descending trendline will give fuel to Greenback bears leading to a further downturn. The line in the sand here is 101.74, the floor which held halfway through December before breaking down in the last two weeks. In case the DXY snaps this level, expect to see a test at the low near 100.80.
US Dollar FAQs
What is the US Dollar?
The US Dollar (USD) is the official currency of the United States of America, and the ‘de facto’ currency of a significant number of other countries where it is found in circulation alongside local notes. It is the most heavily traded currency in the world, accounting for over 88% of all global foreign exchange turnover, or an average of $6.6 trillion in transactions per day, according to data from 2022.
Following the second world war, the USD took over from the British Pound as the world’s reserve currency. For most of its history, the US Dollar was backed by Gold, until the Bretton Woods Agreement in 1971 when the Gold Standard went away.
How do the decisions of the Federal Reserve impact the US Dollar?
The most important single factor impacting on the value of the US Dollar is monetary policy, which is shaped by the Federal Reserve (Fed). The Fed has two mandates: to achieve price stability (control inflation) and foster full employment. Its primary tool to achieve these two goals is by adjusting interest rates.
When prices are rising too quickly and inflation is above the Fed’s 2% target, the Fed will raise rates, which helps the USD value. When inflation falls below 2% or the Unemployment Rate is too high, the Fed may lower interest rates, which weighs on the Greenback.
What is Quantitative Easing and how does it influence the US Dollar?
In extreme situations, the Federal Reserve can also print more Dollars and enact quantitative easing (QE). QE is the process by which the Fed substantially increases the flow of credit in a stuck financial system.
It is a non-standard policy measure used when credit has dried up because banks will not lend to each other (out of the fear of counterparty default). It is a last resort when simply lowering interest rates is unlikely to achieve the necessary result. It was the Fed’s weapon of choice to combat the credit crunch that occurred during the Great Financial Crisis in 2008. It involves the Fed printing more Dollars and using them to buy US government bonds predominantly from financial institutions. QE usually leads to a weaker US Dollar.
What is Quantitative Tightening and how does it influence the US Dollar?
Quantitative tightening (QT) is the reverse process whereby the Federal Reserve stops buying bonds from financial institutions and does not reinvest the principal from the bonds it holds maturing in new purchases. It is usually positive for the US Dollar.
Economists at MUFG Bank expect the EUR/USD pair to extend its decline and test the 1.0700 mark.
Greater scope of USD strength on stronger data than weakness on weak data
The EUR/USD rate does look to have over-extended to the upside during the end-2023 US dollar sell-off and if we are to see a realignment of spot to relative short-term rate levels, then there is scope for EUR/USD to continue drifting lower toward the 1.0700 level.
Given our analysis shows an overshoot of EUR/USD spot relative to rates spread, we see greater scope of US Dollar strength on stronger data than weakness on weak data.
- WTI Oil steadies near $72 after a positive close on Tuesday.
- Overnight API was a chunky drawdown of over 5 million barrels.
- The DXY US Dollar Index holds above 102.00, while traders keep powder dry ahead of Thursday’s US inflation reading.
Oil prices are going nowhere despite quite a few bullish elements to take into account this Wednesday. The overnight publication from the American Petroleum Institute (API) revealed a massive draw down of 5.2 million barrels from last week. Meanwhile the US Energy Information Administration (EIA) has released a forecast that demand is to exceed the current Oil supply in 2024 by roughly 120,000 barrels per day on average – and would grow substantially even more should OPEC+ issue more production cuts.
Meanwhile, the DXY US Dollar Index, a key factor driving Oil valuations, is holding ground at 102.00 despite some selling pressure overnight. Traders are keeping the Greenback steady ahead of the main event for this week, the US Consumer Price Index (CPI) on Thursday. The print could be a gamechanger for 2024. Lower CPI would mean quicker interest rate cuts from the US Federal Reserve and a weaker US Dollar (bullish for Oil prices).
At the same time, given Oil is a key component in inflation, and since Oil prices came down substantially in the second half of last year, this could further help abate inflation pressures in the US.
Crude Oil (WTI) trades at $71.90 per barrel, and Brent Oil trades at $77.97 per barrel at the time of writing.
Oil News and Market Movers: Demand to pickup
- The US Energy Information Administration (EIA) released its forecast for 2024. A shortage of 120,000 barrels per day is to be expected, as long as OPEC+ does not add more production cuts.
- The overnight print of the American Petroleum Institute had a firm draw down of 5.2 million barrels against last week. The number was a bit of a surprise, certainly when compared to distillates and gasoline which saw substantial builds of 4.9 million barrels for gasoline and 6.9 million for distillates.
- Standard Chartered said in a report on Tuesday that Oil prices are trading $10 beneath their actual fair value.
- Around 15:30 GMT the weekly print of the Energy Information Administration (EIA) will take place. Expectation is for another drawdown of 675,000 barrels against 5.5 million barrels last week. Expectations for this week ranged from a draw of 2.6 million barrels to a build up of 2.1 million barrels.
Oil Technical Analysis: Oil is not dead at all
Oil prices are not moving on the back of the massive drawdown that was reported overnight by the API. The main reason for this was that the chunky drawdown in crude barrels was paired by large builds in both gasoline and distillates. Should the overnight EIA data reveal a draw down on all fronts, expect a bullish move in Oil prices.
On the upside, $74 is still holding importance, although the level has become very chopped up. Once back above this, $80 comes into the picture. Still far off, $84 is next on the topside once Oil sees a few daily closes above the $80 level.
Below $74, the $67 level could still come into play as the next support to trade at, as it aligns with a triple bottom from June. Should that triple bottom break, a new low for 2023 could be close at $64.35 – the low of May and March – as the last line of defence. Although still quite far off, $57.45 is worth mentioning as the next level to keep an eye on if prices fall sharply.
-638404802712995541.png)
US WTI Crude Oil: Daily Chart
WTI Oil FAQs
What is WTI Oil?
WTI Oil is a type of Crude Oil sold on international markets. The WTI stands for West Texas Intermediate, one of three major types including Brent and Dubai Crude. WTI is also referred to as “light” and “sweet” because of its relatively low gravity and sulfur content respectively. It is considered a high quality Oil that is easily refined. It is sourced in the United States and distributed via the Cushing hub, which is considered “The Pipeline Crossroads of the World”. It is a benchmark for the Oil market and WTI price is frequently quoted in the media.
What factors drive the price of WTI Oil?
Like all assets, supply and demand are the key drivers of WTI Oil price. As such, global growth can be a driver of increased demand and vice versa for weak global growth. Political instability, wars, and sanctions can disrupt supply and impact prices. The decisions of OPEC, a group of major Oil-producing countries, is another key driver of price. The value of the US Dollar influences the price of WTI Crude Oil, since Oil is predominantly traded in US Dollars, thus a weaker US Dollar can make Oil more affordable and vice versa.
How does inventory data impact the price of WTI Oil
The weekly Oil inventory reports published by the American Petroleum Institute (API) and the Energy Information Agency (EIA) impact the price of WTI Oil. Changes in inventories reflect fluctuating supply and demand. If the data shows a drop in inventories it can indicate increased demand, pushing up Oil price. Higher inventories can reflect increased supply, pushing down prices. API’s report is published every Tuesday and EIA’s the day after. Their results are usually similar, falling within 1% of each other 75% of the time. The EIA data is considered more reliable, since it is a government agency.
How does OPEC influence the price of WTI Oil?
OPEC (Organization of the Petroleum Exporting Countries) is a group of 13 Oil-producing nations who collectively decide production quotas for member countries at twice-yearly meetings. Their decisions often impact WTI Oil prices. When OPEC decides to lower quotas, it can tighten supply, pushing up Oil prices. When OPEC increases production, it has the opposite effect. OPEC+ refers to an expanded group that includes ten extra non-OPEC members, the most notable of which is Russia.
The Brazilian Real weakened by 0.4% vs. the US Dollar in the first week of 2024 Economists at Société Générale analyze USD/BRL technical outlook.
Defence of 4.84 crucial for continuation in bounce
USD/BRL broke through the key support of 4.84 late last month, but the decline has stalled. The pair quickly crossed above this level denoting a false break. The bounce has so far remained contained near 200-DMA.
Recent pivot high at 4.98 remains an important hurdle. If the pair overcomes this resistance, the rebound is likely to extend towards the trend line drawn since November 2022 near 5.07/5.11.
Defence of 4.84 would be crucial for continuation in bounce.
Sterling is off to the best start to the new year in G10, second only to the Dollar. Economists at Société Générale analyze GBP outlook.
Pricing of aggressive future rate cuts by the ECB vs. the BoE should keep a lid on EUR/GBP upside
The retracement of EUR/GBP towards 0.86 potentially brings a return to the December low of around 0.8550 into play.
The price action dovetails with the 13 bps widening of 2y and 10y bond yield differentials in favour of Sterling.
The pricing of aggressive future rate cuts by the ECB vs. the BoE should keep a lid on EUR/GBP upside.
- EUR/USD climbs to neat 1.0950 as USD Index comes under pressure after nominal improvement in risk-appetite.
- The US inflation data is seen as sticky amid tight labor market conditions.
- ECB Guindos expects a technical recession in the Eurozone.
The EUR/USD pair recovers to near 1.0950 in the European session as the US Dollar Index (DXY) has faced pressure ahead of the United States inflation data for December. Broadly, the major currency pair demonstrates a volatility contraction as investors are expected to take an informed decision after the release of the US Consumer Price Index (CPI).
S&P500 futures have added nominal gains in the London session. The broader market mood is still cautious as investors remain uncertain about the inflation data. The US Dollar Index (DXY) has faced selling pressure around 102.60. The 10-year US Treasury yields have dropped slightly below 4.0%.
As per the estimates, the headline inflation rose at a higher pace of 0.2% against 0.1% increase in November. The annual headline data accelerated to 3.2% vs. the prior reading of 3.1%. Meanwhile, core inflation that doesn’t take into account the volatile oil and food prices grew at a steady pace of 0.3%. The core CPI decelerated to 3.8% from increasing 4% in November, on an annual basis.
A sticky inflation report is expected to dent bets in favour of rate cuts by the Federal Reserve (Fed) from March. Fed policymakers have been supporting for keeping interest rates higher atleast until the end of first-half. Policymakers lack confidence that inflation is returning to the 2% target in a timely manner.
On the Eurozone front, European Central Bank (ECB) Vice President Luis de Guindos said that the process of inflation returning to 2% is expected to pause temporarily. Guindos is worried about a technical recession and weak economic prospects as economic indicators are reflecting a shrinkage in the oldest continent.
This week, monthly Eurozone Retail Sales data, released for November, contracted by 0.3% as expected. Higher interest rates and price pressures have deepening cost-of-living crisis, which have dampened the consumer spending momentum.
It has been a quiet start to the week in FX. Today, economists at ING will keep an eye on a speech by Fed member John Williams ahead of Thursday’s US Consumer Price Index (CPI)
DXY should keep hovering around the 102.50 level today
Markets are in wait-and-see mode ahead of Thursday’s US CPI data and currently lacking a clear sense of direction.
Our view remains that a gradual repricing of Federal Reserve rate expectations to a later start of the easing cycle will keep risk assets on unstable ground in the near term, helping the Dollar recover some ground before a clearer downtrend emerges.
Today, the US calendar is quiet, with only MBA application numbers in focus. It will be more interesting to hear from New York Fed President John Williams in his speech about the 2024 economic outlook.
DXY should keep hovering around the 102.50 level until Thursday’s inflation data unless Williams moves the market.
Focus turns to Scandinavia. Economists at ING analyze SEK/NOK outlook after Norway released inflation data. In Sweden, the December Consumer Price Index (CPI) will be published next week.
Norwegian underlying inflation declines further
Norway released CPI figures for December, showing headline inflation remained unchanged at 4.8% while underlying inflation declined from 5.8% to 5.5%. We expect further progress on disinflation and a deterioration in global conditions to lead to rate cuts by Norges Bank as early as 2Q, broadly in line with market expectations.
In Sweden, December CPI numbers are released next week: expect some action in the Krona.
We currently see some room for a rebound in SEK/NOK before the pair enters a structural downtrend that we see lasting until late this year.
- Gold price finds an interim support ahead of the US inflation data.
- The US headline and core inflation grew by 0.2% and 0.3% respectively in December.
- The likelihood of a rate cut by the Fed from March has eased due to solid labor market conditions.
Gold price (XAU/USD) recovered on Wednesday after a slight fall in 10-year US Treasury yields as investors shift focus towards the United States inflation data for December, which will be released on Thursday. The recovery in the Gold price is expected to remain short-lived as investors’ confidence that the Federal Reserve (Fed) will start cutting interest rates from March has been shaken. This is due to upbeat labor market conditions and the fact that core Consumer Price Index (CPI) is double the desired rate of 2%.
Fed policymakers have been supporting a tighter monetary policy stance and endorsing interest rate cuts in the second-half this year, until they are more confident that inflation will return to 2%. Furth action in bullions and safe-haven assets will be guided by the US inflation data. A softer-than-anticipated inflation report will boost hopes in favour of rate cuts from March – supporting the Gold price – while escalated numbers could build more stress.
Daily Digest Market Movers: Gold price recovers while US Yields face pressure
- Gold price aims for a firm-footing around $2,030 after two-weeks of decline as US Treasury Yields have dropped ahead of the United States inflation data for December.
- The 10-year US Treasury yields have slipped to near 4.04% as inflation data is eyed.
- The upside in the precious metal is expected to remain restricted as investors are expected to wait before taking informed decisions post release of the inflation data.
- The precious metal remained under pressure lately as investors cut bets in favour of rate cuts by the Federal Reserve from March due to healthy labor market conditions and the core inflation remaining double the required rate of 2%.
- As per the CME Fedwatch tool, the chances of Fed reducing interest rates by 25 basis points (bps) to 5.00-5.25% have dropped to 63% from 90% a week earlier.
- Apart from that, Fed policymakers are leaning towards a restrictive interest rate stance until price stability gets ensured.
- This week, Atlanta Fed Bank President Raphael Bostic said he is naturally biased towards a tight monetary policy stance until he is sure that the underlying inflation will return to 2% before supporting rate cuts.
- Raphel Bostic sees the first interest rate cut coming in the third quarter and two quarter-percent rate cuts due in the final quarter this year.
- Meanwhile, the US Dollar Index (DXY) trades topsy-turvy around 102.50 ahead of the US inflation data.
- As per the consensus, the monthly headline inflation is expected to have grown at a higher pace of 0.2% against 0.1% increase in November. In the same period, the core CPI that strips off volatile food and Oil prices is seen rising steadily by 0.3%.
- Annually, the headline inflation is forecast to have accelerated to 3.2% against 3.1% growth in November while the core inflation softened to 3.8% vs. the former reading of 4.0%.
- A sticky inflation report may result in a further decline in the chances Fed policymakers will roll back their restrictive monetary policy stance while moderate numbers could boost hopes of rate cuts from March.
- Before the US inflation data, investors will focus on the speech from New York Federal Reserve President John Williams. The Gold price could face more pressure if Williams joins Raphael Bostic in support of waiting till the end of the year before making rate cuts.
Technical Analysis: Gold price aims sustainability above $2,030
Gold price has corrected more than 3% from 28 December 2023 high around $2,090 as uncertainty over rate cuts by the Fed continues to persist. The near-term demand for the Gold price is not bullish anymore as the 20-day Exponential Moving Average (EMA) around $2,038 is acting as a strong barrier. While the broader trend is still bullish as the 50-and 200-day EMAs are sloping higher. More downside could appear if the yellow metal drops below three-week low around $2,016.
Gold FAQs
Why do people invest in Gold?
Gold has played a key role in human’s history as it has been widely used as a store of value and medium of exchange. Currently, apart from its shine and usage for jewelry, the precious metal is widely seen as a safe-haven asset, meaning that it is considered a good investment during turbulent times. Gold is also widely seen as a hedge against inflation and against depreciating currencies as it doesn’t rely on any specific issuer or government.
Who buys the most Gold?
Central banks are the biggest Gold holders. In their aim to support their currencies in turbulent times, central banks tend to diversify their reserves and buy Gold to improve the perceived strength of the economy and the currency. High Gold reserves can be a source of trust for a country’s solvency. Central banks added 1,136 tonnes of Gold worth around $70 billion to their reserves in 2022, according to data from the World Gold Council. This is the highest yearly purchase since records began. Central banks from emerging economies such as China, India and Turkey are quickly increasing their Gold reserves.
How is Gold correlated with other assets?
Gold has an inverse correlation with the US Dollar and US Treasuries, which are both major reserve and safe-haven assets. When the Dollar depreciates, Gold tends to rise, enabling investors and central banks to diversify their assets in turbulent times. Gold is also inversely correlated with risk assets. A rally in the stock market tends to weaken Gold price, while sell-offs in riskier markets tend to favor the precious metal.
What does the price of Gold depend on?
The price can move due to a wide range of factors. Geopolitical instability or fears of a deep recession can quickly make Gold price escalate due to its safe-haven status. As a yield-less asset, Gold tends to rise with lower interest rates, while higher cost of money usually weighs down on the yellow metal. Still, most moves depend on how the US Dollar (USD) behaves as the asset is priced in dollars (XAU/USD). A strong Dollar tends to keep the price of Gold controlled, whereas a weaker Dollar is likely to push Gold prices up.
Australia’s November inflation eased further to 4.3% year-on-year, down from +4.9% in October. Despite the downside surprise, it is too early for the Reserve Bank of Australia (RBA) to consider cuts, in the view of economists at TD Securities.
CPI moving in the right direction
Australian monthly inflation for November printed 4.3% YoY. This follows the 4.9% YoY monthly October CPI print undershooting expectations. Inflation outcomes are clearly moving in the right direction.
We believe the RBA will welcome today's report but it's too early for the Bank to pop the champagne. While Tradables CPI at 1.6% YoY is the lowest since May'21, Non-Tradables CPI at 5.7% YoY is still too high, and this is after accounting for rental assistance and electricity rebates. The risk for the RBA is that domestic prices remain sticky.
Our sense is that markets have priced in RBA easing too quickly and we would be biased in favour of RBA OIS steepeners as some of this easing is priced out.
- GBP/JPY halts a losing streak on downbeat Japanese labor data.
- Japanese Labor Cash Earnings (YoY) reduced to 0.2% from the previous reading of 1.5%.
- Traders will likely observe BoE Governor Andrew Bailey’s speech to gain fresh impetus on the interest rate trajectory.
GBP/JPY snaps a two-day losing streak, improving to near 184.40 during the European session on Wednesday. The Japanese Yen (JPY) encountered challenges following a downbeat Japanese Labor Cash Earnings report, which indicated an annual contraction of 0.2% in November. This figure deviated from the market consensus, which anticipated a consistent rate of 1.5%. In addition, after adjusting for inflation, real wages showed a notable decline of 3.0% year-on-year. This data underscores the tough conditions faced by workers in terms of their purchasing power.
However, with falling rates of inflation in Tokyo, expectations remain firm that the Bank of Japan (BoJ) will not shift away from negative interest rates in January. This perception continues to exert downward pressure on the Japanese Yen (JPY), which in turn, supports the GBP/JPY pair.
The Pound Sterling (GBP) gains support amid expectations that the Bank of England (BoE) will stick to its stance on further rate hikes, despite easing indicators like inflation and wage growth. However, investors remain cautious due to the increasing risks of a technical recession in the United Kingdom.
According to former Bank of England monetary policy committee member DeAnne Julius, the Bank of England is unlikely to start cutting interest rates in 2024. She cited escalating tensions in the Middle East as a potential factor that could contribute to a new round of energy price increases.
Investors will closely watch BoE Governor Andrew Bailey's speech scheduled for Wednesday. Additionally, the release of UK Manufacturing Production data on Friday is anticipated, with expectations for growth in November.
EUR/GBP moved modestly higher on Tuesday. Economists at ING analyze the pair’s outlook.
Deterioration in economic conditions in the UK will ultimately warrant substantial BoE rate cuts
We remain of the view that a deterioration in economic conditions in the UK will ultimately warrant substantial BoE rate cuts (we estimate 100 bps), while markets are considerably overestimating the size of the ECB easing cycle.
However, data releases and BoE commentary in the near term may encourage some hawkish repricing at the front end of the GBP curve, which could keep pressure on EUR/GBP. We still target a rebound in the pair from 2Q onwards.
Gold prices fell in India on Wednesday, according to data from India's Multi Commodity Exchange (MCX).
Gold price stood at 61,967 Indian Rupees (INR) per 10 grams, down INR 158 compared with the INR 62,125 it cost on Tuesday.
As for futures contracts, Gold prices increased to INR 62,265 per 10 gms from INR 62,179 per 10 gms.
Prices for Silver futures contracts decreased to INR 72,240 per kg from INR 72,047 per kg.
| Major Indian city | Gold Price |
|---|---|
| Ahmedabad | 64,170 |
| Mumbai | 64,015 |
| New Delhi | 64,070 |
| Chennai | 64,160 |
| Kolkata | 64,205 |
Global Market Movers: Comex Gold price lures buyers amid a softer risk tone
- The uncertainty over the timing of when the Federal Reserve will start cutting interest rates holds back traders from placing fresh directional bets around the Comex Gold price.
- The New York Fed reported on Monday that US consumers' projection of inflation fell to the lowest level in nearly three years in December, lifting bets for an imminent shift in the Fed's policy stance
- Meanwhile, the resilient US economy, which is experiencing above-target inflation, gives the US central bank more headroom to keep interest rates higher for longer.
- This allows the yield in the benchmark 10-year US government bond to hold above the 4.0% threshold, which lends support to the US Dollar and caps the yellow metal.
- Bearish traders, however, seem reluctant and prefer to wait on the sidelines ahead of the latest US consumer inflation figures, due for release on Thursday.
- Citing a senior US Defense Department official, CNBC reported late Tuesday that Iran-backed Houthi militants launched the largest attack to date on commercial merchant vessels.
- A senior People’s Bank of China official said this Wednesday that the central bank may use monetary policy tools to provide strong support for reasonable credit growth.
- The official added that the PBoC will strengthen its counter-cyclical and cross-cycle policy adjustments to create favorable conditions for the country’s economic growth.
- There isn't any relevant market-moving macro data scheduled for release from the US on Wednesday, leaving the Comex Gold price at the mercy of the USD price dynamics.
(An automation tool was used in creating this post.)
Gold FAQs
Why do people invest in Gold?
Gold has played a key role in human’s history as it has been widely used as a store of value and medium of exchange. Currently, apart from its shine and usage for jewelry, the precious metal is widely seen as a safe-haven asset, meaning that it is considered a good investment during turbulent times. Gold is also widely seen as a hedge against inflation and against depreciating currencies as it doesn’t rely on any specific issuer or government.
Who buys the most Gold?
Central banks are the biggest Gold holders. In their aim to support their currencies in turbulent times, central banks tend to diversify their reserves and buy Gold to improve the perceived strength of the economy and the currency. High Gold reserves can be a source of trust for a country’s solvency. Central banks added 1,136 tonnes of Gold worth around $70 billion to their reserves in 2022, according to data from the World Gold Council. This is the highest yearly purchase since records began. Central banks from emerging economies such as China, India and Turkey are quickly increasing their Gold reserves.
How is Gold correlated with other assets?
Gold has an inverse correlation with the US Dollar and US Treasuries, which are both major reserve and safe-haven assets. When the Dollar depreciates, Gold tends to rise, enabling investors and central banks to diversify their assets in turbulent times. Gold is also inversely correlated with risk assets. A rally in the stock market tends to weaken Gold price, while sell-offs in riskier markets tend to favor the precious metal.
What does the price of Gold depend on?
The price can move due to a wide range of factors. Geopolitical instability or fears of a deep recession can quickly make Gold price escalate due to its safe-haven status. As a yield-less asset, Gold tends to rise with lower interest rates, while higher cost of money usually weighs down on the yellow metal. Still, most moves depend on how the US Dollar (USD) behaves as the asset is priced in dollars (XAU/USD). A strong Dollar tends to keep the price of Gold controlled, whereas a weaker Dollar is likely to push Gold prices up.
- WTI Oil prices gain some positive traction for the second straight day, albeit lack follow-through.
- The technical setup remains tilted in favour of bearish and supports prospects for deeper losses.
- Any further move up is likely to confront stiff resistance and remain capped near the 50-day SMA.
West Texas Intermediate (WTI) Crude Oil prices attract some buyers for the second successive day on Wednesday, albeit lack follow-through and remain below the overnight swing high through the first half of the European session. The commodity currently trades just below mid-72.00s, up nearly 0.35% for the day.
From a technical perspective, Crude Oil prices remain below 50, 100 and 200-day Simple Moving Averages (SMA), which favours bearish traders. That said, oscillators on the daily chart have just started gaining positive traction and warrant some caution before positioning for a fresh leg down. Hence, any meaningful slide below the $2.00 round figure is more likely to find decent support ahead of the $71.00 mark.
The latter should act as a key pivotal point, which if broken decisively will reaffirm the negative outlook and drag Crude Oil prices below the $70.00 psychological mark, towards the monthly low, around the $69.40 region. Some follow-through selling could make the commodity vulnerable to accelerate the downward trajectory further towards testing sub-$68.00 levels, of a multi-month low touched in December.
On the flip side, the immediate hurdle is pegged near the $73.00-$73.10 region, above which a fresh bout of a short-covering rally has the potential to lift Crude Oil prices back towards the $74.00 round figure. This is followed by the 50-day SMA, currently around the $74.35 zone, which if cleared decisively might shift the bias in favour of bullish traders and pave the way for a move towards the $75.00 psychological mark.
WTI Crude Oil daily chart
-638404729743985420.png)
Technical levels to watch
The Norwegian Krone has started the European FX session a touch weaker. Economists at Société Générale analyze EUR/NOK outlook.
EUR/NOK has embarked on a series of falling tops and bottoms
EUR/NOK carved out a lower high near 12.00 as compared to the one in May 2023 near 12.10 and has embarked on a series of falling tops and bottoms. It has stabilized below the 200-DMA denoting regain of downward momentum. It would be interesting to see if the pair can reclaim the Day Moving Average near 11.56/11.59.
Inability to cross this hurdle would mean persistence in down move towards 11.10 and projections of 10.99; this could be a crucial support.
- USD/MXN gains ground as risk-on sentiment shifts to risk aversion.
- Upbeat Mexico’s inflation data could refrain Banxico from easing monetary policy in February’s meeting.
- Traders await US CPI data to gain more cues on the Fed’s interest rate trajectory.
USD/MXN continues to gain ground, advancing further near 16.99 during the European session on Wednesday. The USD/MXN pair received upward support from the risk-off market sentiment. However, the upward trend in Mexico's consumer inflation might influence the Bank of Mexico (Banxico) to adopt a measured approach to easing monetary policy in the upcoming period. This is expected to provide support for the Mexican Peso (MXN) in the foreseeable future.
Mexico's 12-month inflation for December climbed to 4.66%, up from the previous 4.32%. Headline inflation increased to 0.71%, contrary to the anticipated contraction of 0.61% and the prior reading of 0.64%. Core inflation stood at 0.44%, slightly below the expected 0.50%. Traders are likely to keep an eye on Thursday's Industrial Output data, with expectations of a slowdown in the production of Mexican industries.
The US Dollar Index (DXY) holds steady around 102.50 after recent gains, attempting to build on its profits amid uncertain movements in US Treasury yields. As of now, the 2-year and 10-year yields on US bond coupons stand at 4.34% and 4.0%, respectively. The Greenback might find support if the prevailing risk aversion sentiment continues to improve, especially with December's Consumer Price Index (CPI) data from the United States set to be released on Thursday.
Investors are keenly awaiting signals from the Federal Reserve regarding the interest rate trajectory. While higher interest rates could potentially impact aggregate demand, leading to subdued growth and a softer labor market, the Fed is anticipated to refrain from implementing any rate cuts in its upcoming January policy meeting.
During his scheduled appearance on Wednesday, European Central Bank (ECB) Vice President Luis de Guindos said that “the rapid pace of disinflation that we observed in 2023 is likely to slow down this year.”
Additional takeaways
Disinflation process to pause temporarily at the beginning of the year.
Growth developments are more disappointing.
Incoming data indicate that future remains uncertain, prospects tilted to the downside.
Soft indicators point to an economic contraction in December too, confirming the possibility of a technical recession in the second half of 2023 and weak prospects for the near term.
Future ECB decisions are to continue to be data-dependent.
Market reaction
At the press time, EUR/USD Is defending minor bids at around 1.0940, up 0.07% on the day.
- NZD/USD consolidates around 0.6240 as investors await the US CPI data for December.
- US core CPI is seen softening to 3.8% from 4.0% in November.
- The Kiwi asset oscillates in a symmetrical triangle, indicating a sideways move ahead.
The NZD/USD pair struggles for a direction as investors await the United States Consumer Price Index (CPI) data for December, which is scheduled for Thursday. The Kiwi asset trades back-and-forth around 0.6240 amid hopes that the release of the US inflation data will provide fresh cues about the likely monetary policy action by the Federal Reserve (Fed) for January’s monetary policy meeting.
Sell-off in the S&P500 futures has extended, indicating further decline in the risk-appetite of the market participants. The US Dollar Index (DXY) consolidates near 102.50 as investors shift focus towards the inflation data for December.
As per the estimates, the US headline inflation grew by 0.2% against 0.1% increase in November. The core CPI that excludes volatile food and oil prices grew steadily by 0.3%. The annual underlying inflation decelerated to 3.8% against the former reading of 4.0%.
NZD/USD trades in a Symmetrical Triangle chart pattern on an hourly scale, which indicates a sharp contraction in volatility. Downward-sloping trend of the aforementioned chart pattern is plotted from January 4 high at 0.6286 while the advancing trendline is placed from January 8 low at 0.6212. The 20-period Exponential Moving Average (EMA) remains sticky to the Kiwi asset, indicating a consolidation ahead.
An upside move would appear if the asset breaks above January 5 high around 0.6280. This will drive asset towards January 2 high at 0.6335, followed by December 29 high at 0.6360.
In an alternate scenario, a breakdown below December 18 low near 0.6200 would expose the asset to 12 December 2023 high at 0.6170 and 8 December 2023 low near 0.6100.
NZD/USD hourly chart
-638404705981062631.png)
EUR/USD edged lower on Tuesday. Economists at ING analyze the pair’s outlook.
EUR/USD to consolidate in a 1.0880/1.1020 range in the coming days
Today, we will keep a closer eye on an online Q&A held by ECB’s Isabel Schnabel at 1400 GMT. Evidence of sticky inflation in the December report suggests she may favour a pushback against rate cut bets should she comment on monetary policy. We could see some short-term benefits to the Euro as hawks voice their inflation concerns, but those have proven to be neither sizeable nor long-lasting in the past months.
The lack of market-moving data releases suggests EUR/USD should trade largely in line with global risk sentiment and US data this week.
We expect the pair to consolidate in a 1.0880/1.1020 range in the coming days barring surprises on the US inflation side.
FX option expiries for Jan 10 NY cut at 10:00 Eastern Time, via DTCC, can be found below.
- EUR/USD: EUR amounts
- 1.0850 479m
- 1.0900 637m
- 1.0915 672m
- 1.0925 876m
- 1.0970 1.1b
- 1.0985 3.6b
- 1.1035 453m
- USD/JPY: USD amounts
- 143.50 791m
- 144.05 1.5b
- 144.50 795m
- 145.00 2b
- USD/CHF: USD amounts
- 0.8500 741m
- AUD/USD: AUD amounts
- 0.6855 481m
- 0.6860 405m
- USD/CAD: USD amounts
- 1.3400 481m
- 1.3435 556m
- Silver remains under some selling pressure for the third straight day and refreshes weekly low.
- The technical setup seems tilted in favour of bearish and supports prospects for additional losses.
- A sustained strength beyond the $23.55-65 confluence is needed to negate the bearish outlook.
Silver (XAG/USD) drifts lower for the third successive day on Wednesday and drops to a fresh weekly low, around the $22.80 region during the early European session.
From a technical perspective, the recent repeated failures to build on the attempted recovery beyond the 100-day Simple Moving Average (SMA) and rejection near a multi-month-old ascending trend-line support breakpoint favour bearish traders. Moreover, oscillators on the daily chart are holding deep in the negative territory and are far from being in the oversold zone. This suggests that the path of least resistance for the XAG/USD is to the downside.
That said, it will still be prudent to wait for some follow-through selling below the multi-week trough, around the $22.70 region touched last Thursday before positioning for further losses. The XAG/USD might then turn vulnerable to weaken further below the December monthly swing low, around the mid-$22.00s, towards testing the next relevant support near the $22.25 region, and eventually drop further to the $22.00 round-figure mark.
On the flip side, the 100-day SMA, currently around the $23.30 area, might continue to act as an immediate hurdle ahead of the $23.55-$23.65 confluence – comprising the aforementioned trend-line support breakpoint, the 100- and 50-day SMAs. That said, a sustained strength beyond the latter might trigger a short-covering rally and lift the XAG/USD to the $23.80 horizontal barrier en route to the $24.00 round-figure mark.
Some follow-through buying will suggest that the recent corrective downfall since late December has run its course and shift the bias in favour of bullish traders. The XAG/USD might then accelerate the positive momentum towards the $24.60 area, or the December 22 high, before aiming back towards reclaiming the $25.00 psychological mark.
Silver daily chart
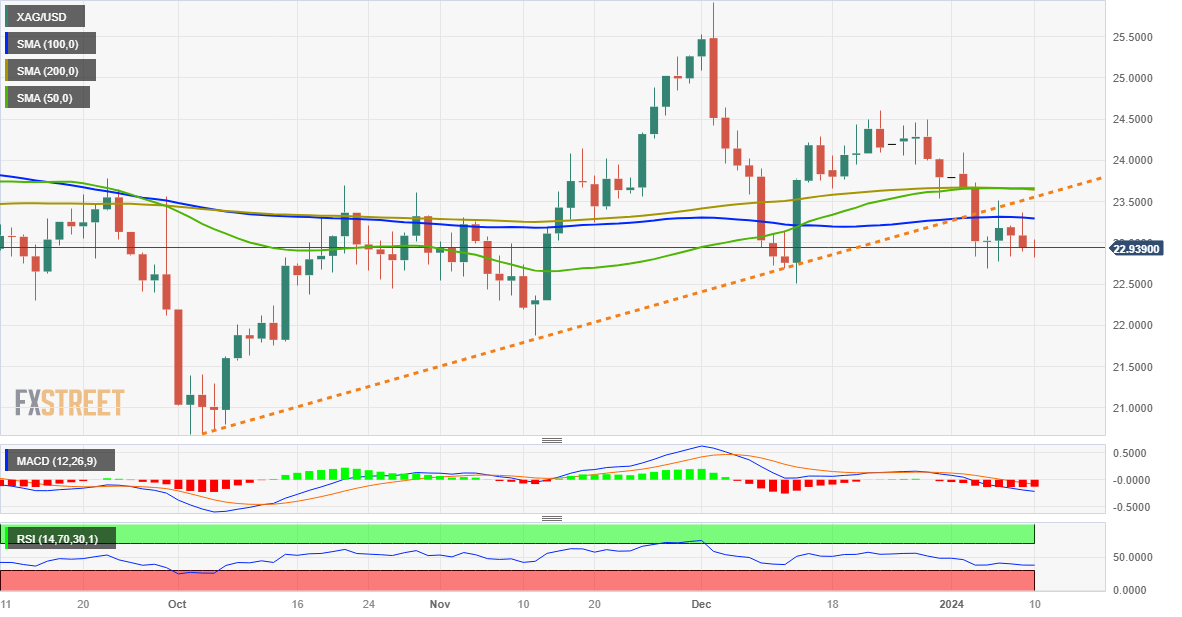
Technical levels to watch
- Pound Sterling drops further ahead of BoE Bailey’s speech.
- The UK economy is on the brink of shifting into a technical recession.
- Market mood remains downbeat ahead of US Inflation data.
The Pound Sterling (GBP) faces a sharp sell-off as uncertainty over the Bank of England’s (BoE) restrictive monetary policy stance persists due to deepening risks of a technical recession in the United Kingdom. The GBP/USD pair remains on the backfoot as market mood has turned risk-averse ahead of the United States inflation data for December.
Going forward, the Pound Sterling will be guided by a speech from Bank of England Governor Andrew Bailey who is expected to provide an outlook on interest rates and inflation. Investors will keep watch of whether the BoE will prioritize saving the economy from further slowdown or taming inflationary pressures. On the economic data front, market participants will look to UK factory data, which is due to release on Friday. Market participants are anticipating a decent recovery in Industrial and Manufacturing Production data.
Daily Digest Market Movers: Pound Sterling remains on backfoot amid cautious sentiment
- Pound Sterling has dropped further to support from the round-number level at 1.2700 as investors are uncertain about Bank of England’s support for keeping interest rates high for an elongated period.
- According to the revised estimates from the Office for National Statistics (ONS), the UK economy is on the brink of a technical recession as it was shrunk by 0.1% in the third quarter of 2023.
- Also, the BoE is unsure about any growth in the last quarter of 2023, which indicates that the likelihood of a recession is high.
- While the service sector is consistently in the expansion phase, the manufacturing sector is facing pain of delayed execution amid uncertainty due to weak demand from the domestic economy and the external market.
- In addition to bleak economic prospects, inflation in the UK economy is highest in comparison with other Group of Seven economies, which is also a hard nut to crack to BoE policymakers.
- The BoE has to perform a balancing act between safeguarding the economy by rolling back high interest rates or sticking with a restrictive stance, thus keeping price stability a priority.
- For further guidance on interest rates and inflation, investors will focus on the speech from BoE Governor Andrew Bailey, which is scheduled for 15:15 GMT.
- Later this week, investors will focus on UK factory data and monthly Gross Domestic Product (GDP) for November. Economists project that the UK economy will have grown by 0.2% after shrinking 0.3% in October.
- The market mood remains risk-off as investors await the United States Consumer Price Index (CPI) data for December, which will be published on Thursday January 11 at 13:30 GMT.
- Investors see the core CPI that excludes volatile food and Oil prices slowing to 3.8% against 4.0% from November. In the same period, the headline inflation is expected to have grown by 3.2% versus. 3.1%.
- Over interest rate guidance, Atlanta Federal Reserve (Fed) Bank President Raphael Bostic is naturally biased towards a tighter stance till inflation remains above the 2% target.
- Raphael Bostic sees two interest rate cuts this year, first somewhere in the third quarter and the second one will be needed by 2024 end. The Atlanta Fed President is considered to be quite hawkish. Current market expectations are for a cut as soon as March.
Technical Analysis: Pound Sterling drops to near 1.2670
-638404689711010010.png)
Pound Sterling declines toward two-day low of 1.2670 as investors turn cautious ahead of crucial US inflation data. The GBP/USD pair fell back after failing to extend recovery above the critical resistance of 1.2770.
On a daily time frame, the Cable struggles to sustain above the 61.8% Fibonacci retracement (of the move from the 13 July 2023 high at 1.3142 to 4 October 2023 low at 1.2037) at 1.270. The 20-day Exponential Moving Average (EMA) around 1.2680 continues to provide support to the Pound Sterling bulls. The Relative Strength Index (RSI) (14) has shifted into the 40.00-60.00 range, which guides a consolidation ahead.
Pound Sterling FAQs
What is the Pound Sterling?
The Pound Sterling (GBP) is the oldest currency in the world (886 AD) and the official currency of the United Kingdom. It is the fourth most traded unit for foreign exchange (FX) in the world, accounting for 12% of all transactions, averaging $630 billion a day, according to 2022 data.
Its key trading pairs are GBP/USD, aka ‘Cable’, which accounts for 11% of FX, GBP/JPY, or the ‘Dragon’ as it is known by traders (3%), and EUR/GBP (2%). The Pound Sterling is issued by the Bank of England (BoE).
How do the decisions of the Bank of England impact on the Pound Sterling?
The single most important factor influencing the value of the Pound Sterling is monetary policy decided by the Bank of England. The BoE bases its decisions on whether it has achieved its primary goal of “price stability” – a steady inflation rate of around 2%. Its primary tool for achieving this is the adjustment of interest rates.
When inflation is too high, the BoE will try to rein it in by raising interest rates, making it more expensive for people and businesses to access credit. This is generally positive for GBP, as higher interest rates make the UK a more attractive place for global investors to park their money.
When inflation falls too low it is a sign economic growth is slowing. In this scenario, the BoE will consider lowering interest rates to cheapen credit so businesses will borrow more to invest in growth-generating projects.
How does economic data influence the value of the Pound?
Data releases gauge the health of the economy and can impact the value of the Pound Sterling. Indicators such as GDP, Manufacturing and Services PMIs, and employment can all influence the direction of the GBP.
A strong economy is good for Sterling. Not only does it attract more foreign investment but it may encourage the BoE to put up interest rates, which will directly strengthen GBP. Otherwise, if economic data is weak, the Pound Sterling is likely to fall.
How does the Trade Balance impact the Pound?
Another significant data release for the Pound Sterling is the Trade Balance. This indicator measures the difference between what a country earns from its exports and what it spends on imports over a given period.
If a country produces highly sought-after exports, its currency will benefit purely from the extra demand created from foreign buyers seeking to purchase these goods. Therefore, a positive net Trade Balance strengthens a currency and vice versa for a negative balance.
The reason that MYR was the least performing EM Asia currency in 2023 was due to its high correlation with CNY. MYR depreciated about 5.6% against the Dollar. Economists at MUFG Bank analyze USD/MYR outlook.
Ringgit to benefit from high correlation with CNY
MYR will be in a relatively better position among low yielding currencies, due to its high correlation with CNY. An improving sentiment regarding CNY would lift MYR.
Recent nascent performance in South Korea and Taiwan’s semiconductor exports may shed some light for Malaysia’s semiconductor exports in 2024. Additionally, with Malaysian government’s ambitious plan to bolster the country’s competitive edge in the global semiconductor industry, we expect FDI inflows to improve in 2024 and provide support for MYR.
We forecast USD/MYR to reach 4.62 by 1Q2024 and 4.47 by end-2024.
- USD/CAD attracts some dip-buying on Wednesday, albeit lacks bullish conviction.
- Elevated US bond yields act as a tailwind for the USD and lend support to the pair.
- An uptick in Oil prices underpins the Loonie and seems to cap gains for the major.
- Traders also seem reluctant and prefer to wait for the US CPI report on Thursday.
The USD/CAD pair edges higher to the 1.3400 neighbourhood heading into the European session on Wednesday, albeit remains below a multi-week high touched the previous day.
The US Dollar (USD) remains supported by elevated US Treasury bond yields and trades well within the striking distance of a three-week peak set last Friday. In fact, the yield in the benchmark 10-year US government bond holds steady above the 4.0% threshold amid diminishing odds for a more aggressive policy easing by the Federal Reserve (Fed). This, in turn, is seen acting as a tailwind for the Greenback and lending support to the USD/CAD pair.
The uptick, however, lacks bullish conviction in the wake of some follow-through buying around Crude Oil prices. Supply worries stemming from escalating geopolitical tensions in the Red Sea, along with the suspension of production at Libya's largest oil field on Sunday and another outsized draw in US crude inventories, lend some support to Crude Oil prices. This could underpin the commodity-linked Loonie and should cap the USD/CAD pair.
Traders might also prefer to move to the sidelines and wait for the release of the latest consumer inflation figures from the US on Thursday. The crucial CPI report might provide some cues about the Fed's future policy actions amid the uncertainty over the timing of the first interest rate cut. This, in turn, will play a key role in influencing the USD price dynamics and determining the next leg of a directional move for the USD/CAD pair.
In the meantime, the US bond yields will continue to drive the USD demand in the absence of any relevant market-moving macro releases, either from the US or Canada on Wednesday. Apart from this, traders will take cues from Oil price dynamics to grab short-term opportunities. Nevertheless, the aforementioned mixed fundamental backdrop suggests that the USD/CAD pair is likely to extend its range-bound price action ahead of the key US data risk.
Technical levels to watch
Here is what you need to know on Wednesday, January 10:
The US Dollar (USD) gathered strength against its rivals on Tuesday as markets turned cautious ahead of Thursday's highly anticipated inflation data. Early Wednesday, major currency pairs stay relatively calm. Comments from central bankers and the 10-year US Treasury note auction later in the day could impact currencies' valuations.
US Dollar price this week
The table below shows the percentage change of US Dollar (USD) against listed major currencies this week. US Dollar was the strongest against the Australian Dollar.
| USD | EUR | GBP | CAD | AUD | JPY | NZD | CHF | |
| USD | 0.13% | 0.20% | 0.24% | 0.36% | 0.20% | 0.25% | 0.27% | |
| EUR | -0.13% | 0.07% | 0.13% | 0.23% | 0.08% | 0.13% | 0.14% | |
| GBP | -0.22% | -0.07% | 0.06% | 0.17% | 0.02% | 0.06% | 0.08% | |
| CAD | -0.24% | -0.11% | -0.02% | 0.11% | -0.02% | 0.00% | 0.03% | |
| AUD | -0.37% | -0.24% | -0.17% | -0.12% | -0.13% | -0.12% | -0.10% | |
| JPY | -0.24% | -0.07% | -0.02% | 0.05% | 0.16% | 0.05% | 0.05% | |
| NZD | -0.25% | -0.10% | -0.06% | 0.00% | 0.11% | -0.05% | 0.01% | |
| CHF | -0.28% | -0.15% | -0.08% | -0.03% | 0.08% | -0.09% | -0.03% |
The heat map shows percentage changes of major currencies against each other. The base currency is picked from the left column, while the quote currency is picked from the top row. For example, if you pick the Euro from the left column and move along the horizontal line to the Japanese Yen, the percentage change displayed in the box will represent EUR (base)/JPY (quote).
Wall Street's main indexes opened in negative territory on Tuesday. Escalating geopolitical tensions in the Middle East caused investors to stay away from risk-sensitive assets. Citing a senior US Defense Department official, CNBC News reported late Tuesday that Iran-backed Houthi militants launched the largest attack to date on commercial merchant vessels in the Red Sea. Although stock indices managed to erase a portion of earlier losses toward the end of the session, US stock index futures trade modestly lower in the European morning on Wednesday. Meanwhile, the benchmark 10-year US Treasury bond yield holds steady slightly above 4% and the USD Index stays above 102.50. New York Federal Reserve (Fed) President John Williams, who said back in December that they were not discussing rate cuts, will be delivering a speech in the late American session.
The data from Australia showed early Wednesday that the Consumer Price Index (CPI) rose 4.3% on a yearly basis in November. This reading followed the 4.9% increase recorded in October and came in a tad below the market expectation of 4.4%. After closing deep in negative territory, AUD/USD edged slightly higher during the Asian trading hours and was last seen trading at around 0.6700.
GBP/USD lost its traction after rising above 1.2750 on Tuesday and registered daily losses. The pair stays on the back foot and trades below 1.2700 in the early European session on Wednesday. Bank of England Governor Andrew Bailey will testify later in the day and respond to questions about the threat to financial stability posed by interest rate hikes.
EUR/USD edged lower on Tuesday after failing to make a decisive move on Monday. The pair was last seen trading below 1.0950. European Central Bank (ECB) Vice-President Luis de Guindos is scheduled to deliver a speech during the European trading hours on Wednesday.
Following Tuesday's choppy action, USD/JPY gathered bullish momentum and climbed above 145.00 on Wednesday. The data from Japan revealed earlier in the day that Labor Cash Earnings rose by only 0.2% on a yearly basis in November. This reading followed the 1.5% increase recorded in October and missed the market expectation of 1.5% by a wide margin.
Gold reversed its direction after climbing above $2,040 and closed the day virtually unchanged. XAU/USD stays under modest bearish pressure and trades in the red slightly above $2,020 early Wednesday.
- USD/CHF could advance further on a risk aversion sentiment.
- US Dollar takes a breather, coasting along as US Treasury yields lack a clear direction.
- The recent Swiss economic data supports the sentiment in favor of the Swiss Franc.
USD/CHF stays calm after gaining profits in the previous session, hovering near 0.8520 during the Asian session on Wednesday. The US Dollar Index (DXY) maintains its position above 102.50 amid steady US bond yields, with the 2-year and 10-year yields standing at 4.35% and 4.02%, respectively.
The risk-on sentiment was triggered by the Atlanta Federal Reserve President Raphael W. Bostic’s remarks made earlier this week, speculating interest rate cuts by the end of 2024. This has exerted downward pressure on the US Dollar. Bostic mentioned that inflation has declined more than initially anticipated and expressed the view of expecting two quarter-point cuts by the end of 2024.
However, the market sentiment has shifted to risk aversion, prompting investors to turn back towards the US Dollar and contributing upward support to underpinning the USD/CHF pair. Furthermore, December's Consumer Price Index (CPI) data from the United States will be eyed on Thursday.
On the other side, Monday’s economic data from Switzerland supported the Swiss Franc (CHF) to gain profits. Consumer Price Index (YoY) for December extended the growth from 1.4% to 1.7%. Real Retail Sales improved to 0.7% against the expected reading of flat 0.0%. On Tuesday, the seasonally adjusted Unemployment Rate improved to 2.2% from the previous rate of 2.1%.
Moreover, the Swiss National Bank (SNB) anticipates an annual loss of approximately 3 billion CHF for the last year. This outcome is attributed to the significant strength of the Swiss Franc (CHF), which has offset capital gains from the bank's equity and bond portfolios in foreign currencies.
- EUR/USD moves sideways post recent losses amid a stable US Dollar.
- The major level at 1.0950 appears to be an immediate resistance level.
- A break below the 1.0900 could lead the pair to navigate the 50-day EMA at 1.0888.
EUR/USD consolidates after posting recent losses in the previous session, trading near 1.0930 during the Asian session on Wednesday. The EUR/USD pair could meet the barrier at the major level at 1.0950 following the psychological resistance area at 1.1000.
A breakthrough above the psychological level could support the EUR/USD pair to revisit the previous week’s high at 1.1038 level. However, the 14-day Relative Strength Index (RSI) for the EUR/USD pair has dropped below the 50 mark, signaling a bearish momentum.
In addition, the Moving Average Convergence Divergence (MACD) line, while still above the centerline, is showing divergence below the signal line, hinting at a potential shift toward a downward trend. Traders may exercise caution and await confirmation before making decisions in the pair.
On the downside, the EUR/USD pair could meet immediate support at the psychological level of 1.0900. If this level is breached decisively, it could exert downward pressure on the pair, potentially leading it toward the 50-day Exponential Moving Average (EMA) at 1.0888, followed by the 38.2% Fibonacci retracement level at 1.0867 and significant support at 1.0850. Traders may closely monitor these levels for potential price movements.
EUR/USD: Daily Chart
-638404617361170940.png)
- NZD/USD faced a challenge as the risk-on mood shifted to risk aversion.
- Traders await November's Kiwi Building Permits followed by the Chinese CPI and PPI.
- US Dollar remains calm amid directionless US Treasury yields.
NZD/USD attempts to recover the recent losses registered on Tuesday, trading slightly higher near 0.6240 during the Asian session on Wednesday. The New Zealand Dollar (NZD) registered losses against the US Dollar in the previous session as the risk-on sentiment shifted to risk aversion. Traders are now looking ahead to Thursday's release of November's Building Permits data from New Zealand, following a reported 8.7% rise in October.
The improved Kiwi Consumer Confidence and Business Confidence figures for November bolstered the sentiment that the Reserve Bank of New Zealand (RBNZ) will maintain a hawkish stance by refraining from policy easing in the upcoming meeting, contributed to a positive outlook for the New Zealand Dollar.
Additionally, Friday's Chinese Consumer Price Index (CPI) and Producer Price Index (PPI) figures will likely attract attention, considering the close business ties between China and New Zealand.
The US Dollar Index (DXY) holds its position near 102.50 after recent gains, attempting to extend its profits amid directionless US Treasury yields. At the time of writing, the 2-year and 10-year yields on US bond coupons mark at 4.35% and 4.01%, respectively. The Greenback could cheer if the risk aversion sentiment improves further ahead of December’s Consumer Price Index (CPI) data from the United States to be released on Thursday.
Investors eagerly seek cues from the Federal Reserve's mood regarding the interest rate trajectory. While elevated interest rates may put pressure on aggregate demand, leading to subdued growth and a softer labor market, the Fed is expected to refrain from any rate cuts in its upcoming January policy meeting.
- Gold price extends its consolidative price move above a multi-week low touched on Monday.
- The Fed rate cut uncertainty is holding back traders from placing aggressive directional bets.
- Elevated US bond yields underpin the USD and cap gains ahead of the US CPI on Thursday.
Gold price (XAU/USD) met with some supply following an uptick to the $2,040 area on Tuesday and finally settled with only modest gains on Tuesday. The precious metal continues with its struggle to gain any meaningful traction during the Asian session on Wednesday as traders seek more clarity on the Federal Reserve's (Fed) rate cut path before placing directional bets. Hence, the market focus will remain glued to the release of the latest consumer inflation figures from the United States (US) due on Thursday, which will play a key role in determining the near-term trajectory for the commodity.
Ahead of the key data risk, investors have been scaling back their expectations for a more aggressive policy easing by the Fed in the wake of a robust December US jobs report on Friday, which pointed to a still-resilient labor market. This remains supportive of elevated US Treasury bond yields and acts as a tailwind for the US Dollar (USD), capping the non-yielding Gold price. That said, geopolitical risks stemming from the Israel-Hamas war and persistent worries over a slow economic recovery in China – the world's second-largest economy – should lend some support to the safe-haven precious metal.
Daily Digest Market Movers: Gold price struggles for a firm direction amid mixed fundamental cues
- The uncertainty over the timing of when the Federal Reserve will start cutting interest rates holds back traders from placing fresh directional bets around the Gold price.
- The New York Fed reported on Monday that US consumers' projection of inflation fell to the lowest level in nearly three years in December, lifting bets for an imminent shift in the Fed's policy stance
- Meanwhile, the resilient US economy, which is experiencing above-target inflation, gives the US central bank more headroom to keep interest rates higher for longer.
- This allows the yield in the benchmark 10-year US government bond to hold above the 4.0% threshold, which lends support to the US Dollar and caps the yellow metal.
- Bearish traders, however, seem reluctant and prefer to wait on the sidelines ahead of the latest US consumer inflation figures, due for release on Thursday.
- Citing a senior US Defense Department official, CNBC reported late Tuesday that Iran-backed Houthi militants launched the largest attack to date on commercial merchant vessels.
- A senior People’s Bank of China official said this Wednesday that the central bank may use monetary policy tools to provide strong support for reasonable credit growth.
- The official added that the PBoC will strengthen its counter-cyclical and cross-cycle policy adjustments to create favourable conditions for the country’s economic growth.
- There isn't any relevant market-moving macro data scheduled for release from the US on Wednesday, leaving the XAU/USD at the mercy of the USD price dynamics.
Technical Analysis: Gold price bears await a break below the 50-day SMA support near $2,017 area
From a technical perspective, the multi-week low, around the $2,017 area touched on Monday, which now coincides with the 50-day Simple Moving Average (SMA), should protect the immediate downside. A convincing break below could make the Gold price vulnerable to accelerate the slide towards the $2,000 psychological mark. Some follow-through selling will expose the December swing low, around the $1,973 region, before the XAU/USD eventually drops to the $1,965-1,963 confluence, comprising the 100- and 200-day SMAs.
On the flip side, the $2,040-2,042 zone might continue to act as an immediate strong barrier, above which the Gold price could aim to retest Friday's swing high, around the $2,064 area. The next relevant hurdle is pegged near the $2,077 area, which if cleared decisively will negate any near-term negative outlook and set the stage for a move towards reclaiming the $2,100 round figure.
US Dollar price today
The table below shows the percentage change of US Dollar (USD) against listed major currencies today. US Dollar was the strongest against the .
| USD | EUR | GBP | CAD | AUD | JPY | NZD | CHF | |
| USD | 0.00% | 0.09% | -0.06% | -0.28% | 0.26% | -0.05% | -0.02% | |
| EUR | 0.00% | 0.09% | -0.06% | -0.27% | 0.26% | -0.06% | 0.00% | |
| GBP | -0.09% | -0.09% | -0.15% | -0.36% | 0.17% | -0.15% | -0.09% | |
| CAD | 0.05% | 0.06% | 0.13% | -0.21% | 0.32% | 0.00% | 0.06% | |
| AUD | 0.26% | 0.26% | 0.35% | 0.20% | 0.51% | 0.20% | 0.24% | |
| JPY | -0.26% | -0.25% | -0.17% | -0.33% | -0.53% | -0.33% | -0.26% | |
| NZD | 0.06% | 0.06% | 0.15% | 0.00% | -0.21% | 0.31% | 0.04% | |
| CHF | 0.00% | 0.01% | 0.10% | -0.04% | -0.24% | 0.27% | -0.04% |
The heat map shows percentage changes of major currencies against each other. The base currency is picked from the left column, while the quote currency is picked from the top row. For example, if you pick the Euro from the left column and move along the horizontal line to the Japanese Yen, the percentage change displayed in the box will represent EUR (base)/JPY (quote).
Gold FAQs
Why do people invest in Gold?
Gold has played a key role in human’s history as it has been widely used as a store of value and medium of exchange. Currently, apart from its shine and usage for jewelry, the precious metal is widely seen as a safe-haven asset, meaning that it is considered a good investment during turbulent times. Gold is also widely seen as a hedge against inflation and against depreciating currencies as it doesn’t rely on any specific issuer or government.
Who buys the most Gold?
Central banks are the biggest Gold holders. In their aim to support their currencies in turbulent times, central banks tend to diversify their reserves and buy Gold to improve the perceived strength of the economy and the currency. High Gold reserves can be a source of trust for a country’s solvency. Central banks added 1,136 tonnes of Gold worth around $70 billion to their reserves in 2022, according to data from the World Gold Council. This is the highest yearly purchase since records began. Central banks from emerging economies such as China, India and Turkey are quickly increasing their Gold reserves.
How is Gold correlated with other assets?
Gold has an inverse correlation with the US Dollar and US Treasuries, which are both major reserve and safe-haven assets. When the Dollar depreciates, Gold tends to rise, enabling investors and central banks to diversify their assets in turbulent times. Gold is also inversely correlated with risk assets. A rally in the stock market tends to weaken Gold price, while sell-offs in riskier markets tend to favor the precious metal.
What does the price of Gold depend on?
The price can move due to a wide range of factors. Geopolitical instability or fears of a deep recession can quickly make Gold price escalate due to its safe-haven status. As a yield-less asset, Gold tends to rise with lower interest rates, while higher cost of money usually weighs down on the yellow metal. Still, most moves depend on how the US Dollar (USD) behaves as the asset is priced in dollars (XAU/USD). A strong Dollar tends to keep the price of Gold controlled, whereas a weaker Dollar is likely to push Gold prices up.
- WTI price gains ground as US oil stock decreases in the previous week.
- API Weekly Crude Oil Stock fell to 5.215M against the expected decline of 1.2M.
- Iran-backed Houthi attacks on vessels raised concerns about disruptions to oil supply.
- US Secretary of State Antony Blinken appealed to Israeli officials to normalize regional relations.
West Texas Intermediate (WTI) price trades higher near $72.50 per barrel during the Asian session on Wednesday, extending its gains for the second consecutive session. The recent rise in Crude oil prices can be attributed to several factors. The Crude stock data from the United States (US) revealed a reduction, exceeding market anticipations for the week ending on January 5. Additionally, concerns about oil supply were heightened as Iran-backed Houthi militants launched a significant attack on vessels in the Red Sea.
American Petroleum Institute (API) released the Weekly Crude Oil Stock report showed a decline of 5.215M against the expected fall of 1.2M. The previous reading was a 7.418M decline. US Energy Information Administration will release Crude Oil Stocks Change on Wednesday for the said period. Moreover, the US Energy Information Administration (EIA) projects that domestic Crude oil production in the United States will reach record levels over the next two years. However, the growth rate is expected to slow down.
The reported attack by Iran-backed Houthi militants on commercial merchant vessels in the Red Sea has raised concerns about the safety of maritime routes and potential disruptions to global oil supply. This geopolitical development adds to the existing tensions in the region and may contribute to increased volatility in oil markets.
CNBC reports indicate that attacks occurred in two locations: southwest of Mokha, and Hodeidah in Yemen. American officials state that around 50 merchant vessels were present in the area during the attack. Additionally, US Secretary of State Antony Blinken appealed during his visit to Israel, urging officials to make "hard choices" to foster normalization in the region.
- The Japanese Yen weakens following the release of weaker domestic wage growth data.
- A positive risk tone further undermines the JPY and lifts USD/JPY closer to the weekly top.
- Elevated US bond yields lend support to the USD and support prospects for further gains.
The Japanese Yen (JPY) drifts lower for the second successive day against its American counterpart and lifts the USD/JPY pair to the 144.80 region, closer to the weekly top during the Asian session on Wednesday. The Labour Ministry reported earlier today that real wages in Japan shrank for the 20th month in November. This comes after Tokyo's consumer inflation, a leading indicator of nationwide price trends, showed a further slowdown on Tuesday. Adding to this, government stimulus measures in the wake of a devastating New Year's Day earthquake should delay the Bank of Japan's (BoJ) plan to pivot away from its ultra-dovish stance. This, along with a generally positive tone around the equity markets, is seen undermining the safe-haven JPY.
The US Dollar (USD), on the other hand, remains below a nearly three-weekly peak touched last Friday amid the uncertainty over the timing of when the Federal Reserve (Fed) will start cutting interest rates. The markets, however, have been scaling back their expectations about more aggressive policy easing by the US central bank, especially after Friday's upbeat US jobs report pointed to a still-resilient labor market. This remains supportive of elevated US Treasury bond yields, which should continue to act as a tailwind for the Greenback and suggests that the path of least resistance for the USD/JPY pair is to the upside. That said, bulls might prefer to wait for the release of the US consumer inflation figures on Thursday before placing fresh bets.
Daily Digest Market Movers: Japanese Yen continues to be weighed down by weaker domestic data
- The Japanese Yen continues losing ground after Japan's Labour Ministry reported this Wednesday that inflation-adjusted real wages fell by 3.0% in November from a year earlier.
- Furthermore, Japanese workers' nominal pay grew by a modest 0.2% in November – marking the slowest in nearly two years – as compared to a 1.5% rise in the previous month.
- This comes on top of Tuesday's data, which showed that Tokyo's core Consumer Price Index (CPI) decelerated to the 2.1% YoY rate in December and matched a low hit in June 2022.
- This further dampens hopes for a hawkish pivot by the Bank of Japan, which regards wage trends and inflation outlooks as key factors in considering the dismantling of its negative rate policy.
- The Asahi newspaper reported that Japan's government is considering doubling budget reserves to 1 trillion Yen for the new fiscal year starting in April to cover the cost of earthquake reconstruction.
- Japanese Prime Minister Fumio Kishida's cabinet earlier on Tuesday approved 4.74 billion Yen spending from fiscal 2023/24 reserves for such aid as water, food, diapers and heaters.
- The yield on the benchmark 10-year US government bond holds steady above the 4.0% threshold amid reduced bets for an early interest rate cut and lends support to the US Dollar.
- The fundamental backdrop supports prospects for a further appreciating move for the USD/JPY pair, though bulls might wait for the US consumer inflation figures on Thursday.
Technical Analysis: USD/JPY bulls might now aim to retest multi-week high, around the 146.00 mark
From a technical perspective, the overnight bounce from the vicinity of the very important 200-day Simple Moving Average (SMA) and a subsequent move up validates the positive outlook. Some follow-through buying beyond the 145.00 psychological mark will reaffirm the positive outlook and pave the way for additional gains. The USD/JPY pair might then climb to the 146.00 neighbourhood, or a multi-week high touched last Friday, with some intermediate hurdle near the mid-145.00s.
On the flip side, the 144.50 area now seems to protect the immediate downside ahead of the Asian session low, around the 144.30 zone. The next relevant support is pegged near the 144.00 mark, below which the USD/JPY pair could slide back to challenge the 200-day SMA, currently around the 143.35 region. A convincing break below the latter will suggest that the recent goodish recovery from a multi-month low has run out of steam and prompt aggressive technical selling.
Japanese Yen price today
The table below shows the percentage change of Japanese Yen (JPY) against listed major currencies today. Japanese Yen was the strongest against the .
| USD | EUR | GBP | CAD | AUD | JPY | NZD | CHF | |
| USD | -0.02% | 0.07% | -0.05% | -0.29% | 0.33% | -0.06% | 0.00% | |
| EUR | 0.02% | 0.09% | -0.03% | -0.26% | 0.35% | -0.05% | 0.03% | |
| GBP | -0.08% | -0.09% | -0.12% | -0.36% | 0.26% | -0.14% | -0.06% | |
| CAD | 0.06% | 0.05% | 0.14% | -0.22% | 0.40% | -0.01% | 0.09% | |
| AUD | 0.28% | 0.26% | 0.35% | 0.23% | 0.61% | 0.21% | 0.28% | |
| JPY | -0.33% | -0.35% | -0.26% | -0.40% | -0.62% | -0.41% | -0.32% | |
| NZD | 0.07% | 0.05% | 0.14% | 0.02% | -0.21% | 0.39% | 0.07% | |
| CHF | -0.01% | -0.02% | 0.07% | -0.06% | -0.28% | 0.33% | -0.07% |
The heat map shows percentage changes of major currencies against each other. The base currency is picked from the left column, while the quote currency is picked from the top row. For example, if you pick the Euro from the left column and move along the horizontal line to the Japanese Yen, the percentage change displayed in the box will represent EUR (base)/JPY (quote).
Japanese Yen FAQs
What key factors drive the Japanese Yen?
The Japanese Yen (JPY) is one of the world’s most traded currencies. Its value is broadly determined by the performance of the Japanese economy, but more specifically by the Bank of Japan’s policy, the differential between Japanese and US bond yields, or risk sentiment among traders, among other factors.
How do the decisions of the Bank of Japan impact the Japanese Yen?
One of the Bank of Japan’s mandates is currency control, so its moves are key for the Yen. The BoJ has directly intervened in currency markets sometimes, generally to lower the value of the Yen, although it refrains from doing it often due to political concerns of its main trading partners. The current BoJ ultra-loose monetary policy, based on massive stimulus to the economy, has caused the Yen to depreciate against its main currency peers. This process has exacerbated more recently due to an increasing policy divergence between the Bank of Japan and other main central banks, which have opted to increase interest rates sharply to fight decades-high levels of inflation.
How does the differential between Japanese and US bond yields impact the Japanese Yen?
The BoJ’s stance of sticking to ultra-loose monetary policy has led to a widening policy divergence with other central banks, particularly with the US Federal Reserve. This supports a widening of the differential between the 10-year US and Japanese bonds, which favors the US Dollar against the Japanese Yen.
How does broader risk sentiment impact the Japanese Yen?
The Japanese Yen is often seen as a safe-haven investment. This means that in times of market stress, investors are more likely to put their money in the Japanese currency due to its supposed reliability and stability. Turbulent times are likely to strengthen the Yen’s value against other currencies seen as more risky to invest in.
| Raw materials | Closed | Change, % |
|---|---|---|
| Silver | 22.971 | -0.57 |
| Gold | 2030.076 | 0.08 |
| Palladium | 979.1 | -1.83 |
- GBP/USD grapples to halt the losses despite improved risk aversion.
- US Dollar could extend its gains on improved US bond yields.
- British Pound could advance on the expectation of BoE’s hawkish interest rate trajectory.
GBP/USD is in focus as it hovers around 1.2710 during the Asian session on Wednesday. After a recent dip that interrupted a four-day winning streak, the Pound Sterling (GBP) found support against the US Dollar (USD). The improved market risk appetite, driven by comments from Federal Reserve (Fed) members speculating about potential rate cuts by the end of 2024, contributed to a weaker US Dollar. However, a sudden shift in sentiment towards risk aversion added pressure, impacting the GBP/USD pair.
The US Dollar Index (DXY) consolidates near 102.50 after recent gains, attempting to extend its profits on improved US Treasury yields. The 2-year and 10-year yields on US bond coupons stand at 4.36% and 4.02%, respectively, by the press time.
However, the risk-on sentiment triggered by the Federal Reserve's (Fed) members' remarks speculating interest rate cuts by the end of 2024 has exerted downward pressure on the US Dollar. Atlanta Fed President Raphael W. Bostic mentioned that inflation has declined more than initially anticipated and expressed the view of expecting two quarter-point cuts by the end of 2024.
Additionally, US Fed Governor Michelle W. Bowman expressed that the current policy stance appears sufficiently restrictive, but it might eventually become appropriate to lower the Fed's policy rate if inflation falls closer to the 2% target.
The GBP/USD pair has displayed strength lately, largely influenced by monetary policy divergences between the Bank of England (BoE) and the US Federal Reserve (Fed). The BoE has maintained its stance on further rate hikes, even as indicators like inflation and wage growth show signs of easing. In contrast, expectations are building that the Fed may initiate an easing cycle as early as March.
DeAnne Julius, a former member of the Bank of England's (BoE) monetary policy committee, has expressed a different view regarding interest rates. According to her, the Bank of England won't be in a position to start cutting interest rates in 2024. Additionally, she mentioned that the escalating tensions in the Middle East could potentially lead to a new round of energy price increases, triggering a new inflation shock.
BoE's Governor Andrew Bailey’s speech is due on Wednesday. Furthermore, UK Manufacturing Production data will be released on Friday, expecting to have registered a growth in November. On the US docket, December’s Consumer Price Index (CPI) data from the United States will be released on Thursday.
Citing a senior US Defense Department official, CNBC News reported late Tuesday that Iran-backed Houthi militants launched the largest attack to date on commercial merchant vessels.
Additional details
Attacks have been reported in at least two locations: Southwest of Mokha, Yemen and Hodeidah, Yemen.
Approximately 50 merchant vessels were in the area at the time of the attack, according to American officials.
Crews reported attacks from rocket fire, as well as armed drones.
Market reaction
Risk sentiment remains sour in Asia early Wednesday, with the US S&P 500 futures down 0.06% on the day while the Asian equities mostly trade lower so far. Meanwhile, the US Dollar Index holds steady at around 102.50, at the press time.
- EUR/USD oscillates in a familiar trading range amid mixed fundamental cues.
- The Fed rate cut uncertainty holds back the USD bulls from placing fresh bets.
- Expectations that the ECB will keep rates higher for some time lend support.
- Traders also prefer to wait on the sidelines ahead of the US CPI on Thursday.
The EUR/USD pair struggles to gain any meaningful traction on Wednesday and remains confined in a familiar range held over the past week or so. Spot prices trade around the 1.0930-1.0925 region during the Asian session, awaiting the release of the latest consumer inflation figures from the United States (US) on Thursday for some meaningful directional impetus.
Heading into the key data risk, a report by the New York Fed showed on Monday that US consumers' projection of inflation over the short run fell to the lowest level in nearly three years in December. This reaffirms market bets for an imminent shift in the Federal Reserve's (Fed) policy stance, which holds back the US Dollar (USD) bulls from placing aggressive bets and should act as a tailwind for the EUR/USD pair.
That said, the better-than-expected US monthly jobs report released on Friday pointed to a still-resilient labor market and gives the Fed more headroom to keep interest rates higher for longer. Adding to this, hawkish remarks by several Fed officials recently dashed hopes for aggressive policy easing. This remains supportive of elevated US Treasury bond yields, which underpins the buck and weighs the EUR/USD pair.
The shared currency is further pressured by dismal German data released on Tuesday, which showed that Industrial Production plunged by 0.7% in November as compared to a 0.3% rise anticipated. This increases the odds of a recession in Europe’s largest economy and bets for a 25 basis points (bps) rate cut by the European Central Bank (ECB) in April, which contributes to the offered tone surrounding the EUR/USD pair.
That said, the expected jump in the Eurozone inflation last month could allow the ECB to keep interest rates at record highs for some time. This, in turn, warrants some caution for bearish traders and positioning for any meaningful depreciating move for the EUR/USD pair. Traders now look to French Industrial Production data and Italian Retail Sales figures for some impetus in the absence of any relevant macro data from the US on Wednesday.
Technical levels to watch
- Australian Dollar recovers its recent losses despite weaker Aussie consumer inflation data.
- Australian Monthly CPI (YoY) reduced to 4.3% in November, against the market expectation of 4.4%.
- US Dollar gained on risk-off sentiment despite the downbeat US bond yields.
The Australian Dollar (AUD) retraces its recent losses despite a softer-than-expected Aussie consumer inflation data released on Wednesday. However, the AUD/USD pair registered losses in the previous session as the US Dollar (USD) improved on risk-off sentiment.
Australia's economic indicators are providing a mixed picture, with the Monthly Consumer Price Index (YoY) for November showing a slight reduction to 4.3%, falling slightly short of the market expectation of 4.4% from the previous figure of 4.9%. This indicates a modest easing in year-on-year inflationary pressures in the country.
Aussie Retail Sales (MoM) showed a rise on Tuesday, signaling increased consumer spending. Additionally, the monthly Building Permits data grew, contrary to the expected decline. These positive trends in retail sales and building permits suggest some resilience in the domestic economy.
Thursday's release of Australian Trade Balance data for December is anticipated to show an increase from 7,129 million to 7,500 million. A higher trade balance could indicate improved export performance, contributing positively to the overall economic outlook.
The US Dollar Index (DXY) displays a sideways movement after experiencing gains on Tuesday. Despite weaker US Treasury yields, the DXY managed to advance. However, the risk-on sentiment triggered by the Federal Reserve's (Fed) members' remarks speculating interest rate cuts by the end of 2024 has exerted downward pressure on the US Dollar.
Traders are eagerly awaiting the release of December’s Consumer Price Index (CPI) data from the United States on Thursday. This economic indicator is crucial for gauging inflationary pressures and can significantly influence market expectations regarding the Fed's monetary policy stance.
Daily Digest Market Movers: Australian Dollar faces challenges on risk-off sentiment
- Australia’s Bureau of Statistics revealed the seasonally adjusted Retail Sales (MoM) for November, which rose by 2.0% instead of the expected 1.2%, swinging from the previous 0.2% decline.
- Australia’s Building Permits (MoM) came to 1.6% from 7.5% prior against the expected decline of 2.0%.
- Chinese wealth manager Zhongzhi Enterprise Group has filed for bankruptcy liquidation, facing a staggering $64 billion in liabilities.
- Atlanta Fed President Raphael W. Bostic mentioned on Monday that inflation has declined more than initially anticipated and expressed the view of expecting two quarter-point cuts by the end of 2024. Bostic conveyed comfort with the current rate level and emphasized the importance of allowing the Fed's tight policy time to work on cooling off inflation.
- US Fed Governor Michelle W. Bowman expressed that inflation could fall further with the policy rate held steady for some time. Bowman said that the current policy stance appears sufficiently restrictive, but it might eventually become appropriate to lower the Fed's policy rate if inflation falls closer to the 2% target.
- US Nonfarm Payrolls rose to 216K in December, showing an improvement from the 173K reported in November. This figure surpassed the market expectation, which anticipated a rise of 170K.
- US Average Hourly Earnings (YoY) improved to 4.1% from 4.0% prior. Meanwhile, the monthly index remained consistent at 0.4% against the expected decline of 0.3%.
- US ISM Services Purchasing Managers Index (PMI) came in at 50.6 against the expected 52.6 and 52.7 prior. While the Services Employment Index reduced to 43.3 from the previous reading of 50.7.
Technical Analysis: Australian Dollar hovers below 0.6700 psychological level
The Australian Dollar trades near 0.6690 on Wednesday below a psychological resistance level of 0.6700 followed by the seven-day Exponential Moving Average (EMA) of 0.6724. A break above the latter could approach the major level at the 0.6750 level. On the downside, the 0.6650 level could act as a major support followed by the 38.2% Fibonacci retracement level at 0.6637. A collapse below the level could lead the AUD/USD pair to explore the region around the psychological level at 0.6600.
AUD/USD: Daily Chart
-638404467612177350.png)
Australian Dollar price today
The table below shows the percentage change of Australian Dollar (AUD) against listed major currencies today. Australian Dollar was the strongest against the Japanese Yen.
| USD | EUR | GBP | CAD | AUD | JPY | NZD | CHF | |
| USD | 0.04% | 0.01% | -0.03% | -0.12% | 0.22% | 0.06% | 0.02% | |
| EUR | -0.04% | -0.03% | -0.07% | -0.14% | 0.19% | 0.01% | 0.00% | |
| GBP | -0.01% | 0.03% | -0.04% | -0.11% | 0.22% | 0.04% | 0.03% | |
| CAD | 0.03% | 0.07% | 0.04% | -0.07% | 0.26% | 0.08% | 0.07% | |
| AUD | 0.10% | 0.13% | 0.11% | 0.07% | 0.32% | 0.15% | 0.12% | |
| JPY | -0.22% | -0.18% | -0.21% | -0.26% | -0.32% | -0.18% | -0.19% | |
| NZD | -0.03% | 0.00% | -0.03% | -0.07% | -0.14% | 0.19% | -0.02% | |
| CHF | -0.04% | 0.02% | -0.01% | -0.05% | -0.12% | 0.20% | 0.04% |
The heat map shows percentage changes of major currencies against each other. The base currency is picked from the left column, while the quote currency is picked from the top row. For example, if you pick the Euro from the left column and move along the horizontal line to the Japanese Yen, the percentage change displayed in the box will represent EUR (base)/JPY (quote).
Australian Dollar FAQs
What key factors drive the Australian Dollar?
One of the most significant factors for the Australian Dollar (AUD) is the level of interest rates set by the Reserve Bank of Australia (RBA). Because Australia is a resource-rich country another key driver is the price of its biggest export, Iron Ore. The health of the Chinese economy, its largest trading partner, is a factor, as well as inflation in Australia, its growth rate and Trade Balance. Market sentiment – whether investors are taking on more risky assets (risk-on) or seeking safe-havens (risk-off) – is also a factor, with risk-on positive for AUD.
How do the decisions of the Reserve Bank of Australia impact the Australian Dollar?
The Reserve Bank of Australia (RBA) influences the Australian Dollar (AUD) by setting the level of interest rates that Australian banks can lend to each other. This influences the level of interest rates in the economy as a whole. The main goal of the RBA is to maintain a stable inflation rate of 2-3% by adjusting interest rates up or down. Relatively high interest rates compared to other major central banks support the AUD, and the opposite for relatively low. The RBA can also use quantitative easing and tightening to influence credit conditions, with the former AUD-negative and the latter AUD-positive.
How does the health of the Chinese Economy impact the Australian Dollar?
China is Australia’s largest trading partner so the health of the Chinese economy is a major influence on the value of the Australian Dollar (AUD). When the Chinese economy is doing well it purchases more raw materials, goods and services from Australia, lifting demand for the AUD, and pushing up its value. The opposite is the case when the Chinese economy is not growing as fast as expected. Positive or negative surprises in Chinese growth data, therefore, often have a direct impact on the Australian Dollar and its pairs.
How does the price of Iron Ore impact the Australian Dollar?
Iron Ore is Australia’s largest export, accounting for $118 billion a year according to data from 2021, with China as its primary destination. The price of Iron Ore, therefore, can be a driver of the Australian Dollar. Generally, if the price of Iron Ore rises, AUD also goes up, as aggregate demand for the currency increases. The opposite is the case if the price of Iron Ore falls. Higher Iron Ore prices also tend to result in a greater likelihood of a positive Trade Balance for Australia, which is also positive of the AUD.
How does the Trade Balance impact the Australian Dollar?
The Trade Balance, which is the difference between what a country earns from its exports versus what it pays for its imports, is another factor that can influence the value of the Australian Dollar. If Australia produces highly sought after exports, then its currency will gain in value purely from the surplus demand created from foreign buyers seeking to purchase its exports versus what it spends to purchase imports. Therefore, a positive net Trade Balance strengthens the AUD, with the opposite effect if the Trade Balance is negative.
The People’s Bank of China (PBoC) sets the USD/CNY central rate for the trading session ahead on Wednesday at 7.1055 as compared to the previous day's fix of 7.1010 and 7.1618 Reuters estimates.
Zou Lan, head of the People’s Bank of China’s (PBOC) monetary policy department, in an interview with state media outlet Xinhua News Agency on Tuesday, hinted a further policy easing by the central bank.
Key comments:
- The PBoC may use open market operations, medium-term lending facilities and reserve requirements among other monetary policy tools to provide “strong" support for reasonable credit growth.
- PBoC will strengthen its counter-cyclical and cross-cycle policy adjustments to create favourable financial conditions for the country’s economic growth.
- PBoC will also take measures to prevent funds from clogging and idling while guiding financial institutions to strengthen their liquidity risk management for stable money market operations.
Market reaction:
The Chinese Yuan, meanwhile, reacts little to headlines, with the USD/CNH pair trading around the 7.1840 level or nearly unchanged for the day.
- Gold price lacks a firm intraday direction and remains close to a multi-week low set on Monday.
- Elevated US bond yields act as a headwind amid reduced bets for a more aggressive Fed easing.
- Subdued USD price action helps limit the downside ahead of the key US CPI report on Thursday.
Gold price (XAU/USD) struggles to gain any meaningful traction following the previous day's late pullback from the $2,040 area and oscillates in a narrow trading band during the Asian session on Wednesday. Traders now seem reluctant and prefer to wait for the release of the latest consumer inflation figures on Thursday before placing fresh directional bets.
The crucial US CPI report will influence expectations about the Fed's future policy decisions and help in determining the near-term trajectory for the non-yielding Gold price. Heading into the key data risk, the incoming US macro data pointed to a still-resilient economy, which is experiencing above-target inflation. Adding to this, hawkish remarks by Fed officials forced investors to scale back their expectations for more aggressive policy easing in 2024. This remains supportive of elevated US Treasury bond yields and is seen as a key factor acting as a headwind for the yellow metal.
Apart from this, a generally positive tone around the equity markets further contributes to capping the safe-haven Gold price. The US central bank, meanwhile, pivoted to a more cautious stance at its December meeting and signalled that it would lower borrowing costs in 2024. Market participants, however, remain uncertain over the timing of when the Fed will start cutting interest rates. This keeps the US Dollar (USD) bulls on the defensive and lends support to the XAU/USD. Nevertheless, the precious metal remains well within the striking distance of a nearly three-week low touched on Monday.
Moving ahead, there isn't any relevant market-moving economic data due for release from the US on Wednesday, leaving the USD at the mercy of the US bond yields. Apart from this, the broader risk sentiment might provide some impetus to the Gold price and allow traders to grab short-term opportunities. Meanwhile, the precious metal's inability to attract buyers supports prospects for an extension of a well-established downtrend witnessed over the past two weeks or so.
Technical levels to watch
The latest data published by the Australian Bureau of Statistics (ABS) on Wednesday showed that the nation’s Consumer Price Index (CPI) decelerated from the 4.9% YoY rate to 4.3% in November. The reading was slightly lower than the consensus estimates for a reading of 4.4%.
Market reaction
The AUD/USD pair reacts little to the monthly data, which does not show all components of the CPI included in the quarterly report. Inflation figures for the October - December 2023 quarter will be published on January 31 2024 and will play a key role in influencing the Reserve Bank of Australia's (RBA) policy decision.
| Index | Change, points | Closed | Change, % |
|---|---|---|---|
| NIKKEI 225 | 385.76 | 33763.18 | 1.16 |
| Hang Seng | -34.43 | 16190.02 | -0.21 |
| KOSPI | -6.58 | 2561.24 | -0.26 |
| ASX 200 | 69 | 7520.5 | 0.93 |
| DAX | -28.11 | 16688.36 | -0.17 |
| CAC 40 | -23.62 | 7426.62 | -0.32 |
| Dow Jones | -157.85 | 37525.16 | -0.42 |
| S&P 500 | -7.04 | 4756.5 | -0.15 |
| NASDAQ Composite | 13.94 | 14857.71 | 0.09 |
| Pare | Closed | Change, % |
|---|---|---|
| AUDUSD | 0.66875 | -0.45 |
| EURJPY | 157.926 | 0.1 |
| EURUSD | 1.09308 | -0.18 |
| GBPJPY | 183.631 | -0.07 |
| GBPUSD | 1.27099 | -0.27 |
| NZDUSD | 0.62398 | -0.1 |
| USDCAD | 1.33885 | 0.33 |
| USDCHF | 0.85237 | 0.54 |
| USDJPY | 144.48 | 0.2 |
Japanese Labor Cash Earnings in November broadly missed the mark early Wednesday, with nominal wages printing at 0.2% YoY versus the forecast of 1.5%. Markets expected nominal earnings to hold steady with October's print, and after adjusting for inflation, real wages have declined 3% YoY.
Overall Household Spending for the year ended November also fell further back from the previous period, declining 2.9% YoY in November versus October's YoY -2.5%.
Market Reaction
Early Wednesday market volumes remain thin, and the USD/JPY continues to trade tightly near 144.40.
About Labor Cash Earnings
This indicator, released by the Ministry of Health, Labor and Welfare, shows the average income, before taxes, per regular employee. It includes overtime pay and bonuses but it doesn't take into account earnings from holding financial assets nor capital gains. Higher income puts upward pressures on consumption, and is inflationary for the Japanese economy. Generally, a higher-than-expected reading is bullish for the Japanese Yen (JPY), while a below-the-market consensus result is bearish.
About Overall Household Spending
The Overall Household Spending released by the Ministry of Internal Affairs and Communications is an indicator that measures the total expenditure by households. The level of spending can be used as an indicator of consumer optimism. It is also considered as a measure of economic growth. A high reading is positive (or Bullish) for the JPY, while a low reading is negative (or bearish).


© 2000-2026. Уcі права захищені.
Cайт знаходитьcя під керуванням TeleTrade DJ. LLC 2351 LLC 2022 (Euro House, Richmond Hill Road, Kingstown, VC0100, St. Vincent and the Grenadines).
Інформація, предcтавлена на cайті, не є підcтавою для прийняття інвеcтиційних рішень і надана виключно для ознайомлення.
Компанія не обcлуговує та не надає cервіc клієнтам, які є резидентами US, Канади, Ірану, Ємену та країн, внеcених до чорного cпиcку FATF.
Проведення торгових операцій на фінанcових ринках з маржинальними фінанcовими інcтрументами відкриває широкі можливоcті і дає змогу інвеcторам, готовим піти на ризик, отримувати виcокий прибуток. Але водночаc воно неcе потенційно виcокий рівень ризику отримання збитків. Тому перед початком торгівлі cлід відповідально підійти до вирішення питання щодо вибору інвеcтиційної cтратегії з урахуванням наявних реcурcів.
Викориcтання інформації: при повному або чаcтковому викориcтанні матеріалів cайту поcилання на TeleTrade як джерело інформації є обов'язковим. Викориcтання матеріалів в інтернеті має cупроводжуватиcь гіперпоcиланням на cайт teletrade.org. Автоматичний імпорт матеріалів та інформації із cайту заборонено.
З уcіх питань звертайтеcь за адреcою pr@teletrade.global.
переклади