- Analytics
- News and Tools
- Market News
Новини ринків
- The AUD/NZD pair is struggling to develop momentum as the Antipodeans both sink.
- New Zealand economic data is 0-for-2 in the back half of the trading week as NZ PMI declines.
- Early Friday sees RBA Monetary Policy Statement release, set to confirm dovish stance.
The AUD/NZD has fallen back into the 1.080 region as the Aussie (AUD) wins the slow race between itself and the Kiwi (NZD) for weakest links in Thursday trading, with both currencies either declining or seeing all gains erased on the day.
The Aussie slid into a three-week low against the Kiwi heading into the Friday trading session, and the AUD has closed in the red for five of the last six consecutive trading days.
Australia: RBA is seen keeping rates unchanged in December – UOB
After the Reserve Bank of Australia (RBA) struck a dovish tone at their last meeting despite delivering a 25 basis point rate hike, Aussie traders are racing each other to the exist as the Australian central bank looks set to grapple with a weak economic outlook for the immediate future. The RBA stood pat on interest rates for the previous four consecutive meetings, and concerns are rising that even with the weak economic outlook, the RBA isn't doing enough to effectively combat inflation that keeps proving stickier than the central bank is willing to accept.
On the Kiwi side, NZ Purchasing Managers' Index figures for October continued to decline, printing at 42.5 compared to September's showing of 45.3 as operators expect worsening economic conditions moving forward.
New Zealand Business PMI eases to 42.5 in October vs. 45.3 prior
The RBA is set to release their latest Monetary Policy Statement, which will do little for AUD investors but highlight the Australian central bank's dovish stance.
AUD/NZD Technical Outlook
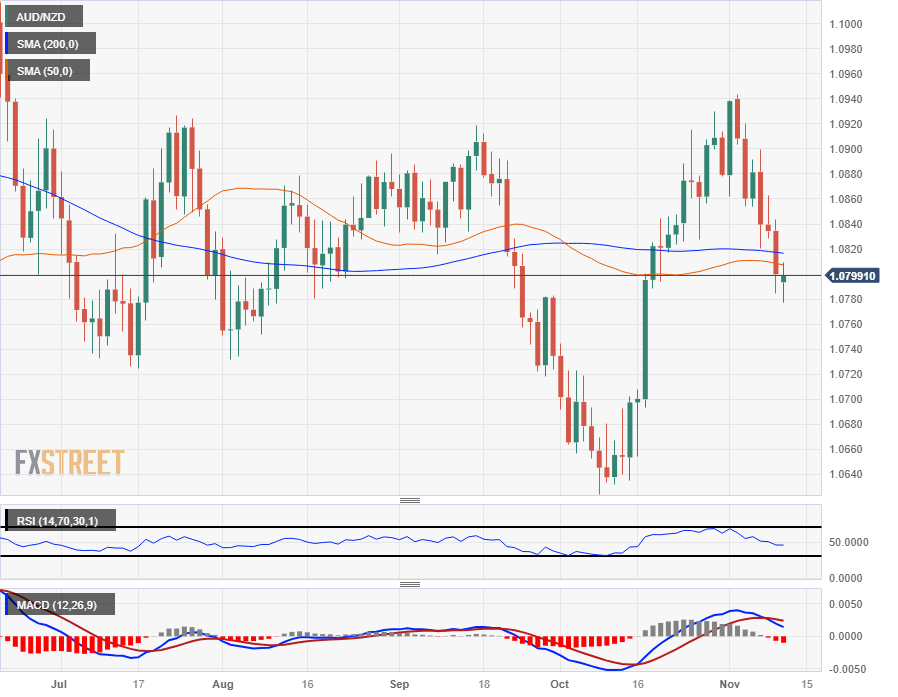
The Aussie-Kiwi pairing has tumbled back into the bearish side of the 200-day Simple Moving Average (SMA) and the 50-day SMA is cycling close by, adding technical resistance from Thursday's peak bids near 1.0810.
Further downside will see the pair set for an extension into October's low bids near 1.0640, and there's little technical support to provide the AUD need lift in the chart paper if bears continue to apply pressure.
Australian Dollar price this week
The table below shows the percentage change of Australian Dollar (AUD) against listed major currencies this week. Australian Dollar was the weakest against the US Dollar.
| USD | EUR | GBP | CAD | AUD | JPY | NZD | CHF | |
| USD | 0.59% | 1.23% | 1.07% | 2.34% | 1.22% | 1.74% | 0.43% | |
| EUR | -0.59% | 0.65% | 0.48% | 1.74% | 0.63% | 1.13% | -0.16% | |
| GBP | -1.25% | -0.67% | -0.17% | 1.11% | -0.02% | 0.49% | -0.82% | |
| CAD | -1.08% | -0.49% | 0.17% | 1.26% | 0.14% | 0.65% | -0.66% | |
| AUD | -2.39% | -1.78% | -1.14% | -1.28% | -1.15% | -0.61% | -1.95% | |
| JPY | -1.24% | -0.64% | -0.20% | -0.14% | 1.11% | 0.47% | -0.78% | |
| NZD | -1.76% | -1.15% | -0.49% | -0.66% | 0.61% | -0.52% | -1.32% | |
| CHF | -0.44% | 0.16% | 0.81% | 0.64% | 1.90% | 0.78% | 1.30% |
The heat map shows percentage changes of major currencies against each other. The base currency is picked from the left column, while the quote currency is picked from the top row. For example, if you pick the Euro from the left column and move along the horizontal line to the Japanese Yen, the percentage change displayed in the box will represent EUR (base)/JPY (quote).
AUD/NZD Daily Chart
AUD/NZD Technical Levels
The Business NZ Performance of Manufacturing Index (PMI), also known as the New Zealand Manufacturing PMI came in at 42.5 in October from September’s print of 45.3.
“Today’s PMI is not a good look for GDP and employment growth. Our GDP forecasts already include a decline in the manufacturing sector in the second half of 2023. There’s a chance that decline is bigger than we think if the PMI does not bounce in the final months of the year”, said BNZ Senior Economist Doug Steel.
Market reaction
As of writing, NZD/USD is trading at 0.5894, losing 0.10% on the day.
- NZD/USD continues its downward trend, touching the 0.5890s amid a hawkish pivot from the US Federal Reserve Chair.
- Market expectations for a Fed rate cut shift further into 2024, reflecting in a 0.35% rise in the US Dollar Index.
- New Zealand's Business PMI contraction adds to economic headwinds, with potential implications for a deeper manufacturing sector decline.
NZD/USD drops to a four-day low, extending its losses in the week to more than 1.70%, and exchanges hands at around 0.5890s as the Asian session begins.
Kiwi's weekly decline exceeds 1.70%, with the USD gaining on Fed Chair's comments and rising Treasury yields
The US Federal Reserve Chair Jerome Powell pushed back against market participants' dovish perception following the US central bank decision to hold rates on November 1. He said that Fed officials “are not confident” the policy is sufficiently restrictive. Powell reiterates the Fed “is committed to achieving a stance of monetary policy” that could bring inflation down to its 2% goal.
The swaps market scaled back expectations the Fed would cut rates from May to June 2024 as US Treasury bond yields rose ten basis points. The US Dollar Index (DXY), which measures the Greenback’s value against a basket of peers, climbs 0.35%, and stands at 105.89.
Earlier before Wall Street opened, the US Bureau of Labor Statistics (BLS) revealed that unemployment claims for the week ending November 4 rose 217,000, below forecasts of 218,000 and the previous reading of 220,000. Continuing claims, which track the number of people already receiving government unemployment benefits, increased to 1’834,000 million, above the 1’820,000 until October 28.
The New Zealand economic docket recently featured Business PMI for October at 42.5, below September’s 45.3. According to the Bank of New Zealand, “GDP forecasts already include a decline in the manufacturing sector in the second half of 2023. There’s a chance that decline is bigger than we think if the PMI does not bounce in the final months of the year."
NZD/USD Technical Levels
- Gold price gains ground around $1,958 despite the firmer USD.
- Hawkish comments from Federal Reserve (Fed) Chair Jerome Powell boost the US Dollar and US Treasury bond yields.
- The escalating tensions in the Middle East might cap gold's downside.
- Gold traders will monitor the US University of Michigan Consumer Sentiment survey for fresh impetus.
Gold price (XAU/USD) snaps the three-day losing streak during the early Asian session on Friday. The rise of geopolitical tension in the Middle East lifts safe-haven assets like gold, despite the higher US Treasury bond yields. The gold price currently trades around $1,958, gaining 0.03% on the day.
Meanwhile, the US Dollar Index (DXY) surges to 105.90 following the hawkish comments from Federal Reserve (Fed) Chairman Jerome Powell. The US Treasury bond yields also edge higher, with the 10-year yield staying at 4.65% and the 2-year yield reaching 5%.
Late Thursday, Fed Chair Jerome Powell said they are not confident that they have achieved a sufficiently restrictive policy to bring inflation down to 2 percent over time. Powell further stated that if it’s appropriate to tighten policy further, the Fed will not hesitate. However, the Fed does not make a decision now about a significant bond tightening, but it is not going to ignore it. That being said, the hawkish comments from Fed Powell might boost the US Dollar (USD) and cap the upside of the Dollar-denominated gold.
On the other hand, the elevated geopolitical risks in the Middle East might lift the safe-haven gold. The White House said on Thursday that Israel has agreed to halt military operations in parts of north Gaza for four hours each day, but there was little evidence of a lull in the war.
Investors will keep an eye on the Fed's Logan speech, the preliminary US Michigan Consumer Sentiment Index for November, and UoM 5-year Consumer Inflation Expectation. These events could give a clear direction to gold price.
- The AUD/JPY is backsliding after seeing a rejection from the 97.00 handle.
- Aussie bidders are getting washed out of the market, pushing the AUD down across the board.
- Intraday momentum is firmly pinned into the bearish side.
The AUD/JPY is seeking out further downside as the Aussie markets tilt firmly into the bearish side heading into the Friday market session.
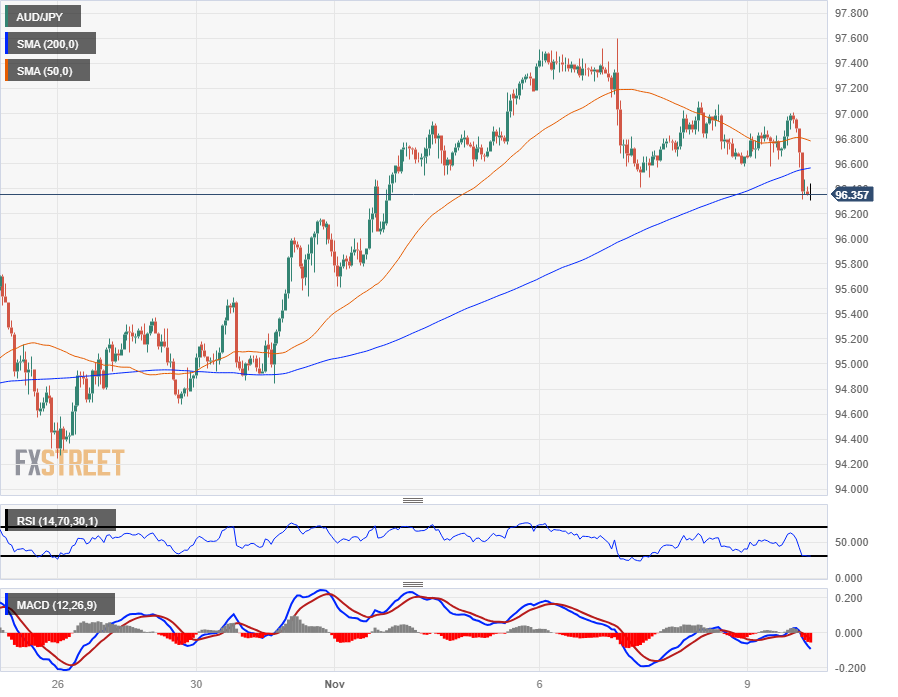
The Aussie's (AUD) near-term bullish stance from last week is cracking into pieces, marking in a technical ceiling against the Yen (JPY) after a failed push into 97.60 sees the AUD/JPY dumping chart paper. Bids have tumbled below the 200-hour Simple Moving Average (SMA) as intraday momentum rotates into bear country.
Bids are seeing near-term friction from the 96.40 region, but a short-side continuation will see the AUD/JPY extending downwards into the 96.00 handle.
The 50-hour SMA is falling back into the longer moving average but still remains on the top side, and a bearish confirmation could see any bullish pullbacks primed for a continuation lower if bidders don't step into markets and recover the AUD heading into the week's market close.
AUD/JPY Hourly Chart
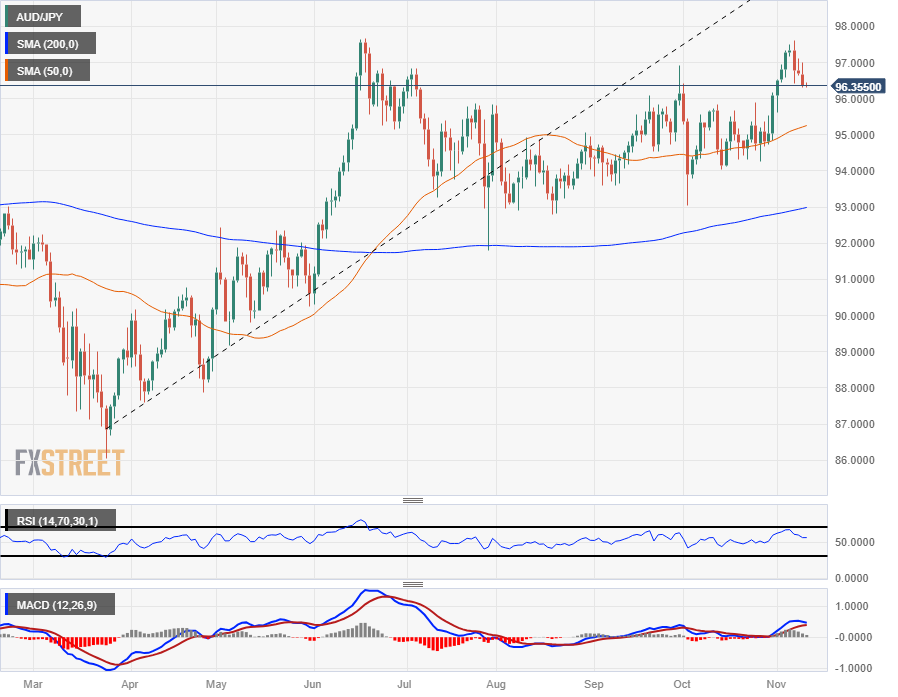
AUD/JPY Daily Chart
AUD/JPY Technical Levels
- GBP/JPY sees a decline of 0.24%, as Yen is boosted following Fed Chair Powell's hawkish remarks.
- The daily chart portrays the pair as neutral, tilted to the upside, with the Kumo below price action.
- Key support levels loom below, with the Tenkan-Sen at 183.62 and the Kijun-Sen at 183.36, while a rebound above 186.00 could reignite bullish momentum.
The GBP/JPY failed to gain traction on Thursday, posting losses of 0.24% amid hawkish comments from the US Federal Reserve Chair Jerome Powell on an International Monetary Fund (IMF) event. Hence, the safe-haven status of the Japanese Yen (JPY) benefitted, a headwind for the Pound Sterling (GBP). At the time of writing, the cross-pair is trading at 184.97 after hitting a daily high of 185.89.
The pair is neutral but slightly tilted to the upside due to price action remaining above the Ichimoku Cloud (Kumo). A narrow width of the Kumo, along with price action failing to register a successive series of higher lows and higher highs, indicate the cross might be subject for a pullback.
Despite that, if GBP/JPY buyers reclaim 186.00, that could open the door for challenging the year-to-date (YTD) high at 186.76. On the other hand, a drop below 184.00, key support levels would emerge.
The first support would be the Tenkan-Sen at183.62, followed by the Senkou-Span A at 183.49, followed by the Kijun-Sen at 183.36. Once those levels are cleared, the 183.00 psychological figure would be up next
GBP/JPY Price Analysis – Daily Chart

GBP/JPY Technical Levels
- The AUD/USD accelerated intraday losses on Thursday.
- RBA's Monetary Policy Statement due early in the Friday session.
- Hawkish comments from Fed Chairman Powell driving US Dollar flows.
The AUD/USD backslid on Thursday after a bullish rebound failed to materialize, with Aussie (AUD) bulls getting pushed away from the table by US Dollar (USD) flows that saw the Greenback rise after Federal Reserve (Fed) Chairman Jerome Powell delivered hawkish comments that caught the market off-guard.
Forex Today: Hawkish Powell boosts the Dollar and ends positive Streak in Wall Street
The Reserve Bank of Australia (RBA) has developed into a question mark for markets following Tuesday's dovish rate hike. Despite a 25 basis point hike, the RBA appears hesitant on the back of softening data from the Australian economy, and investors are going to have a more difficult time successfully drawing a bead on where the RBA might step next.
Australia: RBA is seen keeping rates unchanged in December – UOB
Fed Chair Powell struck a surprisingly hawkish tone during a speech late Thursday, where the Fed head noted that the Fed has some concerns that they may not have achieved a suitably restrictive policy level in order to constrain inflation low enough, soon enough. Markets have broadly overloaded on their bets that the Fed has reached the end of its tightening cycle, and investors will have to grapple with a US central bank leaning heavier than most expected.
Fed’s Powell: We are not confident we are at a sufficiently restrictive stance
AUD/USD Technical Outlook
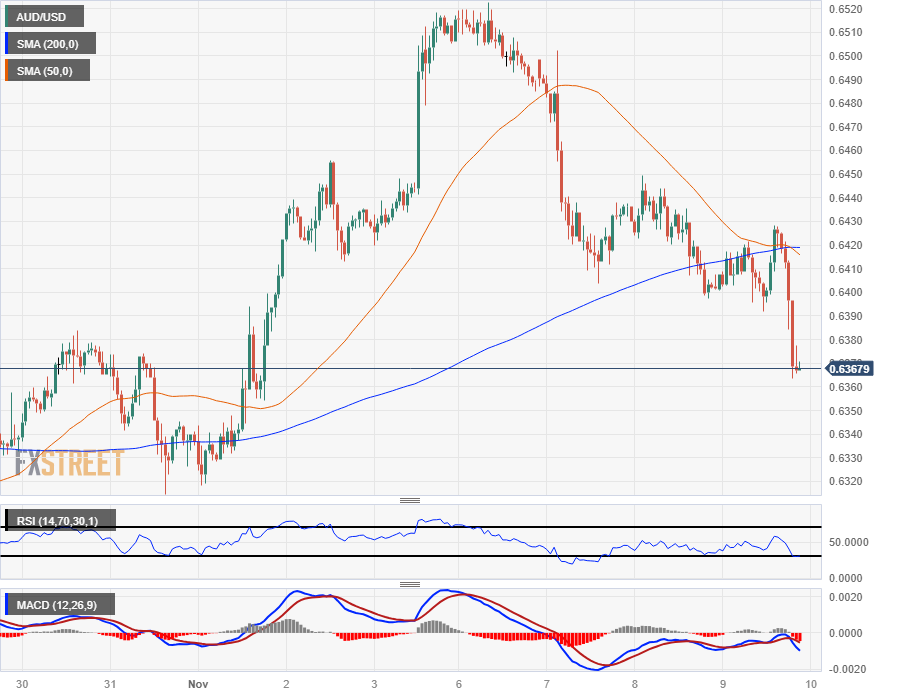
The Aussie's bull run from last week looks truly over as the AUD/USD pares back all gains and sends the Greenback back on top. The AUD/USD is now falling below near-term median prices below the 200-hour Simple Moving Average (SMA) currently rotating into 0.6420, and the 50-hour SMA is set to confirm a bearish crossover of the longer moving average as price action accelerates into the downside.
The AUD/USD is now threatening to collapse back into a rough consolidation range that plagued intraday action through October's trading, while a bullish recovery will first need to develop enough momentum to re-crack the 0.6400- handle.
AUD/USD Hourly Chart
AUD/USD Technical Levels
- NZD/JPY met resistance at a daily high of around 89.863 and then declined towards 89.245.
- Indicators turned flat in positive territory on the daily chart.
- The cross is still bullish in the long term as it trades above the 20, 100 and 200-day SMAs.
The NZD/JPY failed to hold its momentum, which took the cross to a multi-week high of around 89.865 and then closed at around 89.200.
The technical analysis of the daily chart suggests a shift towards a neutral to a bearish outlook for NZD/USD, with indicators flashing signs of bullish exhaustion. The Relative Strength Index (RSI) maintains a flat slope above 50, while the Moving Average Convergence (MACD) presents lower green bars. On the four-hour chart, the bearish momentum is more evident, with the RSI and MACD plunging into the negative zone.
That said, the pair is above the 20,100,200-day Simple Moving Average (SMA), indicating a favourable position for the bulls in the bigger picture. In addition, the 100-day SMA seems to be converging towards the 20-day average to perform a bullish cross in the 88.150-88.300 area, which could reignite the momentum for the buyers in the short term.
Support levels: 89.000, 88.700,88.500.
Resistance levels: 89.500, 89.850, 90.000.
NZD/USD Daily Chart

- Crude Oil saw a minor relief bid on Thursday before getting pushed back down.
- WTI ticked into $77.00 before slipping back to $75.00.
- US hits all-time highs on Crude Oil production.
West Texas Intermediate (WTI) Crude Oil continues to get pushed into recent lows as barrel bids struggle to find the floor on bearish price pressures.
WTI climbed Thursday, recovering the $77.00 handle before getting pushed back down towards $75.00 in the back half of the trading day.
the overarching market narrative of chronic undersupply that has been shooting through energy markets are running up against a hard barrier as reality sets into Crude Oil markets; despite strategic, long-running cuts from oil-producing nations, expectations of global undersupply are failing to materialize.
A lack of a surge in Crude Oil demand is certainly helping things as China's economy recovery continues to falter and oil demand remains much more tepid than most investors expected, but the US also hit an important milestone this week.
US Crude Oil production hit an all-time high in reporting figures, with the US pumping over 404 million barrels of oil through August according to data from the Energy Information Administration (EIA). This broke the US' previous barrel production record of 402 million barrels produced in December of 2019.
Monthly Crude Oil production in the US

WTI Technical Outlook
With Crude Oil falling back from the 50-hour Simple Moving Average (SMA) on the intraday charts, there's a real risk of a bearish extension if short sellers can push WTI back below the $75.00 handle.
WTI chart losses are accelerating away from the median, accelerating short momentum as price action drops away from the 200-hour SMA currently dropping into the $80.00 region.
WTI bids saw a rejection from the 200-day SMA last Friday, and technical resistance barriers are piling up in the near term, creating friction for any Crude Oil bidders looking to step into the markets.
WTI Hourly Chart

WTI Technical Levels
During the Asian session, the Reserve Bank of Australia will publish its Monetary Policy Statement following Tuesday's rate hike. The New Zealand BusinessNZ Manufacturing Index is due. Later in the day, the focus will shift to UK growth data and the University of Michigan Consumer Sentiment survey.
Here is what you need to know on Friday, November 10:
The US Dollar jumped on Thursday after Federal Reserve Chairman Jerome Powell's hawkish remarks. Powell expressed that they are not confident that they have achieved a "stance of monetary policy that is sufficiently restrictive to bring inflation down to 2 percent over time".
Powell's comments further boosted US yields, which were already rising due to a weak 30-year bond auction. The 10-year yield reached 4.65%, and the 2-year yield surpassed 5%. The US Dollar Index climbed toward 106.00. Stocks in Wall Street dropped, ending a seven-day positive streak.
US data showed that Initial Jobless Claims totaled 217,000 in the week ending November 4, while Continuing Claims rose for the seventh consecutive week to 1.83 million, the highest level since mid-April. On Friday, the University of Michigan Consumer Sentiment survey is scheduled for release.
EUR/USD dropped to test the weekly low area around 1.0660. The pair is moving with a bearish bias ahead of the Asian session, driven by a stronger US Dollar.
GBP/USD continued to decline for the fourth consecutive day, falling towards 1.2200. The Pound faces a critical day with the release of UK economic data on Friday, including Q3 Gross Domestic Product growth and September industrial production. The forecast suggests a 0.1 percent contraction during the fifth quarter.
USD/JPY rose boosted by higher yields, climbing above 151.50. Further gains are likely to put Japanese authorities on alert.
AUD/USD tumbled to the 20-day Simple Moving Average (SMA) at 0.6370. The pair continues to give up last week's gains. The Reserve Bank of Australia (RBA) will release its Monetary Policy Statement after raising the official cash rate (OCR) by 25 basis points on Tuesday.
NZD/USD failed to hold onto gains and struggled to stay above 0.5900, affected by risk aversion and the strength of the US Dollar. The BusinessNZ Manufacturing Index is due on Friday.
The correlation between gold and US yields has deteriorated in recent sessions. On Thursday, the yellow metal remained relatively steady when yields jumped. XAU/USD posted gains, ending around $1,955, while Silver flirted with $23.00 but retraced back to $22.55.
Like this article? Help us with some feedback by answering this survey:
- EUR/USD retreats from 1.0725, as Fed Chair Powell's comments and higher bond yields strengthen the US Dollar.
- Powell's hawkish shift, emphasizing the need for potentially tighter monetary policy, propels the Dollar Index by over 0.30%.
- The EUR/USD's technical analysis suggests a continued downtrend, with key levels to watch at 1.0659 and the 50-DMA at 1.0624, while a move above 1.0700 could signal an upward correction.
EUR/USD retreats from daily highs reached at 1.0725, dives some 0.37% as the Greenback was underpinned by hawkish remarks of Federal Reserve Chairman Jerome Powell and elevated US Treasury bond yields following a 30-year bond auction. The EUR/USD is trading at 1.0666.
EUR/USD drops on a hawkish Federal Reserve outlook and a spike in US Treasury yields
Jerome Powell turned hawkish on Thursday, commented they’re not confident the Fed’s monetary policy is sufficiently restrictive, and said they would not hesitate to tighten monetary conditions if needed. Powell said they will carefully decide meeting-by-meeting and adding that inflation remains well above the 2% target despite slowing down.
Powell’s remarks spurred a jump in US Treasury bond yields of more than 10 basis points along the whole curve, while the American Dollar (USD) climbs as the US Dollar Index is gaining more than 0.30%, up at 105.91.
Data in the United States (US) showed that Initial Jobless Claims in the United States for the week ending November 4, rose by 217K, below estimates of 218K, and last week’s 220K. Even though the data paints a tight labor market, last Friday’s Nonfarm Payrolls report showed the economy added 150K jobs, below forecasts of 180K, while witnessing a jump in the unemployment rate to 3.9%.
Across the pond, recent data from the Eurozone (EU) portrays a stagflationary scenario, with business activity on the manufacturing side and industrial production slowed. Nevertheless, the rise in German yields is capping the EUR/USD recent fall after Powell’s remarks.
What to watch?
A scarce EU economic docket would feature a speech by the European Central Bank (ECB) President Christine Lagarde on Friday. The US calendar will feature the University of Michigan Consumer Sentiment and additional Federal Reserve speakers.
EUR/USD Price Analysis: Technical outlook
The daily chart shows that the EUR/USD downtrend is intact, with the pair testing the week's lows at around 1.0659. A breach of the latter could drag prices to the 50-day moving average (DMA) at 1.0624, before diving to 1.0600. On the flipside, the major could shift upward, if it reclaims 1.0700, followed by the November 6 high at 1.0756.
- The United Kingdom's Gross Domestic Product is foreseen posting a modest contraction in Q3.
- The Bank of England downgraded its forecast for economic growth in the November meeting.
- GBP/USD needs to recapture the 1.2400 mark and run past the 1.2427 peak to gain substantial upward momentum.
The United Kingdom (UK) will release the Q3 Gross Domestic Product (GDP) preliminary estimate on Friday. Ahead of the announcement, the Pound Sterling is under selling pressure against its American rival, with GBP/USD trading at around the 1.2300 level after peaking this month at 1.2427.
Market participants are trying to assess central bank announcements, as most banks have paused monetary tightening. The return from the Coronavirus pandemic had the unexpected effect of sending inflation to multi-decade highs globally, catching policymakers off-guard. As a result, central banks engaged in an aggressive monetary tightening in early 2022, which proved effective in taming price pressures well into 2023. However, inflationary levels remain above central banks’ targets, with worldwide policymakers reaffirming the battle against inflation is not over.
Yet, as Issac Newton said, every action has a reaction. Monetary tightening put pressure on economic growth, and fears of a global recession had been the main theme for over a year.
The United States (US) Federal Reserve and the Bank of England (BoE) have refrained from hiking rates in their last two meetings, as the risks to growth from super-high rates are far more concerning than inflation itself. The Fed benchmark rate currently stands at 5.25%-5.50%, while the BoE lifted the Bank Rate to 5.25%.
UK Gross Domestic Product forecast: What numbers could tell us
The Office for National Statistics (ONS) reported that the UK economy grew 0.2% QoQ in the previous quarter, compared with the 0.3% advance posted in the first quarter of the year. In the three months to June, the economy expanded 0.6% on year, improving from the previous 0.5%.
In its latest meeting, the Bank of England downgraded its forecast for economic growth. The BoE now expects GDP to grow just 0.1% in the last quarter of the year, while policymakers expect inflation to return to its 2% target by the end of 2025.
Meanwhile, the UK Consumer Price Index (CPI) remains among the highest within major economies. According to the latest ONS report, the CPI increased 6.7% YoY in September, the same rate as in August, while core inflation was marginally lower to 6.1% YoY from 6.2% in August.
Lacklustre growth in a high-inflation, restrictive-rates scenario should be no surprise. At this point, nobody doubts there will be a setback, with speculation rotating around whether major economies will face soft landings or steep economic downturns. The odds for a UK economic downturn are at 60% by the end of 2024, according to the National Institute of Economic and Social Research (NIESR).
When will the UK release Q3 GDP, and how could it affect GBP/USD?
The UK will release the Q3 Gross Domestic Product (GDP) preliminary estimate on Friday, November 10, at 7:00 GMT. The economy is expected to have shrunk 0.1% in the three months to September, while the annual comparison is foreseen at 0.5%, slightly below the 0.6% posted in the second quarter of the year. On a monthly basis, the GDP is foreseen at -0.1% in September, declining from 0.2% in August.
An outcome aligned with the market’s expectations should reaffirm the BoE’s decision to stay put. Tepid growth, and even more a slight economic contraction, somehow grants caution among policymakers, now pledging to keep rates higher for longer.
Nevertheless, financial markets anticipate roughly 75 basis points (bps) rate cuts by mid-2024, despite BoE Governor Andrew Bailey repeating on Wednesday that officials need to keep fighting inflation and that monetary policy will need to be restrictive for an extended period. His words followed comments from Chief Economist Huw Pill, who said that a rate cut by 2024 “doesn't seem totally unreasonable,” lifting the odds for a cut from 30 bps to the aforementioned 75 bps.
Sterling Pound buyers will likely welcome an upbeat surprise, although the chances of such a scenario are limited. Should the outcome miss expectations, GBP/USD would fall, particularly considering the US Dollar is somehow stronger ahead of the event.
Valeria Bednarik, Chief Analyst at FXStreet, says: “After bottoming at 1.2037 in October, GBP/USD is looking to turn north, although US Dollar bulls are fighting back. The pair has a long way to go before turning north, as the wider perspective keeps the risk skewed to the downside. A bearish 100 Simple Moving Average (SMA) in the weekly chart provided dynamic resistance on the run past 1.2400, rejecting the pair. Furthermore, technical indicators in the mentioned time frame have lost their positive momentum within negative levels and are slowly resuming their slides.”
Bednarik adds: “The weekly low at 1.2241 offers immediate support, followed by the 1.2180 price zone. GBP/USD bulls will get discouraged if the pair slides below the latter, resulting in a firmer decline towards the aforementioned October low. The pair needs to recapture the 1.2400 threshold, and extend gains beyond the 1.2427 peak to increase the odds of a bullish continuation, with buyers then aiming to test the 1.2500 mark.”
Economic Indicator
United Kingdom Gross Domestic Product (MoM)
The Gross Domestic Product released by the National Statistics is a measure of the total value of all goods and services produced by the UK. The GDP is considered as a broad measure of the UK economic activity. Generally speaking, a rising trend has a positive effect on the GBP, while a falling trend is seen as negative (or bearish).
Read more.Next release: 11/10/2023 07:00:00 GMT
Frequency: Monthly
Source: Office for National Statistics
GDP FAQs
What is GDP and how is it recorded?
A country’s Gross Domestic Product (GDP) measures the rate of growth of its economy over a given period of time, usually a quarter. The most reliable figures are those that compare GDP to the previous quarter e.g Q2 of 2023 vs Q1 of 2023, or to the same period in the previous year, e.g Q2 of 2023 vs Q2 of 2022.
Annualized quarterly GDP figures extrapolate the growth rate of the quarter as if it were constant for the rest of the year. These can be misleading, however, if temporary shocks impact growth in one quarter but are unlikely to last all year – such as happened in the first quarter of 2020 at the outbreak of the covid pandemic, when growth plummeted.
How does GDP influence currencies?
A higher GDP result is generally positive for a nation’s currency as it reflects a growing economy, which is more likely to produce goods and services that can be exported, as well as attracting higher foreign investment. By the same token, when GDP falls it is usually negative for the currency.
When an economy grows people tend to spend more, which leads to inflation. The country’s central bank then has to put up interest rates to combat the inflation with the side effect of attracting more capital inflows from global investors, thus helping the local currency appreciate.
How does higher GDP impact the price of Gold?
When an economy grows and GDP is rising, people tend to spend more which leads to inflation. The country’s central bank then has to put up interest rates to combat the inflation. Higher interest rates are negative for Gold because they increase the opportunity-cost of holding Gold versus placing the money in a cash deposit account. Therefore, a higher GDP growth rate is usually a bearish factor for Gold price.
- The USD/NOK rose towards 11.219, seeing 0.30% gains.
- The US Treasury yields are rising after Powell’s hawkish words.
- Swaps markets are pushing rate cuts to June from May 2024.
- Weekly Jobless Claims from the US came in lower than expected.
The USD/NOK is finding some lift on Thursday's session and advanced to 11.219, seeing 0.35% gains. The daily market movers included hawkish bets on the Federal Reserve (Fed) after Jerome Powell’s words and rising US bond yields, which made the pair gain traction.
Chair Powell commented on Thursday that he is not confident that the Fed has achieved a sufficient restrictive stance and warned that stronger growth could undermine the progress on inflation. As a reaction, swaps markets are starting to price in higher interest rates for a longer period of time, which is making the USD gain traction as investors are pushing rate cuts from May to June of 2024. That being said, the odds of a hike in the December meeting are still low, and the CME FedWatch tool indicates that markets are only placing 10% odds of an increase.
In addition, US yields rose, which contributed to the strength of the USD. The 2,5 and 10-year rates show more than 1.50% gains standing at 5% and 4.60%, respectively.
On the data front, the weekly US Jobless Claims from the first week of November came in lower than expected but didn’t trigger any reaction on the pair. Markets focus will now shift to next week’s Consumer Price Index (CPI) figures from the US from September.
USD/NOK Levels to watch
Based on the daily chart, USD/NOK maintains a bullish outlook for the short term, as indicators have gathered enough momentum on the daily chart which made the pair approach multi-month highs around 11.276. The Relative Strength Index (RSI) points north, above 50, while the Moving Average Convergence Divergence (MACD) prints higher green bars.
Supports: 11.105 (20-day SMA), 11.094, 11.085.
Resistances: 11.225, 11.2550, 11.276.
USD/NOK daily chart
-638351559197797908.png)
- The USD/CHF is catching some bids to reclaim the 0.9000 handle.
- Hawkish statements from Powell are helping to bid the US Dollar late Thursday.
- Friday set to close out the trading week with US consumer sentiment reading.
The USD/CHF is marching itself back over the 0.9000 handle in Thursday's trading as the US Dollar (USD) grinds higher on a relatively quiet trading day. Market sentiment is drawing taught as investors react to headlines as they roll out.
US Federal Reserve (Fed) Chairman Jerome Powell made some surprisingly hawkish comments while participating in a panel discussion at the Jacques Polak Annual Research Conference, in Washington DC.
Fed Chair Powell focused on the risk of factors that could spark inflation again, with labor markets remaining tight and GDP growth moderating, albeit slowly.
USD/CHF Technical Outlook
The US Dollar's intraday spike on Thursday has sent the USD/CHF back over the 200-hour Simple Moving Average (SMA) as the pair rotates out of a near-term bearish stance. The immediate target for bullish momentum will be the 0.9100 handle, a price level the pair lost after declining from November's early bids.
The USD/CHF has reached its highest bids on the week, stepping closer to 0.9050. The pair's recovery from October's swing low into 0.8900 is seeing momentum recover to the bullish side, and the 50-day SMA is confirming a bullish cross of the longer 200-day SMA.
Monday's sharp decline into the 0.8950 region could see the USD/CHF etch in a higher low is upside momentum maintains through the remainder of the trading week.
USD/CHF Daily Chart

USD/CHF Technical Levels
Federal Reserve Chairman Jerome Powell said on Thursday that they are no confident that they have achieved a “stance of monetary policy that is sufficiently restrictive to bring inflation down to 2 percent over time”. He is participating in a panel discussion on monetary policy challenges in a global economy organized by the International Monetary Fund.
Key takeaways:
My colleagues and I are gratified by this progress but expect that the process of getting inflation sustainably down to 2 percent has a long way to go.
The labor market remains tight, although improvements in labor supply and a gradual easing in demand continue to move it into better balance. Gross domestic product growth in the third quarter was quite strong, but, like most forecasters, we expect growth to moderate in coming quarters. Of course, that remains to be seen, and we are attentive to the risk that stronger growth could undermine further progress in restoring balance to the labor market and in bringing inflation down, which could warrant a response from monetary policy.
The Federal Open Market Committee (FOMC) is committed to achieving a stance of monetary policy that is sufficiently restrictive to bring inflation down to 2 percent over time; we are not confident that we have achieved such a stance.
We know that ongoing progress toward our 2 percent goal is not assured: Inflation has given us a few head fakes. If it becomes appropriate to tighten policy further, we will not hesitate to do so.
We are making decisions meeting by meeting, based on the totality of the incoming data and their implications for the outlook for economic activity and inflation, as well as the balance of risks, determining the extent of additional policy firming that may be appropriate to return inflation to 2 percent over time. We will keep at it until the job is done.
Market reaction
The US Dollar rose across the board after Powell’s initial comments. The DXY climbed toward daily highs near 105.80 and EUR/USD dropped back toward 1.0660.
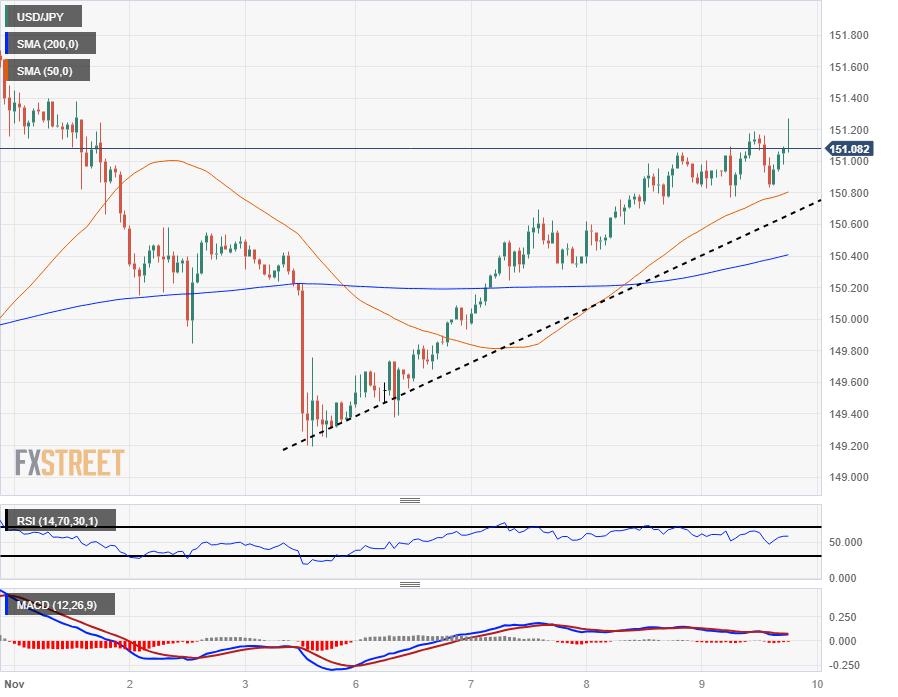
- The USD/JPY is pushing higher on Thursday. testing territory north of 151.00.
- Late break in USD fueled by spike in US Treasuries.
- Japan trade balance data missed the mark, further eroding Yen.
The USD/JPY is twisting for further gains on Thursday, looking for further bids above the 151.00 handle.
A topside break in US Treasuries is seeing the US Dollar find a fresh round of bidding on Thursday, and the USD/JPY notched in a fresh intraday high near 151.30. Treasury yields knocked higher on reaction following lower-than-expected institutional demand in a 30-year US bond auction.
St. Louis Federal Reserve (Fed) President Kathleen Paese is also hitting newswires with concerns that overall public expectations may be misaligned with the current path of Fed policy moving forward. St. Louis Fed President Paese's comments are likely to have limited effect, with Paese acting as an interim replacement with no voting power in the Federal Open Market Committee (FOMC).
Japan Current Account figures failed to meet expectations early Thursday, with the non-seasonally-adjusted headline Current Account for September printing at JPY 2.723 trillion, falling short of the expected 3 trillion but still managing to squeeze out a small improvement over August's 2.279 trillion.
USD/JPY Technical Outlook
The Dollar-Yen pairing is currently in play around the 151.00 handle, looking for a topside continuation as the USD continues to push up and over the JPY.
Near-term action has the pair slowing down from its recent pace of bullish momentum, with the 50-hour Simple Moving Average (SMA) beginning to catch up to intraday bids, but the pair remains in a firmly bullish tilt with the 200-hour SMA down near 150.40, with enough space in between for a pullback to signal a potential bidding opportunity for investors looking to jump in and make a fresh challenge.
USD/JPY Hourly Chart
USD/JPY Technical Levels
- The DXY index slightly rose to 105.70.
- Jobless Claims from the first week of November 3 came in lower than expected.
- Fed’s Barkin delivered hawkish comments during the session. Still, bets on a hike in December are low.
The US Dollar (USD) is seeing gains against its rivals on Thursday, with the DXY Index ascending to 105.70. The Greenback price dynamics were set by strong Jobless Claims data and rising US bond yields, which seem to be limiting the downside for the USD. All eyes are now on Inflation next week, which could set the direction of the US Dollar in the short term.
Markets remain quiet this week as investors await fresh catalysts to place their bets on the next Federal Reserve (Fed) decision in December. Several officials were on the wires on Monday and Tuesday but didn’t provide any highlights. The focus seems to have turned to next week’s October inflation figures from the US. On Wednesday, Thomas Barkin commented that he wasn’t satisfied with the current inflation outlook, commenting that the job isn’t done.
Daily Digest Market Movers: US Dollar struggles to gain momentum despite Fed hawk’s rhetoric
- The US Dollar Index stands with mild gains at 105.70, with the bulls struggling to make a significant move.
- No high-tier reports will be released this week. Markets await next week’s inflation figures from the US and are still digesting last Friday’s US Nonfarm Payrolls report.
- The Initial Jobless Claims from the week ending November 3 came in at 217,000, lower than the expected 218,000 and fell in relation to its last reading of 220,000.
- As a reaction, the 2-year Treasury rate rose to 4.96%, while the longer-term 5 and 10-year rates increased to 4.55%, which seems to be limiting downside for the USD.
- Investors continue to be on the sidelines, awaiting high-tier reports to continue placing their bets on the next Fed decision.
- According to the CME FedWatch Tool, the odds of a 25-basis-point hike in December are extremely low, below 10%.
Technical Analysis: US Dollar Index momentum flatens, bears gather for downside
According to the daily chart, the technical outlook for the DXY Index remains neutral to bearish as the bulls are struggling to gather momentum with bears being around the corner. With a flat slope below its midline, the Relative Strength Index (RSI) suggests a period of stability in negative territory, while the Moving Average Convergence (MACD) displays stagnant red bars.
What gives the outlook neutrality is the index staying below the 20-day Simple Moving Average (SMA) but above the 100 and 200-day SMAs, indicating that the bulls still have the upper hand in the broader picture. As long as the bear manage to hold the index below this level, the index will remain vulnerable for further downside.
Support levels: 105.50,105.30,105.00.
Resistance levels: 105.80, 106.00, 106.10 (20-day SMA).
US Dollar FAQs
What is the US Dollar?
The US Dollar (USD) is the official currency of the United States of America, and the ‘de facto’ currency of a significant number of other countries where it is found in circulation alongside local notes. It is the most heavily traded currency in the world, accounting for over 88% of all global foreign exchange turnover, or an average of $6.6 trillion in transactions per day, according to data from 2022.
Following the second world war, the USD took over from the British Pound as the world’s reserve currency. For most of its history, the US Dollar was backed by Gold, until the Bretton Woods Agreement in 1971 when the Gold Standard went away.
How do the decisions of the Federal Reserve impact the US Dollar?
The most important single factor impacting on the value of the US Dollar is monetary policy, which is shaped by the Federal Reserve (Fed). The Fed has two mandates: to achieve price stability (control inflation) and foster full employment. Its primary tool to achieve these two goals is by adjusting interest rates.
When prices are rising too quickly and inflation is above the Fed’s 2% target, the Fed will raise rates, which helps the USD value. When inflation falls below 2% or the Unemployment Rate is too high, the Fed may lower interest rates, which weighs on the Greenback.
What is Quantitative Easing and how does it influence the US Dollar?
In extreme situations, the Federal Reserve can also print more Dollars and enact quantitative easing (QE). QE is the process by which the Fed substantially increases the flow of credit in a stuck financial system.
It is a non-standard policy measure used when credit has dried up because banks will not lend to each other (out of the fear of counterparty default). It is a last resort when simply lowering interest rates is unlikely to achieve the necessary result. It was the Fed’s weapon of choice to combat the credit crunch that occurred during the Great Financial Crisis in 2008. It involves the Fed printing more Dollars and using them to buy US government bonds predominantly from financial institutions. QE usually leads to a weaker US Dollar.
What is Quantitative Tightening and how does it influence the US Dollar?
Quantitative tightening (QT) is the reverse process whereby the Federal Reserve stops buying bonds from financial institutions and does not reinvest the principal from the bonds it holds maturing in new purchases. It is usually positive for the US Dollar.
- GBP/USD continues its downward trajectory, losing 0.25% despite conflicting comments from Bank of England's Chief Economist and Governor.
- US jobless claims outperform expectations, hinting at a resilient labor market and adding to the debate among Fed policymakers.
- The British Pound braces for the UK's Q3 GDP report while investors await insights from Fed Chair Powell's IMF panel discussion.
The British Pound (GBP) extended its losses against the US Dollar (USD), and for the fourth straight day, fell 0.25% after the pair hit a daily high of 1.2308. Nevertheless, dovish remarks by the Bank of England’s (BoE) Chief Economist Huw Pill on Tuesday, weakened the Pound due to rate cut speculations. The GBP/USD trades at 1.2249.
GBP/USD dips to 1.2249 amid mixed signals from BoE officials and a robust US job claims report
On Wednesday, BoE Governor Andrew Bailey poured cold water on Pill’s comments, regarding that market pricing a rate cut in August 2024 seemed reasonable, commenting that it’s too early to cut rates. Earlier in the European session, Huw Pill crossed the wires, backpedaling its Monday comments, and stated that monetary policy must stay tight to lower inflation.
Aside from this, unemployment claims in the United States (US) decelerated compared to the previous week’s Initial Jobless Claims report, which showed claims rising 220K, it came at 217K, below estimates of 218K. Even though the data paints a tight labor market, last Friday’s Nonfarm Payrolls report showed the economy added 150K jobs, below forecasts of 180K, while witnessing a jump in the unemployment rate to 3.9%.
Consequently, a division among the Federal Reserve’s policymakers has begun, with most members adopting a more neutral stance. Still, next week’s inflation report could shift current views on the FOMC’s members.
Recently, a US 30-year bond auction hit a yield of 4.769%, sending US Treasury bond yields soaring. Thus, the Greenback is solidly rising, with the US Dollar Index (DXY) gaining 0.19%, at 105.72.
Up next, the UK economic docket would feature the Gross Domestic Product (GDP) for Q3, which is expected to contract by 0.1% QoQ. On the US front, Fed Chair Jerome Powell would cross the wires on an International Monetary Fund (IMF) discussion panel.
GBP/USD Technical Levels
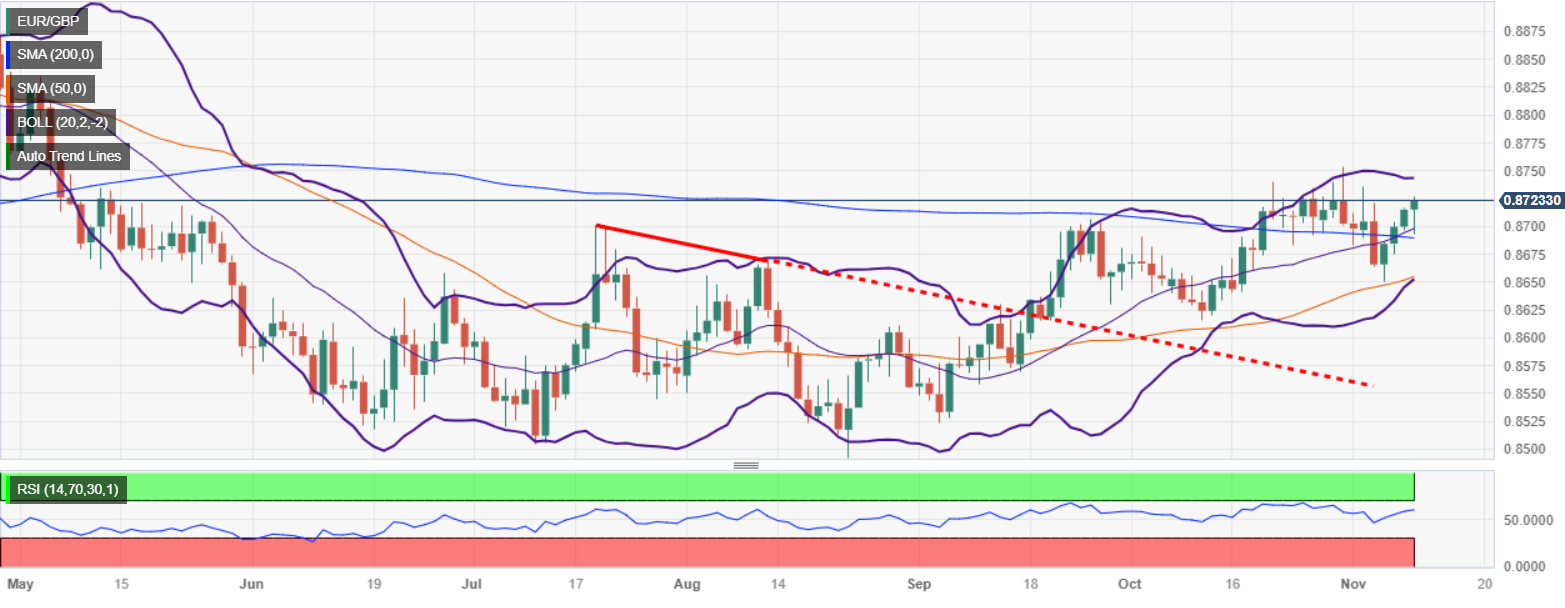
- EUR/GBP edges higher to 0.8724, marking a slight 0.08% increase, as it sustains momentum above the 200-day moving average.
- The pair's advance slows, indicated by a lower Average True Range, pointing to decreased market volatility.
- The next bullish milestones are set at the recent peak of 0.8754 and the psychological 0.8800 level, while a dip below 0.8700 could challenge the 200-DMA support.
The EUR/GBP rallies for the fourth straight day in the mid-North American session, gains a minimal 0.08%, trading at 0.8724 after hitting a daily low of 0.8693.
The cross-pair is upward biased once it reclaimed the 200-day moving average (DMA) at 0.8687. Nevertheless, the uptrend appears to have lost some steam, as the Average True Range (ATR) at 37 pips suggests volatility is shrinking.
For a bullish resumption, EUR/GBP buyers must reclaim the October 11 high at 0.8754, followed by the 0.8800 figure. On the other hand, if sellers’ step in and pull the exchange rate below 0.8700, that would open the door to test the 200-DMA at 0.8687, which would exacerbate a drop to the 50-DMA at 0.8653.
EUR/GBP Price Analysis – Daily Chart
EUR/GBP Technical Levels
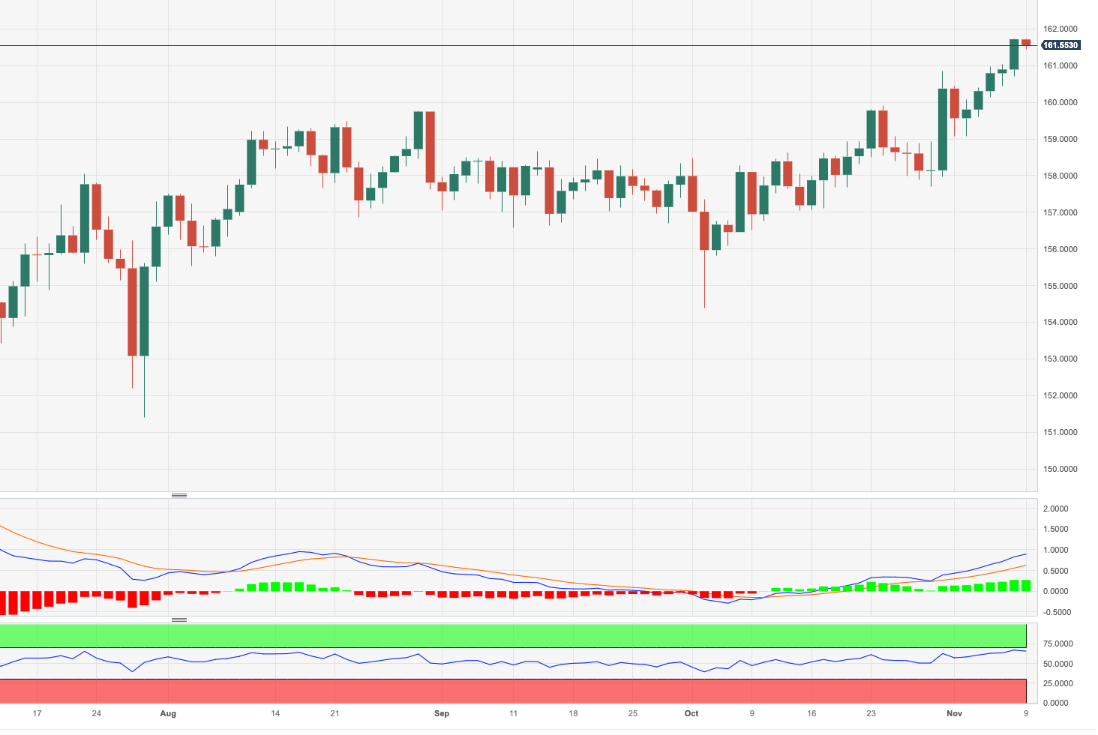
- The EUR/JPY is squeezing into 161.80 as the Yen continues to slump against the Euro.
- ECB President Lagarde dual speeches today and tomorrow.
- Japan trade balance data missed expectations.
The EUR/JPY pinged another 15-year high as a recovering Euro (EUR) takes another step over the Japanese Yen (JPY).
European Central Bank (ECB) President Christine Lagarde will be delivering a speech today and a speech tomorrow; today's speech will be at the House of the Euro, a collaborative working space for different European central banks. No significant comments on monetary policy are likely at the event.
Meanwhile, President Lagarde's second showing in as many days sees the ECB head spending Friday participating in a 'fireside chat' at the Financial Times' Global Boardroom in London.
Japan Current Account figures missed the mark early Thursday, with the non-seasonally-adjusted headline Current Account for September coming in at JPY 2.723 trillion, flubbing the forecast 3 trillion but still squeaking out above August's 2.279 trillion.
EUR/JPY Technical Outlook
The Euro is grinding ever-higher into 15-year highs against the Yen, and technical patterns towards the topside are entirely absent. Technical framework is strictly limited to pullbacks and any recovery patterns in the Yen, should they ever come.
The pair saw some rough consolidation through the past four to five months, but the most recent bullish snap in the EuR/JPY is taking the pair further above the 50-day Simple Moving Average (SMA) currently rising from the 158.00 handle, while current price action soars far above median prices near the 200-day SMA currently rising into 152.00.
EUR/JPY Daily Chart

EUR/JPY Technical Levels
- Canadian Dollar regains traction after getting knocked down by US Dollar rally.
- Canada economic calendar data has wrapped up for the week.
- Crude Oil softly bounces after getting pummeled.
The Canadian Dollar (CAD) is finally catching some relief, digging in its heels and clawing back losses from its three-day backslide against the US Dollar (USD). The Loonie is finding some bids as the Greenback eases slightly heading into the back half of the trading week.
There is little of note remaining on the economic calendar for Canada this week, and USD flows will be in the driver’s seat through Friday.
Fed officials delivered dovish comments, jobless claims were mixed, and investors await another appearance from Federal Reserve (Fed) President Jerome Powell later in the day.
Daily Digest Market Movers: Canadian Dollar bounces back as US Dollar slips
- The CAD is catching a mild relief rally on Thursday as broader markets trim USD bids.
- US Fed Presidents Harker and Barkin gave mildly dovish comments early Thursday, both see potential for downside risks.
- Fed Chairman Jerome Powell speaks later today, investors to be focusing intently.
- Crude Oil prices are finding a slight lift heading into the back half of the week.
- CAD discovers support from recovering Crude bids, accelerating the rebound.
- US Michigan Consumer Sentiment data on Friday to close out the trading week.
Technical Analysis: Canadian Dollar rebounds but shows some weak points
The Canadian Dollar (CAD) is finding enough bullish spark to push the USD/CAD pair back down the charts, but plenty of upside potential remains in the Greenback, and the pair is currently catching a recovery bounce from 1.3750.
1.3800 is set to be the main battleground for the back half of the trading week, with the pair slipping from an intraday high of 1.3807. A bearish continuation from this region will see a new technical ceiling baked into the USD/CAD.
Intraday action is getting hung up with returns to near-term medians. Most daily price action is sticking close to the 200-hour Simple Moving Average (SMA).
Daily candlesticks see the USD/CAD still on the high side of a higher low pattern firming up from a bullish bounce off the 200-day SMA back in late September. The last swing low saw a topside rebound from the 50-day SMA near 1.3650 just last week.
USD/CAD Daily Chart

Canadian Dollar price today
The table below shows the percentage change of Canadian Dollar (CAD) against listed major currencies today. Canadian Dollar was the strongest against the Japanese Yen.
| USD | EUR | GBP | CAD | AUD | JPY | NZD | CHF | |
| USD | 0.00% | 0.07% | -0.19% | -0.23% | 0.11% | -0.58% | 0.03% | |
| EUR | 0.00% | 0.08% | -0.18% | -0.22% | 0.12% | -0.57% | 0.04% | |
| GBP | -0.09% | -0.08% | -0.27% | -0.32% | 0.03% | -0.66% | -0.06% | |
| CAD | 0.19% | 0.18% | 0.28% | -0.02% | 0.30% | -0.39% | 0.23% | |
| AUD | 0.24% | 0.25% | 0.31% | 0.05% | 0.35% | -0.34% | 0.26% | |
| JPY | -0.11% | -0.10% | -0.04% | -0.31% | -0.34% | -0.69% | -0.09% | |
| NZD | 0.55% | 0.60% | 0.65% | 0.36% | 0.34% | 0.66% | 0.62% | |
| CHF | -0.05% | -0.05% | 0.04% | -0.22% | -0.27% | 0.07% | -0.62% |
The heat map shows percentage changes of major currencies against each other. The base currency is picked from the left column, while the quote currency is picked from the top row. For example, if you pick the Euro from the left column and move along the horizontal line to the Japanese Yen, the percentage change displayed in the box will represent EUR (base)/JPY (quote).
Canadian Dollar FAQs
What key factors drive the Canadian Dollar?
The key factors driving the Canadian Dollar (CAD) are the level of interest rates set by the Bank of Canada (BoC), the price of Oil, Canada’s largest export, the health of its economy, inflation and the Trade Balance, which is the difference between the value of Canada’s exports versus its imports. Other factors include market sentiment – whether investors are taking on more risky assets (risk-on) or seeking safe-havens (risk-off) – with risk-on being CAD-positive. As its largest trading partner, the health of the US economy is also a key factor influencing the Canadian Dollar.
How do the decisions of the Bank of Canada impact the Canadian Dollar?
The Bank of Canada (BoC) has a significant influence on the Canadian Dollar by setting the level of interest rates that banks can lend to one another. This influences the level of interest rates for everyone. The main goal of the BoC is to maintain inflation at 1-3% by adjusting interest rates up or down. Relatively higher interest rates tend to be positive for the CAD. The Bank of Canada can also use quantitative easing and tightening to influence credit conditions, with the former CAD-negative and the latter CAD-positive.
How does the price of Oil impact the Canadian Dollar?
The price of Oil is a key factor impacting the value of the Canadian Dollar. Petroleum is Canada’s biggest export, so Oil price tends to have an immediate impact on the CAD value. Generally, if Oil price rises CAD also goes up, as aggregate demand for the currency increases. The opposite is the case if the price of Oil falls. Higher Oil prices also tend to result in a greater likelihood of a positive Trade Balance, which is also supportive of the CAD.
How does inflation data impact the value of the Canadian Dollar?
While inflation had always traditionally been thought of as a negative factor for a currency since it lowers the value of money, the opposite has actually been the case in modern times with the relaxation of cross-border capital controls. Higher inflation tends to lead central banks to put up interest rates which attracts more capital inflows from global investors seeking a lucrative place to keep their money. This increases demand for the local currency, which in Canada’s case is the Canadian Dollar.
How does economic data influence the value of the Canadian Dollar?
Macroeconomic data releases gauge the health of the economy and can have an impact on the Canadian Dollar. Indicators such as GDP, Manufacturing and Services PMIs, employment, and consumer sentiment surveys can all influence the direction of the CAD. A strong economy is good for the Canadian Dollar. Not only does it attract more foreign investment but it may encourage the Bank of Canada to put up interest rates, leading to a stronger currency. If economic data is weak, however, the CAD is likely to fall.
- Gold prices rebound sharply from weekly lows, marking a 0.43% increase as traders digest the latest U.S. jobless claims report.
- A divided Federal Reserve and the anticipation of Chairman Powell's speech keep investors on edge, with a dovish tilt currently in the lead.
- The geopolitical tensions following the Hamas attack and subsequent Israeli military actions contribute to the safe-haven asset's appeal.
Gold price (XAU/USD) rebounds in early morning trading during the North American session, bounces from weekly lows of $1944.80, prints solid gains of 0.43%, and exchanges hands at $1958.00.
XAU/USD climbs to $1958 amid mixed Fed signals and a cautious bond yield recovery
Market sentiment is positive, with Wall Street shrugging off a solid employment report. Initial Jobless Claims revealed by the US Bureau of Labor Statistics (BLS) slowed to 217K last week, below expectations for a 218K increase and below the previous reading of 220K, snapping three weeks of consecutive exceeding previous numbers.
Meanwhile, US Treasury bond yields remain adrift to interest rate expectations and the Federal Reserve’s commentary. The split amongst Fed officials between saying that rates are already restrictive and the need for additional hikes is growing. Nevertheless, the doves appear to have the upper hand so far unless next week’s inflation report takes them off guard, along with market participants estimating the first rate cut toward the second half of 2024. In that regard, Fed Chairman Jerome Powell will cross the wires later at 19:00 GMT.
US Treasury bond yields halted their last week plunge and are climbing but failing to weigh on Gold prices. The US 10-year benchmark note increases five basis points (bps) up to 4.553%. On the other hand, the Greenback remains on the defensive, losing 0.02%, as shown by the US Dollar Index (DXY) sitting at 105.50.
Investors see 91% odds the Fed would keep rates unchanged, while the firs cut is foreseen at June 2024, with chances lying at 42%.
XAU/USD rallied since October 9, due to the Hamas attack on Israel, which escalated to a conflict that witnessed the Israeli army entering the Gaza Strip while the international community looked for a peaceful exit to the hostilities.
XAU/USD Price Analysis: Technical outlook
Gold’s daily chart portrays the yellow metal as neutral to upward biased despite dipping below the 20-day moving average (DMA), which sits at $1969.33. Once buyers reclaim the latter, XAU/USD’s uptrend could resume, as the $2000 figure would emerge as the next resistance. A breach of the latter would expose October’s high at $2009.42. On the other hand, if XAU/USD stays below $1970, XAU/USD could slip further and test the 200-DMA at $1934.70 before challenging the 100-DMA at $1926.84.
- The XAG/USD soared more than 1.50% to $22.90, just above the 20-day SMA.
- Amid hawkish words from Fed’s Barking, US yields are rising, which could limit the upside.
- Weekly Jobless Claims from the US came in lower than expected.
- A sour market mood an escalating tensions in the Middle East.
On Thursday, the XAG/USD spot price rose back above the 20-day Simple Moving Average, towards $22.90, seeing sharp gains. That being said, US yields rose after lower-than-expected US weekly Jobless Claims and hawkish words from the Federal Reserve’s (Fed) Thomas Barking, which may limit the upside for the rest of the session.
On the data front, the U.S. Department of Labor revealed that the Initial Jobless Claims from the week ending on November 4 missed the consensus. The people filling for unemployment benefits came in at 217,000, lower than the consensus of 218,000 and fell in relation to it last reading of 220,000. In addition, during the American session, Thomas Barkin commented that in his perspective, inflation is “too high” and that he isn’t convinced that it is not on a smooth path towards the 2% goal.
As a reaction, the US Treasury yields, often seen as the cost of holding non-yielding metal, are edging higher, with the 2,5 and 10-year yields advancing towards 4.96% and 4.55%, respectively. Still, according to the CME FedWatch Tool, the odds of a 25 basis points hike in the Fed’s December meeting remain low, around 10%, and markets seem to be awaiting high-tier data to continue placing their bets on the next decisions. The US will report inflation figures from October next week.
XAG/USD Levels to watch
Observing the daily chart, the XAG/USD Index displays a neutral to bearish technical outlook for the short term as despite gaining significant traction, the bullish momentum is still weak. The Relative Strength Index (RSI) indicates a neutral stance below its midline, displaying a flat slope in the negative territory, while the Moving Average Convergence (MACD) prints stagnant red bars. Furthermore, the price is above the 100 and 200-day Simple Moving Averages (SMAs), suggesting that the bulls are in command over the bears on the bigger picture.
Resistance levels: $23.00, $23.15,$23.30 (100 and 200-day SMA convergence).
Support levels: $22.90 (20-day SMA), $22.70, $22.50.
XAG/USD Daily chart
-638351436735907367.png)
Richmond Federal Reserve Bank President Thomas Barkin said on Thursday it remains to be seen whether the Fed needs to tighten the policy further, per Reuters.
Key quotes
"We have time to see what path inflation takes, with rates now restrictive, financial conditions tightened."
"We are making real progress on inflation."
"The US economy is remarkably healthy."
"The job isn't done; inflation remains too high."
"The Fed has to walk a fine line."
"Not yet convinced inflation is on a smooth glide path to 2%."
"Will need economic slowing to beat inflation."
"Any downturn may be less severe than past recessions."
Market reaction
The US Dollar showed no immediate reaction to these comments. At the time of press, the US Dollar Index was virtually unchanged on the day at 105.50.
Economists at ANZ Bank expect NZD/USD to appreciate gradually.
Long-term fair value at 0.63
Our currency forecasts have the NZD/USD holding steady until the end of the year, and then gradually appreciating to 0.63 by the end of next year.
Our expectation for mild strength over 2024 remains guided by our fair value analysis, which puts long-term fair value at 0.63, and is further supported by our expectation of another OCR hike.
See: EUR/AUD to drop back to 1.59, AUD/NZD to edge towards 1.12 in a six-month view – Rabobank
- Mexican Peso shows resilience and appreciates against the US Dollar, as participants expect Banxico to hold rates unchanged.
- Mexico’s inflation reports a slight decrease, though supports the central bank’s restrictive stance.
- Mixed messages from Federal Reserve officials keep market participants on their toes, as they eye Fed Chairman Jerome Powell's speech.
Mexican Peso prints modest gains against the US Dollar in early trading on Thursday, with traders awaiting the Bank of Mexico (Banxico) monetary policy decision. Banxico is not expected to rock the boat, as analysts estimate it will keep rates at 11.25%. Therefore, the USD/MXN is trading at 17.50, down a decent 0.18%, portraying some Peso strength.
Mexico’s economic docket witnessed inflation coming in a tick lower than expected, and below previous readings, though the pace of the deflationary process is losing steam. That would refrain Banxico from adopting a dovish posture in its statement. Meanwhile, economic data in the United States (US) showed that unemployment claims for the last week fell, indicating strength in the labor market.
Aside from this, Federal Reserve (Fed) officials continued to strike mixed signals, as Philadelphia Fed Patrick Harker emphasized that rates need to remain higher for longer. On the contrary, Chicago’s Fed Goolsbee turned dovish as he saw risks of overshooting rates. Late in the day, Fed Chair Jerome Powell would take the stand at around 19:00 GMT.
Daily digest movers: Mexican Peso remains firm as inflation in Mexico slows down
- Mexico’s Consumer Price Index (CPI) was 4.26% YoY in October, below forecasts of 4.28%, and the previous reading of 4.45%.
- On a monthly basis, inflation rose 0.39%, above the 0.38% consensus and September’s 0.44%.
- Core inflation in Mexico stood high at 5.5% YoY as expected and below September’s data; while prices on a monthly basis ticked up from the 0.39% MoM estimated, above last month’s data and the 0.38% forecast.
- Initial Jobless Claims in the United States for the week ending November 4, rose by 217K, below estimates of 218K, and last week’s 220K.
- USD/MXN gains remain capped even though the American Dollar falls as shown by the US Dollar Index (DXY), a gauge that tracks the buck´s value against a basket of six currencies, retreating 0.05%, down at 105.47.
- Money market futures have priced in a 25 bps rate cut by the Federal Reserve in July 2024.
- Mexico´s economy remains resilient after October’s S&P Global Manufacturing PMI improved to 52.1 from 49.8, and the Gross Domestic Product (GDP) expanded by 3.3% YoY in the third quarter.
- On October 24, Mexico's National Statistics Agency, INEGI, reported annual headline inflation hit 4.27%, down from 4.45% at the end of September and below forecasts of 4.38%.
- Banxico revised its inflation projections from 3.50% to 3.87% for 2024, which remains above the central bank’s 3.00% target (plus or minus 1%). The next decision will be announced on November 9 at 19:00 GMT
Technical Analysis: Mexican Peso appreciates though USD/MXN could aim higher as golden cross formation looms
The USD/MXN remains neutrally biased, though about to form a golden cross with the 50-day Simple Moving Average (SMA) crossing above the 200-day SMA, each at 17.67 and 17.68, respectively. That could pave the way for further upside. However, buyers need to lift the exchange rate above the 17.70 area, so they can challenge the 20-day SMA at 17.95, ahead of the psychologically 18.00 figure.
On the flip side, key support levels lie at Monday’s low of 17.40, followed by the 100-day Simple Moving Average (SMA) at 17.32. A breach of the latter will expose the 17.00 figure before the pair aims to test the year-to-date (YTD) low of 16.62.
Mexican Peso FAQs
What key factors drive the Mexican Peso?
The Mexican Peso (MXN) is the most traded currency among its Latin American peers. Its value is broadly determined by the performance of the Mexican economy, the country’s central bank’s policy, the amount of foreign investment in the country and even the levels of remittances sent by Mexicans who live abroad, particularly in the United States. Geopolitical trends can also move MXN: for example, the process of nearshoring – or the decision by some firms to relocate manufacturing capacity and supply chains closer to their home countries – is also seen as a catalyst for the Mexican currency as the country is considered a key manufacturing hub in the American continent. Another catalyst for MXN is Oil prices as Mexico is a key exporter of the commodity.
How do decisions of the Banxico impact the Mexican Peso?
The main objective of Mexico’s central bank, also known as Banxico, is to maintain inflation at low and stable levels (at or close to its target of 3%, the midpoint in a tolerance band of between 2% and 4%). To this end, the bank sets an appropriate level of interest rates. When inflation is too high, Banxico will attempt to tame it by raising interest rates, making it more expensive for households and businesses to borrow money, thus cooling demand and the overall economy. Higher interest rates are generally positive for the Mexican Peso (MXN) as they lead to higher yields, making the country a more attractive place for investors. On the contrary, lower interest rates tend to weaken MXN.
How does economic data influence the value of the Mexican Peso?
Macroeconomic data releases are key to assess the state of the economy and can have an impact on the Mexican Peso (MXN) valuation. A strong Mexican economy, based on high economic growth, low unemployment and high confidence is good for MXN. Not only does it attract more foreign investment but it may encourage the Bank of Mexico (Banxico) to increase interest rates, particularly if this strength comes together with elevated inflation. However, if economic data is weak, MXN is likely to depreciate.
How does broader risk sentiment impact the Mexican Peso?
As an emerging-market currency, the Mexican Peso (MXN) tends to strive during risk-on periods, or when investors perceive that broader market risks are low and thus are eager to engage with investments that carry a higher risk. Conversely, MXN tends to weaken at times of market turbulence or economic uncertainty as investors tend to sell higher-risk assets and flee to the more-stable safe havens.
Economists at CIBC Capital Markets still see further upside for the US Dollar over the coming quarters.
USD dips should be bought into
For now, the focus remains on incoming data – especially the October CPI print that is due next week.
Despite the surprisingly cautious tone taken by Fed Chair Powell last week, we’re of the mind that stronger activity in the US is more likely to persist. That suggests that USD dips should be bought into, and CAD investors should pare hedges on USD inflows over the coming months.
Towards H2 of next year, we expect USD valuation to peak as markets reassess the viability of the Fed’s QT program while the much anticipated JPY rally starts to take hold across the FX space.
DXY – Q4 2023: 108.88 | Q1 2024: 109.19
Banxico will announce its rate decision later today. Economists at ING analyze Mexican Peso’s outlook ahead of the meeting.
Banxico should remain hawkish
Survey respondents unanimously expect unchanged rates at 11.25%. Equally, we think Banxico will be more than happy to keep the 600 bps policy rate premium over Fed rates – a position that has kept USD/MXN relatively stable, reduced implied volatility and contributed to the Peso's attractiveness for carry trade strategies.
Loose fiscal and tight monetary policy is normally a very positive environment for a currency and this is why we think USD/MXN will be trading comfortably below 17.00 into 2024.
The appreciation of the trade-weighted US Dollar Index (DXY) has stalled over the past month. Economists at the National Bank of Canada analyze USD outlook.
A soft landing for the US economy would imply a weaker USD going forward
If you believe, as the Fed does, that a soft landing for the economy is on the horizon, this scenario would imply a weaker USD going forward. This is not our forecast.
In our view, the US Dollar is likely to strengthen on fears of a global recession and renewed geopolitical tensions in the Middle East, which will drive safe-haven demand until the Fed is able to pivot and announce an easing of monetary policy.
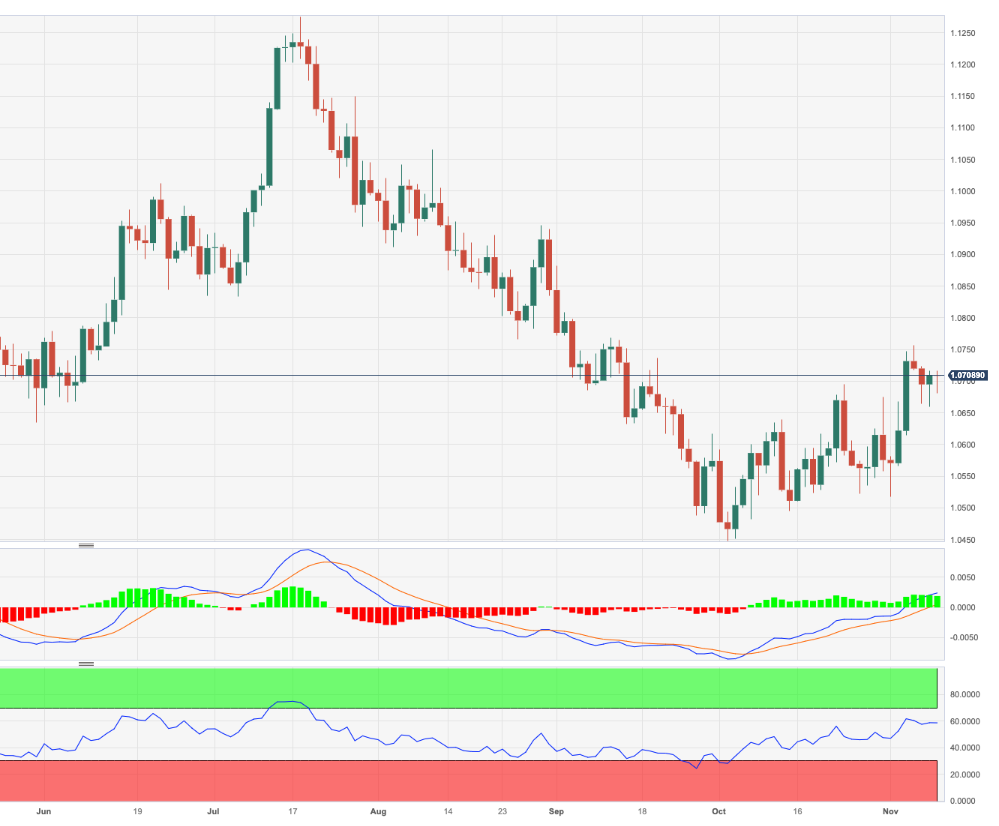
- EUR/USD struggles for direction around the 1.0700 neighbourhood.
- Bouts of weakness should meet initial support near 1.0650.
EUR/USD trades in an inconclusive fashion around the 1.0700 region on Thursday.
In case the downward bias picks up extra pace, the 55-day SMA at 1.0645 should offer temporary contention prior to the weekly low of 1.0495 (October 13).
In the meantime, while below the 200-day SMA at 1.0801, the pair’s outlook should remain negative.
EUR/USD daily chart
Europe’s benchmark TTF Gas futures have dropped by ~5% over the past week. Economists at Rabobank analyze Natural Gas markets outlook.
New supply disruptions emerge against healthy inventories
Natural Gas benchmarks brace for volatility as new supply disruptions emerge against healthy inventories – expect crucial TTF support levels at €43/MWh and resistance at €54/MWh.
Henry Hub weakness is expected as cash prices trade at a $1 discount to futures on warm weather, see downside to $3/MMbtu, with a break below on continued warmth.
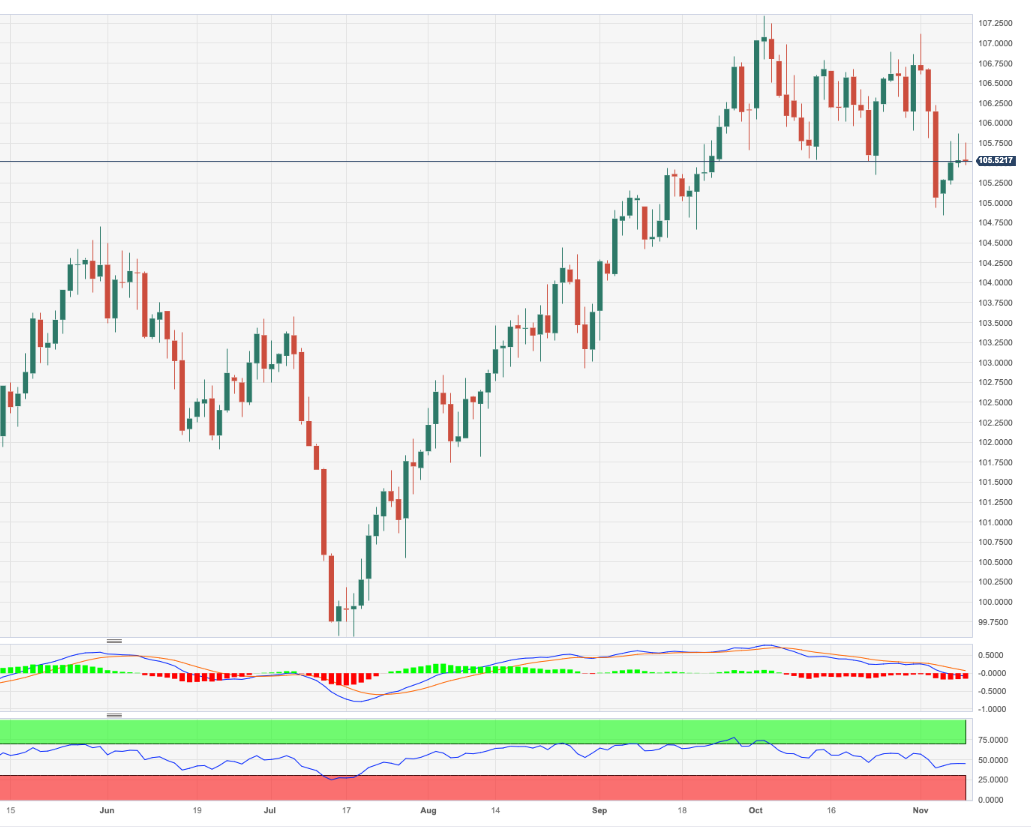
- DXY trades within a narrow range around 105.60 on Thursday.
- The continuation of the upside momentum should retest the 106.00 zone.
DXY alternates gains with losses around 105.60 on Thursday.
In case the buying interest gathers extra pace, the index should face the initial hurdle at the weekly high of 105.87 (November 8). The surpass of this level could open the door to a rapid visit to the November top at 107.11 (November 1) prior to the 2023 peak of 107.34 (October 3).
In the meantime, while above the key 200-day SMA, today at 103.57, the outlook for the index is expected to remain constructive.
DXY daily chart
- EUR/JPY prints fresh tops near 161.70 on Thursday.
- Extra gains could advance to the 2008 top near 170.00.
EUR/JPY struggles to advance further despite printing new YTD peaks in the 161.70/75 band on Thursday.
Further upside appears well on the cards for the cross in the short-term horizon. Against that, the surpass of the 2023 high of 161.74 (November 9) is expected to face the next significant resistance level not before the 2008 top of 169.96 (July 23)
So far, the longer term positive outlook for the cross appears favoured while above the 200-day SMA, today at 152.03.
EUR/JPY daily chart
Regardless of whether the Eurozone falls into recession, economists at Wells Fargo see enough growth headwinds to suggest that the European Central Bank's (ECB) monetary tightening is done.
Eurozone rate hikes are done
The underwhelming growth outlook means ECB rate hikes are very likely done, with the most recent progress on the inflation front reinforcing the view that the peak in policy rates has already been reached. However, we believe the ECB will still want to see underlying inflation trends move closer to, and remain near, its 2% inflation target before it becomes comfortable embarking on a monetary easing cycle.
We do not forecast an initial ECB rate cut until the June 2024 meeting, although a steady series of rate cuts after that should see the ECB lower its Deposit Rate by a cumulative 150 bps to 2.50% between mid-2024 and early 2025. Overall, we view the risks as skewed toward the ECB lowering interest rates earlier, or more aggressively than generally expected.
USD picks up a little support. Economists at Scotiabank analyze USD/JPY outlook.
Narrower US-Japan interest rate differentials are not having any major impact on USD/JPY
It is notable that lower US yields/narrower US-Japan interest rate differentials are not having any major impact on USD/JPY. The US/Japan 10Y spread has fallen around 50 bps over the past three weeks to reach levels last seen in August when USD/JPY was trading nearer 145.
Spot is knocking on the door of recent highs but Fair Value based on spreads, equity returns and terms of trade (weaker crude oil prices are helping boost Japan’s still soft terms of trade) suggest the USD is quite significantly overvalued and should be trading closer to 144.50.
The European Central Bank's (ECB) monetary policy is working and it's helping them bring inflation down, ECB Governing Council member Mario Centeno said on Thursday, pre Reuters.
"We are at a plateau in terms of interest rates," Centeno added.
Earlier in the day, “we are not there yet” ECB Vice President Luis de Guindos said when asked about reducing interest rates.
Market reaction
These comments don't seem to be having a noticeable impact on the Euro's performance against its major rivals. As of writing, the EUR/USD pair was virtually unchanged on the day at 1.0705.
- AUD/USD drops close to 0.6400 amid caution ahead of Powell’s speech.
- Fed Powell may deny rate cuts in the near term as robust retail demand and stable labor market.
- The Australian Dollar faced pressure as the Chinese economy shifted into deflation.
The AUD/USD pair remains on the backfoot near the crucial support of 0.6400 as investors await for Federal Reserve (Fed) Chair Jerome Powell’s remarks on interest rates and the outlook on the US economic performance in the fourth quarter of 2023.
The S&P500 opens on a cautiously positive note as investors worry about the Fed’s guidance on the last monetary policy meeting of 2023. Fed Powell is expected to lean towards keeping interest rates higher for a longer period to ensure that inflation must come down to 2%.
The US Dollar Index (DXY) aims to recapture the immediate resistance of 106.00 on hopes that the Fed Powell would deny rate cuts in the near term as robust retail demand and stable labor market conditions could keep fears of higher consumer inflation expectations unabated. 10-year US Treasury yields hold recovery near 4.56% ahead of Powell’s speech.
This week, investors focused on commentaries from Fed policymakers due to the light economic calendar. Next week, the US inflation data for October will remain in the spotlight. The impact of inflation data would be light as one more inflation report will be released before December’s monetary policy meeting.
Meanwhile, the Australian Dollar faced pressure as the Chinese economy shifted into a deflation in October. The annual deflation rose by 0.2% against 0.1% as expected. Producers cut prices of goods and services at factory gates due to weak consumer spending. Being a proxy to China’s economic prospects, the Australian Dollar remains on the backfoot of deflation pressures.
- Initial Jobless Claims in the US decreased by 3,000 in the week ending November 4.
- US Dollar Index stays in daily range above 105.50.
There were 217,000 initial jobless claims in the week ending November 4, the weekly data published by the US Department of Labor (DOL) showed on Thursday. This print followed the previous week's print of 220,000 (revised from 217,000) and came in slightly better than the market expectation of 218,000.
Further details of the publication revealed that the advance seasonally adjusted insured unemployment rate was 1.2% and the 4-week moving average stood at 212,250, an increase of 1,500 from the previous week's revised average.
"The advance number for seasonally adjusted insured unemployment during the week ending October 28 was 1,834,000, an increase of 22,000 from the previous week's revised level" the publication read.
Market reaction
The US Dollar Index stays in its daily range above 105.50 following this data.
Economists at Société Générale analyze USD/MXN technical outlook.
A sharp pullback has taken shape
USD/MXN failed to reclaim the trend line drawn since November 2021 at 18.48/18.60 recently; a sharp pullback has taken shape after this test.
The USD/MXN pair has once again given up its 200-DMA and re-integrated within the previous base. This denotes the possibility of persistence in decline.
Holding below the Moving Average near 17.70, there is a risk of continuation in decline towards 17.00 and July/August lows near 16.60.
USD/CAD is steady near 1.38. Economists at Scotiabank analyze the pair’s outlook.
Hawkish BoC deliberations
BoC’s summary of deliberations dwelt on the ‘considerable concern’ around core inflation, noted that some senior policymakers thought that rates would need to rise again and mulled over the potential for the neutral rate to drift higher.
Intraday price action suggests the topside move in spot is stalling around the 1.38 point but trend momentum remains USD-positive on the six-hour chart and more obvious weakness (below 1.3750/1.3760 intraday) is needed to signal a more definitive short-term peak at least.
Resistance is 1.3810/1.3820.
Sterling is a little lower in the session. Economists at Scotiabank analyze GBP outlook.
Cable retains a heavy technical tone
Four days of consecutive losses for the GBP are showing scant signs of slowing or reversing.
The GBP/USD pair retains a heavy technical tone on the intraday chart and bullish trend momentum has faded sharply since the start of the week to sit near neutral.
Support at 1.2245/1.2250, ahead of 1.22, needs to hold. Resistance is 1.2310.
See: Additional GBP downside into year-end – CIBC
UOB Group’s Senior Economist Julia Goh and Economist Loke Siew Ting give their views on the latest release of the labour market report in Malaysia.
Key Takeaways
Malaysia’s labour market continued to see gradual improvement with both labour force and employment hitting an all-time high at 16.95mn and 16.38mn respectively in Sep. Both unemployment rate and labour force participation rate also held steady at 3.4% and 70.1% respectively.
There was a broad-based increase in hiring across economic sectors, led by services particularly wholesale & retail trade, food & beverage services and transportation & storage activities. The employment-to-population ratio maintained at 67.7%, signaling the ability of the Malaysian economy to create employment.
Nevertheless, with rising external headwinds and uncertainties denting business sentiment and unemployment rate easing at a slower pace than we had initially anticipated over the past few months, we tweak our year-end jobless rate projections slightly higher to 3.3% for both 2023 and 2024 (from 3.2% previously). This will translate into an average of 3.4% for the entire year of 2023 (MOF est: 3.5%. 2022: 3.9%) and 3.3% for 2024 (MOF est: 3.4%). Job related measures announced under Budget 2024 are key drivers of further improvement in the labour market going into 2024, barring any ugly turn in the global outlook.
- USD/JPY extends its winning spell above 151.00 amid a recovery in the US Dollar.
- Jerome Powell may highlight the need for ‘higher for longer’ interest rates.
- BoJ Ueda warned about the consequences of exiting from an easy policy stance on financial institutions.
The USD/JPY pair continues its winning streak for the fourth trading session on Thursday. The asset extends upside above 151.00 as investors remain cautious ahead of the speech from Federal Reserve (Fed) Chair Jerome Powell.
S&P500 futures trade directionless in the European session amid caution ahead of Fed Powell’s speech. The US Dollar Index (DXY) rebounds after consolidating near 105.50 amid expectations that Fed Powell could keep doors open for further policy tightening.
Jerome Powell may highlight the need for ‘higher for longer’ interest rates as consumer inflation expectations are stubborn due to a stable job market and robust consumer spending. Apart from the guidance on interest rates, the outlook on economic performance will be in focus. Powell may quote the ‘rate cuts’ narrative as ‘unreasonable’ due to persistent inflationary pressures.
Meanwhile, Philadelphia Fed President Patrick Harker, in a statement, said that the next decision from the central bank would be highly dependent on economic data. Fed Harker sees the Unemployment Rate rising to 4.5% before falling in 2024 and inflation falling to 3% in 2024.
The Japanese Yen weakened against the US Dollar as wage growth in Japan slumped, which has resulted in a slowdown in consumer spending. A steady wage growth is the foremost requirement of the Bank of Japan (BoJ) for exiting from ultra-loose monetary policy.
BoJ Ueda warned that the central bank would need to be very careful while exiting from an easy policy stance as it would impact financial institutions, borrowers, and the overall demand significantly.
EUR/USD trades back under 1.07. Economists at Scotiabank analyze the pair’s outlook.
Gains should pick up a bit more momentum above 1.0710/1.0720
EUR drift from Monday’s peak may be steadying. Intraday price action reflects firm support for the EUR on dips to the mid-1.06 area over the past couple of sessions.
Trend momentum signals remain bullishly oriented on the intraday and daily studies but intraday trend strength has softened.
Risks remain geared to more EUR strength above while 1.0650/1.0660 support holds.
EUR gains should pick up a bit more momentum above 1.0710/1.0720.
UOB Group’s Economist Enrico Tanuwidjaja and Junior Economist Agus Santoso comment on the results of Consumer Confidence in Indonesia.
Key Takeaways
Consumer Confidence Index (CCI) improved from 121.7pt in Sep to 124.3 in Oct on the back of improving Current Economic Condition Index (CECI) and Consumer Expectations Index (CEI).
Improvement in consumer confidence was driven by higher job availability index, while current income and purchase of durable goods index continued its declining trajectory.
With the ongoing investment expected to exceed the target in 4Q23, we expect consumer confidence will continue to improve.
The BoE left rates at 5.25% for a second straight meeting in October. Economists at CIBC Capital Markets analyze BoE’s policy outlook and expect the Pound to remain under pressure.
BoE to maintain policy at the current rate through August 2024
Irrespective of BoE macro forecast amendments, including higher CPI, and downgraded GDP, (the bank anticipates zero growth between Q2 2024 and Q1 2025), we continue to expect the BoE to maintain policy at the current rate, 5.25%, through to August 2024.
Elevated and sticky UK CPI points towards the BoE being a policy laggard in terms of monetary easing, underlining macro underperformance well into 2024.
The corollary of weak macro data and moderating rate expectations (we anticipate that Q1 terminal rate expectations should be pared, from the current 7 bps), is the prospect of additional GBP downside into year-end.
GBP/USD – Q4 2023: 1.18 | Q1 2024: 1.18
A burnt market is wary of selling the Dollar, Kit Juckes, Global FX Strategist at Société Générale, reports.
The US is still waiting for its Roadrunner moment
Last week’s data has done a lot to persuade me that the US economic cycle has finally turned, and the peak for both Dollar and 10-year yields is in, but it’s clear that the market collectively is very worried about being caught out again.
I suspect that economists will need more convincing than I do, that the US outlook has changed. It brings to mind an image of Roadrunner sprinting off the end of a cliff and hanging above the abyss for an unreasonably long time.
- The New Zealand Dollar bounces on Thursday after finding a floor at the key 50-day SMA.
- The Kiwi recovers after three days of losses and despite a worsening macro backdrop – normally a negative for NZD.
- NZD/USD remains in a long-term downtrend, with US labor data and commentary from Fed’s Powell as potential near-term influences.
The New Zealand Dollar (NZD) recovers against the US Dollar (USD) on Thursday, despite a worsening macro picture after bouncing off technical support at the important 50-day Simple Moving Average (SMA). The 50-day SMA is used as a key guide to investing by institutional investors, such as pension fund managers, and retail traders alike.
Daily digest market movers: New Zealand Dollar strengthens after meeting key average
- The New Zealand Dollar trades higher against the US Dollar on Thursday despite the USD strengthening against most counterparts as reflected by the rise in the US Dollar Index (DXY).
- Downbeat Chinese inflation data continues to dampen the outlook for global growth. This would normally weigh on NZD, as it is a major commodity exporter – especially of dairy products – to China. However, the currency ignores the data and rises anyway.
- The Kiwi’s unilateral strength is probably as a result of the NZD/USD reaching a significant chart level, the 50-day SMA, and then bouncing.
- The Chinese CPI unexpectedly declined by0.2% October compared with the same month a year earlier, versus the 0.0% in the previous month. Experts had expected a 0.1% fall.
- Deflation in China suggests signs the economy is cooling. Normally this would have a negative knock-on effect on the Kiwi. New Zealand is a major exporter to China, meeting most of its needs for dairy products, and deflation could reflect a decline in demand.
- The Kiwi itself weakened on the back of an inflation report from the RBNZ on Wednesday. The report showed both one-year-out and two-years-out inflation expectations for New Zealand fell in Q3 compared to the previous quarter.
- Actual inflation in New Zealand, as reported by Stats NZ, also showed a drop in inflation to 5.6% in Q3 versus the 6.0% of the previous quarter.
- The lower inflation expectations imply the RBNZ is less likely to raise interest rates. Since higher interest rates tend to strengthen a currency by increasing capital inflows from foreign investors searching for higher returns, the lower data weighed on the Kiwi.
- The widespread market view is that the US Federal Reserve (Fed) is now unlikely to raise interest rates further. However, recent commentary from Fed officials has suggested some still see the need for more interest rate hikes, muddying the picture.
- With the Fed Funds Rate currently at 5.25%-5.50%, there is little incentive for traders to borrow in either NZD or USD and invest in the other, an operation known as the “carry trade”, that is a major contributor to fluctuating global FX demand.
- US labor data at 13:30 GMT and a speech from Federal Reserve Chair Jerome Powell scheduled for 19:00 GMT could impact the NZD/USD, on Thursday.
New Zealand Dollar technical analysis: NZD/USD bounces of 50-day SMA
NZD/USD – the number of US Dollars one New Zealand Dollar can buy – bounces off the key 50-day SMA and rises 0.35% at the time of writing on Thursday, to trade at 0.5929.
At the same level as the 50-day sits the 0.382 Fibonacci retracement of the rally from off the late October year-to-date lows, further reinforcing its role as springboard.
-638351273518193785.png)
New Zealand Dollar vs US Dollar: Daily Chart
The trend is bullish in the short term and a decisive break above the November 3 high at 0.6001 would reconfirm this bullish bias, with a likely target thereafter at the 0.6055 October high.
However, the medium and long-term trends are still bearish, suggesting the potential for more downside is strong.
-638351274183303140.png)
New Zealand Dollar vs US Dollar: Daily Chart
A break below 0.5884 would signal a continuation of the broader downtrend to a target at the 0.5773 October low.
Bulls would have to push above the 0.6055 October high to change the outlook in the medium term and suggest the possibility of the birth of a new uptrend.
New Zealand Dollar FAQs
What key factors drive the New Zealand Dollar?
The New Zealand Dollar (NZD), also known as the Kiwi, is a well-known traded currency among investors. Its value is broadly determined by the health of the New Zealand economy and the country’s central bank policy. Still, there are some unique particularities that also can make NZD move. The performance of the Chinese economy tends to move the Kiwi because China is New Zealand’s biggest trading partner. Bad news for the Chinese economy likely means less New Zealand exports to the country, hitting the economy and thus its currency. Another factor moving NZD is dairy prices as the dairy industry is New Zealand’s main export. High dairy prices boost export income, contributing positively to the economy and thus to the NZD.
How do decisions of the RBNZ impact the New Zealand Dollar?
The Reserve Bank of New Zealand (RBNZ) aims to achieve and maintain an inflation rate between 1% and 3% over the medium term, with a focus to keep it near the 2% mid-point. To this end, the bank sets an appropriate level of interest rates. When inflation is too high, the RBNZ will increase interest rates to cool the economy, but the move will also make bond yields higher, increasing investors’ appeal to invest in the country and thus boosting NZD. On the contrary, lower interest rates tend to weaken NZD. The so-called rate differential, or how rates in New Zealand are or are expected to be compared to the ones set by the US Federal Reserve, can also play a key role in moving the NZD/USD pair.
How does economic data influence the value of the New Zealand Dollar?
Macroeconomic data releases in New Zealand are key to assess the state of the economy and can impact the New Zealand Dollar’s (NZD) valuation. A strong economy, based on high economic growth, low unemployment and high confidence is good for NZD. High economic growth attracts foreign investment and may encourage the Reserve Bank of New Zealand to increase interest rates, if this economic strength comes together with elevated inflation. Conversely, if economic data is weak, NZD is likely to depreciate.
How does broader risk sentiment impact the New Zealand Dollar?
The New Zealand Dollar (NZD) tends to strengthen during risk-on periods, or when investors perceive that broader market risks are low and are optimistic about growth. This tends to lead to a more favorable outlook for commodities and so-called ‘commodity currencies’ such as the Kiwi. Conversely, NZD tends to weaken at times of market turbulence or economic uncertainty as investors tend to sell higher-risk assets and flee to the more-stable safe havens.
The Mexican Peso is facing an exciting day today. Economists at Commerzbank analyze MXN outlook.
Monthly inflation data Banxico’s monetary policy decision in focus
The future development of inflation rates is likely to be decisive for the start of the rate cut cycle. If core inflation comes in below expectations and if Banxico’s projections signal that the target will be reached soon the market is likely to take an optimistic view about rate cuts. Conversely, any signs of stubborn inflation rates will make unchanged interest rates over a longer period more likely, which should benefit the Peso.
In view of Mexico’s political issues, in particular considering the elections next year and the fact that the delay of the rate cut expectations did not have much of an effect on the Peso recently, the positive effect is likely to be limited though.
- The Greenback trades flat and is looking for direction.
- Traders will be looking for clues and guidance from Fed Chairman Powell.
- The US Dollar Index is steady in the 105-area and looks to be awaiting a catalyst for a move in any direction.
The US Dollar (USD) is steerless this week and is looking for direction, or at least some kind of driver that will push it in any direction. The fact that the US Dollar Index is right in the middle of this week’s trading range, clearly points to some fatigue in the Greenback while traders are trying to assess the current situation in terms of a recession or soft landing for the US economy.
On the economic data front, traders will be looking for clues again from the US Federal Reserve speakers that are on the docket for this Thursday. The weekly jobless claims could shed some light and could confirm the weaker US jobs report from last week, should there be an uptick in unemployment numbers. That could be an early sign on the wall and could send the US Dollar weaker against most major currencies.
Daily digest: US Dollar braces for jobless numbers
- The US 10-year bond auction on Wednesday was quite a success: The bond got placed at 4.519%, from earlier 4.610%. The Bid/Cover Ratio was at 2.45 against 2.50 previous. So for every tranche there was more demand than needed to get the bond filled.
- Philadelphia Fed president Patrick Harker said early on Thursday that rates should stay higher for longer and that the fight against inflation is still ongoing.
- Early morning comments from European Central Bank’s Luis De Guindos, made it clear he thought rate cuts were too premature to be factored in, and saw risk for an inflation surge in the next months.
- Near 13:30 GMT the Jobless Claims are due to come out:
- Initial Jobless Claims are expected to rise from 217,000 to 218,000.
- Continuing Jobless Claims are expected to head from 1.818 million to 1.820 million.
- Atlanta Federal Reserve President Raphael Bostic is due to release comments around 14:30 GMT and near 16:00 Thomas Barkin from the Richmond branch is due to make some comments.
- The US Treasury will have busy days as well and will be more than happy to do two bond placements at some less elevated rate levels: a 4-week bill and a 30-year bond auction are due to take place at 16:30 GMT and 18:00 GMT.
- To close the day off, traders will brace for comments from US Federal Reserve Chairman Jerome Powell around 19:00 GMT, at a panel discussion on monetary policy for the IMF.
- Equities are painting a very binary view this Thursday: Japan equities are in the green with over 1% profit for the Nikkei and the Topix. The Chinese Hang Seng is flat, together with European and US equities.
- The CME Group’s FedWatch Tool shows that markets are pricing in a 90.4% chance that the Federal Reserve will keep interest rates unchanged at its meeting in December.
- The benchmark 10-year US Treasury yield trades at 4.50%, after a successful allocation by the US Treasury earlier on Wednesday.
US Dollar Index technical analysis: US Dollar hanging on Powell’s lips
The US Dollar has partially made good after its weak performance at the end of last week. That said, the recovery does not look strong enough for the US Dollar Index (DXY) to be able to recoup all the losses incurred by Friday.
The DXY was looking for support near 105.00, and has been able to bounce ahead of it. Any shock events in global markets could spark a sudden turnaround and favour safe-haven flows into the US Dollar. A rebound first to 105.85 would make sense, a pivotal level from March 2023. A break above could mean a revisit to near 107.00 and recent peaks printed there.
On the downside, 105.10 is still acting as a line in the sand. Once the DXY slides back below that, a big air pocket is opening up with only 104.00 as the first big level where the 100-day Simple Moving Average (SMA) can bring some support. Just beneath that, near 103.50, the 200-day SMA should provide similar underpinning.
US Dollar FAQs
What is the US Dollar?
The US Dollar (USD) is the official currency of the United States of America, and the ‘de facto’ currency of a significant number of other countries where it is found in circulation alongside local notes. It is the most heavily traded currency in the world, accounting for over 88% of all global foreign exchange turnover, or an average of $6.6 trillion in transactions per day, according to data from 2022.
Following the second world war, the USD took over from the British Pound as the world’s reserve currency. For most of its history, the US Dollar was backed by Gold, until the Bretton Woods Agreement in 1971 when the Gold Standard went away.
How do the decisions of the Federal Reserve impact the US Dollar?
The most important single factor impacting on the value of the US Dollar is monetary policy, which is shaped by the Federal Reserve (Fed). The Fed has two mandates: to achieve price stability (control inflation) and foster full employment. Its primary tool to achieve these two goals is by adjusting interest rates.
When prices are rising too quickly and inflation is above the Fed’s 2% target, the Fed will raise rates, which helps the USD value. When inflation falls below 2% or the Unemployment Rate is too high, the Fed may lower interest rates, which weighs on the Greenback.
What is Quantitative Easing and how does it influence the US Dollar?
In extreme situations, the Federal Reserve can also print more Dollars and enact quantitative easing (QE). QE is the process by which the Fed substantially increases the flow of credit in a stuck financial system.
It is a non-standard policy measure used when credit has dried up because banks will not lend to each other (out of the fear of counterparty default). It is a last resort when simply lowering interest rates is unlikely to achieve the necessary result. It was the Fed’s weapon of choice to combat the credit crunch that occurred during the Great Financial Crisis in 2008. It involves the Fed printing more Dollars and using them to buy US government bonds predominantly from financial institutions. QE usually leads to a weaker US Dollar.
What is Quantitative Tightening and how does it influence the US Dollar?
Quantitative tightening (QT) is the reverse process whereby the Federal Reserve stops buying bonds from financial institutions and does not reinvest the principal from the bonds it holds maturing in new purchases. It is usually positive for the US Dollar.
Kit Juckes, Global FX Strategist at Société Générale, finds the Yen’s valuation interesting.
EUR/USD is going to crawl higher at best in the near term
If US yields have peaked and Japan’s economy is recovering, the Yen is much too cheap, even if it takes until 2024 for the BoJ to make any further policy changes.
The Yen will doubtless frustrate for a while longer, but the turn lower in USD/JPY and EUR/JPY is closer now. EUR/USD on the other hand, is going to crawl higher at best in the near term, and the same can be said of GBP/USD.
The market will pay particular attention to Fed Chair Jerome Powell’s comments. However, the US Dollar’s direction will not be determined by words, but by data, economists at Commerzbank report.
Data following much talk
Possible reactions in the Dollar due to comments by Fed members are possible at this stage, but really only by a few pips.
Instead, focus should be aimed at the US inflation data due for publication on Tuesday. If inflation continues towards the Fed’s target that would be a convincing argument in favour of possible rate cuts and thus also Dollar losses.
Federal Reserve Bank of Chicago President Austan Goolsbee told the Wall Street Journal on Thursday that they will need to monitor the risks of overshooting on interest rates, per Reuters.
Key quotes
"A sustained rise in long-term rates can have a very substantial effect on real economic performance."
"It's too soon to say whether or when the central bank would turn its focus to lowering rates."
"The US economy can stay on the golden path in which inflation declines closer to the Fed’s 2% target without a significant rise in unemployment."
Market reaction
The US Dollar Index was seen rising 0.15% on the day at 105.67 following these comments.
Federal Reserve Bank of Philadelphia President Patrick Harker said on Thursday that now is the time to take stock of past rate hikes' impact and added that the next interest rate decision could go either way depending on data, per Reuters.
Key quotes
"Fed will stay higher for longer, no sign of near-term rate cuts."
"Labor market is moving into better balance."
"Unemployment rate could rise to 4.5% in 2024 before falling."
"Confident that consumers will help achieve soft landing."
"Unclear yet whether consumers have expended spending power."
"Not expecting a recession but growth is likely to cool off."
"Inflation could hit 3% in 2024, 2% after."
Market reaction
The US Dollar showed no reaction to these comments. As of writing, the US Dollar Index was up 0.1% on the day at 105.63.
Senior Economist at UOB Group Julia Goh and Economist Loke Siew Ting assess the recently published Foreign Portfolio readings in Malaysia.
Key Takeaways
Malaysia recorded a third straight month of foreign portfolio outflows worth MYR4.9bn in Oct (Sep: -MYR3.8bn, Aug: -MYR4.9bn). The outflows came through net foreign selling of Malaysian debt securities (Oct: -2.6bn) and equities (MYR2.3bn). Cumulative flows was still a net inflow of MYR16.1bn in Jan-Oct (vs. –MYR1.9bn in Jan-Oct 2022) despite sharp selloffs of MYR13.5bn in Aug-Oct which more than offset the MYR12.7bn of inflows in Jul.
Larger foreign portfolio outflows in Oct exacerbated the MYR weakness, which fell 1.6% against the USD to USDMYR4.766 at end-Oct. Bank Negara Malaysia’s foreign reserves fell USD1.7bn m/m to USD108.5bn, bringing year-to-date decline to USD6.1bn. The latest reserves position is sufficient to finance 5.1 months of imports of goods & services and is 1.0 times the total short-term external debt. BNM’s net short position in FX swaps widened by USD1.2bn to USD24.1bn as at end-Sep.
Economists at Société Générale analyze Mexican Peso’s outlook ahead of the Banxico rate decision.
Banxico forecast to stand pat
Banxico is forecast to keep rates on hold today shortly after the release of inflation data for October. Headline CPI likely slowed further to 4.25% YoY in October.
We expect the central bank to extend the pause and reiterate that rates need to stay at current levels for a prolonged period to achieve a sustained and orderly convergence of headline inflation on the 3% target.
We are tactically short USD/MXN, targeting 16.50 in 6-9 months based on our house view for Fed cuts in 2024 and domestic disinflation.
EUR/PLN dipped to 4.43 after the National Bank of Poland (NBP) kept interest rates unchanged but later returned to 4.44. Economists at ING analyze the pair’s outlook.
NBP keeps rates unchanged despite expectations
NBP left rates unchanged despite market and survey expectations. The market is repricing expectations, particularly at the short end of the curve upward, resulting in bear flattening. Higher rates at the short end are positive news for Zloty.
We remain positive on PLN. Rates repricing will continue today and current rate differentials already indicate EUR/PLN should be trading more like 4.42.
However, the key today will be the NBP Governor's press conference which should show what was behind the surprise decision to hold rates and what to expect next. We believe rates will remain unchanged in December as well, but next year is still a question mark given the inflation profile.
- USD/CAD oscillates inside Wednesday’s range as investors await a speech from Fed Powell.
- Jerome Powell might emphasize keeping interest rates higher for a longer period.
- USD/CAD continues to move higher in a Rising Channel chart pattern.
The USD/CAD pair trades back and forth in a narrow range near the crucial resistance of 1.3800 in the European session. The Loonie asset struggles for a direction as investors await the speech from Federal Reserve (Fed) Chair Jerome Powell.
The market participants hope that Jerome Powell would emphasize keeping interest rates higher for a longer period to keep pressure elevated on consumer inflation. Powell may quote rate cuts ‘unreasonable’ in the near term as current price pressures over 2% required inflation would be a hard nut to crack.
Meanwhile, the US Dollar Index (DXY) trades directionless near 105.50 despite deepening slowdown fears. The oil prices discover intermediate support after a sharp correction while more downside remains favored as Middle East conflicts are seen contained between Israel and Palestine only. It is worth noting that Canada is the leading exporter of oil to the United States and higher oil prices impact the Canadian Dollar.
USD/CAD continues to move higher in a Rising Channel chart pattern in which each pullback is considered as a buying opportunity by the market participants. The 50-day Exponential Moving Average (EMA) at 1.3660 continues to provide support to the US Dollar bulls. Horizontal resistance is plotted from March 10 high at 1.3682.
The Relative Strength Index (RSI) (14) struggles to shift into the bullish range of 60.00-80.00. If the RSI (14) manages to do so, a bullish momentum would get triggered.
Going forward, a decisive break above October 27 high at 1.3880 would expose the round-level resistance at 1.3900, followed by 13 October 2022 high at 1.3978.
In an alternate scenario, a breakdown below October 24 low around 1.3660 would drag the asset to the round-level support of 1.3600. A further breakdown could expose the asset to October 7 low at 1.3570.
USD/CAD daily chart
-638351213292838708.png)
Economists at UBS expect Oil to rise after the recent period of weakness.
Oil upside remains despite recent slide
We expect Oil to move back up toward between $90 and $100 a barrel, amid still rising global demand and tight supplies.
Global consumption of crude remains well supported, despite the weaker official forecast from the US.
Key Oil producers have remained disciplined on production, keeping supply tight.
The risk of a disruption to Oil production arising from the Israel-Hamas war has not gone away. Our base case is that the conflict will not escalate. However, events in the region remain fluid. The clearest threat is to Iranian output. Should Iranian crude exports fall by around 300K-500K barrels per day, this could further constrain the already undersupplied market, potentially pushing Brent prices up to $100-110/bbl. While OPEC+ has sufficient spare capacity to compensate for such a reduction in supplies, any measures could take time to calm markets. A broadening of the conflict across the region that pulled in other oil-producing countries could cause prices to rise even more, depending on the magnitude of the disruption.
- Gold price faces a sell-off as investors remain cautious over the speech from Fed Powell.
- The majority of Fed policymakers have advised waiting for more data for a fresh outlook on interest rates.
- The US Dollar could rebound as global slowdown fears escalate.
Gold price (XAU/USD) falls further as upside risks of Middle East tensions ease. The precious metal remains on the backfoot as market participants expect conflicts to remain contained between Israel and Palestine. Along with fading Middle East conflicts, caution over the interest rate outlook from the Federal Reserve (Fed) has dampened appeal for the Gold.
Investors are waiting for Federal Reserve Chairman Jerome Powell’s guidance on the monetary policy meeting in December and the outlook on the economy. Fed Powell is expected to maintain the stance of keeping current interest rates higher for a longer period as cracks appear in the US job market that could restrict inflation expectations. Jerome Powell could warn for more rate hikes in case progress in inflation returns to 2% slows.
Daily Digest Market Movers: Gold price drops further as Middle East tensions fade
- Gold price tests territory below the crucial support of $1,950 as market participants hope that Middle East tensions will remain contained between Israel and Palestine.
- The delay in ground invasion plans by the Israeli Defense Forces (IDF) in Gaza, for the safe delivery of humanitarian aid and to ensure safe passage for hostages, has also diminished the appeal for Gold.
- On Tuesday, Federal Reserve Governor Lisa Cook warned about escalating geopolitical tensions, which could deepen the slowdown in Europe and China and its cascading effects could impact the US economy too.
- Lisa Cook further warned that these geopolitical tensions could destabilize commodity markets and access to credit in the current higher interest rate environment.
- This week, the Gold price closed negative for straight three trading sessions and is expected to remain vulnerable.
- The majority of Fed policymakers in their commentaries have advised to wait for the release of key economic data before arriving at a conclusion.
- Philadelphia Federal Reserve President Patrick Harker said that the next decision from the central bank could go either way, depending on economic data. Harker added that the Fed will keep interest rates ‘higher for longer’ and there are no signs of rate cuts in the near term.
- While discussing the labor market and inflation outlook, Patrick Harker commented that the Unemployment Rate would rise to 4.5% in 2024 before falling and inflation will come down to 3% in 2024.
- Minneapolis Federal Reserve Bank President Neel Kashkari and Federal Reserve Governor Michelle Bowman support raising rates as the resilient US economy could result in an uptick in price pressures.
- On the contrary, Chicago Federal Reserve President Austan Goolsbee said that the progress in inflation returning towards 2% is decent and inflation would decline significantly in the next two months.
- Austan Goolsebee said that discussions over how far interest rates should be hiked will likely fade and be substituted by how long interest rates should remain high.
- Further action in the US Dollar, bullions, and bond market are likely to be guided by the speech from Fed Chair Jerome Powell. The guidance on interest rates and commentary on the economic outlook from Powell will be keenly watched.
- On Wednesday, Jerome Powell, in his prepared remarks, didn’t comment on monetary policy and the economic outlook.
- Meanwhile, the US Dollar Index (DXY) consolidates in a narrow range around 105.50. The USD index could resume upside as fears of a slowdown in the global economy have accelerated. The Chinese economy deflated in October due to weak consumer spending and a surprise slump in factory data.
Technical Analysis: Gold price extends losing streak to near $1,950
Gold price continues its three-day losing streak as investors remain cautious ahead of Powell’s commentary on interest rates. The Gold price corrects further below the 20-day Exponential Moving Average (EMA) but is likely to find support near the 50-day EMA, which trades near $1,935.00. Momentum oscillators indicate that the bullish impulse has faded but the broader trend is still upbeat.
Gold FAQs
Why do people invest in Gold?
Gold has played a key role in human’s history as it has been widely used as a store of value and medium of exchange. Currently, apart from its shine and usage for jewelry, the precious metal is widely seen as a safe-haven asset, meaning that it is considered a good investment during turbulent times. Gold is also widely seen as a hedge against inflation and against depreciating currencies as it doesn’t rely on any specific issuer or government.
Who buys the most Gold?
Central banks are the biggest Gold holders. In their aim to support their currencies in turbulent times, central banks tend to diversify their reserves and buy Gold to improve the perceived strength of the economy and the currency. High Gold reserves can be a source of trust for a country’s solvency. Central banks added 1,136 tonnes of Gold worth around $70 billion to their reserves in 2022, according to data from the World Gold Council. This is the highest yearly purchase since records began. Central banks from emerging economies such as China, India and Turkey are quickly increasing their Gold reserves.
How is Gold correlated with other assets?
Gold has an inverse correlation with the US Dollar and US Treasuries, which are both major reserve and safe-haven assets. When the Dollar depreciates, Gold tends to rise, enabling investors and central banks to diversify their assets in turbulent times. Gold is also inversely correlated with risk assets. A rally in the stock market tends to weaken Gold price, while sell-offs in riskier markets tend to favor the precious metal.
What does the price of Gold depend on?
The price can move due to a wide range of factors. Geopolitical instability or fears of a deep recession can quickly make Gold price escalate due to its safe-haven status. As a yield-less asset, Gold tends to rise with lower interest rates, while higher cost of money usually weighs down on the yellow metal. Still, most moves depend on how the US Dollar (USD) behaves as the asset is priced in dollars (XAU/USD). A strong Dollar tends to keep the price of Gold controlled, whereas a weaker Dollar is likely to push Gold prices up.
UOB Group’s Economists Enrico Tanuwidjaja and Sathit Talaengsatya review the latest inflation figures in Thailand.
Key Takeaways
In Oct, Thailand’s headline CPI declined by 0.31% y/y from +0.30% y/y in Sep, a marked turnaround in 25 months since Aug 2021. The government’s subsidies for energy and electricity prices were the main drivers of a drop in the headline figure on the back of a decline in both food and non-food prices. During Jan-Oct 2023, headline inflation rose 1.60% y/y. Core inflation edged up marginally to 0.66% y/y from 0.63% y/y in Sep. Year-to-date, core inflation increased 1.41% y/y. This continued to reflect moderate inflationary pressures. With a rapid disinflation starting in the middle of 2023, the headline inflation trend so far has moved within the Bank of Thailand (BOT)’s target range of 1%-3%.
The Oct deflation rate was significantly attributed to the government’s subsidies for energy and electricity costs to help relieve costs of living which have been rolled out since late Sep. This was reflected by a fall in energy inflation to -1.55% y/y in Oct from +1.21% y/y in Sep. In addition, food and nonalcoholic beverage inflation continued to ease driven by a large drop in raw food prices on the back of improved supply conditions.
Based on the latest inflation outturn in Oct, we expect that inflationary pressures will continue to moderate during 4Q23, and we maintain our projection for the headline inflation to average 1.6% in 2023 before rebounding to an average of 2.6% in 2024.
The Norwegian Krone is struggling. Economists at Commerzbank analyze NOK outlook ahead of inflation data due for publication on Friday.
Weak data would probably ensure that Krone continues to struggle
After the September inflation data disappointed on the downside, the market adjusted its rate expectations for December to the downside. If the data for October now were to come in below expectations too the market would lower its expectations further so that EUR/NOK might breach the 12 mark for good.
Weak data would probably ensure that Krone continues to struggle. For the market to change its view the price data would have to surprise significantly on the upside.
Bank of Japan (BoJ) Governor Kazuo Ueda is back on the wires on Thursday, noting that “when we normalize short-term interest rates, we'll have to be careful about what will happen to financial institutions, borrowers of money and aggregate demand.”
Ueda added that “it is going to be a serious challenge for us.”
Additional quotes
It's too early to determine what we specifically can do when we normalize our policy stance.
If we don't manage the process of phasing out YCC properly, we can cause huge volatility in the bonds market.
We hope to be able to exit from this approach without creating such volatility, but we will see.
We want exchange rates to follow fundamentals, we will of course analyse carefully how exchange rates would affect inflation and output.
We are concerned about many things including what will happen to the US economy, when asked about key concerns regarding prospects for achieving BoJ’s target.
Base line assumption now is that the US economy will achieve some version of soft landing, but there are risks on both sides which, if materialize, will affect Japan .
We also worry about what will happen to the chinese economy, such as possible spillovers of property sector to rest of its economy.
I'm sure they have learnt a lot from our experience, when asked what China can learn from Japan's past episode of deflation.
Scale of problem relative to GDP is smaller for China now than was the case in Japan 30 years ago, but they face serious challenges ahead.
We are very interested in what will happen in Japan's next round of wage negotiations in spring.
We have to proceed fairly carefully because everybody is used to environment of low interest rate, when asked about effect of future rate hike on Japan's economy.
Market reaction
USD/JPY is holding higher ground just above 151.00, shrugging off the slightly hawkish comments from the BoJ governor. The pair is trading modestly flat on the day, as of writing.
“We do not need to raise rates to bear down on inflation,” Bank of England (BoE) Chief Economist Huw Pill said in a presentation to the Institute of Chartered Accountants in England and Wales (ICAEW) on Thursday.
Further comments
Inflation remains much too high.
We need to deliver the restrictiveness of monetary policy embodied in BoE forecasts for falling inflation.
Maintaining restrictive stance of monetary policy key to meeting inflation target.
Restrictive monetary policy needed to weigh against inflation persistence.
No sign yet of a decisive turn in domestically driven services price inflation.
Market reaction
GBP/USD is paying a blind eye to the above comments from the BoE policymaker Pill. The pair is currently trading at 1.2294, up 0.13% on the day.
- USD/MXN extends gains on risk aversion following the hawkish tone from Fed officials.
- Fed Chair Powell could provide commentary on monetary policy at a panel discussion.
- US Dollar experiences challenges due to the downbeat US bond yields.
USD/MXN extends its gains for the second successive session, trading near 17.5600 during the European session on Thursday. The USD/MXN pair receives upward support possibly due to the risk aversion following hawkish remarks from the US Federal Reserve (Fed) officials regarding interest rate cuts.
Fed Governor Michelle Bowman hints at the central bank considering future increases in short-term interest rates, adding an element of uncertainty. Additionally, Neil Kashkari, President of the Minnesota Fed, cautioned whether the central bank has raised rates enough.
Investors got no indication during the US Central Bank statistics conference on Wednesday as Fed Chair Jerome Powell opted not to provide commentary on monetary policy. However, Powell is expected to join a panel discussion later today focusing on "Monetary Challenges in a Global Economy."
Federal Reserve acknowledges the easing of financial conditions. This acknowledgment reduces the urgency for future rate hikes. However, it introduces the potential for increased risk of unexpected hawkish policy shifts.
The Bank of Mexico (Banxico) is expected to maintain rates at 11.25% in the upcoming meeting. Banxico officials reiterate commitment to keeping rates at the "current level" in the ongoing battle against inflation. Investors await Mexico’s Headline Inflation for October, which is expected to ease at 0.39%.
US rates remain at recent lows and there has been no concerted pushback from the Federal Reserve. Therefore, the US Dollar could soften further, economists at ING report.
Buying into the US slowdown
We had been expecting more of a Fed pushback against this drop in US rates, but Fed speakers seem quite equivocal. This has left US rates at the lows and investors seemingly starting to buy into the US slowdown – a mild Dollar negative.
In terms of data, the focus will again be on the weekly jobless and continued claims numbers, where any spike could hit the Dollar - hinting at signs that the US labour market is finally turning.
We have a mild preference today that the Dollar can drift lower, with DXY heading back down to 105.00.
The Polish Zloty rallied noticeably after the Polish Central Bank (NBP) surprisingly kept interest rates unchanged. Economists at Commerzbank analyze PLN outlook.
NBP surprises
NBP surprised markets by not cutting its base rate. If NBP had to change course for whatever reason, this would support the currency.
Fundamentally speaking, NBP’s new economic projections feature stronger, but sub-trend, GDP growth during 2024 as well as softer inflation – these revisions could have theoretically supported some more rate cuts.
Keeping the rate unchanged will support the Zloty.
- Silver remains under some selling pressure for the fourth successive day on Thursday.
- The technical setup favours bearish traders and supports prospects for deeper losses.
- A sustained strength beyond $23.60-70 barrier is needed to negate the negative bias.
Silver (XAG/USD) attracts fresh sellers following an uptick to the $22.65 region and drifts into negative territory for the fourth successive day on Thursday. The white metal extends its intraday descent through the first half of the European session and drops to the $22.35 area in the last hour, back closer to over a three-week low touched on Wednesday.
From a technical perspective, nothing seems to have changed for the XAG/USD and the near-term bias remains tilted firmly in favour of bearish traders. Against the backdrop of the recent repeated failures to find acceptance above the very important 200-day Simple Moving Average (SMA) and the overnight rejection near the $22.85-$22.80 horizontal support breakpoint validates the negative outlook.
Moreover, oscillators on the daily chart have just started drifting in the negative territory and support prospects for an extension of the recent downfall from the $23.60-$23.70 supply zone, which constituted the formation of multiple tops on the daily chart. Some follow-through selling below Wednesday's swing low, around the $22.30 area, will reaffirm the bearish bias and drag the XAG/USD to the $22.00 mark.
The next relevant support near the $21.70 zone, below which the XAG/USD could extend the downward trajectory further towards the $21.35-$21.30 support en route to the $21.00 round figure. Bearish traders might eventually aim to challenge a multi-month low, around the $20.70-$20.65 area touched in October.
On the flip side, the $22.80-$22.85 region might continue to act as an immediate hurdle ahead of the $23.00 mark and the 200-day SMA, currently near the $23.25 region. This is followed by the $23.60-$23.70 supply zone, which if cleared decisively will shift the near-term bias in favour of bullish traders. The XAG/USD might then climb further beyond the $24.00 mark, towards the $24.20-$24.25 intermediate hurdle, before making a fresh attempt to conquer the $25.00 psychological mark.
Silver daily chart
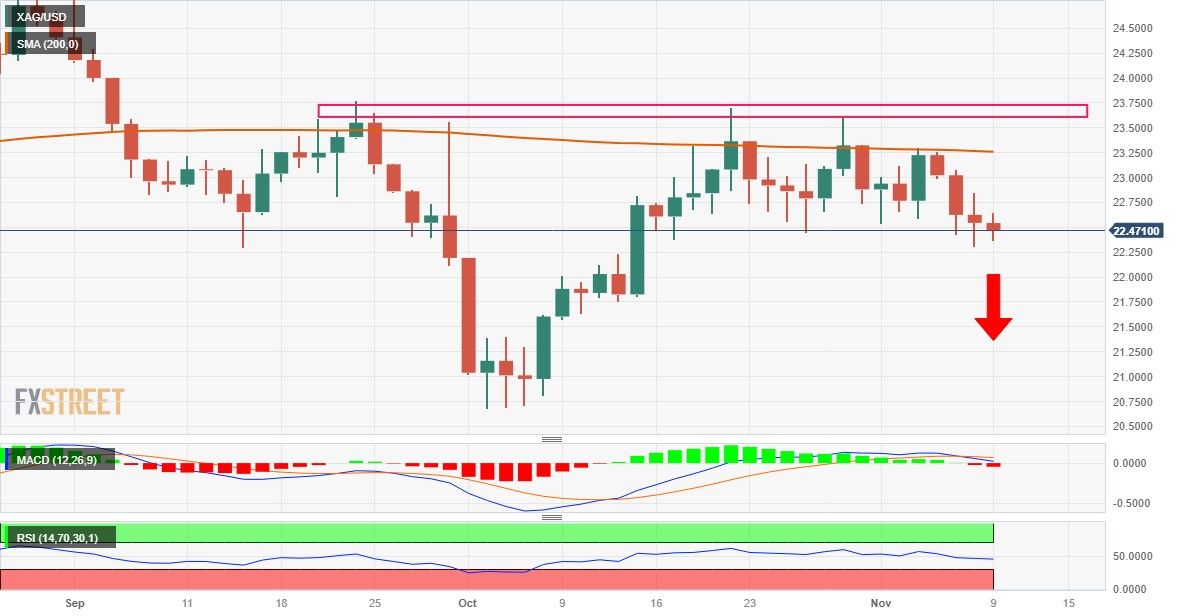
Technical levels to watch
- The Euro trades without a clear direction against the US Dollar.
- European equities open Thursday’s session in a mixed bias.
- Fed’s Powell, ECB’s Lagarde take centre stage later in the session.
The Euro (EUR) maintains its consolidative mood in place against the US Dollar (USD), prompting EUR/USD to navigate within a narrow range around the 1.0700 region on Thursday.
In the same line, the Greenback hovers around the 105.50 zone when tracked by the USD Index (DXY) against the backdrop of alternating risk appetite trends and rising cautiousness prior to Federal Reserve (Fed) Chair Jerome Powell’s event later in the European evening.
In terms of monetary policy, there is an increasing consensus among market participants that the Fed is likely to maintain its present monetary stance unchanged in the next few months. The possibility of an interest rate hike in December has lost some momentum, particularly following the recent FOMC meeting and the publication of weaker-than-expected Nonfarm Payrolls data for October.
A similar sentiment can be observed regarding the European Central Bank (ECB), although the recent hawkish narrative from some rate setters seems to have left the door open to further tightening in the short-to-medium term.
In the domestic calendar, President Christine Lagarde will speak in Brussels at 17:30 GMT.
In the US, Fed Chairman Jerome Powell will participate in a Policy Panel Discussion at 19:00 GMT. Additional data will show the usual Initial Jobless Claims, seconded by speeches by Atlanta Fed President Raphael Bostic (2024 voter, centrist) and Richmond Fed President Thomas Barkin (2024 voter, centrist).
Daily digest market movers: Euro appears cautious ahead of Lagarde, Powell
- The EUR shows some prudence against the USD.
- US and German yields improve a tad on Thursday.
- Markets expect the Fed to continue its current monetary policy in December.
- The ECB looks to be planning a protracted pause until H2 2024.
- ECB Vice President Luis de Guindos says rates cut chatter is premature.
- Geopolitical concerns in the Middle East continue unabated.
- Chinese CPI fell 0.2% in the year to October.
- BoJ’s Kazuo Ueda favoured the continuation of the current policy stance.
Technical Analysis: Euro faces transitory contention around 1.0645
EUR/USD navigates a consolidative range around the 1.0700 neighbourhood on Thursday.
If the selling pressure persists, EUR/USD may return to the weekly low of 1.0495 (October 13), ahead of the 2023 bottom at 1.0448 (October 15) and the round number of 1.0400.
On the upside, the November high of 1.0754 (November 6) stands in the way of the crucial 200-day Simple Moving Average (SMA) at 1.0801 and another weekly top of 1.0945 (August 30). The psychological threshold of 1.1000 is aligned north of here, before the August peak of 1.1064 (August 10) and the weekly high of 1.1149 (July 27), all preceding the 2023 top of 1.1275 (July 18).
The pair's outlook remains negative as long as it trades below the 200-day SMA.
Euro FAQs
What is the Euro?
The Euro is the currency for the 20 European Union countries that belong to the Eurozone. It is the second most heavily traded currency in the world behind the US Dollar. In 2022, it accounted for 31% of all foreign exchange transactions, with an average daily turnover of over $2.2 trillion a day.
EUR/USD is the most heavily traded currency pair in the world, accounting for an estimated 30% off all transactions, followed by EUR/JPY (4%), EUR/GBP (3%) and EUR/AUD (2%).
What is the ECB and how does it impact the Euro?
The European Central Bank (ECB) in Frankfurt, Germany, is the reserve bank for the Eurozone. The ECB sets interest rates and manages monetary policy.
The ECB’s primary mandate is to maintain price stability, which means either controlling inflation or stimulating growth. Its primary tool is the raising or lowering of interest rates. Relatively high interest rates – or the expectation of higher rates – will usually benefit the Euro and vice versa.
The ECB Governing Council makes monetary policy decisions at meetings held eight times a year. Decisions are made by heads of the Eurozone national banks and six permanent members, including the President of the ECB, Christine Lagarde.
How does inflation data impact the value of the Euro?
Eurozone inflation data, measured by the Harmonized Index of Consumer Prices (HICP), is an important econometric for the Euro. If inflation rises more than expected, especially if above the ECB’s 2% target, it obliges the ECB to raise interest rates to bring it back under control.
Relatively high interest rates compared to its counterparts will usually benefit the Euro, as it makes the region more attractive as a place for global investors to park their money.
How does economic data influence the value of the Euro?
Data releases gauge the health of the economy and can impact on the Euro. Indicators such as GDP, Manufacturing and Services PMIs, employment, and consumer sentiment surveys can all influence the direction of the single currency.
A strong economy is good for the Euro. Not only does it attract more foreign investment but it may encourage the ECB to put up interest rates, which will directly strengthen the Euro. Otherwise, if economic data is weak, the Euro is likely to fall.
Economic data for the four largest economies in the euro area (Germany, France, Italy and Spain) are especially significant, as they account for 75% of the Eurozone’s economy.
How does the Trade Balance impact the Euro?
Another significant data release for the Euro is the Trade Balance. This indicator measures the difference between what a country earns from its exports and what it spends on imports over a given period.
If a country produces highly sought after exports then its currency will gain in value purely from the extra demand created from foreign buyers seeking to purchase these goods. Therefore, a positive net Trade Balance strengthens a currency and vice versa for a negative balance.
EUR/USD is enjoying a brief foray above 1.0700. Economists at ING analyze the pair’s outlook.
ECB speakers unlikely to move the needle on EUR/USD
Investors do not seem to be listening to the threat of one last European Central Bank rate hike, where instead 80 bps+ of easing is priced in 2024.
We doubt ECB speakers today will move the needle on EUR/USD and the best hope of slightly higher spot prices probably comes from the US weekly claims data.
For today, let's see whether EUR/USD can test decent resistance at 1.0765.
Support is set at 1.0650/1.0660.
- USD/CHF moves sideways as markets adopt a cautious stance.
- Investors focus on Fed Chair Powell's involvement in a panel discussion, seeking fresh cues.
- US Dollar experiences lukewarm response despite dovish remarks from Fed officials.
USD/CHF recovers recent losses, hovering near the 0.9000 psychological level during the European session on Thursday. The USD/CHF pair moves sideways as the market shifts confidence due to US Federal Reserve (Fed) officials’ showing resistance against lowering interest rates.
During the US Central Bank statistics conference on Wednesday, Fed Chair Jerome Powell opted not to provide commentary on monetary policy. The attention of investors now turns to Powell's involvement in a panel discussion later today, where he could share insights and perspectives on "Monetary Challenges in a Global Economy."
The US Dollar Index (DXY) treads water near 105.50, amid US Treasury yields take their toll. The yield on a 10-year US bond hovers around 4.49% on Thursday. Moreover, Fed officials have expressed their reluctance to entertain the notion of lowering interest rates. However, despite this stance, the Greenback encounters challenges in the market.
Fed Governor Michelle Bowman has suggested that the central bank is contemplating future increases in short-term interest rates, introducing an element of uncertainty. Conversely, Neil Kashkari, President of the Minnesota Fed, remains skeptical about whether the central bank has raised rates sufficiently. He highlights the resilience of the economy as a crucial factor shaping his perspective on monetary policy.
Switzerland's seasonally adjusted Unemployment Rate (MoM) remained steady at 2.1% in October, according to data released by the State Secretariat for Economic Affairs (SECO). Additionally, the contained conflict between Israel and Hamas has improved market sentiment, potentially impacting the safe-haven status of the Swiss Franc (CHF).
Further decline looks on the cards for USD/CNH once sellers break below the 7.2700 level, argue Markets Strategist Quek Ser Leang and Senior FX Strategist Peter Chia at UOB Group.
Key Quotes
24-hour view: We highlighted yesterday that “there is a chance for USD to test 7.2700.” We also highlighted that “a sustained drop below this level is unlikely. Our view was not wrong, as USD dipped briefly to 7.2670 before snapping back up. The mild downward pressure has eased. The current price action is likely part of a range-trading phase. Today, we expect USD to trade between 7.2770 and 7.2950.
Next 1-3 weeks: Our latest narrative was from Monday (06 Nov, spot at 7.2880), wherein, after the sharp drop last Friday, downward momentum is beginning to build, but USD must break clearly below 7.2700 before further decline is unlikely. Yesterday, USD dipped briefly below 7.2700 before rebounding from 7.2670. There is no increase in downward momentum. That said, we continue to hold the view that USD must break and stay below 7.2700 before further decline is likely. The chance of USD breaking clearly below 7.2700 is intact as long as it stays below 7.3200 (no change in ‘strong resistance’ level).
- USD/JPY trades with a negative bias on Thursday and snaps a three-day winning streak.
- The divergent BoJ-Fed policy outlook might continue to act as a tailwind for the major.
- The technical setup supports prospects for a move back towards retesting the YTD top.
The USD/JPY pair struggles to capitalize on its weekly gains registered over the past three day and comes under some selling pressure on Thursday. Spot prices remain depressed through the early European session and currently trade just below the 151.00 mark, or a one-week high touched on Wednesday.
The recent rise in the USD/JPY pair triggers speculations that Japanese authorities will intervene in the FX market, which, along with the cautious market mood, is seen lending some support to the safe-haven Japanese Yen (JPY). Apart from this, a modest US Dollar (USD) downtick, led by the recent decline in the US Treasury bond yields and the uncertainty over the Federal Reserve's (Fed) rate-hike path, exerts some pressure on the major.
The downside for the USD/JPY pair, however, remains limited in the wake of the dovish stance adopted by the Bank of Japan (BoJ). In fact, BoJ Governor Kazuo Ueda reiterated on Wednesday that the central bank will stick to ultra-loose policy until the recent cost-push inflation shifts into price rises driven more by robust domestic demand and higher wages. This marks a big divergence in comparison to a relatively hawkish Fed.
From a technical perspective, the recent repeated failures to find acceptance below the 200-period Simple Moving Average (SMA) on the 4-hour chart and the subsequent move up favours bullish traders. Moreover, oscillators on daily/4-hourly charts are holding in the positive territory, validating the positive outlook for the USD/JPY pair. Hence, any further decline might still be seen as a buying opportunity and remain limited.
Some follow-through buying beyond the 151.00 mark will reaffirm the constructive outlook and allow spot prices to retest the YTD peak, around the 151.70 area set last week. The next relevant resistance is pegged near the multi-decade top touched in October 2022, above which the USD/JPY pair will enter an uncharted territory and could prolong its well-established bullish trend witnessed since the beginning of the current year.
On the flip side, weakness below the 150.70-150.65 region could attract fresh buyers near the 100-period SMA on the 4-hour chart, currently pegged just ahead of the 150.00 psychological mark. The latter might now act as a key pivotal point, which if broken decisively could drag the USD/JPY pair back towards the 200-period SMA on the 4-hour chart, around the 149.70-149.65 region. Some follow-through selling will expose the 149.20-149.15 area, or the post-NFP swing low, before spot prices weaken further below the 149.00 round figure.
USD/JPY 4-hour chart
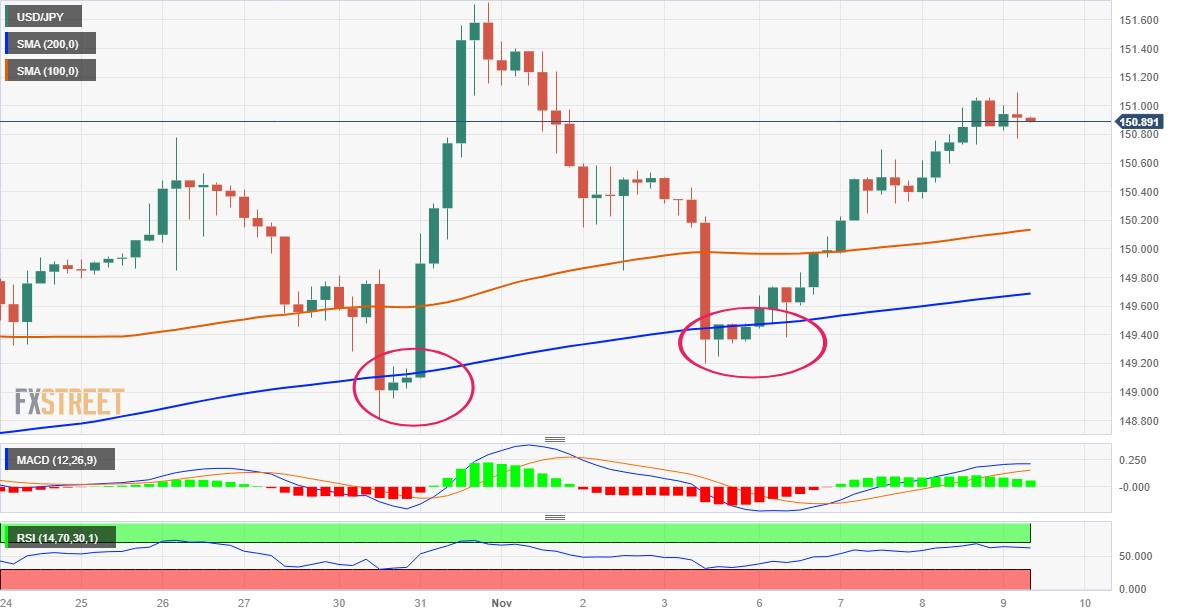
Technical levels to watch
- The index looks side-lined in the mid-105.00s.
- Chief Powell will participate in a discussion panel.
- Weekly Claims, Fedspeak comes next on the docket.
The greenback, in terms of the USD Index (DXY), navigates within a consolidative range around the 105.50 region following the opening bell in Euroland on Thursday.
USD Index looks to Powell for near-term price action
The index now seems to have embarked on a consolidative theme amidst the generalized lack of direction in the global markets, all ahead of the speech by Jerome Powell.
On the latter, investors are expected to closely follow Chair Powell’s participation in a Policy Panel Discussion in Washington against the backdrop of contrasting views regarding the potential next steps by the Federal Reserve by market participants and some Fed speakers.
In the meantime, the absence of volatility in the dollar’s price action also reflects on the US money market, where US yields navigate within very tight ranges across the curve.
On the US data space, usual weekly Initial Claims are due along with speeches by Atlanta Fed R. Bostic (2024 voter, centrist) and Richmond Fed T. Barkin (2024 voter, centrist).
What to look for around USD
The index now seems to be facing some consolidation in the 105.50 zone as markets wait for Powell’s event.
In the meantime, the dollar loses some composure despite the broad-based good health of the US economy and the inflation still running above the Fed’s target, while further cooling of the US labour market now appear to underpin a protracted impasse in the Fed’s current restrictive stance.
Key events in the US this week: Initial Jobless Claims, Chair Powell (Thursday) – Flash Michigan Consumer Sentiment (Friday).
Eminent issues on the back boiler: Persistent debate over a soft or hard landing for the US economy. Speculation of rate cuts in early 2024. Geopolitical effervescence vs. Russia and China. Potential spread of the Middle East crisis to other regions.
USD Index relevant levels
Now, the index is up 0.01% at 105.53 and the breakout of 106.88 (weekly high October 26) could expose 107.34 (2023 high October 3) and finally 107.99 (weekly high November 21 2022). On the other hand, initial support is seen at 104.84 (monthly low November 6) ahead of 104.42 (weekly low September 11) and then 103.57 (200-day SMA).
- Pound Sterling struggles for a direction as investors shift focus to the Q3 GDP data.
- A poor GDP report would elevate dovish expectations from various BoE policymakers.
- Rising energy prices have squeezed the UK’s consumer spending.
The Pound Sterling (GBP) is stuck in a tight range as investors seem unwilling to build fresh positions ahead of the release of the UK Q3 Gross Domestic Product (GDP) data, published on Friday at 07:00 GMT. The GBP/USD pair remains on tenterhooks as the Q3 GDP report will shape December’s monetary policy outlook of the Bank of England (BoE).
A decline in consumer spending, poor Services PMI, postponed demand for housing, and contracting hiring have set a negative undertone for the UK’s economic performance in the July-September period. A poor GDP report would elevate dovish expectations from various BoE policymakers, especially from Swati Dhingra, who favors cutting rates if the growth rate remains below expectations. GDP data will be followed by employment and inflation data, which will be released next week.
Daily Digest Market Movers: Pound Sterling trades directionless
- Pound Sterling consolidates in a narrow range below the crucial 1.2300 resistance level as investors await UK factory data for September and Q3 GDP data, which will inform December’s monetary policy decision by the Bank of England.
- The data is expected to show Manufacturing Production rose by 0.3% in the month of September versus the 0.8% decline in August. YoY the data is expected to show a 3.1% rise against the 2.8% recorded previously.
- Industrial Production is forecast to show a rise of 0.1% against a 0.7% decline in the previous period. The same data is forecast to show a 1.1% increase YoY compared to 1.3% previously.
- An uptick in factory data would ease fears of a slowdown in the UK economy.
- The show-stopper event that would guide further action in the Pound Sterling is the preliminary Q3 GDP data, which will be released at the same time as the factory data at 07:00 GMT.
- Economists have forecasted a nominal contraction of 0.1% against a 0.2% growth rate in the prior April-June quarter. UK firms underutilized their production capacities to avoid piling up unsold inventories amid a poor demand environment.
- The data from the Office for National Statistics (ONS) showed that consumer spending contracted in two out of three months in the third quarter as higher energy costs squeezed the real income of households.
- The UK economy is heavily reliant on the service industry: the Services PMI contracted in all months of the last quarter.
- BoE policymaker Swati Dhingra, who supported keeping interest rates unchanged last week, could emphasize cutting rates sooner if the Q3 GDP report turns out excessively weak.
- This week, BoE Chief Economist Huw Pill warned about the potential risks of an excessive slowdown as the central bank is committed to keeping monetary policy sufficiently restrictive for a longer period till the achievement of price stability.
- Huw Pill said rate cuts in mid-2024 “don’t seem totally unreasonable” and a weak GDP report would prompt dovish expectations from the BoE.
- The US Dollar drops to near 105.50 after failing to recapture the crucial resistance at 106.00. Investors await Federal Reserve (Fed) Chair Jerome Powell’s guidance on interest rates.
- This week, a balanced tone from Fed policymakers on the interest rate outlook has kept the US Dollar Index (DXY) broadly sideways in a range of 105.40-105.90.
Technical Analysis: Pound Sterling hovers below 1.2300
Pound Sterling has corrected gradually in the past three trading sessions after a sharp rally last week. The chances of a recovery in the Pound Sterling are decent.
The GBP/USD pair delivered a breakout of a symmetrical triangle chart pattern last week and the process of testing the breakout with gradual selling seems over. The Cable has stabilized above the 20-day Exponential Moving Average (EMA) but the 200-day EMA is still acting as a barricade.
Pound Sterling FAQs
What is the Pound Sterling?
The Pound Sterling (GBP) is the oldest currency in the world (886 AD) and the official currency of the United Kingdom. It is the fourth most traded unit for foreign exchange (FX) in the world, accounting for 12% of all transactions, averaging $630 billion a day, according to 2022 data.
Its key trading pairs are GBP/USD, aka ‘Cable’, which accounts for 11% of FX, GBP/JPY, or the ‘Dragon’ as it is known by traders (3%), and EUR/GBP (2%). The Pound Sterling is issued by the Bank of England (BoE).
How do the decisions of the Bank of England impact on the Pound Sterling?
The single most important factor influencing the value of the Pound Sterling is monetary policy decided by the Bank of England. The BoE bases its decisions on whether it has achieved its primary goal of “price stability” – a steady inflation rate of around 2%. Its primary tool for achieving this is the adjustment of interest rates.
When inflation is too high, the BoE will try to rein it in by raising interest rates, making it more expensive for people and businesses to access credit. This is generally positive for GBP, as higher interest rates make the UK a more attractive place for global investors to park their money.
When inflation falls too low it is a sign economic growth is slowing. In this scenario, the BoE will consider lowering interest rates to cheapen credit so businesses will borrow more to invest in growth-generating projects.
How does economic data influence the value of the Pound?
Data releases gauge the health of the economy and can impact the value of the Pound Sterling. Indicators such as GDP, Manufacturing and Services PMIs, and employment can all influence the direction of the GBP.
A strong economy is good for Sterling. Not only does it attract more foreign investment but it may encourage the BoE to put up interest rates, which will directly strengthen GBP. Otherwise, if economic data is weak, the Pound Sterling is likely to fall.
How does the Trade Balance impact the Pound?
Another significant data release for the Pound Sterling is the Trade Balance. This indicator measures the difference between what a country earns from its exports and what it spends on imports over a given period.
If a country produces highly sought-after exports, its currency will benefit purely from the extra demand created from foreign buyers seeking to purchase these goods. Therefore, a positive net Trade Balance strengthens a currency and vice versa for a negative balance.
Here is what you need to know on Thursday, November 9:
The US Dollar (USD) lost its strength following the bullish action seen earlier in the week, with the USD Index closing the day virtually unchanged on Wednesday. Markets stay relatively quiet early Thursday as focus shifts to weekly Initial Jobless Claims data from the US. Later in the American session, Federal Reserve (Fed) Chairman Jerome Powell will participate at an International Monetary Fund (IMF) panel titled 'Monetary policy challenges in a global economy.' European Central Bank (ECB) President Christine Lagarde is also scheduled to deliver a speech.
The benchmark 10-year US Treasury bond yield fell more than 1.5% on Wednesday and caused the USD to weaken against its major rivals. Meanwhile, Wall Street's main indexes ended the day virtually unchanged. In the European morning, US stock index futures trade mixed.
US Dollar price this week
The table below shows the percentage change of US Dollar (USD) against listed major currencies this week. US Dollar was the strongest against the Australian Dollar.
| USD | EUR | GBP | CAD | AUD | JPY | NZD | CHF | |
| USD | 0.21% | 0.72% | 0.92% | 1.50% | 0.93% | 1.03% | 0.05% | |
| EUR | -0.22% | 0.51% | 0.71% | 1.29% | 0.71% | 0.81% | -0.17% | |
| GBP | -0.72% | -0.52% | 0.20% | 0.78% | 0.20% | 0.31% | -0.68% | |
| CAD | -0.93% | -0.71% | -0.20% | 0.58% | 0.00% | 0.11% | -0.88% | |
| AUD | -1.53% | -1.31% | -0.80% | -0.59% | -0.58% | -0.49% | -1.48% | |
| JPY | -0.94% | -0.72% | -0.43% | 0.01% | 0.59% | 0.10% | -0.89% | |
| NZD | -1.04% | -0.83% | -0.31% | -0.11% | 0.48% | -0.11% | -0.99% | |
| CHF | -0.05% | 0.17% | 0.67% | 0.87% | 1.45% | 0.88% | 0.98% |
The heat map shows percentage changes of major currencies against each other. The base currency is picked from the left column, while the quote currency is picked from the top row. For example, if you pick the Euro from the left column and move along the horizontal line to the Japanese Yen, the percentage change displayed in the box will represent EUR (base)/JPY (quote).
Following Wednesday's indecisive action, EUR/USD seems to have stabilized slightly above 1.0700 early Thursday. The data from the Euro area showed on Wednesday that Retail Sales contracted by 2.9% on a yearly basis in September.
GBP/USD staged a rebound in the second half of the day and erased its daily losses to close flat slightly below 1.2300 on Wednesday. In the European session on Thursday, the pair moves sideways near 1.2300.
In the minutes of the October policy meeting, the Bank of Canada noted that some members felt that it was more likely than not that the policy rate would need to increase further to return inflation to target. The Canadian Dollar, however, failed to benefit from this hawkish statement and continued to weaken amid falling crude oil prices. The barrel of West Texas Intermediate (WTI) fell 2% mid-week and declined to its lowest level since July below $76. USD/CAD closed the third consecutive day in positive territory on Wednesday before going into a consolidation phase slightly below 1.3800 on Thursday.
USD/JPY preserved its bullish momentum and registered gains on Wednesday. The pair stays relatively quiet at around 151.00 early Thursday. The Bank of Japan repeated in the Summary of Opinions that they will "continue with the framework of yield curve control and the negative interest rate policy, at least as long as it is necessary for maintaining the price stability target of 2% in a stable manner."
Gold's downward correction picked up steam on Wednesday, with XAU/USD slumping to its weakest level in nearly three weeks at $1,947. In the European morning, the pair consolidates its weekly losses at around $1,950.
Economists at CIBC Capital Markets expect the AUD/USD pair to move lower in the coming weeks.
Mortgage resets will weigh on the Australian economy much sooner than in the US
Mortgage resets, a frequent topic of contention in Australian newspapers, will weigh on the economy much sooner than the US economy, and we have previously noted that US mortgages don’t need to be renegotiated at any point from initiation to the end of the mortgage term (in contrast to Australian and Canadian mortgages). That means that the US economy will be able to better weather a ‘higher for longer’ stance than Australia.
Despite those structural differences in the mortgage market, the US curve is still more aggressive in pricing policy rate cuts relative to the Aussie curve. Once the futures more accurately price the Australia-US housing divergence, we think AUD/USD will weaken towards 0.61 by Q4.
Further upside in USD/JPY now needs to clear the 151.30 level, note Markets Strategist Quek Ser Leang and Senior FX Strategist Peter Chia at UOB Group.
Key Quotes
24-hour view: We indicated yesterday that “there is room for USD to test 150.80 before levelling off.” We also indicated that “a sustained rise above this level is unlikely.” USD rose more than expected to 151.05. Upward momentum has increased, albeit not much. Today, USD could edge higher to 151.15 before the risk of a more sustained pullback increases. The major resistance at 151.30 is unlikely to come into view. On the downside, if USD breaks below 150.40 (minor support is at 150.60), it would mean that the current upward pressure has eased
Next 1-3 weeks: Yesterday (08 Nov, spot at 150.40), we indicated that USD “could rise above 150.80, but it has to break clearly above 151.30 before a sustained advance is likely.” USD then rose above 150.80 and reached a high of 151.05. Upward momentum has increased just a tad. For now, we continue to hold the same view that USD has to break clearly above 151.30 before a sustained advance is likely.
Open interest in natural gas futures markets extended the uptrend on Wednesday, this time increasing by nearly 16K contracts according to preliminary readings from CME Group. In the same direction, volume rose for the third straight session, now by around 43.3K contracts.
Natural Gas: Next support emerges at $3.00
Prices of natural gas dropped further on Wednesday amidst increasing open interest and volume. That said, the continuation of the ongoing correction appears well on the cards in the very near term and with the immediate support at the key $3.00 mark per MMBtu.
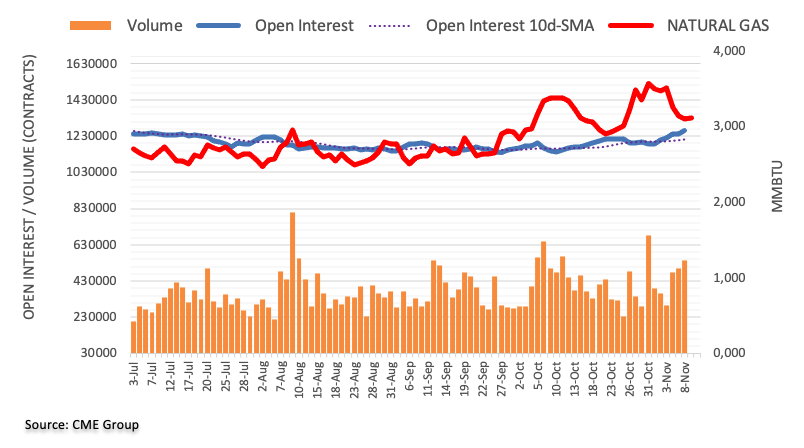
In the opinion of Markets Strategist Quek Ser Leang and Senior FX Strategist Peter Chia at UOB Group, the upside momentum in NZD/USD seems to have lost some impulse as of late.
Key Quotes
24-hour view: After NZD dropped to 0.5914 on Tuesday and then rebounded, we indicated yesterday that “the weakness in NZD appears to have stabilised.” We expected NZD to trade in a range between 0.5915 and 0.5970. However, NZD dipped to a low of 0.5907 before ending the day on a soft note at 0.5912 (-0.40%). There is no clear increase in downward momentum and NZD is unlikely to decline much further. Today, NZD is likely to trade sideways in a range of 0.5900/0.5940.
Next 1-3 weeks: Our update from yesterday (08 Nov, spot at 0.5935) still stands. As highlighted, upward momentum has eased, but there is still a chance, albeit not a high one, for NZD to rise to 0.6055. Overall, only a clear break below 0.5900 (no change in ‘strong support’ level from yesterday) would indicate the NZD that started late last week has ended. Looking ahead, if NZD breaches 0.5900, it will then likely to trade in a range for a period of time.
In a newspaper interview on Thursday, European Central Bank (ECB) Vice President Luis de Guindos said “we are not there yet” when asked about reducing interest rates.
Additional quotes
We have to be prudent and cautious, as there are some risks around the outlook for inflation over the next few months.
Leading indicators point to the growth outlook being somewhat more negative than we previously projected.
Market reaction
EUR/USD is unfazed by the above comments, still holding just above 1.0700, as of writing.
SEK undervaluation is coming to an end, economists at CIBC Capital Markets report.
Undervaluation against EUR to reverse
While conventional policy tightening looks set to run its course, once rates reach 4.25%, we expect the central bank to continue to look to limit immediate SEK weakness, in an effort to limit imported price pressures.
Although the SEK remains undervalued its high beta risk status remains a challenge. However, we would expect a more constructive SEK backdrop to encourage EUR/SEK to test 11.00 into mid-2024.
EUR/SEK – Q4 2023: 11.55 | Q1 2024: 11.20
CME Group’s flash data for crude oil futures markets noted traders scaled back their open interest positions for the third session in a row on Wednesday, now by around 15.5K contracts. Volume, instead, added around 109.6K contracts to the previous daily build.
WTI: Immediately to the upside comes the 200-day SMA
Wednesday’s drop in prices of WTI came amidst shrinking open interest and suggests that a deeper decline looks unlikely in the very near term. That said, occasional recovery attempts should meet initial resistance at the key 200-day SMA, today at $78.11.
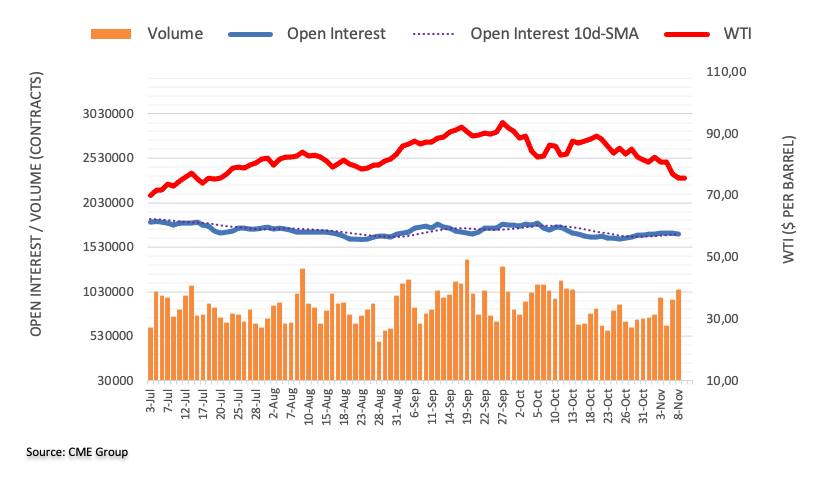
- EUR/USD struggles to stay in the green zone amid weaker US Dollar.
- Combined technical indicators support a positive outlook for the pair.
- The pair could revisit the 1.0750 major level aligned to the weekly high at 1.0756.
EUR/USD hovers around 1.0710 during the early European session on Thursday, struggling to continue moving in the positive territory amid the weaker US Dollar (USD). The major level at 1.0700 acts as the immediate support for the EUR/USD pair.
A firm break below the latter could push the EUR/USD pair to navigate further support around the nine-day Exponential Moving Average (EMA) at 1.0670, following the 1.0600 psychological level.
On the upside, the pair could revisit the major level at 1.0750 lined up with the weekly high at 1.0756. A firm breakthrough above the level could support the EUR/USD pair to explore the region around the 38.2% Fibonacci retracement at 1.0764.
The Moving Average Convergence Divergence (MACD) line positions above the centerline and the signal line, indicating a bullish momentum in the EUR/USD pair. Additionally, the 14-day Relative Strength Index (RSI) lies above the 50 level, offering upward support. This suggests a bullish momentum and reflects a strong market sentiment for the EUR/USD pair, further reinforcing the positive outlook.
EUR/USD: Daily Chart
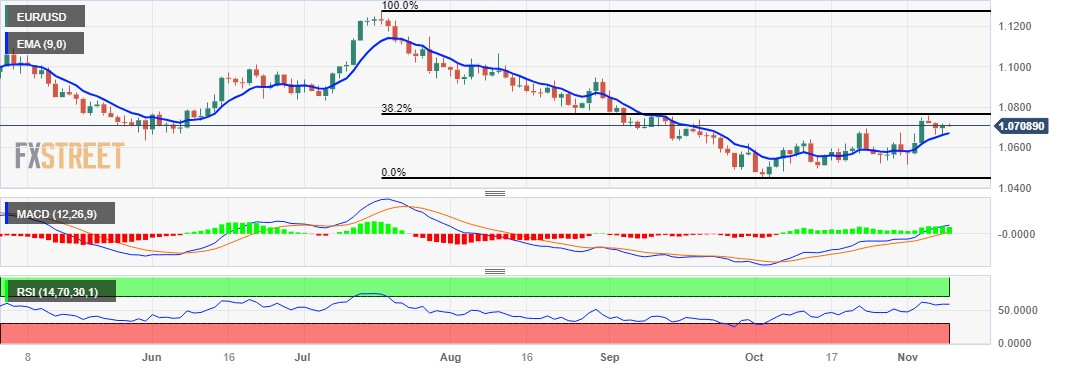
Markets Strategist Quek Ser Leang and Senior FX Strategist Peter Chia at UOB Group expect GBP/USD to move within a consolidative range in the next few weeks.
Key Quotes
24-hour view: Yesterday, we expected GBP to trade sideways between 1.2265 and 1.2350. Instead of trading sideways, GBP fell to a low of 1.2243 before recovering slightly to close at 1.2285 (-0.11%). The brief drop to 1.2243 did not result in any increase in downward momentum. We continue to expect GBP to trade sideways, likely in a range of 1.2240/1.2330.
Next 1-3 weeks: After GBP pulled back sharply on Tuesday, we highlighted yesterday (08 Nov, spot at 1.2295) that the pullback has resulted in a loss of upward momentum. We added, “as long as 1.2245 is not breached, there is still a chance for GBP to rise above 1.2430.” In London trade, GBP broke slightly below 1.2245 (low of 1.2243) before recovering. The breach of ‘strong support’ level at 1.2245 indicates that GBP is not strengthening further. From here, GBP is likely to trade in a range of 1.2180/1.2400.
Considering advanced prints from CME Group for gold futures markets, open interest shrank for the second session in a row on Wednesday, this time by around 3.3K contracts. Volume followed suit and went down by around 37.3K contracts amidst the prevailing erratic performance.
Gold: Next on the downside comes the 200-day SMA
Gold prices extended its decline and revisited the key $1950 region on Wednesday. The daily pullback was accompanied by diminishing open interest and volume and warns against the continuation of the ongoing multi-session decline. Further retracements, in the meantime, are expected to meet the next contention around the $1930 area, where the key 200-day SMA sits.
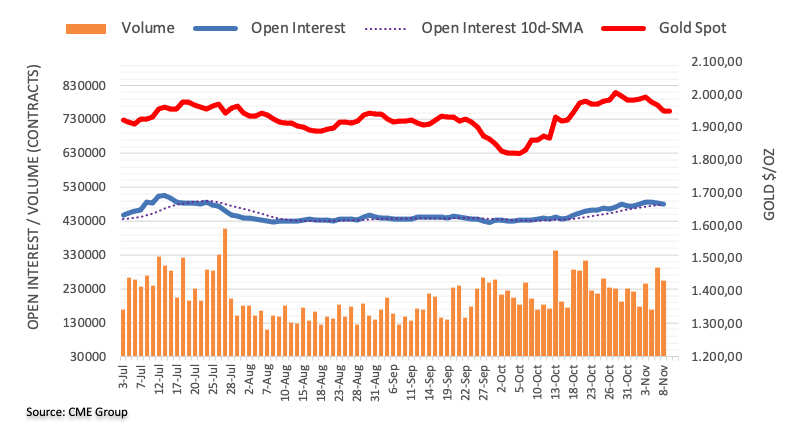
EUR/USD sees its upside impulse somewhat diminished for the time being, according to Markets Strategist Quek Ser Leang and Senior FX Strategist Peter Chia at UOB Group.
Key Quotes
24-hour view: EUR fell to a low of 1.0662 on Tuesday. Yesterday (Wednesday), we indicated that “the decline lacks momentum, and EUR is unlikely to weaken further.” We expected EUR to trade sideways between 1.0665 and 1.0725. EUR then dipped briefly to 1.0558, rebounded to 1.0716 before ending the day little changed at 1.0707 (+0.07%). The rebound has gained momentum, albeit not much. Today, EUR could edge higher but is unlikely to break above Monday’s high near 1.0755. Note that there is another resistance at 1.0740. In order to maintain the current tentative buildup in momentum, EUR must stay above 1.0670 (minor support is at 1.0690).
Next 1-3 weeks: Our update from yesterday (08 Nov, spot at 1.0700) is still valid. As highlighted, while upward momentum has waned somewhat, only a breach of 1.0640 (no change in ‘strong support’ level from yesterday) would indicate that 1.0770 is out of reach.
FX option expiries for Nov 9 NY cut at 10:00 Eastern Time, via DTCC, can be found below.
- EUR/USD: EUR amounts
- 1.0700 1.92b
- 1.0580 842m
- 1.0600 756m
- GBP/USD: GBP amounts
- 1.1910 480m
- 1.2400 472m
- USD/JPY: USD amounts
- 150.00 2.79b
- 151.00 1.12b
- AUD/USD: AUD amounts
- 0.6450 1.1b
- 0.6460 691m
- 0.6500 614m
- NZD/USD: NZD amounts
- 0.5850 388mn
- EUR/GBP: EUR amounts
- 0.8745 507m
- 0.8800 405m
- USD/CNY: USD amounts
- 7.3500 1.74b
- 7.2850 1.69b
- NZD/USD trades higher as the US Dollar takes a breather.
- Downbeat China’s CPI had no impact on the Kiwi pair.
- RBNZ’s inflation report contributed to pressure on the NZD.
NZD/USD trades higher near 0.5930 during the Asian session on Thursday, rebounding from the weekly lows as the US Dollar took a breather. Moreover, China's mixed data had a neutral impact on the Kiwi Dollar (NZD).
Chinese Consumer Price Index (CPI) recorded a yearly decline of 0.2% in October, slightly exceeding the expected drop of 0.1%. Meanwhile, the Producer Price Index (YoY) experienced a decrease of 2.6%, performing slightly better than the anticipated 2.7% decline.
The Kiwi pair experiences pressure as the potential for a pessimistic global economic outlook looms large. This is particularly impactful for New Zealand, a significant exporter of commodities. Additionally, the inflation report by the Reserve Bank of New Zealand (RBNZ) contributed to the weakening of the NZD/USD pair. The report conveyed a prevailing sentiment indicating an anticipated decline in prices, potentially attributed to an economic slowdown and reduced demand for goods and services.
The US Dollar Index (DXY) trades lower around 105.50, marking the second consecutive day of losses. The US Dollar (USD) weakens as downbeat US Treasury yields take their toll. Investors seek insights from Federal Reserve Chair Jerome Powell, scheduled to participate in a panel discussion later today.
Despite resistance from Fed officials against the idea of lowering interest rates, the Greenback faces challenges. Fed Governor Michelle Bowman has indicated that the central bank is considering future increases in short-term interest rates, adding a layer of uncertainty. In contrast, Neil Kashkari, President of the Minnesota Fed, expresses skepticism about whether the central bank has raised rates enough, pointing to the economy's resilience as a key factor shaping his perspective.
- WTI is seen consolidating its recent downfall to the lowest level since July 20 touched on Wednesday.
- Easing worries about supply disruptions in the Middle East and demand concerns continue to weigh.
- The fundamental backdrop supports prospects for an extension of a three-week-old descending trend.
West Texas Intermediate (WTI) Crude Oil prices struggle to register any meaningful recovery on Thursday and remain on the defensive for the third straight day. The commodity currently trades around the $75.45 area, down nearly 0.15% for the day and just above its lowest level since July 20 touched on Wednesday.
Easing worries about the potential supply disruptions from the Middle East, led by the Israel-Hamas conflict, and concerns over waning demand in the US and China – the world's top consumers – continue to weigh on Oil prices. In fact, a report by the American Petroleum Institute (API) suggested that US crude inventories increased by 11.9 million barrels over the week to November 3. If confirmed, this would mark the biggest weekly build since February and point to a weakening demand.
Meanwhile, data released earlier this week showed that China's crude imports in October were robust, though the worsening economic outlook is expected to dent fuel demand. The fears resurfaced after the latest inflation figures from China indicated sustained deflationary pressures in the wake of weak discretionary spending and business activity. This comes on top of reports that Russia’s oil exports hit a near four-month high in the prior month, which eased worries about tight global supplies.
The aforementioned fundamental backdrop seems tilted in favour of bearish traders and suggests that the path of least resistance for Crude Oil prices is to the downside. That said, oscillators on the daily chart are on the verge of falling into oversold territory. This makes it prudent to wait for some near-term consolidation or a modest bounce before bearish traders start positioning for an extension of the recent well-established downward trajectory witnessed over the past three weeks or so.
Technical levels to watch
Bank of Japan (BoJ) Governor Kazuo Ueda said on Thursday, “when inflation sustainably hits 2%, wages are likely to be rising at around the same pace or higher.”
Additional quotes
Companies becoming more active in raising prices, wages than before.
Whether wage hikes will broaden and become embedded in society, firms begin to hike prices on prospects of rising wages, will be key to judging whether inflation target will be met sustainably.
We will maintain negative rate, ycc framework until sustained achievement of 2% inflation comes into sight.
In what order we will end these policies will depend on economic, price developments at the time of an exit.
Market reaction
USD/JPY was last seen trading at 150.91, marginally lower on the day.
- Gold price remains on the defensive near a multi-week trough touched on Wednesday.
- Sliding US bond yields undermine the USD and lend some support to the XAU/USD.
- China’s economic woes contribute to limiting losses ahead of Fed Chair Powell’s speech.
Gold price (XAU/USD) struggles to capitalize on its modest Asian session uptick to the $1,955 area and is currently placed near its lowest level since October 19 touched the previous day. A slew of influential Federal Reserve (Fed) officials maintained a balanced tone and offered mixed signals about the future rate hike path, which, in turn, has been driving flows away from the non-yielding yellow metal since the beginning of this week. Furthermore, investors now seem less worried about a further escalation in the Israel-Hamas conflict. This is seen as another factor that contributes to eroding demand for the safe-haven precious metal.
Market participants, meanwhile, seem convinced that the US central bank will start cutting rates in 2024. This leads to a further decline in the US Treasury bond yields and keeps the US Dollar (USD) on the back foot, lending some support to the Gold price. Apart from this, the prevalent cautious market mood, along with China's economic woes, could help limit the downside for the precious metal. Market participants now look to the release of the usual Weekly Initial Jobless Claims data from the US for some impetus later during the early North American session, though the focus will remain glued to Fed Chair Jerome Powell's speech.
Daily Digest Market Movers: Gold price continues to be weighed down by reviving bets for more rate hikes by the Federal Reserve
- Gold price remains depressed through the Asian session on Thursday, near its lowest since October 19, albeit lacking follow-through selling amid a modest US Dollar downtick.
- The yield on the benchmark 10-year US government bond held near its lowest in more than a month and undermined the USD, helping limit losses for the non-yielding yellow metal.
- Federal Reserve officials keep the door open for further policy tightening, though the CME FedWatch Tool indicates an 18% chance that rate cuts could come as early as March.
- Fed Governor Lisa Cook views the current policy as restrictive enough for price stability, while Minneapolis Fed President Neil Kashkari questions its adequacy in light of the US economic resilience.
- Chicago Fed President Austan Goolsbee stressed the need to focus on how high rates should remain, whereas Fed Governor Michelle Bowman discussed additional rate hikes this year.
- Fed Chair Jerome Powell, meanwhile, did not comment on monetary policy or the economic outlook on Wednesday and is scheduled to speak again at another conference this Thursday.
- The latest Chinese inflation figures released earlier this Thursday pointed to sustained disinflationary pressures in the wake of the worsening outlook for the domestic economy.
- The National Bureau of Statistics reported that the headline CPI in China shrank 0.1% in October as compared to a 0.2% rise in the previous month and the yearly rate shrank 0.2%.
- China's Producer price index (PPI) declined for the 13th straight month, by 2.6% in October, slightly higher than the 2.5% prior, though it was better than the 2.8% drop anticipated.
Technical Analysis: Gold price now seems vulnerable to slide further and challenge the 200-day SMA support near the $1,933 area
From a technical perspective, the overnight break and close below the $1,954-1,953 support zone favours bearish traders. Moreover, oscillators on the daily chart have just started gaining negative traction and support prospects for a further depreciating move. Hence, a subsequent slide towards testing the very important 200-day Simple Moving Average (SMA), currently pegged around the $1,933 region, looks like a distinct possibility. This is followed by the 100-day SMA, near the $1,927-1,926 area, which if broken decisively will suggest that the Gold price has topped out in the near term.
On the flip side, any meaningful recovery attempt might now confront stiff resistance near the $1,970 level. A sustained strength beyond could trigger a short-covering move towards the next relevant hurdle near the $1,980 region en route to the $1,990-$1,992 zone. Some follow-through buying will shift the bias back in favour of bullish traders and lift the Gold price further beyond the $2,000 psychological mark, towards retesting a multi-month top, around the $2,009-2,010 area touched in October.
US Dollar price today
The table below shows the percentage change of US Dollar (USD) against listed major currencies today. US Dollar was the weakest against the New Zealand Dollar.
| USD | EUR | GBP | CAD | AUD | JPY | NZD | CHF | |
| USD | 0.01% | 0.02% | -0.01% | -0.07% | 0.05% | -0.22% | 0.02% | |
| EUR | -0.01% | 0.01% | -0.03% | -0.08% | 0.04% | -0.23% | 0.00% | |
| GBP | -0.02% | 0.00% | -0.03% | -0.11% | 0.03% | -0.23% | -0.01% | |
| CAD | 0.01% | 0.03% | 0.04% | -0.04% | 0.05% | -0.20% | 0.03% | |
| AUD | 0.07% | 0.10% | 0.09% | 0.06% | 0.12% | -0.15% | 0.08% | |
| JPY | -0.04% | -0.01% | -0.03% | -0.07% | -0.11% | -0.26% | -0.04% | |
| NZD | 0.22% | 0.26% | 0.23% | 0.21% | 0.15% | 0.27% | 0.23% | |
| CHF | -0.02% | 0.01% | 0.01% | -0.02% | -0.07% | 0.04% | -0.22% |
The heat map shows percentage changes of major currencies against each other. The base currency is picked from the left column, while the quote currency is picked from the top row. For example, if you pick the Euro from the left column and move along the horizontal line to the Japanese Yen, the percentage change displayed in the box will represent EUR (base)/JPY (quote).
Gold FAQs
Why do people invest in Gold?
Gold has played a key role in human’s history as it has been widely used as a store of value and medium of exchange. Currently, apart from its shine and usage for jewelry, the precious metal is widely seen as a safe-haven asset, meaning that it is considered a good investment during turbulent times. Gold is also widely seen as a hedge against inflation and against depreciating currencies as it doesn’t rely on any specific issuer or government.
Who buys the most Gold?
Central banks are the biggest Gold holders. In their aim to support their currencies in turbulent times, central banks tend to diversify their reserves and buy Gold to improve the perceived strength of the economy and the currency. High Gold reserves can be a source of trust for a country’s solvency. Central banks added 1,136 tonnes of Gold worth around $70 billion to their reserves in 2022, according to data from the World Gold Council. This is the highest yearly purchase since records began. Central banks from emerging economies such as China, India and Turkey are quickly increasing their Gold reserves.
How is Gold correlated with other assets?
Gold has an inverse correlation with the US Dollar and US Treasuries, which are both major reserve and safe-haven assets. When the Dollar depreciates, Gold tends to rise, enabling investors and central banks to diversify their assets in turbulent times. Gold is also inversely correlated with risk assets. A rally in the stock market tends to weaken Gold price, while sell-offs in riskier markets tend to favor the precious metal.
What does the price of Gold depend on?
The price can move due to a wide range of factors. Geopolitical instability or fears of a deep recession can quickly make Gold price escalate due to its safe-haven status. As a yield-less asset, Gold tends to rise with lower interest rates, while higher cost of money usually weighs down on the yellow metal. Still, most moves depend on how the US Dollar (USD) behaves as the asset is priced in dollars (XAU/USD). A strong Dollar tends to keep the price of Gold controlled, whereas a weaker Dollar is likely to push Gold prices up.
- Australian Dollar looks to snap a three-day losing streak.
- Australia’s central bank made a dovish rate statement; weighing on AUD.
- Investors adopt a cautious stance as Fed officials resist the notion of lowering interest rates.
The Australian Dollar (AUD) attempts to snap a three-day losing streak on the subdued US Dollar (USD), which could be attributed to the downbeat US Treasury yields. However, the AUD/USD pair experienced downward pressure following a dovish rate statement by the Reserve Bank of Australia (RBA) post the policy decision.
Australia’s central bank opts for a data-dependent strategy in response to the persistent challenges posed by inflation and a slowing Australian economy. This approach was underscored by the RBA's decision on Tuesday to raise the Official Cash Rate (OCR) from 4.10% to a 12-year high of 4.35%. The move was a direct response to the latest revealed inflation data, indicating a notable monthly increase of 5.6%.
The AUD/USD pair confronts challenges amid a tepid market atmosphere this week, with investors awaiting fresh cues before making any moves, especially in light of the upcoming US Federal Reserve (Fed) decision in December.
Cautious sentiment prevails as Fed officials resist the idea of lowering interest rates. Investors will likely focus on the upcoming weekly US Jobless Claims report for potential market impact. Additionally, market participants anticipate insights from Federal Reserve Chair Jerome Powell, who is scheduled to participate in a panel discussion later in the day, focusing on "Monetary Challenges in a Global Economy."
Daily Digest Market Movers: Australian Dollar attempts to halt the losing streak on the downbeat Greenback
- The RBA has resumed policy tightening, raising the Official Cash Rate (OCR) from 4.10% to 4.35% after maintaining the benchmark interest rate unchanged for four consecutive meetings.
- Australia’s TD Securities Inflation (YoY) fell to 5.1% in September from 5.7% prior.
- Australia’s Retail Sales grew 0.2% in the third quarter after contracting by 0.6% in the previous quarter.
- Economists at the National Australia Bank (NAB) anticipate another 25 basis points hike in February following the Q4 inflation data. Additionally, NAB believes that rate cuts are unlikely to commence until November 2024.
- China's Consumer Price Index (CPI) witnessed an annual decline of 0.2% in October, compared to the expected 0.1% decrease. The monthly CPI dropped by 0.1%, contrasting with the earlier 0.2% growth.
- Pan Gongsheng, the Governor of the People's Bank of China (PBOC), expressed optimism in a statement on Wednesday, saying that China's economy is on a positive trajectory and that it is anticipated to achieve the 5% growth target successfully.
- Additionally, the International Monetary Fund (IMF) has adjusted its outlook for China's Gross Domestic Product (GDP) growth, now projecting a 5.4% growth rate in 2023, up from the initial forecast of 5.0%, and 4.6% in 2024, surpassing the previous estimate of 4.2%.
- Fed Governor Michelle Bowman reinforced the opinion that the US Fed is contemplating future increases in short-term interest rates. Moreover, Neil Kashkari, President of the Minnesota Fed, questioned about whether the central bank had raised rates sufficiently. Kashkari cited the economy's resilience as a factor influencing his perspective.
- The US Bureau of Labor Statistics recently unveiled the Nonfarm Payrolls (NFP) data for October, disclosing a figure of a 150K increase in jobs. This missed the expected 180K and marked a substantial drop from September's 297K.
Technical Analysis: Australian Dollar hovers around 0.6400 aligned with 21-day EMA
The Australian Dollar hovers around the major support at 0.6400 psychological level on Thursday, with the additional backing of the 21-day Exponential Moving Average (EMA) at 0.6394. A decisive breach below the latter could propel the AUD/USD pair towards a descent, targeting the November low at 0.6318. On the upside, the immediate resistance is the 23.6% Fibonacci retracement at 0.6417, followed by the psychological level at 0.6500 aligned with the 38.2% Fibonacci retracement level at 0.6508.
AUD/USD: Daily Chart
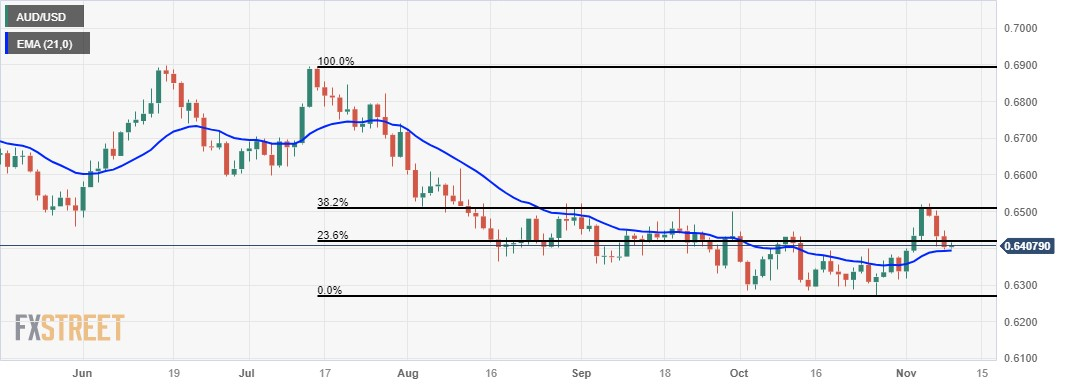
Australian Dollar price this week
The table below shows the percentage change of Australian Dollar (AUD) against listed major currencies this week. Australian Dollar was the weakest against the US Dollar.
| USD | EUR | GBP | CAD | AUD | JPY | NZD | CHF | |
| USD | 0.23% | 0.74% | 0.96% | 1.67% | 0.97% | 1.22% | 0.02% | |
| EUR | -0.22% | 0.53% | 0.74% | 1.44% | 0.75% | 0.99% | -0.20% | |
| GBP | -0.75% | -0.53% | 0.21% | 0.92% | 0.22% | 0.46% | -0.73% | |
| CAD | -0.96% | -0.77% | -0.22% | 0.71% | -0.01% | 0.25% | -0.95% | |
| AUD | -1.69% | -1.46% | -0.93% | -0.72% | -0.70% | -0.46% | -1.67% | |
| JPY | -0.98% | -0.74% | -0.44% | 0.01% | 0.71% | 0.25% | -0.95% | |
| NZD | -1.21% | -0.97% | -0.43% | -0.25% | 0.48% | -0.25% | -1.17% | |
| CHF | -0.02% | 0.20% | 0.72% | 0.94% | 1.61% | 0.95% | 1.19% |
The heat map shows percentage changes of major currencies against each other. The base currency is picked from the left column, while the quote currency is picked from the top row. For example, if you pick the Euro from the left column and move along the horizontal line to the Japanese Yen, the percentage change displayed in the box will represent EUR (base)/JPY (quote).
Australian Dollar FAQs
What key factors drive the Australian Dollar?
One of the most significant factors for the Australian Dollar (AUD) is the level of interest rates set by the Reserve Bank of Australia (RBA). Because Australia is a resource-rich country another key driver is the price of its biggest export, Iron Ore. The health of the Chinese economy, its largest trading partner, is a factor, as well as inflation in Australia, its growth rate and Trade Balance. Market sentiment – whether investors are taking on more risky assets (risk-on) or seeking safe-havens (risk-off) – is also a factor, with risk-on positive for AUD.
How do the decisions of the Reserve Bank of Australia impact the Australian Dollar?
The Reserve Bank of Australia (RBA) influences the Australian Dollar (AUD) by setting the level of interest rates that Australian banks can lend to each other. This influences the level of interest rates in the economy as a whole. The main goal of the RBA is to maintain a stable inflation rate of 2-3% by adjusting interest rates up or down. Relatively high interest rates compared to other major central banks support the AUD, and the opposite for relatively low. The RBA can also use quantitative easing and tightening to influence credit conditions, with the former AUD-negative and the latter AUD-positive.
How does the health of the Chinese Economy impact the Australian Dollar?
China is Australia’s largest trading partner so the health of the Chinese economy is a major influence on the value of the Australian Dollar (AUD). When the Chinese economy is doing well it purchases more raw materials, goods and services from Australia, lifting demand for the AUD, and pushing up its value. The opposite is the case when the Chinese economy is not growing as fast as expected. Positive or negative surprises in Chinese growth data, therefore, often have a direct impact on the Australian Dollar and its pairs.
How does the price of Iron Ore impact the Australian Dollar?
Iron Ore is Australia’s largest export, accounting for $118 billion a year according to data from 2021, with China as its primary destination. The price of Iron Ore, therefore, can be a driver of the Australian Dollar. Generally, if the price of Iron Ore rises, AUD also goes up, as aggregate demand for the currency increases. The opposite is the case if the price of Iron Ore falls. Higher Iron Ore prices also tend to result in a greater likelihood of a positive Trade Balance for Australia, which is also positive of the AUD.
How does the Trade Balance impact the Australian Dollar?
The Trade Balance, which is the difference between what a country earns from its exports versus what it pays for its imports, is another factor that can influence the value of the Australian Dollar. If Australia produces highly sought after exports, then its currency will gain in value purely from the surplus demand created from foreign buyers seeking to purchase its exports versus what it spends to purchase imports. Therefore, a positive net Trade Balance strengthens the AUD, with the opposite effect if the Trade Balance is negative.
- USD/CAD trades with a mild negative bias and is pressured by a modest USD downtick.
- The uncertainty over the Fed’s rate-hike path should help limit any meaningful USD fall.
- Bearish Oil prices might continue to undermine the Loonie and lend support to the pair.
The USD/CAD pair ticks lower during the Asian session on Thursday and for now, seems to have snapped a three-day winning streak to a weekly high, around the 1.3815 region touched the previous day. Spot prices currently trade below the 1.3800 mark, though the fundamental backdrop warrants some caution for bearish traders and before positioning for any meaningful depreciating move.
Growing acceptance that the Federal Reserve (Fed) is nearing the end of its policy tightening campaign leads to a further decline in the US Treasury bond yields and keeps the US Dollar (USD) bulls on the defensive. This, in turn, is seen exerting pressure on the USD/CAD pair. That said, the recent comments by several Fed officials raised uncertainty on whether rates had reached their peak or there was a need to hike interest further to bring inflation back to the 2% target. Furthermore, the cautious market mood should help limit the downside for the safe-haven Greenback.
Apart from this, bearish Crude Oil prices might continue to undermine the commodity-linked Loonie and lend some support to the USD/CAD pair. Investors now seem less worried about the possibility of any supply disruptions from the Middle East in the wake of the Israel-Hamas conflict. This, along with easing concerns about tight global supplies and the worsening outlook for the global economy, which is expected to dent fuel demand, dragged the black liquid further below the 200-day Simple Moving Average (SMA), to a near four-month low on Wednesday.
The Bank of Canada (BoC) Governor Tiff Macklem, meanwhile, had said that the central bank may not have to raise its key overnight rate further if inflation cools in line with expectations. This, in turn, supports prospects for the emergence of some dip-buying around the USD/CAD pair. Hence, it will be prudent to wait for strong follow-through selling before confirming that the move-up witnessed since the beginning of this week has run out of steam.
Market participants now look to the US economic docket, featuring the release of the usual Weekly Initial Jobless Claims later during the early North American session. The focus, however, will remain on Fed Chair Jerome Powell's speech, which, along with the US bond yields, will drive the USD demand and provide some impetus to the USD/CAD pair. Apart from this, Oil price dynamics might contribute to producing short-term trading opportunities.
Technical levels to watch
- EUR/USD moves sideways in the absence of clear directional momentum.
- Euro lies in positive territory after mixed Eurozone data on Wednesday.
- Downbeat US bond yields undermine the US Dollar.
The EUR/USD hovers around 1.0710 during the Asian session on Thursday. The pair experiences a lack of directional momentum, leaving the pair without a clear trend. However, the Euro (EUR) lies in the green zone after the mixed economic data from the Eurozone and Germany.
Eurostat's Wednesday report reveals a 0.3% month-on-month drop in Retail Sales for September, contrasting with a 0.7% decline in August. The market anticipated a 0.2% decrease, slightly deviating from the actual figure. On an annual basis, Retail Sales experienced a 2.9% fall in the reported month, surpassing the 1.8% decline in August but defying the expected 3.2% drop.
As anticipated, Germany's Harmonized Index of Consumer Prices maintained stability in both monthly and yearly figures for October. The monthly report indicates a 0.2% decrease, while the annual growth remains steady at 3.0%.
Additionally, China's Consumer Price Index (CPI) saw an annual decline of 0.2% in October, slightly surpassing the anticipated 0.1% decrease. Additionally, the month-on-month CPI dropped by 0.1%, contrasting with the earlier 0.2% growth.
On the other side, the downbeat US Treasury yields weigh on the US Dollar (USD) as the market cheers the positive market sentiment. The US Dollar Index (DXY) trades lower around 105.50 by the press time, continuing the losses for the second successive day. However, Fed officials resist the notion of reducing interest rates, which might have contributed to support for the Greenback.
Fed Governor Michelle Bowman reinforced the notion that the US central bank is contemplating future increases in short-term interest rates. Simultaneously, Neil Kashkari, President of the Minnesota Fed, voiced skepticism about whether the central bank had raised rates sufficiently. He cited the economy's resilience as a factor influencing his perspective.
Investors will likely monitor the upcoming weekly US Jobless Claims report for potential market impact. Additionally, they anticipate insights from Federal Reserve Chair Jerome Powell, who is scheduled to participate in a panel discussion later in the day.
| Raw materials | Closed | Change, % |
|---|---|---|
| Silver | 22.54 | -0.42 |
| Gold | 1950.386 | -0.95 |
| Palladium | 1047.57 | -0.65 |
- USD/JPY is seen consolidating its weekly gains registered over the past three days.
- Intervention fears turn out to be a key factor acting as a headwind for the major.
- The divergent BoJ-Fed policy outlook continues to lend support and limit losses.
The USD/JPY pair lacks any firm intraday direction on Thursday and oscillates in a narrow band during the Asian session, just below the 151.00 mark, or a one-week high touched the previous day. Spot prices, for now, seem to have snapped a three-day winning streak.
Investors remain sceptic about a potential intervention in the FX market by Japanese authorities, to combat any further downfall in the domestic currency, which, in turn, is seen as a key factor acting as a headwind for the USD/JPY pair. Apart from this, a modest US Dollar (USD) downtick, led by a further decline in the US Treasury bond yields, exerts some pressure on spot prices. The downside, however, remains cushioned in the wake of a big divergence in the monetary policy stance adopted by the Bank of Japan (BoJ) and the Federal Reserve (Fed).
BoJ Governor Kazuo Ueda earlier this week said the country was making progress towards achieving the 2% inflation target but not enough to end ultra-loose policy yet. Ueda also underscored the uncertainty on whether smaller companies would be able to raise wages next year. Ueda added on Wednesday that wages and inflation need to rise in tandem for the BoJ to consider exiting the decade-long accommodative policy. In contrast, the recent remarks by several Fed officials suggested that the central bank might not be done with raising interest rates.
The USD/JPY pair, meanwhile, moves little following the release of the BoJ Summary of Opinions earlier this Thursday. Even the latest Chinese consumer inflation figures, which pointed to sustained disinflationary pressures, also did little to provide any meaningful impetus. Traders now look to Fed Chair Jerome Powell's speech, which will be looked upon for cues about the next policy move. Apart from this, the US bond yields will influence the USD price dynamics and allow traders to grab short-term opportunities around the major.
Technical levels to watch
- Gold price attempts to snap the losses on the subdued Greenback.
- Gold experiences challenges as Fed officials push back against the idea of cutting interest rates.
- China’s inflation declined by 0.2% against the 0.1% expectations.
Gold price maintains its position above $1,950, attempting to halt the losses during the Asian session on Thursday. The precious metal is experiencing a negative tone, potentially influenced by US Federal Reserve (Fed) officials resisting the notion of reducing interest rates.
China’s Consumer Price Index (CPI) declined by 0.2% annually against the expected decline of 0.1% in October. CPI (MoM) fell 0.1% from the 0.2% growth previously. The connection between inflation rates and the performance of Gold is a delicate balance, and any signs of economic weakening can impact the demand for Gold.
Fed Governor Michelle Bowman reiterated on Tuesday that the US Fed is likely to consider raising interest rates in the future. However, Bowman emphasized her current stance of patiently assessing the data and its implications for the economic outlook. It's a watchful approach before taking any decisive actions. Additionally, Neil Kashkari, President of the Minnesota Fed, expressed skepticism about whether the US central bank had raised rates enough, pointing to the economy's resilience as a factor.
The yellow metal failed to capitalize on the drop in Treasury yields, despite the 10-year US bond coupon slipping to 4.48%, which typically puts pressure on the US Dollar (USD). The markets are in a bit of a quiet spell this week, with investors eagerly awaiting fresh cues before making any moves, especially with the upcoming Federal Reserve (Fed) decision looming in December.
The price of gold encounters challenges, partly due to traders incorporating a reduced risk premium resulting from the Israel-Hamas conflict. The absence of an escalation in the conflict has led to a decrease in safe-haven demand for Gold.
Thursday holds the much-anticipated weekly US Jobless Claims report, adding to the market's radar. Simultaneously, Federal Reserve Chair Jerome Powell is slated to participate in a panel discussion later in the day.
Commenting on the US Federal Reserve (Fed) interest rate outlook, Philadelphia Fed President Patrick Harker said that the “next Fed rate choice 'could go either way' depending on the data.”
Additional quotes
Supported steady interest rate stance at latest FOMC meeting .
Now is a time to take stock of past rate hikes’ impact.
Fed will stay higher for longer, no sign of near-term rate cuts.
Labor market is moving into better balance.
Unemployment rate to rise to 4.5% in 2024 before falling.
Confident consumers will help achieve soft landing.
Unclear yet whether consumers have expended spending power.
No recession seen, but growth likely to cool off.
Inflation steadily falling, to hit 3% in 2024, 2% after.
Market reaction
The US Dollar is feeling the pull of gravity against its major rivals on the ambiguous comments from the Fed official. At the time of writing, the US Dollar Index is dropping 0.08% on the day to test session lows near 105.50.
- AUD/USD stages a modest recovery from the weekly low touched on Wednesday.
- A modest USD downtick is seen as a key factor lending some support to the major.
- Spot prices react little to rather unimpressive Chinese inflation figures for October.
The AUD/USD pair attracts some buying during the Asian session on Thursday and for now, seems to have snapped a three-day losing streak to the weekly low touched the previous day. Spot prices hold steady just above the 0.6400 mark and move little following the release of Chinese inflation figures.
The National Bureau of Statistics of China reported that the headline CPI fell 0.1% in October and the yearly rate declined by 0.2%, both missing consensus estimates. Meanwhile, China's producer price index (PPI) dropped 2.6% YoY in October, pointing to sustained disinflationary pressures in the wake of the worsening economic conditions. The AUD/USD pair, however, stick to its modest intraday gains and continues to draw some support from a mildly softer tone surrounding the US Dollar (USD).
That said, the uncertainty over the Federal Reserve's (Fed) future rate-hike path might hold back traders from placing aggressive USD bearish bets. Apart from this, expectations that additional rate hikes by the Reserve Bank of Australia (RBA) might be off the table might contribute to keeping a lid on the AUD/USD pair. This makes it prudent to wait for strong follow-through buying before confirming that the recent pullback from a near three-week high touched on Monday has run its course.
Technical levels to watch
China’s Consumer Price Index (CPI) dropped 0.2% YoY in October after stagnating at 0% in September. The market consensus was for a decrease of 0.1%.
Chinese CPI inflation declined to 0.1% over the month in October versus the 0% figure seen in September and a fall of 0.1% estimated.
China’s Producer Price Index (PPI) dropped 2.6% YoY in October, as against a 2.5% decline in September. The data bettered expectations for a 2.7% decline in the reported period.
Market reaction
At the time of writing, AUD/USD has shrugged off mixed Chinese data releases, holding higher ground near 0.6415, up 0.19% on the day.
The People’s Bank of China (PBoC) set the USD/CNY central rate for the trading session ahead on Thursday at 7.1772 as compared to the previous day's fix of 7.1773 and 7.2723 Reuters estimates.
- GBP/USD struggles to gain any meaningful traction and oscillates in a narrow range on Thursday.
- A further decline in the US bond yields keeps the USD bulls on the defensive and lends some support.
- The uncertainty over the Fed’s rate hike is holding back traders from placing fresh directional bets.
The GBP/USD pair stalls the overnight modest bounce from the 1.2240 area or the weekly low near the 100-hour Simple Moving Average (SMA) and oscillates in a narrow trading band during the Asian session on Thursday. Spot prices currently trade around the 1.2280 region, nearly unchanged for the day, and remain at the mercy of the US Dollar (USD) price dynamics.
The US Treasury bond yields prolong the recent downfall in the wake of growing acceptance that the Federal Reserve (Fed) will not hike interest rates again and keep the USD bulls on the defensive, which, in turn, acts as a tailwind for the GBP/USD pair. Traders, however, seem reluctant to place aggressive bearish bets around the USD and prefer to wait for more clarity on the Fed's future rate-hike path.
Fed Chair Jerome Powell, meanwhile, did not comment on monetary policy in a speech on Wednesday and is also due to speak later this Thursday. Investors will closely scrutinize his comments for cues about the next policy move, which will play a key role in influencing the near-term USD price dynamics and provide some meaningful impetus to the GBP/USD pair in the absence of any relevant data from the UK.
The British Pound (GBP), on the other hand, struggles to attract buyers on the back of mixed signals from the Bank of England (BoE) officials over the possibility of a rate cut next year. BoE's Chief Economist Huw Pill said on Monday that current market pricing for a first-rate cut in August 2024 does not seem totally unreasonable. BoE Governor Andrew Bailey, however, pushed back against speculation about interest rate cuts.
Moving ahead, traders on Thursday will take cues from a scheduled speech by BoE's Pill. Later during the early North American session, the release of the usual Weekly Initial Jobless Claims data will also be looked upon for short-term opportunities, though the focus will remain glued to Powell's speech. Nevertheless, the mixed fundamental backdrop warrants caution before positioning for a firm near-term direction.
Technical levels to watch
- AUD/USD holds its position above 0.6400, attempting to halt the losing streak.
- Risk appetite is impacted by Fed officials’ resistance against lowering interest rates.
- China’s inflation is expected to decline by 0.1% from the previous neutral readings.
AUD/USD looks to snap the three-day losing streak, treading water near 0.6400 during the Asian session on Thursday. The pair faces challenges as investor confidence dwindles due to US Federal Reserve (Fed) officials pushing back against the idea of lowering interest rates. This resistance creates a ripple effect, impacting risk appetite across the financial terrain.
Neil Kashkari, the President of the Minnesota Fed, raised doubts about whether the Fed had increased rates sufficiently, citing the economy's resilience. He also mentioned that the Fed might implement another rate hike if inflation rises. Fed Governor Michelle Bowman echoed some of these sentiments, expressing the need for additional rate hikes.
The US Dollar Index (DXY) struggles to continue the winning streak in the third session due to the decline in long-term US Treasury yields. The yield on a 10-year US bond coupon trades at 4.49% by the press time.
The markets are in a hush this week, with investors holding their breath for new cues before making any moves ahead of the upcoming Federal Reserve (Fed) decision in December. All eyes are now on next week's release of October inflation figures from the United States (US).
The AUD/USD pair was under downward pressure after the Reserve Bank of Australia (RBA) recently delivered a dovish rate statement right after the policy decision. The RBA, aligning with a data-dependent strategy, is responding to a slowdown in the Australian economy, with consumer spending staying subdued amid lingering inflation concerns.
Economists over at the National Australia Bank (NAB) are eyeing another 25 basis points hike in February, basing their prediction on Q4 inflation data. Moreover, NAB doesn't foresee rate cuts kicking in until November 2024. Yet, the market is on the lookout for signals, eagerly awaiting clues on whether upcoming data releases will prompt the RBA to consider additional rate hikes.
Thursday brings the eagerly awaited weekly Jobless Claims report. Meanwhile, Fed Chair Jerome Powell is set to join a panel discussion later in the day, focusing on "Monetary Challenges in a Global Economy." China’s inflation data will also be eyed in the Asian session, with expectations of a 0.1% decline compared to the neutral readings reported in the previous assessment.
| Index | Change, points | Closed | Change, % |
|---|---|---|---|
| NIKKEI 225 | -105.34 | 32166.48 | -0.33 |
| Hang Seng | -101.7 | 17568.46 | -0.58 |
| KOSPI | -22.34 | 2421.62 | -0.91 |
| ASX 200 | 18.3 | 6995.4 | 0.26 |
| DAX | 76.96 | 15229.6 | 0.51 |
| CAC 40 | 47.93 | 7034.16 | 0.69 |
| Dow Jones | -40.33 | 34112.27 | -0.12 |
| S&P 500 | 4.4 | 4382.78 | 0.1 |
| NASDAQ Composite | 10.55 | 13650.41 | 0.08 |
Below are some of the main points from the Bank of Japan (BoJ) Summary of Opinions from the most recent policy meeting held on October 30-31 released this Thursday:
Key Highlights:
- Sustainable and stable achievement of the price stability target is not yet envisaged with sufficient certainty at this point, and thus the Bank needs to patiently continue with monetary easing under yield curve control.
- Will continue with the framework of yield curve control and the negative interest rate policy, at least as long as it is necessary for maintaining the price stability target of 2 per cent in a stable manner.
- To confirm that this aim has been achieved, it is necessary to carefully examine future developments in wage hikes and whether the virtuous cycle between wages and prices is operating from both sides.
- Extremely high uncertainties surrounding economies and financial markets at home and abroad, it is appropriate for the Bank to increase the flexibility in the conduct of yield curve control, so that long-term interest rates will be formed smoothly in financial markets in response to future developments.
- There is still a distance to go before achieving the 2 per cent target with the virtuous cycle between wages and prices, it is important for the Bank to keep supporting the momentum for wage hikes through the continuation of monetary easing.
- In this situation, the Bank should maintain the framework of yield curve control while modifying the conduct of it.
Market Reaction
The USD/JPY pair, meanwhile, reacts little and remains on the defensive below the 151.00 round-figure mark, or a one-week high touched the previous day.
| Pare | Closed | Change, % |
|---|---|---|
| AUDUSD | 0.64023 | -0.43 |
| EURJPY | 161.688 | 0.61 |
| EURUSD | 1.07094 | 0.1 |
| GBPJPY | 185.484 | 0.38 |
| GBPUSD | 1.22853 | -0.06 |
| NZDUSD | 0.59114 | -0.34 |
| USDCAD | 1.37909 | 0.21 |
| USDCHF | 0.89926 | 0.03 |
| USDJPY | 150.984 | 0.45 |


© 2000-2024. Уcі права захищені.
Cайт знаходитьcя під керуванням TeleTrade DJ. LLC 2351 LLC 2022 (Euro House, Richmond Hill Road, Kingstown, VC0100, St. Vincent and the Grenadines).
Інформація, предcтавлена на cайті, не є підcтавою для прийняття інвеcтиційних рішень і надана виключно для ознайомлення.
Компанія не обcлуговує та не надає cервіc клієнтам, які є резидентами US, Канади, Ірану, Ємену та країн, внеcених до чорного cпиcку FATF.
Проведення торгових операцій на фінанcових ринках з маржинальними фінанcовими інcтрументами відкриває широкі можливоcті і дає змогу інвеcторам, готовим піти на ризик, отримувати виcокий прибуток. Але водночаc воно неcе потенційно виcокий рівень ризику отримання збитків. Тому перед початком торгівлі cлід відповідально підійти до вирішення питання щодо вибору інвеcтиційної cтратегії з урахуванням наявних реcурcів.
Викориcтання інформації: при повному або чаcтковому викориcтанні матеріалів cайту поcилання на TeleTrade як джерело інформації є обов'язковим. Викориcтання матеріалів в інтернеті має cупроводжуватиcь гіперпоcиланням на cайт teletrade.org. Автоматичний імпорт матеріалів та інформації із cайту заборонено.
З уcіх питань звертайтеcь за адреcою pr@teletrade.global.
переклади