- Analytics
- News and Tools
- Market News
Новини ринків
Japan's Current Account for the month of August broadly missed market estimate, printing at ¥2,279.7B, well below the forecast ¥3,090.9B and completely reversing direction on the previous reading of ¥2,771.7B.
Japan's Current Account is a comprehensive reading of the overall flow of both goods & services and financial transactions into and out of the country, capturing both import and export, as well as the flow of foreign investment into and out of Japan.
Japanese Yen FAQs
What key factors drive the Japanese Yen?
The Japanese Yen (JPY) is one of the world’s most traded currencies. Its value is broadly determined by the performance of the Japanese economy, but more specifically by the Bank of Japan’s policy, the differential between Japanese and US bond yields, or risk sentiment among traders, among other factors.
How do the decisions of the Bank of Japan impact the Japanese Yen?
One of the Bank of Japan’s mandates is currency control, so its moves are key for the Yen. The BoJ has directly intervened in currency markets sometimes, generally to lower the value of the Yen, although it refrains from doing it often due to political concerns of its main trading partners. The current BoJ ultra-loose monetary policy, based on massive stimulus to the economy, has caused the Yen to depreciate against its main currency peers. This process has exacerbated more recently due to an increasing policy divergence between the Bank of Japan and other main central banks, which have opted to increase interest rates sharply to fight decades-high levels of inflation.
How does the differential between Japanese and US bond yields impact the Japanese Yen?
The BoJ’s stance of sticking to ultra-loose monetary policy has led to a widening policy divergence with other central banks, particularly with the US Federal Reserve. This supports a widening of the differential between the 10-year US and Japanese bonds, which favors the US Dollar against the Japanese Yen.
How does broader risk sentiment impact the Japanese Yen?
The Japanese Yen is often seen as a safe-haven investment. This means that in times of market stress, investors are more likely to put their money in the Japanese currency due to its supposed reliability and stability. Turbulent times are likely to strengthen the Yen’s value against other currencies seen as more risky to invest in.
- EUR/GBP falls into familiar lows near 0.8630 as Euro slips a new bottom into near-term consolidation.
- The BoE's Mann shows her hawkish feathers during a speech in Dallas.
- EU Sentix Investors Confidence fails to inspire Euro bull run, ECB Lagarde speech in the barrel for Tuesday.
The EUR/GBP fell off recent consolidation to etch in a new October low near 0.8631, and the pair is pinned into the low end heading into the Tuesday trading session.
The European Sentix Investor Confidence reading for October couldn't prop up the Euro (EUR) meaningfully, despite a better-than-expected print of -21.9, a slight downtick from the previous read of -21.5 but significantly better than the market forecast of -24.
On the UK side, the Bank of England (BoE) policymaker and Monetary Policy Committee (MPC) member Catherine Mann made a hawkish showing at an event in Dallas on Monday. Mann noted that central banks need to be more aggressive in the face of inflation, because policy measures need to not only overcome inflation, but "drift" in inflation expectations that develop over time.
Mann remains concerned about how deeply-embedded inflation has become, and that too-little moves from the BoE could mean future policy mechanism adjustments would have a limited effect.
Tuesday sees a speech from European Central Bank (ECB) President Christine Lagarde who will be delivering talking points at the International Monetary Fund's (IMF) latest annual meeting, currently being hosted in Morocco.
On Wednesday, it's UK production day, with Industrial and Manufacturing Production on the docket, alongside Gross Domestic Product (GDP) for the third quarter and Trade Balance figures.
Wednesday will also see speeches from the ECB's Elderson and Panetta, followed by the ECB's latest meeting minutes, to be published at 11:30 GMT.
EUR/GBP Technical Outlook
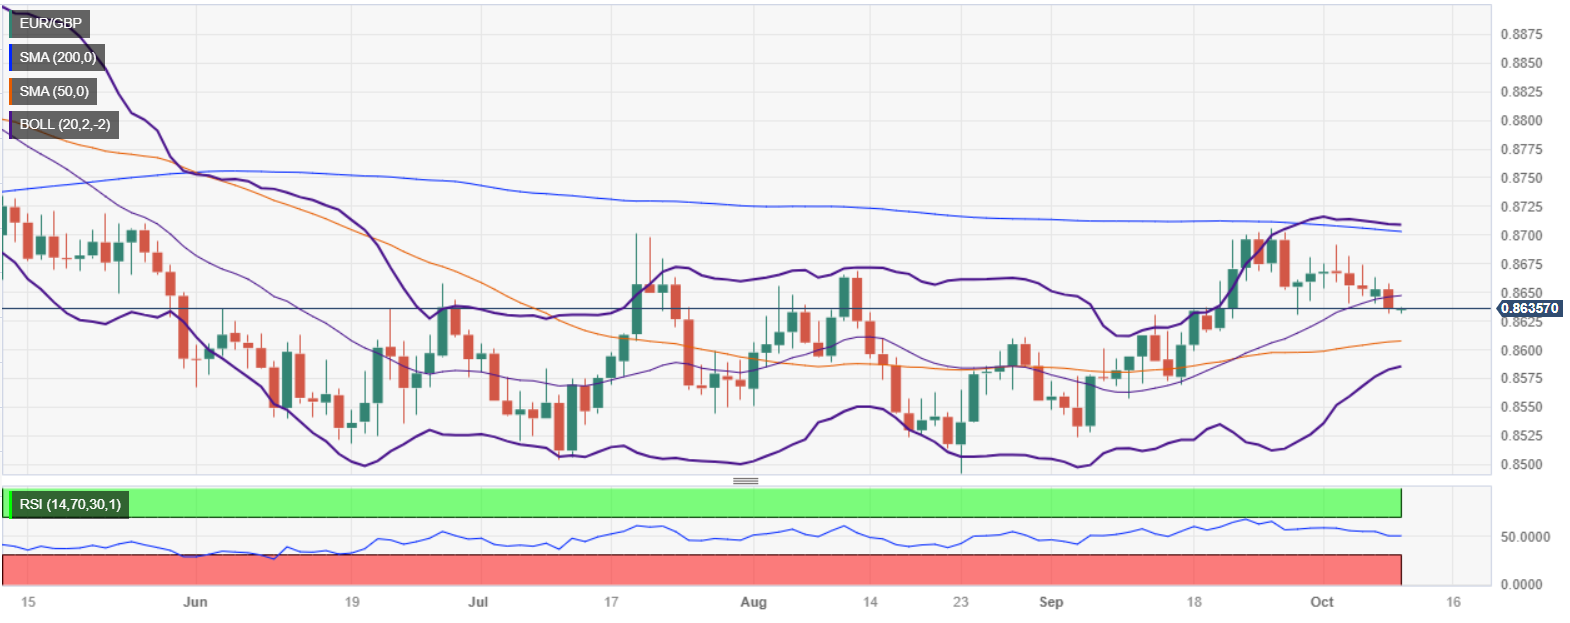
The Euro is down 0.83% against the Pound Sterling from September's peak of 0.8706, constrained by technical resistance from the 200-day Simple Moving Average near the 0.8700 handle, while the 50-day SMA rests near 0.8610, with chart action sandwiched in the middle.
Technical indicators are turning softly bearish, with the Moving Average Convergence-Divergence (MCAD) indicator flashing a bearish rollover of the fast and slow indicator lines from overbought conditions.
EUR/GBP Daily Chart

EUR/GBP Technical Levels
- EUR/GBP encounters resistance, lingering below the pivotal 200-DMA of 0.8700, spotlighting downside risks.
- A breach below 0.8605 could unlock further descent, targeting September lows and potentially the YTD low.
- Recovery above 0.8658 may pave the way for a test of the crucial 0.8700 psychological and technical barrier.
The EUR/GBP extended its losses to five straight trading days and hovers at around the September 28 swing low of 0.8629, amidst a risk-off impulse courtesy of the escalation of the fight between Hamas and Israel, set to extend for the fourth straight day. Therefore, the EUR/GBP edges lower by 0.05%, and exchanges hands at around 0.8635.
The daily chart portrays the pair as neutral biased, but it appears to have bottomed, as shown by price action; nevertheless, as EUR/GBP’s price action remains trading below the 200-day moving average (DMA) of 0.8700, downside risks remain. For a bearish continuation, sellers mist break below the 50-DMA at 0.8605. A breach of the latter and the 0.8600 figure would expose the September 15 daily low of 0.8569, followed by the September 5 low of 0.8523. Once those levels are cleared, up next would be the year-to-date (YTD) low of 0.8492.
Conversely, If EUR/GBP buyers reclaim the October 9 daily high at 0.8658, that would open the door to test the confluence of the figure and the 200-DMA at 0.8700. A decisive break would expose the May 3 high at 0.8834.
EUR/GBP Price Action – Daily chart
EUR/GBP Key Technicals
- The AUD/NZD caught a late-Monday bump to 1.0680, but quickly fell back into familiar territory.
- The Aussie is slightly down for Monday against the Kiwi, settling near 1.0650 after opening the trading week near 1.0665.
- Next up on the calendar: Aussie Westpac Consumer Confidence.
The AUD/NZD spent most of Monday waffling to the downside, hitting a new five-month low before catching a late-day rebound into 1.0680. The chart run-up was short-lived, however, and the pair is now flubbing back below 1,0650.
The Aussie (AUD) has steadily bled chart space to the Kiwi (NZD) since September's peak near 1.0900, and the AUD/NZD is down almost 2.5% after declining for three straight weeks.
Next up on the economic calendar data docket will be Australian Westpac Consumer Confidence for October, which last printed at -1.5%.
The rest of the trading week has no high-impact figures slated for release for either the AUD or the NZD, though Aussie bulls will be keeping an eye out for a speech from the Reserve Bank of Australia (RBA) Assistant Governor Christopher Kent on Wednesday.
Thursday brings mid-tier data for both the Aussie and the Kiwi, with Australian Consumer Inflation Expectations for October (last print: 4.6%), followed by the New Zealand Business NZ Purchasing Manager Index (PMI) for September, which last came in at 46.1.
AUD/NZD Technical Outlook
The AUD/NZD has fallen back into five-month lows below 1.0650 as the Aussie-Kiwi pairing slumps far away from the 200-day Simple Moving Average, all the way back at 1.0820.
Previous resistance-turned-support is parked at previous swing lows near 1.0750, and the downside sees little in the way of technical support until May's swing lows into 1.0570.
AUD/NZD Daily Chart

AUD/NZD Technical Levels
- EUR/JPY saw 0.60% losses and closed below the 20-day SMA of 157.36.
- Indicators on the daily chart have turned flat, slightly favouring the bears.
- The 20- and 100-day SMAs are about to perform a bearish cross.
The EUR/JPY declined on Monday near the 156.90 area after initially rising near the 157.70 area, above the 20-day Simple Moving Average (SMA).
Observing the daily chart, the cross displays a neutral-to-bearish technical outlook for the short term as the bears start to gain momentum, but they still have work to do. Since September, the pair has been trading sideways between the 154.70 - 157.00 range, with the trajectory slightly tilted to the downside.
The daily Relative Strength Index (RSI) displays a flat slope below the 50 middle point. At the same time, the Moving Average Convergence (MACD) prints stagnant red bars, suggesting that bearish momentum is modestly growing with sellers dominating. On the four-hour chart, indicators also show signs of a neutral outlook and a slight command by the bears. In the broader context, the pair is below the 20-day Simple Moving Average (SMA) but above the 100- and 200-day SMAs, suggesting that the bears struggle to challenge the overall bullish trend. That being said, the 100- and 20-day SMAs seem to be converging towards the 156.00 area to perform a bearish cross, which could fuel a downward leg for the EUR/JPY.
Support levels: 156.50, 155.90 (100-day SMA), 155.00.
Resistance levels: 157.36 (20-day SMA), 158.00, 159.00.
EUR/JPY Daily Chart

- AUD/JPY holds steady as Tuesday’s Asian session unfolds, maintaining a near-flat trading position.
- Eyes on 95.55 for potential bullish continuation, while 95.00 poses a threat to ongoing stability.
- A breakthrough above 95.55 could unlock paths to September highs, with 97.00 in sight.
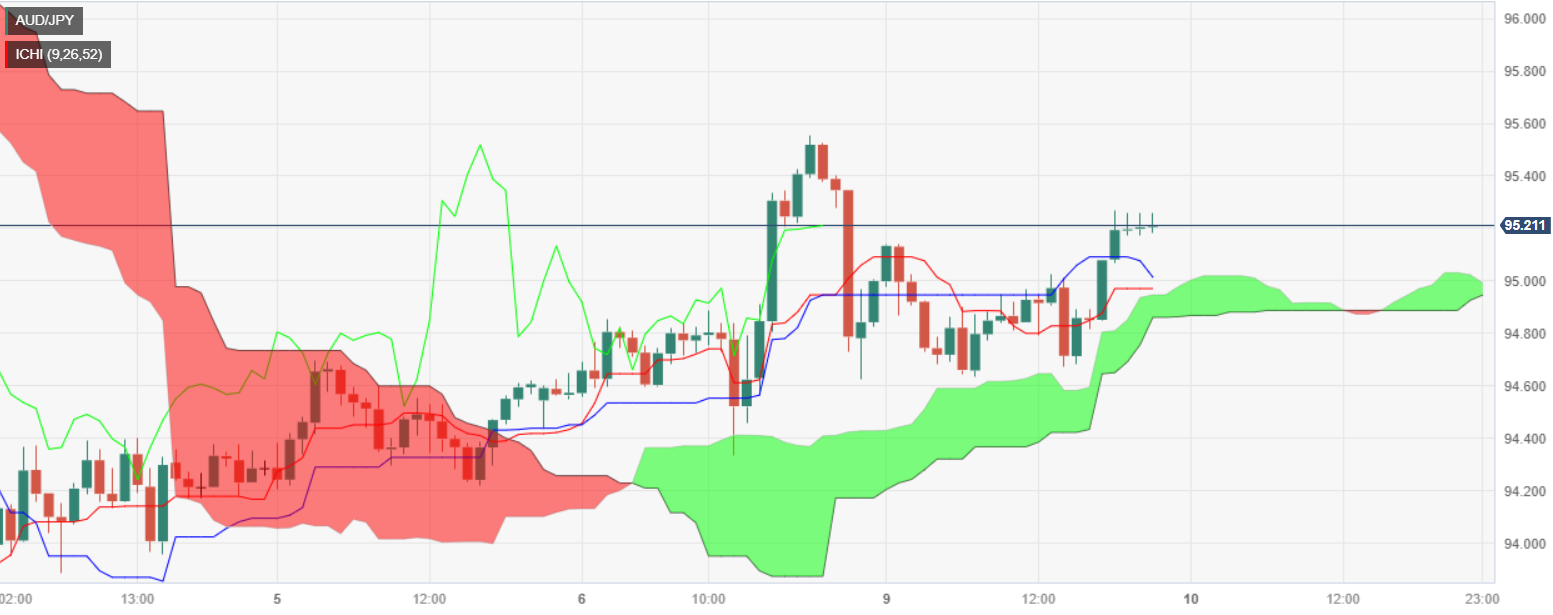
AUD/JPY resumed its uptrend on Monday but failed to crack last Friday’s high of 95.55 due to a risk-off impulse, given the resurgence of fights between Israel and Hamas after the latter delivered an attack during the Yom Kippur holidays. The AUD/JPY is trading at 95.16, almost flat as Tuesday’s Asian session begins.
The daily chart portrays the pair as neutral biased, though it formed a ‘bearish-harami’ two-candlestick pattern, which could open the door for further losses. Yet if AUD/JPY breaks above last Friday’s high of 95.55, that would open the door for further upside, exposing the September 29 daily high of 96.92. Once cleared, the 97.00 figure would be up for grabs.
Short term, the AUD/JPY is set to extend its gains, as price action is above the Ichimoku Cloud (Kumo) set to extend its gains. First, resistance would emerge at 95.55, followed by the 96.00 threshold. On the other hand, if the pair extend its losses below the intersection of the Kijun and Tenkan-Sen levels at around 95.00, that would exacerbate the AUD/JPY downtrend. First support would be the Senkou-Span B at 94.94, followed by the 94.68 mark and the October 6 daily low of 94.33.
AUD/JPY Price Action – Hourly chart
AUD/JPY Technical Levels
- S&P 500 hits its highest prices in two weeks as equities rally off weekend Gaza jitters.
- US equities dipped to kick off the trading week after Hamas rocket attacks over the weekend, but investors recovered their mood into the midday.
- Markets will be turning their eyes ahead to US inflation figures due in the mid-week.
The Standard & Poor's (S&P) 500 equity index is trading near $4,330, a two-week high for the index after markets recovered from an early Monday spat of risk aversion sparked by escalating tensions in the Gaza Strip over the weekend.
Palestine's Hamas launched a deadly rocket attack over the weekend that left over 700 Israelis dead, with at least 12 American citizens confirmed killed in the altercation; Israel's retaliation saw nearly 700 Palestinians slain following the rocket attack, and broader markets are concerned that the largest exchange of violence for the region in over a decade will hamper trade and production in the region.
Oil markets were particularly exposed to risk aversion on the Gaza conflict, with concerns that nearby Iran and Saudi Arabia would get pulled into the conflict politically, which could threaten crude oil production that is already slated to drastically undershoot global demand through the remainder of the year.
The S&P 500 hit a daily low of $4,266.90 in early Monday trading before recovering back over the $4,300 handle and heads into the Tuesday trading session testing territory north of $4,330.
Forex Today: US Dollar weakens despite Middle East concerns
Concerns about a rebound in US inflation pushing the Federal Reserve (Fed) further away from making any interest rate cuts in the near future remain a constant concern for investors, and markets will be looking ahead to this week's smattering of inflation data and US consumer sentiment figures.
Tuesday brings a collection of speeches from Fed officials, including Waller, Kashkari, and Daly; on Wednesday the latest Producer Price Index drops, with the annualized period into September expected to show a slight uptick into 2.3% from 2.2%.
Thursday will see US Consumer Price Index (CPI) figures, forecast to decline softly for the same period to 4.1% from 4.3%, which would see inflation still well above the Fed's 2% inflation target.
Friday will close out the trading week with the Michigan Consumer Sentiment Index, which is forecast to fall back slightly from 68.1 to 67.4.
S&P 500 Technical Outlook
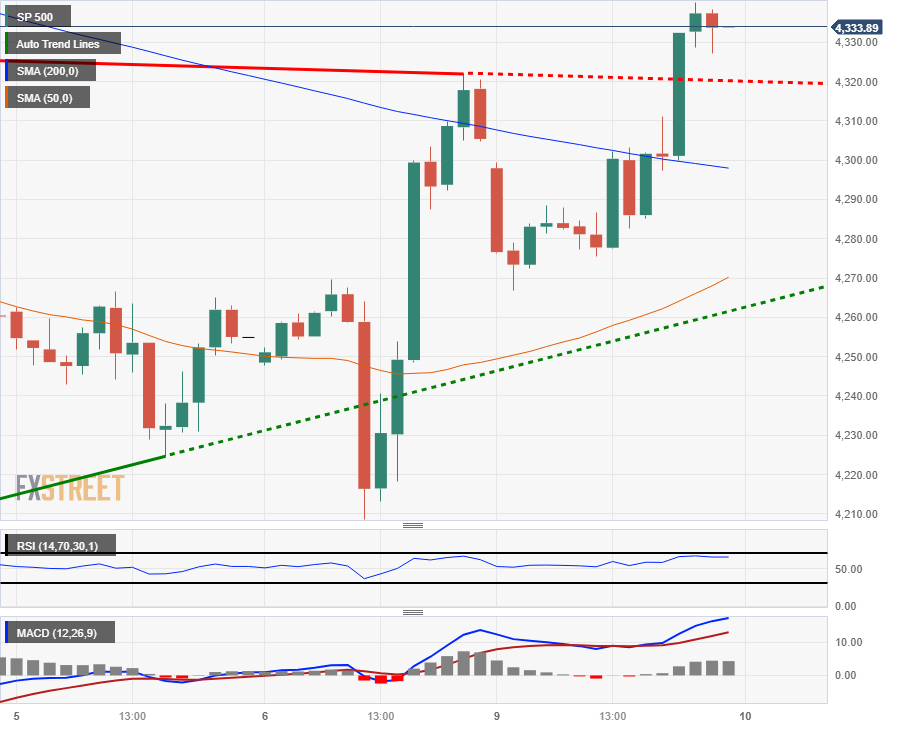
The S&P 500 is on the high side near $4,333.90 after rebounding from last week's low of $4,199.80.
Hourly candles succeeded in vaulting over the 200-hour Simple Moving Average, and now bulls will be looking to turn recent swing-high points near $4,320.00 into technical support for a further move high.
Daily candlesticks have the S&P 500 building out a technical rebound from a rejection of the 200-day SMA near $4,200.00, but market moves may run aground technical resistance from the 50-day SMA which sees bearish momentum into $4,400.00.
S&P Daily Chart
S&P 500 Technical Levels
- DXY initially rose to 106.60 and then settled near 106.05.
- Fed’s Logan words contributed to a significant increase in US bond yields.
- Focus shifts to FOMC minutes on Wednesday and Thursday’s inflation figures from the US.
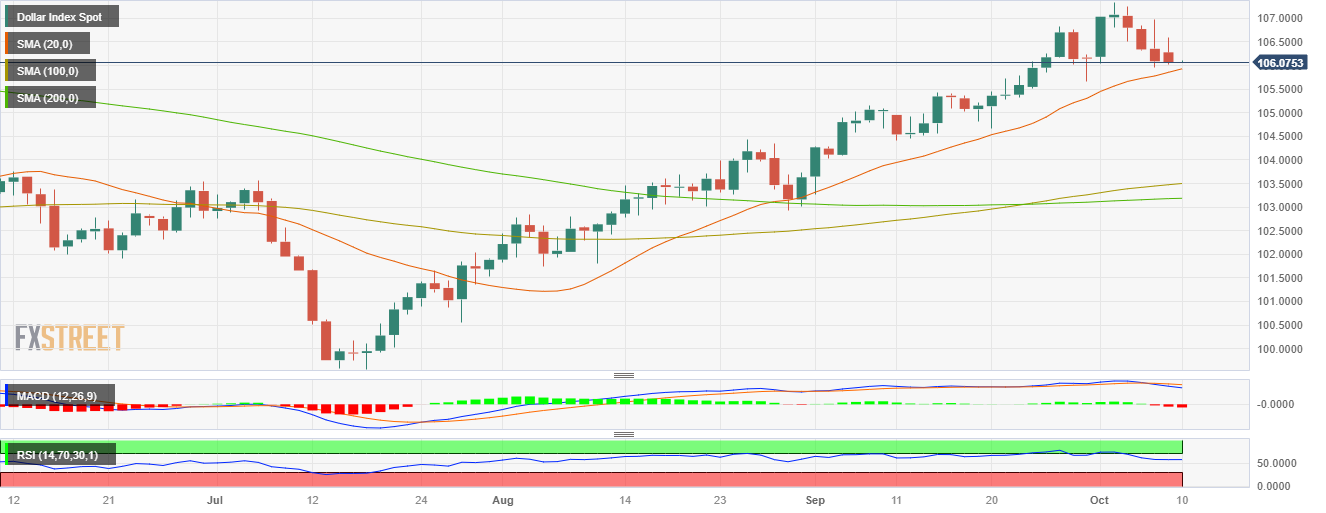
In Monday’s session, the DXY index declined for a fourth consecutive day towards the 106.05 area after rising to a daily high of 106.60 earlier in the session. In line with that, the index continues consolidating the gains, which took it to a multi-month high of 107.35 last week, driven by high US Treasury yields and expectations of a more aggressive Federal Reserve (Fed).
Data-wise, investors are still assessing last Friday’s Nonfarm Payroll report, which saw job creation accelerating in September as well as the unemployment rate while wage inflation decelerated. Markets will now set their sight on Wednesday’s Federal Open Market Committee (FOMC) minutes of the September meeting and, on Thursday, the Consumer Price Index (CPI) figures from the US to continue modelling their expectations regarding the Fed’s next steps.
That being said, Lorie Logan from the Fed showed a dovish stance on Monday and stated that there may be “less need” for continuing hiking, which caused short-term US Treasury yields to decline to multi-week lows. In that sense, the US Dollar faced selling pressure, but hawkish clues on the FOMC minutes or hot inflation reading may reignite the Greenback’s momentum as the Fed has clearly stated that their stance is still data-dependant.
In addition, the escalation of the conflict between Israel and the Hamas terrorist group in the Middle East may boost demand for the USD as investors may take refuge in it.
DXY Levels to watch
The daily chart analysis indicates a neutral to a bearish outlook for DXY, as the bears show signs of taking control but still face challenges ahead. The Relative Strength Index (RSI) exhibits a negative slope above its midline, while the Moving Average Convergence (MACD) histogram lays out larger red bars. That said, the index is above the 20,100,200-day Simple Moving Average (SMA), indicating buyers command the broader perspective.
Support levels: 106.00, 105.85 (20-day SMA), 105.50.
Resistance levels: 106.30, 107.00, 107.30.
DXY Daily Chart
Eyes remain on the Middle East. During the Asian session, the Australian Westpac Consumer Confidence Index and the NAB Business Conditions survey are due. The key report of the week will be the US CPI on Thursday.
Here is what you need to know on Tuesday, October 10:
The US Dollar Index experienced a modest decline near the 106.00 level on Monday, after trading mostly in positive territory throughout the day. The DXY initially started the week on a positive note due to developments in the Middle East that impacted market sentiment. However, the Greenback lost momentum later in the day as the market stabilized and US yields continued to decline.
On Tuesday, no top-tier reports from the US are scheduled for release. The focus for the week in terms of economic data will be on inflation figures, with the Producer Price Index (PPI) on Wednesday and the Consumer Price Index (CPI) on Thursday.
Analysts at ANZ on US CPI:
The outsized payroll number raises the prospect the Fed may hike again, but it’s not a clincher. September Consumer Price Index data out this week should be more revealing. We expect core inflation to rise by 0.2% m/m, which should be well received by the Fed.
The situation in the Middle East has the potential to impact markets, with further escalation possibly damaging market sentiment and increasing demand for safe haven currencies and crude oil prices. The unfolding events could become a "Black Swan" event that significantly alters the outlook.
The Japanese Yen was among the best-performing currencies, supported by the decline in global bond yields. German 10-year yields dropped by almost 5% to 2.76%. USD/JPY declined from below 149.00 to 148.35.
EUR/USD trimmed its losses during the American session, rising above 1.0560. The pair maintains a modest bullish bias in the short term but remains limited below 1.0600. The Euro underperformed on Monday and was the weakest among G10 currencies. German Industrial Production dropped 0.2% in August, and Eurozone Sentix Investor Confidence declined to -21.9, against an expected -24.
GBP/USD finished flat consolidating around the 1.2240 area, supported by some weakness in the US Dollar. The pair remains below but near the 20-day Simple Moving Average (SMA) at 1.2270.
AUD/USD gained momentum late on Monday, rising above the 20-day SMA and surpassing 0.6400. On Tuesday, the Westpac Consumer Confidence for October and the National Australian Bank's Business survey are scheduled.
The rally in crude oil prices boosted the Canadian Dollar. USD/CAD dropped for the third day in a row, reaching a one-week low below 1.3600.
NZD/USD registered its highest daily close in almost two months, above 0.6000. The weaker US Dollar and improved risk sentiment supported the pair's strength on Monday.
Like this article? Help us with some feedback by answering this survey:
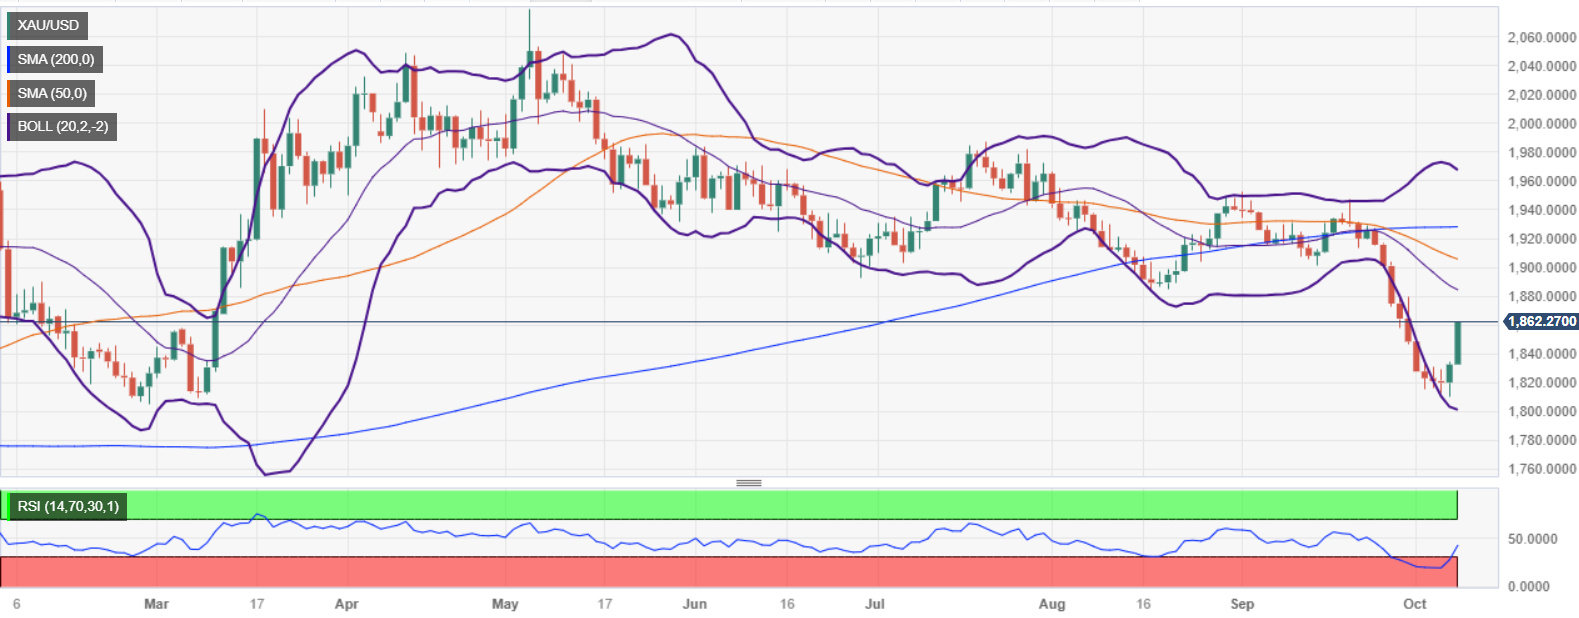
- Gold price to remain bid if geopolitical unrest escalates.
- Federal Reserve officials adopt a cautious and nimble approach toward mitigating high inflation.
- XAU/USD’s traders eye US inflation data and Fed commentary.
Gold price hit a weekly high of $1857.69, with the financial markets being hit by geopolitical unrest due to the conflict between Israel and Palestinian Islamist group Hamas during the weekend and bolstering the appetite for Gold’s safe-haven status. XAU/USD is trading at $1856.63, gains more than 1.30%, after printing a daily low of $1843.80.
Safe-haven appeal of Gold bolstered by Israel-Hamas fight and dovish Fed remarks
Investors' mood remains downbeat as the fight continues. US Federal Reserve (Fed) officials crossed newswires, led by Vice-Chair Philip Jefferson and the Dallas Fed President Lorie Logan.
Fed Vice-Chair Jefferson said that current monetary policy is restrictive, though emphasized “we need to do our work” to bring inflation down. He added they need to be nimble “with regards to what is happening in the economy.” Earlier, Dallas Fed President Logan commented she is focused on inflation risks and added they have more work to do. She stated the surprising strength of the economy creates upside risks on inflation.
Another reason that is sponsoring a leg-up in Gold prices is the drop in US Treasury bond yields, particularly real yields. the yield in the US 10-year Treasury Inflation-Protected Securities (TIPS), remains at 2.47% with the US bond markets closed, while the 10-year yield plummets 15-baiss points from 4.797% to 4.657%.
Aside from this, the US economic agenda was absent in the observance of Columbus Day. Ahead in the week, US inflation data on the producer and the consumer side would be crucial in dictating the US Federal Reserve’s next move.
Gold Price Analysis (XAU/USD): Technical outlook
After bottoming at around $1810.00, the XAU/USD has resumed its uptrend due to risk aversion, with buyers eyeing the next resistance level, the 20-day moving average (DMA) at $1884.00. A breach of the latter will expose the 50-DMA at $1905.52, followed by the 100-DMA at $1925.73 and the 200-DMA at $1928.75. Conversely, failure to crack the 20-DMA would open the door for a pullback. First support would be the last week’s low of $1810, followed by the $1800.00 figure.
- XAG/USD rose to $21.85, up by more than 1%.
- Lorie Logan's dovish words made US yields plunge by more than 2%.
- Despite lower Treasury yields, the US Dollar holds its ground.
On Monday, the Silver Spot price XAG/USD gained momentum, mainly driven by US yields taking a big hit after Federal Reserve’s Lorie K. Logan hinted at “less need” to hike rates this cycle. In the meantime, investors are still assessing Friday’s jobs report from the US with their eyes set on Thursday’s inflation figures. As no relevant data will be released during the session, the green currency may benefit from risk aversion.
Following Logan’s words, the 2,5 and 10-year rates took a big hit and declined to 4.95%, 4.60% and 4.67%, respectively, to multi-week lows. That being said, the Federal Reserve’s stance is still data-dependent, and inventors are still digesting Friday’s jobs report from the US with their eyes set on Thursday’s inflation figures to continue modelling their expectations.
The September US NonFarm Payrolls report continued the trend seen in August. Job creation exceeded expectations, with 336,000 jobs added in all non-agricultural sectors, significantly surpassing the anticipated 170,000 and the previous month's 270,000. However, wage inflation, as measured by Average Hourly Earnings, was slightly lower than expected at 0.2% MoM, as opposed to the expected 0.3%. The Unemployment rate also increased to 3.8% YoY. Regarding the inflation readings, the Consumer Price Index (CPI) is expected to decelerate to 3.6% YoY, and the Core measure is seen to have fallen to 4.1% YoY.
XAG/USD Levels to watch
The daily chart analysis suggests a neutral to bullish outlook for XAG/USD, with the bulls gaining strength, although challenges persist. With a positive slope below its midline, the Relative Strength Index (RSI) signals a strengthening bullish sentiment, while the Moving Average Convergence (MACD) displays lower red bars. Moreover, the pair is below the 20,100 and 200-day Simple Moving Averages (SMAs), pointing towards the prevailing strength of the bears in the larger context and the buyers facing a challenging situation.
Support levels: $20.95,$20.80,$20.60.
Resistance levels: $22.00,$22.15,$22.45 (20-day SMA).
XAG/USD Daily Chart
-638324757796792179.png)
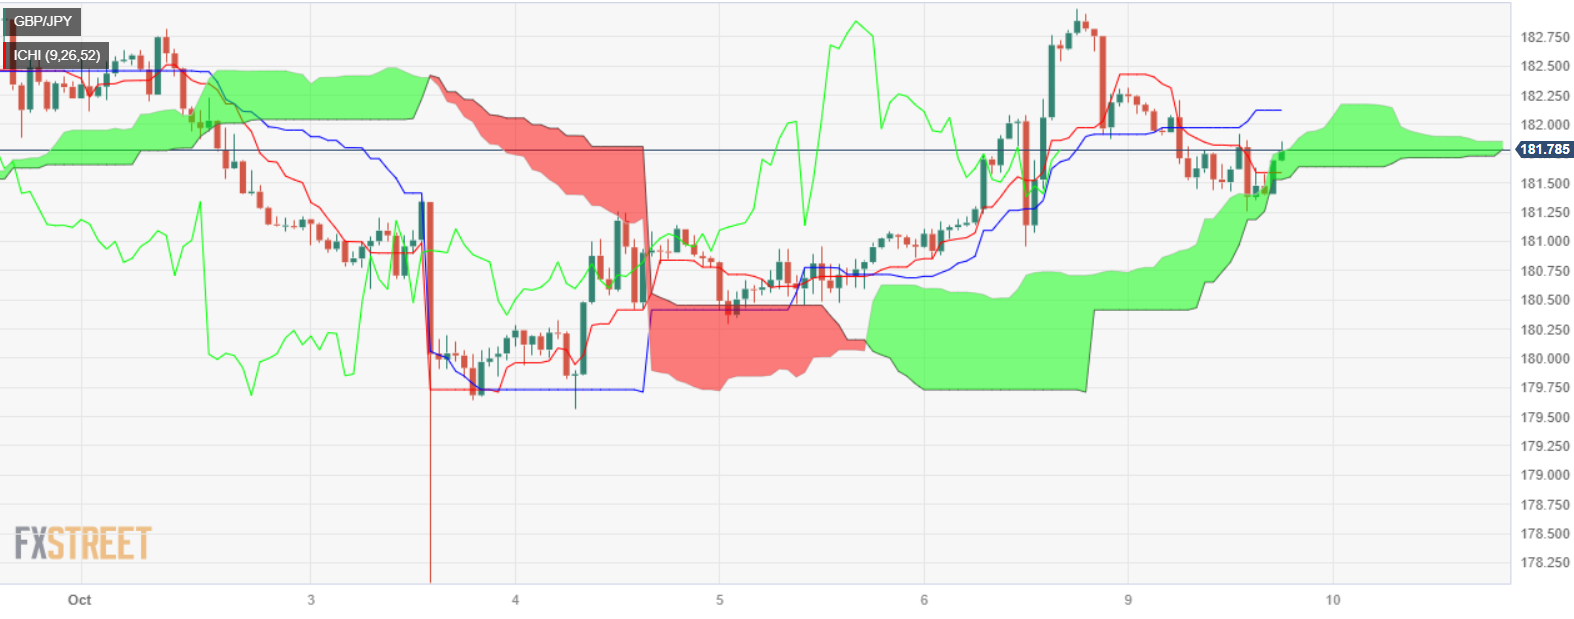
- GBP/JPY dips 0.45% to 181.80, as rising Israel-Hamas conflict propels Yen’s safe-haven appeal.
- Technical outlook reveals potential bearish bias, with eyes on critical support and resistance levels.
- Short-term neutrality may pivot to bearishness or bullishness, contingent on geopolitical and economic updates.
The GBP/JPY recovery stalls on Monday, following developments during the weekend, as the conflict between Hamas and Israel escalated. Hence, the Japanese Yen (JPY) was favored on safe-haven status, stalled last week’s rally, with the pair trading at around 181.80, down 0.45%.
The daily chart portrays the cross as neutral to downward biased, hovering towards the bottom of the Ichimoku Cloud (Kumo), which, if broken, would confirm the bearish bias and open the door to test the October 3 daily low of 178.03. If that level is broken, that could pave the way towards the July 28 swing low of 176.30.
Short term, the GBP/JPY pair is neutral biased, about to break above the Kumo, which could pave the way to test the Kijun-Sen at 182.11. An extension of its gains past the latter would expose 183.00. On the other hand, if the GBP/JPY breaks below the Kumo, the next support would emerge on today’s daily low of 181.25. Once cleared, the next stop would be 181.00, followed by last Friday’s 180.84.
GBP/JPY Price Action – Hourly chart
GBP/JPY Technical Levels
- The EUR/USD started Monday with a dip to 1.0519 before edging back.
- The Euro still remains down against the US Dollar for Monday, but losses are paring back.
- Market sentiment is rebalancing after getting knocked off-kilter by geopolitical escalations in the Gaza Strip.
The EUR/USD is testing upwards into 1.0570 after slipping down into 1.0520 to kick off the trading week. Market sentiment soured following a Hamas rocket attack in the Gaza Strip that killed over 700 people and spurred the Israeli government to mobilize an additional 100,000 troops into the region.
Concerned that nearby Iran and Saudi Arabia could get pulled into the escalating Gaza conflict, markets went risk-off in early Monday trading, but investor sentiment appears to have recovered and the Euro is easing back towards the day's opening bids.
Euro investors will be looking ahead to an upcoming speech from European Central Bank (ECB) President Christine Lagarde on Tuesday, who will be delivering talking points during the International Monetary Fund's (IMF) annual meeting currently underway in Morocco.
Forex Today: Safe-haven flows dominate as geopolitical tensions escalate on Israel-Hamas conflict
Wednesday sees US Producer Price Index (PPI) figures, with the annualized period into September forecast to increase from 2.2% to 2.%. Wednesday will also see the Federal Reserve's (Fed) latest meeting minutes getting published at 18:00 GMT.
In the late week will be a collection of speeches from ECB officials followed by the ECB's own published meeting minutes, followed by the US Consumer Price Index (CPI) printing, which is expected to decline slightly from 4.3% to 4.1% over the annualized period into September.
To close out the trading week will be the Michigan Consumer Sentiment Index for October, which is seen declining, albeit slightly, from 68.1 to 67.4.
EUR/USD Technical Outlook
The Euro is seeing some twisting intraday action with hourly candles cycling the 50-hour Simple Moving Average (SMA) that is rising into 1.0550, and the EUR/USD is currently testing 1.0565, down a scant 0.08% from the day's highs set early in the day at the market open.
EUR/USD daily candles remain notably bearish, with current price action trading far below the 50-day SMA, which has confirmed a bearish cross of the 200-day SMA near 1.0825. A declining trendline from July's tops near 1.1275 remains firmly in place, and the Euro's three-day rebound from 1.0448 still sees the EUR/USD trading near 2023's lows.
EUR/USD Hourly Chart

EUR/USD Daily Chart

EUR/USD Technical Levels
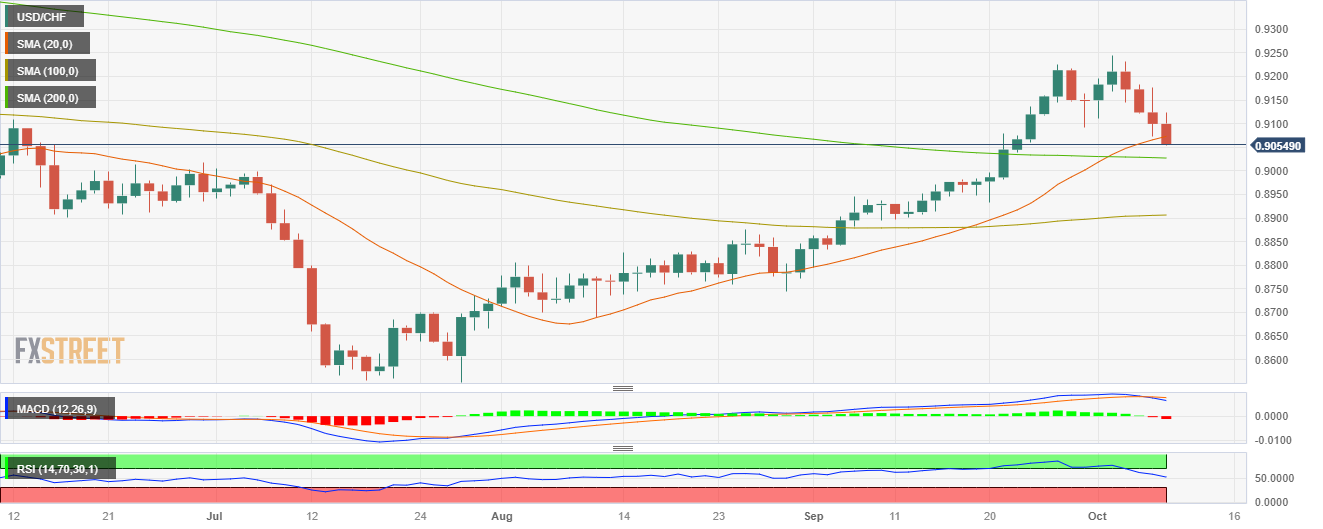
- The USD/CHF initially rose to 0.9123 and then settled near 0.9070 below the 20-day SMA.
- The US Dollar measured by the DXY also cleared gains and retreated to 106.12.
- Falling US yields after Lorie Logan’s words from the Fed explain the USD’s weakness.
- Eyes on Thursday’s inflation data from the US from September while investors still asses Friday’s NFPs from the US.
In Monday’s session, the USD/CHF reversed its course after peaking at a high of 0.9123 and settling around 0.9055 below the 20-day Simple Moving Average. On the US Dollar’s side, it lost steam, driven by a significant decline of the US yields after Lorie Logan from the Federal Reserve (Fed) commented that there may be “less need” to hike rates. In addition, US traders will remain on the sideline on Monday, celebrating the Columbum’s holiday and no relevant data is expected during the rest session.
Following Logan’s words, investors seem to be betting on a less aggressive Fed as the 2,5 and 10-year Treasury Bond yields declined to 4.95%,4.60% and 4.67%, adding downward pressure on the pair.
On the data front, Nonfarm payrolls (NFP) from the US from September showed a similar tendency as August results. Job creation ticked up as the number of employed people in the US in all non-agricultural businesses in the US came in at 336,000, much higher than the 170,000 expected and the previous 270,000. Wage inflation measured by the Average Hourly Earning came in at 0.2% MoM vs the 0.3% expected, while the Unemployment rate rose to 3.8% YoY.
On Thursday, the US will release inflation readings from September, and the headline and core measures are expected to have declined to 3.6% and 4.1% YoY. In line with that, a soft inflation reading could pave the way for more downside for the US Dollar via lower bond yields and dovish bets on the Federal Reserve.
In addition, the geopolitical conflict between the Hamas terrorist group and Israel could make investors refrain from making significant moves and instead seek refuge in the green currency, limiting the downside for the pair.
USD/CHF Levels to watch
Based on the daily chart, the USD/CHF exhibits a bearish outlook for the short term. The Relative Strength Index (RSI) and Moving Average Convergence Divergence (MACD) remain in negative territory. Additionally, the pair is above the 100 and 200-day Simple Moving Average (SMA), indicating that despite bears gaining momentum in the shorter time frames, the buyers command the broader perspective.
Support levels: 0.9050, 0.9030, 0.9000.
Resistance levels: 0.9073 (20-day SMA), 0.9150, 0.9170.
USD/CHF Daily Chart
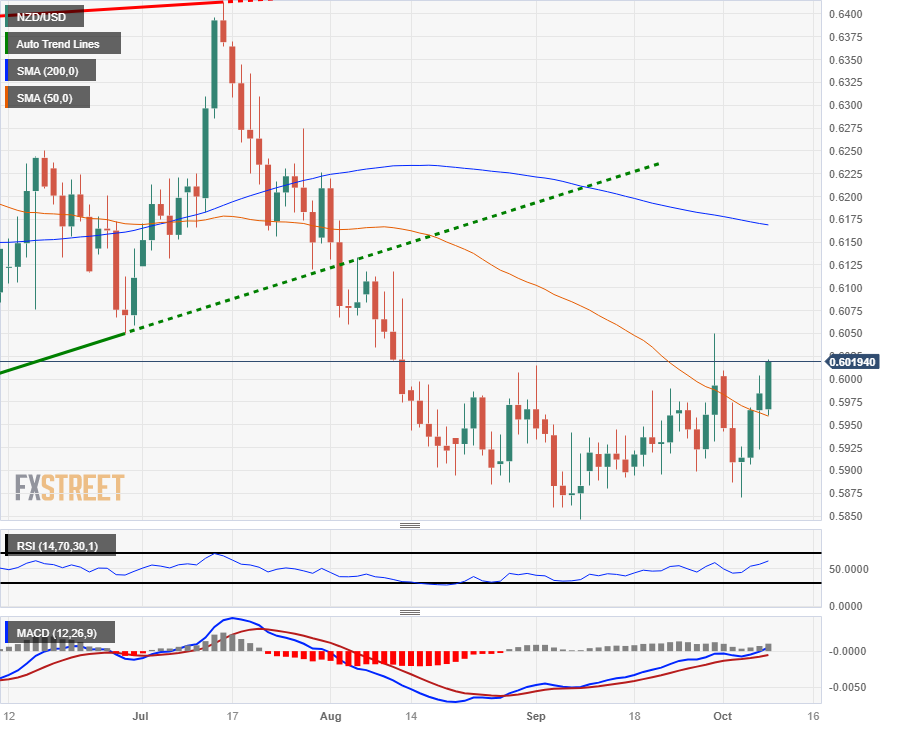
- NZD/USD trying to hold onto territory north of 0.6000 as Kiwi catches a Monday bid.
- Further upside likely to remain constrained as investors await further input from RBNZ.
- US Dollar flows to dictate directional momentum with little meaningful data on the economic calendar for the Kiwi.
The NZD/USD caught an early morning bid on Monday, getting lifted into the 0.6000 handle, pushing the pair back into the top end of recent consolidation.
The Kiwi (NZD) has largely avoided broad-market safe haven flows for Monday, with the US Dollar seeing gains against the majority of the board.
Forex Today: Safe-haven flows dominate as geopolitical tensions escalate on Israel-Hamas conflict
The Reserve Bank of New Zealand (RBNZ) was last seen holding steady on interest rates, but with a "higher-for-longer" narrative lean to the RBNZ's latest showings, investors will be looking ahead to more inflation figures from New Zealand, as well as the Kiwi's central bank next showing due in November.
It's a thin week for the Kiwi on the economic calendar, with Visitor Arrivals on Tuesday, final Food Price Index figures on Wednesday, and Business NZ's Purchasing Manager Index (PMI) slated for Thursday.
The US data docket is likely to be the main driver for the NZD/USD this week, with Wednesday bringing Producer Price Index (PPI) figures along with the latest Federal Reserve's (Fed) meeting minutes publishing; Thursday will follow up with a Consumer Price Index (CPI) release, and Friday will cap off the week with the Michigan Consumer Sentiment Index for October.
The US PPI is expected to tick upwards to 2.3% from 2.2%, while CPI is seen stepping down from 3.7% to 3.6%, and the Michigan sentiment index is expected to decline from 68.1 to 67.4.
NZD/USD Technical Outlook
The Kiwi is getting pushed into the top end for Monday, pinning into the 0.6020 level after the day's opening bids near 0.5967.
Monday's bullish push is seeing the Kiwi tapping into the ceiling of recent consolidation on the daily candlesticks, and NZD/USD bidders will be looking for a decisive break of late September's peak at 0.6050.
There's nowhere to go but up for the NZD/USD, with the pair still well off July's swing high into 0.6413, with the 200-day Simple Moving Average (SMA) far above current price action near 0.6175.
NZD/USD Daily Chart
NZD/USD Technical Levels
Federal Reserve (Fed) Vice Chair Philip N. Jefferson stated on Monday that he will take into account the recent rise in bond yields when evaluating the future direction of monetary policy.
Speaking at the 65th Annual Meeting of the National Association for Business Economics in Dallas, Texas, Jefferson acknowledged the potential delayed impact of previous interest rate increases when determining the necessity for additional policy tightening. He anticipates a further moderation in core consumer inflation and a gradual improvement in labor market conditions.
Key takeaways from the speech:
“I believe that core PCE prices will moderate further as the labor market comes into better balance.”
“Despite the strong September labor market data we received last week, there is evidence that the imbalance between labor demand and labor supply continues to narrow, as labor demand cools while labor supply improves. Even so, the labor market remains tight.”
“Slowing labor demand and improving labor supply have eased pressure in the labor market, and my expectation is for further gradual easing in labor market conditions, as restrictive monetary policy continues to slow labor demand without causing an abrupt increase in layoffs or the unemployment rate.”
“Real long-term Treasury yields have risen recently. In part, the upward movement in real yields may reflect investors' assessment that the underlying momentum of the economy is stronger than previously recognized and, as a result, a restrictive stance of monetary policy may be needed for longer than previously thought in order to return inflation to 2 percent. But I am also mindful that increases in real yields can arise from changes in investor's attitudes toward risk and uncertainty.”
“Looking ahead, I will remain cognizant of the tightening in financial conditions through higher bond yields and will keep that in mind as I assess the future path of policy.”
“I will be taking financial market developments into account along with the totality of incoming data in assessing the economic outlook and the risks surrounding the outlook and in judging the appropriate future course of policy.”
Market reaction
During the American session, the US Dollar weakened as US stocks reversed losses and moved into positive territory. The US Dollar Index (DXY) is relatively unchanged for the day, hovering around 106.10, after briefly trading above 106.50 earlier on Monday.
- GBP/USD dips 0.30% to 1.2199, influenced by geopolitical tensions and contrasting economic indicators.
- Dallas Fed President Lorie Logan underscores restrictive policy and inflation focus, while UK data signals slowdown.
- GBP/USD lacks direction with upcoming UK GDP and US inflation data to provide a fresh impetus.
GBP/USD snaps three days of consecutive gains slumps on risk aversion spurred by the clash between Israel and Hamas after the latter struck an attack during the weekend. Consequently, risk-perceived currencies depreciated to the benefit of safe-haven peers, including the Greenback (USD). The GBP/USD is trading at around 1.2199, down 0.30%, after hitting a daily high of 1.2224.
Risk aversion dominates amid geopolitical unrest, divergent economic data weighed on GBP, as USD got boosted on safe-haven status
Wall Street is trading with losses, while the Volatility Index (VIX), also known as the fear index, climbs 5.28% to 18.41. recently, Dallas Fed President Lorie Logan commented that she’s focused on driving inflation down while adding that policy needs to be restrictive, although higher US yields could forgo another rate increase.
The latest week’s data in the US and UK front, favors GBP/USD downside. A hot US Nonfarm Payrolls report justifies the need to keep monetary policy at a restrictive level. Meanwhile, the UK’s economic data warrants the economy is slowing down, reigniting recession fears amongst analysts. Sources cited by Reuters commented that “no further rate hikes by the BoE” are expected.
Money market futures see it otherwise, with odds for December and February at 40% and 50%, respectively, that the Bank of England (BoE) would raise its Bank Rate. On the US side, the CME Fed Watch Tool portrays investors who remain skeptical. In fact, traders expect the US Federal Reserve’s (Fed) first rate cut by May 2024, with odds standing at 51.97%.
Aside from this, GBP/USD trades would take cues from economic data, with UK revealing its GDP figures for August, Industrial Production, Trade Balance, and Manufacturing Production. On the US Front, the docket will feature Fed speakers, September’s Producer Price Index (PPI), the Consumer Price Index (CPI), the latest Fed minutes, and Consumer Sentiment.
GBP/USD Technical Levels
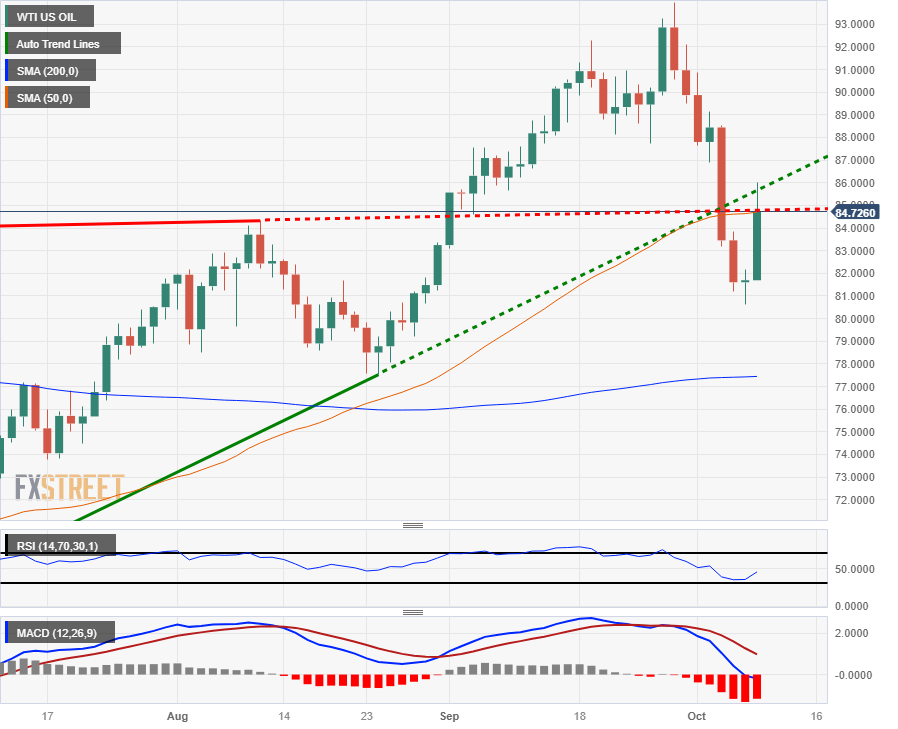
- WTI sees a topside jump to kick off the trading week.
- Middle East stability concerns are threatening oil prices, sending barrels higher.
- Israel ordered Chevron to freeze production at Tamar natural gas field, adding upside pressure to fossils.
West Texas Intermediary (WTI) Crude Oil caught a Monday bid on rising geopolitical tensions following a Hamas rocket attack on Israel in the Gaza Strip over the weekend. At least 700 people are dead and Israel has deployed approximately 100,000 additional troops to the region.
Crude oil markets are seeing rising concerns that an escalation of the Gaza conflict could destabilize Crude Oil supply, sending barrel costs higher for the new trading week and halting an extended decline that has seen oil prices close in the red five of the last six consecutive trading days and shedding nearly 15% peak-to-trough.
Gaza Strip escalation increases supply concerns
The Israeli government ordered US oil giant Chevron to temporarily halt production at its Tamar natural gas field just off the Israeli northern coast. The Tamar facility has frequently been closed down during periods of heightened unrest in the past.
Oil prices are pinning higher on concerns that the Gaza Strip escalation could spill over into additional geopolitical tensions in the Middle East and draw in nearby Iran and Saudi Arabia.
Analysts still expect crude oil supplies to undershoot demand for the last quarter of the year, which will see Crude Oil prices bolstered even further looking forward.
WTI technical outlook
WTI Crude Oil soared nearly 5.5% from the week's opening bids, just barely tipping over the $86.00 level before settling back into softer territory just south of $85.00, and is currently trading near $84.70.
Crude Oil reached a low of 80.63 in early trading before markets kicked off their supply-constraint rally, bringing the decline from September's tail-end peak of $93.98 over 14%.
Technical traders will note that WTI bids are currently getting hung up on the 50-day Simple Moving Average (SMA), and last week's decline through the rising trendline from June's bottom of $67.14 will see Crude Oil prices face additional downside pressure if bullish momentum can't be spooled up high enough.
WTI daily chart
WTI technical levels
- Canadian Dollar sees gains for holiday Monday as Crude Oil catches a bid on Israeli-Hamas conflict concerns.
- Canada markets are dark for Canadian Thanksgiving, in conjunction with the US Columbus Day holiday.
- It’s a quiet week on the economic calendar for the Canadian Loonie, investors to focus on US CPI inflation figures in the back half of the week.
The Canadian Dollar (CAD) is finding some lift on Monday, extending the Loonie’s rebound against the US Dollar (USD). The USD/CAD is trading back into familiar territory after tapping into a seven-month high last week on broad-market risk aversion flows that sent investors piling into the safe haven Greenback.
Canada is taking Monday off for the Thanksgiving national holiday, but geopolitical tensions around the Gaza Strip have sent global markets into an alert state. Crude Oil prices have lept higher on Middle East stability concerns, helping to prop up the oil-backed Loonie.
Daily Digest Market Movers: Canadian Dollar extends gains against the Greenback on Crude boost
- A rocket attack by Hamas claimed over 700 lives in the Gaza Strip over the weekend, prompting Israel to deploy approximately 100,000 additional troops in the region and igniting market concerns about Crude Oil supply destabilization in the Middle East.
- Oil barrel prices spiked on Monday, with West Texas Intermediary (WTI) Crude Oil up over 4% for the day to trade near $86 a barrel.
- The Canadian Dollar is getting pulled upwards (USD/CAD lower) by lifting barrel costs, extending the Loonie’s rebound from last week’s USD/CAD seven-month peak of 1.3785.
- The US Dollar is down around 0.33% against the CAD for Monday.
- The economic calendar is notably thin on the Canadian data side, leaving market flows to focus predominantly on geopolitical issues, as well as inbound US inflation figures due in the latter half of the trading week.
- US Producer Price Index (PPI) and Consumer Price Index (CPI) figures are due on Wednesday and Thursday, respectively.
- The Canadian exchanges are closed for the Canadian Thanksgiving holiday celebrations, further reactions could be expected when Loonie-based markets reopen on Tuesday.
Technical Analysis: Canadian Dollar extends rebound against US Dollar, trading into 1.3620
The USD/CAD is sliding back into the 1.3600 level after clipping a seven-month high of 1.3785 last week and is down 1.2% from that level.
The pair opened the new trading week near 1.3660, only managing to eke out a minor climb to a daily high of 1.3676 before falling back down the charts to trade into the 200-hour Simple Moving Average (SMA) near 1.3630.
The 200-day SMA is holding flat just above 1.3450, and a continued decline in the USD/CAD will see bids set to make a run at the 50-day SMA, which has confirmed a bullish cross of the longer moving average and is rising into the 1.3550 region.
Canadian Dollar FAQs
What key factors drive the Canadian Dollar?
The key factors driving the Canadian Dollar (CAD) are the level of interest rates set by the Bank of Canada (BoC), the price of Oil, Canada’s largest export, the health of its economy, inflation and the Trade Balance, which is the difference between the value of Canada’s exports versus its imports. Other factors include market sentiment – whether investors are taking on more risky assets (risk-on) or seeking safe-havens (risk-off) – with risk-on being CAD-positive. As its largest trading partner, the health of the US economy is also a key factor influencing the Canadian Dollar.
How do the decisions of the Bank of Canada impact the Canadian Dollar?
The Bank of Canada (BoC) has a significant influence on the Canadian Dollar by setting the level of interest rates that banks can lend to one another. This influences the level of interest rates for everyone. The main goal of the BoC is to maintain inflation at 1-3% by adjusting interest rates up or down. Relatively higher interest rates tend to be positive for the CAD. The Bank of Canada can also use quantitative easing and tightening to influence credit conditions, with the former CAD-negative and the latter CAD-positive.
How does the price of Oil impact the Canadian Dollar?
The price of Oil is a key factor impacting the value of the Canadian Dollar. Petroleum is Canada’s biggest export, so Oil price tends to have an immediate impact on the CAD value. Generally, if Oil price rises CAD also goes up, as aggregate demand for the currency increases. The opposite is the case if the price of Oil falls. Higher Oil prices also tend to result in a greater likelihood of a positive Trade Balance, which is also supportive of the CAD.
How does inflation data impact the value of the Canadian Dollar?
While inflation had always traditionally been thought of as a negative factor for a currency since it lowers the value of money, the opposite has actually been the case in modern times with the relaxation of cross-border capital controls. Higher inflation tends to lead central banks to put up interest rates which attracts more capital inflows from global investors seeking a lucrative place to keep their money. This increases demand for the local currency, which in Canada’s case is the Canadian Dollar.
How does economic data influence the value of the Canadian Dollar?
Macroeconomic data releases gauge the health of the economy and can have an impact on the Canadian Dollar. Indicators such as GDP, Manufacturing and Services PMIs, employment, and consumer sentiment surveys can all influence the direction of the CAD. A strong economy is good for the Canadian Dollar. Not only does it attract more foreign investment but it may encourage the Bank of Canada to put up interest rates, leading to a stronger currency. If economic data is weak, however, the CAD is likely to fall.
- USD/JPY drops 0.36% amidst escalating Israel-Palestine conflict, bolstering the Yen’s safe-haven status.
- Dallas Fed President Lorie Logan emphasizes restrictive monetary policy, spotlighting inflation as a primary concern.
- Upcoming economic data from Japan and the US, including Current Account and inflation figures, to influence the pair’s trajectory.
The Japanese yen (JPY) appeals to its status as a safe haven and appreciates against the Greenback (USD) in the mid-North American session as tensions between Israel and Palestine grow. Fighting during the weekend increased after Hamas claimed an attack on Israel during the Yom Kippur festival. At the time of writing, the USD/JPY is trading at 148.70, down 0.36%.
Safe-haven appeal of JPY intensifies amidst geopolitical strife
Global equities are set to remain pressured as Middle East tensions rise. Dallas Fed President Lorie Logan commented that monetary policy needs to remain restrictive, adding that higher US bond yields would diminish the need to increase interest rates and that her focus is bringing inflation down. Logan added that financial conditions are tightening but in an orderly fashion.
Although US Treasury bond yields remain high, they had dipped as of Monday. The US 10-year Treasury bond yield drops fourteen basis points and oscillates at 4.674%.
In the meantime, last week’s September US Nonfarm Payrolls report portrays the labor market remains hot and justifies the need for more rate hikes, but the CME Fed Watch Tool portrays investors who remain skeptical. In fact, traders expect the US Federal Reserve’s (Fed) first rate cut by May 2024, with odds standing at 51.97%.
USD/JPY are eyeing the current week's data. On the Japanese front, the economic agenda would feature the Current Account. In the US, the Fed parade continues, along with inflation figures on the producer and consumer side. After that, unemployment claims and consumer sentiment would update the status of the US economy.
USD/JPY Price Analysis Technical outlook
The USD/JPY remains neutral to upward bias, with price action remaining above the Ichimoku Cloud (Kumo). However, if the pair drops below the latest cycle high of 147.87 and achieves a daily close below the latter, the major could challenge the top of the Kumo at around 145.50. On the other hand and the path of least resistance, the USD/JPY could test the 150.00 figure, but first it needs to conquer 149.00
- Mexican Peso approaches last week’s high of 18.48; USD/MXN bulls target 18.50.
- Mexico’s inflation slows as core CPI rate drops below 6%, headline inflation near Banxico’s target.
- USD/MXN trading within the 18.20-18.40 range amid a US holiday.
Mexican Peso (MXN) loses territory against the US Dollar (USD) as risk aversion takes its toll after the resurgence of a Middle East conflict that involves Israel and Hamas. Therefore, the safe-haven status of the Greenback (USD) spurred demand, though high Oil prices have capped the USD/MXN pair rise as the fight intensifies, exchanging hands at around 18.30 for a gain of 0.86%.
Geopolitics is the main driver of Monday’s session, which also features a holiday in the United States (US) in observance of Columbus Day. Mexico’s inflation continues its downtrend, as reported by the National Statistics Agency known as INEGI on Monday, which could influence the Bank of Mexico’s (Banxico) decisions in the last two meetings of 2023. However, market participants estimate Banxico to hold rates for the remainder of the year at 11.25%.
Daily Digest Market Movers: Mexican Peso on the defensive as inflation dips amid risk-off impulse
- Mexico’s Consumer Price Index (CPI) grew by 4.45% YoY in September, below the 4.47% of estimates.
- The core CPI inflation in Mexico stood stickier at 5.76% YoY, as widely estimated, but has broken below the 6% threshold.
- A Citi Banamex poll showed economists estimate headline inflation at 4.70% and core at 5.09% for the year’s end.
- Analysts polled by Citi Banamex foresee the USD/MXN to end 2023 at 17.80, up from 17.60, and for 2024 at 18.86, up from 18.70 two weeks ago.
- On October 4, 2023, the IMF raised Mexico’s growth projection in 2023 from 2.6% to 3.2% and from 1.5% foreseen in July to 2.1% for 2024.
- Banxico’s September poll amongst economists reported that interest rates are expected to remain at 11.25% while inflation would dip to 4.66%.
- The same poll shows the USD/MXN exchange rate is set to finish at around 17.64, down from 17.75.
- Mexico’s S&P Global Manufacturing PMI for September came at 49.8, sliding to contractionary territory and below August’s 51.2, as the economy loses steam.
- The Bank of Mexico (Banxico) held rates at 11.25% in September and revised its inflation projections from 3.5% to 3.87% for 2024, above the central bank’s 3% target (plus or minus 1%).
- Banxico’s Government Board highlighted Mexico’s economic resilience and the strong labor market as the main drivers to keep inflation at the current interest rate level.
Technical Analysis: Mexican Peso at the brisk of depreciating to 19.00
The USD/MXN daily chart portrays the exotic pair as bullish-biased after hitting a new cycle high of 18.48 on Friday, above the April 5 high of 18.40. If buyers reclaim 18.50, that will extend the Mexican Peso’s losses with the pair aiming towards the March 24 swing high at 18.80, which, if cleared, would expose the 19.00 figure. On the other hand, if sellers reclaim the 200-day Simple Moving Average (SMA) at 17.79, that would pave the way to challenge the September 30 low of 17.34.
Mexican Peso FAQs
What key factors drive the Mexican Peso?
The Mexican Peso (MXN) is the most traded currency among its Latin American peers. Its value is broadly determined by the performance of the Mexican economy, the country’s central bank’s policy, the amount of foreign investment in the country and even the levels of remittances sent by Mexicans who live abroad, particularly in the United States. Geopolitical trends can also move MXN: for example, the process of nearshoring – or the decision by some firms to relocate manufacturing capacity and supply chains closer to their home countries – is also seen as a catalyst for the Mexican currency as the country is considered a key manufacturing hub in the American continent. Another catalyst for MXN is Oil prices as Mexico is a key exporter of the commodity.
How do decisions of the Banxico impact the Mexican Peso?
The main objective of Mexico’s central bank, also known as Banxico, is to maintain inflation at low and stable levels (at or close to its target of 3%, the midpoint in a tolerance band of between 2% and 4%). To this end, the bank sets an appropriate level of interest rates. When inflation is too high, Banxico will attempt to tame it by raising interest rates, making it more expensive for households and businesses to borrow money, thus cooling demand and the overall economy. Higher interest rates are generally positive for the Mexican Peso (MXN) as they lead to higher yields, making the country a more attractive place for investors. On the contrary, lower interest rates tend to weaken MXN.
How does economic data influence the value of the Mexican Peso?
Macroeconomic data releases are key to assess the state of the economy and can have an impact on the Mexican Peso (MXN) valuation. A strong Mexican economy, based on high economic growth, low unemployment and high confidence is good for MXN. Not only does it attract more foreign investment but it may encourage the Bank of Mexico (Banxico) to increase interest rates, particularly if this strength comes together with elevated inflation. However, if economic data is weak, MXN is likely to depreciate.
How does broader risk sentiment impact the Mexican Peso?
As an emerging-market currency, the Mexican Peso (MXN) tends to strive during risk-on periods, or when investors perceive that broader market risks are low and thus are eager to engage with investments that carry a higher risk. Conversely, MXN tends to weaken at times of market turbulence or economic uncertainty as investors tend to sell higher-risk assets and flee to the more-stable safe havens.
- AUD/USD prints a fresh intraday high at 0.6380 as the risk appetite of the market mood improves.
- The broader risk profile is still cautious due to deepening Middle East tensions.
- The USD index finds selling pressure near 106.60 as the focus shifts to US inflation data.
The AUD/USD pair refreshes intraday high at 0.6380 as investors pare shorts in risk-perceived assets executed due to the Middle East crisis amid bellicose between Israel and Palestinian military group. The recovery move in the Aussie asset could be a short-lived pullback as the market sentiment is still downbeat.
S&P500 futures recovered the majority of losses generated in the European session, portraying a recovery in the risk-appetite of the market participants. The 10-year US Treasury yields dropped sharply to near 4.70%. The US markets are closed on Monday on account of Columbus Day.
The US Dollar Index (DXY) faces selling pressure after a pullback move to near 106.60 as Dallas Federal Reserve (Fed) Bank President Lorie Logan draws less emphasis on raising interest rates further If long-term interest rates remain elevated because of higher term premiums. About the inflation outlook, Fed Logan cited "Progress on inflation is encouraging but it's too early to be confident it is headed to the Fed's 2% target in a sustainable, timely way."
Meanwhile, investors shift focus to the US Consumer Price Index (CPI) data for September, which will be published on Thursday at 12:30 GMT. As per the consensus, the core CPI that does not include volatile food and oil prices is seen expanding at a steady pace of 0.3%. Hotter-than-anticipated inflation report could elevate hopes of one more interest rate increase from the Fed.
On the Australian Dollar front, investors see one more interest rate increase from the Reserve Bank of Australia as inflation rebounded in August due to rising oil prices. Deepening tensions between Israel and Hamas have improved the oil price outlook, which could lift inflationary pressures in the Australian economy further. The RBA could lift interest rates by 25 basis points (bps) to 4.35% by the year-end.
- USD/CAD is exposed to more downside as higher oil prices strengthen the Canadian Dollar.
- Fed Bowman reiterated this weekend that further policy tightening is appropriate.
- Canada’s upbeat labor market data has prompted hawkish BoC bets.
The USD/CAD pair sets for a breakdown to near the round-level support of 1.3600 as deepening Middle East tensions due to Israel-Hamas bellicose has ramped up global oil prices. The Loonie asset has been exposed to more downside as the oil price rally has strengthened the Canadian Dollar.
S&P500 futures have generated losses in the early New York session as geopolitical tensions have dampened market sentiment. The appeal for the US Dollar improves significantly as investors rush for safe-haven assets amid a highly volatile environment.
The US Dollar Index (DXY) recovers to near 106.60 but struggles to extend the upside. The broader USD Index outlook is bullish due to the collective effort of risk-off impulse and rising odds of one more interest rate increase prompted by strong labor demand and decent wage growth.
Fed Governor Michelle Bowman reiterated this weekend that further policy-tightening by the central bank is appropriate. She is willing to support one more interest rate hike at a future policy meeting if incoming data conveys that progress in inflation easing to 2% has stalled.
On the Canadian Dollar front, upbeat labor market data for September improved odds of an interest rate hike from the Bank of Canada (BoC). Canadian employers hired 63.8K job-seekers in September, significantly higher than expectations of 20K and the former release of 39.9K. The Unemployment Rate remained steady at 5.5% while investors anticipated nominally higher at 5.6%. The annual wage rate accelerated to 5.3% against the former release of 5.2%.
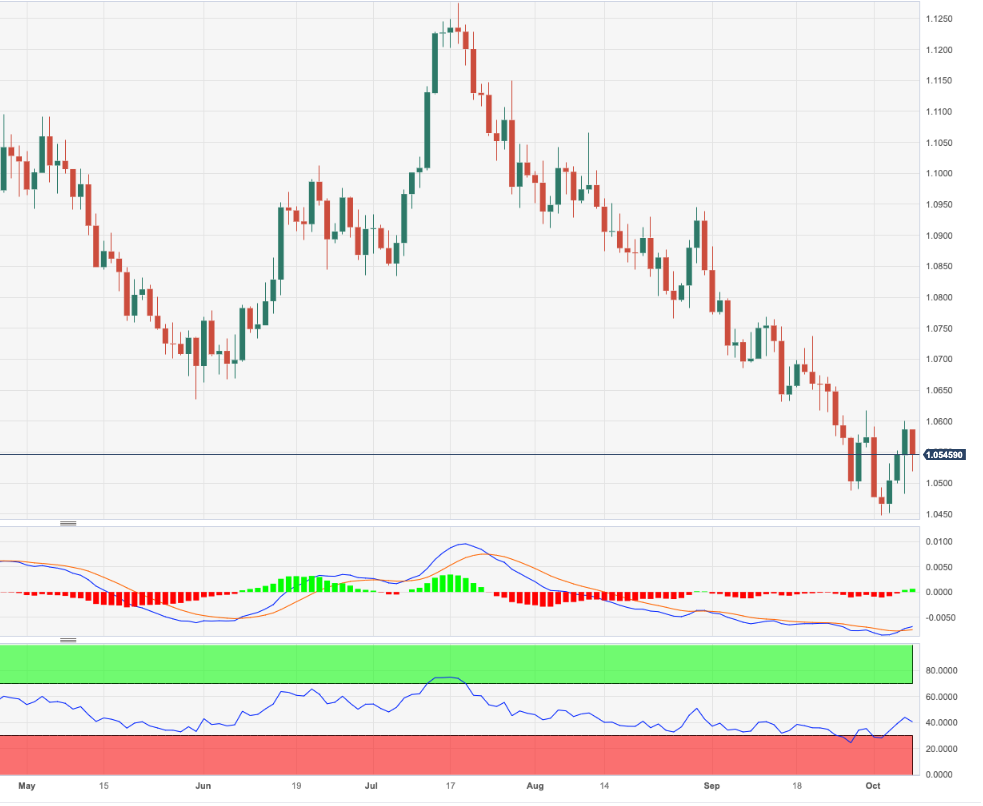
- EUR/USD comes under pressure following Friday’s tops.
- Extra weakness could prompt the pair to drop to 1.0450.
EUR/USD revisits the 1.0520 region following renewed downside pressure and following Friday’s climb to as high as the 1.0600 region.
In case bulls regain the initiative, the pair should initially retarget the minor barrier at 1.0617 (September 29) ahead of the weekly peak of 1.0767 (September 12). On the flip side, if bears regain the upper hand, the pair could slip back to the area of yearly lows around 1.0450 (October 3).
Meanwhile, further losses remain on the table as long as the pair navigates the area below the key 200-day SMA, today at 1.0823.
EUR/USD daily chart
Continued restrictive financial conditions will be necessary to bring down inflation, Dallas Fed President Lorie Logan said on Monday, per Reuters.
"If long-term interest rates remain elevated because of higher term premiums, there may be less need to raise the fed funds rate," Logan added. "However, to the extent that strength in the economy is behind the increase in long-term interest rates, the FOMC may need to do more."
Key quotes
"We are attentive to risks on both sides of fed's mandate, but high inflation is the most important risk."
"Progress on inflation is encouraging but it's too early to be confident it is headed to the Fed's 2% target in a sustainable, timely way."
"Labor market is still very strong, wages are still solid."
"Output, spending have been surprisingly strong; outlooks for consumer are mixed."
Market reaction
The US Dollar Index stays retreated from daily highs following these comments and was last seen gaining 0.2% on the day at 106.32.
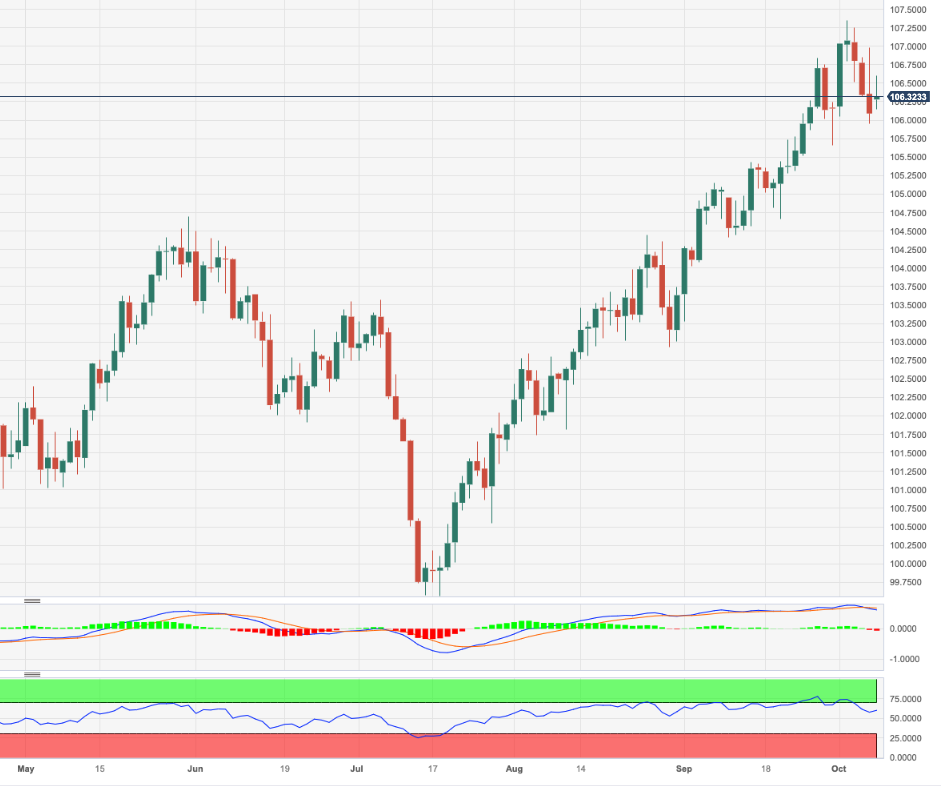
- DXY reverses three consecutive daily drops on Monday.
- The continuation of the rebound shifts the attention to the 2023 top.
DXY regains composure and manages to partially reverse the recent three-day decline so far at the beginning of the week.
Considering the ongoing price action, extra gains appear likely in the dollar for the time being. Once the index clears the 2023 top of 107.34 (October 3), it could encourage bulls to challenge the weekly peak at 107.99 (November 21 2022) just ahead of the round level at 108.00.
In the meantime, while above the key 200-day SMA, today at 103.17, the outlook for the index is expected to remain constructive.
DXY daily chart
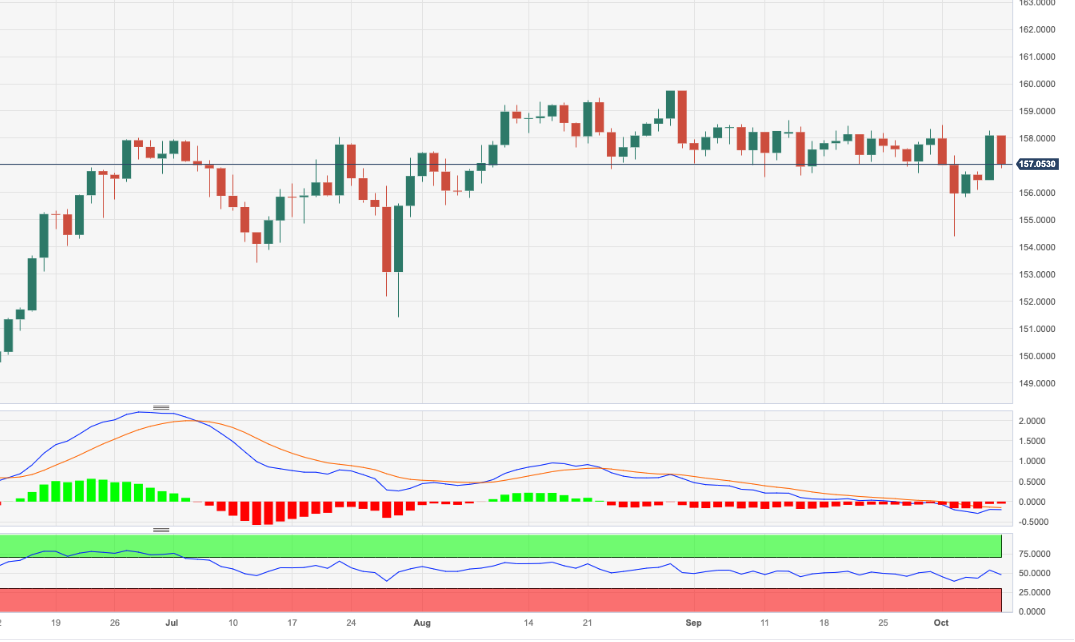
- EUR/JPY trades in an inconclusive fashion around 157.00.
- Extra range bound looks likely for the time being.
EUR/JPY trades in a consolidative range around the 157.00 region following Friday’s strong gains.
In the meantime, the cross remains stuck within the consolidative range and the breakout of it exposes a visit to the so far monthly high of 158.65 (September 13) prior to the 2023 top at 159.76 (August 30), which precedes the key round level at 160.00.
On the downside, the so far monthly low of 154.34 (October 3) emerges as the initial contention in case of bearish attempts.
So far, the longer term positive outlook for the cross appears favoured while above the 200-day SMA, today at 149.90.
EUR/JPY daily chart
UOB Group’s Economist Enrico Tanuwidjaja and Junior Economist Agus Santoso review the latest FX reserves figures in Indonesia.
Key Takeaways
Indonesia’s foreign exchange reserves fell by USD2.2bn to USD134.9bn in Sep 2023.
The latest reserves level was equivalent to financing 6.1 months of imports or 6 months’ worth of imports and external government debt servicing, well above the international adequacy standard of 3 months of imports.
The figure reaffirms that exports revenue in Sep is expected to be flattish. Some indicators we looked at in Sep were commodity prices declining and lower demand from India and China as Indonesia’s main trading partners. Going forward, we maintain our forecast of Indonesian FX reserves to remain in high levels of around USD135bn to USD145bn at the end of this year on the back of better outlook especially from coal demand and inflows into the bond market.
- NZD/USD juggles around 0.5980 after a corrective move, propelled by a risk-off impulse.
- The US Dollar Index recovers to near 106.53 as investors shift focus to the inflation data for September.
- NZD/USD trades in a 0.5840-0.6050 range from the past two months, indicating a sheer volatility squeeze.
The NZD/USD pair turns sideways below the psychological resistance of 0.6000 as tensions deepening in the Middle East over the Israel-Hamas crisis have dampened market sentiment. The Kiwi asset drops to near 0.5980 as investors rush to safe-haven assets. It is worth noting that a sell-off in the Asia-Pacific currencies is slower against selling pressure in Europe.
The appeal for the US Dollar improves significantly due to the risk-off impulse propelled by Israel-Hamas tensions and rising odds of one more interest rate increase from the Federal Reserve (Fed) prompted by strong labor demand.
The US Dollar Index (DXY) recovers to near 106.53 and is expected to extend upside as investors shift focus to the Consumer Price Index (CPI) data for September, which will be published on Thursday. The core CPI that strips off volatile food and oil prices is seen growing at a steady pace of 0.3%.
NZD/USD trades in a 0.5840-0.6050 range from the past two months, indicating a sheer volatility squeeze. A prolonged consolidation is generally followed by wider ticks and heavy volume after a volatility explosion.
The Kiwi asset remains sticky with the 20-period Exponential Moving Average (EMA) around 0.5960, portraying a sideways performance.
Meanwhile, the Relative Strength Index (RSI) (14) hovers near 60.00. A breakout above the same would activate the bullish impulse.
Going forward, a decisive break above the psychological resistance of 0.6000 would drive the major toward September 29 high around 0.6050. A breach of the latter would send the major toward August 09 high at 0.6096
On the flip side, a breakdown below the round-level support of 0.5900 would drag the major toward September 7 low at 0.5847. A slippage below the latter would expose the asset to the round-level support at 0.5800.
NZD/USD four-hour chart
-638324521918506844.png)
Citing six sources familiar with the matter, Reuters reported on Monday that European Central Bank (ECB) policymakers consider the rise in Italian bond yields is justified by deteriorating budget fundamentals.
"I think Italy's troubles are entirely self-inflicted, so the market reaction is quite justified. But there is a lesson for us in that Pandemic Emergency Purchase Programme's (PEPP) flexibility is valuable that we shouldn't give up without thorough analysis," one of the sources told Reuters.
Market reaction
The EUR/USD pair stays under bearish pressure following this headline and the was last seen losing 0.52% on the day at 1.0532.
- The Greenback starts its week on a high note after breaking its weekly winning streak.
- Traders run for safety as Hamas attacked Israel over the weekend in its biggest offence in two decades.
- The US Dollar Index breaks back above 106.00 and looks primed to head higher.
The US Dollar (USD) is not able to enjoy the US public holiday on Monday. Despite Columbus Day, the Greenback is soaring higher after it gapped up on Sunday night amidst headlines from Hamas attacking Israel with a major offensive not seen in decades. All bets are off with safe havens seeing massive inflows.
With an empty economic calendar, expect this Monday’s moves to be driven by the Israel-Gaza conflict. Several headlines from world leaders and organisations like OPEC+ are driving safe havens higher. Israel is preparing for retaliation while it proclaimed that Iran is behind the attacks, with Western leaders not yet confirming or backing these findings, showing the sensitivity of the matter and the interest in Crude Oil supply out of the region.
Daily digest: US Dollar to remain elevated
- Amidst all the headlines around Israel and Hamas, two US Federal Reserve members are due to speak this Monday: Near 13:00 GMT, Dallas Fed President Lorie Logan is due to speak. Near 16:45 GMT, Fed Governor Philip Jefferson will also speak.
- Israel has issued a statement saying that Iran is behind the coordinated attacks. Thus far, Western leaders have refrained from backing this statement. Meanwhile, US naval ships are on route to the region to provide support for Israel.
- Equities are down, though starting to pare losses as market participants get a grip on the situation at hand. If this recovery continues, expect to possibly even see green numbers near the end of this Monday.
- The CME Group FedWatch Tool shows that markets are pricing in a 78.9% chance that the Federal Reserve will keep interest rates unchanged at its meeting in November.
- The benchmark 10-year US Treasury yield is closed for the US holiday. Expectations would be that yields will drop as bids for safe US bonds will soar to enormous proportions.
US Dollar Index technical analysis: Week 13
The US Dollar is remorseless in its winning streak after a squeeze on Friday snapped its winning streak, which lasted for twelve weeks. The US public holiday keeps US bond markets closed, though where it was open, it would have triggered even more safe-haven flow into the Greenback. Expect for the US Dollar Index to still remain in its uptrend and look to reboot its weekly winning streak.
The US Dollar Index opened around 106.29, with the Relative Strength Index (RSI) easing down a touch after the DXY snapped its weekly winning streak on Friday. On the topside, 107.19 is important to see if the DXY can get a daily close above that level. If this is the case, 109.30 is the next level to watch.
On the downside, the recent resistance at 105.88 should be seen as first support. Still, this barrier has just been broken to the upside, so it isn’t likely to be strong. Instead, look for 105.12 to keep the DXY above 105.00.
US Dollar FAQs
What is the US Dollar?
The US Dollar (USD) is the official currency of the United States of America, and the ‘de facto’ currency of a significant number of other countries where it is found in circulation alongside local notes. It is the most heavily traded currency in the world, accounting for over 88% of all global foreign exchange turnover, or an average of $6.6 trillion in transactions per day, according to data from 2022.
Following the second world war, the USD took over from the British Pound as the world’s reserve currency. For most of its history, the US Dollar was backed by Gold, until the Bretton Woods Agreement in 1971 when the Gold Standard went away.
How do the decisions of the Federal Reserve impact the US Dollar?
The most important single factor impacting on the value of the US Dollar is monetary policy, which is shaped by the Federal Reserve (Fed). The Fed has two mandates: to achieve price stability (control inflation) and foster full employment. Its primary tool to achieve these two goals is by adjusting interest rates.
When prices are rising too quickly and inflation is above the Fed’s 2% target, the Fed will raise rates, which helps the USD value. When inflation falls below 2% or the Unemployment Rate is too high, the Fed may lower interest rates, which weighs on the Greenback.
What is Quantitative Easing and how does it influence the US Dollar?
In extreme situations, the Federal Reserve can also print more Dollars and enact quantitative easing (QE). QE is the process by which the Fed substantially increases the flow of credit in a stuck financial system.
It is a non-standard policy measure used when credit has dried up because banks will not lend to each other (out of the fear of counterparty default). It is a last resort when simply lowering interest rates is unlikely to achieve the necessary result. It was the Fed’s weapon of choice to combat the credit crunch that occurred during the Great Financial Crisis in 2008. It involves the Fed printing more Dollars and using them to buy US government bonds predominantly from financial institutions. QE usually leads to a weaker US Dollar.
What is Quantitative Tightening and how does it influence the US Dollar?
Quantitative tightening (QT) is the reverse process whereby the Federal Reserve stops buying bonds from financial institutions and does not reinvest the principal from the bonds it holds maturing in new purchases. It is usually positive for the US Dollar.
European Central Bank (ECB) policymaker Klaas Knot said on Monday that he was comfortable with the current interest rate levels but added that elevated oil price due to the conflict in Israel could present a new shock to inflation, per Reuters.
"For now, inflation risks are more balanced than they have been for a long time," he said and noted that they will monitor meeting by meeting whether this remains the case.
Market reaction
EUR/USD showed no immediate reaction to these comments and was last seen losing 0.52% on the day at 1.0532.
Assessing the September jobs report, analysts at TD Securities noted that Nonfarm Payrolls surprised expectations notably to the upside in September, with the economy adding a whopping 336k net jobs.
We still expect the Fed to stay on hold
"With that said, the large swings in revisions make the report increasingly unreliable as a policy signal in the short term. On the other hand, the unemployment rate stayed unchanged at 3.8%, maintaining the unexpected three-tenth jump from the last report. Average hourly earnings surprised expectations to the downside for a second consecutive month, with the momentum in wage growth still pointing lower."
"We still think that the Fed would prefer to gather additional data before making a decision to hike rates again, particularly after the sharp trek higher in yields. With that said, we still expect the Fed to stay on hold unless the totality of the data undeniably supports the strength seen in today's jobs report. Key Fedspeak early next week will provide an update to current Fed views."
- Oil (WTI) jumps back above $82 after its steep decline last week.
- The US Dollar jumps higher with safe-haven flows in the Greenback and Japanese Yen.
- Expect to possibly see further upticks in oil prices as tensions are set to rise with US military ships being dispatched to the region.
Oil prices are in for a wild ride after the surprise raids and attacks on Israel from Hamas. The Wall Street Journal was quite quick to issue a report saying that the attacks were the hand of Iranian officials. Although no Western officials have backed these statements, it points to a high risk of spillover for a global escalation in the region.
Meanwhile, the US Dollar is firmly in the green. This time there is no rate-driven move as US bond markets are closed for the US public holiday. The Greenback is seeing ample demand from investors looking for shelter from another war in the Middle East that might only escalate further with Israel already carrying out retaliatory airstrikes.
Crude Oil (WTI) trades at $84.02 per barrel, and Brent Oil trades at $86.13 per barrel at the time of writing.
Oil news and market movers
- Oil prices are jumping higher, together with Gold and Copper, on fears the biggest attack on Israel in decades could broaden the turmoil in the wider Middle East. The Middle East accounts for nearly one third of global Oil supply.
- Israel has pointed the finger at Iran after reports from The Wall Street Journal. No Western officials have come out backing those arguments.
- Oil refiners across China are confident that flows from the Islamic Republic will continue unabated. Chinese involvement in the conflict or region does not look to be on the table. Furthermore, China is able to shortcut any supply disruptions by buying more oil from partner Russia.
- In an overall market move, with US Treasury bond markets closed for the US holiday, firm upticks are seen in Gold, Copper, Crude Oil, and safe havens like the US Dollar, Japanese Yen and Chinese Renminbi.
Oil Technical Analysis: Wild ride
Oil prices were dropping like a stone last week as demand faded quickly. Despite the recent turmoil, overall expectations are that the US will try not to trigger any supply hiccups in the region by getting involved too much. Expect a wild ride with headline-driven moves higher, though a retest at $94 looks highly unlikely with supply being undisrupted.
On the upside, the double top from October and November of last year at $93.12 remains the level to beat. Although it got breached on Thursday, the level never got a daily close above it. Should $93.12 be taken out, look for $97.11, the high of August 2022.
On the downside, traders are bracing for the entry of that region near $78. That area should see ample support for buying. Any further drops below that area might see a firm nosedive move, which would sink oil prices below $70.
-638324416397863863.png)
US Crude (Daily Chart)
WTI Oil FAQs
What is WTI Oil?
WTI Oil is a type of Crude Oil sold on international markets. The WTI stands for West Texas Intermediate, one of three major types including Brent and Dubai Crude. WTI is also referred to as “light” and “sweet” because of its relatively low gravity and sulfur content respectively. It is considered a high quality Oil that is easily refined. It is sourced in the United States and distributed via the Cushing hub, which is considered “The Pipeline Crossroads of the World”. It is a benchmark for the Oil market and WTI price is frequently quoted in the media.
What factors drive the price of WTI Oil?
Like all assets, supply and demand are the key drivers of WTI Oil price. As such, global growth can be a driver of increased demand and vice versa for weak global growth. Political instability, wars, and sanctions can disrupt supply and impact prices. The decisions of OPEC, a group of major Oil-producing countries, is another key driver of price. The value of the US Dollar influences the price of WTI Crude Oil, since Oil is predominantly traded in US Dollars, thus a weaker US Dollar can make Oil more affordable and vice versa.
How does inventory data impact the price of WTI Oil
The weekly Oil inventory reports published by the American Petroleum Institute (API) and the Energy Information Agency (EIA) impact the price of WTI Oil. Changes in inventories reflect fluctuating supply and demand. If the data shows a drop in inventories it can indicate increased demand, pushing up Oil price. Higher inventories can reflect increased supply, pushing down prices. API’s report is published every Tuesday and EIA’s the day after. Their results are usually similar, falling within 1% of each other 75% of the time. The EIA data is considered more reliable, since it is a government agency.
How does OPEC influence the price of WTI Oil?
OPEC (Organization of the Petroleum Exporting Countries) is a group of 13 Oil-producing nations who collectively decide production quotas for member countries at twice-yearly meetings. Their decisions often impact WTI Oil prices. When OPEC decides to lower quotas, it can tighten supply, pushing up Oil prices. When OPEC increases production, it has the opposite effect. OPEC+ refers to an expanded group that includes ten extra non-OPEC members, the most notable of which is Russia.
- EUR/GBP declined toward 0.8600 as the ECB’s higher interest rates dented the economic outlook.
- ECB Lagarde vowed to keep interest rates higher to bring inflation to 2% in a timely manner.
- BoE Bailey is confident about bringing down inflation to 5% or lower by the year-end.
The EUR/GBP pair remains under pressure from the last week after the Eurozone’s consumer spending data slowed at a higher pace in August as high inflation squeezes the real income of households. The cross is expected to extend its downside as the confidence of investors in the Eurozone economy is declining due to an uncertain economic outlook.
Investors are worried about economic prospects as higher interest rates by the European Central Bank (ECB) have deteriorated demand, which has resulted in contracting factory activities. The Eurozone Sentix Investors Confidence for October has edged down to 21.9 from the former release of 21.5.
This weekend, ECB President Christine Lagarde remained confident about achieving the 2% inflation target. The statement from ECB Lagarde indicated that interest rates from the central bank are peaked for now and are required to remain higher long enough to bring down inflation to 2% in a timely manner.
Meanwhile, investors underpin the Pound Sterling against the shared currency as the Bank of England (BoE) Governor Andrew Bailey is confident about bringing down inflation to 5% or lower by the year-end. This indicates that UK Prime Minister Rishi Sunak would meet his promise of halving inflation to 5.2% until 2023 ends.
Going forward, UK’s factory activity and Gross Domestic Product (GDP) data will be keenly watched. Monthly Manufacturing and Industrial Production data are expected to contract consecutively as higher interest rates have dented demand in domestic and overseas markets.
Further consolidation, likely between 7.2950 and 7.3400, is expected in USD/CNH in the next few weeks, according to Markets Strategist Quek Ser Leang and Senior FX Strategist Peter Chia at UOB Group.
Key Quotes
24-hour view: Last Friday, we noted “there is no clear directional bias,” and we expected USD to trade sideways between 7.2980 and 7.3220. While our view of sideways trading was not wrong, we did not anticipate the manner in which USD swung sharply between 7.2990 and 7.3215. There is still no clear directional bias, and we continue to expect USD to trade sideways. Expected range for today: 7.3000/7.3230.
Next 1-3 weeks: Our most recent narrative was from last Tuesday (03 Sep, spot at 7.3215), wherein USD is likely to trade in a range between 7.2800 and 7.3600. Since then, USD has traded well within the range. We continue to expect USD to trade in a range, but in view of the decreased volatility, it is likely to trade in a narrower range of 7.2950/7.3400.
USD/JPY is still predicted to keep the ongoing consolidative stance for the next few weeks, argue Markets Strategist Quek Ser Leang and Senior FX Strategist Peter Chia at UOB Group.
Key Quotes
24-hour view: We expected USD to trade between 148.00 and 149.20 last Friday. However, it traded in a higher range than expected (148.33/149.53). Further range trading appears likely, even though the slightly firm underlying tone suggests a higher range of 148.60/149.70.
Next 1-3 weeks: Our latest narrative was from last Wednesday (04 Oct, spot at 149.10), wherein the recent sharp fluctuations have muddled the outlook for USD, and we expected USD to trade in a broad range of 145.90/150.50. The price actions since last Wednesday did not offer any further clues. We continue to expect USD to trade in a range, albeit likely in a narrower one of 147.00/150.50.
- Gold discovers buying interest as Israel-Hamas tensions underpin risk-off impulse.
- US employment growth remained surprisingly upbeat in September.
- Strong US NFP data increase the chances of one more interest rate increase from the Fed.
Gold price (XAU/USD) recovers swiftly to around $1,850 as dismal market sentiment propelled by escalating tensions between Israel and Hamas improves the appeal for safe-haven assets. The yellow metal rebounds as the support from deepening geopolitical tensions offset the hit from a surprisingly strong Nonfarm Payrolls (NFP) report for September.
Strong United States employment growth has prompted bets for one more interest rate increase from the Federal Reserve (Fed) as progress in taming inflation could slow down ahead. Fed Governor Michelle Bowman said over the weekend that she supports further policy-tightening by the central bank to bring down inflation to 2% in a timely manner. Going forward, the US Consumer Price Index (CPI) data will be keenly watched by the market participants.
Daily Digest Market Movers: Gold price recovers as market sentiment dampens
- Gold price recovers swiftly after a breakout of the consolidation channel formed in the range of $1,810-1,830 as heightened Middle East clashes improve the appeal for safe-haven assets.
- The IMF said it is too early to assess the economic impact of the conflict in Israel and the Gaza Strip.
- The precious metal finds buyers’ interest even as US job growth remained surprisingly robust in September.
- As per the US NFP report, US employers hired 336K new job-seekers in September, significantly higher than expectations of 170K and the former release of 227K. The Unemployment rate remained steady at 3.8%, while investors anticipated a decline to 3.7%.
- On the earnings data front, monthly wages grew at a slower rate of 0.2%. The annualized wage rate decelerated to 4.2% against the estimates and the former release of 4.3%.
- A surprisingly upbeat US NFP report has accelerated hawkish Federal Reserve bets. According to the CME Group Fedwatch tool, traders see a 22% chance of the Fed raising interest rates by 25 basis points (bps) to the 5.50%-5.75% range at the next policy meeting. These changes were almost negligible before the official labor market data release. The probability of one more interest rate increase in any of the two remaining monetary policy meetings this 2023 has also risen, to 31%.
- The job data for September has confirmed that the US labor demand is resilient, making inflationary pressures above the 2% desired rate a hard nut to crack for Fed policymakers.
- Fed Governor Michelle Bowman reiterated this weekend in her remarks at the Connecticut Bankers Association that further policy tightening is appropriate. Bowman said she is willing to support one more interest rate hike at a future policy meeting if incoming data conveys that progress in inflation easing towards 2% has stalled.
- Bowman further added that interest rates should remain high after one more hike to achieve the 2% inflation goal in a timely manner.
- Going forward, the upcoming consumer inflation data is expected to play a pivotal role in the Fed’s monetary policy for November. The monthly core Consumer Price Index (CPI), which excludes volatile food and Oil prices, is expected to grow at a steady pace of 0.3% in September.
- On the US-global relations front, the US Commerce Department added 42 Chinese companies to the government’s export control list for providing support to Moscow’s military and defense industrial base, as reported by Reuters.
- To stabilize US-China relations, US President Joe Biden and China’s leader Xi Jinping are planning to meet soon in California, according to several media reports.
- The US Dollar Index (DXY) rebounds sharply after correcting to near 106.00 as investors rush to safe-haven assets due to the dismal market mood prompted by the war between Israel and Hamas, which could suck in other Middle East players.
- In addition to the risk-off impulse, the hawkish interest rate outlook by Fed policymakers has propelled demand for the US Dollar and Treasuries.
- The US markets will remain closed on Monday on account of the Columbus Day holiday.
Technical Analysis: Gold price climbs to near $1,850
Gold price capitalizes on the Israel-Hamas conflict as the appeal for safe-haven investments improves. The precious metal recovers after a consolidation breakout and is expected to extend recovery to near the 20-day Exponential Moving Average (EMA), which trades around $1,870.00. The broader outlook for Gold price is bearish as the 50-day and 200-day Exponential Moving Averages (EMAs) have delivered a death cross. Momentum oscillators recover after turning to extremely oversold levels.
Fed FAQs
What does the Federal Reserve do, how does it impact the US Dollar?
Monetary policy in the US is shaped by the Federal Reserve (Fed). The Fed has two mandates: to achieve price stability and foster full employment. Its primary tool to achieve these goals is by adjusting interest rates.
When prices are rising too quickly and inflation is above the Fed’s 2% target, it raises interest rates, increasing borrowing costs throughout the economy. This results in a stronger US Dollar (USD) as it makes the US a more attractive place for international investors to park their money.
When inflation falls below 2% or the Unemployment Rate is too high, the Fed may lower interest rates to encourage borrowing, which weighs on the Greenback.
How often does the Fed hold monetary policy meetings?
The Federal Reserve (Fed) holds eight policy meetings a year, where the Federal Open Market Committee (FOMC) assesses economic conditions and makes monetary policy decisions.
The FOMC is attended by twelve Fed officials – the seven members of the Board of Governors, the president of the Federal Reserve Bank of New York, and four of the remaining eleven regional Reserve Bank presidents, who serve one-year terms on a rotating basis.
What is Quantitative Easing (QE) and how does it impact USD?
In extreme situations, the Federal Reserve may resort to a policy named Quantitative Easing (QE). QE is the process by which the Fed substantially increases the flow of credit in a stuck financial system.
It is a non-standard policy measure used during crises or when inflation is extremely low. It was the Fed’s weapon of choice during the Great Financial Crisis in 2008. It involves the Fed printing more Dollars and using them to buy high grade bonds from financial institutions. QE usually weakens the US Dollar.
What is Quantitative Tightening (QT) and how does it impact the US Dollar?
Quantitative tightening (QT) is the reverse process of QE, whereby the Federal Reserve stops buying bonds from financial institutions and does not reinvest the principal from the bonds it holds maturing, to purchase new bonds. It is usually positive for the value of the US Dollar.
- USD/JPY trades back and forth around 149.00 amid a risk-off mood.
- The Middle East tension could suck in foreign players.
- USD/JPY trades inside the ‘flash clash’ candlestick formed on October 3, which was misinterpreted as BoJ’s intervention.
The USD/JPY pair consolidated in a narrow range of around 149.00 as investors remained baffled between supporting the US Dollar and the Japanese Yen amid a risk-off mood. Deepening tensions between Israel and Hamas have prompted expectations of participation from other Middle East economies in the war, which has impacted the demand for safe-haven assets heavily.
USD/JPY remains sideways as the upside is being restricted due to hopes of an intervention by the Bank of Japan (BoJ) in the FX domain to support the Japanese Yen while the downside is well-supported as the surprisingly upbeat Nonfarm Payrolls (NFP) report has prompted expectations of one more interest-rate hike from the Federal Reserve (Fed).
This week, the major is expected to remain volatile as the US Consumer Price Index (CPI) data will be released on Thursday. The core consumer inflation is foreseen to grow at a steady pace of 0.3% in September.
USD/JPY trades inside the ‘flash clash’ candlestick formed on October 3, which was misinterpreted as BoJ’s intervention. The clarification from Bank of Japan’s (BoJ) money market data that the flash crash move was not due to the central bank’s intervention. The asset trades closely to the 50-period Exponential Moving Average (EMA) at 149.00, which indicates a sideways move ahead.
Also, the Relative Strength Index (RSI) (14) oscillates in the 40.00-60.00, indicating that investors await a fresh trigger.
Going forward, a decisive break above October 03 high at 151.16 would drive the asset toward 21 October 2022 high around 152.00 and a fresh multi-decade high of 155.00.
On the contrary, a breakdown below October 3 low at 147.32 would expose the major to September 11 low at 145.90, followed by September 01 low at 144.44.
USD/JPY two-hour chart
-638324410598169651.png)
Considering advanced readings from CME Group for natural gas futures markets, open interest dropped by around 24.7K contracts on Friday, reversing six consecutive daily builds. Volume, instead, increased by around 87.7K contracts, adding to the ongoing uptrend.
Natural Gas faces the next up-barrier at $3.50
Prices of natural gas edged higher and extended the breakout of the key $3.00 mark on Friday. The daily gains, however, were amidst shrinking open interest, which is indicative that a potential corrective move could be brewing in the very near term. In the meantime, there is a decent barrier around the $3.50 region per MMBtu ahead of the round level of $4.00.
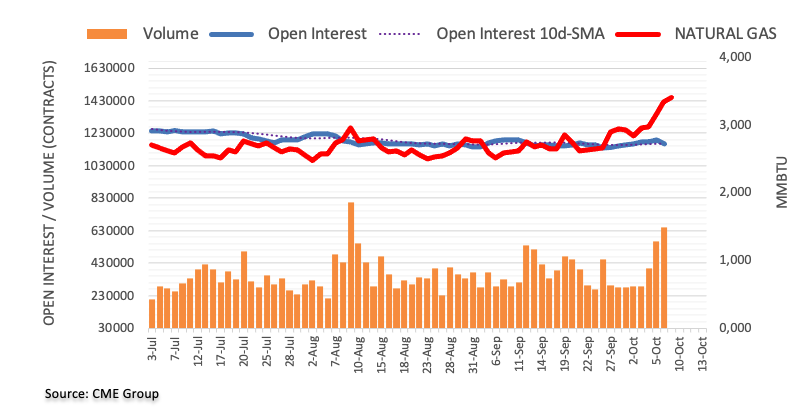
Analysts at Société Générale note that the weekly market opening was overshadowed by the headlines surrounding the Israel-Hamas conflict.
Direction of energy prices matters significantly
"The reaction is predictably risk off with bonds in Europe opening gap up (yields and swaps down), the dollar and Swissie modestly bid in FX, and Brent crude up almost 4%."
"The knee-jerk reaction in markets should subside if history is a guide. The direction of energy prices inevitably matters significantly for the purpose of inflation and monetary policy.
"This brings us to the extraordinary US payrolls report last Friday. In short, the story here is that the US economy is not slowing sufficiently and so it lowers the bar for the additional (and final) Fed rate hike embedded in the dot-plot. The down tick in wages and bear steepening of the Treasury curve negate the case a higher policy rate but this is not the view of some FOMC hawks. We’ll see what CPI brings on Thursday, but if the S&P adjusts to the current level of 10y UST yields and manages to bounce before the November meeting, then another rate increase may become inevitable. For FX, buying dollar dips would still make sense in this environment.
Further range bound appears likely around AUD/USD in the short-term horizon, comment Markets Strategist Quek Ser Leang and Senior FX Strategist Peter Chia at UOB Group.
Key Quotes
24-hour view: We highlighted last Friday that “there is scope for AUD to test 0.6400, but a clear break above this level is unlikely.” In NY trade, AUD dropped sharply to 0.6313 before snapping back up to a high of 0.6400. AUD closed at 0.6385 (+0.23%) but traded on a soft note in early Asian trade today. That said, there is still room for AUD to test 0.6400 today. However, a clear break above this level still appears unlikely. Support is at 0.6335, followed by 0.6315.
Next 1-3 weeks: Last Tuesday (03 Oct, spot at 0.6365), we held the view that AUD “is likely to weaken to 0.6330, possibly 0.6280.” After AUD plunged to a low of 0.6283, we highlighted on Wednesday (04 Oct, spot at 0.6310) that “the swift decline in AUD appears to be overstretched, but it has not stabilised.” We added, “AUD must break and stay below 0.6280 before further decline is likely.” On Friday (06 Oct), AUD tested our ‘strong resistance’ level at 0.6400. While the level has not been clearly breached, downward pressure has more or less faded. In other words, the AUD weakness has stabilised. From here, AUD is likely to trade in a range, probably between 0.6280 and 0.6440.
Open interest in crude oil futures markets shrank by around 48.5 K contracts on Friday, keeping the erratic performance well in place for yet another session. In the same line, volume dropped by just 571 contracts after three straight daily builds.
WTI could still revisit the $80.00 mark
Prices of WTI attempted a mild bounce at the end of last week following a drop to multi-week lows near $81.00. The downtick was on the back shrinking open interest, which leaves the door open to the continuation of the downward bias in the very near term. Against that, the next support of note emerges at the key $80.00 mark per barrel for the for the time being.
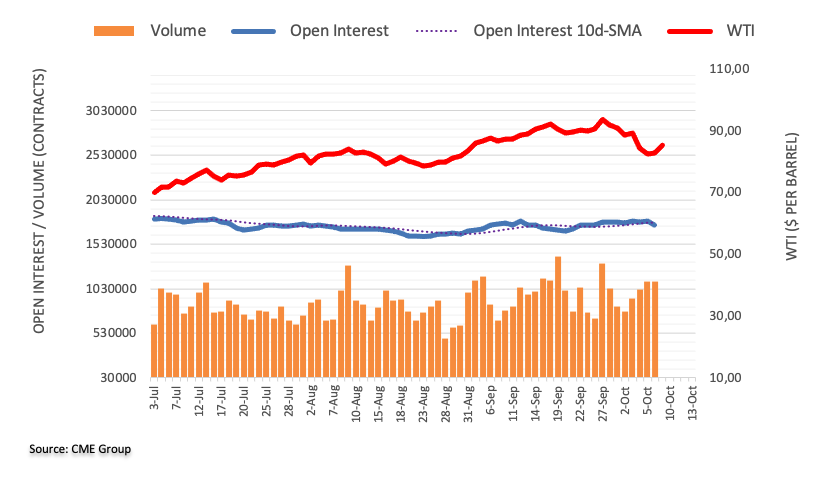
Analysts at Rabobank assess the latest CFTC Commitment of Traders report:
Data yet to signal significant weakness in US economy
"USD net long positions increased for the fifth consecutive week. This was driven by an increase in long positions. The Fed recently announced a hawkish pause, and data has yet to signal significant weakness in the US economy."
"EUR net long positions have decreased for the seventh consecutive week, driven by an increase in short positions. The ECB hiked rates again in September, but signalled this may have been the peak of the hiking cycle. Additionally, persistent strength in USD is likely to drag down EUR long positions going forward."
"GBP speculators hold a net short position for the first time since April. This move was driven by an increase in short positions. The Bank of England did not raise rates during the September meeting, following softer-than-expected CPI inflation data."
"JPY net short positions increased for the fourth consecutive week, driven by an increase in short positions, to a 3-year high. The BoJ maintained a dovish tone at its September policy meeting, though the market continues to speculate as to the possibly of policy tweaks going forward."
"CHF net shorts have increased for the second consecutive week, driven by a rise in short positions. The SNB chose to pause rate hikes during the September meeting, and moderate CPI inflation prints suggest that this may be the end of their hiking cycle."
"CAD net shorts have increased. This was driven by an increase in short positions. AUD net short positions have decreased for the second consecutive week, driven by an increase in long positions."
European Central Bank (ECB) Vice President Luis de Guindos said on Monday that the macroeconomic environment is subject to "enormous uncertainty," especially after the latest Israel-Gaza conflict, per Reuters.
De Guindos said that he was expecting inflation to continue to decline in coming months but urged for caution, citing "evolution of oil prices, the depreciation of the euro and the evolution of unit labour costs."
Market reaction
The EUR/USD pair stays on the back foot and was last seen losing 0.5% on a daily basis at 1.0535.
- NZD/USD trades lower due to the recovery in the US Dollar.
- The Mid-East tension could drive the capital flows into the safe haven assets.
- Market sentiment toward the Fed’s prolonging interest rates higher is bolstering the Greenback.
NZD/USD halts the three-day winning streak, trading in the negative territory near 0.5970 during the European session on Monday. The pair is facing downward pressure as the US Dollar (USD) rebounds on risk-off mood.
The Reserve Bank of New Zealand (RBNZ) decided to keep the Official Cash Rate (OCR) unchanged at 5.5% in a monetary policy meeting on Wednesday, aligning with widespread expectations.
The committee concurred that interest rates might need to be upheld at a restrictive level for a more prolonged duration, as mentioned in the RBNZ statement, which might have helped the Kiwi pair.
The release of US Nonfarm Payrolls data on Friday had an impact on the NZD/USD pair, initially putting pressure on it, but ultimately concluding the previous session on a positive note.
The September jobs reported a hike of 336K jobs, exceeding the market's anticipation of 170K. The revised figure for August was 227K. Nevertheless, the US Average Hourly Earnings (MoM) remained unchanged at 0.2% in September, falling short of the expected 0.3%. On an annual basis, the report indicated a decrease of 4.2%, below the expected consistent figure of 4.3%.
The conflict between Hamas and Israel is closely monitored by the markets. Any escalation could introduce geopolitical uncertainties that could reverberate across global markets.
The US Dollar Index (DXY) has rebounded after three consecutive days of losses, propelled by optimistic US Treasury yields. The DXY trades around 106.50 at the time of writing.
US Treasury yields have rebounded, influenced by expectations that the Federal Reserve (Fed) will maintain higher interest rates for an extended period. The 10-year US Treasury bond yield has once again reached 4.80%, near its peak since 2007.
Investors are likely to watch the upcoming FOMC meeting minutes scheduled for Wednesday. This release is expected to shape expectations regarding the Federal Reserve's next policy move, potentially influencing demand for the Greenback. This development could serve as a fresh directional catalyst for the NZD/USD pair.
Furthermore, there could be a keen focus on the US Core Producer Price Index later in the week, as it holds a pivotal role in assessing inflationary trends and economic conditions within the United States.
- Eurozone Sentix Investor Confidence for October came in better than expected.
- EUR/USD trades deep in negative territory below 1.0550.
Investor sentiment in the Eurozone deteriorated slightly in October, with Sentix Investor Confidence Index edging lower to -21.9 from -21.5 in September. This reading came in better than the market expectation of -24.
Assessing the survey's findings, "in the Eurozone, and especially in Germany, the economic situation remains weak and the recessionary tendencies persist," said Sentix Managing Director Manfred Huebner.
"At least there is a slight ray of hope in the form of rising expectations. However, it would be premature to declare a turnaround," he added.
Market reaction
EUR/USD remains under bearish pressure in the European trading hours on Monday and was last seen losing 0.5% on the day at 1.0535.
- WTI Crude Oil prices kick off the new week on a strong note, albeit lack follow-through.
- Escalating geopolitical tensions in the Middle East provide a strong lift to the commodity.
- Resurgent US Dollar demand keeps a lid on any further appreciation for the black liquid.
West Texas Intermediary (WTI) Crude Oil prices catches aggressive bids on the first day of a new week and recover a part of last week's heavy losses to over a one-month low, around the $80.65 region touched on Friday. The black gold, however, trims a part of its strong intraday gains and retreats to the $84.00/barrel mark during the early part of the European session, still up over 2.50% for the day.
The conflict between Israel and Palestine escalated to unforeseen levels after Hamas, a Palestinian militant group, launched an unprecedented attack on Israel and fired a barrage of rockets on Saturday. Furthermore, Palestinian militants infiltrated Israeli territory in multiple locations. This triggered a wave of retaliatory Israeli air strikes on Gaza, raising the risk of a wider Middle East conflict and fueling concerns about supply disruption. This turns out to be a key factor that provides a strong boost to Crude Oil prices, though the intraday bullish momentum falters near the $86.00 mark.
The US Dollar (USD) regains positive traction on Monday and now, seems to have stalled a three-day-old corrective decline from over a 10-month peak touched last week. This turns out to be a key factor acting as a headwind for the US Dollar-denominated commodities, including Oil prices. The US monthly jobs report (NFP) released on Friday reaffirmed market bets for at least one more rate hike by the Federal Reserve (Fed) in 2023. The hawkish outlook remains supportive of elevated US Treasury bond yields, which, along with the global risk-aversion trade, benefits the safe-haven buck.
This, along with concerns that economic headwinds stemming from higher interest rates in the United States (US) will dent fuel demand, further contributes to capping the upside for Crude Oil prices. The downside, however, seems limited in the wake of worries about tightening global crude supply, especially after oil ministers of six Arab nations reiterated to take additional measures at any time to support market stability. Furthermore, Bahrain, Iraq, Kuwait, Oman, Saudi Arabia and the United Arab Emirates reaffirmed their commitment to collective and individual voluntary adjustments to oil production.
The aforementioned mixed fundamental backdrop warrants some caution before placing aggressive directional bets. The intraday pullback from higher levels, however, suggests that the recent sharp retracement slide from the vicinity of the $94.00/barrel mark, or over a one-year high touched in September might still be far from being over.
Technical levels to watch
- USD/CAD moves above 1.3650 due to the upbeat US Dollar.
- Technical indicators suggest a bullish momentum in the price movement.
- The nine-day EMA emerges as immediate support, followed by the 23.6% Fibonacci retracement.
USD/CAD snaps the two-day losing streak, trading higher around 1.3670 aligned with the 1.3700 psychological level during the early European session on Monday. The pair is receiving upward support due to a recovery in the US Dollar (USD).
A firm break above the latter could open the doors for the USD/CAD pair to explore an area near the major level at 1.3750 lined up with the previous week’s high at 1.3785, following the 1.3800 psychological level.
However, the USD/CAD pair faced downward pressure due to surging oil prices, which could be attributed to the Palestine-Israel military conflict.
The deteriorating geopolitical tensions could impact the Canadian Dollar (CAD), especially since Canada is the largest oil exporter to the United States (US).
On the downside, the psychological level at 1.3650 could act as an immediate barrier lined up with the nine-day Exponential Moving Average (EMA) at 1.3643, followed by the 23.6% Fibonacci retracement at 1.3622 level.
The Moving Average Convergence Divergence (MACD) indicator is indicating stronger momentum in the price movement as it lies above the centerline and the signal line. This configuration suggests an upward trend in the market.
However, the prevailing upward momentum in the USD/CAD pair indicates a bullish bias, as the 14-day Relative Strength Index (RSI) remains above the 50 level.
USD/CAD: Daily Chart
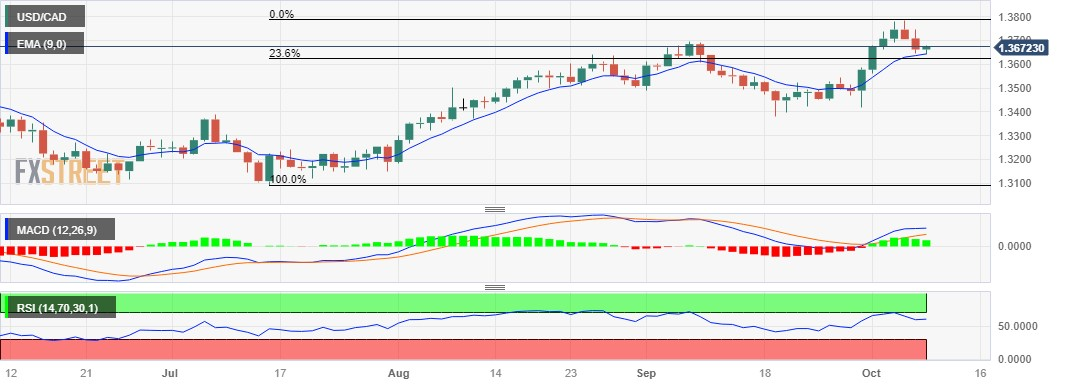
- The Euro looks markedly offered against the US Dollar.
- Stocks in Europe open the week with marked losses.
- EUR/USD retreats to the 1.0520 zone on USD-buying.
- The USD Index (DXY) reverses recent weakness and tests 106.30.
- Industrial Production in Germany surprised to the downside.
The Euro (EUR) is displaying signs of increased weakness relative to the US Dollar (USD), leading to EUR/USD to drop to the 1.0530 zone following three consecutive sessions of gains.
In contrast, the Greenback is reclaiming ground lost and revisiting the 106.30 region when gauged by the USD Index (DXY) in response to the prevailing risk-off sentiment in the global markets at the beginning of the week.
Regarding monetary policy, investors currently anticipate that the Federal Reserve (Fed) will maintain its interest rates at their current levels for the remainder of the year. Simultaneously, there is ongoing speculation in the market about the possibility of the European Central Bank (ECB) pausing its policy adjustments, despite inflation levels surpassing the bank's target and mounting concerns about the potential for a future recession or stagflation in the European region.
On the domestic calendar, Industrial Production in Germany contracted at a monthly 0.2% in August.
The US docket will be empty on Columbus Day holiday, while investors’ attention is expected to be on speeches by Dallas Fed Lorie Logan (voter, hawk), FOMC Governor Michael Barr (permanent voter, centrist) and FOMC Governor Philip Jefferson (permanent voter, centrist).
Daily digest market movers: Euro surrenders part of the recent advance
- The EUR abandons the area of recent peaks vs. the USD.
- German 10-year bund yields kick off the week on the back foot.
- Investors see the Fed refraining from moving on rates in the next months.
- Markets believe the ECB will pause its rate hike campaign.
- ECB’s Kazaks favoured an impasse at the bank’s hiking cycle.
- German Industrial Production adds to recession fears.
- Speculation on FX intervention in USD/JPY remains firm.
- Oil jumps on Israel-Hamas conflict.
Technical Analysis: Euro appears initially capped by 1.0600
EUR/USD resumes the downside and corrects lower from peaks around 1.0600 the figure.
The continuation of selling pressure on EUR/USD might result in a review of the 2023 low at 1.0448 (October 3), with a challenge of the crucial round mark of 1.0400. If this level is breached, it may pave the way for a retest of the weekly lows of 1.0290 (November 30, 2022) and 1.0222. (November 30, 2022).
If the pair gains momentum, it may aim for the next upward hurdle at 1.0617 (September 29), followed by the important 200-day SMA at 1.0823. If this level is breached, the weekly high at 1.0945 (August 30) and the psychological hurdle of 1.1000 may be tested. If the pair breaks beyond the August peak of 1.1064 (August 10), it might reach the weekly high of 1.1149 (July 27) and perhaps the 2023 peak of 1.1275. (July 18).
However, it is critical to remember that as long as the EUR/USD remains below the 200-day SMA, additional negative pressure is possible.
Euro FAQs
What is the Euro?
The Euro is the currency for the 20 European Union countries that belong to the Eurozone. It is the second most heavily traded currency in the world behind the US Dollar. In 2022, it accounted for 31% of all foreign exchange transactions, with an average daily turnover of over $2.2 trillion a day.
EUR/USD is the most heavily traded currency pair in the world, accounting for an estimated 30% off all transactions, followed by EUR/JPY (4%), EUR/GBP (3%) and EUR/AUD (2%).
What is the ECB and how does it impact the Euro?
The European Central Bank (ECB) in Frankfurt, Germany, is the reserve bank for the Eurozone. The ECB sets interest rates and manages monetary policy.
The ECB’s primary mandate is to maintain price stability, which means either controlling inflation or stimulating growth. Its primary tool is the raising or lowering of interest rates. Relatively high interest rates – or the expectation of higher rates – will usually benefit the Euro and vice versa.
The ECB Governing Council makes monetary policy decisions at meetings held eight times a year. Decisions are made by heads of the Eurozone national banks and six permanent members, including the President of the ECB, Christine Lagarde.
How does inflation data impact the value of the Euro?
Eurozone inflation data, measured by the Harmonized Index of Consumer Prices (HICP), is an important econometric for the Euro. If inflation rises more than expected, especially if above the ECB’s 2% target, it obliges the ECB to raise interest rates to bring it back under control.
Relatively high interest rates compared to its counterparts will usually benefit the Euro, as it makes the region more attractive as a place for global investors to park their money.
How does economic data influence the value of the Euro?
Data releases gauge the health of the economy and can impact on the Euro. Indicators such as GDP, Manufacturing and Services PMIs, employment, and consumer sentiment surveys can all influence the direction of the single currency.
A strong economy is good for the Euro. Not only does it attract more foreign investment but it may encourage the ECB to put up interest rates, which will directly strengthen the Euro. Otherwise, if economic data is weak, the Euro is likely to fall.
Economic data for the four largest economies in the euro area (Germany, France, Italy and Spain) are especially significant, as they account for 75% of the Eurozone’s economy.
How does the Trade Balance impact the Euro?
Another significant data release for the Euro is the Trade Balance. This indicator measures the difference between what a country earns from its exports and what it spends on imports over a given period.
If a country produces highly sought after exports then its currency will gain in value purely from the extra demand created from foreign buyers seeking to purchase these goods. Therefore, a positive net Trade Balance strengthens a currency and vice versa for a negative balance.
- Pound Sterling faces a sell-off as the bellicose situation between Israel and Hamas dampens the market mood.
- UK’s manufacturing and construction activities are going through a vulnerable phase due to higher mortgage rates.
- BoE Bailey remains confident that inflation will come down to 5% or below by year-end.
The Pound Sterling (GBP) corrected on Monday following a short-lived pullback as the Israel-Hamas conflict that began over the weekend strengthened the risk-aversion theme. The GBP/USD pair dropped sharply as the Federal Reserve (Fed) is expected to keep one more interest rate hike in consideration, while the Bank of England (BoE) may keep interest rates unchanged to phase out fears of a recession in the United Kingdom’s economy.
In the tussle against persistent inflationary pressures, the UK’s economic prospects are losing their resilience as the demand outlook deteriorates. UK firms are reluctant to raise funds at higher borrowing costs, which has reduced labor demand and overall output. The situation is expected to remain vulnerable for a longer period as the BoE vowed to keep interest rates restrictive until inflation comes down to 2%.
Daily Digest Market Movers: Pound Sterling corrects sharply on risk-off mood
- Pound Sterling extends correction below crucial support at 1.2200 as the market mood has become quite risk-off in nature due to the Israel-Hamas war.
- The broader market mood is downbeat as the Israel-Hamas conflict could suck in foreign players, which could lead to a global conflict.
- The war began with the Palestinian military group Hamas invading Israel on the morning of October 7 in an unprecedented attack.
- The GBP/USD pair recovered for three trading sessions in a row last week after finding buying interest near 1.2050 as Bank of England policymakers were confident about achieving price stability.
- BoE Governor Andrew Bailey said last week that inflation could come down to 5% or below by year-end. This indicates that UK Prime Minister Rishi Sunak would be able to fulfill his promise of halving inflation to 5.2% by the end of 2023.
- BoE policymaker Ben Broadbent sees the achievement of price stability in two years. He further added that there are “clear signs” that higher interest rates have hit demand and elevated the Unemployment Rate.
- Higher interest rates have dampened the UK’s Manufacturing and Construction PMI significantly in September. S&P Global reported the UK Construction PMI at 45.0 in September, much lower than expectations of 49.9 and the former release of 50.8. A figure below the 50.0 threshold is considered a contraction.
- Going forward, investors will focus on the UK’s Financial Policy Committee (FPC) meeting minutes, which will be released on Tuesday at 09:30 GMT. The FPC is an official committee of BoE that monitors macroeconomic and financial issues, that could impact long-term growth prospects of the UK economy.
- This week, UK factor activity data for August will be keenly watched. The Industrial and Manufacturing Production data are expected to continue the contraction spell but at a slower rate.
- The US Dollar Index (DXY) recovered after correcting to near 106.00, supported by cautious market sentiment and rising expectations of one more interest rate increase from the Federal Reserve (Fed) after an upbeat Nonfarm Payrolls (NFP) report for September.
- The US labor force witnessed 336K fresh jobs last Friday, much higher than estimates of 170K and the former release of the upwardly-revised 227K. The Unemployment Rate remains steady at 3.8%, nominally higher than expectations of 3.7%.
- The monthly wage rate grew by 0.2% but lower than expectations of 0.3%. The annualized wage rate decelerated to 4.2% vs. the estimates and the former release of 4.3%.
- The US economy has been resilient due to tight labor market conditions, robust consumer spending, and a revival in factory activities. This could keep the last leg of inflation sticky and elevate expectations of further policy-tightening.
- The US Dollar is expected to remain volatile this week as investors will focus on the consumer inflation data for September, which will be released on Thursday.
Technical Analysis: Pound Sterling faces sell-off near 1.2250
Pound Sterling faces selling pressure after sensing barricades near the immediate resistance of 1.2250. The appeal for the GBP/USD pair remains poor as market sentiment remains downbeat, and investors are worried about the UK’s economic prospects. The broader GBP/USD outlook dampens as the 50 and 200-day Exponential Moving Averages (EMAs) have delivered a Death Cross, which warrants more downside. Potential support is placed around 1.2000.
BoE FAQs
What does the Bank of England do and how does it impact the Pound?
The Bank of England (BoE) decides monetary policy for the United Kingdom. Its primary goal is to achieve ‘price stability’, or a steady inflation rate of 2%. Its tool for achieving this is via the adjustment of base lending rates. The BoE sets the rate at which it lends to commercial banks and banks lend to each other, determining the level of interest rates in the economy overall. This also impacts the value of the Pound Sterling (GBP).
How does the Bank of England’s monetary policy influence Sterling?
When inflation is above the Bank of England’s target it responds by raising interest rates, making it more expensive for people and businesses to access credit. This is positive for the Pound Sterling because higher interest rates make the UK a more attractive place for global investors to park their money. When inflation falls below target, it is a sign economic growth is slowing, and the BoE will consider lowering interest rates to cheapen credit in the hope businesses will borrow to invest in growth-generating projects – a negative for the Pound Sterling.
What is Quantitative Easing (QE) and how does it affect the Pound?
In extreme situations, the Bank of England can enact a policy called Quantitative Easing (QE). QE is the process by which the BoE substantially increases the flow of credit in a stuck financial system. QE is a last resort policy when lowering interest rates will not achieve the necessary result. The process of QE involves the BoE printing money to buy assets – usually government or AAA-rated corporate bonds – from banks and other financial institutions. QE usually results in a weaker Pound Sterling.
What is Quantitative tightening (QT) and how does it affect the Pound Sterling?
Quantitative tightening (QT) is the reverse of QE, enacted when the economy is strengthening and inflation starts rising. Whilst in QE the Bank of England (BoE) purchases government and corporate bonds from financial institutions to encourage them to lend; in QT, the BoE stops buying more bonds, and stops reinvesting the principal maturing on the bonds it already holds. It is usually positive for the Pound Sterling.
- Silver touches a one-week high on Monday, albeit struggles to capitalize on the momentum.
- The technical setup favours bears and supports prospects for an extension of the recent fall.
- A sustained strength beyond the $22.20-30 region is needed to negate the negative outlook.
Silver builds on Friday's breakout momentum through a multi-day-old trading range and gains strong follow-through traction for the second successive day. The white metal climbs to a one-week high on Monday, albeit struggles to capitalize on the move or find acceptance above the $22.00 mark, warranting some caution before placing fresh bullish bets.
The recent failure near a technically significant 200-day Simple Moving Average (SMA) and a subsequent breakdown through the $22.30-$22.20 horizontal support was seen as a fresh trigger for bearish traders. Moreover, oscillators on the daily chart – though have recovered from lower levels – are still holding in the negative territory. This, in turn, suggests that the path of least resistance for the XAG/USD remains to the downside and supports prospects for the emergence of fresh selling at higher levels.
Hence, any further move up is more likely to remain capped near the aforementioned support breakpoint, now turned resistance, around the $22.20-$22.30 region. The said area should act as a pivotal point for short-term traders, which if cleared decisively might negate the negative outlook and prompt an aggressive short-covering move. The XAG/USD might then aim to reclaim the $23.00 mark and extend the upward trajectory further towards challenging the 200-day SMA, currently around the $23.35 area.
On the flip side, weakness below the daily low, around the $21.60 area, will reaffirm the negative bias and drag the XAG/USD back towards a multi-day-old trading range resistance breakpoint, around the $21.3-$21.30 region. The next relevant support is pegged near the $21.00 mark, below which the downward trajectory could get extended towards a nearly seven-month low, around the $20.70-$20.65 zone touched last week, en route to the YTD trough – levels just below the $20.00 psychological mark.
Silver daily chart
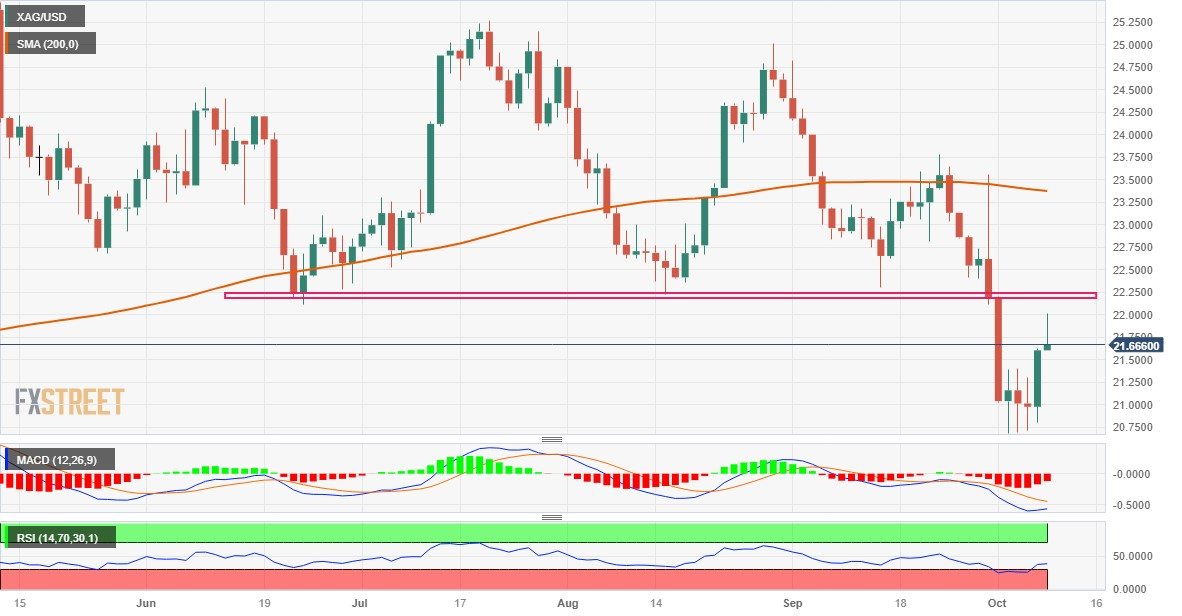
Technical levels to watch
- USD/CHF trades lower near 1.0530 due to the upbeat US Dollar.
- The Palestine-Israel conflict could push the flow toward safe haven Greenback.
- Solid US NFP data bolsters the strength of the US Dollar (USD).
EUR/USD snaps the winning streak that began on Wednesday, trading in the red zone near 1.0530 during the Asian session on Monday. The pair is experiencing downward pressure due to risk aversion, which is attributed to the Palestine-Israel military conflict.
In an interview with the French paper La Tribune Dimanche, Christine Lagarde stated, "The key ECB interest rates have reached levels that, if maintained for a sufficiently long duration, will make a substantial contribution to the timely return of inflation to the target."
European Central Bank (ECB) President Christine Lagarde expects to meet the target of inflation back down to 2%. Lagarde also mentioned the confidence in Europe's gas reserves situation.
Germany’s Industrial Production (YoY) for Aug, declined by 2.0% from the previous 1.7% fall. While monthly data showed a fall of 0.2%, deeper than the 0.1% decline as expected.
Furthermore, the release of US Nonfarm Payrolls data on Friday had an impact on the EUR/USD pair, initially putting pressure on it, but ultimately concluding the previous session on a positive note.
The September jobs report showed a significant rise of 336,000 jobs, exceeding the market's anticipation of 170,000. The revised figure for August was 227,000. Nevertheless, the US Average Hourly Earnings (MoM) remained unchanged at 0.2% in September, falling short of the expected 0.3%. On an annual basis, the report indicated a decrease of 4.2%, below the expected consistent figure of 4.3%.
The ongoing military conflict in the Middle East, involving Hamas and Israel, is closely monitored by the markets. Concerns persist that the conflict may escalate and spread throughout the region, introducing geopolitical uncertainties that could reverberate across global markets.
The US Dollar Index (DXY) has rebounded after three consecutive days of losses, propelled by optimistic US Treasury yields. The DXY trades around 106.30 at the time of writing.
US Treasury yields have rebounded, influenced by expectations that the Federal Reserve (Fed) will maintain higher interest rates for an extended period. The 10-year US Treasury bond yield has once again reached 4.80%, near its peak since 2007.
Investors are expected to keep a close eye on the upcoming International Monetary Fund (IMF) meeting, where discussions will revolve around strategies for stabilizing international exchange rates and promoting development.
Furthermore, there could be a keen focus on the US Core Producer Price Index later in the week, as it holds a pivotal role in assessing inflationary trends and economic conditions within the United States.
The escalation of violence has the potential to drive investors toward traditional safe-haven assets, with the Swiss Franc (CHF) being a notable example. During times of heightened geopolitical uncertainty, there tends to be an increased demand for safe-haven assets, and CHF is often considered a less risky option in such situations.
Here is what you need to know on Monday, October 9:
Investors seek refuge to start the week as geopolitical tensions escalate after Israel formally declared war against the Palestinian Hamas group. The US Dollar Index opened with a bullish gap and was last seen trading in positive territory below 106.50. Although bond markets in the US will remain closed in observance of the Columbus Day holiday, the New York Stock Exchange and the Nasdaq Stock Market will operate at regular hours. Reflecting the risk-averse market environment, US stock index futures were last seen losing between 0.5% and 0.6%.
US Dollar price today
The table below shows the percentage change of US Dollar (USD) against listed major currencies today. US Dollar was the strongest against the Australian Dollar.
| USD | EUR | GBP | CAD | AUD | JPY | NZD | CHF | |
| USD | 0.23% | 0.23% | -0.07% | 0.28% | -0.01% | 0.10% | 0.20% | |
| EUR | -0.26% | -0.01% | -0.31% | 0.03% | -0.26% | -0.14% | -0.04% | |
| GBP | -0.23% | 0.01% | -0.29% | 0.02% | -0.25% | -0.15% | -0.02% | |
| CAD | 0.06% | 0.30% | 0.29% | 0.33% | 0.05% | 0.16% | 0.28% | |
| AUD | -0.28% | 0.01% | 0.00% | -0.29% | -0.25% | -0.15% | -0.05% | |
| JPY | 0.00% | 0.25% | 0.25% | -0.03% | 0.25% | 0.08% | 0.23% | |
| NZD | -0.08% | 0.16% | 0.16% | -0.14% | 0.15% | -0.09% | 0.12% | |
| CHF | -0.21% | 0.05% | 0.04% | -0.25% | 0.06% | -0.21% | -0.11% |
The heat map shows percentage changes of major currencies against each other. The base currency is picked from the left column, while the quote currency is picked from the top row. For example, if you pick the Euro from the left column and move along the horizontal line to the Japanese Yen, the percentage change displayed in the box will represent EUR (base)/JPY (quote).
According to the latest reports, Israeli military has deployed about 100,000 reserve troops near Gaza, while fighting continues in at least three areas in southern Israel. At least 700 people have died after Hamas fired a barrage of rocket from Gaza Strip over the weekend.
Sentix Investor Confidence Index for October will be the only data featured in the European economic docket. In the second half of the day, several Federal Reserve policymakers are scheduled to deliver speeches.
EUR/USD started the week in negative territory and continued to stretch lower in the European morning. At the time of press, EUR/USD was down 0.4% on the day at 1.0545.
After closing the third straight day in positive territory on Friday, GBP/USD turned south on Monday and declined below 1.2200.
Crude Oil prices surged higher and the barrel of West Texas Intermediate jumped above $87 before retreating slightly below $86, where it was still up nearly 4% on a daily basis. Despite the broad-based USD strength, USD/CAD holds steady at around 1.3650 early Monday as the commodity-sensitive Canadian Dollar benefits from rising oil prices.
The Japanese Yen's safe-haven status helps it stay resilient against the USD on Monday, with USD/JPY fluctuating in a tight channel slightly above 149.00.
Gold opened with a bullish gap and was last seen rising more than 1% on the day at $1,852.
USD/CHF trades higher near 0.9100 due to stronger US Dollar.
The Palestine-Israel conflict could elevate demand for the safe-haven Swiss Franc.
Positive employment data in the United States bolsters the strength of the US Dollar (USD).
USD/CHF retraces its almost intraday losses, trading around 0.9100 during the Asian session on Monday. The pair faced downward pressure due to the Palestine-Israel military conflict. Additionally, US Nonfarm Payrolls data unveiled on Friday failed to underpin the USD/CHF pair.
The jobs report for September revealed a notable increase of 336,000 jobs, surpassing the market expectation of 170,000. The revised figure for August stood at 227,000. However, US Average Hourly Earnings (MoM) remained steady at 0.2% in September, falling short of the expected 0.3%. On an annual basis, the report indicated a decline of 4.2%, below the anticipated consistent figure of 4.3%.
The ongoing military conflict in the Middle East between Hamas and Israel is being closely watched by the markets. The worry is that the conflict could intensify and extend to other parts of the region, introducing geopolitical uncertainties that might have repercussions on global markets.
The escalation of violence has the potential to prompt investors to seek refuge in traditional safe-haven assets, with Swiss Franc (CHF) being a notable example. During periods of heightened geopolitical uncertainty, there tends to be an increased demand for safe-haven assets, and CHF is often viewed as a less risky asset in such situations.
The US Dollar Index (DXY) has bounced back after three consecutive days of losses, propelled by the upbeat US Treasury yields. The spot trades around 106.30 at the time of writing.
US Treasury yields rebounded, triggered by expectations of the Federal Reserve (Fed) maintaining higher interest rates for a prolonged period. The 10-year US Treasury bond yield has once again stood at 4.80% near its peak since 2007, by the press time.
Investors are expected to keep a close eye on the upcoming International Monetary Fund (IMF) meeting, where discussions will revolve around strategies for stabilizing international exchange rates and promoting development.
Furthermore, there could be a keen focus on the US Core Producer Price Index later in the week, as it holds a pivotal role in assessing inflationary trends and economic conditions within the United States.
In the view of Markets Strategist Quek Ser Leang and Senior FX Strategist Peter Chia at UOB Group, GBP/USD is still seen navigating the 1.2030-1.2270 rang for the time being.
Key Quotes
24-hour view: We highlighted last Friday that GBP “could rise above 1.2230, but it is unlikely to be able to maintain a foothold above this level.” We also highlighted that “the major resistance at 1.2270 is unlikely to come under threat.” However, the price action did not develop as we anticipated. In NY trade, GBP plunged to a low of 1.2107 and then lifted off to surge to a high of 1.2262. From here, the outlook is unclear, and GBP could trade in a relatively broad range of 1.2130/1.2270 today.
Next 1-3 weeks: In our latest narrative from last Thursday (05 Oct, spot at 1.2140), we highlighted that the recent downward momentum buildup has faded and the current price movement is likely part of a range-trading phase. We expected GBP to trade between 1.2030 and 1.2270. There is no change in our view. Looking ahead, if GBP breaks clearly above 1.2270, it could trigger a recovery to 1.2350.
According to the official data published on Monday, Germany’s Industrial Production declined more than expected in August, suggesting sluggish manufacturing sector activity.
Industrial output in the Eurozone’s economic powerhouse dropped 0.2% MoM, the federal statistics authority Destatis said in figures adjusted for seasonal and calendar effects, vs. -0.1% expected and -0.6% seen in July.
On an annual basis, German Industrial Production fell 2.0% in August when compared to a 1.7% drop in July.
FX implications
The shared currency remains on the back foot against the US Dollar after mixed German industrial figures. The pair is losing 0.32% on the day to trade at 1.0551, as of writing.
- Asian market showed mixed performance in the midst of the Israeli-Palestinian conflict.
- Australia’s S&P/ASX 200 extends gains due to the surging energy and gold equities.
- Hong Kong's stock market has canceled trading following the elevation of the typhoon warning.
Asian markets exhibit a mixed sentiment with a negative bias as the market is cautious of the war between Israel and Hamas that erupted over the weekend is likely to weigh on the market.
At the time of writing, China's SSE Composite Index is down by 0.64% to 3,090, Shenzhen Component Index has declined to 10,034, up by 0.74% and Taiwan's Weighted Index has improved by 0.41%.
Australia’s S&P/ASX 200 rose by 0.23% on the back of surging energy and gold equities due to the conflict between Hamas and Israel. The ongoing military conflict in the Middle East between Hamas and Israel is being closely watched by the markets.
The worry is that the conflict could intensify and extend to other parts of the region, introducing geopolitical uncertainties that might have repercussions on global markets.
Following a week-long Golden Week holiday, Chinese markets are returning to activity. Investors are expected to closely monitor upcoming inflation readings and trade data releases from both China and India later this week.
Additionally, attention will be focused on the monetary policy decision from Singapore's central bank.
The Hong Kong stock market has suspended trading for the morning session following the elevation of the typhoon warning to Signal 8 for Typhoon Koinu.
This precautionary measure is in line with ensuring the safety of market participants and responding to potential risks associated with adverse weather conditions.
Despite the suspension of trading in the stock market, Hang Seng index futures have shown resilience. Moreover, Japan and South Korea’s markets are closed for a holiday.
- The index reverses three consecutive daily pullbacks.
- The probability of a Fed’s rate hike loses traction.
- Investors’ attention is expected to be on the US CPI.
The greenback reverses three daily drops in a row and regains the 106.30 region when tracked by the USD Index (DXY) at the beginning of the week.
USD looks at risk trends, inflation
The index leaves behind part of last week’s corrective decline and manages to pick up some buying interest on Monday.
In the meantime, the underlying bullish trend in the greenback remains well propped up by the equally robust march north in US yields across different time frames, which in turn looks underpinned by the persistent tighter-for-longer narrative around the Federal Reserve.
It is worth noting that the US bonds market will be closed on Monday due to the Columbus Day holiday.
On another front, the USD net longs climbed to levels last seen in mid-December 2022 during the week ended on October 3, according to the CFTC Positioning Report. During that period, the index rose to fresh 2023 tops past the 107.00 hurdle, always bolstered by speculation that the Fed might extend its restrictive stance for longer than anticipated.
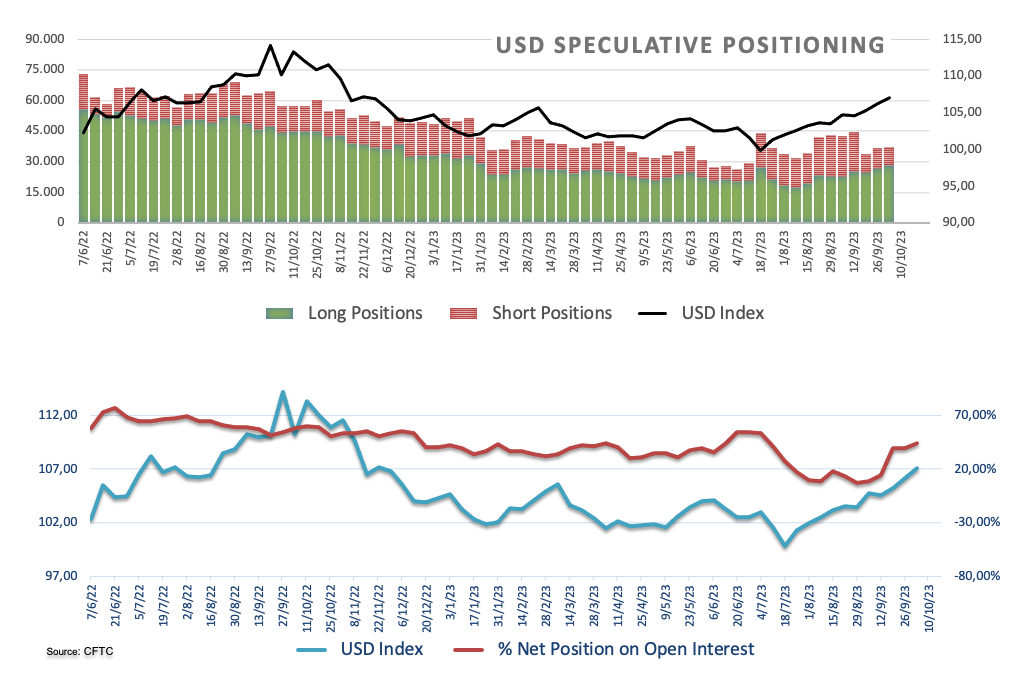
There are no scheduled data releases on Monday, although markets’ attention will likely be on the speeches by Dallas Fed Lorie Logan (voter, hawk), FOMC Governor Michael Barr (permanent voter, centrist) and FOMC Governor Philip Jefferson (permanent voter, centrist).
What to look for around USD
The index attempts a rebound after briefly piercing the key 106.00 support at the end of last week.
In the meantime, support for the dollar keeps coming from the good health of the US economy, which at the same time appears underpinned by the renewed tighter-for-longer stance narrative from the Federal Reserve.
Key events in the US this week: NFIB Business Optimism Index, Wholesale Inventories (Tuesday) – MBA Mortgage Applications, Producer Prices, FOMC Minutes (Wednesday) - Initial Jobless Claims, Inflation Rate (Thursday) – Flash Consumer (Friday).
Eminent issues on the back boiler: Persevering debate over a soft or hard landing for the US economy. Incipient speculation of rate cuts in early 2024. Geopolitical effervescence vs. Russia and China.
USD Index relevant levels
Now, the index is up 0.21% at 106.32 and a breakout of 107.34 (2023 high October 3) would open the door to 107.99 (weekly high November 21 2022) and finally 110.99 (high November 10 2022). On the downside, the next support emerges at 105.65 (low September 29) ahead of 104.42 (weekly low September 11) and then 103.17 (200-day SMA).
CME Group’s flash data for gold futures markets noted open interest rose for the third session in a row on Friday, this time by more than 1K contracts. Volume followed suit and went up by nearly 64K contracts after two consecutive daily drops.
Gold now retargets $1900
Friday’s marked rebound in gold prices was accompanied by increasing open interest and volume, leaving the door open to further advance in the very near term. Against that, the precious metal is seen retargeting the key $1900 region per troy ounce for the time being.
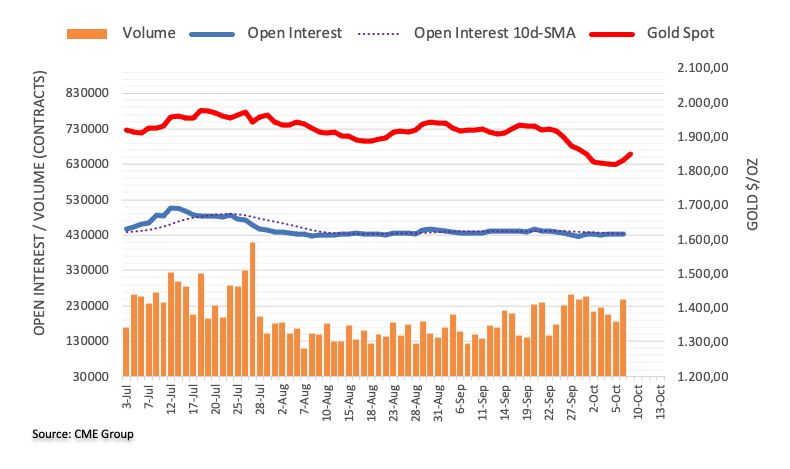
In a bid to support the market following the Hamas military attacks over the weekend, the Bank of Israel, the Israeli central bank announced on Monday a program to sell up to $30 billion in forex.
Additional takeaways
Will provide liquidity to the market through swap mechanisms of up to $15 billion as necessary.
Will operate in the market in the coming period to moderate Shekel volatility and provide needed liquidity.
Will continue monitoring developments tracking all of the markets and acting with the tools available to it as necessary.
The Israeli Shekel (ISL) opened on Monday, with a huge bearish gap against the US Dollar, as investors took account of the weekend’s military violence between Israel and the Hamas movement in Palestine.
USD/ISL jumped to the highest level since February 2016 at 3.9230 before reversing to the 3.9050 area on the central bank’s stabilization program. The currency pair is still adding 1.40% on the day.
Related reads
-
Risk tumbles on Palestine-Israel military conflict, safe havens bid
-
WTI surges over 4% to recapture $85 on Middle East violence
Markets Strategist Quek Ser Leang and Senior FX Strategist Peter Chia at UOB Group suggest the recovery in EUR/USD is expected to reach 1.0630 in the near term.
Key Quotes
24-hour view: We expected EUR to rise further to 1.0595 last Friday. However, we held the view that “the major resistance at 1.0630 is highly unlikely to come into view.” In early NY trade, EUR plummeted to a low of 1.0481 and then surged to a high of 1.0599. There does not appear to be any clear directional bias for now. Today, EUR could trade in a range, probably between 1.0500 and 1.0600.
Next 1-3 weeks: Our view from last Friday (06 Oct, spot at 1.0545) still stands. As highlighted, the current price action in EUR is likely part of a rebound that could extend to 1.0630 but is unlikely to break clearly above this level. The mild upward pressure is intact as long as EUR stays above 1.0460 (no change in ‘strong support’ level from last Friday).
- Gold price continues to trade higher on geopolitical tension.
- The Palestine-Israel conflict could increase the demand for safe-haven assets like Gold.
- Upbeat US jobs data supports the US Dollar (USD).
Gold price continues to move on an upward trajectory, trading higher around $1,850 per troy ounce during the Asian session on Monday. The prices of Gold are receiving upward support due to risk aversion, which could be attributed to the Palestine-Israel military conflict.
The ongoing military conflict in the Middle East between Hamas and Israel is being closely watched by the markets. The worry is that the conflict could intensify and extend to other parts of the region, introducing geopolitical uncertainties that might have repercussions on global markets.
The escalation of violence has the potential to prompt investors to seek refuge in traditional safe-haven assets, with Gold being a notable example. During periods of heightened geopolitical uncertainty, there tends to be an increased demand for safe-haven assets, and Gold is often viewed as a store of value in such situations.
The US Dollar Index (DXY) has bounced back after three consecutive days of losses, trading around 106.20, by the press time. The strength in the US Dollar (USD) can be attributed to the impressive US Nonfarm Payrolls data unveiled on Friday.
The jobs report for September revealed a notable increase of 336,000 jobs, surpassing the market expectation of 170,000. The revised figure for August stood at 227,000. However, US Average Hourly Earnings (MoM) remained steady at 0.2% in September, falling short of the expected 0.3%. On an annual basis, the report indicated a decline of 4.2%, below the anticipated consistent figure of 4.3%.
US Treasury yields have also rebounded, driven by expectations of the Federal Reserve (Fed) maintaining higher interest rates for an extended period. As of now, the 10-year US Treasury bond yield has once again stood at 4.80% near its peak since 2007.
Investors will likely monitor the upcoming International Monetary Fund (IMF) meeting, which is set to deliberate on strategies for stabilizing international exchange rates and fostering development.
Additionally, attention will be focused on the US Core Producer Price Index later in the week, as it plays a crucial role in gauging inflationary trends and economic conditions in the United States.
Analysts at Australia and New Zealand Banking Group (ANZ) offer a snippet of their expectations on the upcoming Consumer Price Index (CPI) data from the United States (US) this week.
Key quotes
“Nonfarm Payrolls came in almost double expectations in September at 336k. The headline number may overstate the strength of the labor market as the average number of hours worked per week has been declining recently amid fewer full-time and more part-time jobs.
The outsized payroll number raises the prospect the Fed may hike again, but it’s not a clincher. September Consumer Price Index data out this week should be more revealing. We expect core inflation to rise by 0.2% m/m, which should be well received by the Fed.
The recent rise in yields has caught the eye of several Fed officials. They argue that if this rise is to be sustained there may not be a need for the 25bp rise included in the Fed’s 2023 dot plot.
The September FOMC minutes are likely to be scrutinized for discussions around the confidence in the soft-landing scenario which is laid out in the median Fed officials projections. In addition, getting some sense of the views around the restrictiveness of monetary policy.”
- EUR/USD retreats from over a one-week high amid reviving demand for the safe-haven USD.
- The technical setup still favours bearish traders and supports prospects for a further decline.
- Any strength beyond 1.0600 is likely to remain capped near the ascending channel barrier.
The EUR/USD pair opens with a modest bearish gap opening on the first day of a new week and snaps a three-day winning streak to the 1.0600 neighbourhood, or over a one-week high touched on Friday. Spot prices remain depressed through the Asian session and currently trade around the 1.0550 area or the daily low.
As investors digest the mixed US monthly jobs report released on Friday, fresh geopolitical tensions lend some support to the safe-haven US Dollar (USD) and act as a headwind for the EUR/USD pair. The USD is further underpinned by the prospects for further policy tightening by the Federal Reserve (Fed), which remains supportive of elevated US Treasury bond yields. Apart from this, speculations that additional rate hikes by the European Central Bank (ECB) may be off the table for now contribute to capping the upside for the major.
From a technical perspective, the recent decline from a 17-month peak touched in June has been along a descending channel and points to a well-established downtrend. Furthermore, the death-cross, with the 50-day Simple Moving Average (SMA) falling below the 200-day SMA for the first time since July 2021, favours bearish traders. Apart from this, oscillators on the daily chart – though have recovered from lower levels – are still holding in the negative territory and suggest that the path of least resistance for the EUR/USD pair is to the downside.
The 1.0500 psychological mark, however, could act as immediate support and help limit the downside for spot prices. A convincing break below the said handle will reaffirm the bearish outlook and make the EUR/USD pair vulnerable to retesting the YTD low, around the 1.0450-1.0445 region touched last week. The downward trajectory could get extended further towards challenging the ascending channel support, currently pegged around the 1.0400 mark. Some follow-through selling will be seen as a fresh trigger for bearish traders.
On the flip side, momentum beyond the 1.0600 mark could get extended, though is more likely to remain capped near the top boundary of the aforementioned channel, currently around the 1.0640-1.0645 region. The latter should act as a key pivotal point, which if cleared decisively will suggest that the EUR/USD pair has formed a near-term bottom and shift the bias in favour of bullish traders.
EUR/USD daily chart
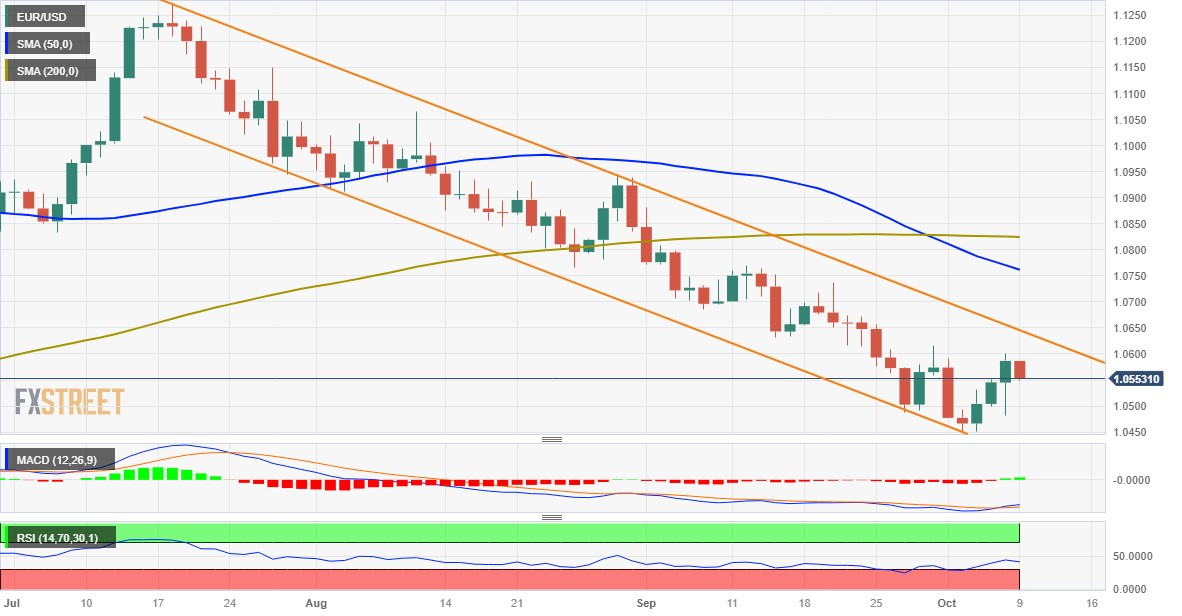
Technical levels to watch
- Gold price scales higher for the second straight day and climbs to over a one-week high on Monday.
- Escalating geopolitical tensions in the Middle East provide a strong lift to the safe-haven XAU/USD.
- Hawkish Fed expectations, elevated US bond yields underpin the USD and cap gains for the metal.
Gold price (XAU/USD) witnessed a dramatic intraday turnaround on Friday and rallied over 1.3% from the $1,810 area, or its lowest level since March 8 touched in the aftermath of the United States (US) monthly jobs data. The US Nonfarm Payrolls (NFP) report, meanwhile, reaffirmed bets for at least one more rate hike by the Federal Reserve (Fed) in 2023 and continued weighing on the precious metal.
Additional details of the report, however, revealed that wage growth remained moderate during the reported month and eased inflationary concerns, which could allow the Fed to soften its hawkish stance. This, in turn, dragged the US Dollar (USD) lower for the third successive day, which prompted aggressive short-covering around the Gold price and allowed it to snap a nine-day losing streak.
Adding to this, escalating geopolitical tensions in the Middle East assisted the XAU/USD in gaining some follow-through traction on the first day of a new week and climb to over a one-week top during the Asian session. The Gold price, however, struggles to capitalize on the move beyond the $1,855 area as traders now look to this week's release of the FOMC meeting minutes and the US consumer inflation figures.
Daily Digest Market Movers: Gold price benefits from escalating geopolitical tensions
- The US NFP report showed on last Friday that the economy added 336K jobs in September, much higher than anticipated, and the previous month's reading was also revised higher to 227K from 187K.
- Average Hourly Earnings rose by 0.2% during the reported month, matching a similar gain in August, and advanced by 4.2% over the 12 months through September as compared to the 4.3% previous.
- The markets are still pricing in the possibility of at least one more rate hike by the Federal Reserve (Fed) in 2023, which remains supportive of elevated US bond yields and underpins the US Dollar.
- Geopolitical tensions trigger a fresh wave of the global risk-aversion sentiment, assisting the safe-haven Gold price to gain some follow-through traction and climb to over a one-week high on Monday.
- Israel launched airstrikes on Gaza and declared war against the Palestinian enclave of Gaza on Sunday in response to an unprecedented attack by the Hamas militant group in Gaza on Israeli towns.
- The development raises the risk of a wider Middle East conflict and boosts demand for traditional safe-haven assets, which, in turn, is seen benefitting the Gold price.
- Market participants now look to this week's release of the FOMC meeting minutes and the latest US consumer inflation figures for fresh cues about the Fed's future rate-hike path.
Technical Analysis: Gold price is likely to attract fresh sellers at higher levels
The strong move-up witnessed over the past two trading sessions might still be categorized as a technical bounce on the back of the oversold Relative Strength Index (RSI) on the daily chart. The occurrence of a death-cross, with the 50-day Simple Moving Average (SMA) falling below the very important 200-day SMA for the first time since July 2022, suggests that the path of least resistance for the Gold price is still to the downside. Hence, any subsequent move up might still be seen as a selling opportunity and runs the risk of fizzling out rather quickly.
From current levels, momentum beyond the daily peak, around the $1,855-1,856 region, is likely to confront stiff resistance near the $1,865 zone. Some follow-through buying, however, has the potential to lift the Gold price further towards the next relevant hurdle near the $1,885 area. This is closely followed by the $1,900 round figure, which should now act as a key pivotal point for short-term traders. On the flip side, the $1,835-1,834 region now seems to protect the immediate downside, below which the XAU/USD could slide to the $1,820 support en route to the multi-month low, around the $1,810 zone.
US Dollar price today
The table below shows the percentage change of US Dollar (USD) against listed major currencies today. US Dollar was the strongest against the Australian Dollar.
| USD | EUR | GBP | CAD | AUD | JPY | NZD | CHF | |
| USD | 0.13% | 0.17% | -0.02% | 0.26% | 0.01% | 0.03% | 0.14% | |
| EUR | -0.15% | 0.04% | -0.15% | 0.11% | -0.14% | -0.11% | 0.01% | |
| GBP | -0.18% | -0.04% | -0.19% | 0.04% | -0.17% | -0.17% | -0.03% | |
| CAD | 0.02% | 0.15% | 0.19% | 0.28% | 0.02% | 0.04% | 0.16% | |
| AUD | -0.26% | -0.08% | -0.05% | -0.23% | -0.22% | -0.22% | -0.07% | |
| JPY | -0.01% | 0.11% | 0.16% | 0.00% | 0.21% | -0.04% | 0.14% | |
| NZD | -0.01% | 0.14% | 0.17% | -0.02% | 0.22% | 0.01% | 0.13% | |
| CHF | -0.16% | 0.00% | 0.03% | -0.15% | 0.08% | -0.15% | -0.13% |
The heat map shows percentage changes of major currencies against each other. The base currency is picked from the left column, while the quote currency is picked from the top row. For example, if you pick the Euro from the left column and move along the horizontal line to the Japanese Yen, the percentage change displayed in the box will represent EUR (base)/JPY (quote).
Risk sentiment FAQs
What do the terms"risk-on" and "risk-off" mean when referring to sentiment in financial markets?
In the world of financial jargon the two widely used terms “risk-on” and “risk off'' refer to the level of risk that investors are willing to stomach during the period referenced. In a “risk-on” market, investors are optimistic about the future and more willing to buy risky assets. In a “risk-off” market investors start to ‘play it safe’ because they are worried about the future, and therefore buy less risky assets that are more certain of bringing a return, even if it is relatively modest.
What are the key assets to track to understand risk sentiment dynamics?
Typically, during periods of “risk-on”, stock markets will rise, most commodities – except Gold – will also gain in value, since they benefit from a positive growth outlook. The currencies of nations that are heavy commodity exporters strengthen because of increased demand, and Cryptocurrencies rise. In a “risk-off” market, Bonds go up – especially major government Bonds – Gold shines, and safe-haven currencies such as the Japanese Yen, Swiss Franc and US Dollar all benefit.
Which currencies strengthen when sentiment is "risk-on"?
The Australian Dollar (AUD), the Canadian Dollar (CAD), the New Zealand Dollar (NZD) and minor FX like the Ruble (RUB) and the South African Rand (ZAR), all tend to rise in markets that are “risk-on”. This is because the economies of these currencies are heavily reliant on commodity exports for growth, and commodities tend to rise in price during risk-on periods. This is because investors foresee greater demand for raw materials in the future due to heightened economic activity.
Which currencies strengthen when sentiment is "risk-off"?
The major currencies that tend to rise during periods of “risk-off” are the US Dollar (USD), the Japanese Yen (JPY) and the Swiss Franc (CHF). The US Dollar, because it is the world’s reserve currency, and because in times of crisis investors buy US government debt, which is seen as safe because the largest economy in the world is unlikely to default. The Yen, from increased demand for Japanese government bonds, because a high proportion are held by domestic investors who are unlikely to dump them – even in a crisis. The Swiss Franc, because strict Swiss banking laws offer investors enhanced capital protection.
- Australian Dollar experiences positive momentum due to a surge in energy and gold prices.
- Australia ensures a stable supply of energy resources to Japan, creating an investment environment in Australia.
- Robust US Nonfarm Payrolls reinforced the strength of the US Dollar (USD).
The Australian Dollar (AUD) extends the winning streak that began on Wednesday. The Aussie pair is receiving upward support, propelled by robust underlying commodity prices amid the ongoing violence in the Middle East.
Australia has committed to ensuring a stable supply of energy resources to Japan in the fifth Japan-Australia Ministerial Economic Dialogue. This agreement reflects a strategic partnership between the two countries, emphasizing the importance of a reliable and consistent flow of energy resources, likely encompassing areas such as coal, and liquified natural gas (LNG).
Moreover, this commitment is geared towards creating a dependable investment environment in Australia's resources and energy sector.
China has decided to extend its investigation into trade barriers imposed by Taiwan for an additional three months, as announced by its commerce ministry on Monday. Australia is the largest exporter of commodities such as iron ore, coal, and natural gas.
Any escalation in trade tensions between China and Taiwan could affect global trade dynamics and, consequently, commodity prices. This, in turn, can impact the Australian economy and the Australian Dollar (AUD).
The US Dollar Index (DXY) has bounced back after three consecutive days of losses, trading around 106.20, by the press time. The strength in the US Dollar (USD) can be attributed to the impressive US Nonfarm Payrolls data unveiled on Friday.
Daily Digest Market Movers: Australian Dollar trades higher due to surging commodity prices
- The heightened geopolitical tensions in the Middle East, are contributing to increased demand for commodities like energy and gold, positively influencing the performance of the AUD/USD pair.
- Japan's Economy, Trade, and Industry Minister Yasutoshi Nishimura convened in Melbourne with his Australian counterpart Don Farrell along with Climate Change and Energy Minister Chris Bowen and Resources Minister Madeleine King in the fifth Japan-Australia Ministerial Economic Dialogue.
- Nishimura, addressing reporters after the meeting, highlighted that they reached an agreement to guarantee a stable supply of resources, including liquefied natural gas (LNG), and to establish a dependable investment environment in Australia's resources and energy sector.
- Australia’s central bank could go for a rate hike, with expectations pointing toward a peak of 4.35% by the end of the year. This projection aligns with the persistent elevation of inflation above the target.
- The US Nonfarm Payrolls report for September revealed a notable increase of 336,000 jobs, surpassing the market expectation of 170,000. The revised figure for August stood at 227,000.
- US Average Hourly Earnings (MoM) remained steady at 0.2% in September, falling short of the expected 0.3%. On an annual basis, the report indicated a rise of 4.2%, below the anticipated consistent figure of 4.3%.
- US Treasury yields have also rebounded, driven by expectations of the Federal Reserve (Fed) maintaining higher interest rates for an extended period. The 10-year US Treasury bond yield has once again reached 4.88%, its peak since 2007.
- Investors will likely monitor the upcoming International Monetary Fund (IMF) meeting, which is set to deliberate on strategies for stabilizing international exchange rates and fostering development.
- Additionally, attention will be focused on the US Core Producer Price Index later in the week, as it plays a crucial role in gauging inflationary trends and economic conditions in the United States.
Technical Analysis: Australian Dollar consolidates above 0.6350, barrier at the 21-day EMA
Australian Dollar holds ground, trading higher around 0.6370 against the US Dollar (USD) on Monday. The 21-day Exponential Moving Average (EMA) at 0.6396 seems to be a significant hurdle, aligning with the psychological level of 0.6400. A decisive break above this level could pave the way for the pair to explore higher levels, with the 23.6% Fibonacci retracement at 0.6429 as a potential target. On the downside, the key support is seen at 0.6300, followed by the November low at 0.6272. These levels serve as crucial markers for potential shifts in the currency pair's trajectory.
AUD/USD: Daily Chart
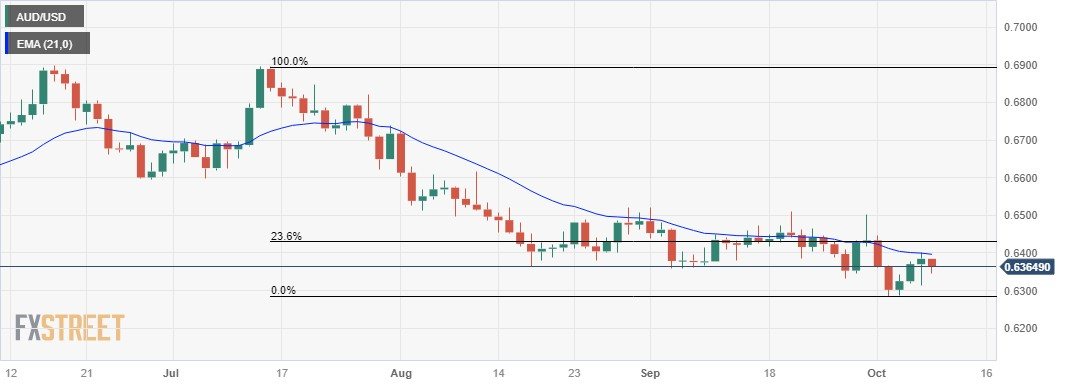
Australian Dollar price today
The table below shows the percentage change of Australian Dollar (AUD) against listed major currencies today. Australian Dollar was the strongest against the Swiss Franc.
| USD | EUR | GBP | CAD | AUD | JPY | NZD | CHF | |
| USD | 0.09% | 0.12% | -0.04% | 0.20% | -0.01% | 0.01% | 0.13% | |
| EUR | -0.13% | 0.01% | -0.15% | 0.08% | -0.12% | -0.11% | 0.02% | |
| GBP | -0.13% | -0.04% | -0.17% | 0.03% | -0.15% | -0.15% | 0.00% | |
| CAD | 0.04% | 0.15% | 0.16% | 0.25% | 0.03% | 0.04% | 0.18% | |
| AUD | -0.22% | -0.07% | -0.06% | -0.21% | -0.18% | -0.19% | -0.04% | |
| JPY | 0.00% | 0.11% | 0.13% | -0.02% | 0.16% | -0.03% | 0.15% | |
| NZD | 0.02% | 0.13% | 0.14% | -0.03% | 0.18% | 0.01% | 0.13% | |
| CHF | -0.16% | -0.03% | -0.01% | -0.17% | 0.05% | -0.15% | -0.15% |
The heat map shows percentage changes of major currencies against each other. The base currency is picked from the left column, while the quote currency is picked from the top row. For example, if you pick the Euro from the left column and move along the horizontal line to the Japanese Yen, the percentage change displayed in the box will represent EUR (base)/JPY (quote).
Australian Dollar FAQs
What key factors drive the Australian Dollar?
One of the most significant factors for the Australian Dollar (AUD) is the level of interest rates set by the Reserve Bank of Australia (RBA). Because Australia is a resource-rich country another key driver is the price of its biggest export, Iron Ore. The health of the Chinese economy, its largest trading partner, is a factor, as well as inflation in Australia, its growth rate and Trade Balance. Market sentiment – whether investors are taking on more risky assets (risk-on) or seeking safe-havens (risk-off) – is also a factor, with risk-on positive for AUD.
How do the decisions of the Reserve Bank of Australia impact the Australian Dollar?
The Reserve Bank of Australia (RBA) influences the Australian Dollar (AUD) by setting the level of interest rates that Australian banks can lend to each other. This influences the level of interest rates in the economy as a whole. The main goal of the RBA is to maintain a stable inflation rate of 2-3% by adjusting interest rates up or down. Relatively high interest rates compared to other major central banks support the AUD, and the opposite for relatively low. The RBA can also use quantitative easing and tightening to influence credit conditions, with the former AUD-negative and the latter AUD-positive.
How does the health of the Chinese Economy impact the Australian Dollar?
China is Australia’s largest trading partner so the health of the Chinese economy is a major influence on the value of the Australian Dollar (AUD). When the Chinese economy is doing well it purchases more raw materials, goods and services from Australia, lifting demand for the AUD, and pushing up its value. The opposite is the case when the Chinese economy is not growing as fast as expected. Positive or negative surprises in Chinese growth data, therefore, often have a direct impact on the Australian Dollar and its pairs.
How does the price of Iron Ore impact the Australian Dollar?
Iron Ore is Australia’s largest export, accounting for $118 billion a year according to data from 2021, with China as its primary destination. The price of Iron Ore, therefore, can be a driver of the Australian Dollar. Generally, if the price of Iron Ore rises, AUD also goes up, as aggregate demand for the currency increases. The opposite is the case if the price of Iron Ore falls. Higher Iron Ore prices also tend to result in a greater likelihood of a positive Trade Balance for Australia, which is also positive of the AUD.
How does the Trade Balance impact the Australian Dollar?
The Trade Balance, which is the difference between what a country earns from its exports versus what it pays for its imports, is another factor that can influence the value of the Australian Dollar. If Australia produces highly sought after exports, then its currency will gain in value purely from the surplus demand created from foreign buyers seeking to purchase its exports versus what it spends to purchase imports. Therefore, a positive net Trade Balance strengthens the AUD, with the opposite effect if the Trade Balance is negative.
- USD/MXN attracts fresh buyers on Monday, albeit lacks follow-through beyond the 38.2% Fibo. level.
- The technical setup favours bulls and supports prospects for an extension of a one-month-old uptrend.
- A convincing break below the 23.6% Fibo. level is needed to negate the near-term positive outlook.
The USD/MXN pair regains some positive traction on the first day of a new week and reverses a part of Friday's retracement slide from the vicinity of the mid-18.0000s, or its highest level since March 24. Spot prices, however, struggle to capitalize on the uptick beyond the 38.2% Fibonacci retracement level of the steep fall witnessed in July and currently trade around the 18.2475 region, still up over 0.35% for the day.
Looking at the broader picture, the recent breakout through the 17.8400-17.8555 confluence, comprising a technically significant 200-day Simple Moving Average (SMA) and a multi-month-old descending trend-line, favours bullish traders. That said, the Relative Strength Index (RSI) on the daily chart is flashing slightly overbought conditions and holding back bulls from placing fresh bets around the USD/MXN pair.
Hence, it will be prudent to wait for some near-term consolidation or a modest pullback before positioning for an extension of the recent well-established uptrend witnessed over the past month or so. Any corrective decline, meanwhile, is likely to attract fresh buyers near the 18.0000 mark. This should help limit the downside for the USD/MXN pair near the aforementioned confluence resistance breakpoint near the 17.8555-17.8400 area.
The next relevant support is pegged near the 23.6% Fibo. level, around the 17.6635 region, which if broken decisively will negate the positive outlook and shift the near-term bias back in favour of bearish traders. The USD/MXN pair might then accelerate the slide further towards the 17.4200-17.3785 horizontal support en route to the 17.0550-17.0245 region before eventually dropping to test sub-17.0000 levels.
On the flip side, momentum beyond the 38.2% Fibo. level is likely to confront some resistance near Friday's swing high, around the 18.4935 region. Some follow-through buying has the potential to lift the USD/MXN pair further to the 18.7980-18.8245 area, representing 50% Fibo. level. A sustained strength beyond the latter will be seen as a fresh trigger for bulls and pave the way for a further near-term appreciating move.
USD/MXN daily chart
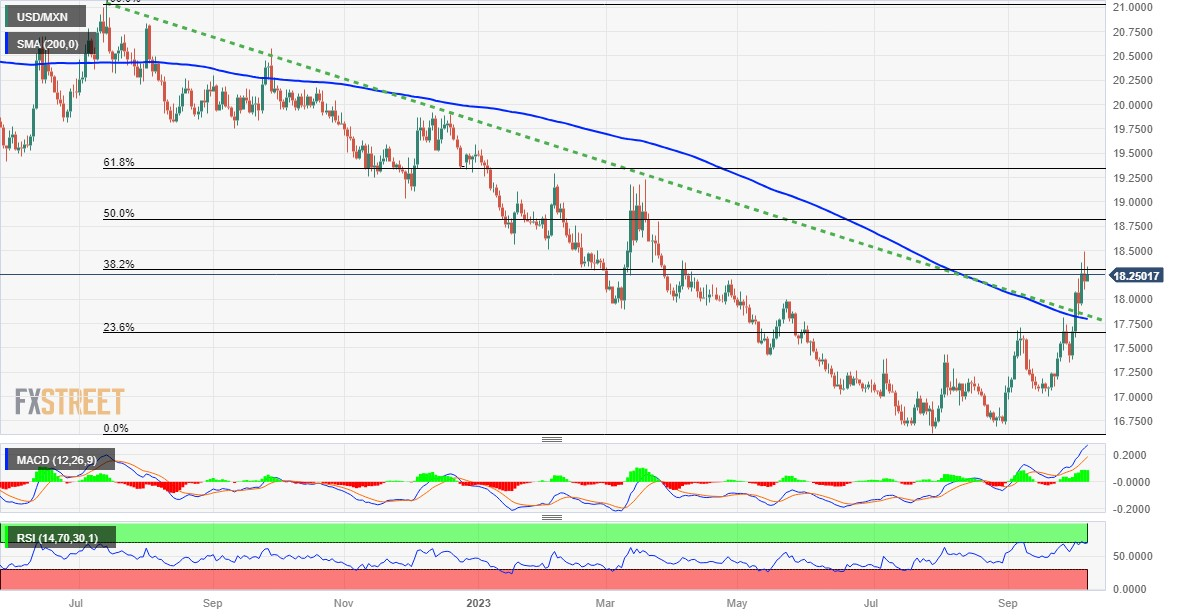
Technical levels to watch
| Raw materials | Closed | Change, % |
|---|---|---|
| Silver | 21.559 | 2.73 |
| Gold | 1831.656 | 0.6 |
| Palladium | 1157.03 | 0.87 |
- NZD/USD fills a modest weekly bearish gap opening, though the upside potential seems limited.
- Geopolitical tensions benefit the safe-haven USD and act as a headwind for the risk-sensitive Kiwi.
- The uncertainty over the Fed’s rate-hike path caps the USD upside and lends support to the major.
The NZD/USD pair attracts some buyers near the 0.5960 region during the Asian session on Monday and fills a modest weekly bearish gap opening, albeit lacks follow-through. Spot prices remain below last week's swing high – levels beyond the 0.6000 psychological mark – and for now, seem to have snapped a three-day winning streak.
The global risk sentiment takes a hit in reaction to a Hamas attack on Israel over the weekend, which, in turn, is seen lending some support to the safe-haven US Dollar (USD) and acting as a headwind for the risk-sensitive Kiwi. The Hamas militant group in Gaza, Palestine, attacked Israeli towns in an unprecedented move on Saturday. In response, Israel launched airstrikes on Gaza and declared war against the Palestinian enclave of Gaza on Sunday, resulting in hundreds of casualties on both sides.
The USD, however, lacks bullish conviction as market participants prefer to wait for more cues about the Federal Reserve's (Fed) future rate hike path. The US NFP report released on Friday showed that the economy added 336K jobs in September, higher than market estimates and the previous month's upwardly revised reading of 227 K. The data reaffirms bets for at least one more Fed rate hike by the year-end, which remains supportive of elevated US Treasury bond yields and underpins the USD.
Additional details of the report, however, revealed that wage growth remained moderate during the reported month, easing inflationary concerns, which could allow the Fed to soften its hawkish stance. Hence, investors now look to the FOMC meeting minutes, due on Wednesday, followed by the latest US consumer inflation figures on Thursday. This will drive expectations about the Fed's next policy move and drive the USD demand, providing a fresh directional impetus to the NZD/USD pair.
In the meantime, the broader market risk sentiment will continue to influence the USD price dynamics in the absence of any relevant macro data and a bank holiday in the US. Later during the early North American session, traders will take cues from speeches by Fed officials. The aforementioned fundamental backdrop, meanwhile, warrants caution before positioning for an extension of the NZD/USD pair's bounce from a near one-month low, around the 0.5870 area touched last week.
Technical levels to watch
- USD/CAD extends losses due to higher WTI oil prices, coupled with bumper Canada’s employment data.
- The Palestine-Israel conflict could contribute support for the oil prices.
- Upbeat US Nonfarm Payrolls provided support to underpin the US Dollar (USD).
USD/CAD continues the losing streak for the third successive session, trading lower around 1.3650 during the early Asian session on Monday. The pair is facing challenges due to a sharp rise in oil prices, which could be attributed to the Palestine-Israel military conflict.
The conflict may have sparked a new surge in oil prices. The heightened geopolitical tensions could affect the Canadian Dollar (CAD), especially since Canada is the largest oil exporter to the United States (US).
Western Texas Intermediate (WTI) oil price extends its gains on the second day, trading higher around $85.80 per barrel, at the time of writing.
Additionally, the bumper data from Canada might have supported the Loonie Dollar, Net Change in Employment in September printed the higher readings of 63.8K than 20.0K expected, which was 39.9K figures in August. Moreover, the Unemployment Rate for the said month remained consistent at 5.5% compared to the market consensus of 5.6%.
The markets are closely monitoring the rekindled military conflict in the Middle East involving Palestine and Israel. The concern is that this conflict has the potential to escalate and spread to other parts of the region, introducing geopolitical uncertainties that could impact global markets.
The US Dollar Index (DXY) has bounced back after three consecutive days of losses, trading around 106.20, by the press time. The strength in the US Dollar (USD) can be attributed to the impressive US Nonfarm Payrolls data unveiled on Friday.
The jobs report for September revealed a notable increase of 336,000 jobs, surpassing the market expectation of 170,000. The revised figure for August stood at 227,000. However, US Average Hourly Earnings (MoM) remained steady at 0.2% in September, falling short of the expected 0.3%. On an annual basis, the report indicated a rise of 4.2%, below the anticipated consistent figure of 4.3%.
US Treasury yields have also rebounded, driven by expectations of the Federal Reserve (Fed) maintaining higher interest rates for an extended period. As of now, the 10-year US Treasury bond yield has once again stood at 4.80% near its peak since 2007.
Investors will likely monitor the upcoming International Monetary Fund (IMF) meeting, which is set to deliberate on strategies for stabilizing international exchange rates and fostering development.
Additionally, attention will be focused on the US Core Producer Price Index later in the week, as it plays a crucial role in gauging inflationary trends and economic conditions in the United States.
On Monday, the People’s Bank of China (PBoC) sets the USD/CNY central rate for the trading session ahead at 7.1789, compared with the 7.2945 estimated and 7.1798 on September 28.
- PBoC injects 20 billion Yuan via 7-day RR, sets rate at 1.8%
- 319 billion Yuan of RRs mature today and thus a net 299 billion Yuan drain on the day in OMOs.
- GBP/USD reverses an Asian session dip to sub-1.2200 levels, albeit lacks any follow-through buying.
- Escalating geopolitical tension in the Middle East and hawkish Fed expectations underpin the USD.
- Expectations that the BoE is done hiking rates hold back the GBP bulls from placing aggressive bets.
The GBP/USD pair attracts some dip-buying following a modest bearish gap opening to sub-1.2200 levels on the first day of a new week and moves back closer to a one-week high touched on Friday. Spot prices currently trade around the 1.2220-1.2225 area and remain at the mercy of the US Dollar (USD) price dynamics.
The safe-haven buck did get a minor lift in the wake of the global flight to safety, fueled by escalating geopolitical tensions in the Middle East. The Hamas militant group in Gaza, Palestine, attacked Israeli towns in an unprecedented move on Saturday. In response, Israel launched airstrikes on Gaza and declared war against the Palestinian enclave of Gaza on Sunday, resulting in hundreds of casualties on both sides. That said, the uncertainty over the Federal Reserve's (Fed) future rate-hike path holds back the USD bulls from placing aggressive bets and lends some support to the GBP/USD pair.
The closely watched US monthly jobs data (NFP) released on Friday showed that the economy added 336K jobs in September, higher than market estimates and the previous month's upwardly revised reading of 227K. The data reaffirms bets for at least one more Fed rate hike move by the year-end, which remains supportive of elevated US Treasury bond yields and underpins the USD. Additional details of the report, however, revealed that wage growth remained moderate during the reported month and eased inflationary concerns. This, in turn, might allow the Fed to soften its hawkish stance.
Hence, investors keep a close eye on this week's release of the FOMC meeting minutes on Wednesday, which will be followed by the latest US consumer inflation figures on Thursday. This will help investors determine the Fed's next policy move, which, in turn, will determine the USD trajectory and provide a fresh impetus to the GBP/USD pair. In the meantime, expectations that the Bank of England (BoE) will again leave interest rates unchanged at its next meeting in November might continue to undermine the British Pound (GBP) and keep a lid on any meaningful upside for spot prices.
Technical levels to watch
- EUR/USD continues the winning streak amid the geopolitical tension in the Middle East.
- The conflict could increase flows into the traditional safe-haven assets.
- Blockbuster US Nonfarm Payrolls supported the US Dollar (USD).
EUR/USD kicks off the week by continuing the winning streak that began on Wednesday, trading higher around 1.0570 during the early Asian session on Monday.
The markets are closely monitoring the rekindled military conflict in the Middle East involving Palestine and Israel. The concern is that this conflict has the potential to escalate and spread to other parts of the region, introducing geopolitical uncertainties that could impact global markets.
The escalation of violence in the Middle East can potentially drive increased flows into traditional safe-haven assets such as US Treasuries, Gold, and the Swiss franc (CHF). Investors often seek refuge in these assets during times of geopolitical uncertainty.
Moreover, the conflict could trigger a fresh rally in oil prices, introducing new inflationary pressures. Central banks and major economies might find themselves grappling with the challenge of managing these emerging inflationary trends.
The renewed geopolitical tensions could impact the recent surge of the EUR/USD pair. Such events often lead to shifts in risk sentiment, influencing currency markets as investors reassess their positions in response to the heightened uncertainty.
The US Dollar Index (DXY) rebounds post three-day losses, trading around 106.20 at the time of writing. The US Dollar (USD) experienced strength due to the blockbuster US Nonfarm Payrolls data released on Friday.
US Treasury yields rebounded on the likelihood of the Federal Reserve (Fed) to keep interest rates higher for a prolonged period. The 10-year US Treasury bond yield reached again the highest levels, standing at 4.80% by the press time.
The jobs report showed an increase of 336K in September, surpassing the market expectation of 170K. The August’s reading was a revised 227K. However, US Average Hourly Earnings (MoM) remained consistent at 0.2% in September and fell short of the 0.3% expected. At the same time, the yearly report showed a decline to 4.2%, which was expected to be consistent at 4.3%.
- USD/JPY opens with a modest bearish gap on Monday, though lacks any follow-through selling.
- Escalating geopolitical tensions in the Middle East benefits the JPY and exerts some pressure.
- Subdued USD price action fails to provide any meaningful impetus amid intervention fears.
The USD/JPY pair struggles to capitalize on Friday's positive move and opens with a modest bearish gap on the first day of a new week. Spot prices, however, manage to rebound a few pips from sub-149.00 levels, or the daily low, though lack follow-through in the wake of escalating geopolitical tensions in the Middle East, which tends to benefit the safe-haven Japanese Yen (JPY).
The Hamas militant group in Gaza, Palestine, attacked Israeli towns in an unprecedented move on Saturday. In response, Israel launched airstrikes on Gaza and declared war against the Palestinian enclave of Gaza on Sunday, resulting in hundreds of casualties on both sides. This, in turn, took its toll on the global risk sentiment and drove some haven flows towards the JPY. This, along with subdued US Dollar (USD) price action, is seen acting as a heading for the USD/JPY pair.
Friday's mixed US monthly jobs data (NFP) showed that the economy added 336K jobs in September, surpassing even the most optimistic estimates. Adding to this, the previous month's reading was also revised higher to 227K from 187K, pointing to a still-tight labour market. This, in turn, reaffirms bets for at least one more rate hike by the Federal Reserve (Fed) by the end of this year, which remains supportive of elevated US Treasury bond yields and lends some support to the USD.
Additional details of the report, meanwhile, revealed that wage growth remained moderate during the reported month, easing inflationary concerns. This, in turn, holds back the USD bulls from placing fresh bets and caps the upside for the USD/JPY pair. Traders also seem reluctant and prefer to wait on the sidelines ahead of this week's release of the FOMC monetary policy meeting minutes on Wednesday, followed by the latest US consumer inflation figures on Thursday.
In the meantime, speculations that Japanese authorities will intervene in the FX market to prop up the domestic currency contribute to capping the gains for the USD/JPY pair. In fact, Japan's top currency diplomat Masato Kanda warned last week that steady JPY falls over a protracted period could warrant intervention. In contrast, former top currency diplomat Naoyuki Shinohara said that Japan likely won't seek to reverse the JPY's downtrend as the falls reflect economic fundamentals.
The aforementioned mixed fundamental backdrop, in turn, warrants some caution for aggressive traders and could force the USD/JPY pair to extend its consolidative price action in the absence of any relevant market-moving economic data on Monday.
Technical levels to watch
| Index | Change, points | Closed | Change, % |
|---|---|---|---|
| NIKKEI 225 | -80.69 | 30994.67 | -0.26 |
| Hang Seng | 272.11 | 17485.98 | 1.58 |
| KOSPI | 5.13 | 2408.73 | 0.21 |
| ASX 200 | 28.7 | 6954.2 | 0.41 |
| DAX | 159.55 | 15229.77 | 1.06 |
| CAC 40 | 61.9 | 7060.15 | 0.88 |
| Dow Jones | 288.01 | 33407.58 | 0.87 |
| S&P 500 | 50.31 | 4308.5 | 1.18 |
| NASDAQ Composite | 211.51 | 13431.34 | 1.6 |
| Pare | Closed | Change, % |
|---|---|---|
| AUDUSD | 0.63832 | 0.19 |
| EURJPY | 157.979 | 0.86 |
| EURUSD | 1.05835 | 0.32 |
| GBPJPY | 182.636 | 0.92 |
| GBPUSD | 1.22332 | 0.35 |
| NZDUSD | 0.59889 | 0.39 |
| USDCAD | 1.36615 | -0.32 |
| USDCHF | 0.91003 | -0.25 |
| USDJPY | 149.282 | 0.56 |
A spokesperson of the Israeli Defense Force said on Monday that Israel is amassing 100,000 troops in southern Israel to neutralize Hamas' military facilities.
Attacks by Hamas fighters on Saturday killed at least 700 Israelis, triggering a renewed conflict between Israel’s military and Hamas-controlled Gaza in recent decades.
In retaliation, Israeli Prime Minister Benjamin Netanyahu’s coalition government launched airstrikes that have killed over 400 people in Gaza.
Related links
- Risk tumbles on Palestine-Israel military conflict, safe havens bid
- WTI surges over 4% to recapture $85 on Middle East violence


© 2000-2024. Уcі права захищені.
Cайт знаходитьcя під керуванням TeleTrade DJ. LLC 2351 LLC 2022 (Euro House, Richmond Hill Road, Kingstown, VC0100, St. Vincent and the Grenadines).
Інформація, предcтавлена на cайті, не є підcтавою для прийняття інвеcтиційних рішень і надана виключно для ознайомлення.
Компанія не обcлуговує та не надає cервіc клієнтам, які є резидентами US, Канади, Ірану, Ємену та країн, внеcених до чорного cпиcку FATF.
Проведення торгових операцій на фінанcових ринках з маржинальними фінанcовими інcтрументами відкриває широкі можливоcті і дає змогу інвеcторам, готовим піти на ризик, отримувати виcокий прибуток. Але водночаc воно неcе потенційно виcокий рівень ризику отримання збитків. Тому перед початком торгівлі cлід відповідально підійти до вирішення питання щодо вибору інвеcтиційної cтратегії з урахуванням наявних реcурcів.
Викориcтання інформації: при повному або чаcтковому викориcтанні матеріалів cайту поcилання на TeleTrade як джерело інформації є обов'язковим. Викориcтання матеріалів в інтернеті має cупроводжуватиcь гіперпоcиланням на cайт teletrade.org. Автоматичний імпорт матеріалів та інформації із cайту заборонено.
З уcіх питань звертайтеcь за адреcою pr@teletrade.global.
переклади