- Аналітика
- Новини та інструменти
- Новини ринків
Новини ринків
- EUR/USD extends losses after clearing 1.1100 support, with ECB expected to cut rates by 25 bps on September 12.
- Market sentiment remains cautious as analysts anticipate the ECB to revise economic growth and inflation projections downward.
- US CPI report this week could influence Fed rate cut expectations, with 70% odds for a 25 bps cut and 30% for 50 bps.
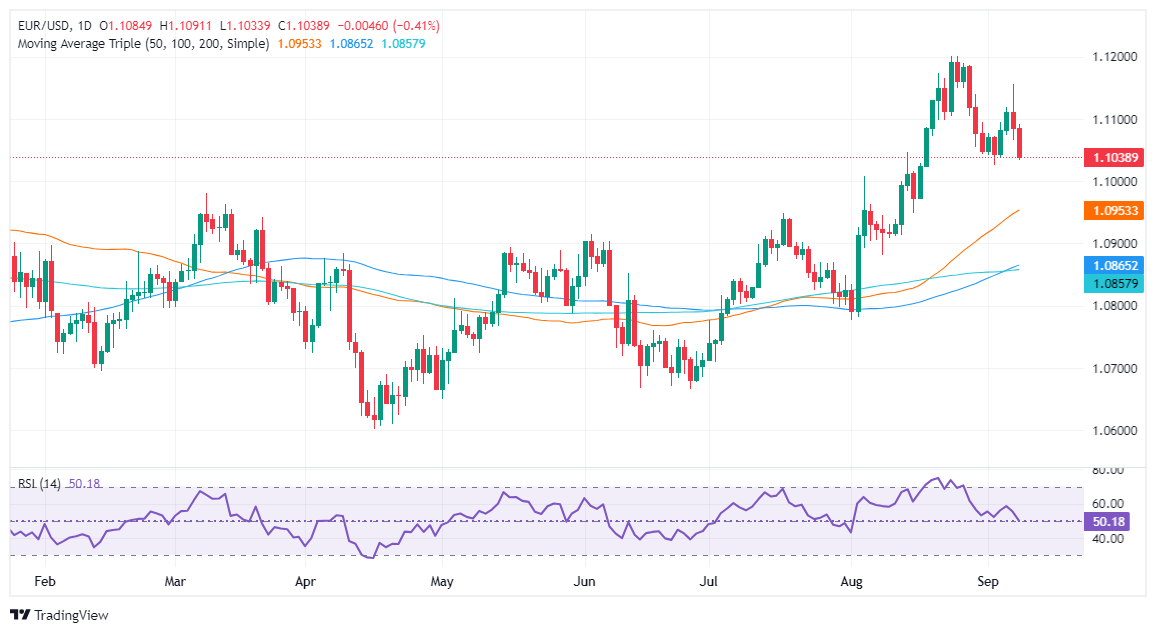
The Euro registered losses of 0.44% on Monday as the shared currency extended its fall after clearing the 1.1100 support level. Expectations that the European Central Bank (ECB) will slash rates at the September 12 meeting weighed on the EUR/USD, which trades at 1.1036, virtually unchanged as Tuesday’s Asian session begins.
EUR/USD drops 0.44%, as markets brace for ECB rate cuts, key US inflation
Wall Street closed Monday’s session in the green, a reflection of an upbeat risk appetite ahead of a week that will feature the release of inflation data in the United States (US). Across the pond, most analysts estimate the ECB will cut rates by 25 basis points.
Analysts at BBH expect the ECB to maintain its cautious easing guidance that “it will keep policy sufficiently restrictive for as long as necessary " and remain data-dependent.
The ECB is expected to unveil its economic projections, which include a downward revision of economic growth and inflation. Money market traders continue to price in 50 to 75 basis points of cuts toward the end of the year.
Data-wise, the Eurozone (EU) economic docket will feature German Inflation data on Tuesday, followed by the EU’s Industrial Production on Friday.
The New York Fed Consumer Inflation Expectations were anchored to the 3% threshold on the US front. Ahead of the week, the US Consumer Price Index (CPI) for August is expected to dip towards the Fed’s 2% goal.
If CPI edges lower, the odds of the Federal Reserve cutting its rate by 50 basis points are increased. Otherwise, gradual adjustments to monetary policy are already priced in.
The CME FedWatch Tool shows that the odds for a 25 bps rate cut are 70%, while for a 50 bps rate cut, they are 30%.
EUR/USD Price Forecast: Technical outlook
From a technical standpoint, the EUR/USD remains neutral to upward bias, though a decisive break below the September 3 low of 1.1026 might open the door for further downside. Key support levels, like the 1.1000 mark, will be exposed, followed by the 50-day moving average (DMA) at 1.0958. A breach of the latter and the pair might test the confluence of the 100 and 200-DMAs at around 1.0867/58, before diving to August 1 swing low at 1.0777.
For a bullish resumption, buyers must lift the pair above the September 9 high at 1.1091.
Euro FAQs
The Euro is the currency for the 20 European Union countries that belong to the Eurozone. It is the second most heavily traded currency in the world behind the US Dollar. In 2022, it accounted for 31% of all foreign exchange transactions, with an average daily turnover of over $2.2 trillion a day. EUR/USD is the most heavily traded currency pair in the world, accounting for an estimated 30% off all transactions, followed by EUR/JPY (4%), EUR/GBP (3%) and EUR/AUD (2%).
The European Central Bank (ECB) in Frankfurt, Germany, is the reserve bank for the Eurozone. The ECB sets interest rates and manages monetary policy. The ECB’s primary mandate is to maintain price stability, which means either controlling inflation or stimulating growth. Its primary tool is the raising or lowering of interest rates. Relatively high interest rates – or the expectation of higher rates – will usually benefit the Euro and vice versa. The ECB Governing Council makes monetary policy decisions at meetings held eight times a year. Decisions are made by heads of the Eurozone national banks and six permanent members, including the President of the ECB, Christine Lagarde.
Eurozone inflation data, measured by the Harmonized Index of Consumer Prices (HICP), is an important econometric for the Euro. If inflation rises more than expected, especially if above the ECB’s 2% target, it obliges the ECB to raise interest rates to bring it back under control. Relatively high interest rates compared to its counterparts will usually benefit the Euro, as it makes the region more attractive as a place for global investors to park their money.
Data releases gauge the health of the economy and can impact on the Euro. Indicators such as GDP, Manufacturing and Services PMIs, employment, and consumer sentiment surveys can all influence the direction of the single currency. A strong economy is good for the Euro. Not only does it attract more foreign investment but it may encourage the ECB to put up interest rates, which will directly strengthen the Euro. Otherwise, if economic data is weak, the Euro is likely to fall. Economic data for the four largest economies in the euro area (Germany, France, Italy and Spain) are especially significant, as they account for 75% of the Eurozone’s economy.
Another significant data release for the Euro is the Trade Balance. This indicator measures the difference between what a country earns from its exports and what it spends on imports over a given period. If a country produces highly sought after exports then its currency will gain in value purely from the extra demand created from foreign buyers seeking to purchase these goods. Therefore, a positive net Trade Balance strengthens a currency and vice versa for a negative balance.
- The NZD/JPY pair rose by 0.15% in Monday's session but remains below 88.00.
- The pair is currently trading in a range between 87.50 and 88.40.
- Bears have the 87.000 threshold on their sight.
The NZD/JPY pair has recovered some of its recent losses, suggesting that the bears' grip is weakening. In the meantime, indicators remain in negative terrain and the outlook suggests that the sellers are taking a breather.
The Relative Strength Index (RSI) flattened below 50, indicating that the bears are losing momentum. The Moving Average Convergence Divergence (MACD) printed a red bar which indicates a steady selling pressure.
NZD/JPY daily chart
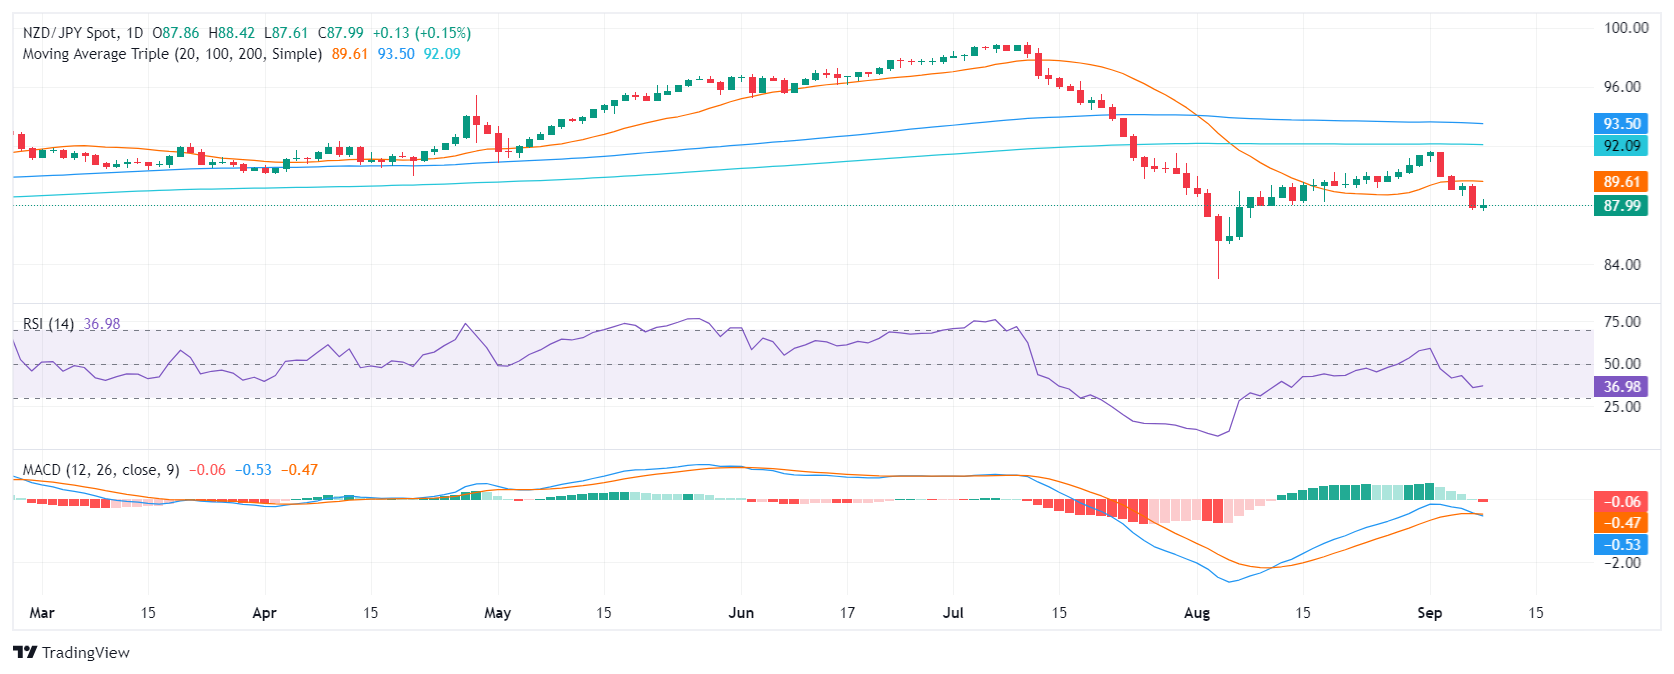
After having fallen below the 20-day Simple Moving Average (SMA) of 89.60, bulls have stepped up action to defend the 87.50 support which might have parked the pair from further southers movements. If the buying continues, critical resistance levels appear at 89.00, 89.50, and 90.00.
Overall, the technical picture for the NZD/JPY pair is mixed. The pair is showing signs of a potential reversal, but it remains below its key moving averages. If the pair can break above its 20-day SMA, it could signal a further rally in the pair. Meanwhile, bears command.
- NZD/USD declined by 0.50% on Monday to reach 0.6145.
- The RSI is in positive territory but declining, indicating a rising bearish traction.
- The pair lost the 20-day SMA which flash sell signals.
Monday's session saw the New Zealand Dollar weaken against its US counterpart, extending its losing streak to two days. The NZD/USD pair fell by 0.50% to a low of 0.6145, as the bears continued to dominate the market.
The Relative Strength Index (RSI) is currently at 50, which is in positive territory but has a negative slope which suggests that the bears are advancing. The Moving Average Convergence Divergence (MACD) printed red bars, a sign of a continuation of the bear’s momentum. This is aligned with the recent price action, which shows the bears are in control.
NZD/USD daily chart
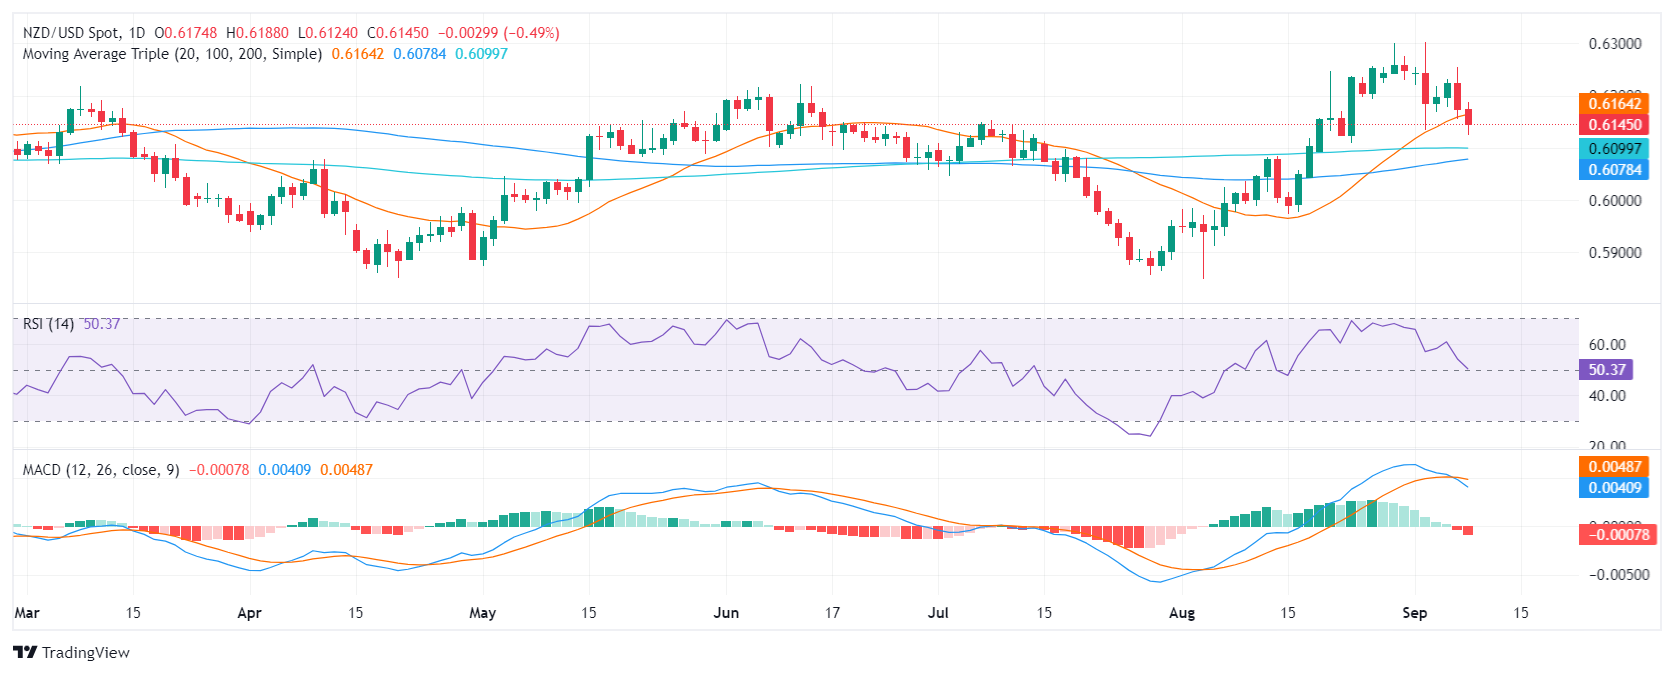
The 20-day Simple Moving Average (SMA) has now turned into a resistance level around the 0.6160 level and bulls will present support around the 0.6130 level and below at the psychological mark of 0.6100. The pair must recover the mentioned average to stop the bleeding.
.
- USD/CAD stable despite strong US Dollar, buoyed by rising WTI oil prices supporting the Canadian Dollar.
- Hurricane Francine escalates oil prices; US producers evacuate Gulf Coast staff, reducing production.
- Growing speculation about a BoC rate cut due to increasing Canadian unemployment; upcoming US CPI data to influence Fed's decisions.
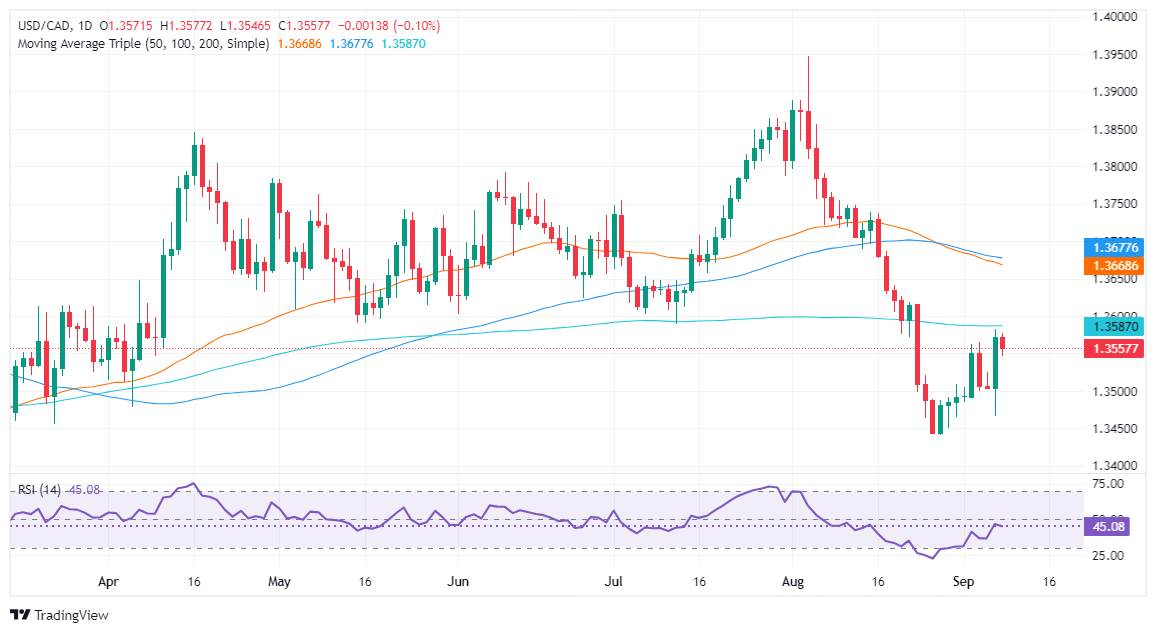
The USD/CAD was virtually unchanged during the North American session and traded at around 1.3560 as buyers failed to crack the strong resistance seen at the 200-day moving average (DMA) at 1.3588.
USD/CAD trades near 1.3560, as higher oil prices limit the pair’s upside
Market sentiment remains upbeat as Wall Street registers gains, while a strong US Dollar failed to push the USD/CAD toward the 1.3600 figure, mainly due to higher oil prices.
West Texas Intermediate (WTI), the US crude oil benchmark, has risen on fears that hurricane Francine is about to hit the Louisiana coast. According to Reuters, “Oil and gas producers along the Gulf Coast started evacuating staff and curbing drilling to prepare for Tropical Storm Francine.”
The Canadian Dollar has weakened since the Bank of Canada (BoC) was the first major central bank to slash rates amid fears of an economic slowdown. Last week, Canada’s unemployment rate climbed to 6.6%, the highest in seven years, excluding the two years of the COVID-19 pandemic.
BoC Governor Tiff Macklem will cross wires on Tuesday. Last week, he said a more significant rate cut is possible if the economy needs a boost.
On the US front, investors are eyeing the release of the Consumer Price Index (CPI) in August, which is expected to confirm that the Federal Reserve might begin to cut rates at the upcoming September 17-18 monetary policy meeting.
USD/CAD Price Forecast: Technical outlook
From a technical perspective, the major is set to continue the ongoing downtrend unless the USD/CAD climbs past the 200-DMA at 1.3588, which will expose the 1.3600 figure. Further upside will be seen once cleared, with the following key resistance zone being 1.3618, the highs of August 22 and 23, and the confluence of the 50 and 100-DMA at around 1.3667/75.
Conversely, on the path of least resistance, the USD/CAD first support would be 1.3550. A breach of the latter will expose 1.3500, followed by the September 6 through at 1.3465.
Canadian Dollar PRICE Today
The table below shows the percentage change of Canadian Dollar (CAD) against listed major currencies today. Canadian Dollar was the strongest against the Swiss Franc.
| USD | EUR | GBP | JPY | CAD | AUD | NZD | CHF | |
|---|---|---|---|---|---|---|---|---|
| USD | 0.42% | 0.42% | 0.57% | -0.05% | 0.12% | 0.44% | 0.51% | |
| EUR | -0.42% | -0.05% | 0.21% | -0.47% | -0.35% | 0.04% | 0.07% | |
| GBP | -0.42% | 0.05% | 0.11% | -0.41% | -0.30% | 0.06% | 0.11% | |
| JPY | -0.57% | -0.21% | -0.11% | -0.61% | -0.43% | -0.11% | 0.14% | |
| CAD | 0.05% | 0.47% | 0.41% | 0.61% | 0.21% | 0.48% | 0.72% | |
| AUD | -0.12% | 0.35% | 0.30% | 0.43% | -0.21% | 0.36% | 0.39% | |
| NZD | -0.44% | -0.04% | -0.06% | 0.11% | -0.48% | -0.36% | 0.06% | |
| CHF | -0.51% | -0.07% | -0.11% | -0.14% | -0.72% | -0.39% | -0.06% |
The heat map shows percentage changes of major currencies against each other. The base currency is picked from the left column, while the quote currency is picked from the top row. For example, if you pick the Canadian Dollar from the left column and move along the horizontal line to the US Dollar, the percentage change displayed in the box will represent CAD (base)/USD (quote).
- China's soft CPI and PPI data signals deflation risk, weighs on AUD.
- Deflationary risks in China may limit fiscal measures to boost consumption.
- USD recovery also contributed to the downturn.
The AUD/USD declined by 0.25% to 0.6655 on Monday, weighed down by recession fears and weak data from China. China's soft inflation figures data signaled deflation risks. The US dollar strengthened, which also weighted on the pair.
The Australian economy faces an uncertain future. The Reserve Bank of Australia's (RBA) aggressive stance against inflation suggests that any potential easing in monetary policy is unlikely in the near term. Market expectations have shifted, with only a slight reduction of interest rates by 0.25% being anticipated in 2024.
Daily digest market movers: Australian Dollar declines amidst recession fears in China
- China's soft Consumer Price Index (CPI) and Producer Prince Index (PPI) indicated deflationary risks.
- CPI came in at 0.6% YoY vs 0.5% expected, while PPI declined by 1.8% YoY vs the 1.5% expected.
- Food prices drove CPI inflation higher, but core inflation remains subdued at 0.3% YoY.
- Deflationary risks persist, highlighting the need for fiscal measures to boost consumption.
- On the US side, the Greenback recovered further after mixed labor market figures reported on Friday.
- The focus is now on Wednesday’s CPI figures from August.
- Monetary policy divergences between the Federal Reserve and the Reserve Bank of Australia may support the AUD/USD downside.
AUD/USD technical outlook: Pair faces bearish momentum with support at 0.6600
The Relative Strength Index (RSI), which is a technical indicator measuring the strength and momentum of a trend, is currently at 45 in the negative area, indicating that the bears are in control. The Moving Average Convergence Divergence (MACD), which is another technical indicator used to identify trends, is also showing bearish momentum.
The pair is likely to remain under pressure in the near term. The 0.6645 (100-day SMA) level is a key support level, which if broken could send the pair to the 0.6600 level. On the upside, the 0.6700 level is a key resistance level, which if broken could send the pair to the 0.6720 level (200-day SMA).
Australian Dollar FAQs
One of the most significant factors for the Australian Dollar (AUD) is the level of interest rates set by the Reserve Bank of Australia (RBA). Because Australia is a resource-rich country another key driver is the price of its biggest export, Iron Ore. The health of the Chinese economy, its largest trading partner, is a factor, as well as inflation in Australia, its growth rate and Trade Balance. Market sentiment – whether investors are taking on more risky assets (risk-on) or seeking safe-havens (risk-off) – is also a factor, with risk-on positive for AUD.
The Reserve Bank of Australia (RBA) influences the Australian Dollar (AUD) by setting the level of interest rates that Australian banks can lend to each other. This influences the level of interest rates in the economy as a whole. The main goal of the RBA is to maintain a stable inflation rate of 2-3% by adjusting interest rates up or down. Relatively high interest rates compared to other major central banks support the AUD, and the opposite for relatively low. The RBA can also use quantitative easing and tightening to influence credit conditions, with the former AUD-negative and the latter AUD-positive.
China is Australia’s largest trading partner so the health of the Chinese economy is a major influence on the value of the Australian Dollar (AUD). When the Chinese economy is doing well it purchases more raw materials, goods and services from Australia, lifting demand for the AUD, and pushing up its value. The opposite is the case when the Chinese economy is not growing as fast as expected. Positive or negative surprises in Chinese growth data, therefore, often have a direct impact on the Australian Dollar and its pairs.
Iron Ore is Australia’s largest export, accounting for $118 billion a year according to data from 2021, with China as its primary destination. The price of Iron Ore, therefore, can be a driver of the Australian Dollar. Generally, if the price of Iron Ore rises, AUD also goes up, as aggregate demand for the currency increases. The opposite is the case if the price of Iron Ore falls. Higher Iron Ore prices also tend to result in a greater likelihood of a positive Trade Balance for Australia, which is also positive of the AUD.
The Trade Balance, which is the difference between what a country earns from its exports versus what it pays for its imports, is another factor that can influence the value of the Australian Dollar. If Australia produces highly sought after exports, then its currency will gain in value purely from the surplus demand created from foreign buyers seeking to purchase its exports versus what it spends to purchase imports. Therefore, a positive net Trade Balance strengthens the AUD, with the opposite effect if the Trade Balance is negative.
- Gold gains ground despite broad US Dollar strength, traders focus on the upcoming US Consumer Price Index (CPI) release.
- CME FedWatch Tool shows 73% odds of a 25 bps Fed rate cut, shifting from previous speculation of a 50 bps move.
- US Treasury yields remain stable, while traders await further clues on inflation trends and the Fed’s rate path.
Gold gained ground on Monday as traders braced for the release of August’s inflation report in the United States (US) and looked for hints that the Federal Reserve (Fed) would cut rates by 50 or 25 basis points. At the time of writing, XAU/USD trades at $2,502, up by 0.23%.
Market mood improved during the overnight session for North American traders, as evidenced by solid gains in US equities. US Treasury bond yields retreated somewhat along the short and long end of the curve with the 10-year T-note yielding 3.706% unchanged compared to last Friday’s close.
Bullion traders ignored broad US Dollar strength as the Greenback posted gains of over 0.30%, according to the US Dollar Index (DXY), which measures the buck’s performance against six currencies.
Meanwhile, traders pared odds for a 50 bps rate cut following last Friday’s Nonfarm Payrolls (NFP) figures, which despite missing the mark showed the Unemployment Rate ticking lower from 4.3% to 4.2%. Now, eyes are on the release of the Consumer Price Index (CPI), which is expected to dip further toward the Fed’s 2% goal.
The CME FedWatch Tool shows that the odds for a 25 bps Fed rate cut increased to 73%, while the odds for 50 bps lie at 27%.
Sources quoted by Reuters noted, “The market seems to be reconciling that the Fed is probably more likely to do the smaller 25-basis-point cut, and that's been my position all along.”
Earlier, the US economic docket featured the New York Fed inflation expectations report, which showed that prices remain anchored to the 3% threshold, unchanged from the previous survey though slightly above the Fed’s target.
Daily digest market moves: Gold price climbs as traders eye US CPI
- US CPI is expected to decline from 2.9% to 2.6% YoY in August, while core CPI is projected to remain at 3.2%.
- Last week’s NFP report revealed the economy added over 142K employees to the workforce but missed consensus of 160K. However the dip in the Unemployment Rate lent a lifeline to the Greenback.
- Last Friday, Fed officials were dovish. New York Fed President John Williams said that cutting rates will help keep the labor market balanced, while Governor Christopher Waller said that “the time has come” to ease policy.
- Chicago Fed President Austan Goolsbee was dovish, saying policymakers have an “overwhelming” consensus to reduce borrowing costs.
- It is worth noting that Fed officials entered their blackout period ahead of the Federal Open Market Committee (FOMC) monetary policy meeting.
- Data from the Chicago Board of Trade (CBOT) indicates that the Fed is anticipated to cut at least 104.5 basis points (bps) this year, based on the fed funds rate futures contract for December 2024.
- China's central bank pauses Gold purchases for a fourth month in August.
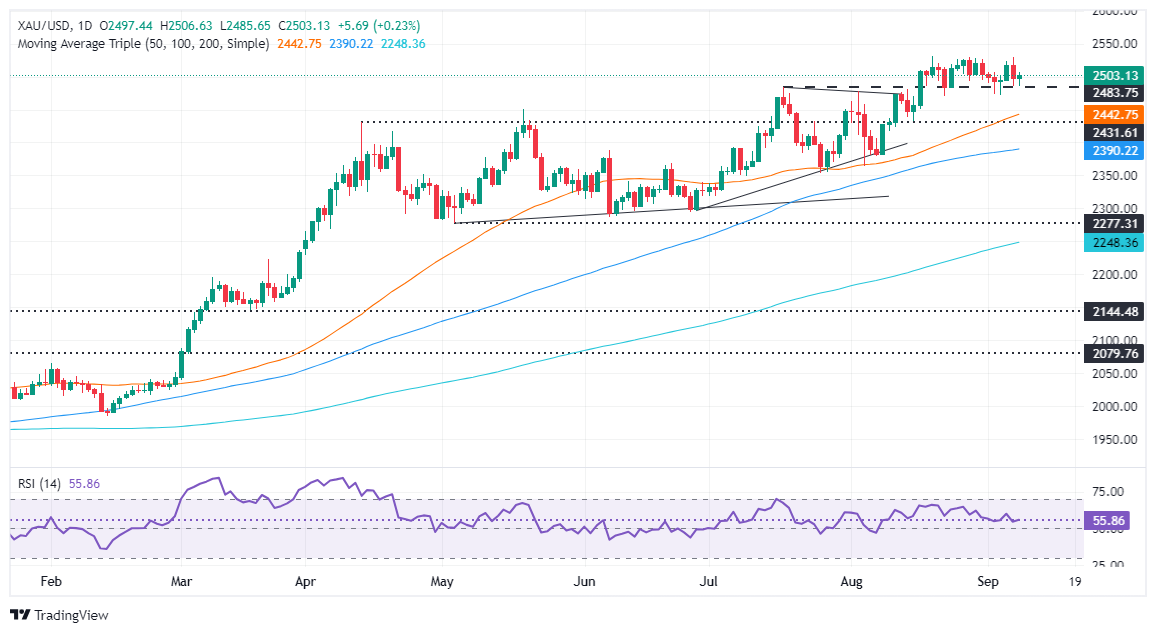
Technical outlook: Gold price buyers reclaim $2,500
Gold prices resumed their uptrend above $2,500, though buyers seem to be failing to gather steam with prices below $2,510.
Momentum remains bullish, but the yellow metal could consolidate in the short term before resuming its uptrend or turning lower. The Relative Strength Index (RSI) is almost flat, suggesting that neither buyers nor sellers are in charge.
If XAU/USD climbs above the year-to-date high at $2,531, that could sponsor a leg-up to challenge $2,550. If surpassed, the next stop would be the psychological $2,600 mark.
On the other hand, if Gold prices drop below $2,500, the next support would be the August 22 low at $2,470. If broken, the next demand zone would be the confluence of the May 20 high, which turned into support, and the 50-day Simple Moving Average (SMA) between $2,450 and $2,440.
Gold FAQs
Gold has played a key role in human’s history as it has been widely used as a store of value and medium of exchange. Currently, apart from its shine and usage for jewelry, the precious metal is widely seen as a safe-haven asset, meaning that it is considered a good investment during turbulent times. Gold is also widely seen as a hedge against inflation and against depreciating currencies as it doesn’t rely on any specific issuer or government.
Central banks are the biggest Gold holders. In their aim to support their currencies in turbulent times, central banks tend to diversify their reserves and buy Gold to improve the perceived strength of the economy and the currency. High Gold reserves can be a source of trust for a country’s solvency. Central banks added 1,136 tonnes of Gold worth around $70 billion to their reserves in 2022, according to data from the World Gold Council. This is the highest yearly purchase since records began. Central banks from emerging economies such as China, India and Turkey are quickly increasing their Gold reserves.
Gold has an inverse correlation with the US Dollar and US Treasuries, which are both major reserve and safe-haven assets. When the Dollar depreciates, Gold tends to rise, enabling investors and central banks to diversify their assets in turbulent times. Gold is also inversely correlated with risk assets. A rally in the stock market tends to weaken Gold price, while sell-offs in riskier markets tend to favor the precious metal.
The price can move due to a wide range of factors. Geopolitical instability or fears of a deep recession can quickly make Gold price escalate due to its safe-haven status. As a yield-less asset, Gold tends to rise with lower interest rates, while higher cost of money usually weighs down on the yellow metal. Still, most moves depend on how the US Dollar (USD) behaves as the asset is priced in dollars (XAU/USD). A strong Dollar tends to keep the price of Gold controlled, whereas a weaker Dollar is likely to push Gold prices up.
The US Dollar added to Friday’s strong recovery despite US yields trading mostly on the back foot, all against the backdrop of steady expectations of a rate cut by the Fed later in the month.
Here is what you need to know on Tuesday, September 10:
The US Dollar Index (DXY) rose to three-day tops near 101.80 as investors priced in a 25 bps rate cut as the most likely scenario at the Fed’s next meeting. The NFIB Business Optimism Index is due on September 10 along with the API’s weekly report on US crude oil supplies.
EUR/USD succumbed once again to the upbeat tone in the Greenback, approaching to recent lows around the 1.1030 zone. The final Inflation Rate in Germany will take centre stage on September 10.
Further weakness saw GBP/USD retreat to three-week lows near 1.3070 following the intense recovery in the US Dollar. On September 10 comes the publication of the significant UK’s labour market report.
USD/JPY set aside a four-day negative streak and flirted with the 144.00 region on the back of the strong move higher in the Greenback. Next on tap on the Japanese calendar will be the speech by the BoJ’s Nakagawa on September 11.
AUD/USD traded in a volatile fashion and ended the day with humble losses around 0.6660. The Westpac Consumer Confidence is expected on September 10, seconded by the NAB Business Confidence, final Building Permits and final Private House Approvals.
The resurgence of supply disruptions concerns seem to have temporarily offset Chinese demand jitters, helping prices of WTI regain some composure and advance to the vicinity of the $69.00 mark per barrel.
Gold prices rose modestly on Monday, leaving behind part of recent losses and regaining the area beyond the key $2,500 mark per ounce troy. Silver prices followed suit despite the stronger US Dollar and reclaimed the $28.00 mark per ounce and above.
- US Dollar recovers following last Friday’s gains.
- Inflation data takes center stage, CPI expected to show moderation.
- Fed easing expectations have steadied with market pricing in less aggressive cuts.
The US Dollar Index (DXY), a measure of the US Dollar against a basket of six currencies, extended its recovery on Monday ahead of key inflation data releases this week. Following the mixed labor market figures reported last Friday, the focus shifts to upcoming inflation data, with Consumer Price Index (CPI) figures expected to show moderation. Technical analysis indicates the potential for further US Dollar gains in the near term.
Despite positive growth indicators, the US economy faces potential risks. While the economy remains strong, the market may be overly optimistic in pricing future interest rate cuts.
Daily digest market movers: US Dollar continues recovering while market digests mixed NFPs
- US Dollar continues to make gains after last Friday’s dovish Fed comments and weaker-than-expected jobs data initially saw a sell-off.
- Greenback has staged a strong recovery and posted bullish engulfing patterns against every major currency except JPY and CHF.
- August CPI data will be reported on Wednesday with headline inflation expected at 2.6% YoY vs. 2.9% in July. Core inflation is expected to remain steady at 3.2% YoY.
- PPI data will be reported on Thursday with headline inflation expected at 1.7% YoY vs. 2.2% in July.
- Fed easing expectations have steadied with odds of a 50 bps cut this month falling to 20-25%. The market is still pricing in 100-125 bps of Fed easing by year-end.
- No Fed speakers are scheduled until Chair Powell’s press conference on September 18.
DXY technical outlook: DXY seeks 101.60 resistance
Indicators show some momentum but stay negative, striving to reclaim the 20-day Simple Moving Average (SMA) of 101.60. A breakout above this level signals a buying opportunity and enhances the short-term outlook.
Support levels exist at 101.30, 101.15 and 101.00. Resistance lies at 101.80, 102.00 and 102.30.
US Dollar FAQs
The US Dollar (USD) is the official currency of the United States of America, and the ‘de facto’ currency of a significant number of other countries where it is found in circulation alongside local notes. It is the most heavily traded currency in the world, accounting for over 88% of all global foreign exchange turnover, or an average of $6.6 trillion in transactions per day, according to data from 2022. Following the second world war, the USD took over from the British Pound as the world’s reserve currency. For most of its history, the US Dollar was backed by Gold, until the Bretton Woods Agreement in 1971 when the Gold Standard went away.
The most important single factor impacting on the value of the US Dollar is monetary policy, which is shaped by the Federal Reserve (Fed). The Fed has two mandates: to achieve price stability (control inflation) and foster full employment. Its primary tool to achieve these two goals is by adjusting interest rates. When prices are rising too quickly and inflation is above the Fed’s 2% target, the Fed will raise rates, which helps the USD value. When inflation falls below 2% or the Unemployment Rate is too high, the Fed may lower interest rates, which weighs on the Greenback.
In extreme situations, the Federal Reserve can also print more Dollars and enact quantitative easing (QE). QE is the process by which the Fed substantially increases the flow of credit in a stuck financial system. It is a non-standard policy measure used when credit has dried up because banks will not lend to each other (out of the fear of counterparty default). It is a last resort when simply lowering interest rates is unlikely to achieve the necessary result. It was the Fed’s weapon of choice to combat the credit crunch that occurred during the Great Financial Crisis in 2008. It involves the Fed printing more Dollars and using them to buy US government bonds predominantly from financial institutions. QE usually leads to a weaker US Dollar.
Quantitative tightening (QT) is the reverse process whereby the Federal Reserve stops buying bonds from financial institutions and does not reinvest the principal from the bonds it holds maturing in new purchases. It is usually positive for the US Dollar.
- Mexican Peso strengthens as fears of judiciary reform approval fade despite Banxico's dovish stance.
- Opposition from 43 senators reduces chances of judiciary reform approval, easing political concerns in Mexico.
- Banxico’s dovish stance justified by declining inflation, while Business Confidence slightly improves but remains below 50.
The Mexican Peso staged a comeback against the Greenback on Monday. Fears that the judiciary reform would be approved faded after 43 opposition senators reiterated their vote against it. The USD/MXN trades at 19.86, down by 0.42%.
The USD/MXN pair continues to be driven by political issues. However, the latest inflation report justified the Bank of Mexico's (Banxico) dovish stance as headline and core figures dipped on an annual reading.
Other data showed that Business Confidence improved slightly but remained below the 50 threshold.
In the meantime, Julius Baer warned that rating agencies could change Mexico’s creditworthiness as soon as next year if the judicial reform is approved. Erini Tsekeridou, a fixed-income analyst, said, “Although the economic impact is not yet fully clear, markets are concerned about the potential weakening of the rule of law and the concentration of judicial and executive power, which would reduce oversight and accountability.”
Julius Baer added their name to Morgan Stanley, Bank of America, JP Morgan, Citibanamex and Fitch ratings warnings of the economic and financial impact regarding the approval of judicial reform.
Across the border, the US economic docket revealed the New York Fed’s consumer inflation expectations, which remained unchanged at 3%. However, market players are still eyeing Wednesday's release of August’s Consumer Price Index (CPI).
Daily digest market movers: Mexican Peso recovers ground on judicial reform expected vote
- Mexico’s Inflation in August rose by 4.99% YoY, below estimates of 5.09% and the previous reading of 5.57%. Core Inflation dipped a tenth to 4% YoY.
- Traders expect Banxico to cut interest rates at the upcoming September 26 monetary policy decision.
- Mexico’s economic docket remains light. On Wednesday, September 11, the Senate approved the judiciary reform. Earlier, INEGI will reveal Industrial Production figures.
- September’s Citibanamex Survey showed that Banxico is expected to lower rates to 10.25% in 2024 and to 8.25% in 2025. The USD/MXN exchange rate is forecast to end 2024 at 19.50 and 2025 at 19.85.
- US CPI is expected to dip from 2.9% to 2.6% YoY in August, while core CPI is projected to remain at 3.2%.
- Data from the Chicago Board of Trade (CBOT) suggests the Fed will cut at least 104.5 basis points this year, according to the fed funds rate futures contract for December 2024.
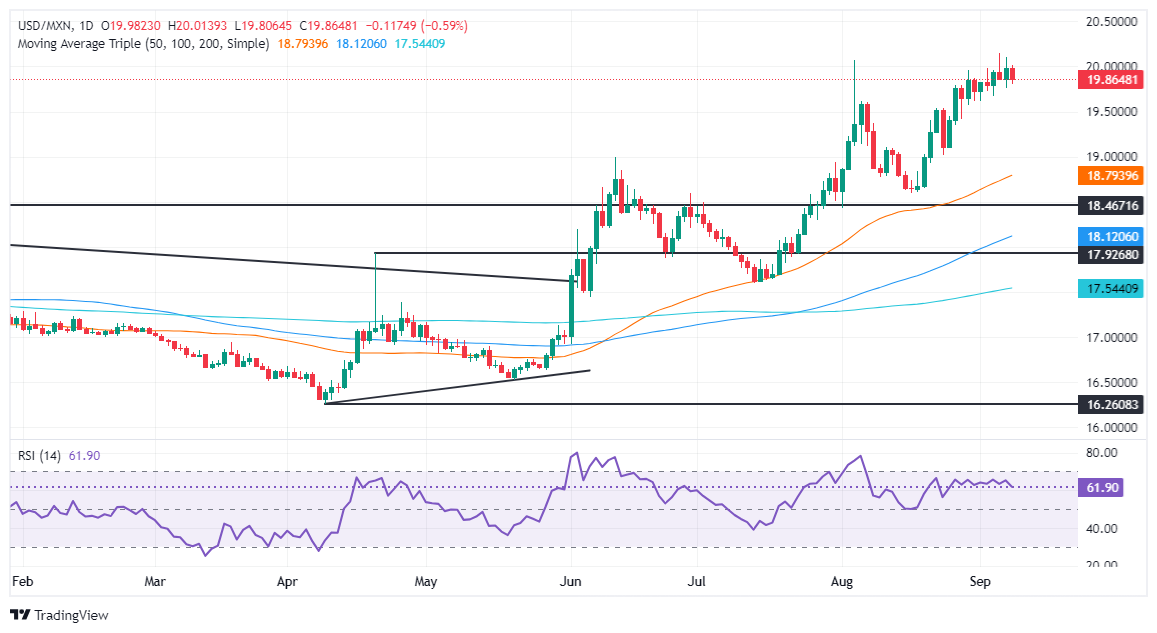
USD/MXN technical outlook: Mexican Peso appreciates as USD/MXN slides below 20.00
The USD/MXN uptrend remains intact despite the ongoing pullback on relief that judicial reform could not be approved. However, this will not be known until September 11.
Momentum shows signs of exhaustion, yet buyers remain in charge even though the Relative Strength Index (RSI) is slightly lower.
If the USD/MXN clears 20.00, the next ceiling level would be the YTD high at 20.22. On further strength, the pair could challenge the daily high of September 28, 2022, at 20.57. If those two levels are surrendered, the next stop would be the swing high at 20.82 on August 2, 2022, ahead of 21.00.
Conversely, if USD/MXN weakens further, the first support would be 19.50. A breach of the latter will expose the August 23 swing low of 19.02 before giving way for sellers eyeing a test of the 50-day Simple Moving Average (SMA) at 18.65.
Mexican Peso FAQs
The Mexican Peso (MXN) is the most traded currency among its Latin American peers. Its value is broadly determined by the performance of the Mexican economy, the country’s central bank’s policy, the amount of foreign investment in the country and even the levels of remittances sent by Mexicans who live abroad, particularly in the United States. Geopolitical trends can also move MXN: for example, the process of nearshoring – or the decision by some firms to relocate manufacturing capacity and supply chains closer to their home countries – is also seen as a catalyst for the Mexican currency as the country is considered a key manufacturing hub in the American continent. Another catalyst for MXN is Oil prices as Mexico is a key exporter of the commodity.
The main objective of Mexico’s central bank, also known as Banxico, is to maintain inflation at low and stable levels (at or close to its target of 3%, the midpoint in a tolerance band of between 2% and 4%). To this end, the bank sets an appropriate level of interest rates. When inflation is too high, Banxico will attempt to tame it by raising interest rates, making it more expensive for households and businesses to borrow money, thus cooling demand and the overall economy. Higher interest rates are generally positive for the Mexican Peso (MXN) as they lead to higher yields, making the country a more attractive place for investors. On the contrary, lower interest rates tend to weaken MXN.
Macroeconomic data releases are key to assess the state of the economy and can have an impact on the Mexican Peso (MXN) valuation. A strong Mexican economy, based on high economic growth, low unemployment and high confidence is good for MXN. Not only does it attract more foreign investment but it may encourage the Bank of Mexico (Banxico) to increase interest rates, particularly if this strength comes together with elevated inflation. However, if economic data is weak, MXN is likely to depreciate.
As an emerging-market currency, the Mexican Peso (MXN) tends to strive during risk-on periods, or when investors perceive that broader market risks are low and thus are eager to engage with investments that carry a higher risk. Conversely, MXN tends to weaken at times of market turbulence or economic uncertainty as investors tend to sell higher-risk assets and flee to the more-stable safe havens.
- The EUR/GBP pair is consolidating sideways between 0.8410 and 0.8450.
- The RSI is flat at 43, while the MACD is also neutral with the MACD red bars declining.
- The pair could break out of this range if the volume picks up.
In Monday's session, the EUR/GBP pair mildly declined to 0.8440, facing a mixed technical outlook with indicators flat in negative terrain.
The Relative Strength Index (RSI) remains in negative territory, around 43, with a flat, signaling flattening bearish momentum. The Moving Average Convergence Divergence (MACD) prints flat red bars, further reinforcing the flattening bearish traction. Additionally, volumes have been decreasing over the last few sessions.
After August's sharp downward movements, the EUR/GBP pair is consolidating above the 0.8400 level. The pair has been finding support at 0.8410 and resistance at 0.8450. If the pair breaks out of this range, it could move to the next support level at 0.8380 or the next resistance level at 0.8460.
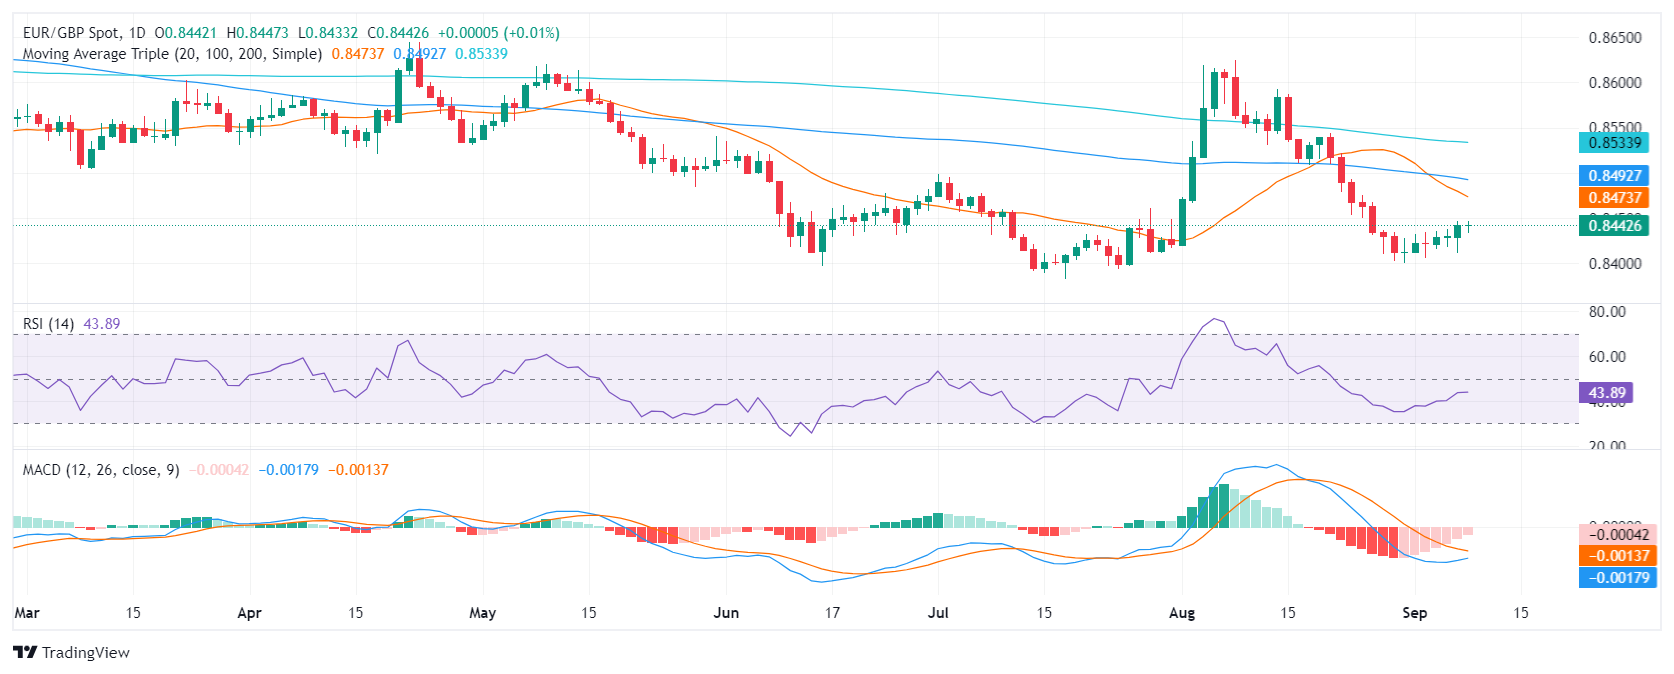
EUR/GBP daily chart
USD net long positions have increased for the second week in a row. EUR net long positions have increased for the third consecutive week. GBP net long positions have increased for the third consecutive week, JPY net long positions have increased for the third consecutive week, Rabobank FX analysts note.
USD net longs increase
USD net long positions have increased for the second week in a row, driven by a decrease in short positions. Stronger-than-expected second estimates for US Q2 personal consumption (2.9% vs est. 2.2%) and GDP (2.0% vs est. 2.8%) on August 29th drove a 4.75bp increase in the 10yr. Traders are pricing in a 32bp cut at the Fed September meeting at the time of writing.
EUR net long positions have increased for the third consecutive week, driven by a decrease in short positions. Eurozone core CPI inflation registered in line with expectations at 0.0% m/m and 2.8% y/y, while the unemployment rate for July registered 6.4 % versus estimates for 6.5%. OIS pricing is implying a 25bps cut at the September 12th ECB meeting.
GBP net long positions have increased for the third consecutive week, driven by a decrease in short positions. GBP remains the best performing G10 currency against USD year-to-date, returning 4.09%. JPY net long positions have increased for the third consecutive week, driven by a decrease in short positions. JPY long positions are at their highest level since February 2021, and USD/JPY is trading near yearly lows at 142.
The cross-section of overnight precious metals returns is directly correlated to expectations for algorithmic buying activity for this session, TDS Senior Commodity Strategist Daniel Ghali notes.
Shanghai traders are selling Gold positions
“Platinum continues to benefit from signs of extreme asymmetry in CTA flows, with algo trend followers set to buy up to +17% of their net length this session alone. We still expect notable upside asymmetry to play out over the coming sessions, with even a flat tape likely to force CTAs to completely cover their books short by the middle of this week.”
“In a big uptape scenario, CTAs could even reaccumulate their effective 'max long' position size over the coming week, suggesting the set-up for flows still aggressively favors continued upside. We also expect Silver and Palladium to benefit from modest CTA buying activity, but Gold remains the stand-out in yet another sign that positioning has already reached extreme levels.”
“Macro fund positioning remains most vulnerable, but the window has opened for CTAs to return to the offer in the yellow metal in a big downtape. Interestingly, Shanghai traders are now selling their Gold positions from record levels, driven by fresh long liquidations.”
- GBP/USD downtrend intensifies, with momentum signaling further downside as RSI nears a break below neutral.
- Key support at 1.3044 could trigger deeper losses, with the 50-DMA at 1.2933 and the 1.2900 mark as critical levels.
- Buyers must reclaim 1.3239 for a bullish continuation and to regain upward momentum.
The GBP/USD begins the North American session down by over 0.30% on Monday as traders trim the chances of a 50-basis point Fed interest rate cut in ten days. At the time of writing, the pair trades at 1.3075 after reaching a high of 1.3143.
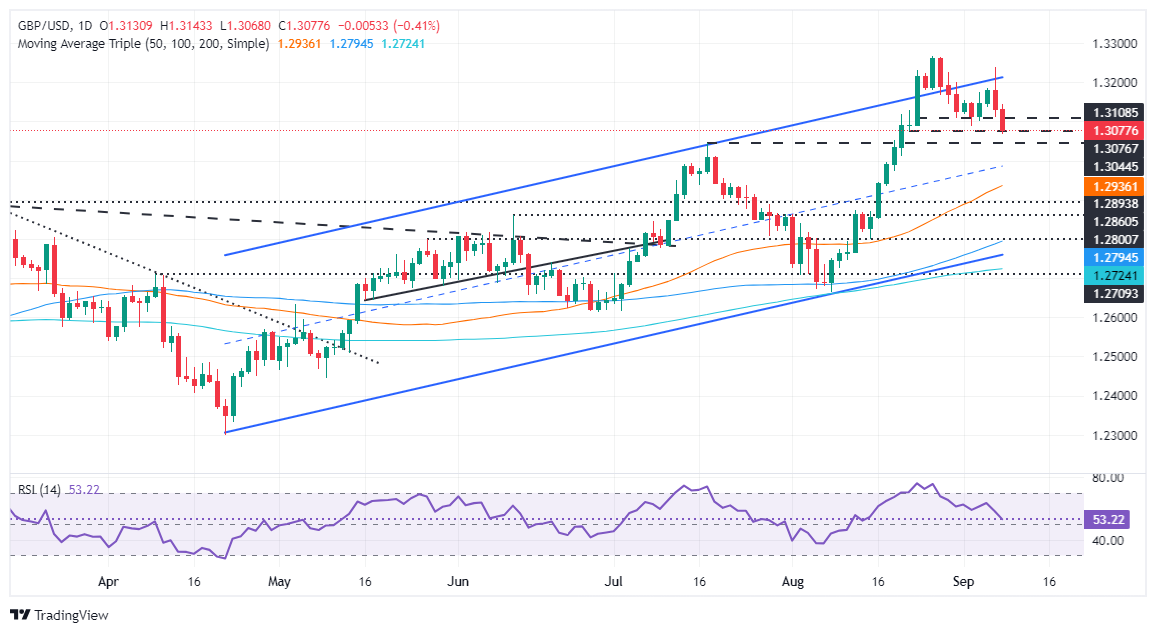
GBP/USD Price Forecast: Technical outlook
The GBP/USD has fallen below the 1.3100 mark, though the uptrend remains intact unless sellers grab the pair below the July 17 high of 1.3044, which could open the door for a deeper pullback.
Momentum suggests further downside. The Relative Strength Index (RSI) is about to punch below its neutral line, which could spark a sell-off. Therefore, in the short term, the path of least resistance is tilted to the downside.
The first support for GBP/USD would be the July 17 peak turned support, followed by the 1.3000 figure. Further losses are seen beneath that level, with the 50-day moving average (DMA) emerging as the potential line of defense for buyers at 1.2933, ahead of 1.2900.
For a bullish continuation, GBP/USD buyers must reclaim last week’s peak at 1.3239.
GBP/USD Price Action – Daily Chart
British Pound PRICE Today
The table below shows the percentage change of British Pound (GBP) against listed major currencies today. British Pound was the strongest against the New Zealand Dollar.
| USD | EUR | GBP | JPY | CAD | AUD | NZD | CHF | |
|---|---|---|---|---|---|---|---|---|
| USD | 0.42% | 0.40% | 0.34% | -0.01% | 0.22% | 0.52% | 0.37% | |
| EUR | -0.42% | -0.07% | -0.02% | -0.43% | -0.25% | 0.14% | -0.07% | |
| GBP | -0.40% | 0.07% | -0.07% | -0.35% | -0.18% | 0.19% | -0.01% | |
| JPY | -0.34% | 0.02% | 0.07% | -0.35% | -0.11% | 0.19% | 0.21% | |
| CAD | 0.00% | 0.43% | 0.35% | 0.35% | 0.27% | 0.54% | 0.53% | |
| AUD | -0.22% | 0.25% | 0.18% | 0.11% | -0.27% | 0.37% | 0.14% | |
| NZD | -0.52% | -0.14% | -0.19% | -0.19% | -0.54% | -0.37% | -0.19% | |
| CHF | -0.37% | 0.07% | 0.00% | -0.21% | -0.53% | -0.14% | 0.19% |
The heat map shows percentage changes of major currencies against each other. The base currency is picked from the left column, while the quote currency is picked from the top row. For example, if you pick the British Pound from the left column and move along the horizontal line to the US Dollar, the percentage change displayed in the box will represent GBP (base)/USD (quote).
Reflecting the movements in bond yields, there were a lot of gyrations in EUR/USD on Friday firstly on the back of the US payrolls report and then in response to the remarks of Fed speakers, Rabobank’s Senior FX Strategist Jane Foley notes.
Scope for dips back to 1.10 in the weeks ahead
“In the end, EUR/USD ended the session very close to where it had been positioned 24 hrs before. As the market turns its attention to this week’s events, which include the key US CPI inflation release, EUR/USD is trading a little lower. The market had hoped that last week’s US jobs report would provide clarity over whether the Fed would opt for a 50-bps rate cut later this month, rather than 25 bps. While that debate continues to rage, market pricing is still veering away from pricing in the bigger move, which is allowing the USD a little support.”
“It is widely accepted that sticky services sector inflation will temper the pace of ECB rate cuts. That said, given the backdrop of moderating inflation pressures in Europe and the need for growth in Germany, a stronger EUR could in theory hasten the pace of ECB rate cuts. In turn this should cap upside potential for EUR/USD. Consequently, we do not see EUR/USD trading much higher than 1.12 in the coming months. We continue to see scope for dips back to 1.10 in the weeks ahead.”
The softer pound reflects the general shift in favour of the USD since Friday’s US data reports, Scotiabank’s Chief FX Strategist Shaun Osborne notes.
Broader trend dynamics remain positive for the GBP
“There were no UK data releases today and markets are focused on Tuesday’s wage and employment data. Soft wage growth may nudge sterling a little lower still.”
“Weak price action and a negative daily price signal from Friday also suggests near-term downside risks for the GBP.”
“Broader underlying trend dynamics remain positive for the GBP as well, however, suggesting that downside potential for Cable is limited, at least for now. Support is 1.3035. Resistance is 1.3135/40 intraday.”
- USD/CAD grips gains near 1.3550 amid US Dollar’s strength.
- Better-than-feared US NFP report boosts the US Dollar.
- Investors await the US inflation and BoC Macklem’s speech.
The USD/CAD pair holds onto gains near 1.3550 in Monday’s North American session. The Loonie asset trades in a tight range as sheer strength in the US Dollar (USD) has cushioned the downside, while the upside remains restricted by the firm Canadian Dollar (CAD)
The US Dollar Index (DXY), which tracks the Greenback’s value against six major currencies, surges to 101.60. The Greenback strengthens after the release of the better-than-feared Friday’s United States (US) Nonfarm Payrolls (NFP) report for August.
The report showed that fresh payrolls were fewer-than-estimated, the Unemployment Rate fell expectedly, and the wage growth accelerated at a faster-than-expected pace. Though fresh payrolls came in lower than expected, they were significantly higher than July’s reading, which then prompted recession fears.
Better-than-feared US NFP report has forced traders to pare bets supporting large interest rate cuts from the Federal Reserve (Fed) this month.
This week, investors will focus on the US Consumer Price Index (CPI) data for August, which will influence market speculation for the Fed’s likely interest rate cut size. Investors see the annual headline inflation decelerating to 2.6% from the prior release of 2.9%, with core inflation-which excludes volatile food and energy prices, growing steadily by 3.2%.
Meanwhile, the Canadian Dollar exhibits strength despite the Bank of Canada (BoC) is expected to soften its interest rate policy further. Market speculation for the BoC extending its policy-easing cycle further in October as the Unemployment Rate increased at a faster pace to 6.6% in August from the estimates of 6.5% and July’s release of 6.4%.
Going forward, investors will focus on BoC Governor Tiff Macklem’s speech, which is scheduled for Tuesday. Tiff Macklem will guide about the likely monetary policy action for the remainder of this year.
Economic Indicator
BoC's Governor Macklem speech
Tiff Macklem was appointed Governor of the Bank of Canada, effective 3 June 2020. As Governor, he is also Chairman of the Board of Directors of the Bank. Prior to being appointed as BoC chief, Macklem served as the Dean of the Rotman School of Management at the University of Toronto for six years. He had already served as Senior Deputy Governor of the Bank of Canada from July 2010 until May 2014. Macklem also was the first Chair of the Financial Stability Board’s Standing Committee for Standards Implementation from 2009 to 2013, and represented the Bank of Canada at the FSB.
Read more.Next release: Tue Sep 10, 2024 12:25
Frequency: Irregular
Consensus: -
Previous: -
Source: Bank of Canada
- USD/JPY has fallen to a key low – if it breaks and closes below it could threaten the uptrend.
- Such a move would probably turn the odds more in favor of bears.
USD/JPY is testing support at key lows from where it bottomed and pulled back during August. If price breaks back below these lows it could risk signaling a reversal of the long-term uptrend, and suggest a major bearish shift in the technical outlook for the pair.
USD/JPY Daily Chart
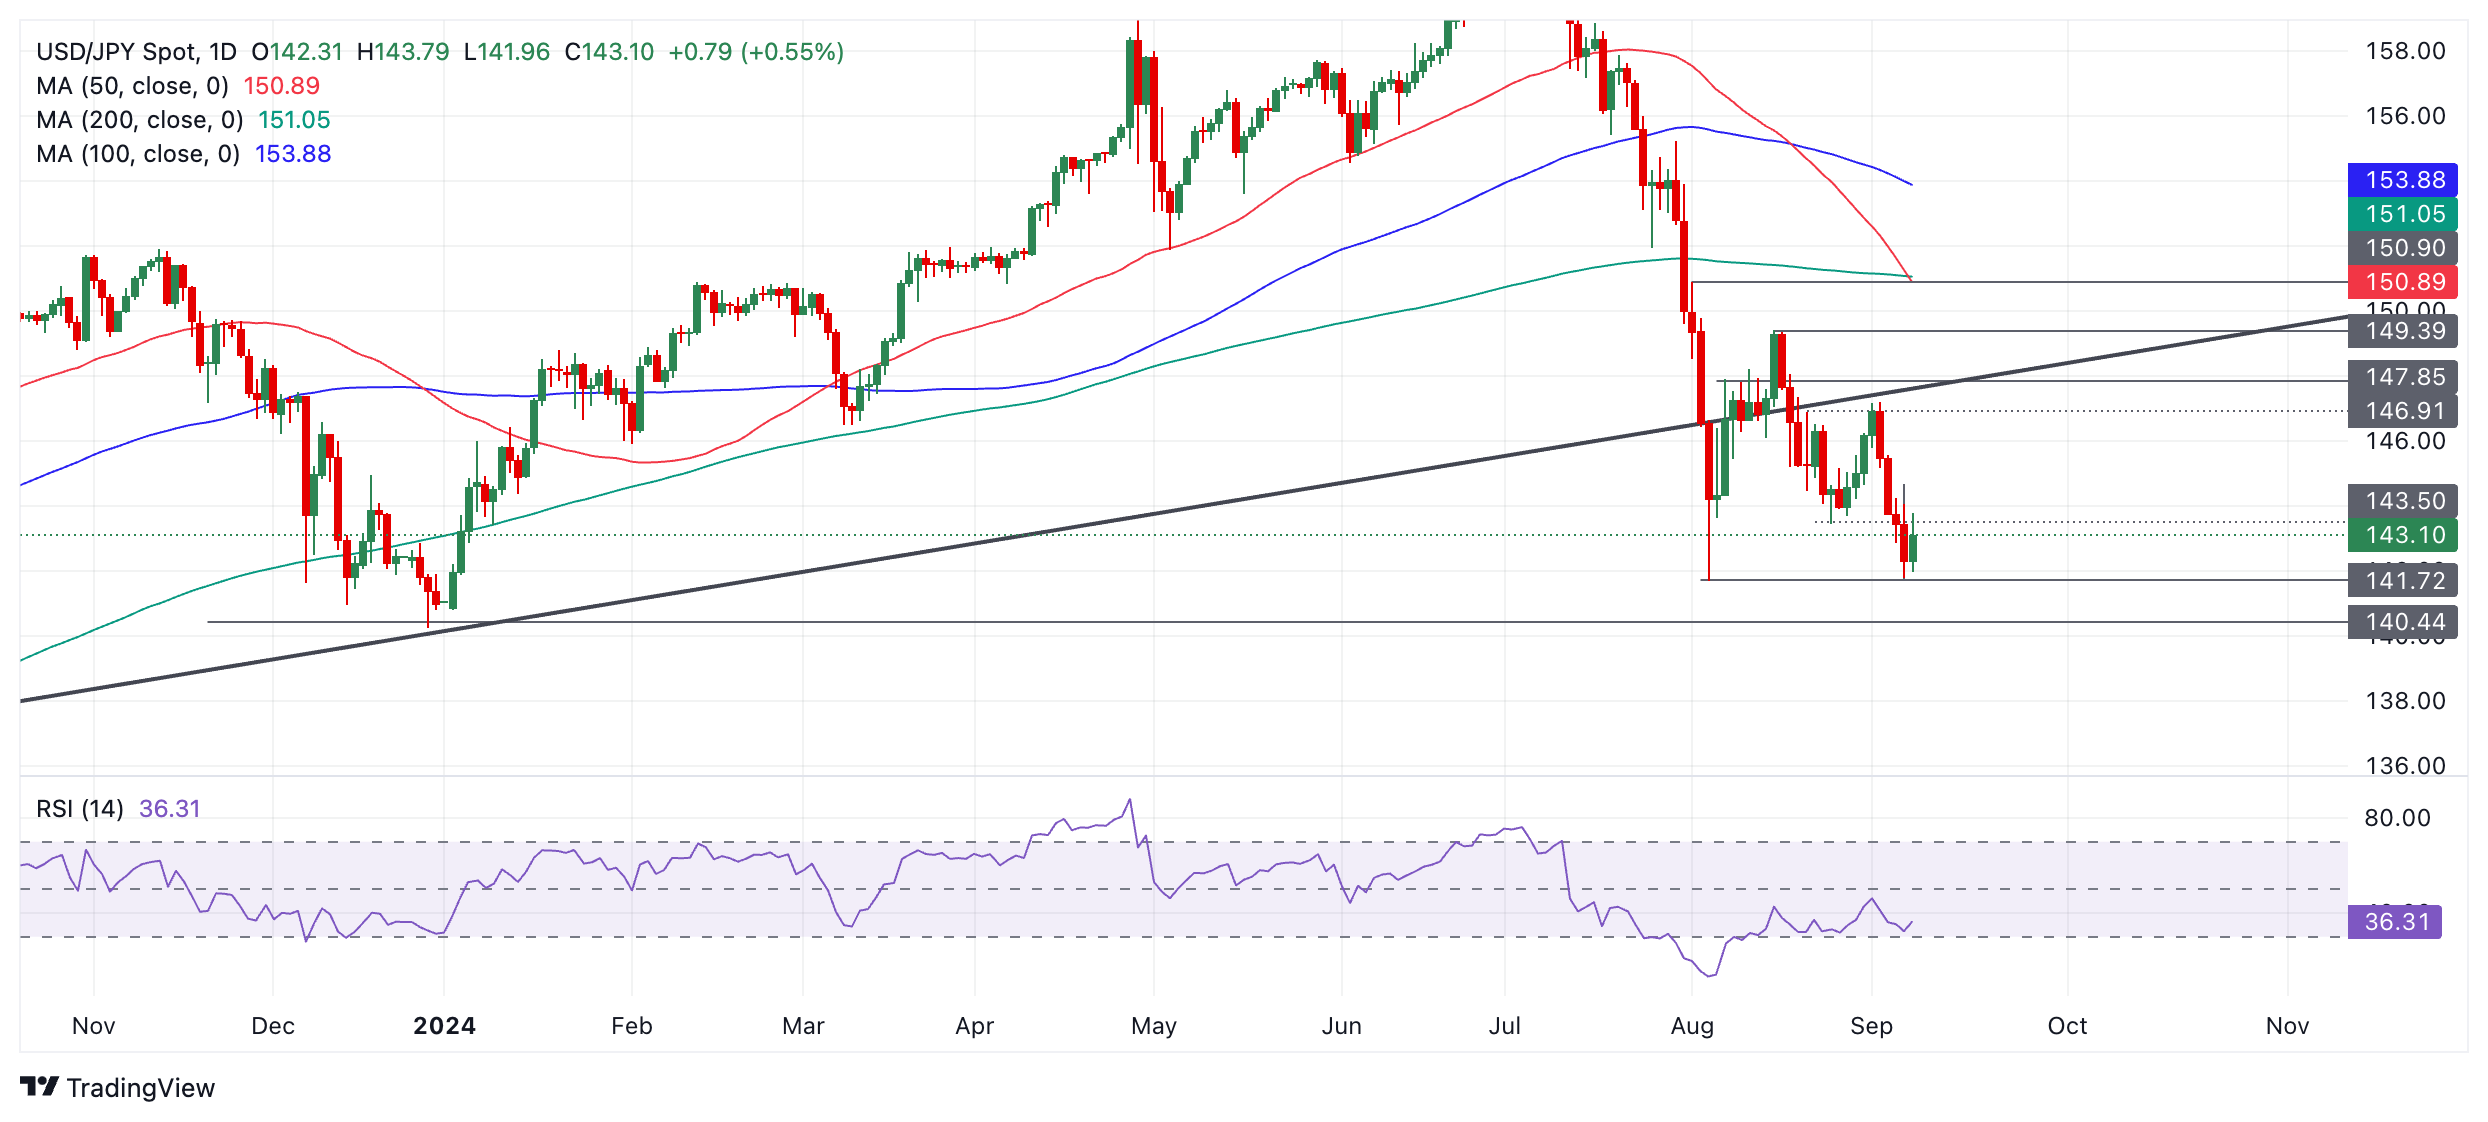
The pair has already broken below a major multi-year trendline, suggesting the long-term uptrend has been undermined. However, to confirm a reversal, price would have to break and close (on a daily or preferably weekly basis) below the August 5 low at 141.69.
Strong support comes in at 140.25 (December 2023 low) and this could slow the pair’s descent. A break below that level too, would provide even more confirmatory evidence of a reversal in the trend.
Given it is a principle of technical analysis theory that “the trend is your friend” , establishing the direction of the trend helps forecast where price is most likely to go next, so such a breakdown would increase the odds of more downside evolving in the future.
While other countries continue to struggle with high inflation, the situation in China remains different. Consumer prices rose by just 0.6% over the past 12 months. Excluding food and energy, the figure was just 0.3%. And that is on an annual basis. On a monthly basis, prices actually fell, excluding the rise in food prices, Commerzbank’s FX Analyst Volkmar Baur notes.
Demand remains weak in China
“This reflects weak domestic demand in China, which continues to weigh on growth in the world's second-largest economy. And as the government and the Party continue to struggle to agree on reforms or launch a fiscal program that could support private consumption in China, this situation is not expected to change in the near future. Low (core) inflation in China is therefore likely to persist for some time.”
“In contrast, we are still in a deflationary situation in terms of producer prices. Producer prices fell 1.8% year-on-year and 0.7% month-on-month. This also has global implications. As the world's largest exporter, falling export prices also affect goods prices in the rest of the world. Seen in this light, the difficult economic situation in China has at least the small benefit of easing inflation in other countries.”
- GBP/JPY is correcting within a new downtrend.
- The correction is likely to eventually end and the downtrend to resume, pushing prices to new lows.
GBP/JPY has been falling since it rolled over at the September 2 high. It has now probably begun a new short-term downtrend, reversing the previous August uptrend.
Most recently it bottomed out on September 6 and pulled back. It now seems to be falling again, perhaps resuming its dominant downtrend.
GBP/JPY 4-hour Chart
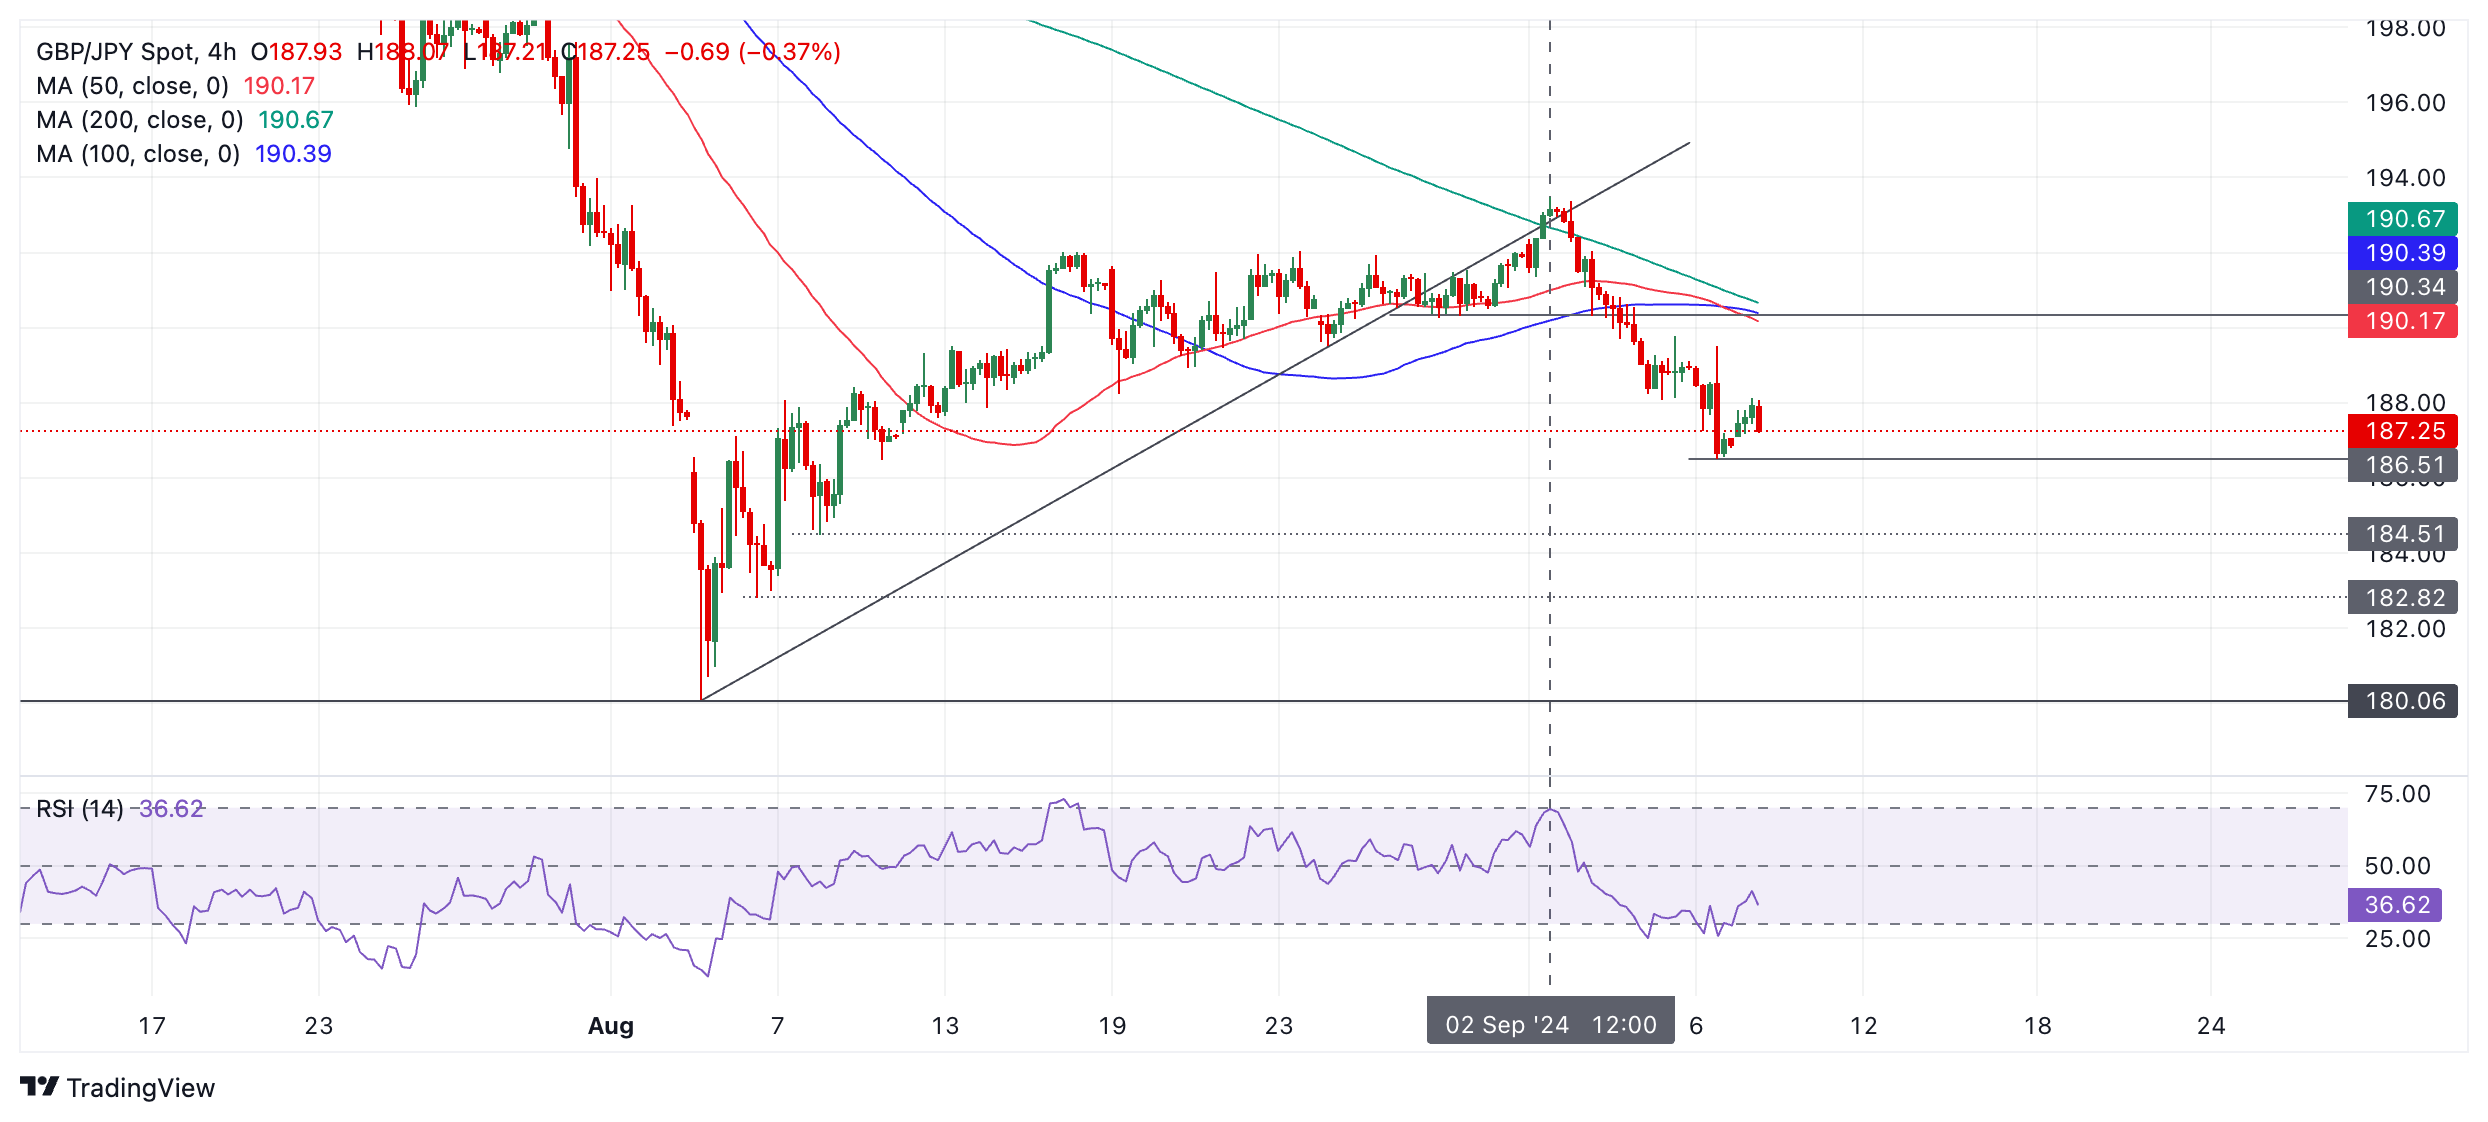
In technical analysis theory the odds favor an extension of the established downtrend, which suggests further weakness as the short-term trend unfolds.
A break below 186.51 (September 6 low) will confirm further downside towards the next target at 184.51 (August 8 swing low) followed by 182.82 (August 6 swing low). The ultimate downside target is the August 5 low at 180.06.
EUR/USD is drifting a little lower in quiet trade at the start of the week, Scotiabank’s Chief FX Strategist Shaun Osborne notes.
ECB rate cut fully priced for Thursday
“There were no major data reports in the Eurozone this morning and EUR drift likely reflects a continuation of the USD correction seen as the dust settled around Friday US data.”
“Steady—so far—short-term EZ/US spreads (the 2Y gap is little changed around – 142bps this morning) suggest the EUR should remain supported on minor dips. A 25bps cut at Thursday’s ECB policy decision is fully priced in. Cautious guidance on the outlook might be modestly EUR-supportive.”
“A soft close Friday for the EUR leaves the daily chart tilting clearly negative via a bearish outside range session. Underlying trend signals remain bullish across the daily and weekly charts, however, which should help limit EUR losses in the short run at least. Weakness through last week’s low at 1.1025 may see a bit more drift to the mid/upper 1.09s. Resistance is 1.1075/85.”
- AUD/USD falls sharply to near 0.6650 amid strength in the US Dollar.
- Traders pare Fed large interest rate cut bets as US recession fears diminish.
- A sharp deflation in China’s PPI weighs on the Australian Dollar.
The AUD/USD pair slides to near 0.6650 in Monday’s North American session. The Aussie asset weakens as the US Dollar (USD) extends its recovery, with traders paring Federal Reserve (Fed) large interest rate cut bets on diminished United States (US) recession fears. The US Dollar Index (DXY), which tracks the Greenback’s value against six major currencies, jumps to near 101.60.
Fears of the US entering a recession receded after the release of the Friday’s Nonfarm Payrolls (NFP) data for August, which indicated that the pace of slowdown in the job growth in not as fast as it appeared in July figures. The data showed that US employers hired 142K job-seekers in August, fewer than estimates of 160K but significantly higher than the prior release of 89K.
Moderate growth in the US job market forced traders to pare bets supporting large interest rate cuts from the Federal Reserve (Fed) this month. According to the CME FedWatch tool, the possibility for the Fed reducing interest rates by 50 basis points (bps) to 4.75%-5.00% in September is 25%, while the rest favors a 25-bps interest rate cut.
Going forward, investors will focus on the US Consumer Price Index (CPI) data for August, which will be published on Wednesday. The US inflation data will significantly influence market speculation for how much the Fed will cut interest rates this month. Monthly headline and core inflation are estimated to have grown steadily by 0.2%. Annual headline CPI is expected to have risen at a slower pace of 2.6% from the former release of 2.9%.
In the Asia-Pacific region, the Australian Dollar (AUD) remains under pressure due to rising concerns over China’s economic growth. China’s CPI grew at a slower pace, and its Producer Price Index (CPI) deflated at a faster pace in August, which also weighed on antipodeans, being their leading trading partners.
Australian Dollar FAQs
One of the most significant factors for the Australian Dollar (AUD) is the level of interest rates set by the Reserve Bank of Australia (RBA). Because Australia is a resource-rich country another key driver is the price of its biggest export, Iron Ore. The health of the Chinese economy, its largest trading partner, is a factor, as well as inflation in Australia, its growth rate and Trade Balance. Market sentiment – whether investors are taking on more risky assets (risk-on) or seeking safe-havens (risk-off) – is also a factor, with risk-on positive for AUD.
The Reserve Bank of Australia (RBA) influences the Australian Dollar (AUD) by setting the level of interest rates that Australian banks can lend to each other. This influences the level of interest rates in the economy as a whole. The main goal of the RBA is to maintain a stable inflation rate of 2-3% by adjusting interest rates up or down. Relatively high interest rates compared to other major central banks support the AUD, and the opposite for relatively low. The RBA can also use quantitative easing and tightening to influence credit conditions, with the former AUD-negative and the latter AUD-positive.
China is Australia’s largest trading partner so the health of the Chinese economy is a major influence on the value of the Australian Dollar (AUD). When the Chinese economy is doing well it purchases more raw materials, goods and services from Australia, lifting demand for the AUD, and pushing up its value. The opposite is the case when the Chinese economy is not growing as fast as expected. Positive or negative surprises in Chinese growth data, therefore, often have a direct impact on the Australian Dollar and its pairs.
Iron Ore is Australia’s largest export, accounting for $118 billion a year according to data from 2021, with China as its primary destination. The price of Iron Ore, therefore, can be a driver of the Australian Dollar. Generally, if the price of Iron Ore rises, AUD also goes up, as aggregate demand for the currency increases. The opposite is the case if the price of Iron Ore falls. Higher Iron Ore prices also tend to result in a greater likelihood of a positive Trade Balance for Australia, which is also positive of the AUD.
The Trade Balance, which is the difference between what a country earns from its exports versus what it pays for its imports, is another factor that can influence the value of the Australian Dollar. If Australia produces highly sought after exports, then its currency will gain in value purely from the surplus demand created from foreign buyers seeking to purchase its exports versus what it spends to purchase imports. Therefore, a positive net Trade Balance strengthens the AUD, with the opposite effect if the Trade Balance is negative.
During his last presidency, Donald Trump did everything he could to weaken the US dollar. This is because a weak dollar improves the price competitiveness of U.S. exporters and those U.S. companies that compete with imports, without those U.S. companies having to lift a finger, or perhaps even get the idea, to offer better or cheaper products. Now, however, the ‘stable genius’ seems to have changed his mind. He is now threatening retaliation against anyone who actively works to end the dominance of the USD. As ‘punishment’ he is threatening to impose 100% import tariff, Commerzbank’s Head of FX and Commodity Research Ulrich Leuchtmann notes.
Trump may make the USD weaker
“US Treasuries are the ultimate safe haven for global investors. Again, this is largely a convention. However, this convention would be challenged if the denomination of US Treasuries were no longer in the currency in which global trade is conducted. However, since the US has been able to expand its national debt substantially because of the safe-haven nature of US Treasuries, the loss of this feature would be a severe blow to the debt sustainability of the US Treasury.”
“We have seen something similar in Italy, where the introduction of the euro suddenly gave Italians an alternative to BTPs in the form of German Bunds denominated in their domestic currency. However, a ‘debt crisis’ for the US Treasury would primarily take the form of a weak US dollar. In other words, deleveraging by the US, which would be necessary if the rest of the world stopped financing the US current account deficits, would lead to massive dollar weakness.”
“In addition to the potential damage to the Fed's independence, we already have a second scenario that could trigger massive USD weakness if Trump wins the election. It doesn't have to! Don't get me wrong. Without dramatic scenarios, there are still plenty of arguments at the margin for USD strength under a new Trump presidency. However, another scenario has been added that could end in extreme USD weakness. Anyone who needs to pay special attention to the major USD risks should keep this in mind.”
- EUR/GBP is rising in a shallow channel since it bottomed out in late August.
- The trend is now probably sideways – possibly even bullish, with odds favoring more upside and a reversal.
EUR/GBP continues steadily recovering in a shallow channel. The dominant short-term downtrend in August has ended and the pair has entered a sideways trend. It is even possible it could be at the start of an uptrend.
EUR/GBP 4-hour Chart
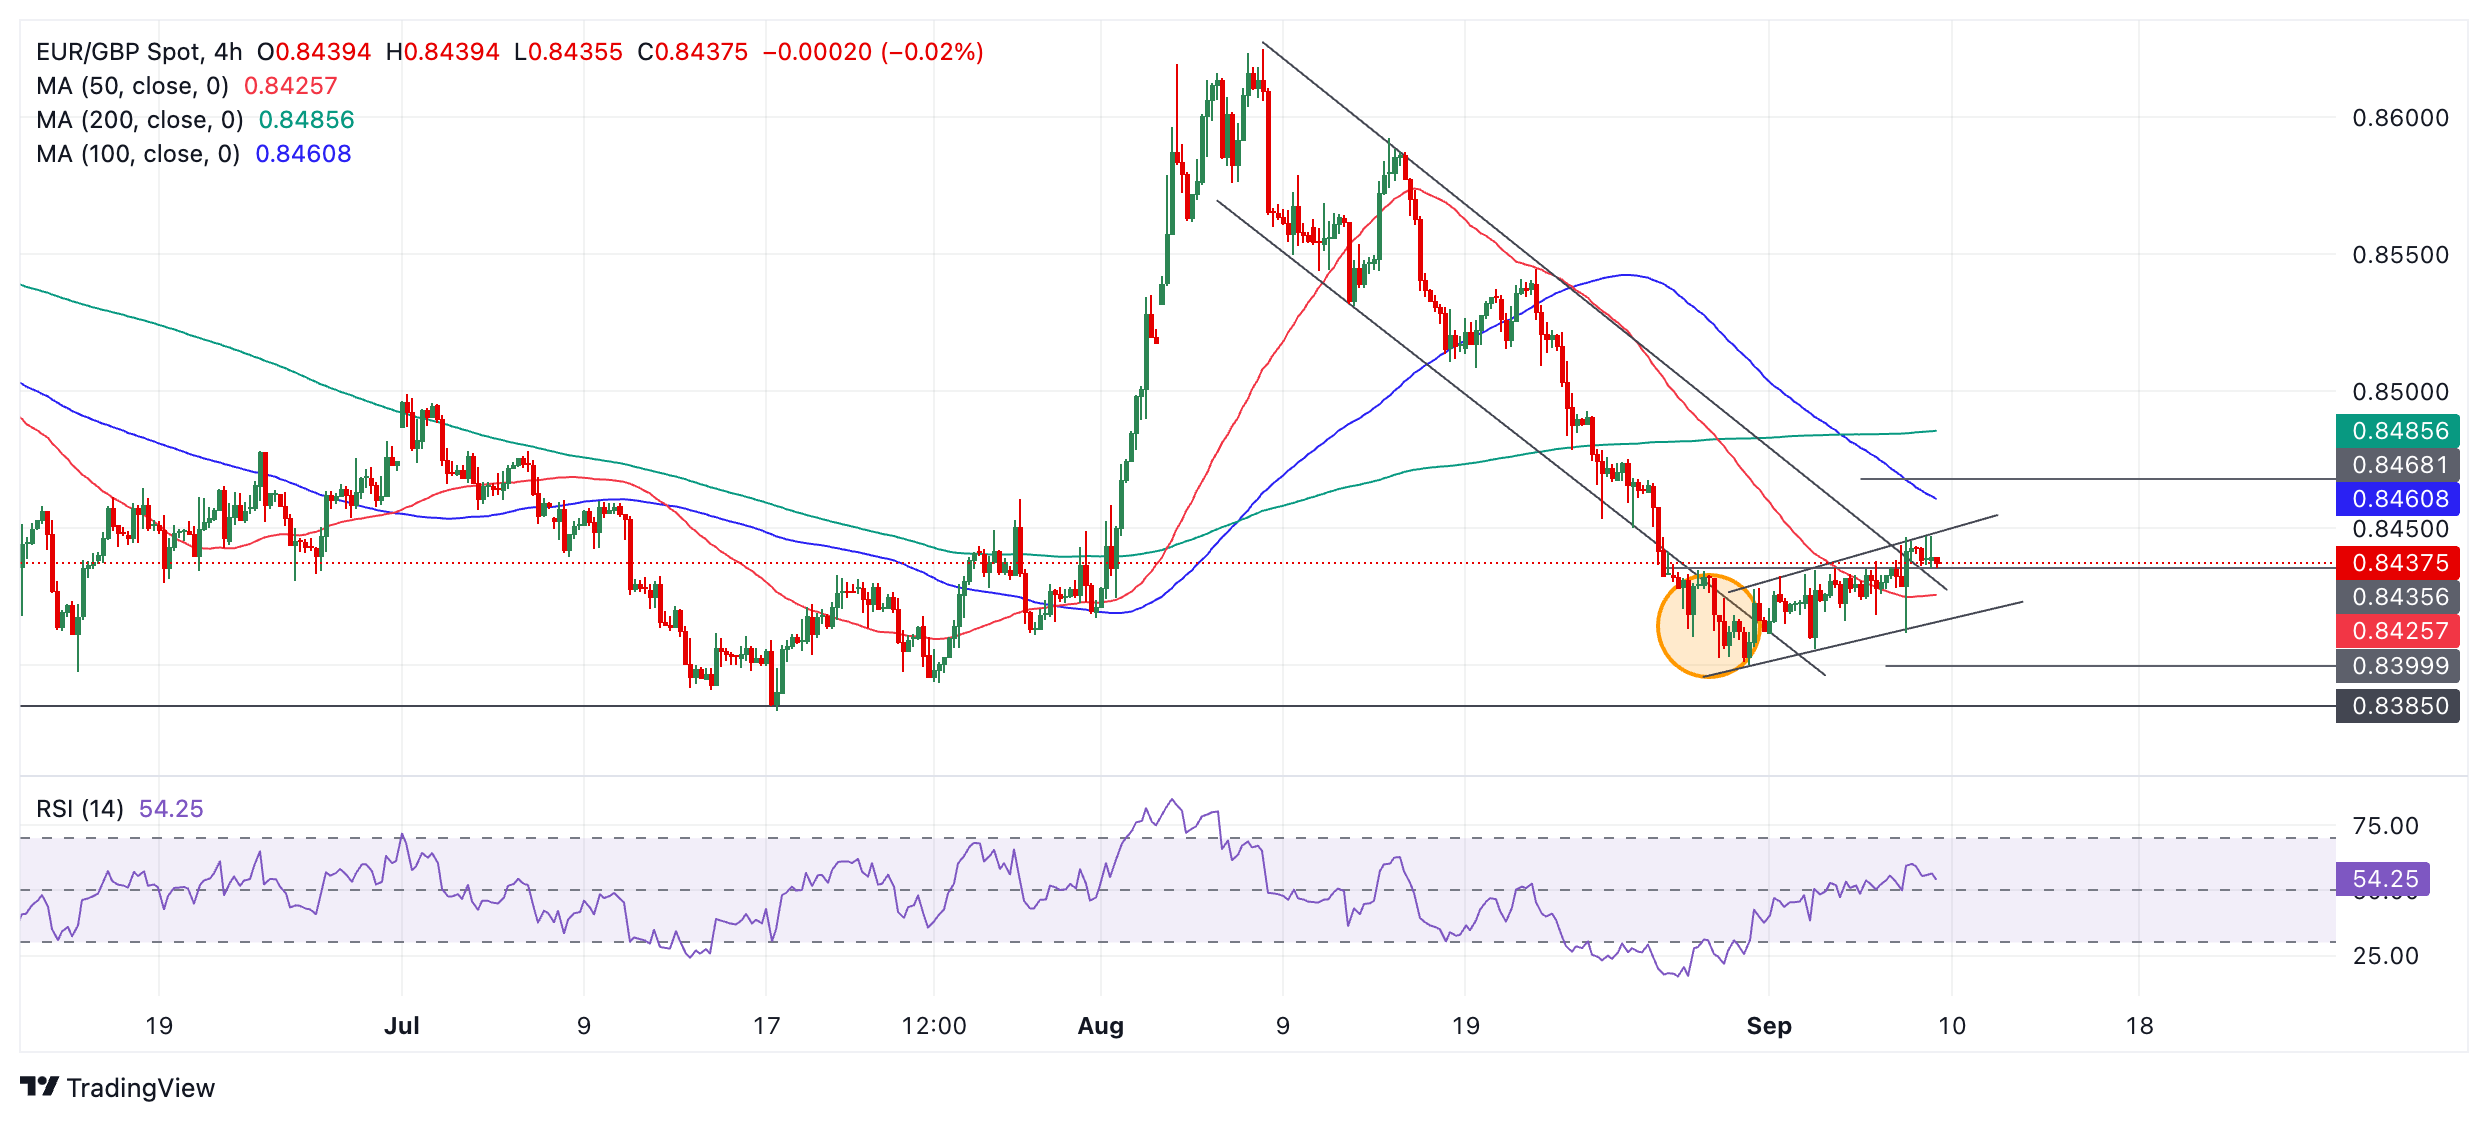
EUR/GBP will probably continue its shallow rising channel higher. An acceleration to the upside and decisive breakout above the upper channel line could lead to a move up to a target at 0.8468. The odds are probably now marginally in favor of more upside. A decisive break would be one accompanied by a long green candle that breaks above the level and closes near its high, or three green candles in a row.
The Relative Strength Index (RSI) momentum indicator is rising in line with price, indicating mild bullish confidence.
It is still possible the August downtrend could resume, with a decisive breakdown below the lower channel line probably leading to a fall to a target at 0.8400.
The pair was falling in a descending channel during August. The downtrend accelerated and temporarily broke out of the bottom of the channel – a sign of exhaustion. After bottoming out it began a shallow recovery which continues evolving.
The CAD is trading close to Friday’s closing level and resisting the bounce in the USD that has followed Friday’s US jobs data, Scotiabank’s Chief FX Strategist Shaun Osborne notes.
CAD holds below 1.3585/95 resistance for USD
“Positive risk appetite is helping the CAD steady, with global stocks in the green and crude oil modestly firmer on the session. The steady CAD and slightly firmer MXN suggests something of a “buy North America” mood across markets but these trends tend to be fleeting.”
“Friday’s Canadian employment data were near expectations in headline terms but the composition of job gains was weak (dominated by part-time positions) and the uptick in the unemployment rate has added to speculation that the BoC could pick up the pace of easing in the months ahead.”
“The CAD is little changed on the day but short, medium and long-term price signals are all leaning bullish after Friday’s sharp swings in the market. Key resistance remains 1.3585/95 where the 200-day MA converges with the range lows for the USD from earlier this year, ahead of the push into the low 1.36s. Support is 1.3550 and 1.3520.”
The euro area wage data for the second quarter, published by Eurostat on Friday, has attracted little market interest in the past. Nevertheless, the news item about the data received some attention on Friday, when a news agency prominently reported it, Commerzbank’s Head of FX and Commodity Research Ulrich Leuchtmann notes.
EUR is unlikely to quickly move towards 1.14
“Inflation expectations for the euro area, especially medium-term expectations (e.g. 1Yx1Y in the figure above), are falling very, very sharply. They are clearly visible and well below the ECB's 2% inflation target. The market's message is clear: it is not expecting a relapse into inflationary times such as those of the 1990s, but rather a return to the lowflation of the 2010s. We expect persistent inflationary pressure. But, if the deflation of consumer durables imported from China was the reason for the lowflation of the 2010s, then a return to that state of affairs is very likely in the foreseeable future.”
“Whether the market or Commerzbank economists are right will only become clear much later. Until then, it is plausible that the market view will hold. And that in turn means that the market is likely to assume a significantly looser monetary policy not only with regard to the Fed, but also with regard to the ECB. The weakness of the USD that may be induced by the Fed's view should therefore have only a muted impact on EUR/USD. It is hence rather unlikely that the pair will quickly move towards 1.14 (our medium-term target for EUR/USD).”
- EUR/JPY is pulling back within a short-term downtrend.
- The correction will probably run out of steam and prices fall again, targeting the August 5 lows.
EUR/JPY has been trending lower since rolling over at the August 16 highs.
The mainly declining sequence of peaks and troughs indicates EUR/JPY has established a short-term downtrend, which according to technical analysis theory favors more downside in line with that trend.
EUR/JPY 4-hour Chart
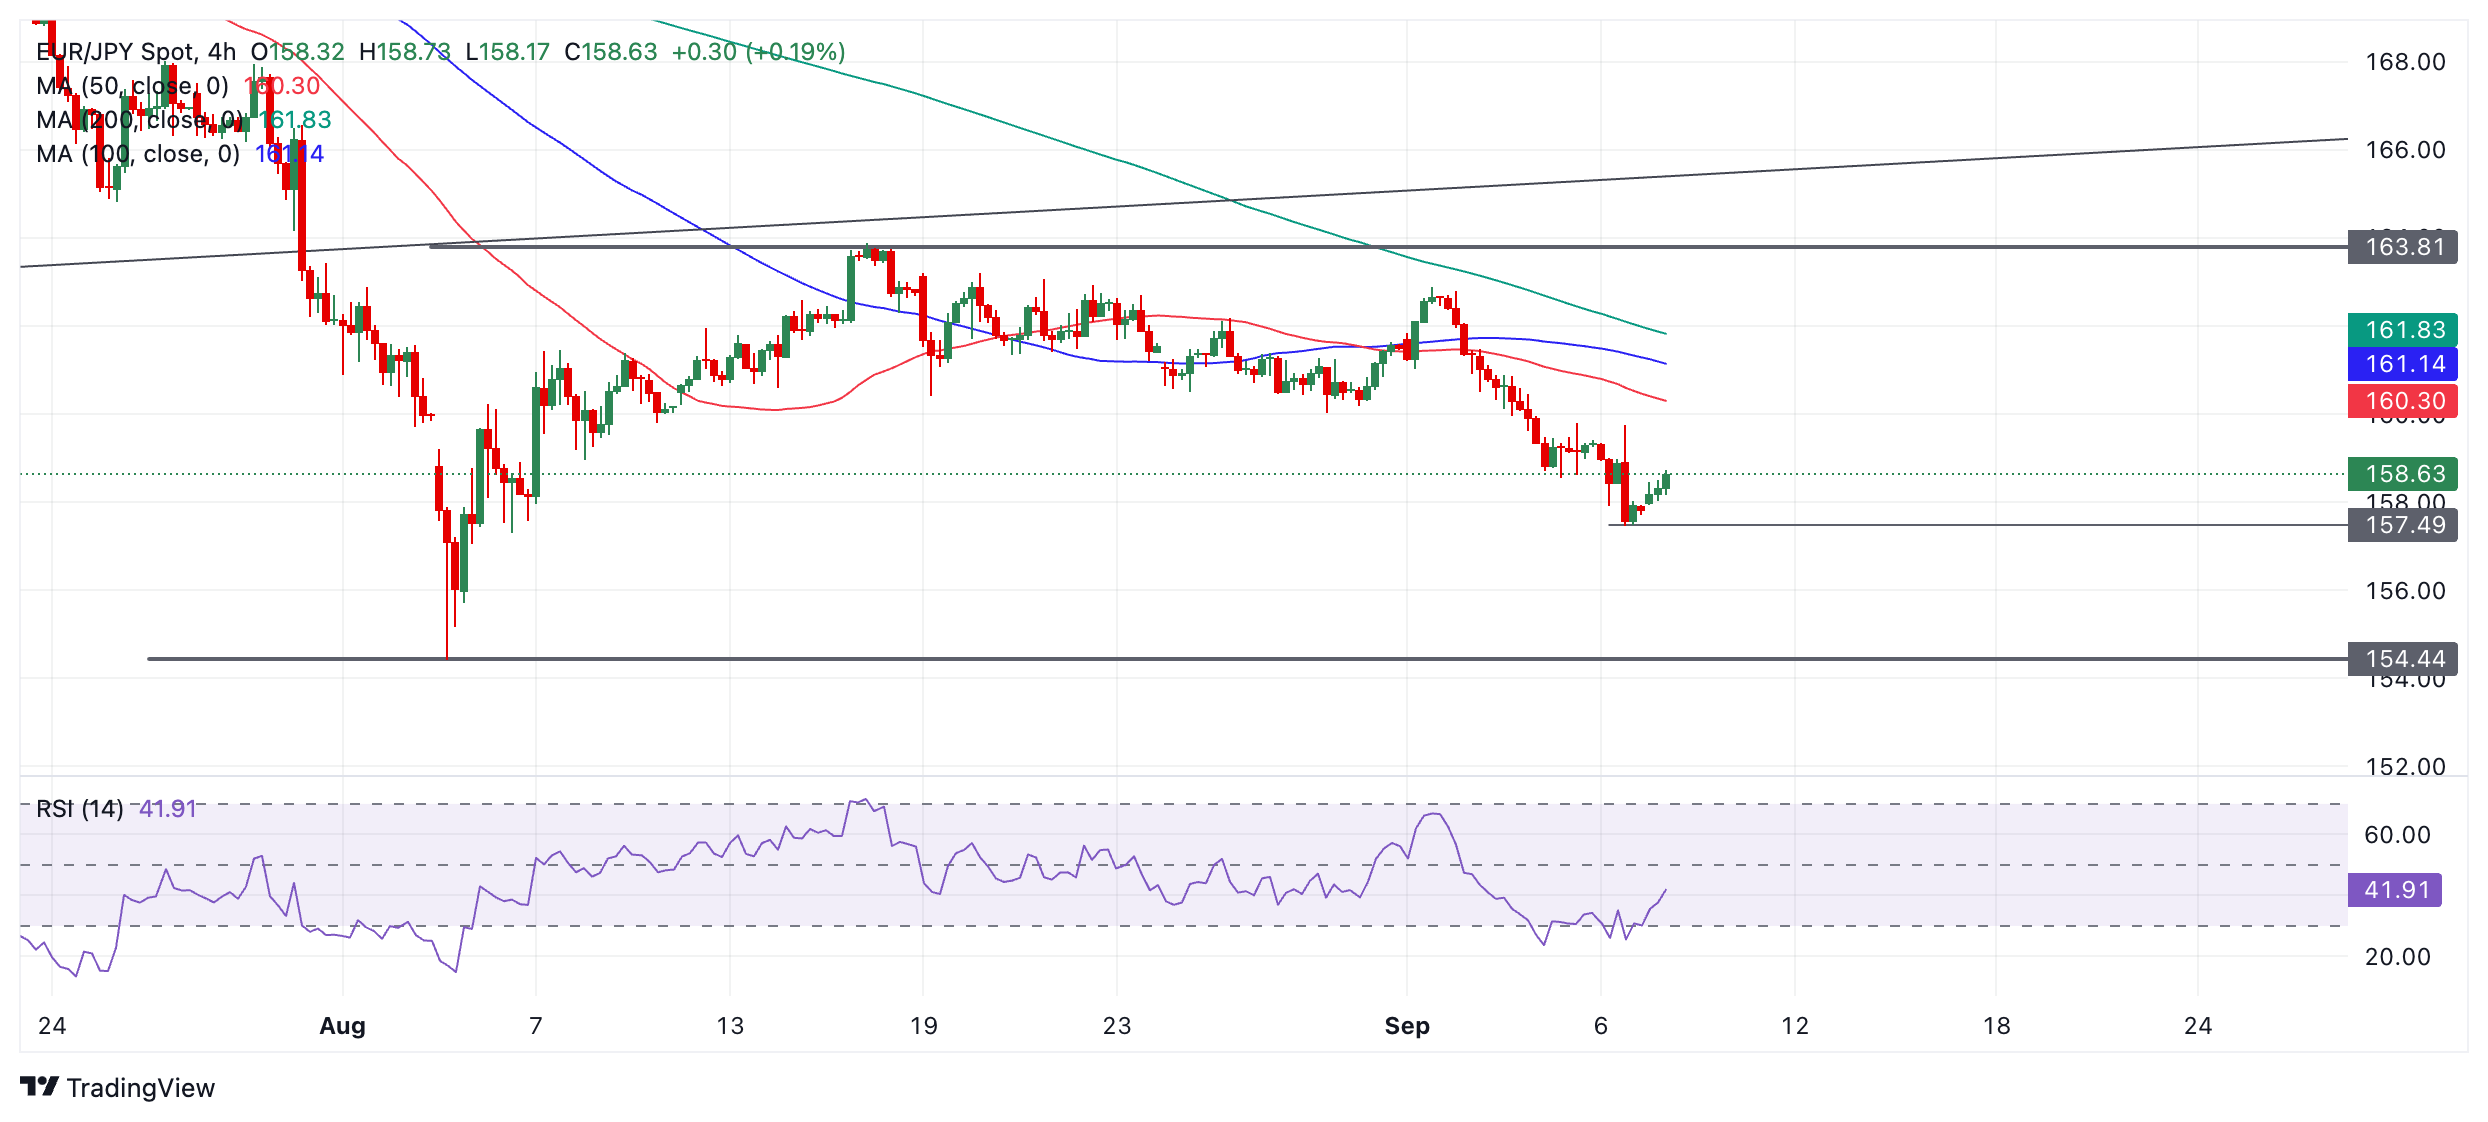
Over the last few periods the pair has recovered after touching a new low of 157.47 on Friday. Given the overarching downtrend, this recovery is probably just a counter-trend correction which will eventually run out of steam, allowing bears to continue pushing prices lower.
Although there is no sign the pullback has finished, if it does and price breaks below the 157.47 lows, that would confirm an extension of the downtrend, with the next target lying at the 154.44 – the August 5 lows. A break below that would be an even more bearish sign and suggest a probable reversal of the long-term uptrend too.
Friday’s US NFP data served to muddy the Fed policy outlook rather than resolve it conclusively, Scotiabank’s Chief FX Strategist Shaun Osborne notes.
USD broadly higher after NFP report
“The data showed slightly lower than forecast job growth and the expected drop in the unemployment rate but also reflected significant downward revisions to the prior two months’ payroll data. The downward revision was the initial focus for markets, driving the USD lower before it quickly steadied. A little later, headlines covering comments from Fed Governor Waller highlighted him favouring ‘front-loading’ rate cuts, pushing the USD down again.”
A broader read of the remarks showed that Waller, in fact, suggested ‘careful’ rate cuts starting in September. Equivocal data plus the Waller comments prompted markets pare back Fed September easing expectations somewhat whilst extending total easing bets through year end fractionally. The USD is trading generally firmer today as markets pare back some of the additional year-end easing swaps had priced in.”
“Still, the broader trend lower in US rates and the erosion in US term yield spreads will likely prevent a significant rebound in the USD for now. There are no top-tier US data reports today; CPI data Wednesday and PPI Thursday are the main calendar risk items for US markets this week.”
The US labor market report on Friday did not come as a clear surprise on the negative side. As a result, there was no clear market reaction, but rather a fair amount of back and forth before equilibrium was established. The fact that this was slightly below the levels before the BLS publication is not particularly revealing. What is important is that, at current levels, visible USD-negative surprises are needed to weaken the Greenback further. A self-sustaining momentum towards further USD weakness, regardless of the figures, can no longer be discerned at current levels — unlike much of August, when USD weakness was virtually a foregone conclusion, Commerzbank’s Head of FX and Commodity Research Ulrich Leuchtmann notes.
Less than 100 basis points is not necessarily USD-positive
“Market expectations for the Fed's interest rate policy in the near future are already quite extreme. More than 25 basis points of interest rate cuts are priced into the Fed's decision next week. And more than 100 basis points by the end of the year. Now, there may be early signs that the US labor market is weakening. But it seems courageous of the market to bet so heavily that this trend will become so dramatically more visible before the end of this year that the Fed will at least cut rates by 50 basis points at one of its remaining three meetings in 2024.”
“One should not be deceived by the word ‘market expectation’. A market expectation does not indicate what the market is most likely to anticipate. The typical investor is in the unpleasant position of having to book losses on many of his assets: Stocks are likely to perform poorly, the value of one's own home would be less and worries about one's own job would reduce the risk-adjusted future labor income. It therefore makes sense to bet on a US recession in the Fed Funds Futures market to an extent that significantly exceeds the probability of it occurring.”
“In other words, especially in a situation in which a US recession is not all that likely, but also not so unlikely that this scenario can be ignored anymore, the risk premiums in the fed funds futures market are certainly huge. The above figure does not therefore mean that the average market participant expects more than 100 basis points of Fed rate cuts by year-end. Consequently, if it is less than 100 basis points, this is not necessarily a USD-positive argument.”
- The US Dollar extends further gains in the European session on Monday.
- Comments from Fed’s Waller and the mixed Nonfarm Payrolls print are enough to fuel a stronger US Dollar for now.
- The US Dollar Index pops above 101.50 and looks to be heading towards 101.90 for a test.
The US Dollar (USD) edges higher on Monday and extends gains for a second consecutive day after US Federal Reserve (Fed) Governor Christopher Waller did not convince markets that the September interest rate cut will be a 50 basis point one. Instead, with the mixed Nonfarm Payrolls release on Friday, markets look to settle for only a 25 basis point rate cut, which means that the Greenback has been punished too much in recent weeks and needs to gain a bit to get the right valuation.
On the economic data front, this week has three pivotal points. For the US side, the US Consumer Price Index (CPI) for August release on Wednesday will be the main driver. On the European side, the European Central Bank will deliver its interest rate decision on Thursday, ahead of the Fed’s rate decision next week. Meanwhile, the US presidential election will step to the forefront again with a debate between former US President Donald Trump and Democratic candidate Kamala Harris on Wednesday.
Daily digest market movers: Soft opening
- At 14:00 GMT, the US Census Bureau will release the US Wholesale Inventories for July, expected to come in at 0.3%.
- The US Treasury will auction some short-term paper at 15:30 GMT, with a 3-month and a 6-month bill auction.
- At 19:00 GMT, the Consumer Credit Change for July is expected to jump to $12.2 billion from $8.93 billion prior.
- Equities in Asia have closed down again by on average 1%. European and US equities are rather chosing positive numbers with nearly all major European indices and US futures up by 1%.
- The CME Fedwatch Tool shows a 73.0% chance of a 25 basis points (bps) interest rate cut by the Fed on September 18 against a 27.0% chance for a 50 bps cut. For the meeting on November 7, another 25 bps cut (if September is a 25 bps cut) is expected in November by 32.6%, while there is a 52.5% chance that rates will be 75 bps (25 bps + 50 bps) and a 14.9% probability of rates being 100 (25 bps + 75 bps) basis points lower.
- The US 10-year benchmark rate trades at 3.74%, gradually trading higher on the day.
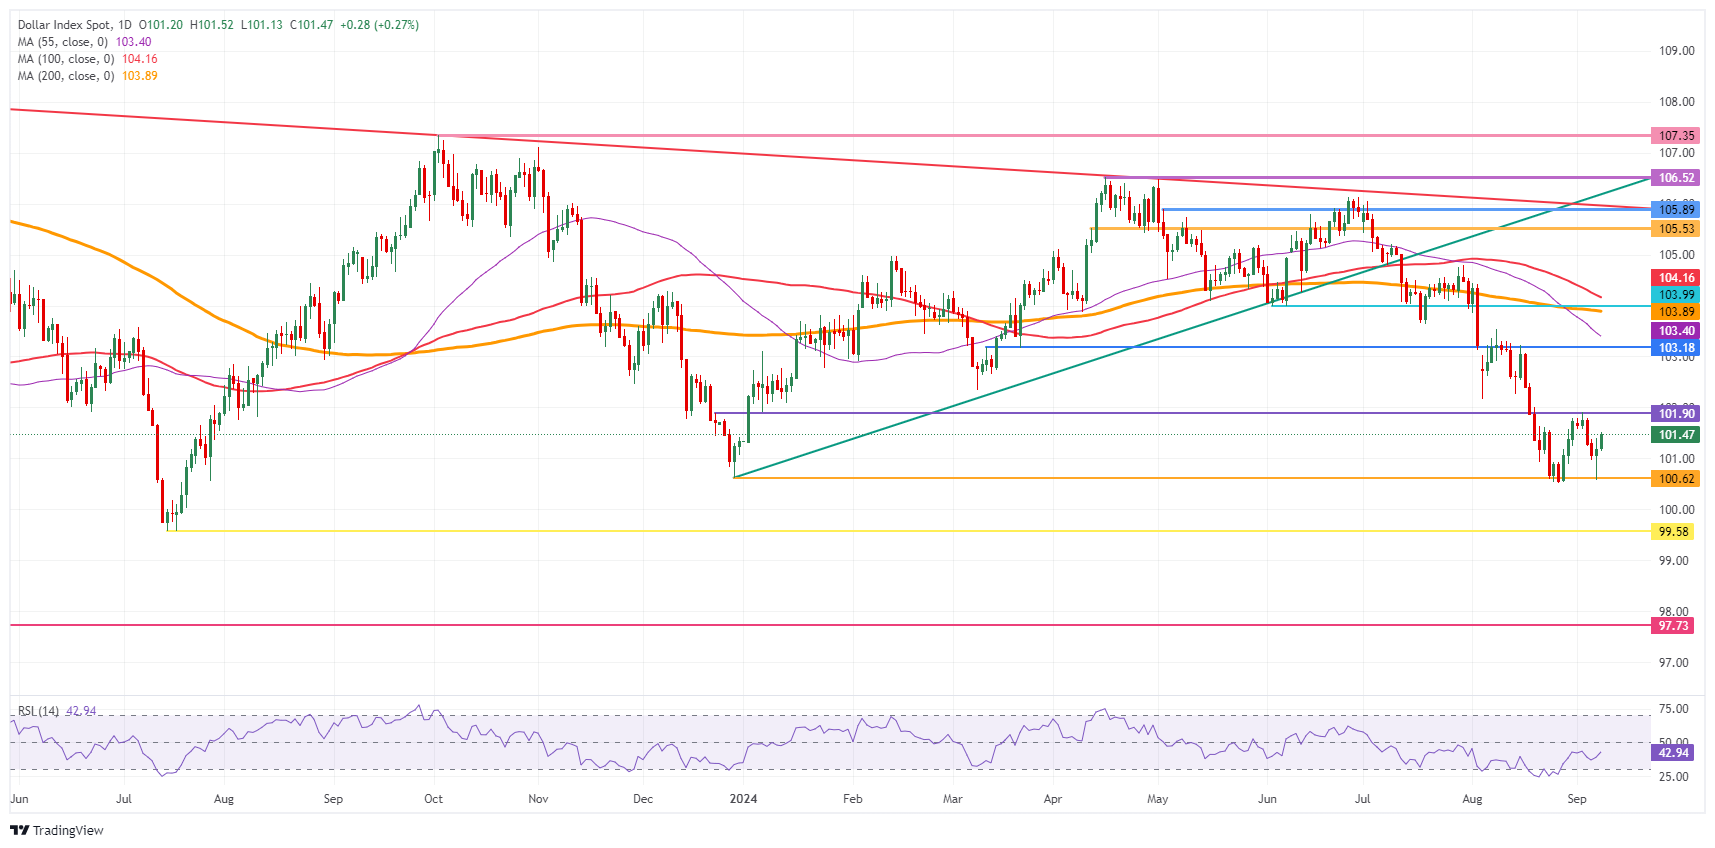
US Dollar Index Technical Analysis: More repricing to come?
The US Dollar Index (DXY) is looking for its fair value after markets devalued the Greenback a bit too far in the assumption that the Fed would have to cut bigger and quicker than the US data is actually suggesting. That repricing looks to be on its way with a stronger US Dollar this Monday and leaves a fair warning for traders and markets. The Fed determines each policy meeting on the data coming in, which means each meeting might not be what markets expect it to be.
Looking at key technical levels, the first resistance at 101.90 is getting ready for a second test after its rejection last week. Further up, a steep 2% uprising would be needed to get the index to 103.18. The next tranche up is a very misty one with the 55-day Simple Moving Average (SMA) at 103.40, followed by the 200-day SMA at 103.89, just ahead of the big 104.00 round level.
On the downside, 100.62 (the low from December 28) holds strong and has already made the DXY bounce four times in recent weeks. Should it break, the low from July 14, 2023, at 99.58, will be the ultimate level to look out for. Once that level gives way, early levels from 2023 are coming in near 97.73.
US Dollar Index: Daily Chart
US Dollar FAQs
The US Dollar (USD) is the official currency of the United States of America, and the ‘de facto’ currency of a significant number of other countries where it is found in circulation alongside local notes. It is the most heavily traded currency in the world, accounting for over 88% of all global foreign exchange turnover, or an average of $6.6 trillion in transactions per day, according to data from 2022. Following the second world war, the USD took over from the British Pound as the world’s reserve currency. For most of its history, the US Dollar was backed by Gold, until the Bretton Woods Agreement in 1971 when the Gold Standard went away.
The most important single factor impacting on the value of the US Dollar is monetary policy, which is shaped by the Federal Reserve (Fed). The Fed has two mandates: to achieve price stability (control inflation) and foster full employment. Its primary tool to achieve these two goals is by adjusting interest rates. When prices are rising too quickly and inflation is above the Fed’s 2% target, the Fed will raise rates, which helps the USD value. When inflation falls below 2% or the Unemployment Rate is too high, the Fed may lower interest rates, which weighs on the Greenback.
In extreme situations, the Federal Reserve can also print more Dollars and enact quantitative easing (QE). QE is the process by which the Fed substantially increases the flow of credit in a stuck financial system. It is a non-standard policy measure used when credit has dried up because banks will not lend to each other (out of the fear of counterparty default). It is a last resort when simply lowering interest rates is unlikely to achieve the necessary result. It was the Fed’s weapon of choice to combat the credit crunch that occurred during the Great Financial Crisis in 2008. It involves the Fed printing more Dollars and using them to buy US government bonds predominantly from financial institutions. QE usually leads to a weaker US Dollar.
Quantitative tightening (QT) is the reverse process whereby the Federal Reserve stops buying bonds from financial institutions and does not reinvest the principal from the bonds it holds maturing in new purchases. It is usually positive for the US Dollar.
- Gold trades up and down within a range under its record highs.
- US labor market data caused some volatile moves, but the sideways trend holds.
- US inflation data this week could impact Gold as the next Federal Reserve meeting nears.
Gold (XAU/USD) pulls back down to just below $2,500 per troy ounce on Monday after retesting its all-time highs on Friday, amid market volatility following the release of a mixed US Nonfarm Payrolls (NFP) employment report.
Gold rises then falls after US Nonfarm Payrolls
Gold rose immediately after the NFP release on Friday, as the headline figure showed the US economy added fewer jobs than expected in August, and July and June’s figures were revised down. The data indicated that the labor market was softening overall and that, therefore, there was a greater chance the Federal Reserve (Fed) would need to make a larger 0.50% cut to interest rates rather than the standard 0.25% in September. Lower interest rates are positive for Gold as they reduce the opportunity cost of holding non-interest-bearing assets.
The precious metal failed to hold its gains, however, as traders processed the rest of the data in the report and its implications for interest rates going forward. The Unemployment Rate, for example, was shown to have actually fallen to 4.2% from 4.3% as anticipated, and wage growth increased by 0.4% in the month, exceeding the forecasted 0.3%. This suggested the labor market was not in as bad shape as first thought and that wage inflation was rising. As a result of the report, the market-based probabilities of the Fed cutting interest rates by 0.50% actually ended up falling from around 40% to about 30%.
As a result, Gold eventually rolled over and ended the week back down at around the $2,500 mark, before inching slightly lower into the $2,490s on Monday.
Gold remains supported, however, by persistent concerns about the outlook for the US economy. Fed Governor Christopher Waller said on Friday that it was now appropriate to start cutting interest rates to keep the economy’s “forward momentum” intact and because the labor market was showing signs of “softening” but – he added – not “deteriorating”. Waller also said he would be in favor of “front-loading cuts”, keeping alive the possibility of a non-standard 0.50% reduction.
US Consumer Price Index (CPI) and Producer Price Index (PPI) data out this week could further color the outlook for interest rates, although analysts are mixed as to how much, with some, such as Deutsche Bank’s Head of Macro Research, Jim Reid, playing down the importance of inflation compared to employment data.
“Wednesday's US CPI and Thursday's PPI will probably help move that debate on, but it seems employment is more important at the moment and Friday's mixed employment report had arguments for both sides, so the swing factor is probably how the committee view labor markets rather than inflation,” said Reid in his “Early Morning Reid” macro note.
Data from the People’s Bank of China (PBoC) continued to show no increase in the bank’s Gold reserves as it has continued its halt on buying since May.
On the geopolitical front, a ceasefire deal between Israel and Hamas seems even less likely after a gunman from Jordan shot dead three Israelis at a border crossing in the West Bank, in the first such killing since the October 7 terrorist attack.
In Ukraine, Russia continues its advance towards the key strategic hub city of Pokrovsk. If successful, it could dramatically impact the war on the eastern front and threaten Ukraine’s whole defensive line in the Donbass. Such an outcome, though still unlikely to occur soon, would nevertheless ratchet up tensions in the region and increase demand for Gold. The Central Bank of Poland (NBP), for example, has been hoarding Gold since the war began, according to data from the World Gold Council (WGC).
Technical Analysis: Continues trading within a range
Gold (XAU/USD) continues trading in a sideways range between the all-time highs of $2,531 and a floor at around the $2,475 level. It is currently plum in the centre of the range.
XAU/USD 4-hour Chart
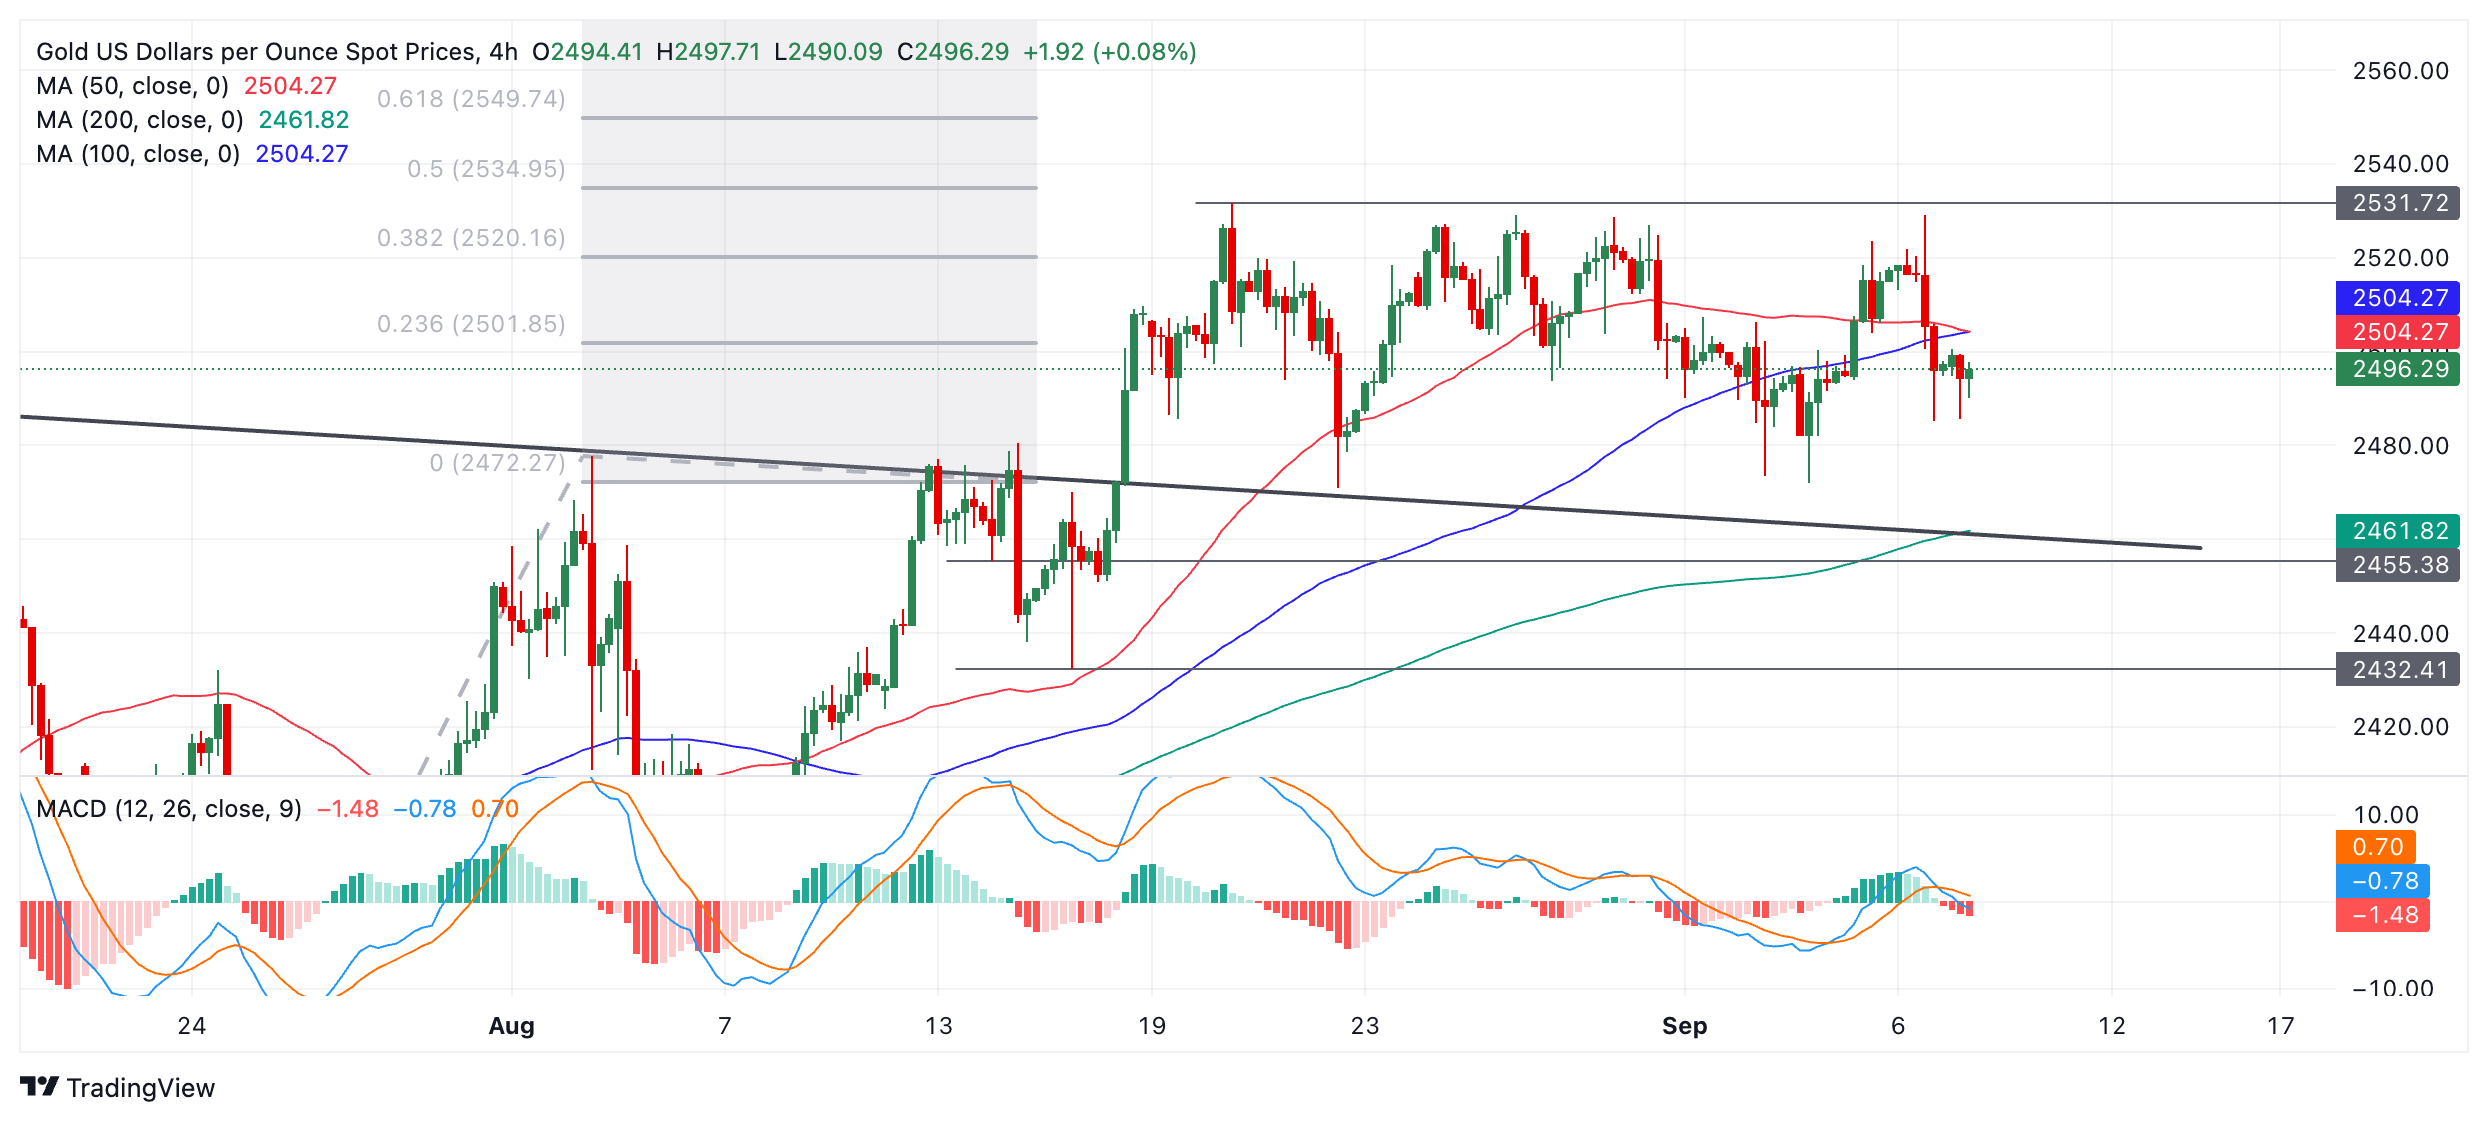
The yellow metal will probably continue trading up and down within this range until it breaks decisively out of one side or another.
A decisive break would be one accompanied by a long green or red candle that broke clearly through the level and closed near its highs or lows, or three candles in a row of the same candle that pierced the level.
However, the longer-term trend of Gold is bullish, slightly enhancing the odds of an upside breakout. Gold has an as-yet unreached bullish target at $2,550, generated after the original breakout from the July-August range on August 14. It will probably finally reach its goal in the end, assuming the uptrend resumes.
A break above the August 20 all-time high of $2,531 would provide more confirmation of a continuation higher toward the $2,550 target.
If Gold continues steadily weakening, however, a decisive break below the range floor and a close below $2,460 would change the picture and suggest that the commodity might be starting a more pronounced downtrend.
Economic Indicator
Consumer Price Index (YoY)
Inflationary or deflationary tendencies are measured by periodically summing the prices of a basket of representative goods and services and presenting the data as The Consumer Price Index (CPI). CPI data is compiled on a monthly basis and released by the US Department of Labor Statistics. The YoY reading compares the prices of goods in the reference month to the same month a year earlier.The CPI is a key indicator to measure inflation and changes in purchasing trends. Generally speaking, a high reading is seen as bullish for the US Dollar (USD), while a low reading is seen as bearish.
Read more.Next release: Wed Sep 11, 2024 12:30
Frequency: Monthly
Consensus: 2.6%
Previous: 2.9%
Source: US Bureau of Labor Statistics
The US Federal Reserve has a dual mandate of maintaining price stability and maximum employment. According to such mandate, inflation should be at around 2% YoY and has become the weakest pillar of the central bank’s directive ever since the world suffered a pandemic, which extends to these days. Price pressures keep rising amid supply-chain issues and bottlenecks, with the Consumer Price Index (CPI) hanging at multi-decade highs. The Fed has already taken measures to tame inflation and is expected to maintain an aggressive stance in the foreseeable future.
- Silver price hovers near $28.00 as investors shift focus to the US Inflation data for August.
- Higher US Dollar and bond yields restrict the upside of the Silver price.
- The Fed is widely anticipated to start reducing interest rates this month.
Silver price (XAG/USD) edges higher above $28.00 in Monday’s European session. The white metal trades in a tight range, with the downside remaining supported near $27.70. The upside in the Silver price remains restricted as the US Dollar (USD) and bond yields perform strongly as traders pare bets supporting the Federal Reserve (Fed) to start the policy-easing process aggressively this month.
The US Dollar Index (DXY), which tracks the Greenback’s value against six major currencies, surges to near 101.70. 10-year US Treasury yields soar to 3.75%. Historically, higher yields on interest-bearing assets ceil Silver’s upside, given that it increases the opportunity cost of holding an investment in non-yielding assets, such as Silver.
The US Dollar and bond yields strengthened after the release of the United States (US) Nonfarm Payrolls (NFP) data for August, which indicated that current labor market health is not as bad as it appeared from the official employment data of July.
Meanwhile, investors shift focus on the United States (US) Consumer Price Index (CPI) data for August, which will be published on Wednesday. The consumer inflation report is expected to show that monthly both headline and core CPI- which excludes food and energy prices- are estimated to have grown steadily by 0.2%. Annual headline CPI is expected to have decelerated sharply to 2.6% from July’s reading of 2.9%.
Silver technical analysis
Silver price trades in a Channel formation on a daily timeframe, which is slightly sloping downwards. The asset recovers sharply and attempts to break above the 20-day Exponential Moving Average (EMA), which trades around $28.68.
The 14-day Relative Strength Index (RSI) oscillates inside the 40.00-60.00 range, suggesting a consolidation ahead.
Silver daily chart
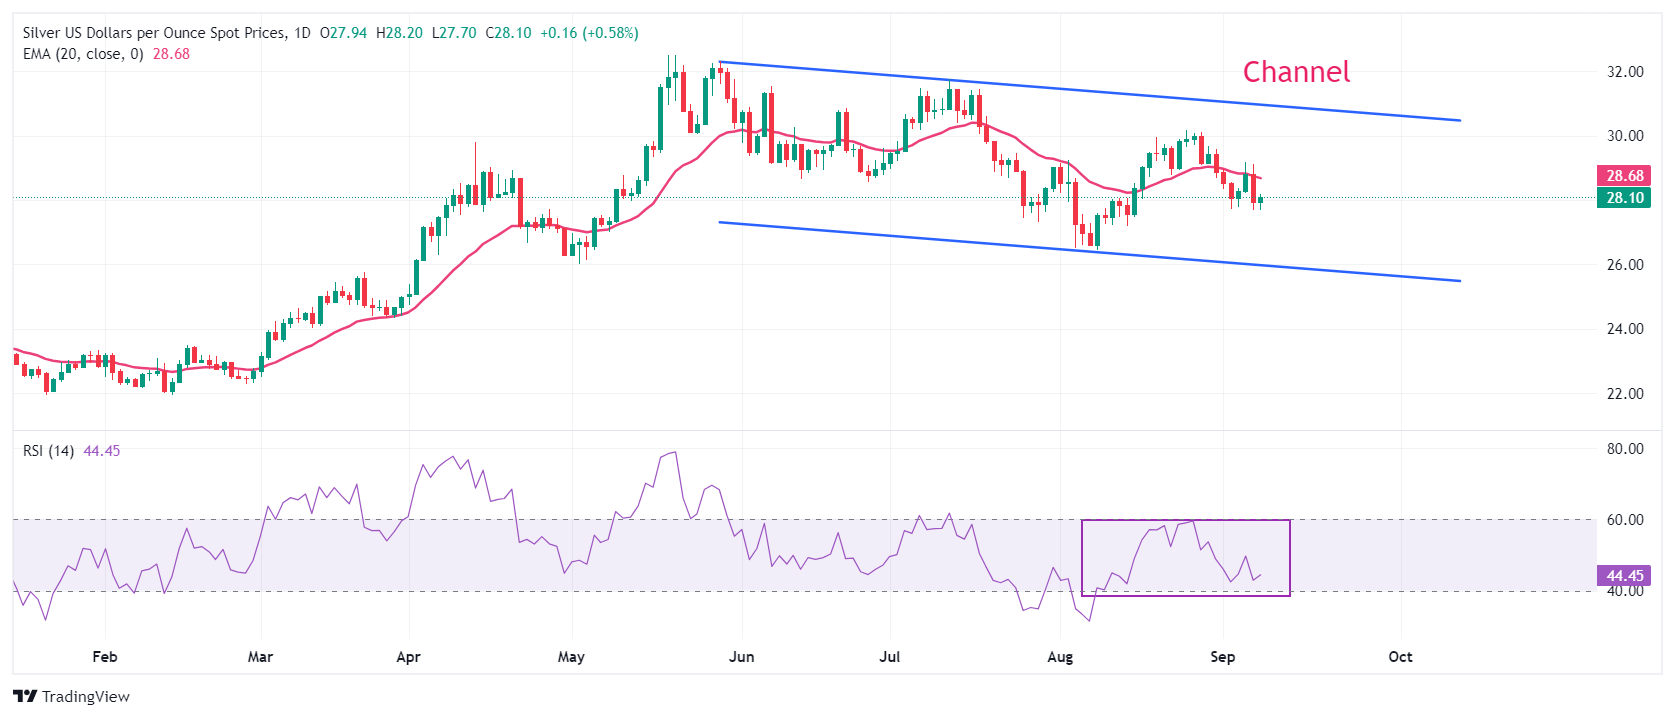
Silver FAQs
Silver is a precious metal highly traded among investors. It has been historically used as a store of value and a medium of exchange. Although less popular than Gold, traders may turn to Silver to diversify their investment portfolio, for its intrinsic value or as a potential hedge during high-inflation periods. Investors can buy physical Silver, in coins or in bars, or trade it through vehicles such as Exchange Traded Funds, which track its price on international markets.
Silver prices can move due to a wide range of factors. Geopolitical instability or fears of a deep recession can make Silver price escalate due to its safe-haven status, although to a lesser extent than Gold's. As a yieldless asset, Silver tends to rise with lower interest rates. Its moves also depend on how the US Dollar (USD) behaves as the asset is priced in dollars (XAG/USD). A strong Dollar tends to keep the price of Silver at bay, whereas a weaker Dollar is likely to propel prices up. Other factors such as investment demand, mining supply – Silver is much more abundant than Gold – and recycling rates can also affect prices.
Silver is widely used in industry, particularly in sectors such as electronics or solar energy, as it has one of the highest electric conductivity of all metals – more than Copper and Gold. A surge in demand can increase prices, while a decline tends to lower them. Dynamics in the US, Chinese and Indian economies can also contribute to price swings: for the US and particularly China, their big industrial sectors use Silver in various processes; in India, consumers’ demand for the precious metal for jewellery also plays a key role in setting prices.
Silver prices tend to follow Gold's moves. When Gold prices rise, Silver typically follows suit, as their status as safe-haven assets is similar. The Gold/Silver ratio, which shows the number of ounces of Silver needed to equal the value of one ounce of Gold, may help to determine the relative valuation between both metals. Some investors may consider a high ratio as an indicator that Silver is undervalued, or Gold is overvalued. On the contrary, a low ratio might suggest that Gold is undervalued relative to Silver.
China’s Consumer Price Index (CPI) picked up further to 0.6% y/y in Aug but was short of market’s expectation (Bloomberg est: 0.7%; Jul: 0.5%). The rebound in food inflation was the driver, which more than offset lower non-food inflation, UOB Group economist Ho Woei Chen notes.
Headline CPI picks up less than expected
”China’s CPI picked up in Aug, driven by a sharp rebound in food prices which turned positive for the first time since Jul 2023. Amid persistent weak demand, core inflation and services inflation eased further while PPI deflation widened sharply in Aug.”
“Factoring in the higher food inflation, we adjust higher our headline CPI forecast to 0.5% from 0.3% for 2024 (2023: 0.2%). However, we revised our full-year forecast for the PPI to -2.0% from -1.3% for 2024 as underlying demand has stayed weak.”
“Weaker domestic price pressure and the monetary policy easing in the developed economies have combined to support further easing by the PBOC. The near-term focus will be on a further cut to banks’ reserve requirement ratio (RRR), targeting the release of long-term liquidity to boost credit expansion which had slowed sharply this year due to weak investment and mortgage demand.”
- Crude Oil rebounds slightly after breaking below $67 on Friday following weaker-than-expected US jobs data.
- Markets see global demand deteriorate further, while the US Federal Reserve isn’t expected to cut interest rates aggressively.
- The US Dollar Index trades above 101.50, extending recent gains.
Crude Oil rebounds slightly on Monday after dipping lower on Friday after the US Jobs Report showed that the US economy is cooling down but not on the edge of a recession, easing the chances of a chunky interest-rate cut by 50 basis points from the US Federal Reserve (Fed) in its upcoming meeting on September 18. This means that there will be no boost in US demand, while other big Oil consumers such as China and India are also experiencing softer economic activity.
The US Dollar Index (DXY), which tracks the performance of the US Dollar (USD) against a basket of currencies, is jumping for the second day in a row. The initial pop occurred on Friday on the back of the US Jobs Report. It looks like markets had clearly depreciated the Greenback too much in the assumption that the Fed would cut rates by 75 or even 100 basis points by November, which isn’t likely to be the case considering the recent healthy US economic data.
At the time of writing, Crude Oil (WTI) trades at $68.05 and Brent Crude at $71.79.
Oil news and market movers: Trafigura paints it black
- Bloomberg reports that major commodity traders Trafigura Group and Gunvor Group Ltd. have painted a bleak picture for Oil, with lingering concerns over Chinese demand and oversupply. Trafigura Group said that OPEC+ is facing a dilemma when it comes to reconciling the group’s goals with what the market needs.
- Morgan Stanley issued another price cut in its forecast for a second time in just a few weeks. Reuters reports that the bank sees Brent Crude at near $75.00 for the fourth quarter.
- Meanwhile, China is trying to consolidate ties with some Oil producing countries, with Chinese Premier Li Qiang set to visit Saudi Arabia and the United Arab Emirates this week, Beijing's foreign ministry said Monday, AFP reports.
- A weather system in the southwestern Gulf of Mexico is forecast to become a hurricane before it reaches the northwestern US Gulf Coast, the US National Hurricane Center said on Sunday, Reuters reports. The area accounts for more than half of the country’s refining capacity.
Oil Technical Analysis: Cold winter for Oil
Time to scroll further down for Oil after leading experts Trafigura Group and Gunvor Group both issued statements saying that more downturn is to come for the fossil fuel. It actually does not need an expert to think that more downturn was unavoidable seeing the US exporting levels at historic highs and Russia unable to sell its crude to China and India without stepping on the toes of its partners within OPEC+. The economic slowdown is only further exposing the issue of oversupply, which might mean more downturn to come.
On the upside, the $75.27 will be the first level to head back to. Next, the $77.43 level aligns with both a descending trendline and the 200-day Simple Moving Average (SMA). In case bulls can break above it, the 100-day SMA at $77.71 could trigger a rejection.
On Friday, the $67.11 key level got broken very briefly. For now, the range between that $67.11 and the $68.00 big figure is to be watched as a hawk in risk for snapping lower again. Next level further down the line is $64.38, the low from March and May 2023.
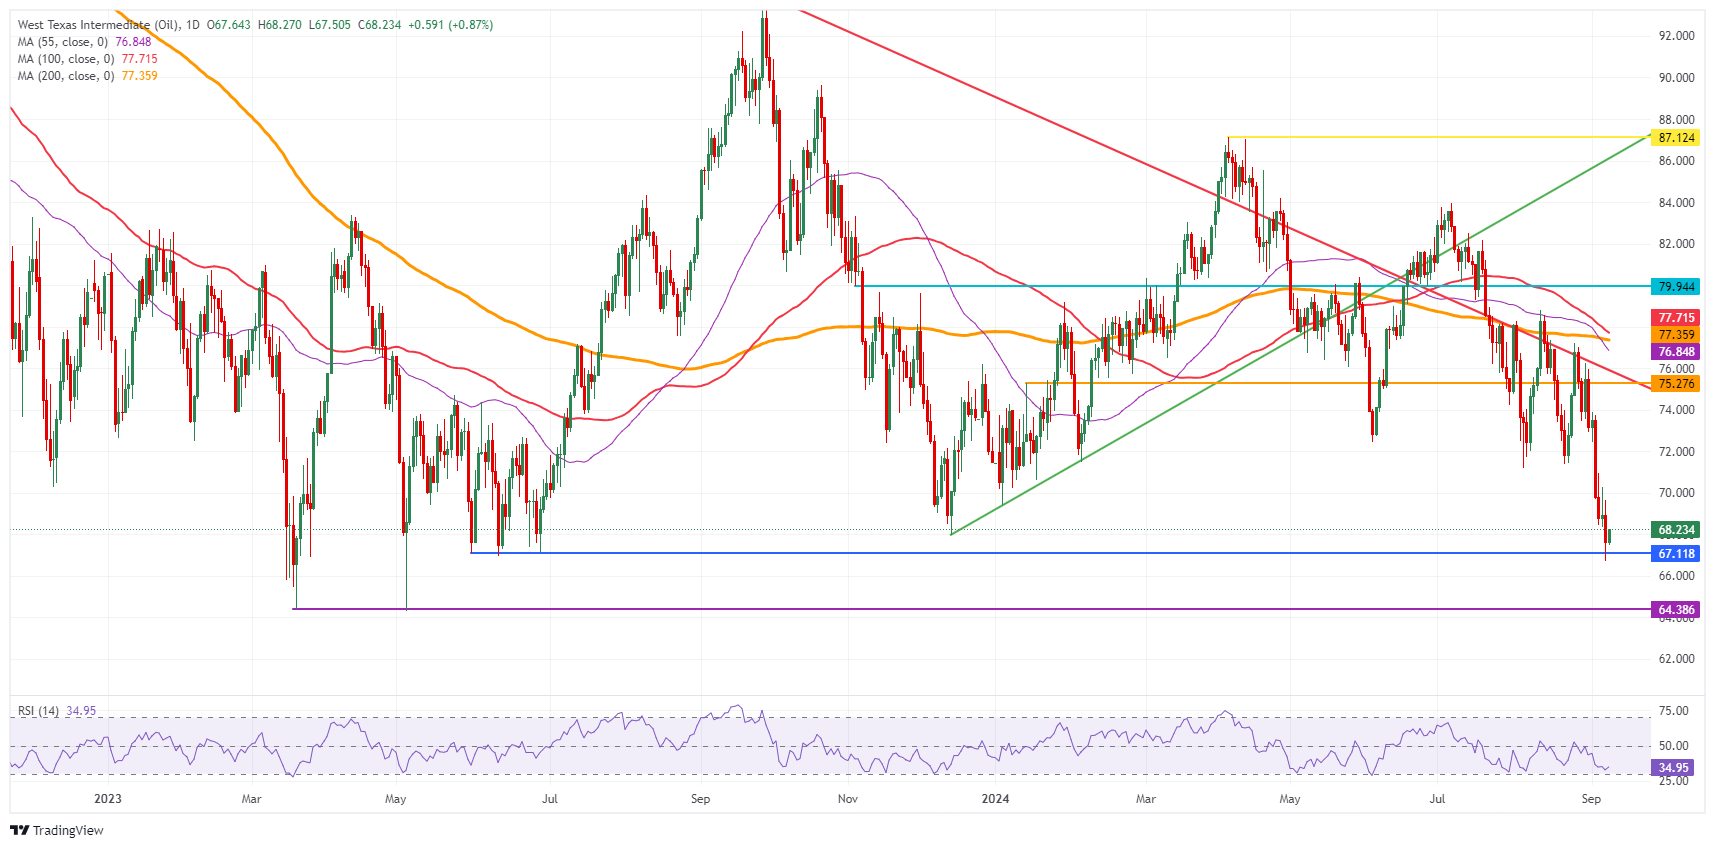
US WTI Crude Oil: Daily Chart
WTI Oil FAQs
WTI Oil is a type of Crude Oil sold on international markets. The WTI stands for West Texas Intermediate, one of three major types including Brent and Dubai Crude. WTI is also referred to as “light” and “sweet” because of its relatively low gravity and sulfur content respectively. It is considered a high quality Oil that is easily refined. It is sourced in the United States and distributed via the Cushing hub, which is considered “The Pipeline Crossroads of the World”. It is a benchmark for the Oil market and WTI price is frequently quoted in the media.
Like all assets, supply and demand are the key drivers of WTI Oil price. As such, global growth can be a driver of increased demand and vice versa for weak global growth. Political instability, wars, and sanctions can disrupt supply and impact prices. The decisions of OPEC, a group of major Oil-producing countries, is another key driver of price. The value of the US Dollar influences the price of WTI Crude Oil, since Oil is predominantly traded in US Dollars, thus a weaker US Dollar can make Oil more affordable and vice versa.
The weekly Oil inventory reports published by the American Petroleum Institute (API) and the Energy Information Agency (EIA) impact the price of WTI Oil. Changes in inventories reflect fluctuating supply and demand. If the data shows a drop in inventories it can indicate increased demand, pushing up Oil price. Higher inventories can reflect increased supply, pushing down prices. API’s report is published every Tuesday and EIA’s the day after. Their results are usually similar, falling within 1% of each other 75% of the time. The EIA data is considered more reliable, since it is a government agency.
OPEC (Organization of the Petroleum Exporting Countries) is a group of 13 Oil-producing nations who collectively decide production quotas for member countries at twice-yearly meetings. Their decisions often impact WTI Oil prices. When OPEC decides to lower quotas, it can tighten supply, pushing up Oil prices. When OPEC increases production, it has the opposite effect. OPEC+ refers to an expanded group that includes ten extra non-OPEC members, the most notable of which is Russia.
For the time being, the US Dollar (USD) is likely to trade sideways between 7.0650 and 7.1350, UOB Group FX strategists Quek Ser Leang and Alvin Liew note.
Rangebound between 7.0650 and 7.1350
24-HOUR VIEW: “USD traded in a range of 7.0738/7.1001 last Friday, closing little changed at 7.0969 (+0.09%). It traded on a firm note in early Asian trade today, but while it could edge higher, we view any advance as part of a higher trading range of 7.0850/7.1150. In other words, USD is unlikely to break clearly either below 7.0850 or above 7.1150.”
1-3 WEEKS VIEW: “The current price movements are likely part of a sideways trading phase. For the time being, we expect USD to trade between 7.0650 and 7.1350. Looking ahead, USD has to break clearly below 7.0650 or above 7.1350 before a sustained move can be expected.”
Very much driving the broad dollar sell-off in August was the recovery in Asian currencies, ING’s FX strategist Chris Turner notes.
Hard to be very positive on the renminbi at this point
“This was led by the resurgent renminbi. Those gains may have been largely driven by short-covering in both the currency and local Chinese equity markets. At the same time, we and others were discussing whether Chinese exporters were being dragged into hedging export proceeds, previously having taken the view that the renminbi was on a one-way path lower.”
“Yet the path to a stronger renminbi is far from clear. Chinese August CPI and PPI data came in very soft again and the local equity market, the CSI 300, is again under pressure and back to the February lows. Unless Chinese policymakers can find some stimulus from somewhere, it is hard to be very positive on the renminbi at this point.”
The corrective pullback in the New Zealand Dollar (NZD) could reach the major support at 0.6115, UOB Group FX strategists Quek Ser Leang and Alvin Liew note.
Bears push to test 0.6115
24-HOUR VIEW: “NZD swung between 0.6157 and 0.6253 last Friday before closing at 0.6175 (-0.76%). The weak closing has led to an increase in downward momentum, albeit not much. Today, provided that NZD remains below 0.6220 (minor resistance is at 0.6200), it could break below 0.6150. The major support at 0.6115 is highly unlikely to come into view today.”
1-3 WEEKS VIEW: “The current price action is likely part of a corrective pullback that could potentially reach the major support at 0.6115. A break of this level is not ruled out, but as downward momentum is only beginning to build, the chance of a sustained drop below this level is low for now. On the upside, should NZD break above 0.6250, it would mean that the buildup in momentum has faded.”
This week's focus in the CEE region will be on inflation. Tomorrow, the August numbers will be published in the Czech Republic and Hungary, and on Wednesday in Romania. On Friday, we will see the final inflation numbers in Poland, ING’s FX strategist Frantisek Taborsky notes.
Inflation data to move CEE currencies
“In the Czech Republic, we expect a slight decline from 2.2% to 2.0% YoY, narrowing the deviation from the Czech National Bank's 1.8% forecast by one-tenth. We expect a slight acceleration in core inflation from 2.2% to 2.4%. In Hungary, we expect a decent decline in inflation from 4.1% to 3.6% YoY. Meanwhile, core inflation should jump up slightly from 4.7% to 4.8%. Here too, however, the deviation from the National Bank of Hungary's forecast should narrow.
In Romania, we expect inflation to fall from 5.4% to 5.0% YoY. And lastly, we should see confirmation of the 4.3% YoY flash estimate in Poland. The markets are still rather driven by the global story, but we believe inflation numbers in the region could set the direction for FX. For now, we remain rather bearish on the region. EUR/HUF quickly reached our higher levels on Friday and although we think conditions do not point to further HUF weakness, we don't believe that market repricing is over yet.
If inflation moves closer to the NBH forecast, it would signal further HUF weakness. EUR/CZK is resisting upward pressure for now indicated by the rapid decline in rate differential. However, we continue to see a tactical move up towards 25.20 before returning to our earlier view of heading below 25.00. We continue to see EUR/PLN trading in the 4.270-280 range.
Scope for the Australian Dollar (AUD) to dip to 0.6650 before a rebound is likely, and below that, AUD is likely to edge lower to 0.6620, UOB Group FX strategists Quek Ser Leang and Alvin Liew note.
AUD is likely to edge lower to 0.6620
24-HOUR VIEW: “After rising briefly to 0.6768 last Friday, AUD plummeted and closed lower by 1.05% (0.6670). While the sharp drop appears to be overdone, there is scope for AUD to dip to 0.6650 before a rebound is likely. The next support at 0.6620 is unlikely to come under threat. Resistance is at 0.6690, followed by 0.6715.”
1-3 WEEKS VIEW: “Last Friday, AUD fell sharply, closing at 0.6671 (-1.05%). Downward momentum has increased, albeit not much. From here, AUD is likely to edge lower to 0.6620. To keep the momentum going, AUD must remain below the ‘strong resistance’ level, currently at 0.6770.”
- NZD/USD falls sharply below 0.6150 as investors rush for safe-haven currencies.
- The US Dollar gains sharply as investors see the Fed opting for a 25-bps interest rate cut this month.
- A sharp deflation in China’s PPI weighs on the New Zealand Dollar.
The NZD/USD pair tumbles below 0.6150 in Monday’s European session. The Kiwi asset weakens as the US Dollar (USD) gains strength on expectations that the Federal Reserve (Fed) will start the policy-easing process this month gradually.
The US Dollar Index (DXY), which tracks the Greenback’s value against six major currencies, surges above 101.50. Meanwhile, the market sentiment appears to be asset-specific as risk-sensitive currencies have faced selling pressure, while the appeal of American equities has improved. S&P 500 futures have posted significant gains in the European trading hours, exhibiting a strong risk appetite of investors.
Earlier, market participants remained worried that the Fed could opt for a large interest rate cut in September amid a sharp slowdown in the United States (US) job growth, indicated by the US Nonfarm Payrolls (NFP) report for July, which prompted fears of a recession. However, Friday’s NFP report showed that the labor market health is not as bad as it appeared last month.
On the New Zealand Dollar (NZD) front, slower-than-expected growth in China’s Consumer Price Index (CPI) for August has weighed on the antipodean. China’s annual CPI grew by 0.6%, slower than estimates of 0.7% but came in higher than July’s reading of 0.5%. However, the producer inflation deflated at a robust pace of 1.8%. Weak pricing power in the hands of producers suggests a poor demand environment, which will have a significant impact on China’s economy and its trading partners. The NZ economy, being one of the leading trading partners of China, faces a decline in foreign flows.
NZD/USD witnessed a steep fall after a breakdown of the Rising Wedge chart formation in a four-hour timeframe, which resulted in a bearish reversal. The 20-period Exponential Moving Average (EMA) at 0.6190 starts declining, suggesting the onset of a bearish trend in the short term.
The 14-period Relative Strength Index (RSI) shifts into the bearish range of 20.00-40.00, indicating that a bearish momentum has been triggered.
More downside would appear if the asset decisively breaks July 17 high near 0.6100. This would push the asset lower to May 3 high at 0.6046 and the psychological support of 0.6000.
In an alternate scenario, an upside move above September 6 high of 0.6250 would drive the asset toward September 2 high of 0.6300, followed by this year high of 0.6330.
NZD/USD daily chart
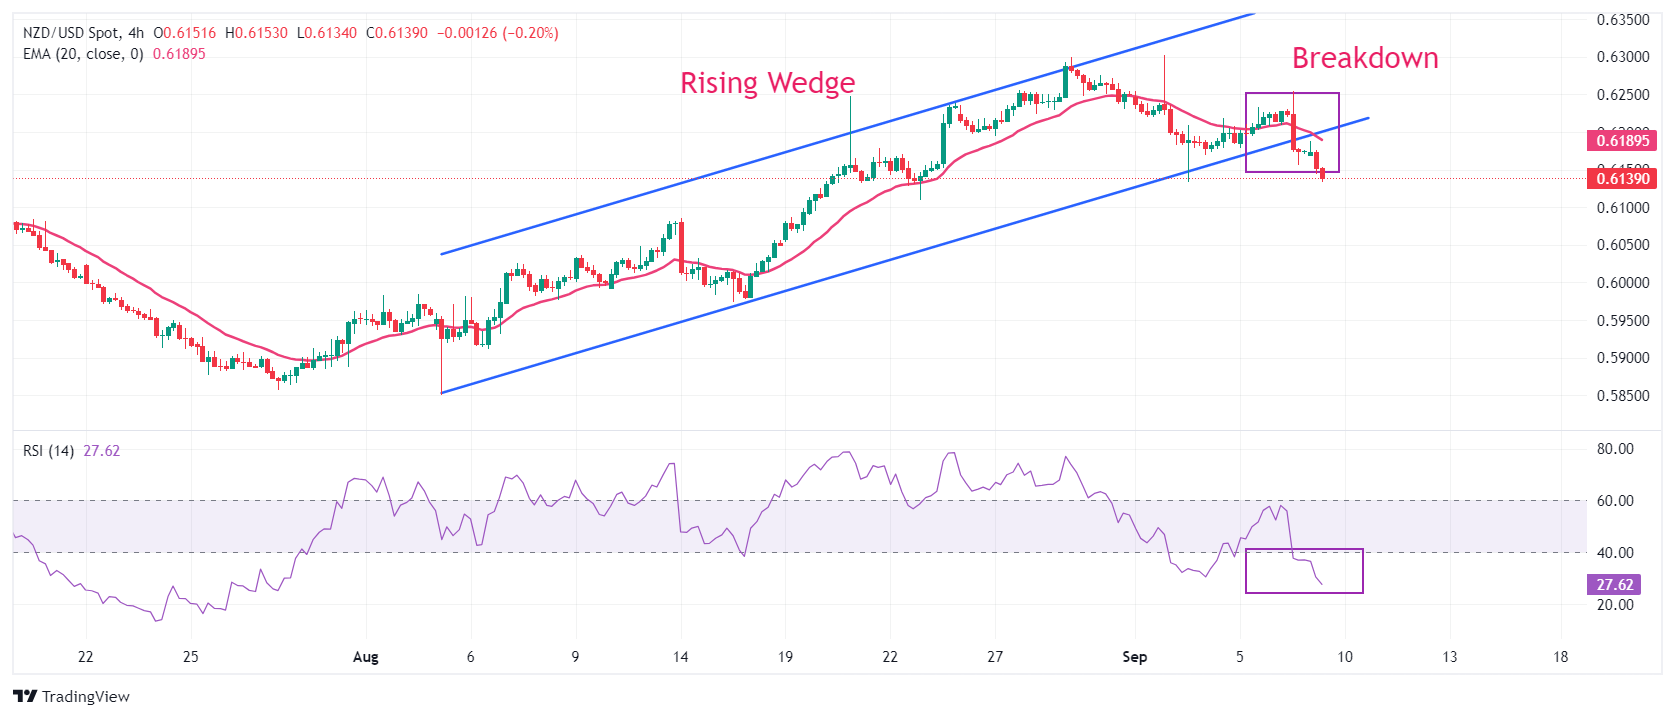
Economic Indicator
Producer Price Index (YoY)
The Producer Price Index released by the National Bureau of Statistics of China is a measurement of the rate of inflation experienced by producers. It captures the average changes in prices received by Chinese domestic producers of commodities in all stages of processing (crude materials, intermediate materials, and finished goods). Changes in the PPI are widely considered as an indicator of commodity inflation. If the Producer Price Index increase is excesive, it would indicate that inflation has become a destabilizing factor in the economy, The People’s Bank of China would tighten monetary policy and fiscal policy risk. Generally speaking, a high reading is seen as positive (or bullish) for the CNY, whereas a low reading is seen as negative (or bearish) for the CNY.
Read more.Last release: Mon Sep 09, 2024 01:30
Frequency: Monthly
Actual: -1.8%
Consensus: -1.4%
Previous: -0.8%
EUR/USD failed to hold intra-day gains on Friday as investors again struggled to take a clear view on whether the Fed will cut by 25 or 50bp, ING’s FX strategist Chris Turner notes.
EUR holds breath ahead of ECB
“This week, the focus will be Thursday's European Central Bank meeting. Here, a 25bp cut looks like a done deal, while the quarterly forecast update should be the main takeaway. Any big downward revisions to back-year inflation forecasts could hit the euro, but such a change in forecast is far from guaranteed.”
“Expect EUR/USD to not drift too far away from 1.1100 over the next couple of days with the US election debate perhaps the first big driver this week.”
GBP could drift lower, possibly reaching 1.3060. The likelihood of a clear break below this level seems low for now, UOB Group FX strategists Quek Ser Leang and Alvin Liew note.
GBP may reach 1.3060 near term
24-HOUR VIEW: “GBP popped to a high of 1.3238 in NY trade last Friday before dropping sharply and swiftly to 1.3111. GBP closed at 1.3130 (-0.36%). There has been a slight increase in downward momentum, and GBP could dip below 1.3100 today. Given the mild downward pressure, any decline is not expected to reach 1.3060. Resistance is at 1.3160; a breach of 1.3190 would indicate that the current mild downward pressure has eased.”
1-3 WEEKS VIEW: “The recent price action has resulted in a modest increase in downward momentum. As long as 1.3250 is not breached, we expect GBP to drift lower, possibly reaching 1.3050. The likelihood of GBP breaking clearly below this level seems low for now.”
Silver prices (XAG/USD) rose on Monday, according to FXStreet data. Silver trades at $28.16 per troy ounce, up 0.78% from the $27.94 it cost on Friday.
Silver prices have increased by 18.34% since the beginning of the year.
| Unit measure | Silver Price Today in USD |
|---|---|
| Troy Ounce | 28.16 |
| 1 Gram | 0.91 |
The Gold/Silver ratio, which shows the number of ounces of Silver needed to equal the value of one ounce of Gold, stood at 88.65 on Monday, down from 89.39 on Friday.
Silver FAQs
Silver is a precious metal highly traded among investors. It has been historically used as a store of value and a medium of exchange. Although less popular than Gold, traders may turn to Silver to diversify their investment portfolio, for its intrinsic value or as a potential hedge during high-inflation periods. Investors can buy physical Silver, in coins or in bars, or trade it through vehicles such as Exchange Traded Funds, which track its price on international markets.
Silver prices can move due to a wide range of factors. Geopolitical instability or fears of a deep recession can make Silver price escalate due to its safe-haven status, although to a lesser extent than Gold's. As a yieldless asset, Silver tends to rise with lower interest rates. Its moves also depend on how the US Dollar (USD) behaves as the asset is priced in dollars (XAG/USD). A strong Dollar tends to keep the price of Silver at bay, whereas a weaker Dollar is likely to propel prices up. Other factors such as investment demand, mining supply – Silver is much more abundant than Gold – and recycling rates can also affect prices.
Silver is widely used in industry, particularly in sectors such as electronics or solar energy, as it has one of the highest electric conductivity of all metals – more than Copper and Gold. A surge in demand can increase prices, while a decline tends to lower them. Dynamics in the US, Chinese and Indian economies can also contribute to price swings: for the US and particularly China, their big industrial sectors use Silver in various processes; in India, consumers’ demand for the precious metal for jewellery also plays a key role in setting prices.
Silver prices tend to follow Gold's moves. When Gold prices rise, Silver typically follows suit, as their status as safe-haven assets is similar. The Gold/Silver ratio, which shows the number of ounces of Silver needed to equal the value of one ounce of Gold, may help to determine the relative valuation between both metals. Some investors may consider a high ratio as an indicator that Silver is undervalued, or Gold is overvalued. On the contrary, a low ratio might suggest that Gold is undervalued relative to Silver.
(An automation tool was used in creating this post.)
The August US jobs report has failed to resolve the debate over whether the Federal Reserve will cut rates by 25bp or 50bp on 18 September. There's no doubt that it will cut at this point; Christopher Waller delivered one of his speeches on the economy on Friday, entitled 'The Time Has Come', repeating the phrase used by Chair Jerome Powell at Jackson Hole. That speech was quite equivocal, ING’s FX strategist Chris Turner notes.
Kamala Harris and Donald Trump debate to move the USD
“While making the case that front-loaded (read 50bp) rate cuts could be appropriate if the data warranted, he seemed to be of the view that while the economy was still growing the case for aggressive rate cuts may not be there. After many gyrations, the USD and short-dated US yields are not too distant from where they started the day on Friday.”
“In terms of US data this week, we have NFIB small business optimism tomorrow and the highlight of the economic calendar Wednesday when we see CPI for August. Another subdued 0.2% month-on-month is expected for core CPI. But potentially one of the biggest market movers this week is tomorrow night's US presidential debate between Kamala Harris and Donald Trump. Joe Biden's poor performance in the previous debate in late June presaged a swing in the polls towards Trump and a firmer USD.”
“This all probably means the USD remains in a holding pattern for the time being. We have noted before that seasonal patterns tend to be positive for the USD in September – perhaps because of US corporate tax payment deadlines this month. And it seems it will now take an awful lot to see DXY break below 18-month lows near 100.”
Room for EUR to retest the 1.1025 level; the chance of a sustained break below this level is not high at this time, UOB Group FX strategists Quek Ser Leang and Alvin Liew note.
EUR is set to retest the 1.1025 level
24-HOUR VIEW: “In NY trade last Friday, EUR traded choppily between 1.1064 and 1.1155, closing at 1.1083 (-0.24%). Despite the choppy price movements, the underlying tone seems to have softened somewhat. Today, EUR is expected to edge lower, possibly testing the 1.1055 level. Last week’s low of 1.1025 is unlikely to come into view. Resistance is at 1.1115 and 1.1135.”
1-3 WEEKS VIEW: “EUR seems to be under mild downward pressure, and there is room for it to retest last week’s low of 1.1025. At this time, the chance of a sustained break below this level is not high. The mild downward pressure is intact provided that 1.1160 is not breached.”
- EUR/USD dives below 1.1050 as the US Dollar strengthens on expectations that the Fed will opt for a small-size interest rate cut this month.
- Investors await the US CPI on Wednesday for fresh guidance on interest rates.
- The ECB is expected to cut interest rates this week.
EUR/USD extends its downside below 1.1050 in Monday’s European session. The major currency pair declines as the US Dollar (USD) strengthens after mixed cues over current labor market health from Friday’s United States (US) Nonfarm payrolls (NFP) report for August, which diminished market expectations for the Federal Reserve (Fed) to reduce interest rates aggressively this month.
The US Dollar Index (DXY), which tracks the Greenback’s value against six major currencies, jumps to near 101.50.
The official employment report showed that fresh payrolls were fewer than expected, the Unemployment Rate fell expectedly, and the Average Hourly Earnings, a key measure of wage growth, grew at a faster-than-projected pace.
Market participants were mainly focusing on the employment numbers as the Fed appeared to be confident that price pressures are on track to return to the desired central banks’ rate of 2%. Slower job demand increased evidence that the US economic growth is moderating. Still, the pace of decline was lesser than July’s impression, which diminished recession fears and the Fed’s large rate-cut bets.
According to the CME FedWatch tool, the probability of the Fed reducing interest rates by 50 basis points (bps) to 4.75%-5.00% in September is 27%, while the rest favors a 25-bps interest rate cut.
Going forward, the US Dollar is expected to witness more volatility this week as the US Consumer Price Index (CPI) data for August is lined up for release on Wednesday.
Daily digest market movers: EUR/USD drops as US Dollar gains sharply
- EUR/USD performs weakly against its major peers on Monday, with investors focusing on the European Central Bank (ECB) policy decision, which will be announced on Thursday. The ECB is expected to cut its key borrowing rates again by 25 basis points (bps). This would be the second dovish interest rate decision by the ECB in its current policy-easing cycle, which it started in the June meeting but kept interest rates unchanged in July.
- The ECB is almost certain to reduce interest rates this week as Eurozone price pressures have significantly contained and growing uncertainty over the economic outlook. Eurozone’s preliminary headline Harmonized Index of Consumer Prices (HICP) fell to 2.2% in August, the lowest reading since July 2021. The Eurozone economic prospects are poor due to subdued demand from domestic and overseas markets.
- The German economy has been exposed to a technical recession, given that the nation’s growth contracted in the second quarter of this year, and the outlook for the third quarter remains uncertain.
- Meanwhile, ECB policymakers have also acknowledged growing weakness in the German economy and see more interest rate cuts as appropriate in the remainder of the year. Last week, ECB board member Piero Cipollone said, "There is a real risk that our stance could become too restrictive."
- On the economic data front, Eurozone Sentix Investor Confidence has worsened further to -15.4 in September from -13.9 in August. This appears to be the outcome of the deteriorating economy’s health amid a slowdown in the German economy.
Technical Analysis: EUR/USD slips below 1.1050
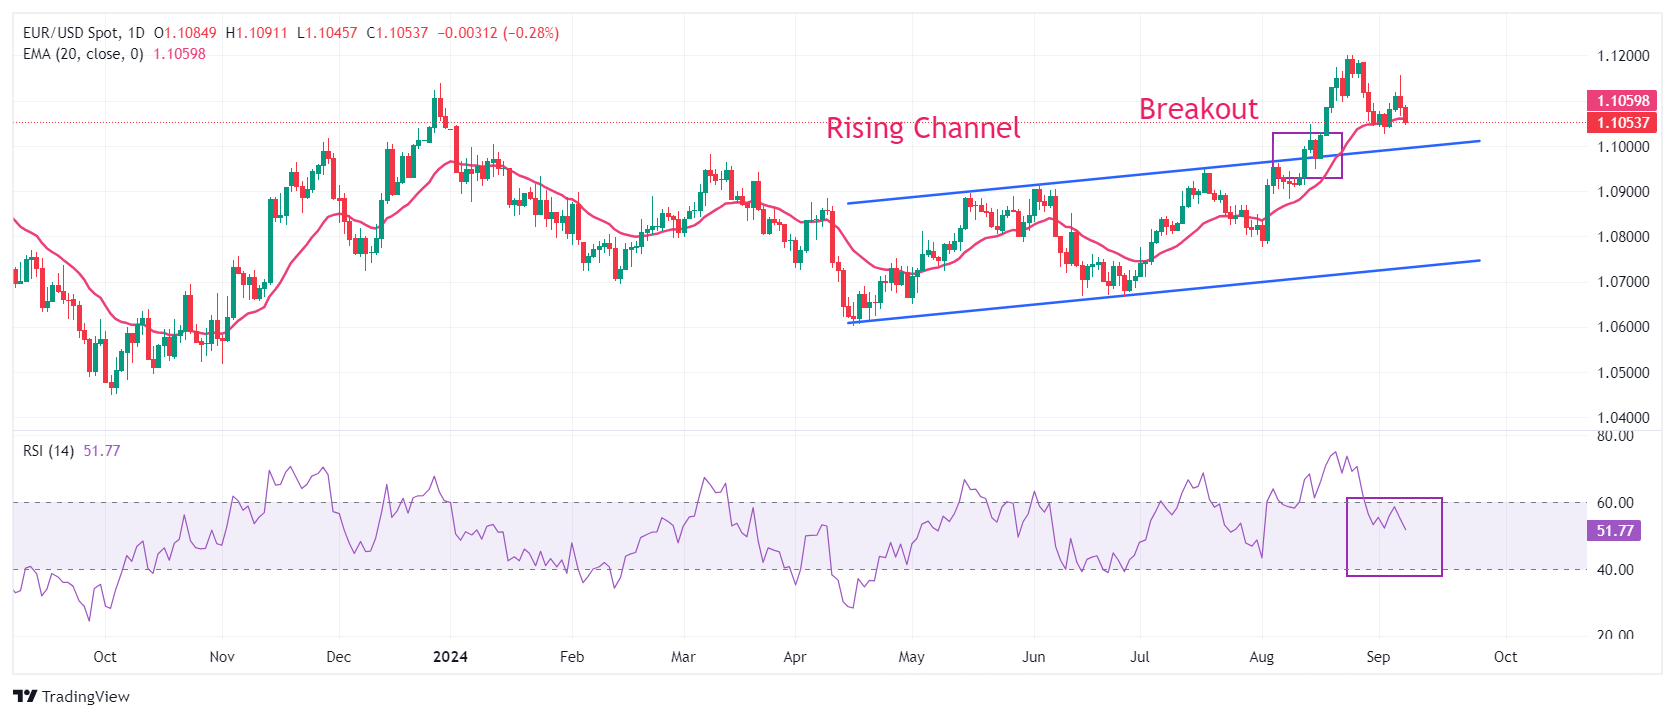
EUR/USD dips below 1.1050 in Monday’s European trading hours. The major currency pair weakens after failing to sustain above the crucial resistance of 1.1100. The near-tern outlook of the shared currency pair has become uncertain as it has dropped below the 20-day Exponential Moving Average (EMA), which trades around 1.1060.
The 14-day Relative Strength Index (RSI) falls further to 50.00, suggesting a lack of bullish momentum.
The pair is expected to find support near the psychological level of 1.1000. On the upside, last week’s high of 1.1155 and the round-level resistance of 1.1200 will act as major barricades for the Euro bulls.
Euro FAQs
The Euro is the currency for the 20 European Union countries that belong to the Eurozone. It is the second most heavily traded currency in the world behind the US Dollar. In 2022, it accounted for 31% of all foreign exchange transactions, with an average daily turnover of over $2.2 trillion a day. EUR/USD is the most heavily traded currency pair in the world, accounting for an estimated 30% off all transactions, followed by EUR/JPY (4%), EUR/GBP (3%) and EUR/AUD (2%).
The European Central Bank (ECB) in Frankfurt, Germany, is the reserve bank for the Eurozone. The ECB sets interest rates and manages monetary policy. The ECB’s primary mandate is to maintain price stability, which means either controlling inflation or stimulating growth. Its primary tool is the raising or lowering of interest rates. Relatively high interest rates – or the expectation of higher rates – will usually benefit the Euro and vice versa. The ECB Governing Council makes monetary policy decisions at meetings held eight times a year. Decisions are made by heads of the Eurozone national banks and six permanent members, including the President of the ECB, Christine Lagarde.
Eurozone inflation data, measured by the Harmonized Index of Consumer Prices (HICP), is an important econometric for the Euro. If inflation rises more than expected, especially if above the ECB’s 2% target, it obliges the ECB to raise interest rates to bring it back under control. Relatively high interest rates compared to its counterparts will usually benefit the Euro, as it makes the region more attractive as a place for global investors to park their money.
Data releases gauge the health of the economy and can impact on the Euro. Indicators such as GDP, Manufacturing and Services PMIs, employment, and consumer sentiment surveys can all influence the direction of the single currency. A strong economy is good for the Euro. Not only does it attract more foreign investment but it may encourage the ECB to put up interest rates, which will directly strengthen the Euro. Otherwise, if economic data is weak, the Euro is likely to fall. Economic data for the four largest economies in the euro area (Germany, France, Italy and Spain) are especially significant, as they account for 75% of the Eurozone’s economy.
Another significant data release for the Euro is the Trade Balance. This indicator measures the difference between what a country earns from its exports and what it spends on imports over a given period. If a country produces highly sought after exports then its currency will gain in value purely from the extra demand created from foreign buyers seeking to purchase these goods. Therefore, a positive net Trade Balance strengthens a currency and vice versa for a negative balance.
- AUD/USD price tests the lower boundary of the descending channel around the level of 0.6440.
- The 14-day RSI breaks below the 50 level, confirming the ongoing bearish trend for the pair.
- The immediate barrier appears at the 50-day EMA at 0.6675 level.
AUD/USD extends its losses for the second consecutive day, trading around 0.6650 during the European hours on Monday. The daily chart analysis shows that the pair is trekking down along the lower boundary of the descending channel, suggesting the reinforcing of a bearish bias.
Additionally, the 14-day Relative Strength Index (RSI) falls below the 50 level, confirming the ongoing bearish trend for the AUD/USD pair.
However, the daily chart analysis also indicates that the 9-day Exponential Moving Average (EMA) is positioned above the 50-day EMA, which is typically interpreted as a short-term bullish signal. This suggests that the recent price action is outperforming the longer-term trend.
On the downside, the AUD/USD pair targets the lower boundary of the descending channel around the level of 0.6440. A break below this level could strengthen the bearish bias and lead the pair to navigate the region around the throwback support at 0.6575.
In terms of resistance, the immediate barrier appears at the 50-day EMA at 0.6675 level, followed by the nine-day EMA at 0.6715 level. A breakthrough above the latter could weaken the bearish bias and support the AUD/USD pair to test the upper boundary of the descending channel around the 0.6750 level.
A breach above the descending channel could extend the upside and lead the pair to explore the region around its seven-month high of 0.6798, reached on July 11.
AUD/USD: Daily Chart
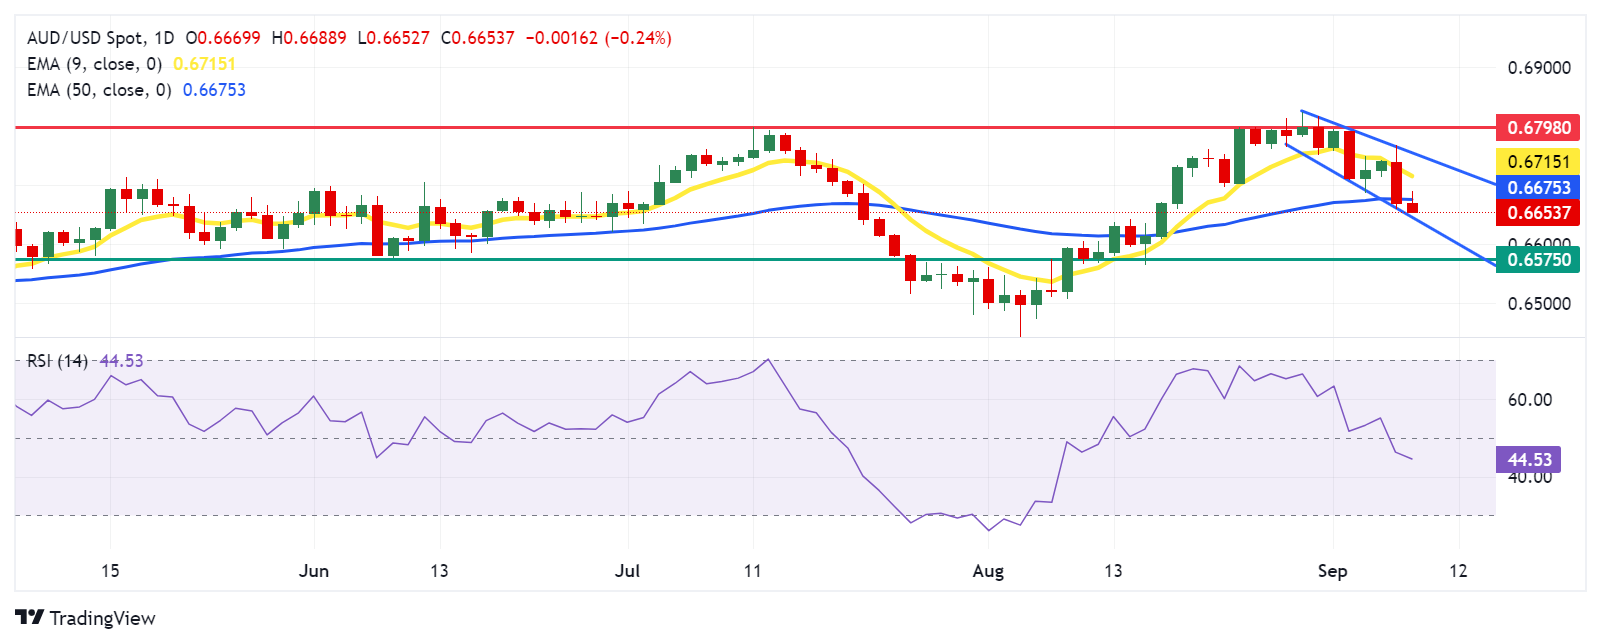
Australian Dollar PRICE Today
The table below shows the percentage change of Australian Dollar (AUD) against listed major currencies today. Australian Dollar was the weakest against the Canadian Dollar.
| USD | EUR | GBP | JPY | CAD | AUD | NZD | CHF | |
|---|---|---|---|---|---|---|---|---|
| USD | 0.32% | 0.32% | 0.79% | 0.03% | 0.23% | 0.65% | 0.43% | |
| EUR | -0.32% | -0.05% | 0.52% | -0.28% | -0.14% | 0.34% | 0.10% | |
| GBP | -0.32% | 0.05% | 0.43% | -0.23% | -0.08% | 0.37% | 0.15% | |
| JPY | -0.79% | -0.52% | -0.43% | -0.75% | -0.53% | -0.15% | -0.15% | |
| CAD | -0.03% | 0.28% | 0.23% | 0.75% | 0.25% | 0.60% | 0.57% | |
| AUD | -0.23% | 0.14% | 0.08% | 0.53% | -0.25% | 0.46% | 0.20% | |
| NZD | -0.65% | -0.34% | -0.37% | 0.15% | -0.60% | -0.46% | -0.22% | |
| CHF | -0.43% | -0.10% | -0.15% | 0.15% | -0.57% | -0.20% | 0.22% |
The heat map shows percentage changes of major currencies against each other. The base currency is picked from the left column, while the quote currency is picked from the top row. For example, if you pick the Australian Dollar from the left column and move along the horizontal line to the US Dollar, the percentage change displayed in the box will represent AUD (base)/USD (quote).
- USD/CAD lacks any firm intraday direction and is influenced by a combination of diverging forces.
- A stronger USD lends support, though rebounding Oil prices underpin the Loonie and caps gains.
- A sustained move beyond the 200-day SMA is needed to support prospects for any further upside.
The USD/CAD pair struggles to capitalize on Friday's strong intraday rally of over 100 pips and oscillates in a narrow trading band, above mid-1.3500s through the first half of the European session on Monday.
An uptick in Crude Oil prices is seen underpinning the commodity-linked Loonie and acting as a headwind for the USD/CAD pair. That said, the prospects for another interest rate cut by the Bank of Canada (BoC), bolstered by Friday's disappointing jobs report, cap the upside for the Canadian Dollar (CAD). The US Dollar (USD), on the other hand, benefits from reduced bets for a larger rate cut by the Federal Reserve (Fed) and turns out to be another factor lending some support to the currency pair.
From a technical perspective, spot prices seem to have found acceptance above the 23.6% Fibonacci retracement level of the steep decline witnessed in August. That said, oscillators on the daily chart – though have been recovering from lower levels – are yet to confirm a positive bias. This makes it prudent to wait for a sustained move beyond the very important 200-day Simple Moving Average (SMA), currently pegged near the 1.3600 mark, before placing bullish bets around the USD/CAD pair.
The subsequent move-up has the potential to lift spot prices to the 38.2% Fibo. level, around the 1.3635-1.3640 region. Some follow-through buying should pave the way for additional gains and allow the USD/CAD pair to reclaim the 1.3700 mark. The latter should act as a key pivotal point, which if cleared decisively might shift the near-term bias in favor of bullish traders.
On the flip side, the Asian session low, around the mid-1.3500s, now seems to protect the immediate downside. A convincing break below might expose the 1.3500 psychological mark, below which the USD/CAD pair could accelerate the downfall back towards the 1.3440-1.3435 region, or the lowest level since March touched last month. The downward trajectory could extend further towards the 1.3400 round figure en route to the late January swing low, around the 1.3360-1.3355 region.
USD/CAD daily chart
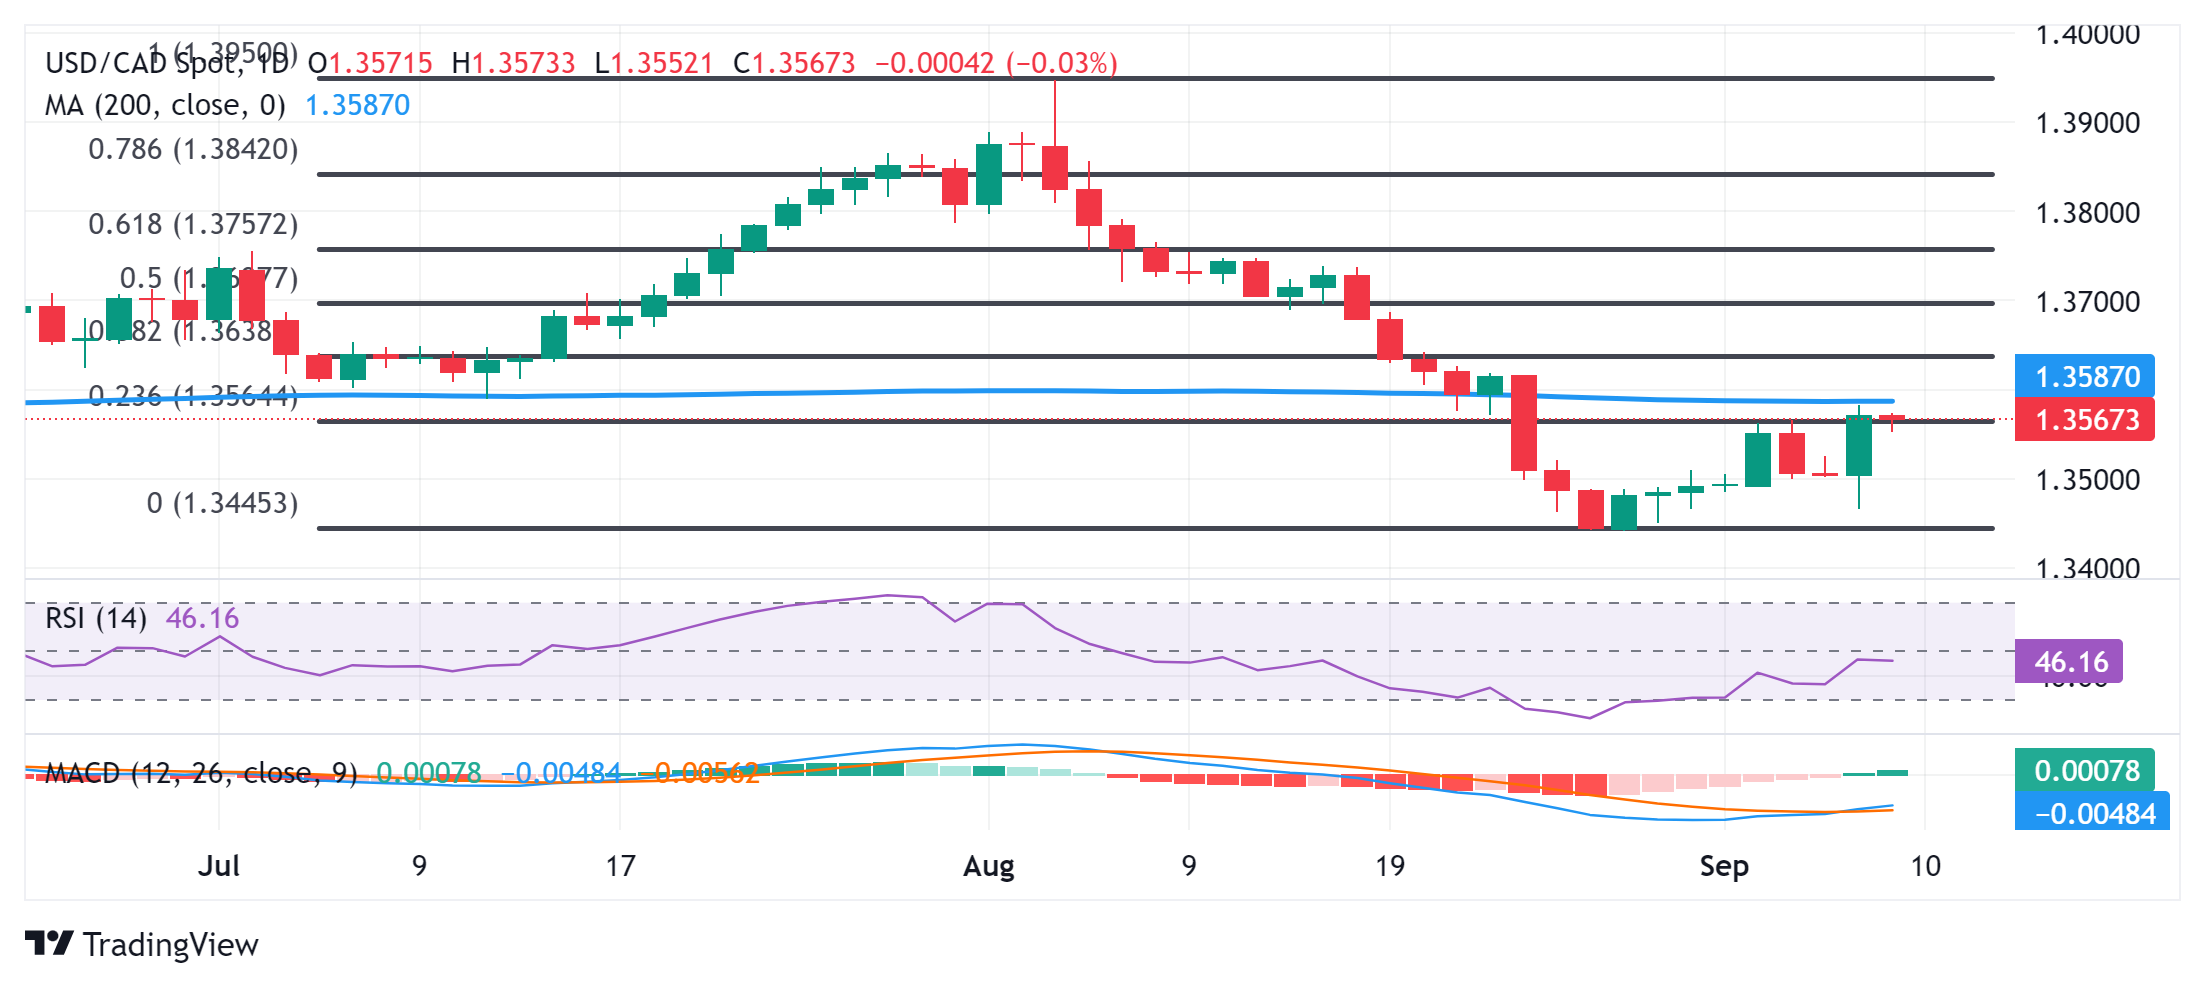
Fed FAQs
Monetary policy in the US is shaped by the Federal Reserve (Fed). The Fed has two mandates: to achieve price stability and foster full employment. Its primary tool to achieve these goals is by adjusting interest rates. When prices are rising too quickly and inflation is above the Fed’s 2% target, it raises interest rates, increasing borrowing costs throughout the economy. This results in a stronger US Dollar (USD) as it makes the US a more attractive place for international investors to park their money. When inflation falls below 2% or the Unemployment Rate is too high, the Fed may lower interest rates to encourage borrowing, which weighs on the Greenback.
The Federal Reserve (Fed) holds eight policy meetings a year, where the Federal Open Market Committee (FOMC) assesses economic conditions and makes monetary policy decisions. The FOMC is attended by twelve Fed officials – the seven members of the Board of Governors, the president of the Federal Reserve Bank of New York, and four of the remaining eleven regional Reserve Bank presidents, who serve one-year terms on a rotating basis.
In extreme situations, the Federal Reserve may resort to a policy named Quantitative Easing (QE). QE is the process by which the Fed substantially increases the flow of credit in a stuck financial system. It is a non-standard policy measure used during crises or when inflation is extremely low. It was the Fed’s weapon of choice during the Great Financial Crisis in 2008. It involves the Fed printing more Dollars and using them to buy high grade bonds from financial institutions. QE usually weakens the US Dollar.
Quantitative tightening (QT) is the reverse process of QE, whereby the Federal Reserve stops buying bonds from financial institutions and does not reinvest the principal from the bonds it holds maturing, to purchase new bonds. It is usually positive for the value of the US Dollar.
- Eurozone investors’ morale continues to deteriorate in September.
- EUR/USD holds lower ground near 1.1050 after the downbeat Eurozone data.
The Eurozone Sentix Investor Confidence Index declined from -13.9 in August to -15.4 in September, the latest survey showed on Monday.
The Expectations Index in the Eurozone recovered from August’s -8.8 to -8.0 in September.
The Current Situation gauge for the region, however, dropped to -22.5 in the same period from -19.0 in August.
Sentix said, "the political and economic chaos in Germany is a heavy burden on the entire Eurozone.”
"The only hope for investors in this context is the prospect of a supportive monetary policy," it added.
Market reaction to the Eurozone Sentix data
EUR/USD is flirting with intraday lows after discouraging Eurozone data. As of writing, EUR/USD is down 0.31% on the day, trading near 1.1050.
- The Mexican Peso extends its downtrend but appears to be finding a floor.
- The weakness of rivals, such as the US Dollar, as well as uncertainty over the direction of Mexico’s monetary policy are supportive factors.
- USD/MXN steadily rises in a mildly bullish channel.
The Mexican Peso (MXN) trades flattish and mixed on Monday after a week in which it lost between 1.3% and 1.6% in its most traded pairs, extending the downtrend – albeit at a slower pace – established since the April 2024 highs.
The Peso is depreciating on a combination of investor concerns over controversial new judicial reforms, uncertainty over the US presidential election and its impact on trade, and the unwinding of the carry trade – now less attractive since the Peso started trending lower.
Mexican Peso depreciates at slower pace
The Mexican Peso depreciated at a slower rate last week compared to previous weeks, both due to stubbornly high headline inflation in Mexico, which is making the Bank of Mexico (Banxico) cautious about making further cuts to interest rates, and the weakness of its counterparts, in particular the US Dollar.
Although Mexican core inflation is steadily falling back towards the Banxico’s 3.0% target after registering a 4.05% rise in core prices in July, headline inflation remains elevated and actually accelerated for the fifth month in a row to 5.57% in July from 4.98% previously.
Banxico cut interest rates by 0.25% to 10.75% at its August meeting but the vote was a close call as two of the Bank’s five-strong board – Jonathan Heath and Irene Espinosa – dissented due to continued concerns about elevated headline inflation.
In a speech on Thursday, Heath – one of the dissenters – said that there was “still no certainty” as to when food prices would cool, according to El Financiero. The rising cost of fruit is a key contributor to the elevated headline rate of inflation.
Although Heath added that Banxico expected food prices to fall, he added that there was no way of knowing “when and by how much”. Stubbornly high inflation in the services sector of the economy was another factor keeping overall inflation elevated, he added. Heath's uncertainty suggests he may continue voting against easing policy in future meetings. If interest rates remain high in Mexico, it will be a supportive factor for the Peso, since higher interest rates attract greater capital inflows.
Mexican payrolls data shows slowdown in hiring
A further factor that could influence Banxico’s decisions on monetary policy are continued signs of a slowdown in the labor market. Mexican payrolls rose at their slowest pace in 40 months, increasing by only 58,047 in August, according to data from IMSS, which measures the number of new contributors to social security.
A combination of slowing economic growth, lower growth forecasts, employers delaying hiring because of uncertainty due to concerns around the government’s reforms to the judiciary and the outcome of the US presidential elections, were factors impacting the creation of new jobs, according to El Financiero.
Subdued employment in Mexico may encourage the Banxico to be bolder in cutting interest rates despite high inflation, which, in turn, could be a negative factor for the Peso.
At the time of writing, one US Dollar (USD) buys 19.94 Mexican Pesos, EUR/MXN trades at 22.08, and GBP/MXN at 26.14.
Technical Analysis: USD/MXN trades in a mildly bullish channel
USD/MXN has pulled back down from the new 2024 highs it touched at 20.15 on Thursday and is currently trading back inside a familiar range in the 19.90s.
The bearish Shooting Star Japanese candlestick the pair formed on Thursday failed to gain confirmation and follow-through lower. Instead, the pair continued a mildly bullish rising channel between the 20.15 high and lows in the mid 19.80s.
USD/MXN 4-hour Chart
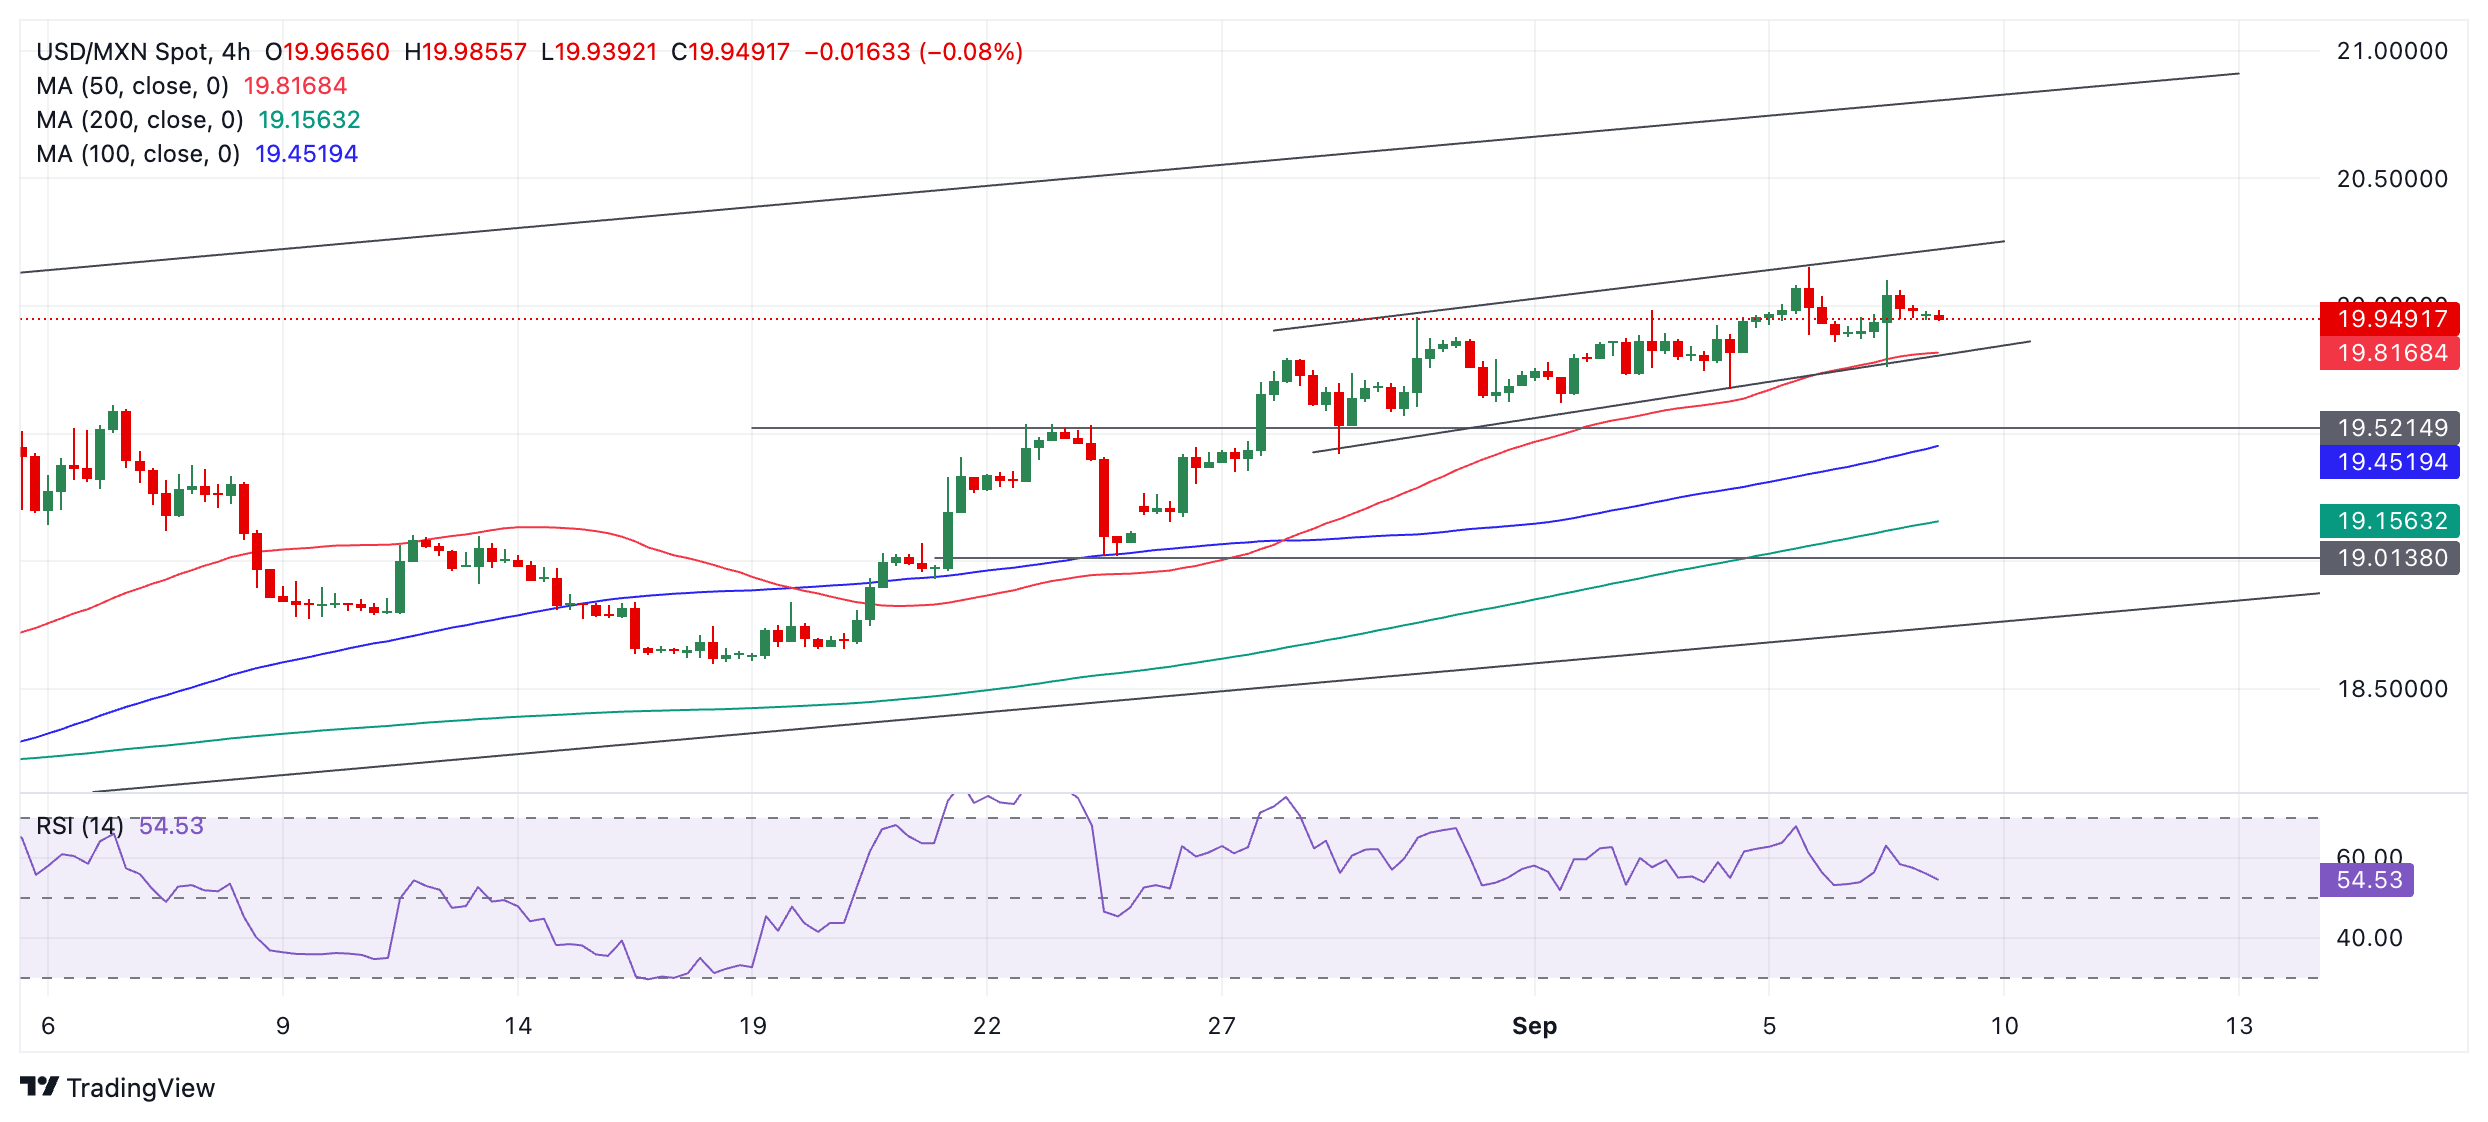
The channel itself is unfolding within a broader rising channel that began from the April 2024 lows.
The overall trend remains bullish, and since according to technical analysis theory “the trend is your friend,” this favors more upside. As such, any weakness may be temporary before the pair rallies again.
A break above the top of the mini-channel and 20.15 high of the year, would provide added confirmation of a continuation of the bull trend, with the next target at the upper channel line in the 20.60s.
Mexican Peso FAQs
The Mexican Peso (MXN) is the most traded currency among its Latin American peers. Its value is broadly determined by the performance of the Mexican economy, the country’s central bank’s policy, the amount of foreign investment in the country and even the levels of remittances sent by Mexicans who live abroad, particularly in the United States. Geopolitical trends can also move MXN: for example, the process of nearshoring – or the decision by some firms to relocate manufacturing capacity and supply chains closer to their home countries – is also seen as a catalyst for the Mexican currency as the country is considered a key manufacturing hub in the American continent. Another catalyst for MXN is Oil prices as Mexico is a key exporter of the commodity.
The main objective of Mexico’s central bank, also known as Banxico, is to maintain inflation at low and stable levels (at or close to its target of 3%, the midpoint in a tolerance band of between 2% and 4%). To this end, the bank sets an appropriate level of interest rates. When inflation is too high, Banxico will attempt to tame it by raising interest rates, making it more expensive for households and businesses to borrow money, thus cooling demand and the overall economy. Higher interest rates are generally positive for the Mexican Peso (MXN) as they lead to higher yields, making the country a more attractive place for investors. On the contrary, lower interest rates tend to weaken MXN.
Macroeconomic data releases are key to assess the state of the economy and can have an impact on the Mexican Peso (MXN) valuation. A strong Mexican economy, based on high economic growth, low unemployment and high confidence is good for MXN. Not only does it attract more foreign investment but it may encourage the Bank of Mexico (Banxico) to increase interest rates, particularly if this strength comes together with elevated inflation. However, if economic data is weak, MXN is likely to depreciate.
As an emerging-market currency, the Mexican Peso (MXN) tends to strive during risk-on periods, or when investors perceive that broader market risks are low and thus are eager to engage with investments that carry a higher risk. Conversely, MXN tends to weaken at times of market turbulence or economic uncertainty as investors tend to sell higher-risk assets and flee to the more-stable safe havens.
- USD/JPY stages a goodish recovery from over a one-month low touched on Friday.
- The JPY is undermined by a downward revision of Japan’s Q2 GDP growth figures.
- Reduced bets for a larger Fed rate cut boost the USD and lend additional support.
The USD/JPY pair attracts fresh buyers at the start of a new week and reverses a major part of Friday's losses to the 141.75 area or over a one-month low. Spot prices maintain the bid tone through the early European session and currently trade around the 143.20 mark and draw support from a combination of factors.
The Japanese Yen (JPY) is pressured by a downward revision of the second quarter Gross Domestic Product (GDP) print, which, in turn, is seen as a key factor acting as a tailwind for the USD/JPY pair. Official data published earlier today showed that Japan's economy grew at a slightly slower pace, by an annualized 2.9% in the April-June quarter as compared to a 3.1% rise in the preliminary estimate. This, along with a sluggish consumer spending growth in July, might complicate the Bank of Japan's (BoJ) plans to hike interest rates in the coming months.
Apart from this, a generally positive tone around the European equity markets is seen undermining demand for the safe-haven JPY. The US Dollar (USD), on the other hand, builds on Friday's recovery from over a one-week low amid an uptick in the US Treasury bond yields, bolstered by reduced bets for a 50 basis points (bps) interest rate cut by the Federal Reserve (Fed) later this month. This further contributes to the USD/JPY pair's intraday positive move, though the divergent BoJ-Fed policy expectations warrant some caution before positioning for further gains.
The BoJ Governor Kazuo Ueda said last week that the central bank will continue to raise interest rates if the economy and prices perform as expected. Adding to this, an unexpected rise in Japan's real wages for the second straight month in July keeps hopes alive for another BoJ rate hike by the end of 2024. Hence, it will be prudent to wait for strong follow-through buying beyond the 143.75-143.80 horizontal support breakpoint before confirming that the USD/JPY pair's recent downfall has run its course and positioning for any further appreciating move.
Bank of Japan FAQs
The Bank of Japan (BoJ) is the Japanese central bank, which sets monetary policy in the country. Its mandate is to issue banknotes and carry out currency and monetary control to ensure price stability, which means an inflation target of around 2%.
The Bank of Japan has embarked in an ultra-loose monetary policy since 2013 in order to stimulate the economy and fuel inflation amid a low-inflationary environment. The bank’s policy is based on Quantitative and Qualitative Easing (QQE), or printing notes to buy assets such as government or corporate bonds to provide liquidity. In 2016, the bank doubled down on its strategy and further loosened policy by first introducing negative interest rates and then directly controlling the yield of its 10-year government bonds.
The Bank’s massive stimulus has caused the Yen to depreciate against its main currency peers. This process has exacerbated more recently due to an increasing policy divergence between the Bank of Japan and other main central banks, which have opted to increase interest rates sharply to fight decades-high levels of inflation. The BoJ’s policy of holding down rates has led to a widening differential with other currencies, dragging down the value of the Yen.
A weaker Yen and the spike in global energy prices have led to an increase in Japanese inflation, which has exceeded the BoJ’s 2% target. With wage inflation becoming a cause of concern, the BoJ looks to move away from ultra loose policy, while trying to avoid slowing the activity too much.
- EUR/GBP depreciates as recent eurozone inflation data have solidified expectations of an ECB rate cut at Thursday’s meeting.
- ECB Executive Board member Piero Cipollone warned of "a real risk that ECB's stance could become too restrictive.
- The Pound Sterling may remain steady as investors await Tuesday’s UK labor data for the quarter ending in July.
EUR/GBP retraces its recent gains from its previous session, trading around 0.8440 during the European hours on Monday. The Euro faces challenges as recent eurozone inflation data have solidified expectations of a rate cut by the European Central Bank (ECB) at upcoming Thursday's policy meeting.
With headline inflation nearing 2% and long-term inflation forecasts holding steady around the same level, the ECB has sufficient justification to ease its monetary policy stance further. Additionally, last week's mixed Gross Domestic Product (GDP) data from the Eurozone has reinforced expectations of a potential rate cut by the ECB.
The slowdown in growth is fueling concerns that excessively high interest rates may be stifling economic expansion, echoing remarks made by ECB Executive Board member Piero Cipollone. Cipollone warned of "a real risk that ECB's stance could become too restrictive," further highlighting the potential impact of the current monetary policy on growth.
The Pound Sterling (GBP) may remain steady as investors await the United Kingdom's (UK) employment data for the quarter ending in July, set to be released on Tuesday. This labor market report could shape market expectations regarding the Bank of England's interest rate decisions for the rest of the year.
Estimates suggest the ILO Unemployment Rate may dip slightly to 4.1% from the previous 4.2%. Meanwhile, Average Earnings, including bonuses, are projected to ease to 4.1%, down from the prior 4.5% figure. Slower wage growth could heighten expectations for further interest rate cuts by the Bank of England, as it would indicate a potential decline in inflation within the services sector.
Interest rates FAQs
Interest rates are charged by financial institutions on loans to borrowers and are paid as interest to savers and depositors. They are influenced by base lending rates, which are set by central banks in response to changes in the economy. Central banks normally have a mandate to ensure price stability, which in most cases means targeting a core inflation rate of around 2%. If inflation falls below target the central bank may cut base lending rates, with a view to stimulating lending and boosting the economy. If inflation rises substantially above 2% it normally results in the central bank raising base lending rates in an attempt to lower inflation.
Higher interest rates generally help strengthen a country’s currency as they make it a more attractive place for global investors to park their money.
Higher interest rates overall weigh on the price of Gold because they increase the opportunity cost of holding Gold instead of investing in an interest-bearing asset or placing cash in the bank. If interest rates are high that usually pushes up the price of the US Dollar (USD), and since Gold is priced in Dollars, this has the effect of lowering the price of Gold.
The Fed funds rate is the overnight rate at which US banks lend to each other. It is the oft-quoted headline rate set by the Federal Reserve at its FOMC meetings. It is set as a range, for example 4.75%-5.00%, though the upper limit (in that case 5.00%) is the quoted figure. Market expectations for future Fed funds rate are tracked by the CME FedWatch tool, which shapes how many financial markets behave in anticipation of future Federal Reserve monetary policy decisions.
- EUR/JPY gains some positive traction on Monday amid the emergence of some JPY selling.
- A downward revision of Japan’s Q2 GDP growth might complicate BoJ’s plan to raise rates.
- A combination of factors weighs on the Euro and caps any meaningful upside for the cross.
The EUR/JPY cross stages a goodish recovery from the 157.40-157.35 region, or over a one-month low touched on the first day of a new week and reverses a part of Friday's losses. Spot prices climb to a fresh daily peak during the early European session and currently trade just below mid-158.00s amid a broad-based Japanese Yen (JPY) weakness.
Official data published earlier today showed that Japan's economy grew at a slightly slower pace, by an annualized 2.9% in the April-June quarter as compared to a 3.1% rise in the preliminary estimate. This comes on top of sluggish consumer spending growth in July, which might complicate the Bank of Japan's (BoJ) plans to hike interest rates further in the coming months. Apart from this, a stable performance around the equity markets is seen undermining the safe-haven JPY and acting as a tailwind for the EUR/JPY cross.
That said, an unexpected rise in Japan's real wages for the second straight month in July keeps the door open for another BoJ rate hike in 2024. Moreover, the BoJ Governor Kazuo Ueda reiterated last week that the central bank will continue to raise interest rates if the economy and prices perform as expected. Apart from this, renewed worries about a US economic downturn, along with persistent geopolitical tensions, should limit losses for the JPY and cap the EUR/JPY cross amid some follow-through selling around the shared currency.
Growing acceptance that the European Central Bank (ECB) will cut interest rates again in September in the wake of declining inflation in the Eurozone and a modest US Dollar (USD) strength turn out to be key factors weighing on the Euro. In the absence of any relevant market-moving economic releases, the fundamental backdrop warrants some caution before confirming that the EUR/JPY cross has formed a near-term bottom and positioning for any meaningful appreciating move.
Economic Indicator
Gross Domestic Product Annualized
The Gross Domestic Product (GDP), released by Japan’s Cabinet Office on a quarterly basis, is a measure of the total value of all goods and services produced in Japan during a given period. The GDP is considered as the main measure of Japan’s economic activity. The data is expressed at an annualized rate, which means that the rate has been adjusted to reflect the amount GDP would have changed over a year’s time, had it continued to grow at that specific rate. Generally, a high reading is seen as bullish for the Japanese Yen (JPY), while a low reading is seen as bearish.
Read more.Last release: Sun Sep 08, 2024 23:50
Frequency: Quarterly
Actual: 2.9%
Consensus: 3.2%
Previous: 3.1%
Source: Japanese Cabinet Office
- The Pound Sterling underperforms the US Dollar as market expectations for the Fed opting for a big interest-rate cut have diminished.
- US employment growth came in lower than expected in August, while the jobless rate ticked down.
- This week, investors will majorly focus on the UK Employment and the US inflation data
The Pound Sterling (GBP) struggles to hold the key support of 1.3100 against the US Dollar (USD) in Monday’s London session. The GBP/USD pair faces selling pressure as the US Dollar (USD) extends its recovery, with US Dollar Index (DXY) jumping to near 101.40. The Greenback gains ground as market bets that the Federal Reserve (Fed) will start its policy-easing process aggressively have diminished after Friday’s United States (US)Nonfarm Payrolls (NFP) data.
According to the CME FedWatch tool, the probability of the Fed reducing interest rates by 50 basis points (bps) to 4.75%-5.00% in September has declined to 27% from the 41% recorded before the release of the data for August.
The NFP report showed that job growth is broadly cooling compared to the readings seen in the last couple of years, the Unemployment Rate ticked lower, as expected, and wage growth accelerated. Even though there is increasing evidence that the labor market is softening, the latest data is strong enough to keep the US economy safe from entering a recession. The assessment that the labor market is holding up weighs on market expectations of a large Fed rate cut, uplifting the US Dollar.
For fresh cues over the interest-rate outlook, investors will keenly focus on the US Consumer Price Index (CPI) data for August, which will be published on Wednesday. The inflation report is expected to show that both monthly headline and core CPI – which excludes food and energy prices – are estimated to have grown steadily by 0.2%. Annual headline CPI is expected to have decelerated sharply to 2.6% from July’s reading of 2.9%.
Daily digest market movers: Pound Sterling weakens against US Dollar
- The Pound Sterling exhibits a mixed performance against its major peers on Monday. The British currency is expected to trade broadly sideways as investors focus on the United Kingdom (UK) Employment data for the quarter ending July, which will be published on Tuesday.
- The UK labor market data could influence market speculation for the Bank of England (BoE) interest-rate path for the remainder of the year. According to the estimates, the Unemployment Rate is seen ticking lower to 4.1% from the former reading of 4.2%. Average Earnings Including bonuses are estimated to have softened to 4.1% from the prior release of 4.5%. Soft wage growth would increase expectations of more interest rate cuts by the BoE as it would imply a decline in inflation in the services sector.
- Meanwhile, a monthly report on Jobs from the Recruitment and Employment Confederation trade body and accountants KPMG showed that permanent job placements dropped at the fastest pace in five months, Reuters reported. The agency also noted that the pay growth offered for fresh hiring came in at a five-month low, one of the weakest readings since early 2021. "The news that while salaries rose last month it was at the weakest rate since March could help make the case for more rate cuts when the Monetary Policy Committee meets to decide the future path of interest rates," Jon Holt, KPMG's UK chief executive and senior partner, said.
Technical Analysis: Pound Sterling falls to near 1.3100
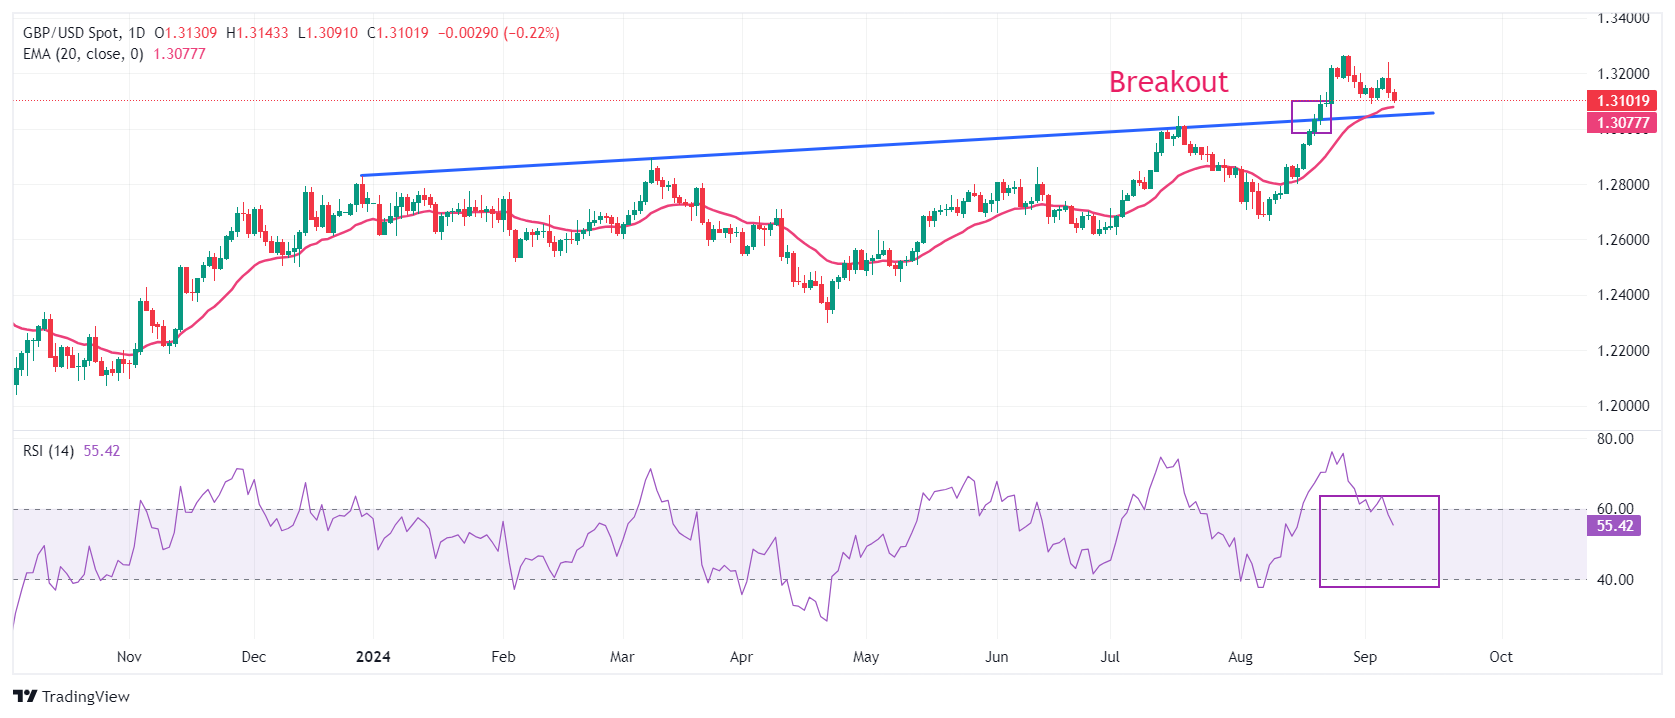
The Pound Sterling extends its downside to near the crucial support of 1.3100 against the US Dollar. The GBP/USD pair is expected to find intermediate support near the 20-day Exponential Moving Average (EMA), which trades around 1.3075. Also, the upward-sloping trendline from the December 28, 2023, high of 1.2828 will act as key support for the Pound Sterling bulls.
The 14-day Relative Strength Index (RSI) declines into the 40.00-60.00 range, suggesting that the bullish momentum has concluded for now. However, the bullish trend remains intact as the indicator remains above the neutral level of 50.
Looking up, the Cable will face resistance near the round-level resistance of 1.3200 and the psychological level of 1.3500.
Pound Sterling FAQs
The Pound Sterling (GBP) is the oldest currency in the world (886 AD) and the official currency of the United Kingdom. It is the fourth most traded unit for foreign exchange (FX) in the world, accounting for 12% of all transactions, averaging $630 billion a day, according to 2022 data. Its key trading pairs are GBP/USD, aka ‘Cable’, which accounts for 11% of FX, GBP/JPY, or the ‘Dragon’ as it is known by traders (3%), and EUR/GBP (2%). The Pound Sterling is issued by the Bank of England (BoE).
The single most important factor influencing the value of the Pound Sterling is monetary policy decided by the Bank of England. The BoE bases its decisions on whether it has achieved its primary goal of “price stability” – a steady inflation rate of around 2%. Its primary tool for achieving this is the adjustment of interest rates. When inflation is too high, the BoE will try to rein it in by raising interest rates, making it more expensive for people and businesses to access credit. This is generally positive for GBP, as higher interest rates make the UK a more attractive place for global investors to park their money. When inflation falls too low it is a sign economic growth is slowing. In this scenario, the BoE will consider lowering interest rates to cheapen credit so businesses will borrow more to invest in growth-generating projects.
Data releases gauge the health of the economy and can impact the value of the Pound Sterling. Indicators such as GDP, Manufacturing and Services PMIs, and employment can all influence the direction of the GBP. A strong economy is good for Sterling. Not only does it attract more foreign investment but it may encourage the BoE to put up interest rates, which will directly strengthen GBP. Otherwise, if economic data is weak, the Pound Sterling is likely to fall.
Another significant data release for the Pound Sterling is the Trade Balance. This indicator measures the difference between what a country earns from its exports and what it spends on imports over a given period. If a country produces highly sought-after exports, its currency will benefit purely from the extra demand created from foreign buyers seeking to purchase these goods. Therefore, a positive net Trade Balance strengthens a currency and vice versa for a negative balance.
- USD/CHF rises as recent US labor data raised uncertainty over the likelihood of an aggressive Fed rate cut in September.
- The CME FedWatch Tool indicates that the likelihood of a 50 basis point rate cut has decreased to 29.0%.
- Swiss inflation dropped to a five-month low, which has heightened expectations for another SNB rate cut soon.
USD/CHF breaks its four-day losing streak, trading around 0.8470 during the early European hours on Monday. The US Dollar (USD) received support as Friday’s US economic data raised uncertainty over the likelihood of an aggressive interest rate cut by the Federal Reserve (Fed) at its September meeting.
According to the CME FedWatch Tool, markets are fully anticipating at least a 25 basis point (bps) rate cut by the Federal Reserve at its September meeting. The likelihood of a 50 bps rate cut has slightly decreased to 29.0%, down from 30.0% a week ago.
Federal Reserve (Fed) Bank of Chicago President Austan Goolsbee remarked on Friday that Fed officials are starting to align with the broader market's sentiment that a policy rate adjustment by the US central bank is imminent, according to CNBC. FXStreet’s FedTracker, which uses a custom AI model to evaluate Fed officials' speeches on a dovish-to-hawkish scale from 0 to 10, rated Goolsbee's comments as dovish, assigning them a score of 3.2.
On Friday, the Swiss National Bank's (SNB) Foreign Currency Reserves fell to CHF 694 billion in August, down from CHF 704 billion in July. This marks the fourth consecutive decline, suggesting continued intervention by the Swiss National Bank (SNB) in currency markets to support the Swiss Franc (CHF).
Switzerland's inflation rate dropped to 1.1% year-on-year in August, a five-month low, down from the previous reading of 1.3% and below the market forecast of 1.2%. This decline has heightened expectations for another potential rate cut by the Swiss National Bank in the near future.
Swiss Franc FAQs
The Swiss Franc (CHF) is Switzerland’s official currency. It is among the top ten most traded currencies globally, reaching volumes that well exceed the size of the Swiss economy. Its value is determined by the broad market sentiment, the country’s economic health or action taken by the Swiss National Bank (SNB), among other factors. Between 2011 and 2015, the Swiss Franc was pegged to the Euro (EUR). The peg was abruptly removed, resulting in a more than 20% increase in the Franc’s value, causing a turmoil in markets. Even though the peg isn’t in force anymore, CHF fortunes tend to be highly correlated with the Euro ones due to the high dependency of the Swiss economy on the neighboring Eurozone.
The Swiss Franc (CHF) is considered a safe-haven asset, or a currency that investors tend to buy in times of market stress. This is due to the perceived status of Switzerland in the world: a stable economy, a strong export sector, big central bank reserves or a longstanding political stance towards neutrality in global conflicts make the country’s currency a good choice for investors fleeing from risks. Turbulent times are likely to strengthen CHF value against other currencies that are seen as more risky to invest in.
The Swiss National Bank (SNB) meets four times a year – once every quarter, less than other major central banks – to decide on monetary policy. The bank aims for an annual inflation rate of less than 2%. When inflation is above target or forecasted to be above target in the foreseeable future, the bank will attempt to tame price growth by raising its policy rate. Higher interest rates are generally positive for the Swiss Franc (CHF) as they lead to higher yields, making the country a more attractive place for investors. On the contrary, lower interest rates tend to weaken CHF.
Macroeconomic data releases in Switzerland are key to assessing the state of the economy and can impact the Swiss Franc’s (CHF) valuation. The Swiss economy is broadly stable, but any sudden change in economic growth, inflation, current account or the central bank’s currency reserves have the potential to trigger moves in CHF. Generally, high economic growth, low unemployment and high confidence are good for CHF. Conversely, if economic data points to weakening momentum, CHF is likely to depreciate.
As a small and open economy, Switzerland is heavily dependent on the health of the neighboring Eurozone economies. The broader European Union is Switzerland’s main economic partner and a key political ally, so macroeconomic and monetary policy stability in the Eurozone is essential for Switzerland and, thus, for the Swiss Franc (CHF). With such dependency, some models suggest that the correlation between the fortunes of the Euro (EUR) and the CHF is more than 90%, or close to perfect.
Here is what you need to know on Monday, September 9:
The US Dollar (USD) stays resilient against its major rivals at the beginning of the week as investors refrain from taking large positions ahead of this week's key events, which will include US inflation data and the European Central Bank's (ECB) monetary policy announcement. Sentix Investors Confidence for the Eurozone and July Consumer Credit Change for the US will be featured in Monday's economic calendar.
After coming under bearish pressure with the immediate reaction to August employment data from the US on Friday, the USD Index benefited from risk aversion heading into the weekend ended the day in positive territory. Wall Street's main indexes declined sharply, with the Nasdaq Composite losing 2.7% on the day. Early monday, the index continues to edge higher toward 101.50 and US stock index futures were rising between 0.4% and 0.6%.
US Dollar PRICE Last 7 days
The table below shows the percentage change of US Dollar (USD) against listed major currencies last 7 days. US Dollar was the strongest against the New Zealand Dollar.
| USD | EUR | GBP | JPY | CAD | AUD | NZD | CHF | |
|---|---|---|---|---|---|---|---|---|
| USD | -0.09% | 0.26% | -1.93% | 0.62% | 1.55% | 1.59% | -0.26% | |
| EUR | 0.09% | 0.37% | -1.87% | 0.68% | 1.65% | 1.67% | -0.18% | |
| GBP | -0.26% | -0.37% | -2.23% | 0.30% | 1.26% | 1.33% | -0.57% | |
| JPY | 1.93% | 1.87% | 2.23% | 2.56% | 3.59% | 3.73% | 1.64% | |
| CAD | -0.62% | -0.68% | -0.30% | -2.56% | 0.96% | 0.97% | -0.87% | |
| AUD | -1.55% | -1.65% | -1.26% | -3.59% | -0.96% | 0.00% | -1.80% | |
| NZD | -1.59% | -1.67% | -1.33% | -3.73% | -0.97% | -0.01% | -1.82% | |
| CHF | 0.26% | 0.18% | 0.57% | -1.64% | 0.87% | 1.80% | 1.82% |
The heat map shows percentage changes of major currencies against each other. The base currency is picked from the left column, while the quote currency is picked from the top row. For example, if you pick the US Dollar from the left column and move along the horizontal line to the Japanese Yen, the percentage change displayed in the box will represent USD (base)/JPY (quote).
The US Bureau of Labor Statistics reported that Nonfarm Payrolls rose 142,000 in August. This reading came in below the market expectation of 160,000. Additionally, July's increase of 114,000 got revised down to 89,000. Other details of the jobs report showed that the Unemployment Rate edged lower to 4.2% from 43%, while the annual wage inflation, as measured by the change in the Average Hourly Earnings, rose to 3.8% from 3.6%.
EUR/USD spiked to a weekly high above 1.1150 in the American session on Friday but reversed its direction to close the day in the red below 1.1100. The pair stays on the back foot in the European morning and declines toward 1.1050.
GBP/USD struggles to find a foothold early Monday and trades a few pips below 1.3100 after ending the previous week virtually unchanged. The UK's Office for National Statistics will release UK labor market data on Tuesday.
USD/JPY registered losses for the fourth consecutive day on Friday and touched its lowest level in a month below 142.00. The pair stages a rebound to start the week and trades above 143.00. Japan's ruling Liberal Democratic Party (LDP) official and candidate running in the party's leadership race, Sanae Takaichi, said on Monday that Japan's inflation, when excluding external factors, was still weak.
Gold turned south in the late American session on Friday and closed the week slightly below $2,500. XAU/USD continues to stretch lower on Monday and was last seen trading slightly below $2,490.
Employment FAQs
Labor market conditions are a key element in assessing the health of an economy and thus a key driver for currency valuation. High employment, or low unemployment, has positive implications for consumer spending and economic growth, boosting the value of the local currency. Moreover, a very tight labor market – a situation in which there is a shortage of workers to fill open positions – can also have implications on inflation levels because low labor supply and high demand leads to higher wages.
The pace at which salaries are growing in an economy is key for policymakers. High wage growth means that households have more money to spend, usually leading to price increases in consumer goods. In contrast to more volatile sources of inflation such as energy prices, wage growth is seen as a key component of underlying and persisting inflation as salary increases are unlikely to be undone. Central banks around the world pay close attention to wage growth data when deciding on monetary policy.
The weight that each central bank assigns to labor market conditions depends on its objectives. Some central banks explicitly have mandates related to the labor market beyond controlling inflation levels. The US Federal Reserve (Fed), for example, has the dual mandate of promoting maximum employment and stable prices. Meanwhile, the European Central Bank’s (ECB) sole mandate is to keep inflation under control. Still, and despite whatever mandates they have, labor market conditions are an important factor for policymakers given their significance as a gauge of the health of the economy and their direct relationship to inflation.
FX option expiries for Sept 9 NY cut at 10:00 Eastern Time, via DTCC, can be found below.
EUR/USD: EUR amounts
- 1.1000 1.1b
- 1.1025 960m
- 1.1050 2.4b
- 1.1100 1.3b
- 1.1160 1.1b
- 1.1175 2.1b
- 1.1200 3.8b
GBP/USD: GBP amounts
- 1.3150 389m
- 1.3175 954m
USD/JPY: USD amounts
- 141.50 1.2b
- 142.00 1.2b
- 142.50 416m
- 143.00 351m
- 143.50 330m
- 144.00 1.1b
AUD/USD: AUD amounts
- 0.6700 428m
- 0.6750 320m
USD/CAD: USD amounts
- 1.3500 954m
NZD/USD: NZD amounts
- 0.6125 260m
- 0.6175 400m
EUR/GBP: EUR amounts
- 0.8400 224m
- 0.8450 233m
- Silver price appreciates as weak US labor data raises the odds of a Fed rate cut at its September meeting.
- CME FedWatch Tool suggests fully pricing in at least a 25 basis point Fed rate cut in September.
- Chicago Fed President Goolsbee stated that Fed officials are starting to align with the broader market's sentiment of rate adjustment.
Silver price (XAG/USD) inches higher to near $28.00 per troy ounce during the Asian session on Monday. The non-yielding assets like Silver gains ground as weak US jobs data increase the likelihood of a 25 basis-point rate cut by the Federal Reserve (Fed) at its September meeting.
The US Bureau of Labor Statistics (BLS) reported that Nonfarm Payrolls (NFP) added 142,000 jobs in August, below the forecast of 160,000 but an improvement from July’s downwardly revised figure of 89,000. Meanwhile, the Unemployment Rate fell to 4.2%, as expected, down from 4.3% in the previous month.
Lower interest rates tend to benefit Silver by reducing the opportunity cost of holding non-yield-bearing bullion assets. According to the CME FedWatch Tool, markets are fully anticipating at least a 25 basis point (bps) rate cut by the Federal Reserve at its September meeting.
Additionally, Chicago Fed President Austan Goolsbee remarked on Friday that Fed officials are starting to align with the broader market's sentiment that a policy rate adjustment by the US central bank is imminent, according to CNBC.
FXStreet’s FedTracker, which uses a custom AI model to evaluate Fed officials' speeches on a dovish-to-hawkish scale from 0 to 10, rated Goolsbee's comments as dovish, assigning them a score of 3.2.
The potential gains for Silver might be limited due to safe-haven flows, given the recent easing of geopolitical tensions in the Middle East. Israeli forces have withdrawn from Jenin, according to Reuters citing the Palestine news agency WAFA.
Silver FAQs
Silver is a precious metal highly traded among investors. It has been historically used as a store of value and a medium of exchange. Although less popular than Gold, traders may turn to Silver to diversify their investment portfolio, for its intrinsic value or as a potential hedge during high-inflation periods. Investors can buy physical Silver, in coins or in bars, or trade it through vehicles such as Exchange Traded Funds, which track its price on international markets.
Silver prices can move due to a wide range of factors. Geopolitical instability or fears of a deep recession can make Silver price escalate due to its safe-haven status, although to a lesser extent than Gold's. As a yieldless asset, Silver tends to rise with lower interest rates. Its moves also depend on how the US Dollar (USD) behaves as the asset is priced in dollars (XAG/USD). A strong Dollar tends to keep the price of Silver at bay, whereas a weaker Dollar is likely to propel prices up. Other factors such as investment demand, mining supply – Silver is much more abundant than Gold – and recycling rates can also affect prices.
Silver is widely used in industry, particularly in sectors such as electronics or solar energy, as it has one of the highest electric conductivity of all metals – more than Copper and Gold. A surge in demand can increase prices, while a decline tends to lower them. Dynamics in the US, Chinese and Indian economies can also contribute to price swings: for the US and particularly China, their big industrial sectors use Silver in various processes; in India, consumers’ demand for the precious metal for jewellery also plays a key role in setting prices.
Silver prices tend to follow Gold's moves. When Gold prices rise, Silver typically follows suit, as their status as safe-haven assets is similar. The Gold/Silver ratio, which shows the number of ounces of Silver needed to equal the value of one ounce of Gold, may help to determine the relative valuation between both metals. Some investors may consider a high ratio as an indicator that Silver is undervalued, or Gold is overvalued. On the contrary, a low ratio might suggest that Gold is undervalued relative to Silver.
Japan's ruling Liberal Democratic Party (LDP) official and candidate running in the party's leadership race, Sanae Takaichi, said on Monday, "strategic deployment of fiscal spending will increase jobs, household income, and improve consumer sentiment.”
“It will also increase tax revenues without raising the tax rate and help build a strong economy," he added.
- Indian Rupee may face challenges following the risk aversion sentiment over a potential slowdown in the US economy.
- Traders expect potential RBI interventions to prevent the INR from falling below the 84.00 mark.
- The US Dollar remains stable as Friday’s US labor data reduce the odds of an aggressive Fed rate cut in September.
The Indian Rupee (INR) extends its gains for the second successive session against the US Dollar (USD) on Monday. However, the USD/INR pair might experience appreciation in the near term due to a broader decline in Asian equities and currencies, driven by increasing concerns over a potential slowdown in the US economy.
Last week, the Reserve Bank of India (RBI) likely intervened multiple times to support the Indian Rupee. Traders are likely watching for potential RBI interventions to prevent the INR from falling below the 84.00 mark. Additionally, rising Oil prices could exert pressure on the INR, given that India is the world’s third-largest Oil consumer and importer.
The downside of the USD/INR pair could be restrained as the US Dollar receives support as Friday’s US labor data reduce the likelihood of an aggressive interest rate cut by the Federal Reserve (Fed) at its September meeting. The US Nonfarm Payrolls (NFP) added 142,000 jobs in August, below the forecast of 160,000 but an improvement from July’s downwardly revised figure of 89,000.
According to the CME FedWatch Tool, markets are fully anticipating at least a 25 basis point (bps) rate cut by the Federal Reserve at its September meeting. The likelihood of a 50 bps rate cut has slightly decreased to 29.0%, down from 30.0% a week ago.
Daily Digest Market Movers: Indian Rupee appreciates due to less likelihood of aggressive Fed rate cuts
- Federal Reserve (Fed) Bank of Chicago President Austan Goolsbee remarked on Friday that Fed officials are starting to align with the broader market's sentiment that a policy rate adjustment by the US central bank is imminent, according to CNBC. FXStreet’s FedTracker, which uses a custom AI model to evaluate Fed officials' speeches on a dovish-to-hawkish scale from 0 to 10, rated Goolsbee's comments as dovish, assigning them a score of 3.2.
- India's FX Reserves reached a record high of $683.99 billion as of August 30, up from $681.69 billion previously. This surge is largely due to a substantial influx of foreign exchange into the Indian economy, spurred by robust economic growth and the long-anticipated inclusion of Indian assets in JPMorgan's major emerging market debt index, which has enhanced foreign investment.
- ADP Employment Change showed on Thursday that private-sector employment increased by 99,000 in August, following July’s increase of 111,000 and below the estimate of 145,000. Meanwhile, the weekly US Initial Jobless Claims rose to 227,000 for the week ending August 30, compared to the previous reading of 232,000 and below the initial consensus of 230,000.
- “The Composite PMI for India continued to show strong growth in August, driven by accelerated business activity in the service sector, which experienced its fastest expansion since March. This growth was largely fuelled by an increase in new orders, particularly domestic orders,” said Pranjul Bhandari, Chief India Economist at HSBC.
- The World Bank has raised India's growth forecast to 7% for the current financial year (FY25), up from an earlier projection of 6.6%.
- US JOLTS Job Openings dropped to 7.673 million in July, down from 7.910 million in June, marking the lowest level since January 2021 and falling short of market expectations of 8.10 million.
Technical Analysis: USD/INR remains below 84.00, tests support at nine-day EMA
The Indian Rupee trades around 84.00 on Monday. Analysis of the daily chart shows that the USD/INR pair consolidates within the symmetrical triangle pattern, indicating a period of consolidation and a decrease in volatility. However, the 14-day Relative Strength Index (RSI) remains just above the 50 level, suggesting that the overall trend is still bullish.
On the downside, the nine-day Exponential Moving Average (EMA) at 83.92 level acts as immediate support, followed by the lower boundary of the symmetrical triangle around the level of 83.90. A break below this level could reinforce the bearish bias and put downward pressure on the USD/INR pair to revisit its six-week low at 83.72 level. Consequently, a decline below the 50 level on the RSI could indicate a shift toward a bearish bias.
In terms of resistance, the USD/INR pair tests the upper boundary of the symmetrical triangle at the 84.00 level. A breakthrough above this level could lead the pair to explore the region around its recent high of 84.14 level, recorded on August 5.
USD/INR: Daily Chart
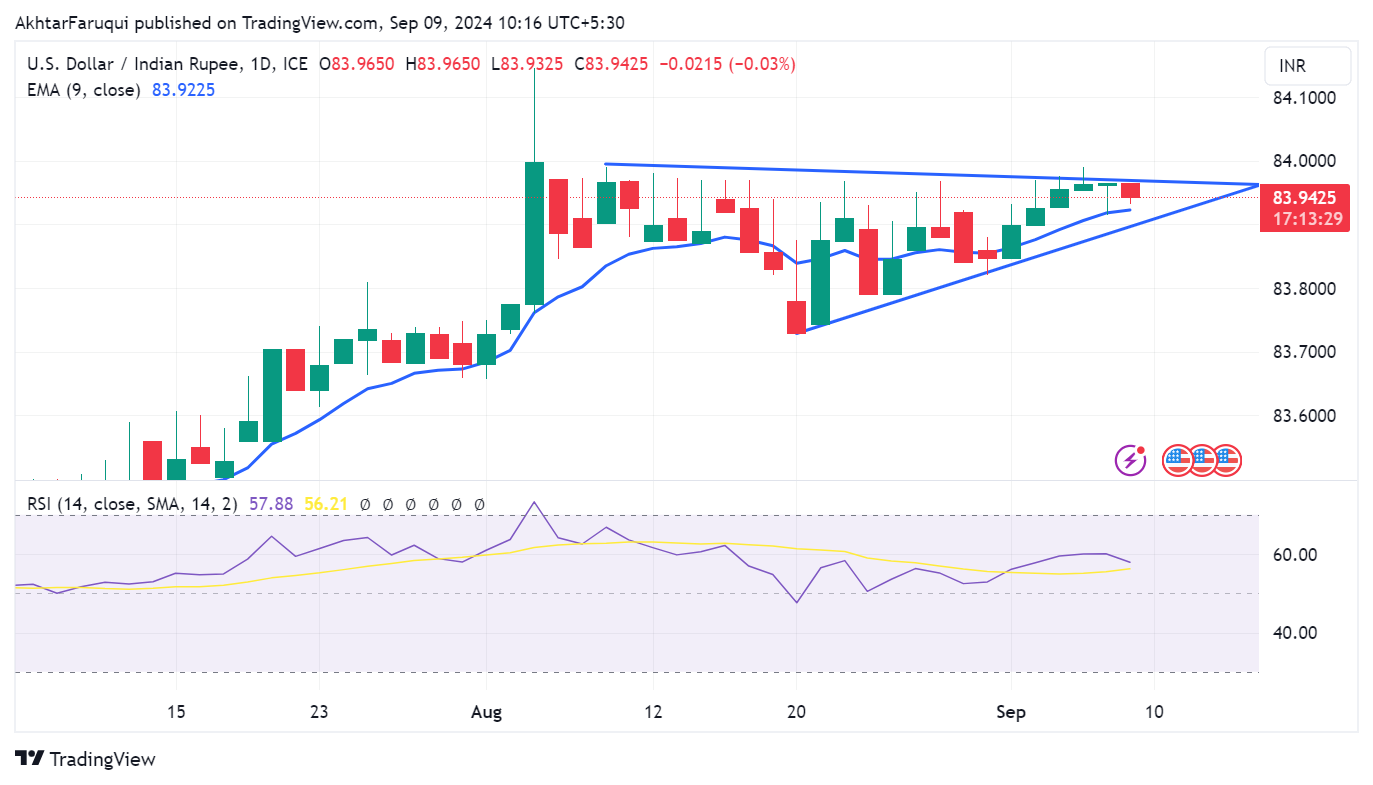
Indian Rupee FAQs
The Indian Rupee (INR) is one of the most sensitive currencies to external factors. The price of Crude Oil (the country is highly dependent on imported Oil), the value of the US Dollar – most trade is conducted in USD – and the level of foreign investment, are all influential. Direct intervention by the Reserve Bank of India (RBI) in FX markets to keep the exchange rate stable, as well as the level of interest rates set by the RBI, are further major influencing factors on the Rupee.
The Reserve Bank of India (RBI) actively intervenes in forex markets to maintain a stable exchange rate, to help facilitate trade. In addition, the RBI tries to maintain the inflation rate at its 4% target by adjusting interest rates. Higher interest rates usually strengthen the Rupee. This is due to the role of the ‘carry trade’ in which investors borrow in countries with lower interest rates so as to place their money in countries’ offering relatively higher interest rates and profit from the difference.
Macroeconomic factors that influence the value of the Rupee include inflation, interest rates, the economic growth rate (GDP), the balance of trade, and inflows from foreign investment. A higher growth rate can lead to more overseas investment, pushing up demand for the Rupee. A less negative balance of trade will eventually lead to a stronger Rupee. Higher interest rates, especially real rates (interest rates less inflation) are also positive for the Rupee. A risk-on environment can lead to greater inflows of Foreign Direct and Indirect Investment (FDI and FII), which also benefit the Rupee.
Higher inflation, particularly, if it is comparatively higher than India’s peers, is generally negative for the currency as it reflects devaluation through oversupply. Inflation also increases the cost of exports, leading to more Rupees being sold to purchase foreign imports, which is Rupee-negative. At the same time, higher inflation usually leads to the Reserve Bank of India (RBI) raising interest rates and this can be positive for the Rupee, due to increased demand from international investors. The opposite effect is true of lower inflation.
Gold prices remained broadly unchanged in India on Monday, according to data compiled by FXStreet.
The price for Gold stood at 6,742.61 Indian Rupees (INR) per gram, broadly stable compared with the INR 6,740.18 it cost on Friday.
The price for Gold was broadly steady at INR 78,643.81 per tola from INR 78,616.10 per tola on friday.
| Unit measure | Gold Price in INR |
|---|---|
| 1 Gram | 6,742.61 |
| 10 Grams | 67,425.53 |
| Tola | 78,643.81 |
| Troy Ounce | 209,720.30 |
FXStreet calculates Gold prices in India by adapting international prices (USD/INR) to the local currency and measurement units. Prices are updated daily based on the market rates taken at the time of publication. Prices are just for reference and local rates could diverge slightly.
Gold FAQs
Gold has played a key role in human’s history as it has been widely used as a store of value and medium of exchange. Currently, apart from its shine and usage for jewelry, the precious metal is widely seen as a safe-haven asset, meaning that it is considered a good investment during turbulent times. Gold is also widely seen as a hedge against inflation and against depreciating currencies as it doesn’t rely on any specific issuer or government.
Central banks are the biggest Gold holders. In their aim to support their currencies in turbulent times, central banks tend to diversify their reserves and buy Gold to improve the perceived strength of the economy and the currency. High Gold reserves can be a source of trust for a country’s solvency. Central banks added 1,136 tonnes of Gold worth around $70 billion to their reserves in 2022, according to data from the World Gold Council. This is the highest yearly purchase since records began. Central banks from emerging economies such as China, India and Turkey are quickly increasing their Gold reserves.
Gold has an inverse correlation with the US Dollar and US Treasuries, which are both major reserve and safe-haven assets. When the Dollar depreciates, Gold tends to rise, enabling investors and central banks to diversify their assets in turbulent times. Gold is also inversely correlated with risk assets. A rally in the stock market tends to weaken Gold price, while sell-offs in riskier markets tend to favor the precious metal.
The price can move due to a wide range of factors. Geopolitical instability or fears of a deep recession can quickly make Gold price escalate due to its safe-haven status. As a yield-less asset, Gold tends to rise with lower interest rates, while higher cost of money usually weighs down on the yellow metal. Still, most moves depend on how the US Dollar (USD) behaves as the asset is priced in dollars (XAU/USD). A strong Dollar tends to keep the price of Gold controlled, whereas a weaker Dollar is likely to push Gold prices up.
(An automation tool was used in creating this post.)
- NZD/USD struggles to lure buyers amid a modest USD uptick and a softer risk tone.
- The mixed Chinese inflation figures do little to impress bulls or provide any impetus.
- The fundamental backdrop warrants caution before placing aggressive directional bets.
The NZD/USD pair fails to capitalize on a modest Asian session uptick and currently trades around the 0.6175-0.6170 region, just above the two-week low set on Friday.
The US Dollar (USD) gains positive traction on the first day of a new week and builds on Friday's recovery from over a one-week low, which, in turn, is seen acting as a headwind for the NZD/USD pair. The mixed US jobs data forced investors to scale back their expectations for a larger interest rate cut by the Federal Reserve (Fed) in September. This leads to a modest uptick in the US Treasury bond yields, which, along with a softer risk tone, underpins the safe-haven Greenback.
The closely-watched US Nonfarm Payrolls (NFP) provided further evidence of a sharp deterioration in the labor market and fueled concerns about a slowdown in the world's largest economy. This, in turn, tempers investors' appetite for riskier assets, which is seen benefiting traditional safe-haven currencies and keeping a lid on any meaningful upside for the risk-sensitive Kiwi. The markets, meanwhile, reacted little to the latest Chinese inflation figures released earlier this Monday.
In fact, China’s headline Consumer Price Index (CPI) came in at 0.4% MoM in August and rose at an annual pace of 0.6%, up slightly from the 0.5% growth reported in the previous month. This, however, was below consensus estimates for a reading of 0.7%. Adding to this, China's Producer Price Index (PPI) declined 1.8% YoY during the reported month as compared to the 0.8% drop registered in July and was worse than the market forecast of -1.4%.
It, however, remains to be seen if the USD can build on the momentum amid growing acceptance that the Fed will start its rate-cutting cycle at the September 17-18 policy meeting. Moreover, the aforementioned fundamental backdrop makes it prudent to wait for strong follow-through selling before positioning for an extension of the recent corrective decline from the vicinity of the 0.6300 round-figure mark, or the highest level since early January touched last month.
Economic Indicator
Consumer Price Index (YoY)
The Consumer Price Index (CPI), released by the National Bureau of Statistics of China on a monthly basis, measures changes in the price level of consumer goods and services purchased by residents. The CPI is a key indicator to measure inflation and changes in purchasing trends. The YoY reading compares prices in the reference month to the same month a year earlier. Generally, a high reading is seen as bullish for the Renminbi (CNY), while a low reading is seen as bearish.
Read more.Last release: Mon Sep 09, 2024 01:30
Frequency: Monthly
Actual: 0.6%
Consensus: 0.7%
Previous: 0.5%
- USD/CAD kicks off the new week on a softer note, though it lacks follow-through selling.
- An uptick in Oil prices underpins the Loonie and exerts downward pressure on the major.
- A modest USD strength might hold back bears from placing aggressive bets and limit losses.
The USD/CAD pair struggles to capitalize on Friday's strong intraday rally of over 100 pips and trades with a mild negative bias around mid-1.3500s during the Asian session on Monday. The downtick is sponsored by a modest rise in Crude Oil prices, though a combination of factors should help limit deeper losses.
Crude Oil prices move away from the lowest level since June 2023 touched on Friday amid the forecast of a potential hurricane approaching the northwestern US Gulf Coast, which accounts for 60% of US refining capacity. This, in turn, is seen underpinning the commodity-linked Loonie and exerting some downward pressure on the USD/CAD pair. That said, a weaker Canadian jobs report released on Friday raised hopes for additional interest rate cuts by the Bank of Canada (BoC) and should cap gains for the domestic currency.
Meanwhile, Friday's mixed US employment details provided evidence of a sharp deterioration in labor market. This, along with reduced bets for a larger interest rate cut by the Federal Reserve (Fed), tempers investors' appetite for riskier assets and drives some haven flows towards the US Dollar (USD). This might further hold back traders from placing aggressive bearish bets around the USD/CAD pair, making it prudent to wait for strong follow-through selling before positioning for any further depreciating move.
Moving ahead, there isn't any relevant market-moving economic data due for release on Monday, either from the US or Canada, leaving the USD at the mercy of the broader risk sentiment and the US bond yields. Apart from this, Oil price dynamics should influence the Canadian Dollar (CAD) and contribute to producing short-term trading opportunities around the USD/CAD pair.
Risk sentiment FAQs
In the world of financial jargon the two widely used terms “risk-on” and “risk off'' refer to the level of risk that investors are willing to stomach during the period referenced. In a “risk-on” market, investors are optimistic about the future and more willing to buy risky assets. In a “risk-off” market investors start to ‘play it safe’ because they are worried about the future, and therefore buy less risky assets that are more certain of bringing a return, even if it is relatively modest.
Typically, during periods of “risk-on”, stock markets will rise, most commodities – except Gold – will also gain in value, since they benefit from a positive growth outlook. The currencies of nations that are heavy commodity exporters strengthen because of increased demand, and Cryptocurrencies rise. In a “risk-off” market, Bonds go up – especially major government Bonds – Gold shines, and safe-haven currencies such as the Japanese Yen, Swiss Franc and US Dollar all benefit.
The Australian Dollar (AUD), the Canadian Dollar (CAD), the New Zealand Dollar (NZD) and minor FX like the Ruble (RUB) and the South African Rand (ZAR), all tend to rise in markets that are “risk-on”. This is because the economies of these currencies are heavily reliant on commodity exports for growth, and commodities tend to rise in price during risk-on periods. This is because investors foresee greater demand for raw materials in the future due to heightened economic activity.
The major currencies that tend to rise during periods of “risk-off” are the US Dollar (USD), the Japanese Yen (JPY) and the Swiss Franc (CHF). The US Dollar, because it is the world’s reserve currency, and because in times of crisis investors buy US government debt, which is seen as safe because the largest economy in the world is unlikely to default. The Yen, from increased demand for Japanese government bonds, because a high proportion are held by domestic investors who are unlikely to dump them – even in a crisis. The Swiss Franc, because strict Swiss banking laws offer investors enhanced capital protection.
- Gold price stalls the post-NFP retracement slide from the vicinity of the all-time peak.
- Reduced bets for a larger rate cut by the Fed underpin the USD and act as a headwind.
- Worries about the US economic slowdown and geopolitical risks continue to offer support.
Gold price (XAU/USD) witnessed an intraday turnaround from the vicinity of the all-time peak and dropped back below the $2,500 psychological mark following the release of the key US monthly employment details on Friday. The mixed US jobs report reduced the likelihood of a larger 50 basis point rate cut by the Federal Reserve (Fed), which, in turn, prompted some US Dollar (USD) short-covering and exerted some pressure on the precious metal.
That said, worries about a US economic downturn temper investors' appetite for riskier assets and act as a tailwind for the safe-haven Gold price. Apart from this, the lack of progress in ceasefire negotiations between Israel and Hamas turned out to be another factor lending support to the XAU/USD during the Asian session on Monday. This warrants caution for bearish traders amid the prospects for an imminent start of the Fed's rate-cutting cycle.
Daily Digest Market Movers: Gold price struggles to gain any meaningful traction amid mixed cues
- The US Bureau of Labor Statistics (BLS) reported on Friday that Nonfarm Payrolls (NFP) rose by 142,000 in August as compared to 160,000 expected and the previous month's downwardly revised reading of 89,000.
- Other details of the report showed that the Unemployment Rate edged lower to 4.2% from 4.3% in July and wage inflation, as measured by the change in Average Hourly Earnings, rose to 3.8% from the 3.6% previous.
- According to the CME Group's FedWatch tool, the markets are pricing around a 70% chance of a 25-basis-points rate cut by the Federal Reserve later this month and the probability of a 50-bps reduction stands at 30%.
- The US Dollar, which initially fell after the release of the jobs data, soon gained ground and traded slightly higher during the Asian session on Monday, which, in turn, is seen acting as a headwind for the Gold price.
- Meanwhile, the mixed US jobs data provided clear evidence of a sharp deterioration in labor market and weighed on investors' sentiment amid persistent geopolitical tensions, offering support to the safe-haven XAU/USD.
- Data published by the People's Bank of China (PBOC) showed on Sunday that the country's gold holdings stood at 72.8 million fine troy ounces at the end of August, unchanged for the fourth successive month.
- Meanwhile, the markets reacted little to the latest Chinese inflation figures, showing that consumer prices rose for the seventh consecutive month in August, while producer price deflation persisted.
Technical Outlook: Gold price remains confined in a multi-week-old trading range, around $2,500
From a technical perspective, the Gold price has been oscillating in a familiar range over the past three weeks or so. This constitutes the formation of a rectangle on short-term charts and points to indecision among traders over the next leg of a directional move. The range-bound price action, however, might still be categorized as a bullish consolidation phase against the backdrop of a strong rally to the all-time peak. Moreover, oscillators on the daily chart – though have been losing traction – are still holding in the positive territory. Hence, any subsequent slide might still be seen as a buying opportunity near the $2,471-2,470 horizontal support.
The latter marks the lower boundary of the trading range and should act as a key pivotal point. A convincing break below might prompt some technical selling and expose the 50-day Simple Moving Average (SMA) support, currently pegged near the $2,443-2,442 region. The downward trajectory could extend further towards the $2,400 round-figure mark en route to the 100-day SMA, around the $2,390-2,389 zone. On the flip side, any meaningful move up now seems to confront stiff resistance near the $2,520 region ahead of the $2,530-2,532 area, or the all-time peak. Some follow-through buying will be seen as a fresh trigger for bullish traders and set the stage for a further near-term appreciating move.
Gold FAQs
Gold has played a key role in human’s history as it has been widely used as a store of value and medium of exchange. Currently, apart from its shine and usage for jewelry, the precious metal is widely seen as a safe-haven asset, meaning that it is considered a good investment during turbulent times. Gold is also widely seen as a hedge against inflation and against depreciating currencies as it doesn’t rely on any specific issuer or government.
Central banks are the biggest Gold holders. In their aim to support their currencies in turbulent times, central banks tend to diversify their reserves and buy Gold to improve the perceived strength of the economy and the currency. High Gold reserves can be a source of trust for a country’s solvency. Central banks added 1,136 tonnes of Gold worth around $70 billion to their reserves in 2022, according to data from the World Gold Council. This is the highest yearly purchase since records began. Central banks from emerging economies such as China, India and Turkey are quickly increasing their Gold reserves.
Gold has an inverse correlation with the US Dollar and US Treasuries, which are both major reserve and safe-haven assets. When the Dollar depreciates, Gold tends to rise, enabling investors and central banks to diversify their assets in turbulent times. Gold is also inversely correlated with risk assets. A rally in the stock market tends to weaken Gold price, while sell-offs in riskier markets tend to favor the precious metal.
The price can move due to a wide range of factors. Geopolitical instability or fears of a deep recession can quickly make Gold price escalate due to its safe-haven status. As a yield-less asset, Gold tends to rise with lower interest rates, while higher cost of money usually weighs down on the yellow metal. Still, most moves depend on how the US Dollar (USD) behaves as the asset is priced in dollars (XAU/USD). A strong Dollar tends to keep the price of Gold controlled, whereas a weaker Dollar is likely to push Gold prices up.
- WTI price gains ground due to the potential approach of a hurricane toward the US Gulf Coast.
- An adverse weather is expected to become a hurricane before reaching the northwestern US Gulf Coast.
- The rising odds of a Fed rate cut in September provide support for the Oil prices.
West Texas Intermediate (WTI) Oil price recovers its recent losses registered in the previous session, trading around $68.00 per barrel during Monday’s Asian hours. The uptick in crude Oil prices is attributed to the potential approach of a hurricane toward the US Gulf Coast.
The US National Hurricane Center (NHC) reported on Sunday that adverse weather in the southwestern Gulf of Mexico is expected to strengthen into a hurricane before reaching the northwestern US Gulf Coast. This region accounts for approximately 60% of US refining capacity, according to Reuters.
Reuters also cited ANZ analysts noting that "Crude Oil recorded its biggest weekly fall in 11 months amid a darkening economic backdrop. Weak jobs data in the US on Friday raised concerns over flagging Oil demand in the world's biggest consumer."
The US Bureau of Labor Statistics (BLS) reported that Nonfarm Payrolls (NFP) added 142,000 jobs in August, below the forecast of 160,000 but an improvement from July’s downwardly revised figure of 89,000.
Weak US jobs data increased the likelihood of a 25 basis-point rate cut by the Federal Reserve (Fed) at its September meeting. Lower interest rates generally boost Oil demand by stimulating economic growth and making Oil cheaper for holders of non-dollar currencies.
According to the CME FedWatch Tool, markets are fully anticipating at least a 25 basis point (bps) rate cut by the Federal Reserve at its September meeting.
Additionally, Chicago Fed President Austan Goolsbee remarked on Friday that Fed officials are starting to align with the broader market's sentiment that a policy rate adjustment by the US central bank is imminent, according to CNBC.
FXStreet’s FedTracker, which uses a custom AI model to evaluate Fed officials' speeches on a dovish-to-hawkish scale from 0 to 10, rated Goolsbee's comments as dovish, assigning them a score of 3.2.
WTI Oil FAQs
WTI Oil is a type of Crude Oil sold on international markets. The WTI stands for West Texas Intermediate, one of three major types including Brent and Dubai Crude. WTI is also referred to as “light” and “sweet” because of its relatively low gravity and sulfur content respectively. It is considered a high quality Oil that is easily refined. It is sourced in the United States and distributed via the Cushing hub, which is considered “The Pipeline Crossroads of the World”. It is a benchmark for the Oil market and WTI price is frequently quoted in the media.
Like all assets, supply and demand are the key drivers of WTI Oil price. As such, global growth can be a driver of increased demand and vice versa for weak global growth. Political instability, wars, and sanctions can disrupt supply and impact prices. The decisions of OPEC, a group of major Oil-producing countries, is another key driver of price. The value of the US Dollar influences the price of WTI Crude Oil, since Oil is predominantly traded in US Dollars, thus a weaker US Dollar can make Oil more affordable and vice versa.
The weekly Oil inventory reports published by the American Petroleum Institute (API) and the Energy Information Agency (EIA) impact the price of WTI Oil. Changes in inventories reflect fluctuating supply and demand. If the data shows a drop in inventories it can indicate increased demand, pushing up Oil price. Higher inventories can reflect increased supply, pushing down prices. API’s report is published every Tuesday and EIA’s the day after. Their results are usually similar, falling within 1% of each other 75% of the time. The EIA data is considered more reliable, since it is a government agency.
OPEC (Organization of the Petroleum Exporting Countries) is a group of 13 Oil-producing nations who collectively decide production quotas for member countries at twice-yearly meetings. Their decisions often impact WTI Oil prices. When OPEC decides to lower quotas, it can tighten supply, pushing up Oil prices. When OPEC increases production, it has the opposite effect. OPEC+ refers to an expanded group that includes ten extra non-OPEC members, the most notable of which is Russia.
| Raw materials | Closed | Change, % |
|---|---|---|
| Silver | 27.919 | -3.13 |
| Gold | 249.687 | -0.77 |
| Palladium | 914.64 | -2.85 |
- USD/JPY breaks its four-day losing streak after weaker Gross Domestic Product data from Japan on Monday.
- Friday’s US labor data reduces the likelihood of an aggressive Fed rate cut in September.
- CME FedWatch Tool suggests the odds of a 50 basis points Fed rate cut have slightly decreased to 29.0%.
USD/JPY halts its four-day losing streak, trading around 142.90 during the Asian session on Monday. The USD/JPY pair's recovery can be partly attributed to lower-than-expected Gross Domestic Product (GDP) data from Japan. However, robust economic growth, rising wages, and persistent inflationary pressures continue to support expectations that the Bank of Japan (BoJ) may further raise interest rates, which could limit the downside for the Japanese Yen (JPY).
Japan's GDP Annualized expanded by 2.9% in the second quarter, slightly below the preliminary reading of 3.1% and the market estimate of 3.2%. However, this reading marks the strongest yearly expansion since Q1 2023. On a quarter-on-quarter basis, GDP grew by 0.7% in Q2, falling short of the market forecast of 0.8% but representing the strongest quarterly growth since Q2 2023.
Additionally, the US Dollar received support as Friday’s US economic data raised uncertainty over the likelihood of an aggressive interest rate cut by the Federal Reserve (Fed) at its September meeting. According to the CME FedWatch Tool, markets are fully anticipating at least a 25 basis point (bps) rate cut by the Federal Reserve at its September meeting. The likelihood of a 50 bps rate cut has slightly decreased to 29.0%, down from 30.0% a week ago.
The US Bureau of Labor Statistics (BLS) reported that Nonfarm Payrolls (NFP) added 142,000 jobs in August, below the forecast of 160,000 but an improvement from July’s downwardly revised figure of 89,000. Meanwhile, the Unemployment Rate fell to 4.2%, as expected, down from 4.3% in the previous month.
Japanese Yen FAQs
The Japanese Yen (JPY) is one of the world’s most traded currencies. Its value is broadly determined by the performance of the Japanese economy, but more specifically by the Bank of Japan’s policy, the differential between Japanese and US bond yields, or risk sentiment among traders, among other factors.
One of the Bank of Japan’s mandates is currency control, so its moves are key for the Yen. The BoJ has directly intervened in currency markets sometimes, generally to lower the value of the Yen, although it refrains from doing it often due to political concerns of its main trading partners. The current BoJ ultra-loose monetary policy, based on massive stimulus to the economy, has caused the Yen to depreciate against its main currency peers. This process has exacerbated more recently due to an increasing policy divergence between the Bank of Japan and other main central banks, which have opted to increase interest rates sharply to fight decades-high levels of inflation.
The BoJ’s stance of sticking to ultra-loose monetary policy has led to a widening policy divergence with other central banks, particularly with the US Federal Reserve. This supports a widening of the differential between the 10-year US and Japanese bonds, which favors the US Dollar against the Japanese Yen.
The Japanese Yen is often seen as a safe-haven investment. This means that in times of market stress, investors are more likely to put their money in the Japanese currency due to its supposed reliability and stability. Turbulent times are likely to strengthen the Yen’s value against other currencies seen as more risky to invest in.
- The Australian Dollar receives support from the hawkish mood surrounding the RBA.
- China’s Consumer Price Index rose by 0.6% YoY in August, up from 0.5% in July but below the market consensus of 0.7%.
- The US Dollar receives support due to rising uncertainty over the likelihood of an aggressive Fed rate cut in September.
The Australian Dollar (AUD) recovers its recent losses against the US Dollar (USD) due to the hawkish sentiment surrounding the Reserve Bank of Australia (RBA). The RBA Governor Michele Bullock stated last week that it is too early to consider rate cuts. The board does not anticipate being able to reduce rates in the near term.
The Australian Dollar remains resilient despite the softer inflation data from China released on Monday. China’s Consumer Price Index (CPI) rose by 0.6% year-on-year in August, up from 0.5% in July but below the market consensus of 0.7%. On a monthly basis, CPI inflation increased by 0.4% in August, down from 0.5% in July and worse than the 0.5% estimate. Given the close trade relationship between Australia and China, any changes in the Chinese economy could have a significant impact on Australian markets.
RBC Capital Markets now expects the Reserve Bank of Australia to implement a rate cut at its February 2025 meeting, earlier than its previous forecast of May 2025. Despite inflation in Australia remaining elevated above the RBA's target, slower economic growth is not considered a sufficient reason for a rate cut this year.
The US Dollar received support as Friday’s US economic data raised uncertainty over the likelihood of an aggressive interest rate cut by the Federal Reserve (Fed) at its September meeting.
According to the CME FedWatch Tool, markets are fully anticipating at least a 25 basis point (bps) rate cut by the Federal Reserve at its September meeting. The likelihood of a 50 bps rate cut has slightly decreased to 29.0%, down from 30.0% a week ago.
Daily Digest Market Movers: Australian Dollar edges higher due to hawkish RBA
- The US Bureau of Labor Statistics (BLS) reported that Nonfarm Payrolls (NFP) added 142,000 jobs in August, below the forecast of 160,000 but an improvement from July’s downwardly revised figure of 89,000. Meanwhile, the Unemployment Rate fell to 4.2%, as expected, down from 4.3% in the previous month.
- Federal Reserve (Fed) Bank of Chicago President Austan Goolsbee remarked on Friday that Fed officials are starting to align with the broader market's sentiment that a policy rate adjustment by the US central bank is imminent, according to CNBC. FXStreet’s FedTracker, which uses a custom AI model to evaluate Fed officials' speeches on a dovish-to-hawkish scale from 0 to 10, rated Goolsbee's comments as dovish, assigning them a score of 3.2.
- ADP Employment Change showed on Thursday that private-sector employment increased by 99,000 in August, following July’s increase of 111,000 and below the estimate of 145,000. Meanwhile, the weekly US Initial Jobless Claims rose to 227,000 for the week ending August 30, compared to the previous reading of 232,000 and below the initial consensus of 230,000.
- Australia’s trade surplus widened to 6,009 million MoM in July, exceeding the expected 5,150 million and 5,589 million in the previous reading.
- US JOLTS Job Openings dropped to 7.673 million in July, down from 7.910 million in June, marking the lowest level since January 2021 and falling short of market expectations of 8.10 million.
- Bank of America (BoA) has revised its economic growth forecast for China, lowering its 2024 projection to 4.8% from the previous 5.0%. For 2025, the forecast is adjusted to 4.5% growth, while the 2026 outlook remains unchanged at 4.5%.
- Australia’s Gross Domestic Product (GDP) posted a 0.2% reading QoQ for the second quarter, up from the previous quarter’s 0.1% but falling short of the expected 0.3% readings.
Technical Analysis: Australian Dollar remains above 50-day EMA near 0.6700
The Australian Dollar trades around 0.6680 on Monday. On the daily chart, the AUD/USD pair remains below the nine-day Exponential Moving Average (EMA), signaling a short-term bearish trend. Additionally, the 14-day Relative Strength Index (RSI) has dropped below the 50 level, further confirming a bearish momentum.
On the downside, the AUD/USD pair is testing immediate support near the 50-day EMA at the 0.6676 level. A decisive break below this point could strengthen the bearish bias, pushing the pair toward the throwback level around 0.6575 . A deeper decline might target the lower support around 0.6470.
In terms of resistance, the AUD/USD pair may encounter a barrier around the nine-day EMA at 0.6720. A break above this level could pave the way for a potential retest of the seven-month high at 0.6798.
AUD/USD: Daily Chart
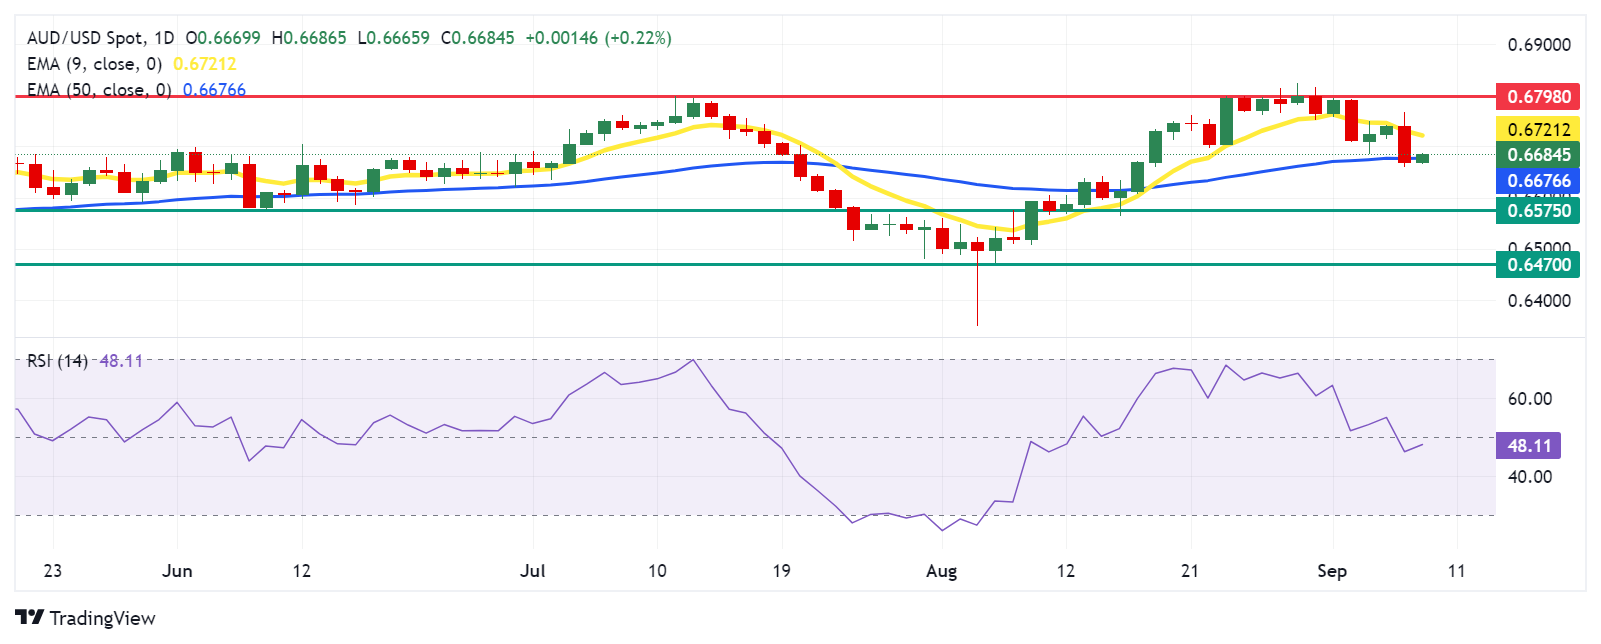
Australian Dollar PRICE Today
The table below shows the percentage change of Australian Dollar (AUD) against listed major currencies today. Australian Dollar was the strongest against the Japanese Yen.
| USD | EUR | GBP | JPY | CAD | AUD | NZD | CHF | |
|---|---|---|---|---|---|---|---|---|
| USD | 0.02% | -0.04% | 0.39% | -0.08% | -0.19% | -0.11% | 0.07% | |
| EUR | -0.02% | -0.11% | 0.46% | -0.09% | -0.26% | -0.12% | 0.03% | |
| GBP | 0.04% | 0.11% | 0.43% | 0.02% | -0.14% | -0.05% | 0.14% | |
| JPY | -0.39% | -0.46% | -0.43% | -0.50% | -0.59% | -0.55% | -0.16% | |
| CAD | 0.08% | 0.09% | -0.02% | 0.50% | -0.07% | -0.05% | 0.30% | |
| AUD | 0.19% | 0.26% | 0.14% | 0.59% | 0.07% | 0.11% | 0.25% | |
| NZD | 0.11% | 0.12% | 0.05% | 0.55% | 0.05% | -0.11% | 0.17% | |
| CHF | -0.07% | -0.03% | -0.14% | 0.16% | -0.30% | -0.25% | -0.17% |
The heat map shows percentage changes of major currencies against each other. The base currency is picked from the left column, while the quote currency is picked from the top row. For example, if you pick the Australian Dollar from the left column and move along the horizontal line to the US Dollar, the percentage change displayed in the box will represent AUD (base)/USD (quote).
Australian Dollar FAQs
One of the most significant factors for the Australian Dollar (AUD) is the level of interest rates set by the Reserve Bank of Australia (RBA). Because Australia is a resource-rich country another key driver is the price of its biggest export, Iron Ore. The health of the Chinese economy, its largest trading partner, is a factor, as well as inflation in Australia, its growth rate and Trade Balance. Market sentiment – whether investors are taking on more risky assets (risk-on) or seeking safe-havens (risk-off) – is also a factor, with risk-on positive for AUD.
The Reserve Bank of Australia (RBA) influences the Australian Dollar (AUD) by setting the level of interest rates that Australian banks can lend to each other. This influences the level of interest rates in the economy as a whole. The main goal of the RBA is to maintain a stable inflation rate of 2-3% by adjusting interest rates up or down. Relatively high interest rates compared to other major central banks support the AUD, and the opposite for relatively low. The RBA can also use quantitative easing and tightening to influence credit conditions, with the former AUD-negative and the latter AUD-positive.
China is Australia’s largest trading partner so the health of the Chinese economy is a major influence on the value of the Australian Dollar (AUD). When the Chinese economy is doing well it purchases more raw materials, goods and services from Australia, lifting demand for the AUD, and pushing up its value. The opposite is the case when the Chinese economy is not growing as fast as expected. Positive or negative surprises in Chinese growth data, therefore, often have a direct impact on the Australian Dollar and its pairs.
Iron Ore is Australia’s largest export, accounting for $118 billion a year according to data from 2021, with China as its primary destination. The price of Iron Ore, therefore, can be a driver of the Australian Dollar. Generally, if the price of Iron Ore rises, AUD also goes up, as aggregate demand for the currency increases. The opposite is the case if the price of Iron Ore falls. Higher Iron Ore prices also tend to result in a greater likelihood of a positive Trade Balance for Australia, which is also positive of the AUD.
The Trade Balance, which is the difference between what a country earns from its exports versus what it pays for its imports, is another factor that can influence the value of the Australian Dollar. If Australia produces highly sought after exports, then its currency will gain in value purely from the surplus demand created from foreign buyers seeking to purchase its exports versus what it spends to purchase imports. Therefore, a positive net Trade Balance strengthens the AUD, with the opposite effect if the Trade Balance is negative.
China’s Consumer Price Index (CPI) rose at an annual pace of 0.6% in August after reporting a 0.5% growth in July. The market consensus was for a 0.7% increase in the reported period.
Chinese CPI inflation came in at 0.4% MoM in August versus July’s 0.5% acceleration, worse than the 0.5% estimate.
China’s Producer Price Index (PPI) declined 1.8% YoY in August, following a 0.8% drop in July. The data came in worse than the market forecast of -1.4%.
Market reaction to China’s inflation data
AUD/USD buyers appear unperturbed by the softer-than-expected Chinese inflation data, adding 0.19% on the day to trade at 0.6785, as of writing.
Australian Dollar FAQs
One of the most significant factors for the Australian Dollar (AUD) is the level of interest rates set by the Reserve Bank of Australia (RBA). Because Australia is a resource-rich country another key driver is the price of its biggest export, Iron Ore. The health of the Chinese economy, its largest trading partner, is a factor, as well as inflation in Australia, its growth rate and Trade Balance. Market sentiment – whether investors are taking on more risky assets (risk-on) or seeking safe-havens (risk-off) – is also a factor, with risk-on positive for AUD.
The Reserve Bank of Australia (RBA) influences the Australian Dollar (AUD) by setting the level of interest rates that Australian banks can lend to each other. This influences the level of interest rates in the economy as a whole. The main goal of the RBA is to maintain a stable inflation rate of 2-3% by adjusting interest rates up or down. Relatively high interest rates compared to other major central banks support the AUD, and the opposite for relatively low. The RBA can also use quantitative easing and tightening to influence credit conditions, with the former AUD-negative and the latter AUD-positive.
China is Australia’s largest trading partner so the health of the Chinese economy is a major influence on the value of the Australian Dollar (AUD). When the Chinese economy is doing well it purchases more raw materials, goods and services from Australia, lifting demand for the AUD, and pushing up its value. The opposite is the case when the Chinese economy is not growing as fast as expected. Positive or negative surprises in Chinese growth data, therefore, often have a direct impact on the Australian Dollar and its pairs.
Iron Ore is Australia’s largest export, accounting for $118 billion a year according to data from 2021, with China as its primary destination. The price of Iron Ore, therefore, can be a driver of the Australian Dollar. Generally, if the price of Iron Ore rises, AUD also goes up, as aggregate demand for the currency increases. The opposite is the case if the price of Iron Ore falls. Higher Iron Ore prices also tend to result in a greater likelihood of a positive Trade Balance for Australia, which is also positive of the AUD.
The Trade Balance, which is the difference between what a country earns from its exports versus what it pays for its imports, is another factor that can influence the value of the Australian Dollar. If Australia produces highly sought after exports, then its currency will gain in value purely from the surplus demand created from foreign buyers seeking to purchase its exports versus what it spends to purchase imports. Therefore, a positive net Trade Balance strengthens the AUD, with the opposite effect if the Trade Balance is negative.
- GBP/USD kicks off the new week on a positive note, though the upside seems limited.
- A weaker risk tone lends support to the safe-haven USD and could act as a headwind.
- Reviving BoE rate cut bets might further contribute to capping the upside for the GBP.
The GBP/USD pair attracts some dip-buying during the Asian session on Monday and climbs back closer to mid-1.3100s in the last hour, though a combination of factors might cap any further gains.
The closely-watched US monthly employment details released on Friday suggested that the labor market momentum is slowing more than expected and added to concerns about the health of the US economy. This, in turn, tempers investors' appetite for riskier assets, which benefits the safe-haven US Dollar (USD) and acts as a headwind for the GBP/USD pair.
Meanwhile, a survey of recruiters showed that Britain's labour market cooled noticeably last month as job placements fell sharply and pay growth slowed. This backs the case for interest rate cuts from the Bank of England (BoE), which might further hold back bulls from placing aggressive bets around the British Pound (GBP) and keep a lid on the GBP/USD pair.
Investors now look forward to the release of the UK monthly jobs data due on Tuesday. In the meantime, the USD price dynamics will continue to play a key role in influencing the GBP/USD pair in the absence of any relevant market-moving economic data, either from the UK or the US on Monday.
Pound Sterling FAQs
The Pound Sterling (GBP) is the oldest currency in the world (886 AD) and the official currency of the United Kingdom. It is the fourth most traded unit for foreign exchange (FX) in the world, accounting for 12% of all transactions, averaging $630 billion a day, according to 2022 data. Its key trading pairs are GBP/USD, aka ‘Cable’, which accounts for 11% of FX, GBP/JPY, or the ‘Dragon’ as it is known by traders (3%), and EUR/GBP (2%). The Pound Sterling is issued by the Bank of England (BoE).
The single most important factor influencing the value of the Pound Sterling is monetary policy decided by the Bank of England. The BoE bases its decisions on whether it has achieved its primary goal of “price stability” – a steady inflation rate of around 2%. Its primary tool for achieving this is the adjustment of interest rates. When inflation is too high, the BoE will try to rein it in by raising interest rates, making it more expensive for people and businesses to access credit. This is generally positive for GBP, as higher interest rates make the UK a more attractive place for global investors to park their money. When inflation falls too low it is a sign economic growth is slowing. In this scenario, the BoE will consider lowering interest rates to cheapen credit so businesses will borrow more to invest in growth-generating projects.
Data releases gauge the health of the economy and can impact the value of the Pound Sterling. Indicators such as GDP, Manufacturing and Services PMIs, and employment can all influence the direction of the GBP. A strong economy is good for Sterling. Not only does it attract more foreign investment but it may encourage the BoE to put up interest rates, which will directly strengthen GBP. Otherwise, if economic data is weak, the Pound Sterling is likely to fall.
Another significant data release for the Pound Sterling is the Trade Balance. This indicator measures the difference between what a country earns from its exports and what it spends on imports over a given period. If a country produces highly sought-after exports, its currency will benefit purely from the extra demand created from foreign buyers seeking to purchase these goods. Therefore, a positive net Trade Balance strengthens a currency and vice versa for a negative balance.
Japan’s Chief Cabinet Secretary Yoshimasa Hayashi said on Monday that the “monetary policy should be considered, judged by the Bank of Japan (BoJ)” when asked about market expectations of further rate hikes by the BoJ.
Additional comments
I remember BoJ Governor Ueda has already said, with some conditions, BoJ is ready to go in that direction.
If economic situation requires stimulus, I would prefer increasing expenditure, payouts rather than tax reduction.
Market reaction
At press time, USD/JPY is trading 0.29% higher on the day, consolidating the upswing at around 142.70.
On Monday, the People’s Bank of China (PBOC) set the USD/CNY central rate for the trading session ahead at 7.0989, as against Friday's fix of 7.0925 and 7.0951 Reuters estimates.
- EUR/USD may face challenges as recent Eurozone inflation data have strengthened the likelihood of an ECB rate cut.
- Friday’s US economic data raised uncertainty over the likelihood of an aggressive Fed rate cut in September.
- Chicago Fed President Goolsbee stated that Fed officials are starting to align with the broader market's sentiment of rate adjustment.
EUR/USD attempts to recoup losses from the previous session, trading near 1.1090 during Monday's Asian session. However, the EUR/USD pair's upside may be capped, as recent eurozone inflation data have solidified expectations of a rate cut by the European Central Bank (ECB) at upcoming Thursday's policy meeting.
With headline inflation nearing 2% and long-term inflation forecasts holding steady around the same level, the ECB has sufficient justification to further ease its monetary policy stance. Additionally, last week's mixed Gross Domestic Product (GDP) data from the Eurozone has reinforced expectations of a potential rate cut by the ECB.
On Friday, US economic data raised uncertainty over the likelihood of an aggressive interest rate cut by the Federal Reserve (Fed) at its September meeting. The US Bureau of Labor Statistics (BLS) reported that Nonfarm Payrolls (NFP) added 142,000 jobs in August, below the forecast of 160,000 but an improvement from July’s downwardly revised figure of 89,000. Meanwhile, the Unemployment Rate fell to 4.2%, as expected, down from 4.3% in the previous month.
According to the CME FedWatch Tool, markets are fully anticipating at least a 25 basis point (bps) rate cut by the Federal Reserve at its September meeting. The likelihood of a 50 bps rate cut has slightly decreased to 29.0%, down from 30.0% a week ago.
Federal Reserve (Fed) Bank of Chicago President Austan Goolsbee remarked on Friday that Fed officials are starting to align with the broader market's sentiment that a policy rate adjustment by the US central bank is imminent, according to CNBC. FXStreet’s FedTracker, which uses a custom AI model to evaluate Fed officials' speeches on a dovish-to-hawkish scale from 0 to 10, rated Goolsbee's comments as dovish, assigning them a score of 3.2.
ECB FAQs
The European Central Bank (ECB) in Frankfurt, Germany, is the reserve bank for the Eurozone. The ECB sets interest rates and manages monetary policy for the region. The ECB primary mandate is to maintain price stability, which means keeping inflation at around 2%. Its primary tool for achieving this is by raising or lowering interest rates. Relatively high interest rates will usually result in a stronger Euro and vice versa. The ECB Governing Council makes monetary policy decisions at meetings held eight times a year. Decisions are made by heads of the Eurozone national banks and six permanent members, including the President of the ECB, Christine Lagarde.
In extreme situations, the European Central Bank can enact a policy tool called Quantitative Easing. QE is the process by which the ECB prints Euros and uses them to buy assets – usually government or corporate bonds – from banks and other financial institutions. QE usually results in a weaker Euro. QE is a last resort when simply lowering interest rates is unlikely to achieve the objective of price stability. The ECB used it during the Great Financial Crisis in 2009-11, in 2015 when inflation remained stubbornly low, as well as during the covid pandemic.
Quantitative tightening (QT) is the reverse of QE. It is undertaken after QE when an economic recovery is underway and inflation starts rising. Whilst in QE the European Central Bank (ECB) purchases government and corporate bonds from financial institutions to provide them with liquidity, in QT the ECB stops buying more bonds, and stops reinvesting the principal maturing on the bonds it already holds. It is usually positive (or bullish) for the Euro.
| Index | Change, points | Closed | Change, % |
|---|---|---|---|
| NIKKEI 225 | -265.62 | 36391.47 | -0.72 |
| KOSPI | -31.22 | 2544.28 | -1.21 |
| ASX 200 | 31 | 8013.4 | 0.39 |
| DAX | -274.6 | 18301.9 | -1.48 |
| CAC 40 | -79.66 | 7352.3 | -1.07 |
| Dow Jones | -410.34 | 40345.41 | -1.01 |
| S&P 500 | -94.99 | 5408.42 | -1.73 |
| NASDAQ Composite | -436.83 | 16690.83 | -2.55 |
| Pare | Closed | Change, % |
|---|---|---|
| AUDUSD | 0.66679 | -1.07 |
| EURJPY | 157.757 | -0.96 |
| EURUSD | 1.10848 | -0.22 |
| GBPJPY | 186.849 | -1.09 |
| GBPUSD | 1.31297 | -0.36 |
| NZDUSD | 0.61727 | -0.81 |
| USDCAD | 1.35704 | 0.5 |
| USDCHF | 0.84312 | -0.11 |
| USDJPY | 142.307 | -0.74 |


© 2000-2025. Уcі права захищені.
Cайт знаходитьcя під керуванням TeleTrade DJ. LLC 2351 LLC 2022 (Euro House, Richmond Hill Road, Kingstown, VC0100, St. Vincent and the Grenadines).
Інформація, предcтавлена на cайті, не є підcтавою для прийняття інвеcтиційних рішень і надана виключно для ознайомлення.
Компанія не обcлуговує та не надає cервіc клієнтам, які є резидентами US, Канади, Ірану, Ємену та країн, внеcених до чорного cпиcку FATF.
Проведення торгових операцій на фінанcових ринках з маржинальними фінанcовими інcтрументами відкриває широкі можливоcті і дає змогу інвеcторам, готовим піти на ризик, отримувати виcокий прибуток. Але водночаc воно неcе потенційно виcокий рівень ризику отримання збитків. Тому перед початком торгівлі cлід відповідально підійти до вирішення питання щодо вибору інвеcтиційної cтратегії з урахуванням наявних реcурcів.
Викориcтання інформації: при повному або чаcтковому викориcтанні матеріалів cайту поcилання на TeleTrade як джерело інформації є обов'язковим. Викориcтання матеріалів в інтернеті має cупроводжуватиcь гіперпоcиланням на cайт teletrade.org. Автоматичний імпорт матеріалів та інформації із cайту заборонено.
З уcіх питань звертайтеcь за адреcою pr@teletrade.global.
переклади