- Аналітика
- Новини та інструменти
- Новини ринків
Новини ринків
- The AUD/JPY pair declined to 96.45 on Friday resuming the losses after three sessions with gains.
- However, technical indicators suggest a shift towards neutral territory, with the RSI moving out of the oversold zone and the MACD showing decreasing red bars.
- The cross will close a weekly gain of nearly 1% despite the losses.
In Friday's session, the AUD/JPY pair declined by 0.65% to 96.45, extending its recent downward trajectory. Despite this move lower, technical indicators are showing signs of a potential shift in market sentiment.
The Relative Strength Index (RSI) has moved out of the oversold territory below 30 and is currently hovering around 33. This suggests that the AUD/JPY is no longer considered oversold and is moving towards neutral ground. The Moving Average Convergence Divergence (MACD) is also showing decreasing red bars, indicating that the bearish momentum may be waning.
AUD/JPY daily chart
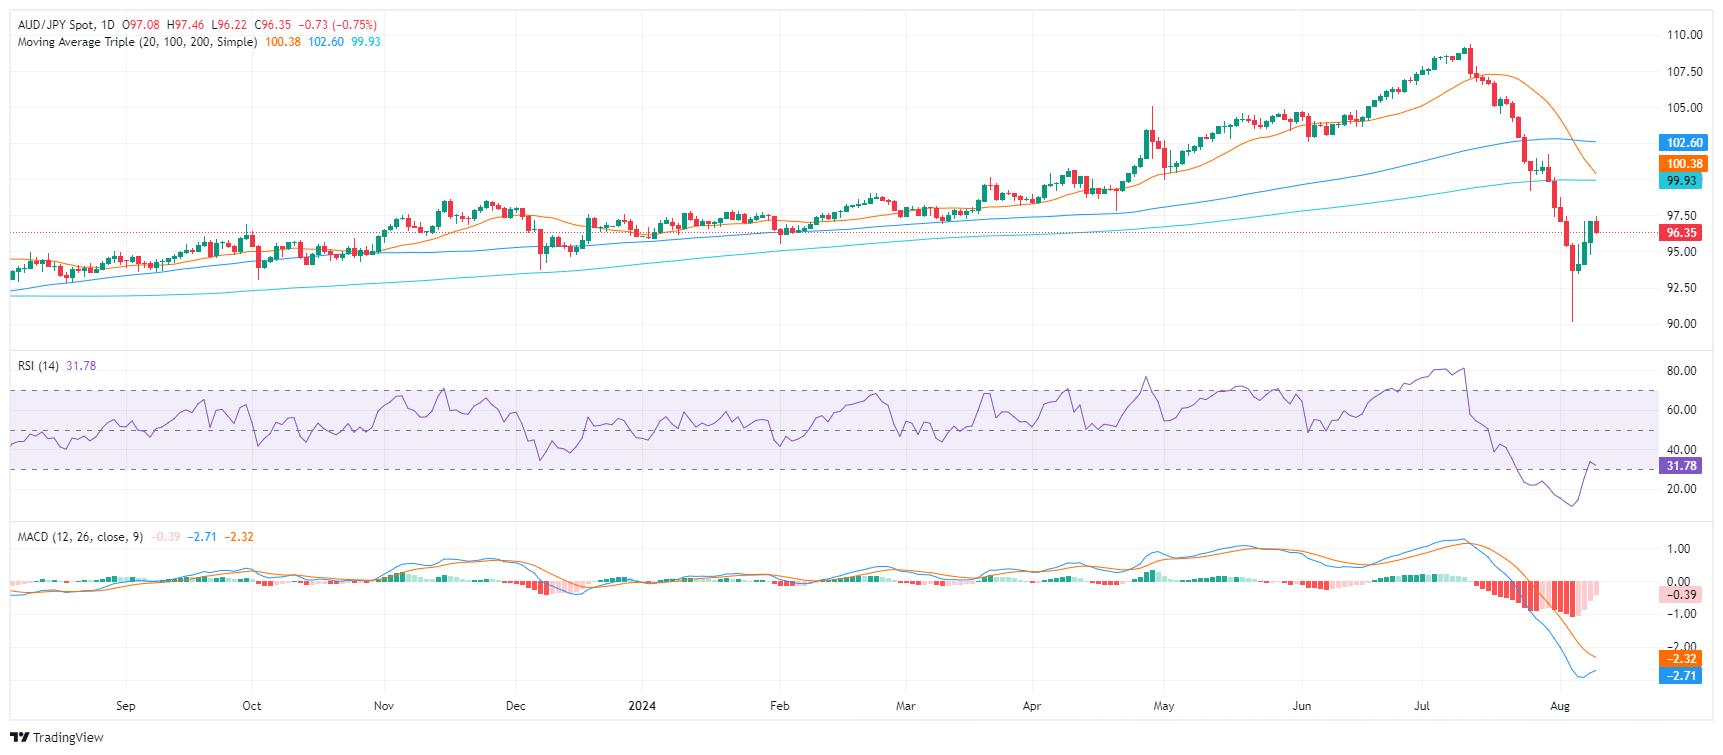
Based on these technical observations, it is possible that the AUD/JPY pair is entering a consolidation phase. The pair may continue to trade within a range, with limited downside potential due to the increasing support at 96.00 and 95.00. On the upside, resistance at 97.00, 98.00, and 100.00 could limit any significant upward movement.
- EUR/USD wrapped up the trading week nearly where it started.
- Market balance has broadly recovered as wait to Fed cuts resumes.
- Coming up next week: EU GDP & US CPI inflation.
EUR/USD finished off a sedate trading week close to where it began, trading within a tight range of slightly more than 1%. Fiber tried to spark a fresh bid back above the 1.1000 handle on Monday, but price spent the rest of the week easing back into familiar technical levels.
Forecasting the Coming Week: US CPI and Fed’s easing should rule the sentiment
Market focus remains squarely on the odds of a September rate cut. Rate markets have fully priced in the start of a rate cutting cycle when the Federal Open Market Committee (FOMC) meets on September 18, but bets of an initial double cut for 50 basis points have eased to slightly-better-than-even from nearly 70% earlier this week. According to the CME’s FedWatch Tool, rate traders are pricing in 53.5% odds of a 50 bps cut in September, with an additional two cuts worth 25 basis points apiece through the remainder of 2024.
Coming up next week, investors will get a fresh batch of inflation data to worry about, with US Producer Price Index (PPI) and Consumer Price Index (CPI) inflation on the cards for Tuesday and Wednesday, respectively. US Retail Sales and another update from the University of Michigan’s Consumer Sentiment Survey Index are also due later next week. Core PPI inflation and headline CPI inflation are both still stuck around 3% YoY, and investors will be hoping for a continued easing in the prints to keep the Fed on the rails toward rate cuts.
Preliminary pan-EU Gross Domestic Product (GDP) growth figures are due next week at the Wednesday hump. Median market forecasts are expecting EU growth to hold steady at current levels, with forecasts matching the previous prints of 0.3% and 0.6% on the QoQ and YoY timeframes, respectively.
Euro PRICE This week
The table below shows the percentage change of Euro (EUR) against listed major currencies this week. Euro was the strongest against the Swiss Franc.
| USD | EUR | GBP | JPY | CAD | AUD | NZD | CHF | |
|---|---|---|---|---|---|---|---|---|
| USD | -0.03% | 0.34% | 0.01% | -1.01% | -0.96% | -0.77% | 0.82% | |
| EUR | 0.03% | 0.32% | -0.08% | -1.11% | -0.87% | -0.82% | 0.75% | |
| GBP | -0.34% | -0.32% | -0.34% | -1.37% | -1.17% | -1.12% | 0.42% | |
| JPY | -0.01% | 0.08% | 0.34% | -0.99% | -0.96% | -0.82% | 0.82% | |
| CAD | 1.01% | 1.11% | 1.37% | 0.99% | 0.10% | 0.24% | 1.68% | |
| AUD | 0.96% | 0.87% | 1.17% | 0.96% | -0.10% | 0.04% | 1.60% | |
| NZD | 0.77% | 0.82% | 1.12% | 0.82% | -0.24% | -0.04% | 1.56% | |
| CHF | -0.82% | -0.75% | -0.42% | -0.82% | -1.68% | -1.60% | -1.56% |
The heat map shows percentage changes of major currencies against each other. The base currency is picked from the left column, while the quote currency is picked from the top row. For example, if you pick the Euro from the left column and move along the horizontal line to the US Dollar, the percentage change displayed in the box will represent EUR (base)/USD (quote).
EUR/USD price forecast
Fiber continues to trade on the high side of a rough descending channel that has weighed on EUR/USD for the duration of 2024. The pair is holding just outside of recent technical ceiling barriers, but bullish momentum remains crimped below 1.1000.
A rising pattern of higher lows is solidifying on daily candlesticks, but EUR/USD is still poised for another dip back into the 200-day Exponential Moving Average (EMA) near 1.0800 if bidders don’t return to the fold and get EUR/USD bolstered into fresh near-term highs.
EUR/USD daily chart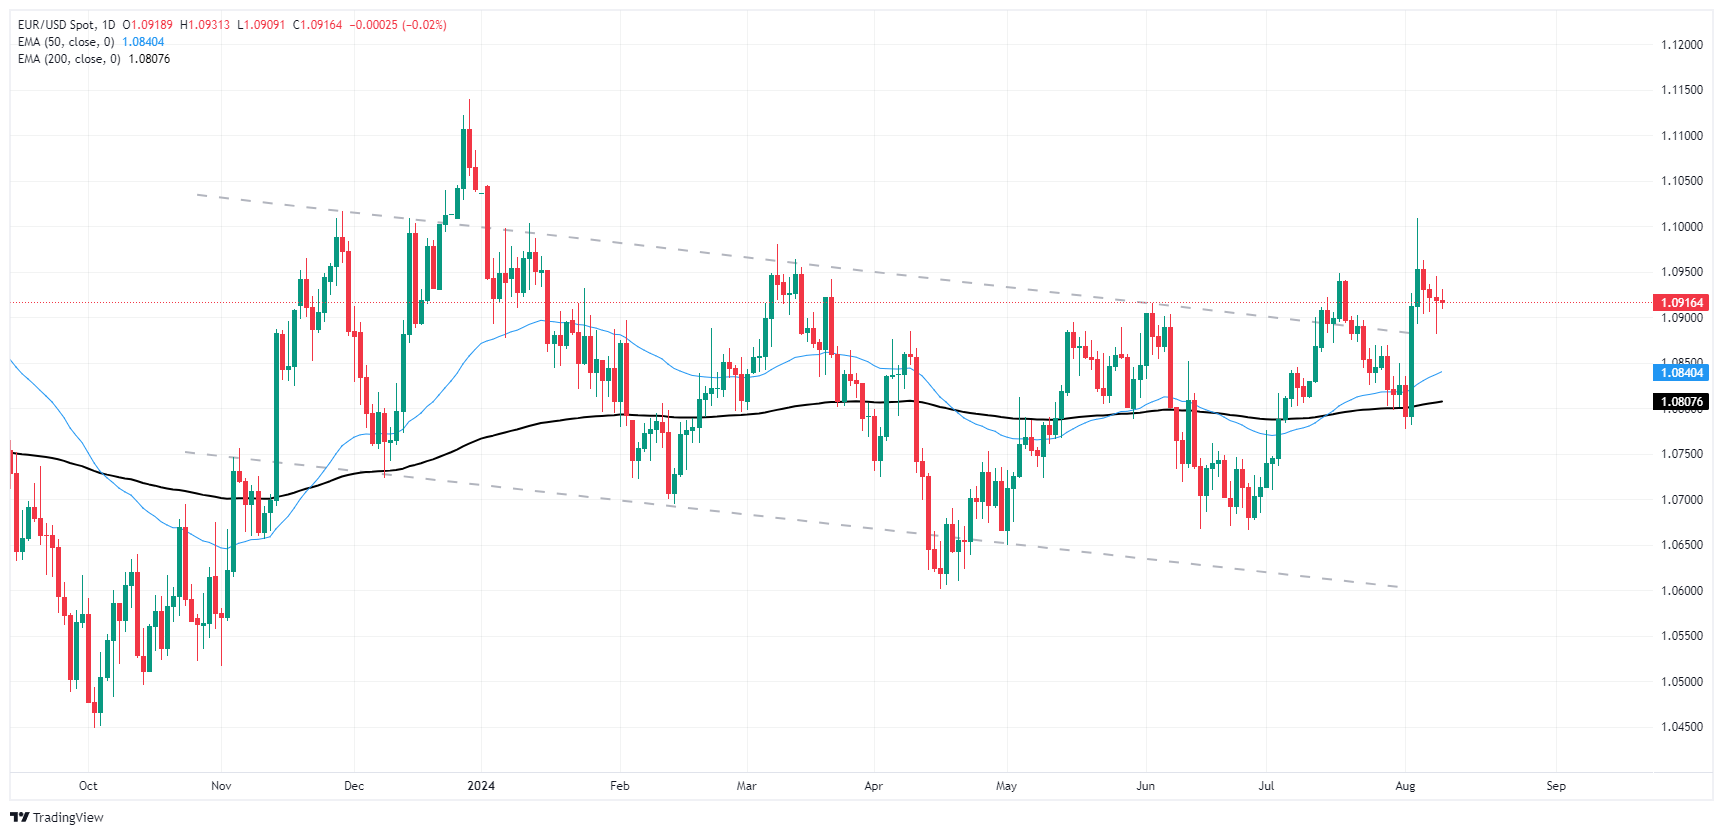
Euro FAQs
The Euro is the currency for the 20 European Union countries that belong to the Eurozone. It is the second most heavily traded currency in the world behind the US Dollar. In 2022, it accounted for 31% of all foreign exchange transactions, with an average daily turnover of over $2.2 trillion a day. EUR/USD is the most heavily traded currency pair in the world, accounting for an estimated 30% off all transactions, followed by EUR/JPY (4%), EUR/GBP (3%) and EUR/AUD (2%).
The European Central Bank (ECB) in Frankfurt, Germany, is the reserve bank for the Eurozone. The ECB sets interest rates and manages monetary policy. The ECB’s primary mandate is to maintain price stability, which means either controlling inflation or stimulating growth. Its primary tool is the raising or lowering of interest rates. Relatively high interest rates – or the expectation of higher rates – will usually benefit the Euro and vice versa. The ECB Governing Council makes monetary policy decisions at meetings held eight times a year. Decisions are made by heads of the Eurozone national banks and six permanent members, including the President of the ECB, Christine Lagarde.
Eurozone inflation data, measured by the Harmonized Index of Consumer Prices (HICP), is an important econometric for the Euro. If inflation rises more than expected, especially if above the ECB’s 2% target, it obliges the ECB to raise interest rates to bring it back under control. Relatively high interest rates compared to its counterparts will usually benefit the Euro, as it makes the region more attractive as a place for global investors to park their money.
Data releases gauge the health of the economy and can impact on the Euro. Indicators such as GDP, Manufacturing and Services PMIs, employment, and consumer sentiment surveys can all influence the direction of the single currency. A strong economy is good for the Euro. Not only does it attract more foreign investment but it may encourage the ECB to put up interest rates, which will directly strengthen the Euro. Otherwise, if economic data is weak, the Euro is likely to fall. Economic data for the four largest economies in the euro area (Germany, France, Italy and Spain) are especially significant, as they account for 75% of the Eurozone’s economy.
Another significant data release for the Euro is the Trade Balance. This indicator measures the difference between what a country earns from its exports and what it spends on imports over a given period. If a country produces highly sought after exports then its currency will gain in value purely from the extra demand created from foreign buyers seeking to purchase these goods. Therefore, a positive net Trade Balance strengthens a currency and vice versa for a negative balance.
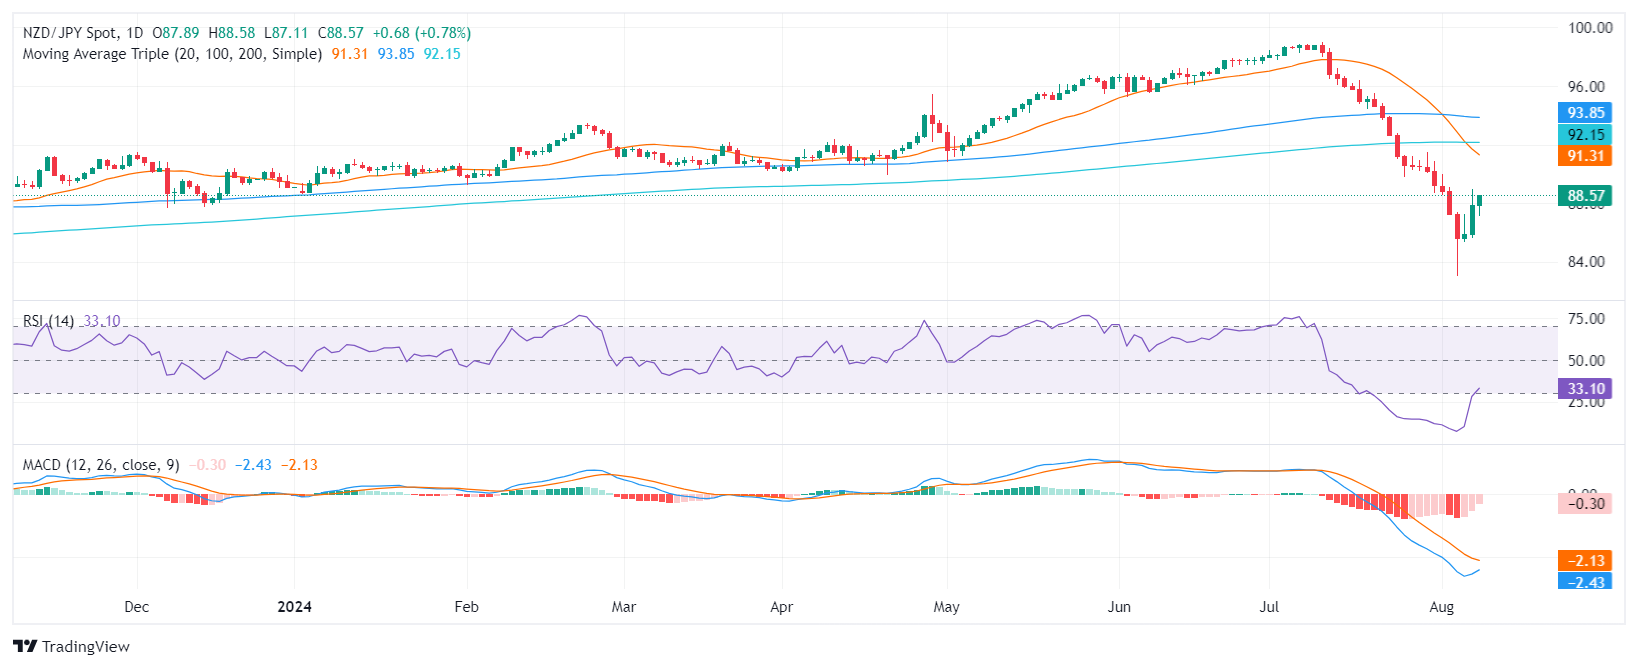
- NZD/JPY moves sideways after a three-day winning streak, and mixed technical signals emerge.
- The RSI remains near the oversold area despite rising, and the MACD prints decreasing red bars.
- Shrinking volume suggests that the selling pressure is waning, indicating a potential reversal.
The NZD/JPY currency pair remained in a consolidation pattern on Friday, hovering around the 88.000 level. While the pair has experienced a three-day winning streak, technical indicators present contrasting signals, and the pair is set to side-ways trade.
From a technical standpoint, the Relative Strength Index (RSI) indicator is currently at 30, indicating that the pair is still in the oversold area. This suggests that there could be further room for recovery. The Moving Average Convergence Divergence (MACD) indicator, on the other hand, is showing decreasing red bars, which could signal a stagnation of the selling pressure. Trading volume has decreased in recent sessions, which could indicate that selling pressure is easing. This is a positive sign for the bulls, as it suggests that they may be gaining some momentum.
The bulls are attempting to push the pair higher towards the 88.50 resistance level and if they succeed in breaking above this level, it could open the door to further gains toward the 89.00 area. However, if the bears regain control and push the pair below the 88.00 level, it could lead to a deeper correction towards the 87.50-87.00 support zone.
NZD/JPY Daily chart
- GBP/USD chalked in a fourth consecutive down week.
- Despite early losses, Cable clawed back some ground late in the week.
- Coming up next week: UK and US CPI inflation updates.
GBP/USD wrapped up a fourth straight week in the red, closing lower around four-tenths of one percent despite a late-week recovery from lows below the 1.2700 handle. A thin showing on the economic calendar from the UK side gave GBP traders a breather after the Bank of England (BoE) sparked a broad-market pummeling of the Pound Sterling. Market flows have since rebalanced, and investors have now pivoted towards next week’s upcoming Consumer Price Index (CPI) inflation prints due from both sides of the Atlantic.
Forecasting the Coming Week: US CPI and Fed’s easing should rule the sentiment
The focus in the market is on the likelihood of a rate cut by the Federal Reserve in September. Rate markets have fully factored in the beginning of a cycle of rate cuts when the Federal Open Market Committee (FOMC) meets on September 18. However, expectations for an initial double cut of 50 basis points have slightly diminished from nearly 70% earlier this week. According to the CME’s FedWatch Tool, rate traders are estimating a 53.5% chance of a 50 bps cut in September, with two additional cuts of 25 basis points each projected for the remainder of 2024.
Next week, investors will receive fresh inflation data to consider, with US Producer Price Index (PPI) and Consumer Price Index (CPI) inflation scheduled for Tuesday and Wednesday, respectively. US Retail Sales and an update from the University of Michigan’s Consumer Sentiment Survey Index are also expected later next week. Both core PPI inflation and headline CPI inflation are currently around 3% year over year, and investors will be looking for further easing in headline figures to support the case for rate cuts by the Fed.
UK CPI inflation is expected to tick up to 2.3% YoY in July from the previous 2.0%, while core CPI inflation figures are forecast to tick down to 3.4% from 3.5%. Gross Domestic Product (GDP) growth numbers from the UK are also expected later next week, and Q2 UK GDP is expected to ease to 0.6% from the previous 0.7%.
GBP/USD price forecast
Cable continues to tease a bearish fall back into the 200-day Exponential Moving Average (EMA) at 1.2649, but bidders have thus far stepped up to keep bids from falling any closer toward the 1.2600 handle. However, bullish momentum has evaporated as GBP/USD remains down over 2% from 12-month peaks just above 1.3000 set in July.
GBP/USD daily chart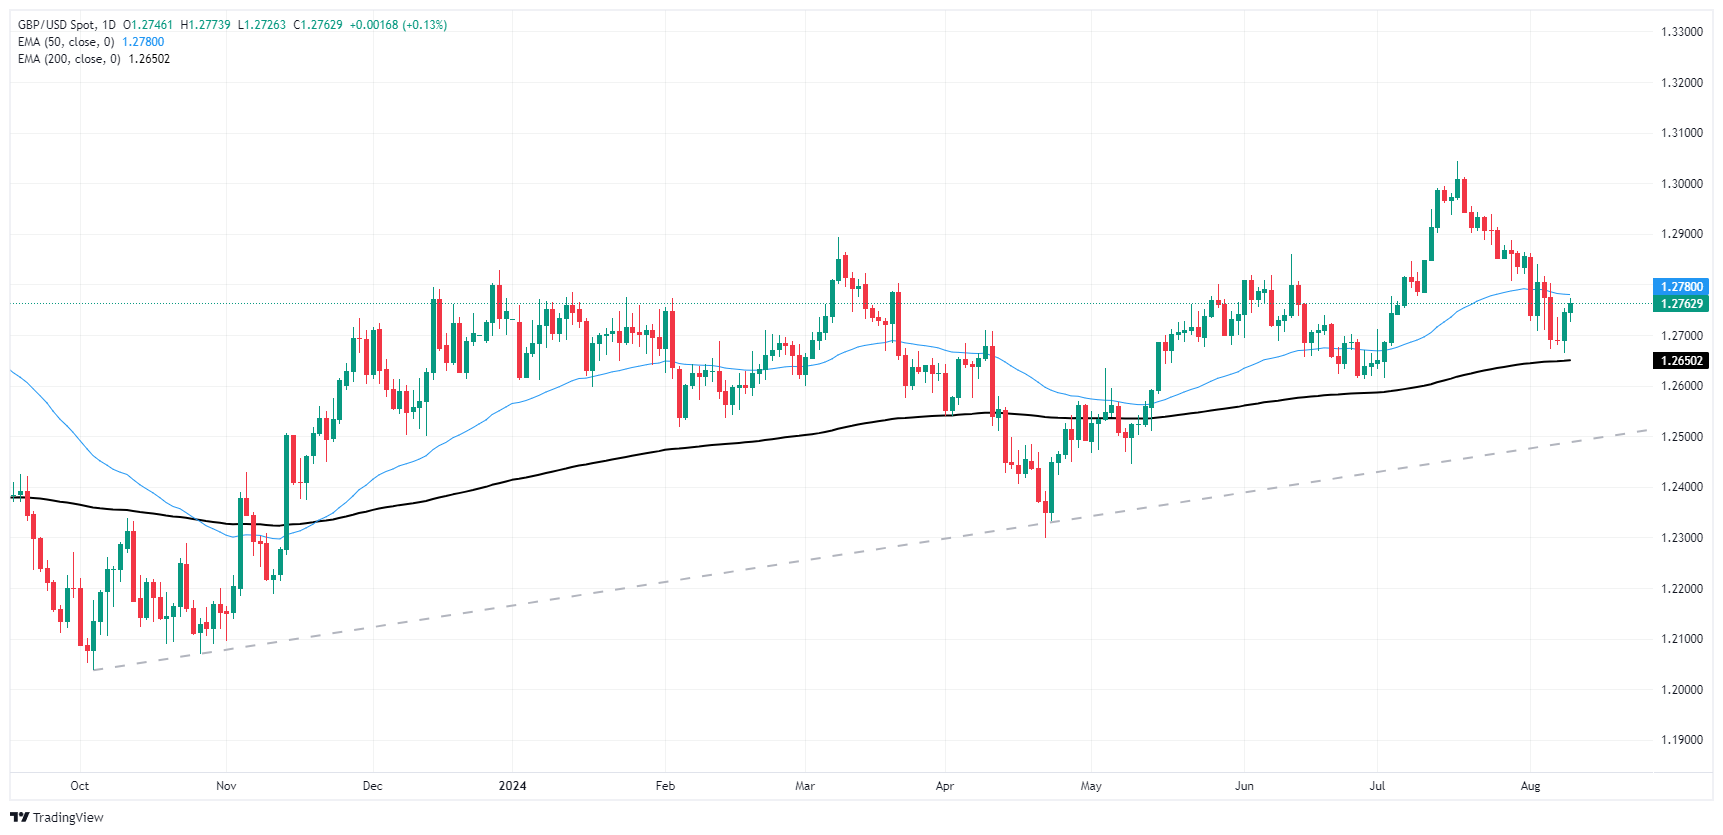
Pound Sterling FAQs
The Pound Sterling (GBP) is the oldest currency in the world (886 AD) and the official currency of the United Kingdom. It is the fourth most traded unit for foreign exchange (FX) in the world, accounting for 12% of all transactions, averaging $630 billion a day, according to 2022 data. Its key trading pairs are GBP/USD, aka ‘Cable’, which accounts for 11% of FX, GBP/JPY, or the ‘Dragon’ as it is known by traders (3%), and EUR/GBP (2%). The Pound Sterling is issued by the Bank of England (BoE).
The single most important factor influencing the value of the Pound Sterling is monetary policy decided by the Bank of England. The BoE bases its decisions on whether it has achieved its primary goal of “price stability” – a steady inflation rate of around 2%. Its primary tool for achieving this is the adjustment of interest rates. When inflation is too high, the BoE will try to rein it in by raising interest rates, making it more expensive for people and businesses to access credit. This is generally positive for GBP, as higher interest rates make the UK a more attractive place for global investors to park their money. When inflation falls too low it is a sign economic growth is slowing. In this scenario, the BoE will consider lowering interest rates to cheapen credit so businesses will borrow more to invest in growth-generating projects.
Data releases gauge the health of the economy and can impact the value of the Pound Sterling. Indicators such as GDP, Manufacturing and Services PMIs, and employment can all influence the direction of the GBP. A strong economy is good for Sterling. Not only does it attract more foreign investment but it may encourage the BoE to put up interest rates, which will directly strengthen GBP. Otherwise, if economic data is weak, the Pound Sterling is likely to fall.
Another significant data release for the Pound Sterling is the Trade Balance. This indicator measures the difference between what a country earns from its exports and what it spends on imports over a given period. If a country produces highly sought-after exports, its currency will benefit purely from the extra demand created from foreign buyers seeking to purchase these goods. Therefore, a positive net Trade Balance strengthens a currency and vice versa for a negative balance.
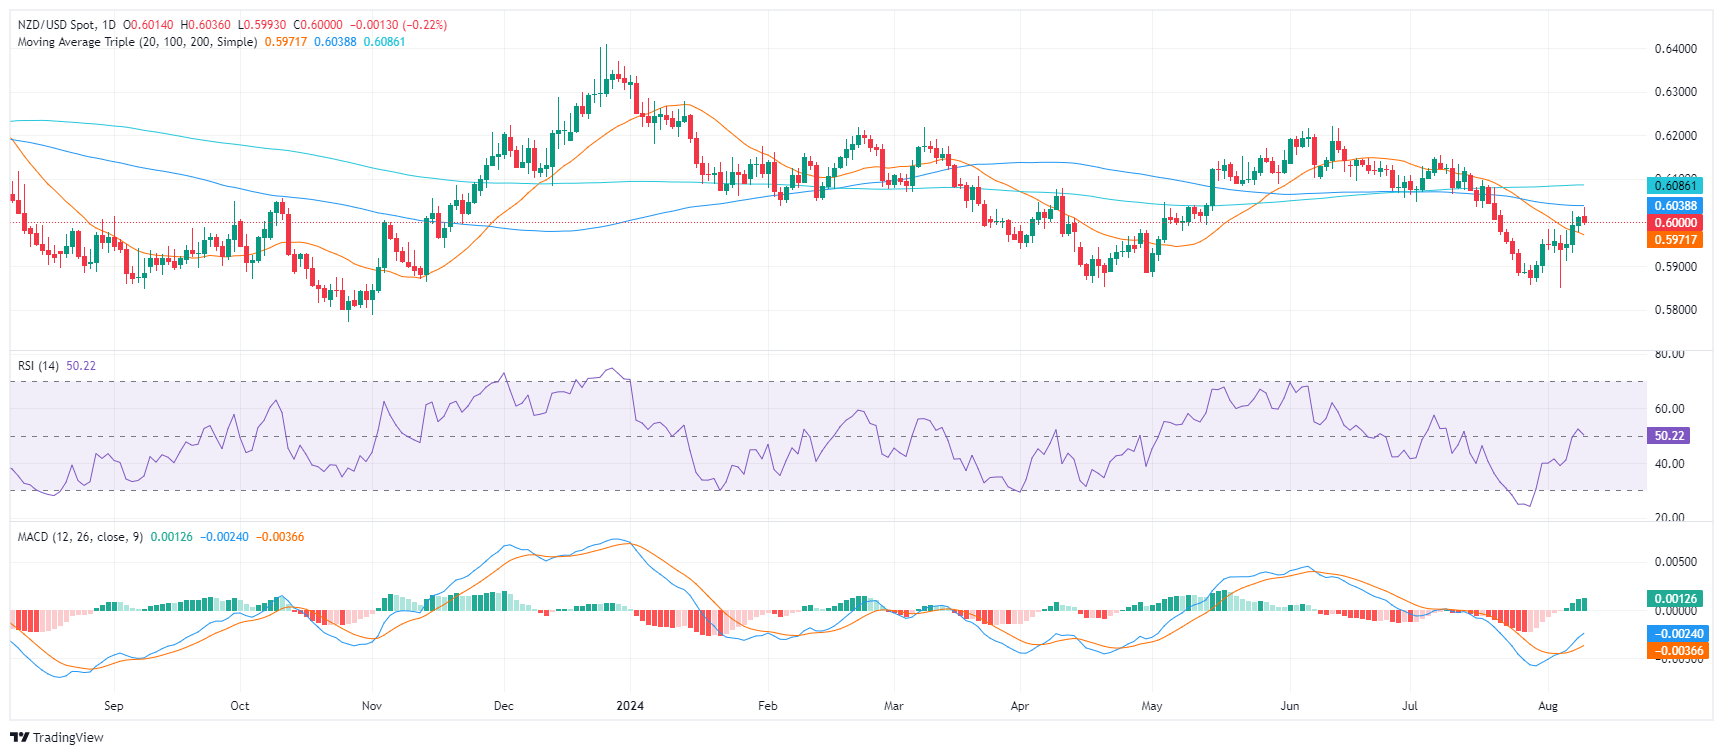
- NZD/USD bulls struggle above 0.6000, bears eye 0.5950.
- RSI neutralizes at 54, MACD flattens.
- The pair will tally a 0.80% weekly gain.
In Friday's session, the NZD/USD pair declined mildly to 0.6010, marking the seventh consecutive day within a narrow range. The technical readings suggest that the pair remains in a consolidative phase, with bulls struggling to push above 0.6000 and bears keeping the downside limited.
The Relative Strength Index (RSI) has neutralized at 51, indicating a balance between buyers and sellers. The Moving Average Convergence Divergence (MACD) has flattened, showing a lack of clear directional bias. However, the histogram remains positive and the green bars, hint at steady buying traction.
The NZD/USD pair is facing immediate resistance at 0.6000 and support at 0.5950. A break above 0.6000 could open the door for a rally towards 0.6040 (100-day Simple Moving Average (SMA)) and then towards 0.6150, while a break below 0.5970 (20-day SMA) could lead to a deeper pullback towards 0.5900.
NZD/USD Daily chart
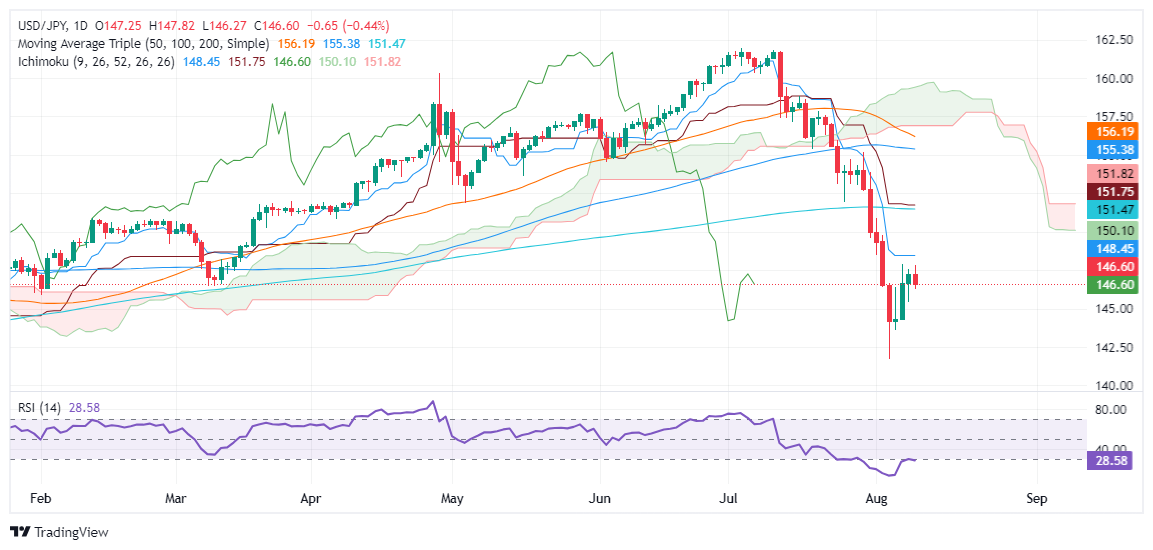
- USD/JPY falls after failing to clear 148.00 resistance, resuming its downtrend below 147.00.
- Bearish momentum strengthens; RSI near oversold, signaling potential for further declines.
- Below 146.00, key support levels include 145.44, 144.28, and 143.61; above 147.00, resistance targets are 147.89 and 148.45.
The USD/JPY retreats after failing to surpass the 148.00 resistance and extends its losses below the 147.00 mark, snapping three days of gains. At the time of writing, the major trades at 146.58, diving 0.48%.
USD/JPY Price Forecast: Technical outlook
On Thursday I wrote, “the USD/JPY is bearishly biased despite registering a recovery that saw the pair rally from under 144.00 to the current exchange rate after dovish comments by a Bank of Japan Deputy Governor.”
Once risk appetite returned, the USD/JPY resumed its downtrend. Buyers failed to clear the weekly high of 147.89, which exacerbated the pair’s fall beneath 147.00.
Momentum is bearish, although the Relative Strength Index (RSI) hovers near oversold condition.
If USD/JPY drops below the 146.00 mark, sellers will undoubtedly challenge the August 8 low of 145.44, followed by the August 7 bottom at 144.28. Once those levels are surpassed, the next support would be the August 6 daily low at 143.61, followed by the latest cycle low of 141.69.
On the other hand, If the pair climbs past 147.00, the next resistance will be the weekly top at 147.89 before challenging 148.00. Up next would be the Tenkan-Sen at 148.45.
USD/JPY Price Action – Daily Chart
Japanese Yen FAQs
The Japanese Yen (JPY) is one of the world’s most traded currencies. Its value is broadly determined by the performance of the Japanese economy, but more specifically by the Bank of Japan’s policy, the differential between Japanese and US bond yields, or risk sentiment among traders, among other factors.
One of the Bank of Japan’s mandates is currency control, so its moves are key for the Yen. The BoJ has directly intervened in currency markets sometimes, generally to lower the value of the Yen, although it refrains from doing it often due to political concerns of its main trading partners. The current BoJ ultra-loose monetary policy, based on massive stimulus to the economy, has caused the Yen to depreciate against its main currency peers. This process has exacerbated more recently due to an increasing policy divergence between the Bank of Japan and other main central banks, which have opted to increase interest rates sharply to fight decades-high levels of inflation.
The BoJ’s stance of sticking to ultra-loose monetary policy has led to a widening policy divergence with other central banks, particularly with the US Federal Reserve. This supports a widening of the differential between the 10-year US and Japanese bonds, which favors the US Dollar against the Japanese Yen.
The Japanese Yen is often seen as a safe-haven investment. This means that in times of market stress, investors are more likely to put their money in the Japanese currency due to its supposed reliability and stability. Turbulent times are likely to strengthen the Yen’s value against other currencies seen as more risky to invest in.
- Gold advances for the second day on Friday, buoyed by expectations of Fed easing in September.
- US economic data shows deceleration but not enough to stoke recession fears.
- Ongoing Middle East tensions between Israel, Lebanon and Iran keep Gold demand firm.
Gold prices advanced modestly for the second straight day as market participants remain convinced the Federal Reserve (Fed) could begin to ease policy at the upcoming September meeting. This and heightened tensions between Israel, Lebanon and Iran keep bullion bid ahead of the weekend. The XAU/USD trades at $2,432, up by 0.22%.
The latest tranche of economic data from the United States (US) showed the economy is indeed decelerating, but not to reignite fears of a recession. Fears after dismal ISM Manufacturing PMI and July Nonfarm Payrolls (NFP) figures began to dissipate as reflected by US equities printing decent gains late in the New York session.
On Thursday, US Initial Jobless Claims for the week ending August 3 were lower than expected, hinting the jobs market still remains solid despite cooling moderately.
Gold prices remain firm due to the drop in US Treasury bond yields and the Greenback. The US 10-year benchmark note rate is down almost five basis points to 3.944%, while the US Dollar Index (DXY), which measures the buck’s performance against other currencies, falls 0.10% to 103.13.
Analysts at ING suggest that Bullion would remain bullish in the near term. They wrote, “Looking ahead, we believe [G]old should regain its footing once again, amid the ongoing geopolitical uncertainties and expectations of interest rate cuts from the US Fed.”
Tensions in the Middle East would keep XAU/USD bid, with headlines hinting at an escalation of the conflict. Reporting suggests that Israeli defense officials said the army is coordinating with the Pentagon to prepare scenarios to respond to Iran and Hezbollah.
Meanwhile, traders are bracing for next week's data. The US economic docket will be busy, with traders focused on inflation data on the producer and consumer side, retail sales, building permits and consumer sentiment.
Daily digest market movers: Gold edges up despite China’s lack of buying
- July’s Producer Price Index is expected to drop from 0.2% to 0.1% MoM.
- The Consumer Price Index (CPI) is foreseen ticking lower from 3% YoY to 2.9%; core CPI is expected to continue its downtrend from 3.3% to 3.2% YoY.
- Economists expect a jump in US Retail Sales from 0% to 0.3% MoM.
- The golden metal price gathered traction despite reports that China’s central bank restrained itself from purchasing Gold for the third consecutive month.
- The CME FedWatch Tool shows the odds of a 50-basis-point interest rate cut by the Fed at the September meeting at 52.5%, down from 57.5% a day ago.
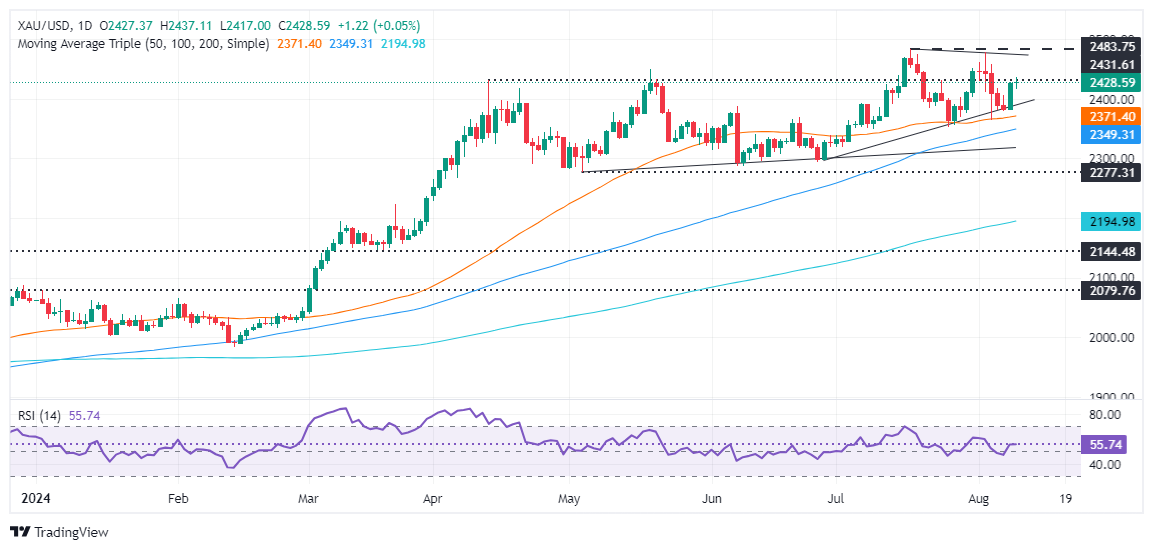
Technical analysis: Gold price consolidates around $2,430
Gold’s uptrend continues, though it faces stirring resistance near $2,430, with buyers unable to clear that area ahead of the psychological $2,450 level mark. The Relative Strength Index (RSI) shows buyers are gathering momentum, meaning higher prices are on the cards.
If buyers push prices above $2,450, the next stop would be the August 2 high at $2,477, ahead of testing the all-time high at $2,483. On further strength, the $2,500 figure is up for grabs.
Conversely, XAU/USD dropping below the 50-day Simple Moving Average (SMA) at $2,370 could intensify the decline, leading to the 100-day SMA at $2,349, followed by a support trendline around $2,320. If this level is breached, the next support would come at $2,300.
Gold FAQs
Gold has played a key role in human’s history as it has been widely used as a store of value and medium of exchange. Currently, apart from its shine and usage for jewelry, the precious metal is widely seen as a safe-haven asset, meaning that it is considered a good investment during turbulent times. Gold is also widely seen as a hedge against inflation and against depreciating currencies as it doesn’t rely on any specific issuer or government.
Central banks are the biggest Gold holders. In their aim to support their currencies in turbulent times, central banks tend to diversify their reserves and buy Gold to improve the perceived strength of the economy and the currency. High Gold reserves can be a source of trust for a country’s solvency. Central banks added 1,136 tonnes of Gold worth around $70 billion to their reserves in 2022, according to data from the World Gold Council. This is the highest yearly purchase since records began. Central banks from emerging economies such as China, India and Turkey are quickly increasing their Gold reserves.
Gold has an inverse correlation with the US Dollar and US Treasuries, which are both major reserve and safe-haven assets. When the Dollar depreciates, Gold tends to rise, enabling investors and central banks to diversify their assets in turbulent times. Gold is also inversely correlated with risk assets. A rally in the stock market tends to weaken Gold price, while sell-offs in riskier markets tend to favor the precious metal.
The price can move due to a wide range of factors. Geopolitical instability or fears of a deep recession can quickly make Gold price escalate due to its safe-haven status. As a yield-less asset, Gold tends to rise with lower interest rates, while higher cost of money usually weighs down on the yellow metal. Still, most moves depend on how the US Dollar (USD) behaves as the asset is priced in dollars (XAU/USD). A strong Dollar tends to keep the price of Gold controlled, whereas a weaker Dollar is likely to push Gold prices up.
- AUD/USD slightly retreats, settling near 0.6575 on Friday.
- RBA reiterates its hawkish stance, contributing to a buoyant AUD.
- Investors digest Chinese inflation reported during the European session.
The AUD/USD pair witnessed a minor setback at 0.6575 during Friday's session, a modest descent of 0.30%. That being said, the Reserve Bank of Australia's (RBA) unwavering hawkish discourse and stronger Chinese inflation figures might limit the downside for the Aussie.
Given the complex Australian economic prospect and the RBA’s hawkish inclination due to elevated inflation, markets persistently price just a 25 bps easing in 2024.
Daily digest market movers: RBA's resolute hawkish tone and robust Chinese inflation data might favor the AUD
- The Reserve Bank of Australia maintained the rates, echoing that "the board is not dismissing any possibility". Notably, the Bank highlighted the importance of remaining alert toward conceivable inflation risks, implying no hastened policy reversals.
- On Thursday, RBA Governor Michele Bullock reiterated the reduced requirement for rate cuts, adopting a hawkish tone and asserting that the board "will not hesitate to lift rates if it needs to" to challenge sustained inflation.
- On the data front, emphasizing Friday's inflation report, the National Bureau of Statistics announced consumer prices in China rose by 0.5% in July YoY vs. the forecasts of 0.3%.
- Additional details revealed that the headline CPI soared 0.5% in July, the highest since February, moderating concerns about a profound economic slump in China.
- In that sense, while good news comes from Australia, the AUD’s downside is limited.
AUD/USD technical outlook: Pair faces strong resistance at the SMA convergence around 0.6000
AUD/USD's price action over the previous week reflects that the bulls are encountering substantial resistance around the 0.6600 level, which coincides with the convergence of the 20,100 and 200-day Simple Moving Averages (SMA). However, support has been persistently holding strong at 0.6500.
The Relative Strength Index (RSI) has been stagnant around the neutral zone, oscillating values near 49, indicating neither a significant buying or selling pressure. The large spike from nearly 30 to 49 this week suggests that the buyers made a stride toward mounting traction.
Australian Dollar FAQs
One of the most significant factors for the Australian Dollar (AUD) is the level of interest rates set by the Reserve Bank of Australia (RBA). Because Australia is a resource-rich country another key driver is the price of its biggest export, Iron Ore. The health of the Chinese economy, its largest trading partner, is a factor, as well as inflation in Australia, its growth rate and Trade Balance. Market sentiment – whether investors are taking on more risky assets (risk-on) or seeking safe-havens (risk-off) – is also a factor, with risk-on positive for AUD.
The Reserve Bank of Australia (RBA) influences the Australian Dollar (AUD) by setting the level of interest rates that Australian banks can lend to each other. This influences the level of interest rates in the economy as a whole. The main goal of the RBA is to maintain a stable inflation rate of 2-3% by adjusting interest rates up or down. Relatively high interest rates compared to other major central banks support the AUD, and the opposite for relatively low. The RBA can also use quantitative easing and tightening to influence credit conditions, with the former AUD-negative and the latter AUD-positive.
China is Australia’s largest trading partner so the health of the Chinese economy is a major influence on the value of the Australian Dollar (AUD). When the Chinese economy is doing well it purchases more raw materials, goods and services from Australia, lifting demand for the AUD, and pushing up its value. The opposite is the case when the Chinese economy is not growing as fast as expected. Positive or negative surprises in Chinese growth data, therefore, often have a direct impact on the Australian Dollar and its pairs.
Iron Ore is Australia’s largest export, accounting for $118 billion a year according to data from 2021, with China as its primary destination. The price of Iron Ore, therefore, can be a driver of the Australian Dollar. Generally, if the price of Iron Ore rises, AUD also goes up, as aggregate demand for the currency increases. The opposite is the case if the price of Iron Ore falls. Higher Iron Ore prices also tend to result in a greater likelihood of a positive Trade Balance for Australia, which is also positive of the AUD.
The Trade Balance, which is the difference between what a country earns from its exports versus what it pays for its imports, is another factor that can influence the value of the Australian Dollar. If Australia produces highly sought after exports, then its currency will gain in value purely from the surplus demand created from foreign buyers seeking to purchase its exports versus what it spends to purchase imports. Therefore, a positive net Trade Balance strengthens the AUD, with the opposite effect if the Trade Balance is negative.
- The Canadian Dollar struggled to find direction on Friday.
- Canada revealed mixed employment figures in July.
- Tepid Friday caps off a tumultuous week, CAD hangs onto previous gains.
The Canadian Dollar (CAD) rounded out the trading week by holding onto a 1.5% gain against the US Dollar after a frothy trading week gave way to a flattened Friday session. The Canadian Dollar struggled to find directional momentum during the week’s final market window as markets take a breather and await the next round of key inflation figures due next week.
Canada delivered a lopsided labor print on Friday, with another contraction in Net Change in Employment but a better-than-expected print in July’s Unemployment Rate. Investors have pivoted into waiting for next week’s US Producer Price Index (PPI) and Consumer Price Index (CPI) inflation figures, slated for Tuesday and Wednesday, respectively.
Daily digest market movers: Canadian Dollar flatlines on mixed labor
- Canada’s Net Change in Employment contracted in July, printing -2.8K versus the expected upswing to 22.5K from the previous month’s -1.4K.
- The Canadian Unemployment Rate held steady at 6.4% in July, averting the forecasted uptick to 6.5%.
- Canadian economic data remains thin next week, leaving USD/CAD traders to focus squarely on upcoming US inflation prints.
- US PPI and CPI inflation are broadly expected to tick lower as markets lean into Federal Reserve (Fed) rate cut hopes.
- Rate markets are pricing in better-than-even odds that Fed will kick off a rate cutting cycle with a 50-basis-point double cut in September.
Canadian Dollar PRICE This week
The table below shows the percentage change of Canadian Dollar (CAD) against listed major currencies this week. Canadian Dollar was the strongest against the Swiss Franc.
| USD | EUR | GBP | JPY | CAD | AUD | NZD | CHF | |
|---|---|---|---|---|---|---|---|---|
| USD | -0.06% | 0.37% | 0.06% | -0.98% | -0.90% | -0.75% | 0.73% | |
| EUR | 0.06% | 0.35% | -0.02% | -1.04% | -0.83% | -0.80% | 0.67% | |
| GBP | -0.37% | -0.35% | -0.32% | -1.36% | -1.15% | -1.14% | 0.33% | |
| JPY | -0.06% | 0.02% | 0.32% | -1.00% | -1.01% | -0.80% | 0.68% | |
| CAD | 0.98% | 1.04% | 1.36% | 1.00% | 0.11% | 0.24% | 1.54% | |
| AUD | 0.90% | 0.83% | 1.15% | 1.01% | -0.11% | 0.03% | 1.52% | |
| NZD | 0.75% | 0.80% | 1.14% | 0.80% | -0.24% | -0.03% | 1.49% | |
| CHF | -0.73% | -0.67% | -0.33% | -0.68% | -1.54% | -1.52% | -1.49% |
The heat map shows percentage changes of major currencies against each other. The base currency is picked from the left column, while the quote currency is picked from the top row. For example, if you pick the Canadian Dollar from the left column and move along the horizontal line to the US Dollar, the percentage change displayed in the box will represent CAD (base)/USD (quote).
Canadian Dollar price forecast: CAD gains poised to run aground of technical levels
The Canadian Dollar (CAD) gave a surprisingly healthy performance this week, climbing over one percent against most of its major currency counterparts and running neck-and-neck with the Australian Dollar (AUD) as the week’s best-performing currencies. USD/CAD fell -1.64% peak-to-trough this week after Monday’s bullish spike failed to claim the 1.3950 level, sending the pair back into the low end near the 50-day Exponential Moving Average (EMA) near 1.3730.
Friday’s flat print in USD/CAD daily candlesticks comes on the heels of five consecutive daily sessions in the red. However, the pair is still holding onto chart paper on the bullish side of the 200-day EMA at 1.3629, and Canadian Dollar buyers are running out of opportunities to drag USD/CAD lower with price action battling for a foothold above the 1.3700 handle.
USD/CAD daily chart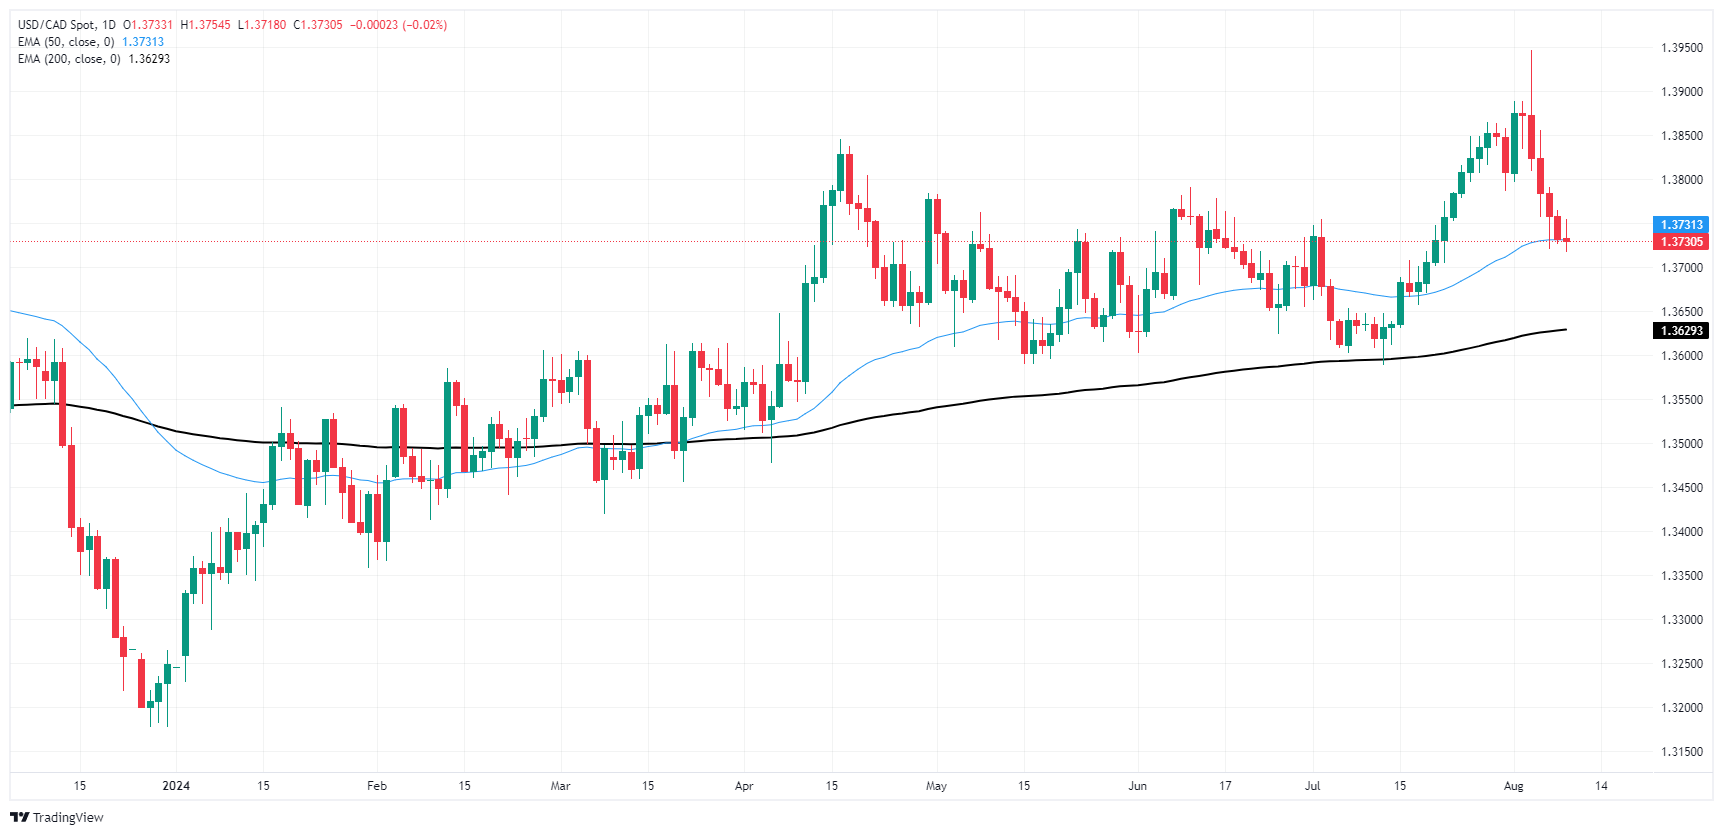
Canadian Dollar FAQs
The key factors driving the Canadian Dollar (CAD) are the level of interest rates set by the Bank of Canada (BoC), the price of Oil, Canada’s largest export, the health of its economy, inflation and the Trade Balance, which is the difference between the value of Canada’s exports versus its imports. Other factors include market sentiment – whether investors are taking on more risky assets (risk-on) or seeking safe-havens (risk-off) – with risk-on being CAD-positive. As its largest trading partner, the health of the US economy is also a key factor influencing the Canadian Dollar.
The Bank of Canada (BoC) has a significant influence on the Canadian Dollar by setting the level of interest rates that banks can lend to one another. This influences the level of interest rates for everyone. The main goal of the BoC is to maintain inflation at 1-3% by adjusting interest rates up or down. Relatively higher interest rates tend to be positive for the CAD. The Bank of Canada can also use quantitative easing and tightening to influence credit conditions, with the former CAD-negative and the latter CAD-positive.
The price of Oil is a key factor impacting the value of the Canadian Dollar. Petroleum is Canada’s biggest export, so Oil price tends to have an immediate impact on the CAD value. Generally, if Oil price rises CAD also goes up, as aggregate demand for the currency increases. The opposite is the case if the price of Oil falls. Higher Oil prices also tend to result in a greater likelihood of a positive Trade Balance, which is also supportive of the CAD.
While inflation had always traditionally been thought of as a negative factor for a currency since it lowers the value of money, the opposite has actually been the case in modern times with the relaxation of cross-border capital controls. Higher inflation tends to lead central banks to put up interest rates which attracts more capital inflows from global investors seeking a lucrative place to keep their money. This increases demand for the local currency, which in Canada’s case is the Canadian Dollar.
Macroeconomic data releases gauge the health of the economy and can have an impact on the Canadian Dollar. Indicators such as GDP, Manufacturing and Services PMIs, employment, and consumer sentiment surveys can all influence the direction of the CAD. A strong economy is good for the Canadian Dollar. Not only does it attract more foreign investment but it may encourage the Bank of Canada to put up interest rates, leading to a stronger currency. If economic data is weak, however, the CAD is likely to fall.
- Dow Jones is set to end the week close to where it started.
- The major equity index recovered after Monday's thousand-point plunge, but nothing more.
- Markets now pivot to focus on next week’s inflation data.
The Dow Jones Industrial Average (DJIA) is trading mostly flat on Friday, testing the water near the week’s opening bids after a run of volatility sparked by broad-market concerns that the Federal Reserve (Fed) might have missed the train on rate cuts. A turn towards the softer side in US data prints late last week sparked a risk-off plunge across the global markets, coupled with an unwinding of the Yen carry trade after the Bank of Japan (BoJ) ended favorable rate differentials.
Forecasting the Coming Week: US CPI and Fed’s easing should rule the sentiment
After kicking off the trading week with a thousand-point plunge, the Dow Jones is back to where it started, paddling around 39,400.00. Investor hopes for an “emergency rate cut” from the Fed failed to materialize after markets realized that six-digit US Nonfarm Payrolls jobs growth, unemployment below 5%, steady wage growth, and week-on-week jobless claims within long-term averages may not be the economic disaster it was made out to be last week.
Still, market focus remains squarely on the odds of a September rate cut. Rate markets have fully priced in the start of a rate cutting cycle when the Federal Open Market Committee (FOMC) meets on September 18, but bets of an initial double cut for 50 basis points have eased to slightly-better-than-even from nearly 70% earlier this week. According to the CME’s FedWatch Tool, rate traders are pricing in 53.5% odds of a 50 bps cut in September, with an additional two cuts worth 25 basis points apiece through the remainder of 2024.
Coming up next week, investors will get a fresh batch of inflation data to worry about, with US Producer Price Index (PPI) and Consumer Price Index (CPI) inflation on the cards for Tuesday and Wednesday, respectively. US Retail Sales and another update from the University of Michigan’s Consumer Sentiment Survey Index are also due later next week. Core PPI inflation and headline CPI inflation are both still stuck around 3% YoY, and investors will be hoping for a continued easing in the prints to keep the Fed on the rails toward rate cuts.
Dow Jones news
The Dow Jones remains on-balance on Friday, with the index split fairly equally between winners and losers. Intel Inc. (INTC) fell back another 4.4%, declining below $20.00 per share as the tech company continues to run out of ways to push its otherworldly P/E ratio back above 100.00. After roughly $4 billion in quarterly earnings missed estimates by $150 million, the company doubled down on keeping investors happy by immediately announcing layoffs of 15,000 people.
Dow Jones technical forecast
Friday’s flat-footed candlestick puts the Dow Jones entirely below the 50-day Exponential Moving Average (EMA) for an entire trading week, a feat the index hasn’t accomplished since mid-April’s swing low. The index still remains sharply down from record highs set at 41,371.38 in July, having fallen -7.22% peak-to-trough.
Despite a soft patch, the index is still holding ground in bull country above the 200-day EMA at 38,025.14, and buyers will take any excuse to reignite the furnace and gets bids back into the high side.
Dow Jones daily chart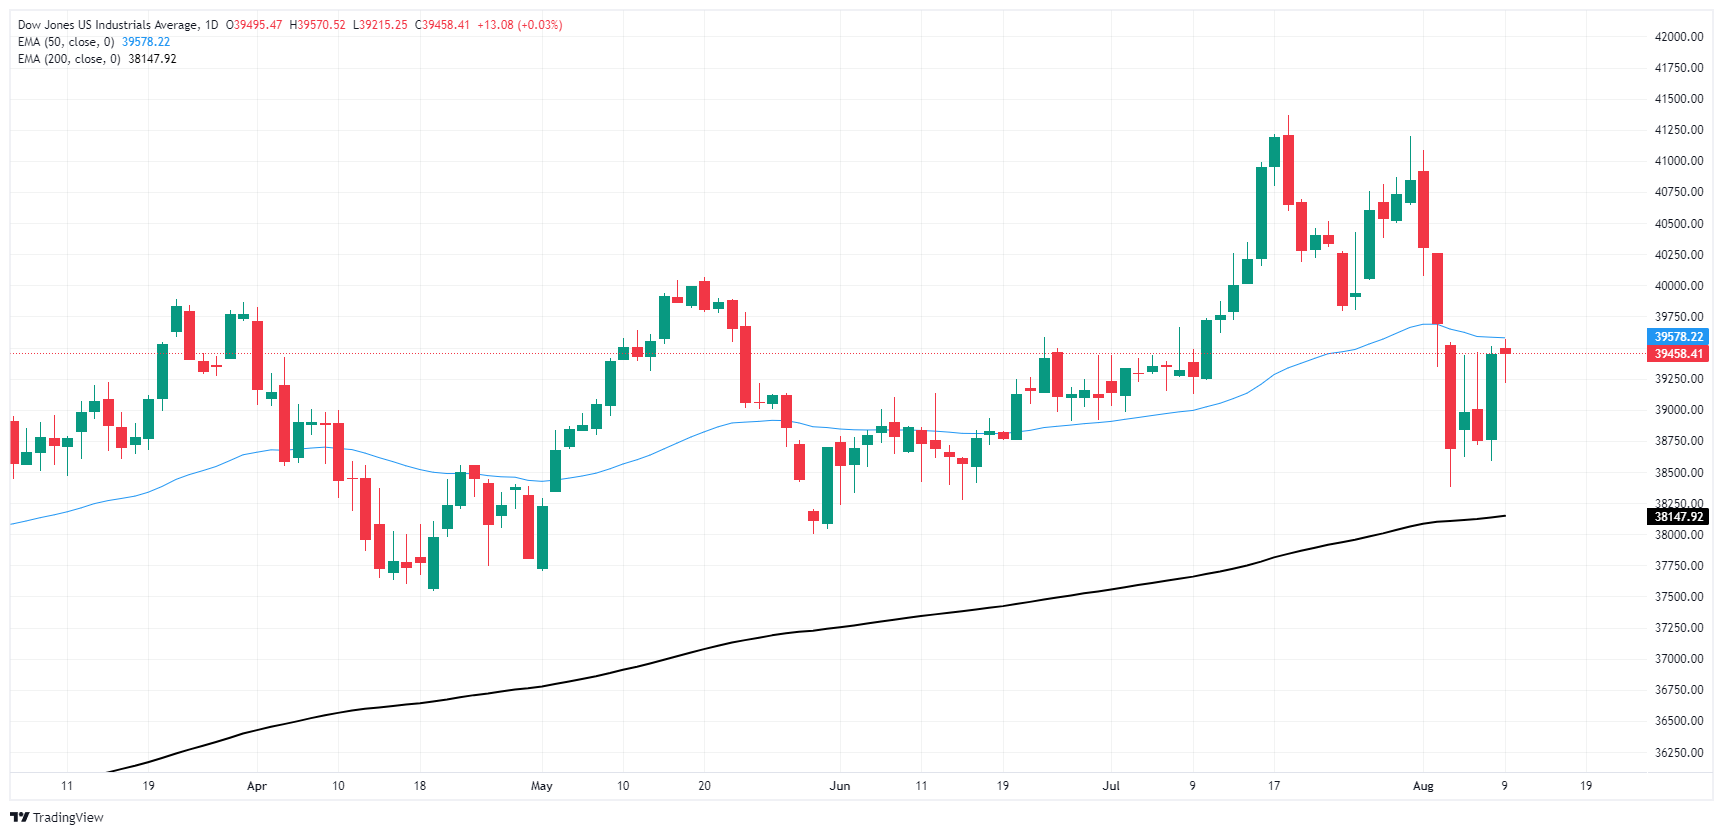
Dow Jones FAQs
The Dow Jones Industrial Average, one of the oldest stock market indices in the world, is compiled of the 30 most traded stocks in the US. The index is price-weighted rather than weighted by capitalization. It is calculated by summing the prices of the constituent stocks and dividing them by a factor, currently 0.152. The index was founded by Charles Dow, who also founded the Wall Street Journal. In later years it has been criticized for not being broadly representative enough because it only tracks 30 conglomerates, unlike broader indices such as the S&P 500.
Many different factors drive the Dow Jones Industrial Average (DJIA). The aggregate performance of the component companies revealed in quarterly company earnings reports is the main one. US and global macroeconomic data also contributes as it impacts on investor sentiment. The level of interest rates, set by the Federal Reserve (Fed), also influences the DJIA as it affects the cost of credit, on which many corporations are heavily reliant. Therefore, inflation can be a major driver as well as other metrics which impact the Fed decisions.
Dow Theory is a method for identifying the primary trend of the stock market developed by Charles Dow. A key step is to compare the direction of the Dow Jones Industrial Average (DJIA) and the Dow Jones Transportation Average (DJTA) and only follow trends where both are moving in the same direction. Volume is a confirmatory criteria. The theory uses elements of peak and trough analysis. Dow’s theory posits three trend phases: accumulation, when smart money starts buying or selling; public participation, when the wider public joins in; and distribution, when the smart money exits.
There are a number of ways to trade the DJIA. One is to use ETFs which allow investors to trade the DJIA as a single security, rather than having to buy shares in all 30 constituent companies. A leading example is the SPDR Dow Jones Industrial Average ETF (DIA). DJIA futures contracts enable traders to speculate on the future value of the index and Options provide the right, but not the obligation, to buy or sell the index at a predetermined price in the future. Mutual funds enable investors to buy a share of a diversified portfolio of DJIA stocks thus providing exposure to the overall index.
- GBP/USD trades at 1.2760, up 0.11%, as it nears key resistance at 1.2785.
- Range-bound movement persists between 1.2680 and 1.2785, with mixed momentum signals.
- A break above 1.2785 targets 1.2800 and 1.2888, while a drop below 1.2657 could see a test of 1.2600 and 1.2445.
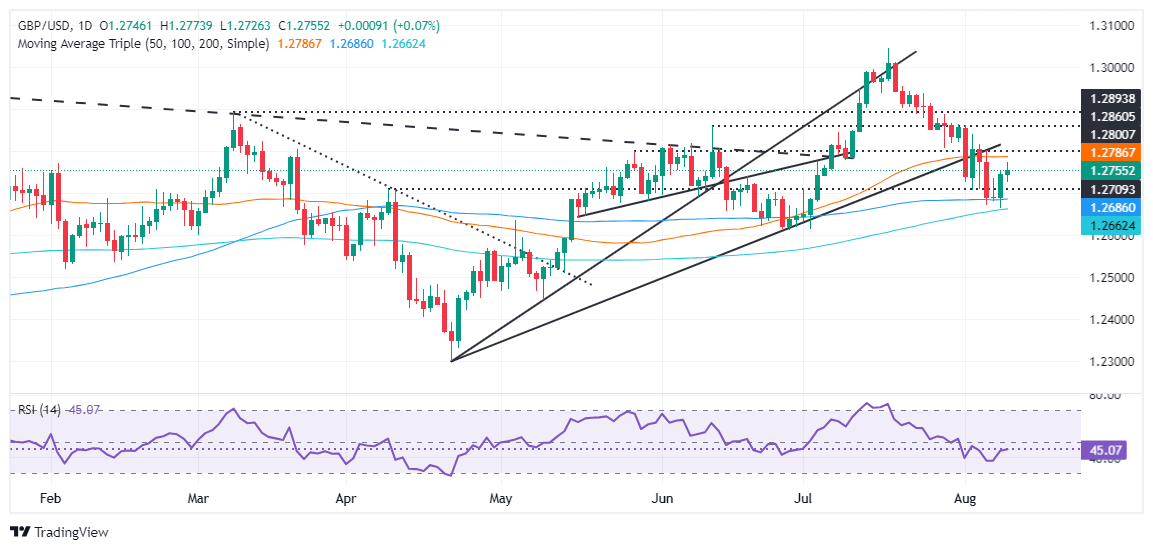
The Pound Sterling continued to register gains on Friday yet found some resistance at 1.2773, shy of hitting the 50-day moving average (DMA) at 1.2785, which, if cleared, could pave the way for further upside. However, the GBP/USD retreats somewhat and registers modest gains of 0.11%, trading at 1.2760.
GBP/USD Price Forecast: Technical outlook
After seesawing through most of the week, the GBP/USD pair has been range-bound, capped within the 1.2680-1.2785 range for the last four days, with key daily moving averages (DMAs) acting as support/resistance.
Momentum is also mixed, with the Relative Strength Index (RSI) standing bearish yet aiming slightly up.
Hence if GBP/USD clears the top of the range, that could pave the way for higher prices. The first resistance would be the 1.2800 figure. Despite that, buyers need to reclaim the July 29 peak at 1.2888, before challenging the 1.2900 figure.
Conversely, if sellers stepped in, they would test the 200-DMA at 1.2657. Once cleared, the pair would shift bearish, and it can challenge the 1.2600 mark. Underneath this level, bears could drag the spot price to test the latest cycle low of 1.2445, the May 9 low.
GBP/USD Price Action – Daily Chart
British Pound PRICE Today
The table below shows the percentage change of British Pound (GBP) against listed major currencies today. British Pound was the strongest against the Australian Dollar.
| USD | EUR | GBP | JPY | CAD | AUD | NZD | CHF | |
|---|---|---|---|---|---|---|---|---|
| USD | -0.01% | -0.07% | -0.47% | -0.04% | 0.32% | 0.13% | -0.30% | |
| EUR | 0.00% | -0.04% | -0.40% | -0.03% | 0.33% | 0.14% | -0.29% | |
| GBP | 0.07% | 0.04% | -0.37% | -0.01% | 0.37% | 0.17% | -0.22% | |
| JPY | 0.47% | 0.40% | 0.37% | 0.37% | 0.76% | 0.55% | 0.16% | |
| CAD | 0.04% | 0.03% | 0.00% | -0.37% | 0.35% | 0.17% | -0.23% | |
| AUD | -0.32% | -0.33% | -0.37% | -0.76% | -0.35% | -0.19% | -0.59% | |
| NZD | -0.13% | -0.14% | -0.17% | -0.55% | -0.17% | 0.19% | -0.40% | |
| CHF | 0.30% | 0.29% | 0.22% | -0.16% | 0.23% | 0.59% | 0.40% |
The heat map shows percentage changes of major currencies against each other. The base currency is picked from the left column, while the quote currency is picked from the top row. For example, if you pick the British Pound from the left column and move along the horizontal line to the US Dollar, the percentage change displayed in the box will represent GBP (base)/USD (quote).
- Stabilization in risk sentiment lends support to the USD despite lack of fresh fundamentals.
- Fed officials paint an optimistic picture of the US labor markets despite slow job growth.
- Market adjusts easing expectations; first rate cut expected in September with slightly lower odds.
The US Dollar (USD), measured by the US Dollar Index (DXY), showed sideways movement above the 103.00 level in Friday's session. This comes amid stabilized risk sentiment and flat trading in US stock index futures following Thursday's rally, with the 10-year US yield remaining around 4% early in the day.
Despite adjustments in market expectations for future monetary policy decisions, the US economic outlook continues to indicate growth above trend, suggesting premature market anticipation for aggressive easing.
Daily digest market movers: US Dollar stable as Fed officials highlight healthy labor market
- Hints on the labor market were provided by Federal Reserve (Fed) officials who shared views that the market is not dire despite slow job growth.
- Barkin noted that businesses are managing headcount through attrition or slowing hiring, but not laying people off, indicating cautious but not panicked market behavior.
- Schmid reaffirmed that inflation is almost within the required range and that the strength of the economy will determine the policy path.
- Goolsbee, however, warned that it's important to determine whether the job market cooling is a temporary or ongoing event.
- The weekly jobless claims data also helped calm markets, with initial claims coming in lower than expected at 233K versus an expected 240K.
- Market pricing suggests less than 10% odds of an immediate cut and around 80% odds of a cut in September. These estimates indicate that markets are still fully pricing in 100 basis points of Fed easing by year-end, as well as 175-200 points of total easing over the next 12 months.
DXY technical outlook: Bearish bias persists as buyers struggle for significant movement
The DXY outlook remains bearish, with buyers struggling to make a significant move. The index is still operating beneath the 20, 100 and 200-day Simple Moving Averages (SMAs), confirming an overall bearish bias.
The momentum-based Relative Strength Index (RSI) is still below 50, indicating continued selling pressure, while the Moving Average Convergence Divergence (MACD) continues to print lower red bars. Despite the week's gains, the overall technical outlook has not significantly improved, with potential for a correction still observed.
Supports: 103.00, 102.50, 102.20 Resistances: 103.50, 104.00
US Dollar FAQs
The US Dollar (USD) is the official currency of the United States of America, and the ‘de facto’ currency of a significant number of other countries where it is found in circulation alongside local notes. It is the most heavily traded currency in the world, accounting for over 88% of all global foreign exchange turnover, or an average of $6.6 trillion in transactions per day, according to data from 2022. Following the second world war, the USD took over from the British Pound as the world’s reserve currency. For most of its history, the US Dollar was backed by Gold, until the Bretton Woods Agreement in 1971 when the Gold Standard went away.
The most important single factor impacting on the value of the US Dollar is monetary policy, which is shaped by the Federal Reserve (Fed). The Fed has two mandates: to achieve price stability (control inflation) and foster full employment. Its primary tool to achieve these two goals is by adjusting interest rates. When prices are rising too quickly and inflation is above the Fed’s 2% target, the Fed will raise rates, which helps the USD value. When inflation falls below 2% or the Unemployment Rate is too high, the Fed may lower interest rates, which weighs on the Greenback.
In extreme situations, the Federal Reserve can also print more Dollars and enact quantitative easing (QE). QE is the process by which the Fed substantially increases the flow of credit in a stuck financial system. It is a non-standard policy measure used when credit has dried up because banks will not lend to each other (out of the fear of counterparty default). It is a last resort when simply lowering interest rates is unlikely to achieve the necessary result. It was the Fed’s weapon of choice to combat the credit crunch that occurred during the Great Financial Crisis in 2008. It involves the Fed printing more Dollars and using them to buy US government bonds predominantly from financial institutions. QE usually leads to a weaker US Dollar.
Quantitative tightening (QT) is the reverse process whereby the Federal Reserve stops buying bonds from financial institutions and does not reinvest the principal from the bonds it holds maturing in new purchases. It is usually positive for the US Dollar.
European gas prices have also been rising significantly for almost two weeks, with the European reference price TTF at EUR 40 per MWh, its highest level since early December, Commerzbank’s commodity strategist Barbara Lambrecht notes.
European gas prices go higher
“The main reason for the price increases in recent days is the fear of a short-term disruption of the remaining Russian pipeline supplies to the EU via Ukraine.”
“Gas supplies via the Sudzha crossing point are considered at risk due to the alleged advance of Ukrainian troops in the Kursk region: According to Bloomberg, 3 to 5 percent of gas supplies still use this route; the customers are Austria and Slovakia, which still cover a large part of their needs.”
“The gas is still flowing, however: the Russian exporter reported only slightly reduced deliveries for Thursday, ultimately due to lower demand from customers. The transit agreement with Ukraine expires at the end of the year anyway. According to Bloomberg, there have been talks about extending it, but Ukraine has shown no willingness to do so.”
- Mexican Peso’s demand increases despite Banxico’s surprising decision.
- Banxico lowers rates by 25 bps in a 3-2 split decision.
- Central bank signals further easing ahead despite inflation risks and growth concerns.
- Core inflation continues to decline, projected to dip below 4% by Q4 2024.
The Mexican Peso advanced for the third straight day following a surprising monetary policy decision by the Bank of Mexico (Banxico). The bank decided to lower borrowing costs despite earlier revelations that inflation had topped 5.50%. The USD/MXN, instead of rallying sharply, retreated and traded at 18.79, down 0.38%.
On Thursday, Banxico decided to lower borrowing costs in a 3-2 split decision among the Governing Council. Governor Victoria Rodriguez Ceja and Deputy Governors Galia Borja and Omar Mejia favored a 25-basis-point (bps) rate cut, while Irene Espinosa and Jonathan Heath voted for keeping rates unchanged.
The statement barely changed compared to the previous two meetings, yet they reiterated, “Looking ahead, the Board foresees that [the] inflationary environment may allow for discussing reference rate adjustments,” meaning that further easing lies ahead.
The central bank acknowledged that inflationary risks remain tilted to the upside, while growth is biased to the downside.
Banxico’s board updated its inflation forecasts, indicating that headline inflation is expected to rise in the short term but remain unchanged in the longer term. Core inflation is projected to edge lower and dip below 4% in the fourth quarter of 2024.
In its monetary policy statement, Banxico officials commented that despite July’s inflation rising to 5.57%, core figures “which better reflects the inflation trend, accumulated eighteen consecutive months of reductions, registering 4.05%.”
Across the board, the US economic docket is scarce. Yet Boston Fed President Susan Collins expressed that it’s appropriate to begin easing soon if the data comes as expected. Collins considers the timing of data as crucial to making Fed policy decisions.
Daily digest market movers: Mexican Peso rises as traders shrugged off Banxico's cut
- Banxico’s board revealed that the Consumer Price Index (CPI) is expected to rise to 5.2% in Q3 and to edge lower to 4.4% in Q4, both readings for the remainder of 2024. They expect it will reach the 3% plus or minus 1% goal by Q4 2025.
- Core CPI is projected to hit 3.9% in Q4 2024 and reach 3% by the end of next year.
- Mexico’s inflation rate rose by 1.05% MoM, exceeding estimates of 1.02% and significantly higher than June’s 0.38%. Over the 12 months to July, inflation increased from 4.98% to 5.57%, in line with expectations.
- Core prices ticked up from 0.22% to 0.32% MoM, surpassing economists' projections of 0.29%. On an annual basis, however, inflation missed the 4.02% consensus but dipped slightly to 4.05%, showing improvement compared to June's 4.13%.
- Mexico’s Industrial Production dipped from 0.7% to 0.4% MoM but exceeded estimates of 0.3%. On an annual basis, it plunged more than the -0.1% YoY projected and came at -0.7%, further confirming that the economy is stagnating.
- The CME FedWatch Tool shows the odds of a 50-basis-point interest rate cut by the Fed at the September meeting at 52.5%, down from 57.5% a day ago.
Technical analysis: Mexican Peso appreciates further as USD/MXN drops further below 19.00
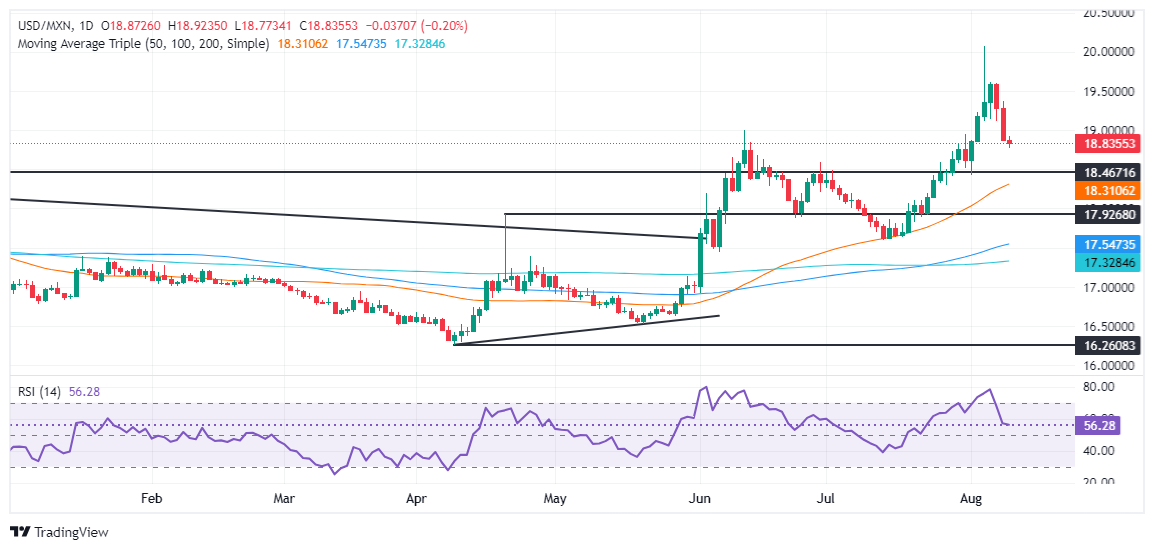
The USD/MXN extended its losses to a six-day low of 18.76, yet the pair remains upwardly biased. Although momentum supports the Peso’s recovery, surpassing the next support at 18.59, the June 28 peak would be difficult as it lies above the psychological 18.50 mark.
On the other hand, if buyers cap the USD/MXN downside and lift the exchange rate above 19.00, this will pave the way for a recovery. The exotic pair’s next resistance would be 19.50, followed by the key 20.00 mark. A decisive break will expose the YTD high at 20.22, followed by the 20.50 mark.
Mexican Peso FAQs
The Mexican Peso (MXN) is the most traded currency among its Latin American peers. Its value is broadly determined by the performance of the Mexican economy, the country’s central bank’s policy, the amount of foreign investment in the country and even the levels of remittances sent by Mexicans who live abroad, particularly in the United States. Geopolitical trends can also move MXN: for example, the process of nearshoring – or the decision by some firms to relocate manufacturing capacity and supply chains closer to their home countries – is also seen as a catalyst for the Mexican currency as the country is considered a key manufacturing hub in the American continent. Another catalyst for MXN is Oil prices as Mexico is a key exporter of the commodity.
The main objective of Mexico’s central bank, also known as Banxico, is to maintain inflation at low and stable levels (at or close to its target of 3%, the midpoint in a tolerance band of between 2% and 4%). To this end, the bank sets an appropriate level of interest rates. When inflation is too high, Banxico will attempt to tame it by raising interest rates, making it more expensive for households and businesses to borrow money, thus cooling demand and the overall economy. Higher interest rates are generally positive for the Mexican Peso (MXN) as they lead to higher yields, making the country a more attractive place for investors. On the contrary, lower interest rates tend to weaken MXN.
Macroeconomic data releases are key to assess the state of the economy and can have an impact on the Mexican Peso (MXN) valuation. A strong Mexican economy, based on high economic growth, low unemployment and high confidence is good for MXN. Not only does it attract more foreign investment but it may encourage the Bank of Mexico (Banxico) to increase interest rates, particularly if this strength comes together with elevated inflation. However, if economic data is weak, MXN is likely to depreciate.
As an emerging-market currency, the Mexican Peso (MXN) tends to strive during risk-on periods, or when investors perceive that broader market risks are low and thus are eager to engage with investments that carry a higher risk. Conversely, MXN tends to weaken at times of market turbulence or economic uncertainty as investors tend to sell higher-risk assets and flee to the more-stable safe havens.
In the year-to-date USD/JPY has traded in a mighty range that has stretched almost from 140 to 162. By contrast EUR/USD has been stuck between 1.06 and 1.10, Rabobank’s FX analyst Jane Foley notes.
Potential risks for a break higher coming from a softer USD
“The lack of strong direction in EUR/USD is despite a wealth of news that has included prolonged weakness in Germany’s manufacturing powerhouse, a shift to the far-right in European politics (most notably France) and a ratcheting up of budgetary concerns in a number of Eurozone countries. In the US, expectations regarding Fed policy have swung markedly during the year as recession fears have risen and fallen.”
“Additionally, US politics has been a market driver which promises to bring a lot more direction both in the approach to the November presidential election and once the outcome is known. In addition to these factors, the risk of a safe haven bid from a potential escalation in Middle Eastern tensions has hung over the greenback this year.”
“The ability of EUR/USD to soak up all this news and remain range bound suggests that more of the same may be on the cards in the months ahead. We have removed our EUR/USD1.05 3-month target mostly on the view that imminent Fed rate cuts are likely to prevent a dip to this level this year. We also weigh up the factors that could push the currency pair above EUR/USD1.10.”
The main economic data release overnight was the latest CPI report from China for July, MUFG FX analyst Lee Hardman notes.
USD/CNY rises back towards the 7.1800 level
“The report revealed that headline inflation picked up modestly by 0.3 points to 0.5% in July. The core measure on inflation fell to 0.4% in July from 0.6% in May-June. The release of the latest PPI report revealed that producer price deflation continued as it fell by an annual rate of -0.8% in July. Overall, the inflation developments alongside the recent loss of growth momentum in Q2 will keep pressure on the PBoC to lower rates further his year.”
“The renminbi has given back some of its recent gains over the past week. After hitting an intra-day low of 7.1153 om 5th August, USD/CNY has since risen back towards the 7.1800-level. The renminbi has benefitted alongside the yen and other Asian currencies from the recent bout of position liquidation as popular short positions have been pared back.”
“It has meant that the renminbi has strengthened following the PBoC’s decision to cut rates further towards the end of last month. While yields in China have continued to fall over the past month, it has been more than offset by the larger drop in US yields as market participants have moved to price in a higher probability of more aggressive Fed rate cuts.”
Following the slump at the beginning of the week, the price of Gold has risen again to almost $2,430 per troy ounce, Commerzbank’s commodity strategist Barbara Lambrecht notes.
Gold is set to remain in demand
“The Gold price was unable to benefit from the turbulence at the start of the week. On the contrary, the Gold price was even caught up in a downward pull at the beginning of the week. It moved well away from its record high and temporarily fell back below the $2,400 per troy ounce mark despite increased rate cut hopes.”
“However, as always, it is all a matter of perspective: looking at the development since the beginning of July, Gold can certainly be labeled a ‘safe haven’. Gold has risen slightly and, on the way, reached a new record high. We assume that Gold will remain in demand against the backdrop of the Middle East tensions and hence the price will remain well supported.”
“The upcoming CFTC data should also be interesting for Gold. After all, the Gold price also fell sharply at the beginning of the week, which could have been accompanied by a reduction in speculative long positions. This would support the idea that Gold was affected by forced selling in order to generate liquidity to offset losses in other investments and to fulfill margin calls.”
The prices of precious metals have recovered, Commerzbank’s commodity strategist Carsten Fritsch notes.
Precious metals prices go up
“Silver is trading at $27.5 per troy ounce again. Platinum is priced at $940 per troy ounce and Palladium at $930 per troy ounce. While Silver and Platinum have so far only regained some of their losses, Palladium has completely made up for the decline and is even trading higher than at the start of the week and around $100 above the 7-year low recorded on Monday.
“The price decline was exaggerated. Apparently, market participants took a similar view, with the result that speculative short positions were probably covered in the days that followed. At the end of July, a few days before the price slide, speculative net short positions in Palladium were only slightly below the record level, according to the CFTC.”
“The CFTC will publish the latest data this evening after the close of trading. This includes the week up to and including Tuesday, i.e. the last price slump. It is therefore quite conceivable that the short positioning of speculative financial investors reached a new record level at the beginning of the week, from where the short covering started.”
The US Department of Energy has revised its forecast for US crude oil production slightly downwards for this year and next, Commerzbank’s commodity strategist Carsten Fritsch notes.
OPEC+ may have some scope to increase production
“It now expects an increase of 300 thousand barrels per day for 2024 and 460 thousand barrels per day for 2025. Production from September onwards is expected to be lower than previously anticipated, which is likely due to the lower oil price level.”
“Contrary to the EIA's forecast a month ago, the production level of 14 million barrels per day is no longer expected to be reached by the end of 2025. The increase in production expected by the EIA through the end of 2025 is primarily driven by the largest shale oil deposit, the Permian Basin, which accounts for almost half of total US crude oil production.”
“The above-mentioned production increases would cover just under a third of the increases in global oil demand expected by the EIA this year and next year. Based on these forecasts, OPEC+ would therefore have some scope to increase production.”
Developed economy labor markets are returning to more normal patterns. The collective mid-life crisis, when everyone decided that happiness was best achieved by changing employer, has faded. With less job churn, the relationship of job vacancies to unemployment has normalized, UBS macro analyst Paul Donovan notes.
Flexible working may be improving labor market efficiency
“Fewer workers quitting has lessened the incentive for employers to hoard labor. This has not resulted in a surge in layoffs—demand in developed economies is not weak enough to justify that—but it may increase the sensitivity of labor markets to future consumer demand.”
“Labor markets today differ from pre-pandemic norms. There is evidence of more automation when labor is hard to find, boosting productivity. Flexible working may be improving labor market efficiency by reducing geographic constraints and allowing people to better match their skills to jobs. This trend also supports more women working for better pay.”
“Cyclically, what matters is whether fear of unemployment remains low. If unemployment rises because of more people entering the workforce, there is less need to worry about economic activity. Reduced hiring signals an economic slowdown, not a recession. However, if things change and more people who currently have jobs are fired, fear of unemployment would rise.”
- Silver price clings to gains above $27.00 as Fed rate cuts in September seems imminent.
- Investors divided over size of Fed’s interest-rate cuts in September.
- Fears of global slowdown have been diminished by lower US jobless claims and China’s hot inflation data.
Silver price (XAG/USD) holds onto gains above the crucial support of $27.00 in Friday’s New York session. The white metal clings to gains as a move towards policy-normalization from the Federal Reserve (Fed) seems certain in September. However, investors divide over the size of interest-rate cuts.
According to the CME FedWatch tool, 30-day Federal Funds Futures pricing data shows that traders see a 56.5% chance that interest rates will be reduced by 50 basis points (bps) in September. The likelihood of 50 bps rate cuts has dropped in a week as fears of global slowdown have diminished after lower-than-expected United States (US) Initial Jobless Claims and hot China’s Consumer Price Index (CPI) data for July.
The US Dollar (USD) exhibits a subdued performance as Fed rate cuts in September seems certain. The US Dollar Index (DXY), which tracks the Greenback’s value against six major currencies, corrects to near 103.15 from four-day high of 103.50. 10-year US Treasury yields slump to near 3.93%.
Historically, lower yields on interest-bearing assets bodes well for the Silver price. But in this case the Silver price is slightly down as investors worry about its global demand as a metal, with application in various industries.
Silver technical forecast
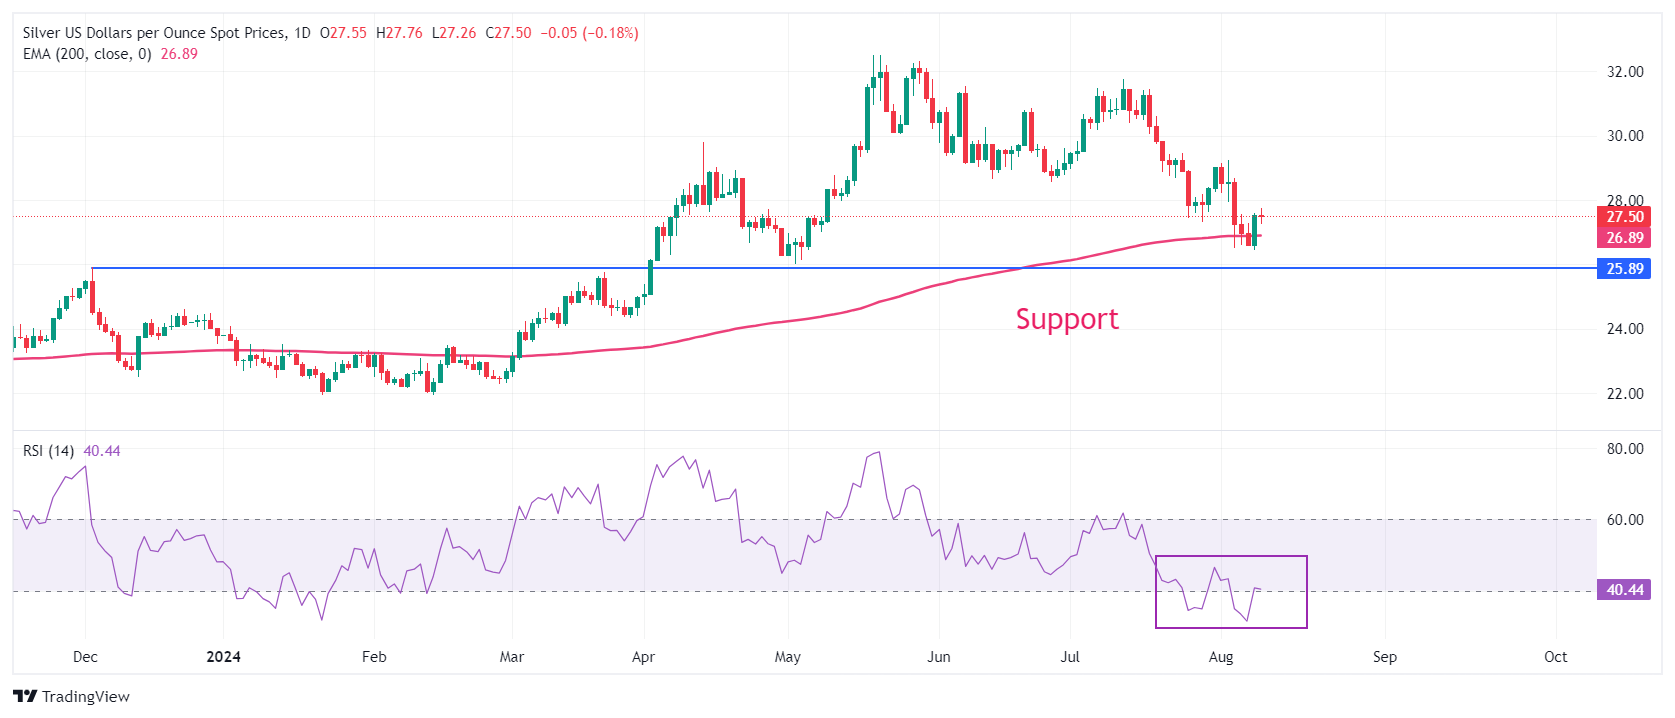
Silver price declines toward the horizontal support plotted from 4 December 2023 high of $25.90 on a daily timeframe. The asset hovers near the 200-day Exponential Moving Average (EMA) around $26.90, suggesting that the overall trend is uncertain.
The 14-day Relative Strength Index (RSI) attempts to return inside the 40.00-60.00 range. A bearish momentum would conclude if the RSI (14) manages to do so.
Silver daily chart
Silver FAQs
Silver is a precious metal highly traded among investors. It has been historically used as a store of value and a medium of exchange. Although less popular than Gold, traders may turn to Silver to diversify their investment portfolio, for its intrinsic value or as a potential hedge during high-inflation periods. Investors can buy physical Silver, in coins or in bars, or trade it through vehicles such as Exchange Traded Funds, which track its price on international markets.
Silver prices can move due to a wide range of factors. Geopolitical instability or fears of a deep recession can make Silver price escalate due to its safe-haven status, although to a lesser extent than Gold's. As a yieldless asset, Silver tends to rise with lower interest rates. Its moves also depend on how the US Dollar (USD) behaves as the asset is priced in dollars (XAG/USD). A strong Dollar tends to keep the price of Silver at bay, whereas a weaker Dollar is likely to propel prices up. Other factors such as investment demand, mining supply – Silver is much more abundant than Gold – and recycling rates can also affect prices.
Silver is widely used in industry, particularly in sectors such as electronics or solar energy, as it has one of the highest electric conductivity of all metals – more than Copper and Gold. A surge in demand can increase prices, while a decline tends to lower them. Dynamics in the US, Chinese and Indian economies can also contribute to price swings: for the US and particularly China, their big industrial sectors use Silver in various processes; in India, consumers’ demand for the precious metal for jewellery also plays a key role in setting prices.
Silver prices tend to follow Gold's moves. When Gold prices rise, Silver typically follows suit, as their status as safe-haven assets is similar. The Gold/Silver ratio, which shows the number of ounces of Silver needed to equal the value of one ounce of Gold, may help to determine the relative valuation between both metals. Some investors may consider a high ratio as an indicator that Silver is undervalued, or Gold is overvalued. On the contrary, a low ratio might suggest that Gold is undervalued relative to Silver.
- GBP/USD surrenders intraday gains amid dismal market sentiment.
- The Fed seems certain to cut interest rates in September.
- The Pound Sterling will be influenced by UK labor market and inflation data.
The GBP/USD pair surrenders its intraday gains and falls back to near 1.2730 in Friday’s New York session. The Cable comes under pressure amid cautious market mood. The S&P 500 opens with some losses, exhibiting that the risk-appetite of investors is weak.
The US Dollar (USD) consolidates in a tight range, with investors focusing on how much the Federal Reserve (Fed) will reduce interest rates in the September meeting. According to the CME FedWatch tool, 30-day Federal Funds Futures pricing data shows that traders see a 56.5% chance that interest rates will be reduced by 50 bps in September.
Going forward, the next trigger for the US Dollar will be the United States (US) Consumer Price Index (CPI) data for July, which will be published on Wednesday. The inflation data will indicate whether price pressures are on track to return to the desired rate of 2%.
Meanwhile, the Pound Sterling will be influenced by the United Kingdom (UK) Employment data for three-months-ending July and the consumer inflation data for July, which will be published on Tuesday and Wednesday. The economic data will indicate whether the Bank of England (BoE) will deliver subsequent rate cuts in September.
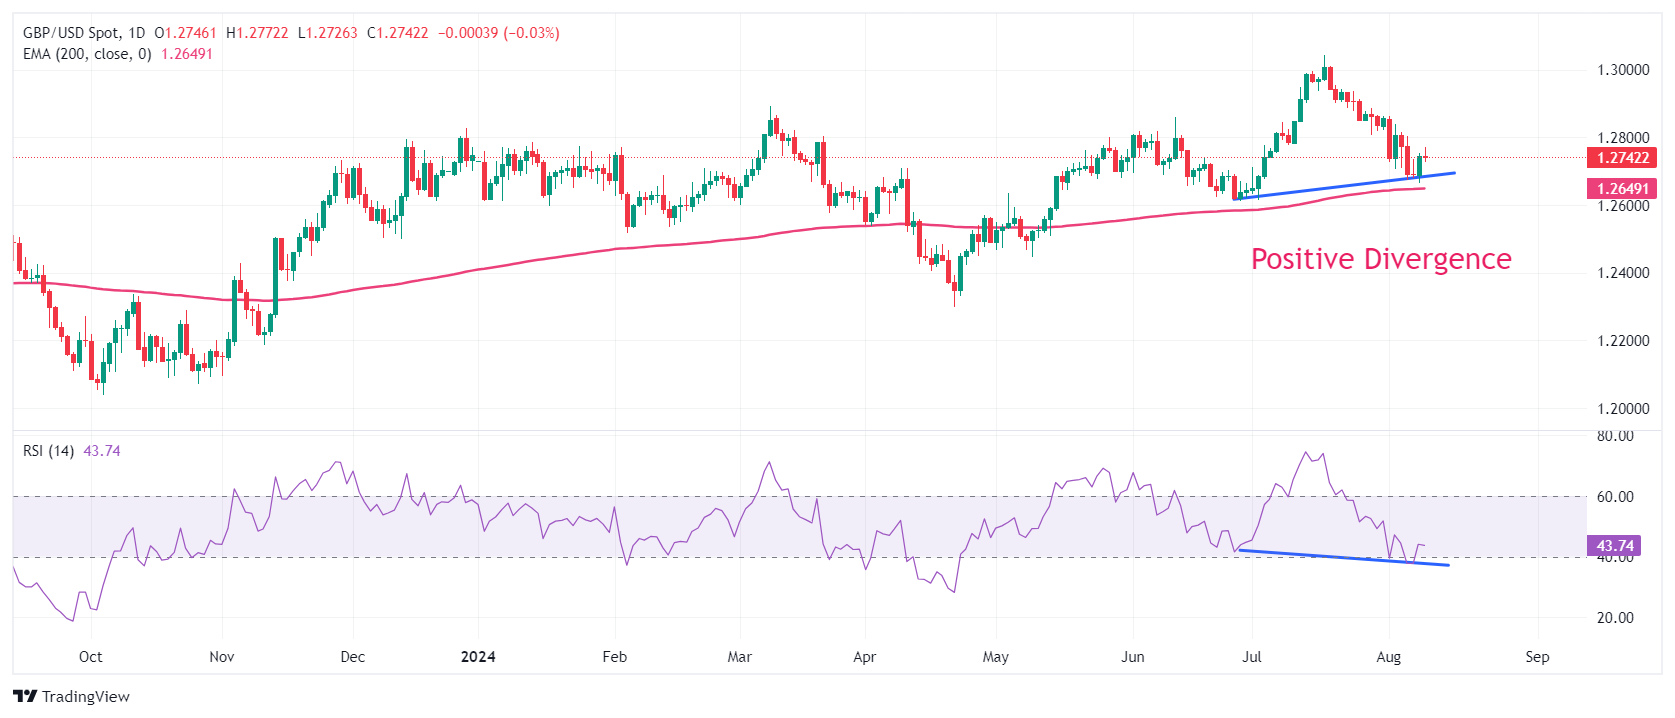
The Cable is at a make or a break below the crucial figure of 1.2700. The major exhibits a Positive divergence formation on a daily timeframe in which the asset continues to build higher lows, while the momentum oscillator makes lower lows. This generally results in a resumption in the uptrend but it should be confirmed with more indicators.
The 14-day Relative Strength Index (RSI) finds cushion near 40.00, exhibiting signs of buying interest at lower levels.
The asset continues to hold the 200-day Exponential Moving Average (EMA), which trades around 1.2650.
More downside could appear if the asset breaks below the intraday low of 1.2665. This would expose the asset to June 27 low at 1.2613, followed by April 29 high at 1.2570.
On the flip side, a recovery move above August 6 high at 1.2800 would drive the asset towards August 2 high at 1.2840 and the round-level resistance of 1.2900.
GBP/USD daily chart
Pound Sterling FAQs
The Pound Sterling (GBP) is the oldest currency in the world (886 AD) and the official currency of the United Kingdom. It is the fourth most traded unit for foreign exchange (FX) in the world, accounting for 12% of all transactions, averaging $630 billion a day, according to 2022 data. Its key trading pairs are GBP/USD, aka ‘Cable’, which accounts for 11% of FX, GBP/JPY, or the ‘Dragon’ as it is known by traders (3%), and EUR/GBP (2%). The Pound Sterling is issued by the Bank of England (BoE).
The single most important factor influencing the value of the Pound Sterling is monetary policy decided by the Bank of England. The BoE bases its decisions on whether it has achieved its primary goal of “price stability” – a steady inflation rate of around 2%. Its primary tool for achieving this is the adjustment of interest rates. When inflation is too high, the BoE will try to rein it in by raising interest rates, making it more expensive for people and businesses to access credit. This is generally positive for GBP, as higher interest rates make the UK a more attractive place for global investors to park their money. When inflation falls too low it is a sign economic growth is slowing. In this scenario, the BoE will consider lowering interest rates to cheapen credit so businesses will borrow more to invest in growth-generating projects.
Data releases gauge the health of the economy and can impact the value of the Pound Sterling. Indicators such as GDP, Manufacturing and Services PMIs, and employment can all influence the direction of the GBP. A strong economy is good for Sterling. Not only does it attract more foreign investment but it may encourage the BoE to put up interest rates, which will directly strengthen GBP. Otherwise, if economic data is weak, the Pound Sterling is likely to fall.
Another significant data release for the Pound Sterling is the Trade Balance. This indicator measures the difference between what a country earns from its exports and what it spends on imports over a given period. If a country produces highly sought-after exports, its currency will benefit purely from the extra demand created from foreign buyers seeking to purchase these goods. Therefore, a positive net Trade Balance strengthens a currency and vice versa for a negative balance.
- USD/CAD shows volatility after a weak Employment report.
- Canada’s labor market was squeezed and the wage growth measure decelerated in July.
- The US Dollar declined on expectations that the Fed will cut interest rates in September.
The USD/CAD pair delivers volatile moves above the round-level support of 1.3700 after the release of the weak Canadian Employment data for July. Statistics Canada reported that the labor market unexpectedly squeezed by 2.8K. Economists expected fresh addition of 22.5K payrolls against lay-off of 1.4K workers in June. The Unemployment Rate rose steadily by 6.4% and remained lower than estimates of 6.5%.
Weak Canadian labor market data has prompted expectations of more rate cuts by the Bank of Canada (BoC). Currently, the BoC has delivered two back-to-back rate cuts by 25 basis points (bps) to 4.5% since June.
Apart from weak payrolls data, annual Average Hourly Wages, a key measure to wage growth that propels consumer spending and eventually influence price pressures, decelerated to 5.2% from the former release of 5.6%. This would also increase speculation of more BoC rate cuts.
Meanwhile, the US Dollar and bond yields have declined as investors expect that the likelihood of the Federal Reserve (Fed) pivoting to policy normalization in September appears certain. Market participants are divided about the size and how much interest rates will be reduced this year.
The US Dollar Index (DXY), which tracks the Greenback’s value against six major currencies, corrects from a four-day high of 103.50. 10-year US Treasury yields tumble to near 3.94%
According to the CME FedWatch tool, 30-day Federal Funds Futures pricing data shows that traders see a 56.5% chance that interest rates will be reduced by 50 bps in September. For the entire year, data shows a 100 bp reduction in interest rates by the Fed.
Next week, investors will focus on the United States (US) Producer Price Index (PPI) and the Consumer Price Index (CPI) data for July, which will be published on Tuesday and Wednesday. The inflation data will indicate whether current market expectations for rate cuts are appropriate.
(The story was corrected at 13:09 GMT to say in the first paragraph that "The Unemployment Rate rose steadily by 6.4%, remained lower than estimates of 6.5% not 6.4%.)
Canadian Dollar FAQs
The key factors driving the Canadian Dollar (CAD) are the level of interest rates set by the Bank of Canada (BoC), the price of Oil, Canada’s largest export, the health of its economy, inflation and the Trade Balance, which is the difference between the value of Canada’s exports versus its imports. Other factors include market sentiment – whether investors are taking on more risky assets (risk-on) or seeking safe-havens (risk-off) – with risk-on being CAD-positive. As its largest trading partner, the health of the US economy is also a key factor influencing the Canadian Dollar.
The Bank of Canada (BoC) has a significant influence on the Canadian Dollar by setting the level of interest rates that banks can lend to one another. This influences the level of interest rates for everyone. The main goal of the BoC is to maintain inflation at 1-3% by adjusting interest rates up or down. Relatively higher interest rates tend to be positive for the CAD. The Bank of Canada can also use quantitative easing and tightening to influence credit conditions, with the former CAD-negative and the latter CAD-positive.
The price of Oil is a key factor impacting the value of the Canadian Dollar. Petroleum is Canada’s biggest export, so Oil price tends to have an immediate impact on the CAD value. Generally, if Oil price rises CAD also goes up, as aggregate demand for the currency increases. The opposite is the case if the price of Oil falls. Higher Oil prices also tend to result in a greater likelihood of a positive Trade Balance, which is also supportive of the CAD.
While inflation had always traditionally been thought of as a negative factor for a currency since it lowers the value of money, the opposite has actually been the case in modern times with the relaxation of cross-border capital controls. Higher inflation tends to lead central banks to put up interest rates which attracts more capital inflows from global investors seeking a lucrative place to keep their money. This increases demand for the local currency, which in Canada’s case is the Canadian Dollar.
Macroeconomic data releases gauge the health of the economy and can have an impact on the Canadian Dollar. Indicators such as GDP, Manufacturing and Services PMIs, employment, and consumer sentiment surveys can all influence the direction of the CAD. A strong economy is good for the Canadian Dollar. Not only does it attract more foreign investment but it may encourage the Bank of Canada to put up interest rates, leading to a stronger currency. If economic data is weak, however, the CAD is likely to fall.
China imported significantly less crude oil in July, Commerzbank’s commodity strategist Carsten Fritsch notes.
Downside risks to the forecasts
“According to customs data, imports fell by almost 12% compared to the previous month to less than 10 million barrels per day. This is the lowest level for almost two years. The still high oil prices until mid-July and only subdued demand for fuel have pushed processing margins down to an unattractive level for Chinese refineries and thus reduced refinery activity.
“The need for imports was correspondingly lower. However, imports have tended towards weakness not only since July. In the first seven months of the year, they were 2.4% lower than in the same period of the previous year. Unless there is a noticeable increase in the remaining months of the year, there is a risk of an annual decline this year.”
“Chinese refineries are apparently also finding it difficult to export the oversupply of oil products. Exports of fuel fell to less than 5 million tons in July for the first time in three months and were 4% lower than in the previous year after seven months. As such, there are downside risks to the forecasts, which assume a significant increase in demand for oil in China and the rest of Asia in the second half of the year.”
The Pound Sterling (GBP) is dead flat on the day, Scotiabank’s chief FX strategist Shaun Osborne notes.
GBP is little changed on the session
“There were no UK data reports out and the pound is essentially reflecting the marginal movement seen in its G10 peers today as investors relax after the past week’s turmoil. More range trading is likely into the weekend. UK jobs and wage data Tuesday may help shape the outlook for BoE rate policy.”
“GBP is little changed on the session but there are clear signs that the GBP’s recent slide is steadying. Noted support at the 200-day MA (1.2663) has provided the platform for a bullish turn in price action via a ‘morning star’ reversal on the daily candle chart.”
“GBP is testing key, trend resistance off the mid-July high this morning. A daily close above 1.2750 should help the turn higher in the pound develop more momentum in the days ahead.”
EUR/USD is unchanged on the day, Scotiabank’s chief FX strategist Shaun Osborne notes.
EUR may try to test the 1.0950 resistance
“European natural gas prices have risen to the highest since late 2023 this week, reflecting supply disruption concerns after Ukraine made a major advance into the Kursk region in Russia. Prices remain well below 2021/22 peaks and European storage levels remain elevated, however, which should mitigate concerns about the economic impact on the Eurozone.”
“The Euro (EUR) is holding the consolidation range established after the US Dollar’s (USD’s) sharp fall between last Friday and Monday. Short-term trends look flat and momentum is weak. The EUR put in a solid, bullish gain overall last week and minor dips should remain well-supported to the 1.0850/75 range. Resistance is 1.0950 and 1.10.”
Copper steadied near its four-month low as a worsening economic outlook keep sentiment depressed, ANZ commodity strategists note.
Copper hit by a selloff across risk assets
“Fear of a US recession added to concerns over soft industrial activity in China. Prices for Copper and the broader base metal market were hit hard earlier this week by a selloff across risk assets.”
“The unwinding of the JPY carry trade could have unexpected implications for Copper. The use of cheap funding in Japan appears to have fuelled a rally across risk assets over the past couple of years.”
“Copper hit a record high earlier this year; but this month’s sharp moves lower in the JPY combined with concerns of a hard economic landing in the US could lead to further downside for Copper in the short term.”
The Canadian Dollar (CAD) is idling in a tight range, Scotiabank’s chief FX strategist Shaun Osborne notes.
Slips into a sideways range trade around 1.3725
“Canadian jobs data this morning are expected to show a rebound in hiring. The consensus expectation is for a 25k gain following the June drop of 1.4k. The 6m moving average for job gains sits at 32k while the 12m average is +39k so there may be some risk of a slightly higher print. But the unemployment rate is forecast to pick up a tenth to 6.5%, reflecting the expansion in the labour force, while hourly wage growth eases to 4.8% (from 5.6% in June).”
“Policymakers are concerned that rising unemployment will weigh on consumer activity and slow the economy in the coming months and are adjusting interest rates accordingly. That seems to be a conviction view that slightly better than expected data or elevated wage growth today is unlikely to shake. USDCAD is likely to remain well supported in the high 1.36s/low 1.37s for now.”
“Spot has slipped into a sideways range trade around noted retracement support at 1.3725 (61.8% of the 1.3598/1.3946 move up). Short-term momentum remains USD-bearish, keeping risks tilted to the downside but markets are showing little intent of pressuring the low 1.37s more intently today. Resistance is 1.3775/90. A concerted push under 1.3720/35 targets a drop back to 1.3675.”
- Oil price ties up with a third consecutive day of gains on Friday.
- Traders are buying back into Crude with fears of recession abating.
- The US Dollar Index trades at a pivotal level ahead of the weekend.
Oil price is rallying over 4% in a three-day winning streak after the commodity was crushed by recession fears earlier this week. Traders are buying back into the Black Gold with an eventful calendar ahead next week and some supportive headlines for Crude prices, with Israel giving the green light for talks again with Hamas. Meanwhile, Yahoo! Finance has reported that an Indian company has received a waiver from US authorities to purchase Crude from Venezuela.
The US Dollar Index (DXY), which tracks the performance of the US Dollar against six major currencies, is playing with fire and might see its recovery efforts pointless. The DXY has attempted for a fourth straight day to close above a pivotal level and is, yet again, giving up on Friday. This could point to a more substantial US Dollar outflow and result in another leg lower for the Greenback against most major peers on the quote board in the coming week.
At the time of writing, Crude Oil (WTI) trades at $75.19 and Brent Crude at $78.75
Oil news and market movers: Headlines pick up
- Yahoo! Finance reports that Reliance Industries in India has received approval from the US to resume its oil trading with Venezuela.
- Oil will have a very full week ahead, with headline risks from the monthly OPEC meeting and the International Energy Administration (IEA) report. The Chinese Industrial Production data for July will also move the needle for Crude prices.
- The recent correction in Oil prices could be a welcomed surprise for US consumers at the pump, and a rise in demand could be expected in the coming weeks, according to the Wall Street Journal.
- The weekly Baker Hughes US Oil Rig Count will be released at 17:00 GMT on Friday. The previous number was 482, and no forecast is available.
Oil Technical Analysis: Pivotal recovery point
Oil price is trying to continue its recovery, with a third consecutive day of profits. However, it might get tricky from here, with a pivotal level at $75.27 making it hard for bulls to cross above it. A second rejection, right at the end of the week, might mean issues ahead, while a break and close above might point to another leg higher to $77.70.
On the upside the first level that is imperative to regain control above is $75.27, which is into play as a pivotal level before heading back to the 200-day Simple Moving Average (SMA) at $77.70. The two other major moving averages reside very close, with the 55-day SMA at $78.58 and the 100-day SMA at $79.88.
The Relative Strength Index (RSI) has rebounded a touch in the daily chart, meaning there is room again to trend lower. Looking down, the first level to watch out for is $72.00. Once a new low for August gets printed in the charts, another leg lower would not rule out $68.00 or even $67.11, an 18-month low.
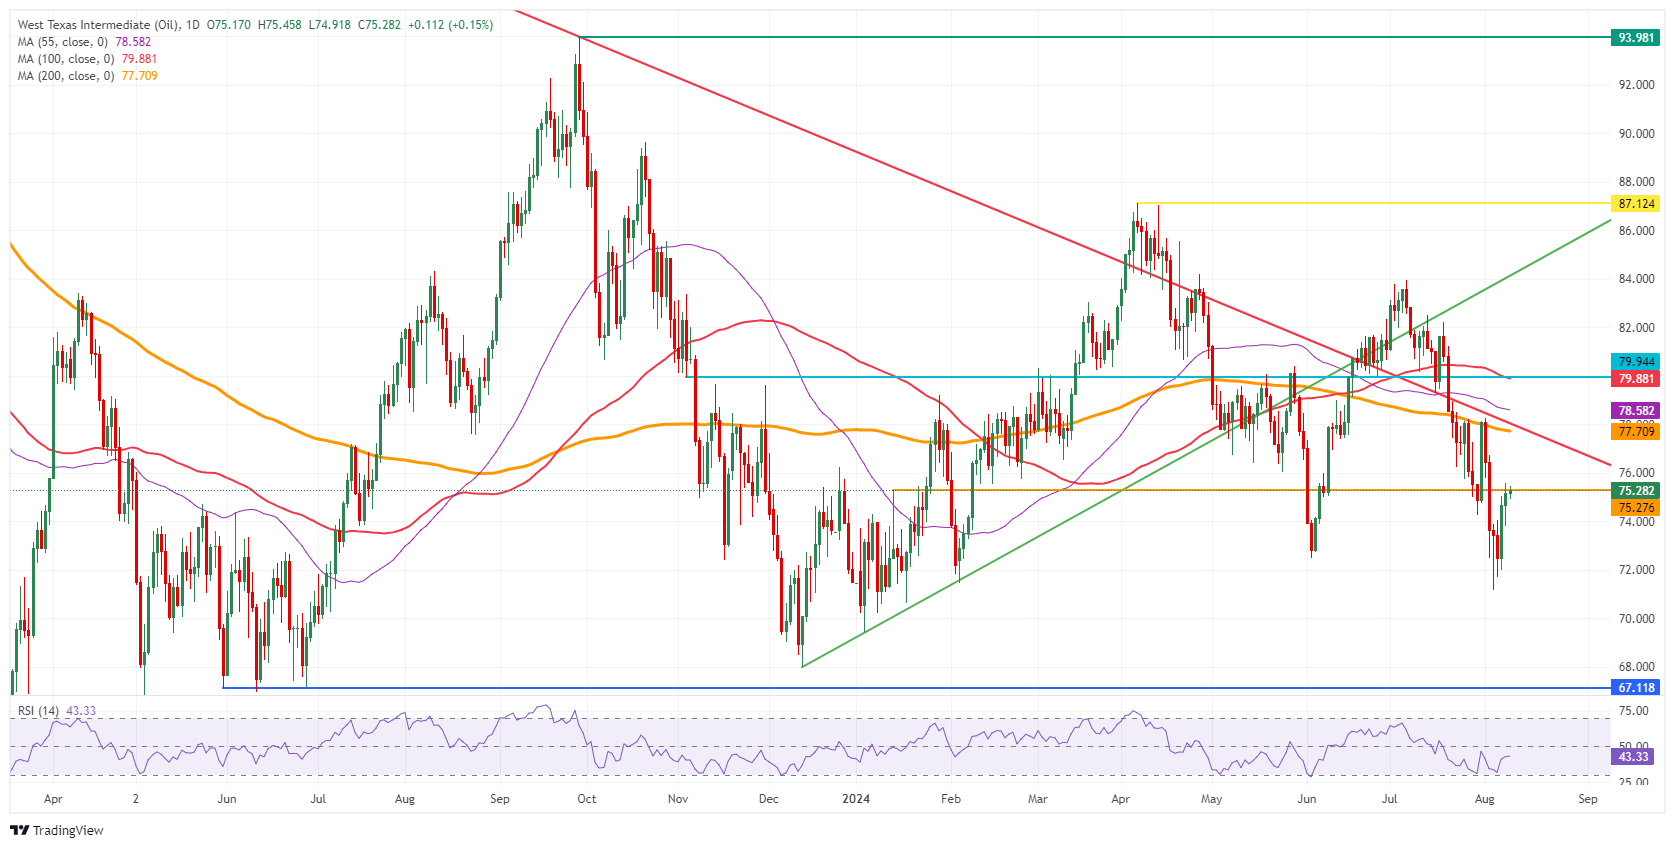
US WTI Crude Oil: Daily Chart
WTI Oil FAQs
WTI Oil is a type of Crude Oil sold on international markets. The WTI stands for West Texas Intermediate, one of three major types including Brent and Dubai Crude. WTI is also referred to as “light” and “sweet” because of its relatively low gravity and sulfur content respectively. It is considered a high quality Oil that is easily refined. It is sourced in the United States and distributed via the Cushing hub, which is considered “The Pipeline Crossroads of the World”. It is a benchmark for the Oil market and WTI price is frequently quoted in the media.
Like all assets, supply and demand are the key drivers of WTI Oil price. As such, global growth can be a driver of increased demand and vice versa for weak global growth. Political instability, wars, and sanctions can disrupt supply and impact prices. The decisions of OPEC, a group of major Oil-producing countries, is another key driver of price. The value of the US Dollar influences the price of WTI Crude Oil, since Oil is predominantly traded in US Dollars, thus a weaker US Dollar can make Oil more affordable and vice versa.
The weekly Oil inventory reports published by the American Petroleum Institute (API) and the Energy Information Agency (EIA) impact the price of WTI Oil. Changes in inventories reflect fluctuating supply and demand. If the data shows a drop in inventories it can indicate increased demand, pushing up Oil price. Higher inventories can reflect increased supply, pushing down prices. API’s report is published every Tuesday and EIA’s the day after. Their results are usually similar, falling within 1% of each other 75% of the time. The EIA data is considered more reliable, since it is a government agency.
OPEC (Organization of the Petroleum Exporting Countries) is a group of 13 Oil-producing nations who collectively decide production quotas for member countries at twice-yearly meetings. Their decisions often impact WTI Oil prices. When OPEC decides to lower quotas, it can tighten supply, pushing up Oil prices. When OPEC increases production, it has the opposite effect. OPEC+ refers to an expanded group that includes ten extra non-OPEC members, the most notable of which is Russia.
It was the expected close decision. By a vote of 3-2, the Mexican central bank (Banxico) yesterday decided to cut interest rates by 25 basis points to 10.75%, Commerzbank’s FX strategist Michael Pfister notes.
Peso set to remain under pressure
“At the same time, the statement clearly indicated that rate cuts could continue in the coming months. This was despite an upward revision to the headline inflation forecast for the end of the year. Banxico seems to be focusing more on the core rate, which is less volatile and, in the eyes of policymakers, has more of a downward trend.”
“In my view, the rate cut sends a very clear signal: inflation no longer seems to be Banxico's main focus, but growth concerns (also underpinned by the second quarter figures, which were again weak last week) prevail. This is certainly justified, given that the real interest rate remains clearly positive even after the decision.”
“However, it should be noted that the core rate has recently given little indication that the inflation target will be reached in the next year and a half. And US recession concerns are unlikely to go away. Given these risks and the fact that Banxico has acted despite the MXN depreciation, we feel confirmed in our view that the Peso will remain under pressure.”
- USD/JPY trades back and forth above 147.00 as investors look for fresh guidance on Fed’s rate-cut path.
- Market speculation for Fed rate cuts in September appears as imminent.
- The BoJ acknowledged the need to hike interest rates further this year.
The USD/JPY pair trades in a tight range above 147.00 in Friday’s European session. The asset consolidates as investors look for fresh cues about how much the Federal Reserve (Fed) will cut interest rates this year.
The Fed seems certain that it will start reducing its key borrowing rates from the September. While investors are divided whether the rate-cut size will be quarter or half to a percent.
According to the CME FedWatch tool, 30-day Federal Funds Futures pricing data shows that traders see a 56.5% chance that interest rates will be reduced by 50 bps in September, which has come down from 74% recorded a week ago.
Market speculation for Fed reducing rates by 50 bps eased slightly as fears of a global slowdown have diminished after the release of the lower-than-expected United States (US) Initial Jobless Claims. The data indicated that labor market conditions have not slowed to great extent as the Nonfarm Payrolls (NFP) report for July exhibited.
A decline in Fed 50 bps rate-cut prospects has offered some relief to the US Dollar (USD). The US Dollar Index (DXY), which tracks the Greenback’s value against six major currencies, edges lower in Friday’s European trading hours but holds its recovery above 103.00.
Meanwhile, the Japanese Yen’s outlook remains firm on expectations that the Bank of Japan (BoJ) could raise interest rates further this year. On Thursday, Bank of Japan’s (BoJ) Summary of Opinions (SoP) indicated that officials acknowledged the need of more rate hikes, in the July 30-31 meeting, to tame inflationary pressures, driven by higher import prices.
Japanese Yen FAQs
The Japanese Yen (JPY) is one of the world’s most traded currencies. Its value is broadly determined by the performance of the Japanese economy, but more specifically by the Bank of Japan’s policy, the differential between Japanese and US bond yields, or risk sentiment among traders, among other factors.
One of the Bank of Japan’s mandates is currency control, so its moves are key for the Yen. The BoJ has directly intervened in currency markets sometimes, generally to lower the value of the Yen, although it refrains from doing it often due to political concerns of its main trading partners. The current BoJ ultra-loose monetary policy, based on massive stimulus to the economy, has caused the Yen to depreciate against its main currency peers. This process has exacerbated more recently due to an increasing policy divergence between the Bank of Japan and other main central banks, which have opted to increase interest rates sharply to fight decades-high levels of inflation.
The BoJ’s stance of sticking to ultra-loose monetary policy has led to a widening policy divergence with other central banks, particularly with the US Federal Reserve. This supports a widening of the differential between the 10-year US and Japanese bonds, which favors the US Dollar against the Japanese Yen.
The Japanese Yen is often seen as a safe-haven investment. This means that in times of market stress, investors are more likely to put their money in the Japanese currency due to its supposed reliability and stability. Turbulent times are likely to strengthen the Yen’s value against other currencies seen as more risky to invest in.
Crude oil continues it recovery from its recent plunge as elevated geopolitical risks came into focus, ANZ commodity analysts note.
Jet fuel demand in China is on the rise
“Israel remains on edge as it prepares for a retaliatory attack from Iran following the assassination of Hamas and Hezbollah leaders. However, a call between Iran’s President Masoud Pezeshkian and French counterpart Emmanual Macron potentially opened a diplomatic path to de-escalation.”
“There is also no end in sight to the political situation that has closed Libya’s Sharara oil field. The National Oil Company has declared force majeure at the field, which was producing about 270kb/d before the closure.
One bright spot in the oil market is jet fuel demand in China. Total air traffic grew by 14% in June compared with the same period 2019. Domestic flights are up nearly 10%, according to government data. This is leading the country’s refiners to lift output of the aviation fuel to take advantage of improved margins.”
- The US Dollar is back in the red after eking out gains earlier in the week.
- The technical picture raises a worrying sign for the coming weeks.
- The US Dollar index closed above a key level on Thursday.
The US Dollar (USD) starts on the back foot again on Friday, as it almost did nearly every trading day this week. As such, there is no issue, seeing that the US Dollar Index has been able to print three consecutive days of gains. The effect of the lower-than-expected Initial Jobless Claims print from Thursday is quickly fading, and with an empty calendar ahead, it could be a day of more outflow for the US Dollar ahead of the weekend.
On the economic data front, there is an empty calendar ahead with no data points that will move markets or the US Dollar. This means that either headlines or geopolitical events will drive markets to close the week. The weekly close for the US Dollar will be vital ahead of next week when the US Consumer Price Index (CPI) and the US Retail Sales data for July are on the docket.
Daily digest market movers: Volatility to pick up again
- A slew of US Federal Reserve (Fed) members left a few comments overnight in terms of where they see the Fed policy at the moment:
- President of the Federal Reserve Bank of Chicago Austan Goolsbee said that the Fed is watching markets, though that does not influence the Fed’s policy. Goolsbee also expressed his unease that the Fed would cut so close to US elections.
- Kansas City Fed President Jeffrey Schmid said that it is appropriate to cut when inflation continues to come in low. Schmid also noted that the job market is still in very good shape.
- China’s data this week remained very disappointing after imports surpassed exports, making the Chinese main exporter suddenly an importer for the month of July. More concerns are now at hand, with Consumer Prices rising 0.5% against July last year. The People’s Bank of China (PBoC) might be forced to raise rates in order to tame inflation, while it wants to keep rates low or even lower in order to boost exports.
- Equity markets look a bit two-faced on Friday, with Asian stocks set to close in positive territory, while European indices and US futures are mildly negative.
- The CME Fedwatch Tool shows a 54.5% chance of a 50 basis points (bps) interest rate cut by the Federal Reserve (Fed) in September against a 45.5% chance for only 25 bps. Another 25 bps cut (if September is a 50 bps cut) is expected in November by 51.9%, while a 15.8% chance for a 50 bps cut and 32.3% for no cut are being pencilled in for that meeting.
- The US 10-year benchmark rate trades at 3.97% after popping above 4.00% briefly on Thursday.
US Dollar Index Technical Analysis: Fools rush in
The US Dollar Index (DXY) faces pressure near the pivotal level of 103.18 after closing above it for the first time this week on Thursday. Thus, Friday’s close will be even more important as there could be more downside in the cards towards next week.
Still the first level to recover, which gains importance every day, is 103.18, a level held on Friday last week though snapped on Monday this week in the Asian hours.. Once the DXY closes above that level, next up is 104.00, which was the support from June. If the DXY can make its way back above that level, the 200-day Simple Moving Average (SMA) at 104.17 is the next resistance level to look out for.
On the downside, the oversold condition in the Relative Strength Index (RSI) indicator has eased in the daily chart and holds room again for a small leg lower. Support nearby is the March 8 low at 102.35. Once through there, pressure will start to build on 102.00 as a big psychological figure before testing 101.90, which was a pivotal level in December 2023 and January 2024.
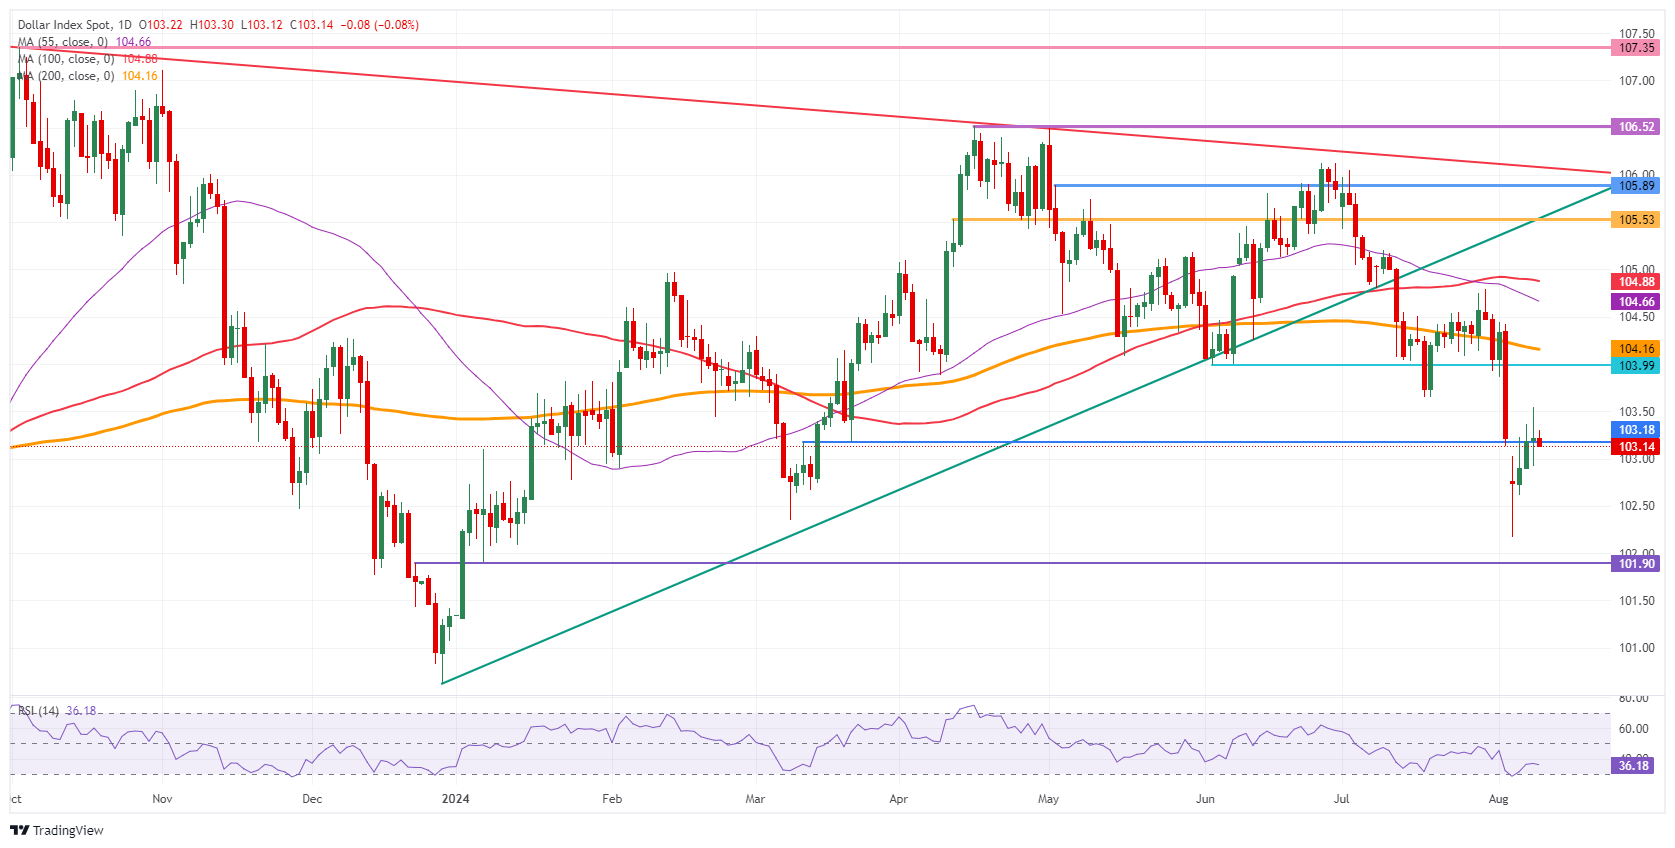
US Dollar Index: Daily Chart
US Dollar FAQs
The US Dollar (USD) is the official currency of the United States of America, and the ‘de facto’ currency of a significant number of other countries where it is found in circulation alongside local notes. It is the most heavily traded currency in the world, accounting for over 88% of all global foreign exchange turnover, or an average of $6.6 trillion in transactions per day, according to data from 2022. Following the second world war, the USD took over from the British Pound as the world’s reserve currency. For most of its history, the US Dollar was backed by Gold, until the Bretton Woods Agreement in 1971 when the Gold Standard went away.
The most important single factor impacting on the value of the US Dollar is monetary policy, which is shaped by the Federal Reserve (Fed). The Fed has two mandates: to achieve price stability (control inflation) and foster full employment. Its primary tool to achieve these two goals is by adjusting interest rates. When prices are rising too quickly and inflation is above the Fed’s 2% target, the Fed will raise rates, which helps the USD value. When inflation falls below 2% or the Unemployment Rate is too high, the Fed may lower interest rates, which weighs on the Greenback.
In extreme situations, the Federal Reserve can also print more Dollars and enact quantitative easing (QE). QE is the process by which the Fed substantially increases the flow of credit in a stuck financial system. It is a non-standard policy measure used when credit has dried up because banks will not lend to each other (out of the fear of counterparty default). It is a last resort when simply lowering interest rates is unlikely to achieve the necessary result. It was the Fed’s weapon of choice to combat the credit crunch that occurred during the Great Financial Crisis in 2008. It involves the Fed printing more Dollars and using them to buy US government bonds predominantly from financial institutions. QE usually leads to a weaker US Dollar.
Quantitative tightening (QT) is the reverse process whereby the Federal Reserve stops buying bonds from financial institutions and does not reinvest the principal from the bonds it holds maturing in new purchases. It is usually positive for the US Dollar.
The Hungarian forint has recovered somewhat from its recent low while world markets were in turmoil. It appears that a stronger-than-expected inflation reading for July helped the recovery yesterday, at least at the margin. In July, all three underlying inflation indicators provided by the National Bank (MNB) were strong, with the tax-adjusted core inflation measure rising by 0.64% m/m compared with 0.5% m/m in June, Commerzbank’s FX strategist Tatha Ghose notes.
Slight further rate cuts are expected
“The ‘conditioned reflex’ of the market – wherein stronger inflation data boost the currency and weaker inflation data hurt the currency – need not make rational sense. An upward inflation surprise would help the currency only if it meant that the central bank would adjust interest rates strongly in response; else, the reaction should be the opposite.”
“In MNB’s case, slight further rate cuts are expected, but the base rate level is still relatively high (6.75%) and if monetary easing were to stop after just a 25bp further reduction, then the monetary stance would remain reasonably restrictive. Conversely, a series of further rate cuts could be detrimental.”
“In other words, the sensitivity of policy to inflation is high. Signs that underlying inflation is accelerating can make a significant difference to MNB’s easing plans – perhaps, the July data will have this effect. Hence, it is consistent that the stronger-than-expected July print had a HUF-positive effect.”
- AUD/JPY turns sideways near 97.00 after a three-day winning spree.
- The Australian Dollar rises on improved market sentiment and RBA Bullock’s hawkish interest rate guidance.
- Growing concerns over BoJ further policy tightening.
The AUD/JPY pair exhibits indecisiveness among market participants near 97.00 in Friday’s European session. The cross struggles to extend its winning spree for the fourth trading session on Friday. However, the near-term trend is bullish as the strong appeal of the Japanese Yen (JPY) as a safe haven amid market mayhem has diminished.
Lower-than-expected United States (US) Initial Jobless Claims for the week ending August 2 and higher-than-expected China’s Consumer Price Index (CPI) data for July have improved risk-appetite of market participants.
Meanwhile, easing expectations of more rate hikes by the Bank of Japan (BoJ) has also limited the upside in Yen. On Wednesday, BoJ Deputy Governor Shinichi Uchida said, “We won’t raise rates when markets are unstable.”
On the Aussie front, hawkish guidance from Reserve Bank of Australia (RBA) Governor Michelle Bullock on interest rates has boosted the Australian Dollar’s (AUD) appeal. Bullock said the central bank is vigilant to inflation risks and interest rates would be hiked further if needed.
Going forward, the next move in the Australian Dollar will be influenced by the Q2 Wage Price Index data, which will be published on Tuesday. Investors will keenly focus on the wage data as it influences consumer spending, which eventually impacts inflationary pressures.
AUD/JPY oscillates in an Ascending Triangle chart pattern on an hourly timeframe, which exhibits a sharp volatility contraction. The 50-hour Exponential Moving Average (EMA) near 96.40 continues to provide support to the Australian Dollar bulls. Earlier, the asset delivered a V-shape recovery after posting a fresh annual low near 90.00.
The 14-period Relative Strength Index (RSI) falls inside the 40.00-60.00 range, suggesting a sideways trend.
The formation of a volatility contraction pattern after a strong recovery leads to a decisive break on the upside. The occurrence of the same would drive the asset towards 98.00 and August 1 high of 98.74.
On the contrary, a breakdown below the round-level support of 95.00 will expose the cross to August 6 low at 93.42, followed by August 5 average price of 92.46.
AUD/JPY hourly chart
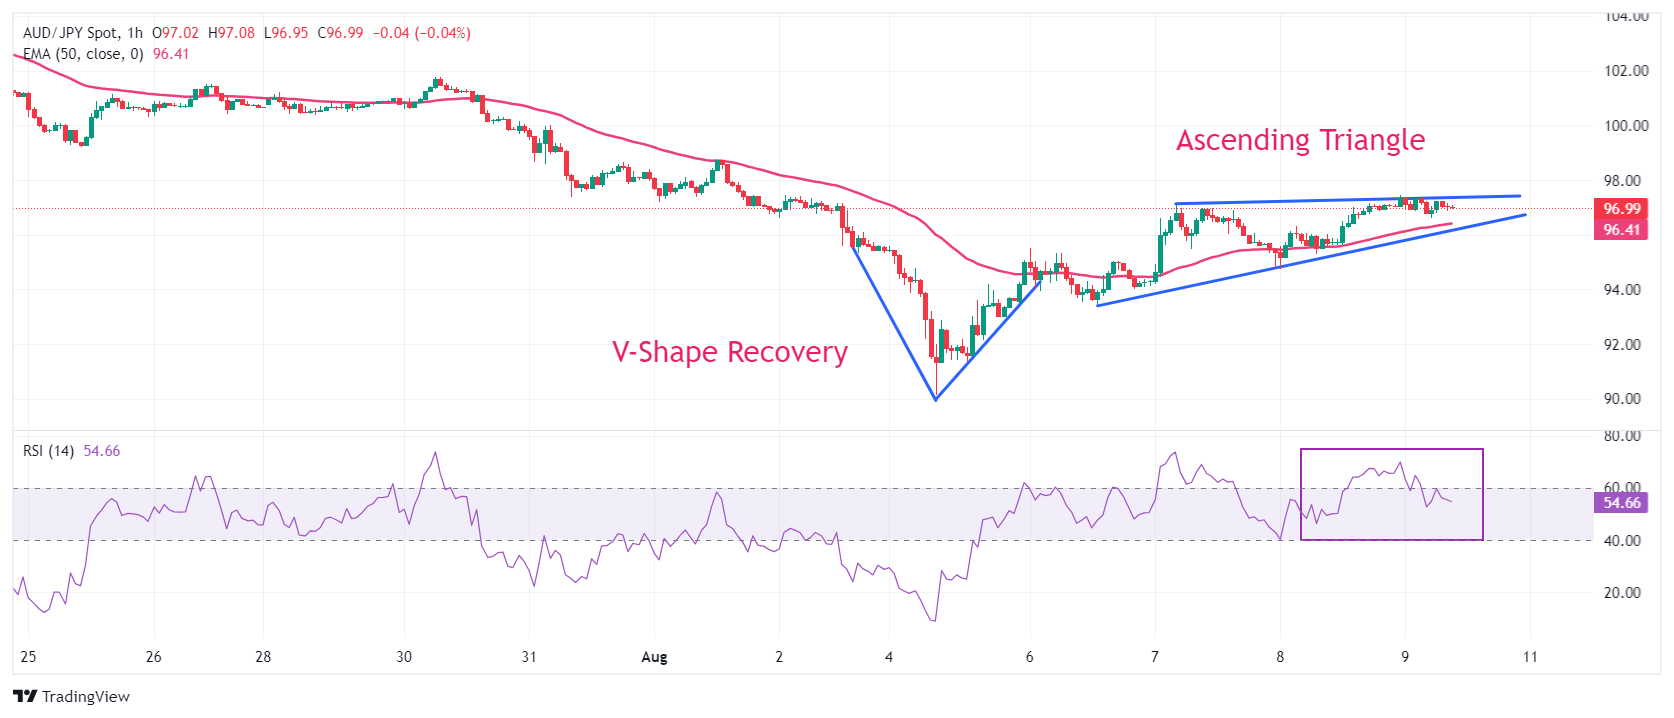
Economic Indicator
RBA Governor Bullock speech
Michele Bullock is the the ninth Governor of the Reserve Bank of Australia. She commenced her current position in September 2023, replacing Philip Lowe. Bullock was the Assistant Governor (Financial System) at the Reserve Bank of Australia, a position she held since October 2016.
Read more.
Consumer prices in China rose 0.5% in July from a year earlier, much more than most analysts in a Bloomberg survey expected. However, the increase was mainly driven by food prices, which stopped declining in July as they had in the previous month, Commerzbank’s FX strategist Volkmar Baur notes.
Low price inflation is not limited to housing
“Core inflation, on the other hand, fell to just 0.4% year-on-year, the same level as in January - the lowest level ever recorded outside the pandemic. China's ongoing property crisis is clearly having an impact on inflation.”
“Although China does not publish official weights for its CPI basket, housing costs are estimated to account for around 20% of the CPI. And here, the negative price trend is becoming more pronounced - also a novelty outside of pandemic times. In July, housing costs fell by 0.3% year-on-year, which is also reflected in the core rate due to its assumed high weight in the index.”
“However, low price inflation is not limited to housing. In addition, none of the 7 major categories has a year-on-year inflation rate above 2%. None of this means that China is in deflation. Price trends are positive and core inflation remains above zero. However, chances are that China is just one external shock away from falling into deflation. This is a risk that is being seen and priced into the currency (and bond) markets – and weighing on the CNY.”
On Friday the calendar is empty in the region except for the Czech National Bank minutes. Last week, the central bank slowed the pace of cutting from 50bp to 25bp for the first time, ING’s FX strategist Frantisek Taborsky notes.
Economic data continues to surprise to the downside
“The forecast showed only limited scope for rate cuts, well above current market pricing, and the governor would not give any forward guidance on what to expect next. So, the minutes could provide some indication of where the discussion is within the board. However, we can expect the minutes to be more on the hawkish side versus current pricing with 3.60% at the end of this year, implying 90bp of rate cuts.”
“The CZK has been the only currency strengthening over the last week and we still see potential for a continued rally here, especially if the market reprices current dovish expectations. On the other hand, economic data continues to surprise to the downside, which will make the case that the central bank is behind the curve and the market will have reasons to keep some rate cuts priced in, limiting the CZK.”
Thursday's inflation in Hungary surprised slightly to the upside with a rise from 3.7% to 4.1%, but there is a bigger surprise here compared to the National Bank of Hungary's (NBH) forecast of 3.8% year-on-year, ING’s FX strategist Frantisek Taborsky notes.
At least three more cuts this year
“Given the rally we have seen in previous weeks in the HUF rates market, it is not so surprising that the market has started to reprice the current dovish expectations of central bank rate cuts. Still, the market is pricing in at least three cuts or even a little more than that with a chance we could see some movement this month.”
“That said, our economists say the inflation numbers do not strongly point to a rate cut in August and see room for only two more reductions this year. While we believe the market will stay on the dovish side of market pricing, there is some room for profit-taking and repricing up. HUF is thus getting some boost for gains after two weeks of depreciation.”
“Yesterday, we saw EUR/HUF already moving lower, the most within the CEE region, and we expect more today below 396 and possibly more if rates remain paid.”
The Norwegian krone has been shaken since the publication of the last inflation figures at the beginning of July. Four weeks ago, inflation for June surprised to the downside, putting downward pressure on the NOK, as the market was obviously speculating that disinflation would finally take hold in Norway, meaning that Norges Bank could possibly cut the key interest rate sooner, Commerzbank’s FX strategist Volkmar Baur notes.
Significant gains are difficult for the NOK
“Today we will likely be able to better assess this since the data for July will be published. Generally speaking, however, it should be noted that inflation at 2.6%, and above all the core rate at 3.4%, are still well above Norges Bank's target of 2%. The monthly rates of change in the trend are also still too high to guarantee a rapid return to the inflation target. Therefore, I think it is quite justified that Norges Bank is cautious with first interest rate cuts.”
“But it is not only the latest inflation figures that have shaken the NOK. Risk aversion and the oil price did the rest, as did the fact that the potential for interest rate cuts plays a role in the performance of a currency when risk aversion increases. And with a key interest rate of 4.50% since the end of 2023 and Norges Bank continuing to sound restrictive, the NOK naturally suffers particularly in such phases.”
“If the inflation figures for July show that Norges Bank is right in its assumption that inflation will remain elevated for longer, the market could regain more confidence in Norges Bank's restrictive stance, especially as it holds its rate meeting next week. Nevertheless, I must of course concede that in the current uncertain and risk-averse market environment, significant gains are difficult for the NOK.”
EUR/USD dived below 1.090 on Thursday after US jobless claims data, but then rapidly rebounded as the initial move proved understandably overdone, ING’s FX strategist Francesco Pesole notes.
The case for a higher EUR/USD is intact
“The 2-year EUR:USD swap rate gap has only marginally re-widened to -104bp, meaning the case for a higher EUR/USD is still very much intact. The improvement in risk sentiment should incidentally favour a leg higher.”
“The risk is, if anything, that markets hold a more defensive view and tolerate an undervalued EUR/USD for longer ahead of the key US CPI risk event. Even in that scenario, we would think EUR/USD would flatten rather than materially depreciate given the favourable rate spread.”
“The eurozone calendar and ECB speaker schedule remain quiet, and we still look for 1.10 in the near term. We also continue to favour a EUR/GBP appreciation back above 0.860 despite yesterday’s risk-driven correction.”
- EUR/USD trades sideways above 1.0900 amid uncertainty over Fed-ECB interest rates.
- The ECB is expected to deliver two more rate cuts this year.
- Lower-than-expected US Initial Jobless Claims offered relief to widespread risk-aversion.
EUR/USD holds gains above 1.0900 as the US Dollar (USD) edges lower on firm Fed rate-cut prospects. The US Dollar Index (DXY), which tracks the Greenback’s value against six major currencies, trades near 103.00 after correcting from a four-day high of 103.50.
The expectations for Fed rate cuts rose significantly this week after the weak United States (US) Nonfarm Payrolls (NFP) report for July published last Friday, which prompted fears that the economy is entering a recession. This bolstered risk aversion, which caused global equity markets to face an intense sell-off on Monday.
Meanwhile, fears of a weakening US labor market have been diminished by lower-than-expected Initial Jobless Claims for the week ending August 2. The data showed on Thursday that the number of individuals claiming jobless benefits for the first time came in lower at 233K than estimates of 240K and the prior release of 250K (upwardly revised from 249K).
Commenting on the latest jobless claims print, Gennadiy Goldberg, head of US rates strategy at TD Securities in New York, said: “This is a very positive print for markets overall. It reinforces the fact that labor market momentum is not slowing to the same extent that was represented by the payroll report, and it also reinforces the absence of very significant layoffs in the economy.”
According to the CME FedWatch tool, investors are divided over the size of Fed rate cuts in September. 30-day Federal Funds futures pricing data shows that traders see a 54.5% chance that interest rates will be reduced by 50 bps in September, down from 74% recorded a week ago.
Daily digest market movers: EUR/USD consolidates while US Dollar edges lower
- EUR/USD trades sideways above the round-level support of 1.0900 in Friday’s European session. The major currency pair trades inside Thursday’s trading range, with investors looking for fresh cues indicating how much the European Central Bank (ECB) and the US Federal Reserve (Fed) will cut interest rates this year.
- The ECB is expected to cut interest rates two times more this year as the Eurozone economy is going through a rough phase, and price pressures are on track to return to the desired rate of 2%. However, ECB officials continue to refrain from committing to a pre-defined rate-cut path as they expect the way towards the central bank’s target of 2%.
- On Wednesday, Finnish ECB policymaker Olli Rehn said in a speech, "Inflation continues to slow down but the path to the two percent target remains bumpy this year." “He added the rate cuts would help the eurozone economy recover, in particular the "fragile" industrial growth and subdued investments,” Reuters reported.
Euro PRICE Today
The table below shows the percentage change of Euro (EUR) against listed major currencies today. Euro was the strongest against the Australian Dollar.
| EUR | USD | GBP | JPY | CAD | AUD | NZD | CHF | |
|---|---|---|---|---|---|---|---|---|
| EUR | 0.02% | -0.01% | 0.00% | 0.07% | 0.23% | -0.04% | -0.22% | |
| USD | -0.02% | -0.05% | -0.07% | 0.05% | 0.21% | -0.05% | -0.25% | |
| GBP | 0.01% | 0.05% | 0.02% | 0.07% | 0.25% | -0.03% | -0.19% | |
| JPY | 0.00% | 0.07% | -0.02% | 0.06% | 0.26% | -0.03% | -0.18% | |
| CAD | -0.07% | -0.05% | -0.07% | -0.06% | 0.16% | -0.09% | -0.27% | |
| AUD | -0.23% | -0.21% | -0.25% | -0.26% | -0.16% | -0.27% | -0.44% | |
| NZD | 0.04% | 0.05% | 0.03% | 0.03% | 0.09% | 0.27% | -0.17% | |
| CHF | 0.22% | 0.25% | 0.19% | 0.18% | 0.27% | 0.44% | 0.17% |
The heat map shows percentage changes of major currencies against each other. The base currency is picked from the left column, while the quote currency is picked from the top row. For example, if you pick the Euro from the left column and move along the horizontal line to the US Dollar, the percentage change displayed in the box will represent EUR (base)/USD (quote).
Technical Analysis: EUR/USD trades inside Channel formation
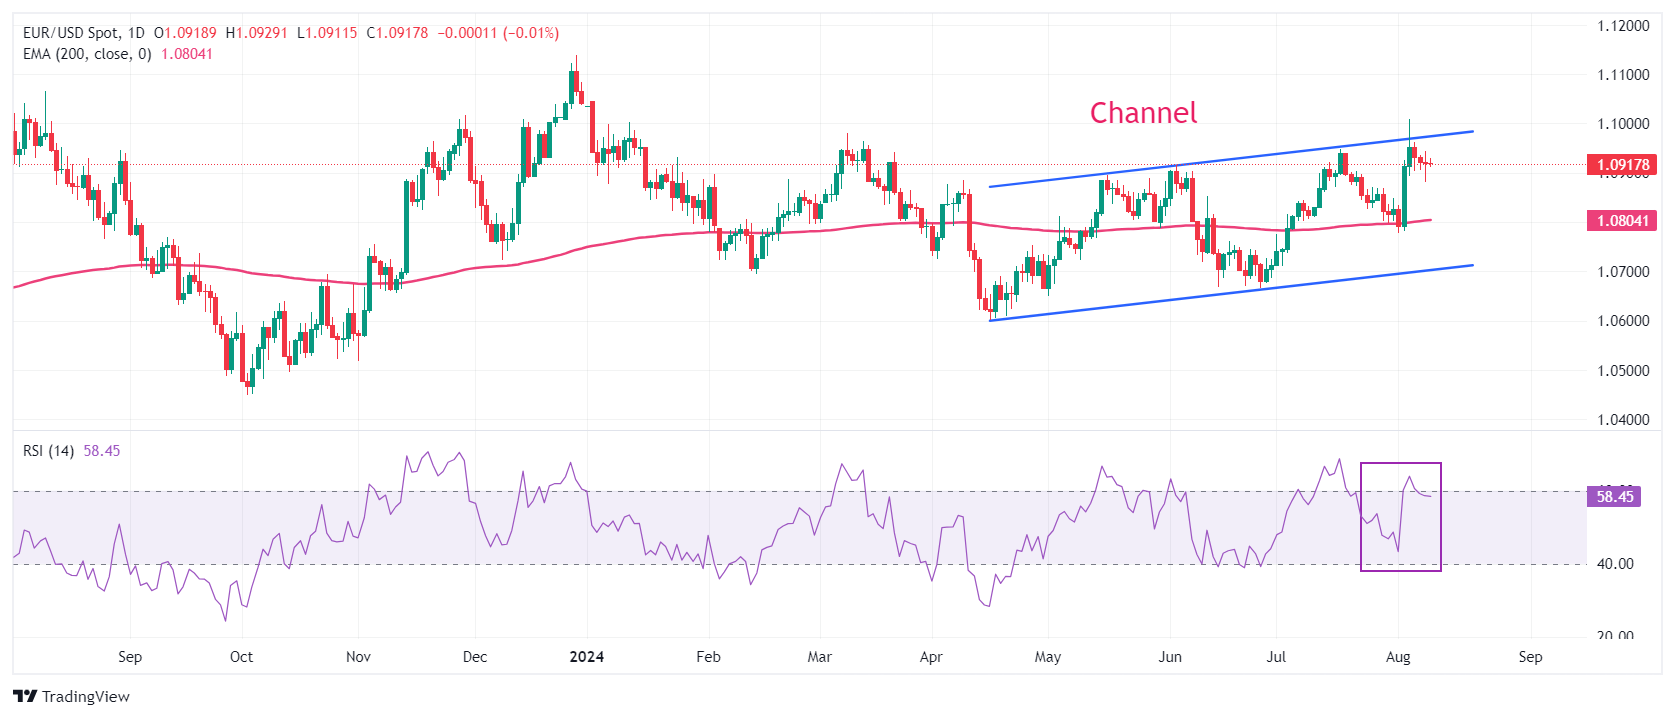
EUR/USD trades near the upper boundary of a Channel formation on a daily timeframe. A breakout of the aforementioned chart pattern results in wider ticks on the upside and heavy volume. The 200-day Exponential Moving Average (EMA), near 1.0800, acted as major support for the Euro bulls.
The 14-day Relative Strength Index (RSI) indicator returns inside the 40.00-60.00 range. If the RSI rises above 60.00, bullish momentum will be triggered.
More upside would appear if the major currency pair breaks above Monday’s high of 1.1009. This would drive EUR/USD towards the August 10, 2023, high at 1.1065, followed by the round-level resistance at 1.1100.
In an alternate scenario, a downside move below the August 1 low at 1.0777 would drag the pair toward the February low near 1.0700. A breakdown below the latter would expose the asset to the June 14 low at 1.0667.
Economic Indicator
Initial Jobless Claims
The Initial Jobless Claims released by the US Department of Labor is a measure of the number of people filing first-time claims for state unemployment insurance. A larger-than-expected number indicates weakness in the US labor market, reflects negatively on the US economy, and is negative for the US Dollar (USD). On the other hand, a decreasing number should be taken as bullish for the USD.
Read more.Last release: Thu Aug 08, 2024 12:30
Frequency: Weekly
Actual: 233K
Consensus: 240K
Previous: 249K
Source: US Department of Labor
Every Thursday, the US Department of Labor publishes the number of previous week’s initial claims for unemployment benefits in the US. Since this reading could be highly volatile, investors may pay closer attention to the four-week average. A downtrend is seen as a sign of an improving labour market and could have a positive impact on the USD’s performance against its rivals and vice versa.
After the wild ride of the past few weeks, USD/JPY seems to be settling down. Over the past three days, the pair has stabilized around the 147 level. Prior to that, the Japanese Yen (JPY) had gained almost 10% against the US Dollar (USD) in just five trading days, only to give back about 4% in two days, Commerzbank’s FX strategist Volkmar Baur notes.
More volatility for USD/JPY
“I could see USD/JPY moving back towards 150, but the calm of the past few days seems more like an unstable equilibrium. For the moment, the exchange rate seems to have calmed down, but the US is still expected to cut its key interest rates about four times by the end of the year. However, our economists still do not expect a recession in the U.S., so they still expect only two rate cuts.”
“In this case, USD/JPY should gradually rise, but only if this repricing also happens gradually. However, market expectations are rarely changed gradually – it usually happens by a trigger and then again somewhat abruptly. And since the market is still struggling to find an appropriate level for USD/JPY, this could well lead to more volatility.”
“I would like to say a few words about the comments made by BoJ Deputy Governor Uchida, which have of course already been discussed at length here. Because there is one thing that I find remarkable. He said that interest rates should remain unchanged as long as market volatility is high. The BoJ has once again maneuvered itself into a very difficult situation. And it is entirely its own fault. One almost feels sorry for the JPY.”
The abnormally large reaction to jobless claims figures yesterday was a testament to markets' extremely elevated sensitivity to all sorts of indications on the US macro outlook right now. Perhaps many investors saw the recent equity selloff and dovish repricing in Fed rate expectations as an excessively pessimistic reflection of what's going on and were waiting for the first encouraging piece of data to pay US Dollar (USD) rates, ING’s FX strategist Francesco Pesole notes.
Any core CPI upside surprise is set to be USD positive
“In practice, the jobless claims report was not that informative. The decline from 250k to 233k was a surprise, but continuing claims actually rose in the week into 27 July from a revised 1869k to 1875k. That still indicates difficulties there for people wanting to rejoin the workforce.”
“Now, we can reasonably expect the market reaction to next week’s US core CPI numbers to be significant even for small from the consensus 0.2% MoM. Any upside surprise would be a clear-cut USD positive, as equities would sell off. However, short-dated UST could also come under pressure on a hawkish Fed repricing, unlike in the first unemployment-driven stock market rout.”
“Today, the data calendar only includes non-market-moving NY Fed inflation expectations and the July monthly budget statement. With two-year USD swap rates struggling to rebound above 3.80-3.85% as Fed rate cut bets by year-end prove sticky around 100bp, the room for the dollar to re-link with less supportive rate fundamentals remains wide. We still look for a return below 103.0 in DXY.”
- USD/CAD bounces off a multi-week low touched this Friday, albeit lacks follow-through.
- An uptick in Oil prices underpins the Loonie and acts as a headwind amid a softer USD.
- Traders also seem reluctant to place aggressive bets ahead of the Canadian jobs report.
The USD/CAD pair once again finds some support near the 50-day Simple Moving Average (SMA) and stages a modest bounce from the 1.3720-1.3715 region, or a three-week low touched earlier this Friday. Spot prices, however, struggle to capitalize on the move and remain below mid-1.3700s through the first half of the European session.
Meanwhile, the uptick lacks any obvious fundamental catalyst and could be solely attributed to some repositioning trade ahead of the release of Canadian monthly employment details. Any meaningful recovery, however, still seems elusive in the wake of the recent rise in Crude Oil prices, which tends to underpin the commodity-linked Loonie. Furthermore, the emergence of some US Dollar (USD) selling, led by a fresh leg down in the US Treasury bond yields, further contributes to capping gains for the USD/CAD pair.
From a technical perspective, oscillators on the daily chart have just started gaining negative traction and support prospects for an extension of the recent sharp pullback from the vicinity of the mid-1.3900s, or the highest level since October 2022 touched on Monday. Bearish traders, however, might wait for a sustained break and acceptance below the 50-day SMA pivotal support before placing fresh bets. The USD/CAD pair might then weaken further below the 1.3700 mark and test the 1.3680-1.3675 support zone.
The downward trajectory could extend further towards the mid-1.3600s en route to the 1.3600 round figure. The latter coincides with the technically significant 200-day SMA, which if broken decisively will be seen as a fresh trigger for bearish traders and pave the way for a further near-term depreciating move.
On the flip side, the overnight swing high, around the 1.3765 region, could act as an immediate hurdle ahead of the 1.3800 mark. A sustained strength beyond will suggest that the corrective decline witnessed since the beginning of the week has run its course and prompt an aggressive short-covering move. The USD/CAD pair might then climb to the 1.3845-1.3850 intermediate hurdle before aiming for the 1.3900 mark. Nevertheless, spot prices remain on track to register weekly losses for the first time in the previous four.
USD/CAD daily chart
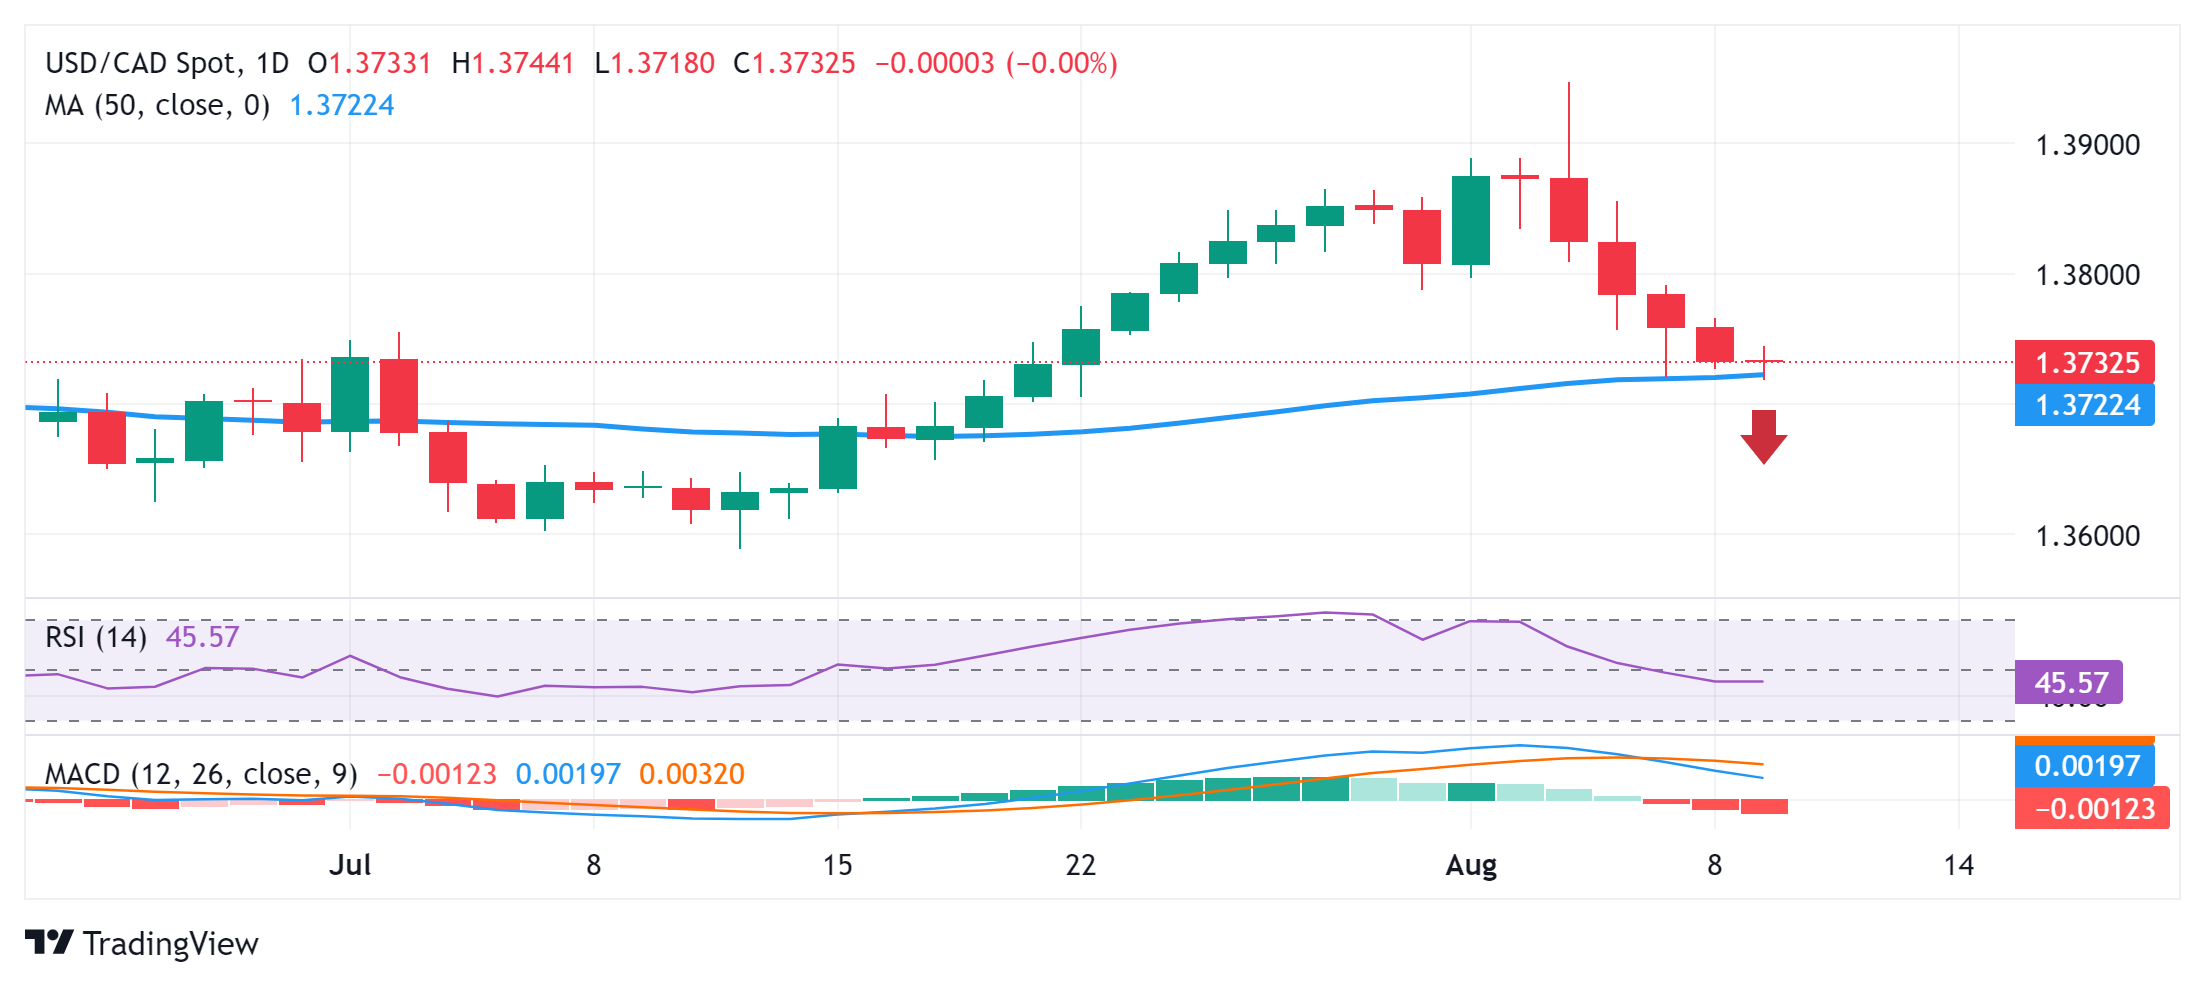
Canadian Dollar FAQs
The key factors driving the Canadian Dollar (CAD) are the level of interest rates set by the Bank of Canada (BoC), the price of Oil, Canada’s largest export, the health of its economy, inflation and the Trade Balance, which is the difference between the value of Canada’s exports versus its imports. Other factors include market sentiment – whether investors are taking on more risky assets (risk-on) or seeking safe-havens (risk-off) – with risk-on being CAD-positive. As its largest trading partner, the health of the US economy is also a key factor influencing the Canadian Dollar.
The Bank of Canada (BoC) has a significant influence on the Canadian Dollar by setting the level of interest rates that banks can lend to one another. This influences the level of interest rates for everyone. The main goal of the BoC is to maintain inflation at 1-3% by adjusting interest rates up or down. Relatively higher interest rates tend to be positive for the CAD. The Bank of Canada can also use quantitative easing and tightening to influence credit conditions, with the former CAD-negative and the latter CAD-positive.
The price of Oil is a key factor impacting the value of the Canadian Dollar. Petroleum is Canada’s biggest export, so Oil price tends to have an immediate impact on the CAD value. Generally, if Oil price rises CAD also goes up, as aggregate demand for the currency increases. The opposite is the case if the price of Oil falls. Higher Oil prices also tend to result in a greater likelihood of a positive Trade Balance, which is also supportive of the CAD.
While inflation had always traditionally been thought of as a negative factor for a currency since it lowers the value of money, the opposite has actually been the case in modern times with the relaxation of cross-border capital controls. Higher inflation tends to lead central banks to put up interest rates which attracts more capital inflows from global investors seeking a lucrative place to keep their money. This increases demand for the local currency, which in Canada’s case is the Canadian Dollar.
Macroeconomic data releases gauge the health of the economy and can have an impact on the Canadian Dollar. Indicators such as GDP, Manufacturing and Services PMIs, employment, and consumer sentiment surveys can all influence the direction of the CAD. A strong economy is good for the Canadian Dollar. Not only does it attract more foreign investment but it may encourage the Bank of Canada to put up interest rates, leading to a stronger currency. If economic data is weak, however, the CAD is likely to fall.
- Silver struggles to capitalize on a modest intraday uptick to the 23.6% Fibo. level.
- The technical setup favours bears and supports prospects for additional losses.
- Any meaningful rise could face difficulty in moving back above the 100-day SMA.
Silver (XAG/USD) struggles to capitalize on the previous day's goodish rebound from the $26.45 area, or the lowest level since early May and seesaws between tepid gains/minor losses through the early European session on Friday. The white metal now seems to have stabilized around the $27.50-$27.55 region and remains below the 23.6% Fibonacci retracement level of the July-August downfall.
The said barrier is pegged near the $27.75 region, which if cleared might trigger a short-covering rally and lift the XAG/USD to the $28.00 mark. The recovery momentum could extend further towards the 38.2% Fibo. level around the $28.50-$28.55 region, though is more likely to remain capped near the 100-day Simple Moving Average (SMA) breakpoint, near the $28.75-$28.80 area. However, some follow-through buying, leading to a subsequent strength beyond the $29.00 mark, might negate any near-term negative bias and pave the way for additional gains.
The XAG/USD might then climb to the $29.45 intermediate hurdle en route to the 61.8% Fibo. level, around the $29.75 region and eventually aim to reclaim the $30.00 psychological mark. That said, technical indicators on the daily chart – though have recovered from lower levels – are still holding deep in negative territory. This, in turn, warrants some caution for bullish traders and positioning for a further intraday appreciating move.
Meanwhile, any meaningful slide now seems to find some support near the $27.30-$27.25 area ahead of the $27.00 mark. A convincing break below has the potential to drag the XAG/USD back towards the $26.50-$26.45 area, or a multi-month low set on Wednesday. The latter should act as a key pivotal point, which if broken will be seen as a fresh trigger for bearish traders and make the white metal vulnerable to test the May monthly swing low, around the $26.00 mark. The commodity could drop further to the $25.60 horizontal support and the $25.00 psychological mark.
Silver daily chart
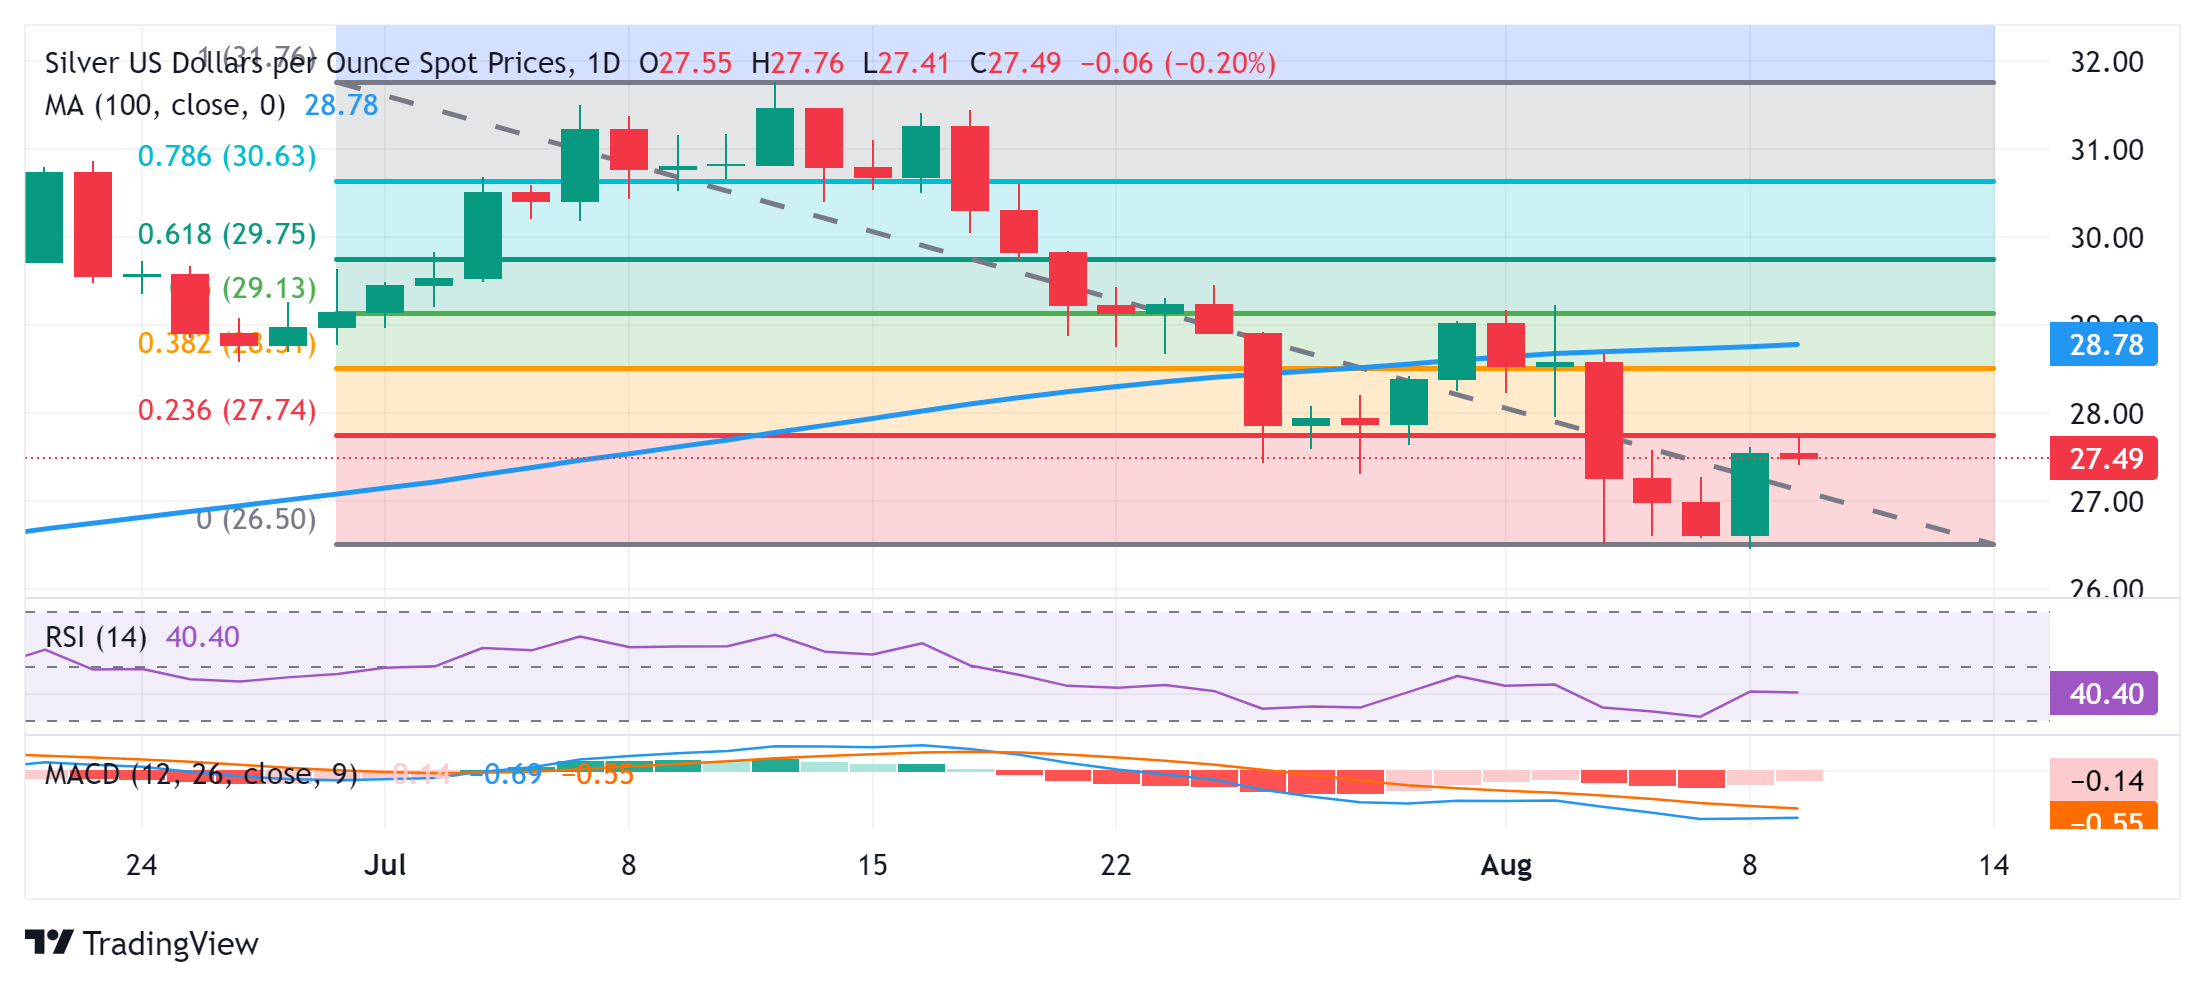
Silver FAQs
Silver is a precious metal highly traded among investors. It has been historically used as a store of value and a medium of exchange. Although less popular than Gold, traders may turn to Silver to diversify their investment portfolio, for its intrinsic value or as a potential hedge during high-inflation periods. Investors can buy physical Silver, in coins or in bars, or trade it through vehicles such as Exchange Traded Funds, which track its price on international markets.
Silver prices can move due to a wide range of factors. Geopolitical instability or fears of a deep recession can make Silver price escalate due to its safe-haven status, although to a lesser extent than Gold's. As a yieldless asset, Silver tends to rise with lower interest rates. Its moves also depend on how the US Dollar (USD) behaves as the asset is priced in dollars (XAG/USD). A strong Dollar tends to keep the price of Silver at bay, whereas a weaker Dollar is likely to propel prices up. Other factors such as investment demand, mining supply – Silver is much more abundant than Gold – and recycling rates can also affect prices.
Silver is widely used in industry, particularly in sectors such as electronics or solar energy, as it has one of the highest electric conductivity of all metals – more than Copper and Gold. A surge in demand can increase prices, while a decline tends to lower them. Dynamics in the US, Chinese and Indian economies can also contribute to price swings: for the US and particularly China, their big industrial sectors use Silver in various processes; in India, consumers’ demand for the precious metal for jewellery also plays a key role in setting prices.
Silver prices tend to follow Gold's moves. When Gold prices rise, Silver typically follows suit, as their status as safe-haven assets is similar. The Gold/Silver ratio, which shows the number of ounces of Silver needed to equal the value of one ounce of Gold, may help to determine the relative valuation between both metals. Some investors may consider a high ratio as an indicator that Silver is undervalued, or Gold is overvalued. On the contrary, a low ratio might suggest that Gold is undervalued relative to Silver.
- AUD/USD climbs to a multi-week top and draws support from a combination of factors.
- The RBA’s hawkish outlook and stronger Chinese inflation figures for July lend support.
- A positive risk tone, 50 bps Fed rate cut bets undermine the USD and benefit the Aussie.
The AUD/USD pair builds on this week's solid recovery move from the 0.6350 area, or its lowest level since November 2023 and climbs to a two-and-half-week high on Friday. Spot prices now seem to have found acceptance above the very important 200-day Simple Moving Average (SMA), with bulls awaiting a sustained strength beyond the 0.6600 round-figure mark before placing fresh bets.
Against the backdrop of hawkish comments from Reserve Bank of Australia (RBA) Governor Michele Bullock, stronger Chinese inflation figures provide an additional lift to the Australian Dollar (AUD). On Thursday, Bullock emphasized the need to stay vigilant about inflation risks and indicated a willingness to hike rates if necessary. Moreover, the National Bureau of Statistics reported this Friday that consumer prices in China rose by 0.5% in July from a year ago as compared to expectations for a print of 0.3%.
Additional details revealed that the headline CPI climbed 0.5% in July, the highest since February, overshadowing the fact that the Producer Price Index shrank for a 22nd consecutive month, by 0.8% in July. Nevertheless, the data eased worries about a deeper economic downturn in China, which, along with receding fears of a US recession, boosts investors' appetite for riskier assets. This, in turn, undermines the safe-haven US Dollar (USD) and contributes to driving flows towards the risk-sensitive Aussie.
The Greenback is further weighed down by a fresh leg down in the US Treasury bond yields, triggered by rising bets for bigger interest rate cuts by the Federal Reserve (Fed) in September. In the absence of any relevant market-moving US economic data, the fundamental backdrop supports prospects for a further appreciating move for the AUD/USD pair. Nevertheless, spot prices remain on track to register strong weekly gains for the first time in the previous four as the focus shifts to the US CPI report next Wednesday.
Risk sentiment FAQs
In the world of financial jargon the two widely used terms “risk-on” and “risk off'' refer to the level of risk that investors are willing to stomach during the period referenced. In a “risk-on” market, investors are optimistic about the future and more willing to buy risky assets. In a “risk-off” market investors start to ‘play it safe’ because they are worried about the future, and therefore buy less risky assets that are more certain of bringing a return, even if it is relatively modest.
Typically, during periods of “risk-on”, stock markets will rise, most commodities – except Gold – will also gain in value, since they benefit from a positive growth outlook. The currencies of nations that are heavy commodity exporters strengthen because of increased demand, and Cryptocurrencies rise. In a “risk-off” market, Bonds go up – especially major government Bonds – Gold shines, and safe-haven currencies such as the Japanese Yen, Swiss Franc and US Dollar all benefit.
The Australian Dollar (AUD), the Canadian Dollar (CAD), the New Zealand Dollar (NZD) and minor FX like the Ruble (RUB) and the South African Rand (ZAR), all tend to rise in markets that are “risk-on”. This is because the economies of these currencies are heavily reliant on commodity exports for growth, and commodities tend to rise in price during risk-on periods. This is because investors foresee greater demand for raw materials in the future due to heightened economic activity.
The major currencies that tend to rise during periods of “risk-off” are the US Dollar (USD), the Japanese Yen (JPY) and the Swiss Franc (CHF). The US Dollar, because it is the world’s reserve currency, and because in times of crisis investors buy US government debt, which is seen as safe because the largest economy in the world is unlikely to default. The Yen, from increased demand for Japanese government bonds, because a high proportion are held by domestic investors who are unlikely to dump them – even in a crisis. The Swiss Franc, because strict Swiss banking laws offer investors enhanced capital protection.
- GBP/USD extends its upside as the Fed is widely expected to deliver a rate cut in September.
- Kansas City Fed President Jeffrey Schmid stated that reducing monetary policy could be "appropriate" if inflation remains low.
- The upside of the pair could be restrained due to increased safe-haven flows amid heightened Middle-East tensions.
GBP/USD trades around 1.2770 during the early European hours, appreciating for the second successive day on Friday. This upside of the GBP/USD pair could be attributed to the rising expectations of the US Federal Reserve (Fed) implementing a rate cut in September.
According to the CME FedWatch tool, markets are now fully pricing in a quarter-basis point interest rate cut by the Fed in September. Additionally, the decline in US Treasury yields is exerting additional pressure on the Greenback, with yields standing at 4.01% and 3.97%, respectively, at the time of writing.
On Thursday, Kansas City Fed President Jeffrey Schmid stated that reducing monetary policy could be "appropriate" if inflation remains low. Schmid noted that the current Fed policy is "not that restrictive" and that while the Fed is close to its 2% inflation goal, it has not yet fully achieved it, per Reuters.
Across the pond, the Pound Sterling (GBP) encountered challenges following the Bank of England's (BoE) decision last week to cut interest rates from a 16-year high. The BoE reduced rates by a quarter-point to 5% after a narrow vote among policymakers, who were divided on whether inflation pressures had adequately eased.
The upside of the GBP/USD pair could be limited due to increased safe-haven flows amid heightened geopolitical tensions in the Middle East. Israeli forces intensified their airstrikes on the Gaza Strip, resulting in at least 40 casualties on Thursday, according to Palestinian medics.
This escalation has further intensified the conflict between Israel and Hamas-led militants, as Israel prepares for the possibility of a broader regional conflict following the killing of senior members of militant groups Hamas and Hezbollah.
British Pound PRICE Today
The table below shows the percentage change of British Pound (GBP) against listed major currencies today. British Pound was the strongest against the Swiss Franc.
| USD | EUR | GBP | JPY | CAD | AUD | NZD | CHF | |
|---|---|---|---|---|---|---|---|---|
| USD | -0.07% | -0.18% | -0.19% | -0.02% | -0.13% | -0.19% | 0.03% | |
| EUR | 0.07% | -0.08% | -0.10% | 0.06% | -0.05% | -0.12% | 0.11% | |
| GBP | 0.18% | 0.08% | -0.02% | 0.13% | 0.02% | -0.04% | 0.21% | |
| JPY | 0.19% | 0.10% | 0.02% | 0.17% | 0.08% | -0.01% | 0.25% | |
| CAD | 0.02% | -0.06% | -0.13% | -0.17% | -0.12% | -0.18% | 0.07% | |
| AUD | 0.13% | 0.05% | -0.02% | -0.08% | 0.12% | -0.06% | 0.17% | |
| NZD | 0.19% | 0.12% | 0.04% | 0.01% | 0.18% | 0.06% | 0.25% | |
| CHF | -0.03% | -0.11% | -0.21% | -0.25% | -0.07% | -0.17% | -0.25% |
The heat map shows percentage changes of major currencies against each other. The base currency is picked from the left column, while the quote currency is picked from the top row. For example, if you pick the British Pound from the left column and move along the horizontal line to the US Dollar, the percentage change displayed in the box will represent GBP (base)/USD (quote).
Pound Sterling FAQs
The Pound Sterling (GBP) is the oldest currency in the world (886 AD) and the official currency of the United Kingdom. It is the fourth most traded unit for foreign exchange (FX) in the world, accounting for 12% of all transactions, averaging $630 billion a day, according to 2022 data. Its key trading pairs are GBP/USD, aka ‘Cable’, which accounts for 11% of FX, GBP/JPY, or the ‘Dragon’ as it is known by traders (3%), and EUR/GBP (2%). The Pound Sterling is issued by the Bank of England (BoE).
The single most important factor influencing the value of the Pound Sterling is monetary policy decided by the Bank of England. The BoE bases its decisions on whether it has achieved its primary goal of “price stability” – a steady inflation rate of around 2%. Its primary tool for achieving this is the adjustment of interest rates. When inflation is too high, the BoE will try to rein it in by raising interest rates, making it more expensive for people and businesses to access credit. This is generally positive for GBP, as higher interest rates make the UK a more attractive place for global investors to park their money. When inflation falls too low it is a sign economic growth is slowing. In this scenario, the BoE will consider lowering interest rates to cheapen credit so businesses will borrow more to invest in growth-generating projects.
Data releases gauge the health of the economy and can impact the value of the Pound Sterling. Indicators such as GDP, Manufacturing and Services PMIs, and employment can all influence the direction of the GBP. A strong economy is good for Sterling. Not only does it attract more foreign investment but it may encourage the BoE to put up interest rates, which will directly strengthen GBP. Otherwise, if economic data is weak, the Pound Sterling is likely to fall.
Another significant data release for the Pound Sterling is the Trade Balance. This indicator measures the difference between what a country earns from its exports and what it spends on imports over a given period. If a country produces highly sought-after exports, its currency will benefit purely from the extra demand created from foreign buyers seeking to purchase these goods. Therefore, a positive net Trade Balance strengthens a currency and vice versa for a negative balance.
- Gold price falls slightly but remains broadly firm on multiple tailwinds on Friday.
- Investors are divided over the size of Fed rate cuts in September.
- Fed officials acknowledge the softening of inflation and slowing labor demand.
Gold price (XAU/USD) edges lower from a three-day high near $2,430 in Friday’s European session but holds above the key support level of $2,400. The precious metal’s near-term outlook remains firm on strong speculation that the Federal Reserve (Fed) will start reducing interest rates in September.
However, investors are divided about whether the Fed will exhibit aggressiveness in the process of pivoting to policy normalization by announcing a 50 basis point (bp) interest-rate reduction or will cut them by 25 bps.
According to the CME FedWatch tool, 30-day Federal Funds futures pricing data shows that traders see a 54.5% chance that interest rates will be reduced by 50 bps in September. For the entire year, data suggests a 100 bp reduction in interest rates by the Fed.
Meanwhile, the US Dollar (USD) and bond yields correct after failing to hold gains driven by lower-than-expected United States (US) Initial Jobless Claims for the week ending August 2. The US Dollar Index (DXY), which tracks the Greenback’s value against six major currencies, drops to nearly 103.15 from a four-day high of 103.50. The 10-year US Treasury yields slump to near 3.97%.
The data, released on Thursday, showed that the number of individuals claiming jobless benefits for the first time was lower at 233K than estimates of 240K and the prior release of 250K (upwardly revised from 249K). Though the jobless claims slowed, the data is insufficient to diminish market expectations for sooner rate cuts.
Daily digest market movers: Gold price capitalizes on multiple tailwinds
- Gold price clings to gains above $2,400 on firm Fed rate-cut prospects and lingering geopolitical conflicts. Expectations for aggressive rate cuts were prompted by a recent stock market rout that was driven by fears of a potential US economic slowdown due to a sharp deceleration in job growth and the rising Unemployment Rate.
- Fed policymakers have been acknowledging cooling labor market conditions and are confident that inflation has returned to its path, leading to the bank’s target of 2%. Officials have cleared that their decisions will be based on economic data, not on stock market mayhem and political considerations.
- On Thursday, Chicago Fed Bank President Austan Goolsbee said: "We're not in the business of responding to the stock market. We're in the business of maximizing employment and stabilizing prices," Reuters reported.
- Meanwhile, escalating Middle East tensions continue to improve Gold’s appeal as a safe haven. Investors worry that Iran could retaliate for the killing of the Hamas leader by an air strike in Tehran.
- Going forward, the Gold price will be influenced by the US Consumer Price Index (CPI) data for July, which will be published on Wednesday. The inflation data will indicate whether current market expectations for rate cuts are appropriate.
Technical Forecast: Gold price oscillates in Channel formation
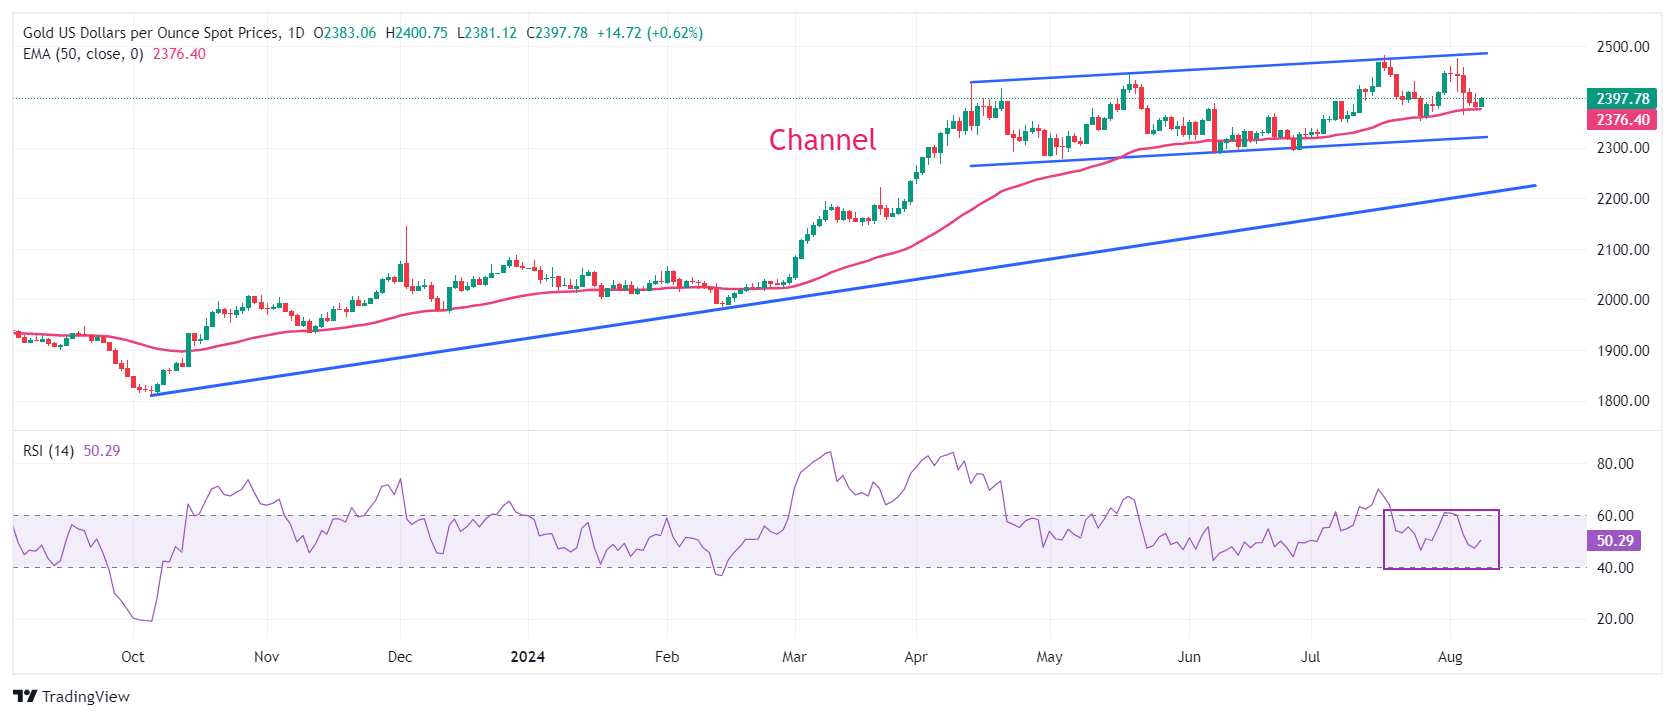
Gold price trades in a channel formation on a daily timeframe, which is slightly rising but broadly exhibited a sideways performance for more than three months. The 50-day Exponential Moving Average (EMA) near $2,370 continues to provide support to the Gold price bulls.
The 14-day Relative Strength Index (RSI) oscillates within the 40.00-60.00 range, suggesting indecisiveness among market participants.
A fresh upside would appear if the Gold price breaks above its all-time high of $2,483.75, which will send it into unchartered territory.
On the downside, the upward-sloping trendline at $2,225, plotted from the October 6 low near $1,810.50, will be a major support in the longer term.
Gold FAQs
Gold has played a key role in human’s history as it has been widely used as a store of value and medium of exchange. Currently, apart from its shine and usage for jewelry, the precious metal is widely seen as a safe-haven asset, meaning that it is considered a good investment during turbulent times. Gold is also widely seen as a hedge against inflation and against depreciating currencies as it doesn’t rely on any specific issuer or government.
Central banks are the biggest Gold holders. In their aim to support their currencies in turbulent times, central banks tend to diversify their reserves and buy Gold to improve the perceived strength of the economy and the currency. High Gold reserves can be a source of trust for a country’s solvency. Central banks added 1,136 tonnes of Gold worth around $70 billion to their reserves in 2022, according to data from the World Gold Council. This is the highest yearly purchase since records began. Central banks from emerging economies such as China, India and Turkey are quickly increasing their Gold reserves.
Gold has an inverse correlation with the US Dollar and US Treasuries, which are both major reserve and safe-haven assets. When the Dollar depreciates, Gold tends to rise, enabling investors and central banks to diversify their assets in turbulent times. Gold is also inversely correlated with risk assets. A rally in the stock market tends to weaken Gold price, while sell-offs in riskier markets tend to favor the precious metal.
The price can move due to a wide range of factors. Geopolitical instability or fears of a deep recession can quickly make Gold price escalate due to its safe-haven status. As a yield-less asset, Gold tends to rise with lower interest rates, while higher cost of money usually weighs down on the yellow metal. Still, most moves depend on how the US Dollar (USD) behaves as the asset is priced in dollars (XAU/USD). A strong Dollar tends to keep the price of Gold controlled, whereas a weaker Dollar is likely to push Gold prices up.
FX option expiries for Aug 9 NY cut at 10:00 Eastern Time, via DTCC, can be found below.
EUR/USD: EUR amounts
- 1.0775 1.2b
- 1.0800 820m
- 1.0900 3.1b
- 1.0905 737m
- 1.1000 616m
USD/JPY: USD amounts
- 146.00 795m
- 147.00 581m
- 149.00 571m
USD/CHF: USD amounts
- 0.8700 539m
AUD/USD: AUD amounts
- 0.6450 596m
- 0.6600 3.1b
USD/CAD: USD amounts
- 1.3700 519m
- 1.3730 419m
- 1.3750 595m
- 1.3850 1.1b
- A combination of supporting factors pushes NZD/USD higher for the fourth straight day.
- Diminishing odds for a rate cut by RBNZ, stronger Chinese inflation data boosts the Kiwi.
- Dovish Fed expectations and the upbeat mood weigh on the USD and remain supportive.
The NZD/USD pair builds on this week's solid recovery from the 0.5850 area, or its lowest level since early November 2023 and gains positive traction for the fourth successive day on Friday. Spot prices cling to intraday gains during the early European session and currently trade around the 0.6025-0.6030 region, just below a three-week high.
The New Zealand Dollar (NZD) continues to be underpinned by Wednesday's better-than-expected employment details, which lowered the likelihood of a rate cut by the Reserve Bank of New Zealand (RBNZ). Furthermore, stronger-than-expected Chinese inflation figures provide an additional boost to antipodean currencies, including the Kiwi, which, along with a modest US Dollar (USD) downtick, continues to push the NZD/USD pair higher.
Despite Thursday's upbeat US labor market report, investors are still pricing in the possibility of a 50 basis points (bps) interest rate cut by the Federal Reserve (Fed) in September. This, in turn, triggers a fresh leg down in the US Treasury bond yields and drags the USD away from the weekly peak touched on Thursday. Furthermore, a positive risk tone undermines the safe-haven buck and contributes to driving flows towards the risk-sensitive Kiwi.
Meanwhile, the NZD/USD pair's positive move could also be attributed to some technical buying above the 0.6000 psychological mark. Nevertheless, spot prices remain on track to register strong gains for the second straight week as the focus now shifts to the crucial RBNZ rate decision and the US consumer inflation figures, both due on Wednesday. The key central bank event risk and the US macro data should provide a fresh directional impetus to spot prices.
Economic Indicator
RBNZ Interest Rate Decision
The Reserve Bank of New Zealand (RBNZ) announces its interest rate decision after its seven scheduled annual policy meetings. If the RBNZ is hawkish and sees inflationary pressures rising, it raises the Official Cash Rate (OCR) to bring inflation down. This is positive for the New Zealand Dollar (NZD) since higher interest rates attract more capital inflows. Likewise, if it reaches the view that inflation is too low it lowers the OCR, which tends to weaken NZD.
Read more.Next release: Wed Aug 14, 2024 02:00
Frequency: Irregular
Consensus: -
Previous: 5.5%
Source: Reserve Bank of New Zealand
The Reserve Bank of New Zealand (RBNZ) holds monetary policy meetings seven times a year, announcing their decision on interest rates and the economic assessments that influenced their decision. The central bank offers clues on the economic outlook and future policy path, which are of high relevance for the NZD valuation. Positive economic developments and upbeat outlook could lead the RBNZ to tighten the policy by hiking interest rates, which tends to be NZD bullish. The policy announcements are usually followed by Governor Adrian Orr’s press conference.
Here is what you need to know on Friday, August 9:
Financial markets hold steady on the last trading of a week that featured extremely volatile action in a variety of asset classes. Following Thursday's risk rally, US stock index futures trade flat in the European morning on Friday. The July jobs report from Canada will be the only data highlighted in the economic calendar in the second half of the day.
US Dollar PRICE This week
The table below shows the percentage change of US Dollar (USD) against listed major currencies this week. US Dollar was the strongest against the Swiss Franc.
| USD | EUR | GBP | JPY | CAD | AUD | NZD | CHF | |
|---|---|---|---|---|---|---|---|---|
| USD | -0.14% | 0.29% | 0.31% | -1.02% | -1.35% | -1.22% | 0.97% | |
| EUR | 0.14% | 0.35% | 0.29% | -1.01% | -1.20% | -1.19% | 1.00% | |
| GBP | -0.29% | -0.35% | 0.00% | -1.33% | -1.54% | -1.53% | 0.63% | |
| JPY | -0.31% | -0.29% | 0.00% | -1.28% | -1.69% | -1.49% | 0.68% | |
| CAD | 1.02% | 1.01% | 1.33% | 1.28% | -0.30% | -0.19% | 1.81% | |
| AUD | 1.35% | 1.20% | 1.54% | 1.69% | 0.30% | 0.02% | 2.21% | |
| NZD | 1.22% | 1.19% | 1.53% | 1.49% | 0.19% | -0.02% | 2.19% | |
| CHF | -0.97% | -1.00% | -0.63% | -0.68% | -1.81% | -2.21% | -2.19% |
The heat map shows percentage changes of major currencies against each other. The base currency is picked from the left column, while the quote currency is picked from the top row. For example, if you pick the US Dollar from the left column and move along the horizontal line to the Japanese Yen, the percentage change displayed in the box will represent USD (base)/JPY (quote).
Wall Street's main indexes registered impressive gains on Thursday as fears over a continuation of the unwinding of the Japanese Yen (JPY) eased. Meanwhile, de-escalation of geopolitical tensions further helped the risk mood improve. According to the CNN, Iran could refrain from attacking Israel in exchange for a ceasefire in Gaza.
After posting modest gains for three consecutive days, the US Dollar Index (DXY) seems to have stabilized above 103.00 in the early European session. In the meantime, the benchmark 10-year US Treasury bond yield fluctuates in a narrow channel slightly below 4% after rising over 5% in the previous three days.
During the Asian trading hours, the data from China showed that the Consumer Price Index (CPI) rose 0.5% on a monthly basis in July. This reading followed the 0.2% decrease recorded in June and came in above the market expectation for an increase of 0.3%. AUD/USD gained more than 1% on Thursday and seems to have gone into a consolidation phase at around 0.6600 on Friday.
EUR/USD failed to make a decisive move in either direction for the second straight day on Thursday. Early Friday, the pair continues to move sideways above 1.0900.
GBP/USD finally benefited from improving risk mood and gathered recovery momentum on Thursday, rising over 0.4% on a daily basis. The pair continues to edge higher in the European session and was last seen trading a few pips above 1.2770.
USD/JPY built on Wednesday's gains and closed in the green on Thursday. The pair stays relatively quiet in the European morning and trades in a tight channel above 147.00.
Gold staged a decisive rebound and continued to push higher after breaking above $2,400 on Thursday, snapping a six-day losing streak. XAU/USD stays relatively quiet and trades at around $2,420.
Risk sentiment FAQs
In the world of financial jargon the two widely used terms “risk-on” and “risk off'' refer to the level of risk that investors are willing to stomach during the period referenced. In a “risk-on” market, investors are optimistic about the future and more willing to buy risky assets. In a “risk-off” market investors start to ‘play it safe’ because they are worried about the future, and therefore buy less risky assets that are more certain of bringing a return, even if it is relatively modest.
Typically, during periods of “risk-on”, stock markets will rise, most commodities – except Gold – will also gain in value, since they benefit from a positive growth outlook. The currencies of nations that are heavy commodity exporters strengthen because of increased demand, and Cryptocurrencies rise. In a “risk-off” market, Bonds go up – especially major government Bonds – Gold shines, and safe-haven currencies such as the Japanese Yen, Swiss Franc and US Dollar all benefit.
The Australian Dollar (AUD), the Canadian Dollar (CAD), the New Zealand Dollar (NZD) and minor FX like the Ruble (RUB) and the South African Rand (ZAR), all tend to rise in markets that are “risk-on”. This is because the economies of these currencies are heavily reliant on commodity exports for growth, and commodities tend to rise in price during risk-on periods. This is because investors foresee greater demand for raw materials in the future due to heightened economic activity.
The major currencies that tend to rise during periods of “risk-off” are the US Dollar (USD), the Japanese Yen (JPY) and the Swiss Franc (CHF). The US Dollar, because it is the world’s reserve currency, and because in times of crisis investors buy US government debt, which is seen as safe because the largest economy in the world is unlikely to default. The Yen, from increased demand for Japanese government bonds, because a high proportion are held by domestic investors who are unlikely to dump them – even in a crisis. The Swiss Franc, because strict Swiss banking laws offer investors enhanced capital protection.
- EUR/JPY trades firmer around 160.75 in Friday’s early European session.
- German HICP inflation rose in July to 2.6%, according to the Federal Statistics Office on Friday.
- Traders will evaluate Japan's monetary policy outlook about the interest rate path.
The EUR/JPY cross holds positive ground near 160.75 during the early European session on Friday. The recent German inflation report provides modest support to the Euro (EUR). However, safe-haven flows amid ongoing geopolitical tensions in the Middle East might lift the Japanese Yen (JPY) and cap the upside for the cross.
The German Harmonized Index of Consumer Prices (HICP) rose 2.6% year-on-year in July, Destatis reported on Friday. This figure was in line with the market expectation. Meanwhile, the HICP inflation remains unchanged at 0.5% MoM in July.
The European Central Bank (ECB) cut the interest rates from 4% to 3.75%, but there is still no firm path for easing policy further. ECB President Christine Lagarde said during the coast conference the question of any move in September is wide open.
On the other hand, the dovish comments from Bank of Japan (BoJ) Deputy Governor Shinichi Uchida on Wednesday weigh on the JPY. According to the JP Morgan Asset Management (JPAM), the Bank of Japan is unlikely to hike in the near term. Analysts said that the BoJ is more likely to occur in 2025 if the global economic environment continues steady. Additionally, Japan’s Finance Minister Shunichi Suzuki stated on Thursday that monetary policy decisions fall under the purview of the Bank of Japan, while they will continue watching market developments closely, as reported by Reuters.
Japanese Yen FAQs
The Japanese Yen (JPY) is one of the world’s most traded currencies. Its value is broadly determined by the performance of the Japanese economy, but more specifically by the Bank of Japan’s policy, the differential between Japanese and US bond yields, or risk sentiment among traders, among other factors.
One of the Bank of Japan’s mandates is currency control, so its moves are key for the Yen. The BoJ has directly intervened in currency markets sometimes, generally to lower the value of the Yen, although it refrains from doing it often due to political concerns of its main trading partners. The current BoJ ultra-loose monetary policy, based on massive stimulus to the economy, has caused the Yen to depreciate against its main currency peers. This process has exacerbated more recently due to an increasing policy divergence between the Bank of Japan and other main central banks, which have opted to increase interest rates sharply to fight decades-high levels of inflation.
The BoJ’s stance of sticking to ultra-loose monetary policy has led to a widening policy divergence with other central banks, particularly with the US Federal Reserve. This supports a widening of the differential between the 10-year US and Japanese bonds, which favors the US Dollar against the Japanese Yen.
The Japanese Yen is often seen as a safe-haven investment. This means that in times of market stress, investors are more likely to put their money in the Japanese currency due to its supposed reliability and stability. Turbulent times are likely to strengthen the Yen’s value against other currencies seen as more risky to invest in.
- USD/MXN continues its losing streak despite a rate cut by Banxico on Thursday.
- Mexico's 12-Month Inflation rose to 5.57% in July, the highest reading since May 2023.
- The US Dollar could receive support from the rising safe-haven flows amid heightened Middle-East tensions.
USD/MXN extends its losing streak for the third successive session, trading around 18.90 during the late Asian hours on Friday. This decline comes despite the Bank of Mexico's (Banxico) unexpected decision to cut the benchmark rate to 10.75% from 11.00% at Thursday’s meeting.
Banxico hinted at possible further rate adjustments, citing ongoing inflationary risks. The 12-Month Inflation Rate rose to 5.57% in July, up from 4.98% previously, and matching market estimates. This is the highest reading since May 2023.
Meanwhile, Core Inflation increased by 0.32%, slightly above the forecast of a 0.29% rise. Headline Inflation also rose by 1.05% in July, the largest increase in nearly three years, and slightly above the estimated 1.02% advance.
The US Dollar Index (DXY), which tracks the value of the US Dollar (USD) against six major currencies, edging lower to near 103.20. The decline in US Treasury yields is exerting additional pressure on the Greenback, with yields standing at 4.01% and 3.97%, respectively, at the time of writing.
The US Dollar faces challenges amid increasing expectations that the Federal Reserve (Fed) may implement a quarter-basis point rate cut in September. Traders evaluate mixed signals from the US economy, trying to determine whether it will experience a soft landing or slip into a recession.
The downside of the Greenback could be limited due to rising safe-haven flows amid heightened geopolitical tensions in the Middle East. Israeli forces intensified their airstrikes on the Gaza Strip, resulting in at least 40 casualties on Thursday, according to Palestinian medics.
This escalation has further intensified the conflict between Israel and Hamas-led militants, as Israel prepares for the possibility of a broader regional conflict following the killing of senior members of militant groups Hamas and Hezbollah.
Mexican Peso FAQs
The Mexican Peso (MXN) is the most traded currency among its Latin American peers. Its value is broadly determined by the performance of the Mexican economy, the country’s central bank’s policy, the amount of foreign investment in the country and even the levels of remittances sent by Mexicans who live abroad, particularly in the United States. Geopolitical trends can also move MXN: for example, the process of nearshoring – or the decision by some firms to relocate manufacturing capacity and supply chains closer to their home countries – is also seen as a catalyst for the Mexican currency as the country is considered a key manufacturing hub in the American continent. Another catalyst for MXN is Oil prices as Mexico is a key exporter of the commodity.
The main objective of Mexico’s central bank, also known as Banxico, is to maintain inflation at low and stable levels (at or close to its target of 3%, the midpoint in a tolerance band of between 2% and 4%). To this end, the bank sets an appropriate level of interest rates. When inflation is too high, Banxico will attempt to tame it by raising interest rates, making it more expensive for households and businesses to borrow money, thus cooling demand and the overall economy. Higher interest rates are generally positive for the Mexican Peso (MXN) as they lead to higher yields, making the country a more attractive place for investors. On the contrary, lower interest rates tend to weaken MXN.
Macroeconomic data releases are key to assess the state of the economy and can have an impact on the Mexican Peso (MXN) valuation. A strong Mexican economy, based on high economic growth, low unemployment and high confidence is good for MXN. Not only does it attract more foreign investment but it may encourage the Bank of Mexico (Banxico) to increase interest rates, particularly if this strength comes together with elevated inflation. However, if economic data is weak, MXN is likely to depreciate.
As an emerging-market currency, the Mexican Peso (MXN) tends to strive during risk-on periods, or when investors perceive that broader market risks are low and thus are eager to engage with investments that carry a higher risk. Conversely, MXN tends to weaken at times of market turbulence or economic uncertainty as investors tend to sell higher-risk assets and flee to the more-stable safe havens.
- USD/CAD remains depressed for the fifth straight day ahead of the Canadian jobs data.
- Rising Oil prices underpin the Loonie and weigh on the pair amid a modest USD slide.
- Spot prices seem poised to register weekly losses for the first time in the previous four.
The USD/CAD pair remains under some selling pressure for the fifth straight day and is weighed down by a combination of factors. Spot prices trade around the 1.3725 region during the early European session, just above a nearly three-week low touched on Wednesday.
Crude Oil prices trade with a positive bias for the third straight day and remain on track to register a weekly gain of more than 3% amid easing demand concerns and fears of a widening Middle East conflict. This, in turn, underpins the commodity-linked Loonie, which, along with the emergence of some US Dollar (USD) selling, acts as a headwind for the USD/CAD pair.
The USD Index (DXY), which tracks the Greenback against a basket of currencies, retreats further from the weekly top touched on Thursday amid a fresh leg down in the US Treasury bond yields, led by bets for bigger rate cuts by the Federal Reserve (Fed). Apart from this, a generally positive tone across the global equity markets further dents demand for the safe-haven buck.
The aforementioned fundamental backdrop suggests that the path of least resistance for the USD/CAD pair is to the downside, though traders might prefer to wait for the release of the monthly Canadian employment details before placing fresh bets. The key jobs report will influence the Canadian Dollar (CAD) and provide some meaningful impetus to the USD/CAD pair.
Apart from this, the USD and Oil price dynamics should contribute to producing short-term trading opportunities on the last day of the week. The market focus will then shift to the latest US consumer inflation figures, due next Wednesday, which will play a key role in determining the Fed's future policy decision and drive the USD demand in the near term.
Economic Indicator
Net Change in Employment
The Net Change in Employment released by Statistics Canada is a measure of the change in the number of people in employment in Canada. Generally speaking, a rise in this indicator has positive implications for consumer spending and indicates economic growth. Therefore, a high reading is seen as bullish for the Canadian Dollar (CAD), while a low reading is seen as bearish.
Read more.Next release: Fri Aug 09, 2024 12:30
Frequency: Monthly
Consensus: 22.5K
Previous: -1.4K
Source: Statistics Canada
Canada’s labor market statistics tend to have a significant impact on the Canadian dollar, with the Employment Change figure carrying most of the weight. There is a significant correlation between the amount of people working and consumption, which impacts inflation and the Bank of Canada’s rate decisions, in turn moving the C$. Actual figures beating consensus tend to be CAD bullish, with currency markets usually reacting steadily and consistently in response to the publication.
- EUR/GBP trades in negative territory for the third consecutive day near 0.8560 in Friday’s early European session.
- The German HICP inflation came in line with consensus, rising by 2.6% YoY in July.
- The Cable will be impacted by the BoE rate cut expectation for the time being.
The EUR/GBP cross trades with mild losses around 0.8560 during the early European session on Friday. Traders await the release of UK monthly employment data, which will be released next Tuesday.
Data released by the German statistics office Destatis on Friday showed that the German Harmonized Index of Consumer Prices (HICP) rose 2.6% YoY in July. This figure was in line with the market expectation. On a monthly basis, the HICP inflation remains unchanged at 0.5% MoM versus 0.5% prior.
The European Central Bank (ECB) policymaker Olli Rehn said on Wednesday that the ECB can continue cutting interest rates if there is confidence among policymakers that the inflation trend is slowing in the near future. The central bank left interest rates on hold at its July meeting. ECB President Christine Lagarde said during the coast conference the question of any move in September is wide open.
On the other hand, the Pound Sterling (GBP) will be influenced by the expectation of a rate cut by the Bank of England (BoE) amid the lack of top-tier economic data released. The BoE lowered its benchmark rate to 5.0% from a 16-year high of 5.25% last week. The UK central bank suggested that the central bank will use a cautious approach in its policy normalization process.
Inflation FAQs
Inflation measures the rise in the price of a representative basket of goods and services. Headline inflation is usually expressed as a percentage change on a month-on-month (MoM) and year-on-year (YoY) basis. Core inflation excludes more volatile elements such as food and fuel which can fluctuate because of geopolitical and seasonal factors. Core inflation is the figure economists focus on and is the level targeted by central banks, which are mandated to keep inflation at a manageable level, usually around 2%.
The Consumer Price Index (CPI) measures the change in prices of a basket of goods and services over a period of time. It is usually expressed as a percentage change on a month-on-month (MoM) and year-on-year (YoY) basis. Core CPI is the figure targeted by central banks as it excludes volatile food and fuel inputs. When Core CPI rises above 2% it usually results in higher interest rates and vice versa when it falls below 2%. Since higher interest rates are positive for a currency, higher inflation usually results in a stronger currency. The opposite is true when inflation falls.
Although it may seem counter-intuitive, high inflation in a country pushes up the value of its currency and vice versa for lower inflation. This is because the central bank will normally raise interest rates to combat the higher inflation, which attract more global capital inflows from investors looking for a lucrative place to park their money.
Formerly, Gold was the asset investors turned to in times of high inflation because it preserved its value, and whilst investors will often still buy Gold for its safe-haven properties in times of extreme market turmoil, this is not the case most of the time. This is because when inflation is high, central banks will put up interest rates to combat it. Higher interest rates are negative for Gold because they increase the opportunity-cost of holding Gold vis-a-vis an interest-bearing asset or placing the money in a cash deposit account. On the flipside, lower inflation tends to be positive for Gold as it brings interest rates down, making the bright metal a more viable investment alternative.
- The US Dollar depreciates as Treasury yields lose ground amid US economic instability.
- CME FedWatch tool indicates a 100% probability of a 25-basis point Fed rate cut in September.
- Weekly US Initial Jobless Claims fell to 233K, against the expected 240K and 250K prior.
The US Dollar Index (DXY), which tracks the value of the US Dollar (USD) against six major currencies, edging lower to near 103.20. The decline in US Treasury yields is exerting additional pressure on the Greenback, with yields standing at 4.01% and 3.97%, respectively, at the time of writing.
The US Dollar faces challenges amid increasing expectations that the Federal Reserve (Fed) may implement a rate cut in September. Traders evaluate mixed signals from the US economy, trying to determine whether it will experience a soft landing or slip into a recession. The CME FedWatch tool indicates that markets are now fully anticipating a 25-basis point interest rate cut by the Fed in September.
On Thursday, Kansas City Fed President Jeffrey Schmid stated that reducing monetary policy could be "appropriate" if inflation remains low. Schmid noted that the current Fed policy is "not that restrictive" and that while the Fed is close to its 2% inflation goal, it has not yet fully achieved it, per Reuters.
On the data side, US Initial Jobless Claims dropped to 233,000 for the week ending August 2, coming in under the market expectation of 240,000. This decline follows an upwardly revised figure of 250,000 for the previous week, which was the highest in a year.
The downside of the Greenback could be limited due to rising safe-haven flows amid heightened geopolitical tensions in the Middle East. Israeli forces intensified their airstrikes on the Gaza Strip, resulting in at least 40 casualties on Thursday, according to Palestinian medics. This escalation has further intensified the conflict between Israel and Hamas-led militants, as Israel prepares for the possibility of a broader regional conflict following the killing of senior members of militant groups Hamas and Hezbollah.
US Dollar FAQs
The US Dollar (USD) is the official currency of the United States of America, and the ‘de facto’ currency of a significant number of other countries where it is found in circulation alongside local notes. It is the most heavily traded currency in the world, accounting for over 88% of all global foreign exchange turnover, or an average of $6.6 trillion in transactions per day, according to data from 2022. Following the second world war, the USD took over from the British Pound as the world’s reserve currency. For most of its history, the US Dollar was backed by Gold, until the Bretton Woods Agreement in 1971 when the Gold Standard went away.
The most important single factor impacting on the value of the US Dollar is monetary policy, which is shaped by the Federal Reserve (Fed). The Fed has two mandates: to achieve price stability (control inflation) and foster full employment. Its primary tool to achieve these two goals is by adjusting interest rates. When prices are rising too quickly and inflation is above the Fed’s 2% target, the Fed will raise rates, which helps the USD value. When inflation falls below 2% or the Unemployment Rate is too high, the Fed may lower interest rates, which weighs on the Greenback.
In extreme situations, the Federal Reserve can also print more Dollars and enact quantitative easing (QE). QE is the process by which the Fed substantially increases the flow of credit in a stuck financial system. It is a non-standard policy measure used when credit has dried up because banks will not lend to each other (out of the fear of counterparty default). It is a last resort when simply lowering interest rates is unlikely to achieve the necessary result. It was the Fed’s weapon of choice to combat the credit crunch that occurred during the Great Financial Crisis in 2008. It involves the Fed printing more Dollars and using them to buy US government bonds predominantly from financial institutions. QE usually leads to a weaker US Dollar.
Quantitative tightening (QT) is the reverse process whereby the Federal Reserve stops buying bonds from financial institutions and does not reinvest the principal from the bonds it holds maturing in new purchases. It is usually positive for the US Dollar.
Gold prices fell in India on Friday, according to data compiled by FXStreet.
The price for Gold stood at 6,537.35 Indian Rupees (INR) per gram, down compared with the INR 6,547.98 it cost on Thursday.
The price for Gold decreased to INR 76,252.54 per tola from INR 76,374.31 per tola a day earlier.
| Unit measure | Gold Price in INR |
|---|---|
| 1 Gram | 6,537.35 |
| 10 Grams | 65,375.36 |
| Tola | 76,252.54 |
| Troy Ounce | 203,335.20 |
FXStreet calculates Gold prices in India by adapting international prices (USD/INR) to the local currency and measurement units. Prices are updated daily based on the market rates taken at the time of publication. Prices are just for reference and local rates could diverge slightly.
Gold FAQs
Gold has played a key role in human’s history as it has been widely used as a store of value and medium of exchange. Currently, apart from its shine and usage for jewelry, the precious metal is widely seen as a safe-haven asset, meaning that it is considered a good investment during turbulent times. Gold is also widely seen as a hedge against inflation and against depreciating currencies as it doesn’t rely on any specific issuer or government.
Central banks are the biggest Gold holders. In their aim to support their currencies in turbulent times, central banks tend to diversify their reserves and buy Gold to improve the perceived strength of the economy and the currency. High Gold reserves can be a source of trust for a country’s solvency. Central banks added 1,136 tonnes of Gold worth around $70 billion to their reserves in 2022, according to data from the World Gold Council. This is the highest yearly purchase since records began. Central banks from emerging economies such as China, India and Turkey are quickly increasing their Gold reserves.
Gold has an inverse correlation with the US Dollar and US Treasuries, which are both major reserve and safe-haven assets. When the Dollar depreciates, Gold tends to rise, enabling investors and central banks to diversify their assets in turbulent times. Gold is also inversely correlated with risk assets. A rally in the stock market tends to weaken Gold price, while sell-offs in riskier markets tend to favor the precious metal.
The price can move due to a wide range of factors. Geopolitical instability or fears of a deep recession can quickly make Gold price escalate due to its safe-haven status. As a yield-less asset, Gold tends to rise with lower interest rates, while higher cost of money usually weighs down on the yellow metal. Still, most moves depend on how the US Dollar (USD) behaves as the asset is priced in dollars (XAU/USD). A strong Dollar tends to keep the price of Gold controlled, whereas a weaker Dollar is likely to push Gold prices up.
(An automation tool was used in creating this post.)
- Asian equities extend the rally on Friday as the US job data helped ease concerns about the labor market.
- The recent US employment market report eased fears of a US recession.
- The hotter Chinese CPI inflation boosts the Asian markets, with the Hang Seng Index leading gains.
Most of Asian stock markets trade in positive territory on Friday, bolstered by positive US Initial Jobless Claims and hotter-than-expected Chinese Consumer Price Index (CPI) inflation data.
The recent US Initial Jobless Claims released on Thursday ease some fears about the US labor market. The US Department of Labor (DoL) on Thursday reported that the number of Americans filing new applications for unemployment benefits rose by 233K for the week ending August 3, compared to the previous week of 250K (revised from 249K), below the market consensus of 240K.
The China’s Shanghai Composite was up 0.12% to 2,875. Meanwhile, the Shenzhen Component increased by 0.06% to 8,450, and the Hang Seng Index rose by 1.77% to 17,120. Chinese CPI inflation jumped faster than expected in July, rising to 0.5% YoY from 0.2% in June. The Producer Price Index (PPI) declined by 0.8% YoY in July, at the same pace as seen in June. The figure was above the market consensus of -0.9%.
Japan’s major indices rebounds on the day, with the Nikkei 225 gained 0.52% to 35,015, while the broad-based Topix was up 0.51% to 2,475. The Japanese Yen (JPY) weakens for the fourth consecutive day against the US Dollar (USD), which provides some relief to the Japanese stocks.
On the Indian front, the Nifty 50 index jumped by 1.00% to 24,350 and the BSE Sensex 30 rose 0.92% to 79,610 on Friday. The Reserve Bank of India's (RBI) Monetary Policy Committee (MPC) decided to leave its repo rates unchanged at 6.50% for the ninth consecutive meeting and maintain its ‘Withdrawal of Accommodation" stance.
The Indian central bank also retains the real Gross Domestic Product (GDP) growth projection for FY25 at 7.2% and maintains the Consumer Price Index (CPI) inflation forecast for FY25 at 4.5%.
AsianStocks FAQs
Asia contributes around 70% of global economic growth and hosts several key stock market indices. Among the region’s developed economies, the Japanese Nikkei – which represents 225 companies on the Tokyo stock exchange – and the South Korean Kospi stand out. China has three important indices: the Hong Kong Hang Seng, the Shanghai Composite and the Shenzhen Composite. As a big emerging economy, Indian equities are also catching the attention of investors, who increasingly invest in companies in the Sensex and Nifty indices.
Asia’s main economies are different, and each has specific sectors to pay attention to. Technology companies dominate in indices in Japan, South Korea, and increasingly, China. Financial services are leading stock markets such as Hong Kong or Singapore, considered key hubs for the sector. Manufacturing is also big in China and Japan, with a strong focus on automobile production or electronics. The growing middle class in countries like China and India is also giving more and more prominence to companies focused on retail and e-commerce.
Many different factors drive Asian stock market indices, but the main factor behind their performance is the aggregate results of the component companies revealed in their quarterly and annual earnings reports. The economic fundamentals of each country, as well as their central bank decisions or their government’s fiscal policies, are also important factors. More broadly, political stability, technological progress or the rule of law can also impact equity markets. The performance of US equity indices is also a factor as, more often than not, Asian markets take the lead from Wall Street stocks overnight. Finally, the broader risk sentiment in markets also plays a role as equities are considered a risky investment compared to other investment options such as fixed-income securities.
Investing in equities is risky by itself, but investing in Asian stocks comes along with region-specific risks to be taken into account. Asian countries have a wide range of political systems, from full democracies to dictatorships, so their political stability, transparency, rule of law or corporate governance requirements may diverge considerably. Geopolitical events such as trade disputes or territorial conflicts can lead to volatility in stock markets, as can natural disasters. Moreover, currency fluctuations can also have an impact on the valuation of Asian stock markets. This is particularly true in export-oriented economies, which tend to suffer from a stronger currency and benefit from a weaker one as their products become cheaper abroad.
- GBP/JPY appreciates as BoJ officials indicate potential further policy tightening.
- JP Morgan Asset Management suggests that the BoJ might only consider increasing rates further if the Fed lowers its rates.
- The Pound Sterling may decline due to increased safe-haven flows amid heightened Middle-East tensions.
GBP/JPY recovers its recent gains from the previous two sessions, trading around 187.40 during the Asian session on Friday. Traders closely monitor Japan's monetary policy outlook, as central bank officials have signaled a readiness to raise rates further. However, they have adopted a more cautious stance due to heightened market volatility.
On Friday, Bloomberg reported that JP Morgan Asset Management (JPAM) believes the Bank of Japan is unlikely to raise interest rates in the near term. According to JPAM, the BoJ may only consider further rate hikes if the Federal Reserve cuts rates and the US economy stabilizes. They anticipate that any additional tightening by the BoJ is more likely to occur in 2025, provided the global economic environment remains stable.
The GBP/JPY cross may experience downward pressure due to increased safe-haven flows amid heightened geopolitical tensions in the Middle East. The recent escalation followed the killing of senior members of militant groups Hamas and Hezbollah, which raised concerns about potential retaliatory actions by Iran against Israel.
On Thursday, Israeli forces intensified their airstrikes on the Gaza Strip, resulting in at least 40 casualties, according to Palestinian medics. This escalation has further intensified the conflict between Israel and Hamas-led militants, as Israel prepares for the possibility of a broader regional conflict.
The Pound Sterling (GBP) faced challenges following the Bank of England's (BoE) decision last week to cut interest rates from a 16-year high. The rate was lowered by a quarter-point to 5% after a close vote among policymakers, who were divided on whether inflation pressures had sufficiently eased. BoE Governor Andrew Bailey indicated that the Monetary Policy Committee would proceed cautiously in the future.
Interest rates FAQs
Interest rates are charged by financial institutions on loans to borrowers and are paid as interest to savers and depositors. They are influenced by base lending rates, which are set by central banks in response to changes in the economy. Central banks normally have a mandate to ensure price stability, which in most cases means targeting a core inflation rate of around 2%. If inflation falls below target the central bank may cut base lending rates, with a view to stimulating lending and boosting the economy. If inflation rises substantially above 2% it normally results in the central bank raising base lending rates in an attempt to lower inflation.
Higher interest rates generally help strengthen a country’s currency as they make it a more attractive place for global investors to park their money.
Higher interest rates overall weigh on the price of Gold because they increase the opportunity cost of holding Gold instead of investing in an interest-bearing asset or placing cash in the bank. If interest rates are high that usually pushes up the price of the US Dollar (USD), and since Gold is priced in Dollars, this has the effect of lowering the price of Gold.
The Fed funds rate is the overnight rate at which US banks lend to each other. It is the oft-quoted headline rate set by the Federal Reserve at its FOMC meetings. It is set as a range, for example 4.75%-5.00%, though the upper limit (in that case 5.00%) is the quoted figure. Market expectations for future Fed funds rate are tracked by the CME FedWatch tool, which shapes how many financial markets behave in anticipation of future Federal Reserve monetary policy decisions.
- The Unemployment Rate in Canada is expected to rise further in July.
- Further cooling of the labour market could favour extra rate cuts.
- The Canadian Dollar remains firm so far in August vs. its US peer.
Statistics Canada is set to release the Canadian Labour Force Survey report on August 9. Market participants so far anticipate that the report will present mixed results, which could further support the Bank of Canada's (BoC) ongoing easing cycle.
In July, the Bank of Canada trimmed its policy rate by an extra 25 bps to 4.50%, following a quarter-point interest rate reduction at its meeting in June. Back to the last gathering, the central bank left the door open to further rate cuts if inflation continues to progress towards the bank’s target, while it projects consumer prices to hover around the 2.0% goal in the latter part of 2025.
Regarding the domestic labour market, the BoC signalled in June that while it has cooled significantly, wage growth is still elevated when compared to productivity growth.
Statistics Canada reported that the Employment Change shrank by 1.4K jobs in June, halting two consecutive months of increases, while the Unemployment Rate ticked higher for the third consecutive month to 6.4%.
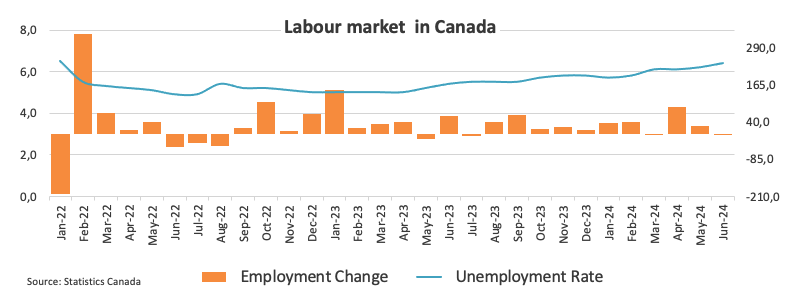
On another key economic indicator, the central bank now sees the Canadian Gross Domestic Product (GDP) expanding by 1.2% in 2024 (from 1.5%), while it expects annualized GDP to expand by 1.7% in Q1, by 1.5% in Q2, and by 2.8% in Q3.
What can we expect from the next Canadian Unemployment Rate print?
Attention remains on the upcoming Canadian labour market report, particularly the wage inflation data, which could influence the bank’s decision on whether to continue reducing its interest rates.
Consensus among market participants projects a slight rise in Canada’s Unemployment Rate to 6.5% in July, up from 6.4% in June. Additionally, investors forecast the economy will add nearly 27K jobs in the same month, reversing June’s 1.4K decrease. It is worth recalling that Average Hourly Wages, a proxy for wage inflation, rose for the second time in a row in June, up by 5.2% vs. June’s 4.8% gain.
BoC’s Minutes from the July meeting, released on August 7, revealed that prior to their decision to cut rates last month, officials expressed concerns that consumer spending in 2025 and 2026 might be considerably weaker than anticipated.
According to analysts at TD Securities: “We look for employment to rise by 30K in July on a rebound in service sector hiring, although this will not be enough to keep the UE rate from climbing 0.1pp to 6.5%. More labour market slack should add to the BoC's confidence that inflation/wage pressures will continue to ease, but wage growth will remain too high for the BoC's comfort even with a 0.5pp deceleration to 5.1%”.
When is August’s Canada Unemployment Rate released, and how could it affect USD/CAD?
The Canadian Unemployment Rate for July, accompanied by the Labour Force Survey, will be released on Friday at 12:30 GMT.
Further cooling of the labour market should leave the door wide open for the BoC to trim its interest rate at its next meeting, exerting at the same time some selling pressure on the Canadian currency. This favours some reversal in the strong monthly pullback in USD/CAD so far.
The rally in USD/CAD sparked around mid-July, sending the pair to as high as the 1.3950 region for the first time since October 2022. However, the Canadian Dollar managed to give away part of those losses since then and has started regaining upside momentum, prompting USD/CAD to retreat markedly to the low-1.3700s earlier this week, a region also neighbouring the interim 55-day SMA.
According to Pablo Piovano, senior analyst at FXStreet, further retracements should not be ruled out on the short-term horizon, with spot expected to meet provisional support at the 55-day and 100-day SMAs at 1.3714 and 1.3689, respectively, prior to the more relevant 200-day SMA at 1.3601. The latter reinforces the July low of 1.3584 (July 11) and should act as decent contention for the time being.
In case bulls regain the upper hand, Pablo adds that the immediate target for USD/CAD emerges at the 2024 top of 1.3946 (August 6), prior to the 1.4000 milestone.
Economic Indicator
Unemployment Rate
The Unemployment Rate, released by Statistics Canada, is the number of unemployed workers divided by the total civilian labor force as a percentage. It is a leading indicator for the Canadian Economy. If the rate is up, it indicates a lack of expansion within the Canadian labor market and a weakening of the Canadian economy. Generally, a decrease of the figure is seen as bullish for the Canadian Dollar (CAD), while an increase is seen as bearish.
Read more.Last release: Fri Jul 05, 2024 12:30
Frequency: Monthly
Actual: 6.4%
Consensus: 6.3%
Previous: 6.2%
Source: Statistics Canada
Employment FAQs
Labor market conditions are a key element in assessing the health of an economy and thus a key driver for currency valuation. High employment, or low unemployment, has positive implications for consumer spending and economic growth, boosting the value of the local currency. Moreover, a very tight labor market – a situation in which there is a shortage of workers to fill open positions – can also have implications on inflation levels because low labor supply and high demand leads to higher wages.
The pace at which salaries are growing in an economy is key for policymakers. High wage growth means that households have more money to spend, usually leading to price increases in consumer goods. In contrast to more volatile sources of inflation such as energy prices, wage growth is seen as a key component of underlying and persisting inflation as salary increases are unlikely to be undone. Central banks around the world pay close attention to wage growth data when deciding on monetary policy.
The weight that each central bank assigns to labor market conditions depends on its objectives. Some central banks explicitly have mandates related to the labor market beyond controlling inflation levels. The US Federal Reserve (Fed), for example, has the dual mandate of promoting maximum employment and stable prices. Meanwhile, the European Central Bank’s (ECB) sole mandate is to keep inflation under control. Still, and despite whatever mandates they have, labor market conditions are an important factor for policymakers given their significance as a gauge of the health of the economy and their direct relationship to inflation.
- USD/CHF edges lower on Thursday and snaps a two-day winning streak to the weekly top.
- Dovish Fed expectations, sliding US bond yields weigh on the USD and exert pressure.
- The risk-on mood could undermine the safe-haven CHF and help limit any further losses.
The USD/CHF pair struggles to capitalize on its strong gains registered over the past two days and trades with a mild negative bias during the Asian session on Friday. Spot prices currently trade around the 0.8660-0.8655 region amid a modest US Dollar (USD) downtick, though lacks follow-through selling or bearish conviction.
Rising bets for a 50 basis points (bps) interest rate cut by the Federal Reserve (Fed) in September triggered a fresh leg down in the US Treasury bond yields. This, in turn, drags the USD Index (DXY), which tracks the Greenback against a basket of currencies, away from the weekly high touched on Thursday and turns out to be a key factor weighing on the USD/CHF pair. That said, the risk-on impulse is seen undermining demand for the safe-haven Swiss Franc (CHF) and acting as a tailwind for spot prices.
The better-than-expected US Initial Jobless Claims released on Thursday eased market fears about an imminent recession in the world's largest economy. Adding to this, Chinese data published on Friday showed that the headline consumer price index (CPI) edged up to a five-month high of 0.5% year-on-year in July. This could be seen as the initial sign of a pickup in domestic demand and further boosts investors' confidence, which is evident from a generally positive tone across the global equity markets.
In the absence of any relevant market-moving economic releases on Friday, the aforementioned mixed fundamental backdrop warrants some caution before positioning for any meaningful intraday depreciating move. Market players now look forward to the release of the latest US consumer inflation figures, due next Wednesday. The crucial data will play a key role in influencing the Fed's future policy decision, which, in turn, should provide some meaningful impetus to the USD and the USD/CHF pair.
Fed FAQs
Monetary policy in the US is shaped by the Federal Reserve (Fed). The Fed has two mandates: to achieve price stability and foster full employment. Its primary tool to achieve these goals is by adjusting interest rates. When prices are rising too quickly and inflation is above the Fed’s 2% target, it raises interest rates, increasing borrowing costs throughout the economy. This results in a stronger US Dollar (USD) as it makes the US a more attractive place for international investors to park their money. When inflation falls below 2% or the Unemployment Rate is too high, the Fed may lower interest rates to encourage borrowing, which weighs on the Greenback.
The Federal Reserve (Fed) holds eight policy meetings a year, where the Federal Open Market Committee (FOMC) assesses economic conditions and makes monetary policy decisions. The FOMC is attended by twelve Fed officials – the seven members of the Board of Governors, the president of the Federal Reserve Bank of New York, and four of the remaining eleven regional Reserve Bank presidents, who serve one-year terms on a rotating basis.
In extreme situations, the Federal Reserve may resort to a policy named Quantitative Easing (QE). QE is the process by which the Fed substantially increases the flow of credit in a stuck financial system. It is a non-standard policy measure used during crises or when inflation is extremely low. It was the Fed’s weapon of choice during the Great Financial Crisis in 2008. It involves the Fed printing more Dollars and using them to buy high grade bonds from financial institutions. QE usually weakens the US Dollar.
Quantitative tightening (QT) is the reverse process of QE, whereby the Federal Reserve stops buying bonds from financial institutions and does not reinvest the principal from the bonds it holds maturing, to purchase new bonds. It is usually positive for the value of the US Dollar.
- EUR/USD breaks its three-day losing streak due to improved risk-on mood.
- The US Dollar appreciated as Initial Jobless Claims fell to 233K, falling below the expected 240K.
- Traders expect Germany's Harmonized Index of Consumer Prices to remain steady in July.
EUR/USD halts its three-day losing streak, trading around 1.0920 during the Asian session on Friday. The upside of the EUR/USD pair could be attributed to the downbeat US Dollar (USD), which could be attributed to heightened expectations of a dovish policy outlook by the US Federal Reserve (Fed).
However, the EUR/USD pair faced challenges as US Initial Jobless Claims fell to 233,000 for the week ending August 2, coming in below the market expectation of 240,000. This decline follows an upwardly revised figure of 250,000 for the previous week, which had been the highest in a year.
The US Dollar Index (DXY), which measures the value of the US Dollar (USD) against the other six major currencies, retraces its recent gains, trading around 103.20. Additionally, the decline in the US Treasury yields put pressure on the Greenback standing at 4.01% and 3.97%, respectively, at the time of writing.
On Thursday, Kansas City Fed President Jeffrey Schmid stated that reducing monetary policy could be "appropriate" if inflation remains low. Schmid noted that the current Fed policy is "not that restrictive" and that while the Fed is close to its 2% inflation goal, it has not yet fully achieved it, per Reuters.
On the EUR front, the European Central Bank (ECB) policymaker Olli Rehn said on Wednesday that the central bank can continue cutting interest rates if the inflation trend is slowing in the near future. Rehn said "Inflation continues to slow down but the path to the 2% target remains bumpy this year," per Reuters.
Traders await Germany's Harmonized Index of Consumer Prices (HICP) scheduled for release on Friday. Market expectations are steady, with forecasts of a 2.6% year-on-year increase and a 0.5% month-on-month rise in July.
Euro FAQs
The Euro is the currency for the 20 European Union countries that belong to the Eurozone. It is the second most heavily traded currency in the world behind the US Dollar. In 2022, it accounted for 31% of all foreign exchange transactions, with an average daily turnover of over $2.2 trillion a day. EUR/USD is the most heavily traded currency pair in the world, accounting for an estimated 30% off all transactions, followed by EUR/JPY (4%), EUR/GBP (3%) and EUR/AUD (2%).
The European Central Bank (ECB) in Frankfurt, Germany, is the reserve bank for the Eurozone. The ECB sets interest rates and manages monetary policy. The ECB’s primary mandate is to maintain price stability, which means either controlling inflation or stimulating growth. Its primary tool is the raising or lowering of interest rates. Relatively high interest rates – or the expectation of higher rates – will usually benefit the Euro and vice versa. The ECB Governing Council makes monetary policy decisions at meetings held eight times a year. Decisions are made by heads of the Eurozone national banks and six permanent members, including the President of the ECB, Christine Lagarde.
Eurozone inflation data, measured by the Harmonized Index of Consumer Prices (HICP), is an important econometric for the Euro. If inflation rises more than expected, especially if above the ECB’s 2% target, it obliges the ECB to raise interest rates to bring it back under control. Relatively high interest rates compared to its counterparts will usually benefit the Euro, as it makes the region more attractive as a place for global investors to park their money.
Data releases gauge the health of the economy and can impact on the Euro. Indicators such as GDP, Manufacturing and Services PMIs, employment, and consumer sentiment surveys can all influence the direction of the single currency. A strong economy is good for the Euro. Not only does it attract more foreign investment but it may encourage the ECB to put up interest rates, which will directly strengthen the Euro. Otherwise, if economic data is weak, the Euro is likely to fall. Economic data for the four largest economies in the euro area (Germany, France, Italy and Spain) are especially significant, as they account for 75% of the Eurozone’s economy.
Another significant data release for the Euro is the Trade Balance. This indicator measures the difference between what a country earns from its exports and what it spends on imports over a given period. If a country produces highly sought after exports then its currency will gain in value purely from the extra demand created from foreign buyers seeking to purchase these goods. Therefore, a positive net Trade Balance strengthens a currency and vice versa for a negative balance.
- GBP/USD scales higher for the second straight day amid the emergence of some USD selling.
- Dovish Fed expectations, sliding US bond yields and the risk-on impulse undermines the USD.
- Bets for two more BoE rate cuts in 2024 and the ongoing riots in the UK might cap the upside.
The GBP/USD pair is seen building on the previous day's goodish rebound from the 1.2665 area, or a five-week low and gaining some follow-through positive traction for the second successive day on Thursday. The momentum lifts spot prices back above the mid-1.2700s during the Asian session and is sponsored by a modest US Dollar (USD) downtick.
As investors look past Thursday's upbeat US labor market report, the USD Index (DXY), which tracks the Greenback against a basket of currencies, retreats further from the weekly high touched on Thursday and acts as a tailwind for the GBP/USD pair. In fact, the US Department of Labor (DoL) reported that there were 233K initial jobless claims in the week ending August 3 as compared to expectations for a 240K print and 249K in the previous week. The upbeat reading eased concerns about an economic downturn in the world's largest economy, though dovish Federal Reserve (Fed) expectations continue to undermine demand for the buck.
The markets have fully priced in a 25-basis points rate cut by the Federal Reserve in September and have been speculating on the possibility of a 50-bps rate cut. This, in turn, triggers a fresh leg down in the US Treasury bond yields, which, along with a positive risk tone, exerts some downward pressure on the safe-haven Greenback. Any meaningful appreciating move for the GBP/USD pair, however, seems elusive in the wake of rising bets for two more interest rate cuts by the Bank of England (BoE) in 2024. This, along with the ongoing riots in the UK, should hold back traders from placing aggressive bullish bets around the British Pound (GBP).
There isn't any relevant market-moving economic data due for release on Friday, either from the UK or the US, leaving the GBP/USD pair at the mercy of the USD price dynamics. Nevertheless, spot prices remain on track to register modest losses for the fourth straight week. The focus now shifts to the release of the UK monthly jobs data, due next Tuesday, which will be followed by the latest consumer inflation figures from the UK and the US on Wednesday. Apart from this, the monthly UK GDP print on Thursday should help in determining the next leg of a directional move for the currency pair.
BoE FAQs
The Bank of England (BoE) decides monetary policy for the United Kingdom. Its primary goal is to achieve ‘price stability’, or a steady inflation rate of 2%. Its tool for achieving this is via the adjustment of base lending rates. The BoE sets the rate at which it lends to commercial banks and banks lend to each other, determining the level of interest rates in the economy overall. This also impacts the value of the Pound Sterling (GBP).
When inflation is above the Bank of England’s target it responds by raising interest rates, making it more expensive for people and businesses to access credit. This is positive for the Pound Sterling because higher interest rates make the UK a more attractive place for global investors to park their money. When inflation falls below target, it is a sign economic growth is slowing, and the BoE will consider lowering interest rates to cheapen credit in the hope businesses will borrow to invest in growth-generating projects – a negative for the Pound Sterling.
In extreme situations, the Bank of England can enact a policy called Quantitative Easing (QE). QE is the process by which the BoE substantially increases the flow of credit in a stuck financial system. QE is a last resort policy when lowering interest rates will not achieve the necessary result. The process of QE involves the BoE printing money to buy assets – usually government or AAA-rated corporate bonds – from banks and other financial institutions. QE usually results in a weaker Pound Sterling.
Quantitative tightening (QT) is the reverse of QE, enacted when the economy is strengthening and inflation starts rising. Whilst in QE the Bank of England (BoE) purchases government and corporate bonds from financial institutions to encourage them to lend; in QT, the BoE stops buying more bonds, and stops reinvesting the principal maturing on the bonds it already holds. It is usually positive for the Pound Sterling.
- The Japanese Yen edges lower as traders adopt caution due to increased market volatility.
- Japan’s Finance Minister Shunichi Suzuki will continue to monitor market developments closely.
- The US Dollar receives downward pressure due to heightened odds of a 25-basis point rate cut in September.
The Japanese Yen (JPY) depreciates against the US Dollar (USD) on Friday. Traders are closely evaluating Japan's monetary policy outlook, as central bank officials have indicated a readiness to raise rates further, although they have become more cautious due to increased market volatility.
Japan’s Finance Minister Shunichi Suzuki emphasized on Thursday that monetary policy decisions fall under the purview of the Bank of Japan, while they continue to monitor market developments closely, as reported by Reuters.
The US Dollar faces challenges amid increasing expectations that the Federal Reserve (Fed) may implement a rate cut in September. Traders evaluate mixed signals from the US economy, trying to determine whether it will experience a soft landing or slip into a recession. The CME FedWatch tool indicates that markets are now fully anticipating a 25-basis point interest rate cut by the Fed in September.
Daily Digest Market Movers: Japanese Yen receives support as Fed may adopt a dovish stance
- A Julius Baer analyst believes there is no need for the Bank of Japan to significantly raise interest rates beyond current levels. Once market conditions stabilize, the approximately 500-basis point interest rate differential between the JPY and USD is expected to become the main factor. The analyst does not foresee the Yen appreciating further.
- Bloomberg reported that JP Morgan Asset Management (JPAM) believes the Bank of Japan is unlikely to raise interest rates in the near term. According to JPAM, the BoJ may only consider further rate hikes if the Federal Reserve cuts rates and the US economy stabilizes. They anticipate that any additional tightening by the BoJ is more likely to occur in 2025, provided the global economic environment remains stable.
- On Thursday, Kansas City Fed President Jeffrey Schmid stated that reducing monetary policy could be "appropriate" if inflation remains low. Schmid noted that the current Fed policy is "not that restrictive" and that while the Fed is close to its 2% inflation goal, it has not yet fully achieved it, per Reuters.
- US Initial Jobless Claims dropped to 233,000 for the week ending August 2, coming in under the market expectation of 240,000. This decline follows an upwardly revised figure of 250,000 for the previous week, which was the highest in a year.
- The Bank of Japan’s Summary of Opinions from the Monetary Policy Meeting on July 30 and 31 showed that several members believe economic activity and prices are progressing as anticipated by the BoJ. The members are targeting a neutral rate of "at least around 1%" as a medium-term goal.
- On Wednesday, BoJ Deputy Governor Shinichi Uchida also noted that BoJ's interest rate strategy will adapt if market volatility alters economic forecasts, risk assessments, or projections. Given recent market volatility, he emphasized the need for careful monitoring of the economic and price impacts of their policies, stating, “We must maintain the current degree of monetary easing for the time being.”
- The minutes from the Bank of Japan's June meeting showed that some members expressed concerns about rising import prices due to the recent decline in the JPY, which could pose an upside risk to inflation. One member noted that cost-push inflation might intensify underlying inflation if it results in higher inflation expectations and wage increases.
Technical Analysis: USD/JPY hovers around 147.50
USD/JPY trades around 147.40 on Friday. The daily chart analysis shows that the pair has breached above the descending channel, suggesting a weakening of a bearish bias. Additionally, the 14-day Relative Strength Index (RSI) is currently at the 30 level. A move toward the 50 level could signal a potential improvement in momentum for the pair.
For support levels, the USD/JPY pair might test the upper boundary around the 146.75 level. A break below this level could place downward pressure on the pair, potentially guiding it toward a throwback support at 140.25, and further to the lower boundary of the descending channel near 139.00.
In terms of resistance, the USD/JPY pair could test the immediate barrier at the nine-day Exponential Moving Average (EMA) around the 148.13 level. A breakout above this level could diminish bearish momentum and allow the pair to approach the "throwback support turned resistance" at 154.50.
USD/JPY: Daily Chart
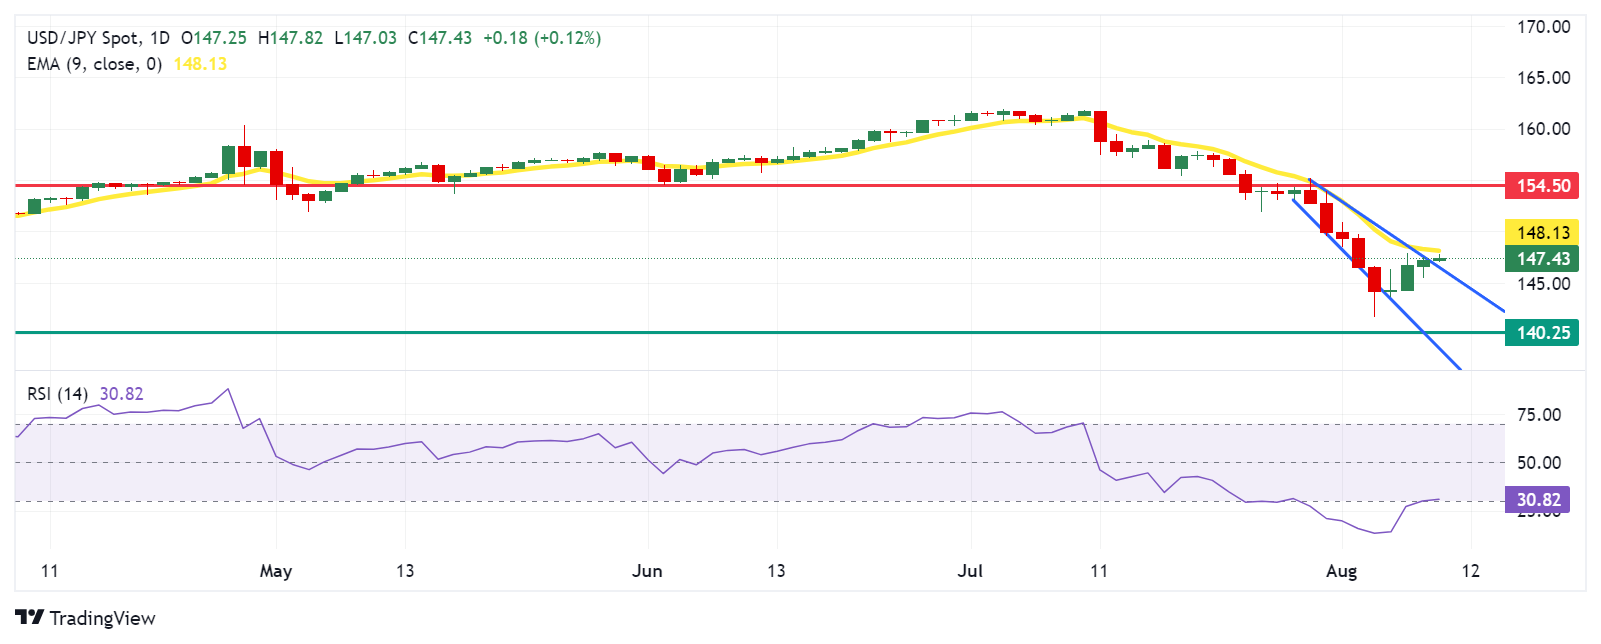
Japanese Yen PRICE Today
The table below shows the percentage change of Japanese Yen (JPY) against listed major currencies today. Japanese Yen was the weakest against the New Zealand Dollar.
| USD | EUR | GBP | JPY | CAD | AUD | NZD | CHF | |
|---|---|---|---|---|---|---|---|---|
| USD | -0.03% | -0.08% | -0.07% | -0.04% | -0.09% | -0.24% | -0.08% | |
| EUR | 0.03% | -0.03% | 0.02% | -0.01% | -0.05% | -0.21% | -0.06% | |
| GBP | 0.08% | 0.03% | 0.06% | 0.01% | -0.02% | -0.18% | -0.01% | |
| JPY | 0.07% | -0.02% | -0.06% | -0.01% | -0.03% | -0.21% | -0.01% | |
| CAD | 0.04% | 0.00% | -0.01% | 0.00% | -0.06% | -0.20% | -0.03% | |
| AUD | 0.09% | 0.05% | 0.02% | 0.03% | 0.06% | -0.16% | 0.01% | |
| NZD | 0.24% | 0.21% | 0.18% | 0.21% | 0.20% | 0.16% | 0.17% | |
| CHF | 0.08% | 0.06% | 0.00% | 0.01% | 0.03% | -0.01% | -0.17% |
The heat map shows percentage changes of major currencies against each other. The base currency is picked from the left column, while the quote currency is picked from the top row. For example, if you pick the Japanese Yen from the left column and move along the horizontal line to the US Dollar, the percentage change displayed in the box will represent JPY (base)/USD (quote).
Japanese Yen FAQs
The Japanese Yen (JPY) is one of the world’s most traded currencies. Its value is broadly determined by the performance of the Japanese economy, but more specifically by the Bank of Japan’s policy, the differential between Japanese and US bond yields, or risk sentiment among traders, among other factors.
One of the Bank of Japan’s mandates is currency control, so its moves are key for the Yen. The BoJ has directly intervened in currency markets sometimes, generally to lower the value of the Yen, although it refrains from doing it often due to political concerns of its main trading partners. The current BoJ ultra-loose monetary policy, based on massive stimulus to the economy, has caused the Yen to depreciate against its main currency peers. This process has exacerbated more recently due to an increasing policy divergence between the Bank of Japan and other main central banks, which have opted to increase interest rates sharply to fight decades-high levels of inflation.
The BoJ’s stance of sticking to ultra-loose monetary policy has led to a widening policy divergence with other central banks, particularly with the US Federal Reserve. This supports a widening of the differential between the 10-year US and Japanese bonds, which favors the US Dollar against the Japanese Yen.
The Japanese Yen is often seen as a safe-haven investment. This means that in times of market stress, investors are more likely to put their money in the Japanese currency due to its supposed reliability and stability. Turbulent times are likely to strengthen the Yen’s value against other currencies seen as more risky to invest in.
- The Indian Rupee trades on a stronger note in Friday’s Asian session.
- A deeper Fed rate cut expectation and the potential RBI intervention underpin the INR.
- Higher crude oil, weakness in its Asian peers and India’s foreign outflows might weigh on the local currency.
The Indian Rupee (INR) gains traction on Friday. Traders increasingly expect the US Federal Reserve (Fed) to cut interest rates in September, which continue undermining the US Dollar (USD). Furthermore, the likely intervention by the Reserve Bank of India (RBI) could prevent the local currency from depreciating.
Nonetheless, further rebound of crude oil prices might exert some selling pressure on the INR as India is the world's third-biggest oil importer and consumer. The weakness in its Asian peers and India’s foreign outflows might contribute to the Indian Rupee’s downside. In the absence of any top-tier data releases from India and the US on Friday, traders will focus on risk sentiment and the USD dynamic for the time being.
Daily Digest Market Movers: Indian Rupee strengthens, potential upside seems limited
- The RBI’s Monetary Policy Committee (MPC) voted by a 4-2 majority to leave policy rates unchanged and decided to maintain its ‘Withdrawal of Accommodation" stance.
- The Indian central bank retains the real Gross Domestic Product (GDP) growth projection for FY25 at 7.2%, with "risks evenly balanced," and maintains the Consumer Price Index (CPI) inflation forecast for FY25 at 4.5%.
- RBI Governor Shaktikanta Das said that inflation is receding gradually across economies, while medium-term global growth faces significant challenges. However, food price pressures cannot be ignored due to their potential spillover effects.
- RBI’s Das further stated that it was premature to discuss the recession in the US, but the central bank will monitor all incoming data, both domestic and external.
- The number of Americans filing new applications for unemployment benefits increased by 233,000 for the week ending August 3 versus 250,000 prior (revised from 249,000). This figure came in below the market consensus of 240K, according to the US Department of Labor (DoL) report on Thursday.
- Investors pare bets the Fed will start cutting interest rates in September with a bigger-than-usual 50 basis points (bps) reduction to nearly 58% odds, down from 70% before the data release, according to the CME FedWatch Tool.
Technical analysis: USD/INR’s broader outlook remains positive
Indian Rupee trades firmer on the day. According to the daily chart, the bullish outlook for the USD/INR pair remains in play, with the price holding above the key 100-day Exponential Moving Average (EMA) and the uptrend line since June 3. The 14-day Relative Strength Index (RSI) reflects ongoing bullish strength as it stands above the midline near 65.80.
The first upside target for USD/INR emerges at the 84.00 psychological barrier. Extended gains could pave the way to the all-time high of 84.24. A bullish breakout above this level could see a rally to 84.50.
On the flip side, the uptrend line around 83.80 acts as a key contention level for the pair. A breach of the mentioned level could drag the pair lower to the 100-day EMA at 83.51.
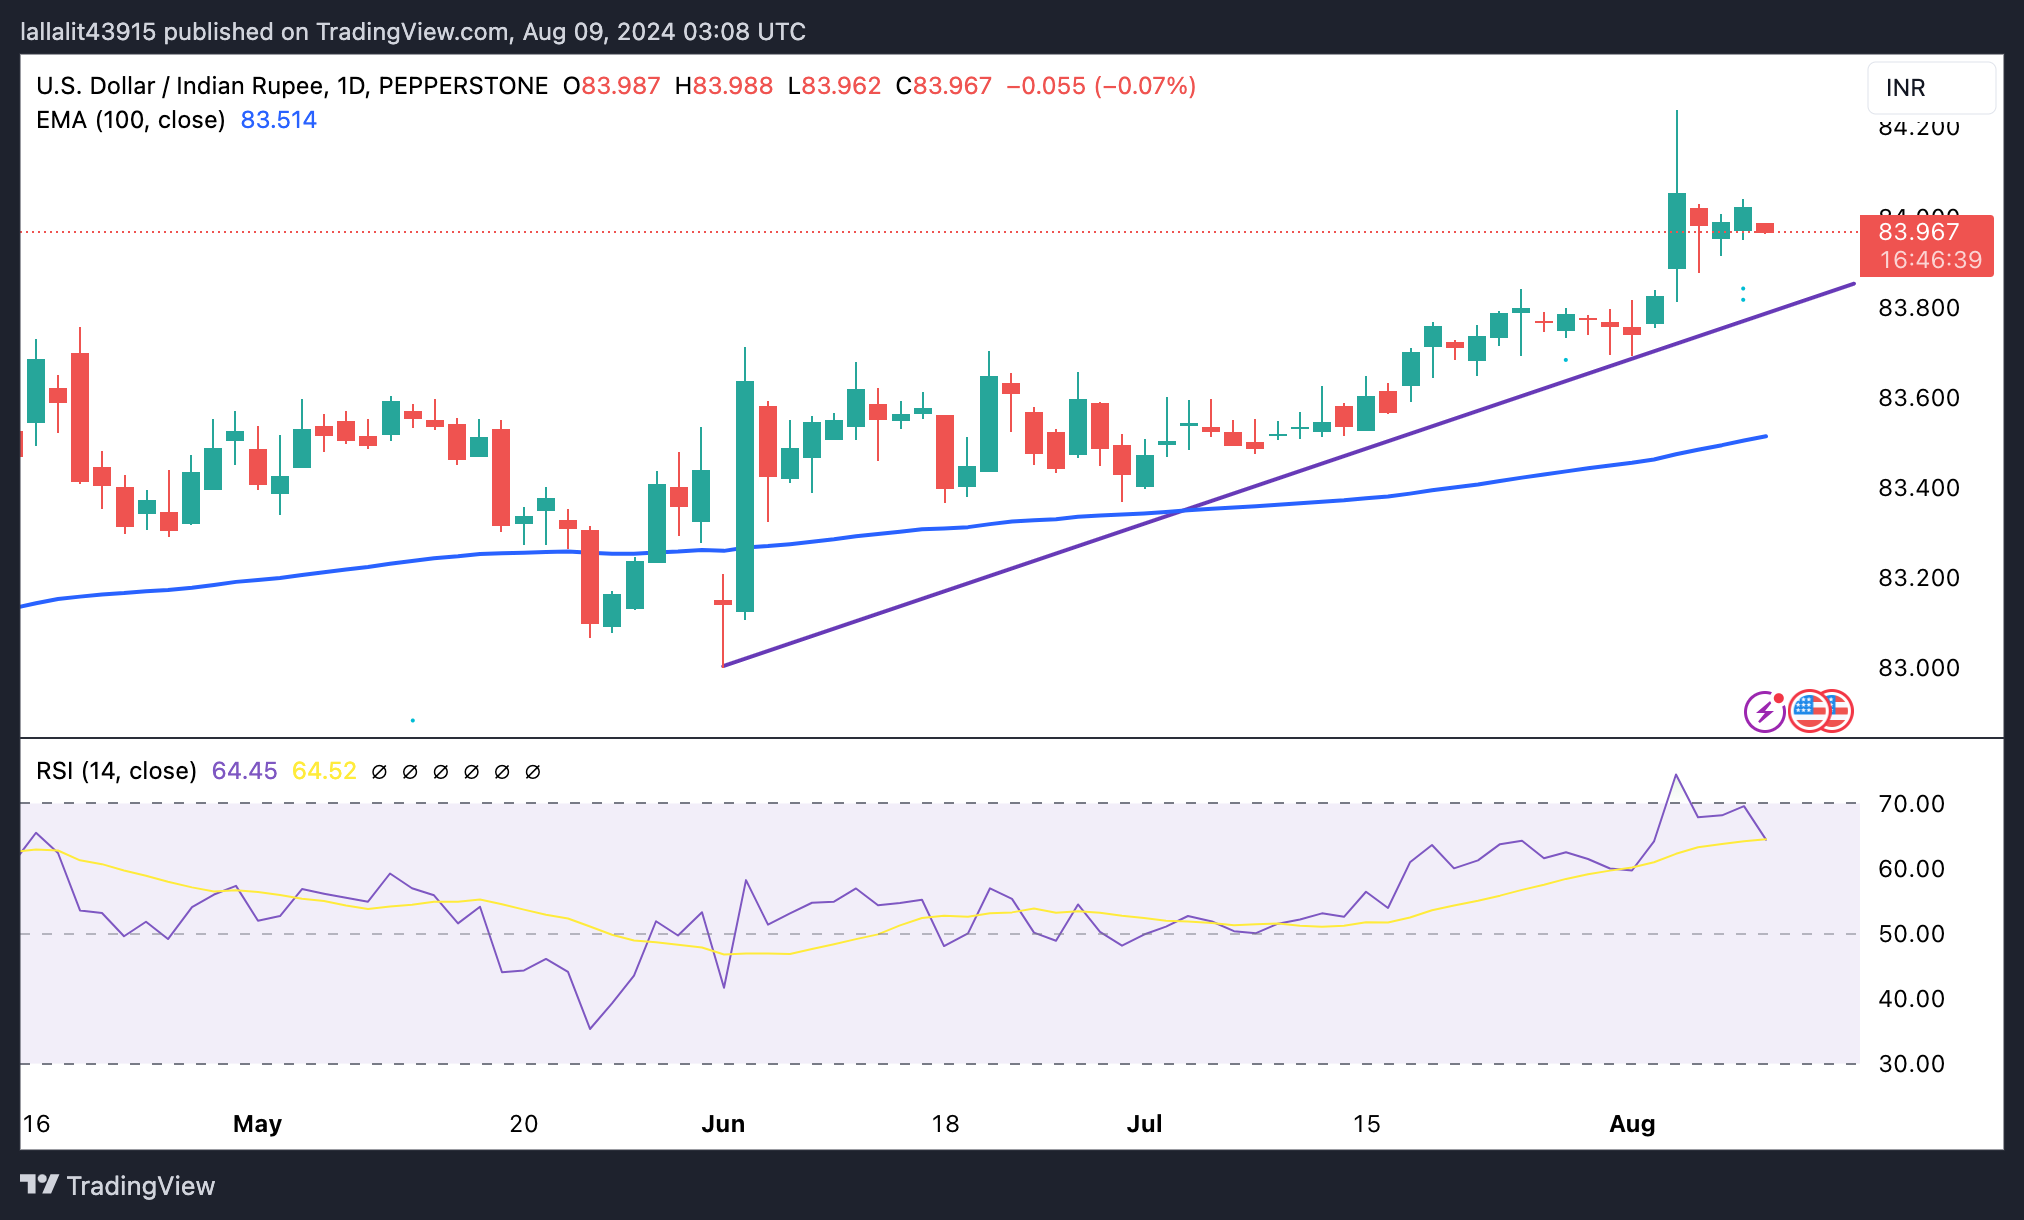
US Dollar price today
The table below shows the percentage change of US Dollar (USD) against listed major currencies today. US Dollar was the weakest against the New Zealand Dollar.
| USD | EUR | GBP | CAD | AUD | JPY | NZD | CHF | |
| USD | -0.07% | -0.09% | -0.05% | -0.08% | -0.18% | -0.37% | -0.07% | |
| EUR | 0.07% | -0.02% | 0.02% | -0.01% | -0.09% | -0.29% | 0.01% | |
| GBP | 0.09% | 0.01% | 0.03% | 0.00% | -0.07% | -0.29% | 0.03% | |
| CAD | 0.06% | -0.01% | -0.04% | -0.02% | -0.09% | -0.30% | 0.00% | |
| AUD | 0.08% | 0.00% | -0.01% | 0.03% | -0.10% | -0.30% | 0.01% | |
| JPY | 0.17% | 0.09% | 0.08% | 0.10% | 0.08% | -0.19% | 0.12% | |
| NZD | 0.38% | 0.30% | 0.28% | 0.33% | 0.30% | 0.20% | 0.31% | |
| CHF | 0.06% | -0.02% | -0.04% | 0.00% | -0.03% | -0.12% | -0.31% |
The heat map shows percentage changes of major currencies against each other. The base currency is picked from the left column, while the quote currency is picked from the top row. For example, if you pick the Euro from the left column and move along the horizontal line to the Japanese Yen, the percentage change displayed in the box will represent EUR (base)/JPY (quote).
Indian Rupee FAQs
The Indian Rupee (INR) is one of the most sensitive currencies to external factors. The price of Crude Oil (the country is highly dependent on imported Oil), the value of the US Dollar – most trade is conducted in USD – and the level of foreign investment, are all influential. Direct intervention by the Reserve Bank of India (RBI) in FX markets to keep the exchange rate stable, as well as the level of interest rates set by the RBI, are further major influencing factors on the Rupee.
The Reserve Bank of India (RBI) actively intervenes in forex markets to maintain a stable exchange rate, to help facilitate trade. In addition, the RBI tries to maintain the inflation rate at its 4% target by adjusting interest rates. Higher interest rates usually strengthen the Rupee. This is due to the role of the ‘carry trade’ in which investors borrow in countries with lower interest rates so as to place their money in countries’ offering relatively higher interest rates and profit from the difference.
Macroeconomic factors that influence the value of the Rupee include inflation, interest rates, the economic growth rate (GDP), the balance of trade, and inflows from foreign investment. A higher growth rate can lead to more overseas investment, pushing up demand for the Rupee. A less negative balance of trade will eventually lead to a stronger Rupee. Higher interest rates, especially real rates (interest rates less inflation) are also positive for the Rupee. A risk-on environment can lead to greater inflows of Foreign Direct and Indirect Investment (FDI and FII), which also benefit the Rupee.
Higher inflation, particularly, if it is comparatively higher than India’s peers, is generally negative for the currency as it reflects devaluation through oversupply. Inflation also increases the cost of exports, leading to more Rupees being sold to purchase foreign imports, which is Rupee-negative. At the same time, higher inflation usually leads to the Reserve Bank of India (RBI) raising interest rates and this can be positive for the Rupee, due to increased demand from international investors. The opposite effect is true of lower inflation.
- Silver attracts buyers for the second straight day and moves away from a multi-month low.
- The technical setup supports prospects for the emergence of fresh selling at higher levels.
- A sustained move beyond the 100-day SMA and $29.00 is needed to negate the bearish bias.
Silver (XAG/USD) builds on the overnight goodish rebound from the $26.45 area, or a three-month low and scales higher for the second successive day on Friday. The white metal climbs to a four-day peak, around the $27.75 region during the Asian session, though the positive momentum runs the risk of fizzling out rather quickly.
From a technical perspective, the XAG/USD pauses near the 23.6% Fibonacci retracement level of the July-August downfall. The said barrier should now act as a key pivotal point, which if cleared might trigger a short-covering rally and lift the XAG/USD beyond the $28.00 mark, towards the 38.2% Fibo. level around the $28.50-$28.55 region. That said, oscillators on the daily chart – though have recovered from lower levels – are still holding deep in negative territory.
Hence, any further move up is likely to confront stiff resistance and remain capped near the 100-day Simple Moving Average (SMA) support breakpoint, around the $28.75-$28.80 zone. This is followed by the $29.00 mark, which if cleared decisively will negate the negative outlook. The XAG/USD might then climb to the $29.45 intermediate hurdle en route to the 61.8% Fibo. level, around the $29.75 region and eventually aim to reclaim the $30.00 psychological mark.
On the flip side, the $27.30-$27.25 area now seems to protect the immediate downside ahead of the $27.00 mark. Any further decline might continue to find strong support near the $26.50-$26.45 area, or a multi-month low touched on Wednesday. Some follow-through selling, however, will be seen as a fresh trigger for bears and drag the XAG/USD to the May monthly swing low, around the $26.00 mark. The next relevant support is pegged near the $25.60 horizontal zone, below which the commodity could fall to the $25.00 psychological mark.
Silver daily chart
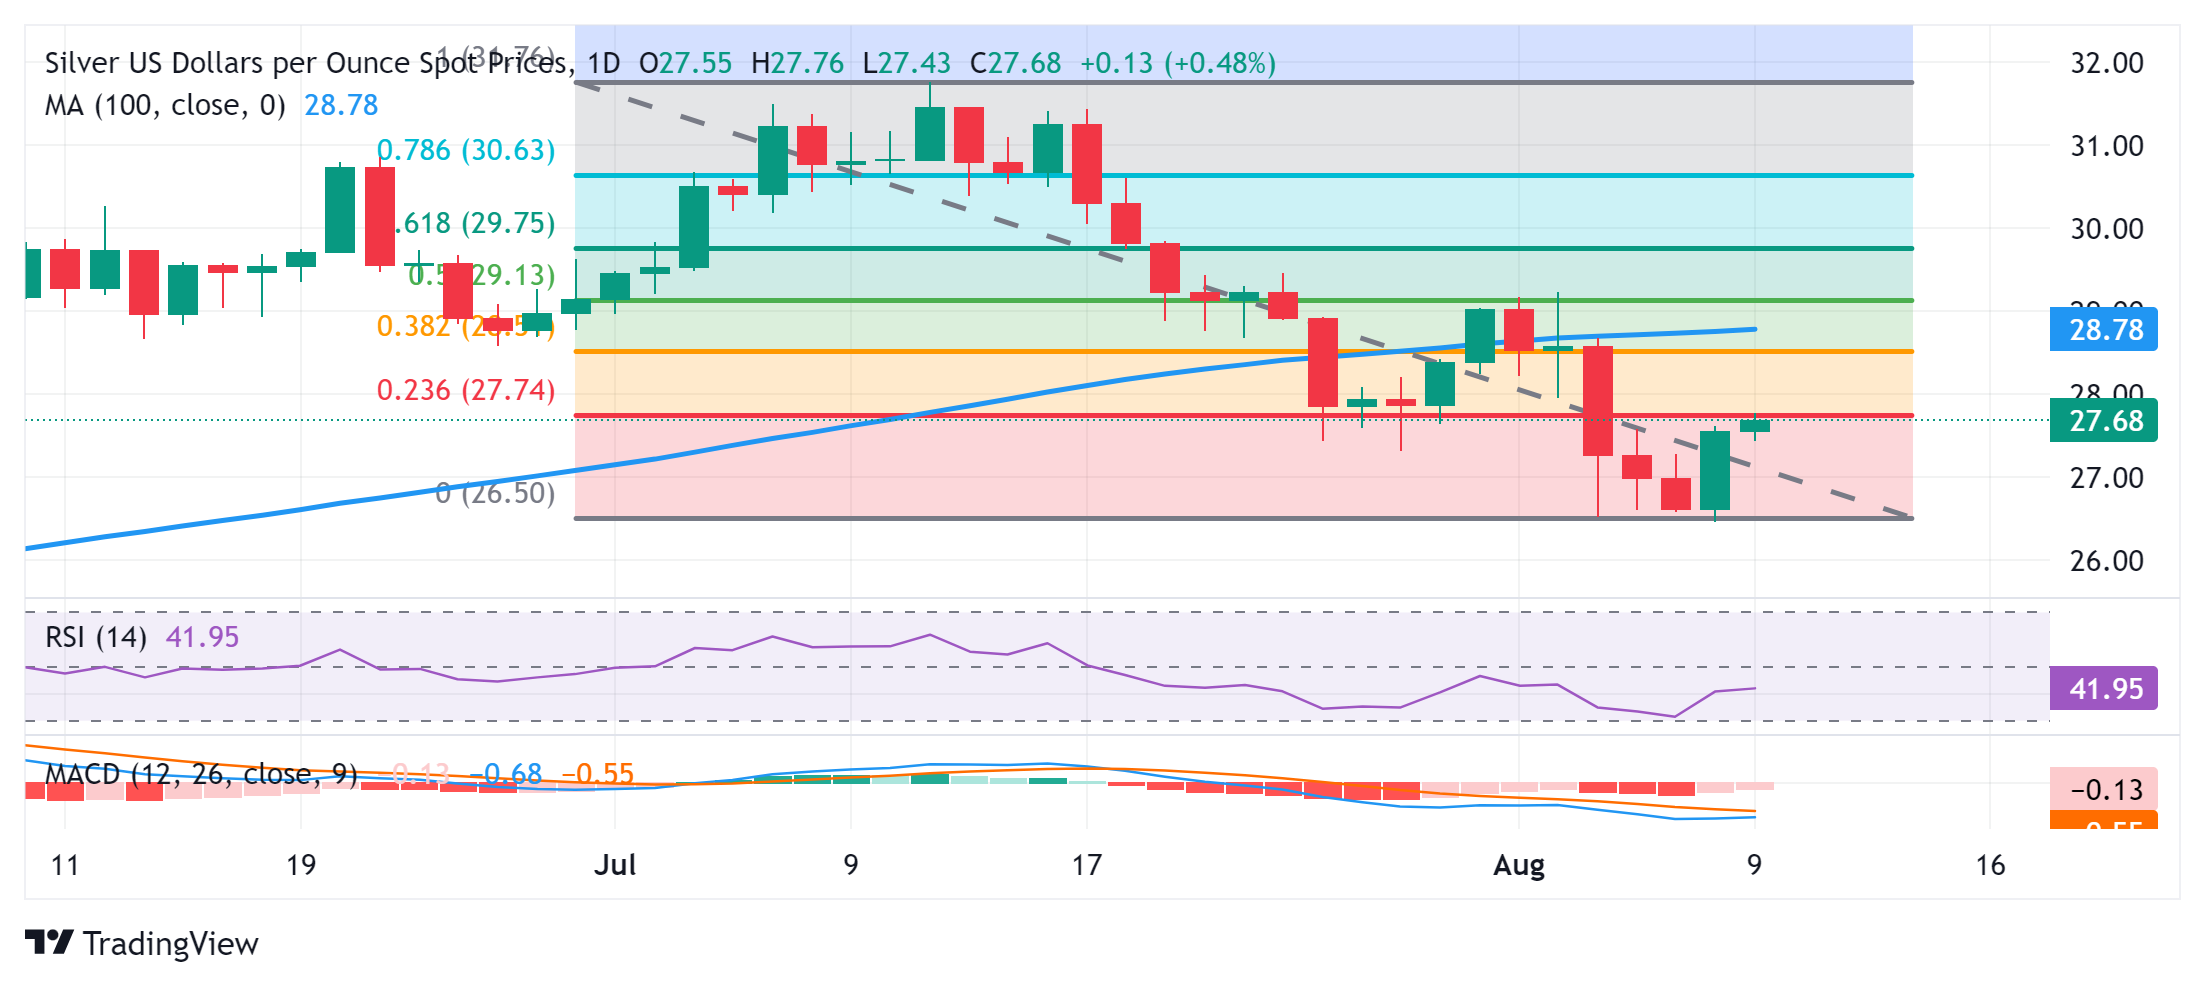
Silver FAQs
Silver is a precious metal highly traded among investors. It has been historically used as a store of value and a medium of exchange. Although less popular than Gold, traders may turn to Silver to diversify their investment portfolio, for its intrinsic value or as a potential hedge during high-inflation periods. Investors can buy physical Silver, in coins or in bars, or trade it through vehicles such as Exchange Traded Funds, which track its price on international markets.
Silver prices can move due to a wide range of factors. Geopolitical instability or fears of a deep recession can make Silver price escalate due to its safe-haven status, although to a lesser extent than Gold's. As a yieldless asset, Silver tends to rise with lower interest rates. Its moves also depend on how the US Dollar (USD) behaves as the asset is priced in dollars (XAG/USD). A strong Dollar tends to keep the price of Silver at bay, whereas a weaker Dollar is likely to propel prices up. Other factors such as investment demand, mining supply – Silver is much more abundant than Gold – and recycling rates can also affect prices.
Silver is widely used in industry, particularly in sectors such as electronics or solar energy, as it has one of the highest electric conductivity of all metals – more than Copper and Gold. A surge in demand can increase prices, while a decline tends to lower them. Dynamics in the US, Chinese and Indian economies can also contribute to price swings: for the US and particularly China, their big industrial sectors use Silver in various processes; in India, consumers’ demand for the precious metal for jewellery also plays a key role in setting prices.
Silver prices tend to follow Gold's moves. When Gold prices rise, Silver typically follows suit, as their status as safe-haven assets is similar. The Gold/Silver ratio, which shows the number of ounces of Silver needed to equal the value of one ounce of Gold, may help to determine the relative valuation between both metals. Some investors may consider a high ratio as an indicator that Silver is undervalued, or Gold is overvalued. On the contrary, a low ratio might suggest that Gold is undervalued relative to Silver.
- AUD/JPY struggles to capitalize on the modest Asian session uptick to a fresh weekly top.
- The better-than-expected Chinese inflation figures fail to impress bulls or provide impetus.
- BoJ rate cut bets, geopolitical risks lend some support to the JPY and cap gains for the cross.
The AUD/JPY cross gains positive traction for the fourth successive day and climbs to a fresh weekly top during the Asian session on Friday. Spot prices currently trade around the 97.20-97.25 region and move little following the release of Chiese inflation figures.
The Australian Dollar (AUD) continues to draw support from the Reserve Bank Australia's (RBA) hawkish stance, showing the willingness to hike interest rates further to suppress still sticky inflation. Apart from this, a generally positive tone around the equity markets undermines the safe-haven Japanese Yen (JPY) and benefits the risk-sensitive Aussie. Bulls, meanwhile, seem rather unimpressed by the mostly better-than-expected Chinese inflation figures.
In fact, the National Bureau of Statistics reported this Friday that consumer prices in China rose by 0.5% in July from a year ago as compared to the 0.2% increase in June and expectations for a reading of 0.3%. Additional details revealed that the headline CPI climbed 0.5% in July, the highest since February. That said, the Producer Price Index shrank for a 22nd consecutive month and came in at -0.8% for July as compared to -0.9% estimated.
The Japanese Yen (JPY), on the other hand, is underpinned by bets for at least one more interest rate hike by the Bank of Japan (BoJ) by the end of the current fiscal year, bolstered by Governor Kazuo Ueda's hawkish comments last week. Meanwhile, the reaction to BoJ Deputy Governor Shinichi Uchida's remarks earlier this week, downplaying the chances of a near-term rate hike, seems to have faded amid the recent unwinding of the JPY carry trades.
Hence, it is prudent to wait for some follow-through buying before confirming that the AUD/JPY cross has formed a near-term bottom ahead of the 90.00 psychological mark, or the lowest level since May 2023 touched earlier this week. Nevertheless, spot prices remain on track to register weekly gains for the first time in the previous five as the market attention now shifts to next week's release of the Australian Wage Price Index and monthly jobs report.
Economic Indicator
Producer Price Index (YoY)
The Producer Price Index released by the National Bureau of Statistics of China is a measurement of the rate of inflation experienced by producers. It captures the average changes in prices received by Chinese domestic producers of commodities in all stages of processing (crude materials, intermediate materials, and finished goods). Changes in the PPI are widely considered as an indicator of commodity inflation. If the Producer Price Index increase is excesive, it would indicate that inflation has become a destabilizing factor in the economy, The People’s Bank of China would tighten monetary policy and fiscal policy risk. Generally speaking, a high reading is seen as positive (or bullish) for the CNY, whereas a low reading is seen as negative (or bearish) for the CNY.
Read more.Last release: Fri Aug 09, 2024 01:30
Frequency: Monthly
Actual: -0.8%
Consensus: -0.9%
Previous: -0.8%
| Raw materials | Closed | Change, % |
|---|---|---|
| Silver | 27.522 | 3.98 |
| Gold | 242.713 | 1.92 |
| Palladium | 923.59 | 5.2 |
- Gold price edges lower on Friday and erodes a part of the overnight strong gains
- Easing fears of an imminent US recession and the risk-on mood act as a headwind.
- Bets for a 50 bps Fed rate cut in September and geopolitical risks to lend support.
Gold price (XAU/USD) struggles to capitalize on the previous day's strong move-up of nearly 2% and edges lower during the Asian session on Friday. A generally positive tone across the global equity markets exerts some downward pressure on the safe-haven precious metal, though a combination of factors should help limit any meaningful downside. Fears of a wider Middle East conflict might keep a lid on the optimism, which, along with bets for bigger rate cuts by the Federal Reserve (Fed), could offer some support to the non-yielding yellow metal.
Meanwhile, dovish Fed expectations act as a headwind for the US Treasury bond yields and drag the US Dollar (USD) away from the weekly high touched on Thursday. This, in turn, favors bullish traders and suggests that the path of least resistance for the Gold price is to the upside. Hence, any further decline might still be seen as a buying opportunity and remain limited in the absence of any relevant market-moving economic releases from the US. The market focus, meanwhile, will remain glued to the US consumer inflation figures, due for release next Wednesday.
Daily Digest Market Movers: Gold price is undermined by fading safe-haven demand, downside seems limited
- The markets have fully priced in a 25-basis points rate cut by the Federal Reserve in September and have been speculating on the possibility of a 50-bps rate cut, offering support to the Gold price.
- Adding to this, the assassination of Hamas chief Ismail Haniyeh in Tehran last week has raised the risk of retaliatory strikes by Iran on Israel and further benefited the safe-haven XAU/USD.
- The US data released on Thursday showed that there were 233K initial jobless claims in the week ending August 3 as compared to expectations for a 240K print and 249K in the previous week.
- The upbeat reading eased concerns about an economic downturn in the world's largest economy, triggering a move higher in the US Treasury bond yields and lifting the US Dollar to the weekly top.
- Meanwhile, receding fears of a possible recession in the US boosted investors' confidence and led to a strong relief rally in the US equity markets, which, in turn, capped gains for the precious metal.
- Traders, meanwhile, reacted little to the better-than-expected Chinese inflation figures, which showed that the headline CPI rose 0.5% over the year in July after reporting a 0.2% increase in June.
- This, however, was offset by the fact that China’s PPI extended a long stretch of declines witnessed since November 2022 and fell by the 0.8% YoY rate in July, at the same pace as seen in June.
Technical Analysis: Gold price is likely to attract dip-buyers near $2,412-2,413 resistance-turned-support
From a technical perspective, the recent bounce from the 50-day Simple Moving Average (SMA) support and the subsequent move up favors bullish traders. Moreover, oscillators on the daily chart have again started gaining positive traction and suggest that the path of least resistance for the Gold price is to the upside. Hence, some follow-through strength towards the next relevant hurdle, near the $2,448-2,450 region, looks like a distinct possibility. The momentum could extend further towards challenging the all-time top near the $2,483-2,484 area touched in July. The latter is closely followed by the $2,500 psychological mark, which if cleared decisively will set the stage for a further near-term appreciating move.
On the flip side, the $2,412-2,410 horizontal resistance breakpoint now seems to protect the immediate downside ahead of the $2,400 round-figure mark. Any further decline might continue to attract dip-buyers and remain cushioned near the 50-day SMA support, currently pegged near the $2,372-2,371 region. This should act as a key pivotal point, below which the Gold price could aim to retest last week's swing low, around the $2,353-2,352 area. Failure to defend the said support levels might shift the bias in favor of bearish traders and expose the 100-day SMA support, around the $2,342 zone.
Risk sentiment FAQs
In the world of financial jargon the two widely used terms “risk-on” and “risk off'' refer to the level of risk that investors are willing to stomach during the period referenced. In a “risk-on” market, investors are optimistic about the future and more willing to buy risky assets. In a “risk-off” market investors start to ‘play it safe’ because they are worried about the future, and therefore buy less risky assets that are more certain of bringing a return, even if it is relatively modest.
Typically, during periods of “risk-on”, stock markets will rise, most commodities – except Gold – will also gain in value, since they benefit from a positive growth outlook. The currencies of nations that are heavy commodity exporters strengthen because of increased demand, and Cryptocurrencies rise. In a “risk-off” market, Bonds go up – especially major government Bonds – Gold shines, and safe-haven currencies such as the Japanese Yen, Swiss Franc and US Dollar all benefit.
The Australian Dollar (AUD), the Canadian Dollar (CAD), the New Zealand Dollar (NZD) and minor FX like the Ruble (RUB) and the South African Rand (ZAR), all tend to rise in markets that are “risk-on”. This is because the economies of these currencies are heavily reliant on commodity exports for growth, and commodities tend to rise in price during risk-on periods. This is because investors foresee greater demand for raw materials in the future due to heightened economic activity.
The major currencies that tend to rise during periods of “risk-off” are the US Dollar (USD), the Japanese Yen (JPY) and the Swiss Franc (CHF). The US Dollar, because it is the world’s reserve currency, and because in times of crisis investors buy US government debt, which is seen as safe because the largest economy in the world is unlikely to default. The Yen, from increased demand for Japanese government bonds, because a high proportion are held by domestic investors who are unlikely to dump them – even in a crisis. The Swiss Franc, because strict Swiss banking laws offer investors enhanced capital protection.
- The Australian Dollar appreciates after higher-than-expected Chinese inflation data.
- China's CPI increased 0.5% YoY in July, against the expected 0.3% and previous 0.2% readings.
- CME FedWatch tool suggests a 100% odds of a 25-basis point Fed rate cut in September.
The Australian Dollar (AUD) extends its upside against the tepid US Dollar (USD) on Friday, following the upbeat inflation data release from China. Additionally, the AUD/USD pair gained ground following the hawkish comments from Reserve Bank of Australia (RBA) Governor Michele Bullock on Thursday.
China's Consumer Price Index (CPI) rose 0.5% year-on-year in July, exceeding the expected 0.3% and previous 0.2% readings. Meanwhile, the monthly index also increased 0.5%, swinging from the previous decline of 0.2%. Any change in the Chinese economy could impact the Australian markets as both countries are close trade partners.
Governor Bullock highlighted the importance of remaining cautious regarding inflation risks and expressed readiness to raise rates if needed, noting that inflation might not fall back to the 2–3% target range until late 2025. Additionally, the Aussie Dollar saw gains following the RBA's assertive choice to keep the cash rate at 4.35% on Tuesday.
The upside of the US Dollar could be restrained as the US Federal Reserve (Fed) is widely anticipated to implement a rate cut in September. According to the CME FedWatch tool, markets are now fully pricing in a quarter-basis point interest rate cut by the Fed in September.
Daily Digest Market Movers: Australian Dollar grapples to extend gains due to a hawkish RBA
- Westpac updated its RBA forecast, now predicting the first-rate cut will occur in February 2025, a shift from the previously anticipated November 2024. They also revised their terminal rate forecast to 3.35%, up from the previous 3.10%. The RBA is now viewed as more cautious, needing stronger evidence before considering rate cuts.
- On Thursday, Kansas City Fed President Jeffrey Schmid stated that reducing monetary policy could be "appropriate" if inflation remains low. Schmid noted that the current Fed policy is "not that restrictive" and that while the Fed is close to its 2% inflation goal, it has not yet fully achieved it, per Reuters.
- US Initial Jobless Claims dropped to 233,000 for the week ending August 2, coming in under the market expectation of 240,000. This decline follows an upwardly revised figure of 250,000 for the previous week, which was the highest in a year.
- China's Trade Balance showed a surplus of 84.65 billion for July, falling short of the 99.0 billion expected and 99.05 billion previously. Exports (YoY) came in at 7.0% vs. 9.7% expected and 8.6% previously. Meanwhile, Imports increased 7.2% YoY against 3.5% expected, swinging from a decline of 2.3% prior.
- The AiG Australian Industry Index showed a slight easing in contraction in July, improving to -20.7 from the previous -25.6 reading. Despite this improvement, the index has indicated contraction for the past twenty-seven months.
- On Wednesday, Treasurer Jim Chalmers contested the RBA's view that the economy remains too robust and that large government budgets are contributing to prolonged inflation, according to Macrobusiness.
- On Tuesday, RBA Governor Michele Bullock mentioned that the board had seriously considered increasing the cash rate from 4.35% to 4.6% due to ongoing concerns about excess demand in the economy. Additionally, RBA Chief Economist Sarah Hunter noted on Wednesday that the Australian economy is performing somewhat stronger than previously anticipated by the RBA.
Technical Analysis: Australian Dollar rises to near 0.6600 amid a bullish reversal
The Australian Dollar trades around 0.6590 on Friday. The daily chart analysis shows that the AUD/USD pair moves upward within an ascending channel, indicating a bullish bias. Meanwhile, the 14-day Relative Strength Index (RSI) is approaching the 50 level. A break above the 50 level could confirm the bullish bias.
In terms of support, the AUD/USD pair may find immediate support at throwback support of 0.6575 level. A break below this level could reinforce the bearish bias and exert pressure on the pair to test the lower boundary of the ascending channel around the 0.6520 level. Further support appears at the throwback support level of 0.6470.
On the upside, the pair could test the upper boundary of the ascending channel at the 0.6610 level. A breakthrough above this level could lead the AUD/USD pair to explore the region again around a six-month high of 0.6798.
AUD/USD: Daily Chart
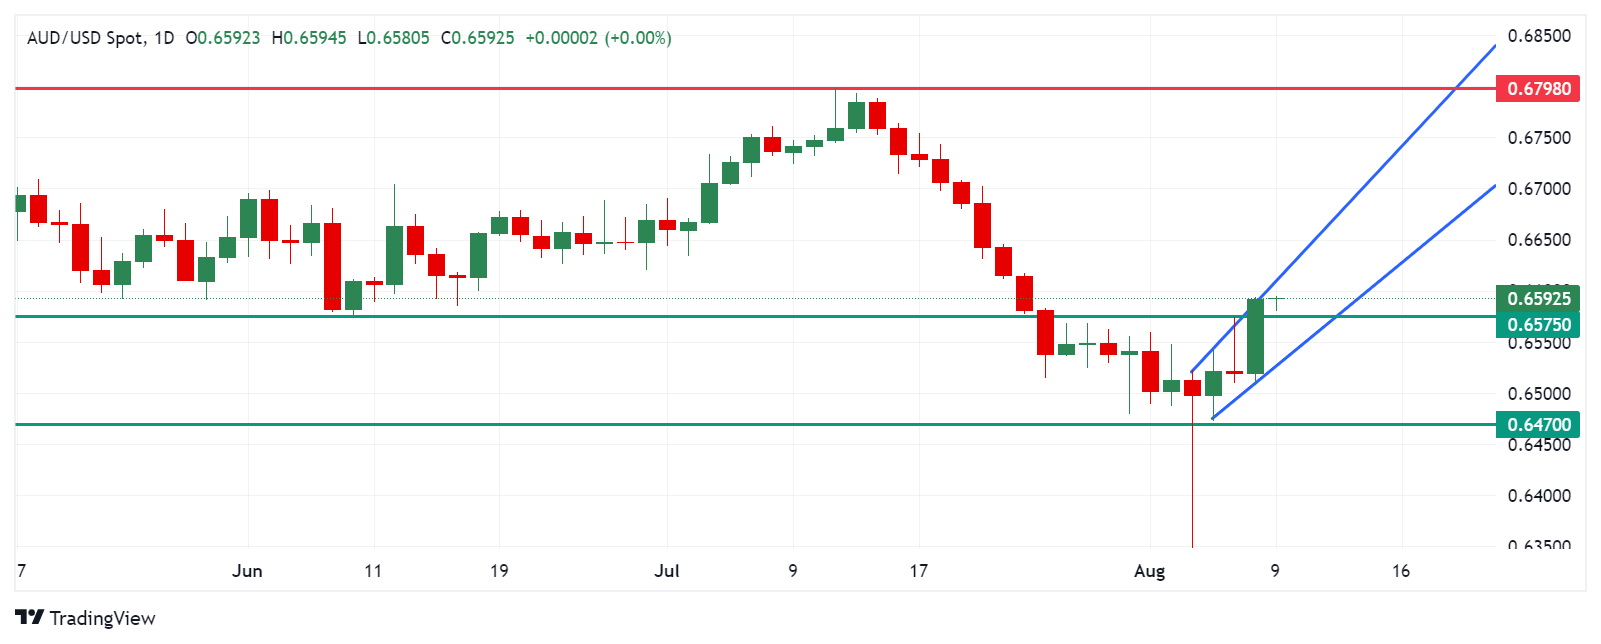
Australian Dollar PRICE Today
The table below shows the percentage change of Australian Dollar (AUD) against listed major currencies today. Australian Dollar was the strongest against the Japanese Yen.
| USD | EUR | GBP | JPY | CAD | AUD | NZD | CHF | |
|---|---|---|---|---|---|---|---|---|
| USD | -0.04% | -0.10% | 0.04% | -0.04% | -0.06% | -0.23% | -0.09% | |
| EUR | 0.04% | -0.04% | 0.14% | 0.00% | -0.02% | -0.20% | -0.02% | |
| GBP | 0.10% | 0.04% | 0.17% | 0.03% | 0.02% | -0.17% | 0.03% | |
| JPY | -0.04% | -0.14% | -0.17% | -0.14% | -0.13% | -0.33% | -0.12% | |
| CAD | 0.04% | -0.00% | -0.03% | 0.14% | -0.03% | -0.19% | -0.00% | |
| AUD | 0.06% | 0.02% | -0.02% | 0.13% | 0.03% | -0.18% | 0.01% | |
| NZD | 0.23% | 0.20% | 0.17% | 0.33% | 0.19% | 0.18% | 0.19% | |
| CHF | 0.09% | 0.02% | -0.03% | 0.12% | 0.00% | -0.01% | -0.19% |
The heat map shows percentage changes of major currencies against each other. The base currency is picked from the left column, while the quote currency is picked from the top row. For example, if you pick the Australian Dollar from the left column and move along the horizontal line to the US Dollar, the percentage change displayed in the box will represent AUD (base)/USD (quote).
Economic Indicator
Consumer Price Index (YoY)
The Consumer Price Index (CPI), released by the National Bureau of Statistics of China on a monthly basis, measures changes in the price level of consumer goods and services purchased by residents. The CPI is a key indicator to measure inflation and changes in purchasing trends. The YoY reading compares prices in the reference month to the same month a year earlier. Generally, a high reading is seen as bullish for the Renminbi (CNY), while a low reading is seen as bearish.
Read more.Last release: Fri Aug 09, 2024 01:30
Frequency: Monthly
Actual: 0.5%
Consensus: 0.3%
Previous: 0.2%
- WTI recovers to near $75.10 in Friday’s early Asian session.
- The upbeat US Initial Jobless Claims data and falling crude inventories support the WTI price.
- Chinese demand concerns might cap the upside in the near term.
West Texas Intermediate (WTI), the US crude oil benchmark, is trading around $75.10 on Friday. WTI price edges higher on the back of falling crude inventories and positive US labor data.
US crude inventories fell for a sixth straight week, reflecting positive demand. According to the US. Energy Information Administration’s (EIA) weekly report, crude oil stockpiles in the United States for the week ending August 2 dropped by 3.728 million barrels, compared to a fall of 3.436 million barrels in the previous week. The market consensus estimated that stocks would decline by 0.4 million barrels.
Furthermore, the US Initial Jobless Claims data released on Thursday has eased some fears about the weakness in the US labor market. The US Initial Jobless Claims for the week ending August 3 rose by 233K, compared to the previous week of 250K (revised from 249K), below the consensus of 240K.
On the other hand, eased fears of geopolitical tensions in the Middle East might cap the upside for the WTI price. Ryan Grabinski, an analyst at Strategas, noted on Wednesday that “Regardless of the ongoing conflicts in the Middle East, particularly with Iran and Israel, there has been no meaningful disruption to the flow of crude oil in the region.”
Meanwhile, the sluggish demand in China might drag the price of black gold lower as China is the world's biggest oil importer. Official data showed that Chinese crude imports dropped to 10.01 million barrels per day in July. Analysts forecast a year-on-year import drop in 2024, with expectations that crude imports could fall by 150,000 to 200,000 barrels per day.
WTI Oil FAQs
WTI Oil is a type of Crude Oil sold on international markets. The WTI stands for West Texas Intermediate, one of three major types including Brent and Dubai Crude. WTI is also referred to as “light” and “sweet” because of its relatively low gravity and sulfur content respectively. It is considered a high quality Oil that is easily refined. It is sourced in the United States and distributed via the Cushing hub, which is considered “The Pipeline Crossroads of the World”. It is a benchmark for the Oil market and WTI price is frequently quoted in the media.
Like all assets, supply and demand are the key drivers of WTI Oil price. As such, global growth can be a driver of increased demand and vice versa for weak global growth. Political instability, wars, and sanctions can disrupt supply and impact prices. The decisions of OPEC, a group of major Oil-producing countries, is another key driver of price. The value of the US Dollar influences the price of WTI Crude Oil, since Oil is predominantly traded in US Dollars, thus a weaker US Dollar can make Oil more affordable and vice versa.
The weekly Oil inventory reports published by the American Petroleum Institute (API) and the Energy Information Agency (EIA) impact the price of WTI Oil. Changes in inventories reflect fluctuating supply and demand. If the data shows a drop in inventories it can indicate increased demand, pushing up Oil price. Higher inventories can reflect increased supply, pushing down prices. API’s report is published every Tuesday and EIA’s the day after. Their results are usually similar, falling within 1% of each other 75% of the time. The EIA data is considered more reliable, since it is a government agency.
OPEC (Organization of the Petroleum Exporting Countries) is a group of 13 Oil-producing nations who collectively decide production quotas for member countries at twice-yearly meetings. Their decisions often impact WTI Oil prices. When OPEC decides to lower quotas, it can tighten supply, pushing up Oil prices. When OPEC increases production, it has the opposite effect. OPEC+ refers to an expanded group that includes ten extra non-OPEC members, the most notable of which is Russia.
China’s Consumer Price Index (CPI) rose 0.5% over the year in July after reporting a 0.2% increase in June. The market expected a growth of 0.3% in the reported period.
Chinese CPI inflation arrived at 0.5% MoM in July versus June’s 0.2% decline, better than the 0.3% forecast.
China’s Producer Price Index (PPI) dropped 0.8% YoY in July, at the same pace as seen in June. The data came in above the market consensus of -0.9%.
Market reaction to China’s inflation data
AUD/USD is picking up fresh on hotter-than-expected Chinese inflation data, adding 0.03% on the day to trade at 0.6593, as of writing.
Australian Dollar FAQs
One of the most significant factors for the Australian Dollar (AUD) is the level of interest rates set by the Reserve Bank of Australia (RBA). Because Australia is a resource-rich country another key driver is the price of its biggest export, Iron Ore. The health of the Chinese economy, its largest trading partner, is a factor, as well as inflation in Australia, its growth rate and Trade Balance. Market sentiment – whether investors are taking on more risky assets (risk-on) or seeking safe-havens (risk-off) – is also a factor, with risk-on positive for AUD.
The Reserve Bank of Australia (RBA) influences the Australian Dollar (AUD) by setting the level of interest rates that Australian banks can lend to each other. This influences the level of interest rates in the economy as a whole. The main goal of the RBA is to maintain a stable inflation rate of 2-3% by adjusting interest rates up or down. Relatively high interest rates compared to other major central banks support the AUD, and the opposite for relatively low. The RBA can also use quantitative easing and tightening to influence credit conditions, with the former AUD-negative and the latter AUD-positive.
China is Australia’s largest trading partner so the health of the Chinese economy is a major influence on the value of the Australian Dollar (AUD). When the Chinese economy is doing well it purchases more raw materials, goods and services from Australia, lifting demand for the AUD, and pushing up its value. The opposite is the case when the Chinese economy is not growing as fast as expected. Positive or negative surprises in Chinese growth data, therefore, often have a direct impact on the Australian Dollar and its pairs.
Iron Ore is Australia’s largest export, accounting for $118 billion a year according to data from 2021, with China as its primary destination. The price of Iron Ore, therefore, can be a driver of the Australian Dollar. Generally, if the price of Iron Ore rises, AUD also goes up, as aggregate demand for the currency increases. The opposite is the case if the price of Iron Ore falls. Higher Iron Ore prices also tend to result in a greater likelihood of a positive Trade Balance for Australia, which is also positive of the AUD.
The Trade Balance, which is the difference between what a country earns from its exports versus what it pays for its imports, is another factor that can influence the value of the Australian Dollar. If Australia produces highly sought after exports, then its currency will gain in value purely from the surplus demand created from foreign buyers seeking to purchase its exports versus what it spends to purchase imports. Therefore, a positive net Trade Balance strengthens the AUD, with the opposite effect if the Trade Balance is negative.
On Friday, the People’s Bank of China (PBOC) set the USD/CNY central rate for the trading session ahead at 7.1449, as against the previous day's fix of 7.1460 and 7.1690 Reuters estimates.
- USD/CAD edges higher to near 1.3740 in Friday’s early Asian session.
- The US Dollar recovery is bolstered by the upbeat US Initial claims last week.
- The Canadian employment data will be in the spotlight on Friday.
The USD/CAD pair trades with mild gains near 1.3740, snapping the five-day losing streak during the early Asian session on Friday. The uptick of the pair is supported by the firmer US Dollar (USD) after the upbeat Initial Jobless Claims.
Initial claims for unemployment insurance came in less than expected last week, easing some fears about the US labor market. Data released by the Department of Labor showed on Thursday that the initial jobless claims for the week ending August 3 increased by 233,000, compared to 250,000 in the previous week (revised from 249,000), below the consensus of 240K. The upbeat reading provides some support to the Greenback against the Loonie.
The markets remain expecting a strong probability of a half percentage point reduction for the first move and a full percentage point cut by the end of the year. According to the CME FedWatch Tool, traders have priced in 57.5% odds that the Federal Reserve (Fed) will cut 50 basis points (bps) at the September meeting, down from 83% earlier this week. A deeper Fed rate cut expectation is likely to limit the pair’s upside in the near term.
On the CAD’s front, the Bank of Canada (BoC) decided to cut interest rates at its July meeting to 4.5%, hinting at further easing of monetary policy where appropriate. BMO and CIBC analysts forecast a further rate reduction of 75 bps in 2024, or a quarter-point cut at each remaining meeting this year. However, traders will take more cues from the key Canadian employment report, which is due later on Friday. The Canadian economy is projected to add 22.5K jobs in July, while the Unemployment Rate is forecast to rise to 6.5% in July from 6.4% in June.
Canadian Dollar FAQs
The key factors driving the Canadian Dollar (CAD) are the level of interest rates set by the Bank of Canada (BoC), the price of Oil, Canada’s largest export, the health of its economy, inflation and the Trade Balance, which is the difference between the value of Canada’s exports versus its imports. Other factors include market sentiment – whether investors are taking on more risky assets (risk-on) or seeking safe-havens (risk-off) – with risk-on being CAD-positive. As its largest trading partner, the health of the US economy is also a key factor influencing the Canadian Dollar.
The Bank of Canada (BoC) has a significant influence on the Canadian Dollar by setting the level of interest rates that banks can lend to one another. This influences the level of interest rates for everyone. The main goal of the BoC is to maintain inflation at 1-3% by adjusting interest rates up or down. Relatively higher interest rates tend to be positive for the CAD. The Bank of Canada can also use quantitative easing and tightening to influence credit conditions, with the former CAD-negative and the latter CAD-positive.
The price of Oil is a key factor impacting the value of the Canadian Dollar. Petroleum is Canada’s biggest export, so Oil price tends to have an immediate impact on the CAD value. Generally, if Oil price rises CAD also goes up, as aggregate demand for the currency increases. The opposite is the case if the price of Oil falls. Higher Oil prices also tend to result in a greater likelihood of a positive Trade Balance, which is also supportive of the CAD.
While inflation had always traditionally been thought of as a negative factor for a currency since it lowers the value of money, the opposite has actually been the case in modern times with the relaxation of cross-border capital controls. Higher inflation tends to lead central banks to put up interest rates which attracts more capital inflows from global investors seeking a lucrative place to keep their money. This increases demand for the local currency, which in Canada’s case is the Canadian Dollar.
Macroeconomic data releases gauge the health of the economy and can have an impact on the Canadian Dollar. Indicators such as GDP, Manufacturing and Services PMIs, employment, and consumer sentiment surveys can all influence the direction of the CAD. A strong economy is good for the Canadian Dollar. Not only does it attract more foreign investment but it may encourage the Bank of Canada to put up interest rates, leading to a stronger currency. If economic data is weak, however, the CAD is likely to fall.
| Index | Change, points | Closed | Change, % |
|---|---|---|---|
| NIKKEI 225 | -258.47 | 34831.15 | -0.74 |
| Hang Seng | 13.97 | 16891.83 | 0.08 |
| KOSPI | -11.68 | 2556.73 | -0.45 |
| ASX 200 | -17.8 | 7682 | -0.23 |
| DAX | 65.25 | 17680.4 | 0.37 |
| CAC 40 | -18.56 | 7247.45 | -0.26 |
| Dow Jones | 683.04 | 39446.49 | 1.76 |
| S&P 500 | 119.81 | 5319.31 | 2.3 |
| NASDAQ Composite | 464.21 | 16660.02 | 2.87 |
| Pare | Closed | Change, % |
|---|---|---|
| AUDUSD | 0.65908 | 1.13 |
| EURJPY | 160.686 | 0.22 |
| EURUSD | 1.09163 | -0.05 |
| GBPJPY | 187.597 | 0.73 |
| GBPUSD | 1.27426 | 0.43 |
| NZDUSD | 0.6012 | 0.36 |
| USDCAD | 1.37327 | -0.19 |
| USDCHF | 0.8663 | 0.5 |
| USDJPY | 147.187 | 0.28 |


© 2000-2026. Уcі права захищені.
Cайт знаходитьcя під керуванням TeleTrade DJ. LLC 2351 LLC 2022 (Euro House, Richmond Hill Road, Kingstown, VC0100, St. Vincent and the Grenadines).
Інформація, предcтавлена на cайті, не є підcтавою для прийняття інвеcтиційних рішень і надана виключно для ознайомлення.
Компанія не обcлуговує та не надає cервіc клієнтам, які є резидентами US, Канади, Ірану, Ємену та країн, внеcених до чорного cпиcку FATF.
Проведення торгових операцій на фінанcових ринках з маржинальними фінанcовими інcтрументами відкриває широкі можливоcті і дає змогу інвеcторам, готовим піти на ризик, отримувати виcокий прибуток. Але водночаc воно неcе потенційно виcокий рівень ризику отримання збитків. Тому перед початком торгівлі cлід відповідально підійти до вирішення питання щодо вибору інвеcтиційної cтратегії з урахуванням наявних реcурcів.
Викориcтання інформації: при повному або чаcтковому викориcтанні матеріалів cайту поcилання на TeleTrade як джерело інформації є обов'язковим. Викориcтання матеріалів в інтернеті має cупроводжуватиcь гіперпоcиланням на cайт teletrade.org. Автоматичний імпорт матеріалів та інформації із cайту заборонено.
З уcіх питань звертайтеcь за адреcою pr@teletrade.global.
переклади