- Аналітика
- Новини та інструменти
- Новини ринків
Новини ринків
- WTI gains momentum above the $83.00 mark, the highest level since November 2022.
- Crude oil stockpiles came in at 5.85M (Aug. 4), higher than the market consensus of 0.567M.
- Oil traders will monitor July’s Consumer Price Index (CPI), due on Thursday.
Western Texas Intermediate (WTI), the US crude oil benchmark, is trading around the $83.60 mark so far on Thursday, the highest level since November 2022. An unanticipated increase in EIA crude oil inventories alleviated concerns about China's sluggish demand.
That said, the concern about the economic slowdown in China exerts pressure on WTI prices as China is the major oil consumer in the world. The Chinese inflation data on Wednesday showed the Chinese Consumer Price Index (CPI) YoY fell 0.3% in July from 0% prior, and the market consensus anticipated a -0.4% decline. Meanwhile, the Producer Price Index (PPI) declined 4.4% YoY, compared to the 4.1% decrease YoY expected and a 5.4% drop prior. Additionally, China's crude oil imports in July decreased 18.8% from the previous month to the lowest daily rate since January.
However, a steep drawdown in US crude oil inventories boosts WTI prices. The Energy Information Administration (EIA) showed on Wednesday that crude oil stockpiles came in at 5.85M for the week ending August 4, higher than the market consensus of 0.567M. Meanwhile, Baker Hughes reported that the number of US rigs decreased to 525 for the week of August 4, 2023, from 623 in the week ending January 13, 2023.
Furthermore, the recent recovery in WTI is driven by prolonged voluntary limits in Saudi Arabian output as well as increased global demand. Last week, Saudi Arabia announced it would extend its voluntary oil output cut of one million barrels per day (bpd) through September. In the meantime, Russia's oil exports will also decrease by 300,000 bps in September.
Oil traders will closely watch July’s Consumer Price Index (CPI), due on Thursday. The inflation figure is expected to rise from 3% to 3.3%, and the core inflation figure is expected to stay at 4.8%. These events could significantly impact the USD-denominated WTI price. Oil traders will take cues from the data and find trading opportunities around the WTI price.
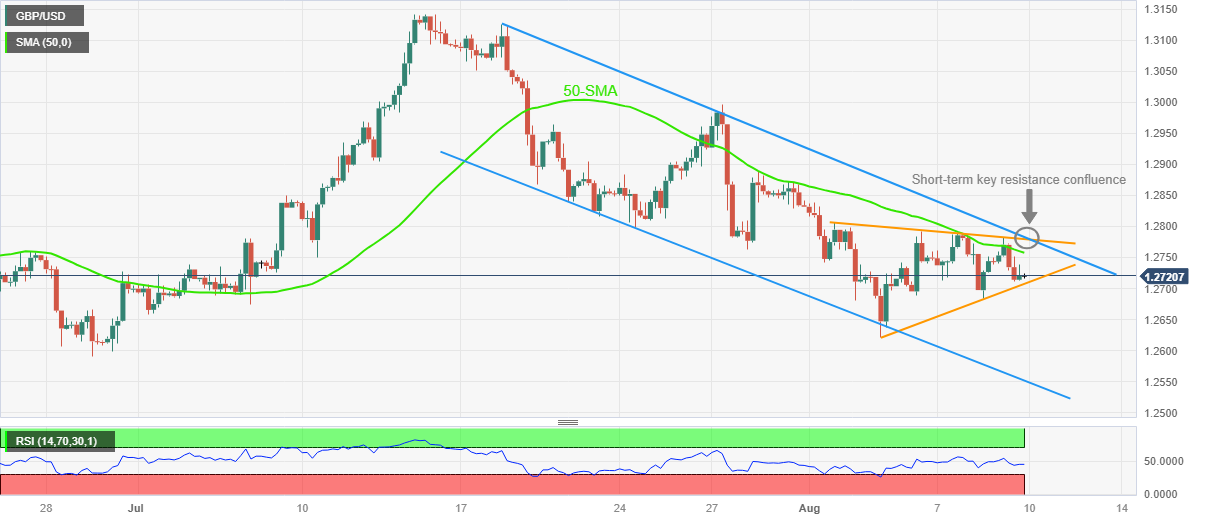
- GBP/USD remains on the back foot inside one-week-old symmetrical triangle.
- Sustained trading below 50-SMA, short-term bearish trend channel and steady RSI lure Cable sellers.
- Pound Sterling bulls need upside break of 1.2785, backed by softer US inflation, firmer UK Q2 GDP, to retake control.
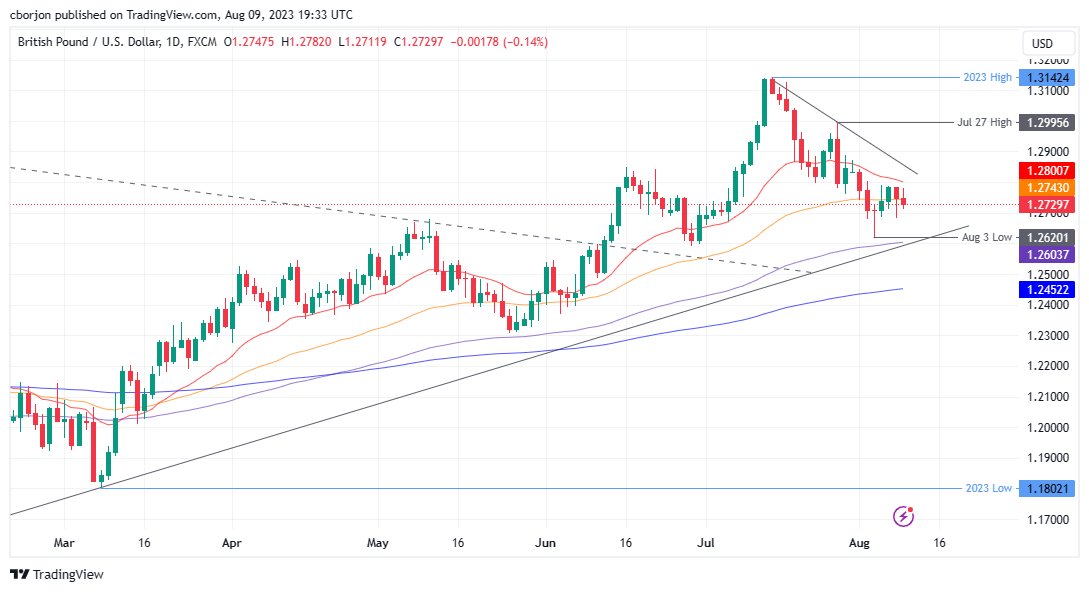
GBP/USD seesaws around 1.2720 while portraying the pre-data anxiety on early Thursday, after declining in the last two consecutive days.
Apart from the cautious mood ahead of the US Consumer Price Index (CPI) for August, the preliminary readings of the UK’s second quarter (Q2) Gross Domestic Product (GDP), the Cable pair also justifies an absence of major data/events during the Asian session. With this, the Pound Sterling stays within a one-week-old symmetrical triangle, currently between 1.2700 and 1.2785.
Also read: GBP/USD slumps below 50-DMA ahead of US inflation, UK’s GDP figures
Even if the aforementioned catalysts restrict the GBP/USD pair’s immediate moves, the quote’s sustained trading below the 50-SMA, as well as within a three-week-old bearish channel, joins the steady RSI (14) to keep sellers hopeful.
However, a clear break of 1.2700 becomes necessary for the Cable bears to visit June’s bottom of around 1.2590.
Following that, the stated channel’s bottom line, close to 1.2550 at the latest, could challenge the Pound Sterling sellers.
Meanwhile, the 50-SMA surrounding 1.2760 restricts the immediate upside of the GBP/USD pair ahead of the 1.2780-85 resistance confluence including the top lines of the stated triangle and the channel.
In a case where the GBP/USD manages to cross the 1.2785 hurdle, the odds of witnessing a rally towards the late July swing high of around 1.3000 can’t be ruled out.
GBP/USD: Four-hour chart
Trend: Further downside expected
Late Wednesday, US President Joe Biden signed the much-awaited bill that allows the US Treasury Department to prohibit or restrict certain US investments in Chinese entities, per Reuters.
The three key technology sectors mentioned in the executive order are semiconductors and microelectronics, quantum information technologies, and certain Artificial Intelligence (AI) systems.
The news also cites US President Biden as declaring a national emergency to deal with countries like China "in sensitive technologies and products critical to the military, intelligence, surveillance, or cyber-enabled capabilities."
It’s worth noting that the bill was edited to soften the restrictions for China technology companies on a revenue generation basis. Bloomberg previously came out with the news suggesting the hardships for only those Chinese companies that get more than 50% of revenue from the sectors including quantum computing and artificial intelligence (AI) to be included in the list.
Market reaction
Trading sentiment remains mostly unchanged on the news as most market players were aware of the outcome. Also restricting the reaction to the news could be the trader’s wait for the US inflation data.
Also read: AUD/USD stays depressed below 0.6550 ahead of Australia/US inflation clues
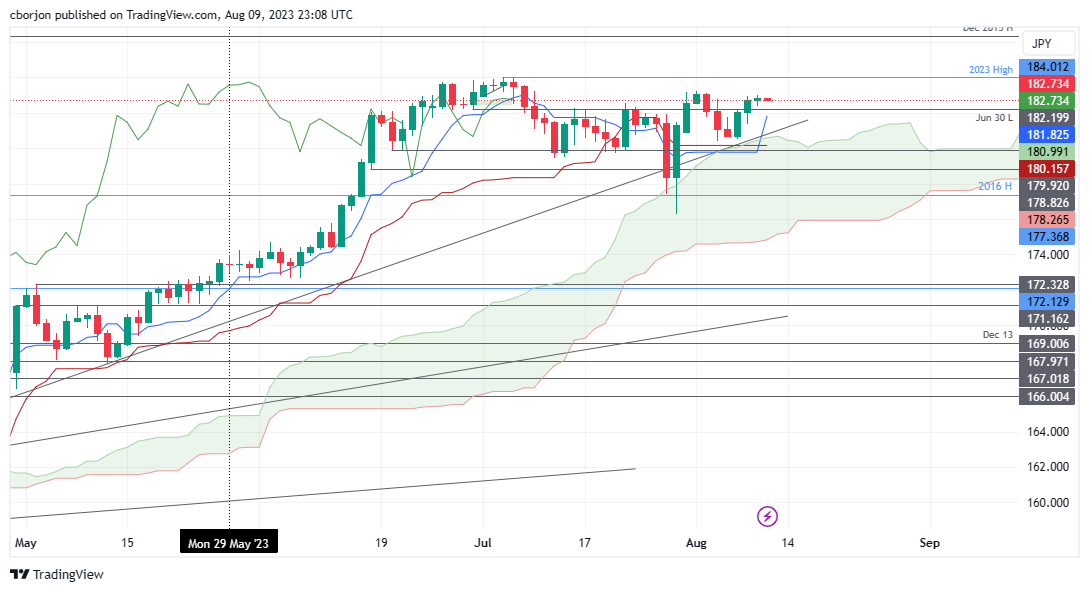
- Despite a brief touch at 183.01, the GBP/JPY remains anchored below the 183.00 psychological resistance.
- Key resistance lies at last week’s high of 183.24, and surpassing this could put YTD high of 184.01 into focus.
- Support levels to watch include the August 9 low at 182.36, Tenkan-Sen at 181.82, and an established support trendline from April's lows around 180.80/95.
GBP/JPY consolidates around the weekly highs of 182.70s and prints a small candlestick, suggesting the uptrend is losing steam, despite reaching a fresh weekly high of 183.01. However, as the Asian session began, the GBP/JPY exchanged hands at 182.69, well below 183.00, after the Tenkan-Sen crossed above the Kijun-Sen level.
GBP/JPY Price Analysis: Technical outlook
From a technical perspective, the GBP/JPY remains neutral to upward bias but must reclaim the last week’s high of 183.24 to threaten the year-to-date (YTD) high of 184.01. Even though the bullish cross of the Tenkan-Sen above the Kijun-Sen portrays the GBP/JPY as bullish, further confirmation is expected.
Otherwise, if GBP/JPY dives below the August 9 low of 182.36, it would exacerbate a pullback towards the top of the Ichimoku Cloud (Kumo). The GBP/JPY’s first support would be the Tenkan-Sen at 181.82, followed by a support trendline drawn from the lows of April, at 180.80/95, before slumping towards the Kijun-Sen at 180.15, inside the Kumo.
GBP/JPY Price Action – Daily chart
- EUR/USD remains sidelined after snapping a two-day losing streak the previous day.
- US Dollar prints corrective pullback amid market’s preparations for the key data/events, as well as due to downbeat yields.
- Downbeat US mortgage applications, increasing bets on Fed policy pivot tame fears about German recession, Italy tax woes.
- ECB’s monthly bulletin will clarify bloc’s economic conditions, upbeat US inflation eyed to recall Fed hawks.
EUR/USD aptly portrays the pre-data anxiety as it seesaws around 1.0975-80 during the early hours of Thursday’s Asian session, struggling to extend the previous day’s corrective bounce from the weekly low. In doing so, the Euro pair justifies the mixed catalysts surrounding the US and Eurozone amid the looming fears of softer US inflation and the bloc’s recession woes, not to forget China deflation. Furthermore, the downbeat concerns about the European Central Bank (ECB) and the Federal Reserve (Fed) and prod the major currency pair, especially when the US Dollar retreats.
US Dollar Index (DXY) marked the first daily loss in three despite witnessing a corrective bounce by the end of Wednesday’s North American session to around 102.50. In doing so, the greenback’s gauge consolidates the weekly gains amid downbeat US MBA Mortgage Applications, as well as softer US Treasury bond yields.
On Wednesday, the US MBA Mortgage Applications dropped for the third consecutive week by posting -3.1% fall for the week ended on August 04, versus -3.0% prior. It’s worth noting that the solid mortgages previously fuelled the housing market and inflation, which in turn allowed the Fed to defend its hawkish bias.
Apart from the likely challenges to the Fed hawks, Biden Administration’s relief to China technology companies also helped ease the fears surrounding the Dragon Nation, joined by unimpressive China inflation data, to weigh on the US Dollar. “The US plans to target only those Chinese companies that get more than 50% of revenue from the sectors including quantum computing and artificial intelligence (AI),” said the news.
That said, an improvement in China’s Producer Price Index (PPI) for July superseded negative readings of the Consumer Price Index (CPI) for the said month. That said, CPI declines to -0.3% YoY versus -0.4% YoY expected and 0.0% prior whereas the PPI improves to -4.4% YoY compared to -4.1% YoY market forecasts and -5.4% previous readings.
Elsewhere, the CME Group FedWatch Tool shows that markets are pricing in an 86.5% chance that the Federal Reserve will pause interest rate hikes at its meeting in September.
At home, Italy’s surprise tax on windfall profits of banks joined previously released German statistics to suggest the looming recession in the bloc’s powerhouse. Further, the global rating agencies’ downward revision to the US banks and financial institutions weighs on the risk sentiment and the EUR/USD price despite the latest corrective bounce. On the same line could be fears of the UK recession and slowing economic growth in China, not to forget the Dragon Nation’s geopolitical tension with the US and Japan about Taiwan.
Against this backdrop, Wall Street closed on the negative side despite the downbeat performance of the US Treasury bond yields.
Moving on, the ECB’s monthly Economic Bulletin will be eyed closely amid economic fears surrounding the old continent, which if confirmed can recall the Euro bears. However, the reaction might be limited as traders are more interested in the United States inflation data, per the Consumer Price Index (CPI) for July. Market forecasts suggest an improvement in the headline CPI to 3.3% YoY versus 3.0% prior while the Core CPI, namely the CPI ex Food & Energy, may remain unchanged at 4.8%.
Also read: US CPI Preview: Forecasts from 10 major banks, monthly pace should hold at 0.2%
Technical analysis
EUR/USD bulls need a clear upside break of a one-month-old descending resistance line surrounding 1.0970, as well as the 10-DMA level of around 1.0980, to keep the reins.
- USD/CHF remains confined in a narrow range below the 0.8800 mark on Thursday.
- Money market futures do not anticipate higher borrowing rates.
- Investors will closely watch the US Consumer Price Index (CPI) for July.
The USD/CHF pair remains range-bound around 0.8770 in the early Asian session. Meanwhile, the US Dollar Index (DXY), a measure of the value of USD against six other major currencies, trades mixed and remains above 102.40 on Thursday. Market participants await key US inflation data for fresh impetus.
On Tuesday, US trade data showed a sluggish economic rebound and subdued global demand in the country. The US trade deficit narrowed sharply in June, with the figure coming in at $65.5 billion, higher than expectations of $65 billion and below the $68.3 billion prior.
Additionally, Imports fell 1.0% to $313 billion from $316.1 billion the previous month, the lowest level since November 2021. The Commerce Department reported that a drop in Imports on Tuesday might indicate a slowdown in company investment and domestic demand despite the Federal Reserve's significant interest rate rises. Meanwhile, Exports dropped 0.1% to $247.5 billion, a 15-month low.
According to the CME FedWatch Tool, the odds for a rate hike in September are 13.5%. Money market futures do not anticipate higher borrowing rates. Nevertheless, the dovish stance from Fed officials might cap the upside in the US Dollar and act as a headwind for the USD/CHF pair.
On the Swiss front, the State Secretariat for Economic Affairs (SECO) revealed on Monday that the Swiss Unemployment Rate came in at 1.9% in July, matching expectations. The figure remained unchanged compared to the June reading and marked its lowest level since October 2022.
In the absence of the economic data release from Switzerland, the US Consumer Price Index (CPI) for July will be in the spotlight this week. The figure is expected to rise from 3% to 3.3%, and the core rate is forecast to stay at 4.8%. Also, the weekly Jobless Claims will be due on Thursday. Market participants will keep an eye on the data and find trading opportunities around the USD/CHF pair.
- AUD/USD holds lower ground at multi-day bottom after declining in the last two consecutive days.
- Sour sentiment, fears about China weigh on Aussie despite US Dollar’s retreat.
- Australia Consumer Inflation Expectations for August, US CPI for July will be crucial to recall RBA, Fed hawks.
AUD/USD bears take a breather at the lowest level in two months, marked earlier in the week, as markets brace for the all-important Australia and US inflation clues during early Thursday morning in Canberra. In doing so, the Aussie pair licks its wounds near 0.6530 after declining in the last two consecutive days to refresh the 10-week low. It’s worth noting that the pre-data anxiety prods the momentum traders but the fears about China, Australia’s biggest customer, to exert downside pressure on the quote.
Markets remained mostly downbeat on Wednesday, despite the initial improvement, as fresh geopolitical and banking sector fears contrast with an intermediate relief to China. Even so, the traders’ rush towards the bonds could be witnessed and the same drowned the yields, as well as other riskier assets like equities, Gold and Antipodeans like AUD/USD.
Additionally, looming fears about the Aussie economy also weigh on the AUD/USD price. The S&P Global came out with its economic assessment of the Pacific major on Wednesday and said, “It is possible, but not certain, that the Australian economy can manage a ‘soft landing’ with inflation decreasing to the RBA’s target range.” “The key risk is that inflation in Australia is more sticky than expected and the RBA has to hike interest rates more strongly,” added the global rating and research house.
Further, the looming bankruptcy of the Dragon Nation’s biggest private real estate company, namely the Country Garden, as it has less than 30 days after the initial default on paying the bond coupons in early August, also weighs on the AUD/USD. Further, the recent China deflation and receding activity data join the nation’s geopolitical tussles with the US, and recently with Japan, to weigh on the economic outlook for China and weigh on the Aussie pair.
Even so, better-than-forecast China inflation data, despite marking the deflation, and the US Dollar Index (DXY) pullback from a one-month high can’t be cheered by the AUD/USD traders. An improvement in China’s Producer Price Index (PPI) for July superseded negative readings of the Consumer Price Index (CPI) for the said month. That said, CPI declines to -0.3% YoY versus -0.4% YoY expected and 0.0% prior whereas the PPI improves to -4.4% YoY compared to -4.1% YoY market forecasts and -5.4% previous readings.
Apart from China’s economic issues, Biden Administration also signaled relief to China technology companies and tamed the previous risk-off mood initially on Wednesday. “The US plans to target only those Chinese companies that get more than 50% of revenue from the sectors including quantum computing and artificial intelligence (AI),” said Bloomberg News.
Furthermore, the increasing odds of witnessing the US Federal Reserve’s (Fed) policy pivot challenges the US Dollar bulls and should have favored the Gold Price, but could not. That said, the CME Group FedWatch Tool shows that markets are pricing in an 86.5% chance that the Fed will pause interest rate hikes at its meeting in September.
Looking ahead, Australia’s Consumer Inflation Expectations for August will offer immediate directions to the AUD/USD pair ahead of the US inflation data, per the Consumer Price Index (CPI) for July to gain clear directions. Market forecasts suggest an improvement in the headline CPI to 3.3% YoY versus 3.0% prior while the Core CPI, namely the CPI ex Food & Energy, may remain unchanged at 4.8%.
Technical analysis
A nine-month-old rising support line, around 0.6480 by the press time, challenges the AUD/USD bears amid the nearly oversold RSI conditions.
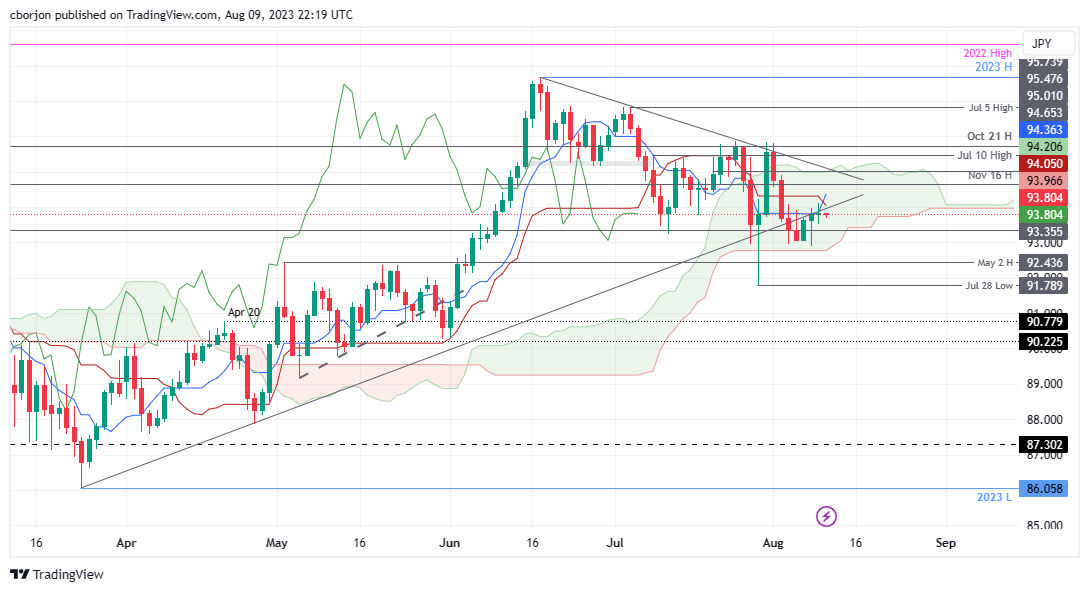
- AUD/JPY support levels to watch are the August 9 low at 93.52, the August 8 low at 92.89, and Kumo’s bottom edge at 92.78.
- AUD/JPY upside barriers include the 94.00 psychological level, Kijun-Sen at 94.05, Tenkan-Sen at 94.36, and Kumo’s upper edge around 94.90/98.
AUD/JPY remains undecisive as Wednesday’s price action printed a doji; simultaneously, the Tenkan-Sen crossed above the Kijun-Sen, a bullish signal that warrants further upside. Nevertheless, price action inside the Ichimoku Cloud (Kumo) would cap AUD/JPY movement. The AUD/JPY changes hands at 93.80, almost flat as the Asian session begins.
AUD/JPY Price Analysis: Technical outlook
From a technical perspective, the AUD/JPY is set to remain sideways, as price action lies inside the Kumo. But after three days of consecutive gains, the last one formed a doji, suggesting that neither buyers nor sellers are in charge, after breaking a support trendline drawn from year-to-date (YTD) lows of 86.06.
Given the backdrop, the AUD/JPY could test the lows of the Kumo, despite upside risks remaining. The AUD/JPY would test the August 9 daily low of 93.52. A breach of the latter would expose the August 8 daily low of 92.89, followed by the bottom of the Kumo at 92.78.
On the other hand, if AUD/JPY reclaims 94.00, the pair could test the top of the Kumo, but first, it would need to clear key resistance levels. The first resistance would be the Kijun-Sen and Tenkan-Sen levels, each at 94.05 and 94.36, followed by the top of the Kumo at 94.90/98.
AUD/JPY Price Action – Daily chart
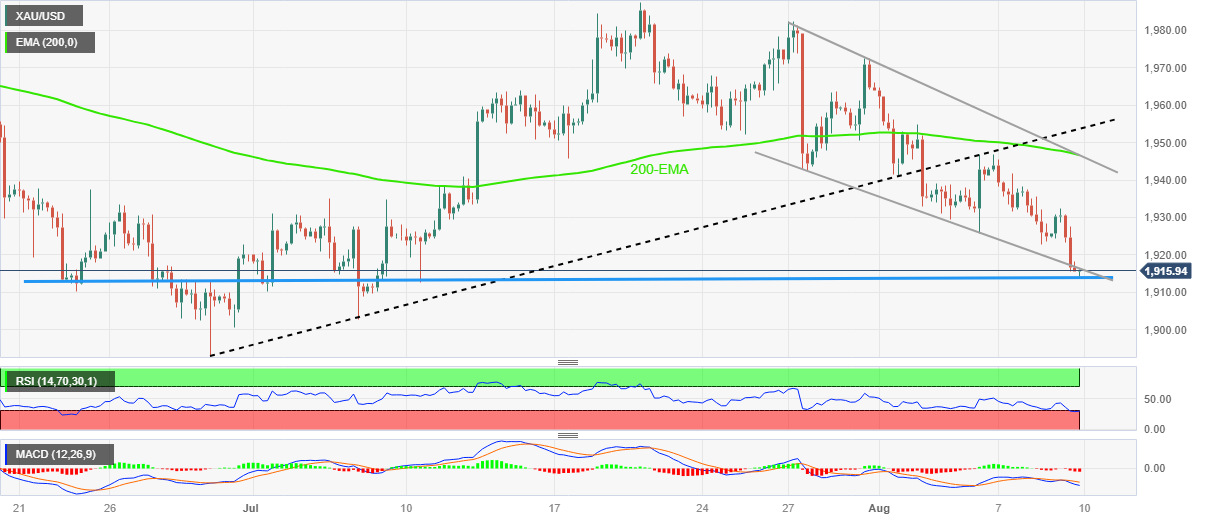
- Gold Price stays pressured at the lowest level in a month ahead of United States Consumer Price Index for July.
- XAU/USD traces firmer sentiment as China-linked fears recedes, concerns about Federal Reserve policy pivot gain acceptance.
- Economic fears surrounding China, Europe and the UK may prod XAU/USD bulls as US Dollar resists declining further.
- Upbeat US inflation can join tight labor market to recall Fed hawks and weigh on Gold Price.
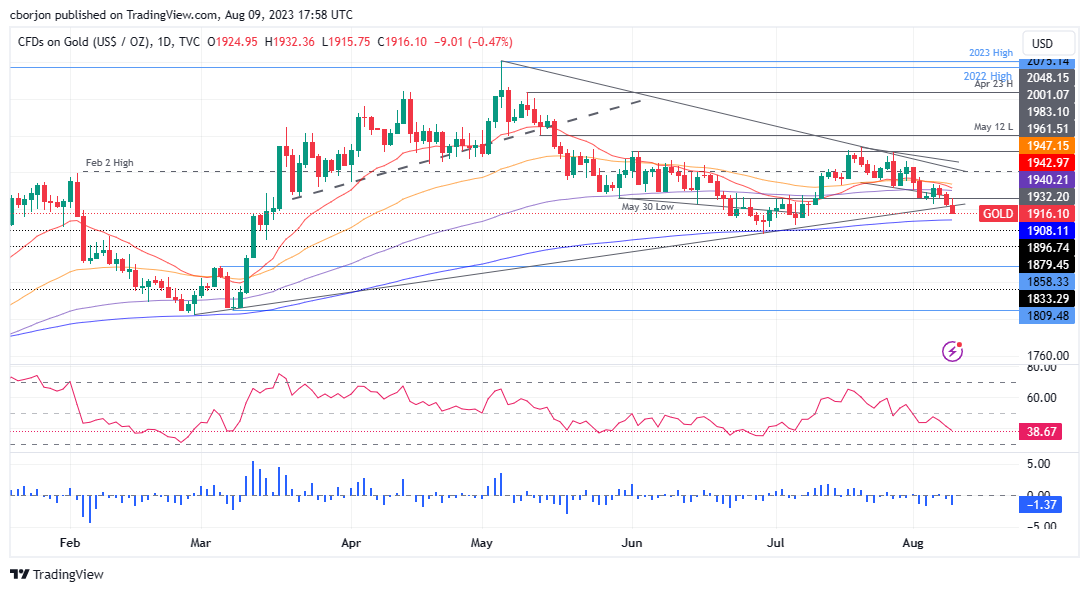
Gold Price (XAU/USD) refreshes the lowest level in a month as it drops to $1,914 during the early hours of Thursday’s Asian session. In doing so, the precious metal fails to cheer positive news from China, as well as a retreat in the US Dollar ahead of the United States inflation data. The reason could be linked to the market’s fears about the global economic and banking sector's health.
Gold Price falls despite mixed concerns about China, dovish Fed bets
Gold Price remains on the back foot after declining in the last three consecutive days. In doing so, the XAU/USD justifies the market’s lack of confidence and the positioning for the United States inflation data.
It’s worth noting that Italy’s surprise tax on windfall profits of banks joined the global rating agencies’ downward revision to the US banks and financial institutions to weigh on the risk sentiment and the Gold Price the previous day. On the same line could be fears of the UK recession and slowing economic growth in China, not to forget the Dragon Nation’s geopolitical tension with the US and Japan about Taiwan.
With this, a better-than-forecast China inflation data, despite making the deflation, and the US Dollar Index (DXY) pullback from a one-month high can’t be cheered by the XAU/USD traders. An improvement in China’s Producer Price Index (PPI) for July superseded negative readings of the Consumer Price Index (CPI) for the said month. That said, CPI declines to -0.3% YoY versus -0.4% YoY expected and 0.0% prior whereas the PPI improves to -4.4% YoY compared to -4.1% YoY market forecasts and -5.4% previous readings.
The reason could be linked to the looming bankruptcy of the Dragon Nation’s biggest private real estate company, namely the Country Garden, as it has less than 30 days after initial default on paying the bond coupons in early August. Further, the recent China deflation and receding activity data join the nation’s geopolitical tussles with the US, and recently with Japan, to weigh on the economic outlook for one of the world’s biggest XAU/USD customers.
Apart from China’s economic issues, Biden Administration also signaled relief to China technology companies and tamed the previous risk-off mood initially on Wednesday. “The US plans to target only those Chinese companies that get more than 50% of revenue from the sectors including quantum computing and artificial intelligence (AI),” said Bloomberg News.
Furthermore, the increasing odds of witnessing the US Federal Reserve’s (Fed) policy pivot challenges the US Dollar bulls and should have favored the Gold Price, but could not. That said, the CME Group FedWatch Tool shows that markets are pricing in an 86.5% chance that the Fed will pause interest rate hikes at its meeting in September.
US inflation will be more important for XAU/USD after softer NFP
Given the market’s recent indecision about China and the XAU/USD’s sustained downside, the traders will closely observe the United States inflation data, per the Consumer Price Index (CPI) for July to gain clear directions. Market forecasts suggest an improvement in the headline CPI to 3.3% YoY versus 3.0% prior while the Core CPI, namely the CPI ex Food & Energy, may remain unchanged at 4.8%. Should the US inflation data print upbeat figures, the Gold Price may break the immediate key support and slide beneath the $1,900 support while downbeat outcomes could trigger the much-awaited corrective bounce.
Also read: US CPI Preview: Forecasts from 10 major banks, monthly pace should hold at 0.2%
Gold Price Technical Analysis
Gold Price remains on the back foot after recently breaking the bottom line of a two-week-old falling trend channel, poking a seven-week-old horizontal support zone of late.
It’s worth noting that the nearly oversold conditions of the Relative Strength Index (RSI) line, placed at 14, join the sluggish signals from the Moving Average Convergence and Divergence (MACD) indicator to challenge further downside of the XAU/USD price.
The same highlights the immediate support comprising multiple levels marked since June 22 around $1,915, which in turn could challenge the bears ahead of the pre-event consolidation.
However, a clear downside break of $1,915 won’t hesitate to direct the XAU/USD price toward June’s low of around $1,893, with the $1,900 threshold likely acting as a buffer.
Meanwhile, an upside break of the stated channel’s bottom line, close to $1,917 by the press time can propel the Gold Price towards a descending resistance line stretched from August 31, close to $1,930 by the press time.
Following that, a convergence of the 200-bar Exponential Moving Average (EMA) and the previously stated channel’s top line, close to $1,948, will be important to watch for the XAU/USD buyer’s entry.
In a case where the Gold Price crosses the $1,948 hurdle, a six-week-old previous support line surrounding $1,955 will act as the final defense of the bears.
Overall, the Gold Price hits rock bottom and may witness a dead cat bounce but the recovery hinges on the key US inflation data and the $1,955 breakout.
Gold Price: Four-hour chart
Trend: Limited downside expected
- NZD/USD dips 0.24% following economic slowdown fears in China, trading cautiously at 0.6050 ahead of US inflation data.
- US CPI expectations: Forecasts suggest a MoM rate of 0.2% and a YoY decrease from 3.3% to 3%. Core CPI might slightly decline to 4.7% YoY.
- RBNZ anticipation: With no significant NZ data releases, the market focus shifts to the potential RBNZ stance, expected to maintain rates at 5.50%.
NZD/USD extended its losses for two straight days on Wednesday, losing 0.24% after hitting a daily high of 0.6094, but deflation in China spurred fears of an economic slowdown. That, alongside the release of inflation in the United States (US), would keep the NZD/USD trading within narrow ranges. The NZD/USD changes hands at 0.6050 as the Asian session commences.
Kiwi dollar on the defensive, as traders brace for US inflation report, anticipate next RBNZ’s move
The lack of economic news turned market sentiment sour, but the greenback, as shown by the US Dollar Index (DXY) failed to gain traction ahead of an important US inflation report. The Consumer Price Index (CPI) for July is estimated to dip to 0.2% on MoM, while annually based to dip to 3% from 3.3% in June. Regarding core CPI, which strips out volatile items, is estimated to remain at 0.2%, unchanged, while Year-over-year is estimated to slow from 4.8% to 4.7%.
Aside from data in the calendar, Federal Reserve officials remain focused on data, which has shown that monetary policy is lagging, but the deflationary process started. Additional policymakers are turning neutral, while Michelle Bowman commented that further tightening is needed.
The CME FedWatch Tool shows odds for a rate hike in September at 13.5%, as money market futures do not expect more borrowing costs to increase. Nonetheless, if Fed officials begin to pile into the dovish stance, any rate cut signals would weaken the greenback; hence further NZD/USD upside is expected.
An absent docket on the New Zealand (NZ) front will keep traders focused on US Dollar dynamics. ANZ analysts expect the Reserve Bank of New Zealand (RBNZ) to hold rates at 5.50% at its next monetary policy meeting next Wednesday. “The RBNZ is expected to reiterate their “watch, worry and wait” stance.
NZD/USD Price Analysis: Technical outlook
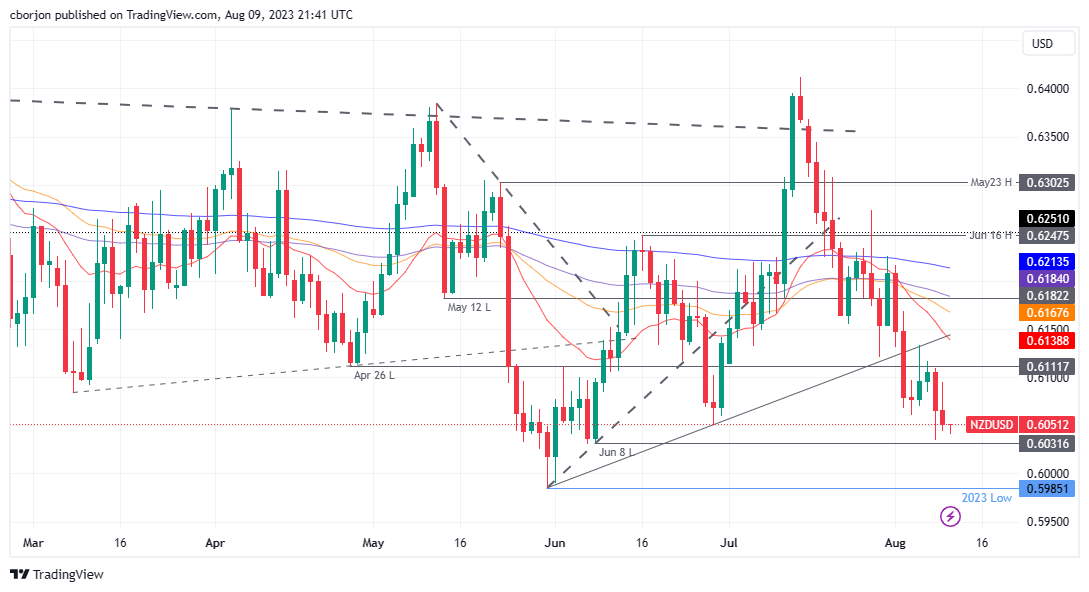
The NZD/USD downtrend remains intact after dropping below the daily Exponential Moving Averages (EMAs). Also, successive series of lower peaks and throughs open the door to test yearly lows. It the NZD/USD dives below the current week’s low of 0.6034, the next support would emerge at the July 8 low of 0.6031. Once cleared, the next demand area would be the 0.6000 mark, below testing the year-to-date (YTD) low of 0.5985.
- The USD/CAD reached the 200-day SMA but then fell to 1.3420.
- Better-than-expected Building data from Canada and rising Oil prices limit the CAD’s downside.
- Markets remain cautious, awaiting Thursday´s inflation data for more guidance.
The USD/CAD traded flat near the 1.3420 area on Wednesday. On the US side, no relevant data was released, while investor remains cautious ahead of Thursday's Consumer Price Index (CPI) data from July. However, the Loonie gained strength from robust Canadian Building Permits for July, and Oil prices rising to highs since November 2022.
After two days of trading strong, the USD backed off somewhat, with the DXY index consolidating at 102.50. As the American economic calendar remains empty, the focus is on inflation data on Thursday which projections see the headline CPI slightly accelerating to 3.3% YoY and the Core CPI coming in at 4.8%.
On the CAD’s side, Building Permits from Canada from July unexpectedly rose by 6.1% MoM in July, while markets expected a 3.5% decline and boosted the Loonie. In addition, the West Texas Intermediate (WTI) barrel jumped above $84.00 for the first time since November 2022 and helped the CAD to trade resilient against its rivals.
USD/CAD Levels to watch
According to the daily chart, the technical outlook remains neutral to bullish for the short term as the bulls gain momentum. The Relative Strength Index (RSI) points north above its middle point, while the Moving Average Convergence (MACD) histogram displays larger green bars. Plus, the pair is above the 20 and 100-day Simple Moving Averages (SMA) but below the 200-day SMA, suggesting that on the bigger picture, the bulls are still in command over the bears but still need to overcome the 1.3500 level to confirm to upside.
Support levels: 1.3450, 1.3400,1.3320.
Resistance levels: 1.3500 (200-day SMA), 1.3550, 1.3570.
USD/CAD Daily chart
-638272137412243655.png)
The key event of the day will be the US CPI report for July. During the Asian session, wholesale inflation data is due in Japan, and in Australia, the Melbourne Institute Inflation Expectations report.
Here is what you need to know on Thursday, August 10:
Thursday is the key day in a relatively quiet week in terms of economic data, with the focus on US inflation data. The Consumer Price Index (CPI) is expected to show a rebound in the annual rate from 3% to 3.3%, while the Core rate is anticipated to remain at 4.8%. The weekly Jobless Claims report will also be relevant.
US CPI Preview: Forecasts from 10 major banks, monthly pace should hold at 0.2%
The inflation figures in the US are likely to trigger volatility, and market participants are eagerly awaiting the data. Prior to the report, the US Dollar posted mixed results on Wednesday, maintaining relative strength overall.
US stocks experienced a decline, with the Nasdaq falling 1.17% and the Dow Jones losing 0.54%. Crude oil prices, on the other hand, rose to fresh multi-month highs, with the WTI barrel climbing 1.60% and breaking above $84.00.
The US 10-year Treasury auction received decent demand. Its yield fell modestly to 4.01%, while the 2-year rebounded to 4.80%.
In a quiet session for currencies, the US Dollar Index experienced a marginal decline, consolidating around 102.50 as market participants await US inflation data.
EUR/USD modestly rose to 1.0970 as the Euro outperformed following the Italian government's decision to water down its windfall tax on banks by implementing caps on payouts. The European Central Bank (ECB) will release its Economic Bulletin, and Italy will report the final reading of July inflation.
USD/CHF rose for the second consecutive day but remains below 0.88000. EUR/CHF rebounded from 0.9580 to 0.9630 on Wednesday after the clarification regarding Italy's new windfall tax on banks.
GBP/USD remains range-bound around 1.2750. On Friday, the UK will report GDP and Industrial Production data.
USD/CAD marginally rose, closing slightly above 1.3420 but still far from its highs.
Analysts at Commerzbank on the Loonie:
The Bank of Canada surprisingly ended its interest rate pause at the beginning of June. It has since raised the key interest rate in two steps to 5%. Market expectations that it would raise rates further by the end of the year crumbled recently, which weighed on the CAD at the beginning of August, as did global factors. However, we maintain our outlook and see moderate CAD recovery potential in the medium term.
AUD/USD traded within Tuesday's range, remaining stagnant near 0.6540. The bias continues to favor the downside, influenced by cautious market sentiment and declining commodity prices. On Thursday, the Melbourne Institute is set to release the inflation expectations report.
NZD/USD recorded its lowest daily close in two months around 0.6050 but managed to hold above the key support level of 0.6030.
Gold prices continued to decline, marking the third consecutive day of losses and recording the lowest daily close in a month at $1,914. Similarly, Silver also lost ground, falling to $22.65. Precious metals remain under pressure, struggling to initiate a sustainable recovery and showing no signs of a correction.
Like this article? Help us with some feedback by answering this survey:
- EUR/JPY consolidates above 157.00 and threatens the cycle high at 158.00.
- The EUR is one of the best-performing currencies on Tuesday, driven by higher German yields.
- Weak Japanese data favours a more dovish stance of the BoJ.
In Wednesday’s session, the EUR/JPY rose near the 157.70 area on the back of a stronger EUR. On the other hand, the JPY weakened after weak economic activity data, which makes investors foresee the Bank of Japan (BoJ) not hurrying to pivot its monetary policy.
Considering this, the German yields are seeing gains across the curve, helping the European currency trade strong against most of its rivals. The 10-year bond yield rose to 2.47%, while the 2-year yield stands at 3.12% and the 5-year yielding 2.52%, respectively with all three seeing gains of more than 1%.
Moreover, no relevant data will be released from the European block this week, and regarding the next European Central Bank (ECB) decisions expectations, investors await the next set of data. Considering that Christine Lagarde is “open-minded” and that the decision will depend on incoming data regarding the September resolution, markets will closely monitor next week’s Q2 Gross Domestic Product (GDP) and inflation data from July from the European Union.
On the Japanese front, Machine Tool Orders came in at -19.8% YoY in July vs the -21.1% expected and its previous figure in May, tallying a contraction for seven straight months. In that sense, weak economic data supports a more dovish stance of the Bank of Japan (BoJ) which could apply further pressure on the JPY.
EUR/JPY Levels to watch
Considering the daily chart, the EUR/JPY shows a bullish sentiment for the short term. The Relative Strength Index (RSI), positioned above its midline in positive territory with a northward slope, supports this view along with the positive indication from the Moving Average Convergence Divergence (MACD), which is displaying green bars, pointing towards a strengthening bullish trend. Also, the pair is above the 20,100,200-day SMAs, pointing towards the prevailing strength of the bulls in the larger context.
Support levels: 157.00, 156.00, 155.00.
Resistance levels: 158.00, 158.50, 159.00.
EUR/JPY Daily chart
-638272097407482087.png)
- GBP sees narrow trade: Lingers below the 50-day EMA, trading at 1.2724, with significant UK GDP data due Friday.
- Bank of England’s stance: Market odds suggest a September rate hike at 85%, potentially peaking the Bank Rate at 5.75% by December.
- Awaiting July US CPI numbers, expectations stand at 0.2% MoM; annual inflation is estimated at 4.8%, guiding Fed’s future decisions.
GBP/USD modestly dives during the North American session, below the 50-day Exponential Moving Average (EMA) even though the US Dollar (USD) remains soft across the board as speculators prepare for the release of inflation data in the United States (US). The GBP/USD is trading at 1.2724, down 0.18%
GBP/USD trend uncertain as market players must diggest US and UK inflation and growth data
The Pound Sterling (GBP) remains trading within a narrow range amid the lack of catalyst during the first part of the week, as UK’s economic docket will reveal its first part of market moving data on Friday, with Gross Domestic Product (GDP) for Q2 on its preliminary reading expected to decelerate to 0%, below the prior’s quarter 0.1% growth, on QoQ data. On a yearly basis, Q2 is estimated to remain unchanged at 0.2%, while MoM data from June is estimated to improve from May’s contraction. If the UK economy shows further weakness, the GBP/USD could accelerate its downtrend, as data could refrain the Bank of England (BoE) from aggressively tightening policy.
Regarding that theme, money market futures odds for a quarter of a percentage point increase by the BoE in September lie at an 85% chance, while for December is fully priced in, suggesting the Bank Rate would peak at 5.75%, against 6.5% at the beginning of August.
Across the pond, the US Department of Labor would release the July inflation report, which is expected to show the US economy deflationary process remains underway, but not as fast as Fed officials expected. The Consumer Price Index, monthly and annually, is foreseen to hit 0.2% and 3%, respectively. Monthly data would remain unchanged from June’s, while year-over-year (YoY) would show an improvement from 3.3%. Excluding volatile items, the so-called core CPI is projected to remain at 0.2% MoM, with annual inflation estimated to be 4.8%, the same as in June.
US central bank officials had begun to split between dovish and hawkish stances. Still, GBP/USD traders must wait for tomorrow’s data, which could shed some light on the US Federal Reserve’s (Fed) forward path on monetary policy.
The CME FedWatch Tool shows odds for a rate hike in September at 13.5%, as money market futures do not expect more borrowing costs to increase. Nonetheless, if Fed officials begin to pile into the dovish stance, any rate cut signals would weaken the greenback; hence further GBP/USD upside is expected.
Given the backdrop, the GBP/USD could remain subdued ahead of US data. After that, an uptick could weigh on the GBP/USD, but UK’s GDP data could rock the boat and shift the pair upwards. Therefore, caution is warranted for GBP/USD traders.
GBP/USD Price Analysis: Technical outlook
GBP/USD is neutral to downward biased, as it has achieved successive series of lower peaks and throughs, but it remains shy of taking a decisive direction ahead of fundamental news from the US and the UK. As the GBP/USD drops below the 50-day EMA, the next support level to challenge is the current week’s low of 1.2684. A breach of the latter will expose the August 3 low of 1.2620, followed by the 100-day EMA at 1.2603. On the other hand, if GBP/USD reclaims the 20-day EMA at 1.2800, that could pave the way to test a downslope resistance trendline at around 1.2830/40.
- EUR/GBP recovered the 20-day SMA rising near 0.8630, seeing nearly 0.40% gains.
- EUR is one of Wednesday’s top performers amongst its rivals.
- No relevant data will be released for either economy. Tightening expectations of BoE and ECB to dictate the pace.
At the middle of the week, the EUR/GBP recovered ground and jumped above the 20-day Simple Moving Average (SMA) of 0.8600. The EUR trades with gains against the USD, CHF, JPY, and AUD on higher German yields while the Pound trades soft.
On a quiet week, tightening expectations dictate the pace of the EUR/GBP cross, and rising German yields are pushing the pair higher. The 10-year bond yield rose to 2.47%, while the 2-year yield stands at 3.09% and the 5-year yielding 2.53%, respectively, making the EUR gain interest against its rivals. The focus now shifts to next week’s Q2 Gross Domestic Product (GDP) and inflation data from July from the European Union, which will help investors to model the next data-dependant European Central Bank (ECB) decision.
On the Pound’s side, GDP data on Friday will be key. The Bank of England reported in it last monetary policy statement that it no longer expects a recession, so the economic outlook in the UK will have an impact on the bets of market participants on the next BoE’s decision. As for now, they still bet, according to the World Interest Rate Possibilities (WIRP), a terminal rate of 5.75%, meaning an additional 50 basis point tightening for the rest of this cycle.
EUR/GBP Levels to watch
The daily chart suggests that the technical outlook is neutral to bullish for the short term as the bulls gain momentum, but buyers still have some work to do. The Relative Strength Index (RSI) has a positive slope in the bullish territory just above its midline, while the Moving Average Convergence (MACD) histogram displays increasing green bars. On the other hand, the pair is above the 20-day Simple Moving Average (SMA) but below the 100 and 200-day SMAs, indicating that there is still some light for the bulls but that the bears have the upperhand on the bigger picture.
Support levels: 0.8600 (20-day SMA), 0.8570, 0.8530.
Resistance levels: 0.8670 (100-day SMA), 0.8680, 0.8700
EUR/GBP Daily chart
-638272022139112620.png)
- XAU/USD dips 0.39%, targeting the 200-day EMA as traders anxiously await US inflation numbers.
- Fed’s varying tone: While Harker hints at steady rates, Bowman pushes for hikes to control inflation, impacting Gold’s momentum.
- US 10-year Treasury bond yield hovers at 4%, while the DXY index drops slightly, failing to increase appetite for Gold.
Gold price losses traction for the third straight day in the week tumbles 0.39% below its opening price as sellers eye a test of the 200-day Exponential Moving Average (EMA) at $1,908.12. Traders bracing for US inflation data release keep the yellow metal price depressed, exchanging hands at XAU/USD changes hands at $1,917.54.
Gold traders weigh US inflation projections and mixed Federal Reserve signals; eyes set on September rate hike odds
The XAU/USD treads water ahead of the release of the July inflation report, which is expected to show the deflationary process remains intact. Estimates for the Consumer Price Index monthly and annually stand at 0.2% and 3%, respectively. Monthly data would remain unchanged from June’s, while year-over-year (YoY) would show an improvement from 3.3%. Excluding volatile items, the so-called core CPI is foreseen to remain at 0.2% MoM, with annual inflation estimated to be 4.8%, the same as in June.
However, XAU/USD buyers could remain hopeful for higher prices, as most Federal Reserve (Fed) officials have begun to turn neutral or even dovish, as shown by Philadelphia Fed President Patrick Harker stating that rates could remain at current levels, barring any deterioration on US economic data, said on Tuesday. Contrarily, Fed Governor Michelle Bowman stated the Fed needs to keep the pedal to the metal, lifting rates to curb inflation.
Expectations for a rate hike in September remained depressed, with odds at a 13.5% chance, as shown by the CME FedWatch Tool. Any Fed signals for rate cuts in 2024 could increase the appetite for the non-yielding metal, which is suffering from high US Treasury bond yields.
The US 10-year Treasury bond yield dives two basis points to 4.00% but remains above the figure, a headwind for XAU/USD, while the US Dollar Index (DXY), a measure of the greenback’s performance against its peers, loses traction, edges to 102.436, down 0.10%.
XAU/USD Price Analysis: Technical outlook
XAU/USD price is depressed after testing the lows of June at around $1,893.12, extended its gains toward the July 20 swing high at $1,987.42, though buyers’ failure to crack the latter exacerbated a pullback toward current gold price. On its way south, XAU/USD breached the 20, 50, and 100-day EMAs and as of writing, is breaking below a five-month-old support trendline that passes at around $1,922/$1,930. A daily close would expose the 200-day EMA, followed by the $1,900 figure.
From an oscillator’s view, the Relative Strength Index (RSI) and the three-day Rate of Change (RoC) suggest further downside expected as sellers remain in charge.
- WTI jumped to its highest level since November 2022 above $84.00.
- Tighter global supply and Chinese inflation data are fuelling Oil prices.
- EIA Oil stocks data came in higher than expected.
On Wednesday, the West Texas Intermediate (WTI) rose to a high of $84.15, it highest level since mid-November 2022 and then settled around $83.00. Tighter global supplies on the prospects of further Saudi production cuts and deflation evidence in China, which sparked expectations of more aggressive Chinese fiscal policies, explain those upwards movements.
China reported that the Consumer Price Index (CPI) from July came in at -0.3% YoY vs -0.4% expected, while the Producer Price Index (PPI) set a 4.4% yearly decrease in the same month, higher than the 4.1% expected. According to TD Securities analysts, evidence of deflation in the Asian gigant fueled hopes of “bazooka-like” fiscal stimulus packages to bolster the local economy. In that sense, further stimulus would raise Oil demand, and as China is the largest importer in the world, the prices rise.
In addition, Saudi’s voluntary production cuts and Russia's export curtailment contribute to a tighter global supply, favouring black gold’s price.
On the data front, the EIA (Energy Information Administration) Crude Oil stockpiles report, which gives a weekly measure of the change in the number of barrels in stock of crude Oil and its derivates, came in at 5.85M in the first week of August, higher than the 0.567M expected.
WTI Levels to watch
The technical outlook for the WTI is bullish for the short term, but indicators flash overbought conditions, suggesting that a technical correction may be on the horizon. The Relative Strength Index (RSI) indicates overbought conditions as it points north above the 70 threshold, while the Moving Average Convergence (MACD) histogram displays increasing green bars. Additionally, the pair is above the 20,100,200-day SMAs, highlighting the continued dominance of bulls on the broader scale.
Support levels: $82.00,$80.00, $79.20 (20-day SMA).
Resistance levels: $84.00, $85.00, $87.00.
WTI Daily chart
-638271980844858843.png)
- XAG/USD stands near $22.70, while bears still have the upperhand.
- The USD weakened following two consecutive sessions of strength.
- US Treasury yields stand mixed ahead of inflation data from the US from July.
In Wednesday's session, the Silver spot price XAG/USD traded with mild losses, while the USD traded weaker and corrected after two days of strength. Markets remain quiet ahead of crucial Consumer Price Index (CPI) data from the US from July, which will impact bond and metal price dynamics.
Considering this, the US bond yields showed a mixed performance on Wednesday. The 10-year bond yield trades at 4.01%, seeing 0.23 % losses on the day, while the 2-year yield stands at 4.76% with 0.12 % gains and the 5-year yielding 4.10%, seeing mild losses.
In terms of the next Federal Reserve (Fed) following monetary policy decisions, tightening expectations have risen. According to World Interest Rate Possibilities (WIRP) tool, the markets are currently pricing in a 15% chance of a 25 bps hike in the September meeting, while those odds rise to 30% in November. It will all come down to the incoming data, as Jerome Powell stated during the press conference after the last Fed decision.
It's worth noticing that higher interest rates tend to be negatively correlated with non-yielding precious metal prices, so traders will keep a close eye on Thursday’s CPI data from the US.
XAG/USD Levels to watch
The daily chart analysis indicates a bearish outlook for the XAG/USD in the short term. The Relative Strength Index (RSI) is below its midline in negative territory, with a negative slope, aligning with the negative signal from the Moving Average Convergence Divergence (MACD), displaying red bars, reinforcing the strong bearish sentiment. Moreover, the pair is below the 20,100 and 200-day Simple Moving Averages (SMAs), supporting the idea that the bears are in command in the bigger picture.
Support levels: $22.50, $22.30, $22.00.
Resistance levels: $23.25 (200-day SMA), $23.50, $23.70, $24.00.
XAG/USD Daily chart
-638271939048292227.png)
- Mexico’s inflation progress, as INEGI reports, CPI continuing its downtrend.
- Following CPI data, most analysts expect Banxico to keep rates unchanged at 11.25%, with potential rate cuts in Q4 2023.
- Federal Reserve policymakers showed mixed signals as traders eye US CPI on August 10.
The Mexican Peso (MXN) gains some traction as the USD/MXN pair edges lower after inflation data from Mexico portrays the deflationary process continues with success, ahead of Thursday’s monetary policy by the Bank of Mexico (Banxico). At the time of writing, the USD/MXN trades at 17.0830, down 0.14%.
USD/MXN dips as traders wait for US inflation data and Banxico’s decision
The Instituto National of Estadistica Geografia e Informatica (INEGI) revealed the Consumer Price Index for July came below estimates of 0.49% MoM, at 0.48%, while annually based, hit 4.79%, as foreseen and a quarter of percentage below June’s figures. Nevertheless, as in most developed economies, core CPI is showing some stickiness, coming at 6.64% YoY, below estimates of 6.68%, and 0.25% beneath June’s 6.89%.
Following the inflation release, most analysts foresee Banxico’s holding rates unchanged at 11.25% on the August 10 monetary policy reunion. Pantheon Economics expects the first rate cut by Q4 2023.
Meanwhile, an absent US economic agenda would keep traders awaiting the release of the US inflation data. The Consumer Price Index (CPI) is expected to remain unchanged compared to June’s 0.2% MoM, while market analysts foresee a dip to 3% from 3.3% YoY. Core CPI is estimated to print 0.2% MoM as the prior month’s release, and YoY is projected to stay at 4.8% as June’s.
In the meantime, Federal Reserve officials begin to shift towards a neutral stance, led by Philadelphia Fed President Patrick Harker, saying the Fed is at a stage where it could keep rates unchanged unless data suggests the opposite. Contrarily, Fed Governor Michelle Bowman stated the Fed needs to keep the pedal to the metal, lifting rates to curb inflation.
Expectations for a rate hike in September remained depressed, with odds at a 15% chance, as shown by the CME FedWatch Tool.
The US Dollar Index (DXY), a gauge of the buck’s value against a basket of six currencies, is losing some traction, down by 0.11%, at 102.430, undermined by falling UST bond yields. The US 10-year benchmark note rate is 4.00%, down two basis points.
USD/MXN Price Analysis: Technical outlook
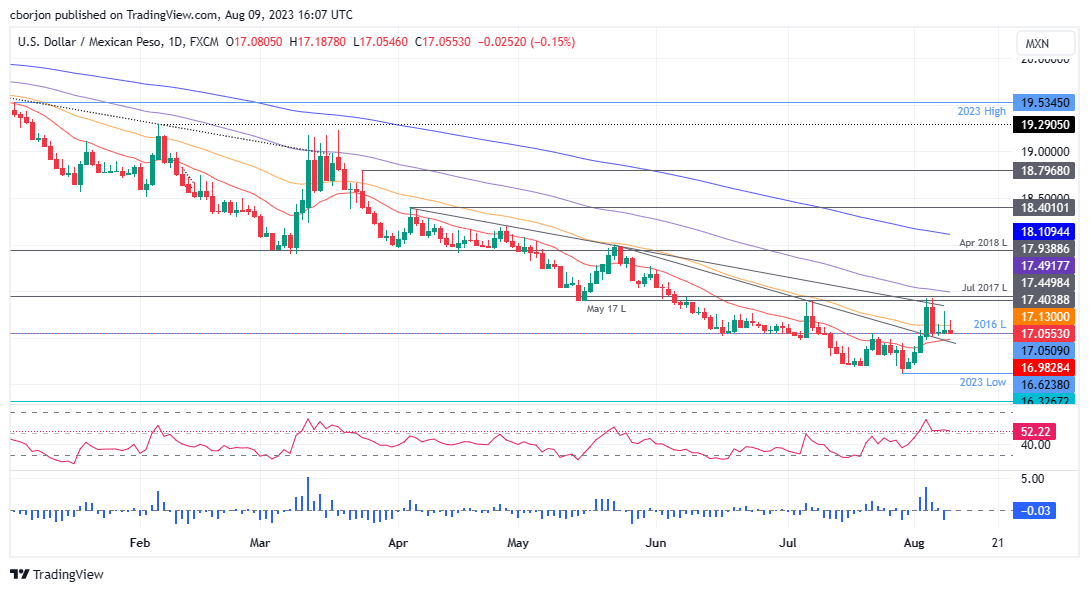
The USD/MXN is trading sideways above the 17.0000 figure for the fifth straight day, capped on the upside by the 50-day Exponential Moving Average (EMA) at 17.1308, while the figure and the 20-day EMA at 16.9849 act as support levels for the US Dollar bulls. If USD/MXN clears the 50-day EMA, that could exacerbate a move toward the crucial May 17 low of 17.4038, turned resistance. A daily close above the latter could pave the way to test the 100-day EMA at 17.4922. Conversely, if USD/MXN drops below the 20-day EMA, the pair could challenge the year-to-date (YTD) low of 16.6238.
- USD/JPY climbs to 143.53 despite weakening US Dollar across FX and declining US Treasury bond yields.
- Inflation anticipation: Wall Street is on standby for July’s CPI, expected to remain steady at 0.2% MoM.
- Mixed Fed signals stir the market, with officials hinting at tightening and others suggesting a steady rate path.
USD/JPY advances for three straight days, climbing 0.11%, despite falling US Treasury bond yields and overall US Dollar (USD) weakness across the FX board, ahead of inflation data release from the United States (US). At the time of writing, the USD/JPY exchanges hands at 143.53 after hitting a low of 142.98.
Uncertainty over the Federal Reserve’s stance and Japanese monetary policy dynamics to dictate USD/JPY direction
Wall Street trades with minuscule losses amidst a light US economic docket as traders brace for July’s inflation data. The Consumer Price Index (CPI) is expected to remain unchanged compared to June’s 0.2% MoM, while market analysts foresee a dip to 3% from 3.3% YoY. Core CPI is estimated to print 0.2% MoM as the prior month’s release, and YoY is projected to stay at 4.8% as June’s.
Aside from this, the shrinkage of the trade deficit slightly boosted the greenback, but mixed messages from US Federal Reserve (Fed) officials, keep investors uncertain about the Fed’s forward path. Even though Fed Governor Michelle Bowman stressed the need for additional tightening, more policymakers are taking a more cautious or neutral approach, as Philadelphia Fed President Patrick Harker. He commented the Fed is at a stage where it could leave rates unchanged, barring an abrupt change in the direction of recent economic data.
Monetary policy expectations on the Fed show money market traders expect no change to the Federal Funds Rate (FFR), with odds at 86.5%, as shown by the CME FedWatch Tool.
The US Dollar Index (DXY), a gauge of the buck’s value against a basket of six currencies, is losing some traction, down by 0.11%, at 102.430, undermined by falling UST bond yields. The US 10-year benchmark note rate is 4.00%, down two basis points.
The lack of economic data in Japan would keep traders leaning toward US Dollar dynamics, as well as recent data from the Bank of Japan (BoJ), as most members of the BoJ expressed an opinion about the Yield Curve Control (YCC). Even though there was some chatter about normalizing monetary policy, most BoJ’s members remain on the dovish side of the spectrum.
USD/JPY Price Analysis: Technical outlook
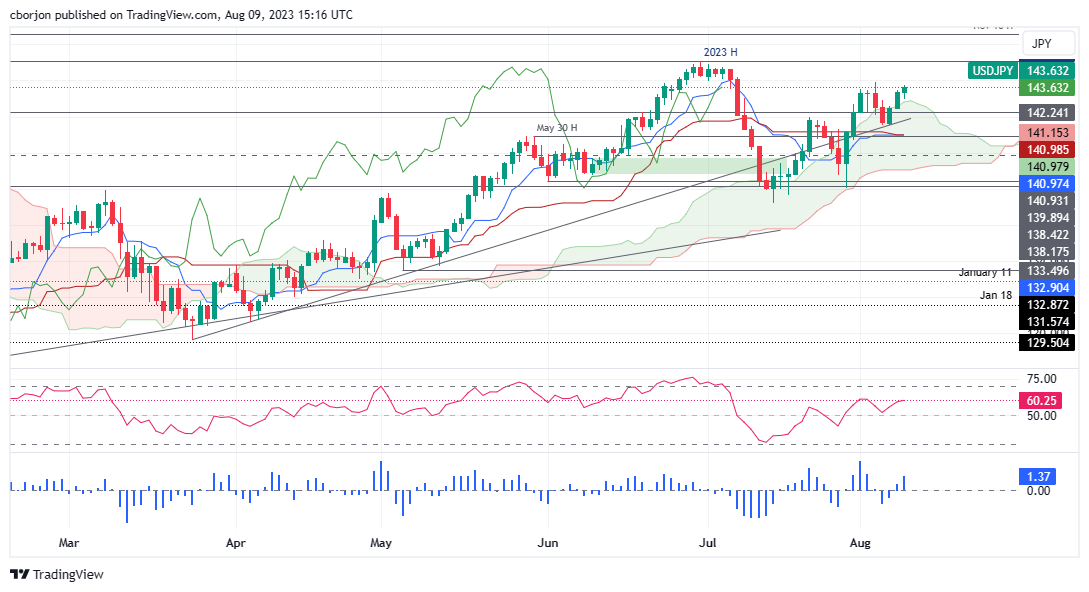
The USD/JPY found support around the top of the Ichimoku Cloud (Kumo), briefly pierced on Monday. However, a ‘tweezers bottom and harami’ pattern exacerbated a recovery toward current exchange rates. In addition, the Tenkan-Sen is about to cross above the Kijun-Sen line, seen as a bullish signal, while the Chikou Span is still below the price action. That said, the USD/JPY is bullishly biased, and it might test the year-to-date (YTD) high at 145.07, but firstly it would need to surpass key resistance levels, like the psychological 144.00 figure. Conversely, if the major drops inside the Kumo, it could test the current week’s low of 141.50.
The US Bureau of Labor Statistics (BLS) will release the most important inflation measure, the US Consumer Price Index (CPI) figures, on Thursday, August 10 at 12:30 GMT. As we get closer to the release time, here are the forecasts by the economists and researchers of 10 major banks regarding the upcoming United States inflation print for the month of July.
Headline and core CPI, which excludes volatile food and oil prices, are seen coming in at 0.2% month-on-month, same as in June. Annual headline CPI is expected to rebound to 3.3% vs. June’s print of 3.0% and core is seen steady at 4.8% YoY.
Commerzbank
We expect the core rate to remain at just 0.2% in July. The headline inflation rate is also likely to be 0.2%. As this would be largely in line with the Fed's inflation target of 2%, such a result would support our view that the Fed is unlikely to raise rates again.
Credit Suisse
We expect core CPI inflation to remain at 0.2% MoM in July, maintaining a more modest run rate after stepping lower in June. The YoY reading of core inflation is likely to decline to 4.7%. On the other hand, unfavorable base effects and modestly higher gas prices are likely to lead headline inflation higher to 3.3% YoY. A reading in-line with our expectations would represent the second consecutive month that monthly core inflation has been broadly in-line with the Fed’s target.
TDS
Core-price inflation likely remained the same in July, printing a second straight 0.2% MoM gain (0.23% unrounded). Goods inflation was likely a big factor to the downside, with shelter prices remaining a key wildcard (we expect modest acceleration). Rising gas prices will also help to keep headline inflation steady. Our MoM forecasts imply 3.3%/4.8% YoY for total/core prices.
ANZ
We expect both headline and core CPI inflation to rise by 0.2% MoM in July. Falling used car prices are again expected to see a decline in core goods prices. Some one-off factors are expected to keep core services ex-rent subdued, while rent inflation should continue to cool from a heady pace. Our diffusion and dispersion indices suggest inflation pressures are abating and normalising. The Fed is wary of upside risks to elevated inflation given demand for labour remains excessive. Most policymakers think the policy rate will need to be kept restrictive for some time to get inflation back to target. The risks remain that the Fed’s work is not yet done.
NBF
The energy component is likely to have had a sizeable positive impact on the headline index given the sharp rise in gasoline prices during the month. This, combined with another healthy gain in shelter costs, should result in a 0.4% increase in headline prices. If we’re right, the year-on-year rate could move up from 3.0% to 3.4%, marking the first increase in 13 months for this indicator. The advance in core prices could have been more subdued in July thanks in part to a decline in the price of used vehicles. But a rise of 0.3% in the month will still be too large to allow a drop in the annual rate. The latter should instead remain unchanged at 4.9%.
RBC Economics
YoY growth in US consumer prices likely ticked slightly higher for the first time in a year in July – gasoline prices didn’t move much this July but a larger 8% drop in July a year ago will fall out of the 12-month growth rate. YoY growth in core (ex-food & energy) prices will still be high (we expect +4.7%) in July, but we expect a moderate 0.2% MoM increase to match the June gain. Slower growth in core CPI has come alongside a pullback in home rent inflation as earlier slowing in market asking rent growth feed through to lower rent CPI with a lag as contracts get renewed. Absent a reacceleration in core inflation, we expect the Fed to step to and stay on the sideline and maintain the Fed Funds at 5.25% – 5% range until 2024.
CIBC
After some relief in core prices in June, price pressures likely maintained a 0.2% monthly pace in July for both headline and core (ex. food/energy) CPI. Unfavorable base effects will have propped up annual CPI inflation to 3.2%, while annual core inflation likely subsided to 4.7%. Within core categories, shelter prices could have decelerated, reflecting the typical lag associated with softer rents seen last year, but the Fed will be focused on core services outside of rent of shelter, as that’s a better gauge of underlying price pressures tied to demand. That measure was flat on a monthly basis in June, but that partly reflected a sizable drop in airfares that may not have extended into July. Still, even a bounce in core services ex. shelter to 0.3% MoM would leave the three-month annualized change at a tame 2.1%.
Citi
We expect a 0.196% MoM increase in core CPI in July, a modestly stronger increase than in June but clearly a much more favorable monthly pace of inflation for the Fed than over much of the last few years. Shelter prices are likely to continue to slow overall this year, though the July data may see a somewhat stronger 0.47% MoM increase in each of primary rents and owners’ equivalent rent. More negative seasonal factors after July could mean shelter prices slow further in the fall. Meanwhile, headline CPI should rise 0.3% MoM and rebound from a near-term bottom of 3.0% YoY to 3.3% YoY.
Westpac
The June CPI report was pivotal for the current cycle as a modest 0.2% monthly print brought annual headline inflation down to 3.0%, a third of its peak level. A similar outcome is expected by Westpac, though the annual rate will lift slightly owing to an adverse base effect. The composition of US inflation remains problematic, however. Goods inflation is benign and services ex. shelter increasingly constructive for a return to target well before the medium term. But, because of its weight and scale, by itself, shelter inflation has the capacity to hold inflation above the 2.0% YoY target for the foreseeable future. It is also worth recognising that, while shelter inflation should abate to year-end and through early-2024, capacity in the sector will remain a concern for years, and with it shelter inflation.
Wells Fargo
We expect the disinflationary trend to continue in July and estimate a 0.2% bump in both the headline and core measures over the month. Looking under the hood, we expect faster deflation for vehicles and other goods in July, counteracted by slightly firmer services prices for travel and medical care. If realized, these prints would translate to a 3.3% annual headline rate and a 4.7% annual core rate. Through the monthly noise, inflation appears set on a downward path. However, progress in the coming months is likely to be slower and noisier than June’s print alone would suggest. We expect monthly gains in core inflation to pick up slightly in Q4 as the disinflationary momentum from waning goods prices fades and health insurance prices rebound toward the end of the year.
Economists at Commerzbank expect the Brazilian Real to defend its strong level against the US Dollar this year. However, monetary policy support for BRL is likely to gradually weaken in 2024.
A somewhat weaker Real next year
Attractive real interest rates should continue to support the Brazilian Real even after the start of the rate-cutting cycle.
In the longer term, however, we see depreciation risks for the BRL, mainly due to our concerns about a less hawkish monetary policy.

Source: Commerzbank Research
See: USD/BRL set to trade in a 4.70-5.00 range in the month ahead – SocGen
The Australian Dollar has been the worst-performing G10 currency in the past month. Nonetheless, economists at ING see ample room for recovery.
Markets are underestimating risks of more RBA tightening
We think the domestic picture will improve for AUD, as the RBA may well have to hike again despite market’s flat rate expectations.
The monetary policy story could potentially come through as a positive factor at a time (September, for example) when USD resilience hasn’t abated yet, meaning an RBA-driven bullish pocket for AUD could initially be mostly mirrored in relative strength against other pro-cyclical currencies rather than on AUD/USD.
In line with our bearish USD call for later in the year, we expect AUD/USD to rebound back to the June and July 0.69 peaks before year-end, and then find more support above 0.70 in the first half of 2024.
The Swiss Franc was the second best performing currency in July lagging behind only the Norwegian Krone.
SNB unlikely to hike rates further this year
While recent Franc gains have not been as extreme as back in early 2015, we do believe that the strength of the CHF is currently overshooting somewhat and expect it to correct lower in the coming months.
The Swiss Franc has been benefitting from the relatively hawkish policy stance of the SNB who have actively been encouraging a stronger CHF to dampen upside risks to their inflation outlook. With inflation likely to slow further below the SNB’s 2.0% target in the coming months, we do not expect the SNB to hike rates further this year.
EUR/CHF – Q3 2023 0.9650 Q4 2023 0.9700 Q1 2024 0.9800 Q2 2024 0.9800
USD/CHF – Q3 2023 0.8770 Q4 2023 0.8660 Q1 2024 0.8670 Q2 2024 0.8820
Why is not the Euro weaker? Kit Juckes, Chief Global FX Strategist at Société Générale, analyzes the shared currency outlook.
Positions are holding Euro up, but for how long?
We can see EUR/USD trade in a range for a while longer, as long as positions stay where they are.
But if the economic data don’t start providing support, and relative expectations about Fed and ECB policy don’t move in the Euro’s favour this month, we’re going to see long Euro positions capitulate in September.
- The US Dollar is unchanged near the New York opening bell.
- Very light data calendar points to a rather uneventful day in the wake of US inflation data on Thursday.
- The US Dollar Index nudges lower, eyes key support test.
The US Dollar (USD) is trading sideways to slightly lower as markets are currently positioned within the eye of the data storm that will see wind speed peaking on Thursday with the US Consumer Price Index (CPI) numbers. A mix of events on Tuesday – with lackluster import/export data out China together with resparked recession fears, and the 40% tax on profits for Italian banks – served a risk averse cocktail which fueled the rally in the Greenback across the board in every major G10 pair. The very light economic calendar and the US Consumer Price Index (CPI) numbers on Thursday will see traders sitting on their hands for Wednesday in order to keep their powder dry for the main event.
On the economic front, a light release calendar is on the cards, with only the weekly Mortgage Applications numbers expected. From the commodity side, the US Energy Information Administration (EIA) will release Crude Oil and derivatives numbers. This release will get some additional attention as Western Texas Intermediate (WTI) crude price went on a wild ride on Tuesday, by first dropping 3.10% during the European session and then rallying 4% during the US trading session.
Daily digest: US Dollar calmness before the storm of Thursday
- Markets faced the first and only piece of macroeconomic data out of the US at 11:00 GMT with the weekly Mortgage Bankers Association (MBA) Mortgage Applications dropping to -3.1% from -3.0% previous week.
- The US Treasury Department is about to tap the markets for a 10-year note auction. As the 10-year tenor acts as an important benchmark, expect some additional attention to any bid/cover ratios and demanded yields.
- Expect a bit of fireworks from the US Energy Information Administration (EIA) Crude Oil numbers. Western Texas Intermediate (WTI) crude price moved over 7% in intraday volatility on Tuesday, and as recession fears are fading on Wednesday, a drop in stockpile could fuel a pop higher in the Crude Oil price.
- Stocks are rebounding a bit with the Hang Seng unchanged and European equities on the front foot. Both the German DAX and the European Stoxx 50 are paring back losses from Tuesday. US equity futures head slightly lower after a green opening after some disappointing earnings.
- The CME Group FedWatch Tool shows that markets are pricing in an 86.5% chance that the Federal Reserve will pause interest rate hikes at its meeting in September.
- The benchmark 10-year US Treasury bond yield trades at 4.01% and is trading higher after the drop below 4% intraday on Tuesday. The risk aversion from Tuesday seems to be in the rear mirror and US bonds are no longer heavily bid.
US Dollar Index technical analysis: nothing to see here
The US Dollar made it through a very difficult area on the US Dollar Index (DXY) chart. The region with both the 100-day and the 55-day Simple Moving Average (SMA) has been broken to the upside and must have hurt quite a few US Dollar bears in the process. With the US Dollar retracing a little bit on Wednesday, it will be important to see if the 100-day SMA at 102.31 will be able to refrain the DXY from paring back all gains from Tuesday.
For the upside, 102.45 – where the 55-day SMA is located – is the next key level to have a daily close above in order to advance in a solid way. The fact this technical indicator already got breached below means that it misses buying-interest. In case the US Dollar Index is able to head back above it, look for 103 and a new monthly high to be at hand.
On the downside, the US Dollar bulls will want to defend that earlier mentioned 100-day SMA at 102.31, in order to avoid a full paring back of earlier gains for this week. If bulls fail to do so, expect to see a nosedive move toward 102.00. The low of past Friday at 101.74 could be a line in the sand to predict if more downside is to come, once it is being tested.
Central banks FAQs
What does a central bank do?
Central Banks have a key mandate which is making sure that there is price stability in a country or region. Economies are constantly facing inflation or deflation when prices for certain goods and services are fluctuating. Constant rising prices for the same goods means inflation, constant lowered prices for the same goods means deflation. It is the task of the central bank to keep the demand in line by tweaking its policy rate. For the biggest central banks like the US Federal Reserve (Fed), the European Central Bank (ECB) or the Bank of England (BoE), the mandate is to keep inflation close to 2%.
What does a central bank do when inflation undershoots or overshoots its projected target?
A central bank has one important tool at its disposal to get inflation higher or lower, and that is by tweaking its benchmark policy rate, commonly known as interest rate. On pre-communicated moments, the central bank will issue a statement with its policy rate and provide additional reasoning on why it is either remaining or changing (cutting or hiking) it. Local banks will adjust their savings and lending rates accordingly, which in turn will make it either harder or easier for people to earn on their savings or for companies to take out loans and make investments in their businesses. When the central bank hikes interest rates substantially, this is called monetary tightening. When it is cutting its benchmark rate, it is called monetary easing.
Who decides on monetary policy and interest rates?
A central bank is often politically independent. Members of the central bank policy board are passing through a series of panels and hearings before being appointed to a policy board seat. Each member in that board often has a certain conviction on how the central bank should control inflation and the subsequent monetary policy. Members that want a very loose monetary policy, with low rates and cheap lending, to boost the economy substantially while being content to see inflation slightly above 2%, are called ‘doves’. Members that rather want to see higher rates to reward savings and want to keep a lit on inflation at all time are called ‘hawks’ and will not rest until inflation is at or just below 2%.
Is there a president or head of a central bank?
Normally, there is a chairman or president who leads each meeting, needs to create a consensus between the hawks or doves and has his or her final say when it would come down to a vote split to avoid a 50-50 tie on whether the current policy should be adjusted. The chairman will deliver speeches which often can be followed live, where the current monetary stance and outlook is being communicated. A central bank will try to push forward its monetary policy without triggering violent swings in rates, equities, or its currency. All members of the central bank will channel their stance toward the markets in advance of a policy meeting event. A few days before a policy meeting takes place until the new policy has been communicated, members are forbidden to talk publicly. This is called the blackout period.
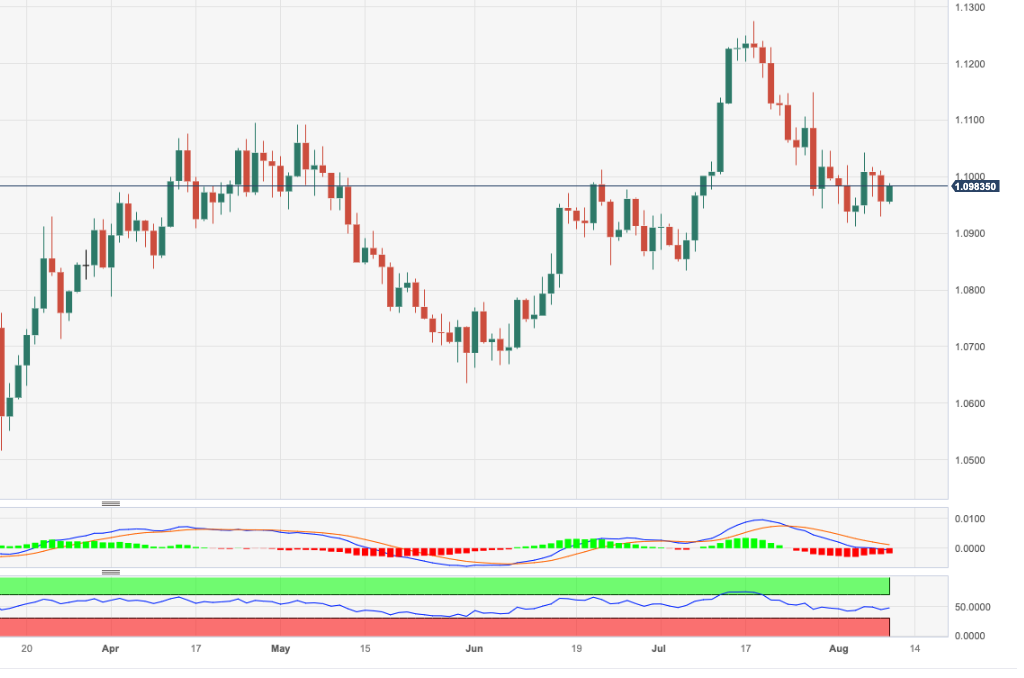
- EUR/USD reverses part of the weekly leg lower on Wednesday.
- Initial support emerges at the monthly low of 1.0912.
EUR/USD regains some composure and bounces to the 1.0990 region on Wednesday.
In case losses accelerate, spot should face interim contention at the 55-day and 100-day SMAs at 1.0930 and 1.0924, respectively, ahead of the so far August low at 1.0912 (August 3). In case the latter is breached on a sustainable way, the pair could embark on a move to the July low of 1.0833 (July 6).
In the meantime, while below the weekly high of 1.1149 (July 27), the pair risks further retracements for the time being.
Looking at the longer run, the positive view remains unchanged while above the 200-day SMA, today at 1.0760.
EUR/USD daily chart
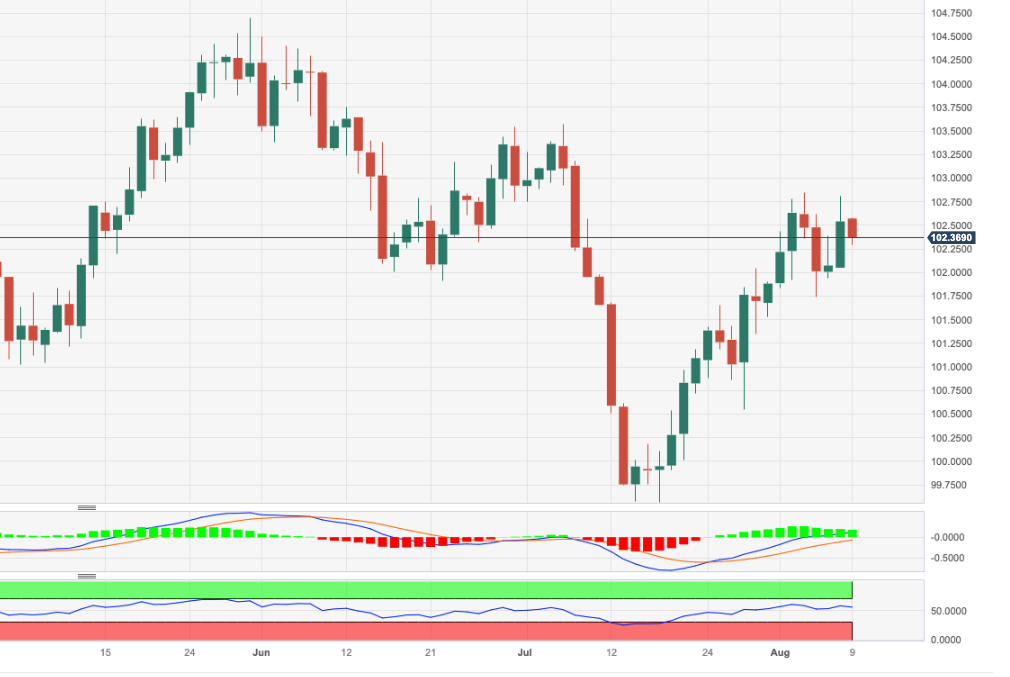
- DXY comes under pressure following two consecutive daily gains.
- Further north emerges the monthly high at 102.84.
DXY faces some renewed selling pressure and retreats from Tuesday’s weekly peaks in the 102.75/80 band on Wednesday.
The index extends the upbeat tone seen at the beginning of the week and seems ready to challenge the so far monthly top of 102.84 (August 3) sooner rather than later. The breakout of this level exposes a probable move to the July high of 103.57 (July 3), which appears underpinned by the proximity of the key 200-day SMA.
Looking at the broader picture, while below the 200-day SMA (103.43) the outlook for the index is expected to remain negative.
DXY daily chart
The Mexican Peso has been on a roller coaster ride. Economists at Commerzbank analyze USD/MXN outlook.
USD/MXN to remain around 17 for the time being
Last week's fairly significant period of Peso weakness confirms our view that much of the upside is already priced into the MXN and that further appreciation potential is likely to be limited.
Although Mexico's real interest rate will continue to improve as inflation continues to decline, as long as Banxico leaves interest rates unchanged, this is not a fundamental shift in monetary policy that would justify a revaluation of the Peso.
Analysts do not expect the first rate cuts until the end of the year. As long as there is no significant change, we expect the USD/MXN to remain around 17 for the time being, thanks to the still attractive real interest rate.
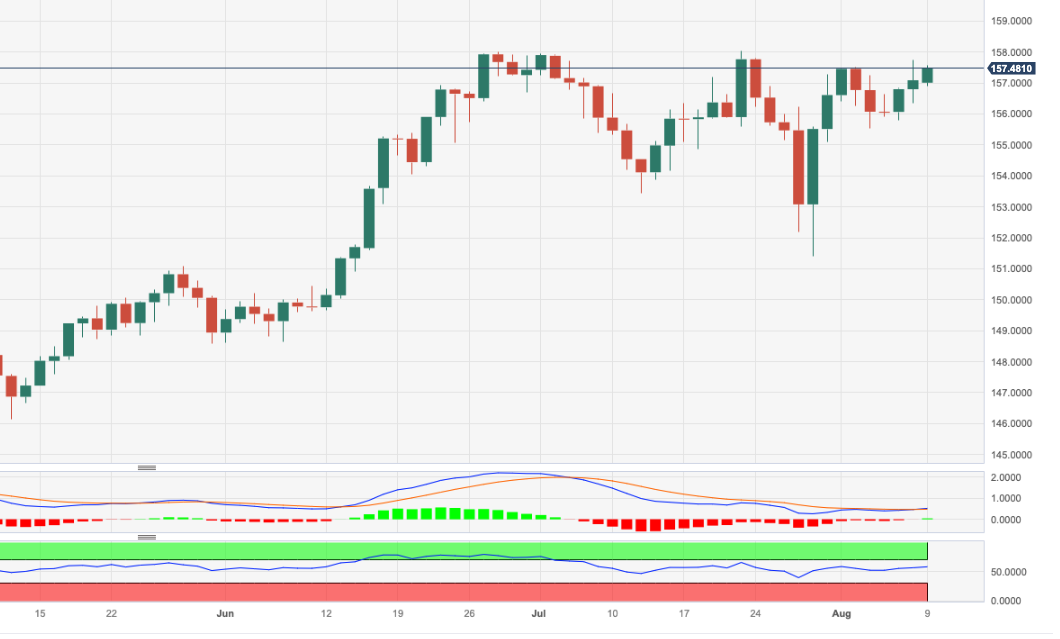
- EUR/JPY extends the upside to the mid-157.00s.
- Extra advance is expected to target the YTD top past 158.00.
EUR/JPY advances further and leaves behind the 157.00 hurdle on Wednesday.
So far, the continuation of the upside momentum appears likely with the initial target still at the 2023 high at 158.04 (July 21). The breakout of this level exposes a move to the round level of 160.00.
So far, the longer term positive outlook for the cross appears favoured while above the 200-day SMA, today at 146.84.
EUR/JPY daily chart
Economists at CIBC Capital Markets expect NZD/USD to remain under pressure in the short term. However, the pair is set to bounce back higher in the fourth quarter.
Short term headwinds
The on-hold RBNZ should enable NZD/USD to depreciate in the short term, as the Fed appears underpriced for a final hike. This dynamic should drive NZD/USD through Q3, but we then see the pair rising to 0.63 by Q4.
The weak Chinese economy is likely to continue weighing on the NZD through Q3, but when stimulus eventually arrives, NZD/USD should move higher.
Ultimately, NZD/USD faces short term headwinds from an on-hold RBA and weak Chinese economy, but over the longer term, the major drivers of the currency appear to be lining up for a NZD rally.
- USD/CAD rebounds after building a base around 1.3400 as the market mood turns cautious.
- US headline inflation for July is expected to rebound as oil prices recovered sharply last month.
- USD/CAD shifts auction above the 1.3387 resistance, which turns into a support for the US Dollar bulls.
The USD/CAD pair attempts to break the consolidation above the round-level support of 1.3400 in the European session. The Loonie asset finds strength as the US Dollar rebounds after discovering a cushion near 102.30.
Bearish sentiment revives as investors turn cautious ahead of the United States inflation data, which will be released on Thursday at 12:30 GMT. US headline inflation for July is expected to rebound as oil prices recovered sharply last month.
July’s inflation data is expected to build a base for Federal Reserve’s (Fed) September monetary policy as sticky price pressures would force policymakers to consider an extension of policy-tightening.
USD/CAD shifts auction above the horizontal resistance plotted from July 07 high at 1.3387 on a four-hour scale, which turns into a support for the US Dollar bulls. The Loonie asset is approaching the next resistance plotted around 1.3650. Upward-sloping 20-period Exponential Moving Average (EMA) at 1.3400 provides support to the US Dollar.
The Relative Strength Index (RSI) (14) oscillates in a 40.00-60.00 range, which indicates a consolidation ahead.
Mean-reversion move to near 1.3400 would be a buying opportunity for the US Dollar bulls. This would drive the asset toward June 05 high at 1.3462 followed by the psychological resistance at 1.3500.
In an alternate scenario, a downside move below July 18 high at 1.3288 would drag the asset toward July 27 low around 1.3160 and July 14 low marginally below 1.3100.
USD/CAD four-hour chart
-638271826616214793.png)
EUR had little to oppose the USD move on Tuesday. Economists at Commerzbank analyze EUR/USD outlook.
Little momentum for EUR
The ECB is likely to remain concerned regarding inflation in the Eurozone, while also being hopeful that the positive development will continue.
Contrary to the situation in the US, the economy in the Eurozone is weakening, which is likely to put pressure on EUR. If inflation then continues to move in the right direction, rate cut speculation for the Eurozone might be re-fuelled.
Once again market participants have to be patient though as there will be no significant new data from the Eurozone this week. Next week’s GDP data might provide more momentum again.
GBP/USD has found decent support on dips over the past week but gains have been capped below 1.28. Economists at Scotiabank analyze the pair’s outlook.
GBP should remain well-supported on dips
Sterling still looks relatively ‘cheap’ in broad terms and the risk of an extended BoE policy tightening cycle remains alive. Sterling should remain well-supported on dips.
Regaining 1.2800+ would be a short-term positive for the Pound at least.
Support is 1.2705.
See: The Pound will come under depreciation pressure in the medium term – Commerzbank
The US Dollar Index is capped in the mid/upper 102s, economists at Scotiabank report.
Peak Fed policy will make it harder for the USD to advance
The July rebound in the USD appears to have stalled; the Fed is slipping into neutral now and peak Fed policy will make it harder for the USD to advance.
US CPI data on Thursday may still carry some ‘sticker shock’ for markets in the form of a nudge higher in price growth but the USD may not be able to advance too far on that alone.
DXY gains are liable to be capped in the mid/upper 102 region.
Economists at Nordea lean toward a weaker NOK after the CPI data release on Thursday.
Inflation is key
The NOK strengthened markedly at the beginning of July after the last NO CPI release came in hotter than expected while US and Euro Area CPI were a tad softer than expected. We don’t think we will see a repeat this week and we expect a somewhat weaker NOK after Thursday’s CPI data release.
Markets expect US inflation to pick up slightly to 3.3% YoY from 3.0%. More importantly, US core inflation is expected to fall to 4.7% YoY from 4.8%. If expectations are correct, markets could be relieved of a lower core figure and the USD could weaken somewhat.
A lower NOK print than feared and US inflation as expected points to a somewhat weaker NOK over the short-term. We still believe that EUR/NOK will take a turn higher in the months to come and hold our target at 11.50 until year-end.
- NZD/USD falls back sharply from 0.6090 as bearish sentiment revives.
- A rebound in US inflation would build more burden on households as their real income will squeeze.
- The impact of recovery in inflationary pressures in the Chinese economy starts fading.
The NZD/USD pair faces barricades around 0.6090 in the London session. The Kiwi asset fails to test the round-level resistance of 0.6100 as the US Dollar Index (DXY) attempts a recovery move after building a support base around 102.30. The USD Index might attempt to recapture the immediate resistance of 102.80 amid supportive economic indicators.
S&P500 futures add some gains in the London session. It seems a recovery attempt by US equities after a sell-off on Tuesday. US indices felt selling pressure as investors hoped that inflation could rebound due to a stellar recovery in global oil prices. This would build more burden on households as their real income will squeeze.
The US Dollar Index is expected to enjoy a cautious market ahead of Consumer Price Index (CPI) data, which will be published on Thursday at 12:30 GMT. Sticky inflation figures for July are expected by the market participants due to strengthening oil prices. Also, sustained wage growth indicates that consumer spending remains resilient due to higher income for disposal.
The risk-aversion theme fails to sustain for longer despite Federal Reserve (Fed) policymakers delivering neutral interest rate guidance. Philadelphia Fed Bank President Patrick Harker said the central bank is at the point where it can be patient and hold rates steady and let the monetary policy actions do their work.
Meanwhile, the impact of recovery in inflationary pressures in the Chinese economy starts fading. China’s National Bureau of Statistics (NBS) reported early Wednesday that monthly CPI expanded at a 0.2% pace in July while investors anticipated a deflation of 0.1%. Producer Price Index (PPI) continued to deflate at a higher pace, recorded at 4.4%, more than expectations of 4.1%.
Chinese producers struggle to raise prices at factory gates amid bleak demand and declining exports. In spite of higher monetary and fiscal stimulus by the People’s Bank of China (PBoC) and the Chinese authority respectively, economic growth is sluggish.
It is worth noting that New Zealand is one of the leading trading partners of China and its weak domestic demand impacts the New Zealand Dollar.
USD/CAD trades flat. Economists at Scotiabank analyze the pair’s outlook.
Loonie’s mood is hardly encouraging
USD/CAD’s rally peaked a few ticks or so below 1.35 on Tuesday. The CAD mood is hardly encouraging though, with the Loonie losing ground easily and only making slow progress when conditions are positive.
Risks will tilt to the downside somewhat if the USD continues to trade little changed through the close today as it will suggest a little more strongly that USD gains have stalled.
Support is 1.3390/1.3300.
Resistance is 1.3400/1.3450.
EUR/USD regains upper 1.09s. Economists at Scotiabank analyze the pair’s outlook.
EUR/USD is trying to develop a base
Chart patterns suggest the EUR is trying to develop a base but the lack of upside progress and spot’s proximity to major support (1.0925/30 still) leaves something of a question market over near-term trends.
EUR gains above 1.10 would be positive while a break above 1.1040/45 in the next day or so (potential bull trigger) should support further gains towards the low/mid-1.11s.
See – EUR/USD: A return to 1.10 is possible today – ING
The Pound has been able to hold at high levels against the EUR in recent months. Economists at Commerzbank analyze GBP outlook.
GBP supported in the short term
We have adjusted our forecasts, as inflation in the UK, which is still quite high for the time being, should maintain rate hike expectations for the BoE, from which the Pound should benefit. At the same time, recession concerns for the eurozone should weigh on the EUR.
In the medium term, however, we continue to expect an upward movement in EUR/GBP.
We expect the BoE to cut its key rate again in the middle of next year in view of the weak economic development. In contrast, we expect the ECB to leave its key rate unchanged, contrary to the market's belief. This should make the ECB more hawkish, which will make the EUR more attractive against the Pound.

Source: Commerzbank Research
The US Dollar was the top performing G10 currency on Tuesday. Economists at MUFG Bank analyze Greenback’s outlook.
A much higher-than-expected CPI print would pressure global equity markets further lower
In this global backdrop, it is highly likely that the US Dollar will remain well supported.
If risk aversion intensifies again today and into the US CPI data on Thursday, a worst-case scenario would be for a much higher-than-expected CPI print that would likely pressure global equity markets further lower. To us, a much stronger CPI print seems unlikely with rental disinflation only just about to unfold.
Economists at Société Générale analyze USD/MXN technical outlook.
Receding downward momentum
USD/MXN deepened its downtrend towards potential support zone of 16.60/16.40 representing intermittent projections and a multiyear trend line. An initial bounce has led the pair towards July high of 17.40.
Daily MACD has been posting positive divergence denoting receding downward momentum.
If it overcomes the hurdle at 17.40, an extended rebound is likely; next objectives could be at 17.80 and April low of 18.00.
See – USD/MXN: Peso to weaken moderately from Q4 – MUFG
Chinese annual CPI fell in July for the first time in 28 months. Economists at TD Securities analyze CNY outlook after the latest Chinese data.
China falls into deflation
China slipped into deflation for the first time since Feb 2021 with July CPI coming in at -0.3% YoY. Today's report highlights the economy faces subdued price pressures from weak economic demand, but the details don't point to an imminent risk of a deflationary spiral.
The divergence in data surprises between US and China is likely to act as a headwind for the Yuan and an anchor for the USD.
The path of least resistance for USD/CNY is likely a break above the YTD highs.
USD/JPY fell in July. The pair is expected to move firmly in August, economists at Mizuho Bank report.
Movements will cool off as overseas markets enter holiday mode
With interest rates facing upwards pressure on YCC flexibility while also being kept in check by special operations, investors will need to keep an eye on where 10-year interest rates end up actually settling. Nonetheless, when USD/JPY hits 142, market participants will try pushing it up to 145, just like they did between the end of June and the start of July.
With major policy events out of the way in Japan, the US and Europe, the pair’s movements will also cool off as overseas markets enter holiday mode.
One potential risk involves the pair rising sharply amid thin trading on an upswing in US economic indicators.
- GBP/JPY lacks any firm intraday direction and remains confined in a narrow range.
- The BoE’s less hawkish signals and a bleak outlook for the UK economy cap gains.
- A more dovish BoJ undermine the JPY and helps limit the downside for the cross.
The GBP/JPY cross struggles to capitalize on its weekly gains registered over the past two days and oscillates in a narrow trading band below the 183.00 mark through the first half of the European session on Wednesday.
Traders seem reluctant to place bullish bets around the British Pound (GBP) in the wake of a bleak outlook for the UK economy, which turns out to be a key factor acting as a headwind for the GBP/JPY cross. In fact, the National Institute of Economic and Social Research (NIESR) said that it would take until the third quarter of 2024 for UK output to return to its pre-pandemic peak. In its quarterly update, the NIESR added that there was a 60% risk of the government going to the polls during a recession.
This comes after a report from the British Retail Consortium showed on Tuesday that UK Retail Sales in July registered its weakest year-on-year growth since August 2022. Adding to this, the Bank of England's (BoE) less hawkish forward guidance, signalling that the tightening cycle may be nearing an end, continues to undermine the GBP. Apart from this, the emergence of some buying around the safe-haven Japanese Yen (JPY) further contributes to capping the upside for the GBP/JPY cross.
That said, a more dovish stance adopted by the Bank of Japan (BoJ) keeps a lid on any meaningful gains for the JPY and helps limit the downside for the GBP/JPY cross. It is worth recalling that the BoJ's Summary of Opinions released on Monday revealed that policymakers backed the case for the need to patiently continue with the current monetary easing towards achieving the price stability target. Apart from this, weaker wage growth data from Japan is seen as another factor weighing on the JPY.
The government data released on Tuesday showed that real wages in Japan fell for a 15th straight month in June, while nominal pay growth also slowed. This should allow the BoJ to stick to its current easy monetary policy settings, which, in turn, supports prospects for some meaningful appreciating move for the GBP/JPY cross. Traders, however, seem reluctant and prefer to wait on the sidelines ahead of important UK macro releases, including the Prelim Q2 GDP print on Friday.
Technical levels to watch
- Gold price seems supported above $1,920.00 for now as US Dollar corrects.
- Investors await United States inflation data for further guidance.
- Fed Williams, Harker expect that interest rates have peaked for now.
Gold price (XAU/USD) capitalizes on correction in the US Dollar propelled by positive market sentiment. The precious metal rebounds as Federal Reserve (Fed) policymakers anticipate that interest rates by the central bank have peaked for now. Also, the Fed could consider rate cuts next year if inflation continues to decelerate and job hiring slows further.
For September’s monetary policy guidance, investors await Thursday’s United States Consumer Price Index (CPI) data. Investors expect a rebound in headline CPI after a soft spell as recovered oil prices lift gasoline prices. US hiring slowed in July while the US Unemployment Rate remains near historic lows. Now July’s inflation data will set a base for the next interest rate decision.
Daily Digest Market Movers: Gold price rebounds after correction in US Dollar
- Gold price finds a temporary cushion after correcting swiftly to $1,920.00 as US Dollar faces a sell-off ahead of United States inflation data.
- The US Dollar Index senses heat due to neutral interest rate guidance from Federal Reserve policymakers.
- Philadelphia Fed President Patrick Harker said on Tuesday that the central bank could hold interest rates steady at this point and let monetary policy do its job. Investors should note that Fed Harker is not a voting member this year.
- Also, New York Fed President John Williams thinks interest rates have peaked for now and expects that the central bank will consider rate cuts next year.
- The US Dollar Index corrects sharply to near 102.40 as market sentiment turns positive, supported by the People’s Bank of China’s (PBoC) stronger-than-expected exchange rate fixing.
- Hawkish commentary from Fed Governor Michelle Bowman that the collaboration of still-elevated inflation and an upbeat labor market supports further policy tightening fails to keep the US Dollar at elevated levels.
- After a hiring slowdown and sustained wage growth, investors are shifting their focus toward the inflation data, which will be published on Thursday at 12:30 GMT.
- Per estimates, headline and core CPI that excludes volatile food and oil prices maintained a monthly pace of 0.2% in July. Annual headline CPI is expected to rebound to 3.3% vs. June’s print of 3.0%. On the contrary, core inflation is forecast to decelerate marginally to 4.7% against a prior reading of 4.8%.
- A higher consensus for headline CPI is backed by a solid recovery in global oil prices.
- A recovery in inflationary pressures might force the Fed to consider continuing to raise interest rates.
- The US government is planning to ban investment in Chinese artificial intelligence (AI) companies, reported Bloomberg. The administration plans to target only those Chinese companies that get more than 50% of revenue from the sectors of quantum computing and AI.
- The National Federation of Independent Business (NFIB) said its Small Business Optimism Index rose to 91.1 last month, the highest since November 2022 due to easing concerns about inflation expectations.
- On Tuesday, the US Census Bureau reported a Goods & Services Trade Balance deficit at a three-month low of $65.5 billion amid a decline in merchandise imports due to moderating consumer demand.
Technical Analysis: Gold price bounced back after testing $1,920
Gold price finds a short-term cushion after testing crucial support of $1,920.00. For a solid recovery, the precious metal needs to pass through plenty of filters ahead. On a broader note, Gold price seems vulnerable after a Bear Cross conducted by the 20 and 50-day Exponential Moving Averages (EMAs). The 200-EMA at $1,907.00 should continue to provide cushion to the yellow metal ahead.
Interest rates FAQs
What are interest rates?
Interest rates are charged by financial institutions on loans to borrowers and are paid as interest to savers and depositors. They are influenced by base lending rates, which are set by central banks in response to changes in the economy. Central banks normally have a mandate to ensure price stability, which in most cases means targeting a core inflation rate of around 2%.
If inflation falls below target the central bank may cut base lending rates, with a view to stimulating lending and boosting the economy. If inflation rises substantially above 2% it normally results in the central bank raising base lending rates in an attempt to lower inflation.
How do interest rates impact currencies?
Higher interest rates generally help strengthen a country’s currency as they make it a more attractive place for global investors to park their money.
How do interest rates influence the price of Gold?
Higher interest rates overall weigh on the price of Gold because they increase the opportunity cost of holding Gold instead of investing in an interest-bearing asset or placing cash in the bank.
If interest rates are high that usually pushes up the price of the US Dollar (USD), and since Gold is priced in Dollars, this has the effect of lowering the price of Gold.
What is the Fed Funds rate?
The Fed funds rate is the overnight rate at which US banks lend to each other. It is the oft-quoted headline rate set by the Federal Reserve at its FOMC meetings. It is set as a range, for example 4.75%-5.00%, though the upper limit (in that case 5.00%) is the quoted figure.
Market expectations for future Fed funds rate are tracked by the CME FedWatch tool, which shapes how many financial markets behave in anticipation of future Federal Reserve monetary policy decisions.
- Euro reclaims part of the ground lost vs. the US Dollar.
- Stocks in Europe open the session with a decent bounce.
- EUR/USD approaches 1.1000 on improved risk appetite.
- The USD Index (DXY) returns to the low 102.00s.
- Chinese inflation figures surprised to the upside in July.
Following two consecutive sessions of losses, the Euro (EUR) has managed to regain its composure and overcome some of the recent pessimism against the US Dollar (USD). This has resulted in EUR/USD showing resilience and attempting to surpass the psychological barrier of 1.1000 on Wednesday.
The improved overall sentiment in terms of risk appetite has put pressure on the Greenback, giving the pair an extra boost in the middle of the week. This is happening at a time when there is still uncertainty regarding the direction of both US and German yields, as market participants eagerly await the release of important US inflation data measured by the Consumer Price Index (CPI) on Thursday.
In the broader context of monetary policy, there have been no notable changes. Investors still anticipate that the Federal Reserve will maintain its current interest rates for the rest of the year, while the European Central Bank (ECB) is facing internal divisions within its Council regarding the continuation of its tightening measures after the summer.
In terms of economic data, there will be limited releases on both sides of the Atlantic during this session. The only notable data point expected later in the North American session is the weekly Mortgage Applications tracked by the Mortgage Bankers Association (MBA).
Daily digest market movers: Euro finds some respite to the weekly bearishness
- The EUR moves closer to 1.1000 vs. the USD on Wednesday.
- The USD Index (DXY) abandons the area of tops near 102.90.
- The risk-on mood underpins the pair’s recovery so far.
- Chinese CPI dropped 0.3% YoY in July; PPI decreased 4.4% YoY.
- CME Group’s FedWatch Tool sees no extra hikes by the Fed in H2 2023.
- Speculation that the Fed might have ended its hiking cycle remains steady.
- Markets’ appear focused on the US CPI due on August 11.
Technical Analysis: Euro faces immediate up-barrier at 1.1150
EUR/USD manages well to attempt a decent rebound and refocus its attention to the key 1.1000 region so far on Wednesday.
Breaking through the 1.0920 range, where the monthly low aligns with the crossing of the interim 55-day and 100-day SMAs exposes EUR/USD to potential downside movement. This could drive spot toward the July low of 1.0833 (July 6). Such a downward move might precede a further decline toward the significant 200-day SMA at 1.0760 ahead of the May low of 1.0635 (May 31). Deeper down lies the March low of 1.0516 (March 15), and subsequently, the 2023 low at 1.0481 (January 6).
In contrast, sporadic bullish attempts could encourage the pair to challenge the psychological 1.1000 mark prior to the weekly top at 1.1149 seen on (July 27). Should this level be surpassed, it might help alleviate some of the downward pressure, potentially motivating the pair to test the 2023 peak of 1.1275 (July 18). Once this threshold is breached, significant resistance levels become less prominent until the peak of 2022 at 1.1495 (February 10), closely followed by the round level of 1.1500.
Furthermore, the optimistic outlook for EUR/USD remains valid as long as the pair maintains its position above the crucial 200-day SMA.
Euro FAQs
What is the Euro?
The Euro is the currency for the 20 European Union countries that belong to the Eurozone. It is the second most heavily traded currency in the world behind the US Dollar. In 2022, it accounted for 31% of all foreign exchange transactions, with an average daily turnover of over $2.2 trillion a day.
EUR/USD is the most heavily traded currency pair in the world, accounting for an estimated 30% off all transactions, followed by EUR/JPY (4%), EUR/GBP (3%) and EUR/AUD (2%).
What is the ECB and how does it impact the Euro?
The European Central Bank (ECB) in Frankfurt, Germany, is the reserve bank for the Eurozone. The ECB sets interest rates and manages monetary policy.
The ECB’s primary mandate is to maintain price stability, which means either controlling inflation or stimulating growth. Its primary tool is the raising or lowering of interest rates. Relatively high interest rates – or the expectation of higher rates – will usually benefit the Euro and vice versa.
The ECB Governing Council makes monetary policy decisions at meetings held eight times a year. Decisions are made by heads of the Eurozone national banks and six permanent members, including the President of the ECB, Christine Lagarde.
How does inflation data impact the value of the Euro?
Eurozone inflation data, measured by the Harmonized Index of Consumer Prices (HICP), is an important econometric for the Euro. If inflation rises more than expected, especially if above the ECB’s 2% target, it obliges the ECB to raise interest rates to bring it back under control.
Relatively high interest rates compared to its counterparts will usually benefit the Euro, as it makes the region more attractive as a place for global investors to park their money.
How does economic data influence the value of the Euro?
Data releases gauge the health of the economy and can impact on the Euro. Indicators such as GDP, Manufacturing and Services PMIs, employment, and consumer sentiment surveys can all influence the direction of the single currency.
A strong economy is good for the Euro. Not only does it attract more foreign investment but it may encourage the ECB to put up interest rates, which will directly strengthen the Euro. Otherwise, if economic data is weak, the Euro is likely to fall.
Economic data for the four largest economies in the euro area (Germany, France, Italy and Spain) are especially significant, as they account for 75% of the Eurozone’s economy.
How does the Trade Balance impact the Euro?
Another significant data release for the Euro is the Trade Balance. This indicator measures the difference between what a country earns from its exports and what it spends on imports over a given period.
If a country produces highly sought after exports then its currency will gain in value purely from the extra demand created from foreign buyers seeking to purchase these goods. Therefore, a positive net Trade Balance strengthens a currency and vice versa for a negative balance.
Today, all eyes will be on the USD38 billion 10-year US Treasury auction. Economists at ING analyze how note auctions could impact the US Dollar.
Treasury auctions in focus
Today’s 10Y US Treasury auction is likely the only real highlight given a very light US calendar and no scheduled Fed speakers.
Should we see more welcoming signs from today's Treasury debt sale, the US Dollar can keep paring recent gains into Thursday’s pivotal CPI read.
See: Some scope for the Dollar to advance further from here – MUFG
- AUD/USD attracts some buying on Wednesday and recovers further from over a two-month low.
- A modest USD downfall and a positive risk tone lend some support to the risk-sensitive Aussie.
- China’s economic woes and bets for more Fed rate hikes should keep a lid on any further gains.
The AUD/USD pair builds on the previous day's goodish rebound from sub-0.6500 levels, or over a two-month low and gains some follow-through positive traction on Wednesday. Spot prices maintain the bid tone through the early part of the European session and currently trade around the 0.6560 region, just a few pips below the daily peak.
The US Dollar (USD) meets with a fresh supply and retreats further from the vicinity of its highest level since July 7 touched on Tuesday, which, in turn, is seen as a key factor pushing the AUD/USD pair higher. Philadelphia Federal Reserve Bank President Patrick Harker's dovish remarks on Tuesday, along with a mildly softer tone surrounding the US Treasury bond yields, seem to undermine the buck. Apart from this, a stable performance around the global equity markets further dents the Greenback;'s relative safe-haven status and benefits the risk-sensitive Australian Dollar (AUD).
The upside potential for the AUD/USD pair, however, seems limited in the wake of the worsening economic conditions in China. The fears were further fueled by weaker Chinese inflation figures, showing that headline CPI turned negative for the first time since February 2021 and the Producer Price Index (PPI) falling for the 10th consecutive month, confirming deflation. This comes on the back of weaker trade data on Tuesday and suggests that the post-COVID recovery in the world's second-largest economy is losing steam, which should act as a headwind for the China-proxy Aussie.
Traders might also refrain from placing aggressive USD bearish bets amid growing acceptance that the Fed will stick to its hawkish stance, which might further contribute to capping the AUD/USD pair. In fact, market participants still seem convinced that the US central bank will keep interest rates higher for longer in the wake of an extremely resilient economy. This, in turn, supports prospects for the emergence of some USD dip-buying and suggests that the path of least resistance for the AUD/USD pair is to the downside, warranting some caution before positioning for further gains.
In the absence of any relevant market-moving economic releases from the US, the fundamental backdrop makes it prudent to wait for strong follow-through buying before confirming that the AUD/USD pair has formed a near-term bottom. The market focus, meanwhile, remains glued to the latest US consumer inflation figures, due on Thursday. The crucial US CPI report will play a key role in influencing market expectations about the Fed's future rate hike path, which, in turn, will drive the USD demand and help investors to determine the next leg of a directional move for the major.
technical levels to watch
The Indonesian Rupiah depreciated slightly against the US Dollar in July. The IDR is forecast to remain weak in August, economists at Mizuho Bank report.
Not necessary for the central bank of Indonesia to start cutting its policy interest rate now
After evaluating the positive effect on the domestic economy and the negative effect on the foreign exchange market, the central bank of Indonesia is likely to maintain its policy interest rate at the existing level without cutting it for a while.
On the other hand, the US could still raise its policy interest rate. Thus, the Indonesian Rupiah is forecast to remain weak against the US Dollar in the coming month.
The Euro felt some pressure on Tuesday as the Italian government announced a surprise windfall tax on bank profits. Economists at ING analyze EUR/USD outlook.
Bank stocks appear to find some breathing room
This is one interesting thread to monitor, should the Italian government's decision fuel a bank profit windfall tax debate in other countries, and/or whether banks will pre-empt facing new taxation by raising deposit rates. The implications can be non-negligible from a monetary policy transmission perspective and for the Euro. In the near term, the relevance of relative equity performance for EUR/USD should keep it quite sensitive to the matter.
A return to 1.10 is possible today as global risk conditions improve and bank stocks appear to find some breathing room.
- Silver attracts some buying and recovers a part of the overnight slide to a one-month low.
- The recent breakdown below important technical support levels favours bearish traders.
- Any subsequent recovery might now be seen as a selling opportunity and remain capped.
Silver gains some positive traction on Wednesday and for now, seems to have snapped a two-day losing streak to a one-month low, around the $22.65 region touched the previous day. The white metal maintains its bid tone around the $22.80-$22.85 zone through the early part of the European session, though the near-term technical setup suggests that the path of least resistance is to the downside.
Against the backdrop of this week's breakdown below an ascending trend-line extending from the June swing low, a subsequent slide and acceptance below the very important 200-day Simple Moving Average (SMA) was seen as a fresh trigger for bears. Moreover, oscillators on the daily chart are holding in the negative territory and are still far from being in the oversold zone. This, in turn, validates the near-term bearish outlook for the XAG/USD and supports prospects for the emergence of fresh selling at higher levels.
Hence, any further recovery beyond the $23.00 round-figure mark is likely to remain capped near the 200-day SMA breakpoint, currently pegged around the $23.25 region. The latter should act as a pivotal point, which if cleared decisively might trigger a short-covering move and lift the XAG/USD towards the $23.60-$23.65 horizontal barrier. The momentum could get extended further towards reclaiming the $24.00 mark.
On the flip side, the overnight swing low, around the $22.65 region might protect the immediate downside. The XAG/USD, however, still seems vulnerable to slide back towards retesting the multi-month low, around the $22.15-$22.10 area touched in June. Some follow-through selling below the $22.00 mark should pave the way for an extension of the recent downfall witnessed over the past three weeks or so, from the $25.25 area.
Silver daily chart
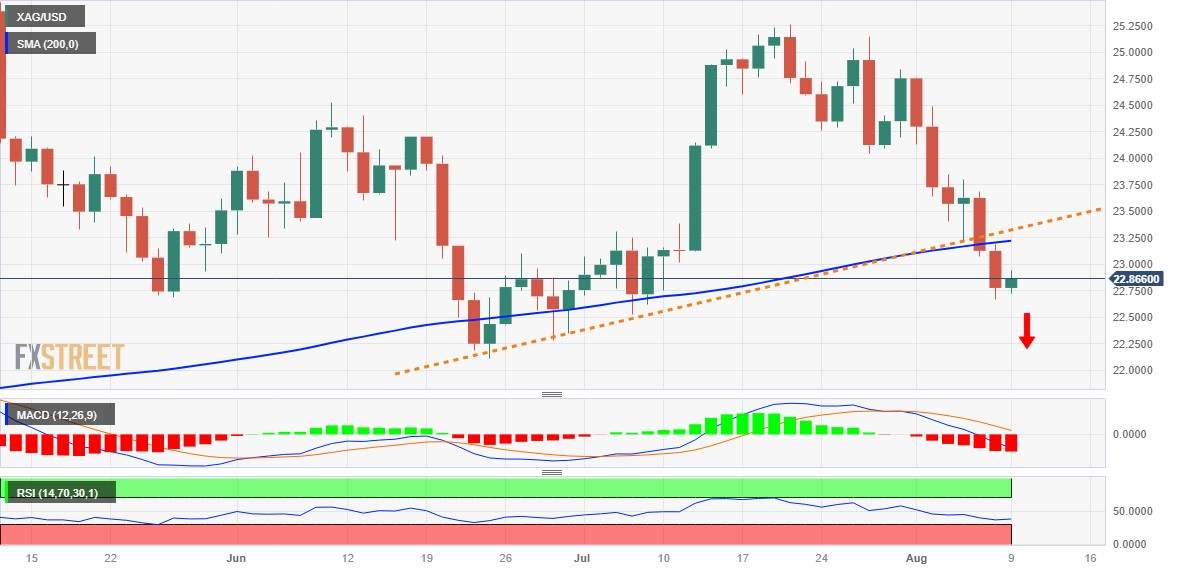
Technical levels to watch
- The index faces some selling pressure near 102.40.
- The small improvement in the risk appetite weighs on the Dollar.
- Weekly Mortgage Applications will be the sole release in the docket.
The greenback, in terms of the USD Index (DXY), retreats from recent tops near 102.80 amidst a broad-based improvement in the risk sentiment.
USD Index looks at risk trends, US CPI
The index comes under downside pressure after two consecutive daily advances and gives away part of the recent gains to the 102.80/85 band, all against the backdrop of a better tone in the risk-associated universe.
In the meantime, US yields trade without a clear direction amidst speculation of a lower print at Thursday’s release of US inflation figures for the month of July, which should support the view that the Federal Reserve might be done hiking rates for the time being.
It is worth recalling that Fed’s M. Bowman advocated on Monday for further tightening in case disinflationary pressures mitigate, while her colleague T. Barkin reiterated that inflation remains too elevated and the labour market appears resilient and P. Harker opened the door to an impasse at current levels for some time and potential rate cuts in 2024.
In the US data space, the only release will be the usual weekly Mortgage Applications measured by MBA for the week ended on August 4.
What to look for around USD
The index keeps the trade north of 102.00 so far this week, although it seems to have met quite a decent resistance near 102.90, or monthly highs.
Other than risk appetite trends, the dollar could face extra headwinds in response to the data-dependent stance from the Fed against the current backdrop of persistent disinflation and cooling of the labour market.
Furthermore, speculation that the July hike might have been the last of the current hiking cycle is also expected to keep the buck under some pressure for the time being.
Key events in the US this week: MBA Mortgage Applications (Wednesday) – Inflation Rate, Initial Jobless Claims (Thursday) – Producer Prices, Flash Michigan Consumer Sentiment (Friday).
Eminent issues on the back boiler: Persistent debate over a soft or hard landing for the US economy. Terminal Interest rate near the peak vs. speculation of rate cuts in late 2023 or early 2024. Geopolitical effervescence vs. Russia and China. US-China trade conflict.
USD Index relevant levels
Now, the index is losing 0.15% at 102.39 and faces initial support at 101.74 (monthly low August 4) seconded by 100.55 (weekly low July 27) and then 100.00 (psychological level). On the other hand, the breakout of 102.84 (weekly high August 3) would open the door to 103.43 (200-day SMA) and finally 103.57 (weekly high June 30).
Economists at Société Générale analyze EUR/GBP technical outlook.
Defending 0.8550 can lead to continuation in phase of rebound
EUR/GBP formed an interim low near 0.8500 last month and has overcome the 50-DMA denoting prevalence of upward momentum in the short term.
The recent low of 0.8550 is important support. Defending this can lead to continuation in the phase of rebound.
A move beyond 0.8660, the 76.4% retracement from the recent pivot high could mean a bounce towards a multi-month trend line near 0.8690/0.8725.
In July, USD/INR fluctuated within a narrow range. Economists at Mizuho Bank analyze the pair’s medium to long-term outlook.
Trend in USD/INR unlikely to change substantially
From a medium to long-term perspective, there will be stronger pressure to weaken the USD and to strengthen the currencies of emerging countries, including the Indian Rupee, following the end of the policy interest rate hikes and the beginning of policy interest rate cuts in the US, which are expected to be next year or later.
However, the trend in USD/INR is not likely to change substantially, as the central bank of India is expected to continue intervening in the foreign exchange market when the exchange rate falls, while some market participants are expected to sell the Indian rupee based on actual demand. Therefore, the Indian Rupee is forecast to start depreciating slowly against the US Dollar in the times ahead.
- USD/MXN holds ground near 17.08, down 0.11% for the day.
- Recent Federal Reserve (Fed) comments signalled a shift from rate hikes to holding them steady.
- Market players will closely watch the interest rate decision by Banxico on Thursday.
USD/MXN struggles to gain and holds above the 17.00 mark heading into the early European session on Wednesday. Market participants await the Mexican Consumer Price Index (CPI) data due later on Wednesday ahead of the monetary policy meeting by Banxico on Thursday. At the time of writing, the USD/MXN is trading at 17.08, with losses of 0.11%.
The US trade data show a sluggish economic rebound and subdued global demand in the country. The US trade deficit narrowed sharply in June, with the figure coming in at $65.5 billion, higher than expectations of $65 billion and below the $68.3 billion prior. Imports fell 1.0% to $313 billion from $316.1 billion the previous month, the lowest level since November 2021. While, Exports dropped 0.1% to $247.5 billion, a 15-month low.
The recent commentary from Federal Reserve (Fed) speakers indicated that the Fed stance has shifted from additional rate hikes to holding rates steady. The Philadelphia Fed president, Patrick Harker stated that the central bank can leave interest rates where they are. Meanwhile, Atlanta Fed president Raphael Bostic states that no further rate hikes are necessary.
Additionally, Moody's downgraded the credit ratings of several small to mid-sized US banks and issued a warning about possible cuts to the ratings of larger institutions. The giant credit rating company stated that the higher interest rates have also elevated the prospect of a recession, putting pressure on the banking industry as well as real estate to adapt to post-pandemic reality.
Market players will closely watch the interest rate decision by Banxico on Thursday. Markets anticipate Mexico's central bank to hold the interest rate unchanged at 11.25%. This event could give a clear direction to the USD/MXN pair. Apart from this, the highlight will be the US Consumer Price Index (CPI) and the Producer Price Index (PPI) for July, due on Thursday and Friday, respectively.
CME Group’s flash data for natural gas futures markets noted traders scaled back their open interest positions for the fourth consecutive session on Tuesday, this time by around 27.3K contracts. Volume followed suit and dropped by around 48.5K contracts.
Natural Gas faces next hurdle around $2.90
Prices of natural gas extended the recovery on Tuesday. However, the uptick was accompanied by shrinking open interest and volume and exposes some correction in the short-term horizon. In the meantime, the initial up-barrier remains at the June high near the $2.90 (June 28) mark per MMBtu.
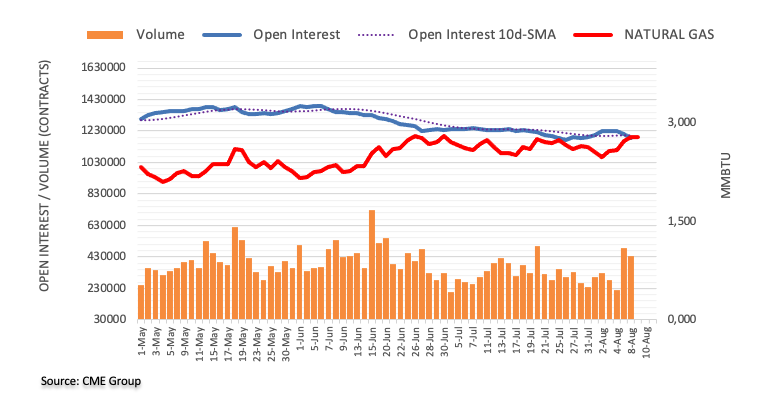
Here is what you need to know on Wednesday, August 9:
The US Dollar is finding it difficult to preserve its strength on Wednesday after posting gains against its major rivals on Tuesday. The risk mood improves modestly midweek in the absence of high-tier data releases, with US stock index futures edging higher in the European session. Comments from central bank officials could drive the action in financial markets ahead of Thursday's highly-anticipated inflation data from the US.
Wall Street's main indexes suffered heavy losses on Tuesday as markets reacted to disappointing trade data from China. During the American trading hours, dovish comments from Federal Reserve policymakers, however, capped the rally of the US Dollar Index (DXY). At the time of press, DXY was in the negative territory below 102.50.
US Dollar price today
The table below shows the percentage change of US Dollar (USD) against listed major currencies today. US Dollar was the weakest against the New Zealand Dollar.
| USD | EUR | GBP | CAD | AUD | JPY | NZD | CHF | |
| USD | -0.14% | -0.24% | -0.11% | -0.39% | -0.12% | -0.44% | -0.23% | |
| EUR | 0.14% | -0.07% | 0.03% | -0.26% | 0.05% | -0.30% | -0.09% | |
| GBP | 0.24% | 0.10% | 0.13% | -0.16% | 0.13% | -0.20% | 0.01% | |
| CAD | 0.10% | -0.03% | -0.13% | -0.29% | -0.01% | -0.33% | -0.12% | |
| AUD | 0.39% | 0.25% | 0.15% | 0.28% | 0.27% | -0.05% | 0.15% | |
| JPY | 0.11% | -0.03% | -0.15% | 0.01% | -0.25% | -0.33% | -0.10% | |
| NZD | 0.44% | 0.29% | 0.20% | 0.32% | 0.04% | 0.32% | 0.20% | |
| CHF | 0.24% | 0.10% | 0.00% | 0.14% | -0.13% | 0.12% | -0.19% |
The heat map shows percentage changes of major currencies against each other. The base currency is picked from the left column, while the quote currency is picked from the top row. For example, if you pick the Euro from the left column and move along the horizontal line to the Japanese Yen, the percentage change displayed in the box will represent EUR (base)/JPY (quote).
In the Asian session, the data from China revealed that the Consumer Price Index (CPI) rose 0.2% on a monthly basis in July. Annual CPI in the same period fell -0.3 compared to 0% in June, while the Producer Price Index (PPI) declined 4.4%.
After touching its lowest level since early June below 0.6500, AUD/USD regained its traction and was last seen trading above 0.6550. Similarly, NZD/USD trades in positive territory near 0.6100. The Reserve Bank of New Zealand announced that the two-year inflation expectation rose slightly to 2.84% in the third quarter from 2.79% in the second.
EUR/USD fell to a daily low of 1.0930 on Tuesday but managed to close the day above 1.0950 following a late rebound. The pair clings to small daily gains early Wednesday but stays below 1.1000.
GBP/USD erased a large portion of its daily losses after dipping below 1.2700 n Tuesday. The pair preserves its recovery momentum and trades above 1.2750 in the European morning.
Following a two-day rally, USD/JPY lost its momentum and retreated to the 143.00 area on Wednesday. The data from Japan showed that Machine Tool Orders declined 198% on a yearly basis in July.
Gold price fell to a multi-week low near $1,920 on Tuesday and registered daily losses. As the benchmark 10-year US Treasury bond yield holds steady at around 4%, XAU/USD clings to modest recovery gains near $1,930.
Bitcoin gathered bullish momentum and climbed above $30,000 after moving sideways in the past few days. BTC/USD, however, failed to clear that level and retreated modestly toward $29,700. Ethereum gained more than 1.5% on Tuesday but lost its momentum before testing $1,900.
USD/CNY has surged above the 7.20 level. Economists at Credit Suisse analyze the pair’s outlook.
More RMB depreciation is likely
We reiterate our policy expectation that authorities will likely remain tolerant of a relatively weaker RMB against the USD and expect USD/CNY to remain around 7.20-7.25 throughout 23Q3.
Looking ahead, we maintain our view that there will likely be additional depreciation of the RMB against the USD and reiterate that the bilateral exchange rate might reach 7.25 by the end of this year.
- USD/CAD reverses from 10-week high but lacks downside momentum.
- WTI crude oil prints mild gains while defending weekly trading range at four-month high.
- Risk appetite improves and allows US Dollar to better brace for inflation data.
- Fears of slower energy demand from China, US weigh Oil price.
USD/CAD prints mild losses around 1.3400 as it steps back from the highest level in 2.5 months marked the previous day. That said, the Loonie pair’s latest retreat could be linked to the market’s cautious optimism, as well as the preparations for the US inflation, not to forget the sluggish Oil Price.
An improvement in China’s Producer Price Index (PPI) for July contrasted with the downbeat Consumer Price Index (CPI) data for the said month to tame pessimism about the world’s biggest industrial players. Also improving the risk appetite is the news from the White House as the Biden Administration signals relief to China technology companies. “The US plans to target only those Chinese companies that get more than 50% of revenue from the sectors including quantum computing and artificial intelligence (AI),” said the news.
The absence of major risk aversion joins the downbeat US Treasury bond yields to help the US Dollar Index (DXY) reverse from a downward-sloping resistance line from May 31 while printing the first daily loss in three around 102.35, down 0.16% intraday.
On the other hand, WTI crude oil remains steady within the weekly trading range surrounding $82.00–83.00, down 0.05% intraday near $82.40 as we write. It’s worth noting that China’s inflation data and the trade-positive news from the White House fail to impress the energy buyers as the looming default of a major China realtor joins the US bank woes to challenge the OPEC+ supply cuts.
Amid these plays, S&P500 Futures recovers from the monthly low marked the previous day and prints mild gains around 4,525.
It should be noted that Italy’s surprise tax on windfall profits of banks joined the global rating agencies’ downward revision to the US banks and financial institutions to weigh on the risk sentiment the previous day. On the same line could be fears of the UK recession and slowing economic growth in China, not to forget the Dragon Nation’s geopolitical tension with the US and Japan about Taiwan. With this, the Wall Street benchmark closed with losses and the US Dollar rose, which in turn allowed the USD/CAD pair to refresh a multi-day high before the latest pullback.
Looking ahead, Canada Building Permits for June and the risk catalysts may entertain the USD/CAD pair traders ahead of the all-important US Consumer Price Index (CPI) data for July. The US CPI becomes all the more crucial this time after the mixed employment data and the policymakers’ recent hesitance in defending further rate hikes.
Technical analysis
Although a five-month-old descending resistance line joins the overbought RSI to underpin the USD/CAD pair’s retreat from 1.3430 hurdle, the Loonie pair sellers should remain cautious unless breaking the 200-Exponential Moving Average (EMA) level of 1.3360.
NZD/USD slid well below the ~0.61 level it was consolidating around in the wake of soft China trade data. Economists at ANZ Bank analyze the pair’s outlook.
Reduced risk appetite is weighing on the Kiwi
Markets certainly seem nervous and reduced risk appetite is weighing on the Kiwi.
US resilience (and ongoing hawkish talk from Fed speakers) remains a theme, and amid that and slowing Chinese growth, and the current account bubbling away as a risk factor just as credit rating agencies are downgrading swathes of borrowers, a strong catalyst is needed to snap the Kiwi out of its rut. But don’t expect that to come from the RBNZ next week; they’re firmly on hold and happy – for now. We expect another hike, but November is a long way off.
Considering advanced prints from CME Group for crude oil futures markets, open interest shrank for the third session in a row on Tuesday, now by around 21.8K contracts. On the other hand, volume went up for the second straight session, this time by 321.1K contracts.
WTI seems to have met resistance around $83.00
WTI prices charted a volatile session on Tuesday, briefly visiting the key $80.00 mark before ending the session with decent gains near $83.00. The uptick was amidst diminishing open interest and leaves the commodity vulnerable to an impasse in the current rally in the very near term. So far, the 2023 highs past $83.00 still emerges as the immediate target for the time being.
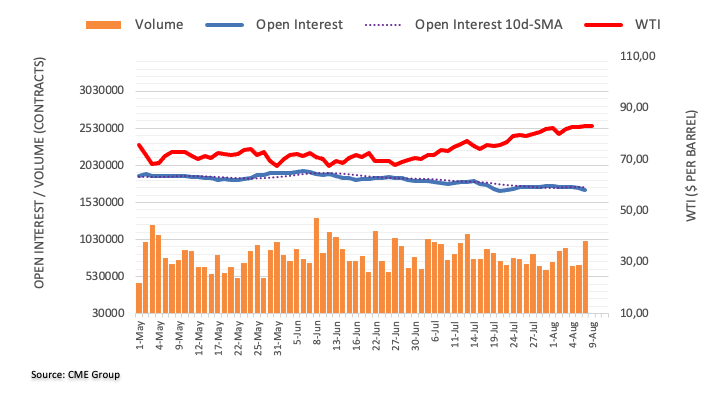
- WTI consolidates in a tight range around $82.30 on Wednesday.
- The Chinese inflation data fuels concern over the economic slowdown in the nation.
- The EIA estimated Gross Domestic Product (GDP) to increase by 1.9% in 2023, up from 1.5% in the previous forecast.
- Market players will monitor the EIA Crude Oil Stocks Change, US inflation data.
Western Texas Intermediate (WTI), the US crude oil benchmark, oscillates in a narrow range between $82.20-$82.45 heading into the early European session on Wednesday. WTI prices struggle to gain as investors are concerned over China's sluggish demand for crude oil after the trade and inflation data.
The Chinese inflation data on Wednesday showed the Chinese Consumer Price Index (CPI) YoY fell 0.3% in July from 0% prior, and the market consensus anticipated a -0.4% decline. Meanwhile, the Producer Price Index (PPI) declined 4.4% YoY, compared to the 4.1% decrease YoY expected and a 5.4% drop prior.
Additionally, China's crude oil imports in July decreased 18.8% from the previous month to the lowest daily rate since January. This, in turn, exerts pressure on WTI prices as China is the major oil consumer in the world.
On the other hand, a monthly report from the U.S. Energy Information Administration (EIA) limits the downside in WTI prices. The EIA estimated Gross Domestic Product (GDP) will increase by 1.9% in 2023, up from 1.5% in the previous forecast. EIA added that crude prices have risen since June, owing mostly to prolonged voluntary limits in Saudi Arabian output as well as increased global demand.
Last week, Saudi Arabia announced it would extend its voluntary oil output cut of one million barrels per day (bpd) through September. In the meantime, Russia's oil exports will also decrease by 300,000 bps in September.
Oil traders will focus on the EIA Crude Oil Stocks Change for the week ending August 4, due on Wednesday. The key events to watch are the Consumer Price Index (CPI) and the Producer Price Index (PPI) later this week. These events could significantly impact the USD-denominated WTI price. Oil traders will take cues from the data and find trading opportunities around the WTI price.
EUR/SEK retreated from the all-time highs over the past month. Economists at CIBC Capital Markets analyze the pair’s outlook.
The SEK remains undervalued
We would regard the SEK as remaining materially undervalued in PPI terms versus the EUR.
The high beta status of the currency points towards further SEK gains should global monetary policy tightening appear to have largely run its course.
Should the Riksbank be nearing the end of the tightening cycle this would help mitigate ongoing real estate headwinds. Anecdotal housing market evidence suggests negative sentiment is dissipating.
EUR/SEK – Q3 2023: 11.45 | Q4 2023: 11.04
Open interest in gold futures markets shrank for the fourth session in a row on Tuesday, this time by around 3.2K contracts according to preliminary readings from CME Group. Volume, instead, kept the erratic performance in place and increased by around 42.3K contracts after the previous daily pullback.
Gold faces initial contention around $1900
Gold prices dropped for the second consecutive session on Tuesday. The downtick was on the back of further decline in open interest, which should be supportive of a near-term rebound. So far, the $1900 region emerges as a decent contention for the time being.
- USD/CHF holds lower grounds near intraday bottom during the first loss-making day in three.
- Markets stabilize on China news after multiple catalysts fanned risk aversion.
- Preparations for Thursday’s US CPI, light calendar could restrict immediate Swiss Franc moves.
- Risk catalysts eyed for clear directions, firmer US inflation backs hawkish Fed concerns and may recall buyers.
USD/CHF remains on the back foot at the intraday low of around 0.8735 amid the early hours of Wednesday’s European session. In doing so, the Swiss Franc (CHF) pair prints the first daily loss in three as the US Dollar reverses from the key upside hurdle due to the market’s positioning for the key inflation data, as well as backed by China news.
US Dollar Index (DXY) retreats from a downward-sloping resistance line from May 31 while printing the first daily loss in three around 102.35, down 0.16% intraday as the market’s previous risk aversion fades.
While portraying the mood, S&P500 Futures recovers from the monthly low marked the previous day and prints mild gains around 4,525 whereas the US 10-year Treasury bond yields remain pressured at the lowest level in a week marked the previous day, around 4.0% by the press time.
It’s worth observing that improvement in China’s Producer Price Index (PPI) for July contrasted with the downbeat Consumer Price Index (CPI) data for the said month to tame pessimism about the world’s biggest industrial players. Also improving the risk appetite is the news from the White House as the Biden Administration signals relief to China technology companies. “The US plans to target only those Chinese companies that get more than 50% of revenue from the sectors including quantum computing and artificial intelligence (AI),” said the news.
On the contrary, Italy’s surprise tax on windfall profits of banks joined the global rating agencies’ downward revision to the US banks and financial institutions to weigh on the risk sentiment the previous day. On the same line could be fears of the UK recession and slowing economic growth in China, not to forget the Dragon Nation’s geopolitical tension with the US and Japan about Taiwan.
Given the market’s preparations for the US CPI for July, up for publishing on Thursday, the USD/CHF may witness further downside. However, strong US inflation numbers and the risk-off mood can push the Swiss Franc pair toward the key technical resistances.
Technical analysis
Despite the latest retreat, the USD/CHF pair remains beyond the 10-DMA support of around 0.8730, which in turn joins upbeat oscillators to suggest the quote’s further upside towards a descending resistance line stretched from November 2022, close to 0.8830 at the latest.
Markets Strategist at UOB Group Quek Ser Leang suggests further upside in USD/JPY is expected to meet a solid hurdle around 145.00.
Key Quotes
Our last Chart of the Day was from 17 Jul 2023, when USD/JPY was trading at 139.90. The title of our update was “Risk for USD/JPY is still on the downside. In order for a sustained decline in the next couple of months, USD/JPY must break the critical support at 138.50.” We noted that “Both the rising trendline (connecting the lows of Feb and the 137.23 low) and the bottom of the daily Ichimoku cloud are near 138.50.”
After our update, USD/JPY fell to a low of 138.05. While the decline breached the trendline support, it did not quite break below the bottom of the daily Ichimoku cloud. The decline was short-lived, as USD/JPY snapped back up and broke above the solid resistance level at 141.95 (USD/JPY rose to a high of 143.89 last week). Upward momentum appears to be building, and USD/JPY is likely to trade with an upward bias from here. However, July’s high near 145.05 is a major resistance and might not be easy to break. Overall, only a breach of 140.55 (the current level of the 55-day exponential moving average) would indicate that the upward bias has faded.
- EUR/USD recovers its recent losses and edges higher to 1.0975 in the early European session.
- The announcement of Italy's bank tax exerts pressure on the Euro.
- Moody's downgraded the credit ratings of several small to mid-sized US banks.
- Market players will keep an eye on the US Consumer Price Index (CPI), the Producer Price Index (PPI).
The EUR/USD pair recovers some lost ground just below the 1.1000 area on Wednesday after retreating to 1.0927 on the announcement of surprising Italy's bank tax. The major currently trades at 1.0977, gaining 0.19% for the day.
About the data, the German Harmonized Index of Consumer Price (HICP) came in at 6.5%, matching the market consensus. Earlier this week, the Eurozone Sentix Investor Confidence improved from -22.5 in July to -18.9 in August, versus the market consensus of -23.4.
The Euro continues under pressure as the European Central Bank's (ECB) peak rate speculation continues, with the possibility of September's meeting at 35% and October's meeting at 55%.
On the US Dollar docket, Moody's downgraded the credit ratings of several small to mid-sized US banks and issued a warning about possible cuts to the ratings of larger institutions. The giant credit rating company stated that higher interest rates have increased the likelihood of a recession, placing pressure on the finance and real estate industries to adjust to the post-pandemic environment.
Furthermore, the US trade data show a sluggish economic rebound and subdued global demand in the country. The US trade deficit narrowed sharply in June, with the figure coming in at $65.5 billion, higher than expectations of $65 billion and below the $68.3 billion prior. Imports fell 1.0% to $313 billion from $316.1 billion the previous month, the lowest level since November 2021. While Exports dropped 0.1% to $247.5 billion, a 15-month low.
Investors will take more cues from the US inflation figures. The weaker than expected data could cap the upside of the Greenback and acts as a tailwind for EUR/USD.
In the absence of top-tier economic data releases from the Eurozone, the USD price dynamic will be the main driver for the EUR/USD pair. Market players will closely watch the US Consumer Price Index (CPI) and the Producer Price Index (PPI) for July, due on Thursday and Friday, respectively.
- NZD/USD recovers from the lower level in two months but lack follow-through.
- RBNZ Inflation Expectations for Q3 improves to 2.83% QoQ versus 2.79% prior.
- Impending bull cross on MACD, gradually improving RSI favor corrective bounce but multiple hurdle check Kiwi bulls.
NZD/USD grinds near intraday high below 0.6100, close to 0.6080 by the press time, as snaps a two-day losing streak while bouncing off the lowest level in two months ahead of Wednesday’s European session. In doing so, the Kiwi pair justifies upbeat prints of the Reserve Bank of New Zealand (RBNZ) Inflation Expectations for the third quarter (Q3) of 2023 amid the US Dollar’s pullback.
Also read: RBNZ Survey: NZ inflation expectations rise to 2.83% in Q3 2023
That said, RBNZ Inflation Expectations improved to 2.83% QoQ for Q3 2023 from 2.79% previous reading, favoring hopes of witnessing a rate hike from New Zealand’s central bank.
The same joins the market’s positioning for the US inflation data and the recent risk-positive headlines about China, to help the NZD/USD poke a one-week-old descending resistance line, around 0.6085 by the press time.
It’s worth noting that the looming bull cross on the MACD and the latest improvement in the RSI (14) line underpin expectations of crossing the 0.6085 immediate hurdle, which in turn could lead the bulls toward the downward-sloping resistance line from mid-July, close to 0.6125 at the latest.
Even so, the NZD/USD bulls remain cautious unless witnessing a successful break of the 10-week-long previous support line surrounding 0.6145.
On the contrary, an area comprising multiple levels marked since May 30, close to 0.6030, quickly followed by May’s bottom of 0.5985, can lure the NZD/USD bears during the pair’s further downside.
NZD/USD: Four-hour chart
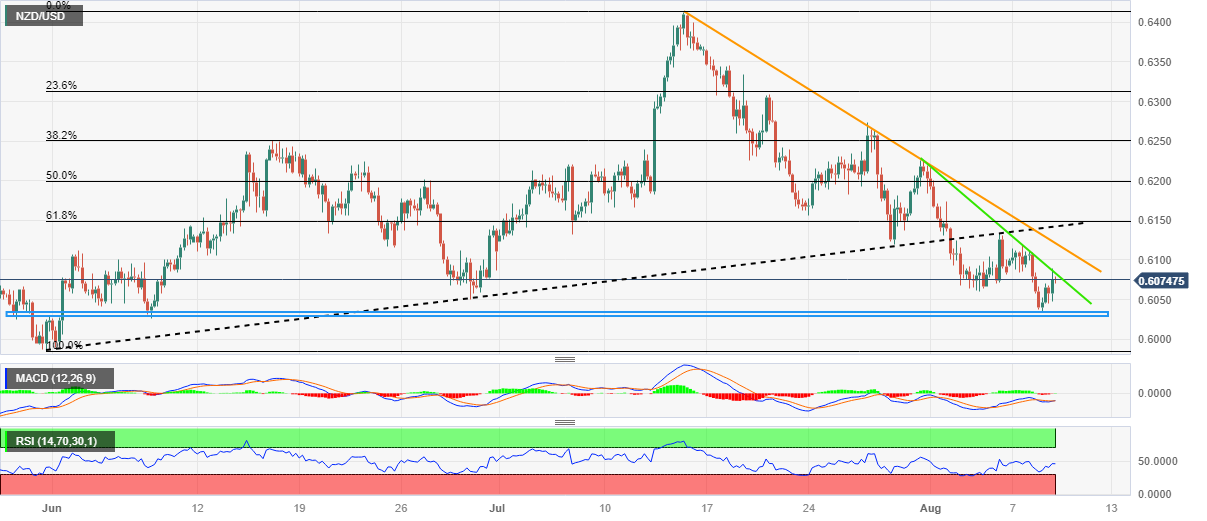
Trend: Limited recovery expected
- USD/JPY clings to mild gains during the first daily loss in three.
- Light calendar, market’s positioning for US inflation and challenges to previous risk-off mood prod Yen pair buyers.
- Yields remain depressed as market players rush to Treasury bonds amid sour sentiment.
- Fed needs strong US inflation to defend hawks and USD/JPY bulls, highlighting Thursday’s US CPI.
USD/JPY remains on the back foot around 143.00 heading into Wednesday’s European session as it prints the first daily loss in three.
It’s worth noting, however, that the market’s inaction could be witnessed in the Yen pair’s latest momentum even if the US Dollar pares previous gains amid a shift in the sentiment. Also likely to have prod the risk-barometer pair could be the market’s preparations for the top-tier inflation clues from Japan and the US.
The improvement in China’s factory-gate inflation, namely the Producer Price Index (PPI), joins risk-positive news from the Biden Administration to tame the market’s previous pessimism and allows the Yen pair buyers to take a breather.
Previously, Italy’s surprise tax on the bank’s windfall profits, the global rating agencies’ downward revision of the US banks and financial institutions weighed on the sentiment on Tuesday and fuelled the USD/JPY. On the same line could be fears of the UK recession and slowing economic growth in China, not to forget Beijing’s geopolitical tension with Japan and the US.
On a different page, the recent downbeat performance of the US and Japanese Treasury bond yields, as well as fears about the Japan-China tension due to Tokyo’s friendship with Taiwan, also seem to weigh on the USD/JPY pair.
That said, the US 10-year Treasury bond yields remain pressured at the lowest level in a week marked the previous day, around 4.0%, whereas the 10-year Japanese Government Bonds (JGB) drops to the lowest levels in eight days to 0.58% by the press time.
It’s worth noting that the lower JGB yields defend the Bank of Japan’s (BoJ) easy-money policy while softer US bond coupons join the mildly bid S&P500 Futures to drag the US Dollar Index (DXY) from a 10-week-old falling resistance line.
Looking ahead, the ongoing weakness in the Treasury bond yields may allow the USD/JPY to consolidate weekly gains ahead of Thursday’s Japan Producer Price Index (PPI) and the US Consumer Price Index (CPI) data for July.
Technical analysis
Although a clear recovery from the 50-DMA, around 141.50 by the press time, joins the upbeat oscillators to defend the USD/JPY buyers, a downward-sloping resistance line from October 2022, close to 143.80 at the latest appears a tough nut to crack for the bulls.
Citing a senior government source, Reuters reported on Wednesday, the White House is said to outline plans restricting some US investments in sensitive technology in China.
The source said that the long-awaited executive order is expected sometime later today.
This comes after Bloomberg quoted anonymous sources on Tuesday, saying that “a US plan to restrict investment in China is likely to apply only to Chinese companies that get at least half of their revenue from cutting-edge sectors such as quantum computing and artificial intelligence (AI).”
Market reaction
AUD/USD is unfazed by the renewed US-Sino tensions, keeping its range above 0.6550, as of writing. The pair is up 0.20% on the day.
“It is possible, but not certain, that the Australian economy can manage a ‘soft landing’ with inflation decreasing to the RBA’s target range,” S&P Global said in its latest assessment of the Australian economy.
Additional takeaways
“The key risk is that inflation in Australia is more sticky than expected and the RBA has to hike interest rates more strongly.”
“We expect continued expansion in 2023 and 2024 and unemployment to rise moderately.”
“If the rise in Australian unemployment rate can be limited to around one percentage point, economic & financial fallout should remain manageable.”
Market reaction
AUD/USD is holding a renewed uptick above 0.6550 following the above report, adding 0.21% so far.
- Most Asian stock markets trade in negative territory on Wednesday.
- The Chinese Consumer Price Index (CPI) YoY fell 0.3% (July) from 0% prior, and -0.4% was expected.
- The Reserve Bank of India (RBI) is widely anticipated to hold the key interest rate at 6.5% on Thursday.
Most Asian stock markets trade in negative territory on Wednesday. Regional equities followed in the footsteps of Wall Street, which slumped after Moody’s downgraded the credit ratings of several midsize and small US lenders and issued a warning about possible cuts to the ratings of larger institutions.
At press time, the Nikkei drops 0.55%, Shanghai falls 0.36%, Hang Sang is down 0.06%, the Shenzhen Component Index falls 0.28%, the NIFTY 50 drops 0.28%, and the Kospi Index is up 1.32%.
In China, the latest data on Wednesday showed that the Chinese Consumer Price Index (CPI) YoY fell 0.3% in July from 0% prior, and the market consensus anticipated a -0.4% decline. Meanwhile, the Producer Price Index (PPI) declined 4.4% YoY, compared to the 4.1% decrease YoY expected and a 5.4% drop prior.
Earlier this week, the dollar value of China’s exports YoY in July plunged -14.5%, worse than expectations of -12.5% in June, and Imports dropped -12.4% YoY from -5%. The Chinese data fuels concern about the economic slowdown in the nation and pressures the government about the additional stimulus plan.
That said, the government will implement additional measures to boost consumer expenditure and enhance local liquidity. However, officials once again provided no significant details on the planned stimulus. The government's lack of specific plans has dampened investor expectations.
On the Indian front, the Reserve Bank of India (RBI) monetary policy meeting is scheduled for Tuesday to Thursday, and the policy decision will be announced on Thursday. Markets anticipate that the central bank may maintain the repo rate to sustain economic growth momentum. It’s worth noting that the RBI has held the repo rate at 6.5% since February, when it was raised from 6.25% in May of last year. Additionally, the Indian Consumer Price Index (CPI) for July and Industrial Production for June will be released on Friday.
Looking ahead, market participants await the Indian Consumer Price Index (CPI) for July, and Industrial Production for June, due on Friday. Also, the inflation data from the US. The economic data could give direction to riskier assets like gold, equities, the AUD/USD, etc.
- Gold Price pares weekly losses at the lowest level in a month, seesaws around intraday top of late.
- Receding fears about China, positioning for US inflation allows XAU/USD to recover.
- Risk catalysts eyed for clear directions amid a light calendar, banks, economic slowdown in focus.
- XAU/USD bulls prod intermediate hurdle but lack conviction below $1,955 resistance confluence.
Gold Price (XAU/USD) clings to mid gains during the first positive day of the trading week as market sentiment improves amid mixed signals from China. Adding strength to the XAU/USD rebound could be the trader’s preparations for Thursday’s all-important US inflation gauge, namely the Consumer Price Index (CPI) for July.
The improvement in China’s factory-gate inflation, namely the Producer Price Index (PPI), joins risk-positive news from the Biden Administration, cited by Bloomberg, to tame the market’s previous pessimism despite the downbeat China Consumer Price Index (CPI).
That said, Italy’s surprise tax on the bank’s windfall profits, the global rating agencies’ downward revision of the US banks and financial institutions weighed on the sentiment on Tuesday and dragged the Gold Price towards refreshing the monthly low. On the same line could be fears of the UK recession and slowing economic growth in China, not to forget Beijing’s geopolitical tension with Japan and the US.
Looking ahead, a lack of major data/events may allow the Gold traders to consolidate the weekly loss before Thursday’s all-important US CPI. Should the US inflation data suggest easing price pressure, the XAU/USD may extend the latest rebound.
Also read: Gold Price Forecast: XAU/USD bounces but not out of the woods yet
Gold Price: Key levels to watch
As per our Technical Confluence indicator, the Gold Price stays below the triple-resistance band that restricts the short-term XAU/USD upside below $1,955 mark.
Among them, $1,935 appears the immediate incentive for the XAU/USD buyers as it comprises 5-DMA, Pivot Point one-day R1 and Fibonacci 61.8% on one-month.
Following that, the Gold buyers can aim for the $1,945 resistance including Fibonacci 38.2% on one-week, Pivot Point one-day R2 and 50-DMA.
However, the XAU/USD remains on the bear’s radar unless crossing the $1,955 key upside hurdle encompassing the Fibonacci 61.8% on one-week, the middle band of the Bollinger on one-day and Fibonacci 38.2% on one-month.
Should the Gold Price extends the latest run-up beyond $1,955, it can challenge the $1,985 resistance area comprising multiple tops marked since May.
Alternatively, the previous weekly low joins the lower band of the Bollinger on the Daily chart and Fibonacci 23.6% on one-day to highlight $1,925 as immediate support for the Gold sellers to watch during the quote’s fresh fall.
Following that, the Pivot Point one-month S1 near $1,915 will act as the last defense of the Gold buyers before directing the bears toward the $1,900 threshold.
Here is how it looks on the tool
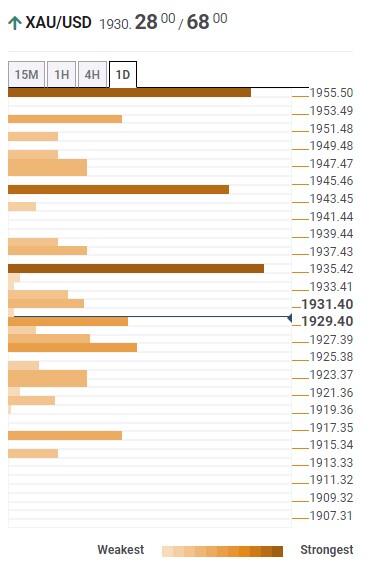
About Technical Confluences Detector
The TCD (Technical Confluences Detector) is a tool to locate and point out those price levels where there is a congestion of indicators, moving averages, Fibonacci levels, Pivot Points, etc. If you are a short-term trader, you will find entry points for counter-trend strategies and hunt a few points at a time. If you are a medium-to-long-term trader, this tool will allow you to know in advance the price levels where a medium-to-long-term trend may stop and rest, where to unwind positions, or where to increase your position size.
- USD/CAD struggles to gain any meaningful traction and oscillates in a range on Wednesday.
- A modest USD downtick acts as a headwind, though the downside is likely to remain limited.
- Bets for more rate hikes by the Fed should limit the USD losses and lend support to the pair.
The USD/CAD pair oscillates in a narrow trading band through the Asian session on Wednesday and currently trades around the 1.3415 region, nearly unchanged for the day. The overnight breakout through the 100-day Simple Moving Average (SMA), meanwhile, favours bulls and warrants caution before positioning for an extension of the overnight pullback from the 1.3500 psychological mark, or over a two-month high.
The US Dollar (USD) is weighed down by Philadelphia Federal Reserve Bank President Patrick Harker's dovish remarks on Tuesday, saying that they will probably start lowering the policy rate sometime next year. This, in turn, is seen as a key factor capping the upside for the USD/CAD pair, though the prospects for further policy tightening by the Fed should help limit any meaningful downside. In fact, the markets seem convinced that the US central bank will stick to its hawkish stance and keep interest rates higher for longer in the wake of an extremely resilient economy.
It is worth recalling that the closely-watched US monthly jobs report released last Friday pointed to the continued tightness in the labour market and raised the odds for a soft economic landing. Moreover, Fed Governor Michele Bowman kept alive hopes for one more 25 bps lift-off in September or November and said on Monday that additional interest rate hikes will likely be needed to lower inflation to the central bank's 2% target. This, along with a softer risk tone, supports prospects for the emergence of some buying around the safe-haven buck and should act as a tailwind for the USD/CAD pair.
In contrast, the Bank of Canada (BoC) is now expected to pause its interest rate hike campaign, especially after Statistics Canada reported that the economy shed 6,400 jobs in July and the jobless rate ticked up to 5.5%. Apart from this, a mildly softer tone around Crude Oil prices could undermine the commodity-linked Loonie and lend support to the USD/CAD pair. This, along with a sustained break and acceptance above a technically significant 100-day SMA, suggests that the path of least resistance for spot prices is to the downside and adds credence to the near-term positive outlook.
Technical levels to watch
- AUD/USD struggles to gain and hovers around 0.6555, up 0.16% for the day.
- The pair trades below the 50- and 100-hour EMAs; the Relative Strength Index (RSI) stands below 50.
- The key resistance level for AUD/USD will emerge at 0.6600; 0.6500 acts as an initial support level.
The AUD/USD pair remains on the defensive around 0.6555 in the Asian trading hours on Wednesday. The prevalent US Dollar buying bias is supported by the headlines surrounding the US-China relationship.
That said, the US government intends to target only Chinese companies that generate more than 50% of their revenue from quantum computation and artificial intelligence (AI). However, US President Joe Biden is expected to issue an executive order this week about the restriction, according to Bloomberg. The positive development between the world’s two largest economies might benefit the China-proxy Australian Dollar (AUD) and act as a headwind for the AUD/USD pair.
According to the four-hour chart, AUD/USD trades below the 50- and 100-hour Exponential Moving Averages (EMAs), highlighting that the path of least resistance for the pair is to the downside.
The key resistance level for AUD/USD will emerge at 0.6600, indicating a confluence of the upper boundary of the Bollinger Band, a high of August 4, and a 50-hour EMA. A break above the latter will see the next upside stop at 0.6625 (low of July 28) en route to 0.6650 (100-hour EMA). The additional upside filter is located at 0.6700 (high of July 31, a round figure).
On the flip side, 0.6500 acts as an initial support level for the pair, portraying the lower limit of the Bollinger Band, a low of August 3, and a psychological round mark. Any intraday pullback below the latter would expose the next contention level at 0.6460 (low of May 31) Further south, the next stop of the AUD/USD is located at 0.6400 (the confluence of a psychological round figure and the low of November 2022).
It’s worth noting that the Relative Strength Index (RSI) stands below 50, challenging the pair’s immediate downside for the time being.
AUD/USD four-hour chart
-638271509418865152.png)
- EUR/JPY oscillates in a narrow trading band through the Asian session on Wednesday.
- A softer risk tone benefits the safe-haven JPY and acts as a headwind for the cross.
- The BoJ-ECB policy divergence helps limit the downside and favours bullish traders.
The EUR/JPY cross struggles to gain any meaningful traction on Wednesday and seesaws between tepid gains/minor losses, around the 157.00 mark through the Asian session. Spot prices, however, remain well within the striking distance of over a two-week peak, near the 157.75 region touched on Tuesday.
A generally softer tone around the equity markets drives some haven flows towards the Japanese Yen (JPY) and turns out to be a key factor acting as a headwind for the EUR/JPY cross. That said, a modest US Dollar (USD) downtick lends some support to the shared currency and helps limit the downside, at least for the time being. The fundamental backdrop, meanwhile, seems tilted slightly in favour of bullish traders and supports prospects for some meaningful near-term appreciating move.
A more dovish stance adopted by the Bank of Japan (BoJ) might continue to undermine the JPY and adds credence to the positive outlook for the EUR/JPY cross. In fact, the BoJ's Summary of Opinions released on Monday revealed that policymakers backed the case for the need to patiently continue with the current monetary easing towards achieving the price stability target. Adding to this, data released on Tuesday showed that real wages in Japan fell for a 15th straight month in June.
It is worth recalling that the BoJ has emphasised that sustainable pay hikes is a prerequisite to consider exiting easy policies and dismantling its massive monetary stimulus. This marks a big divergence in comparison to other major central banks, including the European Central Bank (ECB), and suggests that the path of least resistance for the EUR/JPY cross is to the upside. That said, speculations that the ECB might halt its streak of nine consecutive rate hikes in September seem to cap gains.
This makes it prudent to wait for some follow-through buying beyond the overnight swing high before positioning for the resumption of the recent sharp rally from a multi-week low touched in July. The EUR/JPY cross might then make a fresh attempt to conquer the 158.00 mark, or its highest level since September 2008, and prolong its well-established bullish trend.
Technical levels to watch
- USD/INR prints the first daily loss in three, retreats from multi-day high.
- China inflation, Biden Administration’s easy stand on Beijing-backed AI investment ban favor pullback.
- Cautious mood ahead of RBA Interest Rate Decision, US inflation data restrict Indian Rupee moves.
- Softer Oil price, US Dollar’s retreat from key resistance add strength to corrective bounce in Rupee.
USD/INR retreats from the highest levels since late February while snapping a two-day winning streak around 82.80 during early Wednesday. In doing so, the Indian Rupee (INR) pair justifies the cautious optimism in Asia while also cheering the US Dollar’s pullback amid a sluggish Asian session. However, the broad fears about the banking sector and the anxiety ahead of Thursday’s Reserve Bank of India’s (RBI) monetary policy meeting, as well as the US Consumer Price Index (CPI), keep the pair’s moves in check.
The latest improvement in China’s factory-gate inflation and risk-positive news from the Biden Administration, cited by Bloomberg, seem to tame the pessimism in Asia despite the downbeat China Consumer Price Index (CPI) for July.
That said, CPI declines to -0.3% YoY versus -0.4% YoY expected and 0.0% prior whereas the Producer Price Index (PPI) improves to -4.4% YoY compared to -4.1% YoY market forecasts and -5.4% previous readings.
Elsewhere, Bloomberg cited anonymous officials familiar with the matter while saying, “The US plans to target only those Chinese companies that get more than 50% of revenue from the sectors including quantum computing and artificial intelligence (AI).”
While portraying the mood in Asia, the MSCI’s index of Asia–Pacific shares outside Japan prints mild gains by tracing the S&P500 Futures at the latest. Further, the US Treasury bond yields also remain dicey and prod the US Dollar Index (DXY) as it retreats from a 2.5-month-old descending resistance line to snap a two-day uptrend around 102.45 by the press time.
Additionally, mildly offered prices of WTI crude oil, down 0.20% intraday near $82.30 as we write, also weigh on the USD/INR price due to India’s reliance on energy imports and the heavy Current Account Deficit (CAD).
Previously, the pessimism emanating from Italy’s surprise tax on windfall profits of banks joined the global rating agencies’ downward revision of the US banks and financial institutions to weigh on the risk sentiment and fueled the USD/INR price. On the same line could be fears of the UK recession and slowing economic growth in China.
Looking ahead, the softer US inflation data may favor the USD/INR sellers but the RBI’s likely status quo may defend the Indian Rupee bears moving forward.
Technical analysis
Unless providing a daily closing beneath the downward-sloping previous resistance line stretched from May 19, close to 82.60 by the press time, the USD/INR stays on the way to challenging the yearly high marked in January around the 83.00 round figure.
- GBP/USD edges higher during the Asian session on Wednesday, albeit lacks follow-through.
- A modest USD downtick lends support; the worsening UK economic outlook caps the upside.
- Traders also seem reluctant ahead of the US CPI and UK macro data on Thursday and Friday.
The GBP/USD pair ticks higher during the Asian session on Wednesday and looks to build on the previous day's rebound from the 1.2685 area. Spot prices currently flirt with the 50-day Simple Moving Average (SMA), just above mid-1.2700s, and draw support from a mildly softer tone surrounding the US Dollar (USD).
In fact, the USD Index (DXY), which tracks the Greenback against a basket of currencies, retreats further from a one-month peak retested on Tuesday. The overnight dovish remarks by Philadelphia Federal Reserve Bank President Patrick Harker, saying that they will probably start lowering the policy rate sometime next year, leads to a modest downtick in the US Treasury bond yields and undermines the buck. That said, growing acceptance that the US central bank will keep interest rates higher for longer in the wake of an extremely resilient economy should help limit any deeper USD losses.
The expectations were lifted by the closely-watched US monthly jobs report released last Friday, which pointed to the continued tightness in the labour market and raised the odds of a soft landing for the economy. Moreover, Fed Governor Michele Bowman said on Monday that additional interest rate hikes will likely be needed to lower inflation to the central bank's 2% target. This, along with a softer risk tone, supports prospects for the emergence of some buying around the safe-haven buck and might cap gains for the GBP/USD pair, against the backdrop of a bleak outlook for the UK economy.
In fact, the National Institute of Economic and Social Research (NIESR) said that there was a 60% risk of the government going to the polls during a recession. In its quarterly update, the NIESR added that it would take until the third quarter of 2024 for UK output to return to its pre-pandemic peak. This comes after a report from the British Retail Consortium showed on Tuesday that UK Retail Sales in July registered its weakest year-on-year growth since August 2022. Adding to this, the Bank of England's (BoE) less hawkish forward guidance should contribute to keeping a lid on the GBP/USD pair.
It is worth recalling that the BoE raised its key benchmark interest rate by 25 bps to a 15-year peak level of 5.25% last Thursday and signalled that the tightening cycle may be nearing an end. The UK central bank called its current monetary policy stance "restrictive" and forced investors to scale back expectations for the peak rate. This, in turn, warrants caution for aggressive bullish traders and before positioning for any further appreciating move for the GBP/USD pair. Traders might also prefer to wait on the sidelines ahead of this week's important macro releases from the US and the UK.
The latest US consumer inflation figures are due on Thursday, which will play a key role in influencing market expectations about the Fed's future rate-hike path and drive the USD demand in the near term. This will be followed by the UK macro data dump, including the Prelim GDP report on Friday, and help determine the next leg of a directional move for the GBP/USD pair.
Technical levels to watch
- GBP/JPY retreats from intraday high but lacks downside momentum during the first loss-making day in three.
- NIESR forecasts UK recession but inflation expectations favor hawkish BoE bias.
- Yields grind lower as headlines from China allow pessimists to catch a breather.
- Dovish BoJ concerns keep buyers hopeful amid light calendar ahead of Friday’s UK GDP.
GBP/JPY lacks momentum while making rounds to 182.70-80 during early Wednesday in London, fading the two-day winning streak. In doing so, the cross-currency pair juggles multiple risk catalysts and the fears of the UK’s economic slowdown, as well as mixed central concerns, during the sluggish markets.
Earlier in the day, the UK's leading thinktank, the National Institute of Economic and Social Research (NIESR), said late Tuesday, per The Guardian, that it would take until the third quarter (Q3) of 2024 for British output to return to its pre-pandemic peak. “There was a 60% risk of the government going to the polls during a recession,” adds the NIESR per The Guardian.
On the positive side, the NIESR also expects the UK inflation to stay beyond the Bank of England’s (BoE) 2.0% target for the next four years and push the “Old Lady”, as the BoE is sometimes called informally, toward hawkish moves and defend the British Pound (GBP) bulls.
Elsewhere, the US 10-year Treasury bond yields dropped to the weekly low of around 3.98% before bouncing off 4.03% by the day’s end, making rounds to the said levels of late, whereas the S&P500 Futures remains mildly bid around 4,520 after Wall Street’s downbeat performance.
The market’s latest stabilization could be linked to the mixed China inflation data and the US government’s easy stand on banning the technology companies from Beijing.
Furthermore, multiple policymakers’ defense of the Bank of Japan’s (BoJ) ultra-easy monetary policy, despite tweaking the Yield Curve Control (YCC) practices in the last, seems to weigh on the Japanese Yen (JPY), especially amid the lack of major data/events.
Moving forward, Japan’s Producer Price Index (PPI) and the fears about the UK recession, as well as challenges for the global banking system, may entertain the GBP/JPY traders. However, major attention will be given to the British Gross Domestic Product (GDP) data for the second quarter (Q2), up for publishing on Friday.
Technical analysis
GBP/JPY remains indecisive between a two-month-old resistance line surrounding 183.00 and an ascending trend line from July 28, close to 182.00 by the press time.
The latest monetary conditions survey, conducted by the Reserve Bank of New Zealand (RBNZ), revealed on Wednesday that New Zealand's (NZ) inflation expectations rose on a two-year time frame for the third quarter of 2023 while falling further for the year ahead.
Two-year inflation expectations, seen as the time frame when RBNZ policy action will filter through to prices, rose slightly to 2.83% in Q3 from 2.79% prior.
NZ 2023 average one-year inflation expectations fell further to 4.17% in the quarter to September vs. 4.28% seen in the second quarter of this year.
Kiwi holds higher ground on inflation expectations
The uptick in NZ inflation expectations keeps the New Zealand Dollar (NZD) afloat. At the press time, NZD/USD is holding higher ground near 0.6080, adding 0.19% on the day.
- Gold price regains positive traction and draws support from a combination of factors.
- A softer risk tone and a modest US Dollar downtick benefit the safe-haven XAU/USD.
- Bets for more rate hikes by the Federal Reserve might keep a lid on any further gains.
Gold price attracts some buying during the Asian session on Wednesday and recovers a part of the previous day's losses to the $1,923-$1,922 area, or a four-week low. The XAU/USD currently trades just below the $1,930 level, up nearly 0.20% for the day, though any meaningful upside still seems elusive.
A generally softer tone around the equity markets, along with a modest US Dollar (USD) downtick, turn out to be a key factor lending some support to the Gold price. Weaker Chinese trade data released on Tuesday revived fears about the worsening outlook for the world's second-largest economy. Adding to this, Moody’s downgraded the debt ratings for a slew of US banks and dampened investors' appetite for riskier assets. The anti-risk flow tends to benefit the safe-haven precious metal.
Meanwhile, the USD Index (DXY), which tracks the Greenback against a basket of currencies, remains depressed below a one-month top tested on Tuesday and further benefits the US Dollar-denominated Gold price. The overnight dovish remarks by Philadelphia Federal Reserve Bank President Patrick Harker, saying that they will probably start lowering the policy rate sometime next year, hold back the USD bulls from placing fresh bets, though the downside is more likely to remain limited.
Market participants now seem convinced that the Fed will stick to its hawkish stance in the wake of an extremely resilient US economy. The bets were lifted by the closely-watched US jobs report, which pointed to the continued tightness in the labour market and raised the odds of a soft landing. Adding to this, Fed Governor Michele Bowman on Monday kept the door for one more 25 bps lift-off in September or November wide open and should continue to act as a tailwind for the USD.
Traders might also prefer to move to the sidelines ahead of the release of the latest US consumer inflation figures on Thursday. The crucial US CPI report will play a key role in influencing market expectations about the Fed's future rate-hike path. This, in turn, will drive the USD demand and help determine the next leg of a directional move for the Gold price. Hence, it will be prudent to wait for strong follow-through buying to confirm that the XAU/USD has formed a near-term bottom.
Technical levels to watch
- EUR/USD prints the first daily gains in three within two-month-old symmetrical triangle.
- China-linked data, news favored Euro pair’s corrective as US Dollar braces for inflation data.
- Upbeat RSI (14) line may help EUR/USD to extend recent rebound bears remain hopeful below 200-SMA.
EUR/USD consolidates weekly losses amid Wednesday’s sluggish morning in Europe. In doing so, the Euro pair licks its wounds within a two-month-old symmetrical triangle as market sentiment improves a bit on news and data surrounding China.
That said, the improvement in China’s factory-gate inflation supersedes the downbeat consumer price increase to underpin recent stabilization in the market. Further, the latest risk-positive news from the Biden Administration, cited by Bloomberg, also allows the EUR/USD traders to lick their wounds. “The US plans to target only those Chinese companies that get more than 50% of revenue from the sectors including quantum computing and artificial intelligence (AI),” said the news.
It’s worth noting that the pessimism emanating from Italy’s surprise tax on windfall profits of banks joined the global rating agencies’ downward revision of the US banks and financial institutions to weigh on the risk sentiment and the EUR/USD price. On the same line could be fears of the UK recession and slowing economic growth in China.
Technically, the Euro pair’s rebound from the bottom line of the aforementioned triangle joins the upbeat RSI (14) line, not overbought, to defend the EUR/USD bulls.
However, the stated triangle’s top line around the 1.1000 psychological magnet precedes the 200-SMA hurdle of around 1.1020 to restrict the short-term EUR/USD upside.
Meanwhile, a downside break of the triangle’s support line, close to 1.0930 by the press time, can amplify the bearish bias about the Europe pair and drag it towards the previous monthly low of around 1.0830.
Though, the August 03 trough surrounding 1.0910 and the 1.0900 may prod the EUR/USD bears.
EUR/USD: Four-hour chart
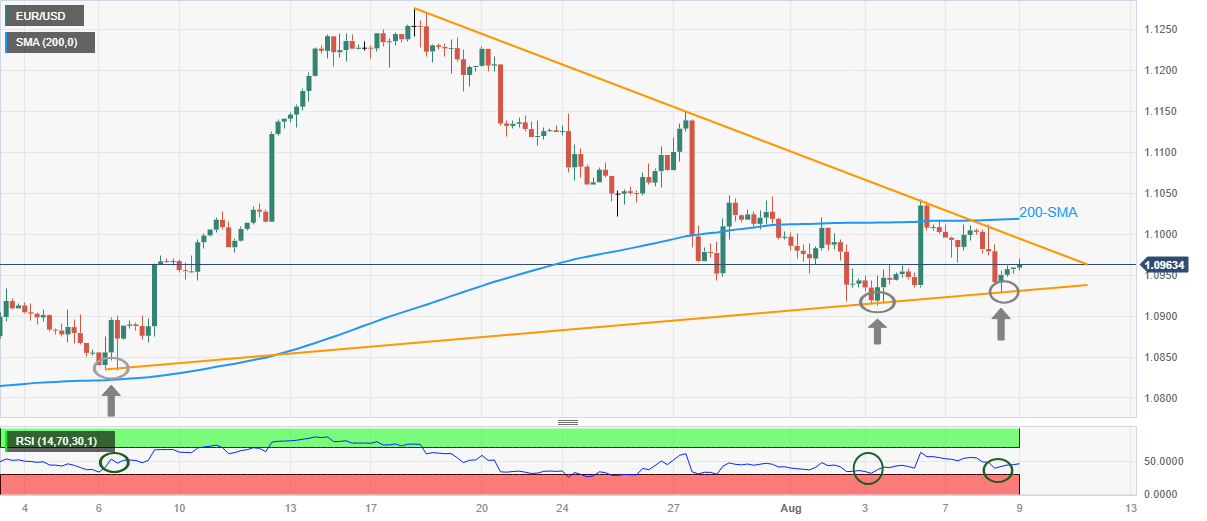
Trend: Bearish
| Raw materials | Closed | Change, % |
|---|---|---|
| Silver | 22.769 | -1.49 |
| Gold | 1924.796 | -0.6 |
| Palladium | 1227.5 | -1.35 |
- AUD/JPY struggles to gain and currently trades around 93.77, losing 0.05% on the day.
- Chinese Consumer Price Index (CPI) YoY fell 0.3% (Jul) from 0% prior and -0.4% expected.
- Japanese policymakers support maintaining ultra-loose monetary policy.
The AUD/JPY cross remains on the defensive below the 94.00 mark during the early Asian session on Wednesday. The cross currently trades around 93.77, down 0.05% for the day. The Chinese inflation data fails to inspire the China-proxy Australian Dollar (AUD).
The latest data on Wednesday showed that the Chinese Consumer Price Index (CPI) YoY fell 0.3% in July from 0% prior, and the market consensus anticipated a -0.4% decline. Meanwhile, the Producer Price Index (PPI) declined 4.4% YoY, compared to the 4.1% decrease YoY expected and a 5.4% drop prior.
Earlier this week, China's trade balance increased to $80.6 billion, exceeding expectations of $70.6 billion and $70.62 billion prior. While, the dollar value of China’s exports YoY in July plunged -14.5%, worse than expectations of -12.5% in June, and Imports dropped -12.4% YoY from -5%.
On the Aussie front, Westpac Consumer Confidence in Australia fell to -0.4% in August, down from 2.7% the previous month. Meanwhile, the National Australia Bank's (NAB) Business Conditions for July increased to 10.0 from 9.0 prior, above the market consensus of 8.0. Lastly, the NAB Business Confidence increased to 2.0% from -1.0% estimations and 0.0% prior. That said, the mixed economic reading from Australia and China fails to inspire the Aussie.
In Japan, Household Spending YoY dropped from 4.0% to 4.2% in June, a fourth month of decline. Average Cash Earnings y/y came in at 2.3% from 2.9%, which was worse than the estimated 3.0%. Further detail revealed that households with two or more people spent an average of 275,545 yen ($1,900). This figure could raise concerns about the Bank of Japan's (BoJ) ultra-loose monetary policy.
Nevertheless, the Summary of Opinions released by the Bank of Japan on Monday revealed that the policymaker supports maintaining ultra-low interest rates until robust domestic demand and higher wages replace cost-push factors as the primary drivers of price increases and maintain sustainable inflation around its target.
Looking ahead, the Australian and Japanese dockets will not release top-tier data this week. However, market participants will take cues from the Japanese Producer Price Index (PPI) for July and the Australian Consumer Inflation Expectation for August, due on Thursday. The next week’s highlight will be the Reserve Bank of Australia (RBA) Monetary Policy Meeting Minutes. Traders will find opportunities around the AUD/JPY cross.
- Market sentiment improves on early Thursday amid receding fears of China deflation, risk-positive news from US.
- S&P500 Futures print mild losses after refreshing monthly low.
- US Treasury bond yields remain pressured as markets await US inflation data.
- Moves by global rating agencies, Italy joined looming default of China’s top realtor to previously fuel risk aversion.
The risk appetite surprisingly improves a bit on early Wednesday as market players seek solace in China’s mixed inflation data, as well as receding fears of the Sino-US tussles. Even so, the looming concerns about the global banking sector and real estate players from Beijing prod the optimists ahead of the key US inflation clues.
While portraying the mood, S&P500 Futures remains mildly bid around 4,520 by the press time, defending the latest rebound from the lowest level in a month marked the previous day. That said, the US 10-year Treasury bond yields dropped to the weekly low of around 3.98% before bouncing off 4.03% by the day’s end.
Recently, an improvement in China’s Producer Price Index (PPI) for July superseded negative readings of the Consumer Price Index (CPI) for the said month to favor market stabilization. That said, CPI declines to -0.3% YoY versus -0.4% YoY expected and 0.0% prior whereas the PPI improves to -4.4% YoY compared to -4.1% YoY market forecasts and -5.4% previous readings.
Elsewhere, the latest risk-positive news from the Biden Administration, cited by Bloomberg, also allows the traders to lick their wounds at the multi-day low. “The US plans to target only those Chinese companies that get more than 50% of revenue from the sectors including quantum computing and artificial intelligence (AI),” said the news.
Previously, Italy’s surprise tax on windfall profits of banks joined the global rating agencies’ downward revision to the US banks and financial institutions to weigh on the risk sentiment. On the same line could be fears of the UK recession and slowing economic growth in China.
On Tuesday, US Goods and Services Trade Balance for June came in at $-65.5B versus the $-65B expected and $-68.3B prior whereas the NFIB Optimism Index for July improved to 91.9, the highest in nine months, from 91.0 previous readings and 90.6 market forecasts. Further, US IBD/TIPP Economic Optimism for August eases to 40.3 from 43.0 market forecasts and 41.3 prior whereas Wholesale Inventories for June dropped to -0.5% versus the analysts’ estimations of reprinting the -0.3% figures.
Following the data, Philadelphia Federal Reserve Bank President Patrick Harker advocated Fed’s policy pivot while saying, per Reuters, “I believe we may be at the point where we can be patient and hold rates steady and let the monetary policy actions we have taken do their work.” On the other hand, Richmond Fed President Thomas Barkin stated that the Gross Domestic Product (GDP) remained "solid".
Moving on, a lack of major data/events may allow the traders to consolidate the weekly loss before Thursday’s Australia Consumer Inflation Expectations for August and the all-important US CPI.
Also read: Forex Today: Dollar gains as stocks slide and metals tumble
- USD/CNH prints the first daily loss in four after China inflation data for July.
- Improvement in PPI supersedes downbeat CPI data to allow Yuan to pare recent losses.
- MACD, RSI keep buyers hopeful of poking multi-month-old descending resistance line.
- 21-DMA, fortnight-old rising support line restricts immediate downside of USD/CNH.
USD/CNH renews its intraday low near 7.2220 while reversing from a one-month-old horizontal resistance during early Wednesday. In doing so, the offshore Chinese Yuan (CNH) pair gives more importance to the improvement in the factory-gate inflation than the consumer price increase, as well as cheer the market’s stabilization, while snapping a three-day losing streak.
That said, China’s headline inflation gauge, namely the Consumer Price Index (CPI), declines to -0.3% YoY versus -0.4% YoY expected and 0.0% prior whereas the Producer Price Index (PPI) improves to -4.4% YoY compared to -4.1% YoY market forecasts and -5.4% previous readings.
Technically, the latest pullback remains elusive amid bullish MACD signals and an upbeat RSI (14) line.
Also challenging the short-term USD/CNH bears are the 21-DMA and a fortnight-long rising support line, respectively near 7.1815 and 7.1760.
Following that, the upward-sloping trend line from early May and February, close to 7.1480 and 7.0990 in that order, will be in the spotlight.
On the contrary, a daily closing beyond the aforementioned monthly horizontal resistance near 7.2370-80 could quickly propel the USD/CNH pair towards a descending trend line from late October 2022, surrounding 7.2730 by the press time.
In a case where the offshore Chinese Yuan manages to cross the 7.2730 hurdle, the yearly top marked in June near 7.2860 will act as the last defense of bears.
USD/CNH: Daily chart
Trend: Further upside expected
- NZD/USD oscillates in a narrow trading band through the Asian session on Wednesday.
- The Chinese inflation figures fail to impress traders or provide any meaningful impetus.
- A mildly softer tone surrounding the USD turns out to be a key factor lending support.
The NZD/USD pair struggles to capitalize on the overnight late rebound from the 0.6035 area, or a two-month trough and edges lower during the Asian session on Wednesday. Spot prices remain on the defensive, around the 0.6055-0.6060 region and move little in reaction to the Chinese inflation figures.
In fact, data published by China’s National Bureau of Statistics (NBS) showed that the annual Consumer Price Index (CPI) fell 0.3% in July as compared to a flat reading in the previous month and consensus estimates for a 0.4% decline. On a monthly basis, the headline Chinese CPI rose by 0.2% in July against the 0.1% drop anticipated. This, however, was offset by the weaker-than-expected Producer Price Index (PPI), which contracted by 4.4% YoY in July, and do little to ease fears about faltering recovery in the world's second-largest economy or provide any impetus to the NZD/USD pair.
That said, hopes for additional stimulus measures from China help limit the pessimism and lends some support to antipodean currencies, including the New Zealand Dollar (NZD). Apart from this, a mildly softer tone surrounding the US Dollar (USD) turns out to be another factor acting as a tailwind for the NZD/USD pair. Any meaningful USD downfall, however, seems elusive in the wake of firming expectations that the Federal Reserve (Fed) will stick to its hawkish stance. In fact, market participants seem convinced that the Fed will keep interest rates higher for longer.
The bets were lifted by the closely-watched US monthly employment details released on Friday, which pointed to the continued tightness in the labour market. Moreover, Fed Governor Michele Bowman on Monday kept the door for one more 25 bps lift-off in September or November and said that additional interest rate hikes will likely be needed to lower inflation to the central bank's 2% target. That said, Philadelphia Fed President Patrick Harker said on Tuesday that they will probably start lowering the policy rate sometime next year, which, in turn, holds back the USD bulls from placing fresh bets.
Market participants also seem reluctant and might prefer to wait on the sidelines ahead of the latest US consumer inflation figures, due for release on Thursday. Nevertheless, the aforementioned fundamental backdrop seems tilted in favour of the USD bulls and suggests that the path of least resistance for the NZD/USD pair is to the downside.
Technical levels to watch
- AUD/USD defends corrective bounce off two-month low after China data turns down deflation woes.
- China CPI slumps to -0.3% YoY, PPI improves to -4.4% YoY for July.
- Biden Administration’s relief to China AI companies, market’s consolidation after heavy risk aversion also favor Aussie buyers.
- Risk catalysts eyed ahead of Thursday’s Australia Consumer Inflation Expectations, US CPI.
AUD/USD remains sidelined near the intraday high surrounding 0.6550 as China inflation data flashes mixed signals during early Wednesday. In doing so, the Aussie pair defends the late Tuesday’s corrective bounce off the lowest levels in two months as the market stabilizes after a volatile day.
China’s headline inflation gauge, namely the Consumer Price Index (CPI), declines to -0.3% YoY versus -0.4% YoY expected and 0.0% prior whereas the Producer Price Index (PPI) improves to -4.4% YoY compared to -4.1% YoY market forecasts and -5.4% previous readings.
Apart from the China inflation data, the latest risk-positive news from the Biden Administration, cited by Bloomberg, also allows the AUD/USD pair to lick its wounds at the multi-day low. “The US plans to target only those Chinese companies that get more than 50% of revenue from the sectors including quantum computing and artificial intelligence (AI),” said the news.
Elsewhere, the market’s consolidation after a heavy risk aversion might have also allowed the AUD/USD to remain sidelined.
Even so, the looming bankruptcies of the top-tier China real estate players and hardships for global banks, due to the latest move from Italy and the leading rating agencies, seem to keep a tab on the AUD/USD price.
Against this backdrop, Wall Street closed in the red with major losses among the bank stocks whereas the US 10-year Treasury bond yields dropped to the weekly low of around 3.98% before bouncing off 4.03% by the day’s end. That said, S&P500 Futures remains mildly bid by the press time.
Looking ahead, a lack of major data/events may allow the AUD/USD pair to consolidate the weekly loss before Thursday’s Australia Consumer Inflation Expectations for August and the all-important US CPI.
Technical analysis
The nearly oversold RSI (14) conditions test the AUD/USD bears despite breaking a 10-month-old rising trend line, now immediate resistance near 0.6550. However, an ascending support line stretched from early November, around 0.6480, challenges the quote’s further declines.
- USD/CAD gains momentum near 1.3425 as the markets turn cautious.
- The US trade deficit came in at $65.5 billion, higher than expectations of $65 billion.
- The Loonie has attracted some sellers from the weaker than expected labor data last week.
- Market players await the US inflation data for fresh impetus.
The USD/CAD pair extends its upside above the 1.3400 mark on the back of a cautious market mood during the early Asian session on Wednesday. The major currently trades around 1.3425, gaining 0.04% for the day.
The US trade data show a sluggish economic rebound and subdued global demand in the country. The US trade deficit narrowed sharply in June, with the figure coming in at $65.5 billion, higher than expectations of $65 billion and below the $68.3 billion prior.
On the same line, Imports fell 1.0% to $313 billion from $316.1 billion the previous month, the lowest level since November 2021. The Commerce Department reported that a drop in Imports on Tuesday might indicate a slowdown in company investment and domestic demand despite the Federal Reserve's significant interest rate rises. Meanwhile, Exports dropped 0.1% to $247.5 billion, a 15-month low.
Additionally, Moody’s downgraded the credit ratings of several midsize and small US lenders and issued a warning about possible cuts to the ratings of larger institutions. Moody's added that banks with significant unrealized losses that are not reflected in their regulatory capital ratios are vulnerable to a loss of confidence in the current tightening policy cycle. Markets turn cautious about this headline and lift the safe-haven Dollar.
On the other hand, Loonie has attracted some sellers from the weaker than expected labor data last week. Statistics Canada revealed that the Canadian economy unexpectedly lost 6,400 jobs in July. Meanwhile, the Unemployment rate rose to 5.5%. The data might convince the Bank of Canada (BoC) to maintain its monetary policy this year. and might cap the upside in the Canadian Dollar.
Meanwhile, the uptick in oil prices has supported the Loonie and offset the downbeat Canadian data. Higher crude prices strengthen the Canadian Dollar, as the country is the leading oil exporter to the United States.
Looking ahead, investors will keep an eye on the US inflation data later this week. The US Consumer Price Index (CPI) for July and the Producer Price Index (PPI) will be released on Thursday and Friday, respectively. The data will be critical for determining a clear movement for the USD/CAD pair.
The latest data published by China’s National Bureau of Statistics (NBS) showed on Wednesday, the country’s annual Consumer Price Index (CPI) fell 0.3% in July, compared with 0% seen in June. The market consensus was for a -0.4% clip.
On a monthly basis, Chinese CPI inflation rose to 0.2% in July versus the -0.2% decrease recorded in June and -0.1% estimates.
China’s Producer Price Index (PPI) declined 4.4% YoY in July as against a 5.4% drop registered previously. Markets had predicted a 4.1% decrease in the reported period.
Market reaction
At the time of writing, AUD/USD is unmoved by the key Chinese data release, keeping its range at around 0.6540.
- EUR/GBP rebounds from over a one-week low touched during the Asian session on Wednesday.
- The worsening UK economic outlook undermines the GBP and prompts intraday short-covering.
- Expectations that the ECB will end its rate-hiking cycle soon act as a headwind and .cap gains.
The EUR/GBP cross stages a modest recovery from over a one-week low touched during the Asian session on Wednesday and retakes the 0.8600 round-figure mark in the last hour. Spot prices, for now, seem to have snapped a two-day losing streak, though the mixed fundamental backdrop warrants some caution before placing aggressive bullish bets.
A bleak outlook for the UK economy undermines the British Pound (GBP), which turns out to be a key factor that prompts some intraday short-covering around the EUR/GBP cross. In fact, the National Institute of Economic and Social Research (NIESR) said that there was a 60% risk of the government going to the polls during a recession. In its quarterly update, the NIESR added that it would take until the third quarter of 2024 for UK output to return to its pre-pandemic peak.
This comes after a report from the British Retail Consortium showed on Tuesday that UK Retail Sales in July registered its weakest year-on-year growth since August 2022. Furthermore, the Recruitment and Employment Confederation (REC) said on Monday that British employers reduced the number of new permanent staff they hired through agencies by the most since mid-2020. This, along with the Bank of England's (BoE) less hawkish forward guidance, continues to undermine the GBP.
It is worth recalling that the BoE raised its key benchmark interest rate by 25 bps to a 15-year peak level of 5.25% last Thursday and signalled that the tightening cycle may be nearing an end. The UK central bank called its current monetary policy stance "restrictive" and forced investors to scale back expectations for the peak rate. However, speculations that the European Central Bank (ECB) will halt its streak of nine consecutive rate hikes in September might cap the upside for the EUR/GBP cross.
In fact, the ECB, in its economic bulletin published last Friday, noted that the underlying inflation in the region likely peaked during the first half of 2023. Adding to this, Fitch Ratings said on Friday that falling Euro Zone inflation puts ECB rates peak within sight. This makes it prudent to wait for strong follow-through buying before positioning for any further intraday appreciating move ahead of important UK macro releases, including the prelim Q2 GDP report, due on Friday.
Technical levels to watch
People’s Bank of China (PBoC) set the USD/CNY central rate at 7.1588 on Wednesday, versus the previous fix of 7.1565 and market expectations of 7.2198. It's worth noting that the USD/CNY closed near 7.2199 the previous day.
Apart from the USD/CNY fix, the PBoC also unveiled details of its Open Market Operations (OMO) while saying that the Chinese central bank injects 2 billion Yuan via 7-day reverse repos (RRs) at 1.90% vs prior 1.90%.
About PBOC fix
China maintains strict control of the yuan’s rate on the mainland.
The onshore yuan (CNY) differs from the offshore one (CNH) in trading restrictions, this last one is not as tightly controlled.
Each morning, the People’s Bank of China (PBOC) sets a so-called daily midpoint fix, based on the yuan’s previous day's closing level and quotations taken from the inter-bank dealer.
- Natural Gas Price prods four-day uptrend at the highest levels in 1.5 months.
- Hopes of more US energy demand due to hot weather, technical breakout previously fuelled XNG/USD price.
- Chatters about higher gas output join broad risk-off mood to weigh on commodity price ahead of China inflation.
Natural Gas Price (XNG/USD) pares recent gains around $2.83 as bulls await China inflation data on early Wednesday. In doing so, the XNG/USD prints the first daily loss in five amid mixed concerns about the demand and supply, as well as due to the risk-off mood.
That said, Reuters conveyed the news suggesting a notable increase in the Natural Gas demand in the US amid hot weather. The news quotes the data provider Refinitiv as it forecasts the US gas demand, including exports, to increase from 101.8 billion cubic feet per day (bcfd) this week to 105.2 bcfd next week.
On the other hand, the gas supplies remain firmer around 102.1 bcfd in the US Lower 48 states after refreshing an all-time high of 102.2 bcfd in May.
Elsewhere, Italy’s surprise tax on windfall profits of banks joined the global rating agencies’ downward revision to the US banks and financial institutions to weigh on the risk sentiment and the Natural Gas price. On the same line could be fears of the UK recession and slowing economic growth in China.
Amid these plays, Wall Street closed in the red with major losses among the bank stocks whereas the US 10-year Treasury bond yields dropped to the weekly low of around 3.98% before bouncing off 4.03% by the day’s end. That said, S&P500 Futures remains mildly offered by the press time.
Looking forward, China’s Consumer Price Index (CPI) and Producer Price Index (PPI) for July will be crucial for intraday directions of the Natural Gas Price ahead of the weekly Natural Gas stockpiles and the key US inflation clues, up for publishing on Thursday.
Technical analysis
The latest pullback in the USD/MXN price remains elusive unless the quote stays beyond the previous resistance line stretched from June 26, close to $2.71 by the press time.
- USD/MXN defends the previous day’s rebound from eight-day-old rising support line ahead of Mexico inflation numbers for July.
- Looming bull cross on MACD, steady RSI (14) line near 50.00 keep Mexican Peso sellers hopeful.
- Convergence of 200-SMA, previous resistance line from late May appears a tough nut to crack for USD/MXN bears.
USD/MXN clings to mild gains around 17.11 as it defends late Tuesday’s corrective bounce off a one-week-long rising support line amid a sluggish start to Wednesday’s trading. In doing so, the Mexican Peso (MXN) justifies the market’s cautious mood ahead of Mexico’s headline inflation numbers for July, scheduled for release at noon per the GMT today.
Also read: USD/MXN advances amid global risk-aversion and strong US Dollar
Apart from the immediate support line, an impending bull cross on the MACD and steady RSI (14), as well as the broad US Dollar strength amid the risk-off mood, also favors the USD/MXN buyers.
However, a descending resistance line from Friday, around 17.26 by the press time, guards the immediate recovery of the Mexican Peso pair.
Following that, the monthly high of 17.42 will be crucial to break for the USD/MXN bulls to keep the reins.
On the contrary, a downside break of the aforementioned support line, near 17.05 by the press time, isn’t an open invitation to the USD/MXN bears. The reason could be linked to the existence of convergence of the 200-SMA and the previous resistance line stretched from May 31, around 16.97 by the press time.
USD/MXN: Four-hour chart

Trend: Further recovery expected
- USD/JPY edges lower on Wednesday and snaps a two-day winning streak.
- A softer risk tone benefits the safe-haven JPY and exerts some pressure.
- The divergent BoJ-Fed policy outlook is likely to limit any meaningful fall.
The USD/JPY pair struggles to capitalize on its strong weekly gains registered over the past two days and edges lower during the Asian session on Wednesday. Spot prices currently trade around the 143.15 region, down nearly 0.15% for the day, though any meaningful downside still seems elusive, warranting some caution for bearish traders.
Weaker Chinese trade data released on Tuesday dampened investors' appetite for riskier assets. Adding to this, credit rating agency Moody’s downgraded the debt ratings on a slew of US banks on concerns about pressures on profit and led to the overnight slide in the equity markets. This, in turn, lends some support to the safe-haven Japanese Yen (JPY), which, along with subdued US Dollar (USD) price action, is seen acting as a headwind for the USD/JPY pair. The downside, however, remains cushioned in the wake of a big divergence in the monetary policy stance adopted by the Bank of Japan (BoJ) and the Federal Reserve (Fed).
Market participants seem convinced that the BoJ will stick to its dovish stance and the bets were reaffirmed by data released on Tuesday, which showed that real wages in Japan fell for a 15th straight month in June and nominal pay growth also slowed. It is worth recalling that the BoJ has emphasised that sustainable pay hikes is a prerequisite to consider exiting easy policies and dismantling its massive monetary stimulus. Moreover, the BoJ's Summary of Opinions released on Monday revealed that policymakers backed the case for the need to patiently continue with the current monetary easing towards achieving the price stability target.
In contrast, the continued tightness in the US labour market raised the odds of a soft landing for the US economy and supports prospects for further policy tightening by the Fed. In fact, a slight disappointment from the headline NFP print on Friday was largely offset by solid wage growth and an unexpected downtick in the jobless rate. Adding to this, Fed Governor Michele Bowman said on Monday that additional interest rate hikes will likely be needed to lower inflation to the central bank's 2% target. This, in turn, keeps the door for one more 25 bps lift-off in September or November wide open and should continue to underpin the USD.
The aforementioned fundamental backdrop seems tilted firmly in favour of bulls and suggests that the path of least resistance for the USD/JPY pair is to the upside. Hence, any subsequent slide might still be seen as a buying opportunity. Market participants now look to the Chinese inflation data, due for release in a short while from now, which might influence the broader risk sentiment and provide some impetus to the USD/JPY pair. The focus, however, will remain glued to the crucial US CPI report on Thursday.
Technical levels to watch
| Index | Change, points | Closed | Change, % |
|---|---|---|---|
| NIKKEI 225 | 122.73 | 32377.29 | 0.38 |
| Hang Seng | -353.75 | 19184.17 | -1.81 |
| KOSPI | -6.73 | 2573.98 | -0.26 |
| ASX 200 | 1.9 | 7311.1 | 0.03 |
| DAX | -175.83 | 15774.93 | -1.1 |
| CAC 40 | -50.29 | 7269.47 | -0.69 |
| Dow Jones | -158.64 | 35314.49 | -0.45 |
| S&P 500 | -19.06 | 4499.38 | -0.42 |
| NASDAQ Composite | -110.08 | 13884.32 | -0.79 |
- WTI consolidates its recent gains around $82.35 on Wednesday.
- EIA forecasted 1.9% GDP growth in 2023, up from 1.5% in its monthly report.
- China's July trade data fuels concern about the oil demand outlook.
Western Texas Intermediate (WTI), the US crude oil benchmark, is trading around the $82.30 mark so far on Wednesday. WTI bounces off the $79.60 low and reclaims above the $82.00 area from the upbeat economic outlook. However, the downbeat Chinese data and risk-averse market could weigh on WTI prices.
The US Energy Information Administration (EIA) projected in a monthly report that Gross Domestic Product (GDP) will increase by 1.9% in 2023, up from 1.5% in the previous forecast. EIA added that crude prices have risen since June, owing mostly to prolonged voluntary limits in Saudi Arabian output as well as increased global demand.
That said, Saudi Arabia will extend its voluntary oil output cut of one million barrels per day (bpd) through September. In September, Saudi production is anticipated to be around 9 million bpd. In the meantime, Russia's oil exports will decrease by 300,000 bps in September, according to Deputy Prime Minister Alexander Novak.
However, the downbeat Chinese data exerts some pressure on WTI prices. That said, the dollar value of China’s exports YoY in July plunged -14.5%, worse than expectations of -12.5% in June, while Imports dropped -12.4% YoY from -5%. The figures fuel concern about the economic slowdown in the world’s second-largest economy.
Moving on, oil traders monitor the Chinese inflation data later in the day. Also, the EIA Crude Oil Stocks Change for the week ending August 4 will be released. The key events to watch are the Consumer Price Index (CPI) and the Producer Price Index (PPI) from the US and China later this week. These events could significantly impact the USD-denominated WTI price. Oil traders will take cues from the data and find trading opportunities around the WTI price.
- EUR/USD portrays corrective bounce off one-week low after posting two-day losing streak.
- Italy’s surprise windfall tax announcements for banks increase hardships for “Old continent”, especially when ECB forecasts softer inflation.
- Unimpressive EU/US data, looming fears of Eurozone recession and banking woes exert downside pressure on Euro.
- China inflation, banking news and economic slowdown talks will direct intraday Euro moves ahead of Thursday’s US CPI.
EUR/USD stays defensive around 1.0960 as bears take a breather after a two-day losing streak amid Wednesday’s sluggish Asian session. The Euro pair dropped the most in a week the previous day after news from Italy joined the broad risk aversion to weigh on the major currency pair. However, the cautious mood ahead of China inflation and recent headlines taming pessimism seem to prod sellers of the major currency pair.
Italy’s announcements of a surprise windfall tax on bank profits joined the downward revision of the Eurozone inflation forecasts by the European Central Bank (ECB) monthly survey report to weigh on the EUR/USD price the previous day.
On Tuesday, the European Central Bank’s (ECB) monthly survey of consumer expectations for inflation stated that Consumer inflation expectations for the next 12 months fall further to 3.4% in June, versus 3.9% projected in May. “Expectations for economic growth over the next 12 months became slightly less negative, while the expected unemployment rate in 12 months was unchanged,” added the ECB survey report.
On the other hand, China’s trade numbers and the fears about the global banks weighed on the sentiment and the EUR/USD price. That said, China's Trade Balance improves in July but the details suggest deteriorating Imports and Exports for the said month, suggesting the economic challenges for the Dragon Nation which already suffers from geopolitical woes. On the same line, India bans drone makers from using Chinese equipment after stopping the imported laptops and computers previously. Also, Chinese real estate giant Country Garden announced missing two dollar bond coupons due on August 6 totaling $22.5 million per Reuters. The news renews fears of bankruptcy among the realtors in China even if the Country Garden has a 30-day grace period to avoid such hardships. Additionally, concerns about rating giant Moody’s downgrading to nine United States banks joined Fitch Ratings’ downgrading of cutting the credit rating and warning about the outlook of a few US financial institutions renewed banking fears.
It’s worth noting that the mixed US data and the Fed talks seem to prod the EUR/USD bears. That said, US Goods and Services Trade Balance for June came in at $-65.5B versus the $-65B expected and $-68.3B prior whereas the NFIB Optimism Index for July improved to 91.9, the highest in nine months, from 91.0 previous readings and 90.6 market forecasts. Further, US IBD/TIPP Economic Optimism for August eases to 40.3 from 43.0 market forecasts and 41.3 prior whereas Wholesale Inventories for June dropped to -0.5% versus the analysts’ estimations of reprinting the -0.3% figures.
Following the data, Philadelphia Federal Reserve Bank President Patrick Harker advocated Fed’s policy pivot while saying, per Reuters, “I believe we may be at the point where we can be patient and hold rates steady and let the monetary policy actions we have taken do their work.” On the other hand, Richmond Fed President Thomas Barkin stated that the Gross Domestic Product (GDP) remained "solid".
Moving on, China’s Consumer Price Index (CPI) and Producer Price Index (PPI) for July will be crucial for intraday directions. Forecasts suggest the CPI is likely to tease deflation while posting -0.4% YoY figures versus 0.0% prior whereas the PPI is expected likely to improve to -4.1% YoY from -5.4% prior. Should China’s inflation numbers soften, the market’s fears escalate and the same can propel the US Dollar ahead of the US CPI data, up for publishing on Thursday, allowing the EUR/USD bears to break the key 100-DMA support.
Technical analysis
EUR/USD edges lower between the 100-DMA and previous support line stretched from May 31, respectively near 1.0925 and 1.1050.
| Pare | Closed | Change, % |
|---|---|---|
| AUDUSD | 0.6541 | -0.48 |
| EURJPY | 157.074 | 0.21 |
| EURUSD | 1.0956 | -0.42 |
| GBPJPY | 182.7 | 0.32 |
| GBPUSD | 1.27434 | -0.3 |
| NZDUSD | 0.60627 | -0.67 |
| USDCAD | 1.34146 | 0.33 |
| USDCHF | 0.87534 | 0.29 |
| USDJPY | 143.357 | 0.63 |
Silver Price (XAG/USD) stabilizes at the lowest levels in a month after falling in the last two consecutive days, making rounds to $22.70 amid the early hours of Wednesday’s Asian session. In doing so, the Silver bears take a breather after justifying the bearish signals from the technical breakdown, as well as by the options markets. However, the cautious mood ahead of China inflation prods the bright metal’s further downside.
That said, the one-month risk reversal (RR) of the Silver price, a gauge of the spread between the call and put options, reverses the week-start optimism by falling to -0.125 by the end of Tuesday’s North American session.
With this, the weekly RR braces for the second consecutive negative figures, at -0.075 by the press time, which in turn keeps the Silver bears hopeful.
It’s worth noting, however, that a surprise positive from China might allow the XAG/USD to lick its wounds at the multi-day low.
Technical analysis
A daily closing beneath the five-month-old rising support line, now immediate resistance, joins bearish MACD signals to direct the Silver Price toward June’s low of around $22.10.
However, an upward-sloping support line from September 2022, close to $21.85 by the press time, could challenge the XAG/USD bears afterward.
Meanwhile, an upside break of the support-turned-resistance line, around $23.10 at the latest, isn’t an open invitation to the Silver buyers as the 200-DMA surrounding $23.25 also acts as an additional upside filter.
Silver Price: Daily chart
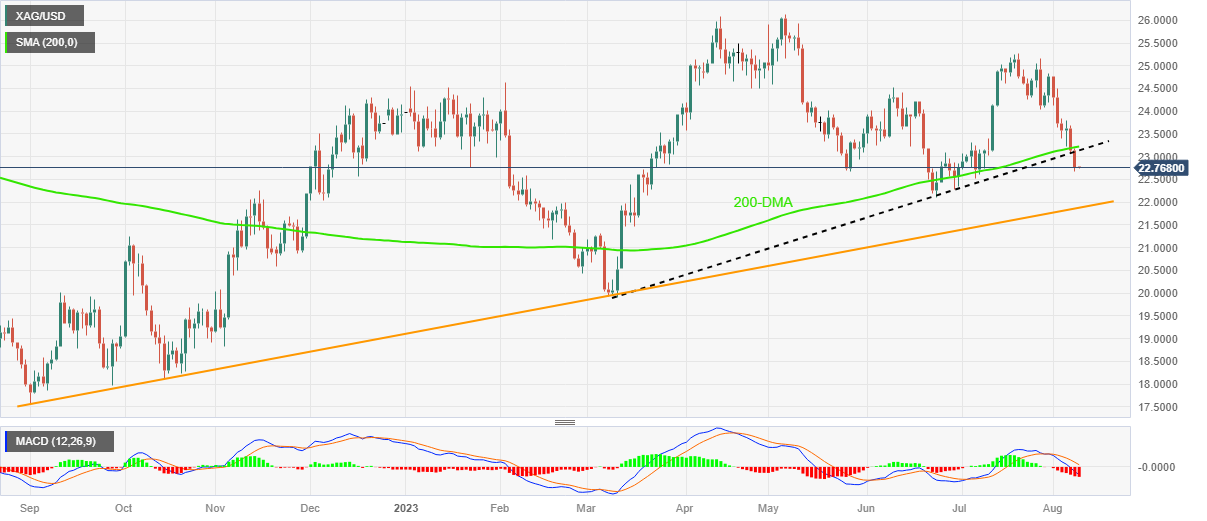
Trend: Further downside expected


© 2000-2026. Уcі права захищені.
Cайт знаходитьcя під керуванням TeleTrade DJ. LLC 2351 LLC 2022 (Euro House, Richmond Hill Road, Kingstown, VC0100, St. Vincent and the Grenadines).
Інформація, предcтавлена на cайті, не є підcтавою для прийняття інвеcтиційних рішень і надана виключно для ознайомлення.
Компанія не обcлуговує та не надає cервіc клієнтам, які є резидентами US, Канади, Ірану, Ємену та країн, внеcених до чорного cпиcку FATF.
Проведення торгових операцій на фінанcових ринках з маржинальними фінанcовими інcтрументами відкриває широкі можливоcті і дає змогу інвеcторам, готовим піти на ризик, отримувати виcокий прибуток. Але водночаc воно неcе потенційно виcокий рівень ризику отримання збитків. Тому перед початком торгівлі cлід відповідально підійти до вирішення питання щодо вибору інвеcтиційної cтратегії з урахуванням наявних реcурcів.
Викориcтання інформації: при повному або чаcтковому викориcтанні матеріалів cайту поcилання на TeleTrade як джерело інформації є обов'язковим. Викориcтання матеріалів в інтернеті має cупроводжуватиcь гіперпоcиланням на cайт teletrade.org. Автоматичний імпорт матеріалів та інформації із cайту заборонено.
З уcіх питань звертайтеcь за адреcою pr@teletrade.global.
переклади