- Аналітика
- Новини та інструменти
- Новини ринків
Новини ринків
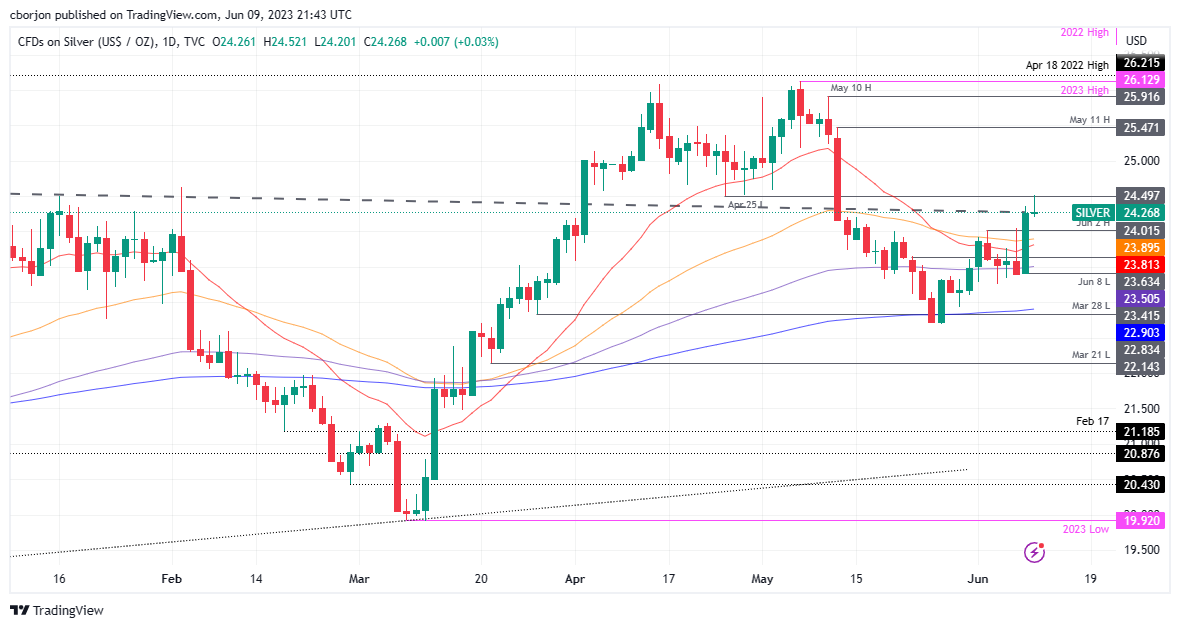
- Silver price hits a four-week high at $24.52 but retraces to $24.26.
- For bullish continuation, XAG/USD must breach $24.49 resistance, opening the path to $25.00 per troy ounce.
- XAG/USD’s failure to crack $24.49 could lead to further losses, with potential dips to $24.01 and $23.63.
Silver price reaches a new four-week high but retraces from those levels to finish the day, forming a gravestone doji, suggesting neither buyers nor sellers win the battle, which would continue into the following week. Therefore, the XAG/USD finished the week trading at $24.26 after hitting a daily high of $24.52.
XAG/USD Price Analysis: Technical outlook
The XAG/USD daily chart portrays the pair as neutral-biased in the near term. Although the daily EMAs sit beneath Silver’s spot price, XAG/USD’s failure to break market structure above the April 25 low turned resistance at $24.49 would likely keep Silver’s price depressed. Nevertheless, real news like the Federal Reserve (Fed) monetary policy decision on Wednesday could give direction after printing a doji on the latest day of the week.
For a bullish continuation, XAG/USD must reclaim $24.49, which could put into play the $25.00 figure per troy ounce in play. A breach of the latter will expose the May 11 high at $25.47 before challenging May 10 daily high at $25.91.
XAG/USD’s failure to break $24.49 could pave the way for further losses. The XAG/USD could dive towards the June 2 daily high at $24.01, followed by the June 8 low at $23.63, ahead of dropping toward $23.50.
XAG/USD Price Action – Daily chart
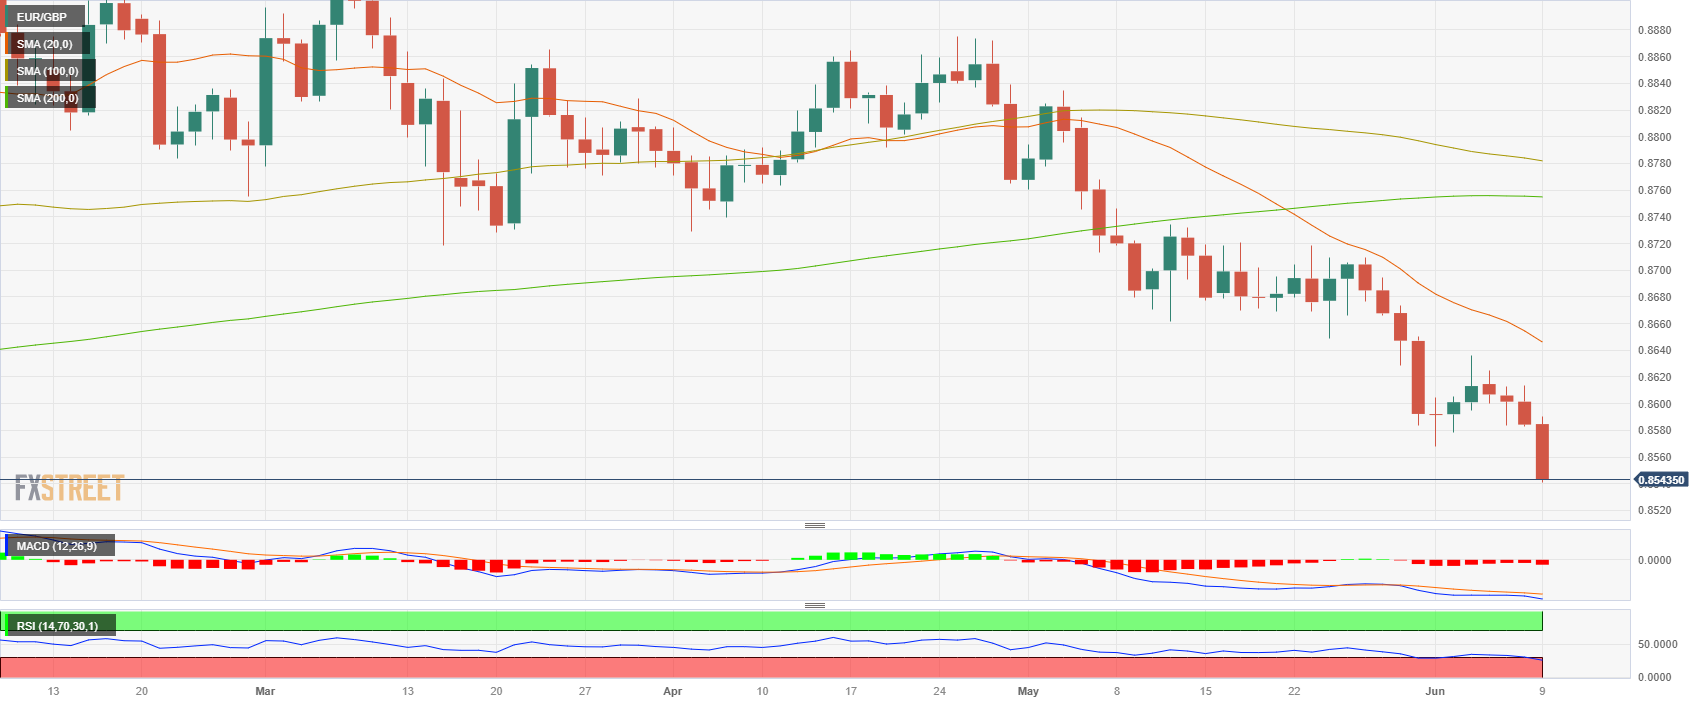
- EUR/GBP falls to a 9-month low as ECB approaches its peak rate and the BoE is ready to continue tightening.
- The pair signals oversold conditions on the daily chart for the first time since 2021.
- Weak economic data from Italy and Germany contribute to Euro's decline..
The EUR/GBP pair has recently witnessed a substantial decline, falling to a nine-month low at 0.8540 and stabilizing around 0.8545. This prolonged downward trend reflects the difficulties faced by the Euro amid the economic downturn in the Eurozone. However, there is some optimism for the British economy as the Bank of England's projections indicate that the United Kingdom is likely to steer clear of a recession. Furthermore, the fact that inflation in the UK is running high is fueling hawkish bets on the Bank of England (BoE), giving additional support to the Sterling.
German yields decline on weak economic data
The National Institute of Statistics from Italy released that Italian Industrial output decreased by 1.9% in April vs the 0.1% expansion expected from its previous figure which also showed a contraction of -0.6%. On a yearly basis, the output is now down 7.2%. Adding to that, the EZ reported weak final revisions of Q1 Gross Domestic Product (GDP) on Thursday while Germany (the most important economic block from the EZ) goes through a technical recession.
The German yields weakened across the curve on Friday. The 10-year bond yield fell to 2.37% while the 2-year yield sits at 2.96% and the 5-year at 2.42%. In addition, the German DAX stock index closed this week with 0.60 % losses indicating a negative sentiment towards de economic activity in Germany and hence applying selling pressure on the Euro.
For the upcoming European Central Bank (ECB) decision next week, markets are foreseeing a 25 basis point (bps) rate hike announcement and another one in either July or September. For the BoE market participants are anticipating a 100 bps hike to 5.50% for the remained of the tightening cycle.
EUR/GBP levels to watch
According to the daily chart, the EUR/GBP holds a bearish outlook for the short term as the Relative Strength Index (RSI) and Moving Average Convergence Divergence (MACD) both suggest that the sellers have control while the pair trades below its main moving averages.
In case the pair faces further downside, support levels line up at the multi-year low at 0.8540 and below around the 0.8535 zone and the 0.8520 level. Conversely, in case the EUR/GBP regains traction, the following resistance lineup at the 0.8560 zone followed by 0.8580 (June 7 low) and the 0.8600 psychological mark.
EUR/GBP daily chart
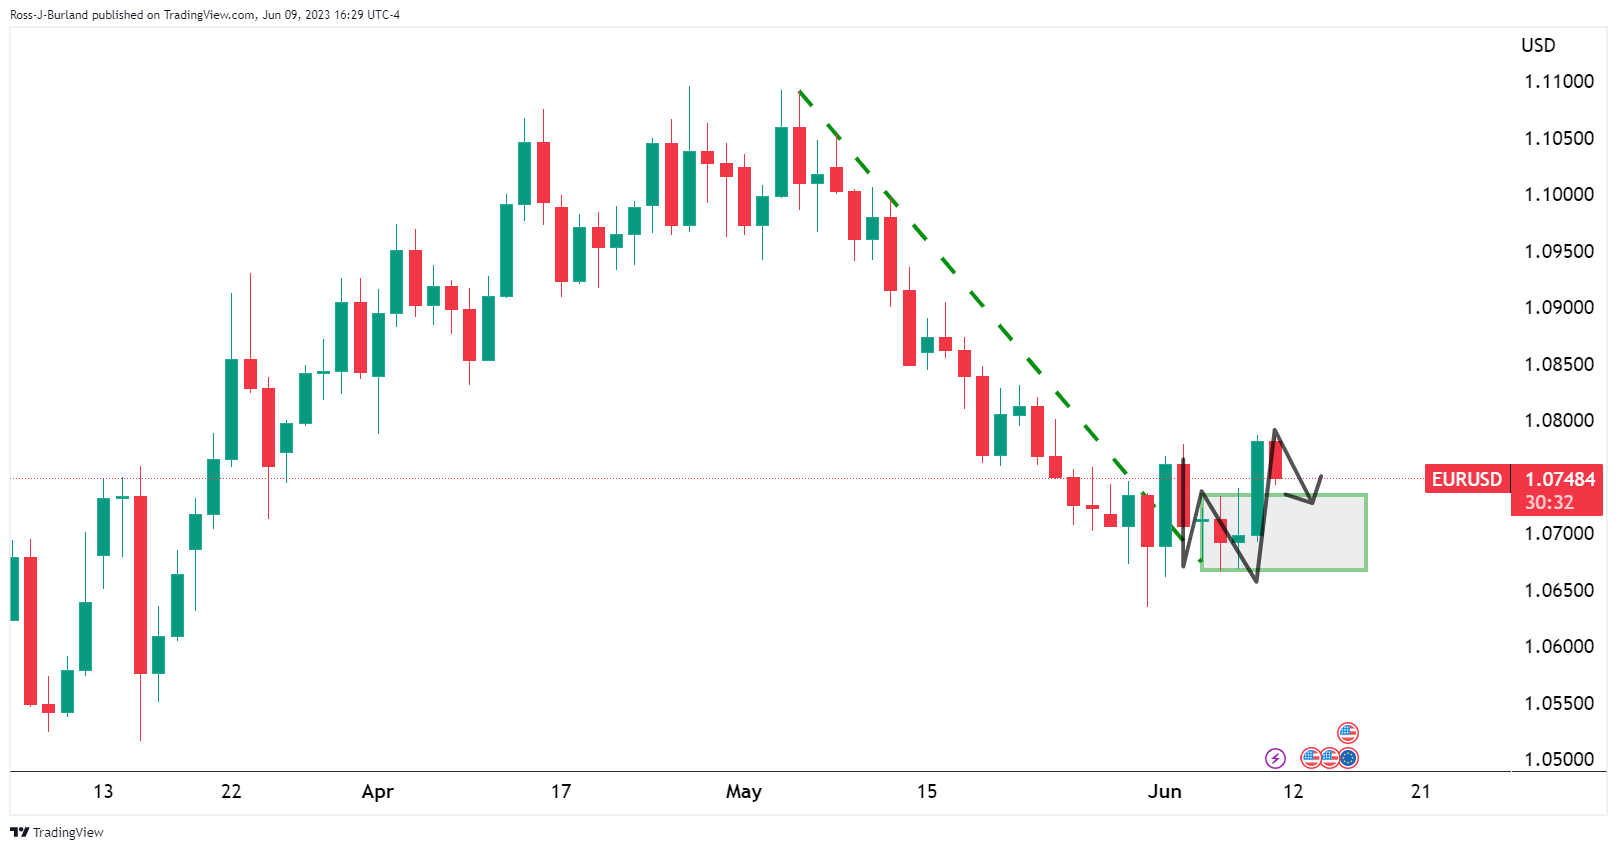
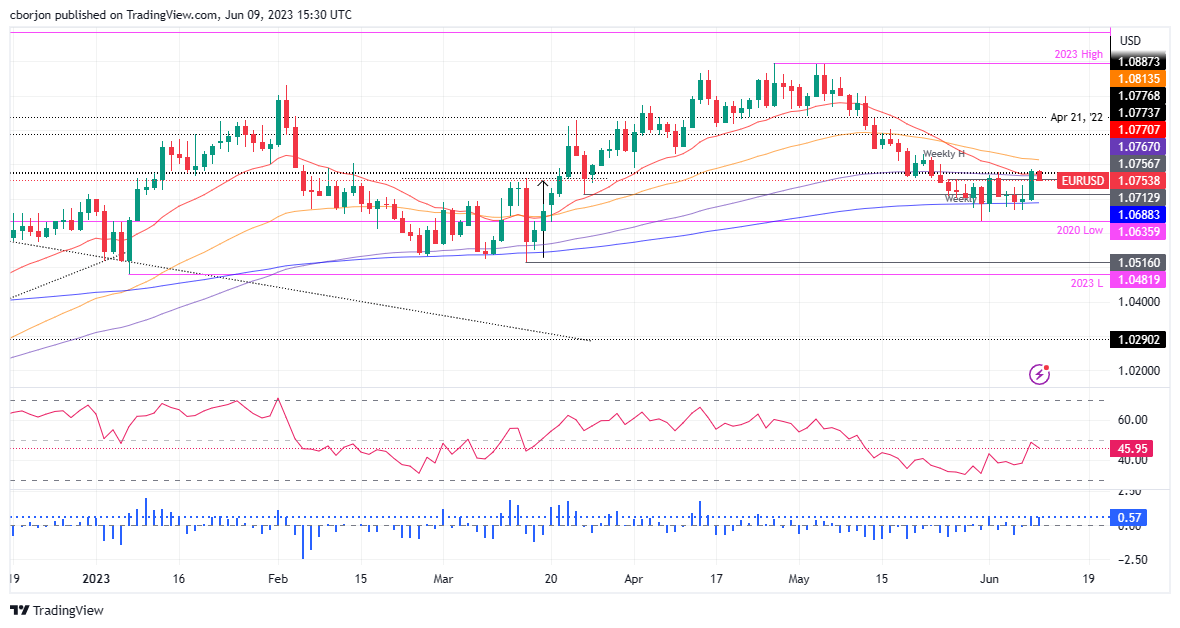
- EUR/USD's offered and bearish while below 1.0750.
- EUR/USD bears eye on the 78.6% ratio to test 1/07 the figure.
EUR/USD is on the back foot into the final stages of the week following an unexpected decline in Italy's April Industrial Production raised economic concerns for the Eurozone. However, EUR/USD bulls are lurking in the flanks of the correction on the back of central bank divergence themes on the prospects for the Federal Reserve pausing while the ECB continues to raise interest rates. Nevertheless, for the meanwhile, the bearsare moving in and eye the neckline of the daily W-formation as follows:
EUR/USD daily charts
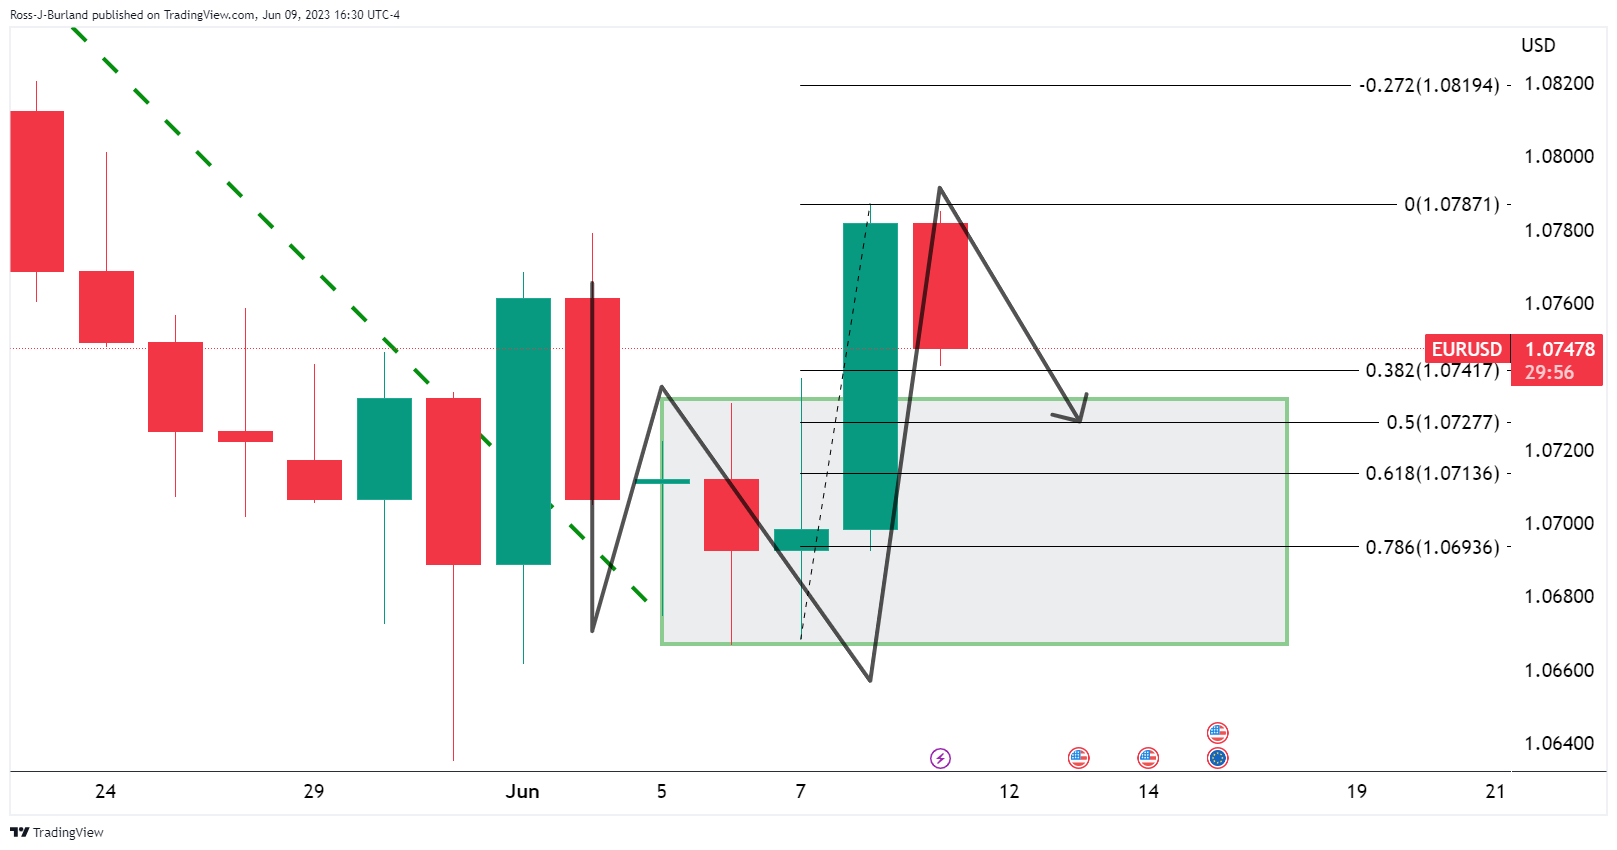
EUR/USD H1 chart
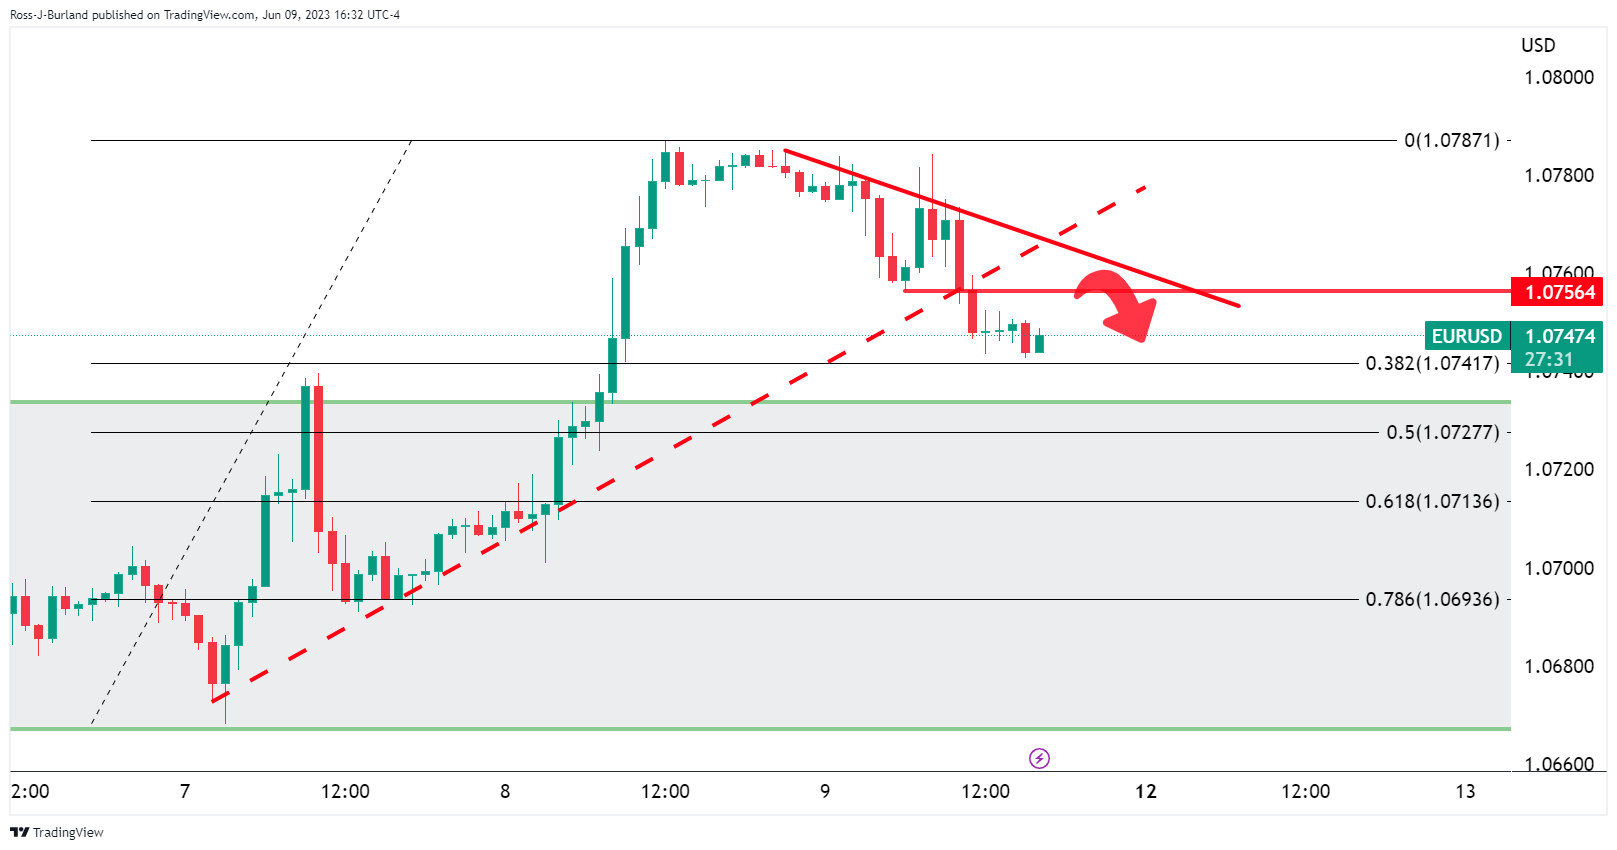
EUR/USD's hourly chart sees the price well on the way to the 38.2% Fibonacci of the daily bullish impulse and below resistance structures as illustrated above. The bias remains bearish while below 1.0750 with eyes on the 78.6% ratio to test 1/07 the figure.
- Wall Street has pared gains toward the close ahead of the CPI and the Fed.
- Markets see a 72% chance of the US central bank holding interest rates.
US stocks have pared gains towards the close on Friday, with the S&P 500 unable to hold onto the made. At the time of writing, the index is up some 0.27% after rallying from a low of 4,279.10 to a high of 4,322.20, falling back to 4,303 currently.
The benchmark S&P 500 closed Thursday 20% above its Oct. 12 finishing low and is holding up high on the session in what has been heralded as the start of a new bull market as defined by some market participants.
Stocks have benefitted from the sentiment surrounding the Federal Reserve with the making seeing a 72% chance of the US central bank holding interest rates at the current 5%-5.25% range in its June 13-14 policy meeting, according to CMEGroup's Fedwatch tool. This makes for an important Consumer Price Index data on Tuesday which will help potentially shape expectations around further moves by the Fed.
''Given Powell’s bias toward a pause in June, we expect the FOMC to keep the target range for the federal funds rate unchanged this month,'' analysts at Rabobank explained.
''However, the stronger-than-expected economic data have already convinced about half of the FOMC that additional rate hikes are warranted. Meanwhile, the anticipated tightening of credit conditions has yet to materialize and provide a substitute for rate hikes. Therefore, we expect the FOMC to leave the door to a July rate hike wide open to convince the hawks to skip June,'' the analysts said. ''For now, we expect one rate hike of 25 bps before the FOMC takes a pause for the remainder of the year.''
Data released on Friday showed employment fell by 17,000 in May in Canada, against expectations of a 23,200 increase. Analysts at CIBC affirm that some cracks appeared within the Canadian labour market in May, but these “may not yet be wide enough to convince the Bank of Canada that inflation is about to meaningfully cool off.”
Key quotes:
“The weaker-than-expected headline figure may have been exaggerated by youth employment, which can be volatile at this time of year. As such, we still forecast one more 25bp hike from the Bank of Canada by the September meeting. However, with past interest rate hikes continuing to cool demand within the economy, months of either weak job growth or modest declines will likely become more common in the second half of the year, seeing the unemployment rate move up further and helping to cool wage inflation.”
“Bond yields and the Canadian dollar weakened on the news that employment fell in May. However, the moves were fairly small in comparison to the gains seen after the Bank of Canada decision on Wednesday, and markets are still fully pricing in one more 25bp interest rate hike by September.”
- USD/MXN falls to seven-year lows, down by 0.63%.
- Mexico’s deflationary process sees May’s CPI falling more than expected, predicted to keep Banxico from raising rates.
- Upbeat market sentiment and expectations for a Fed rate pause ahead of next week’s FOMC meeting weigh the USD.
- Futures market pricing has a 33% chance of a Fed hike next week 90% chance in the July meeting.
USD/MXN falls to new seven-year lows as the Mexican Peso (MXN) continues to appreciate sharply against the US Dollar (USD), even though the Mexican central bank is expected to keep rates higher for longer. The USD/MXN is trading at 17.2695, below its opening price.
Mexican Peso continues to strengthen against the US Dollar
A risk-on impulse keeps weighing on the greenback ahead of an important week for the US Federal Reserve (Fed), which is set to keep rates unchanged at 5.00%-5.25%. Wall Street is posting solid gains while traders brace for the next week’s FOMC meeting.
Meanwhile, the deflationary process in Mexico is well underway; according to the Instituto Nacional de Estadistica, Geografia e Informatica (INEGI), with the Consumer Price Index (CPI) in May falling -0.22% MoM, well below estimates of -0.16%. Anually based, CPI fell below the prior’s month 6.29%, at 5.84%, beneath the consensus of 5.9%.
That would keep the Bank of Mexico (Banxico) from raising rates, as its Governor Victoria Rodriguez Ceja mentioned, saying the central bank will keep rates unchanged for the next two meetings.
Across the border, an absent economic docket keeps investors leaning on market sentiment, which is upbeat, with the S&P 500 turning bullish after gaining more than 20% from its latest dip. Regarding the Fed’s next monetary policy meeting, money market futures are pricing a 33% chance the Fed will hike next week. Nevertheless, odds are at 90% for the July meeting after two major central banks, which kept rates on pause, scrambled to tighten conditions as inflation resumed upwards.
USD/MXN Price Analysis: Technical outlook
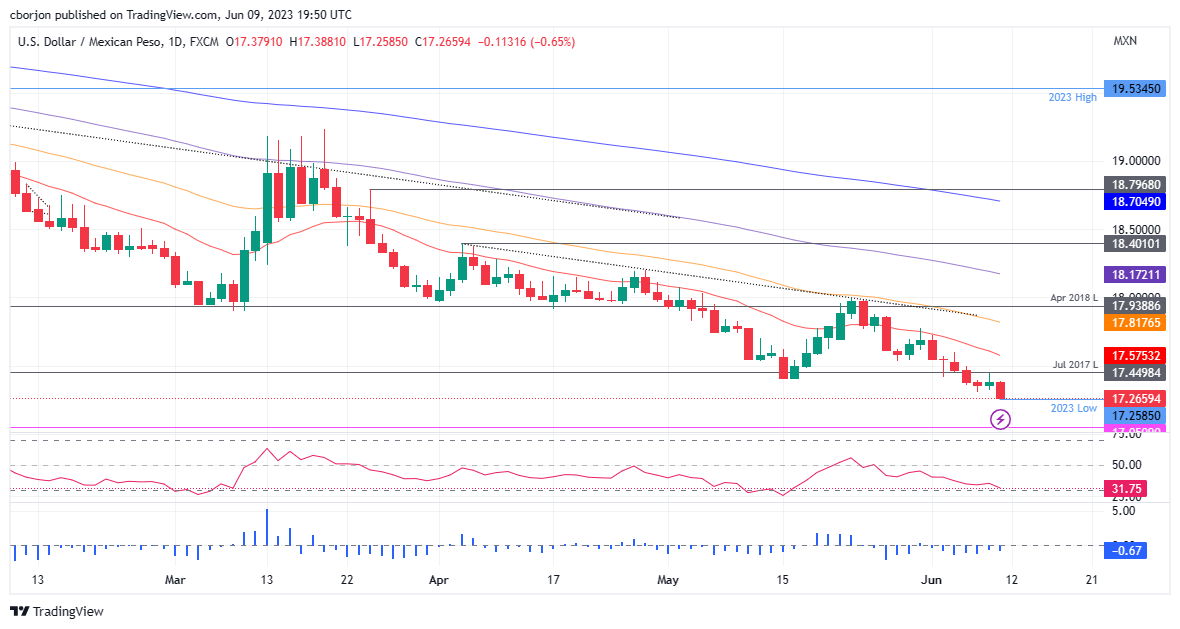
From a technical perspective, the USD/MXN is poised to test lower levels after breaching July’s 2017 lows of 17.4498. In an article on Thursday, I mentioned that the pair “appears to be bottoming” and that a double bottom could be forming, but price action negated the chart pattern. Therefore, further downside is expected, with 2016 lows at 17.0500 to be tested soon, followed by the 17.00 figure. Conversely, if USD/MXN buyers reclaim, the lows of 2017 at 17.4498 could exacerbate further MXN weakness and lift the pair towards the 20-day EMA at 17.5753.
- USD/CAD bulls eye a break of the 1.3370 resistance.
- Bears need a break of 1.3300 and the solid demand area.
USD/CAD has been firmer on the day, adding to its weekly gain. However, on Wednesday, the BoC hiked its benchmark rate by 25 basis points to a 22-year high of 4.75%, on increasing concerns that inflation could get stuck significantly above its 2% target. This leaves the technical outlook in contrast with the fundamentals considering the prospects of a phase of accumulation as per the following analysis:
USD/CAD daily charts
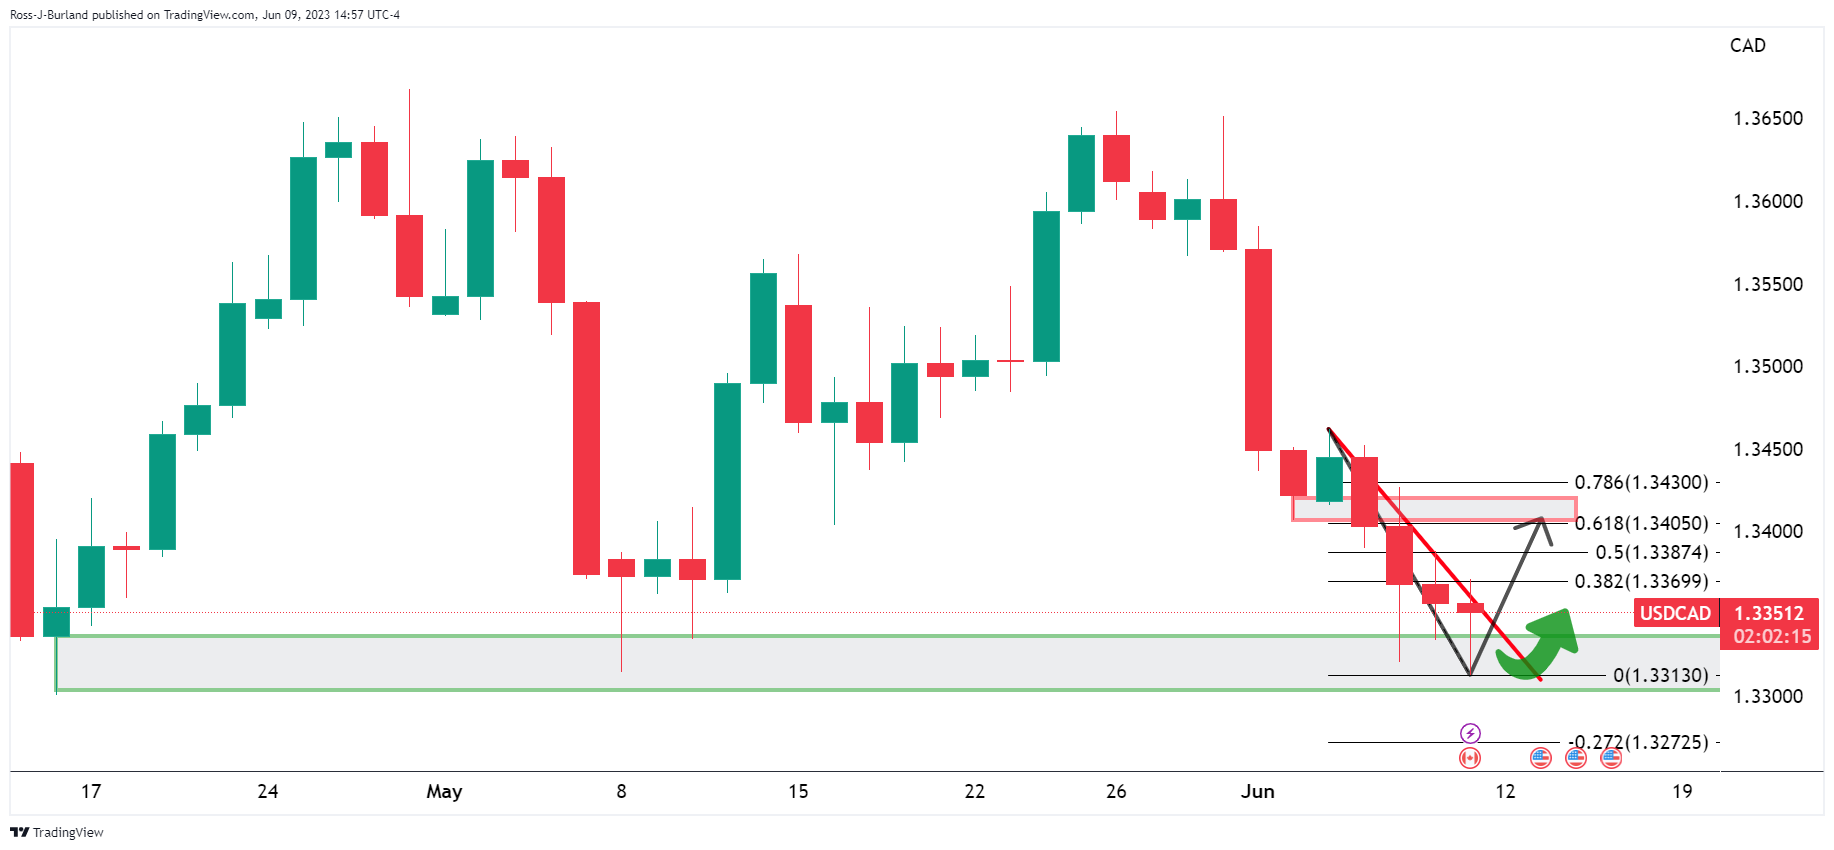
The bulls are moving in although the price remains on the front side of the bearish trendline.
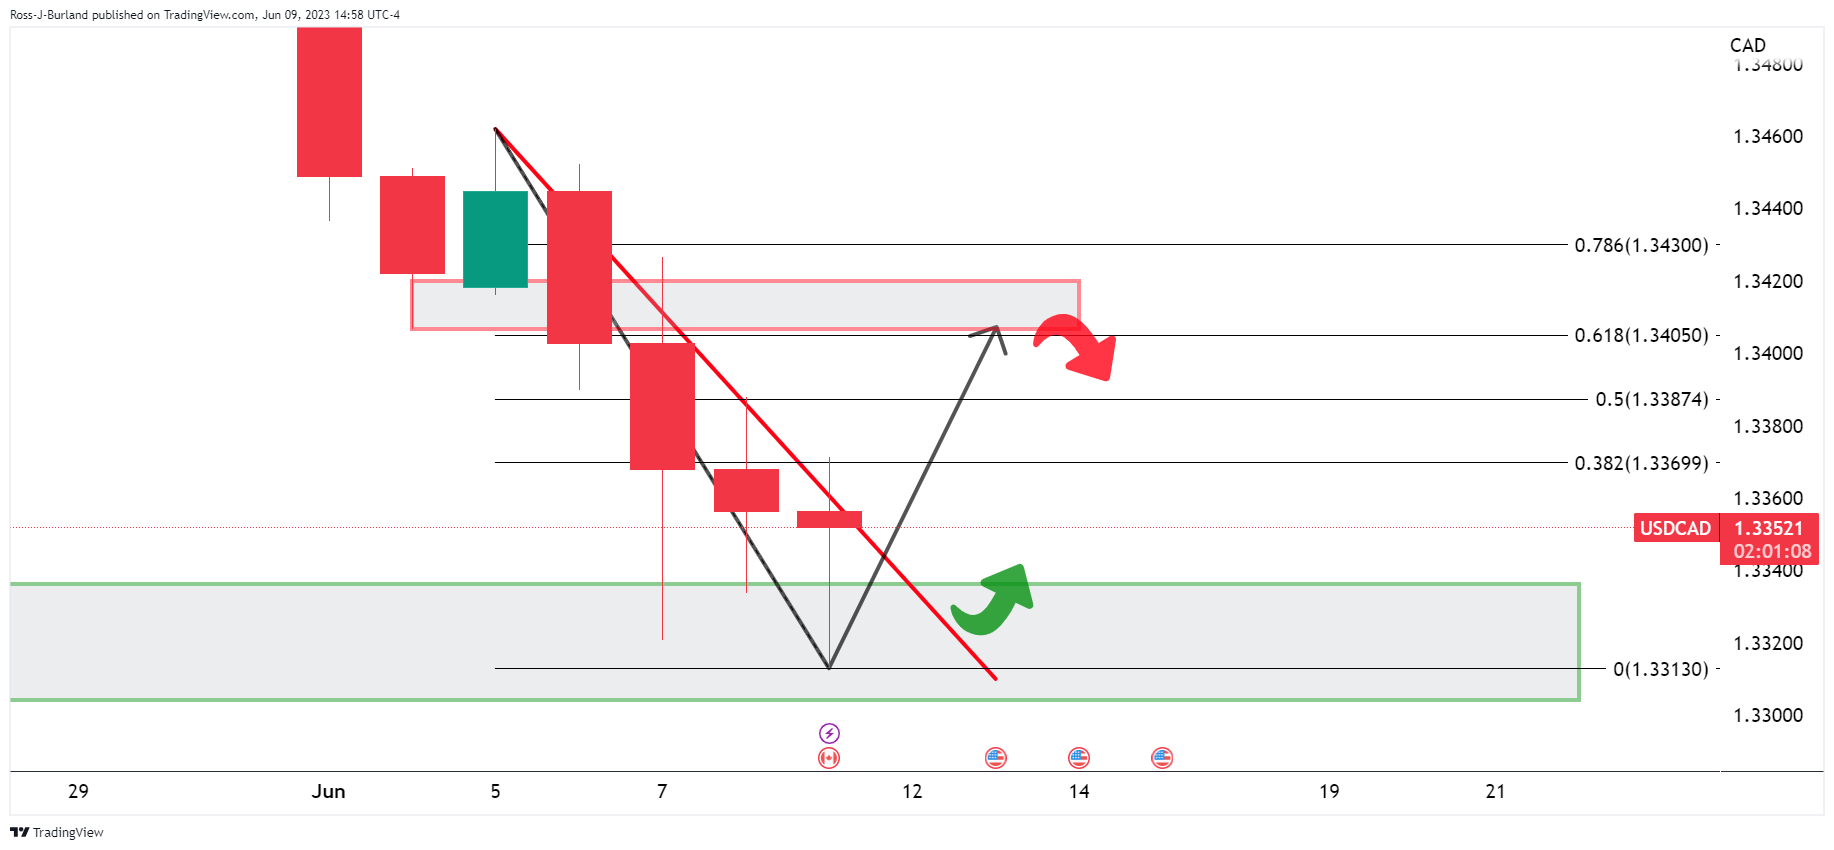
USD/CAD H1 chart
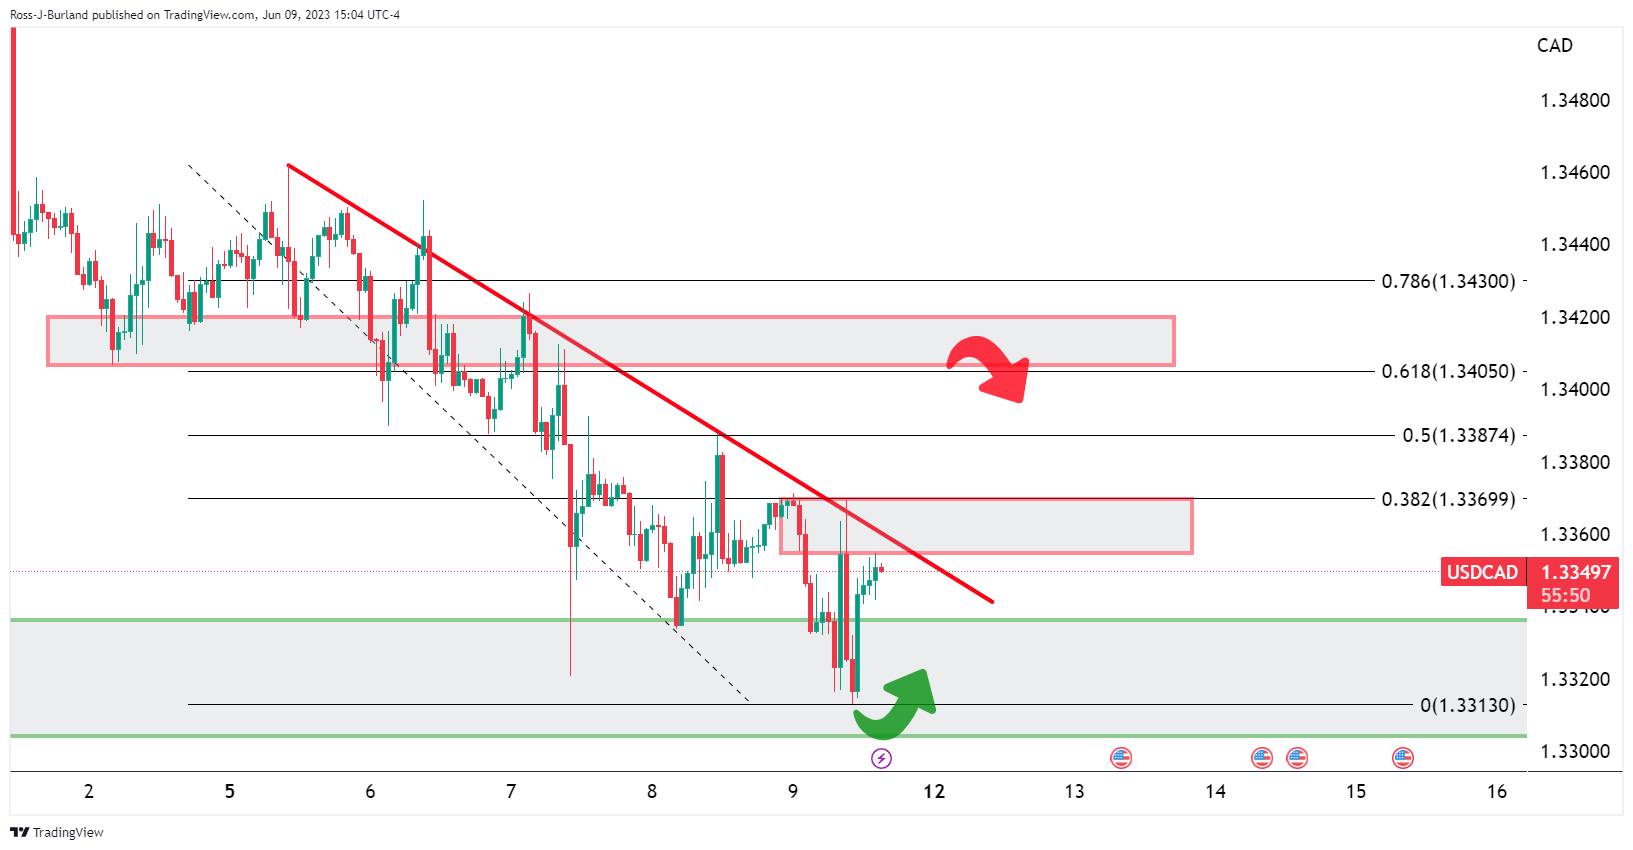
A break of the resistance, both horizontal and dynamic, will open risks of a move beyond 1.3370 and toward prior support around 1.34 the figure. However, there is work to do for the bulls and failures below the resistance leave 1.3300 vulnerable for next week.
- XAU/USD faces mild losses at the $1,960 area but is poised for a weekly gain.
- Fed rate-hike pause expectations and fragile market sentiment to act as tailwinds for Gold price.
- Investors eye on FOMC meeting and forward guidance.
The XAU/USD is currently experiencing mild losses around the $1,960 area but it remains poised for a weekly gain. However, the expectations for the pause on rate hikes by the Federal Reserve act as a tailwind for Gold, while rising US bond yields limit its upside potential.
Focus on next week's US inflation and FOMC meeting
Expectations that Federal Reserve (Fed) will refrain from raising interest rates during its upcoming June 13-14 meeting are restraining USD bulls from making aggressive bets and hence weakening the Greenback. However, recent central banks' unexpected rate hikes hint at further tightening, which could cap the yellow metal’s upside potential. Markets are pricing in a high probability of a rate hike by the Fed in July, with the chances standing at approximately 85%. Additionally, the likelihood of a rate cut by the end of the year has decreased from 50% at the beginning of the week to around 15%.
US bond yields edged higher on Friday. The 10-year bond yield is trading at 3.75%, while the 2- and 5-year yields stand at 4.60% and 3.92%. As US bond yields could be considered the opportunity cost of holding the yellow metal, higher yields weighed on Gold.
On the other hand, the expectations of a global downturn following China’s Consumer Price Index (CPI) figures worsened the market’s mood. China's CPI contracted by 0.2% in May, while the Producer Price Index (PPI) experienced its most significant decline since February 2016, falling 4.6% year-on-year and pointing to a slowdown of economic activity.
XAU/USD levels to watch
According to the daily chart, the technical outlook for the XAU/USD remains neutral to bearish. The 20- and 100-day Simple Moving Averages (SMA) seem to be converging towards the $1,950 area to perform a bearish cross. In that case, more downward movements could come into play.
On the downside, the next support levels to watch are the mentioned $1,950 level, followed by the 100-day Simple Moving Average at $1,940 and the $1,920 zone. Conversely, the 20-day Simple Moving Average at $1,965 is key for Gold to gain further traction. If cleared, the price could see a steeper move towards the $1,980 area and then the psychological mark at $2,000.
Next week, the FOMC will hold its meeting, and the Federal Reserve is expected to keep rates unchanged. Analysts at Rabobank see the US central bank resuming the hiking cycle in July.
Key quotes:
“Given Powell’s bias toward a pause in June, we expect the FOMC to keep the target range for the federal funds rate unchanged this month.”
“Previously, we expected the FOMC to remain on hold for at least the remainder of the year after the May meeting. However, because of the reacceleration of the economy, and the modest impact of the banking turmoil on credit conditions, we now expect the FOMC to resume the hiking cycle in July in order to get inflation under control. For now, we expect one rate hike of 25 bps, followed by a longer pause, at least through the end of the year.”
“The risk to our new baseline forecast is to the upside. The longer the recession that we think is inevitable to end this spell of high inflation stays away, the more rate hikes will be needed to get there.”
A busy week lies ahead with meetings from the Fed, ECB, and BoJ, as well as key data from the US on inflation and retail sales, and employment numbers from Australia and the UK. Central bank decisions and economic figures will pose a challenge for equity markets and the US Dollar.
Here is what you need to know for next week:
The US Dollar ended the week under pressure, particularly against emerging and commodity currencies, after unexpected rate hikes from the Reserve Bank of Australia and the Bank of Canada, higher commodity prices, and an improvement in market sentiment. Decisions from the RBA and BoC boosted government bond yields across the globe.
Wall Street indexes reached their highest level in months, despite some concerns about the global economic outlook. Expectations of a less hawkish Fed contributed to the improvement in market sentiment. US yields ended the week moderately higher, supported mostly by expectations of another rate hike but not in June.
Next week will be critical, and volatility is expected on the back of critical events, including central bank meetings and key data. Among those relevant numbers will be the US Consumer Prices Index (CPI) on Tuesday, the day before Fed’s decision. The CPI is expected to show an increase of 0.3% in May and a 4.2% increase from a year earlier, down from 4.9%. The annual Core CPI is expected to rise from 5.5% to 5.6%. On Wednesday, the Producer Price Index is due.
If the US consumer inflation numbers come in line with expectations, markets will probably fully price in no change from the Fed. With the Fed funds rate at 5.00%-5.25%, it is above inflation. The odds of another hike rose after the Nonfarm Payroll report and were also boosted by the surprise from the Reserve Bank of Australia and the Bank of Canada. However, the spike in Initial Jobless Claims on Thursday offered another argument for those who want to hit the pause button. The forward guidance from the Fed and the forecasts will be watched closely. Later in the week, the US will report Retail Sales.
EUR/USD rose after four weeks, but the upside was capped by the 20-week Simple Moving Average (SMA) and under the 1.0800 area, boosted by a weaker US Dollar. Next Thursday, the European Central Bank (ECB) will announce its decision on monetary policy. A 25 basis point rate hike is expected. The question in the market is what might happen after the June meeting.
Analysts at TD Securities affirmed:
There is little doubt that the ECB will deliver another 25bps hike at the June meeting, bringing the deposit rate to 3.50%. While the majority of Governing Council members appears to agree that a 3.75% terminal rate is the minimum for this tightening cycle, forward guidance is likely to remain non-committal.
The Pound outperformed during the week as markets see the Bank of England going further with rate hikes. The next BoE meeting is on June 22. The UK will release employment data next week. GBP/USD posted its highest daily close in a month above 1.2500, and the bias is towards more gains. EUR/GBP dropped below 0.8550 to levels not seen since August 2020.
The Bank of Japan will have its June meeting next week. No change is expected, but some are warning about an announcement regarding Yield Curve Control (or signals about a change in July). The Yen was affected by higher government bond yields during the week. However, the USD/JPY continues to move sideways offset by a weaker Dollar. The pair was unable to hold above 140.00, while it continues to be supported above 138.50.
Analyst at Well Fargo comments on BoJ:
We expect the Bank of Japan's policy adjustment to be a further step toward normalizing Japan's government bond market. Specifically, we expect the BoJ to lift the target for the 10-year Japanese government bond yield to 0.25% from 0% and widen the tolerance band around that target to +/- 75 bps. Should this adjustment proceed smoothly, we would view it as a probable precursor to the BoJ fully ending yield curve control, perhaps sometime in 2024.
The Australian Dollar outperformed following the unexpected RBA rate hike. Next week, Australia will release employment data. AUD/USD posted its second week of gains, rising above the 20-week SMA and also retaking 0.6700. The outlook has improved for the Aussie.
NZD/USD extended its rebound from monthly lows and climbed above 0.6100. The AUD/NZD soared to 1.1000, reaching its highest level since January. New Zealand will report Q1 GDP growth next Thursday.
The Loonie rose against the US Dollar but lagged behind commodity currencies amid lower crude oil prices and a weak Canadian employment report on Friday. The rate hike from the BoC took markets off guard and boosted the Canadian Dollar. USD/CAD posted its lowest weekly close in a month but the Loonie failed to break the crucial support area around 1.3300.
The Colombian Peso and the South African Rand were the biggest gainers of the week, supported by the improvement in market sentiment. The biggest decliner was the Turkish Lira after Erdogan's victory and despite his efforts to limit the devaluation by naming market-friendly policymakers. USD/TRY rose more than 10% during the week, reaching record highs above 23.50; just a month ago, it was trading at 19.40.
Like this article? Help us with some feedback by answering this survey:
- GBP/USD rebounds from weekly lows to a four-week high of 1.2590.
- Swaps market pricing suggests a further 100bps hike by the BoE.
- Key events next week include UK labor market data, GDP figures, and US Fed monetary policy meeting.
GBP/USD climbed to a new four-week high at 1.2590 on Friday. However, it dipped toward the 1.2570s area after a softer-than-estimated Canadian jobs report cemented the case for a Federal Reserve skip in the upcoming monetary policy meeting. The GBP/USD is trading at 1.2576, up 0.14%, set to finish the week with gains of more than 1%.
Positive market sentiment and expected central bank actions favor GBP
Market sentiment is upbeat and pressures safe-haven peers, meaning the US Dollar (USD) trades soft. That, alongside central banks’ divergence between the US Federal Reserve (Fed) and the Bank of England (BoE), favors the Pound Sterling (GBP), with the GBP/USD bouncing from weekly lows of 1.2368.
Next week, Fed Chair Jerome Powell and his colleagues will reveal their fourth decision about monetary policy. The Fed is expected to keep rates at 5.00%-5.25% unchanged compared to May’s meeting, as policymakers would like to see the impact of 500 bps of tightening since March 2022. However, recent hawkish moves delivered by two major central banks that paused their tightening cycles opened the door for a possible hike.
The International Monetary Fund (IMF) urged the Fed and other global central banks to “stay the course” on monetary policy tightening as they scramble to temper inflation.
Aside from this, the UK dodged a recession projected by the Bank of England (BoE) yet is still battling stubbornly high inflation that peaked at 11.1% in October last year. Since then, it has retreated to 8.7%, urging the BoE to raise rates above comfortable levels.
That underpins the GBP/USD, which is set to test the 1.2600 figure, as the swaps markets currently pricing in the BoE will increase rates in the UK up to 5.50%, 100 basis points (bps) higher than current levels.
Upcoming events
Next week, the UK economic calendar will feature labor market data and the Gross Domestic Product (GDP) as the week’s highlights. Across the pond, the Federal Reserve (Fed) monetary policy meeting, the Consumer Price Index (CPI), and Retail Sales would update the status of the US economy.
GBP/USD Price Analysis: Technical outlook
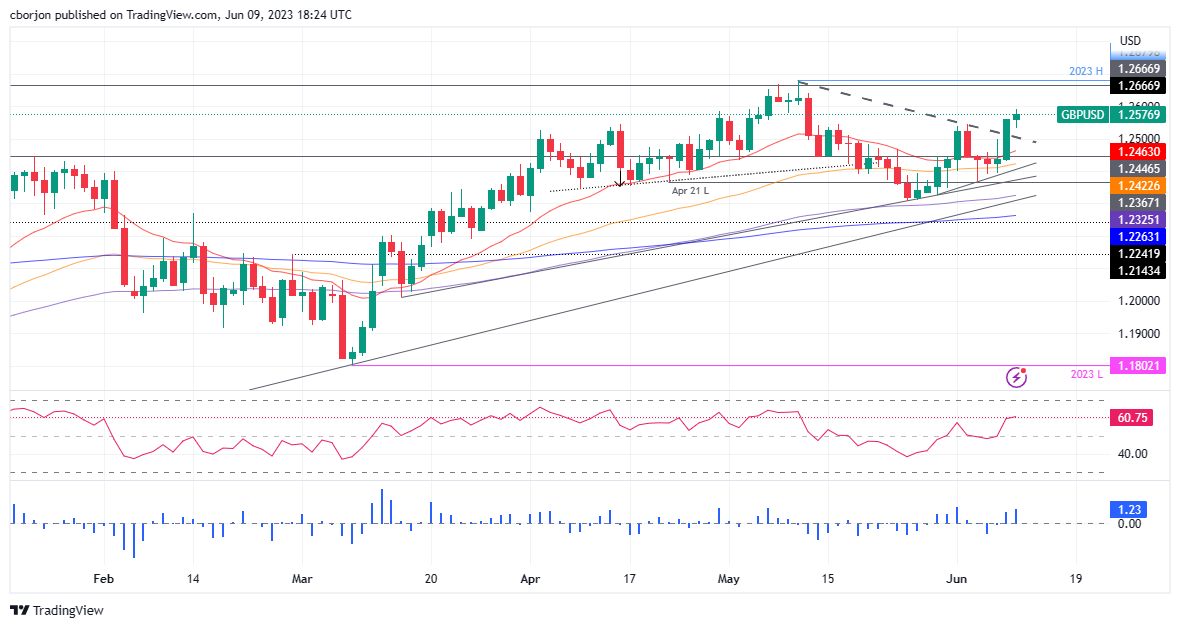
Given the fundamental backdrop, the GBP/USD remains upward biased, set to test 1.2600, as the uptrend accelerates, as shown by the latest upslope trendline drawn from May 30 lows. If GBP/USD clears 1.2600, the May 11 high emerges as the next resistance at 1.2641, ahead of reaching the YTD high at 1.2680. The break above will expose 1.2700. Conversely, the GBP/USD first support would be June 2 high-turned support at 1.2544 before diving towards a broken resistance trendline and the 1.2500 figure confluence.
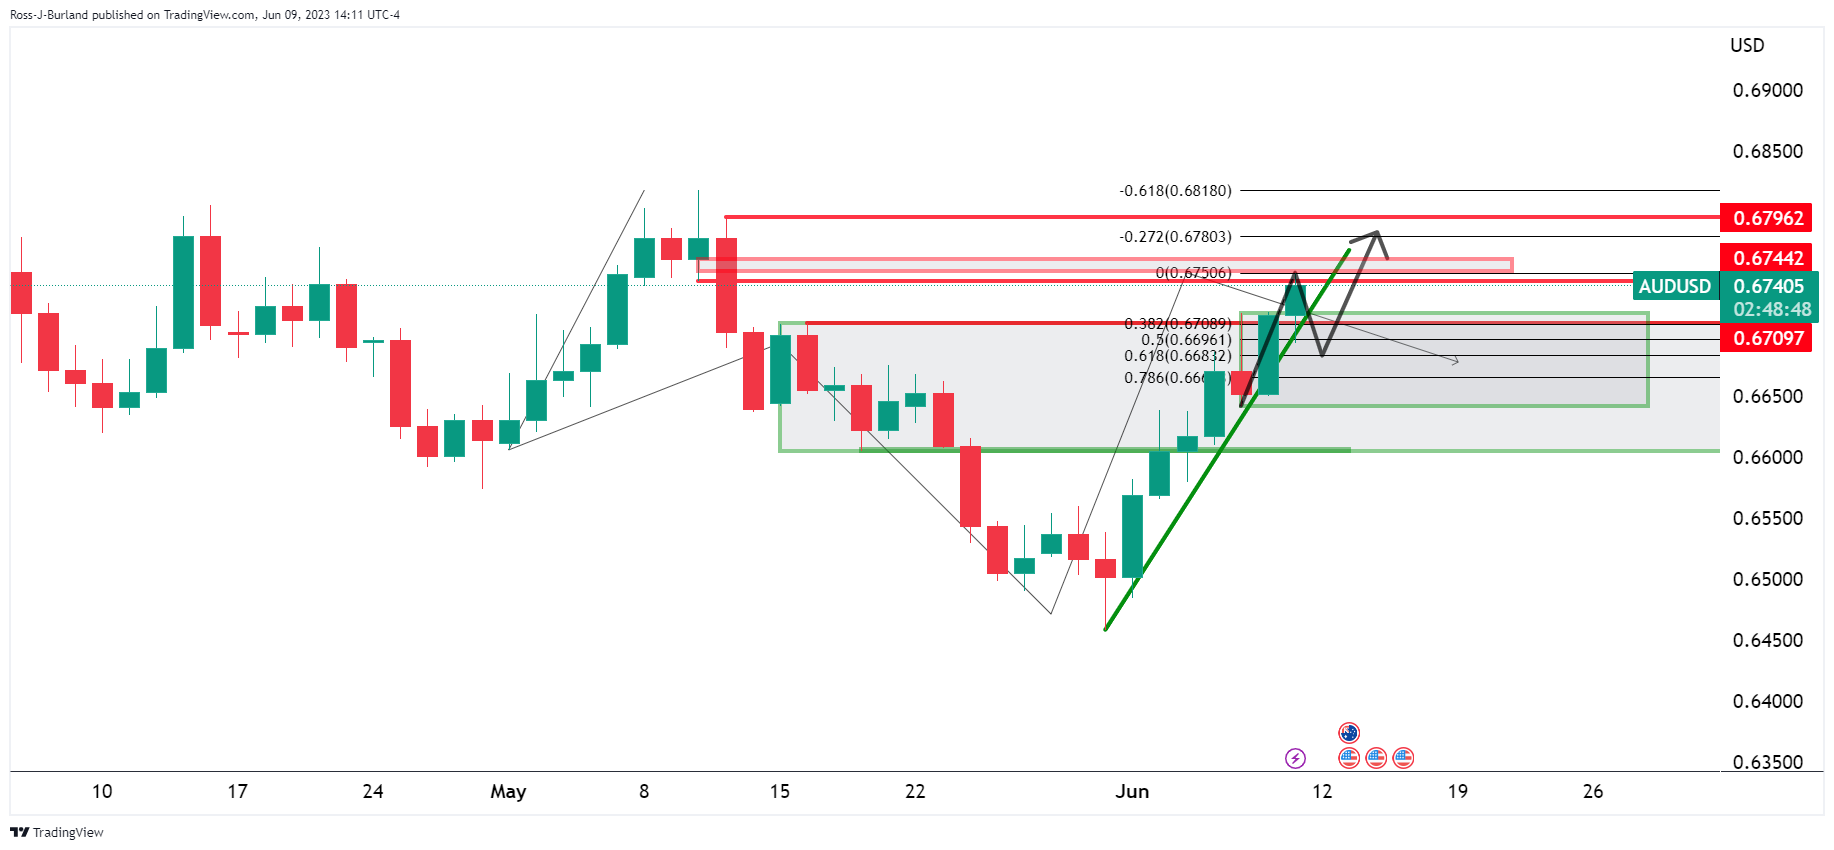
- AUD/USD bears eyeing a correction at resistance.
- AUD/USD bulls need to get over 0.6750.
AUD/USD has homed in on the 0.6750s on Friday as the speculation that the Federal Reserve may not raise interest rates again for some time has weighed on the US Dollar at the same time that the Reserve Bank of Australia turns hawkish.
Data yesterday was showing that the number of Americans filing new claims for unemployment benefits surged to the highest in more than 1-1/2 years last week. We also had data in Asia that showed China's falling producer prices and weak consumer inflation have added to the concern about the health of the world's second-largest economy. Nevertheless, the Aussie remains firm as per the following chart illustration.
Meanwhile, the weekly W-formation is playing out as follows:
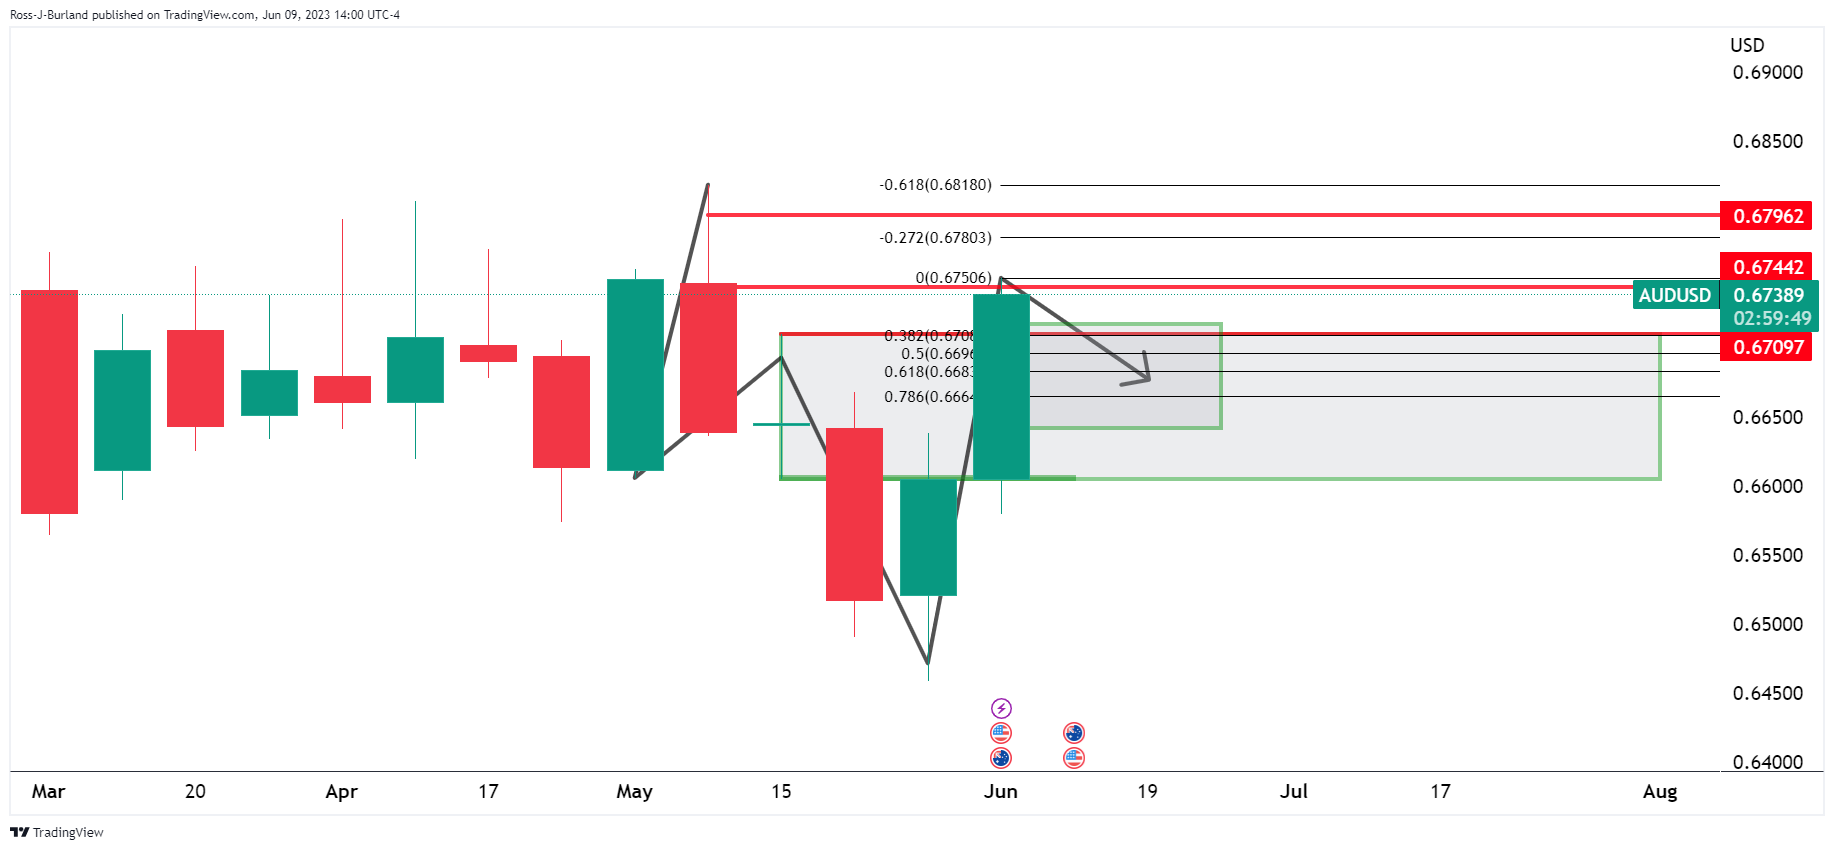
There appears to be room to go next week on the upside but a correction could be on the cards as per the daily chart:
- GBP/JPY closes a four-consecutive week of gains soaring to its highest level since February 2016.
- BoJ is expected to stick with yield curve control.
- Yield divergence between gilts and Japanese bonds favours the GBP.
GBP/JPY has soared to its highest level since February 2016, closing a four-consecutive week of gains. This surge comes in the wake of a dovish stance taken by the Bank of Japan (BOJ), which is expected to stick with its yield curve control policy to keep long-term interest rates low. The yield divergence between UK gilts and Japanese bonds has further favoured the British pound adding to the momentum of the GBP/JPY pair.
BoJ dovish stance weight on the Yen
Bank of Japan (BoJ) officials, acknowledged that inflation has surpassed initial projections, which may result in upward revisions to the bank's inflation forecasts in the upcoming macroeconomic assessments. Despite this, the BoJ maintains a cautious stance and does not express confidence in achieving the sustainable 2% inflation target. Consequently, policymakers emphasize the ongoing need for continued monetary stimulus to support and stabilize the prevailing economic conditions.
On the other hand, rising yields amid the expectations of a rate hike from 4.5% to 4.75% on June 22 by the Bank of England (BoE) seems to be responsible for the GBP/JPY upwards momentum. In that sense, the British yields increased across the board with the 2.5-year yields seeing more than 1% increases on the session.
GBP/JPY levels to watch
Both the weekly and daily charts suggest that the bulls are clearly in charge of the short term. Specifically, on the daily chart, the Relative Strength Index (RSI) and Moving Average Convergence Divergence (MACD) are both showing strength standing in positive territory, and the pair trades above its main moving averages indicating that the buyers are in control.
In case the GBP/JPY continues to gain traction, the following resistance line up at the 175.50 zone followed then by the 176.00 zone and the 176.30 level. On the other hand, in case of a technical correction, support levels line up at the 174.40 zone and below the psychological mark at 174.00 and the 20-day Simple Moving Average (SMA) at 172.90.
GBP/JPY daily chart
-638219292947521257.png)
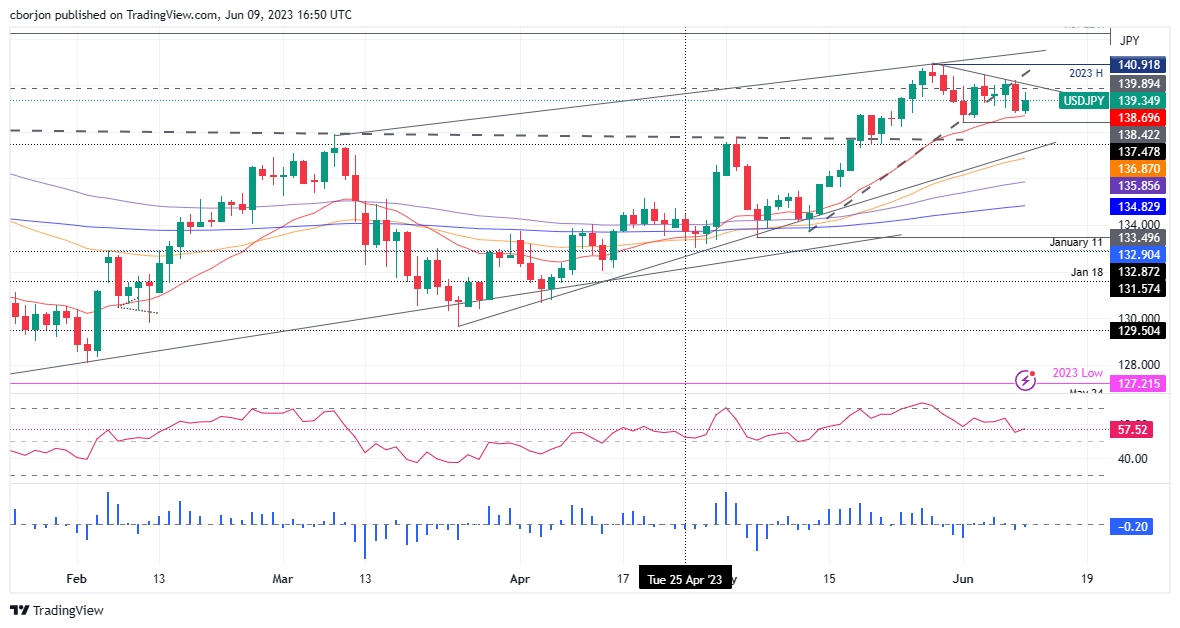
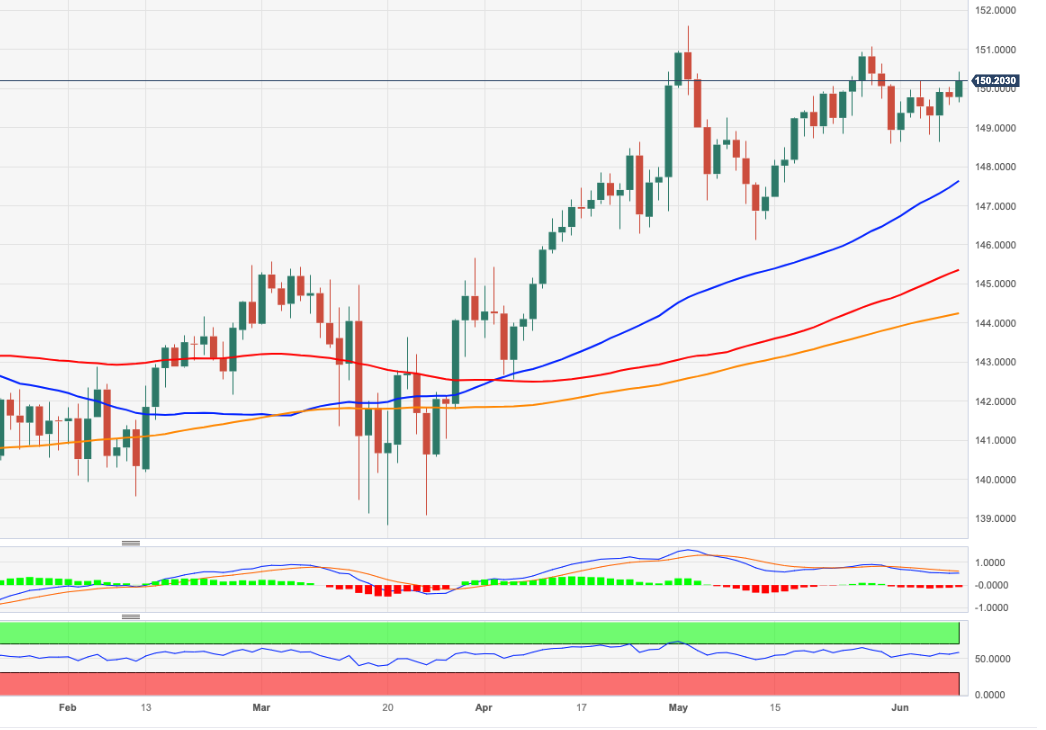
- USD/JPY rallies following soft Canadian jobs data and surge in US Treasury bond yields.
- Bullish engulfing candlestick pattern forms a base for potential upside.
- Technical indicators suggest buying momentum as USD/JPY challenges the 140.00 resistance level.
USD/JPY bounced off weekly lows, and the 20-day Exponential Moving Average (EMA) confluence on Friday after soft jobs data from Canada spurred a jump in US Treasury bond yields. The USD/JPY is trading at 139.37, up 0.32%.
USD/JPY Price Analysis: Technical outlook
After rallying toward new year-to-date (YTD) highs of 140.91 towards the end of May, the USD/JPY dipped towards 138.40, as threats of a possible intervention by Japanese authorities triggered four consecutive days of losses. Amidst those plays, US Treasury bond yields, edging lower, added another reason to the downturn. Since then, a bullish engulfing candlestick pattern formed, creating a base at around the 138.40s area, which was tested on Thursday, but sellers failing to crack below the 20-day EMA at 138.69, kept support intact, as buyers get ready for an assault toward 140.00.
Another factor that supports the USD/JPY moving upwards is the Relative Strength Index (RSI) indicator, which sits in bullish territory, while the three-day Rate of Change (RoC) suggests buyers gathering momentum as the RoC approaches neutral levels.
Therefore, USD/JPY's first resistance would be 140.00. A breach of the latter will expose the weekly high at 140.45, ahead of challenging the YTD high at 140.91. On the other hand, a dip below 139.00 could open the door to test the bottom of the abovementioned range at around 138.40.
USD/JPY Price Action – Daily chart
- The NZD/USD rose to its highest level since late May, above the 20-day SMA at 0.6130.
- ANZ predicts next week New Zealand GDP data will come in mixed.
- NZD/USD to close a second consecutive week of gains.
The NZD/USD currency pair has recently surged to its highest level since May, surpassing the 20-day Simple Moving Average (SMA) at 0.6130. The Greenback’s losses for the next sessions could be limited by hawkish bets for the upcoming Federal Reserve (Fed) meeting past June, as recent development made investors foresee fewer odds of a rate cut by year-end.
Fed expectations remain steady for next week, but later rate cut bets decrease
Ahead of the upcoming Federal Reserve (Fed) June 13-14 meeting, the CME FedWatch Tool suggests that investors are placing higher probabilities on the Fed refraining from hiking rates and, instead, keeping the target rate steady at 5.00%-5.25%. However, the bets for a hike in July stand almost priced in at 85% and the odds of a rate cut by years-end decreased from 50% at the start of the week to nearly 15% due to the recent unexpected hikes by the Reserve Bank of Australia (RBA) and the Bank of Canada (BoC). In that sense, a more hawkish stance by the Fed provides support for the USD.
On the other hand, following NZ Q1 Gross Domestic Product (GDP) data release, ANZ Bank is expecting next week to see “tepid” growth and an improvement from the current account deficit.
NZD/USD levels to watch
Technically speaking, the NZD/USD exchange rate holds a neutral to bullish outlook for the short term as daily indicators show that bulls continue to get momentum. However, the pair needs to consolidate above the 20-day SMA in order to confirm a recovery. On the weekly chart, the pair is poised to confirm a second consecutive week of gains.
A consolidation above the 20-day Simple Moving Average at 0.6130 would suggest a continuation of the momentum towards the 200-day SMA at 0.6150 and then to the 0.6200 area. On the other hand, the 0.6090 area is the immediate support level for NZD/USD. A break below could pave the way towards the 0.6050 and 0.6030 zones.
NZD/USD daily chart
-638219248670505513.png)
- EUR weakens amid falling bond yields; remains supported by monetary policy divergence.
- ECB to tighten monetary conditions despite the Eurozone recession.
- Upcoming US CPI data could set the stage for a surprise at the FOMC meeting.
EUR/USD reversed its course after Thursday’s jobs report in the United States (US) justified the Federal Reserve (Fed) view for skipping a rate hike. Additionally, recent data from Canada pointed to a softening labor market, atoning with recent unemployment claims in the US. The EUR/USD is trading at 1.0753, down 0.26%.
Fed and ECB monetary policies set to diverge, supporting ongoing strength in EUR/USD
The Euro (EUR) feels the pain of falling bond yields across the bloc. That weakened the shared currency, which failed to cling to Thursday’s gains. The EUR/USD stuck to the 20-day Exponential Moving Average at 1.0772., even though Thursday from the US lifted the pair. Data from the US Department of Labor showed that the US labor market is easing, as more Americans filed for unemployment, on its highest jump since October 2021. But, the main driver in the North American session is employment data from Canada.
Statistics Canada revealed the economy slashed 17,300 jobs in May, well below the expected growth of 23,200. Additionally, the Unemployment Rate ticked from 5.1% to 5.2%, a sign of weakness in the labor market.
Although the EUR/USD is retreating from weekly highs, it is set to continue to strengthen, with two central banks set to diverge on their monetary policy stance. In the next week, the Federal Reserve is expected to keep rates unchanged at the 5.0-5.25% area. The European Central Bank (ECB) would likely increase rates toward 3.50%, even though the Eurozone (EU) reported a technical recession after printing back-to-back quarters with negative GDP. However, the ECB will continue to tighten monetary conditions, as stressed by Isabel Schnabel, an ECB Governing Council member, who said: “The costs of doing too little (in monetary tightening) continued to be greater than the costs of doing too much.”
Upcoming events
Next week on Tuesday, the EU docket will feature inflation data in Germany and the ZEW Economic Sentiment Index. On the US front, the Consumer Price Index (CPI) for May, estimates at 4.1% YoY, while core CPI forecasts lie at 5.2%. Upward readings on the CPI could pave the way for a surprise at the following week’s FOMC meeting.
EUR/USD Price Analysis: Technical outlook
The EUR/USD trades sideways, though slightly tilted to the downside, as the 20, 50, and 100-day EMAs lie above the current exchange rate, providing a solid resistance area above the 1.0767 area. Based on price action, the EUR/USD must likely test the June 7 high turned support at 1.0739 before dropping towards the figure at 1.0700, ahead of the June 8 low of 1.0692. A breach of the latter and the EUR/USD will challenge the 200-day EMA at 1.0688.
Economists at Commerzbank discuss Gold outlook ahead of US Federal Reserve meeting next week.
Gold likely to be kept in check by US interest rate outlook
Participants in the Gold market will be focusing their attention primarily on the US Fed next week: if Fed Chair Jerome Powell were to leave the door wide open to further rate hikes at the press conference, this would probably keep the Gold price in check.
We are still confident that interest rates have already peaked and that the market will correct its overly hawkish positioning in due course. Against this backdrop, we envisage higher Gold prices in the medium term.
The Dollar rallied as the market priced out Fed easing hopes, but while that adjustment is largely complete, a catalyst for a change in trend is absent for now, economists at Société Générale report.
Current uptrend can continue for a while longer
The FX market is tracking short-term rates more closely than ever in the face of wider uncertainty, and with positioning still short USD, the current uptrend can continue for a while longer.
As the US economy continues to demonstrate resilience in the face of higher rates, the rates market is pricing out rate cuts and could yet contemplate the idea that a June Fed pause, or ‘skip’, could be followed by another ‘jump’.
Our long-term concerns about Dollar valuation and growth prospects make buying USD hard, but the wind is still clearly blowing in its favour.
Economists at the National Bank of Canada discuss USD outlook.
Fed will leave rates unchanged until the first quarter of 2024
The US sovereign debt crisis, which weighed on the greenback, has been resolved. Last month, we also argued that market expectations of imminent monetary easing seemed rather ambitious. Since then, the market has turned 180 degrees and now expects the Fed to raise its key rate again this summer.
As we see the unemployment rate continuing to rise over the coming months and lending conditions tightening at commercial banks, we believe the Fed will leave rates unchanged until the first quarter of 2024, before lowering them thereafter as the economy contracts.
Expect the Dollar to appreciate slightly over the coming months, before a possible bout of weakness next year.
Economists at Credit Suisse analyze JPY outlook ahead of the Bank of Japan (BoJ) meeting next week.
Highly unlikely the BoJ would think about signaling a policy change
Disappointing Japanese wage data are reducing risks of a hawkish turn in BoJ policy at the upcoming 15-16 Jun, with negative implications for JPY.
We suspect the BoJ will be content to see this unfold for now rather than try to signal a tighter policy stance.
Only if USD/JPY drives higher towards our near-term 145 target would we expect a reaction. But even then, it is first likely to be verbal or actual FX intervention rather than through signalling a monetary policy shift.
- USD/TRY prints a new record high around 23.5000 on Friday.
- President Erdogan appoints a new President for the central bank.
- National lenders supported the lira on Thursday.
The sell-off in the Turkish currency remains unabated, and USD/TRY advances to a fresh all-time peak just above 23.5000 at the end of the week.
USD/TRY pushes higher despite the new CBRT Chief
USD/TRY quickly left behind Thursday’s pullback and resumed the upside to uncharted territory around the 23.5000 region at the end of the week, just to give away some of those gains afterwards.
The move higher in the pair came despite President R. T. Erdogan's appointment of Hafize Gaye Erkan as the new Governor of the Turkish central bank (CBRT).
Erkan, a former banking executive in the US, has become the first female chief of the CBRT. Prior to this role, she had worked at Goldman Sachs and First Republic Bank. Markets may interpret her appointment as a signal of Ankara’s intention to normalize its monetary policies, which have experienced years of extremely low interest rates and rampant inflation.
It remains to be seen, however, whether Erkan can impose her monetary will under Erdogan's leadership. The first round of this match is expected on June 22, when the CBRT will hold its monetary policy meeting.
So far, the Turkish currency has already depreciated over 25% since the start of the new year, while the drop has reached more than 170% since the Turkish central bank (CBRT) embarked on its easing cycle in August 2021.
Further news mentioned that Turkey's new Treasury and Finance Minister M. Simsek and top banks executives intend to meet for the first time next week.
In the calendar, Industrial Production in Türkiye contracted 0.9% MoM in April and 1.2% from a year earlier.
What to look for around TRY
USD/TRY maintains its upside bias well in place, always underpinned by the relentless meltdown of the Turkish currency.
In the meantime, investors are expected to closely monitor upcoming decisions on monetary policy, particularly after President R. T. Erdogan named former economy chief M. Simsek as the new finance minister following the cabinet reshuffle in the wake of the May 28 second round of general elections.
The appointment of Simsek has been welcomed with optimism by market members in spite of the fact that it is not yet clear whether his orthodox stance on monetary policy can survive within Erdogan’s inclination to battle inflation via lower interest rates.
In a more macro scenario, price action around the Turkish lira is supposed to continue to spin around the performance of energy and commodity prices - which are directly correlated to developments from the war in Ukraine, broad risk appetite trends, and dollar dynamics.
Key events in Türkiye this week: Industrial Production (Friday).
Eminent issues on the back boiler: Persistent skepticism over the CBRT credibility/independence. Absence of structural reforms. Bouts of geopolitical concerns.
USD/TRY key levels
So far, the pair is gaining 1.19% at 23.3466 and faces the next hurdle at 23.5196 (all-time high June 9) followed by 24.00 (round level). On the downside, a break below 19.8086 (55-day SMA) would expose 19.3827 (100-day SMA) and finally 18.9661 (200-day SMA).
Gold has now fallen more than 5% from its recent peak in early May. Economists at UBS analyze the yellow metal outlook.
Gold can overcome near-term headwinds
A further slide in Gold to around $1,870 is possible as markets push back expectations for the start of rate cuts from the Fed. But we still see potential gains for Gold over the coming year, and we view the precious metal as a valuable hedge in portfolios.
We keep our forecast of $2,100 by year-end and 2,250 by mid-2024 unchanged.
The Turkish Lira has weakened significantly this week. Economists at Danske Bank analyze TRY's outlook.
Normalizing policies?
Hopes are building up that Erdogan's newly appointed economic team would soon take steps towards normalizing policies.
This week's move in the Lira can perhaps be seen as an 'intentional devaluation' as opposed to a full loosening of controls.
In the absence of interventions, we think there is still room for significant Lira depreciation until the central bank credibility is restored and we see interest rate hikes.
The central bank meetings that are due next week are apparently already casting a shadow as EUR/USD was able to appreciate yesterday. Economists at Commerzbank analyze the pair’s outlook.
Potential for surprises
Whereas the ECB is expected to implement a further 25 bps rate hike, the US central bank is likely to pause its rate hike cycle. However, the expectations for the US central bank meeting are characterised by higher uncertainty, as there are some market participants who expect a rate hike on Wednesday.
Depending on how expectations develop over the coming days, we might see more pronounced moves in EUR/USD.
Whereas we principally expect the EUR to find support as a result of the monetary policy decisions, there is larger potential for surprises on the USD side of things.
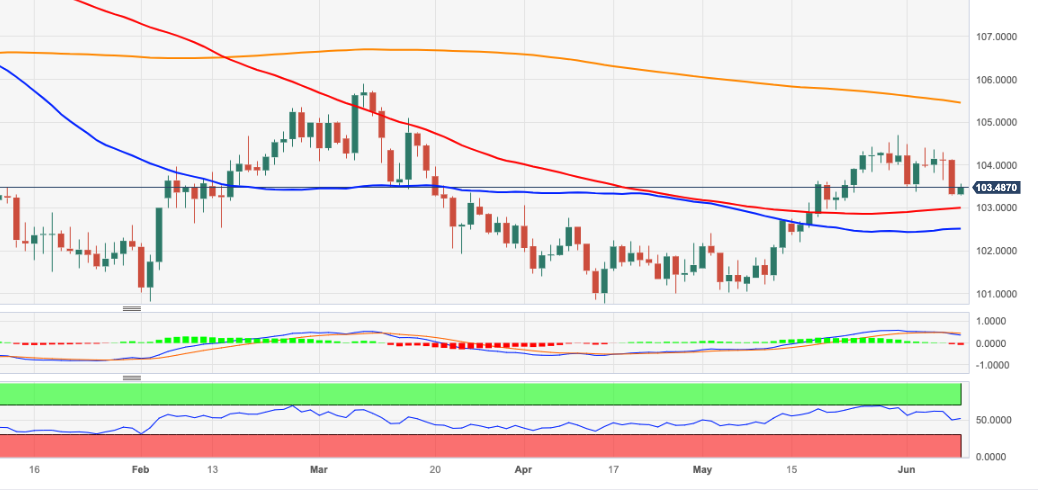
- USD/JPY has found intermediate support near 139.00, following the footprints of the USD Index.
- A volatile action in the USD Index cannot be ruled out as investors are preparing for US inflation.
- The street is anticipating that there would no alteration in BoJ’s current ultra-dovish stance.
The USD/JPY pair has witnessed decent buying interest after a vertical drop to near 139.00 in the early New York session. A supportive move for the USD/JPY pair is backed by a recovery in the US Dollar Index (DXY). The price action in the USD Index indicates that USD Index bulls are not going to surrender their entire gains easily as investors are shifting their focus toward the United States Consumer Price Index (CPI) data, which will release on Tuesday.
S&P500 futures have added more gains in early America amid solid hopes of a neutral interest rate policy by the Federal Reserve (Fed). As US factory activity is consistently contracting straight for the past seven months and the service sector is hardly showing any expansion and labor market conditions have also started easing, Fed policymakers would at least discuss pausing the policy-tightening spell extensively.
The US Dollar Index has witnessed a dynamic recovery to near 103.45. A volatile action in the USD Index cannot be ruled out as investors are preparing for the US inflation as the assessment of 19-month high weekly Initial Jobless Claims looks done.
Considering the recent fall in the oil price, headline inflation is expected to continue its softening spell, however, the core CPI could show persistence as services are getting costly. Investors should note that two-thirds of US economic activities are contributed by the service sector.
On the Japanese Yen front, the focus of investors will remain on the interest rate decision by the Bank of Japan (BoJ), which will be announced next week. The street is anticipating that there would no alteration in the current ultra-dovish stance as BoJ Governor Kazuo Ueda has been constantly discussing the need for monetary stimulus for elevating wages and households demand.
- US Dollar continues to slide against antipodean currencies.
- Australian Dollar is the top performer among major currencies this week.
- AUD/USD is trading at its highest level since May 11.
- The AUD/USD continued to rise and reached a fresh four-week high near 0.6740. The pair has held onto strong weekly gains, supported by a hawkish Reserve Bank of Australia (RBA) and a weaker US Dollar.
The Greenback remains under pressure on Friday, particularly against antipodean currencies, which are outperforming. While the RBA and Bank of Canada have raised rates, expectations are that the Federal Reserve (Fed) will hit the pause button next week. At the same time, an improvement in market sentiment is also helping to boost demand for the AUD and NZD.
On Friday, China reported that the Consumer Price Index rose 0.2% YoY and the Producer Price Index was at -4.6% YoY. The numbers show that the impact of the reopening remains limited. Low inflation numbers keep the door open to more stimulus from Chinese authorities.
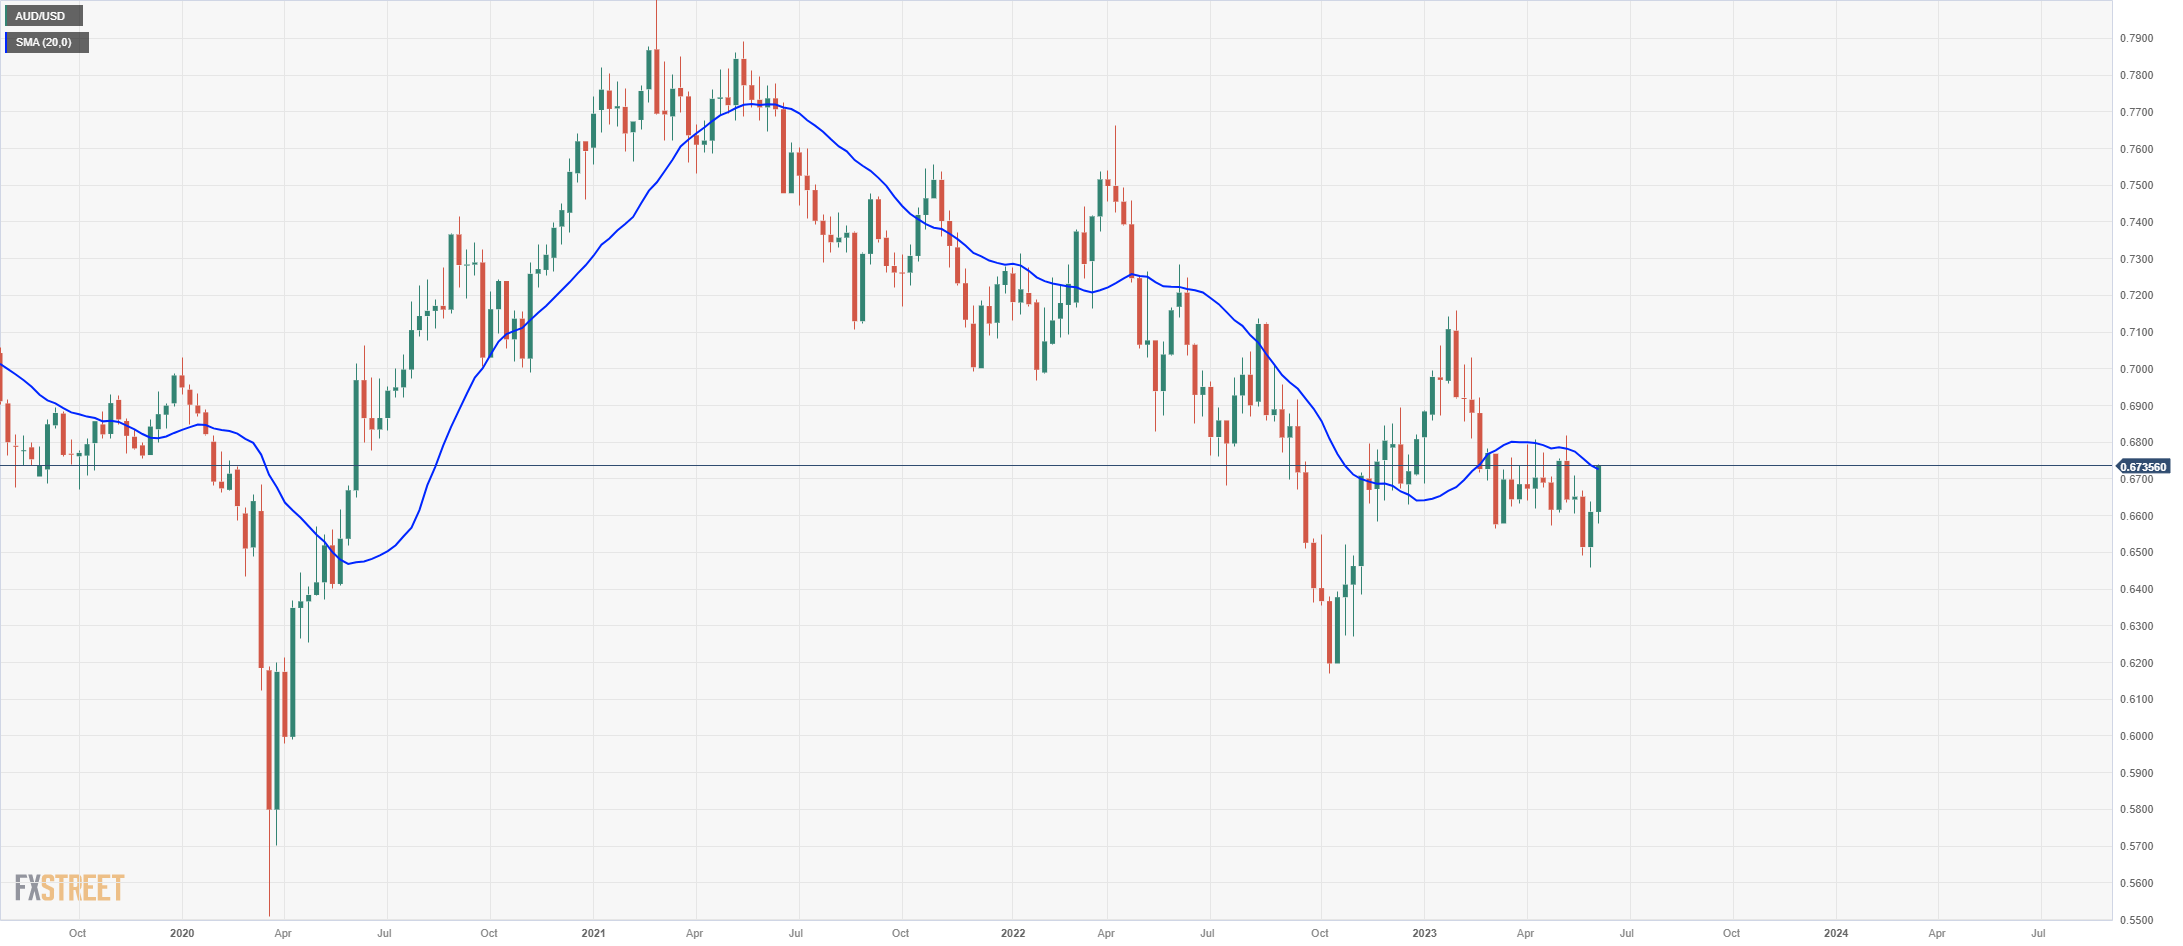
Best week in months for the Aussie
The RBA's rate hike and Governor Lowe's comments about persistent inflation testing the board's patience offered a boost to the Australian Dollar. Risk-on flows and technical factors added fuel to the AUD/USD rally. Weak data from China was mostly ignored.
The AUD/USD has risen almost 150 pips during the week, marking its best performance since January. The price is currently testing the 20-week Simple Moving Average (SMA), and a clear close above it would suggest that more gains are on the table. In the daily chart, the AUD/USD is testing the 100-day SMA and is starting to consolidate above the 0.6715/20 resistance area.
The technical outlook for the Aussie is positive. However, the main risk at the moment could come from a reversal in risk flows and a hawkish surprise from the Federal Reserve next week.
AUD/USD weekly chart
GBP/USD consolidates in the mid-1.25s. Economists at Scotiabank analyze the pair’s technical outlook.
Some modest downside risk in the very near term
It’s been a solid week for the Pound overall though and gains to a four-week high earlier today should draw in trend chasers and momentum traders looking for the GBP to retest the early May peak.
Intraday price action looks a little soft, suggesting some modest downside risk in the very near term but the broader trend in Cable looks constructive and is backed by positive developments on the intraday and daily trend oscillators (DMI) which should mean limited downside potential for the Pound for now.
Look for support on dips towards 1.2500/10.
The S&P 500 has rallied 20% from its recent October 2022 low. Economists at Société Générale analyze S&P 500 Index outlook.
Avoiding Small Caps, Financials and Value stocks
We expect the S&P 500 to return to its trading range of 3,500-4,200 as 2H should see slowing profit margins, credit weakness and rising inflation uncertainty as the impact of easy base effects dissipates.
Prefer Defensive Growth, Staples and Industrials while avoiding Small Caps, Financials and Value stocks.
See – S&P 500 Index: Key resistance at 4,312/4,325 to cap – Credit Suisse
- USD/CAD has shown a solid recovery from the crucial support of 1.3320 after weaker-than-anticipated Canada’s job market data.
- Canada’s Net Change in Employment dropped by 17.3K and the Unemployment Rate jumped to 5.2%.
- S&P500 futures have turned positive after recovering their entire losses, portraying a risk-on market mood.
The USD/CAD pair has recovered sharply to near 1.3360 as Statistics Canada has reported poor Employment data (May). The Canadian labor market has posted a decline in payroll figures by 17.3K while the street was anticipating an addition of 23.2K. Last month the Canadian economy added 41.4K jobs. The Unemployment Rate has increased sharply to 5.2% vs. the estimates of 5.1% and the former release of 5.0%.
Apart from that, annual Average Hourly Earnings have softened to 5.1% from the prior release of 5.2%. This would also ease some heat in resilient consumer spending.
Considering the weakness in the Canadian Employment report, the Bank of Canada (BoC) might reconsider its intention of hiking interest rates further.
Investors should note that the BoC surprisingly raised interest rates by 25 basis points (bps) to 4.75% on Wednesday. BoC Governor Tiff Macklem decided to raise interest rates despite the consistent softening of Canada’s inflation. Consumer Price Index (CPI) in Canada was noted at 4.4% in April. BoC Macklem said in the monetary policy statement that inflationary pressures could turn sticky at these levels consumer spending is resilient. Also, remained doors open for further interest rate hikes.
S&P500 futures have turned positive after recovering their entire losses ahead of the New York session, portraying a risk-on market mood. Lowering the chances of one more interest rate hike from the Federal Reserve (Fed) has improved the appeal for risk-perceived assets.
The US Dollar Index (DXY) has retreated after failing to extend its recovery to near 103.60. Although expectations for a neutral interest rate policy stance by the Fed for the June meeting are skyrocketing, the release of the US CPI (May) data will be keenly watched which will release next week.
As per the preliminary report, headline inflation is expected to soften sharply amid declining oil prices while core inflation that excludes the oil and food prices could continue to remain persistent.
- EUR/USD corrects lower following new monthly peaks near 1.0790.
- Extra advances are expected to reclaim the area above 1.0800.
EUR/USD faces some renewed downside pressure and gives away part of Thursday’s strong move to the vicinity of 1.0800 the figure.
A more serious bullish attempt is expected to quickly surpass the so far monthly high at 1.0787 (June 8) closely followed by the round level at 1.0800, which appears propped up by the transitory 100-day SMA, today at 1.0807.
Looking at the longer run, the constructive view remains unchanged while above the 200-day SMA, today at 1.0518.
EUR/USD daily charts
- USD/CHF has faced barricades above 0.9020 as the recovery move in the USD Index has concluded.
- A sell-off move in the USD Index has come as investors are hoping that the Fed could skip hiking rates in June.
- The IMF still believes that the Fed and other global banks to stay on course of tightening monetary policy.
The USD/CHF pair has faced stiff barricades after a recovery move to near 0.9020 in the late European session. The Swiss Franc asset has resumed its downside journey as the US Dollar Index (DXY) has retreated. A sell-off move in the USD Index has come as investors are hoping that the Federal Reserve (Fed) could skip hiking interest rates in June.
S&P500 futures have recovered their entire losses posted in Europe as the market mood has turned cheerful as expectations for a neutral interest rate policy by the Fed have deepened. According to economists surveyed by Bloomberg, most economists expect the Fed to pause interest-rate increases next week for the first time in 15 months and leave policy on hold through December, even as it confronts a resilient US economy and persistent inflation.
Contrary to the street, International Monetary Fund (IM)F spokesperson Julie Kozack said on Thursday the Fed and other global central banks should continue their policy-tightening spell and remain committed to arresting inflation.
The USD Index has attracted significant offers after recovering to near 103.60 as an unchanged policy stance by the Fed would restrict its upside for a longer period. Meanwhile, the US Treasury yields have extended their gains further. The yields offered on 10-year US Treasury bonds have jumped above 3.76%.
A comparative analysis of the USD/CHF pair and the USD Index shows that the correction in the USD Index has higher strength than in the Swiss Franc asset. This could be the outcome of hawkish commentary by Swiss National Bank (SNB) Chairman Thomas J. Jordan. SNB Jordan said it’s really important to bring Swiss inflation to a level of price stability," He further added it would not be a good idea to wait for inflation to rise and then raise interest rates. Investors should note that the SNB has already raised interest rates to 1.50%.
Economists at Commerzbank discuss USD/MXN outlook after yesterday’s Mexican inflation figures.
End of rate hike cycle in Mexico not in doubt
Mexican inflation data came out yesterday as expected, confirming a declining inflation rate but still high core inflation dynamics. However, unlike for the Fed, the market is convinced that Banxico, Mexico's central bank, has ended its rate hike cycle.
We maintain our view that the Mexican Peso will continue to trade at strong levels for the time being.
The next directional impulse for the USD/MXN is more likely to come from the US in the form of the Fed's interest rate decision next week.
The CAD has perked up a little to retest the low 1.33 zone ahead of the May employment report. Economists at Scotiabank discuss how data could impact the Loonie.
Significantly weaker data will soften the CAD somewhat
Canadian jobs data is expected to show a solid gain (21.3K consensus) for May, with the unemployment rate ticking a tenth higher to 5.1%. Wages are called a tenth lower to 5.1% YoY in the month. Still relatively tight labour markets and wage growth that remains highly incompatible with the Bank’s inflation goals will support the idea that this week’s hike may still not be the last in the cycle.
Firm data will lift the CAD; significantly weaker data will soften the CAD somewhat but minor USD gains still look a decent selling opportunity.
See – Canada Employment Preview: Forecasts from five major banks, tight labour market
EUR/USD drifts from upper 1.07s. Economists at Scotiabank analyze the pair’s technical outlook.
A rounded low is developing on the short-term charts – a bullish sign
Losses are moderate and the short-term technical undertone is still constructive.
Price action through June so far reflects clear EUR accumulation on weakness – a rounded low is developing on the short-term charts after the EUR’s initial push higher at the start of the month. This is a bullish sign which is typically followed by more dynamic gains after a minor consolidation, such as we may be seeing now.
Support is 1.0740/50. Resistance is 1.0790/1.0810.
- USD/CAD is expected to show a vertical decline below 1.3320 as the upside in the USD index seems restricted.
- The Canadian Dollar is struggling to firm its feet ahead of Canada’s Employment data.
- The US labor market is easing some heat and allowing the Fed to strictly consider a neutral interest rate policy.
The USD/CAD pair is expected to deliver a perpendicular fall after a breakdown of the crucial support of 1.3320 in the European session. The Loonie asset is struggling in maintaining its strength ahead of Canada’s Employment data (May).
S&P500 futures have recovered significant losses added in early London, portraying a solid recovery in the risk appetite of the market participants. The US Dollar Index (DXY) is facing barricades while extending its recovery to near 103.60. It seems that the recovery move in the USD Index is expected to conclude as it was not backed with any fundamental support.
On Thursday, a heavy sell-off was recorded in the USD Index after the United States Department of Labor reported a sharp rise in individuals applying for Initial Jobless Claims for the week ending June 02. Jobless claims soared by 28K to 261K vs. the estimates of 235K. This indicated that the tight US labor market is easing some heat and allowing the Federal Reserve (Fed) to strictly consider a neutral interest rate policy.
On the Canadian Dollar front, Employment data will be keenly watched. Analysts at TD Securities expect job growth to slow to 25K in May for a deceleration from the recent trend of 57K, keeping the Unemployment Rate stable at 5.0%. We look for service-sector hiring to drive the headline print, alongside a rebound in full-time employment after the pullback in April. We also look for wage growth to remain elevated at 5.1%, down 0.1pp from last month.
Meanwhile, the oil price is facing difficulties while approaching near $72.00 amid a bleak oil demand outlook. The deflation situation in China showed that domestic demand is extremely weak. Also, the overall demand in the US economy looks vulnerable as their factory activity is consistently contracting.
It is worth noting that Canada is the leading exporter of oil to the United States and the weak oil price could impact the Canadian Dollar.
- DXY meets some fresh oxygen and bounces off recent lows near 103.30.
- There is a transitory support around the 103.00 region.
DXY gathers some upside traction and leaves behind weekly lows around 103.30 at the end of the week.
In case the index breaches the monthly lows near 103.30, it could then put the interim 100-day SMA near 103.00 to the test prior to the temporary 55-day SMA at 102.50.
Looking at the broader picture, while below the 200-day SMA at 105.45 the outlook for the index is expected to remain negative.
DXY daily chart
USD is mixed to slightly firmer on the day but soft weekly close remains a risk, economists at Scotiabank report.
The week ahead may add more pressure on the USD broadly
June price action looks to be gearing up for a reversal of some of the USD gains at least.
The week ahead may add more pressure on the USD broadly; headline US CPI is expected to moderate to the low 4% area, bringing a drop to a 3 handle on the radar in the near future (core prices will ease as well but remain elevated).
Given guidance from senior FOMC officials that a hike was unlikely this month and market pricing suggesting limited expectations for a hike, there is no incentive for policymakers to surprise investors. Skipping this month will contrast with policy hikes (and likely hawkish language) from the ECB and BoE in upcoming meetings.
A low close on the week will be a technical negative for broader measures of the USD’s performance (DXY, BBDXY) and point to a technical reversal in the May USD rebound and perhaps renewed pressure on DXY support around 101.
- EUR/JPY keeps the bid bias well and sound so far this week.
- Extra gains now challenge the 151.00 yardstick and above.
EUR/JPY extends the weekly rebound and trespasses the key 151.00 mark on Friday.
In case bulls remain in control, there is an immediate hurdle at the weekly top at 151.07 (May 29), while a convincing breakout of this level exposes a probable move to the 2023 peak at 151.61 (May 2).
So far, further upside looks favoured while the cross trades above the 200-day SMA, today at 144.21.
EUR/JPY daily chart
Economists at the National Bank of Canada discuss EUR outlook.
Narrowing in policy appears less likely
Tepid growth and waning inflation could be harbingers for an ECB staying its hand on restricting policy further. But real rates in the Eurozone remain largely accommodating and a still decent labour market combined with high inflation should keep the tightening schedule on track.
The likelier scenario is that the Federal Reserve is facing data that is conducive to further rate hikes. As such, the narrowing in stance between both central banks has become less likely.
Growth perspectives for either economy in the latter portions of the year are not positive and could set the stage for further Euro weakness.
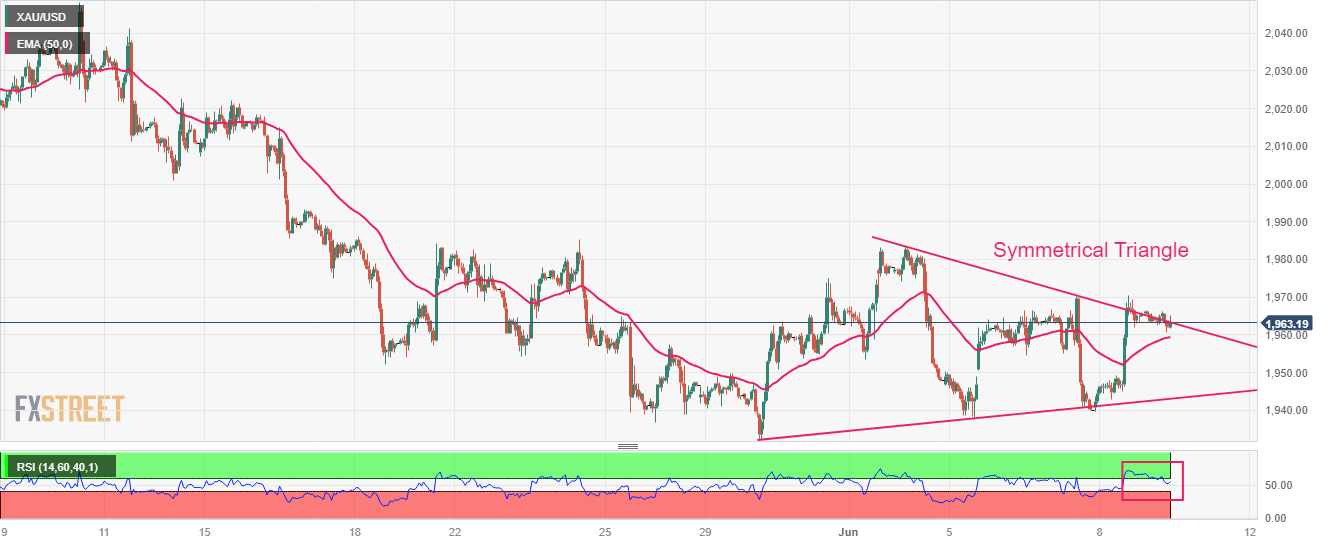
- Gold price is marching towards the $1,970.00 resistance as the recovery move in the USD Index could conclude sooner.
- Easing US labor market conditions have improved the odds of a neutral policy stance by the Fed.
- Gold price is gathering strength for a breakout of the Symmetrical Triangle chart pattern.
Gold price (XAU/USD) has resumed its upside journey towards the $1,970.00 resistance in the European session. The precious metal is repossessing the spotlight as the recovery move in the US Dollar Index (DXY) seems less confident due to the absence of fundamental support.
S&P500 futures have surrendered half of the gains posted on Thursday as investors are shifting their focus toward the release of the United States Consumer Price Index (CPI) data. Market sentiment has turned cautious as the US inflation release could bring variation in expectations for the Federal Reserve (Fed) policy for June.
As per the preliminary report, headline inflation is seen softening to 4.2% vs. the prior release of 4.9%. Core CPI that strips off oil and food prices is expected to accelerate marginal to 5.6% vs. the former release of 5.5%. If core inflation continues to remain persistent, Fed chair Jerome Powell could be more favorable for the continuation of the policy-tightening spell.
Earlier, the street was divided about Fed’s policy stance but now easing labor market conditions have improved the odds of a neutral policy stance by the Fed. The USD Index has extended its recovery to near 103.60. Also, the yields offered on 10-year US Treasury bonds have climbed to 3.74%.
Gold technical analysis
Gold price is gathering strength for a breakout of the Symmetrical Triangle chart pattern formed on an hourly scale. A breakout of the neutral triangle results in wider ticks and heavy volume. The precious metal is hovering near the downward-sloping trendline of the aforementioned pattern plotted from June 02 high at $1,983.50.
The yellow metal is trading above the 50-period Exponential Moving Average (EMA) at $1,959.70, which adds to the upside filters.
A confident break into the bullish range of 60.00-80.00 by the Relative Strength Index (RSI) (14) will trigger the upside momentum.
Gold hourly chart
EUR/GBP has moved back below 0.8600. Economists at ING analyze GBP outlook.
EUR/GBP is undervalued
We estimate the pair to be trading at around a 2.0% short-term undervaluation at the current levels, which falls beyond the 1.4% 1.5 standard-deviation lower-bound.
We remain of the view that EUR/GBP will increasingly struggle to find more bearish momentum now that markets are already pricing in 100 bps of BoE tightening and the pair is already in undervaluation territory.
On the Cable side, we expect some stabilisation around 1.2550-1.2600.
ZAR has seen an aggressive year-to-date capitulation at almost 12% against the USD. Economists at CIBC Capital Markets analyze USD/ZAR outlook.
SARB likely to hike further
Last month, the SARB hiked rates to 8.25%, levels not seen since 2009. Watch for a further 25 bps hike in July.
For USD/ZAR, a retracement back to 18.75 would be consistent with long-end spreads easing back to 800 bps from post-crisis levels at 880 bps. Such a scenario will require confidence that the SARB cycle has peaked while ZAR geo-political tensions need to dissipate.
USD/ZAR – Q3 2023: 18.75 | Q4 2023: 18.45
The Pound has regained its position as the best-performing G10 currency in the year. Economists at Rabobank discuss GBP outlook.
Cable to edge lower toward 1.22 on a three-month view
On the assumption that UK economic data will show increased signs of stress in Q3, and given also our view that the USD will remain well supported in the coming months, we expect that Cable will struggle to hold its recent gains.
The risk for GBP is that further progressive rate hikes from the Bank significantly undermine the recently improved growth outlook.
We see scope for Cable to edge lower to GBP/USD 1.22 on a three-month view.
The US Dollar's stellar run has continued with EUR/USD bottoming out at 1.06 this week. Economists at Nordea analyze the world's most popular currency pair outlook.
Higher EUR/USD ahead
Lower than expected EU inflation and reduced rate hike pricing in Europe, stronger than expected US data, better US stock performance compared to European stocks, and the resolution of the debt ceiling have all contributed to a lower EUR/USD.
We believe that EUR/USD has bottomed out for now and see a higher cross ahead.
Gold price was able to regain some ground yesterday. Economists at Commerzbank analyze how US inflation due out next Tuesday could impact XAU/USD.
Gold unlikely to have much in the way of further upside potential until the Fed meeting
Further volatility is looming for the Gold price in the next few days given that the US inflation data will be published on Tuesday – a data heavyweight that could shift the interest rate expectations of the market significantly again.
The figures would probably have to surprise considerably to the downside for the market to entirely price out any further potential US rate hikes, and this does not appear very likely. Thus, the Gold price is unlikely to have much in the way of further upside potential until the Fed meeting.
Kiwi price action remains defensive. Economists at ANZ Bank discuss NZD/USD outlook ahead of important data due out next week.
Next week is a big week
Next week we get NZ Q1 GDP and current account data. We expect tepid growth and an improved current account deficit respectively. Let’s hope we are right; if the former is soft or negative and the latter worsens, the Kiwi could be in for a torrid time.
Support 0.5750/0.5900/0.6085 Resistance 0.6365/0.6540.
See: NZD/USD to appreciate over 2023 as the US debt-ceiling deal gets through Congress – ANZ
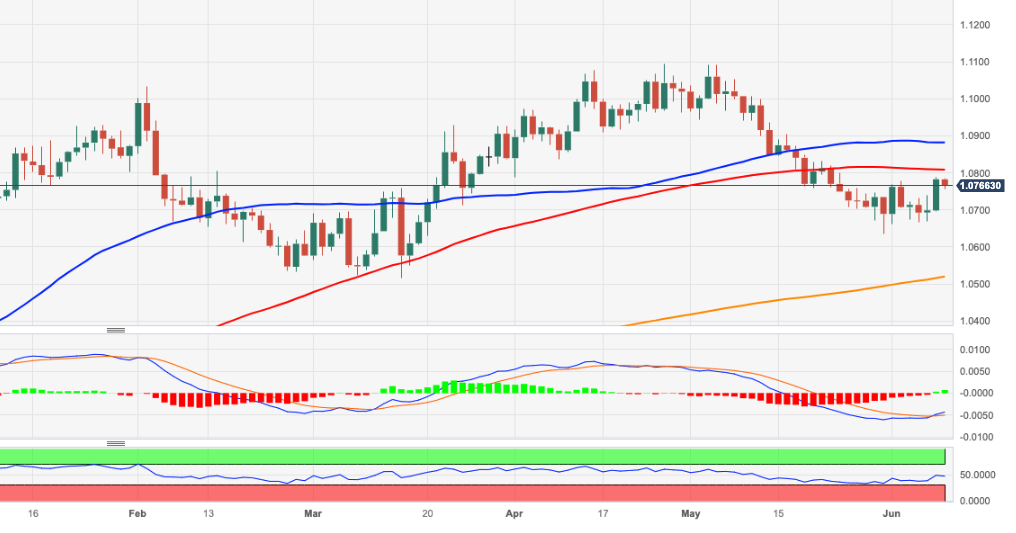
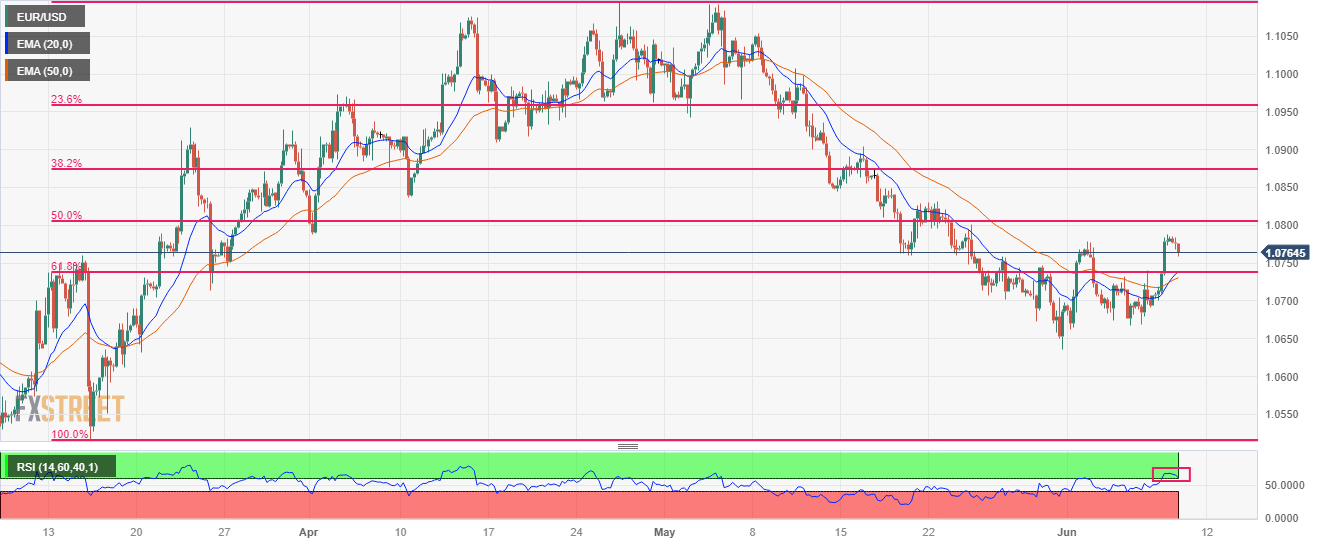
- EUR/USD has witnessed exhaustion in the upside momentum amid a recovery in the USD Index.
- The ECB will keep raising rates further even at the cost of Eurozone’s economic prospects.
- The recovery move in the EUR/USD has pushed it above the 61.8% Fibo retracement at 1.0738.
The EUR/USD pair has displayed an exhaustion in the upside momentum after reaching to near 1.0780 in the European session. The major currency pair has met an intermediate resistance due to an extension in the recovery by the US Dollar Index (DXY).
The USD Index has stretched its recovery to near 103.60, however, the downside seems favored as the United States labor market conditions are easing now and providing room for keeping interest rates steady by the Federal Reserve (Fed) in May.
A corrective move in the Euro could conclude sooner as the European Central Bank (ECB) is expected to raise interest rates further despite deepening fears of a recession in Eurozone.
The recovery move in the EUR/USD has pushed it above the 61.8% Fibonacci retracement (plotted from March 15 low at 1.0516 to April 26 high at 1.1095) at 1.0738. For a strong build-up of positive sentiment, the Euro has to pass through plenty of filters.
A bull cross, represented by the 20-and 50-period Exponential Moving Averages (EMAs) at 1.0724, adds to the upside filters.
Also, the Relative Strength Index (RSI) (14) has shifted into the bullish range of 60.00-80.00, which indicates that the upside momentum has been triggered.
Further correction to near May 30 high at 1.0746 would trigger a bargain buy opportunity, which will drive the asset towards June 02 high at 1.0779 followed by the round-level resistance at 1.0800.
In an alternate scenario, the downside move will resume if the shared currency pair drops below the June 05 low at 1.0675. This will drag the asset towards May 31 low at 1.0635 followed by March 03 low at 1.0588.
EUR/USD four-hour chart
If USD/CNH breaches 7.1100 it could leave the 7.1552 level as a near-term peak, comment Economist Lee Sue Ann and Markets Strategist Quek Ser Leang at UOB Group.
Key Quotes
24-hour view: We highlighted yesterday that USD “is likely to strengthen further but the major resistance at 7.1800 is likely out of reach today”. However, after eking out a fresh 7-month high of 7.1552, USD plummeted to a low of 7.1170. The sharp and swift decline appears to be overdone and USD is unlikely to weaken much further. Today, USD is more likely to trade in a range of 7.1100/7.1400.
Next 1-3 weeks: Yesterday (08 Jun, spot at 7.1500), we held the view that the risk for USD is still on the upside. We added, “the upside risk is intact as long as USD stays above 7.1100”. We did not anticipate the sharp selloff, as after rising to 7.1552, USD plummeted to a low of 7.1170. From here, if USD breaks below 7.1100, it will suggest that USD could have made an interim top at 7.1552.
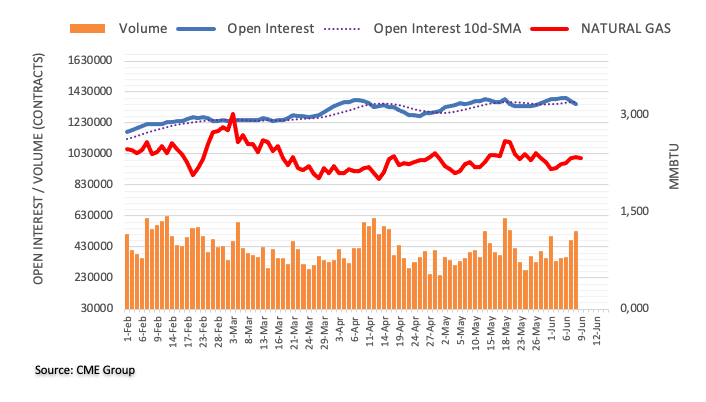
Open interest in natural gas futures markets shrank for the second straight session on Thursday, this time by nearly 21K contracts according to preliminary readings from CME Group. On the other hand, volume rose for the fourth day in a row, now by almost 58K contracts.
Natural Gas: No changes to the consolidation theme
Prices of the natural gas clinched the fourth consecutive session with gains on Thursday. The uptick, however, was in tandem with diminishing open interest and unveils the likelihood of a potential corrective move in the very near term. Looking at the broader scenario, the commodity remains well stuck within the consolidative range in place since late March.
USD/JPY maintains its base and economists at Credit Suisse stay bullish for 142.25/50 next and higher in due course.
Initial support seen at 138.48
USD/JPY extends its consolidation but with an important base seen in place above price and ‘neckline’ resistance at 137.70/98, this is seen as a healthy and corrective move lower.
We stay tactically positive and post some further consolidation we look for a break above 140.94 for strength to the 61.8% retracement and late November 2022 high at 142.25/50. Whilst we continue to look for this to prove a tougher initial barrier we expect a break in due course with resistance then seen next at 145.12.
Support is seen at 138.48 initially, with the ‘neckline’ to the base and 200-DMA at 137.78/31 ideally holding any deeper pullbacks if seen.
- AUD/USD touches a fresh multi-week high on Friday, albeit lacks any follow-through.
- The RBA’s hawkish outlook underpins the Aussie despite dismal Chinese inflation data.
- Rebounding US bond yields revives the USD demand and acts as a headwind for the pair.
The AUD/USD pair reverses an intraday dip to sub-0.6700 levels and climbs to over a four-week high during the early part of the European session on Friday. Spot prices, however, struggle to capitalize on the move and currently trade around the 0.6710-0.6715 region, nearly unchanged for the day.
The Australian Dollar (AUD) continues to draw support from the Reserve Bank of Australia's (RBA) surprise 25 bps rate hike earlier this week and a more hawkish policy statement. In fact, RBA Governor Lowe on Wednesday defended the move to lift the benchmark rates above 4% for the first time in nearly 12 years and reiterated that interest rates may need to rise further in order to curb overheated inflation. This, in turn, acts as a tailwind for the AUD/USD pair, though a combination of factors is holding back bulls from placing aggressive bets and capping the upside, at least for the time being.
A modest uptick in the US Treasury bond yields assists the US Dollar (USD) to regain positive traction following the overnight slump that followed the dismal US macro data, showing that Initial Jobless Claims surged to a 20-month high last week. Apart from this, a generally weaker risk tone provides an additional boost to the safe-haven Greenback and contributes to keeping a lid on any further gains for the AUD/USD pair. The market sentiment remains fragile in the wake of growing worries about a global economic downturn, further fueled by the incoming disappointing Chinese economic data.
In fact, the National Bureau of Statistics reported that China's headline CPI shrank by 0.2% in May, while Producer Price Index (PPI) registered its worst decline since February 2016 and fell 4.6% YoY. This further points to slowing post-COVID recovery in the world's second-largest economy, which tempers investors' appetite for riskier assets and holds back traders from placing aggressive bullish bets around the China-proxy Aussie. Even from a technical perspective, the recent repeated failures near the 100-day Simple Moving Average (SMA) warrant caution before positioning for any further gains.
There isn't any relevant market-moving economic data due for release from the US on Friday, leaving the USD bulls at the mercy of the US bond yields. Apart from this, the broader risk sentiment will drive the safe-haven demand and provide some impetus to the risk-sensitive Aussie. Nevertheless, the AUD/USD pair remains on track to register strong gains for the second successive week as the focus now shifts to the highly-anticipated FOMC policy meeting on June 13-14.
Technical levels to watch
People's Bank of China (PBOC) Yi Gang said in a statement on Friday, China's Q2 GDP YoY growth is expected to be high mainly due to base effects.
Additional quotes
There is plenty of room for policy adjustment.
Will continue to implement prudent monetary policy, safeguard stability of yuan and financial sector.
Will facilitate enterprises to use yuan in cross-border trade and investments.
Market reaction
USD/CNY was last seen trading at 7.1204, up 0.13% on the day.
USD/JPY is still seen trading within the 138.50-141.00 range in the next few weeks, suggest Economist Lee Sue Ann and Markets Strategist Quek Ser Leang at UOB Group.
Key Quotes
24-hour view: Our view for “the rebound in USD to extend above 140.40” yesterday was incorrect as it plummeted to a low of 138.80. The rapid drop appears to be overdone but there is room for USD to test 138.50 before the risk of a rebound increases. In other words, USD is unlikely to break clearly below 138.50. On the upside, a breach of 139.60 (minor resistance is at 139.30) would indicate that the weakness in USD has stabilized.
Next 1-3 weeks: Yesterday (08 Jun, spot at 139.95), we highlighted that that USD “is likely to trade between 138.50 and 141.00”. While there is no change in our view for now, after the sharp drop yesterday, downward momentum is improving, albeit tentatively. Looking ahead, USD has to break clearly below 138.50 before a sustained decline is likely.
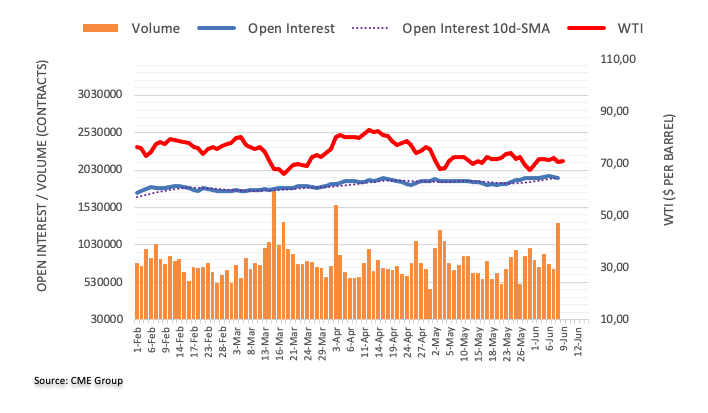
CME Group’s flash data for crude oil futures markets noted traders reduced their open interest positions for the second session in a row on Thursday, this time by around 15.3K contracts. Volume, instead, went up sharply by around 609.4K contracts, the largest single-day build since early April.
WTI: Recovery remains focused on $75.00
Prices of the WTI retreated markedly on Thursday on the back of shrinking open interest, which removes some strength for the prospects for a deeper drop in the very near term. In the meantime, further rebound is expected to meet the next hurdle around the monthly high near the $75.00 mark per barrel (June 5).
- AUD/JPY is looking to reclaim 94.00 as more rate hikes by the RBA would widen RBA-BoJ policy divergence.
- Australia’s monthly CPI has rebounded to 6.8% in April as domestic demand has remained resilient.
- BoJ watchers are seeing no policy adjustments in June as BoJ Ueda is consistently supporting the need for monetary stimulus.
The AUD/JPY pair is marching towards the crucial resistance of 94.00 as investors are hoping that the Reserve Bank of Australia (RBA) would keep raising interest rates to tame stubborn inflation. The cross was consolidating in a narrow range of 93.00-93.50 for the past two trading sessions but has come outside of the woods as more interest rate hikes by RBA Governor Philip Lowe would widen the RBA-Bank of Japan (BoJ) policy divergence.
Australia’s monthly Consumer Price Index (CPI) has rebounded to 6.8% in April as domestic demand has remained resilient. RBA’s Lowe in his monetary policy statement announced that more rate hikes are appropriate to arrest sticky inflation.
A poll from Reuters showed that the RBA would raise its Official Cash Rate (OCR) further by 25 basis points (bps) to 4.35%.
Meanwhile, evidence of weak demand from China could put some pressure on the Australian Dollar. Monthly deflation in China has expanded by 0.2% in May vs. the consensus and the former release of 0.1%. The annual Producer Price Index (PPI) has contracted to 4.6% against the estimates of 4.3%. Firms are scaling down prices of goods and services due to weak domestic demand.
It is worth noting that Australia is the biggest trading partner of China and weak Chinese demand could put some significant pressure on the Australian Dollar.
The Japanese Yen has failed to fetch strength despite discussions over an exit from the ultra-dovish interest rate policy by Bank of Japan (BoJ) Governor Kazuo Ueda. About BoJ’s interest rate guidance, Bloomberg reported that BoJ watchers are seeing no policy adjustments in June as BoJ Ueda is consistently supporting the need of monetary stimulus to keep inflation steadily above 2%.
EUR/GBP has more or less settled in the area of 0.86. Economists at Commerzbank analyze GBP outlook.
GBP upside potential should be limited
The official labour market data by the Office for National Statistics will be published on Tuesday. It is questionable though whether that really will provide more clarity. That means the BoE will continue to worry about a wage-price spiral and will probably continue to see the need for rate hikes. That is likely to support Sterling for now, but the upside potential should be limited now as rate expectations have already gone a long way.
We consider it to be less likely that the BoE will hike interest rates until year-end as we assume that inflation rates will ease more notably over the coming months and that this will provide the BoE with scope to end the rate hike cycle already at an earlier point. That means the market will have to lower its expectations regarding the BoE at which point Sterling will come under depreciation pressure.
Economists at Société Générale analyze Copper technical outlook.
Defence of 8080 is crucial for persistence in up move
Copper has experienced a steady rebound after touching the lower band of a steep channel near 7870 last month. It has broken out from this channel and is now challenging the 200-DMA.
Next potential resistance is located at 8450 representing the lows of March / April. If Copper overcomes this hurdle, ongoing phase of rebound is likely to extend towards 8530 and May peak of 8700/8770.
Defence of 8080, the 61.8% retracement is crucial for persistence in up move.
EUR/USD is back around the 1.0800 handle. Economists at ING analyze the pair’s outlook.
Shrugging off the recession
Domestically, the news of the Eurozone entering a technical recession after the 1Q GDP revision was understandably overlooked by the market, and may well be overlooked too by an inflation-focused ECB next week.
There are no domestic drivers for the Euro today.
We expect some consolidation around current levels in core Dollar pairs. EUR/USD could stabilise marginally below 1.0800.
- USD/JPY gains strong positive traction and recovers a major part of the overnight losses.
- A pickup in the US bond yields revives the USD demand and lends support to the major.
- The technical setup favours bulls and supports prospects for a further appreciating move.
The USD/JPY pair stages a goodish intraday recovery from a fresh weekly low, around the 138.75 region touched this Friday and builds on its steady intraday ascent through the early part of the European session. Spot prices climb further beyond the mid-139.00s in the last hour, reversing a major part of the overnight losses.
A modest pickup in the US Treasury bond yields helps revive the US Dollar (USD) demand and assists the USD/JPY pair to attract some buyers near the lower boundary of the recent trading range held over the past week or so. Meanwhile, worries about a global economic downturn continue to weigh on investors' sentiment, which, in turn, could benefit the safe-haven Japanese Yen (JPY) and act as a headwind for the major.
From a technical perspective, the recent range-bound price action witnessed over the past two weeks or so constitutes the formation of a rectangle on short-term charts. Against the backdrop of a rally from the mid-133.00s, or the May monthly swing low, this might still be categorized as a bullish consolidation phase. The outlook is reinforced by the fact that oscillators on the daily chart are still holding comfortably in bullish territory.
Moreover, technical indicators on hourly charts have also started moving in the positive territory, supporting prospects for a further intraday appreciating move. Hence, some follow-through strength towards the 140.00 psychological mark, en route to the trading range hurdle near the 140.25 area, looks like a distinct possibility. Bulls, however, might pause near the said barrier amid speculations for more sizeable interventions by the Bank of Japan (BoJ).
Investors might also prefer to move to the sidelines ahead of next week's key central bank event risks - the highly-anticipated FOMC monetary policy decision on Wednesday, followed by the BoJ meeting on Thursday.
In the meantime, any meaningful pullback might continue to find decent support near the 139.00 mark ahead of the 138.75-138.70 region. A convincing break below the latter will negate the constructive setup and prompt aggressive technical selling. The USD/JPY pair might then accelerate the downfall towards the monthly low, around the 138.45-138.40 zone, en route to the 138.00 mark and the 137.30 area, representing the 200-day SMA.
USD/JPY 4-hour chart
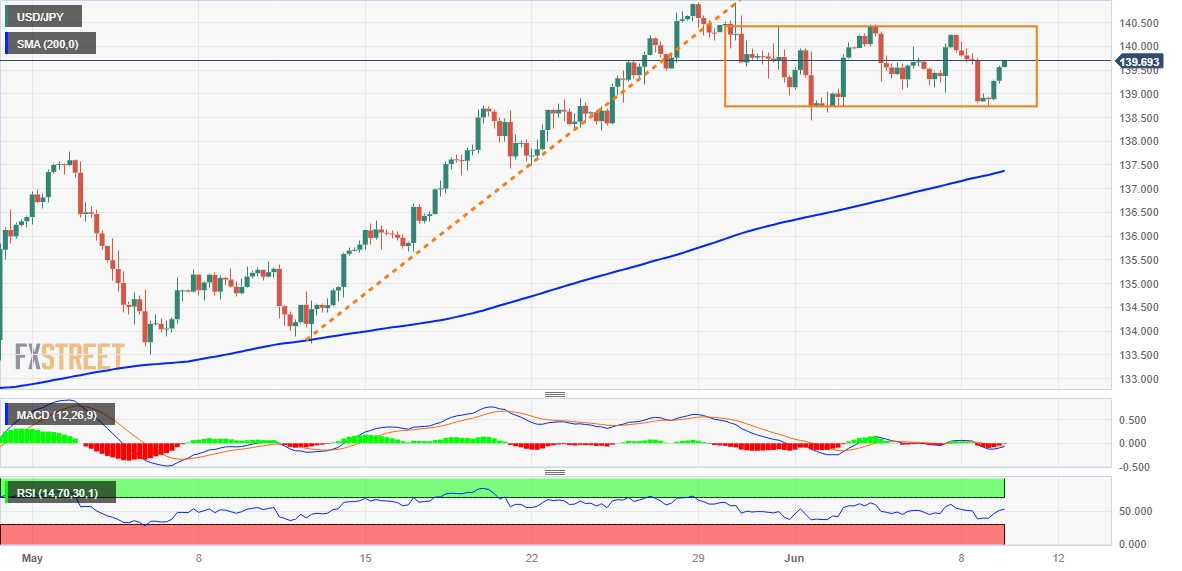
Key levels to watch
- Oil consolidates as the upside is restricted due to weak global demand while the downside is being supported by OPEC’s production cuts.
- The black gold witnessed a nosedive move after a false and misleading report stating that US-Iran nuclear deal.
- Straight 200-period EMA indicates that the overall trend is non-directional.
West Texas Intermediate (WTI), futures on NYMEX, have turned sideways around $71.00 in the London session. The black gold is oscillating post a V-shape recovery from the crucial support of $69.00.
On Thursday, oil prices witnessed a nosedive move after a false and misleading report stating that the US-Iran nuclear deal that would let the Islamic Republic legally export some of its sanctioned oil was refuted by the White House, as reported by Reuters.
The oil price is expected to remain on tenterhooks as demand concerns China is demonstrating a bleak oil demand. The situation of deflation in China and producers' inability of increasing the prices of goods and services at factory gates are evidence that overall demand in China is extremely weak.
Investors should note that China is the leading importer of oil in the world and weak Chinese demand put significant pressure on the oil price.
The oil price is consolidating in a range of $67.00-74.73 for more than one month. The upside in the oil price is restricted due to weak global demand while the downside is being supported by oil production cuts by OPEC.
A straight 200-period Exponential Moving Average (EMA) at $71.80 indicates that the overall trend is non-directional.
In addition to that, the Relative Strength Index (RSI) (14) is oscillating in the 40.00-60.00 range, indicating a lackluster performance.
A solid recovery above May 24 high at $74.70 will drive the asset toward April 28 high at $76.84. Further recovery above the latter would expose the oil price to April 26 high at $77.86.
In an alternate scenario, a downside move below May 31 low at $67.12 will drag the asset toward the $65.00 support followed by May's low at $64.31.
WTI two-hour chart
-638218944875619016.png)
In the opinion of Economist Lee Sue Ann and Markets Strategist Quek Ser Leang at UOB Group, the continuation of the upside momentum in AUD/USD could retest the 0.6755 region in the next few weeks.
Key Quotes
24-hour view: We expected AUD to “trade sideways between 0.6635 and 0.6710” yesterday. However, AUD rose above 0.6710 as it soared to a high of 0.6718. While AUD could continue to rise, the chance of it breaking clearly above 0.6755 today is not high. Support is at 0.6690, followed by 0.6670.
Next 1-3 weeks: Yesterday (08 Jun, spot at 0.6660), we highlighted that AUD could rise further but any advance is expected to encounter solid resistance at 0.6755. While the 0.6755 level remains solid resistance, after yesterday’s strong rise, the chance of AUD breaking clearly above this level has increased. Looking ahead, the next resistance above 0.6755 is at 0.6600. On the downside, a breach of 0.6645 (‘strong support’ level was at 0.6595 yesterday) would indicate that AUD is not advance further.
Brent Crude Oil is still holding its 2023 lows but remains in a clear downtrend, in the view of strategists at Credit Suisse.
Break above 55-DMA and recent high at $78.66/67 would point to another swing higher
With medium-term momentum still negative and with the market still below sharply falling medium-term moving averages after holding below the 55-DMA and range top at $78.66/67 post the OPEC+ supply cut, we still view the market as in an overall downtrend, albeit one that is slowing, and we, therefore, stay biased towards a break below $71.28/70.12 in due course.
Above the 55-DMA and recent high at $78.66/67 would in contrast point to another swing higher towards more important resistance, which remains at the 200-DMA, a key price high and potential downtrend at $84.53/87.49.
- EUR/USD appears slightly offered near 1.0770.
- Italian Industrial Production comes next on the docket.
- ECB De Guindos si due to speak later in the session.
EUR/USD gives away some gains following Thursday’s strong uptick to the 1.0785/90 band at the end of the week.
EUR/USD focused on USD dynamics
EUR/USD comes under some mild downside pressure after Thursday’s monthly peaks in the area below 1.0800 the figure, as the greenback gives some signs of life amidst a so far tepid recovery.
In the meantime, the pair’s recent advance came in response to the pronounced knee-jerk in the greenback, particularly in response to increasing speculation of an impasse in the Fed’s normalization process at the June 14 gathering.
In stark contrast to the latter, the ECB remains poised to extend the hiking cycle beyond the June event, with investors also pencilling in another quarter-point rate hike in July, while a similar move in September is not ruled out.
In the domestic calendar, Industrial Production in Italy will be the sole release, along with the speech by ECB Vice President L. De Guindos.
What to look for around EUR
EUR/USD trades close to the 1.0800 zone amidst some lacklustre recovery attempt in the greenback.
In the meantime, the pair’s price action is expected to closely mirror the behaviour of the US Dollar and will likely be impacted by any differences in approach between the Fed and the ECB with regards to their plans for adjusting interest rates.
Moving forward, hawkish ECB speak continues to favour further rate hikes, although this view appears to be in contrast to some loss of momentum in economic fundamentals in the region.
Eminent issues on the back boiler: Continuation of the ECB hiking cycle in June and July (and September?). Impact of the Russia-Ukraine war on the growth prospects and inflation outlook in the region. Risks of inflation becoming entrenched.
EUR/USD levels to watch
So far, the pair is losing 0.11% at 1.0770 and faces the next support at 1.0635 (monthly low May 31) seconded by 1.0516 (low March 15) and finally 1.0481 (2023 low January 6). On the upside, the surpass of 1.0787 (monthly high June 8) would target 1.0807 (100-day SMA) en route to 1.0880 (55-day SMA).
Here is what you need to know on Friday, June 9:
The US Dollar holds steady on the last trading of the way after having suffered large losses against its major rivals on Thursday. There won't be any high-tier data releases from the Eurozone nor the US ahead of the weekend. In the early American session, Statistics Canada will release the jobs report for May.
Initial Jobless Claims in the US jumped to 261,000 in the week ending June 3 from 233,000, the US Department of Labor reported on Thursday. The benchmark 10-year US Treasury bond yield fell more than 2% after this data and the US Dollar Index (DXY) dropped to its lowest level in two weeks below 103.50, losing 0.75% in the process. Early Friday, the 10-year US yield stays below 3.75% and DXY fluctuates in a narrow channel at around 103.40. Meanwhile, US stock index futures trade in negative territory, pointing to a cautious market stance.
During the Asian trading hours on Friday, the data from China showed that the Consumer Price Index (CPI) declined by 0.2% on a monthly basis in May. This reading failed to trigger a noticeable market reaction. AUD/USD, which extended its weekly rally and gained 150 pips on Thursday, stays relatively calm slightly above 0.6700 early Friday.
Swiss National Bank (SNB) Chairman Thomas Jordan said on Thursday it would not be a good idea to wait for inflation to rise and then have to raise interest rates. These comments provided a boost to the CHF and USD/CHF lost more than 100 pips. Early Friday, the pair trades below 0.9000.
USD/CAD closed the third straight day in negative territory on Thursday and continues to edge lower early Friday. The pair was last seen trading slightly below 1.3350. The Unemployment Rate in Canada is forecast to tick up to 5.1% in May from 5% April.
Canada Unemployment Rate Preview: Canadian Dollar traders to scrutinize jobs report.
EUR/USD benefited from the broad USD weakness on Thursday and rose toward 1.0800 before going into a consolidation phase. In the European morning, the pair moves up and down in a narrow band above 1.0750.
GBP/USD is finding it difficult to build on Thursday's gains and holds steady at around 1.2550.
USD/JPY fell to a fresh weekly low below 139.00 on Thursday but regained its traction early Friday. As of writing, the pair was up 0.4% on the day at 139.50.
Gold price rose sharply toward $1,970 on Thursday, boosted by the retreating US T-bond yields. XAU/USD moves sideways near mid-$1,960s in the European morning.
Bitcoin continues to move sideways near $26,500 for the second straight day on Friday. Similarly, Ethereum remains rangeboud slightly above $1,800.
GBP/USD is expected to edge further up in the short-term horizon, according to Economist Lee Sue Ann and Markets Strategist Quek Ser Leang at UOB Group.
Key Quotes
24-hour view: The sharp rise in GBP to a high of 1.2562 yesterday came as a surprise (we were expecting it to trade in a range). While the rally appears to be overdone, it could extend even though the resistance at 1.2680 is highly unlikely to come into view today (there is another resistance at 1.2600). In order to keep the momentum going, GBP must stay above 1.2495 (minor support is at 1.2520).
Next 1-3 weeks: Yesterday (08 Jun, spot at 1.2445), we were of the view that GBP “is likely to consolidate between 1.2350 and 1.2550 for the time being”. We did not anticipate the strong surge in GBP that sent it above 1.2550 (high has been 1.2562). While GBP is likely to rise further, it remains to be seen if it has enough momentum to revisit last month’s high near 1.2680. On the downside, a breach of 1.2450 (‘strong support’ level) would indicate that 1.2680 is not coming into view.
Considering advanced prints from CME Group for gold futures markets, open interest rose by around 1.3K contracts on Thursday, while volume added to the previous daily build and went up by around 3.7K contracts.
Gold: Immediate upside target appears around $1980
Thursday’s strong bounce in gold prices was on the back of rising open interest and volume, opening the door to the continuation of the recovery in the very near term. Against that, the next target for bulls comes at the June peaks just above the $1980 mark per ounce troy.
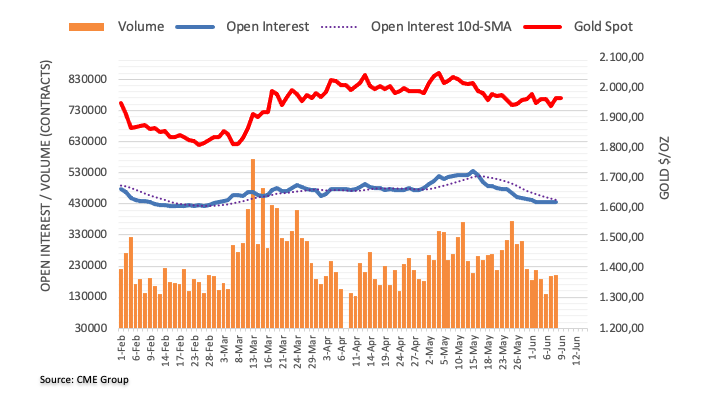
- Silver scales higher for the second straight day and climbs to a near one-month high.
- The overnight breakout through the $24.00 mark supports prospects for further gains.
- A sustained weakness below the $23.60-55 area is needed to negate the positive outlook.
Silver builds on the previous day's strong rally and gains some follow-through traction for the second successive day on Friday. The buying interest picks up pace during the early European session and lifts the white metal to a nearly one-month top, around the $24.40 region in the last hour.
Against the backdrop of the recent repeated failures to find acceptance below the 200-hour Simple Moving Average (SMA), the overnight sustained strength beyond the $24.00 mark was seen as a fresh trigger for bullish traders. The said handle coincides with the 38.2% Fibonacci retracement level of the downfall witnessed in May, from over a one-year peak, and should now act as a pivotal point for short-term traders.
Meanwhile, technical indicators on the daily chart have just started gaining positive traction and support prospects for a further near-term appreciating move. That said, Relative Strength Index (RSI) is flashing slightly overbought conditions on hourly charts and warrants some caution for bulls. This makes it prudent to wait for some intraday consolidation near the $24.45-$24.50 area, or the 50% Fibo. level before placing fresh bets.
Nevertheless, the XAG/USD now seems poised to surpass an intermediate hurdle near the $24.25-$24.30 region and aim to reclaim the $25.00 psychological mark. Some follow-through buying should pave the way for a further near-term appreciating move towards the next relevant hurdle is pegged near the $24.35-$24.40 region, above which the XAG/USD is likely to make a fresh attempt towards conquering the $26.00 mark.
On the flip side, the 38.2% Fibo. level, around the $24.00 round figure, now seems to protect the immediate downside. Any subsequent fall could be seen as a buying opportunity and remain limited near the $23.60-$23.55 confluence, comprising of the 200-period SMA on the 4-hour chart and the 23.6% Fibo. level. The said area should act as a strong base for the XAG/USD, which if broken will negate the positive outlook.
Silver 1-hour chart
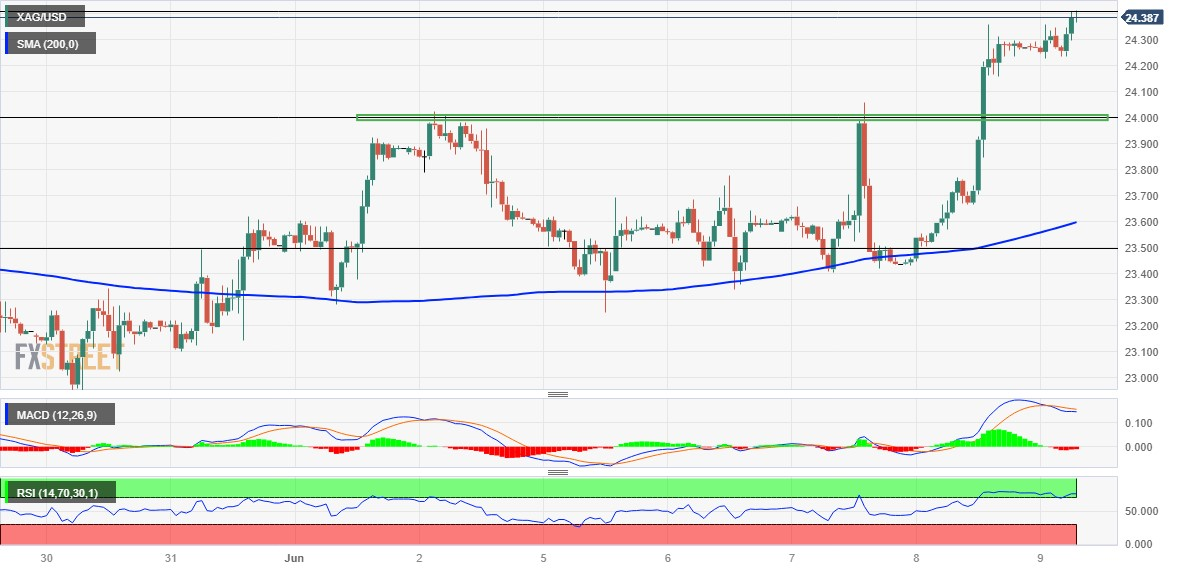
Key levels to watch
- EUR/JPY seems healthy above 150.00 as ECB to remain hawkish ahead.
- Eurozone’s final Q1 GDP contracted by 0.1% which has propelled fears of a recession.
- BoJ Ueda might keep policy unchanged as he is consistently reiterating the need for monetary stimulus.
The EUR/JPY pair is holding its auction confidently above the psychological resistance of 150.00 in the early European session. The cross is holding itself in the bullish trajectory as the European Central Bank (ECB) is committed to raising interest rates further for taming stubborn inflation despite deepening fears of a recession in the Eurozone.
Thursday’s final Eurozone Q1 Gross Domestic Product (GDP) data showed that the growth rate in the shared continent contracted by 0.1% while the market participants were estimating a stagnant performance. In the fourth quarter of CY2022, Eurozone GDP was expanded by 0.1%.
It is worth noting that the German economy is already in recession considering the fact that the nation registered two consecutive contractions in quarterly GDP numbers. Therefore, the odds of the Eurozone falling into a recession are skyrocketing. It seems that higher interest rates by ECB President Christine Lagarde to bring down inflation are heavily impacting Eurozone’s factory and services activity.
Somewhere in the battle of higher interest rates and higher inflation, the shared continent is losing.
According to a clear majority of economists polled by Reuters, ECB President Christine Lagarde will hike its key interest rates by 25 basis points (bps) on June 15 and again in July before pausing for the rest of the year.
Meanwhile, ECB Governing Council member Francois Villeroy de Galhau said “There is really a slowdown in inflation,” He further added, “2023 GDP growth should be at least 0.6%.”
The Japanese Yen is failing to get an upper hand as investors are anticipating that Bank of Japan (BoJ) Governor Kazuo Ueda will keep policy unchanged next week. The street believes that BoJ Ueda is consistently reiterating the need for monetary stimulus to keep inflation steadily above 2%, which could be achieved by higher wages and robust households demand.
- GBP/JPY takes the bids to refresh multi-month high during three-day winning streak.
- Hesitance in confirming 14-week-old rising wedge, clear break of seven-month-long horizontal resistance-turned-support favor bulls.
- Overbought RSI can trigger pullback moves; wedge’s top line challenges buyers.
GBP/JPY stays on the front foot for the third consecutive day around 175.20 as it rises to the fresh high since January 2016 heading into Friday’s London open. In doing so, the cross-currency pair justifies the early week’s rebound from a lower line of the rising wedge bearish chart pattern established in late February.
Apart from the previous rebound within a bearish chart formation, the quote’s successful trading beyond the seven-week-old horizontal resistance, now support around 172.00, also favors the GBP/JPY bulls as the key to refreshing the multi-year high.
It should be noted, however, that the overbought RSI (14) line, challenges the GBP/JPY bulls.
Apart from the overbought RSI, the top line of the aforementioned multi-day-old rising wedge, near 176.20, can also challenge the cross-currency pair.
Hence, the GBP/JPY pair traders are likely to remain bullish unless witnessing a sure confirmation of the bearish chart formation, by downside concurrence of the said wedge’s lower line, close to 173.80 at the latest.
Even so, the 21-DMA level of around 172.75 can act as an extra filter towards the south for the pair sellers ahead of the previous resistance line area surrounding 172.00.
Fundamentally, the British Chambers of Commerce (BCC) said that the UK economy will probably skirt a recession but sputter through “anemic” growth in the year ahead due to lingering inflation, per Bloomberg. On the other hand, the US Treasury bond yields as the benchmark 10-year and two-year Treasury bond yields remain sidelined near 3.73% and 4.52% respectively, after reversing from the highest levels in a fortnight and snapping a two-day winning streak in that order the previous day.
Also read: GBP/JPY jumps to the highest level since 2016, around 174.80 region
GBP/JPY: Daily chart
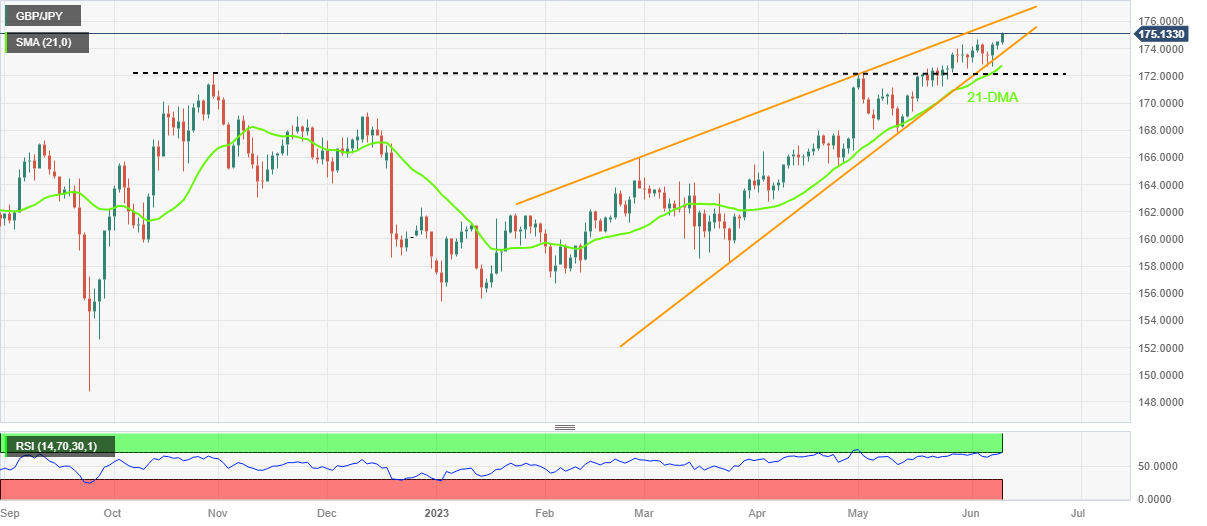
Trend: Limited upside expected
- GBP/USD has resumed its north-side journey as the USD Index has sensed barricades after a less-confident recovery.
- Easing US labor market conditions have faltered expectations of more interest rate hikes from the Fed.
- Higher earnings and upbeat UK Employment would put more pressure on the BoE ahead.
The GBP/USD pair has resumed its upside journey towards the round-level resistance of 1.2600 after a small intervention around 1.2560 in the early London session. Sheer strength in the Cable has been built due to a significant decline in the US Dollar Index (DXY).
S&P500 futures have increased losses in Europe amid a mild caution in the market sentiment as investors are awaiting the release of the United States Consumer Price Index (CPI) (May), which will release on Tuesday.
The USD Index is facing stiff barricades around 103.41 after a less-confident pullback move made after printing a low of 103.30. Investors are dumping positions in the US Dollar after US weekly jobless claims jumped significantly by 28K to 261K for the week ending June 02 vs. upwardly revised expectations of 235K. A 19-month high US Initial Jobless Claims release shows that labor market conditions are not tight enough and the Federal Reserve (Fed) could consider a pause in the policy-tightening spell actively.
For further guidance, US inflation data will be keenly watched. Headline inflation is seen softening to 4.2% vs. the prior release of 4.9%. Core CPI that strips of oil and food prices is expected to accelerate marginal to 5.6% vs. the former release of 5.5%. If core inflation continues to remain persistent, Fed chair Jerome Powell could be more favorable for the continuation of the policy-tightening spell.
Meanwhile, the Pound Sterling would also remain on tenterhooks amid the release of Tuesday’s Employment data (May). As per the preliminary report, Claimant Count Change is expected to drop by 9.6K against a significant increase of 46.7K. The Unemployment Rate is expected to increase to 4.0% vs. the prior release of 3.9%.
Apart from that, three-month Average Earnings excluding bonuses (April) will be keenly watched. The economic data is expected to accelerate to 7.0% vs. the former release of 6.7%. Households equipping higher liquidity for disposal would propel the overall demand and eventually inflationary pressures, which would put more pressure on the Bank of England (BoE) ahead.
- Gold price is seen oscillating in a narrow trading band just below the weekly high.
- Rebounding US bond yields revives the US Dollar demand and acts as a headwind.
- Economic woes, bets for an imminent Fed rate hike pause help limit the downside.
Gold price struggles to capitalize on the previous day's solid rebound from the 100-day Simple Moving Average (SMA) support near the $1,940-$1,939 area and oscillates in a narrow trading band on Friday. The XAU/USD currently trades near the top end of its weekly range, around the $1,965 region, nearly unchanged for the day heading into the European session.
Reviving US Dollar demand caps the upside for Gold price
A modest uptick in the United States (US) government bond yields assists the US Dollar (USD) to attract some dip-buying on the last day of the week and recover a part of the overnight slide to its lowest level since May 24. This, in turn, is seen as a key factor acting as a headwind for the US Dollar-denominated Gold price. The downside remains, however, remains cushioned in the wake of a generally softer risk tone, which tends to benefit the safe-haven XAU/USD.
A softer risk tone lends support to safe-haven XAU/USD
The market sentiment remains fragile on the back of growing worries about a global economic downturn, fueled by the weaker Chinese inflation figures earlier today. In fact, the National Bureau of Statistics reported that China's Consumer Price Index (CPI) shrank by 0.2% in May, while Producer Price Index (PPI) registered its worst decline since February 2016 and fell 4.6% YoY. This further points to slowing post-COVID recovery in the world's second-largest economy.
Federal Reserve rate-hike pause also acts as a tailwind for Gold price
Apart from this, firming expectations that the Federal Reserve (Fed) will skip raising interest rates at its June 13-14 meeting hold back the USD bulls from placing aggressive bets and lend support to the non-yielding Gold price. In fact, the markets have fully priced in an imminent pause in the US central bank's rate-hiking cycle. The bets were reaffirmed by Thursday's US data, which showed that Initial Jobless Claims surged to a 20-month high last week.
The focus remains on the crucial FOMC meeting next week
The Fed funds futures, however, indicate the possibility of another 25 basis point (bps) lift-off at the July Federal Open Market Committee (FOMC) meeting. This, in turn, is holding back traders from placing aggressive bullish bets around the Gold price in the absence of any relevant market-moving economic data. Investors might also prefer to wait on the sidelines ahead of the release of the latest US consumer inflation figures and the FOMC meeting next week.
Gold price technical outlook
From a technical perspective, some follow-through buying has the potential to lift the Gold price to the next relevant hurdle near the $1,983-$1,985 supply zone en route to the $2,000 psychological mark. The XAU/USD could eventually climb towards the $2,010-$2,012 supply zone.
On the flip side, the 100-day SMA, currently around the $1.939 area, might continue to protect the immediate downside. A convincing break below will make the Gold price vulnerable to accelerate the fall towards the $1,900 mark. Some follow-through selling should allow bears to target the very important 200-day SMA, currently around the $1,839 area, with some intermediate support near the $1,876-$1,875 horizontal zone.
Key levels to watch
- USD/CHF remains depressed at the lowest levels in 13 days.
- Clear downside break of one-month-old ascending trend line, the first bearish MACD signal in many days favor Swiss Franc buyers.
- Recovery moves need validation from 100-DMA, RSI suggests continuation of downtrend.
USD/CHF bears take a breather at the lowest level in a fortnight, making rounds to 0.8990 heading into Friday’s European session. In doing so, the Swiss Franc (CHF) pair jostles with the 50-DMA support to extend the previous day’s fall, the biggest in seven months.
It should be noted that the major currency pair’s clear downside break of a one-month-old ascending support line triggered the quote’s major fall on Thursday.
That said, the quote’s latest inaction fails to push back the USD/CHF bears amid the MACD indicator’s first bearish signal since late April, as well as amid the steady RSI (14) line.
Hence, the sellers are to stay on the way to the multi-month low marked in May around 0.8820 even if the 50-DMA support of 0.8988 prods the south-run of late. With this, the Swiss Franc pair sellers may aim for the 0.8800 round figure.
Alternatively, an upside break of the previous support line stretched from early May, around 0.9085, isn’t an open invitation to the USD/CHF bulls.
The reason could be linked to the pair’s U-turn from the 100-DMA and 50% Fibonacci retracement of the March-May fall, respectively near 0.9120 and 0.9135.
USD/CHF: Daily chart
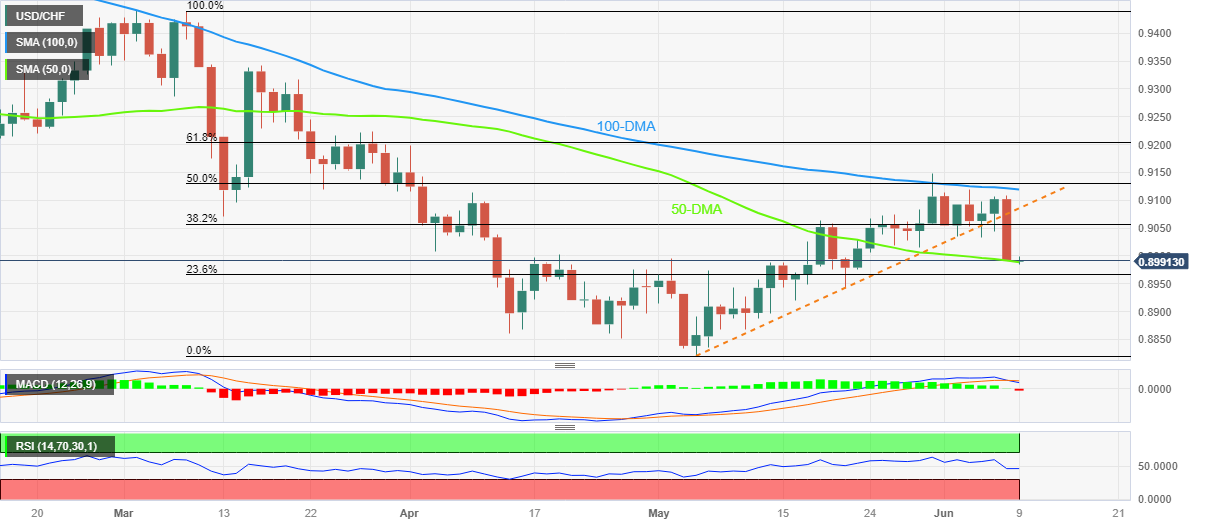
Trend: Further downside expected
- NZD/USD is looking to cross the crucial resistance of 0.6100 amid a fresh sell-off in the USD Index.
- Investors are anticipating that easing US labor market conditions are going to allow the Fed to pause raising rates in June.
- NZD/USD is approaching the horizontal resistance of the Ascending Triangle chart pattern.
The NZD/USD pair has delivered a solid recovery from 0.6085 in the early European session. The Kiwi asset is aiming to recapture the round-level resistance of 0.6100 as the US Dollar Index (DXY) has retreated after a short-lived pullback to near 103.42.
The USD Index has come under pressure as investors are anticipating that easing United States labor market conditions are going to allow the Federal Reserve (Fed) to pause raising interest rates in June.
The New Zealand Dollar has not loosened its strength despite deflation in the Chinese economy. On a monthly basis, the Chinese economy has registered deflation by 0.2% against the estimates and the prior release of 0.1% deflation. This indicates a sheer drop in the overall demand. It is worth noting that New Zealand is one of the leading trading partners of China and weak demand in China impacts the New Zealand Dollar.
NZD/USD is approaching the horizontal resistance of the Ascending Triangle chart pattern plotted from May 25 high at 0.6110. Upward-sloping trendline of the aforementioned chart pattern is placed from May 31 low at 0.5985. The 50-period Exponential Moving Average (EMA) at 0.6073 has turned straight, portraying a non-directional performance. Critical resistance is plotted from May 12 low at 0.6182.
The Relative Strength Index (RSI) (14) is making efforts for shifting into the bullish range of 60.00-80.00, which would trigger the upside momentum.
A confident break above May 25 high at 0.6110 will drive the Kiwi asset toward May 01 low at 0.6160 followed by the round-level resistance at 0.6200.
Alternatively, a downside move below the intraday low at 0.6015 will expose the asset for a fresh six-month low toward 11 November 2022 low at 0.5984. A slippage below the latter would expose the asset toward 02 November 2022 high at 0.5941.
NZD/USD two-hour chart
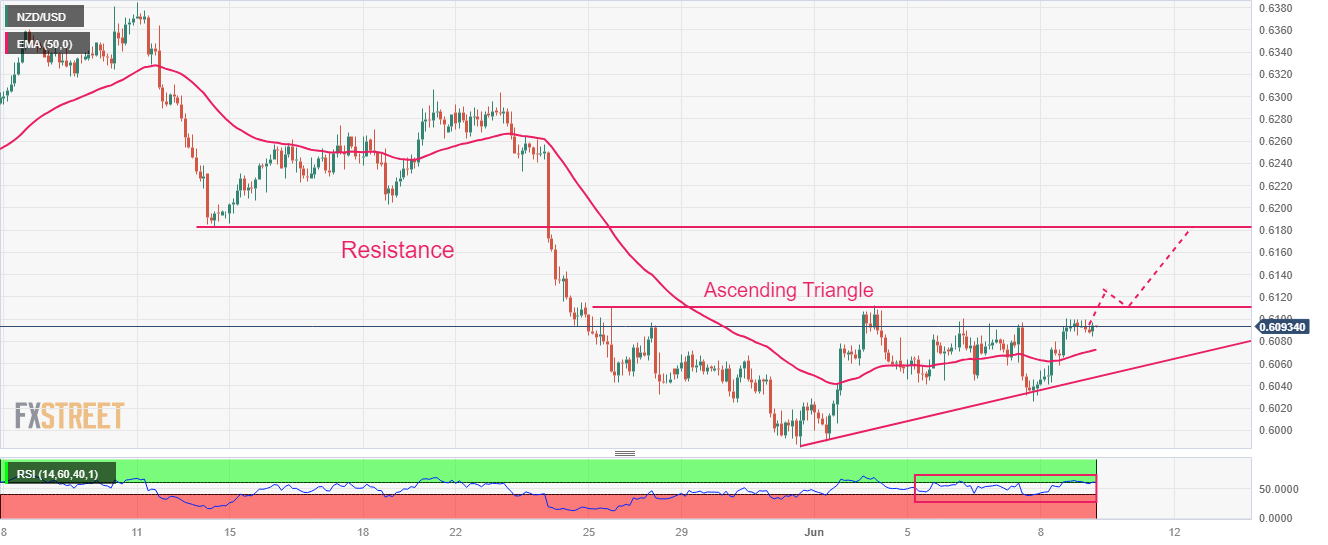
- USD/CAD retreats from intraday high as it snaps three-day losing streak.
- US Dollar consolidates the biggest daily loss in five weeks, Oil grinds lower despite price-positive headlines from Middle East.
- Market’s reassessment of previous risk-on mood, Fed concerns propels Loonie pair.
- BoC’s Beaudry defends latest rate hike but also says, “nothing is determined looking forward”.
USD/CAD takes offers to 1.3360 while reversing from the intraday high as it prepares for Canada employment data for May on early Friday. In doing so, the Loonie pair fails to justify a halt in the US Dollar’s fall, as well as the mixed performance of the Oil price, amid dicey market hours.
US Dollar Index (DXY) clings to mild gains around 103.35 after falling the most in five weeks the previous day. In doing so, the greenback’s gauge versus six major currencies benefits from the market’s reassessment of Fed bets after ruling out the hawkish bias the previous day.
That said, Thursday’s downbeat US Initial Jobless Claims, the highest since October 2021, pushed back the Fed hawks and drowned the US Dollar. Even so, the International Monetary Fund (IMF) urged the US Federal Reserve and other global central banks to "stay the course" on monetary policy and remain vigilant in combating inflation, per Reuters.
On the other hand, WTI crude oil remains pressured near $71.00 after previously cheering the downbeat US Dollar, as well as the headlines surrounding Saudi Arabia’s threat to thwart the US-Saudi ties. That said, the global recession fears, backed by higher rates and downbeat statistics at the major economies keep the black gold on the back foot.
Late on Thursday, Bank of Canada (BoC) Deputy Governor Paul Beaudry initially defended the Canadian central bank’s surprise rate hike by saying, “It is more likely that long-term rates will remain elevated than the opposite.” The policymaker, however, also said tried to be modest while saying that they are taking one rate decision at a time.
Looking ahead, USD/CAD remains depressed due to the latest divergence in the monetary policy bias surrounding the BoC and the Fed. However, today’s Canada jobs report may allow the bears to take a breather in case of disappointing markets and prepare for the next week’s Fed monetary policy meeting.
Technical analysis
USD/CAD’s latest rebound could also be linked to the nearly oversold conditions of the RSI (14) line. Hence, the Loonie pair stays on the seller’s radar unless crossing a convergence of the 100-DMA and 200-DMA, around 1.3515 by the press time. Though, the 1.3400 round figure and the weekly high of near 1.3460 can lure short-term buyers.
Also read: USD/CAD Price Analysis: Bounces off 1.3330 key support ahead of Canada Employment data
- Unemployment Rate in Canada expected to rise a tad to 5.1%, with job growth losing momentum in May.
- Canadian Dollar bulls will need an upbeat jobs report to extend the uptrend versus the US Dollar.
- Bank of Canada unexpectedly raised its policy rate in June but a weak jobs report could attract dovish bets.
The Canadian Labor Force Survey report, released by Statistics Canada, is scheduled for release at 12:30 GMT, on June 9. Markets expect the Unemployment Rate to tick higher to 5.1% in May from 5% in April. Net Change in Employment, which rose by 41,400 in April, is forecast to increase by 23,200.
The Bank of Canada (BoC) unexpectedly announced earlier in the week that it raised its policy rate by 25 basis points (bps) to 4.75% after having left it unchanged at 4.5% in March and April. Upcoming labor market data could influence the Canadian Dollar’s (CAD) performance against its rivals. A stronger-than-expected growth in payrolls and wage inflation, as measured by the Average Hourly Earnings, could help the CAD gather strength against its rivals by suggesting that the BoC could continue to tighten its policy. On the other hand, the currency is likely to have a hard time finding demand if the jobs report reveals loosening conditions in the labor market.
How can the unemployment report shape the Bank of Canada policy?
The BoC noted that increasing concerns over the Consumer Price Index (CPI) inflation getting stuck materially above the 2% target was the primary reason behind the decision to hike the policy rate. The BoC reiterated that labor market conditions remained tight in Canada and further explained:
“Higher immigration and participation rates are expanding the supply of workers but new workers have been quickly hired, reflecting continued strong demand for labor.”
Unless there is a noticeable cooldown in the jobs market, the BoC should continue to stay focused on taming inflation, which could translate into one more rate increase in July. In a recently published note to investors, Citigroup economists said that they are now anticipating the BoC to hike the key rate to 5% at the next policy meeting. In April, annual wage inflation stood at 5.2%. A reading close to that figure coupled with a healthy increase in payrolls, at or above market expectations, should allow the BoC to consider an even tighter policy.
On the other hand, a significant decline in annual wage growth and a disappointing Net Change in Employment, close to 0, could cause markets to reconsider the BoC’s policy outlook, at least until the May CPI inflation data.
We look for job growth to slow to 25K in May for a deceleration from the recent trend of 57K, keeping the unemployment rate stable at 5.0%. We look for service-sector hiring to drive the headline print, alongside a rebound in full-time employment after the pullback in April. We also look for wage growth to remain elevated at 5.1%, down 0.1pp from last month.
– TDSWhen is May’s Canada Unemployment Rate released and how could it affect USD/CAD?
The Canadian Unemployment Rate for May will be released with the publication of the Labor Force Survey on Friday, June 9 at 12.30 GMT. The market expects moderate growth in payrolls in May and sees the Unemployment Rate ticking higher to 5.1% from 5%. Ahead of next week’s CPI data from the US and the Federal Reserve’s policy announcements, investors are unlikely to take large US Dollar (USD) positions. Hence, Canada's jobs report could influence USD/CAD’s action ahead of the weekend.
As explained above, the CAD’s reaction to employment data should be straightforward due to the potential influence on the BoC’s rate outlook. A stronger-than-forecast increase in Employment Change alongside sticky wage inflation could provide a boost to CAD and cause USD/CAD to stretch lower and vice versa.
The daily chart points to a build-up of bearish momentum in USD/CAD with the Relative Strength Index (RSI) indicator dropping below 40 following the BoC’s rate hike on Thursday. On the downside, 1.3300 (psychological level) aligns as the first support ahead of 1.3200, where the Fibonacci 50% retracement of the August-November uptrend is located.
In case USD/CAD gathers bullish momentum after the employment data, it is likely to face first resistance at 1.3400 (psychological level, static level) before 1.3450 (Fibonacci 38.2% retracement). A daily close above the latter could open the door for an extended rebound toward 1.3500 (100-, 200-day Simple Moving Average).
About the Employment Change
The Employment Change released by Statistics Canada is a measure of the change in the number of employed people in Canada. Generally speaking, a rise in this indicator has positive implications for consumer spending which stimulates economic growth. Therefore, a high reading is seen as positive, or bullish for the Canadian Dollar, while a low reading is seen as negative or bearish.
About the Unemployment Rate
The Unemployment Rate released by Statistics Canada is the number of unemployed workers divided by the total civilian labor force. It is a leading indicator for the Canadian Economy. If the rate is up, it indicates a lack of expansion within the Canadian labor market. As a result, a rise normally leads to a weakening of the Canadian Dollar. Otherwise, a decrease of the figure is usually seen as positive (or bullish) for the CAD.
FX option expiries for June 9 NY cut at 10:00 Eastern Time, via DTCC, can be found below.
- EUR/USD: EUR amounts
- 1.0700 933m
- 1.0725 608m
- 1.0750 749m
- 1.0800 607m
- 1.0850 555m
- GBP/USD: GBP amounts
- 1.2335 351m
- 1.2640 376m
- USD/JPY: USD amounts
- 139.00 1.2b
- 140.00 1.1b
- USD/CHF: USD amounts
- 0.8780 635m
- 0.8900 597m
- 0.9150 810m
- AUD/USD: AUD amounts
- 0.6600 425m
- USD/CAD: USD amounts
- 1.3235 604m
- 1.3385 445m
- 1.3400 767m
- 1.3450 1.7b
- 1.3500 2.2b
- 1.3600 687m
- The index regains composure and bounces off lows near 103.30.
- The buying interest in the risk complex takes a breather.
- Investors expect the Fed to pause its hiking cycle next June.
The greenback, when gauged by the USD Index (DXY), regains its smile and manages to rebound from recent weekly lows near 103.30 on Friday.
USD Index looks at risk trends
The index picks up some upside traction following Thursday’s strong retracement to the area of 2-week lows around 103.30.
The bullish attempt in the dollar comes on the back of some profit taking in the risk complex in light of the recent strong advance, while expectations of a Fed impasse at the June event remain firm for the time being.
Moving forward, the index could move into a consolidative phase ahead of the release of crucial US inflation figures next week, just before the FOMC meeting.
There are no scheduled releases on the US docket for Friday.
What to look for around USD
The index seems to have met some initial contention around the 103.30 region so far this week.
In the meantime, bets of another 25 bps at the Fed’s next gathering in June reversed course in spite of the steady resilience of key US fundamentals (employment and prices, mainly), denting the recent rally in the dollar and favouring a further decline in US yields.
Bolstering a pause by the Fed instead appears to be the extra tightening of credit conditions in response to uncertainty surrounding the US banking sector.
Eminent issues on the back boiler: Persistent debate over a soft/hard landing of the US economy. Terminal Interest rate near the peak vs. speculation of rate cuts in late 2023/early 2024. Fed’s pivot. Geopolitical effervescence vs. Russia and China. US-China trade conflict.
USD Index relevant levels
Now, the index is gaining 0.07% at 103.38 and the breakout of 104.69 (monthly high May 31) would open the door to 105.45 (200-day SMA) and then 105.88 (2023 high March 8). On the other hand, the next support comes at 103.29 (monthly low June 8) seconded by 102.99 (100-day SMA) and finally 102.50 (55-day SMA).
“There is really a slowdown in inflation,” European Central Bank (ECB) Governing Council member Francois Villeroy de Galhau said on Friday.
He added: “2023 GDP growth should be at least 0.6%.”
Market reaction
At the time of writing, EUR/USD is trading 1.0778, down 0.06% on the day.
- EUR/GBP has recovered from 0.8580 as ECB to remain hawkish despite deepening fears of recession.
- Eurozone final Q1 GDP contracted by 0.1% while the street was anticipating a stagnant performance.
- Higher interest rates by the BoE are keeping pressure on the BoE.
The EUR/GBP pair has shown a recovery move after finding buying interest near 0.8580 in the early European session. The cross has rebounded despite the Eurostat reported a contraction in final Q1 Gross Domestic Product (GDP) numbers.
On Thursday, the final Q1 GDP displayed a contraction by 0.1% while the street was expecting a stagnant performance from a downwardly revised figure of 0.1% expansion. Annual GDP expanded by 1.0% but at a slower pace than the prediction of 1.2% and the former release of 1.3%. The odds for Eurozone falling into a recession are extremely solid as the European Central Bank (ECB) is not going to pause its policy-tightening spell to tame sticky inflation.
Investors should note that the German economy has already reported a recession after registering a contraction in GDP figures consecutively for two quarters.
According to a clear majority of economists polled by Reuters, ECB President Christine Lagarde will hike its key interest rates by 25 basis points (bps) on June 15 and again in July before pausing for the rest of the year. The move of hiking rates further by a total of 50 bps would push key rates to 4.25%.
On the Pound Sterling front, investors are shifting their focus toward the United Kingdom Employment data, which will release next week. Higher interest rates by the Bank of England (BoE) and expectations of more rate hike announcements by BoE Governor Andrew Bailey would keep pressure on the overall hiring process.
Economists at ING said second or third-tier United Kingdom data has been quite mixed recently, but the main event on the data front will be next Tuesday's release of jobs and wages data. We see that as a negative event risk for the Sterling, where wage growth could continue to slow and take some of the steam out of the 100 bps+ Bank of England tightening expectations still priced in by money markets.
Economist Lee Sue Ann and Markets Strategist Quek Ser Leang at UOB Group note the upside momentum in EUR/USD seems to be gathering traction.
Key Quotes
24-hour view: Our view for EUR to trade in a range yesterday was incorrect, as it soared by 0.79% (NY close of 1.0781), its biggest 1-day advance in 2-1/2 months. Further EUR strength is not ruled out, but in view of the overbought conditions, it remains to be seen if it can maintain a foothold above 1.0800 (there is another nearby resistance at 1.0815). Support is at 1.0760, a break of 1.0740 would suggest the current upward pressure has eased.
Next 1-3 weeks: We highlighted yesterday (08 Jun, spot at 1.0705) that EUR “is likely to consolidate and trade between 1.0635 and 1.0785 for a while more”. We did not anticipate the sharp and rapid rise as EUR rose slightly above 1.0785 (high of 1.0786). Upward momentum is building, albeit tentatively. It is not clear for now whether EUR could rise to 1.0850. It is worth noting, there is a strong resistance zone between 1.0800 and 1.0815. Overall, as long as EUR stays above the ‘strong support’ level (now at 1.0730), upward momentum could continue to build in the next few days.
- EUR/USD clings to mild losses while paring the biggest daily jump in 11 weeks.
- IMF urges Fed to keep fighting inflation, German FinMin flags deadlock on EU fiscal rules reform.
- Risk appetite remains dicey ahead of next week’s US Inflation, Fed and ECB.
- Sluggish markets may allow Euro buyers to take a breather but bear’s return appears doubtful.
EUR/USD remains sidelined near 1.0780-75 as it consolidates the biggest daily jump since March heading into Friday’s European session. In doing so, the Euro pair portrays the market’s sluggish momentum amid a light calendar and positioning for the next week’s top-tier data/events. Additionally, trader’s recheck of the previous concerns about the European Central Bank (ECB) and the Federal Reserve (Fed) concerns also prod major currency pair buyers of late.
The previous day’s downbeat US Initial Jobless Claims, the highest since October 2021, pushed back the Fed hawks and drowned the US Dollar. Even so, the International Monetary Fund (IMF) urged the US Federal Reserve and other global central banks to "stay the course" on monetary policy and remain vigilant in combating inflation, per Reuters.
On the other hand, Euro traders recollect the bad memories of this week’s growth numbers from Germany and the Eurozone as the Financial Times (FT) quotes German Finance Minister (FinMin) Christian Lindner to suggest more pain for the “Old Continent”. “Germany’s finance minister has warned that EU states are failing to bridge their differences in contentious talks over reform of the bloc’s fiscal rules, denting hopes of a deal by the end of the year,” reports the FT.
It should be observed that the latest comments from ECB policymaker Francois Villeroy de Galhau also weigh on the EUR/USD price as he said, “There is really a slowdown in inflation.”
Elsewhere, growth fears of broad economic recession, especially amid the latest hawkish surprises from the central banks of Australia and Canada, also prod the EUR/USD bulls.
While portraying the mood, the S&P500 Futures print mild losses around the highest levels since August 2022, marked the previous day. That said, the benchmark Wall Street index confirmed bull markets on Thursday, by rising around 20.0% from the lows marked in October. Additionally showing the market’s risk-off mood and putting a floor under the US Dollar are the US Treasury bond yields as the benchmark 10-year and two-year Treasury bond yields remain sidelined near 3.73% and 4.52% respectively, after reversing from the highest levels in a fortnight and snapping a two-day winning streak in that order the previous day.
Moving on, a light calendar and cautious mood ahead of the monetary policy meetings of the Fed and ECB, as well as the US inflation, may allow the Euro pair to consolidate the previous day’s heavy gains. That said, major attention should be given to the yields for clear directions.
Technical analysis
EUR/USD’s corrective pullback remains elusive unless the quote stays beyond a three-week-old previous resistance line, around 1.0750 by the press time. That said, the 100-DMA hurdle of near 1.0810 appears limited short-term upside of the Euro. It should be noted, however, that the RSI and MACD also underpin the bullish bias about the major currency pair.
- AUD/USD has sensed barricades while attempting sustainability above 0.6700.
- The risk profile is showing minor caution in an overall upbeat market mood.
- Easing US labor market conditions might provide the luxury of keeping rates steady to the Fed.
The AUD/USD pair has sensed some selling pressure above the round-level resistance of 0.6700 in the Asian session. The Aussie asset is struggling in maintaining an auction above the aforementioned resistance as the US Dollar Index (DXY) has attempted a recovery from near the crucial support of 103.30.
S&P500 futures are showing some losses in the Asian session after a positive Thursday. The risk profile is showing minor caution in an overall upbeat market mood. Investors are taking caution as the street is shifting focus toward the United States Consumer Price Index (CPI) (May) data, which will release on Tuesday.
The USD Index showed a nosedive move on Thursday after the US Department of Labor showed 19-month high weekly Initial Jobless Claims for the week ending June 02. Unemployed claims rose by 28K to 261K while the street was expecting a minor increase of 2K. Higher jobless claims have eased heated labor market conditions, which were forcing Federal Reserve (Fed) policymakers for delivering hawkish guidance. Mammoth jobless claims could provide luxury to Fed chair Jerome Powell of keeping interest rates steady in June.
The demand for US government bonds has dropped slightly which has provided an intermediate cushion to the US Treasury yields. The yields offered on 10-year US Treasury bonds have jumped to near 3.73%.
On the Australian Dollar front, after seeing evidence of persistence in Australian inflation, investors are anticipating that the Reserve Bank of Australia (RBA) will continue raising interest rates further. A poll from Reuters showed that RBA Governor Philip Lowe would raise its Official Cash Rate (OCR) further by 25 basis points (bps) to 4.35%.
Meanwhile, the commentary came from Australian Prime Minister Anthony Albanese in which he said there is no wage-price spiral in the country. He further added, "There isn't one and there hasn't been one for a long period of time.”
- USD/TRY sticks to mild gains at all-time high as Turkish Lira bears take a breather of late.
- Turkish President Erdogan appoints US Finance Executive Erkan as CBRT Governor, talks of policy pivot gain attention.
- Thursday’s US Dollar weakness checked bulls but alleged economic challenges for Turkiye propel USD/TRY.
USD/TRY stays on the front foot around the all-time high below 24.00, close to 23.50 by the press time heading into Friday’s European session. In doing so, the Turkish Lira (TRY) sellers portray a cautious mood as the nation’s recently re-elected President Tayyip Erdogan appoints a new Governor of the Central Bank of the Republic of Türkiye (CBRT).
Earlier in the day, Reuters unveiled news confirming that Turkish President Erdogan appointed Hafize Gaye Erkan, a finance executive in the United States, to head Turkey's central bank as it prepares to reverse course and tighten policy after years of rate cuts and a simmering cost-of-living crisis.
The news also cites the nation’s record low foreign reserves of -$5.7 billion to mention the all-time high of the USD/TRY while suggesting a rate hike amid depleted foreign reserves, unchecked inflation and wide current account deficits.
On the other hand, the US Dollar Index (DXY) dropped the most in five weeks the previous day, licking its wounds near 103.30 of late, as downbeat US data flagged concerns of no rate hike from the Fed in June, as well as the US recession. That said, US Initial Jobless Claims rose to 261K in the week ended on June 02 versus 235K expected and 233K prior (revised). With this, the four-week average rose to 237.25K from 229.75K previous readings. Further, the Continuing Jobless Claims dropped to 1.757M in the week ended on May 26 from 1.794M prior (revised), compared to 1.8M market forecasts. Earlier in the week, the US ISM Services PMI, S&P Global PMIs and Factory Orders also printed downbeat outcomes.
Even so, the International Monetary Fund (IMF) on Thursday urged the US Federal Reserve and other global central banks to "stay the course" on monetary policy and remain vigilant in combating inflation, per Reuters.
Looking forward, the USD/TRY pair traders may witness consolidation of the latest gains should the market accepts the recent hopes of witnessing a CBRT rate hike. Even so, the pair’s momentum could be limited ahead of the next week’s Federal Open Market Committee (FOMC) monetary policy meeting. That said, Turkish Industrial Production for April can offer immediate direction to the pair.
Technical analysis
Although the overbought RSI conditions can trigger the USD/TRY pullback in a case where the Turkish Lira (TRY) price offers a daily closing below the previous day’s low of around 23.00.
- USD/JPY regains positive traction on Friday and recovers a part of the overnight losses.
- A modest uptick in the US bond yields revives the USD demand and lends some support.
- The Fed rate-hike uncertainty to cap gains ahead of next week’s central bank event risks.
The USD/JPY pair attracts some dip-buying near the 138.75 region, or a fresh weekly low touched during the Asian session on Friday and recovers a part of the previous day's heavy losses. The pair is currently trading around the 139.30 area, up nearly 0.30% for the day.
A modest uptick in the US Treasury bond yields assists the US Dollar (USD) regain some positive traction following the overnight slump to a two-week low, which, in turn, is seen acting as a tailwind for the USD/JPY pair. The Japanese Yen (JPY), on the other hand, continues to be undermined by a more dovish stance adopted by the Bank of Japan (BoJ) and seems rather unaffected by comments from Governor Ueda Kazuo. Speaking before the parliament, Ueda said that the BoJ is implementing policies to achieve stable 2% inflation.
The upside for the USD, meanwhile, seems limited as investors remain uncertain over the Federal Reserve (Fed) rate hike path. In fact, the market seems convinced that the US central bank will pause its year-long rate-hiking cycle in June and the bets were reaffirmed by Thursday's weaker US data, showing that Initial Jobless Claims surged to a 20-month high last week. That said, the Fed funds futures indicate the possibility of another 25 bps Fed rate hike in July. Hence, the focus will remain glued to the key central bank event risks next week.
The Fed is scheduled to announce its monetary policy decision at the end of a two-day meeting on Wednesday, which will be followed by the BoJ meeting on Thursday. This, in turn, will play a key role in influencing the USD/JPY pair and help traders to determine the next leg of a directional move. In the meantime, worries about a global economic slowdown, particularly in China, could benefit the safe-havne JPY and keep a lid on any meaningful upside for the pair. Moving ahead, the US bond yields will drive the USD demand in the absence of any relevant macro data on Friday, which, along with the broader risk sentiment, might contribute to producing short-term opportunities around the major.
Technical levels to watch
- Market sentiment remains sluggish after witnessing an optimistic day.
- S&P500 Futures print mild losses but stays on the front foot near yearly high, confirmed bull markets the previous day.
- Treasury bond yields hesitate extending the previous day’s pullback.
- Softer China inflation, broad recession fears prod sentiment.
The risk profile remains dicey during early Friday as market players take a breather after witnessing a volatile day. The same allows traders to pare the previous day’s gains while reassessing concerns about a global economic slowdown.
While portraying the mood, the S&P500 Futures print mild losses around the highest levels since August 2022, marked the previous day. That said, the benchmark Wall Street index confirmed bull markets on Thursday, by rising around 20.0% from the lows marked in October.
On the other hand, US 10-year and two-year Treasury bond yields remain sidelined near 3.73% and 4.52% respectively. It’s worth noting that the benchmark US 10-year bond yields reversed from the highest levels in a fortnight the previous day whereas the two-year counterpart snapped a two-day winning streak.
It’s worth noting that the market’s fears of recession take clues from the latest easing in China inflation and softer economics from Australia, Europe and the US. Also underpinning the pessimism are the hawkish central banks which remain ready to fuel the benchmark rates. It should be observed, however, that the receding hawkish bets on the US Federal Reserve (Fed) seemed to have favored the equities and bond buyers the previous day.
That said, US Initial Jobless Claims rose to 261K in the week ended on June 02 versus 235K expected and 233K prior (revised). With this, the four-week average rose to 237.25K from 229.75K previous readings. Further, the Continuing Jobless Claims dropped to 1.757M in the week ended on May 26 from 1.794M prior (revised), compared to 1.8M market forecasts. Earlier in the week, the US ISM Services PMI, S&P Global PMIs and Factory Orders also printed downbeat outcomes.
Elsewhere, the final version of the Eurozone Gross Domestic Product (GDP) for the first quarter (Q1) of 2023 marked a downward revision to the initial forecasts of 0.1% to -0.1% QoQ, versus 0.0% expected. Further, the yearly GDP figures also eased to 1.0% from 1.3% previous estimations and 1.2% market consensus. Additionally, the region’s final Employment Change matches initial forecasts and market expectations of 0.6% on QoQ during the said period but eased to 1.6% on YoY compared to 1.7% previous predictions.
Earlier in the day, China’s headline inflation gauges for May, namely the Consumer Price Index (CPI) and Producer Price Index (PPI), flashed mixed signals as the CPI drops on MoM but improves on YoY whereas the PPI marks a slump during the stated month.
Following the downbeat China data and the Reserve Bank of Australia’s (RBA) hawkish surprise, the Commonwealth Bank of Australia (CBA) put 50% probability of witnessing a recession in 2023.
Looking ahead, a light calendar, apart from Canada employment data for May, can restrict intraday moves. Also likely to challenge the momentum traders could be the cautious mood ahead of the next weeks’ key monetary policy meetings, namely from the Fed and the ECB.
Also read: Forex Today: Dollar breaks lower and remains under pressure
- USD/INR is seen consolidating in a narrow band around mid-82.00s on Friday.
- The technical setup favours bulls and supports prospects for additional gains.
- A convincing break below the 200- SMA is needed to negate the positive bias.
The USD/INR pair oscillates in a narrow trading band through the Asian session on Friday and is currently placed around the 82.50 region, nearly unchanged for the day.
From a technical perspective, spot prices, so far, manage to hold above the 38.2% Fibonacci retracement level of the April-May rally from the vicinity of the very important 200-day Simple Moving Average (SMA). Against the backdrop of last week's bounce from the 50% Fibo. level, positive oscillators on the daily chart support prospects for some near-term appreciating move.
That said, it will still be prudent to wait for some follow-through buying beyond the 23.6% Fibo. level, around the 82.65 region, before placing fresh bullish bets. The USD/INR pair might then make a fresh attempt to conquer the 83.00 round-figure mark. A sustained strength and acceptance above the latter will confirm a fresh breakout, paving the way for additional gains.
On the flip side, weakness below the 82.40 region, or the 38.2% Fibo. level, might prompt some technical selling and expose the 82.25 confluence - comprising 50% Fibo. level and the 100-day Simple Moving Average (SMA). A convincing break below will make the USD/INR pair vulnerable to challenge the 200-day SMA, currently pegged around the 82.00 mark.
The aforementioned handle should act as a pivotal point, which if broken decisively will negate the positive outlook and shift the near-term bias in favour of bearish traders.
USD/INR daily chart
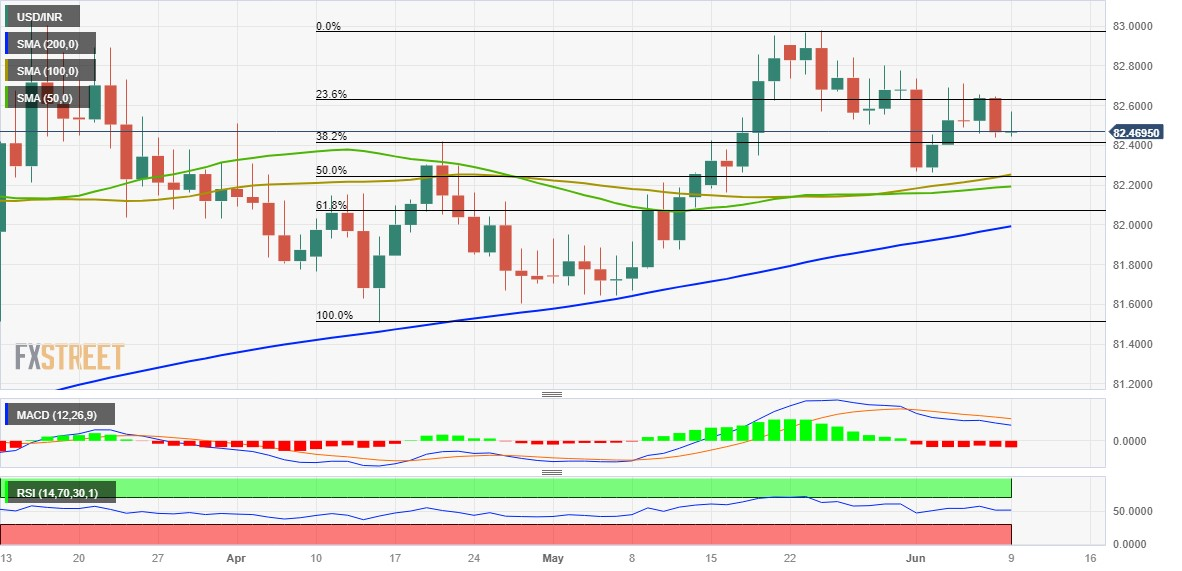
Key levels to watch
- GBP/USD pares the biggest daily jump in three months at monthly peak.
- 12-day-old bullish channel, upbeat oscillators keep buyers hopeful.
- RSI conditions suggest retreat in Cable prices before the next run-up.
GBP/USD buyers take a breather at the highest level in one month, making rounds to 1.2550 during early Friday morning in Europe. In doing so, the Cable bulls pause after posting the biggest daily gain since early March the previous day.
While the above 50.0 levels of the RSI (14) line could be held responsible for the Pound Sterling’s latest retreat, the bullish MACD signals and a two-week-long rising trend channel keeps the buyers hopeful.
Hence, the quote’s latest pullback remains elusive unless it stays within the aforementioned channel, currently between 1.2600 and 1.2410.
That said, a short-term correction toward the 50-bar Exponential Moving Average (EMA) level of around 1.2420 can’t be ruled out.
In a case where the Cable pair breaks the 1.2410 support, the odds of witnessing a quick fall toward the previous monthly low of around 1.2310-05 can’t be ruled out.
Meanwhile, an upside break of the stated channel’s peak of 1.2600 may have a reason to worry unless the GBP/USD remains below the yearly high marked in May at around 1.2680.
Following that, the 61.8% Fibonacci Expansion (FE) of the Cable pair’s March-May moves, near 1.2850, will be in the spotlight.
Overall, GBP/USD remains on the bull’s radar but a pullback can’t be ruled out.
GBP/USD: Daily chart
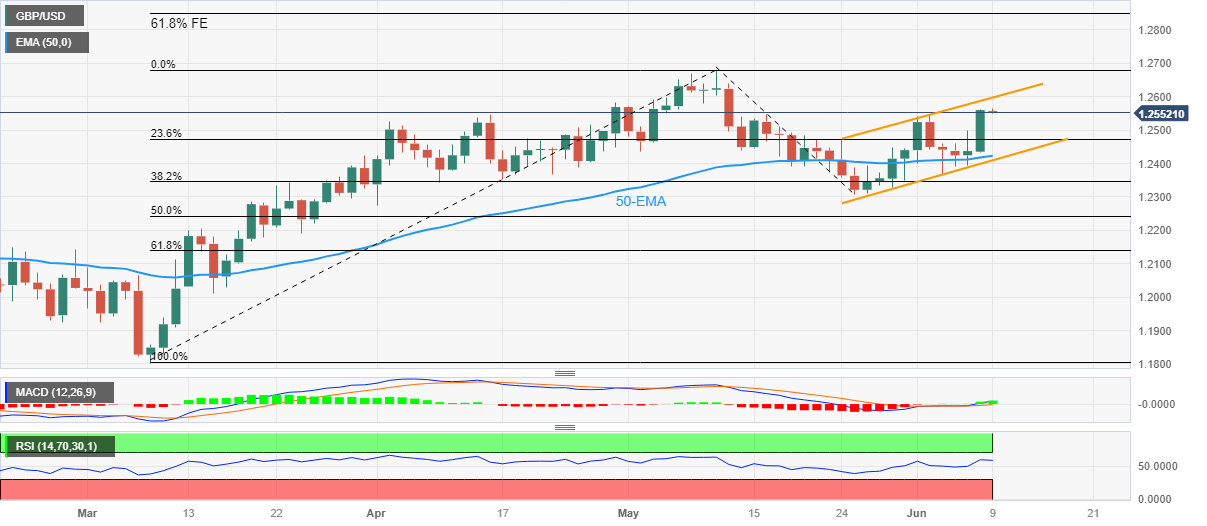
Trend: Gradual upside expected
Australian Prime Minister Anthony Albanese said in an interview on Friday, there is no wage-price spiral in the country.
Albanese noted: "There isn't one and there hasn't been one for a long period of time.”
Market reaction
AUD/USD was last seen trading at 0.6703, down 0.21% on the day.
- NZD/USD ticks lower on the last day of the week and is pressured by a modest USD strength.
- Weaker Chinese inflation figures add to economic woes and benefit the safe-haven Greenback.
- The uncertainty over the Fed’s rate-hike path should cap the USD and lend support to the major.
The NZD/USD pair struggles to capitalize on the previous day's strong move up and edges lower during the Asian session on Friday. Spot prices currently trade just below the 0.6100 mark, though remain just a few pips below the weekly high.
The prevalent cautious mood around the equity markets, which, along with a modest uptick in the US Treasury bond yields, benefits the safe-haven US Dollar (USD) and undermines the risk-sensitive Kiwi. Weaker-than-expected Chinese inflation figures released earlier today add to worries about a global economic slowdown and tempers investors' appetite for riskier assets. In fact, the National Bureau of Statistics reported that China's headline CPI contracted by 0.2% in May and rose by 0.2% over the past 12 months.
Adding to this, China's Producer Price Index (PPI) registered its worst decline since February 2016 and fell 4.6% YoY in May. This comes on the back of the recent dismal macro data from China and points to slowing post-COVID recovery in the world's second-largest economy. The downside for the NZD/USD pair, however, remains cushioned as the USD bulls seem reluctant to place aggressive bets in the wake of firming expectations that the Federal Reserve (Fed) will skip raising interest rates at its June 13-14 meeting.
Against the backdrop of last week's dovish rhetoric from several FOMC members, a rise in the US Initial Jobless Claims to a 20-month high last week lifts bets for an imminent pause in the US central bank's rate-hiking cycle. The markets, however, are still pricing in the possibility of another 25 bps Fed rate hike in July. This could act as a tailwind for the Greenback ahead of next week's release of the latest US consumer inflation figures and the key central bank event risk - the highly-anticipated FOMC monetary policy meeting.
In the meantime, the US bond yields will continue to play a key role in influencing the USD price dynamics and provide some impetus to the NZD/USD pair. Apart from this, the broader risk sentiment might contribute to producing short-term trading opportunities in the absence of any relevant market-moving economic data. Nevertheless, spot prices remain on track to post modest gains for the second straight week.
Technical levels to watch
- EUR/USD consolidates Thursday’s strong move up to over a two-week high.
- Acceptance above the 1.0745-50 confluence hurdle favours bullish traders.
- A convincing beak below the 1.0700 mark will negate the positive outlook.
The EUR/USD pair is seen consolidating the previous day's strong gains to over a two-week high and oscillating in a narrow trading band through the Asian session on Friday. Spot prices currently trade around the 1.0775-1.0780 region and seem poised to build on the recent bounce from the 1.0635 region, or the lowest level since March 20 touched last week.
The overnight sharp rise confirms a breakout through the 1.0745 confluence - comprising the 100-period Simple Moving Average (SMA), the 23.6% Fibonacci retracement level of the downfall witnessed in May and a short-term descending trend-line. This, in turn, favours bullish traders and supports prospects for a further near-term appreciating move. That said, technical indicators on the daily chart - though have recovered from the negative territory - are yet to confirm a bullish outlook. Hence, any subsequent move up is more likely to confront some resistance near the 1.0800 round-figure mark, representing the 38.2% Fibo. level.
Some follow-through buying, however, will set the stage for additional gains and lift the EUR/USD pair to the next relevant hurdle near the 1.0860 region. The latter represents the 200-period SMA on the 4-hour chart and the 50% Fibo. level, which if cleared decisively will suggest that the recent pullback from over a one-year high touched in May has run its course. Spot prices might then aim to surpass the 1.0900 round figure and test the 61.8% Fibo. level, around the 1.0915-1.0920 zone.
On the flip side, the 1.0750-1.0745 confluence resistance breakpoint now seems to protect the immediate downside ahead of the 1.0700 mark. This is closely followed by an upward sloping trend-line, currently pegged near the 1.0680 region, below which the EUR/USD pair could slide back towards the May monthly swing low, around the 1.0635 area. Some follow-through selling will be seen as a fresh trigger for bearish traders and drag spot prices below the 1.0600 mark, towards testing the 1.0540-1.0535 intermediate support en route to the 1.0500 psychological mark.
EUR/USD 4-hour chart
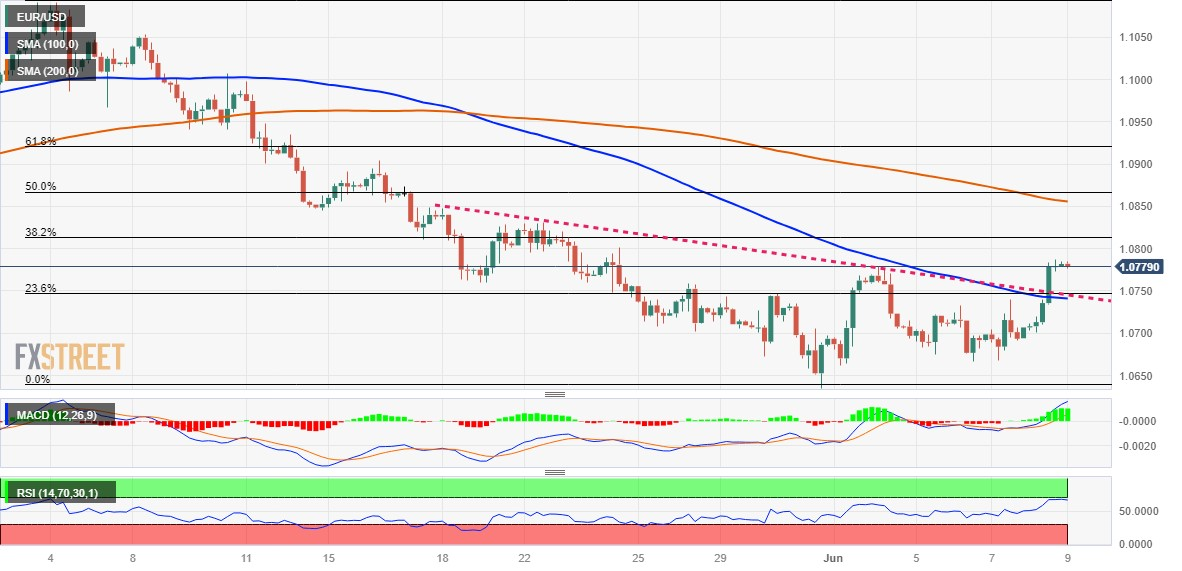
Key levels to watch
- Gold Price fades the previous day’s rebound below key resistances.
- Mixed China inflation, US Dollar’s consolidation and sluggish yields allow XAU/USD to pare consecutive second weekly gain.
- June Fed rate hike concerns are off the table but hints of July rate lift can weigh on the Gold Price.
Gold Price (XAU/USD) remains sidelined as bulls take a breather after rising the most in five weeks the previous day, staying on the way to posting the second consecutive weekly gain. It’s worth noting, however, that the XAU/USD is yet to cross the short-term key hurdles, despite the latest run-up, which in turn joins the looming Fed fears to prod the Gold buyers.
That said, the yellow metal rallied the previous day on the US Dollar’s slump, backed by downbeat employment and activity data. Adding strength to the XAU/USD run-up could be the optimism surrounding China. However, the recent disappointment from China’s headline inflation numbers and the market’s reassessment of the previously dovish concerns about the US Federal Reserve (Fed) seems to prod the Gold buyers.
Moving on, the Fed is almost certain to refrain from a rate hike in June but the latest hawkish surprises from the Reserve Bank of Australia (RBA) and the Bank of Canada (BoC) challenges the XAU/USD buyers amid fears of a hawkish move. Even if the Federal Open Market Committee (FOMC) refrains from a rate hike, the Gold price can witness a downside if the policymakers strongly confirm the rate hike in July and afterward.
Also read: Gold Price Forecast: XAU/USD looks set to cross $1,985 hurdle as softer US data weighs on US Dollar, yields
Gold Price: Key levels to watch
As per our Technical Confluence Indicator, the Gold Price edges higher past $1,960 key support comprising the 200-HMA, Fibonacci 38.2% in the one-day and middle band of the Bollinger on the hourly play.
With this, the XAU/USD prods a convergence of the Fibonacci 38.2% in one-week and 23.6% in one-day, around $1,966 by the press time.
It’s worth noting that the middle band of the Bollinger on the daily chart, around $1,969, also acts as an immediate upside hurdle for the Gold Price.
In a case where the XAU/USD remains firmer past $1,970, the odds of witnessing a rally towards the $1,990 hurdle encompassing the Pivot Point one-day R2 and the Fibonacci 38.2% in one-month can’t be ruled out.
On the contrary, a clear downside break of the $1,960 support may witness a free fall before testing the 100-DMA support of around $1,941. It should be observed that the 5-DMA level near $1,955 may act as an extra check for the Gold sellers past $1,960.
Here is how it looks on the tool
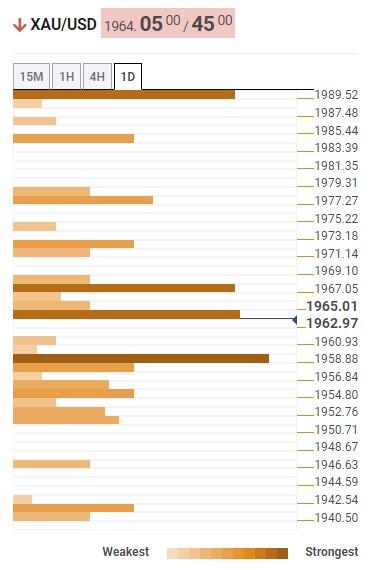
About Technical Confluences Detector
The TCD (Technical Confluences Detector) is a tool to locate and point out those price levels where there is a congestion of indicators, moving averages, Fibonacci levels, Pivot Points, etc. If you are a short-term trader, you will find entry points for counter-trend strategies and hunt a few points at a time. If you are a medium-to-long-term trader, this tool will allow you to know in advance the price levels where a medium-to-long-term trend may stop and rest, where to unwind positions, or where to increase your position size.
| Raw materials | Closed | Change, % |
|---|---|---|
| Silver | 24.264 | 3.54 |
| Gold | 1965.4 | 1.3 |
| Palladium | 1360.3 | -1.92 |
- Natural Gas picks up bids to reverse the previous day’s retreat from one-week high.
- Double tops around $2.43, 50-EMA challenge XNG/USD bulls.
- Impending bull cross on MACD, sustained bounce off 10-EMA keeps buyers hopeful.
- Weekly support line, ascending trend line from April add to the downside filters.
Natural Gas (XNG/USD) Price prints mild gains around $2.37 as XNG/USD bears lick their wounds amid early Friday. In doing so, the energy instrument recovers from the 10-Exponential Moving Average (EMA) while also justifying the looming bull cross on the MACD indicator.
However, the double tops marked at $2.43, quickly followed by the 50-EMA hurdle of $2.45 challenged the Natural Gas buyers.
It should be noted that the XNG/USD run-up beyond $2.45 enables the energy bulls to aim for the 50% Fibonacci retracement of its March-April fall, around $2.60.
Following that, the previous monthly high of around $2.81 gains major attention as being the last defense for the XNG/USD buyers.
On the flip side, a daily closing below the 10-EMA level of $2.35 isn’t an open invitation to the Natural Gas bears.
That said, a one-week-old ascending support line near $2.33 can challenge the XNG/USD bears afterward.
Above all, the Natural Gas buyers remain cautious ahead of witnessing a daily closing below a two-month-old rising support line, close to $2.18 at the latest.
XNG/USD: Daily chart
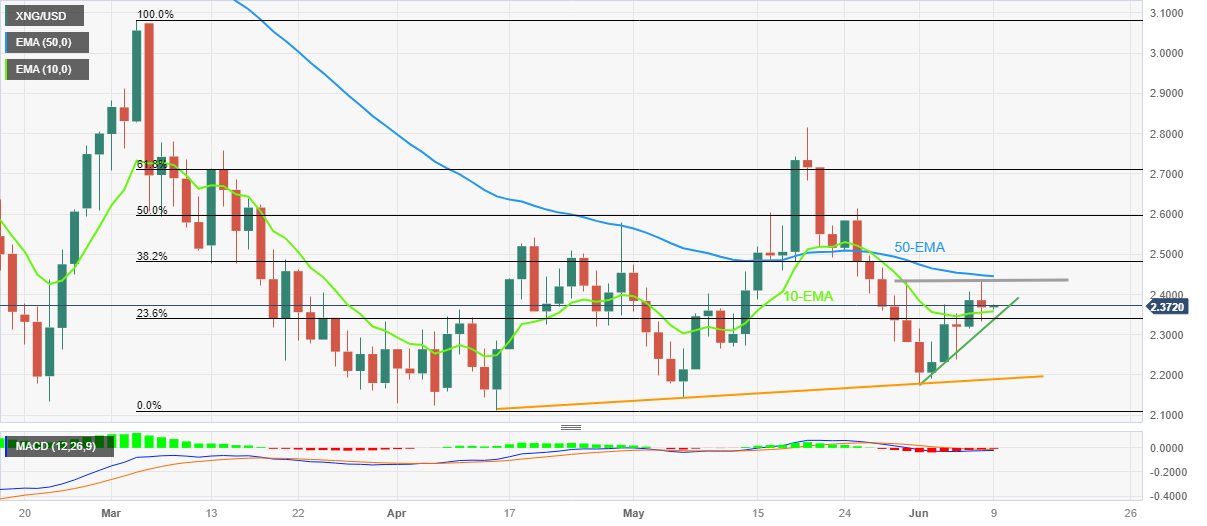
Trend: Further upside expected
- GBP/JPY gains traction for the third straight day and hits a fresh multi-year peak on Friday.
- Bets for additional rate hikes by the BoE underpin the British Pound and remain supportive.
- A slight improvement in the risk sentiment weighs on the JPY and contributes to the move up.
The GBP/JPY cross is seen building on this week's goodish rebound from the 172.70-172.65 region and gaining traction for the third successive day on Friday. The momentum pushes spot prices to the 174.75-174.80 region, or the highest level since February 2016 during the Asian session.
The British Pound (GBP) continues with its relative outperformance on the back of firming expectations for more interest rate hikes by the Bank of England (BoE), which, in turn, acts as a tailwind for the GBP/JPY cross. In fact, the markets seem convinced that the BoE will be far more aggressive in policy tightening to contain stubbornly high inflation and anticipate another 25 bps lift-off on June 22.
The bets were lifted by the official data released last week, showing that the headline UK CPI fell less than expected in April and a closely watched measure of core price surged to a 31-year high. Adding to this, the Organisation for Economic Co-operation and Development (OECD) forecasted on Wednesday that inflation in Britain will be the highest among developed economies, at 6.9% in 2023.
Apart from this, a slight improvement in the global risk sentiment, along with a more dovish stance adopted by the Bank of Japan (BoJ), undermines the safe-haven Japanese Yen (JPY) and offers additional support to the GBP/JPY cross. That said, worries about a global economic slowdown, particularly in China, could cap the optimism, which should help limit losses for the JPY and keep a lid on the cross.
Furthermore, the prospects for more sizeable interventions by the BoJ could support the domestic currency and warrant some before placing aggressive bullish bets around the GBP/JPY cross. Nevertheless, spot prices remain on track to end in the green for the fourth successive week in the absence of any relevant market-moving economic releases on Friday.
Technical levels to watch
- AUD/USD pulls back from a four-week high touched on Friday, though lacks follow-through.
- Weaker than anticipated Chinese inflation figures for May exert some pressure on the Asusie.
- Bets for an imminent Fed rate hike pause continue to weigh on the USD and might lend support.
The AUD/USD pair edges lower during the Asian session on Friday and remains on the defensive following the release of the latest Chinese inflation figures. The pair is currently placed just above the 0.6700 round-figure mark and remains well within the striking distance of a four-week high touched the previous day.
The National Bureau of Statistics of China reported that the headline CPI fell more than expected, by 0.2% in May, and the yearly rate also fell short of consensus estimates, coming in at 0.3% during the reported month. Adding to this, the Producer Price Index (PPI) contracted further and fell by a 4.6% YoY rate in May as compared to the 3.6% decline reported in the previous month. The data adds to worries about a slowdown in the world's second-largest economy and undermines the China-proxy Australian Dollar (AUD). Apart from this, a modest US Dollar (USD) uptick exerts some pressure on the AUD/USD pair.
The upside for the USD, meanwhile, seems limited in the wake of firming expectations that the Federal Reserve (Fed) will pause rate hikes next week. The bets were reaffirmed by Thursday's disappointing release of the US Initial Jobless Claims data, which rose more than anticipated, to a 20-month high last week. The markets, however, are still pricing in the possibility of another 25 bps Fed rate hike in July. This, in turn, holds back traders from placing aggressive bearish bets and contributes to a mildly offered tone surrounding the AUD/USD pair against the backdrop of worries about a global economic slowdown.
It is worth recalling that the Organization for Economic Co-operation and Development (OECD) forecasts that the global economy is set for a weak recovery over the coming years as persistent core inflation and tighter monetary policy weigh on demand. OECD now expects the global economy to expand by 2.7% this year - the lowest annual rate of growth since the 2008-2009 financial crisis excluding the pandemic-hit year of 2020. This, in turn, keeps a lid on the optimism in the markets and should cap any meaningful upside for the risk-sensitive Aussie. Nevertheless, the AUD/USD pair remains on track to register strong gains for the second successive week as the focus shifts to the US CPI and the FOMC meeting next week.
Technical levels to watch
- USD/CNH struggles in reversing the previous day’s pullback from the highest levels since November 2022.
- China CPI drops to -0.2% MoM, improves to 0.2% on YoY whereas PPI marks heavy fall in May.
- US Dollar’s rebound after falling the most in two months also underpin Yuan’s weakness.
- Risk catalysts eyed for directions ahead of next weeks’ FOMC.
USD/CNH clings to mild gains around 7.1230 as it struggles to justify the latest inflation report from China early Friday. Not only the mixed results of inflation clues but the US Dollar’s consolidation also trouble the offshore Chinese Yuan (CNH) pair traders. That said, the pair initially refreshed the daily high to 7.1282 amid the first impressions of the data before falling to 7.1215 by the press time.
That said, China’s headline inflation gauges for May, namely the Consumer Price Index (CPI) and Producer Price Index (PPI), flashed mixed signals as the CPI drops on MoM but improves on YoY whereas the PPI marks a slump during the stated month.
Also read: China CPI: YoY actual 0.2% (forecast 0.2%, previous 0.1%, AUD steady
It should be noted that the US Dollar Index (DXY) also licks its wounds near 103.35, after posting the biggest daily loss in two months due to downbeat data, which in turn puts a floor under the USD/CNH prices.
That said, the DXY refreshed the weekly on Thursday after US Initial Jobless Claims rose to 261K in the week ended on June 02, the highest since October 2021, versus 235K expected and 233K prior (revised). With this, the four-week average rose to 237.25K from 229.75K previous readings. Further, the Continuing Jobless Claims dropped to 1.757M in the week ended on May 26 from 1.794M prior (revised), compared to 1.8M market forecasts. Earlier in the week, the US ISM Services PMI, S&P Global PMIs and Factory Orders also printed downbeat outcomes and pushed back the Fed hawks while weighing on the US Dollar.
On the other hand, multiple Chinese state banks including the Industrial and Commercial Bank of China, Bank of China and Construction Bank cut their benchmark rates. The same raises speculations that the Dragon Nation’s central bank, namely the People’s Bank of China (PBOC), will also cut the rates. The same might have weighed on the USD/CNH price of late, especially after the downbeat China inflation.
Further, the fears of China’s market intervention also favored the USD/CNH bears as PBoC Vice Governor said, “We have confidence, conditions and capacity to maintain stable operations of the FX market.” On the same line was Li Yunze, Director of China's National Administration of Financial Regulation, who also made upbeat remarks on the Chinese economy as he said, “Economy still recovering,” while adding that demand will be boosted.
Technical analysis
USD/CNH recovers from the 10-DMA support of around 7.1150 but overbought RSI challenges the pair buyers.
The China Consumer Price Index that is released by National Bureau of Statistics of China has been released as follows:
- CPI YoY actual 0.2% (forecast 0.2%, previous 0.1%).
- PPI YoY actual -4.6% (forecast -4.3%, previous -3.6%)
AUD/USD update
AUD is unchanged vs the US Dollar on the data at 0.6707 currently on the release.
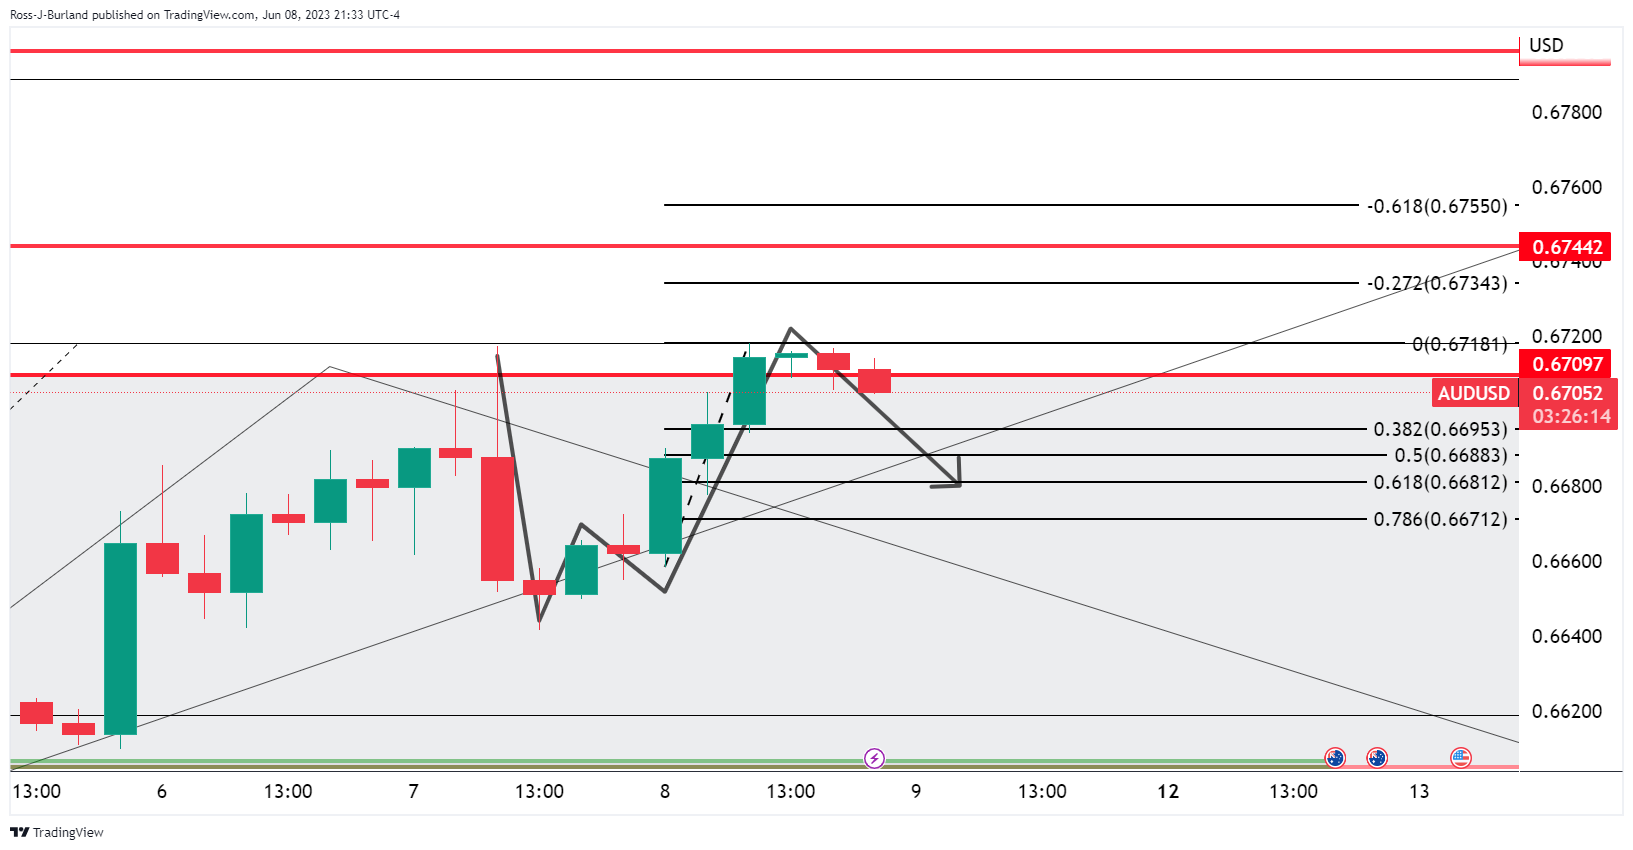
The bears are moving in, however, as per the 4-hour chart, and eye the neckline of the W-formation.
About the Consumer Price Index
The Consumer Price Index is released by the National Bureau of Statistics of China. It is a measure of retail price variations within a representative basket of goods and services. The result is a comprehensive summary of the results extracted from the urban consumer price index and rural consumer price index. The purchase power of the CNY is dragged down by inflation. The CPI is a key indicator to measure inflation and changes in purchasing trends. A substantial consumer price index increase would indicate that inflation has become a destabilizing factor in the economy, potentially prompting The People’s Bank of China to tighten monetary policy and fiscal policy risk. Generally speaking, a high reading is seen as positive (or bullish) for the CNY, while a low reading is seen as negative (or Bearish) for the CNY.
- Silver Price remains firmer at monthly high after crossing the 200-SMA.
- Upside break of previous key resistance area, bullish MACD signals suggest further advances of XAG/USD.
- Overbought RSI hints at limited upside room and highlights lows marked during late April as immediate resistance.
Silver Price (XAG/USD) grinds near the highest level in a month, making rounds to $24.30 during early Friday morning. In doing so, the bright metal cheers upside break of the 200-SMA amid bullish MACD signal.
Adding strength to the upside bias is the XAG/USD run-up beyond the previously important resistance zone of around $24.00-24.05.
However, the nearly overbought RSI conditions challenge the Silver buyers as they approach a horizontal hurdle comprising lows marked during late April, around $24.50. Also acting as an upside filter is the May 02 bottom surrounding $24.60.
Following that, a run-up towards the $26.00 and the previous monthly high of around $26.15 can’t be ruled out.
On the flip side, a break of the 200-SMA level of $24.20 could quickly recall the XAG/USD sellers targeting the $24.05-24.00 resistance-turned-support.
In a case where the Silver Price remains bearish past $24.00, a fortnight-old ascending trend line near $23.50 can act as the last defense of the XAG/USD buyers.
Overall, the Silver Price is likely to remain firmer but the upside room appears limited as the US Dollar bears take a breather.
Also read: US Dollar Index: DXY suffers from downbeat US data, pre-Fed positioning at 13-day low near 103.30
Silver Price: Four-hour chart
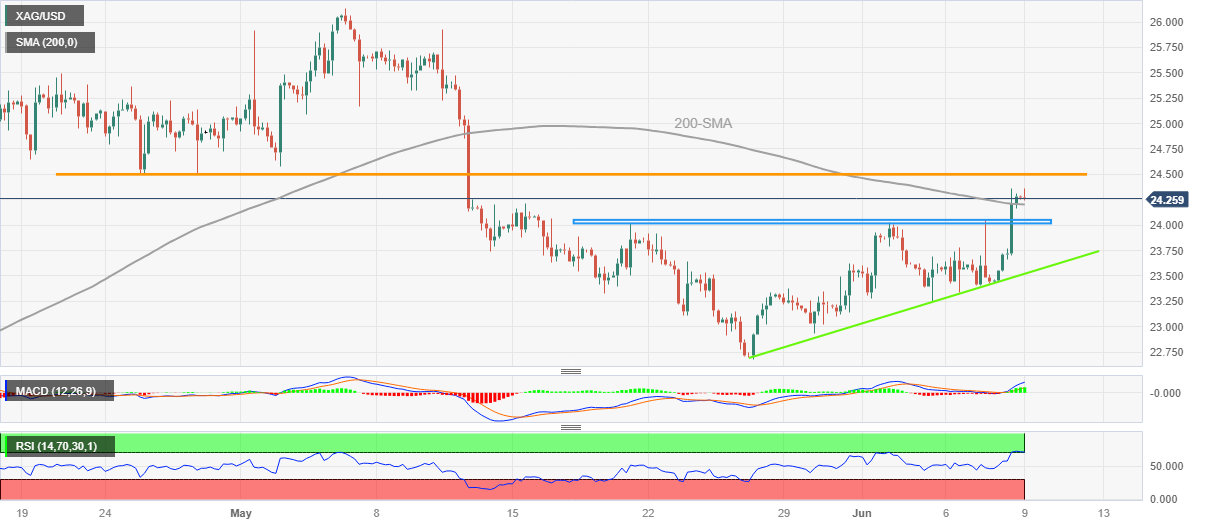
Trend: Limited upside expected
In recent trade today, the People’s Bank of China (PBOC) set the yuan at 7.1115 vs. the estimate of 7.1122 and the last close of 7.1120.
About the fix
China maintains strict control of the yuan’s rate on the mainland.
The onshore yuan (CNY) differs from the offshore one (CNH) in trading restrictions, this last one is not as tightly controlled.
Each morning, the People’s Bank of China (PBOC) sets a so-called daily midpoint fix, based on the yuan’s previous day's closing level and quotations taken from the inter-bank dealer.
Bank of Japan's governor Ueda Kazuo has stated that the BoJ is implementing policies to achieve stable 2% inflation.
Key quotes
Government financial management would not obstruct BoJ policy.
We must consider several scenarios for fed moves.
We want to analyze policy's good impacts and side effects.
USD/JPY update
-
USD/JPY pares the biggest daily loss in a month around 139.00 as yields stabilize after a slump

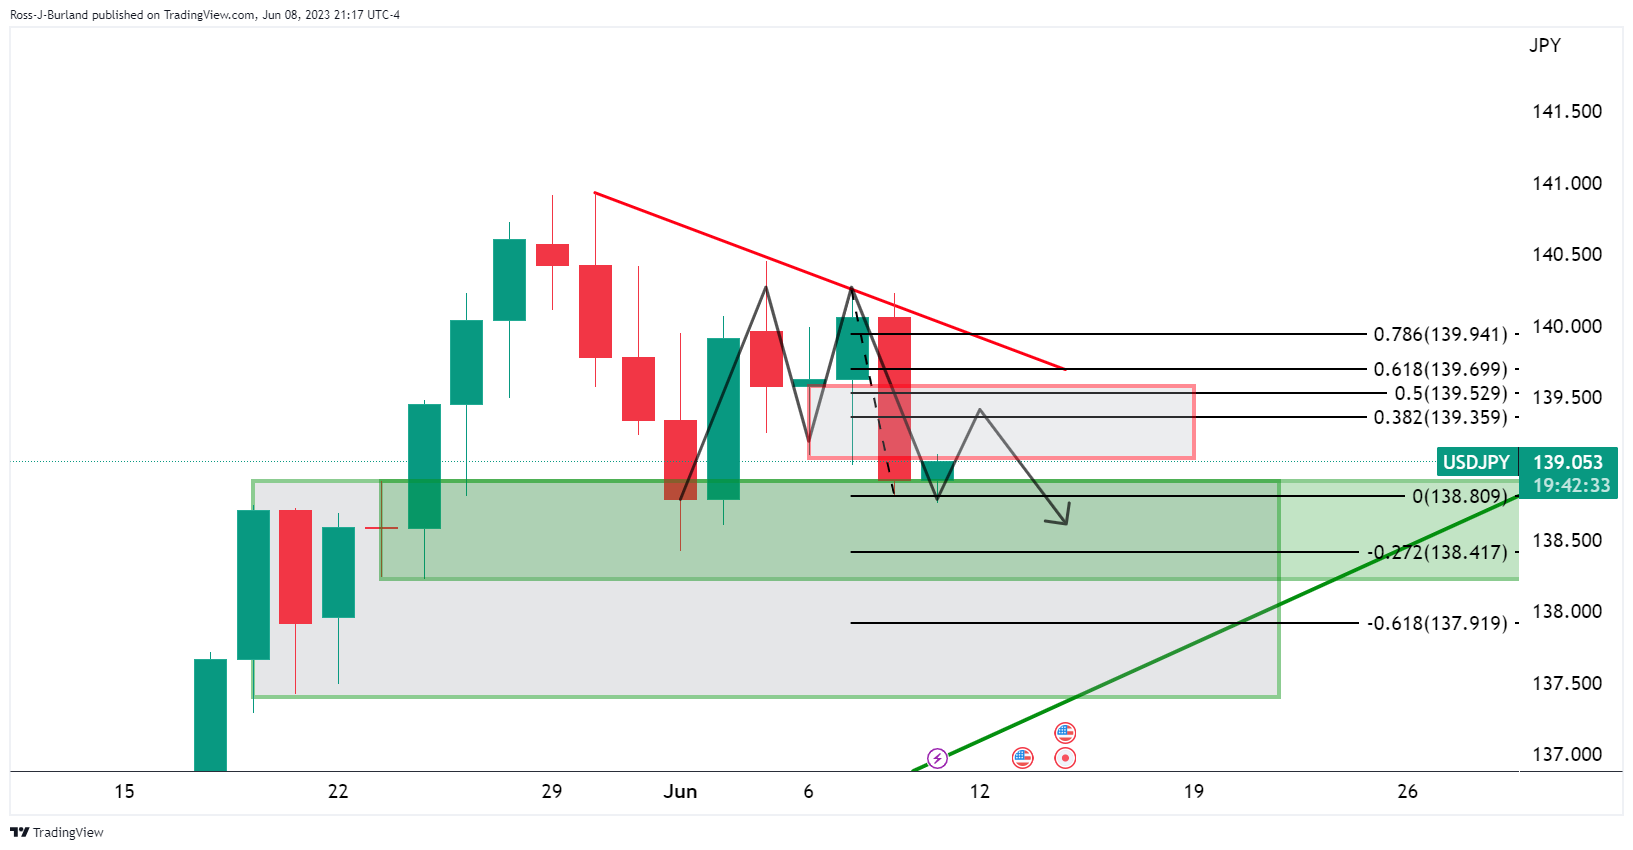
Bulls are moving in andthe necklineof the M-formationis eyed.
- WTI crude oil bounces off weekly low despite lacking upside momentum of late.
- Oil sellers cheered market speculators of US-Iran nuclear deal before getting rejection of the same from White House.
- Saudi Arabia threatens major economic pair for US due to chatters of Oil sanctions.
- China CPI, PPI eyed for clear directions, US Dollar weakness may also help energy buyers.
WTI crude oil picks up bids to pare the biggest daily loss in a week around $71.25 during early Friday. In doing so, the black gold cheers downbeat US Dollar, as well as the latest headlines surrounding Saudi Arabia, to pare the previous day’s heavy fall ahead of China’s headlines inflation data.
That said, the Washington Post recently came out with news quoting the Saudi Crown Prince Mohammed bin Salman’s threat to thwart the US-Saudi ties if the Washington retaliates to the output cut policy. The same joins the sluggish US Dollar Index (DXY) around 103.30, after falling the most in two months the previous day, to favor the energy buyers.
Previously, rumors that the US and Iran have signed a nuclear deal and the same will allow the latter to overcome the Oil sanctions have drowned the WTI prices. However, the White House rejected such claims afterward and triggered the commodity’s rebound from the weekly low.
Elsewhere, downbeat US data weighed on the US Dollar while optimism in China, one of the world’s biggest commodity users, also keeps the energy benchmark positive.
On Thursday, US Initial Jobless Claims rose to 261K in the week ended on June 02 versus 235K expected and 233K prior (revised). With this, the four-week average rose to 237.25K from 229.75K previous readings. Further, the Continuing Jobless Claims dropped to 1.757M in the week ended on May 26 from 1.794M prior (revised), compared to 1.8M market forecasts. Earlier in the week, the US ISM Services PMI, S&P Global PMIs and Factory Orders also printed downbeat outcomes and pushed back the Fed hawks while weighing on the US Dollar.
On the other hand, multiple Chinese state banks including the Industrial and Commercial Bank of China, Bank of China and Construction Bank cut their benchmark rates. The same raises speculations that the Dragon Nation’s central bank, namely the People’s Bank of China (PBOC), will also cut the rates, which in turn fuelled hopes of more credit generation and demand for Oil from China.
Further, the fears of China’s market intervention also favored the WTI bulls as PBoC Vice Governor said, “We have confidence, conditions and capacity to maintain stable operations of the FX market.” On the same line was Li Yunze, Director of China's National Administration of Financial Regulation, who also made upbeat remarks on the Chinese economy as he said, “Economy still recovering,” while adding that demand will be boosted.
Amid these plays, the S&P500 Futures struggle for clear directions even as Wall Street closed with gains.
Moving forward, China’s inflation gauges for May, namely the Consumer Price Index (CPI) and Producer Price Index (PPI), will gain major attention due to the Dragon Nation’s status as one of the biggest Oil consumers. The forecast suggests that the headline CPI will improve to 0.3% YoY in May versus 0.1% prior whereas the PPI could drop further to -4.3% YoY from -3.6% previous readings. Given the mixed outlook, the WTI traders will look for any surprises for major reaction.
Technical analysis
Repeated bounces off the 10-DMA support of around $71.00 keeps the Oil buyers hopeful.
- USD/CAD enters a bearish consolidation phase near a multi-week low touched on Friday.
- Bets for an imminent Fed rate hike pause weigh on the USD and cap the upside for the pair.
- A positive risk tone undermines the safe-haven CHF and helps limit losses, for the time being.
The USD/CHF pair consolidates its recent slide to a nearly three-week low touched during the Asian session on Friday and oscillates in a narrow trading band below the 0.9000 psychological mark.
The US Dollar (USD) remains depressed near its lowest level since May 24 and is weighed down by the disappointing US macro data released on Thursday, which in turn, acts as a headwind for the USD/CHF pair. The US Department of Labor (DOL) reported on Thursday that the number of Americans filing new claims for unemployment benefits rose more than anticipated, to a 20-month high. This, in turn, reaffirms market expectations that the Federal Reserve (Fed) will pause rate hikes that led to the overnight slide in the US Treasury bond yields and continues to weigh the Greenback.
The markets, however, are still pricing in the possibility of another 25 bps Fed rate hike in July. The bets were lifted by surprise rate hikes by the Reserve Bank of Australia (RBA) and the Bank of Canada (BoC) this week, which suggests that the fight against inflation is still not over and supports prospects for further policy tightening by the Fed. This, in turn, is holding back traders from placing aggressive bearish bets around the USD. Apart from this, a slight improvement in the global risk sentiment is seen undermining the safe-haven Swiss Franc (CHF) and lending support to the USD/CHF pair.
Any meaningful upside for the major, meanwhile, still seems elusive in the wake of worries about a global economic slowdown, which might keep a lid on any optimism. In fact, the Organization for Economic Co-operation and Development (OECD) forecasts that the global economy is set for a weak recovery over the coming years as persistent core inflation and tighter monetary policy weigh on demand. OECD now expects the global economy to expand by 2.7% this year - the lowest annual rate of growth since the 2008-2009 financial crisis excluding the pandemic-hit year of 2020.
Investors might also prefer to move to the sidelines ahead of the latest US consumer inflation figures and the key central bank event risk - the highly anticipated FOMC monetary policy meeting - next week. In the meantime, the US bond yields will play a key role in influencing the USD price dynamics in the absence of any relevant market-moving economic data from the US. Traders will further take cues from the broader risk sentiment to grab short-term opportunities. Nevertheless, the USD/CHF pair remains on track to register heavy weekly losses for the first time in the previous five.
Technical levels to watch
The Washington Post is reporting that Crown Prince Mohammed bin Salman threatened to fundamentally alter the decades-old U.S.-Saudi relationship and impose significant economic costs on the United States if it retaliated against the oil cuts.
The Washington Post wrote:
The U.S. intelligence document was circulated on the Discord messaging platform as part of an extensive leak of highly sensitive national security materials.
A spokesperson with the National Security Council said “we are not aware of such threats by Saudi Arabia.”
“In general, such documents often represent only one snapshot of a moment in time and cannot possibly offer the full picture,” the official said, speaking on the condition of anonymity to discuss an intelligence matter.
In separate news, crude oil prices posted moderate losses on reports that Iran and the US have made progress in talks over Iran's nuclear program, which could pave the way for more Iranian crude exports. The Israeli newspaper Haaretz said Iran and the US have made progress which could allow additional crude supplies into the global market.
- EUR/JPY bears eye a test of the daily 38.2% Fibo.
- Bulls eye a break of 150.00 key daily resistance.
EUR/JPY has been trapped between support and resistance for many days and is clinging to trendline support. Both the Yen and Euro are benefitting from a softer US Dollar as the central; bank divergence that has favored the Greenback for so long is wearing thin. Data on Thursday was the latest of a batch that has been signaling to markets that the Federal Reserve is about to pause its interest rate hiking cycle. This makes for a technically mixed outlook look for the crosses as the following will illustrate for EUR/JPY:
EUR/JPY daily chart
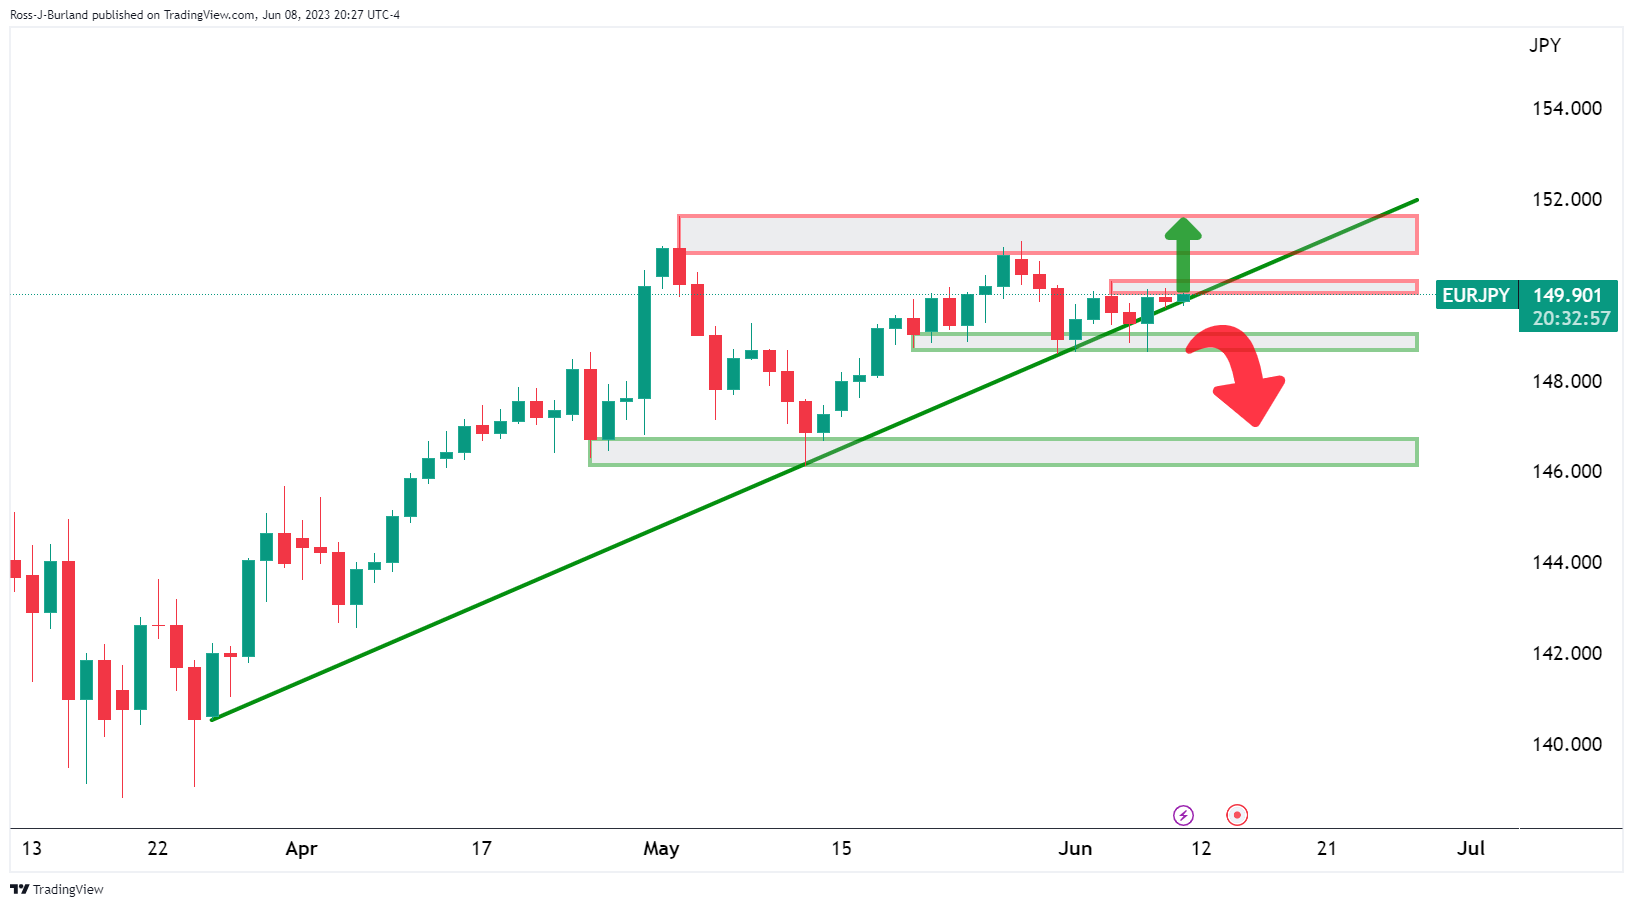
EUR/JPY's daily chart shows the pair hugging trendline support and remaining bid while above 148.50 horizontal support.
EUR/JPY H4 chart
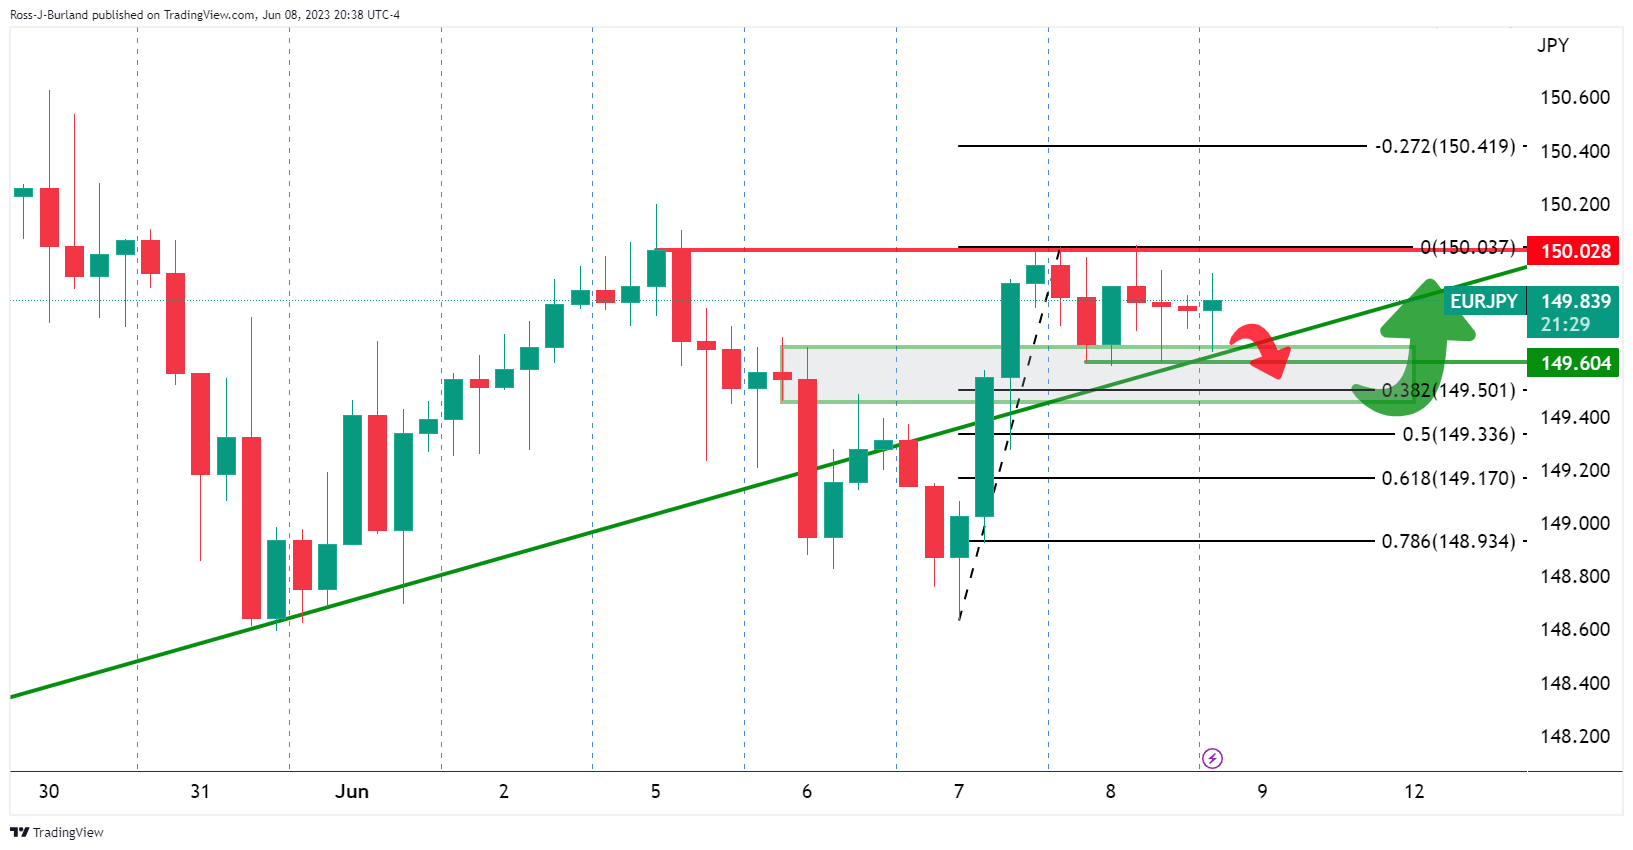
On the 4-hour chart, there are prospects of another move lower if 150 holds as bulls have been building positions protected below the equal lows. We are yet to see a test of the daily 38.2% Fibonacci as well.
- AUD/USD portrays pre-data positioning at one-month high, pares the biggest daily loss in a week.
- Struggles to justify upbeat break of four-month-old resistance line, bullish MACD as RSI conditions prod Aussie bulls.
- Convergence of 100-DMA, descending trend line from early February appears a tough nut to crack for AUD/USD buyers.
- Aussie pair’s further upside also needs validation from China inflation, May’s high.
AUD/USD retreats from the highest level in a month, marked the previous day, to 0.6710 during Friday’s mid-Asian session. In doing so, the Aussie pair consolidates the biggest daily jump in a week as traders prepare for the top-tier inflation gauges from Australia’s biggest customer China.
Also read:
It should be noted that the Aussie pair’s rally on Thursday allowed it to cross the previous key resistance line stretched from May 02 amid bullish MACD signals. However, the nearly overbought RSI conditions prod the Aussie pair buyers amid the pre-data consolidation of late.
Hence, the AUD/USD bulls are in the driver’s seat but need validation from China Consumer Price Index (CPI) and Producer Price Index (PPI) to keep the reins. Even so, a convergence of the descending trend line from February 14 and the 100-DMA, near 0.6740, appears a tough nut to crack for the pair buyers for conviction.
Furthermore, May’s high of 0.6820 can act as the last defense of the AUD/USD bears.
On the contrary, a daily closing below the resistance-turned-support line from early February, around 0.6700 by the press time, could quickly drag the AUD/USD pair towards the 21-DMA support of around 0.6610.
In a case where the AUD/USD drops below 0.6610, the odds of witnessing a slump to 0.6560 and then to the previous monthly low of near 0.6460 can’t be ruled out.
AUD/USD: Daily chart
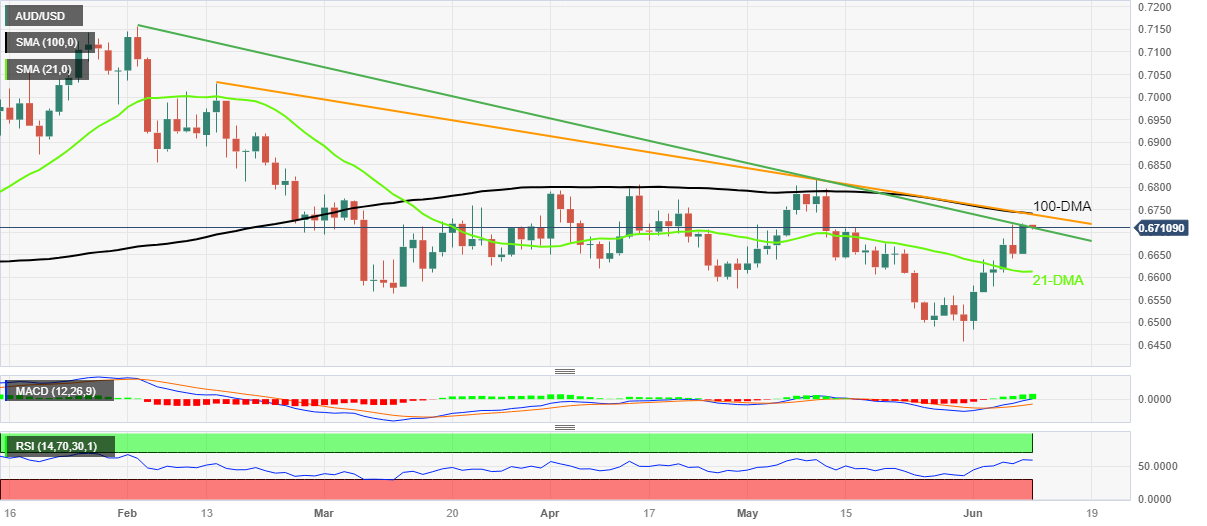
Trend: Limited upside expected
- GBP/USD oscillates in a narrow trading band near its highest level since May 11.
- Bets for an imminent Fed rate hike pause weigh on the USD and act as a tailwind.
- Expectations for more rate hikes by the BoE lend additional support to the major.
The GBP/USD pair is seen consolidating the overnight blowout rally to its highest level since May 11 and oscillating in a narrow trading band, just above mid-1.2500s during the Asian session on Friday.
The US Dollar (USD) languishes near a two-week low and continues to be weighed down by the disappointing release of the US Initial Jobless Claims, which in turn, acts as a tailwind for the GBP/USD pair. The US Department of Labor (DOL) reported on Thursday that the number of Americans filing new claims for unemployment benefits rose more than anticipated, to the highest level in more than 1-1/2 years last week. This, in turn, reinforced market expectations that the Federal Reserve (Fed) will pause rate hikes after a two-day policy meeting on June 13-14. This led to the overnight slide in the US Treasury bond yields and undermines the Greenback.
Adding to this, a slight improvement in the global risk sentiment further weighs on the safe-haven buck and offers additional support to the GBP/USD pair. That said, worries about a global economic slowdown might keep a lid on any optimism in the markets. In fact, the Organization for Economic Co-operation and Development (OECD) forecasts that the global economy is set for a weak recovery over the coming years as persistent core inflation and tighter monetary policy weigh on demand. OECD now expects the global economy to expand by 2.7% this year - the lowest annual rate of growth since the 2008-2009 financial crisis excluding the pandemic-hit year of 2020.
Furthermore, expectations that the Fed will hike rates again in July helps limit the downside for the Greenback and holds back traders from placing aggressive bullish bets around the GBP/USD pair. Despite last week's dovish rhetoric by several Fed officials, surprise rate hikes by the Reserve Bank of Australia (RBA) and the Bank of Canada (BoC) this week suggest that the fight against inflation is still not over. This supports prospects for further tightening by the Fed. The downside for the major, however, remains cushioned on the back of expectations that the Bank of England (BoE) will be far more aggressive in policy tightening to contain stubbornly high inflation.
Traders, meanwhile, might prefer to move to the sidelines ahead of the latest US consumer inflation figures and the key central bank event risk - the highly anticipated FOMC monetary policy meeting - next week. In the meantime, the GBP/USD pair remains at the mercy of the USD price dynamics in the absence of any relevant market-moving economic releases - either from the UK or the US. Nevertheless, spot prices remain on track to register gains for the second successive week.
Technical levels to watch
| Index | Change, points | Closed | Change, % |
|---|---|---|---|
| NIKKEI 225 | -272.47 | 31641.27 | -0.85 |
| Hang Seng | 47.18 | 19299.18 | 0.25 |
| KOSPI | -4.75 | 2610.85 | -0.18 |
| ASX 200 | -18.3 | 7099.7 | -0.26 |
| DAX | 29.4 | 15989.96 | 0.18 |
| CAC 40 | 19.36 | 7222.15 | 0.27 |
| Dow Jones | 168.59 | 33833.61 | 0.5 |
| S&P 500 | 26.41 | 4293.93 | 0.62 |
| NASDAQ Composite | 133.62 | 13238.52 | 1.02 |
- USD/JPY bounces off weekly low while consolidating the biggest daily loss since early May, lacks upside momentum though.
- US 10-year Treasury bond yields remain steady after falling the most in over a week.
- US Dollar licks its wounds amid mixed Fed concerns, Yen pair sellers remain optimistic.
USD/JPY stays sidelined near 139.00 as Tokyo opens for Friday’s trading, after witnessing a slump in the Yen pair the previous. In doing so, the risk-barometer pair justifies the market’s mixed concerns amid mostly downbeat US data and bond market optimism. The same results in the receding hawkish Fed concerns and weigh on the USD/JPY price ahead of the market’s consolidation amid a light calendar and cautious mood before the next week’s US Consumer Price Index (CPI) and the Federal Open Market Committee (FOMC) monetary policy meeting.
The benchmark US 10-year Treasury bond yields reversed from the highest levels in a fortnight to 3.72% the previous day, around the same levels by the press time, whereas the two-year counterpart also snapped a two-day winning streak to drop to 4.52% at the latest.
On the other hand, US Initial Jobless Claims rose to 261K in the week ended on June 02 versus 235K expected and 233K prior (revised). With this, the four-week average rose to 237.25K from 229.75K previous readings. Further, the Continuing Jobless Claims dropped to 1.757M in the week ended on May 26 from 1.794M prior (revised), compared to 1.8M market forecasts. Earlier in the week, the US ISM Services PMI, S&P Global PMIs and Factory Orders also printed downbeat outcomes and pushed back the Fed hawks while weighing on the US Dollar Index (DXY).
While the yields exert downside pressure on the USD/JPY price and the US data also weigh on the US Dollar, the risk appetite struggles to justify the market’s optimism amid the hawkish comments from International Monetary Fund (IMF) spokesperson Julie Kozack. On Thursday, the global lender flagged the inflation woes and pushed major central banks, including the US Federal Reserve (Fed), towards further rate hikes. "If inflation does prove to be more persistent than expected, then the Fed may need to push interest rates higher for longer," IMF’s Kozack told reporters at a regular briefing.
As a result, the S&P500 Futures struggle for clear directions even as Wall Street closed with gains.
Above all, the latest divergence between the Bank of Japan (BoJ) and the US Federal Reserve’s (Fed) monetary policy bias seems to keep the USD/JPY bears hopeful.
Moving on, a light calendar can keep the USD/JPY on its way to posting the second weekly loss while bracing for the upcoming week’s key catalysts.
Technical analysis
A 12-day-old symmetrical triangle restricts immediate USD/JPY moves between 138.55 and 140.05 in that order.
| Pare | Closed | Change, % |
|---|---|---|
| AUDUSD | 0.67128 | 0.88 |
| EURJPY | 149.754 | -0.09 |
| EURUSD | 1.07819 | 0.77 |
| GBPJPY | 174.415 | 0.09 |
| GBPUSD | 1.25563 | 0.94 |
| NZDUSD | 0.60918 | 0.9 |
| USDCAD | 1.33578 | -0.09 |
| USDCHF | 0.89877 | -1.23 |
| USDJPY | 138.902 | -0.85 |


© 2000-2026. Уcі права захищені.
Cайт знаходитьcя під керуванням TeleTrade DJ. LLC 2351 LLC 2022 (Euro House, Richmond Hill Road, Kingstown, VC0100, St. Vincent and the Grenadines).
Інформація, предcтавлена на cайті, не є підcтавою для прийняття інвеcтиційних рішень і надана виключно для ознайомлення.
Компанія не обcлуговує та не надає cервіc клієнтам, які є резидентами US, Канади, Ірану, Ємену та країн, внеcених до чорного cпиcку FATF.
Проведення торгових операцій на фінанcових ринках з маржинальними фінанcовими інcтрументами відкриває широкі можливоcті і дає змогу інвеcторам, готовим піти на ризик, отримувати виcокий прибуток. Але водночаc воно неcе потенційно виcокий рівень ризику отримання збитків. Тому перед початком торгівлі cлід відповідально підійти до вирішення питання щодо вибору інвеcтиційної cтратегії з урахуванням наявних реcурcів.
Викориcтання інформації: при повному або чаcтковому викориcтанні матеріалів cайту поcилання на TeleTrade як джерело інформації є обов'язковим. Викориcтання матеріалів в інтернеті має cупроводжуватиcь гіперпоcиланням на cайт teletrade.org. Автоматичний імпорт матеріалів та інформації із cайту заборонено.
З уcіх питань звертайтеcь за адреcою pr@teletrade.global.
переклади