- Аналітика
- Новини та інструменти
- Новини ринків
Новини ринків
- GBP/USD trades with mild losses around 1.2675 on the consolidation of USD.
- The Fed's Goolsbee said it must weigh how much longer it can maintain its current rate stance without damaging the economy.
- The UK’s OBR forecasts the UK economy to grow by 0.8% this year as domestic demand has rebounded.
The GBP/USD pair trades with a mild negative bias near 1.2675 during the early Asian session on Wednesday. The USD Index (DXY) consolidates just above the 104.00 yardstick amid the cautious mood. Investors await the US Consumer Price Index (CPI) inflation data, along with the speech of Fed’s Bowman and Goolsbee later in the day.
Some Federal Reserve (Fed) officials offered their hawkish language. Chicago Fed President Austan Goolsbee said on Monday that the recent jobs report was “quite strong”, but the central bank must weigh how much longer it can maintain its current interest rate stance without damaging the economy. Meanwhile, Minneapolis Fed President Neel Kashkari said that the labor market is no longer ‘red hot’ but remains tight. He said his base case is that inflation continues to ease.
Financial markets have priced in close to 57% of a rate cut in June, while the chance of a July cut has fallen below 75%, according to the CME FedWatch Tool. All eyes will be on the US March CPI data as it might help the Fed to determine the path of monetary policy after the figure showed an increase of 3.2% YoY last month. The signs of persistent inflation and robust growth in the US might boost the Greenback in the near term.
On the other hand, the latest forecast from the UK Office for Budget Responsibility (OBR) suggested the UK economy is forecast to grow by 0.8% this year as domestic demand has recovered. The nation’s monthly Gross Domestic Product (GDP) will be due on Friday. If it is the case that the GDP number is stronger than estimated, it might slow the easing cycle and lift the Pound Sterling (GBP) against the USD. Markets are currently pricing 75 basis points (bps) of the Bank of England (BoE) rate cuts this year, which would take the benchmark rate from its current level of 5.25% to 4.5%.
- EUR/USD stable as markets await key economic events in the week.
- Focus on US CPI, expecting inflation moderation monthly, annually.
- ECB decision eyed, with rate adjustment speculation affecting Euro.
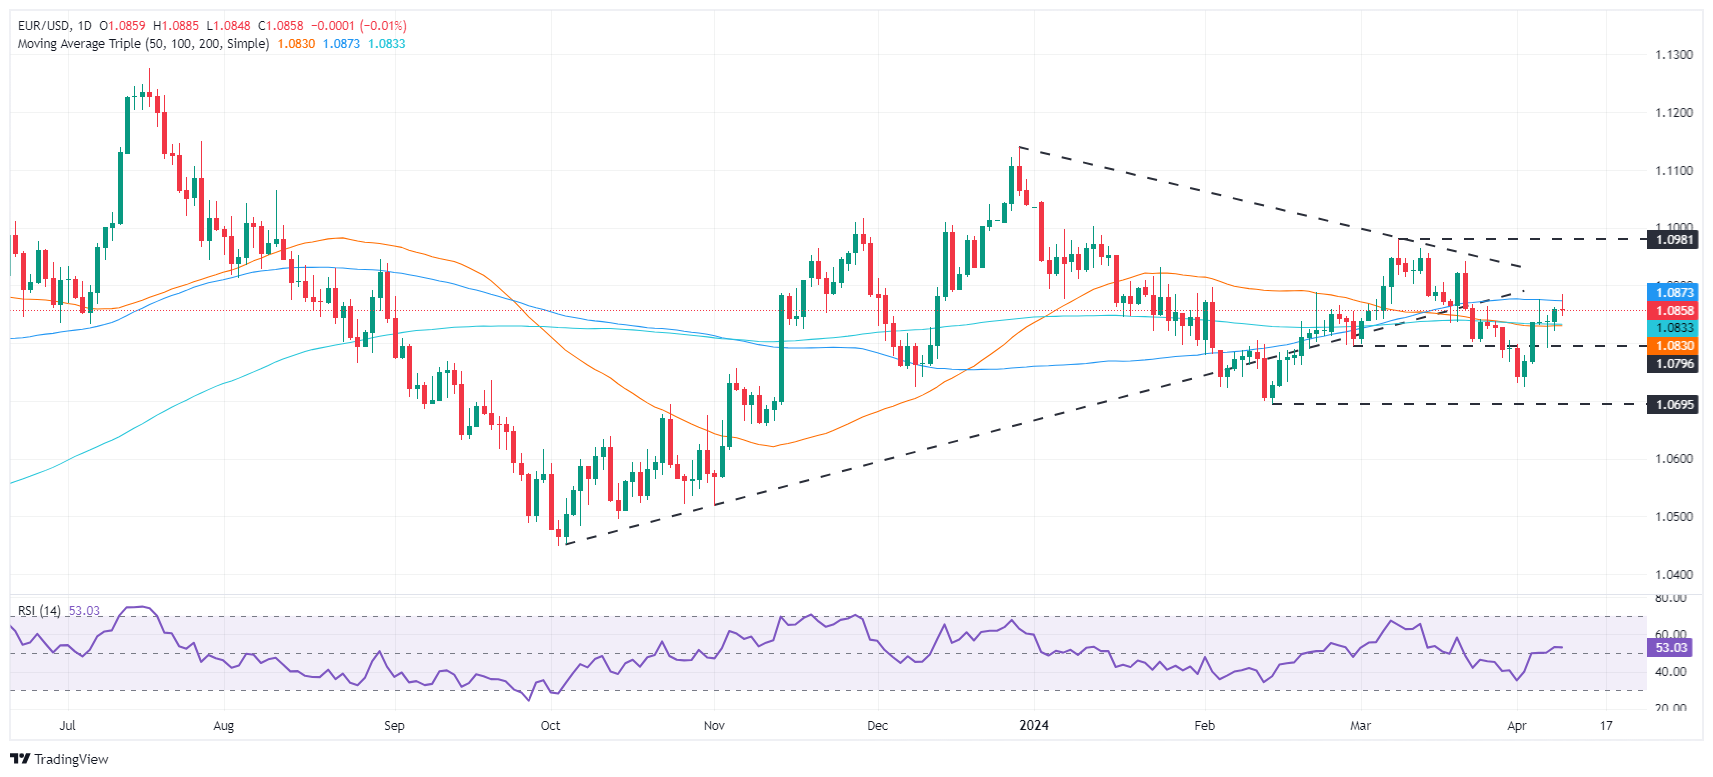
The Euro failed to gain traction against the US Dollar, registered minuscule losses of 0.02%, yet hovers at around the 1.0850 area, capped by dynamic support and resistance levels, namely daily moving averages (DMAs).
EUR/USD hovers around 1.0850, with markets eyeing upcoming economic releases
The economic docket was scarce on both sides of the Atlantic as market participants prepared for Wednesday's release of US inflation data and Thursday's European Central Bank (ECB) monetary policy decision.
The US Consumer Price Index (CPI) for March is anticipated to increase by 0.3% month-over-month, which is below the 0.4% increase in February, while annually, the CPI is expected to escalate from 3.2% to 3.4%. The core CPI, which excludes volatile food and energy prices, is forecasted to decrease from 0.4% to 0.3% month-over-month and from 3.8% to 3.7% year-over-year.
The ECB is expected to keep rates unchanged on April 11, but odds are increasing that President Lagarde and Co. will likely need to ease policy in June if they want to achieve a soft landing.
That would widen the interest rate differentials between the Eurozone (EU) and the US, favoring further EUR/USD downside.
EUR/USD Price Analysis: Technical outlook
With price action capped on the upside by the 100-DNA at 1.0872, buyers remain unable to challenge the 1.0900 figure, which could pave the way to challenge higher levels, like the March 21 high at 1.0942, followed by March’s 8 swings high at 1.0984. On the other hand, if sellers clear the confluence of the 50 and 200-DMAs at around 1.0830s, the EUR/USD could challenge the 1.0800 mark. Further downside is seen at the 1.0750 psychological level, ahead of the April 2 low of 1.0724.
- The daily chart reveals a shift in NZD/USD from a bearish to a bullish short-term outlook.
- Hourly chart indicators echo the bullish trend visible in the daily analysis.
- Buyers will need to claim dominance over key SMAs to make strides in the market.
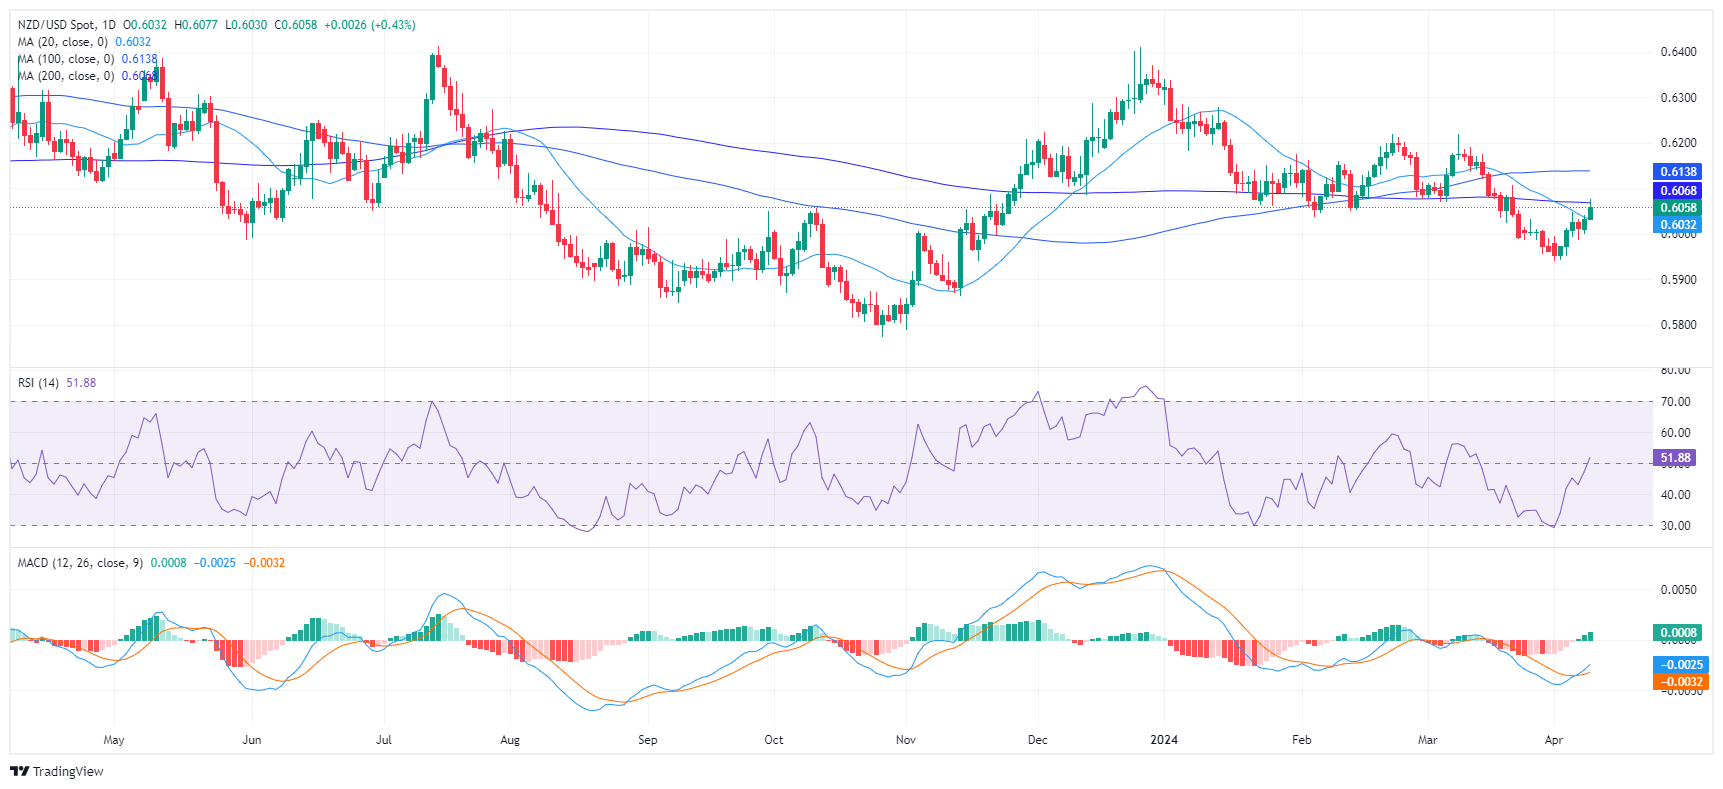
The NZD/USD rose to around 0.6058, reflecting a 0.41% gain on Tuesday's session. Despite the pair experiencing a momentum shift from bearish to bullish, it is positioned beneath key Simple Moving Averages (SMAs), hinting at a possible extended downtrend.
On the daily chart, the Relative Strength Index (RSI) rose from negative territory and is now within the positive zone. This indicates a reversal from a bearish trend to a bullish short-term outlook. Further strengthening that, the Moving Average Convergence Divergence (MACD) histogram prints rising green bars for the first time since mid-March, signaling a potential upward momentum.
NZD/USD daily chart
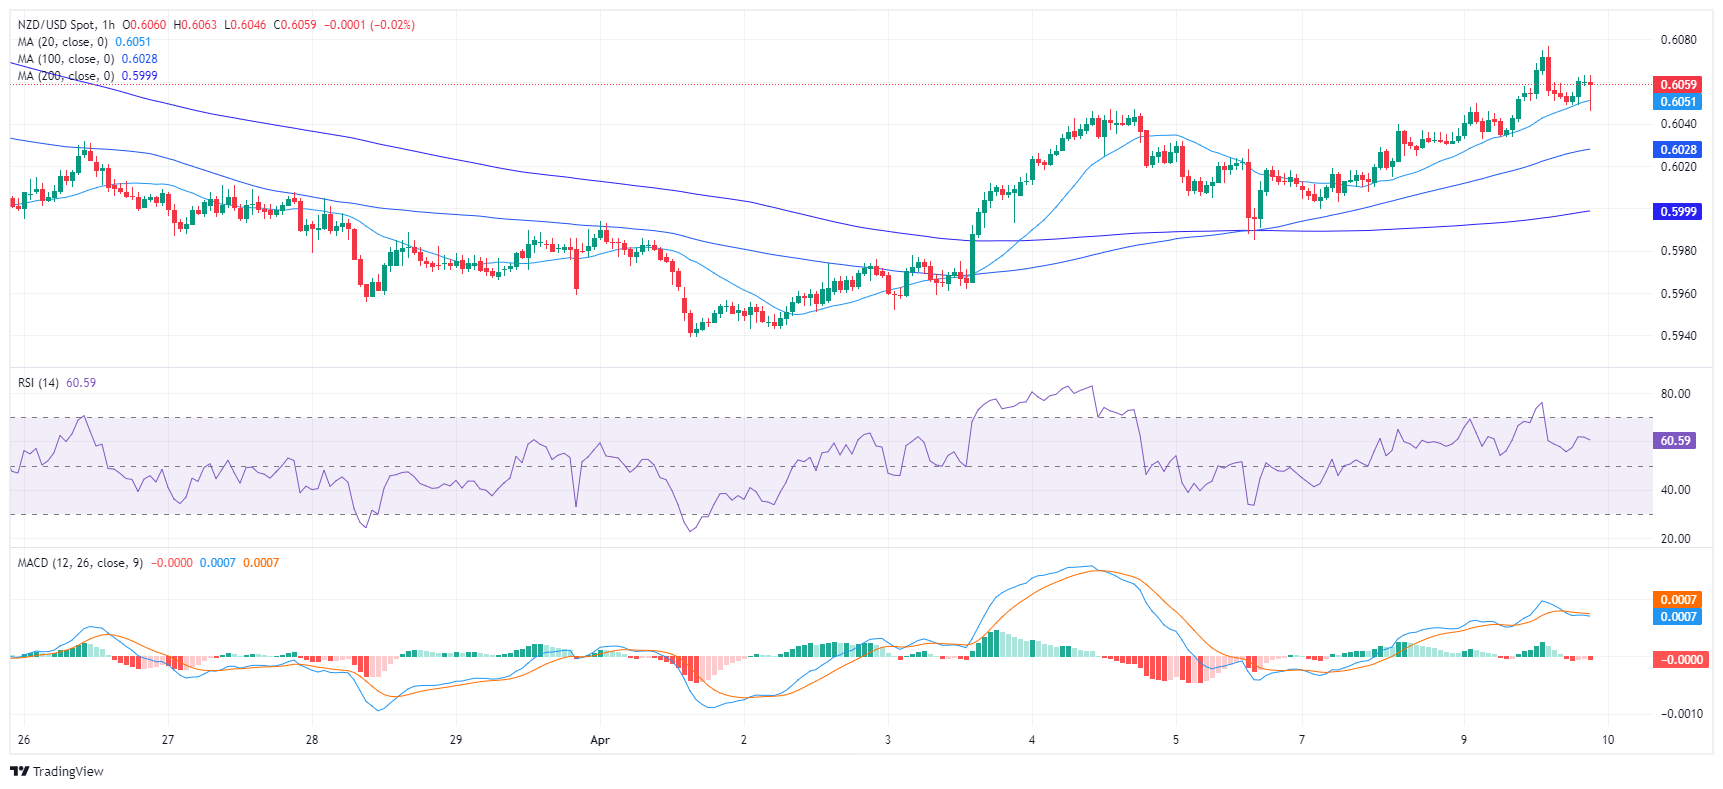
Turning to the hourly chart, the RSI is on the rise, mirroring the trend found on the daily chart. The MACD histogram on the hourly scale is relatively flat but displays red bars, indicating a mild negative momentum, probably hinting that the bulls are taking profits after the RSI hit overbought conditions earlier in the session.
NZD/USD hourly chart
Regarding the overall trend, the NZD/USD has demonstrated a significant jump above its 20-day Simple Moving Average (SMA), suggesting a bullish shift in the short-term outlook. This development indicates that the pair has found some near-term buying strength. However, it continues to be positioned below both the 100 and 200-day SMA, implying a long-term bearish stance. Further to this, the pair was recently rejected by its 100-day SMA at 0.6138, suggesting a reinforced resistance at this level. A sustained move above this level would be required to alter the overall bearish bias.
- The Reserve Bank of New Zealand is set to hold the interest rate at 5.50% on Wednesday.
- The language in the policy statement will offer cues on the RBNZ interest rate outlook.
- The New Zealand Dollar braces for a big reaction to the RBNZ policy announcements.
The Reserve Bank of New Zealand (RBNZ) is widely expected to maintain the Official Cash Rate (OCR) at 5.50% for the sixth consecutive meeting in a row following the conclusion of its monetary policy meeting on Wednesday.
The New Zealand Dollar (NZD) is primed for a big market reaction to the RBNZ policy announcements despite the absence of RBNZ Governor Adrian Orr’s press conference and the publication of updated economic projections.
What to expect from the RBNZ interest rate decision?
As a rates on-hold decision is fully priced in, markets will closely scrutinize the language and the tone in the Reserve Bank of New Zealand’s Monetary Policy Statement (MPS).
After extending the pause in February, the RBNZ policy statement stated, “conditional on our central economic outlook, we expect the OCR will need to remain around current levels for an extended period for the Monetary Policy Committee to meet its inflation target.”
Speaking at the post-policy meeting press conference, Reserve Bank of New Zealand’s (RBNZ) Governor Adrian Orr noted that “we did discuss a hike in rates”, adding that there was a “strong consensus that rates were sufficient.”
Orr said that he is “still concerned about underlying inflation, how grown inflation is easing.”
Since the February meeting, little data of note has been released from New Zealand to help gauge the timing of the RBNZ’s likely policy pivot. However, with New Zealand’s economy facing its second recession in 18 months and consumer confidence dipping sharply, markets may not be surprised by a dovish hold.
New Zealand’s Gross Domestic Product (GDP) growth contracted 0.1% in the fourth quarter of 2023, following a 0.3% contraction in the third quarter. Meanwhile, ANZ-Roy Morgan New Zealand Consumer Confidence fell by 8.1 points in March to 86.4.
Markets are currently pricing in the first RBNZ’s rate cut in August, with a 75 bps of total easing this year, per BBH Analysts.
On the other hand, the RBNZ could stick to its language from the February MPS, awaiting the first-quarter Consumer Price Index (CPI) report and the labor market data before contemplating any change in its policy outlook.
Data published by Stats NZ showed that New Zealand’s annual Consumer Price Index (CPI) increased by 4.7% for the December quarter, the smallest annual rise in more than two years. However, the figure still remains much above the RBNZ target of 1.0%-3.0%.
Previewing the RBNZ policy announcement, analysts at TD Securities noted: “The RBNZ is expected to keep the OCR on hold at 5.50%. Limited data flow since the February MPS suggests the Bank delivers a similarly worded Statement again.”
“GDP released a week after the February MPS missed the Bank's forecast by a whisker but higher oil prices, weaker NZD, monthly survey releases with price and employment data suggest the inflation outlook still looks challenging,” the analysts added.
How will the RBNZ interest decision impact the New Zealand Dollar?
Risks appear skewed to the downside for the NZD/USD pair heading into the RBNZ showdown on Wednesday, as the US Dollar keeps the upper hand across the board following robust Nonfarm Payrolls data that prompted investors to dial down expectations for a June US Federal Reserve (Fed) rate cut.
Furthermore, expectations of an RBNZ status quo also leave the Kiwi Dollar in the back seat, with a fresh sell-off likely on the cards should the RBNZ policy statement hint toward an earlier-than-expected rate cut.
Conversely, if the MPS suggests that the RBNZ could stick to its “higher for longer” interest rate view amid elevated inflation level, the NZD/USD pair could regain the recovery momentum from five-month lows of 0.5939.
Dhwani Mehta, FXStreet’s Senior Analyst, offers a brief technical outlook for trading the New Zealand Dollar on the RBNZ policy announcements: “The NZD/USD pair is challenging the critical 21-day Simple Moving Average (SMA) at 0.6036 on its road to recovery. The 14-day Relative Strength Index (RSI) indicator, however, is still holding below the 50 level, suggesting that sellers are likely to hold the reins.”
“The immediate upside hurdle is seen at the horizontal 200-day SMA at 0.6068, above which the 0.6100 round level will come into play. NZD buyers will then target the 100-day SMA at 0.6138. Conversely, a sustained move below the 0.6000 level could open doors for a test of the April 5 low at 0.5985. Further south, the five-month kow of 0.5939 could be a tough nut to crack for NZD/USD sellers,” Dhwani adds.
Economic Indicator
RBNZ Interest Rate Decision
The Reserve Bank of New Zealand (RBNZ) announces its interest rate decision after its seven scheduled annual policy meetings. If the RBNZ is hawkish and sees inflationary pressures rising, it raises the Official Cash Rate (OCR) to bring inflation down. This is positive for the New Zealand Dollar (NZD) since higher interest rates attract more capital inflows. Likewise, if it reaches the view that inflation is too low it lowers the OCR, which tends to weaken NZD.
Read more.Next release: Wed Apr 10, 2024 02:00
Frequency: Irregular
Consensus: 5.5%
Previous: 5.5%
Source: Reserve Bank of New Zealand
The Reserve Bank of New Zealand (RBNZ) holds monetary policy meetings seven times a year, announcing their decision on interest rates and the economic assessments that influenced their decision. The central bank offers clues on the economic outlook and future policy path, which are of high relevance for the NZD valuation. Positive economic developments and upbeat outlook could lead the RBNZ to tighten the policy by hiking interest rates, which tends to be NZD bullish. The policy announcements are usually followed by Governor Adrian Orr’s press conference.
RBNZ FAQs
The Reserve Bank of New Zealand (RBNZ) is the country’s central bank. Its economic objectives are achieving and maintaining price stability – achieved when inflation, measured by the Consumer Price Index (CPI), falls within the band of between 1% and 3% – and supporting maximum sustainable employment.
The Reserve Bank of New Zealand’s (RBNZ) Monetary Policy Committee (MPC) decides the appropriate level of the Official Cash Rate (OCR) according to its objectives. When inflation is above target, the bank will attempt to tame it by raising its key OCR, making it more expensive for households and businesses to borrow money and thus cooling the economy. Higher interest rates are generally positive for the New Zealand Dollar (NZD) as they lead to higher yields, making the country a more attractive place for investors. On the contrary, lower interest rates tend to weaken NZD.
Employment is important for the Reserve Bank of New Zealand (RBNZ) because a tight labor market can fuel inflation. The RBNZ’s goal of “maximum sustainable employment” is defined as the highest use of labor resources that can be sustained over time without creating an acceleration in inflation. “When employment is at its maximum sustainable level, there will be low and stable inflation. However, if employment is above the maximum sustainable level for too long, it will eventually cause prices to rise more and more quickly, requiring the MPC to raise interest rates to keep inflation under control,” the bank says.
In extreme situations, the Reserve Bank of New Zealand (RBNZ) can enact a monetary policy tool called Quantitative Easing. QE is the process by which the RBNZ prints local currency and uses it to buy assets – usually government or corporate bonds – from banks and other financial institutions with the aim to increase the domestic money supply and spur economic activity. QE usually results in a weaker New Zealand Dollar (NZD). QE is a last resort when simply lowering interest rates is unlikely to achieve the objectives of the central bank. The RBNZ used it during the Covid-19 pandemic.
- Gold retreats slightly but remains bullish, balancing between risk sentiment and US Treasury yields.
- The decline in NFIB Small Business Optimism highlights cautious economic outlook.
- Federal Reserve's rate cut expectations and cautious stance underpin market sentiment.
Gold prices retreated on Tuesday after refreshing all-time highs reached $2,365 during the overnight session for North American traders. The yellow metal trimmed earlier gains amid a risk-on impulse and falling US Treasury yields, while the Greenback takes a breather after dropping 0.16% on Monday. The XAU/USD trades at $2,346, gaining some 0.35%
The US economic calendar was scarce, except for the poll of the National Federation of Independent Business (NFIB) Small Optimism Index for March fell for the third straight month from 89.4 to 88.5. Aside from this, market participants are awaiting Wednesday’s busy schedule with the release of the US Consumer Price Index (CPI) alongside the Federal Open Market Committee (FOMC) Minutes.
In the meantime, Fed officials remain optimistic that they will cut rates but emphasize the need to be patient.
Daily digest market movers: Gold trims gains amid high US yields
- The US Consumer Price Index (CPI) for March is expected to rise 0.3% MoM, below February’s 0.4%, but higher than the 0.17% pace needed to curb inflation to the 2% goal. On an annual basis, the CPI is expected to rise from 3.2% to 3.4%.
- Underlying inflation, also known as core CPI, is expected to dip from 0.4% to 0.3% MoM and from 3.8% to 3.7% YoY.
- Strong price pressure may dampen expectations for rate cuts in June, whereas softer inflation figures could fuel speculation for rate reductions.
- Last week’s stronger-than-expected jobs report kept interest rate investors skeptical of a Fed rate cut in June’s meeting, with odds tumbling from around 70%.
- The CME FedWatch Tool depicts traders remaining slightly more optimistic than Monday, with odds for a 25-basis-point rate cut in June up from 52% to 57.8%.
- World Gold Consortium reveals that the People’s Bank of China was the largest buyer of the yellow metal, increasing its reserves by 12 tonnes to 2,257 tonnes.
Technical analysis: Gold’s advance stalls near $2,350 as bulls take a breather
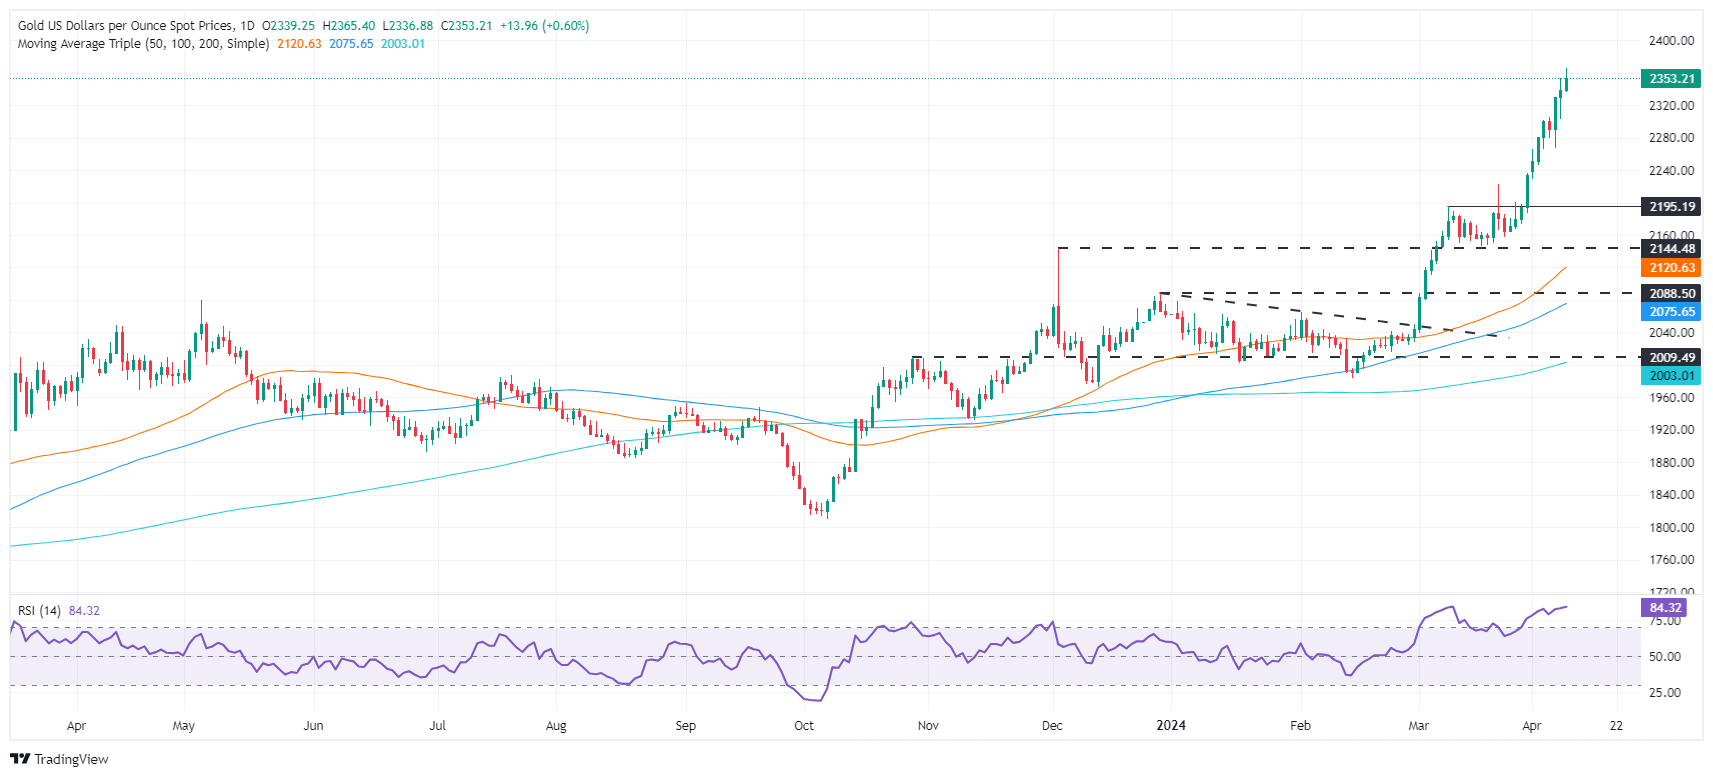
Gold’s rally paused close to $2,350 as the Relative Strength Index (RSI) hit 84.23, its highest level since March 8. This indicates that the RSI is overbought and that the yellow metal is getting less appealing to investors.
If Gold prices dip below the $2,350 area, that will expose the April 8 daily low of $2,303. Once surpassed, that could put downward pressure on the yellow metal and drive it to March’s 21-session high of $2,222. Further losses are seen at $2,200.
On the other hand, if XAU/USD resumes its rally, buyers are eyeing $2,400 and beyond.
Gold FAQs
Gold has played a key role in human’s history as it has been widely used as a store of value and medium of exchange. Currently, apart from its shine and usage for jewelry, the precious metal is widely seen as a safe-haven asset, meaning that it is considered a good investment during turbulent times. Gold is also widely seen as a hedge against inflation and against depreciating currencies as it doesn’t rely on any specific issuer or government.
Central banks are the biggest Gold holders. In their aim to support their currencies in turbulent times, central banks tend to diversify their reserves and buy Gold to improve the perceived strength of the economy and the currency. High Gold reserves can be a source of trust for a country’s solvency. Central banks added 1,136 tonnes of Gold worth around $70 billion to their reserves in 2022, according to data from the World Gold Council. This is the highest yearly purchase since records began. Central banks from emerging economies such as China, India and Turkey are quickly increasing their Gold reserves.
Gold has an inverse correlation with the US Dollar and US Treasuries, which are both major reserve and safe-haven assets. When the Dollar depreciates, Gold tends to rise, enabling investors and central banks to diversify their assets in turbulent times. Gold is also inversely correlated with risk assets. A rally in the stock market tends to weaken Gold price, while sell-offs in riskier markets tend to favor the precious metal.
The price can move due to a wide range of factors. Geopolitical instability or fears of a deep recession can quickly make Gold price escalate due to its safe-haven status. As a yield-less asset, Gold tends to rise with lower interest rates, while higher cost of money usually weighs down on the yellow metal. Still, most moves depend on how the US Dollar (USD) behaves as the asset is priced in dollars (XAU/USD). A strong Dollar tends to keep the price of Gold controlled, whereas a weaker Dollar is likely to push Gold prices up.
- Daily RSI shows rising buying traction, while a positive MACD suggests a growing momentum.
- On the hourly chart, the same indicators hint at potential short-term pullbacks due to minor negative momentum.
- Despite a bullish overall outlook, the buyers need to defend short-term SMAs and defend them to prevent potential losses.
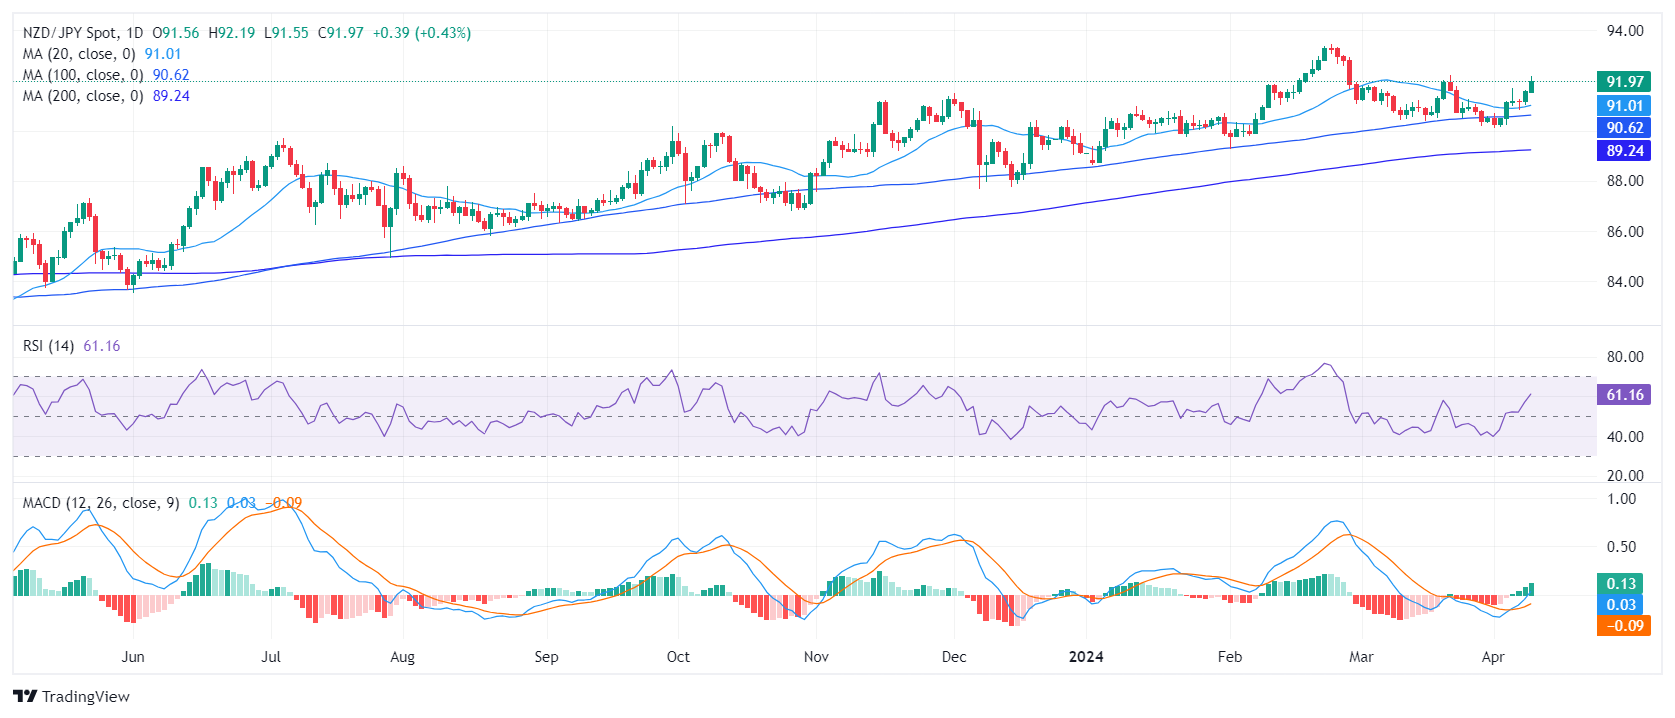
The NZD/JPY pair is trading at 91.79, experiencing a 0.25% uptick. It is currently showcasing a strong bullish course, with reinforced buying momentum as it comfortably positions above its main Simple Moving Average (SMA). Indicators remain strong on the daily chart while hourly indicators may be hinting at an incoming consolidation.
On the daily chart, the Relative Strength Index (RSI) is comfortably positioned within positive territory, suggesting that buying pressure outweighs selling pressure. Moreover, the Moving Average Convergence Divergence (MACD) shows rising green bars, an indication of growing buying momentum.
NZD/JPY daily chart
Switching to the hourly chart, a somewhat comparable trend is noticeable. The RSI took a big hit during the American session and seems to be slowly recovering. The hourly MACD, however, presents red bars, hinting at possible short-term negative momentum. This suggests that some caution is needed for intra-day traders.
NZD/JPY hourly chart
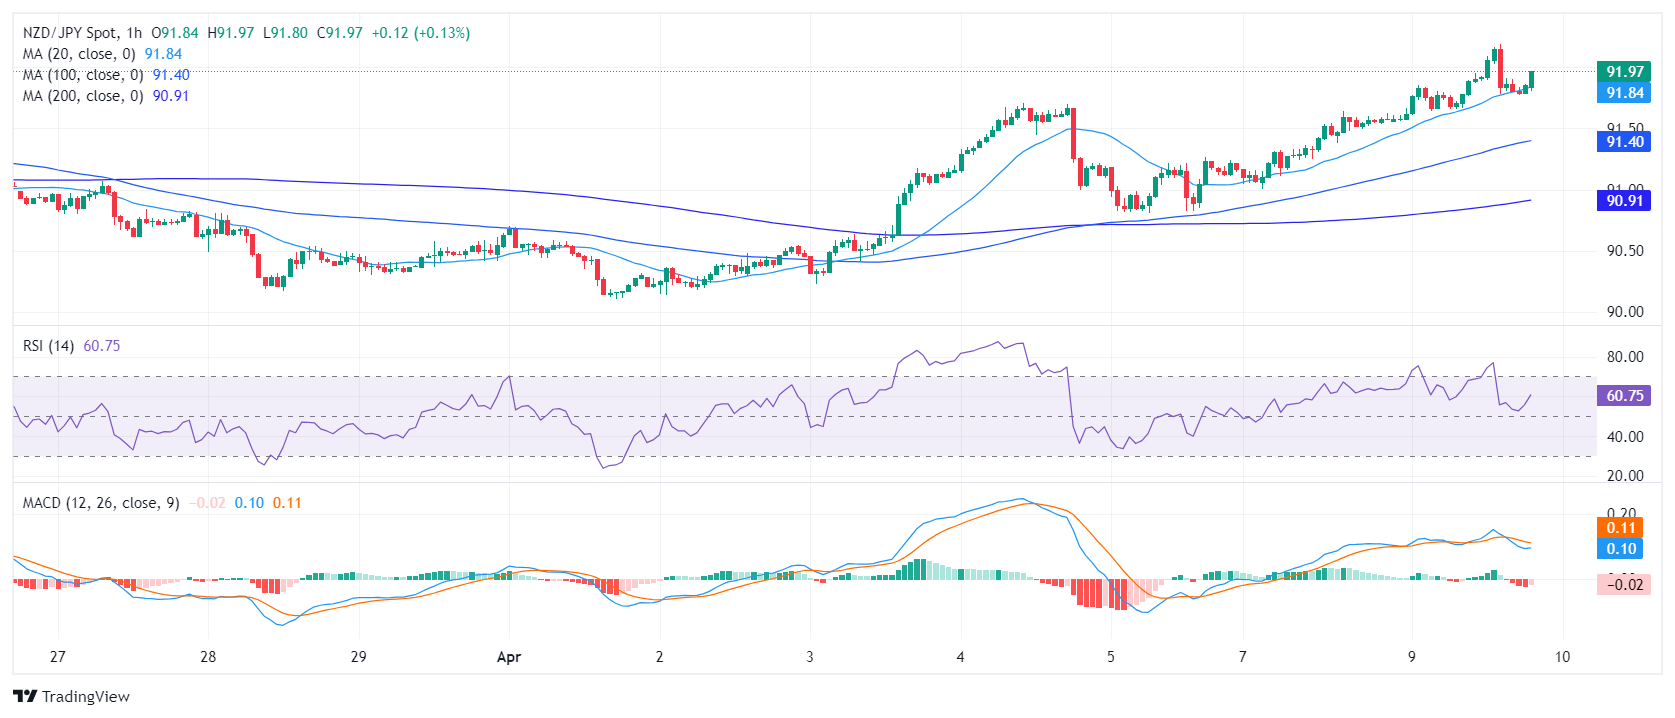
On the broader outlook, the NZD/JPY maintains its position above the 20, 100, and 200-day SMAs, indicating sustained long-term buying pressure. Therefore, both the short-term and long-term technical outlook for the pair seems to point towards a bullish trend. In summary, while the hourly MACD reveals minor negativity which may produce some temporary pullbacks, the overall bias for cross on both the daily and longer-term charts is bullish
- Mexican Peso rally pauses, influenced by mixed inflation data and Banxico rate cut.
- Core CPI deceleration backs Banxico move, yet annual inflation worries linger.
- USD/MXN's next moves are eyed with upcoming US inflation data focusing traders on 16.00, 17.00 levels.
The Mexican Peso loses steam against the US Dollar on Tuesday after refreshing almost nine-year highs of 16.26. Mexico’s inflation data was mixed, though the emerging market currency tumbled more than 0.5%, as price action seems overextended. The USD/MXN trades at 16.40.
Mexico’s Consumer Price Index (CPI) was lower than estimated as the disinflation process continued. In the same tone, core CPI on a yearly and monthly basis decelerated, justifying the Bank of Mexico's (Banxico) decision to lower rates on March 21. However, not everything was good news for the central bank as the yearly CPI exceeded estimates.
Maria Marco, an analyst at Monex Europe, said, “Given that at the March meeting the entire Board of Governors devoted much of their efforts to stressing that the balance of risks to inflation remains skewed to the upside, today’s data confirms our view that Banxico didn’t embark on an uninterrupted sequence of rate cuts last month.”
That said, USD/MXN traders' focus shifts toward the next inflation report in the United States (US). Softer data could drive the USD/MXN toward the 16.00 psychological barrier. Otherwise, the pair could surpass the 16.50 figure with buyers eyeing 17.00.
Daily digest market movers: Mexican Peso slips post inflation report
- Mexico’s CPI rose 0.29% MoM, according to the National Statistics Agency (INEGI). This was lower than the expected 0.36% increase and higher than the 0.09% rise noted in February.
- Core inflation registered a rise of 0.44%, which was lower than the 0.51% that economists had forecast and below the 0.49% increase in February.
- US Treasury bond yields plunged sharply, with the 10-year benchmark coupon down six basis points to 4.362%. Consequently, the US Dollar Index (DXY) remains virtually unchanged with the DXY standing at 104.14, up by a minimal 0.02%.
- Market participants' expectations that the Fed would cut rates three times this year remain volatile, according to the CME FedWatch Tool. The odds for June edged from 52% to 57.7%, while for July, they stood at 74%.
Technical analysis: Mexican Peso loses momentum as USD/MXN jumps from 2015 lows
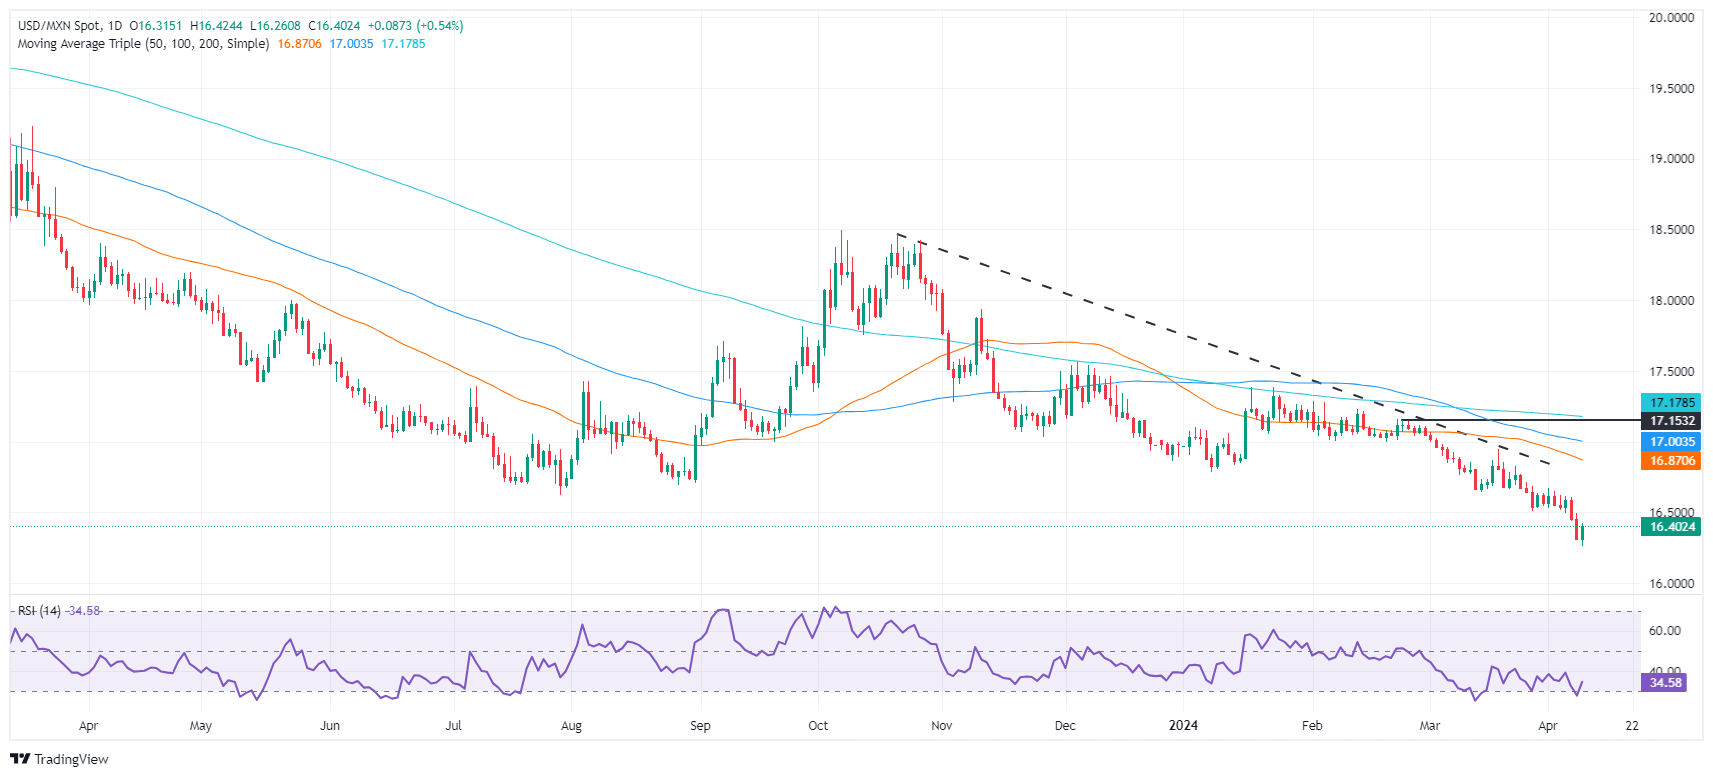
The USD/MXN fell to a new nine-year low at around 16.25, with traders posing to drive the exchange rate below that level toward the 16.00 figure. Even though the Relative Strength Index (RSI) turned oversold, sellers are gaining momentum. Therefore, the next support would be the psychological 16.00 figure.
Nevertheless, the pair made a U-turn, with the USD/MXN about to form a “bullish engulfing” chart pattern that could drive the exchange rate higher. The first resistance would be the psychological 16.50 mark, followed by last year’s 16.62 mark. Once those two levels are cleared, buyers will target 17.00.
Mexican Peso FAQs
The Mexican Peso (MXN) is the most traded currency among its Latin American peers. Its value is broadly determined by the performance of the Mexican economy, the country’s central bank’s policy, the amount of foreign investment in the country and even the levels of remittances sent by Mexicans who live abroad, particularly in the United States. Geopolitical trends can also move MXN: for example, the process of nearshoring – or the decision by some firms to relocate manufacturing capacity and supply chains closer to their home countries – is also seen as a catalyst for the Mexican currency as the country is considered a key manufacturing hub in the American continent. Another catalyst for MXN is Oil prices as Mexico is a key exporter of the commodity.
The main objective of Mexico’s central bank, also known as Banxico, is to maintain inflation at low and stable levels (at or close to its target of 3%, the midpoint in a tolerance band of between 2% and 4%). To this end, the bank sets an appropriate level of interest rates. When inflation is too high, Banxico will attempt to tame it by raising interest rates, making it more expensive for households and businesses to borrow money, thus cooling demand and the overall economy. Higher interest rates are generally positive for the Mexican Peso (MXN) as they lead to higher yields, making the country a more attractive place for investors. On the contrary, lower interest rates tend to weaken MXN.
Macroeconomic data releases are key to assess the state of the economy and can have an impact on the Mexican Peso (MXN) valuation. A strong Mexican economy, based on high economic growth, low unemployment and high confidence is good for MXN. Not only does it attract more foreign investment but it may encourage the Bank of Mexico (Banxico) to increase interest rates, particularly if this strength comes together with elevated inflation. However, if economic data is weak, MXN is likely to depreciate.
As an emerging-market currency, the Mexican Peso (MXN) tends to strive during risk-on periods, or when investors perceive that broader market risks are low and thus are eager to engage with investments that carry a higher risk. Conversely, MXN tends to weaken at times of market turbulence or economic uncertainty as investors tend to sell higher-risk assets and flee to the more-stable safe havens.
The US Dollar failed to gather traction in either direction amidst rising cautiousness prior to the release of US inflation figures and the publication of the FOMC Minutes, both events scheduled for Wednesday. Meanwhile, a glimpse at the risk-linked galaxy saw mixed performances in the FX universe and a broad-based decline in global yields.
Here is what you need to know on Wednesday, April 10:
The Greenback alternated gains with losses, leaving the USD Index (DXY) just above the 104.00 yardstick. On April 10, all attention will be on the release of the Inflation Rate measured by the CPI, seconded by Wholesale Inventories and FOMC Minutes. In addition, Fed’s Bowman and Goolsbee are due to speak.
EUR/USD met some initial resistance around three-week peaks in the vicinity of the 1.0900 barrier. The next risk event in the euro area will be the ECB’s interest rate decision on April 11.
GBP/USD finally managed to briefly surpass the key 1.2700 hurdle, although the bullish attempt ran out of steam afterwards. In the UK, GDP readings will take centre stage towards the end of the week.
The multi-session consolidative range remained unchanged in USD/JPY, always limited by the 152.00 barrier and surrounded by persistent speculation on FX intervention. In Japan, Bank Lending, Producer Prices, and the speech by BoJ’s Ueda are all due on April 10.
The continuation of the upside bias saw AUD/USD climb to multi-week highs near 0.6650, although deflating somewhat as the session drew to a close. The next key release in Oz will be April’s Consumer Inflation Expectations, due on April 11.
Prices of WTI retreated for the third consecutive session and flirted with the $85.00 mark per barrel ahead of the weekly report on US crude oil inventories by the EIA (April 10).
Prices of Gold edged further up and clinched a record high at $2,365 per troy ounce, up for the third straight session. Its cousin Silver followed suit and revisited the $28.30 region for the first time since early June 2021.
- The EUR/GBP daily chart reveals a consolidating bullish momentum.
- In the hourly chart, the EUR/GBP portrays weaker buying traction, with RSI declining deep into negative terrain.
- The pair remaining above the 20-day SMA reveals a short-term bullish bias.
- The cross encountered strong resistance at 0.8580 at the 100-day SMA.
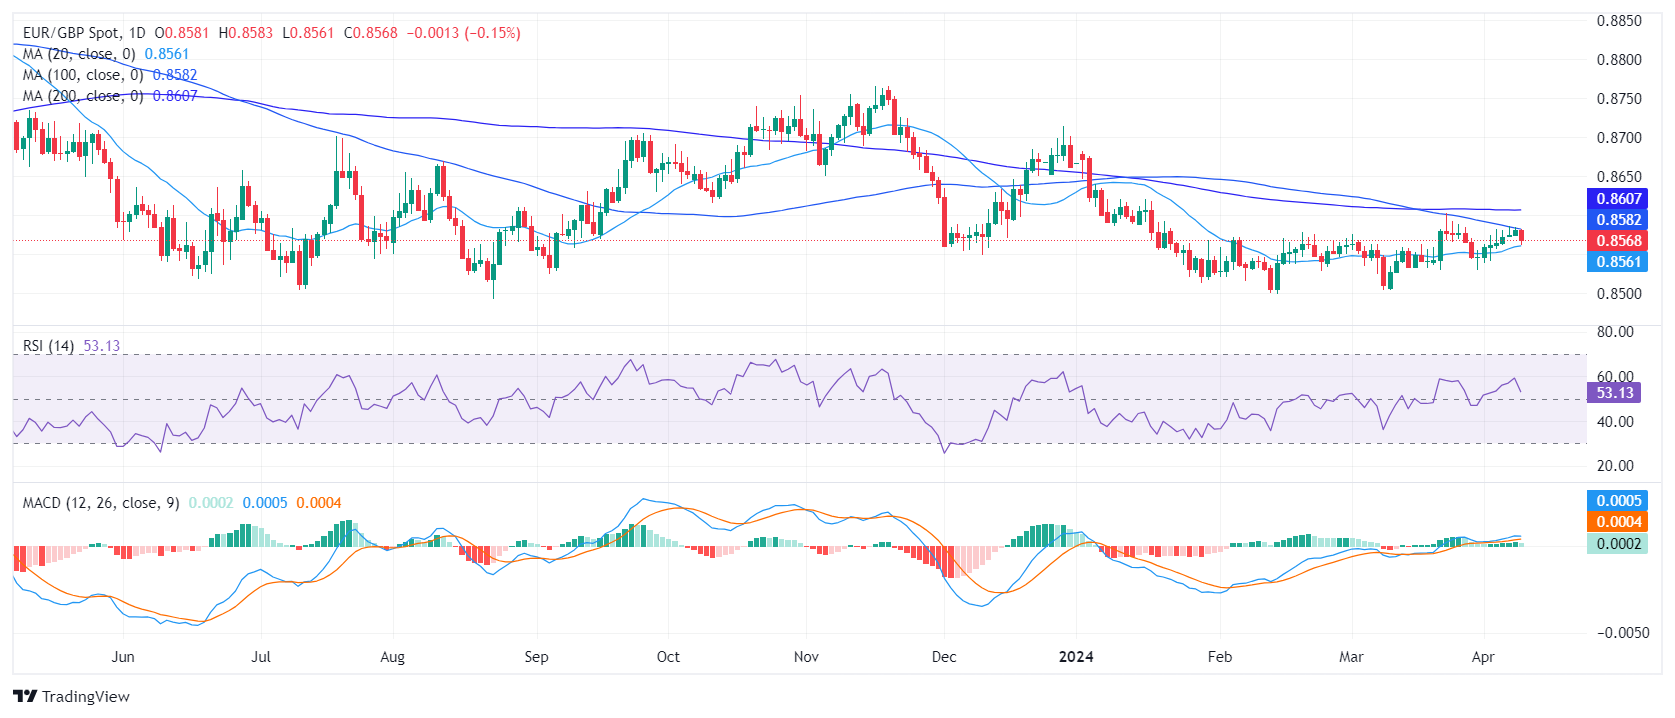
The EUR/GBP pair is currently trading at 0.8566, seeing mild losses. Despite the recent positive momentum, there is a notable resistance at the 0.8580 level, potentially capping further rise. Moreover, the pair remains under key long-term Simple Moving Averages (SMAs), suggesting that any potential gains could face strong resistance due to the overarching bearish sentiments.
On the daily chart, the Relative Strength Index (RSI) shows that the EUR/GBP pair is manifesting positive momentum in bullish territory. The most recent RSI reading for today's session reveals a minor decline to 53, suggesting that despite a slight consolidating buyers possess a slight edge over sellers. The Moving Average Convergence Divergence (MACD) histogram exhibits flat green bars, indicating a consistent positive momentum behind the pair's recent movements.
EUR/GBP daily chart
In contrast, the hourly chart for the EUR/GBP pair displays a disparate picture, with recent RSI readings falling deep in negative territory, towards 35. Given the downward RSI trend and the MACD histogram exhibiting flat red bars, short-term momentum appears to lean toward sellers.
EUR/GBP hourly chart
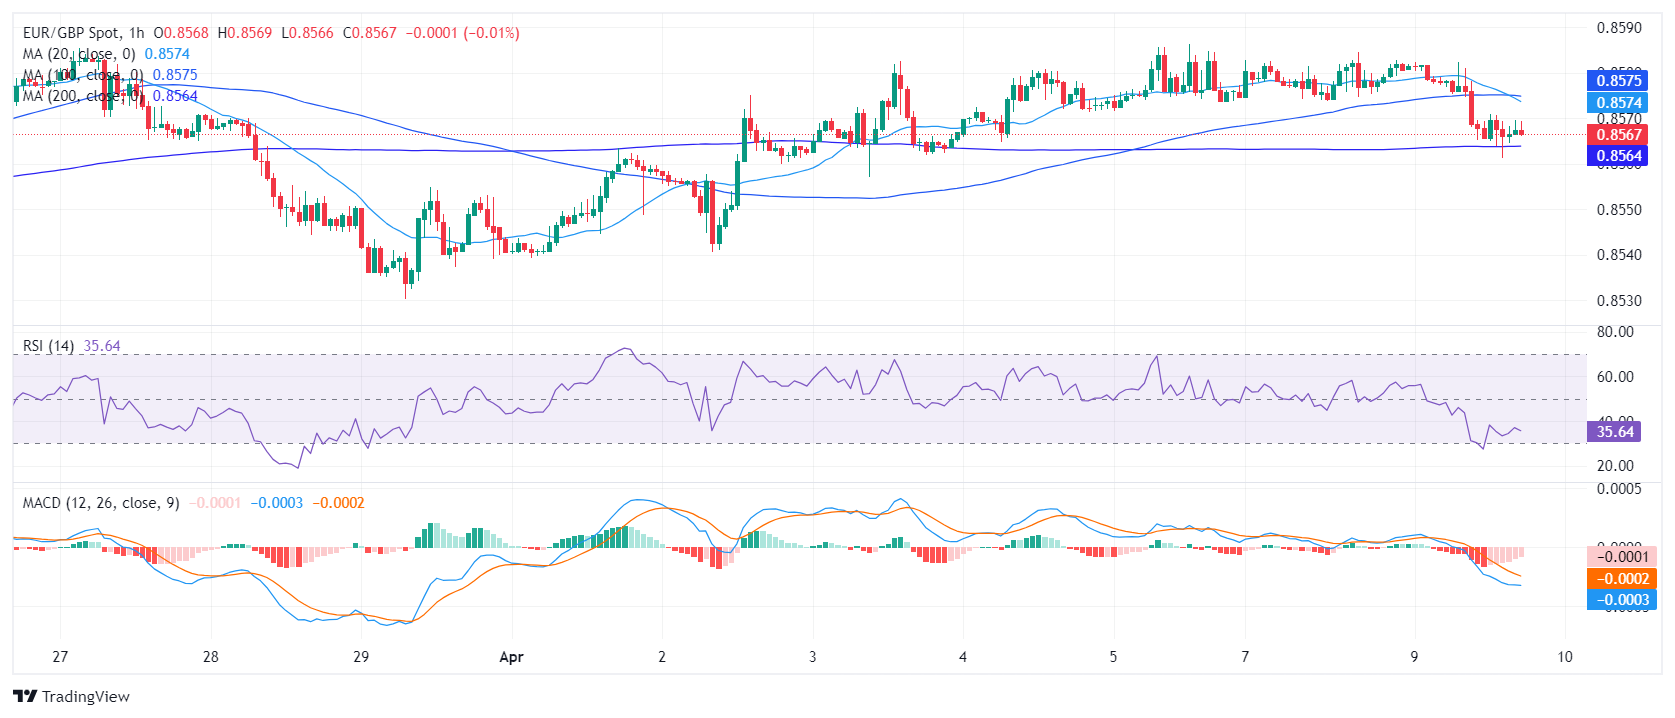
Observing the wider perspective, the EUR/GBP stands above its 20-day Simple Moving Average (SMA), indicative of a short-term bullish inclination. However, this movement is checked by the prospective resistance at the 100-day SMA at the 0.8580 mark, which could restrict further upward progression. Echoing a longer-term concern, the pair currently resides below its 200-day SMA, signaling a sustained bearish trend. This positioning suggests increasingly robust selling pressure over time, as the EUR/GBP has failed to escalate beyond the significant 100-day SMA. That being said, if buyers hold their momentum on the daily chart and regain the mentioned SMA, the outlook might shift in favor of the buyers.
- Sterling’s recovery falters at the 1.6680-1.6700 resistance area.
- An increasing risk aversion ahead of the US CPI release is supporting the USD.
- The broader trend remains negative while below 1.6680
The Pound has found some supply at levels right above the 1.2700 area before pulling back with investors cutting back short USD positions ahead of the US inflation release. The pair, however, remains moderately positive for the second consecutive day.
US CPI to set the Dollar’s near-term direction
All eyes are on the US Consumer Prices Index data, due on Wednesday, which is expected to confirm that price pressures remain steady well above the Fed’s target rate.
The USD risk is skewed to the upside, as recent US data has endorsed a “no landing” scenario, that would be confirmed in case of another upside surprise on inflation. Recent hints on wage growth and industrial prices are pointing to resilient inflation.
The technical picture shows the Pound under an increasing momentum, although the failure to confirm above the 1.6680-1.6700 area leaves the broader bearish trend intact. On the downside, supports are 1.6575 and 1.6535.
- New Zealand Dollar finds sellers at 0.6075 with the USD picking up on a sourer market sentiment.
- Investors are increasingly cautious ahead of the all-important US CPI data, due on Wednesday.
- Somewhat earlier, the monetary policy statement of the RBNZ will be closely watched for more clues on the bank's policy stance.
The New Zealand Dollar remains on the front foot for the second consecutive day on Tuesday. The pair, however, has found some supply at the 50% Fibonacci retracement of the March sell-off and is trimming losses as the market braces for the RBNZ decision and the US CPI release.
The RBNZ will, most likely, leave rates unchanged, thus the main focus will be on the statement. The New Zealand central bank is expected to be one of the last ones to start cutting rates, as inflation remains at levels more than twice the bank’s target rate. This and the improved data from China have been the main fundamental supports for the Kiwi.
Recent data, however, has shown a deteriorating economic outlook. The Q4 GDP confirmed the recession levels, which might open cracks in the bank’s hawkish stance. Any hints of a dovish turn on the statement might hurt the pair’s recovery.
Later on Wednesday, US CPI is expected to reveal that price pressures remain steady at levels above 3% in the US. After the strong US employment levels seen last week, further confirmation of resilient inflation will cast further doubt on the Fed’s easing plans. That would have a positive impact on the US Dollar.
- The DXY Index is neutral at 104.12 and manages to clear daily losses.
- All eyes are set on Wednesday's US CPI figures for March.
- The outcome of the inflation figures will set the tone of the market’s bets on the Fed.
The US Dollar Index (DXY) is currently trading at 104.12, remaining rather neutral. Markets stand largely quiet as the week's highlight is the release of March’s US Consumer Price Index (CPI) figures on Wednesday. In the meantime, declining US Treasury yields seem to be weakening the US Dollar, and minor data releases have failed to trigger a significant reaction.
The data will continue fueling expectations for the Fed's easing cycle and as for now is seen starting in June. Amid two months of high inflation, the Fed revised its projections upward, but Jerome Powell confirmed a complacent attitude toward these figures. Consequently, the US Dollar remains in suspense, awaiting potential policy shifts tied to incoming data. Last week’s hot labor market figures may set the tone for a more hawkish Fed if inflation comes in higher than expected.
Daily digest market movers: DXY remains neutral ahead of CPI data, minor reports didn’t trigger movements
- The National Federation of Independent Business's (NFIB) reported a decline in small business optimism, largely because of inflation and labor market worries. Despite a strong jobs report in March, there's a suggestion that austerity in monetary policies could lead to a rise in unemployment rates if sustained.
- Federal Reserve (Fed) officials seem to have tempered their hawkish tone, indicating a potentially dovish or neutral stance on monetary policy. The markets factor in diminished possibilities of a rate cut, with the chances of a June cut dropping to almost 50%, and a July cut below 90%. Both rates are seen as the lowest since last October.
- US Treasury yields are undergoing a decline. Specifically, the 2-year yield declined to 4.74%, while yields at 5-year and 10-year tenures traded at 4.37% and 4.36%, respectively.
- CPI data will likely fuel volatility in the bond market and on the expectations of the next Fed decisions.
DXY technical analysis: DXY demonstrates bullish tendencies despite short-term constraints
On the daily chart, the static position of the Relative Strength Index (RSI) indicates neutral momentum, while the appearance of a fresh red bar in the Moving Average Convergence Divergence (MACD) histogram signals a potential shift toward bearish momentum in the short term.
On the other hand, the DXY is experiencing some bullish resilience, as evidenced by its stance above the 20, 100, and 200-day Simple Moving Averages (SMAs). The current positioning of DXY suggests that the buying force is still dominating with a defensive line held by the bulls, keeping the DXY above these significant SMAs.
US Dollar FAQs
The US Dollar (USD) is the official currency of the United States of America, and the ‘de facto’ currency of a significant number of other countries where it is found in circulation alongside local notes. It is the most heavily traded currency in the world, accounting for over 88% of all global foreign exchange turnover, or an average of $6.6 trillion in transactions per day, according to data from 2022. Following the second world war, the USD took over from the British Pound as the world’s reserve currency. For most of its history, the US Dollar was backed by Gold, until the Bretton Woods Agreement in 1971 when the Gold Standard went away.
The most important single factor impacting on the value of the US Dollar is monetary policy, which is shaped by the Federal Reserve (Fed). The Fed has two mandates: to achieve price stability (control inflation) and foster full employment. Its primary tool to achieve these two goals is by adjusting interest rates. When prices are rising too quickly and inflation is above the Fed’s 2% target, the Fed will raise rates, which helps the USD value. When inflation falls below 2% or the Unemployment Rate is too high, the Fed may lower interest rates, which weighs on the Greenback.
In extreme situations, the Federal Reserve can also print more Dollars and enact quantitative easing (QE). QE is the process by which the Fed substantially increases the flow of credit in a stuck financial system. It is a non-standard policy measure used when credit has dried up because banks will not lend to each other (out of the fear of counterparty default). It is a last resort when simply lowering interest rates is unlikely to achieve the necessary result. It was the Fed’s weapon of choice to combat the credit crunch that occurred during the Great Financial Crisis in 2008. It involves the Fed printing more Dollars and using them to buy US government bonds predominantly from financial institutions. QE usually leads to a weaker US Dollar.
Quantitative tightening (QT) is the reverse process whereby the Federal Reserve stops buying bonds from financial institutions and does not reinvest the principal from the bonds it holds maturing in new purchases. It is usually positive for the US Dollar.
- Wall Street turns lower with investors turning cautious ahead of US CPI release.
- US inflation is expected to show mixed readings with levels well above the Fed’s 2% core target rate.
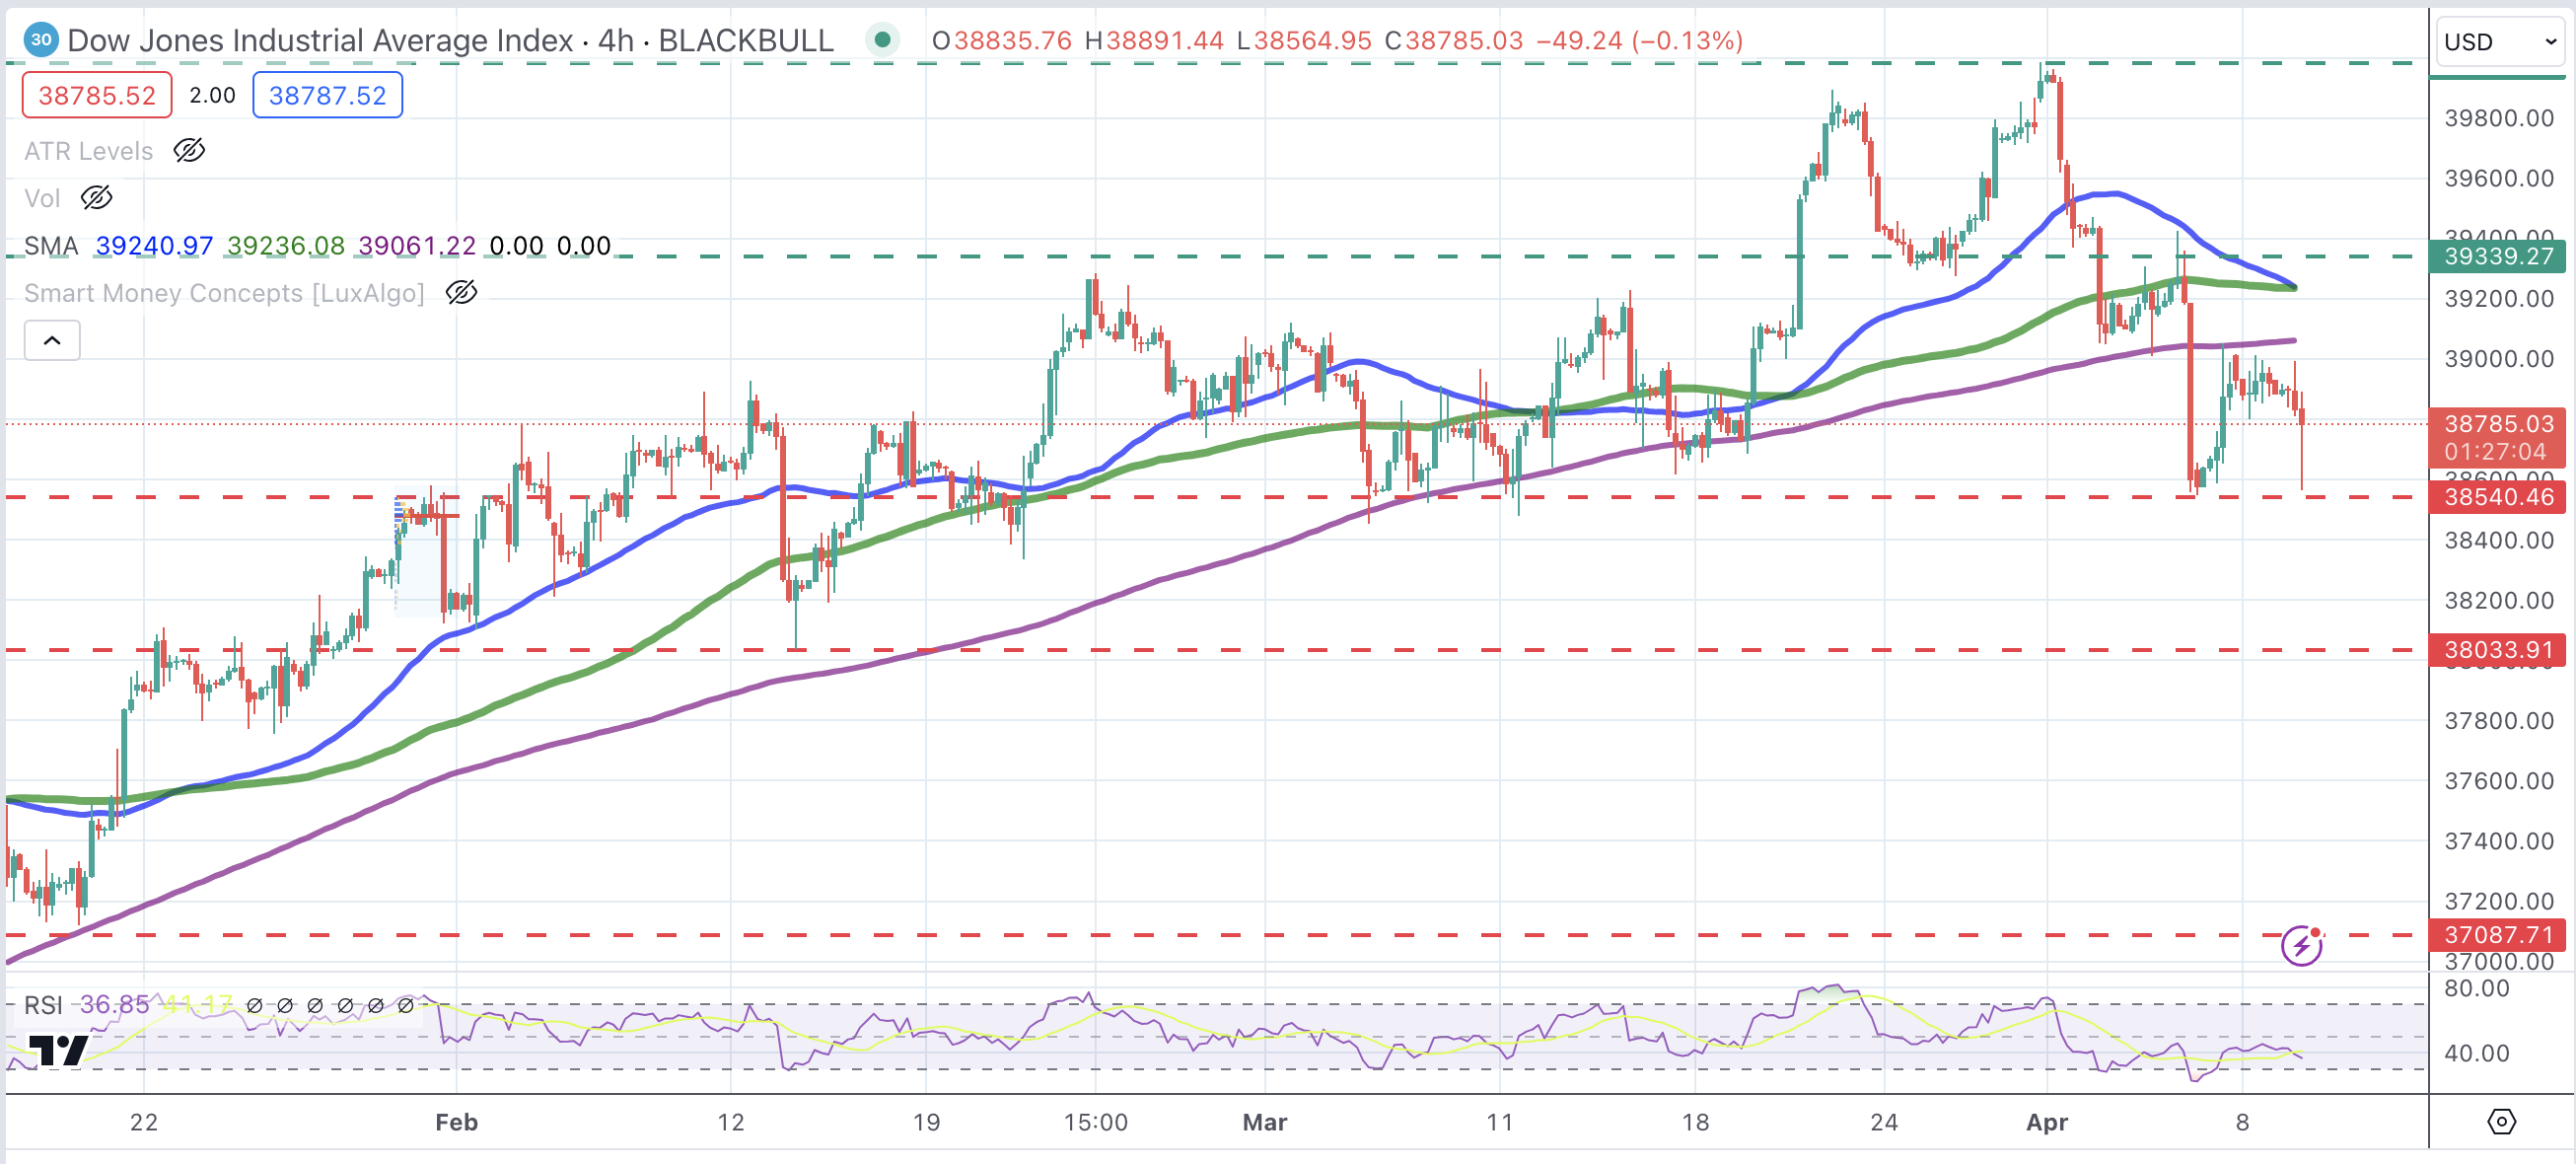
- The Dow Jones Index has found support at 38,540, although broader bias remains negative.
The Dow Jones Industrial Average (DJIA) has dropped into negative territory during Tuesday’s US morning session. The moderate risk appetite seen during the European trading session has waned in the US, with investors taking a cautious stance ahead of Tuesday’s US CPI release.
US Consumer Inflation is expected to have accelerated to 3.4% in March from the 3.2% annual rate in February. The core CPI, which scraps the impact of seasonal food and energy prices, is estimated to ease to 3.7% from a 3.8% annual reading for February. In any case, showing levels well above the Federal Reserve’s (Fed) 2% core inflation rate for price stability.
The cautious market mood has sent all the main Wall Street indices lower on Tuesday, although they are pulling back from session lows at the moment of writing. The Dow Jones drops 0.4% to 38,738, the S&P 500 drops 0.3% to 5,186 and the NASDAQ Index eases 0.15% lower to 16,225.
Dow Jones news
Among sectors, the Financials are getting the biggest blow with a 0.71% loss, followed by the Industrials, 0.5% lower, and Technologies, dropping 0.38%. Real Estate is the only sector showing some advance, up 0.7%, while Utilities and Consumer Staples are flat.
Travelers Companies (TRV) is the worst-performing stock in the Dow Jones, losing 2.3% to $225.28, followed by American Express (AXP) which is down 1.8% to $219.83. The biggest winners are Cisco Systems (CSCO), up 2.79%, to $49.59, and 3M (MMM), advancing 1.23% to $93.06.
Dow Jones technical outlook
The technical picture shows the Dow Jones index picking up after having tested the support area at 38,540. The broader trend, however, remains bearish with the pair correcting lower from March highs near 40,000.
A further decline below 38,540 would expose February’s low at 38,035. On the upside, the pair should breach the 39,340 resistance area to break the negative price structure and open the path toward the all-time high at 39,985.
Dow Jones Index 4-Hour Chart
Inflation FAQs
Inflation measures the rise in the price of a representative basket of goods and services. Headline inflation is usually expressed as a percentage change on a month-on-month (MoM) and year-on-year (YoY) basis. Core inflation excludes more volatile elements such as food and fuel which can fluctuate because of geopolitical and seasonal factors. Core inflation is the figure economists focus on and is the level targeted by central banks, which are mandated to keep inflation at a manageable level, usually around 2%.
The Consumer Price Index (CPI) measures the change in prices of a basket of goods and services over a period of time. It is usually expressed as a percentage change on a month-on-month (MoM) and year-on-year (YoY) basis. Core CPI is the figure targeted by central banks as it excludes volatile food and fuel inputs. When Core CPI rises above 2% it usually results in higher interest rates and vice versa when it falls below 2%. Since higher interest rates are positive for a currency, higher inflation usually results in a stronger currency. The opposite is true when inflation falls.
Although it may seem counter-intuitive, high inflation in a country pushes up the value of its currency and vice versa for lower inflation. This is because the central bank will normally raise interest rates to combat the higher inflation, which attract more global capital inflows from investors looking for a lucrative place to park their money.
Formerly, Gold was the asset investors turned to in times of high inflation because it preserved its value, and whilst investors will often still buy Gold for its safe-haven properties in times of extreme market turmoil, this is not the case most of the time. This is because when inflation is high, central banks will put up interest rates to combat it. Higher interest rates are negative for Gold because they increase the opportunity-cost of holding Gold vis-a-vis an interest-bearing asset or placing the money in a cash deposit account. On the flipside, lower inflation tends to be positive for Gold as it brings interest rates down, making the bright metal a more viable investment alternative.
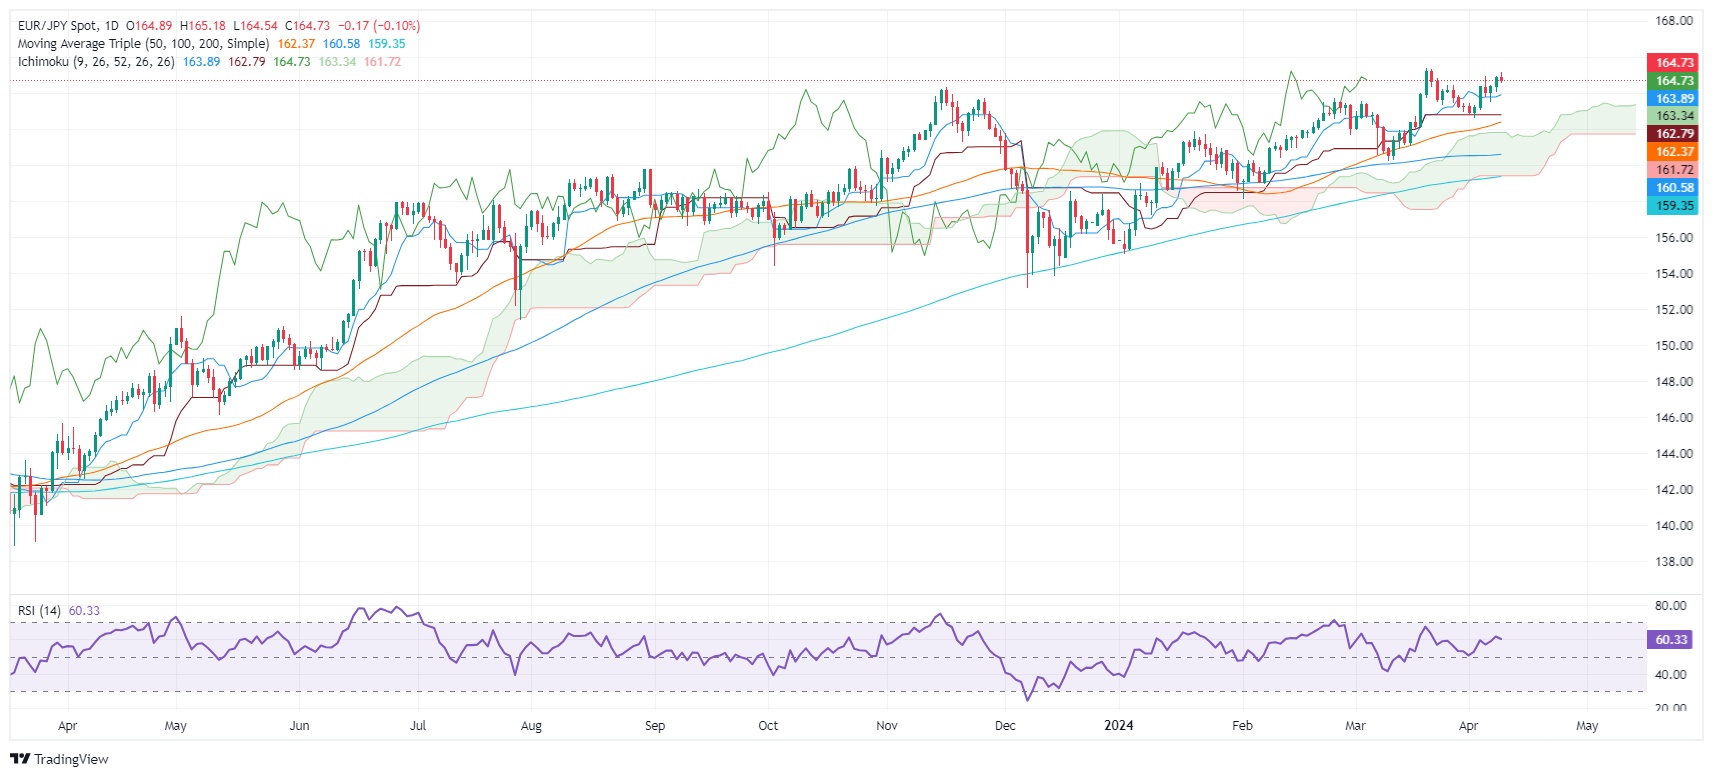
- EUR/JPY slightly falls to 164.65, amid intervention rumors, ECB easing expectations.
- Surpassing 165.00 may indicate bullish trend, aiming beyond YTD high to 166.00.
- Falling below 164.00 might lead to correction, with key supports at Ichimoku Cloud indicators.
The EUR/JPY pair remains subdued in early trading during the North American session, posting minuscule losses of 0.14% and exchanging hands at 164.65. Japanese authorities intervention threats, along with speculations that the European Central Bank (ECB) could begin easing policy in June, increased appetite for the safe-haven Japanese Yen (JPY).
EUR/JPY Price Analysis: Technical outlook
From a technical standpoint, the EUR/JPY is in consolidation at around the 164.00/165.33 year-to-date (YTD) high, with price action getting closer to the Ichimoku Cloud (Kumo). That means the uptrend stalled, and market participants are scrambling for direction in the pair.
For a bullish continuation, the EUR/JPY must break above 165.00, followed by the YTD high of 165.33. Up next sits the psychological 166.00 figure.
Conversely, if sellers push prices below 164.00, that would pave the way for a deeper correction. The next support would be the Tenkan Sen at 163.89, followed by the Senkou Span A at 163.33. Further losses are seen at the Kijun-Sen at 162.78, before clashing with the top of the Kumo around 162.50.
EUR/JPY Price Action – Daily Chart
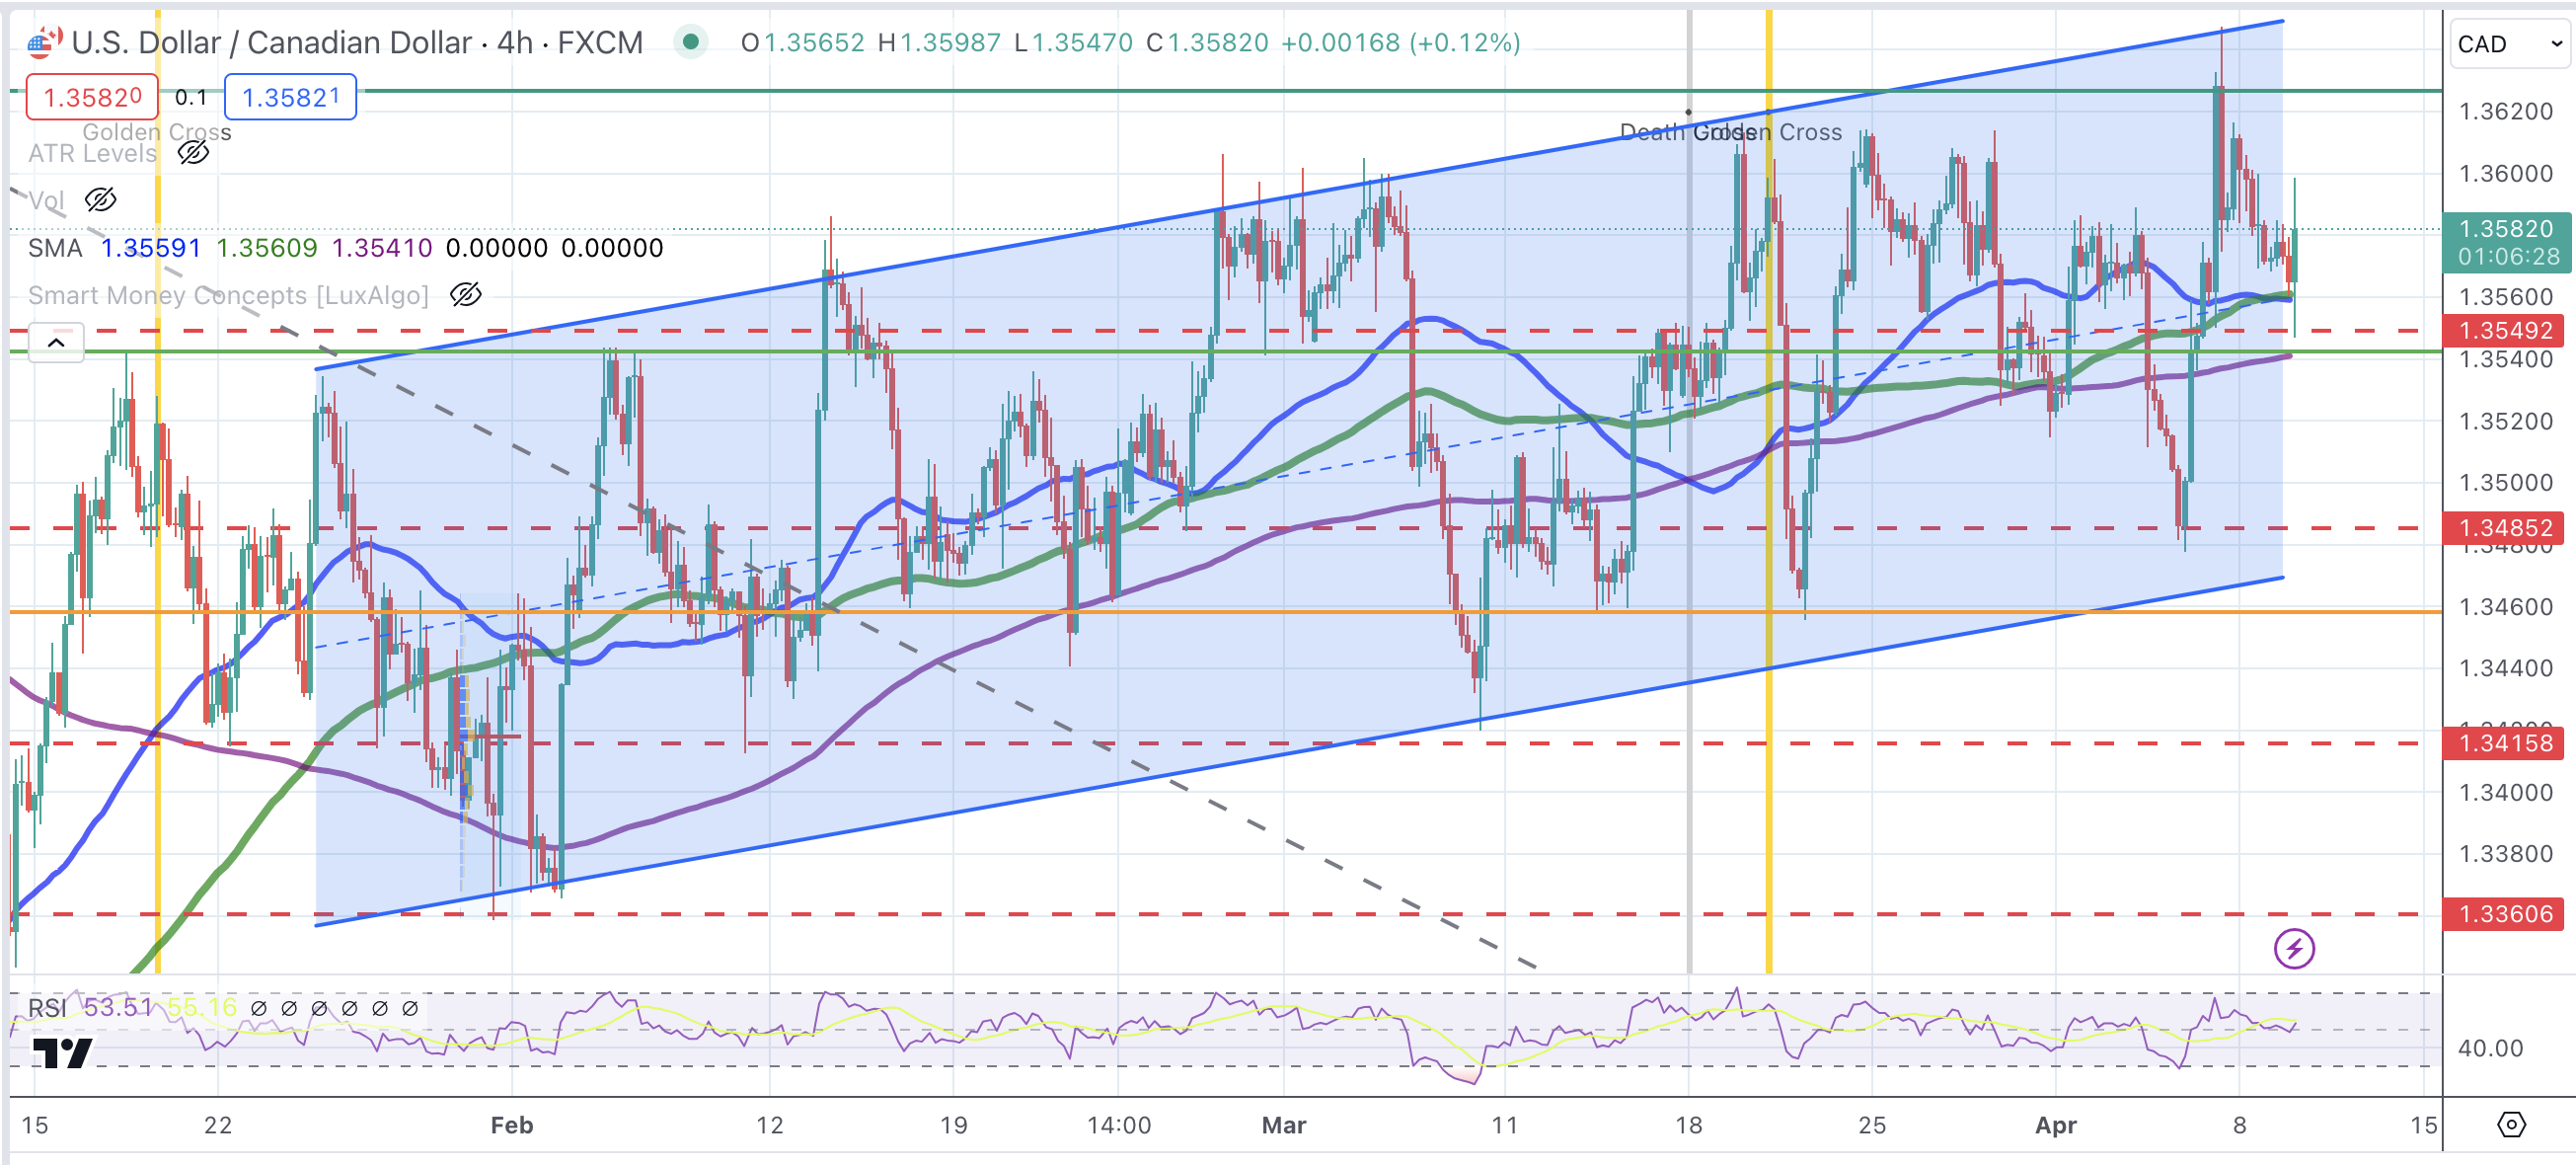
- Canadian Dollar gives away gains with investors increasingly cautious ahead of US CPI release.
- From a wider perspective, CAD continues searching for direction within previous levels.
- US Inflation and the BoC monetary policy decision, due on Wednesday, are likely to set the USD/CAD’s near-term direction.
The Canadian Dollar (CAD) is trading lower on Tuesday, giving back all the ground taken on Monday. A somewhat more sour market sentiment is boosting the US Dollar across the board, with equities dipping into negative territory and investors focusing on Wednesday’s US Consumer Prices Index (CPI) data.
US inflation is expected to show mixed readings with headline inflation ticking up on the back of higher energy prices. The core CPI is expected to have slowed down, yet at levels well above the Fed’s 2% target for price stability. Investors will analyze these figures with particular attention and, in that sense, an upside surprise might trigger a risk-averse reaction, sending the Loonie to fresh lows.
Shortly afterward, the Bank of Canada (BoC) will release its monetary policy decision. No changes are expected on the benchmark rate, although the soft inflation and employment levels seen last week might prompt the bank to hint toward a rate cut, probably in June. This might add negative pressure to the CAD.
Daily digest market movers: USD/CAD keeps trading back and forth, awaiting US CPI data
- Canadian Dollar pares gains with risk appetite fading as investors prepare for Wednesday’s US CPI release.
- US headline inflation is expected to have increased by 0.3% and 3.4% from a 0.4% monthly increment and a 3.2% annual reading in February.
- Core CPI is seen easing to 0.3% in March, from 0.4% in February, with the yearly rate cooling from 3.8% to 3.7%.
- Also on Wednesday, the BoC is expected to leave its benchmark index unchanged at 5%. The main interest will be on any hints toward the timing of the first rate cut.
- Later on Wednesday, Fed Bowman is expected to meet the press. She is a notorious hawk, and last Friday she warned about the likelihood of another rate hike.
- The release of the minutes of the last Fed meeting will close an eventful calendar on Wednesday. In the context of a recent CPI release, Fed policymakers’ comments might have an additional impact on USD crosses.
Canadian Dollar price this week
The table below shows the percentage change of Canadian Dollar (CAD) against listed major currencies this week. Canadian Dollar was the strongest against the .
| USD | EUR | GBP | CAD | AUD | JPY | NZD | CHF | |
| USD | -0.26% | -0.41% | -0.16% | -0.83% | 0.00% | -0.90% | -0.02% | |
| EUR | 0.26% | -0.14% | 0.10% | -0.56% | 0.26% | -0.63% | 0.24% | |
| GBP | 0.40% | 0.15% | 0.24% | -0.42% | 0.41% | -0.49% | 0.39% | |
| CAD | 0.17% | -0.09% | -0.23% | -0.65% | 0.18% | -0.72% | 0.16% | |
| AUD | 0.83% | 0.57% | 0.42% | 0.66% | 0.83% | -0.06% | 0.80% | |
| JPY | 0.01% | -0.28% | -0.42% | -0.15% | -0.83% | -0.90% | -0.01% | |
| NZD | 0.90% | 0.63% | 0.49% | 0.73% | 0.07% | 0.90% | 0.86% | |
| CHF | 0.02% | -0.24% | -0.39% | -0.14% | -0.81% | 0.03% | -0.88% |
The heat map shows percentage changes of major currencies against each other. The base currency is picked from the left column, while the quote currency is picked from the top row. For example, if you pick the Euro from the left column and move along the horizontal line to the Japanese Yen, the percentage change displayed in the box will represent EUR (base)/JPY (quote).
Technical analysis: USD/CAD’s broader bias remains positive, with a key resistance area at 1.3645
The US Dollar has bounced up from the support area at 1.3555. This level is coincident with the US Dollar Index (DXY) support area at 193.90. Investors are cutting back their exposure to risky assets as we head into the US CPI release, returning to the safe-haven US Dollar.
The broader trend remains positive, and the pair has scope for another test at the 1.3645 trendline resistance. Above here, the next target would be the 1.3680-1.3700 area. Support levels remain at 1.3555, the confluence of the 4-hour 50 and 100 SMAs, followed by 1.3480 and 1.3415.
USD/CAD 4-Hour Chart
Inflation FAQs
Inflation measures the rise in the price of a representative basket of goods and services. Headline inflation is usually expressed as a percentage change on a month-on-month (MoM) and year-on-year (YoY) basis. Core inflation excludes more volatile elements such as food and fuel which can fluctuate because of geopolitical and seasonal factors. Core inflation is the figure economists focus on and is the level targeted by central banks, which are mandated to keep inflation at a manageable level, usually around 2%.
The Consumer Price Index (CPI) measures the change in prices of a basket of goods and services over a period of time. It is usually expressed as a percentage change on a month-on-month (MoM) and year-on-year (YoY) basis. Core CPI is the figure targeted by central banks as it excludes volatile food and fuel inputs. When Core CPI rises above 2% it usually results in higher interest rates and vice versa when it falls below 2%. Since higher interest rates are positive for a currency, higher inflation usually results in a stronger currency. The opposite is true when inflation falls.
Although it may seem counter-intuitive, high inflation in a country pushes up the value of its currency and vice versa for lower inflation. This is because the central bank will normally raise interest rates to combat the higher inflation, which attract more global capital inflows from investors looking for a lucrative place to park their money.
Formerly, Gold was the asset investors turned to in times of high inflation because it preserved its value, and whilst investors will often still buy Gold for its safe-haven properties in times of extreme market turmoil, this is not the case most of the time. This is because when inflation is high, central banks will put up interest rates to combat it. Higher interest rates are negative for Gold because they increase the opportunity-cost of holding Gold vis-a-vis an interest-bearing asset or placing the money in a cash deposit account. On the flipside, lower inflation tends to be positive for Gold as it brings interest rates down, making the bright metal a more viable investment alternative.
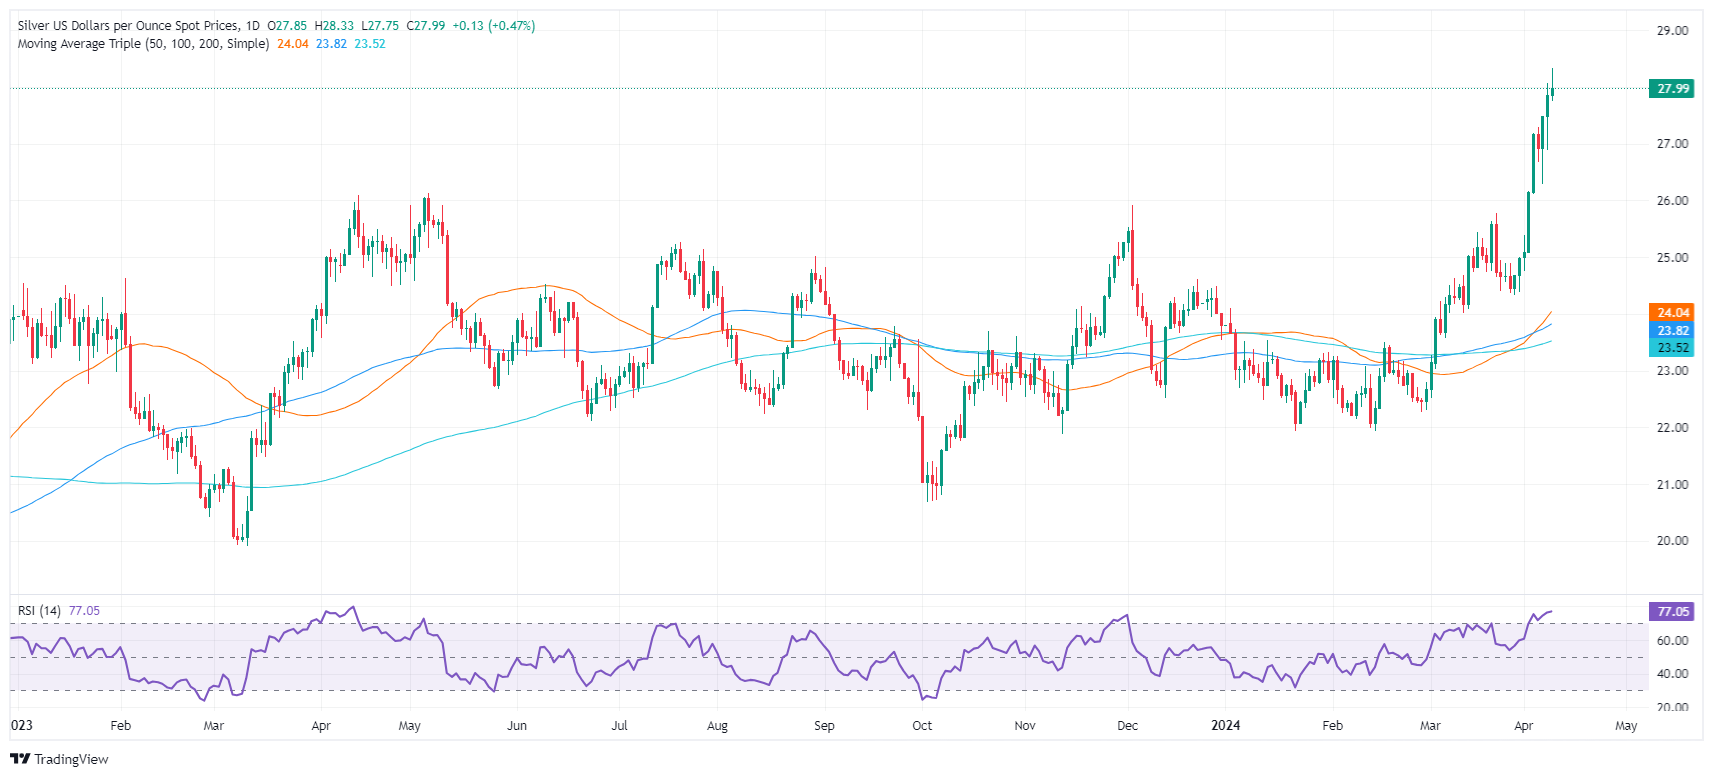
- Silver reaches $28.32, lifted by falling US Treasury yields, softer Dollar, despite Fed's hawkish view.
- Israel's PM comments add to geopolitical tensions, boosting precious metals.
- Market eyes US CPI for inflation insights; Fed vows to tackle inflation.
Silver rallied to an almost three-year high, with the grey metal breaching key resistance on June 10, 2021. Buyers are eyeing May 2021 highs. Factors like a soft US Dollar and falling US Treasury yields underpin the precious metal amid speculations of a less dovish Federal Reserve. The XAG/USD trades at $28.00 a troy ounce after hitting a new multi-month high of $28.32.
XAG/USD breaks past $28.00 as declining US Treasury yields and geopolitical uncertainties fuel demand for safe-haven assets
The sudden reversal in US Treasury yields has driven the rally in precious metals. After gaining 15 basis points in the last two trading days, the US 10-year benchmark note drops to 4.37%, losing five bps. That and a softer Greenback sponsored Silver’s last leg up above the $28.00 threshold.
Geopolitical risks weigh on the buck and underpin precious metals. Israel Prime Minister Benjamin Netanyahu revealed they will complete the elimination of Hamas brigades, including in Rafah, and nothing will prevent this, according to Reuters. In the meantime, Israel's ceasefire proposal was rejected by Hamas.
Market participants are looking for the release of the latest inflation report in the United States (US). The Consumer Price Index (CPI) is expected to ease from a monthly perspective, yet it’s foreseen to be higher than February’s data in yearly figures. Core CPI is projected to dip in both readings.
Federal Reserve’s policymakers had crossed the wires. The latest to cross newswires was Minnesota Fed Neil Kashkari, who said the US central bank can’t fall short on the inflation fight.
XAG/USD Price Analysis: Technical outlook
The daily chart suggests that XAG/USD might continue to rally past the $28.00 figure, though the Relative Strength Index (RSI), turning overbought, spurred a pullback. That could be seen as traders booking profits.
If the retracement continues, Silver’s next support would be $27.50, ahead of testing the April 8 low of $26.87. On the other hand, a resumption of the uptrend would pave the way to test $28.32, ahead of climbing toward $29.00.
Previewing the European Central Bank's (ECB) April policy meeting, analysts at TD Securities said that they expect a straightforward decision, with the ECB opting for another policy hold.
"As with the last press statement, we do not expect much to change in terms of language from the Governing Council (GC). As such, the press statement should continue to reiterate the GC's reaction function, and that policymakers will continue to follow a data dependent approach to policymaking."
"The main question is what ECB President Christine Lagarde says in the press conference. In terms of signalling for June, we do not believe Lagarde will want to be any clearer that the first cut will likely come in June. At the March press conference, Lagarde came as close as possible to saying that the GC will cut in June without explicitly saying so, and we do not think she will feel the need to utilize any stronger language than this. As such, Lagarde will likely reiterate that the GC wants to see Q1 wage data before deciding when to cut."
- USD/CHF drops sharply to 0.9000 as US Dollar slumps ahead of US Inflation data.
- S&P 500 opens on a positive note, indicating demand for risk-perceived assets.
- The SNB is expected to cut interest rates again as Swiss inflation remains below 2%.
The USD/CHF pair falls sharply to 0.9010 in Tuesday’s early New York session. The Swiss Franc asset weakens as the market sentiment remains cheerful even though traders pare bets supporting Federal Reserve (Fed) rate cuts from the June meeting. Market expectations for the Fed reducing rates ease as strong United States Nonfarm Payrolls (NFP) data strengthens the inflation outlook.
The S&P 500 opens on a positive note, exhibiting decent demand for risky assets. 10-year US Treasury yields drop to 4.37% on fears that risks to employment and inflation could be imbalanced if interest rates remain higher for a long period.
On Monday, Chicago Federal Reserve President Austan Goolsbee said the central bank must consider for how long interest rates will remain higher on Monday. Goolsbee warned that the Unemployment Rate could rise if interest rates remain high for too long.
The US Dollar Index (DXY) falls to 103.90 amid cheerful market sentiment. Going forward, investors will focus on the US consumer price inflation data for March, which will be published on Wednesday.
Monthly headline and core inflation are both forecasted to have increased at a slower pace of 0.3% from 0.4% in February. In the same period, economists expect the annual headline CPI to accelerate to 3.4% from 3.2%, while the core inflation is anticipated to decelerate to 3.7% from 3.8%. The inflation data is expected to significantly influence market expectations for Fed rate cuts.
On the Swiss Franc front, investors expect that the Swiss National Bank will cut interest rates again as inflation remains consistently below 2%. The SNB led the global rate-cut cycle as it surprisingly announced a dovish interest rate decision in the March meeting. The central bank lowered its borrowing costs by 25 basis points (bps) to 1.5%.
- AUD/USD climbs to 0.6635 as US Dollar dips amid upbeat market mood.
- US yields fell as Fed Goolsbee warns about risks to labor market if interest rates remain higher for longer.
- The Australian Dollar will be guided by China’s inflation data for March.
The AUD/USD pair prints a fresh two-week high at 0.6635 in the early American session on Tuesday. The Aussie asset strengthens as the US Dollar extend its downside. The US Dollar Index (DXY), which tracks the Greenback’s value against six major currencies, fell to 103.95 despite traders paring big bets supporting the Federal Reserve (Fed) pivoting to rate cuts from the June meeting.
The S&P 500 is expected to open on a bullish note, suggesting cheerful market sentiment. The market sentiment could turn volatile amid uncertainty ahead of the United States Consumer Price Index (CPI) data for March, which will be published on March. The monthly headline and core inflation data are projected to have grown at a slower pace of 0.3% after rising by 0.4% in February. Though price pressures are expected to grow slowly, the pace at which monthly inflation is expected to grow is still higher than 0.17%, which is required for bringing down inflation to the 2% target.
Fed policymakers have been reiterating that it is appropriate to lower interest rates now as they lack confidence that inflation will sustainably return to 2%.
10-year US Treasury yields fell to 4.39% after Chicago Fed Bank President Austan Goolsbee warned that the Unemployment Rate could increase if interest rates remain high for too long.
Meanwhile, the Australian Dollar capitalizes on risk-on sentiment but will dance to the tunes of China’s CPI data for March, which will be published on Thursday. Monthly inflation is expected to have dipped 0.5% after rising 10% in February. The annual CPI data is anticipated to have increased moderately by 0.4% against the former reading of 0.7%. A decline in the inflation data indicates weak consumer spending.
As a proxy for China’s economic outlook, the Australian Dollar could face pressure if the China CPI data TURNS OUT softer than expected.
- The US Dollar stays afloat and sideways after lackluster Monday trading.
- The US economic calendar features Business Optimism numbers.
- The US Dollar Index stays afloat above 104.00 despite rather dovish-tilted comments from both Fed’s Goolsbee and Kashkari.
The US Dollar (USD) remains afloat after a very lackluster start of the trading week. The Greenback did not move that much on Monday and only eased a touch after Federal Reserve Bank of Minneapolis President Neel Kashkari and Chicago Fed President Austan Goolsbee said the job market is holding up fine, although is less on fire as the recent US Jobs Report would let markets believe. This created a bit of retreat overnight in the Greenback with Bullard even taking it further and saying that three rate cuts is the ‘base case’ for the Fed.
On the economic data front, both the National Federation of Independent Business (NFIB) and the TechnoMetrica Institute of Policy and Politics (TIPP) are set to release their last numbers for Business Optimism, making it a leading indicator. Small businesses’ optimism often stands for the best measure to gauge the state of the US economy and might change the current “no landing” stance that starts to trickle into the markets’ outlook on the US economy.
Daily digest market movers: Small Business under a microscope
- Overnight, Minneapolis Fed President Neel Kashkari delivered a small speech where the main key takeaway was that inflation is set to fall and that the labor market is no longer red hot, though still tight, according to Bloomberg.
- Chicago Fed President Austan Goolsbee said that the current level of rates would see joblessness rising, Bloomberg reported.
- Former St. Louis Fed President James Bullard saidon Bloomberg TV that three rate cuts are the base case for the Fed and that the first rate cut is being justified by data. Bullard isn’t part of the Federal Open Market Committee (FOMC) anymore.
- The People’s Bank of China (PBoC) kept its Yuan fixing at 7.0956 overnight while markets are trading it at 7.2450, which is over 2%, increasing the odds of a bigger intervention from the PBoC.
- At 10:00 GMT, the NFIB Business Optimism Index for March got published The March number came in at 88.5, coming from 89.4. Expectations was for 90.2.
- The US Redbook Index is expected to come in around 12:55 GMT, with the previous reading at 5.2%.
- At 14:00 GMT, TIPP will release its reading on April’s number, with an estimation for April at 44.2 points after the reading of 43.5 in March.
- The US Treasury is having a 3-year note auction at 17:00 GMT.
- Asian equities are trading in the green this Tuesday, nearly up by 1%, while European equities are taking over the positive tone from Asia, though less euphoric as increases are by about less than half a percent. US futures are looking for direction after the minor gains booked on Monday.
- According to the CME Group’s FedWatch Tool, expectations for the Fed’s May 1 meeting are at 97.2% for keeping the fed funds rate unchanged, while chances of a rate cut are at 2.8%.
- The benchmark 10-year US Treasury Note trades around 4.42% after rallying over 20 basis points in just one week.
US Dollar Index Technical Analysis: Chopping up the joint
The US Dollar Index (DXY) is back at it, testing the nerve of bigger hedge fund and institutional traders, while retail traders are being squeezed and stopped out again. It looks like this push-and-pull is not ending anytime soon until at least one of the major central banks will start to cut. Range trading is the right approach yet again with the US Dollar Index heading sideways and being trapped between 102.00 and 105.00 for another week.
That first pivotal level for the DXY comes in at 104.60, which was broken last week on Wednesday to the downside, though broken up again from below on Friday. Further up, 105.12 is the key point after the DXY failed to break that level last week. Once above there, 105.88 is the last resistance point before the Relative Strength Index (RSI) will trade in overbought levels.
Support from the 200-day Simple Moving Average (SMA) at 103.82, the 100-day SMA at 103.43, and the 55-day SMA at 103.90 showed their importance last week on Wednesday. Further down, the 103.00 big figure looks to remain unchallenged for longer with ample support thus standing in the way.
US Dollar FAQs
The US Dollar (USD) is the official currency of the United States of America, and the ‘de facto’ currency of a significant number of other countries where it is found in circulation alongside local notes. It is the most heavily traded currency in the world, accounting for over 88% of all global foreign exchange turnover, or an average of $6.6 trillion in transactions per day, according to data from 2022. Following the second world war, the USD took over from the British Pound as the world’s reserve currency. For most of its history, the US Dollar was backed by Gold, until the Bretton Woods Agreement in 1971 when the Gold Standard went away.
The most important single factor impacting on the value of the US Dollar is monetary policy, which is shaped by the Federal Reserve (Fed). The Fed has two mandates: to achieve price stability (control inflation) and foster full employment. Its primary tool to achieve these two goals is by adjusting interest rates. When prices are rising too quickly and inflation is above the Fed’s 2% target, the Fed will raise rates, which helps the USD value. When inflation falls below 2% or the Unemployment Rate is too high, the Fed may lower interest rates, which weighs on the Greenback.
In extreme situations, the Federal Reserve can also print more Dollars and enact quantitative easing (QE). QE is the process by which the Fed substantially increases the flow of credit in a stuck financial system. It is a non-standard policy measure used when credit has dried up because banks will not lend to each other (out of the fear of counterparty default). It is a last resort when simply lowering interest rates is unlikely to achieve the necessary result. It was the Fed’s weapon of choice to combat the credit crunch that occurred during the Great Financial Crisis in 2008. It involves the Fed printing more Dollars and using them to buy US government bonds predominantly from financial institutions. QE usually leads to a weaker US Dollar.
Quantitative tightening (QT) is the reverse process whereby the Federal Reserve stops buying bonds from financial institutions and does not reinvest the principal from the bonds it holds maturing in new purchases. It is usually positive for the US Dollar.
Analysts at Rabobank share their short-term outlook for the USD/JPY pair following the latest developments.
USD/JPY to trade at lower levels later in the year
"While a break of USD/JPY152.00 may not trigger FX intervention immediately, we would see a strong chance of the MoF acting to prevent a move to 155.00. Strong US inflation data and soft Japanese economic numbers would increase the risk of the MoF being forced into taking action."
"On the assumption that the BoJ will be able to announce a second rate hike later this year and given the expectation that the Fed will be cutting rates in 2024, we expect USD/JPY to be trading at lower levels later in the year. However, we have raised our 1- and 3-month forecasts to 150.00 and 148.00 respectively from 148.00 and 146.00."
- NZD/USD advances to 0.6050 as the appeal for risky assets improves.
- The RBNZ is expected to hold the OCR steady at 5.5%.
- US inflation data for March will guide market expectations for Fed rate cuts.
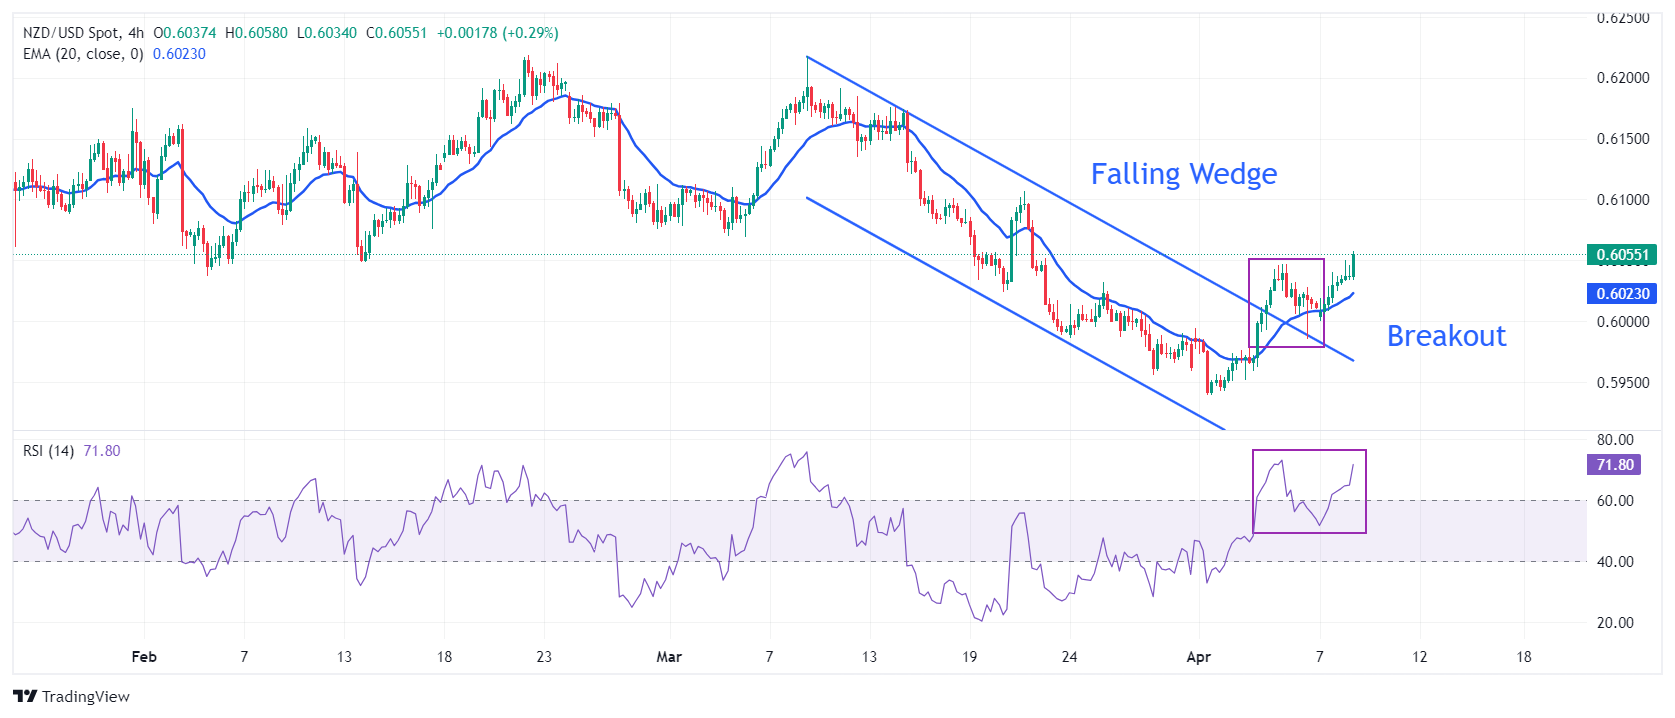
The NZD/USD pair climbs to more than a two-week high near 0.6055 in Tuesday’s London session. The Kiwi asset soars as an appeal for risk-sensitive assets improves despite uncertainty ahead of the United States Consumer Price Index (CPI) data for March, which will be published on Wednesday.
S&P 500 futures have posted decent gains in the London session, portraying demand for risk-perceived assets. 10-year US Treasury yields correct to 4.40%. The US Dollar falls to 104.00.
According to economists, monthly headline and core inflation data are projected to have increased by 0.3%, higher than the pace of 0.17%, which is required for inflation to return to the 2% target. Traders would be wary of betting big on the Federal Reserve (Fed) to begin reducing interest rates from the June meeting if the inflation data remains hotter than anticipated.
Meanwhile, the New Zealand Dollar strengthens ahead of the Reserve Bank of New Zealand’s (RBNZ) interest rate decision, which will be announced on Wednesday. The RBNZ is widely expected to keep its Official Cash Rate (OCR) unchanged at 5.5%. Therefore, the next move in the New Zealand Dollar will be guided by a fresh interest rate outlook from RBNZ policymakers.
NZD/USD delivers a sharp upside after a breakout of the Falling Wedge pattern formed on a four-hour timeframe. A breakout of the aforementioned pattern suggests a bullish reversal, which exposes the asset to more upside.
The near-term demand turns bullish as the 20-period Exponential Moving Average (EMA) at 0.6023 slops higher.
The 14-period Relative Strength Index (RSI) shifts into the bullish range of 60.00-80.00, indicating a strong bullish momentum.
Further upside above March 6 low at 0.6069 will drive the pair toward March 18 high at 0.6100. A breach of the latter will drive the asset further to March 12 low at 0.6135.
In an alternate scenario, a downside move would appear if the asset breaks below April 5 low of 0.5985. This would drag the asset toward November 17 low at 0.5940, followed by the round-level support of 0.5900.
NZD/USD four-hour chart
Analysts at BBH note that the US Dollar is trading softer ahead of Wednesday's inflation data.
Dollar rally should continue this week
"DXY is trading lower for the second straight day near 104.032. The euro is trading higher near $1.0870 while sterling is trading higher near $1.2685. USD/JPY is trading lower near 151.80 after being unable to break above the 152 area on continued jawboning."
"The dollar rally should continue this week on signs of persistent inflation and robust growth in the US. The US data continue to come in mostly firmer and should keep upward pressure on US yields. We believe that while market easing expectations have adjusted somewhat already, there is still room to go. When the market finally capitulates on the Fed, the dollar should gain further."
- USD/JPY rises up to within a hair’s breadth of 152.000 after comments from BoJ governor Ueda.
- His views suggest the BoJ is not in a hurry to raise interest rates, reducing the attractiveness of the Yen.
- Analysts are bullish USD/JPY despite the threat of intervention as US-Japan interest rates continue to diverge.
USD/JPY is edging higher into the 101.90s on Tuesday. The latest move comes after a speech by the Governor of the Bank of Japan (BoJ) Kazuo Ueda in which he suggested that any future interest rate hikes – a key FX-market driver – would be highly dependent on incoming data.
Prior to his comments, views had been mixed about the likelihood of the BoJ hiking interest rates in the future. Some analysts saw more interest-rate hikes on the horizon given that core inflation in Japan has remained above the BoJ’s target of 2.0% for 23 consecutive months.
Others have remained more circumspect, pointing to the fact that in Japan where deflation has ravaged for decades, inflation is actually seen as a positive and something to be fostered.
In his speech Ueda seemed to validate those who expect the BoJ to keep interest rates indefinitely low, by introducing doubt about the imminence of future hikes.
Inflation still below target, says Ueda
According to Ueda, “Trend Inflation”, a somewhat tricky gauge that differs from official headline and core measures, is still running below 2.0% and likely to do so for quite some time. A change in the BoJ’s policy stance, therefore, would be dependent on this measure of inflation rising.
“If trend inflation accelerates toward our 2% inflation target, it becomes possible to reduce degree of monetary stimulus somewhat,” said Ueda in his speech on Tuesday.
The two factors the BoJ would be closely monitoring in regards to inflationary pressures would be wage inflation and services inflation, Ueda added.
USD/JPY trading at historic highs
USD/JPY has been trading at historic highs due to the difference in interest rates in the two countries. In the US they are above 5.0% whereas in Japan they remain at around 0.0%.
The difference is significant as it favors the USD over the JPY since investors can reap higher interest payments simply by parking their money in the US.
The effect of the divergence was highlighted by Japanese Current Account data out on Monday, which showed a lower-than-expected level of net inflows into Japan in February. A surplus of over 3 billion JPY had been expected when actually the figure came out at 2.6 billion JPY.
Doubts over Federal Reserve plans
The effect of interest-rate divergence on USD/JPY has further been exacerbated by changing expectations of monetary policy in the US.
Whereas the US Federal Reserve (Fed) had expected to make three 0.25% reductions in interest rates in 2024 the start of the year, the persistence of stubbornly high inflation has led many to doubt this will be the case.
Strong US labor market data on Friday and an unexpected fall in the Unemployment Rate, have further suggested that inflation is likely to remain sticky as more workers earning are likely to also continue spending.
A key macroeconomic release on the calendar this week will be US Consumer Price Index (CPI) data out on Wednesday. If the data shows a rise above expectations it will further reduce the probability that the Fed will cut interest rates as much as previously expected.
The persistence of higher interest rates in the US and lower interest rates in Japan are likely to maintain upside pressure on USD/JPY.
Intervention Fears
The case of USD/JPY is further complicated by the Japanese government and BoJ’s habit of directly intervening in foreign exchange markets to prop up the Yen.
A quick glance at the charts will immediately suggest to the observer that the current level in the 151s is a level that has rejected price multiple times in the past – both in 2022, 2023 and now again in 2024. This is no coincidence.
The Japanese authorities have repeatedly said they will not tolerate the Yen weakening above this level as it harms businesses. So they tend to intervene at around the 150-152 band to push the exchange rate lower.
On Tuesday the Japanese Finance Minister Shunichi Suzuki said the authorities would not rule out any measures in dealing with excessive Yen moves, repeating warnings made in his previous statements, according to TradingEconomics.
This has been interpreted by markets as a verbal intervention. It raises the risk of a physical intervention, however, if the USD/JPY tests 152 or higher.
USD/JPY to 160, say analysts
Intervention can only achieve so much, however, and strategists at Bank of America Merill Lynch (BofA) recently said in a note that if the fundamentals continue to show such a wide interest-rate divergence, USD/JPY is likely to break higher regardless of the authorities’ attempts to intervene, and potentially make it to 160.
Such a scenario, however, would be dependent on the Fed scraping its plans for cutting interest rates in 2024, something currently not envisaged.
A combination of the BoJ holding back from raising interest rates in 2024 and the Fed delaying its plans to cut rates could continue exerting upside pressure on the pair.
A similar conclusion was reached by analysts at Brown Brothers Harriman (BBH) in a recent note in which they said “It’s only a matter of time before USD/JPY rises”. This, they put down to a combination of the BoJ’s very gradual attempts to raise interest rates and the Fed’s likely delay in making interest rate cuts.
- Gold price jumps above $2,360 on fresh escalation in Israel-Hamas tensions.
- Fed’s Goolsbee warns of upside risks to unemployment if interest rates remain higher for longer.
- US inflation data for March could come in higher than expected due to higher rentals, insurance costs, and portfolio management fees.
Gold price (XAU/USD) keeps moving higher due to fresh escalation in Israel-Hamas tensions in the Middle East region. The precious metal continues its winning spell for the third trading session on Tuesday as strong demand for safe-haven assets amid deepening geopolitical tensions keeps offsetting the negative impact of waning expectations for the Federal Reserve (Fed) pivoting to rate cuts in June.
This week, Gold’s firm appeal in the near term will be tested by the United States Consumer Price Index (CPI) data for March, which will be published on Wednesday. Monthly headline and core CPI data are expected to have risen 0.3%, higher than the pace of 0.17% required for inflation to return to the 2% target.
Higher insurance costs, portfolio management fees, and rising rentals are expected to keep inflationary pressures sticky, economists say. Stubborn inflation numbers would likely lead traders to delay their expectations that the Fed will begin reducing interest rates from June to sometime in Q3.
Meanwhile, 10-year US Treasury yields have dropped to 4.40% after Chicago Federal Reserve President Austan Goolsbee said the central bank must consider for how long interest rates will remain higher on Monday. Goolsbee warned that the Unemployment Rate could go higher if interest rates remain high for too long.
Daily digest market movers: Gold price shines as speculation over Israel-Hamas ceasefire wane
- Gold price continues its bull run to $2,360 as expectations for Israel and Palestine calling a truce wane. This has resulted in a fresh escalation in geopolitical tensions in the Middle East region.
- Speculation favoring a ceasefire eased sharply after Israeli Prime Minister Benjamin Netanyahu said on Monday that their military is set for an invasion of the Rafah enclave in Gaza, reported Reuters. On the other side, Hamas said the proposal it received for a ceasefire from Israel doesn’t fulfill their demands. The precious metal continues to receive strong bids as geopolitical tensions firm safe-haven demand.
- Going forward, the strength in the Gold price will be tested by the United States consumer price inflation data. The monthly headline and core inflation, which strips off volatile food and energy prices, are both forecasted to have increased at a slower pace of 0.3% from 0.4% in February. In the same period, economists expect the annual headline CPI to accelerate to 3.4% from 3.2%, while the core inflation is anticipated to decelerate to 3.7% from 3.8%.
- Soft inflation figures will amplify expectations for the Federal Reserve reducing interest rates from the June meeting. While hot numbers could force investors to shift rate-cut expectations in the third quarter this year.1
- Currently, traders avoid betting big on Fed rate cuts in June as strong payroll data for March has shifted inflation expectations significantly. A tight labour market tends to lead to higher wage growth, which supports consumer spending and, thus, inflation.
- Due to sticky inflation and robust employment data, some Fed policymakers have said that rate cuts at this point are not appropriate as they could unleash upside risks to price pressures.
- Investors will also focus on the Federal Open Market Committee (FOMC) Minutes of the March meeting, to be published on Wednesday. The Fed kept interest rates unchanged at 5.25%-5.50% and projected three rate cuts by year-end but didn’t provide a specific time frame.
Technical Analysis: Gold price jumps to $2,360
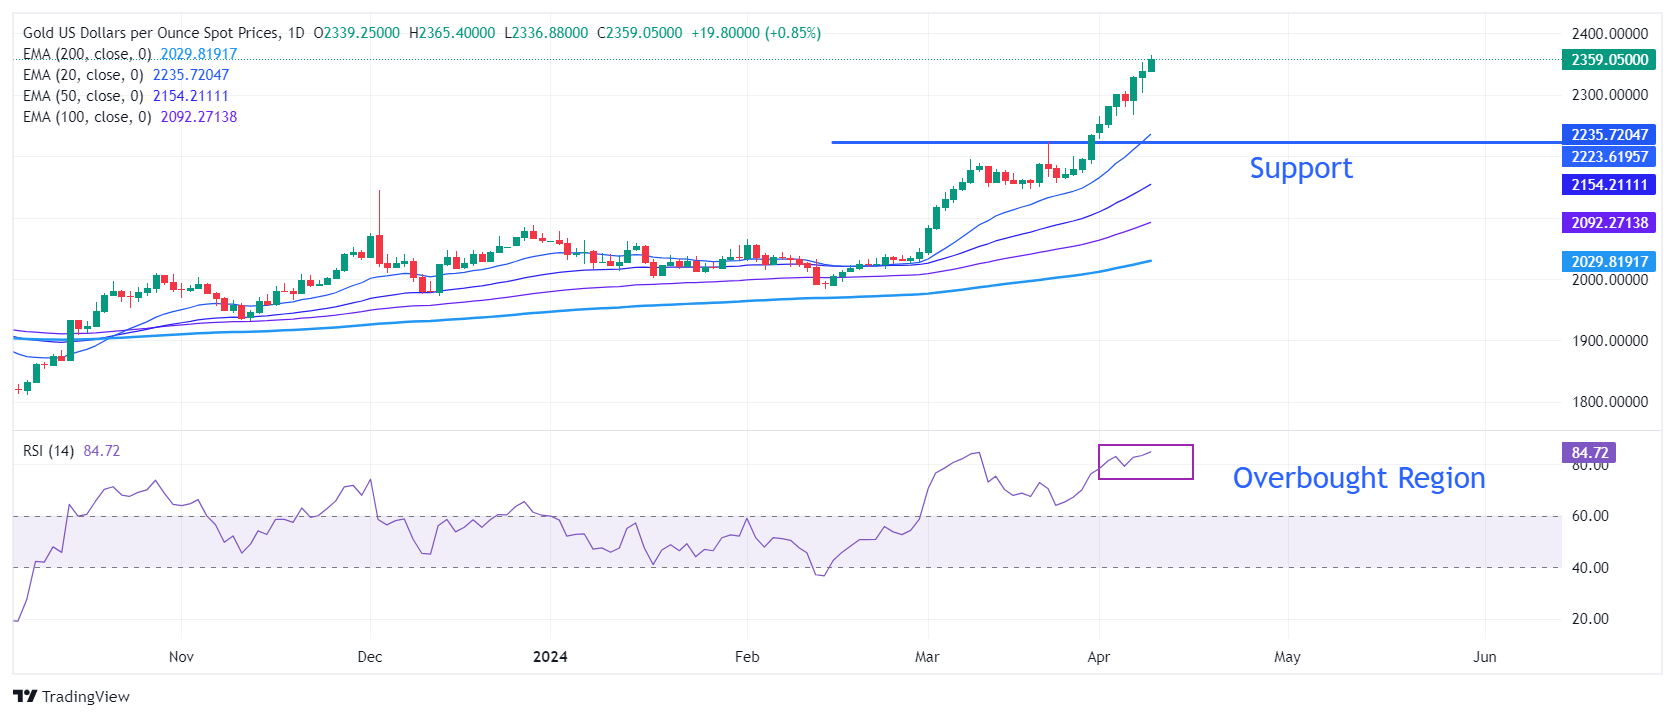
Gold price moves higher to $2,360, remaining in unchartered territory for almost a month. The rally in the precious metal persists despite momentum oscillators reaching extremely overbought levels. On the downside, March 21 high at $2,223 will be a major support area for the Gold price bulls.
The 14-period Relative Strength Index (RSI) reaches 85.00, indicating a strong bullish momentum. However, signs of RSI remains extremely overbought could lead to a correction.
Gold FAQs
Gold has played a key role in human’s history as it has been widely used as a store of value and medium of exchange. Currently, apart from its shine and usage for jewelry, the precious metal is widely seen as a safe-haven asset, meaning that it is considered a good investment during turbulent times. Gold is also widely seen as a hedge against inflation and against depreciating currencies as it doesn’t rely on any specific issuer or government.
Central banks are the biggest Gold holders. In their aim to support their currencies in turbulent times, central banks tend to diversify their reserves and buy Gold to improve the perceived strength of the economy and the currency. High Gold reserves can be a source of trust for a country’s solvency. Central banks added 1,136 tonnes of Gold worth around $70 billion to their reserves in 2022, according to data from the World Gold Council. This is the highest yearly purchase since records began. Central banks from emerging economies such as China, India and Turkey are quickly increasing their Gold reserves.
Gold has an inverse correlation with the US Dollar and US Treasuries, which are both major reserve and safe-haven assets. When the Dollar depreciates, Gold tends to rise, enabling investors and central banks to diversify their assets in turbulent times. Gold is also inversely correlated with risk assets. A rally in the stock market tends to weaken Gold price, while sell-offs in riskier markets tend to favor the precious metal.
The price can move due to a wide range of factors. Geopolitical instability or fears of a deep recession can quickly make Gold price escalate due to its safe-haven status. As a yield-less asset, Gold tends to rise with lower interest rates, while higher cost of money usually weighs down on the yellow metal. Still, most moves depend on how the US Dollar (USD) behaves as the asset is priced in dollars (XAU/USD). A strong Dollar tends to keep the price of Gold controlled, whereas a weaker Dollar is likely to push Gold prices up.
- Natural Gas prices are soaring towards $2.00 at the start of the week.
- Traders seem to be pricing in supply issues ahead in Europe as shortages from Egypt worsen.
- The US Dollar Index is stuck in a ‘push and pull’ pattern with the Fed pushing against markets’ expectations for fewer rate cuts.
Natural Gas (XNG/USD) price soars higher on Tuesday after a stellar performance on Monday, trading up nearly 3% for the week. The move comes as Bloomberg forecasts a decline in Gas supply by 4% in the coming weeks as Egypt is looking to hoard gas exports to keep for its own energy consumption. With the hot season nearing in the region, air conditioning and cooling installations are draining the energy grid and are in need of more electricity, which Egypt gets partially from its Gas-burning installations.
The DXY US Dollar Index, meanwhile, had a soft start of the week, though keeping afloat around 104.00. Markets are digesting rather positive US data that points to a healthy and steady US economy, while US Federal Reserve (Fed) officials keep pushing back against market expectations by saying that rate cuts are coming soon. This keeps traders sidelined and puts the US Dollar Index in a sideways pattern of just 3% volatility from top to bottom, for the better part of 2024.
Natural Gas is trading at $1.98 per MMBtu at the time of writing.
Natural Gas news and market movers: Egypt drains the market
- Bloomberg Intelligence forecasts the Gas supply side is set to drop by 4%, or 34.5 million metric tons, in the coming weeks as Egypt bans its Gas exports to use it for its own electricity needs. This coincides with the beginning of the summer season, when the demand for electricity increases to power air conditioners.
- Dow Jones reports that BP will see a higher profit for this quarter with gas and oil prices picking up.
- Recent lower prices in European Gas markets are seeing heavy buying, pushing up prices locally and could see more chunky buying out of Asia.
Natural Gas Technical Analysis: Demand not the issue anymore, rather supply
Natural Gas prices are soaring this week with traders seeing a change in the supply side after Bloomberg reported Egypt might end its exports over the summer. Markets are facing the possibility of lower supply for the same amount of demand, or even increased demand as the European market is under siege from Asian trading desks buying up cheap Gas contracts. This combination could lead to a significant rise in prices ahead
On the upside, the key $1.97 level needs to be regained before challenging last week’s peak at $2.01. The next key mark is the historic pivotal point at $2.13. Should Gas prices pop up in that region, a broad area opens up with the first cap at the red descending trend line near $2.21.
On the downside, multi-year lows at $1.60 are still nearby, with $1.65 as the first line in the sand. In case of a breakdown below these levels, traders should look at $1.53 as the next supportive area.
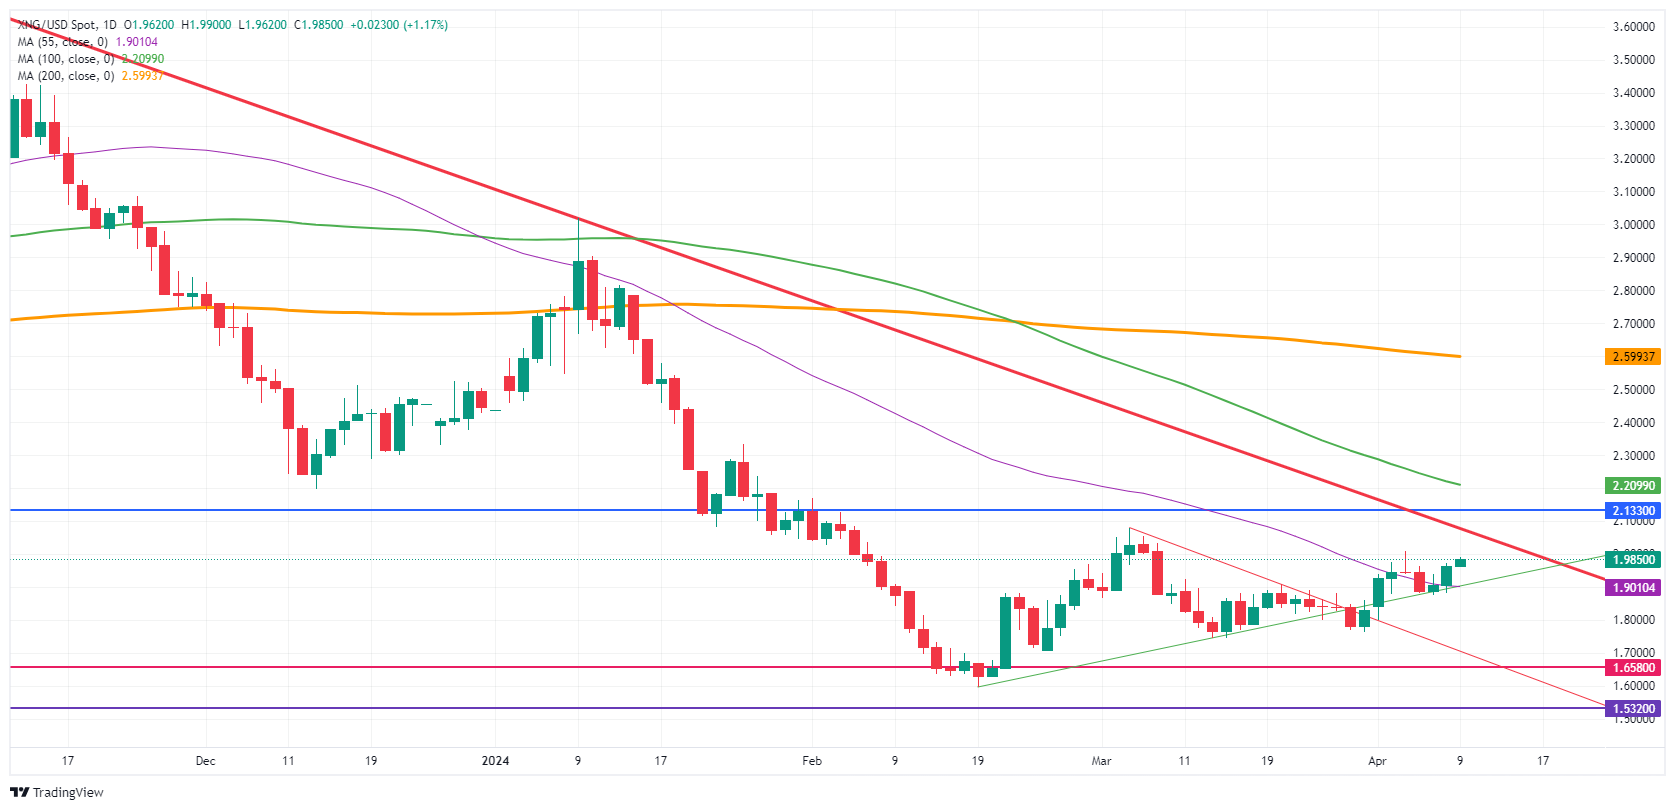
Natural Gas: Daily Chart
Natural Gas FAQs
Supply and demand dynamics are a key factor influencing Natural Gas prices, and are themselves influenced by global economic growth, industrial activity, population growth, production levels, and inventories. The weather impacts Natural Gas prices because more Gas is used during cold winters and hot summers for heating and cooling. Competition from other energy sources impacts prices as consumers may switch to cheaper sources. Geopolitical events are factors as exemplified by the war in Ukraine. Government policies relating to extraction, transportation, and environmental issues also impact prices.
The main economic release influencing Natural Gas prices is the weekly inventory bulletin from the Energy Information Administration (EIA), a US government agency that produces US gas market data. The EIA Gas bulletin usually comes out on Thursday at 14:30 GMT, a day after the EIA publishes its weekly Oil bulletin. Economic data from large consumers of Natural Gas can impact supply and demand, the largest of which include China, Germany and Japan. Natural Gas is primarily priced and traded in US Dollars, thus economic releases impacting the US Dollar are also factors.
The US Dollar is the world’s reserve currency and most commodities, including Natural Gas are priced and traded on international markets in US Dollars. As such, the value of the US Dollar is a factor in the price of Natural Gas, because if the Dollar strengthens it means less Dollars are required to buy the same volume of Gas (the price falls), and vice versa if USD strengthens.
- The Mexican Peso continues rising to almost nine-year highs against the US Dollar (USD).
- Mexican inflation data for March is scheduled for release on Tuesday and could cause volatility for the Peso.
- A higher-than-expected reading would indicate interest rates remaining elevated, increasing demand for MXN.
The Mexican Peso (MXN) is trading at eight almost nine-year highs below 16.30 against the US Dollar (USD) on Tuesday, as it continues its long-term bull trend.
The next major release for the pair is Mexican inflation data for March, which will be released at 12.00 GMT and is likely to influence the outlook for interest rates in the country, a key driver of foreign exchange valuations.
Mexican Peso rallies ahead of CPI data
The Mexican Peso will probably be impacted if the Mexican inflation rate deviates significantly from analyst’s expectations.
Mexican Headline Inflation is expected to rise by 0.36% MoM in March after registering a 0.09% rise in February.
Core Inflation is forecast to rise 0.51% after a 0.49% increase in February.
The Mexican Peso is likely to appreciate if inflation is hotter-than-expected since this will mean the Banco de Mexico (Banxico) will have to keep interest rates higher for longer. Higher interest rates tend to increase demand for a currency as they attract higher foreign capital inflows.
The bank reduced interest rates from 11.25% to 11.00% at its March meeting after seeing a gradual decline in inflation, however, the meeting minutes made it clear that future decisions will be data-dependent, and that the overall outlook for inflation remains elevated.
Technical Analysis: USD/MXN quickens downtrend
USD/MXN has quickened the pace of its long-term downtrend. The trend started after the pair peaked at 25.76 in April 2020 – it has now fallen to the 16.20s. Since “the trend is your friend,” it is likely to extend.
The pair is probably unfolding a large three-wave Measured Move pattern. These are composed of an A, B, and C wave, with wave C extending to a similar length to wave A, or a Fibonacci 0.618 ratio of A.
USD/MXN Weekly Chart
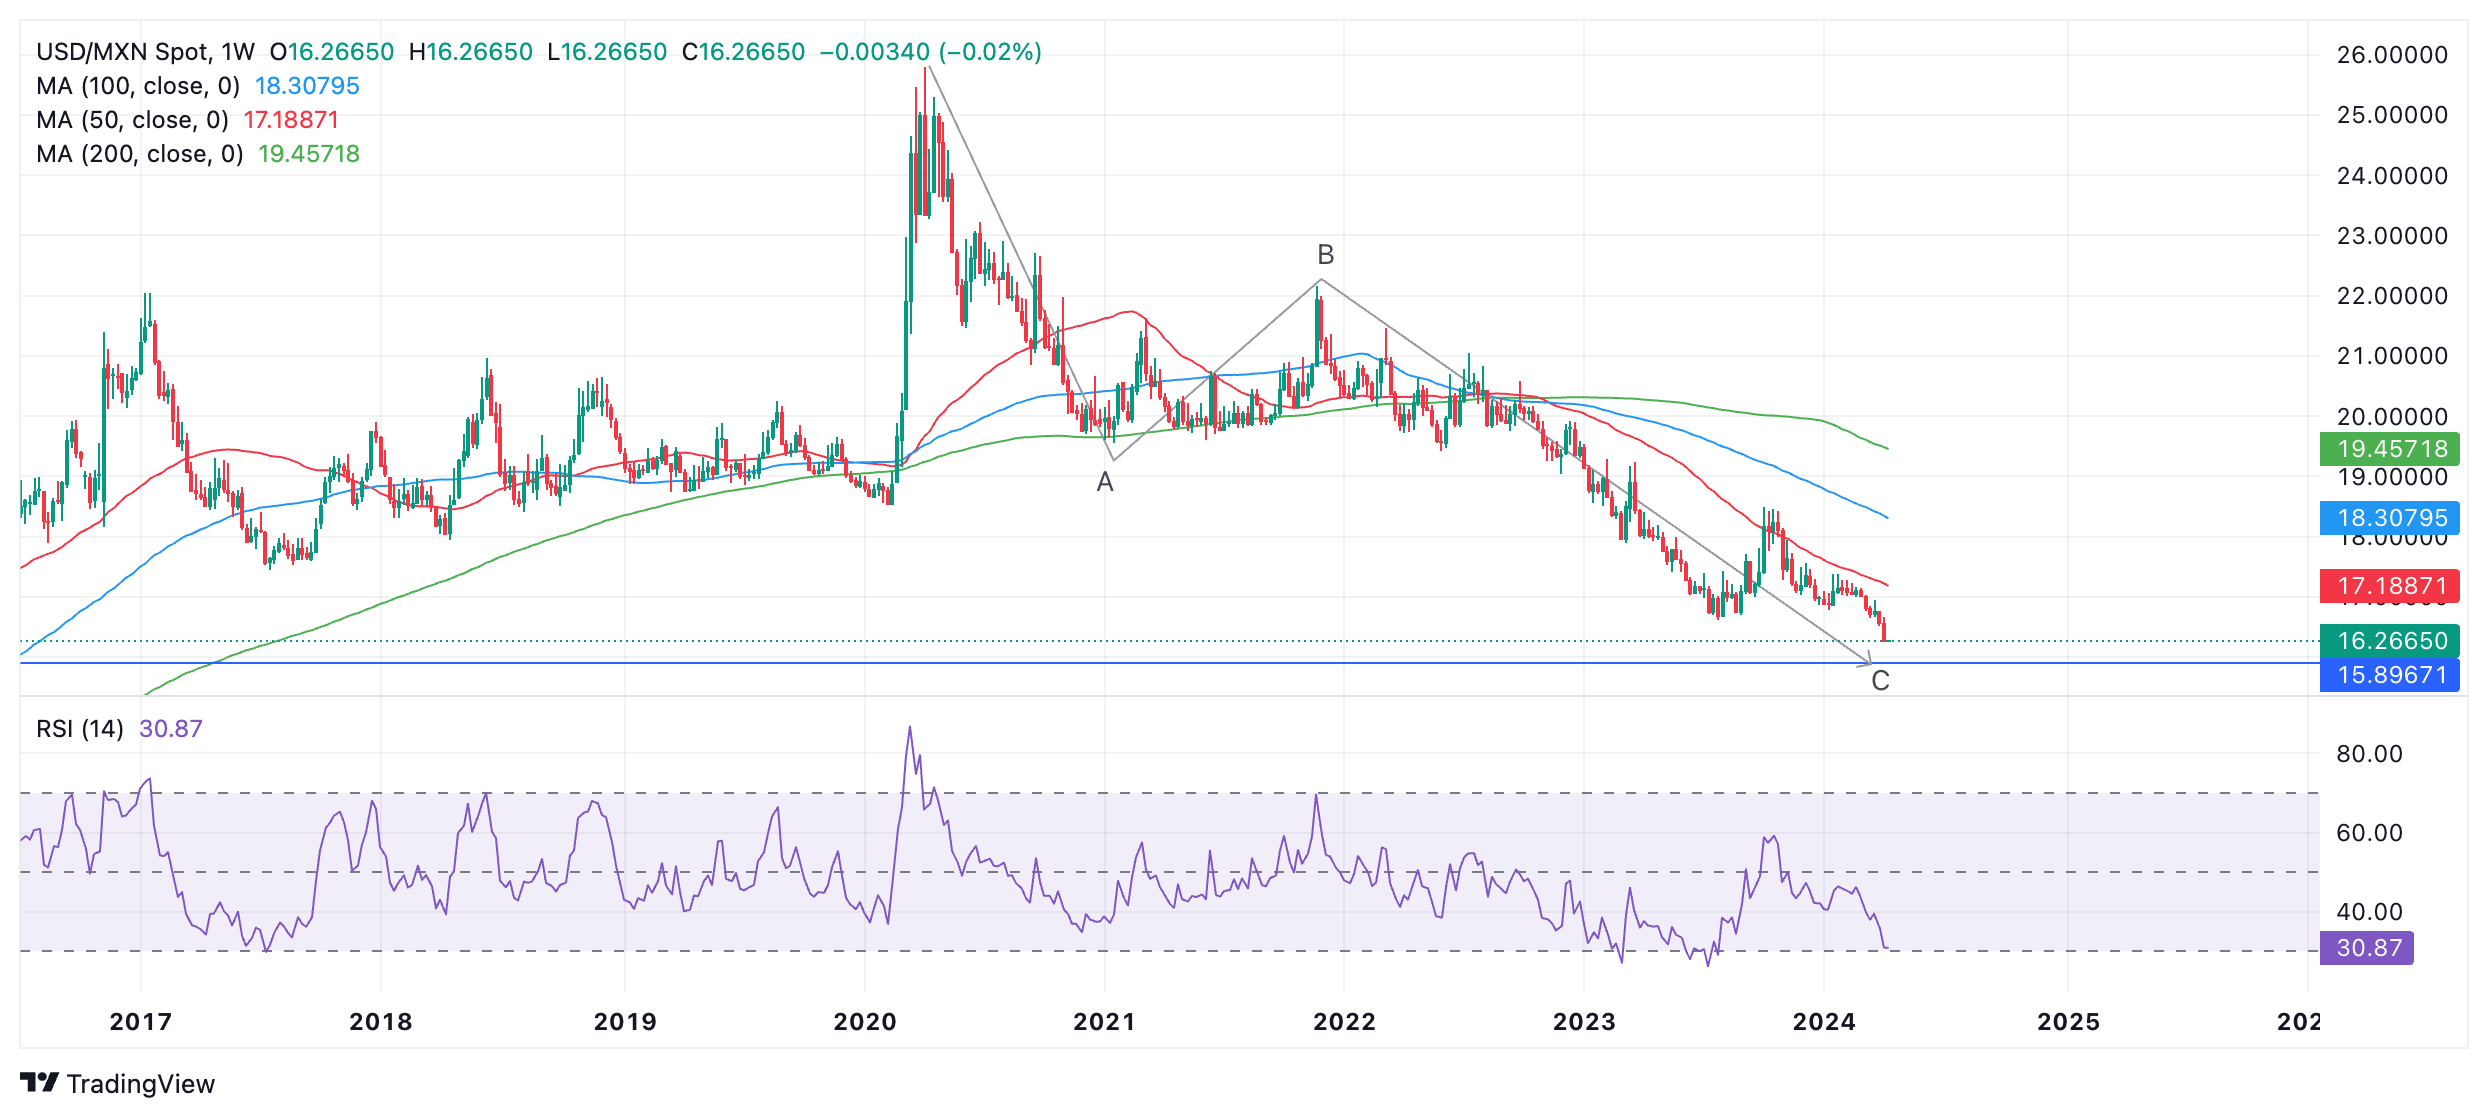
If this is the case, price has almost reached the point at which C will equal A, calculated as lying at 15.89.
It has also by now surpassed the conservative target for the end of C at the 0.618 Fibonacci extension of A (at 18.24).
Once the pattern is complete the market usually reverses or undergoes a substantial correction.
The Relative Strength Index (RSI) is converging acutely with price – a sign the downtrend could be losing momentum. USD/MXN has pushed lower than the 2023 lows but RSI has not followed suit. This non-correlation is a bullish indication. It could lead to a correction higher eventually.
There has been no reaction from price yet, however, so the expectation of upside remains speculatory and unconfirmed.
Economic Indicator
Core Inflation
The core inflation index released by the Bank of Mexico is a measure of price movements by the comparison between the retail prices of a representative shopping basket of goods and services, excluding taxes and energy. The purchase power of Mexican Peso is dragged down by inflation. The inflation index is a key indicator since it is used by the central bank to set interest rates. Generally speaking, a high reading is seen as positive (or bullish) for the Mexican Peso, while a low reading is seen as negative (or Bearish).
Read more.Next release: Tue Apr 09, 2024 12:00
Frequency: Monthly
Consensus: 0.51%
Previous: 0.49%
Source: National Institute of Statistics and Geography of Mexico
- WTI prices gain ground on failure of ceasefire talks between Israel and Hamas in Egypt.
- Israeli Prime Minister Benjamin Netanyahu declared Israel's intention to proceed with its plans to invade the Rafah enclave in Gaza, refraining from specifying a date.
- Mexico's Pemex could reduce Crude exports by at least 330,000 bpd in May.
West Texas Intermediate (WTI) oil price rebounds after a two-day decline, edging up to nearly $86.30 per barrel during Tuesday's European trading session. The surge in Crude oil prices followed the failure of the latest ceasefire negotiations between Israel and Hamas in Egypt on Monday.
Earlier discussions for a ceasefire had halted a multi-session rally, causing WTI to break its six-day winning streak. This was due to the anticipation that geopolitical tensions might ease. However, Israeli Prime Minister Benjamin Netanyahu announced on Monday that Israel intends to carry out its plans to invade the Rafah enclave in Gaza, without specifying a date. Additionally, a senior Hamas official stated that they have rejected the latest ceasefire proposal put forward by Israel during the talks in Cairo.
The ongoing conflict carries the heightened risk of drawing in other regional countries, notably Iran, a significant supporter of Hamas and the third-largest producer in the Organization of the Petroleum Exporting Countries (OPEC). An Iranian retaliation to the suspected Israeli attack on its consulate in Syria last week could potentially embroil the oil market in the conflict. However, Israel has not officially claimed responsibility for the attack.
Mexico's state energy company, Pemex, plans to reduce Crude exports by at least 330,000 barrels per day (bpd) in May. This decision will affect customers in the United States (US), Europe, and Asia, leading to a reduction in supply by a third. The move follows Pemex's directive to its trading arm, PMI Comercio Internacional, to withdraw 436,000 bpd of Maya, Isthmus, and Olmeca crudes this month. This decision aims to meet the needs of domestic refineries as Pemex aims for energy self-sufficiency.
- EUR/GBP faces rejection near the 100-day SMA and snaps a seven-day winning streak.
- The better-than-expected BRC Like-For-Like Sales underpin the GBP and exert pressure.
- Bets for more aggressive policy easing by the BoE should cap the GBP and lend support.
The EUR/GBP cross continues with its struggle to make it through the 100-day Simple Moving Average (SMA) hurdle and meets with some supply on Tuesday. Spot prices remain depressed near the 0.8575 region through the first half of the European session and for now, seem to have snapped a seven-day winning streak.
The British Pound's (GBP) relative outperformance against its European counterpart could be attributed to the upbeat domestic data, which showed that Like-For-Like Retail Sales surged by the 3.2% YoY rate in March. This was better than the 1.8% rise expected and marked the strongest growth since August 2023, which, in turn, is seen as a key factor exerting some downward pressure on the EUR/GBP cross.
Apart from this, speculations that the European Central Bank (ECB) could cut interest rates soon amid a faster-than-anticipated fall in the Eurozone inflation undermine the shared currency and contribute to the offered tone surrounding the pair. That said, rising bets for at least four interest rate cuts this year by the Bank of England (BoE), starting in June, might cap the GBP and lend some support to the EUR/GBP cross.
This, in turn, warrants some caution before positioning for any further downfall in the absence of any relevant economic data due on Tuesday, either from the UK or the Eurozone. Meanwhile, the BoE Governor Andrew Bailey's appearance might influence the Sterling Pound and provide some impetus to the EUR/GBP cross. The focus, however, will remain on the monthly UK GDP print and factory data for February, due for release on Friday.
Silver prices (XAG/USD) rose on Tuesday, according to FXStreet data. Silver trades at $28.07 per troy ounce, up 0.79% from the $27.85 it cost on Monday.
Silver prices have increased by 10.22% since the beginning of the year.
| Unit measure | Today Price |
|---|---|
| Silver price per ounce | $28.07 |
| Silver price per gram | $10.53 |
The Gold/Silver ratio, which shows the number of ounces of Silver needed to equal the value of one ounce of Gold, stood at 84.02 on Tuesday, up from 83.99 on Monday.
Investors might use this ratio to determine the relative valuation of Gold and Silver. Some may consider a high ratio as an indicator that Silver is undervalued – or Gold is overvalued – and might buy Silver or sell Gold accordingly. Conversely, a low ratio might suggest that Gold is undervalued relative to Silver.
Global Market Movers: Comex Silver price rises above $28.00
- Silver price follows the rally in gold as global central banks increase their reserves.
- The price of Silver has advanced to its highest level since June 2021.
- The eased geopolitical situation in the Middle East could limit the advance of Silver price.
- The demand for non-yielding assets like Silver is bolstered as US Treasury yields correct after two days of gains.
- The industrial outlook for metals received a boost from strong manufacturing data from top consumer China and projections for increased solar installations.
- Traders eagerly await the release of the US Consumer Price Index inflation data due on Wednesday for a fresh US Dollar price action, eventually impacting XAG/USD.
(An automation tool was used in creating this post.)
Inflation FAQs
Inflation measures the rise in the price of a representative basket of goods and services. Headline inflation is usually expressed as a percentage change on a month-on-month (MoM) and year-on-year (YoY) basis. Core inflation excludes more volatile elements such as food and fuel which can fluctuate because of geopolitical and seasonal factors. Core inflation is the figure economists focus on and is the level targeted by central banks, which are mandated to keep inflation at a manageable level, usually around 2%.
The Consumer Price Index (CPI) measures the change in prices of a basket of goods and services over a period of time. It is usually expressed as a percentage change on a month-on-month (MoM) and year-on-year (YoY) basis. Core CPI is the figure targeted by central banks as it excludes volatile food and fuel inputs. When Core CPI rises above 2% it usually results in higher interest rates and vice versa when it falls below 2%. Since higher interest rates are positive for a currency, higher inflation usually results in a stronger currency. The opposite is true when inflation falls.
Although it may seem counter-intuitive, high inflation in a country pushes up the value of its currency and vice versa for lower inflation. This is because the central bank will normally raise interest rates to combat the higher inflation, which attract more global capital inflows from investors looking for a lucrative place to park their money.
Formerly, Gold was the asset investors turned to in times of high inflation because it preserved its value, and whilst investors will often still buy Gold for its safe-haven properties in times of extreme market turmoil, this is not the case most of the time. This is because when inflation is high, central banks will put up interest rates to combat it. Higher interest rates are negative for Gold because they increase the opportunity-cost of holding Gold vis-a-vis an interest-bearing asset or placing the money in a cash deposit account. On the flipside, lower inflation tends to be positive for Gold as it brings interest rates down, making the bright metal a more viable investment alternative.
- USD/CAD consolidates below 1.3600 as the focus shifts to US Inflation and BoC monetary policy.
- The US inflation data could be made or a break for market expectations of Fed rate cuts in June.
- The BoC is expected to keep interest rates steady at 5%.
The USD/CAD pair struggles for a direction as investors await the United States Consumer Price Index (CPI) data for March, which will be published on Wednesday. The Loonie asset trades sideways below the round-level resistance of 1.3600 in Tuesday’s European session. The US inflation data for March is expected to provide some cues about when the Federal Reserve (Fed) could start reducing interest rates.
US annual headline inflation is forecasted to have increased to 3.4% from 3.2% in February. In the same period, the core inflation that excludes volatile food and energy prices is estimated to have dropped slightly to 3.7% from 3.8%.
Soft inflation figures could prompt speculation that the Fed will reduce borrowing costs after the June meeting, while hot figures might shift rate cut expectations to the second half of this year.
Meanwhile, the Canadian Dollar will dance to the tunes of the Bank of Canada’s (BoC) interest rate decision, to be announced on Wednesday. The BoC is expected to keep interest rates unchanged at 5%. Therefore, investors will focus on the outlook of borrowing rates. The BoC could deliver a dovish guidance as Canada’s labor market is facing stiff consequences of higher interest rates. Also, BoC’s preferred inflation measure, core CPI, came down to 2.1% in February.
USD/CAD is slightly down from the horizontal resistance of the Ascending triangle formation on a daily timeframe, plotted from December 7 high at 1.3620. The upward-sloping border of the aforementioned pattern is placed from December 27 low at 1.3177. The chart pattern exhibits a sharp volatility contraction and a breakout can happen in any direction.
The 200-day Exponential Moving Average (EMA) near 1.3500 remains a crucial support for the US Dollar bulls.
Meanwhile, the 14-period Relative Strength Index (RSI) oscillates inside the 40.00-60.00 range, indicating indecisiveness among market participants.
The Loonie asset would observe a fresh upside if it breaks above April 5 high at 1.3648. This will drive the asset to the round-level resistance of 1.3700, followed by November 22 high at 1.3765.
On the flip side, a downside move below February 22 low at 1.3441 would expose the asset to February 9 low at 1.3413. A breakdown below the latter would extend downside towards January 15 low at 1.3382.
USD/CAD daily chart
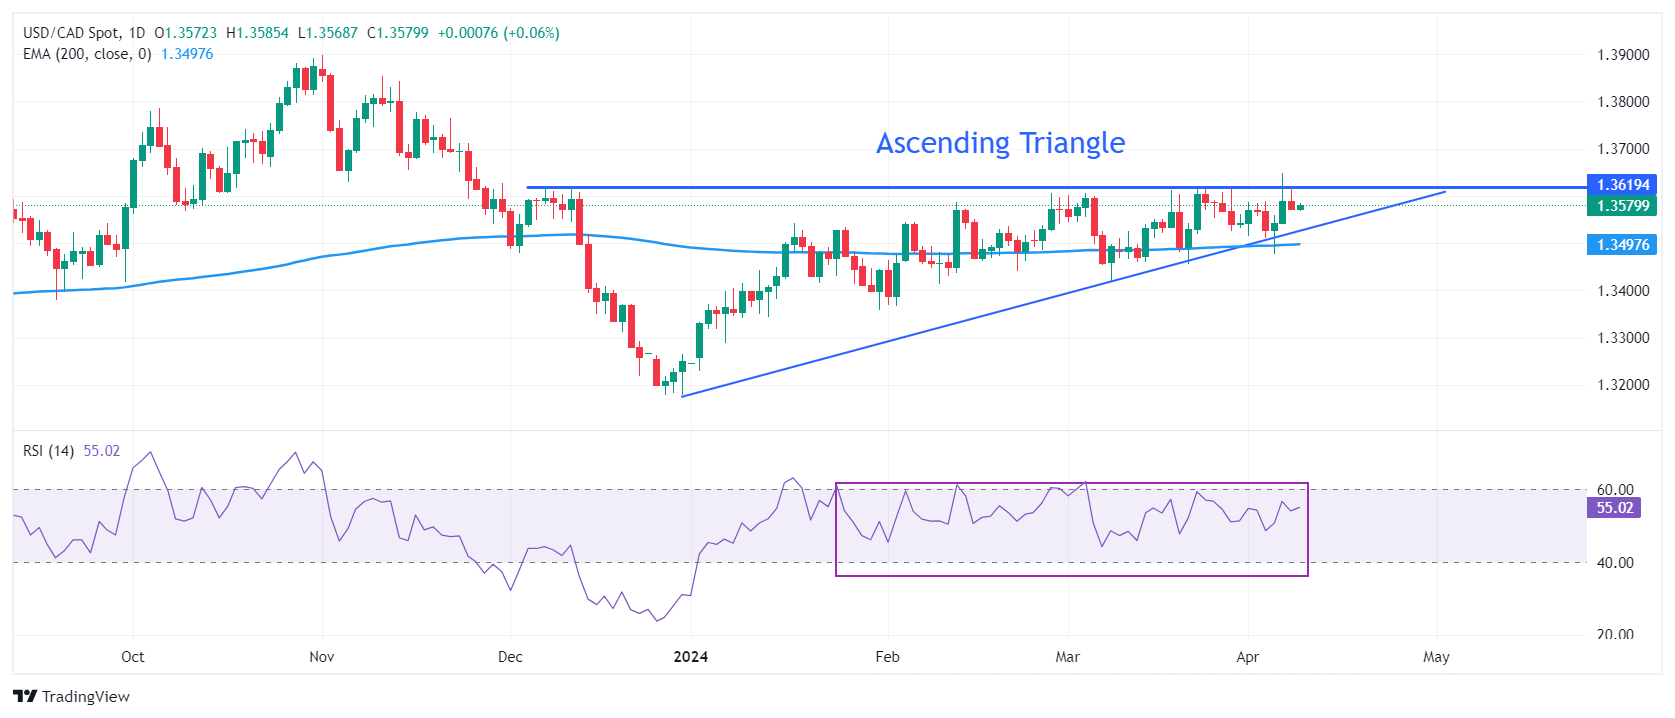
- EUR/USD is captive to a range as traders await the next market mover, the US CPI data on Wednesday.
- US inflation expectations are high while US Treasury yields have made a new high for the year.
- The pair is trading within a narrow range between the 50, 100 and 200-day Simple Moving Averages.
EUR/USD trades penned in, seesawing between tepid gains and losses in the 1.0850s on Tuesday. The lack of volatility could be due to many traders opting to stay on the sidelines ahead of the first big market mover for the week, the US Consumer Price Index (CPI) inflation data for March, scheduled for Wednesday.
EUR/USD traders withdraw to patiently await inflation data
EUR/USD will likely not see much volatility until the release of CPI. Economists expect the data to show that prices in the US to have risen by 3.4% Year-on-Year in March (3.7% YoY for core goods), both of which are still well above the Federal Reserve’s (Fed) 2.0% target. A more substantial decline is required before the Fed will likely bring down interest rates from their current 5.5% level.
For EUR/USD, the maintenance of higher interest rates in the US compared to the Eurozone is a bearish headwind. This is because relatively higher interest rates favor foreign capital inflows.
In contrast to the Fed, the European Central Bank (ECB) is seen as more likely to cut interest rates earlier amid more subdued growth and inflation expectations.
US Treasury Yields reach Year-to-Date Peak
US Treasury yields, a key gauge of US inflation expectations, peaked on Monday, with the 10-year Treasury Note yield reaching YTD highs of 4.46%. US yields are highly correlated to the US Dollar and, therefore, negatively correlated with the EUR/USD pair. Since peaking on Monday, they rolled over and have been trending slightly down.
US inflation expectations increased after the stellar Nonfarm Payrolls (NFP) jobs report released on Friday, which showed another 303K workers joining the economy in March.
More people working usually means more people earning and spending money. This ought to be negative for EUR/USD, however, the pair has been broadly rising over the past five days.
The release of better-than-expected German Industrial Production data on Monday may have helped the Euro at the start of the new week.
German yields are rising faster than US yields according to Gregor Horvat of advisory firm Wavetraders, which may explain why EUR/USD keeps going higher despite the strong US data.
Horvat uses Elliott Wave analysis, a type of cycle theory, and expects EUR/USD to continue its rally up to 1.0920 before the ECB meeting on Thursday.
Technical Analysis: EUR/USD increasingly looking range-bound
EUR/USD looks increasingly range-bound in the short-term.
The pair failed to confirm the bearish Gravestone Doji candlestick posted on Thursday as price recovered on the following day and posted a bullish Dragonfly Doji candlestick – the one canceling out the other (shaded rectangle on chart).
EUR/USD Daily Chart
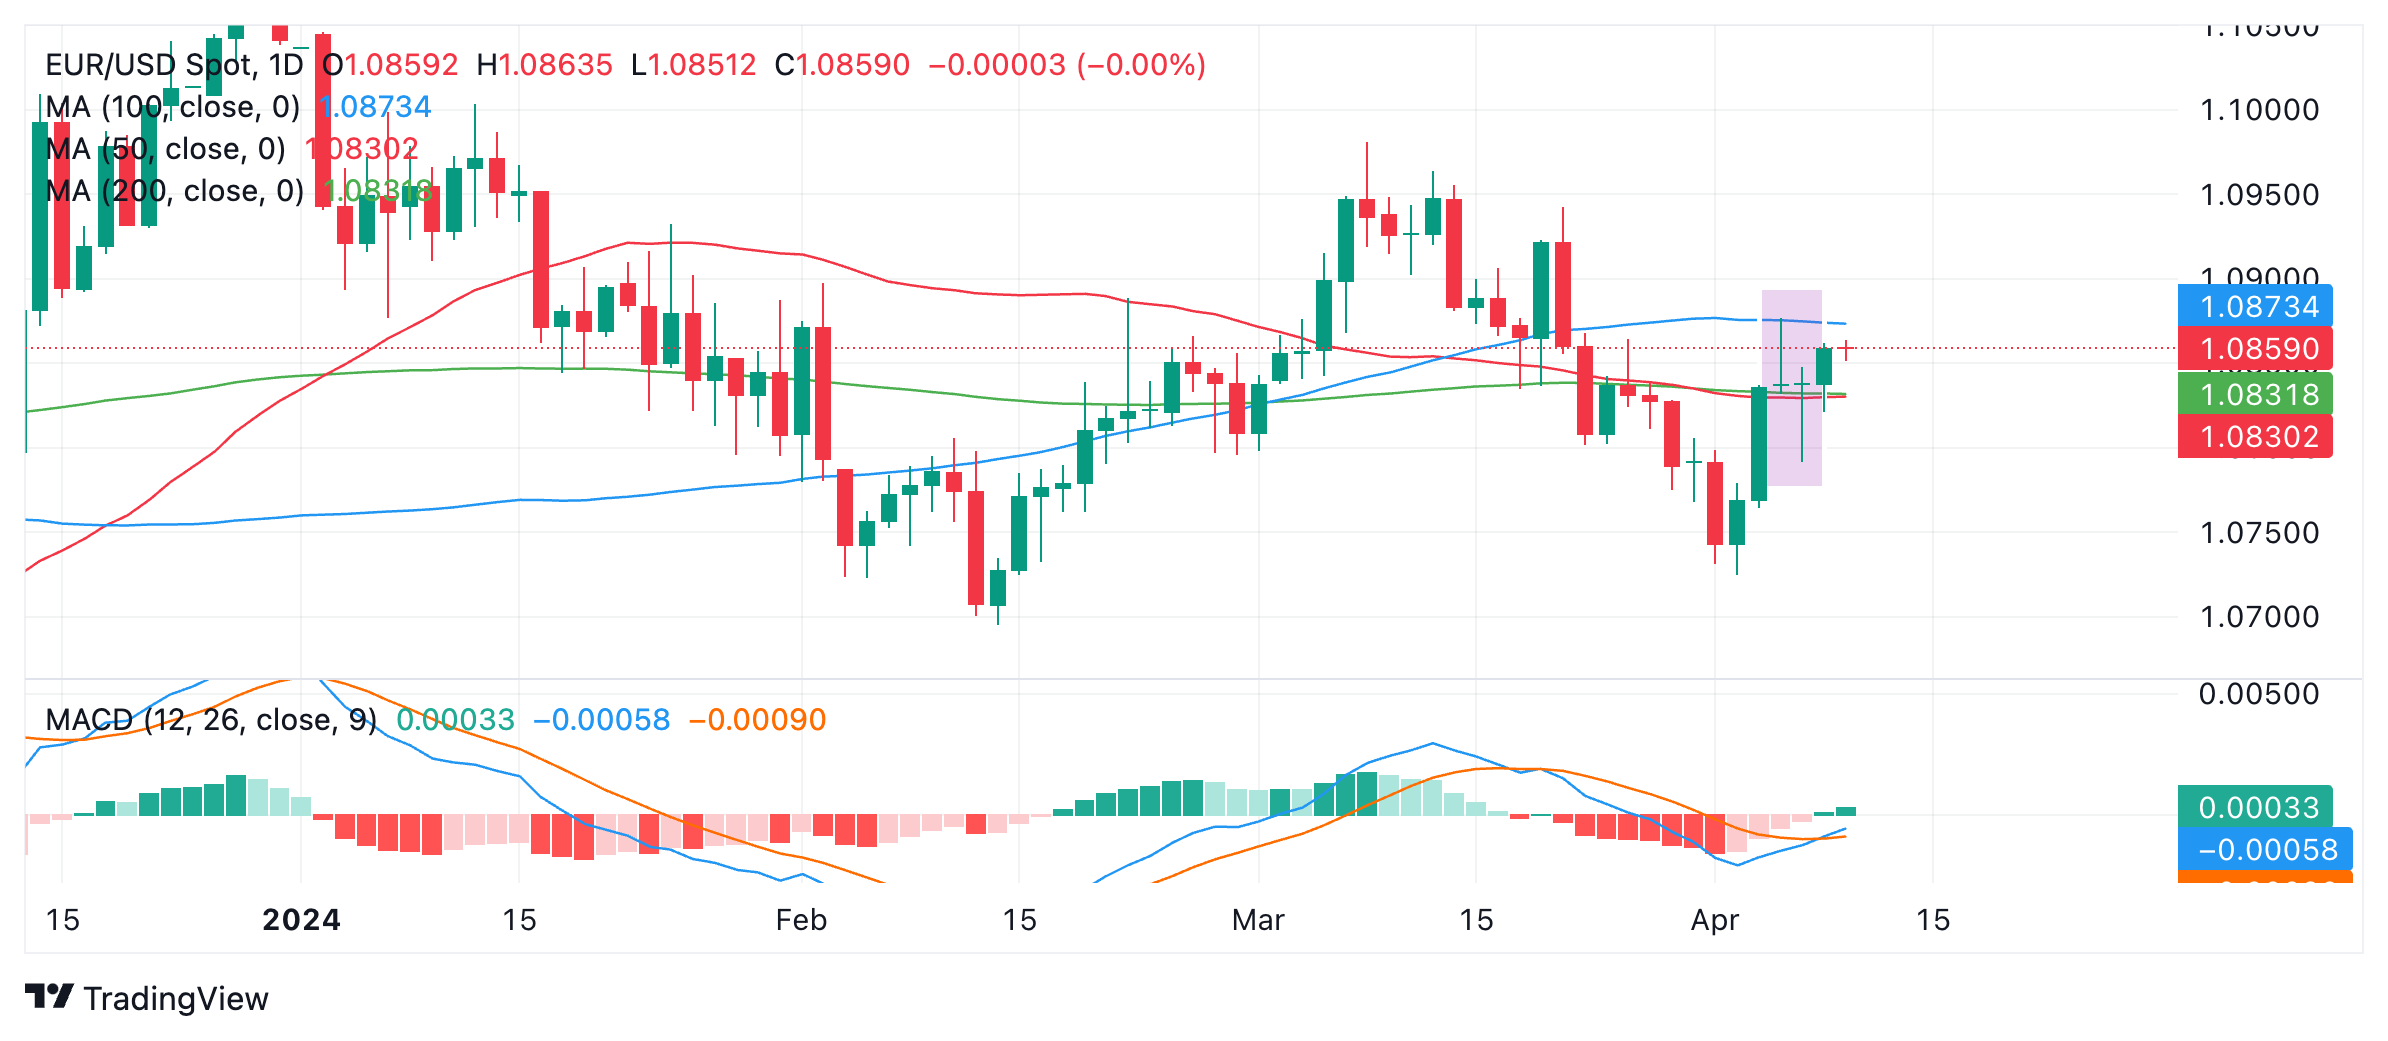
EUR/USD now appears trapped within the pincers of three significant Moving Averages. The 50-day and 200-day SMAs are providing cushioning support at 1.0830 and 1.0831 and the 100-day SMA is showing resistance at 1.0873.
A decisive break above the 100-day SMA would support the bullish case, and see a rally to perhaps the March 21 high at 1.0942.
Alternatively, a decisive break below the cluster of MAs in the 1,0830s might see a pullback evolve down to support at the April 2 swing lows of 1.0725.
Economic Indicator
Consumer Price Index ex Food & Energy (YoY)
Inflationary or deflationary tendencies are measured by periodically summing the prices of a basket of representative goods and services and presenting the data as the Consumer Price Index (CPI). CPI data is compiled on a monthly basis and released by the US Department of Labor Statistics. The YoY reading compares the prices of goods in the reference month to the same month a year earlier. The CPI Ex Food & Energy excludes the so-called more volatile food and energy components to give a more accurate measurement of price pressures. Generally speaking, a high reading is bullish for the US Dollar (USD), while a low reading is seen as bearish.
Read more.Next release: Wed Apr 10, 2024 12:30
Frequency: Monthly
Consensus: 3.7%
Previous: 3.8%
Source: US Bureau of Labor Statistics
The US Federal Reserve has a dual mandate of maintaining price stability and maximum employment. According to such mandate, inflation should be at around 2% YoY and has become the weakest pillar of the central bank’s directive ever since the world suffered a pandemic, which extends to these days. Price pressures keep rising amid supply-chain issues and bottlenecks, with the Consumer Price Index (CPI) hanging at multi-decade highs. The Fed has already taken measures to tame inflation and is expected to maintain an aggressive stance in the foreseeable future.
- AUD/JPY extends its winning streak due to the persistent interest rate differential between Australia and Japan.
- There is uncertainty regarding the necessity for the RBA to implement rate cuts in 2024.
- BoJ’s Ueda shared his expectations of a gradual acceleration in the inflation trend.
The AUD/JPY pair continues its winning streak that began on April 4, climbing to near 100.30 during the European session on Tuesday. The Japanese Yen (JPY) remains subdued as the Bank of Japan (BoJ) adopts a cautious approach amidst an uncertain outlook for future rate hikes.
The AUD/JPY pair may receive upward support due to the persistent gap between Australian and Japanese interest rates. Investors are increasingly skeptical about the need for the Reserve Bank of Australia (RBA) to implement interest rate cuts in 2024, particularly following positive US data, which has raised expectations that the Federal Reserve (Fed) might maintain its higher interest rate stance for a longer period.
However, investors remain vigilant amid the possibility of Japanese authorities intervening in the market to prevent a destabilizing decline in the domestic currency. Bank of Japan (BoJ) Governor Kazuo Ueda continues to address inflation and policy outlook, with expectations of a gradual acceleration in the inflation trend. Therefore, it is crucial to monitor data and information to assess whether this scenario materializes.
Governor Ueda also emphasized that one of the factors to monitor is whether pay hikes offered in annual wage talks will materialize, as reflected in actual data. Another factor is whether service prices will increase, reflecting higher wages. If the inflation trend accelerates towards the 2% target, it may become possible to reduce the degree of monetary stimulus somewhat.
Meanwhile, the Australian Dollar (AUD) continues to advance against the Japanese Yen, despite the subdued Westpac Consumer Confidence data released on Tuesday. The AUD is bolstered by a stronger domestic equity market, with the ASX 200 Index poised for gains as investor attention remains focused on the Reserve Bank of Australia’s (RBA) interest rate decisions.
- The Pound Sterling consolidates as investors seek fresh guidance on interest rates.
- UK Retail Sales for food items rose sharply in March due to early Easter while overall demand remains subdued.
- The US inflation data for March will guide expectations for Fed rate cuts in June.
The Pound Sterling (GBP) is stuck in a tight range around 1.2660 against the US Dollar in Tuesday’s London session. The GBP/USD pair trades sideways as investors shift focus to the United States Consumer Price Index (CPI) data for March, to be published on Wednesday, which will likely provide some clues about when the Federal Reserve (Fed) could start reducing interest rates.
The US Dollar juggles in a narrow range as well ahead of the inflation data. The US Dollar Index (DXY), which tracks the Greenback’s value against six major currencies, trades slightly above 104.00.
Meanwhile, the appeal for the Pound Sterling slightly improves as surveys show that the United Kingdom economy will deliver modest growth this year after falling to a technical recession in the second half of 2023. The latest projections from the UK Office for Budget Responsibility (OBR) showed that the economy is forecast to grow by 0.8% this year. Domestic demand has rebounded while geopolitical tensions remain a major concern, resulting in supply chain disruptions, the OBR report said.
This week, investors will focus on the UK monthly Gross Domestic Product (GDP) and the factory data for February, which will be published on Friday. The data will give a snapshot of the state of the economy after the 0.2% GDP expansion registered in January. The breakdown among sectors will also provide data from the country’s manufacturing sector, which is considered a leading indicator for overall demand.
Daily digest market movers: Pound Sterling stays on sidelines, following US Dollar’s footprints
- The Pound Sterling turns sideways after recovering to 1.2660 against the US Dollar as investors shifted focus to the United States Consumer Price Index (CPI) data for March, which will be published on Wednesday.
- US Monthly headline and core inflation, which strips off volatile food and energy prices, are both forecasted to have risen at a slower pace of 0.3% from 0.4% in February. In the same period, economists expect the annual headline CPI to accelerate to 3.4% from 3.2%, while the core inflation is anticipated to decelerate to 3.7% from 3.8%.
- The inflation data will provide cues about when the Federal Reserve will start reducing interest rates. Currently, market expectations lean towards the June policy meeting for the Fed pivoting to rate cuts. However, upbeat US Nonfarm Payrolls (NFP) data for March has shaken the confidence of investors. Strong labor market data has strengthened the inflation outlook, allowing Fed policymakers to avoid consideration for rate cuts for now.
- On the United Kingdom front, the speculation for the Bank of England lowering interest rates from the June meeting has escalated. UK’s inflation came in below expectations in the first two months of this year. Also, BoE Governor Andrew Bailey said two or three rate cut expectations this year are “reasonable”.
- A significant fall in the UK inflation is majorly driven by weak consumer spending. The British Retail Consortium (BRC) reported on Tuesday that robust spending on food items boosted Retail sales in March. Demand for food items rose due to early Easter but the broader picture remains subdued as wet weather dented sales of other goods.
- Meanwhile, the UK economic outlook improves as large businesses see economic uncertainty easing ahead. A survey by audit and consultancy firm Deloitte said that uncertainties driven by Brexit, the pandemic, and inflation that have clouded the business scene for much of the last eight years “seem to be clearing."
Technical Analysis: Pound Sterling consolidates around 1.2660
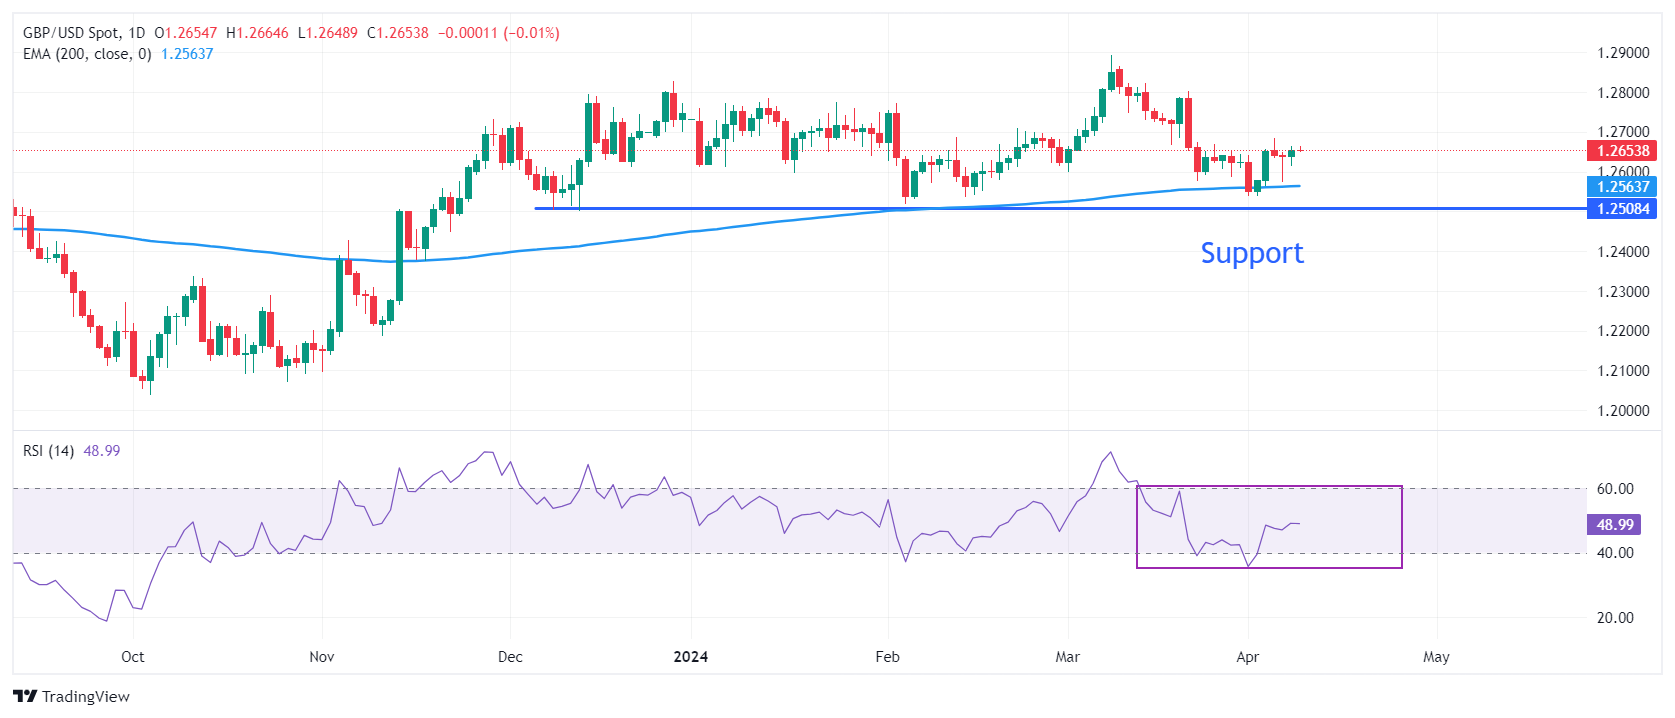
The Pound Sterling demonstrates a sideways performance as investors await the US inflation data for fresh guidance. The GBP/USD trades back and forth around 1.2660, and remains inside Monday’s trading range. The 200-day Exponential Moving Average (EMA) near 1.2570 supports the Pound Sterling bulls.
On the downside, the psychological level of 1.2500 plotted from December 8 low will be a major support for the Cable.
The 14-period Relative Strength Index (RSI) oscillates inside the 40.00-60.00 range, suggesting indecisiveness among market participants.
Pound Sterling FAQs
The Pound Sterling (GBP) is the oldest currency in the world (886 AD) and the official currency of the United Kingdom. It is the fourth most traded unit for foreign exchange (FX) in the world, accounting for 12% of all transactions, averaging $630 billion a day, according to 2022 data. Its key trading pairs are GBP/USD, aka ‘Cable’, which accounts for 11% of FX, GBP/JPY, or the ‘Dragon’ as it is known by traders (3%), and EUR/GBP (2%). The Pound Sterling is issued by the Bank of England (BoE).
The single most important factor influencing the value of the Pound Sterling is monetary policy decided by the Bank of England. The BoE bases its decisions on whether it has achieved its primary goal of “price stability” – a steady inflation rate of around 2%. Its primary tool for achieving this is the adjustment of interest rates. When inflation is too high, the BoE will try to rein it in by raising interest rates, making it more expensive for people and businesses to access credit. This is generally positive for GBP, as higher interest rates make the UK a more attractive place for global investors to park their money. When inflation falls too low it is a sign economic growth is slowing. In this scenario, the BoE will consider lowering interest rates to cheapen credit so businesses will borrow more to invest in growth-generating projects.
Data releases gauge the health of the economy and can impact the value of the Pound Sterling. Indicators such as GDP, Manufacturing and Services PMIs, and employment can all influence the direction of the GBP. A strong economy is good for Sterling. Not only does it attract more foreign investment but it may encourage the BoE to put up interest rates, which will directly strengthen GBP. Otherwise, if economic data is weak, the Pound Sterling is likely to fall.
Another significant data release for the Pound Sterling is the Trade Balance. This indicator measures the difference between what a country earns from its exports and what it spends on imports over a given period. If a country produces highly sought-after exports, its currency will benefit purely from the extra demand created from foreign buyers seeking to purchase these goods. Therefore, a positive net Trade Balance strengthens a currency and vice versa for a negative balance.
- Silver price follows the rally in gold as global central banks increase their reserves.
- The price of Silver has advanced to its highest level since June 2021.
- The eased geopolitical situation in the Middle East could have limited the advance of Silver price.
Silver price advances for the third consecutive session, trading higher to near $28.00 per ounce during the early European hours on Tuesday. This surge in Silver price mirrors the rally in gold, driven by heightened consumer and industrial demand. Global central banks increasing their reserves in gold have also contributed to the increased appetite for precious metals.
Furthermore, the demand for non-yielding assets like silver is bolstered as US Treasury yields correct after two days of gains. At present, the 2-year and 10-year yields on US Treasury bonds stand at 4.78% and 4.39%, respectively.
Traders eagerly await the release of the US Consumer Price Index data scheduled for Wednesday. It is anticipated that the US headline CPI will accelerate in March, while the core measure is expected to show a cooling down. The industrial outlook for metals received a boost from strong manufacturing data from top consumer China and projections for increased solar installations.
However, Silver price could have faced downward pressure as geopolitical tensions have eased in the Middle East, following the withdrawal of most Israel Defense Forces from southern Gaza, possibly due to growing international pressure, has contributed to easing tensions. Additionally, peace talks between Israel and Hamas have resumed in Egypt
Traders will now shift their focus to the upcoming US inflation data and the release of FOMC minutes this week to gain more clarity on the timing of the Fed's monetary policy adjustments.
- EUR/JPY posts modest gains around 164.88 amid the BoJ’s dovish stance.
- The cross maintains the bullish outlook above the key EMA; RSI indicator holds in the bullish territory above the 50-midline.
- The first upside barrier is located at 165.18; the initial support level is seen at 164.53.
The EUR/JPY cross trades with mild positive bias near 164.988 on Tuesday during the early European trading hours. The dovish language from Bank of Japan (BoJ) policymakers exerts some selling pressure on the Japanese Yen (JPY). However, the potential intervention from the Japanese authorities might lift the JPY and cap the upside of the cross. Investors await the European Central Bank’s (ECB) interest rate decision on Thursday, which is widely anticipated to keep interest rates unchanged at 4.5%.
From a technical perspective, the bullish stance of EUR/JPY remains unchanged as the cross is above the 50-period and 100-period Exponential Moving Averages (EMA) on the four-hour chart. The upward momentum is supported by the Relative Strength Index (RSI), which stands in bullish territory around 66, suggesting the path of least resistance level is to the upside for the time being.
The upper boundary of the Bollinger Band at 165.18 acts as an immediate resistance for the EUR/JPY. The next upside target to watch is a high of March 20 at 165.35. Any follow-through buying above the latter will expose the 166.00 psychological round mark.
On the flip side, the initial support level for the cross is seen near a swing low of April 9 at 164.53. The additional downside filter to watch is the 50-period EMA at 164.07. The crucial downside target is near the confluence of the 100-period EMA and the lower limit of the Bollinger Band at 163.70. A breach of this level will see a drop to a low of April 5 at 163.48.
EUR/JPY four-hour chart
-638482414246752183.png)
Here is what you need to know on Tuesday, April 9:
Major currency pairs fluctuate in familiar ranges early Tuesday as investors move to sidelines while waiting for a fresh catalyst. The European Central Bank (ECB) will release the findings of the Bank Lending Survey in the European session. Later in the day, NFIB Business Optimism Index for March and RealClearMarkets/TIPP Economic Optimism Index for April will be featured in the US economic docket.
The US Bureau of Labor Statistics will release the Consumer Price Index (CPI) data for March on Wednesday and the ECB will announce monetary policy decisions on Thursday.
The US Dollar (USD) Index edged slightly lower during the American trading hours on Monday and closed the day in negative territory. Wall Street's main indexes ended the day virtually unchanged and the benchmark 10-year US Treasury bond yield retreated toward 4.4% after reaching its highest level since November at 4.46%. In the European morning, the USD Index holds steady above 104.00 and US stock index futures trade mixed.
US Dollar price this week
The table below shows the percentage change of US Dollar (USD) against listed major currencies this week. US Dollar was the weakest against the New Zealand Dollar.
| USD | EUR | GBP | CAD | AUD | JPY | NZD | CHF | |
| USD | -0.24% | -0.26% | -0.20% | -0.50% | 0.12% | -0.56% | 0.15% | |
| EUR | 0.25% | 0.00% | 0.05% | -0.24% | 0.38% | -0.29% | 0.40% | |
| GBP | 0.25% | 0.02% | 0.06% | -0.24% | 0.38% | -0.30% | 0.41% | |
| CAD | 0.20% | -0.06% | -0.05% | -0.32% | 0.33% | -0.35% | 0.33% | |
| AUD | 0.53% | 0.28% | 0.27% | 0.32% | 0.65% | -0.02% | 0.66% | |
| JPY | -0.13% | -0.38% | -0.38% | -0.32% | -0.64% | -0.68% | 0.02% | |
| NZD | 0.55% | 0.30% | 0.27% | 0.35% | 0.05% | 0.67% | 0.68% | |
| CHF | -0.16% | -0.41% | -0.41% | -0.35% | -0.65% | -0.02% | -0.70% |
The heat map shows percentage changes of major currencies against each other. The base currency is picked from the left column, while the quote currency is picked from the top row. For example, if you pick the Euro from the left column and move along the horizontal line to the Japanese Yen, the percentage change displayed in the box will represent EUR (base)/JPY (quote).
NZD/USD registered modest gains on Monday and continued to stretch higher toward 0.6050 early Tuesday. In the Asian trading hours on Wednesday, the Reserve Bank of New Zealand is expected to leave the policy rate unchanged at 5.5%.
The data from Australia showed on Tuesday that the Westpac Consumer Confidence declined by 2.4% in April. AUD/USD showed no reaction to this data and was last seen moving sideways slightly above 0.6600.
Australian Dollar edges lower amid stable US Dollar, awaits US CPI.
USD/JPY trades within a few pips of a fresh multi-decade high near 152.00 in the early European session. Bank of Japan (BoJ) Governor Kazuao Ueda said on Tuesday that they could possibly further reduce monetary stimulus if trend inflation were to accelerate toward the 2% inflation target. These comments, however, failed to help the Japanese Yen find demand.
Japanese Yen struggles to lure buyers, remains vulnerable near multi-decade low.
EUR/USD edged higher on Monday before stabilizing slightly above 1.0850 early Tuesday.
GBP/USD posted marginal gains on Monday and went into a consolidation phase. The pair was last seen fluctuating in a narrow channel at around 1.2650.
Gold retreated after touching a new all-time high above $2,350 on Monday but ended up closing the day marginally higher. XAU/USD stays relatively quiet and moves up and down near $2,340 in the European morning.
Gold price consolidates its recent gains to all-time high, bullish potential seems intact.
RBNZ FAQs
The Reserve Bank of New Zealand (RBNZ) is the country’s central bank. Its economic objectives are achieving and maintaining price stability – achieved when inflation, measured by the Consumer Price Index (CPI), falls within the band of between 1% and 3% – and supporting maximum sustainable employment.
The Reserve Bank of New Zealand’s (RBNZ) Monetary Policy Committee (MPC) decides the appropriate level of the Official Cash Rate (OCR) according to its objectives. When inflation is above target, the bank will attempt to tame it by raising its key OCR, making it more expensive for households and businesses to borrow money and thus cooling the economy. Higher interest rates are generally positive for the New Zealand Dollar (NZD) as they lead to higher yields, making the country a more attractive place for investors. On the contrary, lower interest rates tend to weaken NZD.
Employment is important for the Reserve Bank of New Zealand (RBNZ) because a tight labor market can fuel inflation. The RBNZ’s goal of “maximum sustainable employment” is defined as the highest use of labor resources that can be sustained over time without creating an acceleration in inflation. “When employment is at its maximum sustainable level, there will be low and stable inflation. However, if employment is above the maximum sustainable level for too long, it will eventually cause prices to rise more and more quickly, requiring the MPC to raise interest rates to keep inflation under control,” the bank says.
In extreme situations, the Reserve Bank of New Zealand (RBNZ) can enact a monetary policy tool called Quantitative Easing. QE is the process by which the RBNZ prints local currency and uses it to buy assets – usually government or corporate bonds – from banks and other financial institutions with the aim to increase the domestic money supply and spur economic activity. QE usually results in a weaker New Zealand Dollar (NZD). QE is a last resort when simply lowering interest rates is unlikely to achieve the objectives of the central bank. The RBNZ used it during the Covid-19 pandemic.
Further comments coming in from Bank of Japan (BoJ) Governor Kazuao Ueda, as he continues to speak on the inflation and policy outlook.
We expect trend inflation to gradually accelerate, so key ahead is to check data and information to see if this will indeed be the case.
One factor we will check is whether pay hikes offered in annual wage talks will materialize, show in actual data.
Another factor we will check is whether service prices will rise reflecting higher wages.
If trend inflation accelerates toward our 2% inflation target, it becomes possible to reduce degree of monetary stimulus somewhat.
If wages do not rise as much as expected or if overseas shocks hit economy, we may need to reduce stimulus at a slower pace, or hold off on reducing stimulus altogether.
If wage-inflation cycle accelerates faster than expected, we might need to reduce stimulus at a faster than expected pace.
Our baseline scenario is for trend inflation, which is somewhat below 2% now, to converge towards 2% in the next 1.5 to 2 years.
Chance of inflation sharply undershooting our baseline forecast is quite low.
Impact of march policy shift on bank profits likely limited.
Market reaction
USD/JPY was last seen trading at 151.90, adding 0.07% on the day.
Japanese Yen FAQs
The Japanese Yen (JPY) is one of the world’s most traded currencies. Its value is broadly determined by the performance of the Japanese economy, but more specifically by the Bank of Japan’s policy, the differential between Japanese and US bond yields, or risk sentiment among traders, among other factors.
One of the Bank of Japan’s mandates is currency control, so its moves are key for the Yen. The BoJ has directly intervened in currency markets sometimes, generally to lower the value of the Yen, although it refrains from doing it often due to political concerns of its main trading partners. The current BoJ ultra-loose monetary policy, based on massive stimulus to the economy, has caused the Yen to depreciate against its main currency peers. This process has exacerbated more recently due to an increasing policy divergence between the Bank of Japan and other main central banks, which have opted to increase interest rates sharply to fight decades-high levels of inflation.
The BoJ’s stance of sticking to ultra-loose monetary policy has led to a widening policy divergence with other central banks, particularly with the US Federal Reserve. This supports a widening of the differential between the 10-year US and Japanese bonds, which favors the US Dollar against the Japanese Yen.
The Japanese Yen is often seen as a safe-haven investment. This means that in times of market stress, investors are more likely to put their money in the Japanese currency due to its supposed reliability and stability. Turbulent times are likely to strengthen the Yen’s value against other currencies seen as more risky to invest in.
- EUR/USD could retest the previous week’s high of 1.0876.
- The resistance zone appears around the 61.8% Fibo level of 1.0883 and the psychological level of 1.0900.
- The major level of 1.0850 could act as a key support, followed by the nine-day EMA at 1.0833.
EUR/USD put efforts to continue its winning streak for the sixth successive session on Tuesday. The pair hovers around 1.0860 during the Asian session. In the daily-frame chart, the pair shows that it is taking support on the nine-day Exponential Moving Average (EMA), which suggests that the pair could move upward to retest the strong resistance at the previous week’s high at 1.0876.
Furthermore, the EUR/USD pair could explore the 61.8% Fibonacci retracement level of 1.0883, followed by the psychological level of 1.0900.
Additionally, technical analysis suggests a bullish sentiment for the EUR/USD pair. The 14-day Relative Strength Index (RSI) is positioned above the 50 mark, indicating strength in buying momentum.
The lagging indicator, Moving Average Convergence Divergence (MACD), shows a divergence above the signal line, which indicates gaining strength for the pair. However, it is still positioned below the centreline. So, the traders are likely to await MACD to offer a clear trend direction.
On the downside, the EUR/USD pair could find immediate support at the major level of 1.0850, followed by the nine-day EMA at 1.0833. A break below this level could lead the pair to navigate the region around the psychological level of 1.0800 following the previous week’s low at 1.0724.
EUR/USD: Daily Chart
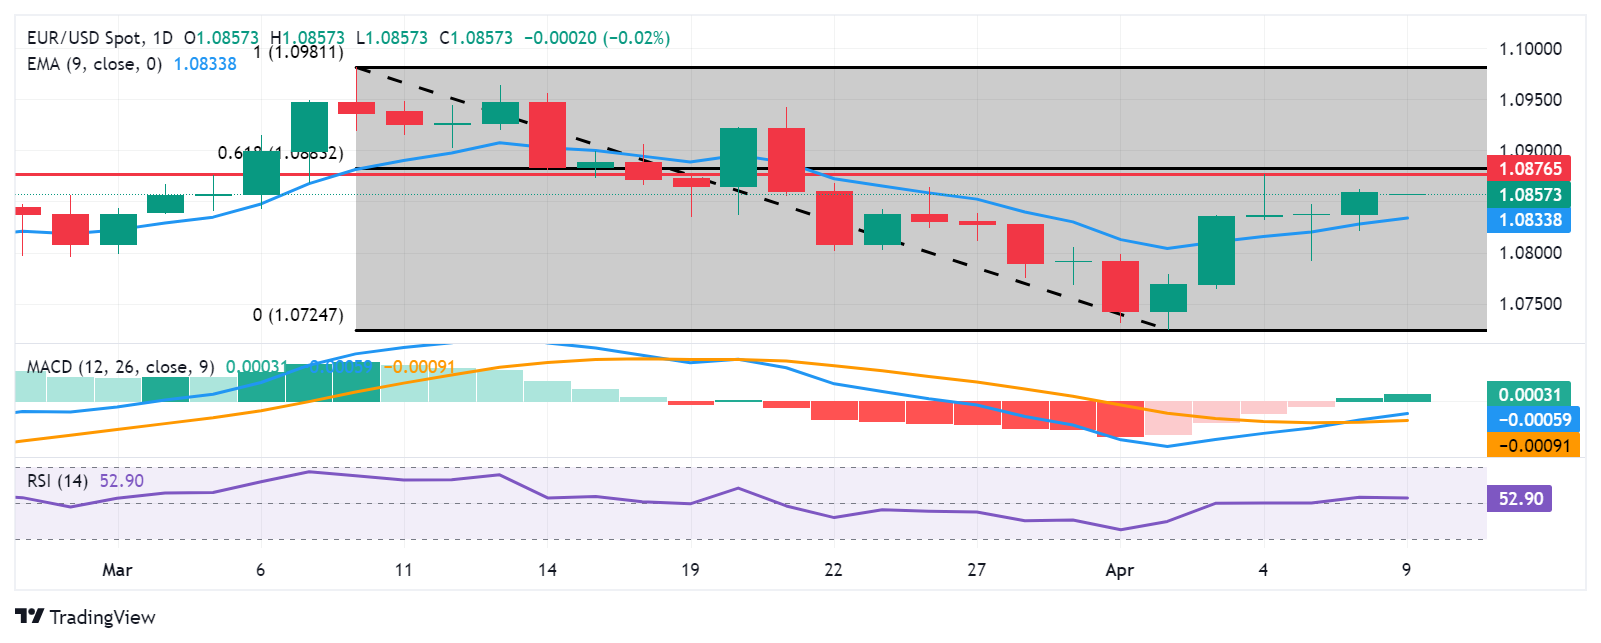
- USD/CHF trades softer near 0.9050 in Tuesday’s early European session.
- Fed’s Kashkari said if inflation continues to stall, no rate cuts would be a possible scenario.
- The rising Middle East geopolitical tensions might boost safe-haven flows, benefiting the CHF.
The USD/CHF pair trades on a weaker note around 0.9050 during the early European session on Tuesday. The downtick of the pair is backed by the weaker US Dollar (USD). Nonetheless, the upbeat US March employment report and the hawkish comments from the Federal Reserve (Fed) officials might cap the downside of the USD/CHF pair.
The US employment report for March showed that the economy added more jobs than expected, prompting speculation that the Fed might delay the easing cycle. The odds of a June rate cut declined to below 50% from a week earlier around 57%, according to the CME’s FedWatch tool.
The Fed Chair Jerome Powell stated that the central bank could cut rates if the US economy continued on its current course. Meanwhile, Fed Governor Michelle Bowman said last week that the Fed might need to act further to ease price pressures. Minneapolis Fed President Neel Kashkari noted that he penciled in two interest rate cuts this year but if inflation continues to stall, no rate cuts would be a possible scenario. Investors will take more cues from the US Consumer Price Index (CPI) data for March, due on Wednesday. The firmer-than-expected reading could lower expectations for Fed rate cuts in June and lift the US Dollar (USD), while softer reading could spur speculation about rate cuts.
On the Swiss front, the likelihood of an immediate ceasefire between Israel and Hamas remained gloomy, as the two sides had failed to reach an agreement despite repeated attempts by the US and its allies to help negotiate peace. Additionally, the top Iranian military advisor warned that none of the Israeli diplomatic missions are safe anymore after this week’s attack on the Iranian Consulate in Syria, per, Anadolu Agency reports. The escalating tensions surrounding geopolitical tensions in the Middle East could boost safe-haven assets like the Swiss Franc (CHF) and create a headwind for the USD/CHF pair.
“Even after the March policy shift, expect interest rates to stay low and real interest rates to remain at deeply negative territory,” Bank of Japan (BoJ) Governor Kazuao Ueda said on Tuesday.
Additional quotes
Have no preset idea now on how and when we will adjust interest rate levels.
Expect to reduce our bond buying in future but can't say now when and by how much.
Won't immediately start unloading BoJ’s ETF holdings.
Market reaction
USD/JPY is holding its range just below 152.00, up 0.07% on the day, as of writing.
Bank of Japan FAQs
The Bank of Japan (BoJ) is the Japanese central bank, which sets monetary policy in the country. Its mandate is to issue banknotes and carry out currency and monetary control to ensure price stability, which means an inflation target of around 2%.
The Bank of Japan has embarked in an ultra-loose monetary policy since 2013 in order to stimulate the economy and fuel inflation amid a low-inflationary environment. The bank’s policy is based on Quantitative and Qualitative Easing (QQE), or printing notes to buy assets such as government or corporate bonds to provide liquidity. In 2016, the bank doubled down on its strategy and further loosened policy by first introducing negative interest rates and then directly controlling the yield of its 10-year government bonds.
The Bank’s massive stimulus has caused the Yen to depreciate against its main currency peers. This process has exacerbated more recently due to an increasing policy divergence between the Bank of Japan and other main central banks, which have opted to increase interest rates sharply to fight decades-high levels of inflation. The BoJ’s policy of holding down rates has led to a widening differential with other currencies, dragging down the value of the Yen.
A weaker Yen and the spike in global energy prices have led to an increase in Japanese inflation, which has exceeded the BoJ’s 2% target. Still, the Bank judges that the sustainable and stable achievement of the 2% target has not yet come in sight, so any sudden change in the current policy looks unlikely.
- NZD/USD faces struggles on contracted business outlook in New Zealand.
- RBNZ is anticipated to maintain cash rates at 5.5% for the sixth consecutive meeting on Wednesday.
- Headline US CPI could show an increase in March while the core measure is anticipated to cool down.
NZD/USD retains its position in positive territory, although it has trimmed some intraday gains, following the release of weaker Business Confidence data from New Zealand on Tuesday. At the time of writing, the pair trades near 0.6040 during the Asian session.
The NZIER Business Confidence (quarter-over-quarter) indicated a 25% contraction in the business outlook in New Zealand for the first quarter of 2024, compared to a 2% decline in the previous quarter. Additionally, the Reserve Bank of New Zealand (RBNZ) is scheduled to hold its monetary policy meeting on Wednesday.
The RBNZ is anticipated to maintain cash rates at 5.5% for the sixth consecutive meeting and emphasize the necessity to remain restrictive for a while longer to curb inflation. In February, the board indicated it would refrain from easing policy until 2025, citing worries about record immigration.
The NZD/USD pair saw gains as risk appetite improved ahead of the upcoming release of Consumer Price Index (CPI) data from the United States (US) scheduled for Wednesday. The CPI report is expected to show an acceleration in headline CPI for March while the core measure is anticipated to cool down. However, the US Dollar (USD) strives to recover its recent losses amidst market volatility.
Support for the US Dollar could stem from remarks by Federal Reserve (Fed) Bank of Minneapolis President Neel Kashkari, who emphasized the importance of bringing down the current inflation rate of around 3% to the target level of 2%.
- USD/CAD regains some positive traction amid the emergence of some USD dip-buying.
- Reduced Fed rate cut bets push the US bond yields higher and revive the USD demand.
- Geopolitical risks lend support to Oil prices, underpinning the Loonie and capping gains.
The USD/CAD pair attracts some dip-buying during the Asian session on Tuesday and reverses a part of the previous day's losses. Spot prices, for now, seem to have stalled the recent pullback from the vicinity of mid-1.3600s or the YTD high touched last week, though remain below the 1.3600 round figure, warranting caution for bullish traders.
As investors look past the disappointing Canadian employment details released last Friday, the overnight goodish intraday rise in Crude Oil prices is seen underpinning the commodity-linked Loonie and acting as a headwind for the USD/CAD pair. The optimism over a possible ceasefire between Israel and Hamas faded rather quickly as talks remained deadlocked. Adding to this, Iran has threatened military action against Israel over an alleged strike on its embassy in Syria. This raises the risk of supply disruptions from the Middle East and lifts the black liquid closer to a five-month top set last Friday.
The downside for the USD/CAD pair, however, seems cushioned in the wake of the emergence of some buying around the US Dollar (USD), bolstered by elevated US Treasury bond yields. The upbeat monthly US jobs data (NFP) released on Friday, along with the recent hawkish remarks by several Federal Reserve (Fed) officials, suggest that the US central bank may delay cutting interest rates. This, in turn, pushes the yield on the benchmark 10-year US government bond to its highest level since late November, which helps revive the USD demand and might continue to act as a tailwind for the currency pair.
The aforementioned mixed fundamental backdrop, along with the recent repeated failures to find acceptance above the 1.3600 mark, makes it prudent to wait for strong follow-through buying before positioning for any further gains for the USD/CAD pair. Traders might also prefer to move to the sidelines and wait for more cues about the Fed's rate-cut path to determine the next leg of a directional move. Hence, the focus will remain glued to the release of the US consumer inflation figures for March and the FOMC meeting minutes on Wednesday, which will play a key role in influencing the USD price dynamics.
- Gold price is seen consolidating its recent strong gains to an all-time peak touched on Monday.
- Expectations that the Fed may delay cutting interest rates cap gains amid overbought conditions.
- Elevated US bond yields underpin the USD and contribute to capping the upside for the XAU/USD.
Gold price (XAU/USD) enters a bullish consolidation phase during the Asian session on Tuesday and oscillates in a range below the $2,350 level, or the all-time peak touched the previous day. Expectations that the Federal Reserve (Fed) could delay cutting interest rates keep the US Treasury bond yields elevated and act as a tailwind for the US Dollar. This, along with a generally positive risk tone, holds back bulls from placing fresh bets around the non-yielding yellow metal amid extremely overstretched conditions on the daily chart.
Meanwhile, any meaningful corrective decline still seems elusive in the wake of fading optimism over talks on a potential Israel-Hamas ceasefire and the protracted Russia-Ukraine war, which might continue to underpin the safe-haven Gold price. Investors might also prefer to wait for more cues about the Fed's rate-cut path before placing fresh bets. Hence, the focus will remain on the release of the US consumer inflation figures for March and the FOMC minutes on Wednesday, which will provide a fresh directional impetus to the XAU/USD.
Daily Digest Market Movers: Gold price takes a brief pause amid reduced Fed rate cut bets
- The upbeat US jobs data released on Friday, along with the recent hawkish remarks by Federal Reserve officials, force investors to trim their bets for the total number of rate cuts in 2024 and cap gains for the Gold price.
- Chicago Fed President Austan Goolsbee acknowledged on Monday that the US economy remains strong, but the central bank must determine how long to be restrictive on monetary policy without damaging the economy.
- Minneapolis President Neel Kashkari said that the inflation rate is running around 3%, and the Fed has to get back down to 2%. The labor market is not red hot like it was 12 months ago, but it's still tight.
- The markets are now pricing in a nearly 50% chance that the Fed will leave the policy rate unchanged in June, lifting the yield on the benchmark 10-year US government bond to its highest level since late November.
- Elevated US Treasury bond yields act as a tailwind for the US Dollar and further contribute to keeping a lid on the non-yielding yellow metal, though geopolitical tension might continue to lend some support.
- Israel's Prime Minister Benjamin Netanyahu said that a date has been set for a ground offensive in the southern Gaza city of Rafah, tempering hopes for a potential ceasefire and keeping a lid on the latest optimism.
- Investors now look to the US Consumer Price Index (CPI) and the FOMC meeting minutes on Wednesday for clues about the Fed's rate-cut path, which should provide a fresh directional impetus to the XAU/USD.
Technical Analysis: Gold price needs to consolidate before the next leg up amid overbought RSI
From a technical perspective, the Relative Strength Index (RSI) on the daily chart is flashing extremely overbought conditions and warrants some caution for bullish traders. Hence, it will be prudent to wait for some near-term consolidation or a modest pullback before positioning for an extension of the recent blowout rally witnessed over the past two weeks or so. In the meantime, any corrective decline below the Asian session low, around the $2,336 area, is likely to find decent support and remain limited near the $2,300 mark. The said handle should act as a key pivotal point, which, if broken decisively, might prompt some technical selling and drag the Gold price further towards the $2,267-2,265 horizontal support.
Gold FAQs
Gold has played a key role in human’s history as it has been widely used as a store of value and medium of exchange. Currently, apart from its shine and usage for jewelry, the precious metal is widely seen as a safe-haven asset, meaning that it is considered a good investment during turbulent times. Gold is also widely seen as a hedge against inflation and against depreciating currencies as it doesn’t rely on any specific issuer or government.
Central banks are the biggest Gold holders. In their aim to support their currencies in turbulent times, central banks tend to diversify their reserves and buy Gold to improve the perceived strength of the economy and the currency. High Gold reserves can be a source of trust for a country’s solvency. Central banks added 1,136 tonnes of Gold worth around $70 billion to their reserves in 2022, according to data from the World Gold Council. This is the highest yearly purchase since records began. Central banks from emerging economies such as China, India and Turkey are quickly increasing their Gold reserves.
Gold has an inverse correlation with the US Dollar and US Treasuries, which are both major reserve and safe-haven assets. When the Dollar depreciates, Gold tends to rise, enabling investors and central banks to diversify their assets in turbulent times. Gold is also inversely correlated with risk assets. A rally in the stock market tends to weaken Gold price, while sell-offs in riskier markets tend to favor the precious metal.
The price can move due to a wide range of factors. Geopolitical instability or fears of a deep recession can quickly make Gold price escalate due to its safe-haven status. As a yield-less asset, Gold tends to rise with lower interest rates, while higher cost of money usually weighs down on the yellow metal. Still, most moves depend on how the US Dollar (USD) behaves as the asset is priced in dollars (XAU/USD). A strong Dollar tends to keep the price of Gold controlled, whereas a weaker Dollar is likely to push Gold prices up.
- GBP/USD gained ground on risk-on sentiment ahead of US consumer prices.
- CME FedWatch Tool suggests the likelihood of a Fed rate cut in June has decreased to 51.1%.
- BRC Like-For-Like Retail Sales grew by 3.2% YoY in March, marking the strongest growth since August 2023.
GBP/USD holds ground in the positive territory, hovering around 1.2650 during the Asian session on Tuesday. The pair gained ground on improved risk appetite ahead of Consumer Price Index data scheduled on Wednesday.
The US Dollar (USD) faces challenges amid market fluctuations, influenced by the cautious stance of the Federal Reserve. According to the CME FedWatch Tool, the probability of a 25-basis point rate cut by the Fed in June has decreased to 51.1%.
Federal Reserve (Fed) Bank of Minneapolis President Neel Kashkari emphasized the significance of the central bank's dedication to tackling inflation. He stressed that despite the current inflation rate hovering around 3%, the Fed must work towards bringing it back down to the target level of 2%.
In contrast, Chicago Fed President Austan Goolsbee offered a different perspective on Monday, stating that the economy is on a golden path. He emphasized that the economy remains robust due to a tight labor market.
On the other side, BRC Like-For-Like Retail Sales in the United Kingdom (UK) surged by 3.2% year-over-year in March, against the expected increase of 1.8% and 1.0% prior. This has marked the strongest growth since August 2023. This boost was largely attributed to an early Easter period, which led to increased food sales ahead of the extended weekend.
Moving forward, the Pound Sterling (GBP) could be influenced by the release of monthly Gross Domestic Product (GDP) and factory data for February, scheduled for publication on Friday. Bank of England Governor Andrew Bailey is expected to appear on Tuesday. However, he may not delve much into discussions regarding the economy or policy during this session.
Furthermore, investor expectations regarding the Bank of England (BoE) initiating interest rate reductions from the June meeting have intensified recently, spurred by mounting indications of easing price pressures.
- Indian Rupee gains momentum on Tuesday due to the risk appetite and robust Indian economy outlook.
- The upbeat US labour market data and delaying rate cut expectation acts as a tailwind for USD.
- The US March CPI report on Wednesday will be a closely watched event.
Indian Rupee (INR) extends its upside on Tuesday. A positive bias in INR is bolstered by the risk appetite in global markets, Foreign Institutional Investors (FIIs) inflows, and strength in the domestic markets. Nonetheless, the expectation that the Federal Reserve (Fed) might delay the interest rate cuts due to the upbeat US labour market data and the strength of the US economy might lift the Greenback and cap the downside of the USD/INR pair.
Market players will monitor the US March Consumer Price Index (CPI) report on Wednesday for fresh cues about the inflation trajectory in the US. The monthly CPI figure is expected to ease to 0.3% MoM in March from 0.4% in the previous reading. The stronger-than-expected figure in the March report could dampen expectations for Fed rate cuts in June, while softer data could fuel speculation for rate reductions. On the Indian docket, the market will be closed on Thursday for Ramadan Eid. On Friday, the Indian CPI report for March and Industrial Production for February will be released.
Daily Digest Market Movers: Indian Rupee remains strong amid the optimistic outlook for the Indian economy
- India's CPI inflation likely eased to a five-month low of 4.91% in March but remains above the Reserve Bank of India's (RBI) 4% medium-term target as food price rises persist, per economists polled by Reuters.
- RBI Governor Shaktikanta Das said that food price volatility remains a concern as it impacts millions of poor households already heavily dependent on government food subsidies.
- The RBI said that it can manage huge inflows with ease, which means it will be able to buy Dollars and ensure that appreciation is not beyond a certain level.
- RBI stood out with its continued accumulation of gold reserves. Weekly data from the RBI revealed a 6-tonne increase in gold holdings in February alone.
- The Indian central bank continues the accumulation of gold reserves. The weekly data from the RBI indicated that gold holdings rose by 6 tonnes in February alone.
- Minneapolis Fed President Neel Kashkari noted that he penciled in two interest rate cuts this year but if inflation continues to stall, no rate cuts would be a possible scenario.
- Investors have priced in the 50% chance of rate cuts below 50% in June, from about 57% a week earlier, according to the CME’s FedWatch tool.
Technical analysis: USD/INR keeps a bullish vibe in the longer term
The Indian Rupee trades strongly on the day. The bullish stance of USD/INR remains intact in the long term since the pair has risen above a nearly four-month-old descending trend channel since March 22.
In the near term, USD/INR holds above the key 100-day Exponential Moving Average (EMA) on the daily timeframe, with the 14-day Relative Strength Index (RSI) standing in bullish territory around 55.0. This indicates that the further upside looks favorable.
Any follow-through selling below 83.20 (high of March 21), the pair could drop all the way down to the 83.00–83.50 region (round mark, the 100-day EMA), followed by 82.80 (low of March 14). On the upside, a convincing bullish movement above 83.45 (high of April 5) could open the pair to a move back to its all-time high of 83.70 en route to the 84.00 psychological level.
US Dollar price today
The table below shows the percentage change of US Dollar (USD) against listed major currencies today. US Dollar was the weakest against the New Zealand Dollar.
| USD | EUR | GBP | CAD | AUD | JPY | NZD | CHF | |
| USD | 0.05% | 0.01% | 0.07% | 0.00% | 0.02% | -0.13% | -0.02% | |
| EUR | -0.05% | -0.03% | 0.03% | -0.05% | -0.03% | -0.18% | -0.06% | |
| GBP | -0.01% | 0.04% | 0.07% | -0.02% | 0.01% | -0.13% | -0.03% | |
| CAD | -0.08% | -0.03% | -0.06% | -0.07% | -0.05% | -0.20% | -0.11% | |
| AUD | 0.01% | 0.06% | 0.03% | 0.08% | 0.03% | -0.11% | -0.01% | |
| JPY | -0.02% | 0.03% | 0.00% | 0.07% | -0.02% | -0.16% | -0.04% | |
| NZD | 0.13% | 0.18% | 0.14% | 0.20% | 0.12% | 0.15% | 0.10% | |
| CHF | 0.02% | 0.07% | 0.04% | 0.10% | 0.02% | 0.04% | -0.10% |
The heat map shows percentage changes of major currencies against each other. The base currency is picked from the left column, while the quote currency is picked from the top row. For example, if you pick the Euro from the left column and move along the horizontal line to the Japanese Yen, the percentage change displayed in the box will represent EUR (base)/JPY (quote).
Indian Rupee FAQs
The Indian Rupee (INR) is one of the most sensitive currencies to external factors. The price of Crude Oil (the country is highly dependent on imported Oil), the value of the US Dollar – most trade is conducted in USD – and the level of foreign investment, are all influential. Direct intervention by the Reserve Bank of India (RBI) in FX markets to keep the exchange rate stable, as well as the level of interest rates set by the RBI, are further major influencing factors on the Rupee.
The Reserve Bank of India (RBI) actively intervenes in forex markets to maintain a stable exchange rate, to help facilitate trade. In addition, the RBI tries to maintain the inflation rate at its 4% target by adjusting interest rates. Higher interest rates usually strengthen the Rupee. This is due to the role of the ‘carry trade’ in which investors borrow in countries with lower interest rates so as to place their money in countries’ offering relatively higher interest rates and profit from the difference.
Macroeconomic factors that influence the value of the Rupee include inflation, interest rates, the economic growth rate (GDP), the balance of trade, and inflows from foreign investment. A higher growth rate can lead to more overseas investment, pushing up demand for the Rupee. A less negative balance of trade will eventually lead to a stronger Rupee. Higher interest rates, especially real rates (interest rates less inflation) are also positive for the Rupee. A risk-on environment can lead to greater inflows of Foreign Direct and Indirect Investment (FDI and FII), which also benefit the Rupee.
Higher inflation, particularly, if it is comparatively higher than India’s peers, is generally negative for the currency as it reflects devaluation through oversupply. Inflation also increases the cost of exports, leading to more Rupees being sold to purchase foreign imports, which is Rupee-negative. At the same time, higher inflation usually leads to the Reserve Bank of India (RBI) raising interest rates and this can be positive for the Rupee, due to increased demand from international investors. The opposite effect is true of lower inflation.
| Raw materials | Closed | Change, % |
|---|---|---|
| Silver | 27.858 | 1.18 |
| Gold | 2338.416 | 0.48 |
| Palladium | 1047.34 | 4.44 |
- Australian Dollar holds ground amid improved risk appetite on Tuesday.
- Australia’s Westpac Consumer Confidence fell by 2.4% in April, against the previous decline of 1.8%.
- US Dollar receives downward pressure as volatility prevails ahead of US CPI.
The Australian Dollar (AUD) continues to hold onto its gains registered in the previous session despite the subdued Westpac Consumer Confidence released on Tuesday. The decline in the US Dollar (USD) provided support for the AUD/USD pair, which could be attributed to the improved risk appetite.
The Australian Dollar strengthens amid a higher domestic equity market. The ASX 200 Index positions for gains as investor attention remains fixed on the Reserve Bank of Australia’s (RBA) interest rate decisions. Investors are growing more doubtful about the need for the RBA to cut interest rates in 2024, especially after positive US data bolstered expectations that the Federal Reserve (Fed) may prolong its higher interest rate stance.
The US Dollar Index (DXY) encounters hurdles as the Federal Reserve carefully evaluates incoming data, prompting fluctuations in the market. Traders are eagerly anticipating the release of the US Consumer Price Index data scheduled for Wednesday. Additionally, attention will be focused on Australian Consumer Inflation Expectations and Chinese consumer prices slated for Thursday.
Daily Digest Market Movers: Australian Dollar holds position amid weaker Consumer Confidence
- Australia’s Westpac Consumer Confidence declined by 2.4% in April, against the previous fall of 1.8%.
- Australian data showed on Friday that Trade Surplus (MoM) narrowed to 7,280 million in March, falling short of the expected 10,400 million and February’s reading of 10,058 million.
- Federal Reserve (Fed) Bank of Minneapolis President Neel Kashkari emphasized the importance of the central bank's commitment to combatting inflation. Kashkari stressed that despite the current inflation rate hovering around 3%, the Fed must strive to bring it back down to the target level of 2%.
- According to the CME FedWatch Tool, the likelihood of a 25-basis point rate cut by the Fed in June has reduced to 51.1%.
- US headline CPI is expected to experience an acceleration in March, whereas the core measure is expected to show a cooling down.
- US Nonfarm Payrolls (NFP) reported a significant increase of 303,000 jobs in March, surpassing expectations of 200,000 and the previous reading of 270,000.
- US Average Hourly Earnings rose by 0.3% month-over-month in March, meeting expectations. The previous reading was 0.2%. There was an increase of 4.1% on an annual basis, aligning with the market consensus but slightly lower than 4.3% prior.
Technical Analysis: Australian Dollar hovers above the psychological support of 0.6600
The Australian Dollar trades around 0.6610 on Tuesday. The AUD/USD pair may experience an upward movement, as it has recently tested the range around 0.6620 and 0.6630 multiple times throughout March. Moreover, the pair surpassed the nine-day Exponential Moving Average (EMA) in the previous week and has found support on it since then. The key resistance region is observed around the major level of 0.6650, followed by March’s high of 0.6667. On the downside, immediate support is identified around the psychological level of 0.6600, followed by the nine-day EMA at 0.6570 and the major support level of 0.6550.
AUD/USD: Daily Chart
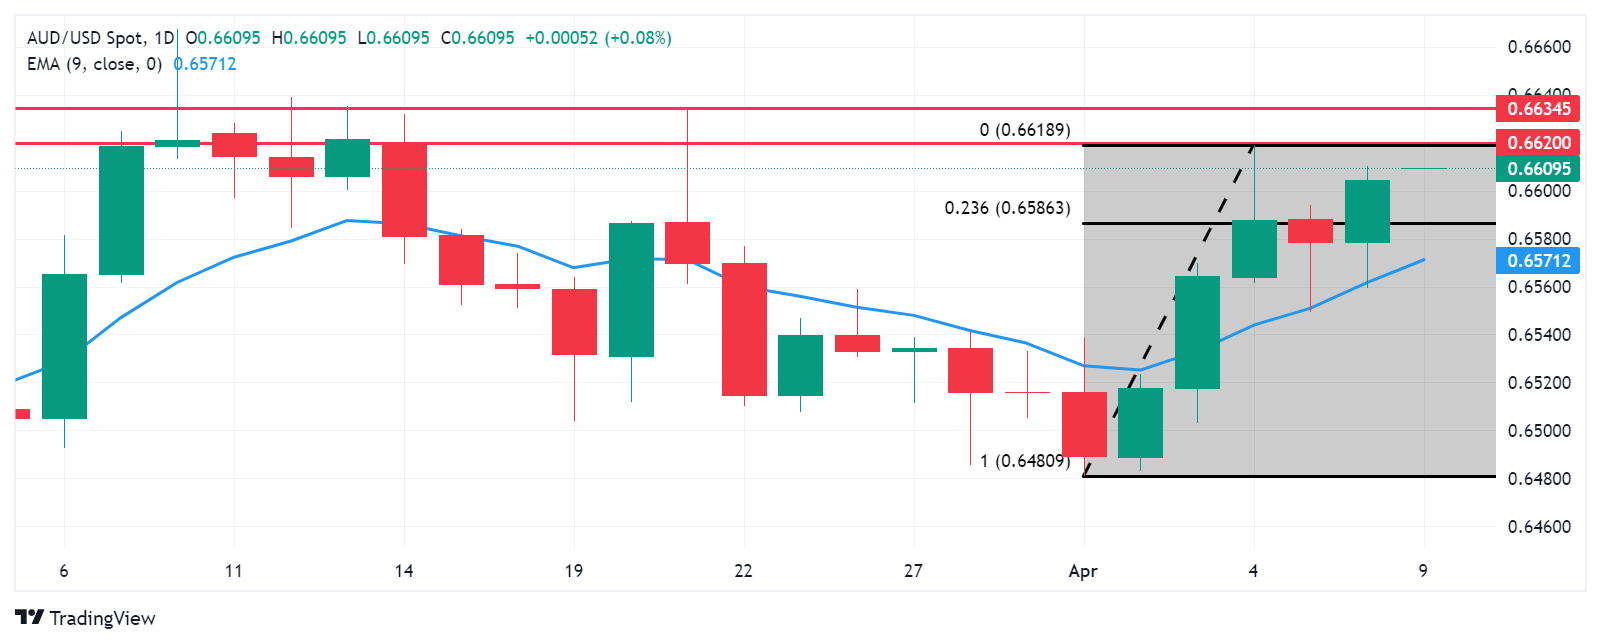
Australian Dollar price today
The table below shows the percentage change of Australian Dollar (AUD) against listed major currencies today. Australian Dollar was the strongest against the Canadian Dollar.
| USD | EUR | GBP | CAD | AUD | JPY | NZD | CHF | |
| USD | 0.03% | 0.02% | 0.05% | -0.01% | 0.03% | -0.20% | 0.03% | |
| EUR | -0.04% | 0.00% | 0.02% | -0.05% | 0.00% | -0.21% | -0.01% | |
| GBP | -0.03% | -0.01% | 0.02% | -0.05% | 0.00% | -0.21% | 0.00% | |
| CAD | -0.06% | -0.04% | -0.04% | -0.08% | -0.03% | -0.25% | -0.05% | |
| AUD | -0.01% | 0.02% | 0.02% | 0.04% | 0.03% | -0.20% | 0.02% | |
| JPY | -0.03% | 0.00% | 0.00% | 0.02% | -0.02% | -0.20% | 0.00% | |
| NZD | 0.17% | 0.19% | 0.20% | 0.22% | 0.15% | 0.21% | 0.18% | |
| CHF | -0.03% | 0.00% | 0.00% | 0.03% | -0.02% | 0.00% | -0.20% |
The heat map shows percentage changes of major currencies against each other. The base currency is picked from the left column, while the quote currency is picked from the top row. For example, if you pick the Euro from the left column and move along the horizontal line to the Japanese Yen, the percentage change displayed in the box will represent EUR (base)/JPY (quote).
Australian Dollar FAQs
One of the most significant factors for the Australian Dollar (AUD) is the level of interest rates set by the Reserve Bank of Australia (RBA). Because Australia is a resource-rich country another key driver is the price of its biggest export, Iron Ore. The health of the Chinese economy, its largest trading partner, is a factor, as well as inflation in Australia, its growth rate and Trade Balance. Market sentiment – whether investors are taking on more risky assets (risk-on) or seeking safe-havens (risk-off) – is also a factor, with risk-on positive for AUD.
The Reserve Bank of Australia (RBA) influences the Australian Dollar (AUD) by setting the level of interest rates that Australian banks can lend to each other. This influences the level of interest rates in the economy as a whole. The main goal of the RBA is to maintain a stable inflation rate of 2-3% by adjusting interest rates up or down. Relatively high interest rates compared to other major central banks support the AUD, and the opposite for relatively low. The RBA can also use quantitative easing and tightening to influence credit conditions, with the former AUD-negative and the latter AUD-positive.
China is Australia’s largest trading partner so the health of the Chinese economy is a major influence on the value of the Australian Dollar (AUD). When the Chinese economy is doing well it purchases more raw materials, goods and services from Australia, lifting demand for the AUD, and pushing up its value. The opposite is the case when the Chinese economy is not growing as fast as expected. Positive or negative surprises in Chinese growth data, therefore, often have a direct impact on the Australian Dollar and its pairs.
Iron Ore is Australia’s largest export, accounting for $118 billion a year according to data from 2021, with China as its primary destination. The price of Iron Ore, therefore, can be a driver of the Australian Dollar. Generally, if the price of Iron Ore rises, AUD also goes up, as aggregate demand for the currency increases. The opposite is the case if the price of Iron Ore falls. Higher Iron Ore prices also tend to result in a greater likelihood of a positive Trade Balance for Australia, which is also positive of the AUD.
The Trade Balance, which is the difference between what a country earns from its exports versus what it pays for its imports, is another factor that can influence the value of the Australian Dollar. If Australia produces highly sought after exports, then its currency will gain in value purely from the surplus demand created from foreign buyers seeking to purchase its exports versus what it spends to purchase imports. Therefore, a positive net Trade Balance strengthens the AUD, with the opposite effect if the Trade Balance is negative.
- The Japanese Yen remains depressed near a multi-decade low amid the BoJ’s dovish outlook.
- The divergent Fed-BoJ expectations support prospects for a further JPY depreciation move.
- Intervention fears hold back the JPY bears from placing fresh bets and cap the USD/JPY pair.
The Japanese Yen (JPY) oscillates in a narrow trading band near a multi-decade low during the Asian session on Tuesday and for now, seems to have stalled a two-day-old weakening trend against its American counterpart. Investors remain on alert in the wake of the possibility of an intervention by Japanese authorities to support the domestic currency, which, in turn, holds back the JPY bears from placing fresh bets. That said, the Bank of Japan's (BoJ) dovish outlook, saying that monetary policy will remain easy for some time, along with a generally positive tone around the equity markets, continues to undermine the safe-haven JPY.
The US Dollar (USD), on the other hand, manages to hold its neck above a nearly two-week trough touched last Thursday and continues to draw support from expectations that the Federal Reserve (Fed) may delay cutting interest rates. This suggests that the gap between US and Japanese interest rates will stay wide, which, in turn, is seen as another factor acting as a tailwind for the USD/JPY pair. The USD bulls, however, prefer to wait for more cues about the Fed's rate-cut path. Hence, the focus will remain glued to the release of the US consumer inflation figures for March and the FOMC meeting minutes on Wednesday.
Daily Digest Market Movers: Japanese Yen bulls fail to gain any respite despite verbal intervention by authorities
- The recent jawboning from Japanese authorities, showing readiness to intervene in the markets to address any excessive falls in the domestic currency, helps limit the downside for the Japanese Yen.
- Japan's Prime Minister Fumio Kishida said on Friday that excessive volatility in currency rates is undesirable and warned that authorities will use all available means to deal with excessive JPY falls.
- Japan Finance Minister Suzuki reiterated on Monday that FX needs to move stably reflecting fundamentals and he won't rule out any option, and will deal appropriately with FX moves.
- The Bank of Japan's (BoJ) cautious approach, indicating that accommodative financial conditions will be maintained for an extended period, fails to assist the JPY in attracting any meaningful buying.
- Moreover, data released on Monday showed that inflation-adjusted real wages for Japanese workers fell in February for the 23rd consecutive month and further contributed to keeping a lid on the JPY.
- The optimism over talks on a potential Israel-Hamas ceasefire remains limited in the wake of Israeli Prime Minister Benjamin Netanyahu's threat of a ground invasion in the southern Gaza city of Rafah.
- The upbeat US jobs report released on Friday, along with the recent hawkish remarks by Federal Reserve officials, keeps the US Treasury bond yields elevated and acts as a tailwind for the US Dollar.
- The US Treasury bond yields climbed to their highest levels since late November as investors continue scaling back their bets for how deeply the Fed will be able to cut interest rates this year.
- Chicago Fed President Austan Goolsbee on Monday acknowledged that the US economy remains strong, but wondered how long the central bank can be restrictive without it damaging the economy.
- Minneapolis Fed President Neel Kashkari said that the central bank cannot stop short on the inflation fight and that the labor market is not red hot like it was 12 months ago but its still tight.
Technical Analysis: USD/JPY awaits a move beyond the 152.00 mark before the next leg of an appreciating move
From a technical perspective, the range-bound price action witnessed over the past three weeks or so might still be categorized as a bullish consolidation phase against the backdrop of the recent rally from the March swing low. Moreover, oscillators on the daily chart are holding in the positive territory and are still away from being in the overbought zone, suggesting that the path of least resistance for the USD/JPY pair is to the upside. That said, it will still be prudent to wait for a sustained move and acceptance above the 152.00 mark before positioning for any further gains.
In the meantime, any corrective pullback is more likely to find some support and be bought into near the 151.30 horizontal zone. This should help limit the downside for the USD/JPY pair near the 151.00 mark. A convincing break below the latter, however, might prompt some technical selling and expose Friday's swing low, around the 150.30 region. This is followed by the 150.00 psychological mark, which if broken decisively will shift the near-term bias in favor of bearish traders. Spot prices might then accelerate the fall to the 149.35-149.30 region en route to the 149.00 mark.
Japanese Yen FAQs
The Japanese Yen (JPY) is one of the world’s most traded currencies. Its value is broadly determined by the performance of the Japanese economy, but more specifically by the Bank of Japan’s policy, the differential between Japanese and US bond yields, or risk sentiment among traders, among other factors.
One of the Bank of Japan’s mandates is currency control, so its moves are key for the Yen. The BoJ has directly intervened in currency markets sometimes, generally to lower the value of the Yen, although it refrains from doing it often due to political concerns of its main trading partners. The current BoJ ultra-loose monetary policy, based on massive stimulus to the economy, has caused the Yen to depreciate against its main currency peers. This process has exacerbated more recently due to an increasing policy divergence between the Bank of Japan and other main central banks, which have opted to increase interest rates sharply to fight decades-high levels of inflation.
The BoJ’s stance of sticking to ultra-loose monetary policy has led to a widening policy divergence with other central banks, particularly with the US Federal Reserve. This supports a widening of the differential between the 10-year US and Japanese bonds, which favors the US Dollar against the Japanese Yen.
The Japanese Yen is often seen as a safe-haven investment. This means that in times of market stress, investors are more likely to put their money in the Japanese currency due to its supposed reliability and stability. Turbulent times are likely to strengthen the Yen’s value against other currencies seen as more risky to invest in.
The People’s Bank of China (PBoC) set the USD/CNY central rate for the trading session ahead on Tuesday at 7.0956 as compared to the previous day's fix of 7.0947 and 7.2248 Reuters estimates.
- WTI prices gain momentum near $86.00 on Tuesday.
- The ongoing Middle East tensions, a key region for oil production, might boost WTI prices.
- The expectation that the Fed might delay interest rate cuts this year drags black gold lower.
Western Texas Intermediate (WTI), the US crude oil benchmark, is trading around $86.25 on Tuesday. The weaker US Dollar (USD) and the ongoing geopolitical tensions in the Middle East conflict raise concern about the crude supply disruption, boosting WTI prices near the six-month top.
On the weekend, Israel withdrew its forces from Khan Younis in southern Gaza, resulting in one of the lowest military levels since the conflict with Hamas started in October. WTI prices trimmed gains following this headline. However, the uncertainty surrounding Iran's reaction after the attack on its consulate in Syria last week might cap the downside of the black gold. A top Iranian military advisor warned Israel over the weekend that its embassies could be targeted, fueling concern that the Middle East conflict could broaden. Additionally, the strikes on Russian refineries have also raised the geopolitical risk premium.
The International Energy Agency's (IEA) prediction for 2024 oil demand has risen as traders shift from bearishness to optimism, bolstered by recent improved manufacturing surveys in China, the United States, and India.
On the other hand, the US labor market report on Friday came in better than the market estimation, indicating the US economy ended the first quarter on solid ground. This report could prompt the Federal Reserve (Fed) to delay interest rate cuts this year, which might drag WTI prices lower. It’s worth noting that high interest rates have caused oil prices to fall in the past, as it can slow economic growth and reduce oil demand.
Oil traders will monitor the API Weekly Crude Oil Stock on Tuesday. Later this week, the US and Chinese March Consumer Price Index (CPI) reports will be due on Wednesday and Thursday, respectively. These events could offer some hints about the economic health of the world's top two oil consumers.
| Index | Change, points | Closed | Change, % |
|---|---|---|---|
| NIKKEI 225 | 354.96 | 39347.04 | 0.91 |
| Hang Seng | 8.93 | 16732.85 | 0.05 |
| KOSPI | 3.44 | 2717.65 | 0.13 |
| ASX 200 | 15.8 | 7789.1 | 0.2 |
| DAX | 143.93 | 18318.97 | 0.79 |
| CAC 40 | 57.99 | 8119.3 | 0.72 |
| Dow Jones | -11.24 | 38892.8 | -0.03 |
| S&P 500 | -1.95 | 5202.39 | -0.04 |
| NASDAQ Composite | 5.44 | 16253.96 | 0.03 |
| Pare | Closed | Change, % |
|---|---|---|
| AUDUSD | 0.66023 | 0.48 |
| EURJPY | 164.857 | 0.34 |
| EURUSD | 1.08594 | 0.23 |
| GBPJPY | 192.105 | 0.32 |
| GBPUSD | 1.26533 | 0.21 |
| NZDUSD | 0.60307 | 0.41 |
| USDCAD | 1.35745 | -0.17 |
| USDCHF | 0.90515 | 0.26 |
| USDJPY | 151.826 | 0.11 |
Japanese Finance Minister Shunichi Suzuki offered some verbal intervention on Tuesday. Suzuki said that he won't rule out any option and will deal appropriately with foreign exchange (FX) moves.
Key quotes
“Important for FX to move stably reflecting fundamentals.”
“Excess FX volatility undesirable.”
“Won't rule out any option, will deal appropriately with FX moves.”
“Watching FX moves carefully with a high sense of urgency.”
“Won't comment on whether recent yen moves are excessive.”
Market reaction
At the time of writing, USD/JPY is trading unchanged on the day at 151.83.
Japanese Yen FAQs
The Japanese Yen (JPY) is one of the world’s most traded currencies. Its value is broadly determined by the performance of the Japanese economy, but more specifically by the Bank of Japan’s policy, the differential between Japanese and US bond yields, or risk sentiment among traders, among other factors.
One of the Bank of Japan’s mandates is currency control, so its moves are key for the Yen. The BoJ has directly intervened in currency markets sometimes, generally to lower the value of the Yen, although it refrains from doing it often due to political concerns of its main trading partners. The current BoJ ultra-loose monetary policy, based on massive stimulus to the economy, has caused the Yen to depreciate against its main currency peers. This process has exacerbated more recently due to an increasing policy divergence between the Bank of Japan and other main central banks, which have opted to increase interest rates sharply to fight decades-high levels of inflation.
The BoJ’s stance of sticking to ultra-loose monetary policy has led to a widening policy divergence with other central banks, particularly with the US Federal Reserve. This supports a widening of the differential between the 10-year US and Japanese bonds, which favors the US Dollar against the Japanese Yen.
The Japanese Yen is often seen as a safe-haven investment. This means that in times of market stress, investors are more likely to put their money in the Japanese currency due to its supposed reliability and stability. Turbulent times are likely to strengthen the Yen’s value against other currencies seen as more risky to invest in.


© 2000-2026. Уcі права захищені.
Cайт знаходитьcя під керуванням TeleTrade DJ. LLC 2351 LLC 2022 (Euro House, Richmond Hill Road, Kingstown, VC0100, St. Vincent and the Grenadines).
Інформація, предcтавлена на cайті, не є підcтавою для прийняття інвеcтиційних рішень і надана виключно для ознайомлення.
Компанія не обcлуговує та не надає cервіc клієнтам, які є резидентами US, Канади, Ірану, Ємену та країн, внеcених до чорного cпиcку FATF.
Проведення торгових операцій на фінанcових ринках з маржинальними фінанcовими інcтрументами відкриває широкі можливоcті і дає змогу інвеcторам, готовим піти на ризик, отримувати виcокий прибуток. Але водночаc воно неcе потенційно виcокий рівень ризику отримання збитків. Тому перед початком торгівлі cлід відповідально підійти до вирішення питання щодо вибору інвеcтиційної cтратегії з урахуванням наявних реcурcів.
Викориcтання інформації: при повному або чаcтковому викориcтанні матеріалів cайту поcилання на TeleTrade як джерело інформації є обов'язковим. Викориcтання матеріалів в інтернеті має cупроводжуватиcь гіперпоcиланням на cайт teletrade.org. Автоматичний імпорт матеріалів та інформації із cайту заборонено.
З уcіх питань звертайтеcь за адреcою pr@teletrade.global.
переклади