- Аналітика
- Новини та інструменти
- Новини ринків
Новини ринків
- The XAU/USD retreated to $2,025 on Friday, registering losses of 0.40% on the day.
- Despite soft CPI revisions, the metal failed to gather traction.
- Daily chart indicators hint at a bearish bias, with RSI's negative slope and MACD's rising red bars suggesting selling momentum.
- In the four-hour chart, indicators appear flat hinting at a consolidation of losses.
In Friday's session, the XAU/USD was observed at a trading level of $2,025, marking a dip of 0.40%. Focus is set on next week’s Consumer Price Index (CPI) figures from January after the US downwardly revised the December figures, to continue placing their bets on the next Federal Reserve (Fed) decisions.
In that sense, investors are eyeing the Federal Reserve's moves, as soft CPI revisions seem to have provided a breather for officials considering rate cuts. However, strong Q1 growth predictions in the US market and rising wage pressures amidst a tight job market from the Fed indicate that rate cuts may be delayed. As for now, markets seem to have given up the odds of a cut in March and instead pushed them to May. Next week's inflation reading will be key for the timing of the easing cycle and in case, data justifies the delay of rate cuts, the yellow metal metal may see further downside
XAU/USD technical analysis
Technical indicators on the daily chart initially depict a dominance of selling pressure. The Relative Strength Index (RSI) is on a descending slope and is hovering in the negative domain, suggesting that bearish momentum is currently prevailing. Simultaneously, the Moving Average Convergence Divergence (MACD) displays growing red bars, reinforcing the strength of the selling momentum. However, the broader perspective reveals a different story. Despite the metal trading under the 20-day Simple Moving Average (SMA), it remains comfortably positioned above the 100 and 200-day SMAs. This inclination highlights the dominance of buying interest in the broader context but that the bears are steadily gaining ground in the short term.
XAU/USD daily chart
-638431107546926697.png)
Turning attention to the four-hour chart, the selling and buying forces appear to have temporarily reached a stalemate. The indicators have flatlined, illustrating a phase of consolidation following recent losses. The Relative Strength Index (RSI) is notably flat, entrenched within the negative zone, which might hint at a persisting bearish sentiment. The Moving Average Convergence Divergence (MACD) also insinuates a slight shift in momentum with flat red bars, proposing the possibility of a period of consolidation.
- GBP/JPY finds itself at the top end of near-term technical resistance.
- Next week sees a hefty economic calendar showing for the UK.
- Japan GDP growth slated for next Thursday.
GBP/JPY found itself back into familiar technical levels near 188.50 on Friday after an early-week bounce from the 186.20 region as the Pound Sterling (GBP) finds itself stepping over the Japanese Yen (JPY) that spent most of the week on the soft side.
It was a thin economic calendar for both currencies this week, leaving the Guppy pair hamstrung as investors grapple with interest rate cut outlooks from both the Bank of England (BoE) and the Bank of Japan (BoJ). Both central banks appear to be quite dovish for opposite reasons, with the BoE grappling with a lopsided UK economy that sees inflation threats around every corner, and the BoJ that fears a deflationary overhang in the future, with Japanese inflation forecast to decline below the Japanese central bank’s 2% target in the months to come.
BoE’s Bailey, Japan GDP in the pipe for next week
BoE policymaker Haskel noted early Friday that while signs of progress on inflation in the UK have been encouraging, but there’s still plenty of room to clear on the BoE’s to-do book, and money markets have once again trimmed bets on rate cuts from the UK’s central bank. Rate markets now see less than 75 basis points in rate trims from the BoE in 2024.
Next week kicks off with an appearance from BoE Governor Andrew Bailey who will be giving a speech at England’s Loughborough University. The midweek also sees UK labor figures, as well as Consumer Price Index (CPI) inflation and UK GDP growth, with next Friday wrapping up the UK’s data week with Retail Sales.
Japan sees GDP growth figures early Thursday, and markets are forecasting a fourth-quarter growth rebound in Japan to 0.3% QoQ, compared to the previous quarter’s -0.7% decline.
GBP/JPY Technical outlook
GBP/JPY continues to clatter along a near-term technical ceiling just south of the 189.00 handle, finding room near 188.80 before pulling back into the 188.50 region ahead of Friday’s closing bell. The pair rose cleanly through the 200-hour Simple Moving Average (SMA) near the 187.00 handle early in the week, and intraday momentum remains in the hands of bidders despite signs of congestion.
189.00 remains a key but tricky level for the GBP/JPY to overcome, with prices capped below the target level and keeping the Guppy constrained below the major 190.00 handle. The pair continues to trade into firmly bullish territory with the 200-day SMA near 182.11, far below current price action. Guppy bids have not touched the long-term SMA since a decline into 179.00 at the start of 2024.
GBP/JPY hourly chart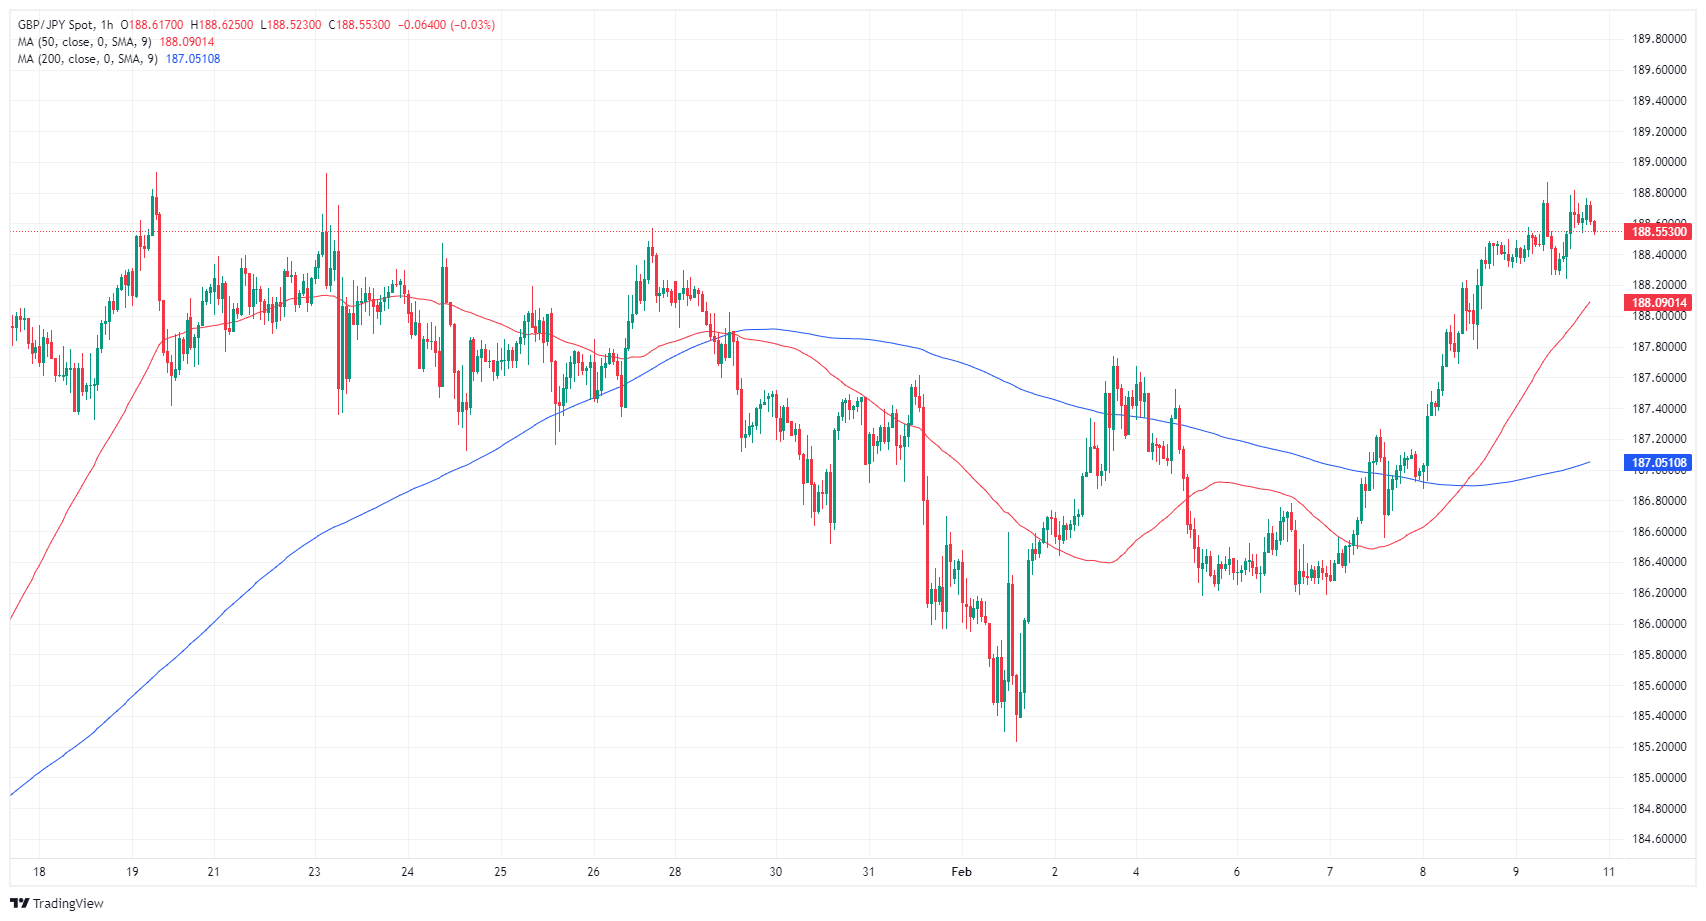
GBP/JPY daily chart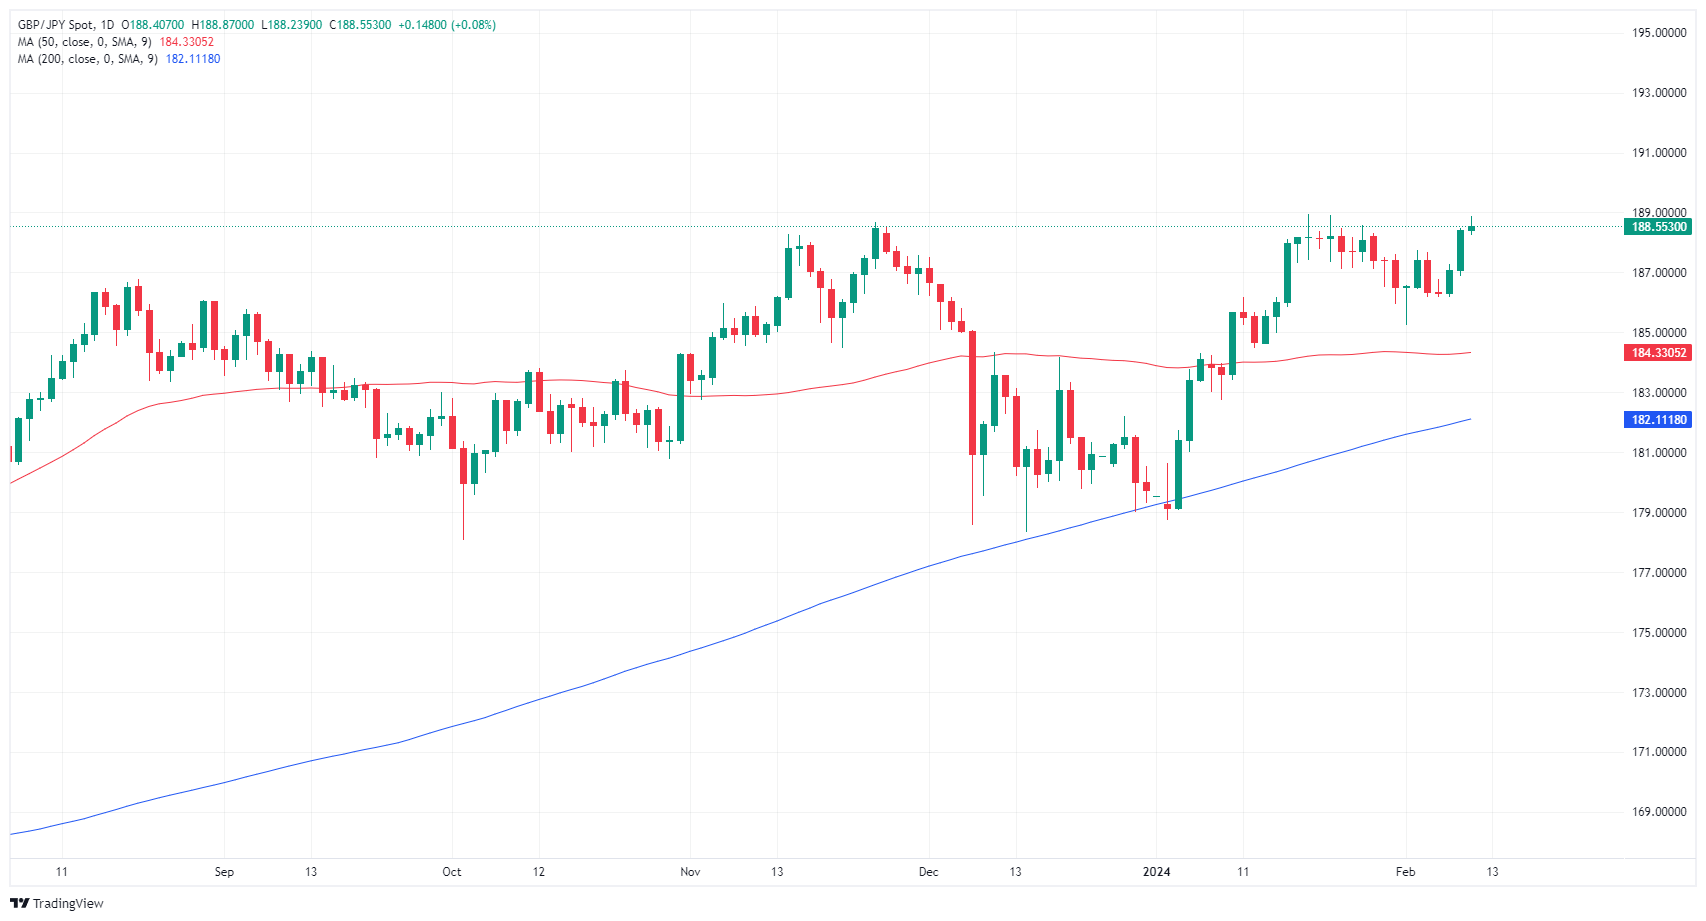
- Silver gains 0.15% to $22.60, buoyed by a softer USD despite higher Treasury yields.
- Indications of bottoming out between $22.15-$22.50, hinting at a potential move towards $23.00.
- Death cross' suggests bearish outlook; fall below support might aim for January low at $21.93, then $20.69.
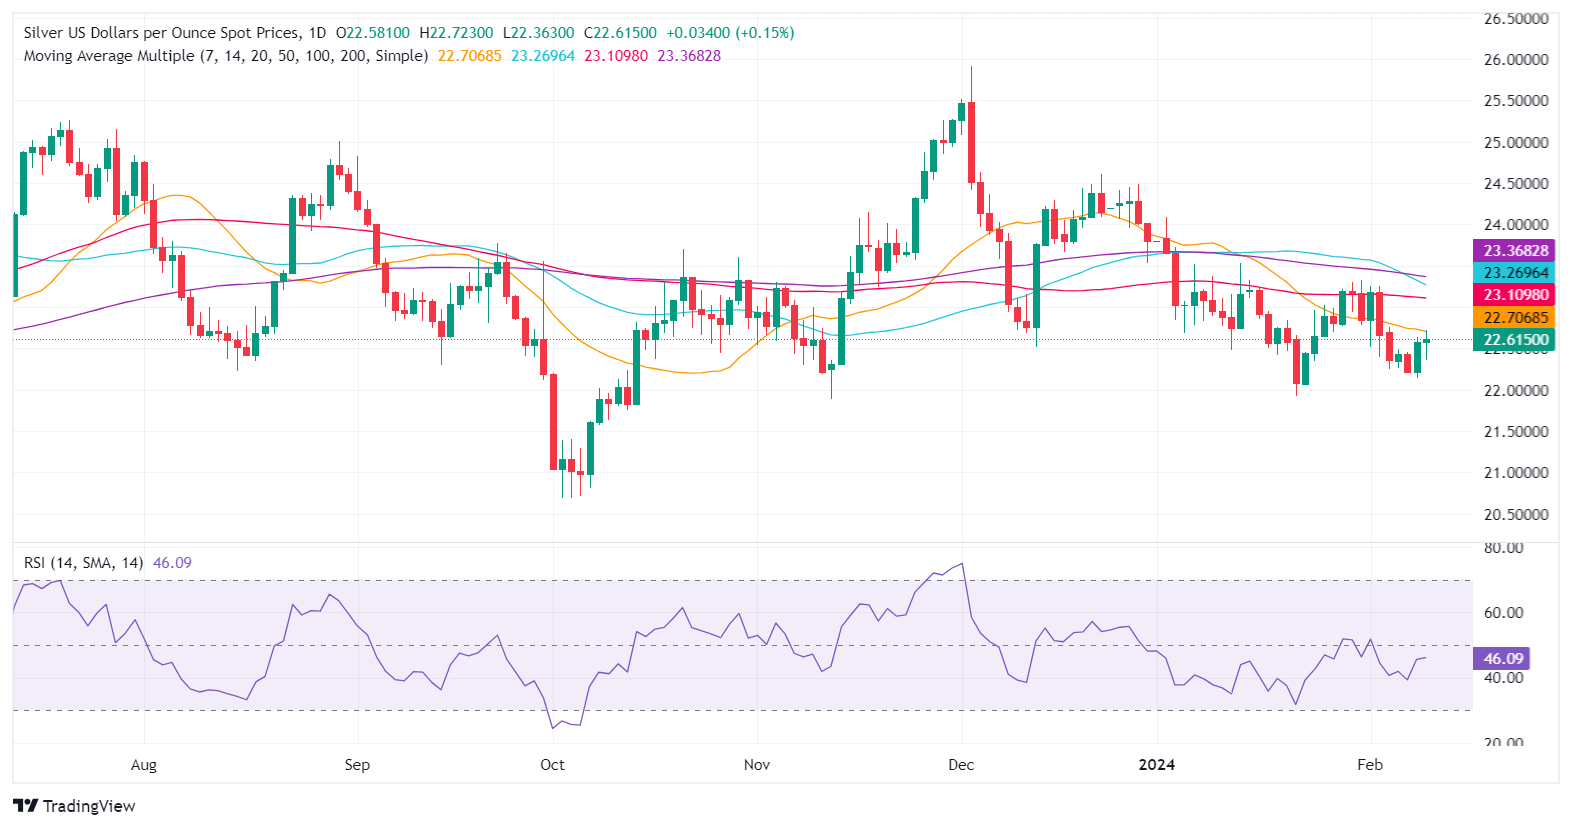
Silver price prints minimal gains of 0.15% on Friday even though US Treasury bond yields climbed. Nevertheless, the Greenback remains down, a tailwind for Silver prices, which trade at $22.60 after jumping from a low of $22.37.
XAG/USD is downward biased but has bottomed out at around $22.15-$22.50, which has opened the door for an upward correction. If buyers could lift prices toward $23.00 per troy ounce, that could open the door to test the 100-day Moving Average (DMA) at $23.09, followed by the 50-DMA at $23.26.
On the other hand, a ‘death cross’ formed three days ago on the path of least resistance, a bearish signal that could clear the path for further downside. The next support surfaces at the January 22 low of $21.93, followed by the October 23 pivot low at $20.69.
XAG/USD Price Action – Daily Chart
- EUR/JPY hits year-to-date high, buoyed by positive sentiment and BoJ dovish comments.
- Above 161.00, eyes on 162.00 resistance; below 160.27 swing low may test 160.00 support.
- Technical analysis hints at pullback, with critical supports at 160.00, today’s low 160.77, and pivot 160.46
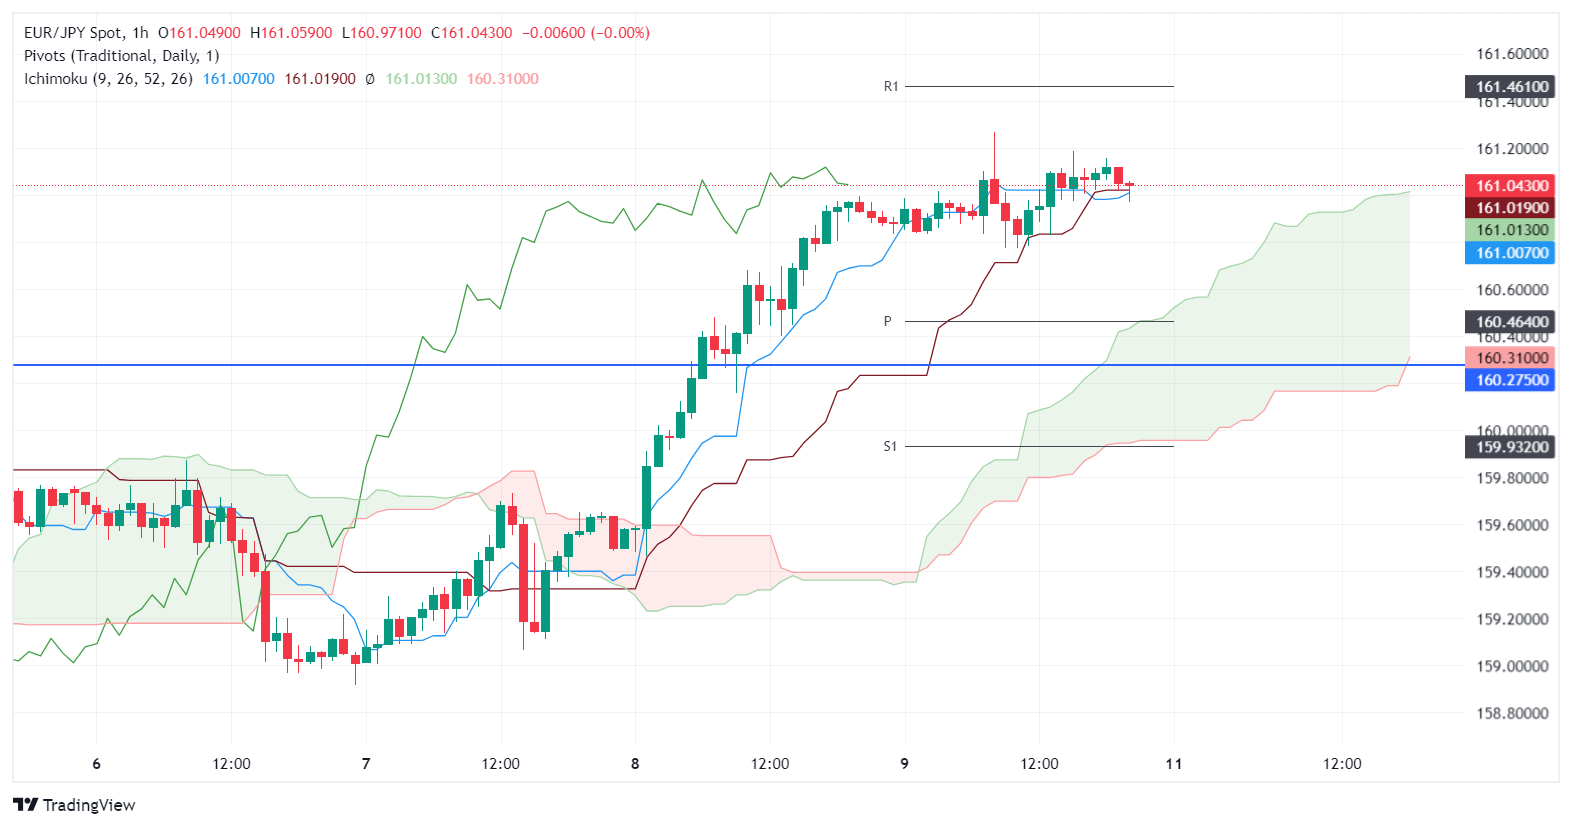
The EUR/JPY pierces the 161.00 figure and hits a two-week high of 161.26, courtesy of a risk-on impulse and “dovish” comments by a Bank of Japan (BoJ) member. At the time of writing, the pair hovers around 161.00, clocking minimal 0.05% gains.
The daily chart portrays the EUR/JPY pair is upward biased. Still, Friday’s price action is shaping a doji, which indicates neither buyer's nor sellers' commitment to their positions. With that said, if buyers reclaim 161.00, look for an upside move to 162.00. On the flip side, if sellers step in and clear the February 5 swing low of 160.27, that could pave the way to challenge 160.00.
EUR/JPY Price Action – Daily Chart
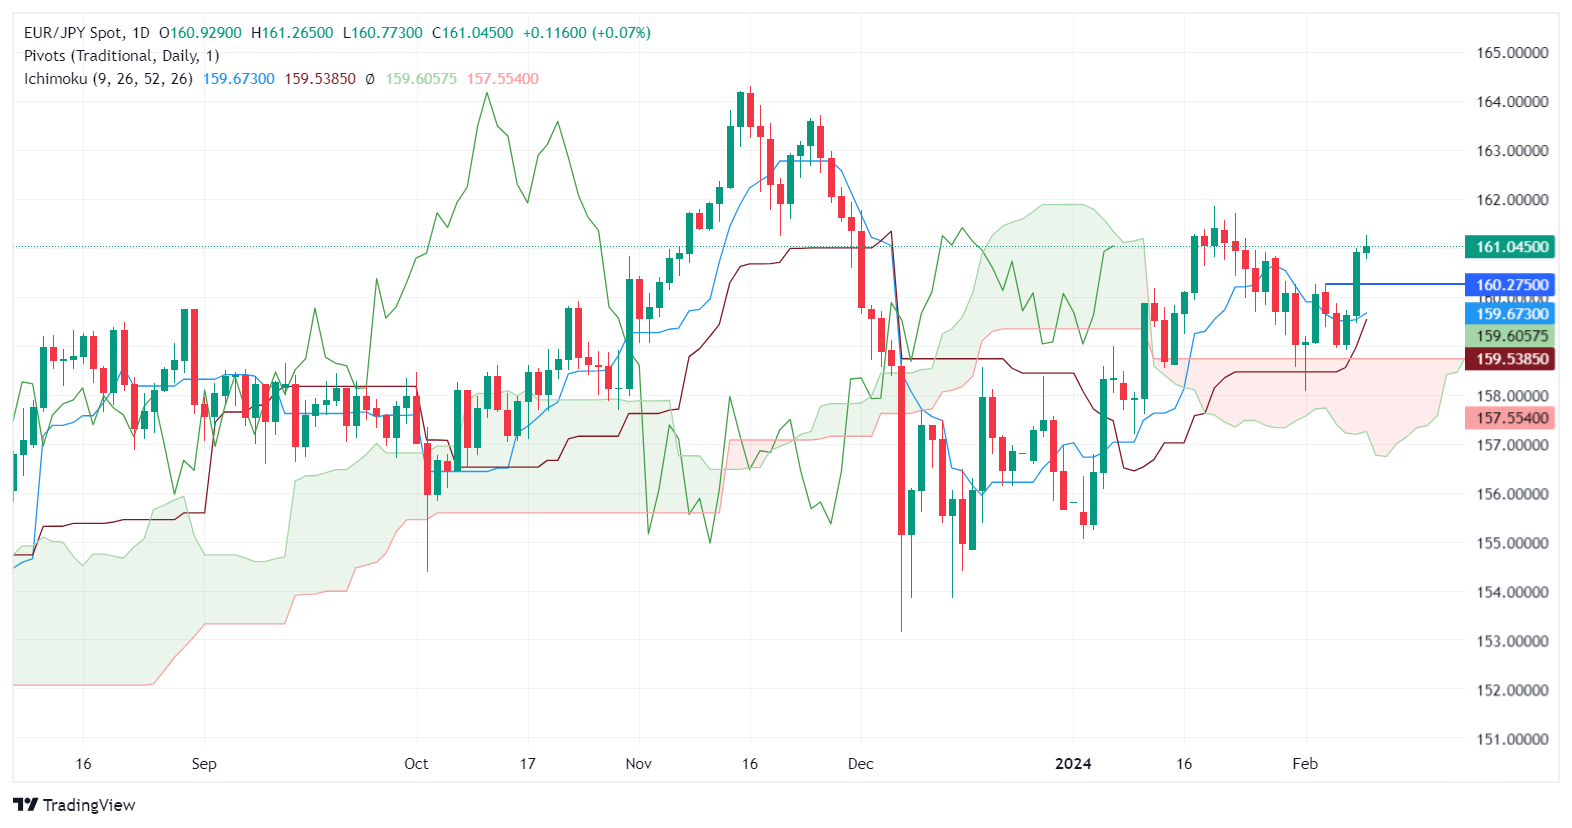
In the short term, the divergence between EUR/JPY price action and Relative Strength Index (RSI) studies could open the door for a pullback. The first support is seen at 160.00 the confluence of the Tenkan and Kijun-Sen, followed by today’s low of 160.77, followed by the daily pivot at 160.46.
EUR/JPY Price Action – Hourly Chart
- WTI crude rises 0.25% above $76.50 amid Israel-Hamas conflict escalation and US production changes.
- Increased geopolitical tensions from Israeli military actions in Gaza and ceasefire rejections impact oil prices.
- US refining shutdowns due to various factors lead to higher gasoline and diesel prices, affecting crude market.
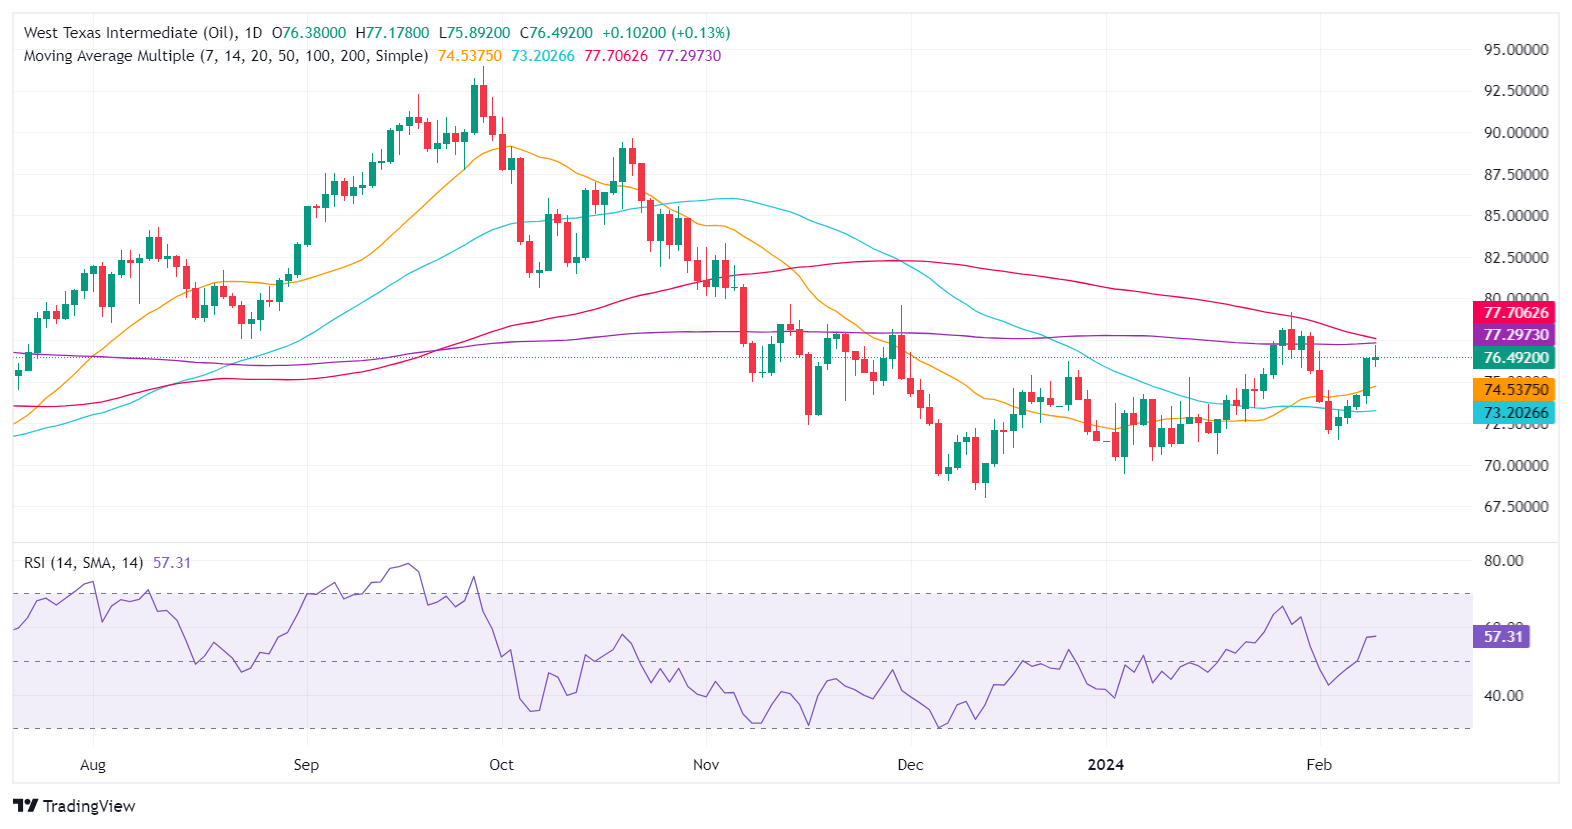
West Texas Intermediate (WTI), the US crude oil benchmark, rises 0.25% late in the North American session as the Israel-Hamas conflict escalates with Israel rejecting a ceasefire offer. That, along with diminished production in oil refined products, sponsored WTI's advance, as it trades at $76.54 per barrel.
Oil prices climb as Israel-Hamas conflict intensifies, US refining cuts impact supply
Israeli military continued their offensive on the Gaza Strip on Friday, sparking a jump in oil prices of around 3% in the previous day. Additionally, refining plants in the US were shut down, which boosted the prices of Gasoline and Diesel.
Ukraine’s attacks against two oil refineries in Southern Russia, and the latter exporting more crude oil in February than planned with the OPEC+, was a tailwind for WTI price.
In the meantime, the US Treasury Department sanctioned three companies based in the United Arab Emirates (UAE) and one ship registered by Liberia for violating a cap placed on the price of Russian oil by a coalition of Western nations.
WTI Price Analysis: Technical outlook
Oil prices are set to remain range-bound but tilted to the downside, as the 200-day moving average (DMA) at $77.29 remains the first resistance level for prices. A breach of the latter could pave the way for further gains toward the $80.00 pb. Nevertheless, despite being bullish, the Relative Strength Index (RSI), the slope shifted flat, and strong resistance would open the door to challenge the 20-DMA at $74.53. A breach of the latter will expose the latest swing low of $71.46.
- The AUD/JPY pair stands at 97.409 showing 0.50% gains in the last session of the week.
- The main reasons for the upward movements are the divergent RBA and BoJ monetary policy, which benefit the Aussie.
- Daily Chart indicators show strong buying momentum while four-hour indicators flash overbought conditions.
- Despite the looming correction, the overall trend is bullish.
In Friday's session, the AUD/JPY was observed rising to 97.40, registering a t gain of 0.50. This performance is primarily shaped by the contrasting economic stances of the Reserve Bank of Australia (RBA) and the Bank of Japan (BOJ). With the daily chart indicating a bullish momentum and the bulls asserting their dominance, the prevailing outlook seems positive. However, the four-hour chart shows indicators have entered the overbought zone, suggesting a potential for imminent correction.
In line with that, recent statements by the RBA Governor Bullock suggest a balanced perspective with the potential for future interest rate changes. The possibility remains open for both an increase or a standstill, subject to inflation and economic growth. The market expects the RBA's first rate cut in August, with a total easing of 50 bp anticipated for the year. In contrast, the Bank of Japan BoJ maintains a dovish stance, with Governor Ueda affirming that accommodative financial conditions may continue after the current negative rates era. As per the latest data, the likelihood of rate liftoff from the BoJ is forecasted for June, with only 25 bps of tightening for the rest of 2024, and as long as markets bet on a dovish BoJ, the pair may see further upside.
AUD/JPY technical analysis
On the daily chart, the Relative Strength Index (RSI) boasts a positive trajectory within positive territory, suggesting buyers maintain control in line with the Moving Average Convergence Divergence (MACD) histogram which reveals diminishing red bars, suggesting that the buyers are in command. On a broader perspective, the pair resides above the 20-day, 100-day, and 200-day Simple Moving Averages (SMAs). This emphasizes that bullish forces hold a firm grip on the larger time frames with the bears nowhere to be found.
AUD/JPY daily chart
-638431046503469120.png)
Moving to the four-hour chart, the momentum switches somewhat. Key performance indicators have approached overbought levels, suggesting an imminent correction. A closer look at the RSI confirms this forecast as it ventures into overbought territory. The MACD confirms this pattern as well, with its green bars gradually shrinking. In summary, whilst the bulls seem to be gaining ground currently, an impending correction looms as short-term momentum indicators align to suggest a pullback.
Two Federal Reserve (Fed) officials hit newswires on Friday, with Atlanta Fed President Raphael Bostic and Dallas Fed President Lorie Logan reiterating common themes about inflation and the Fed's rate outlook.
Both Fed policymakers highlighted that the Fed has made significant progress on reigning in US inflation, but reiterated that there's still plenty of work to be done, with key risk factors plaguing the Fed's ability to deliver rate cuts as fast or as deep as markets are pining for.
Key highlights:
- Bostic:
- Inflation has been too high for too long, and still a ways to go.
- The US is on a path to pre-pandemic economic activity, needs to avoid inflation resurgence.
- Data suggests firm real wage gains will be continuing for some time.
- Fed needs to be "resolute" and "stay the course".
- Logan:
- Fed balance sheet shrinking has been very smooth thus far.
- US federal debt is on an unsustainable path.
- US economy is in a good place right now.
- Inflation outlook appears to be sustained.
- Labor market remains tight, but there has been some loosening.
- Some industries still see supply chain issues.
- Sees no urgency for cutting rates.
- EUR/USD found some room higher but still lacks upside momentum.
- Final German HICP and CPI inflation brought no surprises.
- US CPI inflation, EU GDP figures slated for next week.
The EUR/USD found some room on the high side on Friday, continuing a near-term recovery. However, the pair remains firmly planted on the low side of technical barriers and remains pinned below the 1.0800 price handle.
German inflation figures brought nothing new to the table, confirming initial flash prints, and an adjustment by the US Bureau of Labor Statistics (BLS) made anticipated changes to how seasonal adjustment is calculated in US Consumer Price Index (CPI) figures. Markets jostled after the BLS adjustment, but US inflation figures saw little change, keeping markets on-balance for Friday.
Daily digest market movers: EUR/USD continues slow grind higher as technical ceiling weighs
- Germany’s final Harmonized Index of Consumer Price (HICP) showed no changes from preliminary prints, with the annualized German inflation rate through January holding at 3.1%.
- The US BLS made changes to how seasonal adjustment works for US CPI numbers, with a slight rise in annualized inflation getting offset by a near-term decline after calculations got adjusted.
- US December monthly CPI revised to 0.2% from 0.3%
- Next week brings a fresh print of US CPI inflation, with the YoY CPI through January expected to tick down from 3.4% to 3.0%.
- US CPI inflation slated for Tuesday, European Gross Domestic Product (GDP) figures due Wednesday.
- Pan-European GDP growth is expected to remain pinned in low territory.
- YoY quarterly EU GDP is forecast to print at 0.1%, in-line with the previous annualized quarterly print.
Euro price today
The table below shows the percentage change of Euro (EUR) against listed major currencies today. Euro was the weakest against the New Zealand Dollar.
| USD | EUR | GBP | CAD | AUD | JPY | NZD | CHF | |
| USD | -0.09% | -0.14% | 0.01% | -0.36% | 0.07% | -0.63% | 0.12% | |
| EUR | 0.10% | -0.04% | 0.11% | -0.27% | 0.17% | -0.54% | 0.22% | |
| GBP | 0.14% | 0.04% | 0.15% | -0.23% | 0.20% | -0.49% | 0.26% | |
| CAD | -0.02% | -0.12% | -0.16% | -0.39% | 0.05% | -0.64% | 0.10% | |
| AUD | 0.37% | 0.27% | 0.22% | 0.38% | 0.43% | -0.26% | 0.48% | |
| JPY | -0.06% | -0.16% | -0.19% | -0.06% | -0.45% | -0.67% | 0.07% | |
| NZD | 0.63% | 0.53% | 0.48% | 0.64% | 0.26% | 0.70% | 0.74% | |
| CHF | -0.15% | -0.24% | -0.28% | -0.13% | -0.51% | -0.08% | -0.77% |
The heat map shows percentage changes of major currencies against each other. The base currency is picked from the left column, while the quote currency is picked from the top row. For example, if you pick the Euro from the left column and move along the horizontal line to the Japanese Yen, the percentage change displayed in the box will represent EUR (base)/JPY (quote).
Technical analysis: EUR/USD struggles to grow legs beneath technical recovery
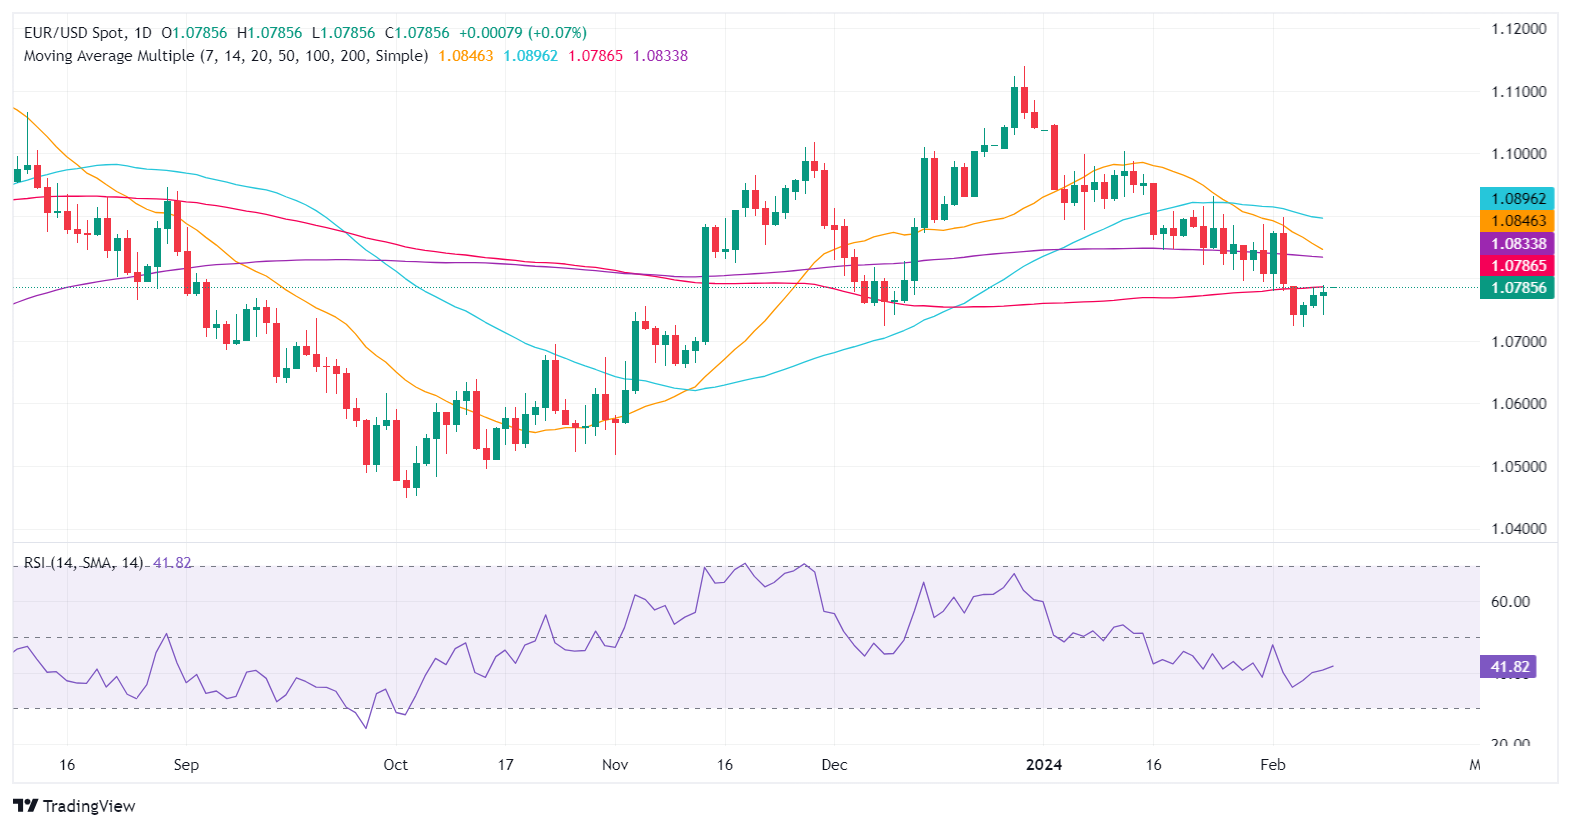
The EUR/USD remains pinned on the south side of the 200-hour Simple Moving Average (SMA) just beneath 1.0800. Although the pair continues to recover into the upside from the early week’s bottom near 1.0725, topside momentum remains capped, with longer-term technical patterns remaining decidedly bearish.
Despite posting three straight days of gains and on pace for a fourth, the EUR/USD remains on the bearish side of the 200-day SMA at 1.0833. The pair is still down over 3% from late December’s peak of 1.1140, and Euro bidders are struggling to lift the Euro off the floor of a nearly 4% decline into January’s bottom bids of 1.0722.
EUR/USD hourly chart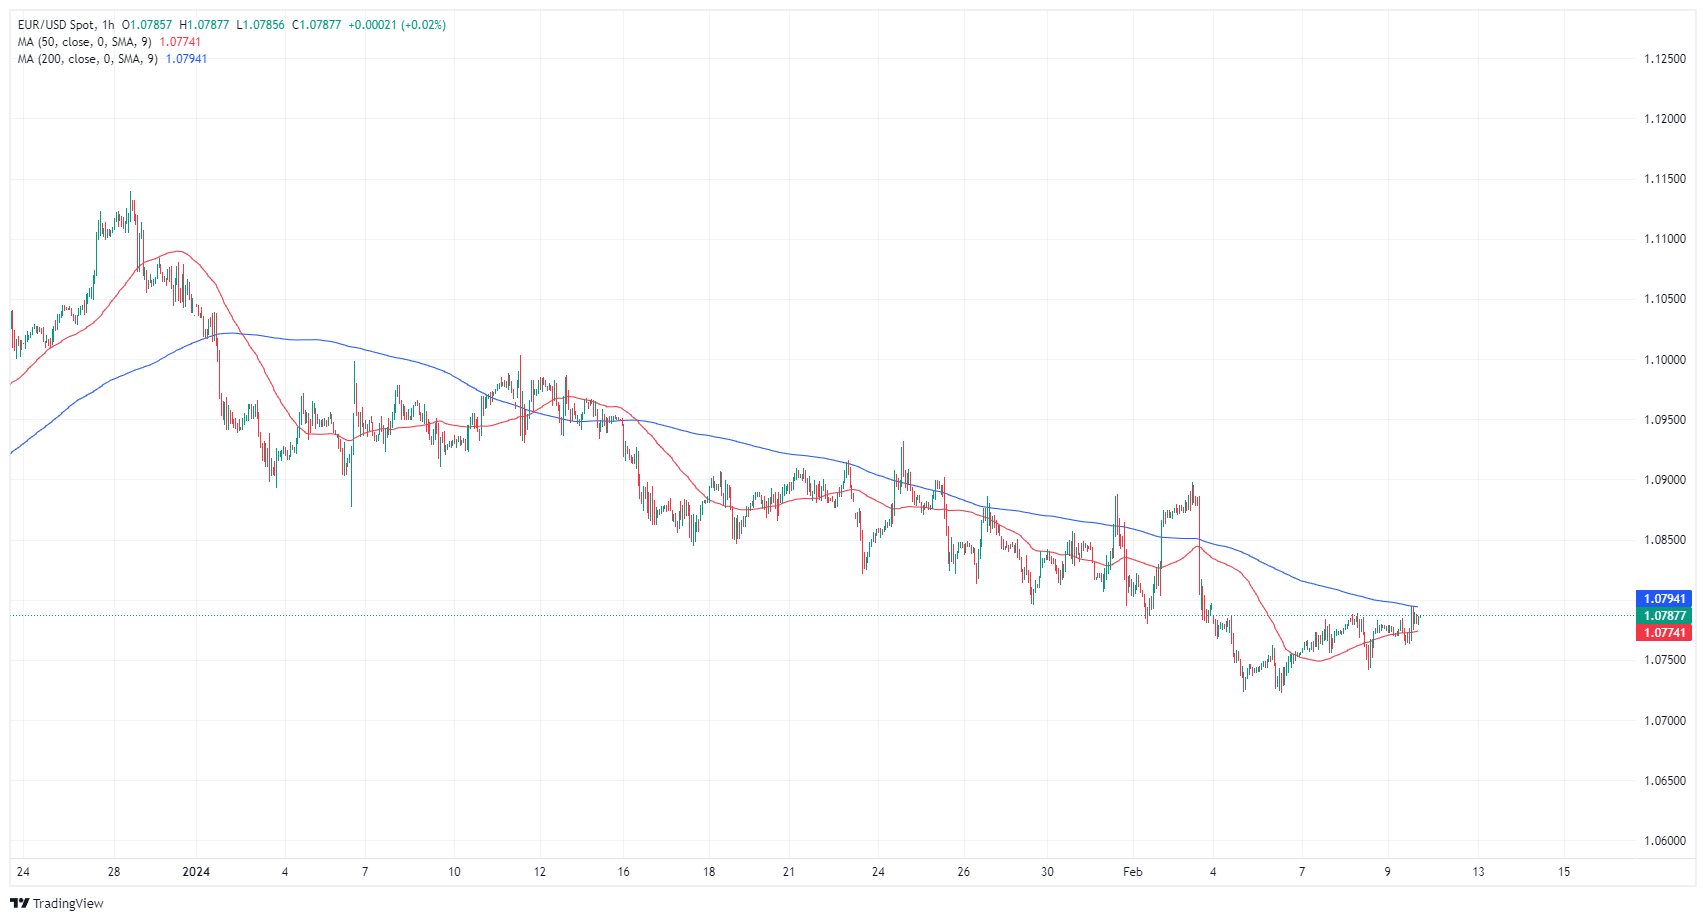
EUR/USD daily chart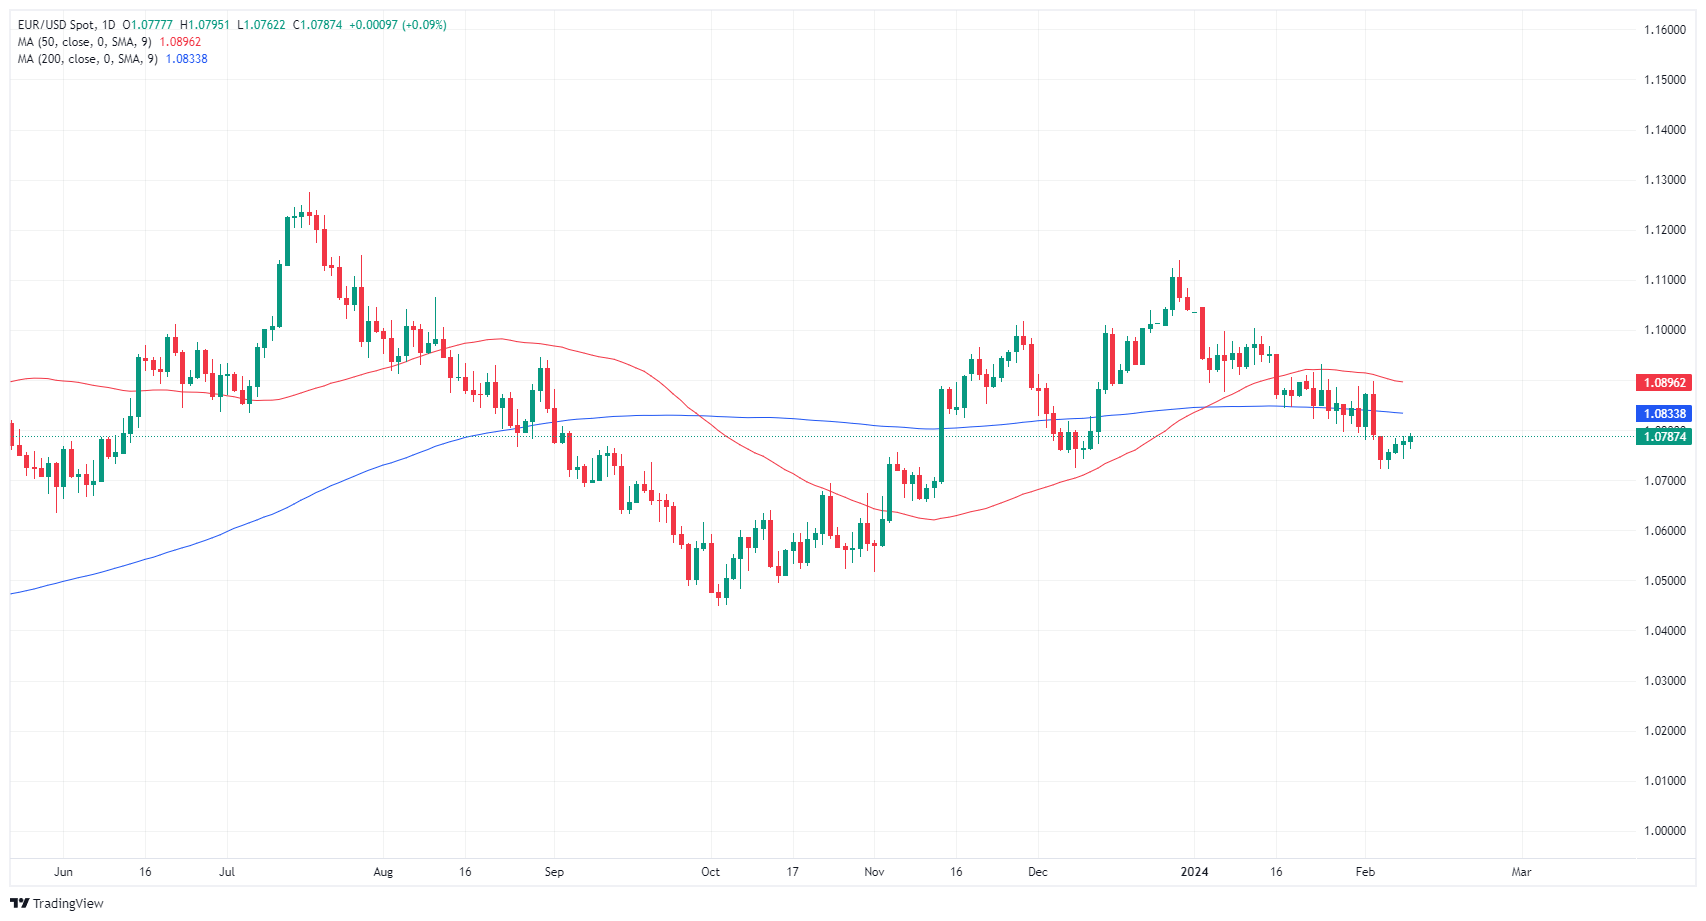
Euro FAQs
What is the Euro?
The Euro is the currency for the 20 European Union countries that belong to the Eurozone. It is the second most heavily traded currency in the world behind the US Dollar. In 2022, it accounted for 31% of all foreign exchange transactions, with an average daily turnover of over $2.2 trillion a day.
EUR/USD is the most heavily traded currency pair in the world, accounting for an estimated 30% off all transactions, followed by EUR/JPY (4%), EUR/GBP (3%) and EUR/AUD (2%).
What is the ECB and how does it impact the Euro?
The European Central Bank (ECB) in Frankfurt, Germany, is the reserve bank for the Eurozone. The ECB sets interest rates and manages monetary policy.
The ECB’s primary mandate is to maintain price stability, which means either controlling inflation or stimulating growth. Its primary tool is the raising or lowering of interest rates. Relatively high interest rates – or the expectation of higher rates – will usually benefit the Euro and vice versa.
The ECB Governing Council makes monetary policy decisions at meetings held eight times a year. Decisions are made by heads of the Eurozone national banks and six permanent members, including the President of the ECB, Christine Lagarde.
How does inflation data impact the value of the Euro?
Eurozone inflation data, measured by the Harmonized Index of Consumer Prices (HICP), is an important econometric for the Euro. If inflation rises more than expected, especially if above the ECB’s 2% target, it obliges the ECB to raise interest rates to bring it back under control.
Relatively high interest rates compared to its counterparts will usually benefit the Euro, as it makes the region more attractive as a place for global investors to park their money.
How does economic data influence the value of the Euro?
Data releases gauge the health of the economy and can impact on the Euro. Indicators such as GDP, Manufacturing and Services PMIs, employment, and consumer sentiment surveys can all influence the direction of the single currency.
A strong economy is good for the Euro. Not only does it attract more foreign investment but it may encourage the ECB to put up interest rates, which will directly strengthen the Euro. Otherwise, if economic data is weak, the Euro is likely to fall.
Economic data for the four largest economies in the euro area (Germany, France, Italy and Spain) are especially significant, as they account for 75% of the Eurozone’s economy.
How does the Trade Balance impact the Euro?
Another significant data release for the Euro is the Trade Balance. This indicator measures the difference between what a country earns from its exports and what it spends on imports over a given period.
If a country produces highly sought after exports then its currency will gain in value purely from the extra demand created from foreign buyers seeking to purchase these goods. Therefore, a positive net Trade Balance strengthens a currency and vice versa for a negative balance.
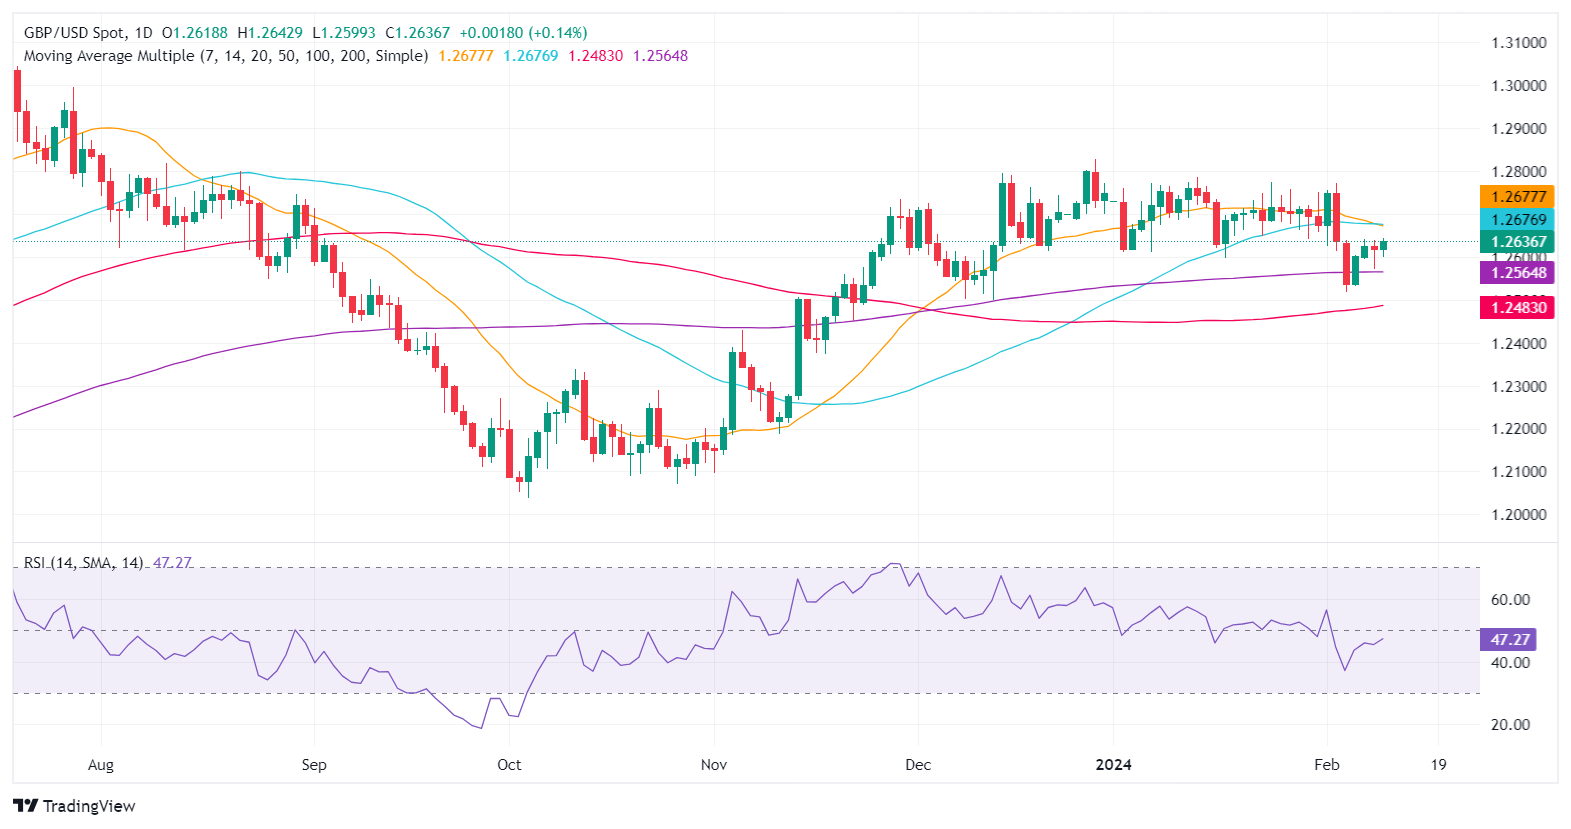
- GBP/USD up 0.10% amid central bank caution, trading near the 50-DMA.
- Richmond Fed's Barkin calls for policy patience, mirroring Fed's focus on data-driven decisions.
- BoE's Haskel sees inflation improvement, supporting a data-dependent policy approach.
- Markets expect substantial Fed easing of 120 bps and a 75 bps rate cut by the BoE, potentially supporting GBP/USD.
The Pound Sterling (GBP) edges up moderately against the US Dollar (USD) in the mid-North American session but trades sideways unable to reclaim a key resistance level at the 50-day moving average (DMA). US and UK central bank speakers adopting a cautious stance and the lack of important economic data would likely keep the major within familiar levels. the GBP/USD trades at 1.2628, up 0.10%, but virtually flat in the week.
GBP/USD is set to finish the week almost flat
Even though the GBP/USD remains up in the day, it remains capped by comments made by Federal Reserve (Fed) officials. During the week, they said that the disinflation process continued and that they would eventually cut rates but pushed against the speed of easing, priced in by market players.
Data-wise, the latest unemployment claims report in the US showed the labor market remains tight. Meanwhile, the revisions for the US Consumer Price Index (CPI) confirmed the progress on inflation, as CPI stood at 3.3% YoY, while Core CPI at 3.7%. The report suggests the Fed is doing a good job, but it’s not done, as said by most policymakers.
Regarding that, the Richmond Fed President Thomas Barkin said, “he's cautious about the accuracy of recent data,” and added they (the Fed) could be patient before making any changes to monetary policy.
On the other side of the Atlantic, the Bank of England (BoE) member Jonathan Haskel commented that he sees progress on inflation despite voting for an interest rate increase in the last meeting. The BoE added they would be data-dependent, and next week’s economic calendar would provide an update on inflation and economic growth.
Meanwhile, monetary policy easing expectations for the Federal Reserve remain high, with traders seeking 120 basis points (bps) of cuts. Contrarily, the BoE is expected to slash rates by 75 bps, which would favor the Pound Sterling, opening the door for some upside in the GBP/USD pair.
GBP/USD Price Analysis: Technical outlook
The GBP/USD trades near weekly highs but buyers must reclaim the 50-DMA at 1.2672, which could open the door for further gains. The next resistance is 1.2700, followed by the February 2 high at 1.2772. On the flip side, if sellers step in and push prices below 1.2600, they could challenge the 200-DMA at 1.2562. Once cleared, an additional downside is seen at 1.2500. Therefore, the path of least resistance is downwards, as the Relative Strength Index (RSI) suggests that buyers are in charge.
- The DXY stands at 104.15 on Friday with mild losses.
- US December’s inflation figures were downwardly revised by the BLS.
- Next week January’s CPI is due.
The US Dollar (USD) stood flat on Friday, with mild losses, closing a winning week but trimming most of its gains. All eyes are on next week’s US inflation data.
The US Dollar gathered significant ground in the first days of February after Jerome Powell, the Chair of the US Federal Reserve (Fed), mentioned that a reduction in interest rates in March seemed improbable. He emphasized the necessity for further proof of declining inflation before the Fed could feel confident about lowering rates, so incoming data will be key. Next week, the US will release Consumer Price Index (CPI) figures from January, which will likely set the pace of the Greenback for the short term.
Daily digest market movers: US Dollar loses some ground on soft CPI revisions
- The US Bureau of Labor Statistics (BLS) updated the Consumer Price Index (CPI) figures with new seasonal adjustments, lowering December's inflation rate to 0.2% from the initial 0.3%.
- The Core CPI for December remained steady at 0.3%, with no revisions made.
- November's CPI was adjusted upwards to a 0.2% increase from the previously reported 0.1%, while October's 0.1% rise was unchanged.
- According to the CME FedWatch Tool, the odds of a cut in March are low at around 20% but may see some changes in case the US CPI from January comes in lower than expected.
Technical analysis: DXY bulls struggle, continue battling with 100-day SMA
On the daily chart, the Relative Strength Index (RSI) is flat, situated in positive territory, which generally suggests a stall in buying momentum but still maintains a generally bullish tilt. Coupled with the Moving Average Convergence Divergence (MACD), which shows flat green bars, it confirms the trend of bullish momentum yet hints at a possible consolidation or minor pullback.
On a wider horizon, Simple Moving Averages (SMAs) provide a mixed picture. The index is trading above the 20-day SMA, a clear signal of short-term bullish strength. However, it remains below the 100-day SMA, indicating that the medium-term selling pressure persists. Interestingly, it holds above the 200-day SMA, underscoring a strong bullish presence in the long run.
This confluence of factors paints a picture of bulls struggling to gain substantial ground, which leaves the index vulnerable for further downside if the bulls don't wake up.
US Dollar FAQs
What is the US Dollar?
The US Dollar (USD) is the official currency of the United States of America, and the ‘de facto’ currency of a significant number of other countries where it is found in circulation alongside local notes. It is the most heavily traded currency in the world, accounting for over 88% of all global foreign exchange turnover, or an average of $6.6 trillion in transactions per day, according to data from 2022.
Following the second world war, the USD took over from the British Pound as the world’s reserve currency. For most of its history, the US Dollar was backed by Gold, until the Bretton Woods Agreement in 1971 when the Gold Standard went away.
How do the decisions of the Federal Reserve impact the US Dollar?
The most important single factor impacting on the value of the US Dollar is monetary policy, which is shaped by the Federal Reserve (Fed). The Fed has two mandates: to achieve price stability (control inflation) and foster full employment. Its primary tool to achieve these two goals is by adjusting interest rates.
When prices are rising too quickly and inflation is above the Fed’s 2% target, the Fed will raise rates, which helps the USD value. When inflation falls below 2% or the Unemployment Rate is too high, the Fed may lower interest rates, which weighs on the Greenback.
What is Quantitative Easing and how does it influence the US Dollar?
In extreme situations, the Federal Reserve can also print more Dollars and enact quantitative easing (QE). QE is the process by which the Fed substantially increases the flow of credit in a stuck financial system.
It is a non-standard policy measure used when credit has dried up because banks will not lend to each other (out of the fear of counterparty default). It is a last resort when simply lowering interest rates is unlikely to achieve the necessary result. It was the Fed’s weapon of choice to combat the credit crunch that occurred during the Great Financial Crisis in 2008. It involves the Fed printing more Dollars and using them to buy US government bonds predominantly from financial institutions. QE usually leads to a weaker US Dollar.
What is Quantitative Tightening and how does it influence the US Dollar?
Quantitative tightening (QT) is the reverse process whereby the Federal Reserve stops buying bonds from financial institutions and does not reinvest the principal from the bonds it holds maturing in new purchases. It is usually positive for the US Dollar.
- USD/MXN drops as revised US inflation data fuel expectations for Fed easing.
- US inflation adjustments show success in price control, leading to a weakened Dollar outlook.
- Banxico holds rates at 11.25% with changes in policy statements indicating a careful stance on future adjustments.
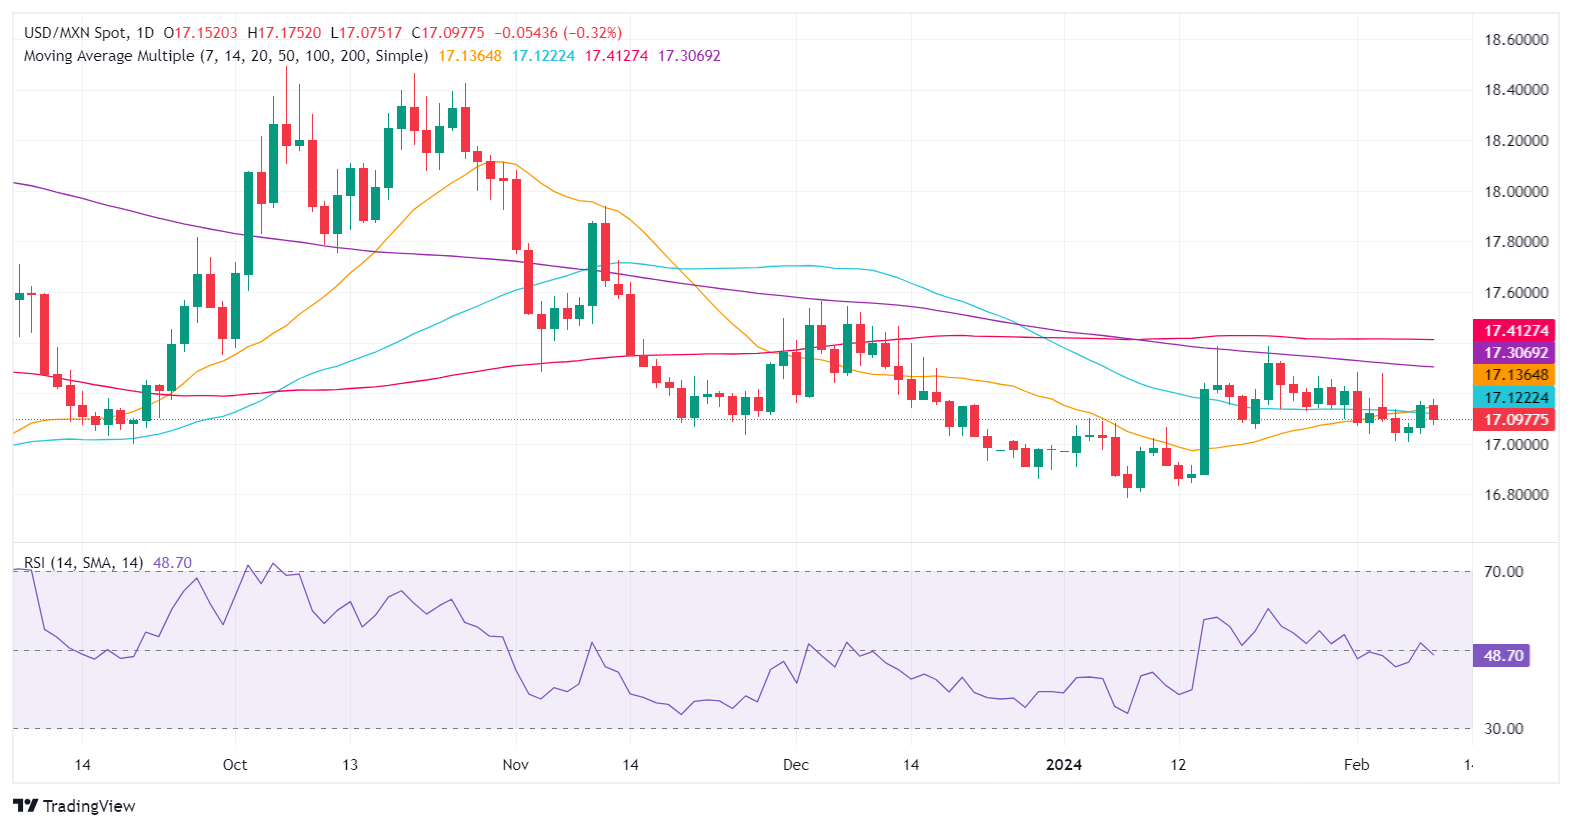
The Mexican Peso (MXN) advanced steadily in early trading on Friday against the US Dollar (USD) following the latest revision on inflation figures in the United States (US). The data confirms the Federal Reserve’s (Fed) attempt to curb elevated prices is working, opening the door to lower interest rates. Therefore, the Greenback (USD) is trading softer, and the USD/MXN exchanges hands at 17.10, down 0.25%.
Mexico’s economic docket during the last two days has been busy. Inflation is heading up, while the Bank of Mexico (Banxico) decided to hold rates at 11.25%, though it removed hawkish language from the monetary policy statement. Instead, they added, “In the next monetary policy meetings, it will assess, depending on available information, the possibility of adjusting the reference rate.”
Daily digest market movers: Mexican Peso appreciates despite Banxico dropping hawkish comments
- Banxico’s Governing Council stated that inflationary risks are tilted to the upside in the near term while adding that higher core inflation, foreign exchange depreciation, and a greater-than-expected economic resilience in the country would keep inflationary pressure up.
- On the downside, a global economic slowdown and lower exchange rate levels in relation to the first months of 2023 “contribute more than anticipated to reduce certain pressures on inflation.”
- Mexico’s central bank revised their inflation expectations to the upside for Q1 to Q3 of 2024, and they expected to converge toward 3.5% in Q4.
- Before Wall Street opened, the National Statistics Agency (INEGI) announced that Mexican Industrial Production fell 0.7% in December from November and was flat YoY.
- On Thursday, INEGI revealed that Mexico´s Consumer Price Index (CPI) in January, rose by 4.88% YoY, while underlying inflation moderated to 4.76%.
- The US Bureau of Labor Statistics (BLS) released an inflation data revision, indicating that US inflation rates at the end of 2023 were consistent with initial reports, even after annual revisions. The core CPI, which excludes food and energy, increased at a 3.3% annualized rate in Q4 2023, aligning with previous estimates. The headline inflation figure saw minimal adjustments with December's monthly rise slightly revised down to 0.2% from 0.3%.
- US Initial Jobless Claims of 218K for the last week were lower than estimates of 220K, down from 227K in the previous reading.
- US Federal Reserve officials remain cautious about guiding market participants about when they would begin easing policy. Yesterday, Richmond Fed President Thomas Barkin was asked about Powell’s comments: “Chairman Powell always speaks for the Committee.”
Technical analysis: Mexican Peso surges as USD/MXN tumbles below 17.10
The USD/MXN is neutral to downwardly biased after clashing with the 50-day Simple Moving Average (SMA) at 17.12 with buyers unable to decisively break that level. Since then, the exotic pair has resumed its downtrend, though it could remain at around the 17.05/17.17 range. Further downside lies ahead as the Relative Strength Index (RSI) shows bears are gathering momentum with the slope peaking two days ago before extending its downtrend. The next support levels lie at 17.05, the psychological 17.00 figure and last year’s low of 16.62.
On the other hand, if buyers reclaim the 50-day SMA, that can pave the way to test the 200-day SMA at 17.31. Upside risks emerge once that barrier is cleared. The next real resistance comes at 17.41, the 100-day SMA.
USD/MXN Price Action – Daily Chart
Mexican Peso FAQs
What key factors drive the Mexican Peso?
The Mexican Peso (MXN) is the most traded currency among its Latin American peers. Its value is broadly determined by the performance of the Mexican economy, the country’s central bank’s policy, the amount of foreign investment in the country and even the levels of remittances sent by Mexicans who live abroad, particularly in the United States. Geopolitical trends can also move MXN: for example, the process of nearshoring – or the decision by some firms to relocate manufacturing capacity and supply chains closer to their home countries – is also seen as a catalyst for the Mexican currency as the country is considered a key manufacturing hub in the American continent. Another catalyst for MXN is Oil prices as Mexico is a key exporter of the commodity.
How do decisions of the Banxico impact the Mexican Peso?
The main objective of Mexico’s central bank, also known as Banxico, is to maintain inflation at low and stable levels (at or close to its target of 3%, the midpoint in a tolerance band of between 2% and 4%). To this end, the bank sets an appropriate level of interest rates. When inflation is too high, Banxico will attempt to tame it by raising interest rates, making it more expensive for households and businesses to borrow money, thus cooling demand and the overall economy. Higher interest rates are generally positive for the Mexican Peso (MXN) as they lead to higher yields, making the country a more attractive place for investors. On the contrary, lower interest rates tend to weaken MXN.
How does economic data influence the value of the Mexican Peso?
Macroeconomic data releases are key to assess the state of the economy and can have an impact on the Mexican Peso (MXN) valuation. A strong Mexican economy, based on high economic growth, low unemployment and high confidence is good for MXN. Not only does it attract more foreign investment but it may encourage the Bank of Mexico (Banxico) to increase interest rates, particularly if this strength comes together with elevated inflation. However, if economic data is weak, MXN is likely to depreciate.
How does broader risk sentiment impact the Mexican Peso?
As an emerging-market currency, the Mexican Peso (MXN) tends to strive during risk-on periods, or when investors perceive that broader market risks are low and thus are eager to engage with investments that carry a higher risk. Conversely, MXN tends to weaken at times of market turbulence or economic uncertainty as investors tend to sell higher-risk assets and flee to the more-stable safe havens.
- Canadian Dollar trends broadly lower after brief rally.
- Canada added more jobs than expected in January.
- Canadian wage growth in January continues to ease.
The Canadian Dollar (CAD) slipped back after testing higher on Friday. Markets readjusted exposure to the US Dollar (USD) after the US Bureau of Labor Statistics (BLS) introduced broad seasonal adjustment changes to how the Consumer Price Index (CPI) is calculated, causing slight changes to near-term inflation prints.
Canadian wage figures eased further in January, and net job additions showed a higher number of job gains than markets forecast, while December’s jobs number also saw an upside revision. The Canadian Unemployment Rate also ticked lower in January.
Daily digest market movers: Canadian Dollar falling back despite economic calendar beats
- Canada’s Unemployment Rate declined to 5.7% in January versus the forecast 5.9%, December’s 5.8%.
- Net Change in Employment added 37.3K new jobs in January, handily beating the forecast of 15K.
- December’s job additions also saw an upside revision to 12.3% from 0.1K.
- Canadian Average Hourly Wages declined to 5.3% in January from the previous month’s 5.7%.
- The US BLS brought far-reaching adjustments to how the CPI is seasonally-adjusted, causing an uptick in adjusted annualized US inflation, though recent inflation measures remain largely unchanged.
- With the adjustments out of the way, markets will focus on next week’s US CPI inflation print due on Tuesday.
- Next week sees a thin, low-impact economic calendar for Canada, exposing the Loonie to broad-market flows.
Canadian Dollar price today
The table below shows the percentage change of Canadian Dollar (CAD) against listed major currencies today. Canadian Dollar was the weakest against the New Zealand Dollar.
| USD | EUR | GBP | CAD | AUD | JPY | NZD | CHF | |
| USD | -0.04% | -0.05% | 0.15% | -0.27% | 0.08% | -0.52% | 0.18% | |
| EUR | 0.04% | -0.01% | 0.18% | -0.24% | 0.13% | -0.49% | 0.23% | |
| GBP | 0.05% | 0.01% | 0.19% | -0.24% | 0.12% | -0.48% | 0.22% | |
| CAD | -0.14% | -0.18% | -0.19% | -0.42% | -0.07% | -0.67% | 0.03% | |
| AUD | 0.28% | 0.24% | 0.23% | 0.43% | 0.35% | -0.25% | 0.45% | |
| JPY | -0.08% | -0.11% | -0.11% | 0.06% | -0.38% | -0.58% | 0.10% | |
| NZD | 0.52% | 0.48% | 0.47% | 0.66% | 0.24% | 0.60% | 0.70% | |
| CHF | -0.19% | -0.23% | -0.23% | -0.04% | -0.46% | -0.09% | -0.71% |
The heat map shows percentage changes of major currencies against each other. The base currency is picked from the left column, while the quote currency is picked from the top row. For example, if you pick the Euro from the left column and move along the horizontal line to the Japanese Yen, the percentage change displayed in the box will represent EUR (base)/JPY (quote).
Technical analysis: Canadian Dollar sheds weight against US Dollar after early rise
The Canadian Dollar is broadly lower on Friday, dipping into the red against the majority of its major currency peers with the New Zealand Dollar (NZD) leading the charge, gaining two-thirds of a percent against the CAD, while the Australian Dollar (AUD) approaches half a percent in gains against the Canadian Dollar.
The Canadian Dollar rallied early against the US Dollar, sending the USD/CAD into a near-term low of 1.3413 before a rally in the USD sent the pair back into the high end near 1.3480. The pair has rallied half a percent bottom-to-top on Friday, keeping the USD/CAD pinned into near-term congestion.
The USD/CAD continues to trade into the 200-day Simple Moving Average (SMA) near 1.3475, and bidders will be looking to drive the pair back into the last meaningful swing high at 1.3900 last November. On the low side, sellers will be looking for a return to December’s bottom bids near 1.3200.
USD/CAD hourly chart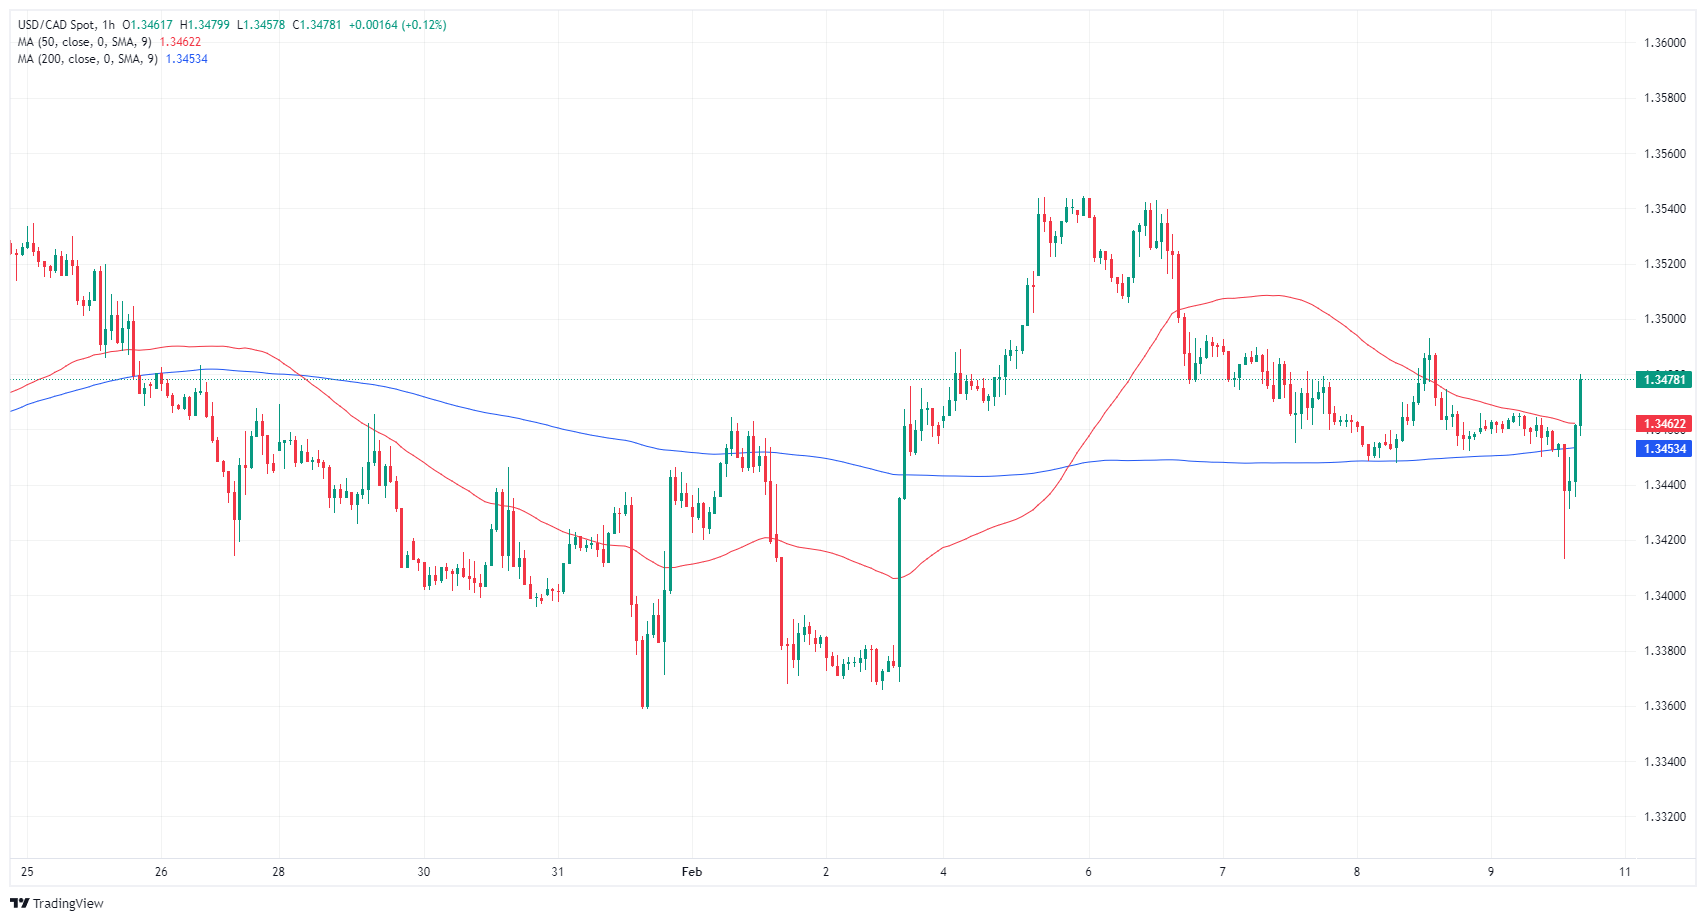
USD/CAD daily chart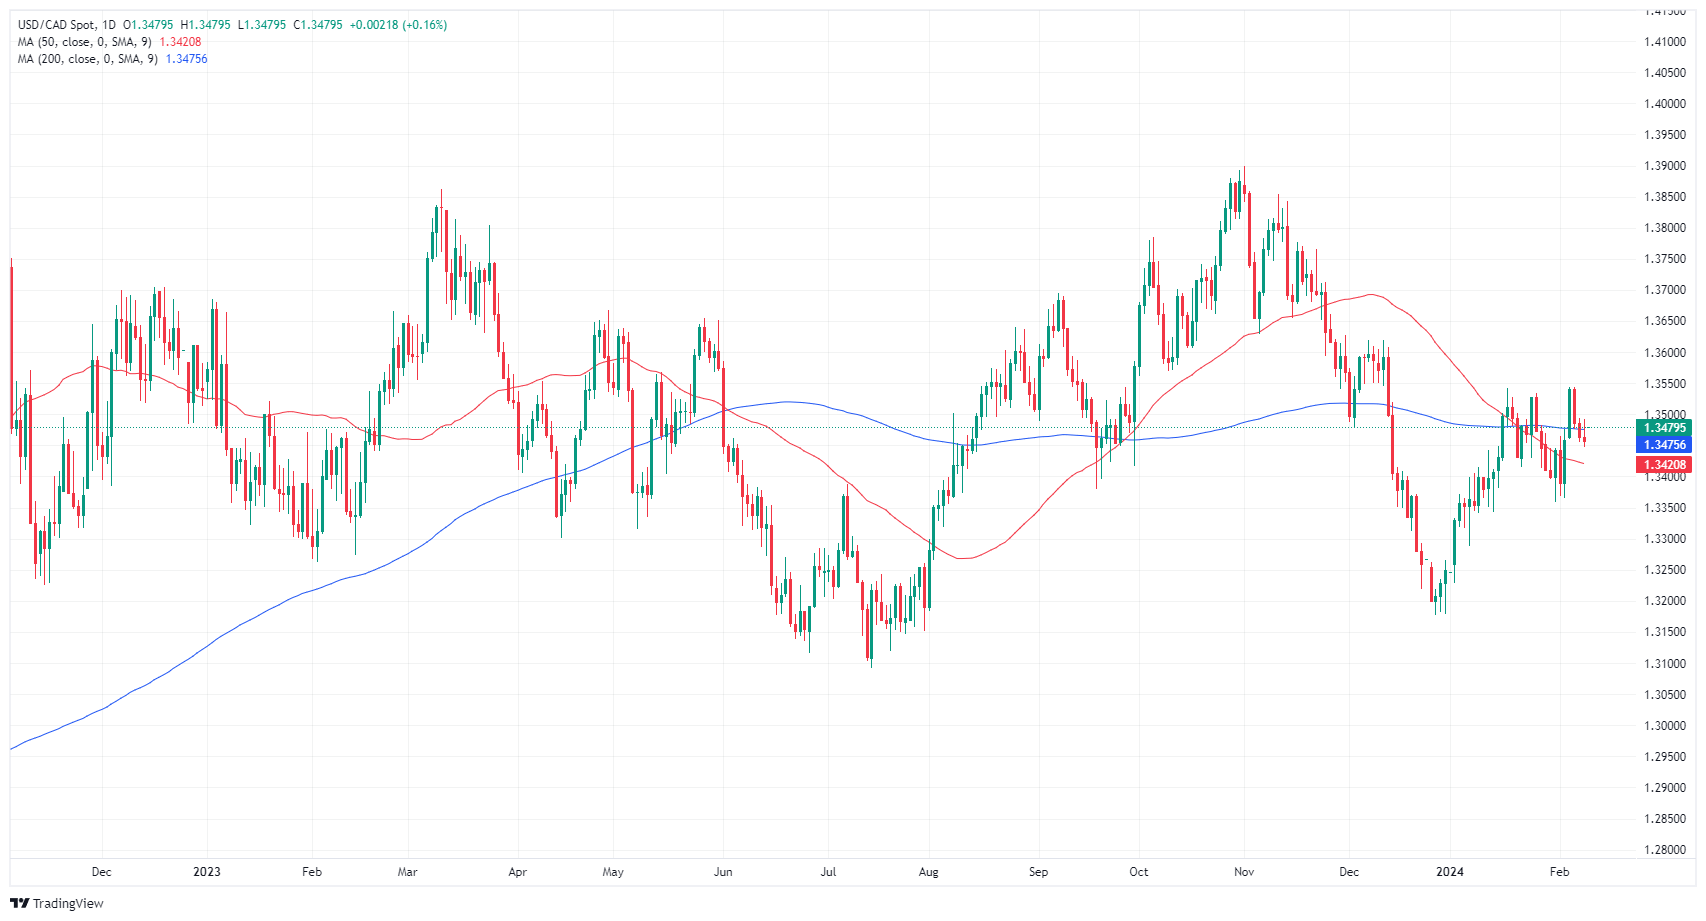
Canadian Dollar FAQs
What key factors drive the Canadian Dollar?
The key factors driving the Canadian Dollar (CAD) are the level of interest rates set by the Bank of Canada (BoC), the price of Oil, Canada’s largest export, the health of its economy, inflation and the Trade Balance, which is the difference between the value of Canada’s exports versus its imports. Other factors include market sentiment – whether investors are taking on more risky assets (risk-on) or seeking safe-havens (risk-off) – with risk-on being CAD-positive. As its largest trading partner, the health of the US economy is also a key factor influencing the Canadian Dollar.
How do the decisions of the Bank of Canada impact the Canadian Dollar?
The Bank of Canada (BoC) has a significant influence on the Canadian Dollar by setting the level of interest rates that banks can lend to one another. This influences the level of interest rates for everyone. The main goal of the BoC is to maintain inflation at 1-3% by adjusting interest rates up or down. Relatively higher interest rates tend to be positive for the CAD. The Bank of Canada can also use quantitative easing and tightening to influence credit conditions, with the former CAD-negative and the latter CAD-positive.
How does the price of Oil impact the Canadian Dollar?
The price of Oil is a key factor impacting the value of the Canadian Dollar. Petroleum is Canada’s biggest export, so Oil price tends to have an immediate impact on the CAD value. Generally, if Oil price rises CAD also goes up, as aggregate demand for the currency increases. The opposite is the case if the price of Oil falls. Higher Oil prices also tend to result in a greater likelihood of a positive Trade Balance, which is also supportive of the CAD.
How does inflation data impact the value of the Canadian Dollar?
While inflation had always traditionally been thought of as a negative factor for a currency since it lowers the value of money, the opposite has actually been the case in modern times with the relaxation of cross-border capital controls. Higher inflation tends to lead central banks to put up interest rates which attracts more capital inflows from global investors seeking a lucrative place to keep their money. This increases demand for the local currency, which in Canada’s case is the Canadian Dollar.
How does economic data influence the value of the Canadian Dollar?
Macroeconomic data releases gauge the health of the economy and can have an impact on the Canadian Dollar. Indicators such as GDP, Manufacturing and Services PMIs, employment, and consumer sentiment surveys can all influence the direction of the CAD. A strong economy is good for the Canadian Dollar. Not only does it attract more foreign investment but it may encourage the Bank of Canada to put up interest rates, leading to a stronger currency. If economic data is weak, however, the CAD is likely to fall.
Following Monday’s Powell-driven sharp rebound in the US Dollar, the risk-linked galaxy managed to regain some balance as the sessions passed by, sparking a decent recovery in the likes of the single currency and the British Pound in an environment broadly dominated by speculations surrounding the potential timing of interest rate cuts by the Federal Reserve.
On Monday, the only release in the US docket will be the January Monthly Budget Statement. Moving forward, the US Inflation Rate is due on February 13, while Retail Sales, Industrial Production, Business Inventories, the NAHB Housing Market Index and Net Long-term TIC Flows are expected on February 15. Finally, Producer Prices, Housing Starts, Building Permits, and the preliminary Michigan Consumer Sentiment all be published on February 16. The USD Index (DXY) entered a small consolidative range following Monday’s sharp rebound to fresh YTD peaks past 104.00.
In the domestic data space, the Economic Sentiment for both Germany and the euro area tracked by the ZEW institute comes on February 13. Additionally, another revision of the Q4 GDP Growth Rate along with Industrial Production readings is due on February 14. The Balance of Trade figures in the euro bloc for the month of December will close the docket on February 15. EUR/USD ended the week on a positive note, regaining some balance following Monday’s steep decline. The pair continues to target the 1.0800 hurdle in the very near term.
It will be an interesting week, data-wise, in the UK. The labour market report is due on February 13, followed by the Inflation Rate on February 14. On February 15, the GDP figures, Balance of Trade, Construction Output, and Industrial and Manufacturing Production are due, all ahead of the NIESR GDP Tracker, Finally, Retail Sales for the month of January will be released on February 16. The weekly recovery in GBP/USD appears to have stalled just ahead of the 1.2650 zone so far.
In the Japanese calendar, Producer Prices are due on February 13 ahead of Industrial Production and the flash Q4 GDP Growth Rate on February 15. Weekly Foreign Bond Investment and the Tertiary Industry Index are both due at the end of the week. USD/JPY approaches the key 150.00 barrier on the back of the intense pick-up in selling pressure around the Japanese currency.
In Australia, the Westpac Consumer Confidence Index kickstarts the week ahead of the publication of the labour market report and Consumer Inflation Expectations on February 15. It was a choppy week for AUD/USD, which extended the trade in the lower end of the range around the 0.6500 zone.
Anticipating Economic Perspectives: Voices on the Horizon
- RBA A. Kohler, BoE Governor A. Bailey and Minneapolis Fed N. Kashkari speak on February 12.
- FOMC Governor M. Barr speaks on February 14.
- RBNZ Governor A. Orr, ECB Board member J. Nagel are due to speak on February 15, along with BoE MPC members C. Mann and M. Greene.
- On February 16, San Francisco Fed M. Daly, Atlanta Fed R. Bostic and BoE MPC member H. Pill are also seen delivering speeches.
- The EUR/GBP currently trades at 0.8536, reflecting minor losses on Friday.
- The pair will tally a seven-week losing streak.
- Focus is set on next week's British economic data including inflation and labor market reports.
- A more hawkish stance of the BoE in relation to the ECB gives the Pound traction.
On Friday's session, the EUR/GBP traded at 0.8536, posting mild losses amid contrasting monetary policy expectations from the European Central Bank (ECB) and the Bank of England (BoE) ahead of key economic figures of the British economy to be released next week. Meanwhile, the technical scenario remains bearish on the weekly and daily chart with bears gaining ground and tallying a seven-week selling spree.
Adding to that, despite the ECB pushing back against market easing expectations, a 55% chance of an interest rate cut in April is still predicted. On the other hand, markets are expecting a potential uptick in inflation in the UK, with the Consumer Price Index (CPI) expected to have risen by 4.1% YoY in January, prompting a greater likelihood of the BoE delaying cuts. The inflation report is due on Wednesday and on Tuesday, the UK will release labor market figures which will also shape the expectations of the next decisions. As for now, markets are seeing 100 bps of easing by the British bank, and 125 bps of easing from its European peer, and as long as investors bet on more easing by the ECB, the pair could continue falling.
EUR/GBP technical analysis
From a technical viewpoint, the daily and weekly chart's negative direction of the Relative Strength Index (RSI) and the cross dwelling under its 20, 100, and 200-day Simple Moving Averages (SMAs) insinuate bearish dominance. This indicates that bearish momentum persists and selling pressure is primarily in control. The current seven-week losing streak of the pair also reinforces the negative outlook leaving the cross exposed for further downside.
EUR/GBP weekly chart
-638430929912432703.png)
The road to the White House currently looks like a rematch between President Joe Biden and former President Donald Trump. Economists at Citigroup explain why not wait to invest until after the US elections.
Markets are likely to go up no matter who wins in the US
The S&P 500 has posted a positive return in 13 of the last 15 Presidential Election years.
Only if there is a major geopolitical event or a radical change in policy after the US elections might there be a negative tilt in economic activity.
Meanwhile, this phase of normalization and growth, of resilience and reshoring will continue, driving future corporate profits and markets higher.
Economists at the Bank of America analyze the potential shift from the US Dollar's (USD) carry advantage to a significant headwind.
Challenging period ahead for the USD
The Fed is predicted to be one of the initial G10 central banks to reduce rates, challenging the USD's carry advantage.
Given the higher starting point of US rates, their potential reduction could significantly narrow the rate differentials with other currencies, diminishing the USD's attractiveness.
The USD stands as one of the most overvalued currencies in the G10, a factor that could amplify its vulnerability in a rate-cutting environment.
Lower interest rates in the US typically boost global risk appetite, a dynamic that historically benefits currencies other than the USD.
It has been a relatively quiet start to the year in FX markets. Economists at ING analyze the EUR/USD outlook.
EUR/USD seen ending the year at 1.1500
Doubts about the timing and speed of central banking easing cycles have contributed to lower levels of volatility and a search for yield.
Assuming the Fed is preparing to cut rates in May/June, the bullish steepening of the US curve should be positive for most activity currencies – including the Euro.
We still forecast EUR/USD ending the second quarter somewhere near 1.1000 and ending the year at 1.1500.
- EUR/USD rises to 1.0784 on mixed central bank remarks and economic data, extending gains for a third day.
- Fed's cautious stance on rate cuts highlighted, with Goolsbee's dovish view contrasting Powell's alignment.
- US Treasury yields hit 2024 peaks, bolstering USD amid varied reactions to CPI updates.
- German inflation continues to drop, sparking ECB's debate on rate adjustment timing.
The EUR/USD rose steadily for the third-straight day in early trading in the North American session, driven by the latest central bank comments from Federal Reserve (Fed) and European Central Bank (ECB) officials. At the time of writing, the pair trades at 1.0784 after hitting a daily low of 1.0762.
Mixed postures amongst Fed, ECB officials keep EUR/USD seesawing below 1.0800
During the last week, Fed policymakers had stressed that it’s too early to cut rates even though the disinflation process continued. On the most “aggressive” dovish side lies Chicago Fed Austan Goolsbee, who remains optimistic about the economy and inflation and has been the most active dove on the board. Other Regional Fed Bank Presidents like Susan Collins, Neil Kashkari, and Thomas Barkin adopted a stance aligned with Fed Chair Jerome Powell. Even when Barkin was asked about Powell’s comments, he said, “Chairman Powell always speaks for the Committee.”
That has driven US Treasury yields higher, with the 10-year note yielding 4.173% after touching 4.195%, the highest level in 2024, a tailwind for the Greenback, which is fluctuating between gains and losses as depicted by the US Dollar Index (DXY). The DXY is clinging to the 104.00 mark, down 0.05%.
Recently, the US Department of Labor revealed the revisions for the US Consumer Price Index (CPI) and confirmed the progress on inflation, as CPI stood at 3.3% YoY, while Core CPI at 3.7%.
Across the pond, Germany’s data revealed that inflation dipped from 3.8% to 3.1% YoY. That maintains the ECB’s progress in curbing inflation. In the meantime, ECB officials Holzmann and Chief Economist Lane remain cautious about opening the door for rate cuts, with the former saying, “There is a certain chance that there will be no interest-rate cut at all this year or only at the very end of the year.” On the dovish side, Kazaks and Villeroy remain optimistic about the disinflation process, maintaining their stance to ease policy.
EUR/USD Price Analysis: Technical outlook
The pair remains downward biased, unable to crack the 200-day moving average (DMA) at 1.0787, which could open the door to challenging 1.0800. Relative Strength Index (RSI) studies remain bearish, with a flattish slope, suggesting that bears remain in charge. Therefore, the path of least resistance is downwards, with the next support emerging at 1.0741, today’s low, followed by the weekly low of 1.0722. Further downside lies at 1.0700.
It has become increasingly likely that Donald Trump will be the Republican candidate in the presidential election in the fall and that there will be a repeat of the 2020 duel: Joe Biden against Donald Trump. Economists at Commerzbank analyze how a Trump victory could impact stock markets.
Another stock market rally?
In November 2016, the stock markets reacted positively to Donald Trump's election victory, as the new US president promised companies lower taxes and less regulation, among other things. However, a number of factors suggest that the stock markets would not welcome a Trump election winner with similar euphoria.
For example, share valuations in 2024 are significantly higher than in 2016, when investors paid a price/earnings ratio (P/E ratio) of 17 for the S&P 500 and 18 for the Nasdaq 100, while the current S&P 500 P/E ratio is 20 and the Nasdaq 100 P/E ratio is 25.
In addition, there was a high level of uncertainty and nervousness in the stock market in 2016 in the run-up to the presidential election, and the implied volatility VIX for the S&P 500 was regularly above 20. We see the current VIX level of 13 as a signal that many investors are quite carefree about Trump winning the election in 2024.
We expect that a possible Trump election victory in 2024 will not have as strong an impact on the stock markets as in 2016.
Gold has recorded a surprisingly strong performance despite interest rates reaching a two decade high in the US and Western world. Strategists at TD Securities analyze the yellow metal’s outlook.
Fed will cut starting around the middle of the year
While the yellow metal is well supported in the current trading range above $2,000, there are no compelling reasons why gold should surge in the relative near-term. With US unemployment materially under 4%, wage growth above 4+% YoY, jobs gains at 350K+, GDP growth at 3+% and inflation running materially above the implied 2% target, the Fed has little latitude to start to take policy rates down from the current 5.50%.
As such, there is consensus that a March rate cut is off the table and May is being priced. High interest rates, modest speculative appetite and slumping physical demand suggest that lease rates may move to levels high enough to attract a significant amount of metal into the market. Meanwhile, high carry costs are also likely to see metal being pushed onto the market or may significantly reduce interest in new long acquisitions.
However, we believe the US central bank will cut starting around the middle of the year. For a sustained rally to start, the market will need to see a material weakening in economic data and an inflation rate that is closer to 2%. We expect that rates will drop by some 250 bps during the upcoming easing cycle, bringing effective rates to just under 3%. Once this becomes baked into broader expectations, Gold should rally again.
Economists at Wells Fargo forecast US Dollar depreciation as 2024 progresses, and into 2025.
Further depreciation in the US Dollar through 2025
While we expect the US to avoid recession, Fed easing and slower economic growth should still weigh on the Greenback as the year progresses.
For the Fed's US Dollar Index against the advanced foreign economies, we see a depreciation of 2.8% over the rest of 2024.
A relatively benign global growth environment that supports broader financial market sentiment could also lessen safe-haven support for the Greenback, contributing to moderate US Dollar losses this year and next.
- USD/CAD falls to near 1.3430 as robust labor demand in Canada.
- US BLS revision shows that monthly CPI for January grew by 0.2% against the reading of 0.3%.
- Oil prices eye more upside as Israel rejects ceasefire proposal.
The USD/CAD pair has come under pressure as the Canadian Employment data for January has outperformed expectations in the early New York session of Friday. Statistics Canada has reported a strong labor growth of 37.5K against expectations of 15K and upwardly revised December’s reading of 12.3K.
The Unemployment Rate surprisingly fell to 5.7% while investors anticipated it rising to 5.9% from the former reading of 5.8%. An upbeat labor market data would strengthen the argument by the Bank of Canada (BOC) for holding interest rates at their current level.
On the oil front, oil price aims to extend its rally above $76.5 as Israeli Prime Minister Benjamin Netanyahu rejected the ceasefire proposal due to unacceptable truce terms proposed by Hamas. This is expected to deepen tensions in the Middle East, which could disrupt oil supply. Lower oil supply results in higher prices. It is worth noting that Canada is the leading oil exporter to the United States, and higher oil prices support the Canadian Dollar.
The US Dollar Index (DXY) comes under pressure as the US Bureau of Labor Statistics (BLS) has revised the monthly headline Consumer Price Index (CPI) to 0.2% from 0.3%. The inflation has been revised as the BLS has employed new seasonal adjustment factors. The new process accurately reflects how consumer prices behaved over the year.
Meanwhile, Federal Reserve (Fed) policymakers emphasize keeping key rates restricted until they get convinced that inflation will come down sustainably to the 2% target. Boston Federal Reserve Bank President Susan Collins said risks of inflation stalling have turned towards the upside due to strong economic growth.
Banxico announced its latest rate decision on Thursday, February 8 with no change to the current 11.25% policy rate. USD/MXN reaction was fairly muted. Economists at Rabobank analyze the pair’s outlook.
USD/MXN to trade up through the 18.00 handle in H2
Banxico decided to leave rates on hold at 11.25%. The accompanying material provided something for everyone, hawks and doves alike.
Our base case remains for a 25 bps cut at the June 27th meeting after the Fed announces its first cut on June 12th. We remain of the view that a cut from Banxico in March is highly unlikely, but we are cognisant that there is a significant risk of a cut at the May 9th meeting.
We still favor a retest of the 17.00 handle in the coming days with 17.00-17.20 likely to dominate in the coming weeks.
We still expect a total of 175 bps of cuts from Banxico this year and USD/MXN to trade up through the 18.00 handle in H2.
The US Dollar (USD) is narrowly mixed in quiet trading. Economists at Scotiabank analyze Greenback’s outlook.
USD needs more support from higher yields and/or stronger data to advance
The USD is trading firm on the day and week and underlying momentum signals are leaning bullish but beyond that, there are some softer technical signals creeping into longer-term price action in the DXY, suggesting markets may be turning a bit less constructive on the USD overall after its early year rally.
At the very least, the USD needs more support from higher yields and/or stronger data to advance from here – and solid US Treasury auctions this week suggest investors are happy to participate with the 10Y yield nearing recent highs around 4.20%.
The US Bureau of Labor Statistics (BLS) reported on Friday that it revised the monthly Consumer Price Index (CPI) increase for December lower to 0.2% from 0.3%. The Core CPI was unrevised at 0.3% for the same period.
November's CPI increase was revised higher to 0.2% from 0.1%, while the October's 0.1% increase was left unchanged.
The BLS noted that CPI revisions reflect the new seasonal adjustment factors.
Market reaction
The US Dollar Index edged slightly lower with the immediate reaction and was last seen losing 0.1% on the day at 104.07.
- USD/JPY marches toward 150.00 as Fed policymakers maintain a hawkish rhetoric.
- Fed Collins said the central bank should prioritize achieving the dual mandate.
- The BoJ is not expected to go aggressive for rate hikes after exiting from an expansionary policy stance.
The USD/JPY pair advances toward the psychological resistance of 150.00 in the late European session on Friday. The asset continues its two-day winning spell as investors turn cautious amid volatility ahead of January's United States Consumer Price Index (CPI) data.
The US Dollar Index (DXY) is slightly up from Thursday’s closing price as Federal Reserve (Fed) policymakers lean towards holding interest rates restrictive for longer. On Thursday, Boston Federal Reserve Bank President Susan Collins said the central bank needs to be sure about strength in the labor market and progress in inflation declining towards 2% before adopting an expansionary policy stance.
On the labor market front, the US economy is outperforming as weekly jobless claims, released on Thursday, were lower despite high lay-offs in the technology sector. For the week ending February 2, individuals claiming jobless benefits for the first time were at 218K, lower than expectations of 220K and the former release of 228K.
Going forward, the inflation will provide fresh guidance on interest rates. A stubborn inflation data would shift the hopes of a rate cut to June from May, which already shifted further from March. The CME Fedwatch tool shows trades see a 53% chance for a rate cut by 25 basis points (bps), declining in the range of 5.00%-5.25%.
On the Tokyo front, the Japanese Yen is under pressure as investors see the Bank of Japan (BoJ) not going aggressive on rate hikes after exiting from its ultra-dovish interest rate stance. On Thursday, BoJ Deputy Governor Uchida Shinichi said that monetary policy conditions in the Japanese economy are in a deep negative trajectory, which is not expected to get blown up aggressively.
Gold (XAU/USD) could trade well above the $2,300 level for a time next quarter, strategists at TD Securities say.
Positioning, Fed credibility angst are catalysts for Gold upside
Lower policy rates are set to send real rates, carry and opportunity costs sharply lower, which should bring speculative and ETF investors back in. This will very much work in tandem with physical markets and relative positioning, which is skewed to the short end, to bring Gold above $2,300 for a time later in the year.
The strong likelihood that the US monetary policy makers will start cutting before inflation reached the desired level suggests that long-term investors, who have an interest in wealth preservation, may boost portfolio weightings of Gold.
Cutting rates before the two percent inflation target is reached may well convince many in the Gold market to hedge their long-term purchasing power. They may question the credibility of the Fed's commitment to the current inflation target. The potential of a US election outcome, which elects politicians who want to cut taxes and grow spending at the same time, may also be a reason investors and central banks continue to buy physical Gold.
- S&P 500 is set to open at new all-time high above 5,000.
- Alibaba, PayPal and Disney were among noteworthy companies that reported earnings this week.
- Energy Sector was the best-performing S&P 500 major sector on Thursday.
S&P 500 futures rise 0.16%, Dow Jones futures are unchanged, and Nasdaq futures gain 0.33%.
S&P 500 (SPX), Dow Jones (DJIA), and Nasdaq (IXIC) indexes closed on Thursday with a 0.06% gain, a 0.13% increase, and a 0.24% rise, respectively.
What to know before stock market opens
- The Energy Sector was the best-performing S&P 500 major sector on Thursday, rising 1.09% on the day. The Utilities Sector settled in the opposite extreme, shedding 0.83%.
- Ralph Lauren Corp. (RL) and Monolithic Power Systems Inc. (MPWR) added over 10%, making it to the top gainers on Thursday. Snap-on Inc. (SNA) lost 9.7% and closed at its lowest level since early November at $266.03.
- The US Department of Labor reported that there were 218,000 Initial Jobless Claims in the week ending February 3, down from the previous week's revised 227,000.
- Federal Reserve (Fed) Bank of Richmond President Thomas Barkin told Bloomberg on Thursday that economic data has been remarkable across the board but noted that he is cautious about the accuracy of numbers at the turn of the year.
- The data from the US showed that the goods and services deficit was $62.2 billion in December, up $0.3 billion from $61.9 billion in November.
- The Federal Reserve (Fed) reported late Wednesday that consumers added $1.56 billion in additional borrowing, far below the $16 billion forecast and declining steeply from the previous month's $23.75 billion.
- In an interview with CNBC on Wednesday, Minneapolis Fed President Neel Kashkari argued they can dial back the policy rate quite slowly if the labor market continues to be strong. "At the moment, two to three rate cuts this year seems appropriate," he added.
- Federal Reserve Board of Governor member Adriana Kugler noted on Wednesday that she is pleased with the great progress on inflation and added that she is optimistic that the progress will continue. "Some measures of financial conditions have eased but remain relatively tight and are consistent with continued progress on inflation,” Kugler elaborated.
Alibaba, PayPal and Disney reported earnings this week
- Pinterest shares collapsed right after the close, as the company reported a $981 million revenue vs $991 million expected. Revenue rose 12% year-over-year from $877.2 million a year earlier, while net income was $201 million, or 29 cents a share, up from $17.49 million, or 3 cents a share, a year ago.
- Walt Disney Co. (DIS) reported a quarterly revenue of $23.5 billion, slightly below the market projection of $23.6 billion, per Reuters. Disney's board of directors authorized a $3 billion share repurchase program for the current fiscal year, and declared a dividend of 45 cents a share. “Our strong performance this past quarter demonstrates we have turned the corner and entered a new era of growth for our company,” Disney CEO Bob Iger said in a statement.
- PayPal Holdings Inc. (PYPL) said revenue rose 8.7% to $8.03 billion from a year ago, surpassing the market forecast of $7.87 billion. Quarterly adjusted earnings were $1.48 per share for the quarter ended in December, and quarterly net income was $1.4 billion. "We're doing a lot of things to drive change internally and externally,” CEO Alex Chriss said in a post-earnings conference call, according to Reuters. “However, nothing happens overnight. It will take time for some of our initiatives to scale and move the needle," Chriss added.
- Alibaba Group Holdings Ltd. (BABA) reported Q3 adjusted net income of RMB 47,951 million and Q3 revenue of RMB 260,348 million before the opening bell on Wednesday. In its earnings report, the company said that the board of directors approved an increase of $25 billion to the share repurchase program. “Our top priority is to reignite the growth of our core businesses, e-commerce and cloud computing,” Alibaba said, per Reuters.
- Uber Technologies Inc. (UBER) announced Q4 net income of $1.4 billion and Q4 gross bookings of $37.6 billion. Net revenue for that period was $9.94 billion. "Uber's platform advantages and disciplined investment in new growth opportunities resulted in record engagement and accelerating Gross Bookings in Q4," Chief Financial Officer Prashanth Mahendra-Rajah said, per Reuters.
S&P 500 FAQs
What is the S&P 500?
The S&P 500 is a widely followed stock price index which measures the performance of 500 publicly owned companies, and is seen as a broad measure of the US stock market. Each company’s influence on the computation of the index is weighted based on market capitalization. This is calculated by multiplying the number of publicly traded shares of the company by the share price. The S&P 500 index has achieved impressive returns – $1.00 invested in 1970 would have yielded a return of almost $192.00 in 2022. The average annual return since its inception in 1957 has been 11.9%.
How are companies chosen to be included in the S&P 500?
Companies are selected by committee, unlike some other indexes where they are included based on set rules. Still, they must meet certain eligibility criteria, the most important of which is market capitalization, which must be greater than or equal to $12.7 billion. Other criteria include liquidity, domicile, public float, sector, financial viability, length of time publicly traded, and representation of the industries in the economy of the United States. The nine largest companies in the index account for 27.8% of the market capitalization of the index.
How can I trade the S&P 500?
There are a number of ways to trade the S&P 500. Most retail brokers and spread betting platforms allow traders to use Contracts for Difference (CFD) to place bets on the direction of the price. In addition, that can buy into Index, Mutual and Exchange Traded Funds (ETF) that track the price of the S&P 500. The most liquid of the ETFs is State Street Corporation’s SPY. The Chicago Mercantile Exchange (CME) offers futures contracts in the index and the Chicago Board of Options (CMOE) offers options as well as ETFs, inverse ETFs and leveraged ETFs.
What factors drive the S&P 500?
Many different factors drive the S&P 500 but mainly it is the aggregate performance of the component companies revealed in their quarterly and annual company earnings reports. US and global macroeconomic data also contributes as it impacts on investor sentiment, which if positive drives gains. The level of interest rates, set by the Federal Reserve (Fed), also influences the S&P 500 as it affects the cost of credit, on which many corporations are heavily reliant. Therefore, inflation can be a major driver as well as other metrics which impact the Fed decisions.
EUR/USD remains well within this week’s range, with early gains capped again in the upper 1.0700s. Economists at Scotiabank analyze the pair’s outlook.
EUR is trying to base in a more sustainable way
Price signals look mixed across the intraday, daily and weekly charts.
The short-term pattern of trade suggests the EUR’s rebound from the early week low has stalled but there are some more positive signals on the daily and weekly charts that might indicate the EUR is trying to base in a more sustainable way – a high close on the week for the EUR would be a technical positive.
Intraday support is 1.0740. Resistance is 1.0790/1.0800.
- The US Dollar not breaking any pots this Friday with minor moves in either direction.
- Traders are taking some profit from the Greenback rally earlier this week with an empty calendar ahead.
- The US Dollar Index fails to close above the 100-day SMA and could slide back below 104.
The US Dollar (USD) is steady to lower this Friday with nothing really to report in markets. All eyes are rather on headlines in the papers with the landslide victory of former US President Donald Trump in both Nevada and the Virgin Islands, giving him a comfortable lead already early in the Primaries. The second big topic is the interview of former Fox news reporter Tucker Carlson with Russian President Vladimir Putin where the broad strokes are that Putin is not interested in invading the West, only Ukraine.
On the economic front, a blank sheet with no economic data to report. Though one US Federal Reserve Speaker is due to make an appearance after the European Closing Bell. Lorie Logan from the Dallas Fed is set to speak around 18:30 GMT.
Daily digest market movers: No news, no moves
- Germany's final inflation reading for January saw yearly Headline inflation closing off at 2.9%.
- Martin Kazaks from the European Central Bank Council said that rate cuts will be taking place this year for the ECB. It is just a matter of when the data is confirming the right time.
- The Senate is advancing with the aid for Ukraine and Israel, detaching the US Border Deal from the bill.
- Equity markets are dragging their feet towards the end of this week. Although several indices are residing near all-time highs, some fatigue is showing, and some profit taking might creep in towards this week’s closing bell.
- The CME Group’s FedWatch Tool is now looking at the March 20th meeting. Expectations for a pause are 84.5%, while 15.5% for a rate cut.
- The benchmark 10-year US Treasury Note trades near 4.17%, though the jump in the yield from the lower 4.06% earlier this week is not reflected in the US Dollar.
US Dollar Index Technical Analysis: Some fatigue
The US Dollar Index (DXY) is showing fatigue after the cost of finally moving away from the 200-day Simple Moving Average (SMA) near 103.61. Ideally a close above the 100-day SMA at 104.27 would have set forth the Greenback for more gains into next week, though US Dollar bulls are not supporting that plan. Instead, a week of false breaks took place and could mean that the DXY now falls back to the 200-day SMA for support.
Should the US Dollar Index move higher again, first look for a test at the peak of Monday, near 104.60. That level needs to be broken and is more important than the 100-day SImple Moving Average snap at 104.28. Once broken above that Monday high, the road is open for a jump to 105.00 with 105.12 as key levels to keep an eye on.
The 100-day SMA (104.28) is clearly the unreliable boyfriend in the rally at the moment. A false break on Monday and no support provided on Tuesday from the moving average opens the door for a bit of a squeeze lower. The first ideal candidate for support is the 200-day SMA near 103.61. Should that give way, look for support from the 55-day SMA near 103.02 itself.
US Dollar FAQs
What is the US Dollar?
The US Dollar (USD) is the official currency of the United States of America, and the ‘de facto’ currency of a significant number of other countries where it is found in circulation alongside local notes. It is the most heavily traded currency in the world, accounting for over 88% of all global foreign exchange turnover, or an average of $6.6 trillion in transactions per day, according to data from 2022.
Following the second world war, the USD took over from the British Pound as the world’s reserve currency. For most of its history, the US Dollar was backed by Gold, until the Bretton Woods Agreement in 1971 when the Gold Standard went away.
How do the decisions of the Federal Reserve impact the US Dollar?
The most important single factor impacting on the value of the US Dollar is monetary policy, which is shaped by the Federal Reserve (Fed). The Fed has two mandates: to achieve price stability (control inflation) and foster full employment. Its primary tool to achieve these two goals is by adjusting interest rates.
When prices are rising too quickly and inflation is above the Fed’s 2% target, the Fed will raise rates, which helps the USD value. When inflation falls below 2% or the Unemployment Rate is too high, the Fed may lower interest rates, which weighs on the Greenback.
What is Quantitative Easing and how does it influence the US Dollar?
In extreme situations, the Federal Reserve can also print more Dollars and enact quantitative easing (QE). QE is the process by which the Fed substantially increases the flow of credit in a stuck financial system.
It is a non-standard policy measure used when credit has dried up because banks will not lend to each other (out of the fear of counterparty default). It is a last resort when simply lowering interest rates is unlikely to achieve the necessary result. It was the Fed’s weapon of choice to combat the credit crunch that occurred during the Great Financial Crisis in 2008. It involves the Fed printing more Dollars and using them to buy US government bonds predominantly from financial institutions. QE usually leads to a weaker US Dollar.
What is Quantitative Tightening and how does it influence the US Dollar?
Quantitative tightening (QT) is the reverse process whereby the Federal Reserve stops buying bonds from financial institutions and does not reinvest the principal from the bonds it holds maturing in new purchases. It is usually positive for the US Dollar.
USD/CAD is trading flat on the session. Economists at Scotiabank analyze the pair’s outlook.
Resistance around 1.3540 firms
Short-term trend signals are weak, supporting the outlook for more range trading in the near term. But the weekly chart – at the moment – reflects another firm rejection of the 1.3540/1.3550 peaks seen in January and a weak close for funds on the day should see spot prices have a run at last week’s low around 1.3360 in the week ahead.
Minor, intraday support sits at 1.3440, with resistance at 1.3490/1.3500.
GBP/USD continues to pivot around 1.2600. Economists at Scotiabank analyze the pair’s outlook.
Medium-term support at 1.2500/1.2520 looks solid
Short-term price action looks a little soft but the weekly pattern of trade is shaping up a little more constructively for the Pound Sterling (GBP), with a solid rebound from the early week low putting a potential bull ‘hammer’ signal on the weekly chart (contingent on a high close for the GBP today).
Medium-term support at 1.2500/1.2520 looks solid now. Intraday support is 1.2575.
Resistance is 1.2640.
The battle for interest rate support in currency markets continues. Kit Juckes, Chief Global FX Strategist at Société Générale, analyzes EUR/USD outlook.
ECB talk of tightening is both very unlikely and a bad idea
The FX market’s strong focus on monetary policy, and the common refrain from major central banks that they think markets are pricing in rate cuts too soon, has helped EUR/USD meander around dispute a yawning growth divide.
If we were to see talk of a Fed rate hike (which is not in our forecasts at all) EUR/USD would fall.
The lack of growth in Europe means that ECB talk of tightening is both very unlikely and a bad idea.
Gold price is treading water while defending the $2,030 level. Economists at Commerbznka analyze the yellow metal’s outlook.
Optimism for rapid interest rate cuts only to return if inflation surprises to the downside
The direction of the Gold market has long been driven by expectations of US interest rate policy. At present, these are still very much determined by Fed Chairman Powell's indication that inflation must first fall sustainably before interest rates can be cut.
The next litmus test will be next Tuesday when the US inflation data for January is published. However, optimism for rapid interest rate cuts is only likely to return if the figures surprise to the downside. We do not expect this to happen: Gold is therefore unlikely to leave its trading range between a good $2,050 and $2,000.
- USD/CAD trades sideways near 1.3450 ahead of Canada’s labor market data.
- Deepening Middle East tensions continue to provide support to the US Dollar.
- A lackluster action in the Loonie asset indicates indecisiveness among market participants.
The USD/CAD pair oscillates in a tight range around 1.3450 as investors await the Canadian Employment data for January, which will be published at 13:30 GMT.
Investors anticipate Canadian employers recruiting 15K new workers against flat demand in December. The Unemployment Rate is expected to increase slightly to 5.9% vs. the prior reading of 5.8%. The Bank of Canada (BoC) may focus on keeping interest rates at their current level longer if the labor market conditions remain upbeat.
Meanwhile, the US Dollar Index (DXY) attempts to recover as market mood remains cautious due to deepening Middle East tensions. Israel denies the ceasefire proposal from Hamas having unacceptable terms. Also, investors await January's United States inflation data, which will be published on Tuesday. Investors see price pressures expanding at a steady pace.
USD/CAD turns sideways in a range of 1.3450-1.3500 after correction from an 11-week high of 1.3544 on an hourly scale. The Loonie asset struggles for a direction ahead of crucial labor market data. The 50-period Exponential Moving Average (EMA) around 1.3460 has overlapped the Loonie asset, indicating a sharp contraction in volatility.
The 14-period Relative Strength Index (RSI) oscillates in the 40.00-60.00 range, indicating a sideways trend.
The fresh upside would emerge if the Loonie asset climbed above the January 17 high at 1.3542, which will drive the asset towards the round-level resistance of 1.3600, followed by the November 30 high at 1.3627.
On the flip side, a sell-off could appear if the Loonie asset drops below January 31 low at 1.3359. This will expose the asset to January 4 low at 1.3318 and January 5 low at 1.3288.
USD/CAD hourly chart
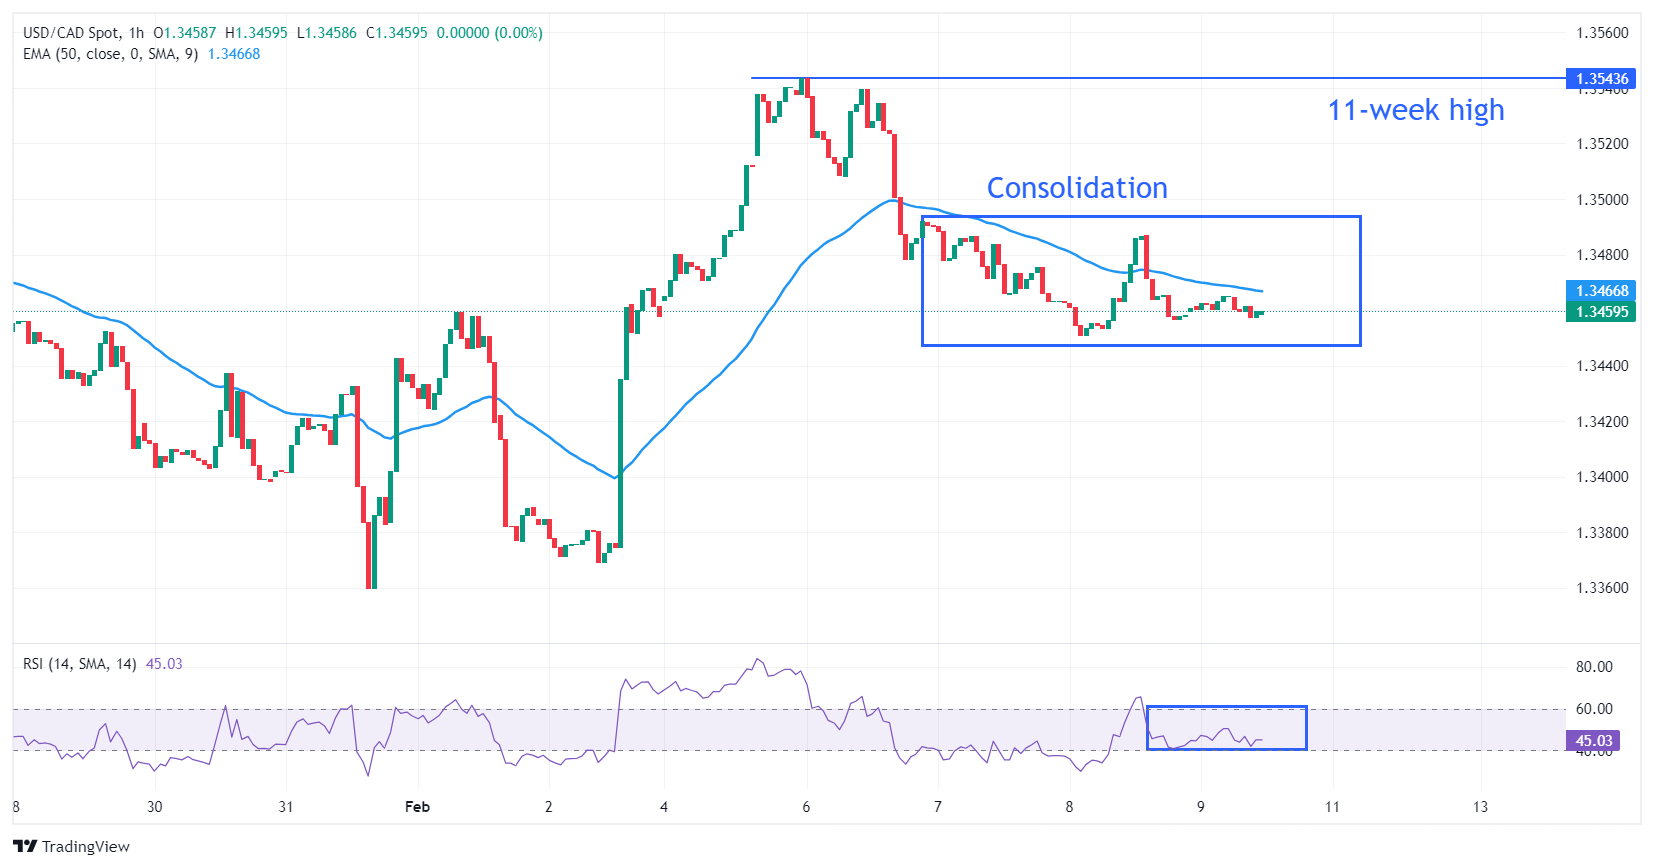
USD/CAD rebound has so far stalled near 1.3540. Economists at Société Générale analyze the pair’s outlook.
1.3350 is crucial support
Both the 200-Day Moving Average and daily MACD are having a flattish slope denoting a lack of clear direction.
Price action is likely to remain in a narrow range in the short term.
A move beyond 1.3540 could confirm an extension in bounce towards the December high of 1.3620 and perhaps even towards 1.3730.
The recent pivot low at 1.3350 is a crucial support.
- Gold price struggles to deliver a decisive move as investors are uncertain about Fed rate cuts.
- Investors shifted focus toward the US inflation data, which will be published next week.
- Middle East tensions continue to offer growth to safe-haven Gold.
Gold price (XAU/USD) stays inside Thursday’s trading range as investors shift focus toward the United States Consumer Price Index (CPI) data for January, which will be released on Tuesday. The inflation data will provide more cues about when the Federal Reserve (Fed) could start reducing interest rates. The sooner interest rates fall, the better it will be for Gold price, which will lower the opportunity cost of holding a non-yielding asset.
As Fed policymakers consistently emphasize keeping interest rates restricted until they get more evidence that inflation will sustainably return to 2% and labor market conditions remain upbeat, investors are losing confidence in the Fed easing interest rates from May. The CME FedWatch tool shows that the chances favoring a rate cut by 25 basis points (bps) in May have fallen to 51%.
When considering cutting interest rates, the Fed consistently observes its dual mandate of easing price pressures and full employment. US labor market conditions are upbeat as weekly jobless claims are consistently declining. For the week ending February 2, individuals claiming jobless benefits for the first time were at 218K, lower than expectations of 220K and the former release of 228K. This suggests less need to lower interest rates and stimulate growth.
As market participants are losing confidence in the Fed easing interest rates from May, the broader appeal of the US Dollar is improving. The US Dollar is negatively correlated to Gold price and tends to attract higher foreign outflows if the Fed maintains a hawkish stance (higher interest rates) for longer.
Daily Digest Market Movers: Gold price trades lacklustre as focus shifts to US CPI
- Gold price remains largely within the $2,020-$2,040 range from the past three trading sessions as Federal Reserve (Fed) policymakers have not declared a timeframe for rate cuts.
- Fed policymakers are holding back from providing a concrete time for rate cuts as they are still unconvinced that inflation will come down sustainably to the 2% target.
- The Fed needs to see price pressures easing for months to be confident about achieving price stability.
- On Thursday, Boston Federal Reserve Bank President Susan Collins reiterated the need to ensure strong labor growth and progress in inflation towards 2% before shifting to an expansionary policy stance.
- Susan Collins warned about risks of inflation remaining stalled due to strong economic growth despite being optimistic about easing price pressures.
- Richmond Federal Reserve Bank President Thomas Barkin advised the central bank to take some time before easing interest rates as they could feed price pressures again.
- While uncertainty over Fed rate-cut timing is capping the upside in the Gold price, deepening Middle East tensions are acting as a tailwind.
- The outlook for safe-haven assets such as Gold improves in times of geopolitical uncertainty.
- Tensions in the Middle East have deepened as Israel’s Prime Minister Benjamin Netanyahu has rejected the ceasefire proposal due to unacceptable terms for a truce. The Israeli leader said the complete destruction of Hamas is only a few months away.
- Meanwhile, the US Dollar Index (DXY) trades back and forth in a narrow range above 104.00 as investors await the United States inflation data for January, which will be released on Tuesday, February 13.
- The appeal for the US Dollar could improve further if the inflation data turns out persistent. A stubborn inflation data would allow the Fed to keep interest rates higher for longer. This would lead to higher foreign capital inflows for the US Dollar.
Technical Analysis: Gold price trades inside Thursday’s range
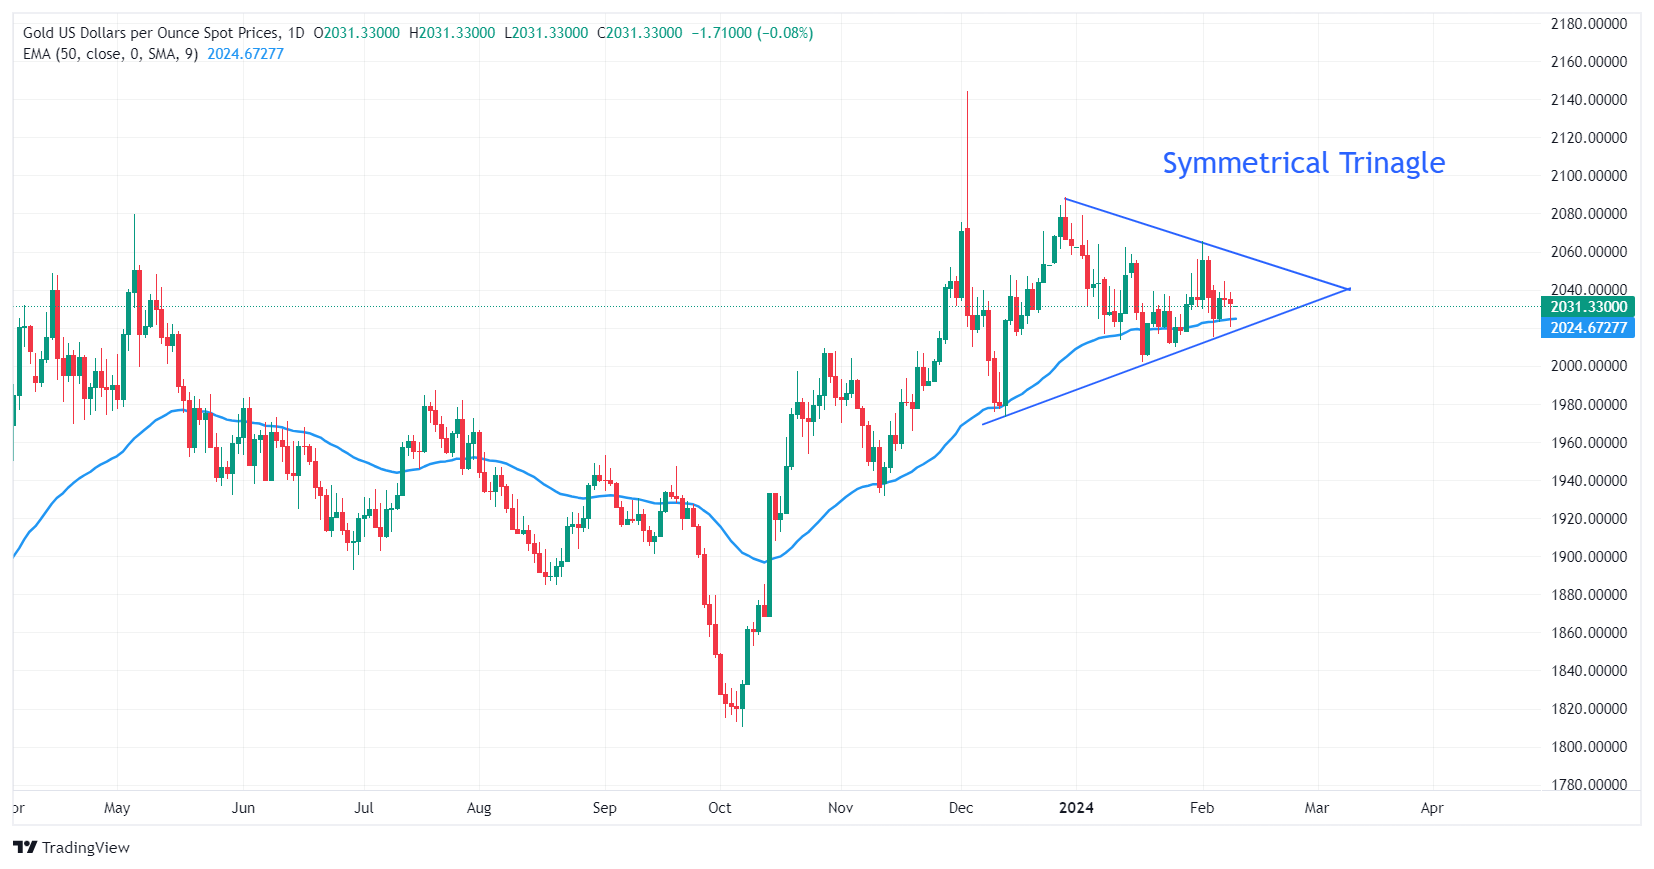
Gold price is struck inside Thursday’s range of $2,020-2,039 in Friday’s London session. An inability to deliver a decisive move indicates a sharp contraction in volatility.
The Gold price has been forming a Symmetrical Triangle chart pattern since December on a daily time frame, demonstrating indecisiveness among market participants. The downward and upward-sloping trendline borders of the aforementioned pattern are plotted from December 28 high at $2,088 and December 13 low at $1,973, respectively. The 50-day EMA at $2,023 continues to cushion the Gold price bulls.
Gold FAQs
Why do people invest in Gold?
Gold has played a key role in human’s history as it has been widely used as a store of value and medium of exchange. Currently, apart from its shine and usage for jewelry, the precious metal is widely seen as a safe-haven asset, meaning that it is considered a good investment during turbulent times. Gold is also widely seen as a hedge against inflation and against depreciating currencies as it doesn’t rely on any specific issuer or government.
Who buys the most Gold?
Central banks are the biggest Gold holders. In their aim to support their currencies in turbulent times, central banks tend to diversify their reserves and buy Gold to improve the perceived strength of the economy and the currency. High Gold reserves can be a source of trust for a country’s solvency. Central banks added 1,136 tonnes of Gold worth around $70 billion to their reserves in 2022, according to data from the World Gold Council. This is the highest yearly purchase since records began. Central banks from emerging economies such as China, India and Turkey are quickly increasing their Gold reserves.
How is Gold correlated with other assets?
Gold has an inverse correlation with the US Dollar and US Treasuries, which are both major reserve and safe-haven assets. When the Dollar depreciates, Gold tends to rise, enabling investors and central banks to diversify their assets in turbulent times. Gold is also inversely correlated with risk assets. A rally in the stock market tends to weaken Gold price, while sell-offs in riskier markets tend to favor the precious metal.
What does the price of Gold depend on?
The price can move due to a wide range of factors. Geopolitical instability or fears of a deep recession can quickly make Gold price escalate due to its safe-haven status. As a yield-less asset, Gold tends to rise with lower interest rates, while higher cost of money usually weighs down on the yellow metal. Still, most moves depend on how the US Dollar (USD) behaves as the asset is priced in dollars (XAU/USD). A strong Dollar tends to keep the price of Gold controlled, whereas a weaker Dollar is likely to push Gold prices up.
- WTI maintains its bullish bias after Israel rejected Hamas's ceasefire deal.
- A combination of factors keeps a lid on any further appreciating move.
- The black liquid remains on track to register strong weekly gains.
West Texas Intermediate (WTI) US Crude Oil prices struggle to capitalize on strong weekly gains registered over the past four days and oscillate in a narrow trading band through the first half of the European session on Friday. The commodity, however, holds steady above the $76.00/barrel mark, or the weekly top and remains well within the striking distance of a technically significant 200-day Simple Moving Average (SMA).
Israel's Prime Minister Benjamin Netanyahu has rejected a proposal to end the war in the Palestinian enclave, raising the risk of a further escalation of geopolitical tensions in the Middle East – the major Oil producing region. This comes on top of the continuous US strikes against Iran-backed Houthi targets in Yemen, which has been fueling supply concerns and is seen acting as a tailwind for Crude Oil prices. That said, a combination of factors is holding back traders from placing aggressive bullish bets and capping the upside.
Investors remain concerned about a weaker demand outlook in the wake of slowing economic growth in China – the world's top Oil importer. Adding to this, output from Norway and Guyana is increasing, while Russia is exporting more crude in February in the wake of damage to refineries from Ukraine's drone attacks and technical outages. This, to a larger extent, offsets the US refinery maintenance, which, along with a bullish US Dollar (USD), bolstered by hawkish Federal Reserve (Fed) expectations, keeps a lid on Crude Oil prices.
Nevertheless, the black liquid remains on track to register strong weekly gains as market participants look forward to the crucial US consumer inflation figures next week for cues about the Fed's rate-cut path. In the meantime, the lower US output growth forecast by the Energy Information Administration (EIA), along with persistent geopolitical risks, might continue to lend some support to Crude Oil prices.
Technical levels to watch
The Euro (EUR) has suffered from the recent dovish talk of ECB policymakers. Economists at Commerbznank analyze how ECB decisions could impact the shared currency.
The ECB would jeopardize the success of past monetary tightening if it were to cut rates prematurely
The ECB would jeopardize the success of past monetary tightening if it were to cut rates prematurely, because in hindsight it would be seen as a tactic rather than a reflection of a fundamental stance.
This is why the Euro has suffered so much from the recent dovish talk of ECB policymakers. And it is also why it has significant recovery potential if the ECB delivers fewer rate cuts than the market is currently pricing in.
S&P 500 scales 5,000. Economists at Société Générale analyze the index outlook.
2022 high of 4,840/4,800 could be an important support
S&P 500 has experienced gradual extension in uptrend after cross above 2022 peak (4,800). It is now in vicinity to the upper limit of the channel drawn since 2022 near 5,000/5,030.
The move is a bit stretched but signals of reversal are not yet visible. In case the uptrend stalls near this zone, a brief pullback can’t be ruled out. 2022 high of 4,840/4,800 could be an important support.
Once the index establishes beyond 5,000/5,030, the rise could extend towards next projections located at 5,220 and 5,365.
FX option expiries for Feb 9 NY cut at 10:00 Eastern Time, via DTCC, can be found below.
- EUR/USD: EUR amounts
- 1.0700 1.2b
- 1.0850 2.8b
- 1.0900 2b
- GBP/USD: GBP amounts
- 1.2725 332m
- 1.2560 330m
- USD/JPY: USD amounts
- 147.50 1.4b
- 148.65 1.1b
- 148.50 1.07b
- AUD/USD: AUD amounts
- 0.6500 690m
- 0.6510 571m
- 0.6600 660m
- USD/CAD: USD amounts
- 1.3300 1.1b
- 1.3350 1.4b
- 1.3400 766m
- USD/CNY: USD amounts
- 7.0000 920m
- 7.1500 1.1b
- 7.2115 1.3b
USD/JPY eyed the 150.00 level following Shinichi Uchida’s, Deputy Governor of the Bank of Japan (BoJ), speech. Ulrich Leuchtmann, Head of FX and Commodity Research at Commerzbank, analyzes Yen’s outlook.
Rate hike only a positive argument for the JPY if it could be interpreted as the start of a rate hiking cycle
Shinichi Uchida, Deputy Governor of the BoJ, speaks from the heart: ‘Even if the Bank were to end the negative interest rate policy, it is hard to imagine a way in which it would continue to raise the interest rate rapidly.’
A rate hike could only be seen as a positive argument for the JPY if it could be interpreted as the start of a rate hiking cycle. However, I have been telling you for a long time that such an interpretation is nonsense. And Mr. Uchida is now telling you the same thing. Perhaps you believe him more than me.
However, when I read the comments on Mr. Uchida's remarks, my hope that the tiresome hype about the end of the BoJ's negative interest rates will die down, fades. ‘Uchida's speech confirms that the end of negative rates is just around the corner,’ one analyst, obviously a JPY bull, is quoted as saying. It seems to me that some people are hearing what they want to hear. As long as such players have yet to capitulate, USD/JPY should have upside potential.
- Silver gains positive traction for the second straight day, albeit lacks follow-through.
- The technical setup warrants some caution before positioning for any further gains.
- A sustained move beyond a descending trend-line is needed for bulls to seize control
Silver (XAG/USD) builds on the previous day's goodish recovery from the $22.15 area, or over a two-week low and trades with a positive bias for the second successive day on Friday. The momentum lifts the white metal to the top end of its weekly range, around the $22.70 region during the first half of the European session, albeit lacks bullish conviction.
From a technical perspective, the commodity's inability to attract any follow-through buying, along with neutral oscillators on the daily chart, warrants some caution for bullish traders and positioning for any further gains. Hence, any subsequent move up is more likely to confront stiff resistance near the $22.85 region, which is closely followed by a descending trend-line hurdle near the $23.00 round figure.
The latter should act as a key pivotal point, which if cleared decisively might shift the near-term bias in favour of bulls and pave the way for a further appreciating move. Some follow-through buying beyond the 200-day Simple Moving Average (SMA), currently pegged near the $23.25-$23.30 zone, will reaffirm the positive outlook and allow the XAG/USD aim back to reclaim the $24.00 round figure.
The upward trajectory could get extended further towards the next relevant hurdle near the $24.50-$24.60 region before the white metal eventually climbs to the $25.00 psychological mark.
On the flip side, the $22.40 horizontal zone now seems to protect the immediate downside ahead of the $22.20-$22.15 area, below which the XAG/USD could retest sub-$22.00 levels or a two-month trough touched in January. Some follow-through selling will expose the $21.40-$21.35 support before the white metal weakens further below the $21.00 mark, towards the October swing low near the $20.70-$20.65 zone.
Silver daily chart
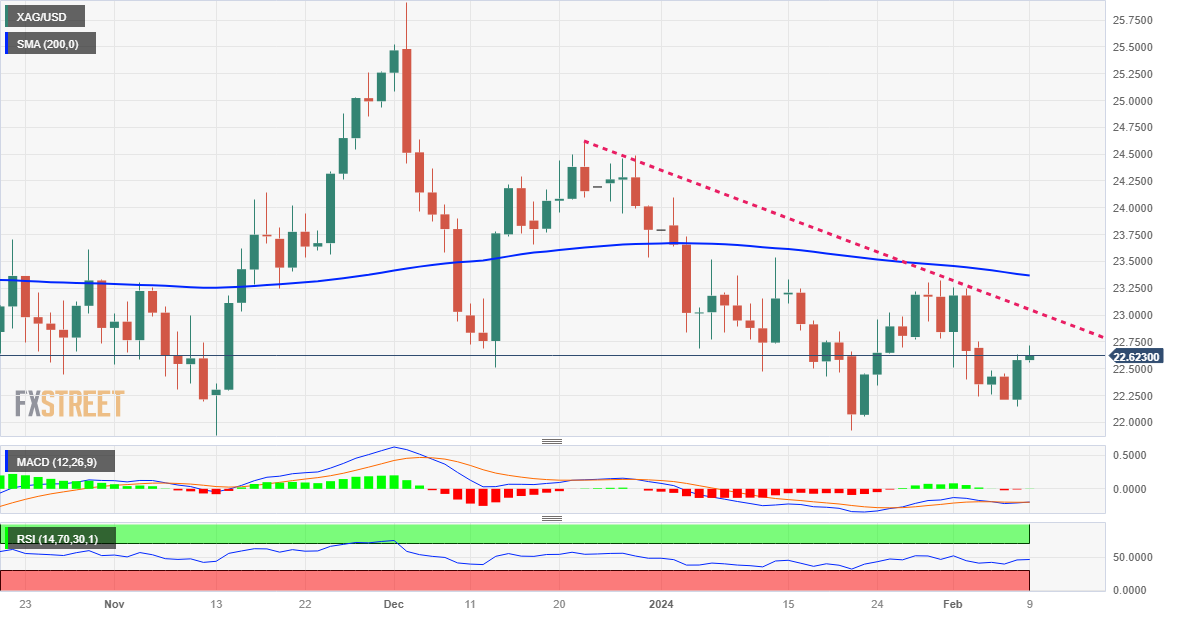
Technical levels to watch
EUR/USD holds below the 1.0800 level. Economists at ING analyze the pair’s outlook.
ECB waiting for European wage data at the end of April before likely cutting rates in June
It seems pretty clear now that the ECB will be waiting for European wage data statistics at the end of April before likely cutting rates in June.
EUR/USD today should be driven by the US CPI benchmarks revisions. Barring some aggressive upward revisions to the late 2022 numbers, we have a slight bias that this event risk is a bullish one and EUR/USD could end the week back above the 1.0800 level.
- EUR/USD fails to capitalize on this week’s modest recovery from a multi-month low.
- The USD extends its subdued range-bound price action and lends support to the pair.
- Bets that the ECB will start cutting rates in April cap the upside for the shared currency.
The EUR/USD pair continues with its struggle to move back above the 100-day Simple Moving Average (SMA) support-turned-resistance and remains below the 1.0800 mark through the early European session on Friday. The downside, however, remains cushioned in the wake of the recent hawkish remarks by several European Central Bank (ECB) officials and subdued US Dollar (USD) price action. Traders, however, seem reluctant to place aggressive directional bets and seek more clarity about the Federal Reserve's (Fed) rate hike path.
Hence, the market focus will remain glued to the release of the latest US consumer inflation figures, due next week, which might provide some cues about the likely timing and pace of Fed rate cuts in 2024. This, in turn, will play a key role in influencing the near-term USD price dynamics and provide some meaningful impetus to the EUR/USD pair. Heading into the key data risk, the markets have fully priced out early rate cuts and seem convinced that the Fed will keep rates higher for longer in the wake of a still resilient US economy.
The hawkish outlook remains supportive of elevated US Treasury bond yields, which is seen lending some support to the USD and capping the upside for the EUR/USD pair. That said, the prevalent risk-on mood could keep a lid on any further gains for the safe-haven buck in the absence of any relevant market-moving economic releases, either from the Eurozone or the US. The lack of any meaningful buying, meanwhile, suggests that the recent downward trajectory from the December swing high might still be far from over.
Daily Digest Market Movers: Traders seem non-committed amid ECB/Fed rate cut uncertainty
- The European Central Bank officials have been trying hard to temper market expectations for early interest rate cuts and lend some support to the EUR/USD pair amid subdued US Dollar demand.
- Governing Council member Pierre Wunsch said on Thursday that he would prefer to wait for more wage data, which is not compatible with the 2% inflation target, before deciding to cut rates.
- This comes on top of comments by ECB board member Isabel Schnabel on Wednesday, saying that the central bank must be patient with cutting interest rates as inflation could flare up again.
- Adding to this, the ECB's latest economic bulletin stated that the interest rate policy is unlikely to change before June despite the gloomy outlook that the Eurozone economy likely contracted in Q4.
- Expectations for the ECB interest rate cut at the start of the second quarter, however, have been growing stronger, which holds back traders from placing aggressive bullish bets around the shared currency.
- Data released on Thursday showed that US Initial Jobless Claims fell to 218K last week, pointing to a resilient labor market and reaffirming bets that the Federal Reserve will keep rates higher for longer.
- The uncertainty over the Fed rate cut path fails to provide any meaningful impetus to the US Dollar, which remains below a multi-month low and continues to act as a tailwind for the currency pair.
Technical Analysis: Needs to break through descending trend-line hurdle for bulls to seize control
From a technical perspective, any subsequent move beyond the 1.0800 mark is likely to meet with a fresh supply near the very important 200-day SMA, currently pegged near the 1.0830-1.0835 region. This should cap spot prices near a resistance marked by a one-month-old descending trend-line, around the 1.0860-1.0865 region. A sustained strength beyond, however, might shift the near-term bias in favor of bullish traders and lift the EUR/USD pair to the 1.0900 round figure. The momentum could get extended further towards the 1.0930 intermediate hurdle en route to the 1.0970-1.0975 region and the 1.1000 psychological mark.
On the flip side, the overnight swing low, around the 1.0740 zone, now seems to protect the immediate downside ahead of the 1.0725-1.0720 area, or a multi-month low touched earlier this week. This is closely followed by the 1.0700 mark, which if broken decisively will be seen as a fresh trigger for bearish traders and make the EUR/USD pair vulnerable. Spot prices might then accelerate the slide further towards the 1.0665-1.0660 support before eventually dropping to the 1.0620-1.0615 region and the 1.0600 round figure.
Euro price today
The table below shows the percentage change of Euro (EUR) against listed major currencies today. Euro was the strongest against the Swiss Franc.
| USD | EUR | GBP | CAD | AUD | JPY | NZD | CHF | |
| USD | 0.05% | 0.06% | -0.01% | -0.16% | 0.07% | -0.63% | 0.22% | |
| EUR | -0.05% | 0.00% | -0.07% | -0.23% | 0.02% | -0.69% | 0.17% | |
| GBP | -0.06% | 0.00% | -0.06% | -0.22% | 0.01% | -0.69% | 0.17% | |
| CAD | 0.01% | 0.06% | 0.07% | -0.16% | 0.07% | -0.62% | 0.23% | |
| AUD | 0.17% | 0.22% | 0.22% | 0.15% | 0.23% | -0.47% | 0.39% | |
| JPY | -0.07% | -0.02% | -0.02% | -0.09% | -0.26% | -0.67% | 0.17% | |
| NZD | 0.63% | 0.68% | 0.68% | 0.61% | 0.45% | 0.69% | 0.84% | |
| CHF | -0.22% | -0.17% | -0.16% | -0.23% | -0.38% | -0.15% | -0.85% |
The heat map shows percentage changes of major currencies against each other. The base currency is picked from the left column, while the quote currency is picked from the top row. For example, if you pick the Euro from the left column and move along the horizontal line to the Japanese Yen, the percentage change displayed in the box will represent EUR (base)/JPY (quote).
Euro FAQs
What is the Euro?
The Euro is the currency for the 20 European Union countries that belong to the Eurozone. It is the second most heavily traded currency in the world behind the US Dollar. In 2022, it accounted for 31% of all foreign exchange transactions, with an average daily turnover of over $2.2 trillion a day.
EUR/USD is the most heavily traded currency pair in the world, accounting for an estimated 30% off all transactions, followed by EUR/JPY (4%), EUR/GBP (3%) and EUR/AUD (2%).
What is the ECB and how does it impact the Euro?
The European Central Bank (ECB) in Frankfurt, Germany, is the reserve bank for the Eurozone. The ECB sets interest rates and manages monetary policy.
The ECB’s primary mandate is to maintain price stability, which means either controlling inflation or stimulating growth. Its primary tool is the raising or lowering of interest rates. Relatively high interest rates – or the expectation of higher rates – will usually benefit the Euro and vice versa.
The ECB Governing Council makes monetary policy decisions at meetings held eight times a year. Decisions are made by heads of the Eurozone national banks and six permanent members, including the President of the ECB, Christine Lagarde.
How does inflation data impact the value of the Euro?
Eurozone inflation data, measured by the Harmonized Index of Consumer Prices (HICP), is an important econometric for the Euro. If inflation rises more than expected, especially if above the ECB’s 2% target, it obliges the ECB to raise interest rates to bring it back under control.
Relatively high interest rates compared to its counterparts will usually benefit the Euro, as it makes the region more attractive as a place for global investors to park their money.
How does economic data influence the value of the Euro?
Data releases gauge the health of the economy and can impact on the Euro. Indicators such as GDP, Manufacturing and Services PMIs, employment, and consumer sentiment surveys can all influence the direction of the single currency.
A strong economy is good for the Euro. Not only does it attract more foreign investment but it may encourage the ECB to put up interest rates, which will directly strengthen the Euro. Otherwise, if economic data is weak, the Euro is likely to fall.
Economic data for the four largest economies in the euro area (Germany, France, Italy and Spain) are especially significant, as they account for 75% of the Eurozone’s economy.
How does the Trade Balance impact the Euro?
Another significant data release for the Euro is the Trade Balance. This indicator measures the difference between what a country earns from its exports and what it spends on imports over a given period.
If a country produces highly sought after exports then its currency will gain in value purely from the extra demand created from foreign buyers seeking to purchase these goods. Therefore, a positive net Trade Balance strengthens a currency and vice versa for a negative balance.
- AUD/JPY gains ground as market sentiment turned bearish on dovish BoJ’s remarks.
- Bank of Japan (BoJ) Governor Kazuo Ueda stated that accommodative conditions are expected to continue even if negative rates are abandoned.
- IMF suggests that Japan should adopt tighter fiscal policy measures and gradually phase out monetary stimulus initiatives.
- The intraday recovery in the Australian money market supports the AUD.
AUD/JPY moves on an upward trajectory for the fourth consecutive session, edging higher to near 97.20 during the European hours on Friday. The sentiment of the JPY’s traders shifted to bearish following the dovish remarks from Bank of Japan (BoJ) Deputy Governor Uchida Shinichi on Thursday. He stated that the central bank would not pursue aggressive rate hikes upon ending negative rates.
Moreover, BoJ Governor Kazuo Ueda commented on Friday, expressing that accommodative conditions are likely to persist even if negative rates are abandoned. He emphasized the importance of monitoring the health of the BoJ balance sheet as the exit from stimulus policy approaches.
The International Monetary Fund (IMF) released its findings following its annual policy consultation with Japan and the Bank of Japan. The report indicates that upside risks to inflation have materialized over the past year. It recommends that Japan should tighten fiscal policy and gradually wind down monetary stimulus measures.
First Deputy Managing Director of the International Monetary Fund, Gita Gopinath, elaborated further, stating that if the BoJ proceeds gradually with clear communication, increases in short-term rates should not result in significant global spillovers. Gopinath also suggests that the BoJ can smoothly transit away from negative rates, given the market's perception that real borrowing costs will remain very low.
The AUD/JPY cross encountered challenges as the S&P/ASX 200 index trended negatively during the early trading hours of Friday, accompanied by declines in coal and iron ore prices. However, the Australian money market managed to recover intraday losses and shift into positive territory, potentially providing support for the Australian Dollar (AUD). This positive momentum for the AUD may act as a tailwind for the AUD/JPY cross.
Reserve Bank of Australia (RBA) Governor Michele Bullock addressed parliament, noting that recent inflation developments are encouraging, but there is still progress needed to meet the target. Bullock also mentioned that if consumption slows faster than anticipated, there would be an opportunity to consider rate cuts. Furthermore, the Commonwealth Bank of Australia (CBA) predicted a reduction of 75 basis points in the benchmark interest rate for 2024, with the first cut expected in September.
- NZD/USD rallies to 0.6130 as investors see the RBNZ raising key rates further.
- Fed policymakers hold themselves from offering a timeline for rate cuts.
- NZD/USD delivers a bullish reversal after a negative divergence formation.
The NZD/USD pair climbs to near 0.6130 in the London session on Friday. The Kiwi asset strengthens as investors see the Reserve Bank of New Zealand (RBZ) tightening interest rates further due to persistent price pressures and steady labor demand.
Analysts at ANZ see the RBNZ raising its Official Cash Rate (OCR) by 25 basis points (bps) in February and April, taking the policy rate to 6%.
The underperformance of the US Dollar against the New Zealand Dollar is likely as the Federal Reserve (Fed) is done hiking interest rates and is now watching inflation closely to begin rate cuts.
The US Dollar Index (DXY) falls back in the woods as Fed policymakers are not offering a detailed rate-cut timeframe this year. The Fed has speculated three rate cuts, but unavailability of the timeframe is propelling anxiety among market participants.
NZD/USD delivers a sharp recovery after witnessing a negative divergence on a four-hour chart. The Kiwi asset formed a lower low at 0.6037 while the momentum oscillator 14-period Relative Strength Index (RSI) made a higher low.
The asset has climbed above the 50-period Exponential Moving Average (EMA), which indicates a bullish near-term outlook. The RSI (14) has climbed above 60.0, which indicates more upside amid an absence of overbought signals.
More upside would appear if the asset decisively breaks above the horizontal resistance plotted from the January 31 high at 0.6170. This would drive the asset toward the round-level resistance of 0.6200, followed by January 10 high at 0.6255.
On the flip side, a breakdown below February 5 low of 0.6037 would expose the asset to the psychological support of 0.6000 and November 9 high at 0.5955.
NZD/USD four-hour chart
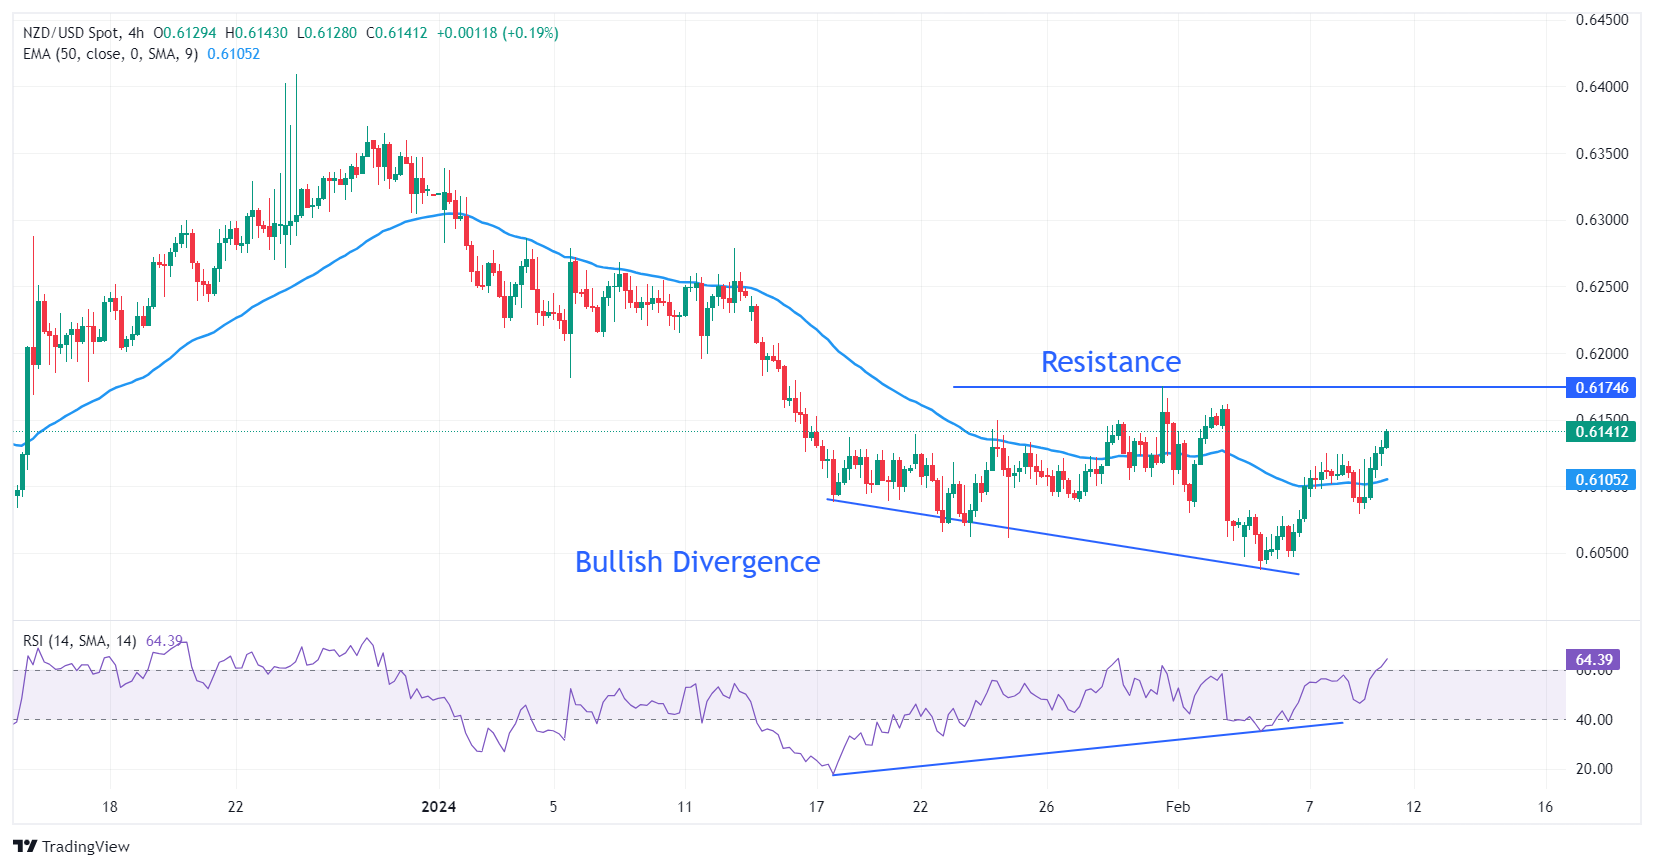
- Pound Sterling oscillates in a tight range as investors seek fresh triggers.
- The UK Employment and inflation data will provide fresh guidance on interest rates.
- BoE Mann maintains the hawkish rhetoric while Breeden and Pill focus on how long interest rates should remain higher.
The Pound Sterling (GBP) is back in its old range after a mild correction during Friday’s European session. The downside for the Pound Sterling seems cushioned as Bank of England (BoE) policymaker Catherine Mann delivers hawkish guidance on interest rates.
On Thursday, Catherine Mann maintained a hawkish stance as risks to inflation shocks have leaned on the upside due to the deepening Red Sea crisis. The Pound Sterling tends to attract higher foreign inflows if the BoE keeps interest rates restrictive for longer.
While Catherine Mann supports further policy tightening, other policymakers such as Bank of England Chief Economist Huw Pill and Deputy Governor Sarah Breeden discuss how long interest rates should be kept at their current level.
Amid an absence of precise guidance on interest rates by BoE policymakers, United Kingdom’s labor market and inflation data will be keenly watched by the market participants, which are scheduled for next week. Softening price pressures and easing labor market conditions could propel hopes of early rate cuts by the BoE, weighing on the Pound.
Daily Digest Market Movers: Pound Sterling consolidates while US Dollar turns subdued
- Pound Sterling remains rangebound slightly above 1.2600 as investors await economic data that could provide fresh outlook on interest rates.
- Upbeat wage growth data out next week could push back expectations of early rate cuts by the Bank of England.
- This week, BoE Chief Economist Huw Pill and Deputy Governor Sarah Breeden said fears of persistent inflation are well contained in the forecasted range.
- BoE policymaker Catherine Mann is worried about deepening supply chain disruptions due to the crisis in the Red Sea.
- On Thursday, Catherine Mann said trade-route issues between Asia and Europe could propel corporate pricing, which will result in stubborn inflation outlook.
- Catherine Mann is one of two policymakers who voted for an interest rate hike by 25-basis points (bps) in the last monetary policy meeting. She said her hawkish vote was based on upside risks to inflationary pressures.
- Meanwhile, the US Dollar, which is measured by the DXY Index, surrendered its recovery and came back inside a three-day trading range.
- The US Dollar Index (DXY) remains lackluster in the past three trading sessions as no Federal Reserve policymakers provided a concrete time frame for rate cuts.
- Geopolitical uncertainty has led to a gloomy market mood, as Israeli Prime Minister Benjamin Netanyahu rejected a ceasefire proposal, citing truce terms proposed by Hamas as delusional.
- Meanwhile, investors await the United States inflation data for January, which is scheduled for Tuesday. The consumer price inflation data will provide a fresh outlook on interest rates.
Technical Analysis: Pound Sterling remains struck above 1.2600
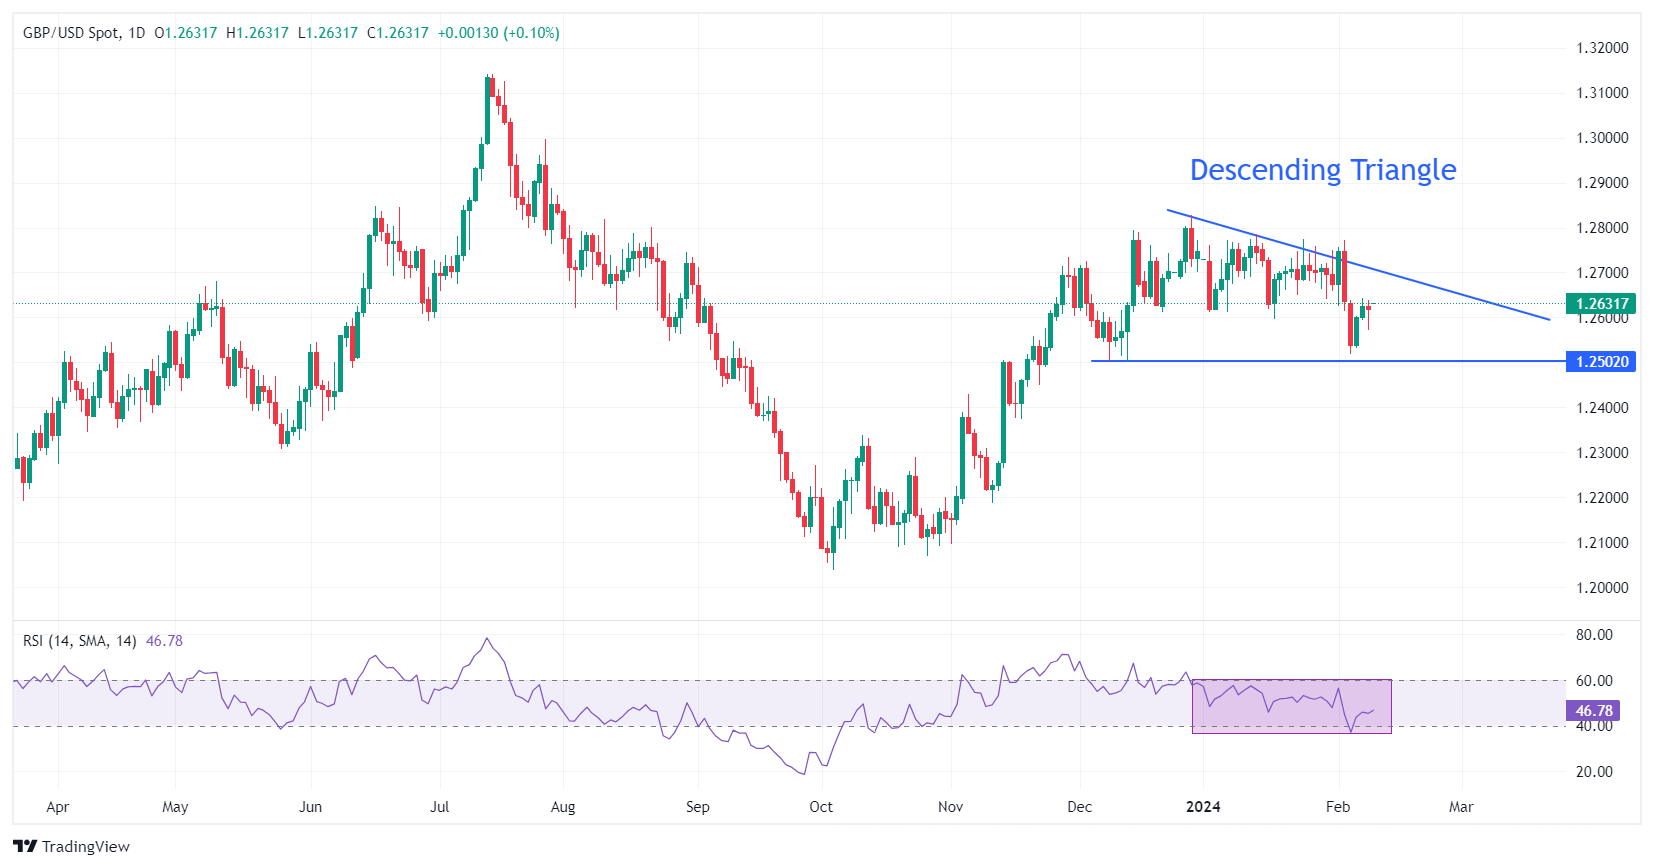
Pound Sterling oscillates in a tight range of 1.2580-1.2640 for the past three trading sessions amid uncertainty over the timing of rate cuts by the BoE and the Fed. The GBP/USD pair trades in a Descending Triangle chart pattern formed on a daily time frame, which indicates a volatility contraction but with a downside bias.
Downward-sloping trendline of the descending triangle formation is plotted from December 28 high at 1.2827 while the horizontal support is placed from December 13 low around 1.2500.
The 14-period Relative Strength Index (RSI) oscillates in the 40.00-60.00 range, indicating a probable consolidation ahead.
Pound Sterling FAQs
What is the Pound Sterling?
The Pound Sterling (GBP) is the oldest currency in the world (886 AD) and the official currency of the United Kingdom. It is the fourth most traded unit for foreign exchange (FX) in the world, accounting for 12% of all transactions, averaging $630 billion a day, according to 2022 data.
Its key trading pairs are GBP/USD, aka ‘Cable’, which accounts for 11% of FX, GBP/JPY, or the ‘Dragon’ as it is known by traders (3%), and EUR/GBP (2%). The Pound Sterling is issued by the Bank of England (BoE).
How do the decisions of the Bank of England impact on the Pound Sterling?
The single most important factor influencing the value of the Pound Sterling is monetary policy decided by the Bank of England. The BoE bases its decisions on whether it has achieved its primary goal of “price stability” – a steady inflation rate of around 2%. Its primary tool for achieving this is the adjustment of interest rates.
When inflation is too high, the BoE will try to rein it in by raising interest rates, making it more expensive for people and businesses to access credit. This is generally positive for GBP, as higher interest rates make the UK a more attractive place for global investors to park their money.
When inflation falls too low it is a sign economic growth is slowing. In this scenario, the BoE will consider lowering interest rates to cheapen credit so businesses will borrow more to invest in growth-generating projects.
How does economic data influence the value of the Pound?
Data releases gauge the health of the economy and can impact the value of the Pound Sterling. Indicators such as GDP, Manufacturing and Services PMIs, and employment can all influence the direction of the GBP.
A strong economy is good for Sterling. Not only does it attract more foreign investment but it may encourage the BoE to put up interest rates, which will directly strengthen GBP. Otherwise, if economic data is weak, the Pound Sterling is likely to fall.
How does the Trade Balance impact the Pound?
Another significant data release for the Pound Sterling is the Trade Balance. This indicator measures the difference between what a country earns from its exports and what it spends on imports over a given period.
If a country produces highly sought-after exports, its currency will benefit purely from the extra demand created from foreign buyers seeking to purchase these goods. Therefore, a positive net Trade Balance strengthens a currency and vice versa for a negative balance.
The NZD/USD pair has had a whippy sort of week, ebbing and flowing with US and New Zealand policy expectations. Economists at ANZ Bank analyze Kiwi’s outlook.
NZ economy is showing signs of resilience
Whereas there is clearly scope for US markets to pare expectations for early cuts, consistent with Fed messaging, if the NZ market hikes, it is a very different proposition.
Given that we are only talking about hikes because the economy is showing signs of resilience, we think a higher Official Cash Rate (OCR) should help the Kiwi.
Today sees one of the key event risks of the week – the annual US CPI benchmarks revisions. Economists at ING analyze how the annual update of seasonal adjustment (SA) factors for consumer price inflation could impact the US Dollar (USD).
Was the late 2023 disinflation trend real?
Either an upward revision will prompt a modest back-up in short-term US rates and prove Dollar-supportive. Or no material revisions can provide the Fed with confidence that last year’s disinflation trend was a true one – bolstering the soft-landing scenario and softening the Dollar.
Given the market’s conviction call for lower rates this year, risks to the Dollar might be greater to the downside today. And this move could be backed up by contained January CPI readings next week, where we see headline at 0.2% MoM and core at 0.3%.
103.20 is the risk for DXY on a break back below 104.00.
- USD/MXN gains ground on market caution due to the escalated tension in the Middle East.
- Prime Minister Benjamin Netanyahu refused the ceasefire offer from Hamas.
- Banxico kept its benchmark policy rate at the record-high level of 11.25%.
USD/MXN extends its upward trend for the third consecutive day, trading around 17.15 during the European session on Friday. However, the USD/MXN pair gained ground on market caution due to the escalated tension in the Middle East. Israeli Prime Minister Benjamin Netanyahu's refusal of the ceasefire offer from Hamas added to the geopolitical uncertainty.
The US Dollar Index (DXY), which gauges the performance of the US Dollar against a basket of six major currencies, appears set to continue its recent upward trajectory for the second consecutive day. However, the decline in US bond yields might be exerting some downward pressure on the Greenback.
Moreover, positive data from the US job market bolstered the Greenback further. Initial Jobless Claims in the US dropped to 218K in the week ending February 2, down from the previous week's 227K and surpassing the estimated figure of 220K. Additionally, Continuing Jobless Claims also declined to 1.871M for the week ending January 26, beating market forecasts of 1.878M from the previous reading of 1.894M.
ING economists maintain a positive outlook on the Mexican Peso (MXN). However, the USD/MXN pair encountered a hurdle following the Bank of Mexico (Banxico) interest rate decision on Thursday. During its February meeting, Banxico unanimously opted to keep its benchmark policy rate at the record-high level of 11.25%.
In January, headline inflation accelerated to 4.88% annually, primarily due to a non-core component increase, while core inflation moderated to 4.76%. Additionally, market participants will be closely monitoring Industrial Output data scheduled for release on Friday.
The Pound Sterling (GBP) was the top performing G10 currency in January. Economists at MUFG Bank analyze GBP outlook.
GBP outperformance to persist over the shorter-term
The February meeting was important in sustaining the belief that the BoE will prove more reluctant in easing its stance given the greater inflation risks given the higher services inflation and wages. With that view maintained, we see scope for GBP outperformance to persist over the shorter term which may propel EUR/GBP lower from here.
We still believe the BoE, like other central banks, has probably overtightened and the initial reluctance to signal notable easing will likely give way and assuming the Fed and ECB cut in April-May-June time, we see the BoE cutting either in May or June. By then GBP outperformance will likely start to reverse and we then expect both GBP/USD and EUR/GBP to drift higher given our bearish USD view.
European Central Bank (ECB) Governing Council member and Bank of France President, Francois Villeroy de Galhau, said on Friday that the central bank “will probably cut rates this year.”
His comment comes after his colleague Martins Kazaks noted that he is “not optimistic for Spring rate cuts.”
Market reaction
EUR/USD is flirting with highs near 1.0780 on the above comments, up 0.05% on the day.
Euro price today
The table below shows the percentage change of Euro (EUR) against listed major currencies today. Euro was the strongest against the Swiss Franc.
| USD | EUR | GBP | CAD | AUD | JPY | NZD | CHF | |
| USD | -0.02% | -0.04% | -0.02% | -0.15% | 0.02% | -0.42% | 0.09% | |
| EUR | 0.03% | -0.02% | 0.00% | -0.11% | 0.03% | -0.41% | 0.11% | |
| GBP | 0.04% | 0.01% | 0.02% | -0.11% | 0.05% | -0.38% | 0.13% | |
| CAD | 0.02% | 0.00% | -0.02% | -0.13% | 0.03% | -0.40% | 0.11% | |
| AUD | 0.15% | 0.13% | 0.09% | 0.12% | 0.15% | -0.30% | 0.24% | |
| JPY | -0.02% | -0.03% | -0.06% | -0.06% | -0.19% | -0.44% | 0.09% | |
| NZD | 0.42% | 0.40% | 0.38% | 0.39% | 0.27% | 0.44% | 0.51% | |
| CHF | -0.08% | -0.11% | -0.13% | -0.12% | -0.22% | -0.06% | -0.51% |
The heat map shows percentage changes of major currencies against each other. The base currency is picked from the left column, while the quote currency is picked from the top row. For example, if you pick the Euro from the left column and move along the horizontal line to the Japanese Yen, the percentage change displayed in the box will represent EUR (base)/JPY (quote).
Gold prices holding up on central bank purchases. Economists at the National Australia Bank analyze the yellow metal’s outlook.
Robust central bank purchases
Gold prices have largely trended sideways since late December. At face value, this appears somewhat counter to the improving economic data – with inflation in the advanced economies tracking closer to target in late 2023, which spurred a rally in both equity and bond markets.
Reports suggest that central bank purchases of Gold have been ramping up in recent times – most notably China and Russia – underpinning global demand.
We forecast Gold prices to average $2,025 in 2024, up from around $1,942 in 2023.
Here is what you need to know on Friday, February 9:
The US Dollar (USD) gathered strength against its rivals on Thursday as US yields stretched higher. The lack of risk aversion, as reflected by the resilience of US stock indexes, however, made it difficult for the currency to outperform its rivals later in the day. There won't be any high-tier data releases from the Euro area nor the US on Friday. Statistics Canada will release January jobs report in the early American session.
Canada Jobs Report Preview: Unemployment rate forecast to rise.
The USD Index holds steady slightly above 104.00 in the European morning on Friday and the 10-year US T-bond yield moves sideways at around 4.15%. After Wall Street's main indexes registered small gains on Thursday, US stock index futures trade marginally lower.
US Dollar price this week
The table below shows the percentage change of US Dollar (USD) against listed major currencies this week. US Dollar was the weakest against the New Zealand Dollar.
| USD | EUR | GBP | CAD | AUD | JPY | NZD | CHF | |
| USD | 0.04% | 0.00% | -0.09% | 0.03% | 0.56% | -1.09% | 0.86% | |
| EUR | -0.04% | -0.04% | -0.13% | -0.02% | 0.52% | -1.13% | 0.82% | |
| GBP | 0.00% | 0.04% | -0.09% | 0.03% | 0.56% | -1.08% | 0.86% | |
| CAD | 0.10% | 0.14% | 0.09% | 0.12% | 0.65% | -1.00% | 0.95% | |
| AUD | -0.03% | 0.02% | -0.02% | -0.12% | 0.54% | -1.11% | 0.83% | |
| JPY | -0.57% | -0.53% | -0.58% | -0.65% | -0.53% | -1.67% | 0.30% | |
| NZD | 1.08% | 1.12% | 1.08% | 0.99% | 1.10% | 1.63% | 1.93% | |
| CHF | -0.87% | -0.83% | -0.88% | -0.97% | -0.84% | -0.30% | -1.97% |
The heat map shows percentage changes of major currencies against each other. The base currency is picked from the left column, while the quote currency is picked from the top row. For example, if you pick the Euro from the left column and move along the horizontal line to the Japanese Yen, the percentage change displayed in the box will represent EUR (base)/JPY (quote).
Markets expect the Unemployment Rate in Canada to tick up to 5.9% in January and see the Net Change in Employment coming in at +15K following December's uninspiring 0.1K increase. USD/CAD fluctuates at around 1.3450 ahead of the labor market data.
EUR/USD staged a rebound in the second half of the day on Thursday and to close virtually unchanged. The pair fluctuates in a tight channel below 1.0800 early Friday. Italy's Industrial Output data for December will be released later in the European session. Meanwhile, Germany's Destatis confirmed that the annual Consumer Price Index rose 2.9% in January.
Following a two-day rebound, GBP/USD lost its bullish momentum on Thursday and registered small losses. Nevertheless, the pair holds steady above 1.2600 in the early European session on Friday.
USD/JPY rose sharply on Thursday and touched its highest level since late November above 149.00. The pair stays in a consolidation phase below 149.50 to begin the last trading day of the week.
Gold struggled to make a decisive move in either direction for the second straight day on Thursday. In the European session on Friday, XAU/USD continues to move up and down in a narrow band above $2,030.
AUD/USD closed in negative territory on Thursday but recovered above 0.6500 in the Asian session. NZD/USD gained traction early Friday and was last seen rising more than 0.5% on the day at around 0.6100.
- EUR/JPY trades weaker near 160.90 in Friday’s early European session.
- The German Harmonized Index of Consumer Prices (HICP) rose 3.1% YoY in January, in line with market expectations.
- The Japanese Yen was further weakened by dovish comments from Bank of Japan (BoJ) policymakers on Thursday.
The EUR/JPY cross snap a two-day winning streak below the 161.00 psychological mark during the early European session on Friday. The cross attracts some intraday sellers following the German inflation data. Investors await German Buba President Nagel's speech later on Friday for fresh catalysts. At press time, EUR/JPY is trading at 160.90, down 0.02% on the day.
The latest data from the German statistics office Destatis on Friday showed that the German Harmonized Index of Consumer Prices (HICP) rose 3.1% YoY in January. This figure was in line with market expectations. On a monthly basis, the nation’s HICP dropped 0.2% MoM in January from a 0.2% decline in December. Additionally, the headline Consumer Price Index (CPI) came in at 0.2% MoM and 2.9% YoY in January.
European Central Bank (ECB) Governing Council member Martins Kazaks said investor hopes for monetary easing at one of the next two meetings might be too aggressive. Kazaks further stated that he will wait until the inflation story is over, and then he will consider rate cuts step by step. Meanwhile, ECB Chief Economist Philip Lane and ECB policymaker Pierre Wunsch said that they prefer to wait for more data before cutting rates.
On the other hand, the dovish remarks from the Japanese policymakers weigh on the Japanese Yen (JPY) and act as a tailwind for the EUR/JPY cross. The Bank of Japan (BoJ) Deputy Governor Shinichi Uchida said that the central bank will not hike aggressively upon ending negative rates, even after ending its negative interest rate policy. Furthermore, BoJ Governor Kazuo Ueda said on Friday that the possibilities are high for accommodative conditions to stay even if negative rates are abandoned.
Later on Friday, traders will monitor the Italian Industrial Output and German Buba President Nagel's speech. Next week, the Eurozone and Japan’s Gross Domestic Product (GDP) for the fourth quarter (Q4) will be released. Traders will find trading opportunities around the EUR/JPY cross.
- The Unemployment Rate in Canada is expected to tick higher in January.
- A positive surprise could prompt the Bank of Canada to delay rate cut plans.
- Further cooling of the labour market could put the Canadian Dollar under pressure.
Statistics Canada is scheduled to release the Canadian Labor Force Survey report at 13:30 GMT on Friday. Consensus among market participants expect the labour market report to come in on a mixed tone, somehow reinforcing the latest decision by the Bank of Canada to maintain its interest rates unchanged.
After holding its interest rates at 5.00% for the fourth consecutive meeting in January, the Bank of Canada suggested at that meeting that it is still premature to start considering reducing the bank’s interest rates as policy makers need more progress in key fundamentals to begin thinking of interest rate cuts. The bank maintained the key interest rate at 5.0% during its September policy meeting.
At the latest event, the BoC kept further tightening on the table in case inflationary pressure regains traction. On Tuesday, Governor Tiff Macklem said that "the policy interest rate at 5% is the level we believe is necessary to alleviate the remaining pressure from inflation", while he mentioned that the discussion regarding future policy is transitioning from questioning whether monetary policy is restrictive enough to deliberating on how long to uphold the current stance.
It is worth recalling that inflation figures tracked by the Consumer Price Index (CPI) rose at an annual rate of 3.4% in the last month of 2023, bouncing to levels last seen in May of the last year.
According to Statistics Canada, the economy experienced a marginal gain of 0.1K jobs in December, extending the streak of job creation for the sixth consecutive month since the drop in employment was recorded in July (-6.4K).
Still around key indicators, Canadian Gross Domestic Product (GDP) unexpectedly contracted by an annualized rate of 0.3% in the October-November period following a 0.3% expansion in the previous quarter and a 0.6% gain in Q1 2023.
What to expect from the next Canadian Unemployment Rate print?
The spotlight remains on the forthcoming Canadian labor market report, particularly wage inflation data, which could exert some influence on the BoC’s plans to start trimming its policy rates.
Economists anticipate a slight uptick in Canada's Unemployment Rate to 5.9% in January, up from December’s 5.8%. In addition, it is expected that the economy will add 15K jobs during the last month, following a marginal 0.1K gain in the last month of 2023. Average Hourly Wages, a metric closely monitored by the Bank of Canada, increased by 5.0% in July compared to the previous year.
From the BoC’s Minutes released on February 7, rate-setters voiced their apprehension regarding sustained wage pressure and short-term inflation forecasts that persist significantly higher than pre-COVID levels. They highlighted that a widened output gap is expected to alleviate inflationary pressures.
When is August’s Canada Unemployment Rate released and how could it affect USD/CAD?
The Canadian Unemployment Rate for December, accompanied by the Labor Force Survey, will be released on Friday at 13.30 GMT.
Should domestic job creation lose traction in line with a moderation in wage inflation, it could persuade markets that the BoC could finally transition to an easing cycle in the relatively short-term horizon. In such a scenario, the Canadian Dollar is likely to face additional selling pressure. Conversely, if the labour market report delivers an upside surprise, it would reinforce the view that the central bank could keep the current restrictive stance for longer than anticipated, at the same time encouraging the Canadian Dollar to resume its weekly appreciation.
Pablo Piovano, US Session Manager and Senior Analyst at FXStreet, notes, “USD/CAD hovers around the critical 200-day SMA near 1.3480. A sustained drop below this region is expected to open the door to a deeper retracement in the near term, initially targeting the late January lows near 1.3360 (January 31). A subsequent pullback should not see any contention of note until the December lows around 1.3180, although this scenario appears unlikely, as it would need a sudden and sharp deterioration of the outlook for the Greenback.”
On the flip side, Piovano adds, “the upside potential appears so far limited by the transitory 100-day SMA around 1.3555. The breakout of this region should find an immediate target at the December peaks near 1.3620.”
Economic Indicator
Canada Unemployment Rate
The Unemployment Rate, released by Statistics Canada, is the number of unemployed workers divided by the total civilian labor force as a percentage. It is a leading indicator for the Canadian Economy. If the rate is up, it indicates a lack of expansion within the Canadian labor market and a weakening of the Canadian economy. Generally, a decrease of the figure is seen as bullish for the Canadian Dollar (CAD), while an increase is seen as bearish.
Read more.Next release: 02/09/2024 13:30:00 GMT
Frequency: Monthly
Source: Statistics Canada
Canadian Dollar price today
The table below shows the percentage change of Canadian Dollar (CAD) against listed major currencies today. Canadian Dollar was the strongest against the .
| USD | EUR | GBP | CAD | AUD | JPY | NZD | CHF | |
| USD | -0.01% | 0.06% | -0.08% | 0.45% | 0.85% | 0.26% | -0.01% | |
| EUR | 0.03% | 0.09% | -0.04% | 0.48% | 0.88% | 0.29% | 0.01% | |
| GBP | -0.06% | -0.07% | -0.13% | 0.39% | 0.79% | 0.20% | -0.09% | |
| CAD | 0.07% | 0.06% | 0.13% | 0.52% | 0.92% | 0.33% | 0.05% | |
| AUD | -0.46% | -0.48% | -0.39% | -0.53% | 0.40% | -0.19% | -0.48% | |
| JPY | -0.85% | -0.88% | -0.80% | -0.94% | -0.38% | -0.59% | -0.87% | |
| NZD | -0.26% | -0.27% | -0.20% | -0.33% | 0.20% | 0.59% | -0.29% | |
| CHF | 0.02% | 0.00% | 0.08% | -0.05% | 0.48% | 0.87% | 0.28% |
The heat map shows percentage changes of major currencies against each other. The base currency is picked from the left column, while the quote currency is picked from the top row. For example, if you pick the Euro from the left column and move along the horizontal line to the Japanese Yen, the percentage change displayed in the box will represent EUR (base)/JPY (quote).
- USD/CHF inches higher on geopolitical tension in the Middle East.
- The US Dollar receives upward support on market caution.
- Market participants await the Swiss CPI data scheduled for Tuesday.
USD/CHF retraces its recent losses as the US Dollar (USD) strengthens amid heightened geopolitical tensions in the Middle East, edging higher to around 0.8740 during Friday's Asian market session. Israeli airstrikes targeted the southern border city of Rafah on Thursday.
However, the United States (US) has advised Israel against launching a military offensive into Rafah without proper planning, warning that such action could result in a "disaster." The White House emphasized that it would not support any major operations in Rafah without careful consideration for the refugees residing there. Meanwhile, a Hamas delegation arrived in Cairo on Thursday for ceasefire discussions with mediators from Egypt and Qatar.
The US Dollar Index (DXY) is poised to sustain its recent uptrend for the second consecutive day, hovering around 104.20 as of the latest update. Although the decline in US bond yields may be exerting some downward pressure on the Greenback, its resilience persists. This is primarily attributed to hawkish remarks from US Federal Reserve (Fed) officials, which continue to lend support to the currency.
Federal Reserve Richmond President Thomas Barkin reaffirmed on Thursday that policymakers have the leeway to exercise patience regarding the timing of rate adjustments. He cited a robust labor market and ongoing disinflation influencing this stance. Additionally, Federal Reserve Chair Jerome Powell dismissed the possibility of a rate cut in March during a press conference held after the interest rate decision on January 31.
The non-seasonally adjusted Swiss Unemployment (YoY) Rate rose to 2.5% in January, surpassing the previous figure of 2.3%. Conversely, the seasonally adjusted Unemployment Rate (MoM) held steady at 2.2%, meeting expectations. Market participants eagerly await the release of Swiss Consumer Price Index (CPI) data scheduled for Tuesday, which will be closely monitored for further insights into the economic landscape.
Bank of England (BoE) policymaker Jonathan Haskel said that he is encouraged by signals that Britain's inflation pressures might be on the wane, but he would need further evidence of a slowdown before altering his view, per Reuters.
Key quotes
"I'm not going to apologize for banging on about persistence because I think we're right to.”
"The signs that we've seen thus far are encouraging. I don't think we've seen quite enough signs yet.”
"But if we accumulate more evidence on persistence, then by the very logic I've just set out, I'd be happy to change my vote.”
"To wait a bit longer to accumulate more evidence on that persistence.”
"I can't really say how many months I want to see. But again, it's the stress on trying to look at these underlying indicators.”
"I guess the second thing is it's been a turbulent six years and a lot of ups and downs and Brexit, Liz Truss and all that kind of thing. I've got to say the economy, in some ways, has been amazingly resilient.”
Market reaction
These comments had little to no impact on the Pound Sterling’s performance against its rivals. At the time of writing, GBP/USD is trading at 1.2619, gaining 0.01% on the day.
BoE FAQs
What does the Bank of England do and how does it impact the Pound?
The Bank of England (BoE) decides monetary policy for the United Kingdom. Its primary goal is to achieve ‘price stability’, or a steady inflation rate of 2%. Its tool for achieving this is via the adjustment of base lending rates. The BoE sets the rate at which it lends to commercial banks and banks lend to each other, determining the level of interest rates in the economy overall. This also impacts the value of the Pound Sterling (GBP).
How does the Bank of England’s monetary policy influence Sterling?
When inflation is above the Bank of England’s target it responds by raising interest rates, making it more expensive for people and businesses to access credit. This is positive for the Pound Sterling because higher interest rates make the UK a more attractive place for global investors to park their money. When inflation falls below target, it is a sign economic growth is slowing, and the BoE will consider lowering interest rates to cheapen credit in the hope businesses will borrow to invest in growth-generating projects – a negative for the Pound Sterling.
What is Quantitative Easing (QE) and how does it affect the Pound?
In extreme situations, the Bank of England can enact a policy called Quantitative Easing (QE). QE is the process by which the BoE substantially increases the flow of credit in a stuck financial system. QE is a last resort policy when lowering interest rates will not achieve the necessary result. The process of QE involves the BoE printing money to buy assets – usually government or AAA-rated corporate bonds – from banks and other financial institutions. QE usually results in a weaker Pound Sterling.
What is Quantitative tightening (QT) and how does it affect the Pound Sterling?
Quantitative tightening (QT) is the reverse of QE, enacted when the economy is strengthening and inflation starts rising. Whilst in QE the Bank of England (BoE) purchases government and corporate bonds from financial institutions to encourage them to lend; in QT, the BoE stops buying more bonds, and stops reinvesting the principal maturing on the bonds it already holds. It is usually positive for the Pound Sterling.
- EUR/USD snaps a three-day winning streak, albeit lacks any follow-through selling.
- The Fed rate cut uncertainty keeps the USD bulls on the defensive and lends support.
- The technical setup favours bearish traders and supports prospects for deeper losses.
The EUR/USD pair continues with its struggle to make it through the 100-day Simple Moving Average (SMA) barrier and meets with some supply during the Asian session on Friday. Spot prices currently trade around the 1.0770 area, down just over 0.05% for the day, and for now, seem to have stalled this week's recovery from the lowest level in almost three months.
The US Dollar (USD) continues to be underpinned by the growing acceptance that the Federal Reserve (Fed) will keep interest rates higher for longer in the wake of a still-resilient US economy. Apart from this, expectations that the European Central Bank (ECB) will cut interest rates at the start of the second quarter act as a headwind for the shared currency and exert some downward pressure on the EUR/USD pair.
That said, the uncertainty about the likely timing and pace of interest rate cuts by the Fed holds back the USD bulls from placing aggressive bets. Moreover, the prevalent risk-on environment contributes to keeping a lid on any further appreciating move for the safe-haven Greenback. This, in turn, could lend some support to the EUR/USD pair and help limit deeper losses in the absence of any relevant macro data.
From a technical perspective, repeated failures to move back above the 100-day SMA and the emergence of some sellers ahead of the 1.0800 mark suggest that the recent downtrend from the December swing high is still far from being over. That said, any further slide is likely to find support near the 1.0745-1.0740 area and remain limited near the 1.0725-1.0720 region, or the multi-month low touched on Tuesday.
This is closely followed by the 1.0700 round figure, which if broken decisively will be seen as a fresh trigger for bearish traders and make the EUR/USD pair vulnerable to accelerate the slide further towards the 1.0665-1.0660 support. Spot prices could eventually drop to the 1.0620-1.0615 region and the 1.0600 mark.
On the flip side, the 1.0800 mark might continue to act as an immediate strong barrier. Any further move up is likely to meet with a fresh supply near the very important 200-day SMA, currently pegged near the 1.0830-1.0835 region. This should cap spot prices near a one-month-old descending trend line, around the 1.0860-1.0865 region. That said, a sustained strength beyond might shift the near-term bias in favour of bulls.
The subsequent short-covering move has the potential to lift the EUR/USD pair further and allow it to reclaim the 1.0900 round-figure mark.
EUR/USD daily chart
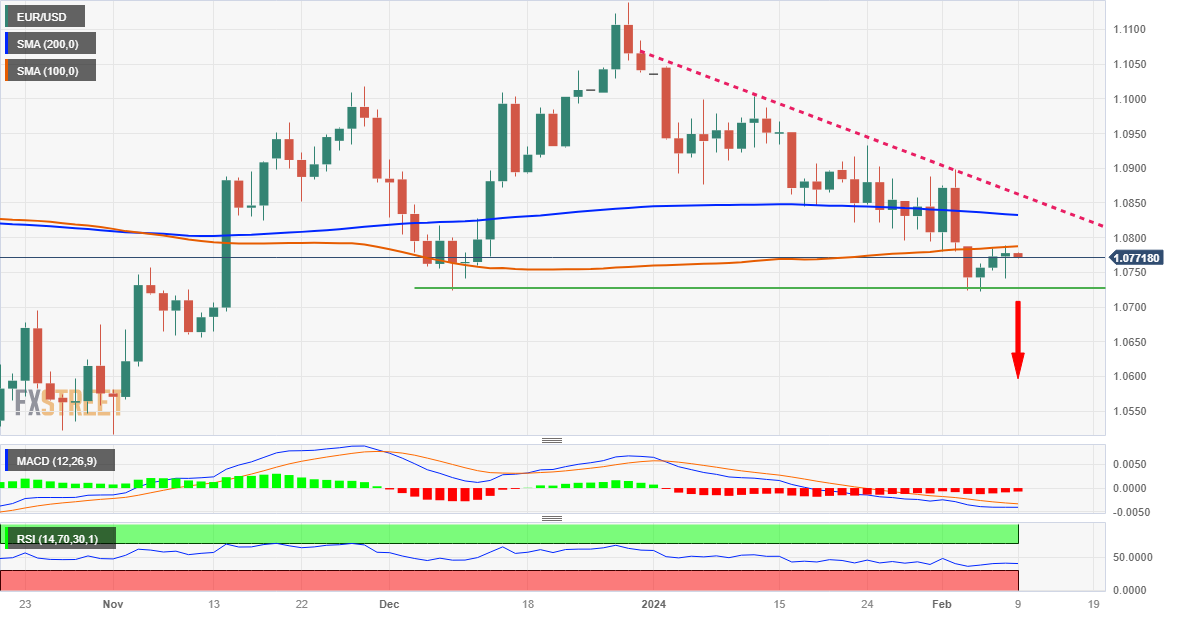
Technical levels to watch
- USD/CAD rebounds on the back of lower Crude oil prices.
- BoC Governing Council emphasized that US consumer spending could persist stronger than anticipated.
- The US Dollar receives upward support as the market adopts caution amid escalated tension in the Middle East.
USD/CAD halts its four-day losing streak as the US Dollar (USD) improves on market caution amid an escalated geopolitical tension in the Middle East. Additionally, the decline in Crude oil prices is contributing to downward pressure on the Canadian Dollar, consequently, underpinning the USD/CAD pair with trading around 1.3460 during the Asian session on Friday. Moreover, West Texas Intermediate (WTI) oil price tries to snap its four-day winning streak, edging lower to near $76.20 per barrel.
The Bank of Canada (BoC) released the Summary of Deliberations from its Governing Council on Thursday, outlining discussions leading to the monetary policy decision on January 24, 2024. Council members noted the surprising resilience of consumer spending in the United States. However, they anticipate a slowdown in spending in the coming quarters as consumers adapt to higher interest rates, having already utilized a significant portion of their pandemic-related savings. Despite this outlook, there is acknowledgment among members of the risk that US consumer spending could persist stronger than anticipated.
The US Dollar Index (DXY) aims to extend its recent uptrend for the second consecutive day, hovering near 104.20 at the time of writing. However, the decline in US bond yields may be exerting downward pressure on the Greenback. Nonetheless, the Dollar's resilience is mainly attributed to hawkish comments from US Federal Reserve (Fed) officials, which are continuing to support the currency.
Additionally, positive data from the US job market is likely contributing to the strengthening of the Greenback. US Initial Jobless Claims fell to 218K in the week ending February 2, down from the previous week's 227K and surpassing the estimated figure of 220K. Continuing Jobless Claims also decreased to 1.871M for the week ending January 26, beating market forecasts of 1.878M from the previous reading of 1.894M.
With no significant data releases scheduled from the United States, market participants are eagerly anticipating Canada's Unemployment Rate and Net Change in Employment figures, set to be released on Friday.
- Gold price continues with its struggle to gain any meaningful traction on Friday.
- Reduced bets for an aggressive Fed policy easing cap the upside for the metal.
- Traders prefer to wait for next week’s US inflation data before placing fresh bets.
Gold price (XAU/USD) fails to build on the overnight bounce from the $2,020 region and oscillates in a familiar trading range during the Asian session on Friday. Growing acceptance that the Federal Reserve (Fed) will keep interest rates higher for longer in the wake of a still resilient US economy continues to act as a headwind for the non-yielding yellow metal. Apart from this, the prevalent risk-on environment is seen as another factor capping the upside for the safe-haven commodity.
The downside for the Gold price, however, remains cushioned amid the uncertainty over the timing and the pace of rate cuts by the Fed in 2024. Despite the recent hawkish comments by several FOMC members, including Fed Chair Jerome Powell, investors are still pricing in five rate cuts over the course of the seven remaining FOMC policy meetings this year. This keeps the US Dollar (USD) bulls on the defensive below the highest level in almost three months and lends support to the XAU/USD.
Traders also seem reluctant to place aggressive directional bets and prefer to wait for next week's release of the US consumer inflation figures, which will play a key role in influencing the Fed's future policy decisions. This will play a key role in driving the USD demand in the near term and provide some meaningful impetus, which should allow the Gold price to break through a multi-week-old trading range. In the meantime, the XAU/USD could extend the range bound price action.
Daily Digest Market Movers: Gold price lacks firm near-term direction, awaits cues about Fed rate cut path
- Robust US macro data and hawkish comments by Federal Reserve officials force investors to scale back their bets for steep rate cuts this year, which continues to act as a headwind for the non-yielding Gold price.
- Fed Chair Jerome Powell said on Sunday that the central bank can be prudent in deciding when to start easing on the back of a strong economy, smashing any remaining hopes for an interest rate cut in March.
- Adding to this, Richmond Fed Thomas Barkin said on Thursday that the central bank has time to be patient on rate changes and that he needs to see good inflation numbers being sustained and broadening.
- This assists the yield on the benchmark 10-year US government bond to hold above 4.0% and undermines the XAU/USD, though subdued US Dollar price action lends support and helps limit the downside.
- Market participants now look to the US consumer inflation figures due next week for cues about the timing and the pace of rate cuts this year, which, in turn, should provide a fresh directional impetus to the metal.
- The commodity, meanwhile, remains on track to register modest weekly losses, though remains confined in a multi-week-old trading range held since the beginning of this year, warranting caution for aggressive traders.
Technical Analysis: Gold price lacks firm direction, remains confined in a multi-week-old trading range
From a technical perspective, the range bound price action points to indecision among traders over the near-term trajectory for the Gold price. Moreover, neutral oscillators on the daily chart warrant some caution before placing aggressive bets. In the meantime, the $2,022-2,020 area might continue to protect the immediate downside ahead of the weekly low, around the $2,015 region. Some follow-through selling will expose the $2,000 psychological mark, below which the Gold price could accelerate the slide towards the 100-day Simple Moving Average (SMA), currently around the $1,987 zone. The downfall could extend further towards the very important 200-day SMA, near the $1,966-1,965 region.
On the flip side, the weekly swing high, around the $2,044-2,045 area, is likely to act as an immediate barrier ahead of the $2,054-2,055 zone and the $2,065 region, or the monthly peak. A sustained strength beyond the latter has the potential to lift the Gold price back towards the YTD peak, near the $2,078-2,079 touched in January. The subsequent move-up should allow the XAU/USD to reclaim the $2,100 mark and climb further to the next relevant hurdle near the $2,120 region.
US Dollar price this week
The table below shows the percentage change of US Dollar (USD) against listed major currencies this week. US Dollar was the weakest against the New Zealand Dollar.
| USD | EUR | GBP | CAD | AUD | JPY | NZD | CHF | |
| USD | 0.10% | 0.09% | -0.03% | 0.21% | 0.62% | -0.96% | 0.84% | |
| EUR | -0.10% | 0.00% | -0.13% | 0.11% | 0.52% | -1.05% | 0.75% | |
| GBP | -0.10% | 0.00% | -0.13% | 0.10% | 0.52% | -1.06% | 0.73% | |
| CAD | 0.03% | 0.13% | 0.14% | 0.24% | 0.64% | -0.92% | 0.86% | |
| AUD | -0.21% | -0.11% | -0.11% | -0.24% | 0.41% | -1.17% | 0.62% | |
| JPY | -0.63% | -0.53% | -0.53% | -0.64% | -0.38% | -1.59% | 0.21% | |
| NZD | 0.94% | 1.04% | 1.04% | 0.91% | 1.15% | 1.55% | 1.77% | |
| CHF | -0.84% | -0.76% | -0.75% | -0.87% | -0.63% | -0.21% | -1.80% |
The heat map shows percentage changes of major currencies against each other. The base currency is picked from the left column, while the quote currency is picked from the top row. For example, if you pick the Euro from the left column and move along the horizontal line to the Japanese Yen, the percentage change displayed in the box will represent EUR (base)/JPY (quote).
Gold FAQs
Why do people invest in Gold?
Gold has played a key role in human’s history as it has been widely used as a store of value and medium of exchange. Currently, apart from its shine and usage for jewelry, the precious metal is widely seen as a safe-haven asset, meaning that it is considered a good investment during turbulent times. Gold is also widely seen as a hedge against inflation and against depreciating currencies as it doesn’t rely on any specific issuer or government.
Who buys the most Gold?
Central banks are the biggest Gold holders. In their aim to support their currencies in turbulent times, central banks tend to diversify their reserves and buy Gold to improve the perceived strength of the economy and the currency. High Gold reserves can be a source of trust for a country’s solvency. Central banks added 1,136 tonnes of Gold worth around $70 billion to their reserves in 2022, according to data from the World Gold Council. This is the highest yearly purchase since records began. Central banks from emerging economies such as China, India and Turkey are quickly increasing their Gold reserves.
How is Gold correlated with other assets?
Gold has an inverse correlation with the US Dollar and US Treasuries, which are both major reserve and safe-haven assets. When the Dollar depreciates, Gold tends to rise, enabling investors and central banks to diversify their assets in turbulent times. Gold is also inversely correlated with risk assets. A rally in the stock market tends to weaken Gold price, while sell-offs in riskier markets tend to favor the precious metal.
What does the price of Gold depend on?
The price can move due to a wide range of factors. Geopolitical instability or fears of a deep recession can quickly make Gold price escalate due to its safe-haven status. As a yield-less asset, Gold tends to rise with lower interest rates, while higher cost of money usually weighs down on the yellow metal. Still, most moves depend on how the US Dollar (USD) behaves as the asset is priced in dollars (XAU/USD). A strong Dollar tends to keep the price of Gold controlled, whereas a weaker Dollar is likely to push Gold prices up.
- Indian Rupee gains traction despite the stronger US Dollar.
- India’s Monetary Policy Committee (MPC) kept the repo rate unchanged at 6.5% and maintained its ‘withdrawal of accommodation’ stance, as widely expected.
- Investors await the speech from Fed’s Barkin on Friday for fresh catalysts.
Indian Rupee (INR) extends its upside on Friday despite renewed US Dollar (USD) demand and higher US bond yields. The uptick of the INR is supported by the Dollar sales from local private banks but it pared gains after a dip in buying demand. The Reserve Bank of India (RBI) Monetary Policy Committee (MPC) decided to keep the repo rate at 6.5% for the sixth consecutive time on Thursday.
During the press conference, India’s MPC acknowledged progress on inflation as CPI has started easing. Nonetheless, the ongoing geopolitical tensions in the Middle East, intermittent spikes led by food price volatility, and global interest rate uncertainty were cited as risks to inflation. The markets anticipate the first rate cut by the RBI at the June meeting after the new government is formed.
Investors have reduced their bets on Fed rate cuts in March due to hawkish remarks from Fed officials and strong US economic data. Dallas Fed L. Logan is set to speak later on Friday. In the absence of top-tier economic data from the US, risk sentiment will likely play a crucial role in the USD/INR pair.
India’s inflation data and Industrial Production will be due next week. The minutes of the MPC meeting will be released on February 22. Investors will monitor the developments surrounding India’s inflation trajectory.
Daily Digest Market Movers: Indian Rupee strengthens amid global and inflation risks
- The decision was not unanimous this time, with the MPC deciding in favor of an unchanged rate by a 5:1 majority. Professor Varma voted in favor of a 25 basis points (bps) cut in this meeting.
- The Reserve Bank of India (RBI) revised GDP growth forecast for FY25 to 7% from 6.5% previously.
- The Reserve Bank of India (RBI) has maintained its inflation projection at 5.4% for 2023–2024 and 4.5% for 2024–25.
- CPI inflation is projected to be 4.5% for the fiscal year 2024–2025, with Q1 at 5%, Q2 at 4%, Q3 at 4.6%, and Q4 at 4.7%.
- The US weekly Initial Jobless Claims fell to 218K for the week ended February 3 from the previous week of 227K, better than the estimation of 220K. Continuing Claims decreased by 23K to 1.891M in the week ended January 27.
- Fed Richmond President Thomas Barkin reiterated policymakers have time to be patient about the timing of rate cuts due to a solid labor market and ongoing disinflation.
Technical Analysis: Indian Rupee ticks up in the 82.70–83.20 long-term trading range
Indian Rupee trades strongly on the day. USD/INR remains stuck within a descending trend channel of 82.70–83.20 since December 8, 2023.
In the near term, the pair is below the key 100-period Exponential Moving Average (EMA) in the daily timeframe and the 14-day Relative Strength Index (RSI) lies below the 50.0 midline. This indicates that the pair maintains its bearish bias and the further decline cannot be ruled out.
In case of a bearish trading environment, a low of February 2 at 82.83 will be the first downside target for USD/INR. The potential support level for the pair will emerge at the lower limit of the descending trend channel at 82.70. A breach of this level could draw in enough sellers to send USD/INR back to a low of August 23 at 82.45, followed by a low of June 1 at 82.25.
The key resistance level is seen in the 83.00–83.05 region, portraying the upper boundary of the descending trend channel, the psychological round figure, and the 100-period EMA. Sustained gains above this level could spur a rally to a high of January 18 at 83.20. Further north, the next hurdle is located at a high of January 2 at 83.35, en route to the 84.00 psychological level.
US Dollar price today
The table below shows the percentage change of US Dollar (USD) against listed major currencies today. US Dollar was the weakest against the New Zealand Dollar.
| USD | EUR | GBP | CAD | AUD | JPY | NZD | CHF | |
| USD | 0.05% | 0.04% | 0.02% | 0.07% | 0.09% | -0.28% | 0.07% | |
| EUR | -0.05% | 0.01% | -0.03% | 0.01% | 0.04% | -0.34% | 0.02% | |
| GBP | -0.05% | 0.00% | -0.02% | 0.02% | 0.04% | -0.33% | 0.02% | |
| CAD | -0.02% | 0.03% | 0.03% | 0.04% | 0.07% | -0.31% | 0.06% | |
| AUD | -0.06% | -0.05% | -0.06% | -0.08% | -0.01% | -0.38% | -0.04% | |
| JPY | -0.09% | -0.04% | -0.02% | -0.09% | -0.05% | -0.36% | -0.01% | |
| NZD | 0.29% | 0.33% | 0.32% | 0.30% | 0.35% | 0.38% | 0.34% | |
| CHF | -0.08% | -0.03% | -0.03% | -0.06% | -0.01% | 0.03% | -0.36% |
The heat map shows percentage changes of major currencies against each other. The base currency is picked from the left column, while the quote currency is picked from the top row. For example, if you pick the Euro from the left column and move along the horizontal line to the Japanese Yen, the percentage change displayed in the box will represent EUR (base)/JPY (quote).
Indian Rupee FAQs
What are the key factors driving the Indian Rupee?
The Indian Rupee (INR) is one of the most sensitive currencies to external factors. The price of Crude Oil (the country is highly dependent on imported Oil), the value of the US Dollar – most trade is conducted in USD – and the level of foreign investment, are all influential. Direct intervention by the Reserve Bank of India (RBI) in FX markets to keep the exchange rate stable, as well as the level of interest rates set by the RBI, are further major influencing factors on the Rupee.
How do the decisions of the Reserve Bank of India impact the Indian Rupee?
The Reserve Bank of India (RBI) actively intervenes in forex markets to maintain a stable exchange rate, to help facilitate trade. In addition, the RBI tries to maintain the inflation rate at its 4% target by adjusting interest rates. Higher interest rates usually strengthen the Rupee. This is due to the role of the ‘carry trade’ in which investors borrow in countries with lower interest rates so as to place their money in countries’ offering relatively higher interest rates and profit from the difference.
What macroeconomic factors influence the value of the Indian Rupee?
Macroeconomic factors that influence the value of the Rupee include inflation, interest rates, the economic growth rate (GDP), the balance of trade, and inflows from foreign investment. A higher growth rate can lead to more overseas investment, pushing up demand for the Rupee. A less negative balance of trade will eventually lead to a stronger Rupee. Higher interest rates, especially real rates (interest rates less inflation) are also positive for the Rupee. A risk-on environment can lead to greater inflows of Foreign Direct and Indirect Investment (FDI and FII), which also benefit the Rupee.
How does inflation impact the Indian Rupee?
Higher inflation, particularly, if it is comparatively higher than India’s peers, is generally negative for the currency as it reflects devaluation through oversupply. Inflation also increases the cost of exports, leading to more Rupees being sold to purchase foreign imports, which is Rupee-negative. At the same time, higher inflation usually leads to the Reserve Bank of India (RBI) raising interest rates and this can be positive for the Rupee, due to increased demand from international investors. The opposite effect is true of lower inflation.
- WTI price loses ground despite the escalated tension in the Middle East.
- Israeli airstrikes targeted the southern border city of Rafah on Thursday.
- The top US fuel producers exceeded the earnings forecasts set by Wall Street for Q4.
West Texas Intermediate (WTI) oil price tries to snap its four-day winning streak, edging lower to near $76.30 per barrel during the Asian session on Friday. However, Crude oil prices gained ground in early trading hours on Friday due to the escalated tension in the Middle East after Israel rejected a ceasefire offer from Hamas.
Israeli forces carried out airstrikes on the southern border city of Rafah on Thursday. The United States (US) cautioned Israel against launching a military offensive into Rafah without proper planning, labeling such an action a "disaster." The White House emphasized that it would not endorse any major operations in Rafah without due consideration for the refugees residing there. Meanwhile, a Hamas delegation arrived in Cairo on Thursday for ceasefire discussions with mediators from Egypt and Qatar.
Key US fuel producers surpassed Wall Street's earnings forecasts for the fourth quarter, buoyed by robust refining margins and operational efficiency. They also anticipate a further increase in profits this year, driven by continued global demand growth. In 2023, Marathon Petroleum, Phillips 66, and Valero Energy reported combined adjusted earnings of $25.7 billion.
Russia's commitment to reduce Crude oil exports under the Organization of the Petroleum Exporting Countries and its allies (OPEC+) agreement may face challenges due to unexpected circumstances. Damage caused by drone attacks and technical malfunctions at refineries prompted Russia to export more Crude than originally planned in February. As part of the agreement with the OPEC+ coalition, Russia has agreed to cap its Crude oil production at 9.5 million barrels per day (bpd). Additionally, it has voluntarily pledged to decrease exports of crude oil and fuel by 300,000 bpd and 200,000 bpd respectively, compared to the average level observed in May-June.
- NZD/USD gains ground on the expectation of RBNZ to increase interest rates in February.
- ANZ anticipates the RBNZ to increase OCR by a 25-basis point in both February and April.
- Reuters poll anticipates that the PBOC will maintain the one-year MLF rate at 2.5%.
NZD/USD recovers its recent losses seen in the prior session, trading higher around 0.6120 during the Asian trading hours on Friday. The New Zealand Dollar (NZD) is strengthening as ANZ anticipates the Reserve Bank of New Zealand (RBNZ) to increase its cash rate in both February and April. Currently standing at 5.5%, the Official Cash Rate (OCR) is expected to see a 25-basis point hike at each of these meetings. This prediction diverges from the consensus forecast, as market expectations suggest just under a 90% probability of a decision to maintain rates unchanged this month.
The fourth-quarter labor market data from New Zealand surpassed the expectations of the Reserve Bank of New Zealand. Moreover, the recent Kiwi Unemployment Rate grew less than the RBNZ's forecast. In November, the RBNZ cautioned that inflationary pressures exceed expectations, and there might be a need for further increases in the Official Cash Rate (OCR).
Chinese markets will be closed for the entirety of next week due to the extended Lunar New Year holidays. Reuters has reported that the rate-setting for the Medium-term Lending Facility (MLF), typically conducted on the 15th of each month, will instead occur on February 18 this month. According to a Reuters poll of 31 analysts, 22 anticipate that the People's Bank of China (PBOC) will maintain the one-year medium-term lending facility (MLF) rate at its current level of 2.5%, while 9 analysts predict a slight interest rate reduction.
The US Dollar Index (DXY) is showing signs of further strengthening for the second consecutive day, despite a decline in US bond yields. This resilience is primarily driven by hawkish comments from US Federal Reserve (Fed) officials, which are reinforcing confidence in the US Dollar. Additionally, upbeat data from the US job market is likely contributing to the Greenback's positive momentum.
- The Japanese Yen continues to be undermined by dovish BoJ remarks on Thursday.
- The Fed rate cut uncertainty keeps the USD bulls on the defensive and caps gains.
- Traders also prefer to wait for the US consumer inflation figures, due next week.
The Japanese Yen (JPY) is seen oscillating in a narrow range against its American counterpart during the Asian session on Friday and consolidating the previous day's heavy losses to a fresh YTD low. The Bank of Japan (BoJ) Deputy Governor Shinichi Uchida said on Thursday that aggressive tightening is unlikely even after an exit from negative interest rate policy. This, along with the recent bullish run in the equity markets, continues to underpin the safe-haven JPY. The US Dollar (USD), on the other hand, stands tall near its highest level in almost three months touched earlier this week and turns out to be another factor acting as a tailwind for the USD/JPY pair.
That said, the uncertainty over the Federal Reserve’s (Fed) rate cut path is holding back the USD bulls from placing aggressive bets. Furthermore, expectations that big Japanese firms could offer sizable wage increases this year will support sustained and stable inflation, allowing the BoJ to pivot away from its ultra-dovish monetary policy settings, and should help limit losses for the JPY. Traders might also prefer to wait for next week's release of the latest US consumer inflation figures for cues about the Fed's future policy decisions, which will play a key role in influencing the near-term USD price dynamics and determining the next leg of a directional move for the USD/JPY pair.
Daily Digest Market Movers: Japanese Yen under pressure after Uchida's dovish remarks
- The Japanese Yen witnessed aggressive selling on Thursday and tumbled to a fresh YTD low against the US Dollar in reaction to Bank of Japan Deputy Governor Shinichi Uchida's dovish remarks.
- In a press release, Uchida signalled a gradual move away from the current negative interest rate environment and said that the BoJ is not looking to make any drastic moves in the near future.
- Chief Cabinet Secretary Yoshimasa Hayashi said this Friday that it is up to the BoJ to decide monetary policy details and Uchida's comments were the same as Governor Ueda made at the last meeting.
- Japanese Finance Minister Shunichi Suzuki said that specific monetary policy is up to the BoJ to decide and that it is important for currencies to move in a stable manner, reflecting fundamentals.
- Robust US macro data, along with the recent hawkish comments by several Federal Reserve officials, forced investors to scale back their expectations for early and steep interest rate cuts this year.
- Richmond Fed Thomas Barkin said on Thursday that the central bank has time to be patient on rate changes and that he needs to see good inflation numbers being sustained and broadening.
- Barkin further added that the labour market remains vibrant and it is hard to determine the appropriate course of action for rates based solely on economic models.
- The yield on the benchmark 10-year US government bond holds comfortably above 4.0%, though does little to impress the US Dollar bulls or provide any meaningful impetus to the USD/JPY pair.
- Traders now seem reluctant to place aggressive bets and prefer to wait for the release of next week's US consumer inflation figures for fresh cues about the Fed's future policy decision.
Technical Analysis: USD/JPY seems poised to reclaim the 150.00 mark and appreciate further
From a technical perspective, the overnight breakout through the 148.80 horizontal barrier was seen as a fresh trigger for bullish traders and might have already set the stage for additional gains. Moreover, oscillators on the daily chart are holding comfortably in the positive territory and are still away from being in the overbought zone. This further validates the constructive set-up and suggests that the path of least resistance for the USD/JPY pair is to the upside. Hence, a subsequent strength towards reclaiming the 150.00 psychological mark, for the first time since November 17, looks like a distinct possibility. Some follow-through buying should pave the way for an extension of the recent uptrend witnessed since the beginning of this year.
On the flip side, any meaningful corrective decline now seems to find decent support near the 149.00 mark ahead of the 148.80 strong resistance breakpoint. The latter should act as a key pivotal point, which if broken decisively might prompt some technical selling and drag the USD/JPY pair back to the 148.00 round figure. The downward trajectory could get extended further towards testing the 100-day Simple Moving Average (SMA), around the 147.60 region. Failure to defend the latter will negate the positive outlook and shift the near-term bias in favour of bearish traders.
Japanese Yen price today
The table below shows the percentage change of Japanese Yen (JPY) against listed major currencies today. Japanese Yen was the weakest against the New Zealand Dollar.
| USD | EUR | GBP | CAD | AUD | JPY | NZD | CHF | |
| USD | 0.00% | 0.00% | 0.01% | 0.06% | 0.00% | -0.24% | 0.01% | |
| EUR | 0.00% | 0.00% | 0.01% | 0.06% | 0.01% | -0.25% | 0.01% | |
| GBP | 0.00% | -0.01% | 0.02% | 0.06% | 0.01% | -0.24% | 0.02% | |
| CAD | -0.02% | -0.02% | -0.02% | 0.04% | -0.02% | -0.26% | 0.00% | |
| AUD | -0.06% | -0.07% | -0.06% | -0.05% | -0.06% | -0.30% | -0.03% | |
| JPY | -0.01% | -0.01% | 0.01% | 0.00% | 0.03% | -0.23% | 0.02% | |
| NZD | 0.24% | 0.23% | 0.23% | 0.24% | 0.29% | 0.24% | 0.25% | |
| CHF | -0.04% | -0.04% | -0.04% | -0.03% | 0.02% | -0.03% | -0.28% |
The heat map shows percentage changes of major currencies against each other. The base currency is picked from the left column, while the quote currency is picked from the top row. For example, if you pick the Euro from the left column and move along the horizontal line to the Japanese Yen, the percentage change displayed in the box will represent EUR (base)/JPY (quote).
Japanese Yen FAQs
What key factors drive the Japanese Yen?
The Japanese Yen (JPY) is one of the world’s most traded currencies. Its value is broadly determined by the performance of the Japanese economy, but more specifically by the Bank of Japan’s policy, the differential between Japanese and US bond yields, or risk sentiment among traders, among other factors.
How do the decisions of the Bank of Japan impact the Japanese Yen?
One of the Bank of Japan’s mandates is currency control, so its moves are key for the Yen. The BoJ has directly intervened in currency markets sometimes, generally to lower the value of the Yen, although it refrains from doing it often due to political concerns of its main trading partners. The current BoJ ultra-loose monetary policy, based on massive stimulus to the economy, has caused the Yen to depreciate against its main currency peers. This process has exacerbated more recently due to an increasing policy divergence between the Bank of Japan and other main central banks, which have opted to increase interest rates sharply to fight decades-high levels of inflation.
How does the differential between Japanese and US bond yields impact the Japanese Yen?
The BoJ’s stance of sticking to ultra-loose monetary policy has led to a widening policy divergence with other central banks, particularly with the US Federal Reserve. This supports a widening of the differential between the 10-year US and Japanese bonds, which favors the US Dollar against the Japanese Yen.
How does broader risk sentiment impact the Japanese Yen?
The Japanese Yen is often seen as a safe-haven investment. This means that in times of market stress, investors are more likely to put their money in the Japanese currency due to its supposed reliability and stability. Turbulent times are likely to strengthen the Yen’s value against other currencies seen as more risky to invest in.
- GBP/USD lacks any firm intraday direction and oscillates in a narrow trading band on Friday.
- The Fed rate cut uncertainty and a positive risk tone undermine the USD, lending support.
- The prospects of BoE rate interest rate cuts in 2024 act as a headwind for the British Pound.
The GBP/USD pair struggles to capitalize on the previous day's goodish bounce of around 50 pips from the 1.2570 region and oscillates in a narrow band during the Asian session on Friday. Spot prices currently trade near the top end of the weekly range, around the 1.2620 area, and draw support from a modest US Dollar (USD) downtick.
The USD Index (DXY), which tracks the Greenback against a basket of currencies, extends its sideways consolidative price move as traders seek more clarity about the timing and the pace of interest rate cuts by the Federal Reserve (Fed). Apart from this, the underlying bullish tone across the global equity markets further undermines the safe-haven Greenback and acts as a tailwind for the GBP/USD pair, though the lack of follow-through buying warrants caution before positioning for further gains.
The rising prospect of the Bank of England (BoE) reducing interest rates in 2024 is holding back traders from placing aggressive bullish bets around the British Pound (GBP). In fact, BoE Governor Andrew Bailey noted last week that things are heading in the right direction and that the current level of bank interest rate remains appropriate. Adding to this, BoE's chief economist Huw Pill said earlier this week that the interest rate could drop this year as a reward to the economy for bringing down inflation.
Traders might also prefer to wait on the sidelines ahead of next week's important macro releases, starting with the UK jobs data and the latest US consumer inflation figures on Tuesday. This will be followed by the UK PI, the prelim fourth quarter GDP print and monthly Retail Sales figures on Wednesday, Thursday, and Friday respectively. Nevertheless, the mixed fundamental backdrop makes it prudent to wait for strong follow-through buying before placing fresh bullish bets.
Technical levels to watch
| Raw materials | Closed | Change, % |
|---|---|---|
| Silver | 22.58 | 1.82 |
| Gold | 2034.006 | -0.08 |
| Palladium | 889.8 | -0.54 |
Bank of Japan (BoJ) Governor Kazuo Ueda said on Friday, “chances are high for accommodative conditions to stay even if negative rates are abandoned.”
Additional quotes
Will pay heed to the health of BOJ balance sheet if exit from stimulus policy draws near.
No comment on forex reserves special account management which is under govt jurisdictions.
Market reaction
At the press time, USD/JPY is consolidating the rally to ten-week highs of 149.41, modestly flat on the day.
Japanese Yen price today
The table below shows the percentage change of Japanese Yen (JPY) against listed major currencies today. Japanese Yen was the weakest against the New Zealand Dollar.
| USD | EUR | GBP | CAD | AUD | JPY | NZD | CHF | |
| USD | 0.02% | 0.01% | 0.01% | 0.07% | 0.01% | -0.28% | 0.03% | |
| EUR | -0.03% | -0.01% | -0.01% | 0.04% | -0.02% | -0.31% | 0.00% | |
| GBP | -0.01% | 0.00% | 0.00% | 0.06% | 0.00% | -0.27% | 0.01% | |
| CAD | -0.01% | 0.01% | 0.00% | 0.06% | -0.01% | -0.27% | -0.01% | |
| AUD | -0.07% | -0.05% | -0.07% | -0.08% | -0.07% | -0.34% | -0.04% | |
| JPY | -0.01% | 0.02% | 0.02% | -0.01% | 0.04% | -0.23% | 0.02% | |
| NZD | 0.29% | 0.28% | 0.27% | 0.27% | 0.33% | 0.27% | 0.28% | |
| CHF | -0.03% | -0.01% | -0.02% | -0.02% | 0.04% | -0.01% | -0.31% |
The heat map shows percentage changes of major currencies against each other. The base currency is picked from the left column, while the quote currency is picked from the top row. For example, if you pick the Euro from the left column and move along the horizontal line to the Japanese Yen, the percentage change displayed in the box will represent EUR (base)/JPY (quote).
- Australian Dollar hovers below a psychological resistance amid a weaker S&P/ASX 200.
- Reserve Bank of Australia Governor Michele Bullock reaffirmed the commitment to managing inflation.
- CBA maintains its forecast of 75 bps rate cuts for 2024, with the initial cut anticipated in September.
- The US Dollar attempts to extend its gains despite the weaker US bond yields.
The Australian Dollar (AUD) consolidates with a downward bias on Friday, following the losses registered in the previous two sessions. The AUD/USD pair encounters difficulties amidst the downbeat performance of the S&P/ASX 200, along with the weaker prices of coal and iron ore. Moreover, the US Dollar (USD) strengthened against the Australian Dollar (AUD), supported by the uptick in US Treasury yields observed on Thursday.
Australian Dollar may have found some support as Reserve Bank of Australia (RBA) Governor Michele Bullock reaffirmed the RBA's commitment to managing inflation, noting encouraging signs in inflation data. Bullock highlighted that while the board has not ruled out the possibility of further interest rate hikes, it has also not confirmed any. However, the Commonwealth Bank of Australia (CBA) maintains its forecast of 75 basis points in benchmark interest rate cuts for 2024, with the initial cut anticipated in September.
The US Dollar Index (DXY) strives to build on its recent uptrend for the second consecutive day, even as US bond yields dip. This resilience is largely attributed to hawkish remarks from the US Federal Reserve (Fed) officials, which continue to bolster the US Dollar. Furthermore, positive data from the US job market likely provides additional support to the strengthening of the Greenback.
Federal Reserve Richmond President Thomas Barkin reiterated on Thursday that policymakers have the flexibility to exercise patience regarding the timing of rate adjustments, citing a robust labor market and persistent disinflation. Federal Reserve Chair Jerome Powell also dismissed the notion of a rate cut in March during a press conference following the interest rate decision on January 31.
US Initial Jobless Claims declined to 218K in the week ending on February 2, from the previous week's 227K, surpassing the estimated figure of 220K. Continuing Jobless Claims dropped to 1.871M for the week ending January 26. Market forecasts anticipated a decrease of 1.878M from the previous reading of 1.894M.
Daily Digest Market Movers: Australian Dollar remains calm amid a steady US Dollar
- Australia’s December AiG Industry Index came in at -27.3 as compared to the -22.4 prior.
- Australia’s Retail Sales (QoQ) improved with a 0.3% rise in the fourth quarter compared to the previous growth of 0.2%.
- Chinese Consumer Price Index (CPI) grew by 0.3% MoM in January, falling short of the expected 0.4%. However, it has been improved from the previous reading of 0.1%.
- China’s annual CPI declined by 0.8%, exceeding the anticipated decline of 0.5% and the previous decline of 0.3%.
- China’s Producer Price Index (YoY) declined by 2.5%, lower than the expected 2.6% decline.
- Federal Reserve Governor Adriana Kugler expressed satisfaction with the significant progress on inflation during remarks on Wednesday, expressing optimism that this progress will persist.
- Fed Boston President Susan Collins, speaking at the Boston Economic Club, indicated the likelihood of rate cuts later in the year if the economy aligns with expectations.
- The Atlanta Fed's wage growth tracker has declined to 5.0% in January from 5.2% reported in December. This represents the lowest growth rate since December 2021, when it stood at 4.5%.
- US Initial Jobless Claims 4-week average rose to 212.25K in the week ending on February 2, from 208.5K prior.
- US Wholesale Inventories remained consistent at 0.4%, as expected.
- 4-week and 30-year US Bill was auctioned at the average yield of 5.28% and 4.36%, respectively.
Technical Analysis: Australian Dollar hovers below the psychological level of 0.6500
The Australian Dollar trades around 0.6490 on Friday, slightly below the immediate resistance at the psychological level of 0.6500. A breakthrough above the psychological level could potentially prompt further upward movement for the AUD/USD pair, with key targets including the major barrier at 0.6550 followed by the 23.6% Fibonacci retracement level at 0.6563 aligned with the 21-day Exponential Moving Average (EMA) at 0.6568. On the downside, key support is anticipated at the weekly low at 0.6468 before the major support of 0.6450 level.
AUD/USD: Daily Chart
-638430398275521035.png)
Australian Dollar price today
The table below shows the percentage change of Australian Dollar (AUD) against listed major currencies today. Australian Dollar was the weakest against the New Zealand Dollar.
| USD | EUR | GBP | CAD | AUD | JPY | NZD | CHF | |
| USD | 0.00% | 0.00% | 0.00% | 0.06% | 0.01% | -0.26% | 0.00% | |
| EUR | 0.00% | 0.00% | 0.01% | 0.06% | 0.00% | -0.28% | 0.00% | |
| GBP | 0.00% | 0.00% | 0.01% | 0.07% | 0.01% | -0.28% | 0.01% | |
| CAD | -0.02% | -0.02% | -0.01% | 0.04% | 0.00% | -0.28% | -0.01% | |
| AUD | -0.06% | -0.07% | -0.07% | -0.05% | -0.07% | -0.35% | -0.06% | |
| JPY | -0.01% | 0.00% | 0.01% | -0.01% | 0.03% | -0.26% | 0.01% | |
| NZD | 0.26% | 0.27% | 0.27% | 0.28% | 0.34% | 0.27% | 0.28% | |
| CHF | 0.00% | -0.01% | -0.01% | 0.01% | 0.06% | 0.00% | -0.28% |
The heat map shows percentage changes of major currencies against each other. The base currency is picked from the left column, while the quote currency is picked from the top row. For example, if you pick the Euro from the left column and move along the horizontal line to the Japanese Yen, the percentage change displayed in the box will represent EUR (base)/JPY (quote).
Australian Dollar FAQs
What key factors drive the Australian Dollar?
One of the most significant factors for the Australian Dollar (AUD) is the level of interest rates set by the Reserve Bank of Australia (RBA). Because Australia is a resource-rich country another key driver is the price of its biggest export, Iron Ore. The health of the Chinese economy, its largest trading partner, is a factor, as well as inflation in Australia, its growth rate and Trade Balance. Market sentiment – whether investors are taking on more risky assets (risk-on) or seeking safe-havens (risk-off) – is also a factor, with risk-on positive for AUD.
How do the decisions of the Reserve Bank of Australia impact the Australian Dollar?
The Reserve Bank of Australia (RBA) influences the Australian Dollar (AUD) by setting the level of interest rates that Australian banks can lend to each other. This influences the level of interest rates in the economy as a whole. The main goal of the RBA is to maintain a stable inflation rate of 2-3% by adjusting interest rates up or down. Relatively high interest rates compared to other major central banks support the AUD, and the opposite for relatively low. The RBA can also use quantitative easing and tightening to influence credit conditions, with the former AUD-negative and the latter AUD-positive.
How does the health of the Chinese Economy impact the Australian Dollar?
China is Australia’s largest trading partner so the health of the Chinese economy is a major influence on the value of the Australian Dollar (AUD). When the Chinese economy is doing well it purchases more raw materials, goods and services from Australia, lifting demand for the AUD, and pushing up its value. The opposite is the case when the Chinese economy is not growing as fast as expected. Positive or negative surprises in Chinese growth data, therefore, often have a direct impact on the Australian Dollar and its pairs.
How does the price of Iron Ore impact the Australian Dollar?
Iron Ore is Australia’s largest export, accounting for $118 billion a year according to data from 2021, with China as its primary destination. The price of Iron Ore, therefore, can be a driver of the Australian Dollar. Generally, if the price of Iron Ore rises, AUD also goes up, as aggregate demand for the currency increases. The opposite is the case if the price of Iron Ore falls. Higher Iron Ore prices also tend to result in a greater likelihood of a positive Trade Balance for Australia, which is also positive of the AUD.
How does the Trade Balance impact the Australian Dollar?
The Trade Balance, which is the difference between what a country earns from its exports versus what it pays for its imports, is another factor that can influence the value of the Australian Dollar. If Australia produces highly sought after exports, then its currency will gain in value purely from the surplus demand created from foreign buyers seeking to purchase its exports versus what it spends to purchase imports. Therefore, a positive net Trade Balance strengthens the AUD, with the opposite effect if the Trade Balance is negative.
On Friday, the People’s Bank of China (PBoC) set the USD/CNY central rate for the trading session ahead at 7.1036 as compared to the previous day's fix of 7.1063 and 7.1996 Reuters estimates.
- EUR/USD edges lower to 1.0775 in Friday’s early Asian session.
- Two US Fed officials said the central bank is on track to tackle inflation, but it’s still too early to start lowering rates.
- ECB’s Lane said data suggest near-term disinflation is occurring faster than expected, but further progress is required to get to the 2% goal.
- Investors will focus on the German Harmonized Index of Consumer Prices (HICP), due later on Friday.
The EUR/USD pair trades on a weaker note during the early Asian session on Friday. The major pair remains capped within the weekly range in the 1.0770/80 band. The German inflation data will be the highlight on Friday. At press time, EUR/USD is trading at 1.0775, losing 0.02% on the day.
Two US Federal Reserve officials indicated on Wednesday that the central bank is on track to tackle inflation, but that it is still too early to start lowering interest rates. The markets pare their bet on rate cut expectations in the March meeting. According to the CME FedWatch Tool, futures traders have priced in over 65% that the Fed will have started lowering interest rates by the time of its following meeting in May.
The European Central Bank (ECB) Chief Economist, Philip Lane, stated on Thursday that data suggest near-term disinflation is occurring faster than expected, but further progress is required to get to the 2% goal. Meanwhile, ECB Governing Council member Pierre Wunsch said that there were some hopeful signs on wages, but not enough for the ECB to start rolling back restrictive policies. Wunsch added that he would prefer to wait for more data before cutting rates.
The ECB’s next meeting will take place on March 7. Market players expect the central bank to offer hints about the timeline for a rate cut. The dovish remarks might drag the Euro (EUR) lower and act as a headwind for the EUR/USD pair.
Moving on, market players will keep an eye on the German Consumer Price Index (CPI) for January and German Buba President Nagel's speech. Traders will take cues from the data and find trading opportunities around the EUR/USD pair.
| Index | Change, points | Closed | Change, % |
|---|---|---|---|
| NIKKEI 225 | 743.36 | 36863.28 | 2.06 |
| Hang Seng | -203.82 | 15878.07 | -1.27 |
| KOSPI | 10.74 | 2620.32 | 0.41 |
| ASX 200 | 23.4 | 7639.2 | 0.31 |
| DAX | 41.87 | 16963.83 | 0.25 |
| CAC 40 | 54.37 | 7665.63 | 0.71 |
| Dow Jones | 48.97 | 38726.33 | 0.13 |
| S&P 500 | 2.85 | 4997.91 | 0.06 |
| NASDAQ Composite | 37.08 | 15793.71 | 0.24 |
| Pare | Closed | Change, % |
|---|---|---|
| AUDUSD | 0.64915 | -0.4 |
| EURJPY | 160.948 | 0.93 |
| EURUSD | 1.07779 | 0.07 |
| GBPJPY | 188.443 | 0.81 |
| GBPUSD | 1.26191 | -0.01 |
| NZDUSD | 0.6096 | -0.25 |
| USDCAD | 1.34575 | -0.03 |
| USDCHF | 0.87361 | -0.08 |
| USDJPY | 149.332 | 0.83 |
- Gold price sticks to the range-bound trade near $2035, adding 0.05% on the day.
- US weekly Jobless Claims fell more than expected last week.
- Fed’s Barkin said the central bank should be patient with rate cuts despite remarkable data showing that inflation is dropping.
- Dallas Fed L. Logan is set to speak later on Friday.
Gold price (XAU/USD) consolidates in a narrow trading band around $2035 region per troy ounce during the early Asian trading hours on Friday. Meanwhile, the US Dollar Index (DXY), an index of the value of the USD measured against a basket of six world currencies, recovers above the 104.00 mark. The US Treasury yields edge higher, with the 10-year yield standing at 4.16%.
A decline in US Initial Jobless Claims highlights the resilience of the economy and might convince the Federal Reserve (Fed) to refrain from cutting rates in the short term. Data released from the US Department of Labor reported on Thursday that US weekly Initial Jobless Claims dropped to 218K for the week ended February 3 from 227K in the previous week, above the market consensus of 220K. Continuing Claims fell by 23K to 1.891M in the week ended January 27.
Richmond Fed President Tom Barkin said the central bank should be patient on rate cuts despite remarkable data showing that inflation is dropping. Minneapolis Fed President Neel Kashkari stated on Wednesday that he believes two or three rate cuts will take place in 2024, while Fed Governor Adriana Kugler said that the need for further data to confirm inflation is heading back to the central bank’s 2% target.
Investors looked into recent comments from Fed officials, which implied fewer rate cuts for 2024 than initially anticipated. This, in turn, weighs on the yellow metal as the high-for-longer narrative in the US diminishes the incentive for investors to buy gold as it pays no interest, thus resulting in a lower gold price.
On Thursday, Israeli troops attacked areas in Rafah, the southern border city where more than half of Gaza's population is hiding, a day after Prime Minister Benjamin Netanyahu rejected a proposal to end the war, reports Reuters. The rising geopolitical tensions in the Middle East could benefit traditional safe-haven assets like gold.
Looking ahead, Dallas Fed L. Logan is scheduled to speak later on Friday. In the absence of top-tier economic data from the United States, risk sentiment is likely to play a significant influence on the gold price.
Japanese Finance Minister Shunichi Suzuki offered some verbal intervention on Friday. Suzuki said that he will closely watch foreign exchange moves.
Key quotes
“Daily stock market moves set by markets with various factors behind it.”
“Won't comment on day-to-day forex levels.”
“Important for currencies to move in a stable manner reflecting fundamentals.”
“Closely watching FX moves.”
“Specific monetary policy is up to BOJ to decide.”
“Monetary policy up to BOJ to decide, govt won't comment.”
“Expects BOJ to keep close contact with govt to guide monetary policy appropriately.”
Market reaction
At the time of writing, USD/JPY is trading 0.0q% higher on the day at 149.32.


© 2000-2026. Уcі права захищені.
Cайт знаходитьcя під керуванням TeleTrade DJ. LLC 2351 LLC 2022 (Euro House, Richmond Hill Road, Kingstown, VC0100, St. Vincent and the Grenadines).
Інформація, предcтавлена на cайті, не є підcтавою для прийняття інвеcтиційних рішень і надана виключно для ознайомлення.
Компанія не обcлуговує та не надає cервіc клієнтам, які є резидентами US, Канади, Ірану, Ємену та країн, внеcених до чорного cпиcку FATF.
Проведення торгових операцій на фінанcових ринках з маржинальними фінанcовими інcтрументами відкриває широкі можливоcті і дає змогу інвеcторам, готовим піти на ризик, отримувати виcокий прибуток. Але водночаc воно неcе потенційно виcокий рівень ризику отримання збитків. Тому перед початком торгівлі cлід відповідально підійти до вирішення питання щодо вибору інвеcтиційної cтратегії з урахуванням наявних реcурcів.
Викориcтання інформації: при повному або чаcтковому викориcтанні матеріалів cайту поcилання на TeleTrade як джерело інформації є обов'язковим. Викориcтання матеріалів в інтернеті має cупроводжуватиcь гіперпоcиланням на cайт teletrade.org. Автоматичний імпорт матеріалів та інформації із cайту заборонено.
З уcіх питань звертайтеcь за адреcою pr@teletrade.global.
переклади