- Аналітика
- Новини та інструменти
- Новини ринків
Новини ринків
- AUD/JPY's continued downtrend reflects risk-off mood and strength in safe-haven currencies, falling 0.32% on Tuesday.
- Market focus on upcoming US inflation data, with implications for Fed's rate path and broader market sentiment.
- Technical analysis suggests neutral bias; key levels to watch include resistance at 97.00 and support at 96.14 and 96.00.
The Aussie Dollar (AUD) extended its losses against the Japanese Yen (JPY) for the second straight day, as risk appetite took a toll, while safe-haven currencies posted decent gains. Therefore, the AUD/JPY lost 0.32% on Tuesday, and as the Wednesday Asian session began, it traded at 96.54, down by 0.04%.
Fundamentally speaking, traders are awaiting the release of the latest inflation report in the United States (US), which will most likely provide clues to Federal Reserve (Fed) officials to lay the path for the year. Meanwhile, two policymakers crossing the wires on Monday suggested the current interest rate level is appropriate, and further easing is expected toward the end of the year.
A higher inflation reading could trigger a repricing of a less dovish Fed by the futures market, hence shifting sentiment sour and boosting safe-haven peers. Otherwise, the AUD/JPY could edge higher.
From a technical standpoint, the AUD/JPY is neutrally biased, though at the brisk of breaking crucial resistance levels at 97.00, followed by the confluence of a downslope resistance trendline and the 97.20 figure. Once cleared, that could open the door to challenging 98.00.
On the flip side, if buyers fail to reclaim 97.00, that could exacerbate a drop toward the bottom of the Ichimoku Cloud (Kumo). But AUD/JPY sellers must reclaim the January 9 low of 96.14, followed by the 96.00 mark, and the bottom of the Kumo at 95.80. Once broken, the Kijun-Sen is up next at 96.54.
AUD/JPY Price Action – Daily Chart
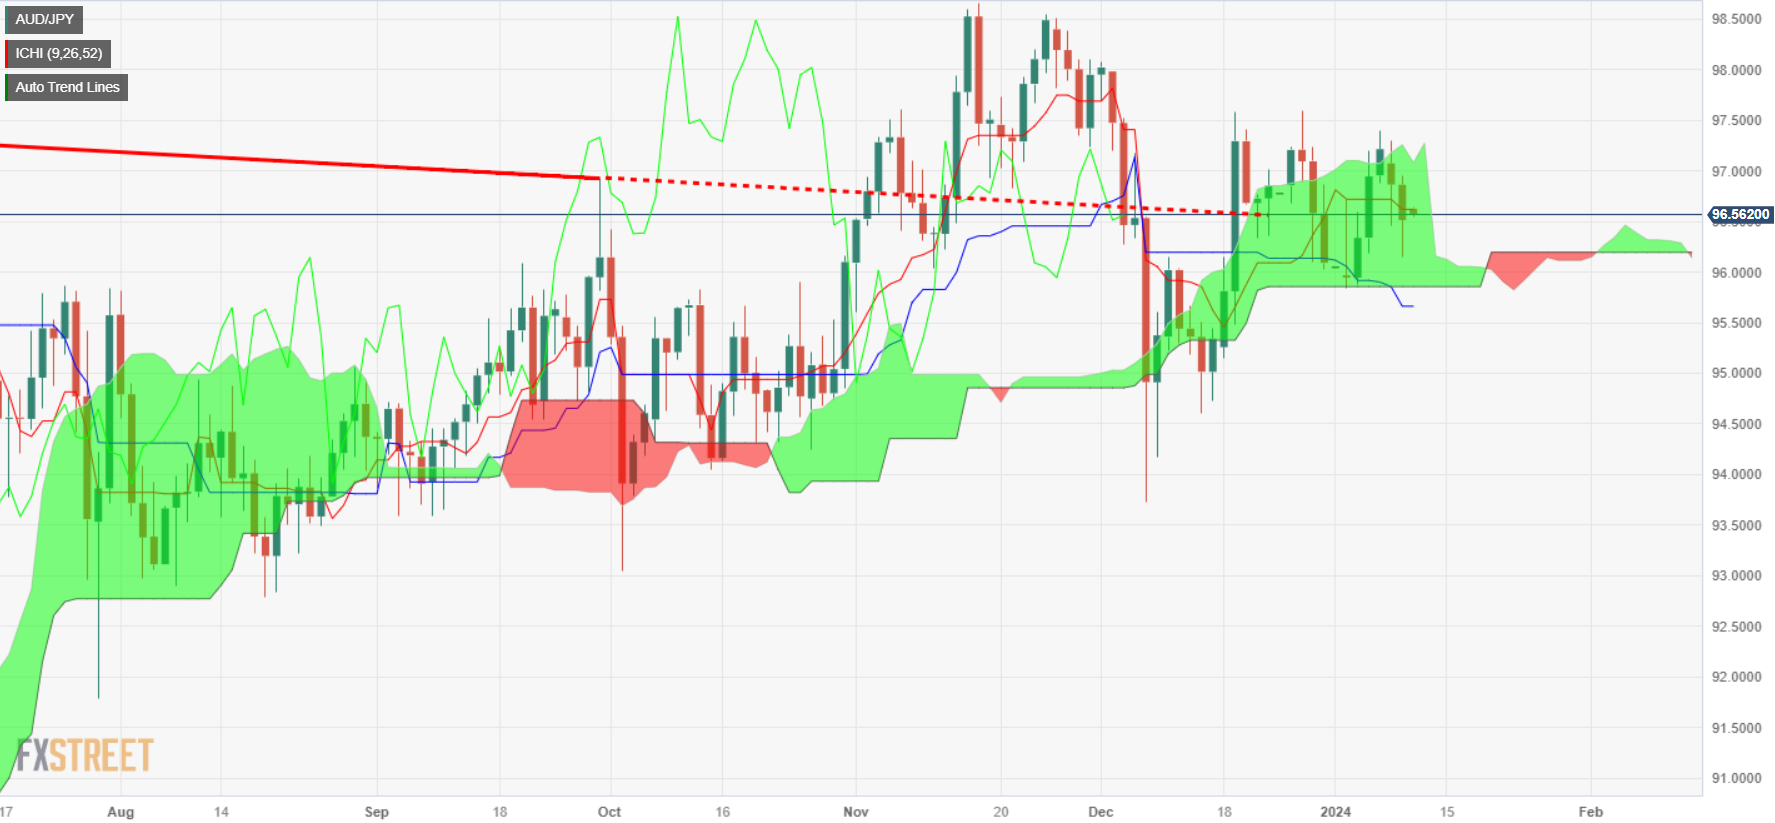
AUD/JPY Technical Levels
- US equity indexes closed mostly in the red as the risk rally draws to a close.
- Risk appetite is struggling in the week following last Friday’s 2024.
- 2023’s last-quarter rally drew to a close as equities struggle in January.
US major equity indexes closed mostly lower on Tuesday with tech stocks leading the charge down the charts, though the NASDAQ composite index managed to squeeze out a minor gain while the rest of the indexes declined heading into a hefty midweek reporting window.
Tuesday saw 113 companies drop earnings reports either throughout the day or after the closing bell, but investors are broadly twisting in place, pulling back slightly from equities ahead of Thursday’s US Consumer Price Index (CPI) inflation print.
Investors were knocked off increased expectations of a faster pace of rate cuts from the Federal Reserve (Fed) after last Friday’s Nonfarm Payrolls (NFP) saw drastic downside revisions to previous prints despite a bumper reading for the most recent dataset, and market bets of the first Fed rate cut coming as soon as March are beginning to recede.
The Dow Jones Industrial Average (DJIA) fell 0.42% on Tuesday, shedding 157.85 points to close at $37,525.16, while the Standard & Poor’s major equity index fell 7.04 points to close down 0.15% at $4,756.50.
The Russell 2000 equity index slid a full percentage point, losing nearly 21 points to close at $1,98.04. The NASDAQ composite, meanwhile, bucked the trend to end Tuesday up a scant 0.09%, climbing just under 14 points to end the day at $14,857.71.
S&P 500 Technical Outlook
The S&P 500 skidded to a halt after Monday’s hopeful gains, getting hung up on the 200-hour Simple Moving Average (SMA) near $4,755, and near-term momentum is draining away as investors get snagged near $4,760.
Despite near-term declines, the S&P 500 remains well-bid, trading just below the $4,800 handle on daily candlesticks and remains up over 16% from late October’s bottom bids near $4,100.
S&P 500 Hourly Chart

S&P 500 Technical Levels
- EUR/JPY's marginal decline influenced risk aversion, as the pair fluctuates within a narrow range.
- Downward trend persists, with potential supports at Tenkan-Sen (157.03), Kijun-Sen (156.42), and 156.00 level.
- Buyers aim to overcome hurdles at 158.00 and 159.00, targeting Ichimoku Cloud bottom for a possible upward shift.
The Euro posts minuscule losses after seesawing in an 80 pip range on Tuesday, with the EUR/JPY trading at 157.91, down 0.01% due to investors turning risk averse, as safe-haven currencies rose.
The downtrend has extended for the second straight day, though the EUR/JPY jumped from around the Tenkan-Sen, sitting at 157.03. nevertheless, the path of least resistance is downward, and if sellers would like to regain control, they must push prices lower.
Therefore, the first support would be the Tenkan-Sen, followed by the 157.00 figure. Once cleared, the next demand area is seen at the Kijun-Sen at 156.42. if bears reclaim that level, they could challenge 156.00.
On the other hand, although the pair failed to print a new daily high in the day, buyers remain hopeful of lifting the cross pair. For them, the first resistance would be the 158.00 figure, followed by the 159.00 mark. A breach of the latter would expose the bottom of the Ichimoku Cloud (Kumo) at around the 159.30/50 area, followed by 160.00.
EUR/JPY Price Action – Daily Chart

EUR/JPY Technical Levels
- EUR/USD slipped 0.2% on Tuesday as investors bid the USD.
- Markets shrugged off a slight decline in euro area unemployment.
- The rest of the week is data-light on the EUR side as investors await US CPI inflation.
The EUR/USD settled lower on Tuesday, slipping back into familiar near-term lows as broader markets step back from the Euro (EUR) and bidding the US Dollar (USD) up 0.2%.
The Eurozone Unemployment Rate ticked down slightly on Tuesday, declining from 6.5% to 6.4% in November. With the European economy grappling with productivity difficulties, a slight decline in the headline unemployment rate did little to galvanize Euro bulls, and the EUR/USD spent most of Tuesday backsliding in one-sided movement.
With the midweek looking notably thin on the economic calendar, investors will be keeping an eye out for Thursday’s US Consumer Price Index (CPI) inflation print, where market forecasts are expecting a slight uptick in headline annualized CPI inflation for December from 3.1% to 3.2%. MoM CPI is also expected to tick upwards from 0.1% to 0.2%.
Investors are looking for signs that the Federal Reserve (Fed) will get pushed into the next rate cut cycle sooner rather than later. Last Friday’s Nonfarm Payrolls (NFP) forecast beat pushed out market bets of a Fed rate cut as soon as March, and market risk sentiment will be hoping for a miss in US inflation prints on Thursday.
EUR/USD Technical Outlook
The EUR/USD remains trapped in a near-term congestion pattern for early 2024 intraday trading, stuck below a 200-hour Simple Moving Average (SMA) turning bearish just below the 1.1000 handle. The pair has been trapped within a rough range between 1.0980 and 1.0900, and near-term pressures are leaning towards the downside.
Daily candlesticks have the EUR/USD stuck in a rut just north of a bullish cross of the 50-day and 200-day SMAs near 1.0850. The pair is down nearly 2% from December’s peak at 1.1140, but is still up over 4.5% from last October’s early bottom near 1.04485.
EUR/USD Hourly Chart

EUR/USD Daily Chart

EUR/USD Technical Levels
- EUR/GBP regains some ground and stands at 0.8605 despite previous losses.
- Daily chart outlook still suggest a bearish outlook..
- In the longer term, the pair remains under major SMAs, painting a bearish picture while the four-hour-chart bears seem to ease off.
On Tuesday's session, the EUR/GBP was observed at 0.8605, experiencing slight gains of 0.15%. Following two days of declines and encountering robust support at the 0.8600 level, bears took a break. Despite this, the daily chart still presents a neutral to bearish outlook, and this bearish tilt remains apparent in the four-hour chart as well.
The indicators on the daily chart reflect a prevailing selling momentum. The Relative Strength Index (RSI) displays a positive incline yet remains within the negative territory, implying that while the selling pressure is somewhat easing, there is no pronounced shift in favor of buyers just yet. Concurrently, the Moving Average Convergence Divergence (MACD) with its rising red bars further highlights the current bear dominance. Moreover, the pair's position beneath the key levels of 20, 100, and 200-day Simple Moving Averages (SMAs) reinforces the widespread bearish control.
Zooming into the four-hour chart, the bearish sentiment is echoed. The tilt remains downhill as the negative slope of the four-hour RSI proclaims that sellers dominate the short-term momentum as well. However, the rising green bars in the four-hour MACD indicates a growing bullish undercurrent and a possible bearish exhaustion. It may imply that bears are taking a breather, and a temporary reversal might be on the cards if buyers manage to build an effective momentum. However, the overall outlook remains dominated by the sellers in the short run.
EUR/GBP technical levels
EUR/GBP daily chart
-638404330816504734.png)
- European equities declined on Tuesday amidst a thin economic calendar.
- UK BRC Retail Sales fell further, fueling risk-off investor sentiment.
- European Unemployment Rate ticks down to 6.4%.
European equity indexes declined on Tuesday, paring back some losses at the midpoint of the day’s trading sessions but still ending the day broadly lower as market sentiment coils with investors awaiting meaningful data.
The Eurozone’s Unemployment Rate ticked slightly lower from 6.5% to 6.4% in November, but the overall employment picture in Europe sees businesses struggling to fill positions and a general mismatch in labor skills plaguing productivity across the continent.
Tuesday also saw the UK’s BRC Like-For-Like Retail Sales for the year ended December, which declined from 2.6% to 1.9% compared to the previous month’s YoY result as UK consumers grapple with still-high inflation eating away at their spending power.
ECB's Villeroy: ECB to cut rates in 2024
Banque de France (BoF) Governor and member of the European Central Bank’s (ECB) Governing Council François Villeroy de Galhau delivered hawkish remarks after the market close to investors, noting that the ECB is well on its way to begin cutting rates in 2024. European shareholders will have to wait until Wednesday’s market open to bid on stocks following Villeroy’s statements.
The German DAX fell 0.17%, sliding 28 points to close at €16,688.36, while France’s CAC 40 Index shed a third of a percent to close at €7,426.62, down 23.62 points. The UK’s FTSE 100 index shed a little over one-tenth of one percent, falling 10.23 points to £7,683.96.
The pan-European STOXX600 index fell 0.92 points to close at €477.26, down a fifth of a percent on Tuesday.
DAX Technical Outlook
The DAX fumbled on Tuesday, paring back Monday’s gains to fall into the €16,6090 neighborhood before moderating in the last half of the trading day.
The German equity index is still down from 2024’s opening bids, and intraday action is getting snarled on the 200-hour Simple Moving Average (SMA).
The Dax snapped a three-day win streak on Tuesday, keeping the index trapped inside a congestion pattern just below December’s recent highs just shy of the €17,000 major handle.
DAX Hourly Chart
DAX Daily Chart
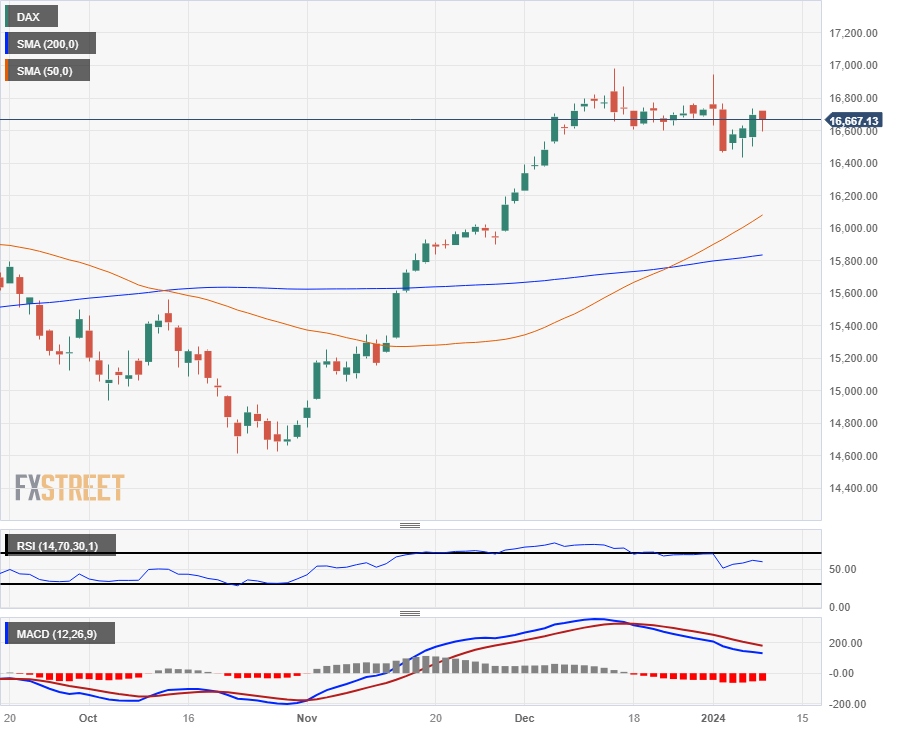
DAX Technical Levels
Fresh demand for the greenback put the risk-linked universe under extra downside pressure against the backdrop of rising cautiousness prior to the publication of US inflation figures measured by the CPI. Moving forward, inflation prints in Australia will gather all the attention early in the session, while BoE Governor A. Bailey is due to speak in the European afternoon.
Here is what you need to know on Wednesday, January 10:
Fresh demand for the greenback supported a marked bounce in the US Dollar Index (DXY) to the 102.70 zone, or two-day highs, despite the directionless stance in US yields across the curve.
In the US, equities tracked by the Dow Jones and the S&P 500 reversed the promising start of the week on the back of rising prudence ahead of key US data releases.
EUR/USD remained on the defensive and briefly approached the proximity of the 1.0900 key support amidst the resumption of the buying interest in the dollar and the safe haven space.
GBP/USD followed the rest of its risky peers and broke below the 1.2700 yardstick, eroding Monday’s gains and halting a four-day positive streak at the same time.
The robust move higher in the greenback motivated USD/JPY to leave behind two consecutive sessions of losses and print a decent advance beyond the key barrier at 144.00 amidst inconclusive developments in US yields and the downtick in JGB 10-year yields.
AUD/USD resumed the decline and retreated markedly to the 0.6680/75 band on Tuesday, setting aside two straight days of slight gains ahead of the release of key inflation data in Oz.
Extra gains in the greenback pushed USD/CAD to fresh four-week tops north of 1.3400 the figure. Poor results from the Canadian trade balance and building permits also kept the selling pressure well and sound around CAD.
Gold closed Tuesday’s session around the previous day’s closing levels near $2030 per troy ounce on the back of the intense demand for the greenback and the vacillating mood in the US money markets. By the same token, silver prices added to the negative start of the week and challenged the key $23.00 mark once again.
- USD/JPY's ascent driven by a cautious market mood, with Wall Street showing mixed performance and US Dollar strength.
- Narrowing US trade deficit and business sentiment improvement overlooked as traders await key US inflation data.
- Tokyo's core inflation report suggests continued ultra-loose monetary policy by BoJ, adding context to currency dynamics.
The USD/JPY posted decent gains late in the North American session, courtesy of risk aversion as investors shrug off economic data from Japan. The major is trading at 144.55, gaining 0.23%.
The Japanese Yen fails to gain traction in a risk-off mood
Risk aversion is driving price action, as Wall Street is trading with losses in two of its three largest stock indices, down between 0.06% and 0.40%. The Nasdaq 100 is the outlier gaining 0.25%.
In the FX space, the US Dollar Index (DXY), which measures the buck’s performance against a basket of six currencies, advances 0.26%, up at 102.56 amid falling US Treasury bond yields.
Economic data in the United States (US) was mainly ignored by market participants focused on the inflation report on Thursday. Nevertheless, the US Department of Commerce revealed that November’s trade deficit narrowed less than estimates and the previous month's data. The Balance of Trade rose to $-63.2 billion, from $-64.5 in October to $-65 billion foreseen.
Earlier, the National Federation of Independent Business (NFIB) revealed the results of their Survey, which showed that business sentiment improved but remained below the 50-year average of 98, coming at 91.9 in December, above November’s 90.6. the survey highlighted that inflation is businesses' main concern.
Aside from this, core inflation in Tokyo was lower than expected and came at 2.1% YoY, from 2.3% in November, matching estimates of 2.1%. Even though there have been speculations the Bank of Japan (BoJ) would normalize monetary policy in the near-term, data suggests maintaining the ultra-loose policy, is the path to follow.
Ahead of the week, the Japanese economic docket will feature the Current Account on Thursday. On the US front, inflation data is widely expected to show a mixed print, which could pave the way for a muted reaction in the financial markets.
USD/JPY Technical Levels
Japanese Yen FAQs
What key factors drive the Japanese Yen?
The Japanese Yen (JPY) is one of the world’s most traded currencies. Its value is broadly determined by the performance of the Japanese economy, but more specifically by the Bank of Japan’s policy, the differential between Japanese and US bond yields, or risk sentiment among traders, among other factors.
How do the decisions of the Bank of Japan impact the Japanese Yen?
One of the Bank of Japan’s mandates is currency control, so its moves are key for the Yen. The BoJ has directly intervened in currency markets sometimes, generally to lower the value of the Yen, although it refrains from doing it often due to political concerns of its main trading partners. The current BoJ ultra-loose monetary policy, based on massive stimulus to the economy, has caused the Yen to depreciate against its main currency peers. This process has exacerbated more recently due to an increasing policy divergence between the Bank of Japan and other main central banks, which have opted to increase interest rates sharply to fight decades-high levels of inflation.
How does the differential between Japanese and US bond yields impact the Japanese Yen?
The BoJ’s stance of sticking to ultra-loose monetary policy has led to a widening policy divergence with other central banks, particularly with the US Federal Reserve. This supports a widening of the differential between the 10-year US and Japanese bonds, which favors the US Dollar against the Japanese Yen.
How does broader risk sentiment impact the Japanese Yen?
The Japanese Yen is often seen as a safe-haven investment. This means that in times of market stress, investors are more likely to put their money in the Japanese currency due to its supposed reliability and stability. Turbulent times are likely to strengthen the Yen’s value against other currencies seen as more risky to invest in.
- The XAG/USD declined towards the $22.95 level, marked by a roughly 0.40% setback from its daily high at $23.35.
- The US dollar rebounded, erasing Monday's downturn favored by a negative market mood.
The XAG/USD witnessed a decline in Tuesday's session, trading around the $22.95 level, showcasing a 0.40% loss. The lingering influence of a stronger US dollar coupled with a risk-averse mood in the markets has contributed to the metal's downward trajectory. A key factor in this movement has been the price's failure to break past the 100-day Simple Moving Average (SMA) at $23.30, making the metal change directions during the American session.
The US Dollar is holding its ground as the US economy proves resilient, as demonstrated by the growth in Q4 and optimistic projections for Q1 2024. This relatively strong economy with sticky inflation concerns could prevent 5-6 predicted rate cuts in 2024 and limit the upside for the price as US Treasury yields may pick up, and the cost of opportunity of holding non-yielding metal would rise as well.
This week's spotlight is on inflation figures from the US, with the December Consumer Price Index (CPI) figures projected at a YoY rate of 3.2%, a slight increase from the previous 3.1%. Conversely, the annual core rate is anticipated to moderate to 3.8%, down from November's 4%. In case the core measure effectively eases, it could apply pressure on the USD and on US Treasuries and may provide a boost to the price.
As for now, US bond yields are mixed. The 2-year rate is seen at 4.38%, while the 5-year and 10-year yields are noted at 3.97% and 4.01%, respectively.
XAG/USD levels to watch
From a technical standpoint, the daily chart's indicators suggest the force of selling may have a slight upper hand in the short-term outlook, owing to the initial observations of the Relative Strength Index (RSI) and Moving Average Convergence Divergence (MACD). Despite a flat position, the RSI resides in negative territory, which ordinarily implies that sellers may have a mild edge.
Similarly, the MACD, producing rising red bars, adds some weight to the premise of a marginal bearish trend. The red bars on the MACD Histogram often imply that sell-side momentum could be gathering pace.
Allining with the near-term bearish signals, the bearish forces also appear to have macro control over the trend as the price trades below the 20,100,200-day Simple Moving Averages (SMAs).
XAG/USD daily chart
-638404255363763130.png)
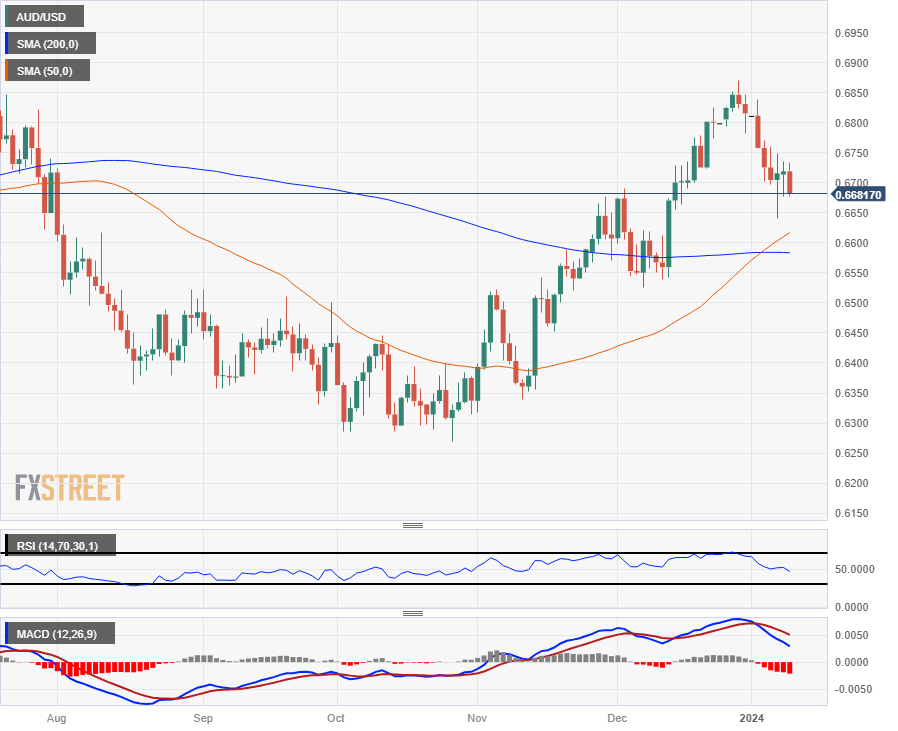
- The Aussie lost ground on Tuesday, paring away intraday gains.
- Broader markets are favoring the US Dollar heading into the midweek.
- This week hinges on US CPI inflation figures due on Thursday.
The AUD/USD slid back into recent lows on Tuesday, paring back Wednesday’s limited bounce as the Australian Dollar (AUD) shrugged off an upside beat in Australian Retail Sales. The US Dollar (USD) saw broad-market uptake on the day as investors adjusted their risk profile heading into the midweek.
Australia’s Retail Sales and Building Permits both beat expectations
Australia’s Retail Sales in November climbed 2% MoM, well above the 1.2% forecast and rebounded from October’s -0.4% decline, which saw a downside revision from -0.2%. Australian Building Permits also beat forecasts, printing at 1.6% in November, well back from October’s 7.2% (revised down slightly from 7.5%) but still above the market’s -2.0% forecast.
Australian Building Permits likewise beat the street, showing 2% growth in November versus the forecast 1.2%. October’s Building Permits were revised slightly lower from 7.5% to 7.2%.
US Data was thin on Tuesday, and markets will be broadly turning focus towards Thursday’s US Consumer Price Index (CPI) inflation figures as investors look to draw a bead on future Federal Reserve (Fed) rate cuts. Last Friday’s Nonfarm Payrolls disappointed market participants hoping for a faster, deeper pace of rate cuts in 2024, as healthier jobs data makes it harder for the Fed to get pushed into a rate cut cycle.
AUD/USD Technical Outlook
The AUD/USD has settled back into familiar near-term lows near 0.6680 as intraday action gets capped underneath the 200-hour Simple Moving Average (SMA) near 0.6760. The Aussie is down 2.75% against the US Dollar from late December’s peak of 0.6871.
The AUD/USD’s near-term decline has the pair getting dragged back towards the 200-day SMA on daily candlesticks, approaching the 0.6600 handle as price action descends into a technical support zone following a bullish crossover of the 50-day and 200-day SMAs.
AUD/USD Hourly Chart
AUD/USD Daily Chart
AUD/USD Technical Levels
- The DXY Index trades with gains at 102.50 after dipping to 102.10.
- Markets turns risk-averse on Tuesday, seeking refuge in the US Dollar.
- CPI inflation figures from December are the week’s highlight on Thursday.
The US Dollar (USD) Index trades on an upward trajectory on Tuesday, touching the 102.50 mark and largely buoyed by the prevailing negative market sentiment that is bolstering the demand for the Greenback. Furthermore, investors are keeping a keen eye on the Consumer Price Index (CPI) outcome on Thursday as a potential determinant of the pair's movement for the next sessions.
For now, markets are betting on five rate cuts in 2024, largely dismissing the Federal Reserve (Fed) forecast of only 75 bps of easing. Strong labor market data from the US economy was largely offset by a weak US ISM PMI print, so December’s CPI reading will play a big role in shaping expectations of the central bank’s easing calendar.
Daily digest market movers: US dollar rises on negative market sentiment, eyes on CPI
- The negative market mood fuels an increase in the demand for the USD as investors turn cautious ahead of CPI figures.
- The December Consumer Price Index is projected to come in at 3.2% YoY, above the previous 3.1%. The core annual reading, however, is expected at 3.8%, easing from 4% in November.
- US bond yields exhibit a mixed behavior, with the 2-year yield at 4.38%, the 5-year yield nearly at 4%, and the 10-year yield hovering a little above 4%.
- The CME FedWatch Tool suggests that the January meeting is expected to maintain rates with low chances of a cut. Markets are now pricing in higher odds of future rate cuts come March and May 2024.
Technical Analysis: DXY Index bulls make another stride and consolidate above the 20-day SMA
The Dollar Index’s Relative Strength Index (RSI) is currently on a positive slope in positive territory, hinting at an energized buying momentum. This is further confirmed by the Moving Average Convergence Divergence (MACD) displaying rising green bars, which reinforce the building's bullish momentum. On the daily chart, the indications are that bulls are gradually reclaiming territory.
However, turning toward the Simple Moving Averages (SMAs), on a broader scope they provide a slightly contradictory outlook. Though the pair sits consolidated above the 20-day SMA, bolstering the short-term bullish viewpoint, it resides below the 100 and 200-day SMAs. This placement reveals that bears are still in command of the overall trend despite short-term bullishness.
Support levels: 102.30, 102.00 (20-day SMA), 101.80.
Resistance levels: 102.70, 102.90, 103.00.
US Dollar FAQs
What is the US Dollar?
The US Dollar (USD) is the official currency of the United States of America, and the ‘de facto’ currency of a significant number of other countries where it is found in circulation alongside local notes. It is the most heavily traded currency in the world, accounting for over 88% of all global foreign exchange turnover, or an average of $6.6 trillion in transactions per day, according to data from 2022.
Following the second world war, the USD took over from the British Pound as the world’s reserve currency. For most of its history, the US Dollar was backed by Gold, until the Bretton Woods Agreement in 1971 when the Gold Standard went away.
How do the decisions of the Federal Reserve impact the US Dollar?
The most important single factor impacting on the value of the US Dollar is monetary policy, which is shaped by the Federal Reserve (Fed). The Fed has two mandates: to achieve price stability (control inflation) and foster full employment. Its primary tool to achieve these two goals is by adjusting interest rates.
When prices are rising too quickly and inflation is above the Fed’s 2% target, the Fed will raise rates, which helps the USD value. When inflation falls below 2% or the Unemployment Rate is too high, the Fed may lower interest rates, which weighs on the Greenback.
What is Quantitative Easing and how does it influence the US Dollar?
In extreme situations, the Federal Reserve can also print more Dollars and enact quantitative easing (QE). QE is the process by which the Fed substantially increases the flow of credit in a stuck financial system.
It is a non-standard policy measure used when credit has dried up because banks will not lend to each other (out of the fear of counterparty default). It is a last resort when simply lowering interest rates is unlikely to achieve the necessary result. It was the Fed’s weapon of choice to combat the credit crunch that occurred during the Great Financial Crisis in 2008. It involves the Fed printing more Dollars and using them to buy US government bonds predominantly from financial institutions. QE usually leads to a weaker US Dollar.
What is Quantitative Tightening and how does it influence the US Dollar?
Quantitative tightening (QT) is the reverse process whereby the Federal Reserve stops buying bonds from financial institutions and does not reinvest the principal from the bonds it holds maturing in new purchases. It is usually positive for the US Dollar.
- Gold remains above $2030, supported by US Dollar strength despite falling US bond yields.
- US economic data shows improved small business sentiment and a narrowing trade deficit, impacting gold dynamics.
- Investors await US CPI data for further direction, with Gold's movement likely influenced by inflation expectations.
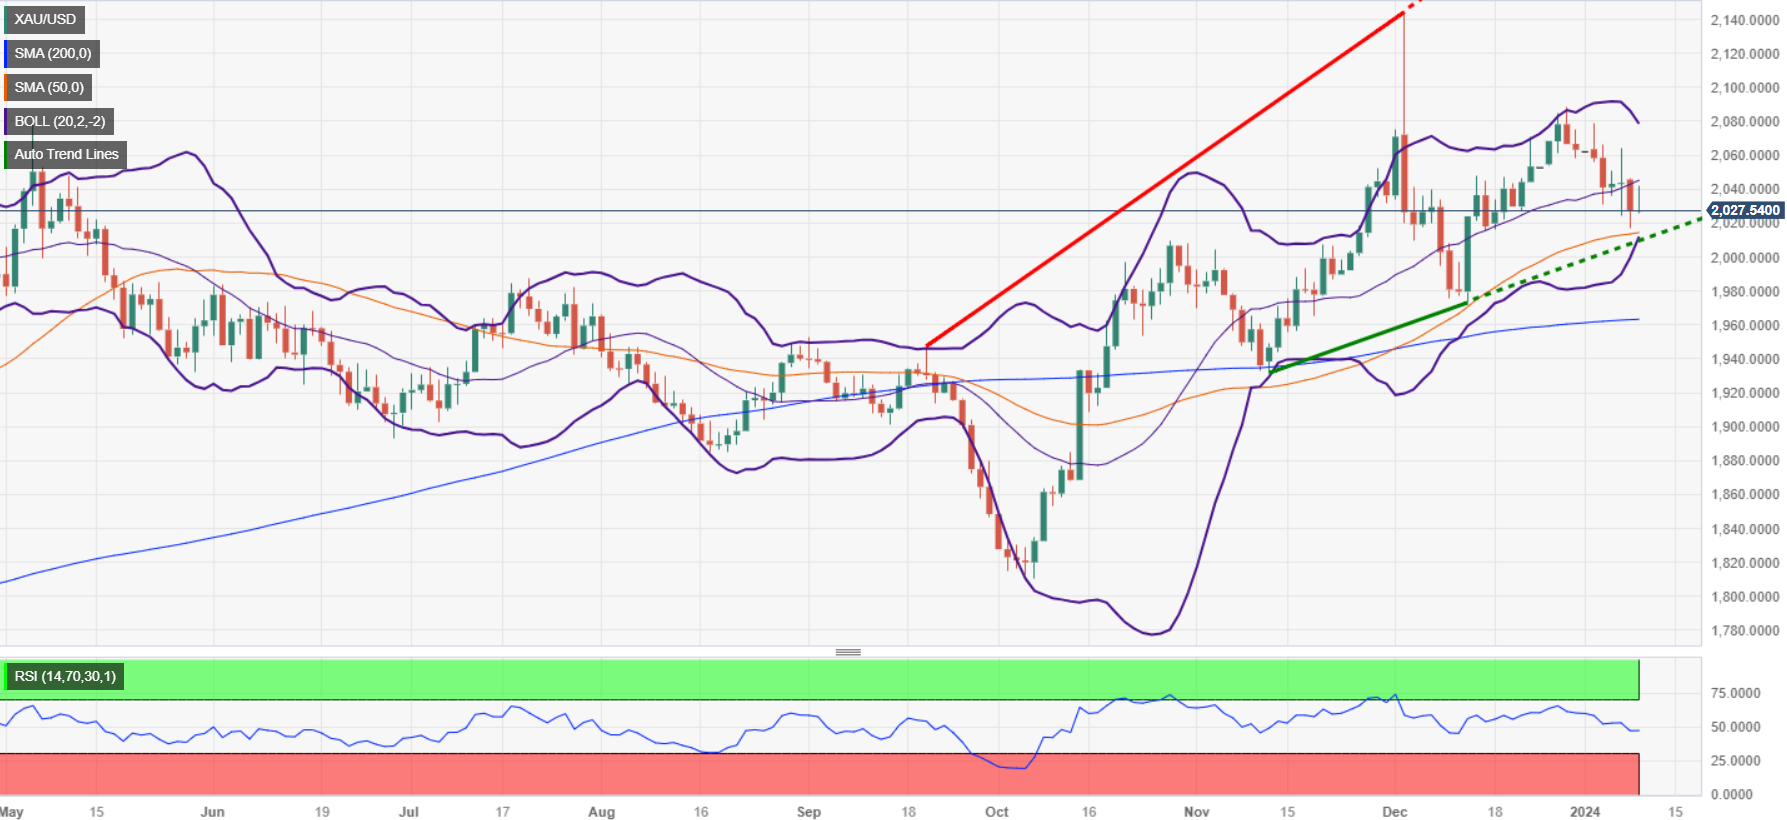
Gold price clings to decent gains above 0.15% during the mid-North American session on Tuesday, amid risk aversion, alongside overall US Dollar (USD) strength across the board. US Treasury bond yields had erased their previous gains, a tailwind for the yellow metal, which has an inverted correlation, particularly with the 10-year benchmark note yield. At the time of writing, XAU/USD trades at $2030 after hitting a daily low of $2026.17.
XAU/USD rises, although US bond yields are dropping
Risk aversion is the name of the game; although it is boosting Gold’s price, the Greenback is gaining some ground against the non-yielding metal. The economic calendar in the United States was scarce, though it revealed the NFIB Business Optimism Survey for December, which showed small business sentiment improved for the first time in five months, though it remains below its 50-year average of 98, came at 91.90.
The US Department of Commerce announced that the US trade deficit narrowed as the Trade Balance for November came at $-63.2 billion, less than estimates of $-65 billion and October’s $-64.5 billion.
That sponsored XAU/USD’s leg up toward its daily high of $2042.01 before retreating toward current spot prices. Although US Treasury bond yields remain depressed, the Greenback posted solid gains, as shown by the US Dollar Index (DXY). The DXY, a basket of six currencies vs. the US Dollar, climbs 0.20% at 102.49.
Meanwhile, Gold’s price action is expected to remain constrained as traders brace for December’s inflation data in the United States. The Consumer Price Index (CPI) is expected to tick up by 3.3% YoY, while the core is expected at 3.8% YoY, lower than the previous reading.
XAU/USD Price Analysis: Technical outlook
Gold’s daily chart portrays the yellow metal upward bias after finding support at the 50-day moving average (DMA) tested Monday, with the level rejecting lower prices. This is despite posting losses of almost 1% yesterday. Although buyers have regained some control, downside risks remain if XAU/USD slides below today’s low of $2026, opening the door to challenge the 50-DMA at $2014, ahead of testing the $2000 figure. On the flip side, the XAU/USD first resistance would be $2050, followed by the January 5 daily high at $2063.98.
- ECB's Villeroy sees rate cuts in 2024, barring any surprises.
- Inflation expectations need to settle at or below 2% before the ECB will act.
Banque de France (BoF) Governor and European Central Bank (ECB) policymaker François Villeroy de Galhau reaffirmed his rate cut expectations in 2024 while delivering his New Year's address to the European financial sector on Tuesday.
As head of the French central bank, Villeroy is part of the ECB's Governing Council, and has an active role in determining European central bank and monetary policy.
Key highlights:
- ECB to cut rates in 2024 as long as underlying fundamentals don't deliver any unforeseen surprises.
- ECB won't move on rates until inflation expectations are "solidly anchored" at 2%.
- ECB decisions to remain based on data, central policy planners refuse to be rushed, but won't be stubborn either.
- ECB must remain vigilant on inflation data.
Market reaction
With markets broadly anticipating rate cuts from the ECB this year, Villeroy's statements did little but confirm what markets already know. The Euro is little changed following Villeroy, with the EUR/USD paddling near 1.0935.
- Canadian Dollar falls back, while US Dollar moves broadly higher.
- Canada International Merchandise Trade fell further than expected, Building Permits also declined.
- Crude Oil market recovery sees friction, limiting CAD support.
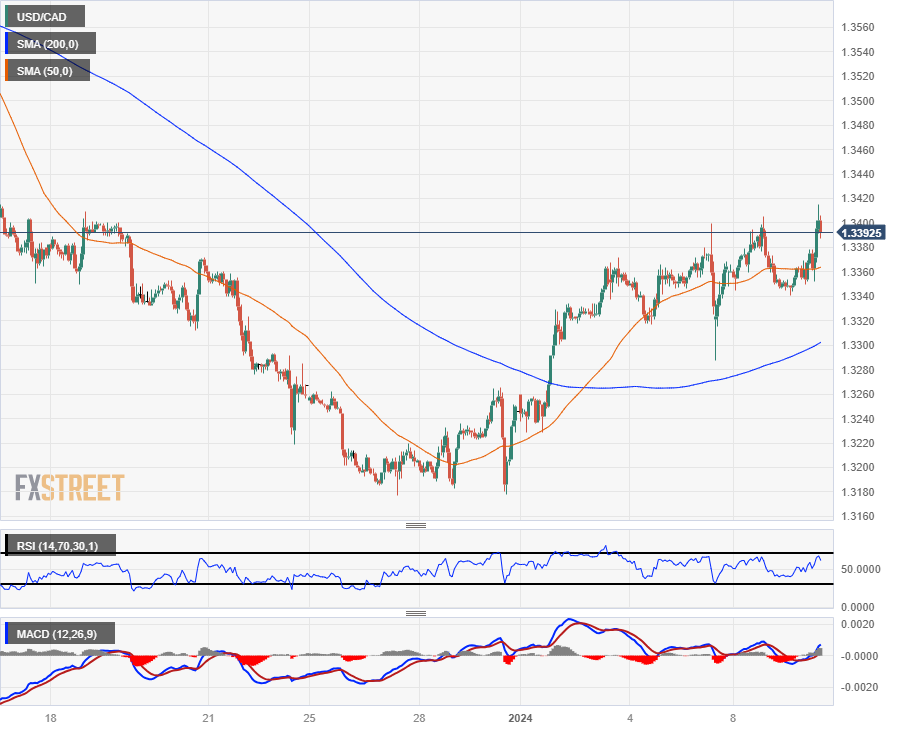
The Canadian Dollar (CAD) extended declines on Tuesday, slipping to a new low for the week as market sentiment recoils in the last quarter of the trading day. Markets pulled back into the US Dollar (USD), pushing the CAD even lower as Canadian economic figures broadly miss the mark.
Canada’s International Merchandise Trade in November fell back after October’s 14-month high, and Canadian Building Permits in November fell by nearly 4%.
Crude Oil is looking for a rebound from Monday’s downside slump, but topside momentum remains limited, leaving Crude Oil largely flat on the week as barrel bids struggle to recover.
Daily digest market movers: Canadian Dollar hesitates amidst US Dollar recovery
- Canada trade balance heads back toward the median: November’s International Merchandise Trade Balance slid from October’s 14-month peak of CAD 3.2 billion to 1.57 billion, with October seeing an upside revision from 2.97 billion.
- Canada Building Permits also fell more than expected in November, declining 3.9% versus the forecast of -1.7%.
- October’s Building Permits grew by 3% after an upside revision from 2.3%.
- The US trade deficit fell less than expected with the Goods Trade Balance for November bouncing slightly from a slightly-revised -90.3 billion to -89.4 billion.
- November’s US Goods and Services Trade Balance likewise fell less than expected, reaching $-63.2 billion versus the forecast of $-65.0 billion. October saw a minor revision from $-64.3 billion to $-64.5 billion.
- Market focus will be squarely on Thursday’s US Consumer Price Index (CPI) inflation print, where headline CPI inflation is expected to rise to 3.2% YoY in December.
Canadian Dollar price today
The table below shows the percentage change of Canadian Dollar (CAD) against listed major currencies today. Canadian Dollar was the strongest against the Australian Dollar.
| USD | EUR | GBP | CAD | AUD | JPY | NZD | CHF | |
| USD | 0.16% | 0.24% | 0.30% | 0.45% | 0.12% | 0.20% | 0.42% | |
| EUR | -0.16% | 0.08% | 0.14% | 0.27% | -0.05% | 0.04% | 0.25% | |
| GBP | -0.25% | -0.08% | 0.05% | 0.16% | -0.13% | -0.05% | 0.18% | |
| CAD | -0.30% | -0.14% | -0.05% | 0.13% | -0.19% | -0.11% | 0.12% | |
| AUD | -0.44% | -0.26% | -0.17% | -0.11% | -0.30% | -0.22% | -0.01% | |
| JPY | -0.12% | 0.07% | 0.13% | 0.19% | 0.32% | 0.07% | 0.31% | |
| NZD | -0.19% | -0.04% | 0.05% | 0.10% | 0.24% | -0.08% | 0.23% | |
| CHF | -0.42% | -0.26% | -0.18% | -0.12% | 0.01% | -0.30% | -0.23% |
The heat map shows percentage changes of major currencies against each other. The base currency is picked from the left column, while the quote currency is picked from the top row. For example, if you pick the Euro from the left column and move along the horizontal line to the Japanese Yen, the percentage change displayed in the box will represent EUR (base)/JPY (quote).
Technical Analysis: Canadian Dollar gives up further ground on Tuesday as markets pick up the Greenback
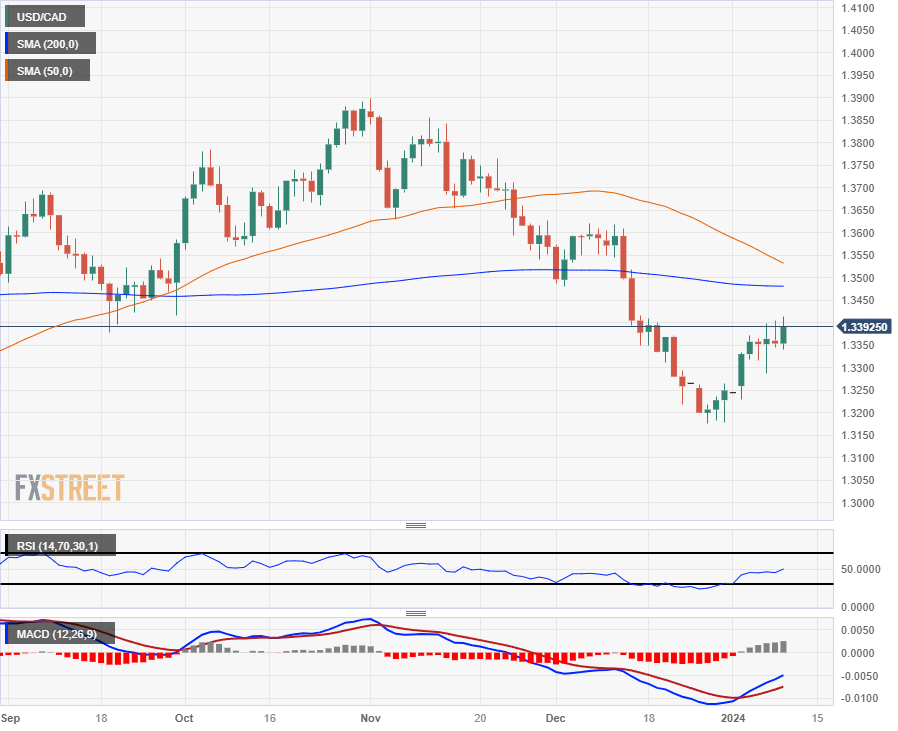
The Canadian Dollar (CAD) slid to a new multi-week low against the US Dollar on Tuesday, sending the USD/CAD pair briefly back over the 1.3400 price level before intraday price action got hung up on the major handle. Near-term USD/CAD momentum has largely been a consolidation story with the pair grinding out higher lows through 2024’s early trading.
Daily candlesticks show the USD/CAD pushing steadily higher in choppy trading as the pair grinds back toward the 200-day Simple Moving Average (SMA) near the 1.3500 handle. Bullish momentum is set to see a fresh technical ceiling from an impending bearish crossover of the 50-day and 200-day SMAs.
USD/CAD Hourly Chart
USD/CAD Daily Chart
Canadian Dollar FAQs
What key factors drive the Canadian Dollar?
The key factors driving the Canadian Dollar (CAD) are the level of interest rates set by the Bank of Canada (BoC), the price of Oil, Canada’s largest export, the health of its economy, inflation and the Trade Balance, which is the difference between the value of Canada’s exports versus its imports. Other factors include market sentiment – whether investors are taking on more risky assets (risk-on) or seeking safe-havens (risk-off) – with risk-on being CAD-positive. As its largest trading partner, the health of the US economy is also a key factor influencing the Canadian Dollar.
How do the decisions of the Bank of Canada impact the Canadian Dollar?
The Bank of Canada (BoC) has a significant influence on the Canadian Dollar by setting the level of interest rates that banks can lend to one another. This influences the level of interest rates for everyone. The main goal of the BoC is to maintain inflation at 1-3% by adjusting interest rates up or down. Relatively higher interest rates tend to be positive for the CAD. The Bank of Canada can also use quantitative easing and tightening to influence credit conditions, with the former CAD-negative and the latter CAD-positive.
How does the price of Oil impact the Canadian Dollar?
The price of Oil is a key factor impacting the value of the Canadian Dollar. Petroleum is Canada’s biggest export, so Oil price tends to have an immediate impact on the CAD value. Generally, if Oil price rises CAD also goes up, as aggregate demand for the currency increases. The opposite is the case if the price of Oil falls. Higher Oil prices also tend to result in a greater likelihood of a positive Trade Balance, which is also supportive of the CAD.
How does inflation data impact the value of the Canadian Dollar?
While inflation had always traditionally been thought of as a negative factor for a currency since it lowers the value of money, the opposite has actually been the case in modern times with the relaxation of cross-border capital controls. Higher inflation tends to lead central banks to put up interest rates which attracts more capital inflows from global investors seeking a lucrative place to keep their money. This increases demand for the local currency, which in Canada’s case is the Canadian Dollar.
How does economic data influence the value of the Canadian Dollar?
Macroeconomic data releases gauge the health of the economy and can have an impact on the Canadian Dollar. Indicators such as GDP, Manufacturing and Services PMIs, employment, and consumer sentiment surveys can all influence the direction of the CAD. A strong economy is good for the Canadian Dollar. Not only does it attract more foreign investment but it may encourage the Bank of Canada to put up interest rates, leading to a stronger currency. If economic data is weak, however, the CAD is likely to fall.
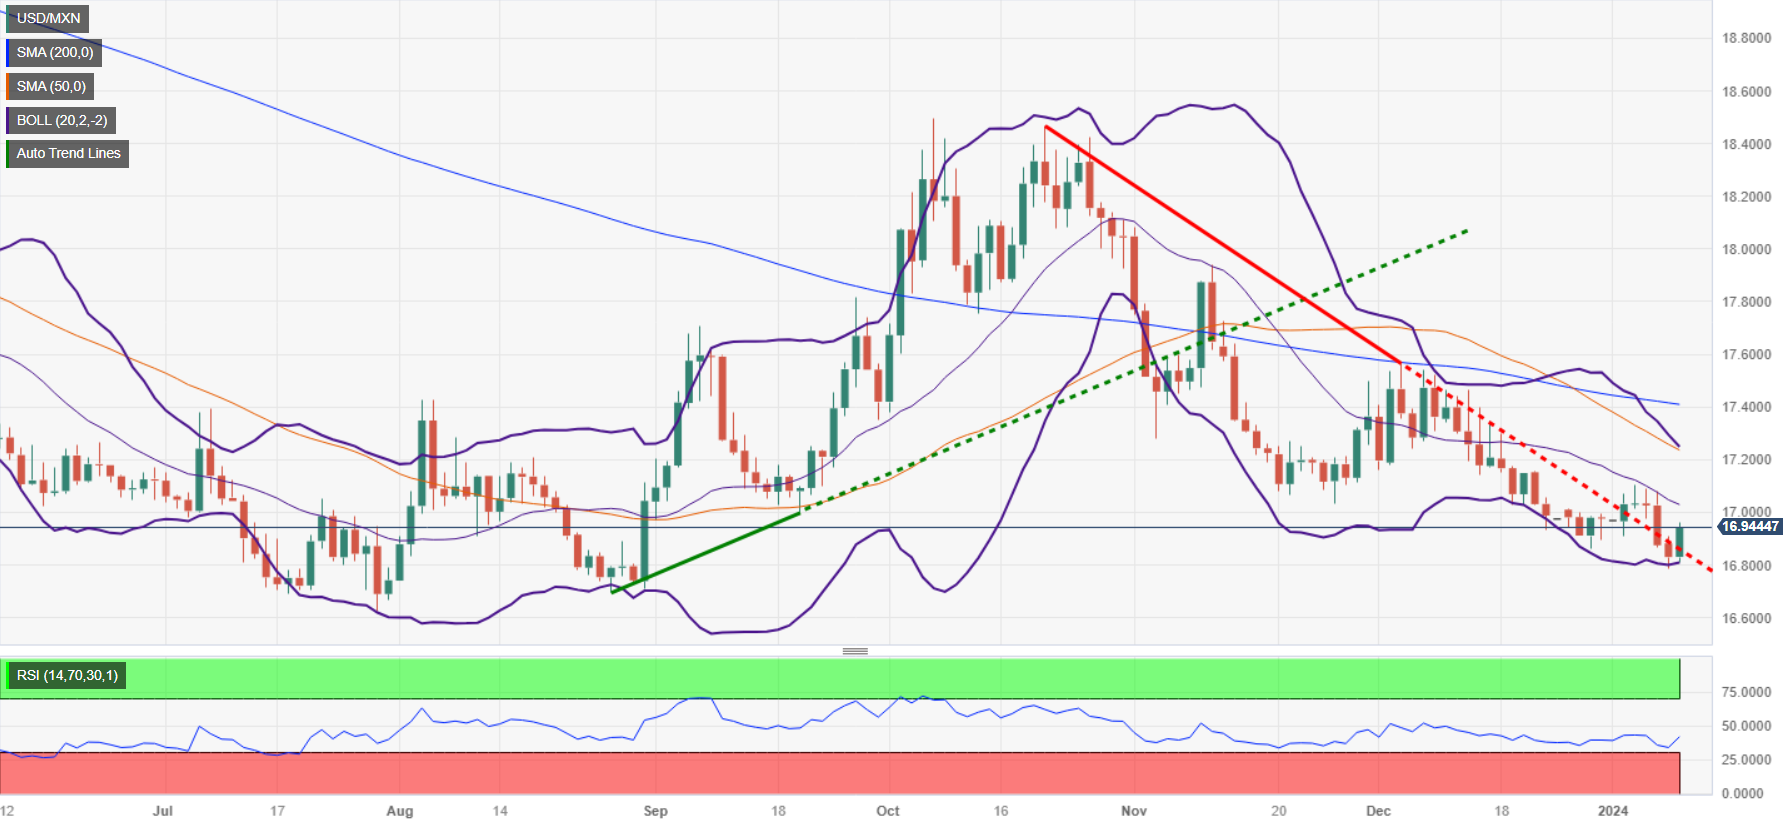
- Mexican Peso depreciates even though inflation data in Mexico was mixed.
- Mexico’s inflation exceeded forecasts, which could deter Banxico from easing policy throughout the first quarter 2024.
- USD/MXN soared toward the 16.90 area due to the overall strength of the US Dollar.
The Mexican Peso (MXN) is losing steam against the US Dollar (USD) in early trading on Tuesday as the Greenback rises. December’s inflation was higher than expected in Mexico, which might deter the Bank of Mexico (Banxico) from easing policy, as two of its policy members expressed in December. At the time of writing, USD/MXN is trading at 16.94, gaining 0.68%.
Mexico’s National Statistics Agency (INEGI) announced that consumer prices rose above estimates in headline inflation, while core inflation reached its lowest level since October 2021. The data initially underpinned the Mexican currency, with the USD/MXN dropping toward 16.78. Buyers moved in and lifted the exchange rate.
Across the border, Federal Reserve (Fed) officials continued to support the current level of interest rates, based on comments from Atlanta Fed President Raphael Bostic and Fed Governor Michelle Bowman. Data-wise, US small business sentiment improved, while the Balance of Trade printed a narrower deficit in November, revealed the US Department of Commerce.
Daily digest market movers: Mexican Peso at the mercy of strong US Dollar
- Mexico’s Consumer Price Index (CPI) rose by 4.66% YoY in December, exceeding forecasts of 4.55%, and November’s was 4.32%. Core figures came at 5.09%, less than the consensus and the previous month’s 5.15% and 5.30%, respectively.
- Federal Reserve officials expressed that interest rates should remain at current levels. Bostic emphasized that policy needs to stay tight, while Bowman added that policy is sufficiently restrictive.
- The US Trade Balance deficit narrowed more than expected in November, from the $-65 billion estimate to $-63.2 billion and less than October’s $-64.5 billion.
- The US 10-year Treasury bond yield advances.
- Consumer Confidence in Mexico deteriorated in December as households remained concerned about the future economic outlook.
- The US economy continues to paint a mixed economic outlook as the latest US jobs data was mixed while business activity in manufacturing contracted and the service sector is deteriorating. Although a soft-landing scenario looms, the chance of a mild recession has increased, so caution is warranted.
- Although the latest Banxico meeting minutes indicate the central bank might consider easing policy, December’s inflation report might prevent the central bank from relaxing policy.
- Last Tuesday, Mexico’s S&P Global Manufacturing PMI for December peaked at 52.0, below November’s 52.5, suggesting the economy is slowing down amid Banxico’s tightening cycle.
- On Wednesday, Business Confidence in Mexico improved to 54.6 from 54.0 in November, although it failed to underpin the Mexican Peso, which remained weak during the session.
Technical analysis: Mexican Peso weakens as the USD/MXN rises and threatens to reach 17.00
Although the USD/MXN resumed its downtrend, the current leg-up toward the 16.90 area could pave the way for an upward correction past the 17.00 figure. A breach of the latter could exacerbate a test of the 17.20 figure, followed by the 50-day Simple Moving Average (SMA) at 17.26.
If sellers prevent the exotic pair from piercing the 17.00 figure, a test of last year’s low is on the cards. But sellers must conquer the 16.80 area, followed by the August 28 swing low of 16.69 ahead of the 2023 low of 16.62.
USD/MXN Price Action – Daily Chart
Mexican Peso FAQs
What key factors drive the Mexican Peso?
The Mexican Peso (MXN) is the most traded currency among its Latin American peers. Its value is broadly determined by the performance of the Mexican economy, the country’s central bank’s policy, the amount of foreign investment in the country and even the levels of remittances sent by Mexicans who live abroad, particularly in the United States. Geopolitical trends can also move MXN: for example, the process of nearshoring – or the decision by some firms to relocate manufacturing capacity and supply chains closer to their home countries – is also seen as a catalyst for the Mexican currency as the country is considered a key manufacturing hub in the American continent. Another catalyst for MXN is Oil prices as Mexico is a key exporter of the commodity.
How do decisions of the Banxico impact the Mexican Peso?
The main objective of Mexico’s central bank, also known as Banxico, is to maintain inflation at low and stable levels (at or close to its target of 3%, the midpoint in a tolerance band of between 2% and 4%). To this end, the bank sets an appropriate level of interest rates. When inflation is too high, Banxico will attempt to tame it by raising interest rates, making it more expensive for households and businesses to borrow money, thus cooling demand and the overall economy. Higher interest rates are generally positive for the Mexican Peso (MXN) as they lead to higher yields, making the country a more attractive place for investors. On the contrary, lower interest rates tend to weaken MXN.
How does economic data influence the value of the Mexican Peso?
Macroeconomic data releases are key to assess the state of the economy and can have an impact on the Mexican Peso (MXN) valuation. A strong Mexican economy, based on high economic growth, low unemployment and high confidence is good for MXN. Not only does it attract more foreign investment but it may encourage the Bank of Mexico (Banxico) to increase interest rates, particularly if this strength comes together with elevated inflation. However, if economic data is weak, MXN is likely to depreciate.
How does broader risk sentiment impact the Mexican Peso?
As an emerging-market currency, the Mexican Peso (MXN) tends to strive during risk-on periods, or when investors perceive that broader market risks are low and thus are eager to engage with investments that carry a higher risk. Conversely, MXN tends to weaken at times of market turbulence or economic uncertainty as investors tend to sell higher-risk assets and flee to the more-stable safe havens.
- The GBP/USD currently trades near the 1.2700 level, seeing losses hovering around 0.26%.
- The US dollar showed a recovery from its previous slump experienced on Monday.
- Markets recalibrated Fed expectations following mixed data last week, with heightened investor focus on the upcoming CPI report.
In Tuesday's trading, the GBP/USD pair suffered a setback, trading at 1.2705 amidst a stabilizing US Dollar and an increasingly risk-averse market mood. No relevant reports were released during the session, and markets eagerly await Consumer Price Index (CPI) data figures from the last month of 2023 from the US on Thursday.
In the last sessions, the pair edged upwards, mainly driven by monetary policy divergences. The Bank of England (BoE) has maintained its stance on further rate hikes, even as inflation and wage growth appear to be easing, while the US Federal Reserve (Fed) is expected to start its easing cycle as soon as March. In addition, markets are expecting five rate cuts this year but it will all come down to the incoming data, as economic figures will be the determinants of the easing calendar.
On Thursday, the US will reveal December's Consumer Price Index, projected to rise slightly to 3.2% YoY from November's 3.1%. However, the core yearly reading is predicted at 3.8%, showing a slight decline from the previous 4% in November, which may provide arguments to the Fed to start its easing cycle soon. If the CPI comes in lower than expected, the pair may resume its upward path.
GBP/USD levels to watch
The daily chart suggests that the pair has a distinctly bullish undertone. The Relative Strength Index (RSI) is currently established in positive territory but appears to be flat, suggesting a momentary equilibrium in buying and selling activity. This halt in the bullish momentum aligns with the Moving Average Convergence Divergence (MACD) currently printing flat red bars, implying that sellers are exerting influence, yet without a more decisive push.
However, despite short-term bearish indications, assessing the larger framework shows that the bulls maintain control. The pair is comfortably positioned above the 20, 100, and 200-day Simple Moving Averages (SMAs), a strong bullish hint at the larger time scale. Any pullbacks may be viewed as buying opportunities in this bullish backdrop until significant bearish changes occur in trend dynamics.
GBP/USD daily chart
-638404144023223967.png)
Australian inflation figures – but only for November – will be released on Wednesday, January 10 at 00:30 GMT. Economists at Commerzbank analyze Aussie’s outlook ahead of the Monthly Consumer Price Index report.
Any premature interpretation of the figures should be made with caution
If the economists surveyed by Bloomberg are correct, we should see another significant drop in the monthly indicator. It would increase the likelihood that the Q4 figures will finally fall below 5%. Such a decline would certainly be a good sign for the RBA. It would mean that the rate hikes are finally having an effect. It would also increase the likelihood that we have reached the peak of interest rates with the somewhat surprising hike in November.
If the labor market remains strong next week, as it has been recently, a soft landing for the Australian economy looks increasingly likely.
However, any premature interpretation of the figures should be made with caution. The monthly figures are generally difficult to forecast. As a result, we could very well be in for a surprise. The mere fact that another rate hike by the RBA cannot be completely ruled out, unlike by other G10 central banks, makes for exciting (and likely volatile) days ahead for the Aussie.
Loonie’s corrective pressures continue to simmer. Economists at Scotiabank analyze USD/CAD outlook.
Risks tilted towards a slightly softer CAD
USD/CAD still looks a bit undervalued, relative to our equilibrium estimate (1.3486) currently.
Somewhat narrower spreads are CAD-supportive and a rebound in crude today is a plus for the CAD. But generally, soft commodities and slack terms of trade are working against the CAD at the same time. These factors are tilting risk towards a slightly (at least) softer CAD.
Seasonality (January is the second-best month of the year for USDCAD in terms of average monthly returns since the 1990s) also leans towards the risk of some additional USD strength in the next few weeks.
The Australian Bureau of Statistics (ABS) will release the Monthly Consumer Price Index (CPI) Indicator for November on Wednesday, January 10 at 00:30 GMT and as we get closer to the release time, here are forecasts from economists and researchers of five major banks regarding the upcoming inflation data.
November CPI is expected at 4.4% YoY vs. the prior release of 4.9%. If so, it would be the lowest since December 2021 but still above the Reserve Bank of Australia's (RBA) 2-3% target range.
ANZ
We expect annual growth in the monthly CPI indicator to slow to 4.1% YoY in November from 4.9% YoY in October. This would be the weakest annual inflation on the monthly measure since January 2022. A result in line with our 4.1% YoY forecast would almost ensure quarterly CPI inflation will print below the RBA’s forecast of 1.0% QoQ in Q4, cementing our view that the cash rate has peaked at 4.35%. Our forecast implies a 0.2% MoM rise in prices. But seasonally adjusted price growth will be stronger and is likely to annualise well above the RBA’s 2-3% target band.
TDS
We are expecting an on-consensus Nov CPI print at 4.5% YoY though uncertainty over the monthly CPI indicator is typically wide at 0.9%-pt. Inflation should extend its downward trend, partly aided by the high base last year and a further retreat in fuel prices. Price pressures are broadly receding which likely pins an end to the hiking cycle and the Bank can afford to be patient. The RBA will have 1 more Dec CPI and Q4 CPI print to confirm the disinflation trend before the Feb RBA's meeting and our base case is that the Board is likely to keep a long restrictive monetary stance till August.
SocGen
Monthly headline CPI inflation for November is likely to show a further decline after dropping from 5.6% in September to 4.9% in October. Our forecast increases the chances that the RBA’s 4Q23 headline inflation forecast of 4.5% is likely to be met, which would support the policymakers’ recent cautious stance on further monetary tightening and our view that there will be no further policy rate hikes.
ING
Last year’s surge in energy and food prices on the back of unseasonal cold and wet weather is unlikely to be repeated, at least not to the same extent, though we note that recent flooding in Queensland could still push up the prices in some areas. Even so, the comparison with last year’s spikes should be benign enough to see the inflation rate decline – perhaps substantially.
Westpac
Our November Monthly CPI Indicator estimate, which includes many of the quarterly services prices, is 0.5% MoM / 4.5% YoY.
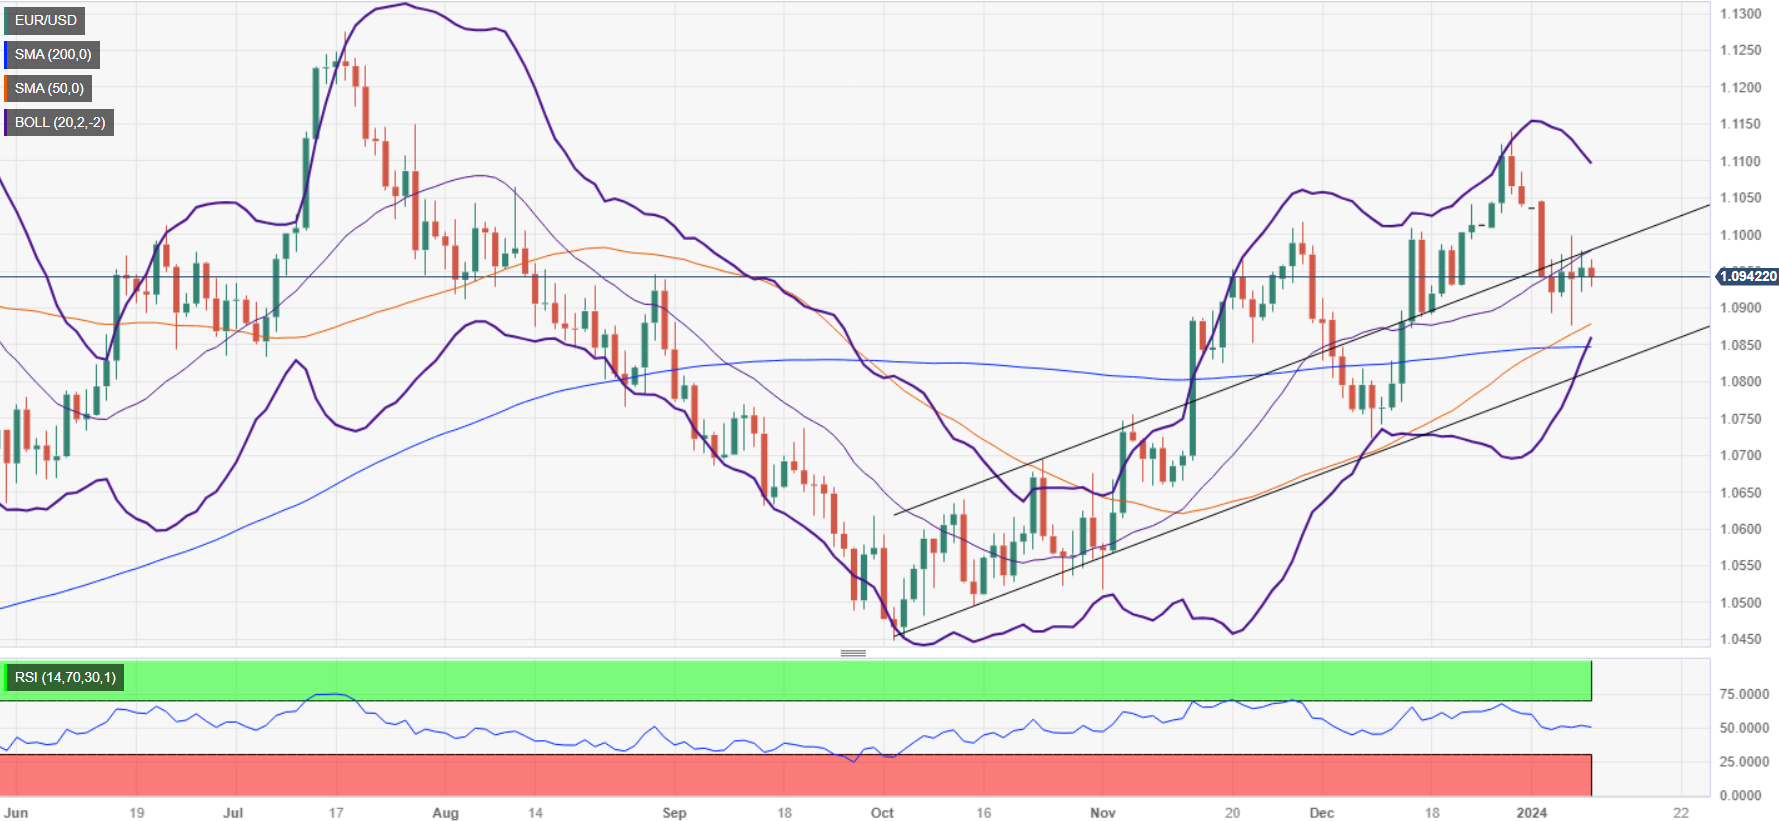
- EUR/USD sees minimal change, impacted by unexpected fall in German industrial production and declining retail sales.
- Improvement in US trade deficit and small business sentiment offers mixed cues to traders ahead of Thursday's US inflation data.
- Market attention on Fed speakers' comments regarding interest rates, and upcoming speeches by ECB and Fed officials.
The EUR/USD is almost flat in early trading in the North American session on Tuesday as economic data in Europe was mixed while traders prepared for Thursday’s inflation report in the United States (US). At the time of writing, the major trades at around 1.0941, losing 0.09%, after hitting a daily high of 1.0966.
Germany’s data continued to weigh on the Euro
In the European session, Industrial Production dropped unexpectedly in November, which printed a -0.7% plunge, below forecasts of a 0.3% rise. Annually-based figures slipped by -4.87%, below forecasts of -4%. Analysts at Commerzbank said, “The unexpected fall in German industrial production in November shows that companies are increasingly reacting to falling order books.”
Given the backdrop, along with German Retail Sales falling more than expected in November, had increased the odds of Europe’s largest economy hitting a recession, following Q3 GDP fall by -0.1%.
That weighed in the Euro (EUR), which also felt the pain of European Central Bank (ECB) officials I the likes of Centeno, who said the ECB wouldn’t have to wait until May to make policy decisions.
Across the pond, the US Economic docket revealed that US small business sentiment rose for the first time in five months in December, though it remained below its 50-year average of 98 for 24 straight months, via Reuters.
Lately, the US Department of Commerce revealed the US Trade Balance deficit narrowed in November, with numbers improving from $-64.6 billion to $-63.2 billion, less than $-65 billion foreseen by street’s analysts.
Aside from this, Federal Reserve (Fed) speakers crossing the newswires stressed that interest rates are sufficiently restrictive at the 5.25%-5.50% range. Even though most had expressed there’s a chance of easing policy, their main focus remain curbing high inflation.
Ahead of the week, the US economic docket will feature Fed’s Michael Barr. On the Eurozone front, the calendar will feature a speech of ECB’s Francois Villeroy.
EUR/USD Price Analysis: Technical outlook
The major is trading sideways; even though a ‘golden cross’ in the daily chart would support a bullish scenario, buyers had remained unable to crack toward the 1.1000 figure. If bulls move in, they must reclaim Tuesday’s high of 1.0966 to test 1.1000. Further upside lies above a two-and-a-half-year resistance trendline at around 1.1030/50, followed by the 1.1100 figure. Conversely, if sellers step in around 1.0950 and drag prices towards the 1.0900 figure, that could pave the way to test the 50-day moving average (DMA) at 1.0877, followed by the 200-DMA at 1.0846.
Gold price went on a rollercoaster ride on Friday following the release of the US employment report. Strategists at Commerzbank analyze the yellow metal’s outlook.
Gold price weaker for now
More jobs were created in December than expected. However, the previous months' data was revised downwards. Nevertheless, there is no evidence of pronounced weakness in the US labor market. Rather, the data may have encouraged those who continue to expect a soft landing for the US economy and as a result, rather late interest rate cuts by the Fed, which explains why Gold is now trading lower.
Although we are far less optimistic – our economists continue to believe that the US will still slip into recession – the robust labor market supports our view that the first interest rate cut by the Federal Reserve will probably not take place until May, rather than earlier as many market participants expect. In this context, we believe that a slightly weaker Gold price is justified in the short term.
USD gains broadly in quiet trade. Economists at Scotiabank analyze Dollar’s outlook.
More range trading in the majors in the short run
Trading impulses look relatively limited, suggesting more range trading for the majors as markets continue to focus on Thursday’s US CPI release as the next major catalyst.
Look for more range trading in the majors in the short run but the window for a USD rebound remains open over the next few weeks as markets reprice March Fed easing bets (15 bps priced in now versus 24 bps at the start of the month).
GBP/USD holds range amid still bullish trend momentum but downside risks linger, economists at Scotiabank report.
The pattern of trade on the intraday chart continues to shape up bearishly
The GBP charts show the Pound retains a lot of bullish momentum across the short, medium and long-term DMI oscillators which does suggest limited downside pressure on this market for now.
But the pattern of trade on the intraday chart continues to shape up bearishly and leans towards a push lower to test – at least – key support at 1.2610. Weakness through here will imply scope for more GBP losses over the next few weeks.
USD/CAD has nudged a bit higher on the session. Economists at Scotiabank analyze the pair’s outlook.
Support is 1.3340
USD/CAD perks up a bit reflecting the upward trend in funds that has developed since the turn of the year.
Trend momentum is weak and the USD/CAD pair has struggled to better resistance around 1.3390/1.3400 over the past few sessions. Still, broader technical trends suggest developing pressure for a correction in the late 2023 USD decline and a retracement towards the 1.35 area.
Gains through 1.3390/1.3400 will bolster near-term upside momentum.
Support is 1.3340.
EUR/USD drifts back to low 1.09s. Economists at Scotiabank analyze the pair’s outlook.
The short-term trend remains lower
The EUR is carving out a broad consolidation range on the chart following the late December/early January slide against the USD.
Friday’s volatility clouds the short-run outlook to some extent but, outside of a move back above 1.10, the short-term trend in spot remains lower – albeit amid slack trend momentum.
Minor support at 1.0930 is under pressure. Weakness through here should see spot retest the upper 1.08s.
- The US Dollar trades in the green while equities retreat.
- Traders will look at US Trade Balance numbers.
- The US Dollar Index remains above 102.00, though downside pressure remains present.
The US Dollar (USD) trades broadly steady on Tuesday’s European morning, posting gains against most G20 currencies. Still, measured by the DXY US Dollar Index, the Greenback is easing a touch as a firm risk-on tone returned on Monday in US equity markets. Asian stocks took over the mood on Tuesday, with the Japanese Nikkei Index posting a fresh 34-year high at the closing bell.
On the economic front, another light agenda is due on Tuesday, with only second-tier data releases. Traders will be on the lookout to hear Federal Reserve’s Vice Chairman Michael Barr speak later this Tuesday. There are no big catalysts on the docket in the runup to the US Consumer Price Index (CPI) report on Thursday.
Daily digest market movers: Hold your horses
- The National Federation of Independent Business (NFIB) has released its Business Optimism Index for December at 11:00 GMT. The November figure was 90.6, with December coming in at 91.9.
- European Central Bank (ECB) member Mário Centeno said that the ECB does not need to wait until May to make a rate decision, with December inflation being considered as very good news in the fight against inflation. The Euro takes a step back against the US Dollar (EUR/USD) on the back of these dovish comments.
- At 13:30 GMT, the US Trade Balance numbers for November will be released:
- The US Goods Trade Balance posted a $90.3 billion deficit in October, and there is no forecast pencilled in for November.
- The US Goods and Services Trade Deficit for November is expected to widen slightly to $65 billion from a $64.3 billion deficit in October.
- The US Redbook for the first week of January will be released at 13:55 GMT. Previous was at 5.6%, with no forecast pencilled in.
- Fed’s Vice Chairman Michael Barr is due to speak around 17:00 GMT.
- The US Treasury will be heading to markets to allocate a 3-year note around 18:00 GMT.
- Equity markets are mixed on Tuesday. Asian markets are in the green after the Nikkei reached a 34-year high at its close for Tuesday. European equities are looking for direction halfway through their session, while US equity futures are down by a quarter of a percent.
- The CME Group’s FedWatch Tool shows that markets are pricing in a 95.3% chance that the Federal Reserve will keep interest rates unchanged at its January 31 meeting. Around 4.7% expect the first cut already to take place.
- The benchmark 10-year US Treasury Note holds near 4%, though calls are being issued by investors and banks that the 4% needs to be revised down.
US Dollar Index Technical Analysis: Risk tone undermines Greenback
The US Dollar is in the green this Tuesday, though be it marginally against most major peers. This makes the US Dollar Index (DXY) look like a standstill, as safe-haven inflows on the back of geopolitical tensions are being matched by the risk-on tone that triggered US Dollar selling. Ahead of the key inflation data on Thursday, the US Dollar isn’t likely to move much unless an unexpected big catalyst or a major breaking news headline moves the needle.
In the DXY US Dollar Index, the first level on the upside is 103.00, which falls nearly in line with the descending trend line from the top of October 3 and December 8. Once broken and closed above there, the 200-day Simple Moving Average (SMA) at 103.43 comes into play. The 104.00 level might be too far off, with 103.93 (55-day SMA) coming in as the next resistance.
To the downside, the rejection on the descending trendline is giving fuel to the Greenback bears for further downturn. The line in the sand here is 101.74, the floor which held halfway through December before breaking down in the last two weeks. In case the DXY snaps this level, expect to see a test at the low near 100.80.
US Dollar FAQs
What is the US Dollar?
The US Dollar (USD) is the official currency of the United States of America, and the ‘de facto’ currency of a significant number of other countries where it is found in circulation alongside local notes. It is the most heavily traded currency in the world, accounting for over 88% of all global foreign exchange turnover, or an average of $6.6 trillion in transactions per day, according to data from 2022.
Following the second world war, the USD took over from the British Pound as the world’s reserve currency. For most of its history, the US Dollar was backed by Gold, until the Bretton Woods Agreement in 1971 when the Gold Standard went away.
How do the decisions of the Federal Reserve impact the US Dollar?
The most important single factor impacting on the value of the US Dollar is monetary policy, which is shaped by the Federal Reserve (Fed). The Fed has two mandates: to achieve price stability (control inflation) and foster full employment. Its primary tool to achieve these two goals is by adjusting interest rates.
When prices are rising too quickly and inflation is above the Fed’s 2% target, the Fed will raise rates, which helps the USD value. When inflation falls below 2% or the Unemployment Rate is too high, the Fed may lower interest rates, which weighs on the Greenback.
What is Quantitative Easing and how does it influence the US Dollar?
In extreme situations, the Federal Reserve can also print more Dollars and enact quantitative easing (QE). QE is the process by which the Fed substantially increases the flow of credit in a stuck financial system.
It is a non-standard policy measure used when credit has dried up because banks will not lend to each other (out of the fear of counterparty default). It is a last resort when simply lowering interest rates is unlikely to achieve the necessary result. It was the Fed’s weapon of choice to combat the credit crunch that occurred during the Great Financial Crisis in 2008. It involves the Fed printing more Dollars and using them to buy US government bonds predominantly from financial institutions. QE usually leads to a weaker US Dollar.
What is Quantitative Tightening and how does it influence the US Dollar?
Quantitative tightening (QT) is the reverse process whereby the Federal Reserve stops buying bonds from financial institutions and does not reinvest the principal from the bonds it holds maturing in new purchases. It is usually positive for the US Dollar.
Atlanta Fed President Raphael Bostic remained optimistic that inflation will continue to cool this year and signaled the possibility of two rate cuts in the second half of 2024. However, economists at Commerzbank do not expect the US Dollar to strengthen.
Little speaks in favor of rising inflation in the US
Atlanta Fed President Raphael Bostic said that ‘inflation has come down more than he expected’ and is on track to reach the 2% target. At the same time, he cautioned that it is too early to give the all-clear. Nevertheless, there is little to suggest that there will be any further upside surprises for the time being, at least as far as US inflation is concerned.
Despite the progress on inflation, he was still cautious and talked about the possibility of two rate cuts in the second half of the year. Fed Governor Michelle Bowman went a step further, saying that ‘it will eventually become appropriate to begin the process of lowering our policy rate’ if inflation continues to fall. And with all signs currently pointing to easing inflationary pressures, the market is already anticipating this.
There is little to suggest that a significant correction in rate expectations is imminent and that the USD will strengthen significantly as a result.
Mexican Peso (MXN) bucked weaker LatAm trend in the first week of 2024. Economists at Société Générale analyze USD/MXN technical outlook.
Next potential supports are at last year's low of 16.60 and 16.40
USD/MXN has resumed its decline after testing the trend line drawn since 2021. Recent attempt of rebound has faltered near 200- DMA (17.42/17.55). Daily MACD is at a higher level as compared to November however signals of bounce are not yet visible in price action; the Moving Average near 17.42/17.55 must be overcome to denote a meaningful up move.
Holding below recent pivot high of 17.10, the pair could head lower towards last year's low of 16.60 and projections of 16.40/16.10.
- WTI Oil steadies near $71.50, finding a floor after Monday’s decline.
- US Secretary of State Anthony Blinken landed in Israel to outline measures to secure safe passage in the Red Sea.
- The DXY US Dollar Index holds above 102.00, with traders split between Goldilocks or geopolitical safe-haven scenarios.
Oil trades near $71.50 on Tuesday, bouncing off Monday’s low near $70, after Saudi Arabia lowered prices of its Oil exports into Asia. Meanwhile, analysts and fund managers are welcoming the current decline in Oil prices, which will bring inflation further down. On the other hand, with lower prices at hand, several large projects which were put on hold due to high energy prices could come online again and create a resurgence in demand soon..
Meanwhile, the DXY US Dollar Index is holding ground at 102.00 despite some selling pressure overnight. US and Japanese equities jumped substantially in a risk-on mood. The Nikkei even printed a new 34-year high. Traders are ignoring the escalation in geopolitical tensions, with elections in Taiwan over the weekend and Middle East tensions alive after Israel claimed it found Chinese weaponry in the hands of Hezbollah.
Crude Oil (WTI) trades at $71.61 per barrel, and Brent Oil trades at $76.81 per barrel at the time of writing.
Oil News and Market Movers: A lot of talks
- Adding to the news of Saudi Arabia offering substantial discounts, Oil prices also reacted to rumours that shipping freight companies paid fees to Houthi rebels in order to get safe passage in the Red Sea region. These rumors were quickly dismissed by several shipping companies.
- US Secretary of State Anthony Blinken landed on Monday in Tel Aviv to further discuss the current situation with Israel’s Prime Minister Benjamin Netanyahu and to further outline an international task force that will monitor the Red Sea passage.
- With the decline in Oil prices, the US Consumer Price Index (CPI) on Thursday is expected to further come down. Lower prices could trigger a pickup in demand, with several oil-dependent projects coming back online.
- The American Petroleum Institute will release on Tuesday its weekly stockpile change numbers. There was a huge drawdown of $7.418 million barrels in the previous week, and there is no forecast for this week’s numbers.
Oil Technical Analysis: Demand comes back
Oil prices are finding a floor as markets have priced in Aramco’s discounts for its sales. With this additional correction, several buyers could come back into the market at these substantially lower prices. Meanwhile, a goldilocks tone in global markets could spark up demand again, while frost temperatures have arrived in Europe and will trigger demand for energy commodities.
On the upside, $74 is still holding importance, although the level has become very chopped up. Once back above this, $80 comes into the picture. Still far off, $84 is next on the topside once Oil sees a few daily closes above the $80 level.
Below $74, the $67 level could still come into play as the next support to trade at as it aligns with a triple bottom from June. Should that triple bottom break, a new low for 2023 could be close at $64.35 – the low of May and March – as the last line of defence. Although still quite far off, $57.45 is worth mentioning as the next level to keep an eye on if prices fall sharply.
-638403895141305094.png)
US WTI Crude Oil: Daily Chart
WTI Oil FAQs
What is WTI Oil?
WTI Oil is a type of Crude Oil sold on international markets. The WTI stands for West Texas Intermediate, one of three major types including Brent and Dubai Crude. WTI is also referred to as “light” and “sweet” because of its relatively low gravity and sulfur content respectively. It is considered a high quality Oil that is easily refined. It is sourced in the United States and distributed via the Cushing hub, which is considered “The Pipeline Crossroads of the World”. It is a benchmark for the Oil market and WTI price is frequently quoted in the media.
What factors drive the price of WTI Oil?
Like all assets, supply and demand are the key drivers of WTI Oil price. As such, global growth can be a driver of increased demand and vice versa for weak global growth. Political instability, wars, and sanctions can disrupt supply and impact prices. The decisions of OPEC, a group of major Oil-producing countries, is another key driver of price. The value of the US Dollar influences the price of WTI Crude Oil, since Oil is predominantly traded in US Dollars, thus a weaker US Dollar can make Oil more affordable and vice versa.
How does inventory data impact the price of WTI Oil
The weekly Oil inventory reports published by the American Petroleum Institute (API) and the Energy Information Agency (EIA) impact the price of WTI Oil. Changes in inventories reflect fluctuating supply and demand. If the data shows a drop in inventories it can indicate increased demand, pushing up Oil price. Higher inventories can reflect increased supply, pushing down prices. API’s report is published every Tuesday and EIA’s the day after. Their results are usually similar, falling within 1% of each other 75% of the time. The EIA data is considered more reliable, since it is a government agency.
How does OPEC influence the price of WTI Oil?
OPEC (Organization of the Petroleum Exporting Countries) is a group of 13 Oil-producing nations who collectively decide production quotas for member countries at twice-yearly meetings. Their decisions often impact WTI Oil prices. When OPEC decides to lower quotas, it can tighten supply, pushing up Oil prices. When OPEC increases production, it has the opposite effect. OPEC+ refers to an expanded group that includes ten extra non-OPEC members, the most notable of which is Russia.
EUR/GBP has edged just below the 0.86 level. Kit Juckes, Chief Global FX Strategist at Société Générale, analyzes Sterling’s outlook.
GBP/USD does not look stretched
One side-effect of the soft German data has been a slide in EUR/GBP since the end of December, to the lowest level since mid-December.
There’s been nothing to shout about from UK data recently, but GBP/USD doesn’t look stretched and if EUR/USD holds here, Sterling may make an early push for USD 1.30.
See: EUR/USD has a chance to push back above 1.10 this week if holds above 1.09 today – SocGen
The Euro is stuck in a range unless we see a turn for the better in German data, according to Kit Juckes, Chief Global FX Strategist at Société Générale, reports.
Soft German data weighs on the Euro
It does feel as though every time the Euro gets a bid, it’s knocked back by another soft German data point.
Maybe the fact there are no further major German data releases this week means the damage has been done for now and if EUR/USD holds above 1.09 today, it has a chance to push back above 1.10 this week, but the more obvious conclusion is that we won’t get back to December’s 1.1140 peak without better German news or a significant deterioration in US data.
Mexico’s inflation figures are on the agenda today. Economists at Commerzbank analyze how the December CPI report could impact the Mexican Peso (MXN).
Mexican inflation figures a non-event?
While today's inflation figures are likely to show an increase, they are unlikely to be a major change in trend. Nevertheless, this should still be relevant for the Peso.
Even if the seasonally adjusted inflation trend is not likely to worsen as much as the figures at first glance suggest, they also make it clear that the decline in inflation is extremely slow. Conversely, this means that Banxico is likely to take a more moderate approach to easing monetary policy in the near future. This should support the Peso for the foreseeable future.
Major FX pairs look to have settled into early-year ranges. Economists at ING analyze FX markets.
If in doubt, seek carry
January and February are typically good months for the Dollar, and our call is for patience rather than jumping on the next leg of the Dollar bar trend just yet. But the overall environment tends to support more range-bound Dollar trading than any aggressive reversal higher in the Dollar just yet.
We doubt US data will move markets today, but as usual, we will be interested in what the NFIB small business survey has to say about activity, employment, and pricing intentions. It is hard to see DXY trading outside of Friday's 101.90 to 103.10 range today – a range that could well define the entire week.
The outperformers this year are the Hungarian Forint, the Mexican Peso, and the Indian Rupee. What do they have in common? They are the highest-yielding currencies in their respective trading blocs. With cross-market volatility remaining fairly subdued it is clear that carry trade strategies will have some enduring appeal. The bigger question may be in which currency to fund them.
2024 is shaping up to be a battleground for the direction of energy markets. In the view of strategists at Rabobank, 2024 will be a muddled year, but the long-term price ranges are upward.
The trends are bearish for Q1 and Q2
We find most energy markets to be balanced to slightly oversupplied, but asymmetric risks stem from the fundamentals and geopolitical issues that create many upside possibilities.
Overall, the trends are bearish for Q1 and Q2, with more positive price outlooks for Q3 and Q4 of 2024.
Brent will range between $71 and $93 in 2024, most likely averaging around $79 compared to $82 in 2023.
The latest study conducted by the European Central Bank (ECB) assessed the impact of the rising interest rates on the Eurozone’s services and manufacturing sectors’ activity, according to the central’s Economic Bulletin published on Tuesday.
Key takeaways
"The dynamics in manufacturing contain information relevant to the near-term dynamics in services, and thus for the rest of the economy,"
"Manufacturing appears to lead services... whereas no clear leading relation can be established in the other direction."
“The overall impact of the downturn on services is likely to be smaller.”
"Monetary policy shocks have an impact on manufacturing that is almost twice as strong and around two quarters faster than their impact on services.”
Market reaction
The Euro seems to have come under fresh selling pressure on the above headlines, driving EUR/USD lower to near 1.0935, down 0.10% so far.
Gold prices rose in India on Tuesday, according to data from India's Multi Commodity Exchange (MCX).
Gold price stood at 62,125 Indian Rupees (INR) per 10 grams, up INR 25 compared with the INR 62,100 it cost on Monday.
As for futures contracts, Gold prices increased to INR 62,323 per 10 gms from INR 62,095 per 10 gms.
Prices for Silver futures contracts decreased to INR 72,568 per kg from INR 72,427 per kg.
| Major Indian city | Gold Price |
|---|---|
| Ahmedabad | 64,210 |
| Mumbai | 64,075 |
| New Delhi | 64,185 |
| Chennai | 64,220 |
| Kolkata | 64,235 |
Global Market Movers: Comex Gold price sticks to modest gains despite bearish fundamental backdrop
- The New York Federal Reserve said in a report on Monday that US consumers' projection of inflation over the short run fell to the lowest level in nearly three years in December, which undermines the US Dollar and benefits the Comex Gold price.
- Inflation one year from now is expected to be at 3%, marking the lowest reading since January 2021, while inflation three years from now is seen at 2.6% and price pressures five years ahead were at 2.5% versus 2.7% in November.
- The data reaffirms expectations for an imminent shift in the Federal Reserve's policy stance, though investors continue scaling back their expectations for more aggressive policy easing in the wake of a still-resilient US economy.
- Atlanta Fed President Raphael Bostic noted that inflation has declined more than expected and that the US central bank still needs to give tight policy time to work on cooling off inflation. Bostic sees two 25 bps cuts by year-end 2024.
- Fed Governor Michelle Bowman said that the current policy stance appears sufficiently restrictive and that inflation could fall further with the policy rate held steady for some time, though the upside inflation risks remain.
- This raises uncertainty over the possibility of early interest rate cuts by the Fed, which assist the yield on the benchmark 10-year US government bond to hold steady above the 4.0% threshold and might cap the non-yielding yellow metal.
- The market focus, meanwhile, remains glued to the US consumer inflation figures on Thursday, which should help determine the next leg of a directional move for the Comex Gold price.
(An automation tool was used in creating this post.)
Gold FAQs
Why do people invest in Gold?
Gold has played a key role in human’s history as it has been widely used as a store of value and medium of exchange. Currently, apart from its shine and usage for jewelry, the precious metal is widely seen as a safe-haven asset, meaning that it is considered a good investment during turbulent times. Gold is also widely seen as a hedge against inflation and against depreciating currencies as it doesn’t rely on any specific issuer or government.
Who buys the most Gold?
Central banks are the biggest Gold holders. In their aim to support their currencies in turbulent times, central banks tend to diversify their reserves and buy Gold to improve the perceived strength of the economy and the currency. High Gold reserves can be a source of trust for a country’s solvency. Central banks added 1,136 tonnes of Gold worth around $70 billion to their reserves in 2022, according to data from the World Gold Council. This is the highest yearly purchase since records began. Central banks from emerging economies such as China, India and Turkey are quickly increasing their Gold reserves.
How is Gold correlated with other assets?
Gold has an inverse correlation with the US Dollar and US Treasuries, which are both major reserve and safe-haven assets. When the Dollar depreciates, Gold tends to rise, enabling investors and central banks to diversify their assets in turbulent times. Gold is also inversely correlated with risk assets. A rally in the stock market tends to weaken Gold price, while sell-offs in riskier markets tend to favor the precious metal.
What does the price of Gold depend on?
The price can move due to a wide range of factors. Geopolitical instability or fears of a deep recession can quickly make Gold price escalate due to its safe-haven status. As a yield-less asset, Gold tends to rise with lower interest rates, while higher cost of money usually weighs down on the yellow metal. Still, most moves depend on how the US Dollar (USD) behaves as the asset is priced in dollars (XAU/USD). A strong Dollar tends to keep the price of Gold controlled, whereas a weaker Dollar is likely to push Gold prices up.
The Mexican Peso (MXN) has started the year strongly. Today sees the release of December CPI data for Mexico. Economists at ING analyze Peso’s outlook ahead of Mexican inflation data.
December CPI should shed light on Banxico easing cycle
Any soft figure could shift expectations toward a Banxico first cut in February. Given implied MXN yields through the forwards in excess of 11%, we doubt an earlier easing cycle from Banxico has to hit the Peso.
However, we do feel it supports non-FX hedged positions in the short-end of the government bond market (MBONOs) and can probably see USD/MXN hanging around the 17.00 area rather than dropping down to last year's low near 16.60.
- USD/MXN attempts to hold a four-day losing streak on the improved US Dollar.
- The Dovish remarks from the Fed’s Bostic contributed to downward pressure on the US Dollar.
- Mexico’s Consumer Confidence improves to 47.2 from the previous reading of 46.9.
USD/MXN grapples to snap its losing streak that began on January 3, hovering near 16.84 during the European trading hours on Tuesday. The USD/MXN pair faced downward pressure following remarks from Atlanta Fed President Raphael W. Bostic.
President Bostic's commentary on the decline in inflation, coupled with his expectation of two quarter-point cuts by the end of 2024, contributed to a negative sentiment surrounding the US Dollar (USD) against the Mexican Peso (MXN). Additionally, his mention of the US being on the path to achieving 2% inflation and the goal to remain on that path suggests a cautious approach to monetary policy.
Moreover, US Fed Governor Michelle W. Bowman mentioned the possibility that inflation could fall further with the policy rate held steady indicating a watchful stance. Bowman's observation that the current policy stance appears sufficiently restrictive aligns with a sentiment that central banks are carefully evaluating the appropriate balance between supporting economic growth and managing inflationary pressures.
Governor Bowman’s view emphasizes the need for patience and a data-dependent approach. The acknowledgment that it might eventually become appropriate to lower the Fed's policy rate if inflation falls closer to the 2% target suggests a potential willingness to adjust policy settings in response to changing economic conditions.
The US Dollar Index (DXY) retraces its recent losses registered on Monday, trading near 102.40. The improved US Treasury yields provide support to underpinning the US Dollar with the 2-year and 10-year yields on US Treasury bonds standing at 4.38% and 4.04%, respectively, by the press time.
The latest data from the National Institute of Statistics and Geography of Mexico (INEGI) provides insights into consumer sentiment in the country. The improvement in Consumer Confidence for December, improving to 47.2 from the previous reading of 46.9, suggests a positive shift in the perception of economic conditions among Mexican consumers.
However, the seasonally adjusted Consumer Confidence slightly reduced to 46.8 from the previous reading of 47.3. This adjustment considers seasonal variations that could impact consumer sentiment. Tuesday's release of Headline Inflation data will be closely watched by traders as it can offer additional impetus for price movements in Mexico.
Inflation figures from Tokyo continue to indicate easing inflationary pressure. Michael Pfister, FX Analyst at Commerzbank, analyzes Yen’s outlook.
Yen exchange rates likely to remain largely dependent on global monetary policy developments
Inflation figures from the Tokyo area for December were broadly in line with expectations. The figures provide little hope that the Bank of Japan will soon implement a turnaround on interest rates.
In the medium term, further disinflation in Japan is not exactly positive for the Yen. Even the strong global inflation shock, coupled with a significant depreciation of the JPY, has not led to a sustainable re-inflation. I, at least, find it hard to imagine what else needs to happen to achieve that goal.
Of course, it is still possible that the BoJ will make a symbolic exit from its negative interest rate policy in the coming months. But in my opinion, given the inflation trend, not much more is to be expected. Yen exchange rates are therefore likely to remain largely dependent on global monetary policy developments.
EUR/USD remains unchanged around 1.0950. Economists at ING analyze the pair’s outlook.
Seasonal factors may keep EUR/USD in check
Over the next month or so seasonal factors may keep the EUR/USD pair in check.
We retain a forecast of 1.08 for the first quarter of 2024, and EUR/USD has recently been more led by equities than by rate differentials.
We expect EUR/USD to consolidate in a 1.08880 to 1.1020 range near term and await Thursday's CPI data for the next big input to the story.
- GBP/USD hovers around a major level at 1.2750.
- 21-day EMA at 1.2684 appears as an immediate support followed by the major level at 1.2650.
- The lagging indicator MACD suggests a degree of caution among investors.
GBP/USD halts a four-day winning streak, trading lower near 1.2750 during the early European session on Tuesday. The GBP/USD pair is at a critical juncture, and the possibility of a break below the major level raises the potential for further downward pressure. The 21-day Exponential Moving Average (EMA) at 1.2684 serves as an immediate support level to monitor.
A breach below the 21-day EMA could signal increased selling pressure, and the pair might then approach the major support at 1.2650. This level, aligned with the 23.6% Fibonacci retracement at 1.2643, adds technical significance to the support zone.
The 14-day Relative Strength Index (RSI) being positioned above the 50 level is a positive sign, indicating bullish momentum for the GBP/USD pair. An RSI above 50 generally suggests that buying pressure is prevailing, and it aligns with the notion of an upward outlook for the pair.
In addition, the Moving Average Convergence Divergence (MACD) indicator also provides interesting insights. The fact that the MACD line is above the centerline is a bullish signal, suggesting potential upward momentum. However, the convergence below the signal line may indicate a degree of caution among investors.
On the upside, the GBP/USD pair could reach the previous week’s high at 1.2771. A breach above the latter could support the GBP/USD pair to explore the region around the psychological level at 1.2800 followed by December’s high at 1.2827.
GBP/USD: Daily Chart
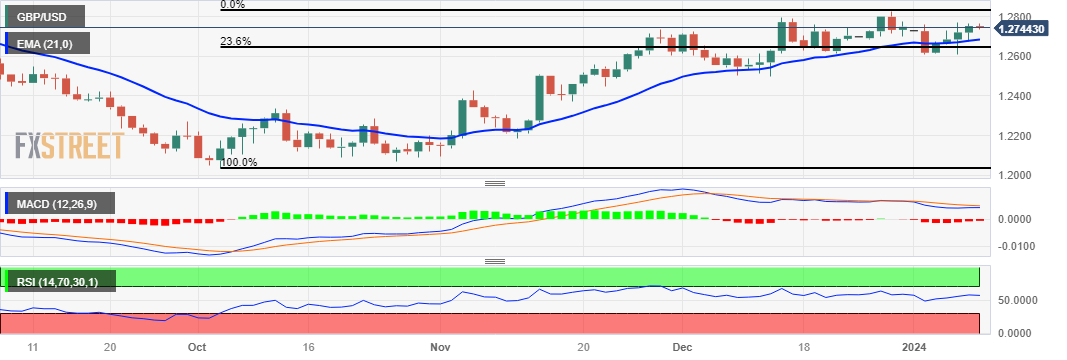
Towards the very end of last year, the Swiss Franc (CHF) hit new recent highs against both the US Dollar (USD) and the Euro (EUR). Economists at Rabobank analyze Franc’s outlook.
CHF could be attractive as a diversification trade
The CHF tends to perform well when the Eurozone is under pressure. Given the stagnating German economy, the CHF could be attractive as a diversification trade.
Our central view is that EUR/CHF will stick close to 0.93 on a 1-to-3-month view. This was recently revised down from 0.94.
Here is what you need to know on Tuesday, January 9:
After struggling to find demand during the American trading hours on Monday, the US Dollar seems to have stabilized early Tuesday, with the USD Index fluctuating above 102.00. Eurostat will release the Unemployment Rate data for November. Later in the day, November Goods Trade Balance, NFIB Business Optimism Index for December and RealClearMarkets/TIPP Economic Optimism Index for January will be featured in the US economic docket.
US Dollar price today
The table below shows the percentage change of US Dollar (USD) against listed major currencies today. US Dollar was the strongest against the New Zealand Dollar.
| USD | EUR | GBP | CAD | AUD | JPY | NZD | CHF | |
| USD | -0.02% | 0.04% | 0.07% | 0.21% | -0.17% | 0.22% | -0.01% | |
| EUR | 0.02% | 0.03% | 0.09% | 0.24% | -0.11% | 0.17% | -0.01% | |
| GBP | -0.02% | -0.03% | 0.05% | 0.17% | -0.19% | 0.13% | -0.02% | |
| CAD | -0.08% | -0.10% | -0.07% | 0.11% | -0.24% | 0.08% | -0.08% | |
| AUD | -0.21% | -0.20% | -0.17% | -0.11% | -0.35% | -0.02% | -0.21% | |
| JPY | 0.13% | 0.12% | 0.15% | 0.26% | 0.33% | 0.28% | 0.16% | |
| NZD | -0.15% | -0.17% | -0.13% | -0.08% | 0.04% | -0.33% | -0.16% | |
| CHF | 0.02% | 0.02% | 0.06% | 0.10% | 0.21% | -0.20% | 0.16% |
The heat map shows percentage changes of major currencies against each other. The base currency is picked from the left column, while the quote currency is picked from the top row. For example, if you pick the Euro from the left column and move along the horizontal line to the Japanese Yen, the percentage change displayed in the box will represent EUR (base)/JPY (quote).
The positive shift seen in risk mood in the second half of the day on Monday caused the USD to lose interest following a bullish start to the week. Growing optimism about the US government avoiding a shutdown after leaders of the House and Senate announced a broad agreement on a $1.59 trillion spending deal allowed risk flows to return to markets. Additionally, the Federal Reserve Bank of New York's monthly survey showed that consumers' year-ahead inflation expectation dropped to its lowest level since January 2021 at 3%, putting additional weight on the USD.
During the Asian trading hours, the data from Japan showed that the annual Tokyo Consumer Price Index rose 2.4% in December, down from 2.6% increase recorded in November. After closing the first day of the week modestly lower, USD/JPY continued to edge lower early Tuesday and was last seen trading at around 144.00.
Retail Sales in Australia increased by 2% on a monthly basis in November, the Australian Bureau of Statistics reported on Tuesday. This reading followed the 0.2% contraction registered in October and came in better than the market expectation for a 1.2% growth. AUD/USD showed no immediate reaction to these figures and retreated to the 0.6700 area.
EUR/USD failed to make a decisive move in either direction on Monday and closed the day virtually unchanged. The pair continues to move up and down in a narrow band at around 1.0950 early Tuesday.
GBP/USD registered small gains on Monday after managing to stabilize above 1.2700. The pair holds steady near 1.2750 in the European morning.
Gold dropped to a multi-week low below $2,020 on Monday but erased a portion of its daily losses to end the day near $2,030. XAU/USD trades marginally higher early Tuesday as the benchmark 10-year US Treasury bond yield holds slightly above 4%.
FX option expiries for Jan 9 NY cut at 10:00 Eastern Time, via DTCC, can be found below.
- EUR/USD: EUR amounts
- 1.0875 949m
- 1.0900 1b
- 1.0975 904m
- 1.0990 449m
- 1.1000 531m
- USD/JPY: USD amounts
- 143.00 527m
- 143.60 1.6b
- AUD/USD: AUD amounts
- 0.6600 2.2b
Germany’s industrial activity extended its south run in November, according to the official data published by Destatis on Tuesday.
Industrial output in the Eurozone’s economic powerhouse fell 0.7% MoM, the federal statistics authority Destatis said in figures adjusted for seasonal and calendar effects, compared with the 0.2% expected and a 0.3% decline seen in October.
On an annual basis, German Industrial Production tumbled 4.8% in November, as against October’s 3.4% drop.
EUR/USD reaction to the German Industrial Production data
The shared currency shrugs off the downbeat German industrial figures. The pair is trading modestly flat on the day at 1.0948, as of writing.
Euro price today
The table below shows the percentage change of Euro (EUR) against listed major currencies today. Euro was the weakest against the Japanese Yen.
| USD | EUR | GBP | CAD | AUD | JPY | NZD | CHF | |
| USD | 0.01% | 0.06% | 0.10% | 0.26% | -0.11% | 0.27% | 0.04% | |
| EUR | -0.02% | 0.03% | 0.08% | 0.21% | -0.13% | 0.24% | -0.01% | |
| GBP | -0.07% | -0.03% | 0.03% | 0.18% | -0.18% | 0.20% | -0.01% | |
| CAD | -0.10% | -0.07% | -0.04% | 0.15% | -0.22% | 0.17% | -0.05% | |
| AUD | -0.25% | -0.22% | -0.18% | -0.14% | -0.36% | 0.03% | -0.22% | |
| JPY | 0.10% | 0.12% | 0.17% | 0.24% | 0.35% | 0.37% | 0.17% | |
| NZD | -0.27% | -0.25% | -0.20% | -0.16% | -0.05% | -0.36% | -0.23% | |
| CHF | -0.04% | -0.04% | 0.01% | 0.05% | 0.17% | -0.17% | 0.21% |
The heat map shows percentage changes of major currencies against each other. The base currency is picked from the left column, while the quote currency is picked from the top row. For example, if you pick the Euro from the left column and move along the horizontal line to the Japanese Yen, the percentage change displayed in the box will represent EUR (base)/JPY (quote).
- EUR/USD retraces its recent gains as the US Dollar trims its intraday losses.
- A break below 1.0900 could push the pair to navigate the 50-day EMA at 1.0887 followed by the 38.2% Fibonacci retracement level at 1.0867.
- The psychological level at 1.1000 appears as the key resistance followed by the previous week’s high at 1.1038 level.
EUR/USD retraces its recent gains as the US Dollar (USD) attempts to recover its recent losses. The EUR/USD pair trades lower near 1.0950 major support during the Asian session on Tuesday. A break below could lead the pair to test the psychological level at 1.0900 as the key support region.
A firm collapse below the latter could put downward pressure on the EUR/USD pair to approach the 50-day Exponential Moving Average (EMA) at 1.0887 followed by the 38.2% Fibonacci retracement level at 1.0867 and a major support at 1.0850.
The 14-day Relative Strength Index (RSI) still lies above the 50 mark, indicating an upward momentum in the EUR/USD pair. However, the lagging indicator Moving Average Convergence Divergence (MACD) line is situated above the centerline but diverging below the signal line, suggesting a potential shift toward a downward trend for the EUR/USD pair. Traders will likely wait for the confirmation before making their bets in the pair.
On the upside, the EUR/USD pair could find the key resistance at the 1.1000 psychological level. A breakthrough above the psychological level could help the EUR/USD pair to reach the previous week’s high at 1.1038 level.
EUR/USD: Daily Chart
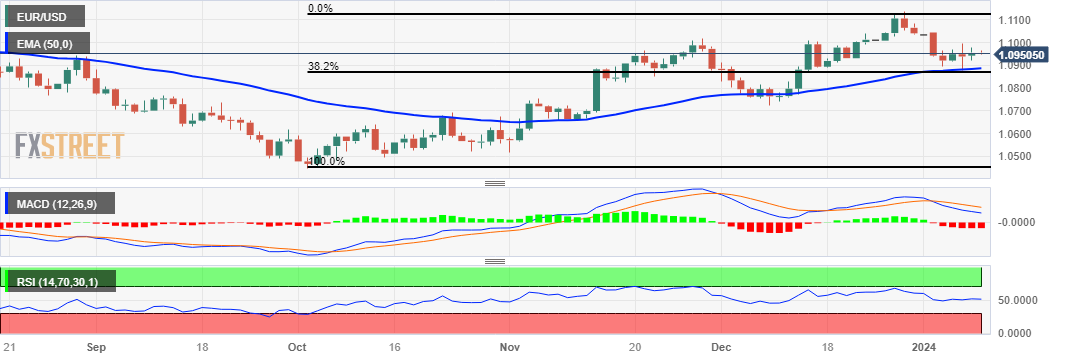
- USD/CAD attempts to gain ground on stable Crude oil prices.
- WTI price holds ground on the uncertainty around the Israel-Gaza conflict.
- Fed members emphasize flexibility in monetary policy; triggering a risk-on sentiment.
USD/CAD consolidates near 1.3350 during the Asian session on Tuesday, attempting to retrace its recent losses registered on Monday. The Canadian Dollar (CAD) could have some balance on steady Crude oil prices.
West Texas Intermediate (WTI) price hovers near $71.00 per barrel, by the press time. The Crude oil prices move sideways on fears over the escalation of the Israel-Gaza war into a regional conflict. US Secretary of State Antony Blinken arrived in Tel Aviv to discuss on communication with Arab leaders.
The upcoming releases of Canadian International Merchandise Trade Balance and Building Permits on Tuesday provide insights into Canada's economic performance. A forecasted decline in the Canadian International Merchandise Trade Balance from 2.97 billion to 2.0 billion for November suggests a potential shift in the imports and exports of Canadian goods.
Furthermore, the anticipated decrease in Canadian November Building Permits from 2.3% to 2.0% indicates a potential moderation in construction activities. Construction data is closely monitored as it reflects broader trends in the real estate and housing sectors, contributing to the movement of corporate investments, which tends to cause some volatility to the CAD.
The cautious stance expressed by Atlanta Fed President Raphael W. Bostic and US Fed Governor Michelle W. Bowman has implications for market sentiment and the US Dollar (USD). Bostic's anticipation of two quarter-point cuts by the end of 2024 reflects a proactive approach in response to the decline in inflation, indicating a willingness to use monetary policy tools to support the economy.
Bowman's acknowledgment that the current policy stance appears sufficiently restrictive but also considering the possibility of lowering the Fed's policy rate if inflation moves closer to the 2% target adds to the dovish sentiment. This stance emphasizes flexibility in monetary policy, triggering a risk-on sentiment. Investors may seek higher-yielding assets, potentially putting downward pressure on the US Dollar.
- Gold price attracts some buyers on Tuesday and draws support from a weaker US Dollar.
- A fall in consumer inflation expectations boosts Fed rate-cut bets and undermines the buck.
- Elevated US bond yields and a positive risk tone cap gains ahead of the US CPI on Thursday.
Gold price (XAU/USD) gains some positive traction during the Asian session on Tuesday and moves away from a near three-week low, around the $2,017-2,016 region touched the previous day. A fall in US Consumer Inflation Expectations boosts market bets that the Federal Reserve (Fed) may start cutting interest rates as early as March. This keeps the US Dollar (USD) bulls on the defensive for the second successive day and turns out to be a key factor benefitting the non-yielding yellow metal.
Investors, however, have been scaling back their expectations for a more aggressive Fed policy easing in the wake of hopes for a soft landing for the US economy, bolstered by a still-resilient labor market. Adding to this, the recent hawkish remarks by several Fed officials have raised uncertainty about the possibility of early interest rate cuts, which remains supportive of elevated US Treasury bond yields. This should help limit losses for the USD and cap any further gains for the Gold price.
Apart from this, a positive trading sentiment around the Asian equity markets might further contribute to keeping a lid on the safe-haven XAU/USD. Traders might also refrain from placing aggressive bets and prefer to wait for the release of the latest US consumer inflation figures on Thursday for cues about the Fed's future policy decision. This, in turn, will play a key role in influencing the USD price dynamics and provide a fresh directional impetus to the Gold price.
Daily Digest Market Movers: Gold price benefits from Fed easing bets, modest USD weakness
- The New York Federal Reserve said in a report on Monday that US consumers' projection of inflation over the short run fell to the lowest level in nearly three years in December, which undermines the US Dollar and benefits the Gold price.
- Inflation one year from now is expected to be at 3%, marking the lowest reading since January 2021, while inflation three years from now is seen at 2.6% and price pressures five years ahead were at 2.5% versus 2.7% in November.
- The data reaffirms expectations for an imminent shift in the Federal Reserve's policy stance, though investors continue scaling back their expectations for more aggressive policy easing in the wake of a still-resilient US economy.
- Atlanta Fed President Raphael Bostic noted that inflation has declined more than expected and that the US central bank still needs to give tight policy time to work on cooling off inflation. Bostic sees two 25 bps cuts by year-end 2024.
- Fed Governor Michelle Bowman said that the current policy stance appears sufficiently restrictive and that inflation could fall further with the policy rate held steady for some time, though the upside inflation risks remain.
- This raises uncertainty over the possibility of early interest rate cuts by the Fed, which assist the yield on the benchmark 10-year US government bond to hold steady above the 4.0% threshold and might cap the non-yielding yellow metal.
- The market focus, meanwhile, remains glued to the US consumer inflation figures on Thursday, which should help determine the next leg of a directional move for the XAU/USD.
Technical Analysis: Gold price might struggle to capitalize on the modest intraday positive move
From a technical perspective, any subsequent move up is likely to confront some resistance near the $2,040 horizontal zone, above which the Gold price could aim to retest Friday's swing high, around the $2,063-2,064 region. The next relevant hurdle is pegged near the $2,077 area, which if cleared decisively will negate any near-term negative outlook and allow bulls to reclaim the $2,100 round figure.
On the flip side, the overnight swing low, around the $2,017-2016 region, now seems to protect the immediate downside ahead of the 50-day Simple Moving Average (SMA), currently near the $2,012-2,011 area. This is followed by the $2,000 psychological mark, below which the Gold price could accelerate the slide towards the $1,988-1,986 intermediate support en route to the December low, around the $1,973 area and the $1,962 confluence, comprising the 100- and the 200-day SMAs.
US Dollar price today
The table below shows the percentage change of US Dollar (USD) against listed major currencies today. US Dollar was the strongest against the Canadian Dollar.
| USD | EUR | GBP | CAD | AUD | JPY | NZD | CHF | |
| USD | -0.12% | -0.10% | -0.02% | -0.09% | -0.42% | -0.13% | -0.13% | |
| EUR | 0.12% | 0.02% | 0.10% | 0.00% | -0.31% | 0.00% | -0.05% | |
| GBP | 0.09% | -0.01% | 0.08% | -0.01% | -0.33% | -0.04% | -0.04% | |
| CAD | 0.01% | -0.11% | -0.09% | -0.10% | -0.42% | -0.12% | -0.12% | |
| AUD | 0.09% | -0.02% | 0.01% | 0.09% | -0.32% | -0.02% | -0.05% | |
| JPY | 0.42% | 0.30% | 0.33% | 0.41% | 0.32% | 0.29% | 0.29% | |
| NZD | 0.13% | 0.00% | 0.03% | 0.10% | 0.01% | -0.31% | -0.02% | |
| CHF | 0.15% | 0.02% | 0.05% | 0.13% | 0.04% | -0.28% | 0.01% |
The heat map shows percentage changes of major currencies against each other. The base currency is picked from the left column, while the quote currency is picked from the top row. For example, if you pick the Euro from the left column and move along the horizontal line to the Japanese Yen, the percentage change displayed in the box will represent EUR (base)/JPY (quote).
Gold FAQs
Why do people invest in Gold?
Gold has played a key role in human’s history as it has been widely used as a store of value and medium of exchange. Currently, apart from its shine and usage for jewelry, the precious metal is widely seen as a safe-haven asset, meaning that it is considered a good investment during turbulent times. Gold is also widely seen as a hedge against inflation and against depreciating currencies as it doesn’t rely on any specific issuer or government.
Who buys the most Gold?
Central banks are the biggest Gold holders. In their aim to support their currencies in turbulent times, central banks tend to diversify their reserves and buy Gold to improve the perceived strength of the economy and the currency. High Gold reserves can be a source of trust for a country’s solvency. Central banks added 1,136 tonnes of Gold worth around $70 billion to their reserves in 2022, according to data from the World Gold Council. This is the highest yearly purchase since records began. Central banks from emerging economies such as China, India and Turkey are quickly increasing their Gold reserves.
How is Gold correlated with other assets?
Gold has an inverse correlation with the US Dollar and US Treasuries, which are both major reserve and safe-haven assets. When the Dollar depreciates, Gold tends to rise, enabling investors and central banks to diversify their assets in turbulent times. Gold is also inversely correlated with risk assets. A rally in the stock market tends to weaken Gold price, while sell-offs in riskier markets tend to favor the precious metal.
What does the price of Gold depend on?
The price can move due to a wide range of factors. Geopolitical instability or fears of a deep recession can quickly make Gold price escalate due to its safe-haven status. As a yield-less asset, Gold tends to rise with lower interest rates, while higher cost of money usually weighs down on the yellow metal. Still, most moves depend on how the US Dollar (USD) behaves as the asset is priced in dollars (XAU/USD). A strong Dollar tends to keep the price of Gold controlled, whereas a weaker Dollar is likely to push Gold prices up.
- WTI price could advance as markets fear the uncertainty around the Middle-East conflict.
- US Secretary of State Antony Blinken arrived in Tel Aviv to discuss with Israeli officials on talks with regional leaders.
- OPEC+ output increase and Saudi’s price cuts appear to have contributed to the depreciation of oil prices.
West Texas Intermediate (WTI) price hovers near $71.10 per barrel during the Asian session on Tuesday. The Crude oil prices move sideways after recent losses registered in the previous session.
The geopolitical conflict between Israel and Gaza is a significant factor influencing the dynamics of Crude oil prices. Such geopolitical tensions in the Middle East have historically contributed to concerns about potential disruptions in oil supply, leading to volatility in oil markets. The possibility of the conflict escalating into a regional crisis adds to the uncertainty surrounding oil prices.
Additionally, the Iran-backed Houthis escalates supply concerns by attacking container ships in the Red Sea. Such provocative actions, especially in maritime routes, have the potential to disrupt oil supply and impact market sentiment.
The warning issued by US Secretary of State Antony Blinken regarding the Gaza conflict highlights the broader implications of the situation. Blinken's visit to Tel Aviv to discuss with Israeli officials talks with Arab leaders reflects diplomatic efforts to address and find a resolution to the ongoing conflict.
However, the rise in the Organization of the Petroleum Exporting Countries and its allies (OPEC+) output reported on Monday, reflecting an increase of 70,000 barrels per day (bpd) in December, appears to have contributed to the depreciation of crude oil prices.
Furthermore, Saudi Arabia's decision to reduce the February Official Selling Price (OSP) of its flagship Arab Light crude to Asia, marking the lowest level in 27 months, is a strategic move with significant implications for oil markets. This decision reflects Saudi Arabia's efforts to remain competitive in the global oil market.
- NZD/USD continues its winning streak on a risk-on-market mood.
- Atlanta Fed President Raphael Bostic expects 50 bps rate cuts by the end of 2024.
- Chinese Zhongzhi’s bankruptcy liquidation might have weighed on the New Zealand Dollar.
- Traders await the Kiwi Building Permits on Thursday to gain fresh cues on New Zealand’s economic landscape.
NZD/USD moves on an upward trajectory, extending gains for the third successive session. The NZD/USD pair trades higher near 0.6260 during the Asian hours on Tuesday. The pair rebounded from a three-week low at 0.6181 on Friday after mixed economic data from the United States (US).
Additionally, the NZD/USD pair appears to be influenced by comments from Federal Reserve (Fed) members, suggesting potential rate cuts by the end of 2024. These remarks triggered a risk-on sentiment and contributed to downward pressure on the US Dollar (USD), consequently leading to an upward movement in the pair.
Atlanta Fed President Raphael W. Bostic's anticipation of two quarter-point cuts by the end of 2024 reflects a cautious approach, considering the decline in inflation more than initially expected. On the other hand, US Fed Governor Michelle W. Bowman's remarks suggest a watchful stance, stating that the current policy stance seems sufficiently restrictive, but acknowledging the possibility of lowering the Fed's policy rate if inflation moves closer to the 2% target.
The US Dollar Index (DXY) seems to extend its losses, trading near 102.10. The downbeat US Treasury yields weigh on the US Dollar with the 2-year and 10-year yields on US Treasury bonds standing lower at 4.37% and 4.02%, respectively, by the press time.
The news from China regarding the bankruptcy liquidation of Zhongzhi Enterprise Group, a major player in the country's shadow banking sector, might have introduced a barrier to the advancement of the New Zealand Dollar (NZD). With significant liabilities amounting to $64 billion, the financial struggles of Zhongzhi Enterprise Group raise concerns about contagion from the broader property debt crisis into the financial sector.
The focus on New Zealand Building Permits, especially ahead of the US Consumer Price Index (CPI) data on Thursday, highlights the potential impact on the NZD/USD pair. Additionally, Friday's Chinese Consumer Price Index (CPI) and Producer Price Index (PPI) figures will likely attract attention, considering the interconnected global economic landscape.
- EUR/USD attracts some buyers for the second straight day amid a modest USD downtick.
- The divergent Fed-ECB expectations act as a tailwind for the major and remain supportive.
- The upside seems limited ahead of the latest US consumer inflation figures on Thursday.
The EUR/USD pair trades with a positive bias for the second straight day on Tuesday, albeit lacks follow-through and remains confined in the previous day's broader range. Spot prices hold steady above mid-1.0900s during the Asian session and draw support from a softer tone surrounding the US Dollar (USD).
The USD Index (DXY), which tracks the Greenback against a basket of currencies, retreats further from a near three-week high touched last Friday amid expectations for an imminent shift in the Federal Reserve's (Fed) policy stance. The bets were lifted by a report by the New York Fed on Monday, which showed that US consumers' projection of inflation over the short run fell to the lowest level in nearly three years in December. This, along with a positive sentiment around the Asian equity markets, is seen undermining the safe-haven buck and acting as a tailwind for the EUR/USD pair.
The shared currency, on the other hand, benefits from expectations that the European Central Bank (ECB) will keep interest rates at record highs for some time, bolstered by the expected jump in the Eurozone inflation last month. Adding to this, ECB official Boris Vujcic said on Monday that the central bank does not foresee cutting interest rates before the summer and anticipates a gradual reduction in inflation within the Eurozone. That said, the markets have fully priced a 25 basis points (bps) ECB rate cut by April, which, in turn, is acting as a headwind for the EUR/USD pair.
Moreover, the US monthly employment report released on Friday pointed to a still-resilient labor market and gives the Fed more headroom to keep interest rates higher for longer. Furthermore, the recent less dovish remarks by several Fed officials forced investors to scale back their expectations for more aggressive policy easing and early interest rate cuts, which remains supportive of elevated US Treasury bond yields. In fact, the yield on the benchmark 10-year US government bond holds steady above 4.0% and should limit any meaningful downside for the Greenback.
The aforementioned mixed fundamental makes it prudent to wait for strong follow-through buying before positioning for any further appreciating move for the EUR/USD pair. Traders now look to the release of German Industrial Production, French Trade Balance data and the Eurozone Unemployment Rate for some impetus. Later during the US session, a scheduled speech by Governor Michael Barr might contribute to producing short-term opportunities, though investors might prefer to wait for the latest US consumer inflation figures on Thursday.
Technical levels to watch
| Raw materials | Closed | Change, % |
|---|---|---|
| Silver | 23.099 | -0.11 |
| Gold | 2027.926 | -0.81 |
| Palladium | 998.1 | -3 |
- The Japanese Yen gains positive traction against the USD for the second straight day on Tuesday.
- The JPY bulls shrug off the expected drop in Tokyo inflation closer to the BoJ’s 2% annual target.
- The uncertainty over the Fed’s rate cut trajectory weighs on the USD and drags USD/JPY lower.
The Japanese Yen (JPY) remains on the front foot against its American counterpart for the second successive day on Tuesday and seems rather unaffected by falling rates of inflation in Tokyo – Japan’s capital city. A fresh leg down in the US equity futures is seen as a key factor benefitting the JPY's relative safe-haven status. Apart from this, a softer tone surrounding the US Dollar (USD) drags the USD/JPY pair back below the 144.00 mark during the Asian session.
Meanwhile, government stimulus measures in the wake of a devastating New Year's Day earthquake in Japan could potentially delay the Bank of Japan's (BoJ) plan to pivot away from its ultra-dovish stance. This could act as a tailwind for the JPY and help limit deeper losses for the USD/JPY pair. Traders might also refrain from placing fresh directional bets amid the uncertainty over the timing of when the Federal Reserve (Fed) will start cutting rates.
The US monthly jobs report released last Friday pointed to a still-resilient labor market and gives the Fed more headroom to keep rates higher for longer. Adding to this, the recent less dovish remarks by Fed officials forced investors to scale back their expectations for more aggressive policy easing. This, in turn, makes it prudent to wait for strong follow-through selling before confirming that the USD/JPY pair's recent recovery from a multi-month low has run its course.
Daily Digest Market Movers: Japanese Yen recovers further from a multi-week low touched on Friday
- The Japanese Yen attracts follow-through buying during the Asian session on Tuesday, though the fundamental backdrop warrants some caution for aggressive bullish traders.
- Inflation in Japan’s capital fell as expected, with Tokyo core Consumer Price Index (CPI) inflation, which excludes volatile fresh food prices, rising 2.1% YoY in December.
- A core reading that excludes both fresh food, and fuel prices, and is closely watched by the Bank of Japan as a measure of underlying inflation, eased from 3.6% to 3.5%.
- Adding to this, the headline Tokyo CPI inflation fell from 2.6% in the prior month to an annualized 2.4% in December and is now within spitting distance of the BoJ's annual target.
- This comes on top of a deadly earthquake in Japan and dampens hopes for an imminent shift in the BoJ's dovish stance at the January 22-23 monetary policy meeting.
- The US Dollar remains on the defensive in the wake of last week's mixed US economic data and bets that the Federal Reserve will start easing its monetary policy soon.
- The New York Fed said in a report on Monday that US consumers' projection of inflation over the short run fell to the lowest level in nearly three years in December.
- The latest survey showed that inflation is expected to be at 3% one year from now, or the lowest reading since January 2021, as against a projection of 3.4% in November.
- Investors, however, have been paring bets for early interest rate cuts by the Fed, which remains supportive of elevated US bond yields and should act as a tailwind for the USD.
Technical Analysis: USD/JPY break through 100-hour SMA and 38.2% Fibo. support levels
From a technical perspective, the intraday downfall drags the USD/JPY pair below the 100-hour Simple Moving Average (SMA). A subsequent break through the 38.2% Fibonacci retracement level of the recent strong recovery from a multi-month low touched in December might have already set the stage for further losses. With oscillators on hourly/daily charts holding in the negative territory, spot prices seem vulnerable to slide further towards testing the very important 200-day SMA, currently around the 143.25 region, en route to the 143.00 mark, or the 50% Fibo. level.
On the flip side, the 144.00 round figure now seems to act as an immediate resistance ahead of the 144.25-144.30 region. A sustained strength beyond the latter could trigger a short-covering rally and lift the USD/JPY pair to the 145.00 psychological mark. Some follow-through buying might shift the bias back in favour of bullish traders and allow spot prices to make a fresh attempt to conquer the 146.00 mark with some intermediate barrier near mid-145.00s.
Japanese Yen price today
The table below shows the percentage change of Japanese Yen (JPY) against listed major currencies today. Japanese Yen was the strongest against the US Dollar.
| USD | EUR | GBP | CAD | AUD | JPY | NZD | CHF | |
| USD | -0.08% | -0.11% | -0.01% | -0.13% | -0.47% | -0.11% | -0.15% | |
| EUR | 0.09% | -0.02% | 0.08% | -0.08% | -0.41% | -0.03% | -0.09% | |
| GBP | 0.11% | 0.03% | 0.10% | -0.04% | -0.36% | 0.00% | -0.04% | |
| CAD | 0.01% | -0.07% | -0.09% | -0.13% | -0.46% | -0.10% | -0.14% | |
| AUD | 0.14% | 0.08% | 0.06% | 0.17% | -0.34% | 0.05% | -0.02% | |
| JPY | 0.50% | 0.42% | 0.41% | 0.50% | 0.36% | 0.40% | 0.36% | |
| NZD | 0.11% | 0.03% | 0.02% | 0.11% | -0.05% | -0.39% | -0.04% | |
| CHF | 0.17% | 0.08% | 0.06% | 0.15% | 0.02% | -0.30% | 0.05% |
The heat map shows percentage changes of major currencies against each other. The base currency is picked from the left column, while the quote currency is picked from the top row. For example, if you pick the Euro from the left column and move along the horizontal line to the Japanese Yen, the percentage change displayed in the box will represent EUR (base)/JPY (quote).
Japanese Yen FAQs
What key factors drive the Japanese Yen?
The Japanese Yen (JPY) is one of the world’s most traded currencies. Its value is broadly determined by the performance of the Japanese economy, but more specifically by the Bank of Japan’s policy, the differential between Japanese and US bond yields, or risk sentiment among traders, among other factors.
How do the decisions of the Bank of Japan impact the Japanese Yen?
One of the Bank of Japan’s mandates is currency control, so its moves are key for the Yen. The BoJ has directly intervened in currency markets sometimes, generally to lower the value of the Yen, although it refrains from doing it often due to political concerns of its main trading partners. The current BoJ ultra-loose monetary policy, based on massive stimulus to the economy, has caused the Yen to depreciate against its main currency peers. This process has exacerbated more recently due to an increasing policy divergence between the Bank of Japan and other main central banks, which have opted to increase interest rates sharply to fight decades-high levels of inflation.
How does the differential between Japanese and US bond yields impact the Japanese Yen?
The BoJ’s stance of sticking to ultra-loose monetary policy has led to a widening policy divergence with other central banks, particularly with the US Federal Reserve. This supports a widening of the differential between the 10-year US and Japanese bonds, which favors the US Dollar against the Japanese Yen.
How does broader risk sentiment impact the Japanese Yen?
The Japanese Yen is often seen as a safe-haven investment. This means that in times of market stress, investors are more likely to put their money in the Japanese currency due to its supposed reliability and stability. Turbulent times are likely to strengthen the Yen’s value against other currencies seen as more risky to invest in.
- GBP/USD extends the rally near 1.2759 amid the risk-on sentiment.
- Fed’s Bostic said inflation in the US has declined further than he had anticipated.
- The Bank of England’s (BoE) former member said the BOE will not be in a position to begin cutting rates in 2024.
The GBP/USD pair traded in positive territory for the fifth consecutive day during the early Asian trading hours on Tuesday. Positive risk-on sentiment and a slight decline in the US Dollar (USD) are supporting the major pair's uptick. At press time, GBP/USD is trading at 1.2759, up 0.05% on the day.
The US labor data last week weakened the Federal Reserve's (Fed) case for rate cuts. Traders are pricing in around 62% odds of rate cuts in the March meeting, according to the CME Fedwatch tool. The New York Fed's 1-year inflation expectations came in at 3.01% versus 3.36% prior.
Fed Atlanta President Raphael Bostic said on Monday that inflation in the United States has declined further than he had anticipated. Furthermore, he affirmed that the rise in unemployment is "far less" than what would typically be expected given the decrease in inflation, while mentioning that the Fed is currently in a "very strong position.”
On the British Pound front, a former member of the Bank of England’s (BoE) monetary policy committee, DeAnne Julius, said the central bank will not be in a position to begin cutting interest rates in 2024. She added that the escalating tensions in the Middle East could contribute to a new round of energy price rises, resulting in a new inflation shock.
Later on Tuesday, the US Goods Trade Balance for November will be due. However, this low-tier data might not impact the market. Attention will turn to the US Consumer Price Index (CPI) on Thursday. On Friday, the UK monthly Gross Domestic Product (GDP) for November, Industrial Production, and Manufacturing Production will be released. Furthermore, many Fed officials are set to speak this week, including Barr (Tuesday), Williams (Wednesday), and Kashkari (Friday).
- Australian Dollar continues its winning streak on the softer US Dollar.
- Australian Retail Sales increased to 2.0% from the previous 0.2% decline.
- Improved risk appetite weakens the Greenback.
- Atlanta Fed President Raphael W. Bostic expects two quarter-point cuts by the end of 2024.
The Australian Dollar (AUD) continues to gain ground, extending its gains for the third successive session on Tuesday. The AUD/USD pair seems to be benefiting from improved risk appetite, driven in part by comments from US Federal Reserve (Fed) members speculating about potential interest rate cuts by the end of 2024. Additionally, the upbeat economic data from Australia could reinforce the strength of the Aussie Dollar (AUD).
Australia’s Bureau of Statistics revealed the seasonally adjusted Retail Sales (MoM) for November, which rose by 2.0% instead of the expected 1.2%, swinging from the previous 0.2% decline. Furthermore, the monthly Building Permits came to 1.6% from 7.5% prior against the expected decline of 2.0%.
Traders will observe the Monthly Consumer Price Index data on Wednesday to gain more impetus on the Reserve Bank of Australia’s (RBA) interest rate trajectory. However, RBA is highly anticipated to refrain from rate cuts in its upcoming February meeting.
The US Dollar Index (DXY) seems to extend its losses due to the decline in US Treasury yields. Additionally, the softer comments from the Fed members triggered the risk-on market mood, which put pressure on the US Dollar (USD).
Atlanta Fed President Raphael W. Bostic shared insights on the 2024 economic outlook during an appearance at the Atlanta Rotary Club on Monday. Notably, he mentioned that inflation has declined more than initially anticipated and expressed the view of expecting two quarter-point cuts by the end of 2024. Bostic conveyed comfort with the current rate level and emphasized the importance of allowing the Fed's tight policy time to work on cooling off inflation. He also mentioned that the US is on the path to achieving 2% inflation, and the goal is to remain on that path.
US Fed Governor Michelle W. Bowman addressed the South Carolina Bankers Association 2024 Community Bankers Conference on Monday. She mentioned that inflation could fall further with the policy rate held steady for some time. Bowman expressed the view that the current policy stance appears sufficiently restrictive, but it might eventually become appropriate to lower the Fed's policy rate if inflation falls closer to the 2% target.
Daily Digest Market Movers: Australian Dollar rises on improved risk appetite
- Australia Judo Bank Services PMI reported a reading of 47.1, falling short of market expectations that it would remain consistent at 47.6. The Composite PMI decreased to 46.9 from the previous figure of 47.4.
- Australia’s Judo Bank Manufacturing PMI indicated a modest contraction in manufacturing activity, declining to 47.6 in December from the previous reading of 47.8.
- Chinese wealth manager Zhongzhi Enterprise Group has filed for bankruptcy liquidation, facing a staggering $64 billion in liabilities.
- Dallas Fed President Lorie K. Logan, provided insights on Saturday, suggesting that a rate hike should not be ruled out given the recent easing in financial conditions. She emphasized the importance of avoiding premature easing, which could stimulate demand. Maintaining sufficiently tight financial conditions is seen as crucial to managing the risk of inflation picking back up and potentially reversing progress.
- US Nonfarm Payrolls rose to 216K in December, showing an improvement from the 173K reported in November. This figure surpassed the market expectation, which anticipated a rise of 170K.
- US Average Hourly Earnings (YoY) improved to 4.1% from 4.0% prior. Meanwhile, the monthly index remained consistent at 0.4% against the expected decline of 0.3%.
- US ISM Services Purchasing Managers Index (PMI) came in at 50.6 against the expected 52.6 and 52.7 prior. While the Services Employment Index reduced to 43.3 from the previous reading of 50.7.
Technical Analysis: Australian Dollar remains below the major barrier at 0.6750
The Australian Dollar trades near 0.6730 on Tuesday. The AUD/USD pair could face a key resistance at the seven-day Exponential Moving Average (EMA) of 0.6737 before the major level at the 0.6750 level. A successful breakthrough above the latter could pave the way for the AUD/USD pair to challenge the psychological barrier at 0.6800. On the downside, the 23.6% Fibonacci retracement at 0.6725 acts as an immediate support followed by the psychological support at 0.6700. A break below the psychological support could push the AUD/USD pair to retest the major support at 0.6650 and the 38.2% Fibonacci retracement level at 0.6637.
AUD/USD: Daily Chart
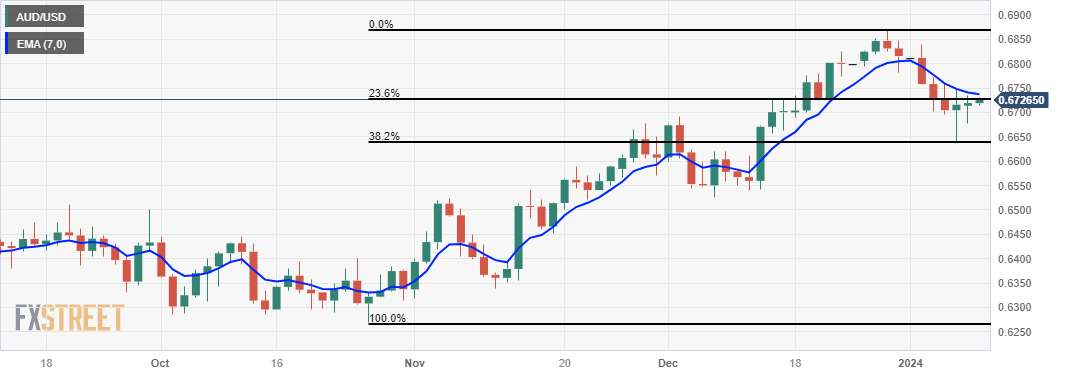
Australian Dollar price today
The table below shows the percentage change of Australian Dollar (AUD) against listed major currencies today. Australian Dollar was the strongest against the Canadian Dollar.
| USD | EUR | GBP | CAD | AUD | JPY | NZD | CHF | |
| USD | -0.04% | -0.10% | 0.00% | -0.04% | -0.25% | 0.00% | -0.07% | |
| EUR | 0.04% | -0.06% | 0.04% | -0.03% | -0.24% | 0.03% | -0.06% | |
| GBP | 0.09% | 0.06% | 0.10% | 0.03% | -0.18% | 0.08% | 0.01% | |
| CAD | -0.01% | -0.04% | -0.10% | -0.07% | -0.28% | -0.02% | -0.09% | |
| AUD | 0.05% | 0.03% | -0.03% | 0.08% | -0.19% | 0.07% | -0.03% | |
| JPY | 0.25% | 0.22% | 0.17% | 0.27% | 0.18% | 0.27% | 0.18% | |
| NZD | 0.00% | -0.03% | -0.08% | 0.02% | -0.06% | -0.27% | -0.07% | |
| CHF | 0.08% | 0.04% | -0.02% | 0.09% | 0.02% | -0.17% | 0.08% |
The heat map shows percentage changes of major currencies against each other. The base currency is picked from the left column, while the quote currency is picked from the top row. For example, if you pick the Euro from the left column and move along the horizontal line to the Japanese Yen, the percentage change displayed in the box will represent EUR (base)/JPY (quote).
Australian Dollar FAQs
What key factors drive the Australian Dollar?
One of the most significant factors for the Australian Dollar (AUD) is the level of interest rates set by the Reserve Bank of Australia (RBA). Because Australia is a resource-rich country another key driver is the price of its biggest export, Iron Ore. The health of the Chinese economy, its largest trading partner, is a factor, as well as inflation in Australia, its growth rate and Trade Balance. Market sentiment – whether investors are taking on more risky assets (risk-on) or seeking safe-havens (risk-off) – is also a factor, with risk-on positive for AUD.
How do the decisions of the Reserve Bank of Australia impact the Australian Dollar?
The Reserve Bank of Australia (RBA) influences the Australian Dollar (AUD) by setting the level of interest rates that Australian banks can lend to each other. This influences the level of interest rates in the economy as a whole. The main goal of the RBA is to maintain a stable inflation rate of 2-3% by adjusting interest rates up or down. Relatively high interest rates compared to other major central banks support the AUD, and the opposite for relatively low. The RBA can also use quantitative easing and tightening to influence credit conditions, with the former AUD-negative and the latter AUD-positive.
How does the health of the Chinese Economy impact the Australian Dollar?
China is Australia’s largest trading partner so the health of the Chinese economy is a major influence on the value of the Australian Dollar (AUD). When the Chinese economy is doing well it purchases more raw materials, goods and services from Australia, lifting demand for the AUD, and pushing up its value. The opposite is the case when the Chinese economy is not growing as fast as expected. Positive or negative surprises in Chinese growth data, therefore, often have a direct impact on the Australian Dollar and its pairs.
How does the price of Iron Ore impact the Australian Dollar?
Iron Ore is Australia’s largest export, accounting for $118 billion a year according to data from 2021, with China as its primary destination. The price of Iron Ore, therefore, can be a driver of the Australian Dollar. Generally, if the price of Iron Ore rises, AUD also goes up, as aggregate demand for the currency increases. The opposite is the case if the price of Iron Ore falls. Higher Iron Ore prices also tend to result in a greater likelihood of a positive Trade Balance for Australia, which is also positive of the AUD.
How does the Trade Balance impact the Australian Dollar?
The Trade Balance, which is the difference between what a country earns from its exports versus what it pays for its imports, is another factor that can influence the value of the Australian Dollar. If Australia produces highly sought after exports, then its currency will gain in value purely from the surplus demand created from foreign buyers seeking to purchase its exports versus what it spends to purchase imports. Therefore, a positive net Trade Balance strengthens the AUD, with the opposite effect if the Trade Balance is negative.
- Gold price holds positive ground around $2,030 on Tuesday.
- The FOMC minutes and the December Nonfarm Payrolls report show monetary policy caution is still needed.
- The US Consumer Price Index (CPI) on Thursday will be in the spotlight this week.
Gold price (XAU/USD) recovers some lost ground below the mid-$2,000s during the early Asian session on Tuesday. The possibility that the US Federal Reserve (Fed) might extend its restrictive stance for longer might exert some selling pressure on the yellow metal in the near term. However, gold traders will take more cues from the US Consumer Price Index (CPI) on Thursday for fresh impetus. The gold price currently trades near $2,030, 0.14% on the day.
Meanwhile, the US Dollar Index (DXY), a measure of the value of the USD against a weighted basket of currencies used by US trade partners, hovers around 102.28 after facing a rejection from a multi-week high of 103.10. The Treasury yields edge lower, with the 10-year yield standing at 4.02%.
The FOMC minutes and the December Nonfarm Payrolls report show monetary policy caution is still needed. The market anticipates that the US economy will remain robust in the fourth quarter (Q4) and in 2024, which certainly wouldn’t require five to six rate cuts from the Fed this year. This, in turn, might boost the US Dollar (USD) and cap the upside for the USD-denominated gold.
On Monday, Atlanta Fed President Raphael Bostic stated that with inflation still above the 2% target and his view is for monetary policy to remain tight even though overall risks in the economy have become balanced between those posed by rising prices and those posed by slower employment growth. Furthermore, Fed Governor Michelle Bowman said that the current policy stance appears sufficiently restrictive. However, she remains willing to raise the federal funds rate further at a future meeting if the incoming data indicate that progress on inflation has stalled or reversed.
This week’s inflation data will provide some fresh impetus. The US Consumer Price Index (CPI) will be released on Thursday. The headline CPI figures are projected to rise 0.2% MoM and 3.2% YoY, respectively. The Core CPI, which excludes volatile food and energy prices, is expected to rise 0.2% MoM in December.
Australia’s Retail Sales, a measure of the country’s consumer spending, improved 2.0% MoM in November from the previous reading of a 0.2% drop, according to the official data published by the Australian Bureau of Statistics (ABS) on Tuesday. The figure came in better than the market expectation for an increase of 1.2%.
Market reaction
Following Australia’s Retail Sales data, the AUD/USD pair is up 0.14% on the day at 0.6729.
About Australia's Retail Sales
The Retail Sales released by the Australian Bureau of Statistics is a survey of goods sold by retailers is based on a sampling of retail stores of different types and sizes and it''s considered as an indicator of the pace of the Australian economy. It shows the performance of the retail sector over the short and mid-term. Positive economic growth anticipates bullish trends for the AUD, while a low reading is seen as negative or bearish.
Australian Dollar FAQs
What key factors drive the Australian Dollar?
One of the most significant factors for the Australian Dollar (AUD) is the level of interest rates set by the Reserve Bank of Australia (RBA). Because Australia is a resource-rich country another key driver is the price of its biggest export, Iron Ore. The health of the Chinese economy, its largest trading partner, is a factor, as well as inflation in Australia, its growth rate and Trade Balance. Market sentiment – whether investors are taking on more risky assets (risk-on) or seeking safe-havens (risk-off) – is also a factor, with risk-on positive for AUD.
How do the decisions of the Reserve Bank of Australia impact the Australian Dollar?
The Reserve Bank of Australia (RBA) influences the Australian Dollar (AUD) by setting the level of interest rates that Australian banks can lend to each other. This influences the level of interest rates in the economy as a whole. The main goal of the RBA is to maintain a stable inflation rate of 2-3% by adjusting interest rates up or down. Relatively high interest rates compared to other major central banks support the AUD, and the opposite for relatively low. The RBA can also use quantitative easing and tightening to influence credit conditions, with the former AUD-negative and the latter AUD-positive.
How does the health of the Chinese Economy impact the Australian Dollar?
China is Australia’s largest trading partner so the health of the Chinese economy is a major influence on the value of the Australian Dollar (AUD). When the Chinese economy is doing well it purchases more raw materials, goods and services from Australia, lifting demand for the AUD, and pushing up its value. The opposite is the case when the Chinese economy is not growing as fast as expected. Positive or negative surprises in Chinese growth data, therefore, often have a direct impact on the Australian Dollar and its pairs.
How does the price of Iron Ore impact the Australian Dollar?
Iron Ore is Australia’s largest export, accounting for $118 billion a year according to data from 2021, with China as its primary destination. The price of Iron Ore, therefore, can be a driver of the Australian Dollar. Generally, if the price of Iron Ore rises, AUD also goes up, as aggregate demand for the currency increases. The opposite is the case if the price of Iron Ore falls. Higher Iron Ore prices also tend to result in a greater likelihood of a positive Trade Balance for Australia, which is also positive of the AUD.
How does the Trade Balance impact the Australian Dollar?
The Trade Balance, which is the difference between what a country earns from its exports versus what it pays for its imports, is another factor that can influence the value of the Australian Dollar. If Australia produces highly sought after exports, then its currency will gain in value purely from the surplus demand created from foreign buyers seeking to purchase its exports versus what it spends to purchase imports. Therefore, a positive net Trade Balance strengthens the AUD, with the opposite effect if the Trade Balance is negative.
| Index | Change, points | Closed | Change, % |
|---|---|---|---|
| Hang Seng | -310.88 | 16224.45 | -1.88 |
| KOSPI | -10.26 | 2567.82 | -0.4 |
| ASX 200 | -37.6 | 7451.5 | -0.5 |
| DAX | 122.26 | 16716.47 | 0.74 |
| CAC 40 | 29.55 | 7450.24 | 0.4 |
| Dow Jones | 216.9 | 37683.01 | 0.58 |
| S&P 500 | 66.3 | 4763.54 | 1.41 |
| NASDAQ Composite | 319.7 | 14843.77 | 2.2 |
| Pare | Closed | Change, % |
|---|---|---|
| AUDUSD | 0.67179 | 0.07 |
| EURJPY | 157.918 | -0.1 |
| EURUSD | 1.09507 | 0.11 |
| GBPJPY | 183.855 | 0.03 |
| GBPUSD | 1.27487 | 0.28 |
| NZDUSD | 0.62493 | 0.24 |
| USDCAD | 1.33474 | 0.04 |
| USDCHF | 0.8482 | -0.01 |
| USDJPY | 144.213 | -0.22 |


© 2000-2026. Уcі права захищені.
Cайт знаходитьcя під керуванням TeleTrade DJ. LLC 2351 LLC 2022 (Euro House, Richmond Hill Road, Kingstown, VC0100, St. Vincent and the Grenadines).
Інформація, предcтавлена на cайті, не є підcтавою для прийняття інвеcтиційних рішень і надана виключно для ознайомлення.
Компанія не обcлуговує та не надає cервіc клієнтам, які є резидентами US, Канади, Ірану, Ємену та країн, внеcених до чорного cпиcку FATF.
Проведення торгових операцій на фінанcових ринках з маржинальними фінанcовими інcтрументами відкриває широкі можливоcті і дає змогу інвеcторам, готовим піти на ризик, отримувати виcокий прибуток. Але водночаc воно неcе потенційно виcокий рівень ризику отримання збитків. Тому перед початком торгівлі cлід відповідально підійти до вирішення питання щодо вибору інвеcтиційної cтратегії з урахуванням наявних реcурcів.
Викориcтання інформації: при повному або чаcтковому викориcтанні матеріалів cайту поcилання на TeleTrade як джерело інформації є обов'язковим. Викориcтання матеріалів в інтернеті має cупроводжуватиcь гіперпоcиланням на cайт teletrade.org. Автоматичний імпорт матеріалів та інформації із cайту заборонено.
З уcіх питань звертайтеcь за адреcою pr@teletrade.global.
переклади