- Аналітика
- Новини та інструменти
- Новини ринків
Новини ринків
- The GBP/JPY catches a soft bid to challenge 182.00 after a week of stubborn losses.
- The Yen surged on the week, bolstered by a hawkish BoJ.
- The Guppy heads into next week’s central bank showdown on the low side.
The GBP/JPY eked out a small gain on Friday, finishing the day up a slim tenth of a percent to cap off a trading week of firm declines. The Guppy ends the trading week down a firm two and a third percent from the week’s opening bids near 186.60, hitting a nine-week low of 178.58 amidst Thursday’s broad-market Yen rally.
The Bank of Japan (BoJ) kicked off a wild surge in the Japanese Yen after BoJ Governor Kazuo Ueda struck unusually hawkish tones in the mid-week, hinting that the BoJ could be on pace to begin tightening monetary policy, specifically highlighting the Japanese central bank’s negative rate regime.
Despite the BoJ fearing a collapse in Japanese inflation sometime in 2025, Japanese Core Consumer Price Index (CPI) inflation continues to run hotter than expected, hitting 2.9% for the year into October and chalking in a nineteenth straight consecutive month of inflation outrunning the BoJ's 2% upper target band.
Yen traders picked up the BoJ’s hawkish tone and ran with it, sending the JPY surging across the board. The GBP/JPY tumbled nearly three and a half percent top-to-bottom on Thursday, pushing the pair down into new lows below 178.60.
Next week sees UK labor figures, followed by Japanese manufacturing figures, culminating in 2023’s last rate call from the Bank of England (BoE).
GBP/JPY Technical Outlook
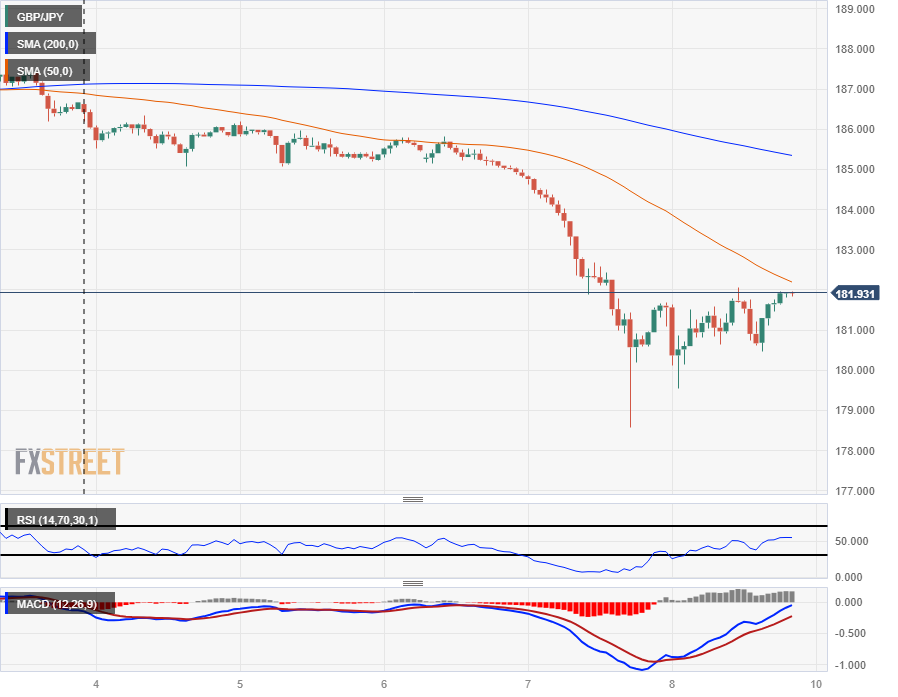
The GBP/JPY’s tumble left the pair knocking into fresh multi-week lows, and Friday’s thin rebound has the Guppy rebounding from the 180.00 major handle.
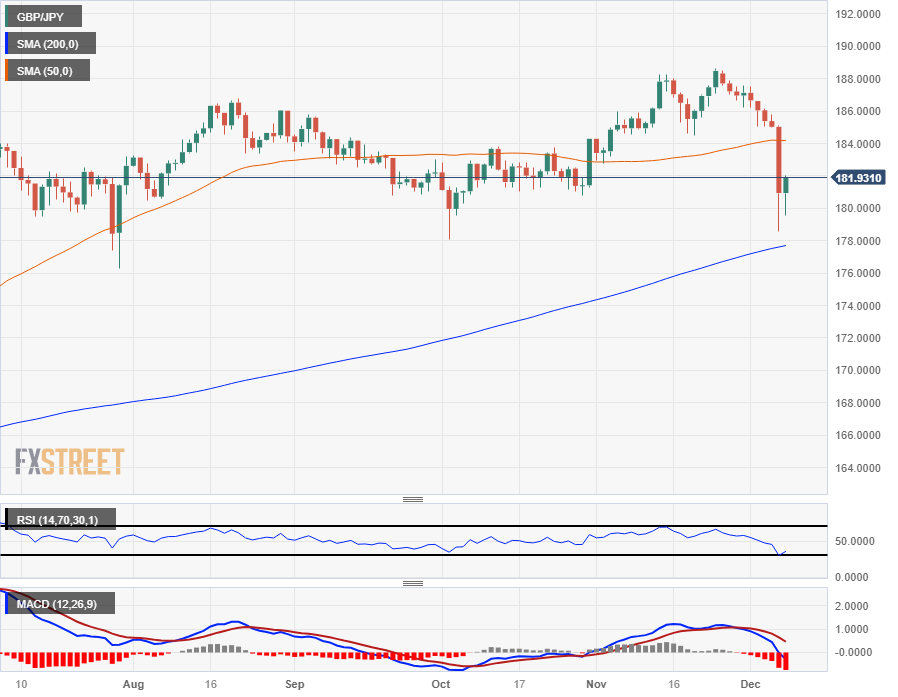
Near-term momentum still leans in favor of the bulls, with technical support coming from the still-untouched 200-day Simple Moving Average (SMA) near 178.00, but the last swing high into 188.66 represents a significant peak that bidders will struggle to retake.
The GBP/JPY is at risk of re-entering a consolidation phase around the 50-day SMA near the 184.00 price level, and short sellers will have their work cut out for them to try and cut the recovery rally short.
GBP/JPY Hourly Chart
GBP/JPY Daily Chart
GBP/JPY Technical Levels
- NZD/JPY tallied a 2.60% weekly decline, its worst since December 2022.
- On the daily chart, indicators favor the bears in the short term.
- On the four-hour chart, bears stepped out to consolidate their recent movements.
At the end of the week, the NZD/JPY declined to 88.75, seeing nearly 0.25% losses, after reaching a low of around 87.95 at the 100-day Simple Moving Average (SMA).
Overall, the outlook is bearish for the short term, but bulls dominate the larger time frames. The daily Relative Strength Index (RSI) printed a negative slope below 50, while the rising red bars on the Moving Average Convergence Divergence (MACD) indicate that the bears are gaining ground.
Concerning Simple Moving Averages (SMAs), the cross stands below the 20-day average but above the 100-day and 200-day SMAs which indicates that on the broader scale, the bulls are still in command in the broader scale, and as long as the bears fail to conquer those averages their momentum won’t be enough to reverse the overall trend.
Zooming, the four-hour chart indicators flattened in negative territory. The Relative Strength Index (RSI) stands neutral just above the oversold threshold, while the MACD prints flat red bars which suggest that bears seem to be consolidating the recent downward movements.
Support Levels: 88.55, 88.15 (100-day SMA), 87.70.
Resistance Levels: 89.25, 89.80, 90.00 (20-day SMA).
NZD/JPY daily chart
-638376672064302186.png)
- Despite printing daily gains, the AUD/JPY is set to finish the week down by more than 2%.
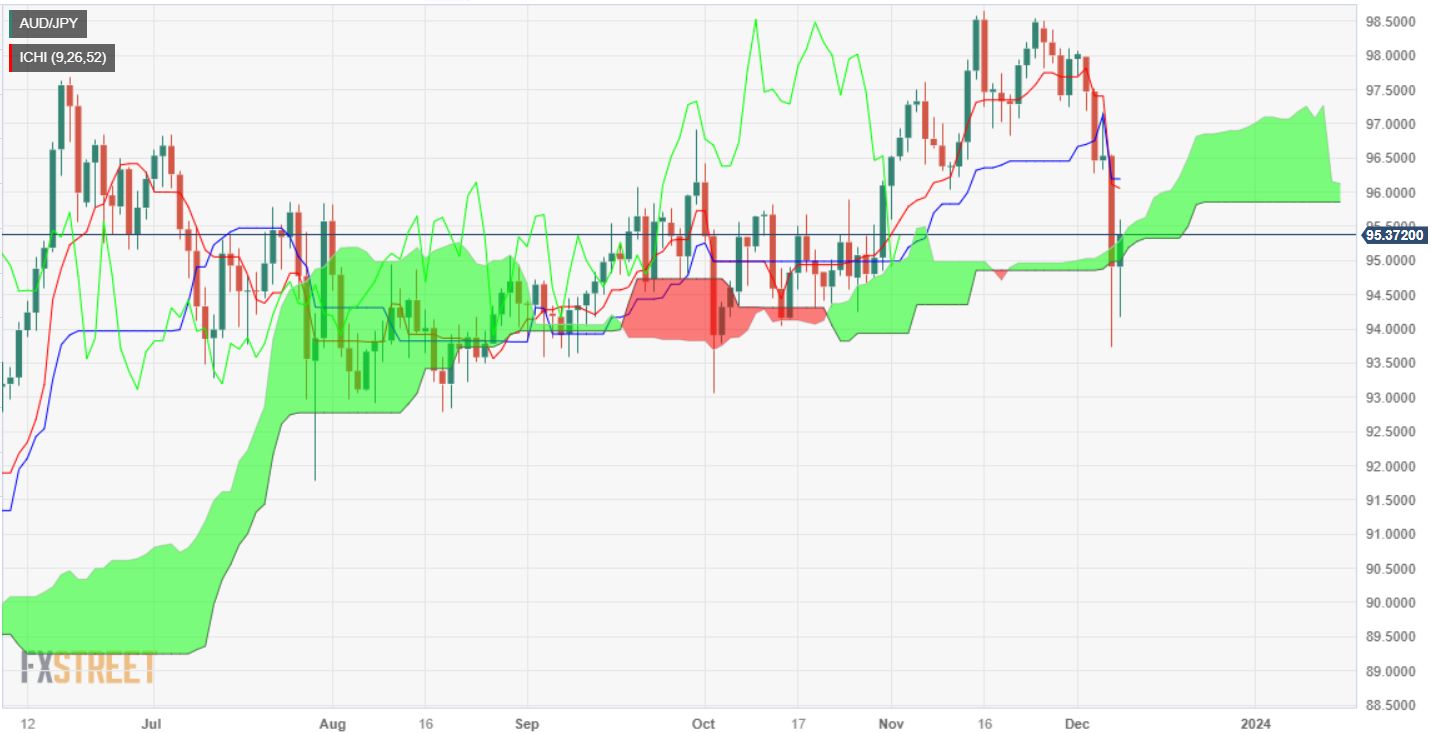
- Daily chart suggests a neutral to downward bias for the pair, with potential upside risks if a daily close is within Ichimoku Cloud boundaries.
- A daily close occurs below the top of the Kumo, the potential for further losses; with key support seen at 95.00, followed by a December 8 low of 94.17.
- Upside resistance includes November 10 swing low-turned resistance at 95.85, ahead of the 96.00 figure, and the Kijun-Sen at 96.14.
The AUD/JPY trimmed some of its Thursday’s losses on Friday, and aims higher 0.27% in late trading during the North American session. Even though the pair is up daily, would finish the week with losses of more than 2.50%, a consequence of comments by Bank of Japan’s (BoJ) Governor Ueda. Therefore, the cross is trading at 95.40, after hitting a daily low of 94.17.
The daily chart portrays the pair as neutral to downward biased, though upside risks remain. If AUD/JPY achieves a daily close within the Ichimoku Cloud (Kumo) boundaries, that could pave the way for further losses; otherwise, the pair could challenge the December 7 high of 96.49.
If AUD/JPY achieves a daily close below the top of the Kumo, the first support would be the 95.00 figure. A breach of the latter will expose the December 8 low of 94.17, ahead of the 94.00 mark
On the upside, if the pair edges above the peak of the Kumo, the first resistance would be the November 10 swing low-turned resistance at 95.85, ahead of the 96.00 figure. The next resistance would be the Kijun-Sen at 96.14.
AUD/JPY Price Analysis – Daily Chart
AUD/JPY Technical Levels
- NZD/USD tumbles more than 0.70%, trading at 0.6124, erasing gains from Thursday's session.
- US jobs data was better than expected, spurring a dip in the unemployment rate.
- University of Michigan Consumer Sentiment Index rises to 69.0, its highest level since August, with revised lower inflation expectations.
NZD/USD is dropping and erased Thursday’s gains on Friday after US economic data sent traders scrambling to pare dovish bets on the US Federal Reserve as November’s Nonfarm Payrolls exceeded estimates. That shows the economy’s resilience; hence, the pair tumbles more than 0.70% and trades at 0.6124.
NZD/USD finished the week down, traders eye next week’s FOMC meeting
As previously mentioned, the US Department of Labor released November’s Nonfarm Payrolls report, which depicted the labor market is in better shape than previously released data in the week. The economy added 199,000 jobs, more than the 150,000 in October, and exceeded forecasts of 180,000. As a consequence, the unemployment rate dipped from 3.9% to 3.7%, and Average hourly earnings stood at 4% during the last 12 months to date, suggesting a wage-price spiral is out of discussion.
Following the data release, the NZD/USD seesawed on a wide range and dived to its low of the day at 0.6103 before recovering some ground. Nevertheless, the damage is done, with the pair set to finish the week with losses.
Besides that, the University of Michigan (UoM) revealed its latest consumer poll, which showed American households are more optimistic regarding the economic outlook, as the Consumer Sentiment Index rose by 69.0, its highest level since August, while inflation expectations were revised lower.
The US Dollar Index (DXY), which tracks the buck’s performance against six rivals, rose by 0.30%, at 104.01, underpinned by a jump in US yields. The US 10-year bond yield climbed 8 basis points and is set to finish the week at 4.236%.
In the meantime in New Zealand, next week’s economic docket will feature the Current Account alongside the Gross Domestic Product (GDP) figures for the third quarter. Estimates lie at 0.2%, less than the previous quarter's growth of 0.9%. On the US front, Traders focus on the following week's US inflation report and the Federal Open Market Committee (FOMC) meeting.
NZD/USD Technical Levels
- WTI's Friday bounce still sees Crude Oil down for a seventh straight week.
- US Crude Oil fell to a near-term floor of $69.01 on Thursday.
- OPEC's pumping caps are seeing little impact as Chinese demand slumps.
Crude Oil markets are seeing a moderate recovery on Friday with West Texas Intermediate (WTI) climbing two percent on the day, but pressured oil markets are still set for a seventh straight week of declines.
The Organization of the Petroleum Exporting Countries (OPEC) scrambled to solidify a group-wide agreement on production cuts after member states came to loggerheads over pumping quotas. Key OPEC members, headed up by Saudi Arabia, have aggressively pursued tighter production caps in order to keep Crude Oil prices bid. However, flagging fuel demand, specifically from China, and disobedient OPEC member states decrying production caps are throwing a wrench in OPEC’s efforts to intentionally undersupply global Crude Oil Markets.
OPEC’s current production caps see the oil cartel agreeing to a combined 2.2 million bpd cut to total Crude Oil production through the first quarter of 2024, but fossil markets remain skeptical about OPEC’s ability to enforce the loose agreement.
OPEC currently has no mechanism of enforcing Crude Oil production quotas, and there is currently no punishment for member countries that choose to flaunt pumping limits and sell more oil than OPEC agreements allow.
Adding fuel to the fire, Chinese imports of Crude Oil declined by 9% in November compared to last year as Chinese demand for fossil fuels sumps alongside China’s growth metrics.
Despite OPEC’s production-limiting efforts, Crude Oil supplies remain well-stocked with barrel inventories at healthy levels, sending the price of Crude down into multi-month lows.
WTI Technical Outlook
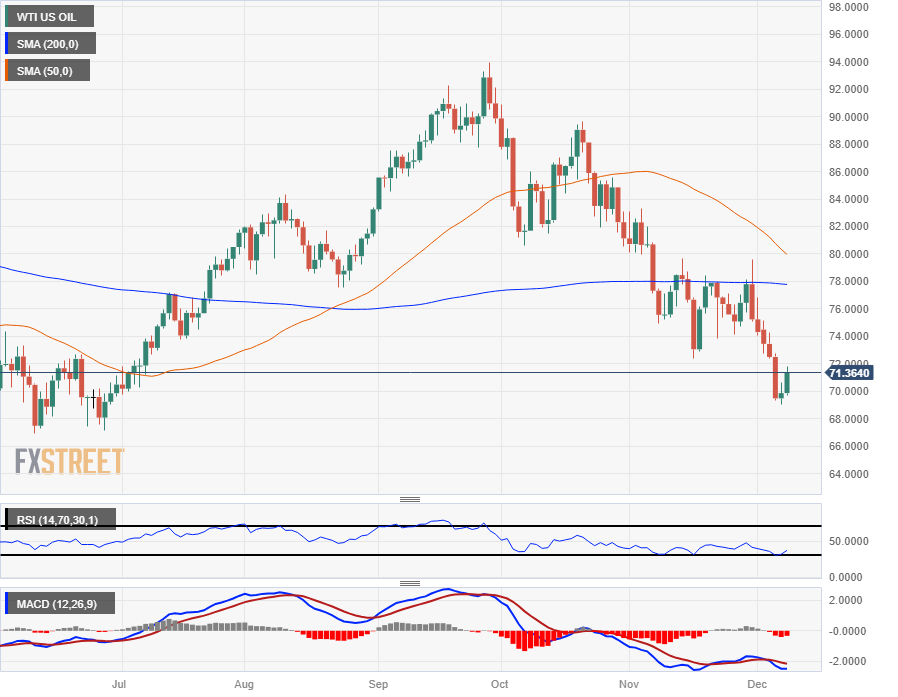
Despite Friday’s rebound after finding a floor on Thursday at $69.01, Crude Oil remains firmly under-bid after closing in the red for five consecutive days into Tuesday, and WTI is on pace to end in the red for a seventh straight week.
WTI Crude Oil daily candlesticks remain firmly capped by the 200-day Simple Moving Average (SMA) near $78.00, with the 50-day SMA accelerating into the downside at $80.00.
Seven straight weeks of declines have dragged WTI down nearly twenty percent plus a half from the last peak of $89.64, and US Crude Oil is down nearly twenty-seven percent from September’s peak just below $94.00 per barrel.
WTI Daily Chart
WTI Technical Levels
- The USD/SEK rose towards the 10.470 level, threatening the 20-day SMA.
- US November Job reports: Unemployment Rate declined while Nonfarm Payrolls Average Hourly Earnings accelerated.
- All eyes are now on next week’s US November CPI and the Fed’s decisions.
In Friday's trading session, the USD/SEK edged higher, primarily driven by strong labor market data from the US and rising American yields, resulting in a 0.80% uptick. Consequently, the USD/SEK now threatens the 20-day SMA of 10.470, a short-term solid resistance.
The US Bureau of Labor Statistics reported that the Unemployment rate for November declined to 3.7%. On the positive side, Nonfarm payrolls defied expectations, climbing to 199K against the foreseen 180K and the previous 150K figure. Meanwhile, Average Hourly Earnings marked up 0.4% for November, overshooting the predicted 0.3% and distinctly surpassing the preceding 0.2% rate.
Its worth noticing that recent hints from Federal Reserve (Fed) officials on potential further regulatory tightening have subdued dovish expectations, which pushed the pair downwards in the last sessions. In that sense, robust labor market data reinforce this caution as the bank seeks additional confirmation of the economy cooling down. Next week, the Consumer Price Index (CPI) figures from November may provide markets with further guidance, but the highlight will be the Fed decision, where investors will seek clues on the bank's next plans.
USD/SEK levels to watch
The technical indicators on the daily chart reflect a certain dominance of the selling momentum. The Relative Strength Index (RSI) is in negative territory with a positive slope, suggesting a potential short-term momentum shift, although it is limited while under the 50-midline. The Moving Average Convergence Divergence (MACD) shows flat green bars, suggesting a temporary pause in the selling pressure.
Yet, the broader picture is tilted toward the bears. The pair are lingering below the 20, 100, and 200-day Simple Moving Averages (SMAs), representing that the bears have the command in the bigger picture. Despite the bearish breather, the selling pressure remains the prominent force, especially after the sellers pushed the price to lows since July last week. Therefore, the short-term technical outlook is inclined toward the sellers.
Support Levels: 10.365, 10.275, 10.180.
Resistance Levels: 10.471 (20-day SMA),10.503, 10.540.
USD/SEK daily chart
-638376612790812488.png)
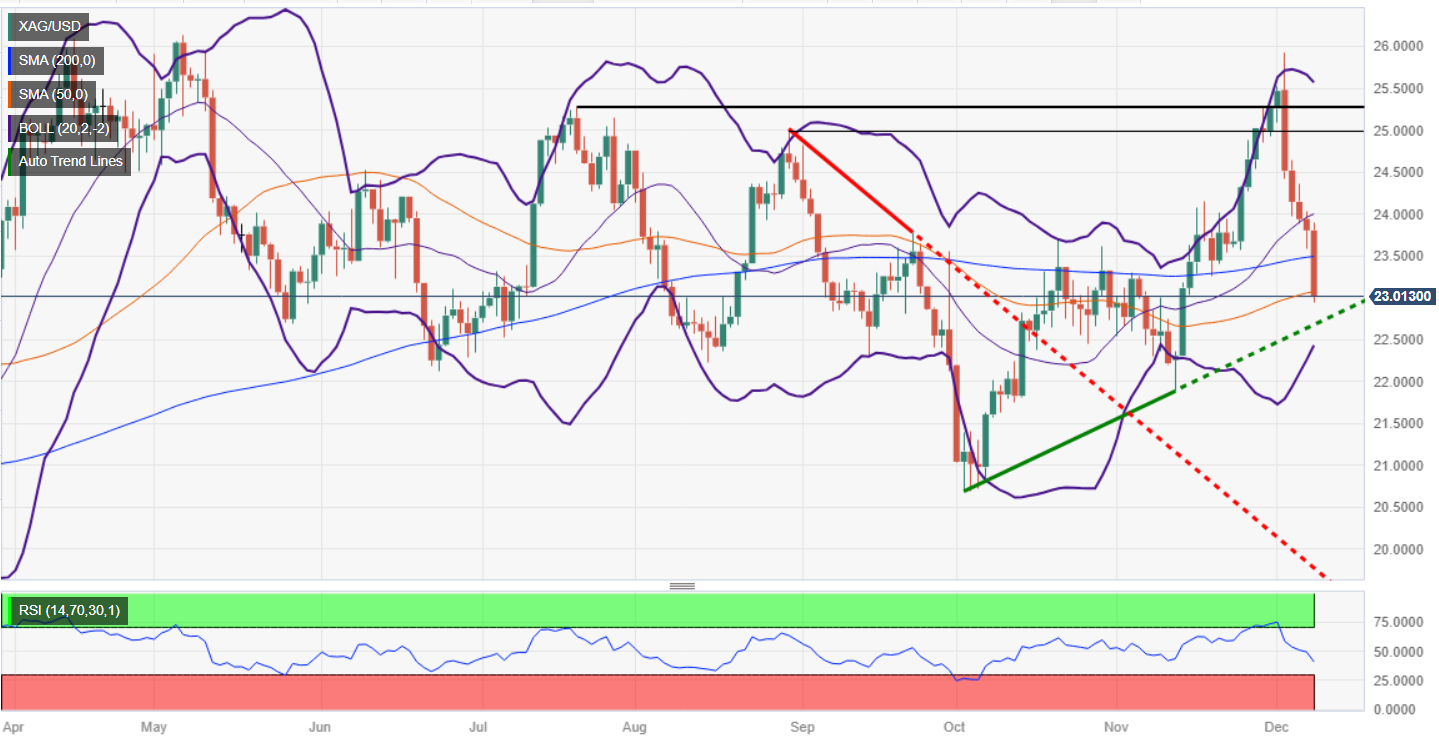
- XAG/USD confirms a downtrend by breaking below 200, 100, and 50-day moving averages.
- Downtrend signals potential testing of November 13 swing low at $21.88 unless buyers intervene to lift the spot price.
- On the upside, buyers must reclaim $23.00 to challenge and surpass broken DMAs, potentially targeting $24.00.
Silver price is collapsing more than 3% in the day, breaking key support levels on its way south, set to finish the week with losses of more than 9.50%. At the time of writing, XAG/USD is trading at $22.97 after hitting a daily high of $23.89.
XAG/USD’s daily chart confirms the grey metal’s downtrend after breaching the 200, 100, and 50-day moving averages (DMAs), each at $23,49, $23.24, and $23.06. That said unless buyers lift the spot price, that would set the stage for a test of the November 13 swing low of $21.88.
Firstly, XAG/USD sellers must drag prices below a support trendline that passes at around $22.69. Once cleared, the next stop would be $22.00, ahead of the November 13 daily low mentioned above.
Conversely, if Silver buyers reclaim the $23.00 figure, that could pave the way for reclaiming each DMA previously broken. Once those levels are cleared, up next would bet the $24.00 mark.
XAG/USD Price Analysis – Daily Chart
XAG/USD Technical Levels
- GBP/USD hits a new low on Friday after a week of rough downside action.
- Next week sees back-to-back central bank appearances from the Fed and BoE.
- Downside momentum remains a key risk for the GBP heading into the year's final CB rate calls.
The GBP/USD is trying to hold onto 1.2550 heading into the Friday market close after dropping into a new low for the week near the 1.2500 handle after a better-than-expected US Nonfarm Payrolls (NFP) gave the US Dollar (USD) one last bump across the board to round out the trading week.
The Pound Sterling (GBP) spent most of the week underwater, waffling against its higher-profile peers and seeing only moderate gains against its weaker competitors. The GBP/USD pair is down one and a third percent from Monday’s opening bids as US economic releases dominated the data docket this week with a thin showing from the UK.
Market reactions centered around Federal Reserve (Fed) positioning this week, with investors weighing increased odds of Fed rate cuts coming sooner rather than later on a case-by-case basis, flipping into and out of risk bids as US economic figures beat or miss market data forecasts from one release to the next.
US NFP beats the street, thin UK data keeps the GBP pinned
Friday ended on a USD-positive note after US Nonfarm Payrolls beat expectations once again, showing the US added a net 199K new jobs to the already-tight labor market, above the market forecast of 180K and climbing above October’s print of 150K payroll additions.
November’s ADP Employment Change released earlier in the week showed a below-expectation performance, with ADP reporting a slower pace of new payroll employees of 103K compared to October’s 106K and missing median market forecasts of 130K. The ADP pullback set up over-eager market participants for disappointment with investors leaning heavier into Fed rate cut bets on the back of softening pre-NFP labor data, but Friday’s employment beat muddied the rate expectations waters to wrap up the trading week.
Next week sees a slew of central bank action through the midweek, with the US Fed giving one last rate call for 2023 and updating their inflation outlook dot plot, to be followed by the Bank of England (BoE) and its latest interest rate decision. Both central banks are expected to keep interest rates steady to close out 2023, at 5.5% and 5.25% respectively.
Before central bank action gets underway, next Tuesday brings UK Average Earnings and Claimant Count Change figures; annualized quarterly average earnings are expected to decline from 7.7% to 7.4% in the third quarter, while November is expected to show a slight increase in the number of unemployment benefits seekers from 17.8K to 20.3K.
Pound Sterling price this week
The table below shows the percentage change of Pound Sterling (GBP) against listed major currencies this week. Pound Sterling was the weakest against the Japanese Yen.
| USD | EUR | GBP | CAD | AUD | JPY | NZD | CHF | |
| USD | 1.16% | 1.25% | 0.76% | 1.55% | -1.01% | 1.42% | 1.42% | |
| EUR | -1.18% | 0.10% | -0.40% | 0.39% | -2.22% | 0.28% | 0.26% | |
| GBP | -1.29% | -0.10% | -0.50% | 0.28% | -2.30% | 0.17% | 0.17% | |
| CAD | -0.76% | 0.41% | 0.51% | 0.80% | -1.79% | 0.68% | 0.67% | |
| AUD | -1.56% | -0.40% | -0.29% | -0.80% | -2.61% | -0.11% | -0.12% | |
| JPY | 0.95% | 2.15% | 2.40% | 1.77% | 2.55% | 2.42% | 2.40% | |
| NZD | -1.44% | -0.27% | -0.17% | -0.68% | 0.11% | -2.47% | 0.00% | |
| CHF | -1.46% | -0.26% | -0.17% | -0.67% | 0.11% | -2.46% | 0.00% |
The heat map shows percentage changes of major currencies against each other. The base currency is picked from the left column, while the quote currency is picked from the top row. For example, if you pick the Euro from the left column and move along the horizontal line to the Japanese Yen, the percentage change displayed in the box will represent EUR (base)/JPY (quote).
GBP/USD Technical Outlook
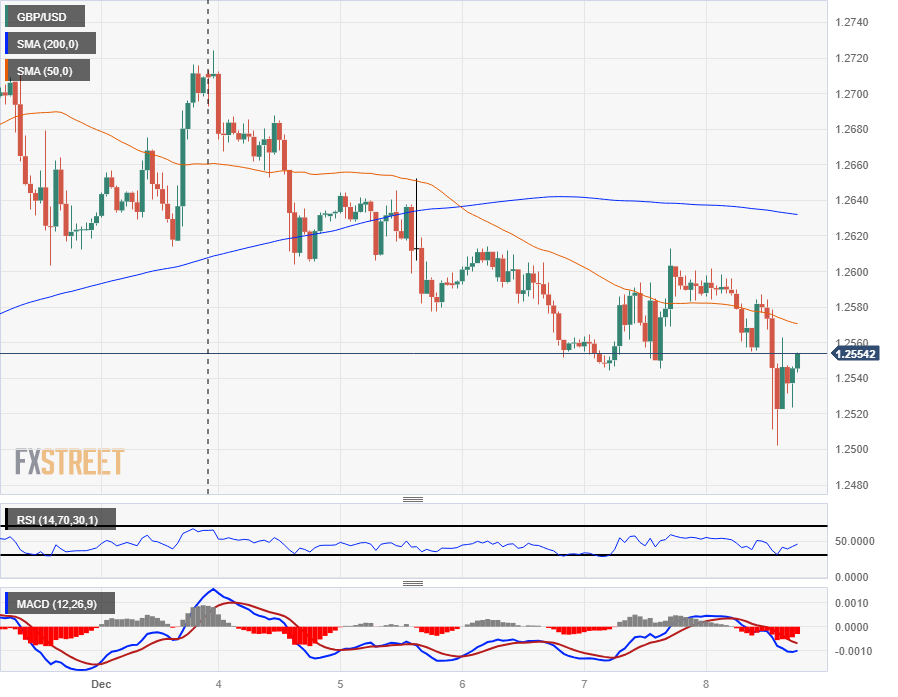
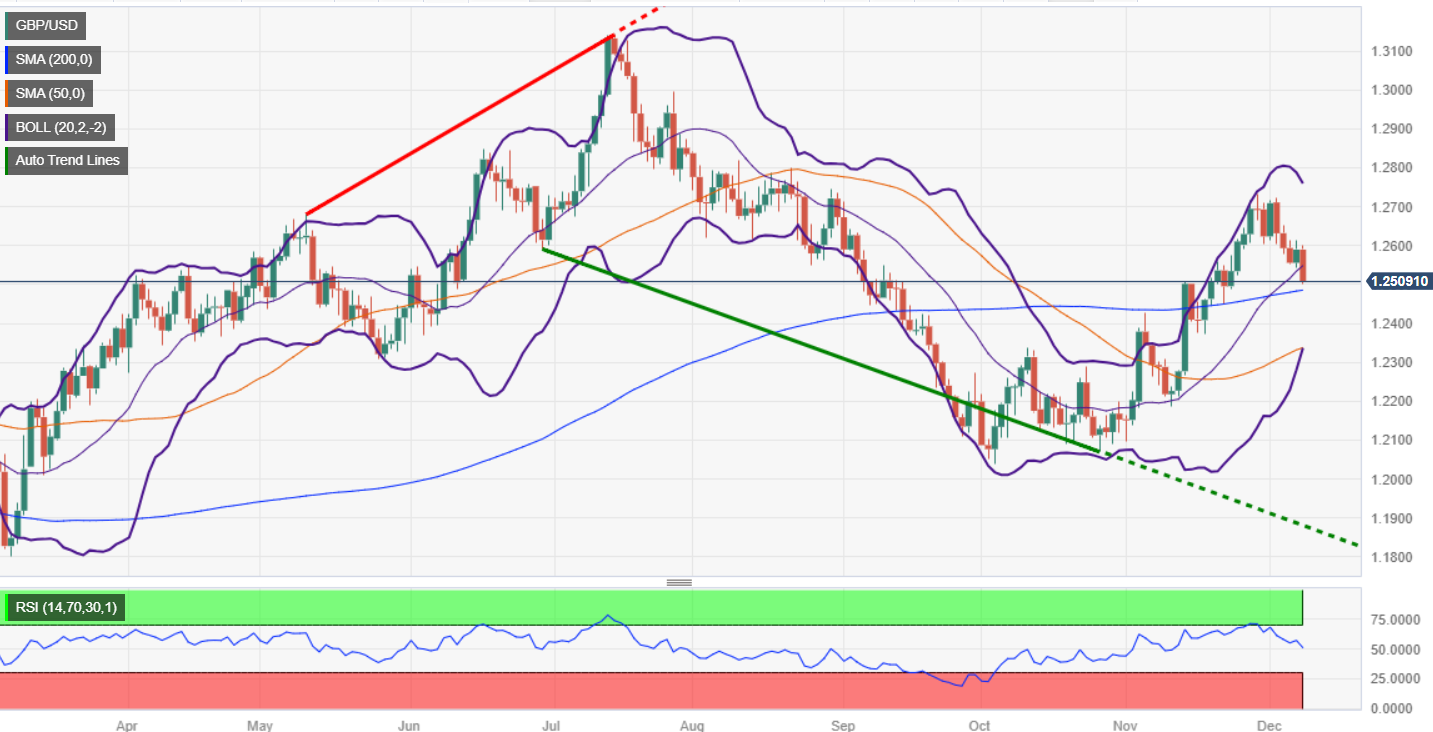
The Pound Sterling shed the 200-hour Simple Moving Average (SMA) early in the week, descending below the 1.2600 handle to remain capped on the low side for the rest of the trading week. The GBP/USD pressed into a new weekly low near 1.2500 on Friday, and heads into the market close struggling to hold onto 1.2550 below the 50-hour SMA.
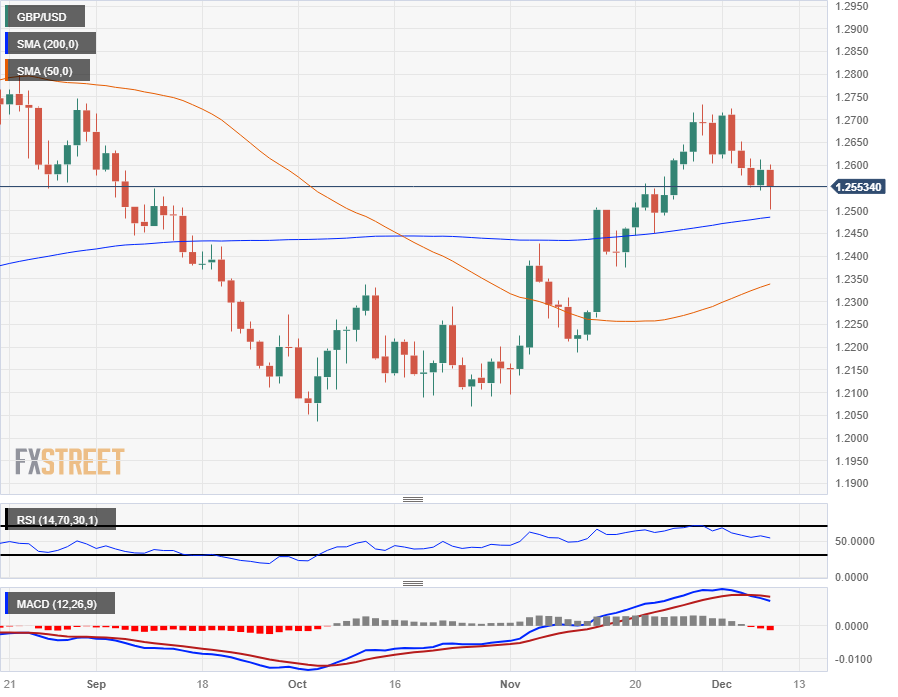
The GBP/USD fell 1.75% peak-to-trough on the week, and still remains down 1.33% despite a soft rebound from Friday’s new low, although GBP bulls will note that daily candlesticks are seeing technical support from the 200-day SMA rising into the 1.2500 handle, with the 50-day SMA accelerating into the upside from 1.2300.
Despite the week’s declines the GBP/USD is still up 4.3% from October’s early low of 1.2037, and the challenge for bullish bidders will be to stage a technical recovery and muscle the pair back over last week’s high bids just beyond the 1.2700 handle.
GBP/USD Hourly Chart
GBP/USD Daily Chart
GBP/USD Technical Levels
- Gold slips below $2,000 down 0.50% spurred by elevated US bond yields as a consequence of solid data.
- US Bureau of Labor Statistics (BLS) revealed the Nonfarm payrolls surpassed estimates, while the Unemployment Rate ticks down to 3.7%.
- University of Michigan (UoM) data shows increased optimism among American households, inflation expectations downward revised.
- Federal Reserve’s rate-cut expectations for 2024 decline to 118 basis points, according to the Chicago Board of Trade (CBOT).
Gold price retreats below the $2,000 mark for the first time since November 24, extending its losses to 0.50%, spurred by solid data from the United States (US). The XAU/USD is trading at $1996 after hitting a daily high of $2034.00.
XAU/USD’s retreated below $2,000, which could push prices further downwards
XAU/USD’s decline follows the latest US employment report showing the labor market is improving in contrast to recent data revealed during the week. The US Bureau of Labor Statistics (BLS) showed the economy created 199K jobs, exceeding forecasts of 180K, while the Unemployment Rate ticked down from 3.9% to 3.7%.
That spurred a rally in the Greenback (USD), as shown by the US Dollar Index (DXY), remaining firm 0.40% above its opening price of 104.03, making dollar-denominated commodities more expensive. The US 10-year benchmark note yields 4.237%, eight basis points higher than Thursday’s close.
Additional data from the University of Michigan (UoM) showed that American households remain more optimistic about the economy while seeing an improvement in the battle against inflation as they downward revised inflation expectations.
All that said, traders paired slashed rate-cut bets on the Federal Reserve’s for the following year. Data from the Chicago Board of Trade (CBOT) suggests investors expect 118 basis points of rate cuts for 2024, below last week’s 140 bps. This means market participants see the Fed as less dovish than the previous week.
Aside from this, traders focus on the following week's US inflation report and the Federal Open Market Committee (FOMC) meeting. Inflation is expected to stay at 3.1% in twelve months, and monthly inflation will likely remain at 0%. The Core Consumer Price Index (CPI) is forecasted to stay at 4% unchanged YoY and 0.3% in monthly readings. Regarding the Fed, traders expect the US central bank to keep rates intact.
XAU/USD Technical Levels
- DXY Index is above the 20-day SMA at 104.05.
- US NFPs from November accelerated, as did Average Hourly Earnings. The Unemployment Rate declined.
- US is set to report CPI inflation next Tuesday.
The US Dollar (USD) continued to command the financial markets as it soared to the 104.05 mark, primarily because of positive labor market cues and a surge in yields, which suggests that markets are delaying rate cuts in 2024. The gains for the USD Index (DXY) were fueled by economic reports from November, prominently Average Hourly Earnings, Unemployment Rate and Nonfarm Payrolls, all of which collectively fuelled hawkish bets on the Federal Reserve (Fed).
Moderating US inflation figures from October fuelled dovish expectations regarding the Federal Reserve's stance at the beginning of November. However, Fed officials' signals considering further tightening are dampening these expectations, and strong labor market data reaffirms this cautious stance by the bank, which is requesting further evidence on the economy cooling down. The upcoming inflation data from November and the Fed meeting next week will be critical determinants for the USD’s short-term trajectory.
Daily Market Movers: US Dollar rising on the strength of labor market data
- The US dollar is making gains today, riding on a wave of strong labor market data and climbing yields.
- According to the US Bureau of Labor Statistics, November's Average Hourly Earnings MoM figures revealed a better-than-expected increase of 0.4%, exceeding both consensus and previous numbers of 0.3% and 0.2%, respectively.
- The Nonfarm Payrolls for November showed 199K new jobs were added to the US economy, surpassing consensus expectations of 180K and the preceding number of 150K jobs.
- The Unemployment Rate came in at 3.7%, lower than the anticipated figure of 3.9%.
- US bond yields are rising, with rates for 2-year, 5-year and 10-year bonds rising to 4.72%, 4.24%, and 4.23%, respectively.
- As per the CME FedWatch Tool, the market expects no rate hike in the December Fed meeting but anticipates less easing in 2024.
- Next week will see Tuesday's release of the Headline and Core Consumer Price Index (CPI) for November, which will likely shape the expectations for the next Fed decisions.
Technical Analysis: US Dollar bulls step in, but bears are still in command
The indicators on the daily chart reflect a short-term conflicted landscape for the US Dollar. The Relative Strength Index (RSI) position is on a positive slope, albeit in negative territory. This signals growing buying momentum, but it isn't robust enough to draw a definitive recovery. On the other hand, the histogram of the Moving Average Convergence Divergence (MACD) indicator paints a similar picture with green bars, which suggests that the selling pressure is declining.
Regarding the Simple Moving Averages (SMAs), the index sits above the 20-day SMA, yet below the 100-day SMA. Nonetheless, with respect to the 200-day SMA, it is clear that the index is operating in a generally bullish zone.
The resilience of bulls, in combination with bears taking a breather, insinuates that the selling force could be losing dominance over the buying force. However, the US Dollar Index needs to make a sustained move above the 100-day SMA for a change in the prevailing selling momentum. Until then, the overall technical outlook remains tentatively balanced toward the downside.
Support levels: 104.00 (20-day SMA), 103.50, 103.30.
Resistance levels: 104.40 (100-day SMA), 104.50,104.70.
US Dollar FAQs
What is the US Dollar?
The US Dollar (USD) is the official currency of the United States of America, and the ‘de facto’ currency of a significant number of other countries where it is found in circulation alongside local notes. It is the most heavily traded currency in the world, accounting for over 88% of all global foreign exchange turnover, or an average of $6.6 trillion in transactions per day, according to data from 2022.
Following the second world war, the USD took over from the British Pound as the world’s reserve currency. For most of its history, the US Dollar was backed by Gold, until the Bretton Woods Agreement in 1971 when the Gold Standard went away.
How do the decisions of the Federal Reserve impact the US Dollar?
The most important single factor impacting on the value of the US Dollar is monetary policy, which is shaped by the Federal Reserve (Fed). The Fed has two mandates: to achieve price stability (control inflation) and foster full employment. Its primary tool to achieve these two goals is by adjusting interest rates.
When prices are rising too quickly and inflation is above the Fed’s 2% target, the Fed will raise rates, which helps the USD value. When inflation falls below 2% or the Unemployment Rate is too high, the Fed may lower interest rates, which weighs on the Greenback.
What is Quantitative Easing and how does it influence the US Dollar?
In extreme situations, the Federal Reserve can also print more Dollars and enact quantitative easing (QE). QE is the process by which the Fed substantially increases the flow of credit in a stuck financial system.
It is a non-standard policy measure used when credit has dried up because banks will not lend to each other (out of the fear of counterparty default). It is a last resort when simply lowering interest rates is unlikely to achieve the necessary result. It was the Fed’s weapon of choice to combat the credit crunch that occurred during the Great Financial Crisis in 2008. It involves the Fed printing more Dollars and using them to buy US government bonds predominantly from financial institutions. QE usually leads to a weaker US Dollar.
What is Quantitative Tightening and how does it influence the US Dollar?
Quantitative tightening (QT) is the reverse process whereby the Federal Reserve stops buying bonds from financial institutions and does not reinvest the principal from the bonds it holds maturing in new purchases. It is usually positive for the US Dollar.
- The USD/JPY is paring back some of Thursday's losses, climbing back into the 145.00 handle.
- The US Dollar is fighting back after a steep decline sparked by a hawkish BoJ.
- US NFP figures beat expectations, keeping the Greenback bid through Friday market action.
The USD/JPY is back on the rebound for Friday after posting an extreme backslide on Thursday, climbing four-tenths of a percent from the day's opening bids and looking to pare back losses. The US Dollar (USD) traded flat against the Japanese Yen (JPY) through the early half of the trading week before getting knocked back after the Yen caught a broad-market rally on the back of unusually hawkish comments from Bank of Japan (BoJ) Governor Kazuo Ueda.
Friday sees the Greenback attempting to claw back chart paper, rising back into the 145.00 handle after a brief dip back into 142.50 at the start of the final trading session of the week.
US Nonfarm Payrolls (NFP) broadly beat the street on Friday, posting a net gain of 199K jobs through November versus the forecast 180K, and climbing over October's net jobs gain of 150K. Broader markets have been ramping up bets of an accelerated path towards rate cuts from the Federal Reserve (Fed), with many market participants expecting the first rate cut from the Fed by as early as next March.
A still-tight US labor market continuing to add more jobs than expected throws a small wrench in the works, bolstered by accelerating Average Hourly Earnings in November, which came in at 0.4% MoM compared to the forecast 0.3%. Worker earnings appear to be gaining in the near term after October printed 0.2% MoM.
Read More: US Nonfarm Payrolls increase by 199,000 in November
Despite the Dollar-positive NFP release, the USD/JPY remains deep in the red for the trading week after the Yen surged in one of its single best trading days in 13 months, fueled by speculation that the BoJ could finally be ending its negative rate regime as the Japanese central bank moves towards tighter monetary policy.
Despite the BoJ fearing a collapse in Japanese inflation sometime in 2025, Japanese Core Consumer Price Index (CPI) inflation continues to run hotter than expected, hitting 2.9% for the year into October and chalking in a nineteenth straight consecutive month of inflation outrunning the BoJ's 2% upper target band.
BoJ Governor Ueda hinted that the BoJ may begin moving to tighten monetary policy if wage growth begins to accelerate heading into 2024, sparking a broad-market bid splurge that sent the USD/JPY tumbling over 4% peak-to-trough on Thursday. The US Dollar recovered some ground, and continues to see a moderate climb heading into the Friday market close, but still remains well off the week's high bids.
Next week will be another Fed watch scenario, with the Federal Reserve delivering their last rate call of 2023, followed by an update to the Fed's 'dot plot', or summary of forward-looking inflation expectations. Any kind of decline in Fed inflation forecasts will likely spark a mark risk relief rally, and could send the US Dollar tumbling even further as investors chomp at the bit for Fed rate cuts.
Japanese Yen price this week
The table below shows the percentage change of Japanese Yen (JPY) against listed major currencies this week. Japanese Yen was the weakest against the US Dollar.
| USD | EUR | GBP | CAD | AUD | JPY | NZD | CHF | |
| USD | 1.30% | 1.42% | 0.84% | 1.76% | -1.07% | 1.60% | 1.50% | |
| EUR | -1.33% | 0.13% | -0.46% | 0.47% | -2.41% | 0.30% | 0.19% | |
| GBP | -1.45% | -0.12% | -0.58% | 0.35% | -2.52% | 0.17% | 0.07% | |
| CAD | -0.85% | 0.46% | 0.59% | 0.93% | -1.94% | 0.76% | 0.64% | |
| AUD | -1.79% | -0.47% | -0.34% | -0.93% | -2.91% | -0.15% | -0.27% | |
| JPY | 1.02% | 2.36% | 2.63% | 1.92% | 2.82% | 2.66% | 2.52% | |
| NZD | -1.61% | -0.29% | -0.17% | -0.75% | 0.17% | -2.68% | -0.09% | |
| CHF | -1.52% | -0.18% | -0.05% | -0.64% | 0.28% | -2.58% | 0.11% |
The heat map shows percentage changes of major currencies against each other. The base currency is picked from the left column, while the quote currency is picked from the top row. For example, if you pick the Euro from the left column and move along the horizontal line to the Japanese Yen, the percentage change displayed in the box will represent EUR (base)/JPY (quote).
USD/JPY Technical Outlook
The US Dollar is up four-tenths of a percent against the Yen on Friday, and looking for further upside momentum after climbing from Friday's early low of 142.50. Topside technical resistance from the 50-hour Simple Moving Average sits nearby just beyond the 145.00 handle, with further pressure from the 200-hour SMA descending into 146.75.
Thursday's dip and Friday's moderate recovery sees the USD/JPY setting up a technical bounce from the 200-day SMA just above 142.00, and the trick for Greenback bidders will be to push the pair back towards the 147.00 handle, where they can take a fresh run at the 50-day SMA parked just below the 150.00 major price level.
USD/JPY Hourly Chart
USD/JPY Daily Chart
USD/JPY Technical Levels
- EUR/USD declines over 0.20%, hits daily low of 1.0723 post-US Nonfarm Payrolls; trims losses to 1.0767 after upbeat UoM Consumer Sentiment.
- US Bureau of Labor Statistics reveals a resilient job market, adding 199K employees, lowering the Unemployment Rate to 3.7%.
- University of Michigan (UoM) Consumer Sentiment beats estimates while inflation expectations slide.
The EUR/USD fell decently more than 0.20% during the North American session after it dived to a daily low of 1.0723 courtesy of a slid US Nonfarm Payrolls report. However, after a better-than-expected University of Michigan Consumer Sentiment report, the pair has trimmed some earlier losses. The major is trading at 1.0747.
EUR/USD dropped as US Nonfarm Payrolls exceed estimates, but UoM Consumer Sentiment provides relief
A busy economic calendar in the United States (US) keeps EUR/USD traders entertained. Initially, the Bureau of Labor Statistics (BLS) revealed the economy remains resilient, as the workforce added 199K employees, exceeding the forecast of 180K. At the same time, the Unemployment Rate dropped from 3.9% to 3.7%, while the Average hourly earnings stood unchanged at 4%.
The US Dollar gathered traction on the data’s release, as the EUR/USD dropped toward its daily low before pairing those losses. The US Dollar Index (DXY), which tracks the currency’s performance against six others, registers gains of 0.40%, up at 103.07
The University of Michigan (UoM) Consumer Sentiment recently showed that American households had grown optimistic, snapping four months of declines. The index rose by 69.4, the highest since August, exceeding estimates of 62.0 while inflation expectations slid. Americans estimate inflation in twelve months at 3.1%, down from 4.5%, while for five years, is foreseen at 2.8%, less than November’s 3.2%.
Across the Atlantic, the inflation in Germany slowed to 2.3% as measured by the HICP, below forecasts prior’s month 3%. That has opened the door for a less hawkish reaction by the European Central Bank (ECB), which is expected to hold its monetary policy meeting next week.
EUR/USD Price Analysis: Technical outlook
The EUR/USD daily chart portrays the pair as neutral to downward biased, with sellers in charge, as they dragged the exchange rate below the 100-day moving average (DMA) at 1.0762. A daily close below that level can pave the way toward the 50-DMA at 1.0700. A breach of the latter will expose the November 10 swing low of 1.0655. Conversely, an uptrend resumption could happen if traders reclaim the 100-DMA, opening the door for a rally to 1.0800.
- The Canadian Dollar follows a broad-market risk bid to higher ground on Friday.
- Economic data from Canada is thin on Friday, as well as all next week.
- Crude Oil takes a little off the top, paring back recent losses and helping to prop up the CAD.
The Canadian Dollar (CAD) is up on Friday, gaining ground across the FX board. Still, gains are thin and the charts remain choppy as investors readjust their positions and expectations after the US Nonfarm Payrolls (NFP) for November surprised to the upside. At the time of writing, the CAD is up a little over a tenth of a percent against the US Dollar (USD), while the Loonie’s strongest performance is against the Kiwi (NZD), climbing over seven-tenths of a percent.
Canada brings little significant economic data on Friday, and the same rings true for next week with next to nothing on the calendar docket for the CAD until next Friday’s appearance from Bank of Canada (BoC) Governor Tiff Macklem. BoC Governor Macklem is expected to answer audience questions after speaking at the Canadian Club of Toronto.
Daily Digest Market Movers: Canadian Dollar in the green for Friday despite rough ride from US NFP
- The Canadian Dollar is up across the broader FX market on Friday, gaining ground against every other major currency, with the US Dollar taking a tight second place.
- The US Dollar climbed ahead of Friday’s US Nonfarm Payrolls before falling back post-release.
- US November NFP figure beats expectations on Friday, coming in at a hair under 200K, well above the forecast for 180K and clearing further ground above October’s 150K showing.
- Despite the swing in risk sentiment after a better-than-expected NFP print, investors will be keeping a close eye on recent figures heading into 2024 and be on the lookout for revisions.
- Of the last twelve consecutive NFP releases, all but four have been revised lower after the fact. Of the four, only two were revised higher; the two most recent prints have yet to fall under the red pen’s stroke.
- The University of Michigan’s Consumer Sentiment Index also came in well above expectations, printing at 69.4, well above the forecasted 62.0 and climbing even further above November’s print of 61.3.
- Next week brings US Consumer Price Index (CPI) inflation figures as well as the Federal Reserve’s (Fed) final Interest Rate Decision, and markets will be keen to see what updates are made to the Fed’s ‘dot plot’ of interest rate projections.
- Crude Oil is seeing a moderate bounceback after declining through most of the week. West Texas Intermediate (WTI) Crude Oil has climbed back to $71.50 per barrel on Friday after declining nearly 8% from Monday’s opening bids, falling to $69.01 per barrel on Thursday.
- A rebound in Crude Oil, even a thin one, is a welcome bump for the Canadian Dollar, which is still down eight-tenths of a percent against the US Dollar from Monday’s open.
Canadian Dollar price today
The table below shows the percentage change of Canadian Dollar (CAD) against listed major currencies today. Canadian Dollar was the strongest against the New Zealand Dollar.
| USD | EUR | GBP | CAD | AUD | JPY | NZD | CHF | |
| USD | 0.19% | 0.30% | -0.13% | 0.11% | 0.10% | 0.57% | 0.44% | |
| EUR | -0.21% | 0.09% | -0.32% | -0.09% | -0.10% | 0.37% | 0.26% | |
| GBP | -0.33% | -0.14% | -0.47% | -0.23% | -0.24% | 0.23% | 0.12% | |
| CAD | 0.14% | 0.32% | 0.45% | 0.25% | 0.23% | 0.71% | 0.58% | |
| AUD | -0.11% | 0.09% | 0.21% | -0.24% | 0.00% | 0.46% | 0.35% | |
| JPY | -0.10% | 0.11% | 0.23% | -0.24% | 0.01% | 0.49% | 0.36% | |
| NZD | -0.56% | -0.37% | -0.25% | -0.70% | -0.45% | -0.47% | -0.10% | |
| CHF | -0.46% | -0.26% | -0.15% | -0.62% | -0.36% | -0.37% | 0.10% |
The heat map shows percentage changes of major currencies against each other. The base currency is picked from the left column, while the quote currency is picked from the top row. For example, if you pick the Euro from the left column and move along the horizontal line to the Japanese Yen, the percentage change displayed in the box will represent EUR (base)/JPY (quote).
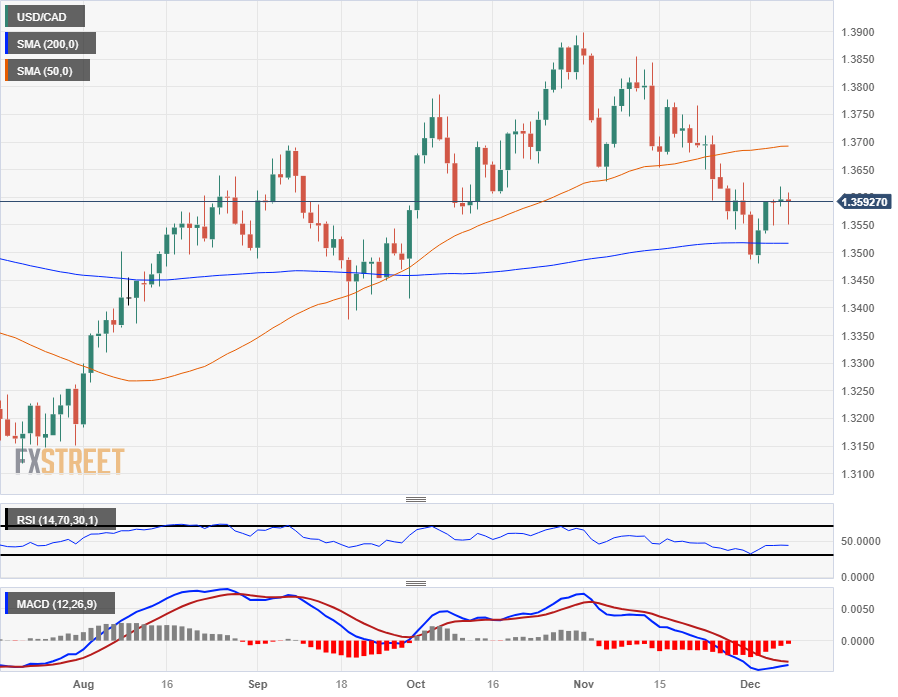
Technical Analysis: Canadian Dollar looking for gains on Monday, USD/CAD hampered by 1.3600
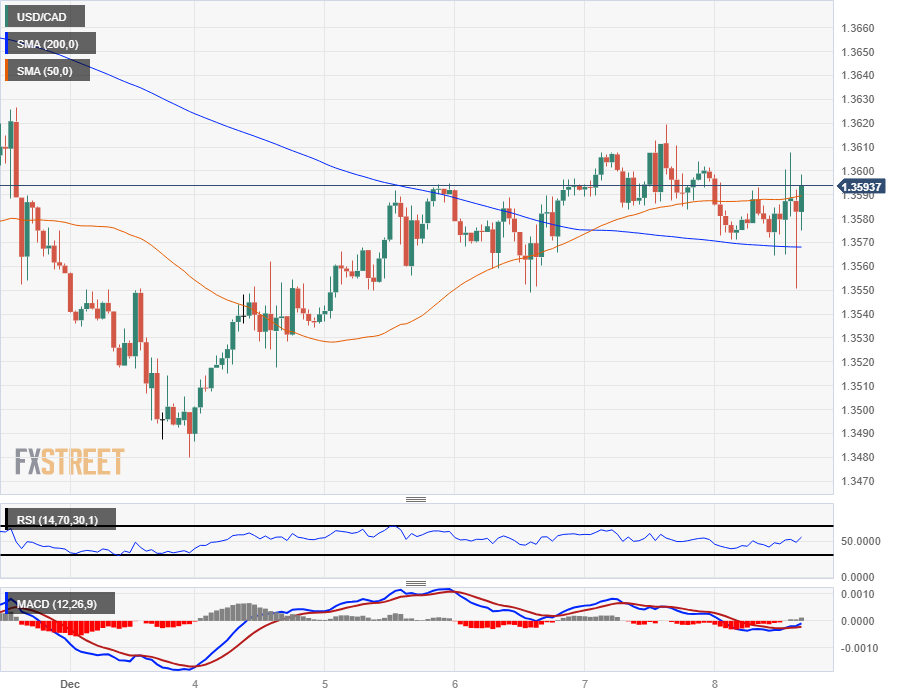
The USD/CAD saw some back-and-forth action on Friday, pointing to 1.3550 before rallying back towards the 1.3600 handle. Intraday action is getting squeezed into the midrange, with technical support coming from the 200-hour Simple Moving Average (SMA) near 1.3570.
Bullish momentum looks set to stall after a bounce from the 200-day SMA just above the 1.3500 handle, and daily candles have been closing in the middle for the back half of the trading week.
A bullish break will take the USD/CAD back toward the 50-day SMA near 1.3700, while a downside retest of the 200-day SMA will clear the way for another bearish run at September’s swing lows into 1.3400.
USD/CAD Hourly Chart

USD/CAD Daily Chart

Canadian Dollar FAQs
What key factors drive the Canadian Dollar?
The key factors driving the Canadian Dollar (CAD) are the level of interest rates set by the Bank of Canada (BoC), the price of Oil, Canada’s largest export, the health of its economy, inflation and the Trade Balance, which is the difference between the value of Canada’s exports versus its imports. Other factors include market sentiment – whether investors are taking on more risky assets (risk-on) or seeking safe-havens (risk-off) – with risk-on being CAD-positive. As its largest trading partner, the health of the US economy is also a key factor influencing the Canadian Dollar.
How do the decisions of the Bank of Canada impact the Canadian Dollar?
The Bank of Canada (BoC) has a significant influence on the Canadian Dollar by setting the level of interest rates that banks can lend to one another. This influences the level of interest rates for everyone. The main goal of the BoC is to maintain inflation at 1-3% by adjusting interest rates up or down. Relatively higher interest rates tend to be positive for the CAD. The Bank of Canada can also use quantitative easing and tightening to influence credit conditions, with the former CAD-negative and the latter CAD-positive.
How does the price of Oil impact the Canadian Dollar?
The price of Oil is a key factor impacting the value of the Canadian Dollar. Petroleum is Canada’s biggest export, so Oil price tends to have an immediate impact on the CAD value. Generally, if Oil price rises CAD also goes up, as aggregate demand for the currency increases. The opposite is the case if the price of Oil falls. Higher Oil prices also tend to result in a greater likelihood of a positive Trade Balance, which is also supportive of the CAD.
How does inflation data impact the value of the Canadian Dollar?
While inflation had always traditionally been thought of as a negative factor for a currency since it lowers the value of money, the opposite has actually been the case in modern times with the relaxation of cross-border capital controls. Higher inflation tends to lead central banks to put up interest rates which attracts more capital inflows from global investors seeking a lucrative place to keep their money. This increases demand for the local currency, which in Canada’s case is the Canadian Dollar.
How does economic data influence the value of the Canadian Dollar?
Macroeconomic data releases gauge the health of the economy and can have an impact on the Canadian Dollar. Indicators such as GDP, Manufacturing and Services PMIs, employment, and consumer sentiment surveys can all influence the direction of the CAD. A strong economy is good for the Canadian Dollar. Not only does it attract more foreign investment but it may encourage the Bank of Canada to put up interest rates, leading to a stronger currency. If economic data is weak, however, the CAD is likely to fall.
- The AUD/USD is oscillating around the 0.6580 level, reflecting a decline of 0.25%.
- US Labor market data from November showed that wages and job creation increased while Unemployment declined.
- US bond yields made the US Dollar gain interest.
The Aussie dollar (AUD) experienced a dip in its Friday trading session, with the AUD/USD trading lower at approximately 0.6580. The downward movement can primarily be attributed to robust American labor market data, coupled with escalating U.S. yields, which drove demand to the Greenaback
The US Bureau of Labor Statistics data indicated that the November Average Hourly Earnings increased by 0.4% MoM, higher than the 0.3% expected and the previous 0.2%. Moreover, US Nonfarm Payrolls surprisingly jumped to 199K in November from the former 150K, surpassing the forecast of 180K, while the Unemployment rate declined to 3.7% from 3.9%.
As a reaction, the US Treasury yields are on the rise. The 2-year rate is at 4.70%, while the 5 and 10-year rates are trading at 4.24% and 4.25%, respectively, which favors the strengthening of the USD. In that sense, the strong employment figures have spurred speculations surrounding the Federal Reserve's monetary policy regarding how long the bank will maintain rates at restrictive levels. It's worth noticing that Fed officials left the door open for further tightening as they haven’t seen enough evidence of the economy cooling down, so strong data may delay rate cuts.
Next week, the US will release Consumer Price Index (CPI) figures from November, which will be closely watched by markets.
AUD/USD levels to watch
The AUD/USD daily chart is delivering mixed signals. Despite the negative slope in the Relative Strength Index (RSI) indicating lowered buying momentum in the short term, the indicator is still within the positive territory, suggesting that, overall, bullish sentiment has not entirely dissipated. However, the Moving Average Convergence Divergence (MACD) prints rising red bars, indicating growing bearish momentum.
Although bears appear to be gaining ground recently, the index's placement above its 20-day, 100-day, and 200-day Simple Moving Averages (SMAs) can't be overlooked. This position illustrates that despite short-term selling pressures, the overall trend remains bullish, indicating that the latter maintains a stronghold in the wider context in this tug-of-war between bears and bulls.
Support Levels: 0.6575 (200-day SMA), 0.6560 (20-day SMA), 0.6530.
Resistance Levels: 0.6600, 0.6630, 0.6650.
AUD/USD daily chart
-638376493599832898.png)
- Mexican Peso recovers from around weekly lows, and reclaims the 100-day SMA.
- Mexico’s Producer Price Index was softer than estimated, keeping Banxico’s hopes of easing policy next year alive.
- US Nonfarm Payrolls in November were better than foreseen, in contrast to previously released jobs data.
Mexican Peso (MXN) rallies against the US Dollar (USD) during the North American session on Friday, although data from the United States (US) showed the labor market is not as soft as suggested by previously released data during the week. Consequently, traders pared bets on rate cuts by the US Federal Reserve (Fed) for the next year while the Greenback rose. Nevertheless, the Mexican currency remains strong, as depicted by the USD/MXN trading at 17.32, losing 0.80% on the day.
Mexico’s economic docket revealed that inflation on the producer side was softer compared to October’s data, revealed the National Statistics Agency (INEGI). That reinforces the thesis that prices are slowing down, which leaves the Bank of Mexico (Banxico) officials scratching their heads as consumer inflation rises.
Across the border, the US Bureau of Labor Statistics (BLS) revealed the labor market remains strong, with the economy adding more jobs than estimated by market participants, pushing the Unemployment Rate further away from projections of the Federal Reserve.
Daily digest market movers: Mexican Peso on the offensive despite solid US jobs report
- Mexico’s Produce Price Index (PPI) rose by 1.20% YoY in November, below October’s 1.30%. In month-over-month figures, the PPI rate plunged from 0.5% in October to -0.4% in November.
- The latest consumer inflation report in Mexico missed forecasts and exceeded October’s reading.
- Banxico’s officials recently expressed their desire to ease monetary policy, though the divergence in consumer and producer inflation could prevent a rate cut by the first quarter of 2024.
- Nevertheless, there is a dissenter as Deputy Governor Irene Espinosa pushed back and said inflationary risks remain and are growing.
- US Nonfarm Payrolls exceeded forecasts of 180K and rose by 199K in November, while the Unemployment Rate slid to 3.7% from 3.9%.
- Average Hourly Earnings, seen as a measure of inflation, grew as expected by 4%, while monthly data advanced by 0.4%, above previous month's 0.2%.
- Following the US employment report, jobs data suggests the labor market is cooling, but at a slower pace than expected by traders. Per the market’s reaction, investors were overly aggressive on the Fed rate cut expectations, with market participants pairing the Federal Reserve’s rate-cut bets for the next year. According to data from the Chicago Board of Trade (CBOT), 120 basis points of rate cuts are estimated, 20 bps less than a week ago.
Technical Analysis: Mexican Peso buyers regain control as the USD/MXN slumps below the 100-day SMA
The USD/MXN shifted gears and is sliding below the 100-day Simple Moving Average (SMA), which lies at 17.39, suggesting that sellers are in charge but they would need a daily close below that level to extend its losses. The first support level is seen at the current week’s low of 17.16, followed by the area within the 17.00/05 range.
On the other hand, if USD/MXN buyers reclaim the 100-day SMA, that could open the door to challenging the 17.50 psychological level. A breach of the latter will expose the 200-day SMA at 17.55 will be exposed, followed by the 50-day SMA at 17.67.
Mexican Peso FAQs
What key factors drive the Mexican Peso?
The Mexican Peso (MXN) is the most traded currency among its Latin American peers. Its value is broadly determined by the performance of the Mexican economy, the country’s central bank’s policy, the amount of foreign investment in the country and even the levels of remittances sent by Mexicans who live abroad, particularly in the United States. Geopolitical trends can also move MXN: for example, the process of nearshoring – or the decision by some firms to relocate manufacturing capacity and supply chains closer to their home countries – is also seen as a catalyst for the Mexican currency as the country is considered a key manufacturing hub in the American continent. Another catalyst for MXN is Oil prices as Mexico is a key exporter of the commodity.
How do decisions of the Banxico impact the Mexican Peso?
The main objective of Mexico’s central bank, also known as Banxico, is to maintain inflation at low and stable levels (at or close to its target of 3%, the midpoint in a tolerance band of between 2% and 4%). To this end, the bank sets an appropriate level of interest rates. When inflation is too high, Banxico will attempt to tame it by raising interest rates, making it more expensive for households and businesses to borrow money, thus cooling demand and the overall economy. Higher interest rates are generally positive for the Mexican Peso (MXN) as they lead to higher yields, making the country a more attractive place for investors. On the contrary, lower interest rates tend to weaken MXN.
How does economic data influence the value of the Mexican Peso?
Macroeconomic data releases are key to assess the state of the economy and can have an impact on the Mexican Peso (MXN) valuation. A strong Mexican economy, based on high economic growth, low unemployment and high confidence is good for MXN. Not only does it attract more foreign investment but it may encourage the Bank of Mexico (Banxico) to increase interest rates, particularly if this strength comes together with elevated inflation. However, if economic data is weak, MXN is likely to depreciate.
How does broader risk sentiment impact the Mexican Peso?
As an emerging-market currency, the Mexican Peso (MXN) tends to strive during risk-on periods, or when investors perceive that broader market risks are low and thus are eager to engage with investments that carry a higher risk. Conversely, MXN tends to weaken at times of market turbulence or economic uncertainty as investors tend to sell higher-risk assets and flee to the more-stable safe havens.
- The Swiss Franc is weakening in most of its pairs, but especially against the USD and GBP after the release of US Payrolls.
- Nonfarm Payrolls in November rose by 199K, higher than the 180K expected; Unemployment dropped to 3.7% and wages rose.
- The data supported the US Dollar and riskier currencies against the safe haven Franc.
The Swiss Franc (CHF) trades lower in most of its major pairs on Friday after the release of a better-than-expected US jobs report supports risk appetite, driving flows away from the safe-haven Franc.
Daily digest market movers: USD/CHF rises as Dollar gains boost from labor report
- The Swiss Franc is weakening versus the US Dollar on Friday after the release of the US Nonfarm Payrolls report shows the US created a higher-than-expected number of jobs in November, reflecting a strong labor market.
- 199K new positions were filled, according to the US Bureau of Labor Statistics report, when a figure of 180K had been expected by economists.
- The report also showed that the US Unemployment Rate fell to 3.7% in November, from 3.9% in October. No change had been expected.
- Average Hourly Earnings came out at 0.4%, beating expectations of 0.3% and suggesting wage inflation pressures could be building. Hours Worked also rose, suggesting more full-time positions filled.
- The higher wage data and stronger employment metrics in general indicate the US economy is healthier than thought and that fresh inflationary pressures may yet emerge.
- The data could make the Federal Reserve keep interest rates higher for longer and think twice before cutting interest rates.
- Higher-for-longer interest rates will benefit the US Dollar since they are a magnet for capital inflows.
- The next big release for the US Dollar is the preliminary Michigan Consumer Sentiment Index out at 15:00 GMT, which is estimated to show a rise to 62 from 61.3 in December.
Swiss Franc technical analysis: USD/CHF posts short-term reversal insignia
USD/CHF – the number of Swiss Francs that one US Dollar can buy – is trading higher on Friday after the release of Nonfarm Payrolls.
The pair is rising after having completed a Measured Move price pattern during October and November. Measured Moves are three wave patterns that look like large zig-zags. The first and third waves are usually of a similar length. Wave C completed after achieving the same length as A. This further reinforces the bullish reversal since the December 4 lows.
-638376441859350614.png)
US Dollar vs Swiss Franc: Daily Chart
The MACD has completed a bullish cross (circled) in negative territory, adding more evidence, signaling potentially more upside on the horizon.
The short-term trend is bullish, and more gains are possible. The next target is at 0.8825, which offers soft resistance. Then comes the confluence of major moving averages residing at 0.8900, where tougher resistance is expected.
A break below the 0.8667 lows would negate the recovery and see bears back in charge, with likely losses to the 0.8552 July lows.
Daily digest market movers: Haven Franc weakens after German inflation data, US jobs
- The Swiss Franc falls against the Euro on Friday as risk appetite pivots on better-than-expected jobs data from the US.
- German inflation data comes out in line with expectations, with the country’s Harmonized Index of Consumer Prices (HICP) rising 2.3% YoY in November but falling 0.7% MoM, according to data from the Federal Statistics Office of Germany.
- Following lower-than-expected Eurozone inflation data as a whole, the German figures suggest a risk the European Central Bank (ECB) will cut interest rates, which is weighing on the Euro and limiting its gains.
- Lower interest rates tend to weaken a currency as they reduce capital inflows.
Swiss Franc technical analysis: EUR/CHF rebounds from 2023 lows
EUR/CHF – the number of Swiss Francs that one Euro can buy – has rebounded after touching its lowest level for the year.
Thursday saw the formation of a Bullish Engulfing Japanese candlestick reversal pattern (see rectangle on chart below) at a major support and resistance level, after the pair recovered from record lows. For the candlestick pattern to be confirmed, it would have to be followed by a green bullish day on Friday. This would provide a short-term bullish reversal signal.
-638376443227078793.png)
Euro vs Swiss Franc: Daily Chart
The pair is in a downtrend on all key timeframes (weekly, daily, 4hr), however, suggesting bears have the upper hand overall and prices remain at risk of capitulation.
A break below the 0.9403 lows would reconfirm the bearish bias and see prices fall into uncharted territory, with major whole numbers then expected to provide support at 0.9300, 0.9200, and so on.
Daily digest market movers: GBP/CHF declines after BoE survey
- The Swiss Franc falls versus the Pound Sterling pair on Friday after the US posts better-than-expected labor market data, easing global recession fears. This supports riskier currencies like the Pound Sterling over safe-havens such as the Swiss Franc.
- Earlier on Friday, the Franc had risen against the Pound after the Bank of England (BoE) published its Consumer Inflation Expectations survey, showing that the British public foresees inflation rising at a slower 3.3% pace in the year ahead, compared to the 3.6% recorded in the August survey.
- The report reflects hopes that inflation may be coming down, and if materialized will mean the BoE will have more incentive to decrease interest rates.
- Lower interest rates are generally negative for a currency as they deter inflows of foreign capital.
- The market view of the course of future interest rates in the UK has turned more dovish recently in line with most of the rest of the world. Traders in interest rate futures saw a relatively high chance of the BoE cutting interest rates by 0.75% (three 0.25% cuts) in 2024, as per data reported on Thursday, December 7.
Swiss Franc technical analysis: GBP/CHF trading at range lows
GBP/CHF – the number of Swiss Francs that one Pound Sterling can buy – is in a sideways trend on short and long timeframes, whilst the medium-term trend could be classified as very marginally bullish.
On the 4-hour chart used to analyze the short-term trend, the pair is bouncing up and down within the parameters of a range-corridor between 1.0990 and 1.1155.
-638376444884104481.png)
Pound Sterling vs Swiss Franc: 4-hour Chart
More recently it seems to have found a floor at the lows of this range. The pair has just formed a bullish Hammer Japanese candlestick formation (see rectangle in chart above) and is seeing strong bullish follow-through in the period that follows. This provides confirmation of the short-term bullish signal.
It is possible to see the outline of a complete measured move in the zig-zag of price action down from the November 29 high, with wave C completing at the November 7 low.
The MACD has risen above its signal line whilst well below the zero-line, further adding weight to the short-term bullish outlook. Indeed, looked at throughout December, the MACD looks like it might have formed a wide double-bottom bullish reversal pattern, further amplifying the strength of the current crossover buy signal.
All in all, the short-term chart suggests the GBP/CHF pair is turning around at the bottom of a range and beginning a bullish ascent back up to the range highs at 1.1155. A break above the 1.1040 level would provide further confirmatory evidence a new leg higher was underway.
Swiss Franc FAQs
What key factors drive the Swiss Franc?
The Swiss Franc (CHF) is Switzerland’s official currency. It is among the top ten most traded currencies globally, reaching volumes that well exceed the size of the Swiss economy. Its value is determined by the broad market sentiment, the country’s economic health or action taken by the Swiss National Bank (SNB), among other factors. Between 2011 and 2015, the Swiss Franc was pegged to the Euro (EUR). The peg was abruptly removed, resulting in a more than 20% increase in the Franc’s value, causing a turmoil in markets. Even though the peg isn’t in force anymore, CHF fortunes tend to be highly correlated with the Euro ones due to the high dependency of the Swiss economy on the neighboring Eurozone.
Why is the Swiss Franc considered a safe-haven currency?
The Swiss Franc (CHF) is considered a safe-haven asset, or a currency that investors tend to buy in times of market stress. This is due to the perceived status of Switzerland in the world: a stable economy, a strong export sector, big central bank reserves or a longstanding political stance towards neutrality in global conflicts make the country’s currency a good choice for investors fleeing from risks. Turbulent times are likely to strengthen CHF value against other currencies that are seen as more risky to invest in.
How do decisions of the Swiss National Bank impact the Swiss Franc?
The Swiss National Bank (SNB) meets four times a year – once every quarter, less than other major central banks – to decide on monetary policy. The bank aims for an annual inflation rate of less than 2%. When inflation is above target or forecasted to be above target in the foreseeable future, the bank will attempt to tame price growth by raising its policy rate. Higher interest rates are generally positive for the Swiss Franc (CHF) as they lead to higher yields, making the country a more attractive place for investors. On the contrary, lower interest rates tend to weaken CHF.
How does economic data influence the value of the Swiss Franc?
Macroeconomic data releases in Switzerland are key to assessing the state of the economy and can impact the Swiss Franc’s (CHF) valuation. The Swiss economy is broadly stable, but any sudden change in economic growth, inflation, current account or the central bank’s currency reserves have the potential to trigger moves in CHF. Generally, high economic growth, low unemployment and high confidence are good for CHF. Conversely, if economic data points to weakening momentum, CHF is likely to depreciate.
How does the Eurozone monetary policy affect the Swiss Franc?
As a small and open economy, Switzerland is heavily dependent on the health of the neighboring Eurozone economies. The broader European Union is Switzerland’s main economic partner and a key political ally, so macroeconomic and monetary policy stability in the Eurozone is essential for Switzerland and, thus, for the Swiss Franc (CHF). With such dependency, some models suggest that the correlation between the fortunes of the Euro (EUR) and the CHF is more than 90%, or close to perfect.
- GBP/USD traded volatile in the data release, though resumed its downtrend.
- US Nonfarm Payrolls figures exceeded estimates; hence traders priced out one Fed rate cut for 2024.
- Traders are eyeing the release of the University of Michigan Consumer Sentiment poll.
The GBP/USD dives 0.50% in early trading during the North American session, sponsored by news showing the economy in the United States (US) remained resilient as the workforce added more jobs than expected. At the time of writing, the major trades at 1.2505, after trading volatile within 1.2578/1.2511 at the news release.
US economy remains stronger than expected, hence the GBP/USD tumbles to new weekly lows
The US Bureau of Labor Statistics (BLS) revealed that 199K jobs were created in November, according to the Nonfarm Payrolls report. Market participants estimated a 180K increase, mainly driven by healthcare gains and auto workers. Digging into the data, the Unemployment Rate ticked lower from 3.9% to 3.7%. Average Hourly Earnings rose as the expected 4% on yearly readings, while month-over-month figures were up to 0.4% from 0.2% a month earlier.
Following the data release, trades had paired US Federal Reserve’s rate cut expectations for the following year. According to data from the Chicago Board of Trade (CBOT), 120 basis points of rate cuts are estimated, 20 bps less than a week ago.
Meanwhile, the Greenback is recovering from Thursday’s losses, as the US Dollar Index (DXY) is up by 0.50%, at 104.15. US Treasury bond yields are climbing from the short to the long end of the curve. The 10-year benchmark note rate is 4.235%, gaining eight basis points.
On the UK front, a scarce economic docket has traders awaiting the Bank of England’s (BoE) next week meeting. Economists expect the BoE to stay pat, though rate cut estimates for 2024 project 80 bps of monetary policy easing.
Ahead in the day, GBP/USD traders are eyeing the release of the University of Michigan (UoM) Consumer Sentiment poll and inflation expectations.
GBP/USD Price Analysis: Technical outlook
Friday’s price action has taken the GBP/USD near the 200-day moving average (DMA), at 1.2488, though it remains above the 1.25 figure. A decisive breach of the latter will expose the previously-mentioned support level, immediately followed by the 100-DMA at 1.2462. Downside risks will be reinforced once those two support levels are taken out, opening the door toward 1.2400. On the flip side, if buyers keep the exchange rate above 1.2500, they could threaten to regain 1.2550.
- The EUR/USD spikes down after better-than expected US payrolls data.
- Nonfarm payrrolls and hourly earnighs increase bayond expectatios in November.
- US data cools holes of Fed cuts and sends the USD higher.
The Euro has dropped more than 40 pips to hit a fresh three-week low below 1.0750 as the US Nonfarm Payrolls report has cooled hopes of Fed rate cuts in early 2024.
Nonfarm Payrolls data cools hopes of Fed cuts
The US economy created 199,000 jobs in November, well above the 1800,00 reading forecasted by market analysts, and up from the 150,000 jobs created in October.
Beyond that, hourly earnings increased at a 0.3% pace, somewhat faster than the 0.2% expected by the market. This reveals that the US labour market remains strong, tackling the doubs triggered by the weak JOLTs and ADP and dampening investors' hopes that the Fed might start easing its monetary policy in March.
The market reaction has supported the US Dollar, sending the EUR/USD to fresh lows below 1.0750 although the pair has trimmed some losses shortly afterwards.
Technical levels to watch
- The US Dollar (Index) dropped over 0.50% overnight after the Yen appreciated 4% in one day.
- Traders brace for Nonfarm Payrolls this Friday.
- The US Dollar Index has broken back below 104, though still holds gains for this week.
The US Dollar (USD) was having a crisis on Thursday after an outside event tripped the US Dollar Index (DXY) 0.50% into the red. The outside pressure came from the Japanese Yen which appreciated at one point nearly 4% intraday against the Greenback, and which is a major part of the basket of FX that makes up the US Dollar Index. The situation has stabilised for now, as traders focus on the US Jobs Report to be published later in the day.
On the economic front, the US Jobs Report will be the main event and will draw up all the attention. Traders will also need to be mindful of the University of Michigan Preliminary numbers coming out at the end of the European trading session. These numbers could either confirm or contradict the earlier Nonfarm Payroll (NFP) numbers and trigger volatility on the last trading day of the week.
Daily digest: NFP and Michigan catalysts
- A standstill in the markets until 13:30 GMT when the US Nonfarm Payrolls report comes out:
- Nonfarm payrolls number for November is expected to rise from 150,000 to 180,000.
- Monthly Average Hourly Earnings are expected to head from 0.2% to 0.3.%.
- Yearly Average Hourly Earnings are to head from 4.1% to 4%.
- The US Unemployment Rate for November is to remain unchanged at 3.9%.
- A bit more detail on the Nonfarm Payroll number: Expectations by economists range from 45,000 to 275,000. Expect thus a much stronger US Dollar and an upward move in the DXY when the NFP number snaps above 275,000. Any number below 45,000 will trigger substantial US Dollar weakness with a devaluing Greenback across the board and a DXY which will be sinking lower.
- Near 15:00 GMT the University of Michigan will release its preliminary data findings for December:
- The Sentiment Index is expected to head from 61.3 to 62.
- The Inflation expectations are set to head from 3.2% to 3.1%.
- Equities in Asia are falling out of bed for a second straight day in the aftermath of the possible decision by the Bank of Japan to increase the benchmark rate, which has been negative for decades. European equities are going the other way and are mildly in the green. US equity futures are flat.
- The CME Group’s FedWatch Tool shows that markets are pricing in a 97.7% chance that the Federal Reserve will keep interest rates unchanged at its meeting next week.
- The benchmark 10-year US Treasury Note drops to 4.17%.
US Dollar Index technical analysis: Where to go from here
The US Dollar is stuck on a crucial crossroads that might trigger either substantially more and longer-term US Dollar appreciation or devaluation. In the runup towards Super Wednesday and Super Thursday when markets will hear from no less than four of the biggest central banks in the world, it looks like the Greenback might reestablish its label as King Dollar. Traders looking for clues would best keep an eye on the spread between the US 2-year yield and the German 2-year yield, which has been getting wider – a situation which is correlated with a stronger US Dollar.
The DXY is bouncing back up again after the decline on Thursday where the Japanese Yen appreciation was just too much to bear. The DXY could still make it further up, should employment data trigger a spike in US yields again. A two-tiered move – first with NFP and then University of Michigan numbers – could move the DXY back above 104.28, with the 200-day and 100-day Simple Moving Averages (SMA) turned over to support levels.
To the downside, the 200-day SMA has done a tremendous job in supporting the DXY with buyers coming in below 103.56 and pushing it back towards that same level near the US closing bell. If it fails this Friday, the lows of November near 102.46 is a level to watch. More downside pressure could bring into view the 100 marker, in a case where US yields sink below 4%.
Nonfarm Payrolls FAQs
What are Nonfarm Payrolls?
Nonfarm Payrolls (NFP) are part of the US Bureau of Labor Statistics monthly jobs report. The Nonfarm Payrolls component specifically measures the change in the number of people employed in the US during the previous month, excluding the farming industry.
How does Nonfarm Payrolls influence the Federal Reserve monetary policy decisions?
The Nonfarm Payrolls figure can influence the decisions of the Federal Reserve by providing a measure of how successfully the Fed is meeting its mandate of fostering full employment and 2% inflation.
A relatively high NFP figure means more people are in employment, earning more money and therefore probably spending more. A relatively low Nonfarm Payrolls’ result, on the either hand, could mean people are struggling to find work.
The Fed will typically raise interest rates to combat high inflation triggered by low unemployment, and lower them to stimulate a stagnant labor market.
How does Nonfarm Payrolls affect the US Dollar?
Nonfarm Payrolls generally have a positive correlation with the US Dollar. This means when payrolls’ figures come out higher-than-expected the USD tends to rally and vice versa when they are lower.
NFPs influence the US Dollar by virtue of their impact on inflation, monetary policy expectations and interest rates. A higher NFP usually means the Federal Reserve will be more tight in its monetary policy, supporting the USD.
How does Nonfarm Payrolls affect Gold?
Nonfarm Payrolls are generally negatively-correlated with the price of Gold. This means a higher-than-expected payrolls’ figure will have a depressing effect on the Gold price and vice versa.
Higher NFP generally has a positive effect on the value of the USD, and like most major commodities Gold is priced in US Dollars. If the USD gains in value, therefore, it requires less Dollars to buy an ounce of Gold.
Also, higher interest rates (typically helped higher NFPs) also lessen the attractiveness of Gold as an investment compared to staying in cash, where the money will at least earn interest.
Sometimes Nonfarm Payrolls trigger an opposite reaction than what the market expects. Why is that?
Nonfarm Payrolls is only one component within a bigger jobs report and it can be overshadowed by the other components.
At times, when NFP come out higher-than-forecast, but the Average Weekly Earnings is lower than expected, the market has ignored the potentially inflationary effect of the headline result and interpreted the fall in earnings as deflationary.
The Participation Rate and the Average Weekly Hours components can also influence the market reaction, but only in seldom events like the “Great Resignation” or the Global Financial Crisis.
- The US Dollar pulls back ahead of the NFP report
- The uptick in Oil prices is providing support to the CAD.
- Longer term, the pair is in a corrective move after November’s sell-off.
The US Dollar is losing ground on Friday, calling an end to a 4-day rally as the loonie trims losses, favoured by higher Oil prices ahead of the US Nonfarm payrolls report.
The Dollar recovery lost steam on Thursday after the increase on last week’s Jobless Claims confirmed the softer US labour market anticipated by the JOLTs Job Openings and the ADP report and heightened speculation of Fed rate cuts in 2024.
In Canada, The BoC left rates on hold on Wednesday, keeping the doors open to further tightening although the comments about the cooling inflationary pressures have acted as a headwind for the CAD.
US Nonfarm Payrolls are likely to boost USD volatility
The main focus today is the US Nonfarm Payrolls, which are expected to show a moderate increase in employment and hourly wages. Investors will look at these figures with a special interest for confirmation that the Fed’s rate hikes have come to an end, which might boost volatility on US Dollar crosses.
The technical picture shows the pair is correcting higher, after a 3% sell-off in November. The next resistances are likely to be at the 4h 100SMA, at 1.3600, the November 30 high, 1.3622 and 1.3700.
Supports are 1.3520 and the December 4 low at 1.3475.
Technical levels to watch
- WTI Oil trades near $70 and briefly broke below it on Wednesday and Thursday.
- Oil outlook supports more downside as recent API and EIA data revealed substantial exports from the US
- The US Dollar (Index) dropped Thursday as Yen soared 4% at one point against the Greenback.
Oil prices are taking a small breather around $70, after their firm decline earlier this week. When looking at the Oil price and events at hand, it all boils down to simple supply and demand. At the moment there is too much supply, which OPEC+ looks unable to control or limit. Meanwhile the United States is dumping every barrel available on the market to take the wind out of the sales of Russia and locally trying to push gasoline prices lower with a presidential election coming up in 2024.
Meanwhile, the US Dollar (USD) got a kick in the back from the Japanese Yen which weighed on the US Dollar Index (DXY). The Yen was up 4% in value against the US Dollar, on the back of comments from the Bank of Japan that alluded to the end of decades of negative yields. With that substantial shift in monetary policy from the Bank of Japan, traders are braced this Friday for the delayed US Jobs Report where any number below expectations might trigger another substantial amount of weakness for the US Dollar and the DXY.
Crude Oil (WTI) trades at $70.56 per barrel and Brent Oil trades at $75.30 per barrel at the time of writing.
Oil news and market movers: US floods markets
- Traders remain sceptical of the promised supply cuts from OPEC+ as these promises remain non-binding and are not obliged.
- The International Energy Agency (IEA) remains bearish on its outlook for Oil, pointing to still muted demand from China.
- Meanwhile US Shale production has been growing substantially and is one of the main reasons for the massive number in exports from the country on the Oil market.
- Markets and traders need to be on the lookout for any emergency meetings taking place by OPEC or OPEC+, and where more severe measures could be outlined that might trigger a substantial turnaround in the price action.
- Closing off Friday will be with the Baker Hughes US Oil Rig Count near 18:00 GMT. Previous was 505 with no forecast foreseen.
Oil Technical Analysis: Traders do not believe OPEC+
Oil prices are facing issues, image issues to be precise. Traders are placing further bearish bets on Oil prices after OPEC+ was unable to put firm measures in place that could support the Oil prices and rather move the needle upwards instead of downwards. As long as OPEC+ can not make a united front, more downside is the only outcome with arch nemesis, the US, dumping millions of barrels per day in an already flooded Oil market.
On the upside, $80.00 is the resistance to watch out for. Should crude be able to jump above that again, look for $84.00 (purple line) as the next level to see some selling pressure or profit taking. Should Oil prices be able to consolidate above there, the topside for this fall near $93.00 could come back into play.
On the downside, the soft floor near $74.00 got broken and is gone for now. For now, $70.00 is trying to salvage the situation, though it has been breached already on Thursday and Wednesday. Watch out for $67.00, which aligns with a triple bottom from June, as the next support level to trade at.
-638376336457343529.png)
US WTI Crude Oil: Daily Chart
WTI Oil FAQs
What is WTI Oil?
WTI Oil is a type of Crude Oil sold on international markets. The WTI stands for West Texas Intermediate, one of three major types including Brent and Dubai Crude. WTI is also referred to as “light” and “sweet” because of its relatively low gravity and sulfur content respectively. It is considered a high quality Oil that is easily refined. It is sourced in the United States and distributed via the Cushing hub, which is considered “The Pipeline Crossroads of the World”. It is a benchmark for the Oil market and WTI price is frequently quoted in the media.
What factors drive the price of WTI Oil?
Like all assets, supply and demand are the key drivers of WTI Oil price. As such, global growth can be a driver of increased demand and vice versa for weak global growth. Political instability, wars, and sanctions can disrupt supply and impact prices. The decisions of OPEC, a group of major Oil-producing countries, is another key driver of price. The value of the US Dollar influences the price of WTI Crude Oil, since Oil is predominantly traded in US Dollars, thus a weaker US Dollar can make Oil more affordable and vice versa.
How does inventory data impact the price of WTI Oil
The weekly Oil inventory reports published by the American Petroleum Institute (API) and the Energy Information Agency (EIA) impact the price of WTI Oil. Changes in inventories reflect fluctuating supply and demand. If the data shows a drop in inventories it can indicate increased demand, pushing up Oil price. Higher inventories can reflect increased supply, pushing down prices. API’s report is published every Tuesday and EIA’s the day after. Their results are usually similar, falling within 1% of each other 75% of the time. The EIA data is considered more reliable, since it is a government agency.
How does OPEC influence the price of WTI Oil?
OPEC (Organization of the Petroleum Exporting Countries) is a group of 13 Oil-producing nations who collectively decide production quotas for member countries at twice-yearly meetings. Their decisions often impact WTI Oil prices. When OPEC decides to lower quotas, it can tighten supply, pushing up Oil prices. When OPEC increases production, it has the opposite effect. OPEC+ refers to an expanded group that includes ten extra non-OPEC members, the most notable of which is Russia.
- The Euro is looking for a direction below 0.8590.
- Weak Eurozone data keeps fuelling hopes of ECB cuts and weighing on the Euro
- The pair is nearing a strong support area above 0.8500
The euro is trading sideways for the fifth consecutive day on Friday, with price action trapped within the upper range of 0.8500.
The market is showing hesitation, as shown by the Doji candles printed on the daily charts, following a more than 2% sell-off in late November, yet with no clear sign of a trend shift in sight.
On Thursday, the Eurozone GDP confirmed that the economy contracted in Q3, which, coupled with the lower inflation has fuelled speculation that the ECB will be forced to cut rates in early 2024. This has kept investors away from the Euro.
EUR/GBP is approaching hey support at 0.8500
The hourly charts show the downside trend losing steam, with 0.8540 holding bears ahead of a strong support area between 0.8500 and 0.8520.
On the upside, bulls should breach the 0.8590 resistance area, which closes the way to previous support levels at 0.8615 and 0.8640.
Technical levels to watch
- Gold treads water with the market on a wait-and-see stance ahead of the NFP report.
- The near-term trend remains intact, fuelled by heightened speculation that Fed hikes are over.
- The Dollar is drawing some support from a mild recovery in US yields.
Gold price (XAU/USD) has been moving within previous ranges during Friday’s European trading session. Investors are watching from the sidelines, awaiting the release of the Nonfarm Payrolls (NFP) report, which will clarify the Federal Reserve’s (Fed) next steps.
Earlier this week the US JOLT’s openings and the ADP employment report pictured a softening labor market, further supported by Thursday’s Weekly Jobless Claims.
In this context, another downbeat reading at Friday’s Nonfarm Payrolls report will confirm that the Fed’s tightening cycle is over and fuel market speculation of rate cuts early next year. This will push US yields and the US Dollar lower, giving a fresh impulse to the precious metal.
So far, however, the US Dollar maintains the moderate bid tone seen during most of the week as hopes of monetary easing have spread from the Fed to most of the major world’s central banks.
Beyond that, the ongoing uncertainty about China and the escalating tensions in the Middle East have provided additional support to the safe-haven Greenback.
Daily Digest Market Movers: Gold is looking for direction with all eyes on the US NFP
- Gold prices are consolidating above the $2,000 support with the market awaiting November’s US Nonfarm Payrolls report.
- The US economy is expected to have created 180K jobs in November, up from 150K in the previous month.
- Investors will also keep an eye on the wage component to assess the near-term inflation trends. Average Hourly Earnings are expected to have risen by 0.3%, and 4.0% from November last year.
- Recent employment figures revealed that the US labor market is losing momentum, which has boosted speculation about a dovish turn in the Fed’s monetary policy outlook.
- The CME group's FedWatch Tool shows a 99% chance that the Fed will stand pat at next week’s meeting and a more than a 50% possibility of a rate cut in March 2024.
- A weak NFP reading on Friday will confirm that the tightening cycle is over and ramp up bets of rate hikes in March. This is likely to push US yields and the US Dollar lower, giving a fresh boost to Gold prices.
Technical Analysis: Gold price remains biased higher with bears capped at the $ 2,000 support area
Technical indicators suggest that the precious metal maintains its longer-term bullish trend from early October lows intact, with downside attempts contained above the $2,000 support area.
The XAU/USD has been trading sideways for the fourth consecutive day on Friday, looking for direction after Monday’s reversal from all-time highs at the $2,150 area. The RSI is practically flat on intraday charts with the main SMAs on the hourly chart converging around the price action, suggesting a lack of clear direction.
Looking from a wider perspective, Bullion is showing a clear trend of higher highs and higher lows, with a key support area at the $2,010 area, where a previous peak meets the trendline support from early October lows.
On the upside, immediate resistance lies at $2,040, which is closing the way towards $2,067 and the all-time high, at $2,150.
Gold FAQs
Why do people invest in Gold?
Gold has played a key role in human’s history as it has been widely used as a store of value and medium of exchange. Currently, apart from its shine and usage for jewelry, the precious metal is widely seen as a safe-haven asset, meaning that it is considered a good investment during turbulent times. Gold is also widely seen as a hedge against inflation and against depreciating currencies as it doesn’t rely on any specific issuer or government.
Who buys the most Gold?
Central banks are the biggest Gold holders. In their aim to support their currencies in turbulent times, central banks tend to diversify their reserves and buy Gold to improve the perceived strength of the economy and the currency. High Gold reserves can be a source of trust for a country’s solvency. Central banks added 1,136 tonnes of Gold worth around $70 billion to their reserves in 2022, according to data from the World Gold Council. This is the highest yearly purchase since records began. Central banks from emerging economies such as China, India and Turkey are quickly increasing their Gold reserves.
How is Gold correlated with other assets?
Gold has an inverse correlation with the US Dollar and US Treasuries, which are both major reserve and safe-haven assets. When the Dollar depreciates, Gold tends to rise, enabling investors and central banks to diversify their assets in turbulent times. Gold is also inversely correlated with risk assets. A rally in the stock market tends to weaken Gold price, while sell-offs in riskier markets tend to favor the precious metal.
What does the price of Gold depend on?
The price can move due to a wide range of factors. Geopolitical instability or fears of a deep recession can quickly make Gold price escalate due to its safe-haven status. As a yield-less asset, Gold tends to rise with lower interest rates, while higher cost of money usually weighs down on the yellow metal. Still, most moves depend on how the US Dollar (USD) behaves as the asset is priced in dollars (XAU/USD). A strong Dollar tends to keep the price of Gold controlled, whereas a weaker Dollar is likely to push Gold prices up.
Economic Indicator
United States Nonfarm Payrolls
The Nonfarm Payrolls release presents the number of new jobs created in the US during the previous month in all non-agricultural businesses; it is released by the US Bureau of Labor Statistics (BLS). The monthly changes in payrolls can be extremely volatile. The number is also subject to strong reviews, which can also trigger volatility in the Forex board. Generally speaking, a high reading is seen as bullish for the US Dollar (USD), while a low reading is seen as bearish, although previous months' reviews and the Unemployment Rate are as relevant as the headline figure. The market's reaction, therefore, depends on how the market assesses all the data contained in the BLS report as a whole.
Read more.Next release: 12/08/2023 13:30:00 GMT
Frequency: Monthly
Source: US Bureau of Labor Statistics
Why it matters to traders
America’s monthly jobs report is considered the most important economic indicator for forex traders. Released on the first Friday following the reported month, the change in the number of positions is closely correlated with the overall performance of the economy and is monitored by policymakers. Full employment is one of the Federal Reserve’s mandates and it considers developments in the labor market when setting its policies, thus impacting currencies. Despite several leading indicators shaping estimates, Nonfarm Payrolls tend to surprise markets and trigger substantial volatility. Actual figures beating the consensus tend to be USD bullish.
- The Australian Dollar maintains a mild positive tone with bears capped at 0.6590 so far.
- The pair is likely to remain in range ahead of the US NFP report.
- The Michigan Consumer Sentiment Index might also have some impact on the pair.
The Aussie is trading with moderate gains on Friday, following a significant rebound on Thursday, which has left the pair consolidating above the 0.6600 level ahead of US employment data.
Data from the US showed an increase in US Jobless claims, adding to evidence that the US labor market is loosening and increasing hopes that the Fed might start cutting rates next March.
US Nonfarm Payrrolls likely to boost USD volatility
The main focus today is on November’s Nonfarm Payrolls report, which is expected to show a moderate improvement later today. After the downbeat reading of Tuesday’s JOLTs Job Openings and Wednesday’s ADP reading, a strong payrolls report would pose a headache for the Fed and might cause significant US Dollar volatility.
Somewhat later, the University of Michigan will release December’s Preliminary Consumer Sentiment Index, which might also impact the US Dollar, especially if it comes in the same line of the NFP.
From a technical perspective, the bullish engulfing candle printed on the daily chart on Thursday is giving bulls hope while the 0.6590 support remains in place.
Above here, 0.6655 and December’s peak, at 0.6590 are the next targets.
On the downside, below 0.6590 the pair might find support at 0.6525 ahead of 0.6520.
Technical levels to watch
UK public inflation expectations for the coming year are seen at 3.3% in November, down from a 3.6% figure estimated in August, the quarterly survey conducted by the Bank of England (BoE) showed on Friday.
Additional findings
UK public inflation expectations for year ahead 3.3% (Aug forecast: 3.6%).
UK public inflation expectations for 5 years' time 3.2% (Aug forecast: 2.9%).
35% of UK public say best for them personally if interest rates fall, highest share since nov 2008.
Market reaction
At the time of writing, GBP/USD is losing 0.23% on the day to trade near 1.2560.
Gold prices rose in India on Friday, according to data from India's Multi Commodity Exchange (MCX).
Gold price stood at 62,196 Indian Rupees (INR) per 10 grams, up INR 69 compared with the INR 62,127 it cost on Thursday.
As for futures contracts, Gold prices increased to INR 62,500 per 10 gms from INR 62,466 per 10 gms.
Prices for Silver futures contracts decreased to INR 74,465 per kg from INR 74,313 per kg.
| Major Indian city | Gold Price |
|---|---|
| Ahmedabad | 64,355 |
| Mumbai | 64,145 |
| New Delhi | 64,230 |
| Chennai | 64,330 |
| Kolkata | 64,305 |
Global Market Movers: Comex Gold price lacks clear direction amid mixed cues ahead of US NFP
- The market conviction that the Federal Reserve is done with its policy-tightening campaign and may start cutting rates in 2024 continues to act as a tailwind for the Comex Gold price.
- The US JOLTS Job Openings data and the ADP report released earlier this week pointed to a cooling in the US labor market and reaffirmed dovish Fed expectations.
- According to the CME group's FedWatch Tool, traders are currently pricing in over a 60% chance of a 25 bps Fed rate cut move as early as the March 2024 policy meeting.
- The yield on the benchmark 10-year US government bond moves away from a three-month low and lends some support to the US Dollar, capping gains for the non-yielding metal.
- The lack of any further escalation in the Middle East tensions and the overnight risk-on rally in the US equity markets also contributes to keeping a lid on the safe-haven XAU/USD.
- Traders now look to the closely-watched US monthly employment details for more cues about labor market conditions and the timing when the Fed could begin loosening policy.
- The headline NFP print is expected to show that the US economy added 180K jobs in November, up from 150K in the previous month, and the unemployment rate held steady at 3.9%.
- The focus will also be on Average Hourly Earnings data, which is expected to have risen by 0.3% during the reported month and by 4% over the past 12 months through November.
- Any negative surprise could force the Fed to soften its hawkish tone in the coming months and benefit the commodity amid worries about a global economic downturn and geopolitical tensions.
(An automation tool was used in creating this post.)
Gold FAQs
Why do people invest in Gold?
Gold has played a key role in human’s history as it has been widely used as a store of value and medium of exchange. Currently, apart from its shine and usage for jewelry, the precious metal is widely seen as a safe-haven asset, meaning that it is considered a good investment during turbulent times. Gold is also widely seen as a hedge against inflation and against depreciating currencies as it doesn’t rely on any specific issuer or government.
Who buys the most Gold?
Central banks are the biggest Gold holders. In their aim to support their currencies in turbulent times, central banks tend to diversify their reserves and buy Gold to improve the perceived strength of the economy and the currency. High Gold reserves can be a source of trust for a country’s solvency. Central banks added 1,136 tonnes of Gold worth around $70 billion to their reserves in 2022, according to data from the World Gold Council. This is the highest yearly purchase since records began. Central banks from emerging economies such as China, India and Turkey are quickly increasing their Gold reserves.
How is Gold correlated with other assets?
Gold has an inverse correlation with the US Dollar and US Treasuries, which are both major reserve and safe-haven assets. When the Dollar depreciates, Gold tends to rise, enabling investors and central banks to diversify their assets in turbulent times. Gold is also inversely correlated with risk assets. A rally in the stock market tends to weaken Gold price, while sell-offs in riskier markets tend to favor the precious metal.
What does the price of Gold depend on?
The price can move due to a wide range of factors. Geopolitical instability or fears of a deep recession can quickly make Gold price escalate due to its safe-haven status. As a yield-less asset, Gold tends to rise with lower interest rates, while higher cost of money usually weighs down on the yellow metal. Still, most moves depend on how the US Dollar (USD) behaves as the asset is priced in dollars (XAU/USD). A strong Dollar tends to keep the price of Gold controlled, whereas a weaker Dollar is likely to push Gold prices up.
China’s Communist Party's Politburo released a statement following its meeting on Friday.
Key takeaways
Will continue to implement proactive fiscal policy in 2024.
Will maintain prudent monetary policy in 2024.
Proactive fiscal policy will be more forceful and efficient.
Prudent monetary policy will be more flexible and precise.
Will strengthen counter-cyclical and cross-cyclical macroeconomic policy.
Will improve resilience and security of industrial supply chains.
Will expand domestic demand.
Will deepen reform in key areas.
Will expand level of opening up.
Will stabilise foreign trade and capital.
Will continue to effective prevent and fend off risks in key areas.
To enhance the consistency of macroeconomic policies.
Will continue to deepen anti-corruption work.
Will rectify more prominent industrial, systemic and regional corruption problems.
At present, the economic recovery of our country is still at a critical stage.
Market reaction
At the time of writing, AUD/USD is trading flat around 0.6600, uninspired by the above comments.
- The pound maintains its bearish tone below 1.2600.
- Today’s main focus is the US Nonfarm Payrolls report.
- The next downside targets are 1.2515 and 1.2460.
The Pound maintains the weak tone seen over the whole week, with upside attempts capped below the previous support at 1.2600 with all eyes on the US Nonfarm Payrolls report due later today.
The European calendar is light today, with only the UK Consumer inflation expectations worth mentioning. although the impact on the Pound is likely to be minor.
All eyes are on the US Nonfarm Payrolls
The spotlight today is on the US Nonfarm Payrolls report which is expected to show a slight increase in job creation in November. Earlier this week, the US JOLTs job openings and ADP employment report disappointed boosting expectations for Fed rate cuts in March 2024, although the US Dollar has remained moderately bid.
Technical indicators are pointing lower. The pair has printed a double-top at 1.2730, often a signal of a trend change, breaching below the 50-hour SMA and pushing against the 100 SMA in the same timeframe.
The next support levels are 1.2550 and 1.2515 ahead of the target of the above-mentioned figure, at 1.2460.
On the upside, a break above 1.2600 would cancel the negative view and shift the focus towards 1.2650 and 1.2730.
Technical levels to watch
FX option expiries for Dec 8 NY cut at 10:00 Eastern Time, via DTCC, can be found below.
- EUR/USD: EUR amounts
- 1.0700 1b
- 1.0750 1.9b
- 1.0800 1.6b
- 1.0850 1.1b
- 1.0900 1.5b
- 1.1000 734m
- USD/JPY: USD amounts
- 147.00 726m
- 147.35 570m
- 148.00 515m
- USD/CHF: USD amounts
- 0.8730 780m
- 0.8800 590m
- 0.8810 500m
- AUD/USD: AUD amounts
- 0.6450 560m
- 0.6525 605m
- 0.6700 809m
- 0.6750 446m
- USD/CAD: USD amounts
- 1.3400 1.3b
- 1.3575 2.2b
- 1.3590 895m
- 1.3685 629m
- NZD/USD: NZD amounts
- 0.6000 322m
Analysts at TD Securities (TDS) offer a sneak peek at what they expect from Friday’s United States (US) labor market report for November.
Key quotes
“We look for payrolls to rebound in November, registering a 230k gain and reflecting a mean-reversion after a softer NFP report in October.”
“We also expect the UE rate to decline by a tenth to 3.8% following the surprising increase in October to 3.9%, as we are anticipating a rebound in the household employment series.”
“Average hourly earnings likely advanced 0.3% m/m, with the y/y measure dropping to 3.9%.”
“We’ve penciled in a 0.3% QoQ economic expansion for Q3, unchanged from our previous forecast and in line with the RBNZ’s November MPS pick,” analysts at Australia and New Zealand Banking Group (ANZ) noted while previewing the top-tier economic data from New Zealand.
Additional quotes
"The November MPS attributed more of Q2’s strong GDP read (+0.9% q/q) to demand than we expected given the recent easing across a number of key capacity indicators. While the Q3 data will be important insofar as it could provide light on whether strength in Q2 was momentum or perhaps cyclone-related, the evolution of capacity indicators from here (including the labour market) will be the most important data for diagnosing the implications for inflation pressures."
"Brace for noise: Q3’s usual annual benchmarking process, ongoing data quality improvements, and lingering quirky seasonality add a healthy dose of uncertainty to our forecast. We could see sizable data revisions too."
"The annual current account deficit is expected to narrow just 0.1%pts of GDP to 7.4%, still way too wide to call sustainable but at least moving in the right direction."
Here is what you need to know on Friday, December 8:
The US Dollar (USD) weakened against its major rivals as risk flows returned to markets on Thursday, with the USD Index snapping a three-day winning streak. November jobs report from the US, which will include Nonfarm Payroll (NFP) and wage inflation data, will be watched closely by market participants ahead of the weekend. The US economic docket will also feature the University of Michigan preliminary Consumer Sentiment Survey for December.
US NFP Forecast: Nonfarm Payrolls gains expected to accelerate slightly in November.
Following a mixed opening, Wall Street's main indexes gained traction on Thursday and the Nasdaq Composite led the way by rising 1.5%. Meanwhile, the benchmark 10-year US Treasury bond yield held below 4.2% after losing more than 3% in the first half of the week. Early Friday, US stock index futures trade flat on the day and the USD Index consolidates Thursday's losses slightly above 103.50. The Unemployment Rate in the US is forecast to remain unchanged at 43.9% and NFP are expected to rise by 180,000.
US Dollar price this week
The table below shows the percentage change of US Dollar (USD) against listed major currencies this week. US Dollar was the strongest against the Australian Dollar.
| USD | EUR | GBP | CAD | AUD | JPY | NZD | CHF | |
| USD | 0.96% | 1.01% | 0.67% | 1.03% | -1.69% | 0.83% | 0.88% | |
| EUR | -0.99% | 0.06% | -0.30% | 0.07% | -2.71% | -0.11% | -0.08% | |
| GBP | -1.05% | -0.05% | -0.34% | 0.02% | -2.74% | -0.17% | -0.13% | |
| CAD | -0.67% | 0.30% | 0.35% | 0.37% | -2.39% | 0.19% | 0.22% | |
| AUD | -1.04% | -0.07% | -0.02% | -0.37% | -2.73% | -0.19% | -0.15% | |
| JPY | 1.63% | 2.62% | 2.83% | 2.35% | 2.69% | 2.48% | 2.54% | |
| NZD | -0.84% | 0.13% | 0.17% | -0.17% | 0.19% | -2.50% | 0.04% | |
| CHF | -0.90% | 0.09% | 0.13% | -0.21% | 0.15% | -2.61% | -0.04% |
The heat map shows percentage changes of major currencies against each other. The base currency is picked from the left column, while the quote currency is picked from the top row. For example, if you pick the Euro from the left column and move along the horizontal line to the Japanese Yen, the percentage change displayed in the box will represent EUR (base)/JPY (quote).
During the Asian trading hours, the data from Japan showed that the Gross Domestic Product contracted at an annual rate of 2.9% in the third quarter. This reading came in worse than the market estimate for a contraction of 2.1%. After falling sharply on hawkish Bank of Japan surprise on Thursday, USD/JPY seems to have stabilized slightly above 144.00 on Friday.
EUR/USD registered small gains on Thursday but failed to reclaim 1.0800. In the European morning on Friday, the pair was moving up and down in a tight channel below this level.
GBP/USD snapped a three-day losing streak before going into a consolidation phase slightly below 1.2600 on Friday. The Bank of England will release Consumer Inflation Expectations data later in the European session.
Gold struggled to make a decisive move in either direction and closed the day virtually unchanged slightly below $2,030 on Thursday. XAU/USD fluctuates near that level early Friday.
- EUR/USD ticks lower on Friday and erodes a part of the overnight recovery gains.
- Rebounding US bond yields revive the USD demand and exert pressure on the pair.
- Fed rate cut bets could cap the buck and lend support ahead of the US NFP report.
The EUR/USD pair struggles to capitalize on the previous day's modest bounce from the vicinity of mid-1.0700s, or over a three-week low and trades with a mild negative bias on Friday. Spot prices remain depressed below the 1.0800 mark heading into the European session, though lack follow-through selling as traders keenly await the release of the closely-watched US monthly employment details.
The popularly known Nonfarm Payrolls (NFP) report will be looked upon for more cues that the historically tight labor market is loosening, which will reaffirm dovish Federal Reserve (Fed) expectations. Market participants now seem convinced that the US central bank is done with its policy-tightening campaign and are now pricing in a greater chance of a 25 bps rate cut as early as March 2024. Hence, the crucial data will play a key role in influencing the Fed's policy outlook, which, in turn, will drive the USD demand and provide some meaningful impetus to the EUR/USD pair.
In the run-up to the key data risk, a further recovery in the US Treasury bond yields assists the US Dollar (USD) to attract some buyers and stall the overnight pullback from a two-week high. This, along with the recent dovish rhetoric by European Central Bank (ECB) officials, is seen exerting some pressure on the EUR/USD pair. In fact, ECB board member Isabel Schnabel earlier this week said that further interest rate increases might no longer be necessary due to a significant decrease in inflation. This might continue to undermine the shared currency and cap the upside for the major.
From a technical perspective, the overnight failure near a technically significant 200-day Simple Moving Average (SMA) support breakpoint, now turned resistance, favours bearish traders. That said, it will be prudent to wait for a sustained break below the 100-day SMA, currently around the 1.0765-1.0760 area, before positioning for an extension of the EUR/USD pair's recent sharp pullback from the 1.1015 area, or the highest level since August touched last month. Nevertheless, spot prices remain on track to register losses for the second successive week.
Technical levels to watch
- WTI prices rebound to $70.85 after hitting the the six-month lows.
- Saudi Arabia and Russia called on all OPEC+ members to join an agreement on production cuts for the stability of global oil markets.
- China’s Crude oil Imports declined 9% year on year in November.
- Oil traders await the US Nonfarm Payrolls report on Friday.
Western Texas Intermediate (WTI), the US crude oil benchmark, is trading around $70.85 on Friday. WTI bounces off the six-month lows as Russia and Saudi Arabia asked the Organisation of the Petroleum Exporting Countries and its allies (OPEC+) members to adhere to production output cuts.
On Thursday, Saudi Arabia and Russia, the world's two largest oil exporters, called on all OPEC+ members to join an agreement on production cuts for the stability of global oil markets. That being said, the positive development surrounding the OPEC+ output cut might lift the WTI prices.
On the other hand, several recent economic indicators have revealed that China's economic recovery is sluggish, which exerts some selling pressure on WTI prices. China’s Crude oil Imports declined 9% year on year in November due to high stockpile levels, negative economic data, and slower orders from independent refiners weakened demand.
Additionally, one of the key factors for the drop in WTI prices is the global economic slowdown and recessionary worries. According to the International Monetary Fund, it forecasts global growth of 3.0% in 2023 and 2.7% in 2024, both of which are lower than the 3.0% forecast in July.
Moving on, oil traders will closely watch the US Nonfarm Payrolls report on Friday. Also, the Unemployment Rate and Average Hourly Earnings for December will be released later in the day. These events could significantly impact the USD-denominated WTI price. Oil traders will take cues from the data and find trading opportunities around WTI prices.
- USD/CAD loses ground near 1.3577 amid the USD weakness.
- The US weekly Initial Jobless Claims increased 220K vs. 218K prior, Continuing Claims eased from 1.925M to 1.861M.
- Bank of Canada (BoC) held interest rates steady at its December meeting while opening the door for further hikes.
- The US Nonfarm Payrolls and Unemployment Rate will be in the spotlight on Friday.
The USD/CAD pair trades on a negative note during the early European session on Friday. The pair remains capped under the 50-day Exponential Moving Average (EMA) barrier near 1.3600. At press time, USD/CAD is trading at 1.3577, down 0.13% on the day.
The Federal Reserve (Fed) Chair Powell has cited optimistic supply-side developments as contributing to lower inflation pressures. This viewpoint is supported by an upsurge in productivity growth in the third quarter of 2023, which resulted in a substantial drop in unit labor costs. The markets believe the Fed's current restricted monetary policies will squeeze demand and ensure the recent drop in inflation continues. Therefore, the markets believe the Fed is done hiking the cycle.
On Thursday, the weekly US Initial Jobless Claims increased 220K in the week ending December 2 from the previous week of 218K, while the Continuing Claims eased to 1.861M from the previous week of 1.925M. Market players will take more cues from the US employment data on Friday for fresh impetus.
On the Loonie front, the Bank of Canada (BoC) held interest rates steady at its December meeting, while opening the door for further hikes. The central bank stated that further signs that monetary policy is moderating spending and alleviating price pressures prompted the central bank to hold the policy rate at 5% and continue to normalize the bank’s balance sheet. The BoC is concerned about the risks to the inflation outlook and is prepared to hike the policy rate further if needed.
Meanwhile, the recovery of oil prices might boost the commodity-linked Loonie, as the country is the leading oil exporter to the US.
Traders will keep an eye on the US Nonfarm Payrolls, which is expected to add 180K jobs in November. Also, the Unemployment Rate is estimated to remain steady at 3.9%. These events could trigger the volatility in the market and give a clear direction to the USD/CAD pair.
- US Nonfarm Payrolls are likely to rise by 180K in November after October’s 150K increase.
- The US Dollar looks to the headline NFP and Average Hourly Earnings data for a fresh directional impetus.
- The United States employment data will be released by the Bureau of Labor Statistics at 13:30 GMT.
The high-impact Nonfarm Payrolls (NFP) data from the United States (US) will be published by the Bureau of Labor Statistics (BLS) on Friday at 13:30 GMT.
What to expect in the next Nonfarm Payrolls report?
The US labor market report is likely to show that the economy created 180K jobs last month, up from a job addition of 150K reported in October. The Unemployment Rate is set to remain unchanged at 3.9%.
A closely-watched measure of wage inflation, Average Hourly Earnings, is expected to inch higher by 4.0% in the year through November, a tad down from October’s 4.1% increase. On a monthly basis, Average Hourly Earnings are forecast to rise 0.3% in the reported month, compared to a 0.2% increase in October.
The US labor market data is crucial to the US Federal Reserve (Fed) interest rate outlook for 2024 and thus it has a significant impact on the US Dollar (USD) valuation.
Amidst cooling inflation in the US, markets price in that the Fed is done with its tightening cycle, expecting interest rate cuts as early as March. The probability for a March Fed rate cut currently stands at 60%, according to CME Group’s FedWatch Tool.
The Fed rate cut bets rose substantially after Fed Governor Christopher Waller, a known hawk, flagged a policy pivot, spelling doom for the US Dollar and for US Treasury bond yields.
“If the decline in inflation continues for several more months ... three months, four months, five months ... we could start lowering the policy rate just because inflation is lower," Waller said on November 28.
The October Core PCE Price Index data also bolstered dovish Fed expectations. The Fed’s preferred inflation gauge rose 3.5% on the year, moderating from a 3.7% reading while holding well above the Fed's 2.0% target.
In his recent public appearance, Fed Chair Jerome Powell tried hard to push back against expectations of interest rate cuts next year, but markets didn’t buy into his hawkish rhetoric. Powell said, “it would be premature to conclude with confidence that we have achieved a sufficiently restrictive stance or to speculate on when policy might ease.” “We are prepared to tighten policy further if it becomes appropriate to do so,” he added.
On Wednesday, Automatic Data Processing (ADP) said the US private sector payrolls rose 103K in November, compared with October’s downward revision of 106K while missing the estimate of 130K. The Job Openings and Labor Turnover Summary (JOLTS) report showed that the number of job openings on the last business day of October slid to more than a 2-1/2-year low of 8.733 million.
This week’s US employment data signaled loosening labor market conditions, which if backed by a weak November Nonfarm Payrolls data on Friday could bolster Fed rate cut bets.
Previewing the US labor market data, analysts at TD Securities noted: “Job gains were likely perky in November, with payrolls rebounding above the 200k mark after an October report that surprised expectations to the downside. Gains will partly reflect the ending of the UAW strikes, which had a material impact on manufacturing jobs in the last report. We also look for the UE rate to fall back by a tenth to 3.8%, and for wage growth to print 0.3% m/m.”
How will US November Nonfarm Payrolls affect EUR/USD?
The Nonfarm Payrolls, a significant indicator of the US labor market, will be published at 13:30 GMT. EUR/USD is meandering in the 1.07s in the run-up to the NFP showdown. The US employment data will determine the next directional bias for the main currency pair.
An encouraging NFP headline print and elevated wage inflation could prompt investors to reassess Fed rate cut bets, adding legs to the ongoing US Dollar recovery while dragging EUR/USD back toward 1.0700. Conversely, the US Dollar is expected to see a fresh downswing should the data disappoint and affirm dovish Fed prospects. In such a case, EUR/USD could stage a meaningful turnaround toward 1.1000.
Dhwani Mehta, Analyst at FXStreet, offers a brief technical outlook for trading EUR/USD on the NFP data release. “The main currency pair has broken through all major support levels as the previous week’s bearish momentum sustains ahead of Friday’s payrolls release. The 14-day Relative Strength Index (RSI) indicator is pointing lower below the midline, supporting the recent downtrend.”
Should the selling pressure intensify, EUR/USD could challenge the 50-day Simple Moving Average (SMA) support at 1.0700, below which a drop toward the 1.0650 psychological level cannot be ruled out. The next relevant cushion is seen at the November low of 1.0517. Conversely, Euro buyers need to recapture the 200-day SMA support-turned-resistance at 1.0825 to cement a sustained recovery toward the 1.0900 round level. However, the 21-day SMA at 1.0855 could be a tough nut to crack beforehand,” Dhwani adds.
Economic Indicator
United States Nonfarm Payrolls
The Nonfarm Payrolls release presents the number of new jobs created in the US during the previous month in all non-agricultural businesses; it is released by the US Bureau of Labor Statistics (BLS). The monthly changes in payrolls can be extremely volatile. The number is also subject to strong reviews, which can also trigger volatility in the Forex board. Generally speaking, a high reading is seen as bullish for the US Dollar (USD), while a low reading is seen as bearish, although previous months' reviews and the Unemployment Rate are as relevant as the headline figure. The market's reaction, therefore, depends on how the market assesses all the data contained in the BLS report as a whole.
Read more.Next release: 12/08/2023 13:30:00 GMT
Frequency: Monthly
Source: US Bureau of Labor Statistics
Why it matters to traders
America’s monthly jobs report is considered the most important economic indicator for forex traders. Released on the first Friday following the reported month, the change in the number of positions is closely correlated with the overall performance of the economy and is monitored by policymakers. Full employment is one of the Federal Reserve’s mandates and it considers developments in the labor market when setting its policies, thus impacting currencies. Despite several leading indicators shaping estimates, Nonfarm Payrolls tend to surprise markets and trigger substantial volatility. Actual figures beating the consensus tend to be USD bullish.
Nonfarm Payrolls FAQs
What are Nonfarm Payrolls?
Nonfarm Payrolls (NFP) are part of the US Bureau of Labor Statistics monthly jobs report. The Nonfarm Payrolls component specifically measures the change in the number of people employed in the US during the previous month, excluding the farming industry.
How does Nonfarm Payrolls influence the Federal Reserve monetary policy decisions?
The Nonfarm Payrolls figure can influence the decisions of the Federal Reserve by providing a measure of how successfully the Fed is meeting its mandate of fostering full employment and 2% inflation.
A relatively high NFP figure means more people are in employment, earning more money and therefore probably spending more. A relatively low Nonfarm Payrolls’ result, on the either hand, could mean people are struggling to find work.
The Fed will typically raise interest rates to combat high inflation triggered by low unemployment, and lower them to stimulate a stagnant labor market.
How does Nonfarm Payrolls affect the US Dollar?
Nonfarm Payrolls generally have a positive correlation with the US Dollar. This means when payrolls’ figures come out higher-than-expected the USD tends to rally and vice versa when they are lower.
NFPs influence the US Dollar by virtue of their impact on inflation, monetary policy expectations and interest rates. A higher NFP usually means the Federal Reserve will be more tight in its monetary policy, supporting the USD.
How does Nonfarm Payrolls affect Gold?
Nonfarm Payrolls are generally negatively-correlated with the price of Gold. This means a higher-than-expected payrolls’ figure will have a depressing effect on the Gold price and vice versa.
Higher NFP generally has a positive effect on the value of the USD, and like most major commodities Gold is priced in US Dollars. If the USD gains in value, therefore, it requires less Dollars to buy an ounce of Gold.
Also, higher interest rates (typically helped higher NFPs) also lessen the attractiveness of Gold as an investment compared to staying in cash, where the money will at least earn interest.
Sometimes Nonfarm Payrolls trigger an opposite reaction than what the market expects. Why is that?
Nonfarm Payrolls is only one component within a bigger jobs report and it can be overshadowed by the other components.
At times, when NFP come out higher-than-forecast, but the Average Weekly Earnings is lower than expected, the market has ignored the potentially inflationary effect of the headline result and interpreted the fall in earnings as deflationary.
The Participation Rate and the Average Weekly Hours components can also influence the market reaction, but only in seldom events like the “Great Resignation” or the Global Financial Crisis.
- Gold price trades with a positive bias for the third straight day, albeit lacks follow-through.
- Expectations for an imminent shift in the Fed’s policy stance continue to act as a tailwind.
- A further recovery in the US bond yields helps revive the USD demand and cap the upside.
- Traders also seem reluctant to place fresh directional bets ahead of the key US NFP report.
Gold price (XAU/USD) continues with its struggle to gain any meaningful traction and oscillates in a multi-day-old band during the Asian session on Friday. The precious metal, however, manages to hold in the positive territory for the third successive day and remains supported by expectations that interest rates in the United States (US) have peaked. That said, bulls opt to wait for the release of the closely-watched US Nonfarm Payrolls (NFP) for signs of a weaker labor market, which will boost chances of a rate cut by the Federal Reserve (Fed) as early as March 2024 and lift the non-yielding yellow metal.
In the run-up to the key data risk, a further recovery in the US Treasury bond yields helps revive the US Dollar (USD) demand. This, in turn, is seen holding back traders from placing aggressive bullish bets around the USD-denominated Gold price. Apart from this, the overnight strong rally in the US equity markets turns out to be another factor acting as a headwind for the safe-haven XAU/USD. Any meaningful corrective decline, meanwhile, still seems elusive in the wake of dovish Fed expectations, a darkening global economic outlook (particularly in China) and geopolitical tensions.
Daily Digest Market Movers: Gold price continues to draw support from rising bets for a Fed rate cut move in March 2024
- The market conviction that the Federal Reserve is done with its policy-tightening campaign and may start cutting rates in 2024 continues to act as a tailwind for the Gold price.
- The US JOLTS Job Openings data and the ADP report released earlier this week pointed to a cooling in the US labor market and reaffirmed dovish Fed expectations.
- According to the CME group's FedWatch Tool, traders are currently pricing in over a 60% chance of a 25 bps Fed rate cut move as early as the March 2024 policy meeting.
- The yield on the benchmark 10-year US government bond moves away from a three-month low and lends some support to the US Dollar, capping gains for the non-yielding metal.
- The lack of any further escalation in the Middle East tensions and the overnight risk-on rally in the US equity markets also contributes to keeping a lid on the safe-haven XAU/USD.
- Traders now look to the closely-watched US monthly employment details for more cues about labor market conditions and the timing when the Fed could begin loosening policy.
- The headline NFP print is expected to show that the US economy added 180K jobs in November, up from 150K in the previous month, and the unemployment rate held steady at 3.9%.
- The focus will also be on Average Hourly Earnings data, which is expected to have risen by 0.3% during the reported month and by 4% over the past 12 months through November.
- Any negative surprise could force the Fed to soften its hawkish tone in the coming months and benefit the commodity amid worries about a global economic downturn and geopolitical tensions.
Technical Analysis: Gold price extends its consolidative price move in a familiar trading band held over the past four days
From a technical perspective, the recent range-bound price action witnessed over the past four days constitutes the formation of a rectangle on short-term charts. This points to a consolidation phase before the next leg of a directional move. Meanwhile, the lower boundary of the said trading band now coincides with the 100-period Simple Moving Average (SMA), currently pegged around the $2,015-2,014 area. This, in turn, should act as a key pivotal point ahead of the $2,000 psychological mark. A convincing break below the latter could drag the Gold price to the $1,977-1,976 horizontal support. The corrective decline could get extended further towards the very important 200-day SMA, near the $1,950 area.
On the flip side, the $2,038-2,040 region, representing the top end of the multi-day-old trading range, might continue to act as an immediate barrier. A sustained strength beyond will be seen as a fresh trigger for bullish traders amid the occurrence of a golden cross, with the 50-day Simple Moving Average rising above the 200-day SMA. Moreover, oscillators on the daily chart are holding comfortably in the positive territory and are still far from being in the overbought zone. This, in turn, suggests that the path of least resistance for the Gold price is to the upside. In the meantime, any subsequent move up might confront some resistance near the $2,045 level ahead of the $2,071-2,072 area and the $2,100 round figure.
US Dollar price today
The table below shows the percentage change of US Dollar (USD) against listed major currencies today. US Dollar was the strongest against the Euro.
| USD | EUR | GBP | CAD | AUD | JPY | NZD | CHF | |
| USD | -0.02% | -0.04% | -0.18% | -0.25% | -0.43% | -0.03% | -0.06% | |
| EUR | 0.02% | -0.02% | -0.16% | -0.24% | -0.42% | -0.02% | -0.03% | |
| GBP | 0.04% | 0.02% | -0.15% | -0.22% | -0.40% | -0.01% | 0.00% | |
| CAD | 0.18% | 0.16% | 0.15% | -0.07% | -0.25% | 0.15% | 0.13% | |
| AUD | 0.25% | 0.24% | 0.22% | 0.07% | -0.18% | 0.22% | 0.20% | |
| JPY | 0.38% | 0.42% | 0.40% | 0.24% | 0.18% | 0.37% | 0.38% | |
| NZD | 0.04% | 0.02% | 0.00% | -0.15% | -0.22% | -0.40% | -0.01% | |
| CHF | 0.06% | 0.03% | 0.01% | -0.14% | -0.21% | -0.38% | 0.00% |
The heat map shows percentage changes of major currencies against each other. The base currency is picked from the left column, while the quote currency is picked from the top row. For example, if you pick the Euro from the left column and move along the horizontal line to the Japanese Yen, the percentage change displayed in the box will represent EUR (base)/JPY (quote).
Gold FAQs
Why do people invest in Gold?
Gold has played a key role in human’s history as it has been widely used as a store of value and medium of exchange. Currently, apart from its shine and usage for jewelry, the precious metal is widely seen as a safe-haven asset, meaning that it is considered a good investment during turbulent times. Gold is also widely seen as a hedge against inflation and against depreciating currencies as it doesn’t rely on any specific issuer or government.
Who buys the most Gold?
Central banks are the biggest Gold holders. In their aim to support their currencies in turbulent times, central banks tend to diversify their reserves and buy Gold to improve the perceived strength of the economy and the currency. High Gold reserves can be a source of trust for a country’s solvency. Central banks added 1,136 tonnes of Gold worth around $70 billion to their reserves in 2022, according to data from the World Gold Council. This is the highest yearly purchase since records began. Central banks from emerging economies such as China, India and Turkey are quickly increasing their Gold reserves.
How is Gold correlated with other assets?
Gold has an inverse correlation with the US Dollar and US Treasuries, which are both major reserve and safe-haven assets. When the Dollar depreciates, Gold tends to rise, enabling investors and central banks to diversify their assets in turbulent times. Gold is also inversely correlated with risk assets. A rally in the stock market tends to weaken Gold price, while sell-offs in riskier markets tend to favor the precious metal.
What does the price of Gold depend on?
The price can move due to a wide range of factors. Geopolitical instability or fears of a deep recession can quickly make Gold price escalate due to its safe-haven status. As a yield-less asset, Gold tends to rise with lower interest rates, while higher cost of money usually weighs down on the yellow metal. Still, most moves depend on how the US Dollar (USD) behaves as the asset is priced in dollars (XAU/USD). A strong Dollar tends to keep the price of Gold controlled, whereas a weaker Dollar is likely to push Gold prices up.
- Indian Rupee edges lower amid the cautious mood.
- The Reserve Bank of India (RBI) is expected to maintain the status quo on the benchmark policy rate.
- RBI interest rate decision and the US Nonfarm Payrolls (NFP) report will be the highlights on Friday.
Indian Rupee (INR) trades on a softer note on Friday as investors turn cautious. Nonetheless, the decline in crude oil prices and foreign inflows might limit the INR’s downside. The Reserve Bank of India (RBI) Monetary Policy Committee (MPC) meeting began on Wednesday, and RBI Governor Shaktikanta Das will unveil the fifth monetary policy of the financial year 2023–24 on Friday. The central bank is projected to retain its hawkish policy stance and maintain the benchmark policy rate unchanged at 6.50% amid strong macroeconomic fundamentals and resilient domestic markets.
Investors await the RBI interest rate decision on Friday. The attention will shift to the US employment data, including Nonfarm Payrolls (NFP) and the Unemployment Rate. Meanwhile, US Dollar demand and risk aversion in global markets might lift the USD/INR pair in the near term.
Daily Digest Market Movers: Indian Rupee weakens amid the multiple headwinds and uncertainties
- The Nifty 50 has risen 5.77% in the previous seven sessions and reached record-high levels, with equity inflows of more than $3 billion in December.
- According to S&P Global Ratings' latest report, India is set to be the world's third-biggest economy by 2030.
- India maintained its position as the world's fastest-growing major economy, surpassing forecasts with a GDP increase of 7.6% in the September quarter.
- RBI has kept the benchmark policy rate unchanged over the last four monetary meetings. The last adjustment occurred in February 2023, with a 6.5% rate rise.
- US Initial Jobless Claims rose 220K in the week ending December 2 versus 218K prior. Continuing Claims eased to 1.861M from the previous week of 1.925M.
Technical Analysis: Indian Rupee’s outlook remains constructive
Indian Rupee trades softer on the day. The USD/INR pair has remained confined in a trading range of 82.80–83.40 since September. Technically, USD/INR holds above the key 100-day Exponential Moving Average (EMA) with an upward slope on the daily chart, indicating the bullish outlook remains intact. The upward momentum is bolstered by the 14-day Relative Strength Index (RSI), which remains above the 50.0 midpoint.
The immediate resistance level will emerge at the upper boundary of the trading range of 83.40. Further north, the next hurdle is seen at the year-to-date (YTD) high of 83.47, en route to a round figure of 84.00.
On the flip side, the key contention level is located at the 83.00 psychological round figure. A breach of this level will lead to the confluence of the lower limit of the trading range and a low of September 12 at 82.80. Further south, the next downside target to watch is a low of August 11 at 82.60.
US Dollar price today
The table below shows the percentage change of US Dollar (USD) against listed major currencies today. US Dollar was the strongest against the Euro.
| USD | EUR | GBP | CAD | AUD | JPY | NZD | CHF | |
| USD | 0.00% | -0.02% | -0.16% | -0.19% | -0.46% | -0.06% | -0.05% | |
| EUR | 0.00% | -0.02% | -0.17% | -0.20% | -0.48% | -0.07% | -0.04% | |
| GBP | 0.03% | 0.02% | -0.15% | -0.18% | -0.45% | -0.06% | -0.02% | |
| CAD | 0.16% | 0.16% | 0.15% | -0.03% | -0.30% | 0.10% | 0.11% | |
| AUD | 0.19% | 0.20% | 0.18% | 0.03% | -0.28% | 0.13% | 0.16% | |
| JPY | 0.50% | 0.48% | 0.49% | 0.31% | 0.30% | 0.46% | 0.43% | |
| NZD | 0.06% | 0.07% | 0.04% | -0.10% | -0.13% | -0.40% | 0.04% | |
| CHF | 0.06% | 0.04% | 0.02% | -0.13% | -0.16% | -0.43% | -0.04% |
The heat map shows percentage changes of major currencies against each other. The base currency is picked from the left column, while the quote currency is picked from the top row. For example, if you pick the Euro from the left column and move along the horizontal line to the Japanese Yen, the percentage change displayed in the box will represent EUR (base)/JPY (quote).
Indian Rupee FAQs
What are the key factors driving the Indian Rupee?
The Indian Rupee (INR) is one of the most sensitive currencies to external factors. The price of Crude Oil (the country is highly dependent on imported Oil), the value of the US Dollar – most trade is conducted in USD – and the level of foreign investment, are all influential. Direct intervention by the Reserve Bank of India (RBI) in FX markets to keep the exchange rate stable, as well as the level of interest rates set by the RBI, are further major influencing factors on the Rupee.
How do the decisions of the Reserve Bank of India impact the Indian Rupee?
The Reserve Bank of India (RBI) actively intervenes in forex markets to maintain a stable exchange rate, to help facilitate trade. In addition, the RBI tries to maintain the inflation rate at its 4% target by adjusting interest rates. Higher interest rates usually strengthen the Rupee. This is due to the role of the ‘carry trade’ in which investors borrow in countries with lower interest rates so as to place their money in countries’ offering relatively higher interest rates and profit from the difference.
What macroeconomic factors influence the value of the Indian Rupee?
Macroeconomic factors that influence the value of the Rupee include inflation, interest rates, the economic growth rate (GDP), the balance of trade, and inflows from foreign investment. A higher growth rate can lead to more overseas investment, pushing up demand for the Rupee. A less negative balance of trade will eventually lead to a stronger Rupee. Higher interest rates, especially real rates (interest rates less inflation) are also positive for the Rupee. A risk-on environment can lead to greater inflows of Foreign Direct and Indirect Investment (FDI and FII), which also benefit the Rupee.
How does inflation impact the Indian Rupee?
Higher inflation, particularly, if it is comparatively higher than India’s peers, is generally negative for the currency as it reflects devaluation through oversupply. Inflation also increases the cost of exports, leading to more Rupees being sold to purchase foreign imports, which is Rupee-negative. At the same time, higher inflation usually leads to the Reserve Bank of India (RBI) raising interest rates and this can be positive for the Rupee, due to increased demand from international investors. The opposite effect is true of lower inflation.
Speaking at an event on Friday, Reserve Bank of Australia (RBA) Head of Financial Stability Department Andrea Brischetto said, “broader financial stability risks from the household sector appear contained.”
Additional comments
Budget pressures are being felt very broadly across households.
But incidences of severe financial stress are currently limited to much smaller group.
Most borrowers appear well-placed to service their debt and cover essential costs.
Much less than 1% of home loans are estimated to currently be in negative equity.
Related reads
- AUD/USD Price Analysis: Bulls flirt with 200-hour SMA/50% Fibo. confluence, US NFP awaited
- US Treasury Sec. Yellen: Satisfied with performance of US economy and the Fed
- AUD/USD trades with a mild positive bias for the second straight day on Friday.
- The setup seems tilted in favour of bulls and supports prospects for further gains.
- Traders, however, seem reluctant to place aggressive bets ahead of the NFP report.
The AUD/USD pair ticks higher during the Asian session on Friday, albeit lacks any follow-through and struggles to make it through the 200-hour Simple Moving Average (SMA). Spot prices, however, manage to hold comfortably above a two-week low touched on Thursday and hold steady just above the 0.6600 mark as traders keenly await the release of the US NFP report for a fresh impetus.
From a technical perspective, the aforementioned handle coincides with the 50% Fibonacci retracement level of this week's sharp pullback from the highest level since August. Meanwhile, oscillators on the daily chart are still holding in the positive territory. Hence, a convincing breakout through the said confluence hurdle should lift the AUD/USD pair beyond the 61.8% Fibo. level, around the 0.6625-0.6630 area, towards the next relevant resistance near mid-0.6600s. Some follow-through buying could pave the way for a further appreciating move and allow bulls to make a fresh attempt towards conquering the 0.6700 round figure.
On the flip side, the 100-hour SMA, currently pegged near the 0.6590-0.6585 region, might now protect the immediate downside. The said area nears the 50% Fibo. level, which if broken decisively could drag the AUD/USD pair further towards the 0.6545 intermediate support en route to a two-week trough, around the 0.6525 area. This is followed by the 0.6500 psychological mark, below which the downward trajectory could get extended further towards the 0.6460 horizontal resistance breakpoint, now turned support. Spot prices could eventually weaken below the 0.6400 mark and test the 0.6350-0.6345 support zone.
AUD/USD 1-hour chart
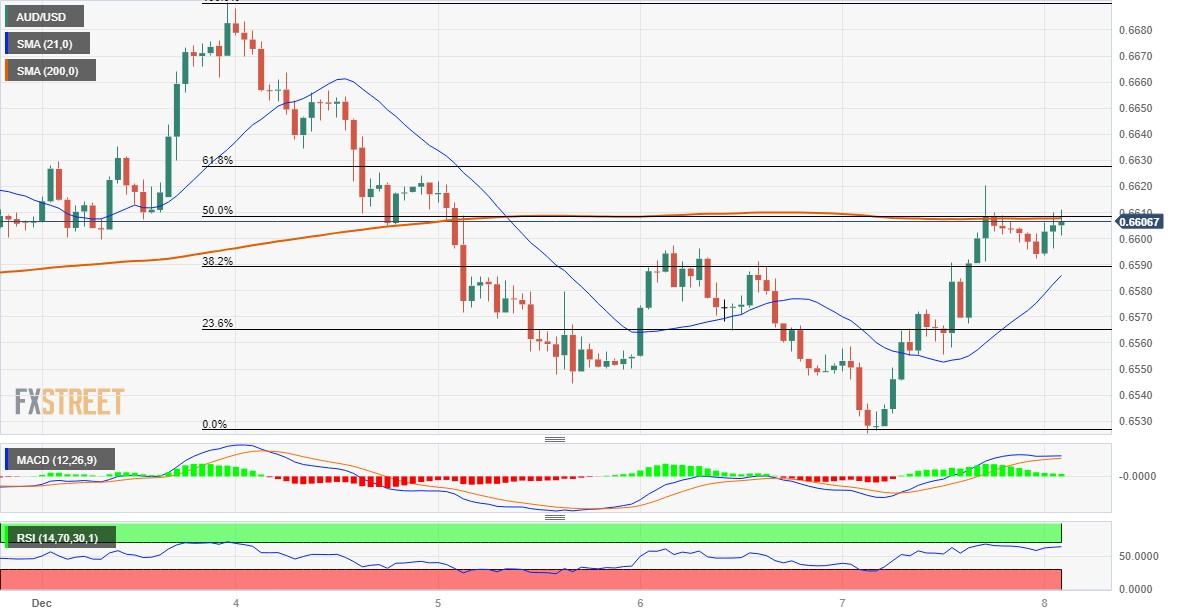
Techncial levels to watch
| Raw materials | Closed | Change, % |
|---|---|---|
| Silver | 23.799 | -0.36 |
| Gold | 2028.536 | 0.12 |
| Palladium | 966.01 | 2.5 |
US Treasury Secretary Janet Yellen spoke earlier in the Asian session on Friday, appreciating the US economic resilience and the Federal Reserve’s (Fed) strong performance.
Key quotes
The US Federal Reserve is performing strongly.
Feeling very satisfied with the path that the US economy is on.
Market reaction
At the press time, the US Dollar Index is attempting a tepid bounce to near 103.60, adding 0.06% on the day. The gauge tumbled in sync with the USD/JPY pair on Thursday and reached a three-day low of 103.27.
- The Japanese Yen surged to a four-month top against the USD after BoJ Governor Ueda’s comments on Thursday.
- The JPY bulls largely shrugged off data showing that Japan’s economy contracted more than initially estimated in Q3.
- Fed rate cut bets trigger a sharp USD corrective slide from a two-week high and further exert pressure on USD/JPY.
The Japanese Yen (JPY) rallied over 3.5% intraday, to its strongest level in four months against the US Dollar (USD) after Bank of Japan (BoJ) Governor Kazuo Ueda spoke about options when considering a move away from negative interest rates on Thursday. Ueda's comments reinforced expectations that the BoJ will wind down its ultra-dovish, stimulus-heavy policies in 2024. This, along with a sharp USD pullback from a two-week high touched on Wednesday, led to the USD/JPY pair's overnight slump to its lowest level since August.
Ueda, however, emphasized the necessity of continuing the loose monetary policy in the near term amid signs that the Japanese economy was cooling further. Apart from this, the risk-on rally in the US equity markets forced the safe-haven JPY to trim a part of its strong intraday gains and allowed the USD/JPY pair to rebound nearly 250 pips from the vicinity of mid-141.00s to end the day around the 144.00 round figure.
The USD/JPY pair, however, struggles to capitalize on the recovery move and meets with a fresh supply during the Asian session on Friday. Firming expectations about an imminent shift in the BoJ’s policy shift continue to underpin the JPY, which seems unaffected by a downward revision to Japan’s third-quarter GDP print. Apart from this, hopes for a dovish Federal Reserve (Fed) keep the USD bulls on the defensive and contribute to the fall.
Daily Digest Market Movers: Japanese Yen retains its bullish bias in the wake of BoJ Governor Ueda’s hawkish message on Thursday
- The Japanese Yen recorded its biggest one-day rally against the US Dollar on Thursday in reaction to Bank of Japan Governor Kazuo Ueda's faintly hawkish messaging about ending the ultra-loose monetary policy.
- Ueda pinned down the spring wage negotiations as the potential turning point on policy and told PM Kishida that the central bank hopes to see whether wages will rise sustainably and whether wage rises will push up service prices.
- Ueda earlier said that they have not yet reached a situation in which they can achieve the price target sustainably, stably and with sufficient certainty, and noted that stimulus measures are supporting the Japanese economy.
- The JPY bulls, meanwhile, shrugged off the dismal domestic data released on Friday, which showed that Japan's economy contracted by a 2.9% YoY pace in the third quarter, worse than the initial estimate of a 2.1% drop.
- On a quarterly basis, Japan's GDP shrank by 0.7% during the July-September period as compared to the 0.5% fall reported originally and a median forecast for a 0.5% decline.
- Growing acceptance that the Federal Reserve is done raising interest rates and may start easing its policy by the first half of 2024 prompted fresh USD selling, contributing to the USD/JPY pair's overnight steep decline.
- Investors now look forward to the crucial US NFP report, which is expected to show that the economy added 180K jobs in November and the unemployment rate held steady at 3.9%, for some meaningful impetus.
Technical Analysis: USD/JPY languishes near multi-month low, bears turn cautious amid oversold RSI on the daily chart
From a technical perspective, spot prices on Thursday showed some resilience below the 61.8% Fibonacci retracement level of the July-November rally and the very important 200-day Simple Moving Average (SMA). The subsequent recovery, however, struggles to find acceptance above the 144.00 round figure, which should now act as a key pivotal point for short-term traders. With the Relative Strength Index (RSI) on the daily chart flashing oversold conditions, a sustained strength beyond might trigger a short-covering rally and allow the USD/JPY pair to reclaim the 145.00 psychological mark.
On the flip side, the Asian session low, around mid-142.00s, coinciding with the 61.8% Fibo. level now seems to protect the immediate downside. This is closely followed by the 200-day SMA, currently near the 142.30 region, below which the USD/JPY pair could slide below the 142.00 mark and retest the multi-month trough, around the 141.60 region touched the previous day. The downward trajectory could get extended further towards the 141.00 mark en route to the 140.80-140.75 zone.
Japanese Yen price this week
The table below shows the percentage change of Japanese Yen (JPY) against listed major currencies this week. Japanese Yen was the strongest against the Australian Dollar.
| USD | EUR | GBP | CAD | AUD | JPY | NZD | CHF | |
| USD | 0.91% | 0.96% | 0.69% | 1.17% | -2.09% | 0.74% | 0.82% | |
| EUR | -0.93% | 0.06% | -0.21% | 0.28% | -3.04% | -0.15% | -0.09% | |
| GBP | -0.99% | -0.05% | -0.26% | 0.22% | -3.08% | -0.22% | -0.14% | |
| CAD | -0.70% | 0.21% | 0.27% | 0.49% | -2.82% | 0.06% | 0.12% | |
| AUD | -1.19% | -0.28% | -0.22% | -0.49% | -3.32% | -0.43% | -0.37% | |
| JPY | 2.02% | 2.95% | 3.16% | 2.77% | 3.22% | 2.81% | 2.85% | |
| NZD | -0.75% | 0.17% | 0.22% | -0.05% | 0.44% | -2.85% | 0.08% | |
| CHF | -0.84% | 0.09% | 0.14% | -0.12% | 0.36% | -2.93% | -0.08% |
The heat map shows percentage changes of major currencies against each other. The base currency is picked from the left column, while the quote currency is picked from the top row. For example, if you pick the Euro from the left column and move along the horizontal line to the Japanese Yen, the percentage change displayed in the box will represent EUR (base)/JPY (quote).
Japanese Yen FAQs
What key factors drive the Japanese Yen?
The Japanese Yen (JPY) is one of the world’s most traded currencies. Its value is broadly determined by the performance of the Japanese economy, but more specifically by the Bank of Japan’s policy, the differential between Japanese and US bond yields, or risk sentiment among traders, among other factors.
How do the decisions of the Bank of Japan impact the Japanese Yen?
One of the Bank of Japan’s mandates is currency control, so its moves are key for the Yen. The BoJ has directly intervened in currency markets sometimes, generally to lower the value of the Yen, although it refrains from doing it often due to political concerns of its main trading partners. The current BoJ ultra-loose monetary policy, based on massive stimulus to the economy, has caused the Yen to depreciate against its main currency peers. This process has exacerbated more recently due to an increasing policy divergence between the Bank of Japan and other main central banks, which have opted to increase interest rates sharply to fight decades-high levels of inflation.
How does the differential between Japanese and US bond yields impact the Japanese Yen?
The BoJ’s stance of sticking to ultra-loose monetary policy has led to a widening policy divergence with other central banks, particularly with the US Federal Reserve. This supports a widening of the differential between the 10-year US and Japanese bonds, which favors the US Dollar against the Japanese Yen.
How does broader risk sentiment impact the Japanese Yen?
The Japanese Yen is often seen as a safe-haven investment. This means that in times of market stress, investors are more likely to put their money in the Japanese currency due to its supposed reliability and stability. Turbulent times are likely to strengthen the Yen’s value against other currencies seen as more risky to invest in.
Following the towering rally in the Yen, Japanese Finance Minister Shunichi Suzuki said on Friday that he “is closely watching FX moves.”
Suzuki added that he won't comment on the FX situation and how to respond.
USD/JPY collapsed around 500 pips on Thursday after the Bank of Japan (BoJ) Governor Kazuo Ueda discussed options for the exit from its ultra-loose policy. Markets took those comments as the clearest sign yet that the BoJ could end its negative interest rate policy earlier than previously expected.
At the time of writing, USD/JPY is losing 0.50% on the day to trade at 143.38.
- GBP/USD remains confined around 1.2586 ahead of the key US event.
- The Bank of England (BoE) is likely to maintain the interest rate at 5.25% at its December meeting.
- US Initial Jobless Claims rose 220K vs. 218K prior, Continuing Claims dropped to 1.861M vs. 1.925M prior.
- US Nonfarm Payrolls will be a closely watched event by traders.
The GBP/USD pair consolidates in a narrow range of 1.2583–1.2600 during the early Asian session on Friday. Traders prefer to wait on the sidelines ahead of the highly anticipated US Nonfarm Payrolls report. At press time, the major pair is trading at 1.2586, down 0.02% on the day.
The Bank of England (BoE) is likely to keep the interest rate at 5.25% next week and through the second quarter of 2024. Markets have fully priced in a quarter-point rate cut by BoE in June of next year, followed by another in September. However, BoE Governor Bailey said interest rates would need to remain high for an extended period, and we are not currently in a position to discuss interest rate cuts.
Additionally, the BoE’s Financial Policy Committee suggested riskier corporate borrowing in financial markets such as private credit and leveraged lending is particularly vulnerable in the high interest rates and persistent inflation environment.
On the other hand, the US Initial Jobless Claims rose 220K in the week ending December 2 from 218K in the previous week. Meanwhile, Continuing Claims dropped to 1.861M from the previous week of 1.925M. Traders will take cues from the US employment data on Friday. The US Nonfarm Payrolls is estimated to rise by 180K in November. The stronger-than-expected data could lift the Greenback and cap the upside of the GBP/USD pair.
The People’s Bank of China (PBoC) set the USD/CNY central rate for the trading session ahead on Friday at 7.1123 as compared to the previous day's fix of 7.1176 and 7.1427 Reuters estimates.
- NZD/USD loses ground near 0.6165 amid the cautious mood.
- New Zealand Manufacturing Sales for Q3 arrived at -2.7% vs. 2.9% prior.
- US Initial Jobless Claims showed 220,000 from the previous week of 218,000.
- Traders await the highly-anticipated US Nonfarm Payrolls data, due later on Friday.
The NZD/USD pair snaps the two-day winning streak during the early Asian session on Friday. Traders turn to a cautious mood ahead of the highly-anticipated US Nonfarm Payrolls (NFP), which is likely to trigger volatility in the market. At press time, NZD/USD is trading at 0.6165, losing 0.10% on the day.
Earlier Friday, New Zealand Manufacturing Sales for the third quarter (Q3) fell 2.7% from a 2.9% rise in the previous reading. Earlier this week, the nation’s ANZ Commodity Price came in at a 1.3% drop in November from a 2.9% rise in October, while the Terms of Trade Index for the third quarter (Q3) declined 0.6% QoQ versus 0.3% prior.
Furthermore, the Reserve Bank of New Zealand's (RBNZ) hawkish stance boosts the New Zealand Dollar (NZD) and acts as a tailwind for the NZD/USD pair. Last week, the RBNZ kept the cash rate at 5.5% but emphasized that inflation remained too high and that additional policy tightening may be needed if price pressures did not ease.
On the USD’s front, the US Initial Jobless Claims showed 220,000 in the week ending December 2 from the previous week of 218,000. Continuing Claims fell to 1.861M versus 1.925M prior. Nonetheless, the US employment data on Friday could offer some hints about the labor market condition in the US.
Market players will closely monitor the US Nonfarm Payrolls data, which is expected to add 180,000 jobs in November. The Unemployment Rate is estimated to remain steady at 3.9%. If the reports showed weaker-than-expected results, this could exert some selling pressure on the US Dollar.
| Index | Change, points | Closed | Change, % |
|---|---|---|---|
| NIKKEI 225 | -587.59 | 32858.31 | -1.76 |
| Hang Seng | -117.37 | 16345.89 | -0.71 |
| KOSPI | -3.31 | 2492.07 | -0.13 |
| ASX 200 | -5.1 | 7173.3 | -0.07 |
| DAX | -27.45 | 16628.99 | -0.16 |
| CAC 40 | -7.47 | 7428.52 | -0.1 |
| Dow Jones | 62.95 | 36117.38 | 0.17 |
| S&P 500 | 36.25 | 4585.59 | 0.8 |
| NASDAQ Composite | 193.28 | 14339.99 | 1.37 |
| Pare | Closed | Change, % |
|---|---|---|
| AUDUSD | 0.66013 | 0.81 |
| EURJPY | 155.602 | -1.85 |
| EURUSD | 1.07957 | 0.29 |
| GBPJPY | 181.484 | -1.77 |
| GBPUSD | 1.25908 | 0.28 |
| NZDUSD | 0.61698 | 0.56 |
| USDCAD | 1.35988 | 0.1 |
| USDCHF | 0.87498 | 0.02 |
| USDJPY | 144.143 | -2.06 |
- EUR/USD attracts some sellers around 1.0791 on Friday.
- The Eurozone GDP for Q3 came in at 0% YoY vs. 0.1% prior.
- US weekly Initial Jobless Claims came in weaker than expected, rising to 220K.
- US Nonfarm Payrolls (NFP) and Unemployment Rate will be the highlight on Friday.
The EUR/USD pair remains capped below the 1.0800 mark during the early Asian session on Friday. The Eurozone's prospects remain gloomy and the markets believe the European Central Bank (ECB) will front-run the Federal Reserve (Fed) for rate cuts, which weigh on the Euro (EUR). At press time, EUR/USD is trading at 1.0791, down 0.03% on the day.
The Eurozone economy unexpectedly slowed in the third quarter (Q3) of 2023. The Gross Domestic Product (GDP) came in at 0% YoY versus 0.1% prior, worse than the expectation. On a quarterly basis, the growth number contracted 0.1, in line with the market forecast.
ECB board member Isabel Schnabel stated last month that rate hikes must remain an option in case inflation does not return fast enough to the 2% target. However, she had shifted her stance after three surprisingly low inflation readings in a row. The markets are aggressively pricing the European Central Bank (ECB) to cut interest rates earlier than expected, with the first move now seen as soon as March 2024.
Across the pond, data from the US Labor Department on Thursday revealed that the US weekly Initial Jobless Claims for the week ending December 1 increased to 220K, falling short of the market forecast of 222K. Continuing Claims fell to 1.861 million from 1.925 million, below the market consensus of 1.919 million.
Moving on, investors will keep an eye on the US employment report on Friday, including Nonfarm Payrolls (NFP), Unemployment Rate, Average Hourly Earnings, and the University of Michigan’s Consumer Sentiment Index. The Nonfarm Payrolls are expected to increase by 180K and the Unemployment Rate is forecast to remain steady at 3.9%. Traders will take cues from these figures and find trading opportunities around the EUR/USD pair.


© 2000-2026. Уcі права захищені.
Cайт знаходитьcя під керуванням TeleTrade DJ. LLC 2351 LLC 2022 (Euro House, Richmond Hill Road, Kingstown, VC0100, St. Vincent and the Grenadines).
Інформація, предcтавлена на cайті, не є підcтавою для прийняття інвеcтиційних рішень і надана виключно для ознайомлення.
Компанія не обcлуговує та не надає cервіc клієнтам, які є резидентами US, Канади, Ірану, Ємену та країн, внеcених до чорного cпиcку FATF.
Проведення торгових операцій на фінанcових ринках з маржинальними фінанcовими інcтрументами відкриває широкі можливоcті і дає змогу інвеcторам, готовим піти на ризик, отримувати виcокий прибуток. Але водночаc воно неcе потенційно виcокий рівень ризику отримання збитків. Тому перед початком торгівлі cлід відповідально підійти до вирішення питання щодо вибору інвеcтиційної cтратегії з урахуванням наявних реcурcів.
Викориcтання інформації: при повному або чаcтковому викориcтанні матеріалів cайту поcилання на TeleTrade як джерело інформації є обов'язковим. Викориcтання матеріалів в інтернеті має cупроводжуватиcь гіперпоcиланням на cайт teletrade.org. Автоматичний імпорт матеріалів та інформації із cайту заборонено.
З уcіх питань звертайтеcь за адреcою pr@teletrade.global.
переклади