- Аналітика
- Новини та інструменти
- Новини ринків
Новини ринків
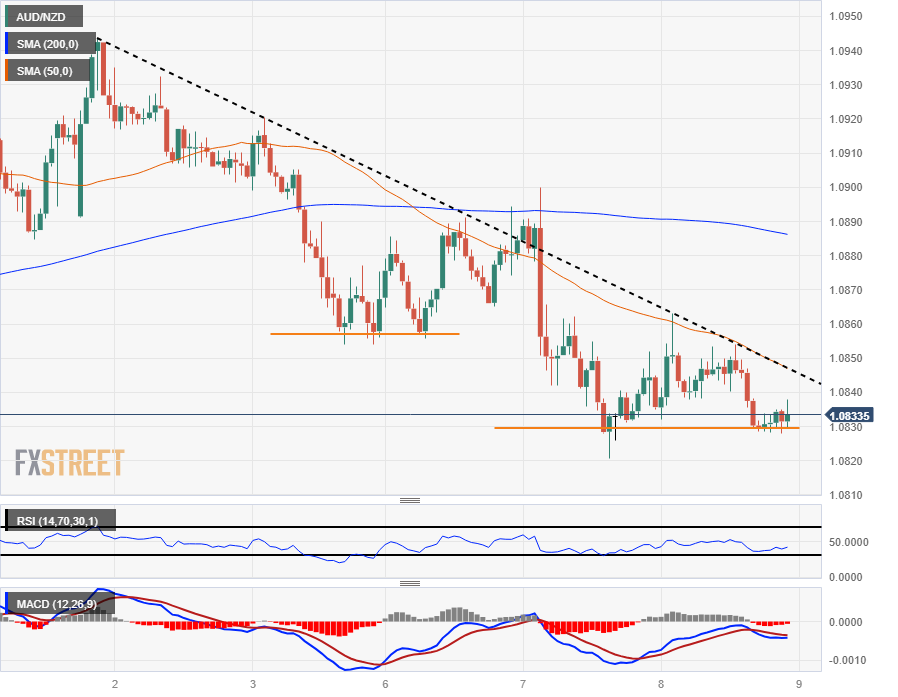
- The AUD/NZD has been stepping down through November as the Aussie loses momentum.
- Short-term interest could see a bounce back into the median range.
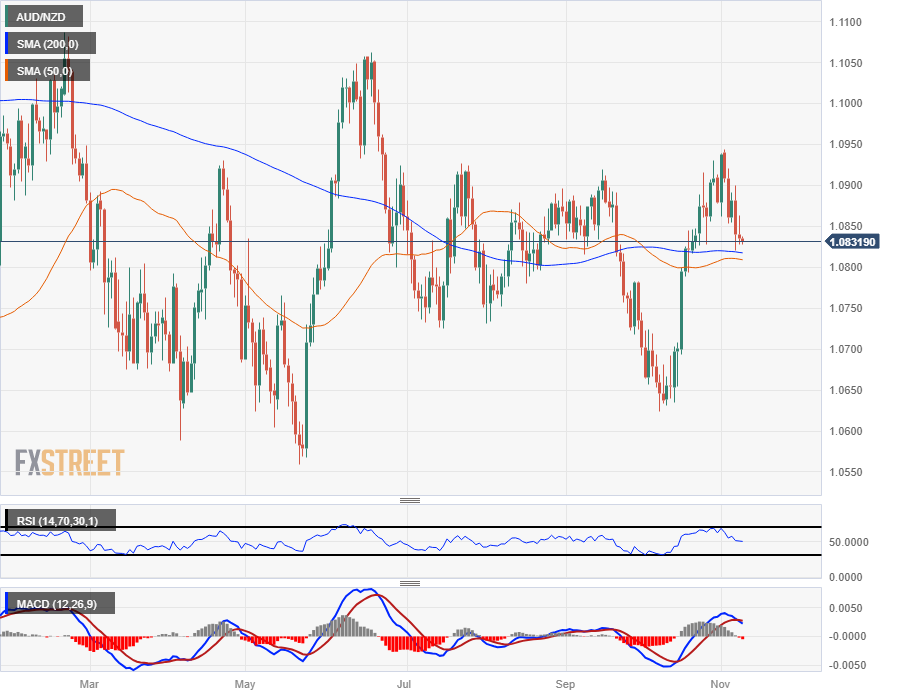
- Longer-term sees significant pressure to return to familiar swing low pattern.
The AUD/NZD is trading into two-week lows as the Aussie (AUD) grapples against a technical rebound on the Kiwi (NZD) side of the pair.
A lower low pattern on the intraday charts has bullish momentum draining out of the Aussie as the pair has slumped below the 200-hour Simple Moving Average (SMA), implying bearish traversal is set to continue.
The 50-hour SMA has been capping off intraday upside corrections since crossing over the 200-hour SMA at the start of the week, and a technical correction above the 50-day SMA could evolve into a false breakout.
On the longer timeframes, daily candlesticks have the AUD/NZD backsliding into the 200-day SMA currently grinding sideways just north of the 1.0800 handle.
The last bullish run-up from October's lows just south of 1.0650 saw the pair quickly run out of gas near 1.0950 and is now heading back towards the midrange, and the 50-day SMA is beginning to turn downwards while still trapped in bearish territory still below the 200-day SMA.
Australian Dollar price this week
The table below shows the percentage change of Australian Dollar (AUD) against listed major currencies this week. Australian Dollar was the weakest against the Swiss Franc.
| USD | EUR | GBP | CAD | AUD | JPY | NZD | CHF | |
| USD | 0.22% | 0.72% | 0.98% | 1.76% | 0.93% | 1.44% | 0.00% | |
| EUR | -0.22% | 0.52% | 0.77% | 1.55% | 0.72% | 1.21% | -0.19% | |
| GBP | -0.72% | -0.51% | 0.27% | 1.04% | 0.20% | 0.71% | -0.74% | |
| CAD | -0.97% | -0.77% | -0.25% | 0.80% | -0.04% | 0.47% | -0.98% | |
| AUD | -1.78% | -1.55% | -1.04% | -0.78% | -0.83% | -0.31% | -1.78% | |
| JPY | -0.96% | -0.74% | -0.46% | 0.06% | 0.79% | 0.51% | -0.94% | |
| NZD | -1.46% | -1.23% | -0.71% | -0.46% | 0.29% | -0.52% | -1.46% | |
| CHF | 0.00% | 0.20% | 0.72% | 0.96% | 1.73% | 0.94% | 1.44% |
The heat map shows percentage changes of major currencies against each other. The base currency is picked from the left column, while the quote currency is picked from the top row. For example, if you pick the Euro from the left column and move along the horizontal line to the Japanese Yen, the percentage change displayed in the box will represent EUR (base)/JPY (quote).
AUD/NZD Hourly Chart
AUD/NZD Daily Chart
AUD/NZD Technical Levels
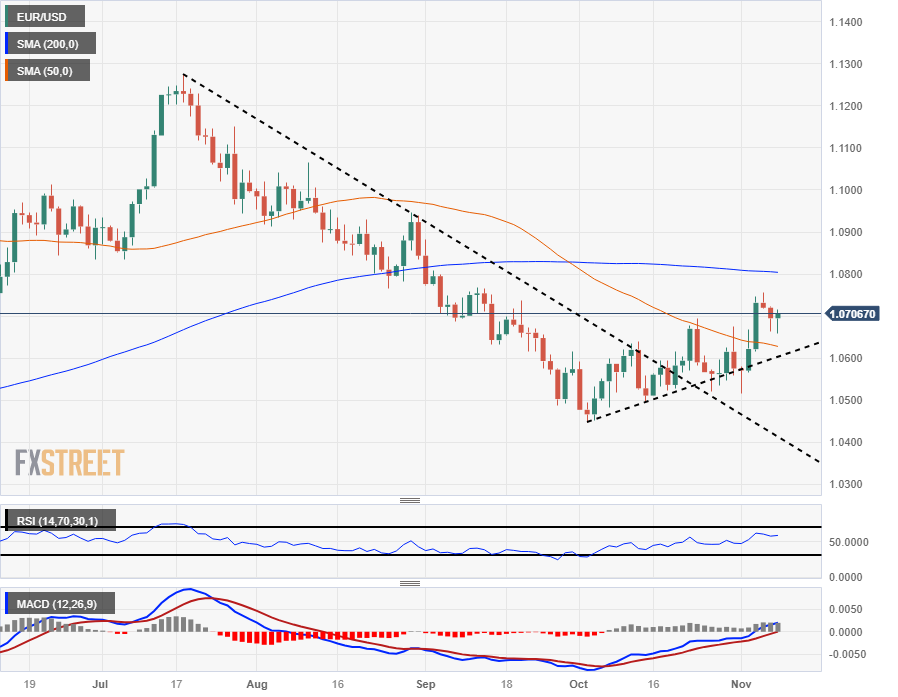
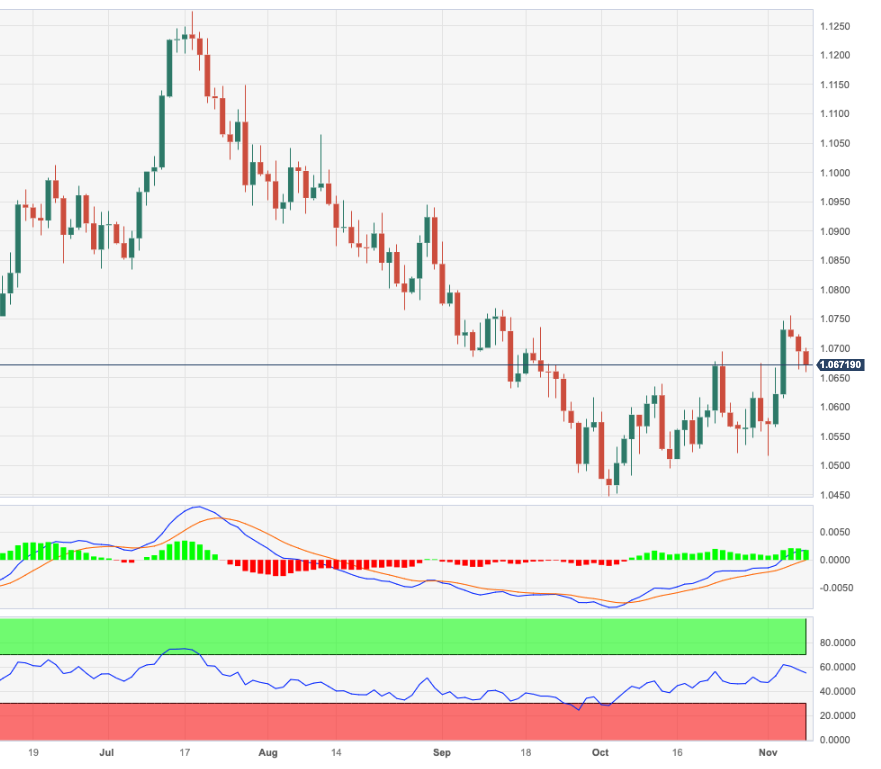
- EUR/USD edges up to 1.0708, forming a bullish 'tweezers bottom' pattern, yet still below the crucial 200-day moving average at 1.0802.
- The currency pair maintains a neutral stance with a slight bullish tilt, trapped within a 'bearish flag' pattern on the daily chart.
- Resistance and support levels are set at 1.0758 and the 38.2% Fibonacci level at 1.0654, respectively, as the pair navigates through pivotal technical junctures.
EUR/USD turns positive late on Wednesday's North American session, but it remains shy of reclaiming the 200-day moving average (DMA) at 1.0802, seen as the next resistance level for buyers. The pair is trading at 1.0708, after forming a ‘tweezers bottom’ chart pattern, with bullish implications.
The daily chart portrays the pair is neutrally biased, though slightly tilted to the upside, but within the boundaries of a ‘bearish flag.’ On November 6, despite breaching the top of the flag, the EUR/USD finished the session offered, forming an inverted hammer, suggesting the EUR/USD could resume downwards. Even though the pair printed a three-day low of 1.0659, it failed to breach support at the 38.2% Fibonacci level of the Fibonacci retracement drawn from the November 1 low to the November 6 swing high, keeping buyers hopeful of higher prices.
Key resistance levels lie at 1.0758, November’s 6 high, followed by the 200-DMA at 1.0802. On the flip side, the first support is seen at the 38.2% Fibonacci level at 10.654, followed by the confluence of the 50-DMA and the 50% Fibo retracement at 1.0624/35.
EUR/USD Price Analysis – Daily Chart

EUR/USD Technical Levels
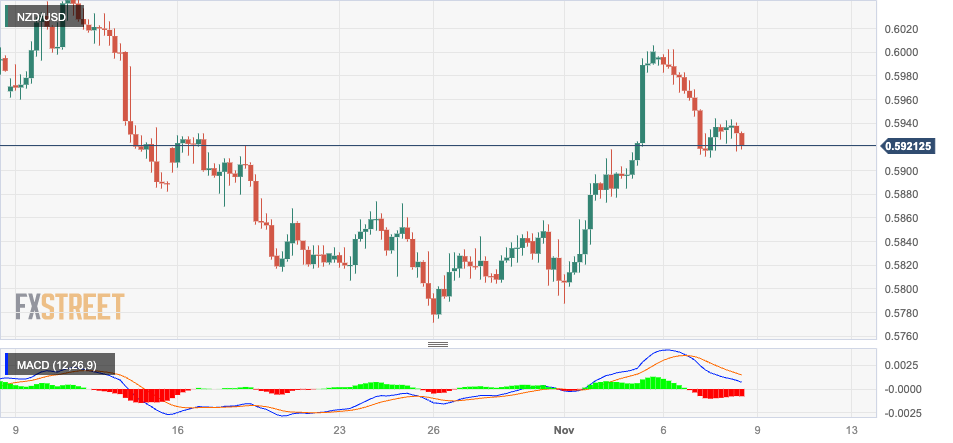
- NZD/USD hits a new three-day nadir at 0.5906, shedding 0.39% amid a broader downtrend and declining US Treasury yields.
- The pair faces immediate support at the psychological 0.5900 level, with further downside risks towards the September low and critical trendline supports.
- A recovery above the 50-day moving average could open the path for the Kiwi to challenge resistances at 0.5900 and potentially the 0.6000 handle.
NZD/USD dives to a three-day low of 0.5906 below the 50-day moving average (DMA) at 0.5913, despite the Greenback (USD) trading unchanged as shown by the US Dollar Index (DXY), while US Treasury bond yields drop for the second consecutive day. The pair exchanges hands at 0.5910, down 0.39%.
The downtrend portrayed in the NZD/USD daily chart suggests the pair would continue to print losses unless the fundamentals change. Next, support is at 0.5900 in the figure, followed by the September 5 low at 0.5859, followed by an upslope support trendline at 0.5815/25, before slumping to the 0.5800 mark. A breach of the latter would expose the year-to-date (YTD) low of 0.5773.
On the other hand, if NZD/USD buyers reclaim the 50-DMA, they could remain hopeful of testing higher prices. Next resistance is seen at 0.5900, before rallying to the 0.6000 mark.
NZD/USD Price Analysis – Daily Chart
NZD/USD Technical Levels
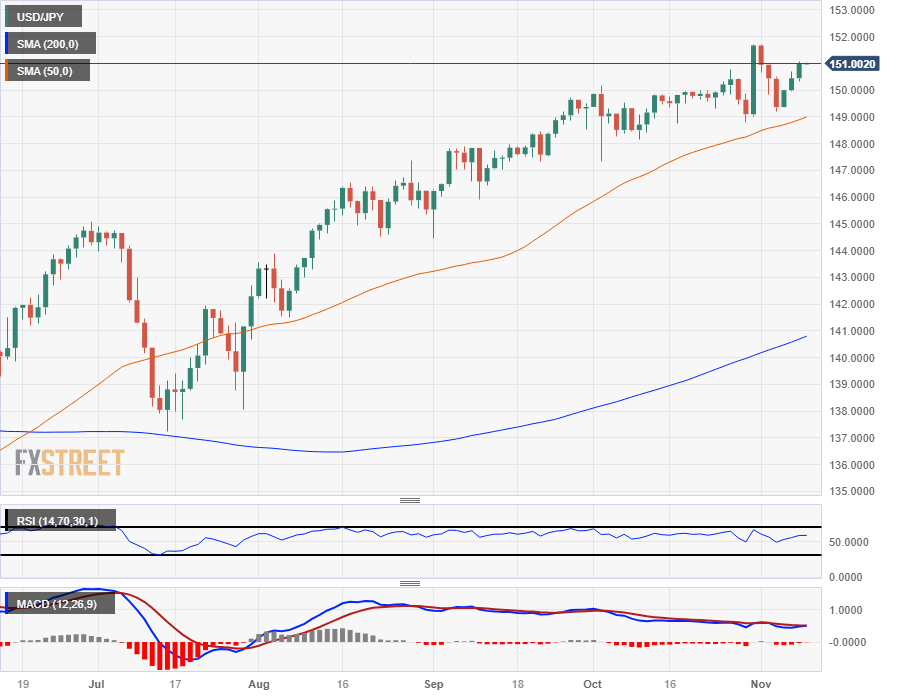
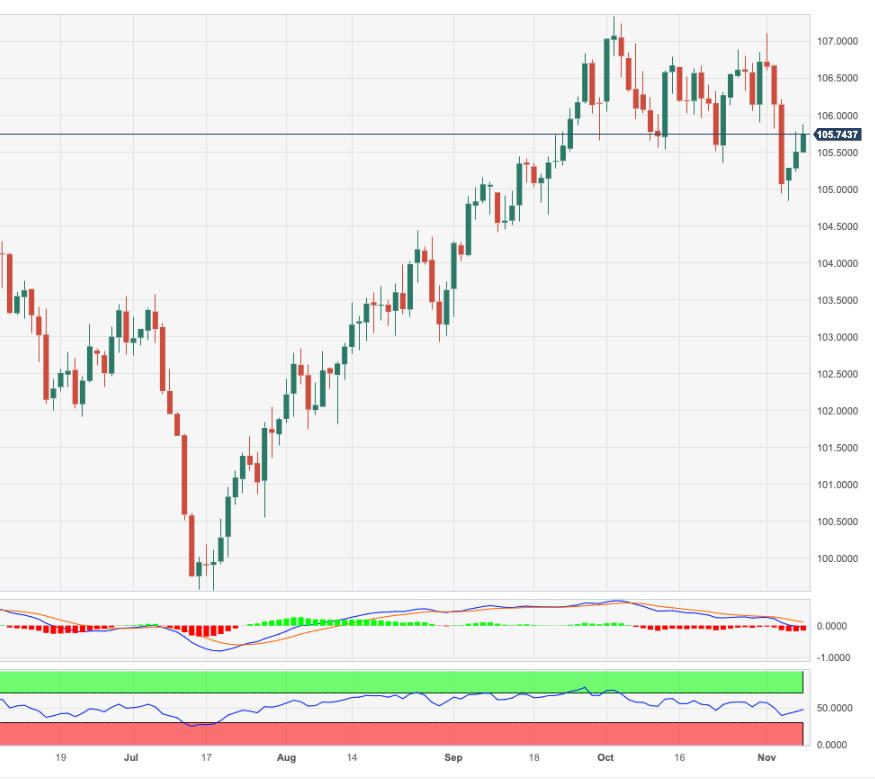
- The USD/JPY is testing back into recent record highs as the Yen slumps.
- Investors will be increasingly concerned of potential BoJ intervention the lower JPY goes.
- Early Thursday sees Japan trade balance figures.
The USD/JPY has reclaimed the 151.00 handle heading into Thursday's market session after the US Dollar (USD) notched in a third straight green candle as the Yen (JPY) continues to slump against the broader market.
The Japanese Yen has continued to decline against its major counterparties with little else to do but go down as a hyper-dovish Bank of Japan (BoJ) hangs the Yen out to dry, though investors will begin to gnaw on the possibility of the BoJ intervening in currency markets to try and defend the beleaguered Yen.
The 150.00-and-above region has historically been a popular exchange level has been a popular intervention zone for the BoJ in the past.
Japan trade balance figures will print early during the Thursday Asia market session, and Japan's Current Account (non-seasonally-adjusted) for September is expected to increase from JPY 2.279 trillion to 3 trillion.
Japan Bank lending for the year into October is also expected to tick down from 2.9% to 2.8% as Japanese banks struggle to find people to lend to despite rock-bottom rates artificially suppressed into the basement and hyper-easy monetary policy that renders funding costs functionally zero.
USD/JPY Technical Outlook
There's little topside technical resistance of note for the USD/JPY except for last week's early jump towards 152.00 that saw the pair quickly tumble back to 149.00, but the next meaningful technical barrier sits at 2022's late swing high that fell just short of claiming 152.00 thirteen months ago.
The 50-day Simple Moving Average (SMA) has struggled to catch up to daily candlesticks, currently rising into 149.00, and long-term technical support is sitting far below current price action with the 200-day SMA rising into 141.00.
USD/JPY Daily Chart
USD/JPY Technical Levels
During the Asian session, the Bank of Japan will release the Summary of Opinions. A critical report will be China's inflation figures, which can impact market sentiment. Later in the day, the weekly US Jobless Claims report is due.
Here is what you need to know on Thursday, November 9:
The US Dollar posted mixed results on Wednesday, gaining against the Euro and Pound but strengthening versus riskier currencies. The US Dollar index (DXY) peaked at 105.80 before retracing its gains, falling to 105.55.
With no significant economic reports, the Treasury market had a quiet session. The 10-year Treasury yield dropped to 4.50%. Wall Street ended the day with little change after main indexes reached fresh weekly highs.
The weekly Jobless Claims report is due on Thursday. Later in the day, Federal Reserve (Fed) Chair Jerome Powell will participate in a panel discussion titled "Monetary Challenges in a Global Economy." It is unclear at this point if Powell will provide any new insights. The next key report in the US will be the Consumer Price Index on November 14.
China will release the Consumer Price Index and Producer Price Index for October on Thursday. These figures will be closely watched.
EUR/USD posted modest gains after rebounding from the 55-day Simple Moving Average (SMA) around the 1.0700 area during the American session. The European Central Bank (ECB) will release its economic bulletin.
GBP/USD hit three-day lows but then trimmed losses, rising to 1.2300. The Pound also lost ground against the Euro, with EUR/GBP rising above 0.8700. UK growth data is due on Friday.
USD/JPY rose for the third consecutive day, climbing to 151.00, despite the decline in government bond yields and the mixed tone in Wall Street. On Thursday, the Bank of Japan (BoJ) will release the Summary of Opinions from the Monetary Policy Meeting held on October 30-31.
USD/CAD climbed for the third consecutive day, testing levels above 1.3800, driven by a stronger US Dollar and lower crude oil prices, which dropped more than 2%. WTI crude fell to $75.50, the lowest level since July.
Antipodean currencies slid during the American session, with AUD/USD dropping to test 0.6400 and NZD/USD approaching 0.5900.
Gold remains under pressure, trading below $1,950 and below the 20-day Simple Moving Average, reaching its lowest level since October 19. The yellow metal failed to benefit from the decline in Treasury yields. Silver ended the day flat at $22.50 after being dragged down by the slide in Gold.
Like this article? Help us with some feedback by answering this survey:
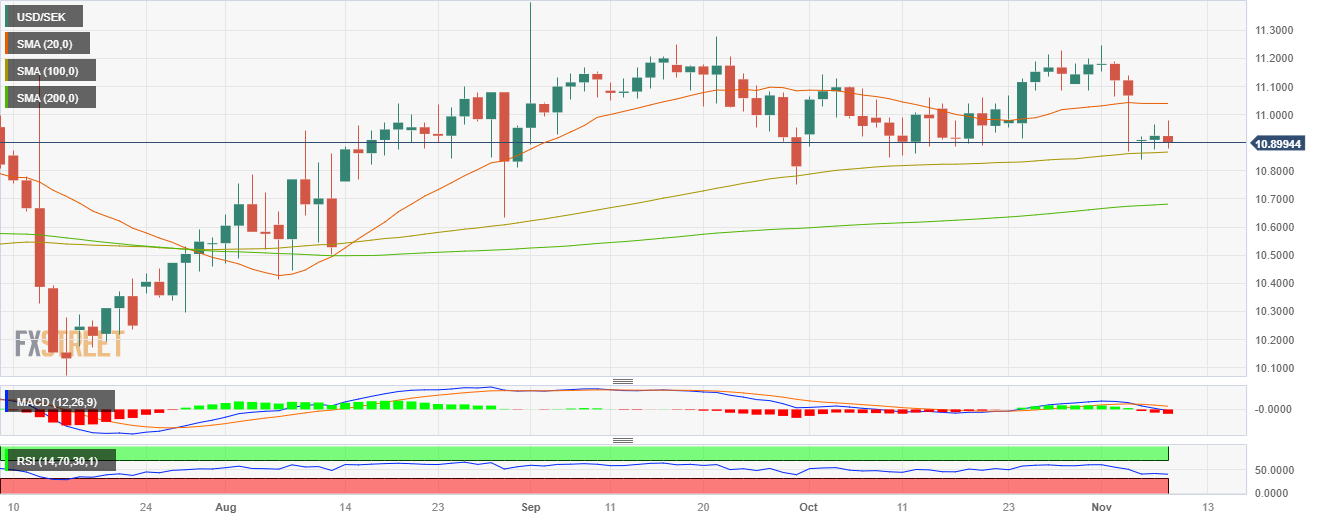
- The USD/SEK trimmed daily gains and declined towards 10.900, seeing mild losses.
- The US government bond yields are falling.
- Fed expectations and the bond markets will dictate the pace of the session.
The USD/SEK initially rose to a high of 10.9790 on Wednesday and then stabilised around the 10.900 area, with the trajectory of the pair being set by falling US bond yields, which limited the pair’s upside. Other than that, there were no relevant highlights during the session, and the focus is set on next week’s inflation figures from the US from October.
As the economic calendar had nothing relevant to offer on Wednesday, markets seem to be awaiting fresh stimulus to place their next positions. At the beginning of the week, several Federal Reserve (Fed) were seen pushing back on the dovish narrative, which eventually favoured the rise of the US Dollar and the Treasury yields. Still, investors seem to be awaiting high-tier data, as those will shape the bank's decision next December.
Next week, the US will release Consumer Price Index (CPI) figures from October, which are expected to show a slight deceleration. In that case, markets would likely take of the table the case of a hike in December, which would fuel downward movements on the back of a weakening US Dollar.
In the meantime, the US Treasury 5 and 10-year bond yields are sharply declining, falling towards 4.51%. The 2-year rate stands flat at 4.90%.
USD/SEK Levels to watch
According to the daily chart, the technical outlook for the USD/SEK remains neutral to bearish as the bears are showing signs of recovery. With a flat slope below its midline, the Relative Strength Index (RSI) suggests a period of stability in negative territory, while the Moving Average Convergence (MACD) displays neutral red bars.
On a broader scale, the pair is below the 20-day Simple Moving Average (SMA) but above the 100 and 200-day SMAs, highlighting the continued dominance of bulls. That being said, in case of not recover the 20-day SMA, the pair may see further downside.
Supports: 10.857 (100-day SMA), 10.830, 10.800.
Resistances: 10.9050, 10.950, 11.020 (20-day SMA).
USD/SEK Daily chart
- GBP/JPY breaks above Tuesday’s high as the uptrend gathers steam.
- On the upside, key resistance levels lie at 186.00 and the YTD high.
- If the cross-pair drops below 184.70, downside risks emerge below 184.00.
The GBP/JPY reverses its course after posting decent losses of 0.20% on Tuesday and has risen past yesterday’s high of 185.46, as buyers target the current week’s high of 185.95. At the time of writing, the cross-pair is trading at 185.57 for a gain of 0.22%.
Even though the uptrend remains intact, price action seems overextended, though, in the short term, GBP/JPY buyers could challenge the 186.00 figure, ahead of testing the year-to-date (YTD) high of 186.77. Nevertheless, it should be said the Ichimoku Cloud (Kumo) is horizontal, indicating the uptrend might be losing steam.
In that scenario, if GBP/JPY dives below the November 6 low of 184.68, the next support would be the 184.00 mark. Once cleared, the Tenkan-Sen would be up next at 183.36, followed by the Kijun-Sen at 182.76.
GBP/JPY Price Chart – Daily

GBP/JPY Technical Levels
- Silver prices show little movement, trading at $22.59 amid a halt in the decline of US Treasury yields and a negligible uptick in the Dollar.
- Technical analysis suggests a neutral to bearish outlook for silver, with a potential drop if it closes below the October 26 low of $22.44.
- Silver's immediate support and resistance levels hover around the $22.00 and $23.00 marks, respectively.
Silver price is almost flat during Wednesday’s North American session, as US Treasury bond yields halted its decline, while the Greenback (USD) prints minuscule gains of 0.01%, as shown by the US Dollar Index (DXY). At the time of writing, the XAG/USD is trading at $22.59, after seesawing in a $22.31/$22.84 range, unable to reach the $23.00 mark.
From a technical perspective, XAG/USD is neutral to downward bias and would extend its losses once it achieves a daily close below the latest cycle low seen on October 26, a swing low of $22.44. In that outcome, the grey metal would shift downwards. Therefore, key support levels could be challenged, with the $22.00 figure, the first line of defense for Silver Bulls, followed by $21.50, followed by the $21.00 mark.
On the flip side, buyers must reclaim the 50-day moving average (DMA) at $22.75, followed by the 20-DMA at $22.84, followed by the $23.00 mark.
XAG/USD Price Chart – Daily

XAG/USD Technical Levels
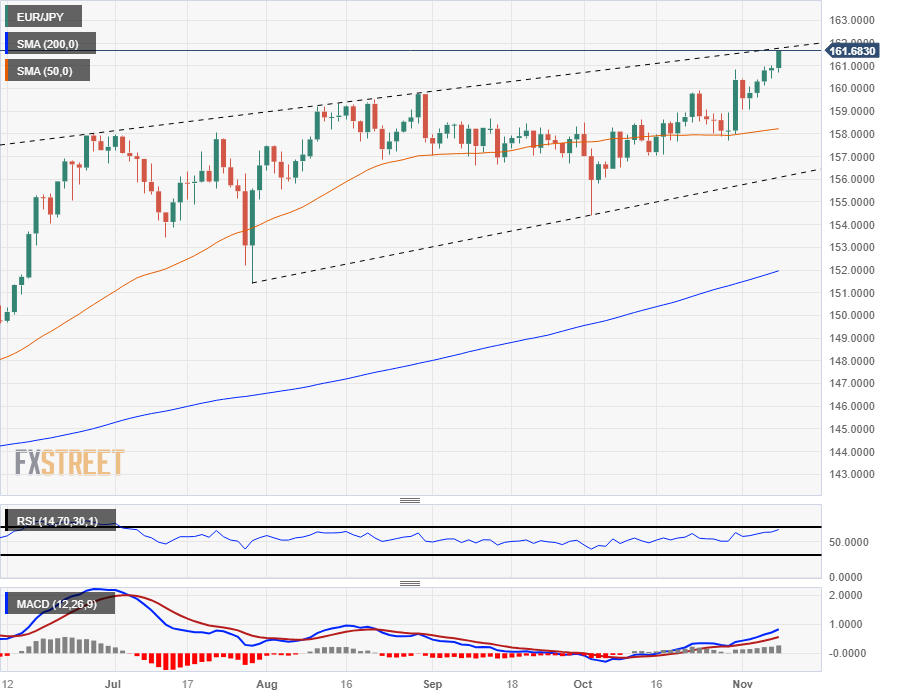
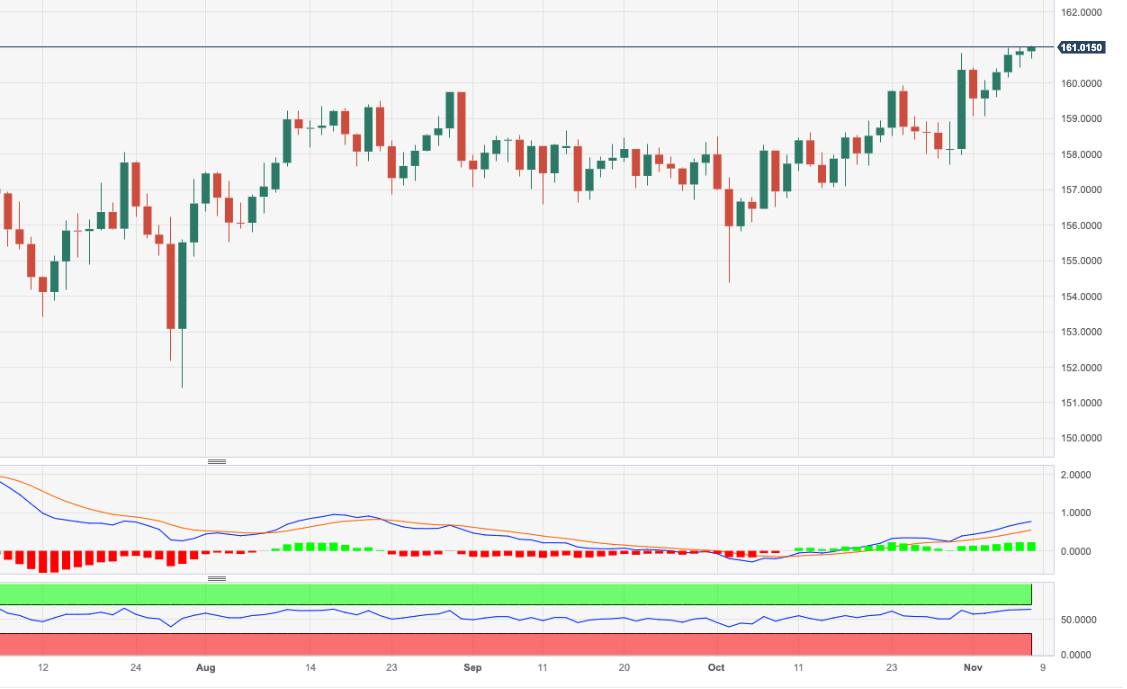
- The EUR/JPY continues to climb, tipping into a 15-year high.
- The Yen is fumbling across the board for Wednesday.
- Investors likely to begin watching for signs of intervention from the BoJ.
The EUR/JPY is edging into its highest bids in over 15 years, trading north of 161.50 and looking for more. The Japanese Yen (JPY) has struggled recently, being all but abandoned by a hyper-dovish Bank of Japan that remains entirely focused on propping up long-run growth expectations for the Japanese economy even as the Yen continues to tumble to record lows.
The BoJ remains firmly dedicated to their hyper-easy monetary policy framework, leaving the Yen little place else to go but to drain down the charts, and the Eur (EUR) is seeing a upshot breakaway.
With the JPY trading so poorly against other assets, it's only a matter of time before someone at the BoJ decides enough is enough and begins to intervene in currency markets in a bid to protect their domestic currency from further selling.
The early Thursday Asia market session sees trade balance figures for Japan, with the headline non-seasonally-adjusted Current Account for September expected to rise from JPY 2.2 trillion to 3 trillion.
EUR/JPY Technical Outlook
The Euro is up over 2.5% against the Yen from last week's swing low into 157.70, and with little technical patterns on the high end to cap bullish momentum, the pair could see an easy break into further record territory.
The EUR/JPY caught a clean bounce from the 50-day Simple Moving Average (SMA) last week, and long-term chart support sits at the 152.00 handle with the 200-day SMA.
A rising trendline from late July's swing low into 152.00 is also pricing in a technical floor from the 156.00 region.
EUR/JPY Daily Chart
EUR/JPY Technical Levels
- AUD/USD takes a hit, dropping 0.40% and struggling to hold the 0.6500 level as Federal Reserve officials hint at no end to rate hikes.
- U.S. Treasury yields fall, yet the Dollar rebounds from two-month lows, signaling a cautious market as traders eye Fed Chair Powell's upcoming speech.
- Despite RBA's rate hik and hawkish outlook, the Aussie Dollar fails to rally, with the market anticipating the end of RBA's tightening cycle ahead of the SoMP release.
The AUD/USD continues to drop further toward the 50-day moving average (DMA) after failing to crack the 0.6500 figure on Tuesday, which exacerbated the pair´s drop, as it trades at 0.6410, losses 0.40%, past the mid-North American session.
Australian Dollar retreats to 0.6410, flirting with the 50-day moving average amid hawkish Fed rhetoric and RBA's rate hike
Risk appetite is taking its toll following Federal Reserve’s officials' remarks, pushing back against the idea of cutting interest rates, led by Minnesota Fed President Neil Kashkari, who questioned whether the Fed had raised rates enough due to the economy’s resilience while adding that an uptick in inflation would trigger another rate hike by the Fed. Some of his comments were echoed by Michelle Bowman, who said further rate hikes are needed.
Against this backdrop, US Treasury bond yields continued to drop, while the Greenback enjoyed a bounce from two-month lows of 104.84 to 105.51 in the last three days of trading.
On the Australian front, the Reserve Bank of Australia (RBA) lifted rates 25 bps, and despite delivering a hawkish statement, as they assume inflation would likely remain high for a longer period, market participants estimate the RBA ended its tightening cycle.
After the RBA’s meeting, the AUD/USD has been on the defensive, falling more than 1.45%, erasing close to a 100-pips of the gains accumulated last week.
Given the fundamental backdrop, AUD/USD traders would look out for clues on the Federal Reserve Chairman Jerome Powell's speech on Thursday. On the Aussie’s front, the RBA would reveal its Statement of Monetary Policy (SoMP) after Powell’s remarks.
AUD/USD Technical Levels
The Bank of Canada released the summary of its deliberations of the October 25 meeting. At that meeting, the central bank kept interest rates unchanged. The document showed that “some members felt that it was more likely than not that the policy rate would need to increase further to return inflation to target.” While others viewed the most likely scenario as the current rate would be sufficient, “provided it was maintained at that level for long enough.”
Key takeaways:
Some members felt that it was more likely than not that the policy rate would need to increase further to return inflation to target. Others viewed the most likely scenario as one where a 5% policy rate would be sufficient to get inflation back to the 2% target, provided it was maintained at that level for long enough.
There was a strong consensus that, with clearer evidence of higher interest rates moderating spending, slowing growth and relieving price pressures, Governing Council should be patient and hold the policy rate at 5%. They agreed to revisit the need for a higher policy rate at future decisions with the benefit of more information.
Given the slower-than-expected progress toward price stability and increased inflationary risks, members agreed to state clearly that they were prepared to raise the policy rate further if needed.
Members noted that they needed to see downward momentum in core inflation to be confident that monetary policy was sufficiently restrictive to restore price stability.
Market reaction
The USD/CAD is up for the third consecutive day, trading around 1.3800, boosted by a stronger US Dollar. The summary of deliberations had no significant impact on the Loonie.
- Crude Oil is extending the week's declines as demand for barrels swoons.
- US Crude stocks soared on Tuesday, and China's data slowdown is hinting at slowing Crude demand.
- Looming risk of Crude Oil undersupply is completely overshadowing geopolitical concerns.
West Texas Intermediate (WTI) Crude Oil barrels are getting knocked back heading into the mid-week, testing the $75.00/barrel region as the narrative of global Crude Oil undersupply runs up against hard data suggesting the recent slump in barrel availability is to have much less impact than initially expected.
US Crude Oil stocks soared by almost 12 million barrels last week according to numbers from the American Petroleum Institute (API). By the API's count, 11.9 million barrels showed up in the US Crude Oil supply stream for the week into November 2nd, a significant jump over the previous week's 1.347 million barrel building.
Adding to Crude Oil woes, Chinese economic data continues to disappoint, dousing fears that China's future Crude Oil demand would suck global markets dry.
China's Trade Balance figures sharply missed the mark on Tuesday, declining to $56.53 billion in October compared to the previous month's $77.71 billion as consumption spending in China sharply contracts.
WTI Technical Outlook
WTI's Wednesday decline sees Crude Oil extending a bearish slide after smashing through the 200-day Simple Moving Average (SMA) near $78.00, making a clean break and heading straight into bear country at the $75.00 handle.
Crude Oil is down over 20% from late September's swing high that just missed the $94.00 handle, and WTI's tumble from the low side of a rising trending from $78.00 sees bearish momentum set to expand heading into the back half of the trading week.
WTI Daily Chart

WTI Technical Levels
- GBP/USD continues its downtrend, touching a weekly low of 1.2241.
- BoE Governor Andrew Bailey's comments on inflation targets and a restrictive policy stance contrast with Chief Economist Huw Pill's openness to rate cuts in 2024.
- Markets have priced in a potential BoE rate cut for August 2024, adding pressure on the Pound.
GBP/USD prolongs its agony, extending its losses to three consecutive days, and falls to a weekly low of 1.2241 as market sentiment shifted sour, as portrayed by Wall Street posting losses. At the time of writing, the major is trading at 1.2287, down 0.10%.
The British Pound struggles as economic concerns weigh on sentiment, with traders eyeing UK GDP data and Fed Chair Powell's speech for direction
A scarce economic docket left traders adrift to Bank of England’s (BoE) Governor Andrew Bailey comments, who said he’s optimistic that inflation would hit the BoE’s target of 2% in 2025, despite lying at 6.7% according to September´s data. He emphasized the need for a restrictive policy and pushed back against BoE’s Chief Economist Huw Pill, who said that market pricing in a rate cut in August 2024 “doesn’t seem too unreasonable.”
Interest rate futures have fully priced in a quarter of a percentage points BoE rate cut for August 2024, with an additional one to November 2024.
In the meantime, GBP/USD traders brace themselves for the release of third-quarter Gross Domestic Product (GDP) data, which is expected to show a contraction of 0.1% QoQ, on Friday.
Across the pond, the US economic calendar was light, led by Federal Reserve´s (Fed) officials. Fed Governor Lisa Cook said that persistent inflationary pressures and China’s economic slowdown could endanger financial stability. She added that the Middle East conflict and the Russia and Ukraine war could put the financial markets under a lot of stress, adding that geopolitical tensions could change the US economic outlook.
Given the fundamental backdrop, the GBP/USD will most likely remain sideways during the next couple of days as traders await UK GDP data and Fed Chair Jerome Powell's speech. Powell’s hawkish remarks could boost the Greenback and exacerbate a drop toward the 1.2200 figure. If UK GDP data on Friday comes better than expected, look for a re-test of the 1.2400 figure.
GBP/USD Price Analysis: Technical outlook
The GBP/USD daily chart portrays the pair as neutral to slightly downward biased, with the exchange rate below the 50 and 200-day moving averages (DMAs). Even though the pair achieved successive series of higher-highs and higher-lows, downside risks remain unless it breaches the 200-DMA at 1.2433. First support is seen at 1.2241, followed by the 1.2200 figure. A breach of the latter will expose the October 26 cycle low of 1.2069. Conversely, if GBP/USD climbs past 1.2300, that could pave the way for a re-test of the 200-DMA.
- After reaching a high of 105.90, the DXY index declined to 105.55.
- Long-term US government bond yields are declining after rebounding from multi-week lows.
- Chair Powell didn’t comment on monetary policy on Wednesday.
The US Dollar (USD) accelerated its gains in Wednesday's session with the DXY index, which measures the value of the US Dollar versus a basket of global currencies, escalating to a high of 105.90 earlier in the session. That said, the index reversed its course and declined toward 105.55, weighed down by falling Treasury yields. No highlights were seen during the session.
Markets remain quiet this week as investors await fresh catalysts to place their bets on the next Federal Reserve (Fed) decision in December. Several officials were on the wires on Monday and Tuesday but didn’t provide any highlights. The focus seems to have turned to next week’s October inflation figures from the US.
Daily Digest Market Movers: US Dollar upside limited as US yields lose traction
- The US Dollar Index stands with mild gains at 105.55.
- No high-tier reports will be released this week. Markets await next week’s inflation figures from the US and are still digesting last Friday’s US Nonfarm Payrolls report.
- The US Bureau of Labor Statistics reported that the Nonfarm Payrolls from October came in lower than expected. The US added 150,000 jobs in October vs the expected 180,000 and decelerated from its revised previous figure of 297,000.
- The Unemployment Rate came in at 3.9% in October, above the expected 3.8% and accelerating compared to its previous reading of 3.8%.
- Average Hourly Earnings increased by 0.2% MoM but rose 4.1% YoY, higher than the expected 4% but beneath the previous reading of 4.3%.
- Meanwhile, the 2-year Treasury rate is flat at 4.90%, while the longer-term 5 and 10-year rates declined to 4.53% and 4.52%, respectively, which seems to be limiting upside for the USD.
- According to the CME FedWatch Tool, the odds of a 25-basis-point hike in December are extremely low, around 10%.
- Escalating tensions arise in the Middle East after an American plane was shot down by Yemeni soldiers, news that may provide a cushion to the Greenback.
Technical Analysis: US Dollar Index struggles to gain momentum, bears around the corner
Based on the daily chart, the DXY Index shows indications of bullish exhaustion, leading to a neutral to bearish technical outlook. The Relative Strength Index (RSI) shows a weakening bullish trend with a negative slope below its midline, while the Moving Average Convergence (MACD) exhibits neutral red bars.
What gives the outlook neutrality is the index staying below the 20-day Simple Moving Average (SMA) but above the 100 and 200-day SMAs, indicating that the bulls still have the upper hand in the broader picture.
Support levels: 104.90, 104.70, 104.50.
Resistance levels: 105.80, 106.00, 106.15.
US Dollar FAQs
What is the US Dollar?
The US Dollar (USD) is the official currency of the United States of America, and the ‘de facto’ currency of a significant number of other countries where it is found in circulation alongside local notes. It is the most heavily traded currency in the world, accounting for over 88% of all global foreign exchange turnover, or an average of $6.6 trillion in transactions per day, according to data from 2022.
Following the second world war, the USD took over from the British Pound as the world’s reserve currency. For most of its history, the US Dollar was backed by Gold, until the Bretton Woods Agreement in 1971 when the Gold Standard went away.
How do the decisions of the Federal Reserve impact the US Dollar?
The most important single factor impacting on the value of the US Dollar is monetary policy, which is shaped by the Federal Reserve (Fed). The Fed has two mandates: to achieve price stability (control inflation) and foster full employment. Its primary tool to achieve these two goals is by adjusting interest rates.
When prices are rising too quickly and inflation is above the Fed’s 2% target, the Fed will raise rates, which helps the USD value. When inflation falls below 2% or the Unemployment Rate is too high, the Fed may lower interest rates, which weighs on the Greenback.
What is Quantitative Easing and how does it influence the US Dollar?
In extreme situations, the Federal Reserve can also print more Dollars and enact quantitative easing (QE). QE is the process by which the Fed substantially increases the flow of credit in a stuck financial system.
It is a non-standard policy measure used when credit has dried up because banks will not lend to each other (out of the fear of counterparty default). It is a last resort when simply lowering interest rates is unlikely to achieve the necessary result. It was the Fed’s weapon of choice to combat the credit crunch that occurred during the Great Financial Crisis in 2008. It involves the Fed printing more Dollars and using them to buy US government bonds predominantly from financial institutions. QE usually leads to a weaker US Dollar.
What is Quantitative Tightening and how does it influence the US Dollar?
Quantitative tightening (QT) is the reverse process whereby the Federal Reserve stops buying bonds from financial institutions and does not reinvest the principal from the bonds it holds maturing in new purchases. It is usually positive for the US Dollar.
- Spot Gold is heading into fresh lows on Wednesday, testing $1,950.
- Precious metals are getting pushed back as investor hopes for a dovish Fed ease.
- US Treasuries remain on the soft side, easing back to 4.5% after hitting 4.615%.
XAU/USD is testing into chart space around the $1,950 price level, and Gold is seeing downside pressure as markets readjust their expectations of the Federal Reserve's (Fed) willingness to ease back interest rates.
US Treasury yields remain elevated, but have eased off recent spikes into decade-plus highs, cutting off a major bullish pipeline for Spot Gold prices.
Last week saw a significant uptick in expectations that the Fed would get pushed further towards beginning a rate-cutting cycle, but investors have been forced to rebalance their expectations this week as Fed officials talk down chances of "sooner rather than later" rate cuts.
Many now expect rate cuts to begin sometime next year, and markets are being forced to adjust their hopes and expectations.
XAU/USD Technical Outlook
Gold's extension into three straight declining days is sending the XAU/USD back towards the 200-day Simple Moving Average (SMA) currently near $1,935.
Recent momentum in the Spot Gold chart has left both a lower low and a higher high acting as technical boundaries for trend momentum; the near-term technical ceiling sits at $2,009 while the floor on any bearish continuations will eventually need to clear $1,810.
XAU/USD Daily Chart

XAU/USD Technical Levels
- The EUR/USD is stuck near the 1.0700 handle as the pair cycles.
- EU Retail Sales came in mixed on Wednesday.
- ECB President Lagarde to speak at a non-central bank event on Thursday.
The EUR/USD is pivoting around 1.0700 on Wednesday, spreading out into a 100-pip range through the week's trading with little direction momentum sending the pair anywhere meaningful.
EU Retail Sales came in mixed on forecasts, with the short end of the data coming in below expectations and a better-than-expected reading for the annual figures.
MoM EU Retail Sales for September printed at -0.3%, declining more than the expected -0.2%, seeing a milder recovery from the previous reading of -0.7% (revised upwards from -1.2%).
Eurozone Retail Sales decline 2.9% YoY in September vs. -3.2% expected
YoY EU Retail Sales were expected to show a 3.2% decline, but managed to eke out a slight forecast beat, printing at -2.9%. The annualized September Retail Sales beat expectations, but still declined from August's annualized -12.8% print, which was also revised upwards from -2.1%.
European Central Bank (ECB) President Christine Lagarde will be speaking at the inauguration of the House of the Euro in Brussels on Thursday. The House of the Euro is a pan-European central bank working space where policymakers from various EU central banks can collaborate and work together.
The event is not a policy event, but investors will be keeping a close eye for any excessively hawkish or dovish comments from the ECB's President Lagarde.
EUR/USD Technical Outlook
The EUR/USD is strung up in the midrange between the 200- and 50-day Simple Moving Averages (SMAs) that are currently stacked bearishly, with the 50-day SMA riding down towards 1.0600 below the 200-day SMA currently parked near 1.0800.
With long-term technical resistance sitting at the 200-day SMA and near-term technical support near the 1.0600 handle, the EUR/USD is set to see some directional drift following a weak break of the descending trendline from July's swing high into 1.1275.
EUR/USD Daily Chart
EUR/USD Technical Levels
- EUR/GBP reaches a weekly peak, trading at 0.8711, buoyed by concerns over the UK's economic stagnation and potential stagflation.
- UK GDP forecasts indicate a possible contraction in Q3, with expectations of a -0.1% decrease in QoQ, pressuring the Pound.
- Bank of England's mixed signals, with Governor Bailey's cautious stance on inflation, contrast with Huw Pill's rate cut discussions, adding to GBP volatility.
EUR/GBP gathers traction, extending its gains to three consecutive days, hitting a weekly high of 0.8713, as the economic outlook for the United Kingdom (UK) looks uncertain as stagnation talks gather momentum. The cross-currency pair trades at 0.8711, up a decent 0.14%.
Euro gains against the Pound amid a challenging economic outlook for the UK, with the Eurozone also facing its own inflationary pressures
Recent economic data from the UK suggests the economy will contract in the third quarter. Forecasts for the release of Gross Domestic Product (GDP)¸ show economists awaiting a -0.1% QoQ contraction, which, added to elevated prices, suggests the economy is at the brisk of stagflation. That, along with comments from the Bank of England (BoE) Governor Andrew Bailey indicating inflation is slowing down, weakened the Pound Sterling (GBP). Nevertheless, contrary to Huw Pill's comments on Tuesday, he said that “it´s too early to be talking about cutting rates.”
On the Eurozone (EU) front, inflation in Germany remains stickier at 3.8% YoY in October, unchanged compared to September’s data. EU Retail Sales shrank -0.3% MoM in September and 2.9% over the last twelve months.
Aside from this, comments from European Central Bank (ECB) officials show mixed readings after Martin Kazaks said he did not rule out further tightening, echoing some of Gabriel Makhlouf's comments that it´s premature to talk about rate cuts. On the dovish side, ECB’s Pierre Wunsch suggested the economy may be entering a stagflation phase.
EUR/GBP Price Analysis: Technical outlook
Given the fundamental backdrop, the EUR/GBP uptrend remains intact, with the pair breaking solid resistance at the 200-day moving average (DMA) at 0.8688, which exacerbated a rally above the 0.8700 figure. Additional upside risks are seen above the October 31 daily high at 0.8754, which could exacerbate an advance to 0.8800. On the other hand, sellers must need to drag spot prices below 0.8700, so they can remain hopeful of reclaiming the 200-DMA.
- Canadian Dollar sees further downside as Loonie loses oil support.
- Canada Building Permits also slid to a five-month low.
- Loonie down a full percent for the week.
The Canadian Dollar (CAD) is extending the week’s decline, getting pushed down as broader markets favor the US Dollar (USD) and Crude Oil bids decline into four-month lows.
Last week’s rally into the close fueled by investors heralding the end of the Federal Reserve’s (Fed) rate hike cycle is hitting a wall this week, and elation is being replaced with trepidation as fears of a global economic slowdown and ongoing geopolitical concerns weigh on risk appetite.
Daily Digest Market Movers: Canadian Dollar heading back for the bottom as investors extend Greenback bets
- CAD set for a third consecutive down day, backsliding 1.25% from Monday’s high bids.
- Broad-market USD pickup is seeing the Loonie get pushed back down after a brief recovery from 13-month lows.
- Canadian Building Permits declined 6.5% MoM in September, erasing August’s print of 4.3% (revised upward from 3.4%).
- Canada Housing Starts next week will round out the housing development picture.
- Bank of Canada Senior Deputy Governor Carolyn Rogers to speak about financial stability at an Advocis event in Vancouver on Thursday.
- The CAD is losing fundamental support as risk aversion flows pick up the US Dollar and West Texas Intermediate (WTI) Crude Oil fumbles barrel bids.
- WTI Crude Oil down over 9% from November’s high.
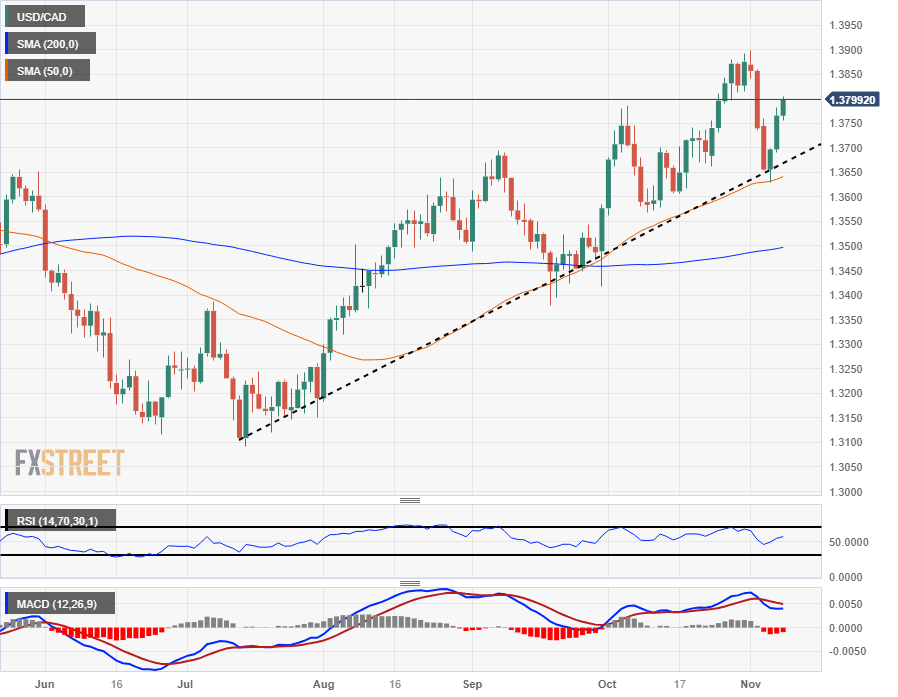
Technical Analysis: Canadian Dollar heading back into the floorboards, sees 1.38 against US Dollar
The USD/CAD has returned to the 1.3800 handle in Wednesday trading as the pair eases back, extending Greenback gains into a third straight day.
After seeing a technical bounce from the 50-day Simple Moving Average (SMA) near 1.3630 in confluence with a soft touch of the rising trendline from July’s low bids near 1.3100, the USD/CAD is set for a fresh challenge of 13-month highs at the 1.3900 handle. Multi-year highs remain locked behind 2022’s October peak of 1.3978.
Long-term trend technical support sits at the 200-day SMA currently rising into 1.2500, far below price action, and indicator traders will note that the Moving Average Convergence-Divergence (MACD) oscillator is still flashing short-side warnings after confirming a signal moving average crossover last week.
USD/CAD Daily Chart
Canadian Dollar price this week
The table below shows the percentage change of Canadian Dollar (CAD) against listed major currencies this week. Canadian Dollar was the weakest against the Swiss Franc.
| USD | EUR | GBP | CAD | AUD | JPY | NZD | CHF | |
| USD | 0.22% | 0.64% | 1.01% | 1.49% | 0.89% | 1.17% | -0.14% | |
| EUR | -0.21% | 0.42% | 0.80% | 1.26% | 0.69% | 0.95% | -0.35% | |
| GBP | -0.64% | -0.44% | 0.36% | 0.84% | 0.24% | 0.51% | -0.79% | |
| CAD | -1.02% | -0.80% | -0.37% | 0.47% | -0.13% | 0.15% | -1.17% | |
| AUD | -1.51% | -1.29% | -0.86% | -0.48% | -0.60% | -0.33% | -1.65% | |
| JPY | -0.90% | -0.68% | -0.48% | 0.14% | 0.60% | 0.27% | -1.04% | |
| NZD | -1.18% | -0.95% | -0.52% | -0.15% | 0.32% | -0.28% | -1.32% | |
| CHF | 0.14% | 0.35% | 0.77% | 1.14% | 1.62% | 1.02% | 1.29% |
The heat map shows percentage changes of major currencies against each other. The base currency is picked from the left column, while the quote currency is picked from the top row. For example, if you pick the Euro from the left column and move along the horizontal line to the Japanese Yen, the percentage change displayed in the box will represent EUR (base)/JPY (quote).
Canadian Dollar FAQs
What key factors drive the Canadian Dollar?
The key factors driving the Canadian Dollar (CAD) are the level of interest rates set by the Bank of Canada (BoC), the price of Oil, Canada’s largest export, the health of its economy, inflation and the Trade Balance, which is the difference between the value of Canada’s exports versus its imports. Other factors include market sentiment – whether investors are taking on more risky assets (risk-on) or seeking safe-havens (risk-off) – with risk-on being CAD-positive. As its largest trading partner, the health of the US economy is also a key factor influencing the Canadian Dollar.
How do the decisions of the Bank of Canada impact the Canadian Dollar?
The Bank of Canada (BoC) has a significant influence on the Canadian Dollar by setting the level of interest rates that banks can lend to one another. This influences the level of interest rates for everyone. The main goal of the BoC is to maintain inflation at 1-3% by adjusting interest rates up or down. Relatively higher interest rates tend to be positive for the CAD. The Bank of Canada can also use quantitative easing and tightening to influence credit conditions, with the former CAD-negative and the latter CAD-positive.
How does the price of Oil impact the Canadian Dollar?
The price of Oil is a key factor impacting the value of the Canadian Dollar. Petroleum is Canada’s biggest export, so Oil price tends to have an immediate impact on the CAD value. Generally, if Oil price rises CAD also goes up, as aggregate demand for the currency increases. The opposite is the case if the price of Oil falls. Higher Oil prices also tend to result in a greater likelihood of a positive Trade Balance, which is also supportive of the CAD.
How does inflation data impact the value of the Canadian Dollar?
While inflation had always traditionally been thought of as a negative factor for a currency since it lowers the value of money, the opposite has actually been the case in modern times with the relaxation of cross-border capital controls. Higher inflation tends to lead central banks to put up interest rates which attracts more capital inflows from global investors seeking a lucrative place to keep their money. This increases demand for the local currency, which in Canada’s case is the Canadian Dollar.
How does economic data influence the value of the Canadian Dollar?
Macroeconomic data releases gauge the health of the economy and can have an impact on the Canadian Dollar. Indicators such as GDP, Manufacturing and Services PMIs, employment, and consumer sentiment surveys can all influence the direction of the CAD. A strong economy is good for the Canadian Dollar. Not only does it attract more foreign investment but it may encourage the Bank of Canada to put up interest rates, leading to a stronger currency. If economic data is weak, however, the CAD is likely to fall.
- XAG/USD found support at a low of around $22.30 and then increased towards $22.65.
- After recovering on Monday, US Treasuries resumed their downfall.
- A strong USD limits the upside.
In Tuesday's session, the Silver spot price XAG/USD cleared most of its daily losses after bottoming at a low of $22.30 and then jumping back to $22.65. There were no relevant highlights during the session, and the metal's price dynamics were set by falling US yields, which benefited the metal.
In line with that, the 2,5 and 10-year yields declined to 4.90%, 4.52% and 4.54% but remained at lows of over a month. Those rates seem to be reflecting dovish bets on the Federal Reserve (Fed) after last week's decision, where markets perceived hints of the bank approaching the end of its tightening cycle. In addition, weak Nonfarm Payrolls figures reported on Friday exacerbated the decline, which benefited further the price of the non-yielding metal.
Markets focus shifts to next week's inflation data from the US, where markets expect the Consumer Price Index (CPI) to have decelerated in October. In that sense, soft figures may trigger further dovish bets on the Fed, which could weaken the US Dollar and fuel the price of Silver. As for now, the CME FedWatch tool indicates that the odds of a 25 bps hike in the Fed's next December meeting declined to nearly 10%.
XAG/USD Levels to watch
Upon analyzing the daily chart, bearish sentiment is evident for the short term for the XAG/USD. Relative Strength Index (RSI) resides below its midline in negative territory, exhibiting a southward trajectory which aligns with a negative indication from the Moving Average Convergence Divergence (MACD), as shown by the presence of red bars, underscoring the growing bearish momentum. On the other hand, the pair is below the 20,100 and 200-day Simple Moving Averages (SMAs), highlighting the continued dominance of bears on the broader scale, requiring the buyers to take action. That being said, fundamentals could revive the bullish momentum in case it aligns with the dovish Fed rhetoric.
Support levels: $22.30, $22.15, $22.00.
Resistance levels: $22.85 (20-day SMA), $23.15-30 (100 and 200-day SMA convergence), $23.50.
XAG/USD Daily Chart
-638350570112670038.png)
The relative resilience of the Australian economy suggests scope for the AUD to outperform both the NZD and the EUR over the coming months, economists at Rabobank report.
AUD/USD at risk of dips to 0.62 on a three-month view
While we expect broad based USD strength and weak risk appetite to push AUD/USD back to 0.62 on a three-month view, we see the relatively better economic outlook in Australia to result in the AUD outperforming both the NZD and the EUR.
We see scope for EUR/AUD to drop back to 1.59 on a six-month view and see potential for AUD/NZD to edge towards 1.12 in a six-month view.
We expect NZD/USD to dip to 0.57 on a three-to-six-month view.
- Mexican Peso witnessed a pullback from Tuesday´s gains, despite an upbeat market sentiment.
- Banxico is expected to hold rates at 11.25%, according to a Reuters poll.
- USD/MXN aims higher on hawkish commentary by Federal Reserve officials.
Mexican Peso erases some of its Tuesday’s gains, though it has recovered from trading near daily lows amid an upbeat market sentiment after Federal Reserve (Fed) speakers pushed back against the perception that the Fed had finished raising interest rates. At the time of writing, the USD/MXN exchanges hands at 17.49 posting a gain of 0.10%.
Mexico´s economic docket remains scarce, with market players awaiting the Bank of Mexico (Banxico) monetary policy meeting on November 9. A Reuters survey polled 18 economists who expect Banxico to hold rates at an all-time high of 11.25%, reached since March. Banxico officials had reiterated they would keep rates at the “current level” as they fight to bring inflation down. The latest Consumer Price Index (CPI) data in September witnessed Mexico’s inflation at 4.27%. A Tuesday poll by Reuters, noted that economists expect inflation to rise to 4.28% in October.
In the meantime, Fed Chairman Jerome Powell crossed the wires but did not comment on monetary policy.
Daily digest movers: Mexican Peso on the defensive on hawkish comments by Fed officials
- Hawkish commentary by Minnesota Fed President and Fed Governor Michelle Bowman underpins the Greenback (USD), which shows decent gains.
- This comes after Kashkari questioned whether the Fed has raised rates enough due to the economy’s resilience, on Tuesday. He added an uptick in inflation would trigger another rate hike by the Fed.
- Fed Governor Michelle Bowman expressed that the Fed may need to raise interest rates further to control inflation. However, she also noted that the significant increase in Treasury yields since September has led to tighter financial conditions.
- The US Dollar Index (DXY), a gauge that tracks the buck´s value against a basket of six currencies, advances 0.18%, changing hands at 105.69.
- The US 10-year Treasury bond yield is almost flat at 4.565%
- Money market futures have priced in a 25 bps rate cut by the Federal Reserve in July 2024.
- Mexico´s economy remains resilient after October’s S&P Global Manufacturing PMI improved to 52.1 from 49.8, and the Gross Domestic Product (GDP) expanded by 3.3% YoY in the third quarter.
- On October 24, Mexico's National Statistics Agency, INEGI, reported annual headline inflation hit 4.27%, down from 4.45% at the end of September and below forecasts of 4.38%.
- Mexico’s core inflation rate YoY was 5.54%, beneath forecasts of 5.60%.
- Banxico revised its inflation projections from 3.50% to 3.87% for 2024, which remains above the central bank’s 3.00% target (plus or minus 1%). The next decision will be announced on November 9 at 19:00 GMT
Technical Analysis: Mexican Peso buyers in charge though a golden-cross looms
The USD/MXN remains neutrally biased, though about to form a golden cross with the 50-day Simple Moving Average (SMA) crossing above the 200-day SMA, each at 17.67 and 17.68, respectively. That could pave the way for further upside. However, buyers need to lift the exchange rate above the 17.70 area, so they can challenge the 20-day SMA at 17.95, ahead of the psychologically 18.00 figure.
On the flip side, look for key support levels at Monday’s low of 17.40, followed by the 100-day Simple Moving Average (SMA) at 17.32. A breach of the latter will expose the 17.00 figure before the pair aims to test the year-to-date (YTD) low of 16.62.
Mexican Peso FAQs
What key factors drive the Mexican Peso?
The Mexican Peso (MXN) is the most traded currency among its Latin American peers. Its value is broadly determined by the performance of the Mexican economy, the country’s central bank’s policy, the amount of foreign investment in the country and even the levels of remittances sent by Mexicans who live abroad, particularly in the United States. Geopolitical trends can also move MXN: for example, the process of nearshoring – or the decision by some firms to relocate manufacturing capacity and supply chains closer to their home countries – is also seen as a catalyst for the Mexican currency as the country is considered a key manufacturing hub in the American continent. Another catalyst for MXN is Oil prices as Mexico is a key exporter of the commodity.
How do decisions of the Banxico impact the Mexican Peso?
The main objective of Mexico’s central bank, also known as Banxico, is to maintain inflation at low and stable levels (at or close to its target of 3%, the midpoint in a tolerance band of between 2% and 4%). To this end, the bank sets an appropriate level of interest rates. When inflation is too high, Banxico will attempt to tame it by raising interest rates, making it more expensive for households and businesses to borrow money, thus cooling demand and the overall economy. Higher interest rates are generally positive for the Mexican Peso (MXN) as they lead to higher yields, making the country a more attractive place for investors. On the contrary, lower interest rates tend to weaken MXN.
How does economic data influence the value of the Mexican Peso?
Macroeconomic data releases are key to assess the state of the economy and can have an impact on the Mexican Peso (MXN) valuation. A strong Mexican economy, based on high economic growth, low unemployment and high confidence is good for MXN. Not only does it attract more foreign investment but it may encourage the Bank of Mexico (Banxico) to increase interest rates, particularly if this strength comes together with elevated inflation. However, if economic data is weak, MXN is likely to depreciate.
How does broader risk sentiment impact the Mexican Peso?
As an emerging-market currency, the Mexican Peso (MXN) tends to strive during risk-on periods, or when investors perceive that broader market risks are low and thus are eager to engage with investments that carry a higher risk. Conversely, MXN tends to weaken at times of market turbulence or economic uncertainty as investors tend to sell higher-risk assets and flee to the more-stable safe havens.
Economists at CIBC Capital Markets maintain their USD/MXN year-end and Q1 2024 forecasts at 18.00 and 18.50, respectively.
Popular carry trades back in the spotlight
We recognize that the early November retreat in UST yields following Fed Chair Powell’s reference to a higher potential output (which was interpreted as a hint to a higher bar for further monetary tightening), put popular carry trades back in the spotlight. However, we don't see that move as one that could be sustained into the rest of the year.
In the case of the MXN, we continue to disagree with the cautious pricing of Banxico's monetary policy easing path in 2024, while we expect US sectors sensitive to high interest rates (i.e. construction and manufacturing) to exert downward pressures on remittances to Mexico going forward.
Hence, we maintain our USD/MXN year-end and Q1 2024 forecasts at 18.00 and 18.50, respectively.
- The USD/CHF declined to 0.8990, with mild downwards movements.
- The USD is extending its gains due to a cautious market outlook.
- Jerome Powell was on the wires on Wednesday and provided no highlights.
The USD/CHF experienced a quiet session on Wednesday near the 0.8990 area, seeing slight losses, with the trajectory of the pair being set by the US Dollar strengthening further. No high-tier reports were released, and the following highlights will be Consumer Confidence data from the US on Friday and next week's inflation data.
In that sense, after sharply declining last week, the US DXY index, which measures the value of the USD against a basket of currencies, rose to 105.60, up by 0.20% as markets turned cautious, awaiting fresh catalyst on a quiet week.
On Tuesday, several Federal Reserve (Fed) officials were on the wires and didn’t provide any relevant insights regarding the bank's overall stance. Overall, they welcomed the latest data from the labor market, which saw evidence of cooling down, but they hinted at needing further evidence to say that the job is done. On Wednesday, Chair Powell was seen at the US Central Bank statistics conference and refrained from commenting on the monetary policy.
For next week, markets are seeing the US Consumer Price Index (CPI) to have advanced 0.1% MoM in October while the Core measures 0.3%. In addition, the outcome of the inflation reading may shape the expectations for the next Fed meeting, which, as for now, markets are betting on low odds of a hike.
USD/CHF Level to watch
The technical analysis of the daily chart points to a neutral to bearish outlook for USD/CHF, indicating a decline in bullish strength. The Relative Strength Index (RSI) points downwards in the bullish territory, suggesting a possible trend reversal, while the Moving Average Convergence (MACD) lays out red bars. In addition, the pair is above the 100-day Simple Moving Average (SMA) but below the 20 and 200-day SMAs, suggesting that despite the recent bearish sentiment, the bulls are still resilient, holding some momentum. However, if the 20- and 200-day averages complete a bearish cross around the 0.9000 area, further downside may be on the horizon for the pair.
Supports: 0.8960, 0.8950, 0.89300
Resistances: 0.9000 (20 and 200-day SMA convergence), 0.9030, 0.9050
USD/CHF Daily chart
-638350527359706114.png)
A combination of domestic and external challenges could point to a lower GBP/USD into 2024, in the view of economists at HSBC.
Rates to remain steady until the first rate cut in February 2025
With inflation set to drop sharply in October and then move gradually lower, our economists’ central case is for no further hikes and for the first rate cut to come in February 2025. We think the GBP will probably face further downward pressure if rates markets find more room to price in rate cuts in the months ahead.
It is worth noting that the BoE is now forecasting a worse growth-inflation trade-off, with the 2024 GDP growth forecast now having been trimmed to zero and the inflation forecasts for 2024 and 2025 having been revised upwards. With concerns over stagflation, we believe that the GBP will continue to struggle.
Externally, slower global economic growth and heightened geopolitical risks could also point to a weaker GBP against the ‘safe-haven’ USD.
The Brazilian Real has performed very impressively against the USD since the beginning of October. Economists at Commerzbank analyze USD/BRL outlook.
Real seems well equipped – for now
Of course, it is easier to sound hawkish while the real economy seems robust. It gets more difficult once a recession is approaching or inflation rises again so a central bank has to take action. Today’s retail sales and the inflation data due on Friday are likely to provide further information in this respect.
If the economy turns out to be robust and inflation does not rise again there is a lot to suggest that the Real will remain better-equipped to stand its ground in possible periods of USD strength than comparable currencies.
With significant negativity already priced for Europe, further EUR/USD weakness will come from the USD leg, economists at CIBC Capital Markets report.
Macro headwinds remain
The market remains braced for a weak Euro macro backdrop to extend into early 2024, as lacklustre Chinese data is far from helpful for the manufacturing sector. However, we would note the impact of weak data on EUR performance has moderated, in part as negativity is already discounted.
However, as implied spread dynamics move against the EUR, we can expect real money players to further unwind excessive EUR longs. Although real money players may have almost halved EUR holdings from early August highs a further consolidation underlines the presumption of fresh 2023 EUR/USD lows prior to year-end.
EUR/USD – Q4 2023: 1.03 | Q1 2024: 1.03
- EUR/USD accelerates its losses to weekly lows near 1.0660.
- The next support of note emerges at 1.0650 ahead of 1.0500.
EUR/USD retreats further and approaches the transitory 55-day SMA near 1.0650 on Wednesday.
In case the downward bias picks up extra pace, the next relevant contention is expected to emerge around the 1.0500 neighbourhood in the short-term horizon.
In the meantime, while below the 200-day SMA at 1.0802, the pair’s outlook should remain negative.
EUR/USD daily chart
- DXY extends the upside momentum near 106.00.
- Further up comes the weekly top past the 107.00 barrier.
DXY climbs to the vicinity of the 106.00 region amidst the positive price action so far this week.
In case the buying interest gathers extra pace, the index could revisit the so far November high at 107.11 (November 1) ahead of the 2023 peak of 107.34 (October 3).
In the meantime, while above the key 200-day SMA, today at 103.55, the outlook for the index is expected to remain constructive.
DXY daily chart
USD continues to consolidate/correct recent losses. Economists at Scotiabank analyze Greenback’s outlook.
Strengthening conviction in markets that US rates have peaked
The US Dollar Index (DXY) has regained the upper 105 area, reflecting some mild gains in US Treasury yields and little else.
Recall that, from a technical point of view at least, the DXY could/should recover to the 106.50 area to fill the gap left on the intraday/daily chart after last week’s slide.
Given the strengthening conviction in markets that US rates have peaked, USD rebounds seem unlikely to get much further than that, all else equal.
- EUR/JPY advances to new yearly highs beyond 161.00.
- There are no up-barriers of note until the 2008 top near 170.00.
EUR/JPY extends the march north of the fifth session in a row and clinches a new 2023 peak past the 161.00 hurdle on Wednesday.
Further upside appears well on the cards for the cross in the short-term horizon. Against that, the surpass of the 2023 high of 161.05 (November 8) is expected to face the next significant resistance level not before the 2008 top of 169.96 (July 23)
So far, the longer term positive outlook for the cross appears favoured while above the 200-day SMA, today at 151.92.
EUR/JPY daily chart
- AUD/USD falls to near 0.6400 as the appeal for the US Dollar improves.
- The US Dollar strengthens ahead of Powell’s speech.
- RBA Bullock kept hopes of further rate-tightening alive, citing that the progress in inflation declining to 2% has slowed.
The AUD/USD pair is declining toward the round-level support of 0.6400 in the early New York session. The Aussie asset is expected to continue its downside trend as the appeal for safe-haven assets has improved. The US Dollar recovers further as Federal Reserve (Fed) policymakers see the need for more interest rate hikes to tame inflationary pressures comfortably.
Fed policymakers: Michelle Bowman and Neel Kashkari remained hawkish while guiding about interest rates on Tuesday, citing risks of persistent inflation due to the resilient US economy. Fed Bowman sees the requirement of further policy hikes as current tightening financial conditions have been deliberately contributed by higher bond yields, which could not remain elevated for a longer period.
The S&P500 has opened on a cautious note as investors are worried ahead of guidance on interest rates from Fed Chair Jerome Powell. Investors are confused about whether Jerome Powell would discuss the need for further policy tightening to cement price stability or emphasize seldom keeping current policy restrictive for a longer period.
The US Dollar Index (DXY) gathers strength to recapture the immediate resistance of 106.00 despite investors seeing that the Fed is done with hiking interest rates. The tight US labor market has started easing as business investment remained weak in the last quarter due to higher borrowing costs.
Meanwhile, the risks of widening Middle East tensions have eased as market participants see conflicts remaining between Israel and Palestine.
The Australian Dollar failed to gain strength despite an interest rate hike from the Reserve Bank of Australia (RBA) on Tuesday. The RBA raised its Official Cash Rate (OCR) by 25 basis points (bps) to 4.35%. RBA Governor Michele Bullock kept hopes of further rate-tightening alive, citing that the progress in inflation declining to 2% has slowed and risks of persistent consumer inflation have escalated.
- The New Zealand Dollar loses ground against the US Dollar after the RBNZ publishes its latest inflation expectations.
- The central bank report suggests prices are likely to come down in the future, capping interest rates.
- NZD/USD remains in a long-term downtrend with commentary from Fed Chair Powell and other governors as potential near-term influences.
The New Zealand Dollar (NZD) edges lower against the US Dollar on Wednesday as the market mood sours on the back of a vaguely downbeat outlook for the global economy. Since New Zealand is a major exporter of commodities, a slowdown in global growth would not help its currency.
Nor has an inflation report released overnight by the Reserve Bank of New Zealand (RBNZ) helped the Kiwi after it showed a widespread perception that a fall in prices lies ahead, possibly as a result of a slowdown in the economy and falling demand for goods and services.
Daily digest market movers: New Zealand Dollar weakens on lower price expectations
- The New Zealand Dollar trades lower versus the US Dollar as a result of a generally risk-off tone to markets on Wednesday.
- The Kiwi further weakened against the US Dollar after the RBNZ released its Q3 inflation expectations report. Respondents expected inflation to fall to a lower level in a year’s time than in the previous report. A year out, they saw inflation of 3.60%, which is lower than the 4.17% in the Q2 report.
- Actual inflation in New Zealand, as reported by Stats NZ, showed inflation drop to 5.6% in Q3 versus the 6.0% of the previous quarter.
- The lower inflation expectations imply the RBNZ is less likely to raise interest rates, of which the principal Cash Rate currently stands at 5.50%. Higher interest rates tend to strengthen a currency by increasing capital inflows from foreign investors searching for higher returns. This explains why the report may have had a negative impact on NZD/USD.
- The RBNZ report also showed inflation expectations two years out, falling to 2.76% from 2.83% previously.
- The current widespread view is that the US Federal Reserve (Fed) is also now unlikely to raise interest rates. With the Fed Funds Rate currently at 5.25-5.50%, there is little incentive for traders to borrow in either NZD or USD and invest in the other, an operation known as the ‘carry trade’.
- The next key event on the calendar for the USD is Federal Reserve Chair Jerome Powell’s speech at 14:15 GMT and commentary from several other Fed governors later this afternoon.
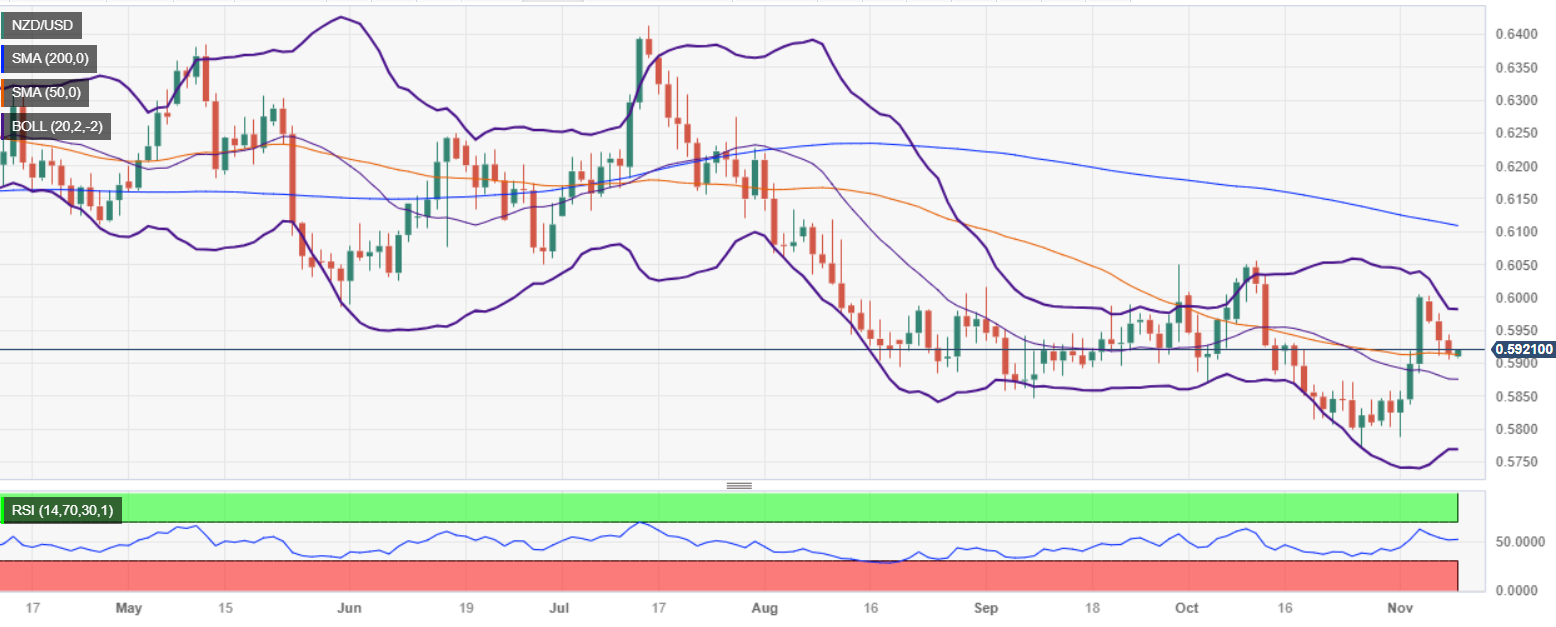
New Zealand Dollar technical analysis: NZD/USD slips lower on charts
NZD/USD – the number of US Dollars one New Zealand Dollar can buy – slipped lower for the third day in a row on Wednesday to trade at 0.5921 at the time of publishing. The pair is pulling back after peaking at 0.6002 on November 6.
New Zealand Dollar vs US Dollar: 4-hour Chart
The pair has found support at the 50-day Simple Moving Average (SMA) (see chart below). It remains in a short-term uptrend, favoring a recovery.
A decisive break above the November 3 high would reconfirm the short-term bullish bias, with a likely target thereafter at the 0.6055 high of October.
-638350484533461283.png)
New Zealand Dollar vs US Dollar: Daily Chart
The trend remains bearish, however, on both the daily chart and weekly charts suggesting the potential for more downside is strong.
In line with the dominant longer-term bear trends seen on higher time frames, a break below 0.5884 would signal a continuation of the broader downtrend to a target at the 0.5773 October low.
Bulls would have to push above the 0.6055 October high to change the outlook on the intermediate chart, to one that was bullish and suggested the possibility of the birth of a new uptrend.
New Zealand Dollar FAQs
What key factors drive the New Zealand Dollar?
The New Zealand Dollar (NZD), also known as the Kiwi, is a well-known traded currency among investors. Its value is broadly determined by the health of the New Zealand economy and the country’s central bank policy. Still, there are some unique particularities that also can make NZD move. The performance of the Chinese economy tends to move the Kiwi because China is New Zealand’s biggest trading partner. Bad news for the Chinese economy likely means less New Zealand exports to the country, hitting the economy and thus its currency. Another factor moving NZD is dairy prices as the dairy industry is New Zealand’s main export. High dairy prices boost export income, contributing positively to the economy and thus to the NZD.
How do decisions of the RBNZ impact the New Zealand Dollar?
The Reserve Bank of New Zealand (RBNZ) aims to achieve and maintain an inflation rate between 1% and 3% over the medium term, with a focus to keep it near the 2% mid-point. To this end, the bank sets an appropriate level of interest rates. When inflation is too high, the RBNZ will increase interest rates to cool the economy, but the move will also make bond yields higher, increasing investors’ appeal to invest in the country and thus boosting NZD. On the contrary, lower interest rates tend to weaken NZD. The so-called rate differential, or how rates in New Zealand are or are expected to be compared to the ones set by the US Federal Reserve, can also play a key role in moving the NZD/USD pair.
How does economic data influence the value of the New Zealand Dollar?
Macroeconomic data releases in New Zealand are key to assess the state of the economy and can impact the New Zealand Dollar’s (NZD) valuation. A strong economy, based on high economic growth, low unemployment and high confidence is good for NZD. High economic growth attracts foreign investment and may encourage the Reserve Bank of New Zealand to increase interest rates, if this economic strength comes together with elevated inflation. Conversely, if economic data is weak, NZD is likely to depreciate.
How does broader risk sentiment impact the New Zealand Dollar?
The New Zealand Dollar (NZD) tends to strengthen during risk-on periods, or when investors perceive that broader market risks are low and are optimistic about growth. This tends to lead to a more favorable outlook for commodities and so-called ‘commodity currencies’ such as the Kiwi. Conversely, NZD tends to weaken at times of market turbulence or economic uncertainty as investors tend to sell higher-risk assets and flee to the more-stable safe havens.
CAD losses against the US Dollar are minimal. Economists at Scotiabank analyze the USD/CAD outlook.
Short-term USD gains remain a technical sell
Spot gains are showing signs of slowing and perhaps stalling intraday as the USD/CAD pair tests the 61.8% retracement of the past week’s slide.
USD/CAD weakness through support at 1.3765 should see losses extend a little more toward the low 1.37 zone.
Short-term USD gains remain a technical sell, given last week’s big, bearish weekly reversal signal of the 1.39 point.
GBP/USD steadies. Economists at Scotiabank analyze the pair’s outlook.
Steady downside pressure may be easing
BoE Governor Bailey said it was ‘too early to talk about rate cuts’ after BoE Economist Pill had done just that on Tuesday (suggesting market pricing for rate cuts by August next year was not ‘unreasonable’).
Steady downside pressure on the GBP may be easing on the short-term chart.
Cable losses are moderating and minor gains off the early session low are testing trend resistance (1.2265) of the Monday high. GBP gains through here could extend to the low 1.23 area.
Resistance is 1.2310/1.2320 and 1.2370. Support is 1.2230/1.2240.
The mid/upper 1.06 zone is set to cushion EUR losses, economists at Scotiabank report.
Resistance seen at 1.0685/1.0690
The EUR retains a soft undertone on the daily chart but losses are steadying in the upper 1.06 zone, right on the 38.2% retracement of the EUR’s rally last week.
The mid/upper 1.06 zone coincides with high/low support or congestion and EUR losses should be cushioned by still bullish-leaning intraday and daily trend strength oscillators.
Resistance is 1.0685/1.0690 intraday.
See: EUR/USD may continue its gradual return towards 1.0600/1.0650 – ING
- The Greenback adds a third straight day of gains in its recovery attempt.
- Traders will be looking for clues and guidance from Fed Chairman Powell.
- The US Dollar Index is still in the 105-region, with still more room to the upside to recover from last week's decline.
The US Dollar (USD) is starting to recover, but it looks to be for all the wrong reasons. As the earning season is coming to an end, traders are now starting to draw a global picture of the US, and ergo, the world’s economy. With several big names disappointing and recently the bigger retailer discounters showing rising profits, it reveals that the current elevated rate environment is eating into people’s wallets and the US is at bigger risk than ever of falling into a recession together with the rest of the world.
On the economic data front, traders will want to hear from US Federal Reserve Chairman Jerome Powell later this Wednesday. More Fed speakers are due to speak at the end of this Wednesday and could paint a clearer picture of the concerns the Fed has at the moment and if a recession is part of that.
Daily digest: US Dollar all about the Fed
- Around 12:00 GMT, the weekly Mortgage Applications index will be released by the Mortgage Bankers Association (MBA). The previous print for the index was -2.1%.
- US Federal Reserve Chairman Jerome Powell is due to speak at 14:15 GMT.
- Near 15:00 GMT the US Wholesale Inventories are due to come out. The previous number was at 0%, and 0% is expected.
- The US Treasury will try to allocate a 10-year note in the markets near 18:00 GMT.
- Two Fed speakers are expected at the end of the US session with John Williams from the New York Fed at 18:40 GMT and Philip Jefferson from the Board of Governors of the Fed at 21:45 GMT.
- Asian equities are yet again in the red, though less severe. Europe and the US are not doing any better. The red numbers are the result of better than expected earnings from the top three US retail discounters in the US, which means that US consumers are looking for cheap alternatives instead of paying full price for goods and services.
- The CME Group’s FedWatch Tool shows that markets are pricing in a 90.4% chance that the Federal Reserve will keep interest rates unchanged at its meeting in December.
- The benchmark 10-year US Treasury yield trades at 4.59%, finding some calmer ground after last week’s volatility.
US Dollar Index technical analysis: US Dollar driven by Fed this Wednesday
The US Dollar is back in grace as an alternative and safe haven as investors are asking whether the world is heading – or is already – in a recession. The element that underpins this thesis comes as US earnings this week revealed that retail discounters have seen increased productivity and earnings in their recent quarter. The US consumer is feeling the pain of elevated rates, which means soon something will snap in the economy.
The DXY was looking for support near 105.00, and has been able to bounce ahead of it. Any shock events in global markets could spark a sudden turnaround and favour safe-haven flows into the US Dollar. A rebound first to 105.85 would make sense, a pivotal level from March 2023. A break above could mean a revisit to near 107.00 and recent peaks printed there.
On the downside, 105.10 is still acting as a line in the sand. Once the DXY slides back below that, a big air pocket is opening up with only 104.00 as the first big level where the 100-day Simple Moving Average (SMA) can bring some support. Just beneath that, near 103.50, the 200-day SMA should provide similar underpinning.
US Dollar FAQs
What is the US Dollar?
The US Dollar (USD) is the official currency of the United States of America, and the ‘de facto’ currency of a significant number of other countries where it is found in circulation alongside local notes. It is the most heavily traded currency in the world, accounting for over 88% of all global foreign exchange turnover, or an average of $6.6 trillion in transactions per day, according to data from 2022.
Following the second world war, the USD took over from the British Pound as the world’s reserve currency. For most of its history, the US Dollar was backed by Gold, until the Bretton Woods Agreement in 1971 when the Gold Standard went away.
How do the decisions of the Federal Reserve impact the US Dollar?
The most important single factor impacting on the value of the US Dollar is monetary policy, which is shaped by the Federal Reserve (Fed). The Fed has two mandates: to achieve price stability (control inflation) and foster full employment. Its primary tool to achieve these two goals is by adjusting interest rates.
When prices are rising too quickly and inflation is above the Fed’s 2% target, the Fed will raise rates, which helps the USD value. When inflation falls below 2% or the Unemployment Rate is too high, the Fed may lower interest rates, which weighs on the Greenback.
What is Quantitative Easing and how does it influence the US Dollar?
In extreme situations, the Federal Reserve can also print more Dollars and enact quantitative easing (QE). QE is the process by which the Fed substantially increases the flow of credit in a stuck financial system.
It is a non-standard policy measure used when credit has dried up because banks will not lend to each other (out of the fear of counterparty default). It is a last resort when simply lowering interest rates is unlikely to achieve the necessary result. It was the Fed’s weapon of choice to combat the credit crunch that occurred during the Great Financial Crisis in 2008. It involves the Fed printing more Dollars and using them to buy US government bonds predominantly from financial institutions. QE usually leads to a weaker US Dollar.
What is Quantitative Tightening and how does it influence the US Dollar?
Quantitative tightening (QT) is the reverse process whereby the Federal Reserve stops buying bonds from financial institutions and does not reinvest the principal from the bonds it holds maturing in new purchases. It is usually positive for the US Dollar.
- USD/JPY recovers sharply amid resilient US Dollar ahead of Powell’s speech.
- Fed Bowman feels the requirement of one more interest rate increase.
- A slowdown in Japan’s wage growth could delay BoJ’s plans of exiting from an easy policy stance.
The USD/JPY pair has climbed above the immediate resistance of 150.70 and is expected to recapture a two-week high near 151.50 amid strength in the US Dollar. The asset is consistently adding gains as the appeal for the US Dollar has improved ahead of the speech from Federal Reserve (Fed) Chair Jerome Powell.
S&P500 futures added nominal gains in the European session, portraying a revival in the risk appetite of the market participants. The US Dollar Index (DXY) gains for the third trading session in a row as Fed policymakers are leaning towards further policy-tightening to ensure achievement of the price stability. 10-year US Treasury yields recovered to near 4.58%.
US Fed Governor Michelle Bowman declared support for tightening policy further to ensure inflation returns to 2% in a timely manner. Bowman added that the monetary policy appears to be restrictive and some tightening in financial conditions has been contributed by higher bond yields, which could be volatile ahead.
While a few Fed policymakers support for raising interest rates further, investors still hope that the central bank is done with hiking interest rates as cracks have appeared in the US job market. The Manufacturing PMI continues to remain below the 50.0 threshold and Services PMI fell sharply in October.
On the Japanese Yen front, a decline in real wages has dampened the appeal of the Japanese Yen. Inflation-adjusted real wages dropped in September by 2.4%, which is likely to build pressure on already vulnerable consumer spending. Higher wage growth is a prerequisite for the Bank of Japan (BoJ) to exit from the expansionary policy stance.
Economist at UOB Group Enrico Tanuwidjaja and Junior Economist Agus Santoso comment on the latest publication of FX Reserves in Indonesia.
Key Takeaways
Indonesia’s foreign exchange reserves fell by USD1.8bn from Sep to USD133.1bn in Oct 2023, as it continued its declining trajectory in 3 consecutive months and recorded a decline of USD4.1bn from its position in Dec 2022.
The latest reserves level was equivalent to financing 6.1 months of imports or 5.9 months’ worth of imports and external government debt servicing, well above the international adequacy standard of 3 months of imports.
The figure represented a decline in exports revenue in Oct which was expected to record a deeper contraction and capital outflow due to heightened global uncertainty. Going forward, we expect that more new and competitive instruments including SRBI, SVBI and SUVBI could attract stronger inflows into Indonesia. Hence, we maintain our forecast of Indonesian FX reserves to remain in high levels of around USD135bn to USD145bn at the end of this year on the back of better outlook especially from CPO prices and higher inflows into Indonesia’s bond market.
Growing risks of divergence between the Fed and the BoC bring additional upside risk to USD/CAD in the coming quarters, economists at CIBC Capital Markets report.
USD/CAD seen ending next year at 1.35
We’ve compounded our forecast for Loonie weakness given the divergence in economic activity that the Canadian economy has seen versus US resilience, and we now see USD/CAD peaking at 1.42 in early 2024.
Canada’s heightened interest rate sensitivity and the deterioration in domestic demand will result in the BoC trimming interest rates a quarter ahead of the Fed, likely starting in Q2 2024. And a shallower path for USD depreciation next year on extended economic resilience leaves less room for loonie appreciation in H2 2024. As a result, we now see USD/CAD ending next year at 1.35, higher than our previous target.
- WTI Oil falls to a near six-month-low.
- The US Dollar is steady and looks for direction.
- Oil faces risk of falling to $74 should Wednesday’s EIA stockpile numbers point to an even bigger build.
Oil prices had their second worst performance of the past six months. At the beginning of October crude price had to endure a 6% drop in one trading day and on Tuesday it printed a near 5% devaluation of the benchmark Oil price. The decline accelerated when the overnight American Petroleum Institute (API) numbers revealed a big build in stockpile of 11.9 million barrels.
Meanwhile, The US Dollar (USD) was trading stronger in a move to recover some of its incurred losses from last week. Add a peculiar rate hike from the Australian Central Bank on Tuesday morning, and traders were starting to second guess if the Fed would venture to hike still one more time. The US Dollar Index (DXY) stays afloat above 105, though it is looking for direction.
Crude Oil (WTI) trades at $77.21 per barrel, and Brent Oil trades at $81.52 per barrel at the time of writing.
Oil news and market movers
- Earning season in both the US and Europe have been rather negative, which means that less demand for Oil could be at hand in the coming quarter.
- The outlook for China’s demand for Oil is not looking great: refining margins are narrowing, stockpiles are building and air travel has made it back to pre-pandemic levels and demand. The recent disappointing data on China exports adds to more worries.
- The weekly American Petroleum Institute Crude Stockpile numbers revealed a build of 11.9 million barrels against the previous build of 1.374 million.
- Around 15:30 GMT, the Energy Information Agency (EIA) is due to print its recent stockpile numbers. The previous build was of 0.774 million barrels – no projections pencilled in.
Oil Technical Analysis: OPEC+ will need to do more
Oil prices are gearing up to only go one way: lower. That is at least under the current conditions. More and more negative signals from the demand side are screaming for a price correction in WTI and Brent Crude futures. Expect to see more declines at hand until OPEC+ issues more supply cuts to meet the faded demand.
On the upside, $80 is the new resistance to watch out for. Should Crude be able to jump higher again, look for $84 (purple line) as the next level to see some selling pressure or profit taking. Should Oil prices be able to consolidate above there, the topside for this fall near $93 could come back into play.
On the downside, traders are bracing for trading in this psychological region near $78. The area should see ample support for buying. Any further drops below this level might see a firm nosedive move, which would likely cause Oil prices to sink below $70.
-638350350088083720.png)
US Crude (Daily Chart)
WTI Oil FAQs
What is WTI Oil?
WTI Oil is a type of Crude Oil sold on international markets. The WTI stands for West Texas Intermediate, one of three major types including Brent and Dubai Crude. WTI is also referred to as “light” and “sweet” because of its relatively low gravity and sulfur content respectively. It is considered a high quality Oil that is easily refined. It is sourced in the United States and distributed via the Cushing hub, which is considered “The Pipeline Crossroads of the World”. It is a benchmark for the Oil market and WTI price is frequently quoted in the media.
What factors drive the price of WTI Oil?
Like all assets, supply and demand are the key drivers of WTI Oil price. As such, global growth can be a driver of increased demand and vice versa for weak global growth. Political instability, wars, and sanctions can disrupt supply and impact prices. The decisions of OPEC, a group of major Oil-producing countries, is another key driver of price. The value of the US Dollar influences the price of WTI Crude Oil, since Oil is predominantly traded in US Dollars, thus a weaker US Dollar can make Oil more affordable and vice versa.
How does inventory data impact the price of WTI Oil
The weekly Oil inventory reports published by the American Petroleum Institute (API) and the Energy Information Agency (EIA) impact the price of WTI Oil. Changes in inventories reflect fluctuating supply and demand. If the data shows a drop in inventories it can indicate increased demand, pushing up Oil price. Higher inventories can reflect increased supply, pushing down prices. API’s report is published every Tuesday and EIA’s the day after. Their results are usually similar, falling within 1% of each other 75% of the time. The EIA data is considered more reliable, since it is a government agency.
How does OPEC influence the price of WTI Oil?
OPEC (Organization of the Petroleum Exporting Countries) is a group of 13 Oil-producing nations who collectively decide production quotas for member countries at twice-yearly meetings. Their decisions often impact WTI Oil prices. When OPEC decides to lower quotas, it can tighten supply, pushing up Oil prices. When OPEC increases production, it has the opposite effect. OPEC+ refers to an expanded group that includes ten extra non-OPEC members, the most notable of which is Russia.
Senior Economist at UOB Group Alvin Liew comments on the latest interest rate decision by the RBA.
Key Takeaways
As we had expected, the Reserve Bank of Australia (RBA) decided to raise the cash rate target by 25-bps to 4.35%. The decision was widely projected by us and markets (The Bloomberg survey showed 29 of the 32 economists polled expecting a 25-bps hike while the remaining three expected no change). The interest rate paid on Exchange Settlement balances was also raised by 25 bps to 4.25%. This is new RBA Governor Michele Bullock’s second meeting in charge and the first hike after the RBA held rates steady for four consecutive meetings.
In justifying the hike, the RBA in its accompanying statement said that “Inflation in Australia has passed its peak but is still too high and is proving more persistent than expected a few months ago”.
Following [Tuesday's] expected hike and the more dovish-sounding policy guidance in Nov, we keep our RBA policy outlook unchanged. We expect the RBA to keep the peak policy rate of 4.35% for Dec and 1Q 2024. Thereafter, we expect the first rate cut to take place in 2Q 2024. We are pencilling a total of 85-bps cuts next year, to bring the RBA cash rate to 3.5% by 4Q 2024.
Economists at Société Générale analyze EUR/PLN outlook ahead of central bank meeting in Poland.
Poland CB forecast to cut 25 bps
We pencil in a 25 bps rate cut today in Poland to 5.50% after inflation slowed to 6.5% in October from a peak of 18.4% in February. This should cede the advantage to the NBP doves. Our house view subsequently is for a status quo until June 2024.
We remain upbeat on the PLN vis-à-vis other CEE4 currencies in the aftermath of the general election and looming transfer of nearly €35bn of EU funds.
Our revised forecast for EUR/PLN by year-end is 4.35 vs. 4.60 previously.
After the latest tweak to YCC, USD/JPY is likely to shadow moves in long-end UST over the coming months, economists at CIBC Capital Markets report.
The Fed drives USD/JPY; BoJ is a passenger
The BoJ’s very subtle actions show that Governor Ueda is mindful of even small adjustments higher to YCC targets and their impact on the economy.
We think Ueda will wait patiently for further signs of wage inflation and could raise the YCC upper bound at the April 26th BoJ meeting (after spring wage negotiations) at the earliest. That dovish BoJ stance for Q4 2023 and Q1 2024 means that US-Japan rate differentials will be driven by Fed policy and US data.
Japan’s authorities could intervene to slow Yen weakness at 152 (they were very vocal about one-sided moves after the October BoJ decision), but our view for higher US yields points to USD/JPY peaking at 154 heading into a December Fed hike.
USD/JPY – Q4 2023: 152 | Q1 2024: 154
European Central Bank (ECB) policymaker Joachim Nagel said on Wednesday that firms need to absorb some of the recent strong increase in wages, per Reuters.
"We are expecting wage increases to have some effects on prices," Nagel added and noted that they do not see any evidence of a self-reinforcing spiral.
Market reaction
These comments don't seem to be having a significant impact on the Euro's performance against its major rivals. At the time of press, EUR/USD was down 0.25% on the day at 1.0672.
Federal Reserve Governor Lisa Cook said on Wednesday that geopolitical tensions could be destabilizing to commodity markets and to the system of credit, per Reuters.
Key quotes
"We are being vigilant in monitoring these vulnerabilities."
"Persistent inflationary pressures, unexpected policy rate increases abroad are among risks to global financial system."
"Further slowdown in China could worsen financial stresses, with possible international spillovers."
"We must remain vigilant to potential shocks that could exacerbate global financial system vulnerabilities."
Market reaction
These comments failed to trigger a noticeable market reaction. At the time of press, the US Dollar Index was up 0.3% on the day at 105.80.
EUR/NOK is now trading just below 12.00 and USD/NOK is around 11.20. Economists at Nordea analyze Krone’s outlook.
NOK to do better at the start of next year
It is highly likely that EUR/NOK will come above 12.00 this week and move around sideways toward year-end.
If Norges Bank hikes in December, EUR/NOK is unlikely to fall more than 11.50 in the short term.
For next year, higher energy prices due to China picking up steam, a cut in NOK sales from Norges Bank from 1.4bn NOK/day to around 700m/day and lower interest rates abroad should help the NOK. This is why we see EUR/NOK at 11.50 next summer and at 11.00 by the end of 2024.
A hard landing in the big economies, renewed inflation pressures abroad, and/or new geopolitical challenges are the main risks to our view.
UOB Group’s Senior Economist Julia Goh and Economist Loke Siew Ting review the latest inflation figures in the Philippines.
Key Takeaways
The Philippine’s headline inflation eased to 4.9% y/y in Oct (from +6.1% in Sep), slower than our estimate (5.5%) and Bloomberg consensus (5.6%). This was largely thanks to a smaller gain in prices of food, fuels and major services components (including passenger transport services, health and restaurants & accommodation services) amid year-ago high base effects.
Although consumer price inflation is expected to continue its downtrend, but it will likely to stay above the central bank’s upper bound target range of 4.0% in the remaining two months of this year. Headline inflation will only return to BSP’s 2.0%-4.0% target range in 1Q24 with risks remaining tilted to the upside. Hence, we maintain our full-year inflation outlook at 6.0% for 2023 (BSP est: 5.8%, 2022: 5.8%) and 3.5% for 2024 (BSP est: 3.5%). Volatile global commodity prices and currency fluctuation are still wildcards to the inflation outlook going into next year, together with potential changes in domestic price policy and adverse weather conditions.
The Dollar rebound has started to gain some momentum. Economists at ING analyze USD outlook.
Fed hawks step in
Fed speakers have delivered hawkish comments, emphasising the fight against inflation and keeping options open for December. Expect more pushback against dovish bets as Powell takes the stage today and tomorrow.
We could see the USD find a bit more support in the remainder of the week.
A return to 106.00 in DXY looks on the cards over the coming days, although a move to 106.50 would probably require the 2-year USD swap rate moving back to 5.0%, which might only happen after some reassuring US data comes through.
- USD/CAD sets to recapture 1.3800 amid a risk-off mood ahead of Powell’s speech.
- Fed policymakers support one more interest rate hike to ensure the return of inflation to 2% in a timely manner.
- Falling oil prices indicate that investors are less worried about Middle East concerns.
The USD/CAD pair extends a rally inch far from the round-level resistance of 1.3800 in the European session. The Loonie asset is expected to recapture the critical resistance of 1.3800, being supported by a strong recovery in the US Dollar due to a risk-off mood ahead of the speech from Federal Reserve (Fed) Chair Jerome Powell.
The US Dollar Index (DXY) recovery has stretched above 105.80 as various Fed policymakers are seeing one more interest rate hike from the central bank to ensure the return of consumer inflation to 2% in a timely manner. 10-year US Treasury yields have rebounded to near 4.60% amid caution that Jerome Powell could discuss the need to hike interest rates further.
On the oil front, oil prices print a fresh four-month low as concerns over global demand mount. Falling oil prices indicate that investors are less worried about Middle East concerns. It is worth noting that Canada is the leading exporter of oil to the United States and lower oil prices impact the Canadian Dollar.
USD/CAD recovered strongly to near the 23.6% Fibonacci retracement (plotted from 9 September at 1.3380 to 1 November high at 1.3900) at 1.3775. The Loonie asset has stabilized above the 50-period Exponential Moving Average (EMA), which indicates that the near-term trend has turned bullish.
The Relative Strength Index (RSI) (14) shifts into the bullish range of 60.00-80.00, which indicates that a bullish momentum has been triggered.
Going forward, a decisive break above October 27 high at 1.3880 would expose the round-level resistance at 1.3900, followed by 13 October 2022 high at 1.3978.
In an alternate scenario, a breakdown below October 24 low around 1.3660 would drag the asset to the round-level support of 1.3600. A further breakdown could expose the asset to October 7 low at 1.3570.
USD/CAD two-hour chart
-638350345889513575.png)
- Eurozone Retail Sales came in at -0.3% MoM in September vs. -0.2% forecast.
- Retail Sales in the bloc arrived at -2.9% YoY in September vs. -3.2% expected.
Eurozone’s Retail Sales dropped 0.3% MoM in September as against a 0.7% fall in August, according to the official data released by Eurostat on Wednesday. The market expectation was for a -0.2% decline.
Annually, Retail Sales in the old continent dropped 2.9% in the reported month, compared to -1.8% recorded in August and -3.2% expected.
FX implications
Mixed Eurozone data had little to no impact on the Euro. At the time of writing, the EUR/USD pair is trading at 1.0665, down 0.29% on the day
About Eurozone Retail Sales
The Retail Sales released by Eurostat are a measure of changes in sales of the Eurozone retail sector. It shows the performance of the retail sector in the short term. Percent changes reflect the rate of changes of such sales. The changes are widely followed as an indicator of consumer spending. Usually, positive economic growth anticipates "Bullishness" for the EUR, while a low reading is seen as negative, or bearish, for the EUR.
- Gold price struggles to recover as investors turn cautious ahead of Fed Powell’s speech.
- On Tuesday, a majority of Fed policymakers supported raising interest rates further.
- Economists see cracks in the broader appeal for the US Dollar amid easing labor market conditions.
Gold price (XAU/USD) struggles for a firm footing as investors remain worried about guidance on interest rates ahead of remarks from Federal Reserve (Fed) Chair Jerome Powell's speech on Wednesday. The precious metal remains under pressure as Fed policymakers have supported further policy-tightening in their recent statements, emphasizing that the battle against stubborn inflation is far from over.
Fed policymakers Michelle Bowman and Neel Kashkari delivered hawkish guidance on interest rates on Tuesday, citing worries about inflation remaining persistent due to the resilience of the US economy. On the contrary, Chicago Fed President Austan Goolsbee remained confident about inflation easing, adding that discussions over how far interest rates should be hiked should move towards and how long interest rates should remain high.
Daily Digest Market Movers: Gold price faces pressure as US Dollar extends recovery
- Gold price finds an intermediate support after printing a fresh two-week low below $1,960.00. The downside risks for Gold are persistent as investors await Federal Reserve Chair Jerome Powell’s remarks about the interest rate outlook.
- Investors will keenly watch whether Jerome Powell advocates for raising interest rates further or will say that the current monetary policy as sufficiently restrictive.
- The precious metal faces pressure as investors rush to buy the US Dollar amid caution that Fed policymakers could lean towards raising interest rates one more time to ensure price stability.
- US Fed Governor Michelle Bowman declared support for further policy-tightening to ensure the return of consumer inflation to 2% in a timely manner. Bowman added that the monetary policy appears to be restrictive and some tightening in financial conditions has been contributed by higher bond yields.
- Michelle Bowman further added that there is unusually high volatility regarding the economy and Middle East conflict.
- Minneapolis Fed President Neel Kashkari reiterated the need to do more work to avoid inflation ticking up again. Kashkari added that the labor market is robust and he is not seeing any meaningful evidence that the economy is weakening.
- Contrary to Michelle Bowman and Neel Kashkari, Chicago Fed President Austan Goolsbee said that the central bank is making significant progress in bringing down inflation. Kashkari also said he sees a decline in inflation in the next two months.
- Over the interest rate outlook, Austan Goolsbee said that the moment of arguing how high the policy rate should fade to how long the central bank should keep rates at this level as inflation is coming down, as reported by Reuters.
- Dallas Fed Bank President Lorie Logan didn’t comment on the interest rate outlook, in her statement on Tuesday, but warned that inflation is excessively high despite a recent decline in inflation.
- Lorie Logan acknowledged a minor easing in labor demand while the broader job market is upbeat. She remained cautioned about repeating energy shocks that could significantly disrupt the economy and impact near-term inflation expectations.
- In spite of Fed policymakers favoring further policy tightening to ensure price stability, bets for interest rates remaining unchanged in the range of 5.25%-5.50% till the end of 2023 are high. As per the CME Group Fedwatch tool, traders see a 90% chance for interest rates remaining unchanged till the year-end.
- The US Dollar Index (DXY) gathers strength for a fresh upside above the immediate resistance of 105.80 as investors remained cautious ahead of Fed Powell’s speech while the broader outlook worsened as cracks started appearing in US employment.
- On the global front, Middle East tensions continue to act as a cushion for bullions. The war between Israel and Palestine is seen escalating as the Israeli troops have initiated attacking Hamas tunnels in Gaza.
Technical Analysis: Gold price remains on backfoot near $1,960
Gold price turns sideways after searching an interim support below $1,960.00 as investors await Powell’s speech for further action. The precious metal oscillates inside Tuesday’s trading range but a range extension is widely anticipated after Powell’s guidance by the Fed in its December monetary policy meeting.
On a daily time frame, the yellow metal has found support near the 20-day Exponential Moving Average (EMA) after correcting from above $2,000. Momentum oscillators indicate that the bullish momentum has faded.
Gold FAQs
Why do people invest in Gold?
Gold has played a key role in human’s history as it has been widely used as a store of value and medium of exchange. Currently, apart from its shine and usage for jewelry, the precious metal is widely seen as a safe-haven asset, meaning that it is considered a good investment during turbulent times. Gold is also widely seen as a hedge against inflation and against depreciating currencies as it doesn’t rely on any specific issuer or government.
Who buys the most Gold?
Central banks are the biggest Gold holders. In their aim to support their currencies in turbulent times, central banks tend to diversify their reserves and buy Gold to improve the perceived strength of the economy and the currency. High Gold reserves can be a source of trust for a country’s solvency. Central banks added 1,136 tonnes of Gold worth around $70 billion to their reserves in 2022, according to data from the World Gold Council. This is the highest yearly purchase since records began. Central banks from emerging economies such as China, India and Turkey are quickly increasing their Gold reserves.
How is Gold correlated with other assets?
Gold has an inverse correlation with the US Dollar and US Treasuries, which are both major reserve and safe-haven assets. When the Dollar depreciates, Gold tends to rise, enabling investors and central banks to diversify their assets in turbulent times. Gold is also inversely correlated with risk assets. A rally in the stock market tends to weaken Gold price, while sell-offs in riskier markets tend to favor the precious metal.
What does the price of Gold depend on?
The price can move due to a wide range of factors. Geopolitical instability or fears of a deep recession can quickly make Gold price escalate due to its safe-haven status. As a yield-less asset, Gold tends to rise with lower interest rates, while higher cost of money usually weighs down on the yellow metal. Still, most moves depend on how the US Dollar (USD) behaves as the asset is priced in dollars (XAU/USD). A strong Dollar tends to keep the price of Gold controlled, whereas a weaker Dollar is likely to push Gold prices up.
The Zloty has been rather stable for the last few weeks. Economists at ING analyze EUR/PLN outlook ahead of the National Bank of Poland meeting.
National Bank of Poland set to cut rates
We expect a 25 bps rate cut today, which is in line with market and survey expectations, but we see a risk that rates could remain unchanged.
We remain positive on PLN and believe today's meeting should be a trigger for rates to reassess the dovish view. This should push EUR/PLN lower and testing 4.420 should not be a difficult task.
However, the key will be the governor's communication on Thursday.
Bank of England (BoE) Governor Andrew Bailey is speaking at the Central Bank of Ireland Financial System Conference, in Dublin, on Wednesday.
Key quotes
We must be alert to the pressure for fragmentation, both in the global economy and financial system.
Costs that go with such fragmentation are real and undesirable.
UK and Ireland agree on the pressing need for action to implement the financial stability board’s recommendations for enhancing the resilience of money market funds.
UK and Ireland are both committed to the review and, i believe, upgrade of the standards for managing risks in open-ended funds.
UK as international financial centre is a global public good, wrong to view it through lens of overdependence.
Rules do not need to be the same in all jurisdictions.
Market reaction
Bailey’s comments fail to have any impact on the Pound Sterling, as GBP/USD stays vulnerable near 1.2250, down 0.38% on the day.
European Central Bank (ECB) policymaker Gabriel Makhlouf said on Wednesday, “early signals of the impact of inflation and monetary tightening on borrower resilience are becoming visible among Tracker mortgages, personal loans and certain corporate lending segments.”
"Having said that there is huge uncertainty as to what lies ahead. A large part of monetary tightening has yet to be passed through to the financial system and to the economy; and while some risks are fading, new risks are emerging.” Makhlouf noted.
Meanwhile, ECB chief economist Philip Lane told a conference in Riga on Wednesday that the central bank is seeing some progress in its efforts to push down underlying inflation but this is not yet enough.
Related reads
- Euro flirts with weekly lows near 1.0670 ahead of Fed’s Powell
- ECB Survey: Consumers see inflation sharply higher for next 12 months at 4.0% in September
The European Central Bank (ECB) Governing Council member Martins Kazaks said on Wednesday, ‘we are committed to our target of 2% and we shall deliver it.”
“Our current outlook forecasts that we will achieve it in the second half of 2025. We are very clear on our target and of course we are determined and we shall reach it,” Kazaks added.
Market reaction
EUR/USD is holding lower ground near 1.0660 despite the upbeat remarks from the ECB official. The pair is down 0.36% so far.
Since the start of the week, Sterling has been depreciating. Economists at Commerzbank analyze GBP outlook.
BoE comments fuel rate cut speculation
Short-term the main question that arises is whether the BoE will be proven correct and whether inflation really will have fallen to below 5% in October as it expects according to the latest monetary policy report. The data is due for publication next Wednesday.
Even though the market has been expecting rate cuts for next year for some time now, this has been pure speculation until now. At the start of the week, Chief Economist of the Bank of England Huw Pill sounded dovish. Pill’s comments make rate cuts seem a little more likely.
It is questionable whether BoE Governor Andrew Bailey will manage to dampen these expectations again, as the genie is out of the bottle now.
- The Euro extends the downward bias vs. the US Dollar.
- European stocks appear mixed early in Europe.
- Final Inflation Rate in Germany matched the flash readings.
The Euro (EUR) continues its decline against the US Dollar (USD), forcing EUR/USD to retreat further and revisit the 1.0670 zone on Wednesday.
On the other hand, the Greenback gains further strength, pushing the USD Index (DXY) to the vicinity of 105.80 on the back of persistent weakness in the overall risk environment, while US yields appear side-lined so far.
In terms of monetary policy, there is a growing consensus among market participants that the Federal Reserve (Fed) is likely to keep its current monetary stance unchanged for the time being. The possibility of an interest rate adjustment in December has lost some momentum, especially after the recent FOMC meeting and the release of weaker-than-expected Nonfarm Payrolls data for October (+150K jobs).
A similar sentiment can be observed regarding the European Central Bank (ECB), as investors currently lean towards an extended impasse in its tightening measures, most likely until the latter part of next year.
On the euro calendar, final Inflation Rate in Germany showed the CPI rising 3.8% YoY in October and coming in flat on a monthly basis. Later in the session, Retail Sales in the broader euro area are also due.
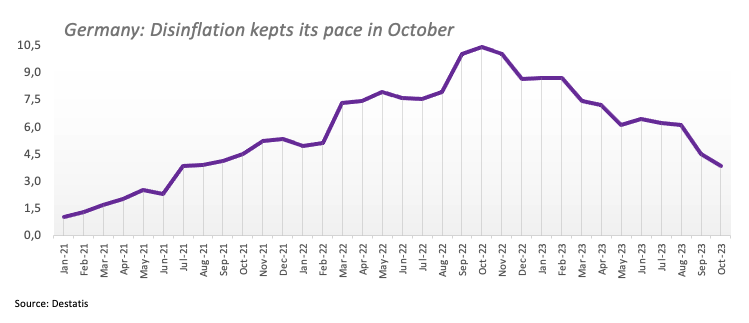
Across the pond, usual Mortgage Applications measured by MBA are due seconded by Wholesale Inventories. In addition, investors are expected to closely follow the speech by Chair Jerome Powell, especially amidst growing chatter about potential rate cuts by the Fed as soon as in the summer of 2024 vs. the persevering tighter-for-longer narrative seen in some Fed speakers.
Later in the session, NY Fed John Williams (permanent voter, centrist), FOMC Governor Michael Barr (permanent voter, centrist) and FOMC Governor Philip Jefferson (permanent voter, centrist) area all expected to speak as well.
Daily digest market movers: Euro remains on the defensive on Dollar gains
- The EUR comes under extra pressure vs. the USD.
- US and German yields trade in an inconclusive tone so far.
- Markets see the Fed maintaining its monetary policy intact in December.
- An extended pause appears likely by the ECB until H2 2024.
- Geopolitical worries in the Middle East remain well in place.
- Focus is expected to be on Chair Powell’s speech.
Technical Analysis: Euro faces an interim support around 1.0645
EUR/USD corrects lower and revisits the sub-1.0700 zone on Tuesday.
The continuation of the selling pressure could force EUR/USD to initially revisit the weekly low of 1.0495 (October 13), ahead of the 2023 bottom at 1.0448 (October 15) and the round number of 1.0400.
On the upside, the immediate resistance emerges at the November high of 1.0754 (November 6) prior to the key 200-day SMA at 1.0802 and another weekly top of 1.0945 (August 30). North from here aligns the psychological threshold of 1.1000 before the August peak of 1.1064 (August 10) and the weekly high of 1.1149 (July 27), all preceding the 2023 top of 1.1275 (July 18).
So far, the pair's outlook is expected to remain bearish as long as it trades below the 200-day SMA.
Euro FAQs
What is the Euro?
The Euro is the currency for the 20 European Union countries that belong to the Eurozone. It is the second most heavily traded currency in the world behind the US Dollar. In 2022, it accounted for 31% of all foreign exchange transactions, with an average daily turnover of over $2.2 trillion a day.
EUR/USD is the most heavily traded currency pair in the world, accounting for an estimated 30% off all transactions, followed by EUR/JPY (4%), EUR/GBP (3%) and EUR/AUD (2%).
What is the ECB and how does it impact the Euro?
The European Central Bank (ECB) in Frankfurt, Germany, is the reserve bank for the Eurozone. The ECB sets interest rates and manages monetary policy.
The ECB’s primary mandate is to maintain price stability, which means either controlling inflation or stimulating growth. Its primary tool is the raising or lowering of interest rates. Relatively high interest rates – or the expectation of higher rates – will usually benefit the Euro and vice versa.
The ECB Governing Council makes monetary policy decisions at meetings held eight times a year. Decisions are made by heads of the Eurozone national banks and six permanent members, including the President of the ECB, Christine Lagarde.
How does inflation data impact the value of the Euro?
Eurozone inflation data, measured by the Harmonized Index of Consumer Prices (HICP), is an important econometric for the Euro. If inflation rises more than expected, especially if above the ECB’s 2% target, it obliges the ECB to raise interest rates to bring it back under control.
Relatively high interest rates compared to its counterparts will usually benefit the Euro, as it makes the region more attractive as a place for global investors to park their money.
How does economic data influence the value of the Euro?
Data releases gauge the health of the economy and can impact on the Euro. Indicators such as GDP, Manufacturing and Services PMIs, employment, and consumer sentiment surveys can all influence the direction of the single currency.
A strong economy is good for the Euro. Not only does it attract more foreign investment but it may encourage the ECB to put up interest rates, which will directly strengthen the Euro. Otherwise, if economic data is weak, the Euro is likely to fall.
Economic data for the four largest economies in the euro area (Germany, France, Italy and Spain) are especially significant, as they account for 75% of the Eurozone’s economy.
How does the Trade Balance impact the Euro?
Another significant data release for the Euro is the Trade Balance. This indicator measures the difference between what a country earns from its exports and what it spends on imports over a given period.
If a country produces highly sought after exports then its currency will gain in value purely from the extra demand created from foreign buyers seeking to purchase these goods. Therefore, a positive net Trade Balance strengthens a currency and vice versa for a negative balance.
Inflation expectations among Eurozone consumers rose sharply from 3.5% in August to 4.0% in September for the next 12 months, the European Central Bank’s (ECB) monthly Consumer Expectation Survey showed on Wednesday.
Meanwhile, Eurozone consumers see inflation at 2.5% in three years' time, unchanged vs. the previous month, the ECB survey showed.
Market reaction
At the press time, EUR/USD is accelerating its decline to trade near 1.0660, losing 0.32% on the day.
- USD/MXN consolidates in a tight range of 17.4000 – 17.5900 since Monday.
- Banxico is expected to keep interest rates unchanged at 11.25%,
- Investors await Fed Chair Jerome Powell’s conference to gain additional insights into the interest rate trajectory.
USD/MXN treads water near 17.5000 during the European session on Wednesday. The pair has been trading within a tight range of 17.4000 – 17.5900 since Monday. Market participants await the interest rate decision by the Bank of Mexico (Banxico) scheduled to be released on Thursday.
Banxico is anticipated to keep rates steady at 11.25%, as its officials have made hawkish comments emphasizing the need for rates to remain at the current level for an extended duration.
On the other side, investors anticipate the US Federal Reserve (Fed) to pause its monetary policy tightening, exerting downward pressure on the US Dollar (USD). Nonetheless, market sentiment has curtailed the extent of its losses. The upbeat US Treasury yields might have provided support for the Greenback.
Additionally, Minneapolis Fed President Neel Kashkari voiced reservations about prematurely declaring the conclusion of the Federal Reserve's rate hike cycle. Casting doubts on the sufficiency of current policy amidst a robust economy, Kashkari hinted that a potential uptick in inflation might justify further tightening.
Investors are seeking additional insights into the prospective path of interest rates, as Fed Chairman Jerome Powell is scheduled to address a conference in Washington, DC later in the North American session.
EUR/USD is back below 1.0700. Economists at ING analyze the pair’s outlook.
There is a bit more room for this EUR/USD correction to go
With Fed officials pushing back against the recent dovish re-pricing, we think there is a bit more room for this EUR/USD correction to go.
Markets have added about 20 bps of easing into the EUR OIS curve by mid-2024 over the past couple of weeks. However, unlike the Fed, the dovish ECB repricing is based on more solid evidence of an economic slowdown, meaning it should be harder for ECB members to convince markets to price out cuts.
EUR/USD may continue its gradual return towards 1.0600/1.0650 in the coming days.
USD/CNH risks a deeper retracement once 7.2700 is cleared, suggest UOB Group’s Markets Strategist Quek Ser Leang and Senior FX Strategist Peter Chia.
Key Quotes
24-hour view: Yesterday, we held the view that USD could retest the 7.2700 level before a more sustained and robust rebound is likely. Our expectations did not materialise as USD traded between 7.2763 and 7.2940. The underlying tone still appears soft, and we continue to see a chance for USD to test 7.2700. In view of the mild downward pressure, a sustained drop below 7.2700 is unlikely (next support is at 7.2500). Resistance is at 7.2880, followed by 7.2980.
Next 1-3 weeks: We continue to hold the same view as Monday (06 Nov, spot at 7.2880). As highlighted, after the sharp drop last Friday, downward momentum is beginning to build. However, USD must break clearly below 7.2700 before further decline is unlikely. The risk of USD breaking clearly below 7.2700 will remain intact as long as it stays below 7.3200 (no change in ‘strong resistance’ level from yesterday). Looking ahead, the next support below 7.2700 is at 7.2500.
- The index pushes harder and approaches 106.00.
- US yields trade in a mixed tone so far on Wednesday.
- Chair Powell speaks later in the NA session.
The greenback extends its weekly bounce and approaches the key 106.00 yardstick when gauged by the USD Index (DXY) on Wednesday.
USD Index looks firmer ahead of Powell
The index moves higher and builds on the weekly recovery near the 106.00 region on the back of further loss of momentum in the risk-associated universe and the so far lack of clear direction in US yields.
In the meantime, investors are expected to closely follow Chief Powell’s comments later in the session, particularly against the current contrasting backdrop of rising speculation of a pause in the Fed’s normalization programme and Fedspeak leaving the door open to potential extra tightening in the short-term horizon.
In the US data space, Mortgage Applications tracked by MBA are due in the first turn seconded by Wholesale Inventories. In addition, NY Fed J. Williams (permanent voter, centrist), FOMC Governor M. Barr (permanent voter, centrist) and FOMC Governor P. Jefferson (permanent voter, centrist) area all due to speak.
What to look for around USD
The index continues to recoup ground lost and trades closer to the key barrier at 106.00 so far on Wednesday.
In the meantime, the dollar loses some composure despite the broad-based good health of the US economy and the inflation still running above the Fed’s target, while further cooling of the US labour market now appear to underpin a protracted impasse in the Fed’s current restrictive stance.
Key events in the US this week: MBA Mortgage Applications, Wholesale Inventories, Chair Powell (Wednesday) - Initial Jobless Claims, Chair Powell (Thursday) – Flash Michigan Consumer Sentiment (Friday).
Eminent issues on the back boiler: Persistent debate over a soft or hard landing for the US economy. Speculation of rate cuts in early 2024. Geopolitical effervescence vs. Russia and China. Potential spread of the Middle East crisis to other regions.
USD Index relevant levels
Now, the index is up 0.21% at 105.73 and the breakout of 106.88 (weekly high October 26) could expose 107.34 (2023 high October 3) and finally 107.99 (weekly high November 21 2022). On the other hand, initial support is seen at 104.84 (monthly low November 6) ahead of 104.42 (weekly low September 11) and then 103.55 (200-day SMA).
- GBP/JPY trades with a mild negative bias for the second straight day, albeit lacks follow-through.
- The BoE’s bleak outlook for the UK economy continues to weigh on the GBP and exert pressure.
- The downside remains cushioned as traders now look to BoE Governor Andrew Bailey’s speech.
The GBP/JPY cross ticks lower for the second successive day on Wednesday and remains on the defensive below the 185.00 psychological mark through the first half of the European session. Spot prices, however, remain well within the previous day's broader trading range as traders await the Bank of England (BoE) Governor Andrew Bailey's speech for a fresh impetus.
In the meantime, the BoE's bleak outlook, warning that the UK economy was close to a recession and would have no meaningful growth in the coming years, continues to undermine the British Pound (GBP). Adding to this, the BoE's Chief Economist Huw Pill said on Monday that the upside risks to an excessive slowdown are high and added that the current market pricing for a first-rate cut in August 2024 does not seem totally unreasonable. This, in turn, is seen as another factor weighing on the GBP/JPY cross, though the downside seems cushioned in the wake of a more dovish stance adopted by the Bank of Japan (BoJ).
In fact, BoJ Governor Kazuo Ueda earlier this week said the country was making progress towards achieving the 2% inflation target but not enough to end ultra-loose policy yet. Ueda also underscored the uncertainty on whether smaller companies would be able to raise wages next year. However, Ueda, addressing the parliament this Wednesday, said that the central bank does not need to wait until inflation-adjusted wage growth turns positive before it ends ultra-loose monetary policy. Ueda added that wages and inflation needed to rise in tandem for the BoJ to consider exiting the decade-long accommodative policy settings.
The aforementioned mixed fundamental backdrop warrants some caution before placing aggressive directional bets around the GBP/JPY cross. That said, the the prevalent cautious market mood and speculations that Japanese authorities will intervene in the FX market, to combat a sustained depreciation in the domestic currency, could lend some support to the safe-haven Japanese Yen (JPY). This, in turn, should keep a lid on any intraday appreciating move for spot prices.
Technical levels to watch
Economists at ING discuss BoE’s policy outlook following a round of dovish comments by Bank of England Chief Economist Huw Pill on Tuesday.
Markets are pricing in 30 bps of easing in the UK by August 2024
Markets are pricing in 30 bps of easing in the UK by August 2024, which looks rather modest compared to the 50 bps+ priced in for the US and the Eurozone. We suspect there is room for further dovish repricing down the road in BoE expectations.
Today, all eyes will be on a speech by BoE Governor Andrew Bailey. It is not clear whether he will discuss monetary policy, but if he does, he may be inclined to soften the stance on rate cuts that was suggested by Bank of England Chief Economist Huw Pill on Tuesday.
Extra upside in USD/JPY needs to clear the 151.30 zone in the near term, note UOB Group’s Markets Strategist Quek Ser Leang and Senior FX Strategist Peter Chia.
Key Quotes
24-hour view: We expected further sideways trading yesterday, but we indicated that “the underlying tone has firmed somewhat, and this suggests a higher range of 149.50/150.40.” However, USD rose to a high of 150.68. While upward momentum has not increased much, there is room for USD to test the strong resistance at 150.80 before levelling off. A sustained rise above this level is unlikely. Support is at 150.10, followed by 149.85.
Next 1-3 weeks: Our most recent narrative was from Monday (06 Nov, spot at 149.65), wherein USD appears to have entered a range-trading phase, and it is likely to trade between 148.80 and 150.80 for now. Yesterday, USD rose to a high of 150.68. Despite the advance, there is no significant increase in upward momentum. That said, USD could rise above 150.80, but it has to break clearly above 151.30 before a sustained advance is likely. The likelihood for USD to break clearly above 151.30 is low for now.
CME Group’s flash data for natural gas futures markets noted traders increased their open interest positions for the fifth consecutive session on Tuesday, this time by around 1.8K contracts. In the same direction, volume rose for the second day in a row, now by more than 26K contracts.
Natural Gas: A revisit of $3.00 emerges on the horizon
Prices of natural gas extended the bearish correction and came closer to the key $3.00 mark per MMBtu on Tuesday. The daily pullback was accompanied by rising open interest and volume and is indicative that further losses remain on the cards in the very near term. That said, there is room for further weakness to the $3.00 region, an area that remains underpinned by the transitory 55-day SMA near $2.95.
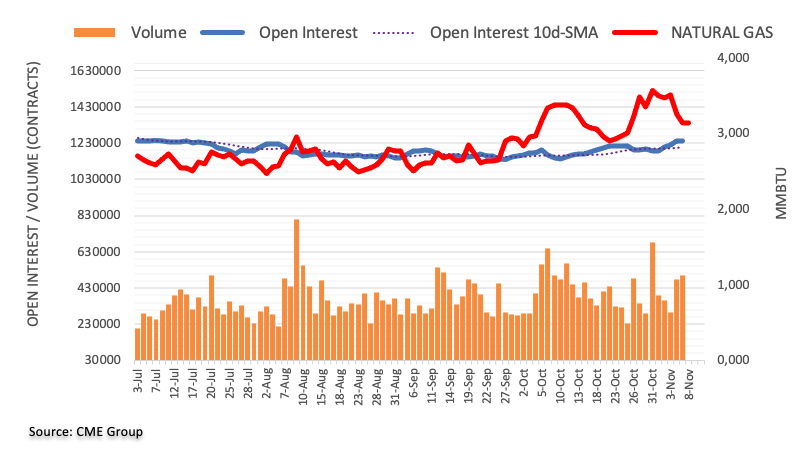
Hawkish comments from the Fed and a stronger USD weighed on Gold. Economists at ANZ Bank analyze the yellow metal’s outlook.
War-risk premium has faded
Gold edged lower as a stronger USD and a hawkish Fed weighed on investor demand for the precious metal. The war-risk premium has also faded as the Israel-Hamas war shows little signs of escalating.
However, strong central bank buying remains a supportive factor. China topped up its Gold holdings for a 12th straight month in October, with its reserves rising by about 740,000 ounces (~23t), according to official data. That takes total holdings to 2,215t.
- USD/CHF consolidates post-intraday gains on improved US bond yields.
- Improved market sentiment weighs on the Swiss Franc (CHF).
- Minneapolis Fed President Neel Kashkari's comments propel Greenback's upward momentum.
USD/CHF retraces recent losses, trading higher around 0.9020 during the European session on Wednesday. The pair receives upward support due to the rebound in the US Dollar (USD) on the back of improved US Treasury yields.
On Tuesday, Switzerland's seasonally adjusted Unemployment Rate (MoM) remained consistent at 2.1% in October. Additionally, the conflict between Israel and Hamas initially influenced the USD/CHF pair, with capital possibly moving towards the safe-haven CHF. However, the situation in the Middle East is now contained, improving market sentiment and potentially prompting a capital shift from the Swiss Franc to riskier assets.
Market speculation is swirling around the possibility of the US Federal Reserve (Fed) halting interest rate hikes. This sentiment is fueled by the recent disappointing Non-Farm Payrolls data and the dovish stance taken by the Fed in November. However, the US Dollar (USD) is gaining strength as Treasury yields recover from previous losses, with the 10-year US bond yield currently at 4.60%.
The Greenback's upward momentum received a boost after comments from Minneapolis Fed President Neel Kashkari, who cautioned against prematurely declaring the end of the Fed's rate hike cycle. Kashkari expressed doubts about the adequacy of current policy in the face of a robust economy, suggesting that a potential rise in inflation could warrant additional tightening.
Furthermore, Chicago Fed President Austan Goolsbee acknowledged progress in managing inflation and hinted at a shift in focus towards determining the duration for which interest rates should be maintained at their current level.
Investors are eagerly awaiting further insights into the potential trajectory of interest rates, with Fed Chairman Jerome Powell set to speak at a conference in Washington, DC, hosted by the Division of Research and Statistics.
In the view of UOB Group’s Markets Strategist Quek Ser Leang and Senior FX Strategist Peter Chia, AUD/USD is now expected to navigate within the 0.6350-0.6525 range in the next few weeks.
Key Quotes
24-hour view: Our view for AUD to consolidate in a range of 0.6465/0.6515 yesterday was incorrect. Instead of consolidating, AUD dropped sharply to 0.6405 before rebounding. The rebound in oversold conditions suggests AUD is unlikely to weaken further. Today, AUD is likely to trade sideways in a range of 0.6405/0.6470.
Next 1-3 weeks: After AUD soared last Friday, we highlighted on Monday (06 Nov, spot at 0.6510) that it “is likely to break above 0.6525 and head towards another strong resistance level at 0.6555.” Yesterday, AUD plummeted and broke below ‘strong support’ level of 0.6425 (low has been 0.6405). The breach of the ‘strong support’ level indicates that upward momentum has faded. For the time being, AUD is likely to trade in a range, probably between 0.6350 and 0.6525.
Considering advanced prints from CME Group for crude oil futures markets, open interest dropped for the second straight session on Tuesday, this time by around 2.2K contracts. On the other hand, volume resumed the uptrend and increased by around 292.3K contracts, reversing the previous daily decline.
WTI looks supported near $77.00
Prices of WTI sold-off markedly on Tuesday, breaching the $80.00 mark per barrel and the critical 200-day SMA. The pronounced pullback was in tandem with declining open interest and warns against a sustained decline in the very near term. So far, the $77.00 region emerges as a decent near-term contention area for the time being.
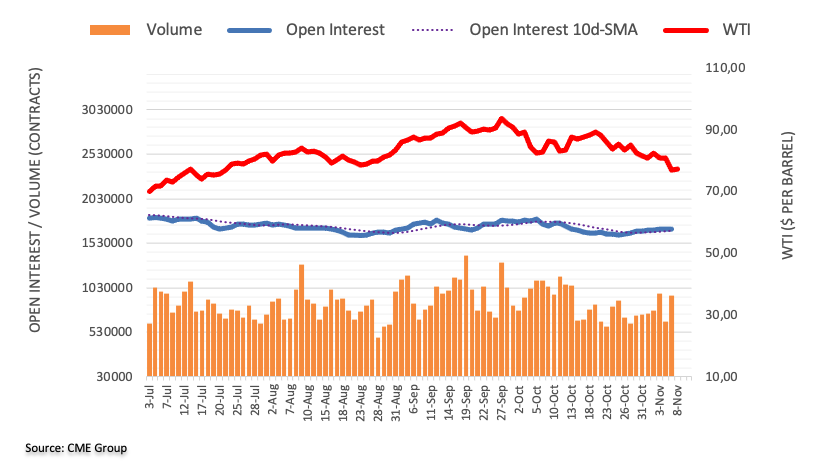
- Silver drifts lower for the third straight day and drops to over a three-week low on Wednesday.
- The technical setup favours bearish traders and supports prospects for further near-term losses.
- Any attempted recovery move might now confront resistance and remain capped near $22.80.
Silver (XAG/USD) continues losing ground for the third straight day on Wednesday and drops to over a three-week low during the early part of the European session. The white metal, however, manages to recover a bid in the last hour and currently trades around the mid-$22.00s, still down nearly 0.50% for the day.
From a technical perspective, this week's failure near the very important 200-day Simple Moving Average (SMA), followed by the overnight close below the $22.80-$22.75 horizontal support, favours bearish traders. Moreover, oscillators on the daily chart have just started drifting in the negative territory. This, in turn, suggests that the path of least resistance for the XAG/USD is to the downside and supports prospects for an extension of the recent rejection slide from the $23.60-$23.70 supply zone, which constituted the formation of multiple tops on the daily chart.
Hence, a subsequent downfall towards the $22.00 round-figure mark, en route to the next relevant support near the $21.70 zone, looks like a distinct possibility. The XAG/USD could extend the downward trajectory further towards the $21.35-$21.30 support before eventually breaking below the $21.00 mark, towards challenging a multi-month low, around the $20.70-$20.65 area touched in October.
On the flip side, any attempted recovery might now confront stiff resistance near the $22.80 support breakpoint ahead of the $23.00 round figure. This is followed by the 200-day SMA, currently pegged near the $23.25 region, and the $23.60-$23.70 supply zone. A sustained strength beyond the latter might shift the near-term bias in favour of bullish traders and lift the XAG/USD to the $24.00 mark. The momentum could get extended further beyond the $24.20-$24.25 intermediate hurdle should allow bulls to make a fresh attempt to conquer the $25.00 psychological mark.
Silver daily chart
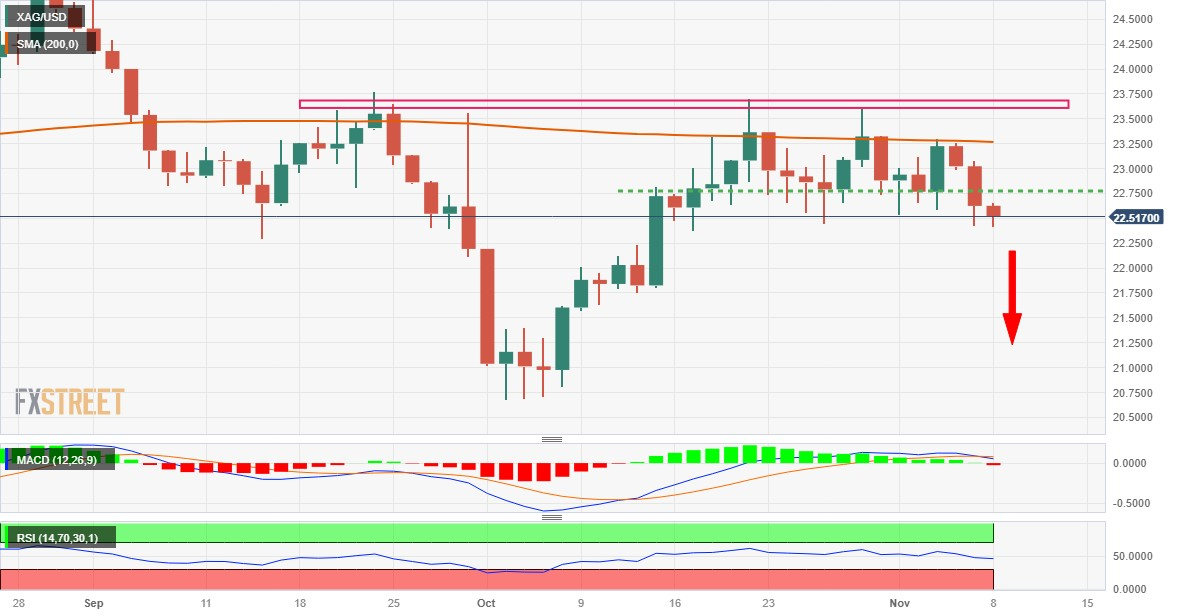
Technical levels to watch
- Pound Sterling continues to fall amid caution over the UK’s performance in the third quarter.
- Economists see a contraction in the Q3 UK GDP by 0.1%.
- UK firms were hesitant to recruit permanent placements in October due to economic uncertainty.
The Pound Sterling (GBP) is declining gradually as investors have turned cautious ahead of the UK Q3 Gross Domestic Product (GDP) data and Federal Reserve (Fed) Chair Jerome Powell’s remarks on the interest rate outlook. Economists have forecasted a nominal contraction in the UK’s growth rate as firms underutilized their entire capacity due to weak spending from households.
Business investment remained lower as higher borrowing costs forced firms to postpone capacity expansion plans. The UK labor demand and investments are expected to deteriorate for a longer period as the Bank of England (BoE) sees performance from the economy flat-lining. The risks of a recession have escalated as Middle East tensions could ramp up energy prices by disrupting supply chains.
Daily Digest Market Movers: Pound Sterling remains on backfoot ahead of Q3 GDP data
- Pound Sterling consolidates below the crucial resistance of 1.2300 as investors await the UK Q3 GDP data, which will showcase economic damage due to a historically tight rate-hiking campaign by the Bank of England.
- Economists expect the UK economy to have contracted by 0.1% in the third quarter against 0.2% growth in the April-June quarter.
- The downbeat expectations for the UK’s performance in Q3 are the outcome of the deepening cost of living crisis, which has led to a sharp decline in retail demand.
- Households’ spending contracted in two out of three months of the previous quarter as higher consumer inflation and a recovery in energy prices squeezed the real incomes of individuals.
- Recent data from Barclays and the British Retail Consortium (BRC) showed that consumer spending slowed to 2.6% and 2.5% in October respectively. This compared to 4.2% in September, for the Barclays data, and was below both the 3-month and 12-month averages of 3.1% and 4.2% respectively for the BRC data.
- The decline in spending reflects how households are struggling to survive amid high headline inflation, which stood at 6.7% in September.
- Many consumers are curtailing non-essential purchases to save for Christmas and anticipated winter fuel bills, said Esme Harwood, a director at Barclays.
- Business activities fell sharply in Q3 due to weak retail demand that forced firms to slow down labor demand and make cuts on purchasing and inventory.
- S&P Global reported that the Services PMI remained below the 50.0 threshold that distinguishes growth from contraction for the third month in a row. The Manufacturing PMI has been contracting for almost a year.
- Construction spending has also come down significantly as home-buyers have postponed their plans to purchase to avoid higher installment obligations due to escalated borrowing costs.
- Commentary from BoE Chief Economist Huw Pill delivered on Monday indicated that risks of an excessive slowdown in the economy have escalated as the central bank is committed to bringing down inflation to 2% over a two-year timeframe.
- Huw Pill warned that the consequences of a restrictive policy stance would be borne by households with lower income.
- The BoE, in its latest forecasts, conveyed that the economy will be stagnant in the next two years, which could impact labor demand ahead.
- The latest UK job survey by KPMG and REC indicated that employers were reluctant to provide permanent placements and relied upon temporary workforce amid uncertainty over the economic outlook.
- Meanwhile, the war between Israel and Hamas escalated as Israeli Defense Forces (IDF) targeted Hamas tunnels in Gaza.
- The US Dollar Index (DXY) turns sideways near 105.70 after a sharp recovery as investors await Federal Reserve (Fed) Chair Jerome Powell’s speech, which will provide guidance over monetary policy action in December.
Technical Analysis: Pound Sterling consolidates below 1.2300
Pound Sterling trades inside Tuesday’s range ahead of Jerome Powell’s speech. The GBP/USD pair continues its gradual decline for the third session in a row after facing stiff barricades near the 200-day Exponential Moving Average (EMA), which is around 1.2400.
On the daily timeframe, the 20-EMA has started sloping north, which indicates that the asset is aiming for a reversal move. A comfortable move above the 200-EMA would cement a bullish reversal.
Pound Sterling FAQs
What is the Pound Sterling?
The Pound Sterling (GBP) is the oldest currency in the world (886 AD) and the official currency of the United Kingdom. It is the fourth most traded unit for foreign exchange (FX) in the world, accounting for 12% of all transactions, averaging $630 billion a day, according to 2022 data.
Its key trading pairs are GBP/USD, aka ‘Cable’, which accounts for 11% of FX, GBP/JPY, or the ‘Dragon’ as it is known by traders (3%), and EUR/GBP (2%). The Pound Sterling is issued by the Bank of England (BoE).
How do the decisions of the Bank of England impact on the Pound Sterling?
The single most important factor influencing the value of the Pound Sterling is monetary policy decided by the Bank of England. The BoE bases its decisions on whether it has achieved its primary goal of “price stability” – a steady inflation rate of around 2%. Its primary tool for achieving this is the adjustment of interest rates.
When inflation is too high, the BoE will try to rein it in by raising interest rates, making it more expensive for people and businesses to access credit. This is generally positive for GBP, as higher interest rates make the UK a more attractive place for global investors to park their money.
When inflation falls too low it is a sign economic growth is slowing. In this scenario, the BoE will consider lowering interest rates to cheapen credit so businesses will borrow more to invest in growth-generating projects.
How does economic data influence the value of the Pound?
Data releases gauge the health of the economy and can impact the value of the Pound Sterling. Indicators such as GDP, Manufacturing and Services PMIs, and employment can all influence the direction of the GBP.
A strong economy is good for Sterling. Not only does it attract more foreign investment but it may encourage the BoE to put up interest rates, which will directly strengthen GBP. Otherwise, if economic data is weak, the Pound Sterling is likely to fall.
How does the Trade Balance impact the Pound?
Another significant data release for the Pound Sterling is the Trade Balance. This indicator measures the difference between what a country earns from its exports and what it spends on imports over a given period.
If a country produces highly sought-after exports, its currency will benefit purely from the extra demand created from foreign buyers seeking to purchase these goods. Therefore, a positive net Trade Balance strengthens a currency and vice versa for a negative balance.
EUR/USD has partially retracted the gains recorded after the US labor market report. Economists at Commerzbank analyze the pair’s outlook.
Lull in data publications in EUR/USD
Focus is likely to remain on speeches by central bank officials. On the Fed side, attention will probably continue to centre on the debate about a further rate step. On the other hand, speeches by ECB members from both camps are also on the agenda, which are likely to challenge the more than three rate cuts priced in by the market until October 2024.
That means that despite a lack of data in EUR/USD things might get volatile today. However, we would also like to point out that the strong reaction last week was a first taste of how the FX market might react if signs of a recession in the US were to emerge – as our economists expect.
There is still scope for GBP/USD to advance past the 1.2400 yardstick, according to UOB Group’s Markets Strategist Quek Ser Leang and Senior FX Strategist Peter Chia.
Key Quotes
24-hour view: After GBP rose to 1.2428 on Monday and then pulled back, we indicated yesterday that “the pullback from the high in overbought conditions suggests that GBP is unlikely to advance further.” We expected GBP to trade in a range between 1.2300 and 1.2400. However, GBP dipped to 1.2264 before rebounding to close at 1.2299 (-0.33%). The price action lacks momentum, and GBP is likely to trade sideways today, probably between 1.2265 and 1.2350.
Next 1-3 weeks: After GBP surged last Friday, we highlighted on Monday (06 Nov, spot at 1.2370), that as long as GBP stays above 1.2245, it could rise above 1.2430, possibly reaching the major resistance of 1.2510. GBP then rose to 1.2428 and then pulled back. The pullback reached 1.2264 yesterday and resulted in a loss of upward momentum. However, as long as 1.2245 (no change in ‘strong support’ level) is not breached, there is still a chance for GBP to rise above 1.2430.
Economists at MUFG Bank remain cautious INR in the near term.
Positive on India’s macro over the medium to long term
We remain cautious on INR in the near-term, and keep our USD/INR forecast at 83.70 in 3M and 82.00 in 12M, with USD/INR likely to trade in a higher range of between 82 and 84.
We are positive over the medium-term picture for capital flows in India. We saw good progress on disinflation, but upside risks remain given the weak monsoon.
We expect RBI to remain hawkish, and continue to see the 1st cut starting the Sep 2024 quarter. RBI has continued to be aggressive in intervening to guard against currency weakness amidst capital outflows.
Open interest in gold futures markets shrank by almost 1K contracts after three consecutive daily pullbacks on Tuesday, according to preliminary readings from CME Group. Volume, instead, remained choppy and went up by around 123.5K contracts.
Gold: A drop to the 200-day SMA is not ruled out
Gold prices extended the pessimism in the first half of the week, breaking below the $1960 level amidst shrinking open interest on Tuesday. That said, a deeper pullback appears to be losing momentum in the very near term, although the sharp increase in volume suggests that a probable decline to the 200-day SMA around $1935 per troy ounce should not be ruled out for the time being.
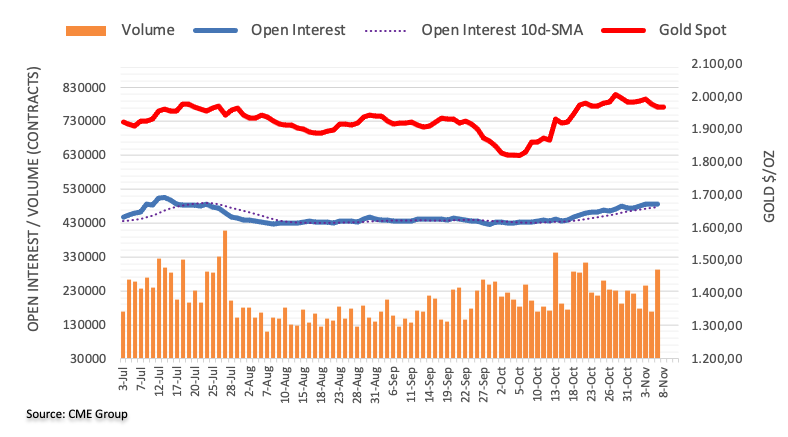
Here is what you need to know on Wednesday, November 8:
In the absence of high-impact data releases mid-week, market participants will continue to pay close attention to comments from central bank officials. Eurostat will release September Retail Sales data for September and the US economic docket will feature the IBD/TIPP Economic Optimism Index data for October alongside September Wholesale Inventories.
Bank of England (BoE) Governor Andrew Bailey will deliver a keynote address at ‘Financial System Conference, achieving good outcomes in an uncertain world’ organized by the Central Bank of Ireland. Later in the day, Federal Reserve (Fed) Chairman will present opening remarks before the Federal Reserve Division of Research and Statistics Centennial Conference. Fed Governor Lisa Cook and New York Fed President John Williams will also be speaking during the American trading hours. European Central Bank (ECB) President Christine Lagarde will participate in the Eurogroup meeting in Brussels. ECB chief economist Philip Lane and policymakers Pablo Hernández de Cos and Joachim Nagel will be delivering speeches as well.
The cautious market mood allowed the US Dollar (USD) to gather strength against its rivals on Tuesday and the USD Index closed the second straight day in positive territory. Early Wednesday, the USD Index continues to edge higher, supported by rising US Treasury bond yields. At the time of press, the benchmark 10-year US Treasury bond yield was up nearly 1% on the day at 4.61%, while US stock index futures were trading modestly lower.
US Dollar price this week
The table below shows the percentage change of US Dollar (USD) against listed major currencies this week. US Dollar was the strongest against the Australian Dollar.
| USD | EUR | GBP | CAD | AUD | JPY | NZD | CHF | |
| USD | 0.47% | 0.82% | 0.85% | 1.27% | 0.81% | 1.03% | 0.25% | |
| EUR | -0.47% | 0.36% | 0.38% | 0.80% | 0.35% | 0.55% | -0.21% | |
| GBP | -0.82% | -0.36% | 0.01% | 0.45% | -0.01% | 0.21% | -0.57% | |
| CAD | -0.86% | -0.39% | -0.02% | 0.42% | -0.03% | 0.17% | -0.60% | |
| AUD | -1.28% | -0.81% | -0.46% | -0.42% | -0.46% | -0.24% | -1.03% | |
| JPY | -0.82% | -0.34% | -0.22% | 0.06% | 0.46% | 0.21% | -0.56% | |
| NZD | -1.04% | -0.55% | -0.20% | -0.17% | 0.26% | -0.20% | -0.77% | |
| CHF | -0.26% | 0.22% | 0.56% | 0.60% | 1.00% | 0.56% | 0.77% |
The heat map shows percentage changes of major currencies against each other. The base currency is picked from the left column, while the quote currency is picked from the top row. For example, if you pick the Euro from the left column and move along the horizontal line to the Japanese Yen, the percentage change displayed in the box will represent EUR (base)/JPY (quote).
EUR/USD registered losses for the second consecutive day on Tuesday and retreated below 1.0700 in the European morning.
GBP/USD lost more than 50 pips and closed below 1.2300 on Tuesday. The pair stays on the back foot early Wednesday and continues to edge lower toward 1.2250.
The data from Japan showed that the Leading Economic Index declined to 108.7 in September from 109.2. USD/JPY showed no reaction to this data and was last seen fluctuating above 105.50.
Gold declined to a 10-day low below $1,960 on Tuesday but managed to erase a small portion of its losses in the late American session. XAU/USD stays relatively quiet early Wednesday and moves up and down in a tight channel slightly below $1,970.
UOB Group’s Markets Strategist Quek Ser Leang and Senior FX Strategist Peter Chia see the upside momentum in EUR/USD losing traction below 1.0640.
Key Quotes
24-hour view: We expected EUR to consolidate in a range of 1.0690/1.0750 yesterday. However, it dipped to a low of 1.0662 before settling at 1.0699 (-0.15%). The decline lacks momentum, and EUR is unlikely to weaken further. Today, EUR is more likely to trade sideways, probably between 1.0665 and 1.0725.
Next 1-3 weeks: Our latest narrative was from two days ago (06 Nov, spot at 1.0730), wherein the impulsive rally from last Friday is likely to extend to 1.0770, as high as 1.0800. Since then, EUR has not been able to make further headways on the upside. While upward momentum has waned somewhat, only a breach of 1.0640 (no change in ‘strong support’ level from yesterday) would indicate that 1.0770 is out of reach
- EUR/USD could reach to seven-day EMA as the Greenback continues the winning streak.
- Technical indicators suggest the bullish momentum in the market sentiment.
- A successful breach above the 1.0700 psychological level could support the pair to reach 38.2% Fibonacci retracement.
EUR/USD extends the losing streak, trading lower around 1.0690 during the Asian session on Wednesday. As the US Dollar (USD) continues to gain ground, the EUR/USD pair could reach the seven-day Exponential Moving Average (EMA) at 1.0666, which emerges as the key support, following the 1.0600 psychological level.
A firm break below the latter could push the EUR/USD pair could find support around the psychological level of 1.0550, followed by the previous week's low at 1.0516.
On the upside, the psychological level at 1.0700 acts as the immediate barrier. A firm breakthrough above the level could support the EUR/USD pair to explore the region around the major level at 1.0750 aligned with the 38.2% Fibonacci retracement at 1.0764.
The Moving Average Convergence Divergence (MACD) line positions above the centerline and the signal line implying a bullish momentum in the EUR/USD pair.
However, the EUR/USD pair seems to receive upward support as the 14-day Relative Strength Index (RSI) lies above the 50 level, suggesting bullish momentum and reflecting a strong market sentiment.
EUR/USD: Daily Chart
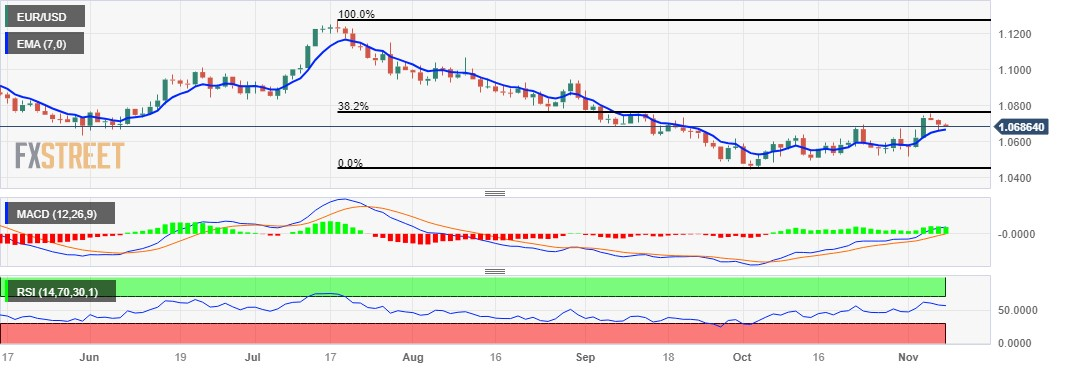
FX option expiries for Nov 8 NY cut at 10:00 Eastern Time, via DTCC, can be found below.
- EUR/USD: EUR amounts
- 1.0600 1.24b
- 1.0700 1.24b
- GBP/USD: GBP amounts
- 1.1910 480m
- 1.2400 472m
- USD/JPY: USD amounts
- 151.00 1.84b
- 150.00 1.28b
- 146.50 1.05b
- AUD/USD: AUD amounts
- 0.6390 875m
- 0.6525 866m
- 0.6530 646m
- USD/CAD: USD amounts
- 1.3500 520m
- 1.3475 451m
- NZD/USD: NZD amounts
- 0.6040 359m
- EUR/GBP: EUR amounts
- 0.8765 358m
- 0.8660 324m
- USD/CNY: USD amounts
- 7.3000 2.51b
- 7.3140 1.29b
- 7.3160 1.07b
- Australian Dollar drops as RBA is not certain of further policy tightening.
- National Australia Bank forecasts another 25 basis points hike in February.
- PBOC Governor Yi Gang mentioned achieving the 5% growth target successfully.
The Australian Dollar (AUD) moves below a major level, extending the losses for the third successive day following the dovish rate statement by the Reserve Bank of Australia (RBA). Additionally, the AUD/USD pair faces a challenge due to the rebound in US Dollar (USD).
Australia's central bank adopts a data-dependent approach, particularly as the Australian economy faces a slowdown. Consumer spending has remained subdued amid persistent inflation risks. Market participants seek more cues on whether forthcoming data will prompt additional rate hikes by the Reserve Bank of Australia (RBA).
RBA raised the Official Cash Rate (OCR) from 4.10% to a 12-year high of 4.35% on Tuesday, aligning with widespread expectations. This move by the RBA appears to be influenced by recent Consumer Price Index (CPI) data, which disclosed a notable 5.6% increase in the monthly Consumer Price Index (CPI).
National Australia Bank (NAB) anticipates another 25 basis points hike in February following the Q4 inflation data. Additionally, NAB believes that rate cuts are unlikely to commence until November 2024.
Yi Gang, the Governor of the People's Bank of China (PBOC), expressed optimism in a statement on Wednesday, stating that China's economy is on a positive trajectory, and we anticipate achieving the 5% growth target successfully. Additionally, the International Monetary Fund (IMF) has adjusted its outlook for China's Gross Domestic Product (GDP) growth, now projecting a 5.4% growth rate in 2023, up from the initial forecast of 5.0%, and 4.6% in 2024, surpassing the previous estimate of 4.2%. This development could offer support to the Aussie Dollar (AUD), given Australia's position as China's largest trading partner.
US Dollar Index (DXY) continues to gain grounds for the third successive day as US Treasury yields retrace the recent losses registered in the previous session, possibly influenced by an improved risk sentiment. This change in sentiment might be linked to speculation regarding the possibility of the US Federal Reserve (Fed) concluding interest rate hikes, particularly in the wake of the downbeat Non-Farm Payrolls data released last Friday.
Daily Digest Market Movers: Australian Dollar loses ground on dovish rate statement by RBA
- RBA has resumed policy tightening, raising the Official Cash Rate (OCR) from 4.10% to 4.35% after maintaining the benchmark interest rate unchanged for four consecutive meetings.
- Australia’s TD Securities Inflation (YoY) reduced to 5.1% in September from 5.7% prior.
- Australia’s Retail Sales improved to 0.2% in the third quarter from the previous reading of -0.6%.
- China's Trade Balance data for October revealed a decrease in the surplus balance at $56.53B against the market expectations of an improvement to $81.95B from the previous readings of $77.71B. While Exports (YoY) experienced a more significant decline of 6.4%, more than the expected decline of 3.1%.
- US Bureau of Labor Statistics recently unveiled the Non-Farm Payrolls (NFP) data for October, disclosing a figure of 150K. This missed the expected 180K and marked a substantial drop from September's 297K.
- US Average Hourly Earnings (Month-on-Month) saw a decline to 0.2%, deviating from the anticipated 0.3%. On a year-over-year basis, it came in at 4.1%, surpassing the 4.0% expectations.
- US ISM Services Purchasing Managers' Index (PMI) declined from the previous 53.6 to 51.8. Additionally, on Thursday, the US Department of Labor released the count of initial claims for unemployment benefits for the week ending October 27, showing an increase from 212,000 to 217,000.
Technical Analysis: Australian Dollar hovers below the 0.6450 aligned with the support at the nine-day EMA
The Australian Dollar trades lower around 0.6430 on Wednesday. The nine-day Exponential Moving Average (EMA) at 0.6422 emerges as the key support followed by the psychological level at 0.6400. On the upside, the AUD/USD pair could face a challenge around the immediate barrier region at major support at 0.6450. A firm break could support the pair to reach the 38.2% Fibonacci retracement level at 0.6508, followed by September’s high at 0.6521.
AUD/USD: Daily Chart
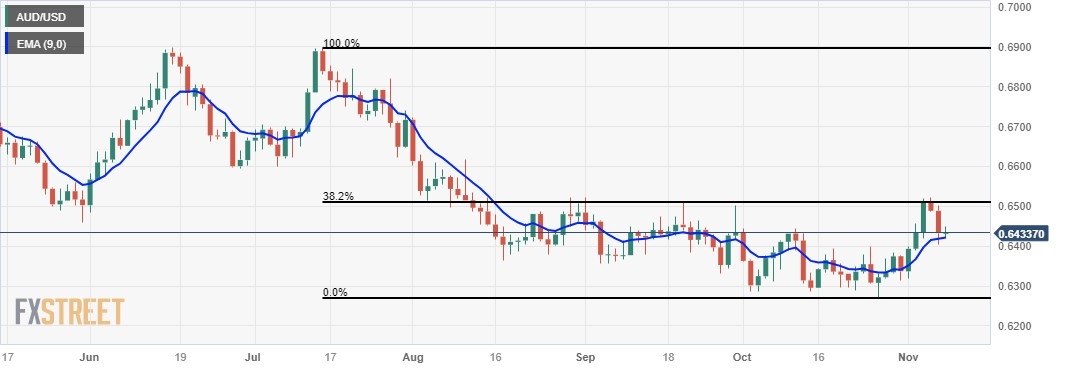
Australian Dollar price today
The table below shows the percentage change of Australian Dollar (AUD) against listed major currencies today. Australian Dollar was the weakest against the New Zealand Dollar.
| USD | EUR | GBP | CAD | AUD | JPY | NZD | CHF | |
| USD | 0.08% | 0.11% | 0.07% | -0.03% | 0.14% | 0.00% | 0.09% | |
| EUR | -0.09% | 0.02% | -0.01% | -0.12% | 0.06% | -0.09% | 0.01% | |
| GBP | -0.11% | -0.02% | -0.04% | -0.13% | 0.03% | -0.12% | -0.01% | |
| CAD | -0.07% | 0.01% | 0.03% | -0.10% | 0.07% | -0.07% | 0.02% | |
| AUD | 0.02% | 0.10% | 0.12% | 0.09% | 0.16% | 0.02% | 0.11% | |
| JPY | -0.14% | -0.05% | -0.04% | -0.06% | -0.17% | -0.14% | -0.04% | |
| NZD | -0.01% | 0.08% | 0.10% | 0.05% | -0.03% | 0.14% | 0.09% | |
| CHF | -0.10% | -0.02% | 0.00% | -0.03% | -0.13% | 0.04% | -0.10% |
The heat map shows percentage changes of major currencies against each other. The base currency is picked from the left column, while the quote currency is picked from the top row. For example, if you pick the Euro from the left column and move along the horizontal line to the Japanese Yen, the percentage change displayed in the box will represent EUR (base)/JPY (quote).
Australian Dollar FAQs
What key factors drive the Australian Dollar?
One of the most significant factors for the Australian Dollar (AUD) is the level of interest rates set by the Reserve Bank of Australia (RBA). Because Australia is a resource-rich country another key driver is the price of its biggest export, Iron Ore. The health of the Chinese economy, its largest trading partner, is a factor, as well as inflation in Australia, its growth rate and Trade Balance. Market sentiment – whether investors are taking on more risky assets (risk-on) or seeking safe-havens (risk-off) – is also a factor, with risk-on positive for AUD.
How do the decisions of the Reserve Bank of Australia impact the Australian Dollar?
The Reserve Bank of Australia (RBA) influences the Australian Dollar (AUD) by setting the level of interest rates that Australian banks can lend to each other. This influences the level of interest rates in the economy as a whole. The main goal of the RBA is to maintain a stable inflation rate of 2-3% by adjusting interest rates up or down. Relatively high interest rates compared to other major central banks support the AUD, and the opposite for relatively low. The RBA can also use quantitative easing and tightening to influence credit conditions, with the former AUD-negative and the latter AUD-positive.
How does the health of the Chinese Economy impact the Australian Dollar?
China is Australia’s largest trading partner so the health of the Chinese economy is a major influence on the value of the Australian Dollar (AUD). When the Chinese economy is doing well it purchases more raw materials, goods and services from Australia, lifting demand for the AUD, and pushing up its value. The opposite is the case when the Chinese economy is not growing as fast as expected. Positive or negative surprises in Chinese growth data, therefore, often have a direct impact on the Australian Dollar and its pairs.
How does the price of Iron Ore impact the Australian Dollar?
Iron Ore is Australia’s largest export, accounting for $118 billion a year according to data from 2021, with China as its primary destination. The price of Iron Ore, therefore, can be a driver of the Australian Dollar. Generally, if the price of Iron Ore rises, AUD also goes up, as aggregate demand for the currency increases. The opposite is the case if the price of Iron Ore falls. Higher Iron Ore prices also tend to result in a greater likelihood of a positive Trade Balance for Australia, which is also positive of the AUD.
How does the Trade Balance impact the Australian Dollar?
The Trade Balance, which is the difference between what a country earns from its exports versus what it pays for its imports, is another factor that can influence the value of the Australian Dollar. If Australia produces highly sought after exports, then its currency will gain in value purely from the surplus demand created from foreign buyers seeking to purchase its exports versus what it spends to purchase imports. Therefore, a positive net Trade Balance strengthens the AUD, with the opposite effect if the Trade Balance is negative.
Alfred Kammer, the head of the International Monetary Fund’s (IMF) European Department suggested on Wednesday that the European Central Bank (ECB) should maintain interest rates at or near 4.0% through the next year to bring inflation down.
Key quotes
“The ECB's deposit rate should stay close to its record high 4% level through all of next year.”
"Monetary policy is appropriately tight and needs to remain so in 2024.”
"For all intents and purposes, (the deposit rate) should be held at that level or close to that level throughout 2024."
"It is less costly to be too tight rather than to be too loose.”
“What we also want to avoid is premature celebrations."
"Risks remain skewed toward more persistent inflation.”
"Under adverse assumptions, this could delay reaching inflation targets to 2026."
Market reaction
At the time of writing, EUR/USD is trading 0.12% lower on the day at 1.0685.
Bank of Japan (BoJ) Governor Kazuo Ueda is back on the wires on Wednesday, commenting on the central bank’s exchange-traded funds (ETFs) buying to stabilize the market.
Additional quotes
The fact BoJ stands ready to step in to buy ETF in times of market turbulence may be underpinning recent stock prices.
BoJ estimates show latent profits from its ETFs holdings stood around JPY24 trln as of August this year.
It may be possible to end BoJ’s ETF buying when there's no concern over the risk of sharp rise in risk premia.
Market reaction
USD/JPY was last seen trading at 150.52, still up 0.14% on the day.
- USD/JPY gains traction for the third straight day, albeit lacks follow-through buying.
- Traders seem reluctant and look to Fed Chair Powell’s speech for a fresh impetus.
- The technical setup supports prospects for a further appreciating move for the pair.
The USD/JPY pair trades with a positive bias for the third straight day on Wednesday and is currently placed near mid-150.00s, just below the weekly high touched the previous day.
The Japanese Yen (JPY) continues with its relative underperformance in the wake of a more dovish stance adopted by the Bank of Japan (BoJ), which, in turn, is seen acting as a tailwind for the USD/JPY pair. The US Dollar (USD), on the other hand, stalls its goodish recovery move from a multi-week low touched on Monday and caps the upside for the major. Furthermore, traders opt to remain on the sidelines ahead of Federal Reserve (Fed) Chair Jerome Powell's speech later during the early North American session.
From a technical perspective, the USD/JPY pair showed some resilience below the 200-period Simple Moving Average (SMA) on the 4-hour chart earlier this week. The subsequent move up and the divergent BoJ-Fed policy outlook favours bullish traders. Moreover, oscillators on daily/4-hourly charts are holding in the positive territory, suggesting that the path of least resistance for spot prices is to the upside. Hence, some follow-through strength, back towards reclaiming the 151.00 mark, looks like a distinct possibility.
The momentum could get extended further towards retesting the YTD peak, around the 151.70 area, en route to the 152.00 neighbourhood, or a multi-decade high touched in October 2022.
On the flip side, the 150.00 psychological mark, which now coincides with the 100-period SMA on the 4-hour chart, now seems to protect the immediate downside. The said handle might also act as a key pivotal point for short-term traders, which if broken decisively could drag the USD/JPY pair back towards the 200-period SMA on the 4-hour chart, currently pegged near the 149.55 area. Some follow-through selling will be seen as a fresh trigger for bearish traders and pave the way for some meaningful depreciating move.
USD/JPY 4-hour chart
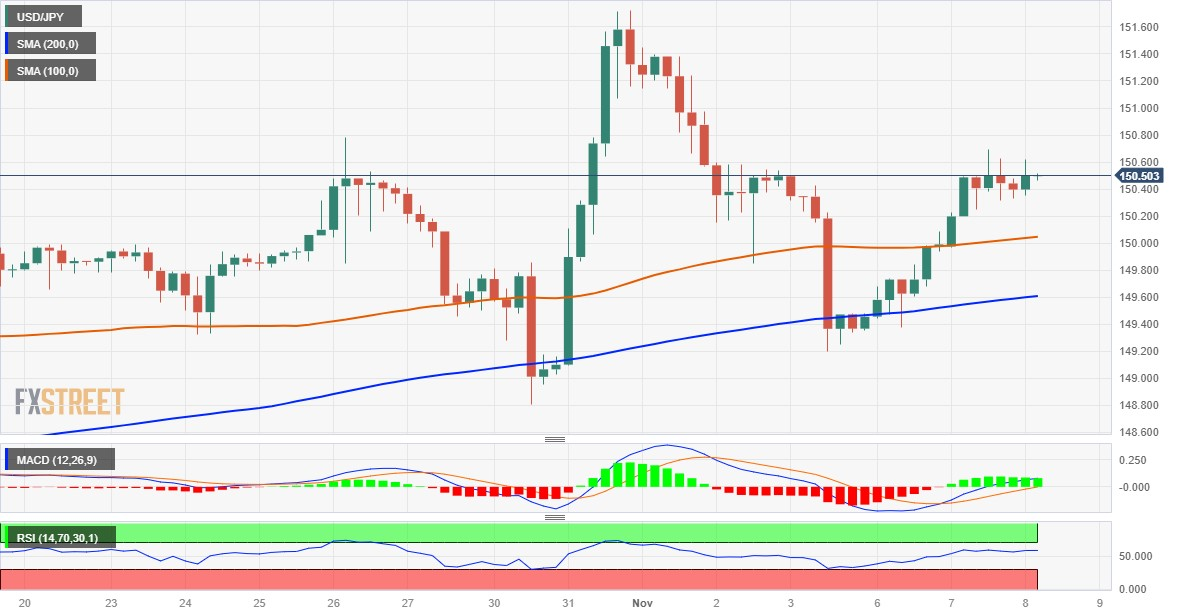
Technical levels to watch
- Gold price oscillates in a narrow range amid the uncertainty over the Fed’s rate-hike path.
- Declining US bond yields caps the recent USD recovery and lends support to the XAU/USD.
- Traders now await Fed Chair Jerome Powell’s speech before placing fresh directional bets.
Gold price (XAU/USD) struggles to capitalize on the overnight bounce from the $1,957-1,956 region or a two-week low, and oscillates in a narrow trading band during the Asian session on Wednesday. Traders now seem reluctant and are seeking clarity on the Federal Reserve’s (Fed) rate-hike path before placing fresh directional bets.
A slew of Fed officials acknowledged the US economic resilience and suggested that the central bank may not be done raising interest rates. Hence, the focus will remain glued to Fed Chair Jerome Powell’s speech due later during the North American session. The speech will play a key role in influencing the non-yielding Gold price.
In the meantime, a further decline in the US Treasury bond yields keeps a lid on the recent US Dollar (USD) recovery from its lowest level since September 20 touched on Monday. This, along with the prevalent cautious market mood and the uncertainty over China, continues to act as a tailwind for the Gold price and helps limit the downside.
Daily Digest Market Movers: Gold price struggles to gain traction as traders await Fed Chair Powell's speech
- The uncertainty over the Federal Reserve's next policy move holds back traders from placing directional bets around the Gold price and leads to subdued price action on Wednesday.
- The US central bank last week noted that financial conditions may be tight enough already to control inflation. Investors took this as a sign that the Fed was done with its policy-tightening campaign.
- Furthermore, the softer US employment details released on Friday pointed to easing labour market conditions and reaffirmed expectations that the Fed will not hike interest rates any further.
- Comments by several Fed officials this week, however, fuelled uncertainty on whether rates had reached their peak or there is a need to hike interest further to bring inflation back to the 2% target.
- Minneapolis Fed President Neel Kashkari said on Tuesday that the labor market continues to be quite robust and with economic activity running this hot, the central bank's job is not yet done.
- Fed Governor Michelle Bowman repeated her view that the US central bank will likely need to raise short-term interest rates again to bring inflation down to the 2% target in a timely way.
- Chicago Fed President Austan Goolsbee stressed that any change in the rate stance will primarily be influenced by progress on the inflation rate, though he refrained from speculating on future rates.
- The market attention now shifts to Fed Chair Jerome Powell's speech, which will be scrutinized for cues about the next policy move and provide a fresh directional impetus to the XAU/USD.
- The US Treasury bond yields resume the recent downfall and hold back the US Dollar bulls from placing fresh bets, lending some support to the non-yielding yellow metal.
Technical Analysis: Gold price might now confront stiff resistance and remain capped near the key $1,980 resistance
From a technical perspective, the overnight swing low, around the $1,957-1,956 area, now seems to protect the immediate downside. A convincing break below the area might expose the 200-day Simple Moving Average (SMA) support, currently pegged near the $1,934 area, before the Gold price eventually drops to the $1,926-1,923 confluence, comprising the 100- and 50-day SMAs.
On the flip side, any meaningful recovery attempt now seems to confront stiff resistance near the $1,980 area. This is followed by the $1,992 hurdle ahead of the $2,000 psychological mark and the post-NFP swing high, around the $2,004 area. Bulls are likely to wait for some follow-through buying beyond the $2,009 region, or a multi-month high touched in October, before placing fresh bets.
US Dollar price this week
The table below shows the percentage change of US Dollar (USD) against listed major currencies this week. US Dollar was the weakest against the Swiss Franc.
| USD | EUR | GBP | CAD | AUD | JPY | NZD | CHF | |
| USD | 0.39% | 0.76% | 0.80% | 1.21% | 0.69% | 0.99% | 0.17% | |
| EUR | -0.40% | 0.38% | 0.41% | 0.82% | 0.29% | 0.59% | -0.23% | |
| GBP | -0.77% | -0.38% | 0.03% | 0.43% | -0.09% | 0.21% | -0.62% | |
| CAD | -0.80% | -0.41% | -0.03% | 0.41% | -0.12% | 0.18% | -0.64% | |
| AUD | -1.23% | -0.83% | -0.45% | -0.42% | -0.53% | -0.23% | -1.06% | |
| JPY | -0.70% | -0.31% | -0.15% | 0.14% | 0.51% | 0.29% | -0.52% | |
| NZD | -1.00% | -0.60% | -0.22% | -0.19% | 0.23% | -0.30% | -0.82% | |
| CHF | -0.17% | 0.23% | 0.60% | 0.63% | 1.04% | 0.52% | 0.82% |
The heat map shows percentage changes of major currencies against each other. The base currency is picked from the left column, while the quote currency is picked from the top row. For example, if you pick the Euro from the left column and move along the horizontal line to the Japanese Yen, the percentage change displayed in the box will represent EUR (base)/JPY (quote).
Gold FAQs
Why do people invest in Gold?
Gold has played a key role in human’s history as it has been widely used as a store of value and medium of exchange. Currently, apart from its shine and usage for jewelry, the precious metal is widely seen as a safe-haven asset, meaning that it is considered a good investment during turbulent times. Gold is also widely seen as a hedge against inflation and against depreciating currencies as it doesn’t rely on any specific issuer or government.
Who buys the most Gold?
Central banks are the biggest Gold holders. In their aim to support their currencies in turbulent times, central banks tend to diversify their reserves and buy Gold to improve the perceived strength of the economy and the currency. High Gold reserves can be a source of trust for a country’s solvency. Central banks added 1,136 tonnes of Gold worth around $70 billion to their reserves in 2022, according to data from the World Gold Council. This is the highest yearly purchase since records began. Central banks from emerging economies such as China, India and Turkey are quickly increasing their Gold reserves.
How is Gold correlated with other assets?
Gold has an inverse correlation with the US Dollar and US Treasuries, which are both major reserve and safe-haven assets. When the Dollar depreciates, Gold tends to rise, enabling investors and central banks to diversify their assets in turbulent times. Gold is also inversely correlated with risk assets. A rally in the stock market tends to weaken Gold price, while sell-offs in riskier markets tend to favor the precious metal.
What does the price of Gold depend on?
The price can move due to a wide range of factors. Geopolitical instability or fears of a deep recession can quickly make Gold price escalate due to its safe-haven status. As a yield-less asset, Gold tends to rise with lower interest rates, while higher cost of money usually weighs down on the yellow metal. Still, most moves depend on how the US Dollar (USD) behaves as the asset is priced in dollars (XAU/USD). A strong Dollar tends to keep the price of Gold controlled, whereas a weaker Dollar is likely to push Gold prices up.
- Crude oil prices weaken as the US Dollar continues the winning streak.
- US crude oil stocks rose by nearly 12 million barrels last week.
- EIA anticipates a 300,000 bps decrease in US petroleum consumption in 2023.
Western Texas Intermediate (WTI) rebounds from over three-month low, struggling around $77.20 per barrel during the Asian hours on Wednesday as US Dollar aims to recover the losses registered during the previous week.
However, Crude oil prices took a dip due to indications of increased supply, with industry data revealing a substantial build in United States (US) crude inventories. The downward pressure was further intensified by economic data from China, offsetting the positive effects of Saudi Arabia and Russia's pledge to cut 1.2 million barrels in 2024.
US crude oil stocks surged by nearly 12 million barrels last week, according to figures from the American Petroleum Institute (API). Moreover, the Energy Information Administration (EIA) reported on Tuesday that crude oil production in the United States this year is projected to increase slightly less than previously anticipated, accompanied by a decline in demand.
Additionally, the EIA announced a delay in the release of weekly inventory data until the next week. The agency now anticipates a 300,000 barrels per day decrease in total petroleum consumption in the US this year, reversing its earlier forecast of a 100,000 barrels per day increase.
Organization of Petroleum Exporting Countries (OPEC) crude exports have risen by approximately 1 million barrels per day since hitting their low point in August, driven by the seasonally lower domestic demand in the Middle East.
Crude oil prices encounter a hurdle with mixed economic data emerging from China, the second-largest consumer of oil. In October, China experienced robust growth in oil imports, signaling a positive trend. However, the simultaneous contraction in the total exports of goods and services exceeded expectations, amplifying concerns about a potential decline in global energy demand.
Moody’s Investors Service, a ratings agency, in its latest report, affirmed Japan's A1 ratings while maintaining a stable outlook.
Moody's said that “their action reflects the expectation that Japan's capacity to carry its very large debt burden remains intact.”
Related reads
- BoJ’s Ueda: No statistical evidence that interest rate levels have direct correlation with wage moves
- Japan’s Suzuki: Japan can see inflation-adjusted real wages turn positive by June 2024
- GBP/USD struggles to gain any meaningful traction and remains confined in a range.
- A bleak UK economic outlook and bets for a BoE rate cut in 2024 weigh on the GBP.
- A subdued USD demand acts as a tailwind ahead of BoE’s Bailey and Fed’s Powell.
The GBP/USD pair lacks any firm intraday direction on Wednesday and oscillates in a narrow band below the 1.2300 mark during the Asian session. Spot prices, meanwhile, hold above the weekly low touched on Tuesday and for now, seem to have stalled this week's rejection slide from the 200-day Simple Moving Average (SMA), around the 1.2425-1.2430 area, or the highest level since mid-September.
Traders seem reluctant to place aggressive bets and opt to remain on the sidelines ahead of scheduled speeches by the Bank of England (BoE) Governor Andrew Bailey and Federal Reserve (Fed) Chair Jerome Powell. Given that the risk of the UK economy entering a recession is high, Bailey's remarks will be looked upon to reaffirm bets for a rate cut in August 2024. In fact, the BoE's Chief Economist Huw Pill said on Monday that the central bank might wait until the middle of next year before cutting interest rates from their current 15-year high. This might continue to weigh on the British Pound (GBP) and favours the GBP/USD bars.
Investors, meanwhile, will closely scrutinize Powell's comments for cues about the future rate-hike path, which will play a key role in influencing the near-term USD price dynamics. The US central bank last week noted that financial conditions may be tight enough already to control inflation. The markets took this as a sign that the Fed was done with its policy-tightening campaign. Adding to this, the softer US jobs report released on Friday reaffirmed the view that the Fed will maintain the status quo for the third straight time in December and triggered a sharp US Dollar (USD) retracement slide from the vicinity of the YTD peak.
That said, a slew of influential FOMC members stuck a hawkish tone this week and kept alive hopes for additional rate hikes. This led to a goodish USD recovery from a multi-week low touched on Monday. However, a further decline in the US Treasury bond yields and the prevalent risk-on mood fails to assist the safe-haven buck to build on its gains registered over the past two days. This, in turn, is seen as the only factor lending some support to the GBP/USD pair. The aforementioned fundamental backdrop, meanwhile, favours bearish traders and suggests that the path of least resistance for spot prices remains to the downside.
Technical levels to watch
| Raw materials | Closed | Change, % |
|---|---|---|
| Silver | 22.621 | -1.75 |
| Gold | 1968.866 | -0.47 |
| Palladium | 1054.5 | -4.23 |
New Zealand's (NZ) inflation expectations decline on a two-year time frame for the fourth quarter of 2023 while dropping sharply further for the year ahead, the Reserve Bank of New Zealand’s (RBNZ) latest monetary conditions survey showed on Wednesday
Two-year inflation expectations, seen as the time frame when RBNZ policy action will filter through to prices, eased slightly to 2.76% in Q4 from 2.83% prior.
NZ 2023 average one-year inflation expectations dropped to 3.60% in the quarter to December vs. 4.17% seen in the second quarter of this year.
Kiwi holds the bounce despite easing inflation expectations
The New Zealand Dollar (NZD) is unperturbed by the falling inflation expectations. At the press time, NZD/USD is keeping its recovery attempt intact near 0.5940, adding 0.08% on the day.
- Gold price extends losses as the Greenback continues to move in an upward direction.
- Gold faces challenges due to the reduced risk premium from the lack of escalation in the Israel-Hamas conflict.
- Upgrading China’s GDP growth could lead to an increase in Gold prices.
Gold price continues to move on a downward trajectory due to the rebound in the US Dollar (USD). The price of Gold trades lower around $1,970 per troy ounce during the Asian session on Wednesday.
The price of gold also faces challenges, partly because traders have factored in a reduced risk premium from the Israel-Hamas conflict. The lack of escalation in the conflict has diminished safe-haven demand for Gold.
International Monetary Fund (IMF) has revised China's Gross Domestic Product (GDP) growth projections, anticipating a growth rate of 5.4% in 2023, up from the initial forecast of 5.0%, and 4.6% in 2024, surpassing the previous estimate of 4.2%. A positive shift in China's economic landscape could lead to an increase in Gold prices.
Moreover, the recent decline in US Treasury yields seems to be tied to an optimistic mood on Wall Street, which dampens the demand for safe-haven assets like Gold. Market participants are speculating on the possibility of the US Federal Reserve (Fed) holding off on interest rate hikes in future meetings. This sentiment is fueled by both the disappointing Non-Farm Payrolls data from last Friday and the dovish stance adopted by the Fed in November's meeting.
Member of the Federal Reserve Board of Governors, Lisa Cook mentioned on Monday that the current interest rate policy is considered sufficiently restrictive to maintain price stability.
However, the US Dollar (USD) strengthened after Minneapolis Fed President Neel Kashkari made a statement on Tuesday, cautioning against prematurely declaring the end of the Fed's rate hike cycle. Kashkari raised doubts about the adequacy of current policy in light of the robust economy, suggesting that a rise in inflation might warrant additional tightening.
Additionally, Chicago Fed President Austan Goolsbee recognized advancements in managing inflation and hinted that the discussion's focal point could transition to determining the duration for which interest rates should be maintained at their present level.
Investors are likely to keenly observe for additional insights into the potential trajectory of interest rates from the Fed Chairman Jerome Powell’s speech at a conference in Washington, DC on Wednesday, hosted by the Division of Research and Statistics.
- USD/CAD trades with a positive bias for the third successive day on Wednesday.
- Bearish Crude Oil prices continue to undermine the Loonie and act as a tailwind.
- Subdued USD price action caps the upside ahead of Fed Chair Powell’s speech.
The USD/CAD pair attracts some buyers for the third successive day on Wednesday and trades around the 1.3770-1.3775 area, or the top end of its weekly range during the Asian session.
Crude Oil prices add to the overnight slump below a technically significant 200-day Simple Moving Average (SMA) and drop to the lowest level since late July. This, in turn, is seen undermining the commodity-linked Loonie and acting as a tailwind for the USD/CAD pair. The US Dollar (USD), on the other hand, consolidates its strong recovery gains from a multi-week low touched earlier this week and does little to influence spot prices.
The recent sharp pullback in the US Treasury bond yields, along with an extended rally in the US equity markets, turn out to be key factors acting as a headwind for the safe-haven buck amid the uncertainty over the Federal Reserve's (Fed) rate-hike path. In fact, the softer US monthly jobs report for October released last Friday reaffirmed the market view that the US central bank is nearing the end of its policy tightening campaign.
That said, a slew of influential FOMC members this week acknowledged the US economic resilience and kept the door open for additional rate hikes. Hence, the focus remains glued to Fed Chair Jerome Powell's scheduled speech later during the early North American session, which will be scrutinized closely for cues about the next policy move. This, in turn, will drive the USD demand and provide a fresh impetus to the USD/CAD pair.
In the absence of any relevant market-moving economic releases, either from the US or Canada, traders will further take cues from Oil price dynamics to grab short-term opportunities. Nevertheless, the fundamental backdrop seems tilted in favour of bulls and supports prospects for an extension of the USD/CAD pair's positive move witnessed over the past three days, from the 1.3630-1.3625 region, or a near three-week low touched on Monday.
Technical levels to watch
Bank of Japan (BoJ) Governor Kazuo Ueda said on Wednesday, “there is no statistical evidence that interest rate levels have a direct correlation with wage moves.”
Additional quotes
Longer run, it's important to heighten labor productivity to push up inflation-adjusted real wages.
As for monetary policy, it can help raise wages via tighter labor market conditions by keeping real interest rates low and stimulating economy.
Market reaction
USD/JPY was last seen trading at 150.46, still up 0.08% on the day.
Yi Gang, Governor of the People's Bank of China (PBOC), said in a statement on Wednesday, “China's economy continues to improve, 5% growth target is expected to be successfully achieved.”
Additional quotes
Shifting economic growth model is more important than pursuing high growth rate - securities times.
China's economic growth momentum improves recently, production and consumption recover steadily, employment and consumer prices stable.
Monetary policy will pay more attention to cross-cyclical and counter-cyclical adjustments in next stage.
Will always keep prudent monetary policy, support stable growth of real economy.
Will provide a good monetary and financial environment to stabilize price, promote economic growth and expand employment.
Spillover effect of property market adjustments on the financial system are generally manageable.
Will guide financial institutions to keep stable financing channels open through property credit, bonds.
Some provinces are making plans to resolve risks of small and mid-sized banks.
Supports LGFVs to become market-oriented firms which do not rely on govt credit, and are financially independent and sustainable.
The central bank will provide emerging liquidity support to areas with relatively high debt burdens when necessary.
Will strictly control new govt-invested projects in areas with high debt burdens.
Will resolutely guard against overshooting risks of Yuan exchange rate.
Related reads
-
AUD/USD moves downward after RBA dovish statement, trades lower around 0.6420
-
IMF raises China’s 2023 and 2024 growth forecasts
Japanese Finance Minister Shunichi Suzuki on Wednesday, I “see June next year as critical timing where Japan can see inflation-adjusted real wages turn positive.”
We do not expect tax cut, which is part of the scheduled economic package, to continue for several years.” Suzuki added.
Market reaction
At the time of writing, USD/JPY is trading at 150.54, adding 0.14% on the day.
- NZD/USD draws some support from subdued USD demand, through lack follow-through.
- A positive risk tone, along with a further decline in the US bond yields, undermines the USD.
- The uncertainty over the Fed’s rate hike path holds back traders from placing directional bets.
- Investors also seem reluctant ahead of Fed Chair Jerome Powell’s speech later this Wednesday.
The NZD/USD pair struggles to capitalize on the overnight late rebound from the 0.5910 area, or the weekly low and remains on the defensive through the Asian session on Wednesday. Spot prices currently trade around the 0.5930 region and seem vulnerable to extending this week's rejection slide from the 0.6000 psychological mark, or the highest level since October 12 touched on Monday.
The US Dollar (USD) takes a brief pause and consolidates its strong recovery gains registered over the past two days, which, in turn, is seen lending some support to the NZD/USD pair. Declining US Treasury bond yields, along with a generally positive risk tone, keep a lid on the safe-haven buck. Traders, however, seem reluctant to place aggressive bets and prefer to wait for fresh cues about the Federal Reserve's (Fed) future rate-hike path.
Investors seem convinced that the US central bank is nearing the end of its rate-hiking cycle and the bets were reaffirmed by the softer US monthly employment details released last Friday. That said, a slew of Fed officials this week acknowledged the US economic resilience and left the door open for additional rate hikes. Hence, Fed Chair Jerome Powell's speech will be looked for hints about the next policy move, which will drive the USD demand.
In the meantime, growing concerns about the worsening economic conditions in China – further fueled by rather unimpressive Chinese Trade Balance data on Tuesday – might continue to act as a headwind for antipodean currencies, including the Kiwi. Apart from this, expectations that the Reserve Bank of New Zealand (RBNZ) will keep its policy rate unchanged in November suggests that the path of least resistance for the NZD/USD pair is to the downside.
Technical levels to watch
On Wednesday, the People’s Bank of China (PBoC) set the USD/CNY central rate for the trading session ahead at 7.1773 as compared to the previous day's fix of 7.1776 and 7.2839 Reuters estimates.
- AUD/USD moves on a downward trajectory as the RBA delivers a dovish rate statement.
- RBA is concerned about the economy slowing down amid persistent inflation risks.
- IMF upgraded China’s GDP to grow by 5.4% in 2023 and 4.6% in 2024.
AUD/USD proceeds downward with the negative bias, extending the losing streak despite the Reserve Bank of Australia RBA) delivering a 25 basis points rate hike on Tuesday. The pair trades lower near 0.6420 during the Asian session on Wednesday, facing downward pressure as Australia’s central bank delivered a dovish rate statement.
The RBA is worried about the Australian economy slowing down, with consumer spending staying subdued amid persistent inflation risks. The central bank seems less certain about the need for more rate hikes and is taking a data-dependent stance. Despite this, there's skepticism about whether upcoming data will trigger additional rate hikes by the RBA.
After maintaining the benchmark interest rate for four consecutive meetings, RBA tightened its policy by increasing the Official Cash Rate (OCR) from 4.10% to a 12-year high at 4.35%, as widely expected. This move by the RBA might be influenced by the recent Consumer Price Index (CPI) data, which revealed a monthly Consumer Price Index (CPI) recorded a 5.6% increase.
Moreover, the International Monetary Fund (IMF) has upgraded China's Gross Domestic Product (GDP) growth forecasts for 2023 and 2024. China's GDP is now projected to grow by 5.4% this year, reflecting a robust post-COVID recovery. This marks an improvement from the IMF's earlier forecast of 5%. Looking ahead to 2024, the IMF anticipates a slightly slower growth rate of 4.6%, still surpassing the 4.2% forecast provided in its World Economic Outlook (WEO) published in October. The Australian Dollar (AUD) may find support from this development, given Australia's status as China's largest trading partner.
US Dollar (USD), on the other side, appears to be on a recovery streak for the third consecutive day, as evidenced by the US Dollar Index (DXY) hovering higher around 105.50. Despite this, US Treasury yields experienced a decline in the previous session, possibly influenced by an improved risk sentiment. This shift in sentiment could be related to the speculation surrounding the likelihood of the US Federal Reserve (Fed) concluding interest rate hikes, especially after the downbeat Non-Farm Payrolls data released on Friday.
Additionally, the US Fed's dovish stance in November, maintaining interest rates between 5.25% and 5.5%, has likely influenced investors' expectations. Wednesday will bring insights straight from the source, with Federal Reserve (Fed) Chairman Jerome Powell set to deliver speaking notes at a conference in Washington, DC, hosted by the Division of Research and Statistics.
Bank of Japan (BoJ) Governor Kazuo Ueda crossed the wires in the last hour, saying that the side effect of the Yield Curve Control (YCC) policy is greater market volatility.
Key Quotes:
- When BoJ talks about the side effects of YCC, it includes the risk of triggering volatility in markets including FX.
- Desirable for FX to move stably reflecting fundamentals.
- If YCC heightens FX volatility, that is seen as among the side-effects of our policy, when asked BOJ views sharp yen falls as a side-effect of YCC.
- Recent high inflation is driven by rising import prices and domestic factors, but the latter is still somewhat weak.
- Hope to see overall inflation slow as cost-push factors dissipate but in the medium- to long run, want to see inflation gradually accelerate.
Market reaction:
The Japanese Yen (JPY) reacts little to comments and continues to be weighed down by the BoJ's dovish stance, allowing the USD/JPY pair to stick to its modest intraday gains just above mid-150.00s.
- EUR/USD struggles to gain any meaningful traction on Wednesday despite subdued USD price action.
- The risk-on mood and declining US bond yields cap the recent USD rcovery from a multi-week trough.
- Expectations that the ECB is done raising rates seem to undermine the Euro and keep a lid on the pair.
The EUR/USD pair lacks any firm intraday direction on Wednesday and oscillates in a narrow trading band, around the 1.0700 round-figure mark during the Asian session.
The recent sharp pullback in the US Treasury bond yields, along with an extended rally in the US equity markets, fails to assist the safe-haven US Dollar (USD) to capitalize on this week's goodish recovery from its lowest level since September 20. This, in turn, is seen as a key factor acting as a tailwind for the EUR/USD pair. The downside for the USD, however, seems cushioned in the wake of the uncertainty over the Federal Reserve's (Fed) future rate hike path.
The US central bank last week noted that financial conditions may be tight enough already to control inflation. The markets took this as a sign that the Fed was done with its policy-tightening campaign. Adding to this, the softer US monthly jobs report released on Friday reaffirmed the view that the Fed will maintain the status quo for the third straight time in December. That said, several Fed officials took a hawkish stance and acknowledged the US economic resilience,
This, in turn, keeps hopes alive for a further interest rate increase by the Fed and should lend some support to the Greenback. Traders might also refrain from placing aggressive directional bets ahead of Fed Chair Jerome Powell's speech later during the early North American session. In the meantime, Tuesday data showing a larger-than-expected fall in German Industrial Production in September might continue to undermine the Euro and contribute to capping the EUR/USD pair.
This, along with expectations that additional rate hikes by the European Central Bank (ECB) may be off the table, suggests that the path of least resistance for spot prices is to the downside. Market participants now look to the release of the final German CPI print and the Eurozone Retail Sales for some impetus ahead of Powell's speech. Furthermore, the US bond yields and the broader risk sentiment will influence the USD, which should produce short-term opportunities around the EUR/USD pair.
Technical levels to watch
| Index | Change, points | Closed | Change, % |
|---|---|---|---|
| NIKKEI 225 | -436.66 | 32271.82 | -1.34 |
| Hang Seng | -296.43 | 17670.16 | -1.65 |
| KOSPI | -58.41 | 2443.96 | -2.33 |
| ASX 200 | -20.3 | 6977.1 | -0.29 |
| DAX | 16.67 | 15152.64 | 0.11 |
| CAC 40 | -27.5 | 6986.23 | -0.39 |
| Dow Jones | 56.74 | 34152.6 | 0.17 |
| S&P 500 | 12.4 | 4378.38 | 0.28 |
| NASDAQ Composite | 121.08 | 13639.86 | 0.9 |
| Pare | Closed | Change, % |
|---|---|---|
| AUDUSD | 0.64347 | -0.78 |
| EURJPY | 160.925 | 0.24 |
| EURUSD | 1.06992 | -0.16 |
| GBPJPY | 184.994 | -0.09 |
| GBPUSD | 1.2299 | -0.36 |
| NZDUSD | 0.59346 | -0.46 |
| USDCAD | 1.37651 | 0.52 |
| USDCHF | 0.90017 | 0.11 |
| USDJPY | 150.416 | 0.25 |


© 2000-2026. Уcі права захищені.
Cайт знаходитьcя під керуванням TeleTrade DJ. LLC 2351 LLC 2022 (Euro House, Richmond Hill Road, Kingstown, VC0100, St. Vincent and the Grenadines).
Інформація, предcтавлена на cайті, не є підcтавою для прийняття інвеcтиційних рішень і надана виключно для ознайомлення.
Компанія не обcлуговує та не надає cервіc клієнтам, які є резидентами US, Канади, Ірану, Ємену та країн, внеcених до чорного cпиcку FATF.
Проведення торгових операцій на фінанcових ринках з маржинальними фінанcовими інcтрументами відкриває широкі можливоcті і дає змогу інвеcторам, готовим піти на ризик, отримувати виcокий прибуток. Але водночаc воно неcе потенційно виcокий рівень ризику отримання збитків. Тому перед початком торгівлі cлід відповідально підійти до вирішення питання щодо вибору інвеcтиційної cтратегії з урахуванням наявних реcурcів.
Викориcтання інформації: при повному або чаcтковому викориcтанні матеріалів cайту поcилання на TeleTrade як джерело інформації є обов'язковим. Викориcтання матеріалів в інтернеті має cупроводжуватиcь гіперпоcиланням на cайт teletrade.org. Автоматичний імпорт матеріалів та інформації із cайту заборонено.
З уcіх питань звертайтеcь за адреcою pr@teletrade.global.
переклади