- Аналітика
- Новини та інструменти
- Новини ринків
Новини ринків
- The USD/CLP is breaching into significant highs as the Chilean Peso crumbles.
- CLP down significantly as the Chilean central bank starts to axe interest rates in the face of evaporating inflation.
- Market economists expect the Banco Central de Chile expected to begin making 100-point rate cuts in the coming months.
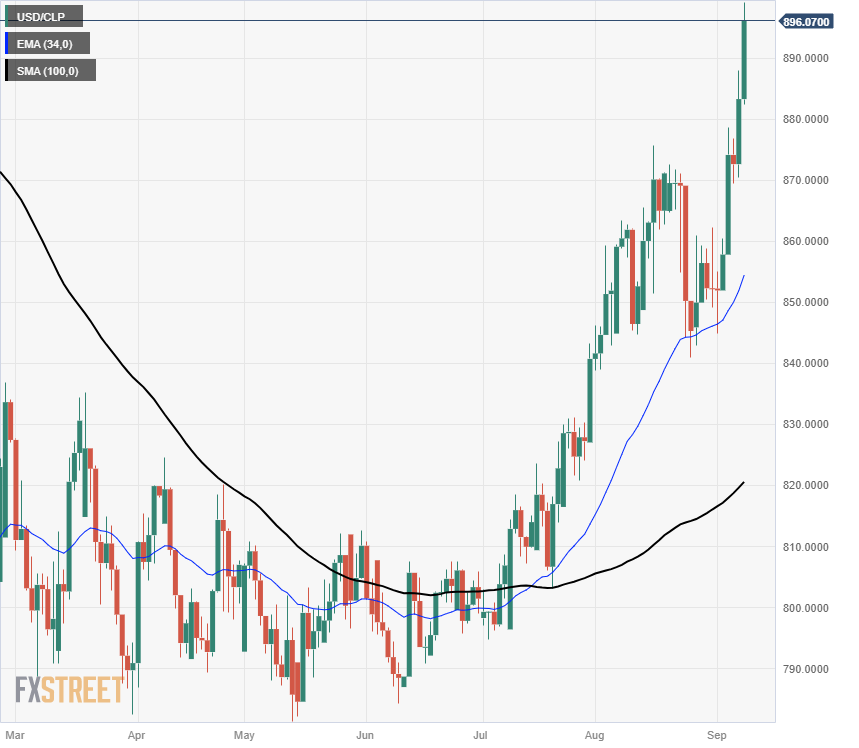
The Chilean Peso (CLP) continues to decay in markets, falling over 5% against the US Dollar (USD) and sending the USD/CLP pair into ten-month highs near 896.0000.
CLP slides on waning copper demand, rapidly-dwindling inflation
The Chilean Peso has declined for three consecutive months against the Greenback as the Banco Central de Chile (BCP) struggles to keep interest rates on-balance as inflation recedes quickly from the Chilean economy.
Inflation reached a two-year low in Chile, down to an annualized 5.3%. The rate of inflation has dropped for 9 straight months, leaving the BCP in the unenviable position of having to step up rate cuts at an increasing amount.
The BCP cut its benchmark rate by 75 basis points at its September meeting, and market economists anticipate the Chilean central bank may have to begin examining 100-point cuts in the near future in order to support the broader economy.
Copper prices continue to sag in the market, down to $3.71 per pound to finish out the week, with the red metal down from January’s high of $4.27/lb.
Combined with weak copper values, copper demand from China continues to worsen as their economy faces downside constraints. Chile, the world’s largest single producer of copper, is especially exposed to floundering Chinese demand, keeping the CLP on the weak side.
USD/CLP Daily chart
- S&P 500 closed up 0.14% at 4,457.49 on Friday but lost 1.13% for the week, reflecting investor caution amid global economic uncertainties.
- US economic data shows resilience with solid service sector activity and tight labor market, contrasting with gloomy outlooks in China and Europe.
- US Treasury bond yields advance to 4.268% on 10-year note, while the US Dollar Index finishes the week up 0.76%, signaling cautious optimism.
Wall Street finished Friday’s session clinging to minuscule gains after a week that witnessed economic data from the United States (US) would keep the US Federal Reserve sitting on its hand but keeping rates “higher for longer,” as Chair Powell stated in several speeches. Consequently, US Treasury bond yields advanced, while the Greenback finished above a crucial level.
Wall Street clings to modest gains on Friday, but broader concerns over the global economic outlook and mixed Fed stances weigh on weekly performance
Daily, the S&P 500 finished the session at 4,457.49, up 0.14%, while the Nasdaq 100 printed gains of 0.09%, at 13,761.53 and the Dow Jones Industrial Average rose 0.22%, at 34,576.59. However, on a weekly basis, the S&P 500 lost 1.13%, the Nasdaq 100 1.09%, and the Dow Jones 0.75%.
Sector-wise, the biggest winner was Energy, followed by Utilities and Communication Services, each gained 0.97%, 0.96% and 0.35%. On the flip side, Real Estate, Industrials, and Health post losses of 0.63%, 0.46% and 0.04%.
Several reasons affected US equities, but mostly on traders slashing bets on riskier assets, as the global economic outlook looks slightly pessimistic. Data from China and Europe shows the economy is losing steam, with the former set to enter a deflationary scenario, while the Eurozone shows signs of recession.
Recent data in the US shows the economy stays strong and resilient as business activity in the services space picks up, as announced by the ISM Non-Manufacturing PMI. Also, the latest labor market data showed that fewer Americans than expected filed for unemployment claims, a sign of tightness in the labor market.
On the European front, traders slashed bets the European Central Bank would raise rates next week despite dealing with high inflationary levels at around 5.3%. Hence, a stagflationary scenario looks like a possibility in the EU.
Several Regional Federal Reserve Presidents have expressed their views on monetary policy. Presidents Collins, Williams, and Bostic have taken a more dovish stance. In contrast, Chicago Fed President Austan Goolsbee has leaned towards a more neutral position. On the other hand, Lorie Logan from the Dallas Fed emphasized the need for the US central bank to be data-dependent but also stressed the necessity for more rate hikes to address inflationary pressures.
US Treasury bond yields finished the session with the 10-year benchmark note rate at 4.268%, gaining 0.47%. The Greenback, shown by the US Dollar Index, was almost flat at around 105.056 but achieved gains of 0.76% in the week.
WTI rose by 0.51% daily, around 7% weekly, in the commodity space underpinned by tight supplies after Saudi Arabia and Russia’s 1.3 million barrel crude oil cut.
S&P 500 Price Action - Daily Chart
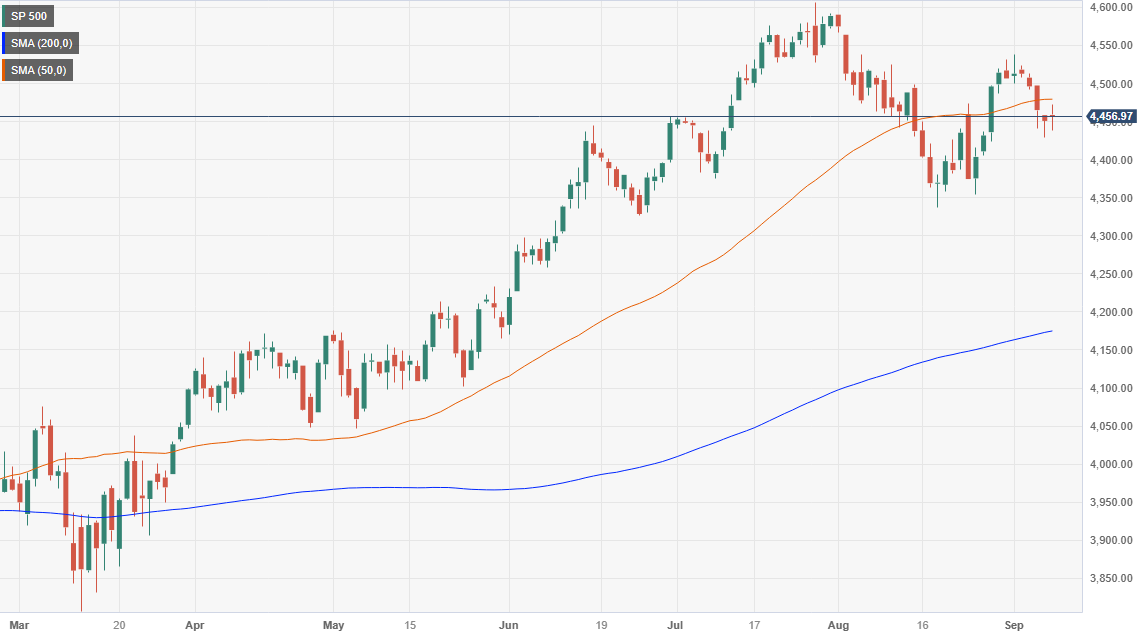
S&P 500 Technical Levels
- XAU/USD closed the week with a 1% weekly decline above the convergence of the 20 and 200-day SMAs.
- US yields are set to close a 2% weekly increase.
- Attention shifts to next week’s US CPI and Retail Sales from the US.
At the end of the week, the XAU/USD traded with mild losses, around $1,918. The precious metal will close the week with sharp losses, 5% for Silver and nearly 1% for Gold driven by US yields edging higher on the back of growing tightening expectations for the Federal Reserve.
In that sense, precious metals tend to be seen as the opportunity cost of holding non-yielding metals, and the US Treasury yields consolidated their weekly rallies on Friday. The 2-year yields stand at 4.99%, while the 5 and 10-year rates are at 4.40% and 4.26%. All three saw mild gains during the session which limited the Gold’s advances on the day.
For next week, investors eagerly await the Consumer Price Index (CPI) and Retail Sales figures from August in the US to continue placing their bets on the next Federal Reserve (Fed) decisions. As for now, markets expect a 25 basis point (bps) hike for the rest of the year but aren’t sure if it will come in November or December. In that sense, the incoming US data will help investors continue modelling their expectations.
XAU/USD Levels to watch
The technical outlook for the XAU/USD appears to be neutral to bearish for the short term, with indicators turning flat in negative territory. The neutral slope of the Relative Strength Index (RSI) below 50 further reinforces this mixed sentiment, as does the MACD, which displays stagnant red bars. On the other hand, the metal is battling to consolidate above the convergence of the 20 and 200-day Simple Moving Averages (SMA), so for now, in the larger context, the bulls command.
Support levels: $1,915 (20 and 200-day SMA convergence), $1,900, $1,880.
Resistance levels: $1,930, $1,950 (100-day SMA), $1,970.
XAU/USD Daily Chart
-638298064845534709.png)
- EUR/JPY advanced towards 158.15, setting a 0.40% weekly gain.
- The cross was rejected by the 20-day SMA the whole week.
- The daily charts flash signals of exhaustion.
At the end of the week, the EUR/JPY cross advanced to the 158.15 area, seeing 0.40% daily and weekly gains.
The daily charts suggest a neutral to bullish outlook for the cross, as the EUR/JPY’s bulls were constantly rejected by the 20-day Simple Moving Average (SMA) of 158.30 since Monday. In that sense, bulls are starting to lose steam as the Relative Strength Index (RSI) has a positive slope slightly above its midline, while the Moving Average Convergence (MACD) exhibits red bars.
On the other hand, the pair above the 100 and 200-day SMAs suggest that the bulls are comfortably in command over the bears on the bigger picture. If the bulls fail to retake the 20-day SMA, the 157.00 zone is open for a retest, followed by the 156.00 and 155.00 areas. Above the 20-day average, the resistance line up at the cycle’s peak at 158.00, followed by 158.50 and 159.00.
EUR/JPY Daily Chart
-638298033704456387.png)
- PLN crumbling on the back of too-soon rate cut from Polish central bank.
- USD/PLN soaring to five-month highs as market punish Zloty.
- PNB Governor Glapinski accused of political manipulation ahead of bitter general election.
The Polish Zloty (PLN) has plunged in value on the back of an unexpected rate cut from the Polish National Bank (PNB). The PNB gave a 75-basis-point cut to the country’s interest rate, down to 6%. Inflation still remains a frontline battle for Poland, and the head of the PNB, Governor Adam Glapinski has been criticized for political motivations behind the move.
Zloty tumbles after rate cut despite high inflation
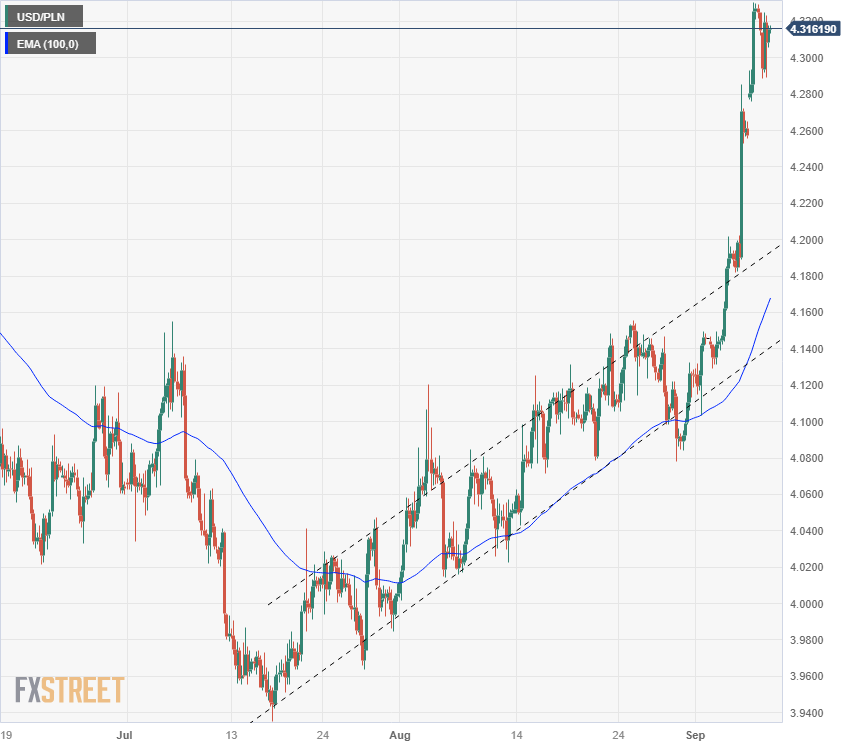
The PLN is poised for its biggest single-week decline in a year, sending the USD/PLN chart soaring to the 4.3200 region from the week’s opening price around 4.1270. The Zloty has fallen 5% against the Greenback (USD) in market trading.
PNB Governor Glapinski has come under fire for the unexpected rate cut, with criticisms from economists and politicians alike taking turns accusing Glapinski of political motivations. Glapinski is an open supporter of the ruling Law & Justice, a right-wing national-conservative government party.
Poland is facing a tight general election next month, and Glapinski is accused of using the poorly-timed rate cut as a means of providing support for the Law & Justice party by temporarily reducing lending and borrowing costs at the expense of the broader economy.
Flash estimates put Polish inflation in the double digits at 10.1%. During a news conference on Thursday, Governor Glapinski declared that the PNB had achieved “victory” over inflation, citing key price growth figures that the central bank does not currently publish.
The PNB Governor also declined to provide comment on the path of rate cuts in the future, claiming that the Polish central bank had now adopted a “wait-and-see” approach to monetary policy.
The price of 3-month Zloty-Euro (EUR) basis swap contracts exploded nearly 50 basis points higher on the rate cut, reaching a peak of 175 points. It has become increasingly expensive for foreign investors to borrow against the Zloty for the purposes of shorting the currency.
Last year Polish authorities took steps to prohibit shorting the PLN by restricting liquidity, in an effort to put a ceiling on further losses for the beleaguered currency which has lost over half of its value since the 2008 global financial crisis.
USD/PLN 4-hour chart
- EUR/USD trades at 1.0699, up 0.03%, but set to finish the week down 0.69% as Wall Street shows a mixed performance.
- German inflation meets expectations at 6.1% YoY, but looming technical recession adds uncertainty ahead of ECB’s September 14 meeting.
- Fed officials show a split stance on monetary policy, adding complexity to the EUR/USD outlook as traders await key economic indicators next week.
The Euro (EUR) gave back earlier gains achieved vs. the Greenback (USD) in the first hour of the Wall Street opening, which lifted the exchange rate towards its daily high at 1.0743, but the pair reversed its course. The EUR/USD is trading at 1.0699, registering minuscule gains of 0.03%, set to finish the week with losses of 0.69%.
Euro seesaws against the US Dollar as both currencies face a lack of decisive economic data, with eyes on upcoming ECB and Fed decisions
As the North American session advances, the EUR/USD loses steam. Wall Street is set to finish the session mixed, with the S&P 500 and the Nasdaq in the red, while the Dow Jones Industrial clings to minuscule gains.
A scarce economic docket from the Eurozone (EU) and the United States (US) kept the pair looking for direction, seesawing within a 40-pip range before the EUR/USD settled down at around current exchange rates. On the EU, Germany revealed its Harmonised Consumer Price Index (HICP) for August, with data coming as expected, at 6.1% YoY, while core HICP hit 6.1%.
Even though inflation stalled, a Reuters poll showed that analysts expect the European Central Bank (ECB) will keep rates unchanged at the upcoming September 14 meeting.
In the meantime, the IFO head of forecasts Timo Wollmershaeuser, noted that Germany’s economy would shrink in Q3 by 0.2%, which would trigger a technical recession, and according to him, they “are not expecting a dramatic” one.
Meanwhile, US business activity in the services segment picked up, while the jobs market remains tight, as Initial Jobless claims show. A few Federal Reserve officials moderated its hawkish tone, turning more cautious as the US central bank walks within a fine line of overtightening monetary policy, which could tip the US economy into a recession.
Regional Federal Reserve Presidents Collins, Williams, and Bostic took a more dovish approach. Contrarily, the Chicago Fed President, Austan Goolsbee, adopted a more neutral stance, while Lorie Logan from the Dallas Fed said the US central bank needs to be data-dependant but added that more rate hikes are required to curb inflation.
In the next week, the EU economic docket will feature the ZEW Economic Sentiment, the Inflation rate in France and Italy, Industrial Production in the latter, and the European Central Bank’s interest rate decision. On the flip side, the US agenda will feature inflation data, Retail Sales, unemployment claims, Industrial Production, and Consumer Sentiment from the University of Michigan.
EUR/USD Price Analysis: Technical outlook
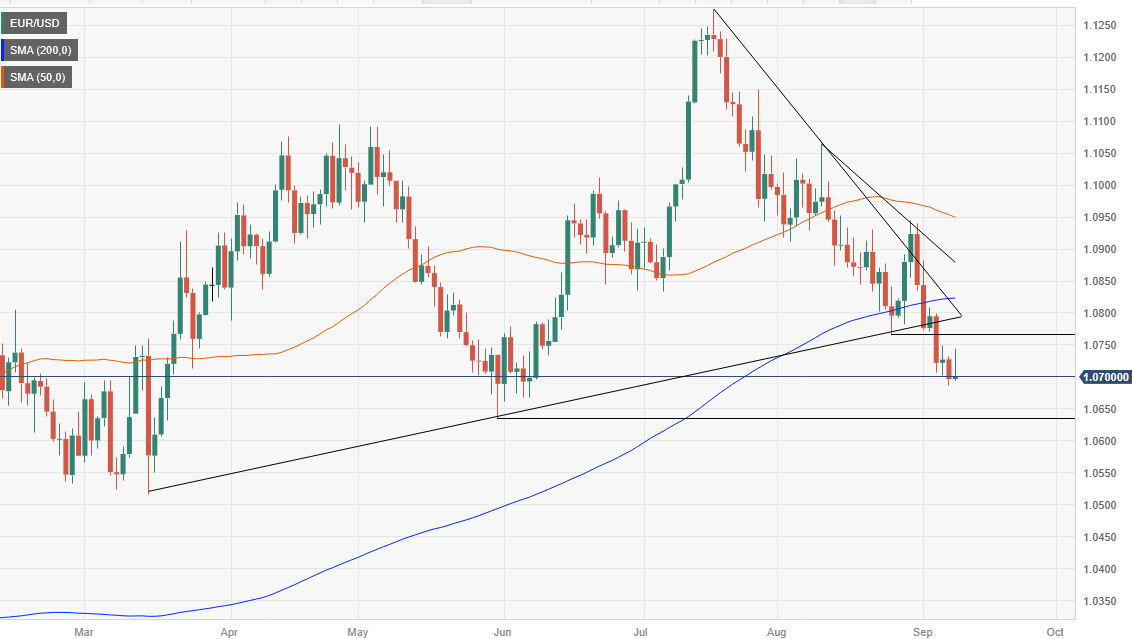
From a daily chart perspective, the pair remains neutral to a downward bias, set to test the May 31 swing low of 1.0635 if the EUR/USD achieves a daily close below the psychological 1.0700 mark. In that scenario, selling pressure could drive the major towards the former, followed by the 1.0600 figure and the March 15 daily low of 1.0516. On the other hand, if the EUR/USD finishes the week above 1.0700, an upward correction is expected, with buyers eyeing the 1.0750 area, followed by the September 5 high at 1.0798.
- GBP/JPY trades into the middle as global eocnomy concerns sap bullish momentum.
- UK data docket looking full for next week, markets forecasting further disappointment.
- Challenges to broad-market risk appetite remains the key driver for the Guppy pair.
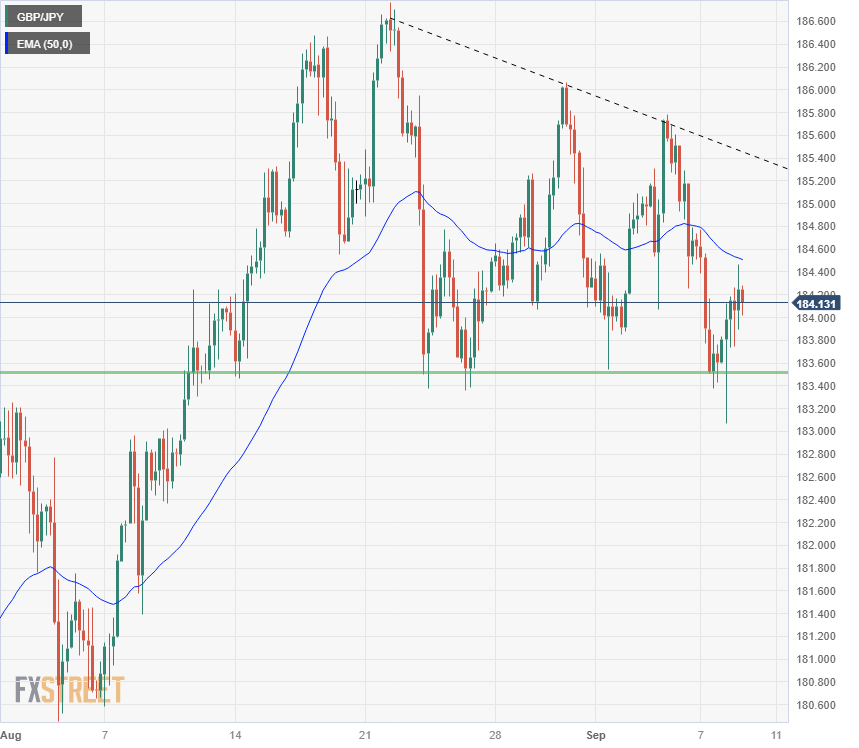
The GBP/JPY pair saw some back-and-forth action this week before entering the end zone almost exactly where it started, hung up just above the 184.00 level.
Guppy closes flat, sapped by bad data
Friday’s trading saw a rebound from the 183.00 handle, but it wasn’t enough to erase the week’s downside from a mid-week peak of 185.78. The Pound Sterling (GBP) took a hit on growing concerns of a slowdown in the global economy, as well as a dovish Bank of England (BoE) that is strongly implying the end of rate hikes is near.
Despite the week’s middling showing on declining economic data and rate concerns, the Guppy has managed to close bullish for seven of the last nine consecutive months, and from a technical standpoint is sitting comfortably at six-year highs.
On the flip side, many chart traders will be concerned about the end of a bullish cycle, especially as the Bank of Japan (BoJ) continues to work against the flow of a weakening Yen (JPY).
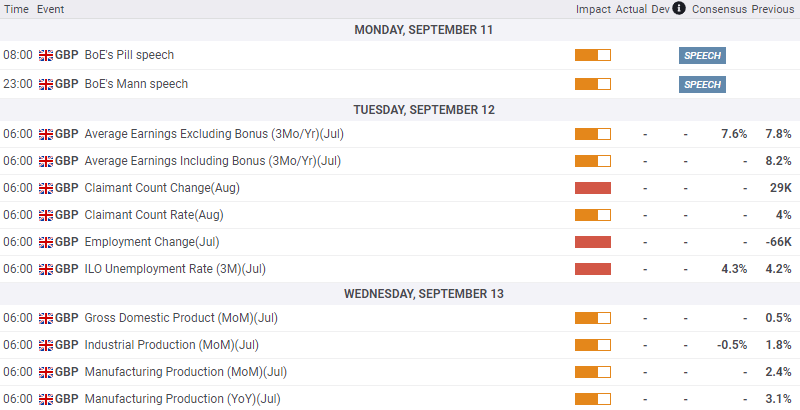
The upcoming trading week brings some hefty economic data for the Pound Sterling in the early half, with UK wage growth, unemployment, and industrial activity numbers into focus.
Economic calendar data for the UK is broadly anticipated to show mild declines across the board. Continued disappointment from economic indicators will see the GBP quickly lose its foothold on the charts.
GBP/JPY technical outlook
The Guppy is hamstrung in a four-week consolidation zone, which means a break to either side could be a definitive direction-setter. Resistance levels have collected into a zone from 186.60 to 185.75, while a hefty support region has coagulated below 183.60 down to 182.80.
An extended snap to the downside will see prices challenged at old bottom-end barriers from July, near the 180.00 major handle.
GBP/JPY 4-hour chart
- European equity indexes end the week on a softer note as economic data continues to disappoint.
- UK stocks facing a collection of tough data points on the calendar early next week.
- Broader EU index manages a slight gain despite being dragged down by large-caps, banking sectors.
European equities broadly ended the trading week in the red on global economy concerns and uncertainty surrounding upcoming interest rate calls. European Union (EU) banking and large-cap stocks bear much of the burden, and Australian gas strikes are also throwing a wrench in the works.
The London-based FTSE came close to ending the week flat, down -0.25% following a Friday afternoon rally that saw the index rebound 1.2% from the day’s opening low of £7,401.40 to touch an after-hours high of £7,490.00.
EU sees a pause in wider index declines, with some bearish hotspots in blue chips
The German DAX index wrapped up Friday’s trading down -0.85% on the week, with the EuroStoxx 50 blue chip index declining -1.5%. Equities are struggling to recover ground following the week’s weak economic data showing for the EU.
Despite growing signs of a struggling economy for the EU, European Central Bank (ECB) officials have struck a surprisingly hawkish tone lately, and markets have upped their bets that there will be a 25-basis-point hike at the ECB’s upcoming rate meeting next week, on September 14th.
A gas worker’s strike in Australia is stepping up front-end fuel prices in Europe, as the strike couples with recently-announced crude production cuts from Saudi Arabia and Russia to increase concerns of possible supply constraint in the near future.
Despite the increasingly-negative outlook for Europe across various sectors, the pan-European STOXX 600 broad equities index managed to eke out a small 0.2% gain on the week, ending the index’s seven-week losing streak.
Upcoming economic calendar events
The UK will be seeing employment, wage growth, and industrial activity figures early next week, with the majority of indicators expected to show minor declines. On the EU side, eyes will be on the ECB’s rate call meeting slated for September 14th.
Markets are calling for a 40% chance of the ECB raising all three policy rates by a quarter of a percent, with the remaining respondents expecting no movement from the central bank.
The key report next week will be the US CPI. China's inflation data is also due. The UK will report GDP and employment. Regarding central banks, the European Central Bank will announce its decision. The US will also release other reports that could challenge the rally of the US Dollar.
Here is what you need to know for next week:
The US Dollar Index has risen for the eighth consecutive week, reaching its highest close since February above 105.00. Economic data from the US, as well as divergences in outlook compared to Europe and the Eurozone, continue to support the strength of the US Dollar.
Next week, on Wednesday, the US Consumer Price Index (CPI) will be released. More inflation data, including the Producer Price Index (PPI) are due on Thursday. Additionally, Retail Sales and Jobless Claims are also on the docket. These numbers will represent an important challenge for the Dollar's rally. Evidence of a pronounced slowdown in economic activity and low inflation could make it difficult for the Dollar to extend its positive streak. Conversely, a rebound in inflation would provide further fuel to the rally.
On Saturday, China will release inflation data, which will be closely watched by the markets. The ongoing economic slowdown in China continues to be a negative factor for risk sentiment. Additionally, G20 meetings kick off during the weekend.
EUR/USD posted another week of losses and closed near the 1.0700 area, the lowest level in months. Apart from a strong Dollar, the Euro was affected by dampened expectations regarding the European Central Bank (ECB) and its monetary policy. The ECB will have its monetary policy meeting on Thursday, and it is unclear whether the central bank will raise interest rates further.
After a rebound, GBP/USD resumed its downside movement and fell below 1.2500, reaching its lowest level since June. The Pound erased previous weekly gains following dovish comments from Bank of England (BoE) officials. The UK will report employment data on Tuesday and GDP data on Wednesday.
USD/JPY posted the second-highest weekly close in decades, just below 148.00. The divergence between the Bank of Japan and the Federal Reserve continues to support the upside. Current levels may warrant more verbal intervention from Japanese authorities.
AUD/USD dropped to its lowest level in months, falling below 0.6400. The Aussie remains under pressure amid lower commodity prices and concerns about the Chinese economy. Australia will report employment data on Thursday.
USD/CAD resumed its upside movement after a pause last week. It approached 1.3700 but lost momentum. Positive employment data from Canada on Friday boosted the Loonie. The bias remains to the upside.
Metals experienced sharp declines, but Gold managed to remain above $1,900, while Silver fell below $23.00, approaching a key medium-term support level at $22.50.
Like this article? Help us with some feedback by answering this survey:
- CAD/JPY rises 0.72% to 108.38 after Canadian jobs report beats expectations, adding 15K jobs and pushing the unemployment rate to 5.5%.
- Odds for a Bank of Canada rate hike by year-end jump to 44% from 36%, following a 5.2% wage increase in August.
- Japanese Q2 GDP growth falls short of estimates at 4.8% YoY but fails to bolster the Yen as Canadian data takes center stage.
The Loonie (CAD) posts solid gains versus the Japanese Yen (JPY) on Friday after an upbeat Canadian jobs report sparked speculations the Bank of Canada would increase rates at a subsequent meeting. That and investors’ risk appetite weighed on the Yen’s safe-haven status. At the time of writing, the CAD/JPY exchanges hands at 108.38, up 0.72% or +77 pips.
Loonie gains ground against the Yen as upbeat employment figures fuel rate hike expectations, overshadowing Japan’s sluggish GDP growth
Statistics Canada revealed that the Canadian economy created more jobs than foreseen at 15K in August, with 39.9K people adding to the workforce, while the unemployment rate stood at 5.5%. The labor market has remained resilient, even though the Bank of Canada (BoC) has lifted rates ten times since March 2022.
Digging deeper into the data, a measure of wages rose by 5.2% in August from 5% in July, increasing the chances the BoC would step in and lift rates. Of note, the BoC kept rates unchanged on September 6 at 5%, but after the data release, the money market futures show odds at 44% chance of another BoC rate hike by the year’s end, from 36% before the employment report crossed the screens.
The data comes one day after the BoC Governor Tiff Macklem said that interest rates may not be high enough to bring supply and demand in balance, bringing inflation down. The BoC’s decision to hold rates unchanged was attributed to Q2’s 2023 unexpectedly contracted -0.2%, signaling the economy could’ve entered a recession.
Aside from this, data from Japan witnessed the economy growing slower than expected, with Q2’s GDP at 4.8% YoY, below the 5.5% estimated. Although it was negative, a risk-off impulse benefitted the Yen during the Asian and European sessions. Nevertheless, as Japanese authorities remained mute about a possible Forex intervention, it was outpaced by Canadian data.
Therefore, further CAD/JPY upside is expected, though caution is warranted on intervention threats and overextended price action.
CAD/JPY Price Analysis: Technical outlook
From a technical perspective, the CAD/JPY is neutral to upward bias, remaining above the Ichimoku cloud (Kumo) but failing to reach the year-to-date (YTD) high at 109.50. A decisive break would expose the 110.00 psychological level before testing last year’s high of 110.52. Failure at 109.50 and sellers would outweigh buyers and drag prices toward the Tenkan-Sen line at 107.61 before extending its losses to the Senkou-Span A at 107.39. Break below, and the pair would dive towards the Kijun-Sen at 107.18.
- USD/CHF advanced towards 0.8930, seeing mild gains.
- Positive risk sentiment impacts the USD's weekly rally; still, the DXY index is poised to close a weekly gain of 0.60%.
- US yields slightly advanced and consolidated the weekly increase.
Despite FX markets being driven by a positive market mood and a declining US Dollar (USD), the USD/CHF continued to gain ground, but bulls are losing momentum. Still, the pair will close a 0.86% weekly gain, its highest since May.
For the rest of the session, the economic calendar will remain quiet, and investors await fresh catalysts to place their bets for the next Federal Reserve (Fed) decisions. Next week, the US will report Consumer Price Index (CPI) figures from August, which is expected to have accelerated. Retail Sales from the same month, expected to have decelerated, will also be watched.
Regarding the Federal Reserve (Fed) expectations, the CME FedWatch tool indicates that markets have already priced in a pause in the September 20 meeting, and the probabilities for the November and December meetings show that the odds of a 25 basis point (bps) hike wander around 40%. In that sense, as long as tightening expectations for the Fed remain high, the USD’s losses are limited.
USD/CHF Levels to watch
The daily chart highlights a neutral to bullish technical outlook for USD/CHF as signs of buying exhaustion become evident. With a flat slope above its midline, the Relative Strength Index (RSI) suggests that the pair may consolidate gains in the next sessions, while the Moving Average Convergence (MACD) histogram exhibits stagnant green bars.
Support levels: 0.8900, 0.8877 (100-day SMA), 0.8850.
Resistance levels: 0.8950, 0.9000, 0.9030.
USD/CHF Daily Chart
-638297951722437393.png)
- The EUR has moved higher on the week against the GBP as ther BoE turns dovish.
- Soft data for the Eurozone caps upside capacity.
- It's the Pound Sterling's ballgame to lose with data-heavy calendar due next week.
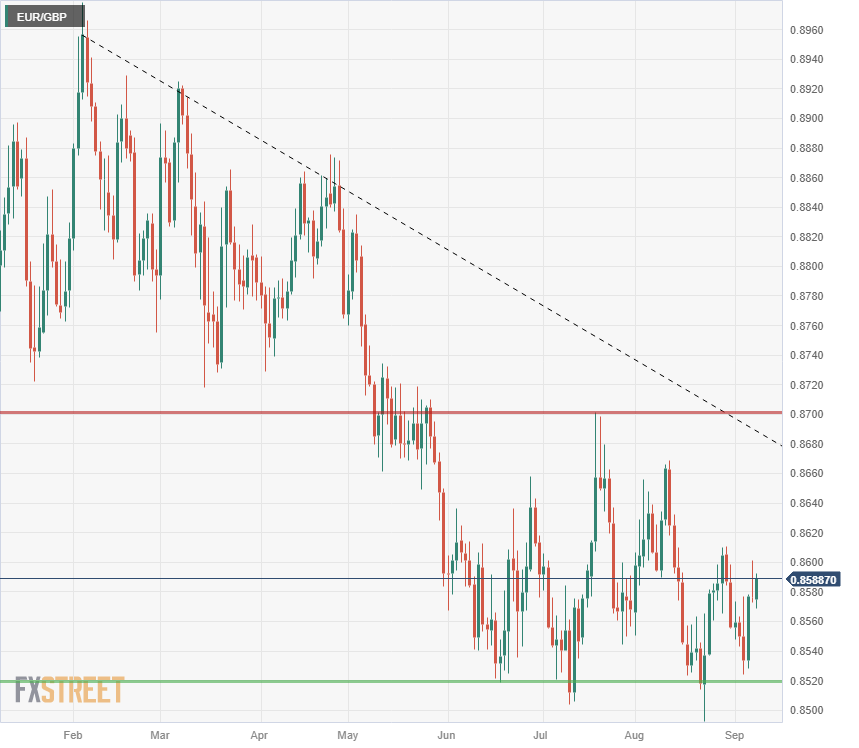
The EUR/GBP pair has moved higher for the week, with the Euro (EUR) gaining some ground against the Pound Sterling (GBP). A dovish Bank of England (BoE) has struck the GBP with bearish undertones, and despite beleaguered economic data for the broader European Union (EU) region, the Euro is the tug-of-war winner for this week.
The EUR started the week on the low end after Purchasing Manager Index (PMI) figures for the EU showed economic sentiment is declining for the continent. Later, Eurostat sales figures showed the retail space contracted by -1%, further capping upside potential for the Euro.
BoE hits dovish notes
On the United Kingdom (UK) side, the BoE’s Governor Andrew Bailey and members of the BoE’s Monetary Policy Committee (MPC) testified before the UK Parliament, speaking about inflation expectations and the overall economy.
Governor Bailey and his fellow MPC members struck a decidedly dovish tone, stating that the rate hike cycle for the BoE could very well be at the top, as well as expressing concerns that too much more action from the UK’s central bank could worsen the odds of achieving a “soft landing” for the domestic economy.
The softening stance from the BoE sent the GBP broadly lower for the week.
Next week: data-heavy UK
The economic calendar for the first half of next week is notably GBP-heavy, with very little meaningful releases from the EU side.
Monday sees appearances from the BoE’s chief economist Huw Pill and MPC member Catherine L. Mann. Tuesday brings UK unemployment figures and wages data, and Wednesday will bring UK manufacturing and Gross Domestic Product (GDP) data.
Wage growth, unemployment, and industrial data are all anticipated to slightly worsen.
UK economic calendar schedule, Monday - Wednesday. All times in GMT.
EUR/GBP technical outlook
The Euro-Pound pair has consolidated since June, cycling in a rough range between 0.8660 and 0.8520. A high-side resistance zone sits above, between 0.8740 and 0.8720, while any significant downside breaks could see the floor give way beneath the 0.8500 major handle.
A break below 0.8500 would see the Euro trading into 13-month lows against the Sterling.
EUR/GBP Daily chart
- WTI rose more than 0.70% on Friday, near $88.00, but indicators on the daily chart started to flash exhaustion signals.
- Tighter supply acts as a tailwind for Oil prices.
- Global weakening demand may cap gains.
On Friday, the West Texas Intermediate (WTI) advanced near $88.00 and settled below $87.00, still poised for a 2% weekly gain. That said, the daily chart continues to show overbought conditions, suggesting that a downward technical correction may be on the horizon.
On the upside, Saudi Arabia and Russia will extend voluntary supply cuts for the rest of the year and boosted Oil prices during the week. Moreover, the demand from the world's biggest consumer, the US, remains resilient, as shown in the last set of data, which could also favour the price.
Additionally, China and the Euro area report soft economic data and lower demand will limit WTI’s upside. In addition, a stronger USD, whose DXY rose to multi-month highs this week on the back of hawkish bets on the Federal Reserve (Fed), will also present challenges to the black gold’s upside in the next sessions. Lastly, Rising oil output from Iran and Venezuela may add selling pressure.
WTI Levels to watch
Based on the daily chart, the WTI shows indications of bullish exhaustion, leading to a neutral to bullish technical outlook. The Relative Strength Index (RSI) is firmly in overbought territory with a positive slope above its midline, suggesting a potential retracement to consolidate gains while the Moving Average Convergence (MACD) shows stagnant green bars. Furthermore, the pair is above the 20,100,200-day Simple Moving Average (SMA), suggesting that buyers are firmly in command of the larger time frame.
Support levels: $87.00, $85.00, $83.50.
Resistance levels: $88.00, $89.80, $91.00.
WTI Daily Chart
-638297917815827365.png)
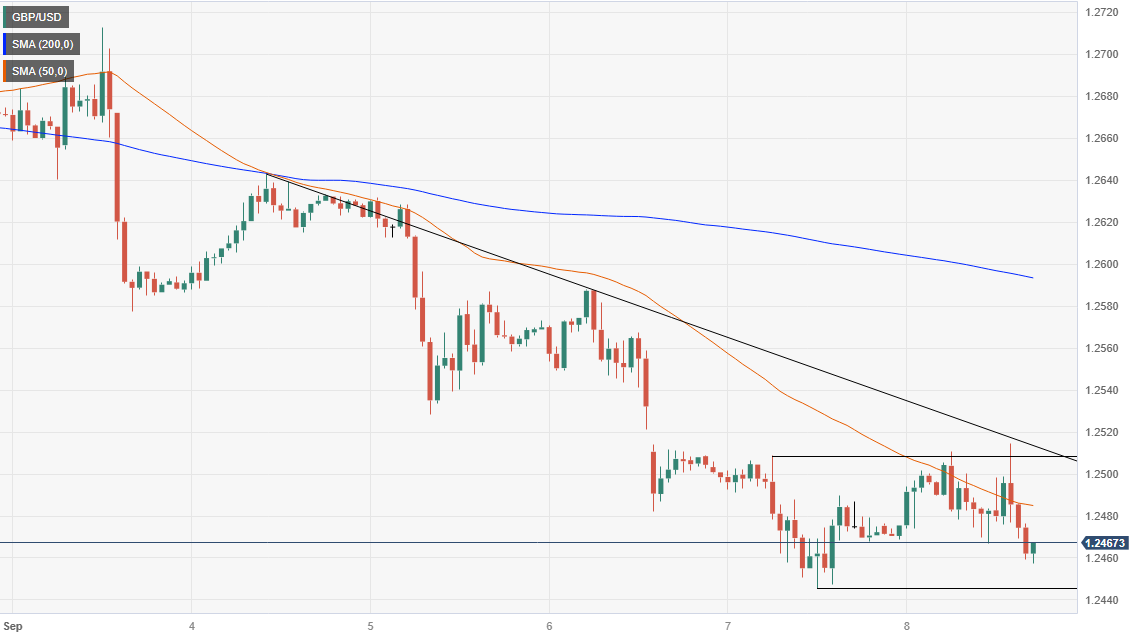
- GBP/USD drops to 1.2458 and puts the 200-day Moving Average at 1.2424 in focus.
- Short-term outlook shows the pair eyeing the week’s low at 1.2455, with a breach potentially targeting the S2 daily pivot at 1.2413.
- A reclaim of the 1.2500 level could signal a bullish reversal, with the next resistance at the 200-hour Moving Average at 1.2593.
The Pound Sterling (GBP) extended its free fall for four straight days versus the US Dollar (USD) due to high US bond yields underpinning the Greenback. The GBP/USD is trading at 1.2458 after hitting a daily high of 1.2514, as sellers set their sights on technical support to prolong their profits.
GBP/USD Price Analysis: Technical outlook
After breaking an upslope support trendline drawn from around May lows, the major dropped below the psychological 1.2500 figure, which exposed the 200-day Moving Average (DMA) at 1.2424. A breach of the latter would shift the pair’s bias to neutral downwards and expose the May 25 swing low at 1.2308, a crucial support area. That could break the uptrend market structure and pave the way for further losses.
Short-term, the GPB/USD hourly chart shows an attempt by buyers to reclaim the 1.2500 figure. AS buyers failed, the pair dived towards the session’s lows, below Friday’s central pivot point, eyeing the week’s low at 1.2455. A breach of the latter could expose the S2 daily pivot at 1.2413, followed by the 1.2400 mark. Conversely, if traders reclaim 1.2500, that could open the door for further upside, with traders eyeing the 200-hour Moving Average (HMA) at 1.2593 before challenging 1.2600.
GBP/USD Price Action – Hourly chart
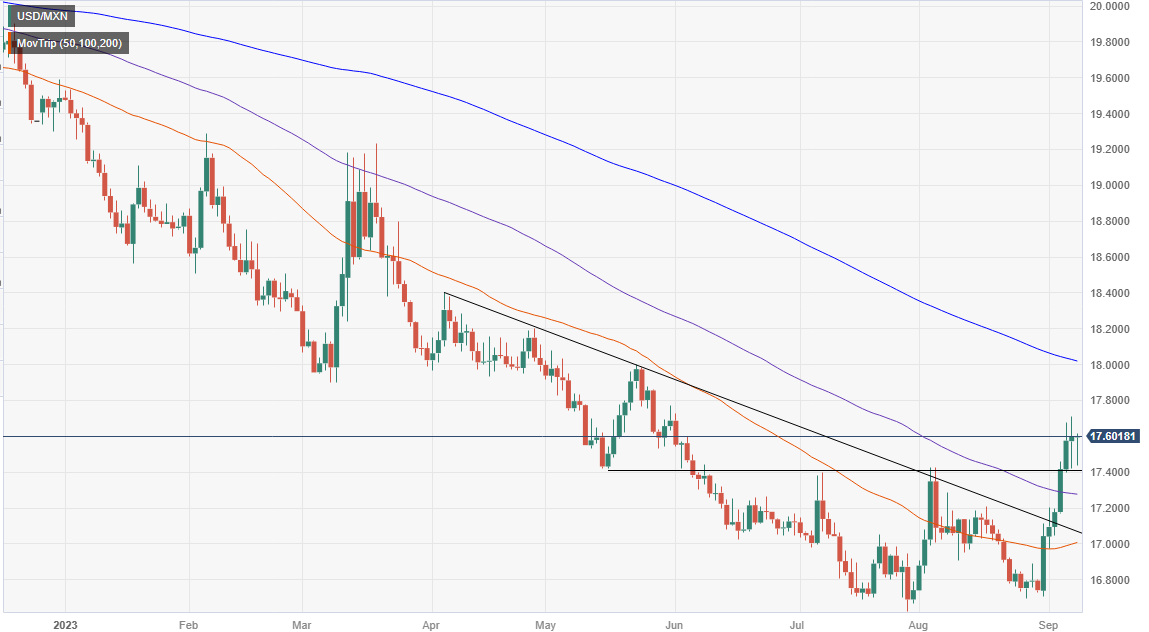
- USD/MXN hovers around 17.5684, as lack of fresh economic catalysts and dovish Fed comments keep the pair in check.
- Despite strong US economic data, November rate hike odds remain at 43.6%, adding uncertainty to the USD/MXN trajectory.
- Easing Mexican inflation to 4.64% YoY in August provides some relief, but traders eye upcoming US and Mexican economic indicators.
The Mexican Peso (MXN) recovered some ground against the US Dollar (USD), though it remains near its week’s lows, while the USD trades soft, printing modest losses. The lack of an economic catalyst and a risk-on impulse keeps the USD/MXN pair oscillating at around 17.5684 after hitting a daily low of 17.4380.
Mexican Peso recovers ground as the US Dollar softens, but traders remain cautious ahead of crucial economic data next week
The Greenback is trading softer on Friday, as it’s headed to print weekly gains for an eighth consecutive week after reaching a six-month high of 105.057. Hence, the USD/MXN pair halted its rally despite data from the United States (US) depicting a solid economy, as business activity remains firm. At the same time, due to the latest unemployment claims data, the labor market is not as loose as expected by the US Federal Reserve.
Given the backdrop, traders braced for additional tightening by the Fed. Even though interest rate probabilities discount a September rate hike, November’s odds remain at 43.6% for a 25 bps increase. This spurred high US bond yields, underpinning the USD/MXN pair. However, appetite for US bonds keeps yields pressured.
Aside from this, the USD/MXN is pairing some of its earlier losses due to dovish comments from Fed officials. The New York Fed President John Williams and Atlanta’s President Raphael Bostic are amongst the most dovish officials in the Federal Reserve, with the former saying that monetary policy is “in a good place.” Contrarily, Dallas Fed President and 2023 voter Lorie Logan added that skipping a rate hike may be appropriate but stressed the Federal Funds Rate (FFR) needs to be at higher levels.
That said, investors trimmed some of their USD/MXN long positions after Mexico’s revealed inflation eased to its lowest level since March 2023 to 4.64% YoY in August. The Bank of Mexico Deputy Governor Jonathan Heath highlighted the same report, saying that core inflation slowing towards 6.08% YoY was “good news” while stressing that there is a long way to go.
Next week, the US agenda will feature inflation data, Retail Sales, unemployment claims, Industrial Production, and Consumer Sentiment from the University of Michigan. On the Mexican front, the docket will feature Industrial Production.
USD/MXN Price Analysis: Technical outlook
From a technical standpoint, the USD/MXN rally stalled at around 17.5000/7000. However, buyers reclaimed the critical May 17 daily lof of 17.4038, keeping buyers hopeful of lifting the exchange rate towards the 18.0000 psychological barrier. A tick above that level sits the 200-day Moving Average (DMA) at 18.0112, which, once cleared, would put into play key resistance areas at 18.4010 and 18.6074, the April 5 high and the March 24 swing high, respectively.
- The AUD/NZD is sagging, breaking down below the two-week range.
- The AUD has lost the coin toss against the NZD as traders position ahead of China inflation figures.
- With data dropping over the weekend, Monday promises further action.
The AUD/NZD pair is trading into two-week lows as the Aussie (AUD) waffles against its close neighbor, the Kiwi (NZD). With both currencies exposed to data impacts from China, investors have pegged the AUD as the bigger loser between the two.
China Consumer Price Index (CPI) numbers for China will be dropping during the market off-hours over the weekend, and markets could be positioning in advance, sending the Aussie out of the recent consolidation range in anticipation.
China CPI heading down the ramp
China inflation figures are expected to show a minor uptick to 0.2% YoY versus the previous contraction of -0.3%. Failure to achieve price growth for the Chinese economy would be a continued sign of economic weakness for the Asia region, and further selling pressure could send the AUD even lower for next week.
China data schedule; times in GMT
AUD/NZD Technical outlook
The Aussie-Kiwi pair has stepped into a two-week low, knocking on 1.0820 heading into the end of the week. With the cross trapped in a consolidation range between 1.0740 to 1.0940 for the past few months, breakout was all but inevitable, and 1.0760 to 1.0740 will be the support range in the near term.
On the bullish side, a break upwards on improving market sentiment will see the AUD/NZD challenging heavy resistance from 1.0880 before being able to move further on from there.
AUD/NZD 4-hour chart
- USD/JPY rose towards 147.70, seeing 0.30%.
- The USD is retreating, and the DXY Index is consolidating after reaching a multi-month high of 105.15.
- Japan revealed soft GDP and Earning figures so the BoJ won’t be urged to pivot.
The USD/JPY increased on Friday towards 147.70 after Japan reported soft data during the Asian session, and the pair is set to close a 1% weekly gain. On the USD side, it is retreating, consolidating its weekly gains, but the DXY index continues to trade at multi-month highs.
Datawise, no relevant data will be released for either country for the rest of the session. On the US side, the focus is on next week’s Consumer Price Index (CPI) figures from August, which will be important for the Federal Reserve (Fed) regarding the November and December decisions.
As for now, economic activity in the US has shown to remain resilient, driven by a strong Services sector, while the labour market, via the Nonfarm Payrolls, showed a mixed outlook, with job creation accelerating while wage inflation picked up in August. It's worth reminding readers that the Federal Reserve (Fed) chairman Jerome Powell has stated that the bank expects the economy to cool down and that it will maintain its restrictive monetary policy as long as inflation does not back away.
According to the CME FedWatch tool, the odds for a 25 basis point (bps) hike in November and December stand near 40%, and rate cuts are seen between June and July 2024.
On the JPY’s side, the Japanese Cabinet Office revealed that the country's Gross Domestic Product (GDP) growth for the second quarter was 1.2% on a quarterly basis, down from the previous reading of 1.5% and below expectations of 1.3%. On an annual basis, the growth rate was 4.8%, down from 6% and missing the market consensus of 5.5%. Lastly, Japanese Labor Cash Earnings for July, closely watched by the Bank of Japan, increased by 1.3%, matching expectations, but was lower than the 2.3% seen in the previous reading.
The BoJ has been lately signalling that unless wage and inflation figures meet their forecasts, they will maintain their dovish stance and monetary policy divergences may continue acting as a tailwind for the pair.
USD/JPY Levels to watch
With both Relative Strength Index (RSI) and Moving Average Convergence Divergence (MACD) comfortably placed in positive territory on the daily chart, the USD/JPY buyers hold the upperhand. However, indicators are approaching overbought conditions, which could lead to a healthy technical correction in the near term. Moreover, the pair is above the 20,100,200-day Simple Moving Average (SMA), indicating a commanding position for the bulls in the bigger picture.
Support levels: 146.00, 144.80, 144.00.
Resistance levels: 148.00, 148.50, 149.00.
USD/JPY Daily Chart
-638297864863172480.png)
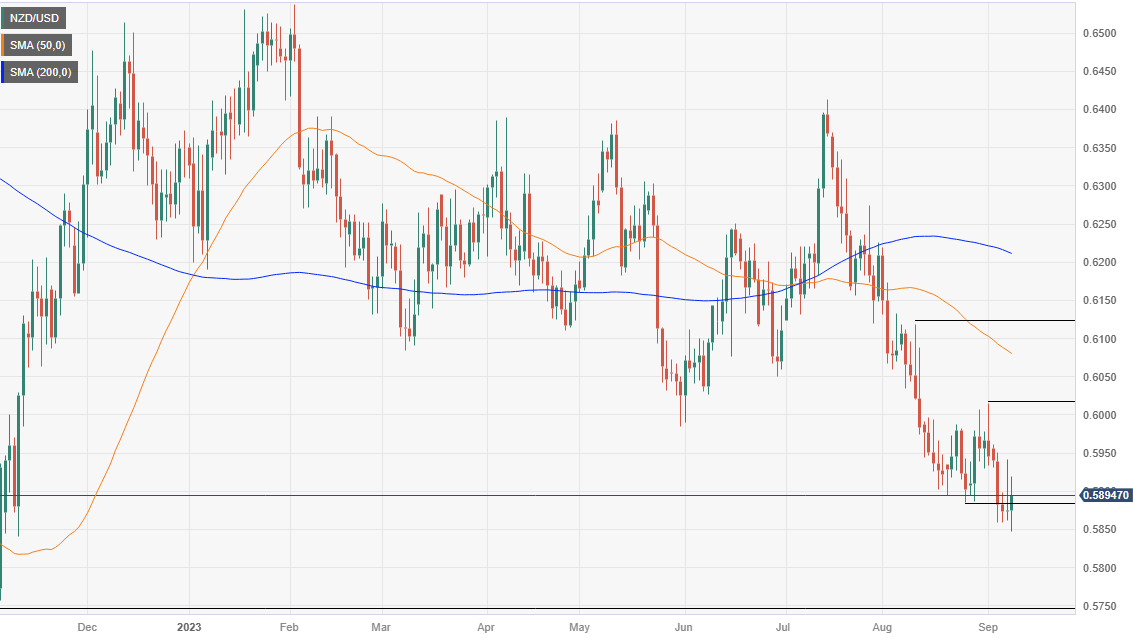
- As Wall Street opens positive, NZD/USD rises 0.57% to 0.5907, partially offsetting fears of a global economic slowdown.
- US Dollar softens after hitting a six-month high, providing a tailwind for NZD/USD amid a lack of fresh US economic data.
- Traders await key economic indicators next week, including US inflation data and New Zealand Retail Card Spending, for directional cues.
The New Zealand Dollar (NZD) stages a rebound against the US Dollar (USD), but it remains set to finish the week with losses. Fears of a global economic slowdown led by Europe and China dented investors’ mood during the European session, but Wall Street opened in the green. This bolstered the NZD/USD, which is trading at 0.5907, a gain of 0.57%.
New Zealand Dollar gains against a softening US Dollar, but concerns over global economic slowdown and upcoming data keep traders cautious
The Greenback (USD) continues to soften after data propelled the buck to a six-month high, according to the US Dollar Index, at 105.057. Nevertheless, the lack of economic data in the US agenda and falling US Treasury bond yields weighed on the USD, a tailwind for the NZD/USD pair.
During the week, US data was positive for the buck, showing the economy’s resilience. Business activity in the services segment picked up, while the jobs market remains tight, as Initial Jobless claims show. However, the NZD/USD was propelled by Federal Reserve officials taking a more cautious stance, particularly Regional Fed Presidents Collins, Williams, and Bostic. Contrarily, the Chicago Fed President, Austan Goolsbee, adopted a more neutral stance, while Lorie Logan from the Dallas Fed said the US central bank needs to be data-dependant but added that more rate hikes are required to curb inflation.
In the meantime, the Kiwi has been influenced by market sentiment and negative data from China. As business activity in the latter struggled, despite Chinese authorities stimulating the economy, the financial markets had not bought that story, as the Chinese stock market was headed for weekly losses.
Aside from this, the NZD/USD would gather direction from next week’s data. The US agenda will feature inflation data, Retail Sales, unemployment claims, Industrial Production, and Consumer Sentiment from the University of Michigan. On the New Zealand front, Retail Card Spending.
NZD/USD Price Analysis: Technical outlook
The pair’s rally above the September 6 high of 0.5904 could be seen as an upward correction, but the overall trend remains downward. To shift the bias, buyers must reclaim the September 1 swing high of 0.6015, which would put the 50-day Moving Average (DMA) at 0.6080 in play. If the NZD/USD prints a daily close below 0.5904, sellers could drive the Kiwi/US Dollar pair toward the week’s lows at 0.5859 before challenging 0.5800.
- Silver price volatility compresses near $23.00 while the US Dollar remains subdued.
- Investors turn baffled between rising hopes of the Federal Reserve’s (Fed) soft landing and resilient US dollar.
- Silver price consolidates below the 61.8% Fibonacci retracement at $23.30.
Silver price (XAG/USD) demonstrates a volatility squeeze near the crucial support of $23.00, following the footprints of the subdued US Dollar. The white metal struggles to find a direction as investors turn baffled between rising hopes of the Federal Reserve’s (Fed) soft landing and resilient US dollar due to deepening global uncertainties.
The S&P500 opens on a positive note as investors start digesting fears of global economic shakedown due to rising interest rates by central banks. The US Dollar Index (DXY) turns sideways around 105.00 after a stalwart rally. More upside remains favored on hopes that the US economy is approaching to golden path.
Chicago Fed Bank President Austan Goolsbee said the central bank is aiming to push the economy to a “golden path,” meaning a situation where inflation recedes without triggering a recession. While strong wage growth is still a major concern for the Fed as higher disposable income could elevate inflationary pressures.
Meanwhile, investors await the US Consumer Price Index (CPI) data for August, which will be published on Wednesday at 12:30. Investors will keenly watch core inflation data as it has remained extremely stubborn due to strong consumer spending momentum.
Silver technical analysis
Silver price consolidates below the 61.8% Fibonacci retracement (plotted from August 15 low at $22.23 to August 30 high at $25.00) at $23.30 on an hourly scale. The 50-period Exponential Moving Average (EMA) at $23.13 continues to act as a barricade for the Silver price bulls.
The Relative Strength Index (RSI) (14) shifts into the 40.00-60.00 range from the bearish range of 20.00-40.00, which indicates that the bearish momentum has faded. While the bearish bias has not faded yet.
Silver hourly chart
-638297789866922685.png)
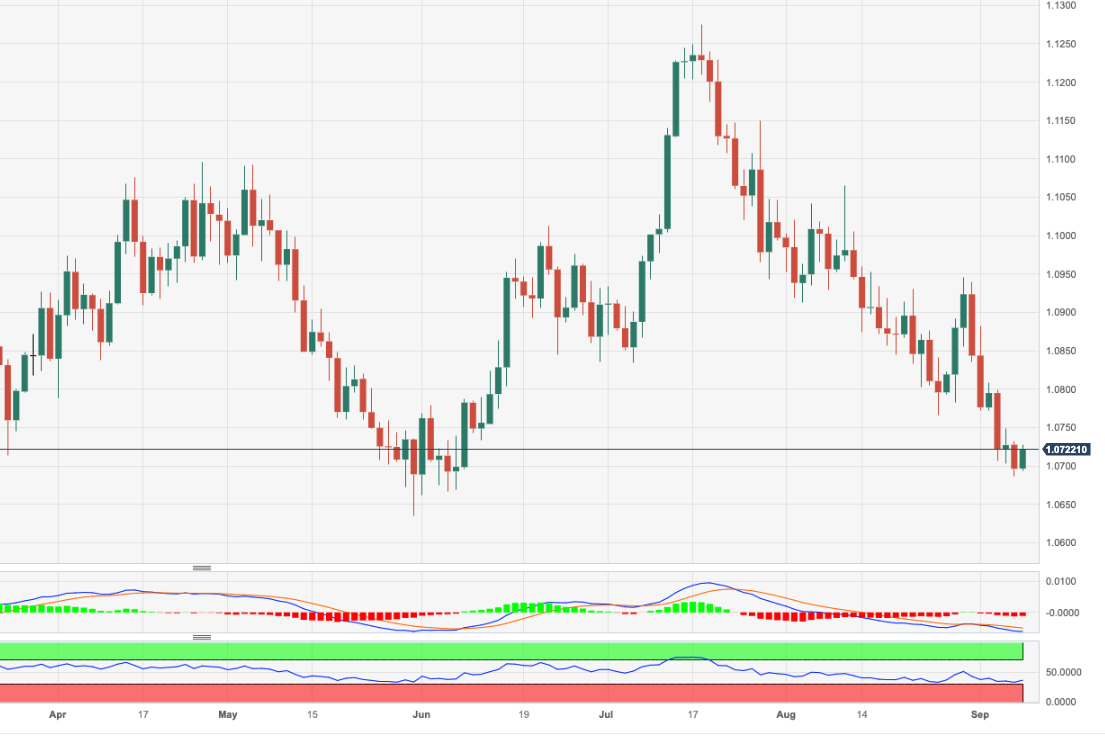
- EUR/USD manages to regain some composure near 1.0700.
- Further losses could retarget the May low at 1.0635.
EUR/USD attempts a mild recovery to the 1.0700 region at the end of the week.
The underlying bearish sentiment remains unchanged and leaves the door open to extra pullbacks in the short-term horizon. Against that backdrop, the pair could now embark on a probable visit to the May low of 1.0635 (May 31) ahead of the March low of 1.0516 (March 15).
In the meantime, further losses remain in the pipeline while below the key 200-day SMA, today at 1.0822.
EUR/USD daily chart
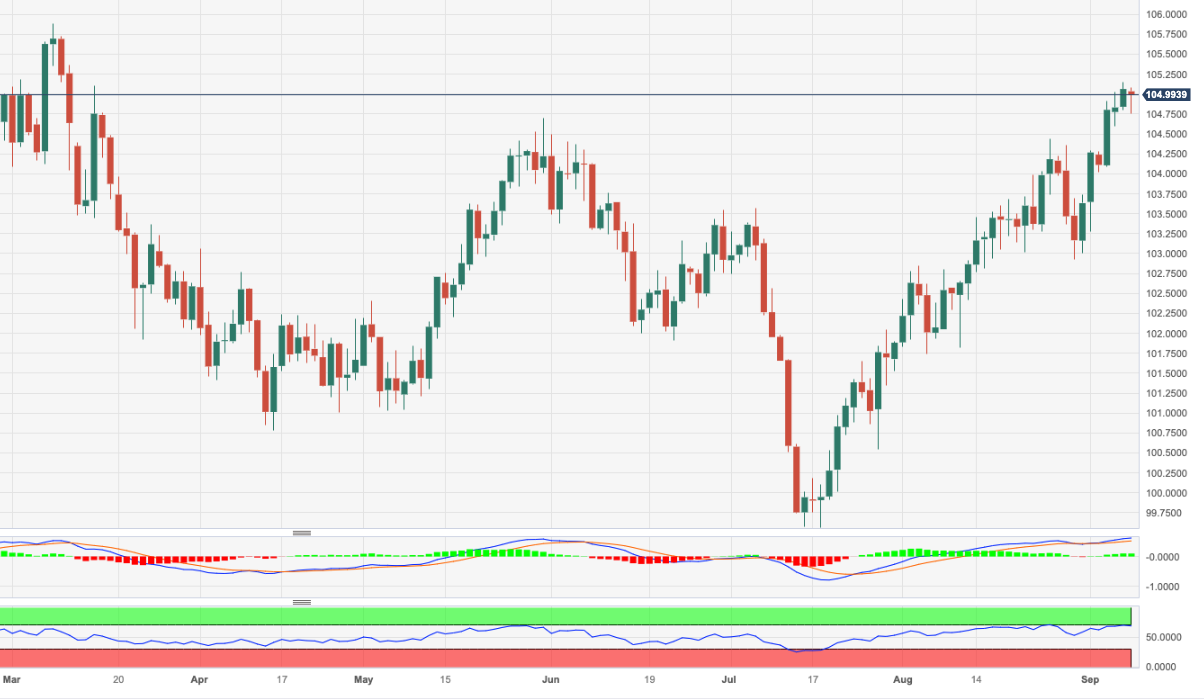
- DXY comes under pressure and revisits the 105.00 zone.
- Extra upside could see the YTD top near 105.60 revisited.
DXY sees its recent strong upside somewhat trimmed and recedes to the 105.00 neighbourhood at the end of the week.
The continuation of the multi-week rally is now expected to shift its attention to the 2023 high of 105.88 (March 8) prior to the round level at 106.00.
While above the key 200-day SMA, today at 103.03, the outlook for the index is expected to remain constructive.
DXY daily chart
- USD/CAD slips vertically to near 1.3600 as Statistics Canada has reported upbeat labor market data.
- The Canadian labor market witnessed fresh additions of 39.9K payrolls in August, more than doubled from the expectations of 15K.
- The US Dollar remains firm as the US economy is resilient due to cooling inflation and stable labor growth.
The USD/CAD pair faces an intense sell-off as Statistics Canada has reported better-than-anticipated labor market data. The Canadian labor market witnessed fresh additions of 39.9K payrolls in August, more than doubling the expectations of 15K. In July, there was a retrenchment of 6.4K. The Unemployment Rate remains unchanged at 5.5% while investors forecasted a higher jobless rate at 5.6%.
Annual Average Hourly Wages rose to 5.2% vs. the former release of 5.0%. Decent wage growth could elevate consumer spending momentum and keep inflationary pressures sticky. This could force the Bank of Canada (BoC) to raise interest rates one more time after pausing them in the past two policy meetings.
Meanwhile, the S&P500 is expected to open on a flat note, considering mixed cues from overnight futures. The US Dollar Index (DXY) remains well-supported near the 105.00 resistance as investors remain mixed between global uncertainty and support for a skip in the policy-tightening spell by Federal Reserve (Fed) policymakers for the September policy meeting.
The US Dollar remains firm as the United States economy is resilient due to cooling inflation and stable labor growth. Chicago Fed Bank President Austan Goolsbee said the central bank is aiming to push the economy to a “golden path,” meaning a situation where inflation recedes without triggering a recession.
The US job market is getting stronger as the Jobless claims came in below expectations for the third straight week. The US Department of Labor reported that individuals claiming jobless benefits for the first time dropped to 216K for the week ending September 1, less than the 234K expected and the former release of 229K.
- AUD/USD trades sideways near 0.6400, following the footprints of the US Dollar.
- Fed speakers supported keeping interest rates unchanged in the September monetary policy.
- The Australian Dollar remained in action this week as the RBA kept the interest rate policy unchanged.
The AUD/USD pair trades back and forth near the crucial resistance of 0.6400 in the London session. The Aussie asset turns sideways following the footprints of the US Dollar Index (DXY), which is holding an auction near a five-month high of 105.20.
S&P500 futures posted some losses in Europe, portraying a cautious market mood amid accelerating fears of economic turmoil due to the strict monetary policy stance by Western central banks. Investors have parked their funds in the US Dollar due to uncertainty about global economic recovery in a high interest-rate environment.
European and Asian economies are facing the wrath of higher interest rates by their respective central banks in the battle against stubborn inflation. Economic activities in the largest continent and the trading bloc are shrinking due to the vulnerable demand environment. Also, firms avoid fresh credit globally due to higher interest obligations.
On Thursday, Fed speakers supported keeping interest rates unchanged in September monetary policy. Investors await August Consumer Price Index (CPI) data to get more cues about the interest rate policy.
The Australian Dollar remained in action this week as the Reserve Bank of Australia (RBA) kept the interest rate policy unchanged. About labor market outlook, RBA Governor Philip Lowe cited that the Unemployment Rate can sustain near 40-year lows and wage growth is strong.
Meanwhile, investors eye China’s Consumer Price Index (CPI) for August, which will be published on Saturday. Monthly economic data is seen expanding at a 0.3% pace, higher than the pace of 0.2%, being recorded for July. Annual inflation is seen at 0.1% against a deflation of 0.3%.
Economist at UOB Group Ho Woei Chen, CFA, reviews the latest measures to underpinned China’s property sector.
Key Takeaways
China has announced stronger support measures for its property market including the relaxation of the definition of first-time homebuyers as well as a cut in down-payment requirement and borrowing costs for new buyers and existing first-home mortgages.
This could help to stabilise outlook for China’s real estate market in the nearterm. But the recovery in buyers’ sentiment will take time given ongoing funding concerns amongst property developers while the economic recovery in the next two years is expected to be weak with risks also coming from soft external demand and geopolitical tensions.
We reiterate our call for lower lending rates by another 10 bps for 1Y LPR and 20 bps for 5Y LPR by end-4Q23. We are keeping our forecast for GDP growth at 5.0% for 2023 and 4.5% for 2024.
- The USD/CLP has climbed higher, hitting new highs as the Chilean Peso lags the US Dollar.
- Inflation is coming down slowly in Chile, but the Chilean central bank may not be going far enough with rate cuts.
- Softening copper prices are wreaking havoc on Chile, the world’s largest copper producer.
The USD/CLP pair has gone on a bit of a tear recently, climbing to nine-month highs as the Chilean Peso takes a step lower in the face of declining copper prices and a central bank caught between a lopsided economy that is stagnating with several notable hot spots.
Copper prices have struggled to find a foothold in the commodities markets, with the red metal trading down to 3.726 USD per pound in the futures market, down from the week’s peak near 3.875 per pound.
Copper peaked at 4.2665 early in the year, and has faltered numerous times, dipping to a low of 3.5283 in late May. With 29% of the global market share, Chile is the world’s single largest producer of copper, and its economy is exposed to fluctuating metal prices on the global market.
Chilean central bank slows rate of cuts as economy lags
The Banco Central de Chile, Chile’s central bank, cut its interest rate to 9.5% this week, down from 10.25%. Chilean inflation remains high, despite dropping quickly from last year’s high near 12%, and currently sits at 6.5%, over double the Chilean central bank’s 3% target.
Chile maintained a decades-long high interest rate that quashed economic activity and investment, and there are concerns that too much off the top of rates could start to re-stoke still aggressive inflation.
The Banco Central de Chile will have its work cut out for it in maintaining stable economic growth while stabilizing a devaluing currency, all while keeping inflation on balance to hit the central bank’s target level by the end of next year, as cited by the Chilean central bank.
Chilean policymakers, ever-uneasy about inflation, have recently raised their projections for end-of-year inflation to 4.4% from 4.3%.
USD/CLP technical outlook
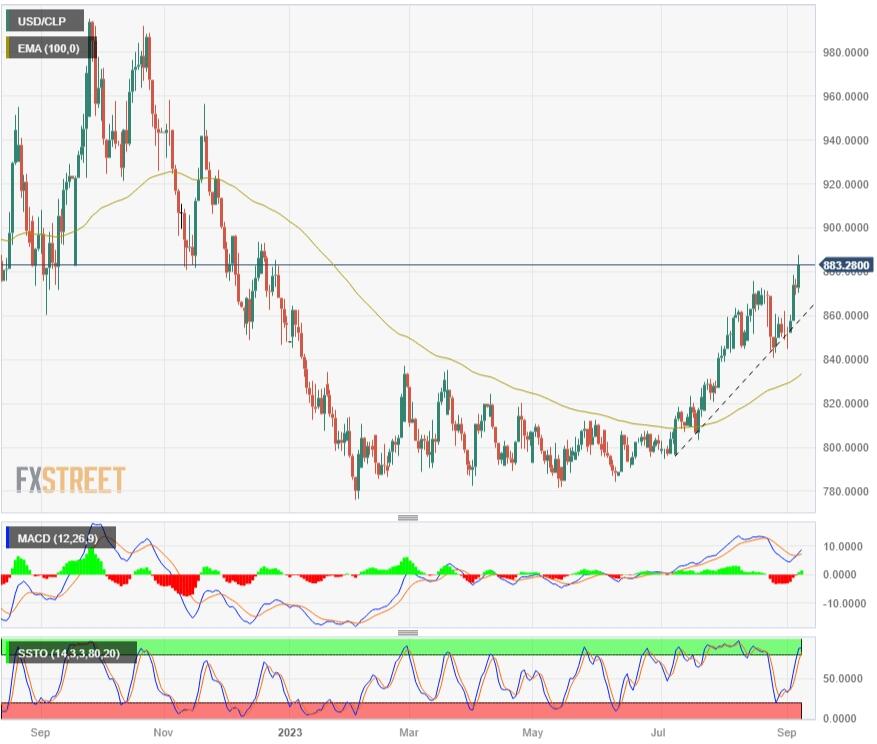
A rising trendline on the daily candlesticks is providing dynamic support for the US Dollar (USD) against the Chilean Peso (CLP), and late August’s swing low near 845.0000 is rapidly looking unattainable unless fierce selling pressure steps into the market.
On the upside, there’s an inflection point near 890.0000, and last September’s peaks near 1,000.0000 may be unattainable without a significant deterioration in Chile’s domestic economy.
USD/CLP Daily chart
- EUR/JPY resumes the upside after two sessions of losses.
- Further consolidation should not be ruled out in the near term.
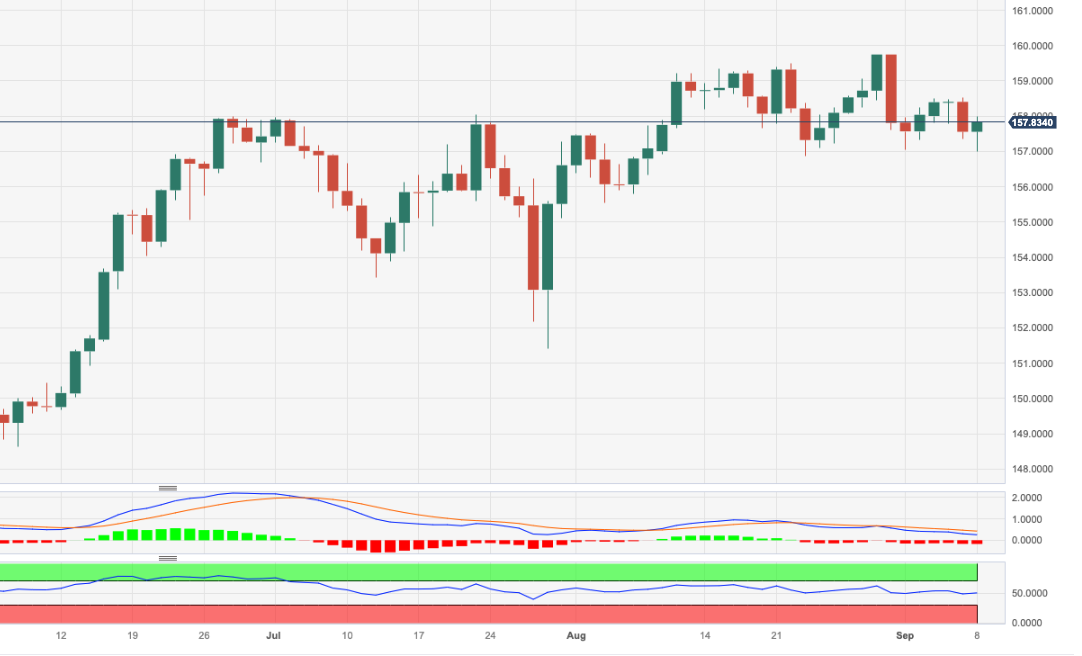
EUR/JPY reverses two consecutive daily pullbacks after briefly dropping to the 157.00 region, where the provisional 55-day SMA also sits.
In the meantime, the cross appears poised to maintain the consolidative mood in the very near term ahead of the potential resumption of the uptrend. That said, immediate hurdle emerges at the recent 2023 peak at 159.76 (August 30) before the key round level at 160.00. The surpass of the latter should not see any resistance level of note until the 2008 high at 169.96 (July 23).
So far, the longer term positive outlook for the cross appears favoured while above the 200-day SMA, today at 148.35.
EUR/JPY daily chart
- The US Dollar is set to book another week of gains.
- No focal data points on Friday, so expect tepid market movements.
- The US Dollar Index fails again to hold the 105.00 level, and could start to peak.
The US Dollar (USD) has had a strong week after a series of US economic indicators appear to convince traders of the strength of the US economy . The path for the Greenback looks to be one of sideways to stronger against most major peers. The US economy is doing well and is on a trajectory for a soft landing, while economic activity in the Eurozone and Central Europe shows increasing signs of distress.
No real market moving data points on the calendar on Friday. Still, data about Wholesale Inventories for July will be released.The Baker Hughes US Rig Count data, to be published at the end of the trading day, could carry more weight than usual in the aftermath of the failed talks in Australia, which will likely lead to nearly 10% of the Natural Gas supply to be withdrawn in the coming weeks.
Daily digest: US Dollar looks happy where it is
- The main datapoint for this Friday is Wholesale Inventories data, which will come out at 14:00 GMT.. Expectations are for inventories to decrease by a marginal 0.1% in July, the same decline it registered in June.
- Baker Hughes US Oil Rig Count at 17:00 GMT will get a bit more attention as markets will look for clues over whether the US can supply itself with oil and natural gas now that 10% of global supply will be drawn from the markets as Australian LNG workers go on strikes.
- Equities in Asia are set to close this week in negative, with the last trading day also registering losses: The Japanese Topic Index closes down 1%. European equities are rather flat, though trading below zero as well.
- The CME Group FedWatch Tool shows that markets are pricing in a 93% chance that the Federal Reserve will keep interest rates unchanged at its meeting in September.
- The benchmark 10-year US Treasury bond yield trades at 4.23% and is off the peak from earlier this week. Markets have been able to digest a substantial amount of debt issuances, which was one of the elements that pushed yields higher.
US Dollar Index technical analysis: Soft landing
The Greenback is back in favor and is rolling through the markets, weighing one equity and bond markets with lower bond prices and stocks dropping below several important support levels. The Greenback is extending its summer rally and could stay steady at stronger levels throughout the fall and winter if other central banks start cutting their benchmark interest rates. With the US Dollar remaining steady, depreciating currencies will push the US Dollar Index substantially higher and might see more Dollar strength to come.
All eyes stay on 105.00 after the DXY briefly broke the level on Wednesday and Thursday. Only a few cents to go and the DXY will be at a new six-month high once it is able to close there. The next levels are at 105.88, March’s high, which would make a new yearly high. If the index reaches this last level, some resistance might kick in.
On the downside, the 104.30 figure is vital to keep the US Dollar Index sustained at these elevated levels. Some room lower, the 200-day Simple Moving Average (SMA) at 103.04 comes into play, which could bring substantially more weakness once the DXY starts trading below it. The double belt of support at 102.68, with both the 100-day and the 55-day SMA, are the last lines of defence before the US Dollar sees substantial and longer-term depreciation.
US Dollar FAQs
What is the US Dollar?
The US Dollar (USD) is the official currency of the United States of America, and the ‘de facto’ currency of a significant number of other countries where it is found in circulation alongside local notes. It is the most heavily traded currency in the world, accounting for over 88% of all global foreign exchange turnover, or an average of $6.6 trillion in transactions per day, according to data from 2022.
Following the second world war, the USD took over from the British Pound as the world’s reserve currency. For most of its history, the US Dollar was backed by Gold, until the Bretton Woods Agreement in 1971 when the Gold Standard went away.
How do the decisions of the Federal Reserve impact the US Dollar?
The most important single factor impacting on the value of the US Dollar is monetary policy, which is shaped by the Federal Reserve (Fed). The Fed has two mandates: to achieve price stability (control inflation) and foster full employment. Its primary tool to achieve these two goals is by adjusting interest rates.
When prices are rising too quickly and inflation is above the Fed’s 2% target, the Fed will raise rates, which helps the USD value. When inflation falls below 2% or the Unemployment Rate is too high, the Fed may lower interest rates, which weighs on the Greenback.
What is Quantitative Easing and how does it influence the US Dollar?
In extreme situations, the Federal Reserve can also print more Dollars and enact quantitative easing (QE). QE is the process by which the Fed substantially increases the flow of credit in a stuck financial system.
It is a non-standard policy measure used when credit has dried up because banks will not lend to each other (out of the fear of counterparty default). It is a last resort when simply lowering interest rates is unlikely to achieve the necessary result. It was the Fed’s weapon of choice to combat the credit crunch that occurred during the Great Financial Crisis in 2008. It involves the Fed printing more Dollars and using them to buy US government bonds predominantly from financial institutions. QE usually leads to a weaker US Dollar.
What is Quantitative Tightening and how does it influence the US Dollar?
Quantitative tightening (QT) is the reverse process whereby the Federal Reserve stops buying bonds from financial institutions and does not reinvest the principal from the bonds it holds maturing in new purchases. It is usually positive for the US Dollar.
USD/CNH could revisit the 7.3800 region once it clears 7.3500, comment UOB Group’s Economist Lee Sue Ann and Markets Strategist Quek Ser Leang.
Key Quotes
24-hour view: While we expected USD to rise further yesterday, we were of the view that it “is unlikely to reach 7.3500.” In line with our view, USD rose, but it did not reach 7.3500 (high has been 7.3460). Upward momentum has slowed a tad, and while USD could reach 7.3500 today, any advance is viewed as a higher trading range of 7.3200/7.3500. To put it another way, USD is unlikely to break clearly below 7.3200 or above 7.3500.
Next 1-3 weeks: Our latest narrative was from two days ago (06 Sep, spot at 7.3100), wherein the risk for USD has shifted to the upside towards 7.3500. Yesterday, USD rose to a high of 7.3460. Despite the advance, upward momentum has not increased all that much. That said, a break of 7.3500 would not be surprising and would then shift the focus to 7.3800. In order to keep the momentum going, USD must stay above 7.3000 (‘strong support’ level previously at 7.2800).
- Natural Gas jumps as overnight headlines point to failed talks between Chevron and union workers in Australia.
- The US Dollar is set to close in weekly gain, making it nearly its best week for 2023.
- Natural gas price could extend the risk rally and hit $2.95.
Natural Gas prices are heading higher as overnight talks between Chevron Australia and local union workers broke down. Strikes are inevitable and could end up to a drawdown of supply on global markets. The land ‘down under’ accounts for 10% of the global supply in Liquefied Natural Gas (LNG), so an interruption in gas flows from the country could bring a firm squeeze in gas prices if the supply side is unable to cope or replace the missing 10% anytime soon.
At the time of writing, Natural Gas is trading at $2.825 per MMBtu.
Natural Gas news and market movers
- European gas futures, which are more sensitive to supply issues, are up 8% on the back of headlines from Australia. At one point futures even peaked to 11%.
- The Gorgon and Wheatstone facilities are set to be shut down as of 05:00 GMT. Those two plants alone account for 7% of the world’s supply.
- The strikes will result in brief work stoppages and no overtime. In case no deal is reached before September 14, the plants will completely shut down for two weeks.
- This action is the culmination of several weeks of discussions that kept markets on edge. Several key issues are still to be discussed, according to several sources from both Chevron and the unions, Reuters reports.
- In a Facebook statement, the Offshore Alliance Union said: “Chevron’s bargaining performance has been the most inept effort of any employer the union has dealt with in the past five years and our members have had enough.”
- The Baker Hughes Rig Count data in the US might get a bit more attention to see if the US can supply itself enough when it comes to LNG production.
Natural Gas Technical Analysis: There is the breakout
Natural Gas is breaking out and is already trading above the highs seen on Wednesday and Thursday. After weeks of nervous communication, traders can finally head into more binary trade setups as the risk of a full shutdown is just a few days away. With the clock ticking, expect to see gas prices to rise as the risk of lower supply increases.
On the upside, $2.83 needs to be taken out in order for this bounce to gain momentum. Once this rebound materialises, look for the the 200-day Simple Moving Average (SMA) near $2.95. In case price starts to break above there and head higher, $3 will be crucial with the high of September at stake.
On the downside, the trend channel has done a massive job underpinning the price action. The 55-day SMA already provided support ahead of any test on the lower end of the trend channel. In case the 55-day SMA breaks, look for support near $2.65.
-638297624695711465.png)
XNG/USD (Daily Chart)
Natural Gas FAQs
What fundamental factors drive the price of Natural Gas?
Supply and demand dynamics are a key factor influencing Natural Gas prices, and are themselves influenced by global economic growth, industrial activity, population growth, production levels, and inventories. The weather impacts Natural Gas prices because more Gas is used during cold winters and hot summers for heating and cooling. Competition from other energy sources impacts prices as consumers may switch to cheaper sources. Geopolitical events are factors as exemplified by the war in Ukraine. Government policies relating to extraction, transportation, and environmental issues also impact prices.
What are the main macroeconomic releases that impact on Natural Gas Prices?
The main economic release influencing Natural Gas prices is the weekly inventory bulletin from the Energy Information Administration (EIA), a US government agency that produces US gas market data. The EIA Gas bulletin usually comes out on Thursday at 14:30 GMT, a day after the EIA publishes its weekly Oil bulletin. Economic data from large consumers of Natural Gas can impact supply and demand, the largest of which include China, Germany and Japan. Natural Gas is primarily priced and traded in US Dollars, thus economic releases impacting the US Dollar are also factors.
How does the US Dollar influence Natural Gas prices?
The US Dollar is the world’s reserve currency and most commodities, including Natural Gas are priced and traded on international markets in US Dollars. As such, the value of the US Dollar is a factor in the price of Natural Gas, because if the Dollar strengthens it means less Dollars are required to buy the same volume of Gas (the price falls), and vice versa if USD strengthens.
- USD/CHF rebounds from 0.8900, supported by the resilient US Dollar.
- Fed policymakers showed no interest in increasing interest rates in September.
- USD/CHF rally pauses after reaching near the previous resistance zone placed in a range of 0.8900-0.9020.
The USD/CHF pair rebounds after correcting to near the crucial support of 0.8900, supported by the resilient US Dollar amid the risk-off market mood. The Swiss Franc asset remains broadly strong as the appeal for the US Dollar is firm due to deepening global uncertainties.
S&P500 futures generated decent gains in the European session due to the risk-aversion theme. US equities also faced selling pressure on Thursday as sheer strength in the United States economy could allow the Federal Reserve (Fed) to discuss further policy tightening actively.
For September monetary policy, Fed policymakers: Dallas Fed Bank President Lorie Logan and New York Fed Bank President John Williams showed no interest in increasing interest rates further.
The Swiss Franc remained in action as the Swiss economy remained stagnant in the April-June quarter while investors anticipated a growth rate of 0.1%. In the January-March quarter, the Swiss economy grew by 0.3%.
USD/CHF rally pauses after reaching to near the previous resistance zone placed in a range of 0.8900-0.9020 on a four-hour scale. The asset is trading in a Rising Channel chart pattern in which each corrective move is considered as a buying opportunity by the market participants. The 50-period Exponential Moving Average (EMA) at around 0.8870 continues to provide support to the US Dollar bulls.
Meanwhile, the Relative Strength Index (RSI) (14) trades in the bullish range of 60.00-80.00, which indicates that the upside impulse is already active.
For a fresh upside, the asset needs to climb above the psychological resistance of 0.9000, which will drive the asset toward June 15 high at 0.9056, followed by June 12 high at 0.9109.
In an alternate scenario, a breakdown below April 30 low around 0.8750 would expose the asset to August 10 low at 0.8890 and July 24 low at 0.8637.
USD/CHF four-hour chart
-638297642530374053.png)
- Gold price discovers support as Fed policymakers see no interest-rate increase in September.
- The USD Index hovers near 105.00, preparing for a fresh upside amid the risk-off mood.
- Fed’s Goolsbee said the central bank is aiming to push the economy on a “golden path”.
Gold price (XAU/USD) rebounded meaningfully on Friday as Federal Reserve (Fed) policymakers suggested that the central bank will not raise interest rates further in the September monetary policy meeting. The precious metal capitalizes on remarks from Fed policymakers, which seem to be backed by cooling inflation and slowing employment growth.
Meanwhile, the appeal for the US Dollar is still strong as fears of a global economic shakedown are still elevated. The US Dollar Index (DXY) is hovering near a five-month high and hopes of more gains are still strong. For the Gold price, a meaningful action will come after the release of the US Consumer Price Index (CPI) data for August, which is scheduled for next week. Scrutiny of the employment report and inflation will provide meaningful cues about the interest rate decision from the Fed for its September monetary policy meeting.
Daily Digest Market Movers: Gold price capitalizes on neutral commentaries from Fed speakers
- Gold price finds buying interest near $1,915.00 and recovers above Thursday’s high around $1,924.00 as the upside momentum in the US Dollar starts exhausting.
- The precious metal attracted bids as Federal Reserve policymakers delivered neutral commentary on Thursday about September’s interest rate policy.
- Dallas Fed Bank President Lorie Logan said it "could be appropriate" to skip an interest rate increase at September’s meeting, but warned that more tightening may be needed to bring down inflation to 2%.
- New York Fed Bank President John Williams said there is no urgency for an interest-rate increase this month as inflation is falling and the economy is better balanced. However, Williams kept options open to keep interest rates higher for longer.
- About the labor market outlook, Fed’s Williams said that labor demand is coming down and the Unemployment Rate could rise to the 4% range.
- Fed’s Beige Book, released on Wednesday, conveyed that labor growth remained subdued. The report also said that the economy grew at a modest pace in the last few weeks and inflationary pressures abated.
- While the Fed’s survey conveyed that labor market conditions are slowing, economic data indicates that broader employment conditions remain strong.
- Unit Labor Costs in the April-June quarter jumped to 2.2% against expectations and a Q1 reading of 1.6%. Decent wage growth defies signs of cooling inflation as it could strengthen the consumer spending momentum.
- On Thursday, the US Department of Labor reported that individuals claiming jobless benefits for the first time dropped to 216K for the week ending September 1, less than the 234K expected and the former release of 229K. Jobless claims came in below expectations for the third straight week, suggesting that labor demand could strengthen again.
- Chicago Fed Bank President Austan Goolsbee said the central bank is aiming to push the economy to a “golden path,” meaning a situation where inflation recedes without triggering a recession.
- After neutral commentaries from Fed policymakers, chances that interest rates will remain unchanged at 5.25%-5.50% for the remainder of the year rose to 55% against the 53% recorded earlier.
- Meanwhile, the US Dollar Index remains below the immediate resistance of 105.00 as investors shift focus to US inflation data for August, which will be published next week.
- Before that, investors will also focus on China’s inflation data. Steady deflation risks in China would strengthen the appeal for the US Dollar.
- The US Dollar has been capitalizing on the potential risks of global economic turmoil. European and Asian economies are facing the wrath of higher interest rates.
- The US Senate confirmed World Bank economist Adriana Kugler at the Fed’s Board of Governors.
Technical Analysis: Gold price stabilizes above $1,920
Gold price stabilizes above the $1,920.00 support after recovering from a weekly low at $1,916.00. The precious metal attempts to shift above the 20-day Exponential Moving Average (EMA) around $1.925, while the 50-day EMA is still declining. Momentum oscillators indicate that the overall trend is sideways. The 200-EMA continues to act as a support for Gold bulls.
Fed FAQs
What does the Federal Reserve do, how does it impact the US Dollar?
Monetary policy in the US is shaped by the Federal Reserve (Fed). The Fed has two mandates: to achieve price stability and foster full employment. Its primary tool to achieve these goals is by adjusting interest rates.
When prices are rising too quickly and inflation is above the Fed’s 2% target, it raises interest rates, increasing borrowing costs throughout the economy. This results in a stronger US Dollar (USD) as it makes the US a more attractive place for international investors to park their money.
When inflation falls below 2% or the Unemployment Rate is too high, the Fed may lower interest rates to encourage borrowing, which weighs on the Greenback.
How often does the Fed hold monetary policy meetings?
The Federal Reserve (Fed) holds eight policy meetings a year, where the Federal Open Market Committee (FOMC) assesses economic conditions and makes monetary policy decisions.
The FOMC is attended by twelve Fed officials – the seven members of the Board of Governors, the president of the Federal Reserve Bank of New York, and four of the remaining eleven regional Reserve Bank presidents, who serve one-year terms on a rotating basis.
What is Quantitative Easing (QE) and how does it impact USD?
In extreme situations, the Federal Reserve may resort to a policy named Quantitative Easing (QE). QE is the process by which the Fed substantially increases the flow of credit in a stuck financial system.
It is a non-standard policy measure used during crises or when inflation is extremely low. It was the Fed’s weapon of choice during the Great Financial Crisis in 2008. It involves the Fed printing more Dollars and using them to buy high grade bonds from financial institutions. QE usually weakens the US Dollar.
What is Quantitative Tightening (QT) and how does it impact the US Dollar?
Quantitative tightening (QT) is the reverse process of QE, whereby the Federal Reserve stops buying bonds from financial institutions and does not reinvest the principal from the bonds it holds maturing, to purchase new bonds. It is usually positive for the value of the US Dollar.
Extra gains could push USD/JPY to test the 149.00 region, according to UOB Group’s Economist Lee Sue Ann and Markets Strategist Quek Ser Leang.
Key Quotes
24-hour view: We expected USD to rise to 148.30 yesterday. However, after eking out a fresh high of 147.87, USD dropped to 147.03 before closing at 147.29 (-0.24%). USD appears to have moved into a consolidation phase. Today, we expect USD to trade in a range, likely between 147.00 and 147.80.
Next 1-3 weeks: After USD soared to a high of 147.80, we indicated on Wednesday (06 Sep, spot at 147.70) that USD “is likely to rise further, probably to 149.00.” Since then, USD has not been able to make much further headway on the upside (it eked out a fresh high of 147.87 yesterday before easing). We continue to hold the same view for now. However, if USD breaks below 146.70 (no change in ‘strong support’ level), it would suggest that the recent momentum buildup has faded.
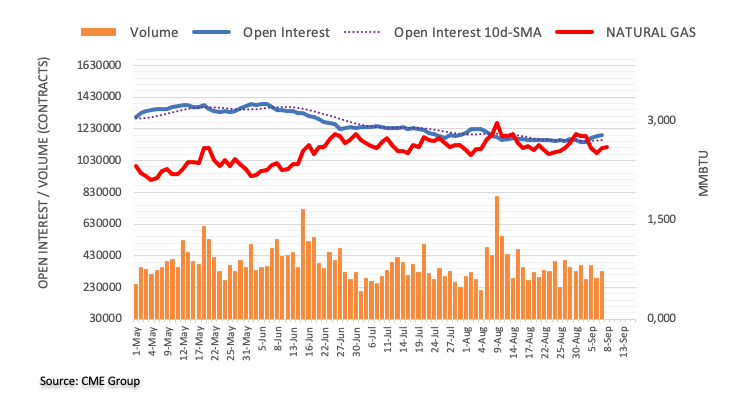
CME Group’s flash data for natural gas futures markets noted traders increased their open interest positions for the third day in a row on Thursday, now by around 4.7K contracts. In the same direction, volume, increased by nearly 45K contracts amids the persevering choppy activity.
Natural Gas: Upside remains limited around $3.00
Thursday’s uptick in prices of natural gas was accompanied by rising open interest and volume and is indicative the further gains could be in store for the commodity in the very near term. In the meantime, the $3.00 region per MMBtu remains an important obstacle for bulls’ aspirations.
- USD/CAD meets with some supply on Friday and is pressured by a modest USD weakness.
- Hawkish Fed expectations and softer Oil prices limit losses ahead of Canadian jobs report.
- A convincing break below the 1.3600 mark might shift the bias in favour of bearish traders.
The USD/CAD pair comes under some selling pressure on Friday and reverses a part of the previous day's positive move to the 1.3700 neighbourhood, or its highest level since late March. Spot prices, however, manage to rebound a few pips from the daily low and trade around the 1.3665-1.3670 area during the first half of the European session, down less than 0.15% for the day.
A modest US Dollar (USD) retracement slide from a six-month top, triggered by retreating US Treasury bond yields, turns out to be a key factor exerting some downward pressure on the USD/CAD pair. That said, expectations that the Federal Reserve (Fed) will keep interest rates higher for longer should act as a tailwind for the US bond yields and the USD. Apart from this, a softer tone surrounding Crude Oil prices undermines the commodity-linked Loonie and contributes to limiting the downside for the major. Traders also seem reluctant to place aggressive bets and prefer to wait for the release of the Canadian jobs report, due later during the early North American session.
From a technical perspective, the intraday downtick stalls near the 1.3650 horizontal resistance breakpoint, now turned support. Any further decline is more likely to attract fresh buyers and remain limited near the 1.3600 round-figure mark. The latter should act as a key pivotal point, which if broken decisively should pave the way for some meaningful corrective decline. The USD/CAD pair might then accelerate the slide towards the next relevant support near the 1.3525 region en route to the 1.3500 1.3500 psychological mark. Some follow-through selling will expose the very important 200-day Simple Moving Average (SMA), currently currently around the 1.3460 region.
On the flip side, bullish traders might now wait for a sustained strength beyond the 1.3700 mark before placing fresh bets. The subsequent move-up has the potential to lift the USD/CAD pair towards the 1.3730 resistance zone en route to the 1.3800 round figure. The upward trajectory could get extended further and push spot prices towards retesting the YTD top, around the 1.3860 region touched in March.
USD/CAD daily chart
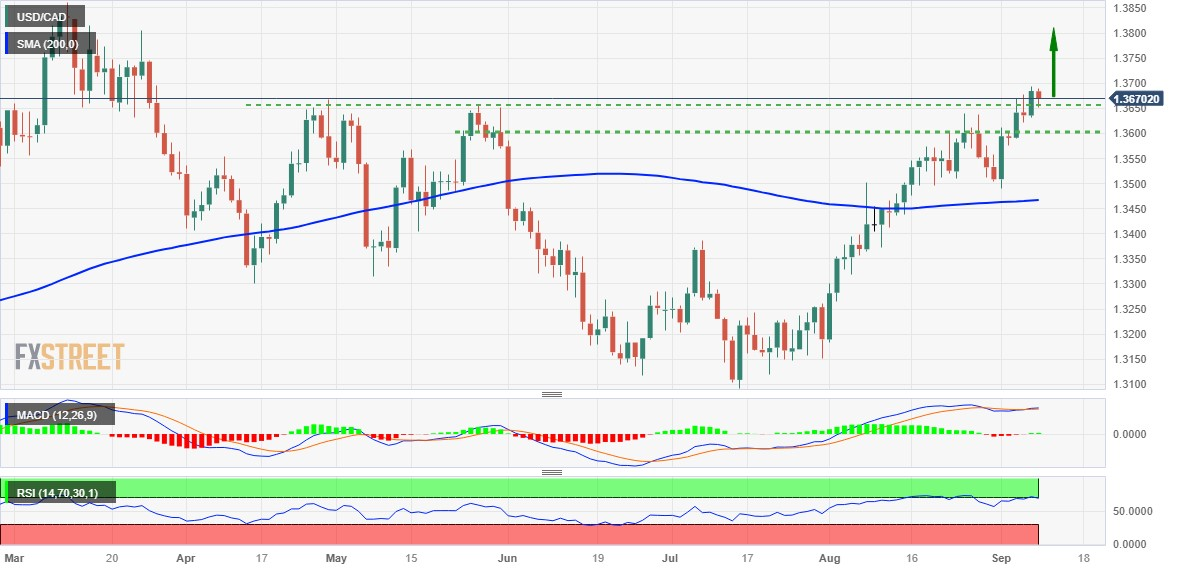
Technical levels to watch
Dr Jörg Krämer, Chief Economist at Commerzbank, offers a brief preview of the upcoming European Central Bank (ECB) policy meeting scheduled next Thursday and expects that council members will probably vote for unchanged key rates.
Key Quotes:
“In view of the weak economy and the downward trend in the inflation rate, the ECB is unlikely to raise its key interest rates further next week, and interest rates are also likely to remain unchanged at subsequent meetings. The same applies to the coming year, as underlying inflation is likely to prove stubborn, especially in the services sector.”
“The economic outlook has deteriorated significantly recently: manufacturing output plummeted in March and has not recovered significantly since then. In addition, the service sector has recently shown clear signs of weakness. The corresponding purchasing managers' index fell sharply again in August and is now in a range that signalled a recession in earlier phases.”
“We expect the ECB to revise down its growth forecast by three-tenths of a percentage point for 2023 and almost halve it for 2024 (Table 1). This is why opponents of further interest rate hikes are likely to point out that the more restrictive monetary policy is having the desired effect on the real economy, i.e. the transmission process is working well.”
“At the same time, the inflation rate has been falling until recently and at 5.3% in August was only half as high as at its peak in October. Although the inflation rate for energy has probably bottomed out, it is likely to come down noticeably in the coming months for food, as the sharp price increases last autumn and winter gradually fall out of the year-on-year comparison. The core inflation rate should also continue to decline, as the prices of (non-energy) industrial goods in particular are hardly likely to increase.”
“However, the decision to leave the key interest rate unchanged is unlikely to be unanimous. This is why ECB President Lagarde is likely to explicitly leave the door open for further rate hikes at the press conference, so that the markets are likely to interpret this as a "hawkish rate pause". However, since the economic situation is likely to deteriorate further for the time being and a recession is becoming more and more apparent for the euro area, a further interest rate hike is hardly to be expected. Rather, the ECB is likely to have reached its high point for the time being with the 3.75% deposit rate reached in July.”
- NZD/USD struggles to hold ground near the 0.5900 psychological level.
- US Treasury yields have trimmed the daily losses, which might support the US Dollar (USD).
- Fed is expected to adopt a hawkish stance, which is exerting pressure on the pair.
NZD/USD retreats from the intraday high as a result of a recovery in the US Dollar (USD), trading higher around 0.5900 during the European session on Friday. The yields on US bonds have trimmed the daily losses, which might contribute to the support in underpinning the Greenback.
US Dollar (USD) remains robust, buoyed by the consistent flow of positive economic data concerning the state of the US economy. The US Dollar Index (DXY), which measures the performance of the Greenback against six other major currencies, is presently trading around 104.90. It's worth noting that it has moderated slightly from its peak on Thursday, which marked its highest level since April.
As said, labor data released on Thursday from the United States (US) showed that as of September 1, US Initial Jobless Claims declined to 216K, indicating a decrease from the previous figure of 229K. This figure was lower than the expected rise of 234K. Furthermore, in the second quarter (Q2), US Unit Labor Costs rose to 2.2%, up from the previous 1.6%, which was contrary to expectations of it remaining consistent.
Additionally, US Federal Reserve (Fed) is anticipated to sustain elevated interest rates over a prolonged period. Furthermore, there is an expectation that the Fed will enact a 25 basis point (bps) interest rate hike by the end of the year 2023. This hawkish sentiment is exerting substantial pressure on the NZD/USD pair.
On China-linked fears, Chinese President Xi Jinping has decided not to participate in the upcoming G20 leaders' summit in New Delhi this Saturday. This may exacerbate the existing tensions within the already fragile and deteriorating relationship between China and the United States (US). This situation is particularly noteworthy given the presence of US President Joe Biden at the event.
- The Euro bounces off lows in the sub-1.0700 area vs. the US Dollar.
- Stocks in Europe open Friday’s session with broad-based advances.
- EUR/USD meets initial contention around 1.0685 so far.
- The USD Index (DXY) sheds some ground following multi-month tops.
- Final CPI in Germany matched the preliminary readings in August.
- Wholesale Inventories, Consumer Credit Change come next in the US docket.
The Euro (EUR) manages to gather some upside traction vs. the US Dollar (USD) at the end of the week, lifting EUR/USD back above 1.0700 the figure at the end of the week.
In the meantime, the Greenback partially retreats from Thursday’s six-month tops north of the 105.00 hurdle when gauged by the USD Index (DXY) amidst some tepid recovery in the appetite for the risk complex.
Back to the monetary policy front, speculation over a potential hike by the Federal Reserve (Fed) in November appears to have lost some momentum as of late, while market participants continue to price in rate cuts at some point in Q2 2024.
Regarding the European Central Bank (ECB), market chatter appears to favour a pause at the September 14 meeting, amidst a so far pretty divided Council.
In the euro docket, final inflation figures in Germany saw the CPI rise at a monthly 0.3% in August and 6.1% over the last twelve months, while Industrial Production in France expanded by 0.8% MoM in July.
Across the pond, Wholesale Inventories and Consumer Credit Change are also due.
Daily digest market movers: Euro regains the smile near 1.0700
- The EUR shows some signs of life vs. the USD.
- US yields appear tilted to the downside early on Friday.
- Investors see the ECB keeping the deposit rate unchanged this month.
- Dallas Fed Lorie Logan favours a pause in September.
- NY Fed John Williams expect unemployment to increase past 4%.
- Markets continue to price in Fed rate cuts in Q2 2024.
- Strikes at Chevron LNG plants kick in today.
- Final GDP Growth Rate in Japan came in at 4.8% YoY.
Technical Analysis: Euro keeps favouring a deeper retracement
EUR/USD is trading with modest gains in the vicinity of the 1.0700 area after hitting multi-week lows near 1.0680 in the previous session.
Should the EUR/USD manage to breach the September low at 1.0685 (September 7), it may retest the May low of 1.0635 (May 31) before potentially reaching the March low of 1.0516 (March 15). A breakdown of the latter level could trigger a possible test of the 2023 low at 1.0481 (from January 6).
Conversely, in terms of upward movement, the current focus is on targeting the critical 200-day SMA at 1.0822. Beyond that, bullish momentum may lead to a challenge of the weekly peak at 1.0945 (August 30), which is further bolstered by the provisional 55-day SMA at 1.0945. Subsequently, this could set the stage for a move towards the psychological level of 1.1000 and the August high at 1.1064 (August 10). If the pair manages to clear this area, it might alleviate some of the bearish pressure and potentially aim for the weekly peak at 1.1149 (July 27) ahead of the 2023 top at 1.1275 (July 18).
It's important to note that as long as the EUR/USD remains below the 200-day SMA, a sustained decline in the pair is probable.
Euro FAQs
What is the Euro?
The Euro is the currency for the 20 European Union countries that belong to the Eurozone. It is the second most heavily traded currency in the world behind the US Dollar. In 2022, it accounted for 31% of all foreign exchange transactions, with an average daily turnover of over $2.2 trillion a day.
EUR/USD is the most heavily traded currency pair in the world, accounting for an estimated 30% off all transactions, followed by EUR/JPY (4%), EUR/GBP (3%) and EUR/AUD (2%).
What is the ECB and how does it impact the Euro?
The European Central Bank (ECB) in Frankfurt, Germany, is the reserve bank for the Eurozone. The ECB sets interest rates and manages monetary policy.
The ECB’s primary mandate is to maintain price stability, which means either controlling inflation or stimulating growth. Its primary tool is the raising or lowering of interest rates. Relatively high interest rates – or the expectation of higher rates – will usually benefit the Euro and vice versa.
The ECB Governing Council makes monetary policy decisions at meetings held eight times a year. Decisions are made by heads of the Eurozone national banks and six permanent members, including the President of the ECB, Christine Lagarde.
How does inflation data impact the value of the Euro?
Eurozone inflation data, measured by the Harmonized Index of Consumer Prices (HICP), is an important econometric for the Euro. If inflation rises more than expected, especially if above the ECB’s 2% target, it obliges the ECB to raise interest rates to bring it back under control.
Relatively high interest rates compared to its counterparts will usually benefit the Euro, as it makes the region more attractive as a place for global investors to park their money.
How does economic data influence the value of the Euro?
Data releases gauge the health of the economy and can impact on the Euro. Indicators such as GDP, Manufacturing and Services PMIs, employment, and consumer sentiment surveys can all influence the direction of the single currency.
A strong economy is good for the Euro. Not only does it attract more foreign investment but it may encourage the ECB to put up interest rates, which will directly strengthen the Euro. Otherwise, if economic data is weak, the Euro is likely to fall.
Economic data for the four largest economies in the euro area (Germany, France, Italy and Spain) are especially significant, as they account for 75% of the Eurozone’s economy.
How does the Trade Balance impact the Euro?
Another significant data release for the Euro is the Trade Balance. This indicator measures the difference between what a country earns from its exports and what it spends on imports over a given period.
If a country produces highly sought after exports then its currency will gain in value purely from the extra demand created from foreign buyers seeking to purchase these goods. Therefore, a positive net Trade Balance strengthens a currency and vice versa for a negative balance.
- USD/JPY recovers nearly 100 pips from the daily low and refreshes the daily high in the last hour.
- A combination of factors undermines the JPY and assists the pair to attract some dip-buying.
- Intervention fears could benefit the JPY and cap any further gains amid a modest USD pullback.
The USD/JPY pair attracts some dip-buying in the vicinity of mid-146.00s, or the 200-hour Simple Moving Average (SMA) on Friday and stalls this week's corrective pullback from its highest level since November 2022. Spot prices build on the steady intraday ascent through the early part of the European session and climb to a fresh daily peak, around the 147.45 region in the last hour.
A downward revision of Japan's second-quarter GDP growth ensures that the Bank of Japan (BoJ) will stick to its ultra-loose policy setting, which undermines the Japanese Yen (JPY) and lends some support to the USD/JPY pair. That said, speculations that Japanese authorities will intervene in the markets to prop up the domestic currency and revive safe-haven demand should limit losses for the JPY. Apart from this, a modest US Dollar (USD) pullback from a six-month top, triggered by retreating US Treasury bond yields, might hold back bulls from placing aggressive bets around the major.
The prospects for further policy tightening by the Federal Reserve (Fed), however, favour the USD bulls and suggest that the path of least resistance for the USD/JPY pair is to the upside. Moreover, technical indicators on the daily chart are holding comfortably in the positive territory and are still far from being in the overbought zone, validating the positive outlook. Hence, a subsequent strength back towards retesting the YTD peak, around the 147.80-147.85 region, looks like a distinct possibility. Some follow-through buying beyond the 148.00 mark will set the stage for additional gains.
On the flip side, the 147.00 round figure now seems to protect the immediate downside ahead of the 200-period SMA on the 4-hour chart, just ahead of the mid-146.00s. A convincing break below might prompt some technical selling and pave the way for some meaningful corrective decline. The USD/JPY pair might then accelerate the fall towards the 146.20 intermediate support en route to the 146.00 mark and the 145.45 horizontal support. The downward trajectory could get extended further towards the 145.00 psychological mark and the monthly low, around the 144.45 region.
USD/JPY 1-hour chart
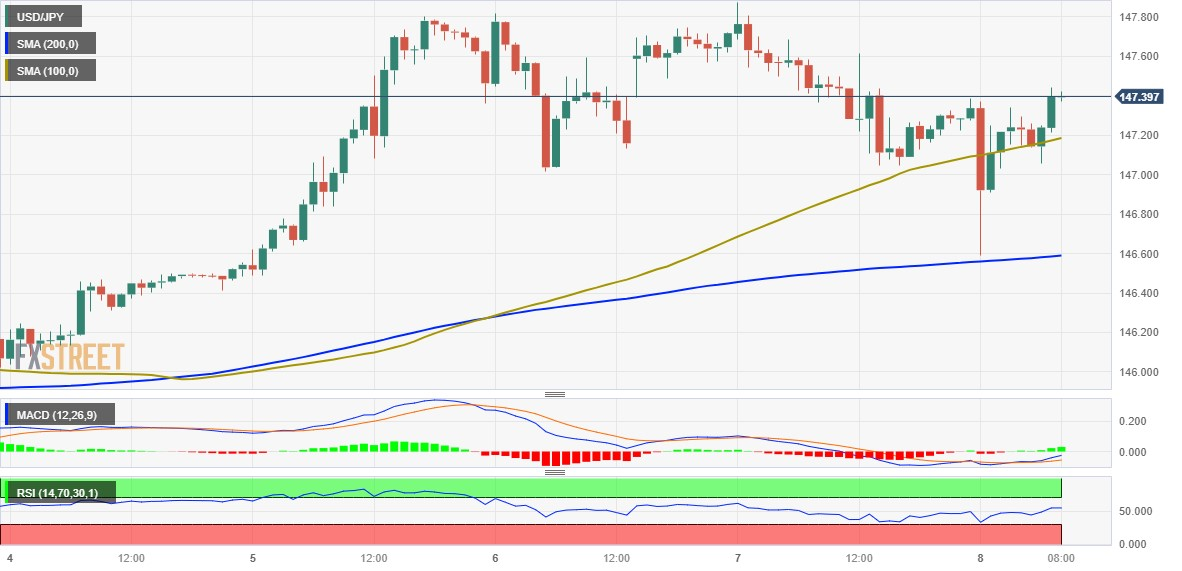
Technical levels to watch
In the opinion of UOB Group’s Economist Lee Sue Ann and Markets Strategist Quek Ser Leang, a drop below the 0.6300 mark in AUD/USD appears unlikely for the time being.
Key Quotes
24-hour view: We highlighted yesterday that “there is still a change for AUD to test 0.6340.” Our view did not materialise as it continued to trade in a quiet manner between 0.6363 and 0.6394 before closing largely unchanged (0.6377, -0.09%). Momentum indicators are turning ‘flat’, and AUD could continue to trade in a range, probably between 0.6355 and 0.6400.
Next 1-3 weeks: Our latest narrative was from two days ago (06 Sep, spot at 0.6375), wherein we highlighted that “while further AUD weakness appears likely, the likelihood of it breaking clearly below 0.6300 is not high.” AUD traded in a relatively quiet manner over the past couple of days. We continue to hold the same view for now. On the upside, if AUD breaks above 0.6430 (no change in the ‘strong resistance’ level from yesterday), it would indicate that AUD is not weakening further.
- Pound Sterling finds an intermediate support, but the downside seems favored amid global uncertainty.
- BoE Dhingra warned that further tightening could hurt the UK economy.
- Investors shift focus to the July Employment data, which will be released on Tuesday.
The Pound Sterling (GBP) discovered intermediate support as investors started digesting the potential risks of global economic turmoil due to restrictive monetary policy by Western central bankers. The GBP/USD pair finds an intermediate cushion, but the broader bias remains bearish as investors expect that policy divergence between the Federal Reserve (Fed) and the Bank of England (BoE) may not vanish this month.
BoE policymaker Swati Dhingra warned that current monetary policy is “sufficiently restrictive” and that more hikes could hurt the UK economy. The narrative of keeping interest rates steady in coming months got support from BoE Governor Andrew Bailey, who conveyed that the interest rate peak is near. Higher wage growth due to labor shortages has been a driving factor in stubborn UK inflation. Therefore, investors would shift focus to the Employment report for July, which will be published on Tuesday.
Daily Digest Market Movers: Pound Sterling attempts recovery, but downside remains favored
- Pound Sterling rebounds after a three-day losing spell near 1.2440 as investors digest potential risks of global economic turmoil.
- The asset attempts to climb above the psychological resistance of 1.2500 as the appeal for risk-sensitive currencies improves.
- Recovery in the Pound Sterling is not backed by supportive fundamentals. Therefore, the market mood could dampen again as repercussions of the tight interest rate policy will keep threatening the economic outlook.
- Potential risks of economic turmoil in the UK region increase as the service sector contracts for the first time in the past seven months, while the Manufacturing PMI has remained below the 50.0 threshold for a lengthy period.
- Bank of England policymaker Swati Dhingra said this week that further policy tightening would hurt the economy.
- While UK economic prospects start faltering due to restrictive monetary policy, a compelling reason to halt rate hikes, solid wage growth is still a concern for the central bank.
- Wage growth momentum is swift due to labor shortages, leaving more money in the palms of households for disposal. This could back higher consumer spending momentum and eventually would result in stubborn inflation.
- BoE Governor Andrew Bailey also commented this week that the central bank is near to pausing its tightening cycle, but interest rates will remain higher for a longer period.
- A monthly survey conducted by the Bank of England (BoE) Decision Maker Panel (DMP) showed that UK businesses reported year-ahead Consumer Price Index (CPI) inflation sharply lower at 4.8% in August vs. 5.4% projected in July. UK businesses see August year-ahead wage growth at 5.0% vs. July 5.0%.
- Meanwhile, the Recruitment & Employment Confederation (REC) reported on Thursday that permanent staff placement dropped to 38.9, the lowest since June 2020.
- For an in-depth understanding of current labor market conditions, investors will focus on the July Employment report, which will be published next Tuesday, September 12, at 06:00 GMT.
- The recovery attempt by the GBP/USD pair is also backed by exhaustion in the US Dollar’s upside momentum. The US Dollar Index (DXY) finds an intermediate resistance near 105.00, while the upside bias is still solid.
- The US Dollar faces some pressure as Federal Reserve (Fed) policymakers delivered a neutral commentary about September's monetary policy.
- Dallas Fed Bank President Lorie Logan said on Thursday that while it "could be appropriate" to skip an interest rate increase at September’s meeting but warned that more tightening may be needed to bring down inflation to 2% in a timely way.
- Chicago Fed Bank President Austan Goolsbee said the central bank is aiming to push the economy on a “global path”. This would mean a situation where inflation recedes without pushing the economy into a recession.
Technical Analysis: Pound Sterling struggles to defend 200-EMA
Pound Sterling attempts a recovery on Friday after a three-day negative closing spell as investors start digesting fears of global uncertainty. The broader downside of the Cable remains weak as it is struggling to remain above the 200-day Exponential Moving Average (EMA), which is around 1.2500. The 20 and 50-day EMAs have started declining, indicating strength in Cable bears’s determination. Momentum oscillators indicate that the bearish impulse has firmed significantly.
BoE FAQs
What does the Bank of England do and how does it impact the Pound?
The Bank of England (BoE) decides monetary policy for the United Kingdom. Its primary goal is to achieve ‘price stability’, or a steady inflation rate of 2%. Its tool for achieving this is via the adjustment of base lending rates. The BoE sets the rate at which it lends to commercial banks and banks lend to each other, determining the level of interest rates in the economy overall. This also impacts the value of the Pound Sterling (GBP).
How does the Bank of England’s monetary policy influence Sterling?
When inflation is above the Bank of England’s target it responds by raising interest rates, making it more expensive for people and businesses to access credit. This is positive for the Pound Sterling because higher interest rates make the UK a more attractive place for global investors to park their money. When inflation falls below target, it is a sign economic growth is slowing, and the BoE will consider lowering interest rates to cheapen credit in the hope businesses will borrow to invest in growth-generating projects – a negative for the Pound Sterling.
What is Quantitative Easing (QE) and how does it affect the Pound?
In extreme situations, the Bank of England can enact a policy called Quantitative Easing (QE). QE is the process by which the BoE substantially increases the flow of credit in a stuck financial system. QE is a last resort policy when lowering interest rates will not achieve the necessary result. The process of QE involves the BoE printing money to buy assets – usually government or AAA-rated corporate bonds – from banks and other financial institutions. QE usually results in a weaker Pound Sterling.
What is Quantitative tightening (QT) and how does it affect the Pound Sterling?
Quantitative tightening (QT) is the reverse of QE, enacted when the economy is strengthening and inflation starts rising. Whilst in QE the Bank of England (BoE) purchases government and corporate bonds from financial institutions to encourage them to lend; in QT, the BoE stops buying more bonds, and stops reinvesting the principal maturing on the bonds it already holds. It is usually positive for the Pound Sterling.
- AUD/USD trades higher around 0.6390 but remains under pressure due to China-linked fears.
- Momentum indicators suggest that the short-term trajectory is favoring a sideways trend.
- Weekly low emerges as the key support aligned to 0.6350 psychological level.
AUD/USD recovers from the previous day’s losses, trading higher around 0.6390 during the early hours of the European session on Friday. The Australian Dollar (AUD) experienced downward pressure due to the Chinese economic fears along with US-China trade tensions. Additionally, investors are expecting a dovish stance by the Reserve Bank of Australia (RBA) regarding the interest rate-hike cycle.
Moreover, Chinese President Xi Jinping's decision not to attend the G20 leaders' summit in New Delhi this upcoming Saturday is anticipated to further intensify the existing strain in the already fragile and deteriorating relationship between China and the United States (US), particularly with the presence of US President Joe Biden at the event.
The Moving Average Convergence Divergence (MACD) line stays below the centerline but lies above the signal line. This configuration indicates that the recent momentum is relatively tepid and in a sideways direction.
The pair could find immediate support around the weekly low at 0.6357 level lined up with the 0.6350 psychological level. A firm break below that level could push the AUD/USD pair to navigate the region around the 0.6200 level.
On the upside, the 0.6400 psychological level is acting as a key resistance, following the 21-day Exponential Moving Average (EMA) at 0.6454 aligned to the 23.6% Fibonacci retracement at 0.6483 level.
In the near future, it is anticipated that the AUD/USD pair will continue to exhibit a bearish outlook, provided that the 14-day Relative Strength Index (RSI) remains below the 50 level.
AUD/USD: Daily Chart
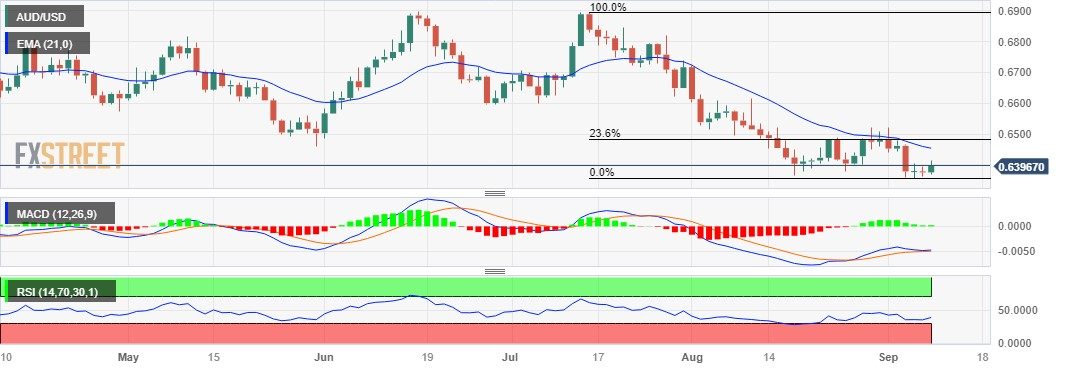
Open interest in crude oil futures markets increased for the fifth session in a row on Thursday, now by around 12.6K contracts according to preliminary readings from CME Group. Volume, instead, shrank for the second straight day, this time by around 188.1K contracts.
WTI: Resistance emerges around $88.00
WTI prices came under some downside pressure on Thursday, soon after hitting fresh yearly highs around $88.00 per barrel. The corrective move was amidst increasing open interest and favours further decline in the very near term, while bullish attempts appear so far capped by the $88.00 region.
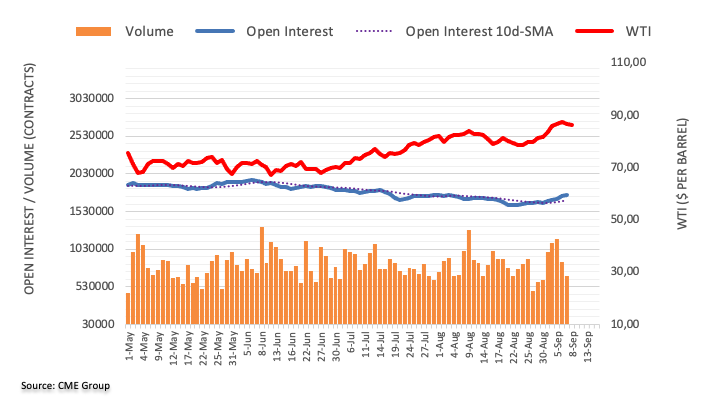
Further weakness should not be ruled out around GBP/USD for the time being, note UOB Group’s Economist Lee Sue Ann and Markets Strategist Quek Ser Leang.
Key Quotes
24-hour view: Yesterday, we expected GBP to “continue to drop.” However, we highlighted that “a sustained break below 1.2470 is unlikely, and the next major support at 1.2400 is highly likely to be out of reach today.” GBP fell more than expected as it dropped to 1.2445 before ending the day on a soft note at 1.2475 (-0.26%). While downward momentum has not improved much, GBP could continue to decline. That said, the major support at 1.2400 is unlikely to come under threat. In order to keep the momentum going, GBP must stay below 1.2510 (minor resistance is at 1.2490).
Next 1-3 weeks: We continue to hold the same view as yesterday (07 Sep, spot at 1.2500). As highlighted, we continue to expect GBP to weaken. However, oversold short-term conditions could slow the pace of any further decline, and the next major support at 1.2400 might not come into view so soon. Overall, only a breach of 1.2555 (‘strong resistance’ level was at 1.2605) would suggest that the GBP weakness that started on Monday has stabilised. Looking ahead, if GBP were to break clearly below 1.2400, it could trigger a further decline towards 1.2310.
- The rally in the dollar enters and impasse around 105.00.
- US yields look poised to extend the decline.
- Wholesale Inventories, Consumer Credit Change next on tap.
Following recent multi-week tops past the 105.00 barrier, the greenback now gives away part of those gains when tracked by the USD Index (DXY) at the end of the week.
USD Index meets resistance around 105.15
The index comes under pressure and slips back below the 105.00 mark on Friday following three consecutive daily advances, although the strong upside in place since mid-July appears unchanged for the time being.
The so far knee-jerk in the dollar comes along with further weakness in US yields across different timeframes and amidst now dwindling bets over a potential rate hike by the Federal Reserve at the November 1 meeting. On this, CME Group now sees the probability of this scenario at around 40%.
In the US docket, Wholesale Inventories and Consumer Credit Change will be in the limelight later in the NA session.
What to look for around USD
The index seems to have met an initial hurdle around six-month peaks north of 105.00 the figure so far this week.
In the meantime, support for the dollar keeps coming from the good health of the US economy, which seems to have reignited the narrative around the tighter-for-longer stance from the Federal Reserve.
Running on the opposite side of the road, the idea that the dollar could face headwinds in response to the data-dependent stance from the Fed against the current backdrop of persistent disinflation and cooling of the labour market appears to have regained some traction as of late.
Key events in the US this week: Wholesale Inventories, Consumer Credit Change (Friday).
Eminent issues on the back boiler: Persistent debate over a soft or hard landing for the US economy. Incipient speculation of rate cuts in H1 2024. Geopolitical effervescence vs. Russia and China.
USD Index relevant levels
Now, the index is retreating 0.15% at 104.89 and the breach of 103.03 (200-day SMA) would open the door to 102.93 (weekly low August 30) and then 102.60 (55-day SMA). On the flip side, the next up barrier comes at 105.15 (monthly high September 7) ahead of 105.88 (2023 high March 8) and finally 106.00 (round level).
- Gold price attracts some buyers for the second successive day and draws support from a combination of factors.
- Worries about a global economic downturn and the worsening US-China relations, benefit the safe-haven metal.
- Retreating US bond yields prompts some US Dollar profit-taking and remains supportive of the positive move.
Gold price gains some positive traction for the second successive day and recovers further from over a one-week low, around the $1,915 region touched on Wednesday. The XAU/USD maintains its bid through the early European session and currently trades around the $1,925-$1,926 area, up over 0.30% for the day.
Against the backdrop of concerns about the worsening economic conditions in China, a downward revision of Japan's second-quarter GDP growth fuels worries about a deeper global downturn. Apart from this, the worsening US-China relations – the world's two largest economies – drive some haven flows towards the Gold price. The Wall Street Journal reported on Wednesday that China has ordered officials at central government agencies not to bring iPhones into the office or use them for work.
This comes after US Secretary of Commerce Gina Raimondo's comments earlier this week that she doesn't expect any changes to the US tariffs imposed on China by the Trump administration until the ongoing review by the US Treasury is complete. The developments continue to weigh on investors' sentiment, which is evident from the prevalent cautious mood around the equity markets. Apart from this, a modest US Dollar (USD) weakness is seen lending additional support to the Gold price.
Reviving safe-haven demand leads to a further decline in the US Treasury bond yields and prompts traders to lighten their USD bullish bets, especially after the recent rally to the highest level since March 9. A weaker Greenback tends to underpin demand for the US Dollar-denominated commodities, including the Gold price. That said, growing acceptance that the Federal Reserve (Fed) will stick to its hawkish stance and keep interest rates higher for longer might cap the upside for the XAU/USD.
The incoming stronger-than-expected macro data from the United States (US), including the ISM Services PMI on Wednesday and Weekly Jobless Claims on Thursday, points to a resilient economy. The narrative, meanwhile, supports prospects for further policy tightening by the Fed, which, in turn, should limit any meaningful downside for the US bond yields and the USD. This, in turn, might hold back traders from placing aggressive bullish bets around the non-yielding Gold price.
Market participants might also prefer to wait on the sidelines ahead of China inflation data and the G20 leaders summit over the weekend. Hence, some follow-through buying is needed to confirm that the recent pullback from a one-month peak, around the $1,953 area touched last Friday, has run its course. Bears, on the other hand, might still wait for a sustained break and acceptance below the 200-day Simple Moving Average (SMA) before placing fresh bets around the Gold price.
Nevertheless, the XAU/USD remains on track to register losses for the first time in the previous three weeks. In the absence of any relevant market-moving economic data from the US, the US bond yields will continue to play a key role in influencing the USD price dynamics. Apart from this, the broader risk sentiment will drive demand for safe-haven assets and further contribute to producing short-term trading opportunities around the Gold price on the last day of the week.
Technical levels to watch
Here is what you need to know on Friday, September 8:
The positive shift seen in risk sentiment early Friday makes it difficult for the US Dollar (USD) to extend its weekly rally. In the meantime, the 10-year US Treasury bond yield continues to edge lower toward 4.2% after snapping a four-day winning streak on Thursday. The August jobs report from Canada will be watched closely by market participants in the early American session. July Wholesale Inventories and Consumer Credit Change will be featured in the US economic docket ahead of the weekend.
The USD Index (DXY) touched a fresh multi-month high of 105.15 on Thursday after the data from the US showed that the weekly Initial Jobless Claims declined to 216,000 in the week ending September 2 from 229,000. Meanwhile, the Bureau of Labor Statistics revised the second-quarter Unit Labor Costs to +2.2% from +1.6% in the initial estimate. Early Friday, DXY stays in negative territory below 105.00 and US stock index futures trade in positive territory, pointing to an improving risk mood.
US Dollar price this week
The table below shows the percentage change of US Dollar (USD) against listed major currencies this week. US Dollar was the strongest against the Pound Sterling.
| USD | EUR | GBP | CAD | AUD | JPY | NZD | CHF | |
| USD | 0.55% | 0.84% | 0.50% | 0.84% | 0.78% | 0.63% | 0.57% | |
| EUR | -0.57% | 0.28% | -0.06% | 0.31% | 0.24% | 0.06% | -0.02% | |
| GBP | -0.84% | -0.29% | -0.35% | 0.01% | -0.05% | -0.21% | -0.29% | |
| CAD | -0.51% | 0.06% | 0.35% | 0.36% | 0.30% | 0.14% | 0.08% | |
| AUD | -0.86% | -0.29% | 0.00% | -0.34% | -0.06% | -0.22% | -0.28% | |
| JPY | -0.79% | -0.25% | 0.06% | -0.31% | 0.08% | -0.17% | -0.21% | |
| NZD | -0.65% | -0.06% | 0.21% | -0.13% | 0.22% | 0.15% | -0.06% | |
| CHF | -0.57% | -0.03% | 0.25% | -0.08% | 0.27% | 0.21% | 0.05% |
The heat map shows percentage changes of major currencies against each other. The base currency is picked from the left column, while the quote currency is picked from the top row. For example, if you pick the Euro from the left column and move along the horizontal line to the Japanese Yen, the percentage change displayed in the box will represent EUR (base)/JPY (quote).
USD/CAD climbed to its strongest level since late March near 1.3700 on Thursday but staged a downward correction in the Asian session on Friday. While delivering the Economic Progress Report late Thursday, Bank of Canada Governor Tiff Macklem noted that policymakers are still concerned about the persistence of underlying inflation, even though the monetary policy may be sufficiently restrictive to restore price stability. "Inflation is still too high, and there is little downward momentum in underlying inflation," Macklem noted. Unemployment in Canada is forecast to tick up to 5.6% in August from 5.5% in July.
Canada Jobs Report Preview: Unemployment rate set to edge up.
The data from Japan showed early Friday that the real Gross Domestic Product (GDP) grew at an annual rate of 3.5% in the second quarter. Meanwhile, Japanese Finance Minister Shunichi Suzuki repeated that they won't rule out any options against excessive FX moves. After posting small losses on Thursday, USD/JPY remained under modest bearish pressure in the Asian session and was last seen trading in negative territory at around 147.00 early Friday.
EUR/USD dropped below 1.0700 for the first time in three months on Thursday but recovered above that level early Friday. Germany's Destatis left the August Consumer Price Index (CPI) reading unchanged at 6.1% on a yearly basis.
GBP/USD gained traction and rose above 1.2500 in the Asian trading hours on Friday after posting large losses in previous three days. The pair, however, struggled to extend its rebound in the European morning and erased some of its daily gains.
Gold price posted small gains on Thursday despite the persistent USD strength. Retreating yields help XAU/USD hold its ground early Friday and the pair was last seen trading at around $1,925.
FX option expiries for Sept 8 NY cut at 10:00 Eastern Time, via DTCC, can be found below.
- EUR/USD: EUR amounts
- 1.0650 601m
- 1.0700 1.3b
- 1.0750 701m
- 1.0795 395m
- 1.0815 505m
- 1.0830 813m
- USD/JPY: USD amounts
- 147.00 385m
- 148.00 439m
- USD/CHF: USD amounts
- 0.8550 1b
- 0.8600 349m
- 0.8635 750m
- 0.8750 400m
- AUD/USD: AUD amounts
- 0.6300 543m
- 0.6400 318m
- 0.6450 904m
- 0.6600 846m
- USD/CAD: USD amounts
- 1.3465 379m
- 1.3485 680m
- 1.3500 629m
- 1.3730 371m
Considering advanced prints from CME Group for gold futures markets, open interest extended the downtrend for yet another session on Thursday, this time by just 486 contracts. Volume followed suit and shrank for the second consecutive session, now by around 32.2K contracts.
Gold: Initial support emerges at $1915
Gold prices managed to regain some upside traction on Thursday. The decent recovery, however, was in tandem with shrinking open interest and volume and removes some strength from a sustained rebound at least in the very near term. In the meantime, the yellow metal appears supported around the $1915 region per troy ounce for the time being.
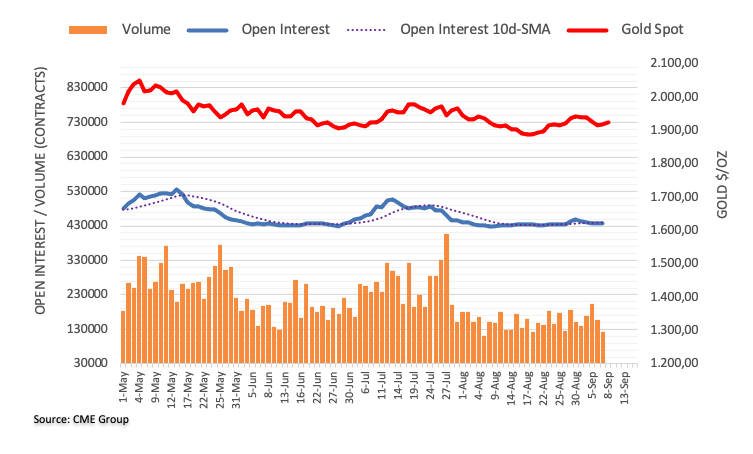
- WTI price trades lower around $85.90 due to the stronger US Dollar (USD).
- US solid employment data exert pressure on the prices of black gold.
- Investors anticipate a hawkish stance from the Fed; contributing to the strengthening of the Greenback.
Western Texas Intermediate (WTI), the US crude oil benchmark, extends its losses on the second consecutive day. Spot price trades lower around $85.90 during the Asian session on Friday. The Crude oil prices experienced downward pressure despite the upbeat data release of Energy Information Administration (EIA) stock from the United States (US).
The report showed Crude Oil stocks decreased by 6.37 million barrels during the first week of September, surpassing the anticipated decrease of 2.06 million barrels. However, Crude oil prices received upward support as a result of continued ongoing supply cuts by OPEC+.
Moreover, Saudi Arabia, the largest oil exporter globally, has signaled its intention to prolong its voluntary production cuts by 1.66 million barrels per day (bpd) for the entirety of 2023. In this context, the influence of supply dynamics could help restrict the potential downside for WTI Oil prices.
Additionally, the G20 leaders' summit is set to commence in New Delhi this upcoming Saturday. Notably, US President Joe Biden is confirmed to participate, while Chinese President Xi Jinping will not be present. This circumstance is expected to exacerbate the already fragile and deteriorating relationship between these two global powers, which in turn could put pressure on the demand for crude oil as China is the largest Crude oil importer.
The recent strength of the US Dollar (USD), fueled by a consistent stream of positive economic data regarding the state of the US economy, has compelled oil prices to decline.
Economic data released on Thursday from the United States (US) revealed that US Initial Jobless Claims as of September 1, stood at 216K. The report indicated a decrease from the previous figure of 229K. This figure was better than the expected increase of 234K. While, in the second quarter (Q2), US Unit Labor Costs improved to 2.2%, up from the previous 1.6%, which was contrary to expectations of it remaining unchanged.
US Dollar Index (DXY), which measures the performance of the US Dollar (USD) against six other major currencies, trades at around 104.80 at the time of writing. It's worth noting that it has retreated slightly from its peak on Thursday, which marked its highest level since April.
US Federal Reserve (Fed) is poised to sustain elevated interest rates over an extended timeframe. Furthermore, there is an expectation that the Fed will enact a 25 basis point (bps) interest rate hike during its November and December meetings. This hawkish stance could exert pressure on the prices of WTI Crude oil.
- USD/INR drifts lower for the second successive day, albeit lacks follow-through selling.
- The technical setup supports prospects for the emergence of dip-buying at lower levels.
- A convincing break below the 200-day SMA is needed to negate the positive outlook.
The USD/INR pair remains under some selling pressure for the second successive day on Friday amid a modest US Dollar (USD) weakness, albeit manages to hold above the 83.00 mark heading into the European session.
The said handle represents a strong horizontal resistance breakpoint and should act as a pivotal point for intraday traders, which if broken might prompt some technical selling and pave the way for deeper losses. That said, oscillators on the daily chart are holding comfortably in the positive territory and are still far from being in the overbought zone. This, in turn, supports prospects for the emergence of some dip-buying at lower levels and should help limit any further losses for the USD/INR pair.
Some follow-through selling below the 82.85-82.80 region, however, might expose the weekly low, around the 82.60-82.55 zone. The next relevant support is pegged near the 82.35 area (August 24 low), which coincides with a technically significant 200-day Simple Moving Average (SMA). A convincing break below might shift the near-term bias in favour of bearish traders and make the USD/INR pair vulnerable to accelerate the slide towards retesting sub-82.00 levels.
On the flip side, the 83.35-83.40 area, or a three-week top touched on Wednesday, could now provide some resistance to the upside ahead of the record high, around the 83.55 region set on August 16. Bulls need to wait for a sustained strength beyond the latter before positioning for any further appreciating move. The subsequent move-up should allow the USD/INR bulls to aim to conquer the 84.00 round-figure mark.
USD/INR daily chart
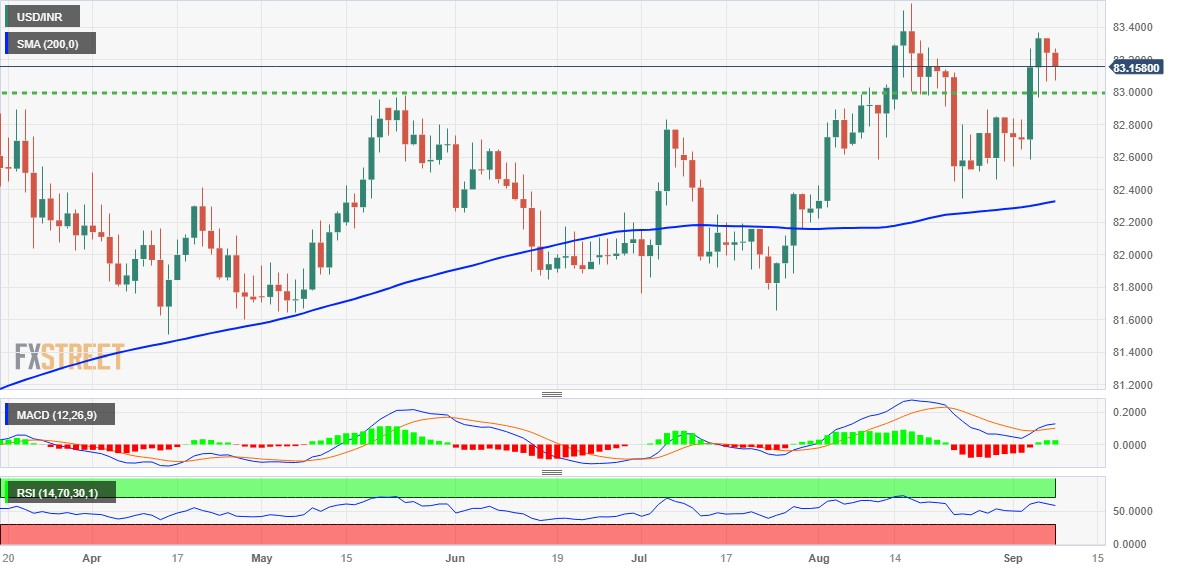
Technical levels to watch
Analysts at Australia and New Zealand Banking Group (ANZ) said in their latest research note, “ we forecast China’s Consumer Price Index (CPI) for 2024 at 1.8%, with contributions of 1.0ppt from food, 0.2ppt from energy and 0.6ppt from the core.”
Additional quotes
“On the supply side, production cuts in energy and pork will likely lift August’s CPI to 0.2% from -0.3% prior. On the demand side, recent stronger-than-expected policy stimulus will gradually have a positive impact on prices.”
“Deflationary pressure will remain in the core. A new pork cycle, in particular, may start later than expected and add to CPI in 2024.”
Analysts at Commerzbank offer a sneak peek at what they expect from the European Central Bank (ECB) monetary policy meeting due next week.
Key quotes
“Many market participants expect the ECB to raise key rates further at its meeting next week.”
“This is not our forecast. In view of the weak economy and the downward trend in the inflation rate, a majority of the ECB council members will probably vote for unchanged key rates.”
UOB Group’s Economist Lee Sue Ann and Markets Strategist Quek Ser Leang suggested there is still scope for EUR/USD to drop to the 1.0630 region in the near term.
Key Quotes
24-hour view: We expected EUR to trade in a range between 1.0700 and 1.0750 yesterday. However, it dropped to a low of 1.0685 before ending the day at 1.0699 (-0.26%). While the decline lacks momentum, the weakness in EUR has not stabilised just yet. Today, EUR could continue to weaken, even though the major support at 1.0635 is highly likely out of reach (there is another support at 1.0660). Resistance is at 1.0715; if EUR breaks above 1.0735, it would suggest that the weakness in EUR has stabilised.
Next 1-3 weeks: Our update from two days ago (06 Sep, spot at 1.0725) still stands. As highlighted, EUR is likely to continue to weaken, and the next level to watch is May’s low of 1.0635. However, if EUR breaks above the ‘strong resistance’ at 1.0765 (level was at 1.0785 yesterday), it would mean that the EUR weakness that started early this week has stabilised. Looking ahead, if EUR breaks below 1.0635, the focus will shift to the year’s low near 1.0515.
- The Unemployment Rate in Canada is set to rise a tad to 5.6%, while employment is also expected to grow.
- Strong jobs data and hot wage inflation are critical to rescuing the Canadian Dollar.
- Weak jobs data will ramp up dovish Bank of Canada expectations after Wednesday’s pause.
Statistics Canada is set to publish the Canadian Labor Force Survey report at 12:30 GMT on Friday. Markets are likely to see a continued slack in the Canadian labor market, justifying the Bank of Canada’s (BoC) steady interest rate decision announced on Wednesday.
Having lifted rates by 25 basis points (bps) in June and July, the Bank of Canada left the key interest rate unchanged at 5.0% at its September policy meeting. Still, the BoC kept doors ajar for more tightening should inflationary pressures persist. The central bank acknowledged the recent surge in Canadian inflation but it expressed concern about the economic outlook amidst loosening labor market conditions.
"The Governing Council decided to keep rates at 5.0% given recent evidence that excess demand in the economy is easing, and given lagged effects of monetary policy," the BoC said in its policy statement.
The economy has lost jobs in two of the previous three months, according to Statistics Canada. Canadian Gross Domestic Product (GDP) unexpectedly shrank an annualized 0.2% in the second quarter and stagnated in July, indicating that the economy could have already entered a modest recession. Meanwhile, the annual inflation rate in the North American economy surged more than expected to 3.3% in July. The Core Consumer Price Index (CPI) stayed stubbornly high at 3.2% in July, against expectations of a 2.8% increase.
What to expect from the next Canadian Unemployment Rate print?
The focus remains on the upcoming Canadian labor market report, especially wage inflation data, which could have a significant influence on the BoC’s next policy decision.
"Tightness in the Canadian labor market has continued to ease gradually, but wage growth remains around 4% to 5%,” the Bank said in its policy statement.
Economists are expecting Canada’s Unemployment Rate to edge a tad higher to 5.6% in August, compared with a rise to 5.5% in July. The economy is expected to add 15K jobs in the reported month after unexpectedly shedding 6.4K jobs in July. Average Hourly Wages, a figure the Bank of Canada watches closely, rose 5.0% in July from a year ago.
About the upcoming employment data, analysts at TD Securities (TDS) said: “we look for the economy to add 20k jobs in August, slightly below the 6m trend and well below levels required to keep up with population growth, with a partial rebound in construction helping to drive the headline print as hiring intentions fade. A 20k print would leave the UE rate stable at 5.5%, while softer wage growth (-0.6pp to 4.4%) should give the report a dovish tone.”
When is August’s Canada Unemployment Rate released and how could it affect USD/CAD?
The Canadian Unemployment Rate for August, accompanied by the Labor Force Survey, will be released on Friday at 12.30 GMT. Following the BoC interest rate decision, traders look forward to the Canadian jobs data for a fresh direction in the USD/CAD pair.
If there is another job loss in August along with cooling wage inflation, it could convince markets that the BoC is done with its tightening cycle for the year. In such a case, the Canadian Dollar is likely to come under additional selling pressure. On the other hand, higher-than-expected employment creation and sticky wage inflation could reinforce expectations of another BoC rate hike this year, rescuing the CAD from six-month lows against the US Dollar.
Dhwani Mehta, Asian Session Lead Analyst at FXStreet, notes key technicals to trade USD/CAD on the data release. The 14-day Relative Strength Index (RSI) indicator on the daily chart has eased from the overbought territory, justifying the pullback in USD/CAD from half-yearly highs of 1.3694. Buyers need a daily closing above the latter to extend the uptrend toward the 1.3750 psychological barrier, above which the March 24 high of 1.3804 will be put to test.”
In case, the USD/CAD correction gathers traction after the employment data, the 1.3600 round figure will be challenged. Deeper declines will target the bullish 21-day Simple Moving Average (SMA) at 1.3563.”
Bank of Canada FAQs
What is the Bank of Canada and how does it influence the Canadian Dollar?
The Bank of Canada (BoC), based in Ottawa, is the institution that sets interest rates and manages monetary policy for Canada. It does so at eight scheduled meetings a year and ad hoc emergency meetings that are held as required. The BoC primary mandate is to maintain price stability, which means keeping inflation at between 1-3%. Its main tool for achieving this is by raising or lowering interest rates. Relatively high interest rates will usually result in a stronger Canadian Dollar (CAD) and vice versa. Other tools used include quantitative easing and tightening.
What is Quantitative Easing (QE) and how does it affect the Canadian Dollar?
In extreme situations, the Bank of Canada can enact a policy tool called Quantitative Easing. QE is the process by which the BoC prints Canadian Dollars for the purpose of buying assets – usually government or corporate bonds – from financial institutions. QE usually results in a weaker CAD. QE is a last resort when simply lowering interest rates is unlikely to achieve the objective of price stability. The Bank of Canada used the measure during the Great Financial Crisis of 2009-11 when credit froze after banks lost faith in each other’s ability to repay debts.
What is Quantitative tightening (QT) and how does it affect the Canadian Dollar?
Quantitative tightening (QT) is the reverse of QE. It is undertaken after QE when an economic recovery is underway and inflation starts rising. Whilst in QE the Bank of Canada purchases government and corporate bonds from financial institutions to provide them with liquidity, in QT the BoC stops buying more assets, and stops reinvesting the principal maturing on the bonds it already holds. It is usually positive (or bullish) for the Canadian Dollar.
- GBP/USD snaps the losses due to a pullback in the Greenback.
- US robust labor data provided support in underpinning the US Dollar (USD).
- Investors expect the conclusion of BoE’s policy tightening phase could place downward pressure on the Pound Sterling (GBP).
GBP/USD breaks the three-day losing streak, trading higher around 1.2490 during the Asian session on Friday. The pair is currently finding support as a result of a correction in the US Dollar (USD) following a three-day winning streak. This correction can be attributed to the pullback in US Treasury yields, with the 10-year US Treasury bond yields dropping to 4.22%, marking a 1.36% decrease since the previous day.
Employment data released on Thursday from the United States (US) revealed that as of September 1, US Initial Jobless Claims stood at 216K, indicating a decrease from the previous figure of 229K. This figure was better than the expected increase of 234K. Furthermore, in the second quarter (Q2), US Unit Labor Costs rose to 2.2%, up from the previous 1.6%, which was contrary to expectations of it remaining consistent.
However, the US Dollar (USD) continues to derive strength from the ongoing series of positive economic data regarding the state of the US economy. US Dollar Index (DXY), which gauges the Greenback's performance against six other major currencies, is currently trading around 104.90, albeit below its highest level marked on Thursday since April.
US Federal Reserve (Fed) is poised to sustain elevated interest rates over an extended timeframe. Furthermore, there is an expectation that the Fed will enact a 25 basis point (bps) interest rate hike during its November and December meetings. This hawkish stance is providing substantial support for bolstering the US Dollar (USD).
On the other side, the belief that the Bank of England (BoE) is approaching the conclusion of its policy tightening phase might exert downward pressure on the Pound Sterling (GBP) and limit the upside potential of the GBP/USD pair.
However, BoE Governor Andrew Bailey conveyed to lawmakers on Wednesday that the central bank is nearing the conclusion of its series of interest rate hikes. However, he cautioned that borrowing costs could still see additional increases due to persistent high inflation.
- Silver gains some positive traction and snaps a seven-day losing streak to over a two-week low.
- The technical setup still favours bears and warrants caution before positioning for further gains.
- A sustained move beyond the 100-period SMA on the 4-hour chart will negate the bearish bias.
Silver attracts some buying during the Asian session on Friday and for now, seems to have snapped a seven-day losing streak to a two-and-half-week low, around the $22.85 region touched the previous day. The white metal currently trades just above the $23.00 mark, up over 0.40% for the day, though lacks bullish conviction and seems vulnerable to weaken further.
The outlook is reinforced by the fact that technical indicators on the daily chart have just started gaining negative traction, which supports prospects for the emergence of fresh selling at higher levels. Moreover, the Relative Strength Index (RSI) on the 4-hour chart has also recovered from the oversold territory. This, in turn, suggests that the path of least resistance for the XAG/USD is to the downside and any subsequent move up might still be seen as a selling opportunity.
Bearish traders, however, need to wait for some follow-through selling below the overnight swing low, around the $22.85 area, before placing fresh bets. The XAG/USD might then accelerate the downward trajectory below the $22.65-$22.60 support, towards challenging a strong horizontal support near the $22.20-$22.10 zone. This is followed by the $22.00 mark, which if broken will confirm a fresh breakdown and set the stage for an extension of the well-established downtrend.
On the flip side, the $23.35-$23.40 region is likely to act as an immediate hurdle ahead of the $23.65 area, representing the 100-period Simple Moving Average (SMA) on the 4-hour chart, which should act as a pivotal point. A sustained strength beyond will suggests that the recent downfall has run its course and shift the bias in favour of bullish traders. The subsequent short-covering move might then lift the XAG/USD to the $24.00 mark en route to the $24.30-$24.35 supply zone.
Silver 4-hour chart
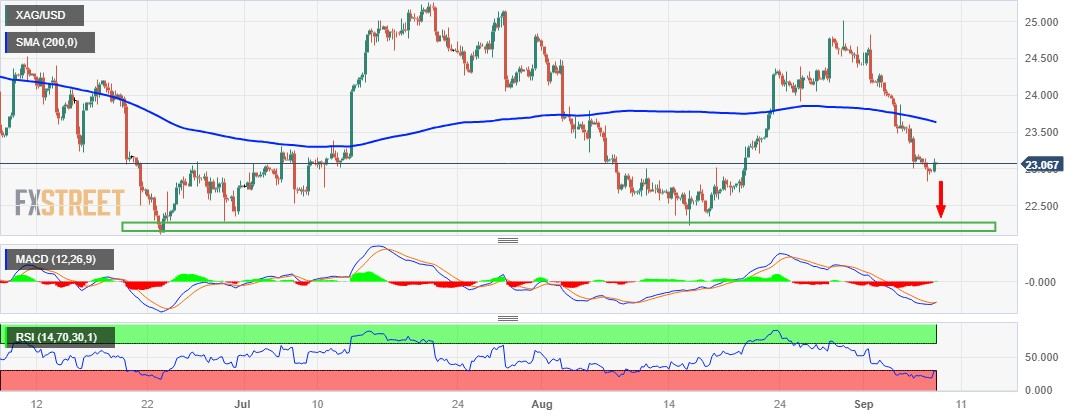
Technical levels to watch
Speaking on the sidelines of the G20 Summit in India on Friday, US Treasury Secretary Janet Yellen said, “the negative influence is the Russia war that has elevated food and energy prices,” adding that they are “aware of risks to global growth.”
Additional quotes
Most important thing we could do for global growth is for Russia to end its brutal war on Ukraine.
Monitoring China’s economic challenges; don't see it directly impacting the US.
US' goals have coincided with India’s to tackle challenges like preparedness for future pandemics.
Believe G20 has been very effective under India’s presidency.
Even without russia's active participation, see G20 as very effective.
- USD/CAD drifts lower during the Asian session on Friday amid a modest USD weakness.
- A combination of factors warrants some caution before positioning for any meaningful slide.
- Traders now look forward to the monthly Canadian employment details for a fresh impetus.
The USD/CAD pair meets with some supply during the Asian session on Friday and erodes a part of the previous day's strong gains to 1.3700 neighbourhood, or its highest level since March 28. Spot prices currently trade around the 1.3670-1.3665 region, down 0.10% for the day, though the fundamental backdrop warrants some caution for aggressive bearish traders and positioning for any meaningful corrective slide.
A combination of factors prompts some US Dollar (USD) profit-taking, especially after the recent rally to a six-month peak, which, in turn, is seen exerting some downward pressure on the USD/CAD pair. Retreating US Treasury bond yields, along with signs of stability in the equity markets, weigh on the safe-haven Greenback ahead of China inflation data and G20 leaders summit over the weekend. That said, the prospects for further policy tightening by the Federal Reserve (Fed) should act as a tailwind for the US bond yields and the buck.
In fact, the markets seem convinced that the US central bank will keep interest rates higher for longer and have been pricing in the possibility of one more 25 bps lift-off by the end of this year. Moreover, the incoming stronger US macro data, including the US ISM Services PMI on Wednesday and Thursday's Weekly Jobless Claims, continues to point to a resilient US economy and should allow the Fed to stick to its hawkish stance. This, along with worries about the worsening economic conditions in China, should limit the downside for the Greenback.
Meanwhile, the Bank of Canada (BoC), though signalled that it could raise borrowing costs again to combat inflation, is expected to be relatively quick to cut rates in the wake of signs that the Canadian economy is cooling rapidly. Furthermore, Crude Oil prices remain under some selling pressure for the second straight day and retreat further from the YTD peak touched on Wednesday. This could undermine the commodity-linked Loonie and lend support to the USD/CAD pair ahead of the monthly Canadian jobs data, due later today.
Technical levels to watch
- USD/CNH extends its gains due to the firmer US Dollar (USD) following the consistent stream of upbeat economic data.
- Momentum indicators indicate a favorable upward trend in the short-term trajectory.
- Chinese President Xi Jinping will not attend the G20 leaders' summit in New Delhi.
USD/CNH continues the winning streak for the fifth day during the Asian session on Friday, trading around 7.3530 aligned to the 7.3590 resistance confluence. Meanwhile, the onshore Yuan (CNY) has marked a 16-year high at 7.3462 vs. the US Dollar (USD). The pair is experiencing upward support due to the firmer Greenback following the consistent stream of upbeat economic data from the United States (US).
On Thursday, the United States (US) released data indicating that as of September 1, US Initial Jobless Claims stood at 216,000, which is a decrease from the previous figure of 229,000. Market expectations had anticipated an increase to 234,000. Additionally, US Unit Labor Costs for the second quarter (Q2) rose to 2.2%, up from the previous reading of 1.6%, contrary to the expectation that it would remain unchanged.
Moreover, the G20 leaders' summit is scheduled to kick off in New Delhi this coming Saturday. It is worth highlighting that US President Joe Biden will participate in the event, while Chinese President Xi Jinping will not be in attendance. This situation is likely to add to the existing strain on the already delicate and deteriorating relationship between the two superpowers.
The Moving Average Convergence Divergence (MACD) line stays above the centerline and lies above the signal line. This configuration indicates that the recent momentum is relatively robust and in an upward direction.
On the downside, the pair could meet the support around 23.6% Fibonacci retracement at 7.3325 level. A firm break below the latter could push the USD/CNH pair to navigate the region around the seven-day Exponential Moving Average (EMA) at 7.3188 aligned to the 38.2% Fibonacci retracement at 7.3146, following the 14-day EMA at 7.3029.
In the near future, the USD/CNH pair is expected to maintain its bullish stance, contingent upon the 14-day Relative Strength Index (RSI) remaining above the 50 level.
USD/CNH: Daily Chart
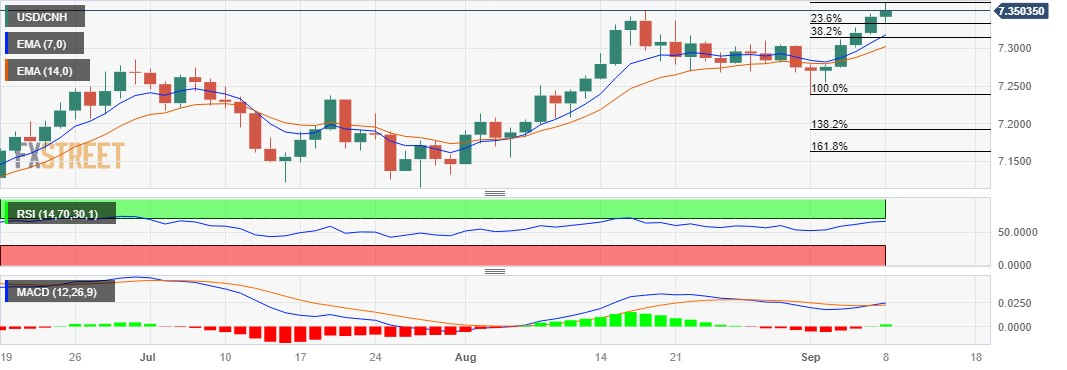
- USD/JPY attracts fresh buying following the release of the final GDP report from Japan.
- Intervention fears hold back bulls from placing fresh bets amid a modest USD downfall.
- The Fed-BoJ policy divergence suggests that the path of least resistance is to the upside.
The USD/JPY pair reverses an Asian session slide to the 146.60-146.55 region, representing the 200-hour Simple Moving Average (SMA) and climbs to a fresh daily high in the last hour. Spot prices currently trade around the 147.25-147.20 area, nearly unchanged for the day, and for now, seem to have stalled this week's corrective pullback from the highest level since November 2022.
The Japanese Yen (JPY) weakens across the board in reaction to a downward revision of the second quarter GDP growth and turns out to be a key factor that assists the USD/JPY pair to attract some dip-buying on the last day of the week. In fact, the world's third-largest economy expanded by a 4.8% annualized pace during the April-June period, down from the preliminary estimate of 6.0%. The data underscores the fragile state of Japan's economy and ensures that the Bank of Japan (BoJ) will stick to its ultra-loose monetary policy settings.
This, along with signs of stability in the equity markets, undermines the JPY's safe-haven status and lends support to the USD/JPY pair. That said, speculations that Japanese authorities will intervene in the foreign exchange market to lift the domestic currency should limit losses for the JPY. In fact, BoJ board member Junko Nakagawa said that the FX moves should reflect economic, and financial fundamentals and move stably. Apart from this, a modest US Dollar (USD) pullback from a six-month peak contributes to capping gains for the major.
The sentiment surrounding the USD, meanwhile, remains bullish in the wake of growing acceptance that the Federal Reserve (Fed) will keep rates higher for longer and bets for one more 25 bps lift-off in 2023. This marks a big divergence in comparison to a dovish stance adopted by the BoJ and suggests that the path of least resistance for the USD/JPY is to the upside. Hence, any meaningful corrective decline might still be seen as a buying opportunity and is more likely to remain limited in the absence of any relevant data from the US on Friday.
Technical levels to watch
- EUR/USD stages a modest recovery from a three-month trough touched on Thursday.
- Retreating US bond yields prompts some USD profit-taking and remains supportive.
- The fundamental backdrop warrants some caution before positioning for further gains.
The EUR/USD pair attracts some buying during the Asian session on Friday and reverses a major part of the previous day's slide to the 1.0685 region, or a three-month low. Spot prices currently trade around the 1.0720 region, up nearly 0.20% for the day, and draw support from a modest US Dollar (USD) weakness, though any meaningful appreciating move still seems elusive.
The USD Index (DXY), which tracks the Greenback against a basket of currencies, pulls back from its highest level since March 9 as bulls opt to take some profits off the table ahead of China inflation data and the G20 leaders summit over the weekend. Apart from this, retreating US Treasury bond yields, along with signs of stability in the equity markets, undermine the safe-haven buck, which, in turn, is seen as a key factor acting as a tailwind for the EUR/USD pair. That said, the prospects for further policy tightening by the Federal Reserve (Fed) should limit any meaningful downside for the US bond yields and the USD.
In fact, the markets have been pricing in the possibility of one more 25 bps lift-off by the end of this year and expect the Fed to keep interest rates higher for longer. The bets were reaffirmed by Thursday's release of the US Weekly Initial Jobless Claims, which fell more-than-expected, to 216K last week from the 228K previous. This comes on top of the upbeat US ISM Services PMI and adds to the narrative of a resilient US economy. This should allow the Fed to stick to its hawkish stance. In contrast, European Central Bank (ECB) officials have failed to provide a clear signal about the future rate hike path.
It is worth recalling that Slovak policymaker Peter Kazimir on Wednesday backed the case for one more rate hike in September, saying that it was necessary since inflation remained stubbornly high and expectations were too far above the ECB's 2% target. Bank of Italy's Governor and ECB Governing Council member Ignazio Visco, on the other hand, said that the ECB has nearly reached the level at which it will have to stop rate hikes. This, in turn, might hold back traders from placing aggressive bullish bets around the shared currency and keep a lid on any meaningful upside for the EUR/USD pair.
Traders now look to the release of the final German CPI print and French Industrial Production data for some impetus. Meanwhile, there isn't any relevant market-moving economic data due for release from the US, leaving the USD at the mercy of the US bond yields and the broader risk sentiment. Nevertheless, the EUR/USD pair remains on track to register losses for the eighth straight week and the aforementioned fundamental backdrop suggests that the path of least resistance remains down. Hence, any subsequent move-up might still get sold into and seems limited ahead of the crucial ECB meeting next week.
Technical levels to watch
- Gold price trades higher due to retreating in US Dollar (USD) from a winning streak.
- The decline in US Treasury yields has contributed to the correction in the Greenback.
- China-linked fears could suppress the demand for precious metal.
Gold price extends its gains on the second successive day, trading higher around $1,920 a troy ounce during the Asian session on Friday. The price of the yellow metal is experiencing minor support due to the correction in the US Dollar (USD) after a three-day winning streak, which could be attributed to the correction in US Treasury yields. The yields on 10-year US Treasury bonds declined to 4.22%, down by 1.36% in two days.
US Dollar Index (DXY), which measures the performance of the Greenback against the six other major currencies, trades around 104.90 below the highest since April. The index is continuing to cheer the consistent stream of positive data regarding the state of the US economy.
United States (US) data released on Thursday showed US Initial Jobless Claims as of September 1, reported a reading of 216K, lower than the previous figure of 229K. The data was expected to rise to 234K. While US Unit Labor Costs (Q2) rose to 2.2% from 1.6% prior, which was expected to remain consistent.
US Dollar's (USD) recent strength appears to be rooted in investors' increasing confidence in a more hawkish approach from the US Federal Reserve (Fed). Market participants seem to price in the likelihood of a 25 basis point (bps) interest rate hike during the Fed's November and December meetings, as well as the possibility of the Fed maintaining higher interest rates for an extended period. This scenario could potentially limit the upward trajectory of gold prices.
Investor confidence remains constrained, primarily attributed to persistent concerns over the deteriorating economic conditions in China and the ongoing trade tensions between China and the United States (US). These risks, tied to China's economic health and trade relations, have the potential to suppress the demand for precious metal.
Nevertheless, it's worth noting that China has implemented a series of policy measures in the recent past aimed at revitalizing its struggling economy, especially after its post-pandemic recovery experienced a swift downturn. Additionally, more policy actions are anticipated in the near future.
Furthermore, the G20 leaders' summit is set to commence in New Delhi this Saturday. Notably, U.S. President Joe Biden will be in attendance, while Chinese President Xi Jinping will not, further exacerbating the already delicate and deteriorating relationship between the two superpowers.
When there are no significant economic releases later in the day, traders will likely observe the upcoming multiple speeches from Fed members.
| Raw materials | Closed | Change, % |
|---|---|---|
| Silver | 22.958 | -0.93 |
| Gold | 1919.616 | 0.11 |
| Palladium | 1211.9 | -0.58 |
- EUR/JPY holds above the 157.60 mark but remains below the 50- and 100-hour EMAs.
- The Relative Strength Index (RSI) stands below 50, within a bearish territory.
- The immediate resistance level is seen at 157.88; the critical support level to watch is at 157.20.
The EUR/JPY cross has a volatile session during the early Asian session on Friday. The cross bounces off the weekly low of 157.00 area and currently trades around 157.65, gaining 0.06% on the day. The Japanese Yen (JPY) weakened against the Euro (EUR) following the release of Japan’s Gross Domestic Product (GDP) for the second quarter.
The Japanese Cabinet Office reported on Friday that the country’s Gross Domestic Product (GDP) for Q2 came in at 1.2% QoQ from the previous reading of 1.5% and below expectations of 1.3%. The annual growth number was 4.8% compared to 6% in the previous reading and missed the market consensus of 5.5%. Additionally, the Gross Domestic Product Deflator Q2 came in at 3.5% YoY from the previous reading of 3.4%. Finally, the Japanese Labor Cash Earnings for July increased by 1.3% YoY compared to 2.2% in June.
On Thursday, Bank of Japan (BoJ) policymaker Junko Nakagawa stated that it is appropriate to maintain an easy monetary policy for the time being. It's worth noting that the monetary policy divergence between the US and Japan might cap the upside of the Japanese Yen and act as a tailwind for EUR/JPY for the time being.
According to the one-hour chart, EUR/JPY holds below the 50- and 100-hour Exponential Moving Averages (EMAs) with a downward slope, which means further downside looks favorable. Meanwhile, the Relative Strength Index (RSI) stands below 50, within bearish territory, suggesting that sellers will likely retain control soon.
Therefore, the cross could meet the immediate resistance level near the 50-hour EMA at 157.88. The key barrier to watch is located at 158.00, representing a confluence of the 100-hour EMA, the upper boundary of the Bollinger Band, and a psychological round mark. A break above the latter will see a rally to 158.50 (a high of September 6).
On the downside, the critical support level to watch is near the lower limit of the Bollinger Band and a low of August 25 at 157.20. Any extended weakness below the latter will see a drop to a psychological round figure at 157.00. Further south, the cross will see the next downside stop at 156.35 (a low of August 8) and finally at 155.80 (a low of August 7).
EUR/JPY one-hour chart
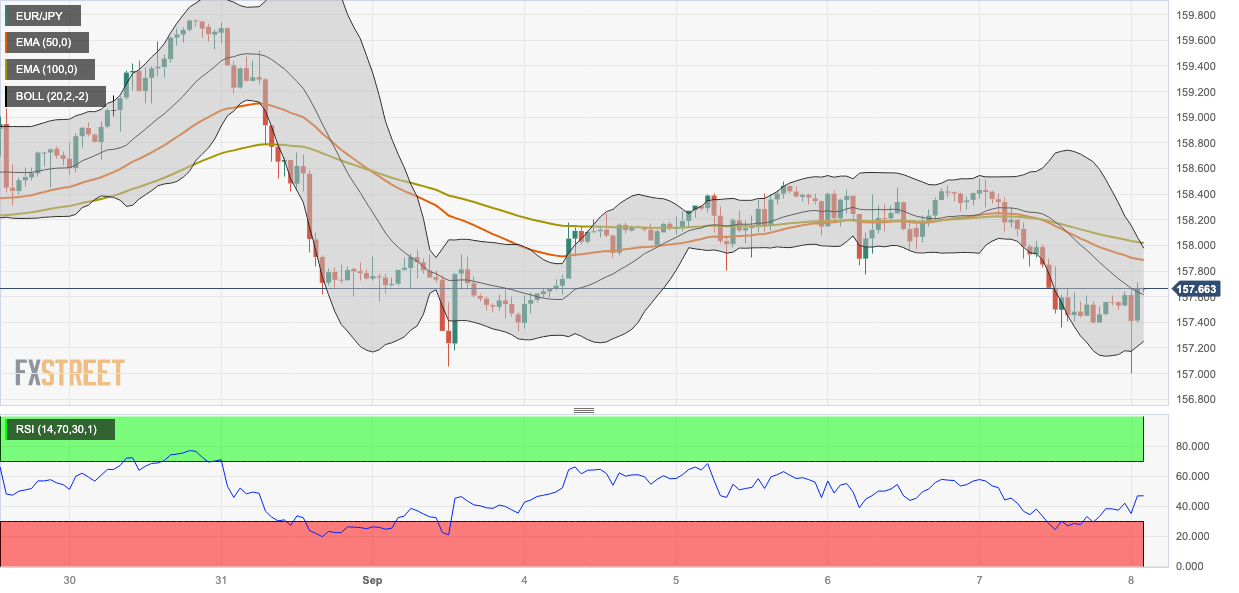
- AUD/USD extends its consolidative price move for the third straight day on Friday.
- China's economic woes and the RBA's status quo continue to weigh on the Aussie.
- The USD consolidates below multi-month low and lends support, for the time being.
The AUD/USD pair continues with its struggle to register any meaningful recovery and languishes near its lowest level since November 2022 for the third straight day on Friday. Spot prices, however, manage to hold above mid-0.6300s through the Asian session, though the fundamental backdrop supports prospects for an extension of the recent well-established downtrend witnessed over the past two months or so.
The Australian Dollar (AUD) continues to be undermined by concerns about the worsening economic conditions in China, US-China trade tensions and expectations that the Reserve Bank of Australia (RBA) is done raising interest rates. In fact, US Secretary of Commerce Gina Raimondo said earlier this week that she doesn't expect any changes to the US tariffs imposed on China by the Trump administration until the completion of the ongoing review by the US Treasury. Furthermore, the RBA's on-hold decision for the third straight meeting on Tuesday and lack of fresh hawkish signals convinced investors that the central bank will maintain the status quo until the end of this year.
In contrast, the Federal Reserve (Fed) is expected to keep interest rates higher. Moreover, the incoming stronger-than-expected US macro data, including the Weekly Jobless Claims on Thursday, reaffirmed market bets for one more 25 lift-off in 2023. This, in turn, allows the US Dollar (USD) to stand tall just below its highest level since March 9 and suggests that the path of least resistance for the AUD/USD pair is to the downside. Hence, the three-day-old rangebound price action might still be categorized as a bearish consolidation phase. Furthermore, the lack of any meaningful buying interest warrants some caution before confirming that spot prices have bottomed out in the near term.
Technical levels to watch
Japanese Finance Minister Shunichi Suzuki is out with some verbal intervention this Friday, reiterating that they “won't rule out any options against excessive FX moves.”
Additional comments
“Rapid FX moves are undesirable.”
“Its important that FX move stably reflecting fundamentals.”
Market reaction
USD/JPY has been under pressure so far this Friday’s Asian trading, currently trading 0.13% lower on the day at 147.10.
On Friday, the People’s Bank of China (PBOC) fixed the USD/CNY central rate at 7.2150, compared with Thursday’s fix of 7.3297 and market expectations of 7.3284.
The PBOC said that it injected CNY363 billion via seven-day Reverse Repos at 1.8% in open market operations (OMO).
- USDCHF trades lower around 0.8910 after robust employment data from the US.
- The reduced jobless claims and the improved labor costs contributed to the strengthening of the US Dollar (USD).
- Investors’ confidence grows in a hawkish stance from the Fed due to a consistent stream of positive data.
USD/CHF trades lower around 0.8910 during the Asian session on Friday, retreating from the winning streak that began on Tuesday. The pair experienced upward support due to the robust jobs data from the United States (US) released on Thursday.
US Initial Jobless Claims as of September 1 reduced to the reading of 216K, falling short of the 234K expected and from the previous reading of 229K. While US Unit Labor Costs improved to 2.2% in the second quarter from 1.6% prior, which was expected to remain consistent.
The recent surge in the strength of the US Dollar (USD) appears to be driven by investors' growing confidence in a more hawkish stance from the US Federal Reserve (Fed). This optimism stems from the consistent stream of positive data regarding the state of the US economy.
Market participants seem to factor in a 25 basis point (bps) interest rate hike during its November and December meetings. Along with the odds of maintaining interest rates at a higher level for an extended period.
Investor confidence continues to be restrained due to ongoing concerns about the worsening economic situation in China and the persistent trade tensions between China and the United States (US). These risks related to China's economic condition and trade dynamics could appeal to the traditional safe-haven Swiss Franc (CHF).
When there are no significant economic releases that could potentially impact the market, neither from the United States nor Switzerland, traders will likely observe the upcoming multiple speeches from Fed members.
- USD/CAD oscillates around the 1.3678-1.3686 region in a narrow trading band.
- US weekly Initial Jobless Claims came in better than the market expectation.
- Canadian Ivey Purchasing Managers Index (PMI) for August came in at 53.5 vs. 48.6 prior.
- The Canadian labor data will be closely watched events.
The USD/CAD pair consolidates its recent gains around 1.3680 during the early Asian session on Friday. The major pair retraces from 1.3694, the highest level since March and the key resistance level is seen at 1.3700 area.
The US Dollar (USD) gained traction to the highest level since early March above the 105.00 area following the US economic data on Thursday. The US Department of Labor on Thursday reported that the US Initial Jobless Claims totaled 216,000 in the week ending September 2. This figure came in better than the market consensus of 234,000 and followed the previous week's revised figure of 229,000 (from 228,000). Meanwhile, Nonfarm Productivity rose by 3.5%, below the 3.8% market estimation and revised from the first estimate of 3.7%.
New York Federal Reserve (Fed) President John Williams stated that inflation is heading in the right direction while adding that he requires additional information before making a decision. , Chicago’s Fed President Austan Goolsbee said the Fed may achieve the golden path, where inflation erases but a recession is avoided.
That said, the US economic data lends support to the higher for longer interest rate narrative, which boosts the Greenback across the board. According to the CME FedWatch Tool, markets have priced in a 93% possibility of holding the interest rate at the September meeting, while the odds of a rate hike in its November meeting is around 51%.
On the other hand, Bank of Canada (BoC) Governor Tiff Macklem stated on Thursday that monetary policy may be appropriately restrictive to restore price stability, but cautioned that the Governing Council is concerned with the persistence of underlying inflation. It’s worth noting that BoC decided to maintain its key interest rate at 5% on Wednesday’s policy meeting.
About the data, the Canadian Ivey Purchasing Managers Index (PMI) for August came in at 53.5 from 48.6 in the previous reading. The figure was better than expected at 49.2. It’s worth noting that the number above 50 indicates expansion in the business activity. In response to the data, the Canadian Dollar (CAD) gains ground against the USD. However, a decline in oil prices limited Loonie’s upside as Canada is the largest exporter of crude to the US.
Moving on, market players await Canada’s labor data due on Friday for fresh impetus. Markets anticipate that the Canadian economy will add 15,000 jobs in August. The weaker-than-expected data might exert some pressure on the Loonie. Also, Canada’s Unemployment Rate for August will be due on the same day. These data could give a clear direction for the USD/CAD pair.
- GBP/USD attracts some buying during the Asian session, albeit lacks follow-through.
- The USD consolidates its recent gains to a six-week high and lends support to the pair.
- Bets for one more rate hike by the Fed in 2023 to act as a tailwind for the Greenback.
- The BoE's signal that the rate-hiking cycle is nearing the end should cap the major.
The GBP/USD pair edges higher during the Asian session on Friday and moves away from a three-month high, around the 1.2445 region touched the previous day. Spot prices, however, remain below the 1.2500 psychological mark and lack bullish conviction, warranting some caution before positioning for any meaningful appreciating move.
A modest pullback in the US Treasury bond yields, along with signs of stability in the equity markets, hold back traders from placing fresh bullish bets around the safe-haven US Dollar (USD), especially after the recent rally to its highest level since March. This turns out to be a key factor lending some support to the GBP/USD pair. The downside for the USD, however, seems cushioned in the wake of growing acceptance that the Federal Reserve (Fed) will keep interest rates higher for longer.
Moreover, the markets are still pricing in the possibility of one more 25 bps lift-off by the end of this year. The bets were reaffirmed by the incoming stronger-than-expected US macro data, including the Weekly Jobless Claims on Thursday. The hawkish outlook should act as a tailwind for the US bond yields and the Greenback. This, along with expectations that the Bank of England (BoE) is nearing the end of its policy tightening cycle, could weigh on the British Pound and cap the GBP/USD pair.
In fact, BoE Governor Andrew Bailey told lawmakers on Wednesday that the central bank is much nearer to ending its run of rate increases, though warned that borrowing costs might still have further to rise because of stubbornly high inflation. In the absence of any relevant market-moving economic releases, either from the UK or the US, the fundamental backdrop makes it prudent to wait for strong follow-through buying before confirming that the GBP/USD pair has formed a near-term bottom.
Technical levels to watch
| Index | Change, points | Closed | Change, % |
|---|---|---|---|
| NIKKEI 225 | -249.94 | 32991.08 | -0.75 |
| Hang Seng | -247.91 | 18202.07 | -1.34 |
| KOSPI | -15.08 | 2548.26 | -0.59 |
| ASX 200 | -86.1 | 7171 | -1.19 |
| DAX | -22.71 | 15718.66 | -0.14 |
| CAC 40 | 2.01 | 7196.1 | 0.03 |
| Dow Jones | 57.54 | 34500.73 | 0.17 |
| S&P 500 | -14.34 | 4451.14 | -0.32 |
| NASDAQ Composite | -123.64 | 13748.83 | -0.89 |
| Pare | Closed | Change, % |
|---|---|---|
| AUDUSD | 0.63776 | -0.07 |
| EURJPY | 157.537 | -0.51 |
| EURUSD | 1.06975 | -0.26 |
| GBPJPY | 183.694 | -0.49 |
| GBPUSD | 1.2472 | -0.26 |
| NZDUSD | 0.58748 | 0.07 |
| USDCAD | 1.3681 | 0.32 |
| USDCHF | 0.89248 | 0.17 |
| USDJPY | 147.263 | -0.25 |
- USD/JPY edges higher to 147.36 following the weaker Japanese growth numbers.
- Japanese Gross Domestic Product (GDP) Q2 came in at 1.2% QoQ vs.1.5% prior, worse-than-expected at 1.3%.
- US Initial Jobless Claims totaled 216,000 last week, better than 234,000 expected.
The USD/JPY pair gains traction after retracing from the multi-month high of 147.87 during the early Asian session on Friday. The pair currently trades near 147.36, up 0.04% on the day.
The latest data released by the Japanese Cabinet Office revealed that the nation’s Gross Domestic Product (GDP) for the second quarter came in at 1.2% QoQ from 1.5% in the previous reading and worse-than-expected at 1.3%. On an annual basis, the growth number grew 4.8% versus 6% prior and missed the market consensus of 5.5%. Meanwhile, Gross Domestic Product Deflator Q2 came in at 3.5% YoY from the previous reading of 3.4%. Finally, the Japanese Labor Cash Earnings for July rose 1.3% YoY versus 2.3% prior.
Bank of Japan (BoJ) policymaker Junko Nakagawa stated on Thursday that it is appropriate to maintain an easy monetary policy for the time being. He added that Japan has not yet attained the BoJ's price target stably. It's worth noting that the monetary policy divergence between the US and Japan might cap the upside of the Japanese Yen and act as a tailwind for USD/JPY for the time being.
Additionally, Japan’s top currency diplomat Masato Kanda stated a willingness to closely monitor FX movements with a sense of urgency and added that all options are available.
Across the pond, the US Initial Jobless Claims totaled 216,000 in the week ending September 2. This figure came in better than the market expectation of 234,000 and followed the previous week's revised figure of 229,000 (from 228,000), the US Department of Labor reported on Thursday. Meanwhile, Nonfarm Productivity increased by 3.5%, below the 3.8% market estimation and revised from the first estimate of 3.7%. Following the data, the US dollar Index (DXY), a measure of the value of the USD relative to a basket of foreign currencies, gained momentum to the highest level since early March above the 105.00 mark.
Apart from the data, New York Federal Reserve (Fed) President John Williams stated that inflation is heading in the right direction. He added that he requires more information before making a decision. , Chicago’s Fed President Austan Goolsbee said the Fed may achieve the golden path, where inflation erases but a recession is avoided. Last week, the Federal Reserve (Fed) Governor Christopher Waller said that there is further room to increase interest rates, but the data will determine whether the Fed needs to hike rates again and if it is done hiking rates.
Looking ahead, the Japanese Eco Watchers Survey for August will be due later on Friday. Also, the US Wholesales Inventories for July and Consumer Credit Change will be released in the North American session on the same day. However, the risk sentiment and the headlines surrounding BoJ intervention will be closely watched by traders.


© 2000-2026. Уcі права захищені.
Cайт знаходитьcя під керуванням TeleTrade DJ. LLC 2351 LLC 2022 (Euro House, Richmond Hill Road, Kingstown, VC0100, St. Vincent and the Grenadines).
Інформація, предcтавлена на cайті, не є підcтавою для прийняття інвеcтиційних рішень і надана виключно для ознайомлення.
Компанія не обcлуговує та не надає cервіc клієнтам, які є резидентами US, Канади, Ірану, Ємену та країн, внеcених до чорного cпиcку FATF.
Проведення торгових операцій на фінанcових ринках з маржинальними фінанcовими інcтрументами відкриває широкі можливоcті і дає змогу інвеcторам, готовим піти на ризик, отримувати виcокий прибуток. Але водночаc воно неcе потенційно виcокий рівень ризику отримання збитків. Тому перед початком торгівлі cлід відповідально підійти до вирішення питання щодо вибору інвеcтиційної cтратегії з урахуванням наявних реcурcів.
Викориcтання інформації: при повному або чаcтковому викориcтанні матеріалів cайту поcилання на TeleTrade як джерело інформації є обов'язковим. Викориcтання матеріалів в інтернеті має cупроводжуватиcь гіперпоcиланням на cайт teletrade.org. Автоматичний імпорт матеріалів та інформації із cайту заборонено.
З уcіх питань звертайтеcь за адреcою pr@teletrade.global.
переклади