- Аналітика
- Новини та інструменти
- Новини ринків
Новини ринків
- The New Zealand Dollar edges lower in Friday’s early Asian session.
- A fall in New Zealand’s two-year inflation expectations and a firmer US Dollar weigh on the pair.
- Traders await the Chinese CPI and PPI data, which are due on Friday.
The New Zealand Dollar (NZD) trades with a mild bearish bias on Friday amid renewed US Dollar (USD) demand. The Greenback advances to a weekly high as the recent US Initial Jobless Claims ease some fears about the US labor market. A fall in New Zealand's two-year inflation expectations might cap the upside for the NZD. Additionally, the heightened geopolitical risks in the Middle East could weigh on riskier assets like the Kiwi and create a headwind for NZD/USD.
On the other hand, a stronger-than-expected New Zealand employment report earlier this week threw cold water on expectations of the Reserve Bank of New Zealand (RBNZ) interest rate cut in the near term. The upbeat reading could be enough to spur another bullish run for the Kiwi in the near term. Traders will keep an eye on Chinese economic data on Friday, including Consumer Price Index (CPI) and Producer Price Index (PPI) for July. Any signs of recovery in the Chinese economy could lift the Kiwi as China is New Zealand's largest trading partner.
Daily Digest Market Movers: New Zealand Dollar loses ground amid stronger US Dollar
- According to RBNZ's latest monetary conditions survey, the two-year inflation expectations fell from 2.33% seen in Q2 2024 to 2.03% in Q3 of this year. The average one-year inflation expectations declined to 2.40% in Q3 versus 2.73% seen in Q2.
- The US Initial Jobless Claims for the week ending August 3 rose by 233K, compared to the previous week of 250K (revised from 249K), the US Department of Labor (DoL) reported on Thursday. This figure came in below the consensus of 240K.
- Continuing Claims increased by 6K to 1.875M in the week ended July 27, beating the estimation of 1.870M.
- Federal Reserve (Fed) Bank of Chicago President Austan Goolsbee said on Thursday that the Fed needs to see more than payrolls and more than one month.
- Richmond Fed President Thomas Barkin noted that cooling in the US labor market is coming from slower hiring rather than a rise in layoffs, giving the Fed time to figure out its next move.
Technical Analysis: New Zealand Dollar remains bearish in the longer term
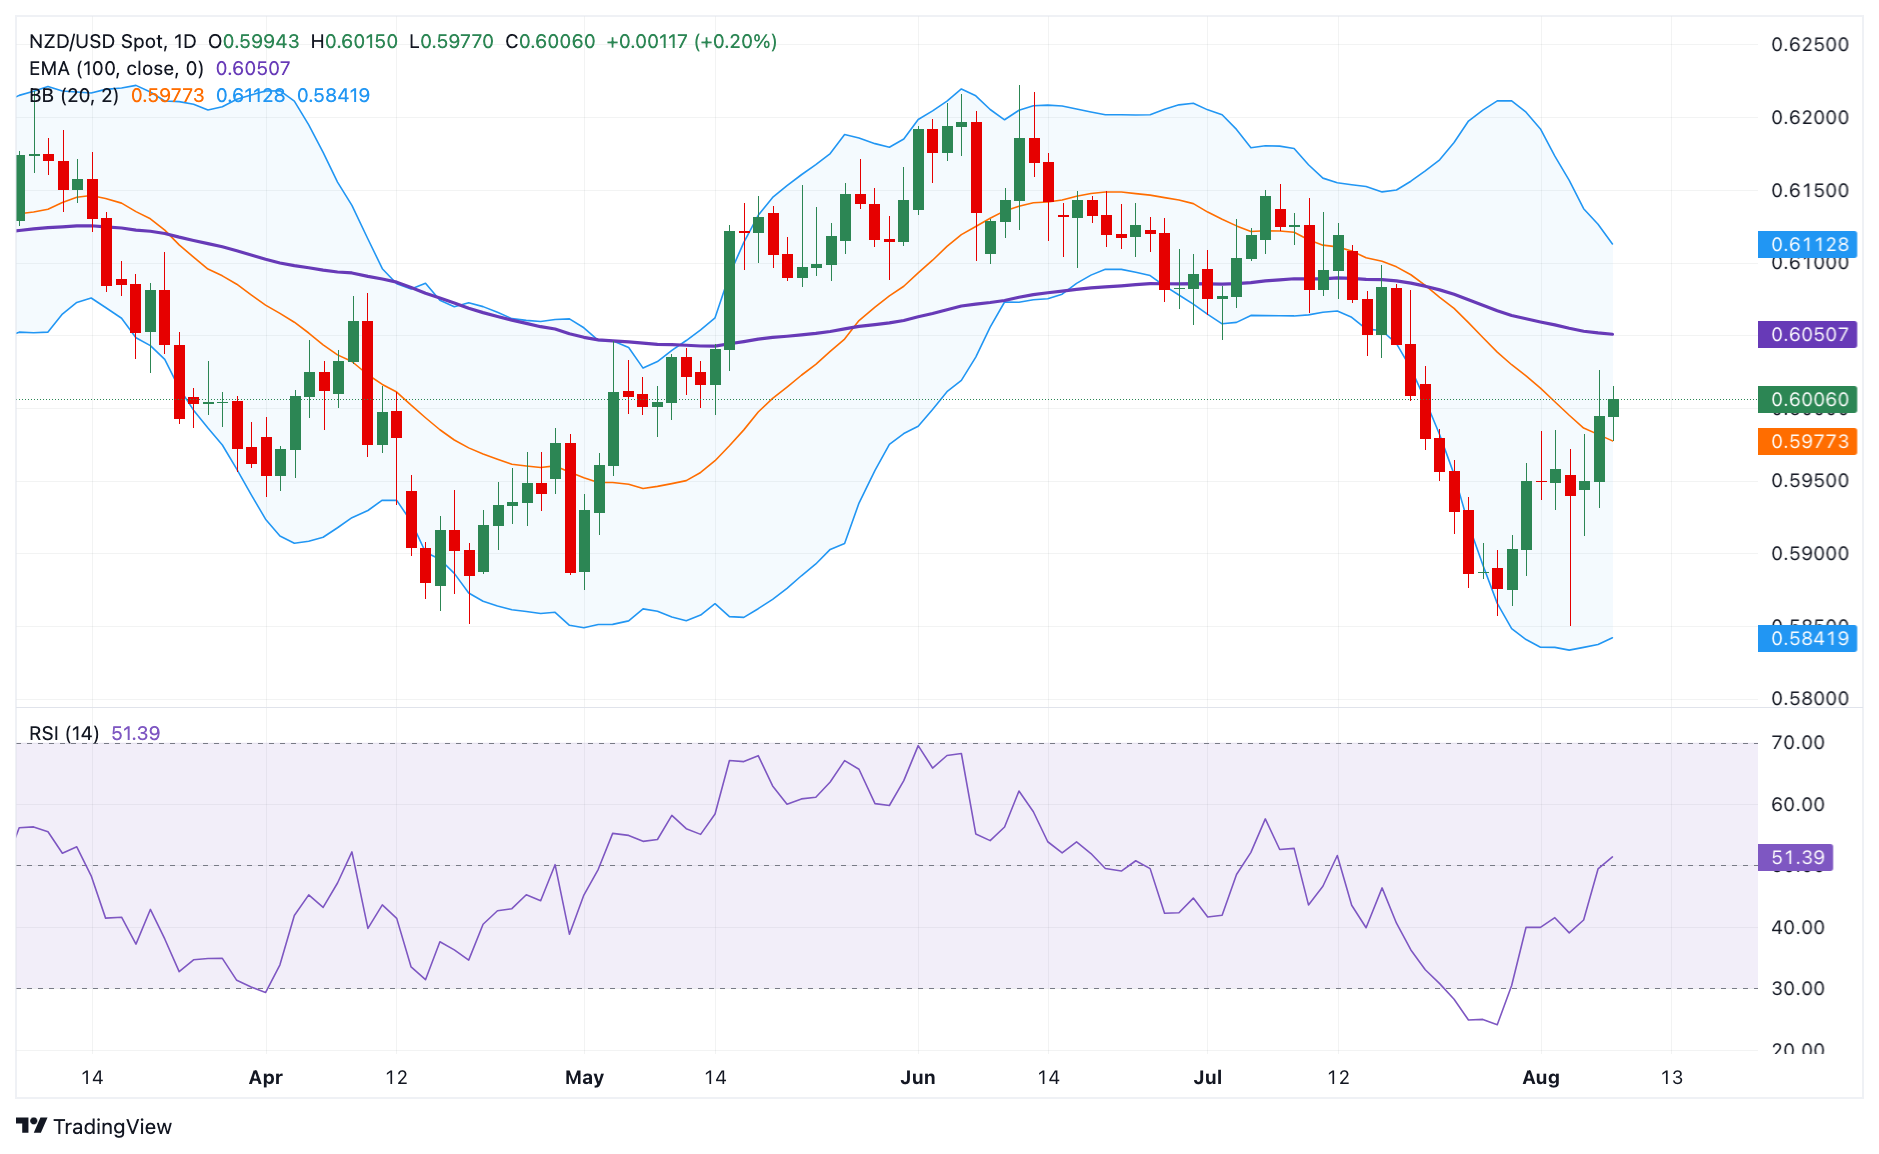
The New Zealand Dollar trades stronger on the day. However, the bearish stance of the NZD/USD pair prevails on the daily chart, with the price remaining below the key 100-day Exponential Moving Average (EMA). Nonetheless, the RSI hovers around the 50-midline, suggesting a potential for consolidation cannot be ruled out.
The 100-period EMA near 0.6050 could act as a potential upside barrier for NZD/USD. If the price manages to break above this level, it would indicate the possibility of further upside. The next hurdle is seen at 0.6112, the upper boundary of the Bollinger Band.
On the downside, the initial support level emerges at 0.5912, a low of August 6. Further south, the additional downside filter to watch is the 0.5850-0.5840 region, representing a low of April 19 and the lower limit of the Bollinger Band.
New Zealand Dollar FAQs
The New Zealand Dollar (NZD), also known as the Kiwi, is a well-known traded currency among investors. Its value is broadly determined by the health of the New Zealand economy and the country’s central bank policy. Still, there are some unique particularities that also can make NZD move. The performance of the Chinese economy tends to move the Kiwi because China is New Zealand’s biggest trading partner. Bad news for the Chinese economy likely means less New Zealand exports to the country, hitting the economy and thus its currency. Another factor moving NZD is dairy prices as the dairy industry is New Zealand’s main export. High dairy prices boost export income, contributing positively to the economy and thus to the NZD.
The Reserve Bank of New Zealand (RBNZ) aims to achieve and maintain an inflation rate between 1% and 3% over the medium term, with a focus to keep it near the 2% mid-point. To this end, the bank sets an appropriate level of interest rates. When inflation is too high, the RBNZ will increase interest rates to cool the economy, but the move will also make bond yields higher, increasing investors’ appeal to invest in the country and thus boosting NZD. On the contrary, lower interest rates tend to weaken NZD. The so-called rate differential, or how rates in New Zealand are or are expected to be compared to the ones set by the US Federal Reserve, can also play a key role in moving the NZD/USD pair.
Macroeconomic data releases in New Zealand are key to assess the state of the economy and can impact the New Zealand Dollar’s (NZD) valuation. A strong economy, based on high economic growth, low unemployment and high confidence is good for NZD. High economic growth attracts foreign investment and may encourage the Reserve Bank of New Zealand to increase interest rates, if this economic strength comes together with elevated inflation. Conversely, if economic data is weak, NZD is likely to depreciate.
The New Zealand Dollar (NZD) tends to strengthen during risk-on periods, or when investors perceive that broader market risks are low and are optimistic about growth. This tends to lead to a more favorable outlook for commodities and so-called ‘commodity currencies’ such as the Kiwi. Conversely, NZD tends to weaken at times of market turbulence or economic uncertainty as investors tend to sell higher-risk assets and flee to the more-stable safe havens.
Federal Reserve Bank of Kansas City Jeffrey Schmid said on Thursday that lowering monetary policy would be "appropriate" should inflation continue to come in low.
Key quotes
If inflation continues to come in low, it will be appropriate to adjust policy.
Current stance of Fed policy is 'not that restrictive.'
Financial conditions can impact real economy, but Fed must remain focused on dual mandate.
Fed is close but 'still not quite there' on reaching 2% inflation goal.
More confident that inflation is on path to target, given recent 'encouraging' inflation data.
Price data is volatile, should look for the worst in the data rather than the best.
Has been 'noticeable cooling' of labor market, but overall it still appears healthy.
Cooling labor market is a necessary condition for easing inflation.
The story could change if conditions were to weaken considerably.
The path of Fed policy will be determined by data and strength of the economy.
Would not want to assume any particular path or endpoint for policy rate.
Market reaction
The US Dollar Index (DXY) is trading 0.07% higher on the day at 103.28, as of writing.
Fed FAQs
Monetary policy in the US is shaped by the Federal Reserve (Fed). The Fed has two mandates: to achieve price stability and foster full employment. Its primary tool to achieve these goals is by adjusting interest rates. When prices are rising too quickly and inflation is above the Fed’s 2% target, it raises interest rates, increasing borrowing costs throughout the economy. This results in a stronger US Dollar (USD) as it makes the US a more attractive place for international investors to park their money. When inflation falls below 2% or the Unemployment Rate is too high, the Fed may lower interest rates to encourage borrowing, which weighs on the Greenback.
The Federal Reserve (Fed) holds eight policy meetings a year, where the Federal Open Market Committee (FOMC) assesses economic conditions and makes monetary policy decisions. The FOMC is attended by twelve Fed officials – the seven members of the Board of Governors, the president of the Federal Reserve Bank of New York, and four of the remaining eleven regional Reserve Bank presidents, who serve one-year terms on a rotating basis.
In extreme situations, the Federal Reserve may resort to a policy named Quantitative Easing (QE). QE is the process by which the Fed substantially increases the flow of credit in a stuck financial system. It is a non-standard policy measure used during crises or when inflation is extremely low. It was the Fed’s weapon of choice during the Great Financial Crisis in 2008. It involves the Fed printing more Dollars and using them to buy high grade bonds from financial institutions. QE usually weakens the US Dollar.
Quantitative tightening (QT) is the reverse process of QE, whereby the Federal Reserve stops buying bonds from financial institutions and does not reinvest the principal from the bonds it holds maturing, to purchase new bonds. It is usually positive for the value of the US Dollar.
- EUR/USD printed flat on Thursday as markets recover balance.
- Investors are refocusing on rate cut expectations.
- EU GDP, US CPI inflation prints due next week.
EUR/USD went nowhere fast on Thursday, testing the 1.0900 handle before wrapping up the day’s action close to where it started. Fiber flubbed a swing for the 1.1000 handle earlier this week, and momentum has drained out of the pair as investors continue to cool off after a surge of panic after last Friday’s misfire in US labor data.
Forex Today: Market turbulence dissipates
Friday is set to wrap up the trading week with little of note on the economic data docket and investors pivoting once more to keeping an eye out for signs the Federal Reserve (Fed) will be pushed into a rate cutting cycle in the next six weeks.
At the current cut, rate traders are pricing in roughly two-to-one odds of a 50-basis-point rate trim from the Fed on September 18, with a further two cuts expected through the rest of 2024. According to the CME’s FedWatch Tool, rate probabilities see an 83% chance of the Fed’s benchmark fed funds rate hitting 425-450 basis points by the end of December.
US Initial Jobless Claims for the week ended August 2 printed at 233K, less than the forecast 240K and easing back from the previous week’s 250K. Cooling initial unemployment figures are helping investors keep a lid on recent downturn fears after last week’s US labor data dump sparked a firm risk-off bid.
US data watchers will be on the lookout for a fresh round of producer and consumer-level inflation figures due next week. US Producer Price Index (PPI) inflation is slated for next Tuesday, with Consumer Price Index (CPI) inflation on the books for next Wednesday. Euro traders will also be looking out for a pan-EU update to Gross Domestic Product (GDP) growth numbers slated for early Wednesday, which are expected to hold steady in the second quarter at 0.3% MoM and 0.6% YoY.
EUR/USD technical outlook
Fiber continues to trade on the high side of a rough descending channel that has weighed on EUR/USD for the duration of 2024. The pair is holding just outside of recent technical ceiling barriers, but bullish momentum remains crimped below 1.1000.
A rising pattern of higher lows is solidifying on daily candlesticks, but EUR/USD is still poised for another dip back into the 200-day Exponential Moving Average (EMA) near 1.0800.
EUR/USD daily chart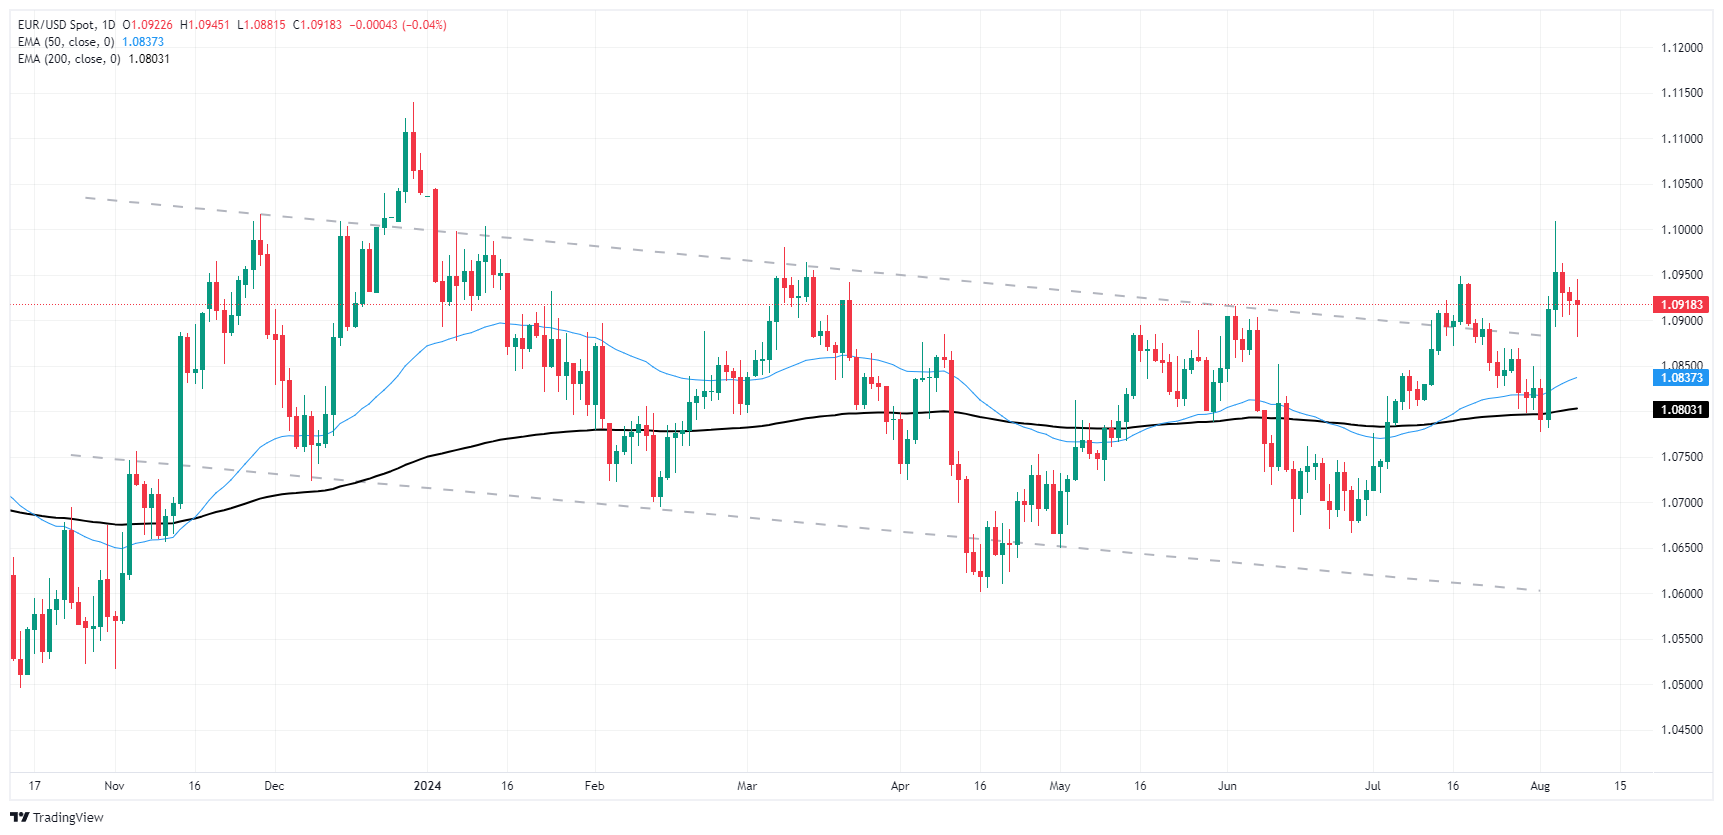
Euro FAQs
The Euro is the currency for the 20 European Union countries that belong to the Eurozone. It is the second most heavily traded currency in the world behind the US Dollar. In 2022, it accounted for 31% of all foreign exchange transactions, with an average daily turnover of over $2.2 trillion a day. EUR/USD is the most heavily traded currency pair in the world, accounting for an estimated 30% off all transactions, followed by EUR/JPY (4%), EUR/GBP (3%) and EUR/AUD (2%).
The European Central Bank (ECB) in Frankfurt, Germany, is the reserve bank for the Eurozone. The ECB sets interest rates and manages monetary policy. The ECB’s primary mandate is to maintain price stability, which means either controlling inflation or stimulating growth. Its primary tool is the raising or lowering of interest rates. Relatively high interest rates – or the expectation of higher rates – will usually benefit the Euro and vice versa. The ECB Governing Council makes monetary policy decisions at meetings held eight times a year. Decisions are made by heads of the Eurozone national banks and six permanent members, including the President of the ECB, Christine Lagarde.
Eurozone inflation data, measured by the Harmonized Index of Consumer Prices (HICP), is an important econometric for the Euro. If inflation rises more than expected, especially if above the ECB’s 2% target, it obliges the ECB to raise interest rates to bring it back under control. Relatively high interest rates compared to its counterparts will usually benefit the Euro, as it makes the region more attractive as a place for global investors to park their money.
Data releases gauge the health of the economy and can impact on the Euro. Indicators such as GDP, Manufacturing and Services PMIs, employment, and consumer sentiment surveys can all influence the direction of the single currency. A strong economy is good for the Euro. Not only does it attract more foreign investment but it may encourage the ECB to put up interest rates, which will directly strengthen the Euro. Otherwise, if economic data is weak, the Euro is likely to fall. Economic data for the four largest economies in the euro area (Germany, France, Italy and Spain) are especially significant, as they account for 75% of the Eurozone’s economy.
Another significant data release for the Euro is the Trade Balance. This indicator measures the difference between what a country earns from its exports and what it spends on imports over a given period. If a country produces highly sought after exports then its currency will gain in value purely from the extra demand created from foreign buyers seeking to purchase these goods. Therefore, a positive net Trade Balance strengthens a currency and vice versa for a negative balance.
- GBP/USD caught a bounce from the 200-day EMA on Thursday.
- Markets recover footing after US labor data plunge.
- Key inflation data for both the UK and US due next week.
GBP/USD found a step higher on Thursday, climbing roughly half of a percent as market sentiment continues to spool back up after a three-day plunge that kicked off in earnest late last week following a misprint in US Nonfarm Payrolls (NFP) figures.
Forex Today: Market turbulence dissipates
Friday will close out the trading week with a thin economic calendar on both sides of the Atlantic, and markets will be gearing up for fresh updates on inflation in both the UK and the US. The Pound Sterling took a beating after a recent quarter-point rate cut from the Bank of England (BoE), and markets are on the lookout for signs of further UK rate cuts and an initial rate trim from the US Federal Reserve (Fed) expected in Semtember.
US Initial Jobless Claims for the week ended August 2 printed at 233K, less than the forecast 240K and easing back from the previous week’s 250K. Cooling initial unemployment figures are helping investors keep a lid on recent downturn fears after last week’s US labor data dump sparked a firm risk-off bid.
US data watchers will be looking forward to a fresh round of producer—and consumer-level inflation figures due next week. US Producer Price Index (PPI) inflation is slated for next Tuesday, with Consumer Price Index (CPI) inflation on the books for next Wednesday. On the UK side, UK labor figures are expected on Tuesday, followed by a July update on UK CPI inflation.
GBP/USD price forecast
Cable’s bullish bounce on Thursday is poised to chalk in a topside run after bids pinged off the 200-day Exponential Moving Average (EMA) at 1.2672. Bidders will be looking to claw back chart paper lost in a -2.9% backslide from 12-month highs set in mid-July near 1.3050.
Bullish momentum will need to climb back over the 50-day EMA at 1.2780 with price action mired in divergence territory between the 50- and 200-day EMAs.
GBP/USD daily chart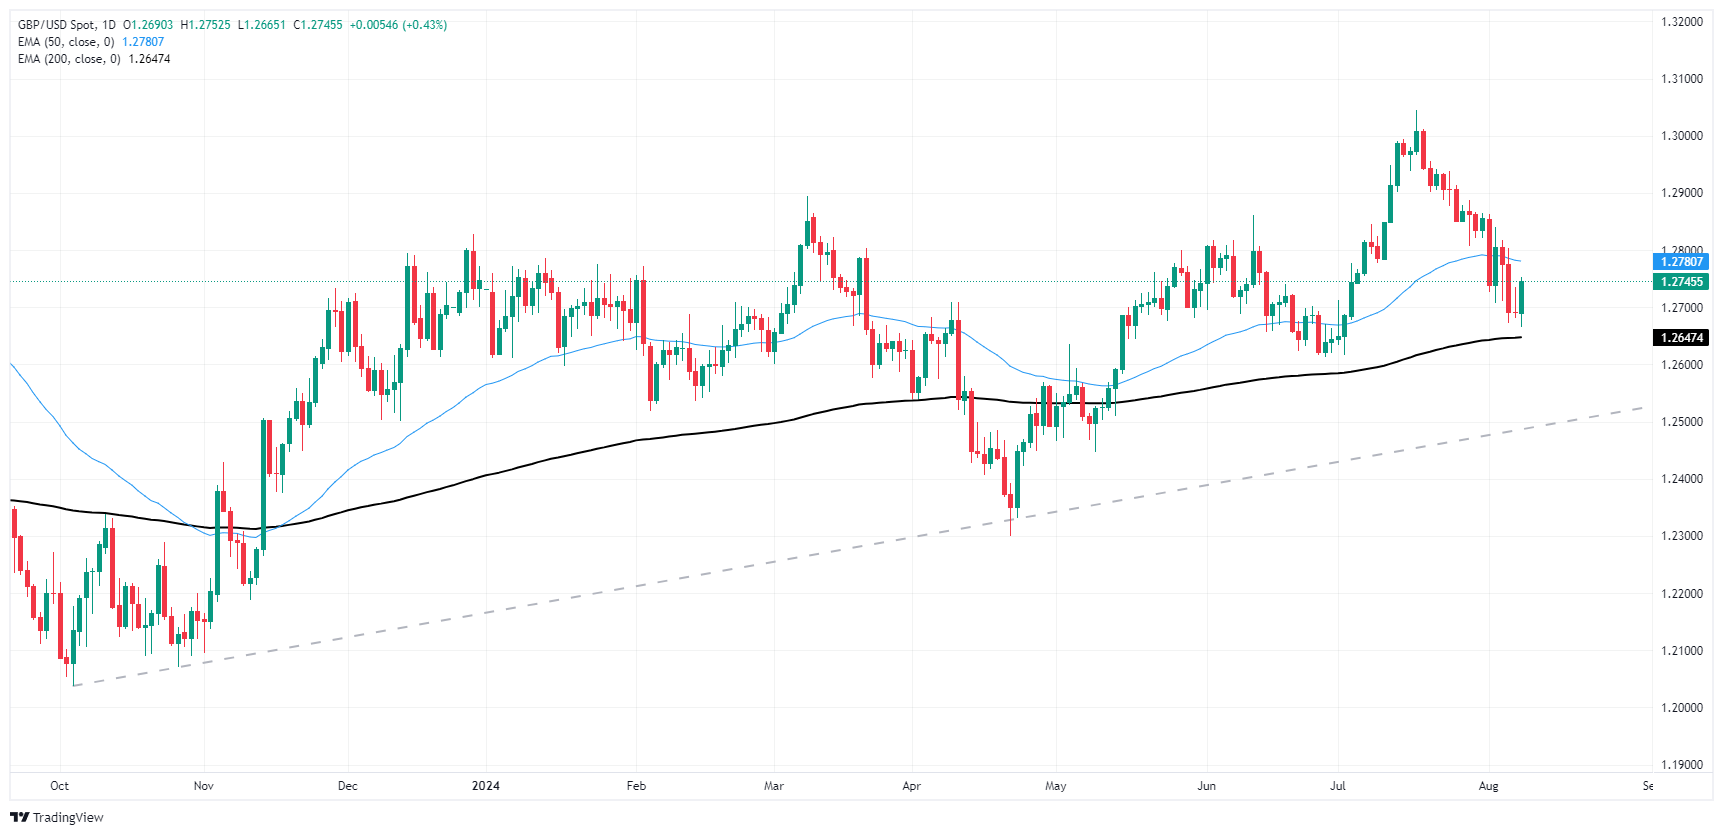
Pound Sterling FAQs
The Pound Sterling (GBP) is the oldest currency in the world (886 AD) and the official currency of the United Kingdom. It is the fourth most traded unit for foreign exchange (FX) in the world, accounting for 12% of all transactions, averaging $630 billion a day, according to 2022 data. Its key trading pairs are GBP/USD, aka ‘Cable’, which accounts for 11% of FX, GBP/JPY, or the ‘Dragon’ as it is known by traders (3%), and EUR/GBP (2%). The Pound Sterling is issued by the Bank of England (BoE).
The single most important factor influencing the value of the Pound Sterling is monetary policy decided by the Bank of England. The BoE bases its decisions on whether it has achieved its primary goal of “price stability” – a steady inflation rate of around 2%. Its primary tool for achieving this is the adjustment of interest rates. When inflation is too high, the BoE will try to rein it in by raising interest rates, making it more expensive for people and businesses to access credit. This is generally positive for GBP, as higher interest rates make the UK a more attractive place for global investors to park their money. When inflation falls too low it is a sign economic growth is slowing. In this scenario, the BoE will consider lowering interest rates to cheapen credit so businesses will borrow more to invest in growth-generating projects.
Data releases gauge the health of the economy and can impact the value of the Pound Sterling. Indicators such as GDP, Manufacturing and Services PMIs, and employment can all influence the direction of the GBP. A strong economy is good for Sterling. Not only does it attract more foreign investment but it may encourage the BoE to put up interest rates, which will directly strengthen GBP. Otherwise, if economic data is weak, the Pound Sterling is likely to fall.
Another significant data release for the Pound Sterling is the Trade Balance. This indicator measures the difference between what a country earns from its exports and what it spends on imports over a given period. If a country produces highly sought-after exports, its currency will benefit purely from the extra demand created from foreign buyers seeking to purchase these goods. Therefore, a positive net Trade Balance strengthens a currency and vice versa for a negative balance.
- Silver trades at $27.49, rising over 3.50% after reclaiming the $27.00 level.
- Path of least resistance remains bearish; below $27.00 targets $26.45 and $26.11 support levels.
- Above $27.56, resistance levels are $28.00 and the August 5 high at $28.67.
Silver price surged on Thursday and gained over 3.50% as traders reclaimed the $27.00 figure although strong US data, bolstered the Greenback. Despite that, the XAG/USD bounced off weekly lows of $26.45 and hit a new weekly high before stabilizing at the current spot price. Silver trades at $27.49 as Friday’s Asian session begins
XAG/USD Price Forecast: Technical outlook
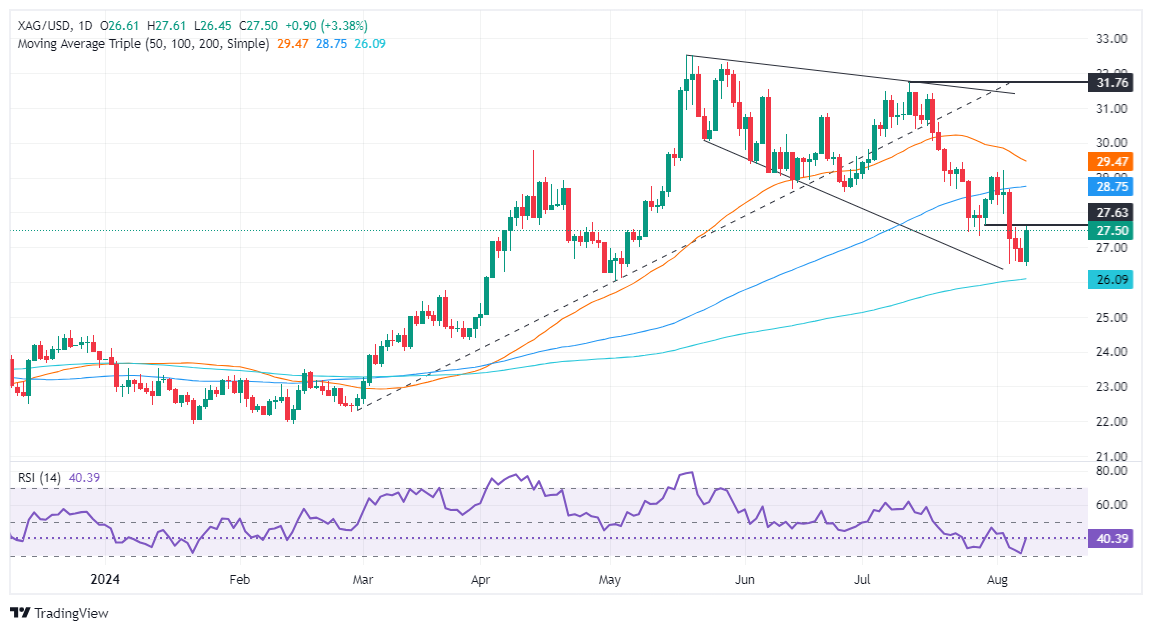
Silver prices climbed above $27.00 yet remain below the 100- and 50-day moving averages (DMAs) at $28.76 and $29.79, hinting that sellers are in control. The Relative Strength Index (RSI), which remains bearish, further confirms this.
Hence, the path of least resistance is tilted to the downside. if XAG/USD drops below $27.00, the next support would be the weekly low of $26.45. On further losses, the 200-DMA at $26.11 emerges as the next support, followed by the psychological $26.00 figure.
Conversely, if XAG/USD buyers reclaim $27.56, the next resistance would be the $28.00 mark ahead of the August 5 high at $28.67.
XAG/USD Price Action – Daily Chart
Silver FAQs
Silver is a precious metal highly traded among investors. It has been historically used as a store of value and a medium of exchange. Although less popular than Gold, traders may turn to Silver to diversify their investment portfolio, for its intrinsic value or as a potential hedge during high-inflation periods. Investors can buy physical Silver, in coins or in bars, or trade it through vehicles such as Exchange Traded Funds, which track its price on international markets.
Silver prices can move due to a wide range of factors. Geopolitical instability or fears of a deep recession can make Silver price escalate due to its safe-haven status, although to a lesser extent than Gold's. As a yieldless asset, Silver tends to rise with lower interest rates. Its moves also depend on how the US Dollar (USD) behaves as the asset is priced in dollars (XAG/USD). A strong Dollar tends to keep the price of Silver at bay, whereas a weaker Dollar is likely to propel prices up. Other factors such as investment demand, mining supply – Silver is much more abundant than Gold – and recycling rates can also affect prices.
Silver is widely used in industry, particularly in sectors such as electronics or solar energy, as it has one of the highest electric conductivity of all metals – more than Copper and Gold. A surge in demand can increase prices, while a decline tends to lower them. Dynamics in the US, Chinese and Indian economies can also contribute to price swings: for the US and particularly China, their big industrial sectors use Silver in various processes; in India, consumers’ demand for the precious metal for jewellery also plays a key role in setting prices.
Silver prices tend to follow Gold's moves. When Gold prices rise, Silver typically follows suit, as their status as safe-haven assets is similar. The Gold/Silver ratio, which shows the number of ounces of Silver needed to equal the value of one ounce of Gold, may help to determine the relative valuation between both metals. Some investors may consider a high ratio as an indicator that Silver is undervalued, or Gold is overvalued. On the contrary, a low ratio might suggest that Gold is undervalued relative to Silver.
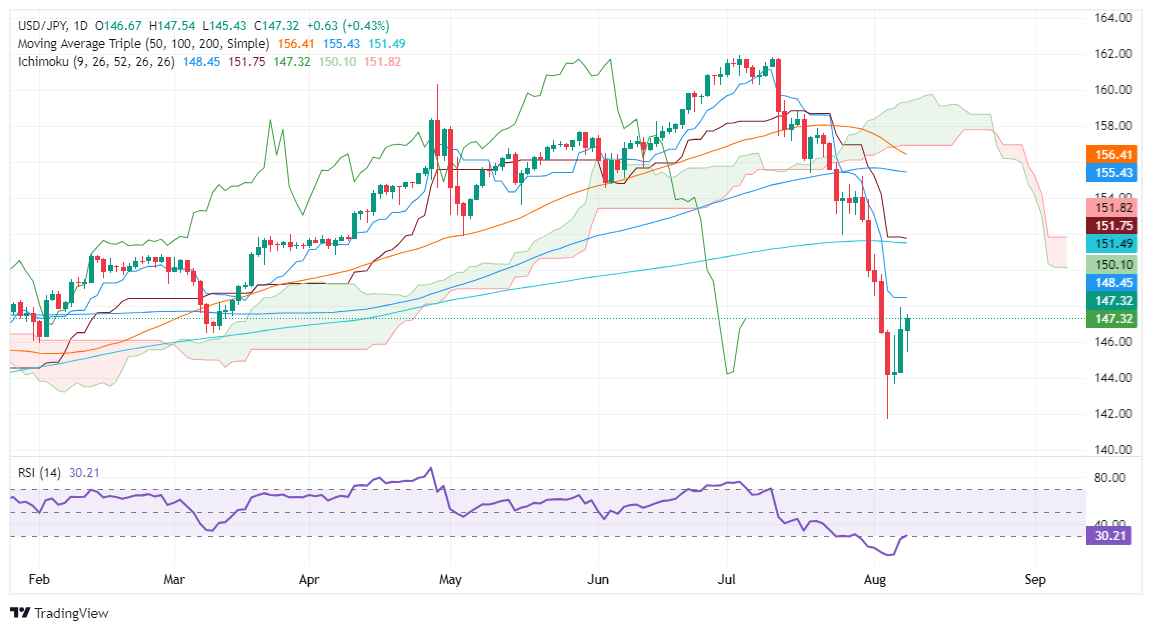
- USD/JPY trades at 147.28, up 0.38%, still unable to clear 147.89 resistance.
- Bearish bias persists despite recovery from under 144.00 on dovish BoJ comments.
- A break above 148.00 targets 148.45 and 149.00; below 147.00 sees support at 145.44 and 144.28.
The USD/JPY rises for the third straight session. However, it remains within familiar levels, unable to decisively clear the August 7 daily high at 147.89, after solid US jobs data boosted the Greenback. At the time of writing, the pair trades at 147.28, up 0.38%
USD/JPY Price Forecast: Technical outlook
The USD/JPY is bearishly biased despite registering a recovery that saw the pair rally from under 144.00 to the current exchange rate after dovish comments by a Bank of Japan Deputy Governor.
Momentum remains bearish, even though the Relative Strength Index (RSI) exited from oversold territory, but its slope remains flat, hinting at a USD/JPY consolidation.
If the pair climbs past 148.00, the next resistance will be the Tenkan-Sen at 148.45. Prices could follow an upward path if they rise above 149.00, challenging the psychological 150.00 figure.
Conversely, and the path of least resistance, if USD/JPY drops below 147.00, the next support woud be the August 8 low of 145.44, followed by August 7 bottom at 144.28. Once those levels are surpassed, the next support would be the August 6 daily low at 143.61, followed by the latest cycle low of 141.69.
USD/JPY Price Action – Daily Chart
Japanese Yen FAQs
The Japanese Yen (JPY) is one of the world’s most traded currencies. Its value is broadly determined by the performance of the Japanese economy, but more specifically by the Bank of Japan’s policy, the differential between Japanese and US bond yields, or risk sentiment among traders, among other factors.
One of the Bank of Japan’s mandates is currency control, so its moves are key for the Yen. The BoJ has directly intervened in currency markets sometimes, generally to lower the value of the Yen, although it refrains from doing it often due to political concerns of its main trading partners. The current BoJ ultra-loose monetary policy, based on massive stimulus to the economy, has caused the Yen to depreciate against its main currency peers. This process has exacerbated more recently due to an increasing policy divergence between the Bank of Japan and other main central banks, which have opted to increase interest rates sharply to fight decades-high levels of inflation.
The BoJ’s stance of sticking to ultra-loose monetary policy has led to a widening policy divergence with other central banks, particularly with the US Federal Reserve. This supports a widening of the differential between the 10-year US and Japanese bonds, which favors the US Dollar against the Japanese Yen.
The Japanese Yen is often seen as a safe-haven investment. This means that in times of market stress, investors are more likely to put their money in the Japanese currency due to its supposed reliability and stability. Turbulent times are likely to strengthen the Yen’s value against other currencies seen as more risky to invest in.
- NZD/JPY consolidates sideways as technical indicators show mixed signals.
- The RSI is near the oversold terrain but rising, while the MACD shows decreasing red bars.
- Volume has been decreasing, indicating that selling pressure may be easing.
The NZD/JPY pair traded sideways on Thursday, consolidating above the 88.00 level. The pair has been in a downtrend since early August, but it has found some support at the 88.00 level. The Relative Strength Index (RSI) is currently at 31, which is slightly oversold. The Moving Average Convergence Divergence (MACD) is also showing signs of a potential reversal, with decreasing red bars. Additionally, the pair's volume has been decreasing in recent sessions, which could indicate that the selling pressure is easing.
NZD/JPY daily chart
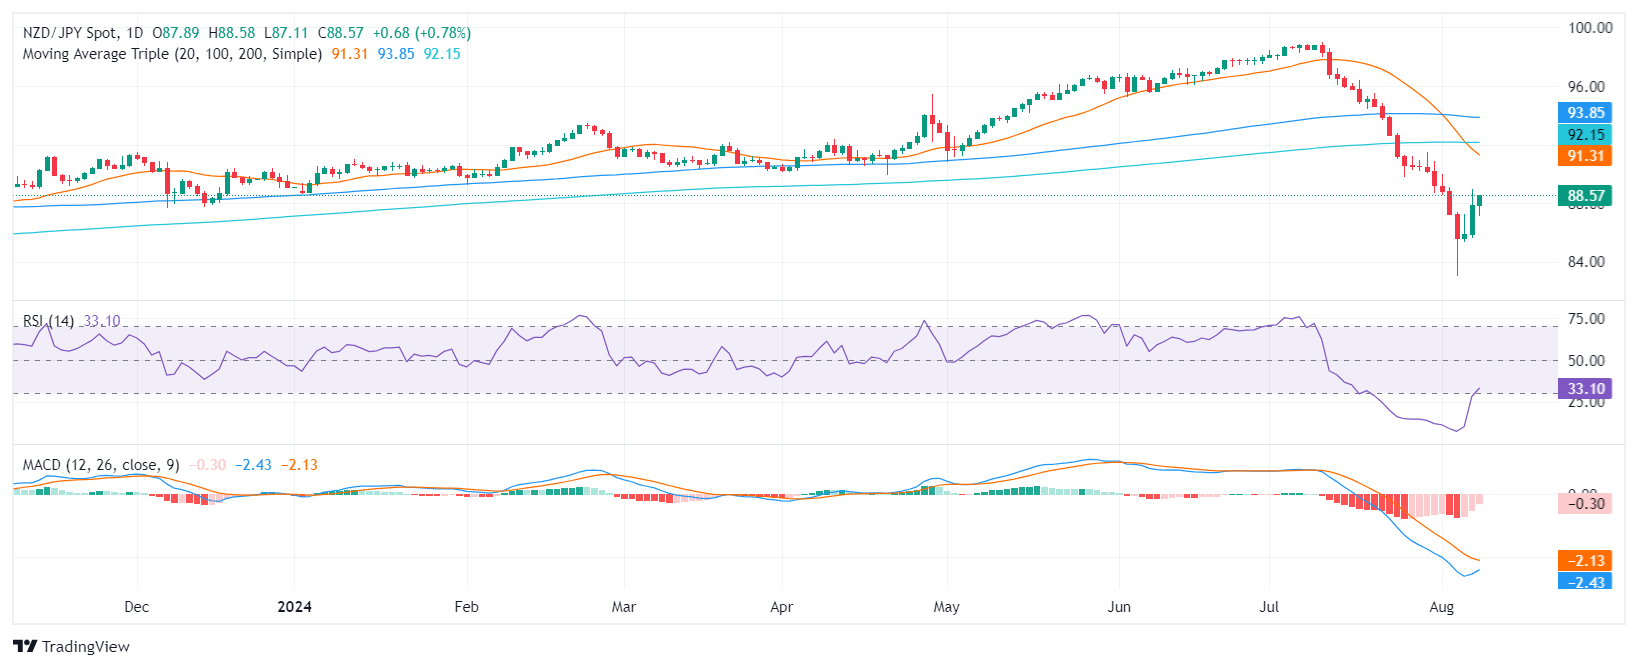
The NZD/JPY pair is consolidating above the 87.00 level, and the bulls are attempting to push the pair towards the 90.00 zone. If the bulls are successful, it could open the door to further gains towards the 91.00 zone. However, if the bears manage to push the pair below the 87.00 level, it could lead to a deeper correction.
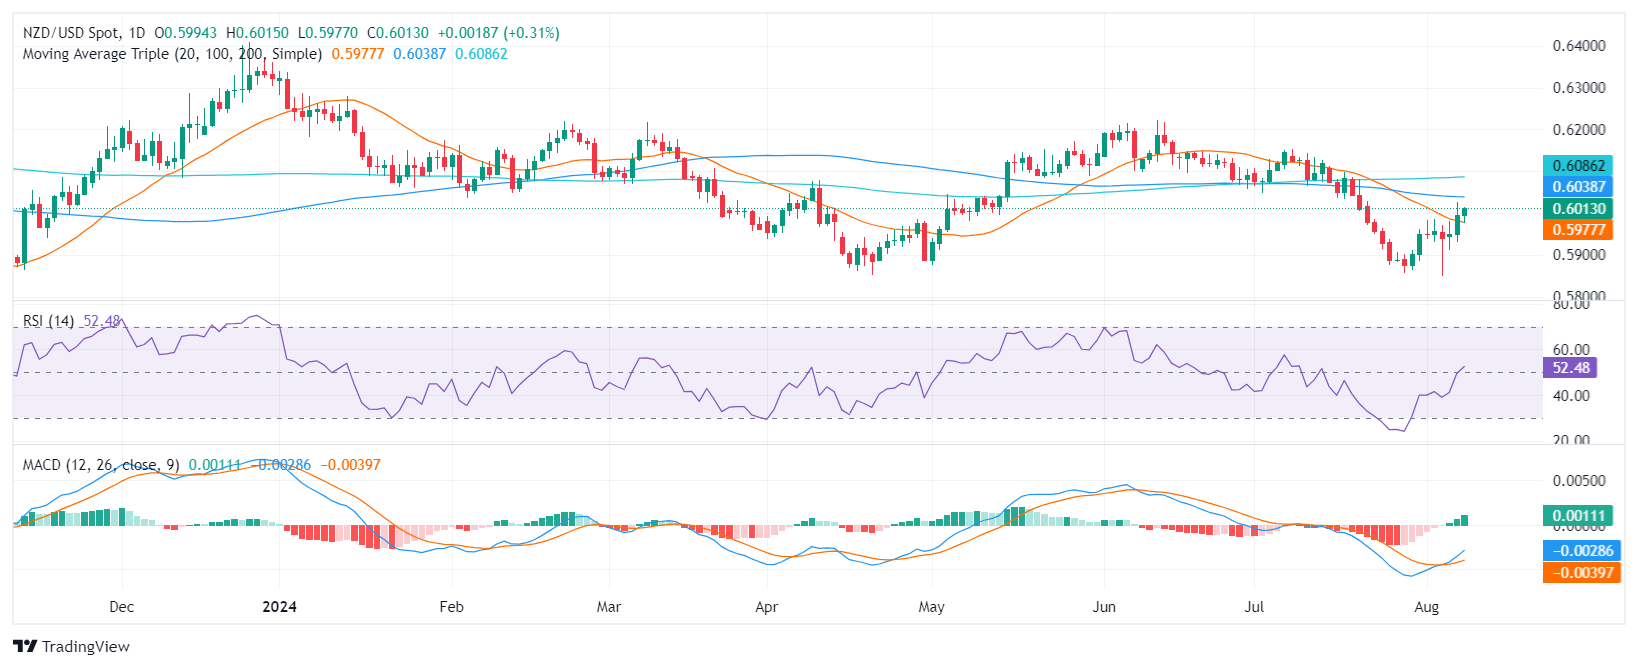
- NZD/USD bulls stand around 0.6000, facing strong resistance.
- RSI at 52 and MACD indicates positive signs.
- The neutral trend remains, with 0.6000 as resistance and 0.5950 as support.
On Thursday, the NZD/USD pair extended its gains, mildly rising to 0.6000, a key resistance level which if it is secured, would improve the outlook. The fact the pair is now above the 20-day Simple Moving Average (SMA) is also good for the pair.
The daily chart shows that the Relative Strength Index (RSI) is at 52, while the Moving Average Convergence Divergence (MACD) also shows a bullish bias, with rising green bars. This suggests that the Kiwi is in a neutral-to-bullish trend as the pair is recovering rather than in a bullish trend. In addition, the volume has been increasing in the last few sessions, which is a positive sign.
The pair is facing resistance at 0.6000 and support at 0.5950. A break above 0.6000 could open the door to further gains to 0.6100, while a break below 0.5950 could lead to a deeper correction to test the 0.5900 support.
NZD/USD Daily chart
Federal Reserve (Fed) Bank of Richmond President Thomas Barkin noted on Thursday that the key thing to watch moving forward will be jobs figures, softly suggesting that equity markets may have overreacted to recent soft data.
Key highlights
Most hurricanes and tropical storms don't affect the macroeconomy.
What I hear from folks on the ground in the labor market is people are cutting back on hiring, but not firing.
No hiring, no firing, that's what we see in the data, and from here it could go either way.
The math of that suggests the unemployment rate goes up.
What would make you more worried is if job growth started to disappear.
For me, the case for lowering in July would have been either absolute conviction that the labor market was on the precipice, or if you thought you had inflation under control.
The equity markets don't feel like there's a big cataclysmic event that just happened.
The financial markets are looking not just at the modal outlook but also at the tails.
The US may be heading into a long-term worker shortage.
Federal Reserve (Fed) Bank of Chicago President Austan Goolsbee hit wires on Thursday, noting the Fed's tricky path forward and highlighting the need to keep a close eye on the jobs market.
Key highlights
The question is if the job market will hold, or keep worsening.
We need to see more than payrolls and more than one month.
We are getting back to more normal conditions in the US economy.
Policy is tight.
If we're too tight for too long, we need to watch the real economy.
Whatever the Fed does, somebody is going to say they don't like it.
- AUD/JPY bulls pushed the pair higher to 96.80 on Thursday, extending its recovery.
- Technical indicators are improving, the RSI scaped oversold terrain and the MACD printed decreasing red bars below its neutral line.
In Thursday's session, the AUD/JPY pair rose by 1.20% to 96.80, continuing its recovery mode after bottoming out at 90.10 on August 5th.
Technical indicators are improving. The Relative Strength Index (RSI) is rising and recently crossed above the oversold threshold, indicating a gain in momentum. Meanwhile, the Moving Average Convergence Divergence (MACD) is decreasing red bars below its neutral line but is losing momentum, suggesting a potential loss in bearish momentum.
AUD/JPY daily chart
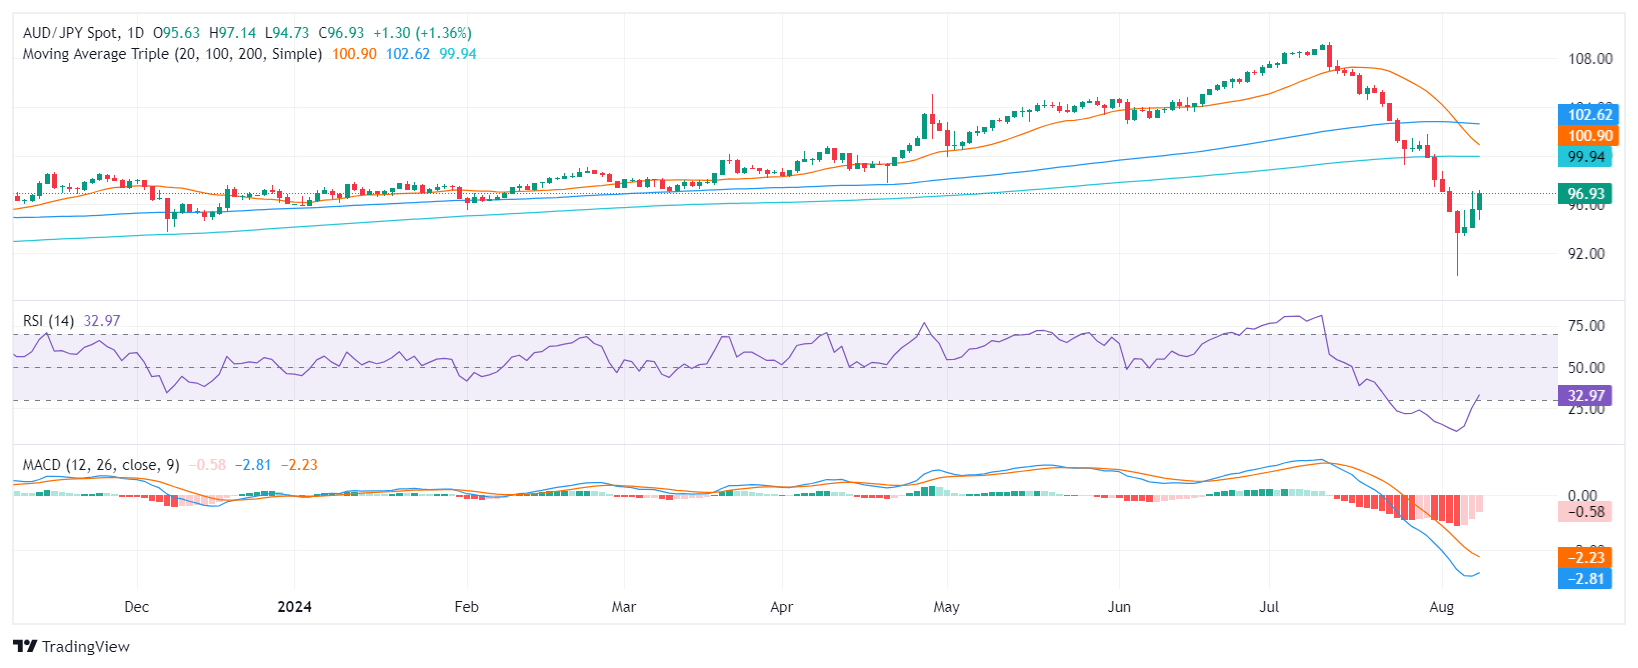
Taking into account the above and Thursday's wider market risk appetite, the AUD/JPY could extend its advance towards 98.00. However, if the pair fails to break above 98.00, then it could correct lower. Immediate support is seen at 96.00 and then at 95.35. Other resistances are seen at 98.00 and then at the psychological 100.00 mark.
- AUD/USD extended its recovery, rising near 0.6580.
- RBA doubled down on its hawkish rhetoric on Thursday.
- Commodity prices are also providing the AUD with traction.
The AUD/USD pair recorded an upturn at 0.6580 during Thursday's sessions, a notable rise by 0.80%. The uplift is linked to a mix of the Reserve Bank of Australia's (RBA) recent echo of their hawkish tone and an increase in commodity prices, hence making the Australian Dollar an eminent performer.
Due to the mixed Australian economic outlook and the RBA’s hawkish stance, markets are now pricing just 25 bps of easing in 2024.
Daily digest market movers: RBA's hawkish tone directs the AUD
- The Reserve Bank of Australia firmly held rates steady at 4.35%, strongly echoing "the Board is not ruling anything in or out”.
- Importantly, the Bank warned about the need to stay vigilant toward potential upside risks to inflation, indicating no quick turnaround in policies.
- RBA's Governor Bullock clearly stressed on Thursday that there is lesser necessity for rate cuts. She struck a hawkish tone, stating that the board "will not hesitate to raise rates if it needs to" to combat persisting inflation.
- Australian interest rate futures were quick to revise from almost 50 bps of cuts by the end of the year to 25 bps.
AUD/USD technical outlook: Volatility and indicators adjust to RBA decision
The AUD/USD in recent sessions has been trading within a specified range between the support at 0.6350 and resistance at 0.6590. The Relative Strength Index (RSI) rose toward 40, indicating a balance between buying and selling pressure, but mostly signifying a recovery of bullish sentiment.
The Moving Average Convergence Divergence (MACD) displays a series of decreasing red bars, aligning with a potential deceleration of bearish momentum.
Australian Dollar FAQs
One of the most significant factors for the Australian Dollar (AUD) is the level of interest rates set by the Reserve Bank of Australia (RBA). Because Australia is a resource-rich country another key driver is the price of its biggest export, Iron Ore. The health of the Chinese economy, its largest trading partner, is a factor, as well as inflation in Australia, its growth rate and Trade Balance. Market sentiment – whether investors are taking on more risky assets (risk-on) or seeking safe-havens (risk-off) – is also a factor, with risk-on positive for AUD.
The Reserve Bank of Australia (RBA) influences the Australian Dollar (AUD) by setting the level of interest rates that Australian banks can lend to each other. This influences the level of interest rates in the economy as a whole. The main goal of the RBA is to maintain a stable inflation rate of 2-3% by adjusting interest rates up or down. Relatively high interest rates compared to other major central banks support the AUD, and the opposite for relatively low. The RBA can also use quantitative easing and tightening to influence credit conditions, with the former AUD-negative and the latter AUD-positive.
China is Australia’s largest trading partner so the health of the Chinese economy is a major influence on the value of the Australian Dollar (AUD). When the Chinese economy is doing well it purchases more raw materials, goods and services from Australia, lifting demand for the AUD, and pushing up its value. The opposite is the case when the Chinese economy is not growing as fast as expected. Positive or negative surprises in Chinese growth data, therefore, often have a direct impact on the Australian Dollar and its pairs.
Iron Ore is Australia’s largest export, accounting for $118 billion a year according to data from 2021, with China as its primary destination. The price of Iron Ore, therefore, can be a driver of the Australian Dollar. Generally, if the price of Iron Ore rises, AUD also goes up, as aggregate demand for the currency increases. The opposite is the case if the price of Iron Ore falls. Higher Iron Ore prices also tend to result in a greater likelihood of a positive Trade Balance for Australia, which is also positive of the AUD.
The Trade Balance, which is the difference between what a country earns from its exports versus what it pays for its imports, is another factor that can influence the value of the Australian Dollar. If Australia produces highly sought after exports, then its currency will gain in value purely from the surplus demand created from foreign buyers seeking to purchase its exports versus what it spends to purchase imports. Therefore, a positive net Trade Balance strengthens the AUD, with the opposite effect if the Trade Balance is negative.
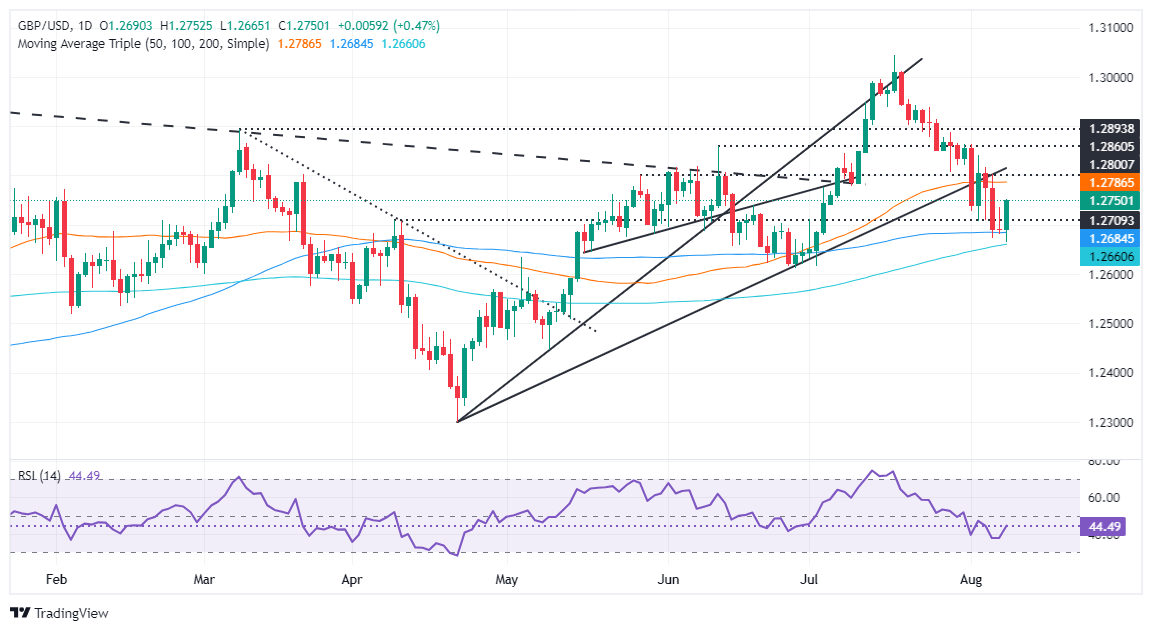
- Pound Sterling surges 0.40% after bouncing off weekly lows near 1.2654.
- RSI indicates upward momentum, with buyers aiming for 1.2785 and 1.2800.
- A drop below 1.2700 could test 100 and 200-DMAs, leading to 1.2600.
The Pound Sterling made a U-turn and surged during the North American session after falling shy of testing the 200-day moving average (DMA) at 1.2654, yet buyers stepped in and lifted the GBP/USD pair. At the time of writing, the major trades at 1.2744 gaining over 0.40%.
GBP/USD Price Forecast: Technical outlook
The GBP/USD bounced off the weekly lows, yet it’s not out of the woods. Momentum remains in the seller’s favor, but in the near term, buyers are in charge. The Relative Strength Index (RSI) remains below the 50-neutral line, but it’s aiming upwards.
For a bullish resumption, buyers need to reclaim the 50-DMA at 1.2785, followed by the 1.2800 figure. Once surpassed, the next stop would be the July 29 peak at 1.2888 before challenging 1.2900.
Conversely, and the path of least resistance, if sellers drag the exchange rate underneath 1.2700, this could exacerbate a test of the 100 and 200-DMAs, each at 1.2683 and 1.2654, respectively. On further weakness, the next stop would be the 1.2600 psychological figure.
GBP/USD Price Action – Daily Chart
Pound Sterling FAQs
The Pound Sterling (GBP) is the oldest currency in the world (886 AD) and the official currency of the United Kingdom. It is the fourth most traded unit for foreign exchange (FX) in the world, accounting for 12% of all transactions, averaging $630 billion a day, according to 2022 data. Its key trading pairs are GBP/USD, aka ‘Cable’, which accounts for 11% of FX, GBP/JPY, or the ‘Dragon’ as it is known by traders (3%), and EUR/GBP (2%). The Pound Sterling is issued by the Bank of England (BoE).
The single most important factor influencing the value of the Pound Sterling is monetary policy decided by the Bank of England. The BoE bases its decisions on whether it has achieved its primary goal of “price stability” – a steady inflation rate of around 2%. Its primary tool for achieving this is the adjustment of interest rates. When inflation is too high, the BoE will try to rein it in by raising interest rates, making it more expensive for people and businesses to access credit. This is generally positive for GBP, as higher interest rates make the UK a more attractive place for global investors to park their money. When inflation falls too low it is a sign economic growth is slowing. In this scenario, the BoE will consider lowering interest rates to cheapen credit so businesses will borrow more to invest in growth-generating projects.
Data releases gauge the health of the economy and can impact the value of the Pound Sterling. Indicators such as GDP, Manufacturing and Services PMIs, and employment can all influence the direction of the GBP. A strong economy is good for Sterling. Not only does it attract more foreign investment but it may encourage the BoE to put up interest rates, which will directly strengthen GBP. Otherwise, if economic data is weak, the Pound Sterling is likely to fall.
Another significant data release for the Pound Sterling is the Trade Balance. This indicator measures the difference between what a country earns from its exports and what it spends on imports over a given period. If a country produces highly sought-after exports, its currency will benefit purely from the extra demand created from foreign buyers seeking to purchase these goods. Therefore, a positive net Trade Balance strengthens a currency and vice versa for a negative balance.
Another positive session saw the Greenback advance to weekly tops, helped by the extra depreciation of the Japanese currency and the unabated march north in US yields across the spectrum.
Here is what you need to know on Friday, August 9:
The USD Index (DXY) climbed to four-day highs beyond 103.50 in the context of higher yields globally and dominating risk-on sentiment. The US docket will be empty on August 9.
EUR/USD clinched its third consecutive daily retracement, breaking below the 1.0900 support in response to extra gains in the US Dollar. Germany’s final Inflation Rate will be the only scheduled release on the euro calendar on August 9.
GBP/USD rapidly set aside an early drop to multi-week lows near 1.2660, reclaiming the area above 1.2700 the figure amidst the prevailing appetite for the risk complex. There will be no data releases in the UK on August 9.
USD/JPY extended its weekly advance following further selling of the Japanese yen and the persistent risk-on mood among traders. On August 9, there will only be a short-term bill auction.
An extra rebound lifted AUD/USD to new two-week peaks near 0.6580, up for the third consecutive day on Thursday. The NAB Business Confidence index is only due on August 9.
WTI prices rose further and clinched weekly tops past the $76.00 mark per barrel, helped by persevering geopolitical concerns in the Middle East.
Gold prices advanced to three-day highs near $2,425 per ounce troy following hopes of a 50 bps rate cut by the Fed beyond the summer. Silver rallied more than 3 % to revisit the $27.60 region per ounce, or multi-day highs.
- Gold price rises past $2,400 figure, brushing aside US Dollar strength and high yields.
- US Initial Jobless Claims drop, Continuing Claims hit highest level since November 2021.
- Geopolitical risks from Iran and Lebanon's potential retaliation against Israel support Gold's allure.
Gold price climbed during the North American session on Thursday after solid data from the United States (US) underpinned the Greenback. Despite that, the precious metal brushed aside the strength of the US Dollar and the rise in US yields. At the time of writing, the XAU/USD trades at $2,419, up over 1.40%.
The US Bureau of Labor Statistics (BLS) released a solid jobs report, as the number of Americans applying for unemployment benefits dipped below estimates and last week's data, a tailwind for the Greenback.
Further data showed that Continuing Claims rose to their highest level since November 2021.
The buck reacted positively, as shown by the US Dollar Index (DXY), which tracks the American currency against six other currencies. It rose by 0.10% to 103.28, while the 10-year benchmark note yield pierced the 4.0% threshold.
Bullion is set to attract investors' interest amid heightened geopolitical risks due to the latest developments in the Middle East. Although the market mood remains positive, fears lurk that retaliation from Iran and Lebanon against Israel are forthcoming.
Daily digest market movers: Gold price on the defensive amid risk-on mood
- Worries of a US recession had faded after US Initial Jobless Claims for the week ending August 3 dipped from 250K to 233K, below forecasts of 240K. Continuing Claims through July 27 increased from 1,869K to 1,875K, exceeding the forecast of 1,870K.
- The golden metal price gathered traction despite reports that China’s central bank restrained itself from purchasing Gold for the third consecutive month.
- The CME FedWatch Tool shows that the odds for a 50-basis-point (bps) cut at the September meeting were lowered from 63.5% on Wednesday to 57.5%.
- The Fed decided to hold rates unchanged last week but indicated that favorable data on inflation and further weakening in the labor market could prompt action.
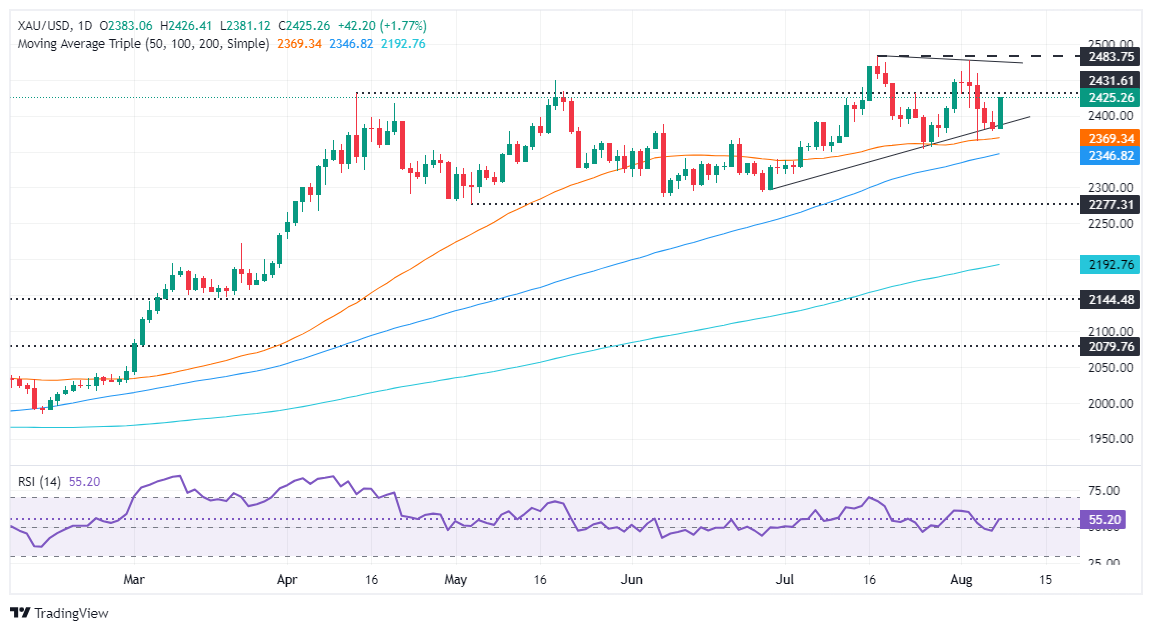
Technical analysis: Gold price counterattacks and rises toward $2,450
The XAU/USD rallies sharply, breaking new weekly highs of $2,424, with buyers eyeing the psychological $2,450 level mark. The Relative Strength Index (RSI) shows buyers are gathering momentum, meaning higher prices are on the cards.
If buyers push prices above $2,450, the next stop would be the August 2 high at $2,477, ahead of testing the all-time high at $2,483. On further strength, the $2,500 figure is up for grabs.
On the other hand, if XAU/USD drops below the 50-day Simple Moving Average (SMA) at $2,368, this would exacerbate a drop to the 100-day SMA at $2,346, followed by a support trendline around $2,316. Once cleared, the next support would be $2,300.
Gold FAQs
Gold has played a key role in human’s history as it has been widely used as a store of value and medium of exchange. Currently, apart from its shine and usage for jewelry, the precious metal is widely seen as a safe-haven asset, meaning that it is considered a good investment during turbulent times. Gold is also widely seen as a hedge against inflation and against depreciating currencies as it doesn’t rely on any specific issuer or government.
Central banks are the biggest Gold holders. In their aim to support their currencies in turbulent times, central banks tend to diversify their reserves and buy Gold to improve the perceived strength of the economy and the currency. High Gold reserves can be a source of trust for a country’s solvency. Central banks added 1,136 tonnes of Gold worth around $70 billion to their reserves in 2022, according to data from the World Gold Council. This is the highest yearly purchase since records began. Central banks from emerging economies such as China, India and Turkey are quickly increasing their Gold reserves.
Gold has an inverse correlation with the US Dollar and US Treasuries, which are both major reserve and safe-haven assets. When the Dollar depreciates, Gold tends to rise, enabling investors and central banks to diversify their assets in turbulent times. Gold is also inversely correlated with risk assets. A rally in the stock market tends to weaken Gold price, while sell-offs in riskier markets tend to favor the precious metal.
The price can move due to a wide range of factors. Geopolitical instability or fears of a deep recession can quickly make Gold price escalate due to its safe-haven status. As a yield-less asset, Gold tends to rise with lower interest rates, while higher cost of money usually weighs down on the yellow metal. Still, most moves depend on how the US Dollar (USD) behaves as the asset is priced in dollars (XAU/USD). A strong Dollar tends to keep the price of Gold controlled, whereas a weaker Dollar is likely to push Gold prices up.
- The Canadian Dollar was led by the nose through markets on Thursday.
- Canada remains absent from the economic calendar until Friday’s labor data.
- US jobless figures chill recent recession fears, but key inflation data looms ahead.
The Canadian Dollar (CAD) followed behind overall market flows on Thursday, pushed around by volumes in other, more interesting currencies as CAD traders await Friday’s Canadian labor numbers. A lack of any data on the Canadian side of the economic calendar left the CAD unsupported, trading into the flat side against the Greenback.
Canada brings its latest Net Change in Employment figures for the year ended in July on Friday, and median market forecasts are expecting a recovery from the previous period’s contraction. The Canadian Unemployment Rate is also expected to tick higher on Friday.
Daily digest market movers: Lazy day for CAD traders
- Canadian Dollar continues to see slim gains against the US Dollar, but momentum remains thin.
- US Initial Jobless Claims eased to 233K for the week ended August 2, below the forecast 240K and slipping back from the previous week’s 250K.
- Easing US unemployment figures are helping to ease risk appetite back into the picture.
- Friday’s Canadian Net Change in Employment for the YoY period in July is forecast to recover to 22.5K net new job additions, compared to the previous period’s -1.4K contraction.
- Despite the forecast upswing in new jobs, the Canadian Unemployment Rate is expected to tick upwards to 6.5% in July from the previous 6.4%.
Canadian Dollar price forecast: Easy CAD gains could be set to end as technical barriers approach
The Canadian Dollar is finding some room above the US Dollar on Thursday, but USD/CAD continues to trade within familiar levels with the long-term trend holding on the flat side. Price action is grinding into the 50-day Exponential Moving Average (EMA) at 1.3731, down -1.58% peak-to-trough from last week’s brief bullish spike above 1.3900.
Long-term traders will be looking for bids to continue easing towards the 200-day EMA at 1.3623, while the immediate chart scenario getting cooked up is a technical bounce from the divergence zone between the 50-day and 200-day EMAs.
USD/CAD daily chart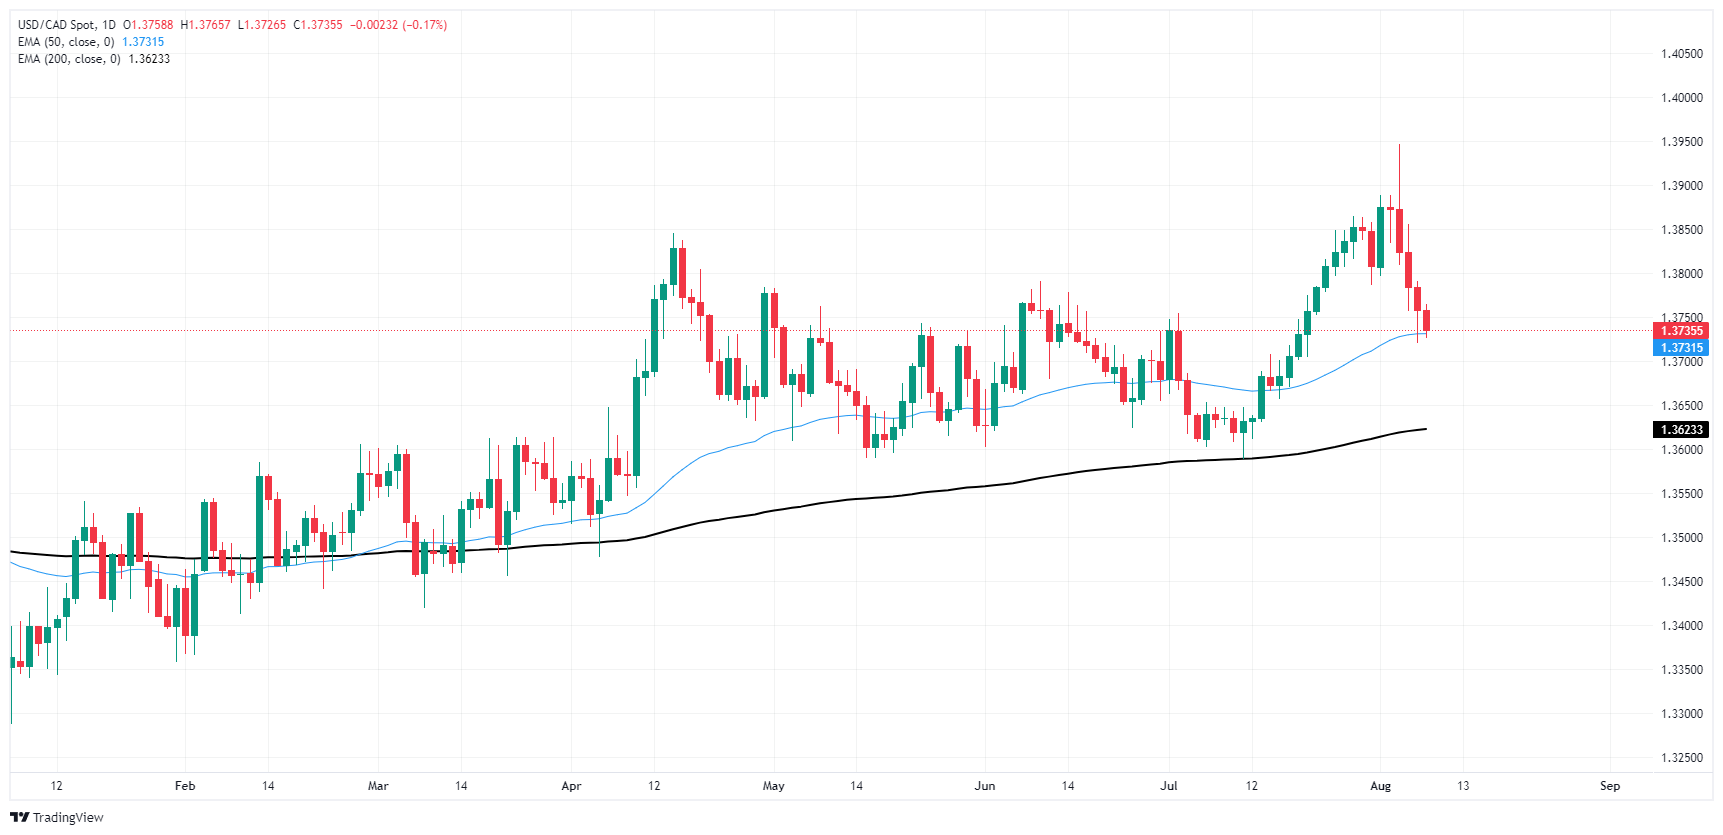
Canadian Dollar FAQs
The key factors driving the Canadian Dollar (CAD) are the level of interest rates set by the Bank of Canada (BoC), the price of Oil, Canada’s largest export, the health of its economy, inflation and the Trade Balance, which is the difference between the value of Canada’s exports versus its imports. Other factors include market sentiment – whether investors are taking on more risky assets (risk-on) or seeking safe-havens (risk-off) – with risk-on being CAD-positive. As its largest trading partner, the health of the US economy is also a key factor influencing the Canadian Dollar.
The Bank of Canada (BoC) has a significant influence on the Canadian Dollar by setting the level of interest rates that banks can lend to one another. This influences the level of interest rates for everyone. The main goal of the BoC is to maintain inflation at 1-3% by adjusting interest rates up or down. Relatively higher interest rates tend to be positive for the CAD. The Bank of Canada can also use quantitative easing and tightening to influence credit conditions, with the former CAD-negative and the latter CAD-positive.
The price of Oil is a key factor impacting the value of the Canadian Dollar. Petroleum is Canada’s biggest export, so Oil price tends to have an immediate impact on the CAD value. Generally, if Oil price rises CAD also goes up, as aggregate demand for the currency increases. The opposite is the case if the price of Oil falls. Higher Oil prices also tend to result in a greater likelihood of a positive Trade Balance, which is also supportive of the CAD.
While inflation had always traditionally been thought of as a negative factor for a currency since it lowers the value of money, the opposite has actually been the case in modern times with the relaxation of cross-border capital controls. Higher inflation tends to lead central banks to put up interest rates which attracts more capital inflows from global investors seeking a lucrative place to keep their money. This increases demand for the local currency, which in Canada’s case is the Canadian Dollar.
Macroeconomic data releases gauge the health of the economy and can have an impact on the Canadian Dollar. Indicators such as GDP, Manufacturing and Services PMIs, employment, and consumer sentiment surveys can all influence the direction of the CAD. A strong economy is good for the Canadian Dollar. Not only does it attract more foreign investment but it may encourage the Bank of Canada to put up interest rates, leading to a stronger currency. If economic data is weak, however, the CAD is likely to fall.
- Dow Jones climbed over 500 points on Thursday.
- US equities are attempting a recovery for the third time.
- Risk appetite is slowly rebuilding as investors pivot back to rate cut watch.
The Dow Jones Industrial Average (DJIA) recovered over 500 points during the Thursday market session as markets take another run at pushing equities back into a bullish trajectory after a near-term plunge fueled by fresh fears of a US recession. Market flows are beginning to return to normal, or some version of it, and indexes are taking another crack at recovering lost ground. However, the Dow Jones still remains on the wrong end of price action and scrambling to reclaim the 40,000.00 handle.
US Initial Jobless Claims for the week ended August 2 printed at 233K, less than the forecast 240K and easing back from the previous week’s 250K. Cooling initial unemployment figures are helping investors keep a lid on recent downturn fears after last week’s US labor data dump sparked a firm risk-off bid.
US data watchers will be on the lookout for a fresh round of producer and consumer-level inflation figures due next week. US Producer Price Index (PPI) inflation is slated for next Tuesday, with Consumer Price Index (CPI) inflation on the books for next Wednesday.
Dow Jones news
The Dow Jones is in a broad recovery mode, with nearly all of the index’s listed securities in the green on Thursday. Walt Disney Co. (DIS) is still down -1.13% and testing below $85.00 per share after reporting weaker-than-expected profits from theme park operations despite an upswing in revenue streaming services.
Intel Corp. (INTC) is in recovery mode on Thursday, rising over 4% and approaching $20.00 per share after hitting a fresh 52-week low early in the day. The tech giant is seeing a bounce in its share price after investors were spooked by a slight miss in Q2 earnings and a downside revision to Intel’s forward guidance for Q3.
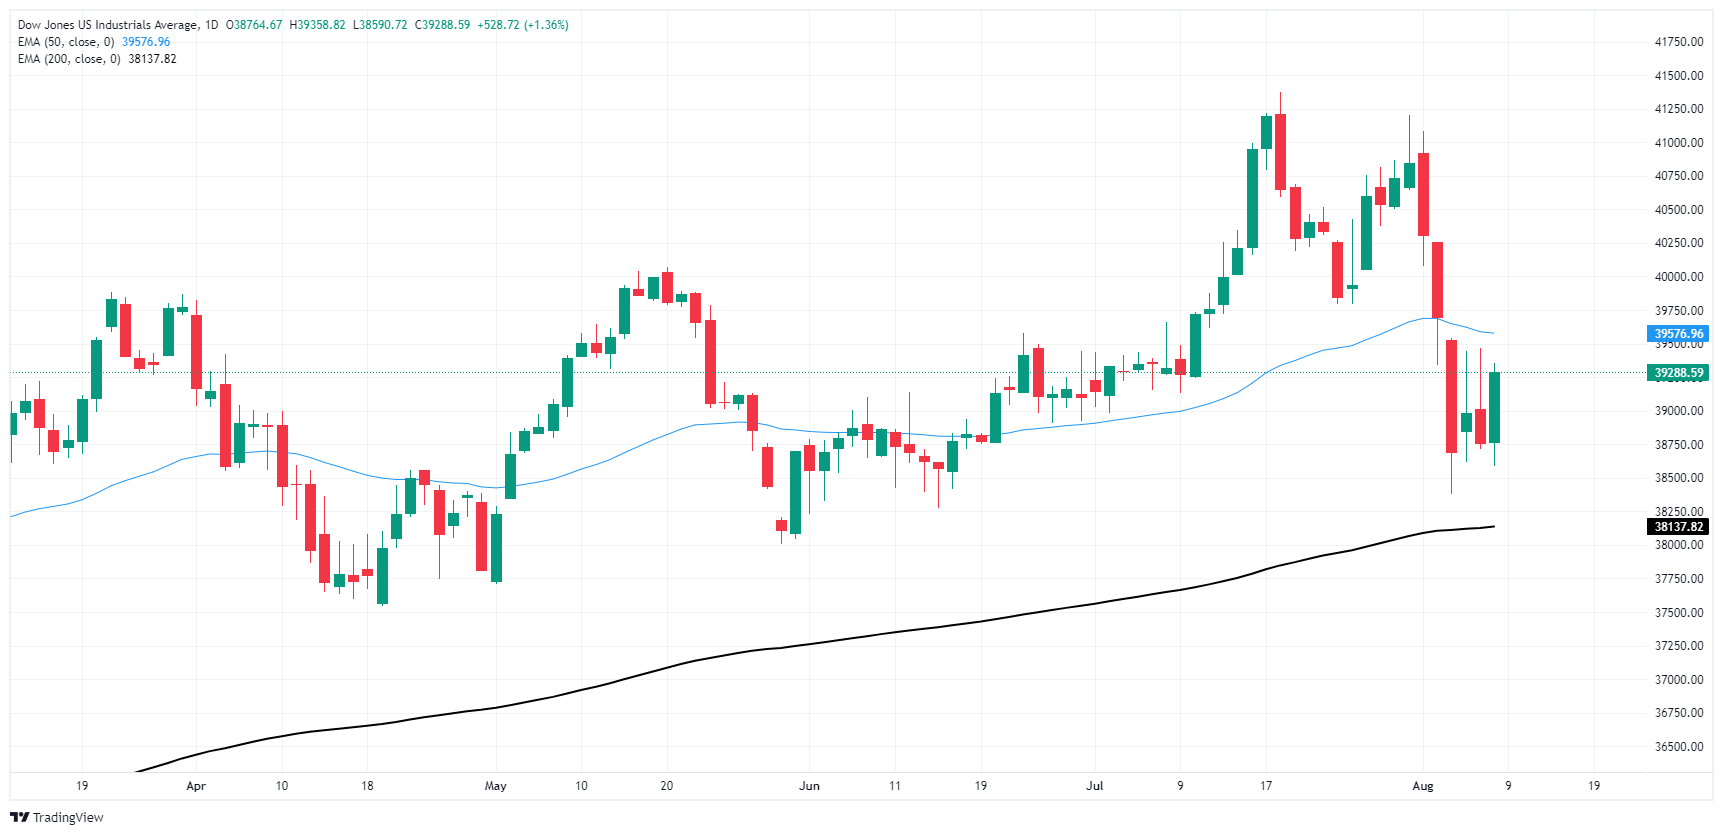
Dow Jones price forecast
The Dow Jones has reclaimed the 39,000.00 handle in another intraday bid to spark fresh topside momentum, and bidders will be hoping that the third time’s the charm after repeated failures to make meaningful headway this week. The index has avoided falling back below the 38,500.00 level after its latest three-day plunge that dragged the equity board down -6.58% top-to-bottom, and bulls remain determined to keep the Dow Jones trading above the 200-day Exponential Moving Average (EMA) at 38,011.45.
Dow Jones daily chart
Dow Jones FAQs
The Dow Jones Industrial Average, one of the oldest stock market indices in the world, is compiled of the 30 most traded stocks in the US. The index is price-weighted rather than weighted by capitalization. It is calculated by summing the prices of the constituent stocks and dividing them by a factor, currently 0.152. The index was founded by Charles Dow, who also founded the Wall Street Journal. In later years it has been criticized for not being broadly representative enough because it only tracks 30 conglomerates, unlike broader indices such as the S&P 500.
Many different factors drive the Dow Jones Industrial Average (DJIA). The aggregate performance of the component companies revealed in quarterly company earnings reports is the main one. US and global macroeconomic data also contributes as it impacts on investor sentiment. The level of interest rates, set by the Federal Reserve (Fed), also influences the DJIA as it affects the cost of credit, on which many corporations are heavily reliant. Therefore, inflation can be a major driver as well as other metrics which impact the Fed decisions.
Dow Theory is a method for identifying the primary trend of the stock market developed by Charles Dow. A key step is to compare the direction of the Dow Jones Industrial Average (DJIA) and the Dow Jones Transportation Average (DJTA) and only follow trends where both are moving in the same direction. Volume is a confirmatory criteria. The theory uses elements of peak and trough analysis. Dow’s theory posits three trend phases: accumulation, when smart money starts buying or selling; public participation, when the wider public joins in; and distribution, when the smart money exits.
There are a number of ways to trade the DJIA. One is to use ETFs which allow investors to trade the DJIA as a single security, rather than having to buy shares in all 30 constituent companies. A leading example is the SPDR Dow Jones Industrial Average ETF (DIA). DJIA futures contracts enable traders to speculate on the future value of the index and Options provide the right, but not the obligation, to buy or sell the index at a predetermined price in the future. Mutual funds enable investors to buy a share of a diversified portfolio of DJIA stocks thus providing exposure to the overall index.
- Strong Initial Jobless Claims data triggers the USD, yet aggressive easing might limit the upside.
- Investors await further clues on the US economy.
- Markets continue to underestimate the Fed and are confident that it will rush to cut.
The US Dollar (USD), measured by the US Dollar Index (DXY), held steady at around 103.00 on Thursday after a two-day rebound. Strong Initial Jobless Claims data for the week ending August 3 is helping the USD to gain traction as the market awaits deeper insights into the US economy.
Taking into account all data, the overall US economic outlook remains positive, with growth still tracking above trend. This suggests that the market may be overvaluing aggressive easing once again, as it did at the start of the week.
Daily digest market movers: USD gains from strong Initial Jobless Claims surrounding wait-and-see sentiment
- On the data front, US citizens applying for unemployment insurance benefits rose by 233K, below the initial consensus of 240K and lower than the previous week's gains of 250K (revised from 249K).
- Market sentiment dipped after the weak 10-year US Treasury auction on Thursday morning, affecting global equity markets today. Despite a moderately dovish BOJ summary, markets are still cautious.
- Volatility across all markets is expected to remain high into next week when top-tier US data should provide a clearer picture of the US economy.
- The market is still pricing in 100 bps of easing by year-end, with a 40% chance that an additional 25 bps will be added. The first cut in September is expected to be around 50 bps.
DXY technical outlook: Indicators improve but remain in red, maintaining a bearish bias
Despite the technical outlook showing improvements, the indicators remain in the red. The Relative Strength Index (RSI) is still below 50, and the Moving Average Convergence Divergence (MACD) is hitting lower red bars.
As the week unfolds, supports stand at 103.00, 102.50 and 102.20 with resistances at 103.50 and 104.00. A break above this last resistance will improve the outlook, and buyers will have gained the 20-day Simple Moving Average (SMA).
US Dollar FAQs
The US Dollar (USD) is the official currency of the United States of America, and the ‘de facto’ currency of a significant number of other countries where it is found in circulation alongside local notes. It is the most heavily traded currency in the world, accounting for over 88% of all global foreign exchange turnover, or an average of $6.6 trillion in transactions per day, according to data from 2022. Following the second world war, the USD took over from the British Pound as the world’s reserve currency. For most of its history, the US Dollar was backed by Gold, until the Bretton Woods Agreement in 1971 when the Gold Standard went away.
The most important single factor impacting on the value of the US Dollar is monetary policy, which is shaped by the Federal Reserve (Fed). The Fed has two mandates: to achieve price stability (control inflation) and foster full employment. Its primary tool to achieve these two goals is by adjusting interest rates. When prices are rising too quickly and inflation is above the Fed’s 2% target, the Fed will raise rates, which helps the USD value. When inflation falls below 2% or the Unemployment Rate is too high, the Fed may lower interest rates, which weighs on the Greenback.
In extreme situations, the Federal Reserve can also print more Dollars and enact quantitative easing (QE). QE is the process by which the Fed substantially increases the flow of credit in a stuck financial system. It is a non-standard policy measure used when credit has dried up because banks will not lend to each other (out of the fear of counterparty default). It is a last resort when simply lowering interest rates is unlikely to achieve the necessary result. It was the Fed’s weapon of choice to combat the credit crunch that occurred during the Great Financial Crisis in 2008. It involves the Fed printing more Dollars and using them to buy US government bonds predominantly from financial institutions. QE usually leads to a weaker US Dollar.
Quantitative tightening (QT) is the reverse process whereby the Federal Reserve stops buying bonds from financial institutions and does not reinvest the principal from the bonds it holds maturing in new purchases. It is usually positive for the US Dollar.
- Mexican Peso accelerates on high inflation data.
- Market participants divided on Banxico's next move: hold or cut rates.
- US jobless claims arrive below consensus, but Peso resists USD strength.
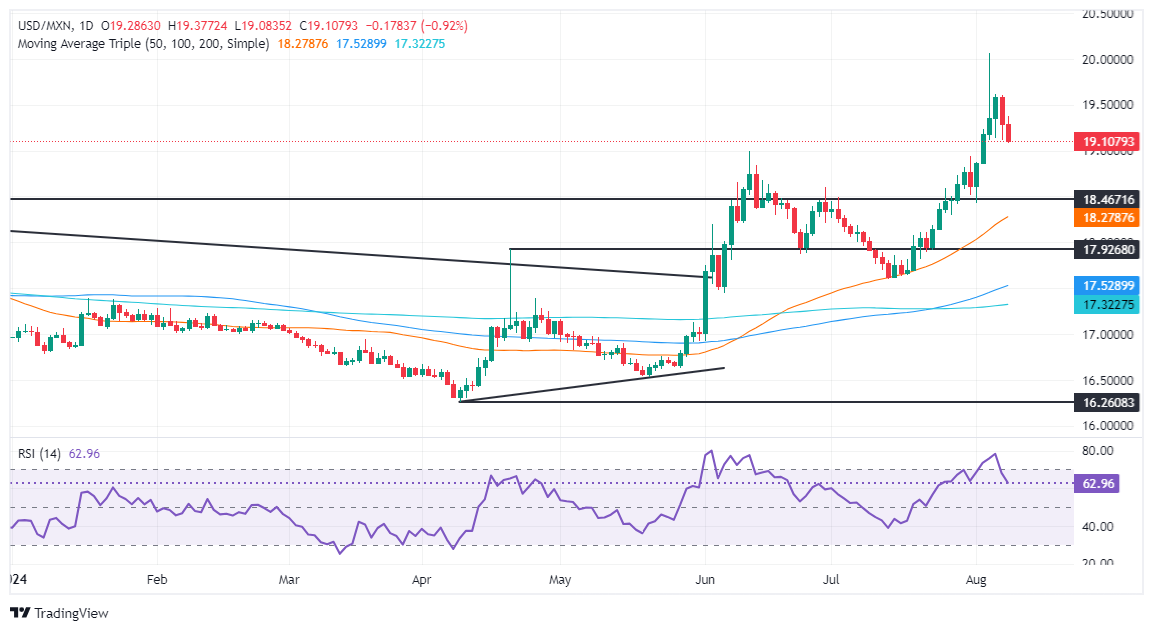
The Mexican Peso rose in early trading in the North American session on Thursday after the Instituto Nacional de Estadistica Geografia e Informatica (INEGI) revealed that the Consumer Price Index (CPI) in July rose above estimates ahead of the Bank of Mexico's (Banxico) monetary policy decision. The USD/MXN trades at 19.15, down 0.70%.
Mexico’s inflation rose to its highest level in more than a year, revealed INEGI, sponsoring a leg-down in the USD/MXN exotic pair as traders brace for the Banxico decision today at around 19:00 GMT. However, the core figure mostly used by policymakers as the main reference for inflation ticked lower.
Given the backdrop, market players are split between Banxico keeping rates in check, following inflation data, or opting for a cut. During the last meeting, Deputy Governor Omar Mejia Castelazo was the outlier in a 4-1 vote for maintaining rates at 11.00%. It is worth noting that Governor Victoria Rodriguez Ceja said later that rate cuts would be “on the table” in the subsequent meetings.
According to swaps, market players expect 50 basis points of easing in the next three months and 175 bps over the next 12 months.
Across the border, the number of Americans filing for unemployment benefits dipped below the consensus, bolstering the Greenback. So far, it has been up against most G7 currencies but failed to gain traction against the Mexican Peso.
Wall Street rallied as a relief that the labor market is not in a bad position. This follows last week’s Initial Jobless Claims report, followed by dismal Nonfarm Payrolls (NFP) figures.
Daily digest market movers: Mexican Peso rallies ahead of Banxico’s meeting
- Mexico’s inflation rate rose 1.05% MoM, exceeded estimates of 1.02%, and crushed June’s 0.38%. In the 12 months to July rose from 4.98% to 5.57% as foreseen.
- Core prices ticked up from 0.22% to 0.32% MoM, above economists' projections of 0.29%. On an annual basis, however, inflation missed the 4.02% consensus but dipped to 4.05%, improving compared to June's 4.13%.
- Societe Generale expects Banxico to hold rates unchanged due to the Mexican Peso depreciation to 20.00 Pesos per US Dollar following NFP data. They noted that this “could be counter-productive to restoring stability and should be delayed.”
- On Friday, Mexico’s Industrial Production is expected to dip, which could put Banxico at a crossroads as headline inflation rises, while the economy stagnates.
- US Initial Jobless Claims for the week ending August 3 dipped from 250K to 233K, below forecasts of 240K. Continuing Claims through July 27 jumped from 1,869K to 1,875K, exceeding the forecast of 1870K.
- Banxico’s decision should influence the USD/MXN and the Fed. The CME FedWatch Tool shows the odds of a 50-basis-point interest rate cut by the Fed at the September meeting at 57.5%, down from 63.5% a day ago.
Technical analysis: Mexican Peso dives as USD/MXN hovers around 19.10
The USD/MXN drops to four-day lows of 19.08 as traders begin to price in Banxico keeping rates unchanged, clearing key support levels as the pair accelerated to the 19.00 psychological mark. Momentum remains in favor of buyers, but in the near term the Relative Strength Index (RSI) shows sellers have the upper hand.
If USD/MXN drops below 19.00, the next support would be the July 31 high at 18.94, before dropping to the August 1 low of 18.42. Once cleared, further losses await, with the 50-day Simple Moving Average (SMA) up next at 18.26.
Conversely, if USD/MXN climbs past 19.50, the next resistance would be 20.00. A decisive break will expose the YTD high at 20.22, followed by the 20.50 mark.
Mexican Peso FAQs
The Mexican Peso (MXN) is the most traded currency among its Latin American peers. Its value is broadly determined by the performance of the Mexican economy, the country’s central bank’s policy, the amount of foreign investment in the country and even the levels of remittances sent by Mexicans who live abroad, particularly in the United States. Geopolitical trends can also move MXN: for example, the process of nearshoring – or the decision by some firms to relocate manufacturing capacity and supply chains closer to their home countries – is also seen as a catalyst for the Mexican currency as the country is considered a key manufacturing hub in the American continent. Another catalyst for MXN is Oil prices as Mexico is a key exporter of the commodity.
The main objective of Mexico’s central bank, also known as Banxico, is to maintain inflation at low and stable levels (at or close to its target of 3%, the midpoint in a tolerance band of between 2% and 4%). To this end, the bank sets an appropriate level of interest rates. When inflation is too high, Banxico will attempt to tame it by raising interest rates, making it more expensive for households and businesses to borrow money, thus cooling demand and the overall economy. Higher interest rates are generally positive for the Mexican Peso (MXN) as they lead to higher yields, making the country a more attractive place for investors. On the contrary, lower interest rates tend to weaken MXN.
Macroeconomic data releases are key to assess the state of the economy and can have an impact on the Mexican Peso (MXN) valuation. A strong Mexican economy, based on high economic growth, low unemployment and high confidence is good for MXN. Not only does it attract more foreign investment but it may encourage the Bank of Mexico (Banxico) to increase interest rates, particularly if this strength comes together with elevated inflation. However, if economic data is weak, MXN is likely to depreciate.
As an emerging-market currency, the Mexican Peso (MXN) tends to strive during risk-on periods, or when investors perceive that broader market risks are low and thus are eager to engage with investments that carry a higher risk. Conversely, MXN tends to weaken at times of market turbulence or economic uncertainty as investors tend to sell higher-risk assets and flee to the more-stable safe havens.
Will Gold bugs manage to withstand this wave of selling activity? Price action over the past months has resulted in capitulation from macro funds and large-scale selling activity from systematic trend followers across nearly every commodity market on our radar, TDS senior commodity strategist Daniel Ghali notes.
Yellow Metal longs are being sold in Shanghai
“Gold is the notable stand-out, with both algos and macro funds still holding onto the bulk of their length, with aggregate readings of money manager positioning still sitting near cycle highs and with a unilaterally bullish consensus. However, Gold won't protect against a deleveraging event.”
“And, in Shanghai, signs of selling activity persist with the top traders continuing to shed some net length in the Yellow Metal. Under the hood, a trend of long liquidations has been only somewhat concealed by simultaneous short covering.”
“Looking forward, however, Shanghai traders' shorts are now trending near pre-pandemic levels, which suggests the scope for continued long liquidations to weigh on prices is more elevated, particularly when considering that physical traders are still on a buyer's strike.”
The AUD is not the only G10 currency that has been on a wild ride in the past few weeks, the JPY clearly takes that crown. That said, between mid-July and the start of this week, AUD/USD retraced all of the gains that it had made since late April, before showing signs of recovery, Rabobank’s senior FX strategist Jane Foley notes.
RBA remains vigilant with respect to a higher inflation
“The reasons for the swings are linked both to a change in expectations regarding RBA policy and to the AUD’s traditional role as the ‘higher risk’ currency within the G10, which left it out of favour in the recent market ructions. The ‘higher risk’ status, however, is no longer as justifiable as it used to be in view of Australia’s good fundamental backdrop. We maintain our 6-month forecast of AUD/USD0.70.”
“The recent release of Australian Q2 CPI inflation on July 31, wiped out remaining expectations that the RBA would hike rates at its August 6 policy meeting. While the AUD softened on the data, the market had already begun to price in a softer path of RBA policy ahead of the inflation release. This was reflected in the lower level of AUD/USD from mid-July.”
“This morning RBA Governor Bullock stated that ‘the Board remains vigilant with respect to the upside risks on inflation and will not hesitate to raise rates if it needs to.’ We have not amended our AUD forecasts this week and continue look for a move to 0.68 on a 3-month view. In the short term we favour buying AUD vs. the EUR and look for a move back below EUR/AUD1.66.”
The Red Metal may now be nearing local lows. CTAs may still have some dry-powder to sell, but are unlikely to do so unless prices break below the $8440/t range, TDS senior commodity strategist Daniel Ghali notes.
A local low may be forming in Copper markets
“The combination of a full-blown capitulation from macro funds and the effective end to algorithmic selling activity suggest that the Red Metal may now be nearing local lows. After all, CTAs may still have some dry-powder to sell, but are unlikely to do so unless prices break below the $8440/t range.”
“While Copper would not be insulated from subsequent pain in global markets tied to a deleveraging event, vulnerabilities are mitigated as it is no longer a crowded trade. Further, our simulations of future price action reveal that CTAs may even return to the bid over the coming week, even in a range-bound trading environment.”
“A local low may now be forming in Copper markets. Still, upside asymmetries in systematic trend follower positions are most extreme in Aluminium, where we would expect large-scale buying activity to hit the tapes in the event that base metals stage a recovery.”
The Pound Sterling (GBP) was a very mild underperformer on the day and now turns slightly bullish, in keeping with its soft undertone since spot peaked in the middle of July, FX chief FX strategist Shaun Osborne notes.
GBP crawls upwards above 1.2700
“The UK housing market softened a little in July, according to the RICS survey data released last night but the underlying data were a little more encouraging.”
“The GBP downtrend from the mid -July peak above 1.30 remains intact but losses have been slowing in the past couple of sessions and the pound may be finding a foothold around the 200-day MA (1.2660).”
“Regaining 1.2735 would be a minor positive for Cable. Above 1.2775 is needed to trigger a bullish turn in price action at the moment.”
- GBP/USD posts a fresh monthly low near 1.2665 as the US Dollar recovers.
- The US Dollar bounces back on lower US jobless claims for the week ending August 2.
- The Cable extends its losing streak for the fourth trading day.
The GBP/USD pair hovers near a fresh monthly low around 1.2665 in Thursday’s American session. The Cable exhibits a subdued performance as the US Dollar (USD) has recovered sharply after the release of the lower-than-expected United States (US) Initial Jobless Claims in the week ending August 2.
The US Dollar Index (DXY), which tracks the Greenback’s value against six major currencies, jumps to near 103.40 after recovering intraday losses. The US Department of Labor showed that individual claiming jobless benefits for the first time came in lower at 233K than estimates of 240K, and the prior release of 249K.
However, the near-term outlook of the US Dollar remains uncertain as soft jobless claims would be insufficient to negatively influence market speculation that the Federal Reserve (Fed) will cut interest rates by more than 100 basis points (bps) this year.
Meanwhile, the Pound Sterling (GBP) remains under pressure on global risk-aversion. The British currency will be influenced by market expectations for Bank of England (BoE) rate cuts amid an absence of top-tier United Kingdom (UK) economic data.
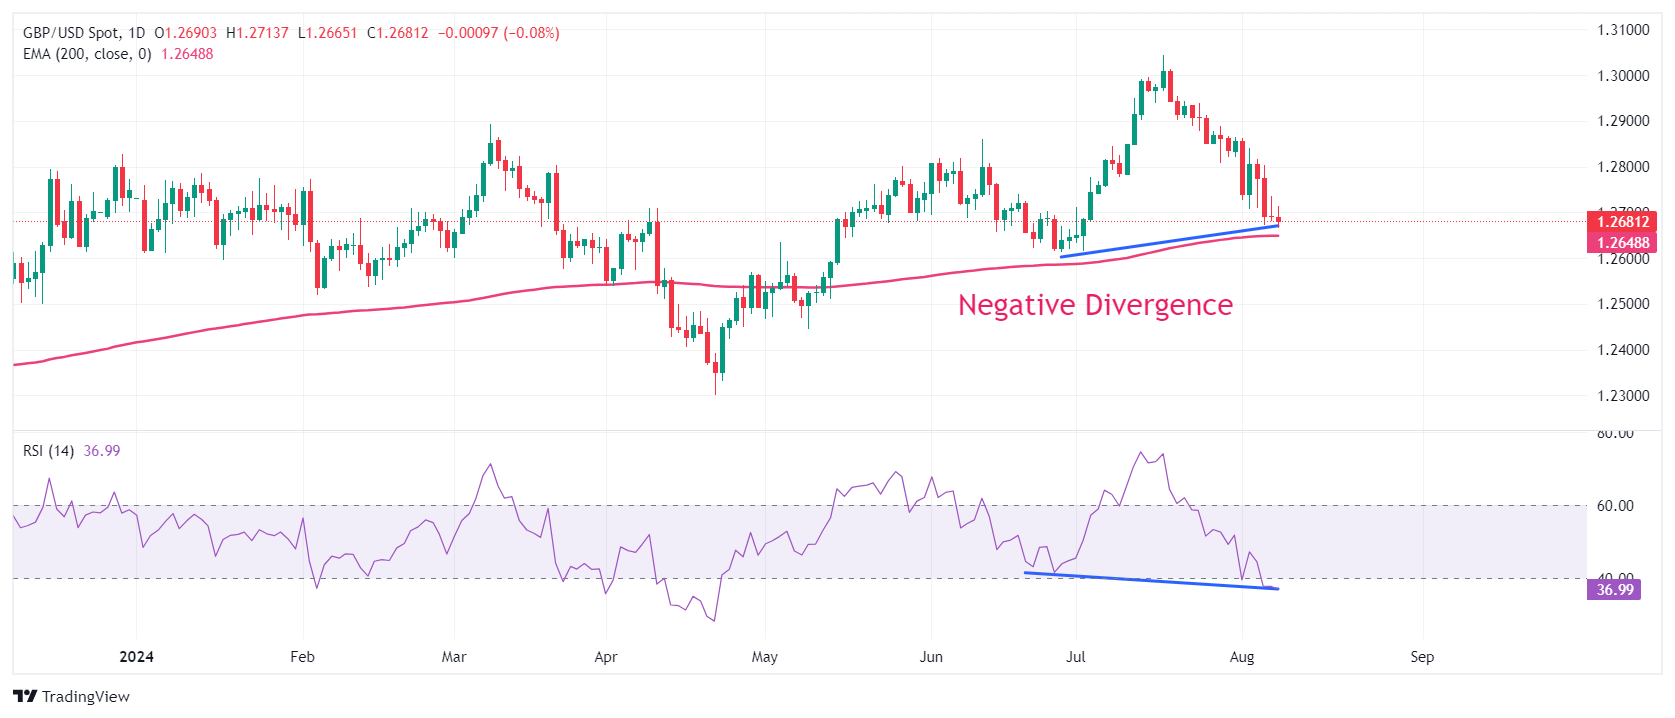
GBP/USD extends its losing spree for the fourth trading session on Thursday. The Cable is at a make or a break below the crucial figure of 1.2700. The major exhibits a Negative divergence formation on a daily timeframe in which the asset continues to build higher lows, while the momentum oscillator makes lower lows. This generally results in a bullish reversal but it should be confirmed with more indicators.
The 14-day Relative Strength Index (RSI) formed a fresh lower swing at 37.00, which suggests that the bearish momentum is still intact.
The asset still holds the 200-day Exponential Moving Average (EMA), which trades around 1.2650.
More downside could appear if the asset breaks below the intraday low of 1.2665. This would expose the asset to June 27 low at 1.2613, followed by April 29 high at 1.2570.
On the flip side, a recovery move above August 6 high at 1.2800 would drive the asset towards August 2 high at 1.2840 and the round-level resistance of 1.2900.
GBP/USD daily chart
Pound Sterling FAQs
The Pound Sterling (GBP) is the oldest currency in the world (886 AD) and the official currency of the United Kingdom. It is the fourth most traded unit for foreign exchange (FX) in the world, accounting for 12% of all transactions, averaging $630 billion a day, according to 2022 data. Its key trading pairs are GBP/USD, aka ‘Cable’, which accounts for 11% of FX, GBP/JPY, or the ‘Dragon’ as it is known by traders (3%), and EUR/GBP (2%). The Pound Sterling is issued by the Bank of England (BoE).
The single most important factor influencing the value of the Pound Sterling is monetary policy decided by the Bank of England. The BoE bases its decisions on whether it has achieved its primary goal of “price stability” – a steady inflation rate of around 2%. Its primary tool for achieving this is the adjustment of interest rates. When inflation is too high, the BoE will try to rein it in by raising interest rates, making it more expensive for people and businesses to access credit. This is generally positive for GBP, as higher interest rates make the UK a more attractive place for global investors to park their money. When inflation falls too low it is a sign economic growth is slowing. In this scenario, the BoE will consider lowering interest rates to cheapen credit so businesses will borrow more to invest in growth-generating projects.
Data releases gauge the health of the economy and can impact the value of the Pound Sterling. Indicators such as GDP, Manufacturing and Services PMIs, and employment can all influence the direction of the GBP. A strong economy is good for Sterling. Not only does it attract more foreign investment but it may encourage the BoE to put up interest rates, which will directly strengthen GBP. Otherwise, if economic data is weak, the Pound Sterling is likely to fall.
Another significant data release for the Pound Sterling is the Trade Balance. This indicator measures the difference between what a country earns from its exports and what it spends on imports over a given period. If a country produces highly sought-after exports, its currency will benefit purely from the extra demand created from foreign buyers seeking to purchase these goods. Therefore, a positive net Trade Balance strengthens a currency and vice versa for a negative balance.
EUR/USD has edged back from its earlier high but trades all but unchanged on the day, FX chief FX strategist Shaun Osborne notes.
Bears break below 1.0900 intraday
“Cross flows may be undercutting the EUR to some extent on the day, with the CHF and JPY in demand. There were no major data reports from the Eurozone this morning.”
“Spot has drifted a bit on the session so far but movement is limited and confined within recent ranges. The EUR chart suggests spot remains well-supported on minor dips at the moment but the market is essentially consolidating after the sharp advance seen Friday and Monday.
Resistance is 1.0895/00, 1.0965/75.
- Initial Jobless Claims rose by 233K vs. the previous week.
- Continuing Jobless Claims rose to 1.875M.
US citizens that applied for unemployment insurance benefits increased by 233K in the week ending August 3 according to the US Department of Labor (DoL) on Thursday. The prints came in below initial consensus (240K) and were lower than the previous weekly gain of 250K (revised from 249K).
Further details of the publication revealed that the advance seasonally adjusted insured unemployment rate was 1.2% and the 4-week moving average was 240.75K, an increase of 2.5K from the previous week's revised average.
In addition, Continuing Claims increased by 6K to 1.875M in the week ended July 27.
Market reaction
The US Dollar Index (DXY) maintains its upside bias unchanged and advances to dailuy highs near 103.40 accompanied by extra gains in US yields across the curve.
(This story was corrected on August 8 at 13:21 GMT to say that Continuing Jobless Claims rose to 1.875M, not rose by around 1.870M).
- Initial Jobless Claims rose by 233K vs. the previous week.
- Continuing Jobless Claims rose by 1.875M.
US citizens that applied for unemployment insurance benefits increased by 233K in the week ending August 3 according to the US Department of Labor (DoL) on Thursday. The prints came in below initial consensus (240K) and were lower than the previous weekly gain of 250K (revised from 249K).
Further details of the publication revealed that the advance seasonally adjusted insured unemployment rate was 1.2% and the 4-week moving average was 240.75K, an increase of 2.5K from the previous week's revised average.
In addition, Continuing Claims increased by 6K to 1.875M in the week ended July 27.
Market reaction
The US Dollar Index (DXY) maintains its upside bias unchanged and advances to dailuy highs near 103.40 accompanied by extra gains in US yields across the curve.
The Canadian Dollar (CAD) is little changed on the day, FX chief FX strategist Shaun Osborne notes.
Limited upside scope for the USD
“Some moderate narrowing in US/ Canada spreads is helping keep my fair value estimate for spot inching lower (1.3703 today) which should mean limited upside scope for the USD, all else equal. The summary of policy deliberations around the Bank of Canada decision to cut rates in July released yesterday did not reveal anything new for markets.”
“Policymakers are concerned that a weaker labor market will dampen consumer demand and, echoing the Bank’s communications around the decision, they are now more focused on downside risks to the outlook. More cuts are coming.”
“Spot losses from Monday’s peak above 1.39 are showing signs of stabilizing in the low 1.37 area. Price action suggests a consolidation, rather than a reversal in the USD at this point. Note that the USD is finding some support around 1.3725 retracement (61.8% Fibonacci of the 1.36/1.39 move up). I expect resistance at 1.3375/95. A break under 1.3725 targets 1.3670/75.”
There is a lot of focus today on whether Banxico will cut its high policy rate to 10.75% from 11.00% when it meets tonight. It has been on hold since it started its easing cycle in March, and economists are split down the middle on whether it will cut, ING’s FX strategist Chris Turner notes.
USD/MXN to trade over 20.00 again
“Those in favour of a cut argue that real interest rates do not need to be this high anymore and that Banxico can resume an orderly softening of restrictive policy; those against a cut argue that the peso has been front and centre of the carry trade unwind and that a cut could prompt USD/MXN to trade over 20.00 again, destabilising local asset markets.”
“We do not have a strong view here, but perhaps a hold under the next meeting on 26 September – a week after the Fed decision – might prove appealing to Banxico. If so, and assuming there is some stability in global risk assets and USD/JPY, USD/MXN could drop into the 18.85/19.00 area.”
“However, we are fearful of Mexican politics again weighing on the peso in September when the new parliament will discuss constitutional reforms. We struggle to see USD/MXN trading sustainably below 18.50 over the coming months.”
As mentioned above, it is not quite clear yet that this corrective phase in equity markets is over. If it is, our view is that EUR/USD can reconnect with the sharp narrowing in eurozone:US interest rate differentials and can start trading over 1.10, ING’s FX strategist Chris Turner notes.
EUR/USD can start trading over 1.10
“Helping that at some stage should be short-dated EUR rates, where the 81bp of European Central Bank currently priced for this year looks far too aggressive. Our house view is currently for just 50bp of further easing this year. We favour EUR/USD holding 1.0900 support and were US initial claims to surprise on the upside today, EUR/USD could take another run at 1.10.”
“Elsewhere, EUR/CHF had a decent bounce yesterday as market interest rates moved higher around the world. Some less dovish re-pricing of the ECB cycle could further help EUR/CHF, though we doubt it will be able to sustain gains over 0.9450/9500 in the currently stressed geopolitical world.”
- Natural Gas drops over 1.5% on Thursday after a stellar 8% surge earlier in the week.
- Some profit-taking took place after headlines emerged that Ukraine forces entered Russia.
- The US Dollar index eases after a two-day recovery.
Natural Gas price (XNG/USD) eases on Thursday after a steep surge that exceeded 8% gains over Tuesday and Wednesday. The surge came on the back of headlines that Ukrainian forces crossed the Russian border and were targeting Russian installations in the Kursk region. The risk that Russia would further limit or fully cut off the Gas supply towards Europe on the back of that news got priced in as of Tuesday.
Meanwhile, the US Dollar Index (DXY), which tracks the Greenback’s value against six major currencies, is easing as well after Dollar bulls were unable to push it above an important level. The risk now is that this technical rejection might result in more downturns for the US Dollar (USD). The weekly US Jobless Claims data on Thursday will be the main economic event for this week, and there might be a surge in volatility.
Natural Gas is trading at $2.13 per MMBtu at the time of writing.
Natural Gas news and market movers: Gearing up for EIA
- At 14:30 GMT, the weekly Natural Gas Storage Change data for the week ending August 2 will be released by the Energy Information Administration (EIA). The expectation is for a build from 18 billion to 22 billion metric tons of Natural Gas.
- The Kursk region is very gas-sensitive and holds a key Gas intake point. This might be one of the reasons why Ukraine decided to have an excursion into Russia in that specific region, according to Bloomberg.
- Temperatures are starting to ease in Egypt, which means the country's massive energy demand could end in the coming weeks.
- Bloomberg forecasts that demand for Natural Gas is set to fall further, with European storage at solid levels for the next heating season and Asian demand starting to fall month over month.
Natural Gas Technical Analysis: Correction back at it
Natural Gas price might has had a nice two-day recovery, but that could be bad for Gas prices in the long run. With that brief relief rally, the Relative Strength Index (RSI) has been able to move away from being oversold in the daily chart, which means there is room now again for another leg lower. Although the $2.15 level might have been reclaimed, pressure will grow for it to snap again.
Should more bullish headlines emerge and pull Gas price higher, look ahead for moving averages as upside resistances. First, the 100-day Simple Moving Average (SMA) and the 200-day SMA near $2.35. That would already be a significant move higher, and would definitely end the losing streak from recent weeks. Further up, the 55-day SMA at $2.51 could be tested.
On the downside, pressure is building on $2.13 to a breakdown again after the brief peak above it. In case that level snaps, $2.00 comes back into play for a test and possible dip below. Although still far away, a return sub-$2.00 could mean a longer-term downward trend, with $1.53 in the cards.
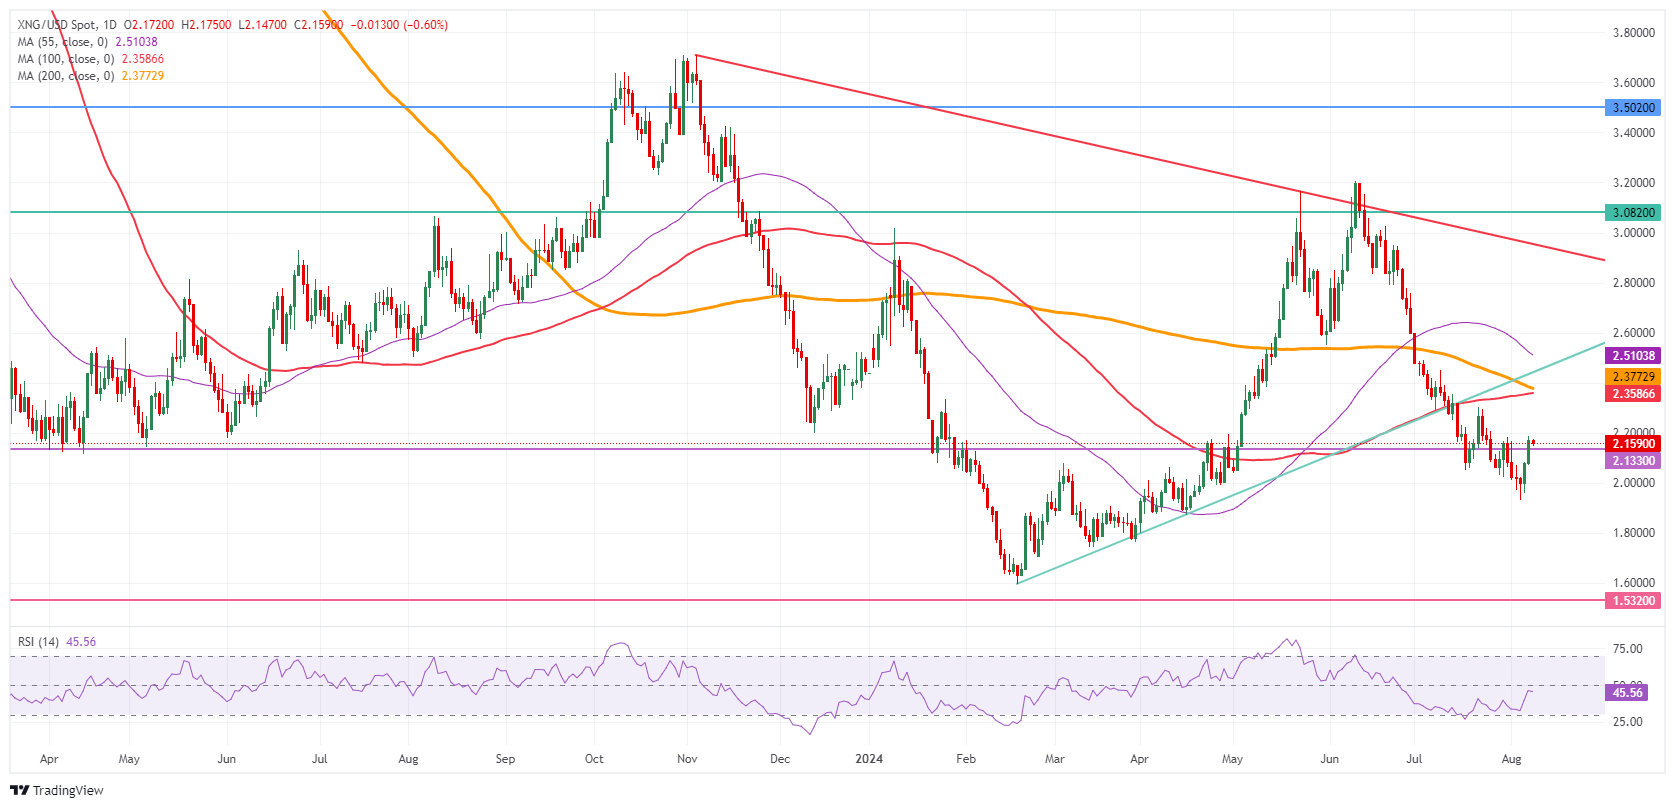
Natural Gas: Daily Chart
Natural Gas FAQs
Supply and demand dynamics are a key factor influencing Natural Gas prices, and are themselves influenced by global economic growth, industrial activity, population growth, production levels, and inventories. The weather impacts Natural Gas prices because more Gas is used during cold winters and hot summers for heating and cooling. Competition from other energy sources impacts prices as consumers may switch to cheaper sources. Geopolitical events are factors as exemplified by the war in Ukraine. Government policies relating to extraction, transportation, and environmental issues also impact prices.
The main economic release influencing Natural Gas prices is the weekly inventory bulletin from the Energy Information Administration (EIA), a US government agency that produces US gas market data. The EIA Gas bulletin usually comes out on Thursday at 14:30 GMT, a day after the EIA publishes its weekly Oil bulletin. Economic data from large consumers of Natural Gas can impact supply and demand, the largest of which include China, Germany and Japan. Natural Gas is primarily priced and traded in US Dollars, thus economic releases impacting the US Dollar are also factors.
The US Dollar is the world’s reserve currency and most commodities, including Natural Gas are priced and traded on international markets in US Dollars. As such, the value of the US Dollar is a factor in the price of Natural Gas, because if the Dollar strengthens it means less Dollars are required to buy the same volume of Gas (the price falls), and vice versa if USD strengthens.
- USD/JPY drops to near 146.00 as Yen strengthens after BoJ’s hawkish Summary of Opinions.
- After global market mayhem, BoJ Uchida preferred to keep the interest rates on hold until markets stabilized.
- The US Dollar will be influenced by the weekly US jobless claims data.
The USD/JPY falls to near 146.00 in Thursday’s European session. The asset weakens as the Japanese Yen (JPY) strengthens after the release of the Bank of Japan’s (BoJ) Summary of Opinions (SoP), which indicated that officials acknowledged the need of more rate hikes, in the July 30-31 meeting, to tame inflationary pressures, driven by higher import prices.
However, the impact of hawkish BoJ’s SOP is expected to be short-lived as the global risk-aversion mood could force officials to pause the policy-tightening spell. Sheer volatility in Japan’s equity markets due to BoJ’s withdrawal of accommodating policy stance has impacted BoJ’s rate-hike prospects.
On Wednesday, BoJ Deputy Governor Shinichi Uchida said, “We won’t raise rates when markets are unstable,” according to Reuters.
Meanwhile, the asset remains in a negative trajectory even though the US Dollar (USD) has recovered its intraday losses. The US Dollar Index (DXY), which tracks the Greenback’s value against six major currencies, hovers around 103.00.
The US Dollar is expected to remain under pressure on firm expectations that the Federal Reserve (Fed) will deliver fat rate cuts.
Going forward, investors will keenly on United States (US) Initial Jobless Claims due to an absence of top-tier economic data, which will be published at 12:30 GMT. Economists have estimated that individuals claiming jobless benefits for the first time were 240K, lower than the prior release of 249K, for the week ending August 2.
Japanese Yen FAQs
The Japanese Yen (JPY) is one of the world’s most traded currencies. Its value is broadly determined by the performance of the Japanese economy, but more specifically by the Bank of Japan’s policy, the differential between Japanese and US bond yields, or risk sentiment among traders, among other factors.
One of the Bank of Japan’s mandates is currency control, so its moves are key for the Yen. The BoJ has directly intervened in currency markets sometimes, generally to lower the value of the Yen, although it refrains from doing it often due to political concerns of its main trading partners. The current BoJ ultra-loose monetary policy, based on massive stimulus to the economy, has caused the Yen to depreciate against its main currency peers. This process has exacerbated more recently due to an increasing policy divergence between the Bank of Japan and other main central banks, which have opted to increase interest rates sharply to fight decades-high levels of inflation.
The BoJ’s stance of sticking to ultra-loose monetary policy has led to a widening policy divergence with other central banks, particularly with the US Federal Reserve. This supports a widening of the differential between the 10-year US and Japanese bonds, which favors the US Dollar against the Japanese Yen.
The Japanese Yen is often seen as a safe-haven investment. This means that in times of market stress, investors are more likely to put their money in the Japanese currency due to its supposed reliability and stability. Turbulent times are likely to strengthen the Yen’s value against other currencies seen as more risky to invest in.
USD/JPY can hang around this 145/148 area. It’s doubtful it sustains a move over 150 and, ING’s FX strategist Chris Turner notes.
USD can hang around this 145/148 area
“Also very much in focus is the size of the yen carry trade and whether a further unwind needs to drive USD/JPY sub 140 and spark more cross-market volatility. We expressed our views on this issue last Friday.”
“We suspect that the top layer of carry – speculators in yen futures markets – may be close to flat in their positions now. As to the deeper layer of the yen carry, we think it is very hard to tell. We would take any definitive declarations of the yen carry trade being 50% or 75% unwound with a pinch of salt.”
“For the time being, however, it looks as though USD/JPY can hang around this 145/148 area. Over the next couple of months, we doubt it sustains a move over 150 and would expect the softer US rate environment to bring it back to the 138/140 area.”
Some high-profile equity markets have seen their recoveries stall at key technical levels such as 5300 for the S&P 500 and 36,000 for the Nikkei 255. Technical analysts would like to see these markets close above those key technical levels before declaring that this corrective phase is over, ING’s FX strategist Chris Turner notes.
DXY may well be capped at 103.15/50
“Determining whether those equity corrections continue or fizzle out will be the combination of US data and Fedspeak. At the heart of the investment story is the issue of whether the US economy is going into recession. A recession without a Fed response could mean a flatter/inverted yield curve, heavy equity losses and a stronger US Dollar (USD).”
“Softer US data and a Fed response – perhaps signalled at the Jackson Hole symposium in two weeks – would deliver a steeper yield curve, more stability/recovery in risk assets and a broadly weaker USD. We are more in the latter camp here and think that the dollar can soften more broadly over the next couple of months.”
“For today, let's look out for initial claims. A higher figure will add to fears of rising unemployment and a Fed response. This is a dollar negative. DXY may well be capped at 103.15/50 on any rallies, with a bias to press 102 over the coming weeks.”
- The US Dollar snaps recovery and retreats against most major peers.
- The Greenback sees earlier gains evaporate in recession fears emerging again.
- The US Dollar index trades back below 103.00 in technical rejection.
The US Dollar (USD) eases across the board against nearly all major peers in what turns out to be a nervous Thursday. Markets are trembling in the run-up to the weekly US Jobless Claims data, which will be released later in the day. It was this same data point that sparked the volatile patch last week ahead of the US Jobs reports and resulted in the massive sell-off on Monday across all asset classes.
On the economic data front, there is a very light calendar ahead. Because of this very calm trading week in terms of economic data, the weekly Initial Jobless Claims print for the week ending on August 2 will gain importance in magnitude. Thus, expect a rough ride later this Thursday on the back of the Jobless Claims data.
Daily digest market movers: Volatility to pick up again
- The economic calendar kicks off at 12:30 GMT with, straight away, the main event being presented: The weekly Jobless Claims
- Initial Claims for the week ending August 2 are expected to head to 240,000 from 249,000.
- Continuing Claims were at 1,877,000. No forecast for the week ending July 26 is pencilled in.
- At 14:00 GMT, Wholesale Inventories data for June is expected to grow by 0.2%, at the same pace as the previous month.
- At 17:00 GMT, the US Treasury will auction a 30-year bond.
- Equity markets are losing steam, with nearly all European incidences in the red. US futures are down as well, though slightly.
- The CME Fedwatch Tool shows a 72.5% chance of a 50 basis points (bps) interest rate cut by the Federal Reserve (Fed) in September. Another 25 bps cut is expected in November by 55.6%, while a 27.2% chance for a 50 bps cut and 17.2% for no cut are being pencilled in for that meeting.
- The US 10-year benchmark rate trades at 3.91%, retreating from this week’s high at 3.98%.
US Dollar Index Technical Analysis: Nervous rejection
The US Dollar Index (DXY) is starting to look dangerous, as Dollar bulls cannot get that daily close above 103.18. This Thursday's decline can be seen as a firm rejection which could result in another leg lower. If the Jobless Claims report this Thursday turns ugly again, a nosedive to 101.00 could not be unthinkable.
Still the first point to recover and gain importance every day is that 103.18, a level held on Friday though snapped on Monday in the Asian hours, is being tested. Once the DXY closes above that level, next up is 104.00, which was the support from June. If the DXY can make its way back above that level, the 200-day Simple Moving Average (SMA) at 104.17 is the next resistance level to look out for.
On the downside, the oversold condition in the Relative Strength Index (RSI) indicator has eased in the daily chart and holds room again for a small leg lower. Support nearby is the March 8 low at 102.35. Once through there, pressure will start to build on 102.00 as a big psychological figure before testing 101.90, which was a pivotal level in December 2023 and January 2024.
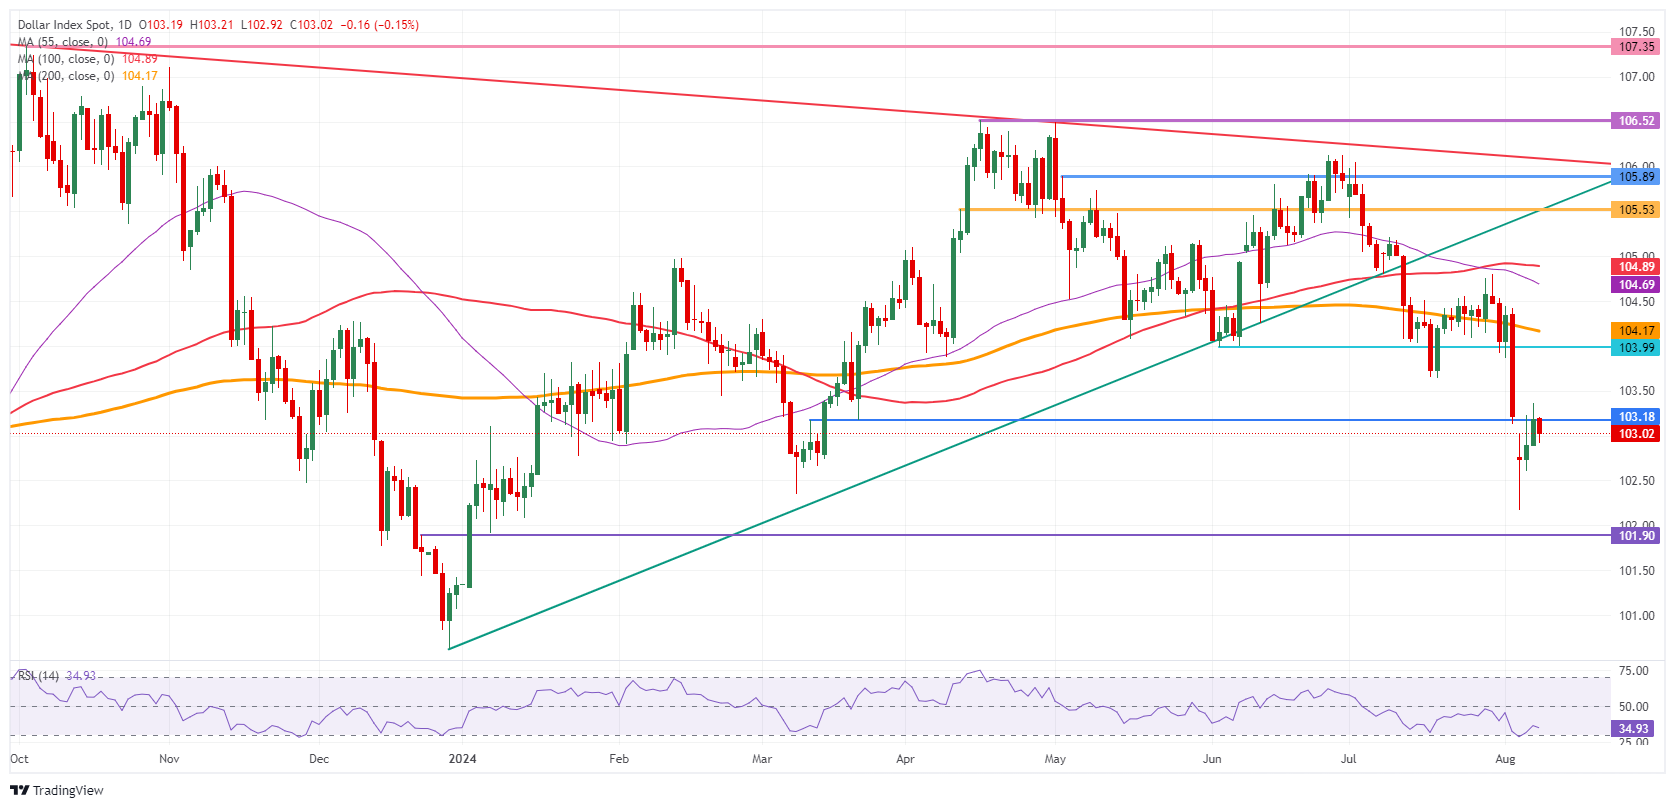
US Dollar Index: Daily Chart
Employment FAQs
Labor market conditions are a key element in assessing the health of an economy and thus a key driver for currency valuation. High employment, or low unemployment, has positive implications for consumer spending and economic growth, boosting the value of the local currency. Moreover, a very tight labor market – a situation in which there is a shortage of workers to fill open positions – can also have implications on inflation levels because low labor supply and high demand leads to higher wages.
The pace at which salaries are growing in an economy is key for policymakers. High wage growth means that households have more money to spend, usually leading to price increases in consumer goods. In contrast to more volatile sources of inflation such as energy prices, wage growth is seen as a key component of underlying and persisting inflation as salary increases are unlikely to be undone. Central banks around the world pay close attention to wage growth data when deciding on monetary policy.
The weight that each central bank assigns to labor market conditions depends on its objectives. Some central banks explicitly have mandates related to the labor market beyond controlling inflation levels. The US Federal Reserve (Fed), for example, has the dual mandate of promoting maximum employment and stable prices. Meanwhile, the European Central Bank’s (ECB) sole mandate is to keep inflation under control. Still, and despite whatever mandates they have, labor market conditions are an important factor for policymakers given their significance as a gauge of the health of the economy and their direct relationship to inflation.
Silver prices (XAG/USD) rose on Thursday, according to FXStreet data. Silver trades at $26.96 per troy ounce, up 1.33% from the $26.61 it cost on Wednesday.
Silver prices have increased by 13.29% since the beginning of the year.
| Unit measure | Silver Price Today in USD |
|---|---|
| Troy Ounce | 26.96 |
| 1 Gram | 0.87 |
The Gold/Silver ratio, which shows the number of ounces of Silver needed to equal the value of one ounce of Gold, stood at 89.16 on Thursday, down from 89.57 on Wednesday.
Silver FAQs
Silver is a precious metal highly traded among investors. It has been historically used as a store of value and a medium of exchange. Although less popular than Gold, traders may turn to Silver to diversify their investment portfolio, for its intrinsic value or as a potential hedge during high-inflation periods. Investors can buy physical Silver, in coins or in bars, or trade it through vehicles such as Exchange Traded Funds, which track its price on international markets.
Silver prices can move due to a wide range of factors. Geopolitical instability or fears of a deep recession can make Silver price escalate due to its safe-haven status, although to a lesser extent than Gold's. As a yieldless asset, Silver tends to rise with lower interest rates. Its moves also depend on how the US Dollar (USD) behaves as the asset is priced in dollars (XAG/USD). A strong Dollar tends to keep the price of Silver at bay, whereas a weaker Dollar is likely to propel prices up. Other factors such as investment demand, mining supply – Silver is much more abundant than Gold – and recycling rates can also affect prices.
Silver is widely used in industry, particularly in sectors such as electronics or solar energy, as it has one of the highest electric conductivity of all metals – more than Copper and Gold. A surge in demand can increase prices, while a decline tends to lower them. Dynamics in the US, Chinese and Indian economies can also contribute to price swings: for the US and particularly China, their big industrial sectors use Silver in various processes; in India, consumers’ demand for the precious metal for jewellery also plays a key role in setting prices.
Silver prices tend to follow Gold's moves. When Gold prices rise, Silver typically follows suit, as their status as safe-haven assets is similar. The Gold/Silver ratio, which shows the number of ounces of Silver needed to equal the value of one ounce of Gold, may help to determine the relative valuation between both metals. Some investors may consider a high ratio as an indicator that Silver is undervalued, or Gold is overvalued. On the contrary, a low ratio might suggest that Gold is undervalued relative to Silver.
(An automation tool was used in creating this post.)
We expect a gradual, calibrated convergence in the CNY fixing back towards the spot rate, which closed at around 7.17, DBS FX & Credit Strategist Chang Wei Liang notes.
PBOC raises its USD/CNY fixing marginally
“USD/CNH has seemingly become a beta play to USD/JPY, rising towards 7.20 yesterday but now easing back towards 7.15 in concert with USD/JPY. This underscores the same speculative positioning forces at play in the offshore RMB as the JPY.”
“Meanwhile, the PBOC had raised its USD/CNY fixing marginally to the highest since November on Wednesday. The RMB mood has turned more positive even in the face of LPR and MLF rate cuts, and thus there is a lesser need for the fixing to anchor RMB stability than before.”
“We now expect a gradual, calibrated convergence in the CNY fixing back towards the spot rate, which closed at around 7.17.”
- AUD/USD surges to near 0.6550 as RBA Bullock prepares to hike interest rates further if needed.
- The Fed is expected to go aggressively on rate cuts amid fears of a potential US slowdown.
- Investors await the US weekly jobless claims data.
The AUD/USD pair climbs to near 0.6550 in Thursday’s European session. The Aussie asset strengthens as Reserve Bank of Australia (RBA) Governor Michelle Bullock delivers a hawkish guidance on interest rates and the US Dollar (USD) corrects on firm Federal Reserve (Fed) rate-cut prospects.
Michelle Bullock said in the Q&A session at Thursday's Rotary Club of Armidale Annual Lecture said the board will not hesitate to hike its Official Cash Rate (OCR) further if needed. She added that central bank will be vigilant to inflation risks. When asked about the inflation outlook, Bullock said. “Don’t expect to be back in 2–3% target range until end of 2025.”
Meanwhile, the market sentiment remains risk-averse on fears of potential global slowdown. S&P 500 futures have posted some losses in the European session. The US Dollar Index (DXY), which tracks the Greenback’s value against six major currencies, edges lower to near 103.00.
The near-term outlook of the US Dollar remains uncertain on market expectations that the Federal Reserve (Fed) will adopt an aggressive policy-easing stance. On the contrary, Economists at Goldman Sachs wrote in a note, “So while market stress is noticeably higher than a week ago, our Financial Stress Index (FSI) suggests that there have been no serious market disruptions to date that would force policymakers to intervene."
In Thursday’s session, investors will focus on the United States Initial Jobless Claims data for the week ending August 2 to know more about the current status of the labor market, which will be published at 12:30 GMT. Economists have estimated that individuals claiming jobless benefits for the first time were 240K, lower than the prior release of 249K.
Australian Dollar FAQs
One of the most significant factors for the Australian Dollar (AUD) is the level of interest rates set by the Reserve Bank of Australia (RBA). Because Australia is a resource-rich country another key driver is the price of its biggest export, Iron Ore. The health of the Chinese economy, its largest trading partner, is a factor, as well as inflation in Australia, its growth rate and Trade Balance. Market sentiment – whether investors are taking on more risky assets (risk-on) or seeking safe-havens (risk-off) – is also a factor, with risk-on positive for AUD.
The Reserve Bank of Australia (RBA) influences the Australian Dollar (AUD) by setting the level of interest rates that Australian banks can lend to each other. This influences the level of interest rates in the economy as a whole. The main goal of the RBA is to maintain a stable inflation rate of 2-3% by adjusting interest rates up or down. Relatively high interest rates compared to other major central banks support the AUD, and the opposite for relatively low. The RBA can also use quantitative easing and tightening to influence credit conditions, with the former AUD-negative and the latter AUD-positive.
China is Australia’s largest trading partner so the health of the Chinese economy is a major influence on the value of the Australian Dollar (AUD). When the Chinese economy is doing well it purchases more raw materials, goods and services from Australia, lifting demand for the AUD, and pushing up its value. The opposite is the case when the Chinese economy is not growing as fast as expected. Positive or negative surprises in Chinese growth data, therefore, often have a direct impact on the Australian Dollar and its pairs.
Iron Ore is Australia’s largest export, accounting for $118 billion a year according to data from 2021, with China as its primary destination. The price of Iron Ore, therefore, can be a driver of the Australian Dollar. Generally, if the price of Iron Ore rises, AUD also goes up, as aggregate demand for the currency increases. The opposite is the case if the price of Iron Ore falls. Higher Iron Ore prices also tend to result in a greater likelihood of a positive Trade Balance for Australia, which is also positive of the AUD.
The Trade Balance, which is the difference between what a country earns from its exports versus what it pays for its imports, is another factor that can influence the value of the Australian Dollar. If Australia produces highly sought after exports, then its currency will gain in value purely from the surplus demand created from foreign buyers seeking to purchase its exports versus what it spends to purchase imports. Therefore, a positive net Trade Balance strengthens the AUD, with the opposite effect if the Trade Balance is negative.
Even as speculative unwinds look largely done, rising geopolitical tensions in the Middle East and Russia should be watched as it could bolster safe haven demand for CHF and JPY, DBS FX & Credit Strategist Chang Wei Liang notes.
SNB introduces a floor for EUR/CHF
“Egypt’s aviation ministry instructed all airlines to avoid Iran airspace due to military drills, while Ukraine staged a surprise military incursion into Russia. We are cautious that further strength in CHF could trigger an unexpected policy reaction.”
“Unlike the undervalued JPY, CHF is highly overvalued. Recent CHF gains have extended its overvaluation towards the Aug 2011 record high based on our DEER model, which subsequently prompted SNB to introduce a floor for EUR/CHF.”
“Yesterday, Swissmem put out a public statement calling SNB to act quickly in response to the sudden rise in CHF that is threatening a vulnerable recovery for overseas sales. SNB has already cut rates twice this year, and there is scope for more cuts to cool CHF demand.”
USD/JPY rebounded above 146 after Deputy Governor Uchida stated that the BOJ won’t raise rates when market is unstable. That said, markets should refrain from bidding USD/JPY back above 150, DBS FX & Credit Strategist Chang Wei Liang notes.
Political environment turns averse towards a weak JPY
“The sharp unwind of carry trades triggered by uncertainty over BOJ’s policy rate trajectory has entered an uneasy pause.”
“Indeed, USD/JPY rebounded above 146 after Deputy Governor Uchida stated that the BOJ won’t raise rates when market is unstable, making clear that financial stability is part of its policy consideration. The Nikkei index has also rebounded about 11% from its low since Monday.”
“That said, markets should refrain from bidding USD/JPY back above 150. Japan’s political environment has turned increasingly averse towards a weak JPY, and the BOJ remains concerned about any inflation pass throughs from the exchange rate.”
- EUR/USD rises as the US Dollar corrects on firm Fed rate-cut prospects.
- Investors see the Fed cutting interest rates aggressively this year.
- The ECB is expected to reduce its key borrowing rates two times more by the year-end.
EUR/USD edges higher to near 1.0940 in Thursday’s European session. The major currency pair rises as the US Dollar corrects from a three-day high. The US Dollar Index (DXY), which tracks the Greenback’s value against six major currencies, drops to near 103.00.
The shared currency pair broadly consolidates in a tight range above the round-level support of 1.0900, with investors looking for more cues about whether the Federal Reserve (Fed) will choose an aggressive monetary policy stance to tame upside risks to potential United States (US) economic slowdown.
According to the CME FedWatch tool, 30-day Federal Funds futures pricing data shows that traders see 50 basis points (bps) cut in interest rates in September as imminent. The data also suggests that the Fed will reduce its key borrowing rates by more than 100 bps this year. Meanwhile, market participants have also anticipated that the Fed could announce emergency rate cuts as the US economy is exposed to a recession.
On the contrary, Economists at Goldman Sachs wrote in a note, “So while market stress is noticeably higher than a week ago, our Financial Stress Index (FSI) suggests that there have been no serious market disruptions to date that would force policymakers to intervene."
Market speculation that the Fed would deliver hefty rate cuts was bolstered by upside risks to job growth and a sharp contraction in the manufacturing sector. For more cues on the current labor market status, investors will focus on the US Initial Jobless Claims data for the week ending August 2, which will be published at 12:30 GMT.
Economists have estimated that individuals claiming jobless benefits for the first time were 240K, lower than the prior release of 249K.
Daily digest market movers: EUR/USD consolidates above 1.0900
- EUR/USD trades in a tight range above 1.0900 since Tuesday amid an absence of top-tier economic data in the Eurozone. Therefore, the Euro will be influenced by market sentiment and speculation for European Central Bank (ECB) and US Federal Reserve (Fed) rate cuts this year.
- The market mood remains risk-averse on fears of a global economic slowdown due to the maintenance of a restrictive interest rate stance for a longer period. The majority of global nations have pivoted to policy normalization, but the broader demand will not revive sooner.
- Meanwhile, investors expect that the ECB will cut its key borrowing rates two times more this year. The ECB kicked off its policy-easing cycle in June as policymakers were confident that price pressures would return to the desired rate of 2% in 2025. However, officials prefer to avoid committing to a specific rate-cut path and left interest rates unchanged in the July meeting, keeping a cautious approach to rate cuts.
- Regarding interest rate guidance, Finnish ECB policymaker Olli Rehn said in a speech on Wednesday, "Inflation continues to slow down, but the path to the two percent target remains bumpy this year." Rehn added, “The rate cuts would help the eurozone economy recover, in particular the "fragile" industrial growth and subdued investments,” Reuters reported.
Technical Forecast: EUR/USD trades close to upper boundary of Channel formation
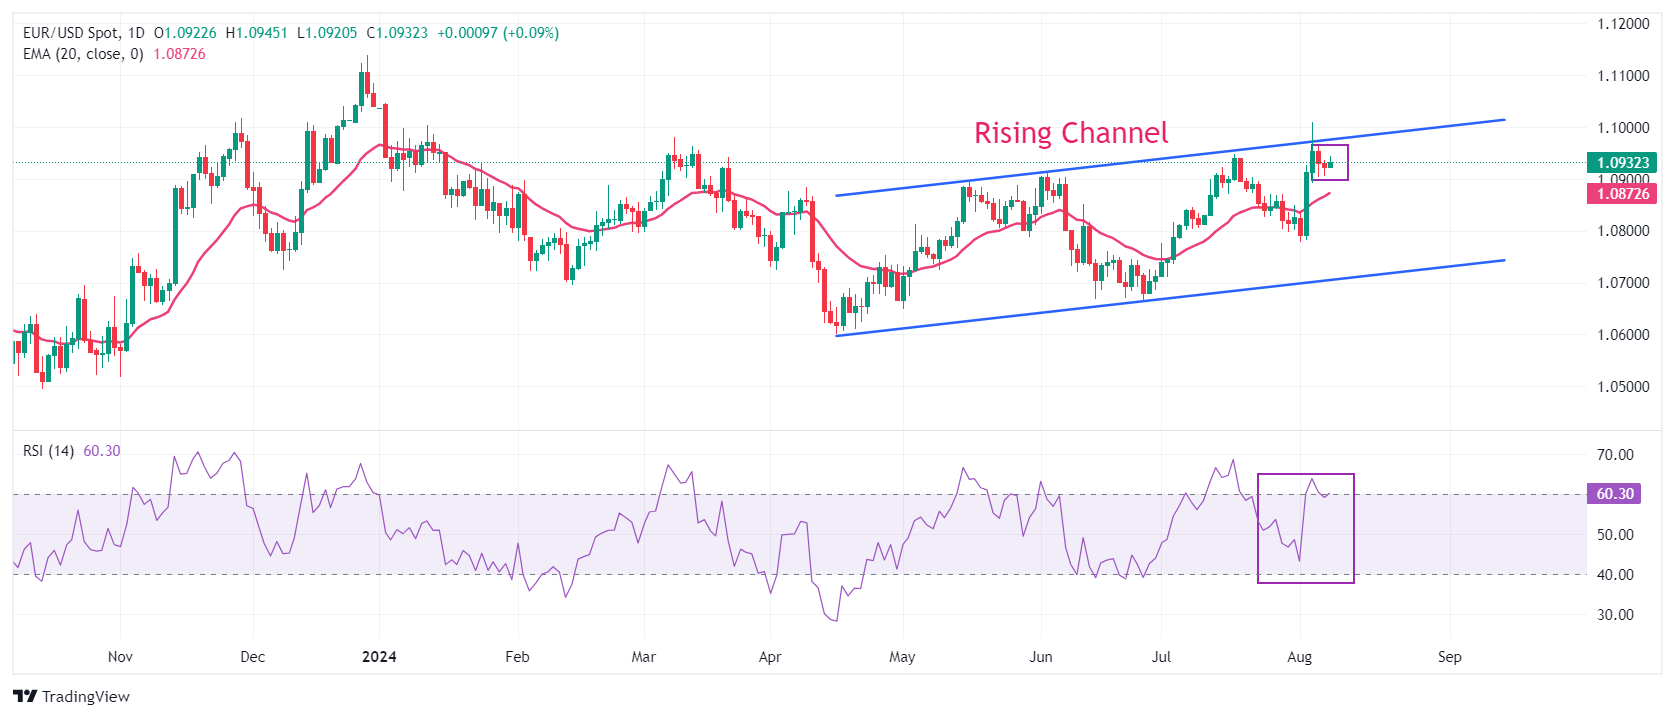
EUR/USD hovers near the upper boundary of a Channel formation on a daily timeframe. A breakout of the aforementioned chart pattern results in wider ticks on the upside and heavy volume. The 200-day Exponential Moving Average (EMA), near 1.0800, acted as major support for the Euro bulls.
The 14-day Relative Strength Index (RSI) indicator in the daily chart climbs above 60.00. If the RSI sustains above that level, bullish momentum will be triggered.
More upside would appear if the major currency pair breaks above Monday’s high of 1.1009. This would drive EUR/USD towards the August 10, 2023, high at 1.1065, followed by the round-level resistance at 1.1100.
In an alternate scenario, a downside move below the August 1 low at 1.0777 would drag the pair toward the February low near 1.0700. A breakdown below the latter would expose the asset to the June 14 low at 1.0667.
Euro FAQs
The Euro is the currency for the 20 European Union countries that belong to the Eurozone. It is the second most heavily traded currency in the world behind the US Dollar. In 2022, it accounted for 31% of all foreign exchange transactions, with an average daily turnover of over $2.2 trillion a day. EUR/USD is the most heavily traded currency pair in the world, accounting for an estimated 30% off all transactions, followed by EUR/JPY (4%), EUR/GBP (3%) and EUR/AUD (2%).
The European Central Bank (ECB) in Frankfurt, Germany, is the reserve bank for the Eurozone. The ECB sets interest rates and manages monetary policy. The ECB’s primary mandate is to maintain price stability, which means either controlling inflation or stimulating growth. Its primary tool is the raising or lowering of interest rates. Relatively high interest rates – or the expectation of higher rates – will usually benefit the Euro and vice versa. The ECB Governing Council makes monetary policy decisions at meetings held eight times a year. Decisions are made by heads of the Eurozone national banks and six permanent members, including the President of the ECB, Christine Lagarde.
Eurozone inflation data, measured by the Harmonized Index of Consumer Prices (HICP), is an important econometric for the Euro. If inflation rises more than expected, especially if above the ECB’s 2% target, it obliges the ECB to raise interest rates to bring it back under control. Relatively high interest rates compared to its counterparts will usually benefit the Euro, as it makes the region more attractive as a place for global investors to park their money.
Data releases gauge the health of the economy and can impact on the Euro. Indicators such as GDP, Manufacturing and Services PMIs, employment, and consumer sentiment surveys can all influence the direction of the single currency. A strong economy is good for the Euro. Not only does it attract more foreign investment but it may encourage the ECB to put up interest rates, which will directly strengthen the Euro. Otherwise, if economic data is weak, the Euro is likely to fall. Economic data for the four largest economies in the euro area (Germany, France, Italy and Spain) are especially significant, as they account for 75% of the Eurozone’s economy.
Another significant data release for the Euro is the Trade Balance. This indicator measures the difference between what a country earns from its exports and what it spends on imports over a given period. If a country produces highly sought after exports then its currency will gain in value purely from the extra demand created from foreign buyers seeking to purchase these goods. Therefore, a positive net Trade Balance strengthens a currency and vice versa for a negative balance.
Instead of continuing to advance, USD is more likely to trade between 7.1450 and 7.1900, but further USD weakness is not ruled out. Although, the low near 7.0635 is solid support now, UOB Group FX analysts Quek Ser Leang and Lee Sue Ann note.
The 7.1450 low is prone to breaking
24-HOUR VIEW: “We expected USD to edge higher yesterday, but we were of the view that ‘any advance is unlikely to break clearly above 7.1800.’ USD subsequently rose more than expected, reaching a high of 7.1935 before pulling back sharply. The advance did not result in a significant increase in momentum. Today, instead of continuing to advance, USD is more likely to trade between 7.1450 and 7.1900.”
1-3 WEEKS VIEW: “After USD plunged to 7.0636 on Monday and then rebounded, we indicated Tuesday (06 Aug, spot at 7.1400) that ‘while downward momentum has slowed somewhat, only a breach of 7.2000 (no change in ‘strong resistance’ level) would mean that the weakness has stabilised.’ We added, ‘until then, further USD weakness is not ruled out, but the low near 7.0635 is solid support now.’ Our view remains unchanged.”
The US Dollar (USD) is expected to trade in a sideways range of 144.50/147.50. The next significant support level is some distance away at 140.80, but it remains to be seen if this level will come into view, UOB Group FX analysts Quek Ser Leang and Lee Sue Ann note.
USD trades sideways withing a range of 144.50/147.50
24-HOUR VIEW: “Our view for USD to trade in a range yesterday was incorrect. Instead of trading in a range, USD soared to 147.89 then pulled back to close at 146.69 (+1.66%). The pullback in overbought conditions indicates that USD is unlikely to advance further. Today, we expect USD to trade in a sideways range 144.50/147.50.”
1-3 WEEKS VIEW: “In our most recent narrative from Monday (05 Aug, spot at 145.25), we noted that ‘the weakness in USD has not stabilised.’ We pointed out that ‘the next significant support level is some distance away at 140.80, but it remains to be seen if this level will come into view.’ We continue to hold the same view. Overall, the USD weakness is intact as long as 148.30 (no change in ‘strong resistance level) is not breached.”
The New Zealand (NZD) is likely to trade in a sideways range of 0.5965/0.6015 or to continue to recover. Overbought short-term conditions could lead to a couple of days of sideways trading, UOB Group FX analysts Quek Ser Leang and Lee Sue Ann note.
The next level to watch is 0.6035
24-HOUR VIEW: “Two days ago, we expected NZD to rise. When our view did not turn out, we indicated yesterday that ‘we continue to see room for NZD to rise, even though any advance is unlikely to break clearly above 0.6010 (next resistance is at 0.6035).’ Our view was not wrong, even though NZD rose more than expected, reaching a high of 0.6025. NZD subsequently pulled back from the high, closing at 0.5994 (+0.66%). The pullback amid slowing momentum and overbought conditions suggests that NZD is unlikely to continue to advance. Today, it is more likely to trade sideways, probably in a range of 0.5965/0.6015.”
1-3 WEEKS VIEW: “On Tuesday (06 Aug, spot at 0.5975), we highlighted that ‘the recent price action continues to suggest NZD could recover, possibly towards 0.6035.’ Yesterday (Wednesday), NZD rose to 0.6025 before pulling back. We continue to expect NZD to recover, even though overbought short-term conditions could lead to a couple of days of sideways trading first. On the downside, a breach of 0.5940 (‘strong support’ previously at 0.5890) would indicate that NZD is not recovering further. Looking ahead, the next level to watch above 0.6035 is at 0.6065.”
- Silver prices appreciate as traders price in a deeper rate cut by the Fed in September.
- CME FedWatch tool indicates 72.0% odds of a 50-basis point Fed rate cut in September, up from 11.8% last week.
- Escalated Middle East tensions support safe-haven demand for precious metals like Silver.
Silver price (XAG/USD) halts its three-day losing streak, trading around $26.80 per troy ounce during the European session on Thursday. The prices of non-yielding assets like Silver gain ground due to the rising expectations of a US Federal Reserve (Fed) rate cut in September.
The Fed is highly expected to implement a more aggressive rate cut beginning in September, following weaker employment data from July that has heightened concerns about a potential US recession. According to the CME FedWatch tool, there is now a 72.0% probability of a 50-basis point (bps) interest rate cut by the US Federal Reserve (Fed) in September, up from 11.8% a week earlier.
Additionally, safe-haven demand for precious metals like Silver has increased due to escalating geopolitical tensions in the Middle East. CNN reported two US intelligence officials, saying that Iran and its allies are preparing for potential retaliation against Israel in response to the recent killings of a top military commander of Iran’s Hezbollah in Lebanon and a senior Hamas leader in Tehran.
Last week’s disappointing GDP figures and an unexpected rate cut by the People's Bank of China (PBOC) have added further selling pressure on Silver. Given that Silver is essential for numerous industrial applications, especially in China, the world's largest manufacturing hub, these developments have intensified concerns about demand. Traders shift their focus to Consumer Price Index data scheduled for release on Friday, to gain further impetus on the Chinese economy.
Silver FAQs
Silver is a precious metal highly traded among investors. It has been historically used as a store of value and a medium of exchange. Although less popular than Gold, traders may turn to Silver to diversify their investment portfolio, for its intrinsic value or as a potential hedge during high-inflation periods. Investors can buy physical Silver, in coins or in bars, or trade it through vehicles such as Exchange Traded Funds, which track its price on international markets.
Silver prices can move due to a wide range of factors. Geopolitical instability or fears of a deep recession can make Silver price escalate due to its safe-haven status, although to a lesser extent than Gold's. As a yieldless asset, Silver tends to rise with lower interest rates. Its moves also depend on how the US Dollar (USD) behaves as the asset is priced in dollars (XAG/USD). A strong Dollar tends to keep the price of Silver at bay, whereas a weaker Dollar is likely to propel prices up. Other factors such as investment demand, mining supply – Silver is much more abundant than Gold – and recycling rates can also affect prices.
Silver is widely used in industry, particularly in sectors such as electronics or solar energy, as it has one of the highest electric conductivity of all metals – more than Copper and Gold. A surge in demand can increase prices, while a decline tends to lower them. Dynamics in the US, Chinese and Indian economies can also contribute to price swings: for the US and particularly China, their big industrial sectors use Silver in various processes; in India, consumers’ demand for the precious metal for jewellery also plays a key role in setting prices.
Silver prices tend to follow Gold's moves. When Gold prices rise, Silver typically follows suit, as their status as safe-haven assets is similar. The Gold/Silver ratio, which shows the number of ounces of Silver needed to equal the value of one ounce of Gold, may help to determine the relative valuation between both metals. Some investors may consider a high ratio as an indicator that Silver is undervalued, or Gold is overvalued. On the contrary, a low ratio might suggest that Gold is undervalued relative to Silver.
The Australian Dollar (AUD) could pullback, but any decline is unlikely to threaten 0.6480. Otherwise, AUD is likely to trade in a 0.6400/0.6600 range for the time being, UOB Group FX analysts Quek Ser Leang and Lee Sue Ann note.
Resistance level is at 0.6560
24-HOUR VIEW: “Yesterday, when AUD was trading at 0.6520, we indicated that ‘the underlying tone still seems firm, and we continue to expect AUD to rebound.’ However, we pointed out that ‘any advance is unlikely to reach the major resistance at 0.6600.’ Our view was not wrong, as AUD rose to 0.6575 then pulled back, closing unchanged at 0.6519. The pullback has gathered some momentum. Today AUD could continue to pullback, but any decline is unlikely to threaten 0.6480 (minor support is at 0.6500). Resistance level is at 0.6560.”
1-3 WEEKS VIEW: “After holding a negative AUD view since late last month, we indicated two days ago (06 Aug, spot at 0.6510) that the weakness has stabilised. We expected AUD to trade in neutral range of 0.6400/0.6600 for the time being. There is no change in our view.”
- GBP/JPY meets with fresh supply on Thursday and erodes a part of the previous day’s move-up.
- A combination of factors underpins the safe-haven JPY and exerts some pressure on the cross.
- Mixed signals from BoJ officials cap gains for the JPY and help spot prices to pare intraday losses.
The GBP/JPY cross extends the previous day's late pullback from the weekly peak – levels just above the 188.00 mark – and attracts some follow-through sellers on Thursday. Spot prices, however, recovered over 100 pips from the daily low and traded just above the mid-185.00s during the early part of the European session.
The Bank of Japan’s (BoJ) summary of opinions from the July policy meeting indicated that some members see room for further rate hikes and policy normalization. This, along with a generally weaker risk tone, underpins the safe-haven Japanese Yen (JPY) and exerts some downward pressure on the GBP/JPY cross. The market sentiment remains fragile in the wake of concerns about an economic downturn in the US and China – the world's two largest economies – and escalating geopolitical tensions in the Middle East.
The British Pound (GBP), on the other hand, benefits from the emergence of some selling around the US Dollar (USD). This, in turn, assists the GBP/JPY cross to attract some dip-buying near the 184.45 region. Any meaningful upside, however, still seems elusive in the wake of the ongoing riots in the UK and dovish Bank of England (BoE) expectations. The BoE lowered rates for the first time in more than four years, from a 16-year high to 5.0% last Thursday, while traders are pricing in the possibility of two more cuts by the year-end.
Meanwhile, BoJ Deputy Governor Shinichi Uchida downplayed the chances of a near-term rate hike on Wednesday. That said, BoJ Governor Kazuo Ueda's hawkish comments last week keep the door open for further policy tightening by the central bank. This, in turn, makes it prudent to wait for strong follow-through buying before confirming that the GBP/JPY cross has formed a near-term bottom and positioning for an extension of this week's bounce from the vicinity of the 180.00 psychological mark, or over a seven-month low.
Bank of Japan FAQs
The Bank of Japan (BoJ) is the Japanese central bank, which sets monetary policy in the country. Its mandate is to issue banknotes and carry out currency and monetary control to ensure price stability, which means an inflation target of around 2%.
The Bank of Japan has embarked in an ultra-loose monetary policy since 2013 in order to stimulate the economy and fuel inflation amid a low-inflationary environment. The bank’s policy is based on Quantitative and Qualitative Easing (QQE), or printing notes to buy assets such as government or corporate bonds to provide liquidity. In 2016, the bank doubled down on its strategy and further loosened policy by first introducing negative interest rates and then directly controlling the yield of its 10-year government bonds.
The Bank’s massive stimulus has caused the Yen to depreciate against its main currency peers. This process has exacerbated more recently due to an increasing policy divergence between the Bank of Japan and other main central banks, which have opted to increase interest rates sharply to fight decades-high levels of inflation. The BoJ’s policy of holding down rates has led to a widening differential with other currencies, dragging down the value of the Yen.
A weaker Yen and the spike in global energy prices have led to an increase in Japanese inflation, which has exceeded the BoJ’s 2% target. With wage inflation becoming a cause of concern, the BoJ looks to move away from ultra loose policy, while trying to avoid slowing the activity too much.
Bias for the Pound Sterling (GBP) is tilted to the downside; any decline is unlikely to break below 1.2645. Rejuvenated momentum indicates that the risk remains on the downside; the levels to watch are 1.2645 and 1.2610, UOB Group FX analysts Quek Ser Leang and Lee Sue Ann note.
Next resistance is at 1.2720
24-HOUR VIEW: “Two days ago, GBP fell sharply. Yesterday, we indicated that ‘while the decline is oversold, it has not stabilised,’ and we held the view that GBP could drop to 1.2645 before stabilisation can be expected. We added, ‘resistance is at 1.2710; a breach of 1.2735 would suggest that the weakness in GBP has stabilised.’ Our view did not materialise, as GBP traded between 1.2682 and 1.2734, closing largely unchanged at 1.2689 (-0.03%). While there has been no clear increase in downward momentum, the bias for GBP still seems to be tilted to the downside. Today, as long as 1.2720 (minor resistance is at 1.2700) is not breached, GBP is likely to drift lower. However, any decline is unlikely to break 1.2645.”
1-3 WEEKS VIEW: “We have held a negative GBP view for about two weeks now. After GBP fell sharply two days ago, we indicated yesterday that ‘the rejuvenated momentum indicates that the risk remains on the downside.’ We pointed out ‘the levels to watch are 1.2645 and 1.2610.’ We added, ‘the latter level is solid support (near June’s low).’ We will continue to hold the same view as long as 1.2765 (‘strong resistance’ level was at 1.2780 yesterday) is not breached.”
The Euro (EUR) is expected to edge higher; the 1.0960 level is expected to offer strong resistance. But EUR has to surpass 1.1010 before further advance to 1.1070 can be expected, UOB Group FX analysts Quek Ser Leang and Lee Sue Ann note.
EUR may test in the near term
24-HOUR VIEW: “Yesterday, we indicated that ‘the current price action is likely part of a consolidation phase,’ and we expected EUR to trade between 1.0895 and 1.0960. Our view of consolidation was correct, even though EUR traded in a much narrower range than expected (1.0905/1.0936), closing largely unchanged at 1.0921 (-0.08%). Despite the quiet price action, upward momentum seems to be building, albeit tentatively. Today, we expect EUR to edge higher. However, the 1.0960 level is expected to offer strong resistance. Support is at 1.0915, followed by 1.0900.”
1-3 WEEKS VIEW: “Our update from two days ago (06 Aug, spot at 1.0955) still stands. As highlighted, ‘while the outlook for EUR is still positive, it has to surpass 1.1010 before further advance to 1.1070 can be expected.’ On the downside, should EUR breach the ‘strong support’ at 1.0875 (level previously at 1.0855), it would mean that EUR is not ready to move above 1.1010.”
- WTI price loses ground despite the rising supply fears over geopolitical tensions.
- Two US intelligence officials said that Iran and its allies are preparing potential retaliation against Israel.
- EIA Crude Oil Stocks Change fell by 3.728 million barrels, marking the sixth consecutive weekly decline.
West Texas Intermediate (WTI) Oil retraces its recent gains from the previous session, trading around $74.00 during the early European hours on Thursday. However, crude Oil prices may regain support from rising concerns about supply constraints due to ongoing geopolitical tensions in the Middle East.
CNN reported two US intelligence officials, saying that Iran and its allies are preparing for potential retaliation against Israel in response to the recent killings of a top military commander of Iran’s Hezbollah in Lebanon and a senior Hamas leader in Tehran.
On Wednesday, Oil prices appreciated due to a larger-than-expected drop in US crude Oil inventories. Energy Information Administration (EIA) Crude Oil Stocks Change declined by 3.728 million barrels for the week ending August 2, marking the sixth consecutive weekly decline. The stockpiles significantly exceeded the anticipated decrease of 0.4 million barrels and the previous decline was 3.436 billion barrels.
On Tuesday, Reuters reported that the EIA estimates global oil inventories decreased by approximately 400,000 barrels per day (bpd) in the first half of 2024. The EIA projects stockpiles will decline by around 800,000 bpd in the second half of the year.
The US Federal Reserve (Fed) is expected to implement a more aggressive rate cut starting in September, following weaker July employment data that has raised concerns about a potential US recession. Lower interest rates could stimulate growth in the US economy, the world’s largest Oil consumer, potentially increasing Oil demand.
WTI Oil FAQs
WTI Oil is a type of Crude Oil sold on international markets. The WTI stands for West Texas Intermediate, one of three major types including Brent and Dubai Crude. WTI is also referred to as “light” and “sweet” because of its relatively low gravity and sulfur content respectively. It is considered a high quality Oil that is easily refined. It is sourced in the United States and distributed via the Cushing hub, which is considered “The Pipeline Crossroads of the World”. It is a benchmark for the Oil market and WTI price is frequently quoted in the media.
Like all assets, supply and demand are the key drivers of WTI Oil price. As such, global growth can be a driver of increased demand and vice versa for weak global growth. Political instability, wars, and sanctions can disrupt supply and impact prices. The decisions of OPEC, a group of major Oil-producing countries, is another key driver of price. The value of the US Dollar influences the price of WTI Crude Oil, since Oil is predominantly traded in US Dollars, thus a weaker US Dollar can make Oil more affordable and vice versa.
The weekly Oil inventory reports published by the American Petroleum Institute (API) and the Energy Information Agency (EIA) impact the price of WTI Oil. Changes in inventories reflect fluctuating supply and demand. If the data shows a drop in inventories it can indicate increased demand, pushing up Oil price. Higher inventories can reflect increased supply, pushing down prices. API’s report is published every Tuesday and EIA’s the day after. Their results are usually similar, falling within 1% of each other 75% of the time. The EIA data is considered more reliable, since it is a government agency.
OPEC (Organization of the Petroleum Exporting Countries) is a group of 13 Oil-producing nations who collectively decide production quotas for member countries at twice-yearly meetings. Their decisions often impact WTI Oil prices. When OPEC decides to lower quotas, it can tighten supply, pushing up Oil prices. When OPEC increases production, it has the opposite effect. OPEC+ refers to an expanded group that includes ten extra non-OPEC members, the most notable of which is Russia.
- USD/CAD remains under some selling pressure for the fourth successive day on Thursday.
- Dovish Fed expectations, sliding US bond yields weigh on the USD and exert some pressure.
- A modest downtick in Oil prices could undermine the Loonie and lend support to the major.
The USD/CAD pair drifts lower for the fourth straight day and trades around the 1.3735-1.3740 area during the early European session on Thursday. Bearish traders now await some follow-through selling below the 1.3720 area, or over a two-week low set on Wednesday, before positioning for an extension of this week's sharp retracement slide from the vicinity of mid-1.3900s, or the highest level since October 2022.
Rising bets for bigger interest rate cuts by the Federal Reserve (Fed), bolstered by the incoming softer US economic data, trigger a fresh leg down in the US Treasury bond yields. This, in turn, drags the US Dollar (USD) away from the weekly peak set the previous day and is seen exerting downward pressure on the USD/CAD pair. That said, the prevalent cautious market mood could help limit any meaningful depreciating move for the safe-haven Greenback.
Against the backdrop of China's economic woes, fears of a possible recession in the US, along with persistent geopolitical risks stemming from the ongoing conflicts in the Middle East, weigh on investors' sentiment. Furthermore, worries that an economic downturn in the world's two largest economies will dent fuel demand weigh on Crude Oil prices, which could undermine demand for the commodity-linked Loonie and lend support to the USD/CAD pair.
Market participants now look to the US economic docket, featuring the usual Weekly Initial Jobless Claims data later during the early North American session. Apart from this, the US bond yields and the broader risk sentiment might influence the USD demand, which, along with Oil price dynamics, should provide some impetus to the USD/CAD pair. The market attention will then shift to the monthly employment details from Canada, due for release on Friday.
Economic Indicator
Unemployment Rate
The Unemployment Rate, released by Statistics Canada, is the number of unemployed workers divided by the total civilian labor force as a percentage. It is a leading indicator for the Canadian Economy. If the rate is up, it indicates a lack of expansion within the Canadian labor market and a weakening of the Canadian economy. Generally, a decrease of the figure is seen as bullish for the Canadian Dollar (CAD), while an increase is seen as bearish.
Read more.Next release: Fri Aug 09, 2024 12:30
Frequency: Monthly
Consensus: 6.5%
Previous: 6.4%
Source: Statistics Canada
- USD/MXN trades back and forth above $19.00 despite the volatile US Dollar.
- The Fed is expected to bring down interest rates aggressively.
- USD/MXN trades inside the Rising Channel chart pattern.
The USD/MXN pair trades in a limited range above the crucial support of 19.00 in Thursday’s European session. The asset consolidates from the last three trading sessions despite the US Dollar (USD) exhibiting sheer volatility.
The US Dollar Index (DXY), which tracks the Greenback’s value against six major currencies, corrects to near 103.00 on firm speculation that the Federal Reserve (Fed) will pivot to policy-normalization aggressively. 10-year US Treasury yields tumble to near 3.90%.
Meanwhile, investors await the United States (US) Initial Jobless Claims data for the week ending August 2, which will be published at 12:30 GMT. Investors will keenly focus on the weekly jobless claims as it is the only data available that will provide some cues about the current status of the labor market.
On the Mexican Peso front, the Mexican currency will be influenced by the spectre of controversial reforms to Mexico's constitution set for votes next month, including a potential judicial overhaul that would subject judges to popular vote, Reuters reported.
USD/MXN trades in a Rising Channel formation on a daily timeframe in which each pullback is considered as buying opportunity by market participants. The asset appears to be in a strong uptrend as the 20-day Exponential Moving Average (EMA) near $28.70 slopes higher.
The 14-day Relative Strength Index (RSI) oscillates in the 60.00-80.00 range, suggesting a strong upside momentum.
Fresh upside would appear if the asset breaks above August 6 high of 19.61, which will drive the asset towards fresh annual high near $20, followed by almost two-year high of 20.50.
USD/MXN daily chart
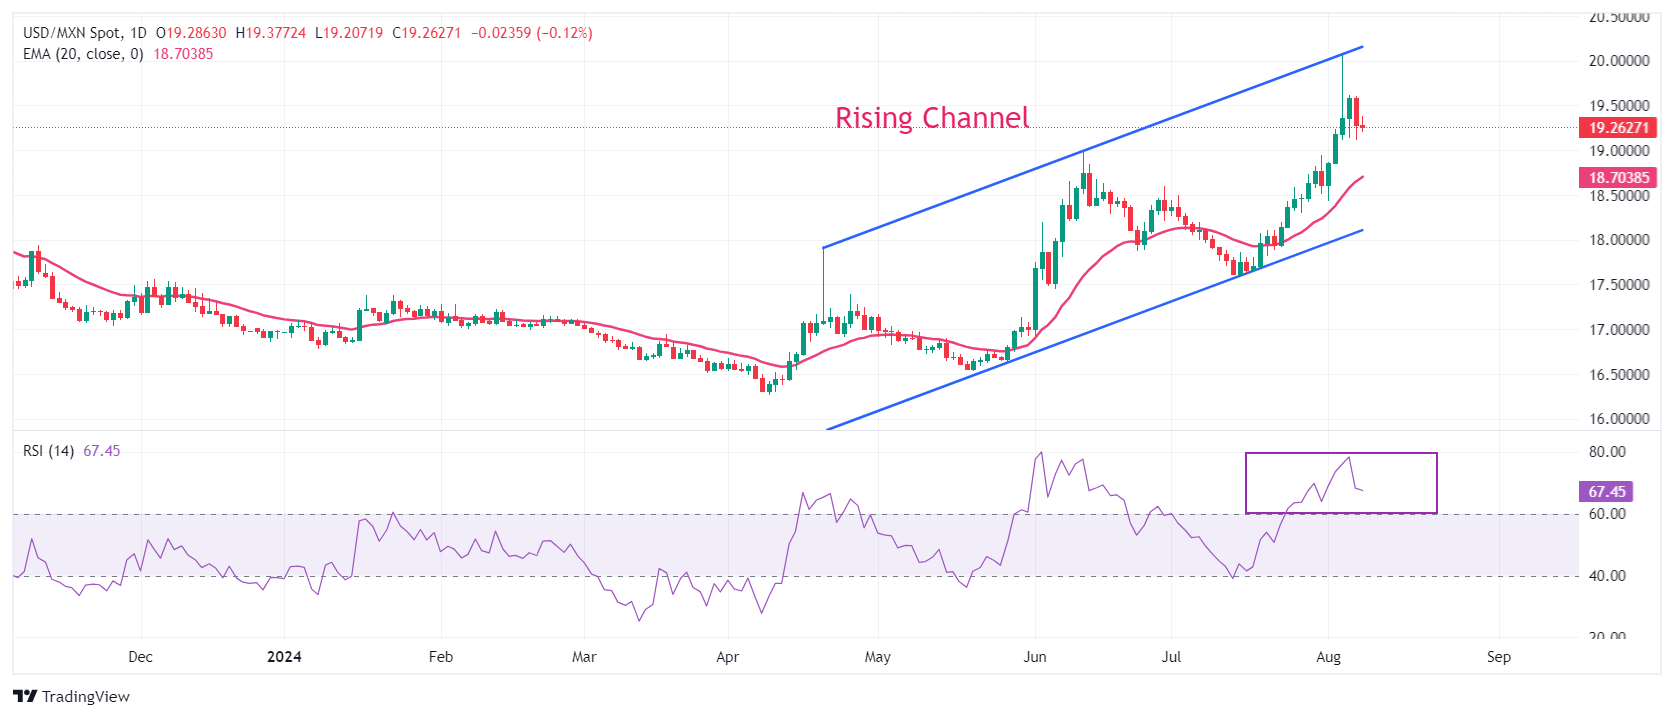
Mexican Peso FAQs
The Mexican Peso (MXN) is the most traded currency among its Latin American peers. Its value is broadly determined by the performance of the Mexican economy, the country’s central bank’s policy, the amount of foreign investment in the country and even the levels of remittances sent by Mexicans who live abroad, particularly in the United States. Geopolitical trends can also move MXN: for example, the process of nearshoring – or the decision by some firms to relocate manufacturing capacity and supply chains closer to their home countries – is also seen as a catalyst for the Mexican currency as the country is considered a key manufacturing hub in the American continent. Another catalyst for MXN is Oil prices as Mexico is a key exporter of the commodity.
The main objective of Mexico’s central bank, also known as Banxico, is to maintain inflation at low and stable levels (at or close to its target of 3%, the midpoint in a tolerance band of between 2% and 4%). To this end, the bank sets an appropriate level of interest rates. When inflation is too high, Banxico will attempt to tame it by raising interest rates, making it more expensive for households and businesses to borrow money, thus cooling demand and the overall economy. Higher interest rates are generally positive for the Mexican Peso (MXN) as they lead to higher yields, making the country a more attractive place for investors. On the contrary, lower interest rates tend to weaken MXN.
Macroeconomic data releases are key to assess the state of the economy and can have an impact on the Mexican Peso (MXN) valuation. A strong Mexican economy, based on high economic growth, low unemployment and high confidence is good for MXN. Not only does it attract more foreign investment but it may encourage the Bank of Mexico (Banxico) to increase interest rates, particularly if this strength comes together with elevated inflation. However, if economic data is weak, MXN is likely to depreciate.
As an emerging-market currency, the Mexican Peso (MXN) tends to strive during risk-on periods, or when investors perceive that broader market risks are low and thus are eager to engage with investments that carry a higher risk. Conversely, MXN tends to weaken at times of market turbulence or economic uncertainty as investors tend to sell higher-risk assets and flee to the more-stable safe havens.
Here is what you need to know on Thursday, August 8:
Following a two-day rebound, the US Dollar (USD) seems to be struggling to keep its footing on Thursday, with the USD Index retreating back below 103.00 in the European session. The US Department of Labor will release the weekly Initial Jobless Claims data later in the day. Wholesale Inventories for June will also be featured in the US economic docket.
US Dollar PRICE This week
The table below shows the percentage change of US Dollar (USD) against listed major currencies this week. US Dollar was the strongest against the British Pound.
| USD | EUR | GBP | JPY | CAD | AUD | NZD | CHF | |
|---|---|---|---|---|---|---|---|---|
| USD | -0.25% | 0.81% | -0.52% | -0.95% | -0.53% | -0.69% | 0.06% | |
| EUR | 0.25% | 0.97% | -0.41% | -0.83% | -0.28% | -0.55% | 0.20% | |
| GBP | -0.81% | -0.97% | -1.32% | -1.76% | -1.24% | -1.51% | -0.76% | |
| JPY | 0.52% | 0.41% | 1.32% | -0.42% | -0.08% | -0.17% | 0.59% | |
| CAD | 0.95% | 0.83% | 1.76% | 0.42% | 0.46% | 0.26% | 0.84% | |
| AUD | 0.53% | 0.28% | 1.24% | 0.08% | -0.46% | -0.27% | 0.48% | |
| NZD | 0.69% | 0.55% | 1.51% | 0.17% | -0.26% | 0.27% | 0.76% | |
| CHF | -0.06% | -0.20% | 0.76% | -0.59% | -0.84% | -0.48% | -0.76% |
The heat map shows percentage changes of major currencies against each other. The base currency is picked from the left column, while the quote currency is picked from the top row. For example, if you pick the US Dollar from the left column and move along the horizontal line to the Japanese Yen, the percentage change displayed in the box will represent USD (base)/JPY (quote).
After registering impressive gains on Tuesday, Wall Street's main indexes opened decisively higher on Wednesday. The risk rally, however, lost its steam in the second half of the session and US stock indexes closed the day deep in negative territory. In the absence of high-tier data releases or geopolitical headlines, this action suggested that investors might have booked their profits before moving to the sidelines to wait for the next catalyst. In the meantime, the benchmark 10-year US Treasury bond yield continued to push higher on Wednesday but lost its momentum after coming within a touching distance of 4%. Early Thursday, the 10-year US yield is down nearly 1% on the day at around 3.9%, while US stock index futures trade in negative territory.
While speaking at Rotary Club of Armidale Annual Lecture early Thursday, Reserve Bank of Australia (RBA) Governor Michele Bullock noted that the RBA considered to hike rates on Tuesday but noted that they could also cut rates if the economy were to turn down quicker than anticipated. AUD/USD gathered bullish momentum during the Asian trading hours and was last seen rising more than 0.5% on the day above 0.6550.
EUR/USD registered modest losses for the second consecutive day on Wednesday but managed to hold above 1.0900. The pair edges slightly higher toward 1.0950 in the European morning on Wednesday.
The Bank of Japan's (BoJ) Summary of Opinions from its July 30-31 showed on Thursday that some members saw the need for further rate hikes, with one member arguing that the BoJ should eventually raise the policy rate to levels deemed neutral to the economy, which is likely at least around 1%. After gaining more than 1.5% on Wednesday, USD/JPY reversed its direction and was last seen losing 0.7% on the day at 145.70.
GBP/USD stays in a consolidation phase at around 1.2700 after closing the day flat on Wednesday.
Gold failed to gather recovery momentum and posted losses for the fifth consecutive day on Wednesday. XAU/USD gains traction in the European morning on Thursday and edges higher toward $2,400.
Interest rates FAQs
Interest rates are charged by financial institutions on loans to borrowers and are paid as interest to savers and depositors. They are influenced by base lending rates, which are set by central banks in response to changes in the economy. Central banks normally have a mandate to ensure price stability, which in most cases means targeting a core inflation rate of around 2%. If inflation falls below target the central bank may cut base lending rates, with a view to stimulating lending and boosting the economy. If inflation rises substantially above 2% it normally results in the central bank raising base lending rates in an attempt to lower inflation.
Higher interest rates generally help strengthen a country’s currency as they make it a more attractive place for global investors to park their money.
Higher interest rates overall weigh on the price of Gold because they increase the opportunity cost of holding Gold instead of investing in an interest-bearing asset or placing cash in the bank. If interest rates are high that usually pushes up the price of the US Dollar (USD), and since Gold is priced in Dollars, this has the effect of lowering the price of Gold.
The Fed funds rate is the overnight rate at which US banks lend to each other. It is the oft-quoted headline rate set by the Federal Reserve at its FOMC meetings. It is set as a range, for example 4.75%-5.00%, though the upper limit (in that case 5.00%) is the quoted figure. Market expectations for future Fed funds rate are tracked by the CME FedWatch tool, which shapes how many financial markets behave in anticipation of future Federal Reserve monetary policy decisions.
- GBP/USD attracts some dip-buying on Thursday, albeit struggles to build on the move up.
- Bets for bigger Fed rate cuts, sliding US bond yields undermine the USD and lend support.
- Dovish BoE expectations and social unrest in the UK keep a lid on any gains for the GBP.
The GBP/USD pair once again shows some resilience below the 100-day Simple Moving Average (SMA) and attracts dip-buyers in the vicinity of over a one-month low touched earlier this week. Spot prices, however, struggle to capitalize on the uptick and currently trade with only modest intraday gains, around the 1.2700 round-figure mark.
The US Dollar (USD) comes under some renewed selling pressure in the wake of rising bets for bigger interest rate cuts by the Federal Reserve (Fed), which triggers to a fresh leg down in the US Treasury bond yields. This, in turn, offers some support to the GBP/USD pair, though a softer risk tone helps limit losses for the safe-haven buck and acts as a headwind.
The market sentiment remains fragile on the back of growing concerns about an economic downturn in China and a possible US recession. Apart from this, geopolitical risks stemming from the ongoing conflicts in the Middle East temper investors' appetite for riskier assets, which, along with dovish Bank of England (BoE) expectations, caps the GBP/USD pair.
In fact, the BoE lowered interest rate for the first time in more than four years, from a 16-year high to 5.0% last Thursday. The markets are also pricing in the possibility of two additional interest rate cuts by the end of this year. Apart from this, the ongoing riots in the UK warrant caution for the British Pound (GBP) bulls and positioning for any upside for the GBP/USD pair.
There isn't any relevant market-moving economic data due for release from the UK on Thursday, while the US economic docket features the usual Initial Weekly Jobless Claims later during the early North American session. This, along with the US bond yields and the broader risk sentiment, will drive the USD demand and provide some impetus to the GBP/USD pair.
BoE FAQs
The Bank of England (BoE) decides monetary policy for the United Kingdom. Its primary goal is to achieve ‘price stability’, or a steady inflation rate of 2%. Its tool for achieving this is via the adjustment of base lending rates. The BoE sets the rate at which it lends to commercial banks and banks lend to each other, determining the level of interest rates in the economy overall. This also impacts the value of the Pound Sterling (GBP).
When inflation is above the Bank of England’s target it responds by raising interest rates, making it more expensive for people and businesses to access credit. This is positive for the Pound Sterling because higher interest rates make the UK a more attractive place for global investors to park their money. When inflation falls below target, it is a sign economic growth is slowing, and the BoE will consider lowering interest rates to cheapen credit in the hope businesses will borrow to invest in growth-generating projects – a negative for the Pound Sterling.
In extreme situations, the Bank of England can enact a policy called Quantitative Easing (QE). QE is the process by which the BoE substantially increases the flow of credit in a stuck financial system. QE is a last resort policy when lowering interest rates will not achieve the necessary result. The process of QE involves the BoE printing money to buy assets – usually government or AAA-rated corporate bonds – from banks and other financial institutions. QE usually results in a weaker Pound Sterling.
Quantitative tightening (QT) is the reverse of QE, enacted when the economy is strengthening and inflation starts rising. Whilst in QE the Bank of England (BoE) purchases government and corporate bonds from financial institutions to encourage them to lend; in QT, the BoE stops buying more bonds, and stops reinvesting the principal maturing on the bonds it already holds. It is usually positive for the Pound Sterling.
- Gold’s price hovers near $2,400 as the US Dollar and bond yields correct.
- The Fed is expected to cut interest rates by more than 100 bps this year.
- Investors await the US weekly jobless claims data.
Gold’s price (XAU/USD) slightly recovers from a two-day low of $2,380 in Thursday’s European session. The precious metal continues to hold ground due to expectations that the Federal Reserve (Fed) will start reducing interest rates from the September meeting.
Meanwhile, some corrections in the US Dollar (USD) and bond yields have offered a cushion to Gold’s price. The US Dollar Index (DXY), which tracks the Greenback’s value against six major currencies, drops to near 103.00 from a three-day high of 103.37. Meanwhile, 10-year US Treasury yields tumble to near 3.90%. Historically, lower yields on interest-bearing assets bode well for non-yielding assets, such as Gold, by reducing the opportunity cost of investment in them.
According to the CME FedWatch tool, 30-day Federal Funds futures pricing data shows that traders see a 50-basis point (bp) cut in interest rates in September as imminent. The data also suggests that the Fed will reduce its key borrowing rates by more than 100 bps this year. Market speculation for the Fed approaching an aggressive policy stance was prompted by softening labor market conditions, signaled by slower job growth and a rising Unemployment Rate in July.
Daily digest market movers: Gold price capitalizes on multiple tailwinds
- Gold price remains steady on multiple tailwinds. Growing expectations for Fed rate-cut prospects and escalating Middle East tensions have kept the Gold price’s downside limited. The prospects for Fed’s bulk rate cuts were bolstered by potential economic slowdown as investors worry that the United States (US) struggles to bear the consequences of higher interest rates.
- While traders priced in aggressive rate-cut announcements by the Fed this year, US economic data has not pointed to a significant slowdown. Though the ISM Manufacturing Purchasing Managers’ Index (PMI) contracted at a faster-than-expected pace in July, activities in the service sector, which accounts for two-thirds of the economy, expanded strongly.
- Commenting on the Services PMI performance, Chris Williamson, chief business economist at S&P Global Market Intelligence, said: “The July surveys are indicative of the economy continuing to grow at the start of the third quarter at a rate comparable to GDP rising at a solid annualized 2.2% pace."
- On the geopolitical front, escalating conflicts between Iran and Israel kept Gold’s safe-haven appeal intact. Saudi Arabia said the killing of the Hamas leader in Tehran is a 'blatant violation' of Iran's sovereignty, Deccan Herald reported. Meanwhile, Israel vowed to eliminate the new Hamas chief, Yahya Sinwar.
- In Thursday’s session, investors will focus on the US Initial Jobless Claims data for the week ending August 2, which will be published at 12:30 GMT. The Department of Labor is expected to show that individuals claiming jobless benefits for the first time were 240K, lower than the prior release of 249K.
Technical Analysis: Gold price hovers near $2,400
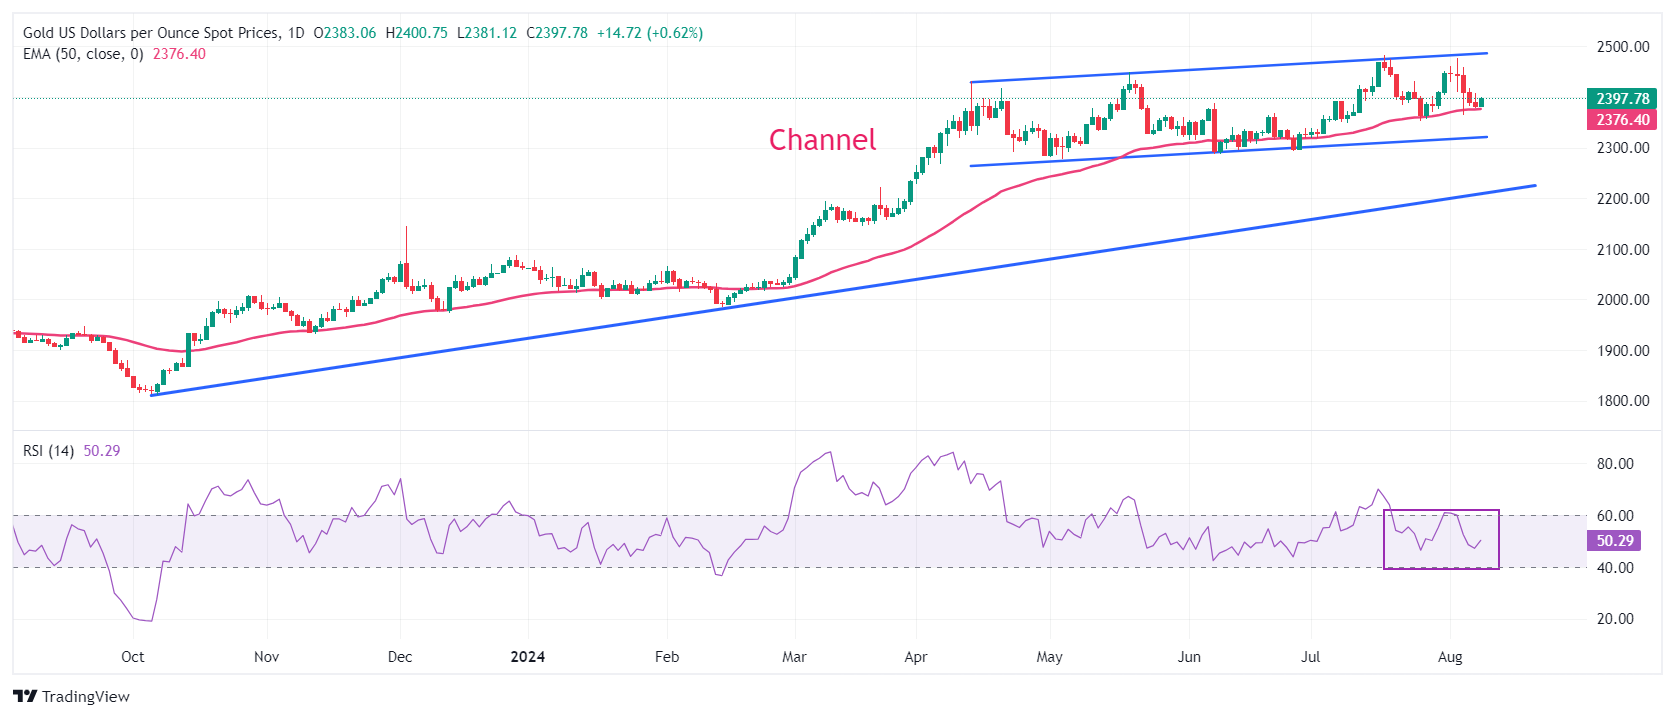
Gold’s price trades in a channel formation on a daily timeframe, which is slightly rising but broadly exhibited a sideways performance for more than three months. The 50-day Exponential Moving Average (EMA) near $2,370 continues to provide support to the Gold price bulls.
The 14-day Relative Strength Index (RSI) oscillates within the 40.00-60.00 range, suggesting indecisiveness among market participants.
A fresh upside would appear if the Gold price breaks above its all-time high of $2,483.75, which will send it into unchartered territory.
On the downside, the upward-sloping trendline at $2,225, plotted from the October 6 low near $1,810.50, will be a major support in the longer term.
Gold FAQs
Gold has played a key role in human’s history as it has been widely used as a store of value and medium of exchange. Currently, apart from its shine and usage for jewelry, the precious metal is widely seen as a safe-haven asset, meaning that it is considered a good investment during turbulent times. Gold is also widely seen as a hedge against inflation and against depreciating currencies as it doesn’t rely on any specific issuer or government.
Central banks are the biggest Gold holders. In their aim to support their currencies in turbulent times, central banks tend to diversify their reserves and buy Gold to improve the perceived strength of the economy and the currency. High Gold reserves can be a source of trust for a country’s solvency. Central banks added 1,136 tonnes of Gold worth around $70 billion to their reserves in 2022, according to data from the World Gold Council. This is the highest yearly purchase since records began. Central banks from emerging economies such as China, India and Turkey are quickly increasing their Gold reserves.
Gold has an inverse correlation with the US Dollar and US Treasuries, which are both major reserve and safe-haven assets. When the Dollar depreciates, Gold tends to rise, enabling investors and central banks to diversify their assets in turbulent times. Gold is also inversely correlated with risk assets. A rally in the stock market tends to weaken Gold price, while sell-offs in riskier markets tend to favor the precious metal.
The price can move due to a wide range of factors. Geopolitical instability or fears of a deep recession can quickly make Gold price escalate due to its safe-haven status. As a yield-less asset, Gold tends to rise with lower interest rates, while higher cost of money usually weighs down on the yellow metal. Still, most moves depend on how the US Dollar (USD) behaves as the asset is priced in dollars (XAU/USD). A strong Dollar tends to keep the price of Gold controlled, whereas a weaker Dollar is likely to push Gold prices up.
- USD/CAD extends its decline near 1.3730 in Thursday’s early European session, losing 0.20% on the day.
- The risk to consumer spending could be significantly weaker than expected in 2025 and 2026, noted the BoC Summary of Deliberations.
- The weekly US Initial Jobless Claims will be released later on Thursday.
The USD/CAD pair trades in negative territory for the fourth consecutive day around 1.3730 during the early European session on Thursday. The extra decline of the Greenback due to the dovish stance of the US Federal Reserve (Fed) drags the pair lower. Investors will take more cues from the weekly US Initial Jobless Claims ahead of the key Canadian employment report on Friday.
The markets raise their bets that the Fed will take action more aggressively on the interest rate in its upcoming meeting in September. The growing expectation of Fed deeper rate cuts might exert selling pressure on the US Dollar (USD) for the time being. Wells Fargo analysts are now forecasting two 50 basis points (bps) rate cuts at the FOMC meetings in September and November.
On the Loonie front, the Bank of Canada (BoC) Summary of Deliberations from the July 24 meeting that was published on Wednesday indicated that the Canadian central bank is concerned about the country’s economic outlook, particularly consumer spending in the coming years. The governing council stated that there was a “clear consensus” that if inflation continued to return to the 2% target, “it would be appropriate to lower the policy rate further.” BMO and CIBC analysts forecast further rate reduction of 75 basis points in 2024, or a quarter-point cut at each remaining meeting this year.
Market players await the employment report from Statistics Canada on Friday for fresh catalysts. The Canadian economy is estimated to add 22.5K jobs in July, while the Unemployment Rate is estimated to tick higher to 6.5% in July from 6.4% in June.
Canadian Dollar FAQs
The key factors driving the Canadian Dollar (CAD) are the level of interest rates set by the Bank of Canada (BoC), the price of Oil, Canada’s largest export, the health of its economy, inflation and the Trade Balance, which is the difference between the value of Canada’s exports versus its imports. Other factors include market sentiment – whether investors are taking on more risky assets (risk-on) or seeking safe-havens (risk-off) – with risk-on being CAD-positive. As its largest trading partner, the health of the US economy is also a key factor influencing the Canadian Dollar.
The Bank of Canada (BoC) has a significant influence on the Canadian Dollar by setting the level of interest rates that banks can lend to one another. This influences the level of interest rates for everyone. The main goal of the BoC is to maintain inflation at 1-3% by adjusting interest rates up or down. Relatively higher interest rates tend to be positive for the CAD. The Bank of Canada can also use quantitative easing and tightening to influence credit conditions, with the former CAD-negative and the latter CAD-positive.
The price of Oil is a key factor impacting the value of the Canadian Dollar. Petroleum is Canada’s biggest export, so Oil price tends to have an immediate impact on the CAD value. Generally, if Oil price rises CAD also goes up, as aggregate demand for the currency increases. The opposite is the case if the price of Oil falls. Higher Oil prices also tend to result in a greater likelihood of a positive Trade Balance, which is also supportive of the CAD.
While inflation had always traditionally been thought of as a negative factor for a currency since it lowers the value of money, the opposite has actually been the case in modern times with the relaxation of cross-border capital controls. Higher inflation tends to lead central banks to put up interest rates which attracts more capital inflows from global investors seeking a lucrative place to keep their money. This increases demand for the local currency, which in Canada’s case is the Canadian Dollar.
Macroeconomic data releases gauge the health of the economy and can have an impact on the Canadian Dollar. Indicators such as GDP, Manufacturing and Services PMIs, employment, and consumer sentiment surveys can all influence the direction of the CAD. A strong economy is good for the Canadian Dollar. Not only does it attract more foreign investment but it may encourage the Bank of Canada to put up interest rates, leading to a stronger currency. If economic data is weak, however, the CAD is likely to fall.
- EUR/JPY struggles to capitalize on the previous day’s positive move amid renewed JPY buying.
- BoJ rate hike bets, geopolitical risks, China’s economic woes underpin the JPY and exert pressure.
- The ECB’s dovish outlook warrants some caution before positioning for any meaningful upside.
The EUR/JPY cross comes under some renewed selling pressure on Thursday and moves away from the weekly peak, around the 161.45 region touched the previous day. Spot prices, however, bounced nearly 100 pips from the daily low and traded with modest intraday losses, just below the 160.00 psychological mark during the early European session.
The Japanese Yen (JPY) gains some positive traction after the Bank of Japan’s (BoJ) summary of opinions from the July meeting indicated that some members see room for further rate hikes and policy normalization. Apart from this, concerns about an economic downturn in the US and China, along with escalating geopolitical tensions in the Middle East, further underpin the safe-haven JPY, which, in turn, exerts pressure on the EUR/JPY cross.
The shared currency, on the other hand, draws some support from the emergence of some selling around the US Dollar (USD) and better-than-expected German data released this week – Factory Orders and Industrial Production figures. That said, the European Central Bank's (ECB) downbeat view of the Eurozone's economic prospects and expectations for additional interest rate cuts by the end of this year might cap the upside for the Euro.
In the absence of any relevant market-moving economic releases on Thursday, the aforementioned fundamental backdrop makes it prudent to wait for a strong follow-through buying before confirming that the EUR/JPY cross has bottomed out. Meanwhile, a sustained strength beyond the overnight swing high, around the 161.45 zone, will set the stage for an extension of this week's goodish recovery from the 154.40-154.35 region, or the YTD low.
Bank of Japan FAQs
The Bank of Japan (BoJ) is the Japanese central bank, which sets monetary policy in the country. Its mandate is to issue banknotes and carry out currency and monetary control to ensure price stability, which means an inflation target of around 2%.
The Bank of Japan has embarked in an ultra-loose monetary policy since 2013 in order to stimulate the economy and fuel inflation amid a low-inflationary environment. The bank’s policy is based on Quantitative and Qualitative Easing (QQE), or printing notes to buy assets such as government or corporate bonds to provide liquidity. In 2016, the bank doubled down on its strategy and further loosened policy by first introducing negative interest rates and then directly controlling the yield of its 10-year government bonds.
The Bank’s massive stimulus has caused the Yen to depreciate against its main currency peers. This process has exacerbated more recently due to an increasing policy divergence between the Bank of Japan and other main central banks, which have opted to increase interest rates sharply to fight decades-high levels of inflation. The BoJ’s policy of holding down rates has led to a widening differential with other currencies, dragging down the value of the Yen.
A weaker Yen and the spike in global energy prices have led to an increase in Japanese inflation, which has exceeded the BoJ’s 2% target. With wage inflation becoming a cause of concern, the BoJ looks to move away from ultra loose policy, while trying to avoid slowing the activity too much.
FX option expiries for Aug 8 NY cut at 10:00 Eastern Time, via DTCC, can be found below.
EUR/USD: EUR amounts
- 1.0770 815m
- 1.0790 1.1b
- 1.0800 1.5b
- 1.0830 1.2b
- 1.0850 1.5b
- 1.0855 813m
- 1.0860 972m
- 1.0900 1.2b
- 1.0955 1.5b
GBP/USD: GBP amounts
- 1.2780 576m
- 1.3080 1.5b
USD/JPY: USD amounts
- 145.00 795m
- 148.45 1b
USD/CHF: USD amounts
- 0.8555 652m
- 0.8725 480m
AUD/USD: AUD amounts
- 0.6500 495m
- 0.6525 572m
- 0.6650 674m
USD/CAD: USD amounts
- 1.3675 924m
- 1.3700 1b
- 1.3750 1b
- 1.3810 824m
- 1.3900 1.4b
- 1.4000 1.2b
EUR/GBP: EUR amounts
- 0.8395 571m
- 0.8475 656m
- 0.8605 763m
- EUR/GBP rose to a three-month high of 0.8623 marked on Thursday.
- The Pound Sterling may struggle due to the rising odds of a BoE rate cut in August.
- ECB policymaker Olli Rehn stated that the central bank could consider further rate cuts if inflation continues to slow.
EUR/GBP edges higher to three-month highs, trading around 0.8610 during the Asian hours on Thursday. The EUR/GBP cross receives support due to the rising expectations of the Bank of England (BoE) delivering a 25-basis point rate cut at its August meeting. Additionally, market expectations now include the possibility of two more quarter-point rate cuts by the BoE by December.
The Royal Institution of Chartered Surveyors (RICS) released the housing costs in the United Kingdom (UK). RICS Housing Price Balance posted a reading of -19% in July, as compared to the previous reading of -17%, the lowest since December last year.
On the Euro front, traders await the release of Germany's Harmonized Index of Consumer Prices (HICP) by the German statistics office Destatis on Friday. Market expectations are steady, with forecasts of a 2.6% year-on-year increase and a 0.5% month-on-month rise.
On Tuesday, Eurozone Retail Sales declined by 0.3% month-over-month in June, exceeding market expectations of a 0.1% decrease. On a yearly basis, retail sales also fell by 0.3%, compared to a 0.1% expected increase and a 0.5% increase previously.
The European Central Bank (ECB) policymaker Olli Rehn said on Wednesday that the central bank can continue cutting interest rates if there is confidence among policymakers that the inflation trend is slowing in the near future. The central bank left interest rates on hold at its July meeting. Rehn said "Inflation continues to slow down but the path to the two percent target remains bumpy this year," per Reuters.
Interest rates FAQs
Interest rates are charged by financial institutions on loans to borrowers and are paid as interest to savers and depositors. They are influenced by base lending rates, which are set by central banks in response to changes in the economy. Central banks normally have a mandate to ensure price stability, which in most cases means targeting a core inflation rate of around 2%. If inflation falls below target the central bank may cut base lending rates, with a view to stimulating lending and boosting the economy. If inflation rises substantially above 2% it normally results in the central bank raising base lending rates in an attempt to lower inflation.
Higher interest rates generally help strengthen a country’s currency as they make it a more attractive place for global investors to park their money.
Higher interest rates overall weigh on the price of Gold because they increase the opportunity cost of holding Gold instead of investing in an interest-bearing asset or placing cash in the bank. If interest rates are high that usually pushes up the price of the US Dollar (USD), and since Gold is priced in Dollars, this has the effect of lowering the price of Gold.
The Fed funds rate is the overnight rate at which US banks lend to each other. It is the oft-quoted headline rate set by the Federal Reserve at its FOMC meetings. It is set as a range, for example 4.75%-5.00%, though the upper limit (in that case 5.00%) is the quoted figure. Market expectations for future Fed funds rate are tracked by the CME FedWatch tool, which shapes how many financial markets behave in anticipation of future Federal Reserve monetary policy decisions.
- USD/CHF loses traction around 0.8590 in Thursday’s early European session, down 0.30% on the day.
- The US Fed is expected to cut rates more aggressively beginning in September.
- Strong safe-haven demand benefits the Swiss Franc against the Greenback.
The USD/CHF pair drifts lower to near 0.8590 during the early European session on Thursday. The Swiss Franc (CHF) gains traction from the unwinding of carry trades and escalating geopolitical tensions in the Middle East. Investors await the weekly US Initial Jobless Claims on Thursday for fresh impetus.
Investors have fully expected the US Federal Reserve (Fed) to start easing its monetary policy in September, with 50 basis points (bps) cuts in both September and November, and another quarter-point cut in December. Wells Fargo analysts are now projecting two 50 bps rate cuts at the FOMC meetings in September and November. More aggressive rate cut expectations from the Fed are triggered by the weaker-than-expected US July employment data last week, which raised the fears of a looming US recession. This, in turn, exerts some selling pressure on the Greenback broadly.
The Swiss Franc has surged almost 4% since mid-July amid a global unwinding of carry trades and safe-haven flows. Iran and its proxies are preparing for a potential retaliation against Israel. The latest intelligence noted that any response may be delayed until Thursday or Friday, according to CNN late Wednesday.
The Swiss National Bank (SNB) has cut interest rates twice this year and hinted at reducing more rates next month. UBS economist Maxime Botteron said at a time when the SNB is cutting interest rates, the Franc's appreciation over the last few days could prompt foreign currency purchases by the bank.
Swiss Franc FAQs
The Swiss Franc (CHF) is Switzerland’s official currency. It is among the top ten most traded currencies globally, reaching volumes that well exceed the size of the Swiss economy. Its value is determined by the broad market sentiment, the country’s economic health or action taken by the Swiss National Bank (SNB), among other factors. Between 2011 and 2015, the Swiss Franc was pegged to the Euro (EUR). The peg was abruptly removed, resulting in a more than 20% increase in the Franc’s value, causing a turmoil in markets. Even though the peg isn’t in force anymore, CHF fortunes tend to be highly correlated with the Euro ones due to the high dependency of the Swiss economy on the neighboring Eurozone.
The Swiss Franc (CHF) is considered a safe-haven asset, or a currency that investors tend to buy in times of market stress. This is due to the perceived status of Switzerland in the world: a stable economy, a strong export sector, big central bank reserves or a longstanding political stance towards neutrality in global conflicts make the country’s currency a good choice for investors fleeing from risks. Turbulent times are likely to strengthen CHF value against other currencies that are seen as more risky to invest in.
The Swiss National Bank (SNB) meets four times a year – once every quarter, less than other major central banks – to decide on monetary policy. The bank aims for an annual inflation rate of less than 2%. When inflation is above target or forecasted to be above target in the foreseeable future, the bank will attempt to tame price growth by raising its policy rate. Higher interest rates are generally positive for the Swiss Franc (CHF) as they lead to higher yields, making the country a more attractive place for investors. On the contrary, lower interest rates tend to weaken CHF.
Macroeconomic data releases in Switzerland are key to assessing the state of the economy and can impact the Swiss Franc’s (CHF) valuation. The Swiss economy is broadly stable, but any sudden change in economic growth, inflation, current account or the central bank’s currency reserves have the potential to trigger moves in CHF. Generally, high economic growth, low unemployment and high confidence are good for CHF. Conversely, if economic data points to weakening momentum, CHF is likely to depreciate.
As a small and open economy, Switzerland is heavily dependent on the health of the neighboring Eurozone economies. The broader European Union is Switzerland’s main economic partner and a key political ally, so macroeconomic and monetary policy stability in the Eurozone is essential for Switzerland and, thus, for the Swiss Franc (CHF). With such dependency, some models suggest that the correlation between the fortunes of the Euro (EUR) and the CHF is more than 90%, or close to perfect.
Gold prices rose in India on Thursday, according to data compiled by FXStreet.
The price for Gold stood at 6,459.57 Indian Rupees (INR) per gram, up compared with the INR 6,432.47 it cost on Wednesday.
The price for Gold increased to INR 75,344.14 per tola from INR 75,027.11 per tola a day earlier.
| Unit measure | Gold Price in INR |
|---|---|
| 1 Gram | 6,459.57 |
| 10 Grams | 64,596.55 |
| Tola | 75,344.14 |
| Troy Ounce | 200,917.00 |
FXStreet calculates Gold prices in India by adapting international prices (USD/INR) to the local currency and measurement units. Prices are updated daily based on the market rates taken at the time of publication. Prices are just for reference and local rates could diverge slightly.
Gold FAQs
Gold has played a key role in human’s history as it has been widely used as a store of value and medium of exchange. Currently, apart from its shine and usage for jewelry, the precious metal is widely seen as a safe-haven asset, meaning that it is considered a good investment during turbulent times. Gold is also widely seen as a hedge against inflation and against depreciating currencies as it doesn’t rely on any specific issuer or government.
Central banks are the biggest Gold holders. In their aim to support their currencies in turbulent times, central banks tend to diversify their reserves and buy Gold to improve the perceived strength of the economy and the currency. High Gold reserves can be a source of trust for a country’s solvency. Central banks added 1,136 tonnes of Gold worth around $70 billion to their reserves in 2022, according to data from the World Gold Council. This is the highest yearly purchase since records began. Central banks from emerging economies such as China, India and Turkey are quickly increasing their Gold reserves.
Gold has an inverse correlation with the US Dollar and US Treasuries, which are both major reserve and safe-haven assets. When the Dollar depreciates, Gold tends to rise, enabling investors and central banks to diversify their assets in turbulent times. Gold is also inversely correlated with risk assets. A rally in the stock market tends to weaken Gold price, while sell-offs in riskier markets tend to favor the precious metal.
The price can move due to a wide range of factors. Geopolitical instability or fears of a deep recession can quickly make Gold price escalate due to its safe-haven status. As a yield-less asset, Gold tends to rise with lower interest rates, while higher cost of money usually weighs down on the yellow metal. Still, most moves depend on how the US Dollar (USD) behaves as the asset is priced in dollars (XAU/USD). A strong Dollar tends to keep the price of Gold controlled, whereas a weaker Dollar is likely to push Gold prices up.
(An automation tool was used in creating this post.)
- The US Dollar depreciates due to heightened expectations of the US Fed reducing rates in September.
- CME FedWatch tool suggests 72.0% odds of a 50-basis point Fed rate cut in September, up from 11.8% last week.
- The rising geopolitical tensions in the Middle East could drive increased safe-haven demand for the Greenback.
The US Dollar Index (DXY), which measures the value of the US Dollar (USD) against six other major currencies, retraces its recent gains from the previous two sessions, trading around 103.00 during the Asian session on Thursday.
This downside of the DXY could be attributed to the rising expectations of the US Federal Reserve (Fed) implementing a more aggressive rate cut beginning in September. According to the CME FedWatch tool, there is now a 72.0% probability of a 50-basis point (bps) interest rate cut by the US Federal Reserve (Fed) in September, up from 11.8% a week earlier. The expectation of deeper rate cuts may put pressure on the US Dollar in the near term.
Weaker employment data from July have heightened concerns about a potential US recession. US Nonfarm Payrolls (NFP) came in weaker than the expectation, data showed on Friday. Meanwhile, the US Unemployment Rate rose to the highest level since November 2021 in July.
Earlier this week, Chicago Fed President Austan Goolsbee stated that the US central bank is prepared to act if economic or financial conditions worsen. Goolsbee emphasized, "We're forward-looking about it, and so if the conditions collectively start coming in like that on the through line, there’s deterioration on any of those parts, we’re going to fix it.” according to Reuters.
Additionally, the decline in US Treasury yields contributes to downward pressure for the US Dollar (USD), with 2-year and 10-year yields on US Treasury yields trading around 3.94% and 3.90%, respectively, at the time of writing.
The increased risk aversion related to escalating Middle East tensions could drive greater demand for the US Dollar as a safe haven. CNN reported two US intelligence officials, saying that Iran and its allies are preparing for potential retaliation against Israel in response to the recent killings of a top military commander of Iran’s Hezbollah in Lebanon and a senior Hamas leader in Tehran.
US Dollar FAQs
The US Dollar (USD) is the official currency of the United States of America, and the ‘de facto’ currency of a significant number of other countries where it is found in circulation alongside local notes. It is the most heavily traded currency in the world, accounting for over 88% of all global foreign exchange turnover, or an average of $6.6 trillion in transactions per day, according to data from 2022. Following the second world war, the USD took over from the British Pound as the world’s reserve currency. For most of its history, the US Dollar was backed by Gold, until the Bretton Woods Agreement in 1971 when the Gold Standard went away.
The most important single factor impacting on the value of the US Dollar is monetary policy, which is shaped by the Federal Reserve (Fed). The Fed has two mandates: to achieve price stability (control inflation) and foster full employment. Its primary tool to achieve these two goals is by adjusting interest rates. When prices are rising too quickly and inflation is above the Fed’s 2% target, the Fed will raise rates, which helps the USD value. When inflation falls below 2% or the Unemployment Rate is too high, the Fed may lower interest rates, which weighs on the Greenback.
In extreme situations, the Federal Reserve can also print more Dollars and enact quantitative easing (QE). QE is the process by which the Fed substantially increases the flow of credit in a stuck financial system. It is a non-standard policy measure used when credit has dried up because banks will not lend to each other (out of the fear of counterparty default). It is a last resort when simply lowering interest rates is unlikely to achieve the necessary result. It was the Fed’s weapon of choice to combat the credit crunch that occurred during the Great Financial Crisis in 2008. It involves the Fed printing more Dollars and using them to buy US government bonds predominantly from financial institutions. QE usually leads to a weaker US Dollar.
Quantitative tightening (QT) is the reverse process whereby the Federal Reserve stops buying bonds from financial institutions and does not reinvest the principal from the bonds it holds maturing in new purchases. It is usually positive for the US Dollar.
- AUD/JPY turns positive for the third straight day, albeit lacks strong follow-through buying.
- RBA Governor Michele Bullock's hawkish remarks boost the AUD and remain supportive.
- BoJ rate hike bets, geopolitical risks, China’s economic woes benefit the JPY and cap gains.
The AUD/JPY cross attracts some dip-buying near the 94.70 region during the Asian session on Thursday and stalls its modest retracement slide from the weekly high touched the previous day. Spot prices, however, struggle to capitalize on the momentum and currently trade with only modest intraday gains, around the 96.00 round-figure mark.
The Australian Dollar (AUD) strengthens in reaction to the Reserve Bank Australia (RBA) Governor Michele Bullock's hawkish remarks, which turned out to be a key factor that assisted the AUD/JPY cross to gain positive traction for the third straight day. Responding to the Q&A session earlier today, Bullock emphasized the need to stay vigilant about inflation risks and indicated a willingness to hike rates if necessary. Apart from this, signs of stability in the equity markets lend additional support to the risk-sensitive Aussie.
Investors, however, remain concerned about a possible recession in the US. This, along with geopolitical risks stemming from the ongoing conflicts in the Middle East and China's economic woes, holds back traders from placing aggressive bullish bets around the China-proxy AUD. The JPY, on the other hand, gained traction after the Bank of Japan’s (BoJ) summary of opinions from the July meeting indicated that some members see room for further rate hikes and policy normalization. This further contributes to capping the AUD/JPY cross.
The aforementioned mixed fundamental backdrop and the lack of strong follow-through buying warrant some caution before confirming that spot prices have bottomed out in the near term and positioning for any further appreciating move. The market focus now shifts to the latest inflation figures from China, due for release during the Asian session on Friday. The data will play a key role in influencing the Aussie and provide some meaningful impetus to the AUD/JPY cross.
Australian Dollar PRICE Today
The table below shows the percentage change of Australian Dollar (AUD) against listed major currencies today. Australian Dollar was the strongest against the US Dollar.
| USD | EUR | GBP | JPY | CAD | AUD | NZD | CHF | |
|---|---|---|---|---|---|---|---|---|
| USD | -0.11% | -0.06% | -0.38% | -0.20% | -0.60% | -0.21% | -0.29% | |
| EUR | 0.11% | 0.05% | -0.24% | -0.11% | -0.50% | -0.10% | -0.19% | |
| GBP | 0.06% | -0.05% | -0.30% | -0.17% | -0.58% | -0.18% | -0.25% | |
| JPY | 0.38% | 0.24% | 0.30% | 0.12% | -0.26% | 0.08% | 0.03% | |
| CAD | 0.20% | 0.11% | 0.17% | -0.12% | -0.39% | -0.00% | -0.09% | |
| AUD | 0.60% | 0.50% | 0.58% | 0.26% | 0.39% | 0.39% | 0.31% | |
| NZD | 0.21% | 0.10% | 0.18% | -0.08% | 0.00% | -0.39% | -0.08% | |
| CHF | 0.29% | 0.19% | 0.25% | -0.03% | 0.09% | -0.31% | 0.08% |
The heat map shows percentage changes of major currencies against each other. The base currency is picked from the left column, while the quote currency is picked from the top row. For example, if you pick the Australian Dollar from the left column and move along the horizontal line to the US Dollar, the percentage change displayed in the box will represent AUD (base)/USD (quote).
- GBP/USD appreciates as the US Fed is widely expected to deliver a deeper rate cut in September.
- The upside of the GBP could be limited due to increased risk aversion amid rising Middle-East tensions.
- Two US intelligence officials said that Iran and its allies are preparing potential retaliation against Israel.
GBP/USD breaks its three-day losing streak, trading around 1.2700 during the Asian session on Thursday. This upside could be attributed to the weaker US Dollar (USD) as the US Federal Reserve (Fed) is widely anticipated to implement a more aggressive rate cut beginning in September.
According to the CME FedWatch tool, there is now a 72.0% probability of a 50-basis point (bps) interest rate cut by the US Federal Reserve (Fed) in September, up from 11.8% a week earlier. The expectation of deeper rate cuts may pressure the US Dollar in the near term.
Weaker employment data from July have heightened concerns about a potential US recession. US Nonfarm Payrolls (NFP) came in weaker than the expectation, data showed on Friday. Meanwhile, the US Unemployment Rate rose to the highest level since November 2021 in July.
According to Reuters, Federal Reserve Bank of San Francisco President Mary Daly expressed increased confidence earlier this week that US inflation is moving toward the Fed's 2% target. Daly noted that “risks to the Fed's mandates are becoming more balanced and that there is openness to the possibility of cutting rates in upcoming meetings.”
On the GBP front, the increased risk aversion linked to escalating Middle-East tensions could lead traders to shy away from risk-sensitive currencies like the Pound Sterling (GBP). According to two US intelligence officials, Iran and its allies are preparing potential retaliation against Israel. This response is expected following the recent killings of a top military commander of Iran’s Hezbollah in Lebanon and a senior Hamas leader in Tehran, as reported by CNN.
Meanwhile, the upside of the British Pound could be restrained from the heightened expectations of BoE delivering a 25-basis point rate cut at its August meeting. Additionally, market expectations now include the possibility of two more quarter-point rate cuts by the BoE by December.
Pound Sterling FAQs
The Pound Sterling (GBP) is the oldest currency in the world (886 AD) and the official currency of the United Kingdom. It is the fourth most traded unit for foreign exchange (FX) in the world, accounting for 12% of all transactions, averaging $630 billion a day, according to 2022 data. Its key trading pairs are GBP/USD, aka ‘Cable’, which accounts for 11% of FX, GBP/JPY, or the ‘Dragon’ as it is known by traders (3%), and EUR/GBP (2%). The Pound Sterling is issued by the Bank of England (BoE).
The single most important factor influencing the value of the Pound Sterling is monetary policy decided by the Bank of England. The BoE bases its decisions on whether it has achieved its primary goal of “price stability” – a steady inflation rate of around 2%. Its primary tool for achieving this is the adjustment of interest rates. When inflation is too high, the BoE will try to rein it in by raising interest rates, making it more expensive for people and businesses to access credit. This is generally positive for GBP, as higher interest rates make the UK a more attractive place for global investors to park their money. When inflation falls too low it is a sign economic growth is slowing. In this scenario, the BoE will consider lowering interest rates to cheapen credit so businesses will borrow more to invest in growth-generating projects.
Data releases gauge the health of the economy and can impact the value of the Pound Sterling. Indicators such as GDP, Manufacturing and Services PMIs, and employment can all influence the direction of the GBP. A strong economy is good for Sterling. Not only does it attract more foreign investment but it may encourage the BoE to put up interest rates, which will directly strengthen GBP. Otherwise, if economic data is weak, the Pound Sterling is likely to fall.
Another significant data release for the Pound Sterling is the Trade Balance. This indicator measures the difference between what a country earns from its exports and what it spends on imports over a given period. If a country produces highly sought-after exports, its currency will benefit purely from the extra demand created from foreign buyers seeking to purchase these goods. Therefore, a positive net Trade Balance strengthens a currency and vice versa for a negative balance.
- EUR/USD holds positive ground around 1.0935 in Thursday’s Asian session.
- Dovish Fed expectations could weigh on the US Dollar in the near term.
- ECB’s Rehn said rate cuts could continue if the downward inflation trend strengthens.
The EUR/USD pair rebounds to near 1.0935, snapping the two-day losing streak during the Asian trading hours on Thursday. The softer US Dollar (USD) provides some support to the major pair. Nonetheless, the risk-off sentiment might cap the upside of EUR/USD amid the escalating geopolitical risks. Later in the day, the weekly US Initial Jobless Claims will be published.
The weaker US July employment report last week triggered the speculation of deeper interest rate cuts by the Federal Reserve (Fed) this year, which continue to undermine the Greenback. The financial markets are convinced the Fed will cut interest rates at its next meeting in September, increasing bets on a 50 basis point (bps) cut rather than 25 bps to nearly 83%, according to the FedWatch tool.
Across the pond, the European Central Bank policymaker Olli Rehn said on Wednesday that the ECB can continue cutting interest rates if there is confidence among policymakers that the inflation trend is slowing in the near future. The central bank left interest rates on hold at its July meeting. ECB President Christine Lagarde said during the coast conference the question of any move in September is wide open.
Traders will take more cues from the German Harmonized Index of Consumer Prices (HICP) for July. The HICP is estimated to remain unchanged at 2.6% YoY in July.
Meanwhile, the rising geopolitical tensions in the Middle East might drag riskier assets like the Euro (EUR). The market turns cautious after CNN reported late Wednesday that Iran and its proxies are preparing for a potential retaliation against Israel. The latest intelligence showed any response may be delayed until Thursday or Friday.
Euro FAQs
The Euro is the currency for the 20 European Union countries that belong to the Eurozone. It is the second most heavily traded currency in the world behind the US Dollar. In 2022, it accounted for 31% of all foreign exchange transactions, with an average daily turnover of over $2.2 trillion a day. EUR/USD is the most heavily traded currency pair in the world, accounting for an estimated 30% off all transactions, followed by EUR/JPY (4%), EUR/GBP (3%) and EUR/AUD (2%).
The European Central Bank (ECB) in Frankfurt, Germany, is the reserve bank for the Eurozone. The ECB sets interest rates and manages monetary policy. The ECB’s primary mandate is to maintain price stability, which means either controlling inflation or stimulating growth. Its primary tool is the raising or lowering of interest rates. Relatively high interest rates – or the expectation of higher rates – will usually benefit the Euro and vice versa. The ECB Governing Council makes monetary policy decisions at meetings held eight times a year. Decisions are made by heads of the Eurozone national banks and six permanent members, including the President of the ECB, Christine Lagarde.
Eurozone inflation data, measured by the Harmonized Index of Consumer Prices (HICP), is an important econometric for the Euro. If inflation rises more than expected, especially if above the ECB’s 2% target, it obliges the ECB to raise interest rates to bring it back under control. Relatively high interest rates compared to its counterparts will usually benefit the Euro, as it makes the region more attractive as a place for global investors to park their money.
Data releases gauge the health of the economy and can impact on the Euro. Indicators such as GDP, Manufacturing and Services PMIs, employment, and consumer sentiment surveys can all influence the direction of the single currency. A strong economy is good for the Euro. Not only does it attract more foreign investment but it may encourage the ECB to put up interest rates, which will directly strengthen the Euro. Otherwise, if economic data is weak, the Euro is likely to fall. Economic data for the four largest economies in the euro area (Germany, France, Italy and Spain) are especially significant, as they account for 75% of the Eurozone’s economy.
Another significant data release for the Euro is the Trade Balance. This indicator measures the difference between what a country earns from its exports and what it spends on imports over a given period. If a country produces highly sought after exports then its currency will gain in value purely from the extra demand created from foreign buyers seeking to purchase these goods. Therefore, a positive net Trade Balance strengthens a currency and vice versa for a negative balance.
- Silver reverses an intraday dip to a fresh multi-month low touched earlier this Thursday.
- The technical setup remains tilted in favor of bearish traders and warrants some caution.
- The intraday positive move is more likely to confront stiff resistance near the $27.50 area.
Silver (XAG/USD) stages a goodish recovery from the $26.45 area, or a three-month low touched during the Asian session on Thursday and for now, seems to have snapped a three-day losing streak. The white metal currently trades just below the $27.00 mark, up over 1.20% for the day, though any meaningful appreciating move still seems elusive.
Against the backdrop of the recent breakdown through the 100-day Simple Moving Average (SMA), the overnight close below the 50% Fibonacci retracement level of the February-July positive move could be seen as a fresh trigger for bearish traders. Moreover, technical indicators on the daily chart are holding deep in negative territory and are still away from being in the oversold zone. This, in turn, validates the negative outlook and suggests that the path of least resistance for the XAG/USD is to the downside.
Hence, any subsequent move up is more likely to attract fresh supply near the $27.50 horizontal resistance. A sustained strength beyond, however, might trigger a short-covering rally and lift the XAG/USD beyond the $28.00 mark, to the $28.20 hurdle. The momentum could extend further, though is likely to remain capped near the 100-day SMA support breakpoint, near the $28.70 region. This is followed by the $29.00 round figure, which if cleared will shift the near-term bias back in favor of bullish traders.
On the flip side, the $26.50-$26.45 region, or a multi-month low, now seems to have emerged as an immediate strong support. Bearish traders need to wait for some follow-through selling below the said area before positioning for a further depreciating move to the May monthly swing low, around the $26.00 mark. The next relevant support is pegged near the $25.60 horizontal zone, below which the XAG/USD could fall to the $25.00 psychological mark before eventually dropping to the $24.40-$24.30 support zone.
Silver daily chart
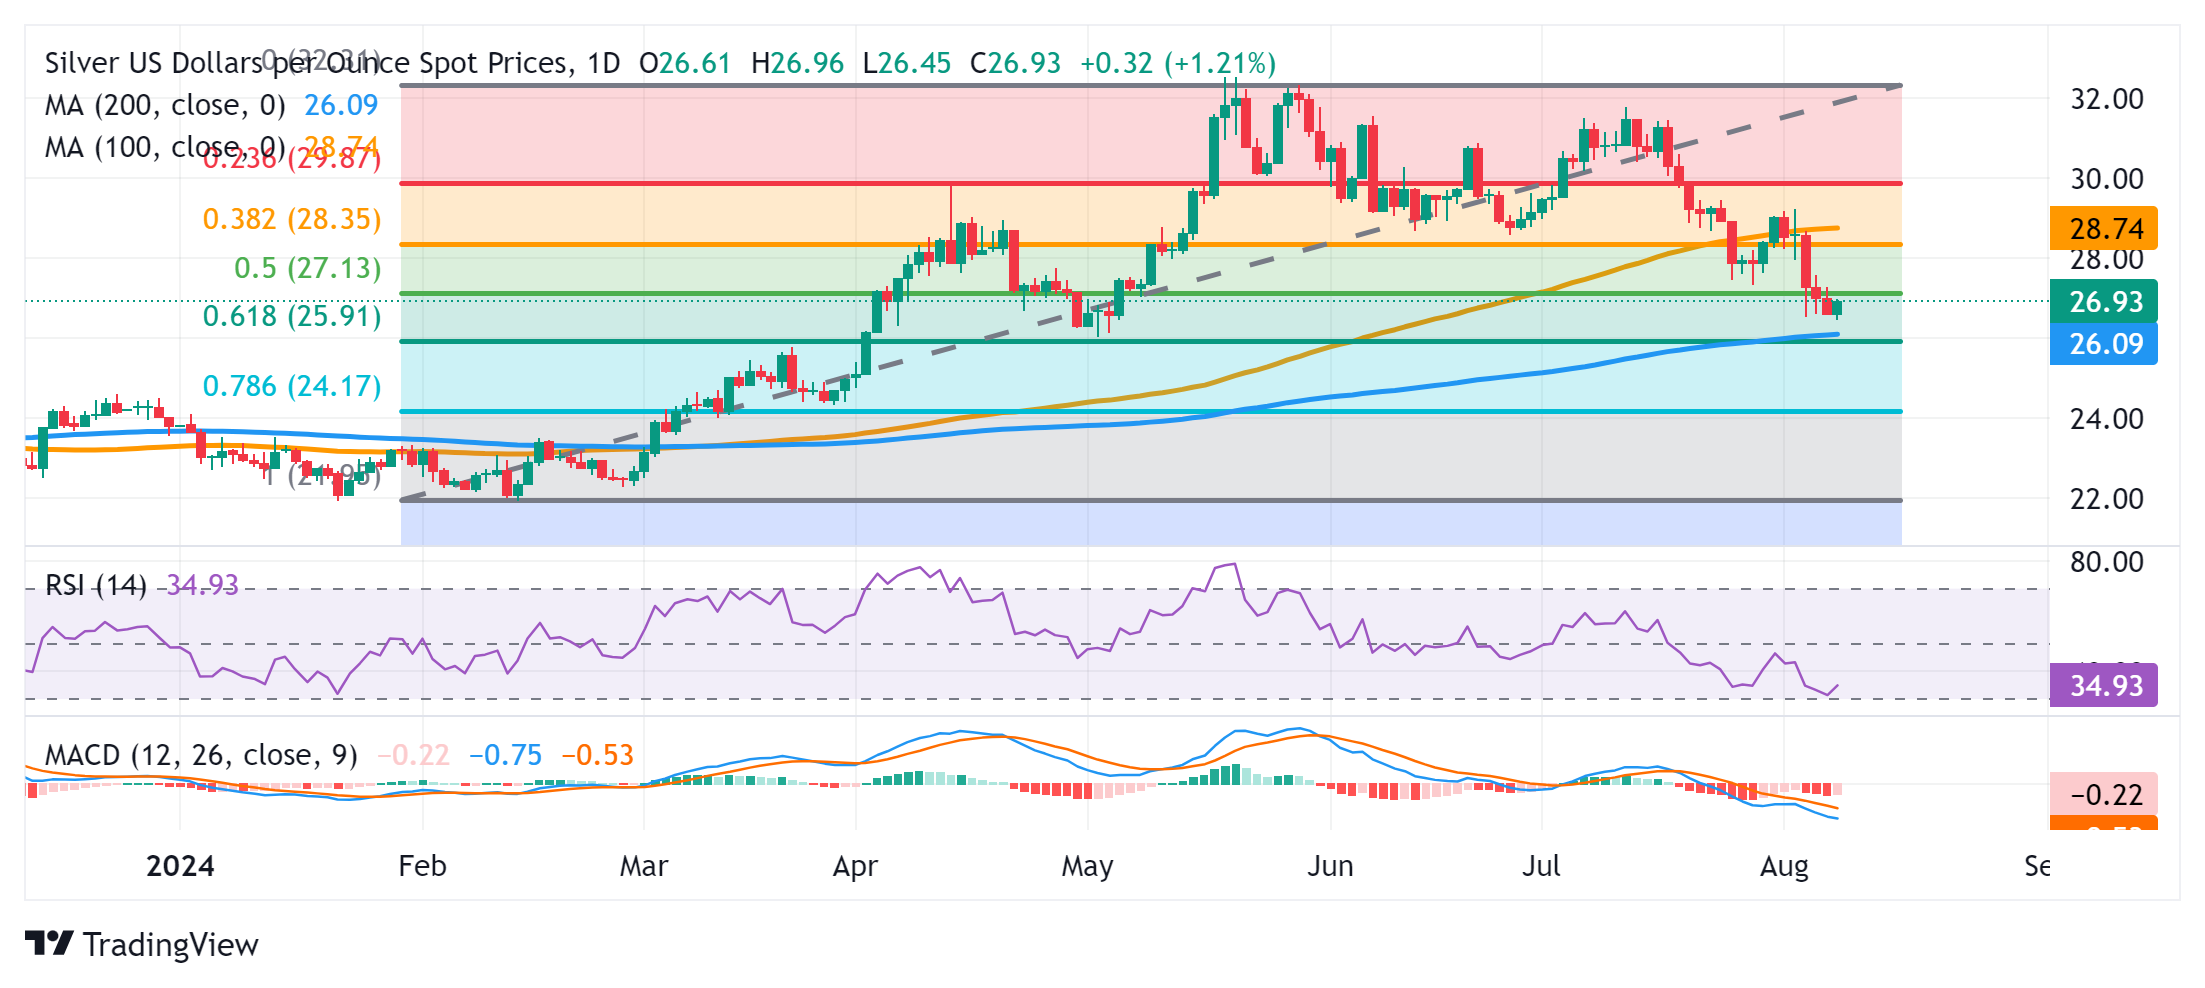
Silver FAQs
Silver is a precious metal highly traded among investors. It has been historically used as a store of value and a medium of exchange. Although less popular than Gold, traders may turn to Silver to diversify their investment portfolio, for its intrinsic value or as a potential hedge during high-inflation periods. Investors can buy physical Silver, in coins or in bars, or trade it through vehicles such as Exchange Traded Funds, which track its price on international markets.
Silver prices can move due to a wide range of factors. Geopolitical instability or fears of a deep recession can make Silver price escalate due to its safe-haven status, although to a lesser extent than Gold's. As a yieldless asset, Silver tends to rise with lower interest rates. Its moves also depend on how the US Dollar (USD) behaves as the asset is priced in dollars (XAG/USD). A strong Dollar tends to keep the price of Silver at bay, whereas a weaker Dollar is likely to propel prices up. Other factors such as investment demand, mining supply – Silver is much more abundant than Gold – and recycling rates can also affect prices.
Silver is widely used in industry, particularly in sectors such as electronics or solar energy, as it has one of the highest electric conductivity of all metals – more than Copper and Gold. A surge in demand can increase prices, while a decline tends to lower them. Dynamics in the US, Chinese and Indian economies can also contribute to price swings: for the US and particularly China, their big industrial sectors use Silver in various processes; in India, consumers’ demand for the precious metal for jewellery also plays a key role in setting prices.
Silver prices tend to follow Gold's moves. When Gold prices rise, Silver typically follows suit, as their status as safe-haven assets is similar. The Gold/Silver ratio, which shows the number of ounces of Silver needed to equal the value of one ounce of Gold, may help to determine the relative valuation between both metals. Some investors may consider a high ratio as an indicator that Silver is undervalued, or Gold is overvalued. On the contrary, a low ratio might suggest that Gold is undervalued relative to Silver.
- The Japanese Yen experienced downward pressure after the dovish remarks from BoJ Deputy Governor Uchida.
- BoJ Summary of Opinions emphasizes targeting a neutral rate of "at least around 1%" as a medium-term goal.
- Traders expect a deeper rate cut by the US Federal Reserve in September.
The Japanese Yen (JPY) extends its losses against the US Dollar (USD) on Thursday, following a retracement of its intraday gains. This downside may be linked to comments from Bank of Japan (BoJ) Deputy Governor Shinichi Uchida, who said on Wednesday, “We won’t raise rates when markets are unstable,” according to Reuters.
The Bank of Japan’s Summary of Opinions from the Monetary Policy Meeting on July 30 and 31 showed that several members believe economic activity and prices are progressing as anticipated by the BoJ. The members are targeting a neutral rate of "at least around 1%" as a medium-term goal.
BoJ’s Summary of Opinions: Members see prices and growth developing in line with outlook, read more.
The downside for the safe-haven Yen could be restrained due to the increased risk-off mood amid rising tensions in the Middle East. According to two US intelligence officials, Iran and its allies are preparing for possible retaliation against Israel following the recent killings of a top military commander of Iran’s Hezbollah in Lebanon and a senior Hamas leader in Tehran, as reported by CNN.
The US Dollar (USD) faces challenges as traders expect a deeper rate cut by the US Federal Reserve (Fed) in September. According to the CME FedWatch tool, there is now a 72.0% probability of a 50-basis point (bps) interest rate cut by the Fed in September, up from 11.8% a week earlier.
Daily Digest Market Movers: Japanese Yen receives pressure after remarks from BoJ’s Uchida
- Japan’s Finance Minister Shunichi Suzuki stated on Thursday that he is “closely watching volatile stock movements but is not in the phase of taking actual action.” Suzuki noted that decisions regarding monetary policy are the responsibility of the Bank of Japan and emphasized that they are monitoring market developments closely, according to Reuters.
- Japan’s Current Account surplus decreased to ¥1,533.5 billion ($10.47 billion) year-on-year in June, from ¥2,849.9 billion prior. This was below market expectations of a surplus of ¥1,790 billion.
- On Wednesday, BoJ Deputy Governor Shinichi Uchida also noted that BoJ's interest rate strategy will adapt if market volatility alters economic forecasts, risk assessments, or projections. Given recent market volatility, he emphasized the need for careful monitoring of the economic and price impacts of their policies, stating, “We must maintain the current degree of monetary easing for the time being.”
- Japan’s Chief Cabinet Secretary Yoshimasa Hayashi stated on Tuesday that “wage increases are expected to extend to part-timers and small businesses by autumn, supported by strong Shunto results and minimum wage hikes.”
- Japan’s Labor Cash Earnings data showed a 4.5% year-on-year increase in average income for June, surpassing both the previous 2.0% and the expected 2.3% readings. This is the highest increase since January 1997, reinforcing Japan's transition toward a rising interest rate environment.
- According to Reuters, Federal Reserve Bank of San Francisco President Mary Daly expressed increased confidence on Monday that US inflation is moving towards the Fed's 2% target. Daly noted that “risks to the Fed's mandates are becoming more balanced and that there is openness to the possibility of cutting rates in upcoming meetings,” according to Reuters.
- The minutes from the Bank of Japan's June meeting showed that some members expressed concerns about rising import prices due to the recent decline in the JPY, which could pose an upside risk to inflation. One member noted that cost-push inflation might intensify underlying inflation if it results in higher inflation expectations and wage increases.
Technical Analysis: USD/JPY consolidates around 146.50
USD/JPY trades around 146.50 on Thursday. The daily chart analysis shows that the pair consolidates within a descending channel, suggesting a bearish bias. Additionally, the 14-day Relative Strength Index (RSI) is remaining below 30, signaling a short-term rebound.
Regarding support, the USD/JPY pair may test the lower boundary of the descending channel around a throwback support at the 140.25 level, which was recorded in December.
In terms of resistance, the USD/JPY pair tests the upper boundary of the descending channel, aligned with the nine-day Exponential Moving Average (EMA) around the 148.15 level. A breakout above this level could reduce bearish momentum and enable the pair to test the "throwback support turned resistance" at 154.50.
USD/JPY: Daily Chart
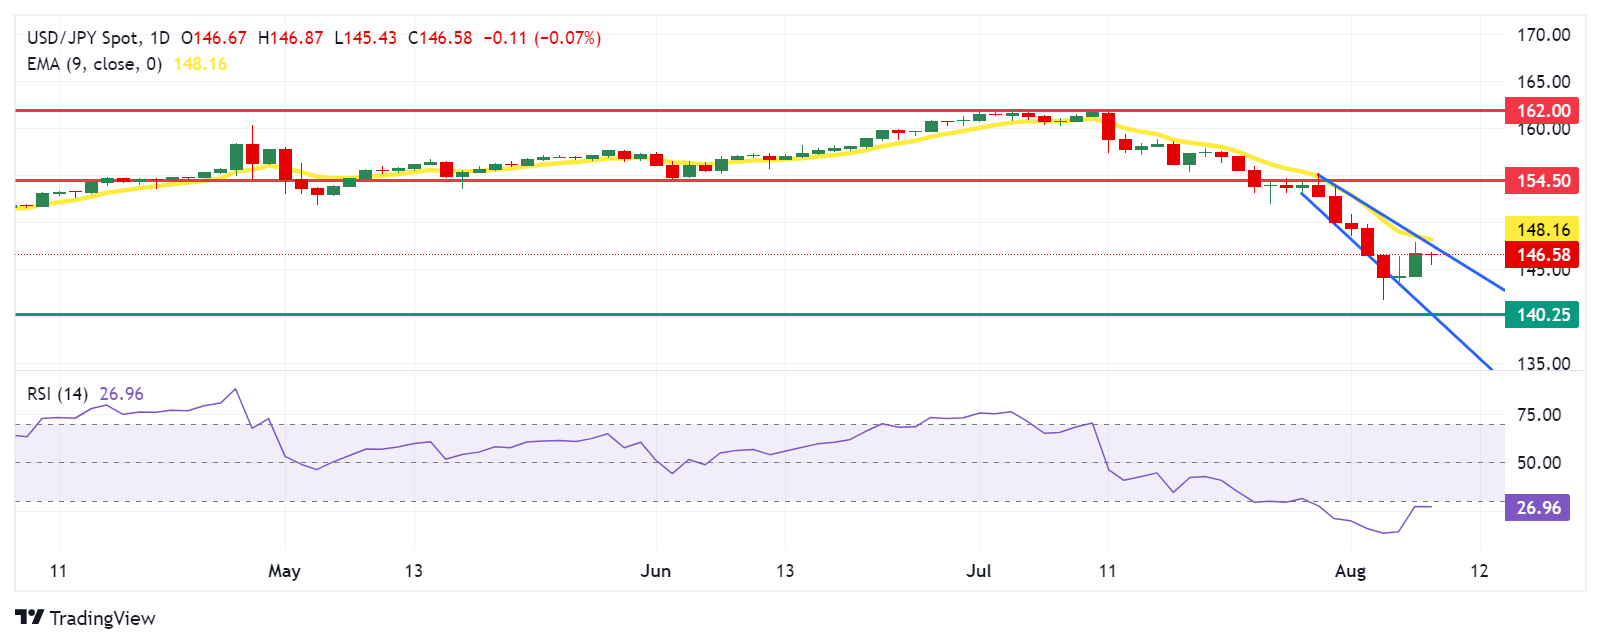
Japanese Yen PRICE Today
The table below shows the percentage change of Japanese Yen (JPY) against listed major currencies today. Japanese Yen was the weakest against the Australian Dollar.
| USD | EUR | GBP | JPY | CAD | AUD | NZD | CHF | |
|---|---|---|---|---|---|---|---|---|
| USD | -0.09% | -0.06% | 0.00% | -0.21% | -0.65% | -0.15% | -0.13% | |
| EUR | 0.09% | 0.05% | 0.06% | -0.14% | -0.57% | -0.06% | -0.04% | |
| GBP | 0.06% | -0.05% | 0.00% | -0.19% | -0.62% | -0.13% | -0.09% | |
| JPY | 0.00% | -0.06% | 0.00% | -0.22% | -0.63% | -0.17% | -0.13% | |
| CAD | 0.21% | 0.14% | 0.19% | 0.22% | -0.43% | 0.07% | 0.09% | |
| AUD | 0.65% | 0.57% | 0.62% | 0.63% | 0.43% | 0.50% | 0.52% | |
| NZD | 0.15% | 0.06% | 0.13% | 0.17% | -0.07% | -0.50% | 0.02% | |
| CHF | 0.13% | 0.04% | 0.09% | 0.13% | -0.09% | -0.52% | -0.02% |
The heat map shows percentage changes of major currencies against each other. The base currency is picked from the left column, while the quote currency is picked from the top row. For example, if you pick the Japanese Yen from the left column and move along the horizontal line to the US Dollar, the percentage change displayed in the box will represent JPY (base)/USD (quote).
Bank of Japan FAQs
The Bank of Japan (BoJ) is the Japanese central bank, which sets monetary policy in the country. Its mandate is to issue banknotes and carry out currency and monetary control to ensure price stability, which means an inflation target of around 2%.
The Bank of Japan has embarked in an ultra-loose monetary policy since 2013 in order to stimulate the economy and fuel inflation amid a low-inflationary environment. The bank’s policy is based on Quantitative and Qualitative Easing (QQE), or printing notes to buy assets such as government or corporate bonds to provide liquidity. In 2016, the bank doubled down on its strategy and further loosened policy by first introducing negative interest rates and then directly controlling the yield of its 10-year government bonds.
The Bank’s massive stimulus has caused the Yen to depreciate against its main currency peers. This process has exacerbated more recently due to an increasing policy divergence between the Bank of Japan and other main central banks, which have opted to increase interest rates sharply to fight decades-high levels of inflation. The BoJ’s policy of holding down rates has led to a widening differential with other currencies, dragging down the value of the Yen.
A weaker Yen and the spike in global energy prices have led to an increase in Japanese inflation, which has exceeded the BoJ’s 2% target. With wage inflation becoming a cause of concern, the BoJ looks to move away from ultra loose policy, while trying to avoid slowing the activity too much.
- NZD/USD trades with positive bias for the third straight day, albeit lacks follow-through.
- A fall in New Zealand's (NZ) two-year inflation expectations caps the upside for the pair.
- Bets for bigger interest rate cuts by the Fed undermine the USD and should lend support.
The NZD/USD pair attracts some dip-buying following the previous day's modest pullback from a two-and-half-week high and retakes the 0.6000 psychological mark during the Asian session on Thursday. This marks the third straight day of a positive move and is supported by a combination of factors.
The New Zealand Dollar (NZD) continues to be underpinned by Wednesday's better-than-expected employment details, which lowered the likelihood of a rate cut by the Reserve Bank of New Zealand (RBNZ). The move up, however, started losing traction after a survey showed that New Zealand's (NZ) two-year inflation expectations fell from 2.33% seen in the second quarter to 2.03% for Q3 2024. This, along with China's economic woes, acts as a headwind for the Kiwi.
The downside for the NZD/USD pair, however, remains cushioned in the wake of a modest US Dollar (USD) downtick. The incoming softer US macro data suggested that the world's largest economy was slowing faster than initially expected. This, in turn, fueled speculations about bigger interest rate cuts by the Federal Reserve (Fed) and triggered a fresh leg down in the US Treasury bond yields, which, in turn, keeps a lid on the recent USD recovery from a multi-month trough.
The aforementioned fundamental backdrop seems tilted in favor of bullish traders and supports prospects for a further near-term appreciating move. That said, the risk of a further escalation of geopolitical tensions in the Middle East, might hold back traders from placing aggressive bullish bets. around the NZD/USD pair. Traders now look forward to the release of the Weekly Initial Jobless Claims data from the US for short-term opportunities later during the North American session.
Economic Indicator
RBNZ Inflation Expectations (QoQ)
The Inflation Expectations released by the Reserve Bank of New Zealand measures business managers´ expectations of annual CPI 2 years from now. An increase in expectations is regarded as inflationary which may anticipate a rise in interest rates. A high reading is positive (or bullish) for the NZD, while a low reading is seen as negative (or bearish).
Read more.Last release: Thu Aug 08, 2024 03:00
Frequency: Quarterly
Actual: 2.03%
Consensus: -
Previous: 2.33%
Source: Reserve Bank of New Zealand
New Zealand's (NZ) inflation expectations kept falling on a 12-month and a two-year time frame for the third quarter of 2024, the Reserve Bank of New Zealand’s (RBNZ) latest monetary conditions survey showed on Thursday.
Two-year inflation expectations, seen as the time frame when RBNZ policy action will filter through to prices, fell from 2.33% seen in Q2 2024 to 2.03% in Q3 of this year.
NZ average one-year inflation expectations dropped notably to 2.40% in Q3 vs. 2.73% seen in the second quarter of 2024.
NZD/USD reaction to falling inflation expectations
The New Zealand Dollar (NZD) remains on the defensive after falling inflation expectations. At the press time, NZD/USD is losing 0.04% on the day to trade the 0.5990.
New Zealand Dollar FAQs
The New Zealand Dollar (NZD), also known as the Kiwi, is a well-known traded currency among investors. Its value is broadly determined by the health of the New Zealand economy and the country’s central bank policy. Still, there are some unique particularities that also can make NZD move. The performance of the Chinese economy tends to move the Kiwi because China is New Zealand’s biggest trading partner. Bad news for the Chinese economy likely means less New Zealand exports to the country, hitting the economy and thus its currency. Another factor moving NZD is dairy prices as the dairy industry is New Zealand’s main export. High dairy prices boost export income, contributing positively to the economy and thus to the NZD.
The Reserve Bank of New Zealand (RBNZ) aims to achieve and maintain an inflation rate between 1% and 3% over the medium term, with a focus to keep it near the 2% mid-point. To this end, the bank sets an appropriate level of interest rates. When inflation is too high, the RBNZ will increase interest rates to cool the economy, but the move will also make bond yields higher, increasing investors’ appeal to invest in the country and thus boosting NZD. On the contrary, lower interest rates tend to weaken NZD. The so-called rate differential, or how rates in New Zealand are or are expected to be compared to the ones set by the US Federal Reserve, can also play a key role in moving the NZD/USD pair.
Macroeconomic data releases in New Zealand are key to assess the state of the economy and can impact the New Zealand Dollar’s (NZD) valuation. A strong economy, based on high economic growth, low unemployment and high confidence is good for NZD. High economic growth attracts foreign investment and may encourage the Reserve Bank of New Zealand to increase interest rates, if this economic strength comes together with elevated inflation. Conversely, if economic data is weak, NZD is likely to depreciate.
The New Zealand Dollar (NZD) tends to strengthen during risk-on periods, or when investors perceive that broader market risks are low and are optimistic about growth. This tends to lead to a more favorable outlook for commodities and so-called ‘commodity currencies’ such as the Kiwi. Conversely, NZD tends to weaken at times of market turbulence or economic uncertainty as investors tend to sell higher-risk assets and flee to the more-stable safe havens.
Reserve Bank of Australia (RBA) Governor Michele Bullock is responding to the Q&A session following her speech titled ‘Economic Conditions in Post-Pandemic Australia with a Regional Lens’ at Thursday's Rotary Club of Armidale Annual Lecture.
Key quotes
Volatility in financial markets does affect sentiment, but not the economy.
Board considered rate hike on tuesday.
Developing story …
Market reaction
AUD/USD holds the rebound near 0.6550 following the hawkish comments from the RBA Governor. The pair is currently trading 0.53% higher on the day to 0.6552.
Reserve Bank of Australia (RBA) Governor Michele Bullock is delivering a speech titled ‘Economic Conditions in Post-Pandemic Australia with a Regional Lens’ at the Rotary Club of Armidale Annual Lecture on Thursday.
Key quotes
Vigilant to inflation risks, will not hesitate to hike if needed.
Repeats, board judged current rates still meet its inflation mandate.
Don’t expect to be back in 2–3% target range until end of 2025.
Investment in renewable energy in regions should bring significant economic benefits.
Renewables needed to mitigate the risks posed by climate change.
Increasing volatility in weather, rising temperatures pose challenges for farmers.
Market reaction
AUD/USD extends the bounce to regain 0.6550 following the hawkish comments from the RBA Governor. The pair is currently trading 0.53% higher on the day to 0.6552.
Australian Dollar PRICE Today
The table below shows the percentage change of Australian Dollar (AUD) against listed major currencies today. Australian Dollar was the strongest against the US Dollar.
| USD | EUR | GBP | JPY | CAD | AUD | NZD | CHF | |
|---|---|---|---|---|---|---|---|---|
| USD | -0.10% | -0.03% | -0.13% | -0.20% | -0.50% | -0.20% | -0.21% | |
| EUR | 0.10% | 0.08% | 0.00% | -0.12% | -0.41% | -0.11% | -0.11% | |
| GBP | 0.03% | -0.08% | -0.09% | -0.20% | -0.50% | -0.21% | -0.19% | |
| JPY | 0.13% | 0.00% | 0.09% | -0.09% | -0.38% | -0.12% | -0.08% | |
| CAD | 0.20% | 0.12% | 0.20% | 0.09% | -0.29% | 0.00% | 0.00% | |
| AUD | 0.50% | 0.41% | 0.50% | 0.38% | 0.29% | 0.30% | 0.31% | |
| NZD | 0.20% | 0.11% | 0.21% | 0.12% | -0.00% | -0.30% | 0.00% | |
| CHF | 0.21% | 0.11% | 0.19% | 0.08% | -0.01% | -0.31% | -0.01% |
The heat map shows percentage changes of major currencies against each other. The base currency is picked from the left column, while the quote currency is picked from the top row. For example, if you pick the Australian Dollar from the left column and move along the horizontal line to the US Dollar, the percentage change displayed in the box will represent AUD (base)/USD (quote).
- WTI struggles to attract follow-through buying amid mixed fundamental cues.
- Concerns about an economic downturn in China and the US act as a headwind.
- Escalating geopolitical tensions in the Middle East to continue lending support.
West Texas Intermediate (WTI) US crude Oil prices struggle to capitalize on the previous day's strong move up and oscillate in a narrow range during the Asian session on Thursday. The commodity currently trades just above mid-$74.00s, nearly unchanged for the day, and for now, seems to have stalled its recovery from the lowest level since January touched earlier this week.
Investors remain concerned about an economic downturn and slowing demand in China – the world's top oil importer. Adding to this, the incoming softer US macro data suggested that the world's largest economy was slowing faster than initially expected, which is further expected to dent fuel demand. This, in turn, holds back traders from placing aggressive bullish bets around Crude Oil prices and caps the upside, though geopolitical risks could act as a tailwind.
Meanwhile, a possible attack by Iran, and its allies, in retaliation to the assassination of Hamas chief Ismail Haniyeh in Tehran and the subsequent Israeli response could lead to a broader conflict in the Middle East. This keeps the risk of supply disruptions from the key Oil producing region and continues to offer some support to Crude Oil prices. Adding to this, a steep draw in US crude stockpiles should contribute to limiting any meaningful downside for the black liquid.
In fact, the US Energy Information Administration (EIA) reported on Wednesday that crude inventories fell for a sixth week in a row by 3.7 million barrels, more than market expectations. That said, Chinese trade data released the previous day showed that July's daily crude oil imports fell to the lowest level since September 2022. The mixed fundamental backdrop makes it prudent to wait for strong follow-through buying before confirming that the commodity has bottomed out.
WTI Oil FAQs
WTI Oil is a type of Crude Oil sold on international markets. The WTI stands for West Texas Intermediate, one of three major types including Brent and Dubai Crude. WTI is also referred to as “light” and “sweet” because of its relatively low gravity and sulfur content respectively. It is considered a high quality Oil that is easily refined. It is sourced in the United States and distributed via the Cushing hub, which is considered “The Pipeline Crossroads of the World”. It is a benchmark for the Oil market and WTI price is frequently quoted in the media.
Like all assets, supply and demand are the key drivers of WTI Oil price. As such, global growth can be a driver of increased demand and vice versa for weak global growth. Political instability, wars, and sanctions can disrupt supply and impact prices. The decisions of OPEC, a group of major Oil-producing countries, is another key driver of price. The value of the US Dollar influences the price of WTI Crude Oil, since Oil is predominantly traded in US Dollars, thus a weaker US Dollar can make Oil more affordable and vice versa.
The weekly Oil inventory reports published by the American Petroleum Institute (API) and the Energy Information Agency (EIA) impact the price of WTI Oil. Changes in inventories reflect fluctuating supply and demand. If the data shows a drop in inventories it can indicate increased demand, pushing up Oil price. Higher inventories can reflect increased supply, pushing down prices. API’s report is published every Tuesday and EIA’s the day after. Their results are usually similar, falling within 1% of each other 75% of the time. The EIA data is considered more reliable, since it is a government agency.
OPEC (Organization of the Petroleum Exporting Countries) is a group of 13 Oil-producing nations who collectively decide production quotas for member countries at twice-yearly meetings. Their decisions often impact WTI Oil prices. When OPEC decides to lower quotas, it can tighten supply, pushing up Oil prices. When OPEC increases production, it has the opposite effect. OPEC+ refers to an expanded group that includes ten extra non-OPEC members, the most notable of which is Russia.
| Raw materials | Closed | Change, % |
|---|---|---|
| Silver | 26.587 | -1.27 |
| Gold | 238.237 | -0.32 |
| Palladium | 883.56 | 1.37 |
- The Indian Rupee loses traction in Thursday’s Asian session.
- The fear of wider Middle East conflicts, renewed US Dollar demand and higher crude oil prices undermine the INR.
- All eyes will be on the RBI’s MPC interest rate decision on Thursday, with no change in rate expected.
The Indian Rupee (INR) weakens on the modest recovery of the Greenback on Thursday, snapping the two-day winning streak. The escalating geopolitical tensions in the Middle East, heightened US Dollar (USD) demand from local importers and a rise in crude oil prices all contribute to the INR’s downside. However, significant weakness might prompt intervention from the Reserve Bank of India (RBI) to stabilize the local currency.
The RBI Monetary Policy Committee (MPC) meeting will take centre stage on Thursday. RBI Governor Shaktikanta Das is scheduled to announce the interest rate decision on Thursday at 4.30 a.m. GMT. The Indian central bank is expected to keep the policy rate at 6.5%. On the US docket, investors will monitor the weekly Initial Jobless Claims for confirmation of slowing economic numbers, particularly employment.
Daily Digest Market Movers: Indian Rupee remains sensitive to global factors
- State-run banks were offering Dollars, likely on behalf of the RBI, but the intervention was not aggressive, a foreign exchange trader at a large private bank said.
- Chief Economist for India at Deutsche Bank AG, Kaushik Das, said, “We expect both the policy repo rate and monetary stance to remain unchanged in the August policy, though we are of the opinion that the stance should change to neutral.”
- Deloitte India forecasted India's economy to grow by 7.0-7.2% in the current fiscal year due to strong economic fundamentals and the continuation of domestic policy reforms.
- US officials are confident that Hezbollah’s and Iran’s response is imminent and initial assessment predicted an early week attack, but the most recent intelligence showed any response may be delayed until Thursday or Friday, per Al Arabiya.
- Rate markets have priced in a roughly 83% chance of a 50 basis points (bps) Fed rate cut in September, with a further two cuts expected through the rest of 2024, according to the CME’s FedWatch Tool.
Technical analysis: USD/INR’s positive picture remains intact
Indian Rupee trades softer on the day. The chart shows a long-term bullish trend for the USD/INR pair as it holds above the key 100-day Exponential Moving Average (EMA) and the uptrend line since June 3. The 14-day Relative Strength Index (RSI) stands above the midline near 68.20, suggesting sustained upward strength.
The immediate upside barrier for the pair emerges at the 84.00 psychological barrier. A decisive break above this level could draw in enough buying pressure to test the next hurdle at 84.50.
In the bearish case, the initial contention level to watch is the uptrend line around 83.80. If the price breaks below this level, it would signal a more significant downside towards the next support level near the 100-day EMA at 83.50.
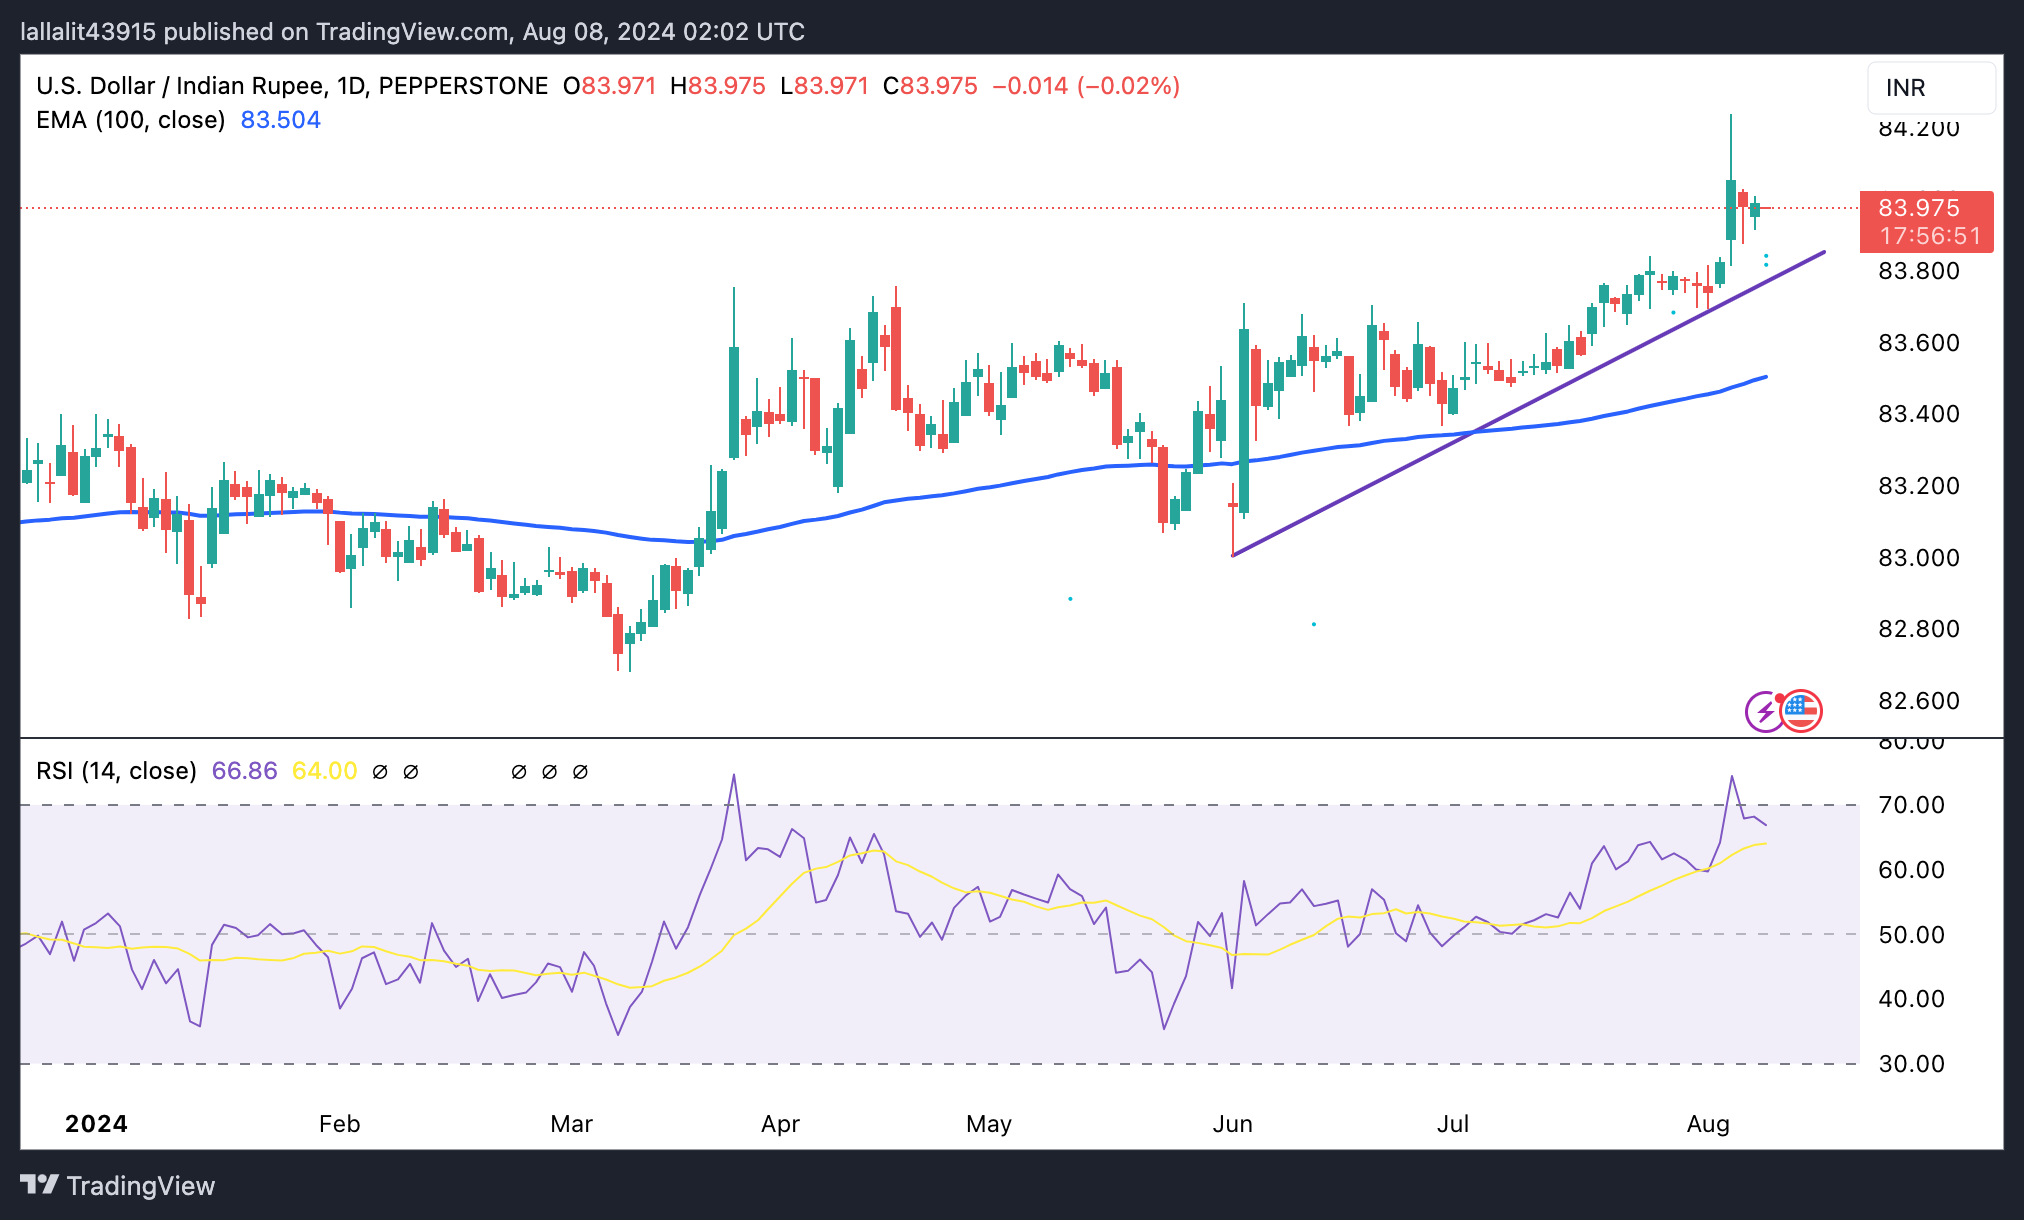
Indian Rupee FAQs
The Indian Rupee (INR) is one of the most sensitive currencies to external factors. The price of Crude Oil (the country is highly dependent on imported Oil), the value of the US Dollar – most trade is conducted in USD – and the level of foreign investment, are all influential. Direct intervention by the Reserve Bank of India (RBI) in FX markets to keep the exchange rate stable, as well as the level of interest rates set by the RBI, are further major influencing factors on the Rupee.
The Reserve Bank of India (RBI) actively intervenes in forex markets to maintain a stable exchange rate, to help facilitate trade. In addition, the RBI tries to maintain the inflation rate at its 4% target by adjusting interest rates. Higher interest rates usually strengthen the Rupee. This is due to the role of the ‘carry trade’ in which investors borrow in countries with lower interest rates so as to place their money in countries’ offering relatively higher interest rates and profit from the difference.
Macroeconomic factors that influence the value of the Rupee include inflation, interest rates, the economic growth rate (GDP), the balance of trade, and inflows from foreign investment. A higher growth rate can lead to more overseas investment, pushing up demand for the Rupee. A less negative balance of trade will eventually lead to a stronger Rupee. Higher interest rates, especially real rates (interest rates less inflation) are also positive for the Rupee. A risk-on environment can lead to greater inflows of Foreign Direct and Indirect Investment (FDI and FII), which also benefit the Rupee.
Higher inflation, particularly, if it is comparatively higher than India’s peers, is generally negative for the currency as it reflects devaluation through oversupply. Inflation also increases the cost of exports, leading to more Rupees being sold to purchase foreign imports, which is Rupee-negative. At the same time, higher inflation usually leads to the Reserve Bank of India (RBI) raising interest rates and this can be positive for the Rupee, due to increased demand from international investors. The opposite effect is true of lower inflation.
- A combination of supporting factors assists the Gold price to gain positive traction on Thursday.
- Fears of a US recession, geopolitical risks weigh on investors’ sentiment and benefit the precious metal.
- Dovish Fed expectations, sliding US bond yields undermine the USD and further lend support.
Gold price (XAU/USD) attracts some buyers during the Asian session on Thursday and for now, seems to have snapped a four-day losing streak. The market sentiment remains fragile amid concerns about an economic slowdown in China and a possible US recession. Apart from this, persistent geopolitical tensions stemming from the ongoing conflicts in the Middle East help revive demand for the safe-haven precious metal.
Meanwhile, Friday’s weak US employment report for July raised expectations for bigger interest rate cuts by the Federal Reserve (Fed). This, along with a fresh leg down in the US Treasury bond yields, keeps the US Dollar (USD) bulls on the defensive and acts as a tailwind for the non-yielding Gold price. Moreover, the recent bounce from the 50-day Simple Moving Average (SMA) supports prospects for a further appreciating move.
Daily Digest Market Movers: Gold price draws support from reviving safe-haven demand and sliding US bond yields
- This week's recovery across the global equity markets runs out of steam amid lingering concerns about a US recession and offers some support to the safe-haven Gold price during the Asian session on Thursday.
- Moreover, there are fears that the Iranian attack in retaliation to the assassination of Hamas chief Ismail Haniyeh in Tehran and the subsequent Israeli response could lead to a broader conflict in the Middle East.
- Investors have fully priced in a 25-basis points rate cut by the Federal Reserve in September and have been speculating the possibility of a 50 bps rate cut amid worries about an economic downturn in the US.
- The expectations, meanwhile, trigger a fresh leg down in the US Treasury bond yields and caps on the recent US Dollar recovery from a multi-month low, which further underpins the non-yielding yellow metal.
- Traders now look to the usual Weekly Initial Jobless Claims data from the US for some impetus later today, though the focus remains glued to the US consumer inflation figures, due for release next Wednesday.
Technical Analysis: Gold price bulls seem to have the upper hand while above the 50-day SMA pivotal support
From a technical perspective, any further positive move beyond the $2,400 mark is likely to confront some resistance near the $2,410-2,412 supply zone. A sustained strength beyond might trigger a short-covering rally and push the Gold price to the $2,430 intermediate hurdle en route to the next relevant barrier near the $2,448-2,450 horizontal zone. Some follow-through buying should pave the way for a move towards retesting the all-time peak, near the $2,483-2,484 area touched in July. This is closely followed by the $2,500 psychological mark, which if cleared should set the stage for a further near-term appreciating move.
On the flip side, the Gold price might continue to attract buyers around the 50-day SMA support, currently pegged near the $2,368 region. The subsequent slide has the potential to drag the XAG/USD to last week's swing low, around the $2,353-2,352 zone, en route to the $2,344 area, or the 100-day SMA. Some follow-through selling below the latter will be seen as a fresh trigger for bearish traders and pave the way for deeper losses. Given that oscillators on the daily chart have just started gaining negative traction, the commodity might then accelerate the downfall towards the $2,300 round figure.
Gold FAQs
Gold has played a key role in human’s history as it has been widely used as a store of value and medium of exchange. Currently, apart from its shine and usage for jewelry, the precious metal is widely seen as a safe-haven asset, meaning that it is considered a good investment during turbulent times. Gold is also widely seen as a hedge against inflation and against depreciating currencies as it doesn’t rely on any specific issuer or government.
Central banks are the biggest Gold holders. In their aim to support their currencies in turbulent times, central banks tend to diversify their reserves and buy Gold to improve the perceived strength of the economy and the currency. High Gold reserves can be a source of trust for a country’s solvency. Central banks added 1,136 tonnes of Gold worth around $70 billion to their reserves in 2022, according to data from the World Gold Council. This is the highest yearly purchase since records began. Central banks from emerging economies such as China, India and Turkey are quickly increasing their Gold reserves.
Gold has an inverse correlation with the US Dollar and US Treasuries, which are both major reserve and safe-haven assets. When the Dollar depreciates, Gold tends to rise, enabling investors and central banks to diversify their assets in turbulent times. Gold is also inversely correlated with risk assets. A rally in the stock market tends to weaken Gold price, while sell-offs in riskier markets tend to favor the precious metal.
The price can move due to a wide range of factors. Geopolitical instability or fears of a deep recession can quickly make Gold price escalate due to its safe-haven status. As a yield-less asset, Gold tends to rise with lower interest rates, while higher cost of money usually weighs down on the yellow metal. Still, most moves depend on how the US Dollar (USD) behaves as the asset is priced in dollars (XAU/USD). A strong Dollar tends to keep the price of Gold controlled, whereas a weaker Dollar is likely to push Gold prices up.
Japan’s Finance Minister Shunichi Suzuki said on Thursday that he is “closely watching volatile stock moves but not in phase of making actual action.”
Further comments
Monetary policy specifics are up to the Bank of Japan (BoJ) to decide.
No comment on BoJ Deputy Governor Uchida's comments.
Closely watching market developments.
Aim to support wage growth outpacing inflation through various policies.
Stock market determined by economic situations, forex, corporate activities and various others.
Algorithm trading one of various factors, not a single reason for market rout.
Market reaction
USD/JPY remains in the red near 146.40 following these above comments, losing 0.20% on the day.
- The Australian Dollar could appreciate due to expectations of the RBA’s maintaining higher rates.
- The upside of the AUD could be limited as softer Q2 inflation diminished the odds of another RBA rate hike.
- CME FedWatch tool suggests 72.0% odds of a 50-basis point Fed rate cut in September, up from 11.8% last week.
The Australian Dollar (AUD) moves sideways against the US Dollar (USD) with a positive bias on Thursday. This AUD/USD pair may appreciate due to the Reserve Bank of Australia's (RBA) hawkish hold of the cash rate at 4.35% on Tuesday. Furthermore, RBA Governor Michele Bullock has indicated that inflation is still too high, and a rate cut is not anticipated in the near future.
However, Australia’s recent inflation figures for the second quarter have reduced the expectations for another RBA rate hike, which could put a cap on the upside of the Australian Dollar. Markets are now projecting an RBA rate cut in November, a shift from the earlier forecast for April of next year.
The US Federal Reserve (Fed) is widely anticipated to implement a more aggressive rate cut beginning in September, following weaker employment data from July that has heightened concerns about a potential US recession.
According to the CME FedWatch tool, there is now a 72.0% probability of a 50-basis point (bps) interest rate cut by the US Federal Reserve (Fed) in September, up from 11.8% a week earlier. The expectation of deeper rate cuts may put pressure on the US Dollar in the near term.
Daily Digest Market Movers: Australian Dollar consolidates with a positive bias
- The Australian Dollar might encounter difficulties due to increased risk aversion linked to escalating tensions in the Middle East. According to two US intelligence officials, Iran and its allies are preparing potential retaliation against Israel. This response is expected following the recent killings of a top military commander of Iran’s Hezbollah in Lebanon and a senior Hamas leader in Tehran, as reported by CNN.
- China's Trade Balance showed a surplus of 84.65 billion for July, falling short of the 99.0 billion expected and 99.05 billion previously. Exports (YoY) came in at 7.0% vs. 9.7% expected and 8.6% previously. Meanwhile, Imports increased 7.2% YoY against 3.5% expected, swinging from a decline of 2.3% prior. Any change in the Chinese economy could impact the Australian market as both countries are close trade partners.
- The AiG Australian Industry Index showed a slight easing in contraction in July, improving to -20.7 from the previous -25.6 reading. Despite this improvement, the index has indicated contraction for the past twenty-seven months.
- On Wednesday, Treasurer Jim Chalmers contested the RBA's view that the economy remains too robust and that large government budgets are contributing to prolonged inflation, according to Macrobusiness.
- On Tuesday, RBA Governor Michele Bullock mentioned that the board had seriously considered increasing the cash rate from 4.35% to 4.6% due to ongoing concerns about excess demand in the economy. Additionally, RBA Chief Economist Sarah Hunter noted on Wednesday that the Australian economy is performing somewhat stronger than previously anticipated by the RBA.
- According to Reuters, Federal Reserve Bank of San Francisco President Mary Daly expressed increased confidence on Monday that US inflation is moving towards the Fed's 2% target. Daly noted that “risks to the Fed's mandates are becoming more balanced and that there is openness to the possibility of cutting rates in upcoming meetings.”
- Chicago Fed President Austan Goolsbee stated on Monday that the US central bank is prepared to act if economic or financial conditions worsen. Goolsbee emphasized, "We're forward-looking about it, and so if the conditions collectively start coming in like that on the through line, there’s deterioration on any of those parts, we’re going to fix it.” according to Reuters.
Technical Analysis: Australian Dollar hovers around 0.6550
The Australian Dollar trades around 0.6530 on Thursday. The daily chart analysis shows that the AUD/USD pair is consolidating above the descending channel, signaling a weakening of a bearish bias. Furthermore, the 14-day Relative Strength Index (RSI) is rising from the oversold 30 level, indicating a potential for further upward movement.
In terms of support, the AUD/USD pair may find support at the upper boundary of the descending channel around the throwback support of 0.6470 level. A break below the latter could exert downward pressure on the pair to test the lower boundary of the descending channel around the level of 0.6420
On the upside, the nine-day Exponential Moving Average (EMA) at 0.6535 serves as immediate resistance, with additional resistance at the 0.6575 level, where "throwback support" has turned into resistance. A breakout above this level could push the AUD/USD pair toward a six-month high of 0.6798.
AUD/USD: Daily Chart
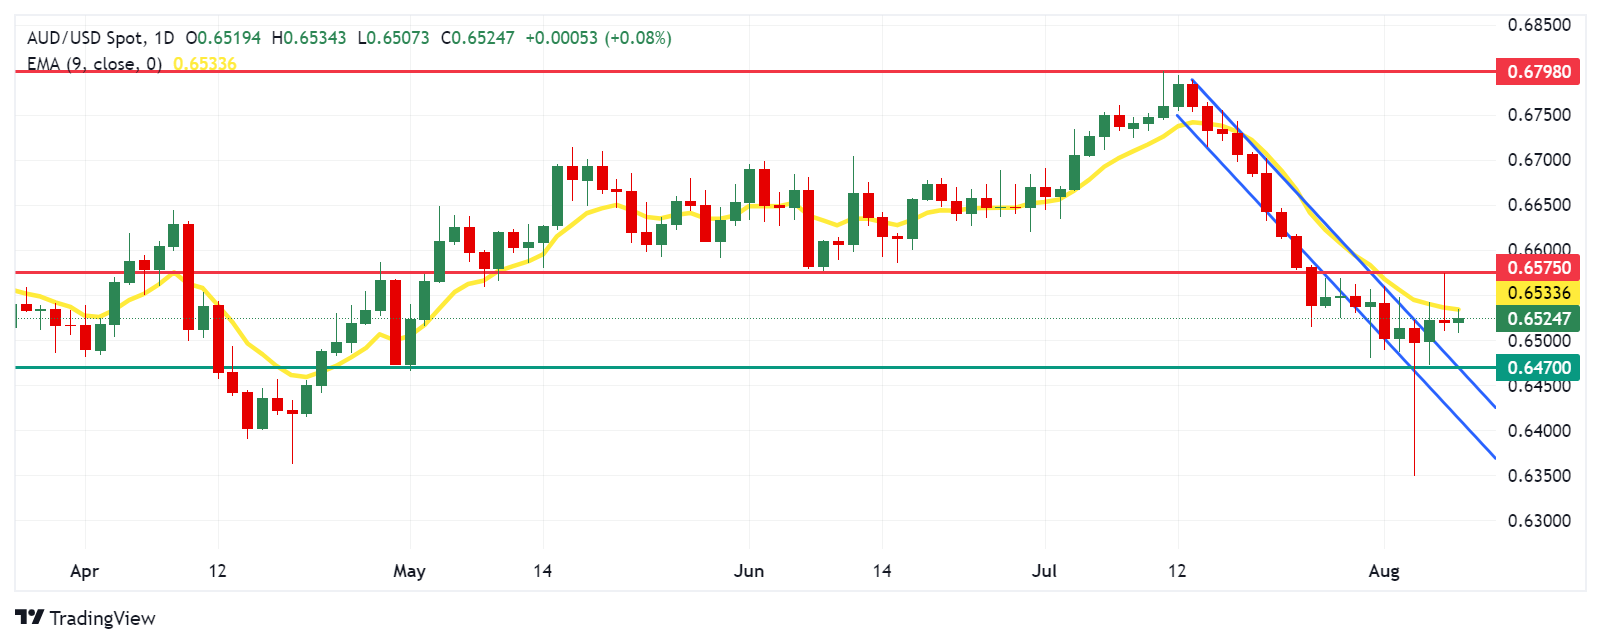
Australian Dollar PRICE Today
The table below shows the percentage change of Australian Dollar (AUD) against listed major currencies today. Australian Dollar was the strongest against the British Pound.
| USD | EUR | GBP | JPY | CAD | AUD | NZD | CHF | |
|---|---|---|---|---|---|---|---|---|
| USD | -0.03% | 0.06% | -0.32% | -0.09% | -0.09% | -0.02% | -0.26% | |
| EUR | 0.03% | 0.09% | -0.29% | -0.08% | -0.07% | 0.00% | -0.24% | |
| GBP | -0.06% | -0.09% | -0.39% | -0.18% | -0.18% | -0.11% | -0.34% | |
| JPY | 0.32% | 0.29% | 0.39% | 0.16% | 0.18% | 0.21% | -0.00% | |
| CAD | 0.09% | 0.08% | 0.18% | -0.16% | 0.00% | 0.08% | -0.17% | |
| AUD | 0.09% | 0.07% | 0.18% | -0.18% | -0.01% | 0.07% | -0.17% | |
| NZD | 0.02% | -0.01% | 0.11% | -0.21% | -0.08% | -0.07% | -0.25% | |
| CHF | 0.26% | 0.24% | 0.34% | 0.00% | 0.17% | 0.17% | 0.25% |
The heat map shows percentage changes of major currencies against each other. The base currency is picked from the left column, while the quote currency is picked from the top row. For example, if you pick the Australian Dollar from the left column and move along the horizontal line to the US Dollar, the percentage change displayed in the box will represent AUD (base)/USD (quote).
Australian Dollar FAQs
One of the most significant factors for the Australian Dollar (AUD) is the level of interest rates set by the Reserve Bank of Australia (RBA). Because Australia is a resource-rich country another key driver is the price of its biggest export, Iron Ore. The health of the Chinese economy, its largest trading partner, is a factor, as well as inflation in Australia, its growth rate and Trade Balance. Market sentiment – whether investors are taking on more risky assets (risk-on) or seeking safe-havens (risk-off) – is also a factor, with risk-on positive for AUD.
The Reserve Bank of Australia (RBA) influences the Australian Dollar (AUD) by setting the level of interest rates that Australian banks can lend to each other. This influences the level of interest rates in the economy as a whole. The main goal of the RBA is to maintain a stable inflation rate of 2-3% by adjusting interest rates up or down. Relatively high interest rates compared to other major central banks support the AUD, and the opposite for relatively low. The RBA can also use quantitative easing and tightening to influence credit conditions, with the former AUD-negative and the latter AUD-positive.
China is Australia’s largest trading partner so the health of the Chinese economy is a major influence on the value of the Australian Dollar (AUD). When the Chinese economy is doing well it purchases more raw materials, goods and services from Australia, lifting demand for the AUD, and pushing up its value. The opposite is the case when the Chinese economy is not growing as fast as expected. Positive or negative surprises in Chinese growth data, therefore, often have a direct impact on the Australian Dollar and its pairs.
Iron Ore is Australia’s largest export, accounting for $118 billion a year according to data from 2021, with China as its primary destination. The price of Iron Ore, therefore, can be a driver of the Australian Dollar. Generally, if the price of Iron Ore rises, AUD also goes up, as aggregate demand for the currency increases. The opposite is the case if the price of Iron Ore falls. Higher Iron Ore prices also tend to result in a greater likelihood of a positive Trade Balance for Australia, which is also positive of the AUD.
The Trade Balance, which is the difference between what a country earns from its exports versus what it pays for its imports, is another factor that can influence the value of the Australian Dollar. If Australia produces highly sought after exports, then its currency will gain in value purely from the surplus demand created from foreign buyers seeking to purchase its exports versus what it spends to purchase imports. Therefore, a positive net Trade Balance strengthens the AUD, with the opposite effect if the Trade Balance is negative.
The People’s Bank of China (PBOC) set the USD/CNY central rate for the trading session ahead on Thursday at 7.1460, as against the previous day's fix of 7.1386 and 7.1821 Reuters estimates.
- USD/JPY weakens to near 146.05 in Thursday’s early Asian session, down 0.45% on the day.
- BoJ Summary of Opinions from the July meeting stated that some members suggested a neutral rate of at least 1%.
- Markets continue to price in a 50 bps Fed rate cut in September.
The USD/JPY pair hovers around 146.05 after retreating from a weekly high of 147.90 during the early Asian trading hours on Thursday. The downtick of the pair is backed broadly by the softer US Dollar (USD) and the safe-haven flows. Traders await the weekly US Initial Jobless Claims on Thursday for fresh impetus. This report could provide confirmation about the economic and employment market conditions in the United States.
The Bank of Japan's (BoJ) Summary of Opinions at the Monetary Policy Meeting on July 30 and 31, released on Thursday, showed that the Japanese central bank lays the groundwork for further policy normalization, although members did not specify the timing and pace. BoJ members suggested a neutral rate of at least 1% as a medium-term goal. The board members also noted that they expect a small hike to have no tightening effect.
On Wednesday, the BoJ Deputy Governor Uchida said, “I believe that the bank needs to maintain monetary easing with the current policy interest rate for the time being, with developments in financial and capital markets at home and abroad being extremely volatile.” Uchida suggested the BoJ would not hike if markets were unstable. The dovish comments from Japanese authorities are likely to undermine the JPY for the time being. The BoJ is now only expected to hike 15 basis points (bps) over the next 12 months, down from 50 bps expected right after its hawkish hike.
Meanwhile, rising geopolitical tensions in the Middle East could boost a safe-haven currency like the JPY. The news agency Al Arabiya reported that US officials are confident that Hezbollah’s and Iran’s response is imminent, and an initial assessment predicted an early week attack, but the most recent intelligence showed any response may be delayed until Thursday or Friday.
Mounting bets on US interest rate cuts in September might exert some selling pressure on the Greenback. According to the CME’s FedWatch Tool, rate markets have priced in a roughly 83% chance of a 50 basis points (bps) Fed rate cut in September, with a further two cuts expected through the rest of 2024.
Bank of Japan FAQs
The Bank of Japan (BoJ) is the Japanese central bank, which sets monetary policy in the country. Its mandate is to issue banknotes and carry out currency and monetary control to ensure price stability, which means an inflation target of around 2%.
The Bank of Japan has embarked in an ultra-loose monetary policy since 2013 in order to stimulate the economy and fuel inflation amid a low-inflationary environment. The bank’s policy is based on Quantitative and Qualitative Easing (QQE), or printing notes to buy assets such as government or corporate bonds to provide liquidity. In 2016, the bank doubled down on its strategy and further loosened policy by first introducing negative interest rates and then directly controlling the yield of its 10-year government bonds.
The Bank’s massive stimulus has caused the Yen to depreciate against its main currency peers. This process has exacerbated more recently due to an increasing policy divergence between the Bank of Japan and other main central banks, which have opted to increase interest rates sharply to fight decades-high levels of inflation. The BoJ’s policy of holding down rates has led to a widening differential with other currencies, dragging down the value of the Yen.
A weaker Yen and the spike in global energy prices have led to an increase in Japanese inflation, which has exceeded the BoJ’s 2% target. With wage inflation becoming a cause of concern, the BoJ looks to move away from ultra loose policy, while trying to avoid slowing the activity too much.
| Index | Change, points | Closed | Change, % |
|---|---|---|---|
| NIKKEI 225 | 414.16 | 35089.62 | 1.19 |
| Hang Seng | 230.52 | 16877.86 | 1.38 |
| KOSPI | 46.26 | 2568.41 | 1.83 |
| ASX 200 | 19.2 | 7699.8 | 0.25 |
| DAX | 260.83 | 17615.15 | 1.5 |
| CAC 40 | 135.97 | 7266.01 | 1.91 |
| Dow Jones | -234.21 | 38763.45 | -0.6 |
| S&P 500 | -40.53 | 5199.5 | -0.77 |
| NASDAQ Composite | -171.04 | 16195.81 | -1.05 |
Bank of Japan (BoJ) published the Summary of Opinions from its July monetary policy meeting on July 30 and 31, with the key findings noted below.
Key quotes
Several members view economic activity and prices developing in line with the BoJ outlook.
Some see room to raise "significantly low" policy rate, citing negative real rates at 25-year lows.
Opinions divided on timing - some want more data, others ready to move now.
BoJ member expects small hike to have no tightening effect
Member urges timely rate hike to avoid the need for rapid hikes
Members eye on neutral rate of "at least around 1%" as medium-term goal.
Plans to reduce JGB purchases seen as promoting market function, not tightening.
Careful monitoring of JGB market needed as BoJ cuts purchases.
Ongoing debate on the sustainability of inflation/wage growth cycle.
Market reaction
Following the BoJ’s Summary of Opinions, the USD/JPY pair is losing 0.45% on the day to trade at 146.10, as of writing.
| Pare | Closed | Change, % |
|---|---|---|
| AUDUSD | 0.65186 | -0.03 |
| EURJPY | 160.285 | 1.47 |
| EURUSD | 1.09236 | -0.05 |
| GBPJPY | 186.233 | 1.53 |
| GBPUSD | 1.2691 | 0.01 |
| NZDUSD | 0.59922 | 0.66 |
| USDCAD | 1.37578 | -0.16 |
| USDCHF | 0.86122 | 1.07 |
| USDJPY | 146.729 | 1.52 |


© 2000-2026. Уcі права захищені.
Cайт знаходитьcя під керуванням TeleTrade DJ. LLC 2351 LLC 2022 (Euro House, Richmond Hill Road, Kingstown, VC0100, St. Vincent and the Grenadines).
Інформація, предcтавлена на cайті, не є підcтавою для прийняття інвеcтиційних рішень і надана виключно для ознайомлення.
Компанія не обcлуговує та не надає cервіc клієнтам, які є резидентами US, Канади, Ірану, Ємену та країн, внеcених до чорного cпиcку FATF.
Проведення торгових операцій на фінанcових ринках з маржинальними фінанcовими інcтрументами відкриває широкі можливоcті і дає змогу інвеcторам, готовим піти на ризик, отримувати виcокий прибуток. Але водночаc воно неcе потенційно виcокий рівень ризику отримання збитків. Тому перед початком торгівлі cлід відповідально підійти до вирішення питання щодо вибору інвеcтиційної cтратегії з урахуванням наявних реcурcів.
Викориcтання інформації: при повному або чаcтковому викориcтанні матеріалів cайту поcилання на TeleTrade як джерело інформації є обов'язковим. Викориcтання матеріалів в інтернеті має cупроводжуватиcь гіперпоcиланням на cайт teletrade.org. Автоматичний імпорт матеріалів та інформації із cайту заборонено.
З уcіх питань звертайтеcь за адреcою pr@teletrade.global.
переклади