- Аналітика
- Новини та інструменти
- Новини ринків
Новини ринків
- US Dollar Index edges higher after rising the most in a week, portrays cautious mood ahead of inflation clues.
- Mixed US data, Fed talks join fears emanating from China data, Country Garden’s missing bond coupon payment to fuel DXY.
- Moody’s, Fitch downgrade multiple US banks, financial institutions and weigh on sentiment, allowing US Dollar to cheer haven allure.
- Italy’s surprise tax on windfall profits of banks adds to the risk-off mood and favors Greenback.
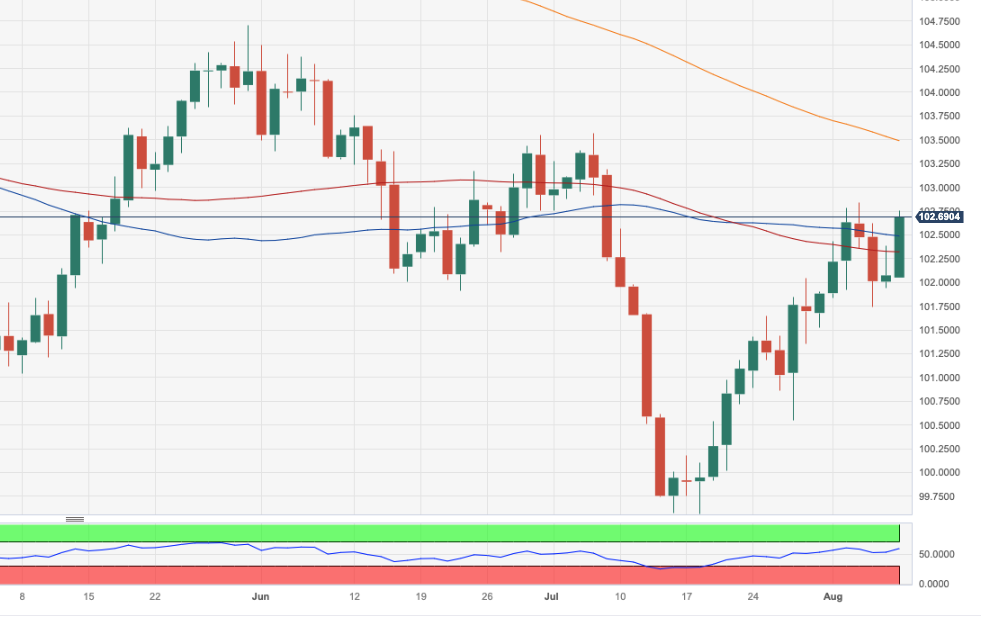
US Dollar Index (DXY) aptly portrays the market’s cautious mood ahead of the top-tier inflation clues from China and the US for further directions after witnessing a heavy risk aversion the previous day. That said, the DXY seesaws around 102.55 amid the early hours of Wednesday’s Asian session following the biggest daily jump in a week, backed by the sour sentiment.
Greenback cheered its traditional haven status and ignored mixed data at home, as well as the unimpressive comments from the Federal Reserve (Fed) officials, to rise in the last two days.
The key risk catalysts are China’s trade numbers and the global banking woes. That said, China's Trade Balance improves in July but the details suggest deteriorating Imports and Exports for the said month, suggesting the economic challenges for the Dragon Nation which already suffers from geopolitical woes. On the same line, India bans drone makers from using Chinese equipment after stopping the imported laptops and computers previously. Also, Chinese real estate giant Country Garden announced missing two dollar bond coupons due on August 6 totaling $22.5 million per Reuters. The news renews fears of bankruptcy among the realtors in China even if the Country Garden has a 30-day grace period to avoid such hardships.
Elsewhere, concerns about rating giant Moody’s downgrading to nine United States banks joined Fitch Ratings’ downgrading of cutting the credit rating and warning about the outlook of a few US financial institutions renewed banking fears. That said, Italy’s announcements of a surprise windfall tax on bank profits exert downside pressure on the Euro and allow the US Dollar to remain firmer.
Recently, the UK’s leading thinktank National Institute of Economic and Social Research (NIESR) flagged concerns about the British recession and challenged the sentiment. However, Bloomberg’s news suggesting the softer ban on Chinese technology companies seems to have tamed the risk-off mood.
Against this backdrop, Wall Street closed in the red with major losses among the bank stocks whereas the US 10-year Treasury bond yields dropped to the weekly low of around 3.98% before bouncing off 4.03% by the day’s end. That said, S&P500 Futures remains mildly offered by the press time.
If we observe the data at home, US Goods and Services Trade Balance for June came in at $-65.5B versus the $-65B expected and $-68.3B prior whereas the NFIB Optimism Index for July improved to 91.9, the highest in nine months, from 91.0 previous readings and 90.6 market forecasts. Further, US IBD/TIPP Economic Optimism for August eases to 40.3 from 43.0 market forecasts and 41.3 prior whereas Wholesale Inventories for June dropped to -0.5% versus the analysts’ estimations of reprinting the -0.3% figures.
Talking about the Fed signals, Philadelphia Federal Reserve Bank President Patrick Harker advocated Fed’s policy pivot while saying, per Reuters, “I believe we may be at the point where we can be patient and hold rates steady and let the monetary policy actions we have taken do their work.” On the other hand, Richmond Fed President Thomas Barkin stated that the Gross Domestic Product (GDP) remained "solid".
Looking ahead, China’s headline inflation data comprising the Consumer Price Index (CPI) and Producer Price Index (PPI) for July will be crucial for intraday directions. That said, the CPI is likely to tease deflation while posting -0.4% YoY figures versus 0.0% prior whereas the PPI is expected likely to improve to -4.1% YoY from -5.4% prior. Should the inflation in the world’s biggest industrial players drops, the market’s fears escalate and the same can propel the DXY ahead of the US CPI data, up for publishing on Thursday.
Technical analysis
A clear upside break of the 14-week-old resistance line, close to 102.50 at the latest, becomes necessary for the US Dollar Index bulls to keep the reins.
- USD/CHF remains confined between 0.8750-0.8765 range on Wednesday.
- Moody's downgraded the ratings of several small to mid-sized US banks.
- The headline surrounding the US-China trade war remains in focus.
- The US Consumer Price Index (CPI), the Produce Price Index (PPI) will be in the spotlight this week.
The USD/CHF pair struggles to gain any meaningful traction and oscillates in a narrow trading range, just above mid-0.8700 during the early Asian session on Wednesday. The pair currently trades around 0.8760, gaining 0.03% for the day.
On Monday, Moody's downgraded the credit ratings of several small to mid-sized US banks and issued a warning about possible cuts to the ratings of larger institutions. The giant credit rating company stated that the higher interest rates have also elevated the prospect of a recession, putting pressure on the banking industry as well as real estate to adapt to post-pandemic reality.
Furthermore, the US trade data show a sluggish economic rebound and subdued global demand in the country. The US trade deficit narrowed sharply in June, with the figure coming in at $65.5 billion, higher than expectations of $65 billion and below the $68.3 billion prior. Imports fell 1.0% to $313 billion from $316.1 billion the previous month, the lowest level since November 2021. While, Exports dropped 0.1% to $247.5 billion, a 15-month low,
On the Swiss front, the State Secretariat for Economic Affairs (SECO) revealed on Monday that the Swiss Unemployment Rate came in at 1.9% in July, matching expectations. The figure remained unchanged compared to the June reading and marked its lowest level since October 2022.
Additionally, the headline surrounding the US-China relationship remains in focus. On Tuesday, Bloomberg reported that the US intends to target only Chinese companies that generate more than 50% of their revenue from quantum computation and artificial intelligence (AI). However, US President Joe Biden is expected to issue an executive order this week about the restriction. The exacerbated trade war tensions between the world’s two largest economies might benefit the safe-haven Swiss Franc and act as a headwind for the USD/CHF pair.
In the absence of the economic data release from Switzerland, the US Consumer Price Index (CPI) for July and the Produce Price Index (PPI) will be in the spotlight this week. Also, the development of the US-China relationship remains in focus. Market participants will keep an eye on the data and find trading opportunities around the USD/CHF pair.
UK's leading thinktank, the National Institute of Economic and Social Research (NIESR), said late Tuesday, per The Guardian, that it would take until the third quarter (Q3) of 2024 for British output to return to its pre-pandemic peak.
“There was a 60% risk of the government going to the polls during a recession,” adds the NIESR per The Guardian.
The NIESR’s quarterly update also states that the poorest tenth of the population had been especially hard hit by Britain’s cost of living crisis and would need an income boost of £4,000 a year to have the same living standards they enjoyed in the year before Covid-19 arrived.
It’s worth noting, however, that the NIESR appears divided about witnessing a contraction in British economic activity during late 2023.
Market reaction
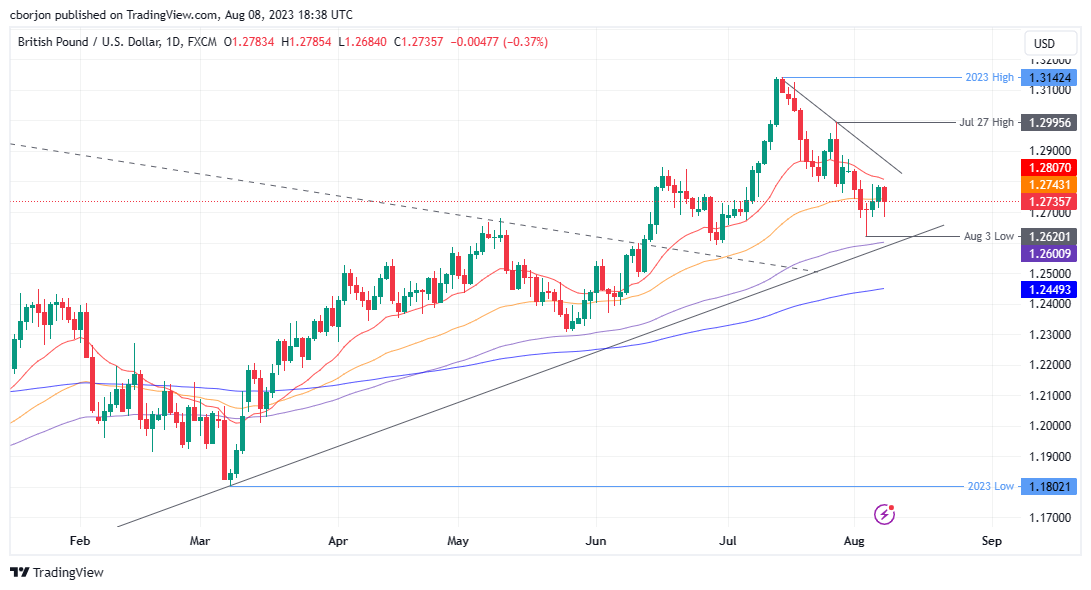
GBP/USD fades bounce off the weekly low around 1.2745 as the news amplifies British recession concerns and gains support from the broad risk-off mood.
Also read: GBP/USD Price Analysis: Cable bears stay hopeful near 1.2750 as US Dollar cheers risk aversion
- GBP/USD fades bounces off one-month low, retreats from 10-DMA.
- Bearish MACD signals, previous support break joins firmer US Dollar to weigh on Cable pair.
- China, banking concerns fuel US Dollar and exert downside pressure on Pound Sterling.
- China inflation, risk catalysts eyed for clear directions.
GBP/USD stays depressed near 1.2745 as it fades the previous day’s corrective bounce off the lowest level in a month amid early Wednesday in Asia. In doing so, the Cable pair portrays the market’s cautious mood ahead of the top-tier China data. However, fears emanating from China’s banking and realty sector join the rating downgrade from Moody’s and Fitch to spoil the sentiment and fuel the US Dollar.
Also read: GBP/USD trips down on woes about global economic growth, also on a solid USD
While portraying the mood, Wall Street closed in the red with major losses among the bank stocks whereas the US 10-year Treasury bond yields dropped to the weekly low of around 3.98% before bouncing off 4.03% by the day’s end.
Technically, bearish MACD signals and the sustained trading below the 10-DMA hurdle, around 1.2770 by the press time, keep the GBP/USD sellers hopeful.
Adding strength to the downside bias is the quote’s previous fall below the rising trend line stretched from early March and June, respectively near 1.2820 and 1.2955.
That said, the 38.2% Fibonacci retracement level of the quote’s March–July upside, near 1.2630, acts as immediate support for the Pound Sterling. Following that, the bears will have more say in directing the GBP/USD prices.
GBP/USD: Daily chart
-09082023-638271327945961575.png)
Trend: Further downside expected
- NZD/USD bounces off the two-month lows and holds ground near 0.6060 on Wednesday.
- The downbeat Chinese trade data exerts some pressure on the Kiwi.
- The US trade deficit narrowed sharply in June; Imports fell to the lowest level since November 2021.
- Investors await Chinese inflation data, New Zealand inflation expectations report.
The NZD/USD pair recovers its recent loss near the 0.6060 region after reaching two-month lows at 0.6033 in the early Asian session. Markets turn cautious as investors expressed concern about Chinese growth, and Fitch downgraded the credit ratings of midsize and small U.S. lenders, and issued a warning about possible cuts to the ratings of larger institutions.
Meanwhile, the US Dollar Index (DXY), a measure of the value of the USD against six other major currencies, attracts some buyers above 102.50. The safe-haven flow benefits the US Dollar (USD) and acts as a headwind for the NZD/USD pair.
The downbeat Chinese data exerts some pressure on the Kiwi. That said, the dollar value of China’s exports YoY in July plunged -14.5%, worse than expectations of -12.5% in June, while Imports dropped -12.4% YoY from -5%. The figures fuel concern about the economic slowdown in the world’s second-largest economy. Market players await Electronic New Zealand’s Car Sales for July and the inflation expectations report for fresh impetus later in the day.
On the other hand, the US trade deficit narrowed sharply in June. Imports fell 1.0% to $313 billion from $316.1 billion the previous month, the lowest level since November 2021. On the same line, Exports dropped 0.1% to $247.5 billion, a 15-month low. The trade deficit came in at $65.5 billion, higher than expectations of $65 billion and below the $68.3 billion prior. The US trade data show a sluggish economic rebound and subdued global demand in the country.
Additionally, Fitch downgraded the credit ratings of midsize and small US lenders and issued a warning about possible cuts to the ratings of larger institutions. The headline adds to the negative sentiment in the market and boosts the Greenback broadly.
Looking ahead, market participants will keep an eye on the Chinese Consumer Price Index (CPI) YoY for July. Also, the New Zealand’s Electronic Car Sales and Inflation Expectations report will be due on Wednesday. On the US front, the release of the July CPI and Producer Price Index (PPI) later this week will be in the spotlight. The data could significantly impact the US Dollar's dynamics and give the NZD/USD pair a clear direction.
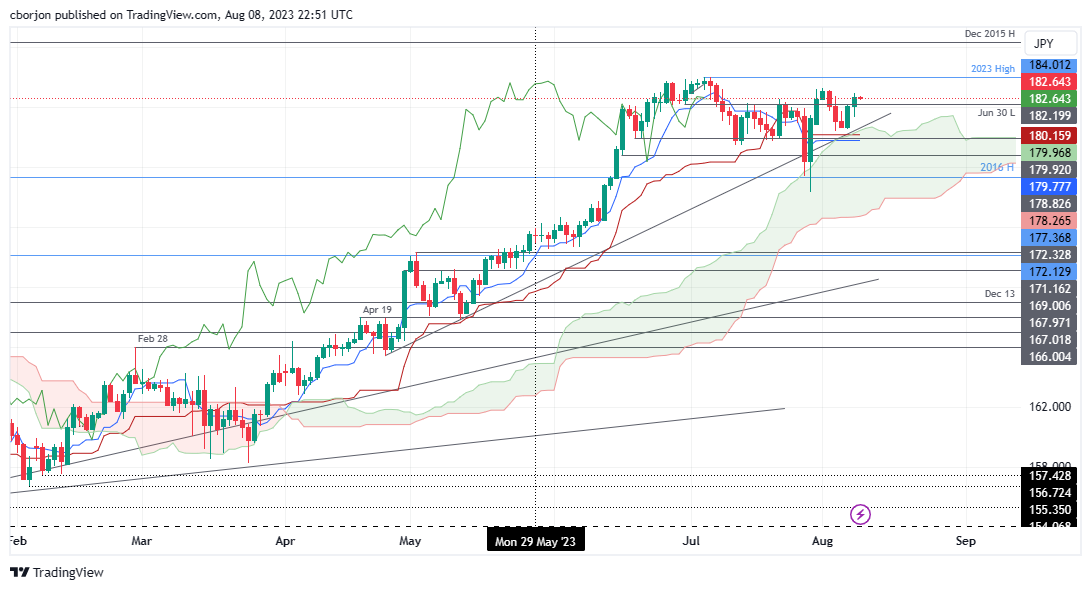
- GBP/JPY experiences gains for the second consecutive day, peaking at a weekly high of 182.95.
- Chikou Span is on the verge of a bullish signal, while flat Tenkan-Sen and Kijun-Sen lines hint at potential subdued movement.
- The 183.00 mark remains pivotal; a breakthrough could lead to testing the YTD high of 184.01.
- Downside risks include supports at 181.37 (August 8 low) and the Ichimoku Cloud top around 180.50/60.
GBP/JPY advanced for the second consecutive day on Tuesday, registering gains of 0.36%, reaching a fresh weekly high of 182.95. Nevertheless, toward the close of the day, the GBP/JPY dipped, and as the Asian session began, the GBP/JPY exchanges hands at 182.65, down 0.03%.
GBP/JPY Price Analysis: Technical outlook
The GBP/JPY remains neutral to upward biased, poised to re-test the year-to-date (YTD) high of 184.01, even though it remains below 183.00. It should be said the Chikou Span is about to give a bullish signal, about to break above price action; however, the Tenkan-Sen remains below the Kijun-Sen, with both lines remaining flat, suggesting the GBP/JPY could remain subdued in the near term.
If GBP/JPY breaks to a new weekly high, the first resistance would be the 183.00 figure. A breach of the latter would expose the August 1 high of 183.24, followed by the YTD high of 184.01
Conversely, if GBP/JPY remains below 183.00, that could open the door for a pullback. First support will emerge at the August 8 daily low of 181.37. The following support would be the top of the Ichimoku Cloud (Kumo) at around 180.50/60, followed by the Kijun-Sen and Tenkan-Sen lines, each at around 180.16 and 179.77, respectively.
GBP/JPY Price Action – Daily chart
Late Tuesday, Bloomberg quotes anonymous sources familiar with the matter while suggesting a comparatively softer US government ban on investment in Chinese Artificial Intelligence (AI) companies.
The news mentions that the US plans to target only those Chinese companies that get more than 50% of revenue from the sectors including quantum computing and artificial intelligence (AI).
“The Biden administration is expected to unveil in the coming days,” said Bloomberg.
Market reaction
The news allows AUD/USD to portray a corrective bounce from the lowest level in two months after posting the biggest daily loss in a week, mainly due to the risk-off mood and China-linked news.
Also read: AUD/USD stays pressured towards 0.6500 as economic woes join fears of China deflation
- AUD/USD fades bounce off two-month low after snapping three-day winning streak with a heavy loss the previous day.
- Mixed Aussie data contrasted with downbeat China trade numbers, Country Garden’s missing payment to lure bears.
- Moody’s, Fitch and Italy offer challenges for majors from three sides and weigh on sentiment, as well as Aussie price.
- China CPI, PPI will be important as fears of deflation, slower economic growth for Australia’s biggest customer intensify.
AUD/USD justifies its risk barometer status by being depressed at the lowest level in two months, fading corrective bounce off the multi-day bottom towards revisiting 0.6540 during the early Asian session on Wednesday. In doing so, the Aussie pair not only takes clues from the market’s risk-off mood but also focuses on the US data and cautious mood ahead of China’s headline inflation release.
The pair dropped heavily the previous day after initially bearing the burden of unimpressive data at home and downbeat China trade numbers, as well as fears surrounding the real estate sector from Beijing. Following that major challenges for the banking sector and pre-data anxiety drowned the quote. However, the day-end consolidation and the news that the US might ease its hardships for China AI firms, per Bloomberg, seemed to have triggered the quote’s rebound.
On Tuesday, Australia’s Westpac Consumer Confidence for August slumped to -0.4% versus 2.7% prior. Alternatively, the National Australia Bank's (NAB) Business Conditions for July edge higher to 10.0 from 9.0 prior and 8.0 market forecasts whereas the NAB Business Confidence came into 2.0% compared to -1.0% market consensus and 0.0% prior.
Further, China’s headline Trade Balance improves in July but the details suggest deteriorating Imports and Exports for the said month, suggesting the economic challenges for the Dragon Nation which already suffers from geopolitical woes. That said, India bans drone makers from using Chinese equipment after stopping the imported laptops and computers previously. Also, Chinese real estate giant Country Garden announced missing two dollar bond coupons due on August 6 totaling $22.5 million per Reuters. The news renews fears of bankruptcy among the realtors in China even if the Country Garden has a 30-day grace period to avoid such hardships.
On the other hand, US Goods and Services Trade Balance for June came in at $-65.5B versus $-65B expected and $-68.3B prior whereas the NFIB Optimism Index for July improved to 91.9, the highest in nine months, from 91.0 previous readings and 90.6 market forecasts. Further, US IBD/TIPP Economic Optimism for August eases to 40.3 from 43.0 market forecasts and 41.3 prior whereas Wholesale Inventories for June dropped to -0.5% versus the analysts’ estimations of reprinting the -0.3% figures.
It should be noted that Philadelphia Federal Reserve Bank President Patrick Harker advocated Fed’s policy pivot while saying, per Reuters, “I believe we may be at the point where we can be patient and hold rates steady and let the monetary policy actions we have taken do their work.” On the other hand, Richmond Fed President Thomas Barkin stated that the Gross Domestic Product (GDP) remained "solid".
Additionally, concerns about rating giant Moody’s downgrading to nine United States banks joined Fitch Ratings’ downgrading of cutting the credit rating and warning about the outlook of a few US financial institutions renewed banking fears. That said, Italy’s announcements of a surprise windfall tax on bank profits exert downside pressure on the Euro and allow the US Dollar to remain firmer, which in turn weighs on the Gold Price.
With this, the market sentiment roiled and allowed the US Dollar Index (DXY) to jump the most in a week before ending Tuesday’s North American session around 102.55. Due to the same, Wall Street closed in the red with major losses among the bank stocks whereas the US 10-year Treasury bond yields dropped to the weekly low of around 3.98% before bouncing off 4.03% by the day’s end.
Looking ahead, China’s headline inflation data comprising the Consumer Price Index (CPI) and Producer Price Index (PPI) will entertain traders. That said, the CPI is likely to suggest deflation in one of the world’s biggest customers of Australia while posting -0.4% YoY figures versus 0.0% prior whereas the PPI is expected likely to improve to -4.1% YoY from -5.4% prior.
Technical analysis
A nine-month-old rising support line, near 0.6480 at the latest, appears the key level to break for the AUD/USD bears to tighten the grip. Failing to do so can join the nearly oversold RSI to trigger the Aussie pair’s corrective bounce towards the lows marked in late June and early July around 0.6600.
- Gold Price prods multi-month-old support as China, inflation concerns weigh on sentiment.
- US Dollar remains firmer despite mixed United States data, pullback in yields, exerting downside pressure on XAU/USD.
- China statistics, fears in banking, realty sector join mixed feelings about inflation, Federal Reserve talks to keep Gold sellers hopeful.
- Firmer inflation can join tighter labor markets to underpin hawkish central bank bias and exert more downside pressure on XAU/USD.
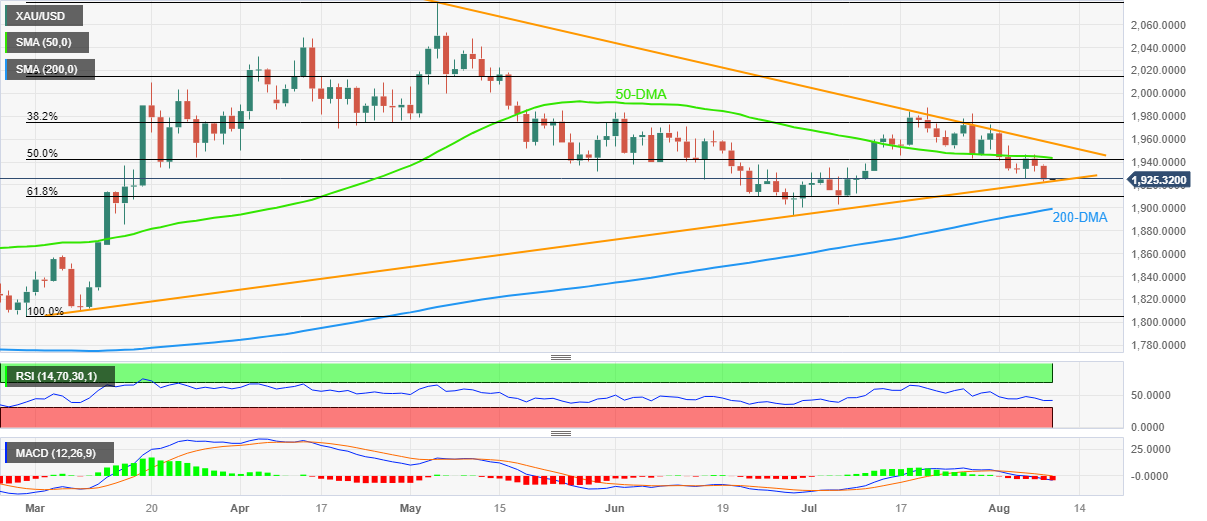
Gold Price (XAU/USD) remains on the back foot at the lowest level in a month, poking an upward-sloping support line from February around $1,925 amid the early hours of Wednesday’s Asian session. In doing so, the yellow metal justifies the firmer US Dollar and the market’s fresh fears emanating from the banking and real estate sector ahead of the top-tier inflation clues from China and the United States.
Gold Price drops on firmer US Dollar, risk aversion
Gold Price marked the biggest daily loss in a week the previous day after market sentiment roiled amid downbeat concerns about China, as well as the broad baking and real estate sector. Also, fears emanating from Italy’s tax surprise and mostly upbeat United States data allowed the US Dollar to remain firmer and weigh on the XAU/USD price.
On Monday, US Goods and Services Trade Balance for June came in at $-65.5B versus $-65B expected and $-68.3B prior whereas the NFIB Optimism Index for July improved to 91.9, the highest in nine months, from 91.0 previous readings and 90.6 market forecasts. Further, US IBD/TIPP Economic Optimism for August eases to 40.3 from 43.0 market forecasts and 41.3 prior whereas Wholesale Inventories for June dropped to -0.5% versus the analysts’ estimations of reprinting the -0.3% figures.
It should be noted that Philadelphia Federal Reserve Bank President Patrick Harker advocated Fed’s policy pivot while saying, per Reuters, “I believe we may be at the point where we can be patient and hold rates steady and let the monetary policy actions we have taken do their work.” On the other hand, Richmond Fed President Thomas Barkin stated that the Gross Domestic Product (GDP) remained "solid".
Talking about the risk catalysts, China’s headline Trade Balance improves in July but the details suggest deteriorating Imports and Exports for the said month, suggesting the economic challenges for the Dragon Nation which already suffers from geopolitical woes. That said, India bans drone makers from using Chinese equipment after stopping the imported laptops and computers previously.
Furthermore, Chinese real estate giant Country Garden announced missing two dollar bond coupons due on August 6 totaling $22.5 million per Reuters. The news renews fears of bankruptcy among the realtors in China even if the Country Garden has a 30-day grace period to avoid such hardships.
Additionally, concerns about rating giant Moody’s downgrading to nine United States banks joined Fitch Ratings’ downgrading of cutting the credit rating and warning about the outlook of a few US financial institutions renewed banking fears. That said, Italy’s announcements of a surprise windfall tax on bank profits exert downside pressure on the Euro and allow the US Dollar to remain firmer, which in turn weighs on the Gold Price.
Against this backdrop, Wall Street closed in the red with major losses among the bank stocks whereas the US 10-year Treasury bond yields dropped to the weekly low of around 3.98% before bouncing off 4.03% by the day’s end. Also, the US Dollar Index (DXY) jumped the most in a week before ending Tuesday’s North American session around 102.55.
Inflation, and risk catalysts are the key to further XAU/USD direction
With China’s headline inflation data comprising the Consumer Price Index (CPI) and Producer Price Index (PPI) scheduled for release on the calendar, the Asian trading for the Gold Price may become entertaining. That said, the CPI is likely to suggest deflation in one of the world’s biggest XAU/USD consumers while posting -0.4% YoY figures versus 0.0% prior whereas the PPI is expected likely to improve to -4.1% YoY from -5.4% prior.
Given the likely weaker inflation data from China, the Gold Price may witness further downside on the price pressures matching the forecasts. Even so, improvement in the market’s sentiment may allow the Gold bears to take a breather at the key support line.
Gold Price Technical Analysis
Gold Price extends a downside break of the 50-DMA as it pokes an upward-sloping support line from late February, close to $1,925 by the press time.
Adding credence to the downside bias for the XAU/USD price are the bearish signals from the Moving Average Convergence and Divergence (MACD) indicator.
It’s worth noting, however, that the Relative Strength Index (RSI) line, placed at 14, remains below 50.0 and suggests bottom-picking, which in turn highlights the 61.8% Fibonacci retracement of the Gold Price run-up from late February to May, near $1,910.
In a case where the XAU/USD drops below $1,910, the $1,900 round figure will precede the 200-DMA surrounding $1,897 and June’s bottom of near $1,893 to challenge the further downside.
Meanwhile, the Gold Price recovery needs to provide a daily closing beyond the $1,942–45 resistance confluence comprising the 50-DMA and 50% Fibonacci retracement.
Following that, a three-month-long descending resistance line surrounding $1,960 will be crucial to watch as it holds the key to the XAU/USD’s further advances.
Overall, the Gold Price is likely to witness further downside but there prevails a limited room towards the south.
Gold Price: Daily chart
Trend: Limited downside expected
- EUR/USD finished Tuesday’s session on a lower note lost 0.42%.
- The introduction of a 40% one-off tax on bank profits in Italy weighed on the Euro.
- A shrinkage in the US trade deficit amidst mixed signals by Fed officials boosted the US Dollar.
On Tuesday, the EUR/USD finished the day with losses of 0.42%, closing at around 1.0954 as risk appetite deteriorated on news that put a possible global economic slowdown into the table. In addition, news from Italy setting a one-off 40% tax on bank profits sent shockwaves across the Eurozone (EU), weakening the Euro (EUR). At the time of writing, the EUR/USD exchanges hands at 1.0956, registering minuscule losses of 0.01%.
Euro dips with Italy’s one-off bank tax and softer German inflation; meanwhile, US Dollar gains ground on solid trade balance figures
The EUR/USD’s fall was precipitated by Italy’s imposing a new tax. At the same time, inflation data from Germany eased from 6.4% in June to 6.2% YoY in July, as estimated by analysts. Month-over-month data also came at 0.3%, as foreseen and unchanged from June.
As inflation in the EU continues to drop, expectations for additional tightening remain subdued, with odds for September’s meeting at 35%, while for October hit 55%. Of note, traders should be aware the European Central Bank (ECB) is on data dependant mode, and sudden changes in monetary policy stances, like “hawkish” members like Klas Knot and Joachim Nagel turning more neutral, could push aside additional hikes by the ECB.
Across the pond, data bolstered the US Dollar (USD), a headwind for the EUR/USD, which extended its losses toward its daily low of 1.0928. the US Commerce Department revealed that its trade deficit contracted in June. Exports rose by $247.5 billion, below May’s $247 billion, while Imports slid to $313 billion from $316.1 billion the prior’s month. Consequently, the Trade Balance came at $-65.5, a tick higher than the $-65 billion estimated but below the previous reading of $-68.3 billion.
The Fed parade continued with the Philadelphia Fed President Patrick Harker stating the Fed “can leave interest rates where they are.” Nevertheless, he said, “Absent any alarming new data between now and mid-September,” the Fed can be “patient and hold rates steady.” Echoing some of his comments was Atlanta’s Fed President Raphael Bostic, saying no more hikes are needed.
On the hawkish camp, the Federal Reserve (Fed) Governor Michell Bowman stated that more rate increases are needed.
Given the backdrop and a light economic docket in the EU, EUR/USD traders focus on US data. Inflation figures will be revealed on Thursday, as well as unemployment claims. Upticks in inflation would be bullish for the greenback, hence further downside in the EUR/USD, as traders could speculate further tightening is needed. Nevertheless, according to analysts’ estimates, inflation is expected to cool down slightly, which could open the door for further upside.
EUR/USD Price Analysis: Technical outlook
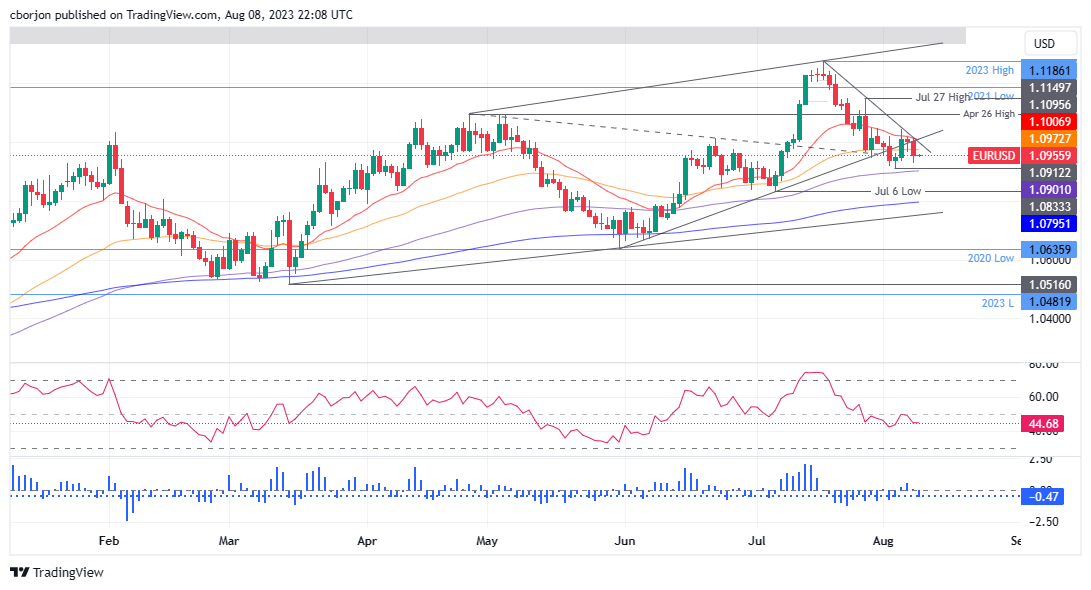
From a daily chart perspective, the EUR/USD is set to extend its losses and test the last week’s low of 1.0912 before claiming the 100-day Exponential Moving Average (EMA) at 1.0901. Break of those two levels and the EUR/USD would dive toward the July 6 low at 1.0833 before challenging the 200-day EMA at 1.0795. On the opposite spectrum, if EUR/USD buyers step in and lift prices past the 20-day EMA at 1.1006, that would exacerbate a rally towards 1.1100.
- The USD/CAD closed near the 1.3415 area after jumping to a high above 1.3500, above the 200-day SMA.
- The US Dollar saw gains amid cautious market sentiment.
- Rising Oil prices limited the CAD’s decline.
The USD/CAD closed with gains on Tuesday but failed to consolidate above the 200-day Simple Moving Average (SMA), closing near 1.3415 but securing the 100-day SMA. The USD strengthened on the back of a sour market mood on the US front. On the other hand, the Canadian dollar managed to mitigate its losses, supported by an upward movement in Oil prices, its main export commodity, the West. Both economic calendars remained empty as investors' eyes are on the Consumer Price Index figures from the US, from Jully scheduled for Thursday.
In that sense, investors' expectations on the next Federal Reserve (Fed) movements will dictate the pair's pace in the week. As Jerome Powell stated, that decision will depend on incoming data, and inflation figures from the US will likely impact the bets placed for the next September meeting.
According to the CME FedWatch tool, tightening expectations for the Federal Reserve remains low. The odds of a hike stand near 14% for the September meeting and rise near 30% in November. However, those odds will likely be impacted by inflation figures on Thursday, also dictating the pace for the bond market and the USD.
USD/CAD levels to watch
According to the daily chart, the technical outlook for the USD/CAD remains neutral to bearish as the bulls show signs of bullish exhaustion. The Relative Strength Index (RSI) has turned flat above its midline, while the Moving Average Convergence (MACD) presents neutral green bars. On the bigger picture, the pair is above the 20 and 100-day Simple Moving Averages (SMA) but below the 200-day SMA, suggesting that the bears are struggling to challenge the overall bullish trend and that the buyers still have the upperhand.
Support levels: 1.3320,1.3300, 1.3280.
Resistance levels: 1.3450, 1.3500 (200-day SMA), 1.3550.
USD/CAD Daily chart
-638271274463818287.png)
Markets will be cautious as they await Chinese inflation data during the Asian session. Additionally, New Zealand's Electronic Card Retail Sales data and the Reserve Bank of New Zealand's inflation expectations for the third quarter will be released. Japan's upcoming data includes Machine Tool Orders for July.
Here is what you need to know on Wednesday, August 9:
Weaker-than-expected Chinese trade data has made markets cautious. Moody's downgrade of US banks has also weighed on risk sentiment. Adding to the negative sentiment was Italy’s announcement of a surprise windfall tax on bank profits. Fitch downgraded credit ratings for mid-size and small US lenders and warned about potential cuts to larger institutions.
The first round of Treasury auctions after the quarterly refunding announcement went well, with strong supply seen in the 52-week bill and 3-year note auctions. On Wednesday, the US will sell 10-year notes. US Treasury yields dropped, with the 10-year testing levels below 4.0% and the 2-year at 4.75%. Attention is focused on the July CPI report, to be released on Thursday.
Federal Reserve's Harker affirmed on Tuesday that he believes the central bank may be at a point where it can be patient and hold rates steady. He added that "sometime probably next year, we'll start cutting interest rates."
Following the negative trade data surprise, China will report July inflation on Wednesday. The Consumer Price Index is expected to decline 0.4% from a year earlier, and the Producer Price Index is forecast to fall to 4.1%.
The announcement of Italy's bank tax weighed on the Euro. The EUR/USD reached a bottom at 1.0927 and then rebounded, rising towards 1.0960, but the overall bias remains bearish.
GBP/USD trimmed losses during the American session, rising from below 1.2700 to 1.2750. Key UK GDP data is due on Friday.
USD/JPY rose despite lower government bond yields and risk aversion, reflecting a stronger US Dollar. The pair advanced for the second consecutive day, climbing back above 143.00. Japan will report Machine Tool Orders for July.
USD/CAD jumped, reaching levels above 1.3500, but then pulled back, approaching 1.3400. Canada will report June Building Permits.
Chinese growth concerns weighed on the Aussie and the Kiwi. NZD/USD reached a bottom at 0.6033, the lowest level in two months, and then rebounded to 0.6060. Earlier on Wednesday, Electronic Car Sales for July are due in New Zealand. Later in the day, the Reserve Bank of New Zealand will release its inflation expectations report.
AUD/USD fell to the lowest level in two months below 0.6500, and then, as the US Dollar weakened, it rose to 0.6550.
USD/MXN spiked to 19.28 and then pulled back toward 17.05, erasing gains as the Mexican Peso remains resilient. Mexico will report inflation on Wednesday.
It was a volatile session for crude oil prices. After a sharp decline during the Asian and European sessions, amid risk aversion, with WTI falling below $80.00, it rebounded and climbed back to the $83.00 area following an announcement from Saudi Arabia that it will continue boosting precautionary efforts to support the stability of the oil market.
Gold posted its lowest close in a month at $1,924 as it remains under pressure despite falling US yields. Silver continues to decline and broke below $23.00.
Like this article? Help us with some feedback by answering this survey:
- EUR/JPY trades with gains near 157.00 but failed to hold the momentum that took it to a high near 158.00.
- Japan reported soft economic data, which outpaced the rise in Labour Cash Earnings in July.
- Weak Chinese data limits the JPY’s upside potential.
On Tuesday, the EUR/JPY jumped near 158.00 and then reversed its course settling near 157.00 as bulls started to show some exhaustion. No data was released in Europe besides the Harmonized Index of Consumer Prices (HICP) from the July revision, which didn’t show any surprises, while Japan reported signs of a weakening economy.
Despite Labour Cash Earning rising by 2.3% YoY in June, Overall Household Spending and Bank Lending came lower than expected and showed signs of a weaker Japanese economy. Plus, China reporting invalid data isn’t good news for Japan. In its leading trading partner, Exports decreased by 14.5% in July, and Imports fell by 6.9%, showing higher declines than anticipated.
On the European side, the EUR traded mixed against its rivals on an empty European calendar session.
EUR/JPY Levels to watch
The technical analysis of the daily chart points to a neutral to a bearish outlook for EUR/JPY, indicating a decline in bullish strength. The Relative Strength Index (RSI) turned flat in positive territory, while the Moving Average Convergence (MACD) displays stagnant red bars. That being said, the pair is above the 20,100,200-day SMAs, indicating a favourable position for the bulls in the bigger picture.
Support levels: 156.00, 155.55, 155.00.
Resistance levels: 157.50, 158.00, 158.50.
EURJ/JPY Daily chart
-638271232669374530.png)
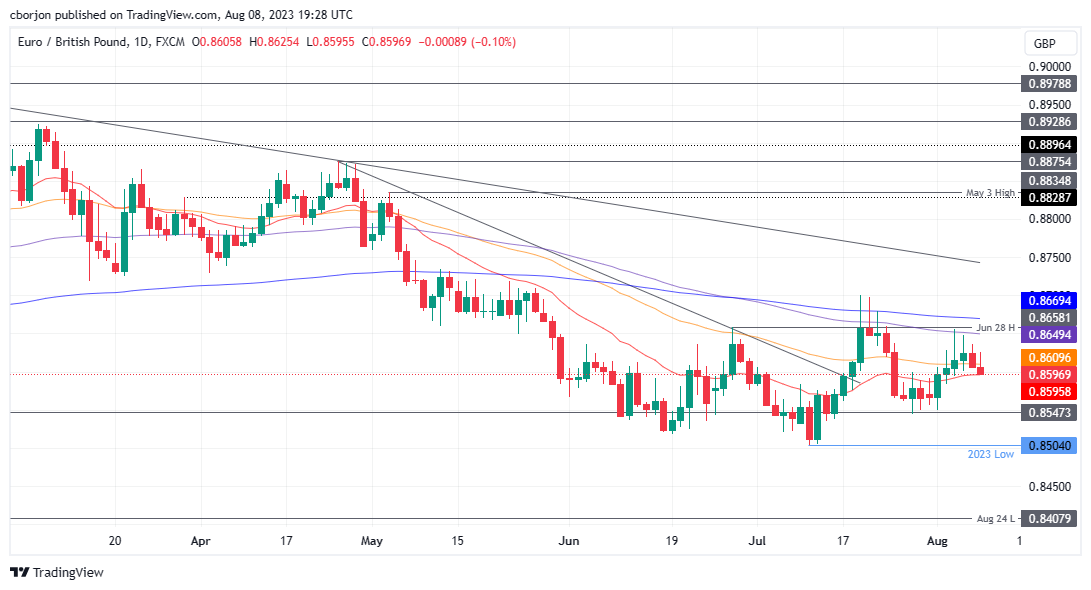
- EUR/GBP struggles to maintain upward momentum, fails to break 0.8650 resistance, and is down by 0.10%.
- The 100-day EMA at 0.8652 is a significant barrier, resulting in a 0.75% slide since Thursday.
- Immediate support lies around the 20-day EMA at 0.8595, with the potential to further test the 0.8550 and YTD low of 0.8504.
- The pair must cross the 0.8600 level for an upside move, with subsequent resistance at the 50-day EMA (0.8610) and 100-day EMA (0.8649).
EUR/GBP extends its losses to two-consecutive days after struggling to break solid resistance at around 0.8650, with the pair sliding towards the 0.8590s area on Tuesday. At the time of writing, the EUR/GBP exchanges hands at 0.8597, down 0.10%.
EUR/GBP Price Analysis: Technical outlook
The EUR/GBP reversed its course to the upside after piercing the 100-day Exponential Moving Average (EMA) at 0.8652 last Thursday, but buyers could not hold to gains above the latter, opening the door for a pullback. Since then, the EUR/GBP slid 0.75%, below the 0.8600 figure, though price action stalled at the 20-day EMA at 0.8595.
If the EUR/GBP drops below the latter, the next support to emerge would be the August 1 low of 0.8550, ahead of testing the year-to-date (YTD) low of 0.8504.
Conversely, if EUR/GBP achieves a daily close above 0.8600, that could open the door for further gains. The first resistance would be the 50-day EMA at 0.8610, followed by the 100-day EMA at 0.8649. Once those levels are cleared, the next resistance would emerge at the 200-day EMA at 0.8669.
EUR/GBP Price Action – Daily chart
- GBP/USD falls 0.36%, stills below the 1.2800 figure.
- Chinese economic recovery woes, deteriorated market moos.
- Fed officials: While some officials like Patrick Harer and Raphael Bostic lean towards rate stability, Governor Michelle Bowman pushes for more rate hikes.
GBP/USD dropped from around weekly highs nearby the 1.2780s due to flows towards safe-haven currencies like the US Dollar (USD), as data from the second largest economy reignited woes for a worldwide economic deceleration. At the time of writing, the GBP/USD exchanges hands at 1.2737, down 0.36%, in the mid-North American session.
Unfavorable Chinese economic data and UK retail sales figures put pressure on GBP/USD, despite a more neutral stance from some Fed officials
The GBP/USD resumed its downtrend on sentiment shifting sour after the Chinese trade balance showed that Imports and Exports plunged below estimates and the prior month’s readings, opening the door for a global economic slowdown.
Aside from this, data revealed in the United Kingdom (UK) showed that retail sales rose 1.5% vs. 4.9% YoYs, down from the current year’s peak of 5.2% in February. British consumers have weathered high inflation during the year, despite efforts from the Bank of England (BoE) to curb sticky elevated prices.
Across the pond, the economic docket in the United States (US) revealed that its trade deficit shrank in June, as revealed by the US Commerce Department. Exports rose by $247.5 billion, below May’s $247 billion, while Imports dipped to $313 billion from $316.1 billion the prior’s month. Hence, the Trade Balance came at $-65.5, a tick higher than the $-65 billion estimated but below the previous reading of $-68.3 billion.
US Treasury bond yields are extending their losses, despite overall US Dollar strength. The US 10-year benchmark note rate sits at 4.022%, losses seven basis points, while the US Dollar Index (DXY) portrays the greenback gaining 0.52%, at 102.612.
Fed speakers’ comments keep the GBP/USD from falling further as a more neutral stance begins to be adopted. Philadelphia Fed President Patrick Harer said the Fed “can leave interest rates where they are.” However, he added, “Absent any alarming new data between now and mid-September,” the Fed can be “patient and hold rates steady.” Echoing some of his comments was Atlanta’s Fed President Raphael Bostic, saying no more increases are necessary.
Contrarily, the Federal Reserve (Fed) Governor Michell Bowman stated that more rate increases are needed.
The US economic docket will feature the July inflation data release ahead of the week. On the UK front, Gross Domestic Product (GDP) for Q2 and June is estimated to show an improvement, as shown by the market consensus.
GBP/USD Price Analysis: Technical outlook
The GBP/USD daily chart portrays a two-candlestick bearish reversal pattern, known as a ‘bearish-engulfing,’ which warrants further downside is expected. Nevertheless, the 50-day Exponential Moving Average (EMA) at 1.2743 capped the GBP/USD’s fall. A daily close below the latter would put a challenge at the 1.2700 psychological level into play. Once that level is surpassed, the next stop would be the August 3 daily low of 1.2620. Conversely, if GBP/USD closes above the 50-day EMA, that could pave the way for a recovery toward 1.2800. Once cleared, the next supply area to test would be the 20-day EMA at 1.2807, ahead of reaching a downslope resistance trendline at around 1.2860/80.
- USD/CHF trades with gains near the 0.8760 area, and bulls are recovering momentum.
- A negative market mood gives the USD traction, and the DXY jumped above 102.50.
- Ahead of CPI data on Thursday, Fed officials delivered mixed signals.
On Tuesday, the USD/CHF traded with gains for a consecutive day. The USD is gaining ground against its rivals due to a cautious market mood while markets try deciphering Federal Reserve (Fed) officials' mixed messages. On the Swiss side, no relevant data will be released during the session.
Federal Reserve officials are conveying conflicting messages to the markets. Michelle Bowman has indicated that further rises will likely be necessary, whereas John Williams has expressed that upcoming Federal Reserve choices remain uncertain. On Tuesday, Thomas Barking stated that he is not sure where the rates in the US will go, while Patrick Harker sounded a bit more hawkish, showing himself concerned with inflation not cooling down.
Meanwhile, as per the CME FedWatch tool, investors remain confident that the Federal Reserve won’t hike in the remainder of 2023. They are discounting low odds of 14% of an increase in September and a 30% probability of a hike in November.
For the rest of the week, the highlight is the release of inflation data on Thursday, with the Headline Consumer Price Index (CPI) index expected to accelerate to 3.3% YoY and the Core CPI, which is seen falling to 4.7% in the same month. In that sense, inflation data will be key for investors to place their bets regarding the next Federal Reserve (Fed) decision.
USD/CHF Levels to watch
According to the daily chart, the outlook for the USD/CHF is neutral to bullish for the short term as the bulls are gaining momentum but still have some work to do. The Relative Strength Index (RSI) has turned flat above its midline, while the Moving Average Convergence (MACD) histogram exhibits more oversized green bars. However, on the broader scale, the pair remains below the 100 and 200-day Simple Moving Averages (SMA), suggesting that the bears have the upperhand in the long term.
Support levels: 0.8673 (20-day SMA), 0.8650, 0.8600.
Resistance levels: 0.8780, 0.8800, 0.8825.
USD/CHF Daily chart
-638271159147701464.png)
- WTI fell to a low below $80.00 and then jumped back above $82.00, clearing most of its daily losses.
- China reported weak Trade Balance data, with Exports and Imports coming in weaker than expected in July.
- A stronger USD also limits the WTI’s advance, but losses are limited by Saudi’s production cut prospects.
On Tuesday, the West Texas Intermediate (WTI) saw more than 1% losses, mainly driven by soft Trade Balance reported by China in July. A recovering USD also contributed to the decline, with the DXY comfortably sitting above 102.50. That being said, the hope for black gold’s prices is the prospects of further production cuts by the Saudis and a tighter global supply.
Investors assess China’s data
During the early Asian session on Tuesday, China reported weak Trade Balance data. Exports fell by 14.5% YoY in July, higher than the 12.5% expected, while Imports declined by 6.9%, also above the expectations of the 2.5% decrease expected. It's important to mention that China is the biggest Oil importer, so a weaker local economy lowers energy demand pushing the WTI downwards.
On the other hand, TD Securities analysts indicate that supply risks are rising to their highest level since early 2022, with the start of the war in Ukraine. In addition, they add, the voluntary production cuts by the Saudis and Russia’s export curtailment should contribute to a tighter global supply and push the price northwards.
WTI levels to watch
Observing the daily chart, it is apparent that WTI is currently experiencing a neutral to bearish trend as the bulls struggle to maintain their momentum. The Relative Strength Index (RSI) shows a weakening bullish trend with a negative slope above its midline, while the Moving Average Convergence (MACD) lays out decreasing green bars. Plus, the pair is above the 20,100,200-day Simple Moving Average (SMAs), suggesting that the bulls are firmly in control of the bigger picture.
Support levels:$80.00, $78.75 (20-day SMA), $78.00.
Resistance levels: $82.50, $83.00, $84.00.
WTI Daily chart
-638271122631667877.png)
- USD/MXN rises 0.30% on Tuesday amidst a risk-off impulse.
- Chinese economic woes spurred by imports and exports plunging weakened the Mexican Peso.
- Upcoming Mexican inflation data on Wednesday could shed some light on the Bank of Mexico’s next monetary policy decision.
USD/MXN gained traction on Tuesday as risk-aversion triggered outflows from the emerging market currency, one of the largest gainers against the US Dollar (USD) during the year. Soft economic data from China shifted sentiment sour while the greenback rose. At the time of writing, the USD/MXN is trading at 17.1488, with gains of 0.52%.
Emerging market currency USD/MXN witnesses a rally due to soft Chinese economic data and robust US Dollar dynamics
Risk aversion is one of the main reasons, behind the USD/MXN advance on Tuesday, with investors shifting toward the safe-haven status of the greenback after data from China showed that Exports and Imports slumped. Given the backdrop, and China’s deflationary scenario, worldwide economic recovery is at the brisk of a deeper slowdown.
Aside from this, the economic agenda in the United States (US) revealed that its trade deficit shrank in June, as revealed by the US Commerce Department. Exports came at $247.5 billion, below May’s $247 billion, while Imports dipped to $313 billion from $316.1 billion the prior’s month. Hence, the Trade Balance came at $-65.5, a tick higher than the $-65 billion estimated but below the previous reading of $-68.3 billion.
US Treasury bond yields are extending their losses, despite overall US Dollar strength. The US 10-year benchmark note rate sits at 4.022%, losses seven basis points, while the US Dollar Index (DXY) portrays the greenback gaining 0.52%, at 102.612.
Nevertheless, recent commentary from Fed speakers is witnessing a shift from hiking rates to keeping them on hold, except for the Federal Reserve (Fed) Governor Michell Bowman, saying that more rate increases are needed.
On the dovish front, Philadelphia Fed President Patrick Harer said the Fed “can leave interest rates where they are.” However, he added, “Absent any alarming new data between now and mid-September,” the Fed can be “patient and hold rates steady.” Echoing some of his comments was Atlanta’s Fed President Raphael Bostic, saying no more increases are necessary.
On the Mexican front, a light agenda would keep USD/MXN traders leaning on market mood and US Dollar dynamics. However, that would change on Wednesday, as inflation figures for July would be revealed. The Consumer Price Index (CPI) every month is expected at 0.9%, while on an annual basis is estimated at 4.79%. On the US front, the release of July inflation data is much awaited by market participants, with estimates remaining unchanged compared to last month’s data.
USD/MXN Price Analysis: Technical analysis
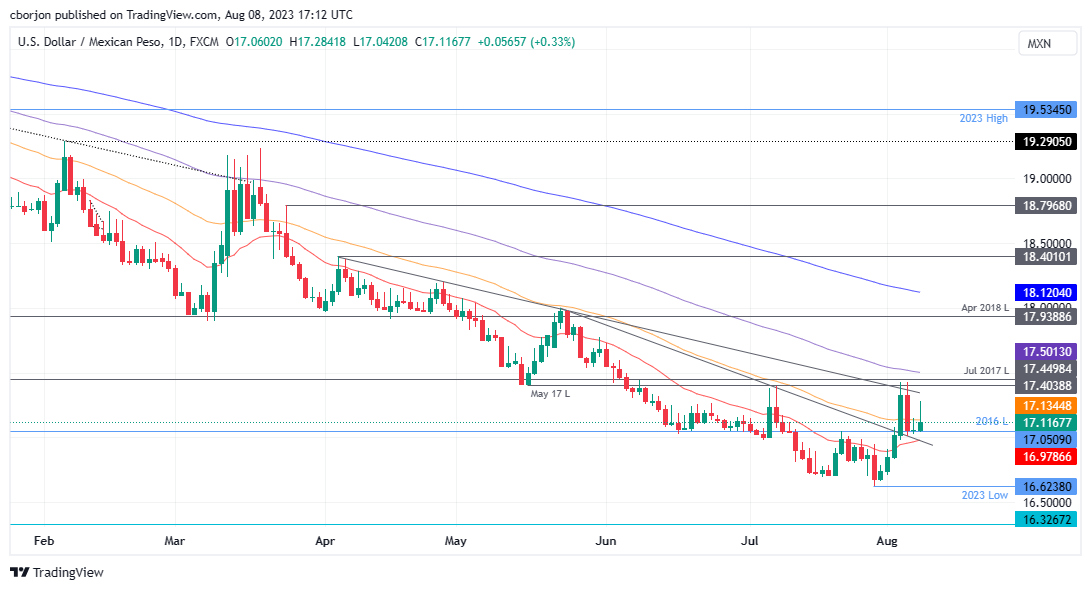
From a technical standpoint, the USD/MXN downtrend remains intact until buyers reclaim the May 17 daily low of 17.4038, which could pave the way for a test of the 100-day Exponential Moving Average (EMA) at 17.5015. Still, firstly, USD/MXN buyers must crack the 50-day EMA at 17.1347. Conversely, if USD/MXN slumps past 17.0000, the year-to-date (YTD) low of 16.6238 could be put into play.
Philadelphia Federal Reserve Bank President Patrick Harker said on Tuesday that they will probably start lowering the policy rate sometime next year.
Harker argued that they don't want to overdo it with policy tightening and reiterated that he thinks there is a path to an "economic soft landing." Commenting on the labor market, Harker said the unemployment rate may tick up a little but not a lot.
Market reaction
The US Dollar Index retreated slightly from daily highs following the comments. As of writing, the index was still up 0.5% on the day at 102.54.
- XAG/USD lost more than 4% this week and fell to monthly lows near $22.65.
- The USD benefited due to a sour market mood.
- Markets try to decipher the next Fed movements while speakers deliver mixed signals.
On Tuesday, the XAG/USD continued its downward path and fell to its lowest since July 7th. The USD measured by the DXY trades strong above 102.50, but lower yields may cap gains. All eyes are now on inflation data on Thursday.
Federal Reserve (Fed) doves and hawks are battling it out publicly, leaving investors scratching their heads. Michelle Bowman pointed out that more increases will likely be appropriate. At the same time, John Williams showed himself comfortable with the Fed’s monetary policy, stating that the bank has the policy where it wants it to be. On Tuesday’s session, Thomas Barkin gave no highlights and said, “ I don't want to predeclare where rates will go.
According to the CME FedWatch tool, tightening expectations for the Federal Reserve remains low. The odds of a hike stand near 14% for the September meeting and rise near 30% in November. However, those odds will likely be impacted by inflation figures on Thursday, also dictating the pace for the bond market and the USD. It's worth noting that non-yielding metals tend to be negatively correlated with higher interest rates, so investors will closely monitor Thursday’s inflation data.
In that sense, the Headline Consumer Price Index (CPI) index is expected to accelerate to 3.3% YoY and the Core CPI, which is seen falling to 4.7% in the same month.
XAG/USD levels to watch
With both Relative Strength Index (RSI) and Moving Average Convergence Divergence (MACD) comfortably placed in negative territory on the daily chart, the XAG/USD sellers hold the upper hand. The downward slope of the Relative Strength Index (RSI) near 30.00 further reinforces this negative sentiment, as does the MACD, which displays red bars, indicating a strengthening bearish momentum. Additionally, the metal is below the 20,100 and 200-day Simple Moving Averages (SMAs), suggesting that the bears are firmly in control of the bigger picture, leaving the buyers with tasks to accomplish.
Support levels: $22.50, $22.30, $22.00.
Resistance levels: $23.20 (200-day SMA), $23.50, $23.70, $24.00.
XAG/USD Daily chart
-638271075983450130.png)
- NZD/USD slips below 0.6100 as China’s economy slows down.
- US trade deficit shrunk in June, with Imports at a 1.5-year low. Trade Balance narrows to $-65.5 billion, slightly above the estimated $-65 billion.
- NZD/USD traders eagerly await China’s upcoming inflation data, and US inflation data for July remains a key focal point.
NZD/USD slides sharply below the 0.6100 figure after data in China portrays a weak economic recovery after the country lifted its Covid-19 restrictions, sparking investor worries. Hence, traders braced for the safe-haven status of the US Dollar (USD), a headwind for the NZD/USD, which exchanges hands at 0.6051, down 1%, after hitting a daily high of 0.6109.
US Dollar safe-haven allure and poor Chinese economic data pressure the New Zealand Dollar below 0.6100
A subdued sentiment characterizes Tuesday’s session as global equities are slumping. Data in the Asian session showed that China, the second largest economy in the world, is struggling to gain traction, which turned the mood sour amongst investors. China’s Imports and Exports plunged below forecasts and June readings, pressuring the Government to provide additional stimulus.
The US economic docket showed the trade deficit shrinking in June, with Imports hitting a one-and-a-half-year low, as the US Commerce Department revealed. Exports came at $247.5 billion, below May’s $247 billion, while Imports dipped to $313 billion from $316.1 billion the prior’s month. Hence, the Trade Balance came at $-65.5, a tick higher than the $-65 billion estimated but below the previous reading of $-68.3 billion.
The NZD/USD reached a daily low after the US data release, while the US Dollar Index (DXY), a measure that tracks the buck’s performance against a basket of peers, advances 0.56%, at 102.650, weighing on the New Zealand Dollar’s (NZD) exchange rate.
Meanwhile, US Treasury bond yields are falling, as US central bank speakers shifted their tone toward a neutral policy stance, except for Federal Reserve (Fed) Governor Michell Bowman, saying that more rate increases are needed.
An absent New Zealand (NZ) economic docket would leave NZD/USD traders leaning toward China’s inflation data. If China’s CPI extends its downtrend, that would portray further economic weakness, suggesting the NZD could weaken further. On the US front, the release of July inflation data is much awaited by market participants, with estimates remaining unchanged compared to last month’s data.
NZD/USD Price Analysis: Technical outlook
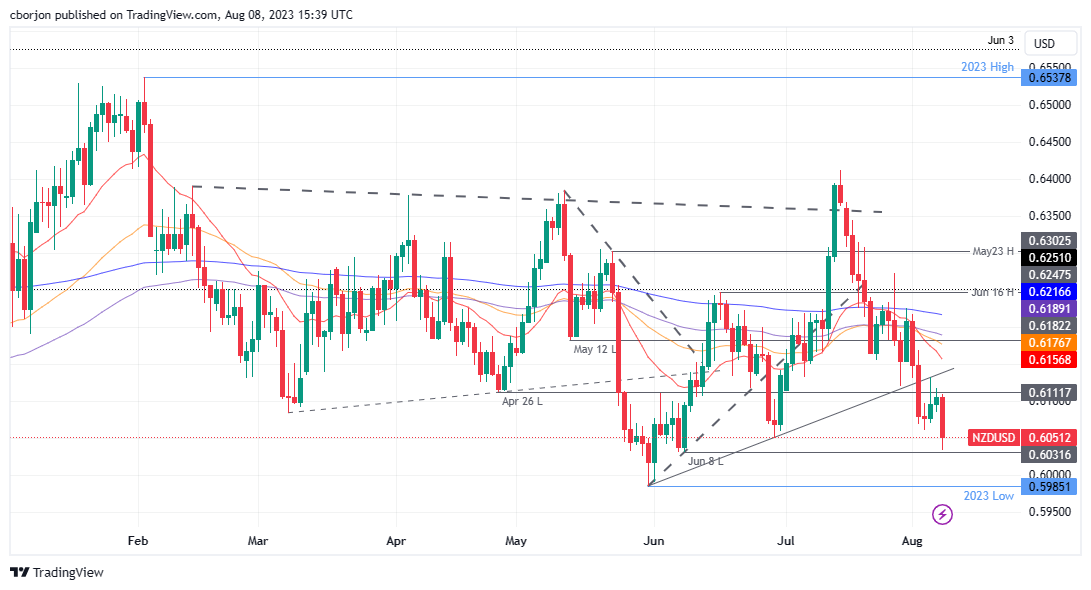
The NZD/USD turned bearish since falling below the daily Exponential Moving Averages (EMAs) and is approaching the June 8 low at 0.6031, which, once cleared, the pair might test the 0.6000 figure. A breach of the latter will expose the year-to-date (YTD) low of 0.5985. If NZD/USD surpasses that level, the next stop would be the November 10 daily low of 0.5840. On the flip side, if NZD/USD buyers keep the pair above 0.6000, the first resistance would be the 0.6100 figure, followed by the August 4 high of 0.6133.
Gold price declined by just shy of 1% last week. Economists at Commerzbank analyze the yellow metal’s outlook ahead of the US inflation report.
Focus on US inflation figures
The focus is now turning to the US inflation figures that are due to be published on Thursday. We expect the price pressure to have eased further in July. This underlines our assumption that interest rates have peaked.
For Gold to begin climbing again, the market’s remaining rate hike expectations need to disappear. We expect this to happen during the course of the fourth quarter. We, therefore, believe that XAU/USD will initially continue to hover around the $1,950 mark and will then rise to $2,000 by year’s end.
While competition for the Dollar is rising, economists at UBS do not see any leading rival to dethrone the currency in coming years.
Dollar supremacy
The US Dollar dominates financial markets and international trade. Changes in the world’s dominant currency have historically taken a long time to materialize. Even as great economic powers rise and fall, their currencies’ reserve status tends to survive well past the peak of their influence.
Liquidity ranks at the very top of the properties that global reserve managers and those involved in international trade look for in a currency. The US Dollar remains the world’s dominant currency in this realm.
For all the challenges the US financial and political system is experiencing, the country still ranks highly in various gauges, including rule of law, regulatory quality and efficiency, and market openness (the prevalence of capital controls, for example). As a result, the US continues to attract large flows of foreign investment.
Ulrich Leuchtmann, Head of FX and Commodity Research at Commerzbank, analyzes how Japanese policy could affect the Yen.
Japanese monetary policy and currency policy has not been particularly consistent over the past decade
For the time being – at least until the next round of bonus payments in winter – there will be no wage-price spiral. And that in turn is an argument in favor of the BoJ sticking to its ultra-expansionary monetary policy for now. The fact that neither the BoJ nor the MOF are happy about the weak Yen does not fit into this picture. However, Japanese monetary policy and currency policy has not been particularly consistent over the past decades. Therefore, that does not come as a surprise. And it does not constitute a JPY-bullish argument.
If the MOF really wants to intervene at some point, it would likely conduct ‘leaning against the wind’. That's what I assume from the past. And ‘leaning against the wind’ is no argument in support of a sustainably stronger Yen.
Economists at Crédit Agricole expect the EUR/USD pair to remain range-bound due to four reasons.
Uncertain timing of Fed dovish pivot
The Federal Reserve's shift to a more dovish stance remains uncertain, and this ambiguity could keep the USD supported in the coming months. Until there's a clear signal from the Fed, the strength of the USD may continue.
Peak Fed followed by peak ECB
If the Fed reaches its peak, it should soon be followed by the ECB doing the same. This would cap any significant widening in the EUR/USD rate spread, limiting the potential upside for the EUR/USD pair.
Potential US economic downturn in Q4 2023
A US economic downturn in the fourth quarter of 2023 could contribute to global cyclical headwinds. This situation could further complicate the currency dynamics between the EUR and USD.
Temporary Eurozone growth outperformance
Any outperformance of Eurozone growth relative to the US might be only temporary. If this occurs, the momentary strength in the EUR could soon fizzle out, keeping the EUR/USD pair within a range.
- EUR/USD’s downside picks up further traction on Tuesday.
- A more sustained decline is expected once 1.0912 is cleared.
EUR/USD extends the downward bias to new weekly lows near 1.0930 on Tuesday.
In case losses accelerate, spot should face interim contention at the 55-day and 100-day SMAs at 1.0925 and 1.0923, respectively, prior to the so far August low at 1.0912 (August 3). Once the latter is breached on a convincing fashion, the pair could embark on a move to the July low of 1.0833 (July 6).
In the meantime, while below the weekly high of 1.1149 (July 27), the pair risks further retracements for the time being.
Looking at the longer run, the positive view remains unchanged while above the 200-day SMA, today at 1.0748.
EUR/USD daily chart
The US Dollar has recovered from its period of weakness in early/mid-July. But what comes next? It makes sense to look at real yields, in the view of Ulrich Leuchtmann, Head of FX and Commodity Research at Commerzbank.
The US economy is better protected against any headwinds than Europe
Following Covid in particular one could have assumed that some of the causes of the US’ economic resilience might have diminished. Perhaps it may no longer be that easy to entice US consumers into over-boarding consumerism. Perhaps – in their role as employees – these consumers may no longer be willing to work under conditions that we Europeans can only imagine for developing markets. Assumptions of this kind are unjustified from today's perspective.
A few years of a pandemic have not changed US consumers substantially. And as a result, the US economy is better protected against any headwinds than Europe. That means capital expenditure in the US yields better longer-term. And that makes the currency that is required to make one’s capital work in the US – the US Dollar – more desirable and therefore more expensive.
It takes a lot of interest rate support to hold Sterling up, Kit Juckes, Chief Global FX Strategist at Société Générale, reports.
Monetary policy expectations remain the biggest short-term driver of currency trends
Monetary policy expectations remain the biggest short-term driver of currency trends. There is a deep well of negative sentiment surrounding the UK and the Pound, that has been in place since the financial crisis and even more so since the Brexit referendum. But long-term concerns about growth can’t drive Sterling lower and lower in real terms – they merely ensure that it remains at a lower level than it was before.
The rate differential required to get Sterling above USD 1.30 today, is far wider than it was a few years ago. That won’t prevent Sterling from being resilient for now, as long as monetary policy tightening remains on the table, but once rates have peaked, in the US, UK, Eurozone and elsewhere, Sterling will look pretty vulnerable.
- USD/JPY gathers strength for a fresh upside amid cautious market mood ahead of US CPI data.
- S&P500 is expected to open on a bearish note, following negative cues from overnight futures.
- Fed Harker said the central bank is at the point where it can be patient and hold rates steady.
The USD/JPY pair gathers strength around 143.00 for a fresh north-side move in the early New York session. The asset is expected to continue to rally after a short-term break as the US Dollar strengthens ahead of the United States Consumer Price Index (CPI) data, which will be published on Thursday at 12:30 GMT.
S&P500 is expected to open on a bearish note, following negative cues from overnight futures. The US Dollar Index (DXY) prints a fresh three-day high at 102.70 and is expected to continue its momentum amid an upbeat market mood. Market sentiment dampens as investors seem cautious ahead of the US inflation data.
Investors hope for a recovery in the US headline inflation as global oil prices recovered strongly in July. This would force Federal Reserve (Fed) policymakers to consider the continuation of its aggressive rate-tightening spell. One more interest rate hike from the Fed would push interest rates to 5.50-5.75%.
Meanwhile, Philadelphia Fed Bank President Patrick Harker delivers a neutral commentary on the interest rate outlook. The Fed is at the point where it can be patient and hold rates steady and let the monetary policy actions yet made do their work”.
On the Japanese Yen front, the Bank of Japan’s (BoJ) Summary of Opinions for July’s monetary policy conveyed one member said the achievement of 2% inflation in a sustainable and stable manner seems to have clearly come in sight. The BoJ provided more flexibility to the Yield Curve Control (YCC), which will result in a contraction in bond-buying operations.
The Saudi Press Agency (SPA) reported that the Saudi Cabinet announced the Kingdom will continue boosting the Organization of the Petroleum Exporting Countries and its allies' (OPEC+) precautionary efforts to support the stability of the global oil market.
Marker reaction:
Crude oil prices rebounded modestly after the report, trimming only a small fraction of its daily losses. The price of WTI barrel is still down by around 2%, trading at $80.35, after briefly dipping below $80.00 earlier. Prices continue to exhibit a bearish bias, influenced by a deterioration in market sentiment.
On Friday, Gold even dipped for a time to a 3 1⁄2-week low of $1,925 despite US rating downgrade. Economists at Commerzbank compare this situation with the way Gold reacted to the first US rating downgrade around twelve years ago.
Gold price under pressure despite US rating downgrade
Gold price declined despite the US credit rating being downgraded by a rating agency. This contrasts with the way Gold reacted to the first US rating downgrade around twelve years ago when the Gold price posted a record level of $1,920 just a few weeks later that was not exceeded until the summer of 2020. At that time, however, Gold had already been on an upward trajectory for over a year that had entered its final phase as a result of the rating downgrade.
The current situation is hardly comparable: this year’s high was already achieved three months ago, and the Gold price has been trending sideways since mid-May. The marked rise in yields sparked by the rating downgrade has even generated headwind, as has the fact that the US Dollar appeared unimpressed and actually appreciated.
“I believe we may be at the point where we can be patient and hold rates steady and let the monetary policy actions we have taken do their work”, said Philadelphia Federal Reserve Bank President Patrick Harker stated on Tuesday.
Speaking about the economic outlook at an event hosted by the Philadelphia Business Journal, Harker mentioned that he expects "only a modest slowdown in economic activity to go along with a slow but sure disinflation." He will answer questions from the audience.
Key takeaways from the speech:
I bet what you want to know is what we are going to do next. Unfortunately, I do not know — it depends on what the data will tell us from now to our next meeting in September.
Ten days ago, the latest PCE inflation report showed continued disinflation year over year on the headline measure and promise on the core measure. We are making progress against inflation. It has been slow progress, and I am watchful of any reemerging price pressures. We remain unwavering in our commitment to bring inflation back to target.
I expect core PCE inflation to decline to a rate perhaps just below 4 percent year over year by the end of 2023, before falling below 3 percent next year and leveling out at our 2 percent target in 2025.
I expect only a modest slowdown in economic activity to go along with a slow but sure disinflation. In other words, I do see us on the flight path to the soft landing we all hope for and that has proved quite elusive in the past.
Absent any alarming new data between now and mid-September, I believe we may be at the point where we can be patient and hold rates steady and let the monetary policy actions we have taken do their work.
Should we be at that point where we can hold steady, we will need to be there for a while.
Market reaction:
The US Dollar Index is up by 0.63% on Tuesday, approaching August highs, trading around 102.70. This surge is boosted by risk aversion.
- USD/CAD jumps to near 1.3475 as the US Dollar remains resilient.
- Weak oil prices amid expectations of one more interest rate hike from the Fed impact the Canadian Dollar.
- US headline and core CPI are expected to maintain a 0.2% pace in July.
The USD/CAD pair climbs swiftly to near 1.3475 in the European session amid sheer strength in the US Dollar and a sell-off in the oil prices. The Loonie asset delivers a perpendicular upside move amid the US Dollar’s resilience due to the cautious market mood ahead of the United States Consumer Price Index (CPI) data for July.
S&P500 futures post significant losses in London, portraying bearish market sentiment. US equities are expected to open on a bearish note as corporate earnings season reaches a peak. The US Dollar Index prints a fresh three-day high at 102.70 as investors expect stubbornness in the US inflation report for July.
As per the estimates, headline and core CPI maintained a pace of 0.2%. Annual headline CPI rebounded to 3.3% vs. June’s print of 3.0%. Contrary, core inflation that excludes volatile food and oil prices decelerated marginally to 4.7% against a prior reading of 4.8%. A recovery in the US headline inflation is expected due to higher oil prices in June.
Meanwhile, the Canadian Dollar witnesses selling pressure as the labor market remains weak in July. The hiring process slows down sharply as firms remain cautious due to the bleak economic outlook. Also, the Unemployment Rate increased to 5.5%. This would allow the Bank of Canada (BoC) to deliver an unchanged interest rate decision.
On the oil front, oil prices dropped sharply to near $80.00 as investors hope that the Federal Reserve (Fed) could continue tightening policy further amid a tight labor market and expectations of sticky inflationary pressures. It is worth noting that Canada is the leading exporter of oil to the United States and low oil prices impact the Canadian Dollar.
- DXY picks up extra impulse and advance to weekly highs.
- Above 102.84 comes the July peak of 103.57.
DXY adds to Monday’s advance and trades at shouting distance from the July highs above 102.80 on Tuesday.
The index extends the upbeat tone seen at the beginning of the week and seems ready to challenge the so far monthly top of 102.84 (August 3) sooner rather than later. The breakout of this level exposes a probable move to the July high of 103.57 (July 3), which appears underpinned by the proximity of the key 200-day SMA.
Looking at the broader picture, while below the 200-day SMA (103.48) the outlook for the index is expected to remain negative.
DXY daily chart
- Australian Dollar returns to its bearish course after China releases below-expectations trade figures for July.
- The data suggests Chinese demand for Australian raw materials will lessen.
- The US Dollar rises on increased safe-haven buying following the poor data.
The Australian Dollar (AUD) dives to new monthly lows against the US Dollar (USD) on Tuesday after the release of weak Chinese trade data indicates lower demand for Australian raw materials from the world’s second-largest economy and a general slowdown in the global economy.
AUD/USD trades in the lower 0.65s at the start of the US session.
Australian Dollar news and market movers
- The Australian Dollar reverses and dives to new lows for the summer after the release of China Trade Balance data shows a substantial decline in imports, exports and the trade surplus.
- The data stokes fears China may be slowing down, that its property bubble could be on the brink of bursting, and that the global economy is in decline.
- It indicates reduced demand for commodities, especially Australia’s main export Iron Ore, traditionally imported and used to make steel for China’s vast property and infrastructure projects.
- Measured in US Dollars, Chinese imports fell by 12.4% which was well below the 5.0% decline expected by economists and the 6.8% drop in the previous month of June.
- In Yuan, imports fell 6.9% vs. -2.5% expected, and -2.6% previous.
- Chinese exports in USD fell 14.5% against -12.5% expected and -12.4% recorded in June. In Yuan, exports declined 9.2% versus -8.9% forecast and -8.3% previously.
- The Chinese trade balance in USD showed an $80.6B surplus versus the 70.6B expected and 70.62B previous.
- In Yuan terms, the Trade Balance showed a surplus of 575.5B versus 625.25B forecast and 491.25B previous.
- Australian data showed a decline into negative territory for the Westpac Consumer Confidence for August, which fell to -0.4% from 2.7% in July.
- National Australia Bank’s (NAB) Business Conditions in July edged down to 10 from 11 in June but still beat estimates of 8. NAB's Business Confidence gauge rose to 2 from -1 forecast and -1 previous.
- US 10-year Treasury Bond yields dived to below 4.000% again as demand for US T-bonds increased on the back of a flight to safety. This supported the Greenback, with the US Dollar Index (DXY) rising 0.5% on Tuesday.
- China’s policy of trying to diversify away from relying too heavily on Australian raw materials is a long-term negative for the Aussie, according to Clifford Bennet, Chief Economist at ACY Securities.
- The Aussie economy will not be ‘saved’ as it has done in the past by Chinese super-growth according to ACY’s Bennet.
- AUD/USD could fall to as low as 0.40, according to David Llewellyn-Smith, Chief Strategist at the MB Fund and MB Super.
- He likens the current market conditions to those in the 1990s, comparing China to Japan, which similarly underwent an economic boom before peaking in the 90s when the Japanese property bubble burst, bringing the good times to an end. Llewellyn-Smith foresees the same fate for China.
- He further expects the US Dollar to maintain its value as the AI revolution creates a tech boom in the US, just as the dot-com bubble did in the 90s.
- The Australian Dollar has been on a weak footing since the RBA left the policy rate unchanged at 4.1% last week, against the market expectation for a 25 basis point hike. In the policy statement, the RBA explained that the decision to hold rates unchanged would provide them more time to assess the impact of policy tightening to date and the economic outlook.
- That said, they did not completely rule out the possibility of more rate hikes in the future, "Some further tightening of monetary policy may be required to ensure that inflation returns to target in a reasonable timeframe, but that will depend upon the data and the evolving assessment of risks," the RBA noted.
Australian Dollar technical analysis
AUD/USD is in a sideways trend on both the long and medium-term charts. The February high at 0.7158 is a key hurdle, which if vaulted, will give the longer-term charts a more bullish tone.
The 0.6458 low established in June is a key level for bears. If this is breached decisively, it would color the charts more bearish. Price is currently closer to this key low.
-638270939692698226.png)
Australian Dollar vs US Dollar: Weekly Chart
Price has now broken cleanly below the confluence of moving averages (MA) close to 0.6700, made up of most of the major SMAs – the 50-week, 50-day and 100-day. The breaching of this key support and resistance level is a bearish sign.
-638270940118866343.png)
Australian Dollar vs US Dollar: Daily Chart
AUD/USD has also broken below the 0.6600 June lows, and a continuation down to the key May lows at 0.6460, is quite possible. A decisive break below them would open the way for a move down to 0.6170 and the 2022 lows.
Because the pair is in a sideways trend overall, it is unpredictable, and the probabilities do not favor either bears or bulls overall – nor is the Relative Strength Index (RSI) providing much insight on either timeframe.
In technical terms, a ‘decisive break’ consists of a long daily candlestick, which pierces cleanly above or below the critical level in question and then closes near to the high or low of the day. It can also mean three up or down days in a row that break cleanly above or below the level, with the final day closing near its high or low and a decent distance away from the level.
Australian Dollar FAQs
What key factors drive the Australian Dollar?
One of the most significant factors for the Australian Dollar (AUD) is the level of interest rates set by the Reserve Bank of Australia (RBA). Because Australia is a resource-rich country another key driver is the price of its biggest export, Iron Ore. The health of the Chinese economy, its largest trading partner, is a factor, as well as inflation in Australia, its growth rate and Trade Balance. Market sentiment – whether investors are taking on more risky assets (risk-on) or seeking safe-havens (risk-off) – is also a factor, with risk-on positive for AUD.
How do the decisions of the Reserve Bank of Australia impact the Australian Dollar?
The Reserve Bank of Australia (RBA) influences the Australian Dollar (AUD) by setting the level of interest rates that Australian banks can lend to each other. This influences the level of interest rates in the economy as a whole. The main goal of the RBA is to maintain a stable inflation rate of 2-3% by adjusting interest rates up or down. Relatively high interest rates compared to other major central banks support the AUD, and the opposite for relatively low. The RBA can also use quantitative easing and tightening to influence credit conditions, with the former AUD-negative and the latter AUD-positive.
How does the health of the Chinese Economy impact the Australian Dollar?
China is Australia’s largest trading partner so the health of the Chinese economy is a major influence on the value of the Australian Dollar (AUD). When the Chinese economy is doing well it purchases more raw materials, goods and services from Australia, lifting demand for the AUD, and pushing up its value. The opposite is the case when the Chinese economy is not growing as fast as expected. Positive or negative surprises in Chinese growth data, therefore, often have a direct impact on the Australian Dollar and its pairs.
How does the price of Iron Ore impact the Australian Dollar?
Iron Ore is Australia’s largest export, accounting for $118 billion a year according to data from 2021, with China as its primary destination. The price of Iron Ore, therefore, can be a driver of the Australian Dollar. Generally, if the price of Iron Ore rises, AUD also goes up, as aggregate demand for the currency increases. The opposite is the case if the price of Iron Ore falls. Higher Iron Ore prices also tend to result in a greater likelihood of a positive Trade Balance for Australia, which is also positive of the AUD.
How does the Trade Balance impact the Australian Dollar?
The Trade Balance, which is the difference between what a country earns from its exports versus what it pays for its imports, is another factor that can influence the value of the Australian Dollar. If Australia produces highly sought after exports, then its currency will gain in value purely from the surplus demand created from foreign buyers seeking to purchase its exports versus what it spends to purchase imports. Therefore, a positive net Trade Balance strengthens the AUD, with the opposite effect if the Trade Balance is negative.
USD gains on weak risk mood. Economists at Scotiabank analyze Greenback’s outlook.
USD firmer as stocks slump on banks, Italian windfall tax, weak China trade
Soft risk sentiment continues to overshadow the FX market. News of weaker Chinese trade data weighed on Asian market sentiment and commodity prices, adding to headwinds from Monday’s (Moody’s) downgrade of US regional banks' credit ratings. Additional pressure on stocks came from a decision in Italy to impose a windfall tax on domestic bank profits.
The USD is trading broadly higher, reversing some of the losses made around the cooler jobs data in the US last week. Gains in the DXY are still likely to struggle in the upper 102 area, assuming the risk backdrop does not deteriorate significantly further.
Weak risk appetite and softer commodity prices are dragging the CAD lower. Shaun Osborne, Chief FX Strategist at Scotiabank, expects the USD/CAD pair to extend its gains.
Gains through the upper 1.33 area are liable to extend
USD gains through the upper 1.33 area are liable to extend. A significant improvement in the market’s overall mood will be needed to lift that CAD at the moment.
I had expected much better support for the CAD to develop over the past week as spot retested the early July high. But with no clear demand for the CAD emerging, there is little to stop additional USD gains in the short run at least.
The 200-DMA at 1.3453 today offers some, potential resistance to the USD advance ahead of a return to 1.35/1.36.
GBP is trading 0.5% down on the USD. Economists at Scotiabank analyze Cable outlook.
Mild compression in spreads
Sterling losses reflect broader US gains, as well as some – moderate – compression in GBP-supportive yield, spreads over the USD on the day.
Spot looks soft on the short-term chart but the intraday and daily patterns reflect firm demand for the Pound on weakness to or just below 1.27 late last week. That should help limit Cable losses in the near term.
Support is 1.2670/75 and 1.2620/25. Resistance is 1.2785.
EUR/USD eases back to the mid-1.09 area. Economists at Scotiabank analyze the pair’s outlook.
Trend and moving average supports are converging in the 1.0925/30 area
The EUR looks soft but scope for losses should remain relatively limited after last week’s solid rejection of trend support in the low 1.09 area.
Trend and moving average (50 and 100-day) supports are converging in the 1.0925/30 area to provide the EUR with some solid-looking support.
Resistance is 1.10 and – firmer – at 1.1045/50.
See: EUR/USD unlikely to drift away from a 1.09-1.11 range this month – ING
The Krona has staged a strong rebound in July which marks an abrupt reversal of losses sustained during the the first half of this year. Economists at MUFG bank analyze SEK outlook.
Elevated inflation keeps pressure on Riksbank to keep hiking rates
The Krona has derived support over the past month from building investor optimism over a softer landing for the global economy.
Riksbank has announced policies recently that are helping to provide more support for the SEK. The Riksbank has signalled concern over upside inflation risks from the weaker Krona. Unlike in other major economies, inflation in Sweden is continuing to surprise to the upside in the near-term which is keeping pressure on the Riksbank to hike rates further.
From September of this year, the Riksbank will also increase the pace of government bond sales from SEK3.5 billion to SEK5.0 billion per month. At the same time, the Riksbank has announced that it is considering hedging part of their FX reserves. The hedging flow should provide more support for the Krona later this year.
EUR/SEK – Q3 2023 11.60 Q4 2023 11.50 Q1 2024 11.40 Q2 2024 11.30
Economists at Société Générale analyze GBP outlook ahead of UK GDP data for the second quarter due on Friday.
GBP seasonality is bearish
Q2 UK GDP and US CPI will decide if the recovery in GBP/USD has legs this week.
EUR/GBP should remain rangebound between 0.8550 and 0.8655 until GDP data is published on Friday.
Sterling seasonality is bearish.
We forecast Q1 GDP growth of 0.1% QoQ (0.3% YoY), the same as Q1, thanks to a rebound in June GDP growth of 0.2% following the contraction of -0.1% in May. The BoE forecasts growth of around 0.2% in H1 and a similar rate in the near term.
- EUR/JPY adds to Monday’s gains and approaches 158.00.
- Further north emerges the 2023 peak just past 158.00.
EUR/JPY gathers extra pace and trades closer to the key 158.00 region on Tuesday.
So far, the continuation of the upside momentum appears likely with the initial target still at the 2023 high at 158.04 (July 21). The breakout of this level exposes a move to the round level of 160.00.
So far, the longer term positive outlook for the cross appears favoured while above the 200-day SMA, today at 146.78.
EUR/JPY daily chart
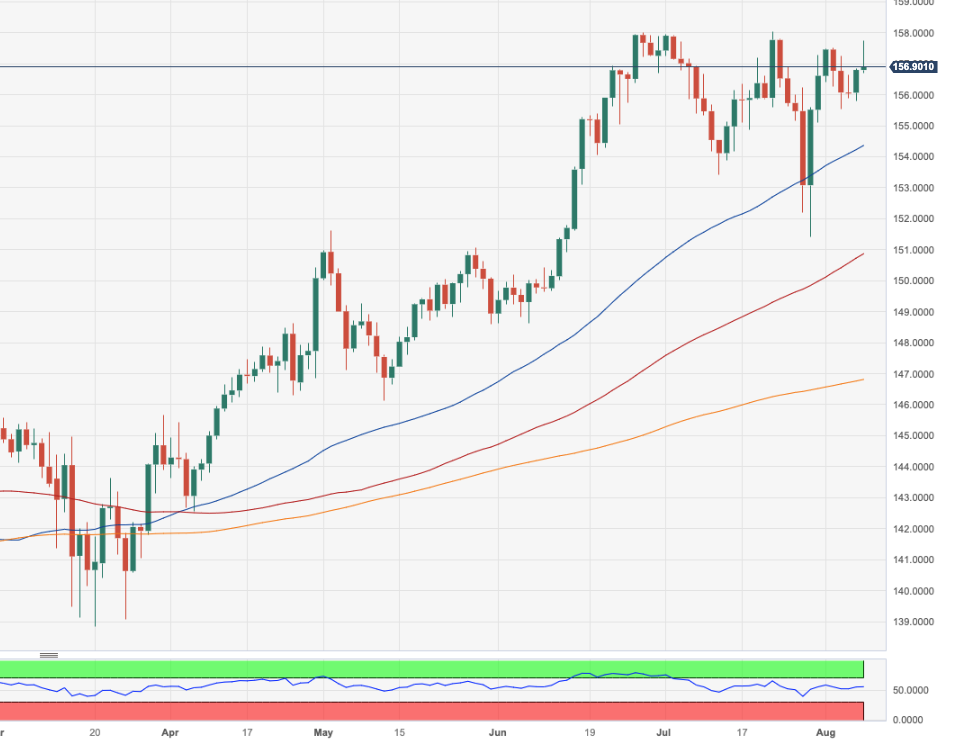
Economist Lee Sue Ann at UOB Group sees the Reserve Bank of India keeping its policy rate unchanged at its August 10 event.
Key Takeaways
While the possibility of further rate increases remains on the table, we see a high likelihood of the RBI maintaining its rate pause, for now, at 6.50%.
Incoming data, particularly consumer prices, as well as developments in the external environment will be the main factors of consideration for the upcoming decisions.
The US Dollar is likely to take a lead from the rates market into the key data release of the week – the July CPI report on Thursday, economists at MUFG Bank report.
Reduced volatility means yields matter
EUR and GBP are a little over-extended to the upside while USD/JPY has scope to drift higher. Of course, the USD/JPY scope may not materialise and that rates/FX divergence likely reflects a degree of uncertainty that has emerged following the change in the YCC framework.
Of course, rate spreads will matter as long as these low vol conditions last. We have entered the Aug-Sept period which historically can be the most volatile times of the year. There doesn’t appear to be anything on the immediate horizon to alter the current conditions and while from a rates spread perspective that might allow for some further US Dollar strength, we equally don’t see these conditions as conducive to any meaningful FX moves either. Given we have another CPI print before the Sept FOMC it also means the importance of this week’s CPI is diminished.
Franc inflection point? Economists at Société Générale note that USD/CHF and EUR/CHF could bounce higher.
SNB hiking cycle over?
The Swissie reversed course last week and surrendered some of the punchy gains of early July vs the USD as yield spreads widened in favour of the Dollar and single currency. Unlike in 2011, the Franc did not capitalise on the rating downgrade of the US from AAA to AA+ by Fitch.
On the data front, inflation in Switzerland surprised to the downside and raised doubts about whether the SNB tightening cycle is over. No further rate increase in September and ‘higher for longer’ policy outlooks at the Fed and ECB, even without further hikes, could precipitate a bounce in USD/CHF and EUR/CHF provided the sky does not fall on equities and credit.
Seasonality is mixed for EUR/CHF in August but is bullish for USD/CHF.
- AUD/USD cracks swiftly to near a two-month low around 0.6500 amid strength in the US Dollar and China’s bleak economic growth.
- US annualized headline inflation is expected to bounce back to 3.3% vs. the former release of 3.0%.
- The Chinese economy struggles to push inflation higher due to weak domestic demand and vulnerable exports.
The AUD/USD pair witnesses a sharp correction amid strength in the US Dollar Index (DXY) and a weakness in China’s business with other nations. The Aussie asset cracks to near a two-month low around 0.6500 and is expected to continue its downside momentum amid caution ahead of a busy economic calendar.
S&P500 futures extend losses in the European session, portraying a buildup of caution among market participants ahead of the United States Consumer Price Index (CPI) data, which will be published on Thursday. The US Dollar Index climbs above the 102.40 resistance as investors hope for stubbornness in CPI’s July reading due to a recovery in global oil prices.
Oil price recovery would elevate gasoline prices and the contribution of cheap oil to consistently softening headline price pressures would start fading. As per the estimates, annualized headline inflation is expected to bounce back to 3.3% vs. the former release of 3.0%. This would ease hopes of no more interest rate hikes from the Federal Reserve (Fed) by the year-end.
But before that, investors will focus on China’s inflation data, which will be released on Wednesday at 01:30 GMT. Monthly CPI is expected to deliver a stagnant performance against a deflation of 0.2%. On an annual basis, inflation is expected to report a deflation by 0.5% against a neutral figure. Producer Price Index (PPI) would continue to remain in the deflation territory, however, the pace of would ease to -4% against the former release of -5.4%.
The Chinese economy struggles to push inflation higher despite monetary and fiscal stimulus due to weak domestic demand and vulnerable exports. It is worth noting that Australia is the leading trading partner of China and weak economic prospects in China impact the Australian Dollar.
- US Dollar rallies against all major peers in global flight to safe haven.
- Big batch of second-tier data from the US set to hit the markets.
- The US Dollar Index takes another stab at key level to continue the rally.
The US Dollar (USD) was able to avoid a meltdown on Monday by closing marginally in the green, avoiding a possible technical rejection in the US Dollar Index (DXY). Meanwhile, this Tuesday the Greenback is back in favor after Chinese import numbers plunged even worse than during the pandemic. This triggers some risk aversion flow with the US Dollar as safe haven and US bonds being bid.
On the economic front, a chunky calendar includes the National Federation of Independent Business Optimism Index (NFIB) and the TechnoMetrica Institute of Policy & Politics Economic Optimism Index (TIPP). Add to that US Federal Reserve (Fed) speakers Patrick Harker of the Reserve Bank of Philadelphia and Thomas Barkin from Richmond, and traders will have a dry-run for the US Consumer Price Index (CPI) numbers later this week.On Monday, the Fed’s John Williams said that cuts will come next year.
Daily digest: US Dollar as investors shun away from Yuan
- The economic calendar starts off early this Tuesday at 10:00 GMT with the National Federation of Independent Business Optimism Index (NFIB) for July, which is expected to drop from 91 to 90.6
- At 12:15 and 12:30 GMT, Fed speakers Patrick Harker of the Reserve Bank of Philadelphia and Thomas Barkin from Richmond will be speaking. Look out for any dovish comments that could be added to the comments from Fed member John Williams on Monday. If more comments are in favor of cuts in 2024, this could be the Fed preparing the markets for a very dovish speech at the yearly Jackson Hole Symposium from August 24 to 26.
- Around 12:30 GMT, the Goods and Services Trade Balance for June is expected to bear a slightly smaller deficit, moving from $-69B to $-65B. The US Goods Trade Balance will come out as well and was at $-87.8B with no forecast pencilled in.
- The last big batch of data is expected around 14:00 GMT with the TechnoMetrica Institute of Policy and Politics Economic Optimism Index (TIPP) for August expected to jump from 41.3 to 43. US Wholesale Inventories for June are expected to remain unchanged at -0.3%.
- The US Treasury Department is about to tap the markets again with a 52-week bill auction and a 3-year note placement.
- The Japanese Topix index saw the closing bell coming in right on time in order to still close this Tuesday with a 0.34% gain. The Chinese Hang Seng Index declined near 2% on the back of those weak Chinese import numbers. European and US equities are being dragged along as global recession fears are creeping back into the markets.
- The CME Group FedWatch Tool shows that markets are pricing in an 86.5% chance that the Fed will pause hikes at its meeting in September.
- The benchmark 10-year US Treasury bond yield trades at 4.01% and continues its decline from Monday. The lower benchmark rate comes on the back of bonds being in demand this Tuesday as global recession fears ignite on the back of weak China import numbers. Investors are buying US bonds, triggering a jump in bond prices. Bond yields are inversely correlated to the bond price, so yields are dropping while bond prices rise.
US Dollar Index technical analysis: 102.47 crucial level
The US Dollar is back in the green after avoiding a technical meltdown, which could have gotten ugly based on the technical analysis from the US Dollar Index (DXY) on Monday. US Dollar bulls were trying to break above the 100-day Simple Moving Average around 102.30 but got rejected and saw all their gains evaporate for the day at the US opening bell. This Tuesday, the safe haven inflow puts the DXY back up above 102.30 with the possibility to get across the 55-day SMA at 102.48.
For the upside, 102.31 remains a key level to watch in the form of the 100-day Simple Moving Average (SMA) and needs to see a daily close above in order to be turned into support going forward. Even should the DXY be able to break and close above there, US Dollar bulls are not out of the woods yet, with the 55-day SMA just above there at 102.48. Two key levels need to be broken and closed above in order to avoid any large pullbacks before targeting 103 to the upside.
On the downside, the US Dollar bears will defend that same mentioned 100-day SMA at 102.31 and try to stage a firm rejection as nearly happened on Monday. The uptrend from mid-July will be broken once bears can pull the price action below 101.74, which is the low of this past Friday. Once that unfolds, the probability of the DXY collapsing all the way back to sub-100 is quite large.
US Dollar FAQs
What is the US Dollar?
The US Dollar (USD) is the official currency of the United States of America, and the ‘de facto’ currency of a significant number of other countries where it is found in circulation alongside local notes. It is the most heavily traded currency in the world, accounting for over 88% of all global foreign exchange turnover, or an average of $6.6 trillion in transactions per day, according to data from 2022.
Following the second world war, the USD took over from the British Pound as the world’s reserve currency. For most of its history, the US Dollar was backed by Gold, until the Bretton Woods Agreement in 1971 when the Gold Standard went away.
How do the decisions of the Federal Reserve impact the US Dollar?
The most important single factor impacting on the value of the US Dollar is monetary policy, which is shaped by the Federal Reserve (Fed). The Fed has two mandates: to achieve price stability (control inflation) and foster full employment. Its primary tool to achieve these two goals is by adjusting interest rates.
When prices are rising too quickly and inflation is above the Fed’s 2% target, the Fed will raise rates, which helps the USD value. When inflation falls below 2% or the Unemployment Rate is too high, the Fed may lower interest rates, which weighs on the Greenback.
What is Quantitative Easing and how does it influence the US Dollar?
In extreme situations, the Federal Reserve can also print more Dollars and enact quantitative easing (QE). QE is the process by which the Fed substantially increases the flow of credit in a stuck financial system.
It is a non-standard policy measure used when credit has dried up because banks will not lend to each other (out of the fear of counterparty default). It is a last resort when simply lowering interest rates is unlikely to achieve the necessary result. It was the Fed’s weapon of choice to combat the credit crunch that occurred during the Great Financial Crisis in 2008. It involves the Fed printing more Dollars and using them to buy US government bonds predominantly from financial institutions. QE usually leads to a weaker US Dollar.
What is Quantitative Tightening and how does it influence the US Dollar?
Quantitative tightening (QT) is the reverse process whereby the Federal Reserve stops buying bonds from financial institutions and does not reinvest the principal from the bonds it holds maturing in new purchases. It is usually positive for the US Dollar.
Senior Economist at UOB Group Alvin Liew comments on the latest results of Retail Sales in Singapore.
Key Takeaways
Singapore’s retail sales rose less than expected, by 1.1% y/y in Jun (easing from 1.8% in May) versus Bloomberg median estimate of 2.1% y/y. On a seasonallyadjusted sequential basis, retail sales fell for the second month in a row by 0.8% m/m (from -0.2% in May). Excluding motor vehicle sales, the sequential change turned positive to 0.2% m/m (from -0.4% in May) and translated to a stronger increase of 2.5% y/y (from 1.7% in May). In line with the weaker headline growth in Jun (compared to May), retail sales value also slipped below the S$4.0bn mark to S$3.8bn (from S$4.03bn in May).
Outlook – We continue to expect retailers to enjoy domestic and external supports, complemented by major events such as various sports, high profile concerts and BTMICE (Business Travel and Meetings, Incentive Travel, Conventions and Exhibitions) activities. In particular, a string of high-profile concerts (starting from Jul onwards) and the upcoming F1 night race (15-17 Sep)
Economists at MUFG Bank note that the British Pound (GBP) is starting to run out of steam as UK economic data help the case for the Bank of England (BoE) pausing.
BoE signs of caution justified by incoming the data
The performance of the Pound is beginning to sag after a strong performance in the first half of the year and in our view, incoming data is certainly strengthening the case for the BoE to possibly pause its tightening cycle.
We have pencilled in one further 25 bps rate hike by the BoE in September but this was a very close call and one further hike was merely a reflection of the higher inflation in the UK than elsewhere and the limited evidence of worsening economic conditions.
It has been a slow start to the week in the currency market, with the Dollar being mixed. Economists at ING analyze USD outlook.
Currencies starting to detach from bond dynamics
With the exception of the Yen, it appears that most G10 currencies are losing their direct exposure to swings in US bond yields. At this stage, it would probably take a larger swing in yields to cause a substantial spill-over into FX than it did before the US credit downgrade by Fitch.
Still, we expect some consolidation of the Dollar around current levels into Thursday’s inflation numbers.
According to the European Central Bank’s (ECB) monthly survey of consumer expectations for inflation, inflation expectations among Eurozone consumers extended its downbeat momentum in June.
Additional takeaways
“Inflation over the next 12 months seen at 3.4% vs. 3.9% projected in May.”
“Inflation three years ahead seen at 2.3% vs. 2.5% seen in May.”
“Expectations for nominal income growth over the next 12 months remained unchanged, while expectations for nominal spending growth declined further.”
“Expectations for economic growth over the next 12 months became slightly less negative, while the expected unemployment rate in 12 months' time was unchanged.”
“Expectations for growth in the price of homes over the next 12 months remained unchanged, while expectations for mortgage interest rates 12 months ahead decreased slightly.”
Market reaction
EUR/USD is testing intraday lows near 1.0970 on the release of the above survey findings. The pair is currently trading at 1.0972, down 0.25% on the day.
UOB Group’s Senior Economist Julia Goh and Economist Loke Siew Ting assess the latest inflation figures in the Philippines.
Key Takeaways
The Philippines’ headline inflation decelerated further to below 5.0% for the first time in 15 months, settling at 4.7% y/y in Jul (from +5.4% in Jun). The outturn came in better than Bloomberg consensus (4.9%) but a tad higher than our estimate (4.6%). It also marked the lowest reading since Mar 2022, thanks to the slowdown in prices of most consumer price index (CPI) components particularly food & non-alcoholic beverages, transport, and housing, utilities & other fuels amid favourable base effects.
Although inflation appears to sustain its downtrend in 2H23, risks to the overall outlook remain tilted to the upside. Recent restrictive trade policies introduced by neighbouring countries on selected food commodities, the event of typhoons Egay and Falcon striking the country, as well as an extended oil output and export cut by major oil producers have presented new upside risks to the nearterm inflation outlook. This is in addition to the existing concerns about potential changes in domestic price policies amid ongoing supply constraints of key food items and currency fluctuation. Hence, in the absence of further supply shock, we keep to our view that inflation will gradually return to the BSP’s 2.0%-4.0% target range only in 4Q23, leading to a full-year inflation rate of 5.3% for 2023 (BSP est: 5.4%, 2022: 5.8%) and 2.5% for 2024 (BSP est: 2.9%).
We reiterate our view of an extended interest rate pause by BSP until year-end since the inflation trajectory remains moving in line with our assessment with persistent positive real interest rates and signs of slowing economic activities in recent months. Having said that, the biggest concern for now is the narrowing interest-rate differential with US rates below 100bps, whether it would prompt the BSP to resume its rate hike at the upcoming Monetary Board (MB) meeting on 17 Aug as a pre-emptive move against imported inflation pressures arising from currency volatility and trade policy changes in neighbouring countries.
- USD/CHF turns topsy-turvy around 0.8750 ahead of US inflation data.
- US equities witnessed buying interest after Fed Goolsbee said Fitch’s downgrade to the US debt won’t make any difference.
- A tight labor market in the Swiss economy could keep inflation higher than the desired rate.
The USD/CHF pair turns directionless around 0.8750 in the European session, following the footprints of the US Dollar Index (DXY). The Swiss Franc asset struggles for a decisive move as investors are sidelined ahead of the United States Consumer Price Index (CPI) data, which will be published on Thursday at 12:30 GMT.
S&P500 futures generate losses in London amid cautious market mood. US equities witnessed buying interest on Monday after Chicago Federal Reserve (Fed) President Austan D. Goolsbee said Fitch’s downgrade to the US government's long-term debt rating won’t make any difference.
The US Dollar Index (DXY) struggles to climb above the immediate resistance of 102.40 as investors need fresh cues about September’s monetary policy from the Fed. This week, investors will keep an eye on the US inflation data.
As per the estimates, headline and core CPI maintained a pace of 0.2% in July. On an annualized basis, headline CPI rebounded to 3.3% vs. June’s print of 3.0%. Contrary, core inflation that excludes volatile food and oil prices decelerated marginally to 4.7% against a prior reading of 4.8%. A rebound in inflationary pressures would force the Fed to discuss more interest rate hikes. Apart from the consumer inflation data, Friday’s Producer Price Index (PPI) will also remain in focus.
In the Swiss economy, a tight labor market could keep inflation higher than the desired rate. The Unemployment Rate for July remained near historic lows at 1.9%. This would force the Swiss National Bank (SNB) to lift interest rates further.
Economists at Société Générale analyze EUR/CHF technical outlook.
A revisit of May/June troughs near 0.9680/0.9700 is on the cards
EUR/CHF has achieved downside projections of 0.9515 resulting in an initial rebound. A revisit of May/June troughs near 0.9680/0.9700 can’t be ruled out.
Daily MACD is still within negative territory which denotes lack of steady upward momentum.
Multi-year trend line near 0.9770 is expected to be an important resistance.
In case the pair fails to defend last week's low of 0.9550, there could be risk of a deeper downtrend.
- USD/CAD catches aggressive bids on Tuesday and rallies to over a two-month top.
- Sliding Oil prices undermines the Loonie and lends support amid a strong USD.
- A sustained breakthrough the 100-day SMA supports prospects for further gains.
The USD/CAD pair gains strong positive traction on Tuesday and rallies to over a two-month peak, around the 1.3435 region during the first half of the European session.
Weaker Chinese trade data revives fears about faltering recovery in the world's second-largest economy and weighs heavily on Crude Oil prices. Apart from this, expectations that the Bank of Canada (BoC) will pause its interest rate hike campaign undermine the commodity-linked Loonie. Meanwhile, the prospects for further policy tightening by the Federal Reserve (Fed), along with a softer risk tone, boost demand for the safe-haven US Dollar (USD) and provides a goodish lift to the USD/CAD pair.
Spot prices, however, pause near a resistance marked by the 61.8% Fibonacci retracement level of the May-July downfall, though the technical setup supports prospects for a further near-term appreciating move. Acceptance above the 50% Fibo. level and a subsequent strength beyond the 1.3400 mark, or the 100-day Simple Moving Average (SMA), was seen as a fresh trigger for bulls. Moreover, oscillators on the daily chart are placed comfortably in the positive territory and are still far from being in the overbought zone.
That said, the Relative Strength Index (RSI) on the 1-hour chart has moved on the verge of breaking above the 70 mark and is seen holding back traders from placing fresh bullish bets around the USD/CAD. Hence, it will be prudent to wait for some follow-through buying beyond the 1.3435 area or intraday consolidation before positioning for any further gains. Nevertheless, spot prices remain on track to prolong the recent recovery move from the YTD low set in July and aim to reclaim the 1.3500 psychological mark.
On the flip side, the 1.3400 mark, or the 100-day SMA, now seems to protect the immediate downside ahead of the 50% Fibo. level, around the 1.3375-1.3370 area. This is followed by support near the mid-1.3300s and the 1.3300 mark (38.2% Fibo. level). Any subsequent downfall is more likely to attract fresh buying near the 1.3250 horizontal support and remain limited near the 1.3225 region, or the 23.6% Fibo. level. That said, some follow-through selling will negate the positive bias and darg the USD/CAD pair below the 1.3200 mark.
Spot prices might then accelerate the slide towards the 1.3160-1.3150 intermediate support before eventually dropping to challenge the 1.3100 round figure.
USD/CAD daily chart
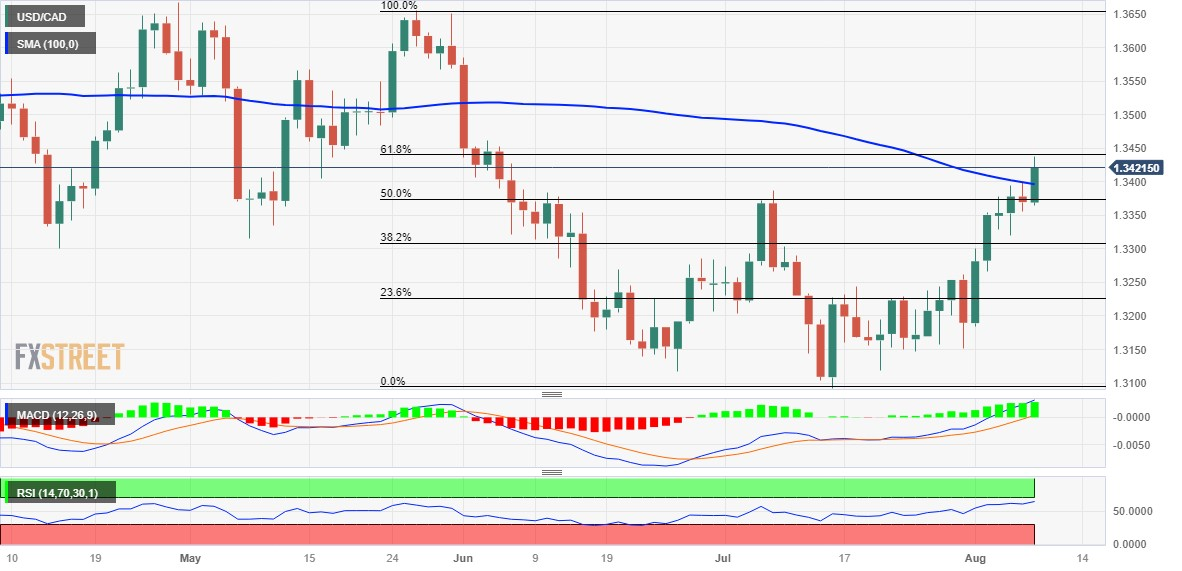
Technical levels to watch
- Euro adds to Monday’s retracement vs. the US Dollar.
- Stocks in Europe trade well on the defensive on Tuesday.
- EUR/USD revisits the 1.0970 zone on USD buying, China.
- The USD Index (DXY) maintains the upward bias above 102.00.
- Final Inflation figures in Germany matched advanced readings.
The Euro (EUR) continues to exhibit pessimism against the US Dollar (USD) at the start of the week, prompting a retreat of EUR/USD below the significant psychological barrier of 1.1000 on Tuesday.
The decline in the commodity is further fueled by negative indicators from China, which reveal a notable contraction in both exports and imports during July. This reinforces the belief that the Chinese economy has yet to experience a significant recovery.
Meanwhile, despite a decrease in US yields across the board, the Greenback manages to hold its ground above the 102.00 level when measured by the USD Index (DXY).
Within the European Central Bank's purview, the Consumer Expectation Survey indicates that inflation in the broader euro area is projected to be 2.3% in three years' time, down from 2.5%, and inflation over the next twelve months is expected to be 3.4%, down from 3.9%.
Turning to domestic matters, final inflation figures in Germany align with preliminary readings, with the Consumer Price Index (CPI) showing a year-on-year increase of 6.2% and a month-on-month increase of 0.3%.

Across the Atlantic, Philadelphia Fed President Patrick Harker, who holds hawkish views, will deliver a speech later in the session. Additionally, the session will see the release of the Balance of Trade results, Wholesale Inventories, the NFIB Business Optimism Index, and the IBD/TIPP Economic Optimism Index.
Daily digest market movers: Euro maintains the offered stance below 1.1000
- The EUR retests the 1.0970 zone vs. the USD on Tuesday.
- The USD Index (DXY) clings to gains above the 102.00 yardstick.
- The risk complex loses further momentum in the first half of the week.
- The ECB’s survey shows dwindling inflation pressures in the next few months.
- Chinese exports and imports contracted more than expected in July.
- CME Group’s FedWatch Tool sees no rate hikes by the Fed in H2 2023.
- Speculation that the Fed might have ended its hiking cycle remains steady.
- Investors’ attention remains on the US CPI due on August 11.
Technical Analysis: Euro risks extra losses below 1.1150
A more substantial recovery in EUR/USD continues to prove elusive at the moment, leading the pair to remain confined within the region below 1.1000.
The breach of the 1.0920 zone, where the monthly low and the interim 55-day and 100-day SMAs intersect, exposes EUR/USD to potential downside, potentially driving it towards the July low of 1.0833 (July 6). This move could precede a descent towards the significant 200-day SMA at 1.0754 ahead of the May low of 1.0635 (May 31). Further downward lies the March trough of 1.0516 (March 15), followed by the 2023 low at 1.0481 (January 6).
On a contrasting note, intermittent bullish attempts might prompt the pair to challenge the weekly pinnacle at 1.1149 (July 27) initially. Surpassing this level could alleviate some of the downward pressure, potentially motivating spot to explore the 2023 peak at 1.1275 (July 18). Once this threshold is surpassed, significant resistance levels become sparse until the 2022 peak at 1.1495 (February 10), closely shadowed by the round milestone of 1.1500.
Moreover, the optimistic perspective on EUR/USD remains intact as long as the pair remains above the pivotal 200-day SMA.
Euro FAQs
What is the Euro?
The Euro is the currency for the 20 European Union countries that belong to the Eurozone. It is the second most heavily traded currency in the world behind the US Dollar. In 2022, it accounted for 31% of all foreign exchange transactions, with an average daily turnover of over $2.2 trillion a day.
EUR/USD is the most heavily traded currency pair in the world, accounting for an estimated 30% off all transactions, followed by EUR/JPY (4%), EUR/GBP (3%) and EUR/AUD (2%).
What is the ECB and how does it impact the Euro?
The European Central Bank (ECB) in Frankfurt, Germany, is the reserve bank for the Eurozone. The ECB sets interest rates and manages monetary policy.
The ECB’s primary mandate is to maintain price stability, which means either controlling inflation or stimulating growth. Its primary tool is the raising or lowering of interest rates. Relatively high interest rates – or the expectation of higher rates – will usually benefit the Euro and vice versa.
The ECB Governing Council makes monetary policy decisions at meetings held eight times a year. Decisions are made by heads of the Eurozone national banks and six permanent members, including the President of the ECB, Christine Lagarde.
How does inflation data impact the value of the Euro?
Eurozone inflation data, measured by the Harmonized Index of Consumer Prices (HICP), is an important econometric for the Euro. If inflation rises more than expected, especially if above the ECB’s 2% target, it obliges the ECB to raise interest rates to bring it back under control.
Relatively high interest rates compared to its counterparts will usually benefit the Euro, as it makes the region more attractive as a place for global investors to park their money.
How does economic data influence the value of the Euro?
Data releases gauge the health of the economy and can impact on the Euro. Indicators such as GDP, Manufacturing and Services PMIs, employment, and consumer sentiment surveys can all influence the direction of the single currency.
A strong economy is good for the Euro. Not only does it attract more foreign investment but it may encourage the ECB to put up interest rates, which will directly strengthen the Euro. Otherwise, if economic data is weak, the Euro is likely to fall.
Economic data for the four largest economies in the euro area (Germany, France, Italy and Spain) are especially significant, as they account for 75% of the Eurozone’s economy.
How does the Trade Balance impact the Euro?
Another significant data release for the Euro is the Trade Balance. This indicator measures the difference between what a country earns from its exports and what it spends on imports over a given period.
If a country produces highly sought after exports then its currency will gain in value purely from the extra demand created from foreign buyers seeking to purchase these goods. Therefore, a positive net Trade Balance strengthens a currency and vice versa for a negative balance.
- Gold price prints a fresh intraday low amid caution ahead of US Inflation data.
- A tight labor market and high inflation could force the Fed to lift interest rates further.
- Fed Williams seems confident that the central bank would consider a rate cut in early 2024.
Gold price (XAU/USD) refreshes its intraday low around $1,930.00 as concerns over Thursday’s Consumer Price Index (CPI) data dampen its appeal. The precious metal comes under severe pressure amid strength in the US Dollar as investors hope that the United States inflation could turn out persistent due to sustained wage growth and global oil price recovery.
Sticky inflationary pressures in the United States economy are going to force Federal Reserve (Fed) policymakers to consider a continuation of its aggressive rate-tightening cycle. US home-buyers are already facing the burden of higher borrowing costs and further policy tightening would impact the demand for new houses.
Daily Digest Market Movers: Gold price seems delicate ahead of inflation data
- Gold price remains directionless above $1,930.00 as investors await United States inflation data for a decisive move.
- The precious metal surrenders marginal gains inspired by a hiring slowdown as wage growth remains steady and the jobless rate near historic lows.
- The Nonfarm Payrolls (NFP) report conveys a significant slowdown in firms’ hiring process, portraying a cautious economic outlook.
- Wage growth remains intact as firms offer decent hikes to retain talent.
- In spite of a hiring slowdown, the labor market is still tight enough to create inflationary pressures.
- Atlanta Fed Bank President Raphael Bostic said on Friday that July’s employment remains in line with expectations and he is not surprised that wage growth is still strong. He further added that the central bank will keep interest rate policy restrictive in 2024.
- In addition to an upbeat labor market, investors have started anticipating that the global oil price recovery could elevate gasoline prices and headline inflation could become stubborn.
- This week, the show-stopper event will be the US Consumer Price Index data, which will be published on Thursday at 12:30 GMT.
- Per estimates, headline and core CPI maintained the pace of 0.2% in July. Annual headline CPI rebounded to 3.3% vs. June’s print of 3.0%. Contrary, core inflation that excludes volatile food and oil prices decelerated marginally to 4.7% against a prior reading of 4.8%.
- Signs of persistence in US inflation would elevate hopes of a continuation of the rate-tightening cycle by the Federal Reserve (Fed).
- Fed Governor Michelle Bowman said at a community event in Atlanta that the duo of the tight labor market and still-elevated inflation supports more interest rate hikes from the central bank ahead.
- About interest rate guidance beyond 2023, New York Fed President John C. Williams said on Monday that the possibility of cutting rates in early 2024 cannot be ruled out. He further added that inflation is coming down as expected and the jobless rate could elevate as the economy cools off.
- The US Dollar Index climbs to near 102.40, supported by a cautious market mood.
- A survey from Fannie Mae showed that the percentage of consumers claiming the current period bad for buying a new home rose to 82%, the highest in at least 13 years due to rising borrowing costs.
Technical Analysis: Gold price looks fragile above $1,930
Gold price struggles to stabilize above the immediate support of $1,930.00 amid an absence of supportive economic indicators. The precious metal shifts into bearish territory after a breakdown of the Head and Shoulders chart pattern formed on a lower time frame. Bear cross, represented by the 20 and 50-day Exponential Moving Averages (EMAs) at $1,950.00, indicates more weakness ahead. The yellow metal is seen declining toward the 200-day EMA, which is hovering around $1,907.00.
Inflation FAQs
What is inflation?
Inflation measures the rise in the price of a representative basket of goods and services. Headline inflation is usually expressed as a percentage change on a month-on-month (MoM) and year-on-year (YoY) basis. Core inflation excludes more volatile elements such as food and fuel which can fluctuate because of geopolitical and seasonal factors. Core inflation is the figure economists focus on and is the level targeted by central banks, which are mandated to keep inflation at a manageable level, usually around 2%.
What is the Consumer Price Index (CPI)?
The Consumer Price Index (CPI) measures the change in prices of a basket of goods and services over a period of time. It is usually expressed as a percentage change on a month-on-month (MoM) and year-on-year (YoY) basis. Core CPI is the figure targeted by central banks as it excludes volatile food and fuel inputs. When Core CPI rises above 2% it usually results in higher interest rates and vice versa when it falls below 2%. Since higher interest rates are positive for a currency, higher inflation usually results in a stronger currency. The opposite is true when inflation falls.
What is the impact of inflation on foreign exchange?
Although it may seem counter-intuitive, high inflation in a country pushes up the value of its currency and vice versa for lower inflation. This is because the central bank will normally raise interest rates to combat the higher inflation, which attract more global capital inflows from investors looking for a lucrative place to park their money.
How does inflation influence the price of Gold?
Formerly, Gold was the asset investors turned to in times of high inflation because it preserved its value, and whilst investors will often still buy Gold for its safe-haven properties in times of extreme market turmoil, this is not the case most of the time. This is because when inflation is high, central banks will put up interest rates to combat it.
Higher interest rates are negative for Gold because they increase the opportunity-cost of holding Gold vis-a-vis an interest-bearing asset or placing the money in a cash deposit account. On the flipside, lower inflation tends to be positive for Gold as it brings interest rates down, making the bright metal a more viable investment alternative.
The Pound has had a good start to the week. Economists at ING analyze the GBP outlook.
Pound’s beta-to-risk sentiment to remain elevated for now
There will be very little on the domestic side for GBP until Friday when Gross Domestic Product (GDP) figures are released.
Expect the Pound’s beta-to-risk sentiment to remain elevated for now: in the longer run, we still think markets are overestimating Bank of England tightening, will have to scale down expectations and EUR/GBP can climb back to 0.87-0.88.
Here is what you need to know on Tuesday, August 8:
Following Monday's choppy action, markets turned cautious on Tuesday. Supported by safe-haven flows, the US Dollar gathered strength against its rivals to begin the European session. Investors will continue to keep a close eye on comments from central bankers. Later in the day, the US economic docket will feature Goods Trade Balance data for June and IBD/TIPP Economic Optimism Index for August.
In the Asian session, the data from China revealed that the trade surplus expanded to $80.6 billion in July from $70.6 billion in June. On a concerning note, however, Exports and Imports declined by 14.5% and 12.4% on a yearly basis, respectively. Meanwhile, Moody's announced late Monday that it cut credit ratings of 10 small to mid-sized US banks. Reflecting the souring market mood, US stock index futures trade in negative territory early Tuesday.
US Dollar price today
The table below shows the percentage change of US Dollar (USD) against listed major currencies today. US Dollar was the strongest against the New Zealand Dollar.
| USD | EUR | GBP | CAD | AUD | JPY | NZD | CHF | |
| USD | 0.21% | 0.23% | 0.46% | 0.79% | 0.37% | 0.81% | 0.14% | |
| EUR | -0.21% | 0.02% | 0.27% | 0.59% | 0.16% | 0.59% | -0.08% | |
| GBP | -0.24% | -0.01% | 0.23% | 0.57% | 0.13% | 0.56% | -0.10% | |
| CAD | -0.47% | -0.25% | -0.21% | 0.36% | -0.08% | 0.35% | -0.32% | |
| AUD | -0.81% | -0.59% | -0.57% | -0.34% | -0.43% | 0.02% | -0.67% | |
| JPY | -0.38% | -0.15% | -0.11% | 0.07% | 0.45% | 0.44% | -0.24% | |
| NZD | -0.80% | -0.59% | -0.57% | -0.34% | 0.00% | -0.43% | -0.67% | |
| CHF | -0.13% | 0.07% | 0.09% | 0.33% | 0.66% | 0.24% | 0.67% |
The heat map shows percentage changes of major currencies against each other. The base currency is picked from the left column, while the quote currency is picked from the top row. For example, if you pick the Euro from the left column and move along the horizontal line to the Japanese Yen, the percentage change displayed in the box will represent EUR (base)/JPY (quote).
EUR/USD recovered above 1.1000 in the early European morning but failed to preserve its bullish momentum. At the time of press, the pair was trading in negative territory below 1.0980.
GBP/USD came within a touching distance of 1.2700 in the European session on Monday but managed to end the day in positive territory as the USD lost its strength during the American trading hours. After encountering resistance at 1.2800, however, the pair retreated to the 1.2750 area on Tuesday.
AUD/USD came under heavy bearish pressure following the disappointing Chinese data in the Asian session on Tuesday. The pair continues to push lower and trades within a touching distance of the two-month low it set at 0.6513 last week. Similarly, NZD/USD is down 0.8% so far on the day and trades at its lowest level since late June at around 0.6050.
USD/JPY registered modest gains on Monday and preserved its bullish momentum on Tuesday, The pair was last seen trading a few pips above 143.00. The data from Japan showed earlier in the day that the Eco Watchers Survey - Outlook improved to 54.1 in July from 52.8 in June.
Gold price stays on the back foot and fluctuate near $1,930 after posting small daily losses on Monday. The benchmark 10-year US Treasury bond yield is down nearly 2% on the day at around 4%, helping XAU/USD limit its losses for the time being.
Bitcoin continues to fluctuate near $29,000 and Ethereum moves sideways at around $1,800.
- GBP/JPY struggles to capitalize on its modest intraday gains to a multi-day peak.
- The BoE’s less hawkish signals undermine the British Pound and cap the upside.
- A softer risk tone benefits the safe-haven JPY and also contributes to keeping a lid.
The GBP/JPY cross climbs to a four-day high on Tuesday, albeit struggles to capitalize on the momentum and fails ahead of the 183.00 round-figure mark. Spot prices erase a major part of the intraday gains and retreat to the 182.35-182.30 region during the early part of the European session.
Data released earlier today showed that real wages in Japan fell for a 15th straight month in June and nominal pay growth also slowed. This reaffirms expectations that the Bank of Japan (BoJ) will stick to its dovish stance, which, in turn, weighs on the Japanese Yen (JPY) and acts as a tailwind for the GBP/JPY cross. In fact, the BoJ has emphasised that a sustainable pay hike is a prerequisite to consider exiting easy policies and dismantling its massive monetary stimulus.
Moreover, the BoJ's Summary of Opinions released on Monday revealed that policymakers backed the case for the need to patiently continue with the current monetary easing towards achieving the price stability target. That said, weaker Chinese trade data dampens investors' appetite for riskier assets and helps limit losses for the safe-haven JPY. This, in turn, holds back traders from placing bullish bets around the GBP/JPY cross, instead attracts fresh sellers at higher levels.
The British Pound (GBP), on the other hand, is weighed down by a report from the British Retail Consortium, which showed that UK Retail Sales in July registered its weakest year-on-year growth since August 2022. This comes after the UK’s Recruitment and Employment Confederation (REC) on Monday revealed downbeat employment conditions in Britain due to economic pessimism and the Bank of England's (BoE) less hawkish forward guidance, which, in turn, caps the GBP/JPY cross.
It is worth recalling that the BoE raised its key benchmark interest rate by 25 bps to a 15-year peak level of 5.25% last Thursday and signalled that the tightening cycle may be nearing an end. The UK central bank called its current monetary policy stance "restrictive" and forced investors to scale back expectations for the peak rate. This contributes to Sterling's relative underperformance and contributes to keeping a lid on any further gains for the GBP/JPY cross.
The aforementioned mixed fundamental backdrop, meanwhile, warrants some caution before positioning for the next leg of a directional move. Traders might also prefer to wait on the sidelines ahead of this week's important macro releases, including the prelim Q2 GDP print, on Friday. In the meantime, the BoJ-BoE monetary policy divergence might continue to lend some support to the GBP/JPY cross and help limit any corrective decline, at least for the time being.
Technical levels to watch
Euro steady at 1.10. Aussie thunders towards 0.65. Economists at analyze the outlook of EUR/USD and AUD/USD pairs
AUD/USD could return to the May/June low of 0.6458
EUR/USD mostly ignored the weakness in Yen and Yuan but could struggle to cling on to 1.10 as European stocks and yields retreat.
The AUD is the biggest faller in G10 after the slump in Chinese imports. A return to the May/June low of 0.6458 could follow.
See: EUR/USD unlikely to drift away from a 1.09-1.11 range this month – ING
UOB Group’s Economist Lee Sue Ann and Markets Strategist Quek Ser Leang see USD/CNH sticking to the consolidative phase for the time being.
Key Quotes
24-hour view: Yesterday, we expected USD to trade in a range of 7.1660/7.2020. USD then traded between 7.1860 and 7.2056. Upward momentum has improved a tad, and there is room for USD to edge higher today. In view of the mild upward pressure, any advance is unlikely to threaten the major resistance at 7.2450 (there is another resistance at 7.2200). Support is at 7.1910, followed by 7.1805.
Next 1-3 weeks: Our most recent narrative was from last Wednesday (02 Aug, spot at 7.1800), wherein USD is likely to trade in a range of 7.1300/7.2450 for the time being. We continue to hold the same view for now.
EUR/USD dropped below the 1.10 mark. But the pair is set to remain between 1.09 and 1.11 levels, in the opinion of economists at ING.
Hard to see EUR/USD trade out of range
It appears that EUR/USD has managed to navigate the worst (barring new volatility peaks) of the US bond sell-off relatively easily, a sign that markets remain reluctant to let go of a cyclical currency like the Euro in the current market environment (despite a deteriorating outlook for the eurozone economy) and the room for a big Dollar recovery remains still narrow given markets now expect the Fed to be done with monetary tightening.
We had warned our readers that August might well have been a directionless month for EUR/USD: things can change (developments in the Russia-Ukraine conflict should be followed closely, to name one), but we have not received any strong indication so far that EUR/USD may materially drift away from a 1.09-1.11 range this month.
- Silver stages a modest recovery from a nearly one-month low touched on Monday.
- The technical setup favours bearish traders and supports prospects for further losses.
- A sustained strength beyond the $24.00 mark is needed to negate the bearish bias.
Silver attracts some buying on Tuesday and recovers a part of the previous day's heavy losses to the $23.00 round-figure mark, or nearly a one-month low. The white metal, however, struggles to capitalize on the move and seesaws between tepid gains/minor losses through the early European session. Moreover, the technical setup suggests that the path of least resistance for the XAG/USD is to the downside.
The overnight breakdown below the $23.30 confluence, comprising the 61.8% Fibonacci retracement level of the June-July rally and an ascending trend-line extending from a multi-month low touched in June, was seen as a fresh trigger for bearish traders. A subsequent slide below a technically significant 200-day Simple Moving Average (SMA) might have already set the stage for an extension of the recent decline from over a two-month top touched in July.
The negative outlook is reinforced by the fact that oscillators on the daily chart have just started drifting into bearish territory. That said, it will still be prudent to wait for some follow-through selling and acceptance below the $23.00 mark before placing fresh bearish bets. The XAG/USD might then accelerate the slide towards the $22.15-$22.10 area. This is followed by the $22.00 mark, which if broken decisively should pave the way for deeper losses.
On the flip side, the aforementioned confluence support breakpoint, around the $23.30 area, now seems to act as an immediate barrier. A sustained strength beyond might trigger a short-covering rally towards the $23.70 area or the 50% Fibo. level. The attempted recovery, however, is likely to attract fresh sellers and remain capped near another confluence comprising the 100-day SMA and the 38.2% Fibo. level, around the $24.00-$24.10 region.
The latter should act as a pivotal point, which if cleared decisively could lift the XAG/USD back towards the 23.6% Fibo. level, around the $24.45-$24.50 supply zone, en route to the $24.75 hurdle and the $25.00 psychological mark.
Silver daily chart
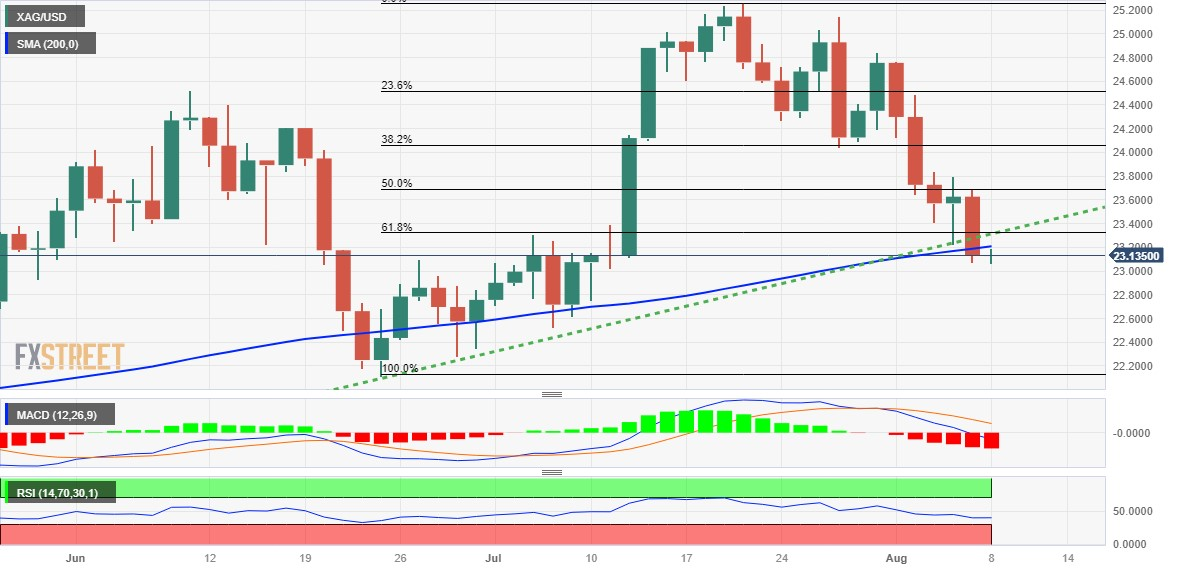
Technical levels to watch
- The index adds to the positive start of the week above 102.00.
- US yields correct lower across the curve on Tuesday.
- Fed’s Harker, Trade Balance, Wholesale Inventories next on tap.
The USD Index (DXY), which gauges the greenback vs. a bundle of its main rival currencies, extends the optimism seen at the beginning of the week and maintains the trade above the 102.00 mark for the time being.
USD Index remains focused on US CPI
The index keeps the optimism well in place following the auspicious start of the week, always trading above the 102.00 hurdle and despite the now loss of momentum in US yields across different maturities.
The march north in the greenback comes amidst persistent weakness in the risk complex as well as increasing prudence among traders ahead of the publication of key US inflation figures on August 10.
The release of the US CPI for the month of July has grown in importance since Chief Powell emphasized the data-dependent stance from the Federal Reserve when it comes to decision on futures moves on interest rates.
So far, and according to CME Group’s FedWatch Tool, investors see the Fed keeping rates on hold for the remainder of the year. On this, NY Fed J. Williams (permanent voter, centrist) suggested on Monday that the Fed could reduce rates in early 2024.
In the US docket, Philly fed P. Harker (voter, hawk) is due to speak later in the session along with the publication of Balance of Trade, Wholesale Inventories, the NFIB Business Optimism Index and the IBD/TIPP Economic Optimism index.
What to look for around USD
The index keeps the trade north of 102.00 so far this week, as market participants continue to assess the latest Payrolls figures amidst increasing cautiousness ahead of key US inflation figures due on August 10.
So far, the pronounced rally in DXY seems to have met a tough initial resistance near 102.80, while the dollar could face extra headwinds in response to the data-dependent stance from the Fed against the current backdrop of persistent disinflation and cooling of the labour market.
Furthermore, speculation that the July hike might have been the last of the current hiking cycle is also expected to keep the buck under some pressure for the time being.
Key events in the US this week: Balance of Trade, Wholesale Inventories (Tuesday) – MBA Mortgage Applications (Wednesday) – Inflation Rate, Initial Jobless Claims (Thursday) – Producer Prices, Flash Michigan Consumer Sentiment (Friday).
Eminent issues on the back boiler: Persistent debate over a soft or hard landing for the US economy. Terminal Interest rate near the peak vs. speculation of rate cuts in late 2023 or early 2024. Geopolitical effervescence vs. Russia and China. US-China trade conflict.
USD Index relevant levels
Now, the index is gaining 0.23% at 102.31 and the breakout of 102.84 (weekly high August 3) would open the door to 103.48 (200-day SMA) and finally 102.57 (weekly high June 30). On the other hand, immediate contention emerges at 101.74 (monthly low August 4) seconded by 100.55 (weekly low July 27) and then 100.00 (psychological level).
Which Fed comments are of interest and which ones are not? Economists at Commerzbank analyze what is relevant for the US Dollar.
It matters to keep an eye on real economic data
It would seem that it is very important for Miki Bowman, a member of the Fed Board of Governors, to get her message across. At least we all heard her on Monday for the second consecutive day: that further rate steps would be required to dampen inflation.
Statements of Fed officials would be newsworthy if they questioned the rate pause in September. However, nobody is likely to do that – certainly not before new inflation data are published. The next publication is due on Thursday.
On the other hand, it matters to keep an eye on real economic data as it will tell us whether and to what extent the economy will slow until November. Only if we know this data, comments like the ones made by Bowman can be relevant for USD exchange rates.
- EUR/GBP oscillates around the 0.8604–24 region in a narrow trading band.
- The German Harmonized Index of Consumer Prices (HICP) came in at 6.5%, as expected.
- The Bank of England (BoE) policymaker said interest rates were expected to remain high for a longer period.
The EUR/GBP pair oscillates in a narrow range around 0.8620 heading into the early European session on Tuesday. Market players await the UK Gross Domestic Product (GDP) Q2 for fresh impetus. The growth rate is expected to grow by 0.2% on a yearly basis.
The latest data from Destatis showed on Tuesday that the German Harmonized Index of Consumer Price (HICP) came in at 6.5%, matching the market expectations. Earlier this week, the Eurozone Sentix Investor Confidence improved from -22.5 in July to -18.9 in August, versus the market consensus of -23.4.
Sentix Managing Director Patrick Hussy said that the Eurozone economy is still in recession. As a result, there can be no delight in this development. Nevertheless, the European Central Bank's (ECB) peak rate speculations were sparked by the global rating agency Fitch Ratings, which impacted the Euro against its rivals.
On the other hand, the Bank of England (BoE) chief economist, Huw Pill, stated on Friday that interest rates were expected to remain high for a longer period. He added that the central bank will be more data-dependent, and policymakers will respond as the economy and the data evolve.
It's worth noting that the Bank of England (BoE) raised interest rates by 25 basis points (bps) to a 15-year high of 5.25% from 5% in its August policy meeting on Thursday. Markets anticipated that the BoE would likely hike two additional rates by the end of the year as inflation remains high. However, the aggressive tightening policy by the BoE fuels concern about the negative impact on the UK economy and exerts pressure on the Pound Sterling.
Looking ahead, market participants will closely watch the UK Q2 Gross Domestic Product (GDP) on Friday. The data could significantly impact the US Dollar and give a clear direction to the EUR/GBP cross.
Economists at Société Générale analyze EUR/NOK technical outlook.
Retracement can quicken on break below 11.09
EUR/NOK broke below a multi-month trend line last month and experienced an extended pullback. It has revisited the 200-DMA near 11.09 which is an interim support. Daily MACD is within deep negative territory which highlights the move is a bit stretched. This is not a reversal signal however an initial bounce can’t be ruled out. May low of 11.48 is an important hurdle near term.
Failure to reclaim 11.48 could mean persistence in downtrend. A break below 11.09 can extend the phase of decline towards 10.93 and perhaps even towards 10.77/10.70, the 50% retracement from 2022.
- WTI crude oil prints 1.0% intraday loss after a lackluster start to the week.
- Fears of slowing energy demand from China, firmer US Dollar weigh on Oil price.
- Risk catalysts eyed ahead of weekly stockpile data, US inflation for clear directions.
WTI crude oil takes offers to refresh the intraday low near $81.40 amid the early hours of Tuesday’s European session. In doing so, the black gold drops nearly 1.0% on a day after witnessing a lackluster start to the week.
That said, the energy benchmark’s latest losses could be linked to the market’s risk aversion, as well as economic and geopolitical fears surrounding China, one of the world’s biggest Oil consumers.
China’s headline Trade Balance improves in July but the details suggest deteriorating Imports and Exports for the said month, suggesting the economic challenges for the Dragon Nation which already suffers from geopolitical woes. That said, India bans drone makers from using Chinese equipment after stopping the imported laptops and computers previously.
Elsewhere, previous concerns suggesting the challenges for the hawkish central banks appear to fade of late, which in turn exerts downside pressure on the crude oil price, especially when the US Dollar remains firmer.
It’s worth noting that the US Dollar Index (DXY) manages to defend the week-start rebound above 102.00, close to 102.30 by the press time, even as the Federal Reserve (Fed) officials struggle to convince hawks. On Monday, Fed Governor Michelle Bowman and New York Fed President John C. Williams flashed mixed signals as the former cited the need for more interest rate hikes while Fed’s William showed indecision about the inflation conditions and prod the hawks.
While portraying the mood, S&P500 Futures prints mild losses around 4,530 as it retreats towards the monthly low marked the last Friday, reversing the first daily gain in five marked on Monday. That said, the US 10-year and two-year Treasury bond yields remain pressured around 4.06% and 4.76% by the press time.
Looking ahead, the US Trade Balance for June and the NFIB Business Optimism Index for July will precede the American Petroleum Institute’s (API) Weekly Crude Oil Stocks Change data to entertain intraday traders of the energy benchmark. However, Wednesday’s China Consumer Price Index (CPI) and Thursday’s US CPI are crucial for a clear guide.
Technical analysis
WTI crude oil justifies Monday’s bearish Doji candlestick to print the latest losses. However, a convergence of the 10-DMA and a six-week-old rising support line could challenge the Oil bears near $80.90.
- Pound Sterling oscillates around 1.2750 as investors await fresh triggers for further action.
- United Kingdom's economic outlook dampens as the BOE prepares for further policy tightening.
- The market mood remains cautious as investors shift focus to inflation data.
The Pound Sterling (GBP)’s upside looks restricted as higher interest rates by the Bank of England (BoE) elevate the burden on the United Kingdom’s housing sector, hiring trend, and factory activities. The GBP/USD pair faces pressure as BoE policymakers keep the door open for further policy tightening so that inflation returns to 2%.
BoE’s Pill seems confident that United Kingdom’s inflation will soften to 5% this year and the desired rate will be achieved in the first half of 2025. In the process of achieving 2% inflation, the British economy could enter into a recession. Going forward, Q2 Gross Domestic Product (GDP) data will remain in the spotlight.
Daily Digest Market Movers: Pound Sterling struggles amid cautious market mood
- Pound Sterling finds selling interest while attempting to cross its two-day high near 1.2780 as fears of a recession in the United Kingdom deepens on expectations of more interest-rate hikes from the Bank of England.
- Due to deepening recession fears, UK firms slowed down permanent staff hiring last month by the most since mid-2020, per a survey by the Recruitment & Employment Confederation (REC) and KPMG, Reuters reported.
- Last week, BoE policymakers delivered a 25-basis-point (bps) interest-rate hike and pushed rates to 5.25%, which keeps the door open for further policy tightening.
- And now, BoE chief economist Huw Pill said on Monday that a lot of interest rate hikes are yet to hit the economy.
- It is worth noting that inflationary pressures in the UK economy are majorly fueled by labor shortages and elevated food inflation.
- BoE Pill believes that food inflation would ease to 10% by late 2023 but should drop further so that a victory over inflation could be announced. UK’s food inflation has already softened to 17.3% from its peak of 19.1%.
- About the overall inflation outlook, Huw Pill seems confident that inflation will fall to 5% this year as promised by UK PM Rishi Sunak. Price stability will be achieved in the first half of 2025.
- On Monday, the British Retail Consortium (BRC) reported a decline in Like-For-Like Retail Sales for July. It dropped sharply to 1.8% vs. June’s reading of 4.2%. Sales growth dropped to an 11-month low as British retailers suffered from heavy rain in July.
- This week, investors will majorly focus on Q2 Gross Domestic Product (GDP), and factory activities data, which will be published on Friday at 06:00 GMT.
- The market mood turns cautious as investors await the Consumer Price Index (CPI), which will be released on Thursday.
- The US Dollar Index (DXY) faces barricades near the immediate high of 102.40. The USD Index could move higher as Federal Reserve (Fed) policymakers deliver mixed guidance about interest rates.
- Fed Governor Michelle Bowman said the collaboration of still-elevated inflation and an upbeat labor market supports further policy tightening ahead.
- New York Fed President John C. Williams said on Monday in the New York Times that the possibility of cutting rates in early 2024 cannot be ruled out.
Technical Analysis: Pound Sterling turns lackluster around 1.2750
Pound Sterling demonstrates a volatility contraction around 1.2750 as investors await crucial inflation data this week. The Cable fails to return above into the Rising Channel chart pattern formed on the daily chart. This could push the asset into a bearish trajectory for a longer period. The asset struggles to sustain above the 50-day Exponential Moving Average (EMA).
BoE FAQs
What does the Bank of England do and how does it impact the Pound?
The Bank of England (BoE) decides monetary policy for the United Kingdom. Its primary goal is to achieve ‘price stability’, or a steady inflation rate of 2%. Its tool for achieving this is via the adjustment of base lending rates. The BoE sets the rate at which it lends to commercial banks and banks lend to each other, determining the level of interest rates in the economy overall. This also impacts the value of the Pound Sterling (GBP).
How does the Bank of England’s monetary policy influence Sterling?
When inflation is above the Bank of England’s target it responds by raising interest rates, making it more expensive for people and businesses to access credit. This is positive for the Pound Sterling because higher interest rates make the UK a more attractive place for global investors to park their money. When inflation falls below target, it is a sign economic growth is slowing, and the BoE will consider lowering interest rates to cheapen credit in the hope businesses will borrow to invest in growth-generating projects – a negative for the Pound Sterling.
What is Quantitative Easing (QE) and how does it affect the Pound?
In extreme situations, the Bank of England can enact a policy called Quantitative Easing (QE). QE is the process by which the BoE substantially increases the flow of credit in a stuck financial system. QE is a last resort policy when lowering interest rates will not achieve the necessary result. The process of QE involves the BoE printing money to buy assets – usually government or AAA-rated corporate bonds – from banks and other financial institutions. QE usually results in a weaker Pound Sterling.
What is Quantitative tightening (QT) and how does it affect the Pound Sterling?
Quantitative tightening (QT) is the reverse of QE, enacted when the economy is strengthening and inflation starts rising. Whilst in QE the Bank of England (BoE) purchases government and corporate bonds from financial institutions to encourage them to lend; in QT, the BoE stops buying more bonds, and stops reinvesting the principal maturing on the bonds it already holds. It is usually positive for the Pound Sterling.
USD/JPY is still seen navigating the 140.00-143.30 range for the time being, comment UOB Group’s Economist Lee Sue Ann and Markets Strategist Quek Ser Leang.
Key Quotes
24-hour view: Our view for USD to weaken yesterday was incorrect. Instead of weakening, USD rebounded to a high of 142.59. Upward momentum has improved a tad, and today, USD is likely to edge higher. However, any advance is not expected to threaten the major resistance at 143.30 (there is another resistance at 142.90). On the downside, if USD breaks below 141.90, it would mean that the current mild upward pressure has eased.
Next 1-3 weeks: Yesterday (07 Aug, spot at 141.60), we highlighted that “the recent buildup in upward pressure has faded” and we expected USD to” trade in a broad range of 140.00/143.30 for now.” There is no change in our view.
Considering advanced figures from CME Group for natural gas futures markets, open interest dropped for the third consecutive session on Monday, this time by around 15.8K contracts. On the flip side, volume reversed two daily pullbacks in a row and increased by around 268.3K contracts, the largest single day build since June 15.
Natural Gas faces the next hurdle near $2.90
Monday’s marked uptick in prices of natural gas was accompanied by shrinking open interest, indicating that extra gains look not favoured for the time being. However, the strong build in volume leaves the door open to a potential test of the June high near the $2.90 mark per MMBtu (June 28).
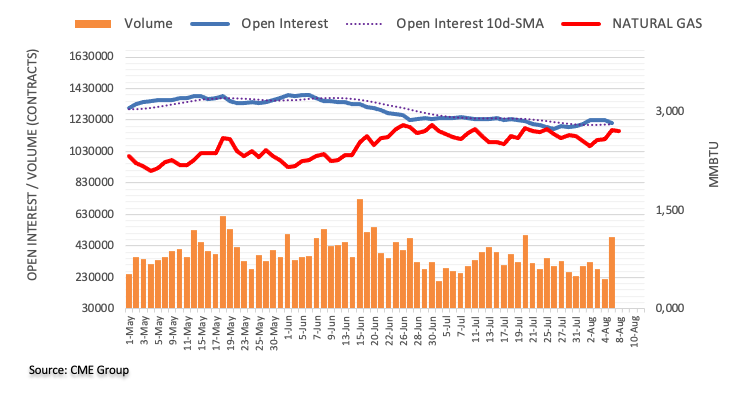
- NZD/USD extends pullback from 10-month-old previous support amid bearish MACD signals.
- Three-week-old descending resistance line, 200-DMA act as additional upside filters.
- Kiwi bears approach 50% Fibonacci retracement, June’s low amid further downside.
- Risk catalysts eyed for clear directions, sellers are likely to keep the reins amid slightly offbeat sentiment.
NZD/USD stands on slippery ground as it renews its intraday low near 0.6060 heading into Tuesday’s European session, printing the biggest daily loss, so far, in a week.
In doing so, the Kiwi pair justifies late previous week’s inability of the bulls to retake control after breaking an upward-sloping support line from October on August 02.
Not only the sustained reversal from the multi-month-old support-turned-resistance but the quote’s sustained trading below the three-week-old descending resistance line and the 200-DMA, respectively near 0.6145 and 0.6230, also challenge the NZD/USD buyers.
It’s worth noting that the Kiwi pair’s recovery beyond 0.6230 appears elusive unless crossing July’s peak of around 0.6415.
On the flip side, a 50% Fibonacci retracement of October 2022 to February 2023 upside, near 0.6025, can restrict the short-term downside of the NZD/USD price.
Following that, June’s low of 0.5985 and the 61.8% Fibonacci retracement level surrounding 0.5900 will lure the Kiwi bears.
To sum up, NZD/USD remains on the bear’s radar and appears set to challenge the yearly low marked in June surrounding 0.5985 as the US Dollar extends the week-start recovery amid sour sentiment.
Also read: NZD/USD keeps the red below 0.6100 on stronger USD, reacts little to Chinese trade data
NZD/USD: Daily chart
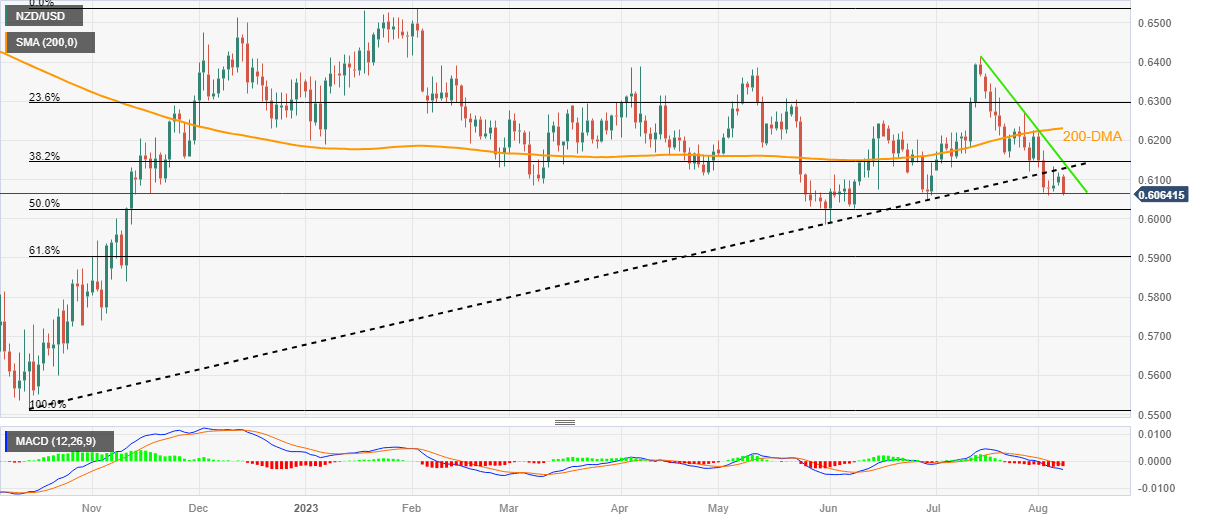
Trend: Further downside expected
In the view of UOB Group’s Economist Lee Sue Ann and Markets Strategist Quek Ser Leang, further downside in NZD/USD appears unlikely in the short-term horizon.
Key Quotes
24-hour view: We highlighted yesterday that “The price actions in NZD appear to be part of a consolidation phase”, and we expected it to trade in a range between 0.6075/0.6130. While our view of consolidation was correct, NZD traded in a narrower range than expected (0.6087/0.6115). The quiet price actions continue to suggest that NZD is likely to consolidate for now, probably in a range of 0.6080/0.6125.
Next 1-3 weeks: NZD traded in a quiet manner and our update from yesterday (07 Aug, spot at 0.6105) still stands. As highlighted, the likelihood of NZD weakening further has decreased. However, only a breach of 0.6145 (no change in ‘strong resistance’ level) would mean that NZD is not weakening further.
- AUD/USD attracts some selling pressure near 0.6530, losing 0.65% for the day.
- The pair holds below the 50- and 100-hour EMAs on the four-hour chart.
- The initial support level is seen at 0.6525; 0.6560 acts as an immediate resistance level.
The AUD/USD pair remains under pressure and trades on a defensive note around the 0.6530 mark heading into the early European session on Tuesday. The prevalent US Dollar buying bias following the hawkish comment from Atlanta Federal Reserve (Fed) Governor Michelle Bowman supports the US Dollar and exerts pressure on AUD/USD. The major pair currently trades around 0.6531, losing 0.65% for the day.
Furthermore, the mixed economic reading from Australia and China joins the headline about geopolitical tension between Japan and China, exerts pressure on the China-proxy Australian Dollar (AUD), and caps the upside in the AUD/USD pair.
From a technical perspective, AUD/USD holds below the 50- and 100-hour Exponential Moving Averages (EMAs) on the four-hour chart, which means further downside looks favourable for the time being.
That said, any intraday pullback below 0.6525 (the lower limit of the Bollinger Band) would expose the next contention level in the 0.6490 area (Low of May 26). Further south, the next stop of the AUD/USD is located at 0.6460 (Low of May 31) and finally at 0.6400 (the confluence of a psychological round figure and the low of Nov 2022).
Looking at the upside, some follow-through buying towards the upper boundary of the Bollinger Band around 0.6560 will see a rally to the next barrier at the 0.6600–0.6610 zone. The mentioned level highlights the confluence of a psychological round figure and a 50-hour EMA. Following that, AUD/USD has room to test the additional upside filter at 0.6655 (the 100-hour EMA) en route to 0.6700 (High of July 31, round figure).
The Relative Strength Index (RSI) stands below 50, challenging the pair’s immediate downside for the time being.
AUD/USD four-hour chart
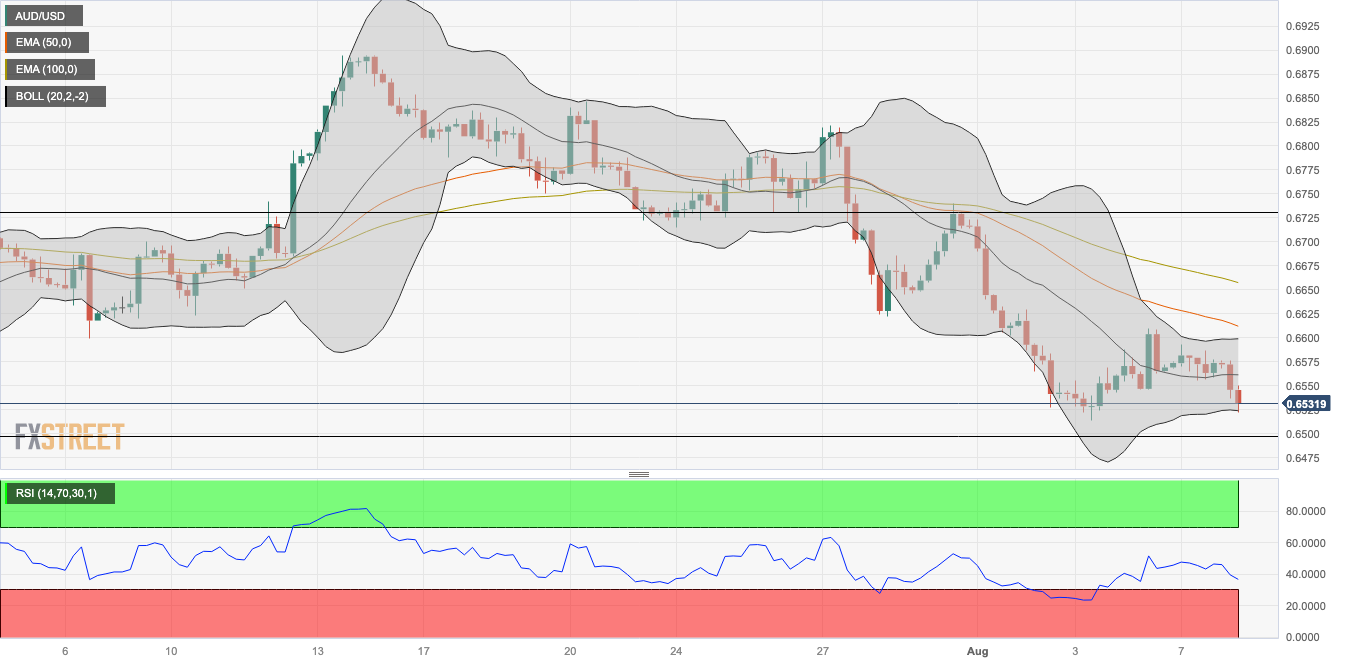
USD/INR has reached the upper end of its consolidation since last year at 82.95/83.30. Economists at Société Générale anlayzes the pair’s technical outlook.
Breakout above 82.95/83.30 can spark next leg up
USD/INR has evolved within a range-bound consolidation since last year in the form of a pattern resembling ascending triangle. This formation contains a flattish upper limit and an ascending lower one; it generally points towards upward potential once a breakout materializes.
The pair has recently defended the lower limit of the formation near 81.60 resulting in a swift bounce. Graphical hurdle of 82.95/83.30 which is also the upper end of the pattern is a crucial resistance zone. Once this is overcome, USD/INR is expected to embark on next leg of uptrend towards projections of 84.20 and 85.10/85.30.
First support is at 200-DMA near 82.25.
- EUR/JPY picks up bids to refresh intraday high, prods six-week-old descending resistance line.
- Germany’s inflation gauges match initial forecasts for July.
- Downbeat Japan real wage pushes back BoJ hawks even as YCC tweak, sluggish yields prod Yen sellers.
- Risk catalysts eyed for clear directions, technical breakout can challenge yearly top.
EUR/JPY takes the bids to refresh its intraday high near 157.70 as it pokes a 1.5-month-long falling resistance line heading into Tuesday’s European session. In doing so, the cross-currency pair pays little heed to the downbeat German inflation clues, confirming the initial forecasts, as well as the sluggish Treasury bond yields. That said, the pair’s run-up could be linked to the increasing odds of the Bank of Japan’s (BoJ) sustained easy-money policy backed by the latest wage data from Tokyo.
Earlier in the day, Japan’s Labor Cash Earnings came in better-than-forecast for June but the real wages were downbeat enough to defend the dovish bias about the BoJ. That said, Japan’s inflation-adjusted real wages dropped for the 15th consecutive month in June to 1.6% YoY versus 0.9% prior.
On Monday, the Bank of Japan’s (BoJ) Summary of Opinions for the July meeting showed that one member said the achievement of 2% inflation in a sustainable and stable manner seems to have clearly come in sight.
It’s worth noting that the tweaking of BoJ’s Yield Curve Control (YCC) policy previously triggered the EUR/JPY pullback.
Elsewhere, Germany’s inflation gauges per the Harmonized Index of Consumer Prices (HICP) and the Consumer Price Index (CPI) match initial forecasts of 6.5% YoY and 6.2% YoY and confirm the bearish bias about the European Central Bank (ECB).
Previously, the Eurozone Sentix Investor Confidence improved to -18.9 for August from -22.5 in July, versus the market consensus of a -23.4 reading. Following the data, Sentix Managing Director Patrick Hussy termed Germany as the sick man of the Eurozone while also adding, “The economy in the Eurozone remains in recession mode. There can therefore be no joy about this development.”
Amid these plays, S&P500 Futures prints mild losses around 4,530 as it retreats towards the monthly low marked the last Friday, reversing the first daily gain in five marked on Monday. That said, the US 10-year and two-year Treasury bond yields remain pressured around 4.06% and 4.76% by the press time.
Looking ahead, a light calendar may challenge the EUR/JPY pair’s upside move targeting the yearly top of 158.00.
Technical analysis
An impending bull cross on the MACD joins the upward-sloping RSI (14) line, not overbought, to propel EUR/JPY prices toward a six-week-old descending resistance line surrounding 157.70, a break of which could push buyers toward the yearly high marked in June near 158.00. Meanwhile, the 21-DMA puts a floor under the prices near 155.95.
Open interest in crude oil futures markets shrank for the second straight session on Monday, now by around 10.5K contracts according to preliminary readings from CME Group. Volume, instead, resumed the uptrend and rose by around 9.7K contracts.
WTI: Upside seems capped above $83.00
Monday’s losses in WTI prices came in tandem with diminishing open interest, which removes some strength from the prospect for further decline in the very near term. So far, the 2023 top at $83.49 (April 12) continues to limit the upside for crude oil bulls.
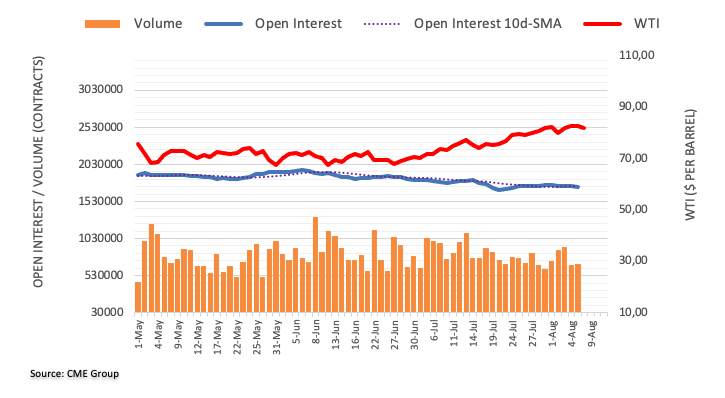
FX option expiries for Aug 8 NY cut at 10:00 Eastern Time, via DTCC, can be found below.
- EUR/USD: EUR amounts
- 1.0875 1.4b
- 1.0885 334m
- 1.0900 713m
- 1.0970 723m
- GBP/USD: GBP amounts
- 1.2750 526m
- USD/JPY: USD amounts
- 142.00 380m
- AUD/USD: AUD amounts
- 0.6450 1.4b
- 0.6500 526m
- USD/CAD: USD amounts
- 1.3335 580m
- NZD/USD: NZD amounts
- 0.6130 481m
- 0.6235 561m
- EUR/GBP: EUR amounts
- 0.8700 818m
- 0.8725 543m
The likelihood of further weakness in GBP/USD now appears mitigated according to UOB Group’s Economist Lee Sue Ann and Markets Strategist Quek Ser Leang.
Key Quotes
24-hour view: GBP traded between 1.2714 and 1.2789 yesterday, narrower than our expected range of 1.2700/1.2800. The underlying tone has improved somewhat, and GBP is likely to edge higher. In view of the mild upward pressure, any advance is unlikely to threaten the major resistance at 1.2830 (minor resistance is at 1.2800). Support is at 1.2755, followed by 1.2725.
Next 1-3 weeks: We have held a negative GBP view for more than a week now (see annotations in the chart below). In our latest narrative from last Friday (04 Aug, spot at 1.2715), we noted that “downward momentum has eased somewhat.” However, we indicated that “there is a chance for GBP to drop further to 1.2580.” Downward momentum has eased further, and the chance for GBP to drop to 1.2580 has diminished. However, only a breach of 1.2830 (no change in ‘strong resistance’ level) would indicate that the GBP weakness has stabilised.
CME Group’s flash data for gold futures markets noted investors trimmed their open interest positions for the third session in a row on Monday, this time by just 729 contracts. Volume followed suit and went down by around 55.6K contracts.
Gold faces some consolidation near term
Gold prices kicked off the week on the back foot amidst shrinking open interest and volume, which suggest that a deeper and sustained pullback seems not favoured for the time being. In the meantime, the so far monthly low at $1924 (August 4) is expected to offer initial support.
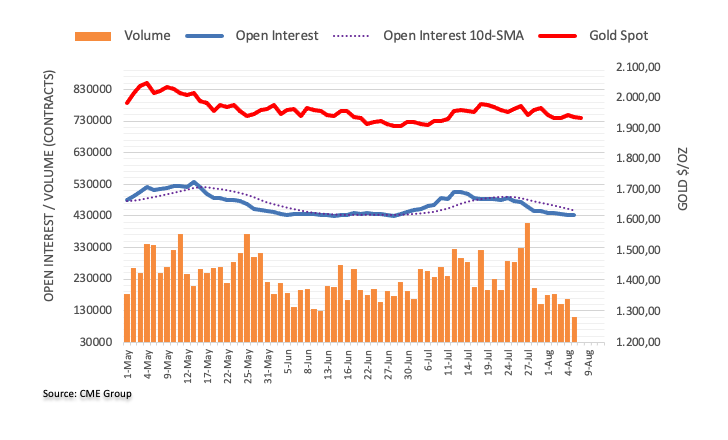
- USD/JPY gains momentum near 143.30, up 0.56% for the day.
- The pair stands above the 50- and 100-hour EMAs with an upward slope on the four-hour chart.
- The immediate resistance emerges at 143.45; the key contention for USD/JPY is located at 143.00.
The USD/JPY pair extends its upside and reclaims the 143.00 barrier heading into the early European session on Tuesday. The major currently trades around 143.30, gaining 0.54% on the day. The hawkish comment from Federal Reserve (Fed) policymakers boosts the Greenback against the Japanese Yen.
That said, Atlanta Fed Governor Michelle Bowman indicated that additional rate increases will likely be necessary to return inflation to the target level. Meanwhile, BoJ policymakers added that it’s necessary to maintain ultra-low interest rates. This, in turn, acts as a tailwind for USD/JPY.
According to the four-hour chart, the USD/JPY pair stands above the 50- and 100-hour Exponential Moving Averages (EMAs) with an upward slope, which means the path of least resistance is to the upside for the major pair.
USD/JPY’s immediate resistance emerges at 143.45 (the upper boundary of the Bollinger Band). Any meaningful follow-through buying could pave the way to the next hurdle at 143.90 (High of August 3). Further north, 144.65 will be the additional upside filter.
On the flip side, the key support for USD/JPY is located at 143.00, representing a psychological round mark. The next stop for the pair is seen at 142.45 (the midline of the Bollinger Band) en route to 142.10 (the 50-hour EMA), followed by 141.70 (the 100-hour EMA) and 141.60 (the lower limit of the Bollinger Band).
It’s worth noting that the Relative Strength Index (RSI) stands above 50, which indicates that the upside momentum has been activated for the time being.
USD/JPY four-hour chart
-638270700893502845.png)
- USD/CHF clings to mild gains despite teasing bearish H&S formation on hourly chart.
- RSI conditions, one-week-old falling resistance line suggest Swiss Franc pair’s further grinding toward the south.
- 200-HMA precedes the key 0.8710 support to challenge bears.
- Buyers need validation from 0.8805 to retake control.
USD/CHF prints minor gains around 0.8740 heading into Tuesday’s European session, after a sluggish week-start.
In doing so, the Swiss Franc (CHF) pair defends Friday’s recovery from the 200-Hour Moving Average (HMA).
However, the hourly play suggests forming of the Head-and-Shoulders (H&S) bearish chart formation and teases the pair sellers, especially amid the mostly steady RSI (14) line.
It’s worth noting that the 200-HMA restricts immediate downside of the USD/CHF pair around 0.8725 but major attention is given to the stated H&S formation’s neckline surrounding 0.8710.
Should the quote breaks the 0.8710, it becomes theoretically vulnerable to drop towards 0.8570.
During the anticipated fall, the late July swing low of around 0.8660 and the 0.8600 round figure may act as buffers for the USD/CHF bears to watch.
On the contrary, an upside break of the descending resistance line stretched from the last Wednesday, close to 0.8760 at the latest, could bolster the bullish bias about the USD/CHF pair.
Even so, the monthly high marked in the last week around 0.8805 could act as the last defense of the USD/CHF bears.
USD/CHF: Hourly chart

Trend: Downside expected
UOB Group’s Economist Lee Sue Ann and Markets Strategist Quek Ser Leang expect EUR/USD to trade within a consolidative range for the time being.
Key Quotes
24-hour view: Yesterday, we held the view that EUR could “test 1.1045 before the risk of a more sustained pullback increases.” Instead of testing 1.1045, EUR traded in a relatively quiet manner between 1.0864 and 1.1017 before ending the day little changed at 1.1002 (-0.07%). The current price movements appear to be part of a consolidation. Today, EUR is likely to trade in a range between 1.0960 and 1.1035.
Next 1-3 weeks: We continue to hold the same view as yesterday (07 Aug, spot at 1.1000). As highlighted, the recent EUR weakness has stabilised. For the time being, EUR is likely to trade in a range, probably between 1.0920 and 1.1100.
- Markets remain downbeat in Asia as China data flag concerns about slowing economic recovery in regional leader.
- China trade numbers, likely political tensions with Asian and Western peers flag economic fears.
- Cautious mood ahead of top-tier inflation data, downbeat wage growth in Japan also weigh on sentiment.
- Risk catalysts eyed for clear directions ahead of front-tier statistics.
The risk profile remains sour in the Asia-Pacific zone during early Tuesday as the region’s leader China roils the mood with downbeat details of foreign trade. Adding strength to the risk-off mood could be headlines surrounding Beijing's economic tension with Japan, India and the US, as well as economic strains due to the typhoon Doksuri.
Against this backdrop, the MSCI’s index of Asia-Pacific shares outside Japan drops to the lowest level in two weeks while posting a nearly 1.0% intraday fall whereas Japan’s Nikkei 225 prints mild gains by the press time.
China’s headline Trade Balance improves in July but the details suggest deteriorating Imports and Exports for the said month, suggesting the economic challenges for the Dragon Nation which already suffers from geopolitical woes. That said, India bans drone makers from using Chinese equipment after stopping the imported laptops and computers previously. On the same line, Japan’s Taro Aso, Vice President of the Liberal Democratic Party (LDP), flags turbulence surrounding Taiwan.
With this, Chinese equities edge lower and drag shares from Australia and New Zealand. It’s worth noting that Australia’s ASX 200 prints mild gains as downbeat Aussie sentiment figures back the dovish concerns about the Reserve Bank of Australia (RBA) and defend the equity bulls in Canberra.
Further, stocks in India remain dicey as traders await this week’s monetary policy announcements of the Reserve Bank of India (RBI).
Elsewhere, mixed comments from the policymakers of the Federal Reserve (Fed) join indecision at the Bank of England (BoE), the Bank of Japan (BoJ) and the European Central Bank (ECB) to also weigh on the market sentiment and drown the S&P500 Futures. The same, however, fails to impress the bond yields as the US 10-year Treasury bond yields remain depressed at around 4.04% by the press time.
Also read: S&P500 Futures fade bounce off one-month low, yields dribble amid mixed central bank signals, light calendar
- EUR/USD remains on the defensive below the 1.1000 barrier in Asian trading hours on Tuesday.
- The Eurozone Sentix Investor Confidence improved from -22.5 in July to -18.9 in August.
- The Greenback attracts some follow-through buying after the hawkish comment from a Federal Reserve (Fed) policymaker.
- Traders will take cues from the German Harmonized Index of Consumer Prices (HICP), US CPI data.
The EUR/USD pair struggles to gain momentum and holds below the 1.1000 barrier on Tuesday. The major pair remains under pressure as investors worry about the recession in the bloc ahead of the US inflation data release on Thursday. EUR/USD currently trades around 1.0988, losing 0.13% for the day.
That said, the Eurozone Sentix Investor Confidence improved from -22.5 in July to -18.9 in August, versus the market consensus of -23.4. Sentix Managing Director Patrick Hussy said that the Eurozone economy is still in recession. As a result, there can be no delight in this development.
Earlier this week, German Industrial Production figures for June fell to -1.5% MoM, worse than expectations of -0.4% and -0.1% prior (revised). Nevertheless, the European Central Bank's (ECB) peak rate speculations were sparked by the global rating agency Fitch Ratings, which impacted the Euro against its rivals.
On the US Dollar front, the Greenback attracts some follow-through buying following the hawkish comment from a Federal Reserve (Fed) policymaker. Atlanta Fed Governor Michelle Bowman indicated on Monday that additional rate hikes will likely be required to return inflation to target levels. The odds of additional rate hikes for the entire year might lift the USD and cap the upside in the EUR/USD pair.
Moving on, market players will take cues from the German Harmonized Index of Consumer Prices (HICP) YoY for July, due on Tuesday. The focus will shift to the US Consumer Price Index (CPI) on Thursday. This event could significantly impact the US Dollar and give a clear direction to the EUR/USD pair.
- USD/MXN attracts fresh buying on Tuesday and stalls its corrective slide from the monthly top.
- The technical setup favours bullish traders and supports prospects for further intraday gains.
- A sustained break below the 17.00 round-figure mark is needed to negate the positive outlook.
The USD/MXN pair regains positive traction during the Asian session on Tuesday and for now, seems to have snapped a two-day losing streak, stalling its pullback from the 17.4275 area or a nearly two-month touched last week. Spot prices currently trade around just above the 17.10 level, up over 0.25% for the day.
The latter represents the 38.2% Fibonacci retracement level of the recent goodish bounce from a multi-year trough and coincides with the 100-hour Simple Moving Average (SMA). Meanwhile, technical indicators have just started gaining positive traction on daily/hourly charts. Hence, a sustained strength beyond the said confluence hurdle will be seen as a fresh trigger for bulls and pave the way for some meaningful intraday appreciating move for the USD/MXN pair.
Spot priced might then aim to surpass the overnight swing high, around the 17.1505 area and accelerate the positive momentum towards testing the 17.2350 region, or 23.6% Fibo. level. Some follow-through buying has the potential to lift the USD/MXN pair further towards the next relevant resistance near the 17.3650 supply zone en route to the monthly peak, around the 17.4275 zone touched last Friday.
On the flip side, the 17.0235-17.0230 region, or the 50% Fibo. level now seems to protect the immediate downside ahead of the 17.00 round-figure mark. This is followed by the 61.8% Fibo. level, around the 16.9270 area, which if broken decisively will shift the bias in favour of bearish traders and drag the USD/MXN pair to the 16.7950-16.7900 intermediate support en route to the multi-year low, around the 16.6260-16.6250 area touched in July.
USD/MXN 1-hour chart
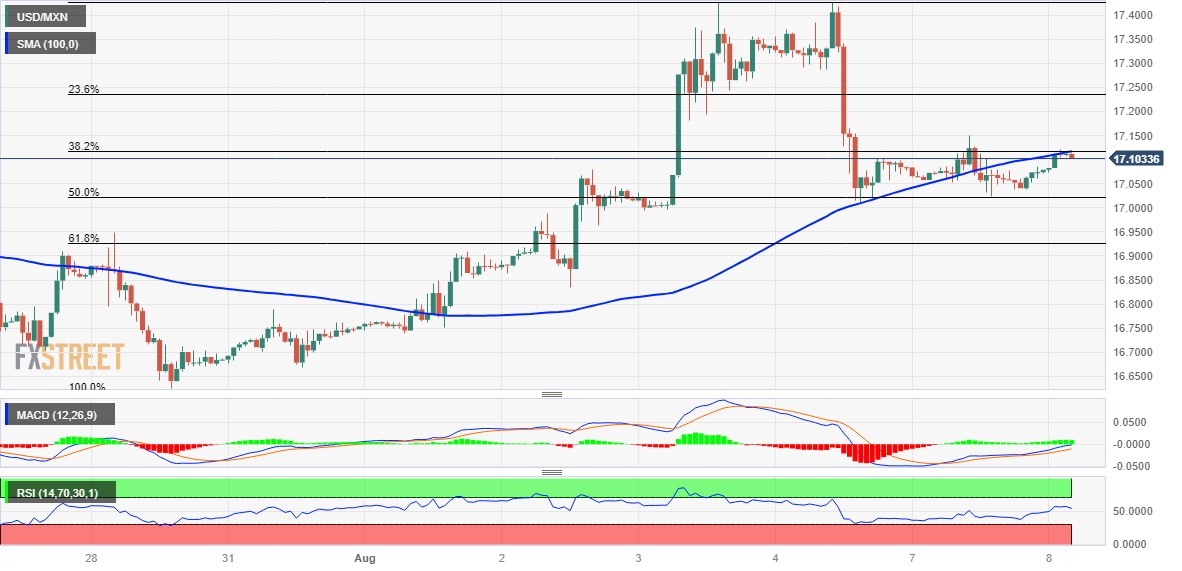
Key levels to watch
- Gold Price stays bearish for the second consecutive day amid sour sentiment, upbeat US Dollar.
- US Dollar ignores mixed Fed talks while preparing for Thursday’s US inflation and weigh on XAU/USD price.
- China inflicted pessimism, cautious mood ahead of top-tier data/events also weigh on the Gold Price.
- Sustained trading below $1,955 resistance confluence favors XAU/USD bears.
Gold Price (XAU/USD) remains depressed for the second consecutive day as markets turn slightly downbeat ahead of this week’s top-tier data/events. Also exerting downside pressure on XAU/USD could be the fears emanating from China, one of the biggest Gold customers. In doing so, the bright metal also bears the burden of the upbeat US Dollar.
That said, the US Dollar Index (DXY) manages to defend the week-start rebound above 102.00, close to 102.30 by the press time, even as the Federal Reserve (Fed) officials struggle to convince hawks. On Monday, Fed Governor Michelle Bowman and New York Fed President John C. Williams flashed mixed signals as the former cited the need for more interest rate hikes while Fed’s William showed indecision about the inflation conditions and prod the hawks.
Not only from the Fed policymakers but the monetary policy signals from the Bank of England (BoE), the Bank of Japan (BoJ) and the European Central Bank (ECB) also came in mixed and favored the market’s rush towards the US Dollar and indirectly weighing on the Gold Price.
Elsewhere, China’s warning about using the face recognition system joins the latest Japan-China tension and the Sino-US tussles to weigh on the sentiment amid a light calendar and lackluster yields. Also, the recent foreign trade numbers from Beijing haven’t been impressive despite marking a strong Trade Balance.
Moving on, the risk catalysts and the second-tier US data will entertain the XAU/USD traders ahead of the key Thursday when the top-tier US inflation clues will be released.
Also read: Gold Price Forecast: XAU/USD downside remains compelling whilst below 50 DMA
Gold Price: Key levels to watch
Our Technical Confluence indicator shows that the Gold Price remains well beneath the key resistance surrounding $1,955, comprising Fibonacci 61.8% on one-week, 161.8% on one-day and the middle band of the Bollinger on one-day.
It’s worth noting that the Fibonacci 23.6% on one-day and 61.8% on one-month together restricts the immediate upside of the Gold price near $1,936.
Adding to the upside filters is the convergence of the previous daily high and 50-SMA on four-hour (4H), near $1,950.
It should be observed that the Gold Price run-up beyond $1,955 enables the bulls to challenge the $1,985 resistance area comprising multiple tops marked since May.
Alternatively, the previous daily low joins the lower band of the Bollinger on the Daily chart to highlight $1,915 as the short-term key support ahead of the $1,900 threshold.
Ahead of that, the previous weekly low of around $1,926 may test the XAU/USD sellers.
Overall, the Gold Price remains on the way to testing $1,915 unless staying beneath the $1,955 key resistance.
Here is how it looks on the tool

About Technical Confluences Detector
The TCD (Technical Confluences Detector) is a tool to locate and point out those price levels where there is a congestion of indicators, moving averages, Fibonacci levels, Pivot Points, etc. If you are a short-term trader, you will find entry points for counter-trend strategies and hunt a few points at a time. If you are a medium-to-long-term trader, this tool will allow you to know in advance the price levels where a medium-to-long-term trend may stop and rest, where to unwind positions, or where to increase your position size.
- A combination of supporting factors lifts USD/CAD to a fresh two-month top on Tuesday.
- Softer Oil prices undermine the Loonie and act as a tailwind amid renewed USD buying.
- Hawkish Fed expectations remain supportive of elevated US bond yields and lift the USD.
The USD/CAD pair touches a two-month peak during the Asian session on Tuesday, with bulls now awaiting a sustained move beyond the 100-day Simple Moving Average (SMA) barrier around the 1.3400 mark before placing fresh bets.
The Canadian Dollar (CAD) continues to be weighed down by the disappointing release of the domestic jobs report on Friday, which reaffirmed expectations that the Bank of Canada (BoC) will pause its interest rate hike campaign. Furthermore, Crude Oil prices remain depressed for the second successive day below a nearly four-month top touched on Monday and turn out to be another factor undermining the commodity-linked Loonie. This, along with a modest pickup in the US Dollar (USD) demand, is seen acting as a tailwind for the USD/CAD pair.
Despite a slight disappointment from the headline NFP print, solid wage growth and an unexpected downtick in the jobless rate pointed to the continued tightness in the US labour market. This, in turn, raised the odds of a soft landing for the US economy and should allow the US central bank to stick to its hawkish stance. Adding to this, Fed Governor Michele Bowman on Monday kept the door for one more 25 bps lift-off in September or November. This remains supportive of elevated US Treasury bond yields, which lend support to the buck and the USD/CAD pair.
In remarks prepared for delivery to a "Fed Listens" event in Atlanta, Bowman said that additional interest rate hikes will likely be needed to lower inflation to the central bank's 2% target. Bowman added that inflation remains elevated, and job growth and other indications of activity show the economy has continued expanding at a "moderate pace." This, along with a softer risk tone, benefits the safe-haven Greenback and suggests that the path of least resistance for the USD/CAD pair is to the upside, though bulls need to wait for a move beyond the 100-day SMA.
Market participants now look to the release of Trade Balance data from the US and Canada for some impetus later during the early North American session. Apart from this, Fedspeak, the US bond yields and the broader risk sentiment will drive the USD demand. Traders will further take cues from Oil price dynamics to grab short-term opportunities around the USD/CAD pair. The focus, however, will remain glued to the latest US consumer inflation figures on Thursday, which will influence expectations about the Fed's future rate-hike path and provide a fresh directional impetus.
Technical levels to watch
- AUD/JPY lacks any firm intraday direction, flat-lines around 93.85 for the day.
- Japanese Household Spending YoY dropped from -4.0% to -4.2% in June.
- The Australian and Chinese data showed mixed results.
- Investors will keep an eye on the Chinese Consumer Price Index (CPI) and Producer Price Index (PPI) YoY.
The AUD/JPY cross struggles to gain and holds below the 94.00 mark during the early Asian session on Monday. The cross currently trades around 93.88, up 0.88% for the day. The cross struggles to gain following the mixed Australian and Chinese data earlier in the day. Investors await the Chinese Consumer Price Index (CPI) for fresh impetus.
In Japan, Household Spending YoY dropped from 4.0% to 4.2% in June, a fourth month of decline. Average Cash Earnings y/y came in at 2.3% from 2.9%, which was worse than the estimated 3.0%. Further detail revealed that households with two or more people spent an average of 275,545 yen ($1,900). This figure could raise concerns about the Bank of Japan's (BoJ) ultra-loose monetary policy.
According to a summary of the opinions of the Bank of Japan (BoJ) released on Monday, one board member said that wages and prices could keep rising at a pace not seen in the past. BoJ policymakers added that it’s necessary to maintain ultra-low interest rates until robust domestic demand and higher wages replace cost-push factors as the primary drivers of price increases and maintain sustainable inflation around its target.
On the Aussie front, Westpac Consumer Confidence in Australia fell to -0.4% in August, down from 2.7% the previous month. Meanwhile, the National Australia Bank's (NAB) Business Conditions for July increased to 10.0 from 9.0 prior and above the market consensus of 8.0. Lastly, the NAB Business Confidence increased to 2.0% from -1.0% estimations and 0.0% prior.
Furthermore, the latest Chinese data release on Tuesday showed that the dollar value of China’s exports YoY in July plunged -14.5%, worse than expectations of -12.5% in June, while Imports dropped -12.4% YoY from -5%. China's trade balance increased to $80.6 billion, exceeding expectations of $70.6 billion and $70.62 billion prior. That said, the mixed economic reading from Australia and China joins the headline about geopolitical tension between Japan and China, which exerts pressure on the China-proxy Australian Dollar (AUD).
Looking ahead, market participants will keep an eye on the Chinese Consumer Price Index (CPI) and Producer Price Index (PPI) YoY on Wednesday. Also, Consumer Inflation Expectations for August will be released on Thursday. Traders will find opportunities around the AUD/JPY cross.
- NZD/USD comes under some renewed selling pressure on Tuesday amid a modest USD strength.
- Bets for more Fed rate hikes remain supportive of elevated US bond yields and underpin the buck.
- The mixed Trade Balance data from China fails to impress bulls or provide any impetus to the pair.
The NZD/USD pair struggles to capitalize on its modest gains registered over the past two trading days and meets with a fresh supply during the Asian session on Tuesday. Spot prices, however, manage to recover a few pips from the daily low touched in the last hour and currently trade just below the 0.6100 mark, still down nearly 0.30% for the day.
The better-than-expected release of Trade Balance data from China, showing that the surplus rose to $80.6 billion in Jul from $70.62 billion in the previous month, lends some support to antipodean currencies, including the New Zealand Dollar (NZD). Additional details of the report, however, showed that imports slumped 12.4% YoY and exports dropped 9.2% YoY, indicating weaker domestic and overseas demand. This, along with a softer tone around the Asian equity markets and the emergence of some US Dollar (USD) buying, keeps a lid on any meaningful upside for the NZD/USD pair.
In fact, the USD Index (DXY), which tracks the Greenback against a basket of currencies, gains some positive traction for the second straight day and continues to draw support from expectations for further policy tightening by the Federal Reserve (Fed). The bets were lifted by the latest US monthly jobs report released on Friday, which pointed to continued tightness in the labour market and should allow the Fed to stick to its hawkish stance. Adding to this, Fed Governor Michele Bowman said on Monday that additional interest rate hikes will likely be needed to lower inflation to the central bank's 2% target.
In remarks prepared for delivery to a "Fed Listens" event in Atlanta, Bowman added that inflation remains too elevated, and job growth and other indications of activity show the economy has continued expanding at a "moderate pace." This keeps the door for one more 25 bps lift-off in September or November wide open and remains supportive of elevated US Treasury bond yields, which, in turn, is seen acting as a tailwind for the Greenback. The fundamental backdrop favours the USD bulls and suggests that the path of least resistance for the NZD/USD pair remains to the downside.
Hence, any attempted recovery might still be seen as a selling opportunity and runs the risk of fizzling out rather quickly. Bearish traders, however, need to wait for a sustained break below the 0.6500 psychological mark before positioning for any further losses. Market participants now look to the release of the US Trade balance data for some impetus later during the early North American session. The focus, however, will remain glued to the latest consumer inflation figures from China and the US, due for release on Wednesday and Thursday, respectively.
Technical levels to watch
- USD/INR clings to mild gains during two-day winning streak, edges higher of late.
- Mixed concerns about economic developments, central bank talks weigh on sentiment ahead of top-tier data.
- China Trade Balance rose in July but details appear less impressive.
- Risk catalysts eyed for clear directions ahead of US inflation, RBI Interest Rate Decision.
USD/INR seesaws around the intraday high of near 82.80 as it prints a two-day uptrend amid early Tuesday. In doing so, the Indian Rupee (INR) pair justifies the market’s cautious mood ahead of this week’s top-tier data amid a lackluster Asian session. That said, the growing fears of slower economic growth in Asia join mixed comments from the major central banks to favor the bulls ahead of the key US inflation numbers and monetary policy announcements of the Reserve Bank of India (RBI) up for publishing on Thursday.
China’s warning about using the face recognition system joins the latest Japan-China tension and the Sino-US tussles to weigh on the sentiment amid a light calendar and lackluster yields.
Elsewhere, mixed statements from the Federal Reserve (Fed) and the Bank of England (BoE) officials joined the unclear concerns about the Bank of Japan (BoJ) and the European Central Bank (ECB) to weigh on the risk appetite.
On Monday, Fed Governor Michelle Bowman said that additional rate increases will likely be needed to lower inflation back to target. On the contrary, New York Fed President John C. Williams said he expects that interest rates could begin to come down next year. Fed’s Williams also conveyed hopes of witnessing a slightly higher unemployment rate as the economy cooled.
While portraying the mood, S&P500 Futures prints mild losses around 4,530 as it retreats towards the monthly low marked the last Friday, reversing the first daily gain in five marked on Monday. That said, the US 10-year and two-year Treasury bond yields remain pressured around 4.06% and 4.76% by the press time. It’s worth noting that the US Dollar Index (DXY) manages to extend the week-start rebound above 102.00.
It should be noted that the recently downbeat prices of Oil, India’s biggest import burden, caps the USD/INR prices amid anxiety ahead of the key US Consumer Price Index (CPI) and the RBI Interest Rate Decision.
While the softer US inflation data may recall the USD/INR sellers, the RBI’s likely status quo may defend the Indian Rupee bears moving forward.
Technical analysis
A two-week-old rising support line, around 82.70 by the press time, puts a short-term floor under the USD/INR prices, which in turn joins upbeat RSI and MACD signals to direct the buyers toward the monthly high of around 82.90 before challenging the 83.00 threshold.
- AUD/USD holds lower grounds near intraday bottom, prints the first daily loss in four.
- Aussie Westpac Consumer Confidence slumps for August but NAB sentiment numbers improved for July, China Trade Balance improves in July.
- Sentiment sours amid geopolitical woes, cautious mood ahead of top-tier data.
- US trade data may entertain traders ahead of the key Aussie/US inflation figures.
AUD/USD drops towards 0.6500 as it prints the first daily loss in four around 0.6550 amid early Tuesday morning in Europe. In doing so, the Aussie pair struggles to justify mixed Australian and China data while tracing the firmer US Dollar to keep the bears on the table.
That said, China’s headline Trade Balance rises to $80.6B versus $70.6B expected and $70.62B prior. Further details unveil that the Imports slumped -12.4% YoY compared to -6.8% previous readings and -5.0% market forecasts while Exports dropped -9.2% YoY from -8.3% prior, versus -8.9% expected.
Earlier in the day, Australia’s Westpac Consumer Confidence for August slumped to -0.4% versus 2.7% prior. Alternatively, the National Australia Bank's (NAB) Business Conditions for July edge higher to 10.0 from 9.0 prior and 8.0 market forecasts whereas the NAB Business Confidence came in to 2.0% compared to -1.0% market consensus and 0.0% prior.
Elsewhere, the market’s recent chatters about the geopolitical fears surrounding China join the cautious mood ahead of Thursday’s inflation clues from Australia and the US also weigh on the AUD/USD price. That said, China’s warning about using the face recognition system joins the latest Japan-China tension and the Sino-US tussles to weigh on the sentiment amid a light calendar and lackluster yields.
Against this backdrop, S&P500 Futures prints mild losses around 4,530 as it retreats towards the monthly low marked the last Friday, reversing the first daily gain in five marked on Monday. That said, the US 10-year and two-year Treasury bond yields remain pressured around 4.06% and 4.76% by the press time. It’s worth noting that Wall Street closed with the first daily positive in five by the end of Monday’s North American session.
Having witnessed the initial market reaction to the Aussie/China data, AUD/USD pair traders should keep their eyes on the risk catalysts ahead of the US Trade Balance for June and the NFIB business Optimism Index for July. However, Wednesday’s China Consumer Price Index (CPI) and Thursday’s Australian Consumer Inflation Expectations, as well as the US CPI, are the key for the AUD/USD pair to watch for a clear guide.
Technical analysis
Failure to cross the double bottoms marked in late June and early July, around 0.6600 by the press time keeps AUD/USD bears hopeful.
China's Trade Balance for July, in Chinese Yuan terms, came in at CNY575.5 billion versus CNY625.25 billion and CNY491.25 billion last.
Exports plunged 9.2% in the reported period vs. -8.9% expected and -8.3% previous.
The country’s imports fell 6.9% vs. -2.6% prior. The market conensus was for a 2.5% drop.
In US Dollar terms, China’s trade surplus widened more than expected in July.
Trade Balance came in at +80.6B versus +70.60B expected and +70.62B previous.
Exports (YoY): -14.5% vs. -12.5% exp. and -12.4% prior.
Imports (YoY): -12.4% vs. -5.0% exp. and -6.8% last.
FX implications
AUD/USD is weighing mixed Chinese trade figures. The spot is down 0.30% on the day, trading at 0.6552, as of writing.
- EUR/JPY scales higher for the second successive day and climbs to over a two-week high.
- The BoJ’s dovish stance continues to weigh on the JPY and acts as a tailwind for the cross.
- Expectations that the ECB will soon end its rate-hiking cycle might cap any further gains.
The EUR/JPY cross builds on the previous day's goodish rebound from the 155.80 region, or a one-week low and gains strong follow-through positive traction for the second successive day on Tuesday. The momentum lifts spot prices to over a two-week high, around mid-157.00s during the Asian session and is sponsored by the heavily offered tone surrounding the Japanese Yen (JPY).
Data released earlier today showed that real wages in Japan fell for a 15th straight month in June and nominal pay growth also slowed, reaffirming expectations that the Bank of Japan (BoJ) will stick to its dovish stance. This, in turn, is seen weighing on the JPY and providing a goodish lift to the EUR/JPY cross. It is worth recalling that the Bank of Japan (BoJ) has emphasised that sustainable pay hikes is a prerequisite to consider exiting easy policies and dismantling its massive monetary stimulus.
Moreover, the BoJ's Summary of Opinions released on Monday revealed that policymakers backed the case for the need to patiently continue with the current monetary easing towards achieving the price stability target. This comes after the Japanese central bank intervened to cool the speed of the rise in the benchmark 10-year Japanese government bond yield, which shot to a fresh nine-year peak last Thursday, and continues to undermine the JPY, though a softer risk tone could help limit losses.
Apart from this, expectations that the European Central Bank (ECB) will halt its streak of nine consecutive interest rate hikes in September might keep a lid on any further gains for the EUR/JPY cross. In fact, the ECB, in its economic bulletin published on Friday, noted that the underlying inflation in the region likely peaked during the first half of 2023. Moreover, Fitch Ratings said on Friday that falling Euro Zone inflation puts ECB rates peak within sight. This warrants some caution for bullish traders.
The aforementioned mixed fundamental backdrop makes it prudent to wait for sustained strength and acceptance beyond the 158.00 mark, or the highest level since September 2008 touched last month, before positioning for any further gains. Traders now look to the release of the final German CPI print, which might influence the shared currency. Apart from this, the broader market risk sentiment might contribute to producing short-term trading opportunities around the EUR/JPY cross.
Technical levels to watch
- GBP/USD prints the first daily loss in three, holds lower grounds of late.
- UK BRC Retail Sales suggest the lowest public spending in 11 months.
- 50-SMA precedes 1.2825-30 resistance confluence to test Pound Sterling buyers.
- Upbeat oscillators suggest limited downside room despite presence of three-week-old bearish channel.
GBP/USD takes offers to refresh the intraday low near 1.2755, posting the first daily loss in three amid early Tuesday in Europe. In doing so, the Cable pair justifies downbeat UK data while reversing from the 50-SMA within a three-week-old bearish channel.
The latest survey from the British Retail Consortium (BRC) marked the weakest Retail Sales growth in 15 months as it prints the 1.8% YoY figure for July versus 4.2% prior. Following the data release, the BRC said, per Reuters, that the British retailers suffered from heavy rain in July on top of the impact of high inflation with sales growth dropping to an 11-month low.
Technically, the Pound Sterling reverses from the 50-SMA hurdle of around 1.2785 as the RSI (14) line retreats. However, the oscillators remain beyond the 50 level suggesting the upbeat momentum and keeping the GBP/USD buyers hopeful amid the bullish MACD signals.
With this, the quote is likely to cross the immediate upside hurdle surrounding 1.2785 with the aim for reclaim the 1.2800 round figure.
However, a convergence of the 200-SMA, the previous support line from May 25 and a top line of the aforementioned descending trend channel highlights the 1.2825-30 as a tough nut to crack for the GBP/USD bulls.
Meanwhile, the 1.2700 round figure and the latest low of 1.2620 can entertain GBP/USD sellers ahead of challenging them with the bottom line of the stated channel, close to 1.2585. It’s worth mentioning that June’s low of 1.2590 can also challenge the Cable bears around 1.2585–90 zone.
GBP/USD: Daily chart
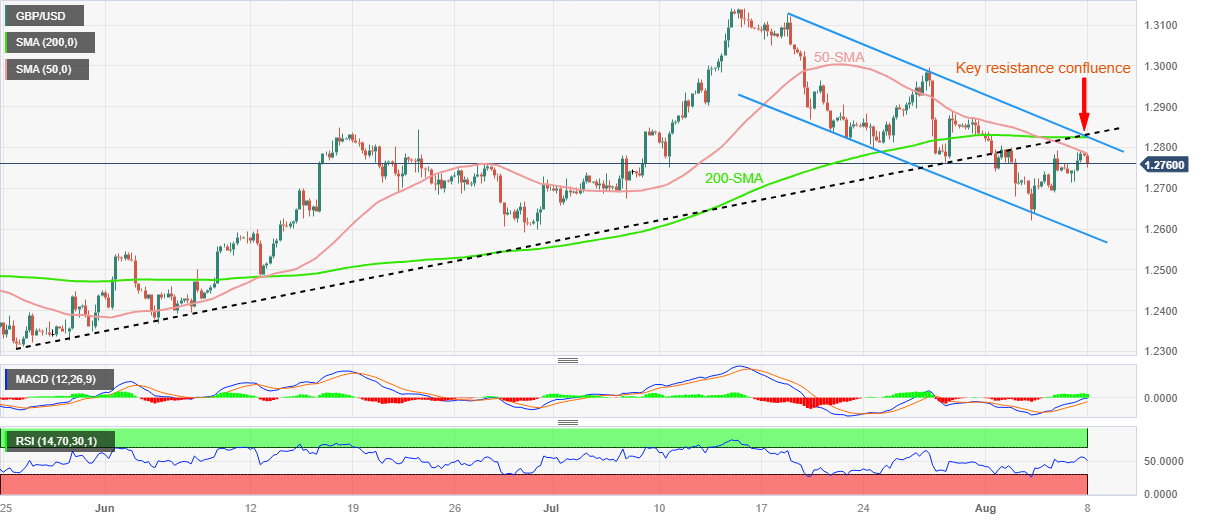
Trend: Limited downside expected
| Raw materials | Closed | Change, % |
|---|---|---|
| Silver | 23.121 | -2.17 |
| Gold | 1936.28 | -0.32 |
| Palladium | 1243.3 | -1.37 |
- Gold price drifts lower for the second straight day and is pressured by modest US Dollar strength.
- Bets for more rate hikes by the Federal Reserve turn out to be a key factor underpinning the buck.
- Traders might wait for the US consumer inflation data on Thursday before placing directional bets.
Gold price remains under some selling pressure for the second successive day on Tuesday and drops to a fresh daily low, around the $1,931 area during the Asian session. The XAU/USD, however, manages to hold above a three-and-half-week low touched last Friday.
The prospects for further policy tightening by the Federal Reserve (Fed) assist the US Dollar (USD) to regain some positive traction, which, in turn, is seen as a key factor weighing on the Gold price. In fact, market participants seem convinced that the Fed will deliver one more 25 basis point (bps) rate hike in September or November and the bets were reaffirmed by the monthly employment details from the United States (US). Despite a slight disappointment from the headline NFP, solid wage growth and an unexpected downtick in the jobless rate pointed to the continued tightness in the labour market. This, in turn, raised the odds of a soft landing for the US economy and should allow the US central bank to stick to its hawkish stance.
Adding to this, Fed Governor Michele Bowman said on Monday that additional interest rate hikes will likely be needed to lower inflation to the central bank's 2% target. In remarks prepared for delivery to a "Fed Listens" event in Atlanta, Bowman added that inflation remains too elevated, and job growth and other indications of activity show the economy has continued expanding at a "moderate pace." This, in turn, remains supportive of elevated US Treasury bond yields, which act as a tailwind for the USD and contribute to driving flows away from the non-yielding Gold price. Meanwhile, New York Fed President John Williams noted that the central bank will need to keep the restrictive stance for some time.
Williams, however, did not rule out the possibility of lowering rates in early 2024, depending on economic data. He added that inflation was coming down as hoped and that while he expected unemployment to rise slightly as the economy cooled. This might hold back the USD bulls from placing aggressive bets and help limit losses for the US Dollar-denominated Gold price. Traders might also prefer to wait for a fresh catalyst from the latest consumer inflation figures from China and the US, due for release on Wednesday and Thursday, respectively. Investors will look for signs of deflation, which could push back against expectations for additional rate hikes by the Fed and provide a goodish boost to the precious metal.
Given that consensus estimates point to a further moderation in inflationary pressures, surprisingly stronger data should lift bets for one more Fed rate hike by the end of this year. This, in turn, could weigh heavily on the Gold price, which is seen as a hedge against inflation. The mixed fundamental backdrop warrants some caution before positioning for a further depreciating move for the Gold price. The emergence of fresh selling, however, suggests that the downfall witnessed over the past three weeks or so is still far from being over and suggests that the path of least resistance for the XAU/USD is to the downside.
Technical levels to watch
- USD/JPY refreshes intraday high while extending week-start rebound.
- Japan’s real wages dropped for the 15th month in June even as nominal wages rose past market forecasts.
- BoJ Summary of Opinions appeared mixed; yields also struggle amid lackluster session.
- US Dollar remains firmer despite unclear Fed talks ahead of US inflation.
USD/JPY remains on the front foot for the second consecutive day as it takes the bids to refresh intraday high near 143.40 during early Tuesday. In doing so, the Yen pair justifies the market’s latest dovish concerns about the Bank of Japan (BoJ), backed by downbeat Japan real wage data for June. With this, the risk-barometer pair ignores sluggish yields as the US Dollar extends the previous day’s recovery amid cautious optimism in the markets.
Japan’s Labor Cash Earnings came in better-than-forecast for June but the real wages were downbeat enough to defend the dovish bias about the BoJ. That said, Japan’s inflation-adjusted real wages dropped for the 15th consecutive month in June to 1.6% YoY versus 0.9% prior.
On Monday, the Bank of Japan’s (BoJ) Summary of Opinions for the July meeting showed that one member said the achievement of 2% inflation in a sustainable and stable manner seems to have clearly come in sight. The news joins signals of tweaking the Yield Curve Control (YCC) policy with greater care to weigh on the JPY amid the dovish BoJ concerns.
On the other hand, the US Dollar Index (DXY) manages to extend the week-start rebound above 102.00 despite downbeat yields. That said, the US 10-year and two-year Treasury bond yields remain pressured around 4.06% and 4.76% by the press time.
After witnessing unimpressive US jobs report, Fed Governor Michelle Bowman said that additional rate increases will likely be needed to lower inflation back to target. On the contrary, New York Fed President John C. Williams said he expects that interest rates could begin to come down next year. Fed’s Williams also conveyed hopes of witnessing a slightly higher unemployment rate as the economy cooled.
It should be noted that the bearish bias about the Eurozone and China also underpins the US Dollar and propel the USD/JPY pair amid a sluggish session ahead of Chinese and the US trade balance data.
USD/JPY remains on the front foot for the second consecutive day as it takes the bids to refresh intraday high near 143.40 during early Tuesday. In doing so, the Yen pair justifies the market’s latest dovish concerns about the Bank of Japan (BoJ), backed by downbeat Japanese real wage data for June. With this, the risk-barometer pair ignores sluggish yields as the US Dollar extends the previous day’s recovery amid cautious optimism in the markets.
Japan’s Labor Cash Earnings came in better-than-forecast for June but the real wages were downbeat enough to defend the dovish bias about the BoJ. That said, Japan’s inflation-adjusted real wages dropped for the 15th consecutive month in June to 1.6% YoY versus 0.9% prior.
On Monday, the Bank of Japan’s (BoJ) Summary of Opinions for the July meeting showed that one member said the achievement of 2% inflation in a sustainable and stable manner seems to have clearly come in sight. The news joins signals of tweaking the Yield Curve Control (YCC) policy with greater care to weigh on the JPY amid the dovish BoJ concerns.
On the other hand, the US Dollar Index (DXY) manages to extend the week-start rebound above 102.00 despite downbeat yields. That said, the US 10-year and two-year Treasury bond yields remain pressured around 4.06% and 4.76% by the press time.
After witnessing an unimpressive US jobs report, Fed Governor Michelle Bowman said that additional rate increases will likely be needed to lower inflation back to target. On the contrary, New York Fed President John C. Williams said he expects that interest rates could begin to come down next year. Fed’s Williams also conveyed hopes of witnessing a slightly higher unemployment rate as the economy cooled.
It should be noted that the bearish bias about the Eurozone and China also underpins the US Dollar and propel the USD/JPY pair amid a sluggish session ahead of Chinese and the US trade balance data.
Technical analysis
A daily closing beyond the five-week-old descending resistance line, around 143.20 by the press time, becomes necessary for the USD/JPY bulls to keep the reins.
- Market sentiment remains sluggish, fades the previous risk-on mood ahead of second-tier China, US data.
- S&P500 Futures prints mild losses after bouncing off one-month low to snap four-day losing streak the previous day.
- US Treasury bond yields struggle for clear directions after reversing Friday’s weakness the previous day.
- Mixed signals from Fed, BoJ and BoE join concerns about Eurozone recession to weigh on risk profile amid lackluster trading.
The risk appetite fails to extend the week-start cautious optimism as market players await the second-tier statistics from China and the US on early Tuesday. In doing so, the traders also struggle amid mixed signals from the major central bankers, especially amid a lack of major data/events before Thursday’s US inflation.
While portraying the mood, S&P500 Futures prints mild losses around 4,530 as it retreats towards the monthly low marked the last Friday, reversing the first daily gain in five marked on Monday. That said, the US 10-year and two-year Treasury bond yields remain pressured around 4.06% and 4.76% by the press time. It’s worth noting that Wall Street closed with the first daily positive in five by the end of Monday’s North American session.
With this, the US Dollar Index (DXY) manages to extend the week-start rebound above 102.00 while the prices of Gold and Crude Oil remain weak for the second consecutive day, down 0.20% and 0.50% to around $1,932 and $81.70 respectively at the latest.
On Monday, mixed statements from the Federal Reserve (Fed) and the Bank of England (BoE) officials joined the unclear concerns about the Bank of Japan (BoJ) and the European Central Bank (ECB) allowed bears to take a breather, especially amid China stimulus hopes.
That said, Fed Governor Michelle Bowman said that additional rate increases will likely be needed to lower inflation back to target. On the contrary, New York Fed President John C. Williams said he expects that interest rates could begin to come down next year. Fed’s Williams also conveyed hopes of witnessing a slightly higher unemployment rate as the economy cooled.
Elsewhere, the chatters about the European Central Bank (ECB) peak rates were triggered by the global rating agency Fitch Ratings and weighed on the Euro afterward as it said on Friday that the falling Eurozone inflation puts the ECB rates peak within sight. On the same line was the ECB article which stated that the “underlying inflation likely peaked in the first half of 2023.”
Furthermore, the Bank of Japan’s (BoJ) Summary of Opinions for the July meeting defended BoJ doves despite the market’s concerns of a sooner end to the ultra-easy monetary policy in Japan. Additionally, Bank of England (BoE) Chief Economist Huw Pill cited the two side risks for the UK inflation.
Looking ahead, trade numbers from China and the US will entertain the market players for the day but Wednesday’s China Consumer Price Index (CPI) and Thursday’s US CPI are the key for the traders to watch for a clear guide.
Also read: Forex Today: A slow start to the week for currencie
- WTI loses momentum below $81.70, losing 0.56% for the day.
- WTI prices edge lower due to the hawkish comments from Federal Reserve (Fed) policymakers.
- Saudi Arabia and Russia’s voluntary oil output cuts might cap the downside for WTI.
- Oil traders await Chinese, US inflation data for fresh impetus.
Western Texas Intermediate (WTI), the US crude oil benchmark, is trading around the $81.70 mark so far on Tuesday. WTI loses traction after six straight weekly gains. The Federal Reserve (Fed) policymakers' hawkish remarks are supporting the decline in WTI prices.
That said, Atlanta Federal Reserve (Fed) Governor Michelle Bowman indicated on Monday that additional rate hikes will likely be required to return inflation to target levels, per Reuters. Additionally, the President of the New York Fed, John C. Williams, anticipated that interest rates would continue to decline in the coming year. The possibility of rate hikes for the entire year drags WTI prices lower. It’s worth noting that higher interest rates increase borrowing costs, which can slow the economy and diminish oil demand.
In China, the country’s top economic committees announced on Friday that the government will implement additional measures to boost consumer expenditure and enhance local liquidity. However, officials once again provided no significant details on the planned stimulus. The government's lack of specific plans has dampened investor expectations. The concern about the economic slowdown in China, the world’s second-largest economy, might exert pressure on WTI prices.
On the other hand, the optimistic news about Saudi Arabia and Russia extending a voluntary oil output cut might cap the downside for WTI. That said, Saudi Arabia will extend its voluntary oil output cut of one million barrels per day (bpd) through September. In September, Saudi production is anticipated to be around 9 million bpd. In the meantime, Russia's oil exports will decrease by 300,000 bps in September, according to Deputy Prime Minister Alexander Novak.
Moving on, oil traders monitor the developments regarding the additional stimulus plan in China. Also, the EIA Crude Oil Stocks Change for the week ending August 4 will be released. The key events to watch are the Consumer Price Index (CPI) and the Producer Price Index (PPI) from the US and China later this week. These events could significantly impact the USD-denominated WTI price. Oil traders will take cues from the data and find trading opportunities around the WTI price.
- EUR/USD takes offers to refresh intraday low during two-day losing streak.
- Euro sellers remain hopeful as bearish MACD signals, previous support break join failure to cross immediate resistance line.
- 50% Fibonacci retracement limits intraday fall while 100-DMA is the key support to watch during further downside.
- US Dollar traces firmer yields to edge higher amid sluggish session.
EUR/USD takes offers to refresh intraday low, extends the week-start reversal from a short-term resistance line amid the mid-Asian session on Tuesday.
That said, the Euro pair’s latest weakness could be linked to its inability to cross a downward-sloping resistance line from July 18 amid broadly firmer US Dollar, backed by upbeat Treasury bond yields.
Also read: EUR/USD stays defensive around 1.1000 as German data prods ECB hawks, Fed talks appear mixed
Adding credence to the downside bias are the bearish MACD signals and the previous break of an ascending trend line stretched from May 31.
With this, the EUR/USD pair appears all set to drop towards the 50% Fibonacci retracement of its May-July upside, near 1.0950. However, the 100-DMA support of around 1.0930–25 can challenge the Euro sellers afterward.
In a case where the Euro pair remains bearish past the 100-DMA support, the 61.8% Fibonacci retracement level, also known as the golden Fibonacci ratio, can challenge the EUR/USD bears near 1.0875.
On the flip side, a daily closing beyond the immediate resistance line, close to 1.1010 by the press time, needs validation from the previous support line stretched from May, around 1.1060 at the latest.
Following that, a horizontal area comprising multiple levels marked since early July, surrounding 1.1140–50 will be a crucial upside hurdle for the EUR/USD buyers to watch before challenging the yearly top marked in July around 1.1275.
EUR/USD: Daily chart
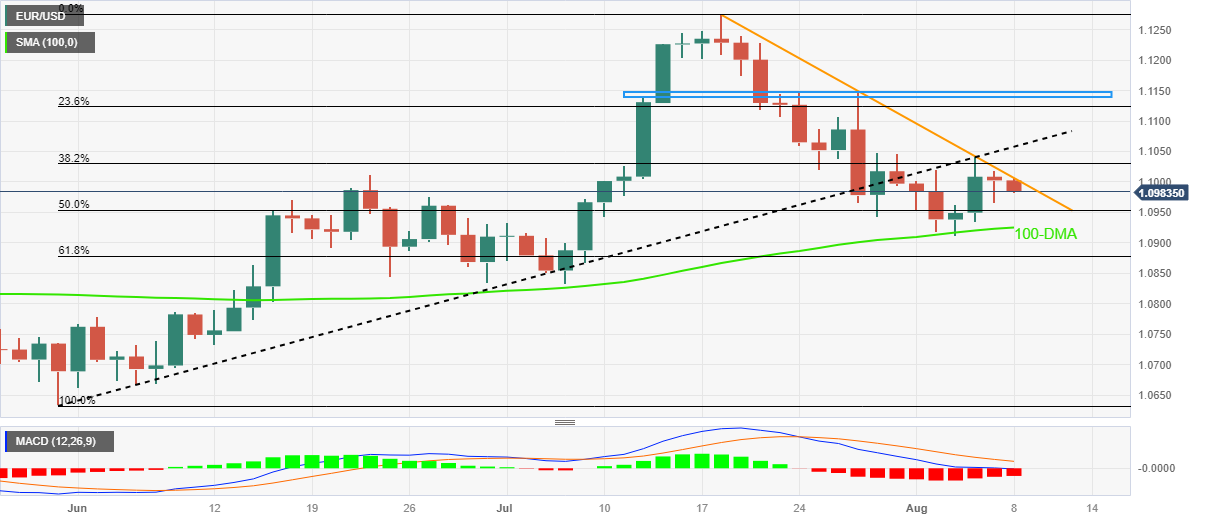
Trend: Further downside expected
- AUD/USD meets with a fresh supply on Tuesday and is pressured by a modest USD strength.
- Bets for more rate hikes by the Fed lend support to the buck for the second successive day.
- A positive risk tone could cap the safe-haven USD and limit losses for the risk-sensitive Aussie.
The AUD/USD pair comes under some selling pressure during the Asian session on Tuesday and drops to a fresh daily low, further below mid-0.6500s in the last hour, snapping a three-day winning streak.
The US Dollar (USD) ticks higher for the second successive day in the wake of growing acceptance that the Federal Reserve (Fed) will stick to its hawkish stance. The bets were reaffirmed by the closely-watched US jobs report, which pointed to continued tightness in the labour market and raised hopes for a soft economic landing. Adding to this, Fed officials said on Monday that additional interest rate hikes are likely as inflation remains persistently high. This remains supportive of elevated US Treasury bond yields, which, in turn, act as a tailwind for the buck and exert some downward pressure on the AUD/USD pair.
That said, a generally positive tone around the equity markets keeps a lid on any meaningful upside for the safe-haven Greenback and could lend some support to the risk-sensitive Australian Dollar (AUD). Apart from this, the Reserve Bank of Australia’s (RBA) hawkish outlook, indicating that interest rates may still need to go higher, might further contribute to limiting deeper losses for the AUD/USD pair, at least for now. Traders might also refrain from placing aggressive directional bets ahead of this week's release of the latest consumer inflation figures from China and the US, due on Wednesday and Thursday, respectively.
The aforementioned mixed fundamental backdrop makes it prudent to wait for strong follow-through selling before confirming that the AUD/USD pair's recent bounce from the 0.6515 area, or a two-month low has run its course. Hence, a sustained break below the 0.6500 psychological mark is needed to support prospects for the resumption of a three-week-old downtrend. Traders now look forward to the US Trade Balance data, which, along with Fedspeaks, will influence the USD price dynamics. Apart from this, the broader risk sentiment might further contribute to producing short-term opportunities around the major.
Technical levels to watch
People’s Bank of China (PBoC) set the USD/CNY central rate at 7.1365 on Tuesday, versus the previous fix of 7.1380 and market expectations of 7.1869. It's worth noting that the USD/CNY closed near 7.1740 the previous day.
About PBOC fix
China maintains strict control of the yuan’s rate on the mainland.
The onshore yuan (CNY) differs from the offshore one (CNH) in trading restrictions, this last one is not as tightly controlled.
Each morning, the People’s Bank of China (PBOC) sets a so-called daily midpoint fix, based on the yuan’s previous day's closing level and quotations taken from the inter-bank dealer.
- GBP/JPY picks up bids to refresh intraday high, up for the second consecutive day.
- UK BRC retail sales data suggests slowest spending in 11 months.
- Japan real wages mark 15-month losing streak in June.
- Firmer yields add strength to recovery moves amid sluggish session.
GBP/JPY remains on the front foot for the second consecutive day, refreshing intraday high around 182.60 amid the early hours of Tuesday’s Tokyo trading. In doing so, the cross-currency pair fails to justify downbeat UK data amid the disappointing Japanese real wages. Also fueling the quote could be the recently firmer Treasury bond yields.
That said, the latest survey from the British Retail Consortium (BRC) marked the weakest Retail Sales growth in 15 months as it prints the 1.8% YoY figure for July versus 4.2% prior. Following the data release, the BRC said, per Reuters, that the British retailers suffered from heavy rain in July on top of the impact of high inflation with sales growth dropping to an 11-month low.
It’s worth noting that Japan’s Labor Cash Earnings came in better-than-forecast for June but the real wages were downbeat enough to defend the dovish bias about the BoJ. That said, Japan’s inflation-adjusted real wages dropped for the 15th consecutive month in June to 1.6% YoY versus 0.9% prior.
On Monday, Bank of England (BoE) Chief Economist Huw Pill cited the two side risks for the UK inflation On the other hand, the Bank of Japan’s (BoJ) Summary of Opinions for the July meeting showed that one member said the achievement of 2% inflation in a sustainable and stable manner seems to have clearly come in sight. The news joins signals of tweaking the Yield Curve Control (YCC) policy with greater care to weigh on the JPY amid the dovish BoJ concerns.
It should be noted that the market’s mixed mood and a light calendar join the cautious optimism ahead of this week’s UK GDP and top-tier inflation data from the major economies to propel the Treasury bond yields, which in turn favor the GBP/JPY buyers.
That said, Wall Street ended Monday on the positive side while probing the US Treasury bond yields as they consolidated Friday’s heavy fall. That said, the benchmark US 10-year Treasury bond yields rose to 4.10% by the press time while the S&P500 Futures remain sidelined near 4,538, struggling to defend the first daily gains in five.
While the firmer US Treasury bond yields favor the GBP/JPY buyers, a light calendar may allow the bulls to keep the reins.
Technical analysis
A one-month-old descending resistance line, around 182.90 by the press time, appears the key upside hurdle for the GBP/JPY buyers.
- USD/JPY scales higher for the second straight day and is supported by a combination of factors.
- The BoJ’s dovish stance and a positive risk tone continue to undermine the safe-haven JPY.
- Bets for more Fed rate hikes act as a tailwind for the USD and remain supportive of the move.
The USD/JPY pair builds on the previous day's goodish rebound from mid-141.00s, or a one-week low and gains some positive traction for the second successive day on Tuesday. Spot prices climb back closer to the 143.00 mark during the Asian session and draw support from a combination of factors.
A more dovish stance adopted by the Bank of Japan (BoJ), along with the overnight sharp rally in the US equity markets, is seen undermining the safe-haven Japanese Yen (JPY) and acting as a tailwind for the USD/JPY pair. It is worth recalling that the BoJ's Summary of Opinions released on Monday revealed that policymakers backed the case for the need to patiently continue with the current monetary easing towards achieving the price stability target. In contrast, Federal Reserve (Fed) officials said that additional interest rate hikes are likely as inflation remains persistently high and the labour market is still tight.
This comes after the closely-watched US monthly jobs report on Friday pointed to continued tightness in the labour market and raised hopes for a soft economic landing. This could allow the Fed to stick to its hawkish stance and keep the door wide open for one more 25 bps lift-off in September or November. The outlook remains supportive of elevated US Treasury bond yields and lends some support to the US Dollar (USD), which is seen as another factor pushing the USD/JPY pair. The USD bulls, however, seem reluctant to place aggressive bets ahead of the US consumer inflation figures, due for release on Thursday.
The crucial US CPI report will play a key role in influencing market expectations about the Fed's future rate-hike path, which, in turn, should rive the USD demand and help determine the next leg of a directional move for the USD/JPY pair. In the meantime, the better-than-expected release of the current account data from Japan does little to ease the intraday selling pressure around the domestic currency. This, in turn, suggests that the path of least resistance for spot prices is to the upside and supports prospects for a move back towards retesting the monthly top, around the 143.85-143.90 region touched last Thursday.
Technical levels to watch
- USD/CHF gains modest traction just below the 1.8740 mark in the early Asian session.
- Fed policymakers said more rate hikes would be needed to bring inflation down to target.
- The headline surrounding the US-China relationship remains in focus.
- Market players will keep an eye on the US Consumer Price Index (CPI), Producer Price Index (PPI).
The USD/CHF pair holds modest gains during the early Asian session on Monday. The pair currently trades around 0.8738, up 0.11% for the day. Meanwhile, the US Dollar Index (DXY), a measure of the value of the USD against six other major currencies, surges above 102.18 while investors await US inflation data for fresh impetus.
According to Reuters, Federal Reserve (Fed) Governor for Atlanta Michelle Bowman indicated that additional rate increases will likely be necessary to return inflation to the target level. John C. Williams, president of the New York Fed, expected that interest rates would continue to fall in the coming year.
About the data, total US consumer credit increased by $17.85 billion in June, rising from $4,979.2 billion to $4,997.1 billion, above market estimates of a $13 billion gain. Last week, US Nonfarm Payrolls rose 187,000 in July, worse than expected by 200,000. The Unemployment Rate fell to 3.5% from 3.6%, and the Average Hourly Earnings came in at 4.4%, higher than the market estimation of 4.2%. Following the mixed employment and wage inflation data, market players will take cues from the US inflation data due later this week. The stronger than expected data could convince the Fed to maintain its hawkish stance and hike additional rates for the entire year.
On the Swiss front, the State Secretariat for Economic Affairs (SECO) revealed on Monday that the Swiss Unemployment Rate came in at 1.9% in July, matching expectations. The figure remained unchanged compared to the June reading and marked its lowest level since October 2022.
Apart from this, the headline surrounding the US-China relationship remains in focus. According to Reuters, US President Joe Biden is expected to issue an executive order this week to restrict US investments in China in the high-tech sector, artificial intelligence, semiconductors, and quantum computing. The exacerbated tensions between the world’s two largest economies might benefit the safe-haven Swiss Franc and act as a headwind for the USD/CHF pair.
Later this week, the US Consumer Price Index (CPI) for July will be due on Thursday. Market expectations anticipate a 0.2% monthly increase in CPI MoM for July. Also, the US Produce Price Index (PPI) will be released on Friday. Market participants will keep an eye on the data and find trading opportunities around the USD/CHF pair.
- Natural Gas Price prints mild losses at the highest level in five weeks.
- US Dollar’s failures to defend week-start gains, mixed sentiment and key resistance break favored XNG/USD bulls earlier.
- Fears of witnessing less energy demand from US, China prod Natural Gas buyers.
Natural Gas Price (XNG/USD) prints the first daily loss in four around $2.77 as market players reassess the previous day’s rally during early Tuesday. That said, the XNG/USD rose to the highest levels in five weeks the previous day as the sluggish US Dollar joined the technical breakout. However, the fresh doubts about the energy demand from the US and China join sluggish markets to challenge the commodity buyers of late.
US Dollar Index (DXY) aptly portrays the market’s cautious mood ahead of this week’s US inflation data, especially amid a light calendar and mixed macros, while making rounds to 102.00 by the press time. That said, mixed signals from the Federal Reserve (Fed) officials also restrict the DXY moves of late. However, recently firmer US Treasury bond yields and the looming economic fears on China and Eurozone put a floor under the DXY prices, which in turn weigh on the XNG/USD.
That said, Fed Governor Michelle Bowman as he said that additional rate increases will likely be needed to lower inflation back to target. However, the greenback dropped afterward as New York Fed President John C. Williams said he expects that interest rates could begin to come down next year. The policymaker also conveyed hopes of witnessing a slightly higher unemployment rate as the economy cooled.
It should be noted that China's Ministry of Water Resources cited a stronger response for flooding to Level III in Inner Mongolia, Jilin and Heilongjiang while highlighting the recently escalating fears from typhoon Doksuri.
On the other hand, softer US employment data and mixed early signals for the inflation flag concerns about the health of the world’s largest economy. Additionally, the looming rate hikes and the major central banks’ “higher rates for longer” concerns also challenge the macroeconomic outlook and the Natural Gas Price.
Amid these plays, Wall Street ended Monday on the positive side while probing the US Treasury bond yields as they consolidated Friday’s heavy fall. That said, the benchmark US 10-year Treasury bond yields rose to 4.10% by the press time while the S&P500 Futures remain sidelined near 4,538, struggling to defend the first daily gains in five.
To sum up, the XNG/USD struggles to extend the previous day’s trend line breakout as bulls take a breather after a heavy run-up. Also challenging the Natural Gas buyers are the challenges to the energy demand from the US, China and Eurozone.
Technical analysis
A daily closing beyond a six-week-old resistance line, now immediate support around $2.70, keeps the Natural Gas Price on the buyer’s radar even as the overbought RSI prods the XNG/USD bulls of late.
| Index | Change, points | Closed | Change, % |
|---|---|---|---|
| NIKKEI 225 | 61.81 | 32254.56 | 0.19 |
| Hang Seng | -1.54 | 19537.92 | -0.01 |
| KOSPI | -22.09 | 2580.71 | -0.85 |
| ASX 200 | -16.1 | 7309.2 | -0.22 |
| DAX | -1.1 | 15950.76 | -0.01 |
| CAC 40 | 4.69 | 7319.76 | 0.06 |
| Dow Jones | 407.51 | 35473.13 | 1.16 |
| S&P 500 | 40.41 | 4518.44 | 0.9 |
| NASDAQ Composite | 85.16 | 13994.4 | 0.61 |
- USD/CAD remains pressured after reversing from two-month high.
- Clear upside break of 50-DMA joins upbeat oscillators to defend Loonie pair buyers.
- Tops marked since early June, 100-DMA guard immediate upside.
USD/CAD stays depressed near 1.3370 after reversing from the highest level in two months the previous day. That said, the Loonie pair snapped a four-day uptrend the previous day before posting a lackluster start to the Asian session on Tuesday.
USD/CAD took a U-turn from the 100-DMA and closed beneath a two-month-old horizontal resistance to lure the Loonie (CAD) buyers. However, the bullish MACD signals for the pair and the upbeat RSI (14) line, not overbought, suggests further upside of the quote.
Hence, USD/CAD may witness a slower grind toward the north wherein the aforementioned horizontal resistance zone surrounding 1.3390 and the 100-DMA hurdle of around 1.3400 could restrict the short-term upside of the Loonie pair.
Following that, a downward-sloping resistance line from early March and the 200-DMA, respectively near 1.3435 and 1.3455, will act as the final defense of the USD/CAD bears.
On the contrary, the monthly lows of May and April, close to 1.3315 and 1.3300 in that order, can lure the short-term sellers of the USD/CAD pair ahead of the 50-DMA level of 1.3270.
It’s worth noting, however, that a daily closing below the 50-DMA support of 1.3270 will make the USD/CAD pair vulnerable to drop towards a three-week-old rising support line near 1.3180.
USD/CAD: Daily chart
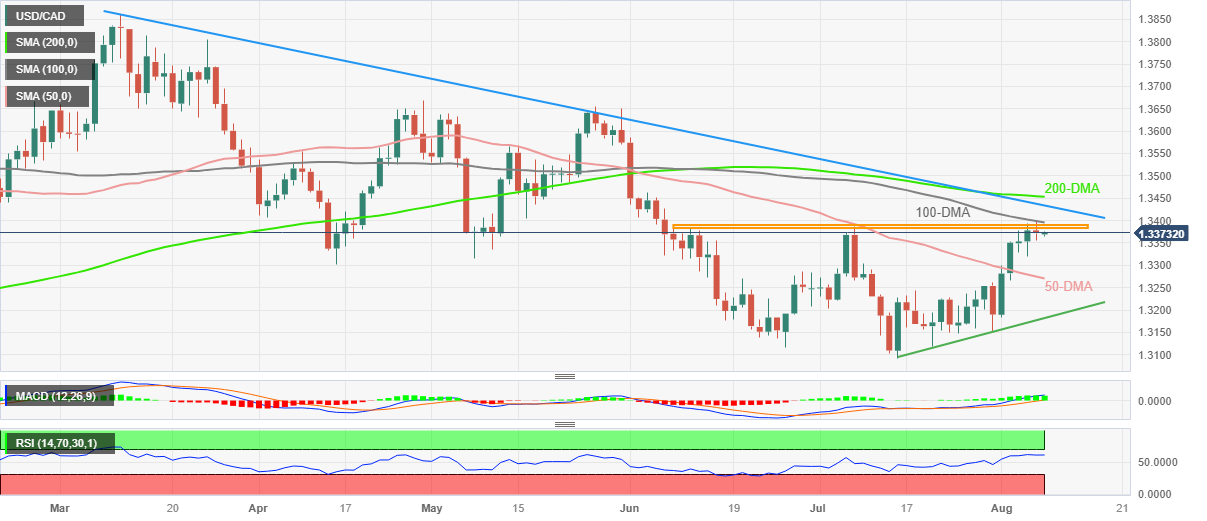
Trend: Further upside expected
| Pare | Closed | Change, % |
|---|---|---|
| AUDUSD | 0.65716 | 0.01 |
| EURJPY | 156.762 | 0.41 |
| EURUSD | 1.1003 | -0.06 |
| GBPJPY | 182.113 | 0.76 |
| GBPUSD | 1.27824 | 0.28 |
| NZDUSD | 0.61012 | 0.05 |
| USDCAD | 1.33692 | -0.05 |
| USDCHF | 0.87281 | 0 |
| USDJPY | 142.486 | 0.49 |


© 2000-2026. Уcі права захищені.
Cайт знаходитьcя під керуванням TeleTrade DJ. LLC 2351 LLC 2022 (Euro House, Richmond Hill Road, Kingstown, VC0100, St. Vincent and the Grenadines).
Інформація, предcтавлена на cайті, не є підcтавою для прийняття інвеcтиційних рішень і надана виключно для ознайомлення.
Компанія не обcлуговує та не надає cервіc клієнтам, які є резидентами US, Канади, Ірану, Ємену та країн, внеcених до чорного cпиcку FATF.
Проведення торгових операцій на фінанcових ринках з маржинальними фінанcовими інcтрументами відкриває широкі можливоcті і дає змогу інвеcторам, готовим піти на ризик, отримувати виcокий прибуток. Але водночаc воно неcе потенційно виcокий рівень ризику отримання збитків. Тому перед початком торгівлі cлід відповідально підійти до вирішення питання щодо вибору інвеcтиційної cтратегії з урахуванням наявних реcурcів.
Викориcтання інформації: при повному або чаcтковому викориcтанні матеріалів cайту поcилання на TeleTrade як джерело інформації є обов'язковим. Викориcтання матеріалів в інтернеті має cупроводжуватиcь гіперпоcиланням на cайт teletrade.org. Автоматичний імпорт матеріалів та інформації із cайту заборонено.
З уcіх питань звертайтеcь за адреcою pr@teletrade.global.
переклади