- Аналітика
- Новини та інструменти
- Новини ринків
Новини ринків
- EUR/USD trimmed near-term gains on Monday, holding above 1.0800 but declining.
- French elections delivered a less-than-solid outcome, coalition minority set for deadlock.
- US Fed Chair Powell due to testify before US federal committees this week.
EUR/USD stumbled on Monday after a muddled election outcome in France leaves policy guidance unclear for the Euro bloc. A coalition minority government win in France kept a financially-disastrous far right party out of the leadership race after a strong upset in earlier European Parliamentary elections. Still, the win was anything but decisive as a hodge-podge of coalition parties with conflicting ideologies is set for policy deadlock in France in the coming months.
Forex Today: All eyes on Powell
Federal Reserve (Fed) Chairman Jerome Powell is set to make the first of two appearances this week as the Fed head delivers the semiannual Monetary Policy Report to the US Senate Banking Committee. This will be followed up by a second appearance on Wednesday to deliver the same report to the US Congressional House Committee on Financial Services.
Later this week, key US inflation data will be released. The US Consumer Price Index (CPI) inflation is due on Thursday, and the Producer Price Index (PPI) wholesale inflation is slated for Friday. Some traders who are hoping for a decrease in inflation to push the Fed into making rate cuts sooner rather than later may be disappointed. Forecasts suggest that both CPI and PPI inflation figures are expected to either remain steady or increase slightly.
Final German inflation figures will be published during the Thursday European market session. German Harmonized Index of Consumer Prices (HCOB) inflation is broadly expected to hold steady 2.5% YoY as inflation pressures continues to vex the Bundestag’s 2% inflation target.
Economic Indicator
Consumer Price Index ex Food & Energy (MoM)
Inflationary or deflationary tendencies are measured by periodically summing the prices of a basket of representative goods and services and presenting the data as the Consumer Price Index (CPI). CPI data is compiled on a monthly basis and released by the US Department of Labor Statistics. The MoM print compares the prices of goods in the reference month to the previous month.The CPI Ex Food & Energy excludes the so-called more volatile food and energy components to give a more accurate measurement of price pressures. Generally speaking, a high reading is seen as bullish for the US Dollar (USD), while a low reading is seen as bearish.
Read more.Next release: Thu Jul 11, 2024 12:30
Frequency: Monthly
Consensus: 0.2%
Previous: 0.2%
Source: US Bureau of Labor Statistics
The US Federal Reserve has a dual mandate of maintaining price stability and maximum employment. According to such mandate, inflation should be at around 2% YoY and has become the weakest pillar of the central bank’s directive ever since the world suffered a pandemic, which extends to these days. Price pressures keep rising amid supply-chain issues and bottlenecks, with the Consumer Price Index (CPI) hanging at multi-decade highs. The Fed has already taken measures to tame inflation and is expected to maintain an aggressive stance in the foreseeable future.
EUR/USD technical levels
Fiber is struggling after repeated near-term failures to breach above 1.0840, and bulls are running out of gas as the 200-hour Exponential Moving Average (EMA) rises into 1.0780, keeping a tight floor under intraday price action.
Daily candles continue to churn in the midrange of a rough descending channel through 2024, and EUR/USD is set to face a drooping technical ceiling as the upper bound eases to 1.0850.
EUR/USD hourly chart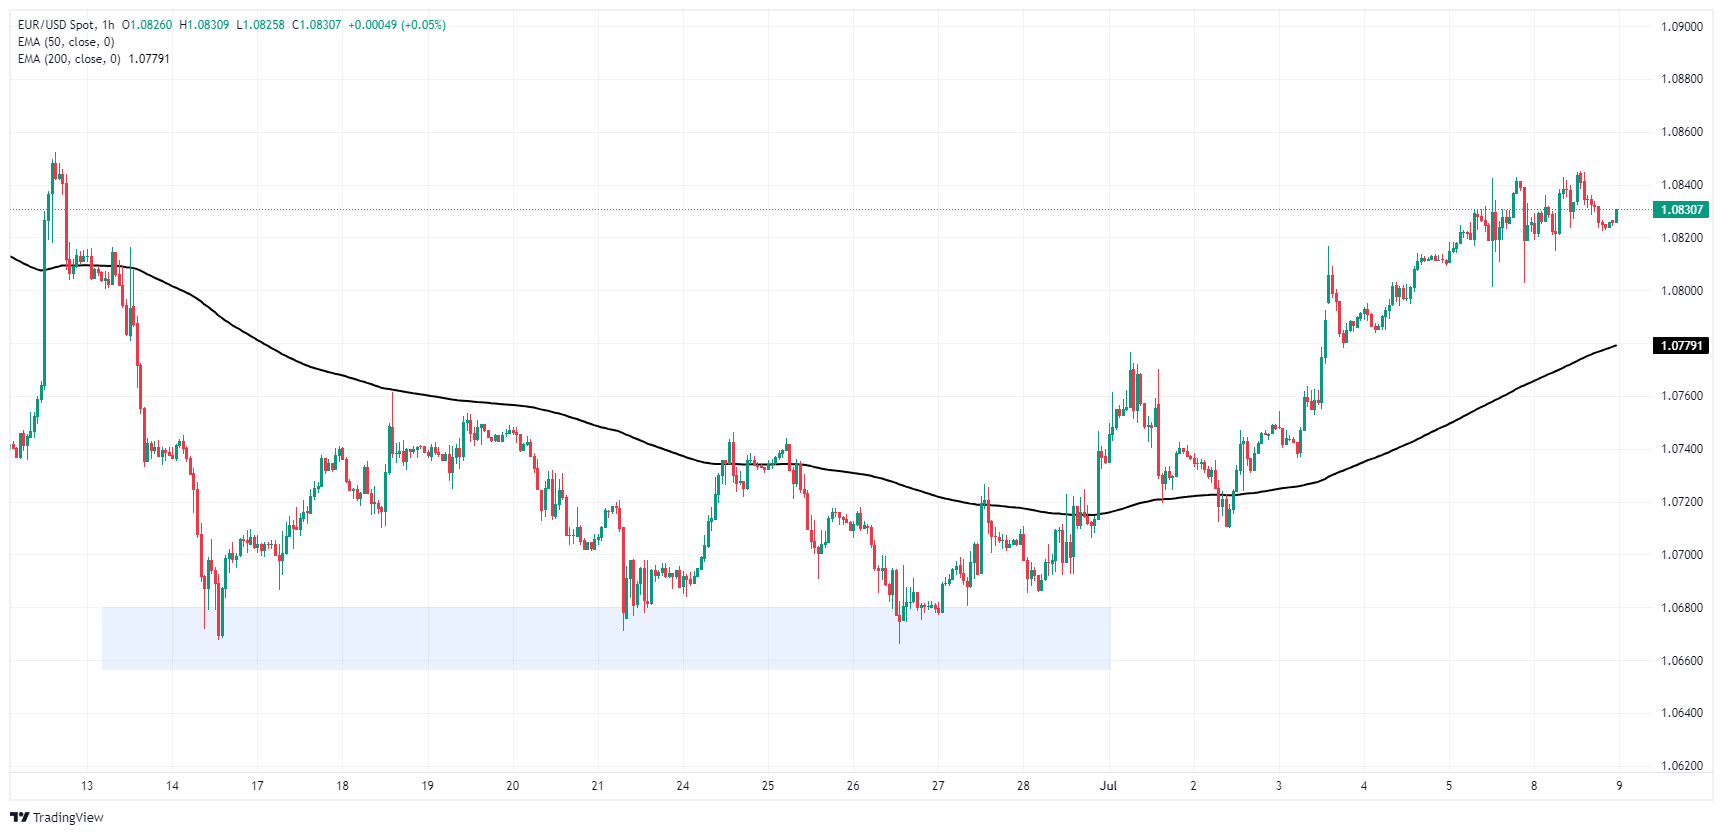
EUR/USD daily chart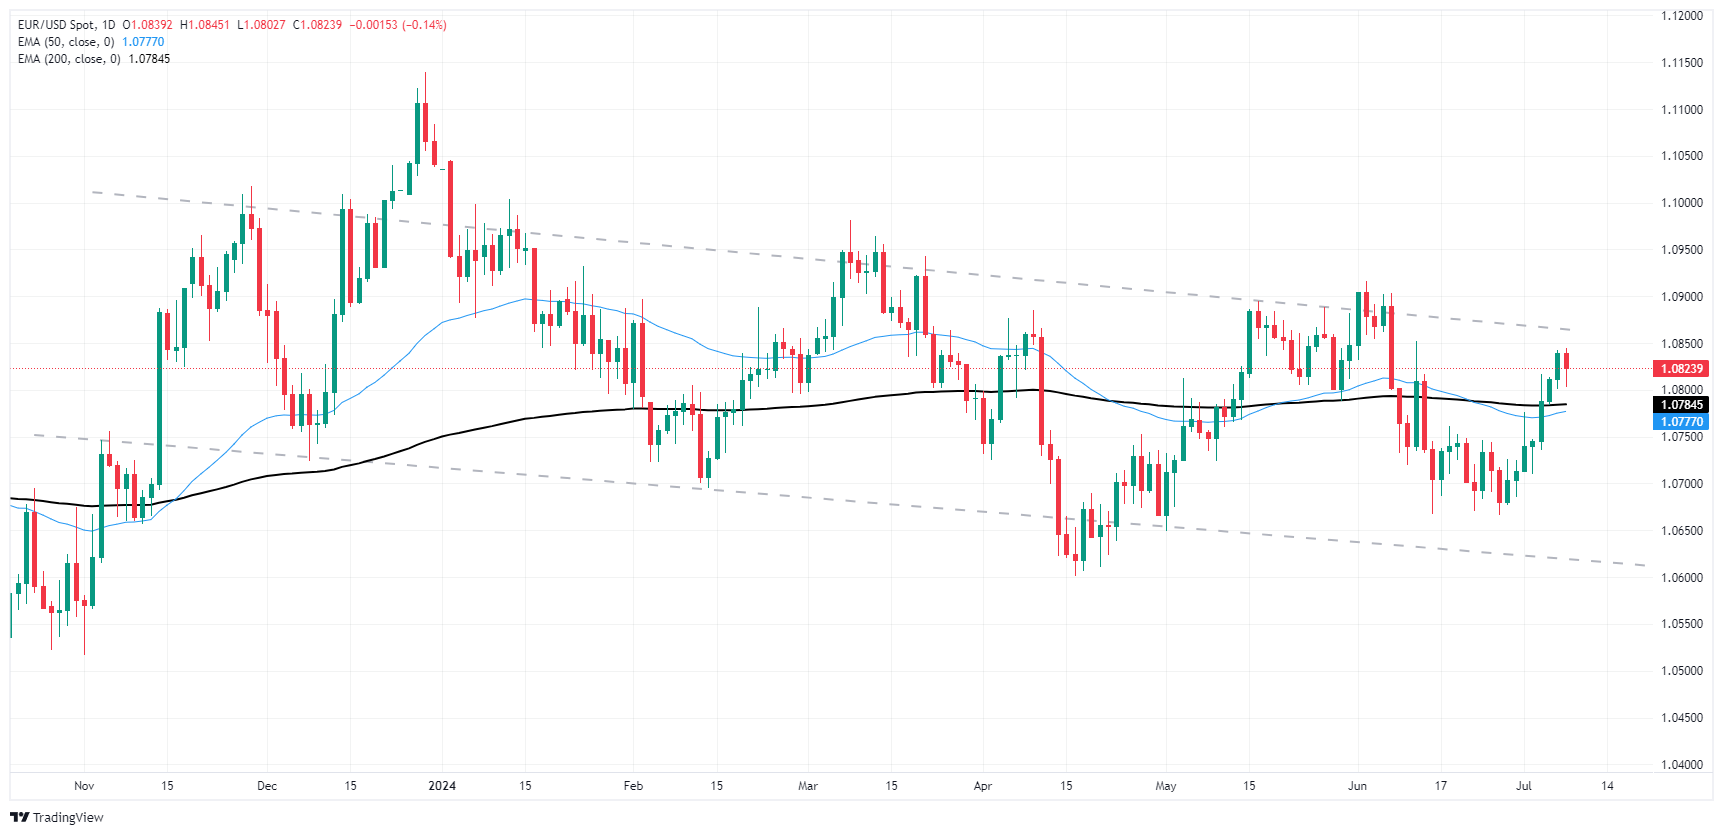
Euro FAQs
The Euro is the currency for the 20 European Union countries that belong to the Eurozone. It is the second most heavily traded currency in the world behind the US Dollar. In 2022, it accounted for 31% of all foreign exchange transactions, with an average daily turnover of over $2.2 trillion a day. EUR/USD is the most heavily traded currency pair in the world, accounting for an estimated 30% off all transactions, followed by EUR/JPY (4%), EUR/GBP (3%) and EUR/AUD (2%).
The European Central Bank (ECB) in Frankfurt, Germany, is the reserve bank for the Eurozone. The ECB sets interest rates and manages monetary policy. The ECB’s primary mandate is to maintain price stability, which means either controlling inflation or stimulating growth. Its primary tool is the raising or lowering of interest rates. Relatively high interest rates – or the expectation of higher rates – will usually benefit the Euro and vice versa. The ECB Governing Council makes monetary policy decisions at meetings held eight times a year. Decisions are made by heads of the Eurozone national banks and six permanent members, including the President of the ECB, Christine Lagarde.
Eurozone inflation data, measured by the Harmonized Index of Consumer Prices (HICP), is an important econometric for the Euro. If inflation rises more than expected, especially if above the ECB’s 2% target, it obliges the ECB to raise interest rates to bring it back under control. Relatively high interest rates compared to its counterparts will usually benefit the Euro, as it makes the region more attractive as a place for global investors to park their money.
Data releases gauge the health of the economy and can impact on the Euro. Indicators such as GDP, Manufacturing and Services PMIs, employment, and consumer sentiment surveys can all influence the direction of the single currency. A strong economy is good for the Euro. Not only does it attract more foreign investment but it may encourage the ECB to put up interest rates, which will directly strengthen the Euro. Otherwise, if economic data is weak, the Euro is likely to fall. Economic data for the four largest economies in the euro area (Germany, France, Italy and Spain) are especially significant, as they account for 75% of the Eurozone’s economy.
Another significant data release for the Euro is the Trade Balance. This indicator measures the difference between what a country earns from its exports and what it spends on imports over a given period. If a country produces highly sought after exports then its currency will gain in value purely from the extra demand created from foreign buyers seeking to purchase these goods. Therefore, a positive net Trade Balance strengthens a currency and vice versa for a negative balance.
- GBP/USD briefly found fresh highs above 1.2840 before slumping back on Monday.
- The first of two appearances from Fed Chair Powell is slated for Tuesday.
- Key US consumer and wholesale inflation figures due later this week.
GBP/USD briefly tested a fresh four-week high on Monday, crossing above 1.2840 before broad-market flows dragged Cable back down to the week’s opening bids just north of 1.2800. UK data remains thin this week, leaving traders grappling with peaking rate cut hopes clashing with an overly-cautious Federal Reserve (Fed) that insists on waiting for further signs that US inflation will ease towards the Fed’s 2% annual inflation target.
Forex Today: All eyes on Powell
Fed Chairman Jerome Powell will make the first of two appearances this week when he delivers the Fed’s latest semiannual Monetary Policy Report to the US Senate Banking Committee. Fed Chair Powell will follow up with a repeat performance when testifying before the Congressional House Committee on Financial Services on Wednesday.
Key US inflation data is due later in the week, with US Consumer Price Index (CPI) inflation due on Thursday and Producer Price Index (PPI) wholesale inflation slated for Friday. Traders hoping for further easing in inflation figure to help bully the Fed into rate cuts sooner rather than later may be setting themselves for disappointment later in the week with both CPI and PPI inflation figures forecast to either hold steady or tick upwards slightly.
UK data also remains limited this week, with various appearances from Bank of England (BoE) policymakers slated for Wednesday and industrial and manufacturing activity survey results on the books for Thursday. UK Industrial and Manufacturing Production are both expected to rebound in May after the previous month’s slight contraction.
Economic Indicator
Consumer Price Index (MoM)
Inflationary or deflationary tendencies are measured by periodically summing the prices of a basket of representative goods and services and presenting the data as The Consumer Price Index (CPI). CPI data is compiled on a monthly basis and released by the US Department of Labor Statistics. The MoM figure compares the prices of goods in the reference month to the previous month.The CPI is a key indicator to measure inflation and changes in purchasing trends. Generally, a high reading is seen as bullish for the US Dollar (USD), while a low reading is seen as bearish.
Read more.Next release: Thu Jul 11, 2024 12:30
Frequency: Monthly
Consensus: 0.1%
Previous: 0%
Source: US Bureau of Labor Statistics
The US Federal Reserve has a dual mandate of maintaining price stability and maximum employment. According to such mandate, inflation should be at around 2% YoY and has become the weakest pillar of the central bank’s directive ever since the world suffered a pandemic, which extends to these days. Price pressures keep rising amid supply-chain issues and bottlenecks, with the Consumer Price Index (CPI) hanging at multi-decade highs. The Fed has already taken measures to tame inflation and is expected to maintain an aggressive stance in the foreseeable future.
GBP/USD technical levels
Cable has firmly rallied after recovering from July’s early swing low towards 1.2600, but bullish momentum has stopped short of breaching June’s key peak at 1.2860. The pair is still trading on the high side of the 200-hour Exponential Moving Average (EMA) at 1.2735.
Bullish daily candles are set for a bearish turnaround as bids get set adrift within a heavy supply zone above 1.2800. Price action has so far stayed on the north side of the 200-day EMA at 1.2609.
GBP/USD hourly chart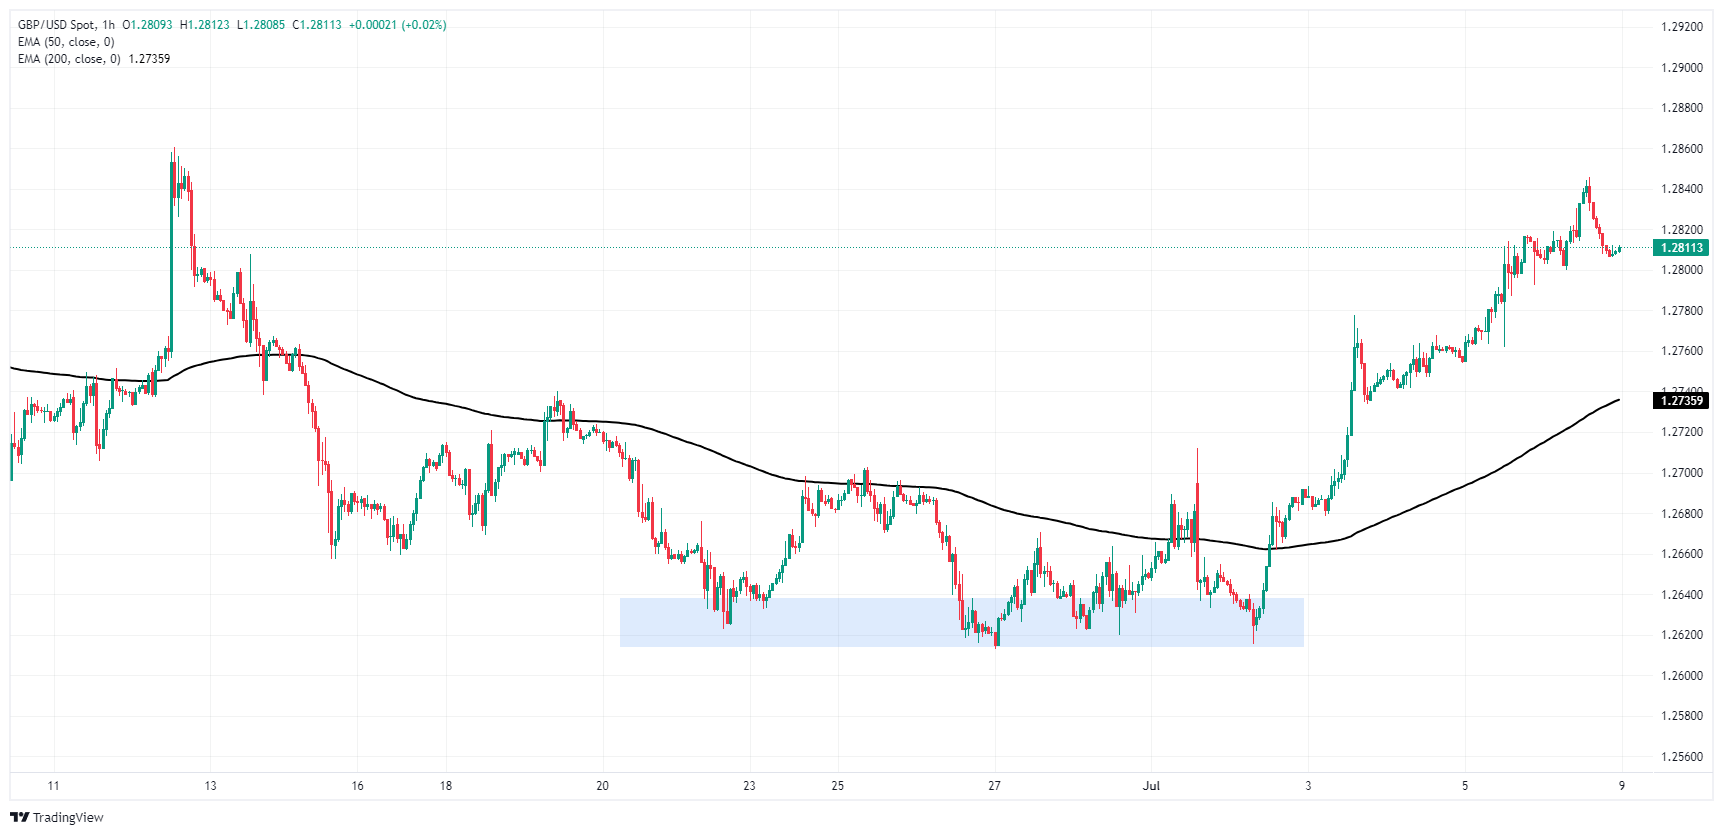
GBP/USD daily chart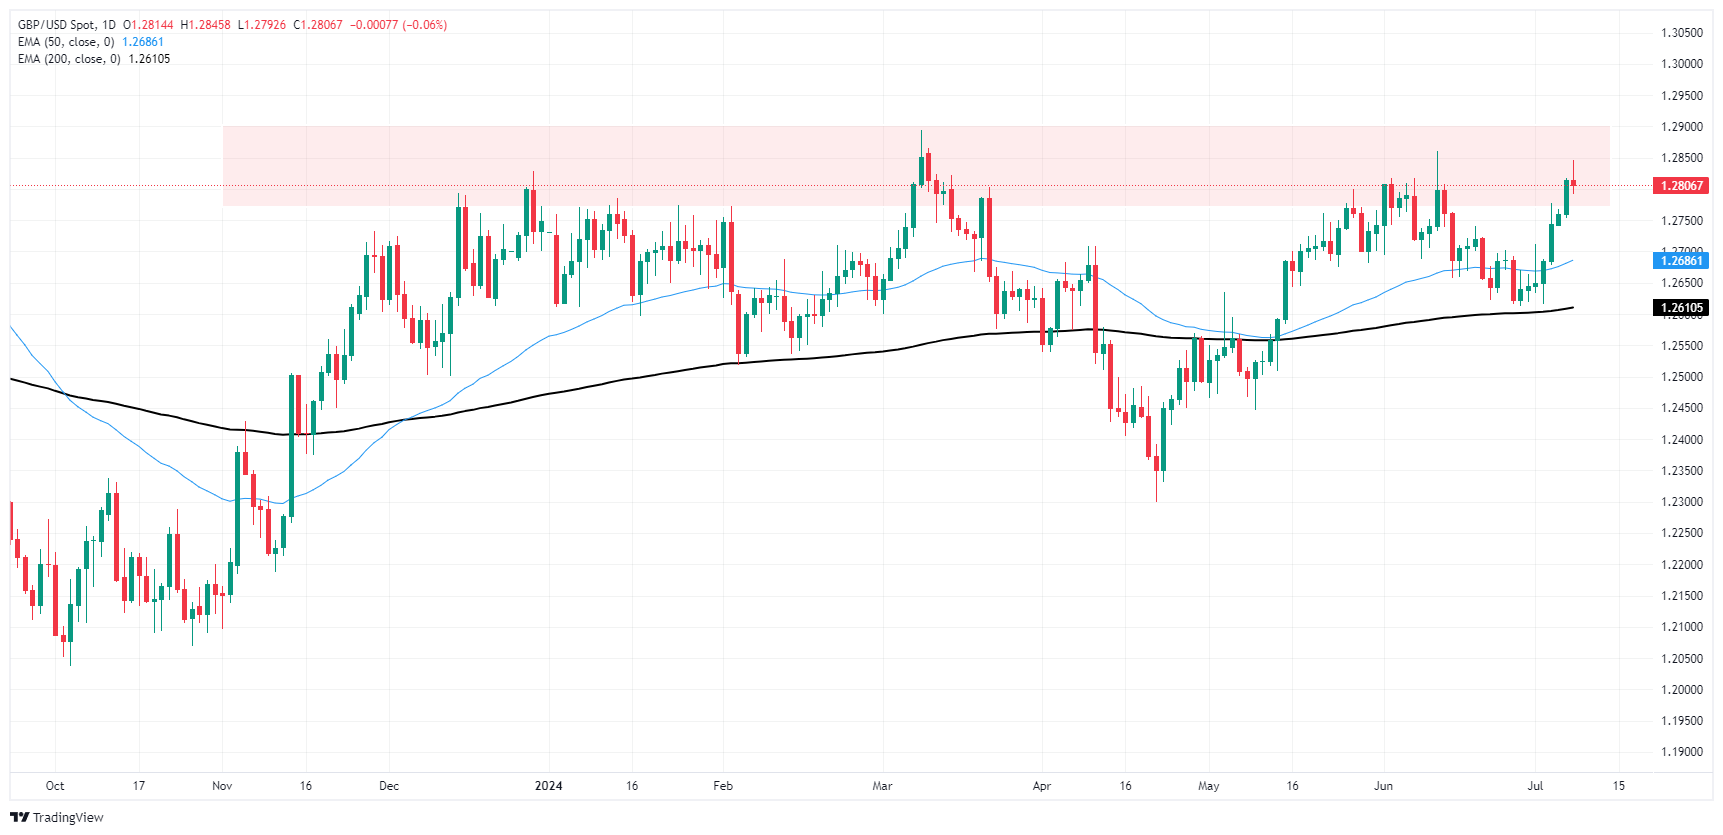
Pound Sterling FAQs
The Pound Sterling (GBP) is the oldest currency in the world (886 AD) and the official currency of the United Kingdom. It is the fourth most traded unit for foreign exchange (FX) in the world, accounting for 12% of all transactions, averaging $630 billion a day, according to 2022 data. Its key trading pairs are GBP/USD, aka ‘Cable’, which accounts for 11% of FX, GBP/JPY, or the ‘Dragon’ as it is known by traders (3%), and EUR/GBP (2%). The Pound Sterling is issued by the Bank of England (BoE).
The single most important factor influencing the value of the Pound Sterling is monetary policy decided by the Bank of England. The BoE bases its decisions on whether it has achieved its primary goal of “price stability” – a steady inflation rate of around 2%. Its primary tool for achieving this is the adjustment of interest rates. When inflation is too high, the BoE will try to rein it in by raising interest rates, making it more expensive for people and businesses to access credit. This is generally positive for GBP, as higher interest rates make the UK a more attractive place for global investors to park their money. When inflation falls too low it is a sign economic growth is slowing. In this scenario, the BoE will consider lowering interest rates to cheapen credit so businesses will borrow more to invest in growth-generating projects.
Data releases gauge the health of the economy and can impact the value of the Pound Sterling. Indicators such as GDP, Manufacturing and Services PMIs, and employment can all influence the direction of the GBP. A strong economy is good for Sterling. Not only does it attract more foreign investment but it may encourage the BoE to put up interest rates, which will directly strengthen GBP. Otherwise, if economic data is weak, the Pound Sterling is likely to fall.
Another significant data release for the Pound Sterling is the Trade Balance. This indicator measures the difference between what a country earns from its exports and what it spends on imports over a given period. If a country produces highly sought-after exports, its currency will benefit purely from the extra demand created from foreign buyers seeking to purchase these goods. Therefore, a positive net Trade Balance strengthens a currency and vice versa for a negative balance.
- USD/CAD remains capped within a trading range near 1.3635 in Tuesday’s early Asian session.
- Loosening US labor market triggered the Fed rate cut expectation this year.
- Lower crude oil prices weigh on the Loonie.
The USD/CAD pair oscillates in a narrow trading range around 1.3635 during the early Asian session on Tuesday. Traders prefer to wait on the sidelines ahead of Powell’s semi-annual testimonies and key US data. Additionally, the Federal Reserve’s (Fed) Michael Barr and Michelle Bowman are set to speak later on Tuesday.
Meanwhile, the USD Index (DXY) hovers around the 105.00 barrier despite lower US bond yields. The recent US employment report for June hinted that the labour market in the United States is cooling sharply, triggering the expectation that the US Fed could lower its borrowing costs sooner than expected this year. This, in turn, is likely to weigh on the Greenback. Investors have priced in nearly 76% odds of a Fed rate cut in September, up from 71% last Friday, according to the CME FedWatch tool.
On the CAD’s front, weakening Canadian employment on Friday raised expectations for rate cuts from the Bank of Canada (BoC). Canada's Unemployment Rate rose to 6.4% in June from 6.2% in May, according to Statistics Canada.
Meanwhile, crude oil prices edge lower in response to growing peace talks in the Middle East, exerting some selling pressure on the commodity-linked Canadian Dollar (CAD) as Canada is the major crude oil exporter to the United States.
Canadian Dollar FAQs
The key factors driving the Canadian Dollar (CAD) are the level of interest rates set by the Bank of Canada (BoC), the price of Oil, Canada’s largest export, the health of its economy, inflation and the Trade Balance, which is the difference between the value of Canada’s exports versus its imports. Other factors include market sentiment – whether investors are taking on more risky assets (risk-on) or seeking safe-havens (risk-off) – with risk-on being CAD-positive. As its largest trading partner, the health of the US economy is also a key factor influencing the Canadian Dollar.
The Bank of Canada (BoC) has a significant influence on the Canadian Dollar by setting the level of interest rates that banks can lend to one another. This influences the level of interest rates for everyone. The main goal of the BoC is to maintain inflation at 1-3% by adjusting interest rates up or down. Relatively higher interest rates tend to be positive for the CAD. The Bank of Canada can also use quantitative easing and tightening to influence credit conditions, with the former CAD-negative and the latter CAD-positive.
The price of Oil is a key factor impacting the value of the Canadian Dollar. Petroleum is Canada’s biggest export, so Oil price tends to have an immediate impact on the CAD value. Generally, if Oil price rises CAD also goes up, as aggregate demand for the currency increases. The opposite is the case if the price of Oil falls. Higher Oil prices also tend to result in a greater likelihood of a positive Trade Balance, which is also supportive of the CAD.
While inflation had always traditionally been thought of as a negative factor for a currency since it lowers the value of money, the opposite has actually been the case in modern times with the relaxation of cross-border capital controls. Higher inflation tends to lead central banks to put up interest rates which attracts more capital inflows from global investors seeking a lucrative place to keep their money. This increases demand for the local currency, which in Canada’s case is the Canadian Dollar.
Macroeconomic data releases gauge the health of the economy and can have an impact on the Canadian Dollar. Indicators such as GDP, Manufacturing and Services PMIs, employment, and consumer sentiment surveys can all influence the direction of the CAD. A strong economy is good for the Canadian Dollar. Not only does it attract more foreign investment but it may encourage the Bank of Canada to put up interest rates, leading to a stronger currency. If economic data is weak, however, the CAD is likely to fall.
- GBP/JPY found yet another new 16-year peak, but momentum is slumping.
- Strictly mid-tier data is on the economic calendar for the Guppy this week.
- GBP/JPY continues to grind out fresh peaks, but topping patterns are growing.
GBP/JPY briefly tested a fresh 16-year peak as the pair continues to grind out years-long high bids. The Guppy touched 206.67 before settling back into Monday’s opening range. Despite setting regular new highs in a one-sided trend, bullish momentum appears to be drying up as the pair begins to hesitate on the top end of a nearly seven-month bull run.
Economic data remains light for both the Pound Sterling (GBP) and the Japanese Yen (JPY) this week. Japanese Labor Cash Earnings, reported early on Monday, rose for the year ended in May, but less than expected. Wages grew 1.9% YoY versus the previous revised 1.6%, missing the forecast of 2.1%. Little else of note remains on the data docket this week for the Yen, leaving JPY traders to struggle at the bottom of a long slide in the currency at the hands of a wide rate differential between the JPY and other major global currencies.
UK data also remains limited this week, with various appearances from Bank of England (BoE) policymakers slated for Wednesday and industrial and manufacturing activity survey results on the books for Thursday.
GBP/JPY technical outlook
GBP/JPY fell away from fresh 16-year highs above 206.50 set on Monday, settling back into familiar intraday territory at the 206.00 handle. Technical pressure is still firmly pinned into the bullish side, but topside momentum is showing signs of petering out, and progress in swing highs is slowly rapidly as bidders run out of gas.
Spinning top daily candles are getting priced into the Guppy charts, and traders should be on the lookout for a retreat to the 50-day Exponential Moving Average (EMA) near 200.00. Despite odds of a near-term pullback, the long-term trend heavily favors the bulls, and a rebound from major technical levels could be on the cards looking forward.
GBP/JPY hourly chart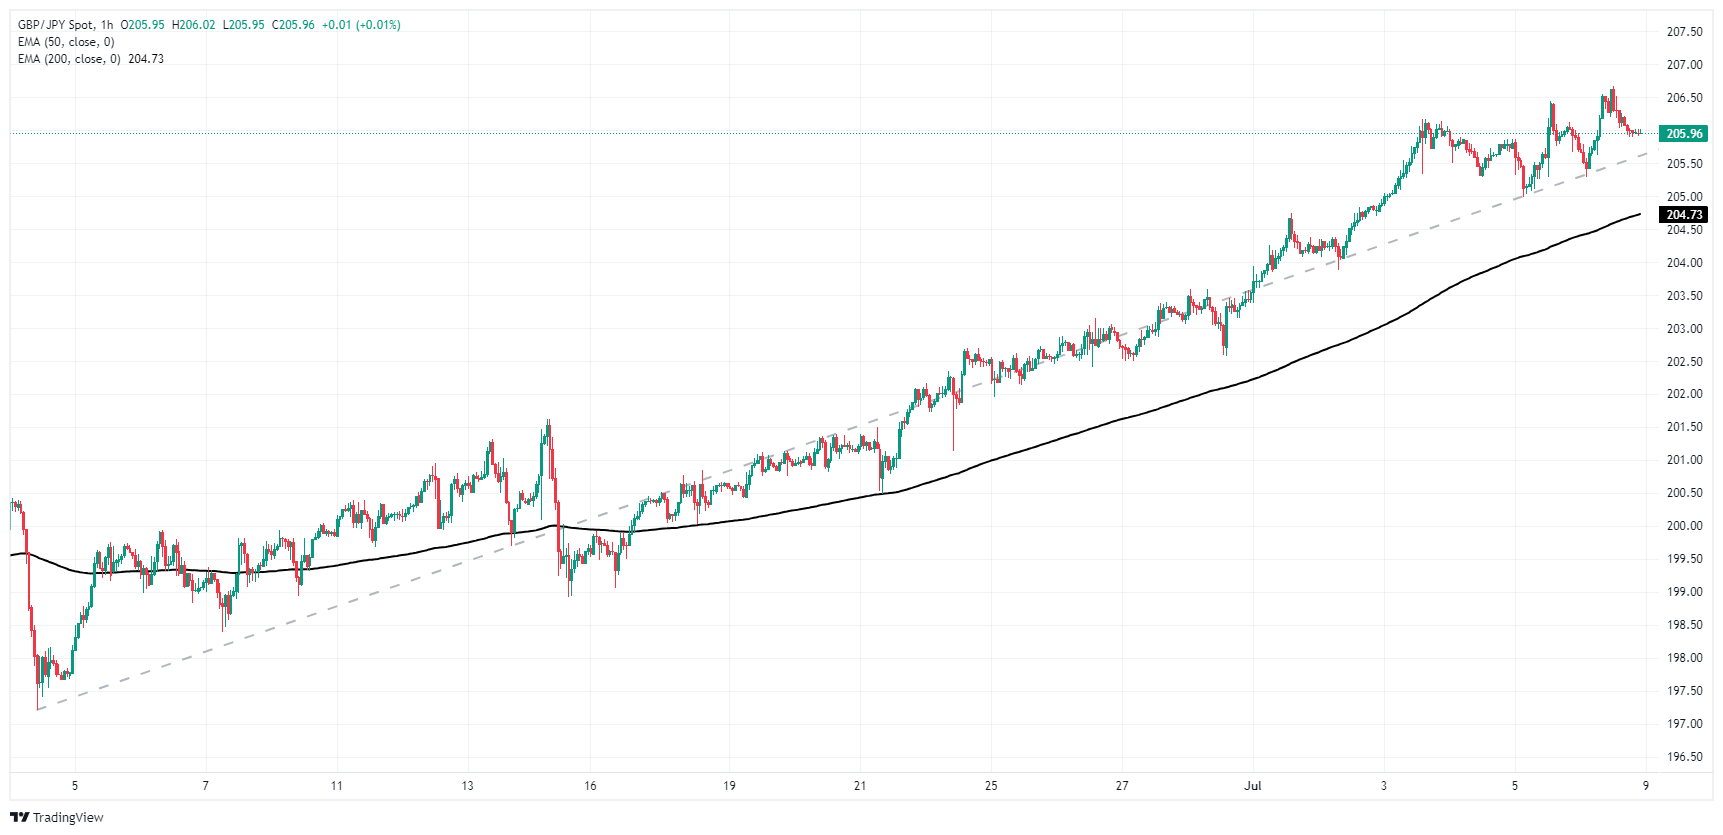
GBP/JPY daily chart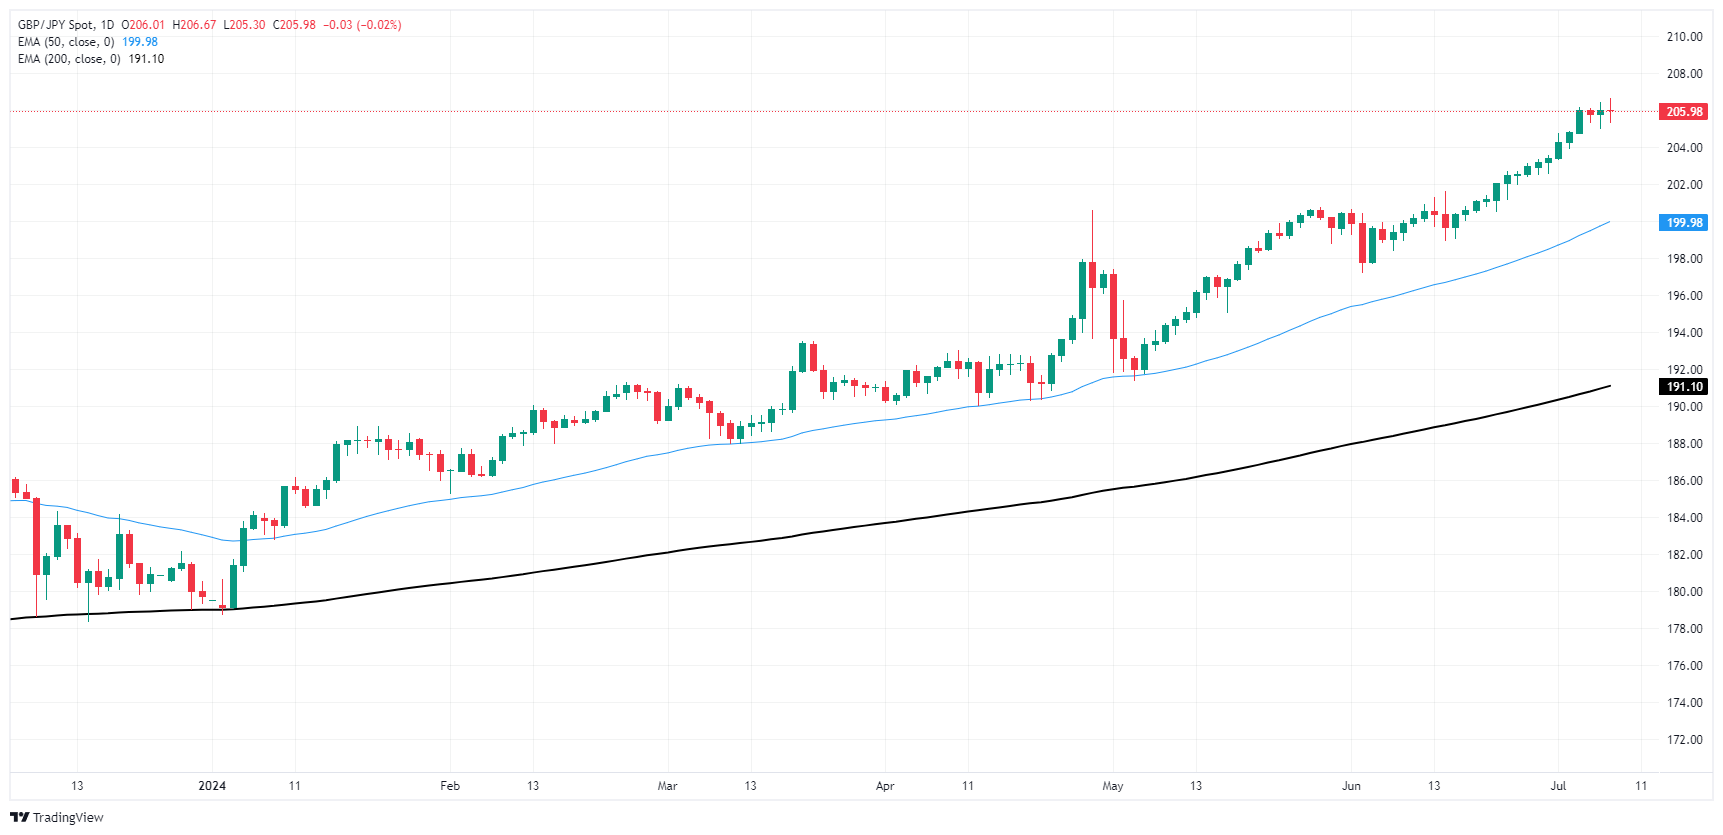
Pound Sterling FAQs
The Pound Sterling (GBP) is the oldest currency in the world (886 AD) and the official currency of the United Kingdom. It is the fourth most traded unit for foreign exchange (FX) in the world, accounting for 12% of all transactions, averaging $630 billion a day, according to 2022 data. Its key trading pairs are GBP/USD, aka ‘Cable’, which accounts for 11% of FX, GBP/JPY, or the ‘Dragon’ as it is known by traders (3%), and EUR/GBP (2%). The Pound Sterling is issued by the Bank of England (BoE).
The single most important factor influencing the value of the Pound Sterling is monetary policy decided by the Bank of England. The BoE bases its decisions on whether it has achieved its primary goal of “price stability” – a steady inflation rate of around 2%. Its primary tool for achieving this is the adjustment of interest rates. When inflation is too high, the BoE will try to rein it in by raising interest rates, making it more expensive for people and businesses to access credit. This is generally positive for GBP, as higher interest rates make the UK a more attractive place for global investors to park their money. When inflation falls too low it is a sign economic growth is slowing. In this scenario, the BoE will consider lowering interest rates to cheapen credit so businesses will borrow more to invest in growth-generating projects.
Data releases gauge the health of the economy and can impact the value of the Pound Sterling. Indicators such as GDP, Manufacturing and Services PMIs, and employment can all influence the direction of the GBP. A strong economy is good for Sterling. Not only does it attract more foreign investment but it may encourage the BoE to put up interest rates, which will directly strengthen GBP. Otherwise, if economic data is weak, the Pound Sterling is likely to fall.
Another significant data release for the Pound Sterling is the Trade Balance. This indicator measures the difference between what a country earns from its exports and what it spends on imports over a given period. If a country produces highly sought-after exports, its currency will benefit purely from the extra demand created from foreign buyers seeking to purchase these goods. Therefore, a positive net Trade Balance strengthens a currency and vice versa for a negative balance.
- NZD/USD saw slight losses but maintained a position above the crucial 20-day SMA support around 0.6120.
- The technical outlook remains positive, despite Monday's bearish activity.
- Bears are testing the 20-day SMA strength.
On Monday, the NZD/USD struggled, losing 0.30% to 0.6125, erasing its daily gains. Despite this, the pair successfully defended its position above the 20-day Simple Moving Average (SMA) support level at 0.6120, a feat securely achieved in the past week.
As for the daily technical indicators, the Relative Strength Index (RSI) now stands at 53, showing a downward movement, indicating that the bullish momentum took a slight hit. The Moving Average Convergence Divergence (MACD) keeps on printing decreasing red bars, noting the fading bearish strength.
NZD/USD daily chart
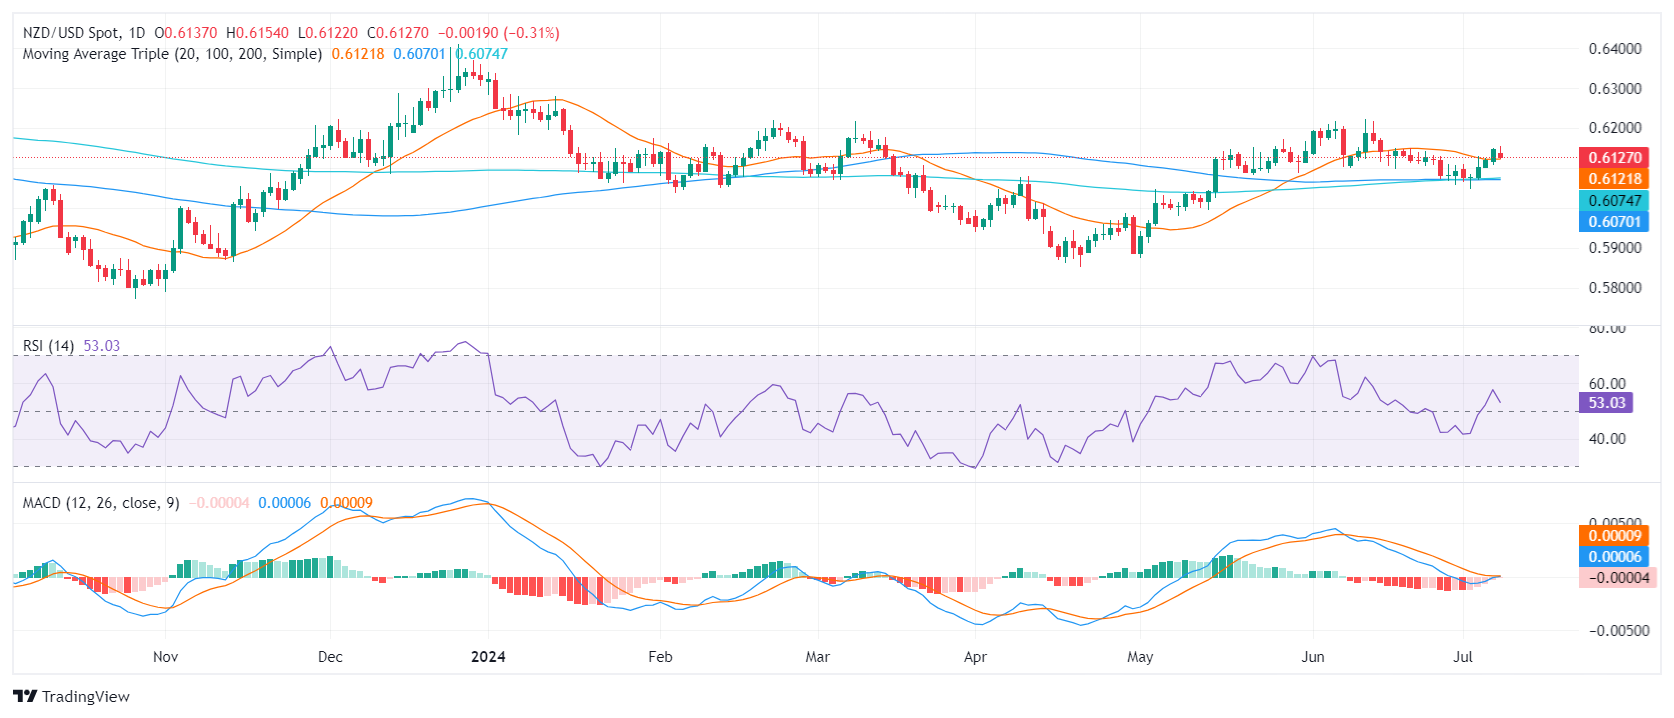
From the perspective of resistances, the 0.6170 level is the immediate challenge, which is trailed closely by the significant 0.6200 mark. A firm break above these levels can be viewed as a full confirmation of the recent bullish momentum, taking the pair deeper into bullish territory.
Ahead lies immediate support near the 20-day SMA at 0.6120, with stronger support at the decisive 0.6070 mark. If the sellers manage to lower the price below these supports, it will indicate a developing selling pressure that could lead to a deeper corrective decline.
- Silver retreats beneath $31.00 after hitting a daily high of $31.36, forming a bearish harami pattern.
- Support levels to watch: $30.81 (June 21 high) and $30.18 (July 5 low).
- Bullish targets: $31.49 (July 5 high) and YTD high of $32.51 if upward momentum resumes.
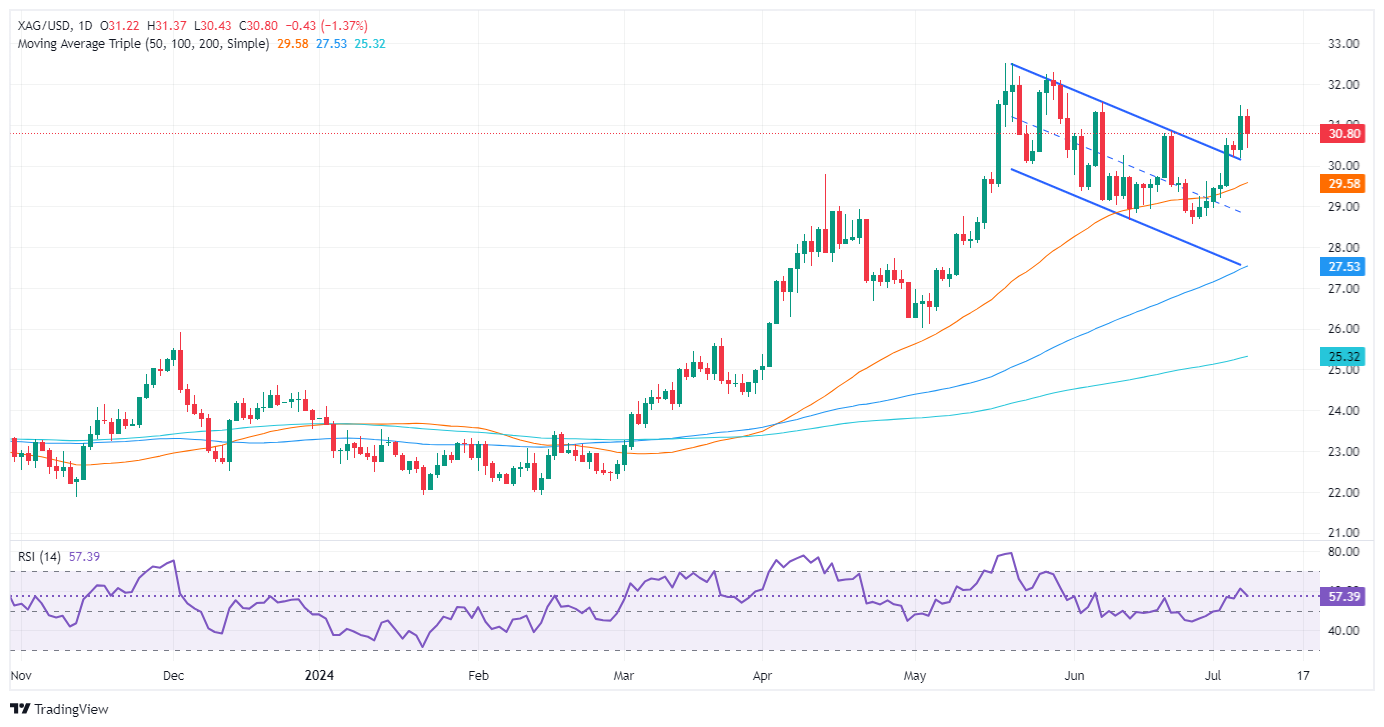
Silver price trims some of its last Friday’s gains. It forms a ‘bearish harami’ candlestick chart pattern, an indication that buyers were unable to capitalize on US Dollar weakness to push the grey metal price above last week’s high of $31.49. Therefore, XAG/USD reversed its course after hitting a daily high of $31.36, trading at $30.79, down more than 1.30%.
XAG/USD Price Analysis: Technical outlook
Silver is upward biased, and as I wrote in an article, XAG “has cleared the ‘double bottom’ neckline at the time of writing, validating the chart pattern.” Nevertheless, today’s formation of a bearish chart pattern could pave the way for a pullback.
If XAG/USD sellers drag the spot price below the June 21 high of $30.81, that will expose the next support at the July 5 low of $30.18. On further weakness, the non-yielding metal would likely drop toward the $30.00 figure, with sellers eyeing a test of the 50-day moving average (DMA).
For a bullish continuation, the XAG/USD must clear the July 5 high at $31.49, clearing the path to challenging the $32.00 figure. Up next would be the year-to-date (YTD) high of $32.51.
XAG/USD Price Action – Daily Chart
Silver FAQs
Silver is a precious metal highly traded among investors. It has been historically used as a store of value and a medium of exchange. Although less popular than Gold, traders may turn to Silver to diversify their investment portfolio, for its intrinsic value or as a potential hedge during high-inflation periods. Investors can buy physical Silver, in coins or in bars, or trade it through vehicles such as Exchange Traded Funds, which track its price on international markets.
Silver prices can move due to a wide range of factors. Geopolitical instability or fears of a deep recession can make Silver price escalate due to its safe-haven status, although to a lesser extent than Gold's. As a yieldless asset, Silver tends to rise with lower interest rates. Its moves also depend on how the US Dollar (USD) behaves as the asset is priced in dollars (XAG/USD). A strong Dollar tends to keep the price of Silver at bay, whereas a weaker Dollar is likely to propel prices up. Other factors such as investment demand, mining supply – Silver is much more abundant than Gold – and recycling rates can also affect prices.
Silver is widely used in industry, particularly in sectors such as electronics or solar energy, as it has one of the highest electric conductivity of all metals – more than Copper and Gold. A surge in demand can increase prices, while a decline tends to lower them. Dynamics in the US, Chinese and Indian economies can also contribute to price swings: for the US and particularly China, their big industrial sectors use Silver in various processes; in India, consumers’ demand for the precious metal for jewellery also plays a key role in setting prices.
Silver prices tend to follow Gold's moves. When Gold prices rise, Silver typically follows suit, as their status as safe-haven assets is similar. The Gold/Silver ratio, which shows the number of ounces of Silver needed to equal the value of one ounce of Gold, may help to determine the relative valuation between both metals. Some investors may consider a high ratio as an indicator that Silver is undervalued, or Gold is overvalued. On the contrary, a low ratio might suggest that Gold is undervalued relative to Silver.
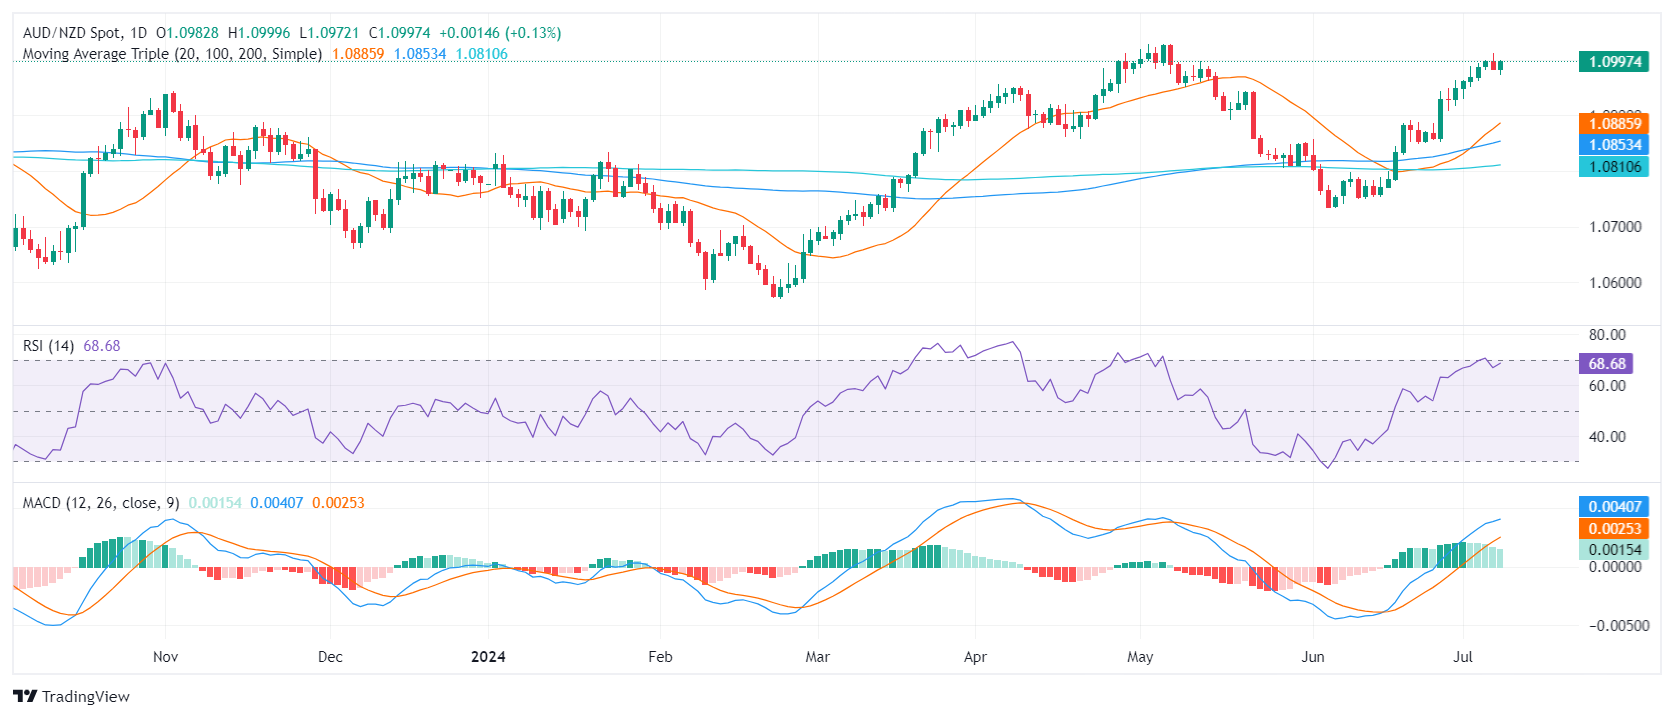
- AUD/NZD opened the week mildly higher at around 1.0990.
- New Zealand's struggling economy still causes worries, as the market awaits the RBNZ meeting later this week.
- The RBA continues its hawkish tone, creating a favorable outlook for the Aussie.
Following a climb to the highest level since mid-May and gaining more than 1.20% since late June, the AUD/NZD buyers stepped back to secure some gains but the pair is poised for some consolidation. The Reserve Bank of New Zealand (RBNZ)'s Wednesday meetup and while New Zealand's economic performance still shows signs of struggle, fundamentals lean in favor of the Aussie.
In New Zealand, the focus is on ongoing concerns such as the sluggish economic outlook and the coming meetings of the RBNZ on Wednesday where a hold is priced in. Other mid-tier data this week include the Consumer Inflation expectations and NZ PMIs on Wednesday and Thursday which might fuel moves on the NZD dynamics.
Despite markets betting on a 60% probability of a rate hike by the end of the year, as shown in the RBNZ’s May rate path projection, the market strongly anticipates a November rate cut. Some even foresee an earlier cut in October, considering New Zealand's slowing growth.
Meanwhile, in Australia, the latest hot inflation data has ramped up market expectations. The market now suggests an almost 40% chance of a 25 bps rate hike on the September 24 meeting of the Reserve Bank of Australia (RBA), rising to around 50% by November 5. The RBA recently has been contemplating raising rates, thus benefiting the Aussie.
AUD/NZD technical analysis
Short-term, the AUD/NZD maintains a bullish stance, though the looming potential for a correction as indicated by nearing overbought conditions warrants caution. The Relative Strength Index (RSI) sits close to 70 and the Moving Average Convergence Divergence (MACD) continues to display rising green bars on the chart.
Support levels lie at 1.0950, 1.0930, and 1.0900. Buyers will be eyeing 1.1000 as the next resistance target. A correction might be on the horizon, but as long as the AUD/NZD stays above the 20, 100, and 200-day Simple Moving Averages (SMA), the outlook remains favorable.
AUD/NZD daily chart
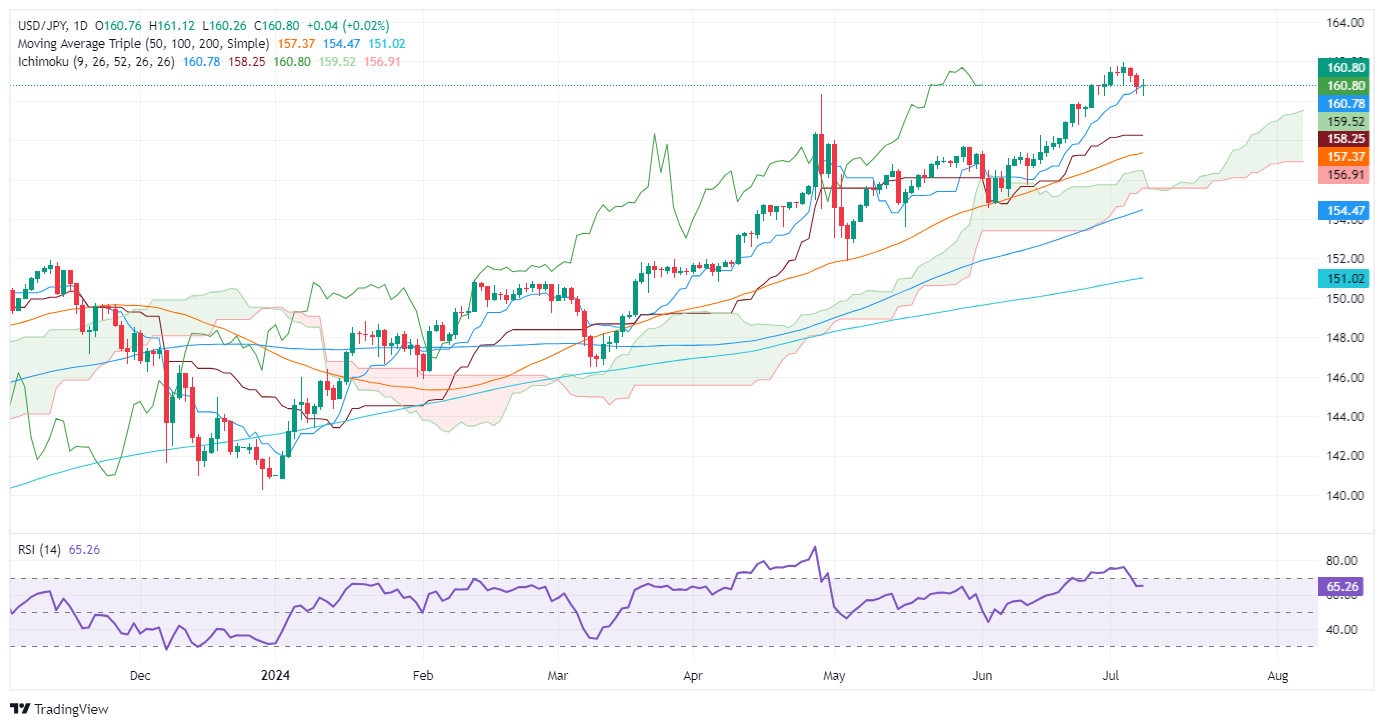
- USD/JPY consolidates with technical indicators suggesting a range-bound movement between 160.00 and 162.00.
- Potential Japanese intervention in FX markets looms, deterring aggressive buyers.
- A break above 161.00 could target YTD high of 161.95, while support lies at 160.22, with further downside risks to 158.25.
The USD/JPY consolidates below the psychological 161.00 figure as US Treasury bond yields edge lower and the Greenback weakens. The traders focus on Fed Chair Jerome Powell's semi-annual testimony at the US Congress and the release of US inflation figures. The major trades at 160.79, virtually unchanged.
USD/JPY Price Analysis: Technical outlook
The USD/JPY daily chart is set to continue to trend higher from a price action standpoint, but fears of intervention by Japanese authorities in the FX markets might dent buyers from pushing the exchange rate higher.
Momentum suggests the pair would consolidate within the 160.00-162.00 range, as the Relative Strength Index (RSI) remains flat in bullish territory.
If USD/JPY buyers reclaim 161.00, that could exacerbate an upward move toward the year-to-date (YTD) high of 161.95. Further gains are seen above 162.00, at around the November 1986 high of 164.87.
Conversely, if the major slumps below the April 29 high at 160.22, the next support would be the Senkou Span A at 159.68. A breach of the latter and the pair will test the Kijun-Sen at 158.25, ahead of the Senkou Span B at 156.91.
USD/JPY Price Action – Daily Chart
Japanese Yen PRICE Today
The table below shows the percentage change of Japanese Yen (JPY) against listed major currencies today. Japanese Yen was the strongest against the US Dollar.
| USD | EUR | GBP | JPY | CAD | AUD | NZD | CHF | |
|---|---|---|---|---|---|---|---|---|
| USD | -0.00% | -0.01% | -0.03% | -0.01% | -0.04% | -0.04% | -0.02% | |
| EUR | 0.00% | -0.04% | -0.02% | -0.02% | -0.03% | -0.01% | -0.02% | |
| GBP | 0.01% | 0.04% | 0.02% | 0.02% | 0.02% | 0.02% | 0.01% | |
| JPY | 0.03% | 0.02% | -0.02% | 0.02% | -0.02% | -0.03% | 0.02% | |
| CAD | 0.01% | 0.02% | -0.02% | -0.02% | -0.04% | -0.01% | -0.02% | |
| AUD | 0.04% | 0.03% | -0.02% | 0.02% | 0.04% | -0.02% | -0.01% | |
| NZD | 0.04% | 0.01% | -0.02% | 0.03% | 0.01% | 0.02% | 0.02% | |
| CHF | 0.02% | 0.02% | -0.01% | -0.02% | 0.02% | 0.00% | -0.02% |
The heat map shows percentage changes of major currencies against each other. The base currency is picked from the left column, while the quote currency is picked from the top row. For example, if you pick the Japanese Yen from the left column and move along the horizontal line to the US Dollar, the percentage change displayed in the box will represent JPY (base)/USD (quote).
- Crude Oil markets chilled on Monday, easing lower as odds of supply constraints drop.
- Fears of supply chain disruptions from Tropical Storm Beryl eased after storm downgrade.
- Barrel traders will be looking for a continuation of last week’s supply declines to bolster prices.
West Texas Intermediate (WTI) eased lower on Monday, bleeding bids as broad-market fears of supply disruptions from Tropical Storm Beryl have receded. The tropical storm, which initially made landfall in Texas as a category 1 hurricane, has been downgraded after wind speeds declined, and looks set to peter out without disrupting US domestic Crude Oil markets.
A risk bid from possible supply chain disruptions from Beryl helped to bolster Crude Oil prices last week. However, Monday’s updates to the storm’s projected dissipation has pulled technical support from beneath Crude bids, extending Friday’s declines and sending WTI down to $81.60.
Crude Oil markets will be looking for a continuation of last week’s sharp supply drawdown after both the American Petroleum Institute (API) and the Energy Information Administration (EIA) both post huge week-on-week contractions in US Crude Oil supplies. Energy investors will be looking for a repeat this week when the API reports Weekly Crude Oil Stocks on Tuesday, followed by EIA barrel counts on Wednesday.
Global energy markets continue to keep Crude Oil prices bid on long-running hopes of a broad uptick in fossil fuel demand, but after a half-year of flubbed sparks in demand upticks, analysts are beginning to express skepticism about the accuracy of demand growth projections from the Organization of the Petroleum Exporting Countries (OPEC). Global Crude Oil demand forecasts were initially built upon a foundation of easing global interest rates, a trend that has failed to materialize through 2024.
WTI technical outlook
WTI US Crude Oil has eased back below the 200-hour Exponential Moving Average (EMA) at $82.14, testing close to a familiar technical inflection point at $81.50. WTI flubbed a bullish push into fresh near-term highs last week, falling just short of reclaiming the $84.00 handle and easing back into recent technical levels.
Daily candlesticks are set to finish an unceremonious end to a recent bullish break north of a near-term congestion zone. An extended backslide will see WTI bids challenging the 200-day EMA at $79.29 once more.
WTI hourly chart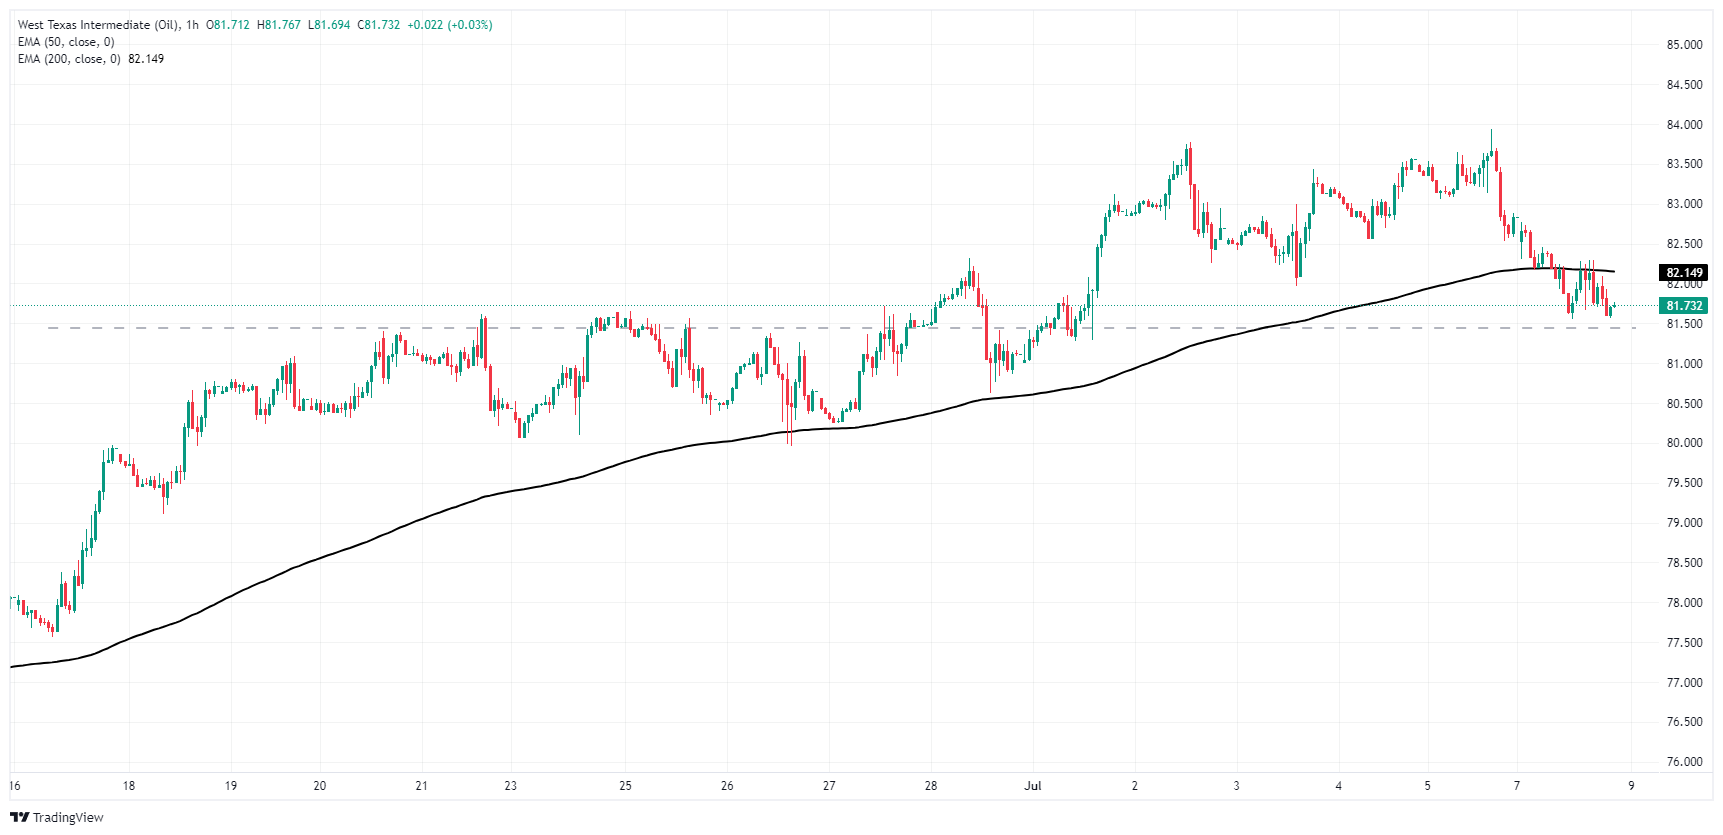
WTI daily chart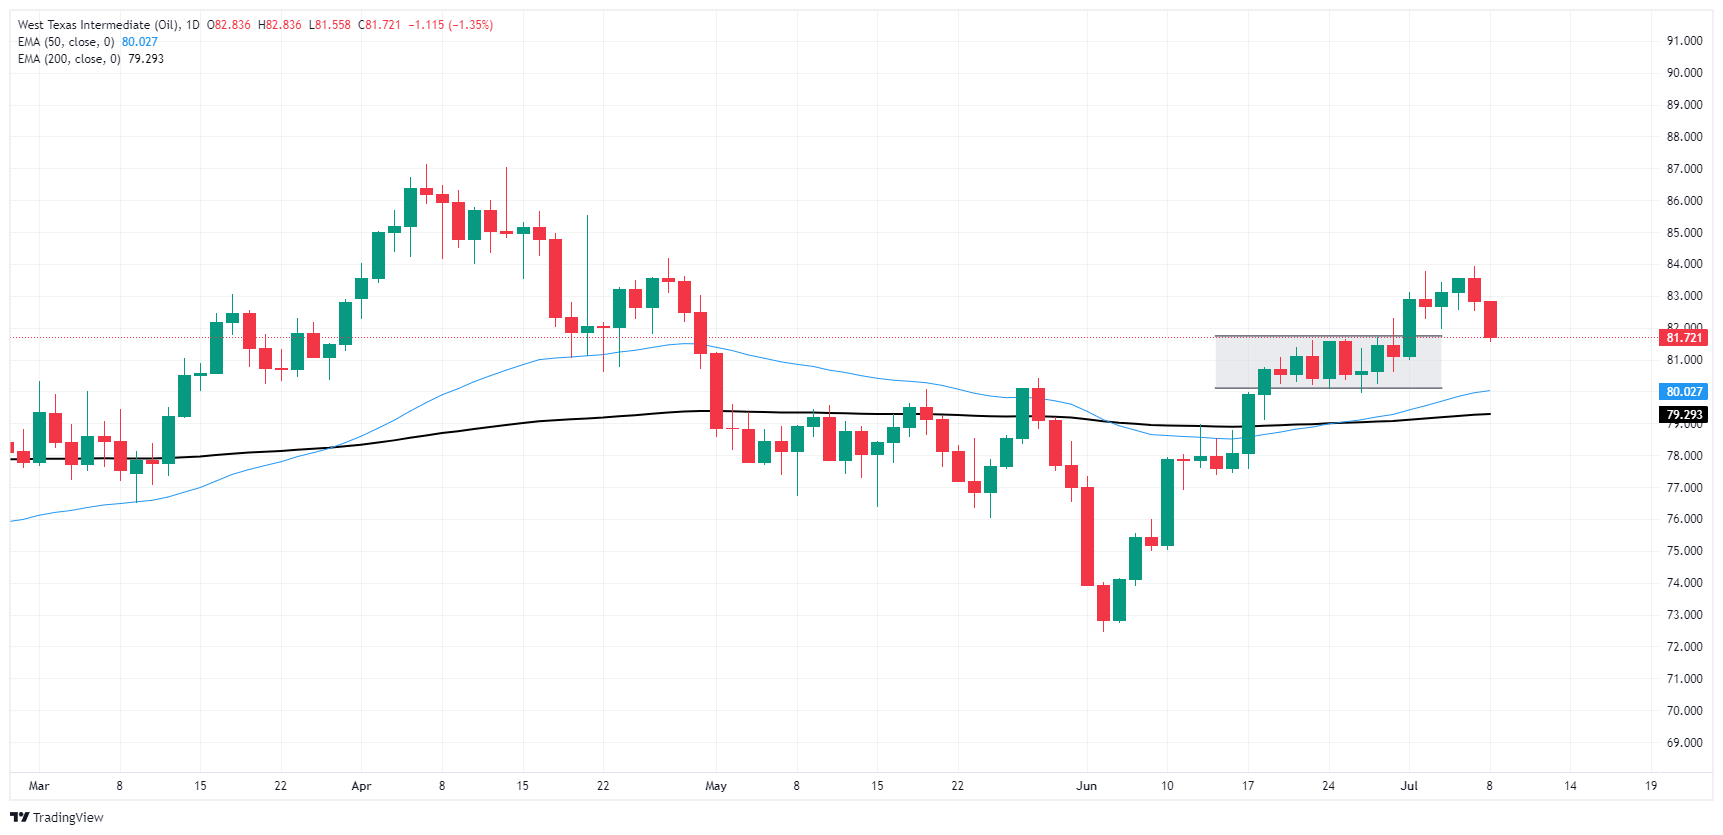
WTI Oil FAQs
WTI Oil is a type of Crude Oil sold on international markets. The WTI stands for West Texas Intermediate, one of three major types including Brent and Dubai Crude. WTI is also referred to as “light” and “sweet” because of its relatively low gravity and sulfur content respectively. It is considered a high quality Oil that is easily refined. It is sourced in the United States and distributed via the Cushing hub, which is considered “The Pipeline Crossroads of the World”. It is a benchmark for the Oil market and WTI price is frequently quoted in the media.
Like all assets, supply and demand are the key drivers of WTI Oil price. As such, global growth can be a driver of increased demand and vice versa for weak global growth. Political instability, wars, and sanctions can disrupt supply and impact prices. The decisions of OPEC, a group of major Oil-producing countries, is another key driver of price. The value of the US Dollar influences the price of WTI Crude Oil, since Oil is predominantly traded in US Dollars, thus a weaker US Dollar can make Oil more affordable and vice versa.
The weekly Oil inventory reports published by the American Petroleum Institute (API) and the Energy Information Agency (EIA) impact the price of WTI Oil. Changes in inventories reflect fluctuating supply and demand. If the data shows a drop in inventories it can indicate increased demand, pushing up Oil price. Higher inventories can reflect increased supply, pushing down prices. API’s report is published every Tuesday and EIA’s the day after. Their results are usually similar, falling within 1% of each other 75% of the time. The EIA data is considered more reliable, since it is a government agency.
OPEC (Organization of the Petroleum Exporting Countries) is a group of 13 Oil-producing nations who collectively decide production quotas for member countries at twice-yearly meetings. Their decisions often impact WTI Oil prices. When OPEC decides to lower quotas, it can tighten supply, pushing up Oil prices. When OPEC increases production, it has the opposite effect. OPEC+ refers to an expanded group that includes ten extra non-OPEC members, the most notable of which is Russia.
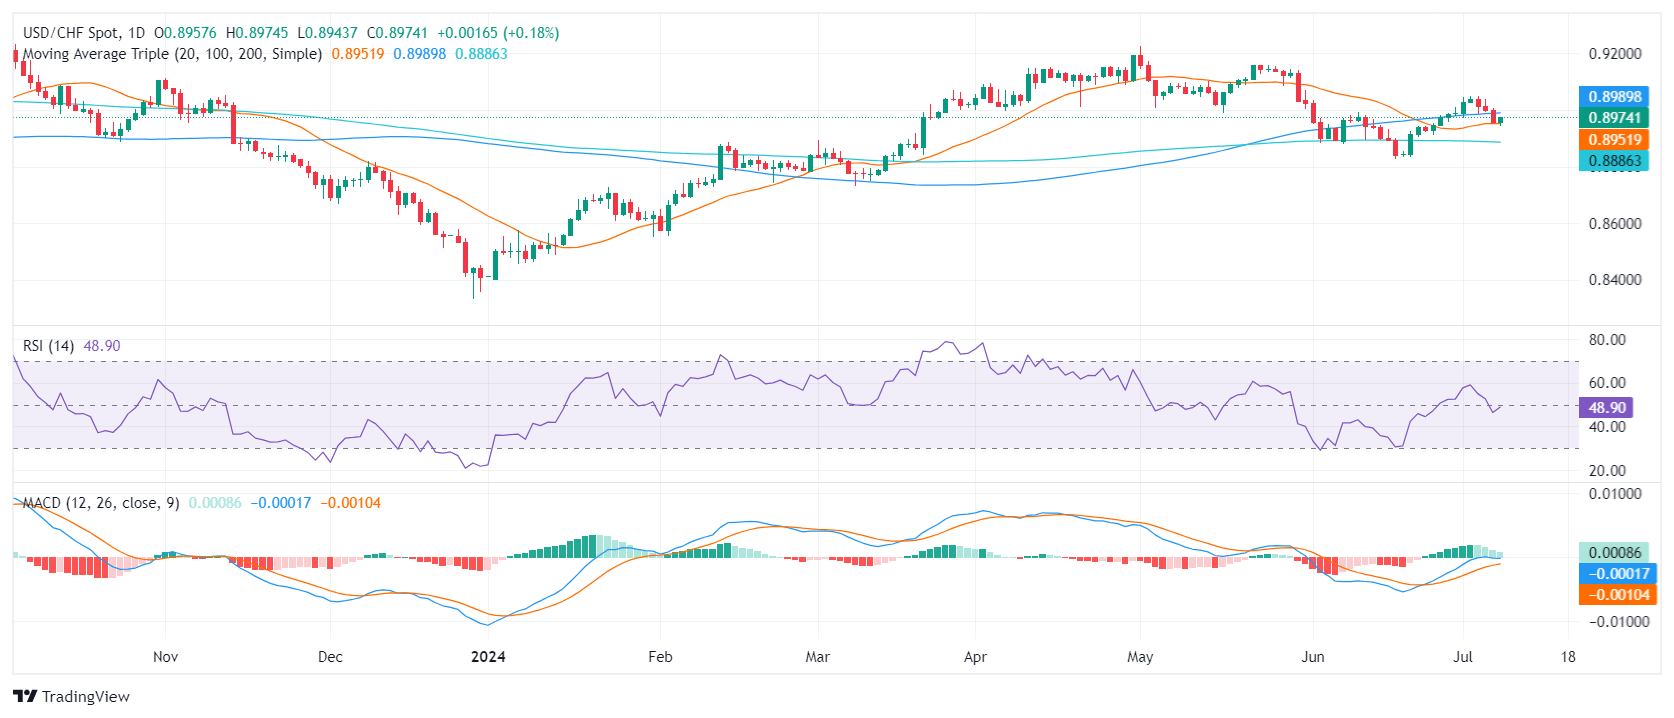
- USD/CHF rose slightly in the quiet market environment ahead of this week's US CPI data.
- Last week's underwhelming US data weighed on the USD.
- Markets are bracing for the US inflation data due later in the week for directional cues.
On Monday, the USD/CHF traded largely neutral around 0.8970 with some gains. That being said, the pair continues soft, following last week's US data which fueled dovish bets on the Federal Reserve (Fed) which made markets dump the USD. There won't be any highlights on Monday and markets brace for inflation data from the US later in the week.
The US markets are now keenly watching for the release of June's Consumer Price Index (CPI). The data will play a crucial role in determining whether the inflation resurgence is tapering off or if the softer readings in April and May were transitory. The headline CPI for June is predicted to decelerate to 3.1% YoY, down from May's 3.3%, marking a third successive month of slowing growth. In addition, Fed Chair Powell delivers his Semiannual Monetary Policy Report to Congress this week on Tuesday which might also shake the USD dynamics.
On the Swiss side, no major highlights are expected this week, hinting that the pair's movement will be mostly driven by the USD's dynamics. Financial markets see over 50% odds of a third interest-rate cut by the Swiss National Bank (SNB) in September. Likewise, the odds of a cut by the Fed in September have soared to around 80% according to the CME FedWatch tool.
USD/CHF technical analysis
The technical outlook remains somewhat negative in the short term. The pair broke the six-day winning streak and has now recorded losses for three consecutive sessions ending last Friday. Moreover, The Moving Average Convergence Divergence (MACD) and Relative Strength Index (RSI) indicators continue to lose momentum.
The pair's movement now centers around whether the buyers will defend the 20-day Simple Moving Average (SMA) at 0.8950. The 100-day SMA, which sits at 0.8990, is now the immediate resistance level.
USD/CHF daily chart
- Gold stumbles after peaking at $2,391 amid revived risk appetite.
- Mixed US jobs data fuel speculation of an imminent Federal Reserve rate cut.
- China's PBoC halts Gold purchases, impacting bullion prices alongside falling Treasury yields.
The Gold price made a U-turn on Monday, trimming some of last Friday's gains and tanking more than 1% as risk appetite returned. US equities posted gains while US Treasury bond yields edged lower. The XAU/USD trades at $2,358 after hitting a daily high of $2,391.
Last week’s US NFP report was mixed. June figures exceeded estimates, but April’s and May’s downward revisions hinted that the US jobs market is cooling sharply. Consequently, the US Unemployment Rate ticked higher, spurring speculation that the Federal Reserve could slash interest rates sooner than expected.
Bullion prices were also hurt by the People Bank of China’s (PBoC) decision not to buy Gold in June, as in May, China held 72.80 million troy ounces of the precious metal at the end of June.
The US 10-year Treasury bond yield fell almost two basis points to 4.27%, reflecting that market players expect the Federal Reserve to lower borrowing costs amid the chances of hurting the labor market.
According to data from the CME FedWatch Tool, investors are pricing in 73% odds of a Fed rate cut in September, up from 71% last Friday.
The US economic docket will feature Fed Chairman Jerome Powell's semi-annual Congressional Testimony and the release of inflation figures on the consumer and producer sides. Initial Jobless Claims and the University of Michigan Consumer Sentiment will also complement the schedule.
Daily digest market movers: Gold price slumps ahead of Fed’s Powell speech
- The US CPI is expected to decrease from 3.3% to 3.1% year-over-year in June, while core inflation is projected to remain steady at 3.4% year-over-year.
- According to the consensus, Initial Jobless Claims for the week ending July 6 are expected to increase from 238K to 240K.
- July Consumer Sentiment is set to improve to 68.5, up from 68.2 in June, according to the consensus.
- Federal Open Market Committee (FOMC) June Meeting Minutes showed that most participants estimated that the current policy is restrictive but had opened the door for rate increases. Policymakers acknowledged the economy is cooling and could react to unexpected economic weakness.
- December 2024 fed funds rate futures contract implies that the Fed will ease policy by 39 basis points (bps) toward the end of the year.
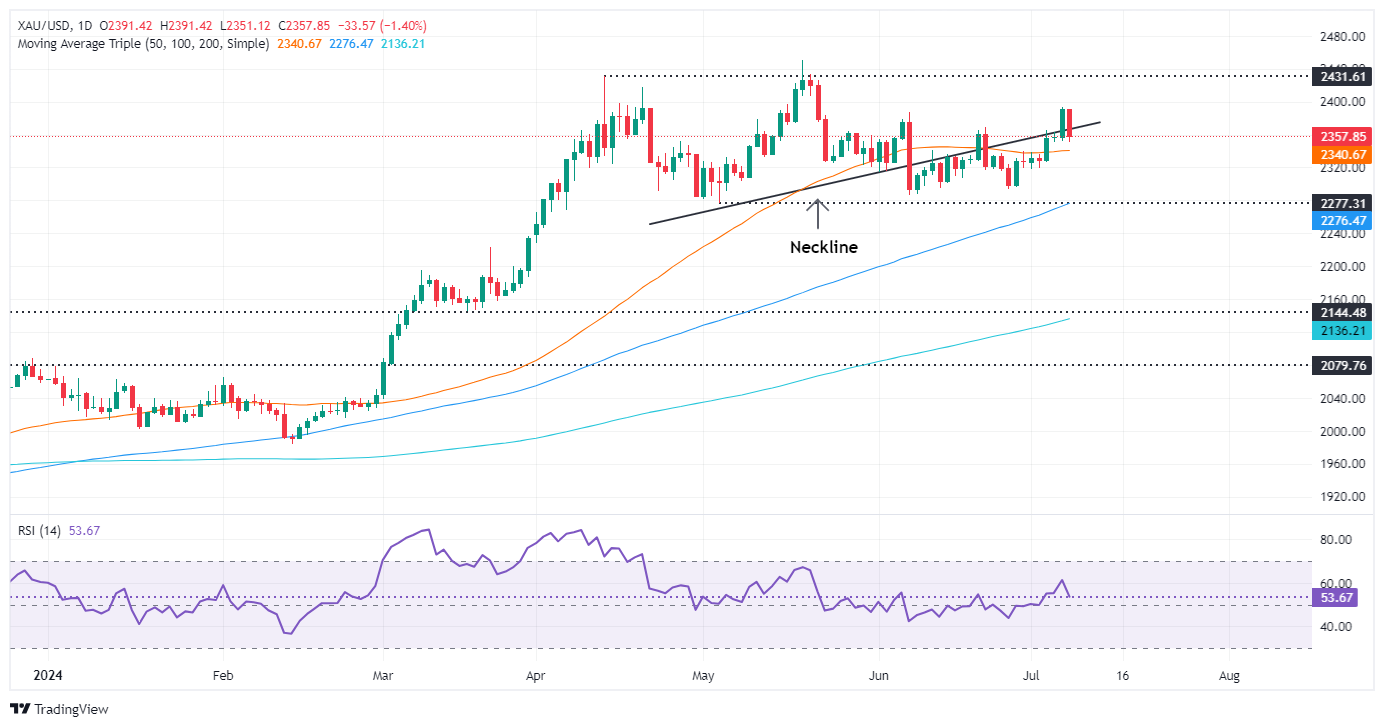
Technical analysis: Gold price retreats below Head-and-Shoulders neckline
Gold price has retreated after decisively breaking the Head-and-Shoulders neckline, which witnessed the XAU/USD price travel to $2,392 before slumping toward $2,357, the current exchange rate, opening the door for a consolidation.
Momentum shows buyers are losing steam, with the Relative Strength Index (RSI) decelerating toward the 50-neutral line, which, if crossed, will hint that sellers are moving in.
If XAU/USD drops below $2,350, further declines could target the $2,300 level. If this support fails, the next demand zone would be the May 3 low of $2,277, followed by the March 21 high of $2,222.
On the other hand, if Gold prices climb above $2,400, further upside is seen, with the next resistance lying at the YTD high of $2,450, ahead of the $2,500 mark.
Gold FAQs
Gold has played a key role in human’s history as it has been widely used as a store of value and medium of exchange. Currently, apart from its shine and usage for jewelry, the precious metal is widely seen as a safe-haven asset, meaning that it is considered a good investment during turbulent times. Gold is also widely seen as a hedge against inflation and against depreciating currencies as it doesn’t rely on any specific issuer or government.
Central banks are the biggest Gold holders. In their aim to support their currencies in turbulent times, central banks tend to diversify their reserves and buy Gold to improve the perceived strength of the economy and the currency. High Gold reserves can be a source of trust for a country’s solvency. Central banks added 1,136 tonnes of Gold worth around $70 billion to their reserves in 2022, according to data from the World Gold Council. This is the highest yearly purchase since records began. Central banks from emerging economies such as China, India and Turkey are quickly increasing their Gold reserves.
Gold has an inverse correlation with the US Dollar and US Treasuries, which are both major reserve and safe-haven assets. When the Dollar depreciates, Gold tends to rise, enabling investors and central banks to diversify their assets in turbulent times. Gold is also inversely correlated with risk assets. A rally in the stock market tends to weaken Gold price, while sell-offs in riskier markets tend to favor the precious metal.
The price can move due to a wide range of factors. Geopolitical instability or fears of a deep recession can quickly make Gold price escalate due to its safe-haven status. As a yield-less asset, Gold tends to rise with lower interest rates, while higher cost of money usually weighs down on the yellow metal. Still, most moves depend on how the US Dollar (USD) behaves as the asset is priced in dollars (XAU/USD). A strong Dollar tends to keep the price of Gold controlled, whereas a weaker Dollar is likely to push Gold prices up.
The Greenback kicked off the week with decent gains, leaving behind some of the NFP-driven weakness and regaining some fresh traction in response to the broad-based knee-jerk in the risk complex. In the meantime, investors continued to digest the French snap elections and gradually shifted their attention to Powell’s semi-annual testimonies and key US data.
Here is what you need to know on Tuesday, July 9:
The USD Index (DXY) reclaimed the 105.00 barrier and above despite the move lower in US yields. The semi-annual testimony by Chair J. Powell to the Congress will be the salient event in the US docket on July 9. In addition, the Fed’s Barr and Bowman are also due to speak.
EUR/USD succumbed to the late rebound in the US Dollar soon after hitting new four-week highs near 1.0850. There are no data releases scheduled for the euro area on July 9.
GBP/USD could not sustain the early move to multi-week tops near 1.2850, eventually ending the session almost unchanged. On July 9, the BRC Retail Sales Monitor is due along with speeches by the BoE’s Cleland and Truran.
USD/JPY alternated gains with losses around the 160.80 region following two daily drops in a row. The Japanese calendar will be empty on July 9.
AUD/USD came under pressure after reaching new six-month peaks in the 0.6760-0.6765 band. The Consumer Confidence gauge tracked by Westpac takes centre stage in Oz on July 9.
WTI prices corrected markedly lower in response to growing peace talks in the Middle East and a stronger US Dollar.
Gold prices retreated from recent peaks near the $2,400 mark per ounce troy on the back of the rebound in the Greenback and some profit taking mood. Silver followed suit and partially left behind the recent robust recovery.
- Despite minimal losses, the AUD/USD remains at its highest level since January, just below 0.6740.
- RBA’s hawkish interest rate stance supports the Aussie.
- Week’s highlight will be inflation figures from the US on Thursday.
The Australian Dollar (AUD) saw some losses on Monday against the USD, which still remains weak after last week's data, which fueled dovish expectations for the Federal Reserve (Fed). With the pair maintaining its highest level since early January, the upside for the Aussie is limited by strong data reported last week along with the Reserve Bank of Australia’s (RBA) hawkish stance.
The RBA appears set to be one of the final G10 countries' central banks to initiate cuts, which should continue to support AUD as it might benefit from monetary policy divergences.
Daily digest market movers: AUD benefited by monetary policy divergences, eyes on US CPI
- US CPI will be reported on Thursday. The headline is expected to decrease slightly to 3.1% YoY, while the core is predicted to remain steady at 3.4% YoY.
- Potential easing by the Fed, juxtaposed with the likely extended restrictive stance of the RBA, could bolster the AUD/USD in coming months.
- Still, concerns about slow momentum of Chinese economy may hinder a sustained recovery of the Australian currency.
- This week doesn't offer any major events on Australia's calendar, and the AUD is forecast to hold its gains against its competitors as long as the RBA maintains its hawkish stance.
- On the Fed's side, there's a 70% chance of a September rate cut, contingent on future data with markets seriously betting on a hike this year by the RBA.
Technical analysis: AUD/USD concedes some ground, further correction possible
The AUD/USD lost ground on Monday, but the overall outlook is positive, backed by deep positive territories on the technical indicators Relative Strength Index (RSI) and Moving Average Convergence Divergence (MACD). With the pair securing a four-day winning streak and reaching its highs since January, the bulls confirmed a bullish outlook last week.
Nevertheless, traders should pay attention to possible overbought conditions, suggesting a slight correction might be imminent.The next bullish targets are at 0.6750 and 0.6780, while support levels to monitor are at 0.6670, 0.6650 and 0.6630.
Australian Dollar FAQs
One of the most significant factors for the Australian Dollar (AUD) is the level of interest rates set by the Reserve Bank of Australia (RBA). Because Australia is a resource-rich country another key driver is the price of its biggest export, Iron Ore. The health of the Chinese economy, its largest trading partner, is a factor, as well as inflation in Australia, its growth rate and Trade Balance. Market sentiment – whether investors are taking on more risky assets (risk-on) or seeking safe-havens (risk-off) – is also a factor, with risk-on positive for AUD.
The Reserve Bank of Australia (RBA) influences the Australian Dollar (AUD) by setting the level of interest rates that Australian banks can lend to each other. This influences the level of interest rates in the economy as a whole. The main goal of the RBA is to maintain a stable inflation rate of 2-3% by adjusting interest rates up or down. Relatively high interest rates compared to other major central banks support the AUD, and the opposite for relatively low. The RBA can also use quantitative easing and tightening to influence credit conditions, with the former AUD-negative and the latter AUD-positive.
China is Australia’s largest trading partner so the health of the Chinese economy is a major influence on the value of the Australian Dollar (AUD). When the Chinese economy is doing well it purchases more raw materials, goods and services from Australia, lifting demand for the AUD, and pushing up its value. The opposite is the case when the Chinese economy is not growing as fast as expected. Positive or negative surprises in Chinese growth data, therefore, often have a direct impact on the Australian Dollar and its pairs.
Iron Ore is Australia’s largest export, accounting for $118 billion a year according to data from 2021, with China as its primary destination. The price of Iron Ore, therefore, can be a driver of the Australian Dollar. Generally, if the price of Iron Ore rises, AUD also goes up, as aggregate demand for the currency increases. The opposite is the case if the price of Iron Ore falls. Higher Iron Ore prices also tend to result in a greater likelihood of a positive Trade Balance for Australia, which is also positive of the AUD.
The Trade Balance, which is the difference between what a country earns from its exports versus what it pays for its imports, is another factor that can influence the value of the Australian Dollar. If Australia produces highly sought after exports, then its currency will gain in value purely from the surplus demand created from foreign buyers seeking to purchase its exports versus what it spends to purchase imports. Therefore, a positive net Trade Balance strengthens the AUD, with the opposite effect if the Trade Balance is negative.
- Dow Jones found early highs before settling back into the low end.
- New trading week kicks things off with a breather after Friday’s NFP.
- US consumer and wholesale inflation figures are due this week.
The Dow Jones Industrial Average (DJIA) whipped on Monday, briefly testing fresh highs and breaking out of Friday’s tight churn before slumping into the red for the new trading week. Federal Reserve (Fed) Chairman Jerome Powell gives the first of a two-day Monetary Policy Report to the US Congress on Tuesday, with key US inflation figures slated for the back half of the trading week.
Fed Chair Powell will deliver the first half of his Monetary Policy Report to the Senate Banking Committee on Tuesday, followed by the same presentation to the House Committee on Financial Services on Wednesday. US Consumer Price Index (CPI) inflation is slated for Thursday, and US Producer Price Index (PPI) wholesale inflation is due Friday.
US inflation figures will be the key data print this week as investors look for signs of rate cuts from the Fed. Despite broad-market hopes for a rate trim, Fed officials have continued to lean into the wait for further evidence that inflation will ease back to the Fed’s 2% annual target. According to the CME’s FedWatch Tool, rate traders are pricing in nearly 80% odds of at least a quarter-point trim to the Fed funds rate on September 18, a little over ten weeks from now.
Waiting for this week’s inflation data will be tense. Core CPI for the year ended June is forecast to hold steady at 3.4% YoY, while core PPI inflation for the same period is expected to tick higher to 2.5% YoY from the previous 2.3% as inflationary pressures remain elevated at the producer-supplier level.
Dow Jones news
The Dow Jones index was mixed on Monday, with roughly half of the equity board’s constituent securities in the green for the day, but overall declines in key goods producers kept headline index prices subdued. Nike Inc. (NKE) fell -2.25% to $73.73 per share, extending into a fresh 52-week low and facing further declines as the shoe manufacturing giant sees growth problems for the year ahead as the footwear giant’s market share gets cannibalized by smaller, more strategic competitors.
Intel Corp. (INTC) surged on Monday, rising 5.3% to $33.72 per share after a note from Melius Research analysts suggested that NVIDIA Corp. (NVDA) competitors like Intel and Advanced Micro Devices Inc. (AMD) could play significant catchup in the AI space with current sector giant NVIDIA.
Dow Jones technical outlook
The Dow Jones Industrial Average (DJIA) rallied in early Monday trading, tapping into a fresh seven-week high of 39,663.30 before a sharp downturn erased the day’s gains. The Dow Jones slid to an intraday low just south of 39,275.00. The major equity index remains down around one-tenth of one percent on Monday.
The Dow Jones has churned in familiar chart territory just above the 50-day Exponential Moving Average (EMA) at 38,983.20 since recovering from late May’s bottom near 38,000.00. Despite holding firmly in the high end, bullish momentum remains limited, and Dow Jones bidders have so far failed to develop the necessary momentum to drag bids back over all-time highs set above the 40,000.00 major price handle.
Dow Jones five minute chart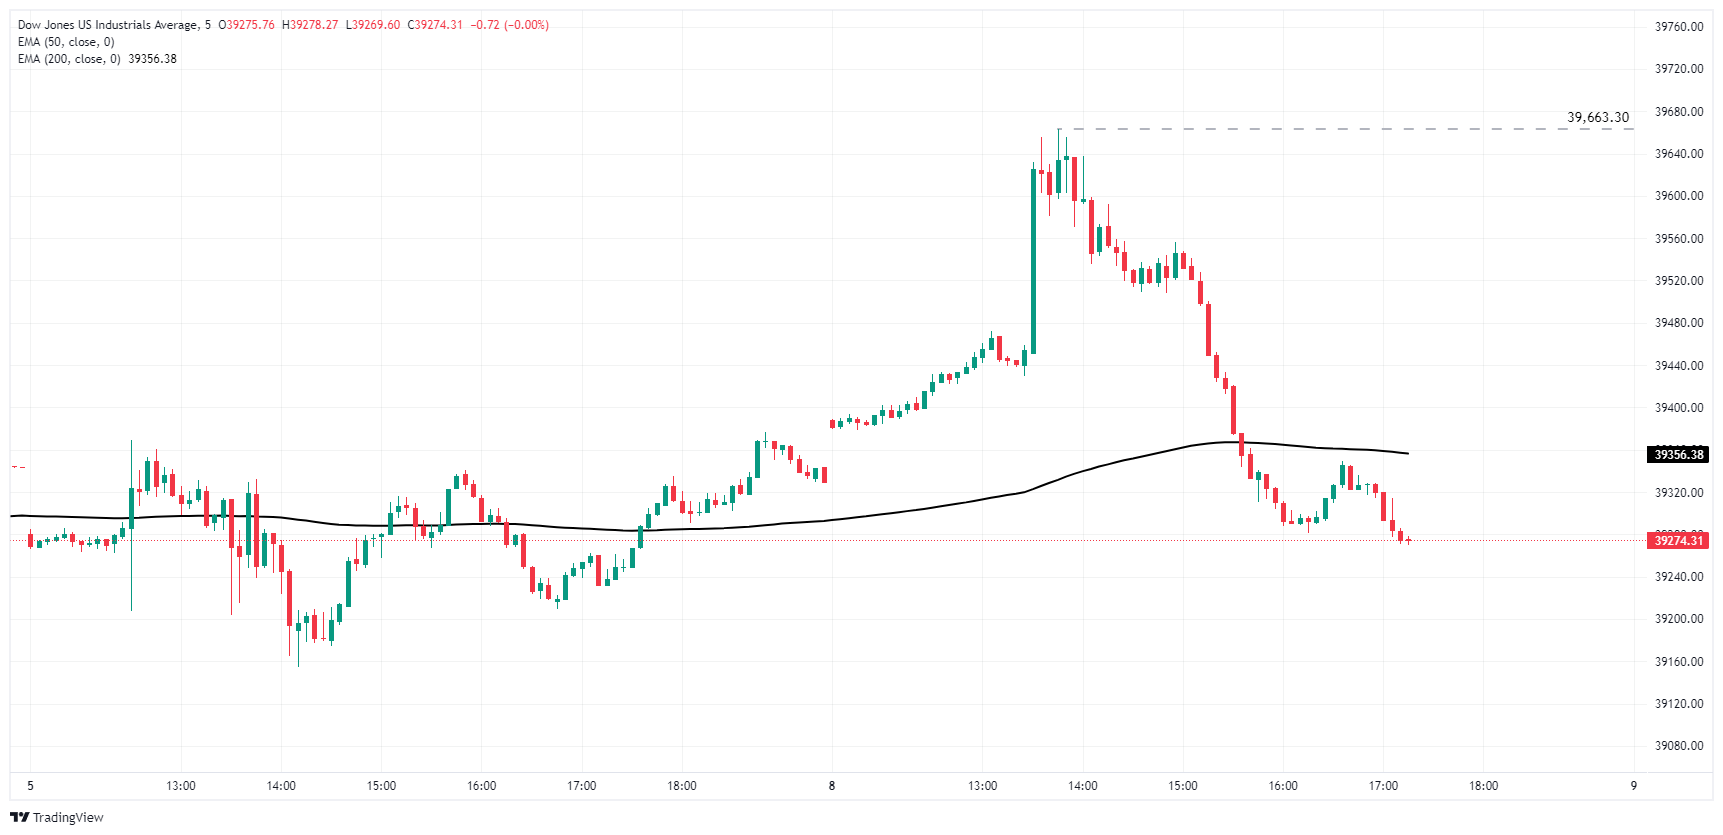
Dow Jones daily chart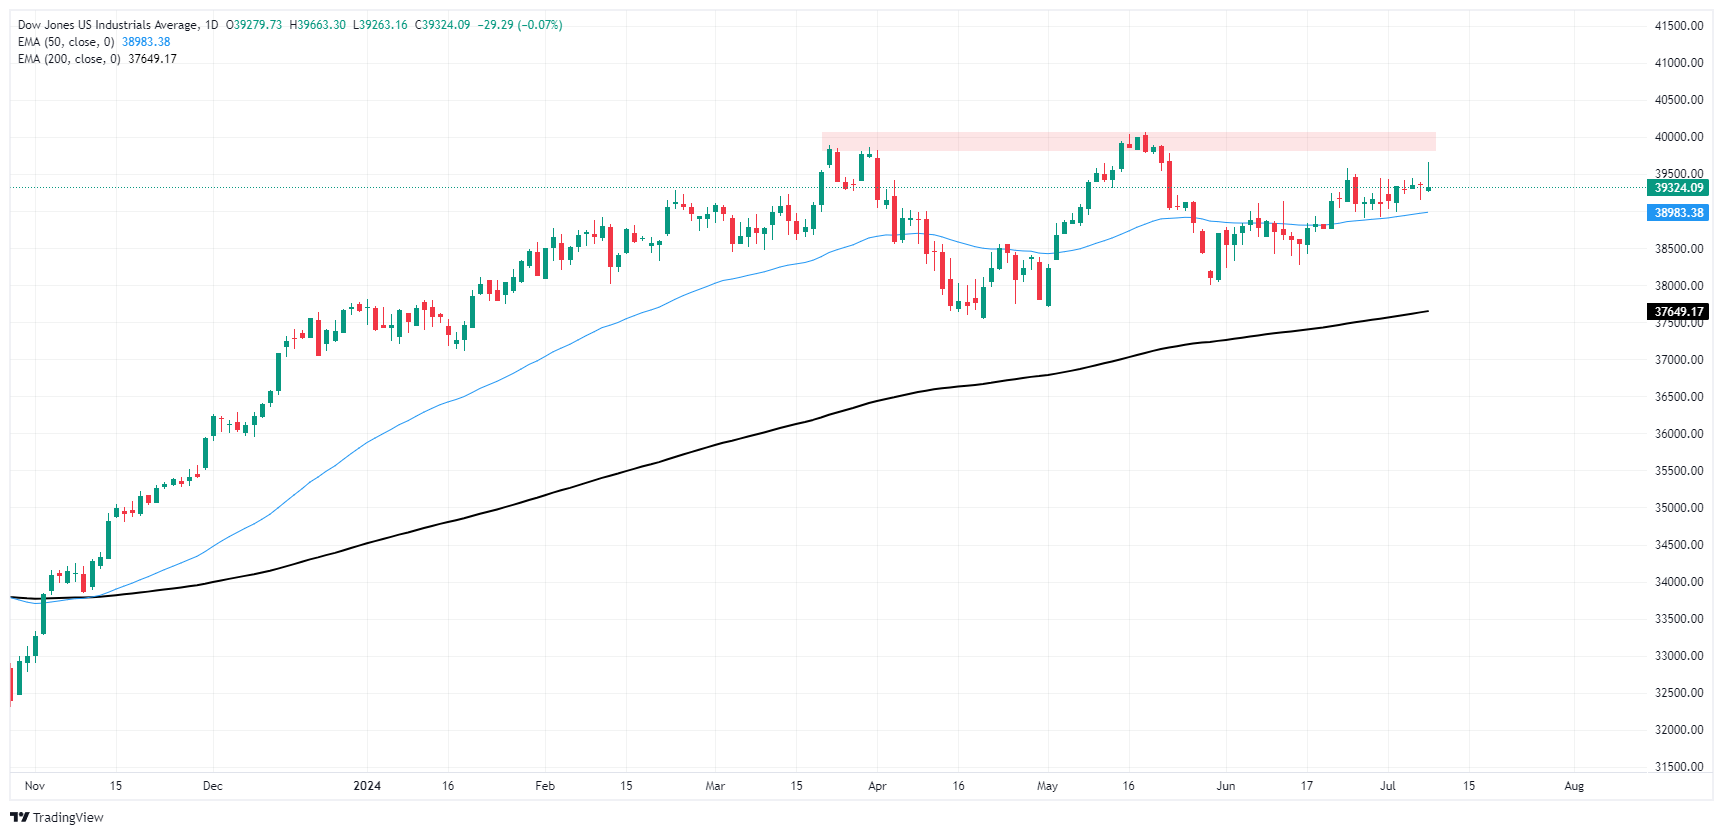
Dow Jones FAQs
The Dow Jones Industrial Average, one of the oldest stock market indices in the world, is compiled of the 30 most traded stocks in the US. The index is price-weighted rather than weighted by capitalization. It is calculated by summing the prices of the constituent stocks and dividing them by a factor, currently 0.152. The index was founded by Charles Dow, who also founded the Wall Street Journal. In later years it has been criticized for not being broadly representative enough because it only tracks 30 conglomerates, unlike broader indices such as the S&P 500.
Many different factors drive the Dow Jones Industrial Average (DJIA). The aggregate performance of the component companies revealed in quarterly company earnings reports is the main one. US and global macroeconomic data also contributes as it impacts on investor sentiment. The level of interest rates, set by the Federal Reserve (Fed), also influences the DJIA as it affects the cost of credit, on which many corporations are heavily reliant. Therefore, inflation can be a major driver as well as other metrics which impact the Fed decisions.
Dow Theory is a method for identifying the primary trend of the stock market developed by Charles Dow. A key step is to compare the direction of the Dow Jones Industrial Average (DJIA) and the Dow Jones Transportation Average (DJTA) and only follow trends where both are moving in the same direction. Volume is a confirmatory criteria. The theory uses elements of peak and trough analysis. Dow’s theory posits three trend phases: accumulation, when smart money starts buying or selling; public participation, when the wider public joins in; and distribution, when the smart money exits.
There are a number of ways to trade the DJIA. One is to use ETFs which allow investors to trade the DJIA as a single security, rather than having to buy shares in all 30 constituent companies. A leading example is the SPDR Dow Jones Industrial Average ETF (DIA). DJIA futures contracts enable traders to speculate on the future value of the index and Options provide the right, but not the obligation, to buy or sell the index at a predetermined price in the future. Mutual funds enable investors to buy a share of a diversified portfolio of DJIA stocks thus providing exposure to the overall index.
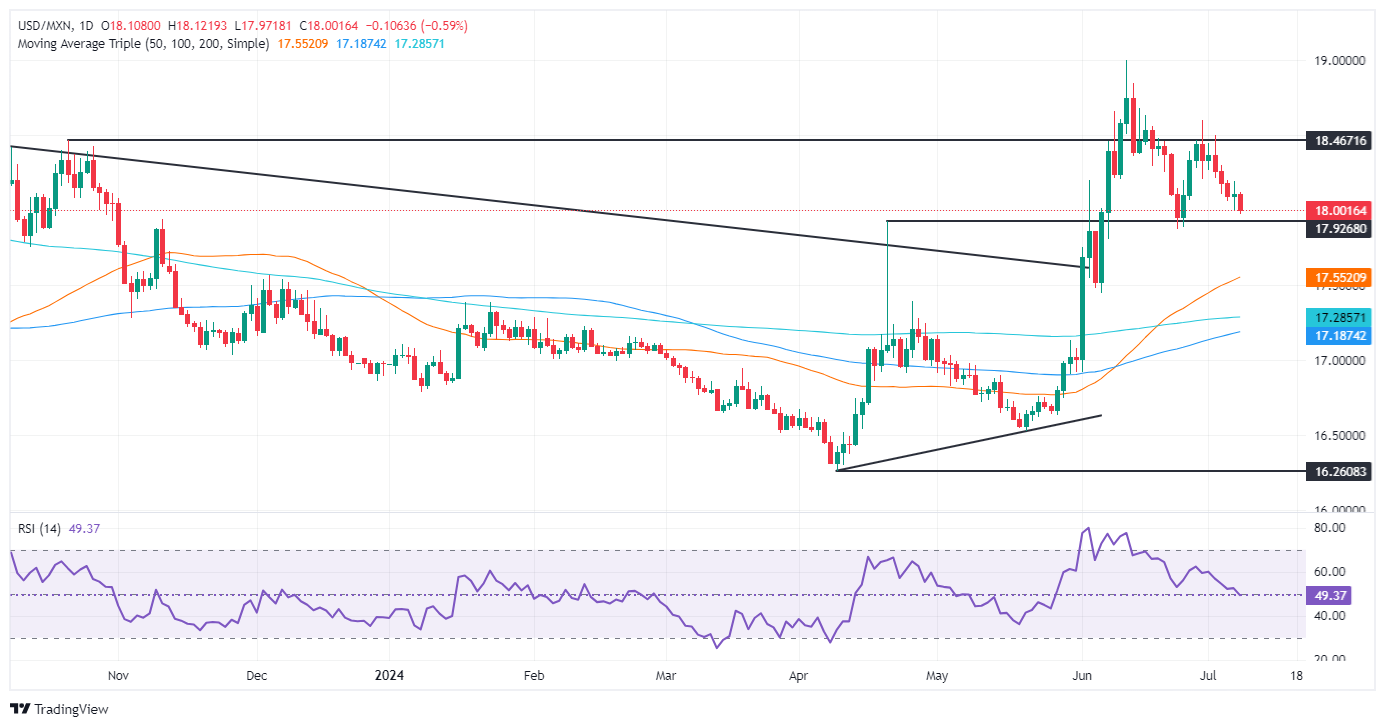
- Mexican Peso rallies as USD/MXN drops below 18.00 and hits lowest level since June 25.
- June’s CPI report, Consumer Confidence, and Industrial Production to shape Mexico's economic outlook.
- Banxico minutes likely to signal patience on rate cuts amid steady inflation expectations.
The Mexican Peso rallied sharply against the US Dollar as the USD/MXN fell below the 18.00 psychological figure on Monday, a level last seen on June 25. This signaled that Peso’s buyers remain committed to the so-called “carry trade,” which underpins the Mexican currency. Therefore, the exotic pair exchanged hands at 17.99, down 0.45%.
Mexico’s economic docket will interest traders. The focus is June’s Consumer Price Index (CPI) report, which will be released on July 9. Further data, like Consumer Confidence and Industrial Production, will be released, which will dictate the economic trend and set it to slow down, according to analysts.
On Thursday, the Bank of Mexico (Banxico) will reveal the latest meeting monetary policy minutes, which are expected to show that the central bank will remain patient regarding cutting borrowing costs.
Across the border, the New York Federal Reserve revealed that consumer inflation expectations were lowered from 3.2% to 3% for one year. Besides that, market players will be focused on Federal Reserve (Fed) Chair Jerome Powell's speech at the US Congress on Tuesday and Wednesday and the release of June’s inflation figures.
Last week’s US jobs data sparked speculation that the Fed might ease policy in September, according to the CME FedWatch Tool data. Odds for a September cut stand at 73%, up from 71% last Friday.
Daily digest market movers: Mexican Peso rises further despite firm US Dollar
- Banxico’s survey showed that economists estimate the Gross Domestic Product (GDP) will end the year at 2%, down from 2.1%. They expect Banxico to cut rates from 11.00% to 10.25%, up from 10.00% projected in May.
- Some analysts in Mexico estimate the economy might slow down but dodge a recession, according to the National Statistics Agency (INEGI) Coincident Indicator. Despite that, they said reforms pushed by President Andres Manuel Lopez Obrador (AMLO), particularly the judiciary reform, could affect the country’s creditworthiness.
- Mexico’s CPI is expected to rise from 4.69% YoY to 4.84% in June, while core CPI is estimated to dip from 4.21% to 4.15% annually.
- US CPI is foreseen to drop from 3.3% to 3.1% in the 12 months to June, while underlying inflation is projected to stay firm at 3.4% YoY.
- US Dollar Index (DXY), which tracks the value of a basket of six currencies against the American Dollar, stays firm at 104.94, up 0.06%.
Technical analysis: Mexican Peso stays near weekly highs as USD/MXN hovers around 18.00
The USD/MXN reached a nine-day low of 17.97, though some bids below the 18.00 figure lifted the pair above the latter. The Greenback remains soft against the Peso. The momentum has shifted in the sellers' favor, with the Relative Strength Index (RSI) about to drop below the 50-neutral line.
If USD/MXN achieves a daily close below 18.00, the next support would be the June 24 swing low of 17.87. Further losses lie underneath at the 50-day Simple Moving Average (SMA) at 17.56, followed by the 200-day SMA at 17.26. The next floor level would be the 100-day SMA at 17.17.
For a bullish resumption, the USD/MXN must surpass 18.10, followed by a rally above the June 28 high of 18.59, so buyers can challenge the YTD high at 18.99. Conversely, sellers will need a drop below 18.00, which could extend the pair’s decline toward the December 5 high, which turned support at 17.56, followed by the 50-day Simple Moving Average (SMA) at 17.37.
Mexican Peso FAQs
The Mexican Peso (MXN) is the most traded currency among its Latin American peers. Its value is broadly determined by the performance of the Mexican economy, the country’s central bank’s policy, the amount of foreign investment in the country and even the levels of remittances sent by Mexicans who live abroad, particularly in the United States. Geopolitical trends can also move MXN: for example, the process of nearshoring – or the decision by some firms to relocate manufacturing capacity and supply chains closer to their home countries – is also seen as a catalyst for the Mexican currency as the country is considered a key manufacturing hub in the American continent. Another catalyst for MXN is Oil prices as Mexico is a key exporter of the commodity.
The main objective of Mexico’s central bank, also known as Banxico, is to maintain inflation at low and stable levels (at or close to its target of 3%, the midpoint in a tolerance band of between 2% and 4%). To this end, the bank sets an appropriate level of interest rates. When inflation is too high, Banxico will attempt to tame it by raising interest rates, making it more expensive for households and businesses to borrow money, thus cooling demand and the overall economy. Higher interest rates are generally positive for the Mexican Peso (MXN) as they lead to higher yields, making the country a more attractive place for investors. On the contrary, lower interest rates tend to weaken MXN.
Macroeconomic data releases are key to assess the state of the economy and can have an impact on the Mexican Peso (MXN) valuation. A strong Mexican economy, based on high economic growth, low unemployment and high confidence is good for MXN. Not only does it attract more foreign investment but it may encourage the Bank of Mexico (Banxico) to increase interest rates, particularly if this strength comes together with elevated inflation. However, if economic data is weak, MXN is likely to depreciate.
As an emerging-market currency, the Mexican Peso (MXN) tends to strive during risk-on periods, or when investors perceive that broader market risks are low and thus are eager to engage with investments that carry a higher risk. Conversely, MXN tends to weaken at times of market turbulence or economic uncertainty as investors tend to sell higher-risk assets and flee to the more-stable safe havens.
- Canadian Dollar flows mostly stuck in place on Monday, limiting price momentum.
- Canada has a strictly low-tier showing on the economic calendar this week.
- Markets to keep an eye out for Fed Chair Powell’s Monetary Policy Report.
The Canadian Dollar (CAD) largely churned in familiar territory on Monday, trading softly against the US Dollar (USD) as markets recovered from last Friday’s US jobs data glut. Monday’s sun rises on calmer markets after US labor figures crimped recent gains for the CAD, and USD/CAD is marking out a thin range just below 1.3650.
Canada is almost entirely absent from the economic calendar this week, leaving the CAD adrift against broader market flows. Key US inflation and activity data are due throughout the week, and market participants will be trying to nail down firmer timing on the Federal Reserve’s (Fed) pace of rate cuts moving forward.
Daily digest market movers: Canadian Dollar mostly treads water in Monday kickoff
- Key CAD data is absent this week; CAD traders are forced to wait for the crumbs of Friday’s low-tier Building Permits.
- North American markets will remain tepid until Tuesday’s first of two appearances from Fed Chairman Jerome Powell, who will deliver his two-day Semi-Annual Monetary Policy Report to the US Senate Banking Committee.
- A smattering of appearances from other Fed policymakers are due throughout the first half of the trading week.
- US Consumer Price Index (CPI) inflation is slated for Thursday, with Producer Price Index (PPI) inflation due on Friday.
- Investors will be looking for a further easing in US inflation data to help muscle the Fed closer to a rate cut in September.
Canadian Dollar PRICE Today
The table below shows the percentage change of Canadian Dollar (CAD) against listed major currencies today. Canadian Dollar was the strongest against the Australian Dollar.
| USD | EUR | GBP | JPY | CAD | AUD | NZD | CHF | |
|---|---|---|---|---|---|---|---|---|
| USD | 0.06% | -0.05% | -0.02% | -0.09% | 0.16% | 0.07% | 0.09% | |
| EUR | -0.06% | 0.09% | 0.24% | 0.17% | 0.26% | 0.34% | 0.37% | |
| GBP | 0.05% | -0.09% | 0.10% | 0.09% | 0.16% | 0.25% | 0.27% | |
| JPY | 0.02% | -0.24% | -0.10% | -0.07% | 0.19% | 0.24% | 0.17% | |
| CAD | 0.09% | -0.17% | -0.09% | 0.07% | 0.20% | 0.16% | 0.20% | |
| AUD | -0.16% | -0.26% | -0.16% | -0.19% | -0.20% | 0.09% | 0.10% | |
| NZD | -0.07% | -0.34% | -0.25% | -0.24% | -0.16% | -0.09% | 0.03% | |
| CHF | -0.09% | -0.37% | -0.27% | -0.17% | -0.20% | -0.10% | -0.03% |
The heat map shows percentage changes of major currencies against each other. The base currency is picked from the left column, while the quote currency is picked from the top row. For example, if you pick the Canadian Dollar from the left column and move along the horizontal line to the US Dollar, the percentage change displayed in the box will represent CAD (base)/USD (quote).
Technical analysis: Canadian Dollar spins in place on tepid Monday
The Canadian Dollar (CAD) eased to broadly higher territory on Monday as market focus shifted elsewhere, leaving the CAD to drift in familiar territory. The Canadian Dollar rose around one-quarter of one percent against the New Zealand Dollar (NZD) and the Swiss Franc (CHF), but is trading flatly elsewhere, trading within one-tenth of one percent against the US Dollar, Euro (EUR), Pound Sterling (GBP), and Japanese Yen (JPY).
Last Friday’s NFP-fueled bounce in USD/CAD has run aground of low-volume rocks, and the pair’s recovery from just north of 1.3600 remains within arm’s reach of fresh lows. Further downside is still on the cards if Greenback bulls cannot muscle the pair back above the 200-hour Exponential Moving Average (EMA) at 1.3660.
USD/CAD hourly chart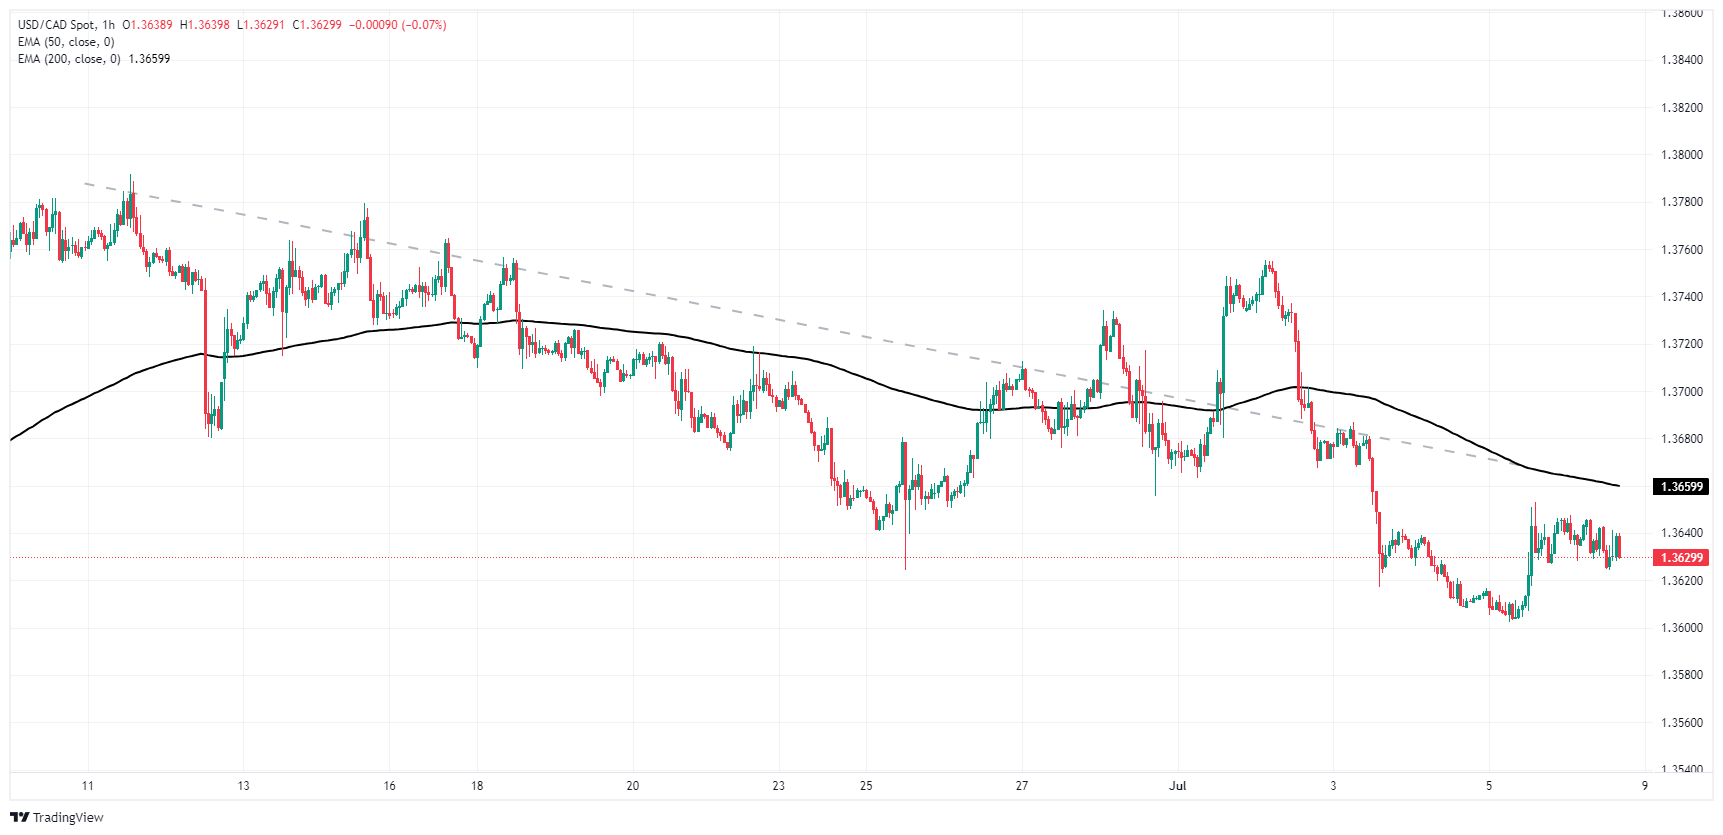
USD/CAD daily chart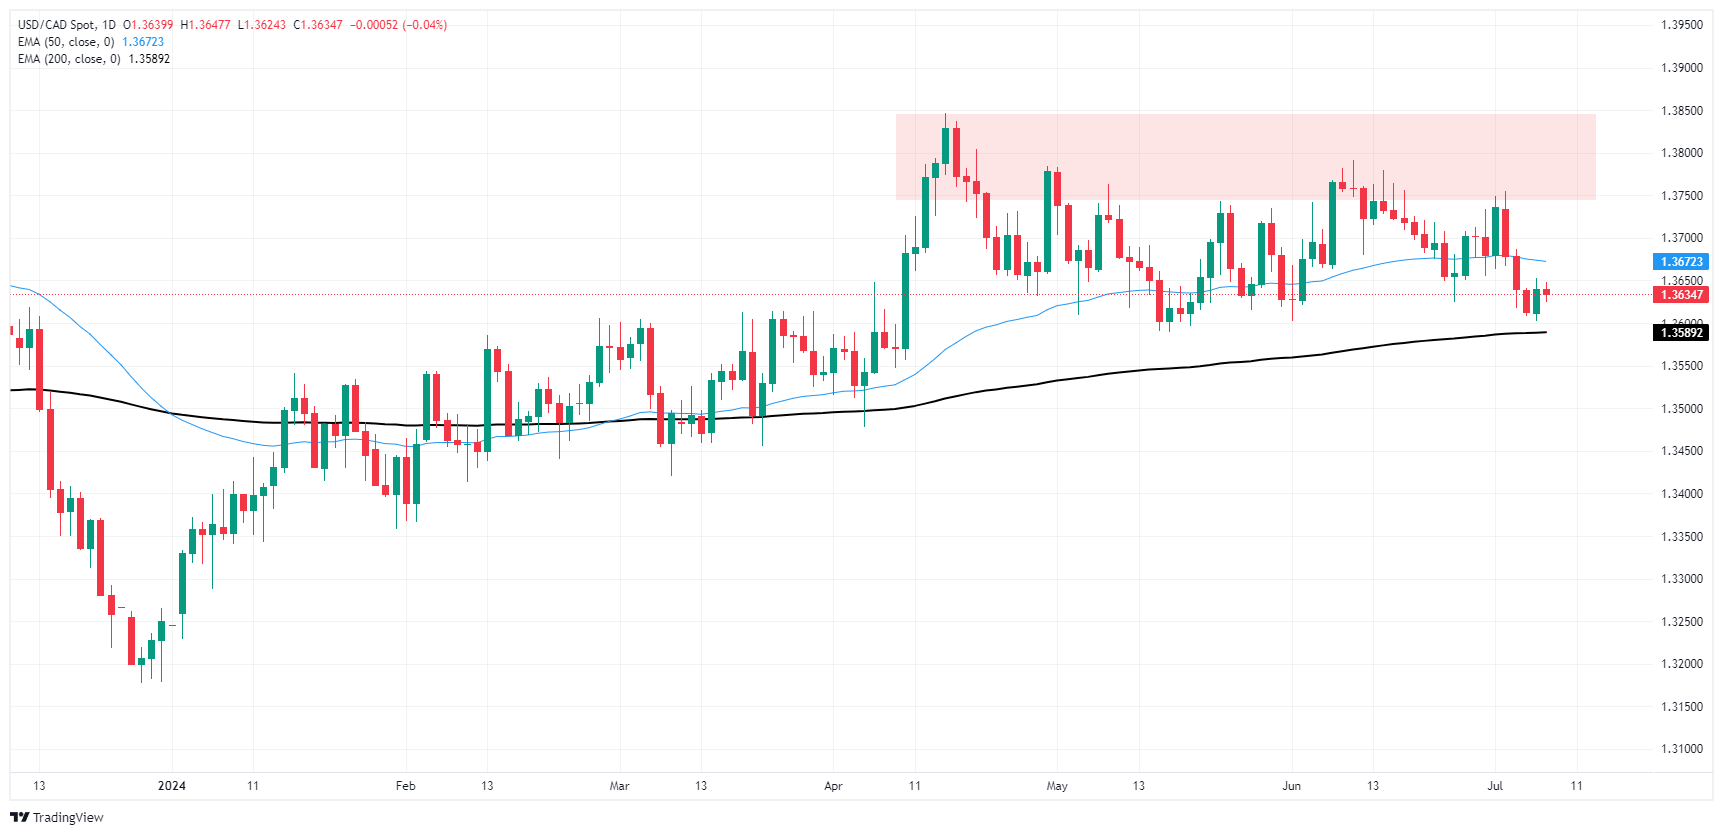
Canadian Dollar FAQs
The key factors driving the Canadian Dollar (CAD) are the level of interest rates set by the Bank of Canada (BoC), the price of Oil, Canada’s largest export, the health of its economy, inflation and the Trade Balance, which is the difference between the value of Canada’s exports versus its imports. Other factors include market sentiment – whether investors are taking on more risky assets (risk-on) or seeking safe-havens (risk-off) – with risk-on being CAD-positive. As its largest trading partner, the health of the US economy is also a key factor influencing the Canadian Dollar.
The Bank of Canada (BoC) has a significant influence on the Canadian Dollar by setting the level of interest rates that banks can lend to one another. This influences the level of interest rates for everyone. The main goal of the BoC is to maintain inflation at 1-3% by adjusting interest rates up or down. Relatively higher interest rates tend to be positive for the CAD. The Bank of Canada can also use quantitative easing and tightening to influence credit conditions, with the former CAD-negative and the latter CAD-positive.
The price of Oil is a key factor impacting the value of the Canadian Dollar. Petroleum is Canada’s biggest export, so Oil price tends to have an immediate impact on the CAD value. Generally, if Oil price rises CAD also goes up, as aggregate demand for the currency increases. The opposite is the case if the price of Oil falls. Higher Oil prices also tend to result in a greater likelihood of a positive Trade Balance, which is also supportive of the CAD.
While inflation had always traditionally been thought of as a negative factor for a currency since it lowers the value of money, the opposite has actually been the case in modern times with the relaxation of cross-border capital controls. Higher inflation tends to lead central banks to put up interest rates which attracts more capital inflows from global investors seeking a lucrative place to keep their money. This increases demand for the local currency, which in Canada’s case is the Canadian Dollar.
Macroeconomic data releases gauge the health of the economy and can have an impact on the Canadian Dollar. Indicators such as GDP, Manufacturing and Services PMIs, employment, and consumer sentiment surveys can all influence the direction of the CAD. A strong economy is good for the Canadian Dollar. Not only does it attract more foreign investment but it may encourage the Bank of Canada to put up interest rates, leading to a stronger currency. If economic data is weak, however, the CAD is likely to fall.
- US Dollar, down 0.80% last week, now at lowest level since mid-June.
- Anticipation builds with the upcoming release of the June inflation figures and Fed talks.
- Market is pricing in less than 10% odds of a cut in July and around 80% in September.
The US Dollar continues to struggle amid signs of disinflation in the US economy, fostering confidence in a potential September rate cut from the Federal Reserve (Fed) among market participants. This week, Fed Chair Jerome Powell and other governors’ words might bail out the USD and limit the losses if they remain cautious.
Despite the trailing softness in the US indicators, Fed officials are still reluctant to embrace cuts, opting to remain data-dependent and might continue asking for patience.
Daily digest market movers: US Dollar continues soft ahead of CPI and Powell’s testimony
- Among the most noteworthy events of the week are Chairman Powell's Semiannual Monetary Policy Report to Congress, multiple Fed members speaking, and the release of inflation data for June.
- On Thursday, the headline Consumer Price Index (CPI) is expected to have dropped two ticks to 3.1% YoY, while the core figure is expected to remain steady at 3.4% YoY.
- As for now, the market predicts less than a 10% chance of a rate cut at the July 31 meeting, with the odds shooting to around 80% for September.
DXY technical outlook: DXY's struggle persists as it resides below 20-day SMA
Following the DXY's slip below the 20-day Simple Moving Average (SMA) and shrinking by 0.80% last week, the technical outlook has shifted for the worst. Both the Relative Strength Index (RSI) and the Moving Average Convergence Divergence (MACD) have slumped into negative territory.
Meanwhile, the 104.70 zone, marked by the 200-day SMA, continues to provide strong support. If the selling pressure continues, the 104.50 and 104.30 areas could potentially put a stop to further losses.
US Dollar FAQs
The US Dollar (USD) is the official currency of the United States of America, and the ‘de facto’ currency of a significant number of other countries where it is found in circulation alongside local notes. It is the most heavily traded currency in the world, accounting for over 88% of all global foreign exchange turnover, or an average of $6.6 trillion in transactions per day, according to data from 2022. Following the second world war, the USD took over from the British Pound as the world’s reserve currency. For most of its history, the US Dollar was backed by Gold, until the Bretton Woods Agreement in 1971 when the Gold Standard went away.
The most important single factor impacting on the value of the US Dollar is monetary policy, which is shaped by the Federal Reserve (Fed). The Fed has two mandates: to achieve price stability (control inflation) and foster full employment. Its primary tool to achieve these two goals is by adjusting interest rates. When prices are rising too quickly and inflation is above the Fed’s 2% target, the Fed will raise rates, which helps the USD value. When inflation falls below 2% or the Unemployment Rate is too high, the Fed may lower interest rates, which weighs on the Greenback.
In extreme situations, the Federal Reserve can also print more Dollars and enact quantitative easing (QE). QE is the process by which the Fed substantially increases the flow of credit in a stuck financial system. It is a non-standard policy measure used when credit has dried up because banks will not lend to each other (out of the fear of counterparty default). It is a last resort when simply lowering interest rates is unlikely to achieve the necessary result. It was the Fed’s weapon of choice to combat the credit crunch that occurred during the Great Financial Crisis in 2008. It involves the Fed printing more Dollars and using them to buy US government bonds predominantly from financial institutions. QE usually leads to a weaker US Dollar.
Quantitative tightening (QT) is the reverse process whereby the Federal Reserve stops buying bonds from financial institutions and does not reinvest the principal from the bonds it holds maturing in new purchases. It is usually positive for the US Dollar.
Economic Indicator
Consumer Price Index (YoY)
Inflationary or deflationary tendencies are measured by periodically summing the prices of a basket of representative goods and services and presenting the data as The Consumer Price Index (CPI). CPI data is compiled on a monthly basis and released by the US Department of Labor Statistics. The YoY reading compares the prices of goods in the reference month to the same month a year earlier.The CPI is a key indicator to measure inflation and changes in purchasing trends. Generally speaking, a high reading is seen as bullish for the US Dollar (USD), while a low reading is seen as bearish.
Read more.Last release: Wed Jun 12, 2024 12:30
Frequency: Monthly
Actual: 3.3%
Consensus: 3.4%
Previous: 3.4%
Source: US Bureau of Labor Statistics
The US Federal Reserve has a dual mandate of maintaining price stability and maximum employment. According to such mandate, inflation should be at around 2% YoY and has become the weakest pillar of the central bank’s directive ever since the world suffered a pandemic, which extends to these days. Price pressures keep rising amid supply-chain issues and bottlenecks, with the Consumer Price Index (CPI) hanging at multi-decade highs. The Fed has already taken measures to tame inflation and is expected to maintain an aggressive stance in the foreseeable future.
USD/CNH traded briefly above 7.31 before turning lower into the week’s close, OCBC FX analysts Frances Cheung and Christopher Wong note.
The pair moves lower tracked broad USD pullback
“Move lower tracked broad US Dollar (USD) pullback while daily fixing reverted to +5pips/day last week (vs. +15 pips/day during 19 – 28 Jun). Today’s fixing came in at -3pips at 7.1286 (vs. 7.1289 on Fri).”
“That said, recent USD/CNY fixings continued to follow a pattern that reinforced our view that authorities are pursuing a measured pace of RMB depreciation, in attempt to let out some depreciation pressure. We believe the Intent is not to pursue a big bang approach so as not to undermine sentiments (for fear of accelerating outflows) – we continue to monitor.”
“But overall, higher USD/CNY fix, wider CNH-CNY spread and worries of escalation in US-China trade tensions may imply some concerns on RMB in the immediate horizon. USDCNH was last at 7.2867 levels. Mild bullish on daily chart eased but decline in RSI moderated. 2-way risks. Resistance at 7.31, 7.3440 (previous high in Oct 2023). Support at 7.28, 7.2770 (21 DMA) and 7.26 (50 DMA).”
The Euro (EUR) started the week on a slightly softer footing after 2nd round election results produced a somewhat surprise outcome, OCBC FX analysts Frances Cheung and Christopher Wong note.
Leftwing government may be a mild negative for EUR
“Leftwing NFP alliance is tops on 182, Macron’s centrists on 163 and the far-right RN and its allies on 143. The outcome shows how elections can be fluid and unpredictable as markets were so fixated on a far-right win. It also shows how tactical dropouts in round 2 elections can affect far-right and swing final outcome.”
“A leftist-dominated government was least expected and most feared as public spending may rise, further putting financial strains on public finance. The only consolation here is that the outcome is a hung parliament, and the left is short of an absolute majority. They will need to find other parties to form a government. A leftist leaning government may be a mild negative for EUR in the interim.”
“EUR was last seen at 1.0833 levels. Mild bullish momentum on daily chart intact but rise in RSI slowed. 2-way risks look more likely. Resistance at 1.0870 (50% fibo). Support at 1.0810 (38.2% fibo retracement of 2024 high to low, 100 DMA). 1.0730/50 levels (23.6% fibo, 21 DMA), 1.0660/ 70 levels (recent low).”
The Dollar Index (DXY) fell last week on softer US data and Fedspeaks, OCBC FX analysts Frances Cheung and Christopher Wong note.
DXY falls on Fedspeaks and softer US data
“While recent headline NFP may have surprised to the upside at +206k vs 190k, the print is now dipping back below the 6month moving average of +222k. 2month payroll downward net revision was also large at -111k while unemployment rate rose to 4.1% (vs. 4% prior). Job vacancy rate is also on a decline. On net, tightness in labour market is easing.”
“This week, we are keeping a close watch on US CPI report (Thu) and Fed Chair Powell’s semi-annual testimony to Banking senate panel (Tue) and House Financial Services Committee (Wed). If there is no change in tune to Powell’s recent remarks and CPI continues to print softer, then the USD slippage may have room to run.”
“DXY was last seen at Last seen at 104.89. Daily momentum turned bearish while RSI fell. Evening star pattern observed on weekly chart. On net, the bearish setup may have room to run. Support at 104.80 (61.8% fibo retracement of Oct high to 2024 low, 100 DMA), 104.50 (200 DMA) and 103.98 (50% fibo). Resistance at 105.10 (50 DMA), 105.80 (76.4% fibo) and 106.20.”
Oil market upside was being driven by supply side risk tied to boiling Middle East tensions, and the rally was extended via Commodity Trading Advisor (CTA) buying flows, TDS Senior Commodity Strategist Ryan McKay notes.
CTAs are set to sell 10% of their max WTI crude position
"Oil market upside was being driven by supply side risk tied to boiling Middle East tensions, and the rally was extended via CTA buying flows."
"However, we highlight that the risk premia associated with Middle East tensions tends to quickly erode without an escalation to a broader conflict, and with systematic flows hitting elevated long levels, the lack of persistent buying is likely to soon weigh on the market. Indeed, CTAs are set to sell roughly 10% of their max WTI crude position, with the $80/bbl region serving as additional key selling levels."
Price action in the base metal complex has successfully fended off Commodity Trading Advisor (CTA) selling pressure in Copper, TDS Senior Commodity Strategist Ryan McKay notes.
Traders cover their recent Copper shorts
“With China's third plenum on the radar in the coming weeks, markets are keenly focused on the potential for fresh stimulus in the Middle Kingdom that could potentially drive commodity demand. In this sense, top Shanghai Futures Exchange (SHFE) traders have covered their recent shorts overnight, and while the nearest CTA trigger remains to the downside, there is a more of a margin of safety with the trigger sitting at $9,597/t.”
“With our gauge of global commodity demand continuing to weaken, while depressed premiums and surging inventories in the Middle Kingdom argue against fundamental tightness, there are plenty of potential catalysts that could still see prices ease once again.”
“With still bloated money manager positioning on Comex, the lack of evidence supporting current physical tightness, or a disappointment on potential Chinese stimulus, can continue to see these money manager positions unwind.”
- GBP/USD continued to edge higher for eight straight days,
- US economic docket led by Fed Chair Powell and inflation data to lay GBP/USD’s path.
- The pair is bullish-biased, with buyers set to test 1.2900.
The Pound Sterling begins the week on a higher note and posted gains of more than 0.20%, as the Greenback continued to edge lower, amid increasing expectations that the Federal Reserve could cut borrowing costs in September. A busy week in the US docket will feature Fed Chair Jerome Powell's speeches at the US Congress, while inflation data on Wednesday will lay the path for the upcoming Fed decision. The GBP/USD trades at 1.2844 at around four-week highs.
GBP/USD Price Analysis: Technical outlook
From a technical perspective, the GBP/USD pair has made a significant move. It has broken a downslope resistance trendline that dates to the August 2023 highs. This trendline has now become a support level, following the pair's clearance of the 1.2750 psychological level.
Momentum suggests that buyers could push the exchange rate higher, as depicted by the Relative Strength Index (RSI) in bullish territory.
This would put the year-to-date (YTD) high of 1.2893 back into play, and further Cable’s strength could push the pair above 1.2900, with buyers setting their sights on the July 27, 2023, high of 1.2995.
For a bearish continuation, the first support to be taken would be the 50-day moving average (DMA) at 1.2678, followed by the 100-DMA at 1.2650, and the latest cycle low being the Jun 27 low of 1.2612.
GBP/USD Price Action – Daily Chart
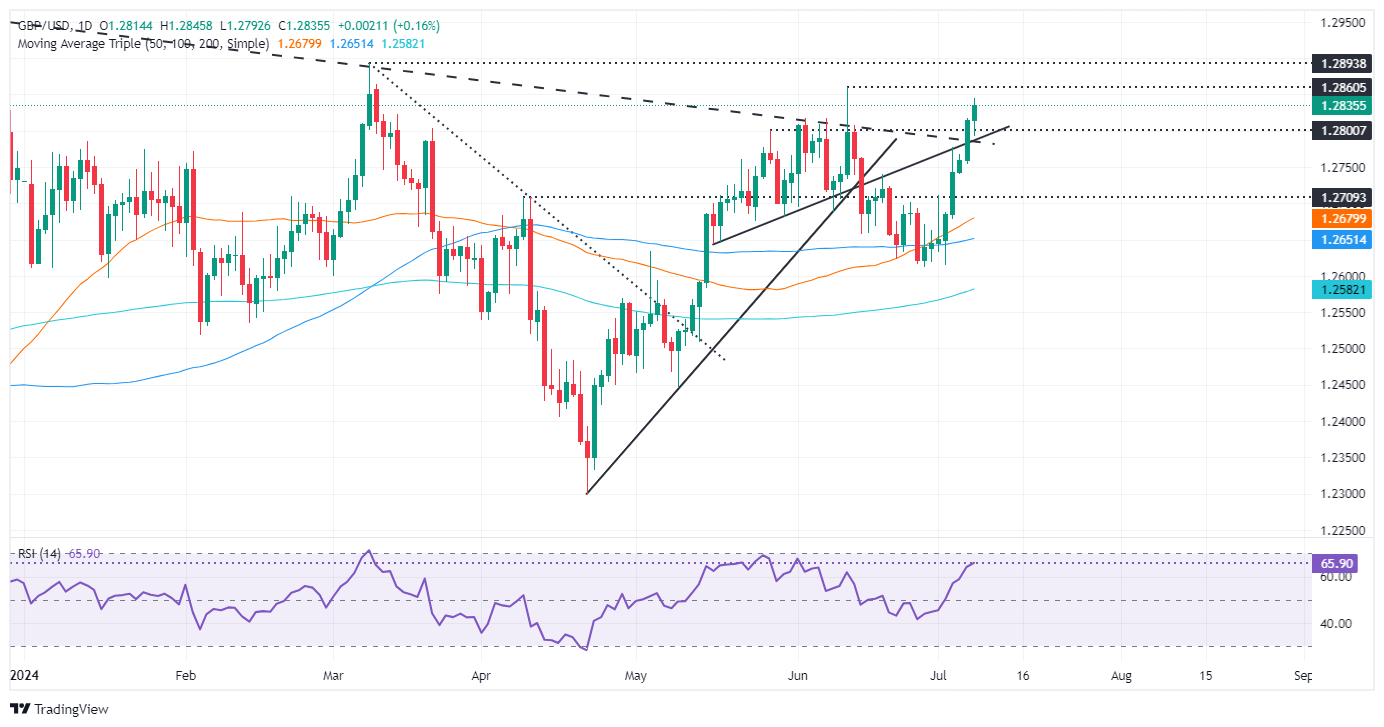
British Pound PRICE Today
The table below shows the percentage change of British Pound (GBP) against listed major currencies today. British Pound was the strongest against the Swiss Franc.
| USD | EUR | GBP | JPY | CAD | AUD | NZD | CHF | |
|---|---|---|---|---|---|---|---|---|
| USD | 0.05% | -0.16% | -0.11% | -0.09% | 0.03% | -0.04% | 0.13% | |
| EUR | -0.05% | -0.01% | 0.16% | 0.17% | 0.14% | 0.25% | 0.41% | |
| GBP | 0.16% | 0.01% | 0.14% | 0.20% | 0.15% | 0.26% | 0.42% | |
| JPY | 0.11% | -0.16% | -0.14% | 0.02% | 0.16% | 0.23% | 0.29% | |
| CAD | 0.09% | -0.17% | -0.20% | -0.02% | 0.08% | 0.06% | 0.24% | |
| AUD | -0.03% | -0.14% | -0.15% | -0.16% | -0.08% | 0.11% | 0.27% | |
| NZD | 0.04% | -0.25% | -0.26% | -0.23% | -0.06% | -0.11% | 0.16% | |
| CHF | -0.13% | -0.41% | -0.42% | -0.29% | -0.24% | -0.27% | -0.16% |
The heat map shows percentage changes of major currencies against each other. The base currency is picked from the left column, while the quote currency is picked from the top row. For example, if you pick the British Pound from the left column and move along the horizontal line to the US Dollar, the percentage change displayed in the box will represent GBP (base)/USD (quote).
- The correction from the June 14 lows appears to have finished.
- EUR/GBP continues descending as the intermediate downtrend resumes.
- The pair now targets 0.8399.
EUR/GBP is resuming its medium-term downtrend after the correction higher from the June 14 lows appears to have peaked and rolled over.
Given “the trend is your friend” more weakness is foreseen.
EUR/GBP Daily Chart
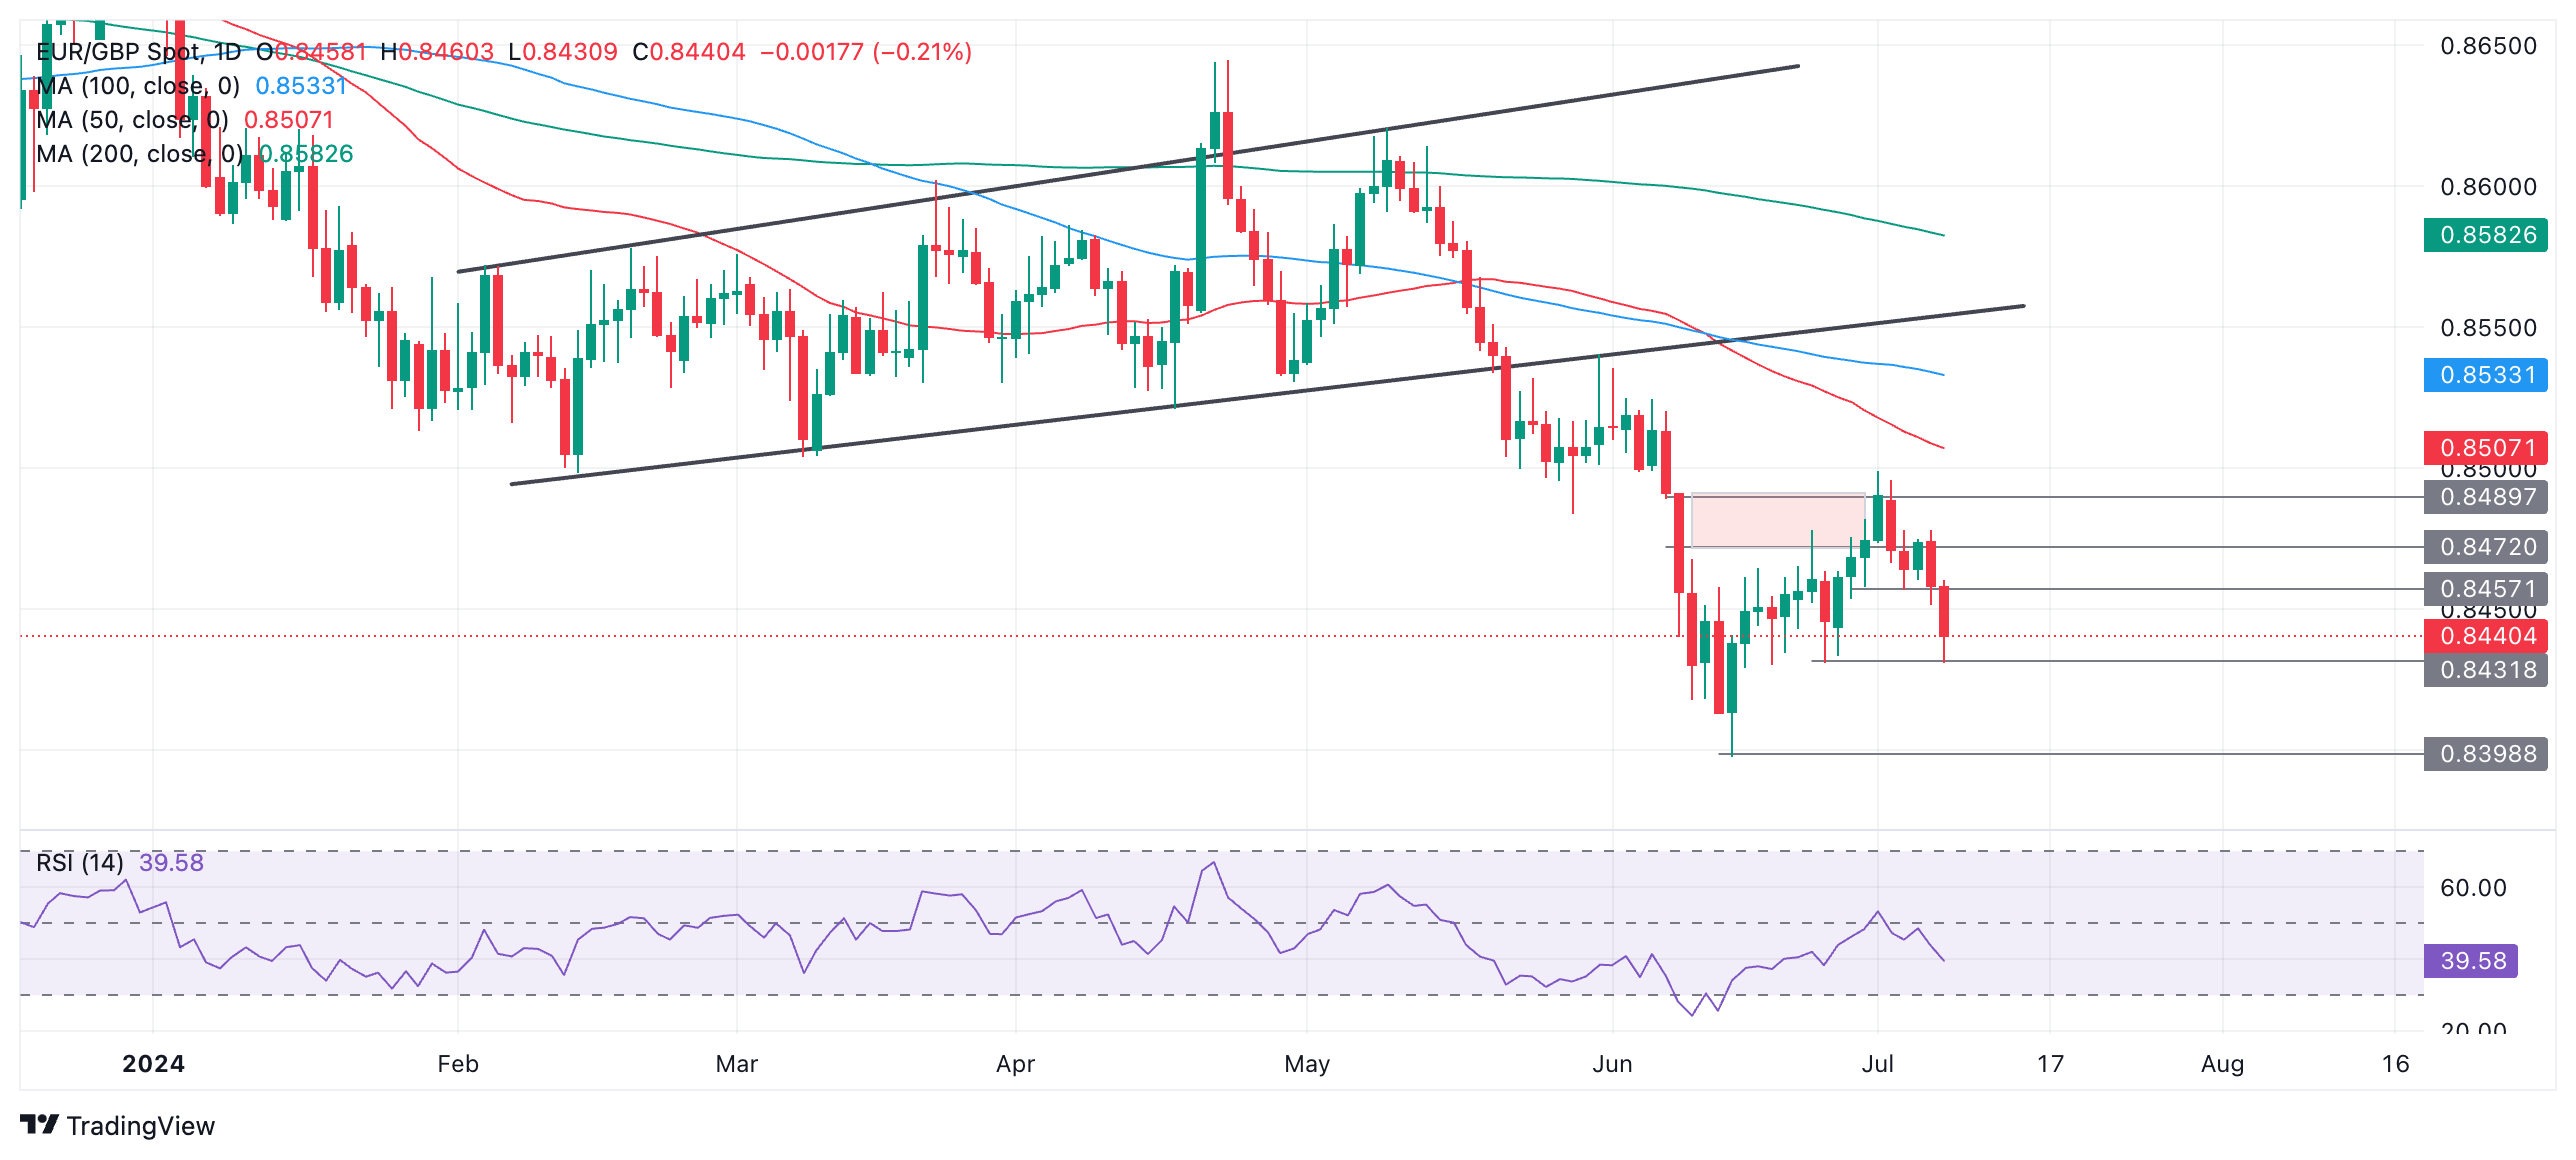
A break below 0.8431 (July 8 low) would provide added bearish confirmation of an extension of the downtrend lower to the next target at 0.8399, the June 14 low.
Precious metals continued to perform well in a holiday-shortened week, TD Securities Senior Commodity Strategist Ryan McKay notes.
Asian XAU/USD demand remains strong
“While nonfarm payrolls printed above consensus expectations in June, the ongoing softish signals stemming from labor market conditions and consumer spending suggest the Federal Reserve (Fed) is likely to start considering its employment mandate more seriously in coming months.”
“In this sense, macro interest may be starting to pick up in gold as ETF positions continue to rise in July, after June saw the first monthly increase since May 2023.”
“Furthermore, while Chinese Gold (XAU/USD) reserves were flat for a second consecutive month amid their noted pause in buying, top traders on the Shanghai Futures Exchange (SHFE) have added back to their net positions, highlighting Asian demand is set to remain strong.”
Markets are monitoring the first week of Keir Starmer as UK Prime Minister following an uneventful election day for sterling and gilts, FX analyst at ING Francesco Pesole notes.
All eyes on BoE speakers
“We doubt that fiscal prospects will have an impact on the pound just yet, while developments in French politics, US macro and Bank of England (BoE) rate expectations will remain the largest drivers for Pound Sterling (GBP).”
“Bank of England (BoE) officials are due to start speaking publicly again following a quiet period before the election, with hawkish external member Jonathan Haskel delivering remarks today, and Huw Pill and Catherine Mann (another hawk) speaking on Wednesday.”
“The UK data calendar includes May GDP (Thursday) but is relatively quiet before next week’s June inflation report. We see some downside risks for GBP/USD this week given the spillover from EU political risk, which however means that a return in EUR/GBP steadily above 0.8500 has been delayed further.”
The dollar is modestly stronger out of the weekend as a surprise win of the left-wing alliance in the French second-round legislative elections sent European currencies lower and fuelled some safe-haven demand, with the Japanese Yen (JPY) and Swiss franc (CHF) rising, ING’s analyst Francesco Pesole suggests.
Inflation and Powell to drive the market
"This week will be a hot one for US macro, with the CPI report for June out on Thursday. We expect the core print at 0.2% month-on-month, in line with consensus, which should be enough to keep markets betting on a September rate cut, which is now 83% (19bp) priced in."
"We are also seeing the pricing for total easing in 2024 starting to inch above 50bp again. The weakening trend in the US jobs market will, in our view, push FOMC to cut three times this year, starting in September. This week also sees Federal Reserve Chair Powell’s testimony to Congress (Tuesday-Wednesday), that we expect to be on the dovish side after an excessively hawkish revision in the June Dot Plot projections."
"All in all, we expect the macro story to keep pointing to a USD decline, but political developments in the eurozone and the US mean that only a few currencies can benefit from it. By extension, the downside risks for the Euro-heavy DXY index may be relatively limited. Today’s US data calendar is rather quiet, and there are no scheduled FOMC speakers."
A hung parliament was widely expected in France, but the surprise win by the left-wing coalition may cause market concern ahead of coalition talks. Still, Macron’s party coming in second may offer some balance and limit the rewidening in French bond spreads. The Euro (EUR) should still be a laggard in our view. In the US, Powell and CPI are the highlights this week, ING’s FX analyst Francesco Pesole notes.
Markets seem more comfortable with the far right than with the far left
“The second round of parliamentary elections in France delivered a surprise result, a hung parliament and two main scenarios: difficult coalition talks or a technocratic government. The positive market reaction after the first round gave an indication that investors were more comfortable with the far right than with the far left, which is perceived as a greater danger to the already fragile French fiscal position.”
“Those fiscal concerns are probably behind the euro trading around 0.2% below its Friday close at 1.0820 after having tested 1.0800 last night. From an FX perspective, there are lingering risks for the euro moving on, and we continue to see the common currency as a likely laggard in the G10 space in an environment that can still support pro-cyclical currencies on the back of softening US data.”
“The absence of market-moving data releases in the eurozone this week and the European Central Bank about to enter the quiet period ahead of its 18 July meeting will contribute to making the coming days all about French political developments. We think EUR/USD can trade below 1.08 on the back of that before US macro developments take over.”
- USD/JPY has corrected back after touching the top of a rising channel.
- It has found support at a key support and resistance level and found its feet.
- The outlook remains bearish on balance in the short-term but the risk of a recovery has increased.
USD/JPY has corrected back after touching the top of a rising channel it has been in since the start of 2023.
USD/JPY Daily Chart
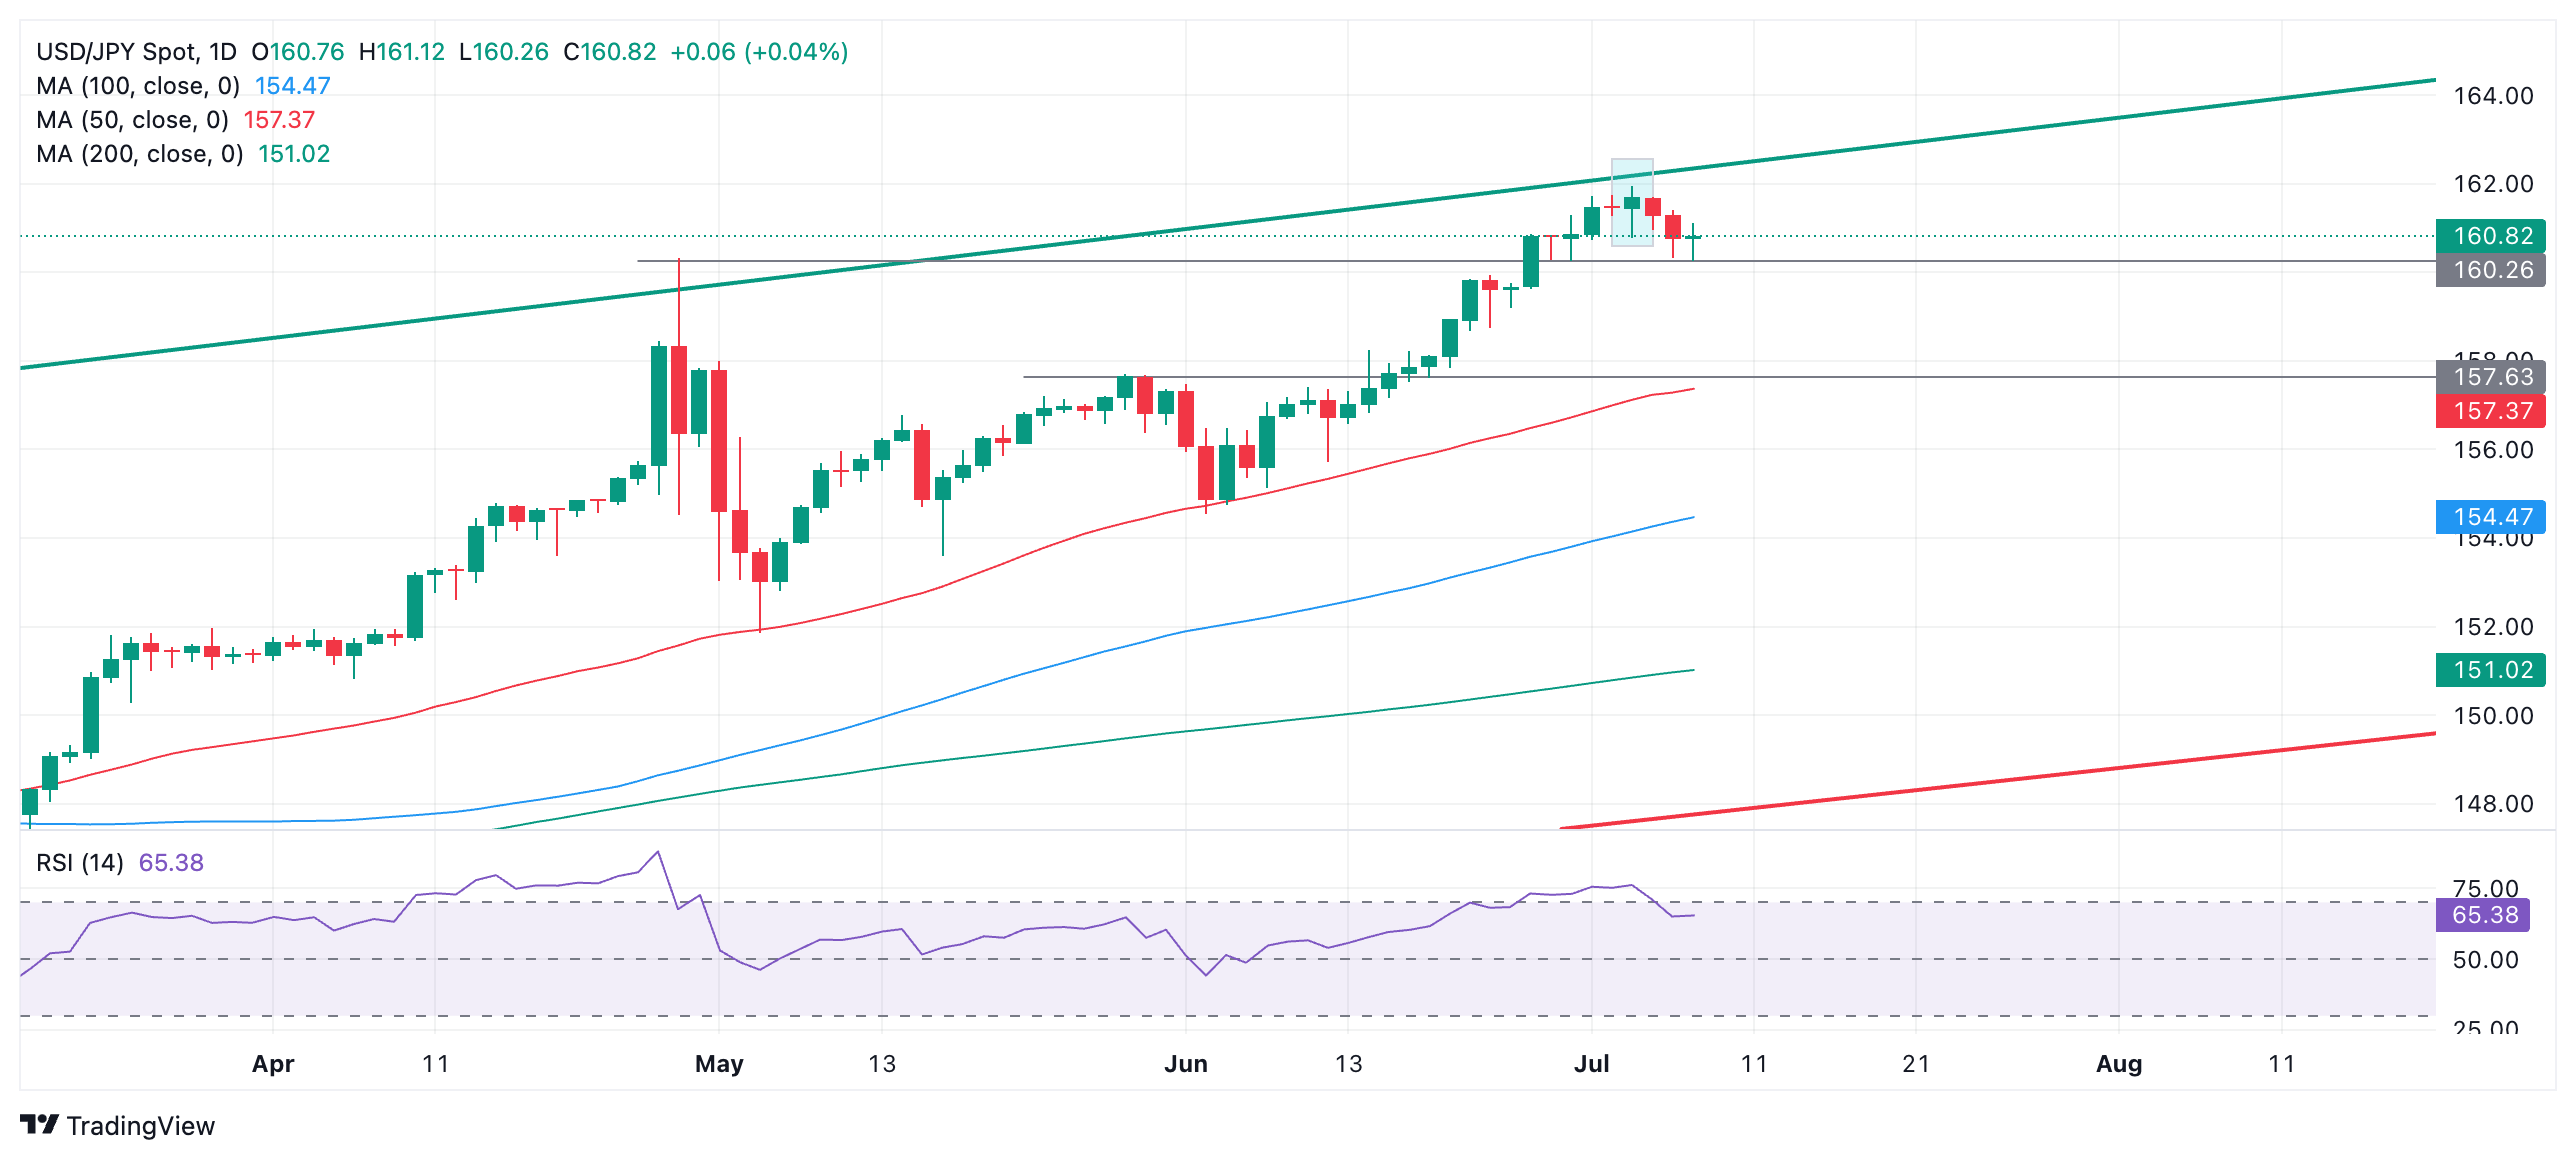
USD/JPY posted a bearish Hanging Man Japanese candlestick pattern on Wednesday July 3 (blue-shaded rectangle). The Hanging Man develops when a candle forms at a peak with a small body near its high and a long wick below. It was followed by a bearish down day, providing bearish confirmation.
USD/JPY proceeded to sell-off down to support from the April 29 high at 160.32, forming a price gap at the end of the move down – a possible sign of exhaustion.
USD/JPY 4-hour Chart
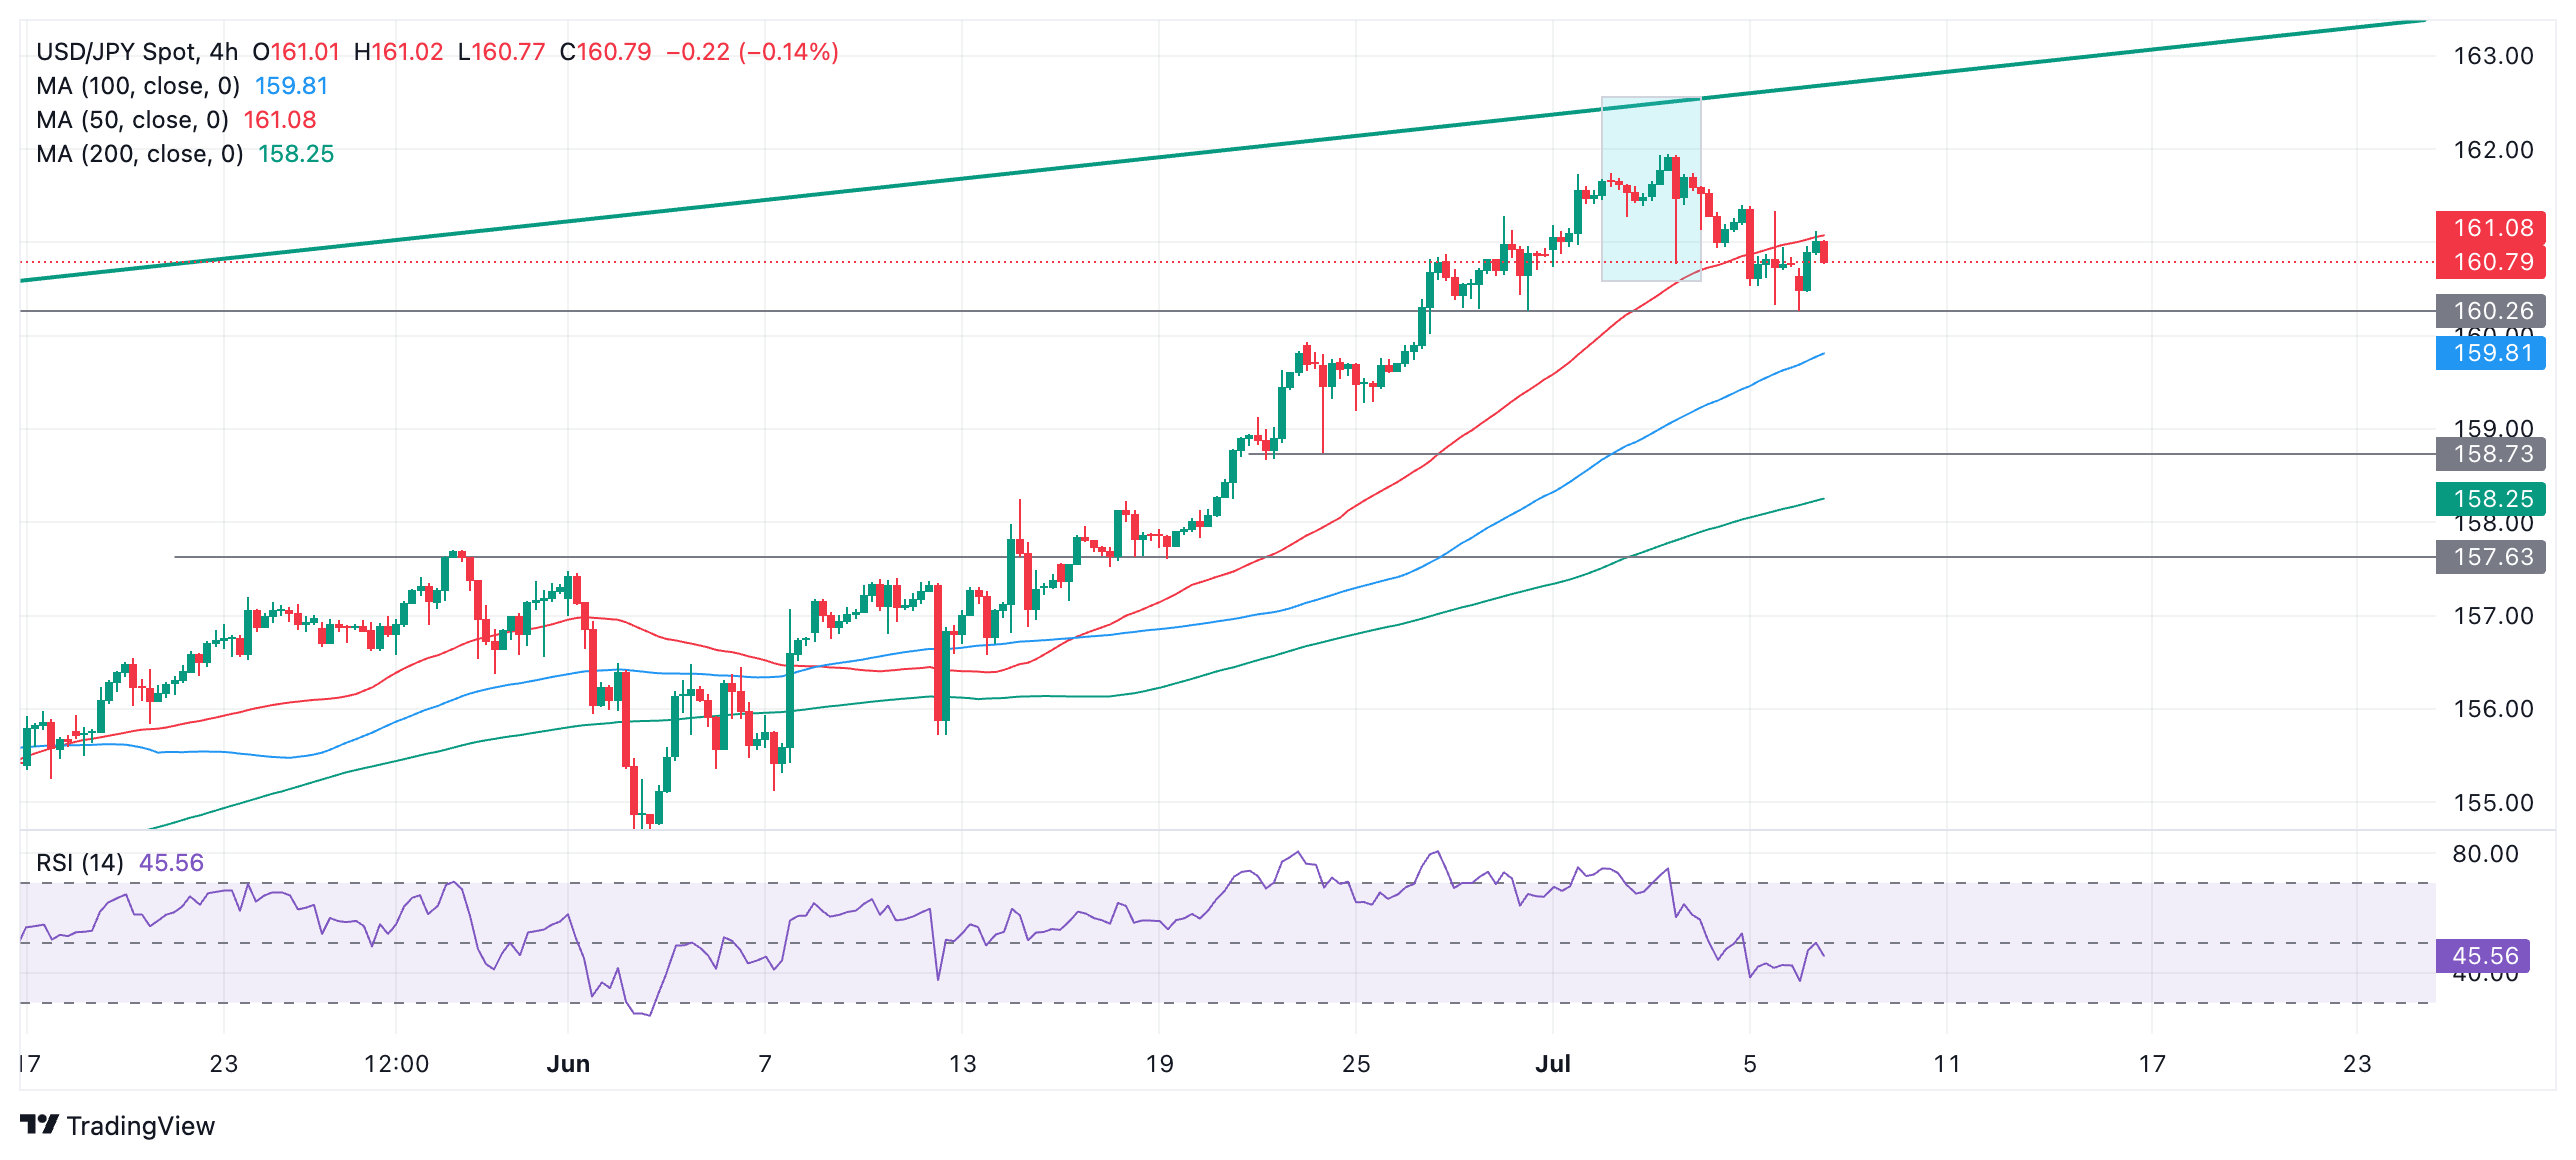
The pair has since recovered on July 8 (today) and filled the gap in the process. It is currently trading up against resistance from the 50-period Simple Moving Average (SMA).
Given the possible exhaustion gap that formed at the end of the sell-off, and the fact that it is in a strong medium and long-term uptrend, there is a risk the pair could continue recovering. Most corrections are composed of three waves and so far the rebound has only formed one complete wave. It is possible it could at the least recover even higher, to a target at 161.40, the July 5 high, as it completes.
As things stand the pair technically remains in short-term downtrend which given “the trend is your friend” could also potentially extend.
A break below 160.26, the July 8 lows, would provide confirmation of more downside to a probable target at 158.73, the June 24 low.
On the other hand, a break above 161.50 would be a bullish sign, and above 161.95 (July 3 high) would establish a higher high and indicate a resumption of the dominant uptrend. Such a move would probably reach the 162.70s initially, at the top of the rising channel, where it would again encounter resistance.
- AUD/USD holds gains near a six-month high around 0.6750 as traders raise Fed rate-cut bets.
- The US labor market strength appears to have lost momentum.
- The RBA could tighten its monetary policy further.
The AUD/USD pair trades close to a six-month high at 0.6760 in Monday’s New York session. The Aussie asset holds gains as the US Dollar (USD) is on the backfoot due to growing speculation that the Federal Reserve (Fed) will begin reducing interest rates from the September meeting.
Traders raise bets for Fed rate cuts in September as the US labor market strength appears to be moderating. June’s Nonfarm Payrolls (NFP) report showed that the Unemployment Rate rose to 4.15 in more than two years. Also, Average Hourly Earnings, a measure of wage growth, has declined expectedly, which has trimmed the risks of inflation remaining persistent.
Higher expectations for early Fed rate cuts have improved the market sentiment. S&P 500 futures have recovered losses delivered in early Europe and have turned positive. The US Dollar Index (DXY), which tracks the Greenback’s value against six major currencies, has fallen to a near a three-week low of around 104.85.
Contrary to market expectations, Fed officials signalled in their latest dot plot that there will be only once rate cut this year. Going forward, US Consumer Price Index (CPI) report for June will be the major trigger, which will be published on Thursday. The US inflation will influence market expectations for Fed rate cuts in September.
On the Aussie front, surged expectations that the Reserve Bank of Australia (RBA) could tighten its policy further have kept the Australian Dollar (AUD) strong. Upside risks to price pressures have boosted bets for more rate hikes by the RBA.
Being a proxy player to world’s second-largest economy, the Australian Dollar will be impacted by China’s CPI report for June, which will be published on Wednesday. The report is expected to show that price pressures grew at a higher pace of 0.4% from the prior release of 0.3% on year.
Australian Dollar FAQs
One of the most significant factors for the Australian Dollar (AUD) is the level of interest rates set by the Reserve Bank of Australia (RBA). Because Australia is a resource-rich country another key driver is the price of its biggest export, Iron Ore. The health of the Chinese economy, its largest trading partner, is a factor, as well as inflation in Australia, its growth rate and Trade Balance. Market sentiment – whether investors are taking on more risky assets (risk-on) or seeking safe-havens (risk-off) – is also a factor, with risk-on positive for AUD.
The Reserve Bank of Australia (RBA) influences the Australian Dollar (AUD) by setting the level of interest rates that Australian banks can lend to each other. This influences the level of interest rates in the economy as a whole. The main goal of the RBA is to maintain a stable inflation rate of 2-3% by adjusting interest rates up or down. Relatively high interest rates compared to other major central banks support the AUD, and the opposite for relatively low. The RBA can also use quantitative easing and tightening to influence credit conditions, with the former AUD-negative and the latter AUD-positive.
China is Australia’s largest trading partner so the health of the Chinese economy is a major influence on the value of the Australian Dollar (AUD). When the Chinese economy is doing well it purchases more raw materials, goods and services from Australia, lifting demand for the AUD, and pushing up its value. The opposite is the case when the Chinese economy is not growing as fast as expected. Positive or negative surprises in Chinese growth data, therefore, often have a direct impact on the Australian Dollar and its pairs.
Iron Ore is Australia’s largest export, accounting for $118 billion a year according to data from 2021, with China as its primary destination. The price of Iron Ore, therefore, can be a driver of the Australian Dollar. Generally, if the price of Iron Ore rises, AUD also goes up, as aggregate demand for the currency increases. The opposite is the case if the price of Iron Ore falls. Higher Iron Ore prices also tend to result in a greater likelihood of a positive Trade Balance for Australia, which is also positive of the AUD.
The Trade Balance, which is the difference between what a country earns from its exports versus what it pays for its imports, is another factor that can influence the value of the Australian Dollar. If Australia produces highly sought after exports, then its currency will gain in value purely from the surplus demand created from foreign buyers seeking to purchase its exports versus what it spends to purchase imports. Therefore, a positive net Trade Balance strengthens the AUD, with the opposite effect if the Trade Balance is negative.
- Silver has broken out of the falling channel it was in and is rallying.
- It could be in the wave C of a Measured Move, indicating it has higher to go.
- Silver is probably in a short-term uptrend now, with the odds favoring more upside.
Silver (XAG/USD) has decisively broken out of the descending channel it was in during the second half of May and June. This is a bullish sign and suggests the pair is now in a short-term uptrend. Given that “the trend is your friend” the odds favor a continuation higher.
Silver Daily Chart
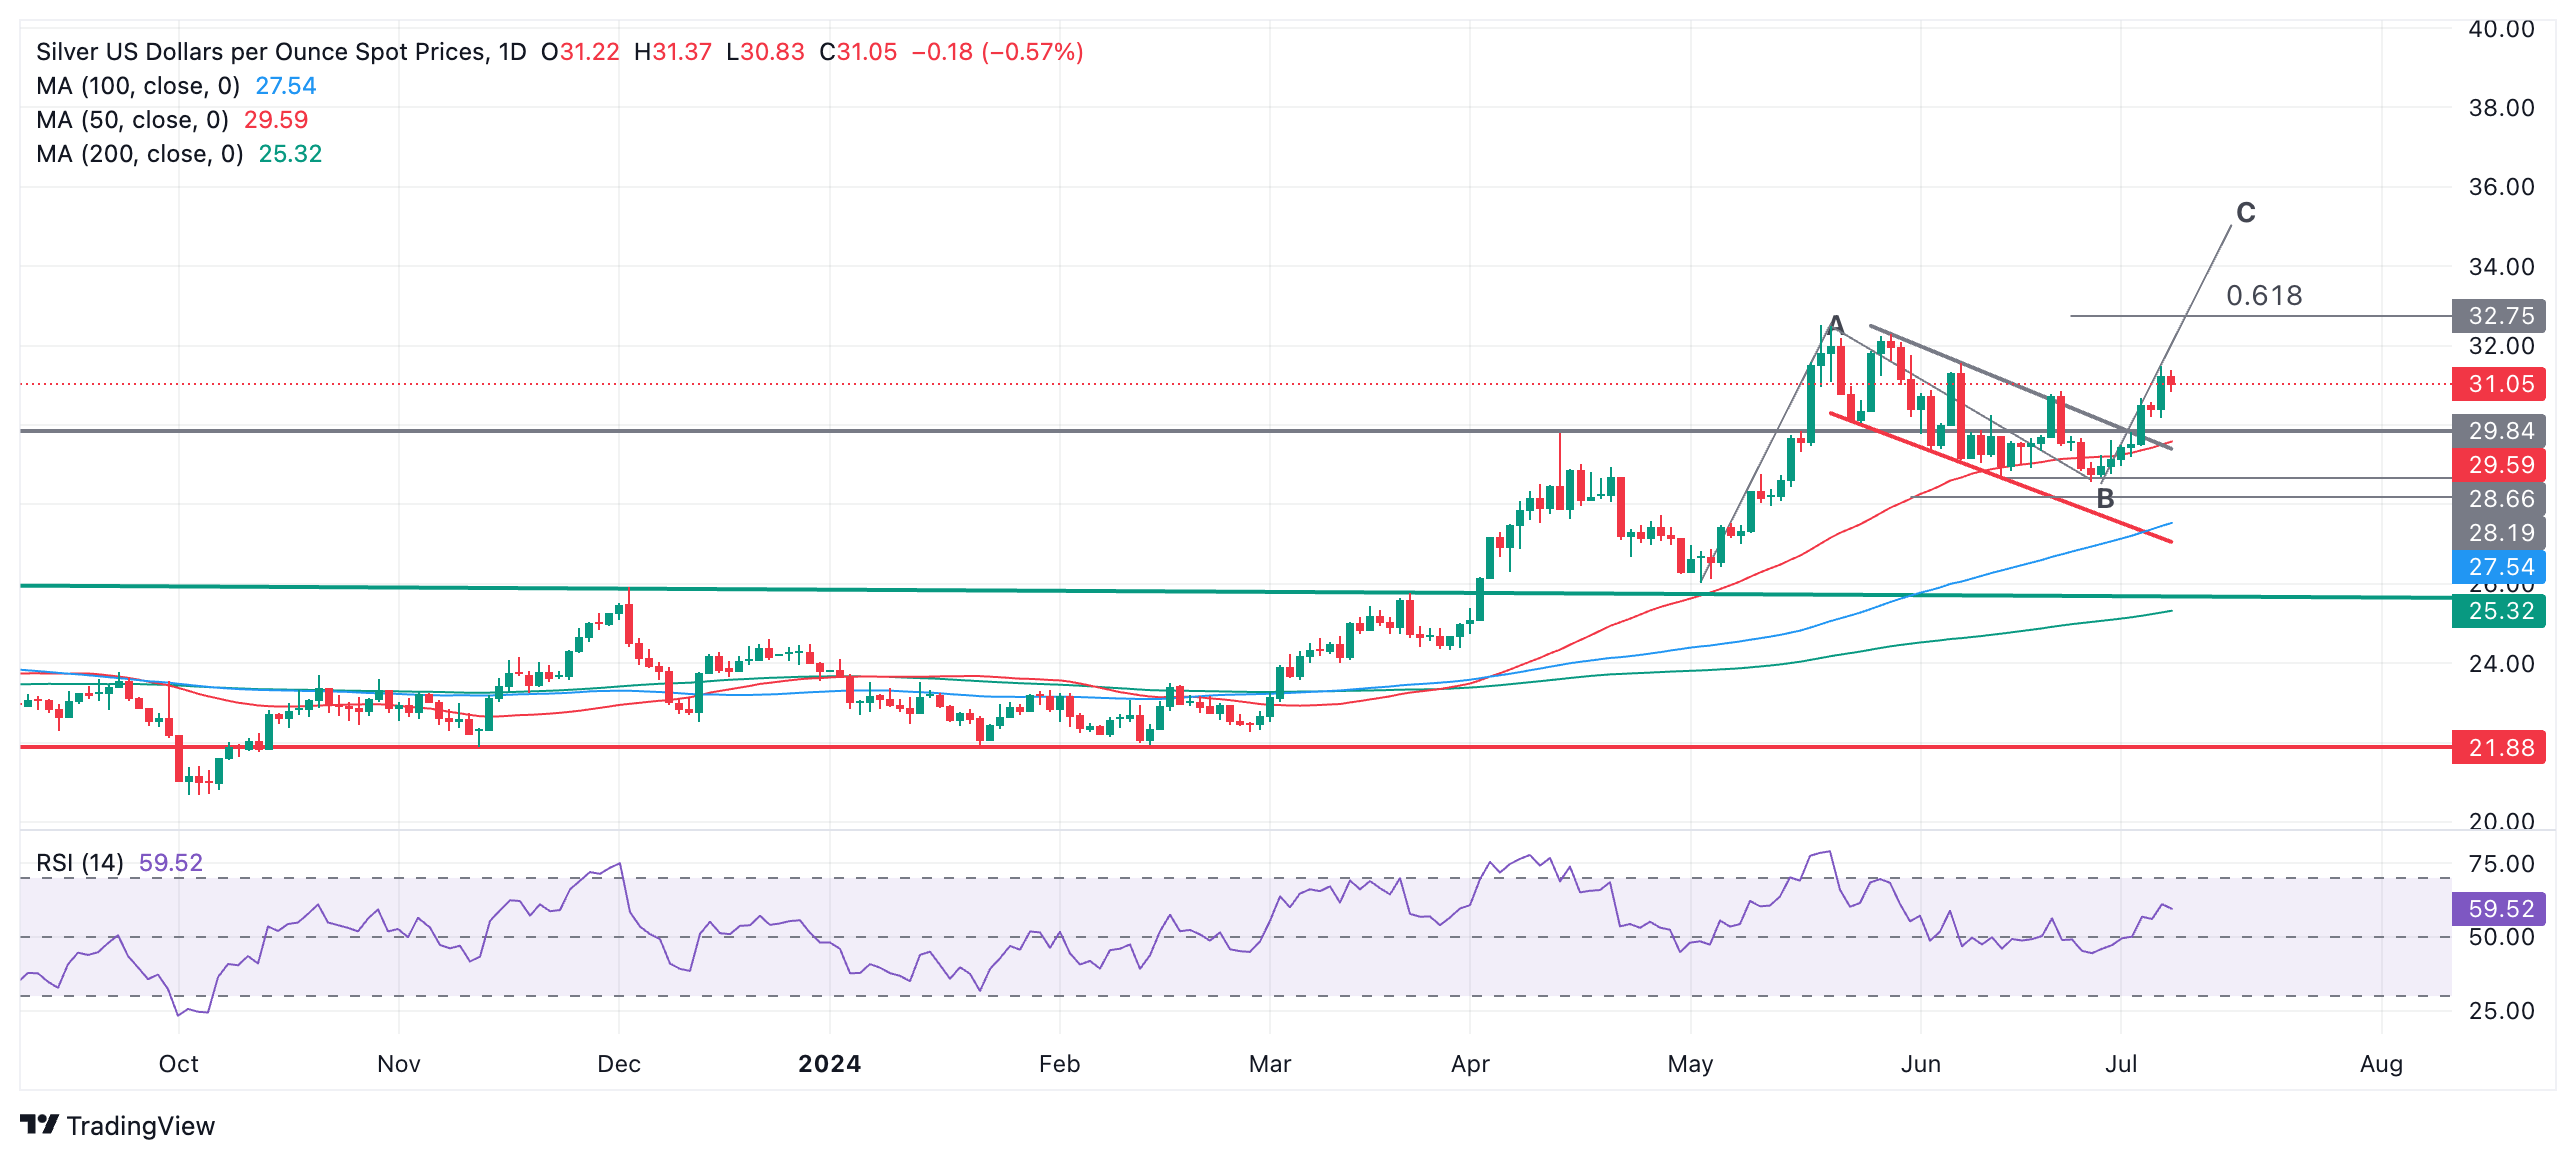
A further bullish sign is that Silver is probably forming a Measured Move (MM) price pattern. MMs are composed of three waves, sometimes labeled A,B and C; they resemble large zig-zags.
Interpreted as an MM, the rally during the start of May could be considered its wave A, the whole of the falling channel its wave B, and the breakout from the channel, the start of wave C.
As a minimum, wave C will probably reach the 0.618 extrapolation of wave A at $32.75. If wave C is the same length as A – as is often the case – then it could reach $35.00.
Silver has also now broken above a major resistance level at the top of a four-year consolidation zone, a further longer-term bullish indication.
USD/JPY has moved from around 140 to 160 in the year to date. We see USD/JPY as holding around the 160 level on a 1 month view with USD/JPY easing back to 152 by year-end, Rabpbank FX analysts note.
USD/JPY to hold close to 160 in the coming weeks
“Broadly speaking USD/JPY has moved from around 140 to 160 in the year to date. Having reached a high last week close to JPY161.95, the currency pair has edged a touch lower, though this move is largely related to the weaker US Dollar (USD) than to a broad-based pick up in the value of the Japanese Yen (JPY).”
“On balance, we see USD/JPY as holding around the 160 level on a 1 month view with USD/JPY easing back to 152 by year-end on the view that real wages will by then also be showing signs of improvement.”
“The US Dollar (USD) could remain on the back foot in the coming weeks allowing USD/JPY to hold close to 160. Later in the year, we are looking for the JPY to win back some ground based on the assumption that a recovery in Japanese real wages will allow for a more hawkish BoJ.”
- USD/CAD stabilizes above 1.3600 as investors expect that the BoC will deliver back-to-back rate cuts.
- Loosening US labor market strength has boosted Fed rate-cut bets.
- Investors await the US CPI data for June.
The USD/CAD pair holds ground above the crucial support of 1.3600 in Monday’s European session. The Loonie asset trades in a tight range inside Friday’s range, while the outlook remains uncertain as easing United States (US) labor market strength has increased investors’ confidence for early rate cuts by the Federal Reserve (Fed).
S&P 500 futures have recovered losses witnessed in early European trading hours, portraying a recovery in investors’ risk appetite. The US Dollar Index (DXY), which tracks the Greenback’s value against six major currencies, trades close to three-week low near 104.85. 10-year US Treasury yields edge higher after falling to near weekly low around 4.3%.
The US NFP report for June showed that the Unemployment rate rose unexpectedly to 4.1%. Also, Average Hourly Earnings, a measure that gauge wage growth, decelerated expectedly on monthly and an annual basis. This has eases risks of inflation remaining persistent.
Next trigger for the US Dollar will be the US Consumer Price Index (CPI) data for June, which will be published on Thursday. The US CPI report is expected to grow steadily on year by 3.4%. The scenario in which the core inflation grew steadily or at a higher pace would dampen market speculation for Fed rate cuts in September. On the contrary, higher-than-expected inflation reading will strengthen the same.
On the Canadian Dollar (CAD) front, market expectations for subsequent rate cuts by the Bank of Canada (BoC) have improved due to turmoil in labor market. Canada’s Unemployment Rate rose at a faster pace to 6.4% from the estimates of 6.3% and the prior release of 6.2%. Also, the labor market faced an unexpected drawdown as 1.4K employees were laid-off.
Economic Indicator
Unemployment Rate
The Unemployment Rate, released by Statistics Canada, is the number of unemployed workers divided by the total civilian labor force as a percentage. It is a leading indicator for the Canadian Economy. If the rate is up, it indicates a lack of expansion within the Canadian labor market and a weakening of the Canadian economy. Generally, a decrease of the figure is seen as bullish for the Canadian Dollar (CAD), while an increase is seen as bearish.
Read more.Last release: Fri Jul 05, 2024 12:30
Frequency: Monthly
Actual: 6.4%
Consensus: 6.3%
Previous: 6.2%
Source: Statistics Canada
- Gold weakens as fears Trump could win the next presidency weigh on bond markets.
- A fear of increased inflation under a Trump presidency with the consequent higher interest rates is negatively impacting Gold.
- Gold is a non-interest-bearing asset that tends to suffer when interest rates remain high.
Gold (XAU/USD) falls on Monday in line with most commodities, which are declining due to global growth fears after under-par US employment data last week.
Rising US Treasury bond yields, as a result of increased probabilities that former President Donald Trump could win the next presidential election in November, may also be weakening Gold. Trump is expected to cut taxes but maintain spending which will lead to higher inflation and interest rates – a negative for the non-interest-bearing asset Gold.
Additionally, short-term traders taking profit after the 1.45% gain witnessed on Friday, could also be weighing.
Gold weakens as bond markets suffer from Trump effect
Gold trades in the $2,370s on Monday, after pulling back from Friday’s peak of $2,393 reached following the release of US NonFarm Payrolls (NFP) data.
Although the overall weaker US labor market data in the NFP report increased bets the Federal Reserve (Fed) will begin cutting interest rates earlier than previously expected, which is positive for Gold, price has started to come down due to a “Trump-put” on the bond markets.
Given the question marks over President Joe Biden’s capacity to hold office and with no popular replacement on the radar, Trump is increasingly being viewed as the most likely candidate to win the presidential election. Known for cutting taxes and borrowing to cover the short-fall, his fiscal policies are likely to keep inflation high, leading to higher interest rates. This is having a negative impact on US Treasury bonds and pushing up yields, which are inversely correlated to Gold. The US Dollar is also benefiting from the outlook and further weighing on Gold price, which is primarily bought and sold in USD, according to Reuters.
Gold supported by geopolitical backdrop
Gold continues to gain some support, however, from other geopolitical and macro factors.
The ongoing conflicts in the Middle East and Ukraine are still factors driving nervous investors to store their wealth in Gold.
The BRICS intergovernmental organization’s attempts to de-dollarize global trade continue to support the longer-term outlook for Gold, which is viewed as the most realistic replacement for the Dollar. BRICS are trying to find an alternative to the US Dollar because of the way the US government has weaponized the currency against enemy states. If the Dollar were not as ubiquitous, international sanctions led by the US would have less impact.
High central bank demand, which accounts for roughly a quarter of the Gold market, is an additional factor underpinning Gold. After the unexpected strengthening of the Greenback in the first quarter of 2024, Asian central banks started to accumulate Gold to use as a hedge against the depreciation of their own domestic currencies versus the US Dollar.
Technical Analysis: Gold could target all-time-highs
Gold has climbed to a major resistance level at the June 7 high at $2,388 and rolled over. If it can break above Friday’s peak of $2,393 it will continue the sequence of higher highs and probably unlock the next target at the $2,451 all-time high.
XAU/USD Daily Chart
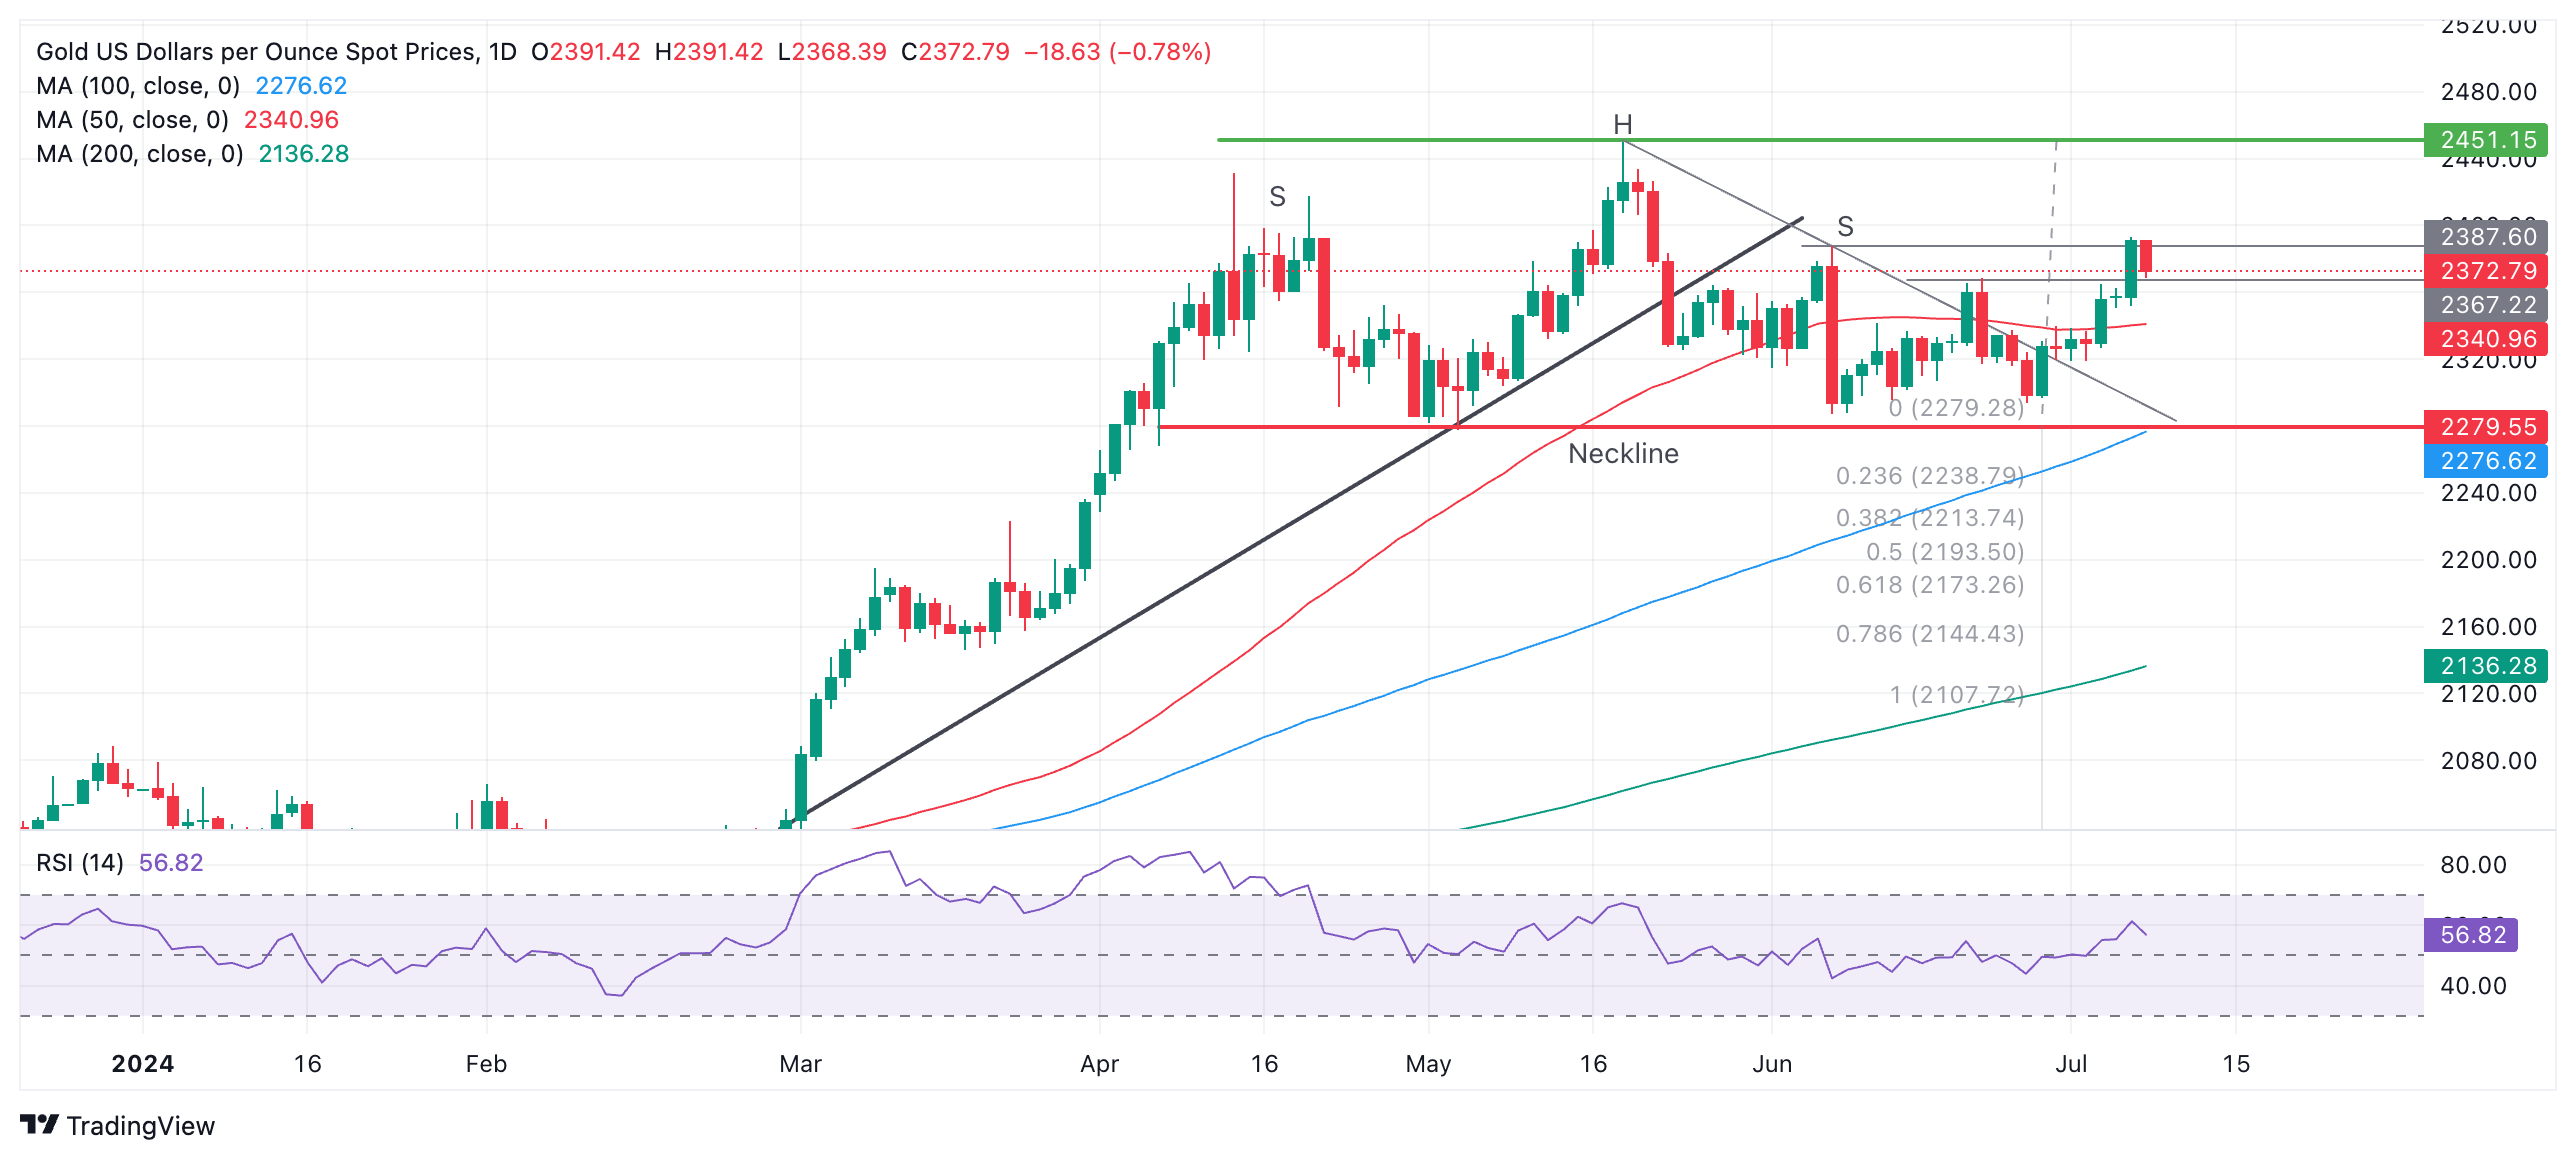
The bearish Head & Shoulders topping pattern that formed from April to June has been invalidated by the recent recovery, however, there is still a chance – albeit much-reduced – that a more complex topping pattern may have formed instead.
If a complex pattern has formed in place of the orthodox H&S, and price breaks below the pattern’s neckline at $2,279, a reversal lower may still be possible with a conservative target at $2,171, the 0.618 ratio of the height of the pattern extrapolated lower.
The trend is now sideways in both the short and medium term. In the long term, Gold remains in an uptrend.
Gold FAQs
Gold has played a key role in human’s history as it has been widely used as a store of value and medium of exchange. Currently, apart from its shine and usage for jewelry, the precious metal is widely seen as a safe-haven asset, meaning that it is considered a good investment during turbulent times. Gold is also widely seen as a hedge against inflation and against depreciating currencies as it doesn’t rely on any specific issuer or government.
Central banks are the biggest Gold holders. In their aim to support their currencies in turbulent times, central banks tend to diversify their reserves and buy Gold to improve the perceived strength of the economy and the currency. High Gold reserves can be a source of trust for a country’s solvency. Central banks added 1,136 tonnes of Gold worth around $70 billion to their reserves in 2022, according to data from the World Gold Council. This is the highest yearly purchase since records began. Central banks from emerging economies such as China, India and Turkey are quickly increasing their Gold reserves.
Gold has an inverse correlation with the US Dollar and US Treasuries, which are both major reserve and safe-haven assets. When the Dollar depreciates, Gold tends to rise, enabling investors and central banks to diversify their assets in turbulent times. Gold is also inversely correlated with risk assets. A rally in the stock market tends to weaken Gold price, while sell-offs in riskier markets tend to favor the precious metal.
The price can move due to a wide range of factors. Geopolitical instability or fears of a deep recession can quickly make Gold price escalate due to its safe-haven status. As a yield-less asset, Gold tends to rise with lower interest rates, while higher cost of money usually weighs down on the yellow metal. Still, most moves depend on how the US Dollar (USD) behaves as the asset is priced in dollars (XAU/USD). A strong Dollar tends to keep the price of Gold controlled, whereas a weaker Dollar is likely to push Gold prices up.
- The US Dollar has a volatile start of the week, though it is on the back foot early on Monday.
- Talk of the town is the surprise gain of the left coalition in France.
- The US Dollar index hovers around 105.00, testing a vital level of support.
The US Dollar (USD) whipsaws on Monday, with markets celebrating the outcome of the second round of elections in France. In a surprise move, the left-wing coalition New Popular Front of Jean-Luc Mélenchon won and claimed victory, while the current ruling French President Emmanuel Macron’s centrist Ensemble alliance came in second. This is a surprise blow to the far-right National Rally of Marine Le Pen, who had a landslide victory in the first election round last week. With no one holding an absolute majority and political agendas being very dispersed and barely having any common ground, a hung parliament or a minority government seems to be the only possible outcome for now. Still, the far-right movement appears to be halted.
On Monday, all eyes will be on the bond market and the spreads between France and Germany. On the US economic front, it is a very calm start to the week. US Federal Reserve (Fed) Chairman Jerome Powell is heading to Capitol Hill on Tuesday and Wednesday for its semi-annual testimony on the economic outlook and recent monetary policy actions before the Joint Economic Committee. That is just ahead of the US Consumer Price Index (CPI) data for June, which is scheduled for Thursday. y.
Daily digest market movers: Bond markets happy
- As mentioned above, a hung parliament looks likely in France, still the far-right movement appears to be halted. This translates into a drop in yield spreads between France and Germany. Last week, the spread between the two 10-year sovereign bond yields rose towards 81 basis points when Marine Le Pen’s far-right party was in the lead. The gap now narrows to 65 basis points, with, on average, the spread being around 50 basis points in normal conditions.
- Markets are applauding the stalemate situation because the far left party has no majority to pass its extensive and excessive spending agenda. Actually, not any party will be able to push through any sort of reform until the next elections, which will be the Presidential ones, on April 11, 2027.
- Over the weekend, more democratic key people in the US came out to ask President Joe Biden to resign and pave the way for someone else.
- At 15:30 GMT, the US Treasury Department will auction a 3-month and a 6-month bill.
- The US Consumer Credit Change for May is expected to rise to $8.65 billion from $6.4 billion.
- All major indices are marginally in the red, looking for direction from across Asia or Europe into US futures. This Monday could be a volatile, choppy ride.
- The CME Fedwatch Tool is broadly backing a rate cut in September despite recent comments from Fed officials. The odds now stand at 69% for a 25-basis-point cut. A rate pause stands at a 26.1% chance, while a 50-basis-point rate cut has a slim 4.8% possibility.
- The US 10-year benchmark rate trades at 4.29%, near its weekly low.
US Dollar Index Technical Analysis: Traders shun away
The US Dollar Index (DXY) fell out of bed on Monday in early trading, with markets scrambling to look for direction on the back of the French election outcome in the second round. Expect this news to get digested by the US markets as no changes are taking place in France on the international forum, with no additional spending packages or reforms to be pushed through with a non-majority government. All eyes will be on the bond markets because the declines in European yields are also spilling over into US bonds, where a further decline could drive the DXY lower.
On the upside, the 55-day Simple Moving Average (SMA) at 105.18 has now turned into resistance after an early test during the Asian session received a firm rejection and pushed the DXY further down again to test the 105.00 level. Should that 55-day SMA be reclaimed again, 105.53 and 105.89 are the next nearby pivotal levels. In case Fed Chairman Powell delivers some hawkish comments before Congress later this week or the US CPI print points to a pickup in inflation again, the red descending trend line in the chart around 106.23 and April’s peak at 106.52 could come into play.
On the downside, the risk of a nosedive move is increasing, with double support at 104.77, the confluence of the 100-day SMA and the green ascending trend line from December 2023. Should that double layer give way, the 200-day SMA at 104.43 is the gatekeeper that should catch the DXY and avoid further declines. Further down, the correction could head to 104.00 as an initial stage.
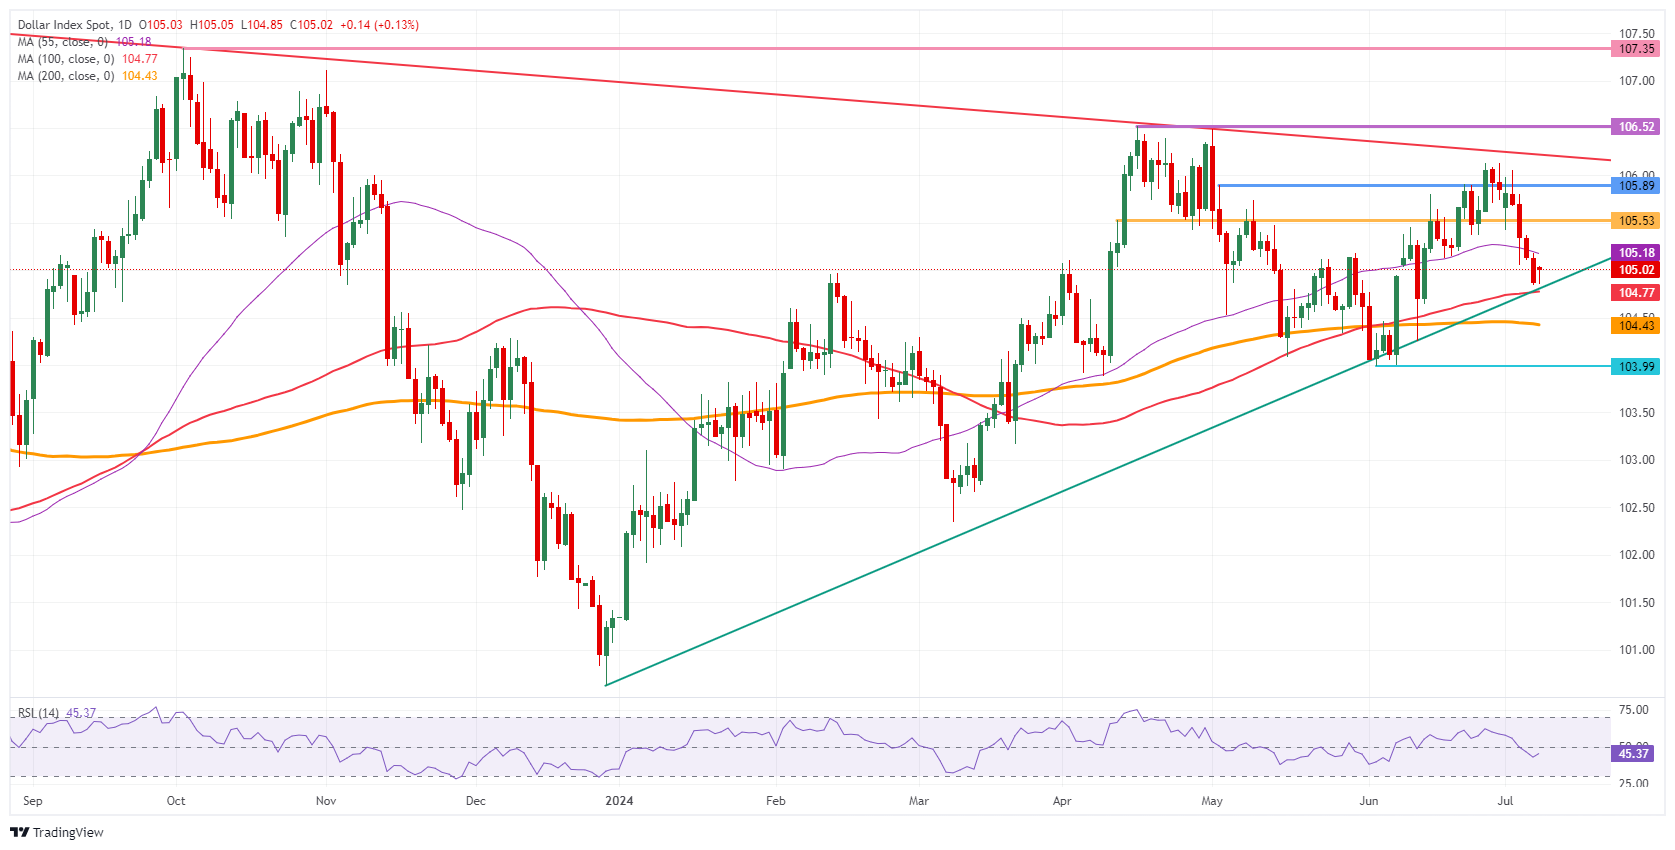
US Dollar Index: Daily Chart
US Dollar FAQs
The US Dollar (USD) is the official currency of the United States of America, and the ‘de facto’ currency of a significant number of other countries where it is found in circulation alongside local notes. It is the most heavily traded currency in the world, accounting for over 88% of all global foreign exchange turnover, or an average of $6.6 trillion in transactions per day, according to data from 2022. Following the second world war, the USD took over from the British Pound as the world’s reserve currency. For most of its history, the US Dollar was backed by Gold, until the Bretton Woods Agreement in 1971 when the Gold Standard went away.
The most important single factor impacting on the value of the US Dollar is monetary policy, which is shaped by the Federal Reserve (Fed). The Fed has two mandates: to achieve price stability (control inflation) and foster full employment. Its primary tool to achieve these two goals is by adjusting interest rates. When prices are rising too quickly and inflation is above the Fed’s 2% target, the Fed will raise rates, which helps the USD value. When inflation falls below 2% or the Unemployment Rate is too high, the Fed may lower interest rates, which weighs on the Greenback.
In extreme situations, the Federal Reserve can also print more Dollars and enact quantitative easing (QE). QE is the process by which the Fed substantially increases the flow of credit in a stuck financial system. It is a non-standard policy measure used when credit has dried up because banks will not lend to each other (out of the fear of counterparty default). It is a last resort when simply lowering interest rates is unlikely to achieve the necessary result. It was the Fed’s weapon of choice to combat the credit crunch that occurred during the Great Financial Crisis in 2008. It involves the Fed printing more Dollars and using them to buy US government bonds predominantly from financial institutions. QE usually leads to a weaker US Dollar.
Quantitative tightening (QT) is the reverse process whereby the Federal Reserve stops buying bonds from financial institutions and does not reinvest the principal from the bonds it holds maturing in new purchases. It is usually positive for the US Dollar.
DXY is trading flat after fourth straight down days. EUR/USD is trading lower on the day, and the USD/JPY is trading higher right below 161, BBH FX analysts note.
The relative story should continue to support the USD
“DXY is trading flat near 104.96 after fourth straight down days. The Euro (EUR) is trading lower near $1.0829 against the US Dollar (USD) but has recovered since the initial post-election selling (see below), while sterling is trading flat near $1.2825. USD/JPY is trading higher right below 161 after mixed wage data.”
“Recent softness in the data is challenging our view that the backdrop of persistent inflation and robust growth in the U.S. remains largely in place. However, we note that weaker data in many of the major economies underscore the fact that the relative story should continue to support the USD.”
The second round of the French elections where an electoral shock with the far-left New Popular Front securing the surprise outcome of being the largest group, Deutsche Bank analysts note.
Markets brace for the politicsl situation in France
“The main story this morning is obviously the second round of the French elections where yet another electoral shock has been served up in 2024 with the far-left New Popular Front securing the surprise outcome of being the largest group. They are in line to win 182 seats. The far-right RN party and allies has claimed 143 seats. Macron’s ENS movement are looking set for 163 seats.”
“The NPF have the most fiscally aggressive program in terms of both spending and taxation and the market will be suspicious that the prospect of them being in government now or later will bring higher deficits with the associated concerns about debt sustainability and tense relations with Europe. They were talking about wealth taxes and increases on taxes on corporates which won’t be market friendly.”
“So far this morning the Euro (-0.01%) is only trading fractionally lower at 1.0835 against the US Dollar while European equity futures tied to the STOXX 50 (+0.32%) are edging higher as I type. OAT futures are lower but well within the trading range from Friday.”
- Natural Gas extends losses early on Monday.
- China’s easing manufacturing activity is limiting demand upside in the near term.
- The US Dollar index trades mixed and choppy on the back of the outcome of the French elections.
Natural Gas price (XNG/USD) prints a tenth negative trading day in a row in early European trading hours. The dive came on the back of a surprise victory for the Jean-Luc Mélenchon left-wing coalition New Popular Frontin France, outpacing the ruling French President Emmanuel Macron’s centrist Ensemble alliance and the far-right National Rally of Marine Le Pen, putting a government formation in a tight spot with no majority, and no reform plans and additional spending possible. This puts another limit on demand resurgence while China’s demand is fading, with manufacturing being softer and green energy catching up.
Meanwhile, the US Dollar Index (DXY), which tracks the Greenback’s value against six major currencies, is on a very choppy ride on Monday, with traders a bit clueless about which direction to follow. Bond markets are applauding the government stalemate formation in France, with the yield spread between Germany and France retreating, while the US Dollar has been dipping lower, though back to flat now into the European trading session. Looking forward, the DXY might be back into a clear pattern, with the US Consumer Price Index (CPI) for June being the main event this week.
Natural Gas is trading at $2.33 per MMBtu at the time of writing.
Natural Gas news and market movers: Hydrogen takes over
- Recent energy component numbers from China reveal that Hydrogen energy is contributing a more significant than expected part of electricity ahead of the summer. With rising temperatures, the need for electricity increases to keep air conditioning cooling, and normally sees an uptick in Gas consumption. That is being partially offset by hydrogen energy taking its place in the energy pie, according to Bloomberg.
- Gas imports into Europe are not at peak levels and are expected to surge from 18% in 2021 to 43% by 2025-2030, Bloomberg predicts.
- Reuters reports that the Freeport Liquefied Natural Gas (LNG) facility in Texas has successfully ramped down its production so that Storm Beryl can make its passage in the region. Production has been reduced by 86%.
- The National Hurricane Center warns of strong winds and flash flooding as Beryl hits the Texas shore on Monday and is set to head further inland over Arkansas, Tennessee and Missouri in the coming days.
Natural Gas Technical Analysis: Was that the bounce yet?
Natural Gas price bounces right off the support level FXStreet mentioned in previous articles at $2.29, with the double trampoline put in place by the 100-day Simple Moving Average (SMA) alongside the green ascending trend line. The bounce seems to be working for now, though any slightest break below $2.29 could see a wave of selling orders. Thus, bullish Gas traders will be trading this bounce with a tight stop-loss trade regime should the double support area not hold.
The 200-day SMA is the first force to reckon with on the upside, near $2.52, closely followed by the 55-day SMA at $2.61. Once back above, the pivotal level near $3.08 (March 6, 2023, high) remains key resistance after its false break last week, which is still 20% away.
On the other hand, the support level, which could mean some buying opportunities, is $2.29, the 100-day SMA that falls in line with the ascending trend line since mid-February. In case that level does not hold as support, look for the pivotal level near $2.13, which has acted as a cap and floor in the past.
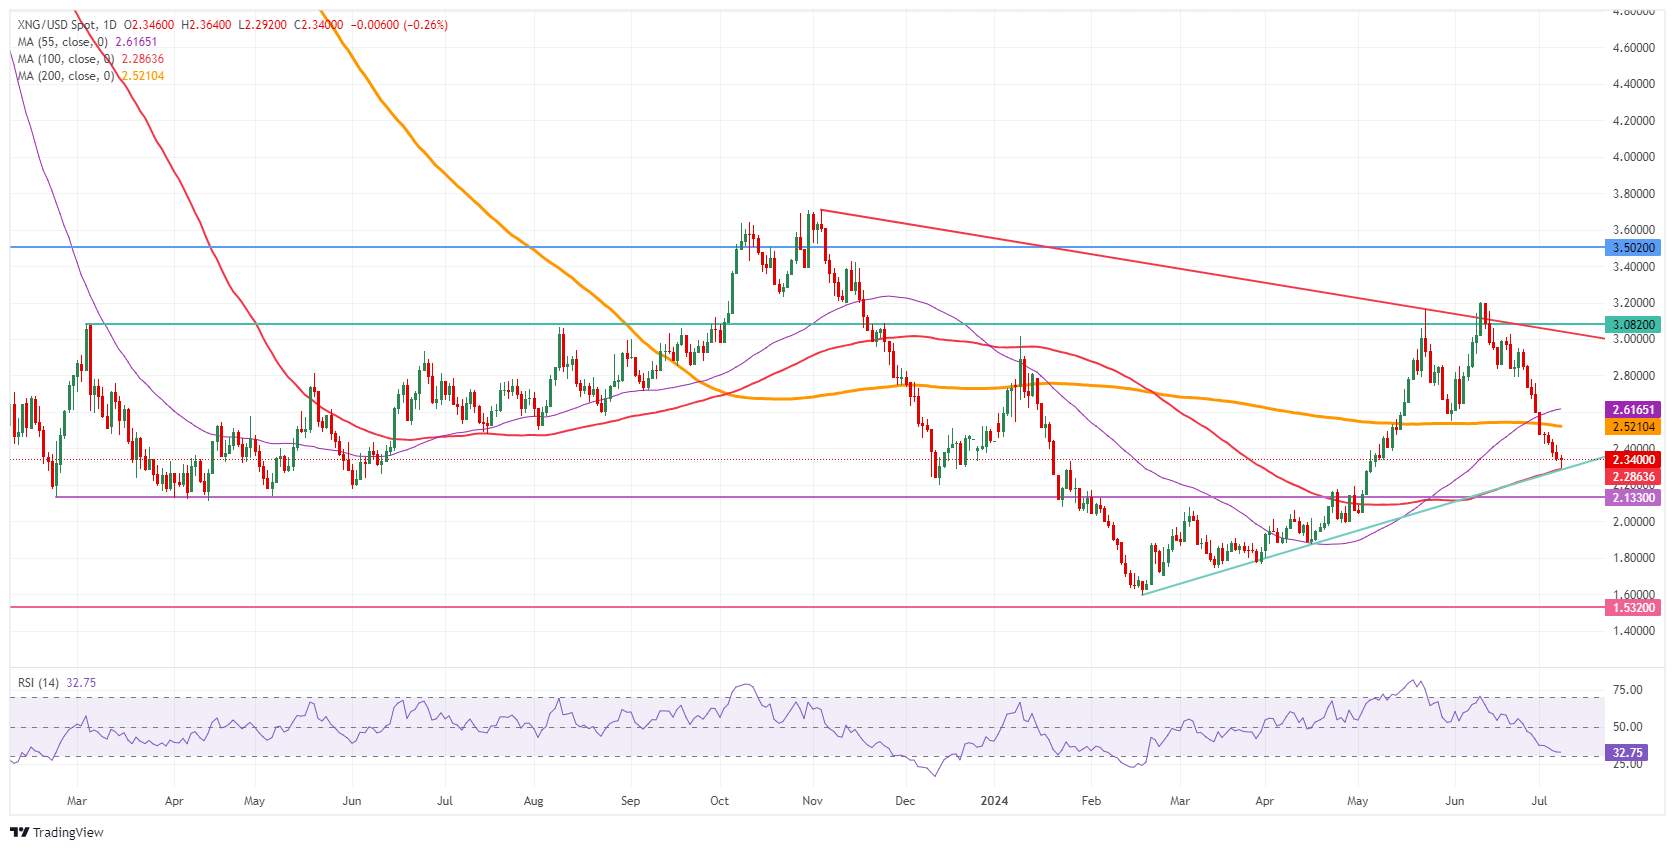
Natural Gas: Daily Chart
Natural Gas FAQs
Supply and demand dynamics are a key factor influencing Natural Gas prices, and are themselves influenced by global economic growth, industrial activity, population growth, production levels, and inventories. The weather impacts Natural Gas prices because more Gas is used during cold winters and hot summers for heating and cooling. Competition from other energy sources impacts prices as consumers may switch to cheaper sources. Geopolitical events are factors as exemplified by the war in Ukraine. Government policies relating to extraction, transportation, and environmental issues also impact prices.
The main economic release influencing Natural Gas prices is the weekly inventory bulletin from the Energy Information Administration (EIA), a US government agency that produces US gas market data. The EIA Gas bulletin usually comes out on Thursday at 14:30 GMT, a day after the EIA publishes its weekly Oil bulletin. Economic data from large consumers of Natural Gas can impact supply and demand, the largest of which include China, Germany and Japan. Natural Gas is primarily priced and traded in US Dollars, thus economic releases impacting the US Dollar are also factors.
The US Dollar is the world’s reserve currency and most commodities, including Natural Gas are priced and traded on international markets in US Dollars. As such, the value of the US Dollar is a factor in the price of Natural Gas, because if the Dollar strengthens it means less Dollars are required to buy the same volume of Gas (the price falls), and vice versa if USD strengthens.
France’s second-round legislative election produced an unexpected result, with the far right Rassemblement National pushed into third place, UBS macro analyst Paul Donovan notes.
Political outcomes are getting more interesting
“An unexpected result highlights that politics is becoming more important to markets, but opinion polls are less reliable as a guide to outcomes. Polarization means financial institutions try to strike a neutral tone—'opinion polls suggest’ rather than ‘we believe that’, but if polls are less reliable market mispricing is more common.”
“For France, there is a prospect of either a minority government or a probably unstable coalition. The largest bloc is the left-wing Nouveau Front Populaire, and on some costings their unfunded fiscal pledges amounted to two Trusses (4% of GDP). It would be difficult to be so radical given these political circumstances.”
“Elsewhere, Japanese nominal wage gains were the best since the 1990s, but fell in real terms. Japanese consumer data has also tended to disappoint a little recently. US consumer credit data is due, and has tended to be lower than expected this year. Germany's May imports and exports fell, and by more than consensus expectations.”
No party secured an absolute majority in the French National Assembly, leaving it highly fractured after the election, Danske Bank analysts note.
Political uncertainty continues in France
“The left-wing New Popular Front (NPF) became the largest party, securing 182 seats. Macron's centrist ‘Ensemble’ alliance finished second with 168 seats. The far-right National Rally (RN) has unexpectedly taken third place, garnering 143 seats. A party or coalition needs 289 seats for an absolute majority.”
“Uncertainty about what the new government will look like is high, and there is no obvious majority government to be formed. Uncertainty in French politics is set to persist even after a government is formed as there is a higher than usual risk of the government breaking given the fragmentated results of the election.”
“However, some uncertainty has been eliminated from markets by the results, as public spending in France is most likely not set to rise significantly since both the left-wing and far-right fell short of an absolute majority. We thus expect the 10y yield spread between France and Germany will tighten to some 40-60 bp within 3 months.”
Instead of declining further, the US Dollar (USD) is more likely to trade in a 7.2800/7.2970 range, or at least in a wider range between 7.2700 and 7.3100, UOB Group analysts note.
USD/CNH can fall to 7.2700
24-HOUR VIEW: “While we expected USD to decline further last Friday, we were of the view that it ‘is unlikely to threaten the support at 7.2800.’ USD fell more than expected, as it dropped briefly to 7.2790 before rebounding to close largely unchanged (7.2882, -0.05%). The rebound in oversold conditions suggests instead of declining further, USD is more likely to trade in a 7.2800/7.2970 range today.”
1-3 WEEKS VIEW: “Last Thursday (04 Jul, spot at 7.3000), we highlighted that the recent buildup of upward momentum had largely dissipated. We were of the view that the current price movements are likely part of a consolidation, and we expected USD to trade between 7.2700 and 7.3100 or the time being. There is no change in our view.”
- EUR/USD exhibits strength as growing speculation for Fed rate cuts in September weighs on the US Dollar.
- US labor market conditions appear to have lost momentum.
- Unexpected progress by the left wing in French elections has increased uncertainty over the economy’s fiscal outlook.
EUR/USD stabilizes above the round-level support of 1.0800 in Monday’s European session. The major currency pair remains firm as the US Dollar (USD) is under pressure due to growing speculation that the Federal Reserve (Fed) will start lowering interest rates at the September meeting.
The US Dollar Index (DXY), which tracks the Greenback’s value against six major currencies, hovers near a three-week low around 104.85.
Market expectations for Fed interest rate cut bets in September have increased further amid evidence that the United States (US) labor market is losing momentum. The US Nonfarm Payrolls (NFP) report for June pointed to a slowdown in labor demand as revised estimates showed that the number of individuals hired in April and May was lower by 110K than previously estimated. Also, the Unemployment Rate surprisingly rose to 4.1% from the consensus and the former release of 4.0%.
Also, upside risks to inflation ease as wage growth momentum appears to have slowed in June. The US NFP report showed that Average Hourly Earnings, a measure of wage growth, declined expectedly on a monthly and annual basis.
Cooling labor market strength favors early Fed rate cut bets. According to the CME FedWatch tool, 30-day Federal Funds futures pricing data shows that the probability of rate cuts in September has increased to 75.8% from 64% a week ago.
Going forward, investors will keenly focus on the US Consumer Price Index (CPI) report for June, which will be published on Thursday. Investors will pay close attention to inflation to know whether the disinflation process, which paused in the first quarter, has resumed.
Daily digest market movers: EUR/USD remains firm despite uncertainty over Euro’s outlook
- EUR/USD clings to gains even though the Euro’s outlook appears uncertain as exit polls show that a coalition government will form in the Eurozone’s second-largest economy, France. Polls showed that the left wing, also known as the New Popular Front, led by Jean-Luc Mélenchon, unexpectedly gained the upper hand with President Emmanuel Macron's centrist alliance and Marine Le Pen-led far-right National Rally as runner-ups.
- The absence of any party gaining an outright majority has deepened uncertainty over France’s fiscal outlook. This would force the Centralist Alliance to enter into severe negotiations with the Left Wing to distribute new ministries and the election of a new Prime Minister. Meanwhile, Jean-Luc Mélenchon proposed that French PM Macron should resign and the mandate should be given to the left wing to manage the economy.
- On the monetary policy front, deepening risks of inflation remaining sticky have diminished expectations about the European Central Bank (ECB) delivering subsequent rate cuts. ECB officials are scheduled to meet on July 18 to make decisions on interest rates.
- Preliminary Eurozone Harmonized Index of Consumer Prices (HICP) grew steadily by 2.9% year-on-year in June as service inflation remained sticky at 4.1%. In the ECB Forum on Central Banking at Sintra, Portugal, ECB President Christine Lagarde said, “The disinflationary path is going to continue, but we need to be particularly attentive to services.”
Technical Analysis: EUR/USD gains firm footing above 1.0800
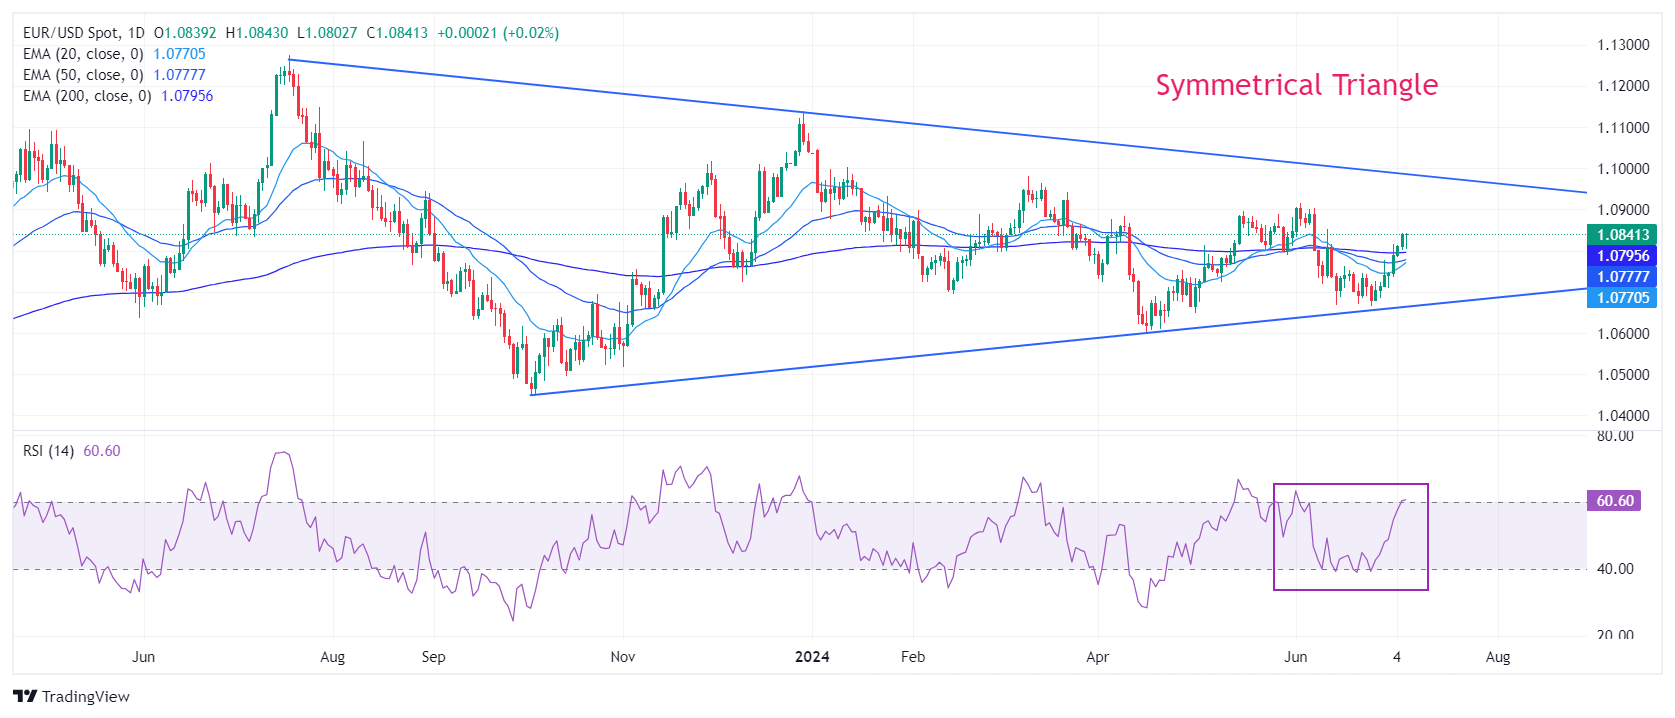
EUR/USD gains ground above 1.0800. The major currency pair strengthens after stabilizing above the 20-day and 50-day Exponential Moving Averages (EMAs), which trade around 1.0750 and 1.0770, respectively. The overall trend of the shared currency pair has also strengthened as it has jumped above the 200-day EMA, which trades around 1.0800.
The Symmetrical Triangle formation on the daily timeframe exhibits a sharp volatility contraction, which indicates low volume and narrow ticks.
The 14-day Relative Strength Index (RSI) reaches 60.00. Should the bullish momentum be triggered if it breaks above 60.00?
Euro FAQs
The Euro is the currency for the 20 European Union countries that belong to the Eurozone. It is the second most heavily traded currency in the world behind the US Dollar. In 2022, it accounted for 31% of all foreign exchange transactions, with an average daily turnover of over $2.2 trillion a day. EUR/USD is the most heavily traded currency pair in the world, accounting for an estimated 30% off all transactions, followed by EUR/JPY (4%), EUR/GBP (3%) and EUR/AUD (2%).
The European Central Bank (ECB) in Frankfurt, Germany, is the reserve bank for the Eurozone. The ECB sets interest rates and manages monetary policy. The ECB’s primary mandate is to maintain price stability, which means either controlling inflation or stimulating growth. Its primary tool is the raising or lowering of interest rates. Relatively high interest rates – or the expectation of higher rates – will usually benefit the Euro and vice versa. The ECB Governing Council makes monetary policy decisions at meetings held eight times a year. Decisions are made by heads of the Eurozone national banks and six permanent members, including the President of the ECB, Christine Lagarde.
Eurozone inflation data, measured by the Harmonized Index of Consumer Prices (HICP), is an important econometric for the Euro. If inflation rises more than expected, especially if above the ECB’s 2% target, it obliges the ECB to raise interest rates to bring it back under control. Relatively high interest rates compared to its counterparts will usually benefit the Euro, as it makes the region more attractive as a place for global investors to park their money.
Data releases gauge the health of the economy and can impact on the Euro. Indicators such as GDP, Manufacturing and Services PMIs, employment, and consumer sentiment surveys can all influence the direction of the single currency. A strong economy is good for the Euro. Not only does it attract more foreign investment but it may encourage the ECB to put up interest rates, which will directly strengthen the Euro. Otherwise, if economic data is weak, the Euro is likely to fall. Economic data for the four largest economies in the euro area (Germany, France, Italy and Spain) are especially significant, as they account for 75% of the Eurozone’s economy.
Another significant data release for the Euro is the Trade Balance. This indicator measures the difference between what a country earns from its exports and what it spends on imports over a given period. If a country produces highly sought after exports then its currency will gain in value purely from the extra demand created from foreign buyers seeking to purchase these goods. Therefore, a positive net Trade Balance strengthens a currency and vice versa for a negative balance.
- The Mexican Peso rises in its most-traded pairs as political risk impacts counterparts.
- The Greenback strengthens as a result of a higher probability of Trump winning the election.
- A strong showing by the far-left in France’s elections raises concerns about the fiscal outlook impacting the Euro.
The Mexican Peso (MXN) trades higher in its key pairs on Monday amid a subdued market mood. Carry flows continue to favor the Mexican Peso due to the attractiveness to foreign investors of the relatively high interest rates on offer in Mexico.
The Peso especially rises against the Euro (EUR), which is falling amid renewed political concerns following the final results of the French legislative elections on Sunday. Although the center and left parties managed to prevent the far-right National Rally (RN) from winning a majority, no one party has enough seats to govern, suggesting the risk of long-term policy paralysis, according to Reuters.
The US Dollar, meanwhile, finds some support from the increasing likelihood of former President Donald Trump winning the November Presidential elections as President Joe Biden is seen as likely to step down amid concerns about his fitness for office. Trump’s tax-cuts-and-spend policies are viewed as inflationary and therefore likely to keep interest rates in the US elevated.
At the time of writing, one US Dollar (USD) buys 18.03 Mexican Pesos, EUR/MXN trades at 19.55, and GBP/MXN at 23.12.
Mexican Peso trades higher amid raised political risk
The Mexican Peso trades higher against the Euro on Monday as the shared currency weakens after the results of the French election raised concerns about France’s future fiscal position. Tactical voting means the far-left Nouveau Front Popullaire (NFP) won the most seats (182), followed by the centrist alliance Ensemble (168) and the far-right National Rally (143) coming third, as per Reuters.
Since no one party got more than the 289 minimum necessary to form a government an uneasy coalition will be necessary – probably between Macron’s centrists and the NFP, which will probably take a long time to agree, leading to policy paralysis, according to Reuters.
Although the greater concern of a far-right victory has been averted, markets are now fretting anew about the impact of the future far-left-dominated government on the economy.
Trump factor keeps US Dollar supported
The Mexican Peso continues rising against the US Dollar but at a much more muted pace, as political risk supports the US currency despite a run of weak US data bringing forward expectations of the Federal Reserve (Fed) cutting interest rates.
The increasing probability that Donald Trump will become the next president of the US is leading to a rise in US Treasury bond yields, which are positively correlated with the US Dollar. Given his inflationary policies, interest rates might remain high in the US, fueling continued foreign capital inflows and supporting USD.
The US Dollar had been weakening after a string of US data releases indicated the economy is cooling down. The June ISM Services Purchasing Managers Index (PMI) fell into contractionary territory, and labor market data has also been below par.
Although US Nonfarm Payrolls for June on Friday showed a higher-than-expected 206K workers joined the economy, the result of the previous month was revised down considerably and the Unemployment Rate rose to 4.1% when economists had expected it to remain at 4.0%. It was the third consecutive rise in unemployment in as many months.
Technical Analysis: USD/MXN plateaus
USD/MXN drifts lower towards the key June 24 swing low at 17.87.
More broadly, it is possible the pair is entering a sideways trend, with the floor at the aforesaid June 24 low and a ceiling at the 18.50 level, although it is still a little too early to be sure.
USD/MXN 4-hour Chart
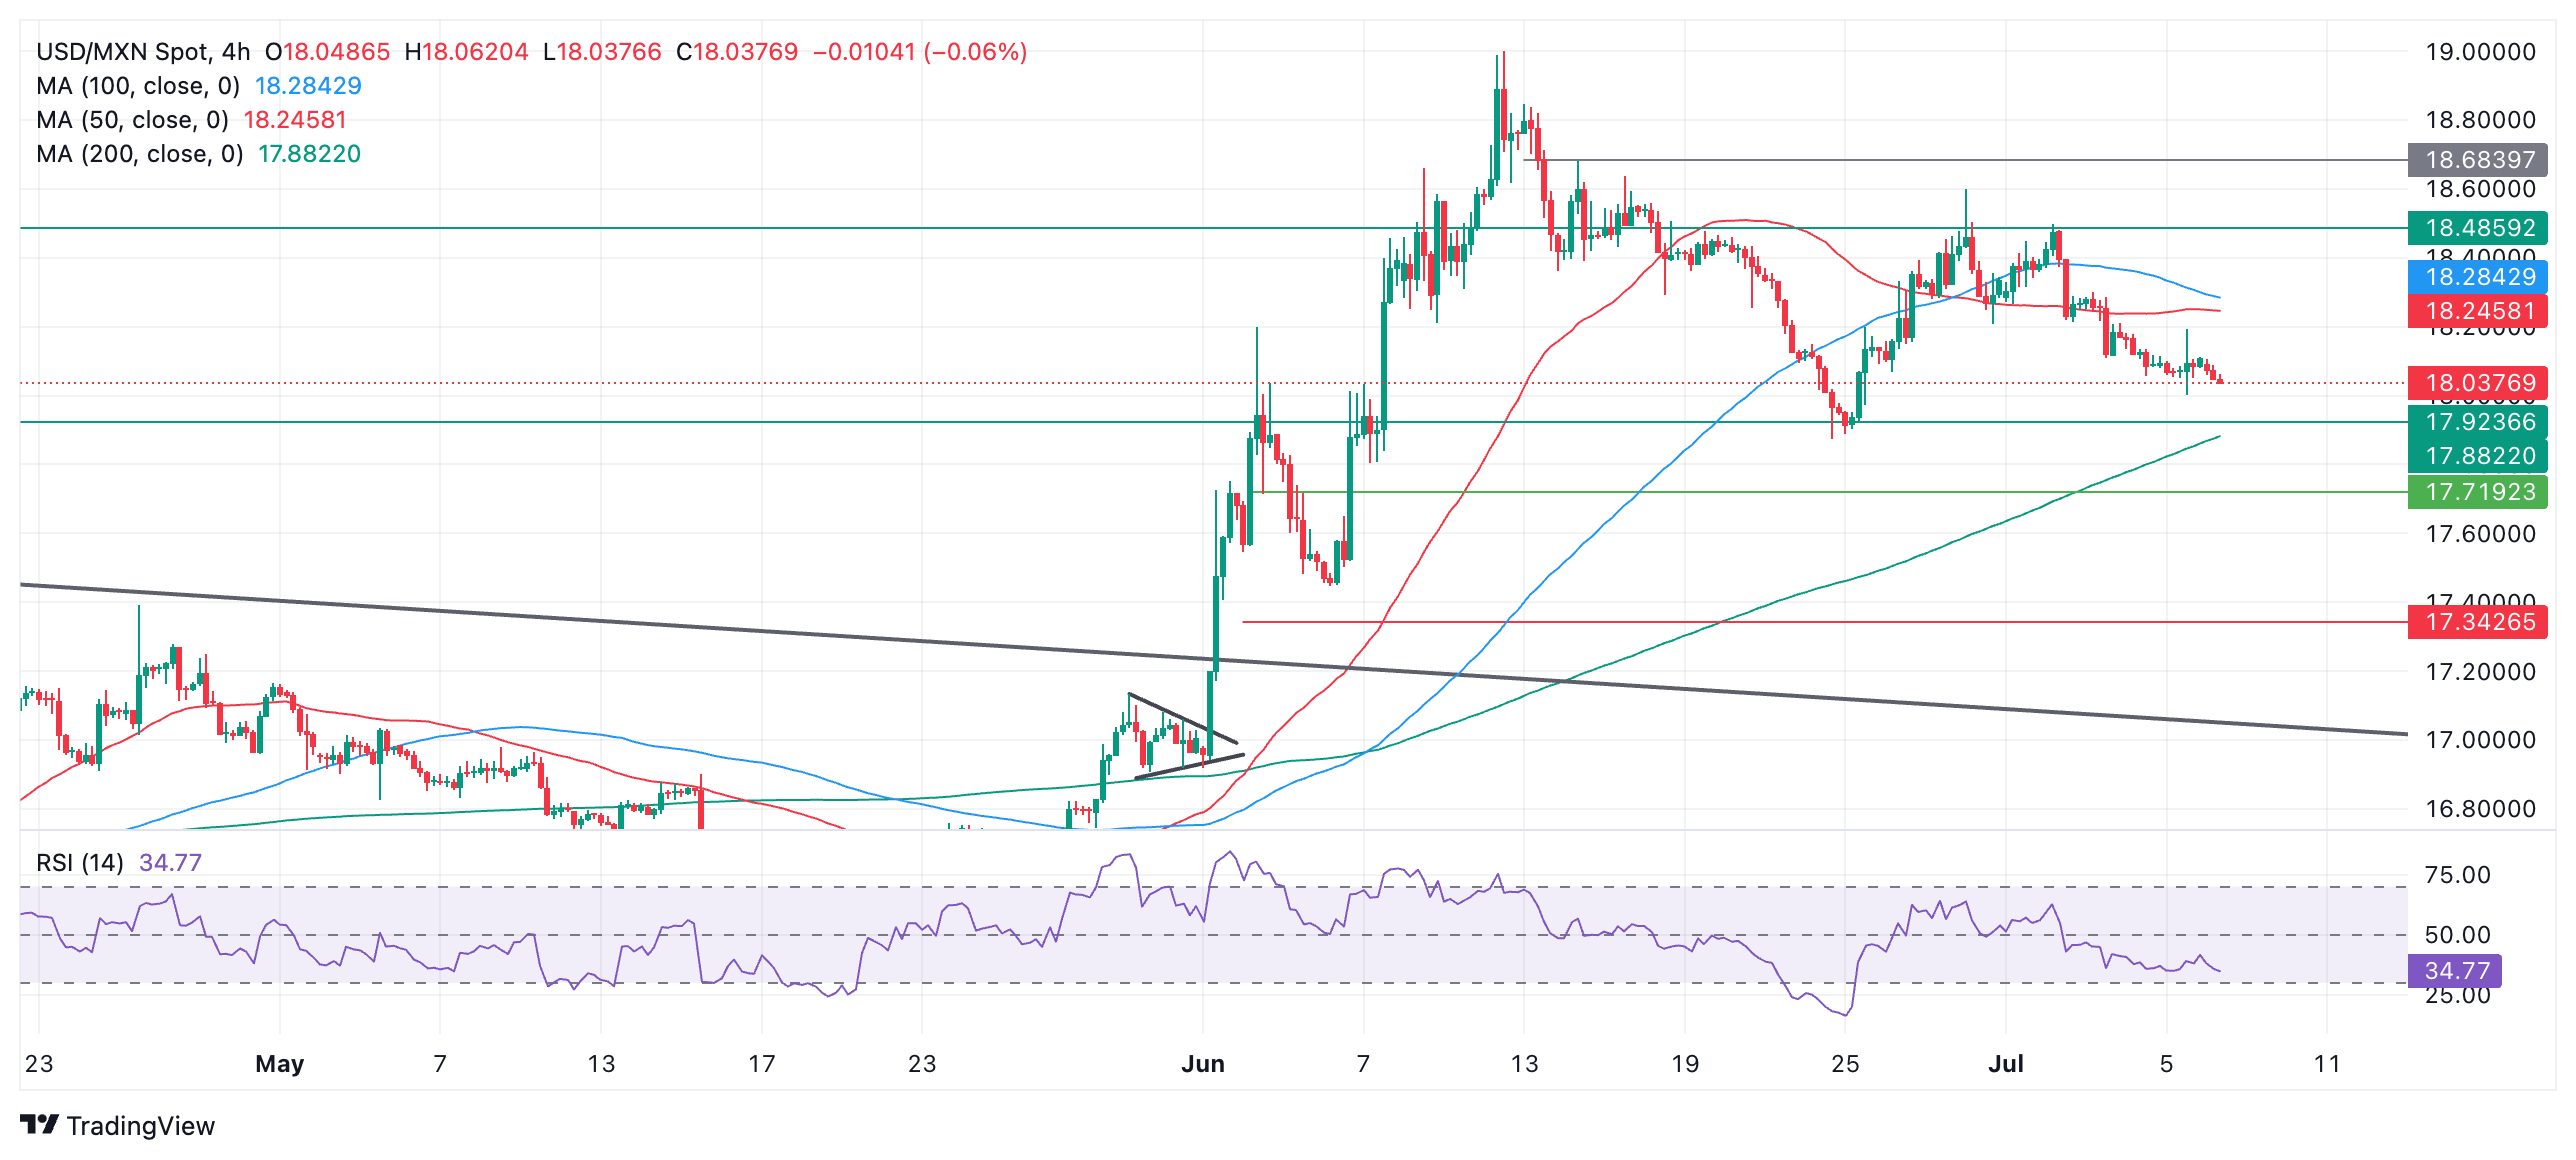
The pair is likely to encounter support at the June 24 low, but a decisive break below 17.87 would suggest a new downtrend was beginning, with the next target lying at 17.50 (50-day Simple Moving Average).
A rally back above 18.59, however, would indicate a continuation up to 18.68 (June 14 high), followed by 19.00 (June 12 high). A break above 19.00 would provide strong confirmation of a resumption of the short-and-intermediate term uptrends.
The direction of the long-term trend remains in doubt.
Economic Indicator
Nonfarm Payrolls
The Nonfarm Payrolls release presents the number of new jobs created in the US during the previous month in all non-agricultural businesses; it is released by the US Bureau of Labor Statistics (BLS). The monthly changes in payrolls can be extremely volatile. The number is also subject to strong reviews, which can also trigger volatility in the Forex board. Generally speaking, a high reading is seen as bullish for the US Dollar (USD), while a low reading is seen as bearish, although previous months' reviews and the Unemployment Rate are as relevant as the headline figure. The market's reaction, therefore, depends on how the market assesses all the data contained in the BLS report as a whole.
Read more.Last release: Fri Jul 05, 2024 12:30
Frequency: Monthly
Actual: 206K
Consensus: 190K
Previous: 272K
Source: US Bureau of Labor Statistics
America’s monthly jobs report is considered the most important economic indicator for forex traders. Released on the first Friday following the reported month, the change in the number of positions is closely correlated with the overall performance of the economy and is monitored by policymakers. Full employment is one of the Federal Reserve’s mandates and it considers developments in the labor market when setting its policies, thus impacting currencies. Despite several leading indicators shaping estimates, Nonfarm Payrolls tend to surprise markets and trigger substantial volatility. Actual figures beating the consensus tend to be USD bullish.
The US Dollar (USD) could drop further to 160.20 before stabilisation can be expected. USD strength from the middle of last month has come to an end, and for the time being, the pair is likely to trade in a 159.40/161.80 range, UOB Group analysts note.
USD/JPY may drop to 160.20
24-HOUR VIEW: “Last Friday, we expected USD to trade in a 160.80/161.80 range. Our view was incorrect, as USD fell to a low of 160.33 before rebounding to close at 160.72 (-0.33%). Despite the rebound, the weakness in USD has not stabilised. Today, provided that USD remains below 161.15 (minor resistance is at 160.95), USD could drop further to 160.20 before stabilisation can be expected.”
1-3 WEEKS VIEW: ” We noted last Thursday (04 Jul, spot at 161.45) that ‘upward momentum is beginning to slow, but only a breach of 160.45 would suggest that USD is not strengthening further.’ On Friday, USD fell to a low of 160.33. The breach of our ‘strong support’ level of 160.45 indicates that the USD strength from the middle of last month has come to an end. The current price movements are likely part of a range trading phase. For the time being, USD is likely to trade between 159.40 and 161.80.”
Silver prices (XAG/USD) fell on Monday, according to FXStreet data. Silver trades at $30.92 per troy ounce, down 0.98% from the $31.22 it cost on Friday.
Silver prices have increased by 29.93% since the beginning of the year.
| Unit measure | Silver Price Today in USD |
|---|---|
| Troy Ounce | 30.92 |
| 1 Gram | 0.99 |
The Gold/Silver ratio, which shows the number of ounces of Silver needed to equal the value of one ounce of Gold, stood at 76.73 on Monday, up from 76.59 on Friday.
Silver FAQs
Silver is a precious metal highly traded among investors. It has been historically used as a store of value and a medium of exchange. Although less popular than Gold, traders may turn to Silver to diversify their investment portfolio, for its intrinsic value or as a potential hedge during high-inflation periods. Investors can buy physical Silver, in coins or in bars, or trade it through vehicles such as Exchange Traded Funds, which track its price on international markets.
Silver prices can move due to a wide range of factors. Geopolitical instability or fears of a deep recession can make Silver price escalate due to its safe-haven status, although to a lesser extent than Gold's. As a yieldless asset, Silver tends to rise with lower interest rates. Its moves also depend on how the US Dollar (USD) behaves as the asset is priced in dollars (XAG/USD). A strong Dollar tends to keep the price of Silver at bay, whereas a weaker Dollar is likely to propel prices up. Other factors such as investment demand, mining supply – Silver is much more abundant than Gold – and recycling rates can also affect prices.
Silver is widely used in industry, particularly in sectors such as electronics or solar energy, as it has one of the highest electric conductivity of all metals – more than Copper and Gold. A surge in demand can increase prices, while a decline tends to lower them. Dynamics in the US, Chinese and Indian economies can also contribute to price swings: for the US and particularly China, their big industrial sectors use Silver in various processes; in India, consumers’ demand for the precious metal for jewellery also plays a key role in setting prices.
Silver prices tend to follow Gold's moves. When Gold prices rise, Silver typically follows suit, as their status as safe-haven assets is similar. The Gold/Silver ratio, which shows the number of ounces of Silver needed to equal the value of one ounce of Gold, may help to determine the relative valuation between both metals. Some investors may consider a high ratio as an indicator that Silver is undervalued, or Gold is overvalued. On the contrary, a low ratio might suggest that Gold is undervalued relative to Silver.
(An automation tool was used in creating this post.)
Room for NZD to rise further. The resistance level at 0.6180 is likely out of reach for now, with a chance to reach 0.6200, analysts at UOB Group note.
A slight chance to rise to 0.6200
24-HOUR VIEW: “We highlighted last Friday that ‘there is a chance for NZD to retest the 0.6130 level.’ We also highlighted that ‘the major resistance level at 0.6150 is unlikely to come into view.’ NZD rose more than expected, reaching a high of 0.6149 before closing at 0.6146 (+0.47%). While the advance is approaching overbought levels, there is room for NZD to rise, even though the next resistance level at 0.6180 is likely out of reach for now. To keep the momentum going, NZD must not break below 0.6115, with minor support at 0.6130.”
1-3 WEEKS VIEW: “Our latest narrative was from last Thursday (04 Jul, spot at 0.6105), wherein ‘the recent weakness has stabilised, and the current price movements are likely part of a recovery that has potential to extend to 0.6150.’ We pointed out that ‘a breach of 0.6070 would indicate that NZD is not recovering further.’ Last Friday, NZD rose to a high of 0.6149. Upward momentum has increased further, and the risk is for further NZD strength. The levels to watch are 0.6180 and 0.6200. On the downside, the ‘strong support’ level has moved higher to 0.6100 from 0.6070.”
- WTI price loses ground due to ongoing discussions about a US ceasefire plan to end the Gaza war.
- Oil prices may appreciate as Tropical Storm Beryl could disrupt US energy supplies.
- Rising bets on Fed rate cuts could provide support for the Oil demand.
West Texas Intermediate (WTI) Oil price extends its losses, trading around $82.00 per barrel during the European session on Monday. This decrease is attributed to easing geopolitical tensions in the Middle East, particularly with the prospects of a ceasefire in Gaza. This development has alleviated concerns over supply disruptions. According to Reuters, discussions about a US ceasefire plan to end the nine-month-old conflict in Gaza are ongoing, with Qatar and Egypt mediating the negotiations.
The decline in Oil prices might be halted due to potential disruptions to US energy supplies from Tropical Storm Beryl. On Sunday, the ports of Corpus Christi, Houston, Galveston, Freeport, and Texas City were closed in preparation for Hurricane Beryl. The storm is expected to make landfall along the middle of the Texas coast between Galveston and Corpus Christi later on Monday, according to Reuters.
On Friday, weaker-than-expected US employment data increased the probability of Federal Reserve’s (Fed) interest rate cuts sooner rather than later. Lower Fed rates could help in growing the business conditions in the largest Oil consumer United States (US), which may support the demand for crude Oil.
US Nonfarm Payrolls (NFP) increased by 206,000 in June, following a rise of 218,000 in May. This figure surpassed the market expectation of 190,000. The US Unemployment Rate edged up to 4.1% in June from 4.0% in May. Meanwhile, Average Hourly Earnings decreased to 3.9% year-over-year in June from the previous reading of 4.1%, aligning with market expectations.
According to the CME's FedWatch Tool, rate markets are currently pricing in a 70.7% probability of a rate cut in September, up from 64.1% just a week earlier. The Greenback faced challenges as the Fed Chair Jerome Powell said last week that the central bank is getting back on the disinflationary path, per Reuters.
WTI Oil FAQs
WTI Oil is a type of Crude Oil sold on international markets. The WTI stands for West Texas Intermediate, one of three major types including Brent and Dubai Crude. WTI is also referred to as “light” and “sweet” because of its relatively low gravity and sulfur content respectively. It is considered a high quality Oil that is easily refined. It is sourced in the United States and distributed via the Cushing hub, which is considered “The Pipeline Crossroads of the World”. It is a benchmark for the Oil market and WTI price is frequently quoted in the media.
Like all assets, supply and demand are the key drivers of WTI Oil price. As such, global growth can be a driver of increased demand and vice versa for weak global growth. Political instability, wars, and sanctions can disrupt supply and impact prices. The decisions of OPEC, a group of major Oil-producing countries, is another key driver of price. The value of the US Dollar influences the price of WTI Crude Oil, since Oil is predominantly traded in US Dollars, thus a weaker US Dollar can make Oil more affordable and vice versa.
The weekly Oil inventory reports published by the American Petroleum Institute (API) and the Energy Information Agency (EIA) impact the price of WTI Oil. Changes in inventories reflect fluctuating supply and demand. If the data shows a drop in inventories it can indicate increased demand, pushing up Oil price. Higher inventories can reflect increased supply, pushing down prices. API’s report is published every Tuesday and EIA’s the day after. Their results are usually similar, falling within 1% of each other 75% of the time. The EIA data is considered more reliable, since it is a government agency.
OPEC (Organization of the Petroleum Exporting Countries) is a group of 13 Oil-producing nations who collectively decide production quotas for member countries at twice-yearly meetings. Their decisions often impact WTI Oil prices. When OPEC decides to lower quotas, it can tighten supply, pushing up Oil prices. When OPEC increases production, it has the opposite effect. OPEC+ refers to an expanded group that includes ten extra non-OPEC members, the most notable of which is Russia.
Room for Australian Dollar (AUD) to rise above 0.6755. Overbought conditions suggest it might not be able to maintain a foothold above this level, but increasing upward momentum suggests AUD is likely to continue to rise to 0.6800, UOB Group analysts note.
AUD is likely to trade towards 0.6800
24-HOUR VIEW: “Last Friday, we noted that ‘upward momentum has increased, albeit not much.’ We highlighted that AUD ‘is likely to edge higher, but the 0.6755 level is expected to offer solid resistance.’ AUD rose as expected, reaching a high of 0.6753. While there is room for AUD to rise above 0.6755 today, overbought conditions suggest it might not be able to maintain a foothold above this level. The resistance level at 0.6770 is also unlikely to come under threat. Support levels are at 0.6730 and 0.6715.”
1-3 WEEKS VIEW: “In our update from last Thursday (04 Jul, spot at 0.6710), we indicated that ‘if AUD can surpass 0.6755, it could continue to rise to 0.6800.’ Last Friday, AUD rose to a high of 0.6753. While 0.6755 has not been clearly breached yet, increasing upward momentum suggests it is likely to continue to rise to 0.6800. Overall, only a breach of 0.6690 (‘strong support’ level previously at 0.6665) would indicate that the AUD strength that started early last week has come to an end.”
Further Pound Sterling (GBP) strength is not ruled out. As rapid rise is approaching overbought levels, 1.2860 is unlikely to come under threat. Nevertheless, risk for GBP remains on the upside, and 1.2860 is the level to watch, UOB Group FX strategists note.
1.2860 is the level to watch
24-HOUR VIEW: “Our view for GBP to trade sideways last Friday was incorrect, as it rose, rising above the solid resistance level at 1.2805. GBP then closed on a firm note at 1.2814 (+0.44%). While the rapid rise is approaching overbought levels, further GBP strength is not ruled out. However, the significant resistance at 1.2860 is highly unlikely to come under threat. Note that there is another resistance level at 1.2840. Support is at 1.2785; a breach of 1.2770 would mean that GBP is not advancing further.”
1-3 WEEKS VIEW: “While we turned positive in GBP last Thursday (04 Jul, spot at 1.2745), we pointed out that ‘there is a solid resistance level at 1.2805, ahead of last month’s high of 1.2860.’ Last Friday, GBP broke above 1.2805, reaching a high of 1.2817. Not surprisingly, the risk for GBP remains on the upside, and the level to watch is 1.2860. The upside risk is intact as long as GBP remains above 1.2740 (‘strong support’ level was at 1.2685 last Friday).”
- Eurozone investors’ morale deteriorates sharply in July.
- EUR/USD keeps range below 1.0850 despite the downbeat Eurozone data.
The Eurozone Sentix Investor Confidence Index dropped sharply from 0.3 in June to -7.3 in July, according to the latest survey published on Monday.
The Expectations Index in the Eurozone fell from June’s 10.0 to 1.5 in July.
The index on the Current Situation also decreased to -32.3 in July from -26.3 in June.
Key takeaways
The results are a "bitter setback".
“The recent recovery of the European economy has come to an abrupt end.”
“The survey said that investors were concerned about French elections, upcoming German state elections and uncertainty over the US presidential election later this year.”
Market reaction to the Eurozone Sentix data
EUR/USD is holding the renewed upside near 1.0830 despite the discouraging Eurozone data. As of writing, EUR/USD is up 0.05% on the day.
Instead of pulling back, the Euro (EUR) is more likely to trade in a range between 1.0800 and 1.0845. Risk of EUR breaking above 1.0850 has increased, albeit moderately, UOB Group analysts note.
EUR is set to break above 1.0850
24-HOUR VIEW: “While we expected EUR to edge higher last Friday, we indicated that ‘it remains to be seen if it can reach the major resistance at 1.0850.’ EUR subsequently edged to a high of 1.0842, closing at 1.0836 (+0.24%). EUR fluctuated upon opening this morning, and upward momentum has not increased much further. That said, instead of pulling back, EUR is more likely to trade in a range today, probably between 1.0800 and1.0845.”
1-3 WEEKS VIEW: “Last Thursday (04 Jul, spot at 1.0785), we indicated that ‘while the increase in momentum suggests further EUR strength, it is too early to determine if it can reach the major resistance at 1.0850.’ On Friday, EUR rose, reaching a high of 1.0842. While there has been no significant increase in momentum, the risk of EUR breaking above 1.0850 has increased, albeit moderately. If EUR breaks clearly above 1.0850, the next level to monitor is 1.0900. Conversely, if EUR breaches 1.0770 (‘strong support’ level was at 1.0745 last Friday), it would mean that the current upward pressure has faded.”
- EUR/GBP gains ground as German Trade Balance increases to €24.9 billion in May.
- The Euro may struggle due to political uncertainty in France.
- The Pound Sterling could limit its downside due to positive sentiment following the Labour Party's landslide victory.
EUR/GBP edges higher to near 0.8460 during the early European session on Monday. This upside could be attributed to the higher-than-expected German Trade Balance. The trade surplus increased to €24.9 billion in May, surpassing the market expectations of €20.3 billion and the previous reading of €22.2 billion (revised from €22.1 billion).
However, political uncertainty in France following the second round of parliamentary elections on Sunday exerted some selling pressure on the Euro (EUR), which might limit the upside of the EUR/GBP cross. According to The Economist, exit polls indicated that the left-wing New Popular Front (NFP), led by Jean-Luc Mélenchon, is on track to win the most seats, having secured at least 174 seats.
Meanwhile, CNBC reported that Deutsche Bank strategists saying “Trying to build a government that has any kind of stability looks a very high bar this morning. Political paralysis for the next 12 months seems the most likely outcome.” They believe markets will be wary of the NFP's “fiscally aggressive” spending and taxation plans.
In the United Kingdom (UK), the Pound Sterling (GBP) receives support due to positive sentiment following the Labour Party's landslide victory in the 2024 general election. Labour won 410 seats, a significant increase of 212 seats from the 2019 elections.
In the absence of high-priority data from the UK, traders are likely to focus on the releases of BRC Like-For-Like Retail Sales on Tuesday and Gross Domestic Product figures on Thursday. These data points could provide fresh insights into British economic conditions.
Euro PRICE Today
The table below shows the percentage change of Euro (EUR) against listed major currencies today. Euro was the strongest against the Japanese Yen.
| USD | EUR | GBP | JPY | CAD | AUD | NZD | CHF | |
|---|---|---|---|---|---|---|---|---|
| USD | -0.02% | -0.03% | 0.10% | -0.12% | 0.13% | -0.04% | -0.06% | |
| EUR | 0.02% | 0.19% | 0.45% | 0.22% | 0.30% | 0.31% | 0.29% | |
| GBP | 0.03% | -0.19% | 0.23% | 0.05% | 0.11% | 0.12% | 0.09% | |
| JPY | -0.10% | -0.45% | -0.23% | -0.21% | 0.05% | 0.02% | -0.10% | |
| CAD | 0.12% | -0.22% | -0.05% | 0.21% | 0.20% | 0.07% | 0.07% | |
| AUD | -0.13% | -0.30% | -0.11% | -0.05% | -0.20% | 0.00% | -0.02% | |
| NZD | 0.04% | -0.31% | -0.12% | -0.02% | -0.07% | -0.01% | -0.02% | |
| CHF | 0.06% | -0.29% | -0.09% | 0.10% | -0.07% | 0.02% | 0.02% |
The heat map shows percentage changes of major currencies against each other. The base currency is picked from the left column, while the quote currency is picked from the top row. For example, if you pick the Euro from the left column and move along the horizontal line to the US Dollar, the percentage change displayed in the box will represent EUR (base)/USD (quote).
- The Pound Sterling remains firm against the US Dollar as expectations for Fed rate cuts in September grew further.
- Keir Starmer’s historic victory in UK parliamentary elections has brought political stability.
- This week, investors will focus on the UK monthly GDP for May and the US CPI for June.
The Pound Sterling (GBP) exhibits a mixed performance against its major peers in Monday’s London session. The near-term outlook of the British currency remains firm as Keir Starmer-led Labour Party gained an outright majority against Rishi Sunak-led Conservative Party in the United Kingdom’s (UK) parliamentary elections. The victory of the Labour Party with an absolute majority has brought political stability to the economy, which has resulted in a sheer strength in UK financial markets.
Uncertainty over the Bank of England’s (BoE) interest-rate outlook remains high even though the annual headline inflation has returned to the desired rate of 2%. Financial markets currently see a 50% chance that the BoE will begin reducing interest rates from the August meeting.
This week, investors will keenly focus on the UK monthly Gross Domestic Product (GDP) and the factory data for May, which will be published on Thursday. The UK economy is estimated to have expanded by 0.2% after remaining unchanged in April.
Daily digest market movers: Pound Sterling clings to gains against US Dollar
- The Pound Sterling holds gains to near 1.2800 against the US Dollar (USD) in Monday’s European session. The GBP/USD pair strengthens as the US Dollar weakens after the United States (US) Nonfarm Payrolls (NFP) report for June pointed to moderating labor market conditions.
- The US NFP report indicated that labor hiring was not as strong in April and May as reported earlier. A revised reading of the above-mentioned months showed that the economy created 111K fewer jobs than previously estimated. The Unemployment Rate unexpectedly rose to 4.1% from estimates and the prior month of 4.0%.
- Signs of loosening labor market strength boost expectations of early rate cuts by the Federal Reserve (Fed). Officials have reiterated that they want to see inflation declining for months before cutting interest rates. However, Fed Chair Jerome Powell said last week that an unexpected weakness in the labor market could force policymakers to react on interest rates sooner.
- Also, Average Hourly Earnings, a measure of wage growth that drives service inflation and consumer spending, softened expectedly on a monthly and annual basis.
- According to the CME FedWatch tool, 30-day Federal Funds futures pricing data shows that the probability of rate cuts in September has increased to 75.8% from 64% recorded a week ago. The data also shows that the Fed will deliver subsequent rate cuts in the November or December meeting.
- This week, investors will pay close attention to the US Consumer Price Index (CPI) data for June, which will be published on Thursday. Economists see the annual core CPI, which strips off volatile food and energy prices, to have grown steadily by 3.4%.
Technical Analysis: Pound Sterling hovers around 1.2800
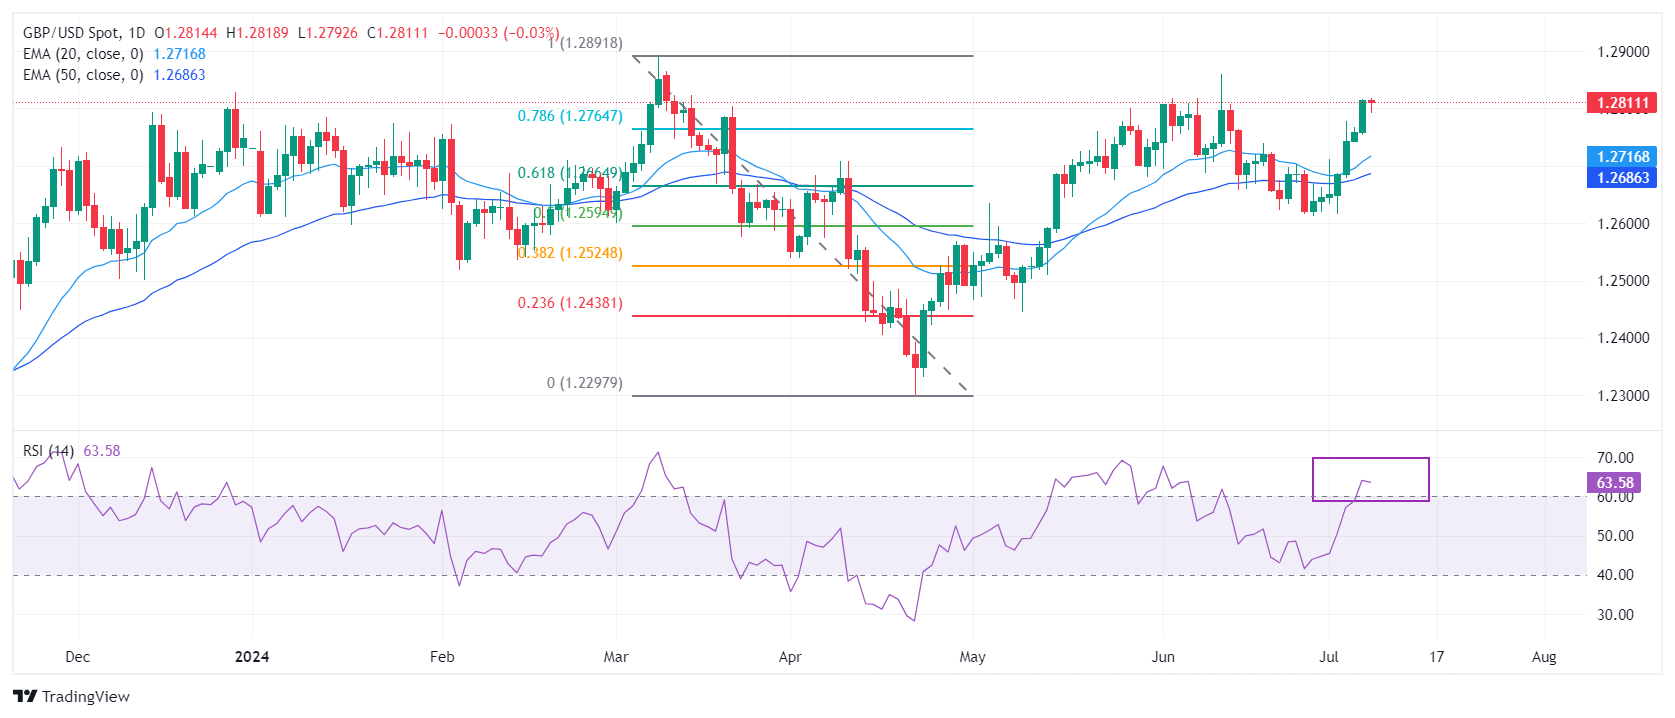
The Pound Sterling trades close to a fresh three-week high at 1.2820 against the US Dollar. The GBP/USD pair has climbed above the 78.6% Fibonacci retracement at 1.2770, plotted from the March 8 high of 1.2900 to the April 22 low at 1.2300.
The pair rises above the 20-day and 50-day Exponential Moving Averages (EMAs) near 1.2695 and 1.2675, respectively, suggesting that the near-term outlook is bullish.
The 14-day Relative Strength Index (RSI) rises above 60.00. A sustained move above this level would shift momentum towards the upside.
Pound Sterling FAQs
The Pound Sterling (GBP) is the oldest currency in the world (886 AD) and the official currency of the United Kingdom. It is the fourth most traded unit for foreign exchange (FX) in the world, accounting for 12% of all transactions, averaging $630 billion a day, according to 2022 data. Its key trading pairs are GBP/USD, aka ‘Cable’, which accounts for 11% of FX, GBP/JPY, or the ‘Dragon’ as it is known by traders (3%), and EUR/GBP (2%). The Pound Sterling is issued by the Bank of England (BoE).
The single most important factor influencing the value of the Pound Sterling is monetary policy decided by the Bank of England. The BoE bases its decisions on whether it has achieved its primary goal of “price stability” – a steady inflation rate of around 2%. Its primary tool for achieving this is the adjustment of interest rates. When inflation is too high, the BoE will try to rein it in by raising interest rates, making it more expensive for people and businesses to access credit. This is generally positive for GBP, as higher interest rates make the UK a more attractive place for global investors to park their money. When inflation falls too low it is a sign economic growth is slowing. In this scenario, the BoE will consider lowering interest rates to cheapen credit so businesses will borrow more to invest in growth-generating projects.
Data releases gauge the health of the economy and can impact the value of the Pound Sterling. Indicators such as GDP, Manufacturing and Services PMIs, and employment can all influence the direction of the GBP. A strong economy is good for Sterling. Not only does it attract more foreign investment but it may encourage the BoE to put up interest rates, which will directly strengthen GBP. Otherwise, if economic data is weak, the Pound Sterling is likely to fall.
Another significant data release for the Pound Sterling is the Trade Balance. This indicator measures the difference between what a country earns from its exports and what it spends on imports over a given period. If a country produces highly sought-after exports, its currency will benefit purely from the extra demand created from foreign buyers seeking to purchase these goods. Therefore, a positive net Trade Balance strengthens a currency and vice versa for a negative balance.
Here is what you need to know on Monday, July 8:
The US Dollar (USD) stays resilient against its major rivals at the beginning of the new week. After losing nearly 1% and snapping a four-week winning streak in the previous week, the US Dollar Index fluctuates in a tight range at around 105.00. Sentix Investor Confidence for July will be featured in the European economic docket. Later in the day, May Consumer Credit Change data from the US will be looked upon for fresh impetus.
US Dollar PRICE Last 7 days
The table below shows the percentage change of US Dollar (USD) against listed major currencies last 7 days. US Dollar was the weakest against the British Pound.
| USD | EUR | GBP | JPY | CAD | AUD | NZD | CHF | |
|---|---|---|---|---|---|---|---|---|
| USD | -1.10% | -1.28% | 0.10% | -0.29% | -1.13% | -0.75% | -0.38% | |
| EUR | 1.10% | -0.41% | 0.91% | 0.51% | -0.15% | 0.04% | 0.42% | |
| GBP | 1.28% | 0.41% | 1.30% | 0.93% | 0.27% | 0.46% | 0.84% | |
| JPY | -0.10% | -0.91% | -1.30% | -0.39% | -1.17% | -0.86% | -0.46% | |
| CAD | 0.29% | -0.51% | -0.93% | 0.39% | -0.80% | -0.47% | -0.09% | |
| AUD | 1.13% | 0.15% | -0.27% | 1.17% | 0.80% | 0.19% | 0.64% | |
| NZD | 0.75% | -0.04% | -0.46% | 0.86% | 0.47% | -0.19% | 0.40% | |
| CHF | 0.38% | -0.42% | -0.84% | 0.46% | 0.09% | -0.64% | -0.40% |
The heat map shows percentage changes of major currencies against each other. The base currency is picked from the left column, while the quote currency is picked from the top row. For example, if you pick the US Dollar from the left column and move along the horizontal line to the Japanese Yen, the percentage change displayed in the box will represent USD (base)/JPY (quote).
The data published by the US Bureau of Labor Statistics (BLS) showed on Friday that Nonfarm Payrolls (NFP) rose 206,000 in June. Although this reading came in above the market expectation of 190,000, the USD struggled to find demand as the BLS also announced that it revised the May's NFP increase of 272,000 lower to 218,000. Other details of the report showed that the Unemployment Rate ticked up to 4.1%, while the annual wage inflation softened to 3.9% from 4.1% in May.
The left-wing alliance New Popular Front won the second round of French election, securing 182 seats in the National Assembly but falling short of the 289 seats required for an absoulte majority. President Macron’s centrist Ensemble Alliance came in second, winning 163 seats, ahead of Marine Le Pen’s far-right National Rally (RN) party, which secured 143 seats. This development failed to trigger a noticeable reaction and EUR/USD was last seen trading virtually unchanged on the day at around 1.0830.
GBP/USD benefited from the selling pressure surrounding the USD and gained more than 1% last week. The pair stays in a consolidation phase slightly above 1.2800 in the European morning on Monday.
USD/JPY registered marginal losses on Thursday and Friday. At the beginning of the new week, the pair fluctuates in a narrow range at around 161.00.
Gold gathered bullish momentum and climbed to a fresh multi-week high above $2,380 ahead of the weekend as US Treasury bond yields turned south following the US employment data. XAU/USD struggles to extend its rally and consolidates its gains at around $2,380.
Euro FAQs
The Euro is the currency for the 20 European Union countries that belong to the Eurozone. It is the second most heavily traded currency in the world behind the US Dollar. In 2022, it accounted for 31% of all foreign exchange transactions, with an average daily turnover of over $2.2 trillion a day. EUR/USD is the most heavily traded currency pair in the world, accounting for an estimated 30% off all transactions, followed by EUR/JPY (4%), EUR/GBP (3%) and EUR/AUD (2%).
The European Central Bank (ECB) in Frankfurt, Germany, is the reserve bank for the Eurozone. The ECB sets interest rates and manages monetary policy. The ECB’s primary mandate is to maintain price stability, which means either controlling inflation or stimulating growth. Its primary tool is the raising or lowering of interest rates. Relatively high interest rates – or the expectation of higher rates – will usually benefit the Euro and vice versa. The ECB Governing Council makes monetary policy decisions at meetings held eight times a year. Decisions are made by heads of the Eurozone national banks and six permanent members, including the President of the ECB, Christine Lagarde.
Eurozone inflation data, measured by the Harmonized Index of Consumer Prices (HICP), is an important econometric for the Euro. If inflation rises more than expected, especially if above the ECB’s 2% target, it obliges the ECB to raise interest rates to bring it back under control. Relatively high interest rates compared to its counterparts will usually benefit the Euro, as it makes the region more attractive as a place for global investors to park their money.
Data releases gauge the health of the economy and can impact on the Euro. Indicators such as GDP, Manufacturing and Services PMIs, employment, and consumer sentiment surveys can all influence the direction of the single currency. A strong economy is good for the Euro. Not only does it attract more foreign investment but it may encourage the ECB to put up interest rates, which will directly strengthen the Euro. Otherwise, if economic data is weak, the Euro is likely to fall. Economic data for the four largest economies in the euro area (Germany, France, Italy and Spain) are especially significant, as they account for 75% of the Eurozone’s economy.
Another significant data release for the Euro is the Trade Balance. This indicator measures the difference between what a country earns from its exports and what it spends on imports over a given period. If a country produces highly sought after exports then its currency will gain in value purely from the extra demand created from foreign buyers seeking to purchase these goods. Therefore, a positive net Trade Balance strengthens a currency and vice versa for a negative balance.
- Silver price trades in negative territory around $30.95 in Monday’s early European session, down 0.95% on the day.
- The US economy added fewer jobs in June, and Unemployment Rate rose to its highest level since late 2021.
- Fed’s hawkish stance or hotter-than-expected CPI inflation data might weigh on the white metal.
Silver price (XAG/USD) edges lower to $30.95 during the early European session on Monday. The white metal declines on the back of renewed US Dollar (USD) demand and higher US bond yields. However, the precious metal’s gains might be limited by the rising bets on the US Federal Reserve (Fed) rate cuts this year.
The US employment report on Friday showed that employers added fewer jobs in June and that the Unemployment Rate rose to its highest level since late 2021, according to the US Bureau of Labor Statistics (BLS). The Nonfarm Payrolls (NFP) in the United States saw 206K job additions in June. The previous month saw a sharp downside revision to 218K from the initial reading of 272K. Meanwhile, the Unemployment Rate ticked higher to 4.1% in June from 4% in May.
The downwardly revised NFP and a further rise in the jobless rate suggested that strength in labour market conditions has eased further, prompting the expectation of Fed rate cuts in the third quarter. This, in turn, weighs on the US Dollar (USD) and creates a tailwind for the precious metal. A lower interest rate generally lifts the Silver price as it reduces the opportunity cost of holding non-yielding assets. Investors are now pricing in nearly 77% odds of a Fed rate cut in September, up from 70% before the US employment report, according to the CME FedWatch tool.
Investors will keep an eye on the Fed's Chair Jerome Powell’s testimony to the Senate Banking Committee on Tuesday ahead of the US Consumer Price Index (CPI) inflation data for June, which is due on Thursday. The hawkish stance from the Fed and hotter-than-expected CPI inflation data could dampen the rate cut speculation, which boosts the Greenback and exerts some selling pressure on the silver price.
Silver FAQs
Silver is a precious metal highly traded among investors. It has been historically used as a store of value and a medium of exchange. Although less popular than Gold, traders may turn to Silver to diversify their investment portfolio, for its intrinsic value or as a potential hedge during high-inflation periods. Investors can buy physical Silver, in coins or in bars, or trade it through vehicles such as Exchange Traded Funds, which track its price on international markets.
Silver prices can move due to a wide range of factors. Geopolitical instability or fears of a deep recession can make Silver price escalate due to its safe-haven status, although to a lesser extent than Gold's. As a yieldless asset, Silver tends to rise with lower interest rates. Its moves also depend on how the US Dollar (USD) behaves as the asset is priced in dollars (XAG/USD). A strong Dollar tends to keep the price of Silver at bay, whereas a weaker Dollar is likely to propel prices up. Other factors such as investment demand, mining supply – Silver is much more abundant than Gold – and recycling rates can also affect prices.
Silver is widely used in industry, particularly in sectors such as electronics or solar energy, as it has one of the highest electric conductivity of all metals – more than Copper and Gold. A surge in demand can increase prices, while a decline tends to lower them. Dynamics in the US, Chinese and Indian economies can also contribute to price swings: for the US and particularly China, their big industrial sectors use Silver in various processes; in India, consumers’ demand for the precious metal for jewellery also plays a key role in setting prices.
Silver prices tend to follow Gold's moves. When Gold prices rise, Silver typically follows suit, as their status as safe-haven assets is similar. The Gold/Silver ratio, which shows the number of ounces of Silver needed to equal the value of one ounce of Gold, may help to determine the relative valuation between both metals. Some investors may consider a high ratio as an indicator that Silver is undervalued, or Gold is overvalued. On the contrary, a low ratio might suggest that Gold is undervalued relative to Silver.
FX option expiries for July 8 NY cut at 10:00 Eastern Time, via DTCC, can be found below
- EUR/USD: EUR amounts
- 1.0650 765m
- 1.0675 842m
- 1.0700 2.1b
- 1.0715 1.2b
- 1.0750 1b
- 1.0800 2.9b
- 1.0815 536m
- USD/JPY: USD amounts
- 160.00 840m
- 161.00 858m
- GBP/USD: GBP amounts
- 1.2750 451m
- AUD/USD: AUD amounts
- 0.6650 505m
- 0.6700 1.3b
- 0.6710 325m
- 0.6720 680m
- 0.6750 592m
- 0.6765 757m
- USD/CAD: USD amounts
- 1.3575 627m
- 1.3710 653m
- NZD/USD: NZD amounts
- 0.6135 494m
- EUR/GBP: EUR amounts
- 0.8400 603m
- USD/CHF falls below 0.9000 amid a weak US Dollar.
- The Fed is expected to start lowering interest rates in September.
- Easing Swiss inflation has boosted prospects of more rate cuts by the SNB.
The USD/CHF pair extends its losing streak for the fourth trading day on Monday. The Swiss Franc asset stays below the psychological figure of 0.9000 as the US Dollar’s (USD) outlook appears to be vulnerable due to growing speculation that the Federal Reserve (Fed) will pivot to policy normalization from the September meeting.
The US Dollar Index (DXY), which tracks the Greenback’s value against six major currencies, finds a temporary support near three-week low around 104.85. 10-year US Treasury yields edge higher to 4.3% but trades close to weekly low.
Improves expectations for the Fed reducing interest rates earlier than previously anticipated is unfavorable for the US Dollar and bond yields. In the latest dot plot, Fed officials signalled only one rate cut this year and policymakers have forecasted that in the last quarter.
The possibility of the Fed lowering interest rates from September has strengthened due to moderating United States (US) labor market strength as indicated by the Nonfarm Payrolls (NFP) report for June. The report showed that the Unemployment Rate rose to 4.1% and annual Average Hourly Earnings, a measure of wage inflation, decelerated expectedly to 3.9%. While payrolls data beat estimates but remained below May’s reading.
This week, investors will keenly focus on the US inflation data for June, which will be published on Thursday.
On the Swiss Franc front, easing inflationary pressures could force the Swiss National bank (SNB) to continue reducing interest rates further. Annual Swiss Consumer Price Index (CPI) decelerated to 1.3% in June, while economists expected price pressures to have grown steadily by 1.4%.
Swiss Franc FAQs
The Swiss Franc (CHF) is Switzerland’s official currency. It is among the top ten most traded currencies globally, reaching volumes that well exceed the size of the Swiss economy. Its value is determined by the broad market sentiment, the country’s economic health or action taken by the Swiss National Bank (SNB), among other factors. Between 2011 and 2015, the Swiss Franc was pegged to the Euro (EUR). The peg was abruptly removed, resulting in a more than 20% increase in the Franc’s value, causing a turmoil in markets. Even though the peg isn’t in force anymore, CHF fortunes tend to be highly correlated with the Euro ones due to the high dependency of the Swiss economy on the neighboring Eurozone.
The Swiss Franc (CHF) is considered a safe-haven asset, or a currency that investors tend to buy in times of market stress. This is due to the perceived status of Switzerland in the world: a stable economy, a strong export sector, big central bank reserves or a longstanding political stance towards neutrality in global conflicts make the country’s currency a good choice for investors fleeing from risks. Turbulent times are likely to strengthen CHF value against other currencies that are seen as more risky to invest in.
The Swiss National Bank (SNB) meets four times a year – once every quarter, less than other major central banks – to decide on monetary policy. The bank aims for an annual inflation rate of less than 2%. When inflation is above target or forecasted to be above target in the foreseeable future, the bank will attempt to tame price growth by raising its policy rate. Higher interest rates are generally positive for the Swiss Franc (CHF) as they lead to higher yields, making the country a more attractive place for investors. On the contrary, lower interest rates tend to weaken CHF.
Macroeconomic data releases in Switzerland are key to assessing the state of the economy and can impact the Swiss Franc’s (CHF) valuation. The Swiss economy is broadly stable, but any sudden change in economic growth, inflation, current account or the central bank’s currency reserves have the potential to trigger moves in CHF. Generally, high economic growth, low unemployment and high confidence are good for CHF. Conversely, if economic data points to weakening momentum, CHF is likely to depreciate.
As a small and open economy, Switzerland is heavily dependent on the health of the neighboring Eurozone economies. The broader European Union is Switzerland’s main economic partner and a key political ally, so macroeconomic and monetary policy stability in the Eurozone is essential for Switzerland and, thus, for the Swiss Franc (CHF). With such dependency, some models suggest that the correlation between the fortunes of the Euro (EUR) and the CHF is more than 90%, or close to perfect.
- The Indian Rupee gains ground in Monday’s early European session.
- Fed rate cut hopes and lower crude oil prices support the INR.
- The renewed US Dollar (USD) demand might limit Indian Rupee’s gains.
The Indian Rupee (INR) strengthens on Monday. The expectation that the US Federal Reserve (Fed) might cut the interest rate in September has lifted the INR. Lower US interest rates could boost capital flows into higher-yielding emerging market assets, benefiting the Indian Rupee. Additionally, the decline of crude oil prices from a four-week high supports the local currency and helps to alleviate the INR’s depreciation, as India is the world's third-biggest oil importer and consumer.
Nonetheless, the renewed US Dollar (USD) demand amid the cautious mood might undermine the INR. Looking ahead, investors await the Fed's Chair, Jerome Powell, who will testify on Tuesday. The attention will shift to the US Consumer Price Index (CPI) inflation data for June, which is due on Thursday.
Daily Digest Market Movers: Indian Rupee remains firm amid positive Indian economic outlook
- "Asian FX took a breather on the back of broad US Dollar weakness ... the risk for Asian currencies, though, remains skewed to the downside, with the Fed staying patient," said Lloyd Chan, senior currency analyst at MUFG Bank.
- Indian benchmark indices opened lower on Monday, with BSE Sensex slipping 161 points to 79,8835 points, while the Nifty50 index fell slightly by 0.06% to 24,310.
- Foreign Portfolio Investors (FPI) continued to show strong buying interest in Indian equities with net inflows of about $1 billion in the first week of July 2024, data with depositories showed.
- US Nonfarm Payrolls (NFP) came in stronger than expected, adding 206K net new jobs in June, according to the US Bureau of Labor Statistics (BLS) on Friday. The previous month saw a sharp downside revision to 218K from the initial reading of 272K.
- The US Average Hourly Earnings declined to 3.9% YoY in June, compared to the previous reading of 4.1%. The Unemployment Rate rose to 4.1% for the first time since December 2021.
- Financial markets are now pricing in a nearly 77% chance of a rate cut from the Fed in September, up from 70% before the US employment report, according to the CME FedWatch tool.
Technical analysis: USD/INR continues oscillating within a range
The Indian Rupee trades on a stronger note on the day. The uptrend of the USD/INR pair prevails in the long term as it is above the key 100-day Exponential Moving Average (EMA) on the daily timeframe.
In the near term, the pair has been capped within the familiar trading range for a couple of months already since March 21. The further consolidation looks favourable as the 14-day Relative Strength Index (RSI) hovers around the 50-midline, indicating neutral momentum.
The first bullish target to watch for USD/INR is 83.60, a high of July 4. Further north, the next hurdle is seen at the record time of 83.75. A decisive break above this level will see a rally to the 84.00 psychological level.
On the flip side, the potential support level is located at 83.35, the 100-day EMA. A breach of this level will expose the 83.00 round mark, followed by 82.82, a low of January 12.
US Dollar price today
The table below shows the percentage change of US Dollar (USD) against listed major currencies today. US Dollar was the weakest against the Pound Sterling.
| USD | EUR | GBP | CAD | AUD | JPY | NZD | CHF | |
| USD | 0.01% | -0.03% | 0.01% | 0.03% | -0.01% | -0.02% | 0.00% | |
| EUR | -0.01% | -0.04% | -0.01% | 0.01% | -0.02% | -0.02% | 0.00% | |
| GBP | 0.02% | 0.04% | 0.04% | 0.04% | 0.01% | 0.02% | 0.03% | |
| CAD | 0.00% | 0.01% | -0.03% | 0.01% | -0.03% | -0.01% | -0.01% | |
| AUD | -0.03% | 0.00% | -0.04% | -0.01% | -0.03% | -0.02% | -0.01% | |
| JPY | 0.00% | 0.02% | -0.03% | 0.01% | 0.06% | -0.02% | 0.00% | |
| NZD | 0.02% | 0.02% | -0.02% | 0.00% | 0.03% | 0.00% | 0.02% | |
| CHF | 0.00% | 0.00% | -0.04% | -0.01% | 0.01% | -0.01% | -0.01% |
The heat map shows percentage changes of major currencies against each other. The base currency is picked from the left column, while the quote currency is picked from the top row. For example, if you pick the Euro from the left column and move along the horizontal line to the Japanese Yen, the percentage change displayed in the box will represent EUR (base)/JPY (quote).
Indian Rupee FAQs
The Indian Rupee (INR) is one of the most sensitive currencies to external factors. The price of Crude Oil (the country is highly dependent on imported Oil), the value of the US Dollar – most trade is conducted in USD – and the level of foreign investment, are all influential. Direct intervention by the Reserve Bank of India (RBI) in FX markets to keep the exchange rate stable, as well as the level of interest rates set by the RBI, are further major influencing factors on the Rupee.
The Reserve Bank of India (RBI) actively intervenes in forex markets to maintain a stable exchange rate, to help facilitate trade. In addition, the RBI tries to maintain the inflation rate at its 4% target by adjusting interest rates. Higher interest rates usually strengthen the Rupee. This is due to the role of the ‘carry trade’ in which investors borrow in countries with lower interest rates so as to place their money in countries’ offering relatively higher interest rates and profit from the difference.
Macroeconomic factors that influence the value of the Rupee include inflation, interest rates, the economic growth rate (GDP), the balance of trade, and inflows from foreign investment. A higher growth rate can lead to more overseas investment, pushing up demand for the Rupee. A less negative balance of trade will eventually lead to a stronger Rupee. Higher interest rates, especially real rates (interest rates less inflation) are also positive for the Rupee. A risk-on environment can lead to greater inflows of Foreign Direct and Indirect Investment (FDI and FII), which also benefit the Rupee.
Higher inflation, particularly, if it is comparatively higher than India’s peers, is generally negative for the currency as it reflects devaluation through oversupply. Inflation also increases the cost of exports, leading to more Rupees being sold to purchase foreign imports, which is Rupee-negative. At the same time, higher inflation usually leads to the Reserve Bank of India (RBI) raising interest rates and this can be positive for the Rupee, due to increased demand from international investors. The opposite effect is true of lower inflation.
Gold prices fell in India on Monday, according to data compiled by FXStreet.
The price for Gold stood at 6,401.34 Indian Rupees (INR) per gram, down compared with the INR 6,418.03 it cost on Friday.
The price for Gold decreased to INR 74,661.48 per tola from INR 74,858.68 per tola on friday.
| Unit measure | Gold Price in INR |
|---|---|
| 1 Gram | 6,401.34 |
| 10 Grams | 64,011.00 |
| Tola | 74,661.48 |
| Troy Ounce | 199,104.10 |
FXStreet calculates Gold prices in India by adapting international prices (USD/INR) to the local currency and measurement units. Prices are updated daily based on the market rates taken at the time of publication. Prices are just for reference and local rates could diverge slightly.
Gold FAQs
Gold has played a key role in human’s history as it has been widely used as a store of value and medium of exchange. Currently, apart from its shine and usage for jewelry, the precious metal is widely seen as a safe-haven asset, meaning that it is considered a good investment during turbulent times. Gold is also widely seen as a hedge against inflation and against depreciating currencies as it doesn’t rely on any specific issuer or government.
Central banks are the biggest Gold holders. In their aim to support their currencies in turbulent times, central banks tend to diversify their reserves and buy Gold to improve the perceived strength of the economy and the currency. High Gold reserves can be a source of trust for a country’s solvency. Central banks added 1,136 tonnes of Gold worth around $70 billion to their reserves in 2022, according to data from the World Gold Council. This is the highest yearly purchase since records began. Central banks from emerging economies such as China, India and Turkey are quickly increasing their Gold reserves.
Gold has an inverse correlation with the US Dollar and US Treasuries, which are both major reserve and safe-haven assets. When the Dollar depreciates, Gold tends to rise, enabling investors and central banks to diversify their assets in turbulent times. Gold is also inversely correlated with risk assets. A rally in the stock market tends to weaken Gold price, while sell-offs in riskier markets tend to favor the precious metal.
The price can move due to a wide range of factors. Geopolitical instability or fears of a deep recession can quickly make Gold price escalate due to its safe-haven status. As a yield-less asset, Gold tends to rise with lower interest rates, while higher cost of money usually weighs down on the yellow metal. Still, most moves depend on how the US Dollar (USD) behaves as the asset is priced in dollars (XAU/USD). A strong Dollar tends to keep the price of Gold controlled, whereas a weaker Dollar is likely to push Gold prices up.
(An automation tool was used in creating this post.)
- EUR/USD may test the upper boundary as the daily chart analysis shows a bullish bias.
- The 14-day RSI indicates a confirmation of a bullish trend for the pair.
- The nine-day EMA at the 1.0782 level could act as a key support.
EUR/USD halts its seven-day winning streak, trading around 1.0830 during the Asian hours on Monday. The renewed demand for the US Dollar (USD) puts pressure on the EUR/USD pair. However, the decline in the US Treasury yields could limit the upside of the Greenback and put pressure on the pair.
The technical analysis of the daily chart shows a bullish inclination, with the pair moving within an ascending channel. Furthermore, the 14-day Relative Strength Index (RSI), a momentum indicator, is above the 50 level, confirming the bullish trend for EUR/USD. Continued upward movement could reinforce the pair's bullish bias.
The EUR/USD pair faces potential resistance near the upper boundary of the ascending channel around 1.0890, with further resistance at the psychological level of 1.0900. A breakout above 1.0900 could strengthen the pair's momentum toward revisiting the three-month high at 1.0915.
On the downside, initial support for EUR/USD lies near the nine-day Exponential Moving Average (EMA) at 1.0782, followed by support near the lower boundary of the ascending channel around 1.0750.
A breach below the latter might increase downward pressure, targeting support around the key level of 1.0670, potentially serving as a rebound support level.
EUR/USD: Daily Chart
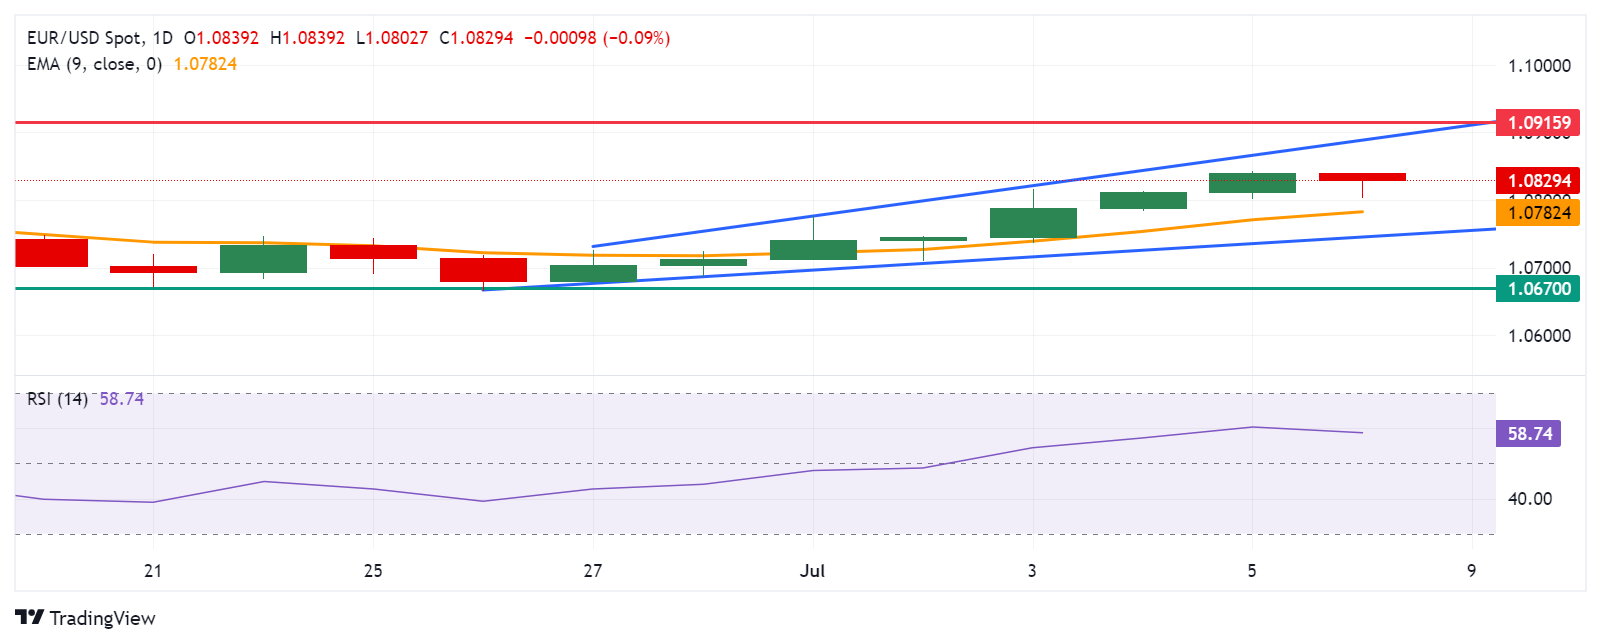
Euro FAQs
The Euro is the currency for the 20 European Union countries that belong to the Eurozone. It is the second most heavily traded currency in the world behind the US Dollar. In 2022, it accounted for 31% of all foreign exchange transactions, with an average daily turnover of over $2.2 trillion a day. EUR/USD is the most heavily traded currency pair in the world, accounting for an estimated 30% off all transactions, followed by EUR/JPY (4%), EUR/GBP (3%) and EUR/AUD (2%).
The European Central Bank (ECB) in Frankfurt, Germany, is the reserve bank for the Eurozone. The ECB sets interest rates and manages monetary policy. The ECB’s primary mandate is to maintain price stability, which means either controlling inflation or stimulating growth. Its primary tool is the raising or lowering of interest rates. Relatively high interest rates – or the expectation of higher rates – will usually benefit the Euro and vice versa. The ECB Governing Council makes monetary policy decisions at meetings held eight times a year. Decisions are made by heads of the Eurozone national banks and six permanent members, including the President of the ECB, Christine Lagarde.
Eurozone inflation data, measured by the Harmonized Index of Consumer Prices (HICP), is an important econometric for the Euro. If inflation rises more than expected, especially if above the ECB’s 2% target, it obliges the ECB to raise interest rates to bring it back under control. Relatively high interest rates compared to its counterparts will usually benefit the Euro, as it makes the region more attractive as a place for global investors to park their money.
Data releases gauge the health of the economy and can impact on the Euro. Indicators such as GDP, Manufacturing and Services PMIs, employment, and consumer sentiment surveys can all influence the direction of the single currency. A strong economy is good for the Euro. Not only does it attract more foreign investment but it may encourage the ECB to put up interest rates, which will directly strengthen the Euro. Otherwise, if economic data is weak, the Euro is likely to fall. Economic data for the four largest economies in the euro area (Germany, France, Italy and Spain) are especially significant, as they account for 75% of the Eurozone’s economy.
Another significant data release for the Euro is the Trade Balance. This indicator measures the difference between what a country earns from its exports and what it spends on imports over a given period. If a country produces highly sought after exports then its currency will gain in value purely from the extra demand created from foreign buyers seeking to purchase these goods. Therefore, a positive net Trade Balance strengthens a currency and vice versa for a negative balance.
- NZD/USD prints a fresh three-week high amid weak US Dollar and uncertainty ahead of RBNZ policy.
- The US Dollar falls on the backfoot due to moderating US labor market conditions.
- Investors expect that the RBNZ will hold its OCR at 5.5%.
The NZD/USD pair refreshes a three-week high near 0.6150 in Monday’s Asian session. The Kiwi pair extends its winning streak for the fifth trading session as a debate over the Federal Reserve (Fed) to begin reducing interest rates from the September meeting has heated up after the United States (US) Nonfarm Payrolls (NFP) report for June pointed to normalization of labor market strength.
According to the CME FedWatch tool, 30-day Federal Funds Futures pricing data shows that the probability of rate cuts in September has improved to 75.8% from 64% recorded a week ago. The data also shows that the Fed will deliver subsequent rate cuts in the November or December meeting.
The data from the NFP report showed that the Unemployment Rate unexpectedly rose to 4.1% from the estimates and the prior release of 4.0%. Average Hourly Earnings, a measure to wage growth momentum, decelerated expectedly on both monthly and an annual basis. Fresh hiring came in higher at 206K from estimates of 190K but lower than May’s reading of 218K.
Growing speculation about Fed rate cuts has weighed heavily on the US Dollar. The US Dollar Index (DXY), which tracks the Greenback’s value against six major currencies, trades close to three-week low near 104.85. 10-year US Treasury yields edge higher in Monday’s trading hours but are close to weekly low around 4.29%.
This week, the New Zealand Dollar (NZD) will be in the spotlight due to the Reserve Bank of New Zealand’s (RBNZ) monetary policy meeting on Wednesday. The RBNZ is widely anticipated to leave its Official Cash Rate (OCR) unchanged at 5.5%. Therefore, investors will pay close attention to the commentary on the interest rate outlook. Market participants see the RBNZ keeping its key rates steady for the entire year.
Economic Indicator
RBNZ Interest Rate Decision
The Reserve Bank of New Zealand (RBNZ) announces its interest rate decision after its seven scheduled annual policy meetings. If the RBNZ is hawkish and sees inflationary pressures rising, it raises the Official Cash Rate (OCR) to bring inflation down. This is positive for the New Zealand Dollar (NZD) since higher interest rates attract more capital inflows. Likewise, if it reaches the view that inflation is too low it lowers the OCR, which tends to weaken NZD.
Read more.Next release: Wed Jul 10, 2024 02:00
Frequency: Irregular
Consensus: 5.5%
Previous: 5.5%
Source: Reserve Bank of New Zealand
The Reserve Bank of New Zealand (RBNZ) holds monetary policy meetings seven times a year, announcing their decision on interest rates and the economic assessments that influenced their decision. The central bank offers clues on the economic outlook and future policy path, which are of high relevance for the NZD valuation. Positive economic developments and upbeat outlook could lead the RBNZ to tighten the policy by hiking interest rates, which tends to be NZD bullish. The policy announcements are usually followed by Governor Adrian Orr’s press conference.
- WTI price corrects from $84.00 due to uncertainty over the impact of Tropical Storm Beryl.
- Various US ports were closed on Sunday as a precaution against Storm Beryl.
- The prospects of Fed rate cuts in September have increased significantly.
West Texas Intermediate (WTI), futures in NYMEX, extend its correction to near $82.20 in Monday’s Asian session after posting a fresh two-month high near $84.00 on Thursday. The Oil price comes under pressure as investors worry about Storm Berly, which could disrupt United States (US) energy supplies.
Should the Tropical Storm Bery turn into a Category two hurricane, a temporary halt could be seen on crude and liquefied natural gas exports, motor fuel deliveries and oil shipments to refineries.
For precautionary purposes, ports of, Houston, Corpus Christi, Galveston, Texas City and Freeport remained close on Sunday.
Meanwhile, Oil demand worries have eased significantly as a rate cut move by the Federal Reserve (Fed) in its September meeting appears to be a done deal. The CME FedWatch tool shows that the probability for Fed reducing interest rates from their current levels in September has increased to 75.8% from 64%, recorded a week ago.
The expectations for the Fed to begin reducing interest rates from September improved after the US Nonfarm Payrolls (NFP) report of June showed that the strength in the US labor market is easing. The report showed that wage growth softened expectedly, the Unemployment Rate increased and payrolls were higher than expectations but lower from downwardly revised May figures.
Brent Crude Oil FAQs
Brent Crude Oil is a type of Crude Oil found in the North Sea that is used as a benchmark for international Oil prices. It is considered ‘light’ and ‘sweet’ because of its high gravity and low sulfur content, making it easier to refine into gasoline and other high-value products. Brent Crude Oil serves as a reference price for approximately two-thirds of the world's internationally traded Oil supplies. Its popularity rests on its availability and stability: the North Sea region has well-established infrastructure for Oil production and transportation, ensuring a reliable and consistent supply.
Like all assets supply and demand are the key drivers of Brent Crude Oil price. As such, global growth can be a driver of increased demand and vice versa for weak global growth. Political instability, wars, and sanctions can disrupt supply and impact prices. The decisions of OPEC, a group of major Oil-producing countries, is another key driver of price. The value of the US Dollar influences the price of Brent Crude Oil, since Oil is predominantly traded in US Dollars, thus a weaker US Dollar can make Oil more affordable and vice versa.
The weekly Oil inventory reports published by the American Petroleum Institute (API) and the Energy Information Agency (EIA) impact the price of Brent Crude Oil. Changes in inventories reflect fluctuating supply and demand. If the data shows a drop in inventories it can indicate increased demand, pushing up Oil price. Higher inventories can reflect increased supply, pushing down prices. API’s report is published every Tuesday and EIA’s the day after. Their results are usually similar, falling within 1% of each other 75% of the time. The EIA data is considered more reliable, since it is a government agency.
OPEC (Organization of the Petroleum Exporting Countries) is a group of 13 Oil producing nations who collectively decide production quotas for member countries at twice-yearly meetings. Their decisions often impact Brent Crude Oil prices. When OPEC decides to lower quotas, it can tighten supply, pushing up Oil prices. When OPEC increases production, it has the opposite effect. OPEC+ refers to an expanded group that includes ten extra non-OPEC members, the most notable of which is Russia.
- USD/CAD loses ground as US Dollar faces challenges after weaker-than-expected US employment data released on Friday.
- According to CME's FedWatch Tool, the probability of a Fed rate cut in September has increased to 70.7%, up from 64.1% just a week ago.
- Canada's 10-year government bond yield fell below 3.53%, indicating an accommodative stance by the BoC.
USD/CAD traces back its recent gains, trading around 1.3630 during the Asian session on Monday. This decline is attributed to the lower US Dollar (USD) following weaker-than-expected US employment growth data released on Friday. This has increased the probability of the Federal Reserve’s (Fed) interest rate cuts sooner rather than later.
US Nonfarm Payrolls (NFP) increased by 206,000 in June, following a rise of 218,000 in May. This figure surpassed the market expectation of 190,000. The US Unemployment Rate edged up to 4.1% in June from 4.0% in May. Meanwhile, Average Hourly Earnings decreased to 3.9% year-over-year in June from the previous reading of 4.1%, aligning with market expectations.
According to the CME's FedWatch Tool, rate markets are currently pricing in a 70.7% probability of a rate cut in September, up from 64.1% just a week earlier. The Greenback faced challenges as the Fed Chair Jerome Powell said last week that the central bank is getting back on the disinflationary path, per Reuters.
However, minutes from the Federal Reserve's June monetary policy meeting indicated that Fed officials were adopting a cautious "wait-and-see" approach. Some participants highlighted the Committee's commitment to a data-dependent approach.
In Canada, the Unemployment Rate rose to 6.4% in June, surpassing the expected 6.3% and reaching its highest level since January 2022. This increase highlights concerns from the Bank of Canada (BoC) that high interest rates are putting significant pressure on the job market, prompting calls for potential rate cuts to support economic recovery. Additionally, Canada's 10-year government bond yield dropped below 3.53%, reflecting expectations of a more accommodative stance from the central bank.
The commodity-linked Canadian Dollar (CAD) may see limited gains due to falling crude Oil prices. Canada, a major crude Oil exporter to the United States (US), is observing West Texas Intermediate (WTI) oil trading around $82.40 per barrel at the time of writing. Geopolitical tensions in the Middle East eased with prospects of a ceasefire in Gaza, contributing to the decline in Oil prices.
Canadian Dollar FAQs
The key factors driving the Canadian Dollar (CAD) are the level of interest rates set by the Bank of Canada (BoC), the price of Oil, Canada’s largest export, the health of its economy, inflation and the Trade Balance, which is the difference between the value of Canada’s exports versus its imports. Other factors include market sentiment – whether investors are taking on more risky assets (risk-on) or seeking safe-havens (risk-off) – with risk-on being CAD-positive. As its largest trading partner, the health of the US economy is also a key factor influencing the Canadian Dollar.
The Bank of Canada (BoC) has a significant influence on the Canadian Dollar by setting the level of interest rates that banks can lend to one another. This influences the level of interest rates for everyone. The main goal of the BoC is to maintain inflation at 1-3% by adjusting interest rates up or down. Relatively higher interest rates tend to be positive for the CAD. The Bank of Canada can also use quantitative easing and tightening to influence credit conditions, with the former CAD-negative and the latter CAD-positive.
The price of Oil is a key factor impacting the value of the Canadian Dollar. Petroleum is Canada’s biggest export, so Oil price tends to have an immediate impact on the CAD value. Generally, if Oil price rises CAD also goes up, as aggregate demand for the currency increases. The opposite is the case if the price of Oil falls. Higher Oil prices also tend to result in a greater likelihood of a positive Trade Balance, which is also supportive of the CAD.
While inflation had always traditionally been thought of as a negative factor for a currency since it lowers the value of money, the opposite has actually been the case in modern times with the relaxation of cross-border capital controls. Higher inflation tends to lead central banks to put up interest rates which attracts more capital inflows from global investors seeking a lucrative place to keep their money. This increases demand for the local currency, which in Canada’s case is the Canadian Dollar.
Macroeconomic data releases gauge the health of the economy and can have an impact on the Canadian Dollar. Indicators such as GDP, Manufacturing and Services PMIs, employment, and consumer sentiment surveys can all influence the direction of the CAD. A strong economy is good for the Canadian Dollar. Not only does it attract more foreign investment but it may encourage the Bank of Canada to put up interest rates, leading to a stronger currency. If economic data is weak, however, the CAD is likely to fall.
- The Japanese Yen appreciates as US Dollar faces challenges following weaker-than-expected US employment growth data released on Friday.
- Japan's Current Account surplus increased to ¥2,849.9 billion ($17.78 billion) in May, up from the prior ¥2,050.5 billion.
- Friday’s employment data prompted speculation that the Fed could initiate rate cuts sooner.
The Japanese Yen (JPY) extends its gains for the third successive session on Monday. The USD/JPY pair loses ground as US Dollar (USD) struggles following weaker-than-expected US employment growth data released on Friday.
Japan's Current Account surplus extended its growth streak to the 15th month in May. The Ministry of Finance reported on Monday that the current account increased to ¥2,849.9 billion ($17.78 billion) in May, up from ¥2,050.5 billion in the previous month, surpassing market expectations of ¥2,450.0 billion.
US Nonfarm Payrolls (NFP) surpassed market expectations in June, although the pace of growth was slower compared to May. Additionally, the Unemployment Rate also increased in June. These developments have prompted speculation among traders that the Federal Reserve (Fed) could potentially initiate interest rate cuts sooner rather than later.
According to the CME's FedWatch Tool, rate markets are currently pricing in a 70.7% probability of a rate cut in September, up from 64.1% just a week earlier.
Daily Digest Market Movers: Japanese Yen improves due to dovish sentiment surrounding Fed
- Japan's Labor Cash Earnings rose by 1.9% year-on-year in May, marking an acceleration from April's 1.6% increase and achieving the highest level since January. However, this growth rate fell short of market expectations, which had anticipated a 2.1% increase.
- US Nonfarm Payrolls (NFP) increased by 206,000 in June, following a rise of 218,000 in May. This figure surpassed the market expectation of 190,000.
- The US Unemployment Rate edged up to 4.1% in June from 4.0% in May. Meanwhile, Average Hourly Earnings decreased to 3.9% year-over-year in June from the previous reading of 4.1%, aligning with market expectations.
- OCBC strategists Frances Cheung and Christopher Wong observe that the persistent strength of USD/JPY is raising intervention expectations. However, there is speculation that authorities may monitor to what extent they allow for further depreciation before intervening.
- Federal Reserve Bank of Chicago President Austan Goolsbee stated on BBC Radio on Wednesday that bringing inflation back to 2% will take time and that more economic data are needed. However, on Tuesday, Fed Chair Jerome Powell said that the central bank is getting back on the disinflationary path, per Reuters.
- The Minutes from the Federal Reserve's June 11-12 monetary policy meeting, released on Wednesday, suggested that Fed officials were in a wait-and-see mode. "Some participants emphasized the Committee’s data-dependent approach, with monetary policy decisions being conditional on the evolution of the economy rather than being on a preset path."
- Rabobank FX strategists pointed out on Wednesday that yield differentials appear crucial to the USD/JPY outlook. They suggested that FX intervention could be imminent due to the weakness of the Japanese Yen, which is exerting downward pressure on consumer confidence.
Technical Analysis: USD/JPY hovers around 160.50
USD/JPY trades around 160.30 on Monday, showing a bullish inclination based on daily chart analysis. The pair remains within an ascending channel pattern. However, caution is warranted as the 14-day Relative Strength Index (RSI) has dropped below 70, indicating a potential weakening of the ongoing uptrend.
In the short term, USD/JPY could approach resistance near 162.50, which marks the upper boundary of the ascending channel. A breakout above this level might strengthen bullish sentiment, potentially driving the pair toward psychological resistance at 163.00.
On the downside, immediate support is seen around the 21-day Exponential Moving Average (EMA) at 159.62, followed by the lower boundary of the ascending channel around 159.00. A further decline below this channel support could see USD/JPY testing the vicinity of June's low at 154.55.
USD/JPY: Daily Chart
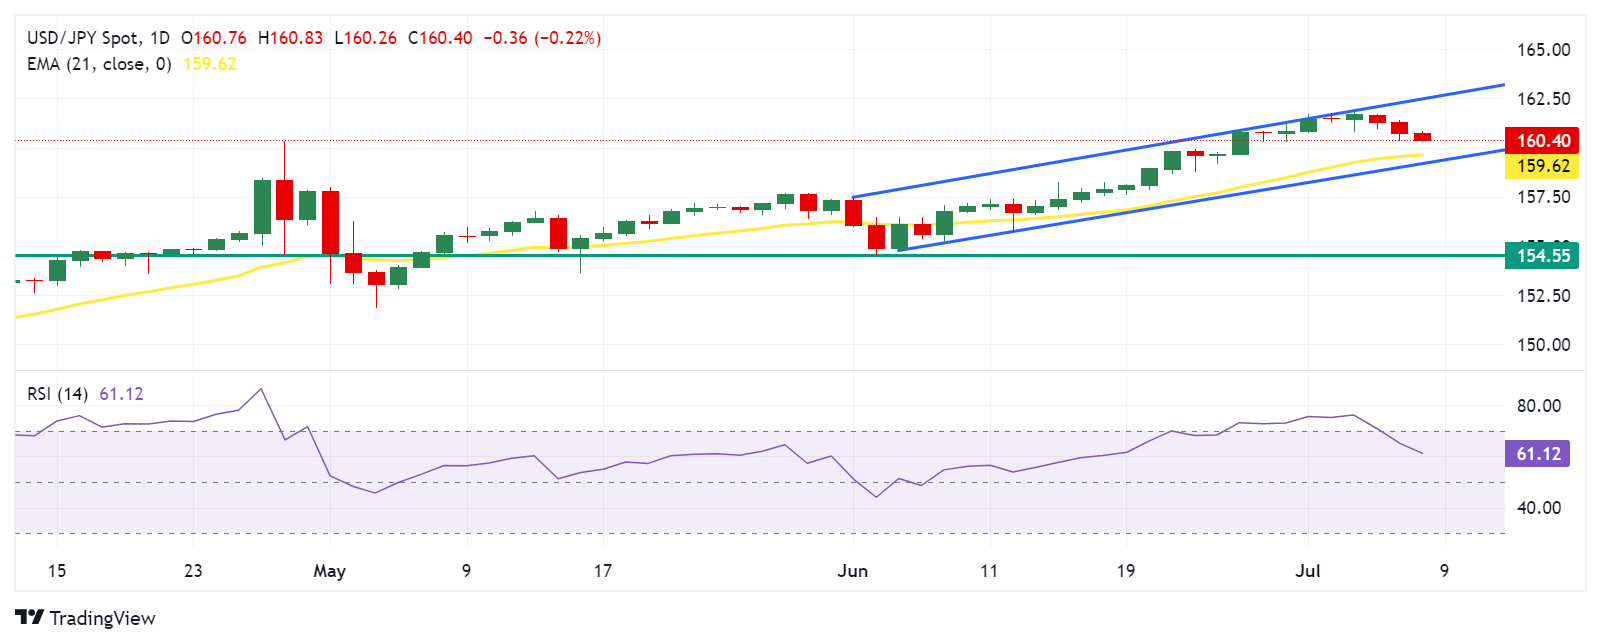
Japanese Yen PRICE Today
The table below shows the percentage change of Japanese Yen (JPY) against listed major currencies today. Japanese Yen was the strongest against the Australian Dollar.
| USD | EUR | GBP | JPY | CAD | AUD | NZD | CHF | |
|---|---|---|---|---|---|---|---|---|
| USD | 0.10% | 0.03% | -0.21% | -0.06% | 0.02% | -0.14% | -0.09% | |
| EUR | -0.10% | 0.14% | 0.02% | 0.15% | 0.08% | 0.10% | 0.14% | |
| GBP | -0.03% | -0.14% | -0.16% | 0.04% | -0.06% | -0.04% | 0.00% | |
| JPY | 0.21% | -0.02% | 0.16% | 0.15% | 0.24% | 0.22% | 0.17% | |
| CAD | 0.06% | -0.15% | -0.04% | -0.15% | 0.04% | -0.08% | -0.02% | |
| AUD | -0.02% | -0.08% | 0.06% | -0.24% | -0.04% | 0.02% | 0.06% | |
| NZD | 0.14% | -0.10% | 0.04% | -0.22% | 0.08% | -0.02% | 0.05% | |
| CHF | 0.09% | -0.14% | -0.01% | -0.17% | 0.02% | -0.06% | -0.05% |
The heat map shows percentage changes of major currencies against each other. The base currency is picked from the left column, while the quote currency is picked from the top row. For example, if you pick the Japanese Yen from the left column and move along the horizontal line to the US Dollar, the percentage change displayed in the box will represent JPY (base)/USD (quote).
Japanese Yen FAQs
The Japanese Yen (JPY) is one of the world’s most traded currencies. Its value is broadly determined by the performance of the Japanese economy, but more specifically by the Bank of Japan’s policy, the differential between Japanese and US bond yields, or risk sentiment among traders, among other factors.
One of the Bank of Japan’s mandates is currency control, so its moves are key for the Yen. The BoJ has directly intervened in currency markets sometimes, generally to lower the value of the Yen, although it refrains from doing it often due to political concerns of its main trading partners. The current BoJ ultra-loose monetary policy, based on massive stimulus to the economy, has caused the Yen to depreciate against its main currency peers. This process has exacerbated more recently due to an increasing policy divergence between the Bank of Japan and other main central banks, which have opted to increase interest rates sharply to fight decades-high levels of inflation.
The BoJ’s stance of sticking to ultra-loose monetary policy has led to a widening policy divergence with other central banks, particularly with the US Federal Reserve. This supports a widening of the differential between the 10-year US and Japanese bonds, which favors the US Dollar against the Japanese Yen.
The Japanese Yen is often seen as a safe-haven investment. This means that in times of market stress, investors are more likely to put their money in the Japanese currency due to its supposed reliability and stability. Turbulent times are likely to strengthen the Yen’s value against other currencies seen as more risky to invest in.
- The Gold price loses momentum below the $2,400 barrier on Monday.
- Yellow metal edges lower as China's Central Bank has stopped buying for the second month in June.
- The expectation that the Fed would cut the rate in September might cap the XAU/USD’s downside.
The Gold price (XAU/USD) attracts some sellers during the Asian session on Monday. The precious metal loses traction as the People’s Bank of China (PBoC), the Chinese central bank kept Gold buying on hold for the second month in June, according to official data released on Sunday. It’s worth noting that China is the world’s biggest bullion consumer, and the pause in gold buying could weigh on the Gold price.
On the other hand, the rising speculation that the US Federal Reserve (Fed) would cut the interest rate in the third quarter might lift the non-yielding Gold price. Furthermore, the political uncertainty in France after exit polls indicated the final round of the French parliamentary elections pointed to a hung parliament, which might boost safe-haven assets like Gold. Traders will take more cues from the Fed's Chair Jerome Powell, who testifies on Tuesday ahead of the US June Consumer Price Index (CPI) inflation data on Thursday.
Daily Digest Market Movers: Gold price loses ground as PBoC refrained from gold purchases for a second month
- The US Nonfarm Payrolls (NFP) rose 206K in June, following the 218K rise (revised from 272K) recorded in May. This figure came in above the market expectation of 190,000.
- The Unemployment Rate ticked higher to 4.1% in June from 4% in May. The Average Hourly Earnings, wage inflation, dropped to 3.9% YoY in June from 4.1% in May, in line with market expectation.
- The recent employment data have raised the chance of a rate cut from the Fed in September, with the markets pricing 77% odds, up from 70% before the report.
- In a shock result, polls indicated the left-wing New Popular Front (NFP), led by Jean-Luc Mélenchon, seems to be on track to win the most seats in the second voting round of French parliamentary elections on Sunday, per The Economist.
- "It appears that gold prices remain a little too high, and the PBoC is waiting for a further pullback before resuming its gold purchasing programme," said Nitesh Shah, a commodity strategist at WisdomTree.
Technical Analysis: Gold price keeps the bullish vibe in the longer term
The gold price edges lower on the day. Technically, the yellow metal maintains the bullish trend on the daily chart as it holds above the key 100-day Exponential Moving Average (EMA). The precious metal sustains a breakout above a descending trend channel that formed on May 10. The path of least resistance of Gold is to the upside as the 14-day Relative Strength Index (RSI) stands in the bullish zone above the 50-midline.
The first upside barrier for XAU/USD will emerge at a $2,400 psychological level. The additional upside filter to watch is $2,432, a high of April 12. The next potential resistance zone is seen at an all-time high of $2,450.
On the downside, the initial support level for the yellow metal is located at the $2,330-$2,340 zone, representing a low of June 17 and the former resistance zone. Extended losses could see a drop to $2,273, the 100-day EMA.
US Dollar price today
The table below shows the percentage change of US Dollar (USD) against listed major currencies today. US Dollar was the strongest against the Canadian Dollar.
| USD | EUR | GBP | CAD | AUD | JPY | NZD | CHF | |
| USD | -0.39% | -0.42% | 0.18% | -0.42% | -0.39% | -0.38% | -0.52% | |
| EUR | 0.37% | -0.03% | 0.48% | 0.07% | -0.03% | -0.01% | -0.17% | |
| GBP | 0.42% | 0.02% | 0.60% | 0.00% | 0.03% | 0.03% | -0.10% | |
| CAD | -0.34% | -0.56% | -0.83% | -0.45% | -0.74% | -0.51% | -0.83% | |
| AUD | 0.34% | -0.05% | -0.10% | 0.51% | -0.11% | -0.08% | -0.21% | |
| JPY | 0.39% | 0.00% | -0.03% | 0.57% | -0.01% | 0.00% | -0.13% | |
| NZD | 0.38% | -0.01% | -0.03% | 0.57% | -0.03% | -0.01% | -0.13% | |
| CHF | 0.52% | 0.12% | 0.10% | 0.70% | 0.13% | 0.13% | 0.13% |
The heat map shows percentage changes of major currencies against each other. The base currency is picked from the left column, while the quote currency is picked from the top row. For example, if you pick the Euro from the left column and move along the horizontal line to the Japanese Yen, the percentage change displayed in the box will represent EUR (base)/JPY (quote).
Gold FAQs
Gold has played a key role in human’s history as it has been widely used as a store of value and medium of exchange. Currently, apart from its shine and usage for jewelry, the precious metal is widely seen as a safe-haven asset, meaning that it is considered a good investment during turbulent times. Gold is also widely seen as a hedge against inflation and against depreciating currencies as it doesn’t rely on any specific issuer or government.
Central banks are the biggest Gold holders. In their aim to support their currencies in turbulent times, central banks tend to diversify their reserves and buy Gold to improve the perceived strength of the economy and the currency. High Gold reserves can be a source of trust for a country’s solvency. Central banks added 1,136 tonnes of Gold worth around $70 billion to their reserves in 2022, according to data from the World Gold Council. This is the highest yearly purchase since records began. Central banks from emerging economies such as China, India and Turkey are quickly increasing their Gold reserves.
Gold has an inverse correlation with the US Dollar and US Treasuries, which are both major reserve and safe-haven assets. When the Dollar depreciates, Gold tends to rise, enabling investors and central banks to diversify their assets in turbulent times. Gold is also inversely correlated with risk assets. A rally in the stock market tends to weaken Gold price, while sell-offs in riskier markets tend to favor the precious metal.
The price can move due to a wide range of factors. Geopolitical instability or fears of a deep recession can quickly make Gold price escalate due to its safe-haven status. As a yield-less asset, Gold tends to rise with lower interest rates, while higher cost of money usually weighs down on the yellow metal. Still, most moves depend on how the US Dollar (USD) behaves as the asset is priced in dollars (XAU/USD). A strong Dollar tends to keep the price of Gold controlled, whereas a weaker Dollar is likely to push Gold prices up.
| Raw materials | Closed | Change, % |
|---|---|---|
| Silver | 31.206 | 2.76 |
| Gold | 239.096 | 1.45 |
| Palladium | 1024.06 | 0.58 |
- GBP/USD trades weaker around 1.2805 in Monday’s early Asian session.
- The US Nonfarm Payrolls beat median market forecasts in June.
- The Labour Party secured a landslide majority in the UK general election, lifting the GBP.
The GBP/USD pair trades on a softer note near 1.2805, snapping the seven-day winning streak during the early Asian session on Monday. The recovery of the Greenback drags the major pair lower. However, the downside for the pair might be limited amid the rising bet that the Federal Reserve (Fed) will cut the interest rate in the third quarter.
Friday’s US Nonfarm Payrolls (NFP) came in stronger than expected, adding 206K net new jobs in June, according to the US Bureau of Labor Statistics (BLS). The previous month saw a sharp downside revision to 218K from the initial reading of 272K.
Additionally, US Average Hourly Earnings declined to 3.9% YoY in June, compared to the previous reading of 4.1%. The Unemployment Rate rose to 4.1% for the first time since December 2021. Traders have raised their bet on a Fed rate cut this year as the employment growth in the United States slowed in June.
The Pound Sterling (GBP) edges higher as the Labour Party has secured a landslide victory in the UK general election 2024, winning 410 seats and marking a significant rise of 212 seats from the 2019 elections. A political party’s outright majority win is considered favorable for its financial markets and boosts the Cable.
Pound Sterling FAQs
The Pound Sterling (GBP) is the oldest currency in the world (886 AD) and the official currency of the United Kingdom. It is the fourth most traded unit for foreign exchange (FX) in the world, accounting for 12% of all transactions, averaging $630 billion a day, according to 2022 data. Its key trading pairs are GBP/USD, aka ‘Cable’, which accounts for 11% of FX, GBP/JPY, or the ‘Dragon’ as it is known by traders (3%), and EUR/GBP (2%). The Pound Sterling is issued by the Bank of England (BoE).
The single most important factor influencing the value of the Pound Sterling is monetary policy decided by the Bank of England. The BoE bases its decisions on whether it has achieved its primary goal of “price stability” – a steady inflation rate of around 2%. Its primary tool for achieving this is the adjustment of interest rates. When inflation is too high, the BoE will try to rein it in by raising interest rates, making it more expensive for people and businesses to access credit. This is generally positive for GBP, as higher interest rates make the UK a more attractive place for global investors to park their money. When inflation falls too low it is a sign economic growth is slowing. In this scenario, the BoE will consider lowering interest rates to cheapen credit so businesses will borrow more to invest in growth-generating projects.
Data releases gauge the health of the economy and can impact the value of the Pound Sterling. Indicators such as GDP, Manufacturing and Services PMIs, and employment can all influence the direction of the GBP. A strong economy is good for Sterling. Not only does it attract more foreign investment but it may encourage the BoE to put up interest rates, which will directly strengthen GBP. Otherwise, if economic data is weak, the Pound Sterling is likely to fall.
Another significant data release for the Pound Sterling is the Trade Balance. This indicator measures the difference between what a country earns from its exports and what it spends on imports over a given period. If a country produces highly sought-after exports, its currency will benefit purely from the extra demand created from foreign buyers seeking to purchase these goods. Therefore, a positive net Trade Balance strengthens a currency and vice versa for a negative balance.
- The Australian Dollar may limit its downside as high inflation prompts the RBA to delay rate cuts.
- Australia’s May inflation has sparked warnings that the RBA might raise the cash rate to 4.6% in September.
- The US Dollar may struggle as slowing US employment growth could lead the Fed to reduce rates sooner.
The Australian Dollar (AUD) edges lower due to risk aversion on Monday. The renewed US Dollar (USD) demand puts pressure on the AUD/USD pair. The AUD could limit its downside due to persistently high inflation and stronger Retail Sales and Services PMI. These factors might prompt the Reserve Bank of Australia (RBA) to delay potential rate cuts.
The RBA’s June Meeting Minutes indicated that policymakers emphasized the need to stay alert to upside inflation risks. The policymakers noted that a significant rise in prices might necessitate substantially higher interest rates. Although rates were steady in June, May’s CPI, which surprisingly increased to 4.0% from the previous 3.6%, prompted warnings that the RBA might raise the cash rate to 4.6% in September.
The US Dollar (USD) may face challenges as US employment growth slowed in May, according to data released on Friday. While Nonfarm Payrolls (NFP) exceeded market expectations in June, the growth was slower compared to May's increase. Additionally, the Unemployment Rate edged higher in June. This could lead traders to speculate that the Federal Reserve (Fed) might reduce interest rates sooner rather than later.
The CME's FedWatch Tool shows that rate markets are pricing in an almost 70.7% probability of a rate cut in September, up from 64.1% a week earlier.
Daily Digest Market Movers: Australian Dollar declines due to risk aversion
- US Nonfarm Payrolls (NFP) increased by 206,000 in June, following a rise of 218,000 in May. This figure surpassed the market expectation of 190,000.
- The US Unemployment Rate edged up to 4.1% in June from 4.0% in May. Meanwhile, Average Hourly Earnings decreased to 3.9% year-over-year in June from the previous reading of 4.1%, aligning with market expectations.
- According to the Australian Bureau of Statistics on Thursday, Australia's trade surplus for May was A$5,773 million ($3,868 million), lower than the expected A$6,678 million and down from the previous reading of A$6,548 million.
- Australia's Retail Sales, a measure of the country's consumer spending, increased by 0.6% MoM in May, up from the previous month's 0.1% rise. This figure exceeded market expectations of a 0.2% increase.
- Judo Bank's Australia Services PMI increased to 51.2 MoM, up from the previous month's 51.0, surpassing the forecasted drop to 50.6. Meanwhile, the Composite PMI rose to 50.7 MoM, compared to 50.6 in the previous month.
- China's Services Purchasing Managers' Index (PMI) fell from 54.0 in May to 51.2 in June, according to the latest data released by Caixin on Wednesday. The market forecast was for a 53.4 figure in the reported period.
- Federal Reserve Bank of Chicago President Austan Goolsbee stated on BBC Radio on Wednesday that bringing inflation back to 2% will take time and that more economic data are needed. However, on Tuesday, Fed Chair Jerome Powell said that the central bank is getting back on the disinflationary path, per Reuters.
Technical Analysis: Australian Dollar holds position around 0.6750
The Australian Dollar trades around 0.6740 on Monday. The analysis of the daily chart shows that the AUD/USD pair breaks below a rising wedge, indicating a potential bearish reversal. Additionally, the 14-day Relative Strength Index (RSI) consolidates slightly below the 70 level. A downward move in the RSI would suggest the asset may undergo a correction.
The AUD/USD pair is likely to test the lower boundary of the rising wedge around 0.6755, followed by the psychological level of 0.6800 near the upper boundary of the wedge.
On the downside, the AUD/USD pair may navigate the region around the 50-day Exponential Moving Average (EMA) at 0.6639.
AUD/USD: Daily Chart
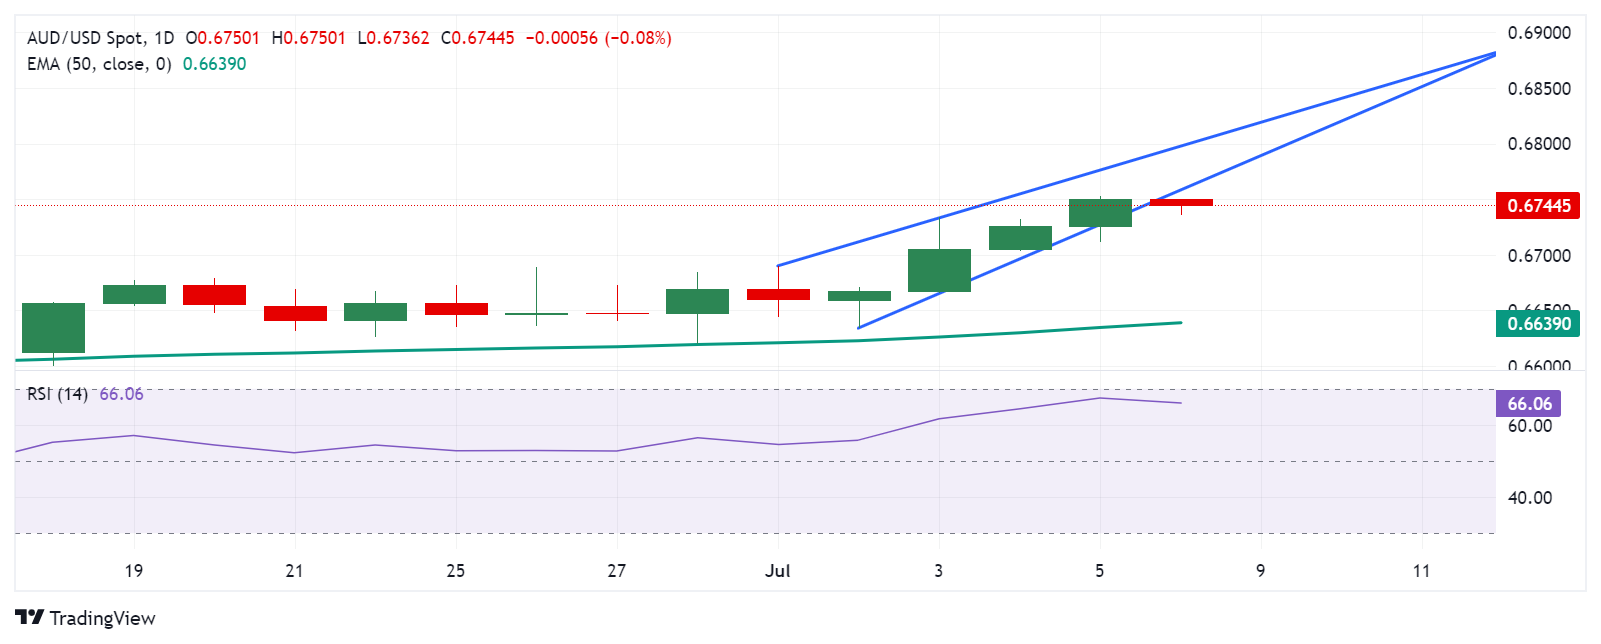
Australian Dollar PRICE Today
The table below shows the percentage change of Australian Dollar (AUD) against listed major currencies today. Australian Dollar was the weakest against the Japanese Yen.
| USD | EUR | GBP | JPY | CAD | AUD | NZD | CHF | |
|---|---|---|---|---|---|---|---|---|
| USD | 0.11% | 0.04% | -0.13% | -0.07% | 0.04% | -0.11% | -0.08% | |
| EUR | -0.11% | 0.14% | 0.09% | 0.15% | 0.08% | 0.12% | 0.15% | |
| GBP | -0.04% | -0.14% | -0.08% | 0.02% | -0.05% | -0.03% | 0.01% | |
| JPY | 0.13% | -0.09% | 0.08% | 0.06% | 0.18% | 0.18% | 0.11% | |
| CAD | 0.07% | -0.15% | -0.02% | -0.06% | 0.06% | -0.04% | 0.01% | |
| AUD | -0.04% | -0.08% | 0.05% | -0.18% | -0.06% | 0.04% | 0.08% | |
| NZD | 0.11% | -0.12% | 0.03% | -0.18% | 0.04% | -0.04% | 0.03% | |
| CHF | 0.08% | -0.15% | -0.01% | -0.11% | -0.01% | -0.08% | -0.03% |
The heat map shows percentage changes of major currencies against each other. The base currency is picked from the left column, while the quote currency is picked from the top row. For example, if you pick the Australian Dollar from the left column and move along the horizontal line to the US Dollar, the percentage change displayed in the box will represent AUD (base)/USD (quote).
Australian Dollar FAQs
One of the most significant factors for the Australian Dollar (AUD) is the level of interest rates set by the Reserve Bank of Australia (RBA). Because Australia is a resource-rich country another key driver is the price of its biggest export, Iron Ore. The health of the Chinese economy, its largest trading partner, is a factor, as well as inflation in Australia, its growth rate and Trade Balance. Market sentiment – whether investors are taking on more risky assets (risk-on) or seeking safe-havens (risk-off) – is also a factor, with risk-on positive for AUD.
The Reserve Bank of Australia (RBA) influences the Australian Dollar (AUD) by setting the level of interest rates that Australian banks can lend to each other. This influences the level of interest rates in the economy as a whole. The main goal of the RBA is to maintain a stable inflation rate of 2-3% by adjusting interest rates up or down. Relatively high interest rates compared to other major central banks support the AUD, and the opposite for relatively low. The RBA can also use quantitative easing and tightening to influence credit conditions, with the former AUD-negative and the latter AUD-positive.
China is Australia’s largest trading partner so the health of the Chinese economy is a major influence on the value of the Australian Dollar (AUD). When the Chinese economy is doing well it purchases more raw materials, goods and services from Australia, lifting demand for the AUD, and pushing up its value. The opposite is the case when the Chinese economy is not growing as fast as expected. Positive or negative surprises in Chinese growth data, therefore, often have a direct impact on the Australian Dollar and its pairs.
Iron Ore is Australia’s largest export, accounting for $118 billion a year according to data from 2021, with China as its primary destination. The price of Iron Ore, therefore, can be a driver of the Australian Dollar. Generally, if the price of Iron Ore rises, AUD also goes up, as aggregate demand for the currency increases. The opposite is the case if the price of Iron Ore falls. Higher Iron Ore prices also tend to result in a greater likelihood of a positive Trade Balance for Australia, which is also positive of the AUD.
The Trade Balance, which is the difference between what a country earns from its exports versus what it pays for its imports, is another factor that can influence the value of the Australian Dollar. If Australia produces highly sought after exports, then its currency will gain in value purely from the surplus demand created from foreign buyers seeking to purchase its exports versus what it spends to purchase imports. Therefore, a positive net Trade Balance strengthens the AUD, with the opposite effect if the Trade Balance is negative.
The People’s Bank of China (PBOC) set the USD/CNY central rate on Monday at 7.1286, as against the previous day's fix of 7.1289 and 7.2640 Reuters estimates.
Official data on Sunday showed that the People's Bank of China (PBoC), China’s central bank, didn’t buy any gold to its reserves for a second consecutive month in June, per Bloomberg.
China's gold reserves were at 72.80 million troy ounces at the end of June, unchanged from the end of May. China's gold reserves dropped to $169.70 billion from $170.96 billion, official data showed.
Market reaction
At the press time, Gold price (XAU/USD) is down 0.21% on the day to trade at $2,386.
Gold FAQs
Gold has played a key role in human’s history as it has been widely used as a store of value and medium of exchange. Currently, apart from its shine and usage for jewelry, the precious metal is widely seen as a safe-haven asset, meaning that it is considered a good investment during turbulent times. Gold is also widely seen as a hedge against inflation and against depreciating currencies as it doesn’t rely on any specific issuer or government.
Central banks are the biggest Gold holders. In their aim to support their currencies in turbulent times, central banks tend to diversify their reserves and buy Gold to improve the perceived strength of the economy and the currency. High Gold reserves can be a source of trust for a country’s solvency. Central banks added 1,136 tonnes of Gold worth around $70 billion to their reserves in 2022, according to data from the World Gold Council. This is the highest yearly purchase since records began. Central banks from emerging economies such as China, India and Turkey are quickly increasing their Gold reserves.
Gold has an inverse correlation with the US Dollar and US Treasuries, which are both major reserve and safe-haven assets. When the Dollar depreciates, Gold tends to rise, enabling investors and central banks to diversify their assets in turbulent times. Gold is also inversely correlated with risk assets. A rally in the stock market tends to weaken Gold price, while sell-offs in riskier markets tend to favor the precious metal.
The price can move due to a wide range of factors. Geopolitical instability or fears of a deep recession can quickly make Gold price escalate due to its safe-haven status. As a yield-less asset, Gold tends to rise with lower interest rates, while higher cost of money usually weighs down on the yellow metal. Still, most moves depend on how the US Dollar (USD) behaves as the asset is priced in dollars (XAU/USD). A strong Dollar tends to keep the price of Gold controlled, whereas a weaker Dollar is likely to push Gold prices up.
- Gold price edges lower to $2,385 in Monday’s early Asian session.
- US Nonfarm Payrolls increased by 206K in June versus 218K prior, above the expectation of 190K.
- The Chinese central bank refrained from gold purchases for a second month, dragging the yellow metal price lower.
Gold price (XAU/USD) attracts some sellers near $2,385, snapping the three-day winning streak during the early Asian trading hours on Monday. The downtick of the yellow metal is backed by the modest rebound of the Greenback and the Chinese central bank paused Gold buying for the second month. However, the safe-haven flows amid the political uncertainty might lift the precious metal.
US Nonfarm Payrolls (NFP) employment increased by 206K in June, above the expectation of 190K. The growth was lower than the previous reading of 218K, according to the US Bureau of Labour Statistics (BLS) on Friday. Meanwhile, the Unemployment rate ticked up from 4.0% in May to 4.1% in June. Finally, Average hourly earnings rose 0.3% MoM in June, matching expectations.
The market is currently pricing in a 77% odds of a September rate cut by the US Federal Reserve (Fed), up from 70% last Friday, according to the CME FedWatch tool. Furthermore, the FOMC minutes showed that policymakers acknowledged that price pressures were easing, triggering the expectation of Fed rate cuts this year, which might drag the Greenback lower and lift the USD-denominated Gold.
Additionally, the political uncertainty in Europe, particularly in France, and geopolitical tensions in the Middle East might boost the safe-haven flows, benefiting precious metals. According to the Economist, exit polls suggested that the left-wing New Popular Front (NFP) seems to be on track to win the most seats in the second voting round of French parliamentary elections on Sunday. Investors are concerned about uncertainty as the final round of the French parliamentary elections pointed to a hung parliament.
Elsewhere, data from China over the weekend showed that the People's Bank of China (PBoC) refrained from gold purchases for a second month. "It appears that gold prices remain a little too high and the PBOC is waiting for a further pullback before resuming its gold purchasing programme," said Nitesh Shah, a commodity strategist at WisdomTree. It’s worth noting that China is the world’s biggest billion consumer and the pause in gold buying could weigh on the Gold price.
Gold FAQs
Gold has played a key role in human’s history as it has been widely used as a store of value and medium of exchange. Currently, apart from its shine and usage for jewelry, the precious metal is widely seen as a safe-haven asset, meaning that it is considered a good investment during turbulent times. Gold is also widely seen as a hedge against inflation and against depreciating currencies as it doesn’t rely on any specific issuer or government.
Central banks are the biggest Gold holders. In their aim to support their currencies in turbulent times, central banks tend to diversify their reserves and buy Gold to improve the perceived strength of the economy and the currency. High Gold reserves can be a source of trust for a country’s solvency. Central banks added 1,136 tonnes of Gold worth around $70 billion to their reserves in 2022, according to data from the World Gold Council. This is the highest yearly purchase since records began. Central banks from emerging economies such as China, India and Turkey are quickly increasing their Gold reserves.
Gold has an inverse correlation with the US Dollar and US Treasuries, which are both major reserve and safe-haven assets. When the Dollar depreciates, Gold tends to rise, enabling investors and central banks to diversify their assets in turbulent times. Gold is also inversely correlated with risk assets. A rally in the stock market tends to weaken Gold price, while sell-offs in riskier markets tend to favor the precious metal.
The price can move due to a wide range of factors. Geopolitical instability or fears of a deep recession can quickly make Gold price escalate due to its safe-haven status. As a yield-less asset, Gold tends to rise with lower interest rates, while higher cost of money usually weighs down on the yellow metal. Still, most moves depend on how the US Dollar (USD) behaves as the asset is priced in dollars (XAU/USD). A strong Dollar tends to keep the price of Gold controlled, whereas a weaker Dollar is likely to push Gold prices up.
| Index | Change, points | Closed | Change, % |
|---|---|---|---|
| NIKKEI 225 | -1.28 | 40912.37 | -0 |
| Hang Seng | -228.67 | 17799.61 | -1.27 |
| KOSPI | 37.29 | 2862.23 | 1.32 |
| ASX 200 | -9.5 | 7822.3 | -0.12 |
| DAX | 24.97 | 18475.45 | 0.14 |
| CAC 40 | -20.16 | 7675.62 | -0.26 |
| Dow Jones | 67.87 | 39375.87 | 0.17 |
| S&P 500 | 30.17 | 5567.19 | 0.54 |
| NASDAQ Composite | 164.46 | 18352.76 | 0.9 |
- EUR/USD loses ground around 1.0830 in Monday’s early Asian session.
- Polls suggested the final round of the French parliamentary elections pointed to a hung parliament, weighing on the Euro.
- Employment growth in the United States slowed in May.
The EUR/USD pair trades on a weaker note near 1.0830 on Monday during the early Asian trading hours. The political uncertainty in France after the second voting round of French parliamentary elections on Sunday exerts some selling pressure on the Euro (EUR). Later on Monday, the Eurozone Sentix Investor Confidence for July will be released.
According to the Economist, exit polls indicated that the left-wing New Popular Front (NFP), led by Jean-Luc Mélenchon, seems to be on track to win the most seats in the second voting round of French parliamentary elections on Sunday. The NFP had secured at least 174 seats.
However, this would still be far short of the 289 seats needed to control the lower house. Meanwhile, President Emmanuel Macron’s centrist Ensemble alliance won 146 seats and Le Pen’s party was pushed into third place, winning some 142 seats. The shared currency has attracted some sellers after exit polls suggested the final round of the French parliamentary elections pointed to a hung parliament.
Across the pond, the rising odds of the US Federal Reserve (Fed) after the slow growth of US employment data might drag the Greenback lower and cap the pair’s downside. Data released by the US Bureau of Labor Statistics (BLS) showed that US Nonfarm Payrolls (NFP) rose 206K in June, followed by a 218K rise (revised from 272K) in May. This figure came in stronger than the estimation of 190,000.
Furthermore, the Unemployment Rate edged higher to 4.1% in June from 4% in May. The Average Hourly Earnings declined to 3.9% YoY in June from the previous reading of 4.1%, matching the market expectation. Traders will take more cues from the US Consumer Price Index (CPI) inflation on Wednesday for fresh impetus, which is expected to ease to 3.1% YoY in June from 3.3% in May.
Euro FAQs
The Euro is the currency for the 20 European Union countries that belong to the Eurozone. It is the second most heavily traded currency in the world behind the US Dollar. In 2022, it accounted for 31% of all foreign exchange transactions, with an average daily turnover of over $2.2 trillion a day. EUR/USD is the most heavily traded currency pair in the world, accounting for an estimated 30% off all transactions, followed by EUR/JPY (4%), EUR/GBP (3%) and EUR/AUD (2%).
The European Central Bank (ECB) in Frankfurt, Germany, is the reserve bank for the Eurozone. The ECB sets interest rates and manages monetary policy. The ECB’s primary mandate is to maintain price stability, which means either controlling inflation or stimulating growth. Its primary tool is the raising or lowering of interest rates. Relatively high interest rates – or the expectation of higher rates – will usually benefit the Euro and vice versa. The ECB Governing Council makes monetary policy decisions at meetings held eight times a year. Decisions are made by heads of the Eurozone national banks and six permanent members, including the President of the ECB, Christine Lagarde.
Eurozone inflation data, measured by the Harmonized Index of Consumer Prices (HICP), is an important econometric for the Euro. If inflation rises more than expected, especially if above the ECB’s 2% target, it obliges the ECB to raise interest rates to bring it back under control. Relatively high interest rates compared to its counterparts will usually benefit the Euro, as it makes the region more attractive as a place for global investors to park their money.
Data releases gauge the health of the economy and can impact on the Euro. Indicators such as GDP, Manufacturing and Services PMIs, employment, and consumer sentiment surveys can all influence the direction of the single currency. A strong economy is good for the Euro. Not only does it attract more foreign investment but it may encourage the ECB to put up interest rates, which will directly strengthen the Euro. Otherwise, if economic data is weak, the Euro is likely to fall. Economic data for the four largest economies in the euro area (Germany, France, Italy and Spain) are especially significant, as they account for 75% of the Eurozone’s economy.
Another significant data release for the Euro is the Trade Balance. This indicator measures the difference between what a country earns from its exports and what it spends on imports over a given period. If a country produces highly sought after exports then its currency will gain in value purely from the extra demand created from foreign buyers seeking to purchase these goods. Therefore, a positive net Trade Balance strengthens a currency and vice versa for a negative balance.
| Pare | Closed | Change, % |
|---|---|---|
| AUDUSD | 0.67484 | 0.33 |
| EURJPY | 174.293 | 0 |
| EURUSD | 1.08388 | 0.25 |
| GBPJPY | 206.054 | 0.17 |
| GBPUSD | 1.28145 | 0.43 |
| NZDUSD | 0.6144 | 0.47 |
| USDCAD | 1.36396 | 0.2 |
| USDCHF | 0.89565 | -0.46 |
| USDJPY | 160.798 | -0.25 |


© 2000-2026. Уcі права захищені.
Cайт знаходитьcя під керуванням TeleTrade DJ. LLC 2351 LLC 2022 (Euro House, Richmond Hill Road, Kingstown, VC0100, St. Vincent and the Grenadines).
Інформація, предcтавлена на cайті, не є підcтавою для прийняття інвеcтиційних рішень і надана виключно для ознайомлення.
Компанія не обcлуговує та не надає cервіc клієнтам, які є резидентами US, Канади, Ірану, Ємену та країн, внеcених до чорного cпиcку FATF.
Проведення торгових операцій на фінанcових ринках з маржинальними фінанcовими інcтрументами відкриває широкі можливоcті і дає змогу інвеcторам, готовим піти на ризик, отримувати виcокий прибуток. Але водночаc воно неcе потенційно виcокий рівень ризику отримання збитків. Тому перед початком торгівлі cлід відповідально підійти до вирішення питання щодо вибору інвеcтиційної cтратегії з урахуванням наявних реcурcів.
Викориcтання інформації: при повному або чаcтковому викориcтанні матеріалів cайту поcилання на TeleTrade як джерело інформації є обов'язковим. Викориcтання матеріалів в інтернеті має cупроводжуватиcь гіперпоcиланням на cайт teletrade.org. Автоматичний імпорт матеріалів та інформації із cайту заборонено.
З уcіх питань звертайтеcь за адреcою pr@teletrade.global.
переклади