- Аналітика
- Новини та інструменти
- Новини ринків
Новини ринків
- US Dollar Index licks its wounds after falling the most in two months.
- US Jobless Claims jumps to the highest since October 2021 and pushes back Fed hawks.
- IMF urges Fed, other central banks to keep tightening monetary policies to tame inflation fears.
- Risk catalysts, bond market moves eyed for directions ahead of next week’s US CPI, FOMC.
US Dollar Index (DXY) bears the burden of the downbeat US data as it remains pressured near 103.30 during the early hours of Friday’s Asian session. It should be noted that the greenback’s gauge versus the six major currencies dropped the most in two months the previous day as United States statistics keep pushing back the Federal Reserve (Fed) hawks ahead of the next week’s Federal Open Market Committee (FOMC) monetary policy meeting.
That said, US Initial Jobless Claims rose to 261K in the week ended on June 02 versus 235K expected and 233K prior (revised). With this, the four-week average rose to 237.25K from 229.75K previous readings. Further, the Continuing Jobless Claims dropped to 1.757M in the week ended on May 26 from 1.794M prior (revised), compared to 1.8M market forecasts. Earlier in the week, the US ISM Services PMI, S&P Global PMIs and Factory Orders also printed downbeat outcomes and pushed back the Fed hawks while weighing on the US Dollar Index (DXY).
While the US data weighed on the Fed outlook, a surprisingly hawkish performance of the Bank of Canada (BoC) and the Reserve Bank of Australia (RBA) offered extra reasons for the DXY traders to prepare for the next week's FOMC. Furthermore, optimism surrounding China, per comments from Li Yunze, Director of China's National Administration of Financial Regulation, also weighed on the US Dollar.
In doing so, the DXY ignores hawkish comments from International Monetary Fund (IMF) spokesperson Julie Kozack. On Thursday, the global lender flagged the inflation woes and pushed major central banks, including the US Federal Reserve (Fed), towards further rate hikes. "If inflation does prove to be more persistent than expected, then the Fed may need to push interest rates higher for longer," IMF’s Kozack told reporters at a regular briefing.
Amid these plays, the US Treasury bond yields slumped while Wall Street benchmarks rose and exerted downside pressure on the greenback. That said, the benchmark US 10-year Treasury bond yields reversed from the highest levels in a fortnight to 3.72% whereas the two-year counterpart also snapped a two-day winning streak to drop to 4.52% at the latest. It should be noted, however, that the S&P500 Futures struggle for clear directions.
Looking ahead, a light calendar can keep the US Dollar Index on its way to posting the second weekly loss while bracing for the next week’s Consumer Price Index (CPI) and the Fed monetary policy meeting.
Technical analysis
A daily closing below the three-week-old previous support line, now immediate resistance near 103.85, directs the DXY bears towards the 100-DMA level surrounding 103.00.
- USD/CAD picks up bids to consolidate the second consecutive weekly loss.
- Seven-month-old ascending trend line, nearly oversold RSI conditions challenge Loonie pair sellers.
- Convergence of 100-DMA, 200-DMA appears a tough nut to crack for the bulls.
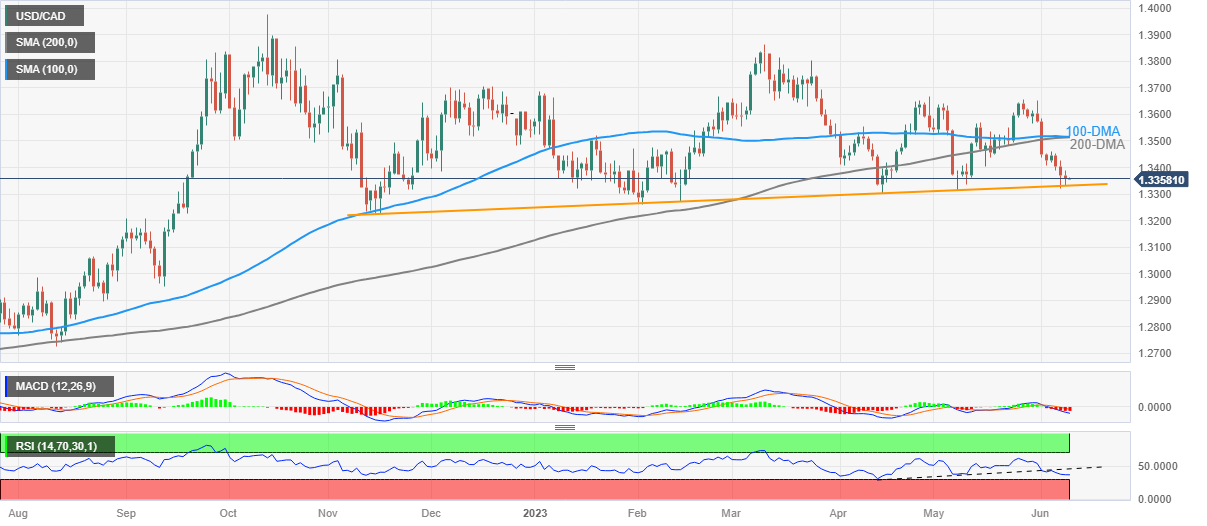
USD/CAD licks its wounds around 1.3360, pausing a three-day downtrend near the lowest levels in a year amid the early hours of Friday’s Asian session.
In doing so, the Loonie pair bounces off an upward-sloping support line from November 2022 ahead of the key Canada employment data. It should be noted that the early week’s surprise rate hike from the Bank of Canada (BoC) joins the latest hawkish comments from BoC’s Deputy Governor Paul Beaudry to keep the Loonie pair sellers hopeful.
Also read: Canada Employment Preview: Forecasts from five major banks, tight labour market
In addition to the pre-data anxiety and failure to break the key support line, the Loonie pair’s latest rebound could also be linked to the nearly oversold conditions of the RSI (14) line.
It’s worth noting, however, that the trend line breakdown on the momentum indicator and the USD/CAD pair’s sustained trading below the key moving averages keep the bears hopeful.
Hence, the pair stays on the seller’s radar unless crossing a convergence of the 100-DMA and 200-DMA, around 1.3515 by the press time. Though, the 1.3400 round figure and the weekly high of near 1.3460 can lure short-term buyers.
On the flip side, a daily closing beneath the aforementioned support line, close to 1.3330 at the latest, could make the USD/CAD pair vulnerable to poking the November 2022 bottom surrounding 1.3225.
USD/CAD: Daily chart
Trend: Limited recovery expected
- Gold Price defends two-week-old trading pattern of repeatedly bouncing off 100-DMA, edges higher of late.
- Downbeat United States statistics propel economic fears, weigh on Federal Reserve bets and underpin XAU/USD rise.
- Gold buyers cheer US Dollar Index’s second consecutive weekly loss ahead of next week’s FOMC.
- China inflation data can entertain XAU/USD traders ahead of next week’s key monetary policy meetings.
Gold Price (XAU/USD) remains on the front foot around the weekly high, making rounds to $1965 during early Friday morning in Asia, after rising the most in five weeks the previous day. It should be noted that a slew of the downbeat United States economics weighed on the Federal Reserve (Fed) bets and the US Dollar to underpin the bullish bias surrounding the XAU/USD. However, the cautious mood ahead of China’s inflation gauges for May, namely the Consumer Price Index (CPI) and Producer Price Index (PPI), prod the Gold buyers due to the Dragon Nation’s status as one of the world’s biggest XAU/USD consumers.
Gold Price cheers US Dollar weakness
Gold Price manage to post the biggest daily gains in more than a week after the sustained weakness in the United States economics raised dovish concerns about the Federal Reserve (Fed) and drowned the US Dollar the previous day.
United States Initial Jobless Claims jumped to the highest levels since October 2021 by rising to 261K in the week ended on June 02 versus 235K expected and 233K prior (revised). With this, the four-week average rose to 237.25K from 229.75K previous readings. Further, the Continuing Jobless Claims dropped to 1.757M in the week ended on May 26 from 1.794M prior (revised), compared to 1.8M market forecasts. Earlier in the week, the US ISM Services PMI, S&P Global PMIs and Factory Orders also printed downbeat outcomes and pushed back the Fed hawks while weighing on the US Dollar and favoring the Gold buyers.
Given the downbeat US data, Gold buyers appear mostly certain of witnessing no rate hike by the US Federal Reserve (Fed) interest rate hike in the next week’s Federal Open Market Committee (FOMC) monetary policy meeting. Additionally, the disappointing statistics also reduce the market’s bets on July rate lifts and drown the US Dollar, as well as add strength to the XAU/USD run-up.
IMF fails to prod XAU/USD bulls
Given the downbeat US data weighing on the greenback, the Gold Price fails to justify hawkish comments from International Monetary Fund (IMF) spokesperson Julie Kozack. That said, the global lender flagged the inflation woes and pushed major central banks, including the US Federal Reserve (Fed), towards further rate hikes. "If inflation does prove to be more persistent than expected, then the Fed may need to push interest rates higher for longer," IMF’s Kozack told reporters at a regular briefing.
Risk catalysts, China updates favor Gold buyers
The global markets portray the risk-on mood due to the aforementioned factors, as well as upbeat headlines from China, which in turn propel the Gold Price.
Multiple Chinese state banks including the Industrial and Commercial Bank of China, Bank of China and Construction Bank cut their benchmark rates. The same raises speculations that the Dragon Nation’s central bank, namely the People’s Bank of China (PBOC), will also cut the rates.
Further, the fears of China’s market intervention also favored the XAU/USD bulls as PBoC Vice Governor said, “We have confidence, conditions and capacity to maintain stable operations of the FX market.” On the same line was Li Yunze, Director of China's National Administration of Financial Regulation, who also made upbeat remarks on the Chinese economy as he said, “Economy still recovering,” while adding that demand will be boosted.
Against this backdrop, the US Treasury bond yields slumped while Wall Street benchmarks rose and exerted downside pressure on the greenback. That said, the benchmark US 10-year Treasury bond yields reversed from the highest levels in a fortnight to 3.72% whereas the two-year counterpart also snapped a two-day winning streak to drop to 4.52% at the latest. It should be noted, however, that the S&P500 Futures struggle for clear directions.
Looking ahead, China’s inflation gauges for May, namely the Consumer Price Index (CPI) and Producer Price Index (PPI), will gain major attention due to the Dragon Nation’s status as one of the biggest Gold consumers. The forecast suggests that the headline CPI will improve to 0.3% YoY in May versus 0.1% prior whereas the PPI could drop further to -4.3% YoY from -3.6% previous readings. Given the mixed outlook, the XAU/USD traders will look for any surprises.
Gold Price Technical Analysis
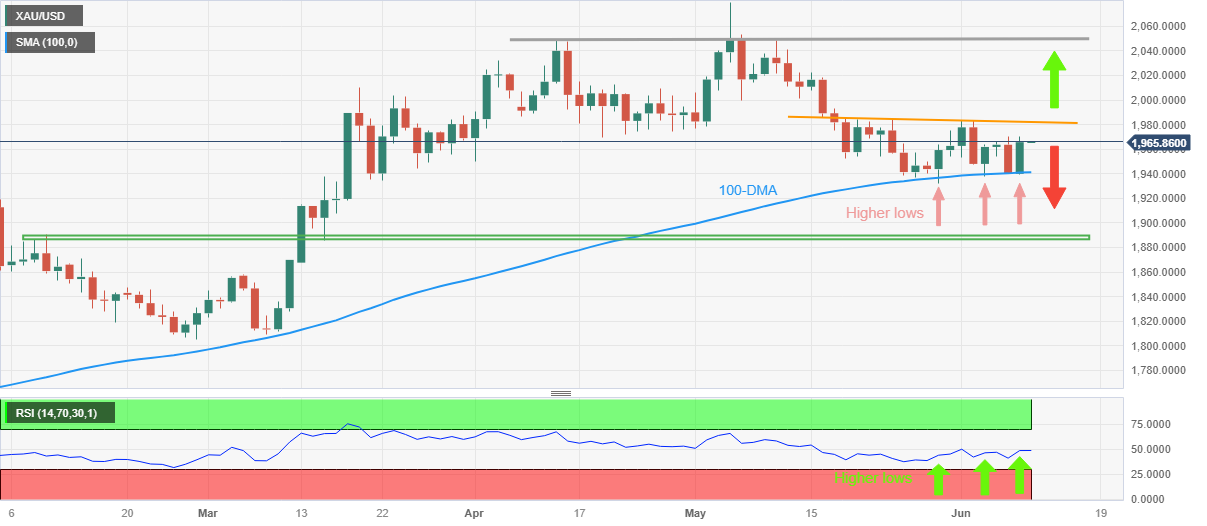
Gold price stays within a three-week-old trading range comprising the 100-DMA support and a slightly downward-sloping trend line from May 18, respectively near $1,940 and $1,985 by the press time.
While closely observing the XAU/USD price, it becomes easy to establish the bullish chart formation backed by the Relative Strength Index (RSI) line, placed at 14.
That said, the Gold Price marks higher lows and gains support from an ascending RSI line, forming higher lows on the oscillator, which in turn confirms the market’s gradually building bullish bias for the yellow metal.
Hence, the XAU/USD is well-set to challenge the stated trading range’s top line, close to $1,985. However, a break of which appears difficult as multiple hurdles stand tall to challenge the Gold buyers around the $2,000 psychological magnet.
On the other hand, a daily closing below the 100-DMA support of around $1,940 defies the bullish chart signals and can drag the Gold Price towards the $1,985-80 support zone, comprising levels marked in February and March of 2023.
Gold Price: Daily chart
Trend: Further upside expected
- NZD/USD approaches short-term key hurdle after rising the most in two months the previous day.
- 12-day-old horizontal resistance zone, descending trend line from early May challenge Kiwi bulls before 200-SMA.
- Sellers may wait for weekly support break for fresh entry.
- China’s CPI, PPI for May can join upbeat RSI to favor bulls ahead of next week’s Fed meeting.
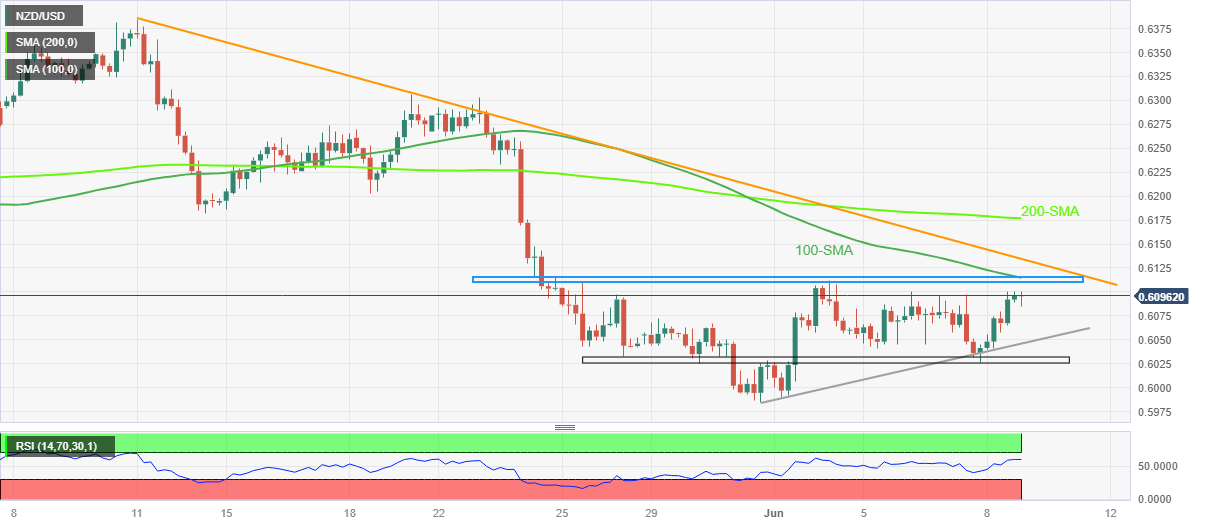
NZD/USD bulls are yet to retake control, despite the most in two months the previous day, as multiple key upside hurdles stand tall to challenge the latest advances ahead of the key China inflation data on early Friday. With this, the Kiwi pair dribbles around 0.6100 by the press time.
It should be noted that the quote’s sustained trading beyond the one-week-old ascending support line and upbeat RSI (14) line, not overbought, keeps the buyers hopeful.
However, a fortnight-long horizontal resistance area, which also comprises the 100-SMA hurdle, restricts the immediate upside of the NZD/USD pair around 0.6110-15.
Following that, a one-month-old descending trend line, close to 0.6135 by the press time, could challenge the Kiwi buyers ahead of directing them to the 200-SMA resistance of around 0.6180 at the latest.
In a case where the NZD/USD remains firmer past 0.6180, the odds of witnessing a rally beyond 0.6200 can’t be ruled out.
On the contrary, the aforementioned one-week-old rising trend line, near 0.6050 at the latest, restricts the immediate downside of the NZD/USD pair.
Even if the pair breaks the 0.6050 support, an area comprising multiple levels marked since May 26, surrounding .6025-30, can act as the last defense of the NZD/USD bulls.
Overall, the NZD/USD bulls are up for retaking control but they need validation from the 200-SMA and China’s inflation gauges for May, namely the Consumer Price Index (CPI) and Producer Price Index (PPI).
NZD/USD: Four-hour chart
Trend: Further upside expected
- EUR/GBP maintains a downward bias, eyes on YTD low amid central bank actions.
- Downside expected due to higher interest rate differential from BoE.
- The upcoming ECB meeting might shift EUR/GBP’s current path; buyers watch the 0.8600 mark.
EUR/GBP finished Thursday’s session with losses though clings to the 0.8580 area, nearby year-to-date (YTD) lows reached on June 1 at 0.8567. At the time of writing, the EUR/GBP exchanges hands at 0.8585, gaining a minuscule 0.01% as the Asian session commences.
EUR/GBP Price Analysis: Technical outlook
The daily chart portrays the EUR/GBP cross pair as downward biased, set to challenge the yearly lows in the near term. Even though both central banks, the European Central Bank (ECB) and the Bank of England (BoE), are hiking rates, the latter is set to finish with a higher interest rate differential. Therefore, further EUR/GBP downside is expected, but next week’s ECB meeting could rock the boat.
Since the path of least resistance is downwards, EUR/GBP sellers must claim the YTD low at 0.8567. A drop below will expose the December 2 swing low of 0.8551, followed by the 0.8500 figure. Once that level is surpassed, the EUR/GBP could tan towards the August 24 low at 0.8408 before challenging the August 2 low of 0.8339.
Conversely, if EUR/GBP reclaims the 0.8600 mark, that could expose the pair to buying pressure. That could lift the cross toward the 20-day EMA at 0.8644 before challenging the 50-day EMA and the figure confluence at 0.8700.
EUR/GBP Price Action – Daily chart

- AUD/USD seesaw around the highest levels in a month, rose the most in a week the previous day.
- US data keeps pushing back Fed hawks and weigh on the US Dollar.
- RBA’s hawkish surprise, optimism surrounding China supersede mixed Aussie data.
- China inflation numbers, risk catalysts can entertain traders ahead of a big week comprising FOMC.
AUD/USD bulls take a breather at the highest level in a month, after rising the most in one week, as they flirt with the 0.6715-20 zone amid the early hours of Friday’s Asian trading session. In doing so, the Aussie pair portrays a cautious mood ahead of inflation data from Australia’s key customer China while also cheering the latest prospects suggesting the monetary policy divergence between the Reserve Bank of Australia (RBA) and the US Federal Reserve (Fed).
With the US Initial Jobless Claims jumped to the highest levels since October 2021, the US Dollar Index (DXY) drowned on Thursday. That said, US Initial Jobless Claims rose to 261K in the week ended on June 02 versus 235K expected and 233K prior (revised). With this, the four-week average rose to 237.25K from 229.75K previous readings. Further, the Continuing Jobless Claims dropped to 1.757M in the week ended on May 26 from 1.794M prior (revised), compared to 1.8M market forecasts. Earlier in the week, the US ISM Services PMI, S&P Global PMIs and Factory Orders also printed downbeat outcomes and pushed back the Fed hawks while weighing on the US Dollar.
The same almost confirms no rate hike by the US Federal Reserve (Fed) interest rate hike in the next week’s Federal Open Market Committee (FOMC) monetary policy meeting while also cutting the market’s bets on July rate lifts and drowns the US Dollar.
On the other hand, the RBA policymakers remain hawkish and gained support from the International Monetary Fund’s (IMF) urge on Thursday to global central banks to "stay the course" on monetary policy and remain vigilant in combating inflation, per Reuters.
As a result, the RBA vs. Fed drama gains attention and supersede the unimpressive Aussie data to propel the AUD/USD price. Australia’s Trade Balance declines to 11,158M in April versus 14,000M market forecasts and 14,822M prior (revised). That said, the Pacific nation’s Exports dropped to -5.0%, versus 4.0% prior, whereas the Imports slid beneath 4.0% prior growth (revised) to 2.0% for the said month.
Elsewhere, multiple Chinese state banks including the Industrial and Commercial Bank of China, Bank of China and Construction Bank cut their benchmark rates. The same raises speculations that the Dragon Nation’s central bank, namely the People’s Bank of China (PBOC), will also cut the rates. Further, the fears of China’s market intervention also favored the AUD/USD bulls as PBoC Vice Governor said, “We have confidence, conditions and capacity to maintain stable operations of the FX market.” On the same line was Li Yunze, Director of China's National Administration of Financial Regulation, who also made upbeat remarks on the Chinese economy as he said, “Economy still recovering,” while adding that demand will be boosted.
Against this backdrop, the US Treasury bond yields slumped while Wall Street benchmarks rose and exerted downside pressure on the greenback.
Looking forward, China’s inflation gauges for May, namely the Consumer Price Index (CPI) and Producer Price Index (PPI), will gain major attention amid the latest chatters of the PBoC rate cuts and the hawkish RBA. Should the inflation data arrive firmer the AUD/USD may renew the monthly high while downbeat outcomes can allow the bulls to retreat ahead of the next week’s Federal Open Market Committee (FOMC) monetary policy meeting.
Technical analysis
Although the AUD/USD bulls are almost successful in piercing the four-month-old resistance line surrounding 0.6715, they need validation from the 100-DMA hurdle of around 0.6740 to challenge the previous monthly high of 0.6818.
- EUR/USD grinds near the highest levels in a fortnight after rising the most in 11 weeks.
- US Dollar Index ignores IMF’s hawkish urge to central bankers and drops heavily on disappointing Initial Jobless Claims.
- Eurozone Q1 GDP traces German growth figures to renew economic slowdown fears.
- Risk catalysts are key to watching for clear directions ahead of the Fed-ECB week.
EUR/USD bulls are in the driver’s seat while bracing for the next week’s European Central Bank (ECB) monetary policy meeting, ignoring the downbeat economic concerns for the old continent, amid broad US Dollar weakness. That said, the major currency pair seesaws around a two-week high after rising the most since early March the previous day, to 1.0780 amid Friday morning in Asia.
That said, the US Dollar Index (DXY) dropped the most in nearly two months the previous day after the weekly prints of the US Initial Jobless Claims jumped to the highest levels since October 2021.
The same almost confirms no rate hike by the US Federal Reserve (Fed) interest rate hike in the next week’s Federal Open Market Committee (FOMC) monetary policy meeting while also cutting the market’s bets on July rate lifts and drowns the US Dollar.
On Thursday, US Initial Jobless Claims rose to 261K in the week ended on June 02 versus 235K expected and 233K prior (revised). With this, the four-week average rose to 237.25K from 229.75K previous readings. Further, the Continuing Jobless Claims dropped to 1.757M in the week ended on May 26 from 1.794M prior (revised), compared to 1.8M market forecasts. Earlier in the week, the US ISM Services PMI, S&P Global PMIs and Factory Orders also printed downbeat outcomes and pushed back the Fed hawks while weighing on the US Dollar.
On the other hand, the final version of the Eurozone Gross Domestic Product (GDP) for the first quarter (Q1) of 2023 marked a downward revision to the initial forecasts of 0.1% to -0.1% QoQ, versus 0.0% expected. Further, the yearly GDP figures also eased to 1.0% from 1.3% previous estimations and 1.2% market consensus. Additionally, the region’s final Employment Change matches initial forecasts and market expectations of 0.6% on QoQ during the said period but eased to 1.6% on YoY compared to 1.7% previous predictions.
With this, the recession fears in the bloc get a boost as Germany also reported a negative growth figure for Q1 2023, which in turn raises bars for the ECB hawks as they prepare for the next week’s monetary policy meeting.
It’s worth noting that the International Monetary Fund (IMF) on Thursday urged the US Federal Reserve and other global central banks to "stay the course" on monetary policy and remain vigilant in combating inflation, per Reuters.
Amid these plays, the US Treasury bond yields slumped while Wall Street benchmarks rose and exerted downside pressure on the greenback.
Looking forward, the Euro pair may witness a lackluster day amid an absence of major data/events, as well as due to the cautious mood ahead of the next week’s Fed and ECB monetary policy meetings, not to forget the US inflation numbers.
Technical analysis
A daily closing beyond a three-week-old descending resistance line, now immediate support near 1.0750, directs EUR/USD towards the 100-DMA hurdle of around 1.0810.
- USD/MXN gains ground as US Jobless Claims soar, Mexican inflation dips.
- Speculation of Banxico pausing tightening cycle boosts USD/MXN advance.
- Market eyeing US inflation data release, FOMC meeting amid global rate decision woes.
After falling to seven-year lows on Wednesday, the USD/MXN staged a comeback on Thursday, though it could be short-lived as the Asian session begins. The USD/MXN is trading at 17.3633, down 0.09%, after finishing Thursday’s session positive, with modest gains of 0.12%.
Peso-Dollar pair reacts as inflation cools down in Mexico
Wall Street closed the session with solid gains. The USD/MXN advanced on data from both countries, which underpinned the pair, as inflation in Mexico dipped below estimates. According to the Instituto Nacional de Estadistica, Geografia e Informatica (INEGI), the Consumer Price Index (CPI) in May fell -0.22% MoM, well below estimates of -0.16%. Annually based, CPI fell below the prior’s month 6.29%, at 5.84%, beneath the consensus of 5.9%.
Across the border, the US Bureau of Labor Statistics (BLS) featured Initial Jobless Claims for the last week ending June 3 jumped 261K, up from 232K expected by analysts, the highest since October 2021. That adds to an outstanding Nonfarm Payrolls report last Friday, which showed the economy created 339K jobs, but the rise in the Unemployment Rate was a prelude to the previous week’s data.
Following both releases, the USD/MXN advanced from around the 17.3500 figure towards the daily high at 17.4426 on speculations of a pause of the Bank of Mexico (Banxico) tightening cycle. Regarding the US Federal Reserve (Fed), comments in the last week cemented the case for skipping raising rates in June and waiting for July.
However, the latest monetary policy decisions by the Reserve Bank of Australia (RBA) and the Bank of Canada (BoC) sparked concerns about what the Fed will do. Given that the RBA and the BoC kept rates on hold, inflation has resumed its upward path in some meetings. That triggered a reaction by both institutions.
Upcoming events
The US calendar is empty, with traders eyeing Tuesday, June 13, with the release of inflation data, alongside the beginning of the FOMC’s meeting.
USD/MXN Price Analysis: Technical outlook
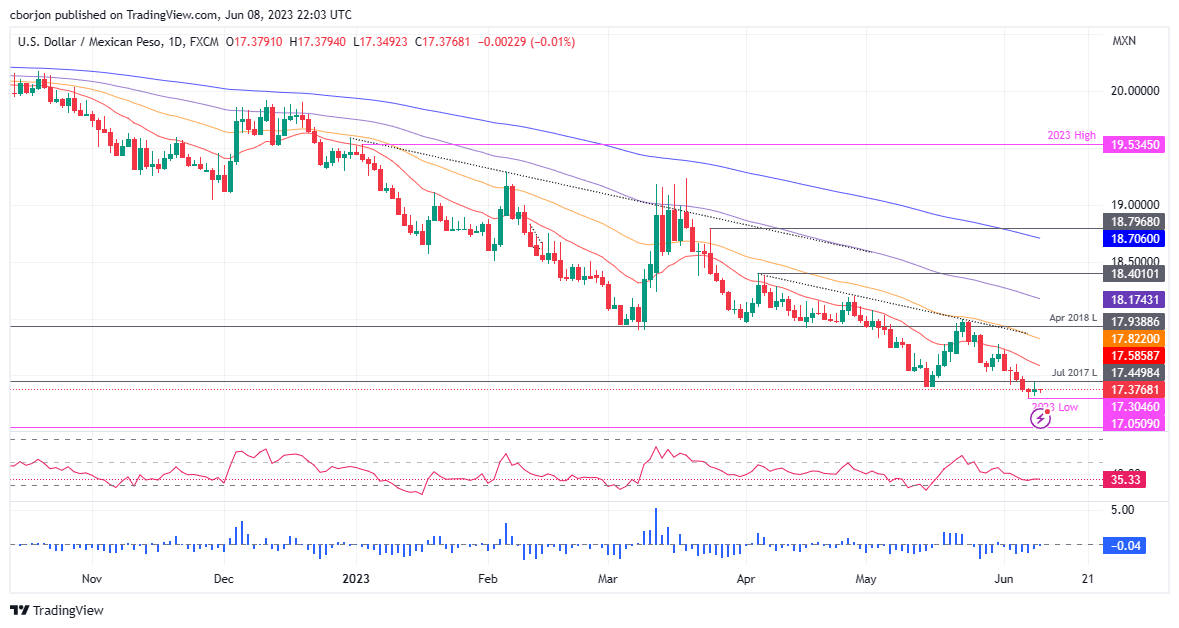
The daily chart portrays the USD/MXN pair as downward biased, though it appears to be bottoming. Although that has been commented on in previous articles, it should be taken cautiously. A double bottom could be forming, but it would need to claim two daily EMAs, the 20 and 50-day period, each at 17.5851 and 17.8217, before challenging resistance at a May 23 high of 17.99. Once cleared, the following supply area to test would be the 100-day EMA at 18.1741. Conversely, the pair could continue printing new multi-year lows below the current YTD low at 17.30.
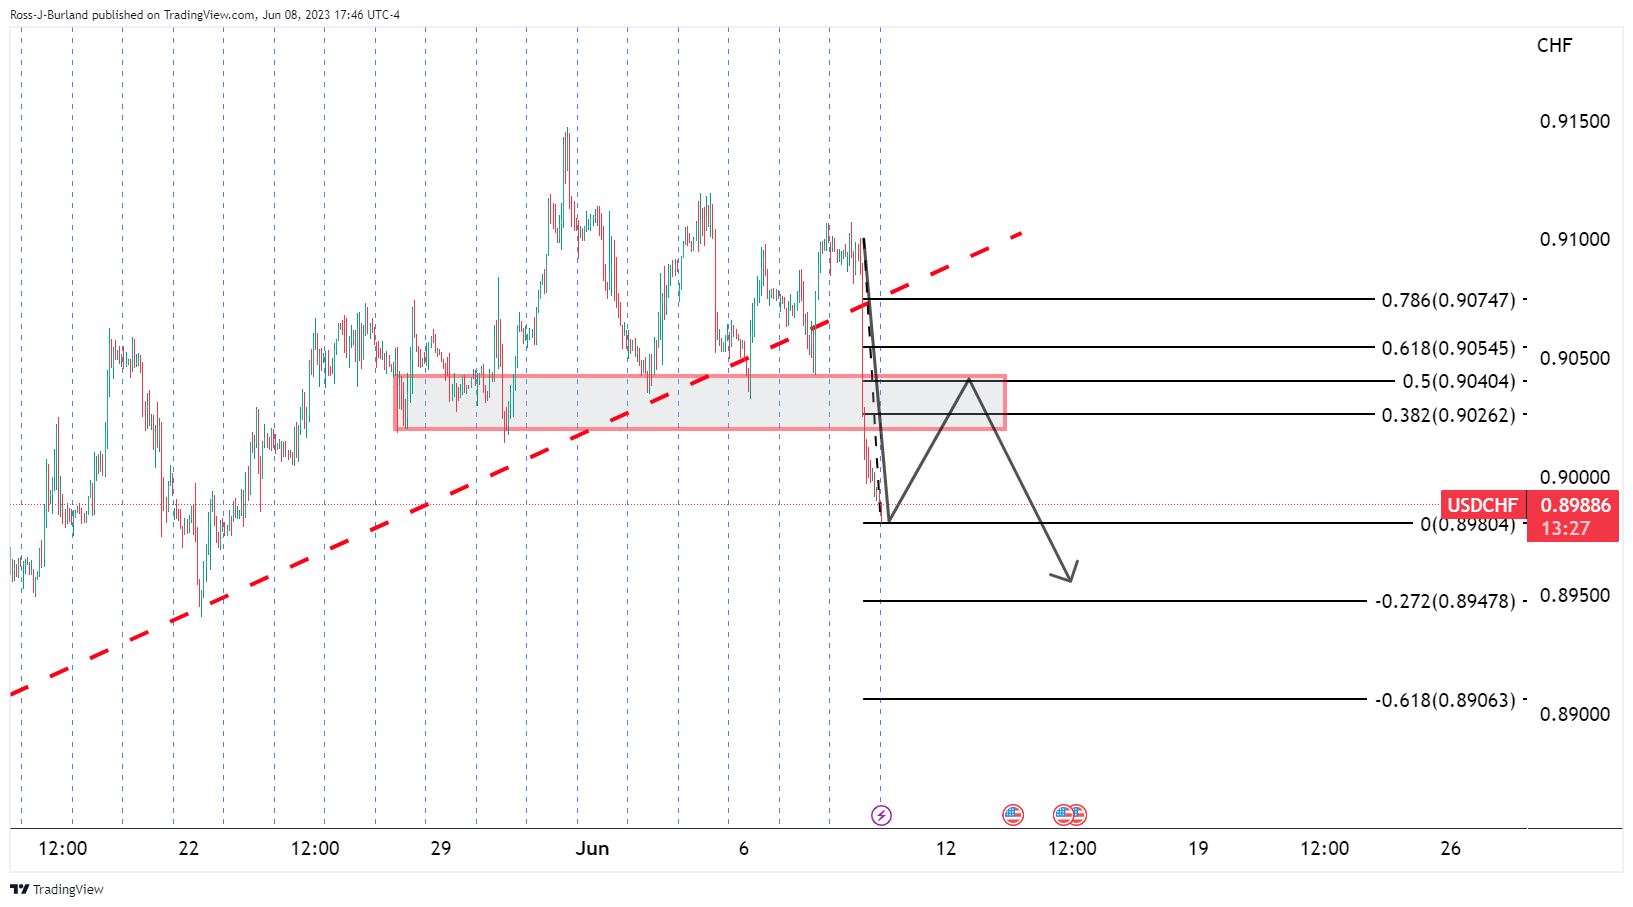
- USD/CHF bears in control below key resistance.
- US Dollar offered as Fed bets of a hold are firm.
The US Dollar slid again on Thursday but remained near three-month highs although there are bets that the Federal Reserve, which may have more work to do to combat inflation, could indeed hold this month.
DXY, hit a 2-week low as the Federal Reserve is now expected to leave interest rates unchanged when its policy committee meets next week. The CME Fedwatch tool is seeing only a 25% probability that the central bank will raise rates again.
This leaves the USD/CHF hanging and well offered with more downside on the cards if the bears stay in control below resistance as the following illustrates:
USD/CHF H1 chart
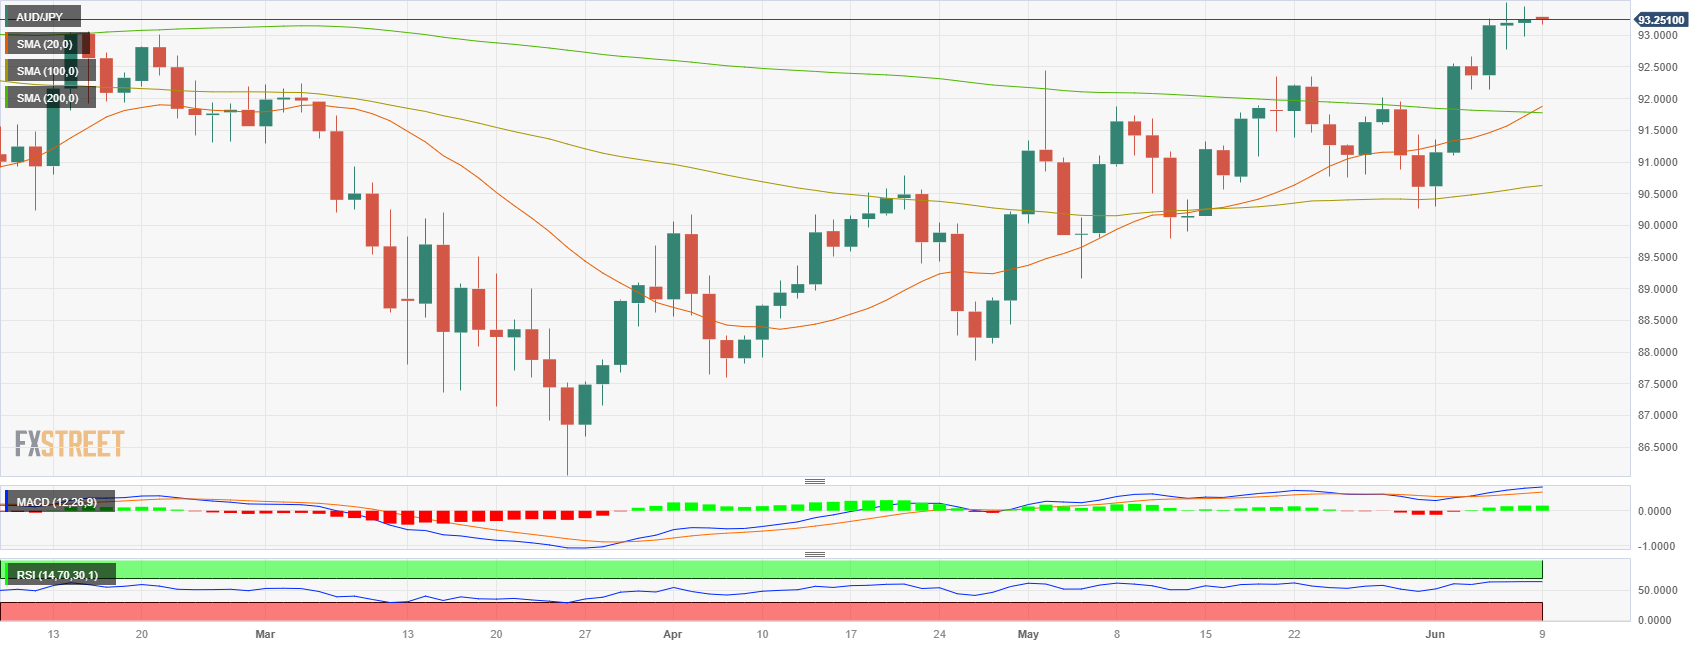
- The AUD/JPY peaked at a daily high of 93.45 on Thursday.
- The Aussie continues to get traction with the hawkish stance of the RBA.
- Cautious market mood and rumours of a BoJ intervention give traction to the Yen.
The AUD/JPY currency pair reached a daily high of 93.45 on Thursday, reflecting the strong performance of the Australian dollar. The hawkish stance of the Reserve Bank of Australia (RBA) has been a driving force behind the Aussie's gains. On the other hand, the Japanese yen is also finding support due to cautious market sentiment and rumours of potential interventions by the Bank of Japan (BoJ).
Aussie got traction on the back of RBA’s hawkish stance
The Australian dollar continues to gain from the surprise interest rate hike by the Reserve Bank of Australia. Governor Lowe emphasized on Wednesday following the announcement the importance of maintaining labour market achievements but clarified that sustained inflation increases will not be tolerated. The expectation of further rate hikes supports the Australian dollar's rise.
The JPY, on the other hand, is finding further support from the recent expectations of further interventions by the BoJ to bolster the domestic currency. Additionally, the JPY's safe-haven appeal is benefiting from a cautious market sentiment due to concerns about a global economic slowdown, particularly in China. However, the recent weakness on Gross Domestic Product (GDP) reported on the early Asian session, fueled dovish bets on the BoJ which could limit the JPY’s upside potential.
AUD/JPY Levels to watch
From a technical perspective, the GBP/JPY pair currently shows a neutral to bullish outlook in the short term, although the bullish momentum appears to have paused, indicators still stand in positive territory.
In terms of resistance levels, the GBP/JPY pair faces upcoming resistance around 93.40 and above at the multi-month high of 93.50 struck on Wednesday. On the other hand, support to take into account line up at 93.00, 92.80 and 92.50.
AUD/JPY daily chart
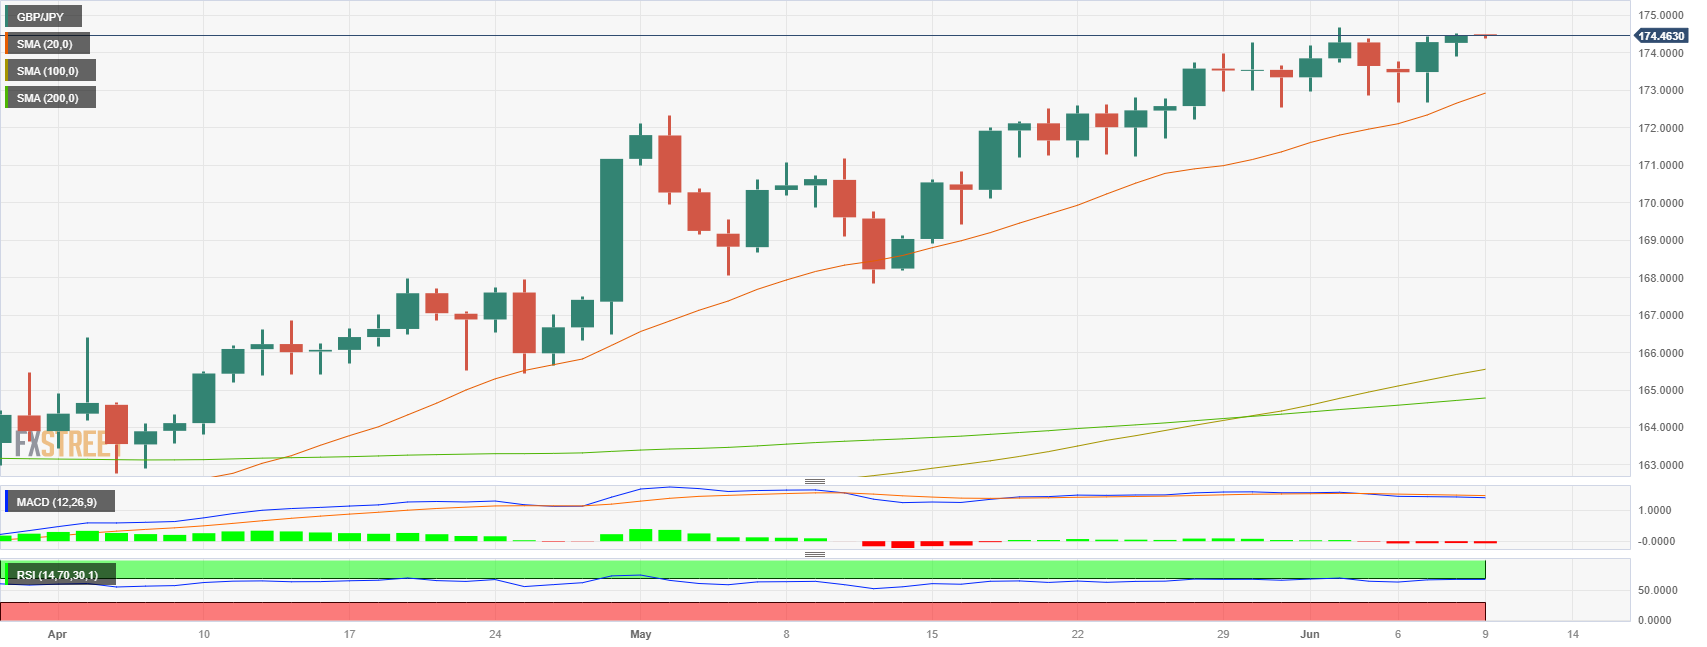
- GBP/JPY advanced slightly on Thursday near the 148.50 mark.
- Technicals still point to overbought conditions, suggesting that a downward correction may be on the horizon.
- The Sterling traded strongly against its major rivals.
The GBP/JPY advanced slightly on Thursday's session, mainly benefiting from weak Q1 Gross Domestic Product (GDP) data from Japan. On the other hand, the Sterling traded strongly across the board, seeing gains against the USD, CHF, EUR and AUD. Furthermore, the JPY’s downside potential is limited as the Yen gets traction on the prospects of the Bank of Japan (BoJ) interventions and cautions market mood.
Cautious markets provide support to the Yen, eyes on BoE’s decision
The Japanese Yen is finding support from the recent expectations of further interventions by the BoJ to bolster the domestic currency. Additionally, the JPY's safe-haven appeal is benefiting from a cautious market sentiment due to concerns about a global economic slowdown, particularly in China.
On the other hand, market expectations are currently pointing towards an anticipated interest rate hike by the Bank of England (BoE) from 4.5% to 4.75% on June 22. Moreover, markets discount a roughly 60% probability that rates will reach a peak of 5.5% later in the year. In that sense, the recent surge in UK core inflation figures to a 31-year high has fueled expectations of a more hawkish stance from the Bank of England, providing traction to the Sterling.
GBP/JPY levels to watch
Technically speaking, the GBP/JPY holds a neutral to bullish outlook for the short term while the bulls seemed to have taken a breather. The Relative Strength Index (RSI) currently stands near 67.00, just below the overbought area after getting rejected by 70.00 since the end of May suggesting that if the bulls fail to break it, a downward correction may come into play.
Upcoming resistance for GBP/JPY is seen at the zone of 174.70 before uncharted territory. On the other hand, the next support levels to watch are the 174.00 zone, followed by the psychological mark at 173.00 and the 172 area.
GBP/JPY daily chart
Chinese inflation data is the highlight of the Asian session on Friday. Later in the day, Canada will release its employment report. Markets cheered weak employment US data that triggered a sharp decline of the US Dollar on Thursday. Investors are getting ready for next week's critical events that include US CPI and Fed and ECB meetings.
Here is what you need to know on Friday, June 9:
Wall Street indexes rose sharply on Thursday, boosted by easing expectations of a hawkish Federal Reserve ahead. A sharp increase in US Initial Jobless Claims pushed the US Dollar further to the downside. The Greenback ended the day looking vulnerable to more losses.
US Treasury yields pulled back, paring Wednesday's advance. The 10-year settled at 3.71%, and the 2-year at 4.50%. European yields also pulled back. The Japanese Yen and metals benefited from the move. Gold prices surged from $1,940 to $1,970, and Silver jumped 3.50%, breaking above $24.00.
On Friday, the economic calendar is light. China will release the Consumer Price Index for May, which is expected to rise 0.3% from a year ago; the Producer Price Index is expected to deepen into negative territory at -4.3%. These numbers would be watched closely amid increasing pressure on Chinese officials for some stimulus and rate cuts.
Euro area GDP was revised down from 0.1% QoQ to -0.1%. The number did not alter European Central Bank expectations for next week. EUR/USD posted the highest daily close in almost a month around 1.0780, and above the 20-day Simple Moving Average. The pair gained more than 80 pips.
Economists at Societe Generale commented on Eurozone data:
This revision is attributable to the revision of German 1Q23 GDP, down from 0% qoq to -0.3% qoq, and of Irish GDP, down from -2.7% qoq to -4.6% qoq. Some observers may hence comment that the euro area has entered a technical recession. We would not go that far.
USD/CAD fell modestly and stabilized around 1.3350/60. The Loonie lagged after Wednesday's rally following the unexpected rate hike from the Bank of Canada. On Friday, Canada will release its May employment report.
Comments from TD Securities regarding Canadian data:
We look for the Canadian economy to add another 25k jobs during the month of May for a deceleration from the recent trend, keeping the unemployment rate at 5.0% for the sixth consecutive month. Wage growth is expected to post a modest decline to 5.1% y/y but remain uncomfortably high for the Bank of Canada.
Canada Employment Preview: Forecasts from five major banks, tight labour market
The AUD/USD and NZD/USD rose sharply on the back of risk appetite and a weaker US Dollar, posting their highest daily close in weeks at 0.6710 and 0.6095, respectively. USD/JPY pulled back from above 140.00 to levels under 139.00.
On a volatile session amid reports of a US-Iran deal, denied by the White House, crude oil prices lost more than 2%. The WTI barrel settled below $71.00.
The improvement in market sentiment dragged cryptocurrencies to the upside. BTC/USD gained 1% to $26,600, and Ethereum climbed to $1,850.
Like this article? Help us with some feedback by answering this survey:
- Gold price rallies into shorts and closes up high.
- Market bets against a Fed hike and US Dollar is under pressure.
The Gold price rallied to a high of $1,970.54 from a low of $1,940.10 on Thursday as the US Dollar and lower bond yields weakened with the United States reporting the largest rise in initial jobless applications since the autumn of 2021. At the time of writing, the Gold price is stationary towards the close of the US forex session at $1,966.
The slump in the US Dollar index, DXY, hit a 2-week low as the Federal Reserve is now expected to leave interest rates unchanged when its policy committee meets next week. The CME Fedwatch tool is seeing only a 25% probability that the central bank will raise rates again.
Initial Jobless Claims last week rose by 261,000, more than expectations for a rise of 236,000 and this sent the yield on the 10-year note to a low of 3.708% and the US two-year note down to 4.475%.
Gold prices continue to toe the line near the psychologically important $1,960/oz range, analysts at TD Securities noted. ''While these liquidations may have dampened the implications of a surprise hike from the Fed this June, gold bugs are not out of the woods just yet.''
Gold technical analysis
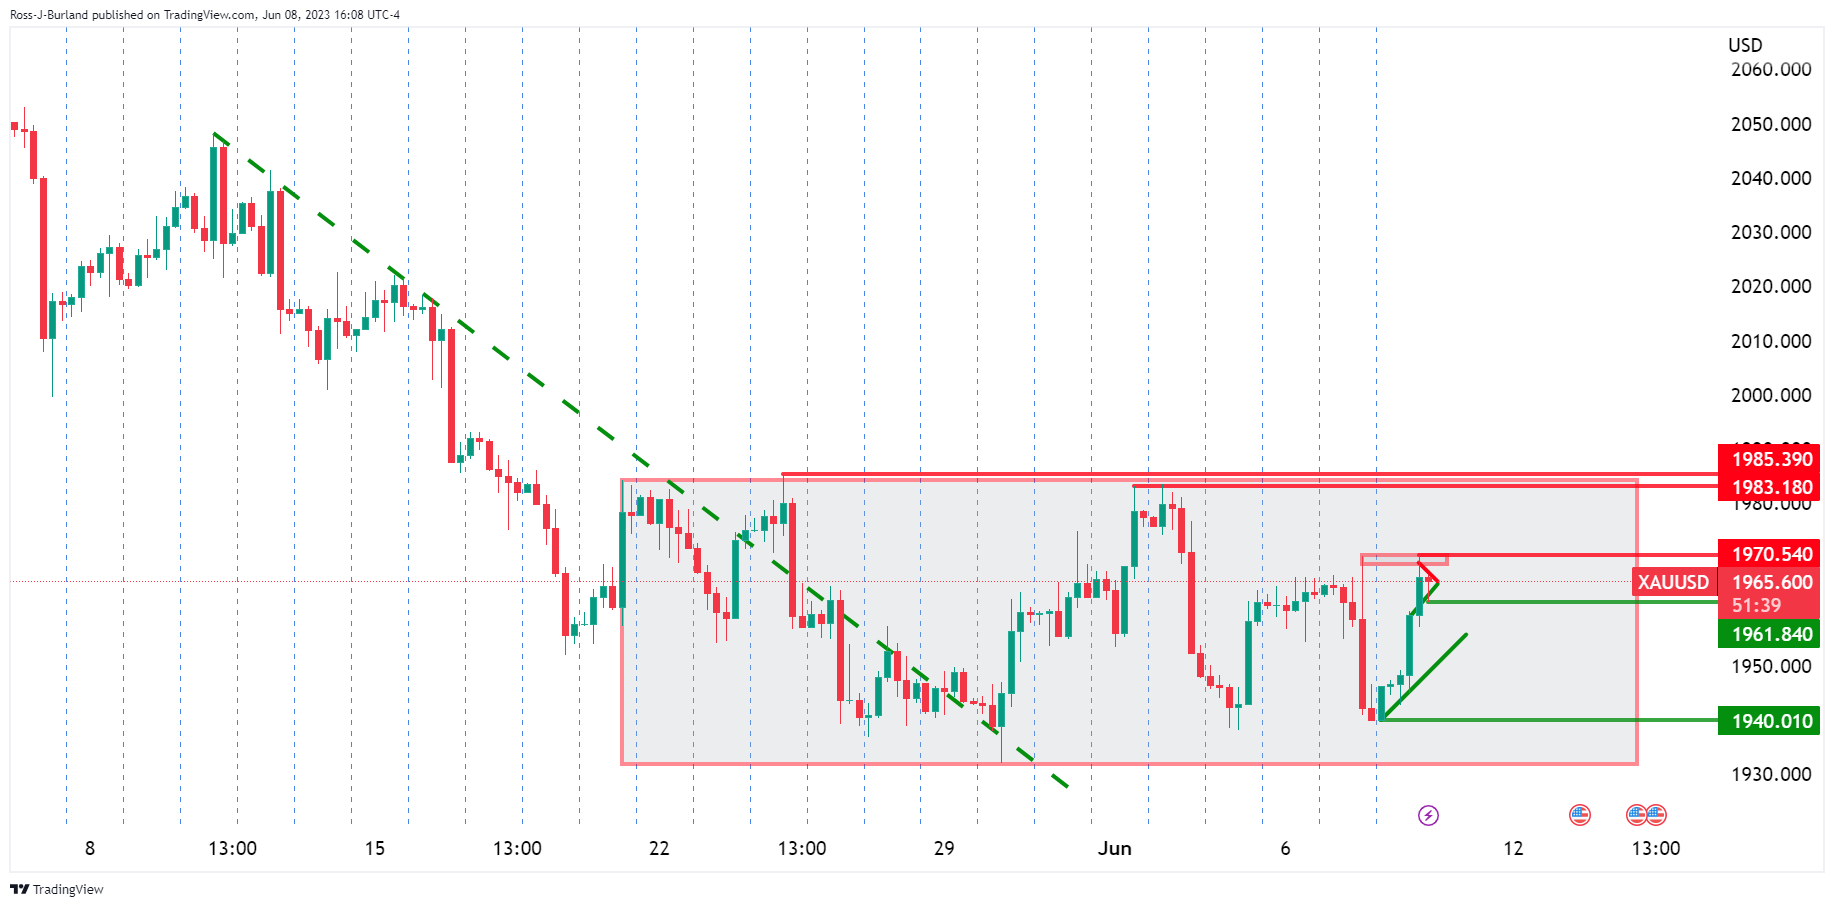
From a 4HR perspective, a bullish bias could be drawn with the price targetting the highs.
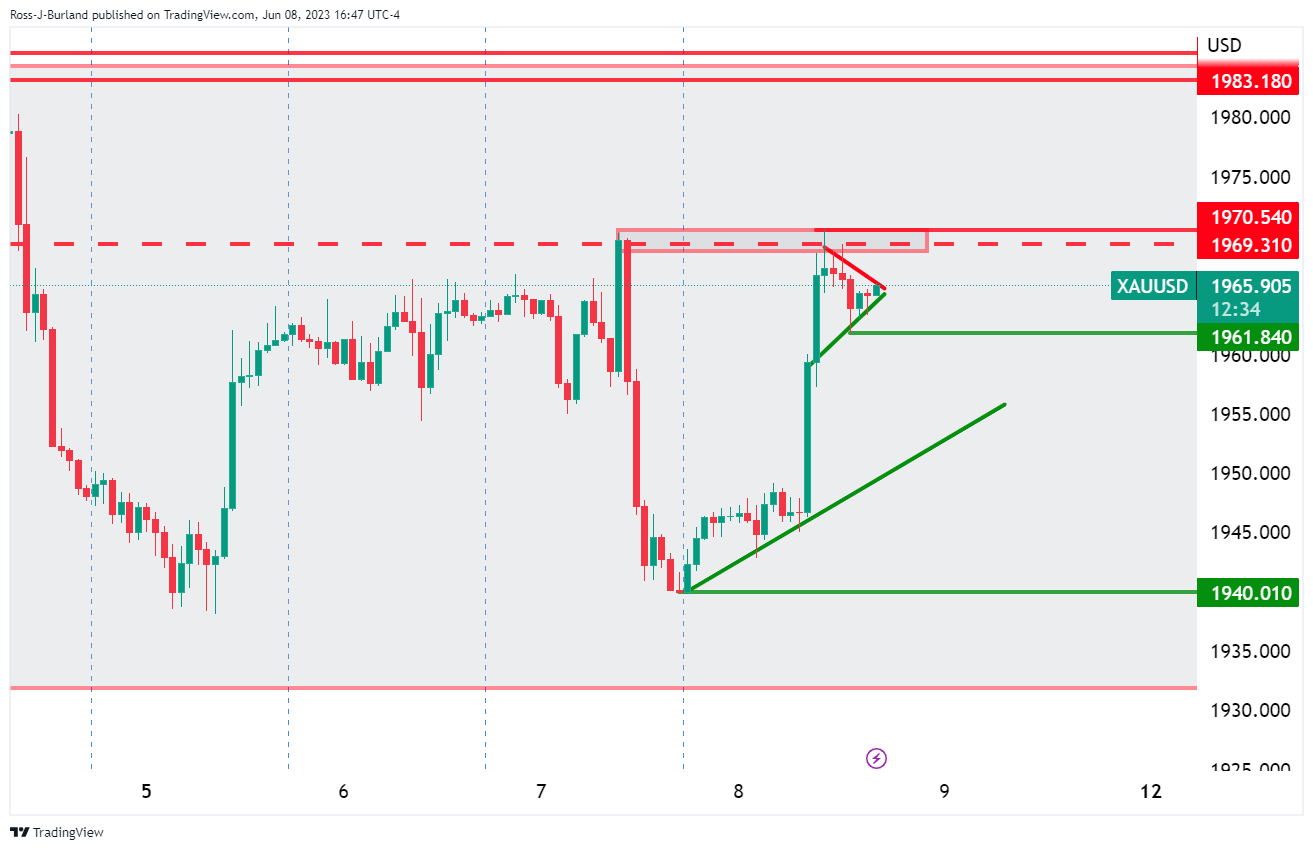
The H1 chart shows the price coiled in a triangle which could lead to a breakout to the upside to target above the equal highs. However, a break below the support of $1,961 opens the risk of a bearish correction.
- EUR/JPY retreated to a daily low near the 149.60 area.
- Euro weakened against the JPY on the back of falling government bond yields.
EUR/JPY trades with mild losses, hovering around the 149.75 area. Data from the Euro zone showed a negative Gross Domestic Product revision to Q1 figures. On the other hand, Japan also reported weak GDP figures on the Asian session but falling German and American yields seem to be favouring the JPY.
German yields decline following EZ Q1 GDP data
Eurostat released that the Gross Domestic Product (GDP) for the Eurozone in Q1 contracted by 0.1% QoQ while markets expected a stagnation. On the other hand, the annualized growth rate of the GDP came in at 1% vs the consensus of 1.2%.
Taking this into consideration, the German yields have declined across the curve as weak economic data from the EZ makes investors think that the European Central Bank (ECB) may not be obliged to continue hiking rates following next week’s meeting where a 25 basis points (bps) hike its already priced in. In that sense, the 10-year bond yield fell to 2.42% seeing a 1.06 % drop on the day, while the 2-year yield sits at 2.94% with a 1.17% slide and the 5-year yielding 2.43% with a 1.06% decline respectively.
On the other hand, Japan's Cabinet Office revealed that the country's Gross Domestic Product (GDP) unexpectedly contracted by 0.3% in Q1, falling short of the anticipated 0.5% expansion. However, the annualized rate showed a positive growth of 2.7% compared to the previous 1.6%. Adding to this, weak economic activity data from Japan may fuel a more dovish stance from the Bank of Japan (BoJ) and hence, continue to weigh on the domestic currency.
EUR/JPY Levels to watch
The EUR/JPY is currently exhibiting a neutral to bullish bias in the short term. Although the bullish momentum has waned, the pair continues to hold above the 20,100 and 200-day Simple Moving Averages (SMA), suggesting that on the bigger picture, the bulls have the upper hand.
On the upside, a move above the 149.80 zone would suggest a continuation of the bullish trend for the EUR/JPY, with the next resistances at the 150.00 area and 150.50 level. On the other hand, in case of further downside, support levels line up at the 20-day SMA at 149.30 and below around the 149.00 area and the 148.50 zone.
-638218526469333449.png)
- US Initial Jobless Claims surge, sparking EUR/USD rally, Treasury yield slump.
- Technical recession in Eurozone overshadowed by hawkish ECB signals.
- Traders eye June 13 US inflation data, FOMC meeting.
EUR/USD soars sharply past the 1.0750 area on Thursday after less stellar jobs data in the United States (US) weakened the US Dollar (USD). That said, the EUR/USD is trading at around 1.0770s after hitting a daily low of 1.0692.
Euro thrives as US Dollar sags weight of soaring jobless claims.
Before Wall Street opened, the EUR/USD climbed on the back of data the US Bureau of Labor Statistics (BLS) revealed. Initial Jobless Claims for the week ending June 3 rose by 261K, up from 232K foreseen by analysts, the highest level since October 2021. That adds to an outstanding Nonfarm Payrolls report last Friday, which showed the economy created 339K jobs, but the rise in the Unemployment Rate was a prelude to the previous week’s data.
EUR/USD reacted upwards, while US Treasury bond yields exerted downward pressure on the greenback. The US 10-year benchmark note rate tumbled seven and a half basis points so far, down at 3.20%, as traders remain optimistic the Federal Reserve (Fed) will not hike rates at the June meeting. The CME FedWatch Tool odds for a 25 bps increase in June are 52%, up from yesterday’s 50.9%.
The US Dollar Index, which measures the performance of a basket of six currencies vs. the buck, collapses by 0.73% at 103.345.
Across the pond, the Eurozone (EU) economy fell into a technical recession, according to Q1 2023, with the Gross Domestic Product (GDP) sliding 0.1% QoQ, unchanged compared to last year’s Q4. On year-over-year data, the EU’s economy slowed to 1% from 1.2% consensus, below the latest quarter of 2022 reading of 1.8%.
Despite the report, recent hawkish commentary by European Central Bank (ECB) officials led by its President Christine Lagarde keeps traders eyeing a 25 bps hike in June and July. Klas Knot, the President of the Dutch central bank and ECB member commented on Wednesday that at least two more walks are needed, and then the ECB could become data-dependent.
Upcoming events
The EU’s agenda will feature the ECB Vice President Luis de Guindos on Friday. The US calendar is empty, with traders eyeing Tuesday, June 13, with the release of inflation data, alongside the beginning of the FOMC’s meeting.
EUR/USD Price Analysis: Technical outlook
The EUR/USD has resumed its upward trajectory after trading sideways for the last nine days. On its way north, the pair claimed the 20-day Exponential Moving Average (EMA) at 1.0772, though they remain shy of cracking the 1.0800 mark. Although the Relative Strength Index (RSI) is about to cross over its bullish area, downside risks remain. If the RSI’s aiming north, the EUR/USD could test the 1.0800 figure, followed by the 50-day EMA at 1.0816. On the flip side, if the RSI shifts downward, the major could drop towards its weekly lows of 1.0660s but firstly must fall below 1.0700.
"We felt it was necessary," said Bank of Canada Deputy Governor Paul Beaudry on Thursday regarding the 25 basis points rate hike announced on Wednesday. He added that strong household spending and high inflation led to the hike.
Beaudry will speak at the Greater Victoria Chamber of Commerce in a few minutes and will answer questions from reporters.
In his economic progress report, entitled 'Are We Entering a New Era of Higher Interest Rates?,' Beaudry argued that a base-case scenario 'where the real neutral rate remains broadly in its pre-pandemic range is possible, but the risks appear mostly tilted to the upside.'
Key takeaways from the speech:
“When we looked at the recent dynamics in core inflation combined with ongoing excess demand, we agreed the likelihood that total inflation could get stuck well above the 2% target had increased. Based on this accumulated evidence, we decided to raise the policy rate to slow demand and restore price stability.”
“We’ll have more to say about all of this in our July forecast.”
“We know this tightening cycle has not been easy for many Canadians. But the alternative—not controlling inflation—would be far worse, particularly for people living on low or fixed incomes. When inflation is stable around the 2% target, it removes the anxiety created by large swings in the cost of living.”
Market reaction:
Beaudry’s comments had no significant impact on the Loonie. The USD/CAD continued to trade steadu around 1.3350/55, modestly lower for the day.
- GBP/USD skyrockets as US Jobless Claims soar; investors expect Fed pause.
- US Treasury bond yields pressured, USD Index collapsed by 0.73%.
- BoE anticipated rate hike cushions GBP amid sparse economic data.
GBP/USD rallies above 1.2500 as labor market data from the United States (US) keeps investors expecting a pause on the Federal Reserve (Fed) hiking cycle. The lack of economic data to be revealed in the UK, alongside traders betting for Bank of England’s (BoE) additional tightening, underpins the GBP/USD. The GBP/USD trades at 1.2550 after hitting a low of 1.2429.
Sterling rally overrides US Dollar amid US jobless claims spike, Fed’s rate hike pause
The GBP/USD advances aggressively following last week’s Initial Jobless Claims report. The US Department of Labor revealed an increase of 261K unemployment claims, above estimates of 232K, the highest record since October 2021. Continuing Claims dropped 37K to 1.757M in the week ending May 27. The report justifies the Fed’s view of skipping an interest rate increase in June, though next week’s inflation report could shift expectations one day before the decision.
In the fixed-income sphere, US Treasury bond yields are under pressure, with 2s and 10s losing four and eight basis points, respectively, at 4.515%, and 3.716%, a headwind for the greenback. The US Dollar Index, which measures the performance of a basket of six currencies vs. the buck, collapses by 0.73%, at 103.345.
Across the pond, estimates that the Bank of England will continue to lift rates cushioned Pound Sterling (GBP) fall at the beginning of the week. Money market futures estimate the BoE will hike 100 bps towards the year-end. That means the Bank Rate will hit 5.50%.
Upcoming events.
Friday’s economic calendar is absent for both countries, but the next week, it will pick up some steam. On Tuesday, the UK will update the labor market status. Meanwhile, the US Consumer Price Index (CPI) will shed some light and could view by Fed officials, who begin the monetary policy meeting on the same day.
GBP/USD Price Analysis: Technical outlook
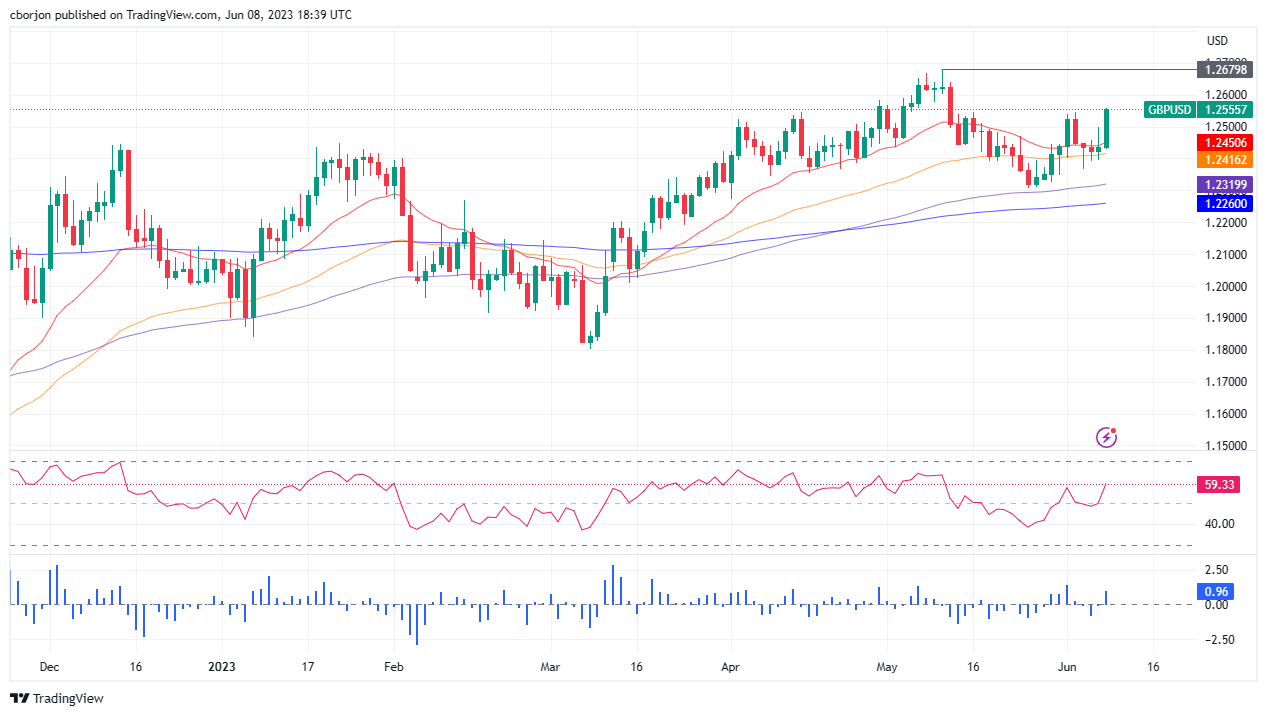
The GBP/USD recovered from its losses and advanced comfortably above 1.2500, with buyers eyeing year-to-date (YTD) highs at around 1.2679. Technical indicators cement the case for an uptrend, with the Relative Strength Index (RSI) reaching new peaks, while the three-day Rate of Change (RoC) depicts buyers gathering momentum. Upside risks lie at the 1.2600 figure, followed by the YTD high, ahead of the 1.2700 mark. On the flip side, the June 7 high-turned support at 1.2499 is the first support, immediately followed by the 20-day Exponential Moving Average (EMA) at 1.2450 before diving to the 50-day EMA at 1.2416.
- AUD/USD gains 0.90% on Thursday following softer-than-expected US jobs data.
- US Dollar weakened as US Initial Jobless Claims jump to the highest since 2021
- Weak labor data softened hawkish bets on the Federal Reserve monetary policy.
The AUD/USD jumped to its highest level since May 11 at the 0.6715 area, gaining more than 90 pips on Thursday’s session. In that sense, US Initial Jobless Claims for the week that ended on June 2 accelerated to the highest in years, softening expectations of a hawkish Federal Reserve (Fed) ahead of next week’s interest rate decision.
Labour market weakness weigh on US bond yields
The US labour market displayed signs of weakness as Initial Jobless Claims for the week ending on June 2 rose to 261K, surpassing market expectations of 235K and above the previous reading of 233K. Consequently, US bond yields experienced widespread declines, with the 2-year, 5-year, and 10-year rates exhibiting declines. This can be attributed to the revised expectations of a less aggressive Fed, resulting from the labour market's display of weakness.
According to the CME FedWatch Tool, there is a higher likelihood 77% of the Fed not raising interest rates in their upcoming meeting, maintaining the target rate at 5.00%-5.25%.
On the other hand, the Aussie continues to benefit from the unexpected 25 basis point hike by the Reserve Bank of Australia (RBA) on Tuesday. Following the decision, RBA Governor Lowe emphasized on Wednesday that while preserving the achievements in the labour market is important, it does not imply that the board will tolerate a sustained increase in inflation restating the hawkish stances of the RBA. In that sense, the expectations of ongoing rate hikes support the Aussie’s gains.
AUD/USD levels to watch
According to the daily chart, the AUD/USD holds a short-term bullish outlook as the Relative Strength Index (RSI) and the Moving Average Convergence Divergence (MACD) suggest that buyers are in control while the pair now trades above the 20-, and 200-day Simple Moving Averages (SMA) en-route towards the 100-day SMA, which stands as strong resistance at 0.6752.
On the upside, the next resistance levels to watch are 0.6785 and 0.6800. In case of consolidating gains, immediate support levels are seen at the 200-day SMA at 0.6690 and the 20-day SMA at 0.6605.
On Thursday, the White House denied a report that the United States and Iran were close to a deal in which Iran would limit its nuclear program in return for sanctions relief.
As a consequence, crude oil prices rebounded, trimming losses. The WTI barrel is down by just 1.50%, hovering around $71.50 after falling earlier to $69.10, the lowest level in a week.
- The NZD/USD pair jumped above 0.6090 showing a 0.95% increase on the day.
- US Initial Jobless Claims for the week ending on June 2 increased to 261K.
- Falling US yields amid dovish bets on the Fed weakened the US Dollar.
The NZD/USD pair experienced a significant surge, surpassing the 0.6090 level and marking a 0.95% increase on the day. This rise was influenced by multiple factors, including the US Initial Jobless Claims for the week ending June 2, which unexpectedly accelerated, fueling dovish expectations towards the upcoming Federal Reserve (Fed) meeting. The USD lost interest on the back of falling US bond yields.
US bond yields decline following Jobless Claims data, eyes on CPI
US Initial Jobless Claims for the week ending on June 2 came in at 261K vs the 235K expected and accelerated from its previous reading of 233K. The rising number of people claiming unemployment benefits in the US hints at weakness in the labour market amid the contractive monetary policy by the Federal Reserve (Fed) which makes investors foresee a less aggressive stance for the upcoming meetings. The CME FedWatch Tool suggests that investors are placing higher probabilities on the Fed refraining from hiking rates in the next meeting scheduled for June 13-14, and instead, keeping the target rate steady at 5.25%.
Against this backdrop, US bond yields slid across the curve with the 2-, 5- and 10-year rates lower on the day.
The forthcoming US Consumer Price Index (CPI) data is expected to play the most crucial role in determining the Fed decision. Analysts predict a decrease in the year-on-year headline inflation rate to 4.2% in May from the previous 4.9%, while the core rate is anticipated to rise to 5.6% from its previous reading of 5.5%.
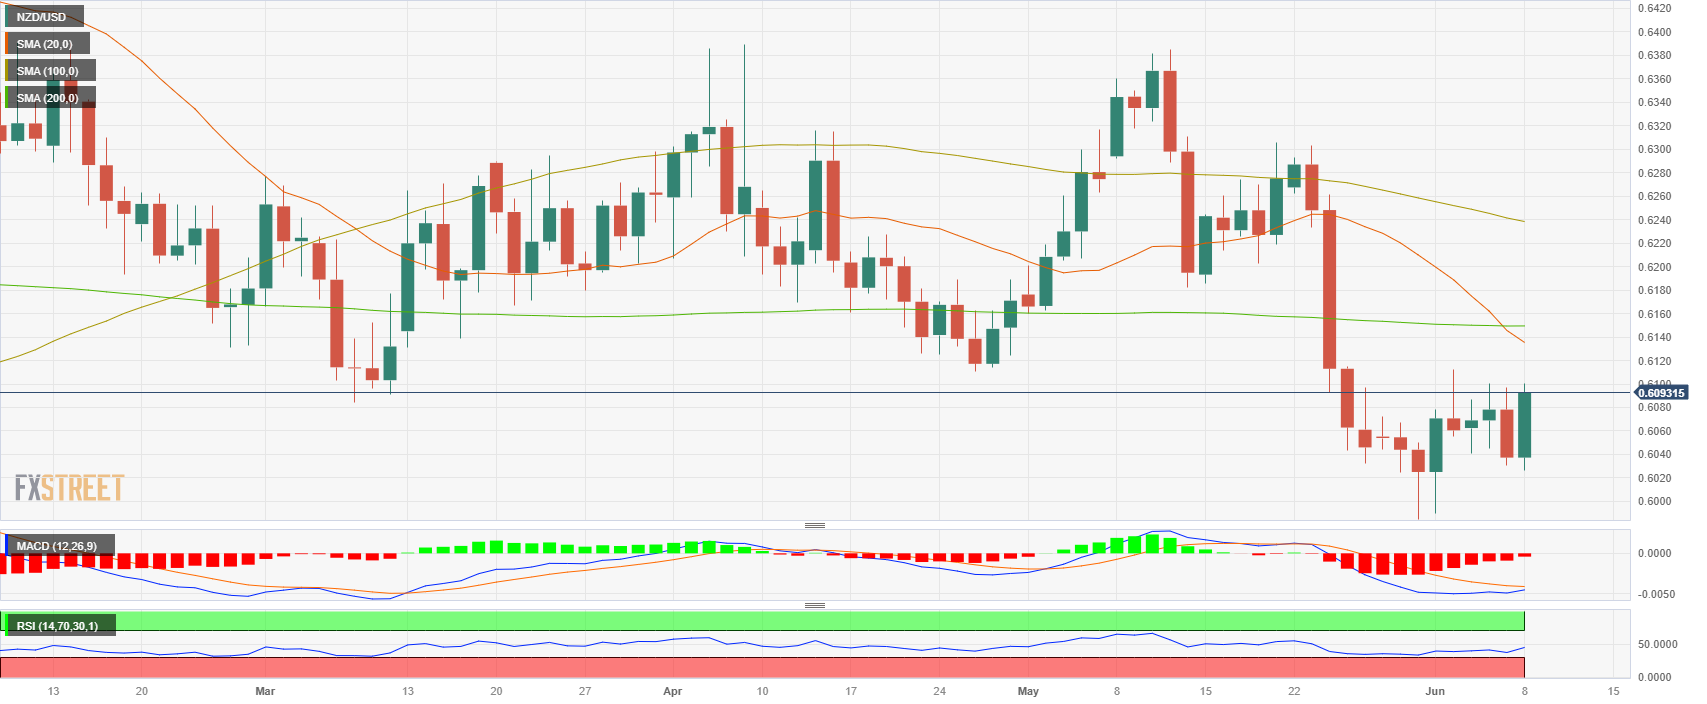
NZD/USD levels to watch
According to the daily chart, the NZD/USD holds a short-term neutral to bearish outlook. Despite technical indicator showing growing bullish momentum, the bearish cross performed by the 20-day Simple Moving Average (SMA) sliding below the 200-day SMA suggests that the negative outlook for the NZD is intact.
On the downside, support levels line up at 0.6050, 0.6030 and the psychological mark of 0.6000. On the other hand, immediate resistance is seen at 0.6115, followed by the 0.6130 - 0.6150 zone, where the mentioned SMAs charted the bearish cross.
NZD/USD daily chart
- Unconfirmed US-Iran deal may unlock Iranian oil exports, pressure WTI prices.
- Saudi Arabia’s crude oil output cut of 1M bpd softens WTI’s decline.
- US Dollar weakness caps WTI’s fall as jobs report spurs rate hike uncertainty.
Western Texas Intermediate (WTI), the US crude oil benchmark, dropped sharply during Thursday’s North American session, courtesy of an “unconfirmed” report that the United States (US) and Iran may be near a temporary nuclear deal, which could unblock sanctions imposed by the US on Iran oil exports. WTI is trading at $70.38, below its opening price by 2.82%.
US crude benchmark plunges amidst rumors of potential Iran sanctions relief
According to Reuters, “Oil fell on a news report, citing sources, that Iran and the US are nearing a temporary deal that would trade some sanctions relief in exchange for reducing Iran’s uranium enrichment.”
If Iran agrees to reduce its uranium-enriched development, it could export up to a million barrels of oil daily and access frozen funds abroad.
WTI’s fall was cushioned by over-the-weekend developments with the Organization of Petroleum Exporting Countries and its allies (OPEC+) meeting on Sunday, with Saudi Arabia agreeing to cut its crude oil output by 1 million barrels per day (bpd) in July, as the cartel tries to boost oil prices.
Another factor that capped WTI’s fall was stockpiles in the US dropped last week by 451K barrels on June 2, as reported by the US Energy Information Administration (EIA). The markets expected a rise of 1M barrels per day.
Notably, the greenback posted several losses after a labor market report indicated that unemployment claims in the United States (US) rose above estimates. After the data, the consensus amongst investors that the US Federal Reserve (Fed) will skip increasing rates at the June meeting weakened the US Dollar. The US Dollar Index (DXY) is down 0.67%, at 103.347.
WTI Price Analysis: Technical outlook
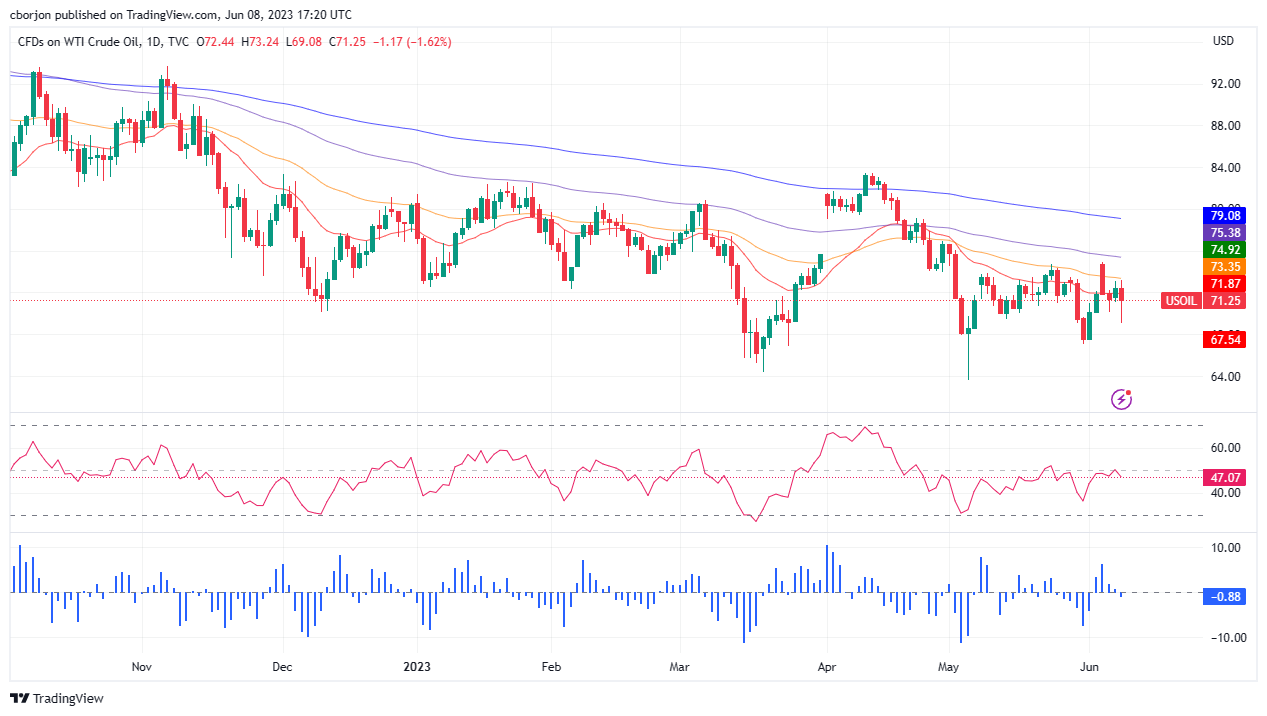
WTI remains neutral to downward bias, yet still below the 20-day Exponential Moving Average (EMA), the first resistance at $71.86. Oil will continue its downtrend past that area and can challenge 2023 year-to-date (YTD) low of $63.61 if sellers claim the May 31 low of $67.08. It should be said that oscillators justify further downside, but if WTI breaks above the 20-day EMA and clears the 50-day EMA at $73.3s5, that could pave the way for further gains.
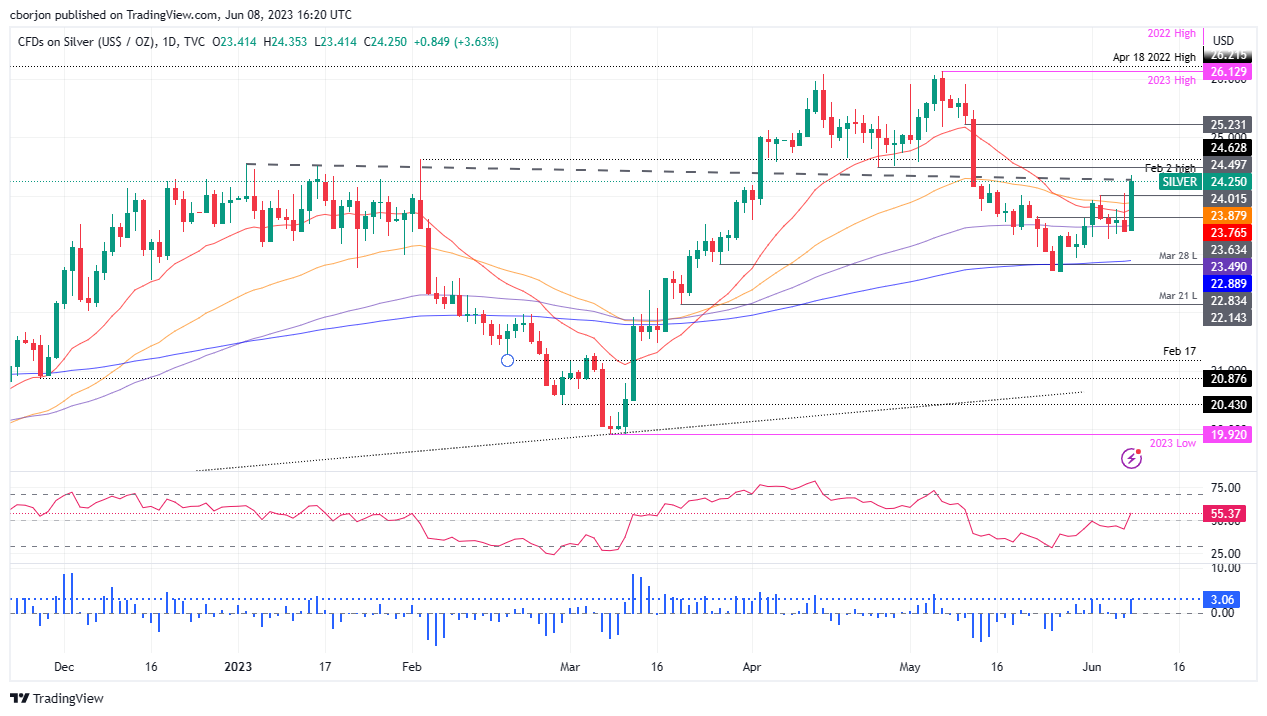
- Silver breaks through ley technical levels, eyes resistance at $24.49.
- Buyers dominate XAG/USD market as RSI crosses 50-midline.
- Falling below the EMA confluence at $23.88-$23.76 could challenge $23.25 weekly lows.
Silver price skyrockets following a worse-than-expected employment report in the United States (US), which sent US bond yields plunging, a headwind for the US Dollar (USD). Therefore, XAG/USD is advancing sharply to new three-week highs, exchanging hands at around $24.18.
XAG/USD Price Analysis: Technical outlook
XAG/USD shifted from neutral biased to upwards, claiming essential technical levels on its way north but capped by resistance at April 25 daily low at $24.49. XAG/USD’s jump in price action spurred a reaction in oscillators, with the Relative Strength Index (RSI) indicator crossing above the 50-midline, while the three-day Rate of Change (RoC) depicts buyers in charge.
Therefore, the XAG/USD path of least resistance is upwards. That said, the XAG/USD first resistance would be $24.49, followed by the $25.00 figure. Once cleared, Silver could rally toward the May 11 high at $25.47, followed by the May 10 swing high at $25.91.
Conversely, if XAG/USD drops below the confluence of the 50 and 20-day Exponential Moving Averages (EMAs) at $23.88-$23.76, that could open the door to challenging weekly lows of $23.25.
XAG/USD Price Action – Daily chart
- US Initial Jobless Claims tops estimates, toppling USD/JPY; UST yields tumble.
- Japan’s economy outperforms with 2.7% GDP; technical recession avoided.
- Investors eye June 13 US inflation figures, Fed meeting amid USD dynamics.
USD/JPY dropped close to 0.70% on Thursday after a jobs report portraying the labor market is easing in the United States (US), which justifies the US Federal Reserve (Fed) skip stance for June’s monetary policy meeting. After hitting a daily high of 140.22, the USD/JPY is trading at 139.13 at the time of writing.
Yen rises as Wall Street bounces, US Dollar fumbles amid labor market easing
Wall Street trades with gains while tumbling US Treasury bond yields, bolstering the Japanese Yen (JPY), which found renewed life and is appreciating against most G8 FX currencies. The US Bureau of Labor Statistics (BLS) stated that unemployment claims for the last week rose above estimates of 232K and reached 261K, its highest level since October 2021. The same data revealed that Continuing Claims fell by 37K to 1.757 M during the week ending May 27.
The USD/JPY dropped after the release, following the direction of the US 10-year Treasury bond yield, which dropped six and a half basis points (bps) as traders began to price in the first Fed pause after the data. At the same time, the US Dollar Index (DXY), which measures the buck’s performance against a basket of currencies, drops 0.60%, at 103.395, below its 20-day Exponential Moving Average (EMA).
On the Japanese front, its economy grew above than initially thought in the first quarter, with GDP coming at 2.7% YoY, vs. forecasts of 1.9%, showing the Japanese economy is developing more resilient than its global counterparts. Notably, data revised out a technical recession as 2022 Q4 was upward revised to 0.4% QoQ. It should be said that growth was driven by inventories, a sign that demand is decelerating.
Upcoming events
The US economic agenda would reveal the latest inflation figures on June 13, when the Federal Reserve begins its two-day meeting to set monetary policy, while a light economic calendar on the Japanese side would lean USD/JPY traders depending on US Dollar dynamics.
USD/JPY Price Analysis: Technical outlook
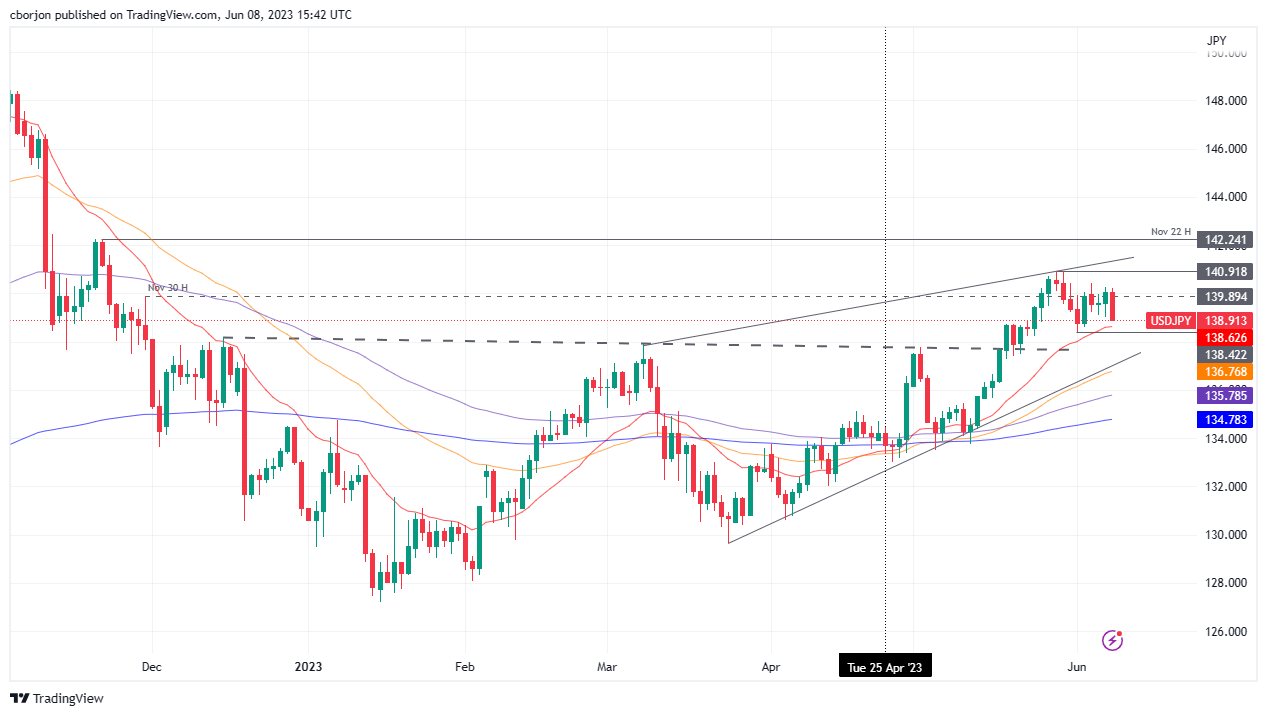
USD/JPY consolidates at around the 139.00-140.40 range for the fourth straight day, unable to break above/below the range, though remaining upward biased as shown by the daily moving averages (MAs) staying below the exchange rate. The pullback is about to test the 20-day EMA at 138.64, which, if broken, would extend the pair slide towards May 2 high-turned support at 137.77. For a bullish continuation, the USD/JPY must surpass the 140.00 mark and challenge the weekly high of 140.45.
Gold has stabilized above the 100-Day Moving Average, with further ranging expected for now, economists at Credit Suisse report.
$2,063/75 record highs posted in 2020 and 2022 will prove a tough barrier
Gold has moved into a range over the past week, helped by the stabilization in US Real Yields and after the hold above the 100-DMA at $1,940. Although this is not an average we typically track, it did floor the market during the February setback earlier this year.
Going forwards, we still expect pivotal resistance at the $2,063/75 record highs posted in 2020 and 2022 will prove a tough barrier given the tiring short-term momentum picture, with a triple bearish momentum divergence still in place. This suggests further rangebound price action is the most likely outcome for now.
Canada’s employment data for May will be reported by Statistics Canada on Friday, June 9 at 12:30 GMT and as we get closer to the release time, here are forecasts from economists and researchers at five major banks regarding the upcoming jobs figures.
The North American economy is expected to have added 23.2K jobs after creating 41.4K positions in April. The unemployment rate is expected to rise a tick to 5.1%. If so, it would be the first increase in the unemployment rate since August 2022. Meanwhile, the Participation Rate is expected to have remained stable at 65.6%.
TDS
We look for job growth to slow to 25K in May for a deceleration from the recent trend of 57K, keeping the unemployment rate stable at 5.0%. We look for service-sector hiring to drive the headline print, alongside a rebound in full-time employment after the pullback in April. We also look for wage growth to remain elevated at 5.1%, down 0.1pp from last month.
RBC Economics
We expect May employment in Canada to post another increase of 20K, building on the ~250K surge between January and April. But the unemployment rate is still expected to tick higher, as the amount of ‘excess’ labour demand continues to ease. Job vacancies are down almost 20% from peak levels as of March, consumer delinquencies have been edging higher, and worker quit rates have been slowing in recent months.
NBF
The job market has been extraordinarily strong recently, with headcounts expanding by 344K over the past 6 months. And while signs of an upcoming reversal remain few and far between, we think such a pace is unsustainable in the medium term. We thus expect more modest gains in the coming months, starting with a 20K result in May. Despite this improvement, and assuming that the participation rate remained unchanged at 65.6%, the unemployment rate could still increase by one-tenth to 5.1%, the result of yet another sharp expansion of the labour force.
Citi
We expect employment to remain flat in May, with an increase in the unemployment rate to a still-low level of 5.2%. Softer employment could be partly due to wildfires in May that constrained activity. Still, we expect some declines in employment to be offset with continued strong immigration, with a higher participation rate. Hours worked will be a useful more-timely indication of how overall activity is evolving than other activity data. We expect hourly wages of permanent employees to remain strong in May with a 5.1% YoY increase. Wages, and employment data broadly, will remain an important factor to watch for risks of possibly further rate hikes beyond June.
CIBC
Rapid population growth is creating a larger pool of potential workers, but cooling demand due to past interest rate hikes should see employment gains start to undershoot growth in the population. While the 20K in jobs we predict for May would have previously been considered solid, in 2023 it would be weak enough to see the unemployment rate rise a tick to 5.1%.
- US Jobless Claims unexpectedly jump to the highest level since October 2021.
- The US Dollar weakens across the board after the data, with the DXY dropping below 103.50.
- The EUR/USD is moving towards last week's high, approaching 1.0800.
The EUR/USD accelerated to the upside following the release of employment data from the US. The pair is trading at 1.0770/75, the highest level since last Friday, supported by a slide of the US Dollar across the board.
Bad news for the Dollar
"The Labor Department's weekly report showed that Initial Jobless Claims jumped to 261K in the week ended June 3, which was above market expectations of 235K. It is the highest level since October 2021. The US Dollar weakened further after the data, falling to fresh daily lows against most of its rivals and US yield turned to the downside. The DXY tumbled to test weekly lows under 103.40.
The employment figures eased expectations about a potential rate hike from the Federal Reserve next week. The FOMC will announce its decision on Wednesday, and the consensus is for the Fed to keep rates unchanged.
Earlier on Thursday, data from Eurostat showed that the Eurozone economy contracted 0.1% during the first quarter, revised from 0.0%. Next Thursday, the European Central Bank (ECB) is expected to announce a rate hike, despite weak activity figures. As ECB President Lagarde said, inflation remains too elevated, in line with comments from other members of the Governing Council.
EUR/USD moving away from 1.0700
During the last few days, the EUR/USD has been unable to sustainably move away from the 1.0700 level. However, on Thursday, the pair appears to be breaking to the upside. Euro's momentum seems strong, and the pair is about to test last week's highs around 1.0780. Above that level, attention would turn to 1.0800/05.
The immediate support is now seen around 1.0740, followed by the 1.0700/05 area, which contains the 20-period Simple Moving Average (SMA) in the 4-hour chart. A slide below this level would negate the current bullish bias in the short term.
Technical levels
EUR/USD remains flat for the year. Economists at Bank of America analyze the pair’s outlook.
A sustained rally in EUR/USD would require a shift in the Fed's stance
As long as global and especially US inflation remain high, EUR/USD is likely to stay weak, with further downside potential during the inevitable hard landing.
A sustained rally in EUR/USD would require a shift in the Federal Reserve's stance, while for now, the carry trade is also exerting downward pressure on the EUR.
While non-USD EUR crosses can remain strong, further upside may be limited. In the long term, EUR strength will depend on the ECB's increasingly difficult commitment to the inflation target compared to the rest of the G10.
The BoC resumed tightening with another 25 bps rate hike in June. Economists at TD Securities analyze USD/CAD outlook after the surprising decision.
USD/CAD needs to move lower to reprice the hike
The Bank of Canada surprised markets with a 25 bps rate hike. While the market was pricing in around a 50/50 chance of a hike, USD/CAD needs to move lower to reprice the hike.
We continue to see a break below 1.33 as a path of least resistance, setting up a test of the 2023 lows around 1.3260.
- USD/TRY moves further up and records new highs near 23.4000.
- Investors continue to adjust to the ongoing “intentional devaluation”.
- Many observers see the lira depreciating to the 28.0000 region.
The continuation of the intense sell-off in the Turkish lira lifts USD/TRY to a new all-time peak near the 23.4000 mark on Thursday.
USD/TRY risks a deeper pullback
Gains in USD/TRY continue to accelerate on Thursday, as the pair has already advanced around 12% since the opening bell on Monday and following the appointment of M. Simsek as Treasury and Finance Minister (on Saturday).
Indeed, the bearish tone in the lira remains everything but abated in a context where market participants keep monitoring the "intentional devaluation" implemented by the new economic team designated by Erdogan’s administration in the wake of the victory in the May 28 elections.
In the meantime, the sharp retracement in the lira gathered extra pace after national lenders stopped selling US dollars to defend the currency this week, a move deemed quite rational and more in line with economic orthodoxy.
So far, the Turkish currency has already depreciated over 25% since the start of the new year, while the drop has reached more than 170% since the Turkish central bank (CBRT) embarked on its easing cycle in August 2021.
What to look for around TRY
USD/TRY maintains its upside bias well in place, always underpinned by the relentless meltdown of the Turkish currency.
In the meantime, investors are expected to closely monitor upcoming decisions on monetary policy, particularly after President R. T. Erdogan named former economy chief M. Simsek as the new finance minister following the cabinet reshuffle in the wake of the May 28 second round of general elections.
The appointment of Simsek has been welcomed with optimism by market members in spite of the fact that it is not yet clear whether his orthodox stance on monetary policy can survive within Erdogan’s inclination to battle inflation via lower interest rates.
In a more macro scenario, price action around the Turkish lira is supposed to continue to spin around the performance of energy and commodity prices - which are directly correlated to developments from the war in Ukraine, broad risk appetite trends, and dollar dynamics.
Key events in Türkiye this week: Industrial Production (Friday).
Eminent issues on the back boiler: Persistent skepticism over the CBRT credibility/independence. Absence of structural reforms. Bouts of geopolitical concerns.
USD/TRY key levels
So far, the pair is gaining 0.80% at 23.3573 and faces the next hurdle at 23.3881 (all-time high June 7) followed by 24.00 (round level). On the downside, a break below 19.7356 (55-day SMA) would expose 19.3401 (100-day SMA) and finally 18.9416 (200-day SMA).
The MXN recaptured 17.50 last week and rallied to a fresh cycle high of 17.32 yesterday against the US Dollar. Economists at Société Générale analyze USD/MXN technical outlook.
Signals of a meaningful rebound are not yet visible
USD/MXN failed to overcome its 50-DMA near 18.00 recently and has cut below the low of last month denoting resumption in downtrend.
Daily MACD has started posting positive divergence however signals of a meaningful rebound are not yet visible.
Holding below the peak formed earlier this week near 17.60, the pair is expected to head lower. Next potential objectives are at projections of 17.30 and 17.10/16.95.
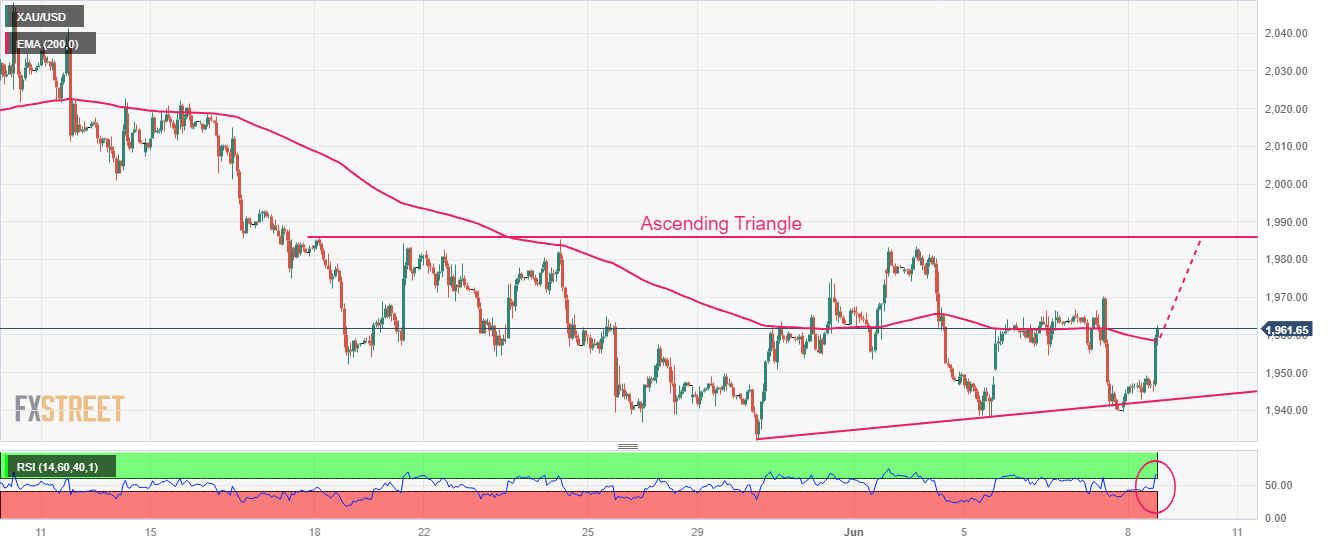
- Gold price has galloped to near $1,960.00 as US weekly jobless claims hit a 19-month high.
- The market mood could turn cheerful as higher jobless claims would trim hawkish Fed bets.
- Gold price has managed to defend a breakdown of the Ascending Triangle chart pattern.
Gold price (XAU/USD) has shown a sharp run after the release of higher-than-expected United States weekly jobless claims data. The precious metal has jumped to near $1,960.00 as the US Department of Labor reported a significant jump in the initial claims by 28K to 261K for the week ending June 02 while the street was anticipating a figure of 235K.
S&P500 futures are likely to open on a cautious note, however, the market mood could turn cheerful as higher jobless claims would trim hawkish Federal Reserve (Fed) bets. The US Dollar Index (DXY) has printed a fresh four-day low at 103.60 higher unemployment claims would ease out severe heat in the United States labor market.
19-month high US jobless claims are expected to fetch dovish commentaries from investment banking firms and Fed policymakers. Upbeat labor market conditions were the major catalyst, which was forcing Fed policymakers for supporting more interest rate hikes. The impact of higher jobless claims can also be seen in the US Treasury yields. The yields offered on 10-year US government bonds have sharply dropped below 3.78%.
In the longer-term, easing labor market conditions would also slim resilience in consumer spending and would further ease inflationary pressures.
Gold technical analysis
Gold price has managed to defend a breakdown of the Ascending Triangle chart pattern formed on an hourly scale. The precious metal has rebounded sharply and is approaching the horizontal resistance of the aforementioned pattern is placed from May 19 high at $1,983.29. While the upward-sloping trendline of the chart pattern is plotted from May 30 low at $1,932.12.
Gold price has climbed above the 200-period Exponential Moving Average (EMA) at $1,958.37, which indicates that the long-term trend has turned bullish.
Meanwhile, the Relative Strength Index (RSI) (14) has climbed above 60.00, which indicates that the upside momentum has been triggered.
Gold hourly chart
Economist at UOB Group Ho Woei Chen, CFA, comments on the recent trade balance figures in the Chinese economy.
Key Takeaways
China’s exports and imports (USD terms) both contracted in May. The decline in exports came in worse than expectation and contributes to a string of negative data indicating that China’s growth momentum has likely slowed in 2Q23.
Further contraction in exports of high-tech products such as semiconductors by a sharp -25.8% y/y suggests that the outlook for the electronics sector has remained weak. Shipments of consumer goods such as handbags, clothing and footwear also weakened in May.
Imports of motor vehicles, plastics, electronics and computers led the drop in May while aircraft and energy-related imports such as refined petroleum products and coal remained robust.
Taking into account the underperformance in imports to-date as a result of more prolonged weakness in both domestic and external demand, we update our forecast for China’s imports to contract by -2.0% in 2023 (previous forecast: +2.0%) while maintaining our forecast for exports to contract by -3.0% this year.
S&P 500 has surged higher for a test of next key resistance at 4,312/4,325, analysts at Credit Suisse report.
Only below 4,104 would be seen to mark a near-term top
The S&P 500 has surged higher and strength has already extended to the cusp of next key resistance at the summer 2022 high and 61.8% retracement of the entire 2022 fall at 4,312/4,325. Our bias remains to try and look for a fresh cap here and correction lower.
Should strength directly extend for a weekly close above 4,325, then this would be seen to mark an important break higher, opening the door to resistance next at 4,500/4,535.
Support is seen at 4,221 initially, beneath which can ease the immediate upside bias, with support then seen next at 4,166. Only below 4,104 though would be seen to mark a near-term top and a more decisive failure at 4,312/4,325.
- USD/CHF has fallen like a house of cards as US weekly jobless claims rose to a 19-month high at 261K.
- Easing US labor market conditions might force the Fed to go for a neutral policy.
- SNB Jordan said it would not be a good idea to wait for inflation to rise and then raise interest rates.
The USD/CHF pair has refreshed its weekly low at around 0.9030 after the release of 19-month high United States Initial Jobless Claims in the early New York session. Soaring jobless claims have dragged the US Dollar Index (DXY) sharply lower to near 103.60. The USD Index was auctioning in a range of 103.67-104.36 for the past two trading sessions and it seems that it is coming out of the woods now.
S&P500 futures have turned positive as a significant jump in the weekly initial jobless claims numbers indicates that tight labor market conditions are releasing some heat. Overall market mood has turned upbeat and the appeal for the risk-perceived assets has strongly improved.
As per the report, US weekly jobless claims for the week ending June 02 rose by 28K to 261K while the street was anticipating a figure of 235K, upwardly revised from the prior release of 233K. A major economic indicator that has been keeping the odds of one more interest rate hike from the Federal Reserve (Fed) is the strong labor market and now surprisingly higher jobless claims have increased support for a neutral interest rate policy by the Fed.
The impact of higher jobless claims is not restricted to the USD Index only. US Treasury yields have also come under extreme pressure. The yields offered on 10-year US government bonds have sharply dropped more than one percent to 3.78%.
The strength behind the dive move in the Swiss Franc asset has also come from hawkish commentary by Swiss National Bank (SNB) Chairman Thomas. J Jordan. SNB Jordan said it’s really important to bring Swiss inflation to a level of price stability," He further added it would not be a good idea to wait for inflation to rise and then raise interest rates. Investors should note that the SNB has already raised interest rates to 1.50%.
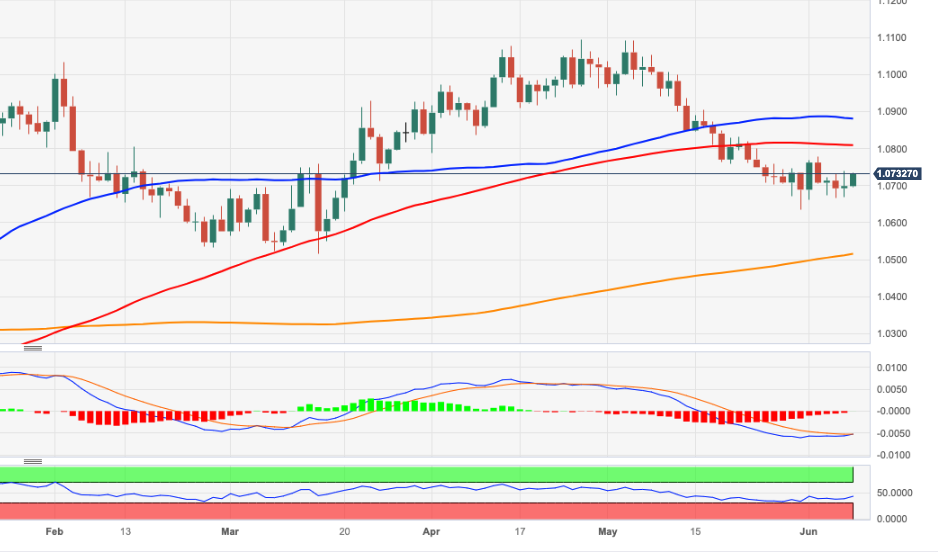
EUR/USD continues to pivot around the 1.07 zone. Economists at Scotiabank analyze the pair’s technical outlook.
EUR/USD remains well-supported on dips to the upper 1.06s
The EUR remains well-supported on dips to the upper 1.06s and is developing some positive trend momentum on the 1 and 6-hour oscillators.
Flatter trading since late May does suggest the sustained decline in spot over the past month is stabilizing but the EUR needs to make more obvious progress (above minor resistance at 1.0740 and firmer resistance at 1.0785) to improve. A somewhat higher close on the week would be a plus.
- GBP/USD is approaching the 1.2500 resistance as the USD Index has dropped further.
- The street is majorly divided about Federal Reserve’s interest rate policy for June.
- The absence of the UK’s inflation softening signs indicates that BoE’s current interest rates are far from over.
The GBP/USD pair is approaching the psychological resistance of 1.2500 in the European session. The Cable has been awarded strength as the US Dollar Index (DXY) has extended its downside journey. The USD Index has come under intense pressure as the street is majorly divided about Federal Reserve’s (Fed) interest rate policy for June.
S&P500 futures have posted nominal losses in Europe as an absence of potential triggers has made investors anxious. Next week is going to be full of economic events as the United States Consumer Price Index (CPI) release will be followed by an interest rate decision by the Federal Reserve (Fed).
The USD Index has printed a fresh day's low at 103.77. For the past two trading sessions, the USD Index is consolidating in a range of 103.67-104.36 amid the preparation of crucial economic events. Contrary, the demand for US government bonds has also remained weak, which has pushed the 10-year US Treasury yields above 3.82%.
Meanwhile, the street is puzzled whether to bank upon a commentary by Fed chair Jerome Powell that further rate hikes are less certain due to tight credit conditions or keep strong labor market conditions the main source.
On the Pound Sterling front, investors will keep focus on next week’s Employment data. Economists at ING said second or third-tier United Kingdom data has been quite mixed recently, but the main event on the data front will be next Tuesday's release of jobs and wages data. We see that as a negative event risk for the Sterling, where wage growth could continue to slow and take some of the steam out of the 100 bps+ Bank of England tightening expectations still priced in by money markets.
The street believes that the BoE’s current interest rates are far from peaking amid an absence of signs of inflation softening. Further operations by BoE Governor Andrew Bailey will be important to watch as investors are excited to see how the showman would keep the promise of halving inflation by year-end made by UK PM Rishi Sunak.
- Initial Jobless Claims in the US rose by 28,000 in the week ending June 3, to the highest level since October 2021.
- Continuing Jobless Claims decreased by 37,000 in the week ending May 27, to the lowest since February.
- US Dollar Index drops to fresh daily lows after report.
Initial Jobless claims totaled 261,000 in the week ending June 3, the weekly data published by the US Department of Labor (DOL) showed on Thursday. The print follows the previous week's 233,000 and came in above market expectations of 235,000. It is the highest reading since October 2021.
“The 4-week moving average was 237,250, an increase of 7,500 from the previous week's revised average. The previous week's average was revised up by 250 from 229,500 to 229,750”, the DOL added in its press release.
Continuing Claims declined by 37,000 in the week ended May 27 to 1.757 million below market estimates of 1.8 million. It is the lowest reading since February. The 4-week moving average was 1.784 million a decrease of 12K from the previous week's average.
Market reaction:
The US Dollar Index extended its losses after the report, falling to fresh daily lows below 103.70. The EUR/USD rose towards 1.0750, and the USD/JPY dropped further below 139.50.
"It's really important to bring Swiss inflation to a level of price stability," Swiss National Bank (SNB) Chairman Thomas Jordan said on Thursday, per Reuters.
Jordan further argued that it would not be a good idea to wait for inflation to rise and then have to raise interest rates. "When inflation remains under 2% for a long time, we don't have a problem," Jordan concluded.
Market reaction
USD/CHF came under heavy bearish pressure following these comments and USD/CHF was last seen trading at 0.9045, where it was down 0.6% on a daily basis.
- EUR/USD adds to the weekly rebound north of 1.0700
- Further gains could challenge the June top around 1.0780.
EUR/USD gathers further steam and flirts with daily highs above 1.0730 on Thursday.
A more serious bullish attempt is expected to dispute the so far monthly high at 1.0779 (June 2). The selling pressure is seen mitigating somewhat once this level is cleared and could encourage the pair to test the round level at 1.0800 just ahead of the interim 100-day SMA, today at 1.0807.
Looking at the longer run, the constructive view remains unchanged while above the 200-day SMA, today at 1.0514.
EUR/USD daily chart
- USD/CAD has shown recovery to near 1.3360 despite a correction in the USD Index.
- The BoC surprisingly raised interest rates due to resilience in the Canadian economy.
- The oil price has renewed its three-day high at $73.20 as various state-run banks in China have slashed their lending rates.
The USD/CAD pair has witnessed buying interest around 1.3340 in the last London session. The Loonie asset has rebounded to near 1.3360 despite a solid recovery in the oil price and soaring expectations of one more interest rate hike from the Bank of Canada (BoC).
S&P500 futures are holding nominal losses in the European session, portraying a cautious market mood. The risk profile has turned filthy as investors are anticipating that the Federal Reserve (Fed) will not pause its policy-tightening spell. Earlier, Fed chair Jerome Powell announced that further interest rate hikes are less certain as tight credit conditions by United States’ regional banks are effecting barricading inflation from showing true colors.
The US Dollar Index (DXY) is consistently contracting right from the first tick made on Thursday. On a broader note, the USD Index is demonstrating topsy-turvy moves in a wide range amid an absence of a potential trigger this week. Investors are preparing for the US Consumer Price Index (CPI) (May) data, which will be announced on Tuesday.
The Canadian Dollar is struggling to dominate the US Dollar despite a surprise rate hike announcement by the Bank of Canada (BoC). BoC Governor Tiff Macklem raised interest rates surprisingly by 25 basis points (bps) to 4.75%. Considering the resilience of the Canadian economy due to a solid labor market, and consumer spending, current monetary policy not remained restrictive enough to tame stubborn inflation.
The BoC has kept doors open for further interest rate hikes if inflation continues to remain persistent.
Meanwhile, the oil price has renewed its three-day high at $73.20 as various state-run banks in China have slashed their lending rates for supporting the economic recovery. It is worth noting that Canada is the leading exporter of oil to the United States and higher oil price supports the Canadian Dollar.
USD/CAD closes on key support at 1.3330. Economists at Scotiabank analyze the pair’s technical outlook.
USD/CAD retains a soft undertone on the charts
USD/CAD retains a soft undertone on the charts despite failing to crack key support at 1.3330 in yesterday’s run lower. This support (tested four previous times this year) has been rock solid so a sustained push lower will be a significant technical event.
Trend momentum studies are tentatively leaning bearishly for the USD across the shorter and longer-term DMI studies. This tilts risks to the downside for spot and should limit the USD’s ability to rebound.
A break under 1.3330 targets a test of 1.3230 (the Nov low) fairly quickly but broader implications would suggest the risk of a drop towards 1.27/1.28 in the next couple of months.
EUR/USD stays seen on course to test a cluster of key supports at 1.0557/1.0501, in the view of analysts at Credit Suisse.
Looking for a fall to a cluster of key supports at 1.0557/1.0501
The decline in the EUR/USD has paused near term but we view this as a temporary breather.
We maintain our negative tactical and 3-6 month outlook for our target of the lower end of the channel, now at 1.0557. With further key supports seen just below here, firstly at the March low at 1.0524/16 and then the 200-DMA, now at 1.0512, our bias remains to look for a floor in this 1.0557/01 zone for now for a fresh and potentially lengthy consolidation phase.
Resistance at 1.0739/81 ideally caps on a closing basis to keep the immediate risk lower. Above can see a recovery back to 1.0832/34, potentially the 55-DMA, now at 1.0883, but with this expected to remain tough resistance.
- EUR/GBP is trading sideways as investors have sidelined ahead of the BoE-ECB policy.
- Broadly, the asset has delivered a breakout of the Falling Channel chart pattern.
- The RSI (14) has shifted its broader trading range from 20.00-60.00 to the bullish range of 40.00-80.00.
The EUR/GBP pair has remained inside the woods around 0.8600 as investors have sidelined ahead of the interest rate decisions by the Bank of England (BoE) and the European Central Bank (ECB). Considering the fact that inflation in Eurozone and the United Kingdom is still stubborn despite the long practice of raising interest rates, the BoE and the ECB are expected to raise rates further.
The street is anticipating that both central banks will raise their current rates by 25 basis points (bps). This will push ECB’s policy rate to 4% while BoE’s financing rate would jump to 4.75%. An occurrence of the same will keep the ECB-BoE policy divergence steady in absolute terms.
EUR/GBP has delivered a breakout of the Falling Channel chart pattern formed on an hourly scale in which each pullback is considered as a selling opportunity by the market participants. A breakout of the aforementioned chart pattern warrants a bullish reversal.
The cross has climbed comfortably above the 50-period Exponential Moving Average (EMA) at 0.8600, which indicates that the short-term trend has turned positive.
Meanwhile, the Relative Strength Index (RSI) (14) has shifted its broader trading range from the bearish range of 20.00-60.00 to the bullish range of 40.00-80.00. The momentum indicator is consistently taking support near 40.00.
Going forward, an upside move above the intraday high at 0.8614 will drive the asset toward June 05 high of 0.8636 and May 25 low at 0.8666.
In an alternate scenario, a downside move below June 01 low at 0.8568 would drag the cross toward a six-month low near 01 December 2022 low at 0.8547 followed by 12 August 2022 high at 0.8493.
EUR/GBP hourly chart
-638218204548601605.png)
GBP/USD grinds higher as markets focus on BoE tightening risks, economists at Scotiabank report.
Gains are choppy
The OECD noted yesterday that the UK will have one of the highest rates of inflation among the major economies this year (6.9%). That’s not a good look for the Pound but it should also be no surprise that markets are still pricing close to another 100 bps of BoE tightening over the coming months to combat price gains.
Cable continues to grind higher after a solid overall performance last week but gains are choppy and the Pound still seems prone to setbacks at or a little above 1.25.
Intraday support is 1.2425/35. Resistance is 1.2490/00 and 1.2550.
Lee Sue Ann, Economist at UOB Group, assesses the recently published Q1 GDP figures Down Under.
Key Takeaways
Australia’s GDP came in at 0.2% q/q in 1Q23, below expectations for a reading of 0.3% q/q, and below the revised 0.6% q/q print in 4Q22 (0.5% q/q previously). From a year earlier, the economy expanded by 2.2% y/y, also a tad below expectations of 2.4% y/y, and lower from 4Q22’s revised reading of 2.6% y/y (2.7% y/y previously).
The latest GDP print is in line with our view of growth turning softer as high inflation and interest rates weigh. We see Australia’s GDP growth at 1.5% this year and only a small improvement to around 1.6% in 2024. Key factors to watch will be how households are impacted by higher interest rates, how quickly inflation is able to moderate, and how wage growth ties in with labour market dynamics.
As for monetary policy, we see a pause at 4.10% at the next monetary policy meeting on 4 Jul. Our view is that while the RBA maintained a tightening stance, the latest move was clearly in reaction to Apr’s inflation numbers. What this also means is that the key risk to our cash rate target call is the reaction function of the RBA and the possibility of the RBA tightening further.
- US Dollar weakens modestly against its major rivals on Thursday.
- US Dollar Index fluctuates below 104.00 but stays in weekly range.
- US Department of Labor will release the weekly Initial Jobless Claims data.
The US Dollar (USD) stays on the back foot in the second half of the week but the currency's losses against its peers remain limited. The US Dollar Index, which gauges the USD's valuation against a basket of six major currencies, fluctuates in negative territory below 104.00, while remaining in the weekly range.
The US Department of Labor will release the weekly Initial Jobless Claims data on Thursday, which could have a short-lasting impact on the USD's performance. Ahead of the May inflation report and the Federal Reserve's policy announcements next week, however, the USD's action could remain subdued.
Daily digest market movers: US Dollar struggles to preserve its strength
- The CME Group FedWatch Tool shows that markets are currently pricing in a nearly 70% probability of the Fed leaving its policy rate unchanged after the June policy meeting.
- The Bank of Canada unexpectedly raised its policy rate by 25 basis points to 4.75% on Wednesday due to increasing concerns over the Consumer Price Index (CPI) inflation getting stuck materially above the 2% target. The benchmark 10-year US Treasury bond yield climbed above 3.8% following this development.
- The risk-sensitive Nasdaq Composite fell more than 1% but the financial-heavy Dow Jones Industrial Average closed modestly higher on Wednesday. Early Thursday, US stock index futures trade mixed.
- In its latest outlook published on Wednesday, the OECD said that it sees the Fed funds rate peaking at 5.25%-5.5% from Q2 2023, followed by two "modest" cuts in the second half of 2024.
- The United States the goods and services deficit stood at $74.6 billion in April, the US Census Bureau reported on Wednesday. Exports declined $9.2 billion to $249 billion, while imports rose $4.8 billion to $323.6 billion.
- The monthly data published by the ISM showed on Monday that the business activity in the US service sector continued to expand in May, albeit at a softer pace than it did in April. The ISM Services PMI declined to 50.3 in May from 51.9 in April and missed the market expectation of 51.5.
- Further details of the ISM PMI report revealed that the Prices Paid Index edged lower to 56.2 from 59.6 and the Employment Index dropped to 49.2 from 50.8.
- Commenting on the data, "there has been a pullback in the rate of growth for the services sector," noted Anthony Nieves, Chair of the Institute for Supply Management (ISM) Services Business Survey Committee. "This is due mostly to the decrease in employment and continued improvements in delivery times (resulting in a decrease in the Supplier Deliveries Index) and capacity, which are in many ways a product of sluggish demand."
- The US Census Bureau announced on Monday that Factory Orders rose 0.4% in April following the 0.9% increase recorded in March.
Technical analysis: US Dollar Index loses bullish momentum
The US Dollar Index (DXY) seems to have lost bullish momentum with the Relative Strength Index (RSI) indicator on the daily chart retreating below 60. DXY, however, continues to trade above the 20-day Simple Moving Average, currently located at 103.70.
The index faces immediate resistance at 104.00 (Fibonacci 23.6% retracement of the November-February downtrend) ahead of 104.50 (static level) and 105.00 (psychological level).
On the downside, bearish pressure could increase if DXY closes the day below 103.70. In that scenario, 103.50 (static level) aligns as interim support before 103.00 (100-day SMA).
How does Fed’s policy impact US Dollar?
The US Federal Reserve (Fed) has two mandates: maximum employment and price stability. The Fed uses interest rates as the primary tool to reach its goals but has to find the right balance. If the Fed is concerned about inflation, it tightens its policy by raising the interest rate to increase the cost of borrowing and encourage saving. In that scenario, the US Dollar (USD) is likely to gain value due to decreasing money supply. On the other hand, the Fed could decide to loosen its policy via rate cuts if it’s concerned about a rising unemployment rate due to a slowdown in economic activity. Lower interest rates are likely to lead to a growth in investment and allow companies to hire more people. In that case, the USD is expected to lose value.
The Fed also uses quantitative tightening (QT) or quantitative easing (QE) to adjust the size of its balance sheet and steer the economy in the desired direction. QE refers to the Fed buying assets, such as government bonds, in the open market to spur growth and QT is exactly the opposite. QE is widely seen as a USD-negative central bank policy action and vice versa.
- DXY seems to be facing some downside pressure below 104.00.
- In case sellers push harder, the June low could become a target.
DXY regains downside traction and breaches the 104.00 support to print daily lows near 103.80 on Thursday.
In case the index breaks below the weekly consolidation, a potential test of the June low of 103.38 (June 2) could emerge on the horizon prior to the transitory 100-day SMA at 102.98.
Looking at the broader picture, while below the 200-day SMA at 105.48 the outlook for the index is expected to remain negative.
DXY daily chart
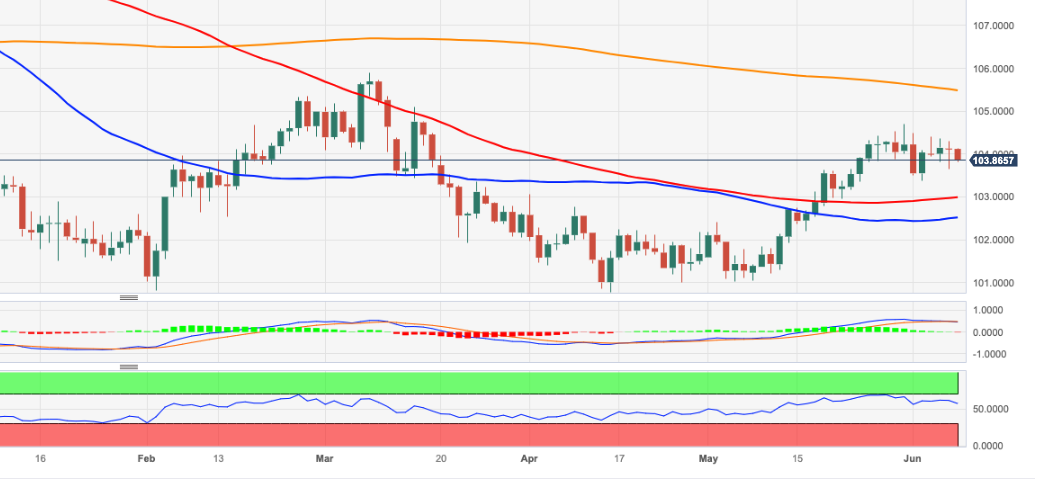
Economist at UOB Group Lee Sue Ann reviews the latest interest rate decision by the RBA (June 6).
Key Takeaways
Today’s decision by the Reserve Bank of Australia (RBA) to increase the cash rate target by 25bps to 4.10% once again came as a surprise. In justifying the increase, the RBA repeated that ‘inflation in Australia has passed its peak, but at 7 per cent is still too high and it will be some time yet before it is back in the target range’.
The back-to-back surprise from the RBA reinforces our view that it remains in a difficult balancing spot of managing inflation without slowing the economy too much. In this regard, tomorrow (7 Jun)’s GDP figures for 1Q23 will be keenly awaited.
Every meeting in the near term will be live, and very dependent on incoming economic data. The next monetary policy is on 4 Jul, where we see a pause at 4.10%. We think that even if the RBA were to move its cash rate target just a little higher, it is likely to hold off until Aug, when it will have the benefit of the full 2Q22 CPI data release on 26 Jul.
Kit Juckes, Chief Global FX Strategist at Société Générale, analyzes EUR/USD outlook.
Rates market now prices the ECB-Fed rate gap narrowing by less than it did
In terms of how the market is trading, we can see EUR/USD struggling as the market pricing for the Oct/Nov ECB-Fed rate gap falls back.
EUR/USD can still trade back above 1.15 in this cycle, but that won’t happen unless/until European data improve enough to push out pricing of early ECB easing.
See: EUR/USD to fall to 1.02 by the end of the year – Morgan Stanley
- EUR/JPY adds to Wednesday’s uptick and revisits the 150.00 region.
- Further upside targets the 151.00 mark and beyond.
EUR/JPY pushes higher and manages to revisit the key 150.00 zone on Thursday.
In case gains accelerate, there is an immediate hurdle at the so far monthly high at 150.19 (June 5). The surpass of this level could put the weekly top at 151.07 (May 29) back on the radar, while a convincing breakout of the latter exposes a probable move to the 2023 peak at 151.61 (May 2).
So far, further upside looks favoured while the cross trades above the 200-day SMA, today at 144.16.
EUR/JPY daily chart
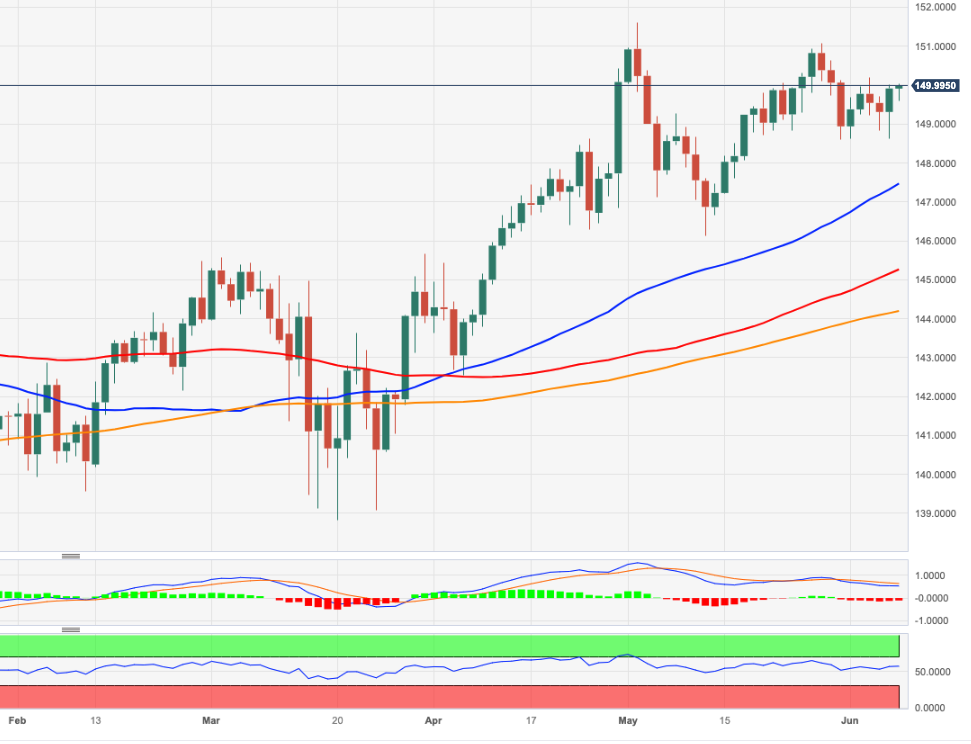
The Canadian Dollar has held up well in recent weeks. Economists at the National Bank of Canada discuss USD/CAD outlook.
Tightening of interest rate and Oil price differentials unlikely to continue
We do not expect the tightening of interest rate and Oil price differentials to continue. We must also prepare for a decline in commodity prices, which will have a negative impact on Canada's terms of trade, corporate profitability and the hiring cycle.
In light of the recent slowdown in global manufacturing momentum, we expect USD/CAD to return to the upper end of the 1.33-1.38 range over the coming quarters.
Kit Juckes, Chief Global FX Strategist at Société Générale, analyzes JPY outlook as the Yen is beginning to look at the BoJ meeting.
BoJ in focus
The Q1 real GDP gain of 2.7% saar, compares with a 25-year average growth rate of 0.7% and the 2% (YoY) deflator compares to a 25-year average of -0.4%. That last number helps explain BoJ caution, of course – they’ve been trapped in disinflation for an awfully long time. Still, there’s got to be a chance that they are contemplating a further tweak to the yield curve control policy next week.
10yr yield differential and USD/JPY re-set itself with the first YCC change at the end of last year. By the end of January USD/JPY was 10 figures lower than the yield differential implied, but that gap has halved in recent weeks. That increases the downside potential for USD/JPY (or EUR/JPY) if we do get a BoJ move.
EUR/USD softened on the BoC rate hike yesterday. Economists at ING discuss the world's most popular currency pair outlook.
Range-bound into next week
Today's session sees some revisions to eurozone 1Q GDP data – expected to be revised down after German figures. However, the market still looks comfortable pricing in two further 25 bps ECB rate hikes by the late summer.
Expect EUR/USD to remain becalmed well within a 1.0650-1.0750 range.
See: EUR/USD to fall to 1.02 by the end of the year – Morgan Stanley
- Gold price has extended its recovery to near $1,950.00 as the USD Index has dropped sharply.
- Investors have started shrugging off fears associated with expectations of more interest rate hikes by the Fed.
- Gold price is hovering near the upward-sloping trendline of the Ascending Triangle chart pattern.
Gold price (XAU/USD) attempted a recovery after dropping to near $1,940.00. The precious metal has extended its rebound move to near $1,950.00 as the US Dollar Index (DXY) has dropped sharply. Broader choppiness in the USD Index has kept investors on their toes. An absence of potential triggers this week has bounded the USD Index in a limited territory.
S&P500 futures have recovered their entire losses and have turned positive, showing signs of recovery in the risk appetite of the market participants. It seems that investors have started shrugging off fears associated with expectations of more interest rate hikes by the Federal Reserve (Fed).
The USD Index has found an intermediate support around 103.80, however, the situation for the USD index seems vulnerable as the market sentiment has turned cheerful. In spite of the short-term correction, strength in the USD Index would stay as the Fed is expected to remain hawkish further.
Meanwhile, a survey from Reuters showed that “It would take rate cuts from the Federal Reserve to weaken the currency substantially.” Also, Fed would pause in June for the first time in more than a year and keep its key interest rate at 5.00%-5.25% then and for the rest of the year.
Gold technical analysis
Gold price is hovering near the upward-sloping trendline of the Ascending Triangle chart pattern on a two-hour scale plotted from May 30 low at $1,932.12. The horizontal resistance of the aforementioned pattern is placed from May 19 high at $1,983.29. The precious metal is trading below the 50-period Exponential Moving Average (EMA) at $1,955.38, which indicates that the short-term trend is bearish.
Meanwhile, the Relative Strength Index (RSI) (14) is struggling in holding itself above 40.00.
Gold two-hour chart
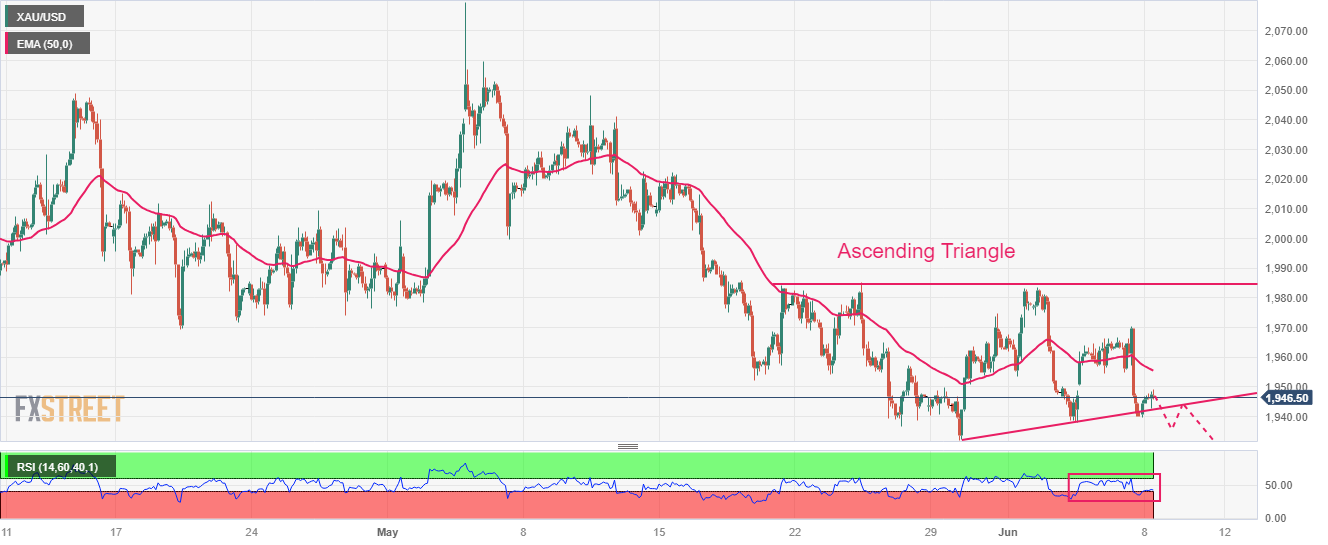
Senior Economist at UOB Group Julia Goh and Economist Loke Siew Ting comments on the latest release of inflation figures in the Philippines.
Key Takeaways
The Philippines’ headline inflation eased for a fourth straight month to 6.1% y/y in May (from +6.6% in Apr), marking the lowest level since Jun 2022. The reading matched Bloomberg consensus but came in a tad lower than our estimate of 6.2%. The easing pace was largely credited to lower prices of food & nonalcoholic beverages, transport, electricity, tobacco, as well as food & beverages serving services amid the ebbing of year-ago high base effects.
Given that the Philippines’ headline inflation has decelerated at a faster pace than we had anticipated over the past four months (Feb-May), we tweak our full-year inflation projections lower to 5.3% for 2023 (from 6.0% previously, BSP est: 5.5%, 2022: 5.8%) and 2.5% for 2024 (from 3.5% previously, BSP est: 2.8%). Nevertheless, we keep our view that inflation will return to the central bank’s 2.0%-4.0% target range only in 4Q23, and our revised outlook does not factor in any potential changes in domestic policy (i.e. public transport fare hikes and wage adjustments) as well as adverse impact of weather and external forces.
The latest month of inflation outturn and anchored inflation expectations continue to strengthen the case that the BSP may have been done with its rate hikes. Real interest rates have turned positive for the first time since Sep 2020 last month while core inflation eased for a second month albeit at a moderate pace, further reflecting the lagged effects of past rate hikes. Hence, we reiterate our year-end BSP rate projection to be unchanged at the current 6.25%, implying no more adjustments for the rest of the year with forward US rate trajectory being the key swing factor.
Economists at ING analyze GBP outlook ahead of important jobs data next week.
Sterling steady into jobs data next Tuesday
EUR/GBP volatility remains near recent lows and spot trades well within a tight 0.8570-0.8640 range.
Second or third-tier UK data has been quite mixed recently, but the main event on the data front will be next Tuesday's release of jobs and wages data. We see that as a negative event risk for Sterling, where wage growth could continue to slow and take some of the steam out of the 100 bps+ BoE tightening expectations still priced in by money markets.
GBP/USD to trade well within a 1.2400-1.2500 range.
According to UOB Group’s Economist Lee Sue Ann and Markets Strategist Quek Ser Leang, further upside in USD/CNH targets the 7.1800 level in the next few weeks.
Key Quotes
24-hour view: “Yesterday, USD soared to a high of 7.1527 before closing on a firm note at 7.1470 (+0.42%). The rapid rise has gathered momentum and USD is likely to strengthen further today. However, the major resistance at 7.1800 is likely out of reach for now (there is another resistance at 7.1640). Support is at 7.1350, followed by 7.1200.”
Next 1-3 weeks: “Yesterday, USD soared to a high of 7.1527. The break above 7.1500 is accompanied by strong momentum and the risk for USD is on the upside. The next level to monitor is 7.1800, followed by the major level of 7.2000. The upside risk is intact as long as USD stays above 7.1100.”
- AUD/USD is marching towards 0.6700 as the RBA is expected to push rates to 4.35%.
- The USD Index is expected to remain sideways as investors are awaiting the release of the US CPI.
- AUD/USD witnessed responsive buying despite delivering a breakdown of the consolidation.
The AUD/USD pair has extended its recovery and is marching toward the round-level resistance of 0.6700 in the European session. The Aussie asset has resumed its upside journey as the US Dollar Index (DXY) has extended its downside.
On a broader note, the USD Index is expected to remain sideways as investors are awaiting the release of the United States Consumer Price Index (CPI) for further action.
The Australian Dollar has gained strength as the street is anticipating that the Reserve Bank of Australia (RBA) will keep raising interest rates further despite deteriorating Australian economic prospects. A poll from Reuters showed that the RBA would raise its Official Cash Rate (OCR) further by 25 basis points (bps) to 4.35%.
AUD/USD witnessed responsive buying despite delivering a breakdown of the consolidation formed in a range of 0.6563-0.6808 on a daily scale. Lack of follow-up selling in the Aussie asset after a consolidation breakdown triggered a solid recovery. A responsive buying move indicates that investors considered the asset a value bet.
The Aussie asset has climbed above the 20-period Exponential Moving Average (EMA) at 0.6607, which indicates that the short-term trend has turned bullish.
Meanwhile, the Relative Strength Index (RSI) (14) has rebounded into the 40.00-60.00 range from the bearish range of 20.00-40.00, which indicates that the downside momentum has receded.
Should the Aussie asset breaks above June 07 high at 0.6718, the Australian Dollar bulls will drive the asset toward April 18 high at 0.6748 followed by May 10 high at 0.6818.
On the flip side, if the Aussie asset breaks below June 01 low at 0.6484, US Dollar bulls would drag the asset to 01 November 2022 high around 0.6464 followed by the round-level support at 0.6400.
AUD/USD daily chart
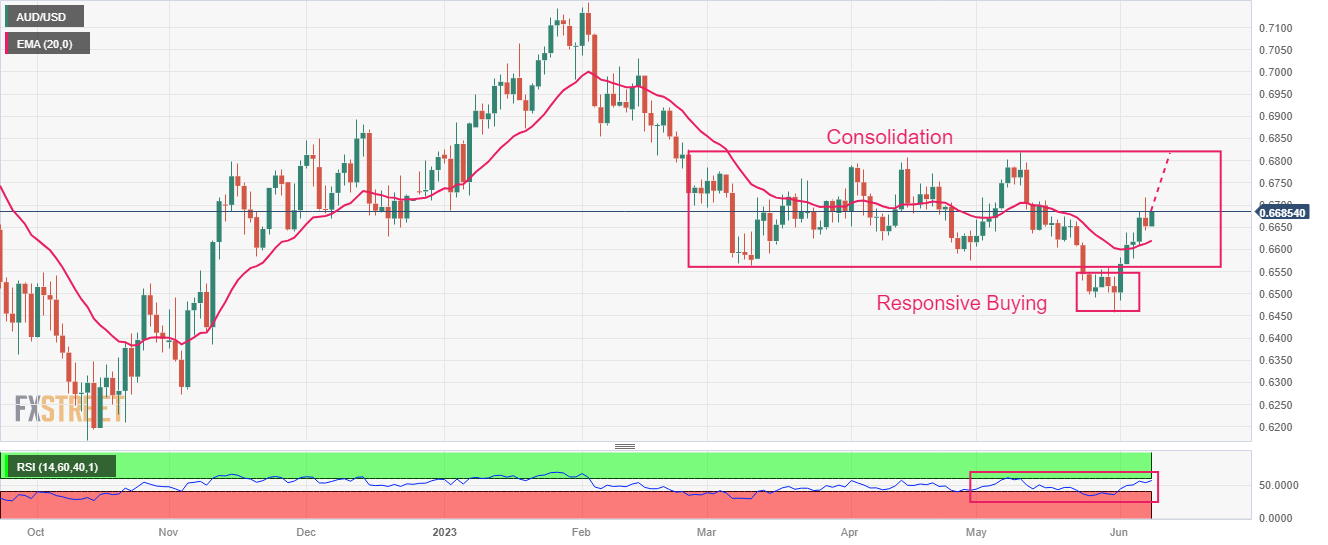
- The Eurozone economy unexpectedly contracted 0.1% in the first quarter.
- EUR/USD holds gains near 1.0730 despite the downbeat Eurozone GDP data.
The Eurozone economy contracted in the first quarter of 2023, the final estimate published by Eurostat confirmed on Thursday.
The Gross Domestic Product (GDP) in the old continent shrank 0.1% in the first three months of this year compared with the previous quarter. The preliminary figure showed a 0.1% growth during the reported period. The market estimated a 0% clip.
On an annual basis, the bloc’s GDP grew 1.0%, down from the 1.3% expansion initially estimated and missing the market expectation of a 1.2% increase.
Eurozone’s Final Employment Change came in at 0.6% and 1.6% on a monthly and yearly basis respectively.
Market reaction
The Euro is unperturbed by the discouraging Eurozone data, with EUR/USD adding 0.28% on the day near 1.0730.
Economists at ING discuss USD outlook.
Dollar will embark on a cyclical bear trend in 2H23
For the near term, it looks like the Dollar can hold the majority of its recent gains into next Wednesday's FOMC meeting – though the release of the US May CPI next Tuesday will be a big market driver too.
Our bigger picture call remains that the Dollar will embark on a cyclical bear trend in 2H23 – probably starting in 3Q – though the risk is that this gets delayed.
- NZD/USD gains strong positive traction on Thursday and reverses the overnight losses.
- The emergence of fresh USD selling is seen as a key factor lending support to the major.
- The Fed rate hike uncertainty, the cautious mood could limit USD losses and cap the pair.
The NZD/USD pair stages a solid bounce from the 0.6030-0.6025 region, or a one-week low touched this Thursday and builds on its momentum through the early part of the European session. Spot prices climb to the 0.6075-0.6080 area in the last hour and have now reversed the previous day's downfall.
The US Dollar (USD) struggles to build on Wednesday's goodish rebound from the weekly low and meets with a fresh supply, which, in turn, is seen as a key factor pushing the NZD/USD pair higher. That said, any meaningful appreciating move still seems elusive as investors remain uncertain about the Federal Reserve's (Fed) rate-hike path. Last week's dovish rhetoric by several Fed officials reaffirmed market expectations for an imminent pause in the US central bank's policy tightening cycle.
In fact, the current market pricing indicates a greater chance that the Fed will keep rates unchanged at its upcoming policy meeting on June 13-14. That said, the recent inflation and labor market data from the United States (US) kept alive hopes for a 25 bps lift-off next week. Furthermore, surprise rate hikes by the Reserve Bank of Australia (RBA) and the Bank of Canada (BoC) this week suggest that the fight against inflation is not over yet, supporting prospects for further tightening by the Fed.
The market expectations remain supportive of elevated US Treasury bond yields, which, along with the prevalent cautious mood, should limit losses for the safe-haven buck and cap gains for the perceived riskier Kiwi. The market sentiment remains fragile amid growing worries about a global economic slowdown, particularly in China. The concerns resurfaced after data released on Wednesday showed that China's trade surplus sank to a 13-month low in May, led by a slump in exports.
The data, meanwhile, pointed to weak overseas demand for Chinese goods and poses additional challenges for the world's second-largest economy. Apart from this, the Reserve Bank of New Zealand's (RBNZ) explicit signal that it was done with its most aggressive hiking cycle since 1999 might continue to undermine the New Zealand Dollar (NZD). This, in turn, suggests that the path of least resistance for the NZD/USD pair is to the downside, warranting some caution for bullish traders.
Technical levels to watch
Economists at Morgan Stanley discuss the EUR outlook.
EUR/CHF to marginally increase toward parity
We expect EUR/USD to fall to 1.02 by the end of the year, driven by defensive investor bias, positive carry, and slow local growth. This trend is somewhat mitigated by the ongoing shift in capital flows.
However, we expect the Euro to outperform its regional peers. We maintain a long-term bullish bias for EUR/GBP, forecasting it to rise above 0.90 over the next 12 months as capital repatriation into Europe significantly contrasts with the lukewarm investor demand for UK investments.
We expect EUR/CHF to marginally increase toward parity, with the Euro's positivity partly countered by the defensive allure of the Swiss Franc.
- EUR/JPY is oscillating in a narrow range below 150.00 as ECB-BoJ policy comes under picture.
- The BoJ is expected to keep monetary policy unchanged till inflation targets don’t get achieved.
- ECB Lagarde is expected to raise interest rates further as inflation in Eurozone is extremely stubborn
The EUR/JPY pair is continuously trading sideways below the psychological resistance of 150.00 in the European session. The cross is trading non-directionally as investors are preparing for the interest rate decisions by the European Central Bank (ECB) and the Bank of Japan (BoJ).
Investors are highly confident that ECB President Christine Lagarde will raise interest rates further as inflation in Eurozone is extremely stubborn. While the BoJ is expected to keep monetary policy unchanged till inflation targets don’t get achieved.
EUR/JPY is demonstrating a back-and-forth action in a range of 148.58-150.21 for the past six trading sessions. This indicates a sheer drop in volatility, which will be followed by wider ticks and heavy volume after the explosion. Potential resistance is plotted from May 02 high at 151.62.
The 50-period Exponential Moving Average (EMA) at 149.55 has turned straight, portraying a non-directional performance.
Adding to that, the Relative Strength Index (RSI) (14) is oscillating in the 40.00-60.00, indicating that investors are awaiting a fresh trigger.
Bullish bets will emerge post a break above June 02 high at 150.12, which will drive the cross toward May 28 high at 151.07 followed by May 02 high at 151.62.
On the flip side, a breakdown below May 31 low at 148.59 will drag the asset toward April 27 high around 148.00. Slippage below the latter would drag the asset toward May 04 low at 147.13.
EUR/JPY four-hour chart
-638218104329618685.png)
The Bank of Canada (BoC) surprised markets with a 25 bps rate hike. Economists at ING analyze USD/CAD outlook following the decision.
BoC tightening is back
The BoC has resumed interest rate increases after a five-month hiatus. Another hike looks likely in July, but we are wary about pushing for more aggressive action.
The BoC hike sent USD/CAD lower and the pair is now aiming at testing the November 2022 lows at 1.32/1.33. Below that, we’d be looking at 1.30 as the next key resistance level for the pair.
Our pre-BoC forecast for USD/CAD had 1.30 as an end-3Q target. We now think the chances of 1.30 being hit earlier this summer are quite elevated.
Later in the year, a negative re-rating in US growth expectations and prospective Fed cuts late in 2023 can impact CAD negatively and we expect it to lag other procyclicals later in the year. But fresh BoC tightening means that USD/CAD may trade closer to 1.25 than 1.30 by year-end.
- EUR/USD extends the choppiness around 1.0700 on Thursday.
- German 10-year bund yields climb further and target 2.50%.
- EMU Flash Q1 GDP Growth Rate, US weekly Claims next of note.
The single currency maintains the erratic performance in place so far this week and now motivates EUR/USD to trade with mild gains around the 1.0700 region on Thursday.
EUR/USD faces extra consolidation near term
EUR/USD adds to Wednesday’s small advance and looks to reclaim the area beyond 1.0700 the figure on a more sustainable fashion against the backdrop of a broad-based consolidative mood in the global markets.
The absence of strong drivers for the pair’s price action continues to underpin the ongoing directionless pattern, although a more cautious trade is expected to emerge in light of the release of crucial US inflation figures and the FOMC event, both due next week.
Around the ECB, there are no changes to the steady bets of a quarter-point rate raise at the bank’s gathering next week.
In the domestic calendar, another revision of the EMU Q1 GDP figures will be the only scheduled release, while weekly Initial Claims and Wholesale Inventories grab all the attention across the ocean.
What to look for around EUR
EUR/USD flirts with the key 1.0700 area amidst the generalized lack of clear direction in the global markets.
In the meantime, the pair’s price action is expected to closely mirror the behaviour of the US Dollar and will likely be impacted by any differences in approach between the Fed and the ECB with regards to their plans for adjusting interest rates.
Moving forward, hawkish ECB speak continues to favour further rate hikes, although this view appears to be in contrast to some loss of momentum in economic fundamentals in the region.
Key events in the euro area this week: EMU Flash GDP Growth Rate (Thursday).
Eminent issues on the back boiler: Continuation of the ECB hiking cycle in June and July (and September?). Impact of the Russia-Ukraine war on the growth prospects and inflation outlook in the region. Risks of inflation becoming entrenched.
EUR/USD levels to watch
So far, the pair is up 0.13% at 1.0711 and the surpass of 1.0779 (weekly high June 2) would target 1.0807 (100-day SMA) en route to 1.0879 (55-day SMA). On the downside, initial support lines up at 1.0635 (monthly low May 31) seconded by 1.0516 (low March 15) and finally 1.0481 (2023 low January 6).
- AUD/JPY has climbed to near 93.40 as the RBA is expected to raise interest rates further.
- Higher interest rates from the RBA are impacting the economic prospects of Australia.
- The BoJ is consistently making efforts for pushing wages and demand higher through sheer monetary stimulus.
The AUD/JPY pair showed a V-shape recovery from the critical support of 93.00 in the London session. The risk barometer has stretched its V-shape recovery to near 93.40 as the street is hoping that the Reserve Bank of Australia (RBA) is going to raise interest rates further.
Australian inflation has shown persistence as the monthly Consumer Price Index (CPI) indicator has jumped to 6.8% from the former release of 6.4%, which is sufficient to support more interest rate hikes from the RBA. In June’s monetary policy meeting, RBA Governor Philip Lowe stated that more interest rate hikes are appropriate to bring down stubborn inflation. The commentary came after RBA Lowe announced a 25 basis point rate hike surprisingly to 4.10%
A poll from Reuters showed that the RBA would raise its Official Cash Rate (OCR) further by 25 basis points (bps) to 4.35%.
Meanwhile, higher interest rates from the RBA are impacting the economic prospects of Australia. Australian GDP has dropped in the first quarter of CY2023 and their surplus Trade Balance has slipped due to weak global demand.
In the Asian region, a few Chinese biggest banks lowered rates on a range of deposit products, responding to the government’s call for help in boosting growth in the world’s second-largest economy. This might accelerate recovery in the Chinese economy and support its vulnerable real estate. It is worth noting that Australia is the leading trading partner of China and monetary stimulus in China would support the Australian Dollar.
In Japan, recovery could be higher led by the Bank of Japan’s (BoJ) efforts of pushing wages and demand higher through sheer monetary stimulus. Economists at Societe Generale cited the most resilient major economy maybe Japan, and that should provide some support for the yen as the market waits for next week’s BoJ meeting.
- EUR/CAD drifts lower for the third successive day and drops to a nearly three-month low.
- The BoC’s surprise rate hike, an uptick in Oil prices underpin the Loonie and exert pressure.
- Bets for further policy tightening by the ECB could limit losses amid a slightly oversold RSI.
The EUR/CAD cross prolongs its recent downtrend witnessed over the past week or so and remains under some selling pressure for the third straight day on Thursday - also marking the sixth day of a negative move in the previous seven. The cross maintains its offered tone through the early European session and drops to the 1.4285-1.4280 region, its lowest level since February 13 in the last hour.
Against the backdrop of the Bank of Canada's (BoC) surprise 25 bps rate hike on Wednesday, a modest uptick in Crude Oil prices is seen underpinning the commodity-linked Loonie and exerting some pressure on the EUR/CAD cross. It is worth recalling that the Canadian central bank defied market expectations by restarting its policy tightening and hiking its overnight rate to 4.75%, or a 22-year high.
In the accompanying policy statement, the BoC noted that concerns have increased that CPI could get stuck materially above the 2% target. The markets were quick to price in yet another increase next month to ratchet down an overheating economy and stubbornly high inflation. The hawkish outlook contributes to the Canadian Dollar's (CAD) relative outperformance and weighs on the EUR/CAD cross.
The shared currency (Euro), on the other hand, draws some support from a modest US Dollar (USD) downtick and rising bets for further policy tightening by the European Central Bank (ECB). In fact, ECB President Christine Lagarde indicated earlier this week that additional interest rate rises were likely as, so far, there was no clear evidence that underlying inflation has peaked.
This comes on the back of the recent hawkish comments by several ECB officials and reaffirms expectations that the central bank is not done raising rates despite a fall in consumer inflation. It is worth recalling that the headline Eurozone CPI decelerated more than anticipated to the 6.1% YoY rate in May from 7.0% previous. Moreover, Core CPI slowed from 5.6% YoY to 5.3% last month.
The aforementioned mixed fundamental backdrop, along with the fact that the Relative Strength Index (RSI) on the daily chart is on the verge of breaking into the oversold territory, warrant some caution for bearish traders. Hence, it will be prudent to wait for some near-term consolidation or a modest bounce before positioning for a further depreciating move for the EUR/CAD cross.
Technical levels to watch
Here is what you need to know on Thursday, June 8:
The market action remains choppy in the second half of the week and major currency pairs stay continue to fluctuate in their weekly ranges. Eurostat will release the final revision for the first-quarter Gross Domestic Product (GDP) growth and the weekly Initial Jobless Claims will be featured in the US economic docket on Thursday.
After the Reserve Bank of Australia (RBA), the Bank of Canada (BoC) became the second major central bank this week to surprise markets with a rate hike. The BoC raise its policy rate by 25 basis points to 4.75% after having held it unchanged in the previous two meetings. In its policy statement, the BoC said that concerns have increased that Consumer Price Index (CPI) inflation could get stuck materially above the 2% target. Following this development, USD/CAD fell to its weakest level in a month near 1.3320 before stabilizing near 1.3350 early Thursday.
The BoC's unexpected hike triggered a rally in global bond yields. The benchmark 10-year US Treasury bond yield rose nearly 4% and settled at around 3.8%. Meanwhile, the CME Group FedWatch Tool's probability of one more Fed rate hike next week climbed above 30% from 20% earlier in the week. Early Thursday, US stock index futures trade flat and the US Dollar Index stays calm near 104.00.
EUR/USD extended its sideways grind and closed virtually unchanged on Wednesday. The pair stays rengebound at around 1.0700 in the European morning on Thursday.
GBP/USD registered small gains on Wednesday and was last seen trading a few pips above 1.2450.
USD/JPY closed in positive territory on Wednesday but lost its bullish momentum after meeting resistance near 140.00. The data from Japan showed that the real Gross Domestic Product grew at an annualized rate of 2.7% in the first quarter, surpassing the initial estimate of 1.6%.
Pressured by surging bond yields, Gold price turned south and broke below $1,950 on Wednesday. Early Thursday, XAU/USD consolidates its losses but stays below $1,950.
Bitcoin failed to build on Tuesday's gains and lost more than 3% on Wednesday. In the European session, BTC/USD trades in a tight channel near $26,500. Ethereum reversed its direction and declined toward $1,800 after having met resistance at $1,900 mid-week.
USD/JPY is now forecast to keep the 138.50-141.00 range for the time being, comment UOB Group’s Economist Lee Sue Ann and Markets Strategist Quek Ser Leang.
Key Quotes
24-hour view: “USD dropped briefly to 139.01 and then rebounded sharply to 140.24 before ending the day at 140.11. The rebound has scope to extend above 140.40. The major resistance at 141.00 is unlikely to come under threat. Support is at 139.55, followed by 139.20.”
Next 1-3 weeks: “USD traded mostly sideways for the past several days. The price actions are likely part of range-trading phase. For the time being, USD is likely to trade between 138.50 and 141.00. Looking ahead, USD has to break clearly above 141.00 before a sustained rise is likely.”
EUR/NOK is up by around 12% YTD and 17% YoY. Economists at ING discuss Krone’s outlook.
Short-term woes
We are not ready to call for a reversal of the NOK bearish trend in the near term.
External factors need to favour a NOK recovery before any domestic factors can seriously become part of the equation.
A re-softening of the Dollar, and prevalence of the European growth story over the US one, paired with pre-emptive easing by the Fed in late 2023 could combine to generate a more benign environment for the Krone in the second half of the year.
Considering advanced prints from CME Group for natural gas futures markets, open interest dropped by around 17.8K contracts on Wednesday after two consecutive daily builds. Volume, instead, increased for the third straight day, now by around 112.7K contracts.
Natural Gas remains supported around $2.00
Prices of the natural gas rose for the fourth session in a row on Wednesday. The uptick, however, came on the back of declining open interest and this removes strength from the continuation of the rebound in the very near term. In the meantime, the lower end of the current multi-week consolidation emerges at the key $2.00 mark per MMBtu.
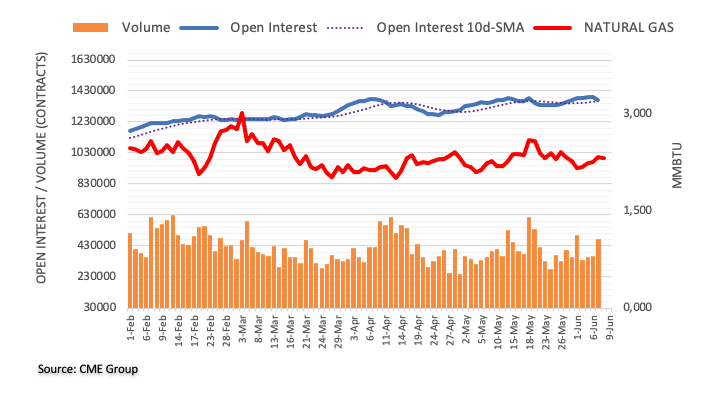
In the opinion of UOB Group’s Economist Lee Sue Ann and Markets Strategist Quek Ser Leang, NZD/USD faces extra range bound trade within 0.5985-0.6140 in the short-term horizon.
Key Quotes
24-hour view: “NZD fell by 0.70% yesterday (NY close of 0.6037). Downward momentum has improved, albeit not much. Today, NZD could edge lower to 0.6020 before the risk of a rebound increases. Resistance is at 0.6065, followed by 0.6085.”
Next 1-3 weeks: “The price actions since last week’s low near 0.5985 is likely part of a consolidation phase. For now, NZD is likely to trade sideways between 0.5985 and 0.6140.”
- USD/JPY is looking to recapture 140.00 as investors eye more interest rate hikes from the Fed.
- Former Fed policymaker Lacker cited interest rates should rise to 6% to arrest sticky inflation.
- BoJ watchers are seeing no policy adjustments in June as BoJ Ueda is consistently supporting monetary stimulus.
The USD/JPY pair has shown some recovery after dropping to near 139.66 in the early London session. The asset is expected to recapture the crucial resistance of 140.00 as investors are hoping that the Federal Reserve (Fed) will raise interest rates further to bring down sticky United States inflation.
S&P500 futures have carry-forwarded losses to Europe generated in the Asian session, indicating cautious market sentiment. US economic prospects are under threat as the street is anticipating that more interest rate hikes are required to keep building pressure on US Consumer Price Index (CPI). Former Richmond Fed President Jeffrey Lacker cited that current interest rates at 5.0-5.25% should rise to 6% in order to bring down sticky inflation.
The US Dollar Index (DXY) has found an intermediate support around 104.00. It is likely that the USD Index would fall into a volatile contraction phase due to a light economic calendar. It seems that investors are preparing for the next week's Consumer Price Index (CPI) data.
Meanwhile, Ray Dalio, founder of Bridgewater Associates, said the US is seeing stubbornly high inflation along with elevated real interest rates, as reported by Bloomberg. He further added “We are at the beginning of a late, big-cycle debt crisis when you are producing too much debt and have a shortage of buyers,”
The Japanese Yen has failed to fetch strength despite discussions over an exit from the ultra-dovish interest rate policy by Bank of Japan (BoJ) Governor Kazuo Ueda. About BoJ’s interest rate guidance, Bloomberg reported that BoJ watchers are seeing no policy adjustments in June as BoJ Ueda is consistently supporting the need for monetary stimulus to keep inflation steadily above 2%.
- GBP/JPY oscillates in a narrow trading band through the early European session on Thursday.
- Intervention fears, the cautious mood benefit the safe-haven JPY and cap gains for the cross.
- Bets for more rate hikes by the BoE underpin the British Pound and help limit the downside.
The GBP/JPY cross struggles to capitalize on the previous day's goodish recovery of over 175 pips from the 172.65 area, or a one-and-half-week low and edges lower on Thursday. Spot prices remain on the defensive heading into the European session and currently hover near the lower end of the narrow intraday trading band, just above the 174.00 mark.
The Japanese Yen (JPY) continues to draw some support from the prospects for more sizeable interventions by the Bank of Japan (BoJ) to support the domestic currency. Apart from this, the prevalent cautious mood benefits the JPY's relative safe-haven status and acts as a headwind for the GBP/JPY cross. The market sentiment remains fragile amid worries about a global economic slowdown, particularly in China. In fact, data released on Wednesday showed that China's trade surplus sank to a 13-month low in May, led by a slump in exports. This, in turn, indicates weak overseas demand for Chinese goods and poses additional challenges for the world's second-largest economy.
Adding to this, the Organization for Economic Co-operation and Development (OECD) forecasts that the global economy is set for a weak recovery over the coming years as persistent core inflation and tighter monetary policy weigh on demand. OECD now expects the global economy to expand by 2.7% this year. Excluding the pandemic-hit year of 2020, this would still be the lowest annual rate of growth since the 2008-2009 financial crisis. The downside for the GBP/JPY cross, however, remains cushioned on the back of expectations that the Bank of England (BoE) will be far more aggressive in policy tightening to contain stubbornly high inflation, which underpins the British Pound.
In fact, investors now anticipate the UK central bank to raise interest rates again from 4.5% to 4.75% on June 22 and see a roughly 60% chance that rate will peak at 5.5% later this year. The bets were lifted by the official data released last week, which showed that the headline UK CPI fell less than expected in April and a closely watched measure of core price surged to a 31-year high. This, in turn, suggests that the path of least resistance for the GBP/JPY cross is to the upside and supports prospects for an extension of a multi-week-old upward trajectory. Bullish traders, however, might wait for some follow-through buying beyond the 174.65-174.7 area, or the monthly peak before placing fresh bets.
Technical levels to watch
- USD/MXN stays pressured for the fourth consecutive day at multi-day low.
- Bearish MACD signals favor clear downside break of three-week-old horizontal support to keep sellers hopeful.
- Three-month-old descending support line can prod Mexican Peso buyers amid adverse RSI conditions.
USD/MXN takes offers to refresh the intraday low near 17.34 during the early hours of Thursday’s European session. In doing so, the Mexican Peso (MXN) pair fades late Wednesday’s corrective bounce off the lowest levels since May 2016 while printing a four-day losing streak.
It’s worth noting that the Bank of Mexico is up for releasing the 12-month Inflation, Core Inflation and Headline Inflation for May, which in turn can prod the USD/MXN bears on matching downbeat forecasts.
That said, the pair sellers take clues from Tuesday’s downside break of three-week-old horizontal support, now resistance around 17.42. Also motivating the USD/MXN sellers are the bearish MACD signals.
However, a downward-sloping support line from early March, near 17.25 by the press time, challenges the pair bears amid the oversold RSI (14) line.
Hence, the Mexican Peso buyers can keep the reins but their dominance appear to have limited reach, till 17.25.
Should the quote break the 17.25 support, the May 2016 low of near 17.05 and the 17.00 psychological magnet will lure the USD/MXN bears.
Meanwhile, recovery moves need to cross the previous support line stretched from mid-May, close to 17.42, to convince intraday buyers.
Even so, a convergence of the 10-DMA and a fortnight-long falling trend line, close to 17.52 at the latest, appears a tough nut to crack for the Mexican Peso sellers to retake control.
USD/MXN: Daily chart
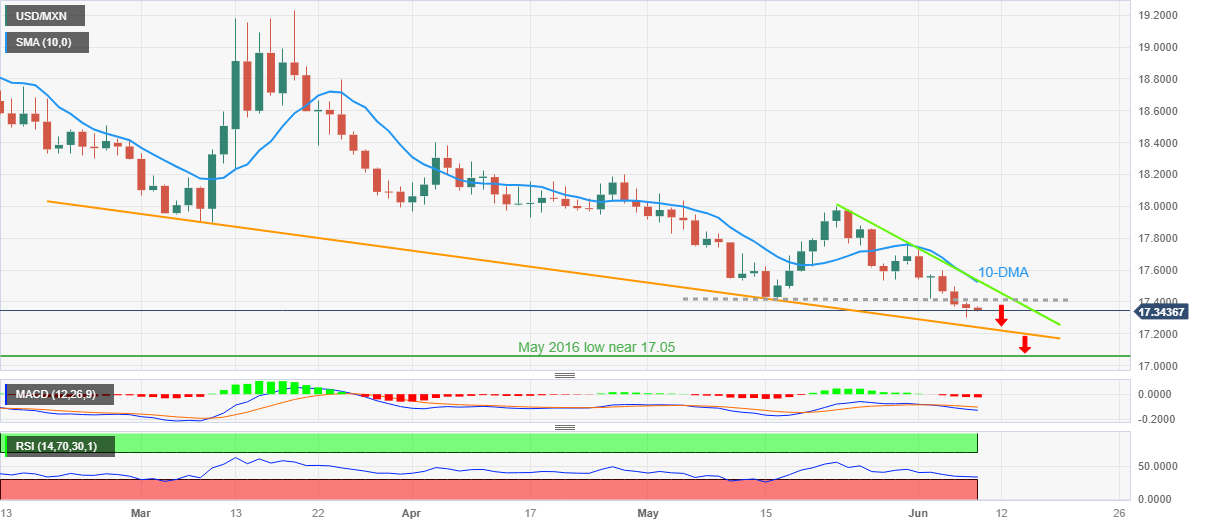
Trend: Limited downside expected
- Gold price has dropped firmly after failing to tap the $1,950.00 resistance amid a recovery in hawkish Fed bets.
- S&P500 futures have recovered some of their losses added in Asia, however, the overall market mood is still cautious.
- US Yellen believes that inflation can be arrested while maintaining an upbeat labor market.
Gold price (XAU/USD) has witnessed a steep fall after failing to kiss the crucial resistance of $1,950.00 in the European session. The precious metal has attracted significant offers as the corrective move in the US Dollar Index (DXY) seems concluded due to an improvement in odds for the continuation of the rate-hiking spell by the Federal Reserve (Fed).
S&P500 futures have recovered some of their losses added in Asia, however, the overall market mood is still cautious as investors are worried that more interest rate hikes by the Fed would worsen the economic outlook.
US Treasury Secretary Janet Yellen stated on Wednesday that robust consumer spending has kept the United States economy resilient. She feels that inflation can be arrested while maintaining an upbeat labor market, with unemployment in the 4% range, up slightly from the 3.7% reading in May, as reported by Reuters.
The odds for one more interest rate hike from the Fed rebounded after former Richmond Fed President Jeffrey Lacker cited current interest rates at 5.0-5.25% should rise to 6% in order to bring down sticky inflation.
The USD Index is expected to remain choppy as the economic calendar has nothing much to offer this week. Economists at MUFG believe that consolidation at these stronger US Dollar levels seems most likely given the probable declining appetite for position-taking ahead of a key week next week with the US Consumer Price Index (CPI) data and the FOMC and European Central Bank (ECB) meetings.
Gold technical analysis
Gold price has formed a textbook-traced Darvas Box chart pattern on a four-hour scale, which indicates a volatility contraction, followed by a one-way move. The precious metal is consolidating in a range of $1,932-1,985 for the past three weeks. Broadly, horizontal support is plotted from March 15 high at $1,937.39.
The magical 200-period Exponential Moving Average (EMA) at $1,975.47 is acting as a strong barrier for the Gold bulls.
The Relative Strength Index (RSI) (14) is hovering near 40.00 and a break below the same will trigger the bearish momentum.
Gold four-hour chart
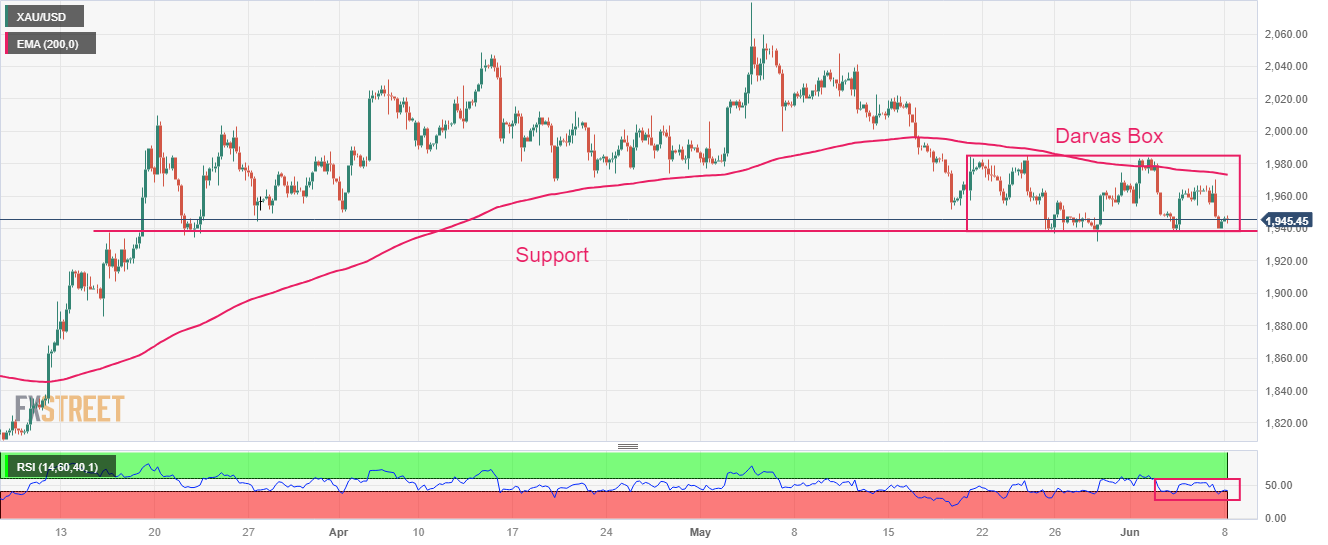
- Silver builds on its steady intraday ascent heading into the European session on Thursday.
- The intraday technical setup supports prospects for a further near-term appreciating move.
- A convincing break below the 200-period SMA on H4 is needed to negate the positive bias.
Silver regains positive traction on Thursday and stalls the previous day's retracement slide from over a three-week high - levels just above the $24.00 round-figure mark. The white metal builds on its steady intraday ascent heading into the European session and hits a fresh daily top, around the $23.65 region in the last hour.
From a technical perspective, the XAG/USD, so far, has shown resilience below the 200-hour Simple Moving Average (SMA), which is currently pegged near the $23.45 region and should act as a pivotal point for intraday traders. A convincing break and acceptance below should pave the way for a slide towards testing the $23.00 round figure. The downward trajectory could get extended further towards the next relevant support near the $22.70-$22.65 region, or over a two-month low touched in May.
Meanwhile, oscillators on hourly charts have again started gaining positive traction and support prospects for further intraday gains, though neutral technical indicators on the daily chart might cap any meaningful upside. Hence, any subsequent move up might continue to face stiff resistance and remain capped near the $24.00 mark. That said, a sustained strength beyond might lift the XAG/USD further beyond the $24.25-$24.30 zone and allow bulls to reclaim the $25.00 psychological mark.
Some follow-through buying will suggest that the recent pullback from over a one-year high touched in May has run its course and pave the way for a further near-term appreciating move. The next relevant hurdle is pegged near the $24.35-$24.40 region, above which the XAG/USD is likely to make a fresh attempt towards conquering the $26.00 round figure.
Silver 1-hour chart
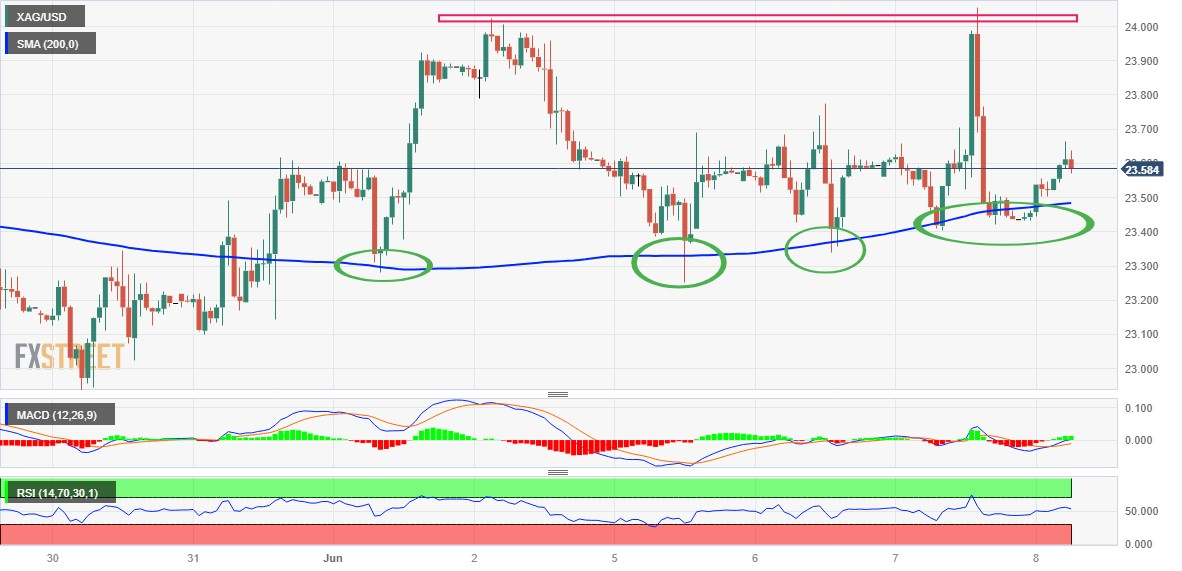
Key levels to watch
- EUR/GBP grinds near intraday high during the first positive day in three.
- Markets pare fears of recession in the bloc amid mixed sentiment, political pessimism in the UK also propel EUR/GBP.
- Mixed signals about BoE rate hike contrast with ECB concerns to favor pair buyers.
- Revised prints of EU Q1 GDP, central bank comments eyed for clear directions ahead of next week’s ECB.
EUR/GBP snaps two-day losing streak as buyers prod the 0.8600 round figure, mildly bid around 0.8605 heading into Thursday’s European session. In doing so, the cross-currency pair takes clues from the recently firmer calls suggesting the European Central Bank’s (ECB) rate hikes versus the market’s indecision about the Bank of England’s (BoE) next move, considering the latest hints surrounding the UK.
On Wednesday, Germany’s Industrial Production (IP) improved to 0.3% MoM versus 0.6% market forecasts and -2.1% prior (revised) whereas the yearly growth figures ease to 1.6% from 2.3% (revised) previous readouts and 1.2% expected.
Considering the data, European Central Bank (ECB) Governing Council member Isabelle Schnabel pushes back the recent dovish concerns by stating that the impact of our tighter monetary policy on inflation is expected to peak in 2024. However, ECB policymaker, Klaas Knot, said that prolonged monetary tightening might still lead to stress in financial markets, which in turn prod ECB hawks. The ECB Official also added, “Inflation expectations in markets seem optimistic.”
It’s worth noting that the UK’s Recruitment and Employment Confederation (REC) released a survey, funded by the global quant giant KPMG, earlier on Thursday saying that Britain's labor market cooled further in May as starting salaries for permanent staff rose at the weakest pace in over two years. As the recruiters involved in the survey are the ones being closely watched by the Bank of England (BoE) and hence the results appear more important for the EUR/GBP pair traders.
Alternatively, another poll of the Royal Institution of Chartered Surveyors (RICS) hints that the measure of new buyer inquiries rose to a net balance of -18, the least negative figure since -14 in May 2022, and up from -34 in April, per Reuters. On the same line, a fading optimism about UK Prime Minister Rishi Sunak’s diplomatic US visit, mainly due to an absence of any major deal news, also favors the EUR/GBP buyers.
Looking ahead, the revised version of the Eurozone first quarter (Q1) 2023 Gross Domestic Product (GDP), expected to ease to 0.0% QoQ and 1.2% on YoY, will join the likely unimpressive Unemployment Change to entertain the intraday traders of the EUR/GBP.
Technical analysis
Unless providing a daily close beyond the previous support line from May 11, now immediate resistance around 0.8635, the EUR/GBP remains pressured towards the yearly low marked the last week around 0.8590.
Open interest in crude oil futures markets shrank by more than 13K contracts on Wednesday, leaving behind six consecutive daily builds according to preliminary readings from CME Group. On the other hand, volume dropped for the second session in a row, this time by around 58.5K contracts.
WTI risks another move to $70.00 and below
Wednesday’s small advance in prices of WTI was in tandem with shrinking open interest and volume, opening the door to a corrective decline in the very near term. That said, the immediate contention emerges at the key $70.00 mark ahead of the late May lows near the $67.00 mark per barrel.
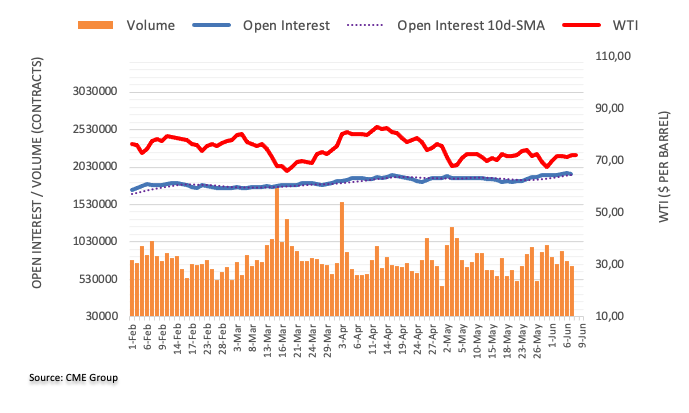
GBP/USD is now expected to navigate between 1.2350 and 1.2550 in the short term, note UOB Group’s Economist Lee Sue Ann and Markets Strategist Quek Ser Leang.
Key Quotes
24-hour view: “Yesterday, GBP rose to a high of 1.2501 before retreating quickly to close at 1.2439 (+0.13%). Despite the advance, there is no significant increase in upward momentum. Today, GBP is likely to trade in a range, expected to be between 1.2400 and 1.2500.”
Next 1-3 weeks: “The recent days price actions of GBP appear to be consolidative. In other words, there is no clear directional bias for now. GBP could trade between 1.2350 and 1.2550 for the time being.”
- GBP/USD has retreated after a short-lived pullback to near 1.2460 amid a recovery in the USD Index.
- Stubborn UK inflation is supporting more interest rate hikes from the BoE.
- GBP/USD is auctioning in a Symmetrical Triangle chart pattern that indicates a contraction in volatility.
The GBP/USD pair has sensed selling pressure around 1.2450 in the early European session. The strength in the Cable seems waned as the US Dollar Index (DXY) attempted a recovery after a correction below 104.00
Stubborn United Kingdom inflation is supporting more interest rate hikes from the Bank of England (BoE), which will keep the Pound Sterling in a bullish trajectory.
The USD Index is likely to remain volatile as the odds of a neutral interest rate policy by the Federal Reserve (Fed) have started receding, knowing the fact that the labor market is extremely solid and an absence of recession signals.
GBP/USD is auctioning in a Symmetrical Triangle chart pattern that indicates a contraction in volatility, which is followed by wider ticks and heavy volume after an explosion. The upward-sloping trendline of the aforementioned chart pattern is plotted from May 25 low at 1.2308 while the downward-sloping trendline is placed from May 10 high at 1.2680.
The 20-period Exponential Moving Average (EMA) at 1.2437 seems sticky to the asset, indicating a sideways performance.
Also, the Relative Strength Index (RSI) (14) has been confined into the 40.00-60.00 range, which signals that investors are awaiting a fresh trigger for a decisive move.
Should the asset break below May 31 low at 1.2348, US Dollar bulls would drag the asset toward May 25 low at 1.2308. Slippage below the latter would expose the asset to April 03 low at 1.2275.
On the flip side, a confident break above May 16 high at 1.2547 will drive the Cable towards May 10 low at 1.2603 followed by May 10 high at 1.2680.
GBP/USD four-hour chart
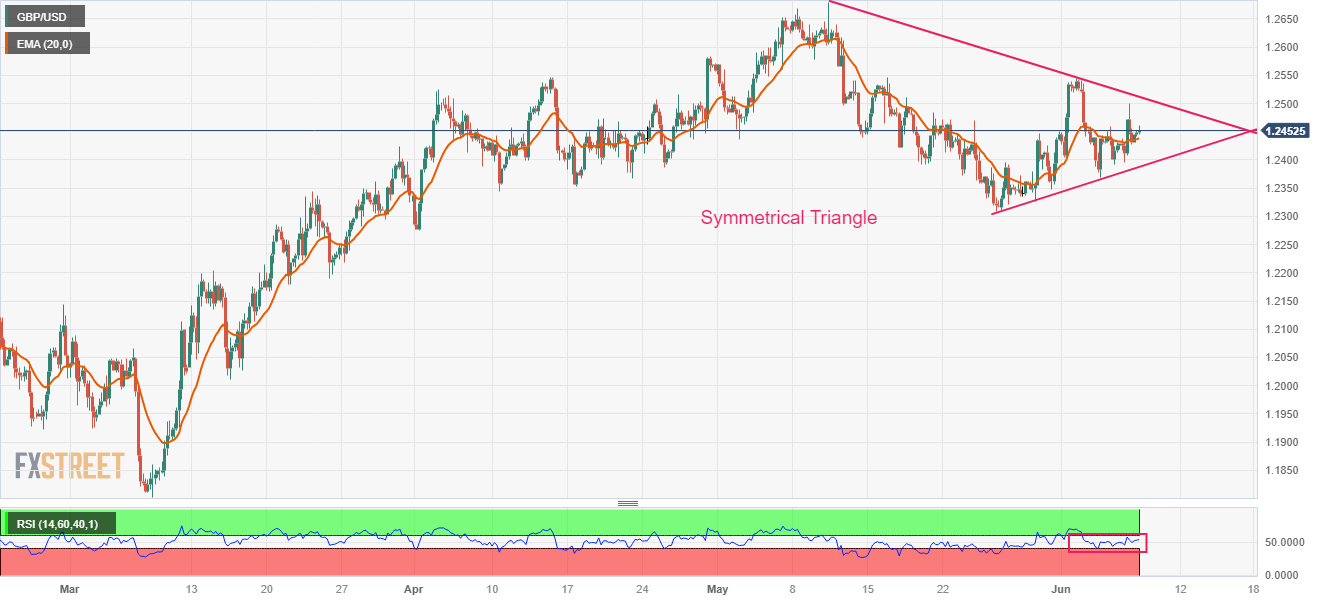
- USD/CHF holds lower ground at intraday low during the first loss-making day in three.
- Overbought RSI, looming bear cross on MACD triggered Swiss Franc pair’s fall.
- Convergence of 100-HMA, previous resistance line challenges bears.
USD/CHF remains pressured around the intraday low near 0.9090, despite the latest corrective bounce off the day’s low heading into Thursday’s European session. In doing so, the Swiss Franc (CHF) pair drops for the first day in three.
While tracing the catalysts for the quote’s latest weakness, the RSI (14) line’s retreat from the overbought territory and previously looming bear cross on MACD, now confirmed, gain major attention.
However, the bullish triangle breakout keeps the USD/CHF pair buyers hopeful unless the quote drops back below the one-week-old descending triangle’s top line, now immediate support near 0.9075. Adding strength to the 0.9075 support is the 100-Hour Moving Average (HMA).
Should the pair slide beneath the 0.9075 support confluence, it can quickly challenge the double bottoms marked around 0.9035-30, forming part of the aforementioned triangle.
On the contrary, the USD/CHF pair’s recovery moves need to refresh the weekly top, currently around 0.9110, to convince bulls for more upside runs, even if they hold the reins.
Even so, a one-week-old horizontal resistance area surrounding 0.9115-20 can act as the last defense of the USD/CHF pair sellers.
Overall, USD/CHF remains on the bull’s radar despite snapping a two-day winning streak.
USD/CHF: Hourly chart
-08062023-638218008245353748.png)
Trend: Limited downside expected
FX option expiries for June 8 NY cut at 10:00 Eastern Time, via DTCC, can be found below.
- EUR/USD: EUR amounts
- 1.0610 953m
- 1.0650 1.1b
- 1.0700 2.9b
- 1.0750 350m
- 1.0800 1.3b
- 1.0900 1.1b
- GBP/USD: GBP amounts
- 1.2200 418m
- 1.2475 800m
- 1.2550 610m
- 1.2690 317m
- USD/JPY: USD amounts
- 138.15 400m
- 139.00 717m
- 140.00 1.0b
- 141.00 518m
- USD/CHF: USD amounts
- 0.8990 506m
- 0.9025 440m
- 0.9300 317m
- AUD/USD: AUD amounts
- 0.6650 429m
- 0.6710 585m
- 0.6775 630m
- USD/CAD: USD amounts
- 1.3350 746m
- 1.3400 1.1b
- 1.3735 756m
- EUR/GBP: EUR amounts
- 0.8620 301m
- The index hovers around the 104.00 region on Thursday.
- Investors continue to price in a pause in June.
- Weekly Claims, Wholesale Inventories next on tap in the docket.
The greenback appears offered just below the 104.00 support when tracked by the USD Index (DXY) on Thursday.
USD Index looks at data, risk trends
The index adds to Wednesday’s small decline and puts the 104.00 region to the test on the back of further improvement in the risk-associated universe ahead of the opening bell in the old continent.
In the meantime, bets for a pause at the Fed’s gathering in June seem to have lost momentum as of late, while a 25 bps rate hike in July seems the most likely scenario when gauged by FedWatch Tool measured by CME Group.
In the US data space, usual Initial Claims for the week ended on June 3 are due seconded by Wholesale Inventories for the month of April.
What to look for around USD
The index looks vulnerable around the 104.00 mark amidst the marked pick-up in the appetite for the risk complex.
In the meantime, bets of another 25 bps at the Fed’s next gathering in June reversed course in spite of the steady resilience of key US fundamentals (employment and prices, mainly), denting the recent rally in the dollar and favouring a further decline in US yields.
Bolstering a pause by the Fed instead appears to be the extra tightening of credit conditions in response to uncertainty surrounding the US banking sector.
Key events in the US this week: Initial Jobless Claims, Wholesale Inventories (Thursday).
Eminent issues on the back boiler: Persistent debate over a soft/hard landing of the US economy. Terminal Interest rate near the peak vs. speculation of rate cuts in late 2023/early 2024. Fed’s pivot. Geopolitical effervescence vs. Russia and China. US-China trade conflict.
USD Index relevant levels
Now, the index is losing 0.15% at 103.94 and the next support comes at 103.38 (monthly low June 2) seconded by 102.98 (100-day SMA) and finally 102.51 (55-day SMA). On the other hand, the breakout of 104.69 (monthly high May 31) would open the door to 105.48 (200-day SMA) and then 105.88 (2023 high March 8).
- USD/CAD remains pressured for the third consecutive day at the lowest level in a month.
- BoC traces RBA’s moves to surprise market with 0.25% rate hike to tame inflation woes.
- WTI crude oil remains depressed on demand-supply fears, ignores US Dollar’s two-day losing streak.
- Speech from BoC’s Beaudry, Canada employment data eyed ahead of next week’s FOMC.
USD/CAD fades bounce off intraday low as it drops to 1.3360 heading into Thursday’s European session, after refreshing the monthly bottom at 1.3320 the previous day. In doing so, the Loonie pair cheers the US Dollar weakness while paying little heed to the mildly offered WTI crude oil price, which is Canada’s main export earner.
On Wednesday, the Bank of Canada (BoC) surprised markets by announcing 25 basis points (bps) increase to increase the benchmark interest rate, to 4.75%, versus market expectations supporting no change in the previous rate of 4.50%. In its policy statement, the BoC said that concerns have increased that Consumer Price Index (CPI) inflation could get stuck materially above the 2% target. That said, the BoC statement appeared dovish as it removed the April language about how the Canadian central bank is prepared to raise rates further if needed.
Elsewhere, WTI crude oil prints mild losses near $72.50 while failing to extend the previous day’s corrective bounce, eyes the second consecutive weekly loss. In doing so, black gold bears the burden of the market’s fears of slower economic growth due to hawkish central bank actions.
It should be noted, however, that the US Dollar Index (DXY) remains pressured despite jittery markets amid the latest increase in the bets on the Federal Reserve’s 25 bps rate hike in July, even as the June Federal Open Market Committee (FOMC) is likely to keep the rates unchanged.
Against this backdrop, S&P500 Futures extend Wednesday’s losses to 4,265, down 0.25% intraday, whereas the US 10-year Treasury bond yields grind near 3.79% after rising the most in five weeks the previous day.
Looking ahead, comments from Bank of Canada (BoC) Deputy Governor Paul Beaudry and Canada’s monthly jobs report will be the key to watching for clear directions ahead of next week’s Fed meeting.
Technical analysis
Despite the latest weakness, the USD/CAD pair is yet to smash a seven-month-old ascending support line, around 1.3330 at the latest, which in turn joins the nearly oversold RSI (14) line to suggest a corrective bounce in price.
- AUD/USD looks prone to more losses as the impact of the surprise RBA’s rate hike has started fading.
- Investors have turned cautious about US economic outlook as expectations for further policy-tightening by the Fed have deepened.
- Rising interest rates in Australia are clearly impacting their economic growth.
The AUD/USD pair has displayed a less-confident recovery to near 0.6620 in the early European session after a vertical sell-off from 0.6717. The Aussie asset seems prone to more losses as gains propelled by a surprise interest rate hike by the Reserve Bank of Australia (RBA) have started waning.
S&P500 futures generated significant losses in Asia. US equities have carry-forwarded their pessimism showed on Wednesday, indicating dented market sentiment. Investors have turned cautious about the United States’ economic outlook as expectations for the continuation of the policy-tightening spell by the Federal Reserve (Fed) have deepened.
The US Dollar Index (DXY) has corrected below 104.00 after a V-shape recovery. On a broader note, the USD Index is expected to remain sideways till the release of the US Consumer Price Index (CPI) data, which will release next week. May’s Employment data is already out and now inflation figures will provide more clarity about the interest rate decision by the Fed.
On the Australian Dollar front, the impact of a surprise interest rate hike of 25 basis points (bps) by RBA Governor Philip Lowe to 4.10% has started waning quickly as the decision is being followed by weak economic indicators.
Australia’s Quarterly GDP was expanded by 0.2% while the street was anticipating an expansion of 0.3%. On an annual basis, Q1 GDP dropped to 2.3% vs. the estimates of 2.4%. Apart from that, the surplus in April’s Trade Balance data dropped sharply due to poor export numbers while imports increased, indicating decent domestic demand.
Australian Treasurer Jim Chalmers said on Wednesday that “rising interest rates are clearly impacting the economic growth,” He further added, “Growth momentum is waning,”
CME Group’s flash data for gold futures markets noted traders added just 465 contracts to their open interest positions on Wednesday. Volume followed suit and went up by more than 56K contracts after two consecutive daily pullbacks.
Gold: A potential test of $1930 looks likely
Wednesday’s daily drop in gold prices was accompanied by increasing open interest and volume and exposes the continuation of the downtrend in the very near term. Against that, the yellow metal could revisit the area of recent lows around $1930 per ounce troy.
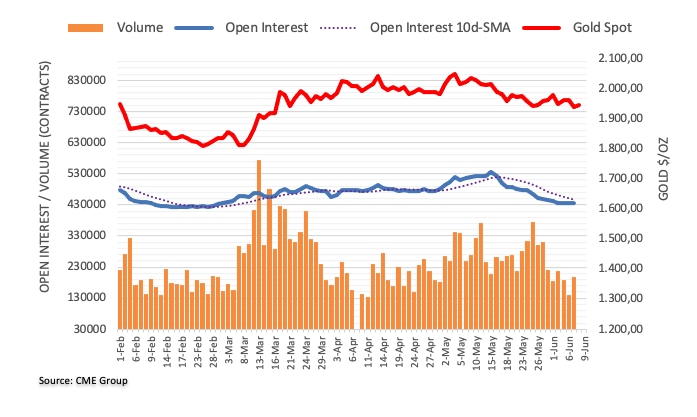
UOB Group’s Economist Lee Sue Ann and Markets Strategist Quek Ser Leang suggest EUR/USD could now trade within 1.0635-1.0785 in the next few weeks.
Key Quotes
24-hour view: “EUR traded between 1.0666 and 1.0739 yesterday before closing little changed at 1.0697 (+0.06%). The price movements are likely part of a consolidation phase and EUR could continue to trade in a range. Expected range for today, 1.0670/1.0740.”
Next 1-3 weeks: “After dropping to a low of 1.0633 last week, EUR rebounded to 1.0778 and it has since traded between the two levels. The price movements appear to be part of a consolidation and EUR could trade between 1.0635 and 1.0785 for a while more.”
- Asia-Pacific equities grind lower amid fears of higher rates, slower economic recovery.
- RBI keeps rates unchanged but multiple China state banks cut rates.
- Aussie trade surplus narrows while Japan’s Annualized GDP growth improves.
- Mixed mood prevails but higher yields, downbeat S&P500 Futures weigh on Asian shares.
Market sentiment in the Asia-Pacific region remains sluggish, mostly downbeat, amid fears of slower economic recovery due to hawkish central bank actions. Adding strength to the downbeat risk profile could be mixed headlines from China, Australia and Japan, as well as due to the upbeat US Treasury bond yields.
While portraying the mood, S&P500 Futures extend Wednesday’s losses to 4,265, down 0.25% intraday, whereas the US 10-year Treasury bond yields grind near 3.79% after rising the most in five weeks the previous day. That said, MSCI’s Index of Asia-Pacific shares ex-Japan drops 0.60% while Japan’s Nikkei 225 prints 1.4% intraday losses heading into Thursday’s Asian session.
It should be noted that the Reserve Bank of India (RBI) keeps the benchmark Repo rate unchanged at 6.5% by matching market forecasts after June’s monetary policy meeting. However, a slew of Chinese state banks including the Industrial and Commercial Bank of China, Bank of China and Construction Bank cut their benchmark rates. The same raises speculations that the Chinese central bank, namely the People’s Bank of China (PBOC), will also cut the rates. With this, India’s BSE Sensex print mild gains but most Chinese stocks are in the red by the press time.
Elsewhere, hawkish concerns about the Reserve Bank of Australia (RBA) and the Reserve Bank of New Zealand (RBNZ) join the downbeat sentiment in China to weigh on the stocks in Australia and China.
On a broader front, the risk profile soured on the latest Organisation for Economic Co-operation and Development (OECD) report that said that the global economy is set for a weak recovery over the coming years as persistent core inflation and tighter monetary policy weigh on demand. Also contributing to the risk-off mood were concerns that the Fed isn’t likely to announce any rate hike in June but is expected to unveil a 0.25% rate lift in July.
Amid these plays, the US Dollar Index (DXY) remains pressured while WTI crude oil prints mild losses and the Gold price remains mildly bid. Further, Antipodeans struggle for clear directions despite positing mild intraday gains of late.
Also read: Forex Today: Another hawkish surprise shows inflation remains central bank’s main concern
- WTI has turned sideways above $72.00 as investors are assessing multiple economic catalysts.
- Inventories of Gasoline and Distillate in the US rose significantly higher, portraying a sharp decline in fuel demand.
- Chances of a steady interest rate decision by the Fed have dropped to 67%, which is sufficient to sour sentiment.
West Texas Intermediate (WTI), futures on NYMEX, are oscillating in a limited range above $72.00 in the late Asian session. The oil price is taking sufficient time required to digest demand catalysts belonging to the United States and China. Apart from that, investors are preparing for the Federal Reserve’s (Fed) interest rate policy for June.
Reading from US Energy Information Administration (EIA) about oil inventory data for the week ending June 02 showed a drawdown by 0.451M while the street was anticipating a build-up. Contrary to that, inventories of Gasoline and Distillate rose significantly higher than estimates, portraying a sharp decline in fuel demand.
Meanwhile, US factory activity has also remained weak in May as the US ISM agency reported a seventh straight contraction in the manufacturing sector, which brings in transparency that the oil demand in the US is extremely bleak.
Going forward, the focus will be on the Fed’s June policy. As per the CME Fedwatch tool, the chances of a steady interest rate decision have dropped to 67%, which is sufficient to trigger a risk-aversion theme.
On the China front, Trade Balance data dropped sharply to $65.81B vs. the estimates of $92B and the former release of $90.21B. Exports were sharply contracted by 7.5%, which indicates that consumers are shifting to other countries for outsourcing or the global demand is turning extremely weak. In all sense, demand for the oil price is getting vulnerable. It is highly likely that the impact of OPEC’s production cuts would wane as demand remains the major catalyst for analyzing the oil price.
Investors should note that China is the world’s biggest importer of oil and poor activity in China impact heavily on the oil price.
- EUR/USD edges higher and retakes the 1.0700 mark during the Asian session on Thursday.
- A mildly softer tone around the USD is seen as a key factor lending support to the major.
- The formation of a bearish pennant warrants caution before positioning for further gains.
The EUR/USD pair attracts some buying following the overnight pullback from the weekly high and climbs back above the 1.0700 mark during the Asian session on Thursday.
The uncertainty over the Federal Reserve's (Fed) rate-hike path keeps the US Dollar (USD) bulls on the defensive, which, in turn, is seen lending some support to the EUR/USD pair. That said, surprise rate hikes by the Reserve Bank of Australia (RBA) and the Bank of Canada (BoC) this week suggest that the fight against inflation is not over yet. This supports prospects for a further policy tightening by the Fed, which remains supportive of elevated US Treasury bond yields and favours the USD bulls.
From a technical perspective, the recent price action between two converging trend lines constitutes the formation of a bearish pennant on hourly charts. This comes on the back of the recent breakdown through the 100-day Simple Moving Average (SMA) and suggests that the path of least resistance for the EUR/USD pair is to the downside. Bearish traders, however, need to wait for weakness below the symmetrical triangle support, currently near the 1.0680-1.0675 region, before placing fresh bets.
The latter is followed by the 1.0635 area, or over a two-month low touched last week, and the 1.0600 round-figure mark. Some follow-through selling will be seen as a fresh trigger for bearish traders and drag the EUR/USD pair towards intermediate support near the 1.0540-1.0535 area en route to the 1.0500 psychological mark. The latter coincides with the very important 200-day SMA and should help protect any further losses ahead of the highly-anticipated FOMC meeting next week.
On the flip side, the top end of the aforementioned symmetrical triangle, currently around the 1.0745-1.0750 area, coincides with the 100-period SMA on the 4-hour chart. A convincing breakthrough could trigger a short-covering rally and allow the EUR/USD pair to reclaim the 1.0800 mark. The upward trajectory could get extended further towards testing the next relevant hurdle near the 1.0865-1.0870 region, representing the 200-period SMA on the 4-hour chart.
EUIR/USD 4-hour chart
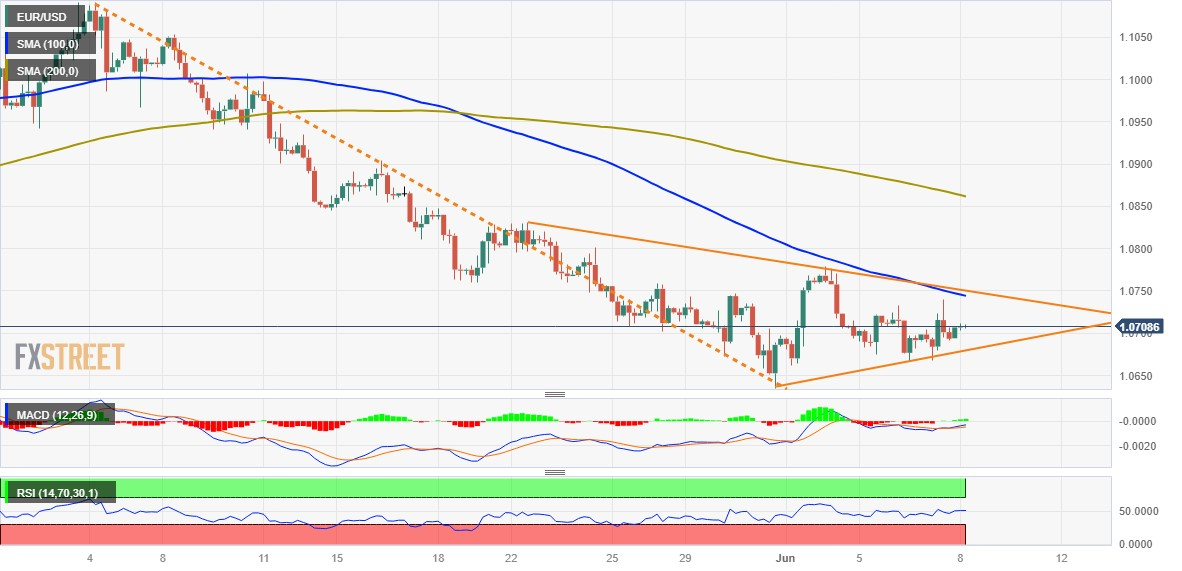
Key levels to watch
- USD/INR grinds lower while keeping the daily loss after RBI’s inaction.
- RBI keeps benchmark Repo rate unchanged at 6.5%, as expected.
- Mixed global growth, Fed concerns prod sentiment in Asia-Pacific zone, putting a floor under US Dollar price.
- Risk catalysts eyed for short-term directions ahead of next week’s FOMC.
USD/INR justifies the Reserve Bank of India (RBI) inaction during early Thursday as it reverses the initial losses around 82.60 after the Indian central bank’s monetary policy decision. In doing so, the Indian Rupee (INR) fails to justify the US Dollar’s weakness amid mixed market sentiment.
RBI keeps the benchmark Repo rate unchanged at 6.5% by matching market forecasts after June’s monetary policy meeting. Following the interest rate announcements, RBI Governor Shaktikanta Das said, “We can derive satisfaction that Indian eco and financial sector stand robust in global environment,” The policymaker also added that the path ahead is now somewhat clearer.
On the other hand, fears of global economic slowdown backed by higher rates weigh on the sentiment, even if the mixed Fed concerns and sluggish yields allow markets to remain slightly positive. That said, the latest increase in the market’s bets on the Federal Reserve’s 25 bps rate hike in July, even as the June Federal Open Market Committee (FOMC) is likely to keep the rates unchanged, propel the USD/INR price even as the US Dollar struggles of late.
Elsewhere, optimism surrounding China and downbeat Oil price allow the USD/INR to consolidate the weekly loss.
A slew of Chinese state banks including the Industrial and Commercial Bank of China, Bank of China and Construction Bank cut their benchmark rates. The same raises speculations that the Chinese central bank, namely the People’s Bank of China (PBOC), will also cut the rates. Further, China’s Director of China's National Administration of Financial Regulation Li Yunze recently mentioned that the economy is still recovering.
It should be noted that the WTI crude oil prints mild losses near $72.50 while failing to extend the previous day’s corrective bounce, eyes the second consecutive weekly loss.
To sum up, USD/INR justifies the RBI’s inaction by paring weekly gain. However, the quote’s further moves appear limited due to a light calendar and cautious mood ahead of the next week’s FOMC monetary policy meeting.
Technical analysis
A daily closing beyond a two-week-old resistance line, now immediate support around 82.53, keeps USD/INR buyers hopeful of witnessing further upside toward the previous monthly high of around 83.00 round figure.
- Natural Gas Price seesaws around one-week high as the key technical levels challenge further upside.
- 200-SMA prods XNG/USD buyers amid nearly overbought RSI conditions.
- Multiple supports, bullish MACD signals can put a floor under the Natural Gas Price even as rising wedge teases bears.
Natural Gas (XNG/USD) Price eases from the weekly top, paring intraday gains, as the energy instrument buyers fail to cross the 200-SMA amid early Thursday. With this, the XNG/USD prints mild losses of around $2.38 by the press time.
In doing so, the asset also eases within a one-week-old rising wedge bearish chart formation, currently between $2.35 and $2.43.
Apart from the 200-SMA and rising wedge, the nearly overbought RSI (14) line also teases the Natural Gas sellers.
However, the quote needs to break the $2.35 support to confirm the bearish chart pattern suggesting a theoretical fall toward $2.15.
During the anticipated downside, the previous resistance line from May 26, close to $2.32 at the latest, can act as an extra filter towards the north.
Following that, a two-month-old ascending trend line and resistance-turned-support from May 19, respectively near $2.20 and $2.16, can challenge the Natural Gas sellers before directing them to the $2.15.
On the contrary, an upside break of the 200-SMA hurdle of $2.40 needs validation from the stated wedge’s top line surrounding $2.43 to convince the XNG/USD bulls.
Even so, the late May swing high around $2.50 and a three-week-long horizontal resistance area around $2.60-61 can challenge the Natural Gas upside before welcoming the bulls.
Natural Gas Price: Four-hour chart
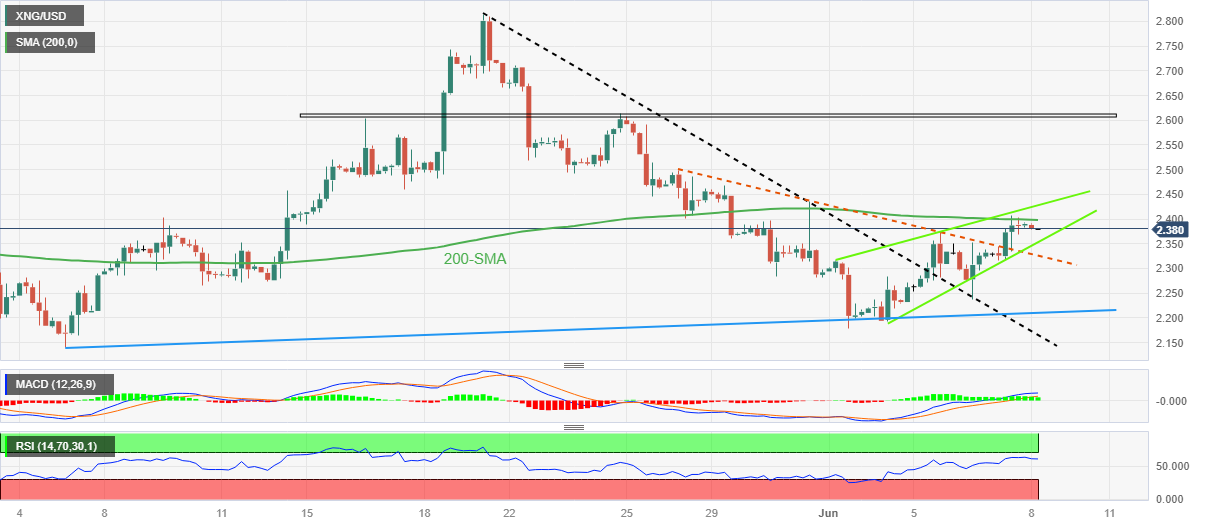
Trend: Limited downside expected
- NZD/USD stages a modest recovery from a one-week low touched earlier this Thursday.
- A modest USD downtick lends some support to the pair, though the upside seems capped.
- The fundamental backdrop warrants some caution before placing aggressive bullish bets.
The NZD/USD pair attracts some buying near the 0.6025 area, or a one-week low touched during the Asian session on Thursday and recovers a part of the previous day's losses. The pair is currently placed around mid-0.6000s, up 0.20% for the day, albeit the intraday uptick lacks bullish conviction.
The US Dollar (USD) continues with its struggle to gain any meaningful traction and edges lower within a familiar trading band held over the past two weeks or so, which, in turn, lends some support to the NZD/USD pair. The uncertainty over the Federal Reserve's (Fed) rate-hike path is seen as a key factor holding back the USD bulls from placing aggressive bets. That said, elevated US Treasury bond yields, along with the caution market mood, should help limit the downside for the safe-haven Greenback.
Last week's dovish rhetoric by several Fed officials fueled speculations that the US central bank will keep rates unchanged at the June 13-14 policy meeting. That said, the inflation and labor market data keep alive hopes for a 25 bps lift-off. Moreover, surprise rate hikes by the Reserve Bank of Australia (RBA) and the Bank of Canada (BoC) this week suggest that the fight against inflation is still not over. This supports prospects for further tightening by the Fed and acts as a tailwind for the US bond yields.
The market sentiment, meanwhile, remains fragile in the wake of the worsening global economic conditions. The concerns resurfaced after Chinese trade data released on Wednesday showed that the surplus sank to a 13-month low in May on the back of a slump in exports. The data indicated weak overseas demand for Chinese goods and poses challenges for the world's largest economy. This could weigh on antipodean currencies, including the Kiwi, and contribute to capping the NZD/USD pair.
This, along with the Reserve Bank of New Zealand's (RBNZ) explicit signal that it was done with its most aggressive hiking cycle since 1999, warrants caution before placing fresh bullish bets. Hence, it will be prudent to wait for strong follow-through buying before positioning for the resumption of the NZD/USD pair's recovery from the YTD low, levels just below the 0.6000 psychological mark touched last week. Market participants now look to the release of the Weekly Initial Jobless Claims data from the US.
Technical levels to watch
- Gold Price grinds higher past $1,930 key support confluence amid softer US Dollar, sluggish markets.
- Risk appetite dwindles as economic slowdown concerns jostle with easing hawkish Fed bets.
- Light calendar may restrict immediate XAU/USD moves but sluggish yields keep sellers hopeful.
Gold Price (XAU/USD) seesaws around intraday high as it prints mild gains after falling the most in a week the previous day. Even so, the XAU/USD remains indecisive on a weekly basis as the markets struggle for clear directions amid the pre-Fed blackout and mixed feelings about global growth concerns.
The Organisation for Economic Co-operation and Development (OECD) flags fears of a weak global economic transition amid higher rates and prod the Gold buyers, especially after the surprise rate hikes from the central banks in Australia and Canada. However, easing concerns about the Federal Reserve’s (Fed) 0.25% rate hike in June contrasts with rising odds of witnessing a July hike to underpin the Gold Price recovery of late. Furthermore, the risk-positive headlines from China and expectations of witnessing easy rates from Beijing also favor the XAU/USD bulls as the dragon nation is one of the world’s key Gold consumers.
Looking ahead, second-tier data and headlines about global growth, as well as central banks, may entertain gold traders ahead of the next week’s all-important Federal Open Market Committee (FOMC) monetary policy meeting. It should be observed that XAU/USD traders should also pay attention to Friday’s China inflation data and yields for clear directions.
Also read: Gold Price Forecast: 100 DMA appears a tough nut to crack for XAU/USD sellers
Gold Price: Key levels to watch
Our Technical Confluence Indicator suggests that the Gold Price edges higher past $1,933 key support comprising the lows marked in the last month, as well as in the last week. The same joins the market’s indecision, as well as the US Dollar's weakness, to lure the buyers.
That said, a convergence of the 100-DMA and the previous daily low restricts the immediate downside of the Gold Price near $1,940.
In a case where the XAU/USD drops below $1,933, a Pivot Point One Week S1 can act as an extra downside filter at $1,926.
Alternatively, Fibonacci 38.2% in one-day and 61.8% in one-week together highlight an immediate upside hurdle for the Gold Price near $1,952.
However, the 10-DMA and middle band of the Bollinger on the four-hour play, close to $1,956 appear the key resistance for the XAU/USD bulls to cross for conviction.
Following that, a slew of resistances around $1,960 and $1,970 can prod the Gold buyers before highlighting the $2,000 psychological magnet.
Here is how it looks on the tool
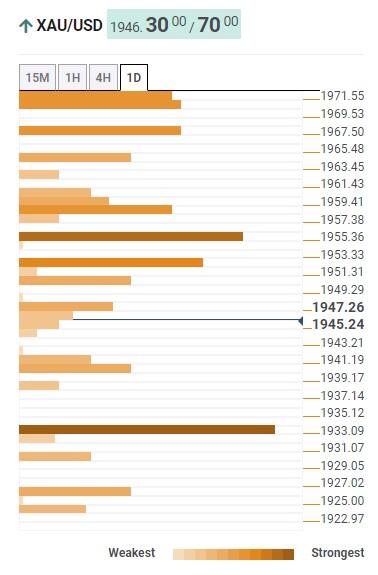
About Technical Confluences Detector
The TCD (Technical Confluences Detector) is a tool to locate and point out those price levels where there is a congestion of indicators, moving averages, Fibonacci levels, Pivot Points, etc. If you are a short-term trader, you will find entry points for counter-trend strategies and hunt a few points at a time. If you are a medium-to-long-term trader, this tool will allow you to know in advance the price levels where a medium-to-long-term trend may stop and rest, where to unwind positions, or where to increase your position size.
- USD/JPY edges lower on Thursday and reverses a part of the overnight positive move.
- The recent range-bound price action constitutes the formation of a bullish rectangle.
- A convincing break below 139.00 is needed to support prospects for additional losses.
The USD/JPY pair struggles to capitalize on the overnight goodish rebound from the 139.00 mark, or the weekly low and meets with some supply during the Asian session on Thursday. Spot prices currently trade around the 139.85 area, down nearly 0.20% for the day, though any meaningful downside still seems elusive.
Speculations for more sizeable interventions by the Bank of Japan (BoJ) to support the domestic currency, along with the cautious market mood, benefit the safe-haven Japanese Yen (JPY). Apart from this, a modest US Dollar (USD) downtick exerts some downward pressure on the USD/JPY pair. That said, the uncertainty over the Federal Reserve's (Fed) rate-hike path and elevated US Treasury bond yields should help limit the downside for the buck, which, in turn, should lend support to the major.
From a technical perspective, the USD/JPY pair has been oscillating in a range since the beginning of the current week, forming a rectangle on hourly charts. Against the backdrop of a rally from the mid-133.00s, or the May monthly swing low, this might still be categorized as a bullish consolidation phase. Moreover, spot prices, so far, manage to hold above the upward-sloping 100-period Simple Moving Average (SMA) on the 4-hour chart, which favours bulls and supports prospects for further gains.
Bullish traders, however, need to wait for acceptance above the 140.00 psychological mark and a sustained break through the 140.20-140.30 horizontal resistance before placing fresh bets. The USD/JPY pair might then accelerate the positive move towards challenging the YTD peak, around the 140.90 region, touched in May. Some follow-through buying beyond the 141.00 mark will be seen as a fresh trigger for bullish traders and set the stage for a further appreciating move for the pair.
On the flip side, the 100-period SMA, currently pegged just ahead of the 139.00 round figure, might continue to protect the immediate downside. A convincing break below the 139.00 mark might prompt some technical selling and drag the USD/JPY pair to the monthly low, around the 138.45-138.40 zone. The downward trajectory could get extended further towards the 138.00 mark before spot prices eventually drop to the 137.30 region, representing the very important 200-day SMA support.
USD/JPY 4-hour chart
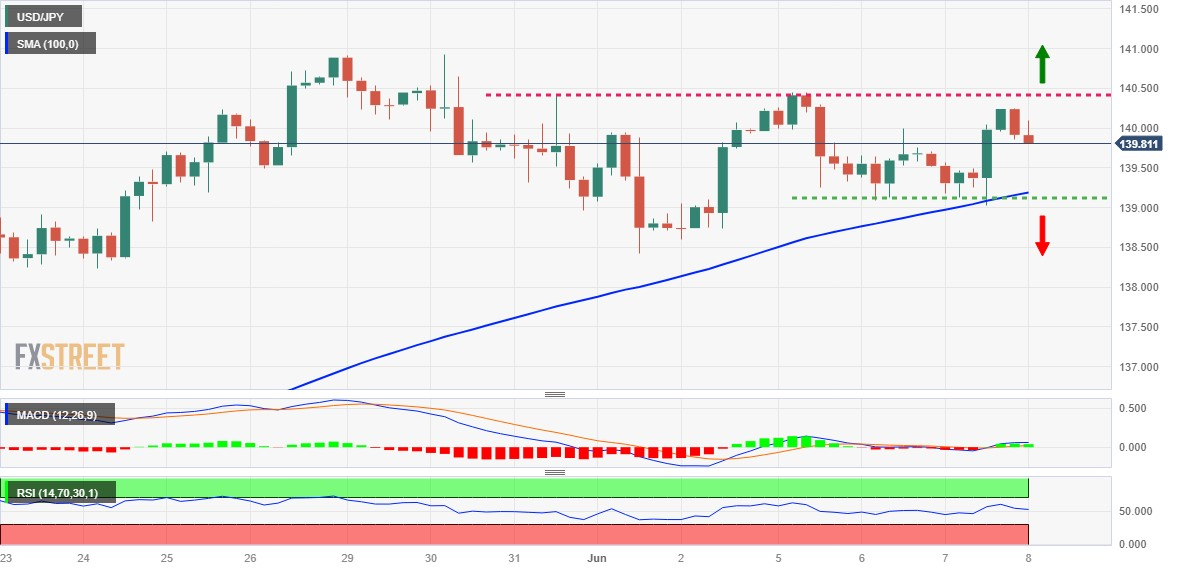
Key levels to watch
A Vice Governor at the People’s Bank of China (PBOC) said on Thursday, the central bank has the ability to maintain stable FX market operations.
He said that “we have confidence, conditions and capacity to maintain stable operations of the FX market.”
Related reads
- China’s Financial Regulator: Economy still recovering, demand will be boosted
- USD/CNH renews six-month high above 7.1500 as Fed vs. PBoC is likely to widen
- GBP/USD stays on the front foot for the second consecutive day after reversing from weekly top.
- Easing British labor shortage contrasts with housing market pressure to challenge BoE rate speculations.
- Fed’s June rate hike slips off the table with July likely being the last rate hike.
- Cable buyers may have limited upside room as UK politics, BoE clues probing Pound Sterling optimists.
GBP/USD buyers occupy driver’s seat around 1.2450, despite marking a slow run towards the north heading into Thursday’s London open. In doing so, the Cable pair buyers cheer the receding odds of a Fed rate hike in June while early signals for the Bank of England’s (BoE) interest rate guide appear mixed.
Earlier in the day, the UK’s Recruitment and Employment Confederation (REC) released a survey, funded by the global quant giant KPMG, saying that Britain's labor market cooled further in May as starting salaries for permanent staff rose at the weakest pace in over two years. It should be noted that the recruiters included in the survey are the ones being closely watched by the Bank of England (BoE) and hence the results appear more important for the GBP/USD pair traders.
On the contrary, another poll of the Royal Institution of Chartered Surveyors (RICS) hints that the measure of new buyer inquiries rose to a net balance of -18, the least negative figure since -14 in May 2022, and up from -34 in April, per Reuters.
Elsewhere, UK Prime Minister Rishi Sunak fails to mark any major achievements during this diplomatic US visit and prods the GBP/USD buyers. “Rishi Sunak confirming he isn’t talking about a UK-US free trade deal with Joe Biden is the final nail in the coffin of promises he and others made to win the 2016 Brexit referendum,” reports UK Mirror.
Apart from the British catalysts, the latest increase in the market’s bets on the Federal Reserve’s 25 bps rate hike in July increased, even as the June Federal Open Market Committee (FOMC) is likely to keep the rates unchanged, also challenge the GBP/USD upside.
That said, the risk profile soured and added negatives for the GBP/USD, which it ignores, on the latest Organisation for Economic Co-operation and Development (OECD) report that said that the global economy is set for a weak recovery over the coming years as persistent core inflation and tighter monetary policy weigh on demand. The OECD report also mentioned, “UK growth of 0.3% in 2023 and 1.0% in 2024 (previously -0.2% in 2023 and 0.9% in 2024).”
Amid these plays, the US 10-year bond coupons remain mostly unchanged at 3.79% by the press time whereas the two-year yields grind higher to 4.54% as we write. While portraying the market’s mood, Wall Street closed mixed and S&500 Futures struggle for clear directions.
Looking ahead, a light calendar in the UK and the US, apart from the weekly Initial Jobless Claims, may fail to provide any major challenge to the Pound Sterling buyers. However, risk catalysts and the bond market moves should be closely observed for clear directions.
Technical analysis
GBP/USD grinds within a 100-pip broad one-month-old symmetrical triangle, currently between 1.2500 and 1.2400, as bulls flex muscles.
- USD/CHF oscillates in a narrow trading band through the Asian session on Thursday.
- The cautious mood benefits the safe-haven CHF and caps gains amid subdued USD.
- Reviving bets more Fed rate hikes lift the US bond yields and lend support to the buck.
The USD/CHF pair struggles to capitalize on its gains recorded over the past two days and oscillates in a narrow trading band through the Asian session on Thursday. Spot prices currently trade below the 0.9100 mark, with bulls still awaiting a sustained move beyond a technically significant 100-day Simple Moving Average (SMA) before placing fresh bets.
The prevalent cautious mood lends some support to the safe-haven Swiss Franc (CHF), which, along with subdued US Dollar (USD) price action, acts as a headwind for the USD/CHF pair. The market sentiment remains fragile in the wake of worries about a global economic sentiment, fueled by dismal Chinese macro data released on Wednesday. In fact, China's trade surplus sank to a 13-month low in May, led by a surprise tumble in exports. This suggests that overseas demand for Chinese goods remained weak and poses additional challenges for the world's second-largest economy, tempering investors' appetite for riskier assets.
The USD, on the other hand, is oscillating in a familiar range over the past two weeks or so as market players seem uncertain over the Federal Reserve's (Fed) next policy move. Last week's dovish rhetoric by several Fed officials fueled speculations that the US central bank will keep interest rates unchanged at its upcoming monetary policy meeting on June 13-14. That said, the inflation and labor market data kept alive hopes for a 25 bps lift-off next week. Moreover, surprise rate hikes by the Reserve Bank of Australia (RBA) and the Bank of Canada (BoC) this week suggest that the fight against inflation is still not over yet.
The prospects for further policy tightening by the Fed remain supportive of elevated US Treasury bond yields, which favours the USD bulls and should help limit the downside for the USD/CHF pair. That said, it will still be prudent to wait for a sustained breakout through the 100-day SMA before positioning for an extension of over a one-month-old uptrend. Traders now look to the release of the Weekly Initial Jobless Claims data from the US, due later during the North American session. This, along with the US bond yields, will influence the USD price dynamics and provide a fresh impetus to the major.
Technical levels to watch
| Raw materials | Closed | Change, % |
|---|---|---|
| Silver | 23.443 | -0.64 |
| Gold | 1940.01 | -1.18 |
| Palladium | 1390.92 | -1.26 |
- USD/TRY retreats from a fresh all-time high, though the downside seems cushioned.
- Extremely overstretched oscillators prompt traders to take some profits off the table.
- Any meaningful corrective decline might still attract fresh buyers and remain limited.
The USD/TRY pair eases from the 24.00 neighbourhood, or a fresh all-time high touched during the Asian session on Thursday, though any meaningful corrective decline still seems elusive. Spot price currently trades around the 23.30 area, down just over 0.10% for the day.
From a technical perspective, extremely overstretched oscillators on daily/weekly/monthly charts turn out to be a key factor holding back traders from placing fresh bearish bets around the Turkish Lira. Any subsequent slide in the USD/TRY pair, however, is more likely to attract fresh buyers and remain cushioned near the 23.00 mark.
The said handle should act as a pivotal point for intraday traders, which if broken decisively might prompt some long-unwinding trade and pave the way for deeper losses. The USD/TRY pair might then accelerate the fall towards the 22.80 horizontal support en route to the 22.30-22.25 region before dropping back to the 22.00 round figure.
On the flip side, bulls might now await a sustained strength beyond the 24.00 mark before placing fresh bets and positioning for an extension of the recent blowout rally witnessed over the past two weeks or so. It is worth recalling that the USD/TRY pair has climbed nearly 17% following President Erdogan’s win at the general elections on May 28.
USD/TRY 1-hour chart
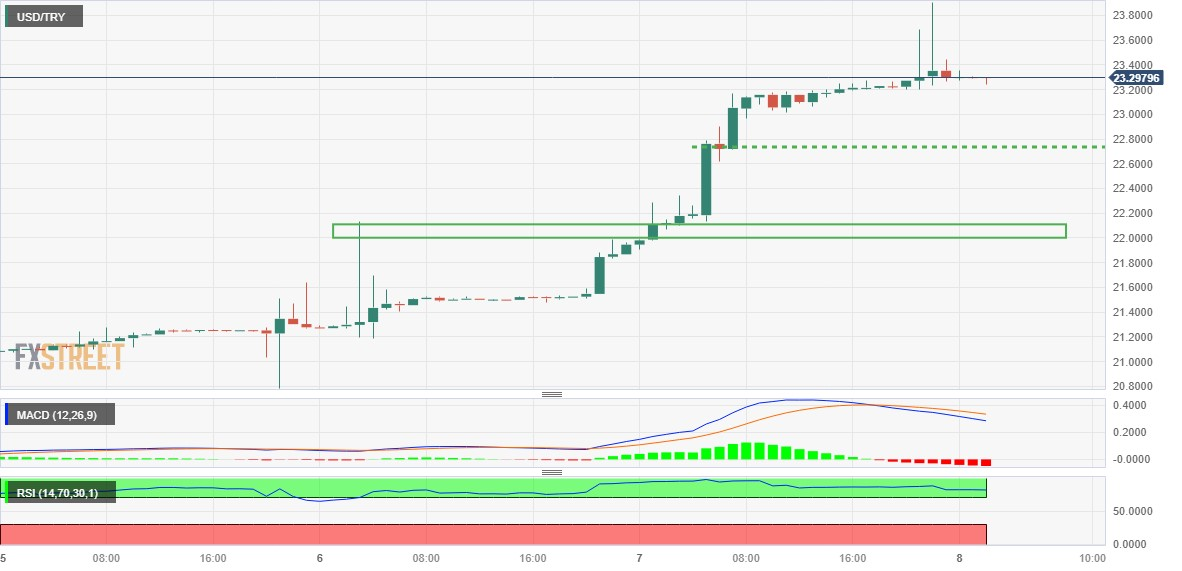
- USD/CNH rises for the fifth consecutive day to prod late November 2022 high.
- Multiple Chinese banks cut rates to fuel speculations of PBoC rate reduction.
- Market sentiment dwindles amid fresh fears of economic slowdown, higher rates.
- China inflation, second-tier US data can entertain traders ahead of the key next week.
USD/CNH remains on the front foot at the highest levels in six months, mildly bid near 7.1530 during early Thursday, as fears of the Federal Reserve’s (Fed) rate hikes contrast with the concerns that the People’s Bank of China will cut the benchmark rates. That said, the market’s fears of economic slowdown also weigh on the offshore Chinese Yuan (CNH).
That said, a slew of Chinese state banks including the Industrial and Commercial Bank of China, Bank of China and Construction Bank cut their benchmark rates. The same raises speculations that the Chinese central bank, namely the People’s Bank of China (PBOC), will also cut the rates.
Alternatively, China’s Director of China's National Administration of Financial Regulation Li Yunze recently mentioned that the economy is still recovering.
On the other hand, the latest increase in the market’s bets on the Federal Reserve’s 25 bps rate hike in July increased, even as the June Federal Open Market Committee (FOMC) is likely to keep the rates unchanged, propel the USD/CNH price even as the US Dollar struggles of late.
Previously, the risk profile soured on the latest Organisation for Economic Co-operation and Development (OECD) report that said that the global economy is set for a weak recovery over the coming years as persistent core inflation and tighter monetary policy weigh on demand. The OECD report also mentioned, “Sees Chinese growth of 5.4% in 2023 and 5.1% in 2024 (previously 5.3% in 2023 and 4.9% in 2024).”
Against this backdrop, the US 10-year bond coupons remain mostly unchanged at 3.79% by the press time whereas the two-year yields grind higher to 4.54% as we write. While portraying the market’s mood, Wall Street closed mixed and S&500 Futures struggle for clear directions.
Looking forward, USD/CNH traders may need to keep their eyes on the risk catalysts for clear directions, which in turn highlights headlines surrounding growth and central banks. That said, Friday’s China inflation data will crucial to watch ahead of the next week’s all-important Federal Open Market Committee (FOMC) monetary policy meeting.
Technical analysis
A one-month-old bullish trend channel, currently between 7.1830 and 7.1000, restricts short-term USD/CNH moves while keeping the bulls hopeful.
Li Yunze, Director of China's National Administration of Financial Regulation, made some upbeat remarks on the Chinese economy this Thursday.
Key quotes
Economy is still recovering.
Demand will be boosted, expanded.
Will optimise private financing, strengthen financial services for private business.
The recent global banking crisis has had little impact on china but does offer a cautionary tale.
China has the conditions and confidence to prevent systemic financial risks.
These comments come after China's biggest banks on Thursday lowered their interest rates on yuan deposits, action that could ease pressure on profit margins and make room for reduced lending costs.
- USD/CNH renews six-month high above 7.1500 as Fed vs. PBoC is likely to widen
- USD/CAD trades with a mild negative bias for the third successive day on Thursday.
- The BoC’s surprise rate hike continues to underpin the CAD and weighs on the pair.
- The Fed rate-hike uncertainty might hold back bears from placing aggressive bets.
The USD/CAD pair struggles to capitalize on the overnight late rebound from the 1.3320 area, or a one-month low and meets with a fresh supply during the Asian session on Thursday. The pair trades with a mild negative bias for the third successive day and is currently placed just above the mid-1.3300s.
The Canadian Dollar (CAD) continues to draw support from the Bank of Canada's (BoC) surprise 25 bps lift-off on Wednesday, which, along with subdued US Dollar (USD) price action, exert some downward pressure on the USD/CAD pair. It is worth recalling that the Canadian central bank defied market expectations by restarting its policy tightening campaign and hiked its overnight rate to 4.75%, or a 22-year high. In the accompanying policy statement, the BoC noted that concerns have increased that CPI could get stuck materially above the 2% target. The markets were quick to price in yet another increase next month to ratchet down an overheating economy and stubbornly high inflation.
The USD, on the other hand, remains confined in a familiar trading band held over the past two weeks or so as investors seem uncertain over the Federal Reserve's (Fed) rate-hike path. Dovish rhetoric by several Fed officials last week fueled speculations for an imminent pause in the US central bank's policy tightening cycle. In fact, the current market pricing indicates a greater chance that the Fed will keep rates unchanged at its June 13-14 policy meeting. That said, the recent inflation and labor market data from the US kept alive hopes for a 25 bps lift-off next week.
Moreover, an unexpected rate hike by other major central banks this week, including the Reserve Bank of Australia and the BoC, suggests that the fight against inflation is not over yet. This, in turn, supports the view that the Fed will likely keep interest rates higher for longer and continues to act as a tailwind for elevated US Treasury bond yields, which is seen lending some support to the buck and the USD/CAD pair Hence, it will be prudent to wait for some follow-through selling before traders start positioning for an extension of an over a one-week-old downtrend.
Market participants now look forward to the release of the Weekly Initial Jobless Claims data from the US, due later during the North American session. Apart from this, the US bond yields and the broader risk sentiment will drive demand for the safe-haven USD. Traders will further take cues from Oil price dynamics, which tend to influence the commodity-linked Loonie, for a fresh impetus and grab short-term trading opportunities around the USD/CAD pair.
Technical levels to watch
- AUD/USD picks up bids to reverse the previous day’s pullback from the highest level in a month.
- Australia Trade Balance, Exports drop in April while Imports improve.
- Bond market’s consolidation after a heavy move, rate chatters in China also underpin Aussie pair’s rebound.
- Risk catalysts, mid-tier US data eyed for clear directions.
AUD/USD eases from intraday high to near 0.6660 while paring the late Wednesday’s rebound from 0.6640 during early Thursday morning. In doing so, the Aussie pair fades the early Asian session’s run-up to refresh the monthly top, after reversing from the highest levels since May 11 the previous day. With this, the Aussie pair justifies mixed Australia trade data for April amid sluggish markets.
Australia’s Trade Balance declines to 11,158M in April versus 14,000M market forecasts and 15,269M prior. That said, the Pacific nation’s Exports drop to -5.0%, versus 4.0% prior, whereas the Imports repeat 2.0% growth for the said month.
Apart from the mixed Aussie data, sluggish sentiment in the market also prods the AUD/USD pair, due to its risk-barometer status. The reason could be linked to the fears of a global economic slowdown and higher rates.
However, hawkish concerns from the Reserve Bank of Australia (RBA) contrast with rate cuts by Chinese banks to underpin the AUD/USD pair’s recovery.
Earlier in the day, a slew of Chinese banks including the Industrial and Commercial Bank of China, Bank of China and Construction Bank cut their benchmark rates. The same raises speculations that the Chinese central bank, namely the People’s Bank of China (PBOC), will also cut the rates, which in turn suggests more fund flow to the economy and is positive for the AUD/USD pair due to the Aussie-China trade ties.
Against this backdrop, the benchmark US 10-year Treasury bond yields rose the most in five weeks to 3.79% while the two-year counterpart marched to 4.52% at the latest. That said, the US 10-year bond coupons remain mostly unchanged at 3.79% by the press time whereas the two-year yields grind higher to 4.54% as we write. While portraying the market’s mood, Wall Street closed mixed and S&500 Futures struggle for clear directions.
Looking ahead, the US Initial Jobless Claims and the central bank chatters can entertain the AUD/USD pair traders ahead of Friday’s inflation data from China.
Technical analysis
Unless providing a clear upside break of the 0.6715 resistance confluence, encompassing two downward-sloping resistance lines from February 02 and 14 respectively, the AUD/USD pair’s upside remains elusive.
According to the latest data published by the Australian Bureau of Statistics, Australia’s trade surplus shrank more than expected in April.
The April Goods/Services Trade Balance came in at 11,158M MoM, compared with the exepctations of 14,000M and 15,269M prior.
Australia April Goods/Services Exports dropped 5.0% on a monthly and seasonally adjusted vs. 2.0% previous.
The country’s April Goods/Services Imports rose 2% MoM and seasonally adjusted vs. 2.0% booked in March.
Market reaction
AUD/USD has paused its upside on the discouraging Australian trade figures. The spot is trading 0.16% higher at 0.6663, at the press time.
- Gold price once again finds some support near 100-day SMA and edges higher on Thursday.
- A mildly softer tone around the US Dollar and the cautious mood lend support to the metal.
- The uncertainty over the Federal Reserve’s next policy move could cap any meaningful gains.
Gold price attracts some buyers near the $1,940 area, representing the 100-day Simple Moving Average (SMA), during the Asian session on Thursday and recovers a part of the overnight slide to a one-week low. The XAU/USD currently trades around the $1,945-$1,946 region and remains well within a familiar trading range held over the past three weeks or so.
Subdued US Dollar acts as a tailwind for Gold price
The US Dollar (USD) struggles to capitalize on the previous day's goodish bounce from the weekly low and turns out to be a key factor lending some support to the Gold price. The downside for the USD, however, seems cushioned amid the uncertainty over the Federal Reserve's (Fed) rate hike path. This, in turn, might hold back traders from placing aggressive bullish bets and act as a headwind for the US Dollar-denominated precious metal.
Federal Reserve’s uncertain rate-hike path caps XAU/USD
Last week's dovish rhetoric by several Fed officials reaffirmed market expectations for an imminent pause in the US central bank's policy tightening cycle. In fact, the current market pricing indicates a greater chance that the Fed will keep rates unchanged at its upcoming policy meeting on June 13-14. That said, the recent inflation and labor market data from the United States (US) kept alive hopes for a 25 basis points (bps) lift-off next week.
Furthermore, surprise rate hikes by the Reserve Bank of Australia (RBA) earlier this week and the Bank of Canada (BoC) on Wednesday suggested that the fight against inflation is not over yet. This, in turn, fueled speculations that the Fed might keep interest rates higher for longer and led to the overnight sharp rise in the US Treasury bond yields, which favours the USD bulls and keep a lid on any meaningful gains for the non-yielding Gold price.
A cautious market mood could lend support to the precious metal
That said, the prevalent cautious mood could lend support to the safe-haven XAU/USD. Dismal Chinese macro data released on Wednesday, showing that trade surplus sank to a 13-month low in May, led by a slump in exports in the wake of weak overseas demand for Chinese goods, continue to weigh on investors' sentiment. Hence, strong follow-through selling is needed to support prospects for an extension of the recent pullback from an all-time high touched in May.
Gold price technical outlook
From a technical perspective, bearish traders still need to wait for a convincing break and acceptance below the 100-day SMA before placing fresh bets. Some follow-through selling below the May monthly swing low, around the $1,932 region, will reaffirm the negative bias and make the Gold price vulnerable to accelerate the fall towards the $1,900 round figure. The downward trajectory could get extended further and drag the XAU/USD towards the $1,876-$1,875 horizontal support en route to the very important 200-day SMA, currently around the $1,839 region.
On the flip side, any meaningful intraday appreciating move is likely to confront stiff resistance near the $1,962-$1,964 region. A sustained strength beyond has the potential to lift the Gold price to the next relevant hurdle near the $1,983-$1,985 supply zone en route to the $2,000 psychological mark. The XAU/USD could eventually climb towards the $2,010-$2,012 supply zone.
Key levels to watch
- EUR/USD picks up bids to refresh intraday high, defends previous rebound from weekly low.
- US Dollar fails to cheer hawkish Fed bets, upbeat yields amid mixed economic concerns.
- Sluggish sentiment prods Euro buyers as fears of recession, higher rates return to the table.
- Final readings of Eurozone Q1 GDP, US employment clues eyed for clear directions.
EUR/USD renews intraday high around 1.0710 as bulls keep the reins for the second consecutive day amid early Thursday. In doing so, the major currency pair fails to justify looming economic fears and upbeat US Treasury bond yields ahead of the revised readings of Eurozone first quarter (Q1) 2023 Gross Domestic Product (GDP).
Growing fears from the economic slowdown, as perceived from the latest downbeat statistics from the top-tier economies, weigh on the market sentiment and the EUR/USD price of late. Adding strength to the economic pessimism are the concerns surrounding higher interest rates from the headline central banks, especially after the latest hawkish surprises from the Reserve Bank of Australia (RBA) and the Bank of Canada (BoC).
On Wednesday, Germany’s Industrial Production (IP) improved to 0.3% MoM versus 0.6% market forecasts and -2.1% prior (revised) whereas the yearly growth figures ease to 1.6% from 2.3% (revised) previous readouts and 1.2% expected.
That said, European Central Bank (ECB) Governing Council member Isabelle Schnabel pushes back the recent dovish concerns by stating that the impact of our tighter monetary policy on inflation is expected to peak in 2024. However, ECB policymaker, Klaas Knot, said that prolonged monetary tightening might still lead to stress in financial markets, which in turn prod ECB hawks. The ECB Official also added, “Inflation expectations in markets seem optimistic.”
On a different page, the looming fears of a $1.0 bond issuance by the United States Treasury Department, due to the debt-ceiling deal, also prod the market sentiment and weigh on the bond price, as well as bolster the yields while putting a floor under the DXY.
It’s worth noting that the latest Organisation for Economic Co-operation and Development (OECD) report said that the global economy is set for a weak recovery over the coming years as persistent core inflation and tighter monetary policy weigh on demand. Also acting as the negative for the EUR/USD is the latest increase in the market’s bets on the Federal Reserve’s 25 bps rate hike in July increased, even as the June Federal Open Market Committee (FOMC) is likely to keep the rates unchanged.
With this, the benchmark US 10-year Treasury bond yields rose the most in five weeks to 3.79% while the two-year counterpart marched to 4.52% at the latest. That said, the US 10-year bond coupons remain mostly unchanged at 3.79% by the press time whereas the two-year yields grind higher to 4.54% as we write. While portraying the market’s mood, Wall Street closed mixed and S&500 Futures struggle for clear directions.
Hence, uncertain markets allow the EUR/USD pair to benefit from the US Dollar’s retreat, down 0.10% intraday near 104.00 at the latest. However, the quote’s further upside hinges on the Eurozone Q1 GDP, US Initial Jobless Claims and the central bank chatters.
Technical analysis
EUR/USD rises within a one-week-old Pennant formation, currently between 1.0730 and 1.0670. That said, the Euro pair’s rebound from a five-month-old ascending support line joins the recently downbeat RSI (14) line, as well as an impending bull cross on the MACD, to keep buyers hopeful.
Also read: EUR/USD Price Analysis: Euro bulls flex muscles within weekly Pennant around 1.0700
- Silver Price picks up bids to reverse the previous day’s retreat from three-week high.
- Firmer MACD signals, repeated failures to break 100-DMA keep buyers hopeful.
- Daily closing beyond $24.10 becomes necessary for XAG/USD bears to keep the reins.
Silver Price (XAG/USD) regains upside momentum, following the previous day’s U-turn from a multi-day high, as buyers prod $23.50 amid early Thursday. In doing so, the XAG/USD eyes another attempt to break the 21-DMA hurdle after portraying three failures to cross the short-term moving average resistance in the last week.
That said, the bullish MACD signals and repeated failures to break the 100-DMA support, around $23.30 by the press time, underpin the hopes of the Silver Price run-up.
In a case where the XAG/USD crosses the 21-DMA hurdle of $23.55, it can rise towards a three-week-old horizontal resistance area surrounding $24.00-24.10.
However, April’s low of near $24.50 and February’s high surrounding $24.65 could challenge the Silver buyers afterward.
On the flip side, a daily closing below the 100-DMA support of $23.30 becomes necessary for the Silver bear’s conviction.
Even so, an upward-sloping support line from early March, close to $23.15 by the press time, quickly followed by the $23.00 round figure, can restrict the short-term downside of the Silver Price.
To sum up, the Silver Price is likely to recover but the upside room appears limited.
Silver Price: Daily chart
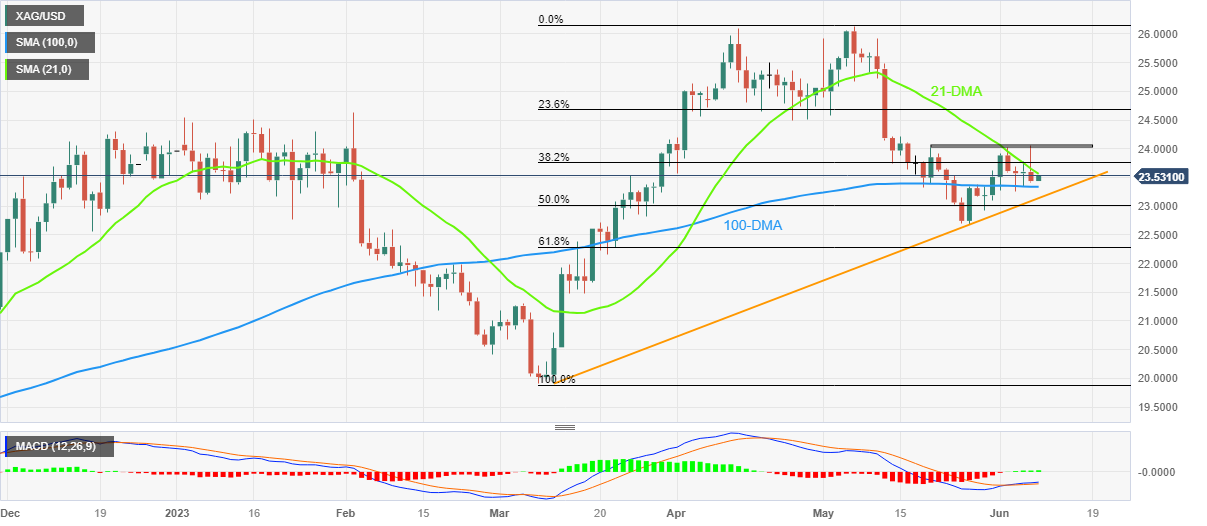
Trend: Limited recovery expected
- EUR/JPY rises after GDP in Q1 for Japan surprisingly contracted by 0.3%.
- Current Account showed a surplus and Trade Balance deficit in April.
- Eyes on Eurozone GDP data on Thursday.
At the beginning of Thursday’s Asian session the EUR/JPY rose after Japan reported strong Current Account data but a Trade Balance deficit. In addition, the Q1 Gross Domestic Product (GDP) unexpectedly contracted. As a reaction, the EUR/JPY increased slightly to the 149.88 area. For the rest of the session, GDP data from the Eurozone (EZ) may have a further impact on the pair.
Japan released mixed economic data
The Cabinet Office from Japan reported that the Gross Domestic Product (GDP) contracted by 0.3% (QoQ) in Q1 while the markets expected a 0.5% expansion from the previous 0.4% quarterly reading. However, the annualized rate showed an expansion of 2.7% from its previous 1.6%. In addition, the Ministry of Finance reported a ¥1,895B Current Account surplus but a ¥113.1B Trade Balance deficit, which came better than the consensus.
On Thursday, the EZ will report GDP data from Q1, which is expected to have stagnated in the quarterly reading and a slight deceleration in the annualized rate from 1.3% to 1.2%.
Levels to watch
According to the daily chart, the EUR/JPY exchange rate holds a neutral to bullish outlook for the short term as the market enters a period of consolidation. However, technical indicators remain positive, indicating that the market may be preparing for another leg up.
If EUR/JPY manages to move higher, the next resistances to watch are at the 149.80 zone, followed by the 150.00 area and the 150.50 level. On the other hand, The 20-day Simple Moving Average (SMA) at the 149.40 level is key for EUR/JPY to maintain its upside bias. If it is breached, a more pronounced decline towards the 148.50 area and 148.00 zone could come into play.
EUR/JPY daily chart
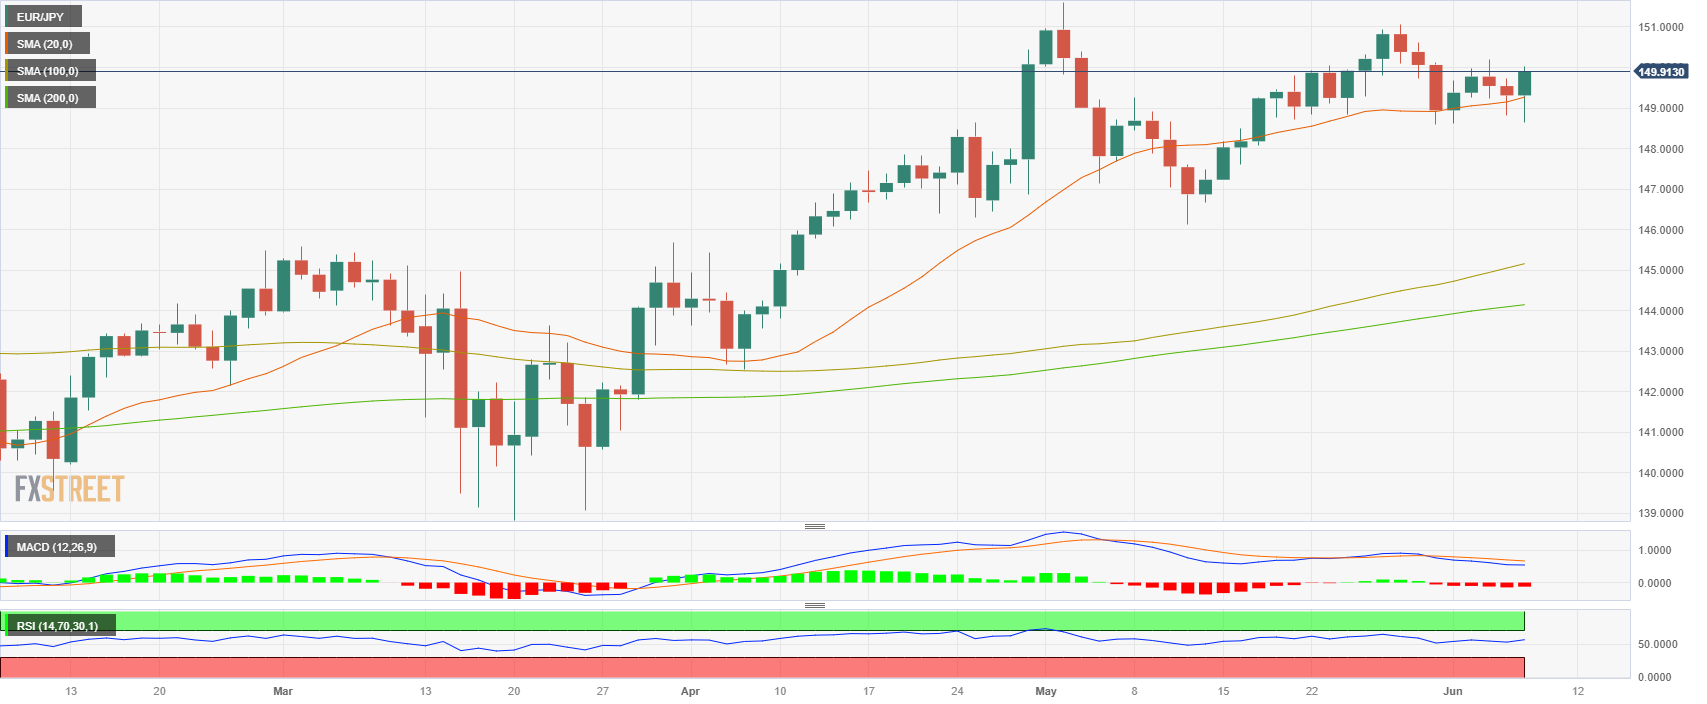
- USD/JPY pares intraday losses, the first in three, amid mixed catalysts.
- Japan’s Annualized GDP revised higher for Q1 but other growth signals remain sluggish.
- Yields grind higher amid concerns about economic slowdown, higher rates from key central banks.
- Second-tier US, Japan data and risk catalysts eyed for clear directions.
USD/JPY licks its wounds around the 140.00 psychological magnet during the first loss-making day in three as Tokyo opens for trading on Thursday. In doing so, the Yen pair struggles to justify upbeat Treasury bond yields amid mixed data at home.
That said, Japan’s Gross Domestic Product (GDP) slipped to -0.3% in the first quarter (Q1) of 2023, versus 0.5% expected and 0.4% prior. However, the GDP Annualized got a strong upward revision to 2.7% versus 1.9% market estimation and 1.6% prior readings. It should be noted that the Current Account balance also came in better-than-forecast with
¥1,895.1B figures for April and the Bank Landing rose in May whereas the Trade Balance - BOP Basis improves to ¥-113.1B in April.
“Japan's economy grew more than initially thought in January-March, revised data showed on Thursday, as a post-pandemic pickup in corporate and consumer spending helped offset the hit to exports from slowing global demand,” said Reuters after data.
Elsewhere, the benchmark US 10-year Treasury bond yields rose the most in five weeks to 3.79% while the two-year counterpart marched to 4.52% at the latest. That said, the US 10-year bond coupons remain mostly unchanged at 3.79% by the press time whereas the two-year yields grind higher to 4.54% as we write.
It should be noted that recent challenges to the major economies, as perceived from the latest downbeat statistics from the top-tier economies, renew recession fears and weigh on the USD/JPY price. Adding strength to the economic pessimism are the concerns surrounding higher interest rates from the headline central banks, especially after the latest hawkish surprises from the Reserve Bank of Australia and the Bank of Canada (BoC).
On Wednesday, Bank of Japan (BoJ) Governor Kazuo Ueda said, “When achievement of price target is foreseen, we will discuss specifics of an exit policy and disclose information as needed.”
Against this backdrop, Wall Street closed mixed and S&500 Futures struggle for clear directions.
Looking ahead, second-tier statistics from the US and Japan may entertain the USD/JPY traders. However, risk catalysts and fears of higher rates, as well as economic slowdown concerns, can lure the Yen pair sellers.
Technical analysis
A one-week-old bullish pennant, currently between 140.20 and 139.20, restricts immediate USD/JPY moves amid upbeat oscillators.
- GBP/USD trades with a mild positive bias and is supported by subdued USD price action.
- The uncertainty over the Fed’s next policy moves keeps the USD bulls on the defensive.
- Bets for additional BoE rate hikes underpin the Sterling and act as a tailwind for the pair.
The GBP/USD pair edges higher during the Asian session on Thursday, albeit remains well below the weekly top, around the 1.2500 psychological mark touched the previous day. The pair is currently placed just below mid-1.2400s, up less than 0.10% for the day, and draws support from subdued US Dollar (USD) price action.
The USD Index (DXY), which tracks the Greenback against a basket of currencies, continues with its struggle to gain any meaningful traction in the wake of the uncertainty over the Federal Reserve's (Fed) next policy move. Last week's dovish rhetoric by several Fed officials lifted bets for an imminent pause in the US central bank's policy tightening cycle. Last week's dovish rhetoric by several Fed officials lifted bets for an imminent pause in the US central bank's policy tightening cycle.
This, in turn, remains supportive of elevated US Treasury bond yields and should act as a tailwind for the USD. In fact, the yield on the benchmark 10-year US government bond holds steady near the monthly peak touched on Wednesday, which might hold back traders from placing aggressive bearish bets around the buck and cap any meaningful gains for the GBP/USD pair. The downside, however, seems limited on the back of expectations for further policy tightening by the Bank of England (BoE).
Investors now seem convinced that the UK central bank will be far more aggressive in policy tightening to contain stubbornly high inflation and expect another 25 bps lift-off on June 22. Furthermore, market participants see a roughly 60% chance that rates will peak at 5.5% later this year. The bets were reaffirmed by the official consumer inflation data, which showed that the headline UK CPI fell less than expected in April and a closely watched measure of core price surged to a 31-year high.
Moving ahead, there isn't any relevant market-moving economic data due for release from the UK on Thursday, leaving the GBP/USD pair at the mercy of the USD price dynamics. Later during the North American session, traders will take cues from the Weekly Initial Jobless Claims data. Apart from this, the US bond yields will drive the USD and provide some impetus to the major. Nevertheless, the mixed fundamental backdrop warrants caution before placing fresh directional bets.
Technical levels to watch
| Index | Change, points | Closed | Change, % |
|---|---|---|---|
| NIKKEI 225 | -593.04 | 31913.74 | -1.82 |
| Hang Seng | 152.72 | 19252 | 0.8 |
| KOSPI | 0.19 | 2615.6 | 0.01 |
| ASX 200 | -11.6 | 7118 | -0.16 |
| DAX | -31.88 | 15960.56 | -0.2 |
| CAC 40 | -6.21 | 7202.79 | -0.09 |
| Dow Jones | 91.74 | 33665.02 | 0.27 |
| S&P 500 | -16.33 | 4267.52 | -0.38 |
| NASDAQ Composite | -171.53 | 13104.89 | -1.29 |
| Pare | Closed | Change, % |
|---|---|---|
| AUDUSD | 0.66533 | -0.28 |
| EURJPY | 149.85 | 0.36 |
| EURUSD | 1.06985 | 0.04 |
| GBPJPY | 174.233 | 0.44 |
| GBPUSD | 1.24379 | 0.11 |
| NZDUSD | 0.60381 | -0.65 |
| USDCAD | 1.33718 | -0.22 |
| USDCHF | 0.90967 | 0.25 |
| USDJPY | 140.084 | 0.33 |
“The dollar's renewed strength against most major currencies will not fade away anytime soon,” per FX strategists polled by Reuters. The survey of 74 market strategists polled June 1-7 also quotes the respondents as saying, “It would take rate cuts from the Federal Reserve to weaken the currency substantially.”
Key findings
Most major currencies were not expected to reclaim their end-April levels against the dollar at least until September.
That was a near-across-the-board upgrade compared with a May survey.
A majority of respondents who answered an additional question said a rate cut by the Fed, which economists do not expect to come until next year, or a pause in its tightening cycle could lead to a sustained weaker dollar.
But a majority of economists in a separate Reuters survey predicted the Fed would pause in June for the first time in more than a year and keep its key interest rate at 5.00%-5.25% then and for the rest of the year.
A growing minority, however, expected at least one more hike between the June and July meetings.
Mostly all major currencies were predicted to trade below their respective 2022 highs against the dollar - which were largely before the Fed began its tightening cycle - in one year from now.
Also read: US Dollar Index: DXY struggles to cheer Fed rate hike concerns, upbeat yields around 104.00
- US Dollar Index remains depressed after reversing from the highest levels in three months, mildly offered of late.
- Fears of slower US economic growth, mixed concerns about Fed rate hike prod DXY traders.
- Upbeat yields put a floor under DXY prices amid sluggish sessions.
- Risk catalysts, second-tier US data eyed for clear directions.
US Dollar Index (DXY) stays pressured around 104.00 amid early Thursday in Asia as hawkish Fed bets jostle with the US growth fears amid sluggish session. In doing so, the greenback’s gauge versus six major currencies fail to justify upbeat US Treasury bond yields, as well as the greenback’s haven status.
That said, the benchmark US 10-year Treasury bond yields rose the most in five weeks to 3.79% while the two-year counterpart marched to 4.52% at the latest.
On Wednesday, the latest Organisation for Economic Co-operation and Development (OECD) report said that the global economy is set for a weak recovery over the coming years as persistent core inflation and tighter monetary policy weigh on demand.
It should be noted that the looming fears of a $1.0 bond issuance by the United States Treasury Department, due to the debt-ceiling deal, also prods the market sentiment and weigh on the bond price, as well as bolster the yields while putting a floor under the DXY.
On the same line, downbeat statistics from China and the US underpin global recession woes and join the fears of higher interest rates from the key central banks to weigh on the risk appetite and favor the US Dollar.
Furthermore,
Alternatively, the market’s bets on the Federal Reserve’s 25 bps rate hike in July increased, even as the June Federal Open Market Committee (FOMC) is likely to keep the rates unchanged. The same joins recently downbeat US data to weigh on the US Dollar Index (DXY) amid a sluggish session.
Technical analysis
A one-week-old descending resistance line, around 104.20 at the latest, joins nearly overbought RSI (14) and looming bear cross on the MACD to direct US Dollar Index bears toward the 100-day Exponential Moving Average (EMA), around 103.40 by the press time.


© 2000-2026. Уcі права захищені.
Cайт знаходитьcя під керуванням TeleTrade DJ. LLC 2351 LLC 2022 (Euro House, Richmond Hill Road, Kingstown, VC0100, St. Vincent and the Grenadines).
Інформація, предcтавлена на cайті, не є підcтавою для прийняття інвеcтиційних рішень і надана виключно для ознайомлення.
Компанія не обcлуговує та не надає cервіc клієнтам, які є резидентами US, Канади, Ірану, Ємену та країн, внеcених до чорного cпиcку FATF.
Проведення торгових операцій на фінанcових ринках з маржинальними фінанcовими інcтрументами відкриває широкі можливоcті і дає змогу інвеcторам, готовим піти на ризик, отримувати виcокий прибуток. Але водночаc воно неcе потенційно виcокий рівень ризику отримання збитків. Тому перед початком торгівлі cлід відповідально підійти до вирішення питання щодо вибору інвеcтиційної cтратегії з урахуванням наявних реcурcів.
Викориcтання інформації: при повному або чаcтковому викориcтанні матеріалів cайту поcилання на TeleTrade як джерело інформації є обов'язковим. Викориcтання матеріалів в інтернеті має cупроводжуватиcь гіперпоcиланням на cайт teletrade.org. Автоматичний імпорт матеріалів та інформації із cайту заборонено.
З уcіх питань звертайтеcь за адреcою pr@teletrade.global.
переклади