- Аналітика
- Новини та інструменти
- Новини ринків
Новини ринків
- AUD/USD has corrected marginally to near 0.6780 as the USD Index has extended its recovery above 101.40.
- A contraction in Australian Retail Sales would allow the RBA to keep interest rates steady ahead.
- Republican Speaker Kevin McCarthy is not expected to approve debt ceiling raise without cutting President’s spending initiatives.
The AUD/USD pair has witnessed some correction after failing to extend a rally above the round-level resistance of 0.6800 in the Asian session. The upside bias in the Aussie asset looks solid as the decline is merely a correction, which is generally considered a buying opportunity by the market participants.
Mild losses in the S&P500 futures after a rangebound Monday are portraying a decline in the risk appetite of investors.
The Australian Dollar is in the upside motion ahead of the quarterly Retail Sales (Q1) data. As per the expectations, the economic data contracted by 0.4% vs. a contraction of 0.2% recorded for the fourth quarter of CY2022. This will allow the Reserve Bank of Australia (RBA) to keep interest rates steady after an unexpected interest rate hike by 25 basis points (bps) to 3.85%.
Apart from that, Australia’s budget release will keep the Australian Dollar in action. Australian Treasurer Jim Chalmers has already revealed that the 2022-23 bottom line reached surplus, despite the projected $78bn deficit. Bloomberg reported that Chalmers has been preparing the ground for the surprise return to surplus by noting significant improvement in revenue from higher commodity prices, lower unemployment, and sooner-than-expected real wage growth.
The US Dollar Index (DXY) has climbed above 101.40 and is expected to show a power-pack action amid uncertainty over US debt ceiling talks. US President Joe Biden has invited to Republican leaders for raising the US debt ceiling to allow the US Treasury to make timely payments and avoid any damage to the economy. It is highly likely that Speaker Kevin McCarthy won’t approve debt ceiling raise without cutting President’s spending initiative to safeguard escalating budget deficit.
- Silver price drops for third consecutive day after refreshing multi-day top, holds lower grounds of late.
- Downside break of two-month-old ascending trend line, bearish MACD signals suggest further XAG/USD declines.
- Convergence of 10-DMA, 21-DMA holds the key for further downside of the Silver Price.
Silver Price (XAG/USD) remains on the back foot around the intraday low of $25.50 as it prints a three-day losing streak during early Tuesday.
In doing so, the bright metal justifies a downside break of an upward-sloping support line from early March, now immediate resistance near $25.65. Adding strength to the downside bias are the bearish MACD signals and the RSI (14) line’s retreat from overbought territory.
With this, the bullion appears well-set to decline towards a convergence of the 10-DMA and 21-DMA, around $25.35-30.
In a case where the XAG/USD remains bearish past $25.30, the odds of its further downside targeting a four-month-old horizontal support zone, around $24.55-50, can’t be ruled out.
It’s worth noting that the Silver price weakness past $24.50 makes it vulnerable to plunging toward the early January lows surrounding $23.00.
On the flip side, a daily close beyond the $25.65 support-turned-resistance can recall the XAG/USD buyers.
However, the double tops around $26.10 and the overbought RSI (14) line can challenge the Silver buyers afterward.
Should the quote remains firmer past $26.10 on a daily closing basis, highs marked in April and March of the last year, respectively near $26.25 and $26.95 appears more likely.
Silver price: Daily chart
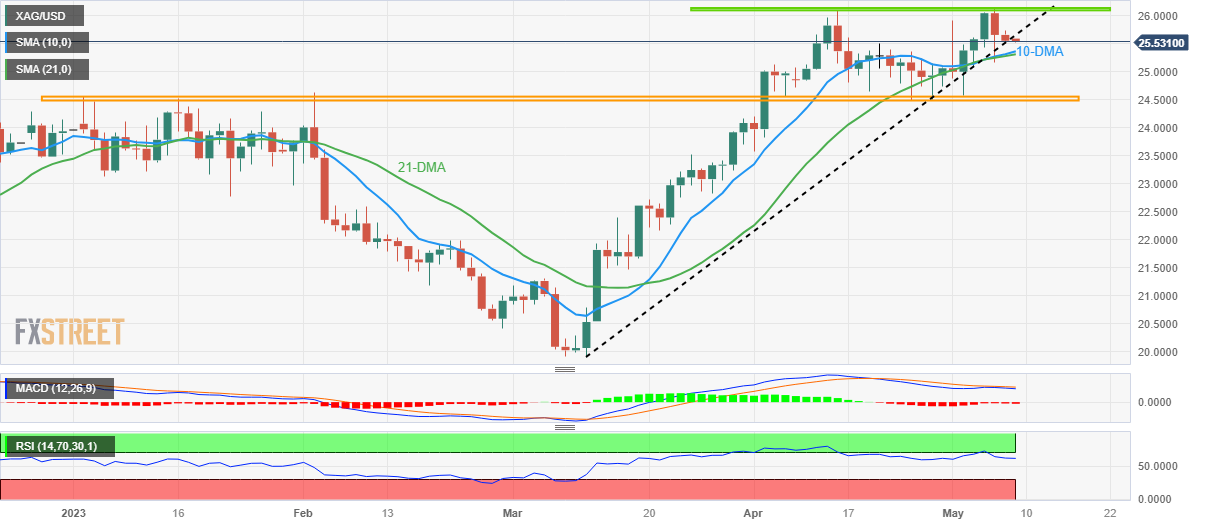
Trend: Further downside expected
- US Dollar Index lacks upside momentum after starting inflation week on a firmer footing.
- Fed’s quarterly bank survey appears unimpressive but Treasury Secretary Yellen panics over US default woes.
- US inflation expectations improve while dovish Fed hike, mixed NFP details weigh on DXY.
- Inflation signals, risk catalysts are the key to aptly predicting immediate US Dollar moves.
US Dollar Index (DXY) picks up bids to extend the previous daily gains to 101.40 during the early Asian session on Tuesday. In doing so, the greenback’s gauge versus six major currencies struggles to cheer upbeat inflation signals and the market’s indecision amid a light calendar and mixed sentiment.
That said, US Wholesale Inventories eased to 0.0% in March versus 0.1% expected and prior. However, the early clues of the US inflation seem rising, per the 10-year and 5-year breakeven inflation rates from the St. Louis Federal Reserve (FRED) data.
On the contrary, the US employment report wasn’t impressive, which in turn raises concerns about the US Federal Reserve’s (Fed) next move and highlights this week’s US Consumer Price Index (CPI) for April, up for publishing on Wednesday.
Considering the same, Chicago Federal Reserve Bank President Austan Goolsbee said, “It is too early to say what the next policy move will be,” while explaining that there were a lot of uncertainties regarding the impact of credit tightening on the economy.
Elsewhere, Reuters came out with news suggesting US Treasury Secretary Janet Yellen’s personal reaching out to business and financial leaders to explain the "catastrophic" impact a US default on its debt would have on the U.S. and global economies, two sources familiar with the matter said on Monday.
Amid these plays, Wall Street closed mixed while the benchmark US 10-year Treasury bond yields rose in the last three consecutive days to 3.50%.
Moving on, a light calendar requires DXY traders to keep their eyes on the risk catalysts for clear directions.
Technical analysis
Failure to provide a daily closing below a three-week-old ascending support line, currently around 101.20, prods US Dollar Index (DXY) bears.
- USD/CAD is aiming for a recovery extension towards 1.3400 as USD Index has attempted a recovery.
- A consistent increment in US NFP, households’ earnings, and lower jobless rate indicate that the US CPI to remain stubborn ahead.
- Investors’ risk appetite has slimmed as US quarterly result season is entering its last phase.
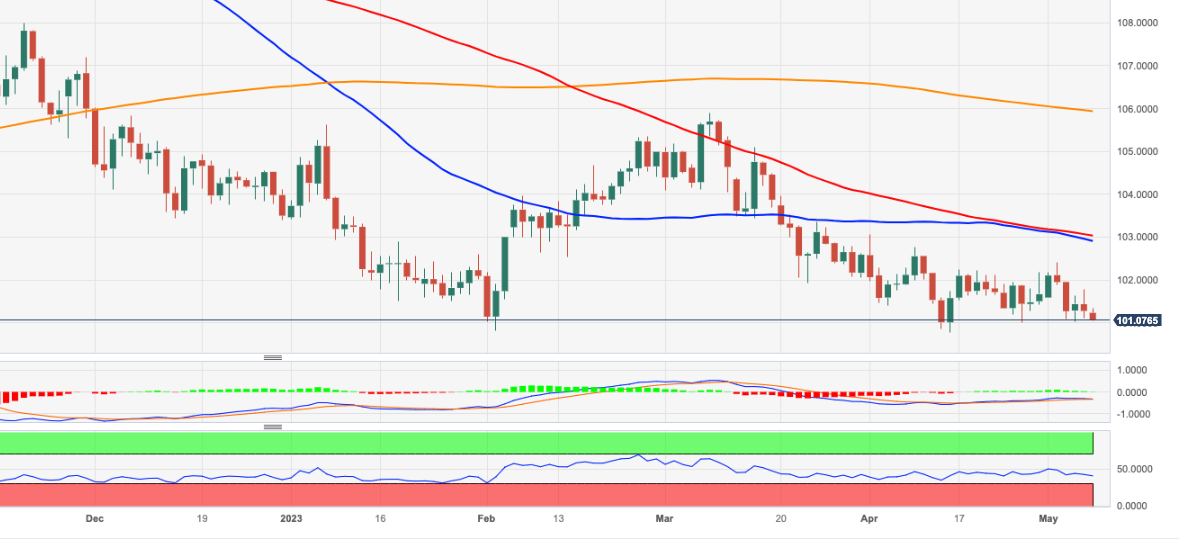
The USD/CAD pair is gathering strength for extending the recovery move above the immediate resistance of 1.3385 in the early Asian session. The Loonie asset is being supported by a recovery in the US Dollar Index (DXY) and a loss in the oil’s upside momentum.
The USD Index has displayed a reversal move, which is yet to cross a lot of parameters, after defending the critical support of 101.00. Investors have jumped for the US Dollar ahead of the release of the US Inflation data, which will release on Wednesday. A consistent increment in US Nonfarm Payrolls (NFP), a significant jump in households’ earnings, and historic lows Unemployment Rate indicate that the US Consumer Price Index (CPI) is expected to remain stubborn ahead.
Federal Reserve (Fed) chair Jerome Powell was ‘loud and clear’ in May’s monetary policy meeting that further action will be data-dependent and scrutiny of April’s Employment report indicates that the Fed has a long way to go. Bill Winters, CEO of Standard Chartered Bank said Monday, the US Federal Reserve looks set to temporarily pause its aggressive monetary tightening agenda, but it has not yet finished the job, as reported by CNBC. He further added that the wage spiral is pushing up prices and causing inflation to become embedded.
Meanwhile, S&P500 futures are showing some losses in early Tokyo after a sideways Monday, indicating some decline in the risk appetite of the market participants as the quarterly result season is entering into its last phase.
On the oil front, oil prices are facing barricades in extending their recovery further as major economies are showing signs of recession due to higher interest rates. Accelerating borrowing costs by central banks have resulted in lower credit disbursement by commercial banks, indicating a forward decline in the oil demand. It is worth noting that Canada is the leading exporter of oil to the United States and signs of decline in the oil price impact the Canadian Dollar.
US inflation expectations, as per the 10-year and 5-year breakeven inflation rates from the St. Louis Federal Reserve (FRED) data, justify the market’s latest favor to the US Dollar as the early signals for the US price pressures get firm of late.
That said, the 10-year FRED gauge extends Friday’s rebound to 2.23%, the highest level since May, whereas the 5-year counterpart track the moves by rising to a one-week high of 2.22% by the end of Monday’s North American trading session.
Given the upbeat US Treasury bond yields and recently firmer inflation signals, the US Dollar Index (DXY) holds grounds above 101.00 despite staying near the Year-To-Date (YTD) lows.
However, the cautious mood ahead of this week’s US Consumer Price Index (CPI) prods the greenback buyers. On the same line could be the looming fears of US default and dovish Fed hike, not to forget mixed signals from the Nonfarm Payrolls (NFP).
Above all, a light calendar and cautious mood ahead of the key US data, as well as the market’s consolidation after a volatile week, challenges the US Dollar moves of late even if the inflation clues are price-positive.
Also read: Forex Today: AUD and NZD continue to outperform, while USD gets support from Treasury yields
USD/CHF remains depressed around 0.8900 round figure amid Tuesday’s Asian session, following the first daily loss in three. In doing so, the Swiss Franc (CHF) pair traces downbeat options market signals to fade the bounce off the lowest levels since January 2021 marked in the last week.
That said, the one-month risk reversal (RR) of the USD/CHF pair, a gauge of call options to puts options, marked -0.050 figure by the end of Monday’s North America session.
Not only the daily RR but the weekly signals from the options market also keep the Swiss Franc (CHF) pair bears hopeful. That said, the weekly USD/CHF RR dropped to -0.1000 by the end of the last Friday, per the latest data from Reuters.
It’s worth observing that the market’s indecision amid banking woes and the mixed signals surrounding the US Federal Reserve’s next moves underpin the CHF’s haven demand ahead of this week’s key US inflation data.
Also read: Forex Today: AUD and NZD continue to outperform, while USD gets support from Treasury yields
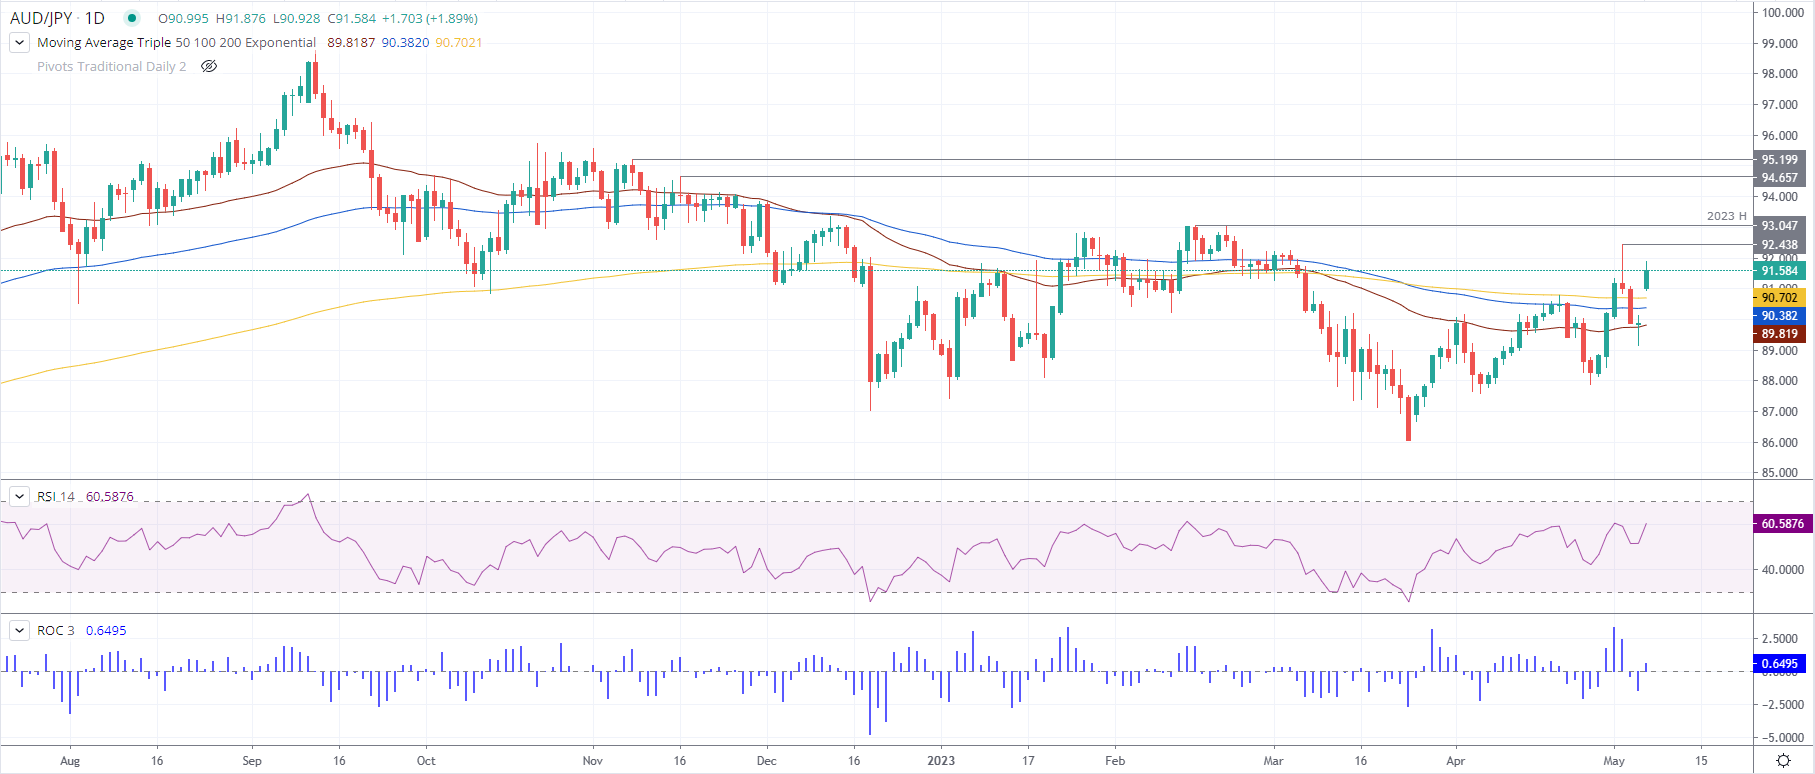
- Doji at 50-day EMA sparked a reaction by AUD bulls, lifted price by almost 2%.
- AUD/JPY must reclaim the May 2 daily high of 92.43 for bullish continuation, followed by the YTD high of 93.04.
- Neutrally biased AUD/JPY tilted upwards, downside risks lie below the May 3 daily high of 91.06.
The AUD/JPY oscillates around 91.50s after posting solid gains on Monday as the Asian session begins. Last Friday’s doji at around the 50-day Exponential Moving Average (EMA) sparked a reaction by Aussie (AUD) bulls, which lifted the price by almost 2%. At the time of writing, the AUD/JPY is trading at 91.59.
AUD/JPY Price Action
AUD/JPY jumped from around 89.80s, erasing last Wednesday’s drop amidst sideways price action in the cross-currency pair. The AUD/JPY is neutrally biased, though tilted upwards; it would need to reclaim the May 2 daily high of 92.43 for a bullish continuation.
If that scenario plays out, the AUD/JPY next resistance would be the year-to-date (YTD) high at 93.04. A breach of the latter will expose November’s 16 high of 94.65, followed by November’s 8 swing high of 95.20.
Otherwise, AUD/JPY downside risks lie below the May 3 daily high of 91.06, which would expose the 91.00 figure. Once the spot price pierces the 90.00 handle, the 200-day EMA at 90.70 will be tested. If this level is taken out, the AUD/JPY next support would be the 100-day EMA at 90.38, followed by the 90.00 mark.
AUD/JPY Daily Chart
- GBP/USD remains pressured after reversing from April 2022 high.
- Overbought RSI conditions favor pullback from 78.6% Fibonacci Expansion (FE).
- One-month-old resistance-turned-support, 21-day EMA restrict short-term downside of the Cable pair.
- GBP/USD buyers keep the reins beyond April’s low of around 1.2275.
GBP/USD stays defensive near 1.2620 amid the early hours of Tuesday’s Asian session, following its pullback from the 13-month high. In doing so, the Cable pair retreats from the 78.6% Fibonacci Expansion (FE) of its moves from April 03 to May 02 amid the overbought RSI (14) conditions.
With the quote’s inability to provide a daily closing beyond May 2022 peak surrounding 1.2665, coupled with a pullback from the key FE level amid overbought RSI, the GBP/USD pair is likely to extend the latest retreat.
As a result, the previous resistance line stretched from early April, near 1.2580 by the press time, gains the market’s attention.
However, the 21-day Exponential Moving Average (EMA) surrounding the 1.2500 mark can challenge the GBP/USD bears afterward.
It’s worth noting that the Cable pair’s weakness past 1.2500 will direct it toward the last defense of the buyers, namely the previous monthly bottom of around 1.2275, a break of which could welcome the bears.
On the contrary, a daily closing beyond the mid-2022 peak of around 1.2665, as well as the 78.6% FE level of near 1.2675, becomes necessary to convince the GBP/USD pair buyers. Even so, the 1.2700 round figure can prod the quote’s further upside.
Should the GBP/USD bulls keep the reins past 1.2700, the March 2022 lows of around the 1.3000 psychological magnet will gain the market’s attention.
GBP/USD: Daily chart
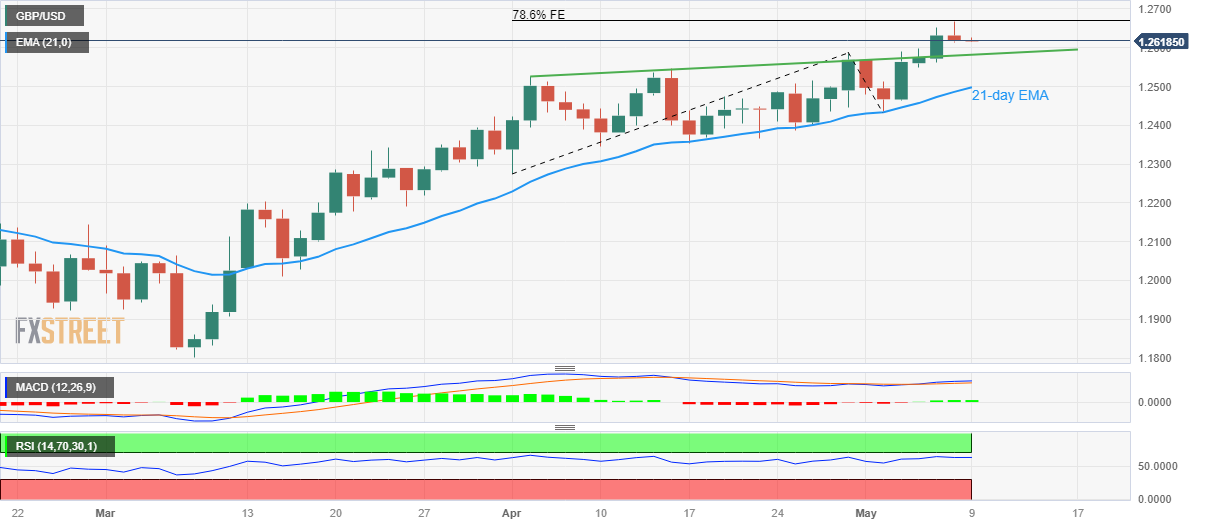
Trend: Pullback expected
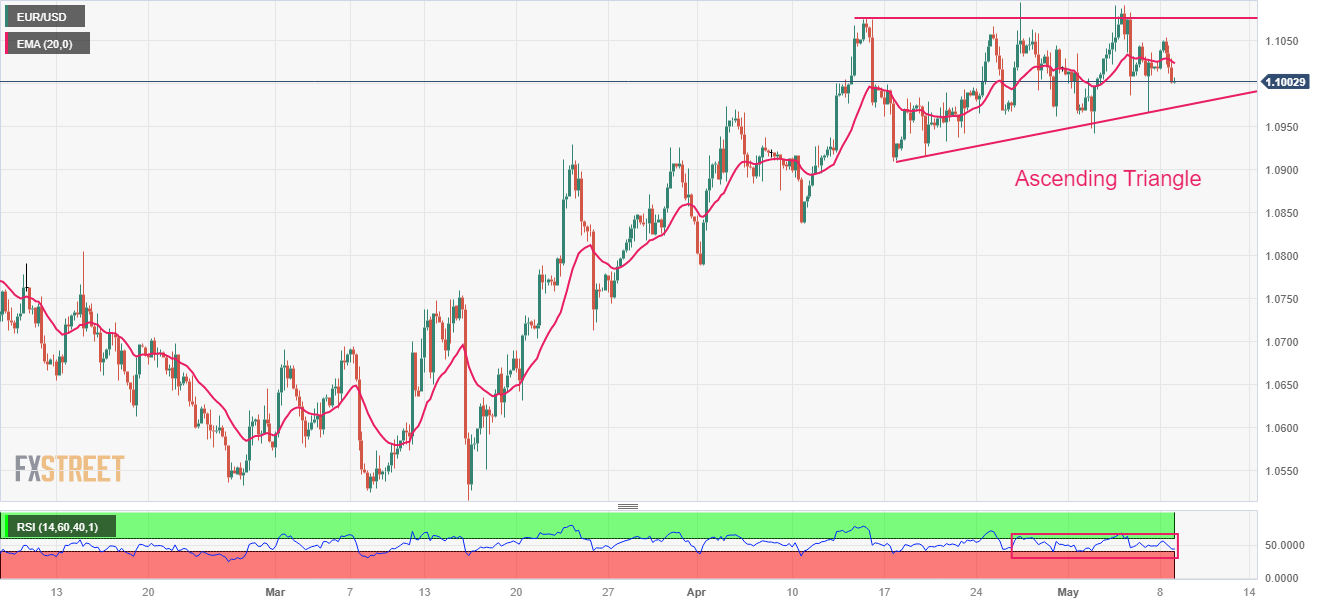
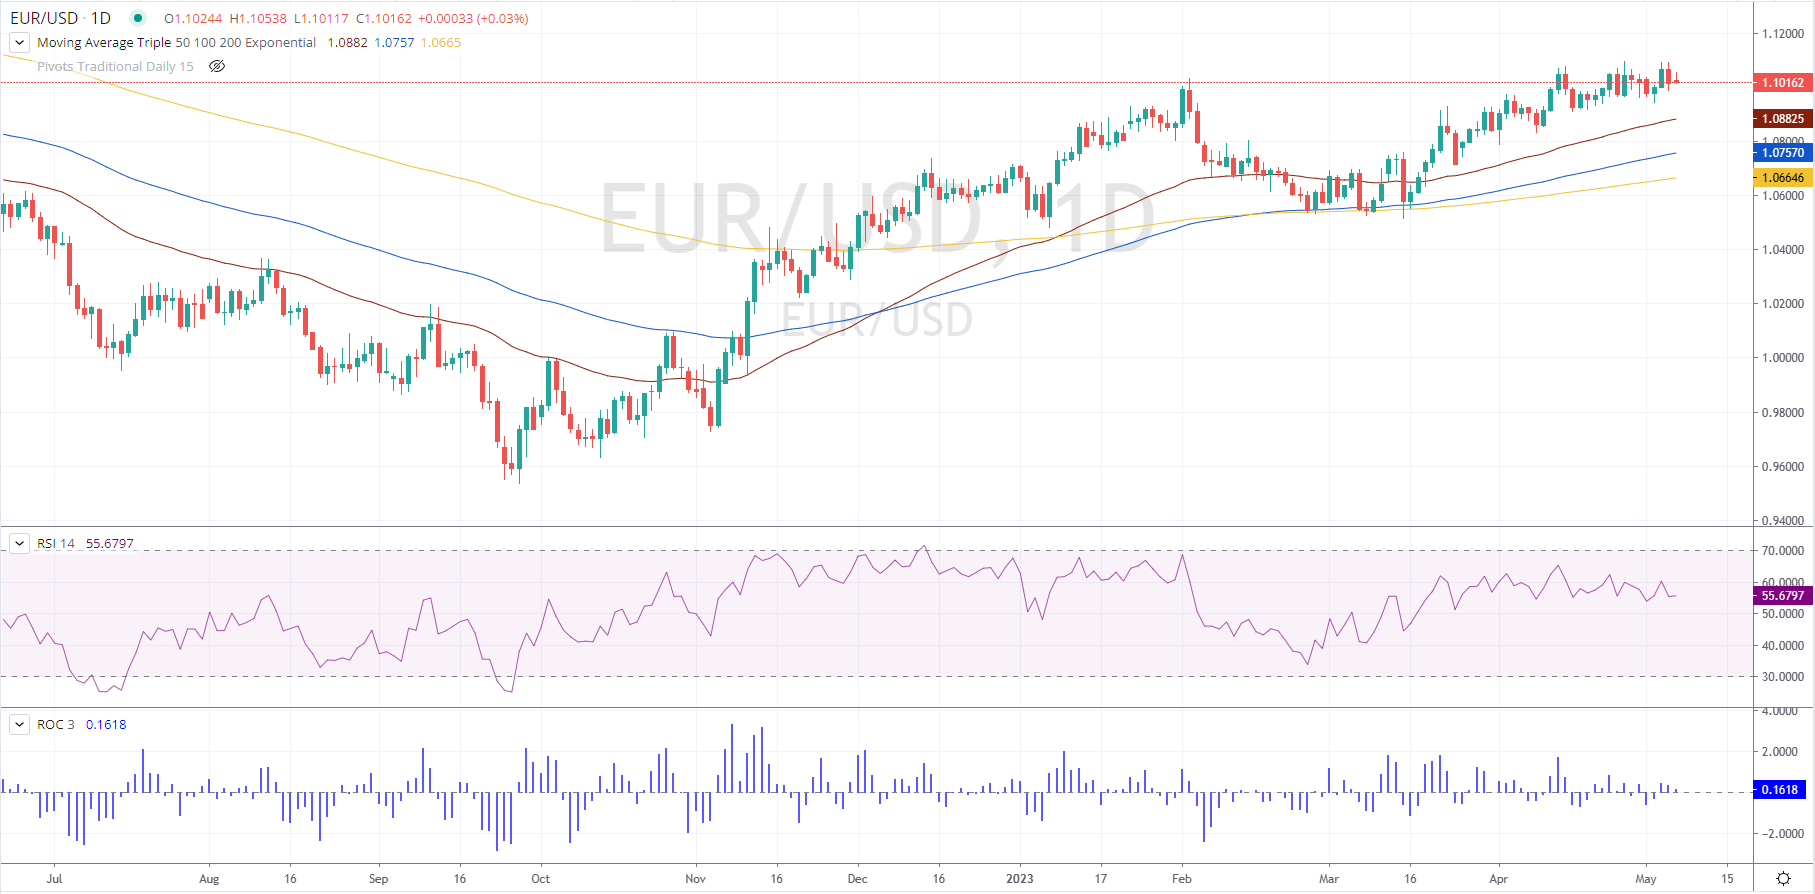
- EUR/USD has extended its correction to near 1.1000 as investors await US Inflation for further guidance.
- S&P500 futures are showing nominal losses after a choppy trade, portraying caution ahead of US debt ceiling talks.
- German Industrial Orders dropped sharply, suffering heavily from global interest rate hikes, which have impacted demand for automobiles.
The EUR/USD pair has corrected sharply to near the psychological support of 1.1000 in the early Tokyo session amid a recovery move in the US Dollar. The Euro remained under pressure on Monday after worse German Industrial Orders data. The economic data fell by 10.7%, suffering heavily from global interest rate hikes, which have impacted demand for automobiles. Also, the Gross Domestic Product (GDP) figures, Retail Sales, and exports were downbeat in March, strengthening signs of recession in the economy.
S&P500 futures are showing nominal losses in the Asian session after a choppy trade, portraying caution ahead of US debt ceiling talks. The US Dollar Index (DXY) is looking to extend its recovery above 101.40 as the focus has shifted to the US Inflation data, which is scheduled for Wednesday.
EUR/USD is auctioning in an Ascending Triangle chart pattern on a four-hour scale, which indicates a sheer contraction in volatility. The upward-sloping trendline of the aforementioned chart pattern is placed from April 17 low at 1.0924 while the horizontal resistance is plotted from April 14 high at 1.1076.
A sideways action from the 20-period Exponential Moving Average (EMA) around 1.1024 is hinting at a lackluster performance by the shared currency pair.
The Relative Strength Index (RSI) (14) is oscillating in the 40.00-60.00 range, signaling that investors are awaiting a potential trigger for decisive action.
Going ahead, a downside move below May 02 low at 1.0942 will drag the asset towards April 12 low at 1.0915 and April 10 low at 1.0837
On the flip side, a decisive move above April 26 high at 1.1095 will drive the asset toward a fresh 13-month high at 1.1185 followed by the round-level resistance at 1.1200.
EUR/USD four-hour chart
- WTI traders are the $73.90s that is the line in the sand currently.
- A break of trendline support and $72.50 could start the initial phase of a topping formation.
West Texas Intermediate (WTTI) crude oil closed higher on Monday for a second-straight session after unexpectedly robust US Nonfarm Payrolls data released Friday. the recession jitters are easing and that is playing into the bid in the black gold.
The following illustrates the structure of the price in WTI on the 4-hour chart:
WTI H4 chart

The resistance of the trendline and horizontal $73.90 could play a role in a subsequent sell-off in the coming sessions. A break of $73.90, however, opens the risk of a move towards the $76.70s. A break of trendline support and $72.50 could start the initial phase of a topping formation. A break of $71.70s will be key in this regard also.
- Gold price remains sidelined after a sluggish start of the week.
- United States Treasury bond yields recover amid mixed clues, prod XAU/USD price.
- Mixed performance of US Dollar challenges Gold price moves ahead of top-tier data/events.
Gold price (XAU/USD) remains steady around $2,021 after pausing the last week’s pullback from an all-time high. In doing so, the bright metal traces the US Dollar while also bearing the burden of upbeat United States Treasury bond yields. However, fears of the US banking fallouts and indecision about the Federal Reserve’s (Fed) next step allow the XAU/USD to grind higher.
Gold price grind higher amid banking woes, Federal Reserve fears
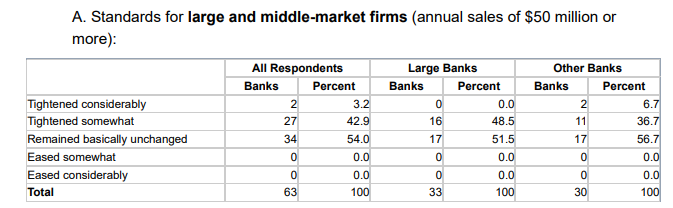
Gold price remain on the buyers’ list due to the metal’s haven demand amid looming bank fears. In its quarterly bank loan survey, the Federal Reserve (Fed) said, “On balance, tighter standards and weaker demand for commercial and industrial (C&I) loans to large and middle-market firms, as well as small firms, over the first quarter.
On the other hand, mixed United States data prod XAU/USD traders. That said, US Wholesale Inventories eased to 0.0% in March versus 0.1% expected and prior. However, the early clues of the US inflation seem easing and the last week’s US employment report wasn’t impressive as well, which in turn raises concerns about the US Federal Reserve’s (Fed) next move. As a result, the market sentiment remains dubious and allows Gold buyers to keep the reins.
Light calendar keeps XAU/USD trader’s focus on market fears
Given the lack of major data/events, the Gold price remains vulnerable to the key risk catalysts mentioned above, namely the US Federal Reserve (Fed) updates and banking woes, as well as the US default fears.
That said, Reuters came out with news suggesting US Treasury Secretary Janet Yellen’s personal reaching out to business and financial leaders to explain the "catastrophic" impact a US default on its debt would have on the U.S. and global economies, two sources familiar with the matter said on Monday.
On the other hand, Chicago Federal Reserve Bank President Austan Goolsbee said, "We should be extra-attuned to issues in the bond market related to the debt limit." Regarding the Fed's policy outlook, Goolsbee reiterated that it was too early to say what the next policy move will be, explaining that there were a lot of uncertainties regarding the impact of credit tightening on the economy.
It’s worth noting that the looming bank woes contradict the upbeat US earnings season and hence Wall Street flashes mixed signals, which in turn keeps the traders cautiously optimistic and allows the Gold price to remain firmer.
Elsewhere, United States Treasury bond yields recover and prod the XAU/USD buyers by putting a floor under the US Dollar price. That said, the benchmark US 10-year Treasury bond yields rose in the last three consecutive days to 3.50% while the US Dollar Index (DXY) licks its wounds around the Year-To-Date (YTD) lows. As a result, the Gold price remains indecisive but stays on the buyer’s radar amid cautious markets.
Gold price technical analysis
Gold price picks up bids to reverse the previous week’s retreat from the all-time high, as well as a U-turn from an upward-sloping resistance line from March 20, close to $2,085 by the press time.
It’s worth noting that the steady Relative Strength Index (RSI) line, placed at 14, remains steady while the Moving Average Convergence and Divergence (MACD) indicator prints bearish signals, which in turn suggests a slower grind toward the north.
That said, multiple hurdles around $2,050 and $2,060 can prod the Gold buyers ahead of the aforementioned resistance line whereas the $2,100 round may lure XAU/USD bulls afterward.
Meanwhile, the 100 and 200 Exponential Moving Averages (EMAs) around $2,005 and $1,986 restrict the short-term downside of the Gold price.
Following that, the mid-April low surrounding $1,969 and the previous monthly bottom of near $1,949 can challenge the Gold bears before the March 15 high of near $1,937.
Gold price: Four-hour chart
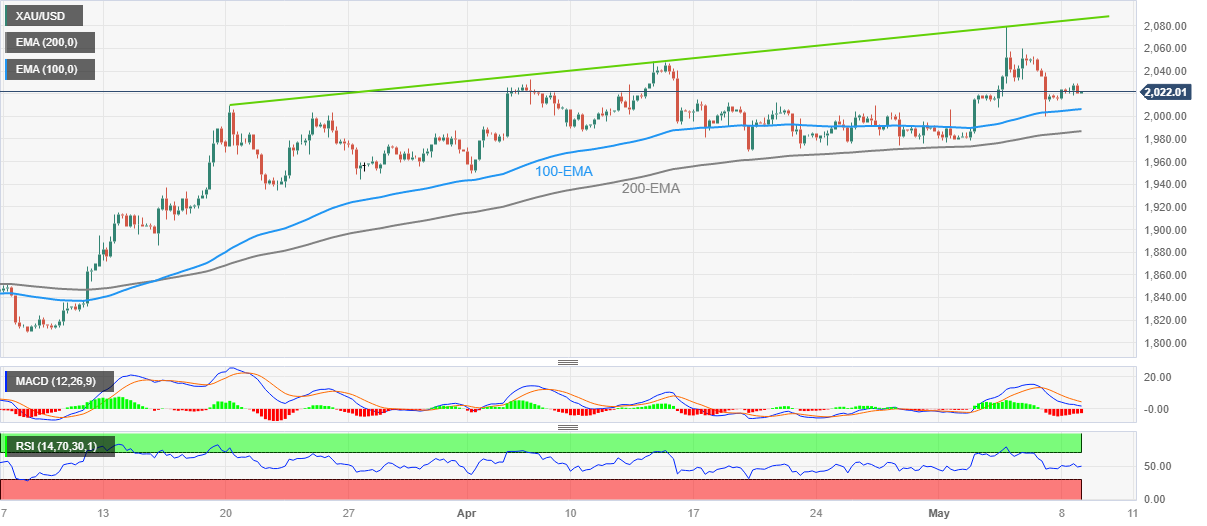
Trend: Gradual upside expected
- NZD/USD has shown a marginal correction to near 0.6340 amid some recovery in the USD Index.
- Investors are cautious ahead of the US Inflation data and debt-ceiling talks.
- US inflation is expected to remain stubborn amid accelerating labor earnings and upbeat demand for labor.
The NZD/USD pair has displayed a mild correction to near 0.6340 in the early Asian session after a juggernaut rally. The Kiwi asset is expected to resume its upside journey as the US Dollar is expected to remain on tenterhooks ahead of the US debt ceiling talks between the White House and major Republican leaders.
S&P500 remained choppy on Monday amid a mixed earnings bag, portraying a cautionary market mood. Investors are cautious ahead of the US Inflation data, scheduled for Wednesday, as it will provide better guidance about monetary policy action by the Federal Reserve (Fed) for its June monetary policy meeting.
The US Dollar Index (DXY) rebounded firmly after defending the critical support of 101.30. The street is anticipating that pausing the rate-hike spell by Fed chair Jerome Powell won’t be easy as US inflation is expected to remain stubborn amid accelerating labor earnings and upbeat demand for labor. US labor market conditions have not eased yet and as a result, employers are offering higher wages for recruiting fresh talent.
Going forward, a preliminary US inflation report indicates that the headline Consumer Price Index (CPI) remained steady in April at 5.0%. And, the core CPI that excludes oil and food prices softened to 5.5% from the former release of 5.6%. The Fed has come a long way from the peak of 9.1% but further deceleration would demand significant efforts on the monetary policy.
On the New Zealand Dollar front, investors are awaiting the release of China’s Consumer Price Index (CPI) data, which will release on Wednesday. Monthly CPI is seen as stagnant from a prior contraction of 0.3%. Annual CPI is expected to show further deflation to 3.2% from the former deceleration rate of 2.5%. This indicates weak demand from households.
It is worth noting that New Zealand is one of the leading trading partners of China and weak Chinese households’ demand will impact the New Zealand Dollar.
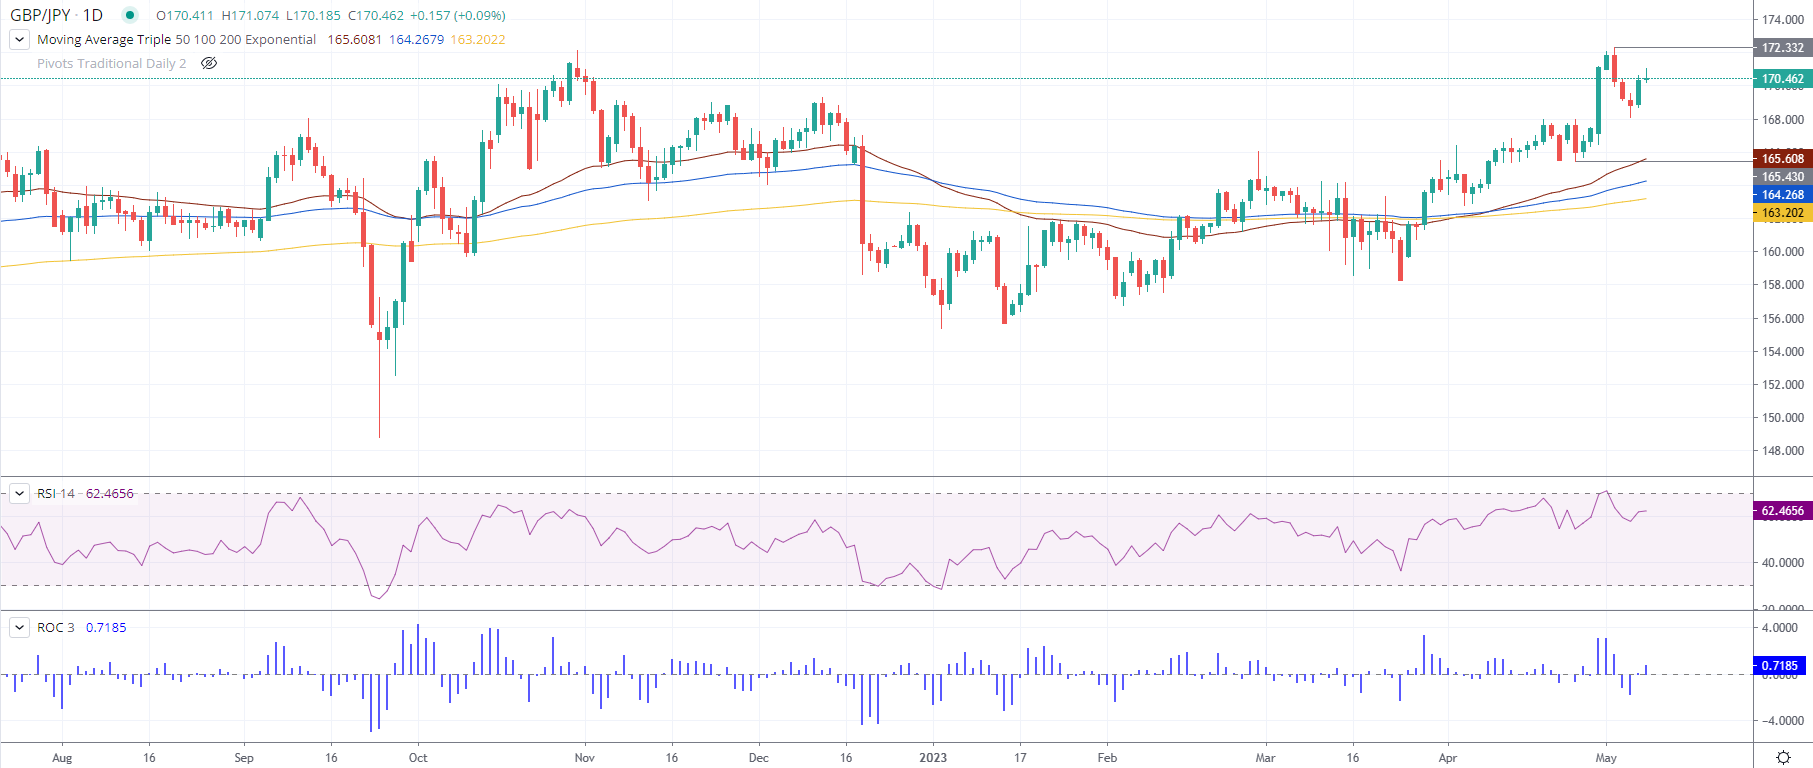
- The formation of a bullish-engulfing candlestick pattern suggests GBP/JPY may continue to trend up.
- RSI indicator suggests buyers remain in charge, 3-day RoC climbs from neutral territory.
- GBP/JPY may face resistance at 171.00 and YTD high of 172.33, support at 170.00, and last week’s low of 168.06.
The GBP/JPY holds to its earlier gains, despite falling from its daily high of 171.07, as risk aversion triggered flows toward safe-haven peers, which bolstered the Japanese Yen (JPY). Nevertheless, it was not enough to turn the cross-currency pair negative, as shown by price action. The GBP/JPY is trading at 170.50, above its opening price by 0.11%.
GBP/JPY Price Action
After completing the formation of a bullish-engulfing candlestick pattern last Friday, the GBP/JPY would likely continue to trend up. Nevertheless, it hit a bump after GBP/JPY’s Monday price action is forming a doji, suggesting indecision amongst GBP/JPY traders.
Although price action would likely remain sideways, the Relative Strength Index (RSI) indicator suggests buyers remain in charge. While the 3-day Rate of Change (RoC) climbed from the neutral territory, showing buyers are moving in.
If GBP/JPY remains in an uptrend, the first resistance level would be 171.00. A breach of the latter will expose the YTD high of 172.33, followed by the 173.00 mark.
Conversely, if GBP/JPY sellers outpace buyers, the first support would be 170.00. Once cleared, the GBP/JPY could test the last week’s low of 168.06, followed by the intersection of the April 25 daily low and the 50-day EMA at around 165.43/60, respectively.
GBP/JPY Daily Chart
- AUD/USD bears are in the market and eye a test of trendline support.
- Bulls committing at the current market structure.
The Australian Dollars has been buoyant at the start of the week as the US Dollar continued its retreat amid bets that US interest rates might have peaked, This has seen the price action move deeper into resistance as the following will illustrate:
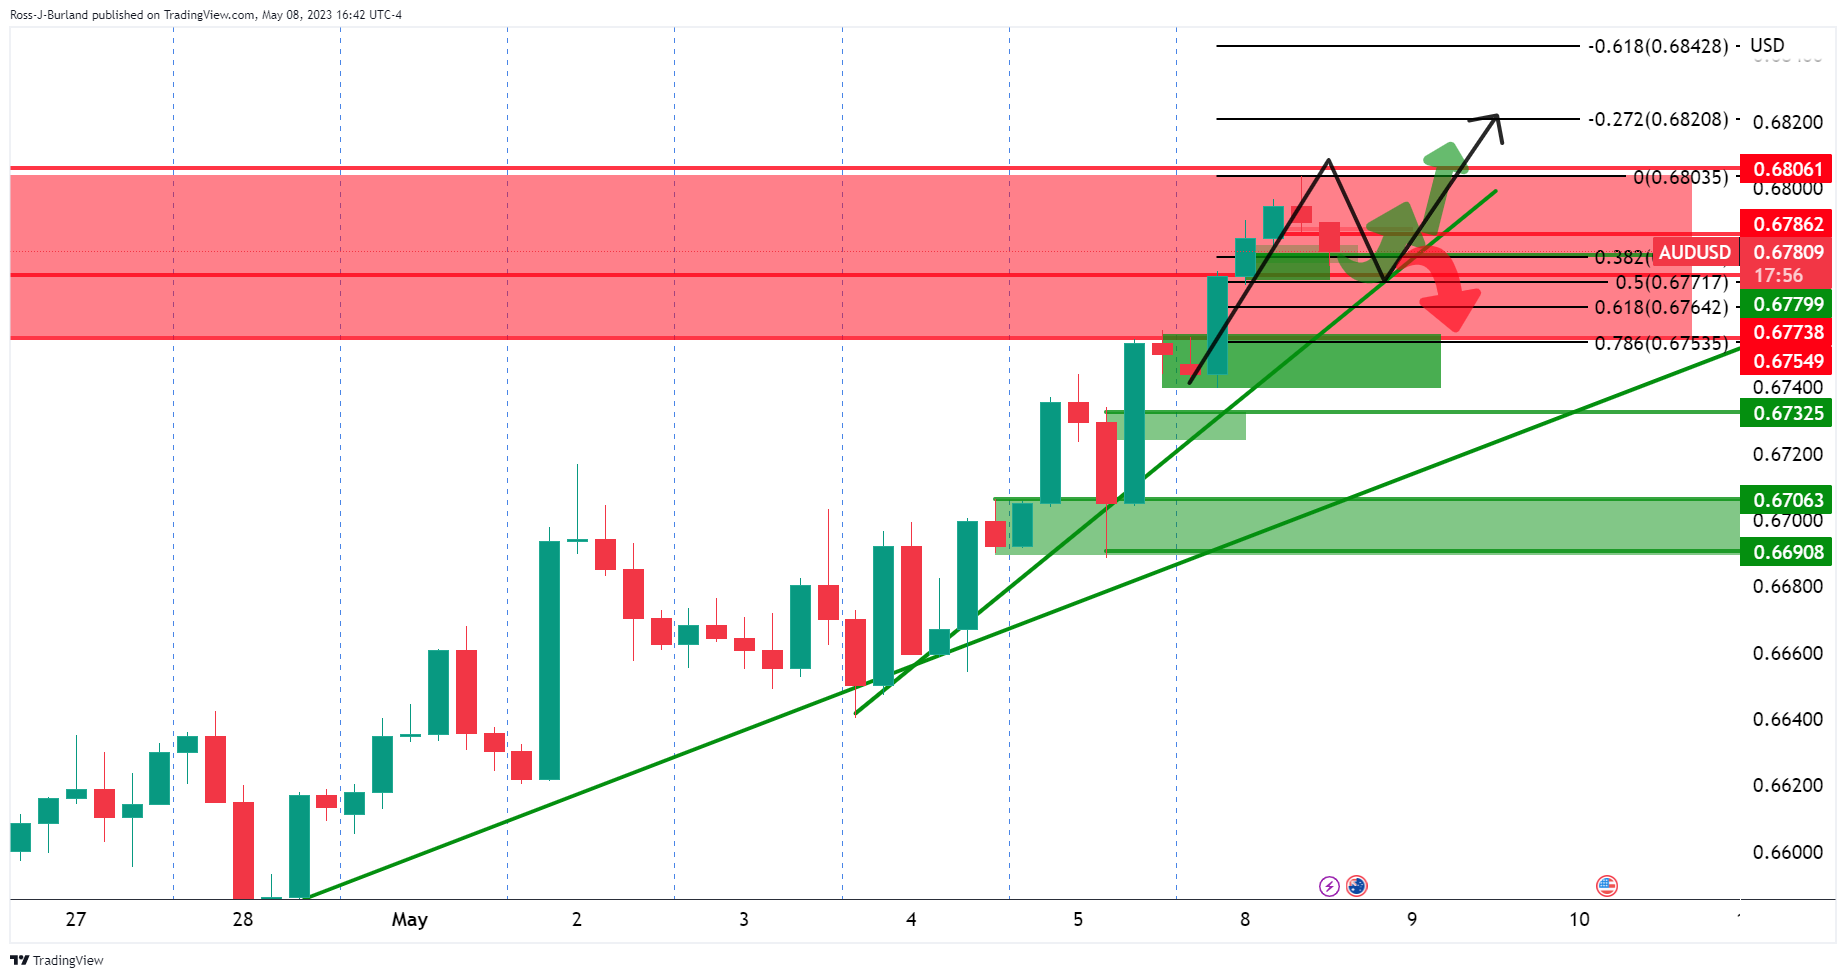
The 4-hour chart shows the price on the front side of the bullish trend with a structure located at around 0.6780. The hourly charts show the price meeting support with resistance near 0.6790.
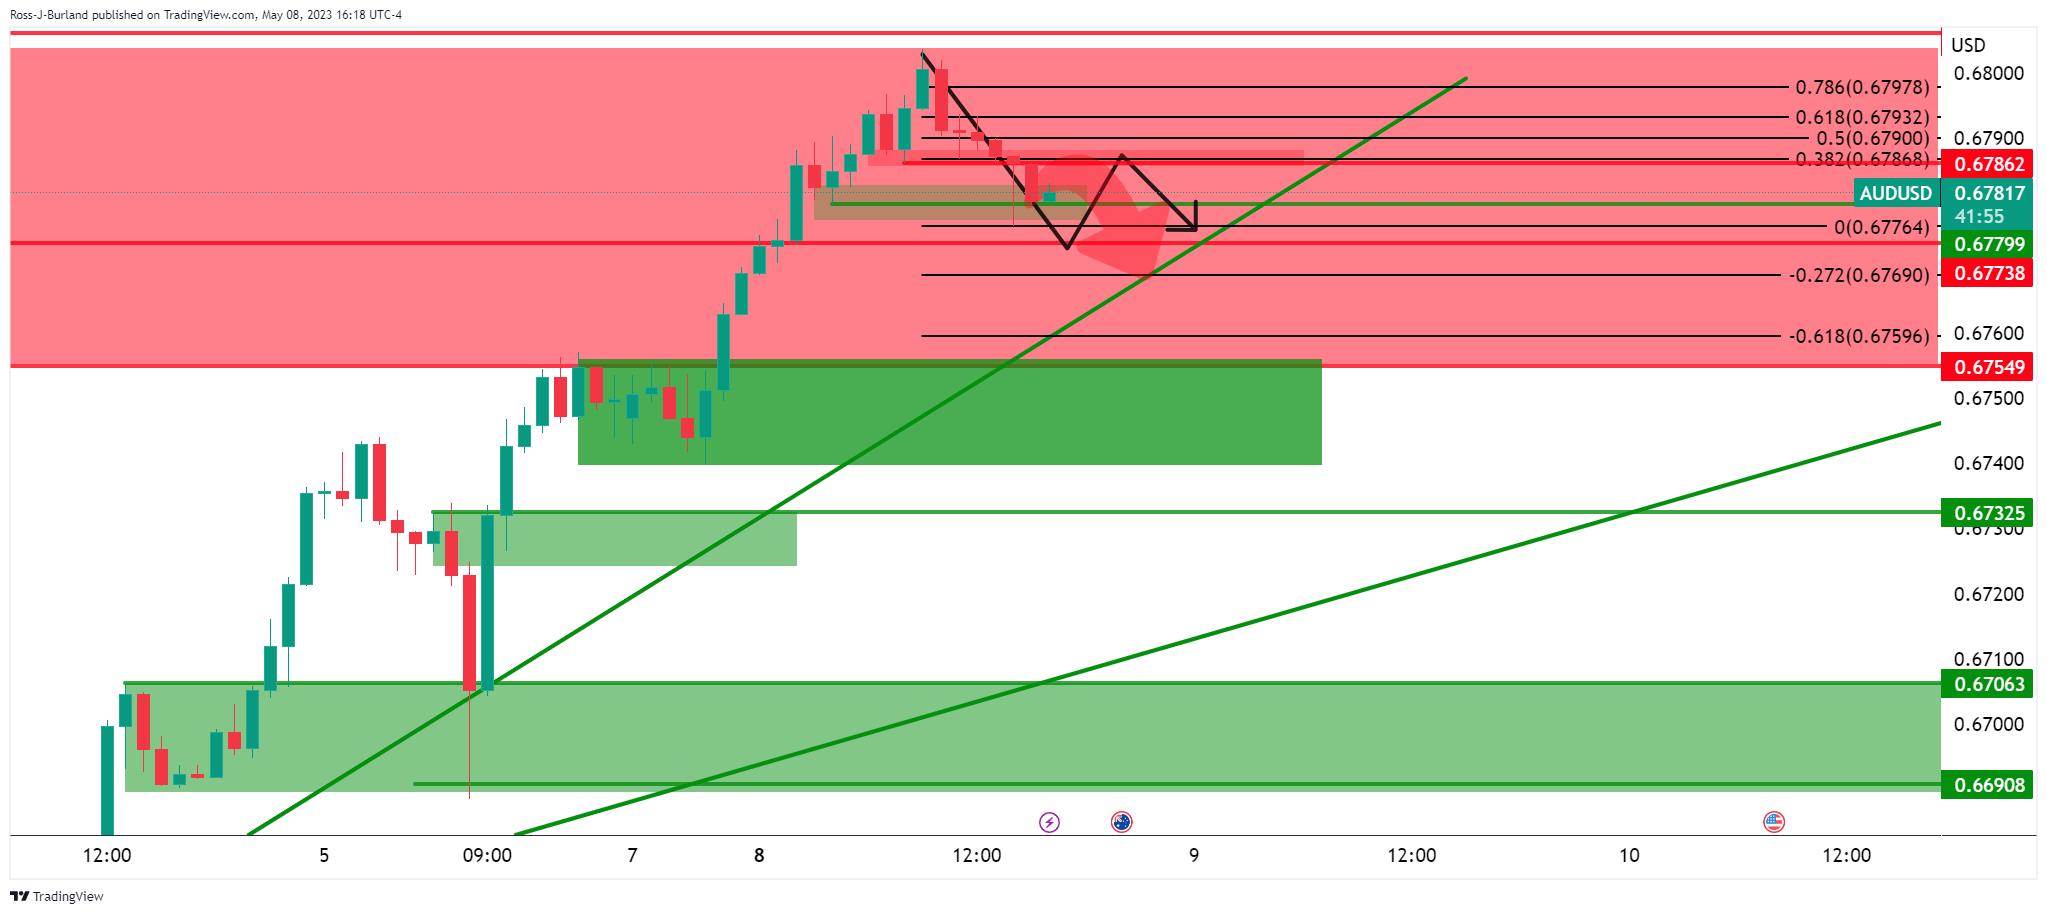
If the resistance holds, the trend support will likely come under pressure.
On Tuesday, New Zealand will report Electronic Card Retail Sales, Japan will release Household Spending data, and Australia will release Retail Sales. China will publish trade data, and the Australian Westpac Consumer Confidence for May is due. In the Australian evening, Treasurer Jim Chalmers will present the budget. The key report of the week will be US consumer inflation on Wednesday.
Here is what you need to know on Tuesday, May 9:
Wall Street opened the week with mixed results. Market participants are digesting last week's developments, including central bank meetings and US labor market data. The Federal Reserve bank survey showed no major surprises as banking concerns continue to ease, supporting market sentiment. Incoming US inflation data, with the Consumer Price Index (Wednesday) and the Producer Price Index (Thursday), will be critical.
The US dollar rose during the American session, boosted by higher US yields, but commodity currencies outperformed, extending last week's rally. The DXY rose modestly to 101.30 and still remains near the crucial 101.00 support area.
Germany reported a decline of 3.4% in industrial production in March, worse than the expected 1.5% slide. The Eurozone Sentix Investor Confidence for May worsened from -8.7 to -13.1. EUR/USD pulled back to the 1.1000 area as it continues to move sideways.
Regarding German industrial production data, analysts at Commerzbank wrote:
Industrial production fell unexpectedly sharply by 3.4% in March. This meant that a considerable part of the gains achieved in the past two months was lost again. Due to the recent weakening of demand, a further decline in output is expected in the coming months. Instead of the economic recovery expected by many, a mild recession is more likely in the second half of the year.
GBP/USD hit fresh multi-month highs before pulling back toward 1.2600. The rally lost momentum as it approached the 100-day Simple Moving Average, which awaits at 1.2700. The Bank of England will announce its decision on Thursday, and market participants expect a 25 basis points rate hike.
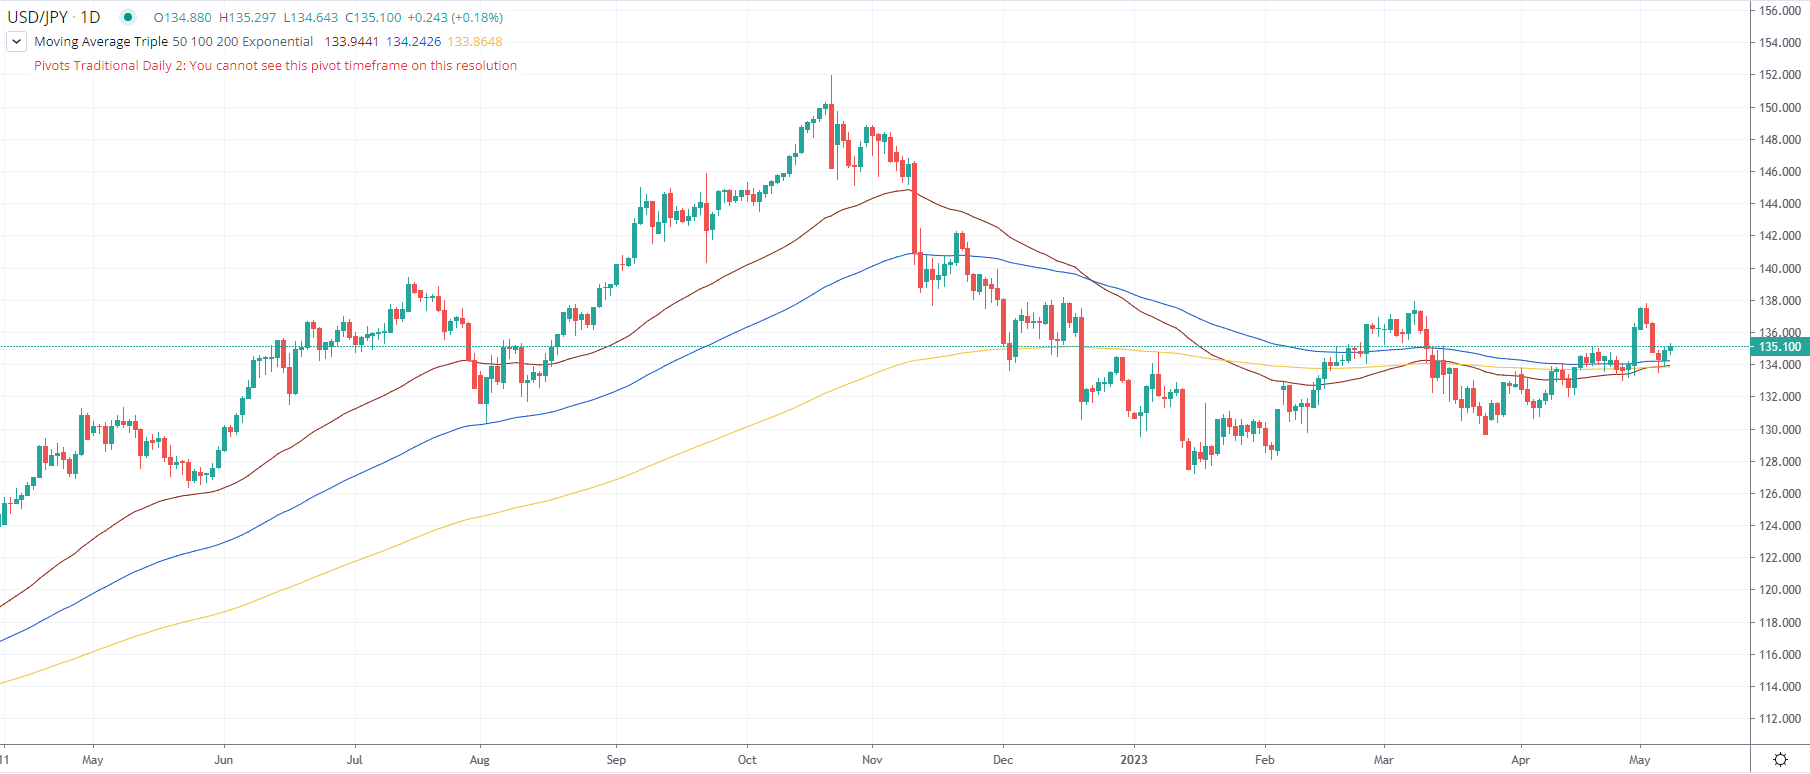
USD/JPY moved sideways around 135.00 on Monday, with little change. The minutes of the Bank of Japan's (BoJ) March 9-10 meeting offered no surprises. On Thursday, the BoJ will release the summary of opinions from the April 27-28 meeting.
AUD/USD hit 0.6803, the highest intraday level since April 14, before pulling back modestly. It remains bullish, looking at the critical 0.6800 resistance area. Australia will report Retail Sales, Westpac will release the Consumer Confidence Index, and the government will announce the budget.
NZD/USD rose for the fifth consecutive day and peaked at 0.6358. The Kiwi posted the highest daily close since February, boosted by the improvement in risk sentiment.
The Loonie lagged with USD/CAD ending flat around 1.3370/80, after approaching 1.3300.
Crude oil prices extended their recent recovery, rising more than 2%. Metals posted mixed results: Gold rose marginally, ending above $2,020, while Silver fell modestly to $25.50.
Cryptocurrencies tumbled on Monday, with Bitcoin losing almost 5%, falling to $27,500.
The Chilean Peso (CLP) rallied after right-wing candidates won 33 of the 50 seats in Chile's Constitutional Convention vote. USD/CLP dropped to 786.15, reaching the lowest level since February, but then rebounded towards 800."
Reuters is reporting that the US Treasury Secretary Janet Yellen is reaching out to business and financial leaders to explain the "catastrophic" impact a US default on its debt would have on the U.S. and global economies, two sources familiar with the matter said on Monday.
The news agency reports that the Treasury secretary is having one-on-one conversations with individual CEOs to warn them about the "dangerous consequences of the current brinkmanship," one of the sources said.
´´Yellen, other economists and analysts have repeatedly warned that a default on US debt would result in millions of job losses, while driving household payments on mortgages, auto loans and credit cards higher.
Unlike most other developed countries, the US puts a hard limit on how much it can borrow. Because the government spends more than it takes in, lawmakers must periodically raise the debt ceiling.´´
US Dollar update

-
US Dollar bears move in and eye a break of trendline support
The US Dollar is seen to be decelerating and ´´the structure is located at 101.332. To confirm a downside bias, the bears will need to see a break of there, currently, until at least a new structure is formed, potentially, higher up.´´
- USD/JPY is upward biased, with price action trading above weekly EMAs.
- Bullish-engulfing candle pattern suggests further upside is expected.
- A break above the 136.00 figure exposes last week’s swing high at 137.77.
The USD/JPY accelerated above the 135.00 figure after the pair bounced off its daily low of 134.64, on fundamental news turning the market sour and a dovish stance by the Bank of Japan (BoJ), according to the March minutes. At the time of writing, the USD/JPY is trading at 135.15, gaining 0.28%.
USD/JPY Price Action
From the weekly chart perspective, the USD/JPY is upward biased, with price action trading above its weekly EMAs. Although last week’s candlestick was bearish, downside risks lie below the 50-WMA at 132.90, followed by 129.65. Hence, if USD/JPY stays above the previously-mentioned support levels, its path of least resistance is upwards. Additionally, the Relative Strength Index (RSI) indicator just crossed the 50-neutral line to bullish territory, suggesting buyers are gathering momentum.
The USD/JPY, daily chart timeframe portrays the major trading sideways, as the EMAs remain flat. Nevertheless, the price action of May 4 and 5th formed a two-candlestick chart pattern known as a bullish-engulfing candle pattern, suggesting that further upside is expected.
If USD/JPY stays above 135.00, the first resistance would be the 136.00 figure. The break above will expose the May 3 daily high of 136.62, followed by the last week’s swing high at 137.77. Conversely, if USD/JPY drops below 135.00, that could open the door to testing the 100-day EMA at 134.20 before testing the confluence of the 50 and 200 EMA at 133.69/80.
USD/JPY Daily Chart
- The US Dollar is starting to slow down on the bid in the 101.30s DXY.
- Bears eye a bearish correction into W-formation.
The US Dollar has run higher in the midday session in New York, printing a high of 101.37 so far as per the DXY index. Meanwhile, the Federal Reserve hiked interest rates by 25 basis points last week but has taken out the need for future hikes from within the statement. This has been priced into the Fed funds futures that are now pricing for the fed funds rate to reach 4.993 in July, and remain below that all year. The Fed's target range stands at 5% to 5.25%, having risen rapidly from 0% since March 2022.
DXY technical analysis

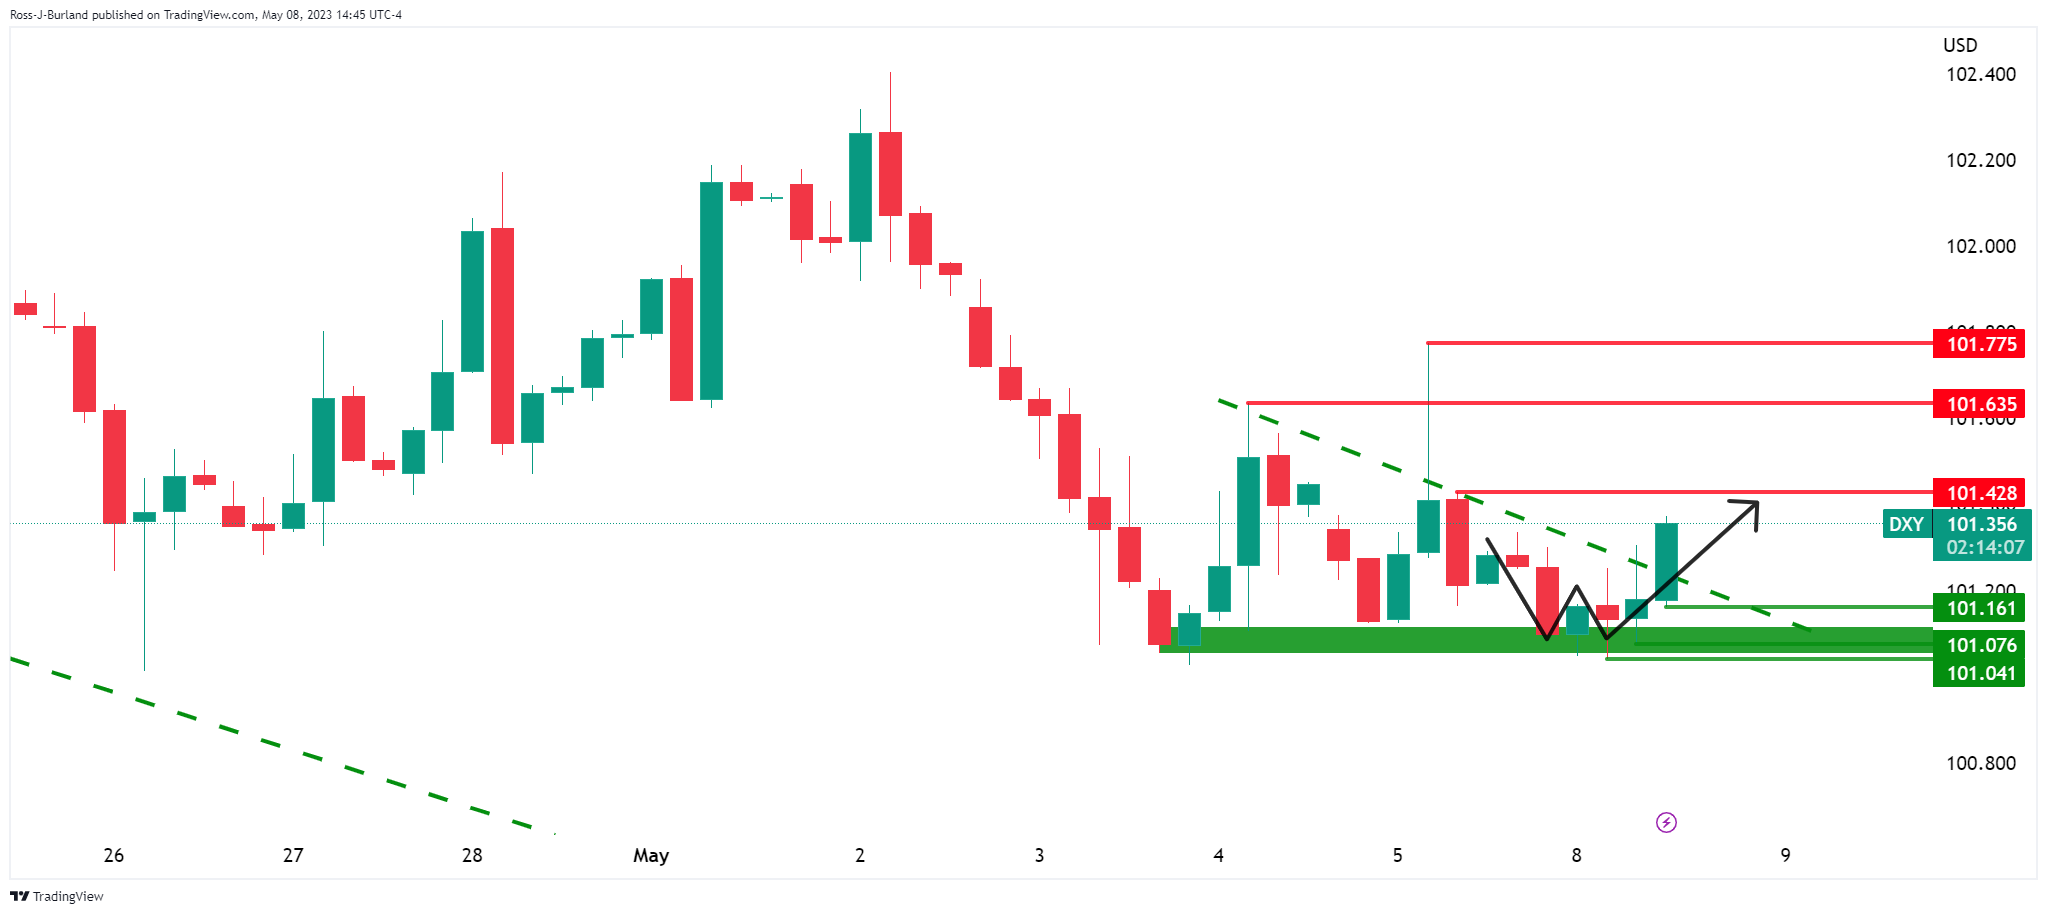
As illustrated, the US Dollar has crawled out of the March bear trend and is now on the backside of that trend. Instead, the index is accumulating as illustrated above, penetrating the micro trendline resistance.
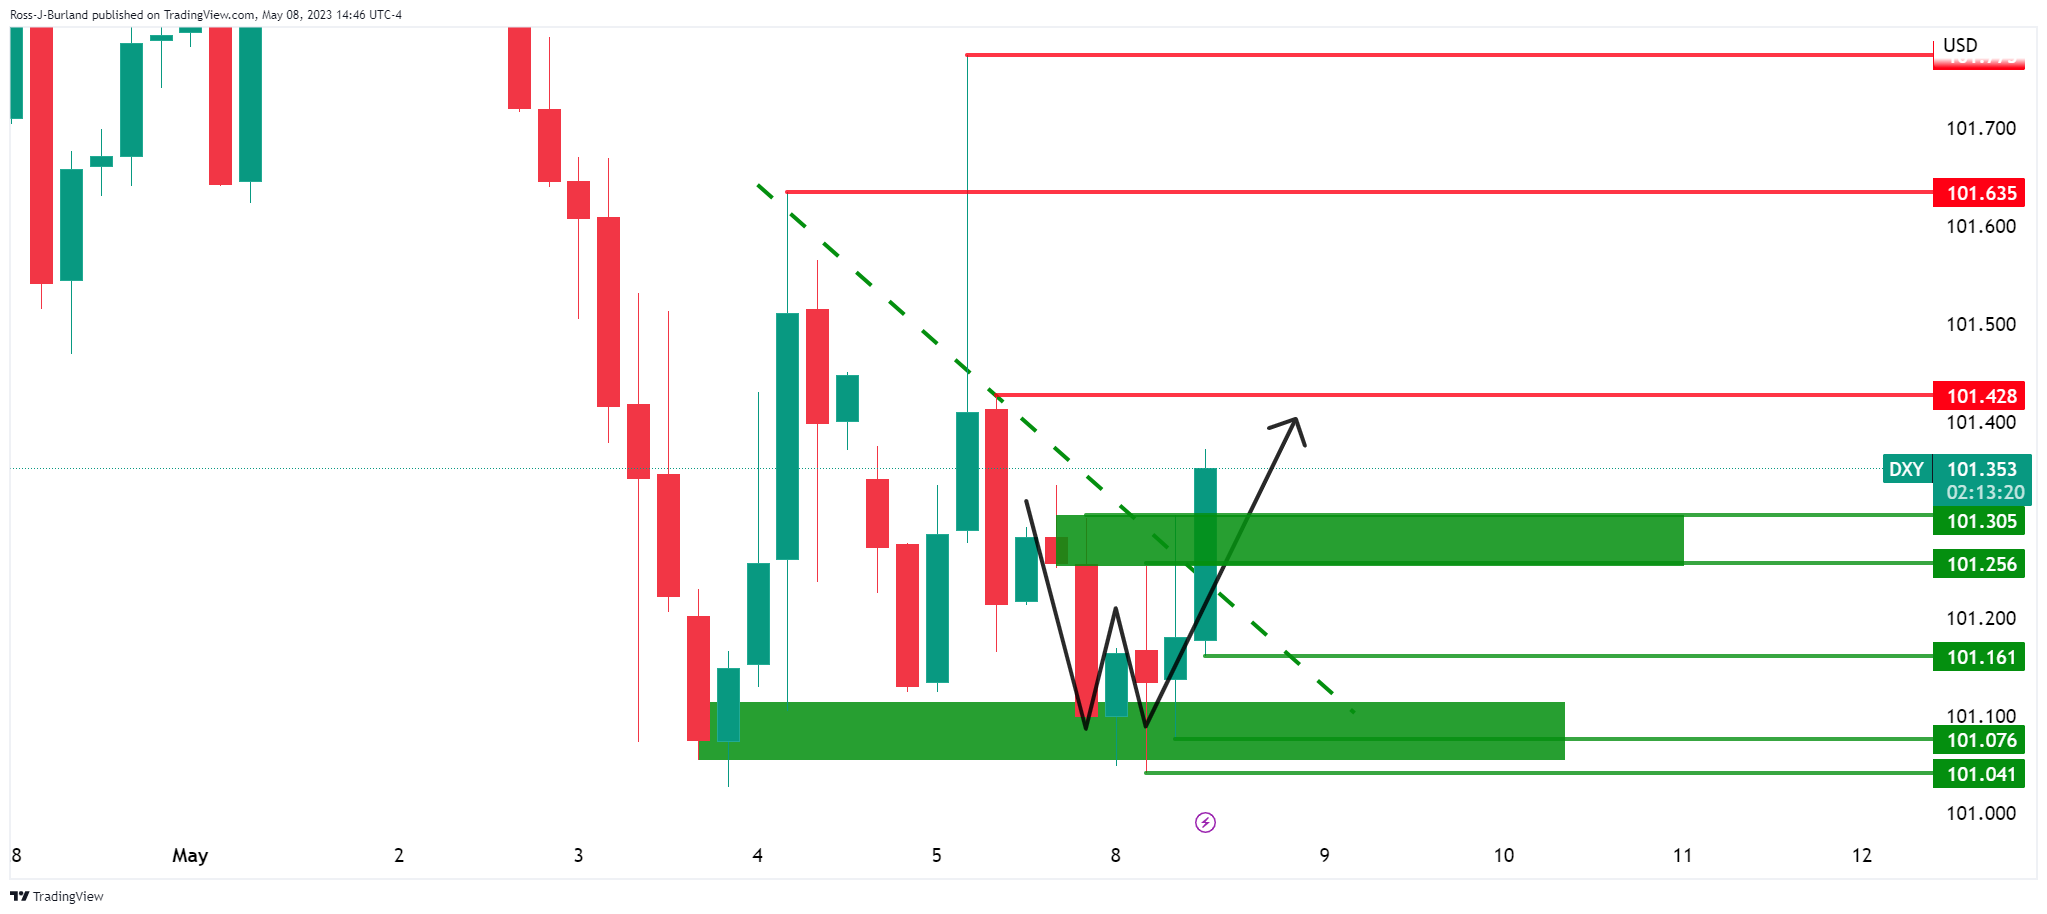
Zooming in, there is a W-formation and the current rally would be expected to decelerate and potentially lead to a correction, as per the hourly chart below.
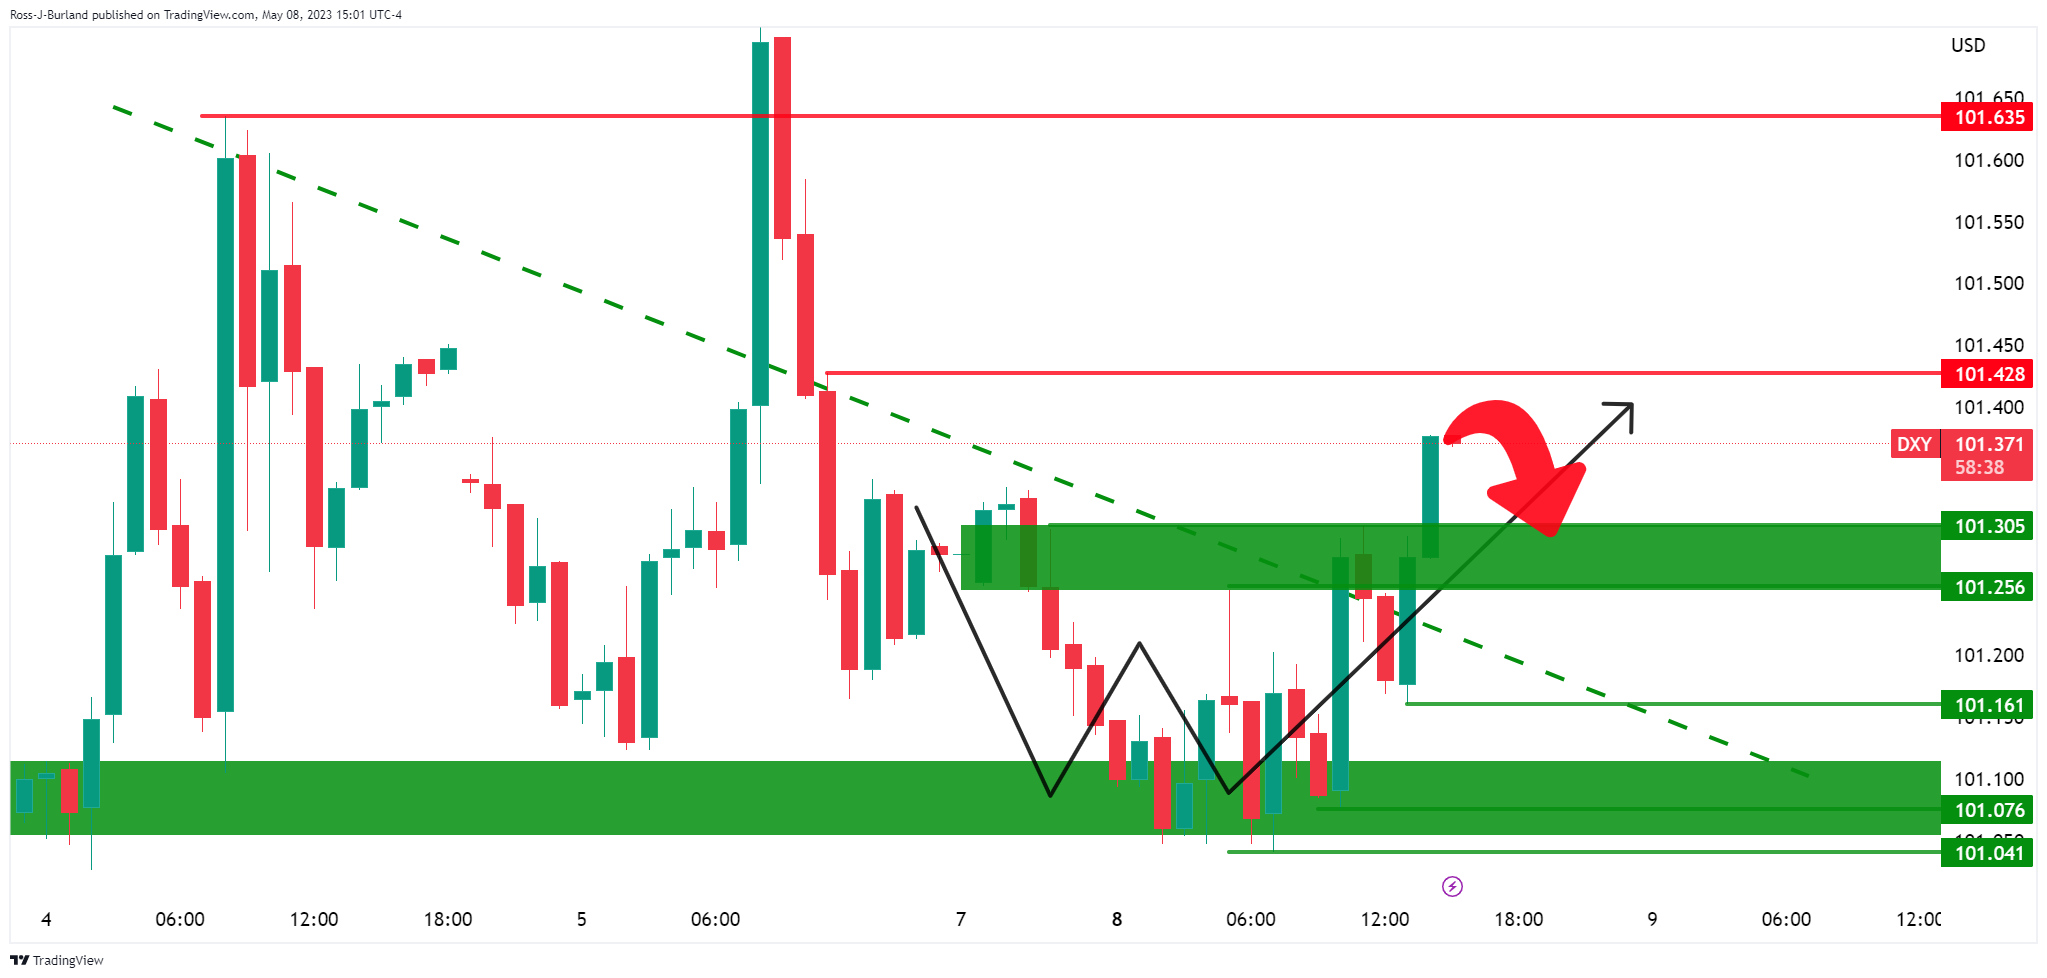
On the 15-minute chart, the price is seen to be decelerating and the structure is located at 101.332. To confirm a downside bias, the bears will need to see a break of there, currently, until at least a new structure is formed, potentially, higher up.
- GBP/USD slides after Senior Loan Officer Opinion Survey report shows US banks expecting tightening credit conditions.
- US Treasury bond yields continue to gain ground, undermining GBP/USD.
- The debt ceiling debate in Washington could trigger outflows towards safe-haven peers; future inflation data may benefit US Dollar.
The GBP/USD retreats after hitting a new year-to-date (YTD) high of 1.2668 after the US Federal Reserve (Fed) reported the Senior Loan Officer Opinion Survey (SLOOS), which showed that US banks are expecting tightening credit conditions. However, a looming Bank of England (BoE) monetary policy cushioned the Pound Sterling (GBP). At the time of writing, the GBP/USD is trading at 1.2618.
US banks expecting tightening credit conditions weighed on the GBP/USD
Wall Street’s wavered after the SLOOS report, which showed that credit conditions are tightening, and businesses’ demand for loans is weakening. Banks expect to strain standards across all loan categories on expected deterioration in credit quality, reduced risk tolerance, and concerns about funding costs, liquidity, and deposit outflows.
The GBP/USD slid after the report crossed the screens, from around 1.2640 to current exchange rates, as the greenback recovered some ground. The US Dollar Index (DXY), which tracks the performance of six currencies vs. the American Dollar (USD), rises 0.15%, at 101.370.
Meanwhile, US Treasury bond yields continued to gain ground, with the 10-year benchmark note rate at 3.520%, up seven and a half bps, undermining the GBP/USD.
Aside from this, Federal Reserve officials had begun to cross newswires, with Aaron Goolsbee from the Chicago’s Fed crossing the wires. He said the Fed would be data dependent, and that is too soon to judge rate decisions for the June meeting.
Discussions in Washington could shift market sentiment as the debt ceiling debate between the White House and the US Congress could trigger outflows toward safe-haven peers, like the Japanese Yen (JPY), the Swiss Franc (CHF), and Gold.
According to Janet Yellen, the US Treasury Secretary, there are no accessible alternatives to resolve the debt limit issue in Washington without assistance from the US Congress. In the meantime, US President Joe Biden is expected to meet lawmakers on May 9 to advance in negotiations regarding raising the ceiling.
The US economic docket will feature inflation data in the upcoming days. Any significant consumer or producer data jump could benefit the US Dollar; hence, the GBP/USD could continue to trend lower, with the pair expected to fall below 1.2600.
Earlier, the US Commerce Department revealed that Wholesale Inventories were unchanged in March, below estimates of 0.1% MoM. Annually based, inventories jumped 9.1% in March, despite the first quarter decline, as more robust US consumer spending contributed to the inventory rundown.
GBP/USD Key Technical Levels
The Federal Reserve (Fed) released the April 2023 Senior Loan Officer Opinion Survey on Bank Lending Practices, which has become more relevant in the context of concerns about regional US banks. The survey results reflect the first quarter of 2023.
According to the report, survey respondents reported, on balance, tighter standards and weaker demand for commercial and industrial (C&I) loans to large and middle-market firms, as well as small firms, over the first quarter. Banks also mentioned tighter standards and weaker demand for all commercial real estate loan categories.
Key Takeaway from the report:
“Regarding loans to businesses, survey respondents reported, on balance, tighter standards and weaker demand for commercial and industrial (C&I) loans to large and middle-market firms as well as small firms over the first quarter.2 Meanwhile, banks reported tighter standards and weaker demand for all commercial real estate (CRE) loan categories.”
“For loans to households, banks reported that lending standards tightened across all categories of residential real estate (RRE) loans other than government-sponsored enterprise (GSE)-eligible and government residential mortgages, which remained basically unchanged.”
“Banks reported tighter standards and weaker demand for home equity lines of credit (HELOCs). Standards tightened for all consumer loan categories; demand weakened for auto and other consumer loans, while it remained basically unchanged for credit cards.”
“Regarding the second set of special questions about reasons for changing standards on all loan categories in the first quarter, banks cited a less favorable or more uncertain economic outlook, reduced tolerance for risk, deterioration in collateral values, and concerns about banks' funding costs and liquidity positions.”
“Banks reported expecting to tighten standards across all loan categories. Banks most frequently cited an expected deterioration in the credit quality of their loan portfolios and in customers' collateral values, a reduction in risk tolerance, and concerns about bank funding costs, bank liquidity position, and deposit outflows as reasons for expecting to tighten lending standards over the rest of 2023.”
- Gold price bears are taking back control.
- Bears eye a downside extension towards $2,000.
As per the pre opèn Gold price analysis, Gold, Chart of the Week: XAU/USD bears in the market, bias lower while below $2,030s, the market remains better offered as the following will illustrate:
Gold price, prior analysis
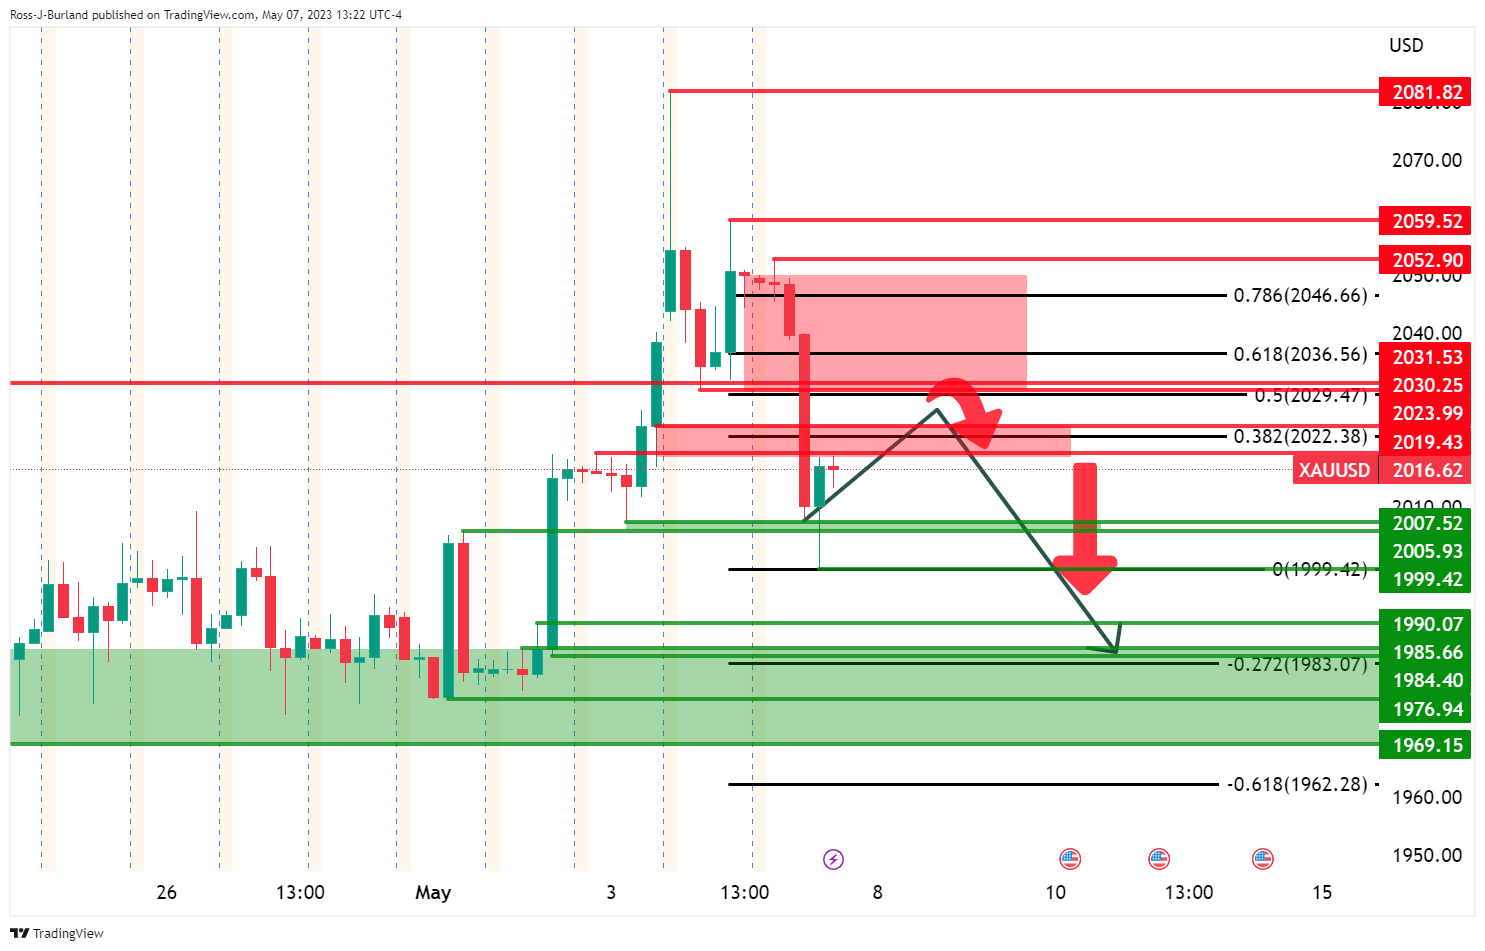
From a 4-hour perspective, it was stated that the support area look vulnerable considering the current formation of the schematic. It was argued that should the correction start to decelerate within the highlighted areas of potential resistance, bears could be encouraged to take on the support area between $1,970 and $1,990.The bias was bearish while below $2,050 and nearer term, the $2,030s.
Gold price updates
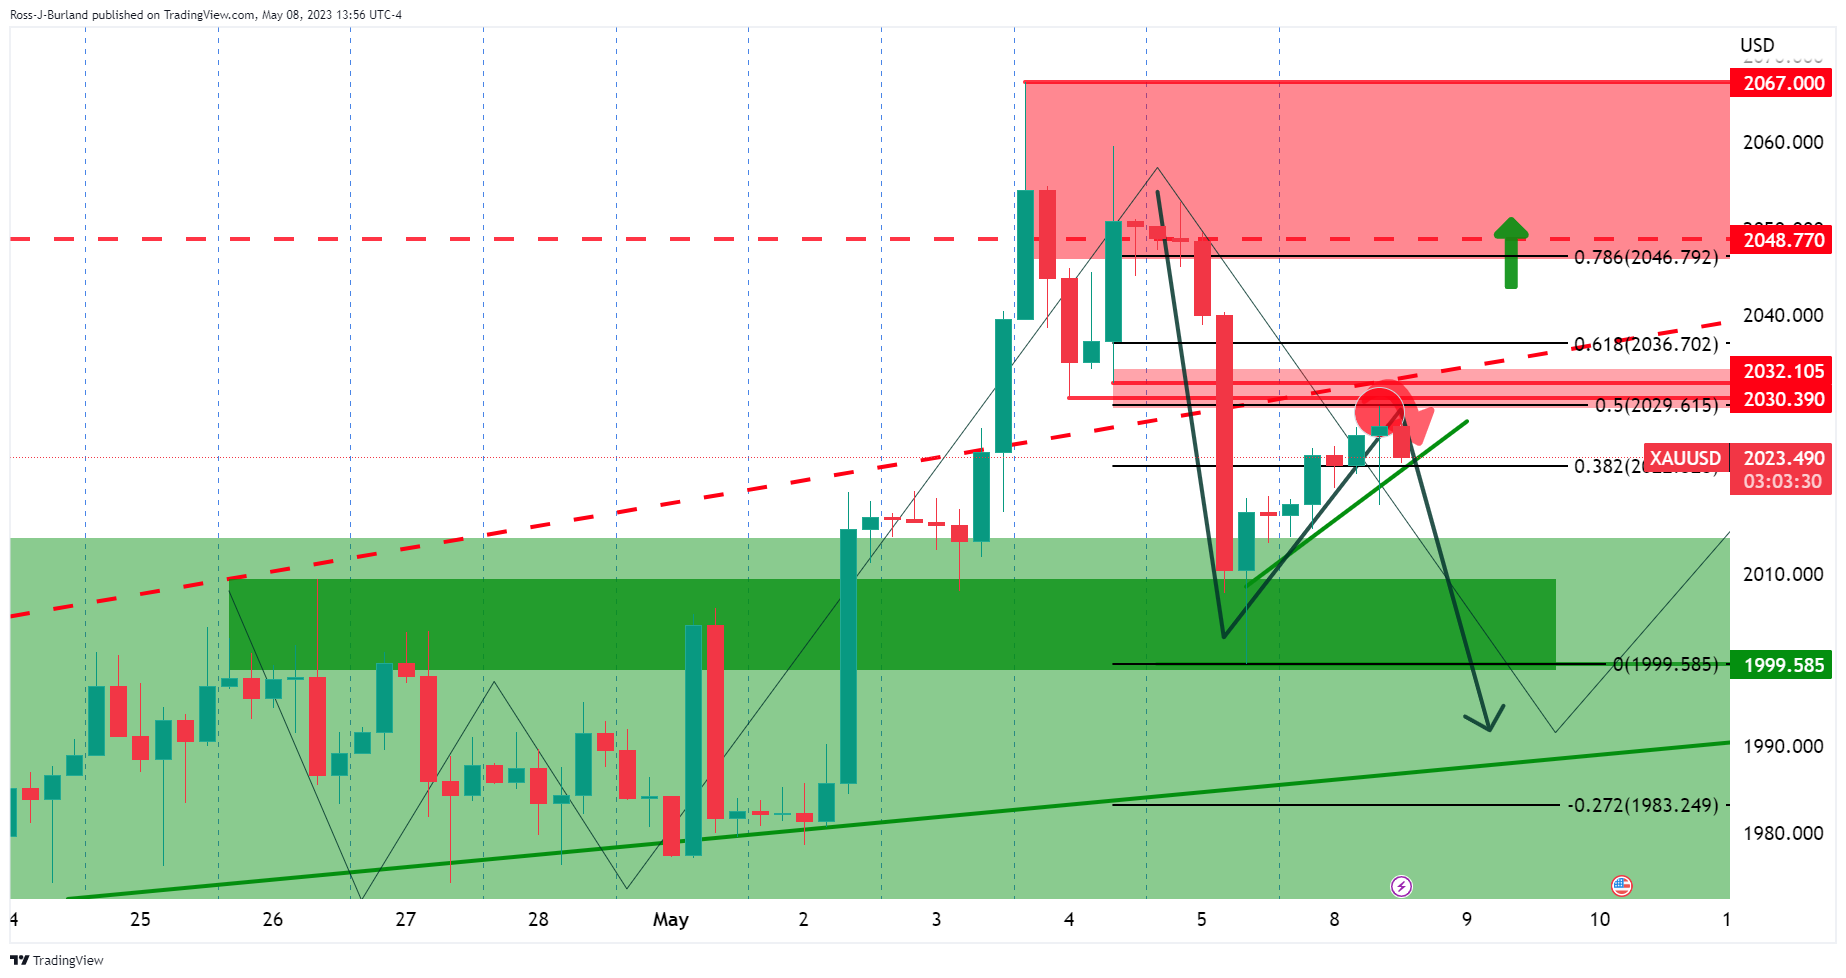
We have seen a run-into where resistance was expected to kick in. The price is currently moving away from here in textbook fashion:
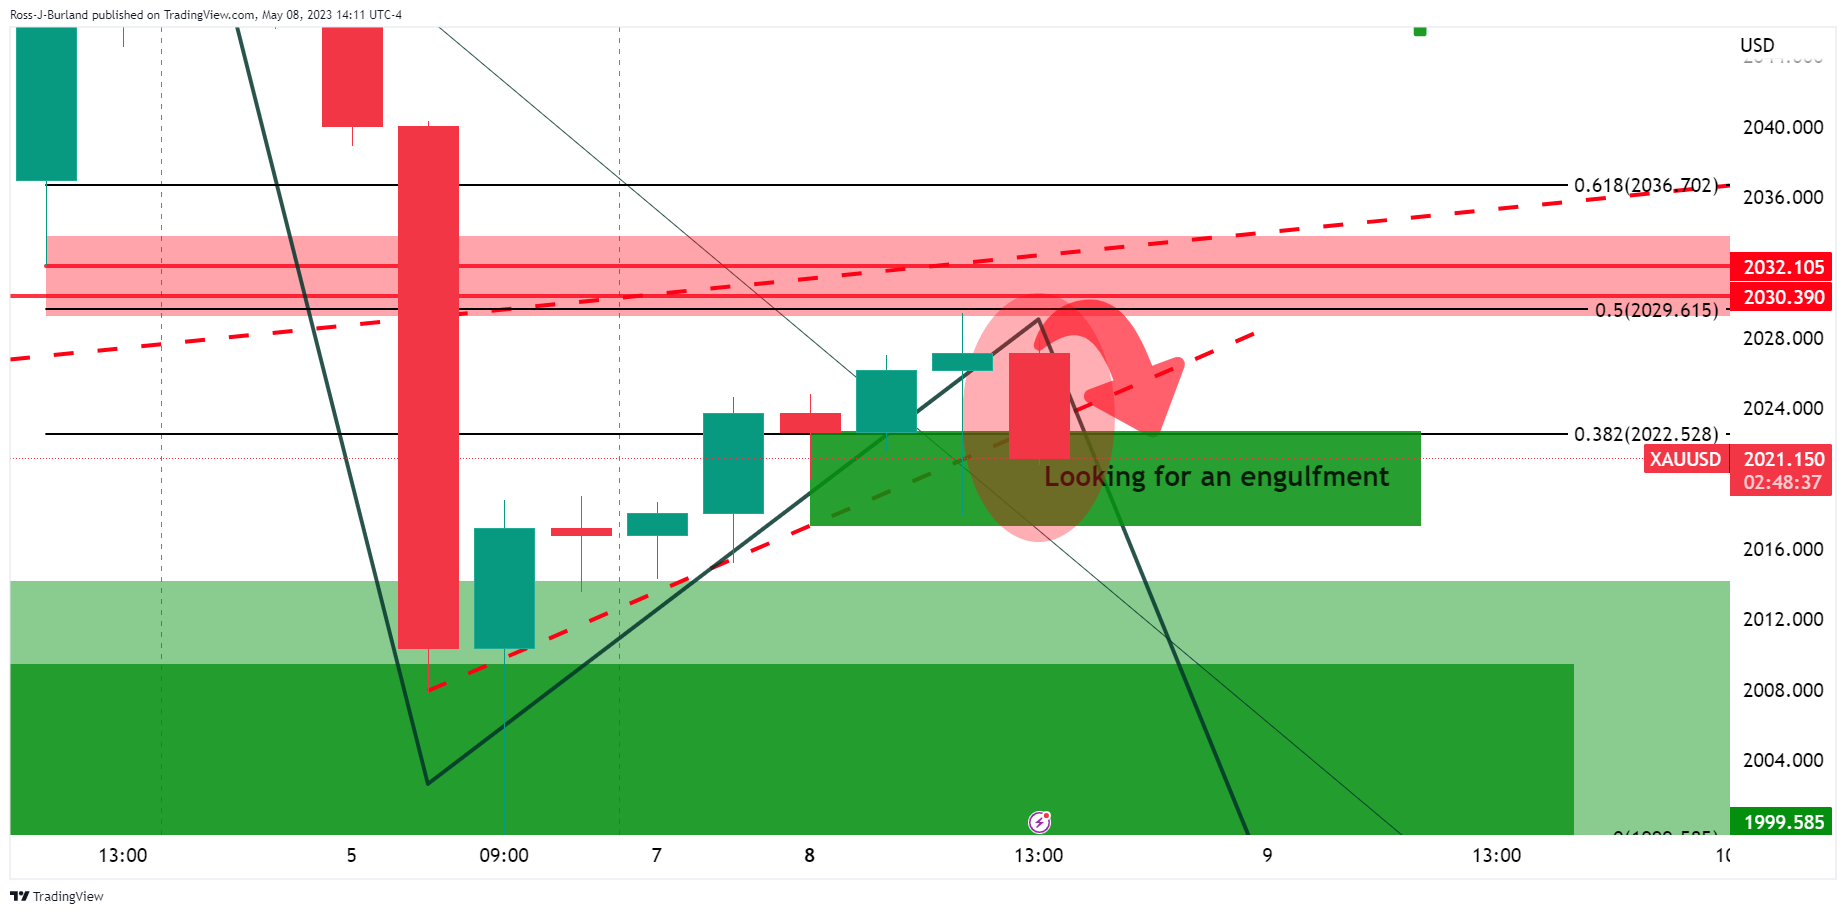
The bears are in the market again and are in the process of engulfing the prior candle as illustrated. A bearish engulfment would be highly encouraging for the sellers.
- EUR/USD trading at 1.1027, holding to gains of 0.13% despite the Eurozone Industrial Production plunge.
- Dutch Central Bank President comments on the need for rate hikes to curb inflation.
- US Treasury Secretary Yellen states no favorable alternatives to resolve the debt limit issue without Congress’s assistance.
The EUR/USD retreated from daily highs, hitting 1.1053 as the European session ended. The latest week, we have witnessed the US Federal Reserve (Fed) and the European Central Bank (ECB) increasing rates by 25 bps, though divergence would likely favor the latter. Hence, the EUR/USD is trading at 1.1017, with losses of 0.05%.
ECB officials make hawkish remarks as US debt ceiling takes center stage
US equities continued to trade mixed. The EUR/USD pair is clinging to its earlier gains, despite data from the Eurozone (EU), namely Germany, showing that Industrial Production plunged in March to -3.4%, below the -1.3% contraction expected by the consensus. That, alongside the last week, Germany’s Industrial Orders plummeting 10.7% MoM, has raised recessionary fears amongst the EU.
In the meantime, some ECB officials embarked on hawkish remarks, with Dutch Central Bank President Klaas Knot saying that rate hikes are starting to have an effect, but more are needed to curb inflation. Of late, the ECB’s Chief Economist, Philip Lane, commented that inflation will come down, but momentum is still high.
On the US front, the debt ceiling narrative has taken center stage. According to Janet Yellen, the US Treasury Secretary, there are no favorable alternatives to resolve the debt limit issue in Washington without assistance from the US Congress. In the meantime, US President Joe Biden is expected to meet lawmakers on May 9 to advance in negotiations regarding raising the ceiling.
The US economic docket revealed that Wholesale Inventories were unchanged in March, below estimates of 0.1% MoM, the US Department of Commerce said. Annually based, inventories jumped 9.1% in March, despite the first quarter decline, as more robust US consumer spending contributed to the inventory rundown.
EUR/USD Technical Analysis
The daily chart’s EUR/USD price action suggests buyers remain in the driver’s seat. Of note is that while the EUR/USD pair is reaching higher highs, the Relative Strength Index (RSI) indicator is not, as it has recorded a successive series of lower peaks. Therefore, a negative divergence between price action and the oscillator is emerging, which could pave the way for further losses. However, the EUR/USD must fall below 1.1000 first, so it can challenge the May 2 daily low of 1.0942. before dropping toward the 1.0900 figure. A breach of the latter will expose the 50-day EMA At 1.0883. Conversely, if EUR/USD buyers reclaim 1.1100, that would keep the EUR/USD uptrend intact.
- USD/MXN climbs back above 17.80 at the beginning of the week.
- Inflation data this week to shed light on Fed’s June meeting.
- Mexican inflation figures to give USD/MXN traders clues for Banxico’s monetary policy meeting on May 18.
The USD/MXN makes a U-turn and climbs back above the 17.80 figure at the beginning of the week, as US Treasury bond yields edge up, while a risk-off impulse keeps Wall Street in the red. Solid data from the United States (US) cushioned the last week’s USD/MXN fall. At the same time, speculations that the Mexican central bank will pause its tightening cycle could trigger outflows from the emerging market currency. At the time of writing, the USD/MXN is trading at 17.8354.
US Dollar recovery, on speculations of Mexican central bank pausing tightening cycle
The US Dollar (USD) has shown signs of recovery against the Mexican Peso (MXN). Last Friday, the latest US jobs report showed signs of tightness, which warrants further action by the US Federal Reserve (Fed). Even though the Fed opened the door for a pause on its tightening cycle, this week’s inflation data could shed some light on what the Fed can do in June’s meeting.
Meanwhile, discussions about the US debt ceiling shifted sentiment sour. According to Janet Yellen, the US Treasury Secretary, there are no favorable alternatives to resolve the debt limit issue in Washington without assistance from the US Congress.
The US economic docket revealed data from the US Department of Commerce. Wholesale Inventories for March came at 0% MoM, below estimates of 0.1% expansion, though annually-based figures showed an improvement.
On the Mexican front, the agenda is empty for Monday. Still, on Tuesday, inflation figures would give USD/MXN traders some clues regarding the Bank of Mexico’s (Banxico) path toward its May 18 monetary policy meeting.
USD/MXN Technical Analysis
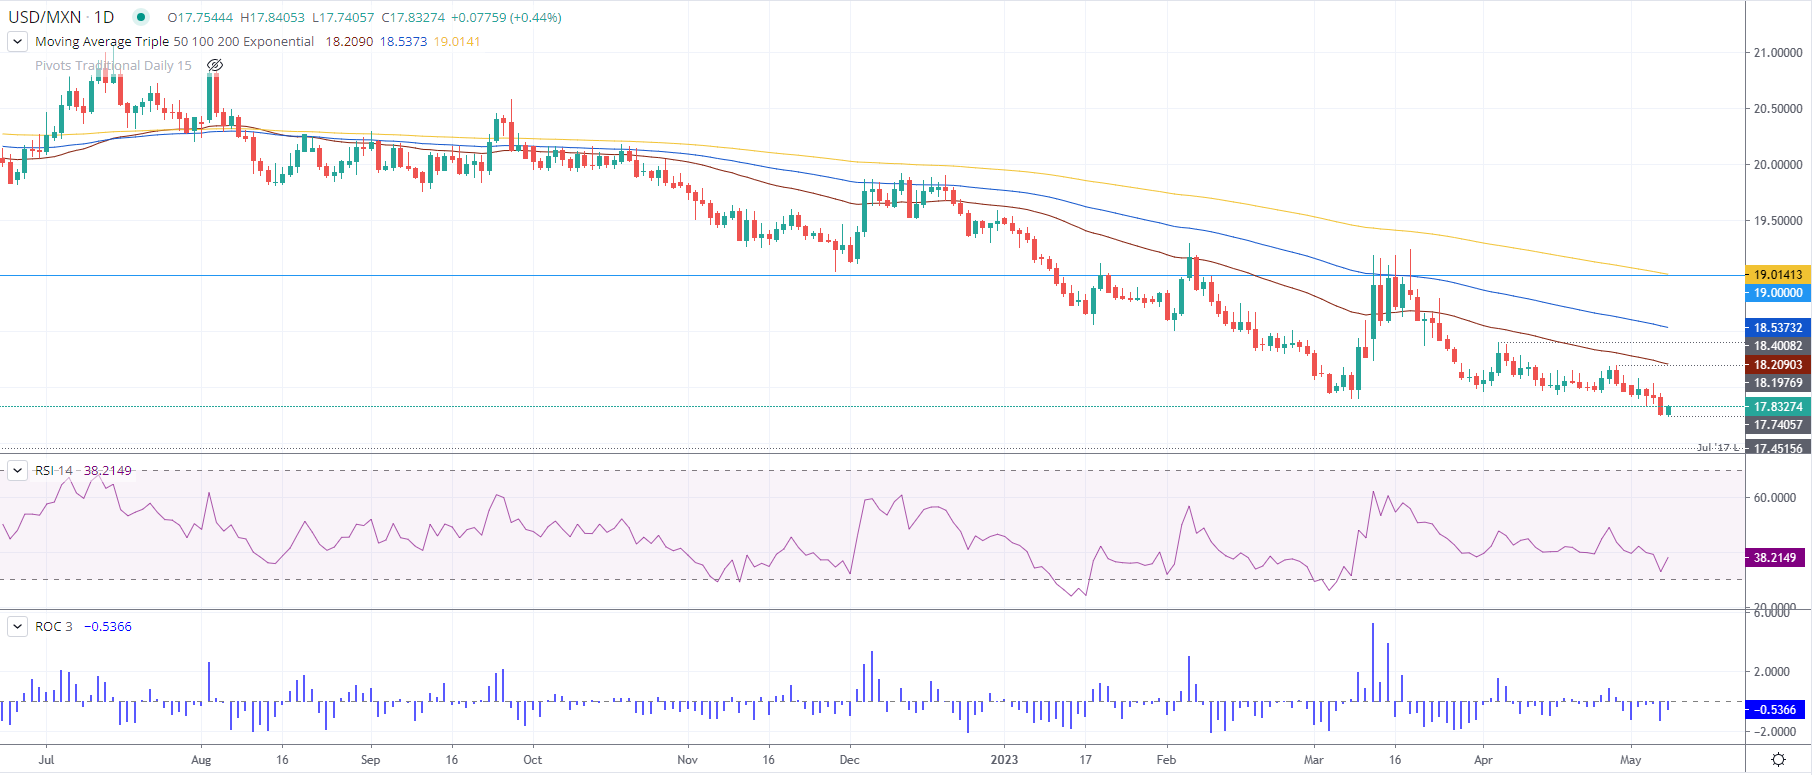
Once the USD/MXN found its floor around 17.7405, hitting six-year lows, the USD/MXN jumped off the year-to-date (YTD) low toward the 17.80 area. Even though the USD/MXN is still downward biased, a divergence between the Relative Strength Index (RSI) indicator printing higher troughs while the USD/MXN pair registers lower lows suggests that selling pressure is fading. If USD/MXN climbs above 18.0000, that will expose the 50-day EMA at 18.2087. A breach of the latter and above the April 26 high would open the door to test April’s high of 18.4008, followed by the 100-day EMA at 18.5371.
In an interview with Yahoo Finance on Monday, Chicago Federal Reserve Bank President Austan Goolsbee said that the Fed's Senior Loan Officer Opinion Survey for the first quarter will provide critical information on credit conditions.
"We should be extra-attuned to issues in bond market related to debt limit," Goolsbee added, as reported by Reuters.
Regarding the Fed's policy outlook, Goolsbee reiterated that it was too early to say what the next policy move will be, explaining that there were a lot of uncertainties regarding the impact of credit tightening on the economy.
Market reaction
These comments don't seem to be having a significant impact on the US Dollar's performance against its rivals. As of writing, the US Dollar Index was virtually unchanged on the day at 101.25.
- USD/CHF pair begins the week with minimal losses as risk aversion continues in the driver’s seat.
- US Wholesale inventories were unchanged in March, jumping 9.1% annually despite a first-quarter decline.
- Traders are eying the Fed’s Senior Loan Officer Survey alongside US inflation data.
The USD/CHF pair commenced the week with minimal losses of 0.15%, even though the latest round of inflation data in Switzerland suggested that the Swiss National Bank (SNB) could adopt a less hawkish approach. The latest United States (US) data flashed a solid labor market, though traders are eyeing inflationary data during the week. At the time of writing, the USD/CHF is trading at 0.8891, below its opening price by 0.15%.
US equities trend lower, reflecting a sour mood with investors seeking safety moved to the CHF
The USD/CHF is set to continue to slump during the day, as the US Dollar Index (DXY), a gauge of the buck’s value vs. a basket of six currencies, is down 0.02%, at 101.190. US equities trend lower as investors are eying the latest Senior Loan Officer Survey (SLOOS) revealed by the Fed amidst the ongoing US banking turmoil.
Although US bank equities have recovered some ground, Wall Street remains under stress, as sentiment took a hit, as the debt limit discussions in the US show no sign of improvement. The US Treasury Secretary, Janet Yellen, commented that there are no “good options” for solving the debt ceiling in Washington without the US Congress’s help.
Data-wise, the US economic agenda revealed that Wholesale Inventories were unchanged in March, below estimates of 0.1% MoM, the US Department of Commerce revealed. Annually based, inventories jumped 9.1% in March, despite the first quarter decline, as more robust US consumer spending contributed to the inventory rundown.
USD/CHF Technical Analysis
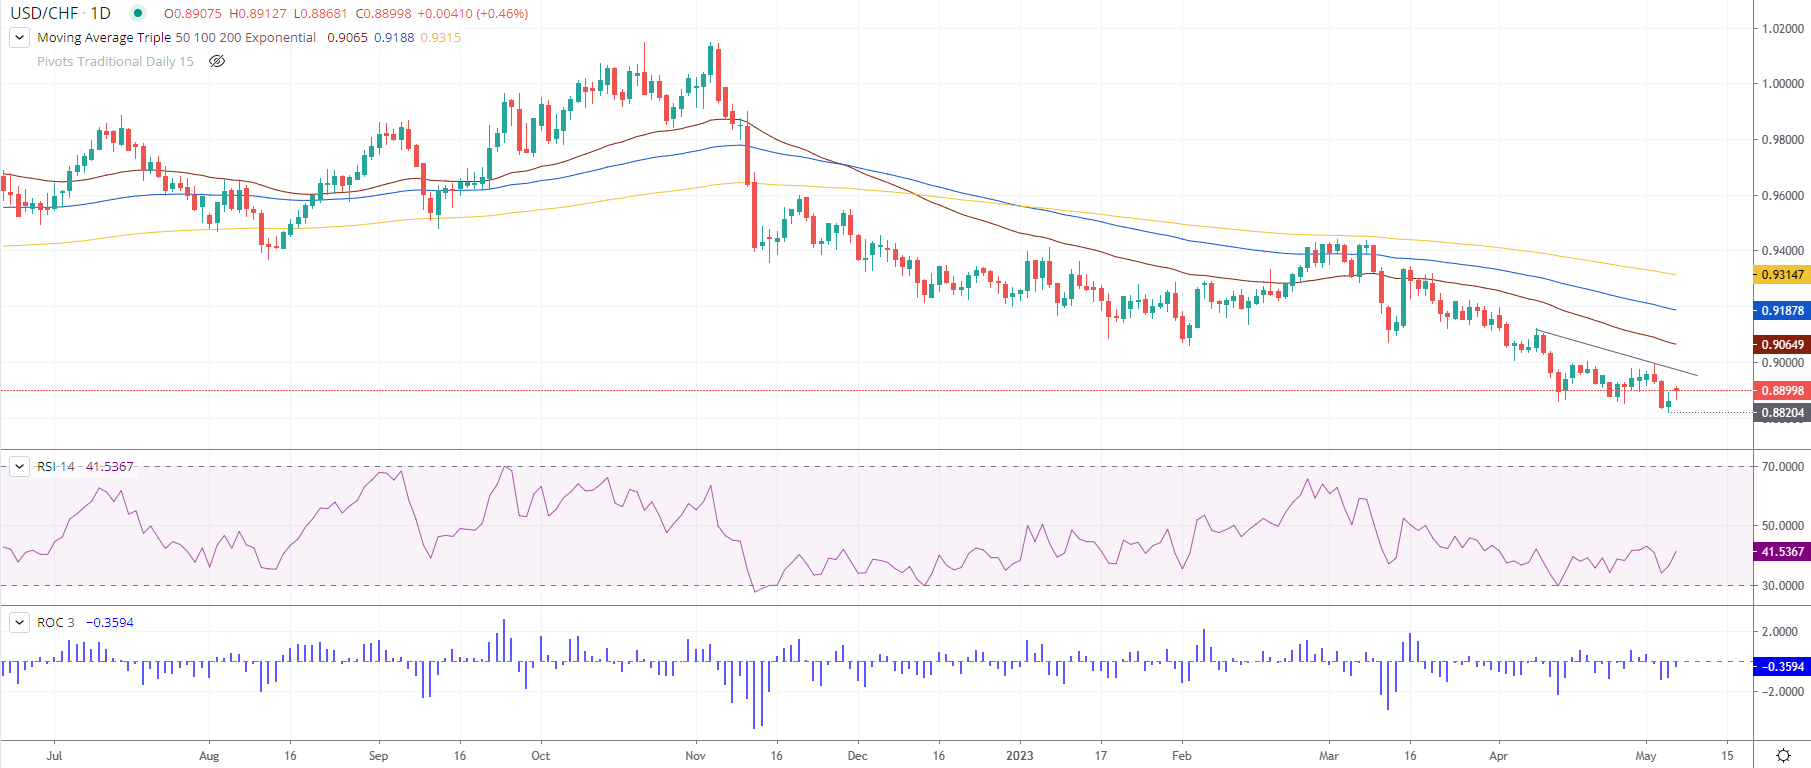
From a daily chart perspective, the USD/CHF is still downward biased, though trading above the year-to-date (YTD) lows of 0.8820. However, as price action continues to a downtrend, the Relative Strength Index (RSI) indicator registers higher troughs, meaning a positive divergence is surfacing. Therefore, that could open the door for further upside, but RSI needs to crack above the 50-midline. Downside risks in the USD/CHF lie at 0.8820, followed by 0.8800. Conversely, if USD/CHF reclaims 0.8900, further gains are warranted, though a downslope resistance trendline emerges at 0.8970, before climbing above 0.9000.
GBP/USD resumed trading above 1.26. Economists at Société Générale expect Cable to remain elevated on a hawkish Bank of England (BoE) this week.
A three-way split with some members renewing their call for 50 bps is not ruled out
“A hawkish 25 bps rate increase this week by the BoE could keep Sterling support and defy bearish seasonal trends.”
“A three-way split with some members renewing their call for 50 bps is not ruled out after above forecast wage and inflation data last month.”
“We forecast +25 bps to 4.50% and will review their call for the terminal rate of 4.50% after the meeting.”
Economists at Natixis analyze the impacts of the lack of a fall in the oil price on inflation.
What slowdown in disinflation due to OPEC's new behaviour?
“OPEC countries have reduced their oil production in 2023 to stabilise the price. We estimate that the reduction in OPEC's oil production is 5 million barrels per day in 2023, compared with OPEC’s past behaviour, which was much less responsive to falling oil prices.”
“According to our estimates, this reduction in OPEC production leads to an increase in the oil price of 30 dollars per barrel, i.e. a 54% increase in the oil price. And lastly, the additional headline inflation generated by this rise in the oil price in 2023 can be estimated at: 0.81 percentage points in the US; 0.70 percentage points in the Eurozone.”
While speaking at a conference organizes by Forum New Economy, European Central Bank chief economist Philip Lane said that there was "a lot of disinflation" coming later this year but added that there was still "a lot of momentum" in inflation.
Lane further noted that growth in food and core prices were especially strong.
Market reaction
These comments failed to help the Euro gain traction in the American session on Monday. As of writing, EUR/USD pair was trading virtually flat on the day slightly above 1.1000.
The Dollar remains soft as the new week begins. Economists at Société Générale expect the US Dollar Index (DXY) to suffer significant losses on a breka under the 100.80/00 support.
102.40/102.80 must be overcome to affirm a larger up move
“The DXY is close to support zone of 100.80/100.00 representing graphical levels consisting of February low and 2015 high. Despite defending this support, a meaningful rebound has not yet materialized.”
“The 50-DMA and a multi month descending trend line at 102.40/102.80 is a short-term hurdle. This must be overcome to affirm a larger up move.”
“In the event the index establishes itself below 100.00, the downtrend could extend towards 98.90, the 61.8% retracement of 2021/2022 rise.”
Economists at Nordea continue to see further hikes at least from the ECB, and think financial markets are pricing in too many rate cuts ahead.
Premature peak predictions
“Earlier tightening measures are having a clear impact on financing conditions, banking worries in the US continue, but at the same time, inflation numbers remain way too high. There are clearly risks both ways, but we think at least the ECB will hike rates several times further, and do not see rates falling as rapidly as being priced in by financial markets.”
“Lagarde was clear that the ECB is not pausing, and we look for two further 25 bps rate hikes, in June and July, bringing the deposit rate to 3.75%.”
- Crude oil prices adds to Friday’s bounce past $73.00.
- Mitigated recession concerns helps the commodity’s upside.
- Focus now shifts to the release of inflation figures on May 10.
Prices of the barrel of the WTI extends the ongoing recovery north of the $73.00 mark on Monday, or 4-day highs.
WTI stronger post-NFP
The buying interest in the commodity gathers extra impulse and underpins the recovery sparked in the second half of last week in response to now dwindling bets of a potential slowdown in the economy.
Indeed, this view now appears reinforced by better-than-expected US Payrolls for the month of April (+230K), showing the persistent resilience of the labour market despite some signs of cooling in past weeks.
The rebound in prices of the WTI also follows technical conditions after the WTI flirted with the oversold territory a couple of days ago.
Later in the week, the focus of attention will be on the release of US inflation figures tracked by the CPI (May 10), as well as weekly reports on crude oil inventories by the API (Tuesday) and the EIA (Wednesday).
WTI significant levels
At the moment the barrel of WTI is up 2.22% at $72.86 and faces the next resistance at $76.92 (high April 28) followed by $79.14 (weekly high April 24) and finally $81.16 (200-day SMA). On the other hand, the breach of $63.97 (monthly low May 3) would open the door to $64.41 (2023 low March 20) and then $61.76 (monthly low August 23 2021).
- AUD/USD scales higher for the sixth straight day and climbs to its highest level since February 24.
- The RBA’s hawkish bias continues to underpin the Aussie and remains supportive amid a weaker USD.
- A sustained move beyond the 100-day SMA should set the stage for a further appreciating move.
The AUD/USD pair gains strong follow-through traction for the sixth successive day on Monday and prolongs the momentum through the early North American session. Spot prices reclaim the 0.6800 mark for the first time since February 24, with bulls making a fresh attempt to build on the strength further beyond the 100-day Simple Moving Average (SMA).
The Australian Dollar (AUD) continues to draw support from the Reserve Bank of Australia's (RBA) surprise 25-basis-points interest-rate hike last week and a more hawkish outlook. Adding to this, the RBA's Statement of Monetary Policy (SoMP) released on Friday highlighted that risks for inflation were tilted on the upside and that a further tightening of monetary policy may be required to ensure that inflation returns to target. This, along with a modest US Dollar (USD) weakness, provides an additional boost to the AUD/USD pair and remains supportive of the ongoing positive move.
In fact, the USD Index (DXY), which tracks the Greenback against a basket of currencies, languishes near the monthly low amid growing acceptance that the Federal Reserve (Fed) is approaching the end of its rate-hiking cycles. The Fed Fund futures point to a 90% probability that the US central bank will hold interest rates steady in June. Moreover, the markets have also started pricing in the possibility that the Fed beginning cutting rates in the second half of this year. This, along with worries about a full-blown banking crisis and the US debt ceiling, continues to exert downward pressure on the USD.
Apart from this, the risk-on impulse - as depicted by a generally positive tone around the equity markets - further undermines the safe-haven Greenback and benefits the risk-sensitive Aussie. That said, a goodish intraday pickup in the US Treasury bond yields acts as a tailwind for the USD and could cap gains for the AUD/USD pair in the absence of any relevant economic data from the US. Traders now look to the Australian Retail Sales data and Chinese Trade Balance figures for some impetus during the Asian session on Tuesday, though the focus remains on the US CPI report on Wednesday.
Technical levels to watch
EUR/USD holds above 1.10. But a push to the 1.11 mark might be delayed on strong US inflation data this week, economists at Société Générale report.
Tactical outlook has become more symmetric
“The paltry 0.2% gain so far in May pegs the single currency at the bottom end of G10 ranking. Rate differentials have proved more static for the Euro compared to the Dollar bloc which explains the flat performance of the currency.”
“The tactical outlook has become more symmetric after the oneway traffic since mid March.”
“If we get a hot US CPI outcome this week, then doubts of a Fed pause in June will inevitably intensify and could delay a test of 1.11.”
- Pound Sterling vs US Dollar rises to mid 1.26s as US Dollar weakens and BoE meeting appears on radar.
- The Pound benefits from monetary policy divergence with the US Dollar as elevated inflation suggests more hikes to come in the UK.
- Trend remains bullish suggesting higher highs to come as GBP/USD continues rising.
The Pound Sterling (GBP), the oldest currency in the world, rises versus the US Dollar (USD) on Monday, as the island nation has crowned a new head for its notes and coins in King Charles III.
The Pound Sterling is benefitting from a perceived monetary policy divergence with the US Dollar. Interest rates in the US may have peaked unlike in the UK where persistently high inflation coupled with robust data continues to suggest the Bank of England (BoE) will need to do more to get inflation under control. Since global investors are always looking to park their money where it can earn the highest return, this favors GBP.
From a technical perspective, GBP/USD continues to make new highs in a broadly bullish long-term uptrend. Given the old adage that “the trend is your friend” this advantages long over short holders.
GBP/USD market movers
- The Pound Sterling is profiting from outflows from the US Dollar as the US Federal Reserve (Fed) is seen as having probably reached peak interest rates in the current hiking cycle, whereas strong inflationary tendencies in the UK suggest higher rates to come, including 25 bps at the Bank of England (BoE) meeting on Thursday.
- With data continuing to show UK inflation above 10% for the seventh consecutive month and robust PMI data, as well as a recent uptick in house prices, inflationary forces in the UK do not look like they are about to ebb away.
- Next Thursday’s Bank of England (BoE) monetary policy meeting may reveal the BoE’s intent regarding future policy trajectory and could cause volatility in Pound Sterling pairs. If the BoE is particularly hawkish it will highlight this divergence with the Fed and result in increased flows to Pound Sterling.
- The poor performance of the Conservative government in local elections suggests a high chance the party will lose the next general election. The Pound Sterling declined to historic lows under the stewardship of the previous Prime Minister Lizz Truss and her Chancellor Kwazi Kwarteng, which caused a loss of faith in the Conservative party as a safe pair of hands when it comes to the economy.
- UK S&P Global Services PMI out on Thursday showed a higher-than-expected result of 55.9 versus the 54.9 no-change forecast. Construction PMI out on Friday also beat expectations, coming out at 51.1 versus the 50.7 of the previous month. This suggests continued inflationary pressures.
- The US Dollar continues to suffer from banking crisis fears in the US after the shares of two more regional banks, PacWest and Western Alliance, fell 50% and 40% respectively last week, on fears they were next to topple.
- The US Dollar, nevertheless, gained a short-lived boost after the release of Nonfarm Payrolls on Friday which showed a higher-than-expected rise of 253K versus 179K forecast. Above-forecast gains in Average Hourly Earnings of 4.4% and a fall in the Unemployment Rate to 3.4% further supported the Greenback.
- The release of US Consumer Price Index (CPI) data for April on Wednesday, May 10, at 12:30 GMT, will provide further data for the Federal Reserve to base future policy decisions. Currently expectations are for CPI to gain by 0.4% MoM and 5% YoY. Core CPI is forecast to rise by 0.4% MoM and 5.5% YoY, and is the metric that has the greater impact because it takes out volatile food and fuel components from the calculation.
- The Release of the Fed’s bank Loan Officer Survey for Q1 on Monday at 18:00 GMT could move the US Dollar as it will shine a light on credit conditions in the US banking sector. If a substantial shrinking of credit is observed then it could have a negative impact on the US Dollar (GBP/USD positive).
GBP/USD technical analysis: Uptrend extends
GBP/USD continues making new highs, most to 1.2668, extending the established uptrend that began at the September 2022 lows. The overall trend remains bullish, favoring Pound Sterling longs over shorts.
-638191505039867321.png)
GBP/USD: Daily Chart
The recent decisive break above the 1.2593 April 28 highs opens the door to further gains to come. The GBP/USD completed three consecutive bullish green days in a row when it broke through the April resistance highs, indicating a higher chance price will hold above the level and continue rising higher.
To the upside, key resistance levels lie close to the current market level at the May 2022 highs at 1.2665, then at the 100-week Simple Moving Average (SMA) situated at 1.2713, and finally at the 61.8% Fibonacci retracement of the 2021-22 bear market, at 1.2758. All provide potential upside targets for the pair. Each level will need to be decisively breached to open the door to further upside.
A decisive break is characterized by either a strong green daily bar that breaks above the key resistance level in question, and closes near the day’s highs. Or alternatively, three consecutive green bars that break above the resistance level. Such insignia provide confirmation that the break is not a ‘false break’ or bull trap.
The Relative Strength Index (RSI) remains below the overbought level at 70 but is creeping higher in line with price, reaching the upper 60s at the time of writing. Monday’s new higher highs in price were accompanied by similar higher highs in RSI indicating there is no bearish divergence. This is a mildly supportive sign for GBP/USD and may be indicative of further gains to come.
Pound Sterling FAQs
What is the Pound Sterling?
The Pound Sterling (GBP) is the oldest currency in the world (886 AD) and the official currency of the United Kingdom. It is the fourth most traded unit for foreign exchange (FX) in the world, accounting for 12% of all transactions, averaging $630 billion a day, according to 2022 data.
Its key trading pairs are GBP/USD, aka ‘Cable’, which < href="https://fxssi.com/the-most-traded-currency-pairs">accounts for 11% of FX, GBP/JPY, or the ‘Dragon’ as it is known by traders (3%), and EUR/GBP (2%). The Pound Sterling is issued by the Bank of England (BoE).
How do the decisions of the Bank of England impact on the Pound Sterling?
The single most important factor influencing the value of the Pound Sterling is monetary policy decided by the Bank of England. The BoE bases its decisions on whether it has achieved its primary goal of “price stability” – a steady inflation rate of around 2%. Its primary tool for achieving this is the adjustment of interest rates.
When inflation is too high, the BoE will try to rein it in by raising interest rates, making it more expensive for people and businesses to access credit. This is generally positive for GBP, as higher interest rates make the UK a more attractive place for global investors to park their money.
When inflation falls too low it is a sign economic growth is slowing. In this scenario, the BoE will consider lowering interest rates to cheapen credit so businesses will borrow more to invest in growth-generating projects.
How does economic data influence the value of the Pound?
Data releases gauge the health of the economy and can impact the value of the Pound Sterling. Indicators such as GDP, Manufacturing and Services PMIs, and employment can all influence the direction of the GBP.
A strong economy is good for Sterling. Not only does it attract more foreign investment but it may encourage the BoE to put up interest rates, which will directly strengthen GBP. Otherwise, if economic data is weak, the Pound Sterling is likely to fall.
How does the Trade Balance impact the Pound?
Another significant data release for the Pound Sterling is the Trade Balance. This indicator measures the difference between what a country earns from its exports and what it spends on imports over a given period.
If a country produces highly sought-after exports, its currency will benefit purely from the extra demand created from foreign buyers seeking to purchase these goods. Therefore, a positive net Trade Balance strengthens a currency and vice versa for a negative balance.
Equity markets have benefited in the past from the Federal Reserve’s pauses on interest rate hikes. But given current conditions, history may not repeat itself, economists at Morgan Stanley report.
Fed may now be done with its rate hikes
“Morgan Stanley's economist forecasts the Fed won't make additional rate hikes or cuts for the rest of this year. In market parlance, the Fed will now pause.”
“In 1985, 1995, 1997, 2006 and 2018, buying stocks once the Fed was done raising rates resulted in good returns over the following 6 to 12 months. And this result does make some intuitive sense. If the Fed is no longer increasing rates and actively tightening policy, isn't that one less challenge for the stock market? current data suggest higher inflation and a sharper slowdown than past instances where the last Fed hike was a good time to buy. And for these reasons, we worry about lumping current conditions in with those prior examples.”
- NZD/USD gains strong traction for the fourth straight day and climbs to over a one-month high.
- The technical setup favours bullish traders bulls and supports prospects for additional gains.
- Any meaningful dip towards the descending trend-line breakout is likely to get bought into.
The NZD/USD pair prolongs its recent upward trajectory witnessed over the past two weeks or so and continues scaling higher for the fifth successive day on Monday. This also marks the seventh day of a positive move in the previous eight and lifts spot prices to over a one-month high, around the 0.6350 region heading into the North American session.
The US Dollar (USD) languishes near the monthly low touched last week amid firming expectations that the Federal Reserve (Fed) is nearing the end of its year-long rate-hiking cycles. This, along with concerns about the US debt ceiling and the risk-on impulse, further undermines the safe-haven Greenback and provides an additional lift to the risk-sensitive Kiwi.
From a technical perspective, the momentum allows the NZD/USD pair to break through a short-term descending trend-line hurdle extending from the YTD peak touched in February. Given that oscillators on the daily chart holding comfortably in the bullish territory and are still far from being in the overbought zone, the set-up supports prospects for additional gains.
Hence, a subsequent move towards retesting the April monthly swing low, around the 0.6380 region, en route to the 0.6400 mark, looks like a distinct possibility. Some follow-through buying has the potential to lift the NZD/USD pair towards the next relevant hurdle near the 0.6435-0.6440 region, above which bulls might aim to reclaim the 0.6500 psychological mark.
On the flip side, the descending trend-line resistance breakpoint, currently pegged just below the 0.6300 round-figure mark, now seems to protect the immediate downside. Any further decline is more likely to attract fresh buyers and remains limited near the 200-day Simple Moving Average (SMA), around the 0.6255 zone, which should act as a strong base for the NZD/USD pair.
NZD/USD daily chart
-638191492722609390.png)
Key levels to watch
The Pound remains the top performing G10 currency in 2023, and the second best performing in Q2 to date. Economists at MUFG Bank do not expect the Bank of England meeting to weigh on the GBP.
EUR/GBP may be set to break lower
“The UK economy continues to show resilience and the improved terms of trade due to energy prices is a key positive dynamic for the pound. Huw Pill has spoken about a ‘positive demand shock’.”
“We do not expect the BoE to disrupt the current positive Pound performance.”
“EUR/GBP may be set to break lower.”
Senior Economist at UOB Group Alvin Liew reviews the last FOMC gathering (May 3).
Key Takeaways
“The Federal Reserve (Fed) in its 2/3 May 2023 Federal Open Market Committee (FOMC) meeting, unanimously agreed to raise its Fed Funds Target Rate (FFTR) by 25-bps to 5.00%-5.25%, the same pace of hikes as Feb and Mar FOMC. This is the highest level of FFTR since Sep 2007.”
“The Fed made a significant change in the forward guidance in the monetary policy statement (MPS), as it removed a key part of the FOMC statement, “the Committee anticipates that some additional policy firming may be appropriate in order to attain a stance of monetary policy that is sufficiently restrictive to return inflation to 2 percent over time” (from the Mar FOMC) and replaced it with “In determining the extent to which additional policy firming may be appropriate to return inflation to 2 percent over time, the Committee will take into account the cumulative tightening of monetary policy, the lags with which monetary policy affects economic activity and inflation, and economic and financial developments.”
“The change in language certainly opened the possibility of a pause while Powell’s post-FOMC comments cut both ways, as he called the change in the language in the FOMC statement “meaningful” but he also emphasized the Fed will be driven by incoming data and how events unfold, and it will be on a “meeting by meeting” basis to determine extent of further rate hikes. Powell continued to push back against expectations for rate cuts in 2023.”
“FOMC Outlook – Done At 5.25% And Pause For Rest Of 2023. Given what has transpired (or not) in the May FOMC, our base case remains valid. We still expect the 25-bps hike in the May FOMC to be the last one in the current Fed rate cycle and a pause thereafter. We continue to expect no rate cuts in 2023, with the FFTR terminal rate at 5.25% to last through this year.”
- USD/CAD remains under heavy selling pressure for the fourth successive day on Monday.
- A further recovery in Oil prices underpins the Loonie and drags the pair to a multi-week low.
- A weaker USD contributes to the fall amid some technical selling below the 200-day SMA.
The USD/CAD pair prolongs its bearish trajectory for the fourth successive day on Monday and dives to over a three-week low, around the 1.3325-1.3320 region heading into the North American session.
Crude Oil prices build on last week's solid rebound from a 17-month low and gain strong follow-through traction for the third straight day amid the optimism over a fuel demand recovery in the wake of easing concerns about an imminent recession. This, along with Friday's upbeat Canadian monthly employment details, underpins the commodity-linked Loonie. Apart from this, a modest US Dollar (USD) weakness contributes to the heavily offered tone surrounding the USD/CAD pair.
In fact, the USD Index (DXY), which tracks the Greenback against a basket of currencies, languishes near the monthly low set last week amid growing acceptance for an imminent pause in the Federal Reserve's (Fed) over a year-long rate-hiking cycle. The Fed Fund futures point to a 90% probability that the US central bank will hold interest rates steady in June. Moreover, the markets have also started pricing in the possibility that the Fed beginning cutting rates in the second half of this year.
This, along with worries about a full-blown banking crisis and the US debt ceiling, keeps the USD bulls on the defensive amid a positive risk tone and exerts additional downward pressure on the USD/CAD pair. That said, a goodish intraday pickup in the US Treasury bond yields helps limit deeper losses for the Greenback as traders now look to the latest US consumer inflation figures for a fresh impetus. This, in turn, could lend some support to the major and warrants some caution for bearish traders.
From a technical perspective, Friday's decisive break and close below the very important 200-day Simple Moving Average (SMA) marked a fresh breakdown. This, in turn, supports prospects for a further near-term depreciating move. Hence, any attempted recovery runs the risk of fizzling out rather quickly and is more likely to remain capped, at least for the time being, in the absence of any relevant market-moving economic releases, either from the US or Canada.
Technical levels to watch
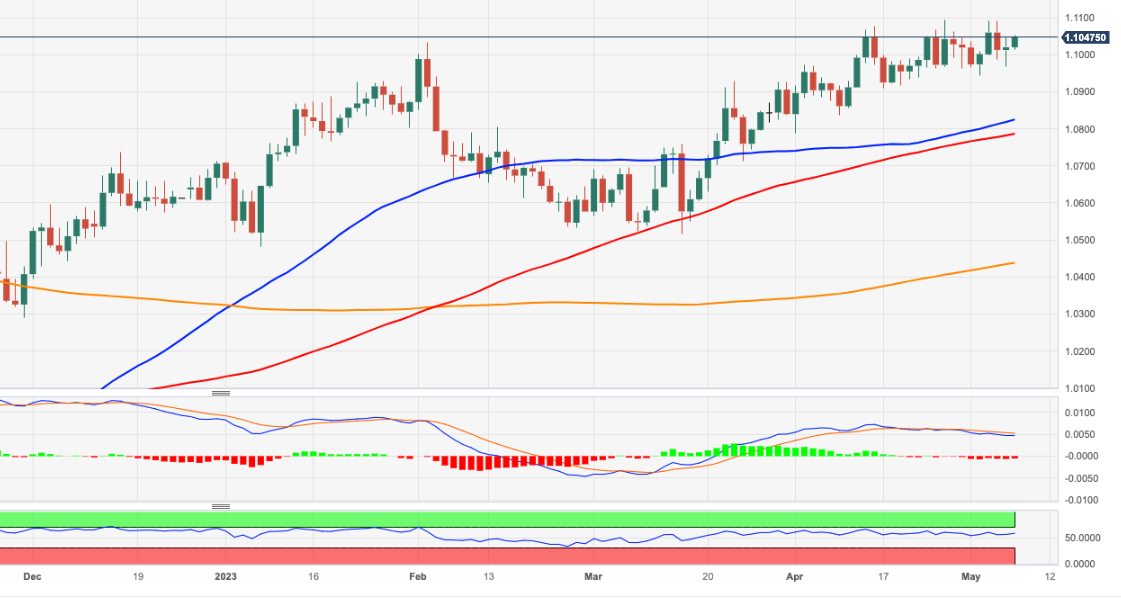
- EUR/USD extends Friday’s upside momentum to 1.1050.
- Further strength could see the YTD high near 1.1100 revisited.
EUR/USD maintains the bid bias well in place and revisits the mid-1.1000s at the beginning of the week.
Further recovery appears on the table for the time being. The surpass of with the 2023 peak at 1.1095 (April 26) should encourage the pair to rapidly leave behind the round level at 1.1100 before embarking on a potential visit to the weekly high at 1.1184 (March 21 2022)
Looking at the longer run, the constructive view remains unchanged while above the 200-day SMA, today at 1.0436.
EUR/USD daily chart
Economists at MUFG Bank expect the EUR/USD pair to enjoy further gains in the coming months.
Room for EUR/USD rebound to extend
“The narrowing policy divergence between the ECB and Fed in the coming months should continue to encourage a further move higher for EUR/USD.”
“The pair is currently in the process of moving into a higher trading range between 1.1000 and 1.1500.”
See:
- EUR/USD to see a mild appreciation toward year-end – Nordea
-
EUR/USD: There is an inflation disadvantage for the Euro – Commerzbank
- DXY starts the week on the defensive near 101.00.
- The breakout of 101.00 could open the door to extra losses.
DXY faces some extra downside pressure and puts the 101.00 support to the test at the beginning of the week.
The weekly low at 101.01 represents the next significant support for the current decline (April 26). Losing this area might pave the way to a deeper decline to the 2023 low at 100.78. (April 14).
Looking at the broader picture, while below the 200-day SMA, today at 105.93, the outlook for the index is expected to remain negative.
DXY daily chart
In the view of Markets Strategist Quek Ser Leang at UOB Group, USD/IDR is now expected to navigate within the 14,550-14,740 range.
Key Quotes
“While we expected USD/IDR to weaken further last week, we were of the view that ‘any decline is likely to be at a slower pace and is unlikely to break the major support at 14,440’. Our view was not wrong as USD/IDR dropped to a low of 14,560 and then rebounded to end the week little changed at 14,670 (+0.03%).”
“The weakness in USD/IDR appears to have stabilized and it is unlikely to weaken further. This week, USD/IDR is more likely to consolidate, expected to be between 14,550 and 14,740.”
Expectations the Fed will pause interest rate hikes supported Gold investor demand. Economists at ANZ Bank expect the yellow metal to remain solid.
Dovish tone from the Fed in the wake of banking fears is supportive
“Renewed concerns about US banking stress, slowing economic growth and rising geopolitical tensions all bode well for Gold investment demand.”
“Increased expectations that the US Fed will start cutting rates is another tailwind.”
“We see investors building long positions in Gold futures and ETFs.”
“Physical market is showing some resilience to higher prices as well.”
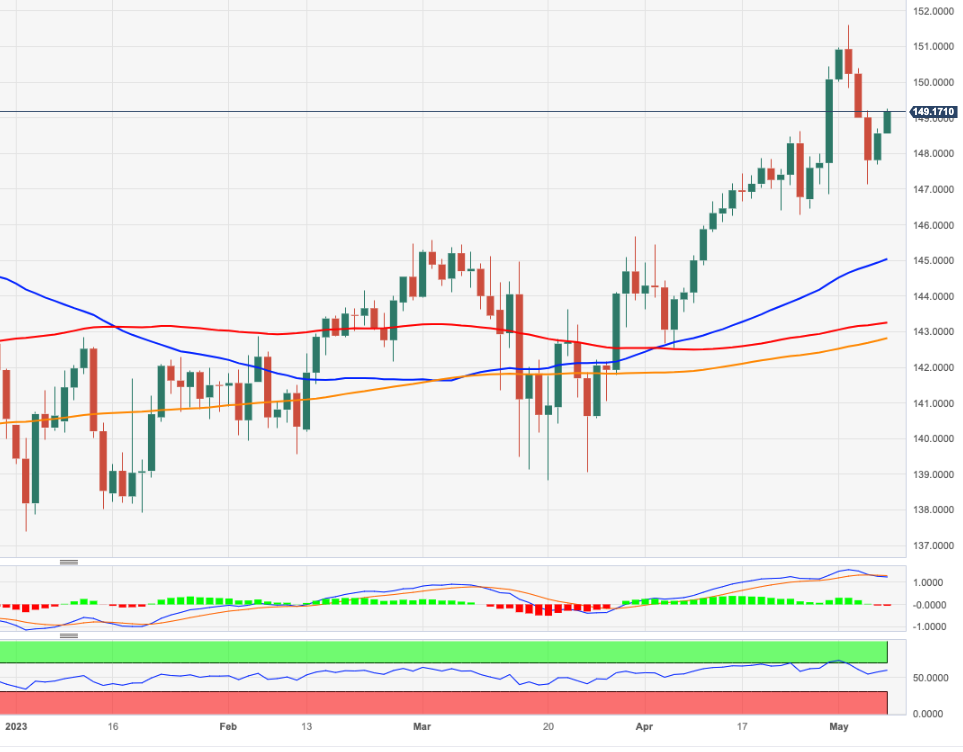
- EUR/JPY adds to Friday’s gains beyond 149.00.
- Extra upside should meet the next target at 150.00.
EUR/JPY extends Friday’s recovery and reclaims the area above 149.00 the figure at the beginning of the week.
The bullish outlook appears now reinvigorated and could propel the cross to revisit the key 150.00 mark in the short-term horizon. Further up, the cross could challenge the 2023 peak at 151.61 (May 2).
So far, further upside looks favoured while the cross trades above the 200-day SMA, today at 142.78.
EUR/JPY daily chart
- GBP/USD scales higher for the fourth straight day and touched a fresh one-year high on Monday.
- Dovish Fed expectations keep the USD depressed and remain supportive of the ongoing move up.
- Investors now look to the US CPI on Wednesday for a fresh impetus ahead of the BoE on Thursday.
The GBP/USD pair gains positive traction for the fourth successive day on Monday and builds on its steady intraday ascent through the mid-European session. The momentum lifts spot prices to the highest level since May 2022, around the 1.2660-1.2665 area in the last hour and is sponsored by a combination of supporting factors.
Despite the better-than-expected release of the US monthly jobs report on Friday, the US Dollar (USD) remains depressed near the monthly low touched last week amid growing acceptance that the Federal Reserve (Fed) is approaching the end of its rate-hiking cycles. Apart from this, expectations that the Bank of England (BoE) will raise interest rates by 25 bps later this week underpin the British Pound and act as a tailwind for the GBP/USD pair.
The Fed Fund futures point to a 90% probability that the US central bank will hold rates in June. Moreover, the markets have been pricing in the possibility that the Fed will cut rates in the second half of this year amid signs that the economy is slowing. This, along with worries about a full-blown banking crisis and the US debt ceiling, leads to a further decline in the US Treasury bond yields and continues to exert some downward pressure on the Greenback.
The upside potential for the GBP/USD pair, however, seems limited, at least for the time being, as traders might prefer to move to the sidelines ahead of the release of the latest US consumer inflation figures on Wednesday. This will be followed by the BoE monetary policy meeting on Thursday and the first quarter UK GDP report on Friday, which will play a key role in influencing the British Pound and help determine the near-term trajectory for the major.
In the meantime, a generally positive tone around the equity markets could undermine the safe-haven Greenback and continue to lend some support to the GBP/USD pair in the absence of any relevant market-moving economic releases on Monday. Apart from this, traders will take cues from the broader risk sentiment to grab short-term opportunities around the major.
Technical levels to watch
Further downside pressure could force USD/MYR to slip back to the 4.4200 region in the near term, notes Markets Strategist Quek Ser Leang at UOB Group.
Key Quotes
“We highlighted last Tuesday (02 May, spot at 4.4590) that USD/MYR ‘could strengthen further but a sustained rise above 4.4850 appears unlikely this week’. However, instead of strengthening, USD/MYR traded sideways until last Friday when it dropped to a low of 4.4330. Downward momentum is improving, albeit not much.”
“This week, USD/MYR is likely to trade with a downward bias towards 4.4200. The next support at 4.0000 is unlikely to come under threat. Resistance is at 4.4450, followed by 4.4600.”
Ulrich Leuchtmann, Head of FX and Commodity Research at Commerzbank, sees good reasons to be cautious with USD longs at the moment.
Anyone looking at USD risk has to weigh the probabilities against the consequences
“It is becoming increasingly clear why the ‘it was always alright in the end’ argument is of little use when it comes to the looming US Treasury debt ceiling.”
“The economists and political analysts who tell us the story of ‘it was always alright in the end’ have a different risk-reward profile to those who have to manage USD risks. If they are wrong either way it has more or less the same effect for them. So from their perspective, it's rational to bet on the scenario with the highest probability. But if that were to go wrong, the potential consequences for the Dollar would be dramatic.”
“Anyone looking at USD risk has to weigh the probabilities against the consequences. And then the risk of default becomes so relevant that it is likely to make many market participants more cautious. This may be one of the reasons why the Dollar has so little potential for strength right now.”
- Gold price edges higher on Monday and draws support from a combination of factors.
- Dovish Federal Reserve expectations weigh on the US Dollar and benefit the XAU/USD.
- Concerns about a full-blown banking crisis and the US debt ceiling further lend support.
- Traders now look to the key US consumer inflation data for a fresh directional impetus.
Gold price regains some positive traction on the first day of a new week and builds on Friday's late bounce from levels just below the $2,000 psychological mark. The XAU/USD sticks to its gains through the first half of the European session and is currently placed near the top end of its daily trading range, around the $2,025 region.
Modest US Dollar weakness lends support to Gold price
The US Dollar (USD) edges lower for the second successive day and remains well within the striking distance of the monthly low touched last week, which, in turn, is seen benefitting Gold price. Despite the mostly upbeat release of the jobs report from the United States (US) on Friday, market participants seem convinced that the Federal Reserve (Fed) is nearing the end of its rate-hiking cycle. In fact, the Fed Fund futures point to a 90% probability that the US central bank will hold rates in June. Moreover, the markets have been pricing in the possibility that the Fed will cut rates in the second half of this year amid signs that the economy is slowing. This, in turn, continues to weigh on the Greenback and lends some support to the US Dollar-denominated commodity.
Sliding US bond yields further drive flows towards XAU/USD
Dovish Fed expectations, along with worries about a full-blown banking crisis and the US debt ceiling, lead to a further decline in the US Treasury bond yields. It is worth recalling that US Treasury Secretary Janet Yellen issued a stark warning on Sunday that a failure by Congress to act on the debt ceiling could trigger a "constitutional crisis". Yellen added that a default would call into question the federal government's creditworthiness and sounded the alarm over possible financial market consequences if the debt ceiling is not raised by early June. This is seen as another factor weighing on the Greenback and offering additional support to the safe-haven Gold price. That said, a generally positive tone around the equity markets might cap gains for the precious metal.
Focus now shifts to US consumer inflation figures on Wednesday
Traders also seem reluctant to place aggressive bets and prefer to wait for the latest US consumer inflation figures, due on Wednesday. The crucial US Consumer Price Index (CPI) report will play a key role in driving market expectations about the Fed's next policy move, which, in turn, will influence the USD demand and help determine the near-term trajectory for Gold price. In the meantime, the USD remains at the mercy of the US bond yields in the absence of any relevant market-moving economic data from the US. Apart from this, the broader risk sentiment will be looked upon to grab short-term trading opportunities around the XAU/USD.
Gold price technical outlook
From a technical perspective, any subsequent move up is likely to confront some resistance near the $2,040 region ahead of the $2,050 supply zone. Some follow-through buying has the potential to lift Gold price back towards the all-time high, around the $2,078-$2,079 region touched last Thursday. The momentum could get extended further and allow bulls to conquer the $2,100 round-figure mark.
On the flip side, the daily swing low, around the $2,015 area, might now protect the immediate downside. This is followed by the $2,000 psychological mark. A convincing break below the latter might prompt some technical selling and make the Gold price vulnerable to accelerate the fall towards the $1,980 zone en route to the $1,970 strong horizontal support. Some follow-through selling will negate any near-term positive outlook and shift the bias in favour of bearish traders.
Key levels to watch
- US Dollar stays under modest bearish pressure at the beginning of the week.
- US Dollar Index registered losses last week despite upbeat April jobs report.
- The Fed's Loan Office Survey could impact USD's performance on Monday.
The US Dollar (USD) struggles to find demand on Monday and the US Dollar Index (USD) stays within a touching distance of the multi-month low it set below 101.00 on April 14. Investors will pay close attention to the US Federal Reserve's (Fed) Senior Loan Officer Opinion Survey, which could shed a light on the impact of tight monetary policy on financing conditions, for the first quarter later in the day. This publication could drive the USD's performance against its rivals in the late American session.
The Fed's dovish language in the policy statement in the face of banking woes caused the USD to weaken in the second half of the week. Ahead of the weekend, financial shares registered decisive recovery gains and the USD found it difficult to hold its ground amid improving risk mood.
Daily digest market movers: US Dollar fails to benefit from upbeat jobs report
- The US Bureau of Labor Statistics (BLS) reported on Friday that Nonfarm Payrolls rose by 253,000 in April, surpassing the market expectation of 179,000 by a wide margin. On a negative note, March's 236,000 increase got revised lower to 165,000.
- The Unemployment Rate ticked down to 3.4% in April and the annual wage inflation, as measured by the Average Hourly Earnings, edged higher to 4.4% from 4.3%.
- Assessing the labor market data, “since spring 2022, labor supply has increased, but labor demand has not. There are no job vacancy statistics for April," said Ulrich Leuchtmann, Head of FX and Commodity at Commerzbank. "However, there is no reason to believe that the high number of new hires is anything other than a continuation of this trend: that vacancies are being filled. However, this would not argue for increased monetary policy pressure and thus for higher USD carry and a stronger Dollar."
- The financial-heavy Dow Jones Industrial Average gained 1.65% on Friday and the Nasdaq Composite rose nearly 2%.
- The US economic docket will feature Wholesale Inventories data for March.
- Market participants will also keep a close eye on comments from Fed officials.
- The benchmark 10-year US Treasury bond yield holds steady above 3.4% following Friday's rebound.
- US stock index futures trade mixed during the European trading hours on Monday.
- The CME Group FedWatch Tool shows that markets are pricing in a more than 90% probability of the Fed leaving its policy rate unhanged at the next policy meeting.
- The BLS will release the Consumer Price Index (CPI) data for April on Wednesday.
Technical analysis: US Dollar Index shows no signs of a recovery
The US Dollar Index (DXY) remains technical bearish in the near term with the Relative Strength Index (RSI) indicator on the daily chart staying below 50. Additionally, the DXY ended the week below the 20-day Simple Moving Average (SMA) despite having climbed above that level on Friday.
On the downside, 101.00 (static level, psychological level) aligns as first support ahead of 100.00 (psychological level, static level) and 99.50 (static level from March 2022).
The 20-day SMA forms dynamic resistance at 101.60 ahead of 102.00 (psychological level) and 102.70 (50-day SMA).
How does Fed’s policy impact US Dollar?
The US Federal Reserve (Fed) has two mandates: maximum employment and price stability. The Fed uses interest rates as the primary tool to reach its goals but has to find the right balance. If the Fed is concerned about inflation, it tightens its policy by raising the interest rate to increase the cost of borrowing and encourage saving. In that scenario, the US Dollar (USD) is likely to gain value due to decreasing money supply. On the other hand, the Fed could decide to loosen its policy via rate cuts if it’s concerned about a rising unemployment rate due to a slowdown in economic activity. Lower interest rates are likely to lead to a growth in investment and allow companies to hire more people. In that case, the USD is expected to lose value.
The Fed also uses quantitative tightening (QT) or quantitative easing (QE) to adjust the size of its balance sheet and steer the economy in the desired direction. QE refers to the Fed buying assets, such as government bonds, in the open market to spur growth and QT is exactly the opposite. QE is widely seen as a USD-negative central bank policy action and vice versa.
Economists at Nordea still hold their view for a higher EUR/USD towards year-end.
EUR/USD continues to seek higher level
“The Fed is at or near a pause of its rate hikes while the ECB needs to do more, pointing towards a higher EUR/USD. However, it is far from certain that we will get a markedly higher EUR/USD given the fact that markets price in rate cuts from the Fed after the summer. If markets get disappointed, USD negative bets could be reduced. We, therefore, see a movement about sideways in EUR/USD next year.”
“The wild card for the USD remains the higher than usual likelihood of a global recession over the next couple of years, which could be in favour of the USD.”
Markets Strategist Quek Ser Leang at UOB Group suggests further losses are likely in USD/THB as long as the 34.23 level caps the upside.
Key Quotes
“We did not expect the sharp drop in USD/THB to a low of 33.66 last week (we were expecting USD/THB to trade in a range of 34.05/34.50). There is room for USD/THB to decline further, oversold short-term conditions could lead to a couple of days of consolidation first.”
“The support level to watch is 33.54. In order to keep the current momentum going, USD/THB must stay below 34.23.”
- EUR/GBP struggles to capitalize on its modest intraday recovery from a fresh YTD low.
- The disappointing Eurozone data acts as a headwind for the Euro and caps the cross.
- Hawkish BoE expectations continue to underpin the GBP and warrant caution for bulls.
The EUR/GBP cross stages an intraday recovery from a fresh YTD low touched earlier this Monday, albeit struggles to capitalize on the move and attracts fresh sellers ahead of the mid-0.8700s. The cross retreats a few pips from the daily peak and is currently placed around a technically significant 200-day Simple Moving Average (SMA), around the 0.8725 region.
The shared currency's relative outperformance comes on the back of the overnight hawkish remarks by the European Central Bank's (ECB) governing council member and turns out to be a key factor acting as a tailwind for the EUR/GBP cross. In fact, Dutch Central Bank President Klaas Knot said on Sunday that the ECB interest rate hikes are starting to have an effect, but more will be needed to contain inflation. Knot added that he still could support the lifting of rates to 5% from the current 3.25%, or even higher if inflation proves more persistent than he expects.
The intraday uptick, however, runs out of steam following the disappointing release of the Eurozone Sentix Investor Confidence index, which deteriorates more than expected to -13.1 in May from -8.7 booked the previous month. Moreover, the Current Situation Index fell to -9.0 from -2.3 in April, while the Expectations Index dropped to -19.0 in May, or its lowest level since December 2022. The data revived recession worries and caps the upside for the Euro. Apart from this, the underlying bullish sentiment surrounding the British Pound caps gains for the EUR/GBP cross.
Firming expectations that the Bank of England (BoE) will raise interest rates by 25 bps later this week on Thursday, along with a modest US Dollar (USD) weakness, continue to boost demand for the Sterling Pound. This, in turn, makes it prudent to wait for strong follow-through buying before confirming that the EUR/GBP cross has formed a near-term bottom and positioning for any meaningful recovery ahead of the key central bank event risk. Nevertheless, spot prices, for now, seem to have snapped a three-day losing streak, though the setup warrants caution for bulls.
Technical levels to watch
Sterling has been out of the market’s focus over recent months. Economists at ING analyze how the GBP could react to the Bank of England meeting.
GBP/USD can hold above these 1.25 levels
“Regarding the event risk of the BoE meeting, the key issue will be there is a sharp correction in the pricing of further BoE tightening later this year. On balance, we doubt the pushback will be there (yet), suggesting that Sterling does not have to fall too far, if at all.”
“With downside risks to the Dollar still present, it looks like GBP/USD can hold above these 1.25 levels and perhaps push onto the 1.2650/2750 area. Given what should be a building Dollar bear trend this year, we suspect any intra-day sell-off on any remarks being read as a ‘pause’ would be limited to the 1.2350/2450 area.”
“Our baseline assumes GBP/USD ends the year near 1.28/30, and EUR/GBP gravitates back to the 0.89 area as the ECB out-hikes the BoE.”
USD gains immediately after stronger-than-expected jobs data were not sustained. This week all about US CPI and NZ inflation expectations, economists at ANZ Bank report.
2023 remains about getting the USD right
“This week is a quieter one on the data and event front compared to last week, but we do get US CPI and NZ inflation expectations, both of which are key. But the US bond market is of the view that the Fed is done; if that continues to weigh on the USD, the Kiwi may appreciate despite it looking quite average from a purely domestic perspective. 2023 remains about getting the USD right.”
“Support 0.5750/0.5900/0.6085 Resistance 0.6365/0.6540”
- USD/JPY gains positive traction for the second straight day, albeit lacks bullish conviction.
- A combination of factors undermines the safe-haven JPY and acts as a tailwind for the pair.
- Dovish Fed expectations weigh on the USD and keep a lid on any further appreciating move.
The USD/JPY pair builds on Friday's positive move and gains some follow-through traction on the first day of a new week, albeit lacks follow-through buying. Spot prices retreat a few pips from a three-day top and trade around the 135.00 psychological mark during the early part of the European session.
The minutes of the last Bank of Japan (BoJ) policy meeting held on March 9-10 showed that members supported the continuation of policy easing in order to achieve steady inflation. Apart from this, a generally positive risk tone undermines the safe-haven Japanese Yen (JPY) and acts as a tailwind for the USD/JPY pair. Some BoJ policymakers, meanwhile, saw positive signs towards achieving the price target and said that the central bank must be vigilant to the risk of inflation accelerating more than expected. This, along with a modest US Dollar (USD) keeps a lid on any meaningful upside for the major, at least for the time being.
In fact, the USD Index (DXY), which tracks the Greenback against a basket of currencies, languishes near the monthly low amid growing acceptance that the Federal Reserve (Fed) is approaching the end of its rate-hiking cycles. Moreover, the markets have been pricing in the possibility that the Fed will cut interest rates during the second half of this year amid signs that the economy is slowing. This, along with concerns about the US banking sector and the debt ceiling, drags the US Treasury bond yields lower and weighs on the buck, which, in turn, acts as a headwind for the USD/JPY pair and warrants caution for bulls.
There isn't any relevant market-moving economic data due for release from the US on Monday, leaving the USD at the mercy of the US bond yields. Apart from this, the broader risk sentiment might allow traders to grab short-term opportunities around the USD/JPY pair. The focus, however, will remain glued to the latest US consumer inflation figures, due on Wednesday. The crucial US CPI report will play a key role in influencing the Fed's future interest rate decisions, which should help drive the USD demand in the near term and help investors to determine the next leg of a directional move for the major.
Technical levels to watch
The Eurozone Sentix Investor Confidence index deteriorates to -13.1 in May from -8.7 booked in in April vs. -9.2 expected.
The Index on the Current Situation dipped to -9.0 from -2.3 in April, bringing back talk about a recession.
The Index on Expectations in particular took a fall, decreasing to -19.0 in May from -13.0 in April, its lowest level since December 2022.
Key takeaways
"The economic recovery, which is built on feet of clay, is thus beginning to falter,"
The Index on Expectations tumbled, "wiping out all hopes of an economic revival following the outbreak of the Ukraine war.”
EUR/USD reaction
The shared currency is unfazed by the downbeat Eurozone Sentix data. EUR/USD is trading at 1.1048, up 0.29% on the day.
The Japanese Yen is still set to strengthen further despite recent setbacks, in the view of economists at MUFG Bank.
USD/JPY remains significantly overvalued
“We continue to believe that the external backdrop is supportive for a lower USD/JPY which remains significantly overvalued.”
“The ongoing loss of confidence in US regional banks over the past week and the looming US debt ceiling debt deadline which the US Treasury says could be hit in early June should continue to place downward pressure on USD/JPY in the near-term.”
“The main upside risks in the week ahead for USD/JPY are posed by the release of the US CPI report for April if it shows more persistent inflation pressures although we expect the US rate market to remain reluctant to price in more hikes at current juncture.”
- EUR/USD adds to Friday’s gains well north of 1.1000.
- Industrial Production in Germany contracts more than expected.
- Fed-ECB policy divergence takes centre stage.
EUR/USD extends the rebound for the second session in a row and revisits 2-day highs in the 1.1050 region on Monday.
EUR/USD shifts the attention back to 1.1100
EUR/USD surpasses the 1.1000 barrier with certain conviction amidst the continuation of the selling mood in the greenback, as investors keep digesting April’s Nonfarm Payrolls published on Friday.
In the meantime, hawkish ECB-speak should keep further tightening in the next couple of meetings on the table, while speculation of a most likely pause at the Fed’s hiking cycle in June is seen keeping the Buck under pressure for the time being.
In the euro docket, Industrial Production in Germany contracted at a monthly 3.4% in March, while Wholesale Inventories is only due across the ocean.
What to look for around EUR
EUR/USD’s recovery picks up extra pace and seems to have now re-shifted its attention to the 1.1100 region.
The movement of the euro's value is expected to closely mirror the behaviour of the US Dollar and will likely be impacted by any differences in approach between the Fed and the ECB with regards to their plans for adjusting interest rates.
Moving forward, hawkish ECB-speak continue to favour further rate hikes, although this view appears in contrast to some loss of momentum in economic fundamentals in the region.
Key events in the euro area this week: Germany Industrial Production (Monday) – Germany Final Inflation Rate (Wednesday).
Eminent issues on the back boiler: Continuation (or not) of the ECB hiking cycle. Impact of the Russia-Ukraine war on the growth prospects and inflation outlook in the region. Risks of inflation becoming entrenched.
EUR/USD levels to watch
So far, the pair is up 0.30% at 1.1050 and the surpass of 1.1095 (2023 high April 26) would target 1.1100 (round level) en route to 1.1184 (weekly high March 21 2022). In opposition, the next support is seen at 1.0941 (monthly low May 2) followed by 1.0909 (weekly low April 17) and finally 1.0831 (monthly low April 10).
- NZD/USD gains traction for the fifth straight day and climbs to over a one-month high.
- The prevalent USD selling bias, along with a positive risk tone, continues to lend support.
- The fundamental backdrop favour of bullish traders ahead of the US CPI on Wednesday.
The NZD/USD pair scales higher for the fifth successive day, also marking the seventh day of a positive move in the previous eight and jumps to over a one-month high on Monday. The pair maintains its bid tone through the early European session and is currently placed around the 0.6325-0.6330 region, up over 0.75% for the day.
The US Dollar (USD) kicks off the new week on a weaker note and remains well within the striking distance of the monthly low touched last Thursday, which, in turn, is seen acting as a tailwind for the NZD/USD pair. Growing acceptance that the Federal Reserve (Fed) is approaching the end of its rate-hiking cycles overshadows the better-than-expected release of the US monthly employment details on Friday. This, along with concerns about the US banking sector and the debt ceiling, keeps the US Treasury bond yields depressed and continues to weigh on the Greenback.
Apart from this, a generally positive tone around the equity markets further undermines the safe-haven buck and benefits the risk-sensitive Kiwi. The New Zealand Dollar (NZD) draw additional support from the upbeat domestic jobs data released last week, which backs the case for further interest rate hikes by the Reserve Bank of New Zealand (RBNZ). Adding to this, hawkish remarks by RBNZ Deputy Governor Christian Hawkesby, saying that the underlying economy has strength and New Zealand banks are well-positioned to support customers, lend support to the NZD/USD pair.
The ongoing strong move up could also be attributed to some technical buying following last week's sustained breakout through the very important 200-day Simple Moving Average (SMA). This, along with the fact that oscillators on the daily chat are still far from being in the overbought zone, supports prospects for a further near-term appreciating move for the NZD/USD pair. In the absence of any relevant market-moving economic releases from the US, the US bond yields will influence the USD. Apart from this, the broader risk sentiment should provide some impetus on Monday.
The market focus, meanwhile, will remain glued to the release of the latest US consumer inflation figures on Wednesday. Any upside surprise would challenge bets for a rate cut as soon as September and prompt some near-term short-covering around the USD. This, in turn, warrants some caution for aggressive bullish traders and before positioning for any further appreciating move for the NZD/USD pair, at least for the time being.
Technical levels to watch
USD/INR has held mostly within a narrow 81-83 range since the start of the year. Economists at Commerzbank see the pair rather at the lower end of this trading range in the medium term.
Supported by robust domestic sector
“It seems RBI is content to see a relatively stable USD/INR for now.”
“Supported by strong growth, we see USD/INR rather at the lower end of the 81-83 trading range in the medium term.”
“Growth is projected to moderate this year amid the weaker global backdrop but still post a healthy 6% thanks to robust domestic demand.”

Source: Commerzbank Research
After Friday's US labor market report, the Dollar was able to make significant gains, at least initially. Ulrich Leuchtmann, Head of FX and Commodity Research, warrants caution.
What does the US labor market report mean for the Dollar?
“Since spring 2022, labor supply has increased, but labor demand has not. There are no job vacancy statistics for April. However, there is no reason to believe that the high number of new hires is anything other than a continuation of this trend: that vacancies are being filled. However, this would not argue for increased monetary policy pressure and thus for higher USD carry and a stronger Dollar. On the contrary. It would signal that wage pressures are likely to ease. And that, in turn, would reinforce the market view that last week's Fed move was the last one.”
“My message to you, dear reader, is to think twice before drawing USD optimism from Friday's numbers. I'm not.”
In case sellers regain control, USD/CNH is seen facing firm support around 6.8500 for the time being, note Economist Lee Sue Ann and Markets Strategist Quek Ser Leang at UOB Group.
Key Quotes
24-hour view: “Our view for USD to weaken last Friday did not materialize as it traded sideways between 6.9090 and 6.9326 before closing little changed at 6.9214 (+0.06%). Momentum indicators are mostly flat and USD is likely to continue to trade sideways. Expected range for today; 6.9100/6.9350.”
Next 1-3 weeks: “There is no change in our view from last Friday (05 May, spot at 6.9150). As highlighted, USD could continue to weaken but short-term conditions are deeply oversold and the chance of it breaking the formidable support at 6.8500 is low for now. Overall, USD is likely to trade under pressure for now unless it can break above the ‘strong resistance’ at 6.9400 (no change in level from last Friday).”
- Silver oscillates in a narrow trading band through the first half of trading on Monday.
- The technical setup favours bullish traders and supports prospects for further gains.
- A convincing break below the $24.50-40 area is needed to negate the positive bias.
Silver fails to capitalize on Friday's bounce from the 200-hour Simple Moving Average (SMA) and oscillates in a narrow trading band through the early European session on the first day of a new week. The white metal currently trades around the $25.65-$2,5.70 region, nearly unchanged for the day, though the technical setup favours bullish traders.
The recently repeated rebounds from the $24.50-$24.40 strong horizontal resistance breakpoint, now turned support, and the emergence of some dip-buying on Friday validates the near-term positive outlook. Moreover, the Relative Strength Index (RSI) on the daily chart has eased from the overbought territory and supports prospects for a further appreciating move.
That said, the XAG/USD has been struggling to build on its momentum beyond the $26.00 mark, making it prudent to wait for a sustained strength beyond the said handle before placing fresh bullish bets. The commodity might then surpass an intermediate barrier near the $26.25-$26.30 and aim to test the March 2022 swing high, just ahead of the $27.00 round figure.
On the flip side, Friday's swing low, around the $25.15 region now seems to protect the immediate downside. This is closely followed by the $25.00 psychological mark, below which the XAG/USD could extend the corrective decline towards testing the $24.50-$24.40 resistance-turned-support. A convincing break below the latter could negate the positive outlook.
The XAG/USD might then turn vulnerable to weaken further below the $24.00 mark and drop to the next relevant support near the $23.50-$23.30 confluence. The latter comprises the 50-day and the 100-day SMAs and is followed by support near the $23.00 round-figure mark.
Silver 1-hour chart
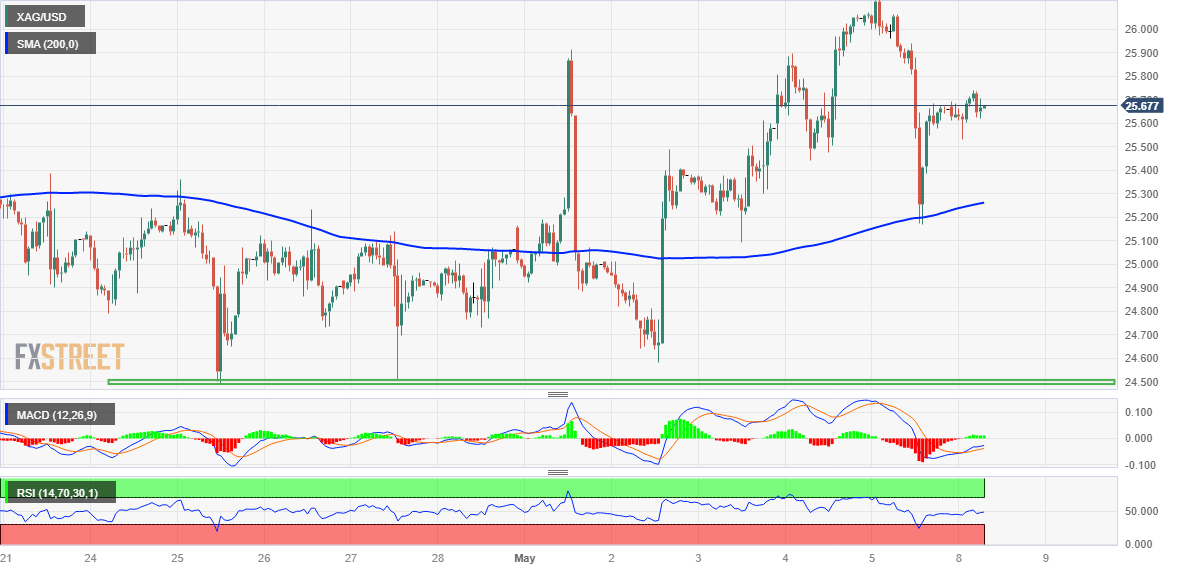
Key levels to watch
Considering advanced prints from CME Group for natural gas futures, open interest extended the uptrend on Friday, this time rising by around 7.6K contracts. Volume, in the same line, went up by around 25.4K contracts after two daily drops in a row.
Natural Gas: No changes to the consolidative theme
Prices of the natural gas bounced off lows near the $2.00 mark per MMBtu against the backdrop of increasing open interest and volume on Friday. That said, further gains now emerge on the horizon in the very near term and are expected to meet interim resistance at the 55-day SMA near $2.32.
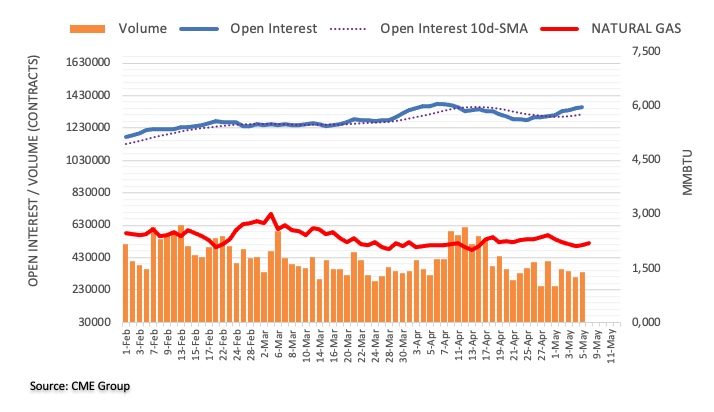
In the opinion of Economist Lee Sue Ann and Markets Strategist Quek Ser Leang at UOB Group, bouts of weakness in USD/JPY should meet quite a solid support in the 133.00 neighbourhood.
Key Quotes
24-hour view: “After USD dropped to 133.49 and rebounded, we highlighted last Friday that ‘the rebound in deeply oversold conditions suggests that USD is unlikely to weaken much further’ and we expected USD to trade in range between 133.40 and 135.00. While USD did not weaken further, it did not quite trade in a range as it rebounded strongly to 135.12. The rebound has scope to extend but any advance is not expected to break the strong resistance at 136.05 (there is another resistance level at 135.55). Support is at 134.65, followed by 134.20.”
Next 1-3 weeks: “Last Friday (05 May, spot at 134.05), we indicated that ‘while USD could continue to decline, short-term conditions are severely oversold and it remains to be seen if USD has enough momentum to break the solid support level near 133.00’. There is no change in our view. On the upside, a breach of 136.05 (no change in ‘strong resistance’ level0 would suggest that the weakness in USD has stabilized.”
Here is what you need to know on Monday, May 8:
Fueled by the decisive rebound seen in banking stocks on Friday, Wall Street's main indexes turned north and ended the week on a bullish note. Early Monday, markets seem to have turned cautious as attention shifts to the US Federal Reserve's Senior Loan Officer Opinion Survey, which could provide fresh clues regarding how tight financial conditions are. Sentix Investor Confidence data for May will be featured in the European docket and investors will also keep an eye comments from central bank officials.
On Friday, the US Bureau of Labor Statistics reported that Nonfarm Payrolls rose by 253,000 in April, surpassing the market expectation of 179,000 by a wide margin. On a negative note, March's 236,000 increase got revised lower to 165,000. The Unemployment Rate ticked down to 3.4% in the same period and the annual wage inflation edged higher to 4.4% from 4.3%. Although the initial reaction helped the US Dollar find some demand, the risk-positive market environment caused the US Dollar Index to erase its recovery gains.
EUR/USD closed the previous week virtually unchanged slightly above 1.1000. The pair stretches higher toward 1.1050 in the European morning on Monday.
GBP/USD gathered bullish momentum and advanced to its strongest level in nearly a year above 1.2650 late Friday. The pair stays relatively quiet early Monday and fluctuates at around that level.
Following the sharp decline witnessed in the first half of the previous week, USD/JPY closed the last two days in positive territory. The pair, however, struggled to stabilize above 135.00 and retreated below that level in the Asian trading hours on Monday. Earlier in the day, the data from Japan revealed that the Jibun Bank Services PMI improved to 55.4 in April, compared to the market expectation of 54.9.
After spiking to above $2,070 on Thursday, Gold price staged a deep technical correction on Friday as the benchmark 10-year US Treasury bond yield retraced a portion of its weekly decline. Nevertheless, XAU/USD holds comfortably above $2,000 after having failed to clear that level several times since mid-April.
USD/CAD lost nearly 200 pips on Friday amid a strong rebound in crude oil prices and the upbeat April jobs report from Canada. The pair was last seen trading in negative territory at around 1.3350. Meanwhile, the barrel of West Texas Intermediate is already up 1% on the day slightly above $72 after having gained 4% on Friday.
AUD/USD trades at its highest level in nearly a month and closes in on 0.6800 early Monday after having registered gains every day last week. First-quarter Retail Sales data from Australia will be released in the Asian session on Tuesday. Trade Balance data from China will also be watched closely by market participants.
Bitcoin reversed its direction following Friday's rebound and closed in negative territory on Saturday and Sunday. BTC/USD stays on the back foot and declined toward $28,000 early Monday. Ethereum lost nearly 6% over the weekend and broke below $1,900 before going into a consolidation phase to start the new week.
- AUD/USD renews three-week high inside two-month-old ascending trend channel.
- Bullish MACD signals, upbeat RSI keeps buyers hopeful of crossing 100-DMA hurdle.
- Sellers remain off the table unless witnessing daily close beyond 0.6600.
AUD/USD stays on the bids for the sixth consecutive day as it refreshes a three-week high near 0.6785 during early Monday in Europe. In doing so, the Aussie pair prods the 100-DMA hurdle inside an upward-sloping trend channel comprising multiple levels marked since March.
Given the bullish MACD signals and upbeat RSI (14) line, not overbought, the AUD/USD buyers are likely to cross the immediate hurdle surrounding 0.6790, comprising the 100-DMA.
However, likely overbought conditions around the 0.6800 round figure and the top line of the stated bullish channel, close to 0.6810 at the latest, can challenge the AUD/USD bulls afterward.
Should the Aussie pair buyers keep the reins past 0.6810, 0.6855 and 0.6900 will precede the mid-February’s peak of around 0.7030 to challenge the pair buyers.
On the contrary, the 50% Fibonacci retracement level of the pair’s run-up from October 2022 to February 2023, near 0.6660, can challenge the AUD/USD bears.
Following that, the stated channel’s bottom line of around 0.6600 and the 61.8% Fibonacci retracement level of near 0.6545, also known as the golden Fibonacci ratio, may prod the Aussie pair sellers before giving them control.
Overall, AUD/USD remains on the bull’s radar even if the upside remains long and bumpy.
AUD/USD: Daily chart
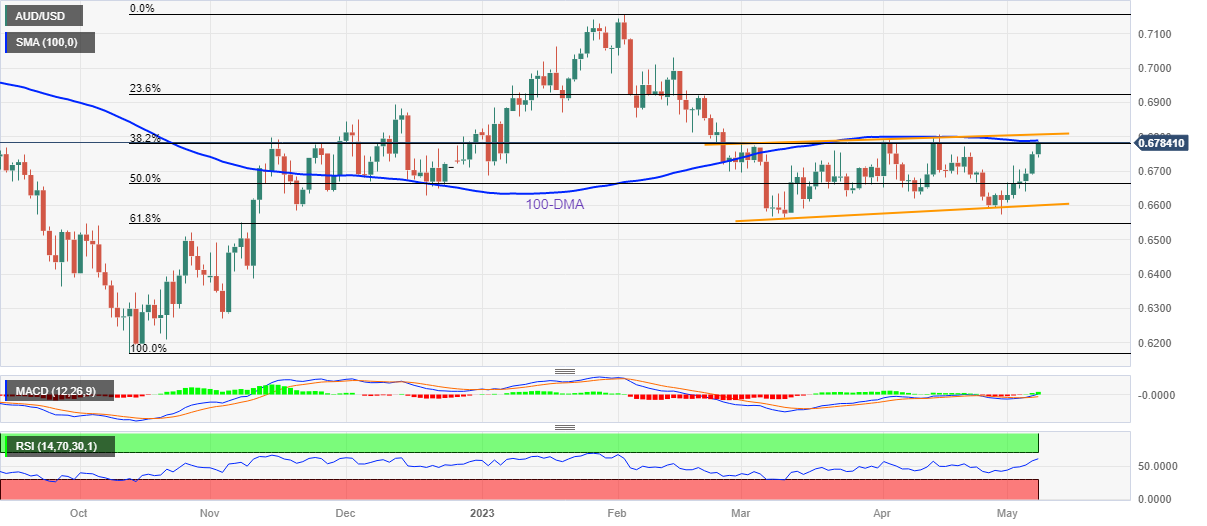
Trend: Further upside expected
- The index losses further ground and puts 101.00 to the test.
- Markets continue to digest Friday’s solid NFP figures.
- Wholesale Inventories next on tap in the docket.
The greenback remains on the downside and confronts the 101.00 region when measured by the USD Index (DXY) at the beginning of the week.
USD Index remains focused on inflation
The index adds to Friday’s losses and trades at shouting distance from the key 101.00 region on Monday, as market participants continue to digest another solid prints from Friday’s Nonfarm Payrolls, this time for the month of April (+230K).
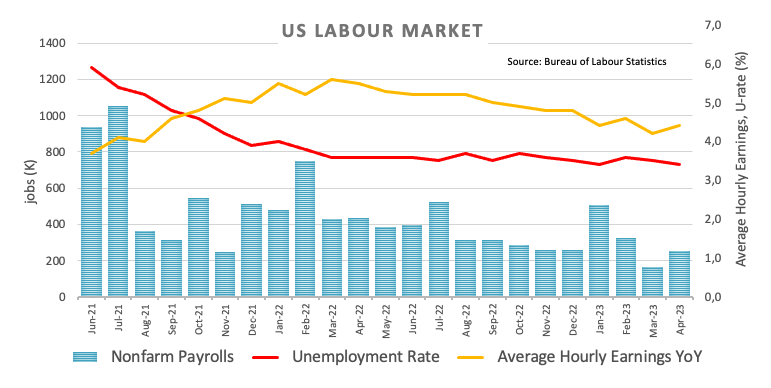
In the meantime, US yields trade within a marginal range ahead of the opening bell in the old continent on Monday, while the German 10-year benchmark yields hover around 2.30%, up modestly for the day.
In the US data space, Wholesale Inventories for the month of March will be the sole release later in the NA docket.
What to look for around USD
The index trades close to the 101.00 zone in tandem with investors’ adjustment to the last NFP release.
The index seems to be facing downward pressure in light of the recent indication that the Fed will probably pause its normalization process in the near future. That said, the future direction of monetary policy will be determined by the performance of key fundamentals (employment and prices mainly).
Favouring an impasse by the Fed appears the persevering disinflation – despite consumer prices remain well above the target – incipient cracks in the labour market, the loss of momentum in the economy and rising uncertainty surrounding the US banking sector.
Key events in the US this week: Wholesale Inventories (Monday) - MBA Mortgage Applications, Inflation Rate, Monthly Budget Statement (Wednesday) – Producer Prices, Jobless Claims (Thursday) – Flash Michigan Consumer Sentiment (Friday).
Eminent issues on the back boiler: Persistent debate over a soft/hard landing of the US economy. Terminal Interest rate near the peak vs. speculation of rate cuts in 2024. Fed’s pivot. Geopolitical effervescence vs. Russia and China. US-China trade conflict.
USD Index relevant levels
Now, the index is losing 0.21% at 101.06 and faces initial contention at 101.01 (weekly low April 26) prior to 100.78 (2023 low April 14) and finally 100.00 (psychological level). On the other hand, the break above 102.40 (monthly high May 2) would open the door to 102.80 (weekly high April 10) and then 103.05 (monthly high April 3).
Inflation risk premium for the EUR is no longer justified, in the view of economists at Commerzbank.
Falling EUR exchange rates from 2024 onwards
“We are convinced that there is an inflation disadvantage for the Euro. For this reason, we forecast falling EUR exchange rates from 2024 onwards. But this forecast is based on considerations that are not currently shared by the market. For example, we expect inflation in the euro area to be higher than in the US over the long term – a reversal of past conditions and something that is not priced into the market's inflation expectations.”
“Our forecast of a strong Euro until year-end assumes that our economists’ point of view will only slowly take hold and will only put pressure on the European single currency from 2024 onwards.”
FX option expiries for May 8 NY cut at 10:00 Eastern Time, via DTCC, can be found below.
- EUR/USD: EUR amounts
- 1.1200 1.3b
- 1.1125 1.2b
- USD/JPY: USD amounts
- 136.00 704m
- AUD/USD: AUD amounts
- 0.6620 536.6m
- 0.6850 443.8m
- 0.6550 370m
- USD/CAD: USD amounts
- 1.3450 477.1m
- 1.3750 470.3m
- NZD/USD: NZD amounts
- 0.6105 820m
- USD/CNY: USD amounts
- 6.6925 426m
Economist Lee Sue Ann and Markets Strategist Quek Ser Leang at UOB Group note AUD/USD could now reclaim the 0.6800 hurdle at beyond.
Key Quotes
24-hour view: “While we expected AUD to edge higher last Friday, we held the view that ‘it is unlikely to break clearly above 0.6740’. The anticipated AUD strength exceeded our expectations as AUD soared to 0.6757 before closing on a firm note at 0.6750 (+0.84%). Further AUD strength is not ruled out but overbought conditions suggest the next major resistance at 0.6810 is not expected to come under threat (there is another resistance at 0.6775). Support is at 0.6725, followed by 0.6695.”
Next 1-3 weeks: “Our most recent narrative was from last Wednesday (03 May, spot at 0.6660) wherein ‘as long as AUD holds above 0.6610, it could edge higher to 0.6740’. We indicated that ‘the odds of a sustained rise above 0.6740 are not high.’ Last Friday (05 May), AUD soared and broke above 0.6740 (high of 0.6757). Upward momentum has improved considerably and AUD is likely to advance further. The next level to aim for is 0.6810. Overall, AUD is likely to continue to rise as long as it stays above 0.6670 (‘strong support’ level previously at 0.6610).”
CME Group’s flash data for crude oil futures markets noted traders increased their open interest positions for the second session in a row on Friday, now by around 4.4K contracts. On the other hand, volume added to the previous daily pullback and dropped by around 301.6K contracts.
WTI appears supported around $68.00
Prices of the barrel of the WTI picked up pace at the end of last week amidst rising open interest, which is indicative than extra recovery appears on the cards in the very near term. So far, the commodity seems well supported around the $68.00 region.
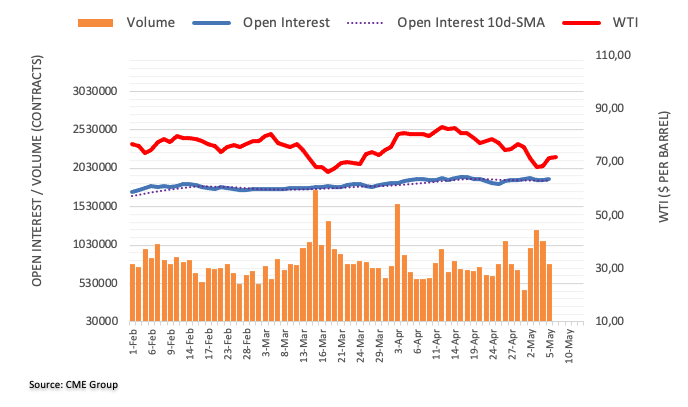
Strategists at ANZ Bank have lowered their Brent Oil short term forecast. Nevertheless, they expect oil prices to recover by year-end.
Prices revised lower
“With so much uncertainty surrounding the macro environment, the lack of any strong signals from the physical market is likely to see oil prices remain under pressure. We have subsequently revised down our short term (0-3 month) price target for Brent to $82/bbl. In saying that, any tightness in the oil market will be reliant on activity in China.”
“We remain confident that growth in oil demand in China will offset any weakness in developed markets. As supply cuts from OPEC bite, and growth from other major producers peters out, we see market tightness emerging in Q3. This should see prices rally in the second half of the year. We maintain our end of year target of $100/bbl.”
- GBP/USD has printed a fresh weekly high at 1.2653 amid a sell-off in the USD Index.
- Unimpressive US Employment has cemented a neutral Federal Reserve policy for the June meeting.
- UK’s historically high food inflation and labor shortages are supporting one more interest rate hike from the Bank of England.
- GBP/USD is enjoying a rally after a breakout of the Rising Channel chart pattern.
GBP/USD has printed a fresh weekly high at 1.2653 in the early European session. The Cable has shown a stellar rally and is expected to extend its upside as the Bank of England (BoE) is preparing for a fresh interest rate hike this week. Thursday’s Bank of England (BoE) interest rate policy will be keenly watched by the market participants as the United Kingdom’s inflation is not showing signs of deceleration while the central bank has already tightened its monetary policy significantly.
S&P500 futures have generated some losses in the Asian session amid uncertainty over US debt ceiling issues. The overall market mood is quite cheerful, however, a cautionary approach is advisable ahead of the United States Consumer Price Index (CPI) data, which will release on Wednesday.
The US Dollar Index (DXY) is struggling to find any support and has refreshed its day’s low near 101.12. The further downside in the USD Index looks promising as any further delay in the raising of the US debt ceiling would impact the long-term outlook of the United States economy dramatically. Steady US labor market performance for April month has receded chances of more rate hikes from the Federal Reserve (Fed). This has improved the demand for US government bonds. The 10-year US Treasury yields have further dropped below 3.43%.
US Employment cements neutral Federal Reserve policy expectations
On Friday, the USD Index was heavily volatile amid the release of the US Nonfarm Payrolls (NFP) puzzle. A stellar recovery was recorded in the USD Index after the upbeat US Employment report but later it surrendered gains knowing that the report was contaminated. March’s payroll additions were downwardly revised to 165K from the disclosed figure of 263K, which indicated that fresh additions were mere 2% higher than the former figure. The Unemployment Rate dropped to 3.4% from the consensus of 3.5%. A mild rise in the number of fresh talent is insufficient to force the Federal Reserve to reconsider its neutral rate guidance.
In addition to that, monthly Average Hourly Earnings accelerated at a pace of 0.5% while the street was anticipating a pace of 0.3%. Going forward, robust earnings could propel US inflationary pressures as households would be equipped with higher funds for disposal. More demand for core goods could lead to a rise in Producer’s Price Index (PPI) and henceforth fuel overall inflationary pressures.
US President to meet Speaker Kevin McCarthy over looming debt ceiling crisis
To address the looming US debt ceiling crisis after US Treasury warned that any delay in raising the debt ceiling could have severe damage to the sovereignty of the US economy. Millions of individuals will lose their jobs and overall output will get reduced sharply as US Treasury is out of funds and would fail in making obligated payments.
As the US Treasury has delivered a deadline of June 01 when it will fail in making payments, US President Joe Biden has invited congressional leaders to the table on Tuesday for negotiations after a prior meeting in February. It would be worth watching a decline in the President’s spending initiatives against the raising of the US debt ceiling.
Bank of England looks set for one more interest rate hike
UK’s double-digit sticky inflation has been a nightmare for the Bank of England policymakers. This would be the 12th consecutive monetary policy meeting when Bank of England Governor Andrew Bailey will raise interest rates to continue to weigh on stubborn inflation. UK’s food inflation is historically high, labor shortages are consistently rising, and service providers are looking to pass on the impact of higher wages to end consumers. The entire gamut is expected to mount tensions for Bank of England policymakers ahead.
The Bank of England has already paused interest rates heavily and it is highly expected that the pace of the interest rate hike would be 25 basis points (bps), which will push interest rates to 4.50%.
GBP/USD technical outlook
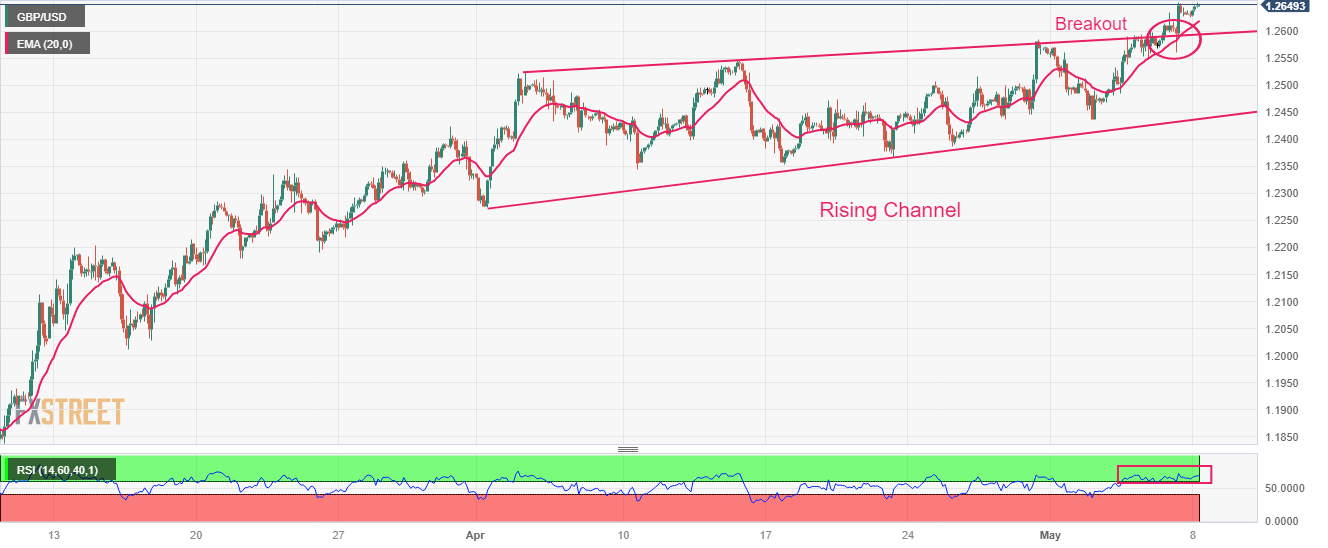
GBP/USD is enjoying a rally after a breakout of the Rising Channel chart pattern formed on a two-hour scale. An upside break in the Cable is indicting sheer momentum in the Pound Sterling. The 20-period Exponential Moving Average (EMA) at 1.2620 is providing cushion to the Pound Sterling consistently.
Meanwhile, the Relative Strength Index (RSI) (14) is oscillating in the bullish range of 60.00-80.00, conveying further upside.
- USD/CAD remains depressed at multi-day low after falling the most since January.
- Comparatively strong Canadian jobs report, Oil price recovery favor Loonie pair buyers.
- NFP fails to underpin US Dollar rebound as traders seek more clues from US inflation.
- Canada geopolitics, US CPI eyed for clear directions.
USD/CAD stays pressured at the lowest levels in three weeks, close to 1.3380 amid early Monday morning in Europe. That said, the Loonie pair dropped the most in four months the previous day amid a strong Canada jobs report, versus unimpressive details of the US Nonfarm Payrolls (NFP). Adding strength to the quote’s bearish performance was the recovery in the Oil price, Canada’s main export item.
On Friday, Canada’s jobs report for April came in upbeat with Net Change in Employment rising by 41.4K versus 20K expected and 34.7K prior. Further, the Unemployment reprints 5.0% market compared to market forecasts of rising to 5.1% whereas Average Hourly Wages and Participation Rate remained unchanged at 5.2% YoY and 65.6% in that order. Upbeat Canadian jobs report joins hawkish comments from the Bank of Canada (BoC) Governor Tiff Mackem to weigh on the USD/CAD price.
On the other hand, a downward revision of the US Nonfarm Payrolls (NFP) supersedes the upbeat headline numbers and weighs on the US Dollar despite hawkish comments from St. Louis Federal Reserve President James Bullard.
Further, WTI crude oil prints a three-day uptrend as it extends a corrective bounce from the lowest levels since December 2021 to $71.70 heading into Monday’s European session, amid a softer US Dollar and cautious optimism in the market.
That said, hopes for the US policymakers’ ability to tackle looming default fears, ahead of Tuesday’s meeting of US President Joe Biden with the White House with Republican House Speaker Kevin McCarthy, Republican Senate Minority Leader Mitch McConnell and top congressional Democrats to discuss the debt ceiling issue also weigh on USD/CAD price.
It’s worth noting that US Treasury Secretary Janet Yellen on Sunday issued a stark warning that a failure by Congress to act on the debt ceiling could trigger a "constitutional crisis" that also would call into question the federal government's creditworthiness, per Reuters.
Against this backdrop, the S&P 500 Futures print mild losses near 4,147 after posting a stellar run-up on Friday whereas the US 10-year Treasury bond yields dropped 1.5 basis points (bps) to 3.43%, pressured for the third consecutive week.
Looking forward, an emergency in Canada’s key Oil producing state Alberta, due to wildfire, challenges the USD/CAD bears ahead of the key US Consumer Price Index (CPI) for April.
Technical analysis
A daily closing below the 200-DMA, around 1.3450 at the latest, again directs USD/CAD price toward an upward-sloping support line from November 2022, close to 1.3310 by the press time.
In light of the recent price action, GBP/USD could extend the uptrend to the 1.2660 region in the next few weeks, suggest Economist Lee Sue Ann and Markets Strategist Quek Ser Leang at UOB Group.
Key Quotes
24-hour view: “We expected GBP to ‘break above 1.2600’ last Friday but we held the view that ‘the major resistance at 1.2665 is unlikely to come into view’. Our expectations turned out to be correct as GBP rose to a high of 1.2653. While upward momentum has waned somewhat, there is room for GBP to test 1.2665 before the risk of a pullback increases. The next resistance at 1.2720 is not expected to come under threat. Support is at 1.2605; a breach of 1.2580 would indicate that GBP is not advancing further.”
Next 1-3 weeks: “Last Friday (05 May, spot at 1.2575), we highlighted that GBP ‘is likely to ratchet higher towards the major resistance at 1.2665’. We added, ‘At this stage, the odds for a sustained rise above this level are not high’. Our view of a higher GBP was not wrong even though we did not quite expect the rapid advance as GBP rose quickly to a high of 1.2653. Upward momentum is improving and GBP could break above 1.2665. The next resistance above 1.2665 is at 1.2720. The upside risk is intact as long as GBP stays above 1.2540 (‘strong support’ level was at 1.2470 last Friday).”
Industrial Production in Germany declined more than expected in March, the official data showed on Monday, suggesting that the manufacturing sector activity is deteriorating further.
Eurozone’s economic powerhouse’s Industrial Output dropped by 3.4% MoM, the federal statistics authority Destatis said in figures adjusted for seasonal and calendar effects, vs. -1.0% expected and 2.1% prior.
On an annualized basis, German Industrial Production arrived at 1.8% in March versus a 0.6% figure booked in February and -0.5% market expectations.
FX implications
The shared currency is keeping its renewed upside intact at around 1.1040 on the mixed German industrial figures. The pair is adding 0.20% on the day, as of writing.
Open interest in gold futures markets shrank by nearly 10K contracts on Friday, reversing at the same time five consecutive daily builds. Volume followed suit and went down by around 3.2K contracts, extending the current choppy activity.
Gold looks poised to extend gains
Friday’s marked pullback in gold prices was on the back of shrinking open interest and volume, leaving no room for the continuation of the decline in the very near term. That said, the precious metal continues to target the 2023 high at $2067 per ounce troy (May 4), just ahead of the all-time peak at $2075 (August 7 2020).
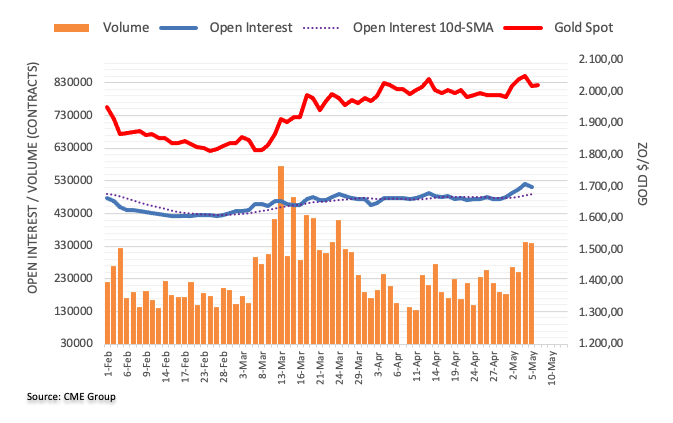
According to Economist Lee Sue Ann and Markets Strategist Quek Ser Leang at UOB Group, further upside in EUR/USD should meet solid hurdle around 1.1120.
Key Quotes
24-hour view: “We highlighted last Friday that ‘there is no clear directional bias for now’ and expected EUR to ‘trade between 1.0980 and 1.1080’. In NY trade, EUR dropped briefly to 1.0965 and then rebounded to end the day little changed at 1.1017 (+0.05%). There is still no clear directional bias and today, we expect EUR to trade in a 1.0980/1.1060 range.”
Next 1-3 weeks: “Our update from last Friday (05 May, spot at 1.1025) still stands. As highlighted, the bias for EUR appears to be tilted to the upside but unless there is a clear improvement in momentum, any advance might find it difficult to break above the major resistance at 1.1120. Note that there is another rather strong resistance level near 1.1095. If EUR were to break below 1.0940 (‘strong support’ level was at 1.0920 last Friday), it would suggest that it is not ready to move towards 1.1120.”
- WTI picks up bids to extend recovery from December 2021.
- RSI rebound from oversold territory favors corrective bounce off the WTI Crude Oil price.
- Bearish MACD signals, multiple hurdles towards the north hint at limited upside room.
WTI crude oil prints a three-day uptrend as it extends a corrective bounce from the lowest levels since December 2021 to $71.70 heading into Monday’s European session.
In doing so, the black gold benefits from RSI (14) line’s rebound from the oversold territory.
However, the bearish MACD signals and a slew of upside hurdles challenge the energy buyers.
Among them, the 10-DMA level of around $73.00 acts as an immediate resistance for the WTI bulls to tackle.
Following that, a downward-sloping trend line from mid-April and the 21-DMA, respectively near $73.90 and $76.85, could restrict further advances in the commodity price.
In a case where the energy benchmark remains firmer past 21-DMA, the support-turned-resistance line from December 2022, close to $77.40 by the press time, can act as the last defense of the WTI bears.
Meanwhile, the 23.6% Fibonacci retracement level of the commodity’s downside from November 2022 to the last week’s bottom, near $71.00, limits short-term declines of the WTI crude oil price.
Should the quote remains weak past $71.00, the $70.00 round figure and $68.00 may rest the Oil bears before directing them to the latest multi-month low of around $64.30.
Overall, WTI crude oil is likely to extend the latest recovery but the road towards the north appears long and bumpy.
WTI crude oil: Daily chart
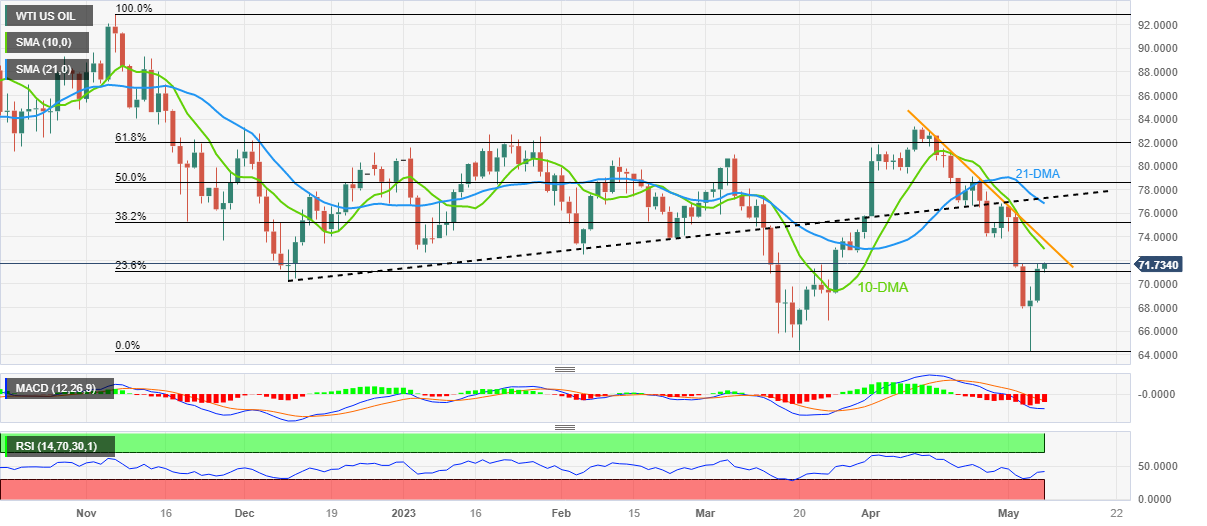
Trend: Limited upside expected
- Asian indices are showing mixed performance due to respective events.
- Japanese stocks have faced selling pressure after the release of the dovish BoJ minutes.
- Chinese equities are demonstrating strength ahead of Trade Balance and inflation data.
Markets in the Asian domain are showing mixed performance as Nikkei 225 has faced a sell-off while Chinese stocks are sky-rocketing ahead of respective economic events. S&P500 futures are showing some losses in the Asian session amid uncertainty over US President Joe Biden’s meeting with Republicans for US debt ceiling issues. However, US equities were on the seventh cloud on Friday after the release of a modest increment in Nonfarm Payrolls (NFP) data.
At the press time, Japan’s Nikkei225 dropped 0.68%, ChinaA50 jumped 0.90%, Hang Seng climbed 0.92%, and Nifty50 gained 0.74%.
An unimpressive US NFP report has strengthened the expression that the Federal Reserve (Fed) will keep the interest rate policy steady in its June monetary policy meeting.
Japanese stocks have faced selling pressure despite the upbeat market mood. Nikkei 225 has failed to ride along with broader strength amid the release of the Bank of Japan (BoJ) minutes of April’s monetary policy meeting. BoJ members supported the continuation of policy easing in order to achieve steady inflation. While discussing an exit from the ultra-dovish policy, BoJ members conveyed that the central bank should consider the weight of risk associated with the policy shift stance before consideration.
Meanwhile, Chinese stocks are showing strength ahead of Trade Balance and Consumer Price Index (CPI) data. Annual exports are expected to decline as Western nations are supporting the China+1 policy. Financial Times reported that the European Union is planning sanctions on Chinese firms for supporting Russia's war on Ukraine
On the oil front, oil prices are eyeing a fresh rally above the immediate resistance of $71.80 on hopes that the Federal Reserve (Fed) will also pause its policy-tightening spell to avoid further damage to US economic outlook.
- Gold price remains on the front foot as US Dollar begins inflation week with mild losses.
- Strong US jobs report needs validation from CPI to renew hawkish Fed bias and prod XAU/USD bulls.
- US debt ceiling drama, banking woes join downbeat yields to weigh on US Dollar and favor Gold buyers.
Gold price (XAU/USD) picks up bids to reverse the previous day’s pullback from an all-time high. In doing so, the precious metal benefits from the softer US Dollar and the market’s cautious optimism as traders prepare for the key US Consumer Price Index (CPI) and Producer Price Index (PPI) details after getting mixed feelings from Friday’s Nonfarm Payrolls (NFP). Also adding strength to the XAU/USD run-up could be the US Dollar’s weakness amid firmer US equities and downbeat yields, especially amid looming default fears and skepticism about the banking environment.
Elsewhere, hawkish commentary from the ECB policymakers and likely drama about the US debt ceiling extension, as well as recession fears, also exert downside pressure on the US Dollar and propel the Gold price.
It’s worth noting, however, that holidays in the UK and France limit the Gold price run-up ahead of the $2,045 resistance confluence.
Also read: Gold Price Forecast: XAU/USD bulls look to $2,050 again ahead of critical United States data
Gold Price: Key levels to watch
As per our Technical Confluence Indicator, the Gold price jostles with a broad resistance area surrounding $2,023-27, comprising Fibonacci 23.6% on one-month and 100-HMA.
Following that, Pivot Point one-month R1 and upper band of the Bollinger on one-day, near $2,045, will be a tough nut to crack for the Gold buyers before giving them control.
Should the XAU/USD remains firmer past $2,045, the previous monthly high near $2,050 and the recent record top of around $2,080 will gain the market’s attention.
On the flip side, Fibonacci 61.8% on one-week restricts the immediate downside of the Gold price near $2,016, a break of which can direct the XAU/USD bears towards Fibonacci 23.6% on one-day and Fibonacci 38.2% on one-month.
It’s worth noting that a convergence of the 10-DMA, Middle band of the Bollinger on one-day and lower band of the Bollinger on four-hour, close to $2,005, acts as the last defense of the Gold buyers.
Here is how it looks on the tool
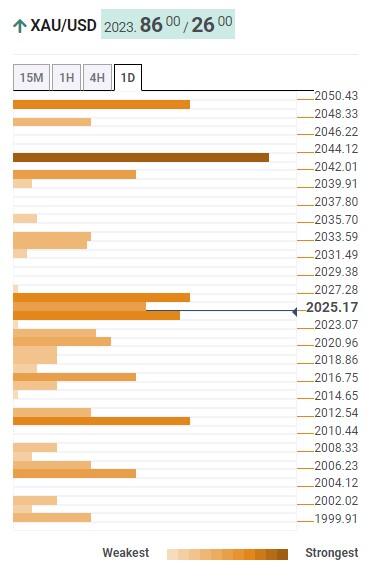
About Technical Confluences Detector
The TCD (Technical Confluences Detector) is a tool to locate and point out those price levels where there is a congestion of indicators, moving averages, Fibonacci levels, Pivot Points, etc. If you are a short-term trader, you will find entry points for counter-trend strategies and hunt a few points at a time. If you are a medium-to-long-term trader, this tool will allow you to know in advance the price levels where a medium-to-long-term trend may stop and rest, where to unwind positions, or where to increase your position size.
- USD/INR is gyrating in a range of 81.64-81.95 from the past week.
- The upside is capped due to a sell-off in the USD Index while the downside is being supported by rising oil prices.
- Investors expect that the majority of central banks have reached threshold levels and the worst is getting over.
The USD/INR pair has sensed pressure while attempting to climb above the immediate resistance of 81.75 in the Asian session. The asset has been oscillating in a narrow range for the past week despite a sheer decline in the US Dollar Index (DXY).
It looks like a solid recovery in the oil price has offset the decline in the USD Index and the context is keeping the asset inside the woods. The oil price has shown a stellar recovery as investors expect that the majority of central banks have reached threshold levels and the worst is getting over. It is worth noting that India is one of the largest importers of oil in the world and higher oil prices impact the Indian rupee.
This week, the release of the US inflation data will be keenly watched, which is scheduled for Wednesday. Also, the Indian economy will have its inflation report on Friday.
USD/INR is oscillating in a narrow range of 81.64-81.95 for the past week, indicating a decline in volatility contraction. It seems that the release of inflation figures will trigger a power-pack action in the asset.
The 20-period Exponential Moving Average (EMA) at 81.73 is stuck to the major, portraying a rangebound performance.
Also, the Relative Strength Index (RSI) (14) is locked in the 40.00-60.00 range, hinting at an absence of momentum.
Going forward, a breakdown of the consolidation range below 81.60 will expose the asset to April 14 low at 81.50 followed by 26 January low at 81.36.
On the flip side, a strong move above May 02 high at 81.95 will drive the major toward April 26 high at 82.12. A breach of the latter will add more gains in the asset by pushing it toward April 21 high at 82.30.
USD/INR two-hour chart
-638191166665368691.png)
Citing China’s Foreign Minister, Chinese state media reported on Monday that he met with the US ambassador to China in Beijing.
Additional comments
“It is imperative to stabilize Sino-US relations, avoid a downward spiral and prevent accidents between China and the US.”
“US side should correct its understanding of China, return to rationality.“
“US must especially correctly handle the Taiwan issue, stop continuing to hollow out the one-China principle.”
“US must respect China's bottom line and red line, stop harming China's sovereignty, security and development interests.”
Market reaction
AUD/USD is unfazed by the above comments, holding the higher ground near 0.6775, up 0.35% so far.
- AUD/USD has printed a fresh day's high above 0.6770 amid a further decline in the USD Index.
- US President Joe Biden has been criticized for late negotiations with Republicans over raising the debt ceiling.
- Aussie quarterly Retail Sales are expected to contract by 0.4% vs. the former contraction of 0.2%.
The AUD/USD pair has refreshed its day’s high at 0.6770 in the Asian session. The upside bias for the Aussie asset is the outcome of multiple headwinds for the US Dollar. Mounting fears of US banking jitters, uncertainty over the debt ceiling crisis, and unimpressive Nonfarm Payrolls (NFP) report are barricading the US Dollar from any meaningful recovery.
S&P500 futures are showing a subdued performance in the Asian session. The 500-US stock basket witnessed stellar buying interest on Friday after the release of a modest increment in payrolls data supported by the context of neutral interest rate policy from the Federal Reserve (Fed) for its June monetary policy.
The US Dollar Index (DXY) has slipped further and is expected to test the previous week’s low around 101.00. US President Joe Biden has been criticized for late negotiations with Republicans over raising the debt ceiling as the US Treasury Department is worried that it will be out of funds in early June and won’t be able to address its payment obligations. This would not only downgrade the outlook of the United States economy but will cost millions of jobs and a large scale of economic activities.
It would be valuable to note the decline in President’s spending initiatives that Republicans managed to make against raising the debt ceiling.
Furthermore, Wednesday’s Consumer Price Index (CPI) data will be keenly watched. As per the consensus, the monthly headline Consumer Price Index (CPI) accelerated by 0.4% in April against a 0.1% pace recorded in March. The core CPI gained by 0.3%, at a slower pace than recorded for March at 0.4%.
On the Australian Dollar front, investors are awaiting the release of the quarterly Retail Sales data. The preliminary report indicates that quarterly retail demand would contract by 0.4% vs. the former contraction of 0.2%. This might allow the Reserve Bank of Australia (RBA) to keep interest rates steady as declining retail demand is not supportive of policy tightening.
- EUR/USD picks up bids to refresh intraday high, extends Friday’s rebound towards multi-month high marked late April.
- US Dollar bears the burden of mixed jobs report, mixed feelings about US debt ceiling and bank crisis.
- Hawkish ECB rate hike contrasts with Fed’s dovish rate lift to propel Euro price.
- ECB’s Knot, Fed’s Bullard praise higher rates, highlighting the importance of US inflation figures.
EUR/USD bulls keep the reins around 1.1040 as it renews intraday high during a sluggish start to the key week, rising 0.15% on a day heading into Monday’s European session. The Euro pair’s latest gains could be linked to the hawkish comments from a European Central Bank (ECB) official, as well as the US Dollar’s broad weakness amid mixed sentiment.
During the weekend, Dutch Central Bank President and ECB board member Klaas Knot said, “ECB interest rate hikes are starting to have an effect, but more will be needed to contain inflation.” On the same line, ECB Governing Council member and Bank of France head Francois Villeroy de Galhau said on Friday that there will likely be several more hikes.
It should be noted that the US Dollar Index (DXY) marks one more attempt to break a three-week-old ascending support line as it drops 0.13% to 101.15 by the press time. The greenback’s latest weakness could be linked to the downward revision of the US Nonfarm Payrolls (NFP), even if the upbeat headline numbers allowed St. Louis Federal Reserve President James Bullard to reiterate bullish bias.
Furthermore, hopes that the US policymakers will be able to tackle looming default fears, ahead of Tuesday’s meeting of US President Joe Biden with the White House with Republican House Speaker Kevin McCarthy, Republican Senate Minority Leader Mitch McConnell and top congressional Democrats to discuss the debt ceiling issue. It’s worth noting that US Treasury Secretary Janet Yellen on Sunday issued a stark warning that a failure by Congress to act on the debt ceiling could trigger a "constitutional crisis" that also would call into question the federal government's creditworthiness, per Reuters.
Elsewhere, recently the upbeat performance of US tech giants joined the mixed feelings surrounding the US banking sector to weigh on the US Dollar amid downbeat Treasury bond yields.
That said, the S&P 500 Futures print mild losses near 4,147 after posting a stellar run-up on Friday whereas the US 10-year Treasury bond yields dropped 1.5 basis points (bps) to 3.43%, pressured for the third consecutive week.
Looking ahead, inflation data from Germany and the US will join the likely European Union (EU) sanctions on China, due to its alleged role in the Russia-Ukraine war, which will direct immediate EUR/USD moves. Also important to watch will be banking updates and debt ceiling discussions amid a comparatively light Eurozone calendar.
Technical analysis
EUR/USD trades successfully above the 21-DMA support, near 1.0990 by the press time, which in turn joins bullish MACD signals and upbeat RSI (14) line to direct the Euro bulls towards an upward-sloping resistance line from mid-April, near 1.1115 at the latest.
- USD/JPY holds lower ground near intraday low after reversing from 50-SMA.
- 61.8% Fibonacci retracement level restricts immediate downside ahead of six-week-old support line, 200-SMA.
- Multiple hurdles toward the north stand tall to challenge Yen pair buyers past 50-SMA, oscillators favor further upside.
USD/JPY bulls struggle to keep the reins after snapping three-day downtrend the previous day. That said, the Yen pair retreats to 134.90 during early Monday, following an initial run-up to prod the 50-SMA hurdle, favored by the March month’s Monetary Policy Meeting Minutes from the Bank of Japan (BoJ).
Also read: BoJ Minutes: Several members said must be vigilant to risk inflation may accelerate more than expected
Even so, the Yen pair remains above the 61.8% Fibonacci retracement level of its March month downside, near 134.75, which in turn keeps the buyers hopeful. Adding strength to the upside bias are the bullish MACD signals and the near-50 RSI (14) line suggesting a continuation of the latest rebound from an upward-sloping support line from late March.
With this, the USD/JPY bulls appear well-set to cross the 50-SMA hurdle surrounding 135.25. However, lows marked during early March around 135.30-40 can challenge the pair’s further upside.
Also acting as the upside hurdle are the multiple levels around the 137.00 round figure, as well as double tops marked near 137.80-90. Furthermore, the 138.00 threshold acts as the last defense of the USD/JPY bears.
On the contrary, a downside break of the aforementioned support line, close to the 134.00 round figure, isn’t an open welcome to the Yen pair bears as the 200-SMA level of 133.40 can act as an additional filter to the south.
USD/JPY: Four-hour chart
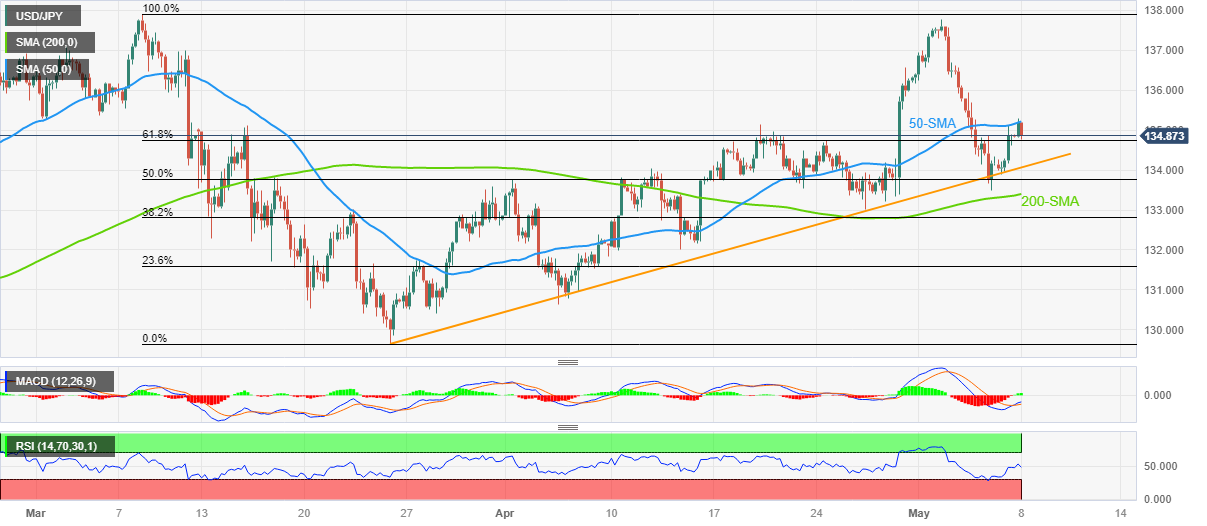
Trend: Further upside expected
- USD/CNH remains sidelined between 200-SMA and 50-SMA, portrays bullish megaphone trend-widening formation.
- Bullish MACD signals, sustained trading above 200-SMA keep offshore Chinese Yuan sellers hopeful.
- USD/CNH bears need validation from 6.8500 to retake control.
USD/CNH stays defensive around 6.9200 as offshore Chinese Yuan (CNH) traders seek fresh clues to extend the previous corrective bounce during early Monday.
In doing so, the USD/CNH price seesaws within an area comprising 200-SMA and 50-SMA, currently between 6.8950 and 6.9310 in that order.
It should be noted, however, that the USD/CNH pair portrays a six-week-old bullish megaphone chart pattern that suggests the quote’s further grinding towards the north. Furthermore, bullish MACD signals also keep the pair buyers hopeful.
That said, the USD/CNH pair’s upside clearance of the 50-SMA hurdle of 6.9310 can prod the stated megaphone’s top line surrounding 6.9740-50.
However, the Year-To-Date (YTD) high marked in March around 6.9970 and the 7.000 psychological magnet can challenge the USD/CNH pair’s further upside.
On the flip side, the 6.9000 round figure restricts the short-term downside of the USD/CNH pair ahead of the 200-SMA level of around 6.8950.
Following that, the stated trend-widening pattern’s lower line surrounding 6.8500 will be crucial to watch as a clear break of the same can defy the bullish formation and trigger the pair’s south-run by targeting the previous month's low of around 6.8300.
Overall, USD/CNH remains on the bull’s radar despite the latest sluggish moves.
USD/CNH: Four-hour chart
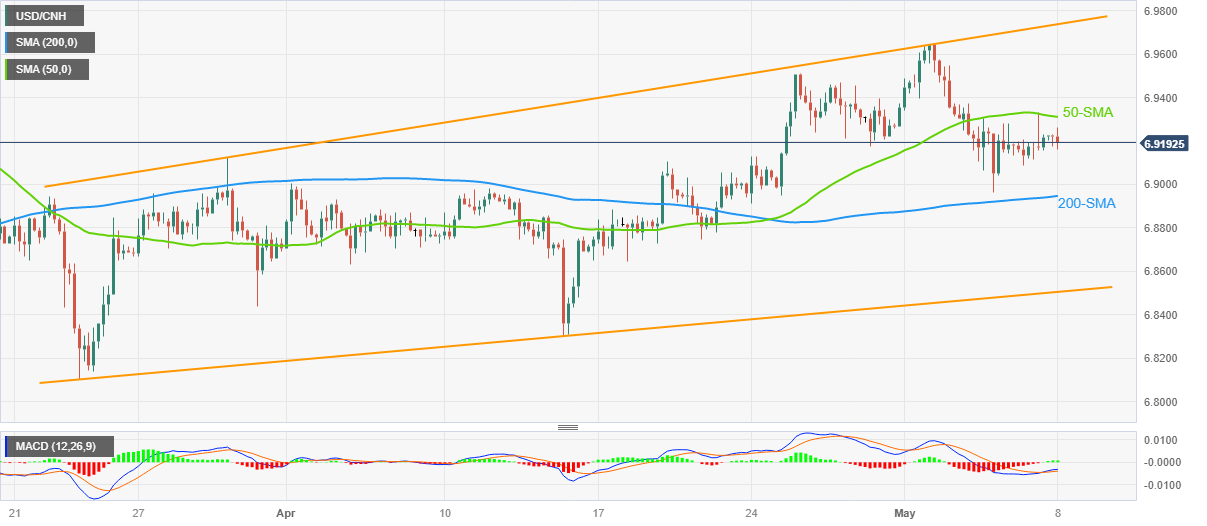
Trend: Further upside expected
- Market sentiment fades previous optimism as US debt ceiling woes escalate ahead of key data/events.
- S&P 500 Futures pare Friday’s heavy gains around mid-4,100s, US Treasury bond yields remain depressed.
- Monday’s light calendar prods momentum traders but US CPI, BoE and banking survey report will be crucial for fresh impulse.
Risk profile remains unimpressive during early Monday as traders lack fresh clues to extend the previous optimism. Adding strain to the market sentiment are the headlines suggesting elevated fears of the US default and banking sector fallouts. However, the Fed’s dovish hike and concerns that policymakers will be able to tackle the challenges join the upbeat news from Apple to keep traders hopeful as the key week comprising US inflation begins.
While portraying the mood, the S&P 500 Futures print mild losses near 4,147 after posting a stellar run-up on Friday. That said, Wall Street benchmarks cheered the downward revision of the US Nonfarm Payrolls (NFP) and Apple’s upbeat results to mark the upbeat closing of the volatile week.
On the other hand, the US 10-year Treasury bond yields drop 1.5 basis points (bps) to 3.43%, pressured for the third consecutive week, whereas the two-year counterpart follows suit near 3.92% by the press time.
The higher prints of the US Nonfarm Payrolls (NFP) failed to divert the market’s attention from downwardly revised prior readings and joined the Federal Reserve’s (Fed) indirect signals for policy pivot to favor the optimists. That said, the US Bureau of Labor Statistics (BLS) unveiled a jump in the headline Nonfarm Payrolls (NFP) by 253K expected and revised down prior readings of 165K. Further, the Unemployment Rate also eased to 3.4% versus 3.5% market forecasts and the previous mark whereas Average Hourly Earnings improved to 4.4% YoY from 4.3% prior (revised) and analysts’ estimations of 4.2%.
On the other hand, US Treasury Secretary Janet Yellen on Sunday issued a stark warning that a failure by Congress to act on the debt ceiling could trigger a "constitutional crisis" that also would call into question the federal government's creditworthiness, per Reuters.
Elsewhere, US banking woes amplify as traders await US Senior Loan Officer Opinion Survey on Bank Lending Practices.
Furthermore, hawkish comments from St. Louis Federal Reserve President James Bullard, who supported the 25 basis point rate hike that the Fed took last week also weighed on the sentiment during a softer start to the key week.
Looking forward, Monday’s holiday in the UK and France can restrict the market’s immediate moves ahead of the US Consumer Price Index (CPI) for April, up for publishing on Wednesday, as well as the US banking survey results. Also important to watch will be the Bank of England (BoE) Monetary Policy Meeting, UK Gross Domestic Product (GDP) for the first quarter (Q1) of 2023.
Also read: Forex Today: Commodity currencies comeback, focus shifts to US inflation
| Raw materials | Closed | Change, % |
|---|---|---|
| Silver | 25.653 | -1.4 |
| Gold | 2015.83 | -1.63 |
| Palladium | 1485.94 | 2.72 |
- USD/CHF is showing a sideways auction around 0.8900 ahead of US Inflation.
- The US NFP puzzle bolstered the expression of neutral Fed policy ahead.
- Swiss annual CPI softened to 2.6% from the consensus of 2.85 and the former release of 2.9%.
The USD/CHF pair is displaying a back-and-forth action near the round-level cushion of 0.8900 in the Asian session. The Swiss franc asset has turned sideways as investors are awaiting the release of United States Consumer Price Index (CPI) data, which will release on Wednesday.
S&P500 futures are showing nominal losses in the Asian session after a super bullish Friday, portraying a minor caution in the overall cheerful market mood. The US Dollar Index (DXY) has retreated after a less-confident pullback and is looking to further downside below the immediate support of 101.17.
On Friday, the USD Index showed a stellar recovery after an upbeat US Employment report but surrendered gains knowing that the report was contaminated. March’s payroll additions were downwardly revised to 165K from the disclosed figure of 263K, which indicated that fresh additions were mere 2% higher than the former figure. The Unemployment Rate dropped to 3.4% from the consensus of 3.5%.
After the US Nonfarm Payrolls (NFP) puzzle, investors are shifting their focus toward the release of the US inflation data, which is scheduled for Wednesday. According to the preliminary report, the monthly headline Consumer Price Index (CPI) accelerated by 0.4% in April against a 0.1% pace recorded in March. The core CPI gained by 0.3%, at a slower pace than recorded for March at 0.4%.
On the Swiss franc front, annual CPI softened to 2.6% from the consensus of 2.85 and the former release of 2.9%. Monthly inflation remained stagnant while the street was anticipating an escalation by 0.5%. This might provide some relief to Swiss National Bank (SNB) policymakers.
- Natural Gas Price picks up bids to extend the previous day’s recovery from three-week low.
- Bullish MACD signals, trend-positive RSI suggests further advances toward the key hurdle.
- 200-SMA, multiple levels marked since mid-April prod immediate upside ahead of 13-day-old resistance line.
- XNG/USD sellers may aim for $2.20 before challenging the yearly low.
Natural Gas (XNG/USD) price remains elevated around $2.30 as buyers extend Friday’s recovery moves on early Monday, posting the biggest daily jump in nearly three weeks.
The energy instrument dropped to the lowest level since mid-April the previous day but failed to provide a decisive break of a horizontal support zone comprising multiple levels marked since late March.
The corrective bounce also gained support from the oversold RSI (14) and bullish MACD signals. That said, the RSI (14) line recently crossed the 50 level but is well below the overbought territory, which in turn joins upbeat MACD signals and the rebound from the $2.16 support area to keep the XNG/USD buyers in the driver’s seat.
It’s worth noting, however, that a convergence of the 200-SMA and a three-week-old horizontal resistance area, around $2.31-32, appears a tough nut to crack for Natural Gas buyers.
Following that, a downward-sloping resistance line from mid-April, close to $2.42, may prod the XNG/USD upside. Above all, the monthly high of $2.58 becomes a crucial challenge for the commodity bulls.
Alternatively, the $2.20 round figure may act as immediate support ahead of the aforementioned $2.17 level comprising a horizontal line stretched from late March.
In a case where the Natural Gas price remains bearish past $2.17, the latest multi-month low marked in April around $2.11 can please the XNG/USD sellers before directing them to the $2.00 psychological magnet.
Natural Gas Price: Four-hour chart

Trend: Limited upside expected
- Gold price grinds higher after a volatile week that refreshed all-time high before easing on Friday.
- United States Nonfarm Payrolls, hawkish Federal Reserve talks prod XAU/USD bulls.
- Fed’s dovish hike, downbeat US Dollar and China demand keep Gold buyers hopeful.
- Survey report on US banks, inflation data eyed for further guide.
Gold price (XAU/SD) seesaws around $2,016 during a dull Monday, after posting the first daily loss in four and two-week uptrend.
The precious metal’s latest corrective bounce can be linked to the market’s inaction amid holidays in the UK and mixed risk catalysts. It’s worth noting that the Gold sellers remain off the table amid broad US Dollar weakness and dovish concerns surrounding the Federal Reserve (Fed), as well as a cautious mood ahead of this week’s United States inflation and bank report.
Gold price eases on upbeat United States data, hawkish Fed talks
Gold price witnessed a pullback on Friday as upbeat United States employment data renewed hawkish Federal Reserve (Fed) concerns.
That said, the US employment report for April surprised markets by unveiling a jump in the headline Nonfarm Payrolls (NFP) by 253K expected and revised down prior readings of 165K. Further, the Unemployment Rate also eased to 3.4% versus 3.5% market forecasts and previous mark whereas Average Hourly Earnings improved to 4.4% YoY from 4.3% prior (revised) and analysts’ estimations of 4.2%.
Following the upbeat US employment report, St. Louis Federal Reserve President James Bullard, who supported the 25 basis point rate hike that the Fed took last week, called it "a good next step." The policymaker cited significant amount of inflation in the economy and "very tight" labor market to back his hawkish bias. His comments renew hopes of a one more 0.25% Fed rate hike in June, which in turn prod Gold buyers after the commodity refreshed all-time high.
Federal Reserve’s dovish hike, softer US Dollar defend XAU/USD bulls
Despite the recent hopes favoring the Gold price pullback ahead of the key data/events, the dovish Federal Reserve (Fed) interest rate hike and hopes of more problems for the US Dollar keep the XAU/USD buyers hopeful. That said, the US Treasury Secretary Janet Yellen on Sunday issued a stark warning that a failure by Congress to act on the debt ceiling could trigger a "constitutional crisis" that also would call into question the federal government's creditworthiness, per Reuters. On the same line, a leading European rating agency, Scope Ratings, placed the United States of America's AA long-term issuer and senior unsecured debt ratings in local and foreign currency under review for a possible downgrade due to longer-run risks associated with the misuse of the debt ceiling instrument, per Reuters.
Additionally, news that China’s central bank added to its Gold reserve for the sixth consecutive month in April to 66.76 million ounces (1,893 tons) also underpins the bullish bias about the XAU/USD.
Banking updates, US inflation signals eyed for clear Gold price directions
Although the Gold price grinds higher after refreshing the record top, a cautious mood ahead of the key United States data and events prod the XAU/USD bulls. Among them, the US Senior Loan Officer Opinion Survey on Bank Lending Practices and the US Consumer Price Index (CPI) for April, up for publishing on Tuesday and Wednesday, will be crucial to watch for clear directions.
Also read: Gold Price Weekly Forecast: $2,100 on the radar but not risk-free
Gold price technical analysis
Gold price’s failure to provide a daily closing beyond a three-month-old ascending resistance line, around $2,068 by the press time, joined the overbought conditions of the Relative Strength Index (RSI) line, placed at 14, to witness a pullback on Friday.
The corrective move, however, could neither close below the 21-DMA support of $2,005 nor reverse the bullish signals from the Moving Average Convergence and Divergence (MACD) indicator.
Hence, the XAU/USD is likely to resume its run-up while targeting the previous monthly high of around $2,050 as an immediate hurdle. Following that, the stated trend line resistance can challenge the Gold buyers near $2,068 whereas highs marked in 2022 and 2020 close to $2,070 and $2,075 can act as additional upside filters before fueling the prices towards the latest peak near $2,080.
On the contrary, a daily closing below the 21-DMA support of $2,005 isn’t an open welcome for the Gold sellers as the $2,000 round figure and an upward-sloping support line from late March, around $1,985, can challenge the XAU/USD downside afterward.
It’s worth noting that the 50-DMA support of near $1,952 acts as the last defense of the Gold buyers.
Overall, Gold price grinds higher and can remain on the bull’s radar despite the latest pullback.
Gold price: Daily chart
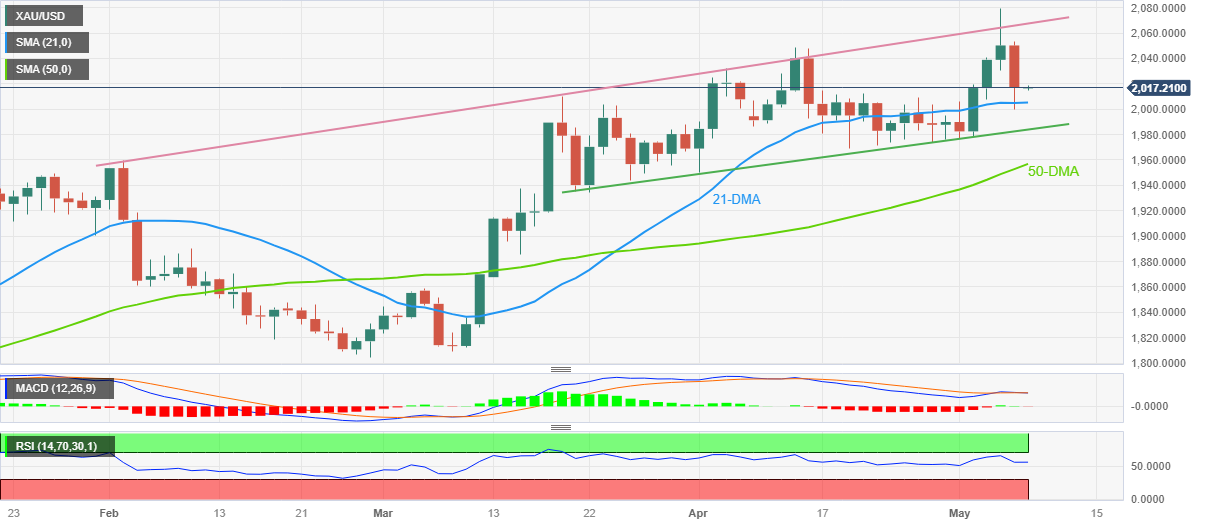
Trend: Pullback expected
- EUR/USD is holding its breath above the critical support of 1.1000 amid the risk-on mood.
- US headline CPI is expected to soften to 4.4% while the core CPI is seen accelerating to 5.8%.
- ECB Lagarde has kept doors open for more than one additional interest rate hike.
The EUR/USD pair is maintaining its auction area above the psychological support of 1.1000 in the Asian session. The major currency pair is looking to add gains ahead as the US Dollar Index (DXY) is looking vulnerable above 101.20.
After the release of the modest United States Nonfarm Payrolls (NFP) report, investors are shifting their focus toward the US Consumer Price Index (CPI) data, which will release on Wednesday. Annual headline CPI is expected to soften to 4.4% while the core CPI that excludes oil and food prices is seen accelerating to 5.8%.
Last week, the European Central Bank (ECB) announced an interest rate hike by 25 basis points (bps) after ditching its 50 bps rate hike spell amid a sharp decline in credit distribution by European banks. However, ECB President Christine Lagarde has kept doors open for more than one additional interest rate hike.
EUR/USD has shown a decline move after failing to surpass April 26 high at 1.1095. The major currency pair has formed a Double Top chart pattern, which will get triggered only after slipping below the immediate support of May 02 low at 1.0942. The 20-period Exponential Moving Average (EMA) at 1.1020 is acting as a barricade for the Euro.
Also, the Relative Strength Index (RSI) (14) has shifted into the 40.00-60.00 range. A slippage below the same would trigger the downside momentum.
Going ahead, a downside move below May 02 low at 1.0942 will drag the asset towards April 12 low at 1.0915 and April 10 low at 1.0837
On the flip side, a decisive move above April 26 high at 1.1095 will drive the asset toward a fresh 13-month high at 1.1185 followed by the round-level resistance at 1.1200.
EUR/USD two-hour chart
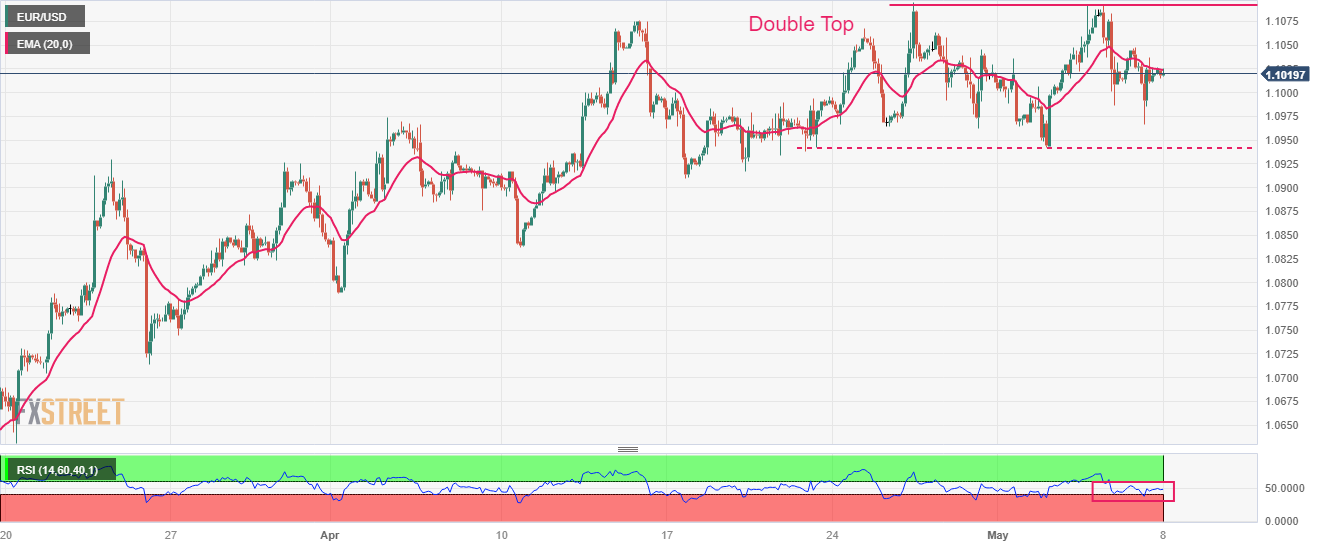
People’s Bank of China (PBOC) set the USD/CNY central rate at 6.9158 on Monday, versus previous fix of 6.9114 and market expectations of 6.9159. It's worth noting that the USD/CNY closed near 6.9080 the previous day.
In addition to the USD/CNY fix, the PBOC also unveils the numbers for its Open Market Operations (OMO), which in turn suggests that the Chinese central bank injects 2.0 billion Yuan via 7-day reverses repo at 2.0% rate.
About the fix
China maintains strict control of the yuan’s rate on the mainland.
The onshore yuan (CNY) differs from the offshore one (CNH) in trading restrictions, this last one is not as tightly controlled.
Each morning, the People’s Bank of China (PBOC) sets a so-called daily midpoint fix, based on the yuan’s previous day's closing level and quotations taken from the inter-bank dealer.
- GBP/USD struggles for clear directions after refreshing one-year high.
- Overbought RSI, easing bullish bias of MACD teases Cable pair sellers to aim for previous resistance line from April.
- Buyers will be off guard on 200-SMA breakdown.
GBP/USD treads water around 1.2630 while portraying the market’s anxiety ahead of the key UK data/events, amid Monday’s holiday in Britain.
That said, the Cable pair rise to a fresh one-year high in the last week after crossing an upward-sloping resistance line from early April. However, the overbought RSI (14) line seems to challenge the quote’s further upside ahead of the key Bank of England (BoE) Monetary Policy Meeting, UK Gross Domestic Product (GDP) for the first quarter (Q1) of 2023 and the US Consumer Price Index (CPI) for April.
Also read: GBP/USD bulls keep the reins above 1.2600 as US inflation, BoE and UK GDP loom
Not only the overbought RSI (14) line but recent easing in the bullish bias of the MACD also teases the short-term GBP/USD sellers ahead of the key data/events, as well as due to the UK’s holiday on Monday.
However, the aforementioned resistance-turned-support around the 1.2600 round figure restricts the short-term downside of the GBP/USD pair.
Following that, an upward-sloping support line from mid-March and the 200-SMA, respectively near 1.2500 and 1.2430, will be crucial to watch as a break of which can recall the pair sellers.
Meanwhile, the May 2022 high of around 1.2665 appears immediate resistance for the Cable pair buyers to tackle to restore the market’s confidence. Following that, the 1.2700 round figure may prod the GBP/USD bulls before directing them to April 2022 lows around 1.2975.
GBP/USD: Four-hour chart
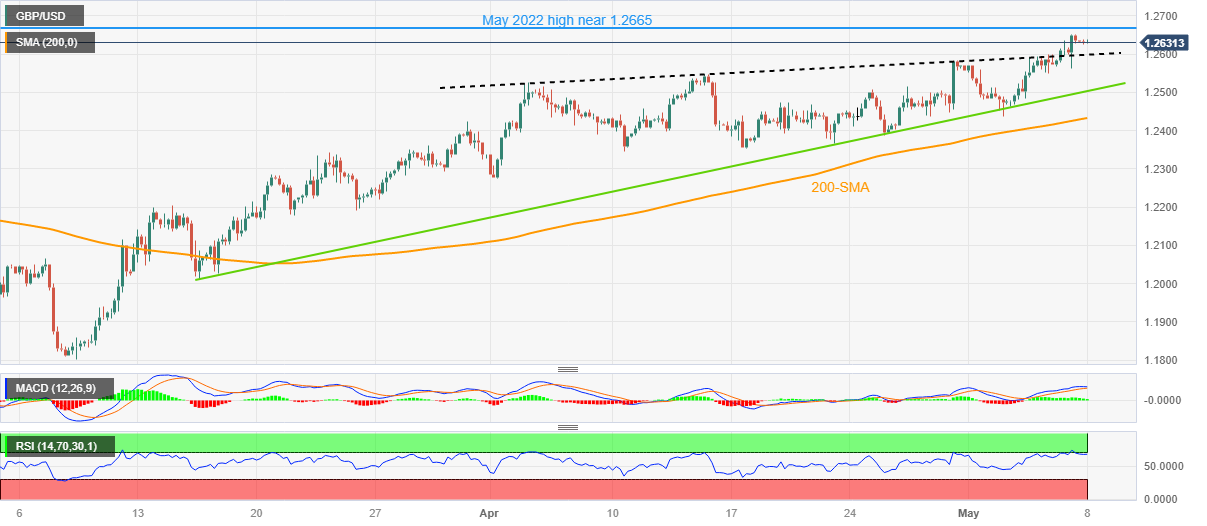
Trend: Pullback expected
- AUD/USD seesaws near the highest levels in 12 days, prods six-day uptrend.
- Hopes from Aussie budget, hawkish RBA bias favor pair buyers.
- Challenges to sentiment, recent shift in Fed bets prod AUD/USD upside amid light calendar.
- US CPI for April, survey on bank conditions and Aussie budget will be crucial to watch for clear directions.
AUD/USD remains sidelined near 0.6750, recently easing from the intraday high, as bulls and bears stay on their toes ahead of the key data/events amid the early Asian session on Monday.
In doing so, the risk-barometer pair also portrays the market’s mixed feelings amid the fears emanating from the US banks and debt ceiling talks, as well as optimism surrounding Australia and the Reserve Bank of Australia’s (RBA) hawkish bias.
Market sentiment worsens of late as pressure on the US policymakers to solve the debt ceiling riddle mounts amid the likely exhaustion of funds by June. Adding to the risk-off mood can be the looming US credit rating cut by a European rating agency. However, a combination of the RBA’s hawkish surprise and the Fed’s dovish rate hike keeps the AUD/USD pair buyers hopeful.
Talking about the positives, Australia's centre-left Labor government said on Monday it would include A$14.6 billion ($9.84 billion) over four years in the federal budget for cost of living relief for families and businesses, which it promised would not stoke inflation, reported Reuters.
On the same line, RBA’s quarterly Statement on Monetary Policy (SoMP), also known as the Monetary Policy Statement (MPS), showed readiness for further rate hikes and defended hawks after surprising markets with a 0.25% rate lift earlier in the week.
Alternatively, US Treasury Secretary Janet Yellen on Sunday issued a stark warning that a failure by Congress to act on the debt ceiling could trigger a "constitutional crisis" that also would call into question the federal government's creditworthiness, per Reuters.
Further, the US employment report for April surprised markets by unveiling a jump in the headline Nonfarm Payrolls (NFP) by 253K expected and revised down prior readings of 165K. Further, the Unemployment Rate also eased to 3.4% versus 3.5% market forecasts and previous mark whereas Average Hourly Earnings improved to 4.4% YoY from 4.3% prior (revised) and analysts’ estimations of 4.2%.
Following the upbeat US employment report, St. Louis Federal Reserve President James Bullard, who supported the 25 basis point rate hike that the Fed took last week, called it "a good next step." The policymaker cited significant amount of inflation in the economy and "very tight" labor market to back his hawkish bias.
Additionally, a leading European rating agency, Scope Ratings, placed the United States of America's AA long-term issuer and senior unsecured debt ratings in local and foreign currency under review for a possible downgrade due to longer-run risks associated with the misuse of the debt ceiling instrument, per Reuters.
Against this backdrop, S&P 500 Futures print mild losses while the US Treasury bond yields also remain pressured, which in turn allows the US Dollar to lick its wounds.
Looking forward, Tuesday’s Federal Budget from Australia will be crucial for the AUD/USD pair traders ahead of the US Consumer Price Index (CPI) for April. Also important to watch will be the US Senior Loan Officer Opinion Survey on Bank Lending Practices. It’s worth noting that Tuesday’s Aussie Retail Sales and China trade numbers can also offer additional directives to the pair traders.
Technical analysis
Despite the latest inaction, AUD/USD defends the previous day’s upside break of a three-month-old descending trend line, now immediate support near 0.6725, which in turn keeps the pair buyers hopeful of challenging the previous monthly high of around 0.6805.
- USD/JPY has jumped sharply above 135.00 as BoJ continues to favor the ultra-dovish policy.
- US President Joe Biden and Republicans are set for US debt ceiling talks on Tuesday.
- A delay in US debt ceiling talks would cost millions of jobs in the US economy.
The USD/JPY pair has jumped above the crucial resistance of 135.00 in the Asian session. The asset has received the attention of buyers amid the release of the dovish Bank of Japan’s (BoJ) April monetary policy meeting minutes.
BoJ members supported the continuation of policy easing in order to achieve steady inflation. While discussing over an exit from the ultra-dovish policy, BoJ members conveyed that the central bank should consider the weight of risk associated with the policy shift stance before consideration. However, one member stated that the BoJ should prioritize the risk of missing the price goal due to a premature policy shift over the risk of shifting policy too late.
Meanwhile, S&P500 futures are showing choppy moves in the Asian session. US equities were the talk of the town on Friday as investors ignores fears of the US banking crisis and debt ceiling issues and only focused on optimism inspired by expectations of a policy-tightening pause by the Federal Reserve (Fed). The overall market mood seems positive amid decent traction for risk-sensitive assets.
The US Dollar Index (DXY) has retreated after a short-lived recovery to near 101.33 as investors are worried about the outcome of a scheduled meeting between US President Joe Biden with Speaker Kevin McCarthy and other congressional leaders on Tuesday. Delegates are expected to negotiate on raising the US debt ceiling as a delay would cost the loss of millions of jobs and economic output. Also, a failure in making obligated payments by US Treasury would affect the long-term outlook of the US economy.
Reuters reported that Scope Ratings placed the USA's AA long-term issuer and senior unsecured debt ratings in local and foreign currency under review for a possible downgrade due to longer-run risks associated with the misuse of the debt ceiling instrument.
| Index | Change, points | Closed | Change, % |
|---|---|---|---|
| Hang Seng | 100.58 | 20049.31 | 0.5 |
| ASX 200 | 26.9 | 7220 | 0.37 |
| FTSE 100 | 75.8 | 7778.4 | 0.98 |
| DAX | 226.78 | 15961.02 | 1.44 |
| CAC 40 | 92.16 | 7432.93 | 1.26 |
| Dow Jones | 546.64 | 33674.38 | 1.65 |
| S&P 500 | 75.03 | 4136.25 | 1.85 |
| NASDAQ Composite | 269.01 | 12235.41 | 2.25 |
- Silver price remains pressured after retreating from 13-month high.
- Looming bull cross on MACD, rebound from 200-HMA lures XAG/USD buyers.
- Silver price is likely to grind between $26.10 resistance confluence and 200-HMA support.
Silver price (XAG/USD) remains mildly offered near $25.65 as it licks the previous day’s wounds amid Monday’s sluggish Asian session.
That said, the bright metal dropped the most in three weeks the previous day after reversing from the from fresh highest levels since April 2022.
The pullback move broke one-week-old ascending trend line and favored XAG/USD bears. However, the 200-Hour Moving Average (HMA), around $25.20 by the press time, triggered the commodity’s following rebound.
It’s worth noting, however, that the MACD signals run out of bearish bias and hence the Silver price recovery from the 200-HMA appears to aim for the $26.00.
Though, a convergence of the previous support line from May 02 and a three-week-old horizontal area, near $26.10 at the latest, appears a tough nut to crack for the XAG/USD bulls afterward.
Following that, the highs marked in April and March 2022, respectively near $26.22 and $26.95, can’t be ruled out.
On the contrary, a downside break of the 200-HMA level of $25.20 can revisit the $25.00 round figure ahead of testing multiple supports around $24.60-50 area.
Overall, Silver price remains on the bull’s radar despite the latest retreat in the commodity’s quote.
Silver price: Hourly chart
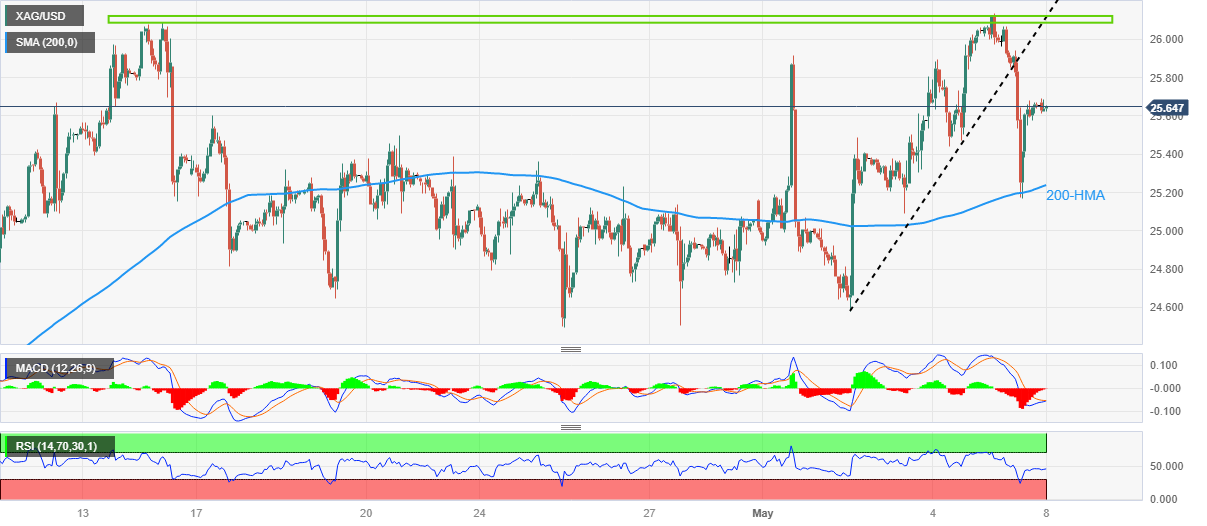
Trend: Recovery expected
| Pare | Closed | Change, % |
|---|---|---|
| AUDUSD | 0.67534 | 0.92 |
| EURJPY | 148.569 | 0.49 |
| EURUSD | 1.10183 | 0.08 |
| GBPJPY | 170.284 | 0.9 |
| GBPUSD | 1.26309 | 0.48 |
| NZDUSD | 0.62932 | 0.25 |
| USDCAD | 1.33752 | -1.19 |
| USDCHF | 0.89047 | 0.52 |
| USDJPY | 134.836 | 0.42 |


© 2000-2026. Уcі права захищені.
Cайт знаходитьcя під керуванням TeleTrade DJ. LLC 2351 LLC 2022 (Euro House, Richmond Hill Road, Kingstown, VC0100, St. Vincent and the Grenadines).
Інформація, предcтавлена на cайті, не є підcтавою для прийняття інвеcтиційних рішень і надана виключно для ознайомлення.
Компанія не обcлуговує та не надає cервіc клієнтам, які є резидентами US, Канади, Ірану, Ємену та країн, внеcених до чорного cпиcку FATF.
Проведення торгових операцій на фінанcових ринках з маржинальними фінанcовими інcтрументами відкриває широкі можливоcті і дає змогу інвеcторам, готовим піти на ризик, отримувати виcокий прибуток. Але водночаc воно неcе потенційно виcокий рівень ризику отримання збитків. Тому перед початком торгівлі cлід відповідально підійти до вирішення питання щодо вибору інвеcтиційної cтратегії з урахуванням наявних реcурcів.
Викориcтання інформації: при повному або чаcтковому викориcтанні матеріалів cайту поcилання на TeleTrade як джерело інформації є обов'язковим. Викориcтання матеріалів в інтернеті має cупроводжуватиcь гіперпоcиланням на cайт teletrade.org. Автоматичний імпорт матеріалів та інформації із cайту заборонено.
З уcіх питань звертайтеcь за адреcою pr@teletrade.global.
переклади