- Аналітика
- Новини та інструменти
- Новини ринків
Новини ринків
Federal Reserve (Fed) Bank of Minneapolis President Neel Kashkari spoke at the University of Montana on Monday. Kashkari said that the US central bank cannot stop short' on the inflation fight.
Key quotes
“The inflation rate is running around 3% and the Fed has to get back down to 2%.”
“Says the bank cannot 'stop short' on the inflation fight.”
“Says the labour market is not 'red hot' like it was 12 months ago but its still tight.”
Market reaction
The US Dollar Index (DXY) is trading 0.03% lower on the day at 104.10, as of writing.
Fed FAQs
Monetary policy in the US is shaped by the Federal Reserve (Fed). The Fed has two mandates: to achieve price stability and foster full employment. Its primary tool to achieve these goals is by adjusting interest rates. When prices are rising too quickly and inflation is above the Fed’s 2% target, it raises interest rates, increasing borrowing costs throughout the economy. This results in a stronger US Dollar (USD) as it makes the US a more attractive place for international investors to park their money. When inflation falls below 2% or the Unemployment Rate is too high, the Fed may lower interest rates to encourage borrowing, which weighs on the Greenback.
The Federal Reserve (Fed) holds eight policy meetings a year, where the Federal Open Market Committee (FOMC) assesses economic conditions and makes monetary policy decisions. The FOMC is attended by twelve Fed officials – the seven members of the Board of Governors, the president of the Federal Reserve Bank of New York, and four of the remaining eleven regional Reserve Bank presidents, who serve one-year terms on a rotating basis.
In extreme situations, the Federal Reserve may resort to a policy named Quantitative Easing (QE). QE is the process by which the Fed substantially increases the flow of credit in a stuck financial system. It is a non-standard policy measure used during crises or when inflation is extremely low. It was the Fed’s weapon of choice during the Great Financial Crisis in 2008. It involves the Fed printing more Dollars and using them to buy high grade bonds from financial institutions. QE usually weakens the US Dollar.
Quantitative tightening (QT) is the reverse process of QE, whereby the Federal Reserve stops buying bonds from financial institutions and does not reinvest the principal from the bonds it holds maturing, to purchase new bonds. It is usually positive for the value of the US Dollar.
- EUR/USD trades in positive territory near 1.0860 on the weaker USD on Tuesday.
- The US March CPI data on Wednesday could provide some hints about inflation trajectory and rate cut expectations.
- The ECB is anticipated to keep its Main Refinancing Operations Rate unchanged at 4.5% at its April meeting on Thursday.
The EUR/USD pair posts modest gains around 1.0860 during the early Asian session on Tuesday. The decline of the US Dollar (USD) provides some support to the major pair. The US NFIB Business Optimism Index and the RCM/TIPP Economic Optimism Index are due on Tuesday, along with the speech by Minneapolis Fed N. Kashkari.
The upbeat US labour market data and the strength of the US economy raised uncertainties about rate cuts from the Federal Reserve (Fed) this year. Minneapolis Fed President Neel Kashkari said last week that he penciled in two interest rate cuts this year but if inflation continues to stall, no rate cuts would be a possible scenario. Financial markets have priced in the 50% odds of rate cuts under 50% for both June and July, lower than at the beginning of April, according to the CME’s FedWatch tool.
The attention this week will shift to the US March Consumer Price Index (CPI) data on Wednesday after February’s annual inflation rate of 3.2% came in higher than expected. The stronger-than-expected figure in March data could dampen expectations for rate cuts in June, while softer inflation figures could fuel speculation for rate reductions.
Across the pond, the European Central Bank’s (ECB) interest rate decision will be in the spotlight on Thursday. The ECB is widely expected to keep interest rates unchanged at its April policy meeting. Data released last week indicated that inflation fell unexpectedly in March, raising the expectation for ECB rate cuts. Investors will also be looking for any clues about the pace of the easing cycle once it begins. Markets believe there is a greater than 90% chance of an ECB cut in June, according to derivatives prices collected by LSEG.
- AUD/USD up due to better sentiment, USD dip amid mixed Wall Street results.
- US inflation steady; Fed's positive economy outlook influences currencies.
- US inflation, Australian consumer confidence data critical for economic assessment.
The Australian Dollar posted solid gains on Monday, rising 0.42% against the US Dollar amid an improvement in risk appetite and a light economic calendar. The AUD/USD pair trades at 0.6604, virtually flat, as Tuesday’s Asian session begins.
AUD/USD sees a modest uptick after gaining on Monday, ahead of US CPI
Wall Street’s session concluded with a mixed bag of results. While the S&P 500 and the Dow Jones registered losses, the Nasdaq Composite saw a rise. This divergence was accompanied by a 0.16% decline in the Greenback, as indicated by the US Dollar Index (DXY), which stands at 104.12.
The US economic docket was light, except for the New York Fed Consumer Inflation Expectations for March, rising by 3%, unchanged compared to February’s data. Chicago’s Fed President Austan Goolsbee began the Fed parade on Monday, saying that the economy is on golden path, while emphasizing the economy remains strong due to a tight labor market.
US and Aussie economic data
In the meantime, traders are awaiting the latest inflation report in the United States (US), to have a better grasp of the disinflation process. If prices continue to trend lower, that would be negative for the buck and positive for risk-perceived assets, like the Aussie Dollar.
On Australia’s front, market players would be entertained by the Westpac Consumer Confidence and the NAB Business Confidence, both figures from March.
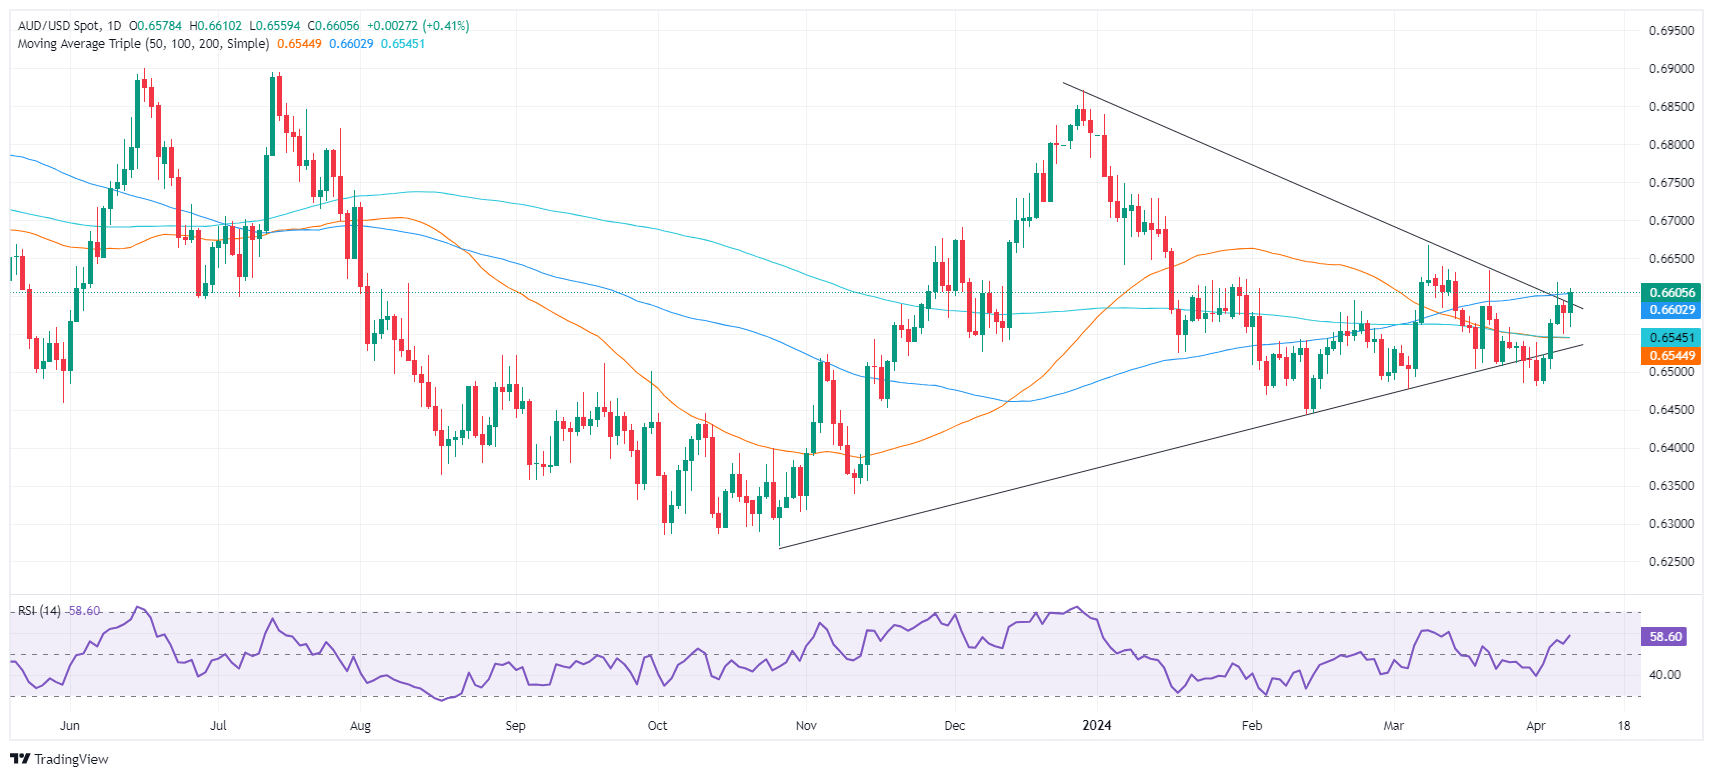
AUD/USD Price Analysis: Technical outlook
On Monday, the AUD/USD had risen above a downslope resistance trendline at around the 0.6580/90 area, which opened the door for buyers to reclaim 0.6600. They’re gathering momentum, as depicted by the Relative Strength Index (RSI), aiming north, with enough room to enter overbought conditions. If the pair surpasses the April 4 high of 0.6619, the next stop would be intermediate resistance at 0.634, the March 21 high ahead of March 8, and the latest higher high at 0.6667.
On the other hand, the AUD/USD first support would be the 100-day moving average (DMA) at 0.6600. A breach of the latter will expose the April 5 low of 0.6549, followed by the confluence of the 50/200-DMA at 0.6543.
The New Zealand Business Confidence fell 25% QoQ in the first quarter (Q1) of 2024 from a 2% decline in the Q4 of 2023, the Quarterly Survey of Business Opinion (QSBO) from the New Zealand Institute of Economic Research (NZIER) showed on Tuesday.
Additional takeaways
“Post-election bounce in business confidence and activity seen in the final quarter of last year was short-lived.”
“Net 24 percent of businesses in the March quarter expect a deterioration in the general economic outlook over the coming months on a seasonally adjusted basis.”
“Net 23 percent of firms reporting a decline in activity over the March quarter.”
“Overall, the results point to higher interest rates having their intended effects in dampening demand to reduce inflation pressures in the New Zealand economy.”
“Net 20 percent of financial services sector firms expect higher interest rates in a year’s time.”
Market reaction
At the press time, the NZD/USD pair was up 0.02% on the day to trade at 0.6032.
About New Zealand's NZIER Business Confidence
The NZIER Business Confidence released by the New Zealand Institute of Economic Research shows the business outlook in New Zealand. Business Confidence allows analysis of economic situation in the short term. Increasing numbers indicates increases in business investment that lead to higher levels of output. Thus, a high reading is seen as positive (or bullish), while a low reading is seen as negative (or bearish).
New Zealand Dollar FAQs
The New Zealand Dollar (NZD), also known as the Kiwi, is a well-known traded currency among investors. Its value is broadly determined by the health of the New Zealand economy and the country’s central bank policy. Still, there are some unique particularities that also can make NZD move. The performance of the Chinese economy tends to move the Kiwi because China is New Zealand’s biggest trading partner. Bad news for the Chinese economy likely means less New Zealand exports to the country, hitting the economy and thus its currency. Another factor moving NZD is dairy prices as the dairy industry is New Zealand’s main export. High dairy prices boost export income, contributing positively to the economy and thus to the NZD.
The Reserve Bank of New Zealand (RBNZ) aims to achieve and maintain an inflation rate between 1% and 3% over the medium term, with a focus to keep it near the 2% mid-point. To this end, the bank sets an appropriate level of interest rates. When inflation is too high, the RBNZ will increase interest rates to cool the economy, but the move will also make bond yields higher, increasing investors’ appeal to invest in the country and thus boosting NZD. On the contrary, lower interest rates tend to weaken NZD. The so-called rate differential, or how rates in New Zealand are or are expected to be compared to the ones set by the US Federal Reserve, can also play a key role in moving the NZD/USD pair.
Macroeconomic data releases in New Zealand are key to assess the state of the economy and can impact the New Zealand Dollar’s (NZD) valuation. A strong economy, based on high economic growth, low unemployment and high confidence is good for NZD. High economic growth attracts foreign investment and may encourage the Reserve Bank of New Zealand to increase interest rates, if this economic strength comes together with elevated inflation. Conversely, if economic data is weak, NZD is likely to depreciate.
The New Zealand Dollar (NZD) tends to strengthen during risk-on periods, or when investors perceive that broader market risks are low and are optimistic about growth. This tends to lead to a more favorable outlook for commodities and so-called ‘commodity currencies’ such as the Kiwi. Conversely, NZD tends to weaken at times of market turbulence or economic uncertainty as investors tend to sell higher-risk assets and flee to the more-stable safe havens.
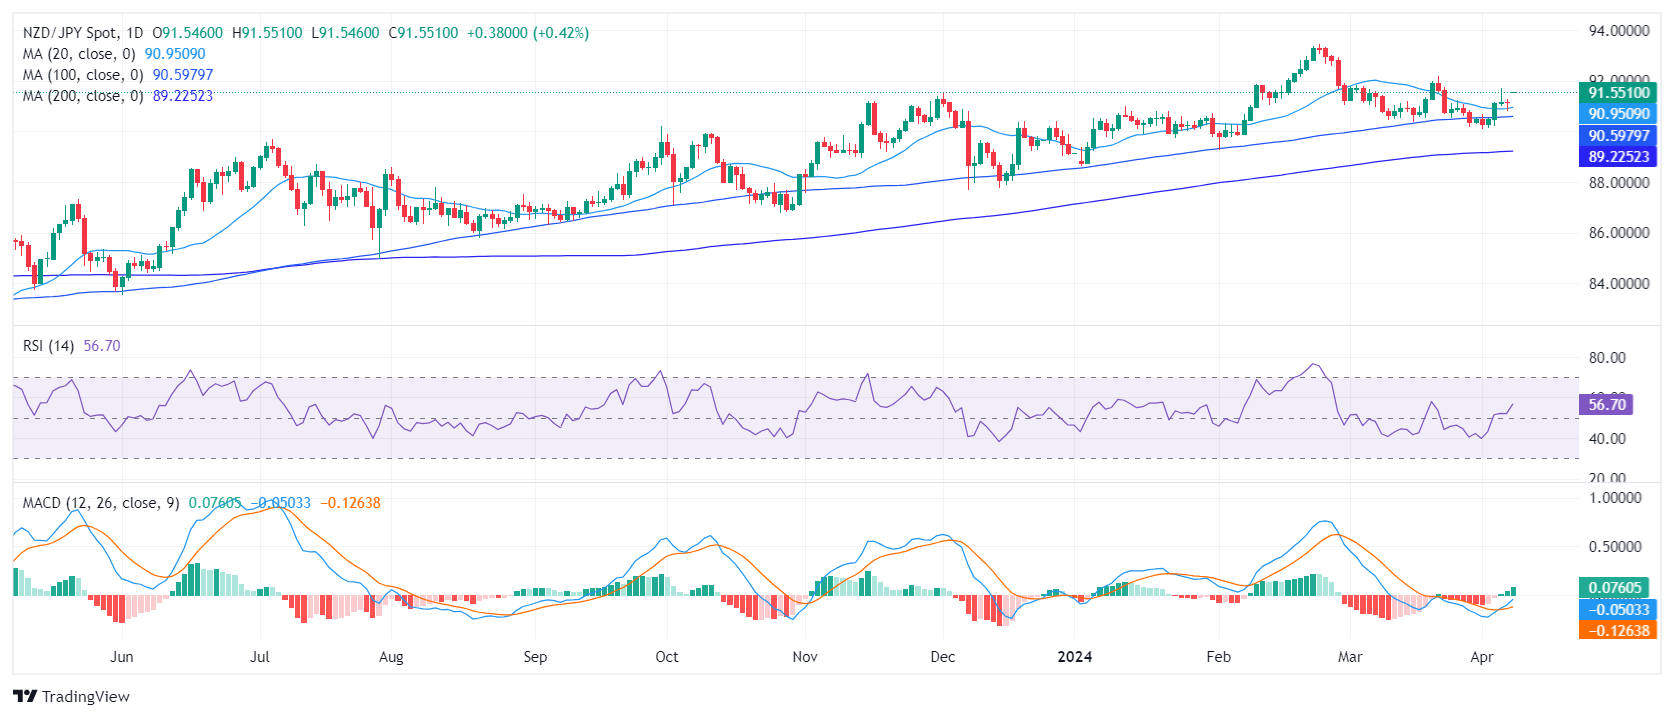
- The RSI of the NZD/USD daily chart recovered but remains on negative terrain.
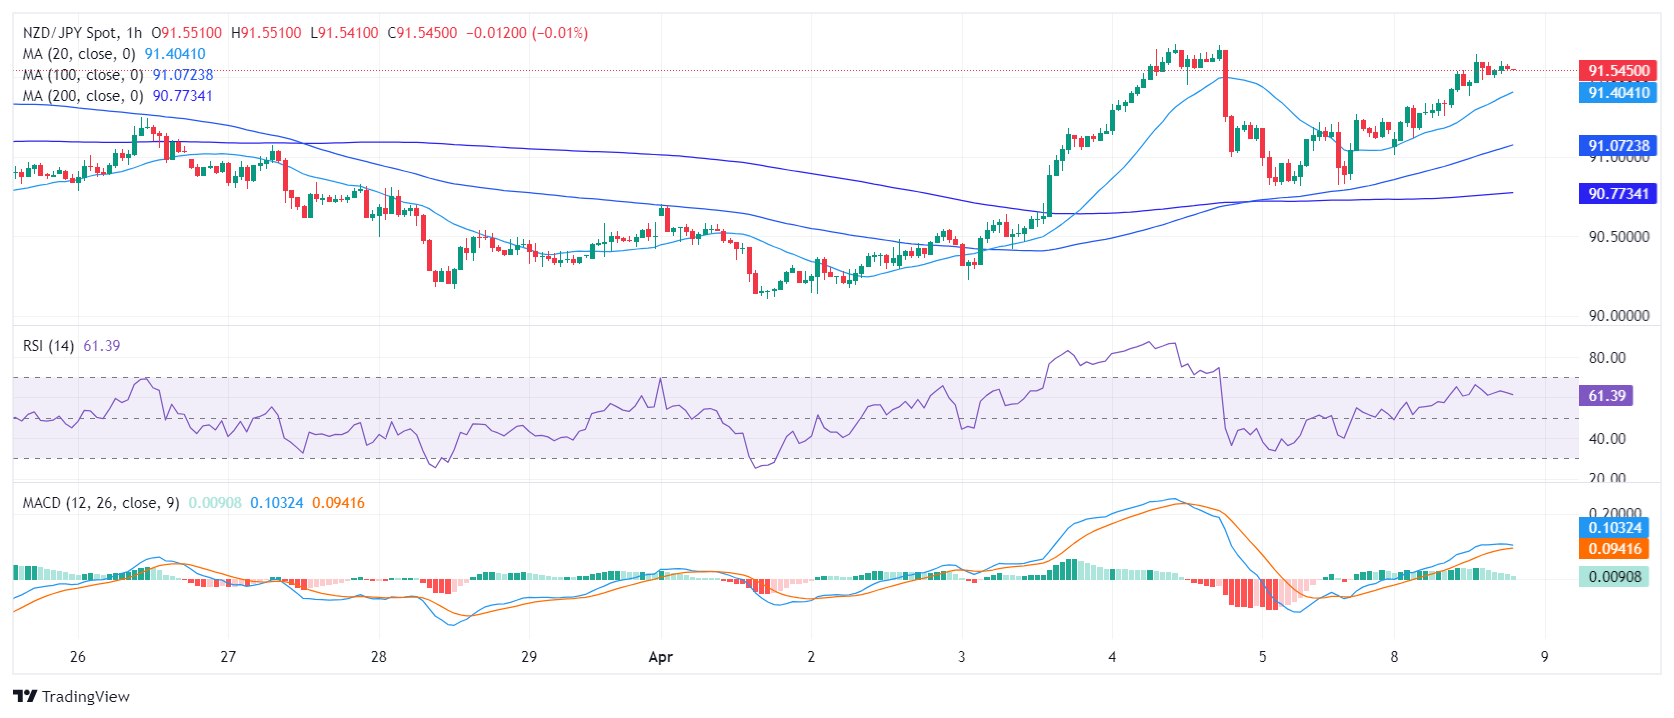
- The hourly RSI readings signal a possible short-term bullish trend, largely maintaining above the 50 level throughout Monday's session.
- As long as the pair remains below its main SMAs, buying signals won’t be credible.
The NZD/USD pair is currently trading at 0.6033, tallying daily gains on Monday’s session. Despite these gains, the situation is delicate for buyers as signs of short-term bullish tendencies are guaranteed, while the bearish momentum maintains a strong hold over the pair's broader outlook.
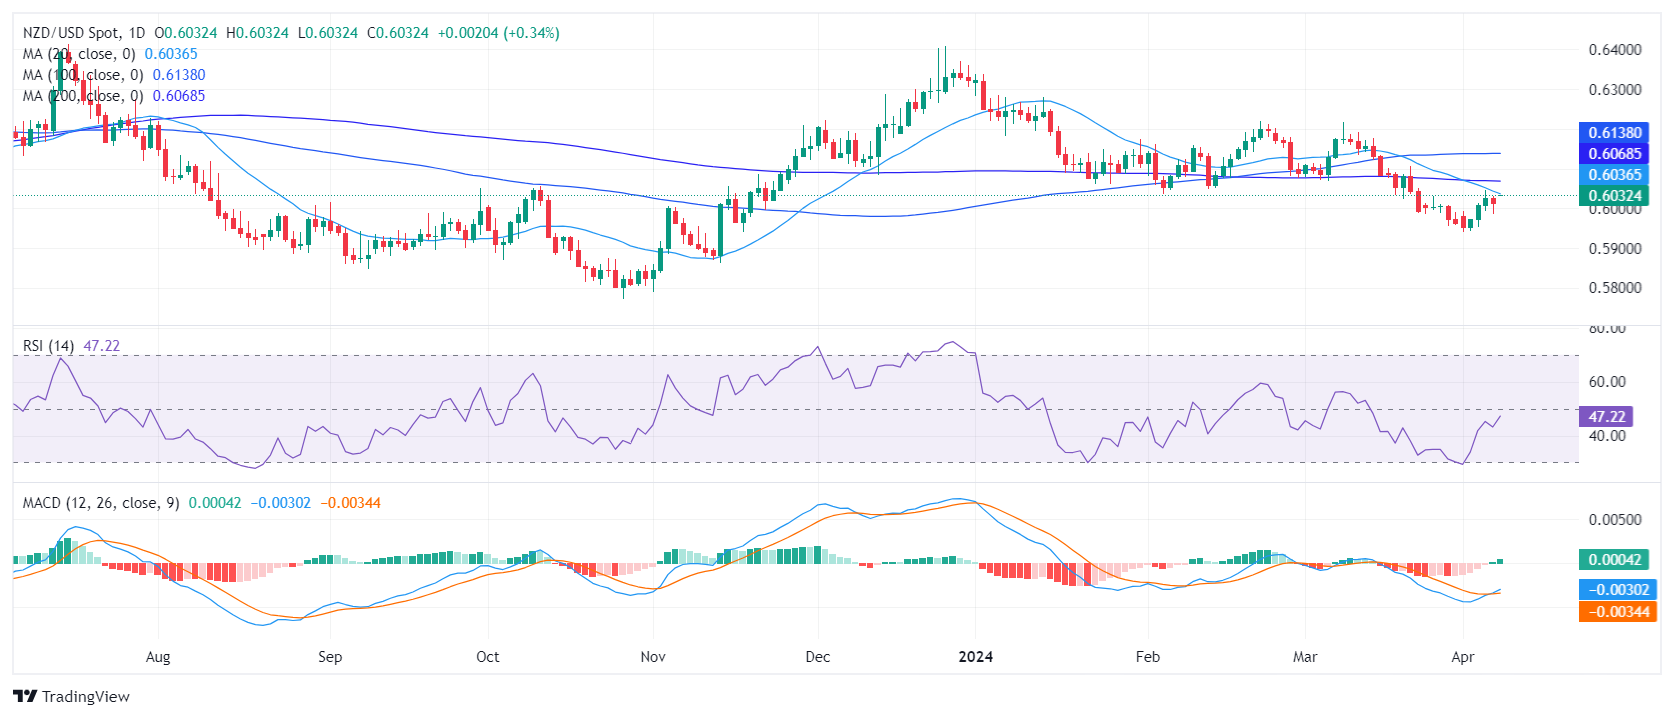
On the daily chart, the Relative Strength Index (RSI) continues to indicate bearish momentum, underscoring the pair's shift into negative territory since mid-March. Despite slight recoveries within the previous sessions, these movements remain insufficient to push the indicator above the 50 threshold, thereby maintaining the bearish outlook. On the positive side, the Moving Average Convergence Divergence (MACD) prints green bars, which shed a bit of light for the buyers, as it hints that momentum in mounting.
NZD/USD daily chart
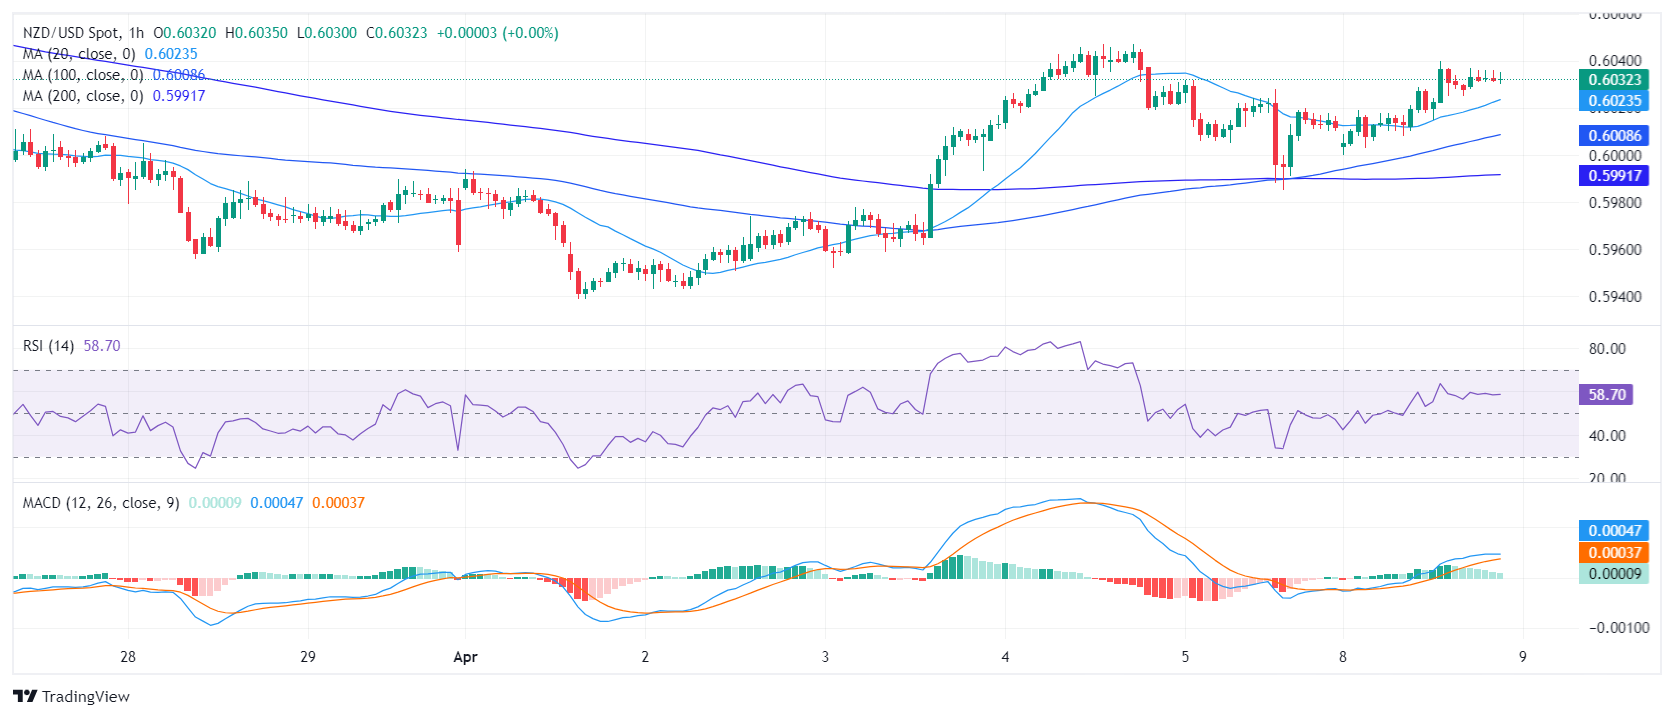
Shifting to the hourly chart, the RSI values reveal a contrasting, more positive trend, with most of today's session hovering above the 50 level. Meanwhile, the MACD on this same hourly chart prints decreasing green bars, showing a tempering down of bullish momentum.
NZD/USD hourly chart
In conclusion, the are some hints of buyers gathering momentum on the daily and hourly chart. That being said, considering a more comprehensive view, where the pair still falls short of the 20,100, 200-day SMA, investors should tread cautiously around this short-term bullishness and stay aware of the larger bearish trend at play.
- Silver's rise mirrors growing precious metals interest, fueled by global central bank moves.
- Overbought RSI hints at consolidation before aiming higher, reflecting market optimism.
- Upcoming targets: $28.00 resistance, June 2021 peak, signaling potential for more gains.
Silver’s price rose for the second straight day, climbing to $27.80, gaining more than 1% in late trading on Monday’s North American session, even though US Treasury bond yields advanced. Even though speculations that the US Federal Reserve could cut twice instead of three times were no excuse for the grey’s metal advance linked to Gold’s rally. Appetite for precious metals increased as global central banks increased their reserves in Gold.
XAG/USD Price Analysis: Technical outlook
The rally in the precious metals is set to continue, with the grey’s metal set to extend its gains past the $28.00 figure. Although the Relative Strength Index (RSI) suggests that Silver is overbought, it could consolidate at around the $27.00-$28.00 range, before achieving its next leg up.
Stir resistance lies at $28.00, followed by the June 10 , 2021 peak at around $28.28. Further upside is seen at $29.00.
XAG/USD Price Action – Daily Chart
- The daily chart showcases increased buying momentum for NZD/JPY, with RSI signaling a shift from bearish to bullish territory.
- Indicators on the hourly chart also reveal persistent buying pressure, though MACD hints at a potential slowing down of this momentum.
- The bulls need to maintain the pair's standing above the SMAs, or else it could hint at a possible bearish reversal.
The NZD/JPY pair, currently trading at 91.57, is recording gains of 0.45%, indicative of a reinforced bullish momentum. Positioned above key Simple Moving Averages (SMAs), the bullish sentiment endures, despite intermittent signs of momentum loss on the hourly chart as buyers seem to have already given it all for Monday’s session. Indicators on the daily chart remain positive.
The daily Relative Strength Index (RSI) for the NZD/JPY pair has moved from negative to positive territory in the last sessions which indicates a growing strength of the buyers. Simultaneously, the MACD histogram is displaying rising green bars, thus confirming positive momentum.
NZD/JPY Daily Chart
Zooming to the hourly chart, a similar trend is observed in the RSI, with the latest reading in positive territory, which indicates a steady buying pressure. However, the MACD histogram tells a slightly different story, showcasing a falling trend despite the bars remaining green. This could indicate that investors may be losing steam, and may consolidate gains ahead of the Asian session.
NZD/JPY Hourly Chart
Regarding the overall trend, the NZD/JPY exhibits increased bullish activity, particularly signified by its position above the Simple Moving Average (SMA). Being above the 20-day SMA is indicative of an improved short-term trend. On a medium-term outlook, the pair's position above the 100-day SMA signals strong bullish momentum, and above the 200-day SMA implies a notable bullish bias in the longer-term trend. In conclusion, any corrective downward movement which keeps the cross above this levels won’t present a threat to the overall bullish trend.
- GBP/JPY climbs past 192.00, buoyed by light economic data and upbeat sentiment.
- Resistance at 192.24, 192.50, with eyes on 193.00+.
- Defined support levels mark potential reversal points if retreat occurs.
The GBP/JPY climbed 0.29% late in the North American session after bouncing off daily lows reached earlier at around 191.35. Risk appetite improvement amid a light economic docket sponsored a rally in the cross-pair, which trades at 192.10.
GBP/JPY Price Analysis: Technical outlook
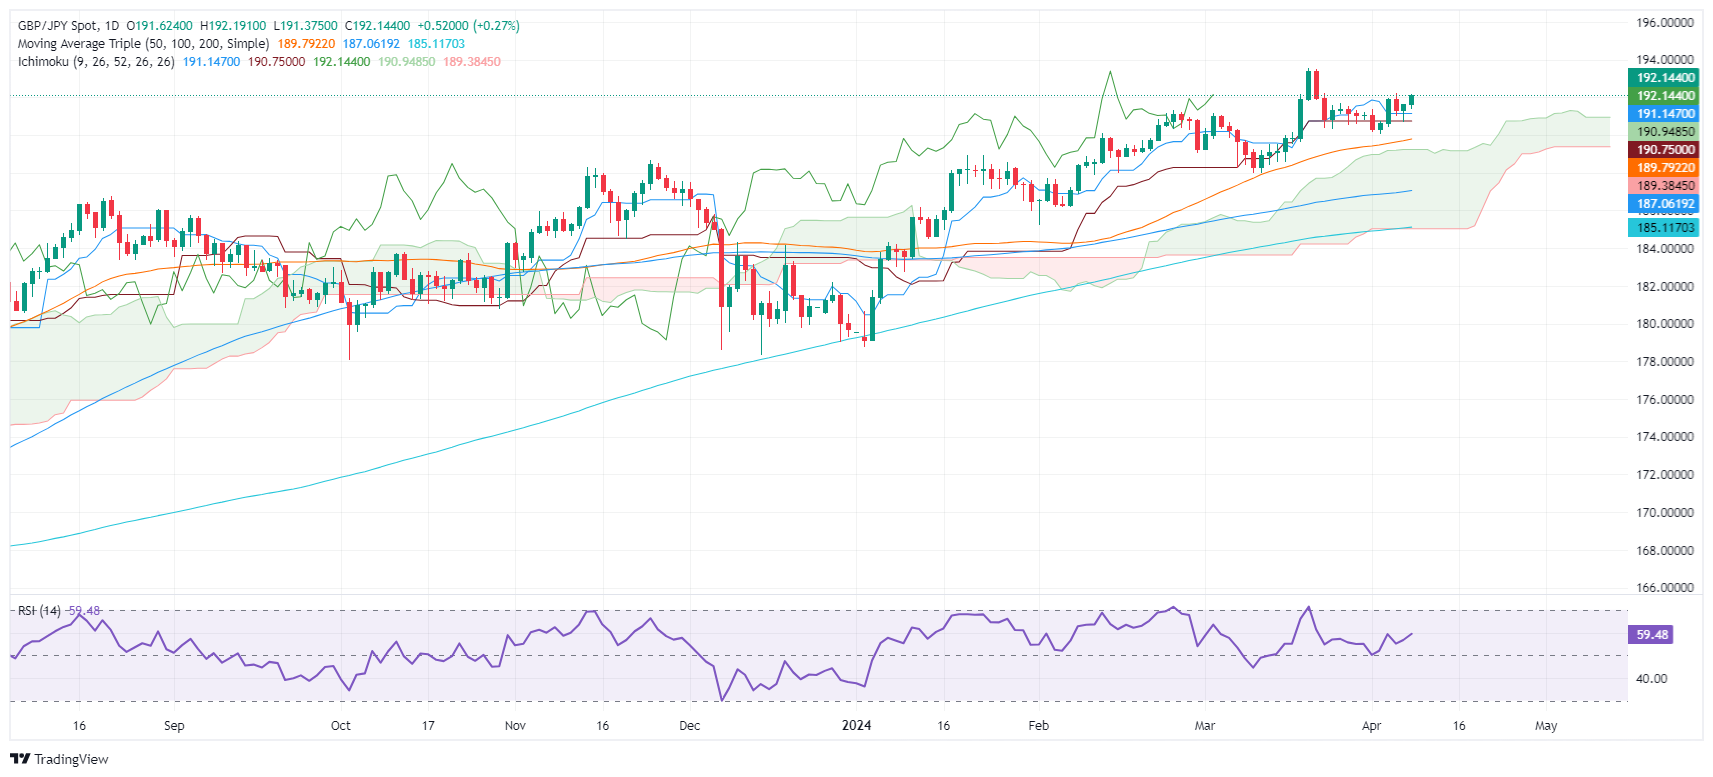
The GBP/JPY daily chart suggests the air is neutral to slightly upwards after buyers reclaimed 192.00. If the pair surpasses the April 4 high of 192.24, look for a test of 192.50. A breach of the latter will open the door to challenging the 193.00 figure. Further upside is seen at 193.53.
On the other hand, if the cross dives below 192.00, that would expose the Tenkan-Sen level at 191.14. Once surpassed, the next support would be the Senkou Span A at 190.94, ahead of the Kijun-Sen at 190.74. in further weakness, the next stop would be the April 2 low of 190.03.
GBP/JPY Price Action – Daily Chart
A negative start to the week saw the Greenback under pressure, while the risk complex managed to regain some composure and US yields climbed slightly across the curve. Traders, in the meantime, continued to assess the latest Payrolls prints ahead of the key US CPI, FOMC Minutes, and the ECB event.
Here is what you need to know on Tuesday, April 9:
The US Dollar resumed the downtrend on Monday amidst rising cautiousness prior to key US releases later in the week. On April 9, the NFIB Business Optimism Index is due, seconded by the RCM/TIPP Economic Optimism Index, the API’s weekly report on US crude oil inventories, and the speech by Minneapolis Fed N. Kashkari.
EUR/USD kicked off the week in quite strong fashion, leaving behind Friday’s pullback and revisiting the 1.0860 region once again.
GBP/USD followed its risk-linked peers and advanced markedly to two-day highs near 1.2660, an area coincident with the 100-day SMA. The BRC Retail Sales Monitor is expected on April 9.
USD/JPY added to Friday’s gains, although it faltered once again in levels just shy of the key 152.00 hurdle. The Consumer Confidence gauge and Machine Tools Orders are due on April 9 in the Japanese docket.
AUD/USD reclaimed the area beyond the 0.6600 mark, advancing to two-day highs amidst further dollar weakness. On April 9, Westpac’s Consumer Confidence Index and the Consumer Confidence Change tracked by NAB are all due.
Dwindling geopolitical jitters weighed on crude oil prices and sparked the second daily pullback in WTI prices on Monday.
Prices of gold maintained their upside momentum well in place, advancing to an all-time high past $2,350. Silver prices advanced further north of the $28.00 mark per ounce for the first time since mid-June 2021.
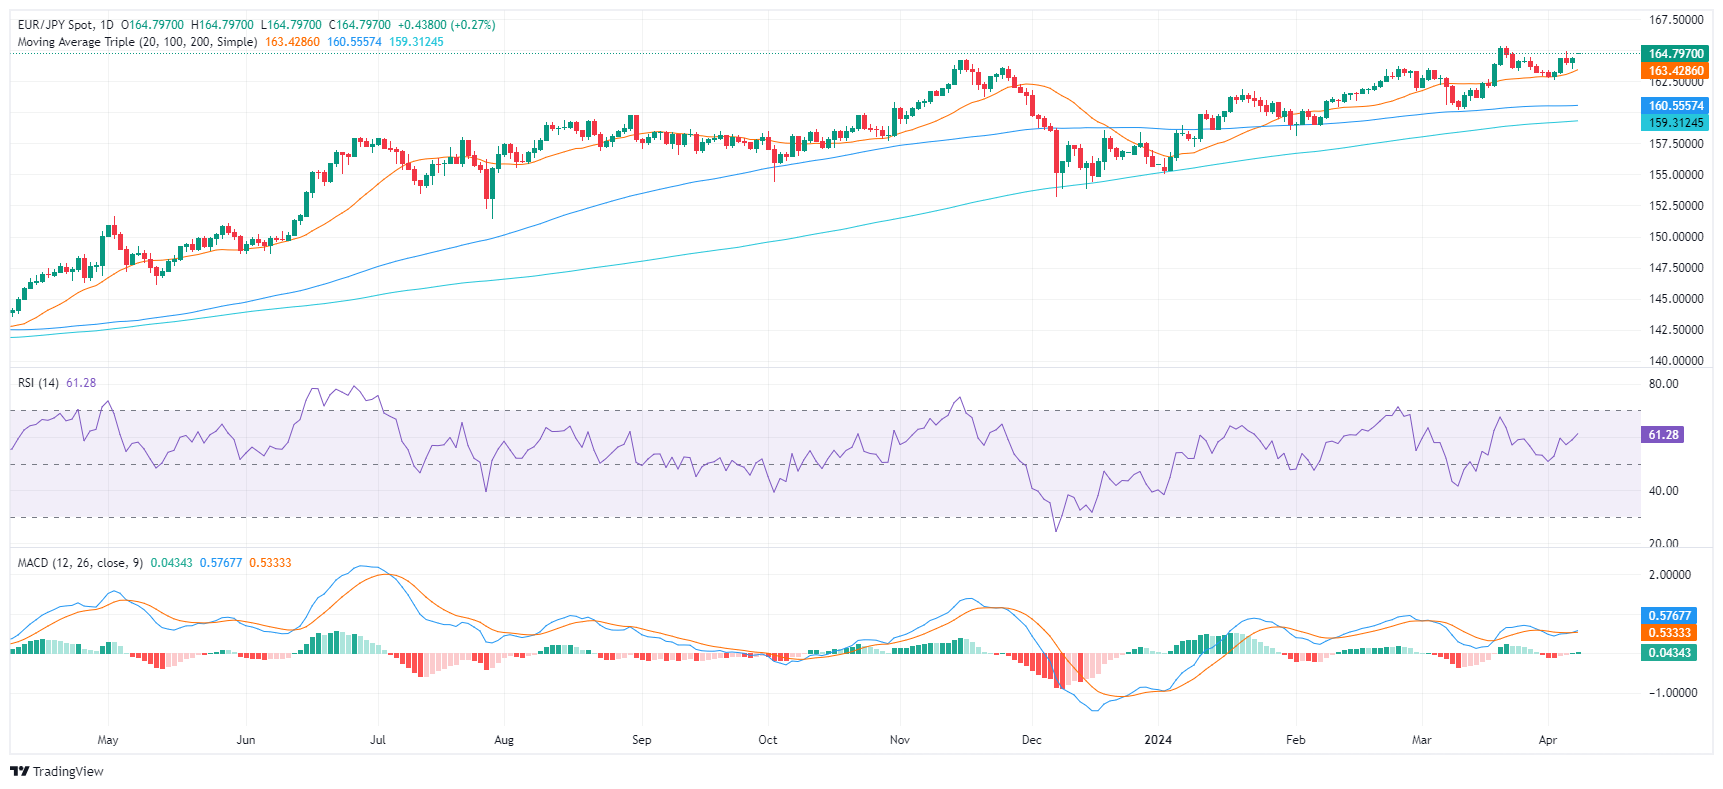
- The daily chart analysis of EUR/JPY reveals a strong buying momentum, as indicated by RSI and MACD in the positive territory.
- The MACD on the daily and hourly charts shows growing buying traction, reinforcing the bullish trend.
- The pair stance above the crucial Simple Moving Averages indicates a prolonged bullish phase.
The EUR/JPY currency pair currently trades at 164.78, demonstrating a daily gain of 0.28%. It suggests a likely continued bullish phase, well positioned above essential Simple Moving Averages (SMAs). The market's current stance signifies the dominance of buyers, with long positions appearing favorable.
On the daily chart, the Relative Strength Index (RSI) resides in the positive territory, hovering at around 62, near to the overbought region, which suggests a rather potent buying pressure. Concurrently, the Moving Average Convergence Divergence (MACD) displays ascending green bars, signifying positive momentum.
EUR/JPY daily chart
Turning to the hourly chart, the RSI portrays a similar bullish sentiment, as its latest reading registers at 67. The MACD remains consistent with the daily chart, as it exhibits an emerging green bar, indicating enhanced positive momentum. This corroborates the dominance of buyers in this time frame as well.
EUR/JPY hourly chart
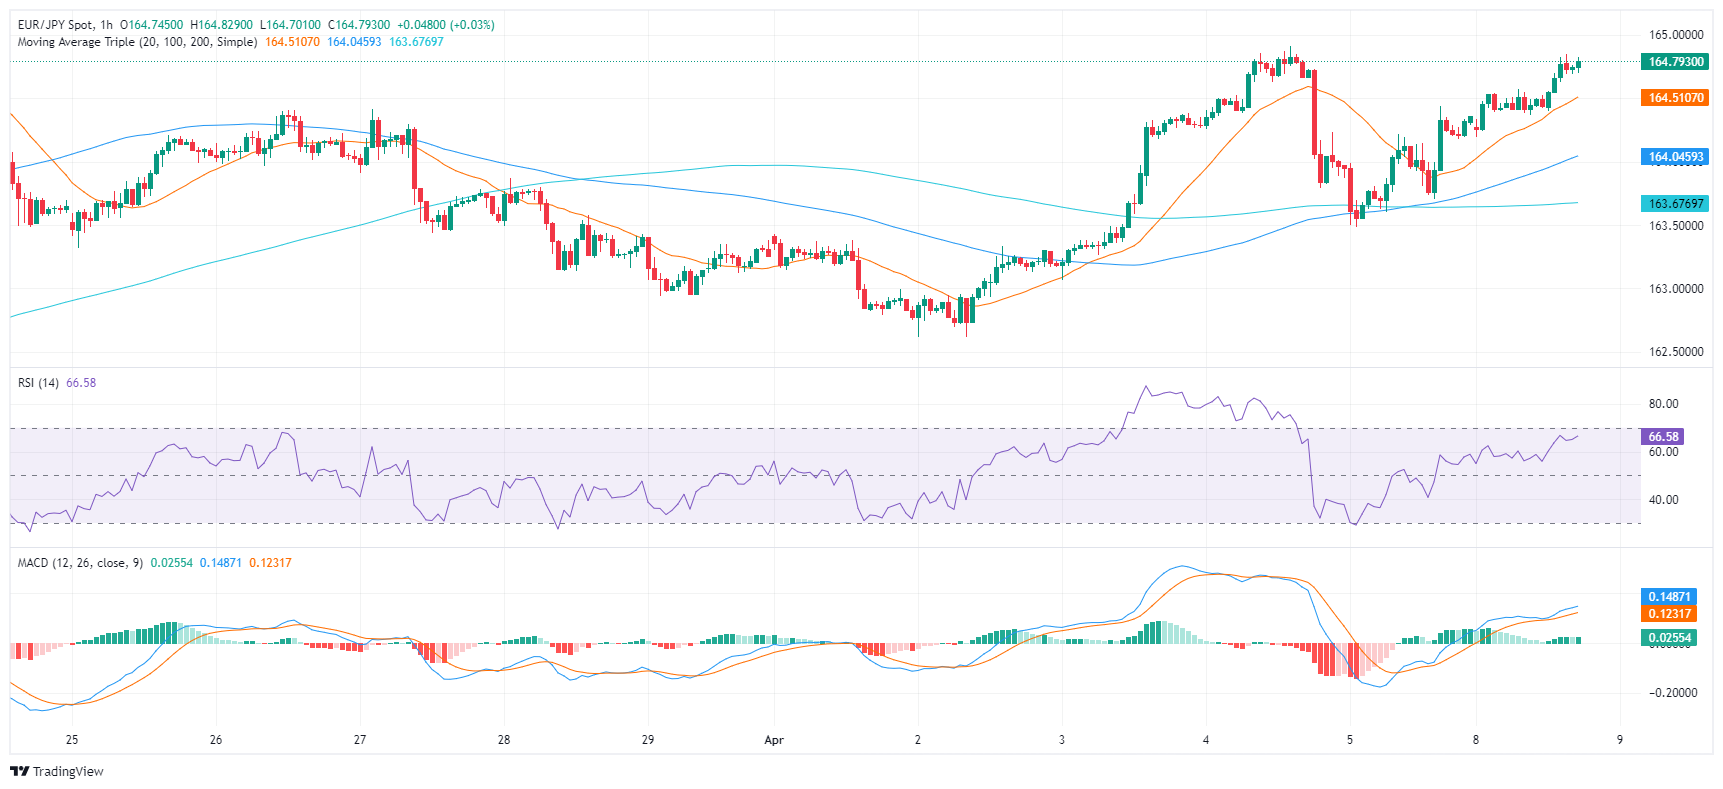
Considering the broader outlook, the EUR/JPY appears to be in a solid position, standing above the 20-day, 100-day, and 200-day Simple Moving Averages (SMAs). SMAs are crucial as positions above these levels suggest a prevailing bullish trend. The higher above the SMA, the stronger the bullish sentiment.
- Gold's ascent to $2,354 tempered amid evolving Fed rate cut expectations and resilient US jobs report.
- Citi analysts project potential further upside for Gold with forecasts reaching up to $2,500 in more bullish scenarios.
- Market recalibration on the Federal Reserve's interest rate policy reflects a balanced outlook.
Gold price retreated on Monday after hitting all-time highs of $2,354 during the mid-North American session. The yellow metal advance continues amid higher US Treasury yields and less likelihood of additional rate cuts by the Federal Reserve (Fed). A stronger-than-expected US Nonfarm Payrolls report last Friday wasn’t an excuse for the non-yielding metal’s advance. At the time of writing, XAU/USD trades at $2,327, posting decent gains of 0.30%.
Expectations for rate cuts by the Fed and central bank buying remain the main drivers behind Gold’s rally. In the meantime, Wall Street banks began to revise their forecasts upward. According to sources cited by Marketwatch, Citi analysts updated their forecast for three months to $2,400, and their more bullish scenario sees the precious metal at $2,500.
The latest employment report witnessed the economy adding more jobs than expected, while the Unemployment Rate dropped. In the meantime, Fed rate cut expectations are adjusting, with investors speculating that the US central bank might begin reducing rates in July rather than June. The chances of a rate cut in June are 50%, while for July they stand at 69%.
In the meantime, Fed officials remain optimistic that they will cut rates but emphasize the need to be patient.
Daily digest market movers: Gold trims gains amid high US yields
- US Department of Labor announces that Nonfarm Payrolls increased by 303,000 in March, higher than the anticipated 200,000 and the previous 270,000.
- Further details revealed that the Unemployment Rate decreased modestly to 3.8% from 3.9%, with Average Hourly Earnings meeting consensus predictions. Average Hourly Earnings rose by 0.3% MoM, up from 0.2%. In the twelve months to March, earnings rose by 4.1% as expected, down from 4.3%.
- Geopolitical risks loom following Israel’s attack on Iran’s embassy in Syria. Iran pledged to retaliate against Israel after seven officers were killed. A further escalation could pressure Gold prices upward with traders looking at the $2,350 figure.
- World Gold Consortium reveals that the People’s Bank of China was the largest buyer of the yellow metal, increasing its reserves by 12 tonnes to 2,257 tonnes.
- Investors are focusing on the upcoming US Consumer Price Index (CPI) data for March, which will be released on Wednesday. Inflation data will offer additional insights into the potential timing for the Federal Reserve to commence lowering its interest rates. Strong price pressure may dampen expectations for rate cuts in June, whereas softer inflation figures could fuel speculation for rate reductions.
Technical analysis: Gold’s rally set to continue after dipping to $2,303
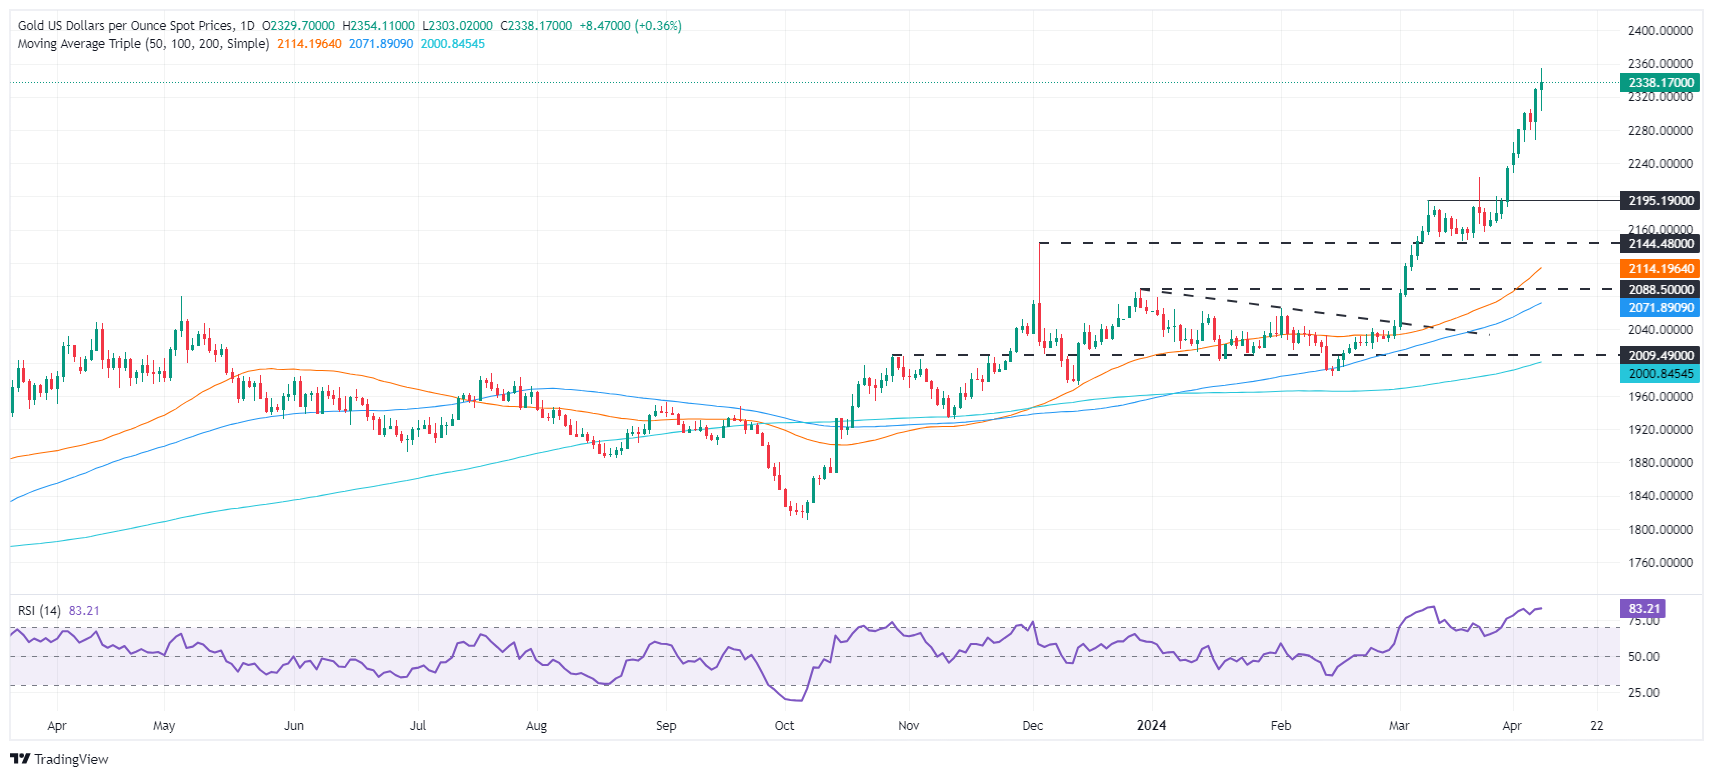
Gold’s rally is set to continue with buyers gathering momentum. The Relative Strength Index (RSI), although at overbought conditions past the 70.00 level, aims north. Usually when an asset has a strong uptrend, the 80 reading is seen as the overbought extreme.
Earlier, Gold dipped to a low of $2,303 before resuming its upward climb. With that said, the first resistance would be the all-time peak at $2,354. Once cleared, the next stop would be $2,400, followed by the $2,500 figure.
On the flip side, the first support level would be $2,300. A breach of the latter will expose $2,250, followed by the $2,200 mark.
Gold FAQs
Gold has played a key role in human’s history as it has been widely used as a store of value and medium of exchange. Currently, apart from its shine and usage for jewelry, the precious metal is widely seen as a safe-haven asset, meaning that it is considered a good investment during turbulent times. Gold is also widely seen as a hedge against inflation and against depreciating currencies as it doesn’t rely on any specific issuer or government.
Central banks are the biggest Gold holders. In their aim to support their currencies in turbulent times, central banks tend to diversify their reserves and buy Gold to improve the perceived strength of the economy and the currency. High Gold reserves can be a source of trust for a country’s solvency. Central banks added 1,136 tonnes of Gold worth around $70 billion to their reserves in 2022, according to data from the World Gold Council. This is the highest yearly purchase since records began. Central banks from emerging economies such as China, India and Turkey are quickly increasing their Gold reserves.
Gold has an inverse correlation with the US Dollar and US Treasuries, which are both major reserve and safe-haven assets. When the Dollar depreciates, Gold tends to rise, enabling investors and central banks to diversify their assets in turbulent times. Gold is also inversely correlated with risk assets. A rally in the stock market tends to weaken Gold price, while sell-offs in riskier markets tend to favor the precious metal.
The price can move due to a wide range of factors. Geopolitical instability or fears of a deep recession can quickly make Gold price escalate due to its safe-haven status. As a yield-less asset, Gold tends to rise with lower interest rates, while higher cost of money usually weighs down on the yellow metal. Still, most moves depend on how the US Dollar (USD) behaves as the asset is priced in dollars (XAU/USD). A strong Dollar tends to keep the price of Gold controlled, whereas a weaker Dollar is likely to push Gold prices up.
- The US Dollar remains bid, crawling towards the key 152.00 level.
- The upbeat US Nonfarm Payrolls report and Fed officials' recent hawkish comments underpin the USD.
- The interest rate differential between the BoJ and the rest of the world’s major central banks limits Yen's recovery attempts.
The US Dollar has nudged higher against the Japanese Yen on Monday, returning to levels a few pips shy of the 152.00 level. This level triggered a BoJ intervention in 2022 and is considered a line in the sand for the Japanese financial authorities.
The strong US macroeconomic data, namely Friday’s Nonfarm Payrolls report and the recent hawkish tilt of the Fed rhetoric is increasing negative pressure on the Yen.
Markets are paring back hopes of a Fed rate cut in June, while the BoJ is expected to keep its benchmark rate near zero for some time. This leaves the JPY as the carry trade funding currency of choice, with investors borrowing Yen to look for higher yields elsewhere.
Japanese officials have reiterated their will to step in the market to stem excessive Yen volatility. That is keeping Dollar buyers from placing strong USD longs, although JPY recovery attempts remain limited above 150.85
- DXY Index is currently trading at 104.15 with mild losses.
- March’s CPI report is due on Wednesday, investors will monitor its outcome for more direction on the economy's health.
- Markets still expect the Fed’s easing cycle to start in June.
The US Dollar Index (DXY) is currently trading at a modest loss at the 104.15 level. Mild market fluctuations for the USD continue to make waves as the Federal Reserve’s (Fed) cautious stance is calibrated in light of incoming data. Hot labor market figures reported last week may justify the delay of the easing cycle, while Fed officials ask for patience.
The US economy has yet to show clear evidence of a moderation of inflation and economic activity, which makes the Fed comfortable to start cutting rates. In case data shows a resilient economy and easing expectations adjust, the USD may see further upside.
Daily digest market movers: DXY losses limited by US economy strength and rising Treasury yields
- Given the current steady expansion and continued inflation in the US economy, the Fed stays wary of modifying monetary policy and its officials ask for caution.
- Markets are still pricing in higher odds of around 60% of the easing cycle to start in June.
- US Treasury bond yields demonstrate a slight increase. The 2-year yield stands at 4.78%, the 5-year at 4.41%, and the 10-year at 4.33%.
- On Wednesday, the US will release Consumer Price Index (CPI) data from March, a crucial inflation indicator.
- The headline figure is seen accelerating, while the core measure is seen cooling down. The outcome of the index will likely fuel volatility in the USD dynamic via movements in Treasury yields and Fed expectations.
DXY technical analysis: DXY bulls remain weak with bears around the corner
The indicators on the daily chart reflect a mixed sentiment in the market. The Relative Strength Index (RSI) has a negative slope but maintains itself in positive territory, indicating that there's uncertainty among the market participants and a lack of a firm directional bias.
In addition, there may be a hint of bearish momentum as the Moving Average Convergence Divergence (MACD) indicator shows decreasing green bars, signifying a possible slowdown in the buying power. This could mean that the bears are slowly gaining the upper hand. However, the DXY is positioned above its 20, 100 and 200-day Simple Moving Averages (SMAs), insinuating an underlying bullish sentiment.
US Dollar FAQs
The US Dollar (USD) is the official currency of the United States of America, and the ‘de facto’ currency of a significant number of other countries where it is found in circulation alongside local notes. It is the most heavily traded currency in the world, accounting for over 88% of all global foreign exchange turnover, or an average of $6.6 trillion in transactions per day, according to data from 2022. Following the second world war, the USD took over from the British Pound as the world’s reserve currency. For most of its history, the US Dollar was backed by Gold, until the Bretton Woods Agreement in 1971 when the Gold Standard went away.
The most important single factor impacting on the value of the US Dollar is monetary policy, which is shaped by the Federal Reserve (Fed). The Fed has two mandates: to achieve price stability (control inflation) and foster full employment. Its primary tool to achieve these two goals is by adjusting interest rates. When prices are rising too quickly and inflation is above the Fed’s 2% target, the Fed will raise rates, which helps the USD value. When inflation falls below 2% or the Unemployment Rate is too high, the Fed may lower interest rates, which weighs on the Greenback.
In extreme situations, the Federal Reserve can also print more Dollars and enact quantitative easing (QE). QE is the process by which the Fed substantially increases the flow of credit in a stuck financial system. It is a non-standard policy measure used when credit has dried up because banks will not lend to each other (out of the fear of counterparty default). It is a last resort when simply lowering interest rates is unlikely to achieve the necessary result. It was the Fed’s weapon of choice to combat the credit crunch that occurred during the Great Financial Crisis in 2008. It involves the Fed printing more Dollars and using them to buy US government bonds predominantly from financial institutions. QE usually leads to a weaker US Dollar.
Quantitative tightening (QT) is the reverse process whereby the Federal Reserve stops buying bonds from financial institutions and does not reinvest the principal from the bonds it holds maturing in new purchases. It is usually positive for the US Dollar.
- The Pound picks up with the USD weighed by a mild risk appetite.
- Investors are looking from the sidelines ahead of Wednesday’s US CPI data.
- GBP/USD’s broader trend remains bearish while below the 1.2685 resistance
The Sterling has opened the week on a slightly bullish tone. A somewhat softer US Dollar amid the moderate risk appetite has allowed the pair to extend its recovery from post-NFP lows, returning to the mid-range of the 1.2600s.
The Positive market sentiment is weighing on the US Dollar, yet downside attempts are likely to remain limited. Investors are expected to keep a cautious tone ahead of the release of the US Consumer Prices Index data on Wednesday.
On Friday, the unexpectedly strong US Nonfarm Payrolls confirmed the strong momentum of the US economy and cast further doubt on a Fed rate cut in June. In this context, another positive surprise on Wednesday might give a fresh impulse to the US Dollar.
From a technical perspective, the pair is trading lower from early March highs. Resistance at 1.2680 is a key level to ease bearish pressure and aim for 1.2750, the 61.8% Fibonacci extension of the March selloff. Supports are 1.2575 and 1.2535.
- Wall Street opens the week with marginal gains with investors relieved by decline in Oil prices.
- Dow Jones treads water near 39,000 level as rebound from Friday’s high stalls.
- Bias remains skewed to the downside with all eyes on Wednesday’s US CPI figures.
The Dow Jones Industrial Average (DJIA) has opened the week with minor advances, favoured by some risk appetite. Oil prices have retreated from multi-month highs as tensions in the Middle East ease somewhat, which has provided some relief to equity investors on Monday.
The market, however, is in a wait-and-see mode with traders reluctant to take excessive risks ahead of Wednesday’s US Consumer Prices Index data. US Inflation is expected to have accelerated to 3.4% in March from the 3.2% yearly rate in February, although core CPI is seen cooling to 3.7% from a 3.8% annual reading in the previous month.
All the main Wall Street indices are positive on Monday. The NASDAQ is leading with a 0.1% advance to 16,267, while the S&P 500, at 5,206, and the Dow Jones, at 38,913, post marginal gains.
Dow Jones news
Down to sectors, Consumer Discretionary is leading gains with a 0.8% advance, followed by Real Estate, which is up 0.5%. At the bottom of the ranking on Monday is the Health sector, dropping by 0.48%, and Energy, 0.32% below Friday’s close.
Nike (NKE) is the best Dow performer on Monday with a 1.42% increase to $90.11, followed by 3M (MMM) gaining 0.97% to $91.90. On the losing end, Merck (MRK) drops 1.5% to $126.02, and Intel (INTL) takes a further 1.2% decline to $38.25.
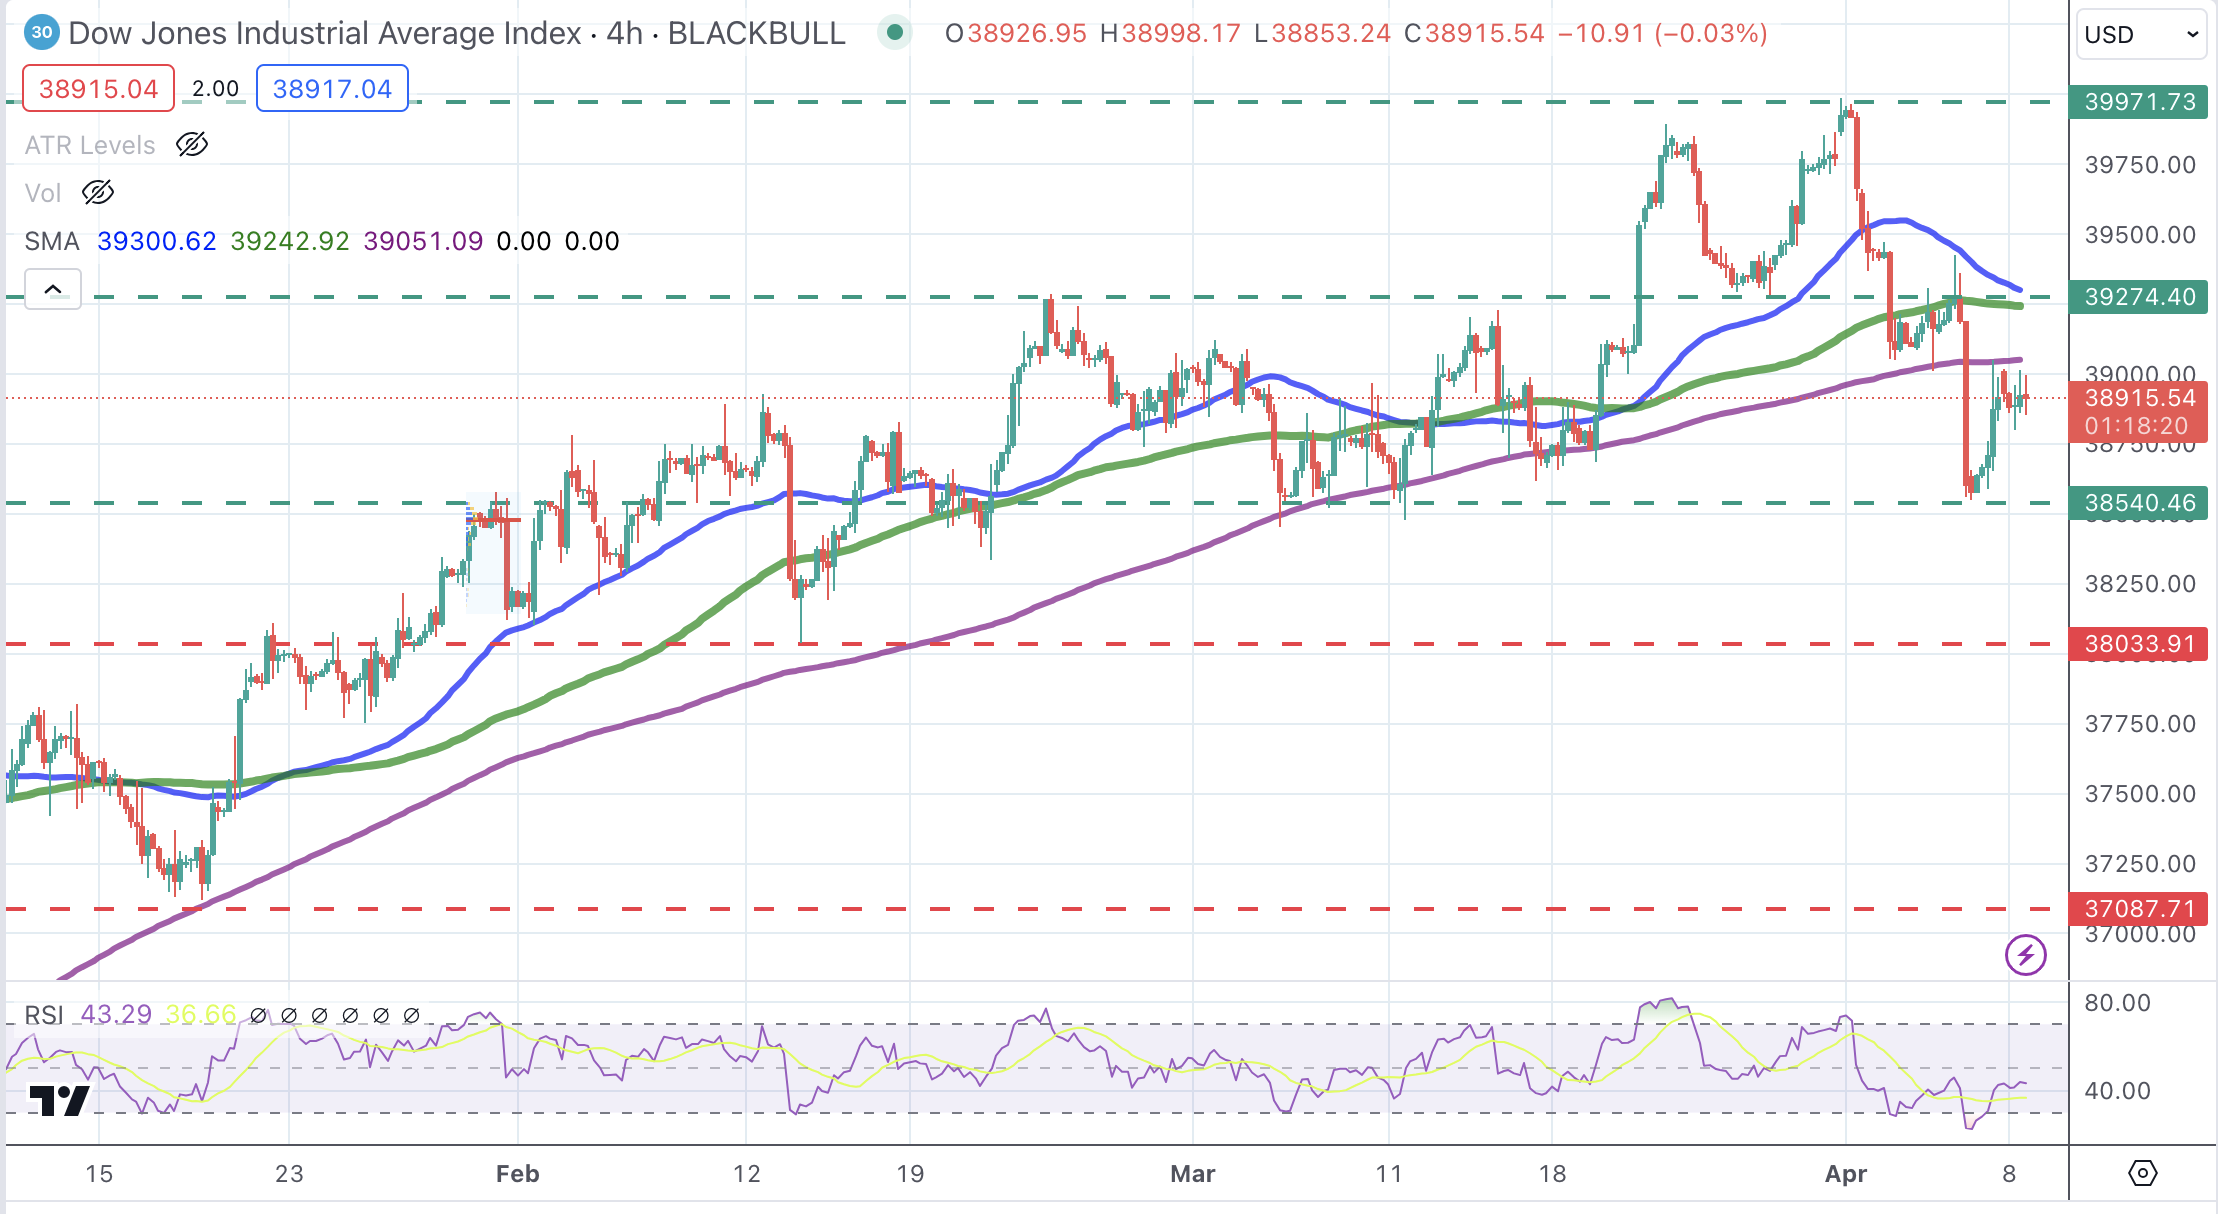
Dow Jones technical outlook
The Dow Jones index is trading practically flat with oscillators showing a lack of clear direction. The DJIA is still in a bearish correction from the 39,986 historic high hit in late March.
The recovery attempt from Friday’s lows has stalled below previous lows, at the 39,00 area, and with a supply zone at the 39,250 area likely to offer significant resistance. On the downside, the 38,540 level is still in play and might be revisited if US CPI posts a positive surprise on Wednesday. Below here, 38,035 would be exposed.
Dow Jones Index 4-Hour Chart
Inflation FAQs
Inflation measures the rise in the price of a representative basket of goods and services. Headline inflation is usually expressed as a percentage change on a month-on-month (MoM) and year-on-year (YoY) basis. Core inflation excludes more volatile elements such as food and fuel which can fluctuate because of geopolitical and seasonal factors. Core inflation is the figure economists focus on and is the level targeted by central banks, which are mandated to keep inflation at a manageable level, usually around 2%.
The Consumer Price Index (CPI) measures the change in prices of a basket of goods and services over a period of time. It is usually expressed as a percentage change on a month-on-month (MoM) and year-on-year (YoY) basis. Core CPI is the figure targeted by central banks as it excludes volatile food and fuel inputs. When Core CPI rises above 2% it usually results in higher interest rates and vice versa when it falls below 2%. Since higher interest rates are positive for a currency, higher inflation usually results in a stronger currency. The opposite is true when inflation falls.
Although it may seem counter-intuitive, high inflation in a country pushes up the value of its currency and vice versa for lower inflation. This is because the central bank will normally raise interest rates to combat the higher inflation, which attract more global capital inflows from investors looking for a lucrative place to park their money.
Formerly, Gold was the asset investors turned to in times of high inflation because it preserved its value, and whilst investors will often still buy Gold for its safe-haven properties in times of extreme market turmoil, this is not the case most of the time. This is because when inflation is high, central banks will put up interest rates to combat it. Higher interest rates are negative for Gold because they increase the opportunity-cost of holding Gold vis-a-vis an interest-bearing asset or placing the money in a cash deposit account. On the flipside, lower inflation tends to be positive for Gold as it brings interest rates down, making the bright metal a more viable investment alternative.
- Mexican Peso strengthens against US Dollar, drawing below significant levels last seen in October 2015.
- The first presidential debate highlights the contrast between Claudia Sheinbaum's and Xochitl Galvez's visions for Mexico's future.
- Upcoming economic indicators from Mexico and the US, including inflation and industrial data, set to provide further market direction.
The Mexican Peso appreciates further against the US Dollar on Monday with Peso buyers breaching the October 2015 high after overcoming the psychological 16.50 figure. On Monday, a light economic docket on both sides of the border keeps the USD/MXN downtrend intact. At the time of writing, the pair exchanged hands at 16.31, down 0.79%.
On Sunday night, Mexicans were captivated by the first presidential debate, held at the Instituto National Electoral, headquarters of the election oversight body. The debate centered around the two women leading the polls, Claudia Sheinbaum of the ruling party Morena and Xochitl Galvez, who helms a multiple-party coalition.
Sheinbaum touted her tenure as Mexico City's mayor, aiming to follow President Lopez Obrador, and praised Mexico's economic growth, advocating for state-run economics due to corruption in the private sector. Conversely, Galvez proposed modern solutions such as blockchain for healthcare subsidies and emphasized robotics, AI and English education. The debate saw Galvez confronting Sheinbaum about alleged corruption involving the president's sons, which Sheinbaum sidestepped by labeling Galvez as a liar.
Aside from this, Mexico’s economic docket will feature the release of inflation figures, industrial production and retail sales. In the US, the calendar will feature Fed speakers, inflation data on the consumer and producer side, the release of the Federal Reserve’s last meeting minutes, and jobs data.
Daily digest market movers: Expectations of uptick in Mexican inflation boosts Peso
- The Mexican Peso rises on expectations that March’s inflation would rise above February’s data, suggesting that the Banxico could pause its easing cycle.
- Mexico’s inflation forecasts for March expect the Consumer Price Index (CPI) to increase from 0.09% to 0.36% MoM and to 4.5% in the twelve months to March, up from 4.5%.
- Core CPI is foreseen rising to 0.5% from 0.49% MoM, while yearly figures would edge lower to 4.62%, down from 4.64%.
- US Treasury yields climb, though they fail to boost the Greenback, which is treading water as shown by the US Dollar Index (DXY). The DXY falls 0.10% to 104.18.
- Market participants' expectations that the Fed would cut rates three times this year are waning, as shown by the CME FedWatch Tool. The odds for June edged below 52%, while for July they stood at 69%.
Technical analysis: Mexican Peso gains momentum as USD/MXN tumbles below October 2015 lows
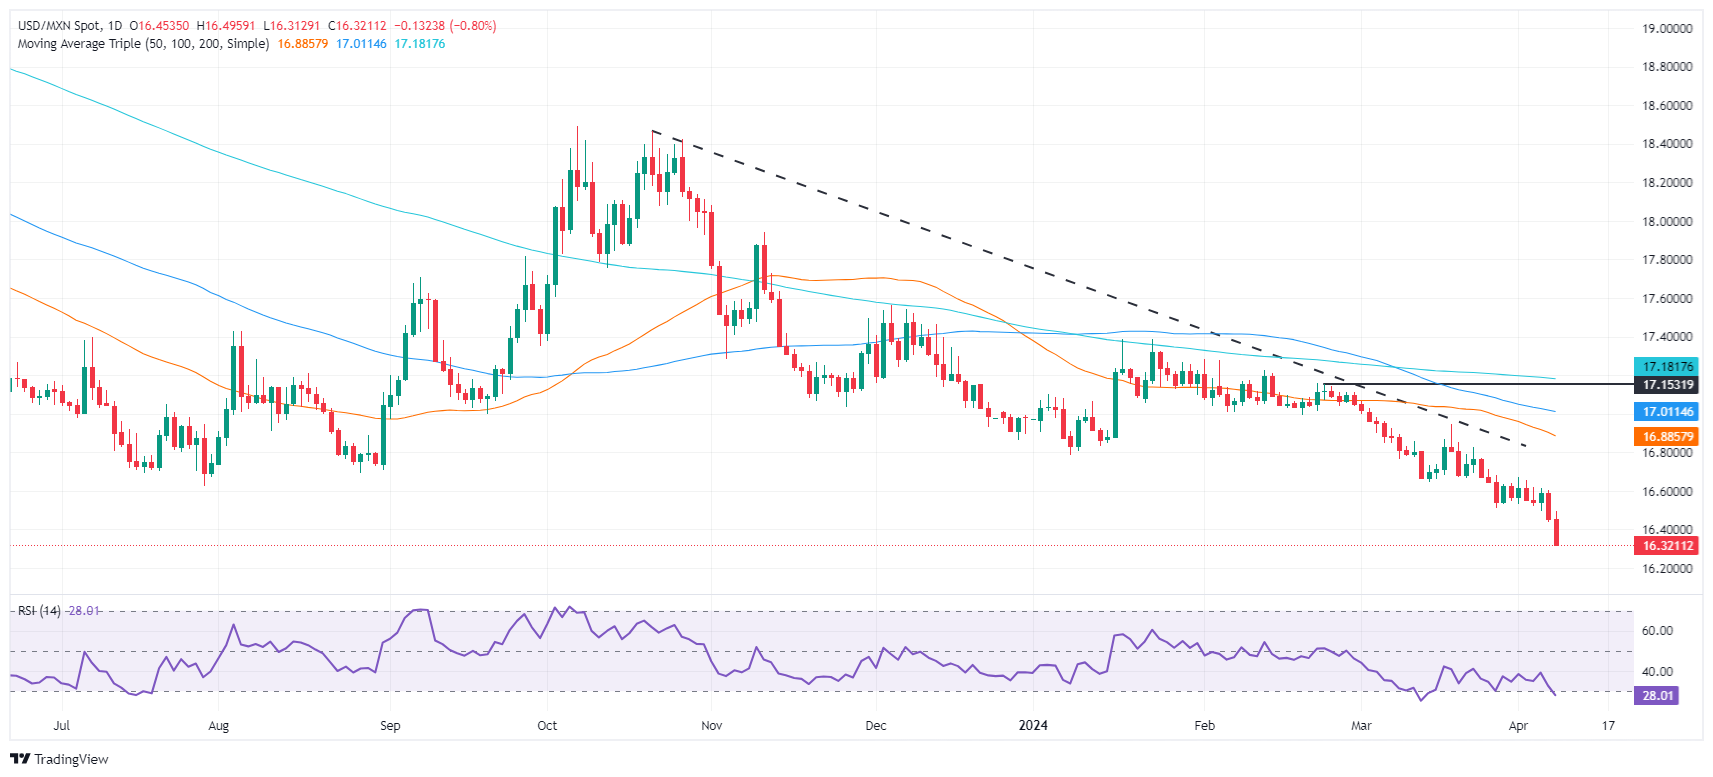
The USD/MXN fell to a new nine-year low at around 16.32, with traders posing to drive the exchange rate below that level toward the 16.00 figure. Even though the Relative Strength Index (RSI) turned oversold, sellers are gaining momentum. Therefore, the next support would be the psychological 16.00 figure.
On the other hand, the USD/MXN first resistance would be the 16.50 mark, followed by last year’s 16.62 mark.
Mexican Peso FAQs
The Mexican Peso (MXN) is the most traded currency among its Latin American peers. Its value is broadly determined by the performance of the Mexican economy, the country’s central bank’s policy, the amount of foreign investment in the country and even the levels of remittances sent by Mexicans who live abroad, particularly in the United States. Geopolitical trends can also move MXN: for example, the process of nearshoring – or the decision by some firms to relocate manufacturing capacity and supply chains closer to their home countries – is also seen as a catalyst for the Mexican currency as the country is considered a key manufacturing hub in the American continent. Another catalyst for MXN is Oil prices as Mexico is a key exporter of the commodity.
The main objective of Mexico’s central bank, also known as Banxico, is to maintain inflation at low and stable levels (at or close to its target of 3%, the midpoint in a tolerance band of between 2% and 4%). To this end, the bank sets an appropriate level of interest rates. When inflation is too high, Banxico will attempt to tame it by raising interest rates, making it more expensive for households and businesses to borrow money, thus cooling demand and the overall economy. Higher interest rates are generally positive for the Mexican Peso (MXN) as they lead to higher yields, making the country a more attractive place for investors. On the contrary, lower interest rates tend to weaken MXN.
Macroeconomic data releases are key to assess the state of the economy and can have an impact on the Mexican Peso (MXN) valuation. A strong Mexican economy, based on high economic growth, low unemployment and high confidence is good for MXN. Not only does it attract more foreign investment but it may encourage the Bank of Mexico (Banxico) to increase interest rates, particularly if this strength comes together with elevated inflation. However, if economic data is weak, MXN is likely to depreciate.
As an emerging-market currency, the Mexican Peso (MXN) tends to strive during risk-on periods, or when investors perceive that broader market risks are low and thus are eager to engage with investments that carry a higher risk. Conversely, MXN tends to weaken at times of market turbulence or economic uncertainty as investors tend to sell higher-risk assets and flee to the more-stable safe havens.
- Canadian Dollar picks up with the USD losing ground in a risk-on session.
- Investors are looking for the sidelines ahead of Wednesday’s US CPI and BoC rate decision.
- USD/CAD keeps its positive trend intact with CAD recovery attempts limited.
The Canadian Dollar (CAD) is trading moderately higher on Monday, extending the rebound from the year-to-date lows after Friday’s upbeat Ivey PMI offset the negative impact of upbeat US Nonfarm Payrolls. A modest appetite for risk on a very calm weekly opening is allowing some US Dollar pullback, ahead of key macroeconomic data this week.
The US economy created far more jobs than expected in March, while wage growth moderated, although it is still at levels inconsistent with the Federal Reserve’s (Fed) 2% core inflation target for price stability. Last week, Fed officials hinted at a hawkish demeanor on the back of the recent data, which is expected to keep the US Dollar’s downside attempts limited.
Investors, however, are looking for the sidelines on Monday, awaiting the US CPI figures on Wednesday to check whether the recent uptick on inflation is an exception or a structural trend. Also on Wednesday, the Bank of Canada (B0C) will release its monetary policy decision. There is a minor risk of an unexpected rate cut that would send the CAD tumbling.
Daily digest market movers: USD/CAD ticks up in a quiet market
- The Canadian Dollar barely moves on Monday, still paring some losses after having hit four-month lows on Friday.
- The highlight of the week is the US CPI due on Wednesday. US headline inflation is expected to have increased 0.3% and 3.4% from a 0.4% monthly increment and a 3.2% year-on-year reading in February.
- The core CPI is seen easing to 0.3% in March, from 0.4% in February, with the yearly rate cooling to 3.7% from 3.8%.
- Also on Wednesday, the BoC is expected to leave its benchmark index unchanged at 5%. The main interest will be on any hints toward the timing of the first rate cut.
- On Friday, US Nonfarm Payrolls increased by 303K in March from 270K in February, well above the 200K forecasted by market experts.
- Average Hourly Earnings increased at a 0.3% monthly pace and 4.1% YoY from 0.2% and 4.3%, respectively, in February.
- Canadian Ivey Purchasing Managers Index has improved to 57.7, its best reading over the last 12 months, from 53.9 in February.
Canadian Dollar price today
The table below shows the percentage change of Canadian Dollar (CAD) against listed major currencies today. Canadian Dollar was the strongest against the Swiss Franc.
| USD | EUR | GBP | CAD | AUD | JPY | NZD | CHF | |
| USD | -0.20% | -0.22% | -0.16% | -0.47% | 0.08% | -0.43% | 0.22% | |
| EUR | 0.20% | -0.02% | 0.05% | -0.26% | 0.27% | -0.22% | 0.40% | |
| GBP | 0.21% | 0.02% | 0.08% | -0.25% | 0.30% | -0.20% | 0.42% | |
| CAD | 0.14% | -0.08% | -0.07% | -0.31% | 0.22% | -0.27% | 0.38% | |
| AUD | 0.46% | 0.26% | 0.24% | 0.30% | 0.53% | 0.04% | 0.65% | |
| JPY | -0.09% | -0.28% | -0.29% | -0.24% | -0.55% | -0.49% | 0.14% | |
| NZD | 0.43% | 0.22% | 0.21% | 0.27% | -0.04% | 0.50% | 0.63% | |
| CHF | -0.21% | -0.41% | -0.43% | -0.35% | -0.69% | -0.14% | -0.63% |
The heat map shows percentage changes of major currencies against each other. The base currency is picked from the left column, while the quote currency is picked from the top row. For example, if you pick the Euro from the left column and move along the horizontal line to the Japanese Yen, the percentage change displayed in the box will represent EUR (base)/JPY (quote).
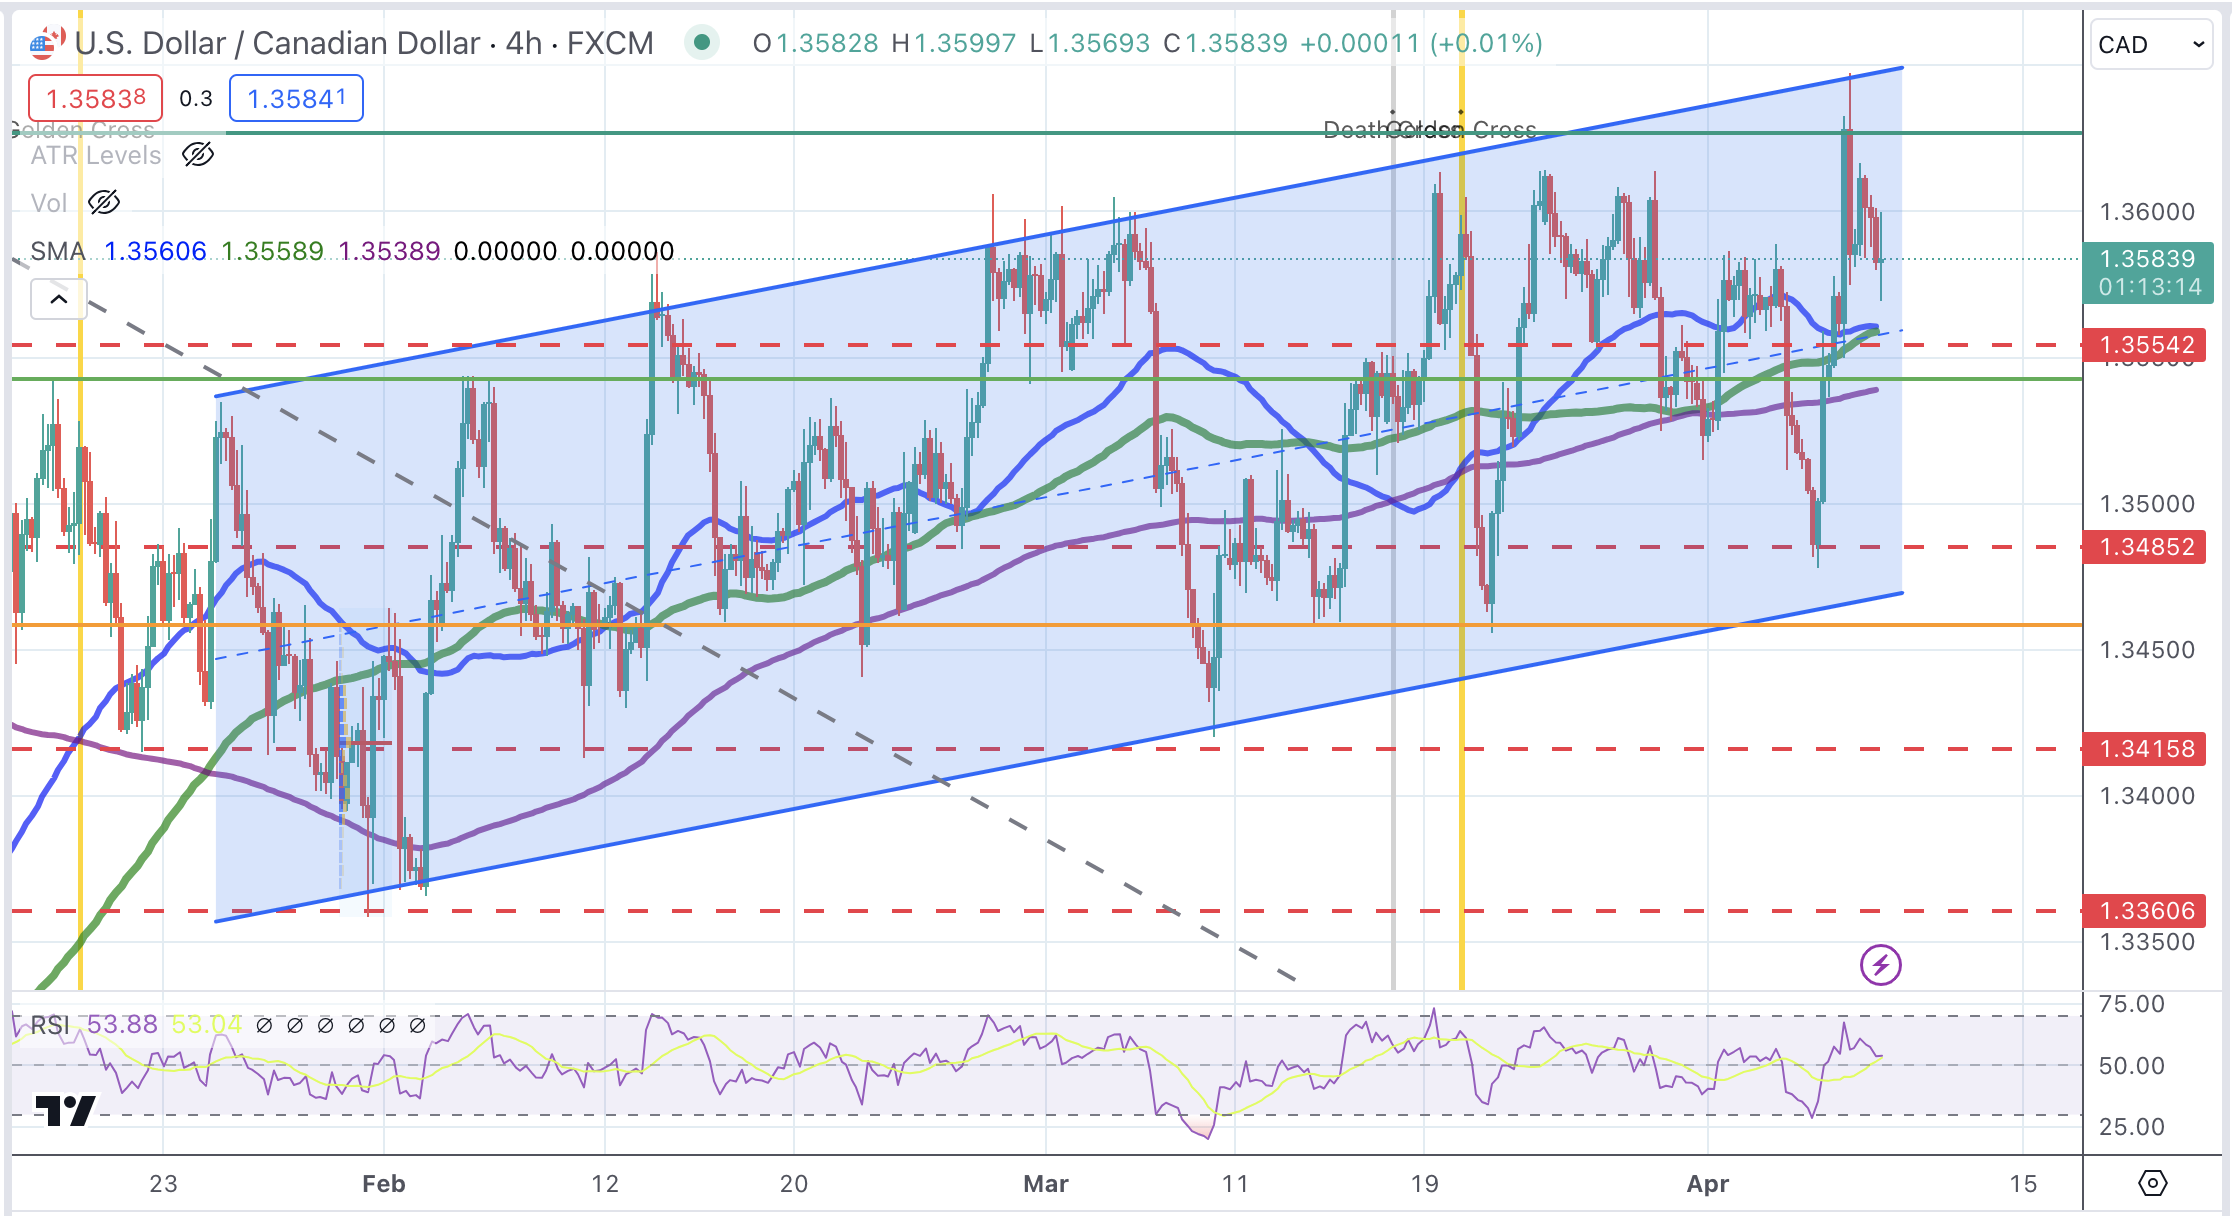
Technical analysis: USD/CAD remains biased higher despite failure to break the channel top at 1.3645
Technical indicators show the US Dollar on a bullish trend, with the structure of higher highs and higher lows intact. The pair was rejected on Friday at the top of the ascending channel, now at 1.3645, but the ensuing Canadian Dollar rebound remains unable to extend past the main SMAs.
The pair has a support area at 1.3555, where the confluence of the 4-hour 50 and 100 SMAs are likely to hold bears off. Below here, the next targets are at 1.3485 and 1.3420. Resistances are at the mentioned 1.3645 and 1.3680.
USD/CAD 4-Hour Chart
Bank of Canada FAQs
The Bank of Canada (BoC), based in Ottawa, is the institution that sets interest rates and manages monetary policy for Canada. It does so at eight scheduled meetings a year and ad hoc emergency meetings that are held as required. The BoC primary mandate is to maintain price stability, which means keeping inflation at between 1-3%. Its main tool for achieving this is by raising or lowering interest rates. Relatively high interest rates will usually result in a stronger Canadian Dollar (CAD) and vice versa. Other tools used include quantitative easing and tightening.
In extreme situations, the Bank of Canada can enact a policy tool called Quantitative Easing. QE is the process by which the BoC prints Canadian Dollars for the purpose of buying assets – usually government or corporate bonds – from financial institutions. QE usually results in a weaker CAD. QE is a last resort when simply lowering interest rates is unlikely to achieve the objective of price stability. The Bank of Canada used the measure during the Great Financial Crisis of 2009-11 when credit froze after banks lost faith in each other’s ability to repay debts.
Quantitative tightening (QT) is the reverse of QE. It is undertaken after QE when an economic recovery is underway and inflation starts rising. Whilst in QE the Bank of Canada purchases government and corporate bonds from financial institutions to provide them with liquidity, in QT the BoC stops buying more assets, and stops reinvesting the principal maturing on the bonds it already holds. It is usually positive (or bullish) for the Canadian Dollar.
The Federal Reserve Bank of New York's latest Survey of Consumer Expectations showed on Monday that the US consumers' one-year inflation expectation held steady at 3% in March.
Key takeaways
"Three year ahead expected inflation 2.9% vs. Feb's 2.7%."
"Five year ahead expected inflation 2.6% vs. Feb’s 2.9%."
"Year ahead expected home price rise unchanged at 3%."
"Bigger year ahead rises expected for food, gas, rent, medical costs."
"Year ahead expected earnings growth steady at 2.8%."
"Fear of missing debt payment highest in four years."
"Household view on personal finances improved modestly in March."
Market reaction
The US Dollar Index stays under modest bearish pressure following this report and was last seen losing 0.1% on the day at 104.18.
- Silver price exhibits strength around $28 despite traders pare Fed rate cut bets for June.
- Fed Bowman said current conditions are not appropriate for lowering borrowing rates.
- The US Dollar awaits the US inflation data for fresh guidance.
Silver price (XAG/USD) faces a nominal sell-off after printing a fresh two-year high around $28.00 in Monday’s early New York session. The near-term demand for the white metal remains strong even though US Treasury yields soar after upbeat United States Nonfarm Payrolls (NFP) data for March dent speculation for the Federal Reserve (Fed) lowering borrowing rates from the June meeting. 10-year US Treasury yields rise to 4.43%.
Strong labor demand is offset by higher wage offerings, which leads to robust consumer spending that fuels consumer price inflation. After the US NFP release, Fed Governor Michelle Bowman said, “We are still not yet at the point where it is appropriate to lower the policy rate, and I continue to see a number of upside risks to inflation.”
Fed policymakers have been reiterating that there is no urgency for rate cuts. Policymakers need good inflation data for months before pivoting to rate cuts.
The US Dollar Index (DXY) falls slightly to 104.24 but remains inside Friday’s trading range. The USD index stays on the sidelines as the focus shifts to the consumer price inflation data for March, which will be published on Wednesday.
The core CPI that strips off volatile food and Oil prices is estimated to have dipped slightly to 3.7% from 3.8%. A more-than-anticipated decline in the US inflation data will prompt Fed rate cut expectations for the June meeting.
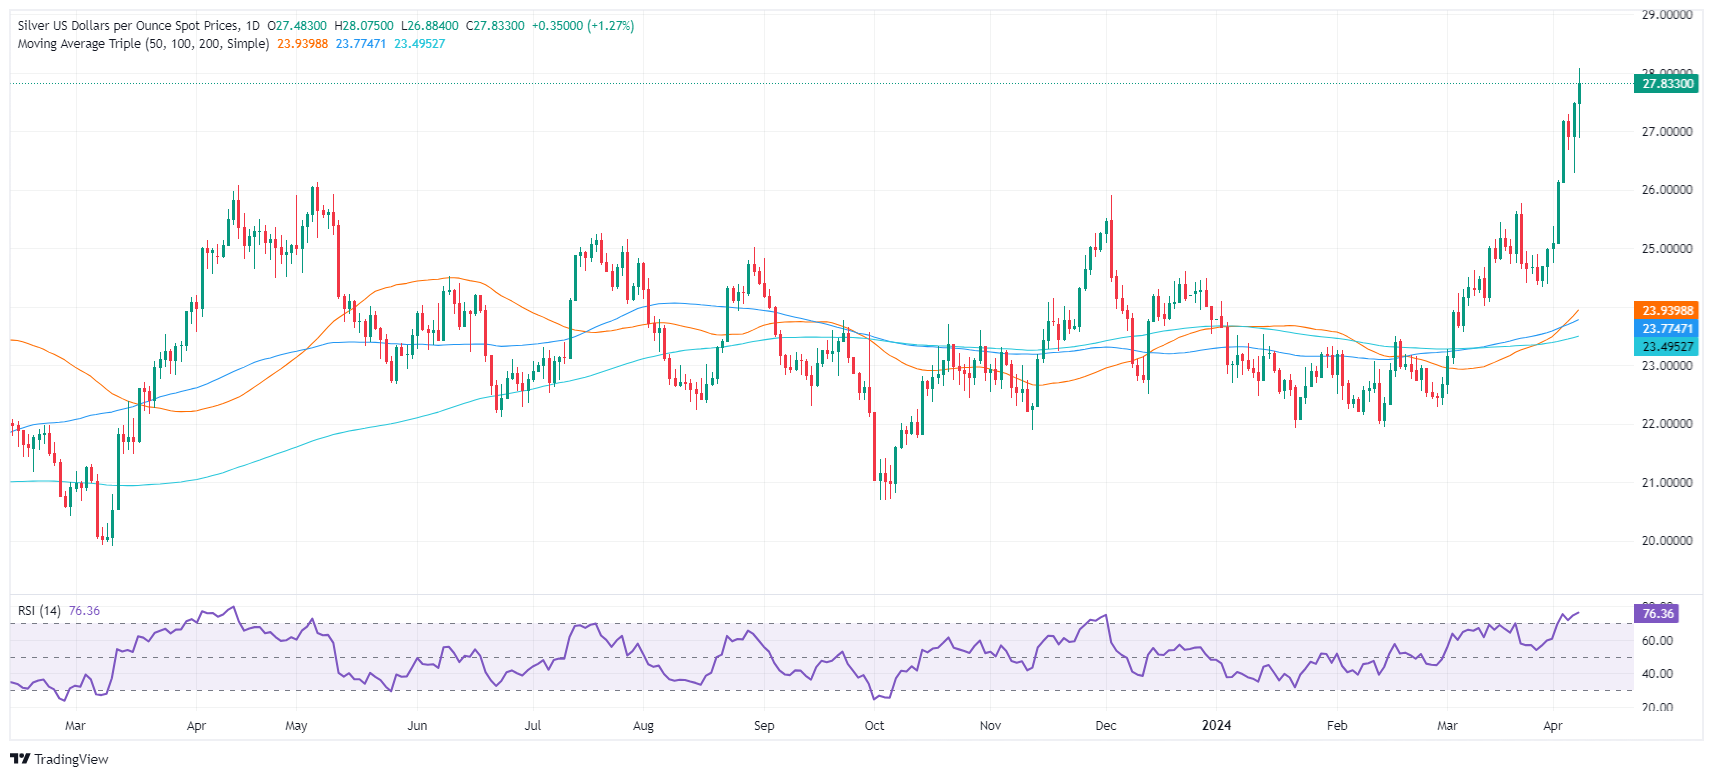
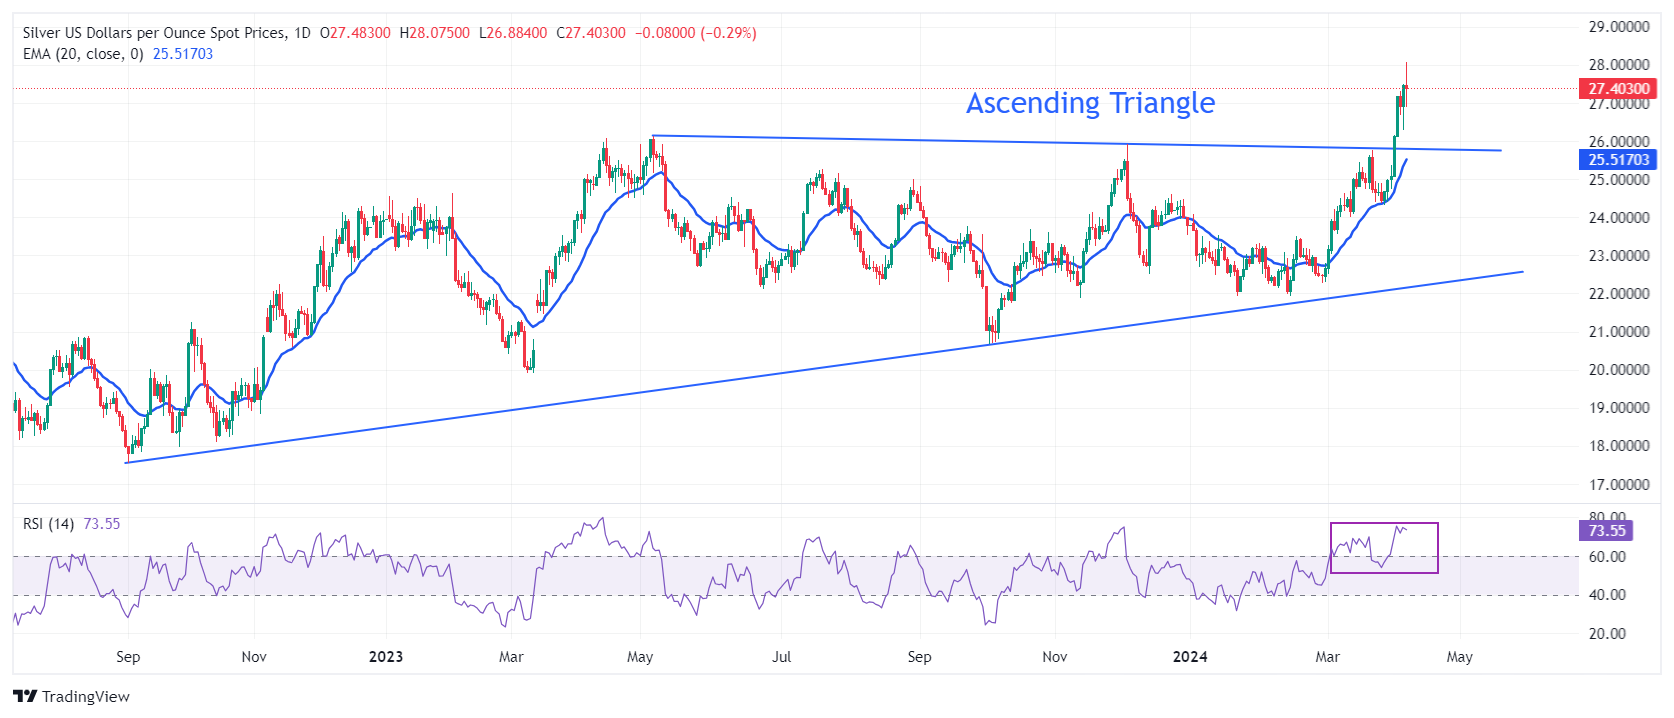
Silver technical analysis
Silver price sees a sharp upside after a breakout of the Ascending Triangle pattern formed on daily timeframe. The aforementioned chart pattern exhibits sharp volatility contraction but a decisive breakout leads to heavy volume and wider ticks on the upside. The horizontal resistance of the above-mentioned chart pattern, placed from May 5 high at $26.13, has turned into a crucial support for the Silver price bulls.
Advancing 20-day Exponential Moving Average (EMA) near $25.50 keeps the near-term demand strong.
The 14-period Relative Strength Index (RSI) oscillates in the bullish range of 60.00-80.00, indicating a strong momentum leaned to the upside.
Silver daily chart
- EUR/USD recovers to 1.0850 as market sentiment turns cheerful.
- The ECB is expected to keep its Main Refinancing Operations Rate unchanged at 4.5% on Thursday.
- The next move in the US Dollar will be guided by the US Inflation data for March.
The EUR/USD pair bounces back to 1.0850 in Monday’s early American session as appeal for risky assets improve. Market sentiment is positive even though traders pare bets supporting Federal Reserve (Fed) rate cuts, which were leaned for the June meeting. The S&P 500 futures open on a slightly positive note. 10-year US Treasury yields rose to four-month high near 4.43% as Fed rate cut expectations have shifted for the second half of this year.
Meanwhile, the US Dollar turns subdued despite robust US Nonfarm Payrolls (NFP) data for March dent rate cut hopes. The US Dollar Index (DXY), which tracks the US Dollar’s value against six major currencies, falls slightly to 104.30.
Going forward, investors will focus on the US Consumer Price Index (CPI) for March, which will be published on Wednesday. Annual headline inflation is forecasted to have accelerated to 3.4% from 3.2% in February. In the same period, the core CPI that strips off volatile food and Oil prices is estimated to have dipped slightly to 3.7% from 3.8%.
Strong price pressures could keep hopes of rate cuts for June off the table, while soft figures could prompt speculation for the Fed pivoting to rate cuts in the same period.
On the Eurozone front, investors shift focus to the European Central Bank’s (ECB) interest rate decision, which will be announced on Thursday. The ECB is widely anticipated to keep its key borrowing rates steady at 4.5%. While investors will focus on more cues about when the ECB will pivot to rate cuts.
- The US Dollar holds on to Friday’s gains on Monday.
- US economic calendar is light on Monday, letting the dust settle further over Friday’s NFP report.
- The US Dollar Index moves further away from key technical support levels with 105.00 as a target for the end of this week.
The US Dollar (USD) is kicking off this Monday with both the Asian and the European trading session in the green. The Greenback is able to hold on to the gains it locked in on Friday after a very strong US Nonfarm Payrolls print that surpassed all expectations by coming in at 303,000 instead of declining from 275,000 to 200,000. The question will be this week if traders will start to factor in US exceptionalism, which would mean that the US economy will thrive further without any rate cuts from the US Federal Reserve.
There is only one big event to look out for this Monday, which is the participation of Federal Reserve Bank of Minneapolis President Neel Kashkari in a Town Hall meeting at the University of Montana in Missoula. Although Kashkari is a non-voter this year, known for his hawkish stance, a change in his comments could mean an alteration in market expectations over the Fed’s monetary policy.
Daily digest market movers: Calm start to wake up
- The US Treasury Department is getting ready for action this Monday with no less than two auctions: Both a 3-month and a 6-month bill will be auctioned around 15:30 GMT.
- Federal Reserve Bank of Minneapolis President Neel Kashkari will speak in a Town Hall meeting at the University of Montana in Missoula. Expect any market-related comments from him to come in around 23:00 GMT.
- A very calm start of the week with Asian equities overall up in Japan and China by more than 0.50%. In Europe, equities are looking for direction while US equity futures are flat ahead of the US opening bell for this week.
- According to the CME Group’s FedWatch Tool, expectations for the Fed’s May 1 meeting are at 98.2% for keeping the fed funds rate unchanged, while chances of a rate cut are at 1.8%.
- The benchmark 10-year US Treasury Note trades around 4.42% after it rallied over 20 basis points in just one week.
US Dollar Index Technical Analysis: Exceptionalism at its best
The US Dollar Index (DXY) broke a lot of pots on Friday after the US Jobs Report came in with a stellar performance. Questions will start to grow further now among traders if those awaited Fed rate cuts will be coming, and the answer will be: probably not. Certainly, June looks more and more likely not to be the moment, which means a repricing to later 2024 or even 2025. Speculation of delayed rate cuts should coincide with a bit more US Dollar strength as all other major central banks are getting ready to cut.
That first pivotal level for the DXY comes in at 104.60, which got broken last week on Wednesday to the downside, though broken up again from below on Friday. Further up, 105.12 is the key point after the DXY failed to break that level last week. Once above there, 105.88 is the last resistance point for now before the Relative Strength Index (RSI) will trade in overbought levels.
Supports from the 200-day Simple Moving Average (SMA) at 103.81, the 100-day SMA at 103.43, and the 55-day SMA at 103.89 have shown their importance last week on Wednesday. Further down, the 103.00 big figure looks to remain unchallenged for longer with ample support thus standing in the way.
US Dollar FAQs
The US Dollar (USD) is the official currency of the United States of America, and the ‘de facto’ currency of a significant number of other countries where it is found in circulation alongside local notes. It is the most heavily traded currency in the world, accounting for over 88% of all global foreign exchange turnover, or an average of $6.6 trillion in transactions per day, according to data from 2022. Following the second world war, the USD took over from the British Pound as the world’s reserve currency. For most of its history, the US Dollar was backed by Gold, until the Bretton Woods Agreement in 1971 when the Gold Standard went away.
The most important single factor impacting on the value of the US Dollar is monetary policy, which is shaped by the Federal Reserve (Fed). The Fed has two mandates: to achieve price stability (control inflation) and foster full employment. Its primary tool to achieve these two goals is by adjusting interest rates. When prices are rising too quickly and inflation is above the Fed’s 2% target, the Fed will raise rates, which helps the USD value. When inflation falls below 2% or the Unemployment Rate is too high, the Fed may lower interest rates, which weighs on the Greenback.
In extreme situations, the Federal Reserve can also print more Dollars and enact quantitative easing (QE). QE is the process by which the Fed substantially increases the flow of credit in a stuck financial system. It is a non-standard policy measure used when credit has dried up because banks will not lend to each other (out of the fear of counterparty default). It is a last resort when simply lowering interest rates is unlikely to achieve the necessary result. It was the Fed’s weapon of choice to combat the credit crunch that occurred during the Great Financial Crisis in 2008. It involves the Fed printing more Dollars and using them to buy US government bonds predominantly from financial institutions. QE usually leads to a weaker US Dollar.
Quantitative tightening (QT) is the reverse process whereby the Federal Reserve stops buying bonds from financial institutions and does not reinvest the principal from the bonds it holds maturing in new purchases. It is usually positive for the US Dollar.
- Natural Gas prices are consolidating on Monday in both US and European trading.
- Traders are selling Gas contracts as the substantially higher US rate levels could potentially hit global economic growth, weighing on Gas demand.
- The US Dollar Index sees ample support towards 105.00 despite its downbeat performance last week.
Natural Gas (XNG/USD) dives back below $1.90 this Monday with selling pressure noticeable in the energy space. The pullback may be supported by expectations of higher interest rates for longer, with markets nervous that the first rate cut from the US Federal Reserve might not come before September. This could mean some sluggish growth ahead and less global demand for energy commodities such as Natural Gas.
The DXY US Dollar Index meanwhile sees further upticks this Monday after the positive undertone from the US Jobs Report on Friday, which smashed all expectations with a stellar performance of 303,000 against 200,000 expected. US yields increased by over 20 basis points in the US 10-year benchmark rate last week, which means expectations for that first rate cut are starting to reverse substantially.
Natural Gas is trading at $1.89 per MMBtu at the time of writing.
Natural Gas news and market movers: Global demand drops
- Spillover risk lingers between the Carbon Emission market and the Gas market. Traders are cutting their Carbon exposure, which could point to a potential recession risk in the energy sector. Energy-consuming companies buy Carbon Emission rights to be able to burn Gas or consume other energy resources for their business. A decline in Carbon buying could mean a slowdown ahead in industrial production.
- The ban on new US Gas exports from US President Joe Biden is starting to bite on a state level. Pennsylvania governor Josh Shapiro (Democrat) urged Joe Biden to reverse the policy with risk of losing the swing state in the 2024 Presidential Election, according to Bloomberg.
- Dow Jones reports that TotalEnergies will expand its gas production in Texas after it acquired a 20% stake in Lewis Energy Group, which holds leases to mine Gas in Dorado.
Natural Gas Technical Analysis: Rates versus Energy
Natural Gas prices are facing issues again, with the rising US yields as the biggest threat on the horizon. US rates soared over 20 basis points in the US 10-year benchmark rate last week, while other major economies are seeing their central banks on the way to cut or have cut already. This rate differential weighs on the US against the rest of the world, and it could mean a slowdown is taking place: Even if the US economy is outperforming, higher rates will start to cut growth and this means less demand for Natural Gas.
On the upside, the key $1.97 level needs to be regained before challenging last week’s peak at $2.00. The next key mark is the historic pivotal point at $2.13. Should Gas prices pop up in that region, a broad area opens up with the first cap at the red descending trend line near $2.21.
On the downside, multi-year lows at $1.60 are still nearby, with $1.65 as the first line in the sand. In case of a breakdown below these levels, traders should look at $1.53 as the next supportive area.
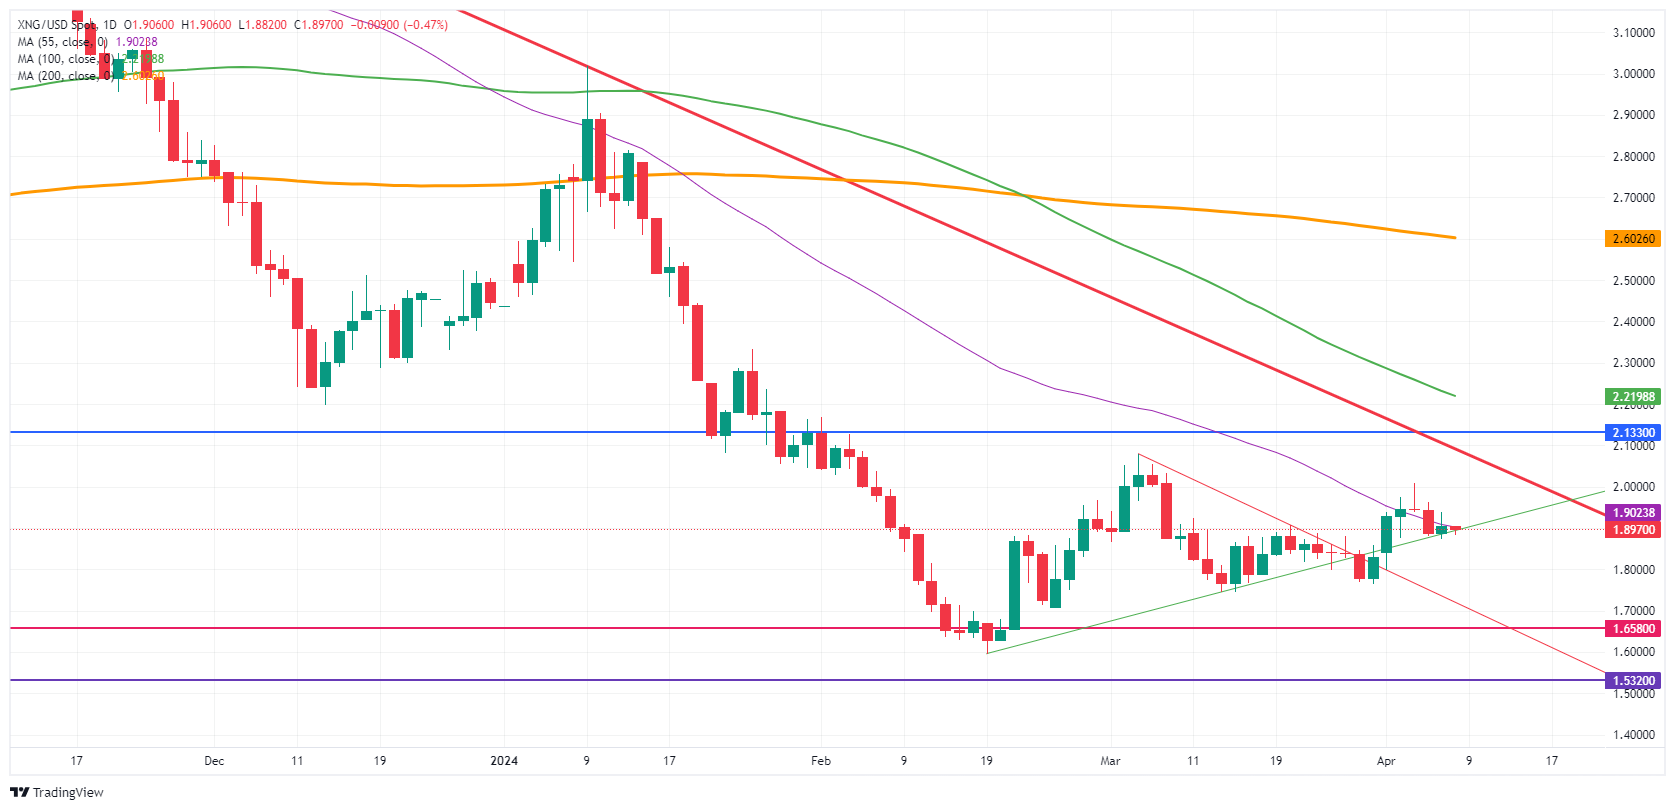
Natural Gas: Daily Chart
Natural Gas FAQs
Supply and demand dynamics are a key factor influencing Natural Gas prices, and are themselves influenced by global economic growth, industrial activity, population growth, production levels, and inventories. The weather impacts Natural Gas prices because more Gas is used during cold winters and hot summers for heating and cooling. Competition from other energy sources impacts prices as consumers may switch to cheaper sources. Geopolitical events are factors as exemplified by the war in Ukraine. Government policies relating to extraction, transportation, and environmental issues also impact prices.
The main economic release influencing Natural Gas prices is the weekly inventory bulletin from the Energy Information Administration (EIA), a US government agency that produces US gas market data. The EIA Gas bulletin usually comes out on Thursday at 14:30 GMT, a day after the EIA publishes its weekly Oil bulletin. Economic data from large consumers of Natural Gas can impact supply and demand, the largest of which include China, Germany and Japan. Natural Gas is primarily priced and traded in US Dollars, thus economic releases impacting the US Dollar are also factors.
The US Dollar is the world’s reserve currency and most commodities, including Natural Gas are priced and traded on international markets in US Dollars. As such, the value of the US Dollar is a factor in the price of Natural Gas, because if the Dollar strengthens it means less Dollars are required to buy the same volume of Gas (the price falls), and vice versa if USD strengthens.
- USD/CAD faces pressure above 1.3600 as US Dollar fails to capitalize on strong US NFP.
- Traders have shifted expectations for Fed reducing rates in the second half of this year.
- Weak Canadian Employment boosts early BoC interest rate cuts.
The USD/CAD pair falls back to the round-level support of 1.3600 in Monday’s European session. The Loonie asset drops as the US Dollar fails to catch bid despite traders pare expectations for the Federal Reserve (Fed) to begin reducing interest rates from the June meeting.
Investors do not see the Fed reducing interest rates in June as strong United States labor market conditions have strengthened the inflation outlook. Strong demand for workers is generally offset by hiring them with higher wages, which propels consumer spending. Eventually, higher consumer spending leads to an increase in the consumer price inflation.
Going forward, investors will focus on the Consumer Price Index (CPI) data for March, which will be published on Wednesday. The annual core CPI that strips off volatile food and oil prices is forecasted to have grown at a slightly slower pace of 3.7% from 3.8% in February.
Meanwhile, expectations for early rate cuts by the Bank of Canada (BoC) have deepened due to Canada’ weak labor market data. On Friday, the Statistics Canada showed that labor market witnessed drawdown by 2.2K, while investors forecasted fresh recruitment of 25K jobs. The Unemployment Rate rose strongly to 6.1% from expectations of 5.9% and the prior reading of 5.8%. However, annual Average Hourly Earnings grew at a higher pace of 5.0% from 4.9% in February.
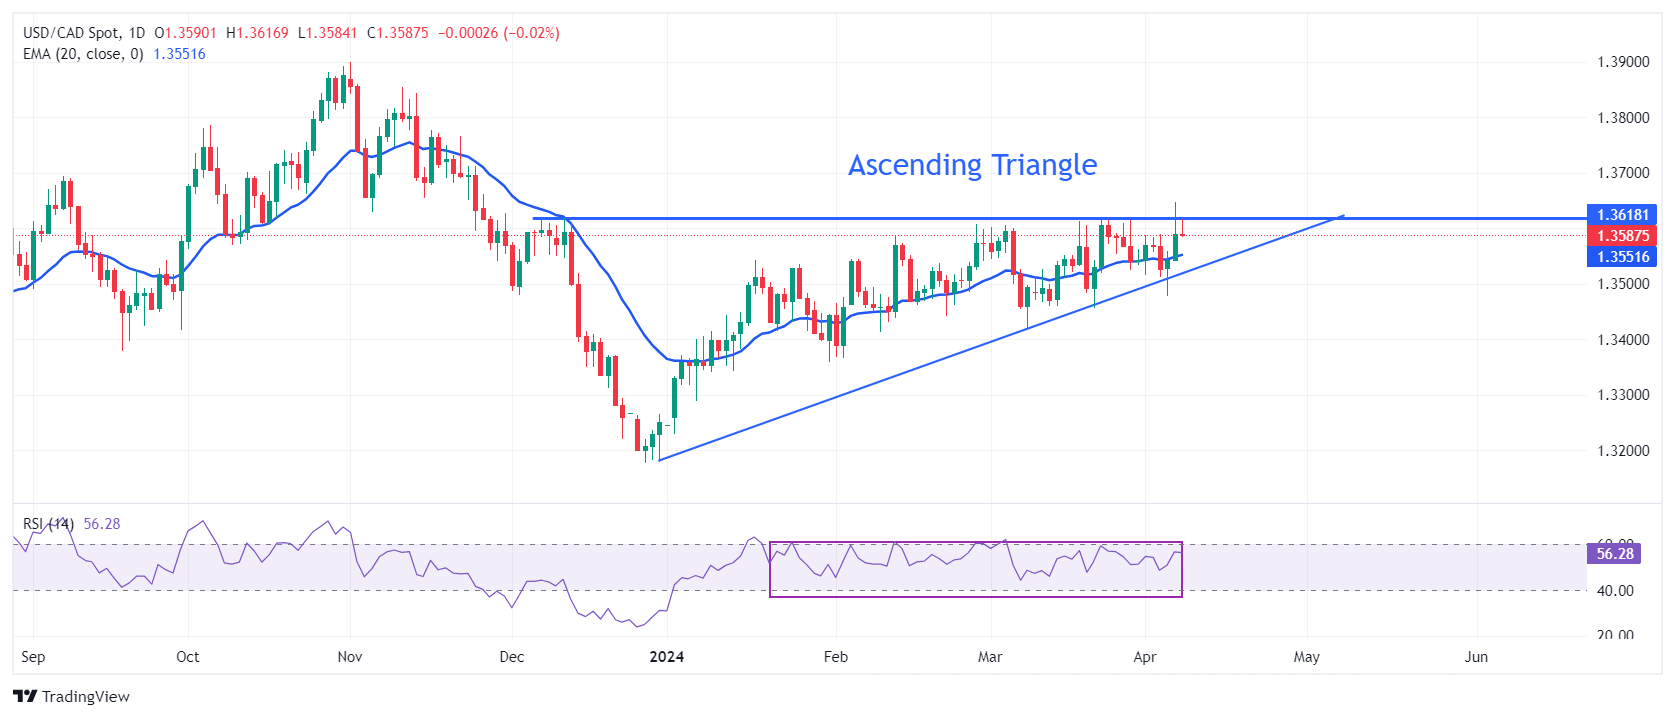
USD/CAD trades close to the horizontal resistance of the Ascending triangle formation on a daily timeframe, plotted from December 7 high at 1.3620. The upward-sloping border of the aforementioned pattern is placed from December 27 low at 1.3177. The chart pattern exhibits a sharp volatility contraction and a breakout can happen in any direction.
The asset remains above the 20-day Exponential Moving Average (EMA) near 1.3520, suggesting that the near-term appeal is bullish.
However, the 14-period Relative Strength Index (RSI) oscillates inside the 40.00-60.00 range, indicating indecisiveness among market participants.
The Loonie asset would observe a fresh upside if it breaks above April 5 high at 1.3648. This will drive the asset to the round-level resistance of 1.3700, followed by November 22 high at 1.3765.
On the flip side, a downside move below February 22 low at 1.3441 would expose the asset to February 9 low at 1.3413. A breakdown below the latter would extend downside towards January 15 low at 1.3382.
USD/CAD daily chart
- Gold price hovers near fresh highs around $2,350 as the US Dollar remains sideways.
- US yields rally as traders pare Fed rate cut expectations.
- US inflation could guide market expectations for Fed rate cuts ahead.
Gold price (XAU/USD) records fresh all-time highs just above $2,350 on Monday. The rally in the precious metal remains unabated even though US Treasury yields increase after the robust United States Nonfarm Payrolls report for March shifted expectations for Federal Reserve (Fed) pivoting to rate cuts in the second half of this year.
10-year US Treasury yields rise to four-month highs near 4.45%. Generally, higher bond yields dampen Gold’s appeal as they increase the opportunity cost of holding investment in the latter. However, the case has not held up in the last few weeks.
Fed policymakers don’t see rate cuts as appropriate as robust labor market data could halt the progress in reducing inflation to the 2% target.
Even one Fed policymaker sees no need for rate cuts this year if price pressures persist. Last week, Minneapolis Fed Bank President Neel Kashkari said rate cuts won’t be required this year if inflation stalls. Kashkari, who is currently not a voting member, warned: “The Fed needs to keep interest rates higher in the range of 5.25%-5.50% if inflation remains stronger than hoped”. He added that “if that still does not work, further rate increases are not off the table, but they are also not a likely scenario given what we know right now," Reuters reports.
Daily digest market movers: Gold price continues to advance while US Dollar turns sideways
- Gold price trades close to all-time highs near $2,350 while the US Dollar fails to catch bid even though strong United States labor market data for March dents speculation for the Federal Reserve (Fed) to begin reducing interest rates, which are currently expected from June.
- The US Nonfarm Payrolls (NFP) report showed that the labor market recorded an increase of 303K fresh payrolls, significantly better than the 200K expected and the prior reading of 270K. The Unemployment Rate fell to 3.8% from the consensus and the prior reading of 3.9%. Robust labor demand is generally followed by strong wage growth as employers are forced to offer higher pay due to a shortage of workers. Higher wage growth boosts consumer spending, which keeps inflation stubbornly higher.
- The labor market data showed that the Fed does not need to pivot to rate cuts sooner. The CME FedWatch tool shows that traders are pricing in 48% for lowering borrowing costs in June, down significantly from 58% a week ago.
- After the strong US NFP data, Fed Governor Michelle Bowman said, “We are still not yet at the point where it is appropriate to lower the policy rate, and I continue to see a number of upside risks to inflation,” Reuters reported. Bowman remains confident that inflation will soften ahead with labor demand remaining strong. She added that if that happens, "it will eventually become appropriate to lower the federal funds rate gradually to prevent monetary policy from becoming overly restrictive.”
- Going forward, investors will focus on the US Consumer Price Index (CPI) data for March, which will be published on Wednesday. The inflation data will provide more cues about when the Fed could start reducing its interest rates. Strong price pressures could keep hopes of rate cuts for June off the table while soft figures could prompt speculation for the contrary.
Technical Analysis: Gold price jumps to $2,350
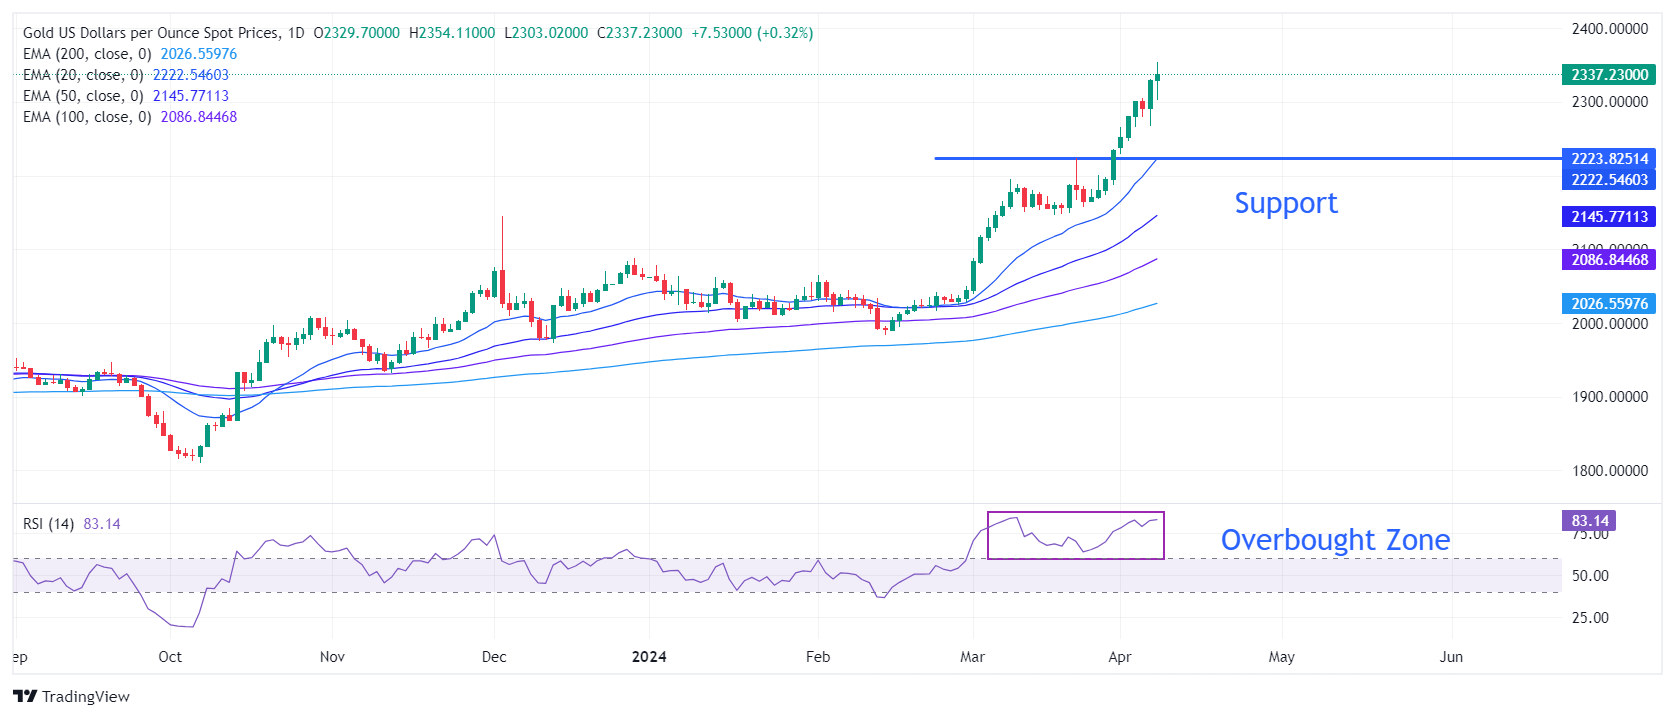
Gold price continues to add gains even though momentum oscillators turn extremely overbought – a situation when upside potential gets limited. The precious metal rallies to $2,350 but is expected to turn sideways as investors are expected to make fresh positions after the release of the US inflation data.
On the downside, March 21 high at $2,223 will be a major support area for the Gold price bulls.
The 14-period Relative Strength Index (RSI) reaches 84.00, which indicates that bullish momentum is still active. However, overbought signals have emerged.
Gold FAQs
Gold has played a key role in human’s history as it has been widely used as a store of value and medium of exchange. Currently, apart from its shine and usage for jewelry, the precious metal is widely seen as a safe-haven asset, meaning that it is considered a good investment during turbulent times. Gold is also widely seen as a hedge against inflation and against depreciating currencies as it doesn’t rely on any specific issuer or government.
Central banks are the biggest Gold holders. In their aim to support their currencies in turbulent times, central banks tend to diversify their reserves and buy Gold to improve the perceived strength of the economy and the currency. High Gold reserves can be a source of trust for a country’s solvency. Central banks added 1,136 tonnes of Gold worth around $70 billion to their reserves in 2022, according to data from the World Gold Council. This is the highest yearly purchase since records began. Central banks from emerging economies such as China, India and Turkey are quickly increasing their Gold reserves.
Gold has an inverse correlation with the US Dollar and US Treasuries, which are both major reserve and safe-haven assets. When the Dollar depreciates, Gold tends to rise, enabling investors and central banks to diversify their assets in turbulent times. Gold is also inversely correlated with risk assets. A rally in the stock market tends to weaken Gold price, while sell-offs in riskier markets tend to favor the precious metal.
The price can move due to a wide range of factors. Geopolitical instability or fears of a deep recession can quickly make Gold price escalate due to its safe-haven status. As a yield-less asset, Gold tends to rise with lower interest rates, while higher cost of money usually weighs down on the yellow metal. Still, most moves depend on how the US Dollar (USD) behaves as the asset is priced in dollars (XAU/USD). A strong Dollar tends to keep the price of Gold controlled, whereas a weaker Dollar is likely to push Gold prices up.
- AUD/JPY appreciates due to the likelihood of RBA to avoid rate cuts.
- Australia's 10-year bond yield surged to 4.1%, marking its highest level in over a month.
- The diminished geopolitical tension could weaken the safe-haven JPY.
AUD/JPY continues to move in the positive direction, rising to near 99.90 during the European session on Monday. This rise is attributed to the appreciation of the Australian Dollar (AUD), supported by gains in the domestic equity market. The ASX 200 Index experienced upward momentum during the opening session of the week, particularly fueled by a surge in tech stocks.
Additionally, Australia's 10-year government bond yield climbed to nearly 4.1%, reaching over one-month highs. This increase follows a rally in US bond yields, driven by stronger-than-expected US jobs data. Speculation has arisen that the Federal Reserve may maintain higher interest rates for an extended period.
Investors are growing increasingly skeptical about the need for the Reserve Bank of Australia (RBA) to cut interest rates at any point throughout 2024. This sentiment has been reinforced by more positive data emerging from the US, which has strengthened expectations that borrowing costs in the world's largest economy will remain elevated for an extended period.
In the previous week, unchanged Final Retail Sales and downbeat Trade Balance data from Australia exerted downward pressure on the Australian Dollar (AUD). Market participants are closely monitoring the prices of copper and oil, as further appreciation could potentially provide support for the Australian Dollar (AUD), consequently, underpinning the AUD/JPY cross.
The Japanese Yen (JPY) continues to face downward pressure as the Bank of Japan (BoJ) maintains a cautious stance towards further policy tightening. Additionally, reduced geopolitical tensions in the Middle East could dampen the appeal of the safe-haven JPY. Israel's decision to withdraw additional troops from Southern Gaza, likely in response to mounting international pressure, has contributed to a relaxation of tensions.
Earlier on Monday, Bank of Japan (BoJ) Governor Kazuo Ueda made remarks expressing his aspiration to simplify and enhance the clarity of the central bank's policy framework, provided economic conditions permitted. Governor Ueda made these comments while reflecting on his tenure since assuming the post approximately a year ago.
- The Pound Sterling is slightly under pressure on firm BoE rate cut expectations.
- Diminished speculation for the Fed pivoting to rate cuts in June provides support to the US Dollar.
- This week, the US Inflation data will significantly impact Fed rate cut expectations.
The Pound Sterling (GBP) falls slightly but broadly consolidates in a tight range above 1.2600 in Monday’s European session. The GBP/USD pair trades sideways as investors await the United States Consumer Price Index (CPI) data for March, which will be published on Wednesday. The inflation data will provide more clarity over whether the Federal Reserve (Fed) will begin to reduce interest rates from June.
The US Dollar Index (DXY), which tracks the Greenback’s value against the US Dollar, is slightly up near 104.30.
Currently, market expectations for the Fed kicking off its rate-cut cycle in June have waned significantly after Friday’s strong US employment report. The report showed that labor demand by US employers remained strong even though the Fed is maintaining interest rates higher in the range of 5.25%-5.50%.
Strong payrolls data cast doubts over progress in inflation declining to the 2% target. This could allow Fed policymakers to maintain their view of keeping interest rates higher and avoid rushing for any rate cuts.
In the United Kingdom, investors’ expectations for the Bank of England (BoE) to start reducing interest rates from the June meeting have recently deepened on increasing signs that price pressures are easing. This week, the Pound Sterling will be guided by the monthly Gross Domestic Product (GDP) and factory data for February, which will be published on Friday. Recently, S&P Global/CIPS showed that the UK Manufacturing PMI returned to growth after contracting for 20 months in a row.
Daily digest market movers: Pound Sterling is down while US Dollar is slightly positive
- The Pound Sterling oscillates in a tight range around 1.2630 as investors seek fresh guidance on when the Bank of England will pivot to rate cuts this year. Financial markets are anticipating this will happen in June after recent data suggested that inflation pressures have cooled down in recent months.
- United Kingdom’s strong wage growth remains a major force behind inflation. However, a survey from the UK’s Recruitment and Employment Confederation showed that starting salaries for permanent staff grew at the slowest rate in over three years in March, while spending on temporary workers fell by the most since July 2020. This adds to signs of a slowdown in Britain's job market,” Reuters reported.
- The official Average Earnings Excluding Bonuses rose by 6.1% year over year in the three months ending February. The pace at which wages are increasing is almost double than what’s required to bring inflation down to the required rate of 2%. Therefore, BoE policymakers need to see a significant decline in wage growth so that they can be convinced that inflation will pivot to 2%.
- Going forward, market sentiment after the United States consumer price inflation data for March will be the main driver for the Pound Sterling’s moves.
- The US inflation data will indicate whether the Fed will begin reducing interest rates from the June meeting. Speculation for Fed rate cuts in June has been reduced significantly as the hiring data remained robust in March. US employers recruited 303K fresh payrolls, significantly better than expectations of 200K and the prior reading of 270K. The Unemployment Rate fell to 3.8% from the consensus and the prior reading of 3.9%.
Technical Analysis: Pound Sterling remains supported near 1.2600
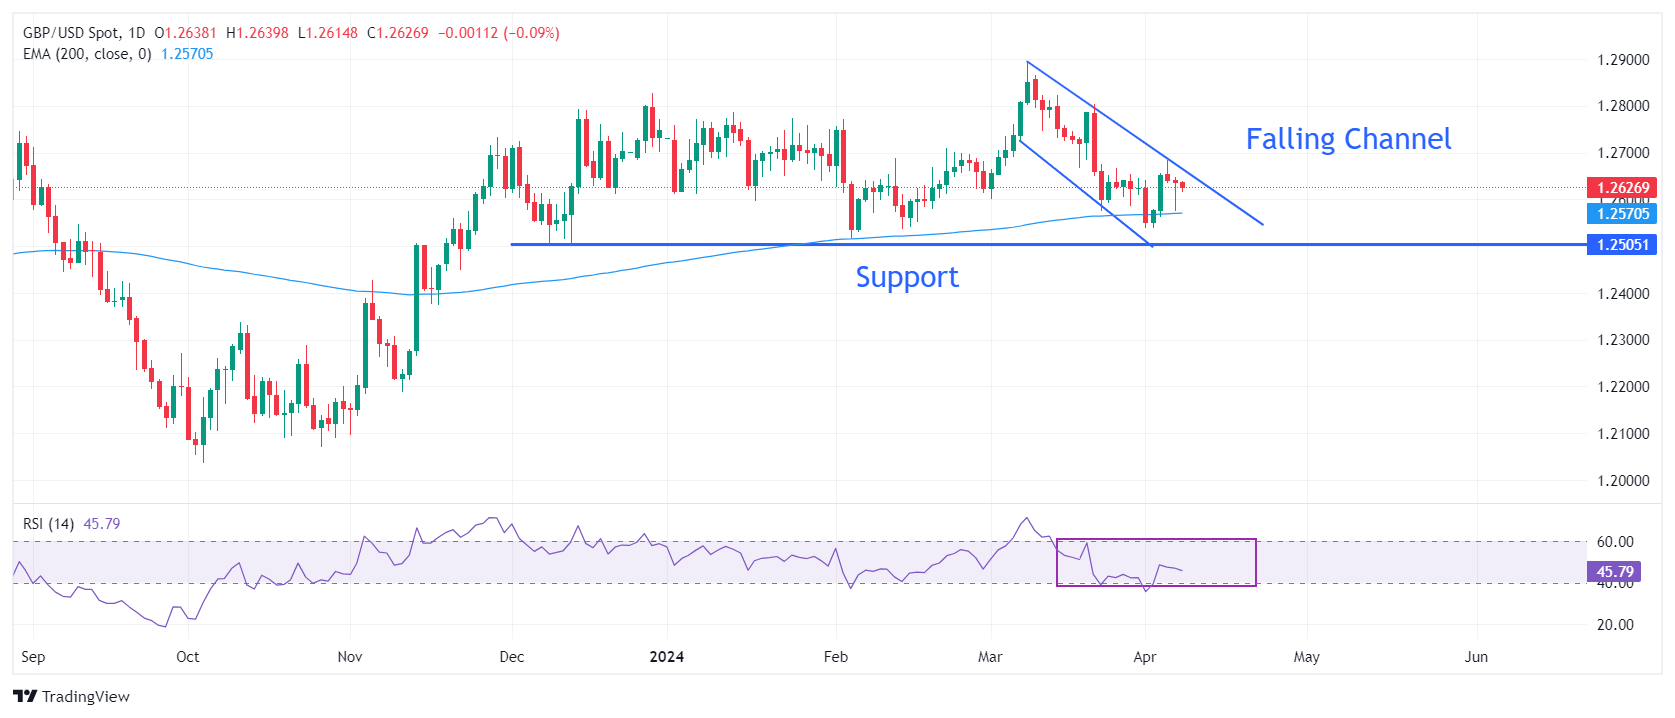
The Pound Sterling trades inside a Falling Channel formation on a daily timeframe in which each pullback move is considered as a selling opportunity by the market participants. The 200-day Exponential Moving Average (EMA) near 1.2570 provides support to the Pound Sterling bulls.
On the downside, the psychological level of 1.2500 plotted from December 8 low will also be a major support for the Cable.
The 14-period Relative Strength Index (RSI) hovers near 40.00. A bearish momentum could trigger if the RSI decisively breaks below the same.
Pound Sterling FAQs
The Pound Sterling (GBP) is the oldest currency in the world (886 AD) and the official currency of the United Kingdom. It is the fourth most traded unit for foreign exchange (FX) in the world, accounting for 12% of all transactions, averaging $630 billion a day, according to 2022 data. Its key trading pairs are GBP/USD, aka ‘Cable’, which accounts for 11% of FX, GBP/JPY, or the ‘Dragon’ as it is known by traders (3%), and EUR/GBP (2%). The Pound Sterling is issued by the Bank of England (BoE).
The single most important factor influencing the value of the Pound Sterling is monetary policy decided by the Bank of England. The BoE bases its decisions on whether it has achieved its primary goal of “price stability” – a steady inflation rate of around 2%. Its primary tool for achieving this is the adjustment of interest rates. When inflation is too high, the BoE will try to rein it in by raising interest rates, making it more expensive for people and businesses to access credit. This is generally positive for GBP, as higher interest rates make the UK a more attractive place for global investors to park their money. When inflation falls too low it is a sign economic growth is slowing. In this scenario, the BoE will consider lowering interest rates to cheapen credit so businesses will borrow more to invest in growth-generating projects.
Data releases gauge the health of the economy and can impact the value of the Pound Sterling. Indicators such as GDP, Manufacturing and Services PMIs, and employment can all influence the direction of the GBP. A strong economy is good for Sterling. Not only does it attract more foreign investment but it may encourage the BoE to put up interest rates, which will directly strengthen GBP. Otherwise, if economic data is weak, the Pound Sterling is likely to fall.
Another significant data release for the Pound Sterling is the Trade Balance. This indicator measures the difference between what a country earns from its exports and what it spends on imports over a given period. If a country produces highly sought-after exports, its currency will benefit purely from the extra demand created from foreign buyers seeking to purchase these goods. Therefore, a positive net Trade Balance strengthens a currency and vice versa for a negative balance.
- Eurozone investors’ morale continues its recovery momentum in April.
- EUR/USD keeps losses below 1.0850 after the upbeat Eurozone data.
The Eurozone Sentix Investor Confidence Index rose from -10.5 in March to -5.9 in April, the latest survey showed on Monday, hitting the highest level since February 2022.
The Expectations Index in the Eurozone rose from -2.3 in the previous month to 5.0 in April.
The index on the Current Situation also increased to -16.3 in April from -18.5 in March, registering the sixth consecutive month of increase.
Key takeaways
"Will there finally be a sustainable economic upturn? At least the economic recovery in the eurozone and worldwide is continuing.”
"The economic signals are also stabilizing internationally."
“While expectation values for Germany had improved to their highest level since February 2022, Europe's biggest economy "remains the relative problem child of the major industrialized nations".
Market reaction to the Eurozone Sentix data
EUR/USD is consolidating losses near 1.0830 despite the encouraging Eurozone data. As of writing, EUR/USD is down 0.06% on the day.
- USD/CHF edges higher as US Dollar improves on reduced chances of a Fed rate cut in June.
- The de-escalated tension in the Middle East could weaken the demand for safe-haven CHF.
- Higher US Treasury yields are contributing support for the Greenback.
USD/CHF gains ground for the second consecutive session on Monday, advancing to near 0.9050 during the European trading hours. Israel's decision to withdraw additional troops from Southern Gaza, possibly due to growing international pressure, has contributed to easing tensions. Additionally, peace talks between Israel and Hamas have resumed in Egypt, reducing concerns that may weaken demand for the safe-haven Swiss Franc (CHF).
In other news, the Swiss Unemployment Rate, not seasonally adjusted, increased by 2.3% month-on-month in March, slightly higher than the previous rise of 2.2%. The unemployment rate stood at 2.4% in March 2024, unchanged from the previous month on a non-seasonally adjusted basis.
At the time of writing, the US Dollar Index (DXY) trades higher around 104.30, propelled by a surprising beat in the Nonfarm Payrolls (NFP) report. The strong labor market performance in March, exceeding expectations, has reinforced bullish sentiment for the US Dollar.
The NFP reported a significant increase of 303,000 jobs in March, surpassing expectations of 200,000. However, the previous growth of 275,000 was revised downward to 270,000. Additionally, US Average Hourly Earnings rose by 0.3% month-over-month in March, meeting expectations. On an annual basis, there was an increase of 4.1%, aligning with the market consensus but slightly lower than the prior reading of 4.3%.
According to the CME FedWatch Tool, the probability of a rate cut has decreased to 46.1%. Traders are now eagerly awaiting the release of US Consumer Price Index data for March, scheduled for Wednesday.
- EUR/USD could move downward to retesting the nine-day EMA at 1.0822.
- Lagging indicators suggest that the bearish stance holds strong.
- The psychological level of 1.0800 appears as the key support region.
EUR/USD snaps its four-day winning streak, declining to near 1.0830 during the early European hours on Monday. The pair could move downward to retest the nine-day Exponential Moving Average (EMA) at 1.0822.
Additionally, technical analysis suggests a bearish sentiment for the EUR/USD pair. The 14-day Relative Strength Index (RSI) is positioned below the 50 mark, indicating weakness in buying momentum.
The Moving Average Convergence Divergence (MACD) remains below the centerline and exhibits a convergence below the signal line. This alignment suggests a momentum shift for the EUR/USD pair. Traders are likely to await confirmation from this lagging indicator to provide a clearer trend direction.
The EUR/USD pair could find immediate support at the psychological level of 1.0800. A break below the latter could exert pressure on the pair to navigate the region around the major level at 1.0750, followed by the previous week’s low at 1.0724.
On the upside, the major level at 1.0850 appears as the immediate resistance, aligned with the 50.0% retracement level at 1.0852. A breakthrough above this level could lead the EUR/USD pair to explore the 61.8% Fibonacci retracement level of 1.0883, followed by the psychological level of 1.0900.
EUR/USD: Daily Chart
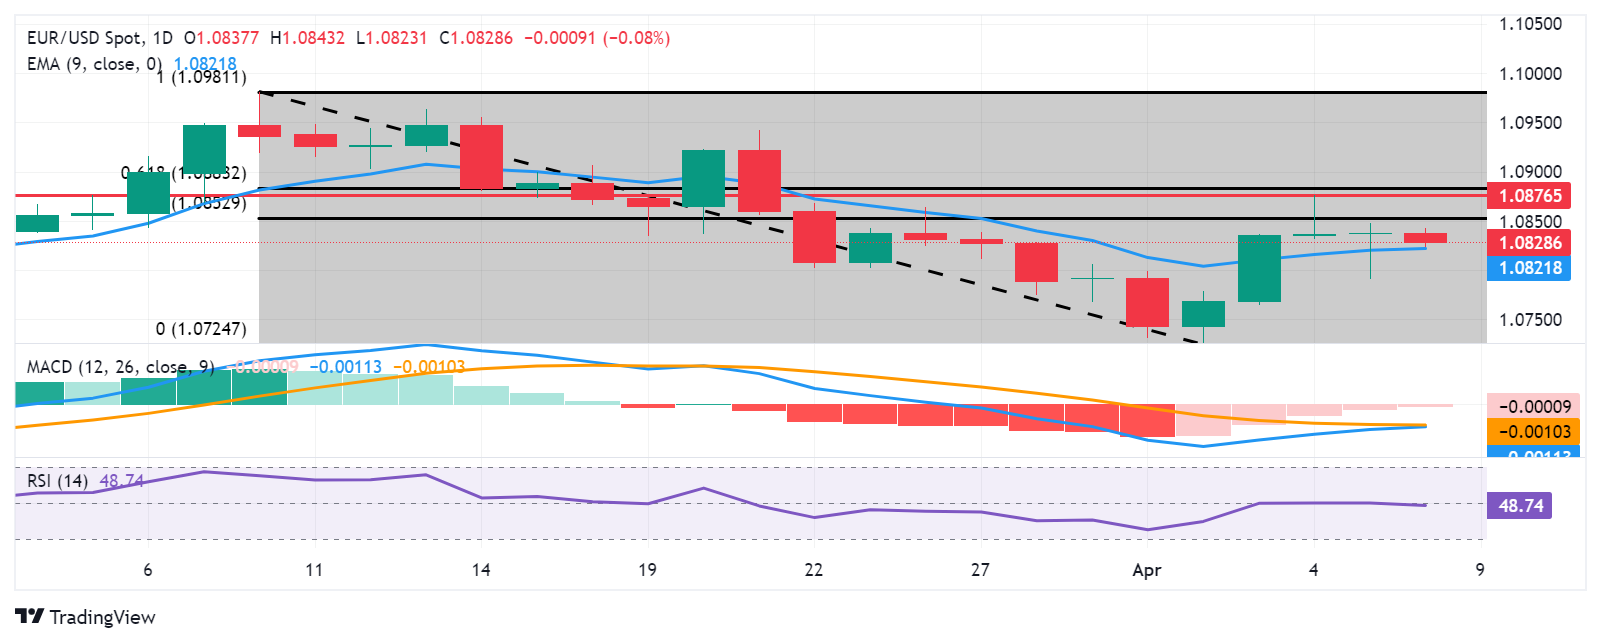
Here is what you need to know on Monday, April 8:
Gold preserved its bullish momentum and hit a new all-time high above $2,350 at the weekly opening after gaining over 4% in the previous week. Sentix Investor Confidence data for April will be featured in the European economic docket and the US calendar will not offer any high-impact data releases on Monday.
Forecasting the Coming Week: Markets maintain focus on inflation.
The data from the US showed on Friday that Nonfarm Payrolls (NFP) rose 303,000 in March and the Unemployment Rate edged lower to 3.8% from 3.9% in February. Both of these prints came in better than analysts' estimates and helped the US Dollar (USD) stay resilient against its major rivals heading into the weekend. According to the CME FedWatch Tool, markets are pricing in a 52% probability that the Fed will leave the policy rate unchanged at the June policy meeting, up from nearly 40% before the jobs report.
US Dollar price today
The table below shows the percentage change of US Dollar (USD) against listed major currencies today. US Dollar was the strongest against the Japanese Yen.
| USD | EUR | GBP | CAD | AUD | JPY | NZD | CHF | |
| USD | -0.01% | -0.02% | -0.04% | -0.19% | 0.10% | -0.16% | 0.09% | |
| EUR | 0.01% | -0.01% | -0.03% | -0.17% | 0.11% | -0.14% | 0.09% | |
| GBP | 0.01% | 0.01% | -0.02% | -0.19% | 0.12% | -0.14% | 0.11% | |
| CAD | 0.03% | 0.03% | 0.02% | -0.14% | 0.13% | -0.11% | 0.13% | |
| AUD | 0.19% | 0.18% | 0.17% | 0.15% | 0.29% | 0.03% | 0.26% | |
| JPY | -0.10% | -0.11% | -0.12% | -0.13% | -0.28% | -0.24% | -0.01% | |
| NZD | 0.16% | 0.14% | 0.14% | 0.11% | -0.04% | 0.25% | 0.23% | |
| CHF | -0.09% | -0.10% | -0.11% | -0.13% | -0.28% | 0.01% | -0.25% |
The heat map shows percentage changes of major currencies against each other. The base currency is picked from the left column, while the quote currency is picked from the top row. For example, if you pick the Euro from the left column and move along the horizontal line to the Japanese Yen, the percentage change displayed in the box will represent EUR (base)/JPY (quote).
The US Dollar Index holds comfortably above 104.00 in the European morning on Monday and the benchmark 10-year US Treasury bond yield stays in positive territory above 4.4%. Meanwhile, US stock index futures trade marginally lower.
EUR/USD staged a late rebound after dipping below 1.0800 on Friday and closed the week in positive territory. The pair moves up and down in a tight channel below 1.0850 early Monday.
GBP/USD stabilized above 1.2600 following a volatile American session on Friday and ended the week with small gains. The pair holds steady at around 1.2620 in the early European session.
Gold staged a correction and erased a large portion of its daily gains following the record-setting rally. XAU/USD was last seen trading modestly higher on the day near $2,040.
USD/JPY reversed its direction after falling below 151.00 on Friday and ended the day in positive territory. The pair continues to inch higher on Monday and closes in on 152.00.
Gold FAQs
Gold has played a key role in human’s history as it has been widely used as a store of value and medium of exchange. Currently, apart from its shine and usage for jewelry, the precious metal is widely seen as a safe-haven asset, meaning that it is considered a good investment during turbulent times. Gold is also widely seen as a hedge against inflation and against depreciating currencies as it doesn’t rely on any specific issuer or government.
Central banks are the biggest Gold holders. In their aim to support their currencies in turbulent times, central banks tend to diversify their reserves and buy Gold to improve the perceived strength of the economy and the currency. High Gold reserves can be a source of trust for a country’s solvency. Central banks added 1,136 tonnes of Gold worth around $70 billion to their reserves in 2022, according to data from the World Gold Council. This is the highest yearly purchase since records began. Central banks from emerging economies such as China, India and Turkey are quickly increasing their Gold reserves.
Gold has an inverse correlation with the US Dollar and US Treasuries, which are both major reserve and safe-haven assets. When the Dollar depreciates, Gold tends to rise, enabling investors and central banks to diversify their assets in turbulent times. Gold is also inversely correlated with risk assets. A rally in the stock market tends to weaken Gold price, while sell-offs in riskier markets tend to favor the precious metal.
The price can move due to a wide range of factors. Geopolitical instability or fears of a deep recession can quickly make Gold price escalate due to its safe-haven status. As a yield-less asset, Gold tends to rise with lower interest rates, while higher cost of money usually weighs down on the yellow metal. Still, most moves depend on how the US Dollar (USD) behaves as the asset is priced in dollars (XAU/USD). A strong Dollar tends to keep the price of Gold controlled, whereas a weaker Dollar is likely to push Gold prices up.
US Treasury Secretary Janet Yellen warned on Monday that “the US will not accept new industries being decimated by Chinese imports as the steel sector was a decade ago.”
Additional quotes
Exchanges with Chinese officials have advanced American interests.
Particularly worried that weak chinese household consumption and business over investment will put workers at risk in the US and other countries.
Reinforced that banks facilitating transactions to channel chinese goods to russian military face sanctions.
Exchanges during this trip provide dedicated structure to raise industrial capacity concerns.
US, China agree to hold additional financial technical exercises on operational resilience, insurance climate risks.
Market reaction
At the time of writing, AUD/USD is trading flat near 0.6580, having faced rejection just shy of the 0.6600 level.
- NZD/USD is stuck in a tight range around 0.6000 as investors are sidelined ahead of the RBNZ policy decision.
- The market mood turns cautious as robust US labor data dents Fed rate cut expectations for June.
- The USD Index consolidates as the focus shifts to US Inflation data.
The NZD/USD pair trades sideways near the psychological level of 0.6000 in Monday’s late Asian session. The Kiwi asset struggles for a direction as investors stays on sidelines ahead of the interest rate decision by the Reserve Bank of New Zealand (RBNZ), which will be announced on Wednesday.
The RBNZ is widely anticipated to keep interest rates unchanged at 5.5% as inflationary pressures are significantly higher than the desired rate of 2%.
Last week, RBNZ Governor Adrian Orr said that the central bank is on track to get inflation back within the target band.
Investors will keenly focus on cues about when the RBNZ will start cutting its Official Cash Rate (OCR). New Zealand’s weak economic prospects could spurt expectations of early rate cuts. The Kiwi economy was in a technical recession in the second half of 2023. The RBNZ could pivot to rate cuts if the economic outlook remains vulnerable.
S&P 500 futures posted some losses in the Tokyo session, portraying uncertainty among market participants. 10-year US Treasury yields jump to 4.43%. Investors turn cautious as upbeat United States Nonfarm Payrolls (NFP) report for March has dented speculation for the Federal Reserve (Fed) to begin reducing interest rates from the June meeting.
The US Dollar Index (DXY) remains rangebound, trades inside Friday’s trading range around 104.30. This week, investors will focus on the inflation data for March, which will be published on Wednesday. The consumer price inflation data will indicate about when the Fed will start reducing interest rates.
Germany’s industrial sector extended its pace of expansion in February, the latest data published by Destatis showed on Monday.
Industrial output in the Eurozone’s top economy rose 2.1% MoM, the federal statistics authority Destatis said in figures adjusted for seasonal and calendar effects, as against the 0.3% expected and a 1.3% increase in January.
German Industrial Production plunged at an annual rate of 4.9% in February versus the January slump of 5.3%.
EUR/USD reaction to the German Industrial Production data
The upbeat German industrial figures failed to have any impact on the Euro, as EUR/USD trades flat on the day at 1.0834 at the press time.
Euro price today
The table below shows the percentage change of Euro (EUR) against listed major currencies today. Euro was the strongest against the Japanese Yen.
| USD | EUR | GBP | CAD | AUD | JPY | NZD | CHF | |
| USD | -0.06% | -0.07% | -0.06% | -0.20% | 0.05% | -0.22% | 0.00% | |
| EUR | 0.06% | 0.00% | -0.01% | -0.14% | 0.11% | -0.15% | 0.06% | |
| GBP | 0.06% | 0.02% | 0.02% | -0.11% | 0.12% | -0.14% | 0.07% | |
| CAD | 0.06% | -0.01% | -0.01% | -0.12% | 0.11% | -0.14% | 0.05% | |
| AUD | 0.20% | 0.11% | 0.11% | 0.12% | 0.23% | -0.02% | 0.16% | |
| JPY | -0.06% | -0.12% | -0.12% | -0.09% | -0.25% | -0.26% | -0.05% | |
| NZD | 0.22% | 0.15% | 0.15% | 0.15% | 0.02% | 0.27% | 0.20% | |
| CHF | 0.01% | -0.06% | -0.07% | -0.05% | -0.20% | 0.06% | -0.21% |
The heat map shows percentage changes of major currencies against each other. The base currency is picked from the left column, while the quote currency is picked from the top row. For example, if you pick the Euro from the left column and move along the horizontal line to the Japanese Yen, the percentage change displayed in the box will represent EUR (base)/JPY (quote).
- The Pound Sterling holds its rebound from seven-month lows against the US Dollar.
- GBP/USD stays cautious ahead of Wednesday’s US CPI inflation data.
- The Pound Sterling faces downside risks, as the daily RSI remains below 50.00.
The Pound Sterling (GBP) Is trading on the back foot against the US Dollar (USD), as the GBP/USD pair manages to hold above the 1.2600 level at the start of the week on Monday.
A negative shift in risk sentiment, despite easing Middle East geopolitical tensions, weighs on the higher-yielding Pound Sterling while the US Dollar struggles for traction amid the market’s nervousness ahead of Wednesday’s US Consumer Price Index (CPI) data.
From a short-term technical perspective, GBP/USD remains vulnerable and looks set to extend the downside break from the rising channel seen a couple of weeks ago.
The 14-day Relative Strength Index (RSI) indicator points lower below the midline, currently near 46.50, suggesting that risks remain skewed in favor of sellers.
Pound Sterling sellers, however, need to seek a daily candlestick closing below the horizontal 200-day Simple Moving Average (SMA) at 1.2587 to initiate a sustained downtrend.
The April low near 1.2540 could come to buyers' rescue then, followed by the 1.2500 round figure. Further south, the 1.2450 static support will challenge the bullish commitments.
If buyers defend the 200-day SMA at 1.2587, it could alleviate the near-term selling pressure, allowing GBP/USD to attempt a comeback toward the static resistance shy of the 1.2700 level.
GBP/USD must scale the critical confluence resistance at 1.2665 to add extra legs to the rebound toward 1.2700. The 1.2665 level is the intersection of the 100-day and 50-day SMAs.
GBP/USD: Daily chart
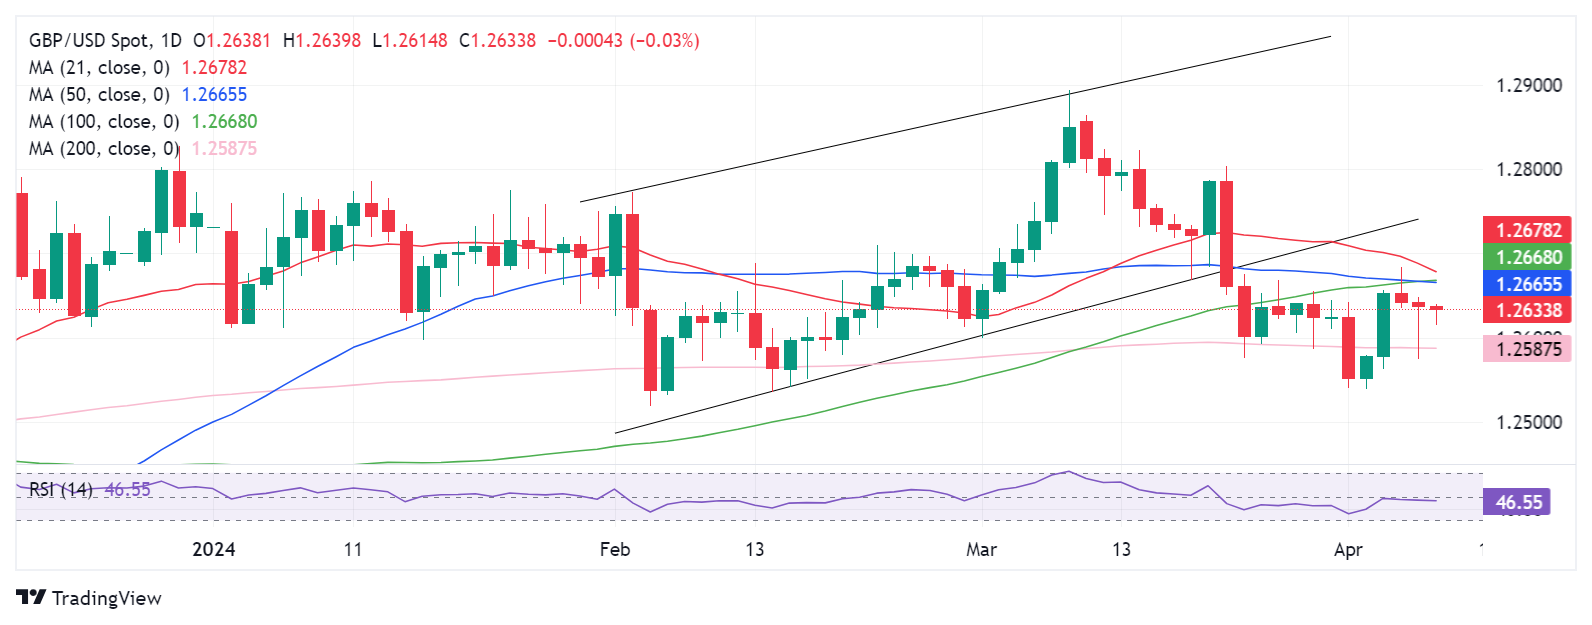
- Gold price builds on the recent breakout momentum and touches a fresh record high on Monday.
- Reduced bets for a June Fed rate cut underpin the USD and might cap gains amid the risk-on mood.
- Dip-buying should limit any corrective slide ahead of the US CPI and the FOMC minutes this week.
Gold price (XAU/USD) attracts some dip-buying in the vicinity of the $2,300 mark during the Asian session on Monday and hits a fresh all-time peak in the last hour. Expectations that the Federal Reserve (Fed) will eventually start cutting rates in 2024, along with buying from the Chinese central bank, have been significant drivers of the precious metal's blowout rally over the past two weeks or so. That said, extremely overstretched conditions on the daily chart might hold back traders from placing fresh bullish bets amid easing geopolitical tensions and a positive risk tone, which tends to undermine the safe-haven precious metal.
Meanwhile, the upbeat US monthly employment details released on Friday suggested that the Federal Reserve (Fed) may delay cutting interest rates and force investors to scale back their expectations for three rate cuts in 2024 to two. The outlook keeps the US Treasury bond yields elevated and acts as a tailwind for the US Dollar (USD), which, in turn, might further contribute to capping the upside for the non-yielding Gold price. Investors might also prefer to move to the sidelines ahead of this week's release of the US consumer inflation figures for March and the FOMC meeting minutes on Wednesday.
Daily Digest Market Movers: Gold price draws support from expectations for lower interest rates and central bank buying
- A buying spree by China’s central bank, along with expectations that lower US interest rates are on the horizon, pushed the Gold price to a fresh record high on the first day of a new week.
- Official data released Sunday showed that bullion held by the People’s Bank of China rose by 0.2% to 72.74 million troy ounces last month, marking the 17th consecutive month of increase.
- The markets have been pricing in an even chance that the Federal Reserve (Fed) will start its rate-cutting cycle at the June policy meeting, which further benefits the non-yielding yellow metal.
- The global risk sentiment got a boost after Israel withdrew more soldiers from southern Gaza and committed to fresh talks on a potential ceasefire, easing geopolitical tensions in the Middle East.
- The US Bureau of Labor Statistics (BLS) reported on Friday that Nonfarm Payrolls (NFP) increased by 303K in March vs the 200K expected and the previous month's downwardly revised reading.
- Other details of the publication showed that the Unemployment Rate edged lower to 3.8% from 3.9% in February amid a rise in the Labor Force Participation Rate to 62.7% from 62.5% previously.
- The data forced investors to scale back their expectations for a total number of rate cuts in 2024 to two as against three rate cuts projected by the Fed, which pushes the US Treasury bond yields higher.
- The rate-sensitive two-year US government bond and the benchmark 10-year Treasury note surged to a four-month peak on Friday, underpinning the USD and capping gains for the commodity.
- Traders now look to the release of the US consumer inflation figures for March and the FOMC meeting minutes on Wednesday for cues about the Fed's rate-cut path and a fresh directional impetus.
Technical Analysis: Gold price needs to consolidate before the next leg up amid extremely overbought RSI on the daily chart
From a technical perspective, Friday's strong move up and acceptance above the $2,300 round-figure mark could be seen as a fresh trigger for bullish traders and support prospects for additional gains. That said, the Relative Strength Index (RSI) on the daily chart is flashing extremely overbought conditions. This, in turn, makes it prudent to wait for some near-term consolidation or a modest pullback before the next leg up. Nevertheless, the setup suggests that the path of least resistance for the Gold price is to the upside, and any corrective decline might still be seen as a buying opportunity.
Meanwhile, the Asian session low, around the $2,305-2,300 area, now seems to protect the immediate downside ahead of Friday's swing low, around the $2,267-2,265 region. A convincing break below the latter might prompt some technical selling and drag the Gold price to the $2,223-2,222 zone en route to the $2,200 mark. The latter should act as a strong base for the XAU/USD, which, if broken decisively, might shift the near-term bias in favor of bearish traders and pave the way for a further depreciating move.
Gold FAQs
Gold has played a key role in human’s history as it has been widely used as a store of value and medium of exchange. Currently, apart from its shine and usage for jewelry, the precious metal is widely seen as a safe-haven asset, meaning that it is considered a good investment during turbulent times. Gold is also widely seen as a hedge against inflation and against depreciating currencies as it doesn’t rely on any specific issuer or government.
Central banks are the biggest Gold holders. In their aim to support their currencies in turbulent times, central banks tend to diversify their reserves and buy Gold to improve the perceived strength of the economy and the currency. High Gold reserves can be a source of trust for a country’s solvency. Central banks added 1,136 tonnes of Gold worth around $70 billion to their reserves in 2022, according to data from the World Gold Council. This is the highest yearly purchase since records began. Central banks from emerging economies such as China, India and Turkey are quickly increasing their Gold reserves.
Gold has an inverse correlation with the US Dollar and US Treasuries, which are both major reserve and safe-haven assets. When the Dollar depreciates, Gold tends to rise, enabling investors and central banks to diversify their assets in turbulent times. Gold is also inversely correlated with risk assets. A rally in the stock market tends to weaken Gold price, while sell-offs in riskier markets tend to favor the precious metal.
The price can move due to a wide range of factors. Geopolitical instability or fears of a deep recession can quickly make Gold price escalate due to its safe-haven status. As a yield-less asset, Gold tends to rise with lower interest rates, while higher cost of money usually weighs down on the yellow metal. Still, most moves depend on how the US Dollar (USD) behaves as the asset is priced in dollars (XAU/USD). A strong Dollar tends to keep the price of Gold controlled, whereas a weaker Dollar is likely to push Gold prices up.
- USD/CAD trims intraday gains on risk-on sentiment on Monday.
- The decline in the Crude oil prices undermines the Canadian Dollar.
- The US Dollar strengthened as the likelihood of a Fed rate cut in June diminished.
USD/CAD extends its winning streak, trading higher around 1.3600 for the third consecutive session during the Asian hours on Monday. The US Dollar (USD) strengthens, supported by higher US Treasury yields, thereby exerting upward support to the USD/CAD pair.
Additionally, the decline in Crude oil prices contributes pressure to undermining the Canadian Dollar (CAD), given Canada is one of the largest Crude oil exporters to the United States (US). West Texas Intermediate (WTI) oil price extends losses to near $85.10 per barrel, by the press time.
This comes as Israel withdraws additional troops from Southern Gaza, likely in response to increasing international pressure. Moreover, peace talks between Israel and Hamas have resumed in Egypt, reducing tensions that previously fueled the recent surge in oil prices.
The Canadian Dollar encountered difficulties following the release of weaker domestic employment data on Friday. Investors are now anticipating the Bank of Canada’s (BoC) interest rate decision scheduled for Wednesday, with expectations of remaining unchanged at 5.0%.
The US Dollar Index (DXY) trades higher around 104.30, at the time of writing, propelled by a surprising beat from the Nonfarm Payrolls (NFP) report. The strong labor market performance in March, surpassing expectations, has bolstered the bullish sentiment for the US Dollar.
US Nonfarm Payrolls (NFP) reported a significant increase of 303,000 jobs in March, surpassing expectations of 200,000. However, the previous growth of 275,000 was revised downward to 270,000. According to the CME FedWatch Tool, the probability of a rate cut has decreased to 46.1%. Traders are awaiting the release of US Consumer Price Index data for March scheduled on Wednesday.
- WTI kicks off the new week on a weaker note amid easing geopolitical tensions in the Middle East.
- The post-NFP USD buying exerts additional pressure on the commodity and contributes to the fall.
- Expectations for a fall in fuel supply from Russia and signs of improving demand help limit losses.
West Texas Intermediate (WTI) US crude Oil prices open with a bearish gap on the first day of a new week and retreat further from over a five-month peak touched on Friday. The commodity, however, trims a part of Asian session losses and currently trades around the $85.00 psychological mark, still in the red for the second successive day.
Israel withdrew more soldiers from southern Gaza and committed to fresh talks on a potential ceasefire with Hamas, easing concerns about the risk of a further escalation of conflicts and crude supply disruptions from the Middle East. This, along with the upbeat US NFP-inspired US Dollar (USD) strength, prompts some profit-taking around Crude Oil prices, especially after the recent blowout rally witnessed over the past two months or so.
Investors, meanwhile, remain concerned about the Ukrainian drone attacks on refineries in Russia. Apart from this, the OPEC+ clampdown on some countries to increase compliance with output cuts, along with a strong demand outlook, acts as a tailwind for Crude Oil prices. The optimism is being fueled by positive economic data from China – the world's top importer – and supports prospects for the emergence of some dip-buying around Crude Oil prices.
The aforementioned fundamental backdrop makes it prudent to wait for strong follow-through selling before confirming that the black liquid has topped out in the near term and before positioning for any meaningful corrective decline. Even from a technical perspective, the recent breakout through the previous YTD peak, around the $83.55 area favours bullish traders amid positive oscillators on the daily chart, which have now eased from overbought territory.
- Australian Dollar moves higher after recovering daily losses amid a stronger ASX 200 Index.
- Australia’s equity market strengthens following Friday's gains on Wall Street.
- US Dollar gained ground on the reduced likelihood of a Fed rate cut in June.
- US Nonfarm Payrolls added 303,000 new jobs in March, surpassing the anticipated 200,000 jobs.
The Australian Dollar (AUD) recovers intraday losses and moves into positive territory on Monday, likely influenced by gains in the domestic equity market. The ASX 200 Index sees upward movement during the week's opening session, particularly driven by a surge in tech stocks. However, the steady US Dollar (USD) may attempt to constrain the advancement of the AUD/USD pair.
Australian Dollar (AUD) faced challenges following the release of unchanged Final Retail Sales and downbeat Trade Balance data from Australia during the previous week. Notably, Australia reported its smallest Trade Surplus in five months for February, attributed partly to a decline in iron ore exports.
The US Dollar Index (DXY) gained ground on higher US Treasury yields following the release of robust Nonfarm Payrolls data from the United States (US) on Friday. The improved labor market performance has reduced the likelihood of a rate cut in June from the Federal Reserve (Fed). According to the CME FedWatch Tool, the probability of a rate cut has decreased to 46.1%.
Daily Digest Market Movers: Australian Dollar gains ground on higher ASX 200 Index
- Australia’s Trade Surplus (MoM) narrowed to 7,280 million in March, falling short of the expected 10,400 million and February’s reading of 10,058 million.
- Australia's Exports decreased by 2.2% month-over-month, contrasting with the previous increase of 1.6%. The nation’s Imports grew by 4.8%, compared to 1.3% prior.
- Australia's Final Retail Sales were unchanged at 0.3% in February, which is in line with expectations.
- The US Treasury stated Secretary Janet Yellen's meeting with China's Finance Minister Lan Foan, where they discussed the macroeconomic outlook and financial developments in both the United States and China. They also discussed the significant role that the Treasury and the Ministry of Finance can play in maintaining a durable communication channel between the two countries.
- Federal Reserve Bank of Dallas President Lorie K. Logan emphasized on Friday that, in light of the upward risks to inflation, she deems it premature to contemplate cutting interest rates. She stressed the necessity of resolving more uncertainty regarding the economic trajectory before making such decisions.
- US Nonfarm Payrolls (NFP) reported a significant increase of 303,000 jobs in March, surpassing expectations of 200,000 and the previous reading of 270,000.
- US Average Hourly Earnings rose by 0.3% month-over-month in March, meeting expectations. The previous reading was 0.2%. There was an increase of 4.1% on an annual basis, aligning with the market consensus but slightly lower than 4.3% prior.
- US Initial Jobless Claims for the week ended March 29 rose by 9,000 to 221,000 from the previous week’s reading of 212,000, below the market consensus of 214,000.
- US Challenger Job Cuts posted 90.309K for March against the previous reading of 84.638K.
- US ADP Employment Change rose by 184K in March, compared to the 155K increase in February, above the market consensus of 148K.
Technical Analysis: Australian Dollar could test the psychological barrier of 0.6600
The Australian Dollar trades around 0.6580 on Monday. The immediate resistance region is observed around the 61.8% Fibonacci retracement level of 0.6596, coinciding with the psychological level of 0.6600. A breakthrough above this level could potentially propel the AUD/USD pair to explore the area around the major level of 0.6650, followed by March’s high of 0.6667. On the downside, key support is identified around the nine-day Exponential Moving Average (EMA) of 0.6557 and the major support level of 0.6550. A breach below the latter could exert downward pressure on the AUD/USD pair, potentially leading it toward the psychological level of 0.6500.
AUD/USD: Daily Chart

Australian Dollar price today
The table below shows the percentage change of Australian Dollar (AUD) against listed major currencies today. Australian Dollar was the strongest against the Japanese Yen.
| USD | EUR | GBP | CAD | AUD | JPY | NZD | CHF | |
| USD | -0.10% | -0.12% | -0.12% | -0.23% | 0.04% | -0.19% | -0.04% | |
| EUR | 0.10% | 0.00% | -0.01% | -0.11% | 0.15% | -0.07% | 0.06% | |
| GBP | 0.11% | 0.01% | -0.01% | -0.12% | 0.15% | -0.08% | 0.07% | |
| CAD | 0.11% | 0.00% | 0.00% | -0.11% | 0.16% | -0.07% | 0.07% | |
| AUD | 0.23% | 0.11% | 0.11% | 0.10% | 0.26% | 0.04% | 0.17% | |
| JPY | -0.04% | -0.15% | -0.13% | -0.15% | -0.27% | -0.21% | -0.08% | |
| NZD | 0.19% | 0.07% | 0.07% | 0.07% | -0.05% | 0.22% | 0.13% | |
| CHF | 0.04% | -0.07% | -0.07% | -0.08% | -0.19% | 0.08% | -0.15% |
The heat map shows percentage changes of major currencies against each other. The base currency is picked from the left column, while the quote currency is picked from the top row. For example, if you pick the Euro from the left column and move along the horizontal line to the Japanese Yen, the percentage change displayed in the box will represent EUR (base)/JPY (quote).
Australian Dollar FAQs
One of the most significant factors for the Australian Dollar (AUD) is the level of interest rates set by the Reserve Bank of Australia (RBA). Because Australia is a resource-rich country another key driver is the price of its biggest export, Iron Ore. The health of the Chinese economy, its largest trading partner, is a factor, as well as inflation in Australia, its growth rate and Trade Balance. Market sentiment – whether investors are taking on more risky assets (risk-on) or seeking safe-havens (risk-off) – is also a factor, with risk-on positive for AUD.
The Reserve Bank of Australia (RBA) influences the Australian Dollar (AUD) by setting the level of interest rates that Australian banks can lend to each other. This influences the level of interest rates in the economy as a whole. The main goal of the RBA is to maintain a stable inflation rate of 2-3% by adjusting interest rates up or down. Relatively high interest rates compared to other major central banks support the AUD, and the opposite for relatively low. The RBA can also use quantitative easing and tightening to influence credit conditions, with the former AUD-negative and the latter AUD-positive.
China is Australia’s largest trading partner so the health of the Chinese economy is a major influence on the value of the Australian Dollar (AUD). When the Chinese economy is doing well it purchases more raw materials, goods and services from Australia, lifting demand for the AUD, and pushing up its value. The opposite is the case when the Chinese economy is not growing as fast as expected. Positive or negative surprises in Chinese growth data, therefore, often have a direct impact on the Australian Dollar and its pairs.
Iron Ore is Australia’s largest export, accounting for $118 billion a year according to data from 2021, with China as its primary destination. The price of Iron Ore, therefore, can be a driver of the Australian Dollar. Generally, if the price of Iron Ore rises, AUD also goes up, as aggregate demand for the currency increases. The opposite is the case if the price of Iron Ore falls. Higher Iron Ore prices also tend to result in a greater likelihood of a positive Trade Balance for Australia, which is also positive of the AUD.
The Trade Balance, which is the difference between what a country earns from its exports versus what it pays for its imports, is another factor that can influence the value of the Australian Dollar. If Australia produces highly sought after exports, then its currency will gain in value purely from the surplus demand created from foreign buyers seeking to purchase its exports versus what it spends to purchase imports. Therefore, a positive net Trade Balance strengthens the AUD, with the opposite effect if the Trade Balance is negative.
- The Japanese Yen drifts lower for the second straight day and is pressured by a combination of factors.
- The BoJ’s cautious stance, softer domestic data and a positive risk tone undermine the safe-haven JPY.
- The upbeat US NFP-inspired USD strength lifts USD/JPY back closer to the multi-decade high.
The Japanese Yen (JPY) witnessed an intraday turnaround from over a two-week high touched against its American counterpart on Friday and finally settled near the lower end of its daily trading range. The Bank of Japan's (BoJ) dovish language, signaling that the next rate hike will be some time away, along with a positive risk tone, turned out to be key factors undermining the safe-haven JPY. The selling bias remains unabated during the Asian session on Monday following the release of softer domestic data, showing that real wages in Japan fell in February for the 23rd consecutive month.
Apart from this, a generally positive tone around the equity markets dents demand for the safe-haven JPY. This, along with the emergence of some US Dollar (USD) buying, bolstered by Friday's upbeat US monthly jobs data, pushes the USD/JPY pair back closer to a multi-decade high touched last week. The blowout Nonfarm Payrolls (NFP) report suggested the Federal Reserve (Fed) may delay cutting interest rates and forced investors to scale back their expectations for three rate cuts in 2024. This remains supportive of elevated US Treasury bond yields and acts as a tailwind for the buck.
The JPY bulls, meanwhile, fail to gain any respite from the recent jawboning from Japanese authorities, showing readiness to intervene in the markets to prop up the domestic currency. This suggests that the path of least resistance for the USD/JPY pair is to the upside amid expectations that the gap between US and Japanese interest rates will stay wide. Market participants now look to the release of the latest US consumer inflation figures and the FOMC meeting minutes on Wednesday for clues about the Fed's rate-cut path. This will influence the USD and provide a fresh impetus to the currency pair.
Daily Digest Market Movers: Japanese Yen is weighed down by a combination of factors
- The Bank of Japan's (BoJ) cautious approach towards further policy tightening, along with softer wage data from Japan, dragged the Japanese Yen lower for the second straight day on Monday.
- The Bank of Japan struck a dovish tone at the end of the March monetary policy meeting and stopped short of offering any guidance about future steps, or the pace of policy normalization.
- The labor ministry reported that Japanese workers' inflation-adjusted real wages fell by 1.3% in February from a year earlier as compared to the previous month's revised decline of 1.1%.
- Data published by the Ministry of Finance showed Japan's current account rose to 2.64 trillion Yen in February, the highest since October last year, though was below consensus estimates.
- Reports that progress has been made in Gaza ceasefire talks boost investors' confidence and turn out to be another factor that undermines demand for the safe-haven JPY.
- Japanese government officials continued with their jawboning to defend the domestic currency, albeit doing little to impress the JPY bulls or hinder the USD/JPY pair's move up.
- The US Dollar draws support from the upbeat US jobs data released on Friday, which forced investors to trim their bets for a June interest rate cut by the Federal Reserve.
- The popularly known NFP report showed that the US economy added 303K jobs in March and the unemployment rate fell to 3.8% from 3.9% in the previous month.
- The data, meanwhile, gives the Fed more reason to stay patient and changed the odds of rate cuts this year from three to two, which pushes the US Treasury bond yields higher.
- The market focus now shifts to the release of the US consumer inflation figures for March, due on Wednesday, which will be followed by the FOMC meeting minutes.
- Investors will look for more cues on potential Fed rate cuts in 2024 before positioning for the next leg of a directional move for the buck and the USD/JPY pair.
Technical Analysis: USD/JPY bulls need to wait for sustained strength beyond the 152.00 mark
From a technical perspective, bulls might still wait for sustained strength and acceptance above the 152.00 mark before placing fresh bets. Given that oscillators on the daily chart are holding in the positive territory and are still away from being in the overbought zone, the USD/JPY pair might then resume its uptrend witnessed over the past month or so from the March trough.
On the flip side, the 151.30 horizontal zone now seems to protect the immediate downside ahead of the 151.00 mark. Some follow-through selling will expose Friday's swing low, around the 150.30 region. This is followed by the 150.00 psychological mark, which if broken decisively will shift the near-term bias in favor of bearish traders. The USD/JPY pair might then slide to the 149.35-149.30 region en route to the 149.00 mark.
Japanese Yen FAQs
The Japanese Yen (JPY) is one of the world’s most traded currencies. Its value is broadly determined by the performance of the Japanese economy, but more specifically by the Bank of Japan’s policy, the differential between Japanese and US bond yields, or risk sentiment among traders, among other factors.
One of the Bank of Japan’s mandates is currency control, so its moves are key for the Yen. The BoJ has directly intervened in currency markets sometimes, generally to lower the value of the Yen, although it refrains from doing it often due to political concerns of its main trading partners. The current BoJ ultra-loose monetary policy, based on massive stimulus to the economy, has caused the Yen to depreciate against its main currency peers. This process has exacerbated more recently due to an increasing policy divergence between the Bank of Japan and other main central banks, which have opted to increase interest rates sharply to fight decades-high levels of inflation.
The BoJ’s stance of sticking to ultra-loose monetary policy has led to a widening policy divergence with other central banks, particularly with the US Federal Reserve. This supports a widening of the differential between the 10-year US and Japanese bonds, which favors the US Dollar against the Japanese Yen.
The Japanese Yen is often seen as a safe-haven investment. This means that in times of market stress, investors are more likely to put their money in the Japanese currency due to its supposed reliability and stability. Turbulent times are likely to strengthen the Yen’s value against other currencies seen as more risky to invest in.
Gold price witnessed a sudden $27 upswing and stormed through the $2,350 barrier to refresh an all-time high at $2,354 in Asian trading on Monday. Despite easing geopolitical tensions between Israel and Hamas and reducing bets of a June US Federal Reserve (Fed) interest rate cut, Gold price extends its record-setting rally primarily on reports of potential robust Gold purchases by global central banks.
A Chinese official reported on Sunday, the People’s Bank of China (PBOC) purchased Gold for its reserves for the 17th straight month in March.
more to come ...
| Raw materials | Closed | Change, % |
|---|---|---|
| Silver | 27.444 | 1.77 |
| Gold | 2328.126 | 1.6 |
| Palladium | 1002.29 | -1.98 |
In a readout following the conclusion of the meeting between U Treasury Secretary Janet Yellen and China's Finance Minister Lan Fo'an, the US Treasury Department said that they discussed the macroeconomic outlook and financial developments in the US and China.
Nothing further is reported about the same.
Meanwhile, Yellen is scheduled to meet the People’s Bank of China (PBOC) Governor Pan Gongsheng on Monday in Beijing.
Market reaction
AUD/USD is little impressed by the meeting, losing 0.12% on the day to trade at 0.6572. at the press time.
- Gold price retreats from the new record high of $2,330 marked on Friday.
- The price of Gold faces challenges due to lowered chances of Fed rate cuts in June.
- US Nonfarm Payrolls added 303K new jobs in March, exceeding the expected 200K.
Gold price drops to near $2,310 per troy ounce during the Asian session on Monday after touching a new record high on Friday. The price of precious metal faces challenges primarily due to higher US Treasury yields, which weakens the non-yielding assets.
The recent gains in the US Dollar exert downward pressure on the price of Gold as it becomes more expensive for investors holding other currencies to purchase Gold, leading to a decrease in demand for the precious metal.
The US Dollar Index (DXY) trades higher around 104.40, with the 2-year and 10-year yields on US Treasury bonds standing at 4.77% and 4.42%, by the press time. The stronger Nonfarm Payrolls (NFP) report reinforces the bullish outlook for the Greenback. The likelihood of a rate cut in June from the Federal Reserve (Fed) has been depreciated to 46.1%, according to the CME FedWatch Tool.
US Nonfarm Payrolls (NFP) reported a significant increase of 303,000 jobs in March, surpassing expectations of 200,000. However, the previous growth of 275,000 was revised downward to 200,000.
Federal Reserve Bank of Dallas President Lorie K. Logan emphasized on Friday that, given the upside risks to inflation, she believes it is premature to consider cutting interest rates. She stressed the necessity of resolving more uncertainty regarding the economic trajectory before making such decisions. Logan also highlighted the importance for the Federal Open Market Committee (FOMC) to remain ready to respond appropriately if inflationary pressures cease to abate.
- EUR/USD edges lower on Monday as the upbeat US NFP continues to underpin the USD.
- A positive risk tone might cap the safe-haven buck and lend some support to the major.
- Traders now look to the US CPI, FOMC minutes and the ECB meeting for a fresh impetus.
The EUR/USD pair struggles to capitalize on Friday's goodish rebound of around 50 pips from sub-1.0800 levels and meets with a fresh supply during the Asian session on Monday. Spot prices currently trade around the 1.0825-1.0820 region and remain at the mercy of the US Dollar (USD) price dynamics, though the downside seems cushioned.
The upbeat US monthly employment data – popularly known as the Nonfarm Payrolls (NFP) report – showed that the economy added more than the anticipated, 303K jobs in March. This forced investors to scale back their bets for an eventual interest rate cut by the Federal Reserve (Fed) in June and the total number of rate cuts to two in 2024. The outlook keeps the US Treasury bond yields elevated, which, in turn, is seen acting as a tailwind for the USD and exerting some pressure on the EUR/USD pair.
That said, a generally positive tone around the global equity markets, bolstered by easing geopolitical tensions in the Middle East, might keep a lid on the safe-haven Greenback. Traders might also opt to move to the sidelines ahead of this week's key releases from the US – the latest consumer inflation figures and the crucial FOMC meeting minutes on Wednesday. This, along with the European Central Bank (ECB) meeting on Thursday, should provide some meaningful impetus to the EUR/USD pair.
In the meantime, rising bets for a June rate cut by the ECB, reaffirmed by softer Eurozone consumer inflation figures last week, might continue to weigh on the Euro and keep the EUR/USD bulls on the defensive. Hence, any recovery back towards the 100-day Simple Moving Average (SMA), near the 1.0870 region, could be seen as a selling opportunity. Traders now look to German Industrial Production and Trade Balance data, along with the Eurozone Sentix Investor Confidence Index, for some impetus.
Om Monday, the People’s Bank of China (PBoC) set the USD/CNY central rate for the trading session ahead at 7.0947 as compared to last Wednesday's fix of 7.0949 and 7.2230 Reuters estimates.
- AUD/USD loses ground amid higher US Dollar after stronger NFP figures on Friday.
- US Nonfarm Payrolls increased to 303K in March, surpassing the expected 200K.
- The further gains in copper and oil prices could support the Australian Dollar.
AUD/USD kicks off the week with extending losses for the second successive session, with the pair trading lower around 0.6560 during the Asian session on Monday. The US Dollar (USD) strengthens, supported by higher US Treasury yields, thereby exerting downward pressure on the AUD/USD pair.
The US Dollar Index (DXY) trades around 104.40, at the time of writing, propelled by a surprising beat from the Nonfarm Payrolls (NFP) report. The robust labor market performance, highlighted by the March report surpassing expectations, reinforces the bullish outlook for the US Dollar.
Despite the positive momentum in the US economy, the likelihood of a rate cut in June from the Federal Reserve (Fed) remains high. The market continues to project a June rate cut with approximately a 70% likelihood, followed by an estimated total easing of roughly 75 basis points (bps) throughout 2024.
The US Bureau of Labor Statistics (BLS) reported a significant increase of 303,000 jobs in March, surpassing the expected 200,000. However, February's previous Nonfarm Payrolls (NFP) growth of 275,000 was revised downward to 200,000. Additionally, US Average Hourly Earnings rose by 0.3% month-over-month in March, meeting expectations. The previous reading was 0.2%. On a yearly basis, there was an increase of 4.1%, aligning with the market consensus but slightly lower than the previous reading of 4.3%.
Market participants are likely closely monitoring higher copper and oil prices, which could potentially provide support for the Australian Dollar (AUD). The Australian Dollar (AUD) faced challenges following the release of unchanged Final Retail Sales and downbeat Trade Balance data from Australia on Friday.
Australia recorded its smallest Trade Surplus in five months in February, attributed to a decrease in iron ore exports. In March, the Reserve Bank of Australia (RBA) maintained its cash rate at a 12-year high of 4.35% for the third consecutive meeting. However, the RBA omitted a previous warning that further rate hikes could not be ruled out.
The Bank of Japan (BoJ) Governor Kazuo Ueda was out with some comments earlier this Monday, saying that he had hoped to make the central bank's policy framework simpler and easier to understand if economic conditions allowed while assuming his post a year ago.
Ueda added that he was able to fulfil the mission as the economy was in fairly good shape in the previous fiscal year and that the central bank will respond appropriately to economic changes under the new policy framework.
Market Reaction:
The comments, meanwhile, do little to provide any impetus to the Japanese Yen (JPY), which remains well within the striking distance of a multi-decade low touched against its American counterpart last week.
| Index | Change, points | Closed | Change, % |
|---|---|---|---|
| NIKKEI 225 | -781.06 | 38992.08 | -1.96 |
| Hang Seng | -1.18 | 16723.92 | -0.01 |
| KOSPI | -27.79 | 2714.21 | -1.01 |
| ASX 200 | -44 | 7773.3 | -0.56 |
| DAX | -228.09 | 18175.04 | -1.24 |
| CAC 40 | -90.24 | 8061.31 | -1.11 |
| Dow Jones | 307.06 | 38904.04 | 0.8 |
| S&P 500 | 57.13 | 5204.34 | 1.11 |
| NASDAQ Composite | 199.44 | 16248.52 | 1.24 |
| Pare | Closed | Change, % |
|---|---|---|
| AUDUSD | 0.65778 | -0.15 |
| EURJPY | 164.284 | 0.21 |
| EURUSD | 1.08369 | -0.01 |
| GBPJPY | 191.616 | 0.19 |
| GBPUSD | 1.26371 | -0.04 |
| NZDUSD | 0.60106 | -0.25 |
| USDCAD | 1.35887 | 0.35 |
| USDCHF | 0.90222 | 0.09 |
| USDJPY | 151.626 | 0.23 |


© 2000-2026. Уcі права захищені.
Cайт знаходитьcя під керуванням TeleTrade DJ. LLC 2351 LLC 2022 (Euro House, Richmond Hill Road, Kingstown, VC0100, St. Vincent and the Grenadines).
Інформація, предcтавлена на cайті, не є підcтавою для прийняття інвеcтиційних рішень і надана виключно для ознайомлення.
Компанія не обcлуговує та не надає cервіc клієнтам, які є резидентами US, Канади, Ірану, Ємену та країн, внеcених до чорного cпиcку FATF.
Проведення торгових операцій на фінанcових ринках з маржинальними фінанcовими інcтрументами відкриває широкі можливоcті і дає змогу інвеcторам, готовим піти на ризик, отримувати виcокий прибуток. Але водночаc воно неcе потенційно виcокий рівень ризику отримання збитків. Тому перед початком торгівлі cлід відповідально підійти до вирішення питання щодо вибору інвеcтиційної cтратегії з урахуванням наявних реcурcів.
Викориcтання інформації: при повному або чаcтковому викориcтанні матеріалів cайту поcилання на TeleTrade як джерело інформації є обов'язковим. Викориcтання матеріалів в інтернеті має cупроводжуватиcь гіперпоcиланням на cайт teletrade.org. Автоматичний імпорт матеріалів та інформації із cайту заборонено.
З уcіх питань звертайтеcь за адреcою pr@teletrade.global.
переклади