- Аналітика
- Новини та інструменти
- Новини ринків
Новини ринків
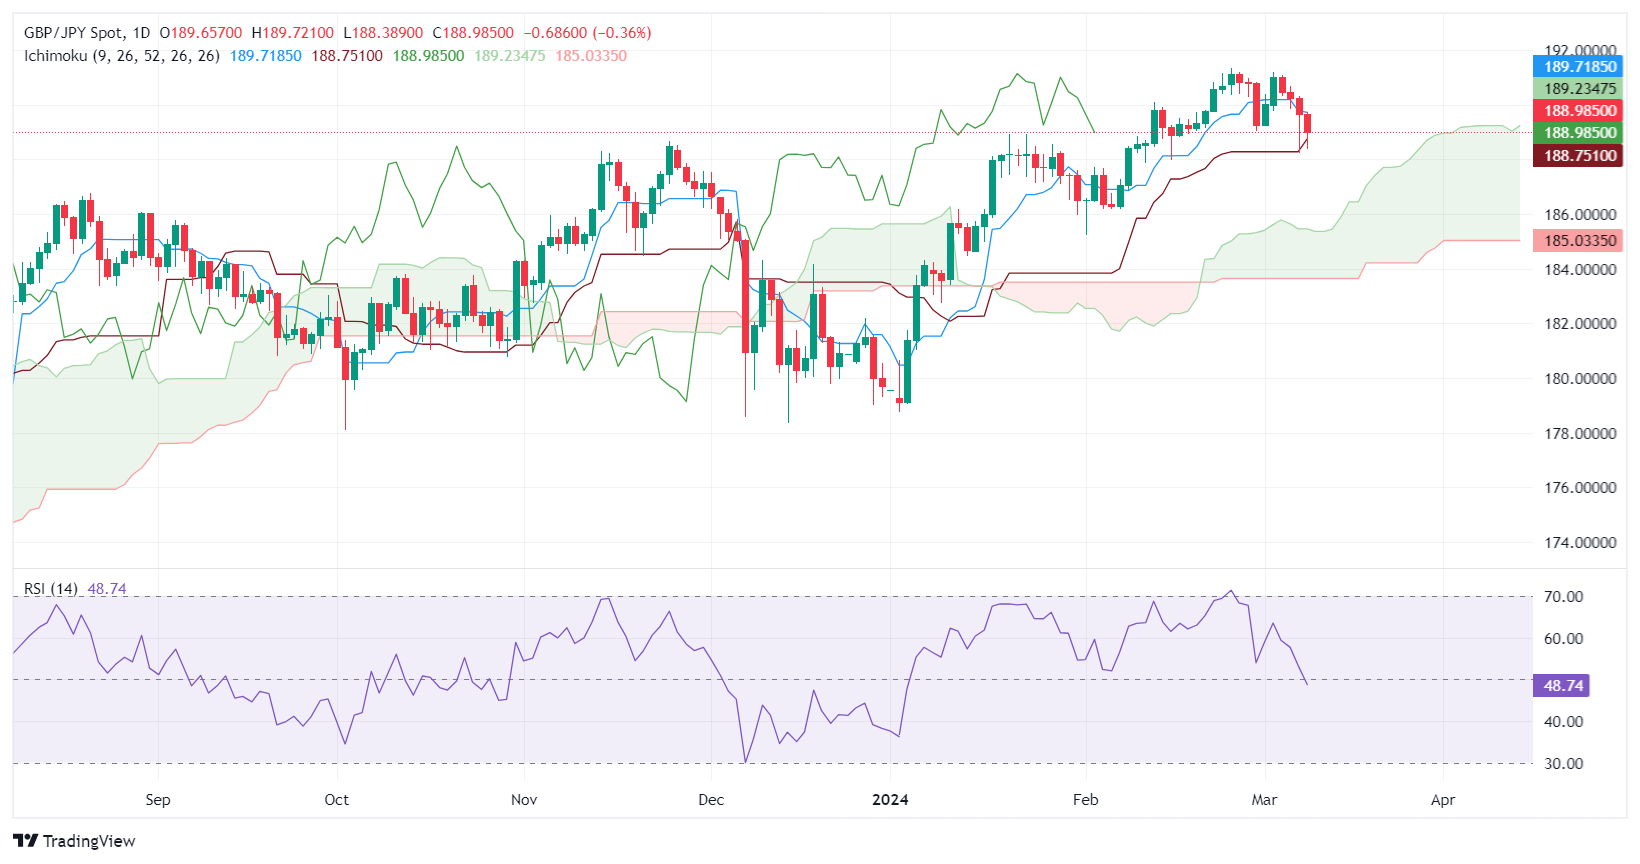
- GBP/JPY's descent under the 190.00 mark aligns with a broader downward trend, eyeing further technical levels.
- A pivotal close below the February 29 low could open paths towards 188.73 Kijun-Sen and beyond.
- Recovery hinges on reclaiming ground above 189.00, with resistances waiting at 189.71 and the early March highs.
The GBP/JPY fell for the fourth straight day late in the North American session, set to finish the week with losses of 0.44%, below the 190.00 threshold. At the time of writing, the cross trades at 188.98, down 0.31%.
GBP/JPY Price Analysis: Technical outlook
After diving below February 29 low of 189.04, the GBP/JPY has tilted to the downside, but sellers need to achieve a daily close below that level, so they test the Kijun-Sen at 188.73. Further losses are seen at 188.00, followed by the 50-day moving average (DMA) at 187.47.
On the other hand, if buyers move in and the pair prints a close above 189.00, that could sponsor a leg up. The first resistance would be the Tenkan-Sen at 189.71, followed by the March 7 high at 190.14. the next ceiling level would be the March 4 high at 191.18.
GBP/JPY Price Action – Daily Chart
Chicago Federal Reserve (Fed) President Austan Goolsbee stated that he expects the Fed to begin lowering interest rates later this year as inflation cools off. The head of the Chicago Fed gave his outlook on the Fed's rate stance during an interview with Fox News on Friday.
Chicago President Goolsbee's comments were the last scheduled speaking engagement from Fed officials before the US central bank enters the media blackout period before the March 19-20 policy meeting.
Key highlights
The Fed remains focused on inflation, not price levels.
It is unrealistic to expect price levels to return to pre-COVID levels immediately.
Higher rates have definitely contributed to housing costs.
Fed's Goolsbee expects rates to come down as inflation falls this year.
- Dow Jones is in the green on Friday after a mixed US NFP print.
- The S&P 500 and NASDAQ indexes are in the red on the day.
- US NFP jobs data came in better than expected, but with steep revisions.
The Dow Jones Industrial Average (DJIA) is up around a quarter of a percent after US Nonfarm Payrolls (NFP) came in wildly mixed, sending broader markets into a confused tailspin. Equities gave a mixed performance as investors grapple with a still-firm US labor market and deep revising cuts to previous data.
Friday’s NFP print showed the US added 275K net new jobs in February, well above the forecast 200K, but January’s print saw a steep revision to 229K. The previous NFP print initially showed an 11-month high of 353K additions, and the large revision is hobbling the market’s ability to pick a direction to wrap up the trading week.
Dow Jones news: Markets reprice rate cut bets, Apple gains pare Intel losses
Friday’s mixed NFP print increased rate market bets that the Federal Reserve (Fed) will trim interest rates at the Federal Open Market Committee’s June rate call. According to the CME’s FedWatch Tool, rate futures are pricing in 75% of at least a 25 basis point trim in June. Investors are shrugging off warnings from Fed Chairman Jerome Powell this week that inflation is still not at a satisfactory level for the US central bank to begin weighing action on interest rates. Markets are hoping that the Fed will get bullied into rate cuts before the end of H1 2024 with not-as-good-as-expected economic figures.
The DJIA’s worst-performing stock on Friday was Intel Corp. (INTC), down nearly 4% in active trading as investors pull back from a recent tech stock splurge fueled by expectations that Intel will be able to capitalize on the recent popularity of Intel’s services dedicated to AI applications. Apple Inc. (AAPL) is the DJIA’s best performer, paring away some of Intel’s declines and gaining around 2.25% on Friday. Apple is snapping a seven-day losing streak as investors scoop up the tech darling.
Other Friday gainers listed on the Dow Jones include 3M Co. (MMM) and Cisco Systems Inc. (CSCO), gaining around 1.7% apiece. On the down side, Boeing Co. (BA) shed 1.4% on the day, declining to $200.21. The airline stock is down significantly from December’s peak at $267.54.
Dow Jones FAQs
What is the Dow Jones?
The Dow Jones Industrial Average, one of the oldest stock market indices in the world, is compiled of the 30 most traded stocks in the US. The index is price-weighted rather than weighted by capitalization. It is calculated by summing the prices of the constituent stocks and dividing them by a factor, currently 0.152. The index was founded by Charles Dow, who also founded the Wall Street Journal. In later years it has been criticized for not being broadly representative enough because it only tracks 30 conglomerates, unlike broader indices such as the S&P 500.
What factors impact the Dow Jones Industrial Average?
Many different factors drive the Dow Jones Industrial Average (DJIA). The aggregate performance of the component companies revealed in quarterly company earnings reports is the main one. US and global macroeconomic data also contributes as it impacts on investor sentiment. The level of interest rates, set by the Federal Reserve (Fed), also influences the DJIA as it affects the cost of credit, on which many corporations are heavily reliant. Therefore, inflation can be a major driver as well as other metrics which impact the Fed decisions.
What is Dow Theory?
Dow Theory is a method for identifying the primary trend of the stock market developed by Charles Dow. A key step is to compare the direction of the Dow Jones Industrial Average (DJIA) and the Dow Jones Transportation Average (DJTA) and only follow trends where both are moving in the same direction. Volume is a confirmatory criteria. The theory uses elements of peak and trough analysis. Dow’s theory posits three trend phases: accumulation, when smart money starts buying or selling; public participation, when the wider public joins in; and distribution, when the smart money exits.
How can I trade the DJIA?
There are a number of ways to trade the DJIA. One is to use ETFs which allow investors to trade the DJIA as a single security, rather than having to buy shares in all 30 constituent companies. A leading example is the SPDR Dow Jones Industrial Average ETF (DIA). DJIA futures contracts enable traders to speculate on the future value of the index and Options provide the right, but not the obligation, to buy or sell the index at a predetermined price in the future. Mutual funds enable investors to buy a share of a diversified portfolio of DJIA stocks thus providing exposure to the overall index.
Dow Jones Industrial Average forecast
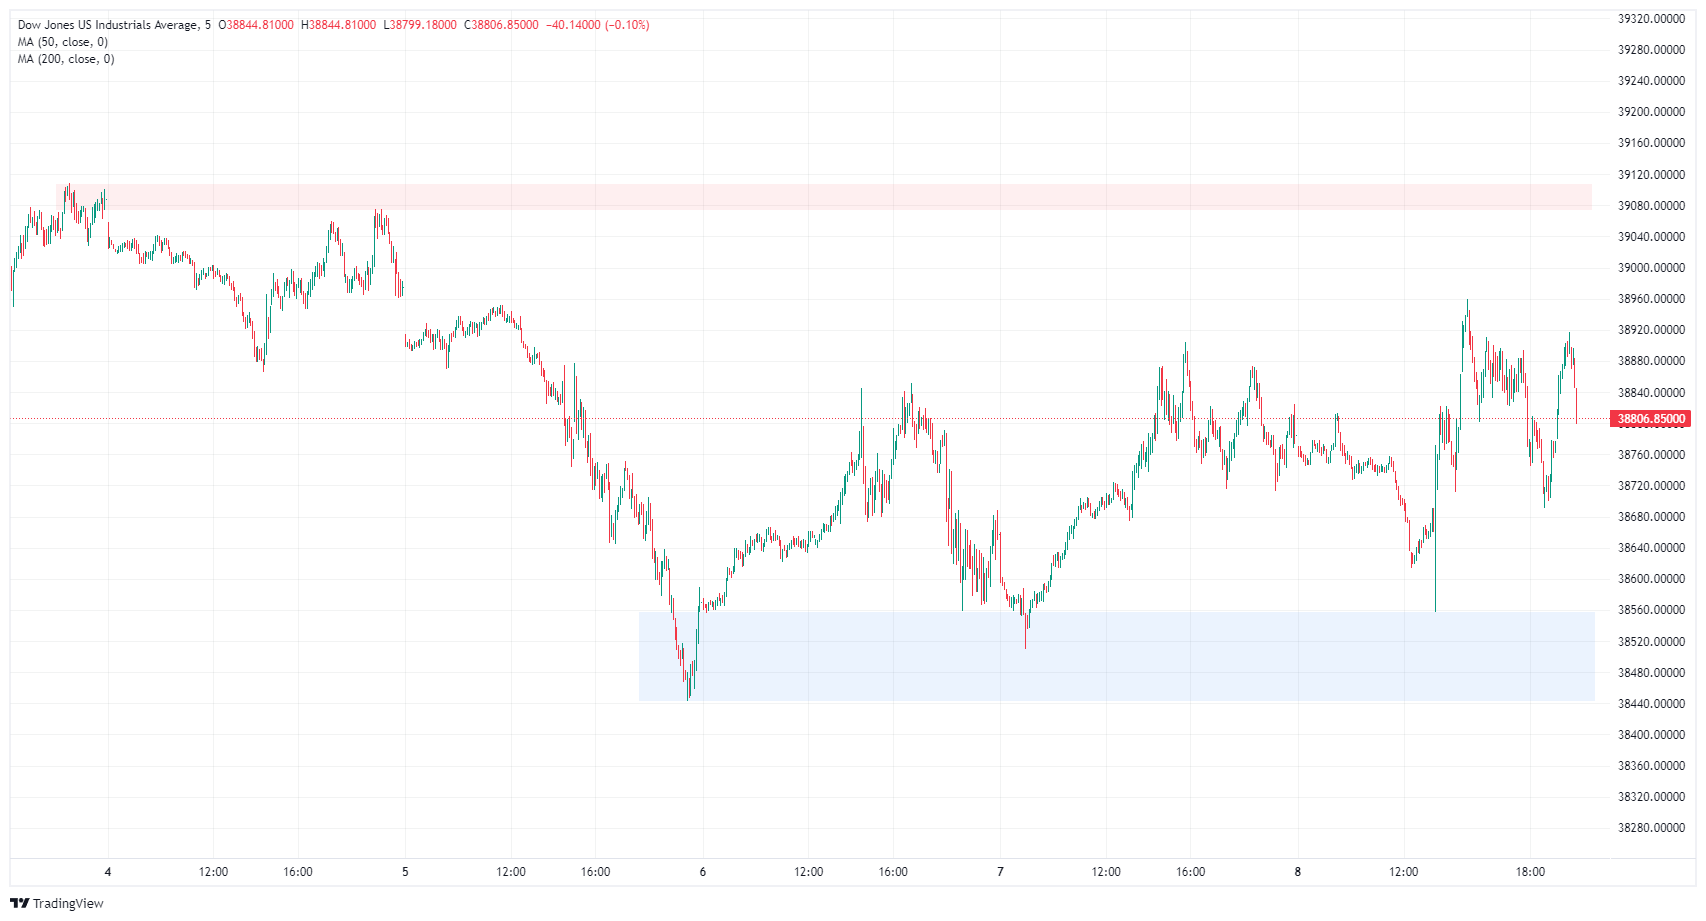
The Down Jones ticked into a new high on Friday, testing 38,960.00 before falling back into range, but the major equity index is on the green side of the day’s opening bids as markets wind down ahead of the week’s closing bell. The DJIA is on pace to close bullish for a third straight day as the index recovers from a near-term decline from Friday’s all-time highs of 39,281.86.
The DJIA recovered from the week’s bottom bids near 38,440.00, but buyers were unable to recover the week’s early peak at 39,075.61.
Dow Jones Industrial Average, 5-minute chart
Nonfarm Payrolls FAQs
What are Nonfarm Payrolls?
Nonfarm Payrolls (NFP) are part of the US Bureau of Labor Statistics monthly jobs report. The Nonfarm Payrolls component specifically measures the change in the number of people employed in the US during the previous month, excluding the farming industry.
How does Nonfarm Payrolls influence the Federal Reserve monetary policy decisions?
The Nonfarm Payrolls figure can influence the decisions of the Federal Reserve by providing a measure of how successfully the Fed is meeting its mandate of fostering full employment and 2% inflation.
A relatively high NFP figure means more people are in employment, earning more money and therefore probably spending more. A relatively low Nonfarm Payrolls’ result, on the either hand, could mean people are struggling to find work.
The Fed will typically raise interest rates to combat high inflation triggered by low unemployment, and lower them to stimulate a stagnant labor market.
How does Nonfarm Payrolls affect the US Dollar?
Nonfarm Payrolls generally have a positive correlation with the US Dollar. This means when payrolls’ figures come out higher-than-expected the USD tends to rally and vice versa when they are lower.
NFPs influence the US Dollar by virtue of their impact on inflation, monetary policy expectations and interest rates. A higher NFP usually means the Federal Reserve will be more tight in its monetary policy, supporting the USD.
How does Nonfarm Payrolls affect Gold?
Nonfarm Payrolls are generally negatively-correlated with the price of Gold. This means a higher-than-expected payrolls’ figure will have a depressing effect on the Gold price and vice versa.
Higher NFP generally has a positive effect on the value of the USD, and like most major commodities Gold is priced in US Dollars. If the USD gains in value, therefore, it requires less Dollars to buy an ounce of Gold.
Also, higher interest rates (typically helped higher NFPs) also lessen the attractiveness of Gold as an investment compared to staying in cash, where the money will at least earn interest.
Sometimes Nonfarm Payrolls trigger an opposite reaction than what the market expects. Why is that?
Nonfarm Payrolls is only one component within a bigger jobs report and it can be overshadowed by the other components.
At times, when NFP come out higher-than-forecast, but the Average Weekly Earnings is lower than expected, the market has ignored the potentially inflationary effect of the headline result and interpreted the fall in earnings as deflationary.
The Participation Rate and the Average Weekly Hours components can also influence the market reaction, but only in seldom events like the “Great Resignation” or the Global Financial Crisis.
- Indications from the daily chart imply a dominance by sellers for the short term.
- The same indicators on the hourly chart also imply a bearish momentum, although depicting potential signs of diminishing selling traction.
- The hourly RSI is recovering after hitting oversold conditions earlier in the session.
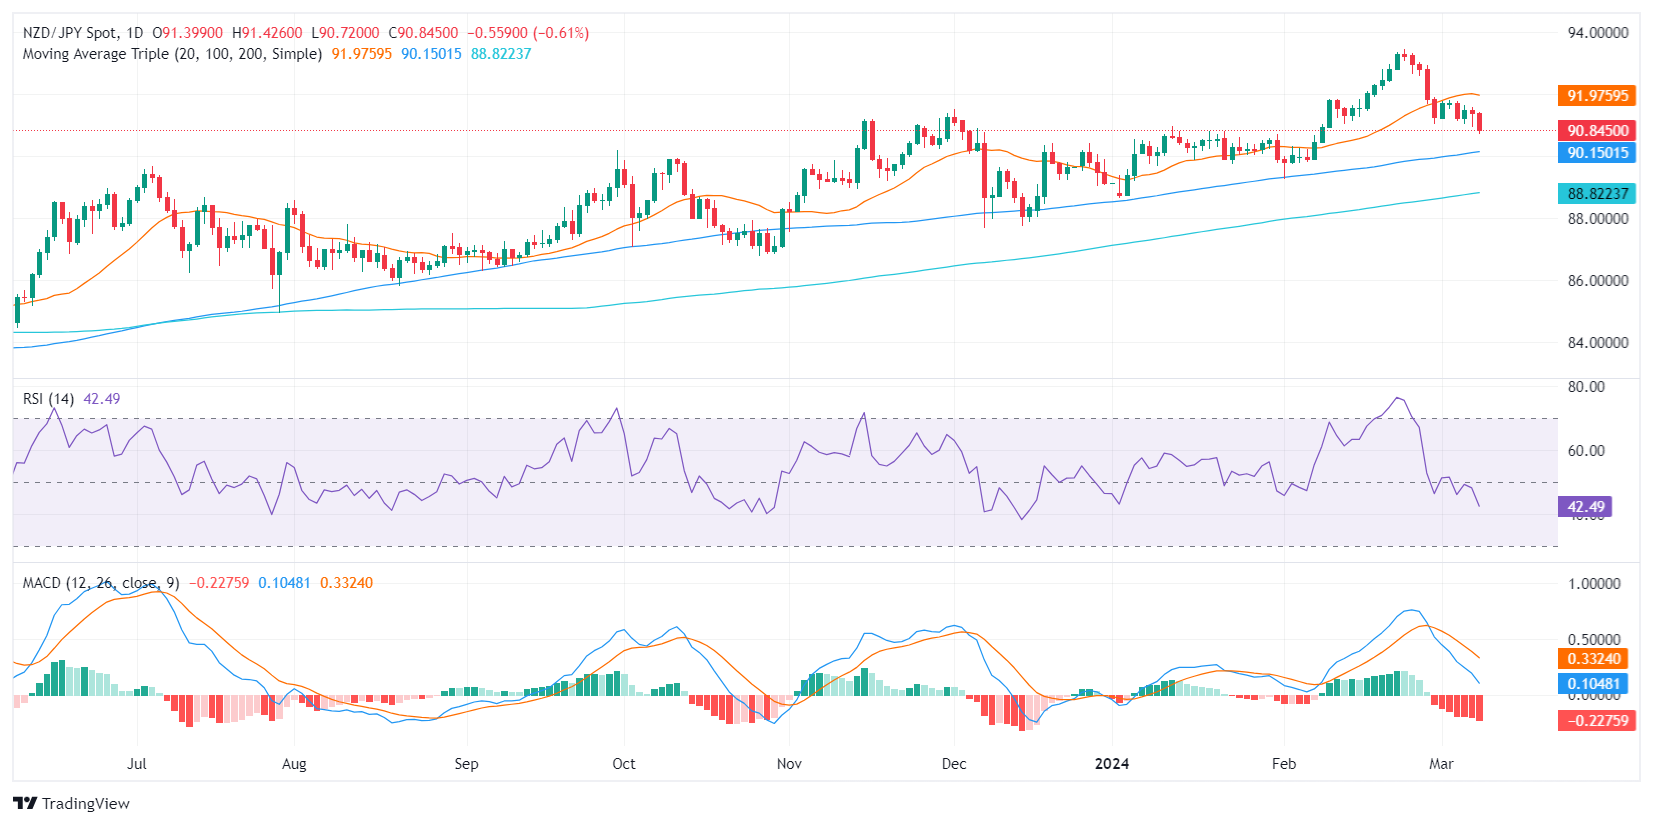
In Friday's session, the NZD/JPY pair is currently changing hands at 90.84, down 0.50%. The technical outlook for the pair points to strong control from sellers. Even though the market has been under a selling spree, recent conditions hint at a potential weakening of this selling pressure.
Based on the indicators of the daily chart, the NZD/JPY pair appears to be dominated by sellers. The Relative Strength Index (RSI) remains within negative territory. Additionally, the rising red bars on the Moving Average Convergence Divergence (MACD), which suggest negative momentum, strengthen the belief of ongoing bearish sentiment.
NZD/JPY daily chart
Shifting attention to the hourly chart, the RSI oscillates near the oversold territory, indicating heavy selling pressure. However, the recent uptick in the RSI value might suggest seller fatigue. Combined with the decreasing red bars in the MACD histogram, this demonstrates a possible loss in the pace of negative momentum.
NZD/JPY hourly chart
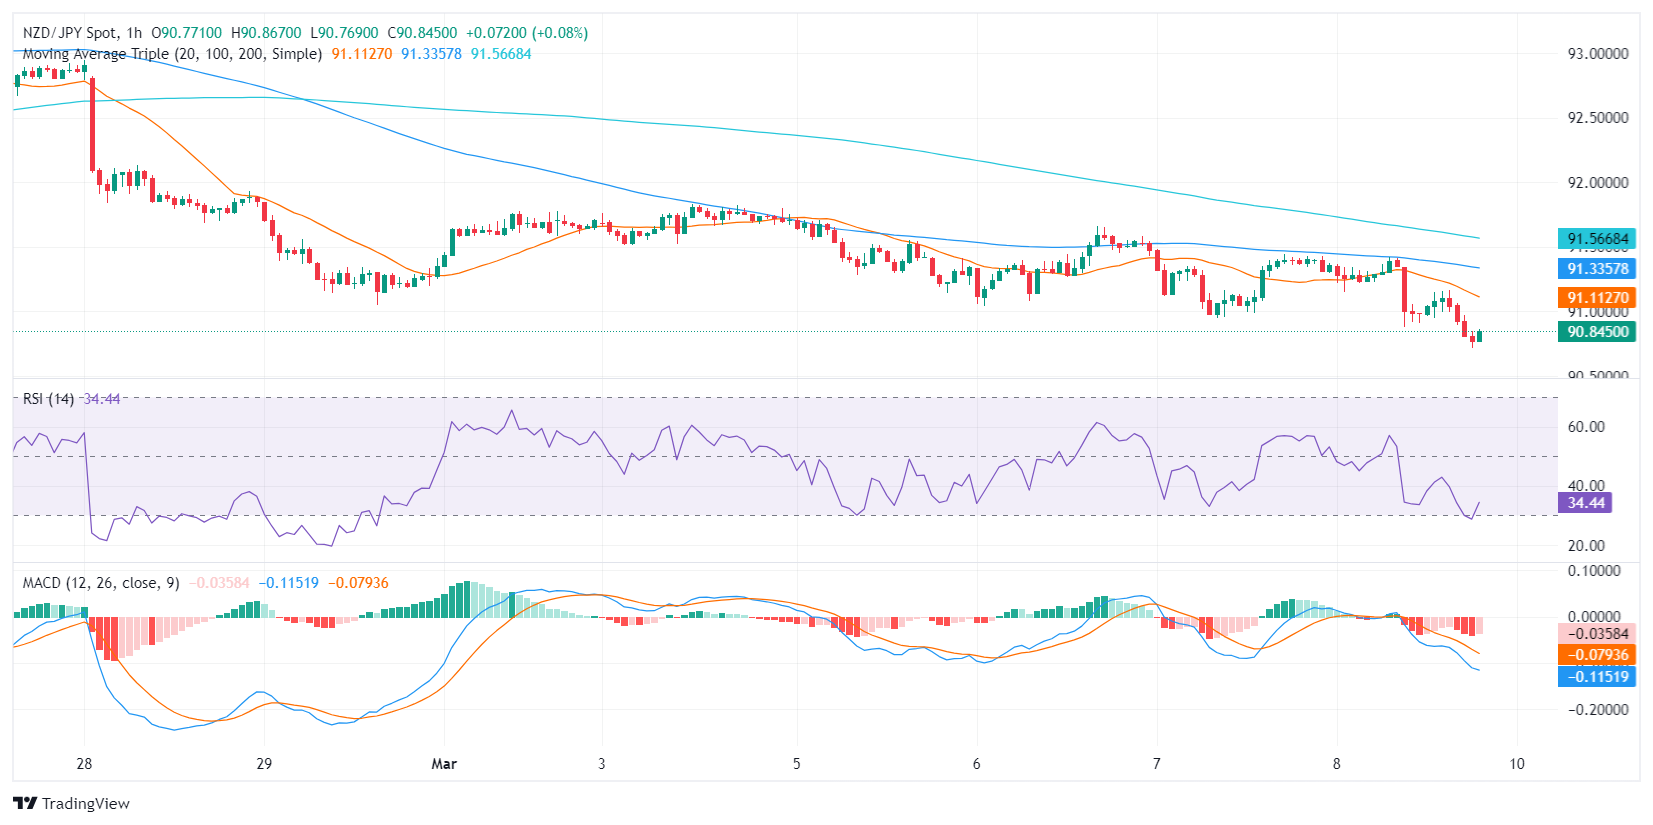
In conclusion, there is consistency between the daily and hourly charts, both implying bearish momentum in NZD/JPY. However, the latest hourly indicators hint towards a possible slowdown in the selling pressure – a divergence that traders should keep an eye on. In addition, the overall trend continues to favor the buyers as the cross remains above the 100 and 200-day Simple Moving Averages (SMAs). The fact that it sits below the 20-day Average adds negativity to the short-term outlook.
- EUR/USD spiked after the US NFP print, but mixed numbers confounded markets.
- US NFP showed more jobs added, but steep revisions crimp risk appetite.
- Next week: US and EU CPI inflation on Tuesday.
EUR/USD found some room on the top end on Friday, climbing to a fresh high for the week near 1.0980. Bullish momentum got pulled down after investors realized the US Nonfarm Payrolls (NFP) print was more complicated than the initial reaction.
US NFP job additions came in above expectations, but the previous print was steeply revised lower, taking it down from an 11-month high. European final Gross Domestic Product (GDP) figures broadly came in at expectations, and markets will be pivoting to face next Tuesday’s Consumer Price Index (CPI) inflation prints for both the US and the euro area.
Daily digest market movers: Mixed US NFP confounds markets
- February’s US NFP showed that 275K new jobs were added during the month, well above the forecast 200 K.
- The figure is now higher than January’s print, which was revised sharply lower to 229K from the initial 11-month high of 353K.
- US Average Hourly Earnings growth in February slowed more than expected to 0.1% MoM, below the expected 0.3% and down from the previous month’s 0.5%.
- Annualized Average Hourly Earnings eased to 4.3%, missing the forecast of 4.4%. The previous period also saw a slight downside revision to 4.4% from 4.5%.
- The EU’s final Gross Domestic Product (GDP) did not change from the preliminary release, with Q4’s QoQ GDP staying flat at 0.0%.
- Germany’s YoY Producer Price Index (PPI) unexpectedly recovered ground in January, coming in at -4.4% compared to the forecast decline to -6.6% versus the previous month’s -5.1%.
Euro price today
The table below shows the percentage change of Euro (EUR) against listed major currencies today. Euro was the weakest against the Japanese Yen.
| USD | EUR | GBP | CAD | AUD | JPY | NZD | CHF | |
| USD | 0.13% | -0.23% | 0.29% | 0.04% | -0.58% | 0.10% | 0.00% | |
| EUR | -0.13% | -0.38% | 0.17% | -0.09% | -0.72% | -0.04% | -0.16% | |
| GBP | 0.24% | 0.37% | 0.54% | 0.28% | -0.34% | 0.34% | 0.23% | |
| CAD | -0.29% | -0.17% | -0.54% | -0.26% | -0.88% | -0.21% | -0.33% | |
| AUD | -0.04% | 0.09% | -0.28% | 0.26% | -0.62% | 0.04% | -0.06% | |
| JPY | 0.58% | 0.72% | 0.33% | 0.87% | 0.61% | 0.69% | 0.56% | |
| NZD | -0.10% | 0.04% | -0.34% | 0.21% | -0.06% | -0.67% | -0.12% | |
| CHF | 0.04% | 0.16% | -0.21% | 0.32% | 0.07% | -0.56% | 0.13% |
The heat map shows percentage changes of major currencies against each other. The base currency is picked from the left column, while the quote currency is picked from the top row. For example, if you pick the Euro from the left column and move along the horizontal line to the Japanese Yen, the percentage change displayed in the box will represent EUR (base)/JPY (quote).
Technical Analysis: EUR/USD finds a new high before slumping back
EUR/USD rose to a new eight-week high on Friday, climbing to 1.0981 before settling into the day’s range near 1.0930. The pair is on pace to finish in the green for a third straight week, and the Fiber is up over 2.2% from the last swing low into the 1.0700 handle.
EUR/USD has closed bullish for all but three of the last 17 straight trading days, but that run will be threatened if the pair closes below 1.0951. The Euro is trading well above the 200-day Simple Moving Average (SMA) at 1.0833, extending a bullish recovery after catching a firm bounce from a pullback to 1.0800.
EUR/USD hourly chart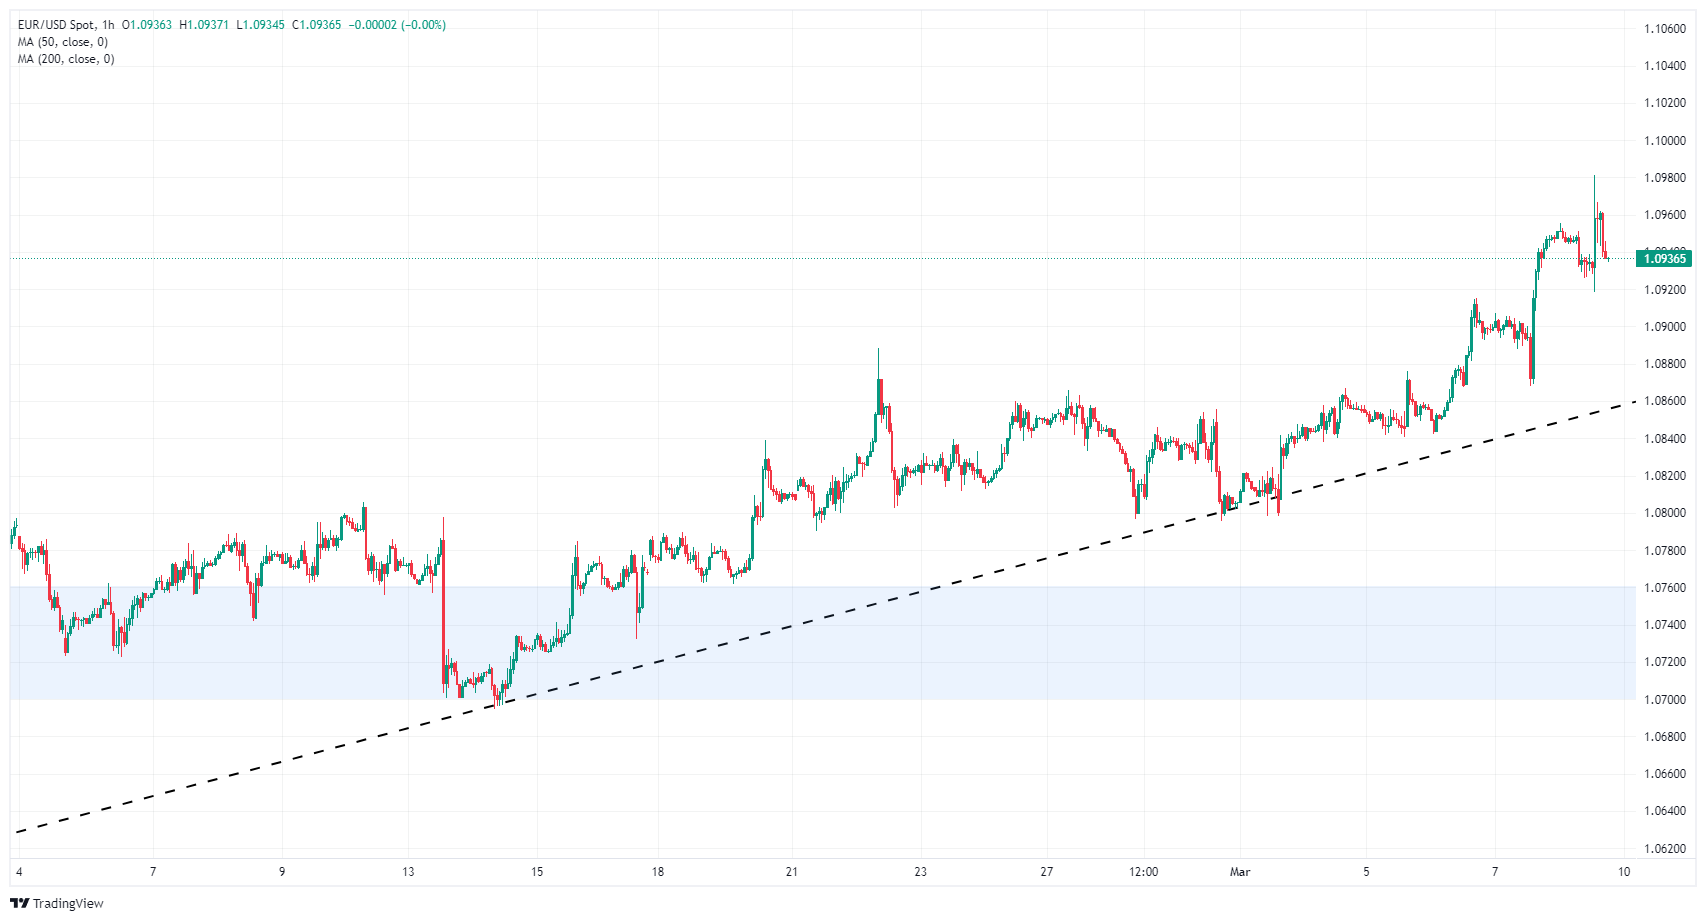
EUR/USD daily chart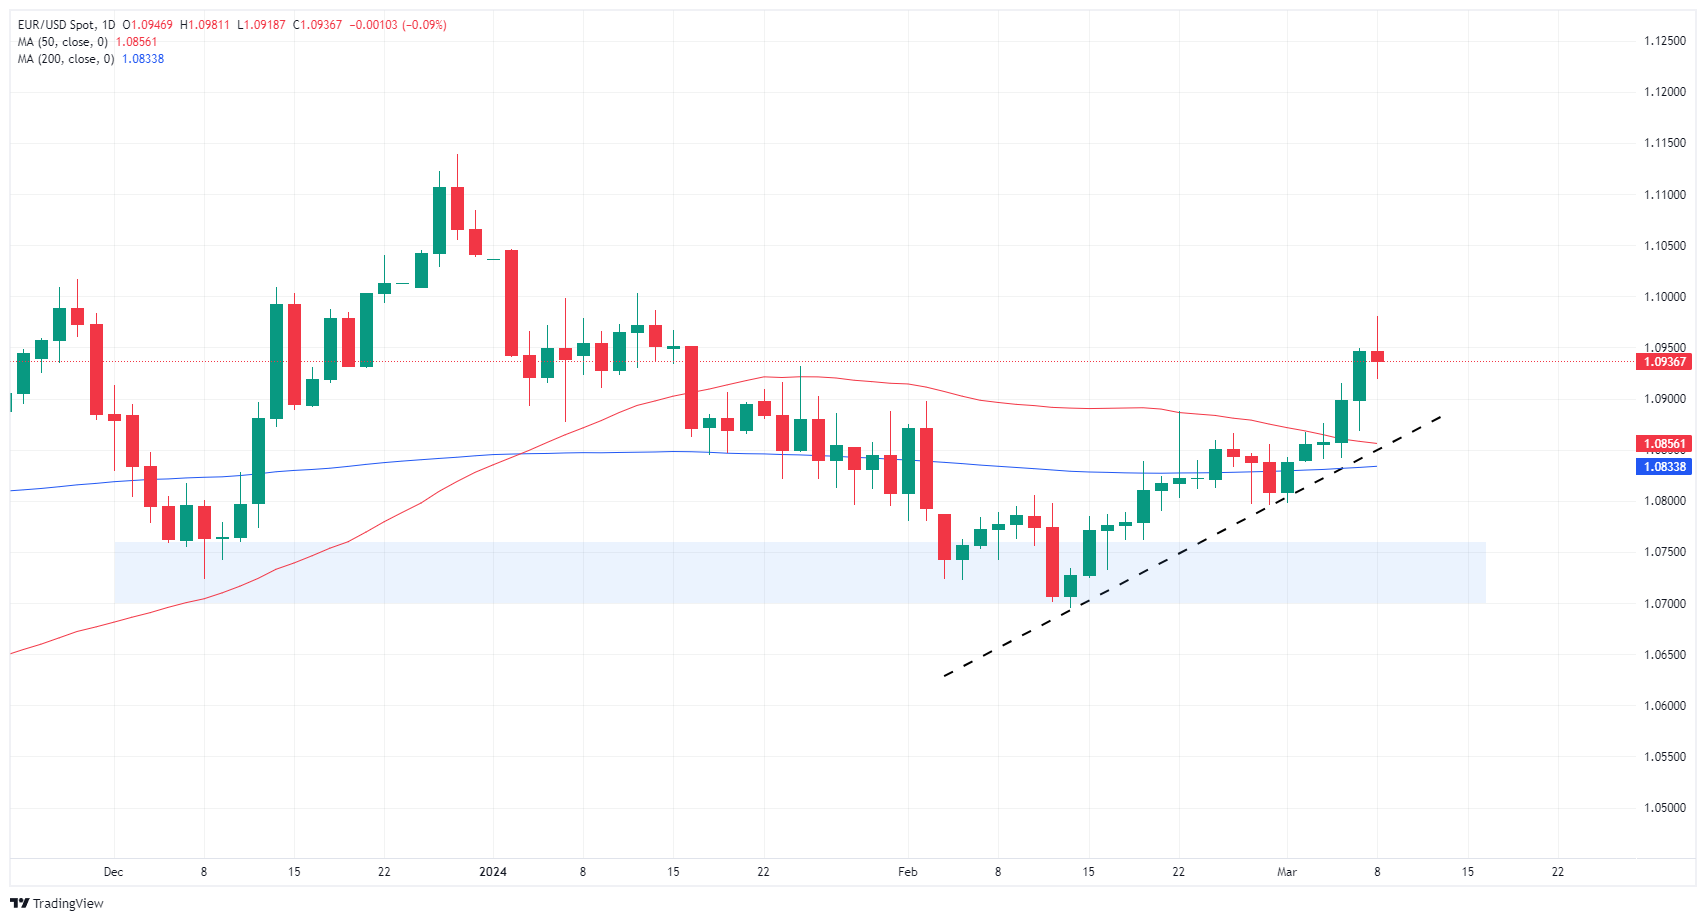
Euro FAQs
What is the Euro?
The Euro is the currency for the 20 European Union countries that belong to the Eurozone. It is the second most heavily traded currency in the world behind the US Dollar. In 2022, it accounted for 31% of all foreign exchange transactions, with an average daily turnover of over $2.2 trillion a day.
EUR/USD is the most heavily traded currency pair in the world, accounting for an estimated 30% off all transactions, followed by EUR/JPY (4%), EUR/GBP (3%) and EUR/AUD (2%).
What is the ECB and how does it impact the Euro?
The European Central Bank (ECB) in Frankfurt, Germany, is the reserve bank for the Eurozone. The ECB sets interest rates and manages monetary policy.
The ECB’s primary mandate is to maintain price stability, which means either controlling inflation or stimulating growth. Its primary tool is the raising or lowering of interest rates. Relatively high interest rates – or the expectation of higher rates – will usually benefit the Euro and vice versa.
The ECB Governing Council makes monetary policy decisions at meetings held eight times a year. Decisions are made by heads of the Eurozone national banks and six permanent members, including the President of the ECB, Christine Lagarde.
How does inflation data impact the value of the Euro?
Eurozone inflation data, measured by the Harmonized Index of Consumer Prices (HICP), is an important econometric for the Euro. If inflation rises more than expected, especially if above the ECB’s 2% target, it obliges the ECB to raise interest rates to bring it back under control.
Relatively high interest rates compared to its counterparts will usually benefit the Euro, as it makes the region more attractive as a place for global investors to park their money.
How does economic data influence the value of the Euro?
Data releases gauge the health of the economy and can impact on the Euro. Indicators such as GDP, Manufacturing and Services PMIs, employment, and consumer sentiment surveys can all influence the direction of the single currency.
A strong economy is good for the Euro. Not only does it attract more foreign investment but it may encourage the ECB to put up interest rates, which will directly strengthen the Euro. Otherwise, if economic data is weak, the Euro is likely to fall.
Economic data for the four largest economies in the euro area (Germany, France, Italy and Spain) are especially significant, as they account for 75% of the Eurozone’s economy.
How does the Trade Balance impact the Euro?
Another significant data release for the Euro is the Trade Balance. This indicator measures the difference between what a country earns from its exports and what it spends on imports over a given period.
If a country produces highly sought after exports then its currency will gain in value purely from the extra demand created from foreign buyers seeking to purchase these goods. Therefore, a positive net Trade Balance strengthens a currency and vice versa for a negative balance.
- The hourly chart portrays the RSI in the oversold territory, signaling a potential short-term rebound.
- On a broader perspective, the AUD/JPY remains above the main SMAs, indicating long-term bullish sentiment.
- The daily RSI is also in negative territory, showing increasing selling pressure.
- In the next sessions, the sellers may take a step back to consolidate their movements.
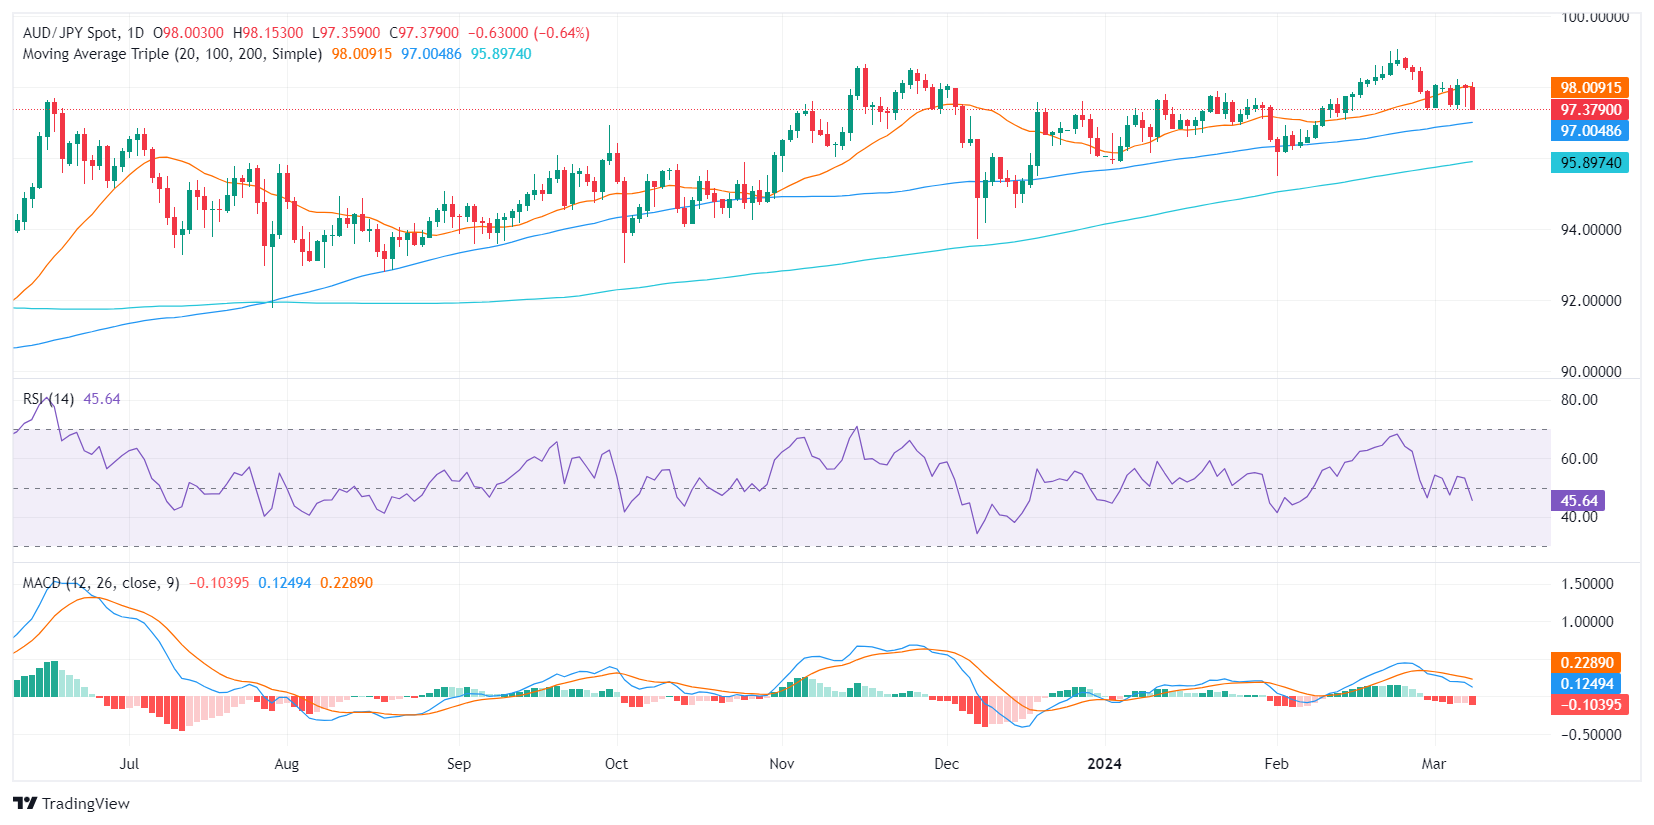
In Friday's session, the AUD/JPY pair is now trading at 97.49, demonstrating a loss of 0.38%. While the pair is currently dominated by sellers, oversold conditions seen on the hourly chart suggest that the pair may see some upside in the short term to consolidate.
Analyzing the daily chart, the pair's Relative Strength Index (RSI) sits in negative territory, showcasing stronger selling momentum. In line with that, the Moving Average Convergence Divergence (MACD) histogram shows increasing negative momentum with rising red bars. Despite the ongoing bearish tendency, the pair manages to stay above the 100 and 200-day Simple Moving Averages (SMAs), which signifies a favorable condition for the bulls overall.
AUD/JPY daily chart
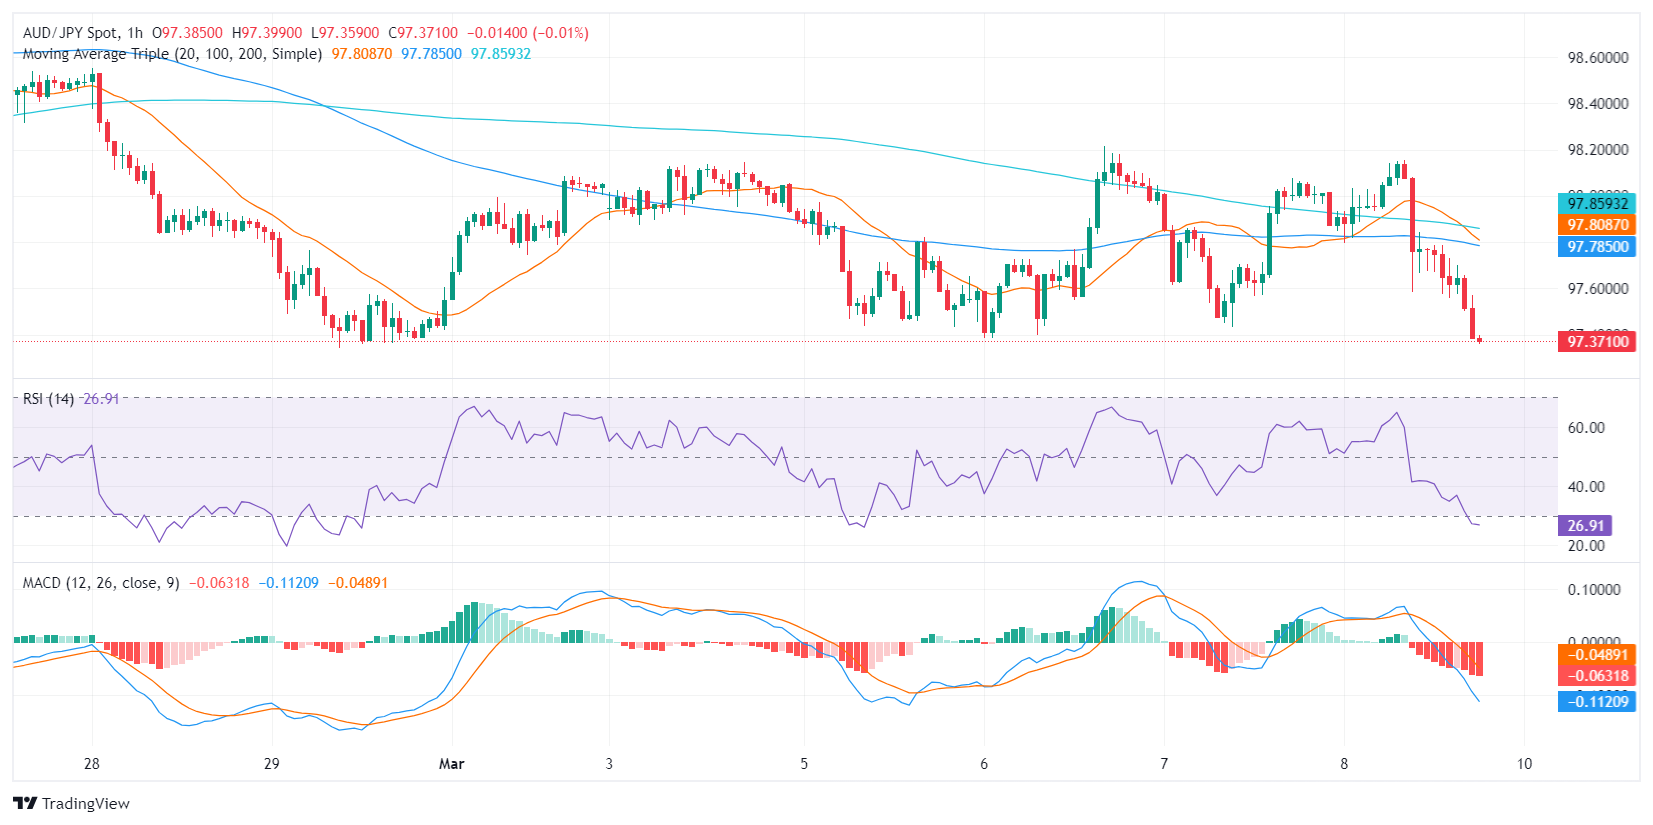
Zooming to the hourly chart, the RSI is currently located in the oversold territory, contrasting sharply with the daily chart, suggesting a possible short-term rebound due to oversold conditions. Likewise, the MACD illustrates increasing negative momentum on the hourly chart, aligning with the daily analysis. Despite differing conditions outlined in the hourly and daily charts, both depict dominant bearish forces, with bulls maintaining their stance in the broader spectrum and with the possibility of a bullish rebound in the short term.
AUD/JPY hourly chart
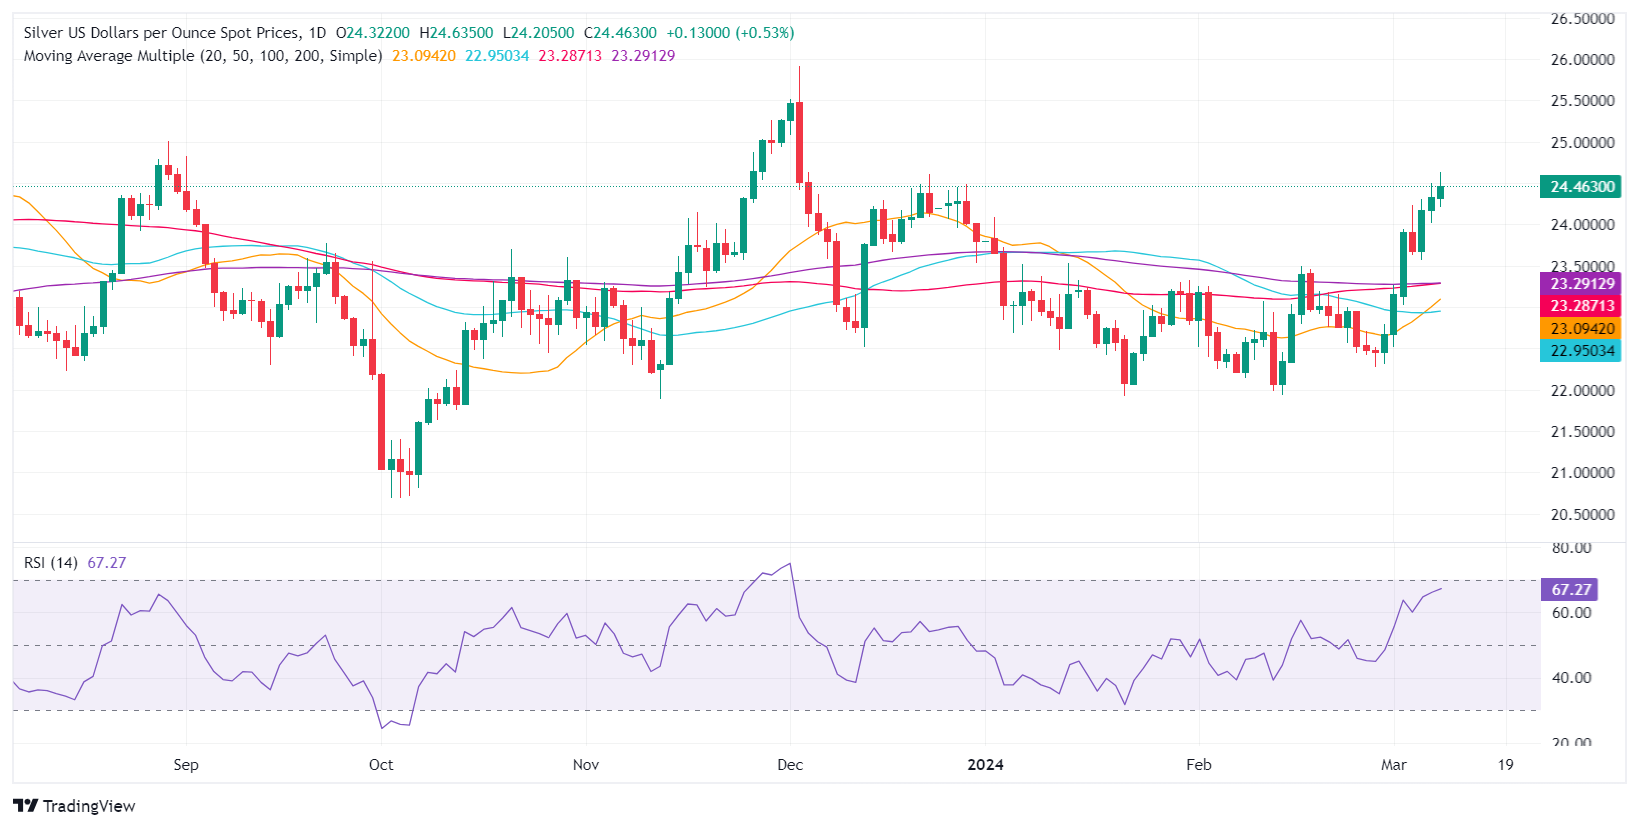
- Silver inches closer to retesting its year-to-date high of $24.63, after marking a 0.86% increase.
- Technical dynamics suggest potential for further gains if silver surpasses the $24.50 resistance.
- Downside risks loom if silver falls below $24.31, targeting supports at $24.00 and the March 6 low of $23.57.
Silver's price rallies, but it remains below the new year-to-date (YTD) high of $24.63. It reached earlier, post gains of 0.86%, and trades at around $24.50 during the mid-North American session.
XAG/USD Price Analysis: Technical outlook
Silver retreated during the day, below the March 7 daily close of $24.31, which could sponsor a leg down if sellers push the prices lower. However, buyers are keeping Silver’s price above the latter, and if they reclaim the $24.50 level, that could push XAG/USD to re-test $24.63, ahead of $25.00.
On the flip side, if sellers drag Silver’s prices below $24.31, XAG/USD could dive to $24.00. A breach of the latter will expose the March 6 low of $23.57, followed by the confluence of the 100 and 200-day moving average (DMA) at $23.27.
XAG/USD Price Action – Daily Chart
- US NFP on Friday prints big upswing to expectations but steep revisions.
- Canada also mixed, adding more jobs than expected but softer wages.
- Next week: US CPI inflation, strictly low-tier Canadian data.
The Canadian Dollar (CAD) roiled against the US Dollar (USD) on Friday after US Nonfarm Payrolls (NFP) figures came in mixed, and Canadian employment figures were broadly overshadowed by US data. The CAD is broadly softer on the day, shedding weight against all of its major currency peers.
Canada added more jobs than expected in February, but wage growth slowed slightly while the Unemployment Rate ticked a bit higher. On the US side, a big beat on NFP forecasts was overshadowed by a massive downside revision to January’s jobs figure, leaving market sentiment hamstrung. Next week’s economic calendar is notably light on Canadian releases, and markets will be getting the next update on US inflation when February’s Consumer Price Index (CPI) prints next Tuesday.
Daily digest market movers: Split NFP print leaves markets churning on Friday
- The US NFP for February added 275K new jobs during the month versus the forecast of 200K.
- January’s NFP print saw a steep correction, revised down to 229K from the previous 11-month peak of 353K.
- Annualized Hourly Earnings growth for the year ended February eased to 4.3% versus the expected 4.4%, and the previous print saw a slight downside revision from 4.5%.
- The US Unemployment Rate also rose in February, ticking up to 3.9% compared to the expected steady print at 3.7%.
- Canada added 40.7K jobs in February, over double the forecast of 20K and rising slightly from the previous month’s 37.2K.
- The Canadian Unemployment Rate also ticked higher to 5.8% in February from 5.7%, in-line with expectations.
- Canadian Average Hourly Wages printed at 4.9% YoY, easing back from the previous period’s 5.3%.
Canadian Dollar price today
The table below shows the percentage change of Canadian Dollar (CAD) against listed major currencies today. Canadian Dollar was the weakest against the Japanese Yen.
| USD | EUR | GBP | CAD | AUD | JPY | NZD | CHF | |
| USD | 0.04% | -0.29% | 0.10% | -0.08% | -0.43% | 0.00% | -0.11% | |
| EUR | -0.06% | -0.36% | 0.05% | -0.13% | -0.51% | -0.06% | -0.18% | |
| GBP | 0.31% | 0.36% | 0.41% | 0.22% | -0.12% | 0.30% | 0.18% | |
| CAD | -0.10% | -0.06% | -0.41% | -0.19% | -0.53% | -0.09% | -0.23% | |
| AUD | 0.09% | 0.13% | -0.24% | 0.20% | -0.33% | 0.08% | -0.02% | |
| JPY | 0.45% | 0.52% | 0.15% | 0.55% | 0.36% | 0.47% | 0.32% | |
| NZD | -0.01% | 0.04% | -0.30% | 0.11% | -0.08% | -0.43% | -0.17% | |
| CHF | 0.13% | 0.18% | -0.18% | 0.22% | 0.05% | -0.31% | 0.13% |
The heat map shows percentage changes of major currencies against each other. The base currency is picked from the left column, while the quote currency is picked from the top row. For example, if you pick the Euro from the left column and move along the horizontal line to the Japanese Yen, the percentage change displayed in the box will represent EUR (base)/JPY (quote).
Technical analysis: Canadian Dollar softens on Friday, leaks recent gains against Greenback
The Canadian Dollar (CAD) is broadly softer on Friday heading into the trading week’s close, shedding around half a percent against the Japanese Yen (JPY) and the Pound Sterling (GBP). The CAD is also down about a fifth of a percent against the Australian Dollar (AUD), as well as down a tenth of a percent against the Euro (EUR) and the US Dollar.
The USD/CAD roiled during the US trading session, sending the pair down to 1.3420 before recovering into the 1.3475 region. The Loonie is still sharply down from the week’s highs near 1.3605, but it is recovering toward the midrange as Friday markets take aim at the weekend.
Friday’s post-dip recovery sends USD/CAD back into the 200-day Simple Moving Average (SMA) at 1.3477. The long-term moving average has flatlined just below the 1.3800 handle for most of 2024, and the pair is set to continue struggling in the near term as it churns within a rough range between 1.3600 and 1.3400.
USD/CAD hourly chart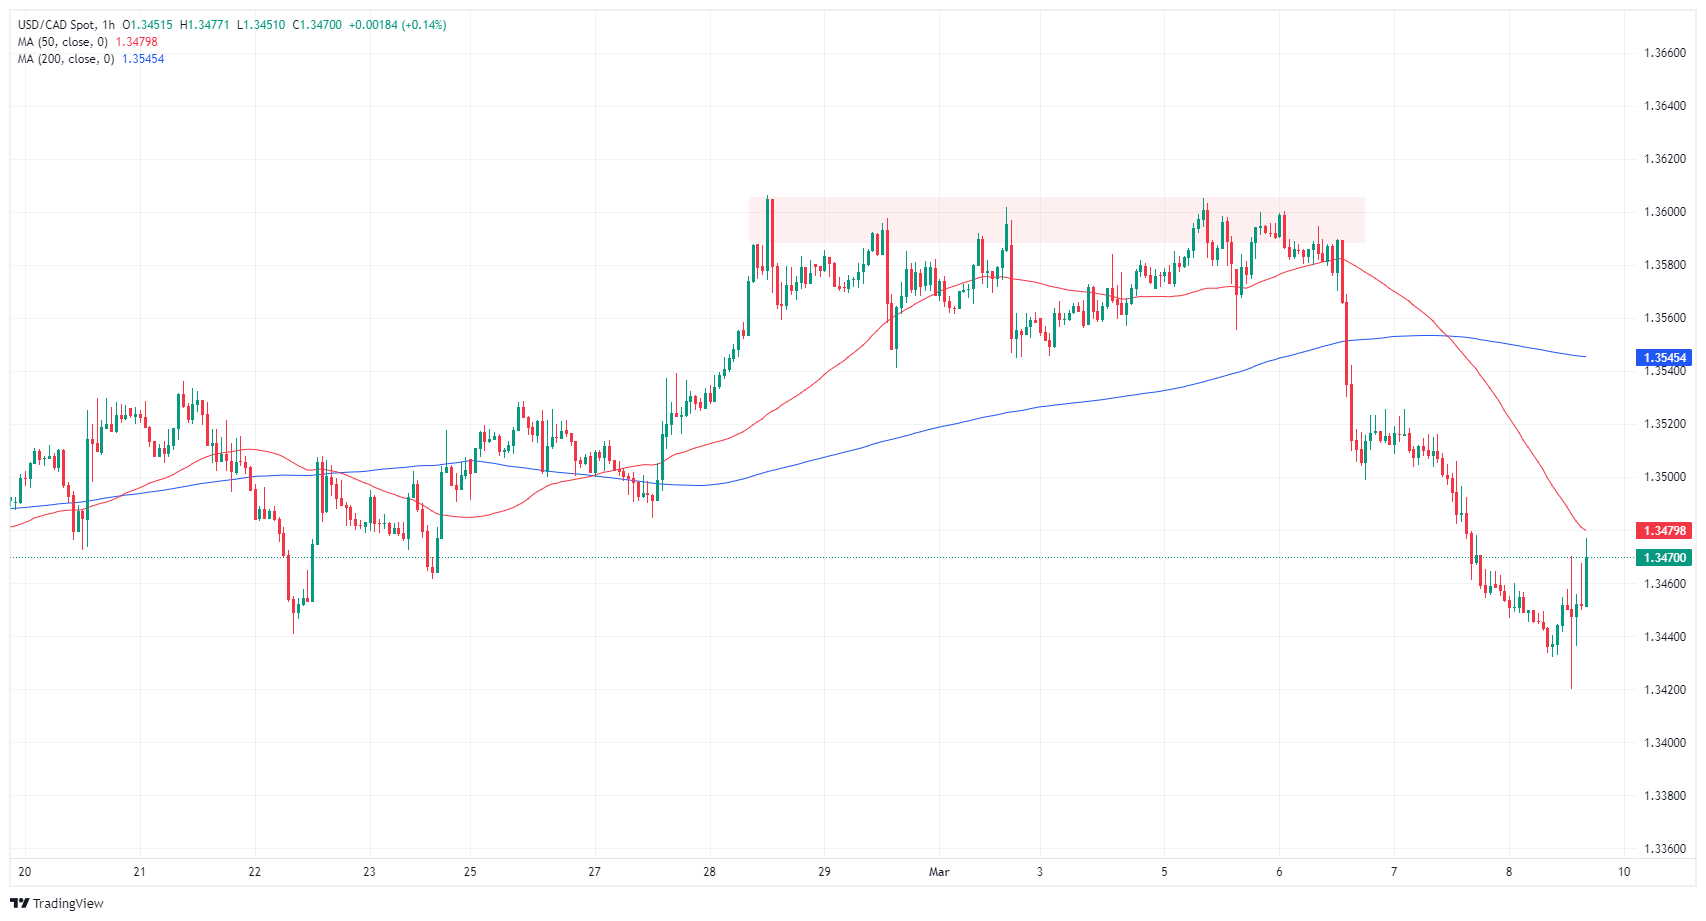
USD/CAD daily chart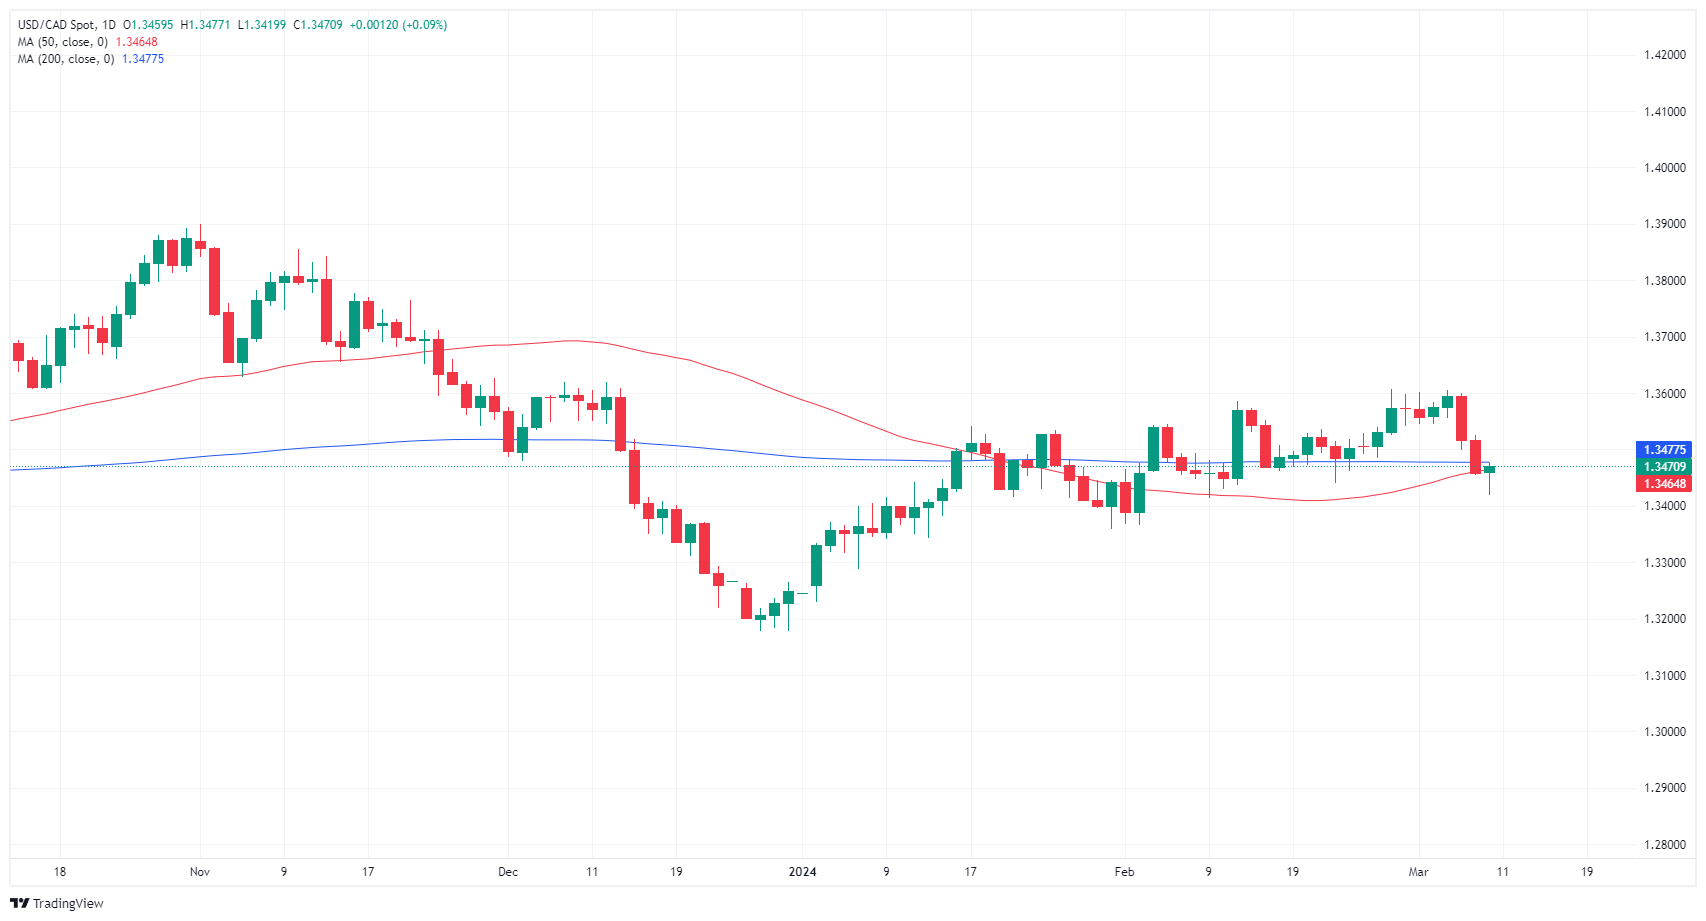
Canadian Dollar FAQs
What key factors drive the Canadian Dollar?
The key factors driving the Canadian Dollar (CAD) are the level of interest rates set by the Bank of Canada (BoC), the price of Oil, Canada’s largest export, the health of its economy, inflation and the Trade Balance, which is the difference between the value of Canada’s exports versus its imports. Other factors include market sentiment – whether investors are taking on more risky assets (risk-on) or seeking safe-havens (risk-off) – with risk-on being CAD-positive. As its largest trading partner, the health of the US economy is also a key factor influencing the Canadian Dollar.
How do the decisions of the Bank of Canada impact the Canadian Dollar?
The Bank of Canada (BoC) has a significant influence on the Canadian Dollar by setting the level of interest rates that banks can lend to one another. This influences the level of interest rates for everyone. The main goal of the BoC is to maintain inflation at 1-3% by adjusting interest rates up or down. Relatively higher interest rates tend to be positive for the CAD. The Bank of Canada can also use quantitative easing and tightening to influence credit conditions, with the former CAD-negative and the latter CAD-positive.
How does the price of Oil impact the Canadian Dollar?
The price of Oil is a key factor impacting the value of the Canadian Dollar. Petroleum is Canada’s biggest export, so Oil price tends to have an immediate impact on the CAD value. Generally, if Oil price rises CAD also goes up, as aggregate demand for the currency increases. The opposite is the case if the price of Oil falls. Higher Oil prices also tend to result in a greater likelihood of a positive Trade Balance, which is also supportive of the CAD.
How does inflation data impact the value of the Canadian Dollar?
While inflation had always traditionally been thought of as a negative factor for a currency since it lowers the value of money, the opposite has actually been the case in modern times with the relaxation of cross-border capital controls. Higher inflation tends to lead central banks to put up interest rates which attracts more capital inflows from global investors seeking a lucrative place to keep their money. This increases demand for the local currency, which in Canada’s case is the Canadian Dollar.
How does economic data influence the value of the Canadian Dollar?
Macroeconomic data releases gauge the health of the economy and can have an impact on the Canadian Dollar. Indicators such as GDP, Manufacturing and Services PMIs, employment, and consumer sentiment surveys can all influence the direction of the CAD. A strong economy is good for the Canadian Dollar. Not only does it attract more foreign investment but it may encourage the Bank of Canada to put up interest rates, leading to a stronger currency. If economic data is weak, however, the CAD is likely to fall.
- Nonfarm Payrolls data reported by the US Bureau of Labor Statistics came in higher than expected.
- Average Hourly Earnings for February unveiled a lower figure than expected, while the Unemployment Rate increased.
- Markets are still seeing the first cut in June.
- The index will close out a 1% losing week, its worst performance since December.
The US Dollar Index (DXY) is trading near 102.60 on Friday, recording a loss. The driving factors for these movements largely include the dovish stance of the Federal Reserve (Fed) Chair, Jerome Powell, and the weak performance of the US labor market in February.
Despite the Nonfarm Payrolls (NFP) report for February showing that the US Unemployment rate increased while Earnings mildly eased, markets are still betting that the easing cycle will begin in June. For the next session, the USD may suffer additional losses as investors fear an economic slowdown.
Daily digest market movers: DXY falls to lows after NFPs figures
- February's Nonfarm Payrolls reported by the US Bureau of Labor Statistics exceeded expectations, coming in at 275,000, remarkably higher than the predicted 200,000, indicating robust employment growth.
- On the negative side, the Unemployment rate for February saw an increase to 3.9%, higher than expectations of 3.7%.
- Wage inflation measured by the Average Hourly Earnings missed the consensus to rise by 4.3% YoY.
- US Treasury yields show a mixed performance with the 2-year yield at 4.48%, the 5-year yield at 4.06%, and the 10-year yield at 4.09%.
- According to the CME FedWatch Tool, the odds of Fed interest rate cuts in March and May remain low. Markets are bracing for the first cut to come in June.
DXY technical analysis: DXY bears seize control, oversold signals loom
The DXY's outlook is predominantly bearish despite the Relative Strength Index (RSI) nearing oversold conditions. The RSI's position near 30 often signals the potential for a price reversal. With the Moving Average Convergence Divergence (MACD) presenting rising red bars, the momentum is currently pointing toward the bears.
Further compounding this bearish notion, DXY resides below its 20, 100 and 200-day Simple Moving Averages (SMAs), contributing to an overall downward trend. These SMAs are pivotal technical markers, and their placement below current prices typically strengthens the sellers’ grip.
The bearish price action in recent trading sessions allies with the technical indicators to forge a negative short-term outlook. However, the RSI's near-oversold position may provide some potential for buyers to contest the bear’s hold, but they will struggle against the prevailing negative momentum.
US Dollar FAQs
What is the US Dollar?
The US Dollar (USD) is the official currency of the United States of America, and the ‘de facto’ currency of a significant number of other countries where it is found in circulation alongside local notes. It is the most heavily traded currency in the world, accounting for over 88% of all global foreign exchange turnover, or an average of $6.6 trillion in transactions per day, according to data from 2022.
Following the second world war, the USD took over from the British Pound as the world’s reserve currency. For most of its history, the US Dollar was backed by Gold, until the Bretton Woods Agreement in 1971 when the Gold Standard went away.
How do the decisions of the Federal Reserve impact the US Dollar?
The most important single factor impacting on the value of the US Dollar is monetary policy, which is shaped by the Federal Reserve (Fed). The Fed has two mandates: to achieve price stability (control inflation) and foster full employment. Its primary tool to achieve these two goals is by adjusting interest rates.
When prices are rising too quickly and inflation is above the Fed’s 2% target, the Fed will raise rates, which helps the USD value. When inflation falls below 2% or the Unemployment Rate is too high, the Fed may lower interest rates, which weighs on the Greenback.
What is Quantitative Easing and how does it influence the US Dollar?
In extreme situations, the Federal Reserve can also print more Dollars and enact quantitative easing (QE). QE is the process by which the Fed substantially increases the flow of credit in a stuck financial system.
It is a non-standard policy measure used when credit has dried up because banks will not lend to each other (out of the fear of counterparty default). It is a last resort when simply lowering interest rates is unlikely to achieve the necessary result. It was the Fed’s weapon of choice to combat the credit crunch that occurred during the Great Financial Crisis in 2008. It involves the Fed printing more Dollars and using them to buy US government bonds predominantly from financial institutions. QE usually leads to a weaker US Dollar.
What is Quantitative Tightening and how does it influence the US Dollar?
Quantitative tightening (QT) is the reverse process whereby the Federal Reserve stops buying bonds from financial institutions and does not reinvest the principal from the bonds it holds maturing in new purchases. It is usually positive for the US Dollar.
- Mexican Peso appreciates for the seventh consecutive day, buoyed by soft US Dollar following mixed US jobs report.
- Banxico's upcoming rate decision eyed closely after subdued Mexican inflation figures.
- US Nonfarm Payrolls exceed expectations, but revisions and higher Unemployment Rate fuel speculation of June Fed rate cut.
The Mexican Peso appreciated for the seventh straight day on Friday against the US Dollar following a mixed jobs report from the United States that increased speculation that the US Federal Reserve (Fed) would cut interest rates in June. The data helped the Greenback tumble to refresh seven-week lows, a tailwind for the emerging market currency that is set to finish the week with gains of more than 0.20%. The USD/MXN trades at 16.78, down 0.52%.
Mexico’s economic docket is empty on Friday, but data revealed during the week could influence the Bank of Mexico (Banxico) decision on March 21. Gross Fixed Investment remained flat on monthly figures but contracted for the 12 months to December, while Consumer Confidence was unchanged. However, Thursday’s inflation data was the main spotlight, with the Consumer Price Index (CPI) lower than expected on monthly and annual figures, while core CPI was mixed.
On the other side of the border, the US Bureau of Labor Statistics (BLS) revealed a mixed US Nonfarm Payrolls (NFP) report. Although the US economy added more jobs than expected, the BLS downwardly revised January’s figures, while the Unemployment Rate jumped close to the 4% threshold.
Daily digest market movers: Mexican Peso boosted by broad US Dollar weakness
- US Nonfarm Payrolls in February were higher than the consensus of 200K and rose by 275K. January’s figures were revised down to 229K from 353K. Further data underscored that the jobs market is cooling as the Unemployment Rate increased from 3.7% to 3.9%, while Average Hourly Earnings edged lower in monthly and annual figures.
- Earlier, New York Fed President John Williams said that the Fed's tight monetary policy has moderated demand, emphasizing the Fed's dedication to price stability. He stressed that the Fed's decisions are independent of politics and remarked on the economy's strong performance in 2023.
- Mexican economic data released in the week:
- Mexico’s inflation was 4.40% YoY, below estimates of 4.42% and January’s 4.88%. On a monthly basis, CPI was down from 0.11% to 0.09%.
- The Core CPI rose by 4.64% above forecasts but lower than the previous reading of 4.76%, while monthly figures were aligned with estimates of 0.49%, up from 0.40%.
- Mexico’s consumer confidence index was 47.0 in February when adjusted for seasonal factors. The unadjusted index was 47.1.
- Mexico’s Gross Fixed Investment remained flat in December. Nevertheless, on an annual basis, it dipped from 19.2% to 13.4%.
- A Reuters poll sees the Mexican Peso depreciating 7% to 18.24 in 12 months from 16.96 on Monday, according to the median of 20 FX strategists polled between March 1-4. The forecast ranged from 15.50 to 19.00.
- A Reuters poll shows 15 analysts estimate that inflation will slow down in February, corroborating bets that the Bank of Mexico (Banxico) could cut rates as soon as the March 21 meeting.
- Banxico’s private analysts' poll projections for February were revealed. They expect inflation at 4.10%, core CPI at 4.06%, and the economy to grow by 2.40%, unchanged from January. Regarding monetary policy, they see Banxico lowering rates to 9.50% and the USD/MXN exchange rate at 18.31, down from 18.50.
- During Banxico’s quarterly report, policymakers acknowledged the progress on inflation and urged caution against premature interest rate cuts. Governor Victoria Rodriguez Ceja said adjustments would be gradual, while Deputy Governors Galia Borja and Jonathan Heath called for prudence. The latter specifically warned against the risks of an early rate cut.
- Banxico updated its economic growth projections for 2024 from 3.0% to 2.8% YoY and maintained 1.5% for 2025. The slowdown is blamed on higher interest rates at 11.25%, which sparked a shift in three of the five governors of the Mexican Central Bank, who are eyeing the first rate cut at the March 21 meeting.
- The political race is almost defined in the United States after Super Tuesday. Former President Donald Trump leads the Republicans with 995 delegates, shy of the 1,215 needed. On the Democratic side, US President Joe Biden leads with 1,497 delegates, short of the 1,968 needed.
- The CME FedWatch Tool shows traders increased their bets for a 25-basis-point rate cut in June from 52.7% a week ago to 78%.
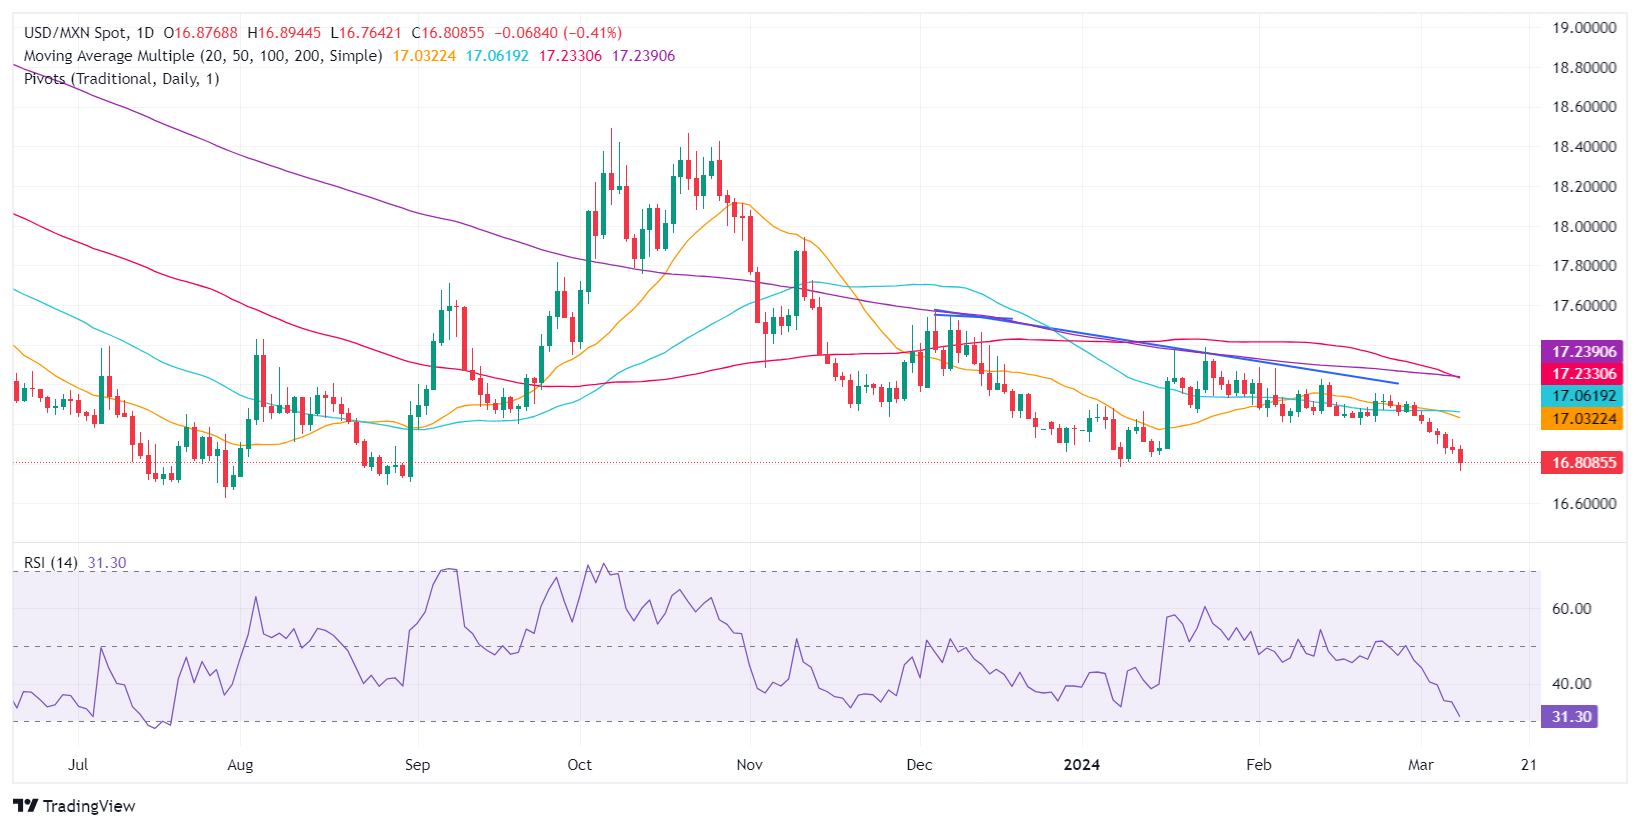
Technical analysis: Mexican Peso posts solid rally as USD/MXN hovers around 16.80
The USD/MXN downtrend remains in play after breaching below 17.90, printing a new yearly low of 16.76. However, sellers need to achieve a daily close below 16.80 if they would like to test the 2023 yearly low of 16.62. Once that barrier is surpassed, look for October 2015’s low of 16.32 and the 16.00 threshold.
On the other hand, if buyers reclaim the 17.00 figure, that could open the door to testing the 50-day Simple Moving Average (SMA) at 17.05, followed by the 200-day SMA at 17.23 and the 100-SMA at 17.24.
USD/MXN Price Action – Daily Chart
Mexican Peso FAQs
What key factors drive the Mexican Peso?
The Mexican Peso (MXN) is the most traded currency among its Latin American peers. Its value is broadly determined by the performance of the Mexican economy, the country’s central bank’s policy, the amount of foreign investment in the country and even the levels of remittances sent by Mexicans who live abroad, particularly in the United States. Geopolitical trends can also move MXN: for example, the process of nearshoring – or the decision by some firms to relocate manufacturing capacity and supply chains closer to their home countries – is also seen as a catalyst for the Mexican currency as the country is considered a key manufacturing hub in the American continent. Another catalyst for MXN is Oil prices as Mexico is a key exporter of the commodity.
How do decisions of the Banxico impact the Mexican Peso?
The main objective of Mexico’s central bank, also known as Banxico, is to maintain inflation at low and stable levels (at or close to its target of 3%, the midpoint in a tolerance band of between 2% and 4%). To this end, the bank sets an appropriate level of interest rates. When inflation is too high, Banxico will attempt to tame it by raising interest rates, making it more expensive for households and businesses to borrow money, thus cooling demand and the overall economy. Higher interest rates are generally positive for the Mexican Peso (MXN) as they lead to higher yields, making the country a more attractive place for investors. On the contrary, lower interest rates tend to weaken MXN.
How does economic data influence the value of the Mexican Peso?
Macroeconomic data releases are key to assess the state of the economy and can have an impact on the Mexican Peso (MXN) valuation. A strong Mexican economy, based on high economic growth, low unemployment and high confidence is good for MXN. Not only does it attract more foreign investment but it may encourage the Bank of Mexico (Banxico) to increase interest rates, particularly if this strength comes together with elevated inflation. However, if economic data is weak, MXN is likely to depreciate.
How does broader risk sentiment impact the Mexican Peso?
As an emerging-market currency, the Mexican Peso (MXN) tends to strive during risk-on periods, or when investors perceive that broader market risks are low and thus are eager to engage with investments that carry a higher risk. Conversely, MXN tends to weaken at times of market turbulence or economic uncertainty as investors tend to sell higher-risk assets and flee to the more-stable safe havens.
A dreadful week for the Greenback ended with the USD Index (DXY) retreating to two-month lows near 102.30 as investors continued to price in a rate cut in June, while the move lower in US yields also accompanied the downside in the Dollar. Closer to home, the ECB left its policy rates unchanged, as expected, while investors also see the central bank starting its easing cycle in June.
The USD Index (DXY) navigated a “sea of red” this week, accelerating its losses to the low-102.00s in the wake of a firmer US NFP on Friday. Next week, the US Inflation Rate is due on March 12 and is expected to remain at the centre of the debate. On March 14, Producer Prices are also due, along with Retail Sales, weekly Initial Jobless Claims, and Business Inventories. Closing the week emerges Industrial Production and the advanced Michigan Consumer Sentiment.
EUR/USD gathered extra upside traction and finally left behind the 1.0900 hurdle in quite convincing fashion amidst rising bets for an ECB rate cut in June. On the domestic calendar, the final Inflation Rate in Germany is due on March 12, while Industrial Production in the broader Euroland will be published on March 13.
The continuation of the upward trend lifted GBP/USD to multi-month peaks at levels just shy of 1.2900 the figure. An interesting UK calendar next week will see the release of the labour market report on March 12, seconded by GDP figures, Construction Output, Goods Trade Balance, Industrial and Manufacturing Production, and the NIESR Monthly GDP Tracker, all due on March 13.
USD/JPY increased its weekly decline to fresh five-week lows near 146.50 on the back of the deep sell-off in the Greenback and investors’ speculations of a potential BoJ lift-off later in the month. Next week kicks in with the final Q4 GDP Growth Rate, while Producer Prices and the BSI Large Manufacturing index are due on March 12. Additionally, the usual weekly Foreign Bond Investment figures are due on March 14, and the Tertiary Industry Index is expected at the end of the week.
AUD/USD managed to surpass the key 0.6600 barrier and rise to two-month peaks exclusively on the back of Dollar dynamics. In Australia, Consumer Inflation Expectations are due on March 15.
In China, Inflation Rate and Producer Prices come on March 9 prior to New Yuan Loans on March 12 and the House Price Index on March 15. USD/CNH navigated a side-lined range throughout the week, slipping back below the 7.2000 region on Friday.
Anticipating Economic Perspectives: Voices on the Horizon
- RBA S. Hunter speaks on March 11.
- BoE C. Mann speaks on March 12.
After a lacklustre start to the year, Oil prices are starting to come to life. Economists at MUFG Bank analyze Brent’s outlook.
Oil bulls are quietly winning the narrative
Oil bulls are quietly winning the narrative as prices are working their way higher, with a breakout of the $10 range that Brent crude has been confined to so far in 2024, now imminent. Granted, the steady climb is not remarkable, but economic exceptionalism, tightening fundamentals and prompt oil time spreads in backwardation (signalling supply tightness) is reinforcing the constructive narrative.
We maintain our Brent call that prices will hover within a $80.00-$90.00 range this year and view that Oil markets will remain supported by tight micro fundamentals (moderate deficits), OPEC+ driven carry and effective hedging value against negative geopolitical supply shocks.
The Japanese Yen (JPY) has depreciated considerably against the US Dollar (USD) and the Euro (EUR) since the start of 2021. Analysts at Natixis explain why a weak Yen is good for Japan.
The Bank of Japan has little incentive to obtain an appreciation of the Yen
Japan's expansionary monetary policy, while the other OECD countries have adopted a restrictive monetary policy since 2022, has caused the Yen to depreciate sharply. But in reality, the depreciation of the yen is good for Japan's economy: It is helping to bring inflation back towards the 2% target; It stimulates exports; Since Japan has very substantial net external assets, mainly in Dollars and Euros, the depreciation of the Yen generates a capital gain on the yen value of these external assets.
As a result of these positive effects of a weak Yen on Japan, we should not expect Japan to switch to a much more restrictive monetary policy. At most, we should expect a symbolic hike in the Bank of Japan’s base rate.
- New Zealand Dollar rises versus the US Dollar following the release of US employment data.
- US Nonfarm Payrolls rose higher than expected in February, but gains were offset by wage and unemployment data.
- Hourly Earnings fell from what was expected, and the Unemployment Rate unexpectedly rose, suggesting underlying labor market weakness.
The New Zealand Dollar rises against the US Dollar on Friday, after the release of US Nonfarm Payrolls data suggests disinflationary tendencies that could bring forward the time of the Federal Reserve’s (Fed) first expected interest rate cut.
NZD/USD – the number of US Dollars that one New Zealand Dollar can buy – rose to day’s high of 0.6218 on Friday, during the US session, following the release of the Bureau of Labor Statistics (BLS) report. If the data prompts an earlier rate cut from the Fed, it will be negative for the US Dollar as lower rates attract less foreign capital inflows.
New Zealand Dollar prints new high after Nonfarm Payrolls
Whilst the headline NFP figure showed the economy adding 275K jobs in February, which was higher than the 200K expected, the other data in the BLS report suggested weaknesses in the labor market.
Average Hourly Earnings, which are a key component of inflation, rose by a lower-than-expected 4.3% YoY and 0.1% MoM. Both were below the 4.4% and 0.3% predicted. The Unemployment Rate, meanwhile, rose to a higher-than-expected 3.9% when it had been projected to stay put at 3.7%.
The data suggests less inflationary pressure from wages and low unemployment, which could prompt the Fed to bring forward interest rate cuts to earlier in the year. Lower interest rates are negative for the US Dollar as they reduce foreign capital inflows.
New Zealand Dollar supported by Brighter outlook for China
The New Zealand Dollar (NZD) has been further supported by the release of better-than-expected trade data from its largest export partner, China, on Thursday.
The Chinese Trade Balance data showed an unexpected rise in the country’s trade surplus to $125.16 billion in February, according to data from the General Administration of Customs for the People’s Republic of China.
Economists had expected the Trade Balance to come out at only $103.70 billion, from a lower $75.34 billion in the previous month of January.
The higher surplus is a sign of economic health and suggests greater prosperity, leading to increased demand for New Zealand exports, primarily milk and dairy products. This, in turn, is likely to result in an increase in demand for New Zealand’s currency.
Technical analysis: NZD/USD rising in a range
NZD/USD is trading plum in the middle of a sideways consolidation that has lasted for over a year. The long-term trend is too opaque to guess, suggesting little overall directional bias.
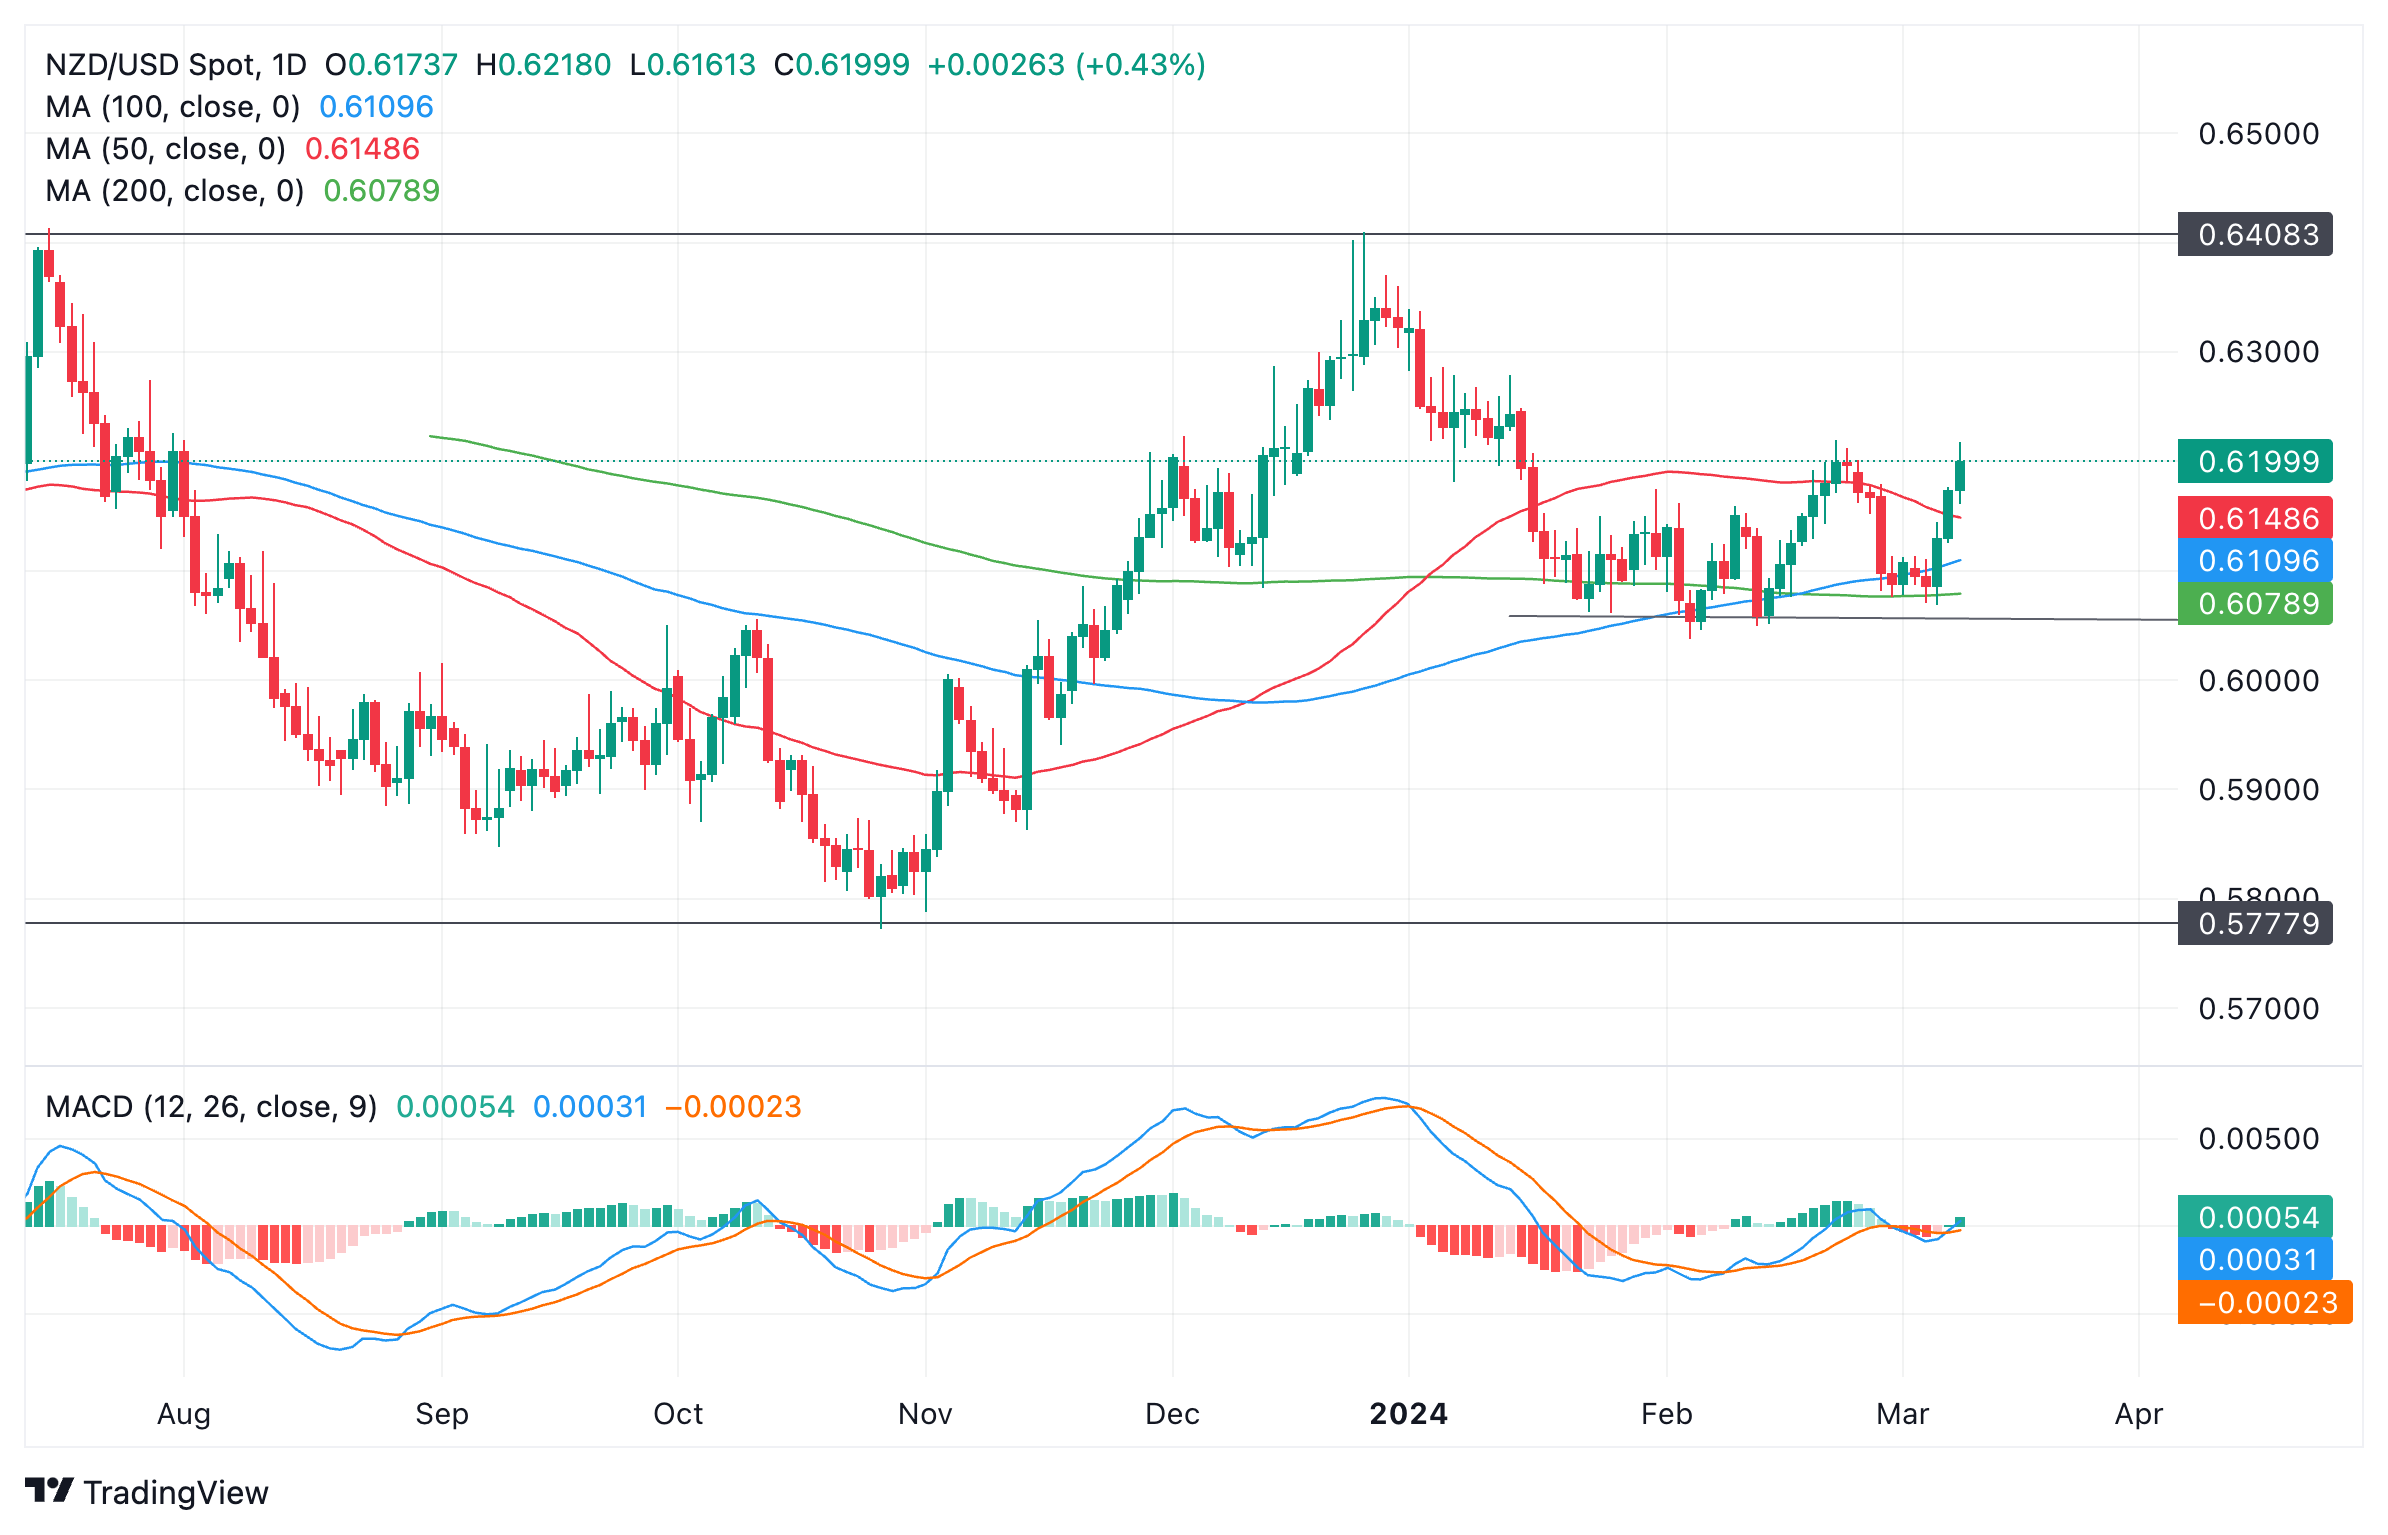
New Zealand Dollar vs US Dollar: Daily chart
The top of the range lies at 0.6400, with only a break above indicating a bullish trend developing. The range bottom – if one can be deduced amongst all the ups and downs – lies near 0.5800. Price would need to sink to below this level to turn the trend bearish.
Since Wednesday, price has bounced back from support at the level of the 100 and 200-day Simple Moving Averages (SMA) acting in concert near 0.6090. Although the recovery has been strong, it is not enough to deduce that a short-term uptrend is in play.
If Friday (today) ends as a green up day, a bullish Three White Soldier Japanese candlestick pattern will have formed, suggesting a greater chance of a bullish continuation. However, given the generally sideways nature of the pair, even such a pattern might not be so reliable unless accompanied by a key shift in fundamentals.
New Zealand Dollar FAQs
The New Zealand Dollar (NZD), also known as the Kiwi, is a well-known traded currency among investors. Its value is broadly determined by the health of the New Zealand economy and the country’s central bank policy. Still, there are some unique particularities that also can make NZD move. The performance of the Chinese economy tends to move the Kiwi because China is New Zealand’s biggest trading partner. Bad news for the Chinese economy likely means less New Zealand exports to the country, hitting the economy and thus its currency. Another factor moving NZD is dairy prices as the dairy industry is New Zealand’s main export. High dairy prices boost export income, contributing positively to the economy and thus to the NZD.
The Reserve Bank of New Zealand (RBNZ) aims to achieve and maintain an inflation rate between 1% and 3% over the medium term, with a focus to keep it near the 2% mid-point. To this end, the bank sets an appropriate level of interest rates. When inflation is too high, the RBNZ will increase interest rates to cool the economy, but the move will also make bond yields higher, increasing investors’ appeal to invest in the country and thus boosting NZD. On the contrary, lower interest rates tend to weaken NZD. The so-called rate differential, or how rates in New Zealand are or are expected to be compared to the ones set by the US Federal Reserve, can also play a key role in moving the NZD/USD pair.
Macroeconomic data releases in New Zealand are key to assess the state of the economy and can impact the New Zealand Dollar’s (NZD) valuation. A strong economy, based on high economic growth, low unemployment and high confidence is good for NZD. High economic growth attracts foreign investment and may encourage the Reserve Bank of New Zealand to increase interest rates, if this economic strength comes together with elevated inflation. Conversely, if economic data is weak, NZD is likely to depreciate.
The New Zealand Dollar (NZD) tends to strengthen during risk-on periods, or when investors perceive that broader market risks are low and are optimistic about growth. This tends to lead to a more favorable outlook for commodities and so-called ‘commodity currencies’ such as the Kiwi. Conversely, NZD tends to weaken at times of market turbulence or economic uncertainty as investors tend to sell higher-risk assets and flee to the more-stable safe havens.
Citing three sources familiar with the matter, Reuters reported on Friday that European Central Bank (ECB) policymakers overwhelmingly back June for a reduction in key rates.
Some policymakers floated the idea on the sidelines of Thursday's ECB meeting of a second cut in July, to win over a small group still pushing for an April start, sources further told Reuters.
Market reaction
This headline failed to trigger a noticeable reaction in EUR/USD. At the time of press, the pair was up 0.1% on the day at 1.0960.
The Cocoa price has reached a new record high due to a shortage of supply. A further increase in prices is quite possible, strategists at Commerzbank say.
Cocoa more expensive than ever
The Cocoa price reached a new record high at the beginning of March due to a shortage of supply. This is due to poorer harvests in the two most important producing countries, Ivory Coast and Ghana. The Cocoa market is therefore likely to post a record supply deficit this crop year, with stocks falling to their lowest level for decades.
No relief is expected in the short term, meaning that a further increase in prices is quite possible.
- EUR/JPY falls to 160.86, reacting to rumors of Bank of Japan possibly ending negative interest rates.
- Technical analysis indicates potential for further pullback if pair closes below the 161.31 Kijun-Sen level.
- Recovery above 161.00 could signal a rebound towards the 162.00 mark, with eyes on the March 7 high.
The EUR/JPY dives for the second consecutive day, losing 0.64% in early trading during the North American session. Rumors that the Bank of Japan (BoJ) could end negative rates are growing, hence sponsoring a leg-up in the Japanese Yen (JPY) against most G7 currencies. At the time of writing, the pair exchanges hands at 160.86.
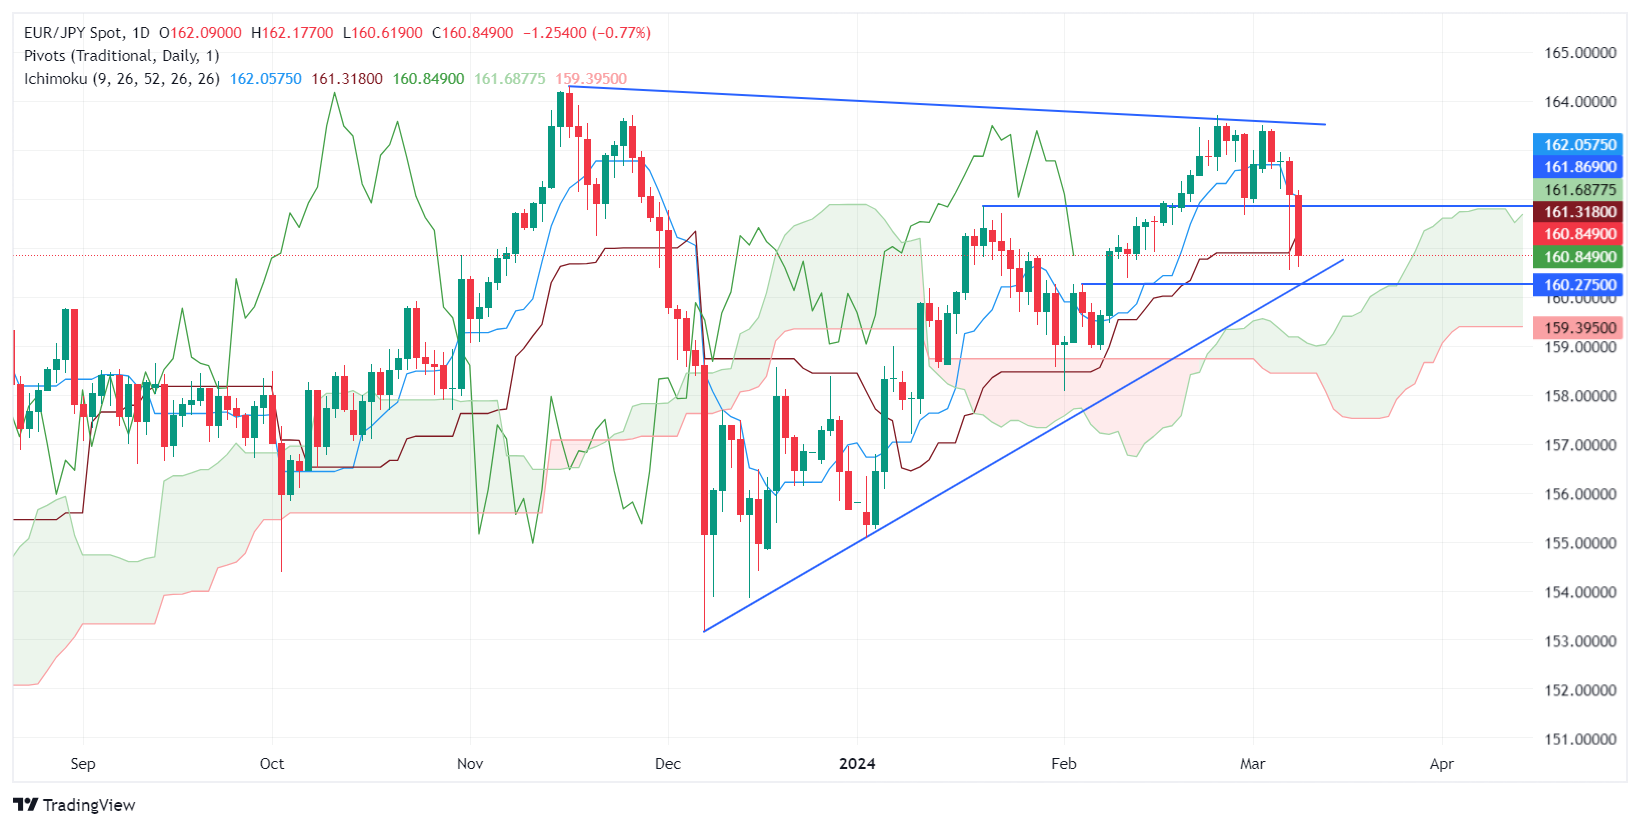
EUR/JPY Price Analysis: Technical outlook
Despite posting a three-week low, the EUR/JPY is slightly tilted to the upside. Nevertheless, if sellers achieve a daily close below the Kijun-Sen at 161.31, that could pave the way for a deeper pullback. The next support would be the 160.00 psychological figures, followed by the Senkou Span B at 159.39 and the top of the Ichimoku Cloud (Kumo) at around 159.00/15.
On the other hand, if buyers lift the exchange rate above 161.00 and reclaim the Kijun-Sen, a leg-up toward 162.00 is on the cards. Once cleared, look for a test of the March 7 high at 162.81.
EUR/JPY Price Action – Daily Chart
USD/MXN fell in February from 17.17 to 17.06. Economists at MUFG Bank analyze Mexican Peso’s outlook.
MXN weakening path ahead
The MXN might weaken in the next few months on the back of a dovish tone of Banxico minutes and weaker-than-expected industrial production and retail sales that could drive a Banxico rate cut coming earlier than the Fed, although some Banxico members are willing to synchronize its decision with the Fed.
From June onwards, the MXN tends to be more strongly influenced by expectations regarding the new government and its policies. Eurasia judges that Ms. Claudia Sheinbaum has an 80% chance to become the next president after the 2nd June election. Morena party tends to maintain the majority at both Lower House and Senate, as well as the majority of state governors. However, the government coalition might not get a two-thirds majority in Congress, thus having to negotiate with the opposition to pass key reforms.
The US election in November and potential immigration and trade policy changes could weigh on Mexico’s economy. In light of those risks, we expect a gradually weaker MXN.
- Australian Dollar rises and marks its third consecutive day of gains.
- US Nonfarm Payrolls outperform expectations at 275K, but rising unemployment and lower wage growth hint at a cooling job market.
- AUD/USD's rally supported by dipping US 10-year Treasury yields and a weakening Dollar Index, amid global monetary policy recalibrations.
The Australian Dollar advanced for the third straight trading day, early in the North American session, edges up 0.35% and exchanges hands at 0.6654.
Aussie Dollar’s strengthens as US Dollar extends its weekly losses
Recently released data by the US Department of Labor revealed the US Nonfarm Payrolls for February exceeded estimates of 200K, came at 275K, and was higher than January’s downward revised 353K reading to 229K. Further data underscored that the jobs market is cooling as the Unemployment Rate increased from 3.7% to 3.9%, while Average Hourly Earnings edged lower in monthly and annual figures.
The AUD/USD extended its rally toward a daily high of 0.6664, while US Treasury bond yields edged lower. The US 10-year benchmark note rate is down to 4.044%, the lowest level since February 2.
At the same time, the US Dollar Index (DXY) is tumbling 0.25%, sitting at 102.52, threatening to drop to an eight-week low.
New York Fed Williams: Neutral interest rates “still quite low”
Earlier, the New York Fed President John Williams said the restrictive monetary stance has cooled demand, adding that the Fed is responsible for achieving price stability. He said the Fed doesn’t consider politics in deliberations and stated the economy in 2023 was remarkable.
Aside from this, Australian data revealed during the week showed a surplus in the Trade Balance, while the economy grew 0.2% QoQ in Q4 2023, below estimates of 0.3%. On a yearly basis, the economy expanded 1.5% YoY, above estimates but shy of the previous reading of 2.1%.
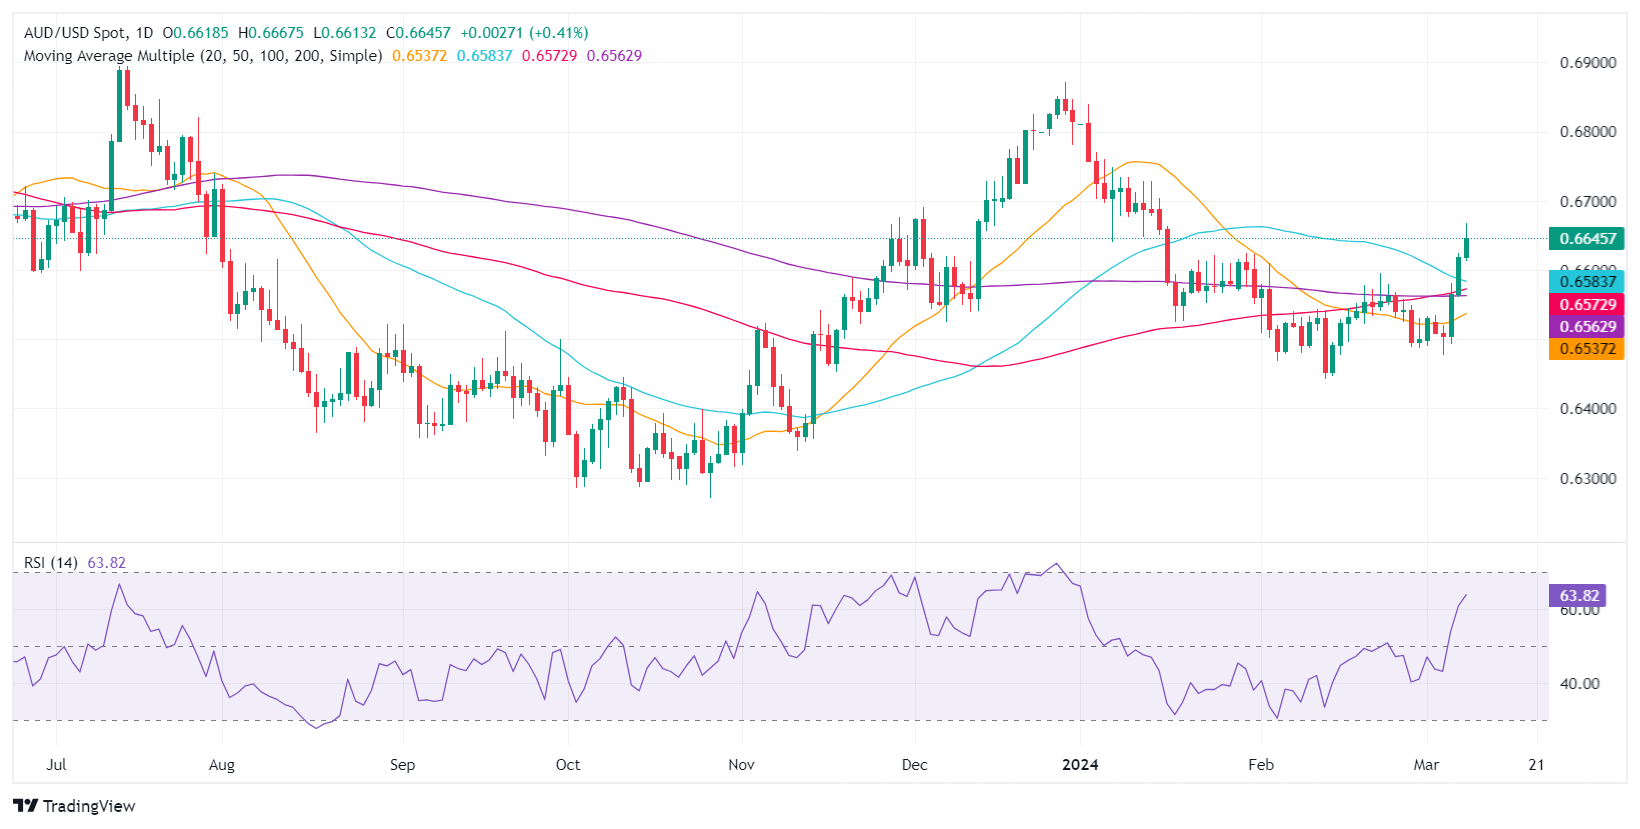
AUD/USD Price Analysis: Technical outlook
The AUD/USD sitting above the 0.6600 figure, has opened the door for further upside, as confirmed by Relative Strength Index (RSI) studies at bullish territory. If buyers extend the rally toward 0.6700, that could open the door for testing the January 5 high at 0.6747, before challenging the 0.6800 mark. On the other hand, a pullback below the January 5 low of 0.6640, could exacerbate a test of the 0.6600 figure.
Economists at HSBC analyze the Swiss Franc (CHF) outlook.
EUR/CHF is likely to track sideways
The CHF’s bad performance is in part due to its safe-haven status, as global equity markets gain. The Swiss Franc has also been hit by the Swiss National Bank’s (SNB) shift in tone around the currency, with FX strength no longer a policy tool or aspiration it seems.
We continue to look for a higher USD/CHF over the near term, while the EUR/CHF pair is likely to track sideways.
- GBP/JPY finds an intermediate support near 188.60. More downside likely on BoJ rate hike bets.
- BoJ policymakers see a positive cycle for wage growth, able to keep inflation above 2%.
- The Pound Sterling will be guided by the UK’s labor market data, scheduled for next week.
The GBP/JPY pair discovers temporary support near 188.60 after sharply correcting from 191.00 in the last three trading sessions. The asset is expected to witness more downside as market expectations for the Bank of Japan (BoJ) abandoning negative interest rates have improved.
A few BoJ policymakers expect a positive cycle in wage growth, improving the odds of inflation remaining above the 2% target sustainable. The BoJ had been reluctant to exit the expansionary policy stance as policymakers were not convinced that wage growth would continue to grow steadily. Investors hope the BoJ will shift to policy normalization in the March monetary policy meeting.
The Japanese Yen would witness strong buying interest if the BoJ delivers a hawkish interest rate decision, as its monetary policy has remained extremely dovish for more than a decade.
Meanwhile, the Pound Sterling awaits fresh guidance on interest rates. The United Kingdom's economic calendar remained light this week. Going forward, investors will focus on the labor market data for three months ending in January, which will be published early next week. Investors will keenly focus on the Average Earnings data, which will provide a fresh outlook on inflation.
The UK’s wage growth has remained almost double what is required to be consistent with the return of inflation to 2%. Strong wage growth momentum would dampen market expectations for rate cuts, which could result in higher investment in the Pound Sterling.
AUD/USD is testing the water above the 0.6600 level for the first time since early February. Economists at Rabobank analyze the pair’s outlook.
Potential for further dips back to 0.6500 in the one-to-three-month horizon
The Aussie should continue to draw support from a relatively hawkish central bank and, compared with various other major economies, a strong set of fundamentals which include both a balanced budget and positive current account position.
We see scope for AUD/USD to move to 0.7000 on a 12-month horizon. That said, we also see the potential for further dips back to 0.6500 in the one-to-three-month horizon on further bouts of USD strength.
Federal Reserve Bank of New York President John Williams noted on Friday that demand has cooled amid the restrictive monetary policy stance, per Reuters.
Key takeaways
"Fed is responsible for achieving price stability."
"Understanding price-wage dynamics is key research topic."
"Inflation expectations have come down quite a bit."
"Neutral interest rate is likely still quite low."
"Nobody thinks high inflation is a good thing."
"Fed focuses on mission, does not consider politics in deliberations."
Market reaction
These comments failed to trigger a noticeable market reaction. At the time of press, the US Dollar Index was unchanged on the day at 102.80.
- The US Dollar extends losses to levels not seen since mid-January.
- US Federal Reserve Chairman Jerome Powell triggered the sell-off by confirming that rate cuts will come this year.
- The US Dollar Index trades below 103.00, and might snap 102.00 if NFP data disappoints.
The US Dollar (USD) is entering on Friday what could become a sixth consecutive day of losses after Thursday ended with the longest red candle of the week. In the showdown between the US Federal Reserve (Fed) and the European Central Bank (ECB), the Fed sounded more dovish as Chairman Jerome Powell committed to rate cuts this year, while ECB’s President Christine Lagarde did not even mention cuts in her statement after the ECB rate decision. Meanwhile, data out of the US that signals losing momentum gives markets the sense of urgency that the Fed will need to move quickly to salvage a soft landing.
On the economic calendar front, only one real data point will be important this Friday. The US EmploymentReport will release its monthly change in Nonfarm Payrolls, with expectations at 200,000, coming from 353,000 a month earlier. The lowest estimate among economists is around 110,000 and the highest at 286,000, which means that any print below the lowest estimate will likely see another leg of US Dollar weakness. In contrast, an upbeat number above 286,000 will probably see the DXY pare back Thursday’s losses.
Daily digest market movers: Fed is ready to pull the trigger on cuts
- The US Jobs Report for February will be published at 13:30 GMT:
- Nonfarm Payrolls growth is expected to decline from 353,000 to 200,000.
- Growth in Yearly Average Hourly Earnings is expected to fall slightly from 4.5% to 4.4%.
- Monthly Average Hourly Earnings growth should also decrease from 0.6% to 0.3%.
- The Unemployment Rate should remain stable at 3.7%.
- Equities are flat to mildly in the green after the Asia closing. Equities were on fire on Thursday after Powell commented that the Fed is ready to cut once data falls in line.
- According to the CME Group’s FedWatch Tool, expectations for a Fed pause in the March 20 meeting are at 95%, while chances of a rate cut stand at 5%.
- The benchmark 10-year US Treasury Note trades around 4.07%, the lowest level in over a week.
US Dollar Index Technical Analysis: Thursday’s nosedive
The US Dollar Index (DXY) broke below 103.00 on Thursday after a string of events with both the ECB and the Fed firing up markets on possible rate cuts to come. The US Jobs Report this afternoon could make it a full week of losses for the DXY, or have it salvage the situation by pushing it back up above 103.00. One thing remains clear: the road to recovery back to 105.00 will be long and hard, with King Dollar going away for a longer time.
On the upside, the first reclaiming ground is at 103.28, the 55-day Simple Moving Average (SMA), and at the 200-day SMA near 103.72. Once broken through, the 100-day SMA is popping up at 103.81, so a bit of a double cap in that region. Depending on the catalyst that pushes the DXY upwards, 104.60 remains the key level on the topside.
The DXY is trading a bit in nomad's land, with not really any significant support levels nearby. More downside looks inevitable with 101.75 up next, which bears some pivotal relevance. Once through there, the road is open for another leg lower to 100.61, the low of 2023.
Nonfarm Payrolls FAQs
Nonfarm Payrolls (NFP) are part of the US Bureau of Labor Statistics monthly jobs report. The Nonfarm Payrolls component specifically measures the change in the number of people employed in the US during the previous month, excluding the farming industry.
The Nonfarm Payrolls figure can influence the decisions of the Federal Reserve by providing a measure of how successfully the Fed is meeting its mandate of fostering full employment and 2% inflation. A relatively high NFP figure means more people are in employment, earning more money and therefore probably spending more. A relatively low Nonfarm Payrolls’ result, on the either hand, could mean people are struggling to find work. The Fed will typically raise interest rates to combat high inflation triggered by low unemployment, and lower them to stimulate a stagnant labor market.
Nonfarm Payrolls generally have a positive correlation with the US Dollar. This means when payrolls’ figures come out higher-than-expected the USD tends to rally and vice versa when they are lower. NFPs influence the US Dollar by virtue of their impact on inflation, monetary policy expectations and interest rates. A higher NFP usually means the Federal Reserve will be more tight in its monetary policy, supporting the USD.
Nonfarm Payrolls are generally negatively-correlated with the price of Gold. This means a higher-than-expected payrolls’ figure will have a depressing effect on the Gold price and vice versa. Higher NFP generally has a positive effect on the value of the USD, and like most major commodities Gold is priced in US Dollars. If the USD gains in value, therefore, it requires less Dollars to buy an ounce of Gold. Also, higher interest rates (typically helped higher NFPs) also lessen the attractiveness of Gold as an investment compared to staying in cash, where the money will at least earn interest.
Nonfarm Payrolls is only one component within a bigger jobs report and it can be overshadowed by the other components. At times, when NFP come out higher-than-forecast, but the Average Weekly Earnings is lower than expected, the market has ignored the potentially inflationary effect of the headline result and interpreted the fall in earnings as deflationary. The Participation Rate and the Average Weekly Hours components can also influence the market reaction, but only in seldom events like the “Great Resignation” or the Global Financial Crisis.
The new all-time highs for Gold are noteworthy. Strategists at Commerzbank think there is too much interest rate optimism on the Gold market and see the sharp rise as an exaggeration.
Lasting upside potential only when interest rate cuts in the US begin
The market is mostly pointing to increasing hopes of Fed interest rate cuts, as the latest US economic indicators have been rather disappointing.
The new all-time highs on the Gold market are driven by short-term speculation. We therefore expect a correction in the coming days and weeks.
Only when the cycle of interest rate cuts in the US actually begins there is likely to be lasting upside potential.
ANZ Bank’s analysis concludes that normalising inflation is sustainable, and the ECB will cut interest rates in the second quarter (Q2).
ECB readying to cut in Q2, rate setters focused on June
We expect that the ECB will begin cutting interest rates in Q2.
We believe that the improvement in inflation is sustainable and that below trend growth and restrictive monetary transmission will drive further weakness in inflation in coming months.
Real policy rates have risen sharply, and we estimate they will make record highs during the first half of this year.
The ECB wants to be doubly sure that inflation is sustainably trending towards 2.0%. It is therefore proceeding with caution.
Our assessment of current guidance from ECB officials is that hawks are in the ascendancy and there is a preference to wait for more data on wage growth before starting to cut. We think there is a consensus building around June.
- WTI Oil recovers on Friday towards $80 on a positive demand outlook.
- Oil traders are betting on a pickup in demand as interest-rate cuts should spur economic growth.
- The US Dollar Index fell below the 103.00 level, trading in the mid-102.00s ahead of NFP.
Oil prices are increasing on Friday, looking again at the $80 level, as investors seem to bet on an improved demand outlook. The move comes after dovish comments from US Federal Reserve Chairman Jerome Powell, who said in a two-day hearing in Congress that the Fed is ready to cut interest rates. Lower rates are likely to spur economic growth, and this could mean more demand for Oil.
The US Dollar, however, didn’t like this message. The US Dollar Index (DXY), which tracks the Greenback against a basket of foreign currencies, fell sharply on Thursday. . With the US Dollar weakening, Oil prices have room to rise in the correlation between the Greenback and the commodity. Should the US Nonfarm Payrolls (NFP) number this afternoon trigger another round of US Dollar weakness, Crude could close off this week above $80.
Crude Oil (WTI) trades at $78.91 per barrel, and Brent Oil trades at $83.04 per barrel at the time of writing.
Oil news and market movers: Demand is already underway
- Oil traders are back to placing bullish bets on Oil with the underlying idea that rate interest-rate cuts in both Europe and the US would spur economic growth and thus see a pickup in demand again.
- An increase in demand is already underway inAsia, with India and China buying up every cheap contract in sight as their industrial and travel demand picks up pace. These two sectors are very Oil-consuming.
- The failed ceasefire talks are keeping tensions high in Gaza.
- This Friday, the Baker Hughes Oil Rig Count is set to be released at 18:00 GMT. The previous count was at 506 rigs.
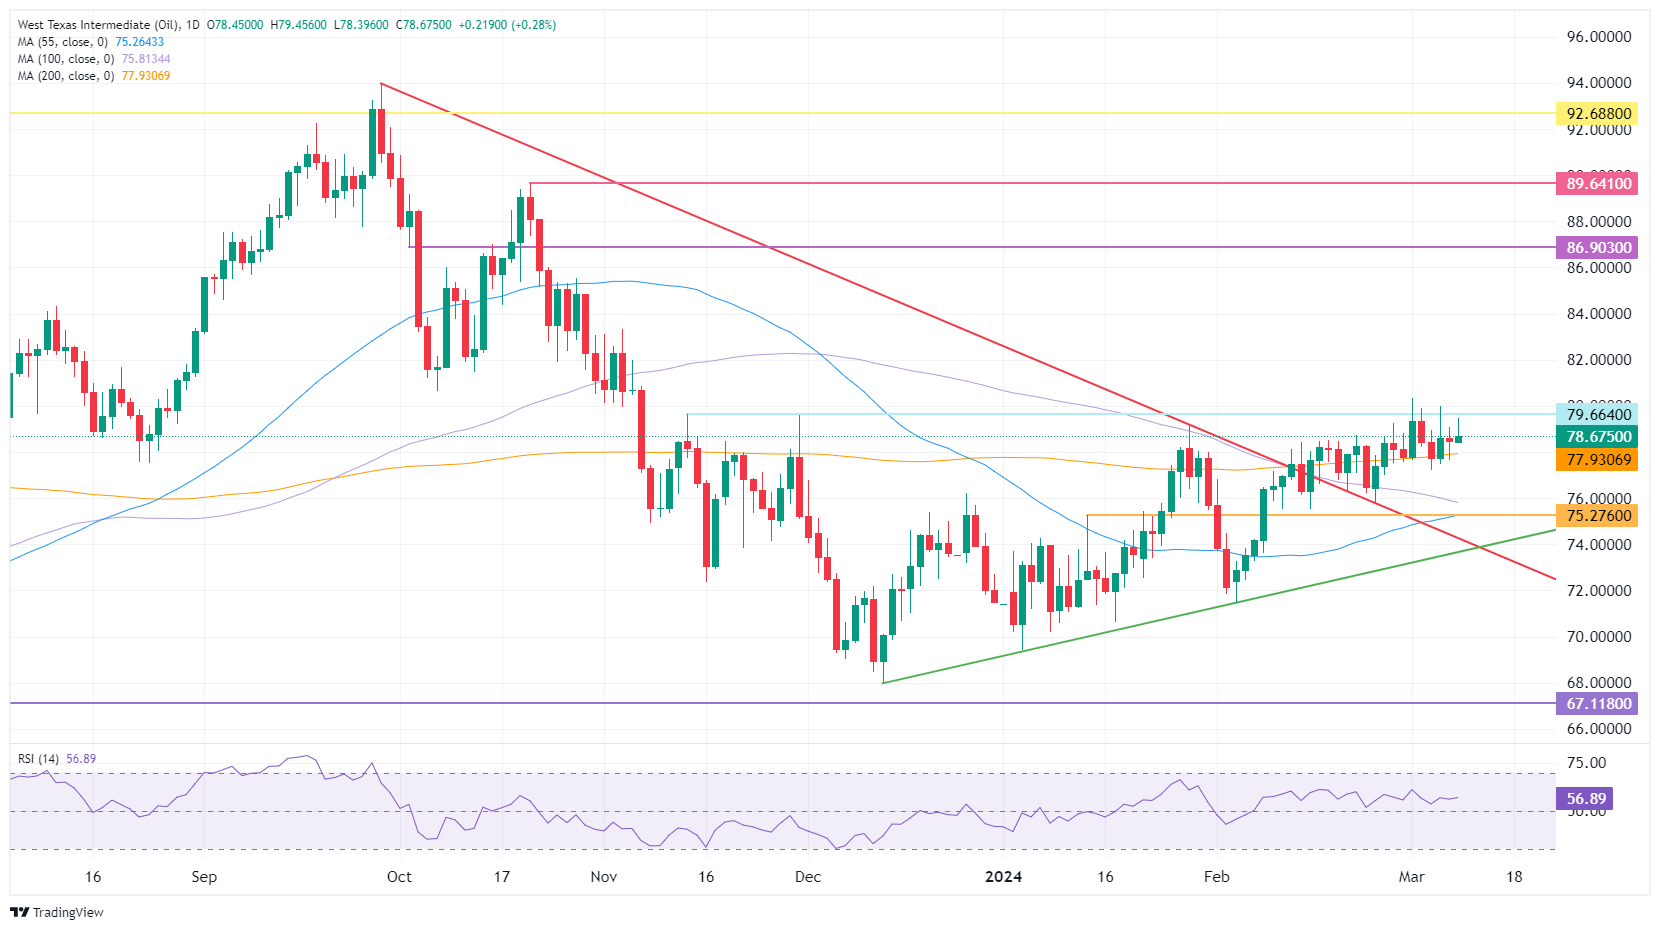
Oil Technical Analysis: Back to 2013
Oil prices are entering dynamics not seen since 2013, when a substantially weaker US Dollar opened up space for Oil prices to rise towards $100. Seeing the current rate cuts and dovish stance by the Fed, more upside could be at hand.. Although $100 is still far off, chances are growing.
Oil bulls still clearly see more upside potential. The break above $80 though does not seem to be taking place that quickly, and $85 is appearing as the next cap. Further up, $86.90 follows suit before targeting $89.64 and $90.00 as top levels.
On the downside, the 200-day Simple Moving average (SMA) near $77.93 is the first point of contact to provide some support. Quite close behind are the 100-day and the 55-day SMAs near $75.81 and $75.26, respectively. Add the pivotal level near $75.27, and it looks like the downside is very limited and well-equipped to resist the selling pressure.
US WTI Crude Oil: Daily Chart
WTI Oil FAQs
WTI Oil is a type of Crude Oil sold on international markets. The WTI stands for West Texas Intermediate, one of three major types including Brent and Dubai Crude. WTI is also referred to as “light” and “sweet” because of its relatively low gravity and sulfur content respectively. It is considered a high quality Oil that is easily refined. It is sourced in the United States and distributed via the Cushing hub, which is considered “The Pipeline Crossroads of the World”. It is a benchmark for the Oil market and WTI price is frequently quoted in the media.
Like all assets, supply and demand are the key drivers of WTI Oil price. As such, global growth can be a driver of increased demand and vice versa for weak global growth. Political instability, wars, and sanctions can disrupt supply and impact prices. The decisions of OPEC, a group of major Oil-producing countries, is another key driver of price. The value of the US Dollar influences the price of WTI Crude Oil, since Oil is predominantly traded in US Dollars, thus a weaker US Dollar can make Oil more affordable and vice versa.
The weekly Oil inventory reports published by the American Petroleum Institute (API) and the Energy Information Agency (EIA) impact the price of WTI Oil. Changes in inventories reflect fluctuating supply and demand. If the data shows a drop in inventories it can indicate increased demand, pushing up Oil price. Higher inventories can reflect increased supply, pushing down prices. API’s report is published every Tuesday and EIA’s the day after. Their results are usually similar, falling within 1% of each other 75% of the time. The EIA data is considered more reliable, since it is a government agency.
OPEC (Organization of the Petroleum Exporting Countries) is a group of 13 Oil-producing nations who collectively decide production quotas for member countries at twice-yearly meetings. Their decisions often impact WTI Oil prices. When OPEC decides to lower quotas, it can tighten supply, pushing up Oil prices. When OPEC increases production, it has the opposite effect. OPEC+ refers to an expanded group that includes ten extra non-OPEC members, the most notable of which is Russia.
- EUR/GBP weakens after several ECB officials talk up the possibility of an early rate cut.
- Francois Villeroy de Galua and Joachim Nagel talk of spring rate cut, putting April back on the table.
- The technical outlook turns more bearish as price sinks back down towards February’s lows.
The Euro (EUR) is sinking, trading in the 0.8510s against the Pound Sterling (GBP) on Friday, after two leading members of the European Central Bank's (ECB) Governing Council (GC) voiced approval for a spring rate cut.
Their dovish views clash with the more cautious stance of the ECB President Christine Lagarde, who said on Thursday, that June would be the next key date for reviewing policy on interest rates.
Spring can be anytime from “April to June” says De Galau
Francois Villeroy de Galau, Governor of the Bank of France and GC member, said a rate cut in spring was now “very likely” on Friday, adding, “spring goes from April to June.”
His ECB colleague, Bundesbank President Joachim Nagel, said "The probability is increasing that we could see an interest-rate cut before the summer break," adding, "This will be data dependent, but the prospects have brightened." According to a report on Poundsterlinglive.com.
The comments led to broad based weakness for the Euro as lower interest rates reduce the attractiveness of a currency as a place for foreign investors to park their capital.
Technical Analysis: Price sinking to key support
EUR/GBP’s long-term technical outlook is sideways with a slight bearish bias in the intermediate and short-term.
Given the overall bearish theme of the charts the price will probably continue sinking to the key support level at 0.8493. A break below that would turn the picture much more bearish.
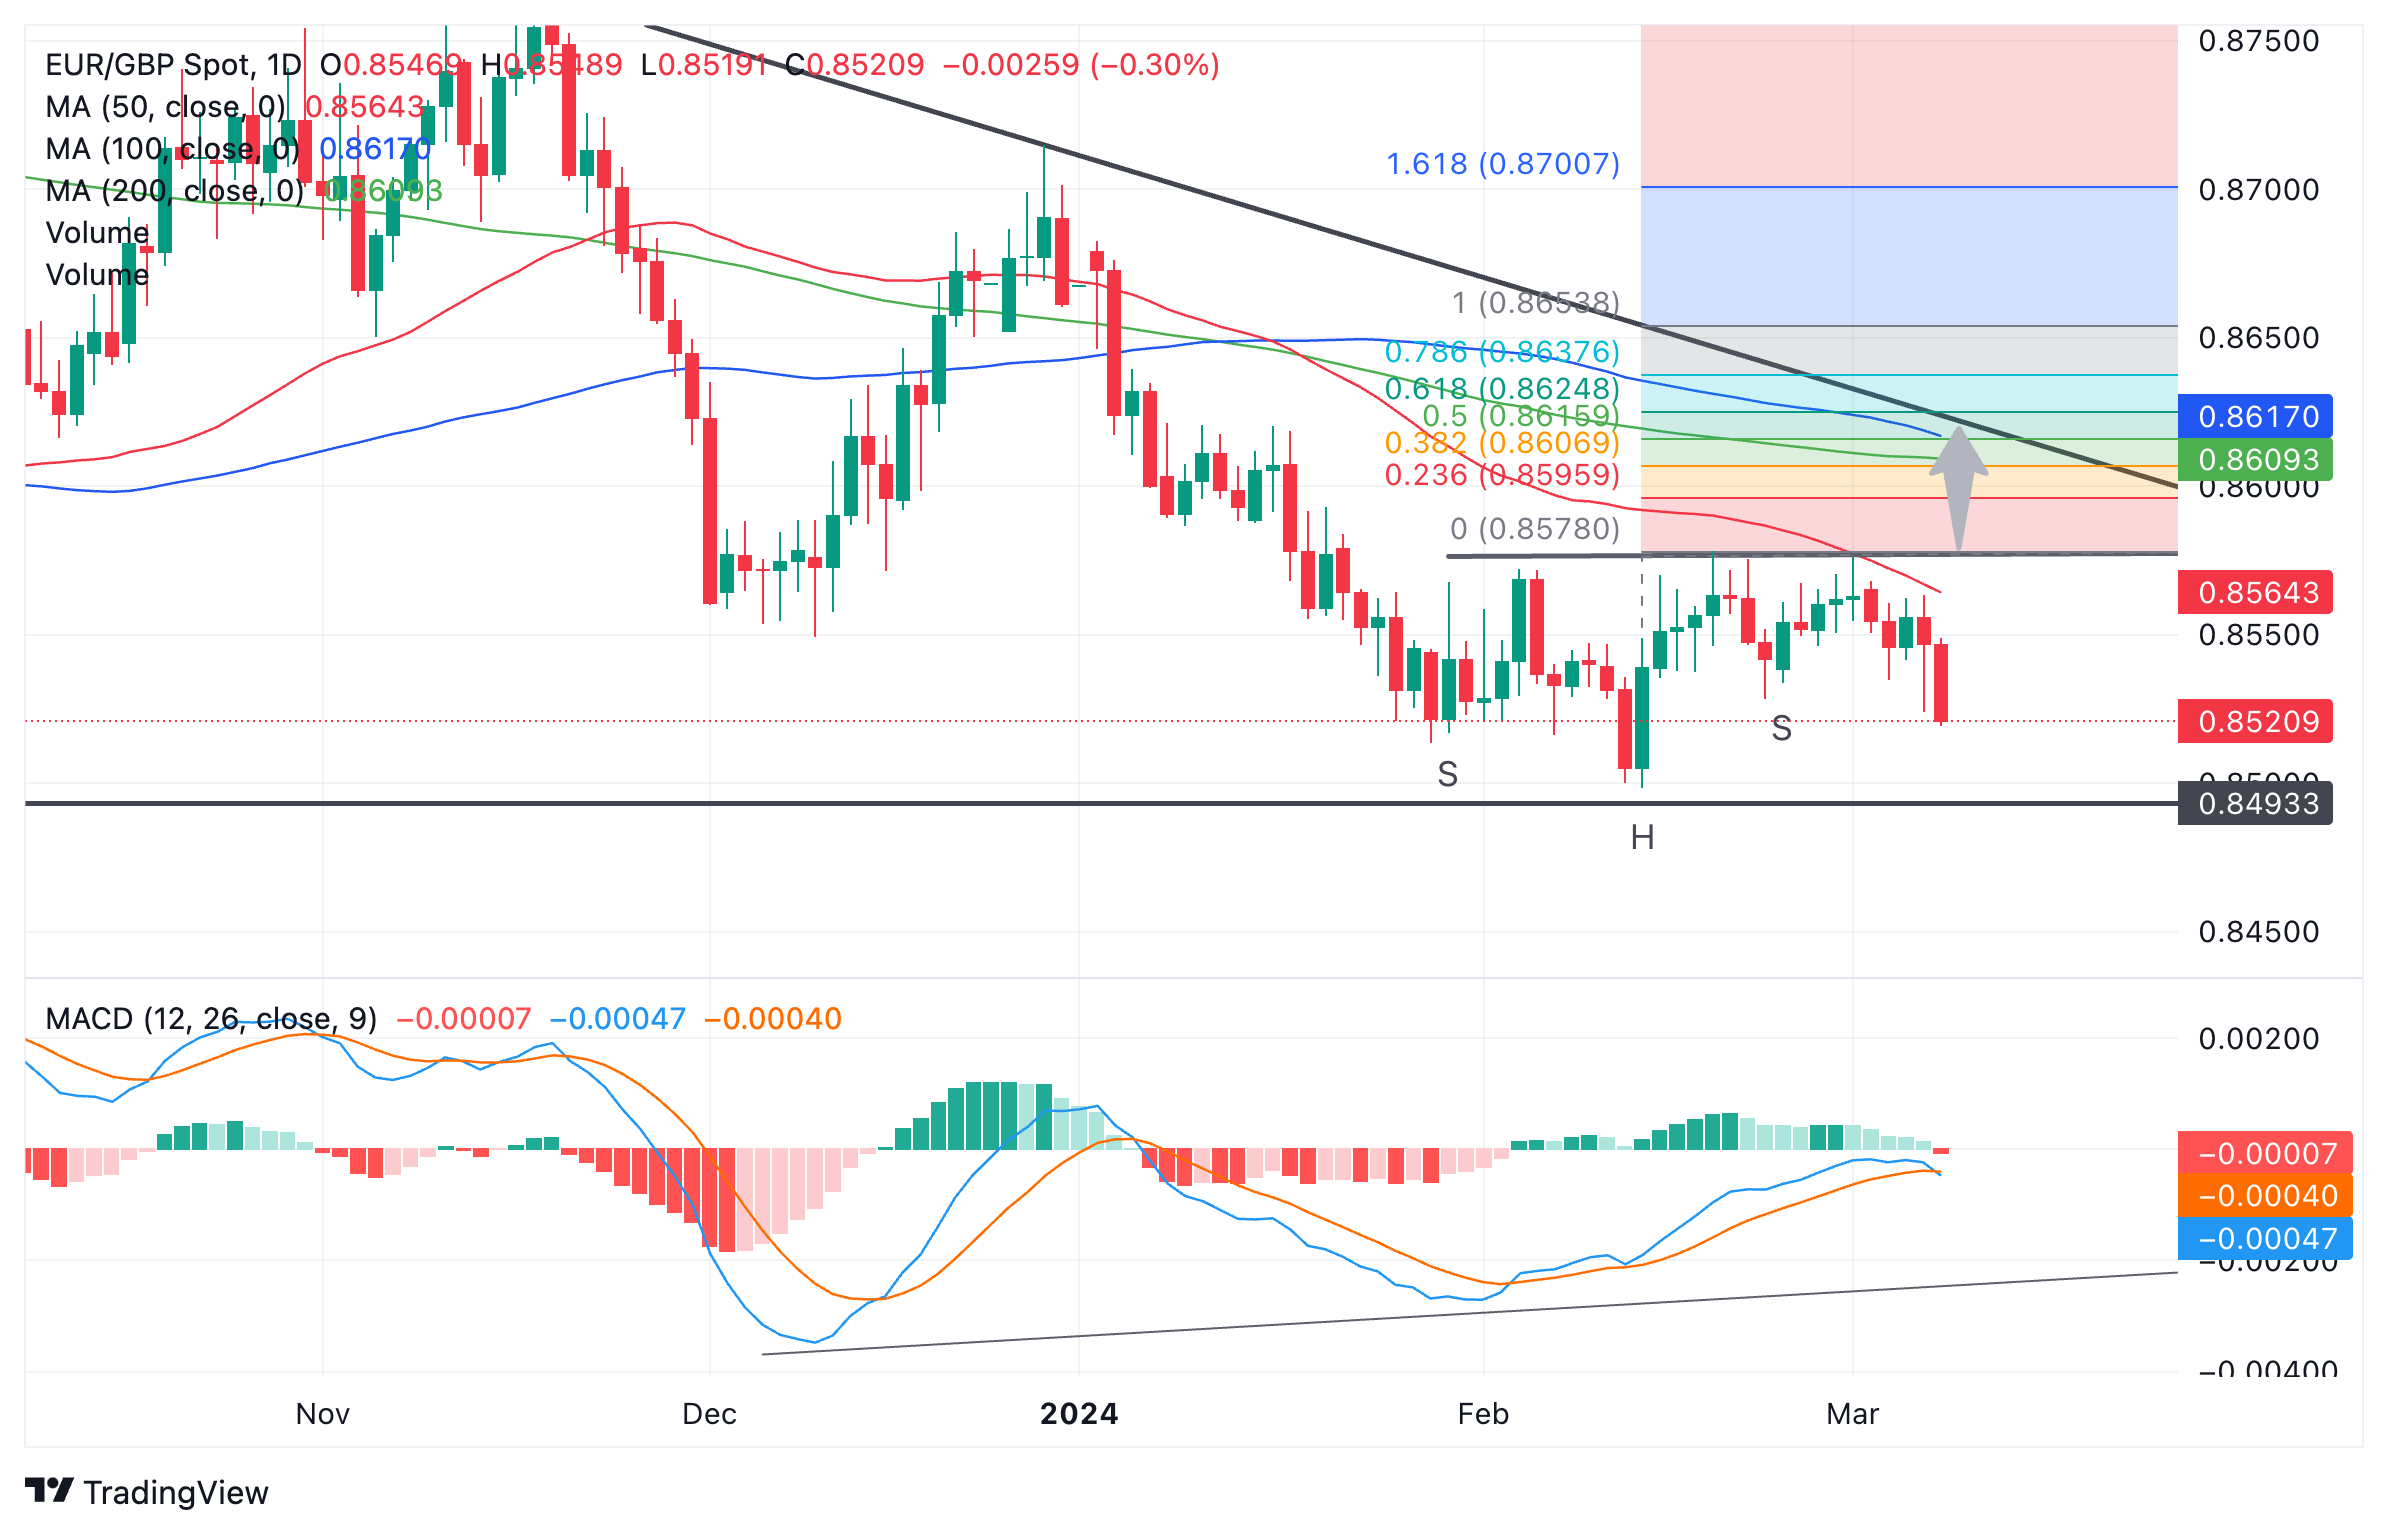
Euro vs Pound Sterling: Daily chart
There are some signs of a possible recovery, however, if price stabilizes.
The Moving Average Convergence/ Divergence (MACD) is converging bullishly with price action suggesting the downtrend may be losing momentum. .
An Inverse Head and Shoulders pattern could be forming, although the chances are diminishing as the market continues falling. For confirmation of the pattern, price would have to break above what is known as “the neckline” which is drawn as a resistance line at the highs. On EUR/GBP the neckline is at 0.8750. Such a break could be followed by a rise of either the same length as the height of the pattern extrapolated higher, or a Fibonacci 61.8%.
Given the confluence of resistance from the 100 and 200-day Simple Moving Averages (SMA) at around 0.8615, as well as resistance from the trendline nearby, this zone provides a potential conservative estimate for the pattern.
- USD/JPY extends its losing spell as the Japanese Yen strengthens on hawkish BoJ bets.
- The US Dollar weakens on firm expectations for the Fed reducing interest rates in June.
- Investors await the US NFP for fresh guidance.
The USD/JPY pair continues its losing spell for the fourth trading session on Friday. The asset falls vertically to 147.00 on firm expectations that the Bank of Japan (BoJ) will pivot to raising interest rates after keeping them in the negative territory for more than a decade.
S&P 500 futures are positive in the European session, indicating a higher risk appetite of the market participants. The 10-year US Treasury yields have dropped significantly to 4.07% as Federal Reserve (Fed) Chair Jerome Powell has recognized the need to dial back the restrictive monetary policy stance to prevent the economy from falling into a recession.
Market expectations for the BoJ exiting the ultra-dovish policy stance increase after a few policymakers said a positive wage cycle is in sight. This has convinced investors that steady wage growth would keep inflation above the 2% target. Investors hope that the BoJ will quit the expansionary policy stance itself in the March policy meeting.
Meanwhile, the US Dollar is under pressure Fed Powell said the central bank is not so far from gaining confidence that inflation will come down to 2%. The US Dollar Index (DXY) has continued its five-day losing spell to Friday and has refreshed its seven-week low at 102.70.
Going forward, the US Dollar will be guided by the US Nonfarm Payrolls (NFP) data for February, which will be published at 13:30 GMT. The Unemployment Rate is anticipated to remain unchanged at 3.7%. Economists have anticipated that the United States employers recruited 200K jobs, lower than the robust hiring of 353K in January.
The Turkish Lira (TRY) has continued to weaken at the start of this year at a similar pace to the end of last year by an annualized rate of around -28% against the US Dollar (USD) between January and February. Economists at MUFG Bank analyze Lira’s outlook.
Upcoming local election results unlikely to alter Erdogan’s tolerance for higher rates
The pace of Lira depreciation will slow in the year ahead based on the assumption that the CBRT sticks to tighter policy.
Economic growth has started to slow in response to higher rates. We are not expecting the upcoming local election results in March to alter President Erdogan’s tolerance for higher rates.
- Gold price prints a fresh all-time high of around $2,170 amid multiple tailwinds.
- US Treasury yields plunge as Fed Powell delivers a slight dovish guidance on interest rates.
- The US Dollar, Gold next moves will be guided by the US NFP data.
Gold price (XAU/USD) is set to deliver a bullish closing for a third straight week as geopolitical tensions continue to run high and the United States Treasury yields fall amid growing expectations that the Federal Reserve (Fed) is close to lowering interest rates. The precious metal rallies to a fresh all-time high around $2,170 as yields on 10-year US bonds fell to 4.07% after Federal Reserve Chair Jerome Powell indicated the central bank is close to gaining evidence for inflation returning sustainably to the 2% target.
In his two-day testimony before Congress, Jerome Powell said: "We are waiting to become more confident that inflation is moving sustainably down to 2%. When we do get that confidence, and we’re not far from it, it will be appropriate to begin to dial back the level of restriction so that we don’t drive the economy into recession.”
The precious metal exhibits a firm footing ahead of the US Nonfarm Payrolls (NFP) data for February, which will be published at 13:30 GMT. Hiring figures in January were robust, and a similar performance in February month along with sticky wage growth could cause the Fed to observe incoming data for some months before considering a rate-cut move. This scenario would provide a relief to the US Dollar, which is facing a sharp sell-off since last week, and weigh on Gold. The US Dollar Index (DXY), which tracks the Greenback’s value against six major currencies, has dropped to 102.70.
Meanwhile, the death of three civilians on a merchant ship flowing from the Red Sea by Iran-backed-Houthis has increased the risk of escalating geopolitical tensions in the region.
Daily digest market movers: Gold price strengthens at the cost of US yields
- Gold price prints a fresh all-time high near $2,170 as Federal Reserve Chair Jerome Powell sounded slightly dovish in his two-day testimony before Congress. Powell said policymakers are not far from gaining confidence that inflation will return to the 2% target. He recognized the need to dial back the restrictive monetary policy stance to prevent the economy from falling into a recession.
- The rally in the Gold price indicates that the slight dovish commentary from Fed Powell has built confidence among investors that rate cuts will be announced sooner. The expectations for the Fed reducing interest rates in the June policy meeting remain firm. The Fed is expected to keep interest rates unchanged in the range of 5.25%-5.5% in the March and May policy meetings.
- In today’s session, the strength of the Gold price will be tested by the US NFP data for February. It is anticipated that the United States employers have recruited 200K jobs, lower than the robust hiring of 353K in January. The Unemployment Rate is anticipated to remain unchanged at 3.7%.
- Apart from that, February's Average Hourly Earnings data will be of utmost importance. Economists expect that monthly wage growth to have halved to 0.3% from 0.6% in January. The annual wage growth is forecasted to have grown by 4.4%, slightly decelerating from the prior reading of 4.5%.
- Higher wage growth could slow the progress in inflation declining towards 2%, which could negatively influence market expectations for Fed rate cuts in June. If this happens, the opportunity cost of holding an investment in non-yielding assets, such as Gold, will increase, weighing on Gold price.
Technical Analysis: Gold price turns overbought around $2,170
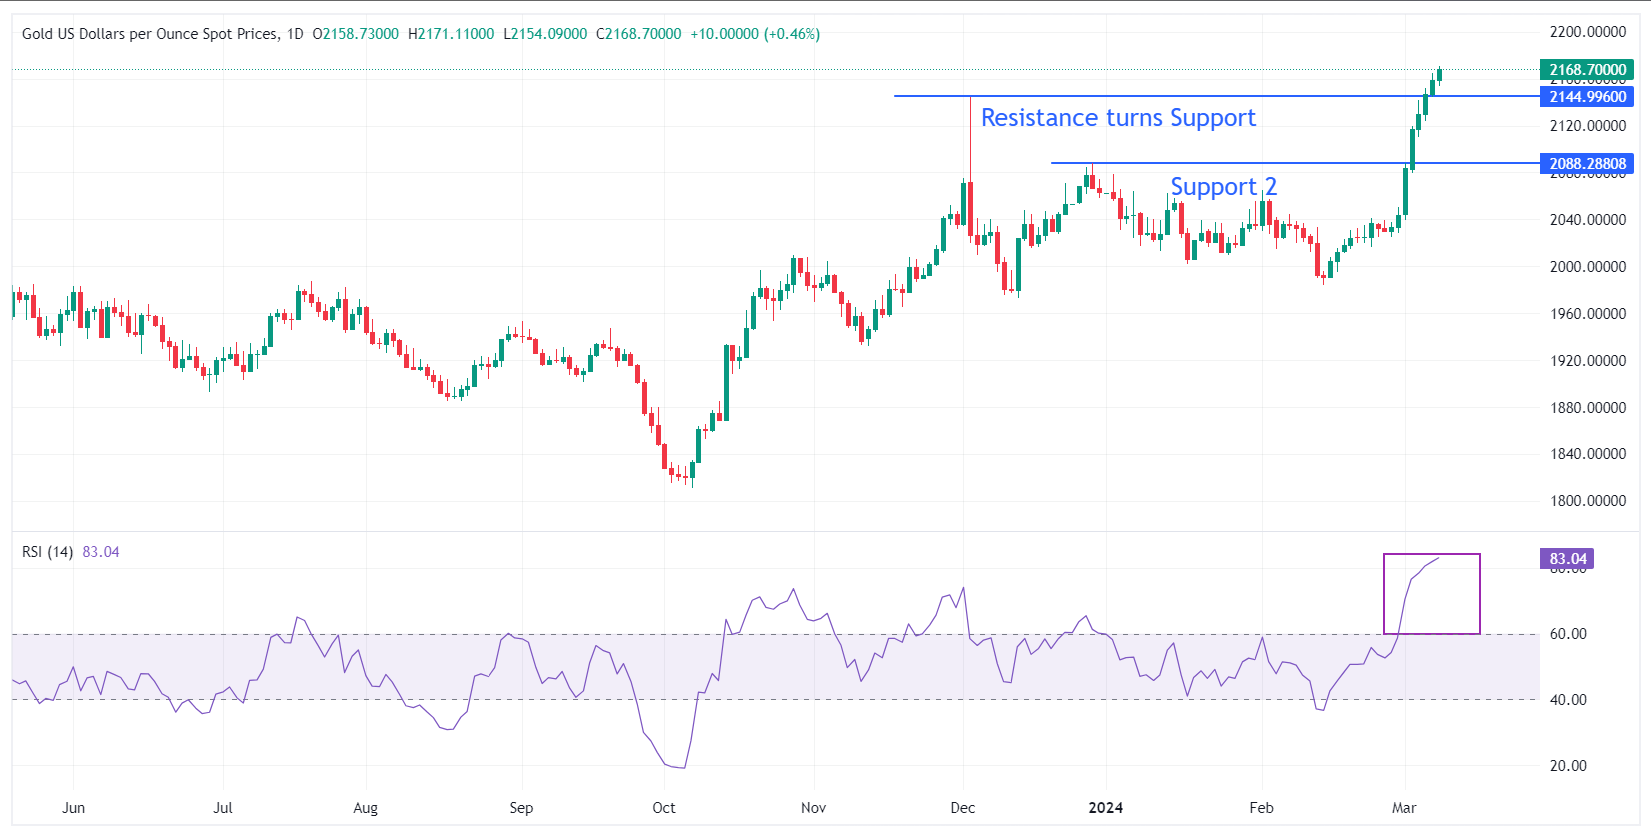
Gold price carry-forwards its winning streak for an eighth trading session on Friday. The precious metal has refreshed its all-time highs at $2,172 after breaking above the horizontal resistance line plotted from December 4 high near $2,145.
The Gold price is trading in unchartered territory and is expected to remain broadly bullish. However, a corrective move in the asset cannot be ruled out as momentum oscillators have reached the overbought territory. The 14-period Relative Strength Index (RSI) has reached 83.00, well above the 70.00 threshold, which signals overbought levels and points to some correction ahead.
On the downside, December 4 high near $2,145 and December 28 high at $2,088 will act as major support levels.
Gold FAQs
Gold has played a key role in human’s history as it has been widely used as a store of value and medium of exchange. Currently, apart from its shine and usage for jewelry, the precious metal is widely seen as a safe-haven asset, meaning that it is considered a good investment during turbulent times. Gold is also widely seen as a hedge against inflation and against depreciating currencies as it doesn’t rely on any specific issuer or government.
Central banks are the biggest Gold holders. In their aim to support their currencies in turbulent times, central banks tend to diversify their reserves and buy Gold to improve the perceived strength of the economy and the currency. High Gold reserves can be a source of trust for a country’s solvency. Central banks added 1,136 tonnes of Gold worth around $70 billion to their reserves in 2022, according to data from the World Gold Council. This is the highest yearly purchase since records began. Central banks from emerging economies such as China, India and Turkey are quickly increasing their Gold reserves.
Gold has an inverse correlation with the US Dollar and US Treasuries, which are both major reserve and safe-haven assets. When the Dollar depreciates, Gold tends to rise, enabling investors and central banks to diversify their assets in turbulent times. Gold is also inversely correlated with risk assets. A rally in the stock market tends to weaken Gold price, while sell-offs in riskier markets tend to favor the precious metal.
The price can move due to a wide range of factors. Geopolitical instability or fears of a deep recession can quickly make Gold price escalate due to its safe-haven status. As a yield-less asset, Gold tends to rise with lower interest rates, while higher cost of money usually weighs down on the yellow metal. Still, most moves depend on how the US Dollar (USD) behaves as the asset is priced in dollars (XAU/USD). A strong Dollar tends to keep the price of Gold controlled, whereas a weaker Dollar is likely to push Gold prices up.
USD/JPY trades near fresh five-week lows below the 148.00 level. However, Ulrich Leuchtmann, Head of FX and Commodity Research at Commerzbank, does not expect the Japanese Yen (JPY) to continue strengthening.
Yen unlikely to strengthen too much in the medium to long term
By normalizing monetary policy quickly, the BoJ risks repeating the mistakes of the early 2000s: choking off inflation before it is truly self-sustaining. If I am right, the BoJ's scope for raising interest rates will remain extremely limited.
If wage pressures disappear and inflation loses momentum, rate hikes will soon be a thing of the past. That's why I agree with the market on the current strength of the Yen. This is because I think it correctly prices in the BoJ's most likely reaction. At the same time, however, I think the Yen's potential is limited. Especially in the medium to long term, I do not expect the Yen to strengthen too much. That is because I do not think there is room for a pronounced normalization of interest rates.
- USD/CAD has broken below a major trendline and is unfolding lower.
- Key fundamental data lies ahead with US Nonfarm Payrolls and Canadian Payrolls both coming out at the same time.
- Unless the fundamental data is substantially bullish for the US Dollar, the downmove will probably extend.
The USD/CAD is down over a tenth of a percent on Friday as traders await the arrival of key employment metrics from both the US and Canada at 13:30 GMT.
Over the last two and a half days the pair has fallen from 1.3600 to the 1.3430s as traders digested Federal Reserve (Fed) Chairman Jerome Powell’s dovish comments to US lawmakers. Powell said “we’re not far” from inflation falling to a level where it would be right to start cutting rates. Lower rates are negative for a currency as they tend to reduce foreign capital inflows.
The mood music around the Bank of Canada (BoC) meanwhile has been much less dovish after the Boc delivered a hawkish hold at its last policy meeting on Wednesday.
The technical picture is showing some interesting developments as we head into what will probably be a volatile afternoon.
USD/CAD is overall looking bearish. It has broken through a key trendline for the 2024 rally and the break coincides with a sell signal from the Moving Average Convergence/ Divergence (MACD) indicator as it crosses below its signal line (circled). The Relative Strength Index (RSI) is also relatively low – a bearish sign.
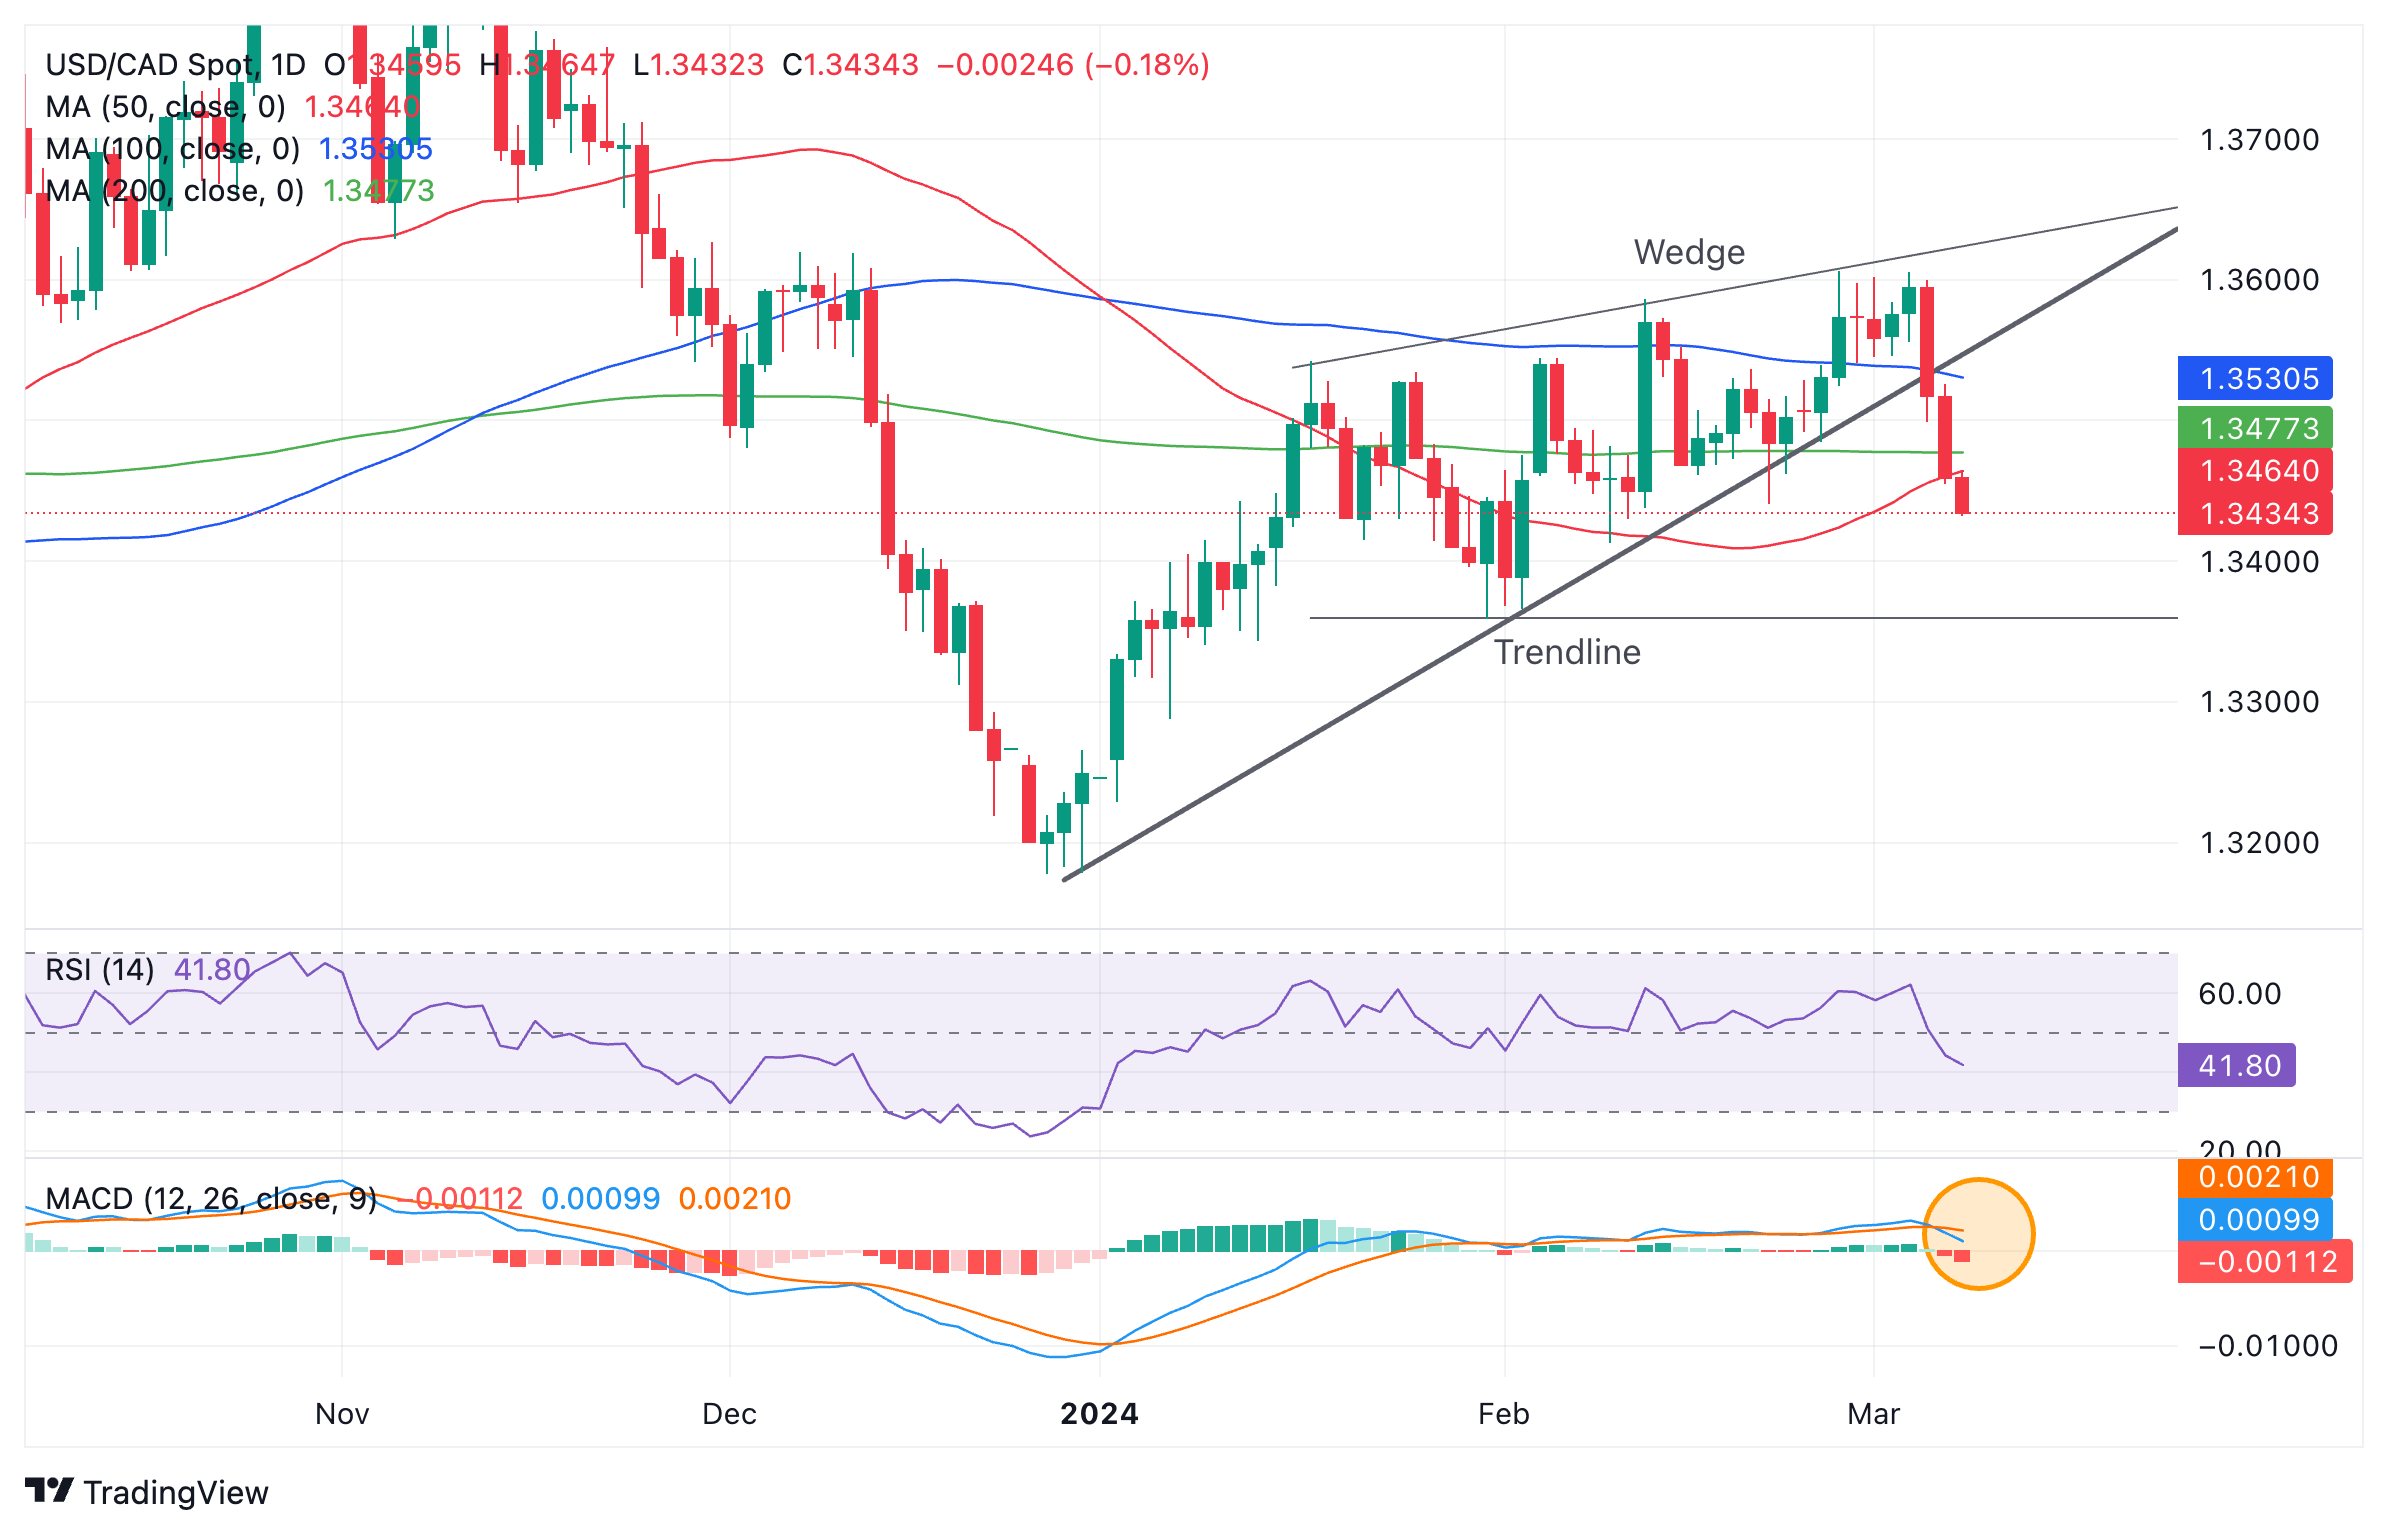
US Dollar vs Canadian Dollar: Daily chart
It is possible to see the 2024 price action as forming a Wedge pattern – another potentially bearish motif. Since the trendline has a dual role as the bottom of the Wedge, the trendline break also indicates a breakout from the price pattern.
The target for the breakdown is equal to the widest part of the Wedge pattern extrapolated lower from the breakout point lower. This gives a target at roughly 1.3350, which is also the level of the January lows.
A break below that would solidify the reversal and probably see a run down to around the vicinity of the 2023 December lows in the 1.3170s.
European Central Bank (ECB) Governing Council member Gediminas Šimkus said on Friday that “a rate cut in June is very likely.”
Additional comments
The conditions are in place to move to a less restrictive monetary policy.
A rate cut in April cannot be ruled out but the probability of that is low.
There are no reasons for cuts of more than 25 bps at a time.
Related reads
- EUR/USD pulls back after rallying to within sight of 1.1000
- ECB’s Rehn: Risk of cutting rates too early has significantly decreased
Ulrich Leuchtmann, Head of FX and Commodity Research at Commerzbank, analyzes what synchronized Fed and ECB rate cuts would mean for EUR/USD.
The Fed has typically moved its key rate much more and with greater amplitude than the ECB
Anyone managing USD and EUR risk has to rely on experience to make forecasts. And experience shows that the Fed is the more ‘active’ of the two central banks. It has typically moved its key rate much more and with greater amplitude than the ECB.
Even its last interest rate cycle from 2015 to 2018, whose amplitude seemed puny compared to the 1990s and early 2000s, is no exception. The ECB skipped this rate cycle altogether.
This means that if the Fed and the ECB start their rate-cutting cycles at the same time, ceteris paribus, this is an argument for higher EUR/USD rates. Until it becomes clear what the Fed's and ECB's rate cycles will look like this time around.
- The Eurozone economy showed no growth in the fourth quarter, as expected.
- EUR/USD consolidates weekly gains below 1.0950 on the Eurozone GDP data.
The Eurozone economy showed no growth in the fourth quarter of 2023, the final estimate published by Eurostat confirmed on Friday.
On a quarterly basis, the Gross Domestic Product (GDP) in the old continent arrived at 0% in the three months to December of last year. The preliminary figure showed no growth during the reported period. The reading matched the market expectations.
On an annual basis, the bloc’s GDP expanded by 0.1%, at the same pace as that seen in the first reading, in line with the market forecast.
Eurozone’s Final Employment Change for Q4 came in at 0.3% and 1.2% on a quarterly and yearly basis respectively.
Market reaction
The Euro is unaffected by the Eurozone data, with EUR/USD keeping its range at around 1.0935, at the time of writing.
Euro price today
The table below shows the percentage change of Euro (EUR) against listed major currencies today. Euro was the strongest against the US Dollar.
| USD | EUR | GBP | CAD | AUD | JPY | NZD | CHF | |
| USD | 0.14% | -0.11% | -0.13% | -0.35% | -0.50% | -0.09% | -0.07% | |
| EUR | -0.14% | -0.25% | -0.26% | -0.48% | -0.64% | -0.24% | -0.22% | |
| GBP | 0.12% | 0.25% | -0.01% | -0.24% | -0.38% | 0.02% | 0.03% | |
| CAD | 0.12% | 0.26% | 0.01% | -0.23% | -0.38% | 0.02% | 0.03% | |
| AUD | 0.34% | 0.48% | 0.22% | 0.22% | -0.11% | 0.23% | 0.27% | |
| JPY | 0.49% | 0.60% | 0.36% | 0.35% | 0.13% | 0.39% | 0.37% | |
| NZD | 0.09% | 0.23% | -0.03% | -0.04% | -0.25% | -0.37% | 0.00% | |
| CHF | 0.11% | 0.21% | -0.04% | -0.05% | -0.25% | -0.38% | -0.01% |
The heat map shows percentage changes of major currencies against each other. The base currency is picked from the left column, while the quote currency is picked from the top row. For example, if you pick the Euro from the left column and move along the horizontal line to the Japanese Yen, the percentage change displayed in the box will represent EUR (base)/JPY (quote).
Canada releases jobs figures for February today. Economists at ING analyze Loonie’s outlook ahead of the employment report.
Loonie still looks at the US more than Canada
Expectations are for a respectable 20K employment print, with the unemployment rate expected to nudge higher from 5.7% to 5.8%.
The implications for the Canadian Dollar should not be material unless we see a big surprise in either direction. Both the Loonie and Bank of Canada rate expectations have followed very closely US data dynamics and we think that today’s US payrolls should have a bigger say in the short-term direction of USD/CAD.
A USD decline should see the Loonie lag other high-beta/commodity currencies, but can still put gradual pressure on USD/CAD, which we expect to break below 1.3000 by 2H24.
Citing sources familiar with the Bank of Japan’s (BoJ) thinking, Reuters reported on Friday that “If the spring wage negotiations outcome is strong, the BoJ may not necessarily need to wait until April” to exit its negative interest rate policy (NIRP).
“The BoJ is leaning toward ending negative rates in March, the key determinant will be the outcome of March 13th wage talks,” the sources said.
Another report published by Jiji News Agency states that the “BoJ is considering a new quantitative monetary policy framework that will show the outlook for upcoming government bond buying amounts.”
“The BoJ will review yield curve control (YCC) as it considers a new quantitative policy framework,” Jiji reported.
Market reaction
The Japanese Yen is back on the bids following the above reports, smashing USD/JPY to near 147.00. The pair is down 0.69% on the day, as of writing.
Japanese Yen price today
The table below shows the percentage change of Japanese Yen (JPY) against listed major currencies today. Japanese Yen was the strongest against the Euro.
| USD | EUR | GBP | CAD | AUD | JPY | NZD | CHF | |
| USD | 0.14% | -0.11% | -0.15% | -0.34% | -0.60% | -0.13% | -0.12% | |
| EUR | -0.14% | -0.26% | -0.29% | -0.49% | -0.75% | -0.28% | -0.26% | |
| GBP | 0.11% | 0.25% | -0.04% | -0.24% | -0.50% | -0.03% | -0.02% | |
| CAD | 0.14% | 0.28% | 0.03% | -0.21% | -0.46% | 0.00% | 0.01% | |
| AUD | 0.34% | 0.49% | 0.23% | 0.20% | -0.25% | 0.19% | 0.22% | |
| JPY | 0.60% | 0.72% | 0.45% | 0.41% | 0.26% | 0.45% | 0.44% | |
| NZD | 0.14% | 0.28% | 0.02% | -0.02% | -0.21% | -0.44% | -0.01% | |
| CHF | 0.14% | 0.26% | 0.03% | -0.02% | -0.21% | -0.47% | 0.00% |
The heat map shows percentage changes of major currencies against each other. The base currency is picked from the left column, while the quote currency is picked from the top row. For example, if you pick the Euro from the left column and move along the horizontal line to the Japanese Yen, the percentage change displayed in the box will represent EUR (base)/JPY (quote).
The US Dollar (USD) has had a bad week even though rates did not move too aggressively against it. Economists at ING analyze Greenback’s outlook ahead of the US Nonfarm Payrolls report.
Many surveys point to a softer NFP read than the consensus of 200K
We have US payrolls on the calendar today. Consensus is centred at 200K, in line with our economists’ call. However, this number does not really reflect the evidence from other surveys – which point to something closer to 100K – but one that embeds the tendency of jobs data to surprise on the upside and diverge from other indicators. In other words, there are no compelling reasons to exclude that we’ll finally see a softer print, but the recent strength in the NFP reports warrants a good deal of caution.
NFP will determine the direction of FX markets today. Following Powell’s testimony, we suspect markets will not be too reluctant to price in more cuts. After all, the Fed funds futures curve has not much changed since the end of last week. Downside risks remain material for the Dollar today.
- EUR/USD is correcting back after a surge on Thursday that took it to the mid 1.0900s.
- The pair was boosted by the Fed sounding more likely to cut interest rates than the ECB.
- The uptrend remains intact and suggests more upside once the pullback expires.
EUR/USD is edging lower as traders book profits ahead of the weekend after a strong performance on Thursday, when bulls knocked on the door of 1.1000 for the first time since early January.
EUR/USD in uptrend as Fed more vociferous about interest-rate cuts
EUR/USD is broadly speaking in a short-term uptrend, propelled higher by prospects that the US Federal Reserve (Fed) is a fraction closer to lowering interest rates than the European Central Bank (ECB). A cut in interest rates is generally negative for a currency as it reduces foreign capital inflows.
Prior to the ECB meeting on Thursday, some analysts had highlighted April as a possible (if unlikely) candidate for initiating rate cuts. In her press conference after the ECB meeting, however, European Central Bank President Christine Lagarde said: “We have not discussed rate cuts at this meeting,” suggesting April is off the table. Her other comments indicated the ECB policymakers were not planning to seriously review this possibility until June, after more data is available.
On the contrary, Federal Reserve Chairman Jerome Powell seemed more dovish during his testimony to the Senate Banking Committee on Thursday. Powell said “we’re not far” from inflation falling to a level where it would be okay to start cutting rates.
On the horizon
With the ECB meeting and Powell’s testimony in the rear view mirror, the next key event for the EUR/USD will be US Nonfarm Payrolls (NFP) data, out on Friday at 13:30 GMT.
If US jobs data is soft, in line with the ADP, JOLTS and jobless claims from earlier in the week, it could suggest the time is coming closer to cut interest rates. This would weigh on the USD, giving EUR/USD another boost.
NFPs cannot be easily predicted, however, and are apt to surprise, sometimes going in the opposite direction to previous labor metrics such as ADP. The fact that certain employment-related indicators leading to the key Nonfarm Payrolls release were negative doesn’t mean that NFPs will follow suit.
Analysts are predicting headline Nonfarm Payrolls to come out at 200K extra jobs in February, the Unemployment Rate to remain steady at 3.7%, and the all-important Average Hourly Earnings figure to show 4.4% YoY rise and a 0.3% MoM advance.
Average Weekly Hours are expected to rise to 34.3 from 34.1, suggesting more full-time employees joining the army of US workers – which is generally taken as a positive for the economy and the US Dollar.
Technical Analysis: Euro overbought and pulling back
Turning to the charts, the EUR/USD has risen up to the 1.0900s from February’s base-camp 1.0600 lows. The sequence of rising peaks and troughs suggests that overall a tentative short-term uptrend is in progress, slightly favoring bulls.
There are, however, signs a pullback is unfolding. During the last eight hours, the Relative Strength Indicator (RSI) has exited the oversold zone, giving a sell signal. At the same time, the pair may have completed a three-wave ABC measured move pattern at the recent 1.0956 highs. This is further evidence a correction may be underway.
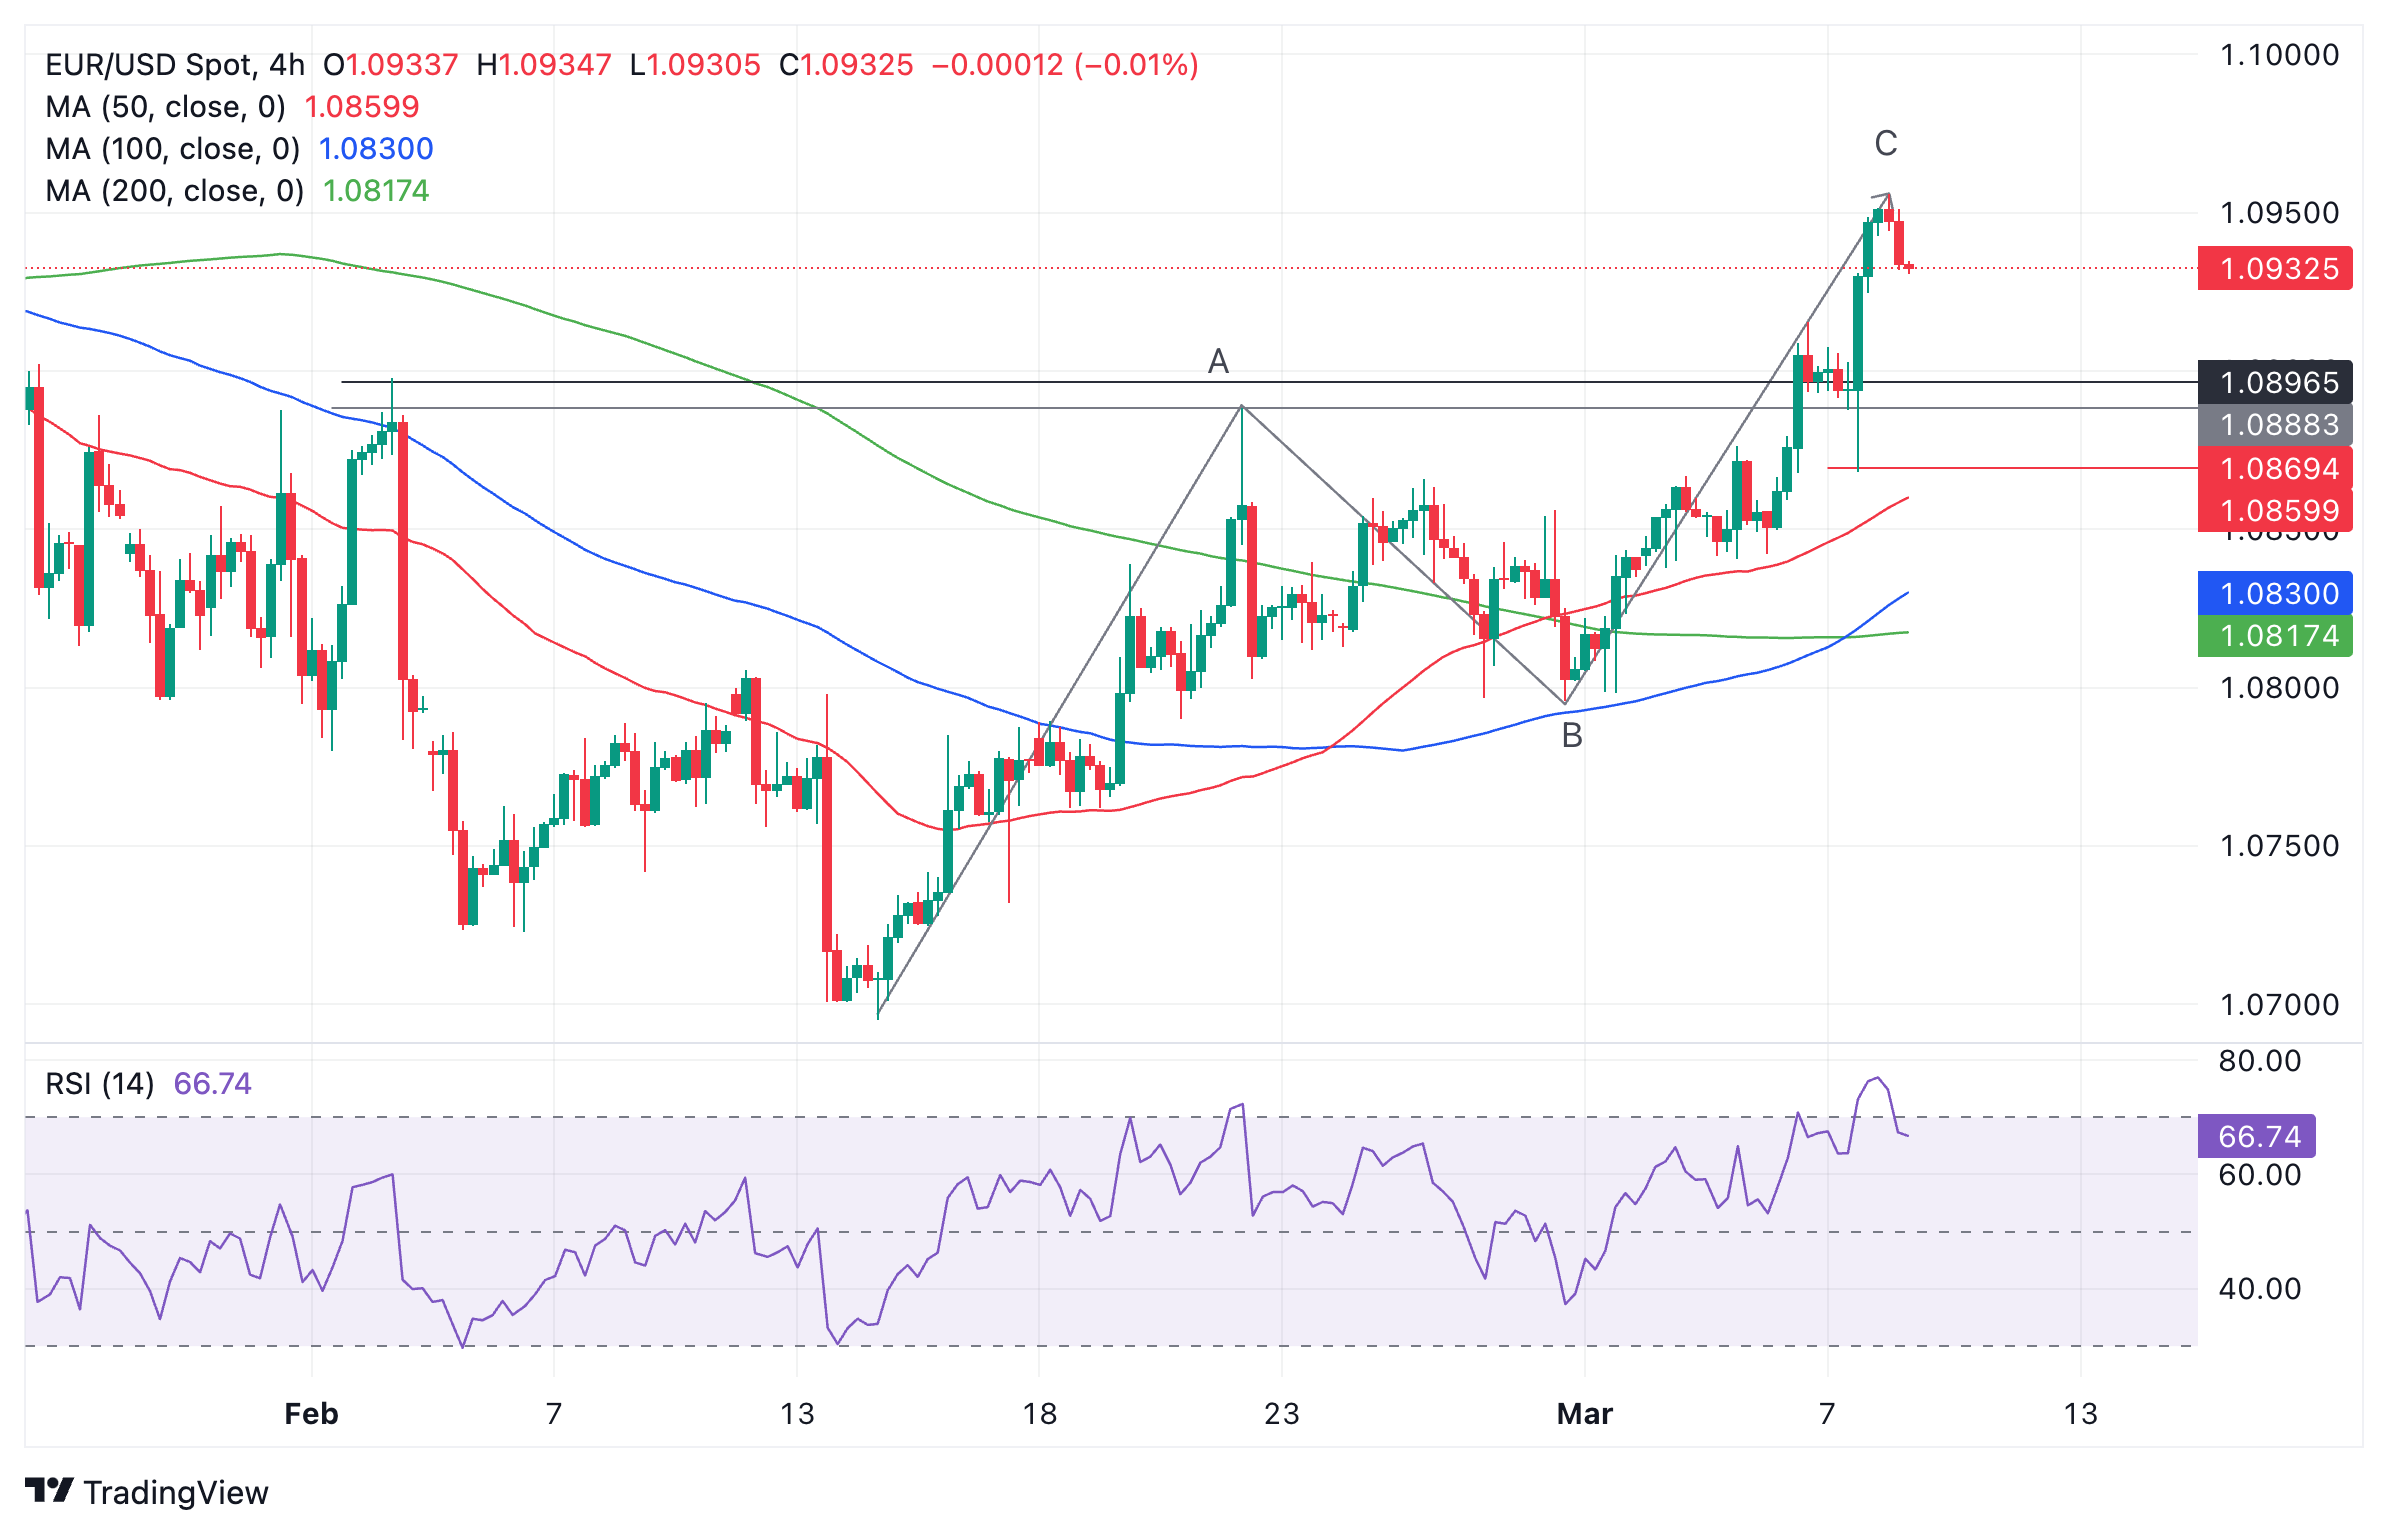
Euro vs US Dollar: 4-hour chart
Whilst these signs are still not enough to indicate a reversal of the short-term uptrend, they do recommend a pullback is underway. The most likely target for the correction to find support is in a zone between the 1.0898 February 2 high and the top of the A wave at 1.0888.
A break below the red line at Thursday’s 1.0867 lows would indicate a greater chance the pair was reversing.
The daily chart shows the pair is also probably now in an intermediate uptrend, although one pass higher after the current pullback would solidify that view.
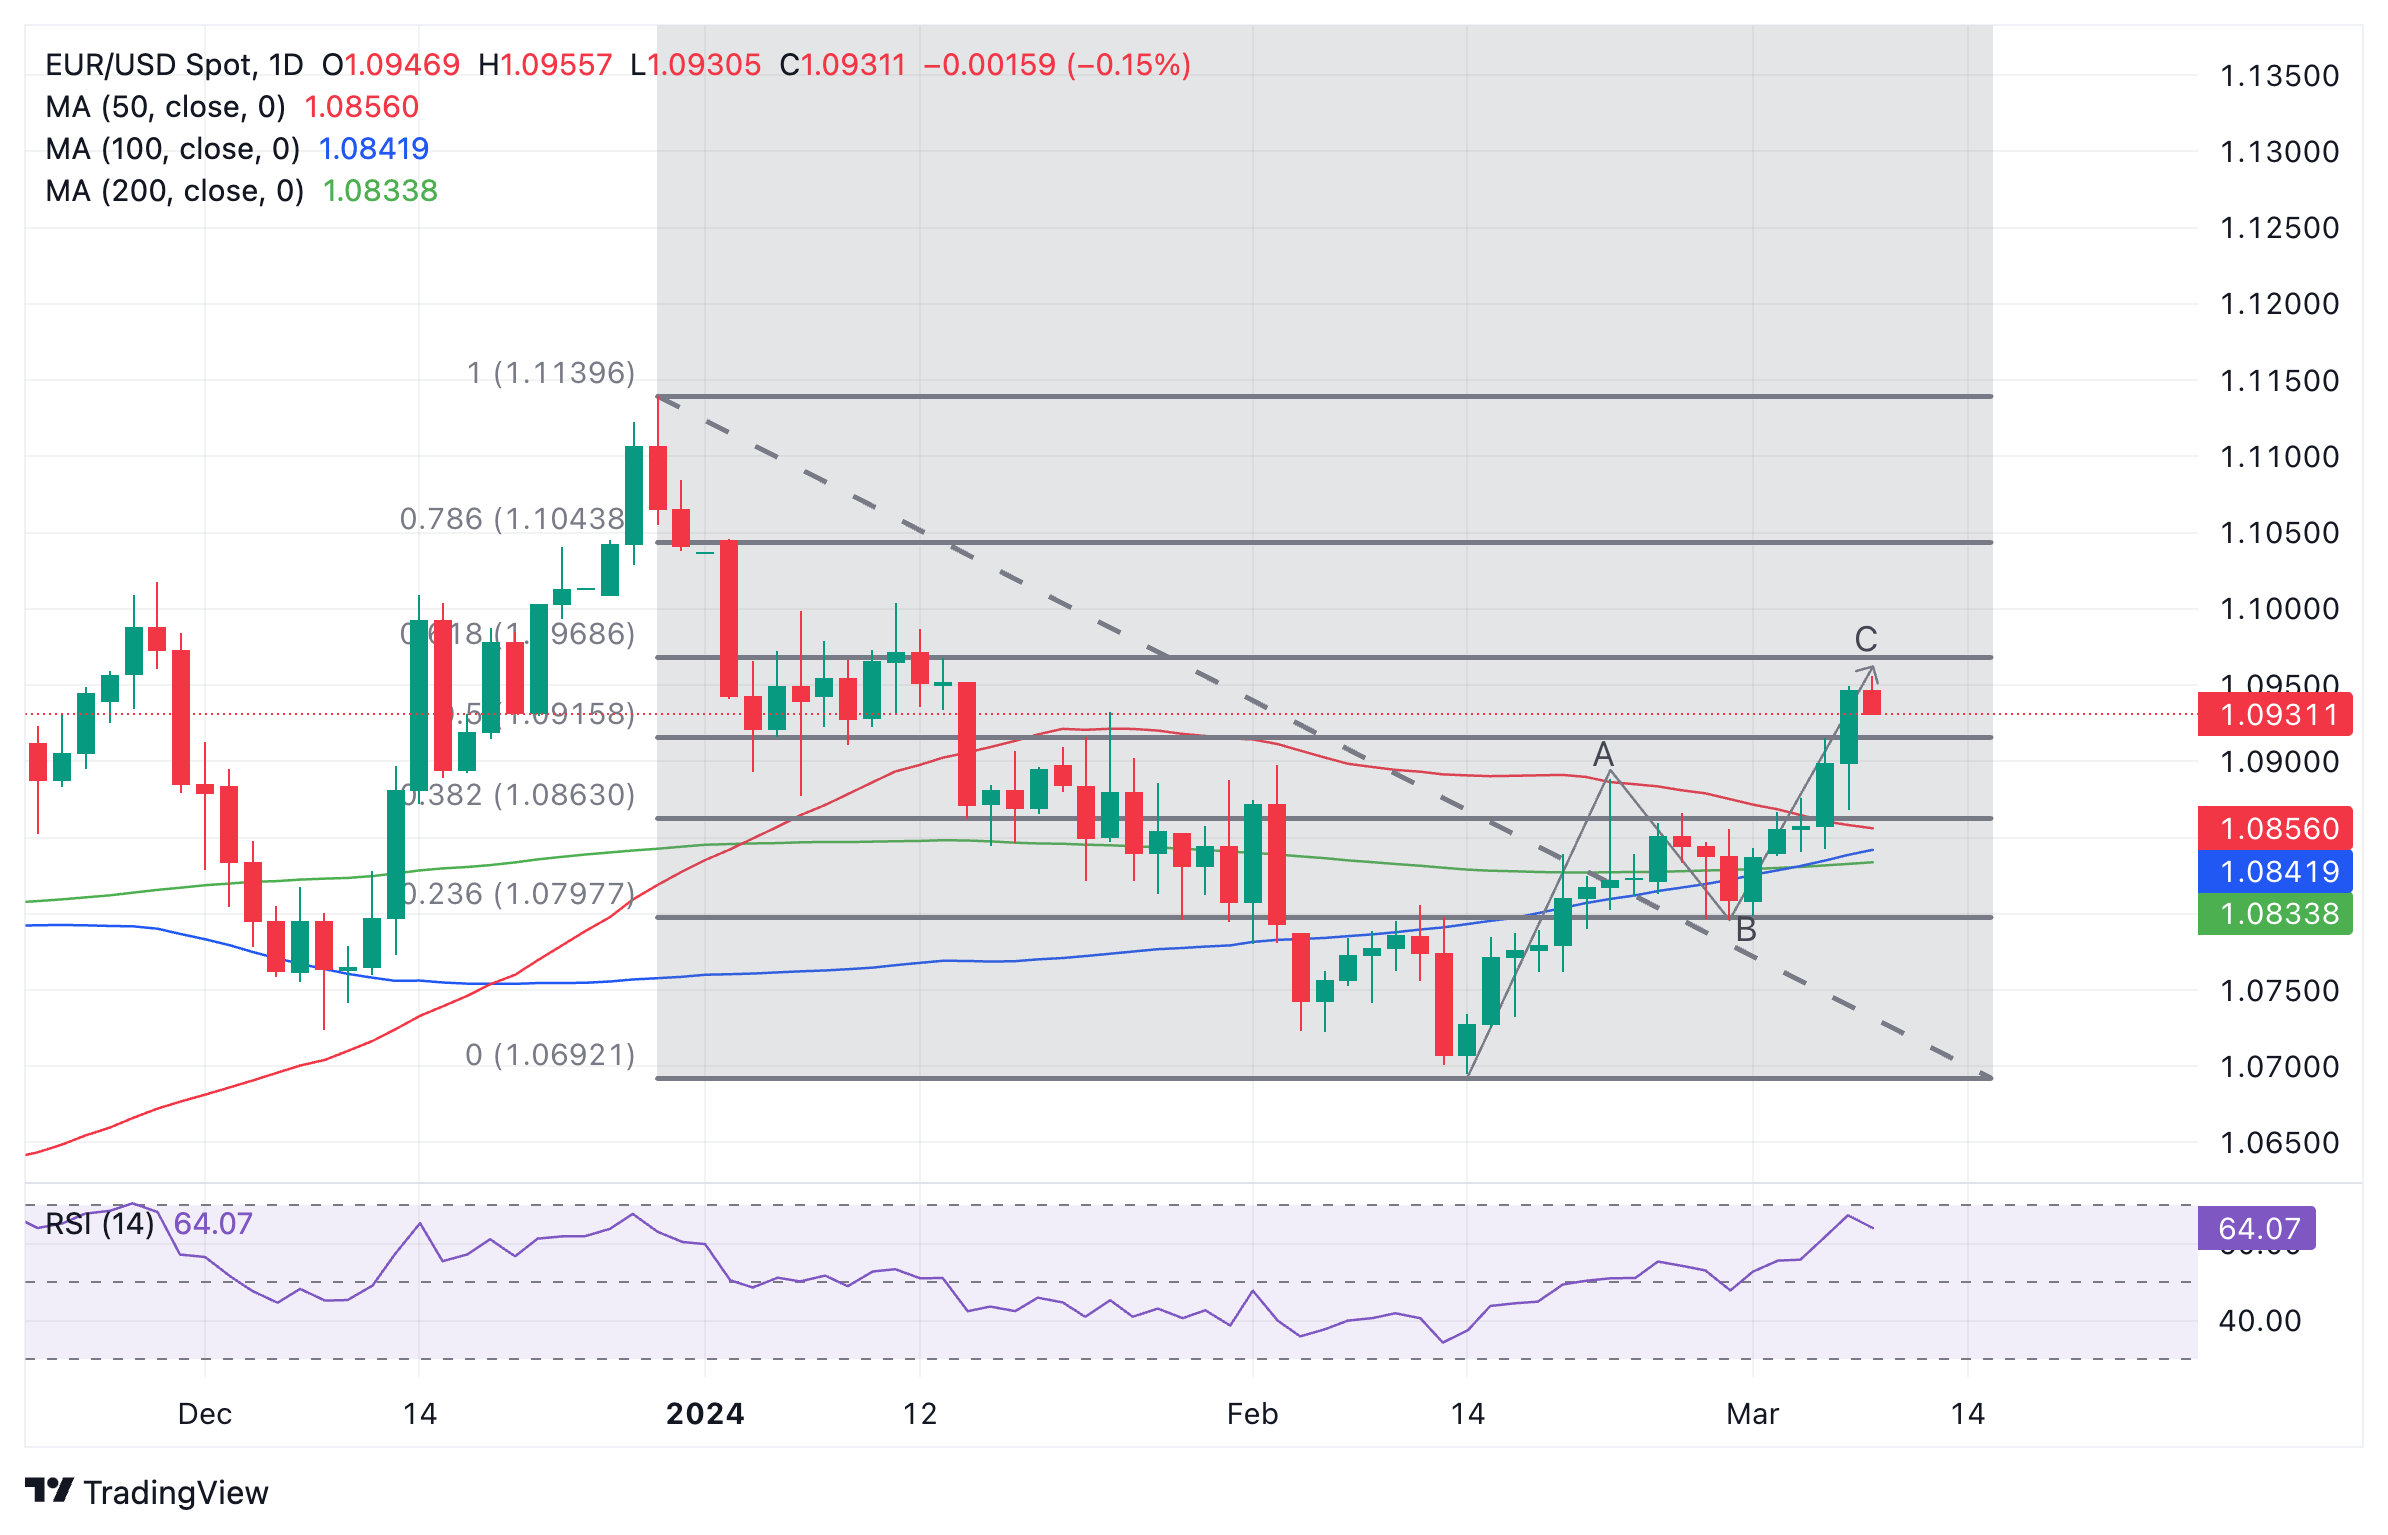
Euro vs US Dollar: 1-day chart
The RSI on the daily chart is not as overbought as on the 4-hour and indicates more upside is still possible before the party gets too rowdy.
The next target higher if the uptrend resumes is the key 0.618 Fibonacci retracement of the early 2024 decline, at 1.0972.
A break above that level would further encourage bulls to strike for the prize – 1.10 – an important psychological level, followed by 1.1043 at the 0.786 Fibonacci retracement.
A break beneath the 1.0795 lows would spoil the buyer’s party and indicate a vulnerability to break down.
The overall long-term trend is sideways and remains difficult to forecast.
Euro FAQs
What is the Euro?
The Euro is the currency for the 20 European Union countries that belong to the Eurozone. It is the second most heavily traded currency in the world behind the US Dollar. In 2022, it accounted for 31% of all foreign exchange transactions, with an average daily turnover of over $2.2 trillion a day.
EUR/USD is the most heavily traded currency pair in the world, accounting for an estimated 30% off all transactions, followed by EUR/JPY (4%), EUR/GBP (3%) and EUR/AUD (2%).
What is the ECB and how does it impact the Euro?
The European Central Bank (ECB) in Frankfurt, Germany, is the reserve bank for the Eurozone. The ECB sets interest rates and manages monetary policy.
The ECB’s primary mandate is to maintain price stability, which means either controlling inflation or stimulating growth. Its primary tool is the raising or lowering of interest rates. Relatively high interest rates – or the expectation of higher rates – will usually benefit the Euro and vice versa.
The ECB Governing Council makes monetary policy decisions at meetings held eight times a year. Decisions are made by heads of the Eurozone national banks and six permanent members, including the President of the ECB, Christine Lagarde.
How does inflation data impact the value of the Euro?
Eurozone inflation data, measured by the Harmonized Index of Consumer Prices (HICP), is an important econometric for the Euro. If inflation rises more than expected, especially if above the ECB’s 2% target, it obliges the ECB to raise interest rates to bring it back under control.
Relatively high interest rates compared to its counterparts will usually benefit the Euro, as it makes the region more attractive as a place for global investors to park their money.
How does economic data influence the value of the Euro?
Data releases gauge the health of the economy and can impact on the Euro. Indicators such as GDP, Manufacturing and Services PMIs, employment, and consumer sentiment surveys can all influence the direction of the single currency.
A strong economy is good for the Euro. Not only does it attract more foreign investment but it may encourage the ECB to put up interest rates, which will directly strengthen the Euro. Otherwise, if economic data is weak, the Euro is likely to fall.
Economic data for the four largest economies in the euro area (Germany, France, Italy and Spain) are especially significant, as they account for 75% of the Eurozone’s economy.
How does the Trade Balance impact the Euro?
Another significant data release for the Euro is the Trade Balance. This indicator measures the difference between what a country earns from its exports and what it spends on imports over a given period.
If a country produces highly sought after exports then its currency will gain in value purely from the extra demand created from foreign buyers seeking to purchase these goods. Therefore, a positive net Trade Balance strengthens a currency and vice versa for a negative balance.
- USD/MXN consolidates as traders await the crucial labor market indicators.
- The US Dollar Index (DXY) attempts to halt its losing streak that began on March 1.
- Mexico’s 12-Month Inflation rose by 4.40% in February, compared to a 4.88% rise in January.
USD/MXN consolidates with reduced volatility, which could be attributed to investors exercising caution ahead of the scheduled release of US Nonfarm Payrolls and other employment data on Friday. The pair trades near 16.90 during the European session on Friday.
The Mexican Peso (MXN) could have faced downward pressure following the release of the country's 12-Month Inflation, rising by 4.40% in February. This figure marked a decline from a seven-month high of 4.88% rise in January and was slightly lower than the forecasted increase of 4.42%.
The Bank of Mexico (Banxico) reported that Core Inflation increased by 0.49%, higher than the previous 0.40% rise. However, Headline Inflation rose by 0.9%, which was lower than the expected 0.11% and the previous 0.89% increase.
On Thursday, US Initial Jobless Claims remained steady at 217K for the week ending on March 1, despite expectations of 215K. Meanwhile, US Nonfarm Productivity maintained a consistent growth rate of 3.2% in the fourth quarter of 2023, slightly surpassing market expectations of 3.1%.
On Friday, US Nonfarm Payrolls are projected to report 200K new jobs created in February, compared to 353K previously, potentially reinforcing market expectations of a Federal Reserve (Fed) rate cut in June. Federal Reserve Chair Jerome Powell hinted at the possibility of interest rate cuts occurring sometime in 2024. The CME FedWatch Tool suggests a 56.7% likelihood of a 25-basis points rate cut in June. These factors are collectively exerting downward pressure on the US Dollar, consequently undermining the USD/MXN pair.
- Pound Sterling exhibits strength against US Dollar ahead of US NFP data.
- BoE policymakers want inflation to come down sustainably to 2% before a shift to policy normalization.
- Fed Powell expects the central bank is closer to gain confidence that inflation will decline to the desired target.
The Pound Sterling (GBP) turns sideways in Friday’s European session as investors remain sidelined ahead of the United States Nonfarm Payrolls (NFP) data for February, which will be published at 13:30 GMT. The broader appeal of the GBP/USD pair is upbeat as markets broadly expect the Federal Reserve (Fed) to cut interest rates before the Bank of England (BoE) does so, which might reduce the policy divergence between them for some time.
While market expectations for a Fed rate cut are for the June meeting, investors see the BoE reducing interest rates from August. Inflation in the UK is still higher than in other developed countries in the Group of Seven (G-7) nations due to sticky services inflation, which is driven by robust wage growth.
Next week, the UK’s Average Earnings data for the three months ending in January will provide fresh guidance on the inflation outlook. Strong wage growth momentum would further dampen rate-cut expectations. BoE policymakers warned that wage growth remains almost double what is required to be consistent for inflation to return to the 2% target.
Daily digest market movers: Pound Sterling turns sideways after strong rally
- The Pound Sterling vs. US Dollar trade is broadly stable after rallying to the round-level resistance of 1.2800. Investors are expected to remain on the sidelines ahead of the crucial United States Employment data for February.
- Economists anticipate that US employers added 200K jobs, lower than the robust hiring of 353K seen in January. The Unemployment Rate is anticipated to remain unchanged at 3.7%. Investors will also focus on the Average Hourly Earnings data, which will provide more cues on the inflation outlook.
- Investors should be prepared for highly volatile action as a drastic change in US employment numbers would influence market expectations for the Federal Reserve rate cut in the June policy meeting. Expectations for a rate-cut decision in June remain firm as Fed Chair Jerome Powell sounded less hawkish in his two-day testimony before Congress.
- The GBP/USD pair is set for weekly gains, mainly due to the weak appeal for the US Dollar. Next week, the Pound Sterling will be guided by the UK’s labor market data for three months ending in January, which could provide some cues about when the Bank of England will start reducing interest rates. Currently, market expectations for a rate cut point to the August meeting.
- BoE policymakers have refrained from specifying any time frame for lowering borrowing costs, saying that cuts are not appropriate until they get confidence that inflation will return sustainably to the 2 % target.
- Meanwhile, UK house prices have risen for a fifth straight month due to a recent fall in mortgage rates and expectations that rate cuts are around the corner. The mortgage lender Halifax reported that house prices rose by 0.4% in February on a month-on-month basis.
Technical Analysis: Pound Sterling approaches six-month high near 1.2830
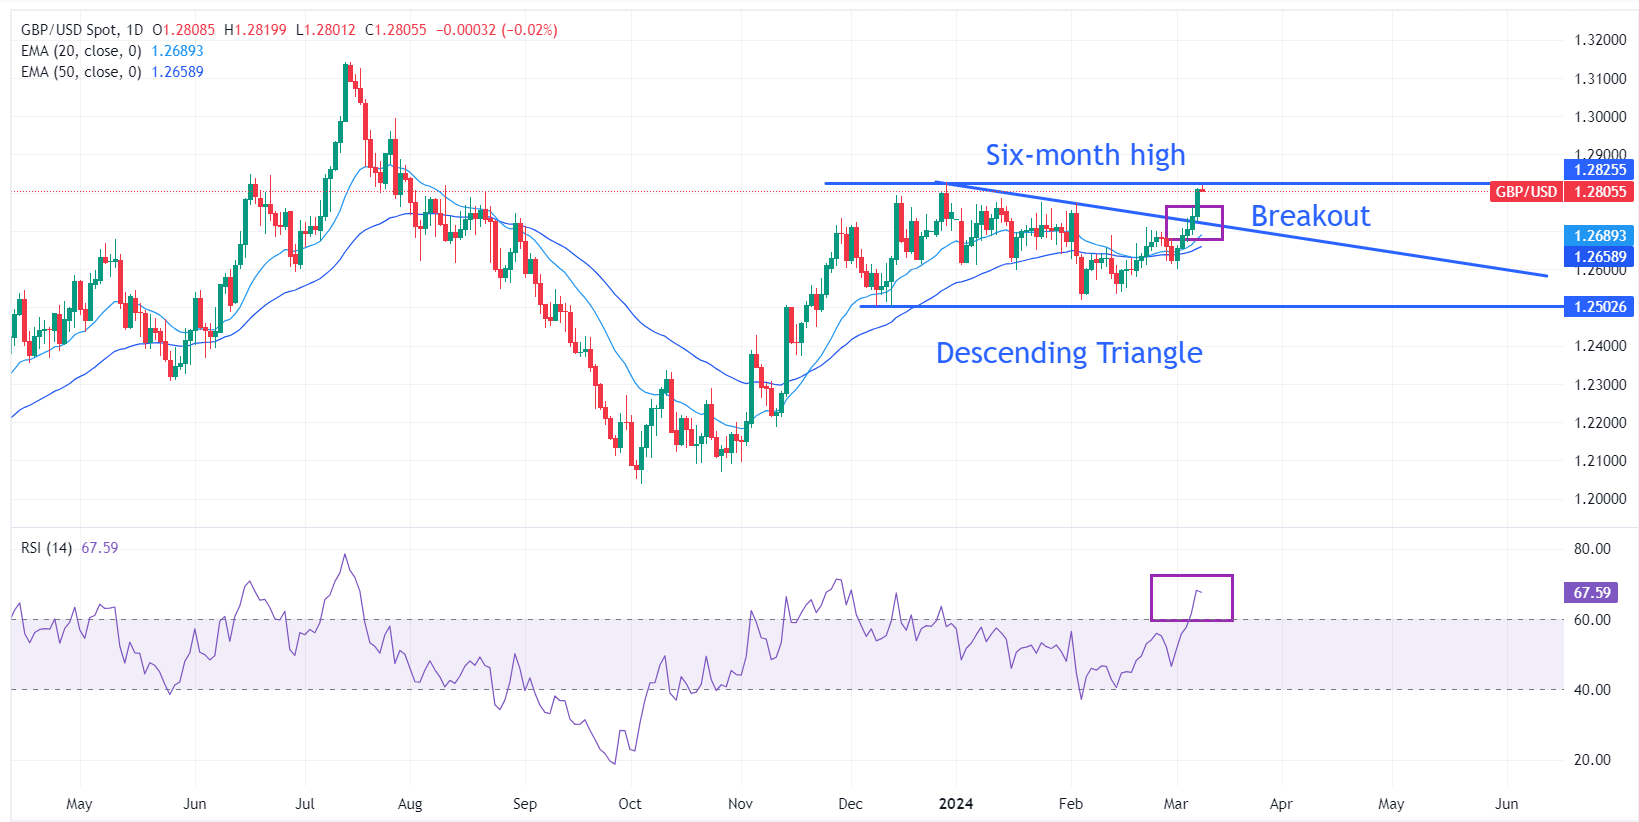
Pound Sterling refreshes a two-month high at 1.2820. The GBP/USD pair strengthens after an upside break of the Descending Triangle formed on a daily time frame. A breakout of the aforementioned chart pattern results in wider-than-average ticks on the upside. The pair is an inch away from revisiting a six-month high at 1.2827.
Upward-sloping 20-day and 50-day Exponential Moving Averages (EMAs) at 1.2690 and 1.2660 suggest more upside.
The 14-period Relative Strength Index (RSI) rises to 70.00, indicating that a bullish momentum is active now.
Pound Sterling FAQs
The Pound Sterling (GBP) is the oldest currency in the world (886 AD) and the official currency of the United Kingdom. It is the fourth most traded unit for foreign exchange (FX) in the world, accounting for 12% of all transactions, averaging $630 billion a day, according to 2022 data. Its key trading pairs are GBP/USD, aka ‘Cable’, which accounts for 11% of FX, GBP/JPY, or the ‘Dragon’ as it is known by traders (3%), and EUR/GBP (2%). The Pound Sterling is issued by the Bank of England (BoE).
The single most important factor influencing the value of the Pound Sterling is monetary policy decided by the Bank of England. The BoE bases its decisions on whether it has achieved its primary goal of “price stability” – a steady inflation rate of around 2%. Its primary tool for achieving this is the adjustment of interest rates. When inflation is too high, the BoE will try to rein it in by raising interest rates, making it more expensive for people and businesses to access credit. This is generally positive for GBP, as higher interest rates make the UK a more attractive place for global investors to park their money. When inflation falls too low it is a sign economic growth is slowing. In this scenario, the BoE will consider lowering interest rates to cheapen credit so businesses will borrow more to invest in growth-generating projects.
Data releases gauge the health of the economy and can impact the value of the Pound Sterling. Indicators such as GDP, Manufacturing and Services PMIs, and employment can all influence the direction of the GBP. A strong economy is good for Sterling. Not only does it attract more foreign investment but it may encourage the BoE to put up interest rates, which will directly strengthen GBP. Otherwise, if economic data is weak, the Pound Sterling is likely to fall.
Another significant data release for the Pound Sterling is the Trade Balance. This indicator measures the difference between what a country earns from its exports and what it spends on imports over a given period. If a country produces highly sought-after exports, its currency will benefit purely from the extra demand created from foreign buyers seeking to purchase these goods. Therefore, a positive net Trade Balance strengthens a currency and vice versa for a negative balance.
Economists at Danske Bank discuss the possibility of a short-term rise in EUR/USD due to USD weakness resulting from softer US data.
EUR/USD to trend lower over the year
If our expectation of a softer US labour market holds true, we could see EUR/USD rise further in the very near term. However, over the year, we still expect EUR/USD to trend lower.
We believe the US economy is in a stronger position relative to the Euro Area, based on factors such as relative terms of trade, real rates, and relative unit labour costs. There are also signs that underlying inflation appears more persistent in the US compared with the euro area, which, all else being equal, should support the USD.
A strong USD, coupled with tighter financial conditions, is a necessary condition for the Fed to sustainably achieve its inflation target of 2%.
We forecast EUR/USD to reach 1.0500/1.0400 within a 6/12M horizon.
European Central Bank (ECB) policymaker Olli Rehn made some comments on the central bank’s interest rate outlook on Friday.
Rehn said that “my assessment is that risk of too early a decrease in rates from inflation control perspective have significantly decreased.”
Market reaction
EUR/USD keeps its corrective decline intact near 1.0935, losing 0.11% on the day.
- USD/JPY recovers intraday losses ahead of US employment data on Friday.
- US Dollar gains ground on market sentiment around Fed rate cuts in June.
- US Nonfarm Payrolls could fall to 200K new jobs in February, lower than the previous figure of 353K.
USD/JPY trims some of its intraday losses on Friday on improved US Dollar (USD) amidst weaker US Treasury yields. Nonetheless, the pair remains in negative territory and continues the losing streak for the fourth successive day, trading around 147.90 during the European trading hours.
The weekly depreciation of the US Dollar against the Japanese Yen is around 1.50%, by the press time, which can be attributed to the positive sentiment surrounding expectations of the Federal Reserve (Fed) initiating a rate-cut cycle starting in June. The CME FedWatch Tool indicates a 56.7% probability of a 25 basis point rate cut in June. Additionally, Federal Reserve Chair Jerome Powell hinted at the possibility of interest rate cuts occurring sometime this year during his second day of testimony before the US Congress.
Additionally, Cleveland Fed President Loretta Mester spoke at the Virtual European Economics and Financial Center, stating apprehension regarding the potential persistence of inflation throughout the year. Mester mentioned that if economic conditions align with forecasts, there may be a probability of rate cuts later in 2024.
The Japanese Yen (JPY) experiences a boost in response to growing speculation that the Bank of Japan (BoJ) will depart from its ultra-loose monetary policy stance, thereby weakening the USD/JPY pair. BoJ Governor Kazuo Ueda mentioned that it is "fully possible to seek an exit from stimulus while striving to achieve the 2% inflation target."
BoJ Governor Ueda also stated that the extent of rate hikes would depend on the prevailing circumstances if negative rates are lifted. Furthermore, BoJ policy board member Junko Nakagawa highlighted that the likelihood of achieving the 2% inflation target sustainably is gradually improving.
In January, Japan's non-seasonally adjusted Current Account Surplus decreased to ¥438.2B, from the previous figure of ¥744.3B. However, the surplus exceeded expectations, reaching ¥330.4B. This outcome could potentially provide some support for the Japanese Yen. Meanwhile, traders are eagerly anticipating US employment data, which includes Average Hourly Earnings and Nonfarm Payrolls, to gain further insights into the economic situation in the United States.
Gold (XAU/USD) has reached a new all-time high above $2,160. Economists at ANZ Bank analyze what is behind this move higher.
Safe haven buying is also likely to be behind the move
Gold extended its record-breaking rally amid further dovish commentary from central bankers. Federal Reserve Chair, Jerome Powell, told a Senate panel the Fed is not far from being confident enough to cut rates. President, Christine Lagarde, indicated the ECB may ease in June. This came amid fresh projections showing inflation falling to 2% in 2025.
Safe haven buying is also likely to be behind the move after a Houthi attack on a ship in the Red Sea led to the first confirmed deaths of crew.
While investors are still pulling metal out of Gold-backed ETFs, central banks remain strong buyers.
The Euro (EUR) experienced non-negligible volatility after the European Central Bank announcement on Thursday. Economists at ING analyze the EUR/USD outlook.
US NFP will determine the direction for EUR/USD
The core of the ECB’s communication did not change. The new round of projections sounded quite encouraging from an easing standpoint: inflation was revised marginally lower and projected at 2.0% in 2025, while the growth forecasts were also revised lower. However, President Christine Lagarde reiterated that the ECB is not confident enough about disinflation and that more information will be received in April and especially in June.
EUR/USD is trading close to the top of the range which is consistent with such a wide short-term rate gap (-125 bps in the two-year swap market). That means that it can be vulnerable to near-term corrections, but also that it is starting from a good level should US rates enter a decisive dive.
Today, US Nonfarm Payrolls will determine the direction for EUR/USD: expect some resistance at the key 1.1000 level should the Dollar decline further today.
The Indian Ruppe (INR) was marginally stronger against the US Dollar (USD) in February 2024. Economists at MUFG Bank analyze USD/INR outlook.
USD/INR to fall to 81.500 by year-end
In the near term in Q1 2024, we expect USD/INR to hover around the 83.00 level as the RBI rebuilds FX reserves before moving more convincingly towards the 82.00 level as the US Dollar weakens in H2 2024.
We maintain our constructive view on INR and see the balance of risks tilting towards INR strength. We expect USD/INR to fall to 81.50 by year-end, even as RBI continues to intervene actively to limit the extent of appreciation.
USD/INR – Q1 2024 83.00 Q2 2024 82.50 Q3 2024 82.00 Q4 2024 81.50
Here is what you need to know on Friday, March 8:
The US Dollar suffered large losses against its major rivals for the second consecutive day on Thursday before stabilizing early Friday. The US Dollar Index was last seen fluctuating below 103.00, losing more than 1% on a weekly basis. The US Bureau of Labor Statistics will publish February jobs report ahead of the weekend, which will feature Nonfam Payrolls, Unemployment Rate and wage inflation figures.
The benchmark 10-year US Treasury bond yield extended its weekly slide on Thursday and declined below 4.1%. In the meantime, Wall Street's main indexes registered strong gains, while the S&P 500 Index reached a new all-time high at the closing bell. Early Friday, US stock index futures trade flat and the 10-year yield consolidates weekly losses below 4.1%.
US Dollar price this week
The table below shows the percentage change of US Dollar (USD) against listed major currencies this week. US Dollar was the weakest against the Australian Dollar.
| USD | EUR | GBP | CAD | AUD | JPY | NZD | CHF | |
| USD | -0.95% | -1.17% | -0.78% | -1.56% | -1.44% | -1.15% | -0.70% | |
| EUR | 0.95% | -0.22% | 0.16% | -0.59% | -0.49% | -0.19% | 0.25% | |
| GBP | 1.16% | 0.23% | 0.37% | -0.39% | -0.26% | 0.02% | 0.47% | |
| CAD | 0.78% | -0.14% | -0.37% | -0.75% | -0.65% | -0.36% | 0.09% | |
| AUD | 1.52% | 0.60% | 0.37% | 0.75% | 0.10% | 0.39% | 0.84% | |
| JPY | 1.42% | 0.48% | 0.22% | 0.62% | -0.13% | 0.27% | 0.72% | |
| NZD | 1.13% | 0.19% | -0.03% | 0.36% | -0.41% | -0.28% | 0.45% | |
| CHF | 0.69% | -0.28% | -0.47% | -0.09% | -0.84% | -0.73% | -0.45% |
The heat map shows percentage changes of major currencies against each other. The base currency is picked from the left column, while the quote currency is picked from the top row. For example, if you pick the Euro from the left column and move along the horizontal line to the Japanese Yen, the percentage change displayed in the box will represent EUR (base)/JPY (quote).
Nonfarm Payrolls in the US are forecast to rise by 200,000 in February following the impressive 353,000 increase recorded in January. The Unemployment Rate is seen holding steady at 3.7% in the same period and the annual wage inflation is expected to edge lower to 4.4% from 4.5%.
US February NFP Forecast: Nonfarm Payrolls look set for another solid increase after January upside surprise.
The data from Germany showed early Friday that the Producer Price Index rose by 0.2% on a monthly basis following the 0.8% decline recorded in December. On a positive note, Industrial Production expanded by 1% in January, surpassing the market expectation for an expansion of 0.6%.
On Thursday, the European Central Bank (ECB) left monetary policy settings unchanged as expected but revised inflation and growth forecasts lower. In the post-meeting press conference, ECB President Christine Lagarde noted that they have just started discussing the dialing-back of the restrictive stance and said that they will have more data to assess until June to be "sufficiently confident" about reaching the inflation goal. Although EUR/USD edged lower during the ECB event, it regained its traction on broad-based USD weakness and reached its highest level since mid-January above 1.0950. The pair stays in a consolidation phase slightly below 1.0950 in the early European session on Friday.
EUR/USD flatlines near 1.0950, US payrolls eyed.
GBP/USD benefited from the selling pressure surrounding the USD and advanced above 1.2800 for the first time in 2024. The pair holds steady near that level in the European morning on Friday.
USD/JPY fell nearly 1% on Thursday, pressured by declining US yields and USD weakness. The pair was last seen trading a few pips below 148.00.
Japanese Yen rallies to 148.00 against USD as BoJ officials lift rate hike bets.
Gold reached a new record high above $2,160 on Thursday before retreating slightly early Friday. XAU/USD is up nearly 4% this week and remains on track to close the third consecutive week in positive territory.
US February Nonfarm Payrolls Preview: Analyzing Gold price reaction to NFP surprises.
European Central Bank (ECB) Governing Council member and Bank of France President, Francois Villeroy de Galhau, said on Friday that a “rate cut in the spring is 'very likely'.”
Villeroy added that “spring can mean being from April to June.”
Market reaction
EUR/USD is inching 0.07% lower following the above comments, trading at 1.0935, as of writing.
ECB FAQs
The European Central Bank (ECB) in Frankfurt, Germany, is the reserve bank for the Eurozone. The ECB sets interest rates and manages monetary policy for the region. The ECB primary mandate is to maintain price stability, which means keeping inflation at around 2%. Its primary tool for achieving this is by raising or lowering interest rates. Relatively high interest rates will usually result in a stronger Euro and vice versa. The ECB Governing Council makes monetary policy decisions at meetings held eight times a year. Decisions are made by heads of the Eurozone national banks and six permanent members, including the President of the ECB, Christine Lagarde.
In extreme situations, the European Central Bank can enact a policy tool called Quantitative Easing. QE is the process by which the ECB prints Euros and uses them to buy assets – usually government or corporate bonds – from banks and other financial institutions. QE usually results in a weaker Euro. QE is a last resort when simply lowering interest rates is unlikely to achieve the objective of price stability. The ECB used it during the Great Financial Crisis in 2009-11, in 2015 when inflation remained stubbornly low, as well as during the covid pandemic.
Quantitative tightening (QT) is the reverse of QE. It is undertaken after QE when an economic recovery is underway and inflation starts rising. Whilst in QE the European Central Bank (ECB) purchases government and corporate bonds from financial institutions to provide them with liquidity, in QT the ECB stops buying more bonds, and stops reinvesting the principal maturing on the bonds it already holds. It is usually positive (or bullish) for the Euro.
Canada’s employment data for February will be reported by Statistics Canada on Friday, March 8 at 13:30 GMT and as we get closer to the release time, here are forecasts from economists and researchers at five major banks regarding the upcoming jobs figures.
The North American economy is expected to have added 20K jobs following a solid 37.3K increase in January. Meanwhile, the Unemployment Rate is seen rising a tick to 5.8%, which would match the cycle high.
RBC Economics
We expect February labour market data to show another gain in employment of 10K. It will however not be large enough to prevent an increase in the unemployment rate to 5.9% as hiring demand keeps falling short of the rising supply of workers. Labour market numbers for January were firmer than expected with wage growth remaining high. But lower job openings continue to highlight slowing labour demand. Other Statistics Canada estimates of wage growth derived from business payrolls submissions have slowed more significantly. The silver lining of all the softening in the economy is that inflation pressures will likely continue to ease rather than reaccelerate. Our base case continues to assume the BoC will start moving the overnight rate lower in June after more data confirms easing inflation back towards target.
NBF
Job creation may have cooled to 15K in February, reflecting an economy operating below its potential. This gain, combined with another significant expansion of the labour force and an unchanged participation rate (65.3%), should translate into a two-tenth increase in the unemployment rate, to 5.9%.
TDS
We look for Canadian job growth to slow in February with total employment rising by just 5K on the heels of last month's 37K increase. A 5K increase in employment would see the unemployment rate rise by 0.2pp to 5.9%, while wage growth for permanent workers is forecast to slow to 5.1% YoY.
CIBC
With job listings remaining well below prior peaks and the employee survey of jobs showing a much weaker trend recently, we expect the labour force survey of employment to show a weaker gain in February. The 20K increase we forecast would be well below the average pace of population growth recently, and unless participation declines further that would see the unemployment rate tick back up to 5.8%. Wage growth has been running above 5% in this survey since last July, but that could be partly compositional as lower-paying industries/positions typically see cutbacks first. With a fairly large monthly gain a year ago dropping out of the YoY calculation, wage growth for permanent employees could decelerate to 5.0%, from 5.3%.
Citi
After a solid 37.3K increase in employment in January, we expect another strong increase of 45K jobs added in February. Seasonal issues could have possibly boosted employment in January, with an even clearer impact on hours worked last month, which rose at the strongest pace since January 2023. Seasonal issues should not repeat in February and, if anything, suggest downside risks to employment. But in February, substantial population growth may help to boost aggregate employment figures leading to greater entry into the labor force in February will likely result in both solid employment and a rebound in the unemployment rate to 5.8%. Wage growth should moderate only slightly to 5.1%YoY in February, continuing to move sideways around 4-5% as it has for over a year.
FX option expiries for Mar 8 NY cut at 10:00 Eastern Time, via DTCC, can be found below.
- EUR/USD: EUR amounts
- 1.0770 1.1b
- 1.0800 1.4b
- 1.0835 2.1b
- 1.0850 501m
- 1.0900 778m
- GBP/USD: GBP amounts
- 1.2550-80 951m
- USD/JPY: USD amounts
- 147.00 1.1b
- USD/CAD: USD amounts
- 1.3500 742m
- 1.3600 1.2b
Germany’s industrial sector returned to expansion in January, the latest data published by Destatis showed on Friday.
Industrial output in the Eurozone’s top economy rose 1.0% MoM, the federal statistics authority Destatis said in figures adjusted for seasonal and calendar effects, as against the 0.6% expected and a 2.0% decline in December.
German Industrial Production fell at an annual rate of 5.5% in January versus December’s 3.0% decline.
EUR/USD reaction to the German Industrial Production data
The mixed German industrial figures failed to have any impact on the Euro, as EUR/USD trades flat on the day at 1.0945 at the press time.
Euro price today
The table below shows the percentage change of Euro (EUR) against listed major currencies today. Euro was the strongest against the New Zealand Dollar.
| USD | EUR | GBP | CAD | AUD | JPY | NZD | CHF | |
| USD | 0.03% | 0.04% | -0.04% | -0.14% | 0.04% | 0.08% | 0.00% | |
| EUR | -0.03% | 0.00% | -0.09% | -0.16% | 0.01% | 0.04% | -0.05% | |
| GBP | -0.03% | -0.02% | -0.08% | -0.18% | 0.01% | 0.03% | -0.05% | |
| CAD | 0.05% | 0.09% | 0.09% | -0.08% | 0.10% | 0.12% | 0.04% | |
| AUD | 0.12% | 0.16% | 0.16% | 0.09% | 0.17% | 0.18% | 0.12% | |
| JPY | -0.05% | 0.00% | -0.01% | -0.09% | -0.19% | 0.04% | -0.06% | |
| NZD | -0.08% | -0.04% | -0.03% | -0.12% | -0.22% | -0.02% | -0.10% | |
| CHF | 0.02% | 0.05% | 0.04% | -0.02% | -0.12% | 0.07% | 0.08% |
The heat map shows percentage changes of major currencies against each other. The base currency is picked from the left column, while the quote currency is picked from the top row. For example, if you pick the Euro from the left column and move along the horizontal line to the Japanese Yen, the percentage change displayed in the box will represent EUR (base)/JPY (quote).
- Gold price gains momentum around $2,165 amid the softer US Dollar, adding 0.12% on the day.
- The dovish comments from central bank policymakers and safe-haven flows boost the demand for gold.
- Gold traders await the Eurozone GDP Q4 growth numbers and US February labor market data.
Gold price (XAU/USD) extends its upside around $2,165 after reaching a record high during the early European session on Friday. A weaker US Dollar (USD) and a decline in US Treasury bond yields provide some support to the gold price. Furthermore, the rising expectation for the first rate cut by the Federal Reserve (Fed) in the June meeting boosts the demand for gold price.
That being said, the dovish commentary from central bank policymakers creates a tailwind for the yellow metal. The Fed Chair Jerome Powell said the US central bank is "not far" from gaining enough confidence that inflation will reach its 2% target to begin lowering interest rates. Investors will take more cues from the US Nonfarm Payrolls (NFP) data on Friday for fresh impetus, which is expected to see 200,000 jobs added to the US economy. However, the stronger-than-expected data might lift the Greenback and exert some selling pressure on the gold price.
Meanwhile, European Central Bank (ECB) Christine Lagarde indicated the ECB may ease policy in its June meeting. The ECB maintained its benchmark rate unchanged at 4.0% at its March meeting on Thursday, but it lowered its inflation forecast for 2024 from 2.7% to 2.3%, indicating the central bank opened the door to possible rate cuts in the coming months.
Furthermore, Chinese investors purchased the yellow metal as a safe place to keep their cash after the property sector and stock markets in China tumbled. The escalating geopolitical tensions in the Middle East might be attributed to the demand for traditional safe-haven assets as well.
Gold traders will closely watch the Eurozone Gross Domestic Product (GDP) for the fourth quarter (GDP). On the US docket, the February labor market data, including Nonfarm-Payrolls, Unemployment Rate, and Average Hourly Earnings will be released. Traders will take cues from the data and find trading opportunities around the gold price.
- EUR/USD moves sideways ahead of key events from both economies.
- Eurozone GDP figures are forecasted to be unchanged in the fourth quarter of 2023.
- US Nonfarm Payrolls are expected to print a reading of 200K against 353K prior.
EUR/USD consolidates after retracing its intraday gains, facing difficulties in extending the winning streak that began on March 1. Market participants are eagerly anticipating key events from both economies, including the Eurozone's Gross Domestic Product (GDP) data and Nonfarm Payrolls from the United States (US). Amidst this anticipation, the EUR/USD pair hovers around 1.0950 during the Asian trading hours on Friday.
The seasonally adjusted Eurozone GDP is forecasted to remain the same at 0.1% annually and flat at 0.0% monthly for the fourth quarter of 2023. Across the pond, US Nonfarm Payrolls could print a 200K figure for new jobs created in February, against 353K prior, which could reinforce the market expectation of Federal Reserve’s (Fed) rate cut in June. Furthermore, the CME FedWatch Tool suggests a 56.7% likelihood of a cut in June.
On Thursday, the European Central Bank (ECB) opted to maintain its current monetary policy, affirming its commitment to steering inflation back into its desired range. The ECB retained the interest rates on the main refinancing operations, marginal lending facility, and deposit facility unchanged at 4.5%, 4.75%, and 4.0%, respectively. The central bank stated its intention to sustain appropriately restrictive policy measures for as long as required to achieve its inflation target.
During his second day of testimony before the US Congress, the Federal Reserve (Fed) hinted at the possibility of interest rate cuts occurring sometime this year. Furthermore, Cleveland Fed President Loretta Mester, speaking at the Virtual European Economics and Financial Center, expressed apprehension regarding the potential persistence of inflation throughout the year. Mester suggested that if economic conditions align with forecasts, there may be a probability of rate cuts later in the year.
- EUR/JPY trades in negative territory for the fourth consecutive day around 161.85 in Friday’s early European session.
- The cross keeps the bearish vibe unchanged below the key EMA; RSI momentum indicator supports the downside.
- The immediate resistance level is seen at 162.30; 161.10 acts as an initial support level.
The EUR/JPY cross remains under some selling pressure below the 162.00 psychological barrier during the early European session on Friday. The growing speculation that the Bank of Japan (BoJ) could remove negative interest rates this month lifts the Japanese Yen (JPY) against the Euro (EUR). At press time, EUR/JPY is trading at 161.85, down 0.16% on the day.
From a technical perspective, EUR/JPY maintains a bearish outlook as the cross holds below the 100-period Exponential Moving Averages (EMA) on the four-hour chart. The downward momentum is supported by the Relative Strength Index (RSI), which lies below the 50-midline, indicating the path of least resistance is to the downside.
The immediate resistance level for EUR/JPY is seen at the 100-period EMA around 162.30. The key hurdle will emerge at the 162.95-163.00 region, representing a high of March 6 and a psychological round figure. Further north, the next upside barrier is located at a high of March 4 at 163.50 and the upper boundary of the Bollinger Band at 163.71.
On the downside, the lower limit of the Bollinger Band at 161.10 acts as an initial support level for the cross. The additional downside filter to watch is a low of March 7 at 160.55, followed by a psychological round mark at 160.00.
EUR/JPY four-hour chart
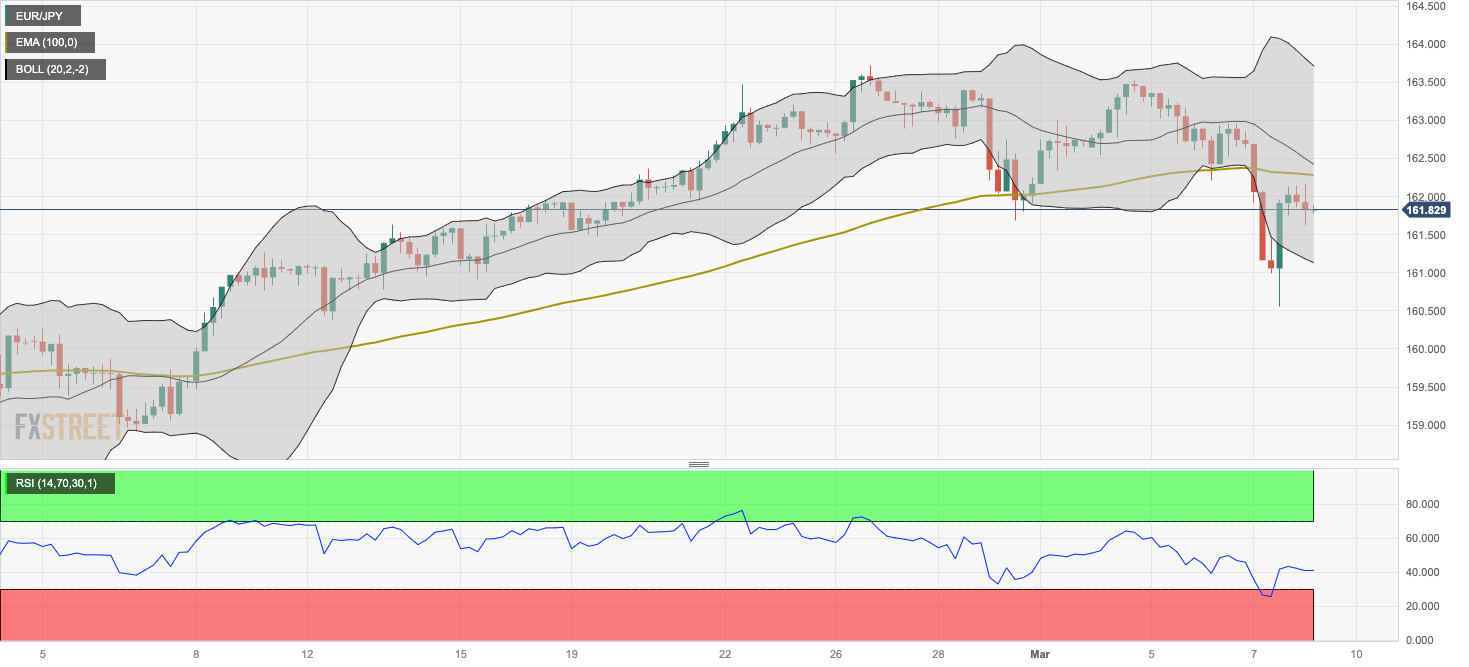
- GBP/USD targets December high at 1.2828 and August high at 1.2841.
- Technical analysis suggests a confirmation of the bullish trend for the pair.
- The psychological level of 1.2800 appears as an immediate support level.
GBP/USD seems to continue its winning streak that began on March 1, hovering around 1.2810 during the Asian session on Friday. The GBP/USD pair receives upward support as the US Dollar (USD) faces challenges on improved risk appetite amid lower US Treasury yields.
The GBP/USD pair finds the immediate barriers at December’s high at 1.2828 and August’s high at 1.2841. A break above these levels could support the pair to test the major level of 1.2850, followed by the psychological resistance area around the 1.2900 level.
The technical analysis of the GBP/USD pair shows that the 14-day Relative Strength Index (RSI) is positioned above 50. This indicates a bullish momentum for the pair. Additionally, the Moving Average Convergence Divergence (MACD), a lagging indicator, suggests a confirmation of the bullish trend for the pair. This is evident from the MACD line being situated above the centerline and shows the divergence above the signal line.
The GBP/USD pair may encounter immediate support at the psychological level of 1.2800 following further support near the major level at 1.2750. A break below the major level could push the pair to test the nine-day Exponential Moving Average (EMA) at 1.2726.
Further support lies at the psychological level of 1.2700, a surpassing of this level could lead the GBP/USD pair to test the 23.6% Fibonacci retracement level of 1.2641.
GBP/USD: Daily Chart
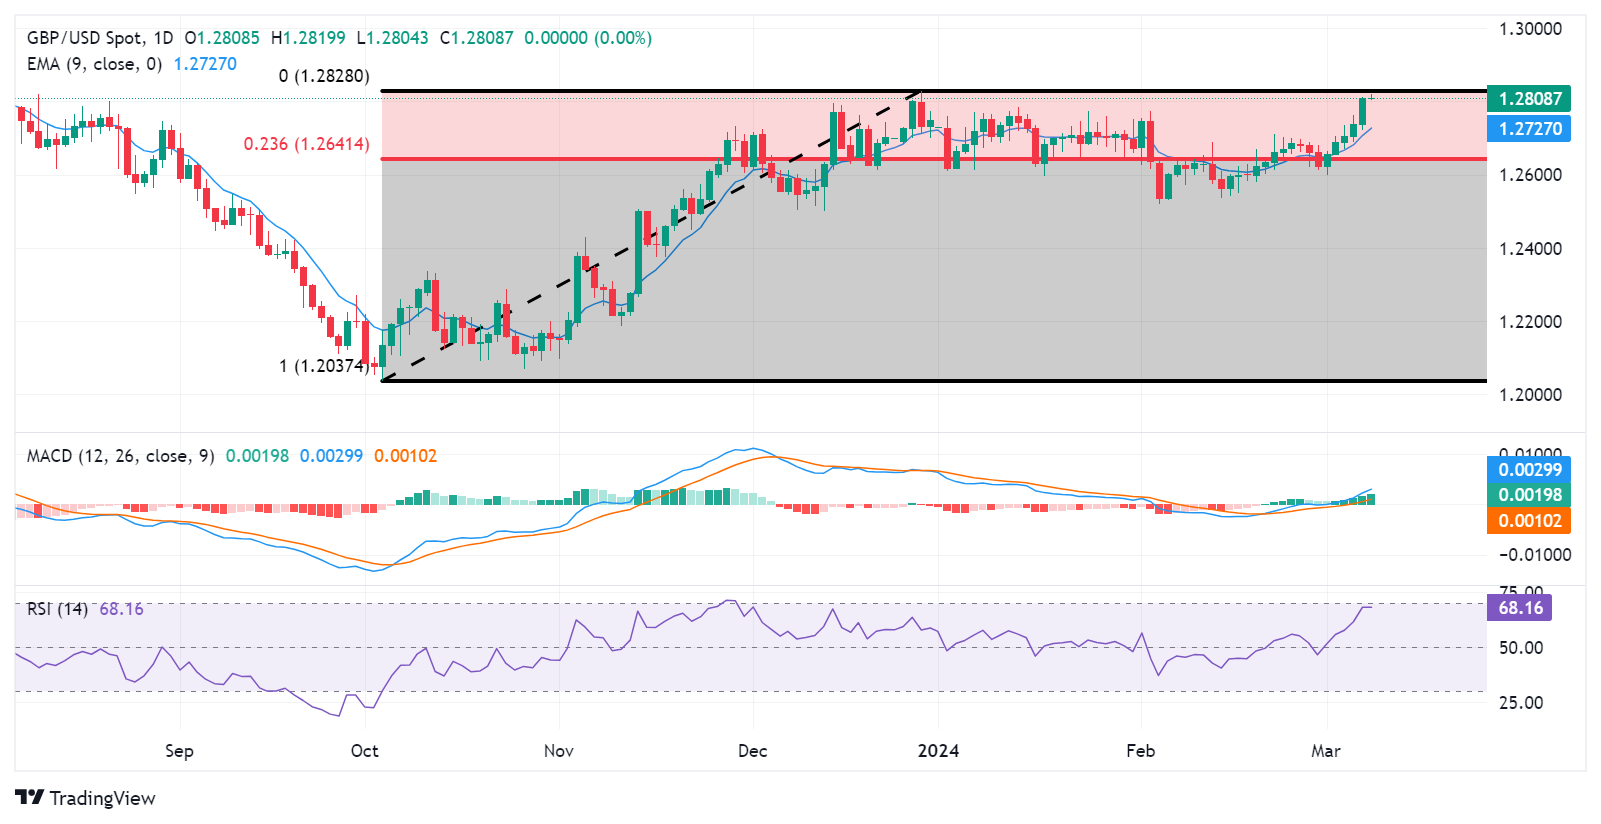
- US Nonfarm Payrolls are set to rise by 200K in February after January’s stellar 353K gain.
- The United States Bureau of Labor Statistics will release the labor market data at 13:30 GMT.
- Robust employment data could provide some relief to US Dollar buyers.
The all-important Nonfarm Payrolls (NFP) data from the United States (US) is slated for release on Friday at 13:30 GMT. The US labor market data, published by the Bureau of Labor Statistics (BLS), could significantly impact the market’s pricing of when the Federal Reserve (Fed) will start lowering interest rates, eventually influencing the US Dollar’s value.
What to expect in the next Nonfarm Payrolls report?
The Nonfarm Payrolls report is likely to show a jobs addition of 200,000 to the US economy last month, down from January’s whopping 353,000 job gain. The Unemployment Rate is expected to stay unchanged at 3.7% in the reported period. A closely watched measure of wage inflation, Average Hourly Earnings, is set to rise 4.4% in the year through February, a tad slower than the 4.5% increase registered in January.
Market participants will closely scrutinize the headline NFP print and the wage inflation data to determine the timing and the scope of the Fed interest rate cut this year, especially after Fed Chair Jerome Powell delivered less hawkish comments during his testimony on the semi-annual Monetary Policy Report (MPR) before the House Financial Services Committee on Wednesday.
Powell said that interest rate cuts are still likely in the coming months if Fed officials are more confident that there is further evidence of falling inflation. Markets are currently pricing in about a 75% chance that the Fed could begin lowering rates in June, higher than the 63% probability seen a day earlier, according to the CME Group’s FedWatch Tool.
Previewing February’s jobs report, TD Securities (TDS) analysts said: “We look for February payrolls to show some moderation in job gains after January's meaningful upside surprise.”
“The upshot is that we are looking for mixed signals from the February data, with a report that will likely point to a still-tight labor market that's yet to act as an obstacle for a normalization in wage growth,” the TDS analysts added.
Meanwhile, the US private sector added 140,000 jobs in February, an increase from the upwardly revised 111,000 increase in January while a tad below the expected 150,000 addition, ADP reported on Wednesday. The number of job openings on the last business day of January stood at 8.86 million, the US Bureau of Labor Statistics (BLS) reported in the Job Openings and Labor Turnover Survey (JOLTS). The data also came in slightly below the market forecast of 8.9 million.
How will US February Nonfarm Payrolls affect EUR/USD?
Loosening US labor market conditions and Powell’s comments smashed the US Dollar to fresh one-month lows across its major counterparts, lifting the EUR/USD pair to a six-week high above 1.0900. Will the US jobs report help the EUR/USD gain further upside traction?
An encouraging NFP headline figure alongside hotter-than-expected wage inflation data could diminish bets for a June Fed rate cut, providing the much-needed relief to the US Dollar at the expense of the Euro. On the other hand, disappointing data could add to the downward pressure on the US Dollar while boosting EUR/USD.
Dhwani Mehta, Analyst at FXStreet, offers a brief technical outlook for EUR/USD:
“The EUR/USD pair broke through the critical 50-day Simple Moving Average (SMA) at 1.0857 on Wednesday, opening the door for further upside. The 14-day Relative Strength Index (RSI) sits just beneath the overbought territory, suggesting that there is more room for the upside.”
“Acceptance above the 1.1000 level is likely to refuel the rally toward the 1.1050 psychological level. EUR buyers will then aim for the December 2023 high of 1.1140. Conversely, the initial demand area is seen at the 1.0900 round figure, below which the 50-day SMA at 1.0856 will be tested. The next support is seen near 1.0835, where the 100- and 200-day SMAs hang around. Further south, the 21-day SMA at 1.0821 could come to the rescue of EUR/USD,” Dhwani adds.
Economic Indicator
United States Nonfarm Payrolls
The Nonfarm Payrolls release presents the number of new jobs created in the US during the previous month in all non-agricultural businesses; it is released by the US Bureau of Labor Statistics (BLS). The monthly changes in payrolls can be extremely volatile. The number is also subject to strong reviews, which can also trigger volatility in the Forex board. Generally speaking, a high reading is seen as bullish for the US Dollar (USD), while a low reading is seen as bearish, although previous months' reviews and the Unemployment Rate are as relevant as the headline figure. The market's reaction, therefore, depends on how the market assesses all the data contained in the BLS report as a whole.
Read more.Next release: 03/08/2024 13:30:00 GMT
Frequency: Monthly
Source: US Bureau of Labor Statistics
Why it matters to traders
America’s monthly jobs report is considered the most important economic indicator for forex traders. Released on the first Friday following the reported month, the change in the number of positions is closely correlated with the overall performance of the economy and is monitored by policymakers. Full employment is one of the Federal Reserve’s mandates and it considers developments in the labor market when setting its policies, thus impacting currencies. Despite several leading indicators shaping estimates, Nonfarm Payrolls tend to surprise markets and trigger substantial volatility. Actual figures beating the consensus tend to be USD bullish.
Nonfarm Payrolls FAQs
Nonfarm Payrolls (NFP) are part of the US Bureau of Labor Statistics monthly jobs report. The Nonfarm Payrolls component specifically measures the change in the number of people employed in the US during the previous month, excluding the farming industry.
The Nonfarm Payrolls figure can influence the decisions of the Federal Reserve by providing a measure of how successfully the Fed is meeting its mandate of fostering full employment and 2% inflation. A relatively high NFP figure means more people are in employment, earning more money and therefore probably spending more. A relatively low Nonfarm Payrolls’ result, on the either hand, could mean people are struggling to find work. The Fed will typically raise interest rates to combat high inflation triggered by low unemployment, and lower them to stimulate a stagnant labor market.
Nonfarm Payrolls generally have a positive correlation with the US Dollar. This means when payrolls’ figures come out higher-than-expected the USD tends to rally and vice versa when they are lower. NFPs influence the US Dollar by virtue of their impact on inflation, monetary policy expectations and interest rates. A higher NFP usually means the Federal Reserve will be more tight in its monetary policy, supporting the USD.
Nonfarm Payrolls are generally negatively-correlated with the price of Gold. This means a higher-than-expected payrolls’ figure will have a depressing effect on the Gold price and vice versa. Higher NFP generally has a positive effect on the value of the USD, and like most major commodities Gold is priced in US Dollars. If the USD gains in value, therefore, it requires less Dollars to buy an ounce of Gold. Also, higher interest rates (typically helped higher NFPs) also lessen the attractiveness of Gold as an investment compared to staying in cash, where the money will at least earn interest.
Nonfarm Payrolls is only one component within a bigger jobs report and it can be overshadowed by the other components. At times, when NFP come out higher-than-forecast, but the Average Weekly Earnings is lower than expected, the market has ignored the potentially inflationary effect of the headline result and interpreted the fall in earnings as deflationary. The Participation Rate and the Average Weekly Hours components can also influence the market reaction, but only in seldom events like the “Great Resignation” or the Global Financial Crisis.
- USD/CHF loses traction near 0.8775 on the softer USD in Friday’s Asian session.
- Fed’s Powell said he still expects to cut rates this year as long as the data continues to cooperate.
- Swiss Unemployment Rate eased to 2.4% in February from 2.5% in January.
- US February Nonfarm Payrolls and Unemployment Rate will be closely watched by traders.
The USD/CHF pair trades in negative territory below the 0.8800 mark during the Asian session on Friday. All eyes are on the US Nonfarm Payrolls (NFP) report due later on Friday. However, the cautious mood in the market might lift the safe-haven Swiss Franc (CHF) against the US Dollar (USD). At press time, USD/CHF is trading at 0.8775, down 0.03% on the day.
Fed Chair Jerome Powell reiterated on Thursday that he still expects to cut interest rates this year as long as the economic data continues to cooperate. However, the Fed officials need more confidence that inflation is returning to 2% before considering rate cuts. The US labor market data later in the day might offer some hints about the economic health of the US, influencing monetary policy decisions and market sentiment. The stronger-than-expected data could boost the Greenback and act as a tailwind for the USD/CHF pair.
On the Swiss front, Data released from the State Secretariat for Economic Affairs (SECO) on Thursday revealed that Switzerland’s Unemployment Rate eased to 2.4% in February from 2.5% in January.
Furthermore, the fall in Swiss inflation in February might fuel expectations that the Swiss National Bank (SNB) could cut interest rates later this month. The interest rate in Switzerland has stood at 1.75%, unchanged since June 2023. Financial markets expect the SNB to lower rates in the coming weeks.
Market players will focus on the US Nonfarm Payrolls for February, which is expected to see a 200K job addition. Additionally, the Unemployment Rate is forecast to hold steady at 3.7%, and finally, the Average Hourly Earnings are projected to drop to 0.2% MoM from 0.6% MoM in January.
- USD/CAD continues its losing streak on higher Crude oil prices.
- Canada’s Unemployment Rate is anticipated to reach 5.8% from 5.7 prior.
- US Nonfarm Payrolls could print a 200K figure for new jobs created in February, against 353K prior.
USD/CAD extends its losses for the third consecutive session on Friday, trading lower to near 1.3450 during the Asian hours. Market participants look forward to the labor data from Statistics Canada on Friday. February’s Unemployment Rate is expected to increase by 5.8% against 5.7 prior. Net Change in Employment is anticipated to print 20K against the previous figure of 37.3K.
The higher Crude oil prices contribute to underpinning the Canadian Dollar (CAD) and, consequently, act as a headwind for the USD/CAD pair. West Texas Intermediate (WTI) inches higher to near $78.90, at the time of writing.
Economists at ING have highlighted the persistent correlation between the Canadian dollar (CAD) and US data, as well as the strong connection between policy expectations of the Federal Reserve (Fed) and the Bank of Canada (BoC). Consequently, they suggest that significant movements in either direction for the USD/CAD pair appear unlikely at this time.
US Dollar Index (DXY) attempts to snap its losing streak ahead of the employment figures from the United States (US), hovering around 102 80, by the press time. US Initial Jobless Claims printed 217K reading for the previous week, surpassing the expectations of 215K. Meanwhile, US Nonfarm Productivity remained consistent, maintaining growth at 3.2% in the fourth quarter of 2023, against the market expectations of 3.1%. Friday is set to release employment numbers from the United States (US), which includes Average Hourly Earnings and Nonfarm Payrolls.
Federal Reserve (Fed) is expected to initiate an interest rate cut cycle starting from June. Fed Chair Jerome Powell reiterated the central bank's stance during his second day of testimony before the US Congress, further fueling speculation regarding potential rate cuts. Powell suggested that cuts in borrowing costs could occur sometime this year, with the condition that the inflation trajectory aligns with the Fed's 2% target.
- Gold price halts its winning streak amid a stable US Dollar.
- Gold price received upward support on speculation of a Fed rate cut in June.
- Fed Chair Powell reiterated at potential rate cuts sometime in 2024.
Gold price snaps its winning streak that began on February 28, correcting lower to near $2,160 per troy ounce during the Asian trading hours on Friday. The prices of yellow metal have been buoyed by market expectations of the Federal Reserve (Fed) potentially initiating an interest rate cut cycle starting in June.
The upward momentum in Gold prices was further strengthened by comments from Fed Chair Jerome Powell during his second day of testimony before the US Congress, where he reaffirmed the central bank's position, thus reinforcing the speculation surrounding potential rate cuts.
Fed Chair Powell has hinted at potential cuts in borrowing costs sometime this year, contingent upon the inflation trajectory aligning with the Fed's 2% target. According to the CME FedWatch Tool, there is a 5.0% probability of a 25 basis points rate cut in March, while the likelihood of cuts in May and June stands at 25.5% and 56.7%, respectively.
Cleveland Fed President Loretta Mester addressed the Virtual European Economics and Financial Center, expressing concerns about the potential persistence of inflation throughout the year. She indicated that if the economy aligns with forecasts, there could be a likelihood of rate cuts later in the year.
On the data front, US Initial Jobless Claims held steady at 217K for the week ending on March 1, against the expectations of 215K. Meanwhile, US Nonfarm Productivity remained consistent, maintaining growth at 3.2% in the fourth quarter of 2023, slightly surpassing market expectations of 3.1%.
Traders are eagerly anticipating Friday's employment data, which includes Average Hourly Earnings and Nonfarm Payrolls, to gain further insights into the economic situation in the United States (US).
- WTI trades in positive territory near $78.80, gaining 0.51% in Friday’s Asian session.
- The prospect of a rate cut from the Fed, a smaller-than-expected US crude oil inventory boosts black gold.
- Oil traders await the revision of the Eurozone Q4 GDP growth number and US labor market data.
Western Texas Intermediate (WTI), the US crude oil benchmark, is trading around $78.80 on Friday. WTI prices edge higher amid the weaker US Dollar (USD) and the prospect that the Federal Reserve (Fed) will lower interest rates this year.
On Thursday, the Chinese Import and Export data for February came in better than expected, indicating a positive signal about the recovery in the second-largest world economies. This, in turn, provides some support to the WTI prices as China is the world’s largest crude oil buyer.
The Fed Chairman Jerome Powell said on Thursday that interest rates have likely peaked and are expected to come down this year despite a cautious stance from the central bank. This potentially lifts the WTI prices as a lower interest rate can increase oil demand.
Furthermore, a smaller-than-expected US crude oil inventory boosts the WTI prices. According to the weekly EIA Crude Oil stockpiles report, US commercial crude oil inventories rose by 1.367M barrels per day (bpd) for the week ending March 1 amid recovering refinery runs from 4.199M bpd in the previous week. The market was anticipating an increase of around 2.166M bps.
Oil traders will closely watch the revision Eurozone Gross Domestic Product (GDP) for the fourth quarter. Also, the US Nonfarm-Payrolls, Unemployment Rate, and Average Hourly Earnings for February will be due on Friday. These events could significantly impact the WTI price. Oil traders will take cues from the data and find trading opportunities around WTI prices.
US President Joe Biden is delivering his State of the Union address (SOTU) on Friday, expressing his outlook on the economy and inflation.
Key quotes
Inflation has dropped to 3%, the lowest in the world and is trending down.
The landing is and will be soft.
Israel must allow more aid into gaza, ensure humanitarian workers aren’t caught in cross fire.
Working non-stop to establish an immediate ceasefire that would last for at least six weeks.
Market reaction
The US Dollar Index is little changed on Biden’s speech, trading flat near two-month lows of 102.72.
US Dollar price today
The table below shows the percentage change of US Dollar (USD) against listed major currencies today. US Dollar was the weakest against the Canadian Dollar.
| USD | EUR | GBP | CAD | AUD | JPY | NZD | CHF | |
| USD | 0.04% | 0.06% | 0.01% | 0.04% | 0.07% | 0.16% | 0.04% | |
| EUR | -0.04% | 0.01% | -0.03% | -0.01% | 0.05% | 0.12% | -0.01% | |
| GBP | -0.06% | -0.02% | -0.05% | -0.03% | 0.00% | 0.10% | -0.04% | |
| CAD | -0.03% | 0.01% | 0.04% | 0.02% | 0.08% | 0.14% | 0.02% | |
| AUD | -0.05% | 0.01% | 0.02% | -0.02% | 0.05% | 0.11% | -0.02% | |
| JPY | -0.09% | -0.03% | -0.02% | -0.08% | -0.07% | 0.09% | -0.07% | |
| NZD | -0.17% | -0.12% | -0.12% | -0.14% | -0.13% | -0.10% | -0.15% | |
| CHF | -0.02% | 0.01% | 0.02% | -0.02% | 0.00% | 0.03% | 0.13% |
The heat map shows percentage changes of major currencies against each other. The base currency is picked from the left column, while the quote currency is picked from the top row. For example, if you pick the Euro from the left column and move along the horizontal line to the Japanese Yen, the percentage change displayed in the box will represent EUR (base)/JPY (quote).
| Raw materials | Closed | Change, % |
|---|---|---|
| Silver | 24.32 | 0.78 |
| Gold | 2159.556 | 0.55 |
| Palladium | 1037.05 | -0.94 |
- EUR/USD holds positive ground near 1.0947 on the softer US Dollar.
- The European Central Bank (ECB) maintained its monetary policy unchanged at its March meeting on Thursday.
- Fed Chair Powell said rate cuts may not be too far off if inflation signals cooperate.
- The Eurozone GDP growth number, US February Nonfarm-Payrolls will be in the spotlight on Friday.
The EUR/USD pair gains ground to new multi-week tops around the mid-1.0900s during the early Asian trading hours on Friday. The European Central Bank (ECB) decided to leave its monetary policy unchanged on Thursday as the central bank is still on course to bring inflation back to its target range. The attention will shift to US Nonfarm Payrolls (NFP) on Friday. The major pair currently trades around 1.0947, adding 0.01% on the day.
On Thursday, the ECB kept the interest rate on the main refinancing operations and the interest rates on the marginal lending facility and the deposit facility unchanged at 4.5%, 4.75%, and 4.0%, respectively. The central bank said it will keep policy appropriately restrictive for as long as necessary to bring inflation down to the ECB’s target. However, a first rate cut at the June meeting is probable if the evidence of inflation continues to improve.
Across the pond, the Fed Chair Jerome Powell said on Thursday that interest rate cuts may not be too far off if inflation signals cooperate. However, Powell emphasized that the timing and scale of rate cuts will depend on the data. Investors anticipate the first cut to come in June, with four reductions totaling a full percentage point by the end of 2024.
Investors will closely watch the US February labor market report on Friday, including US Nonfarm-Payrolls, Unemployment Rate, and Average Hourly Earnings. The labor market data for February will be a key factor in the FOMC's assessment of the current and prospective inflation trajectory. On the Euro docket, the revision of the Eurozone GDP Growth Rate will be due later in the day. These events could give a clear direction to the EUR/USD pair.
- Australian Dollar consolidates with a positive bias ahead of US Nonfarm Payrolls.
- Australia’s S&P/ASX 200 Index rose to new record highs, following a tech-led rally on Wall Street overnight.
- Fed Chair Powell reiterated that the central bank could initiate rate cuts at some point this year.
The Australian Dollar (AUD) attempts to continue its winning streak for a third consecutive session on Friday on a possibility of the US Dollar (USD) moving on a downward trajectory. Federal Reserve (Fed) Chair Jerome Powell, in his second day of testimony before the US Congress, reaffirmed the central bank's position. Powell hinted at potential cuts in borrowing costs sometime this year. However, he emphasized that such actions would hinge on the inflation trajectory aligning with the Fed's target of 2%.
Australian Dollar extends its gains, buoyed by improved market sentiment driven by a surge in equity markets. The S&P/ASX 200 Index has reached new record highs, following a tech-led rally on Wall Street overnight. This positive momentum is fueled by expectations that major central banks may implement interest rate cuts this year, further boosting market confidence.
Australian market remains resilient despite concerns that the domestic economy expanded less than anticipated in the fourth quarter and the Trade Balance surplus fell short of expectations. These economic indicators underscore the argument for the Reserve Bank of Australia (RBA) to consider rate cuts in the near future. Market speculation suggests that the RBA may commence rate cuts as early as August, with a total easing of 45 basis points anticipated for 2024.
Daily Digest Market Movers: Australian Dollar attempts to extend gains on positive sentiment
- Australian Trade Balance (MoM) showed that the surplus increased to 11,027M in February, from 10,743M prior. The market expectation was an increase to 11,500M.
- Aussie Imports (MoM) increased by 1.3% in February, from the previous figure of 4.8%. Monthly Exports grew by 1.6%, exceeding the previous rise of 1.5%.
- Australian Gross Domestic Product (GDP) grew by 0.2% QoQ in the fourth quarter of 2023, slightly below market expectations of no change at 0.3%.
- GDP (YoY) expanded by 1.5%, surpassing the expected 1.4%, but falling short of the previous growth of 2.1%.
- AiG Industry Index reported a print of -14.9 for January, compared to the -27.3 prior.
- Judo Bank Services PMI surged to a ten-month high of 53.1 in February. This increase pushed the index above the 50.0 threshold, indicating expansion, and surpassed the previous reading of 49.1.
- Australian Current Account Balance rose to 11.8 billion in the fourth quarter of 2023, against the expected 5.6 billion and 1.3 billion prior.
- Commerzbank economists anticipate that the Reserve Bank of Australia (RBA) will delay rate cuts, providing support for the Australian Dollar (AUD) in the interim. They do not foresee an imminent slowdown in the Australian economy. However, if clear indications of a slowdown emerge, possibly signaling a recession, the RBA may adjust its monetary policy stance sooner.
- Chinese Trade Balance USD increased to $125.16B against the expected $103.7B for February and $75.34B prior. Imports and Exports (YoY) rose by 3.5% and 7.1%, respectively.
- Cleveland Fed President Loretta Mester addressed the Virtual European Economics and Financial Center, expressing concerns about the potential persistence of inflation throughout the year. She indicated that if the economy aligns with forecasts, there could be a likelihood of rate cuts later in the year.
- Former New York Fed economist Steven Friedman noted that Federal Reserve policymakers are likely to remain cautious about cutting interest rates this year due to strong growth and volatile inflation. He expected the possibility of fewer than the three cuts anticipated for 2024.
- According to the CME FedWatch Tool, there is a 5.0% probability of a 25 basis points rate cut in March, while the likelihood of cuts in May and June stands at 25.5% and 56.7%, respectively.
- US Initial Jobless Claims were unchanged at 217K for the week ending on March 1, against the expected 215K.
- US Nonfarm Productivity remained consistent at the growth of 3.2% in the fourth quarter of 2023, exceeding the market expectation of 3.1%.
- February’s US ADP Employment Change came in at 140K against the expected 150K, increasing from 111K prior.
- January’s US JOLTS Job Openings fell to 8.863M from December’s figure of 9.026M, falling short of the market expectation of 8.900M.
- ISM Services PMI declined to 52.6 in February, against the forecasted downtick to 53.0 from 53.4.
- Factory Orders (MoM) decreased by 3.6% in January, exceeding the expected fall of 2.9%.
- S&P Global Composite PMI (Feb) increased to 52.5 from the previous reading of 51.4.
- US ISM Manufacturing PMI (Feb) dropped to 47.8 from 49.1, surprisingly missing the market expectation 49.5.
Technical Analysis: Australian Dollar rises to near 0.6620 followed by a major resistance
The Australian Dollar trades around 0.6620 on Friday. Key resistance is noted near the major level of 0.6650, followed by the psychological barrier of 0.6700 level. On the downside, the pair meet the psychological support at 0.6600 level followed by the 23.6% Fibonacci retracement level of 0.6585. A break below the latter could push the AUD/USD pair to navigate the region around the nine-day Exponential Moving Average (EMA) at 0.6560 before the major support of 0.6550.
AUD/USD: Daily Chart
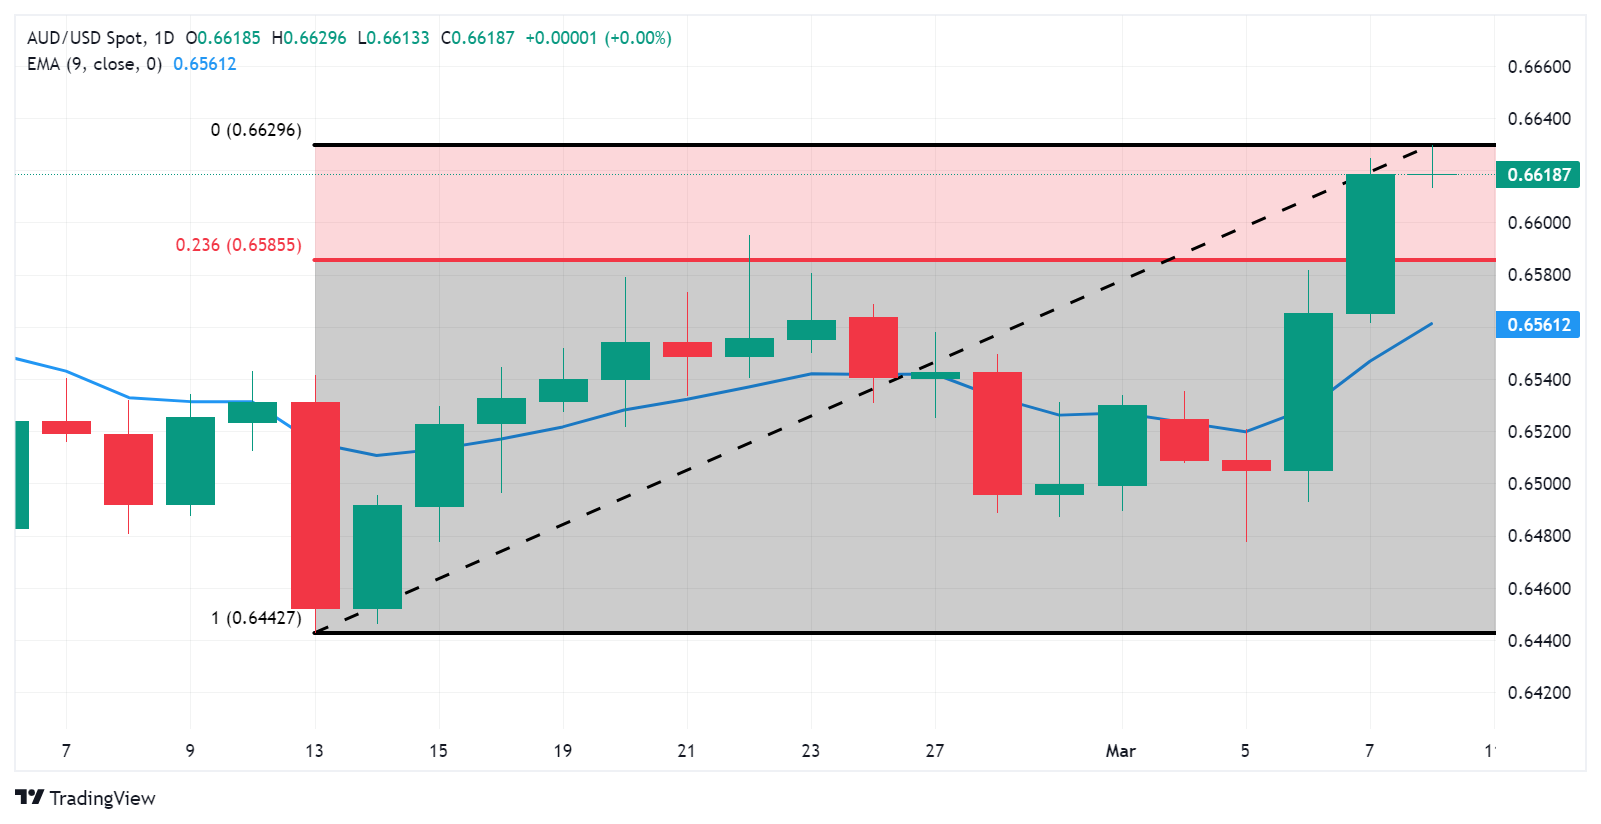
Australian Dollar price today
The table below shows the percentage change of Australian Dollar (AUD) against listed major currencies today. Australian Dollar was the strongest against the New Zealand Dollar.
| USD | EUR | GBP | CAD | AUD | JPY | NZD | CHF | |
| USD | 0.02% | 0.04% | 0.02% | 0.04% | 0.03% | 0.06% | 0.03% | |
| EUR | -0.01% | 0.02% | 0.01% | 0.03% | 0.02% | 0.04% | 0.00% | |
| GBP | -0.03% | -0.01% | -0.01% | 0.01% | 0.00% | 0.03% | -0.01% | |
| CAD | -0.02% | 0.00% | 0.01% | 0.02% | 0.01% | 0.03% | -0.01% | |
| AUD | -0.04% | -0.02% | -0.01% | -0.01% | 0.01% | 0.00% | -0.02% | |
| JPY | -0.03% | 0.01% | 0.00% | 0.00% | 0.01% | 0.04% | -0.01% | |
| NZD | -0.08% | -0.06% | -0.04% | -0.05% | -0.04% | -0.05% | -0.07% | |
| CHF | 0.00% | 0.01% | 0.02% | 0.00% | 0.02% | 0.01% | 0.04% |
The heat map shows percentage changes of major currencies against each other. The base currency is picked from the left column, while the quote currency is picked from the top row. For example, if you pick the Euro from the left column and move along the horizontal line to the Japanese Yen, the percentage change displayed in the box will represent EUR (base)/JPY (quote).
The People’s Bank of China (PBoC) set the USD/CNY central rate for the trading session ahead on Friday at 7.0978 as compared to the previous day's fix of 7.1002 and 7.1863 Reuters estimates.
Japanese Finance Minister Shunichi Suzuki said on Friday that there is a risk that rising interest rates could pressure Japan's debt.
Key quotes
"There's a risk that rising interest rates could pressure Japan's debt.”
“Not at a stage where I can mention fiscal targets other than primary budget balance.”
“Important to make persistent efforts to maintain fiscal health.
Market reaction
At the time of writing, USD/JPY is trading 0.24% lower on the day at 147.73.
- USD/JPY loses traction near 147.70 amid the softer USD and BoJ’s hawkish comments.
- BOJ policymakers said the economy was moving towards its 2% target, raising the chance that BoJ will end its negative rate.
- The US Nonfarm-Payrolls will be a closely watched event for traders.
The USD/JPY pair drops to fresh five-week lows below the 148.00 mark during the early Asian trading hours on Friday. A weaker US Dollar (USD) and growing speculation that the Bank of Japan (BoJ) will exit from an ultra-loose monetary policy stance lift the Japanese Yen (JPY) and exert some selling pressure on the USD/JPY. At press time, the pair is trading at 147.70, down 0.26% on the day.
The Bank of Japan's (BOJ) governor and board members said on Thursday the economy was moving towards the central bank's 2% inflation target, raising the possibility that the BOJ will end its negative interest rates for the first time since 2007. The hawkish comments from BoJ policymakers lift the JPY to a one-month high against the USD
On the other hand, Fed Chair Jerome Powell said the US central bank is "not far" from gaining enough confidence that inflation will reach its 2% target to begin lowering interest rates. The Fed Chair didn’t provide a precise timetable for rate cuts, as Fed officials want to see more evidence before considering cutting rates.
Market participants will take more cues from the US February labor market report on Friday. The US Nonfarm-Payrolls is projected to see 200,000 jobs added to the US economy. The unemployment rate is estimated to hold steady at 3.7%, while Average Hourly Earnings are forecast to ease to 0.2% MoM versus 0.6% MoM in January.
| Index | Change, points | Closed | Change, % |
|---|---|---|---|
| NIKKEI 225 | -492.07 | 39598.71 | -1.23 |
| Hang Seng | -208.31 | 16229.78 | -1.27 |
| KOSPI | 6.13 | 2647.62 | 0.23 |
| ASX 200 | 30.2 | 7763.7 | 0.39 |
| DAX | 126.14 | 17842.85 | 0.71 |
| CAC 40 | 61.48 | 8016.22 | 0.77 |
| Dow Jones | 130.3 | 38791.35 | 0.34 |
| S&P 500 | 52.6 | 5157.36 | 1.03 |
| NASDAQ Composite | 241.83 | 16273.38 | 1.51 |
| Pare | Closed | Change, % |
|---|---|---|
| AUDUSD | 0.66197 | 0.89 |
| EURJPY | 162.069 | -0.33 |
| EURUSD | 1.09488 | 0.5 |
| GBPJPY | 189.616 | -0.26 |
| GBPUSD | 1.28091 | 0.61 |
| NZDUSD | 0.61738 | 0.8 |
| USDCAD | 1.34578 | -0.4 |
| USDCHF | 0.87756 | -0.48 |
| USDJPY | 148.028 | -0.87 |


© 2000-2026. Уcі права захищені.
Cайт знаходитьcя під керуванням TeleTrade DJ. LLC 2351 LLC 2022 (Euro House, Richmond Hill Road, Kingstown, VC0100, St. Vincent and the Grenadines).
Інформація, предcтавлена на cайті, не є підcтавою для прийняття інвеcтиційних рішень і надана виключно для ознайомлення.
Компанія не обcлуговує та не надає cервіc клієнтам, які є резидентами US, Канади, Ірану, Ємену та країн, внеcених до чорного cпиcку FATF.
Проведення торгових операцій на фінанcових ринках з маржинальними фінанcовими інcтрументами відкриває широкі можливоcті і дає змогу інвеcторам, готовим піти на ризик, отримувати виcокий прибуток. Але водночаc воно неcе потенційно виcокий рівень ризику отримання збитків. Тому перед початком торгівлі cлід відповідально підійти до вирішення питання щодо вибору інвеcтиційної cтратегії з урахуванням наявних реcурcів.
Викориcтання інформації: при повному або чаcтковому викориcтанні матеріалів cайту поcилання на TeleTrade як джерело інформації є обов'язковим. Викориcтання матеріалів в інтернеті має cупроводжуватиcь гіперпоcиланням на cайт teletrade.org. Автоматичний імпорт матеріалів та інформації із cайту заборонено.
З уcіх питань звертайтеcь за адреcою pr@teletrade.global.
переклади